Black Friday 2025 marked another significant shopping event for Canadian consumers, with retailers deploying sophisticated pricing strategies to capture holiday spending. Online and in-store spending on Black Friday reached an estimated $865 million in Canada, which marked a 6% increase compared to last year.
At DataWeave, we analyzed Black Friday 2025 pricing dynamics across two major categories in the Canadian market: Consumer Electronics and Home & Furniture. Our AI-powered pricing intelligence platform tracked approximately 16,000 SKUs across leading Canadian retailers like Target, Walmart, Wayfair, Home Depot, Amazon, Best Buy, Loblaws, Metro and more, uncovering distinct patterns in how brands and retailers structured their promotional calendars this year.
Our Methodology
DataWeave monitored pricing and discount trends across Canadian retailers during two key timeframes:
Pre-Black Friday Period: Up to November 23, 2025 – establishing baseline promotional activity and early holiday deals
Black Friday Week: November 24 – December 1, 2025 – spanning Thanksgiving through Black Friday (November 28) and Cyber Monday (December 1)
Our dataset included top-performing products across multiple subcategories on major Canadian retail platforms. We also tracked Share of Search metrics, measuring brand prominence by analyzing which brand names appeared in the top 20 search results for high-value keywords during each period.
Black Friday 2025 Canada: Overview
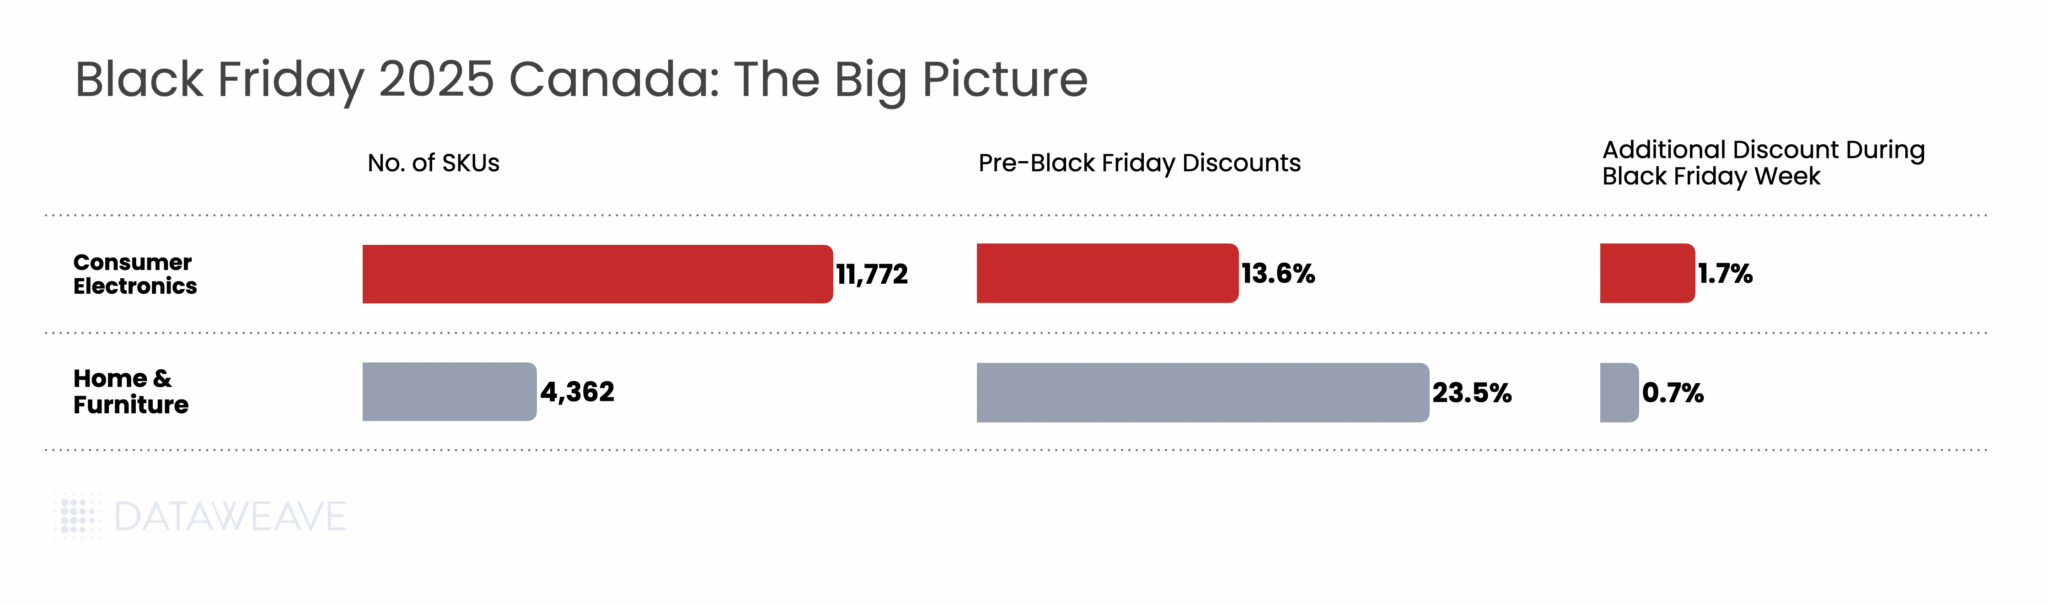
Here’s how average discounts compared between the Pre-Black Friday period and Black Friday Week:
Key Finding: Canadian retailers front-loaded their promotional strategy significantly, with Pre-Black Friday discounts averaging 16.3% across categories. The additional lift during Black Friday Week was modest at 1.4%.
Consumer Electronics
Consumer electronics consistently drives Black Friday traffic, and Canadian retailers delivered compelling early-season value. Our analysis of 11,772 SKUs reveals nuanced subcategory performance.
Subcategory Discount Breakdown
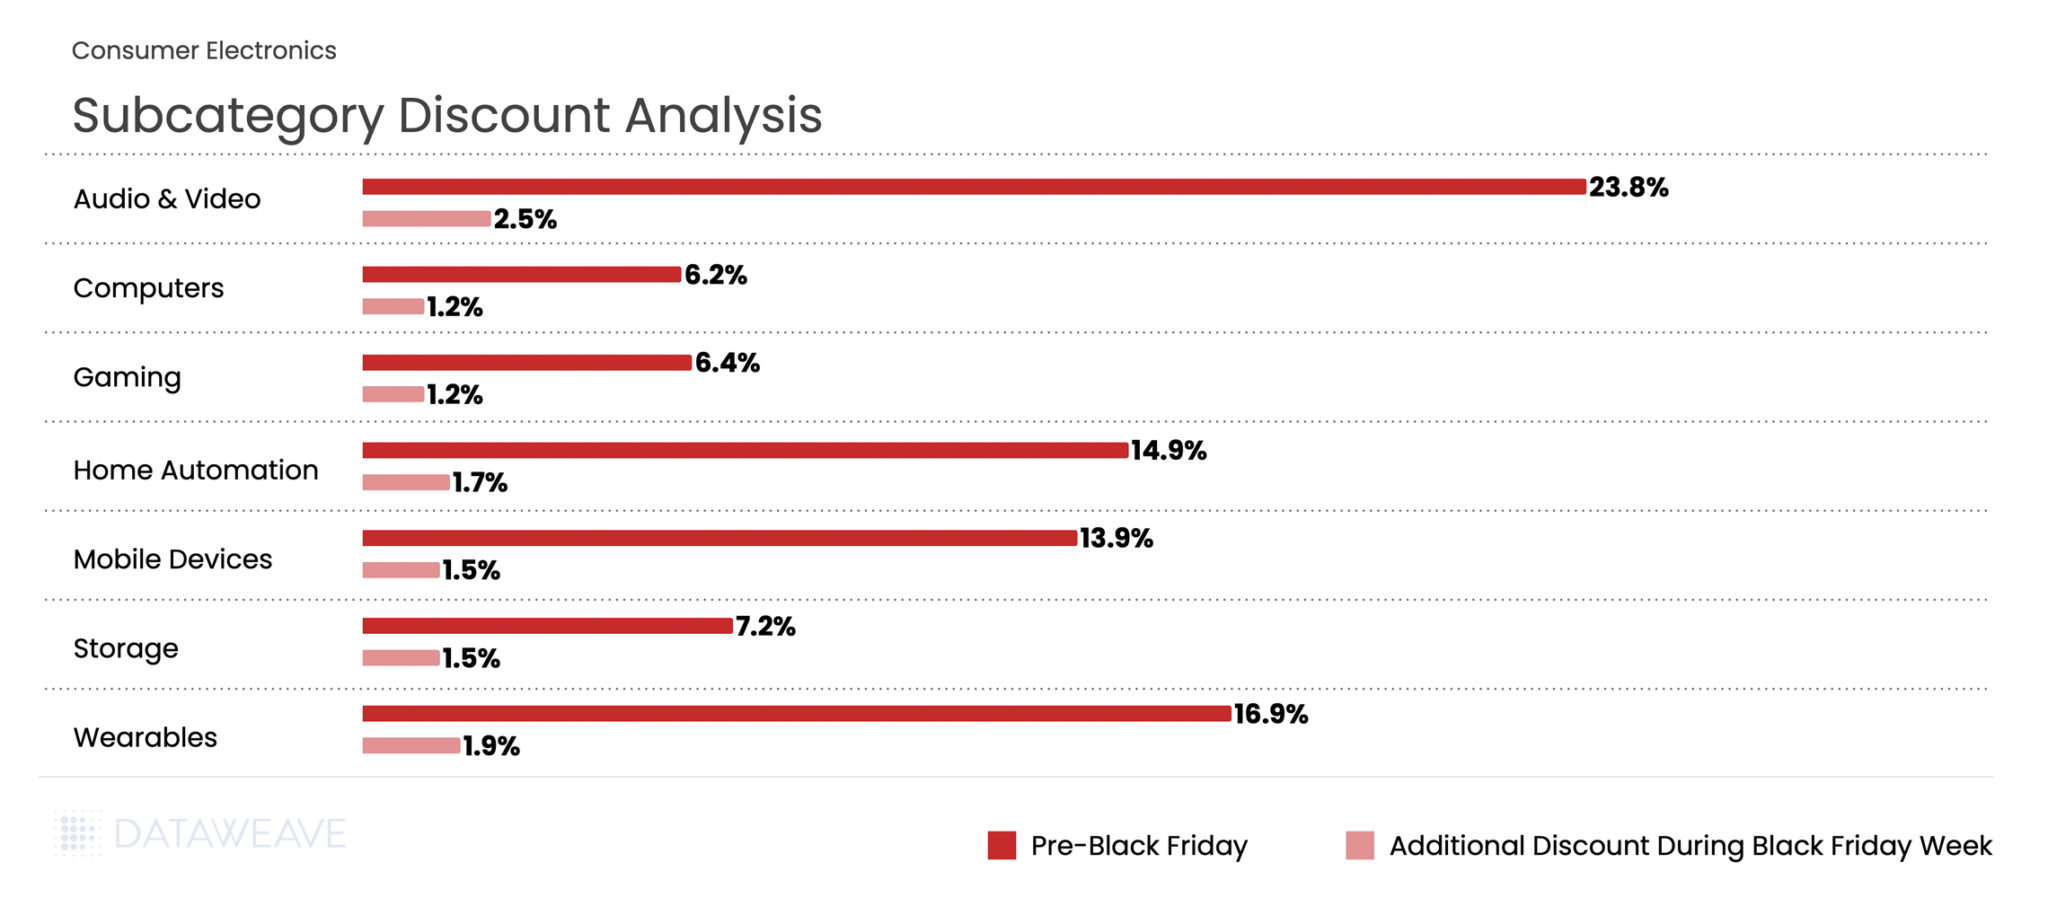
Consumer Electronics averaged 13.6% discounts in the Pre-Black Friday period, with Black Friday Week adding 1.7%. Audio & Video dominated early promotional activity at 23.8%, signalling retailers’ intent to clear inventory ahead of the main event. Wearables followed at 16.9%, likely timed to capture gift-buying momentum.
During Black Friday Week, Audio & Video maintained leadership with an additional 2.5% discount, the highest incremental lift in the category. Meanwhile, Computers and Gaming, already positioned at modest pre-sale discounts of 6.2% and 6.4%, saw minimal additional movement, suggesting constrained inventory or deliberate pricing discipline in these segments.
Share of Search: Brand Visibility Trends
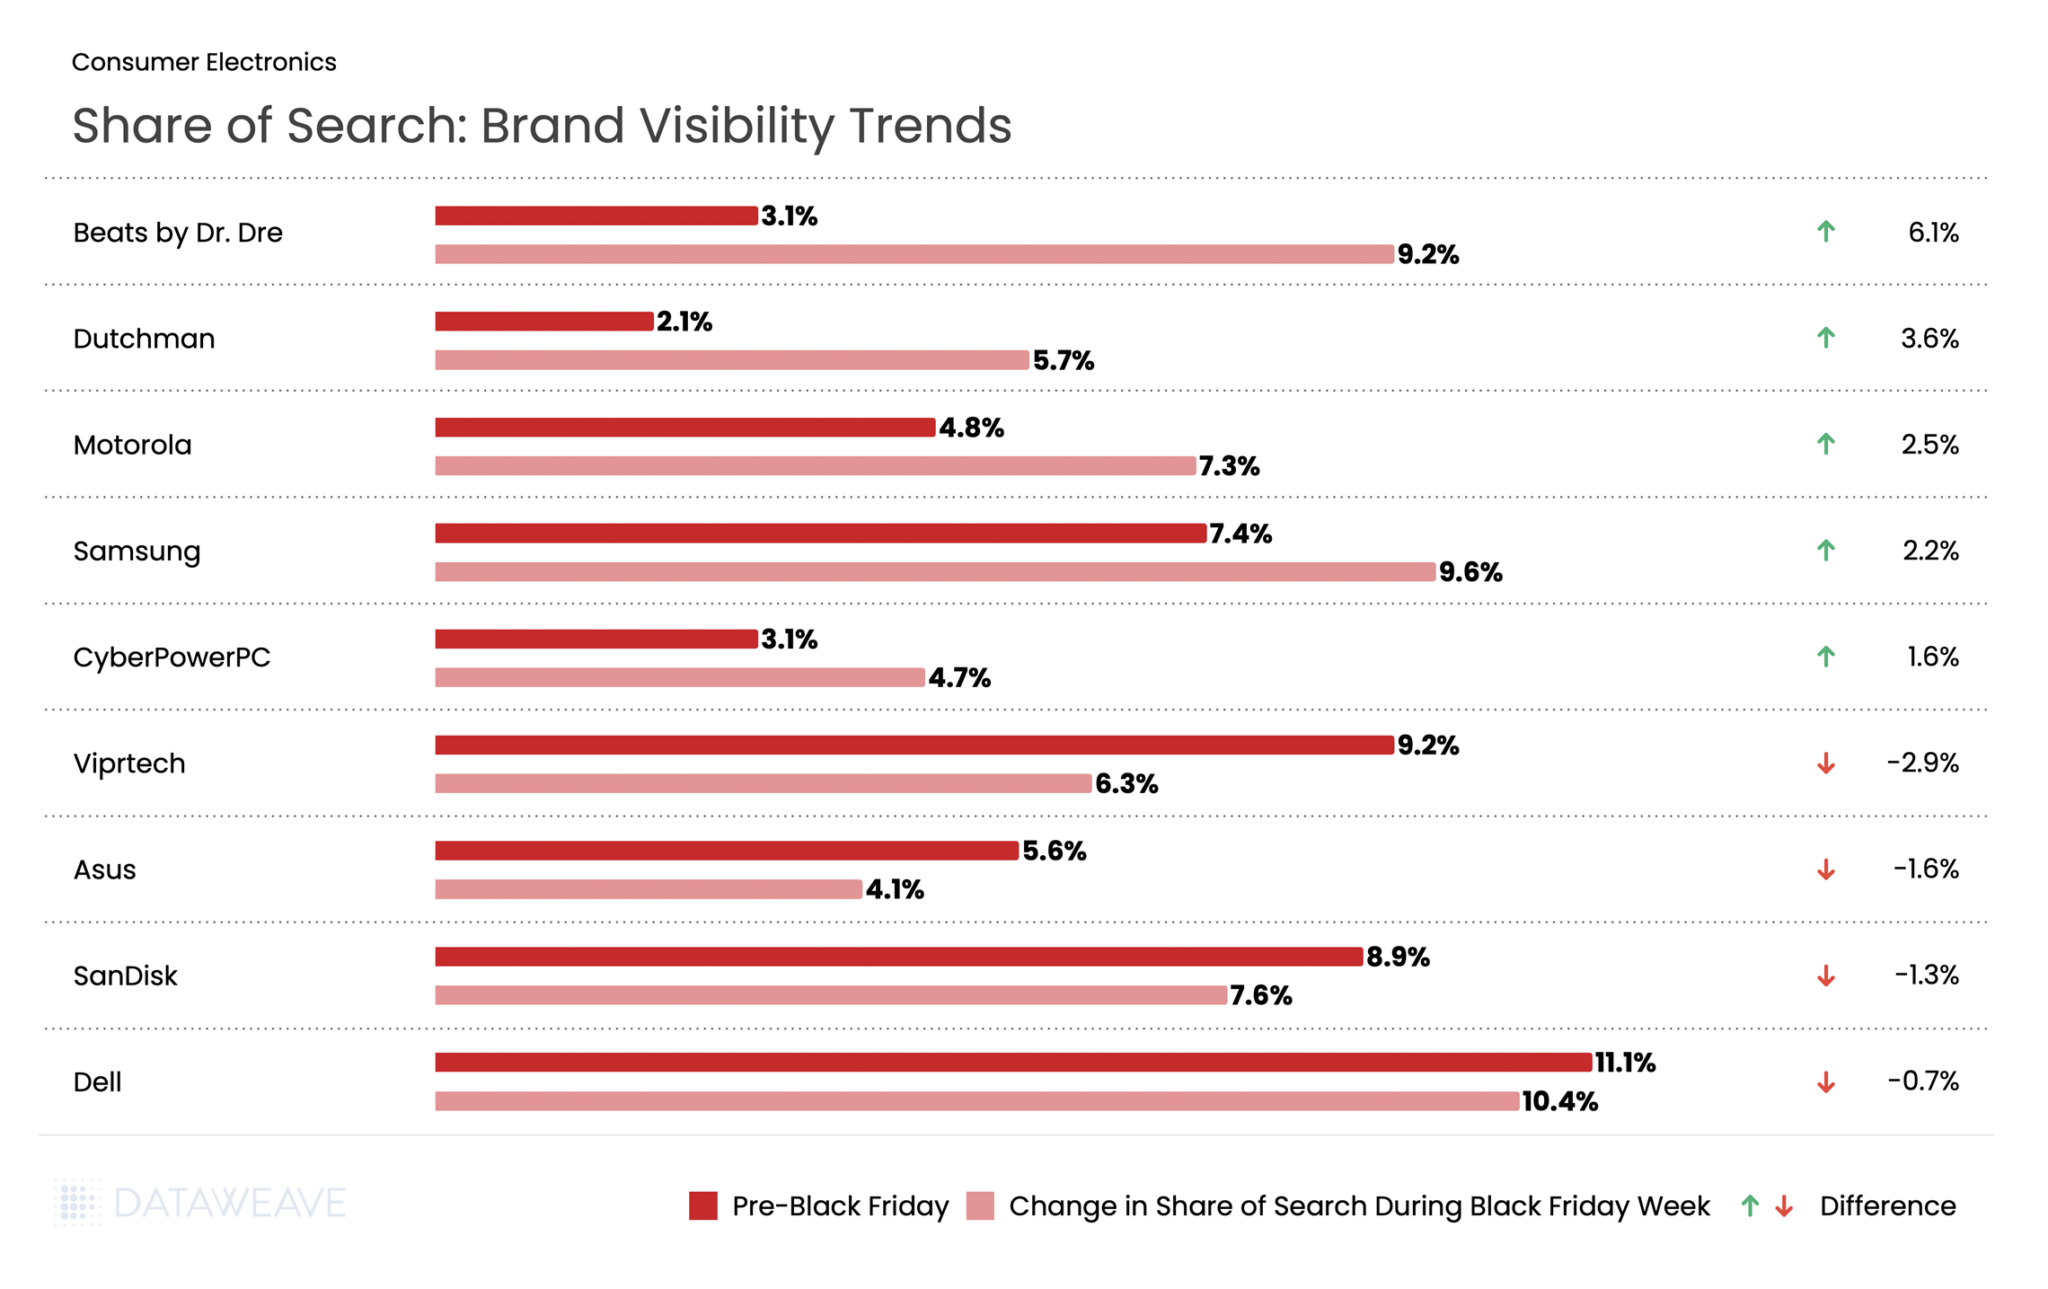
Our Share of Search data reveals which brands gained or lost prominence during Black Friday Week:
Audio brands dominated visibility gains during Black Friday Week. Beats by Dr. Dre nearly tripled its Share of Search from 3.1% to 9.2%, showing the strongest gains. Visibility for Dutchman climbed 3.6%. Motorola and Samsung also captured increased search prominence with gains of 2.5% and 2.2% respectively.
Conversely, some established tech brands experienced visibility declines. Gaming brand Viprtech by 2.9%. Asus declined by 1.6%, and SanDisk dropped by 1.3%.
Home & Furniture
Home & Furniture showed the most aggressive early discounting of any category in our Canadian analysis. Tracking 4,362 SKUs, we found retailers heavily promoted home goods well before Black Friday weekend.
Subcategory Discount Breakdown
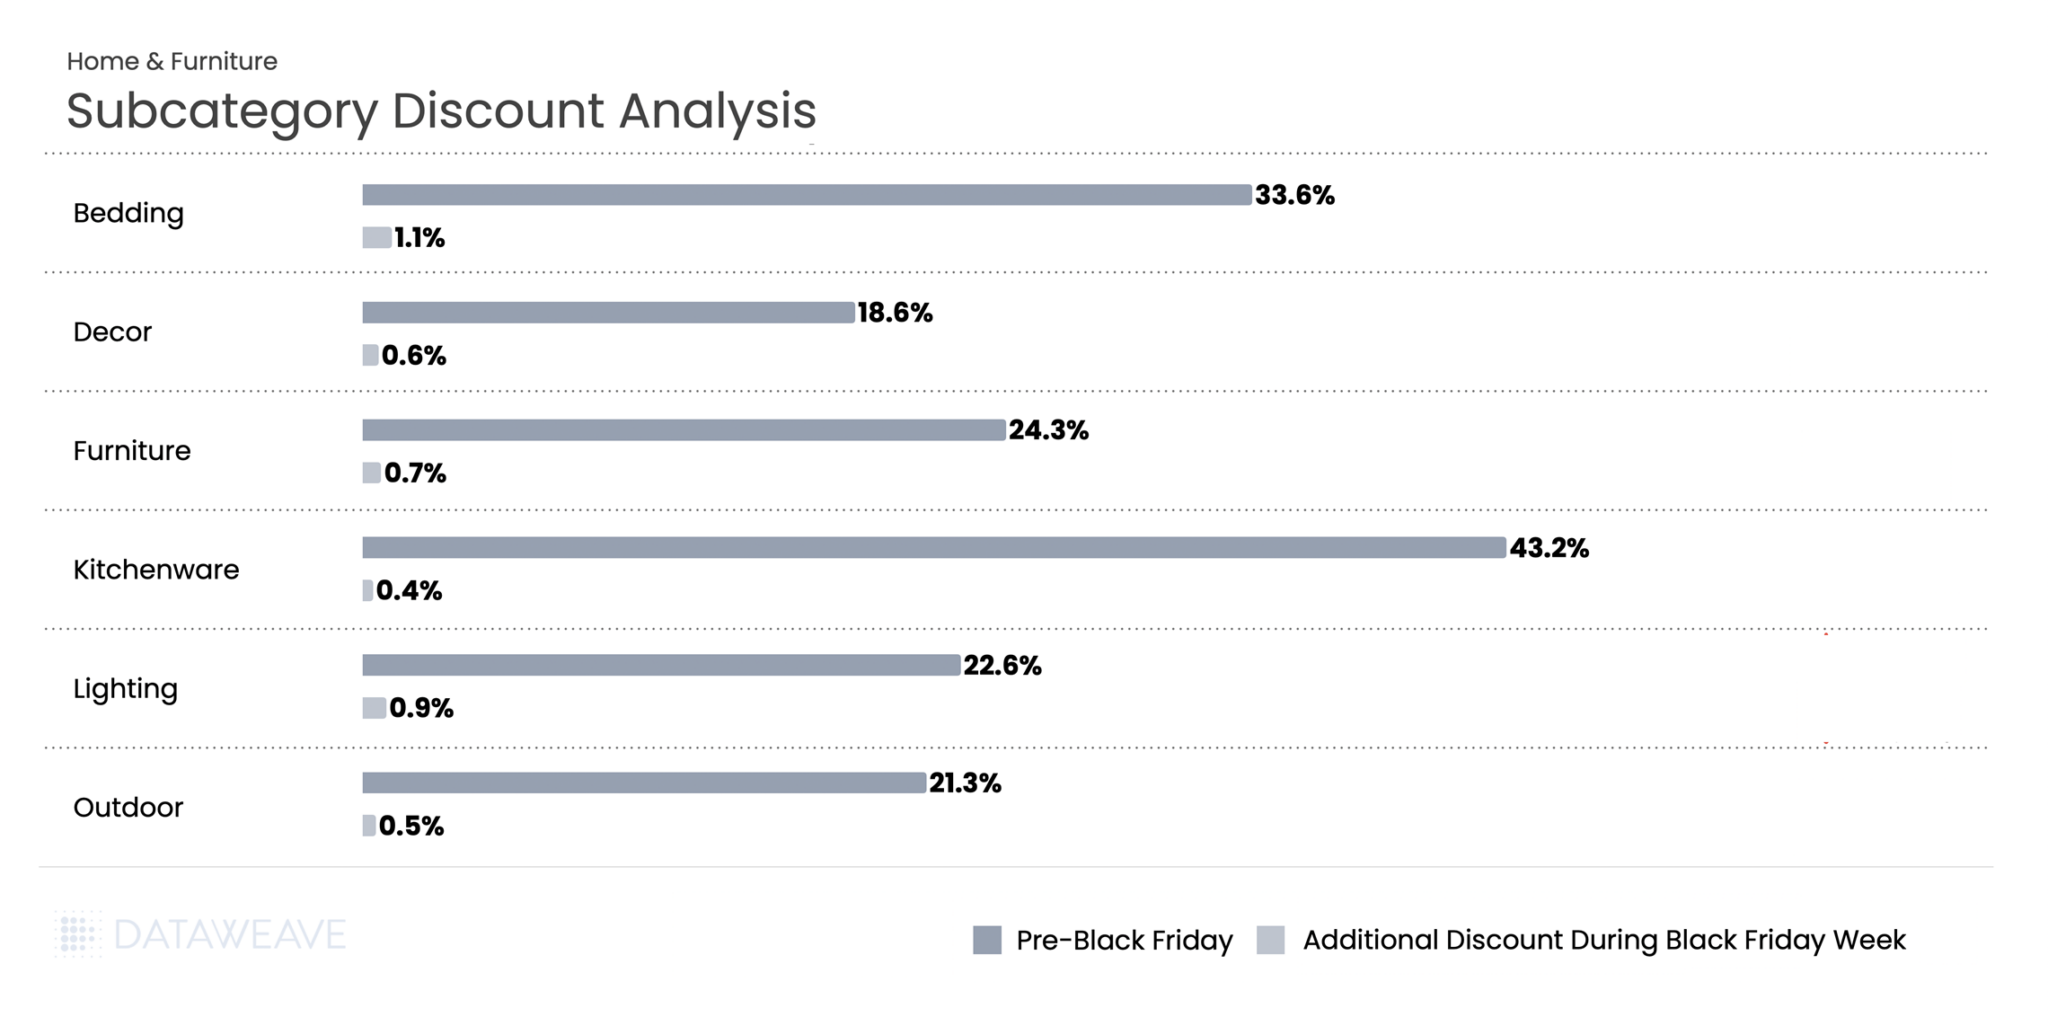
Home & Furniture led all categories with Pre-Black Friday discounts averaging 23.5%, but Black Friday Week added only 0.7%, the smallest incremental discount in our entire study. Kitchenware saw extraordinary pre-sale discounts of 43.2%, the highest in any subcategory we tracked. Bedding followed at 33.6%, while Furniture reached 24.3%. These deep early discounts likely aimed to drive early conversions and manage bulky inventory ahead of peak logistics constraints.
During Black Friday Week, additional discounting remained minimal across the board. Bedding posted the highest lift at 1.1%, while Kitchenware saw just 0.4%. The data suggests Canadian home goods retailers viewed the pre-sale period as their primary promotional window, with Black Friday serving more to sustain momentum than deliver new value.
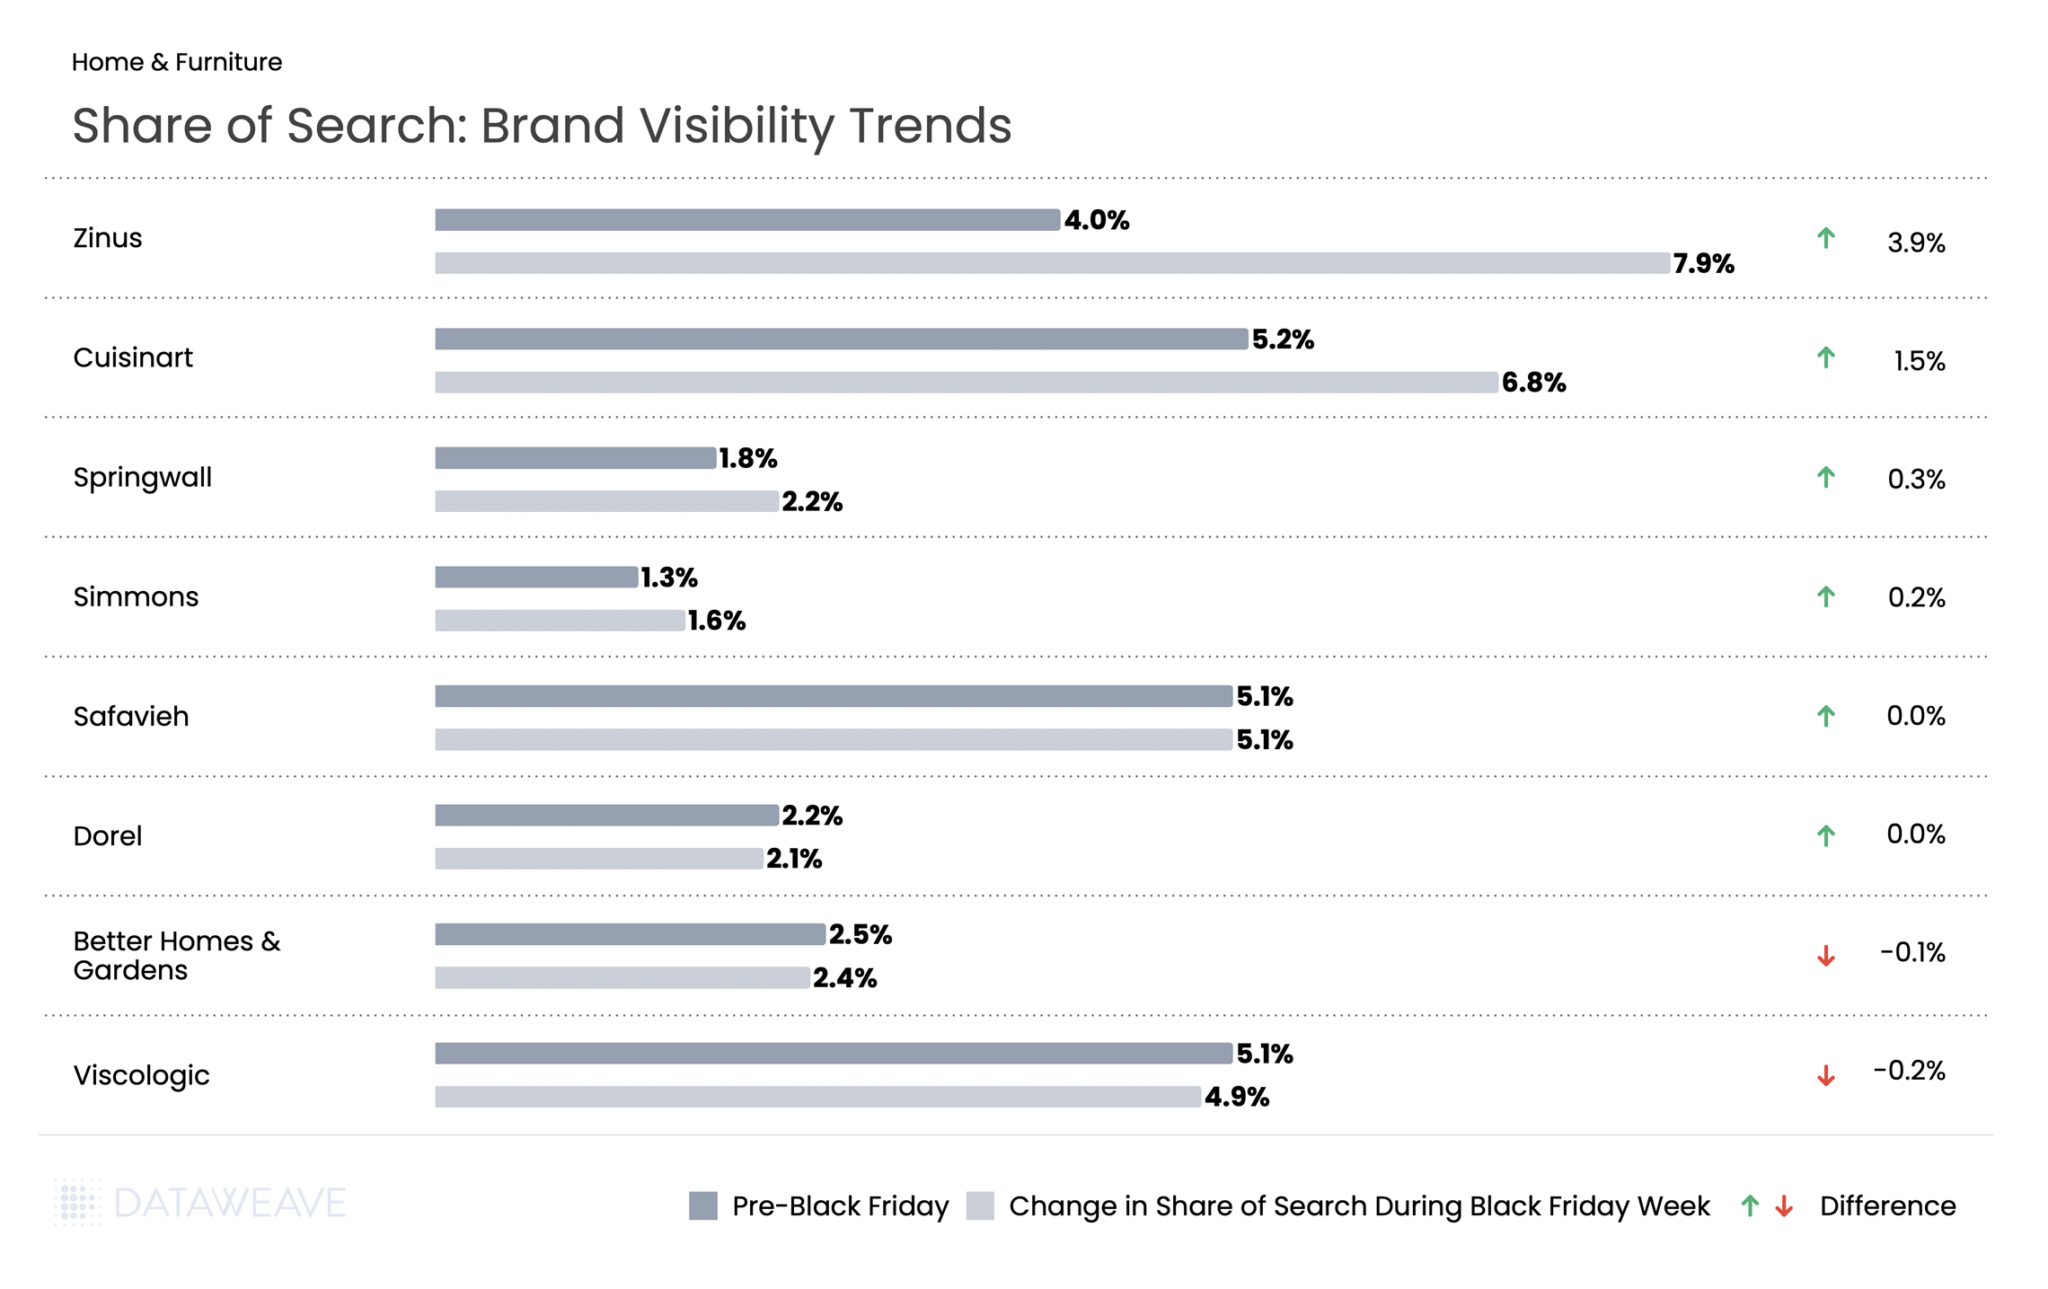
Share of Search: Brand Visibility Trends
Mattress brand Zinus led gains with a 3.9% increase, positioning itself as a value-focused furniture leader during the sale period. Cuisinart climbed by 1.5%, suggesting strategic amplification of this established kitchenware brand.
Most home brands maintained relatively stable visibility throughout the sale period. Safavieh and Dorel showed essentially no change, while Better Homes & Gardens and Viscologic experienced only minor declines of 0.1% and 0.2% respectively.
Want to understand how DataWeave’s pricing intelligence platform can help your business make data-driven decisions during peak sales events? Contact us to learn more about competitive insights, price intelligence, assortment analytics, content analytics, and digital shelf analytics.
Check out our coverage on Black Friday 2025 across US, UK, and Germany. Follow our blog for more insights on retail pricing trends, brand visibility analysis, and data-driven commerce intelligence.
Black Friday 2025 shattered records once again. U.S. consumers spent a record $11.8 billion online on Black Friday, a 9.1% increase from 2024 and the first time online sales exceeded $11 billion. The National Retail Federation (NRF) projects holiday retail sales (November-December) to grow 3.7% to 4.2% over 2024, with total holiday spending expected to surpass $1 trillion for the first time ever. Against this backdrop of robust consumer spending, how did leading retailers and brands perform across key categories this Black Friday?
At DataWeave, we conducted a detailed analysis of Black Friday 2025 pricing trends across five major categories: Consumer Electronics, Home & Furniture, Health & Beauty, Grocery, and Apparel. Our AI-powered pricing intelligence platform monitored nearly 80,000 SKUs across leading U.S. retailers like Amazon, Walmart, Target, Macy’s, Home Depot, Sephora, and more, revealing interesting patterns in how retailers and brands approached this year’s sale season.
Our Methodology
For this analysis, DataWeave monitored average discounts across leading U.S. retailers during two distinct periods:
Pre-Black Friday: Up to November 23, 2025 – capturing early holiday deals and baseline pricing
Additional Discounts During Black Friday Week: November 24 – December 1, 2025 – covering Thanksgiving week through Black Friday (November 28) and Cyber Monday (December 1)
Our sample encompassed the top-ranked products across subcategories on major retail sites. We also analyzed Share of Search data, which measures brand visibility by monitoring which brand names appear in the top 20 search results for critical keywords.
Black Friday 2025: The Big Picture
Here’s the snapshot of average discounts during the Pre-Black Friday period compared to Black Friday Week:
Key Insight: Pre-Black Friday discounts were significant across all categories. This suggests retailers front-loaded their promotions to capture early holiday shoppers, with additional discounts during Black Friday Week adding to the baseline discounts already in place.
Consumer Electronics
Consumer electronics remain one of the most anticipated categories during Black Friday and Cyber Monday. Notably, AI traffic to retail websites grew 805% year-over-year, with consumers using AI tools most frequently for video games, appliances, and electronics categories. Our analysis of 10,356 SKUs reveals how discounts varied across subcategories.
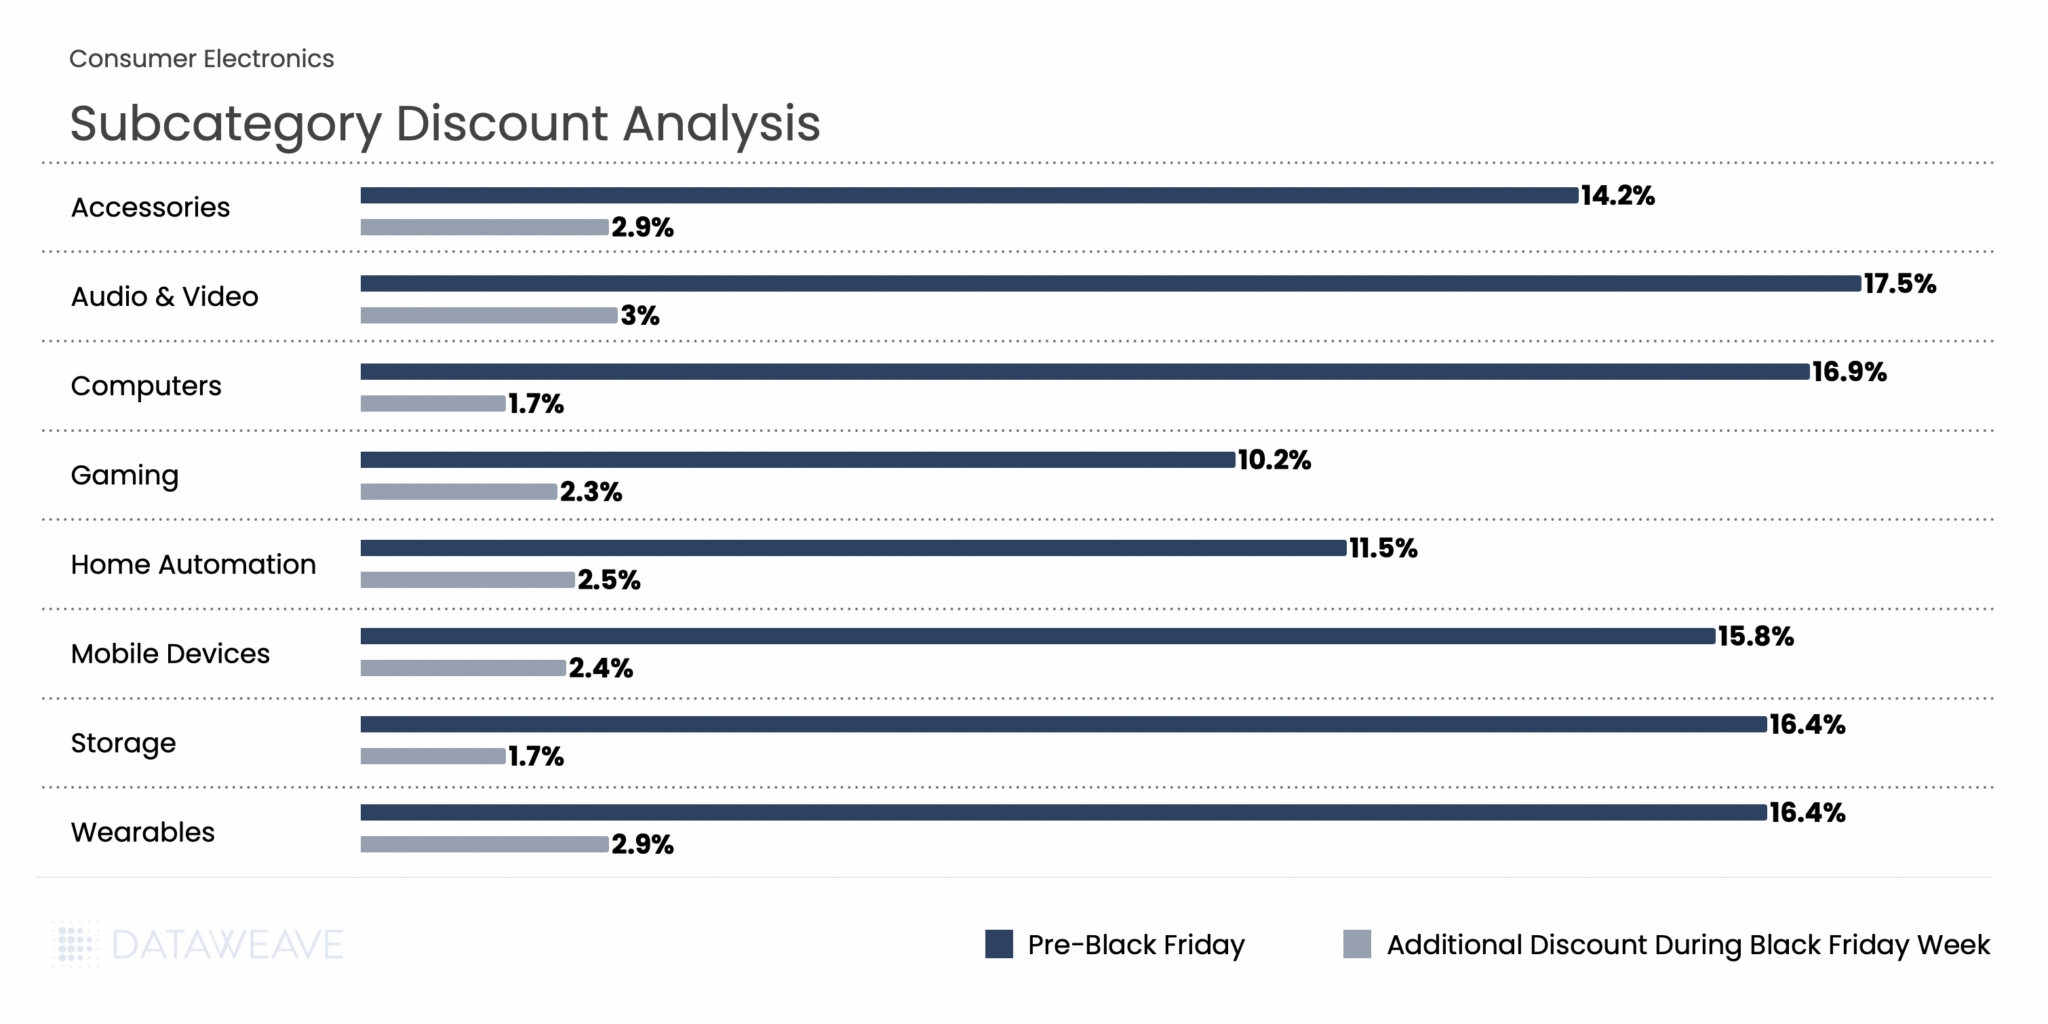
Subcategory Discount Analysis
In Consumer Electronics, Pre-Black Friday discounts averaged 14.6% across subcategories, while Black Friday Week saw an additional 2.6% discount on average. Audio & Video products led the pre-sale discounting at 17.5%, indicating retailers were eager to move inventory early. During Black Friday Week, Audio & Video, Accessories, and Wearables saw the highest additional discounts (2.9-3 %), while Computers and Storage had already been heavily discounted pre-sale, leaving minimal room for further reductions during the main event.
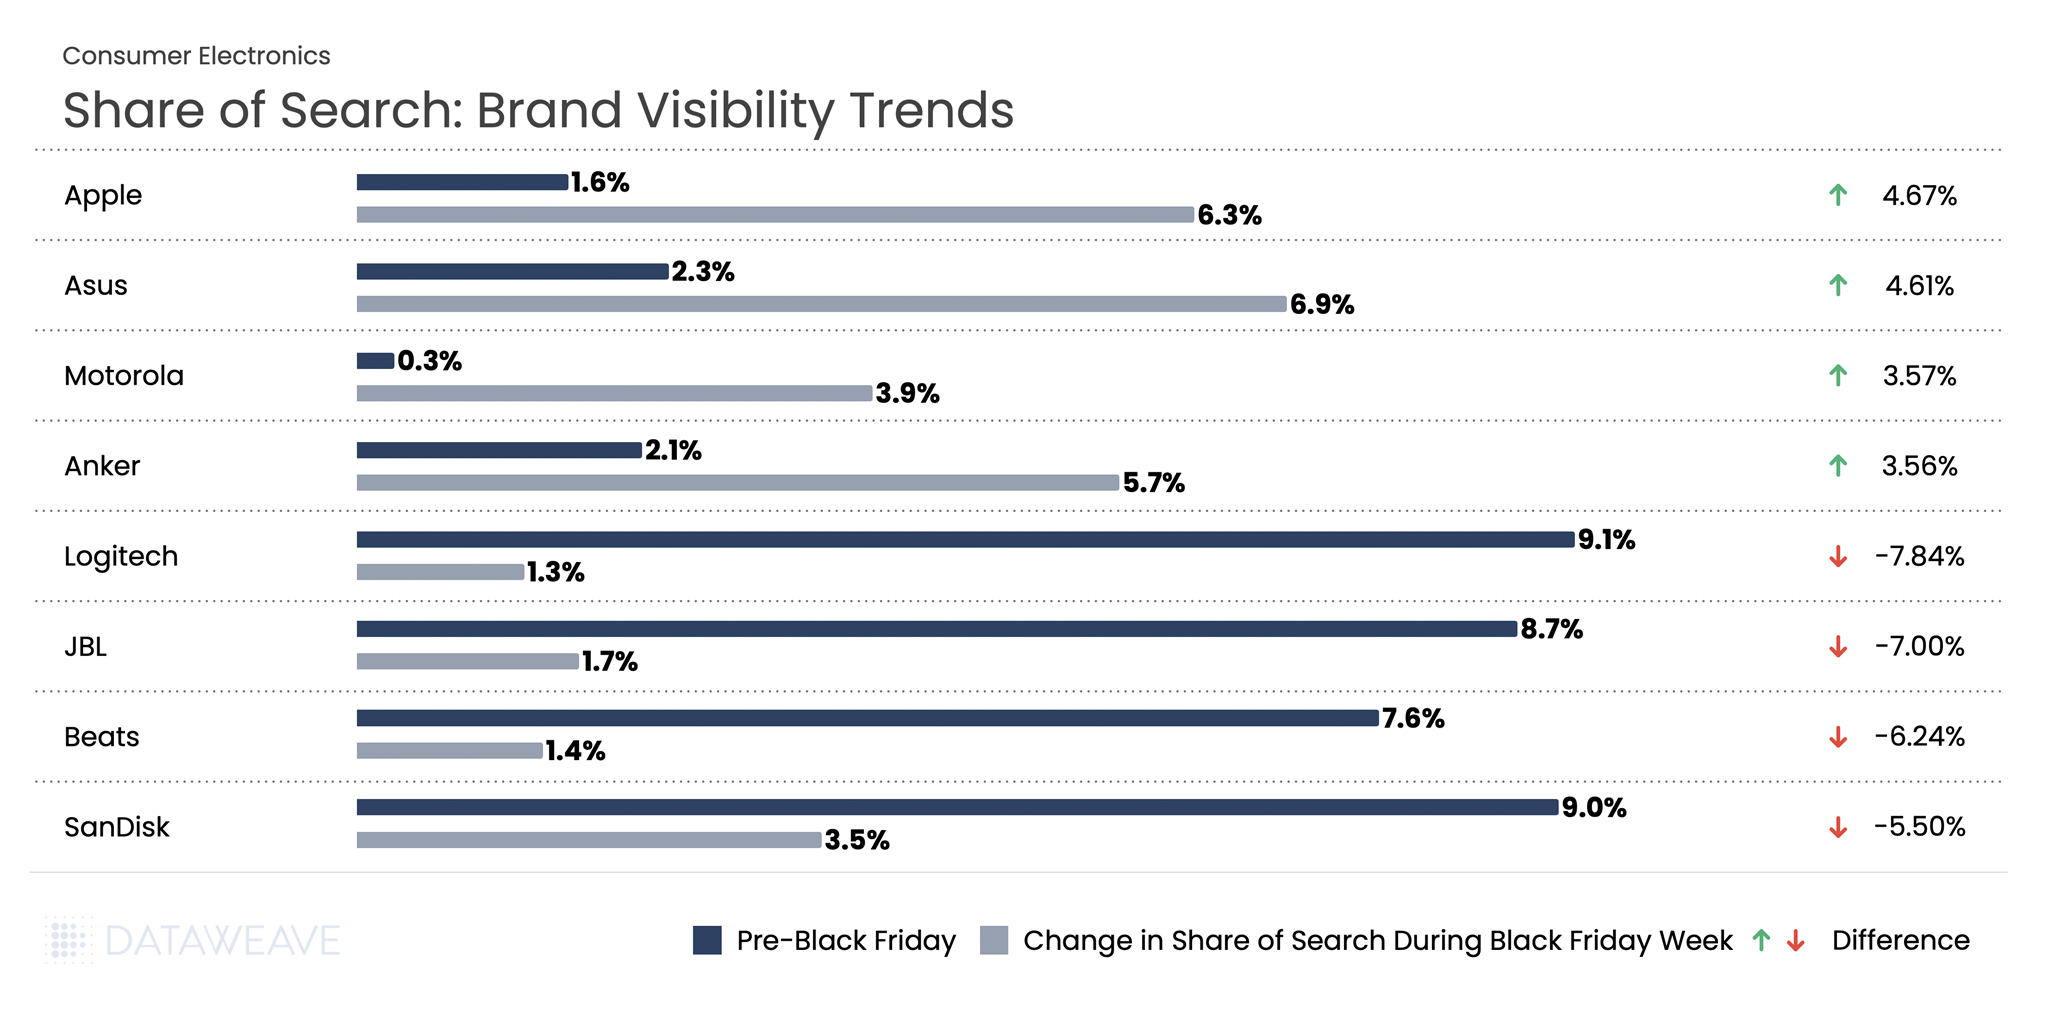
Share of Search: Brand Visibility Trends
Our Share of Search analysis reveals significant shifts in brand visibility during Black Friday Week:
The Takeaway: Our analysis reveals significant shifts in brand visibility during Black Friday Week compared to the pre-sale period. Computing and mobile-focused brands like Apple and Asus gained substantial ground, while audio brands like Logitech, JBL, and Beats saw their visibility plummet. Apple’s Share of Search jumped from 1.58% to 6.2%, a gain of 4.6%, suggesting strong promotional activity or heightened consumer interest. Meanwhile, Logitech dropped nearly 8%, from 9.9% to just 1.2%.
Home & Furniture
The Home & Furniture category continues to be a consumer favorite during Black Friday. Our analysis of 12,610 SKUs shows how discounts were distributed across subcategories.
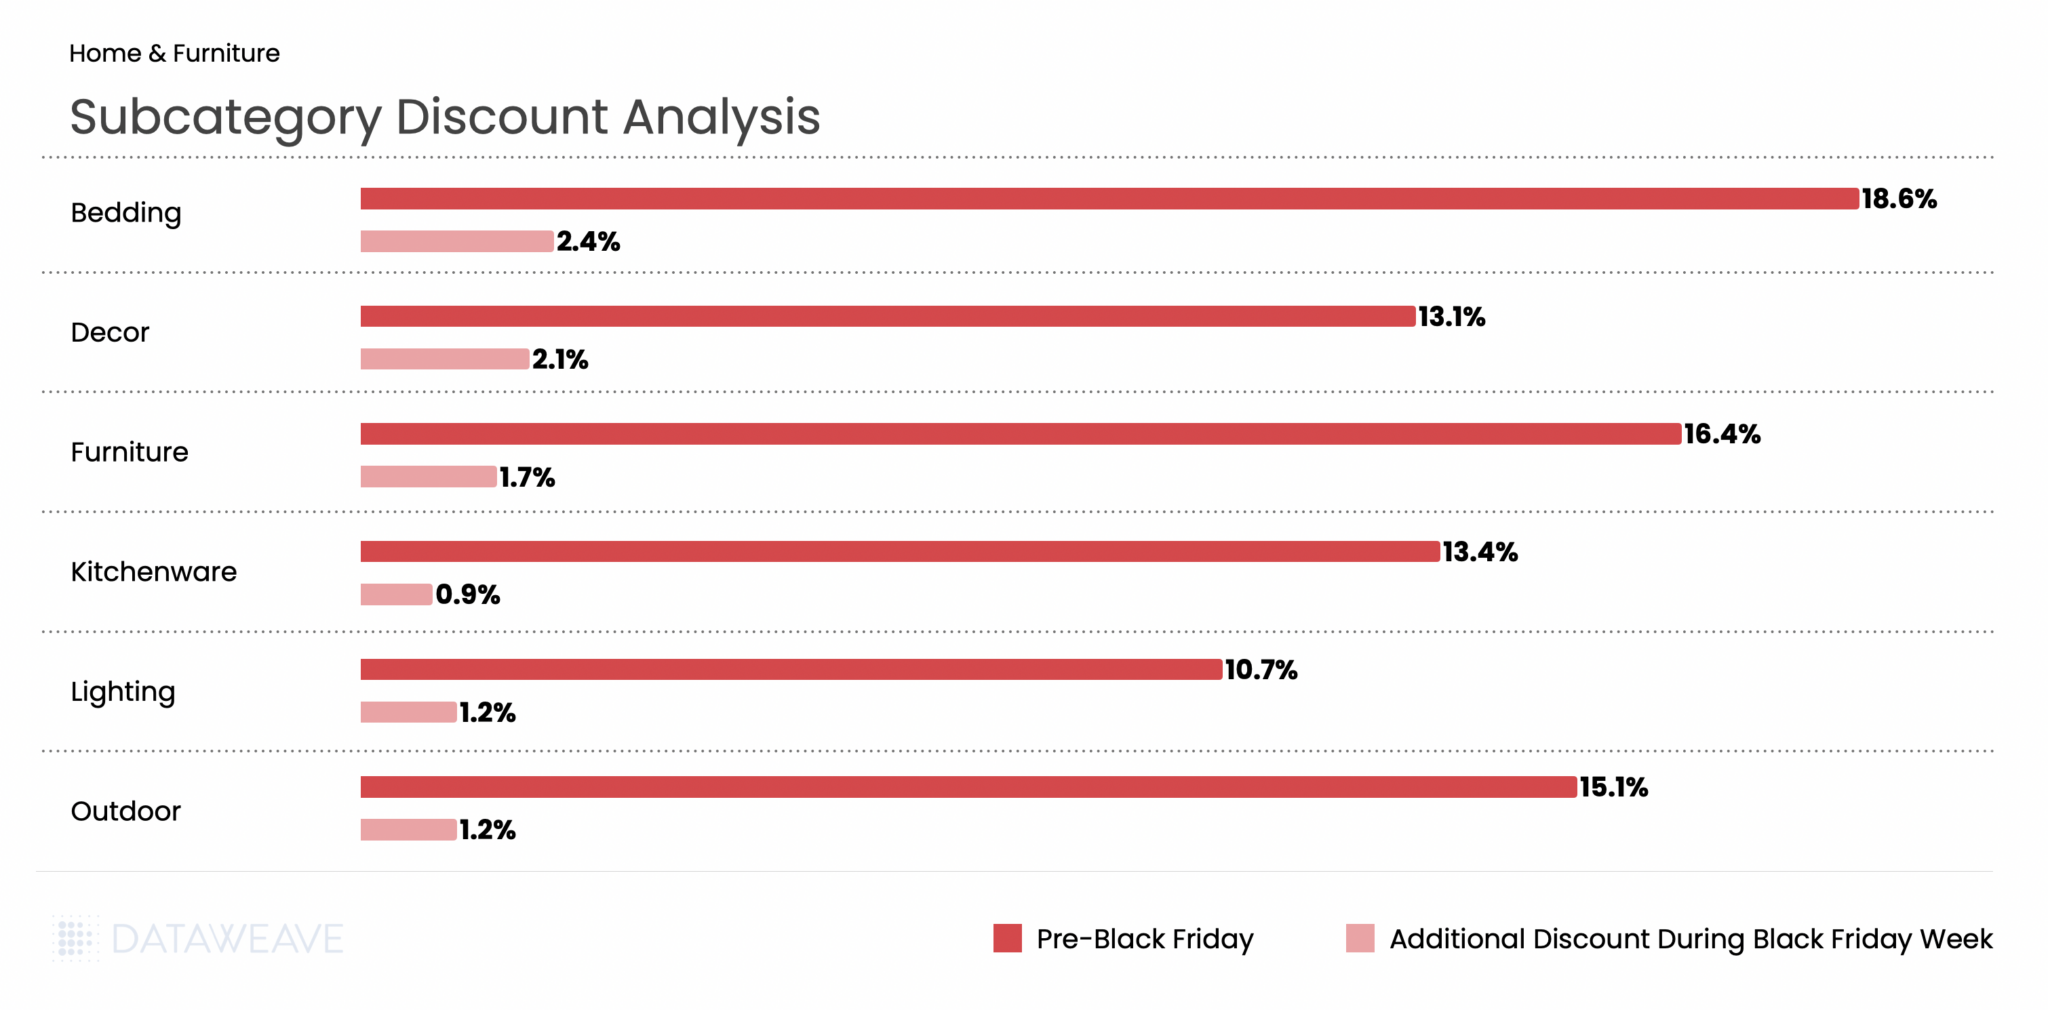
Subcategory Discount Analysis
Home & Furniture saw Pre-Black Friday discounts averaging 13.9%, with Black Friday Week adding just 1.7% on average, the second-lowest additional discount among all categories. Bedding led pre-sale discounts at an impressive 18.6%, followed by Furniture at 16.4% and Outdoor at 15.1%. This suggests retailers aggressively promoted home goods early in the season to capture deal-seekers.
During Black Friday Week, Bedding maintained leadership with 2.4% additional discounts, while Kitchenware saw the smallest bump at just 0.9%, indicating early promotions had already captured most of the discount opportunity.
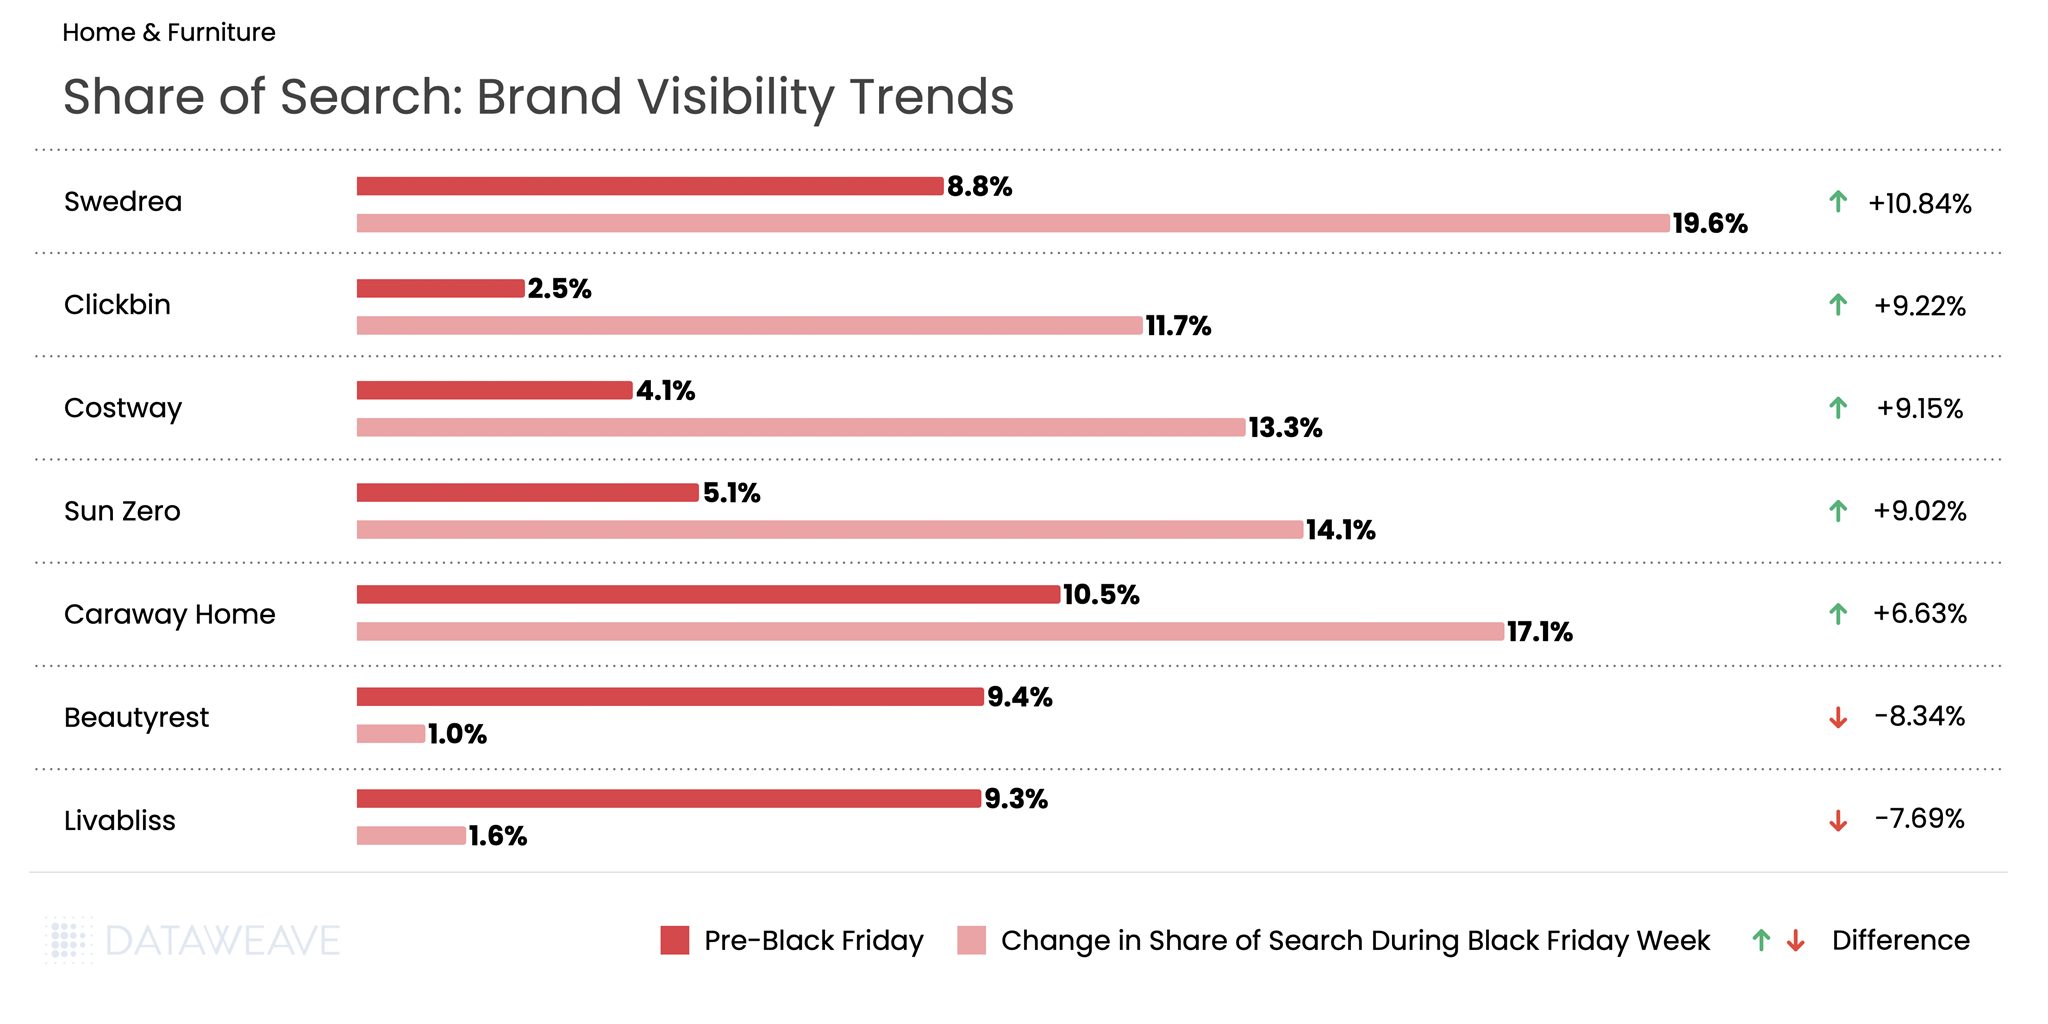
Share of Search: Brand Visibility Trends
The Takeaway: The Home & Furniture category saw some of the most dramatic Share of Search swings in our entire analysis. Emerging and value-oriented brands dominated the gains, with Swedrea surging from 8.7% to 19.6%, a remarkable 10.8% increase. Similarly, Clickbin and Costway each gained over 9%. On the flip side, established premium brands like Beautyrest and Livabliss saw sharp visibility declines, dropping over 7-8%.
Health & Beauty
Health & Beauty has emerged as a growth engine during Black Friday. The beauty industry is projected to grow 5% annually through 2030 according to a McKinsey survey. Our analysis of 16,141 SKUs reveals subcategory-level insights.
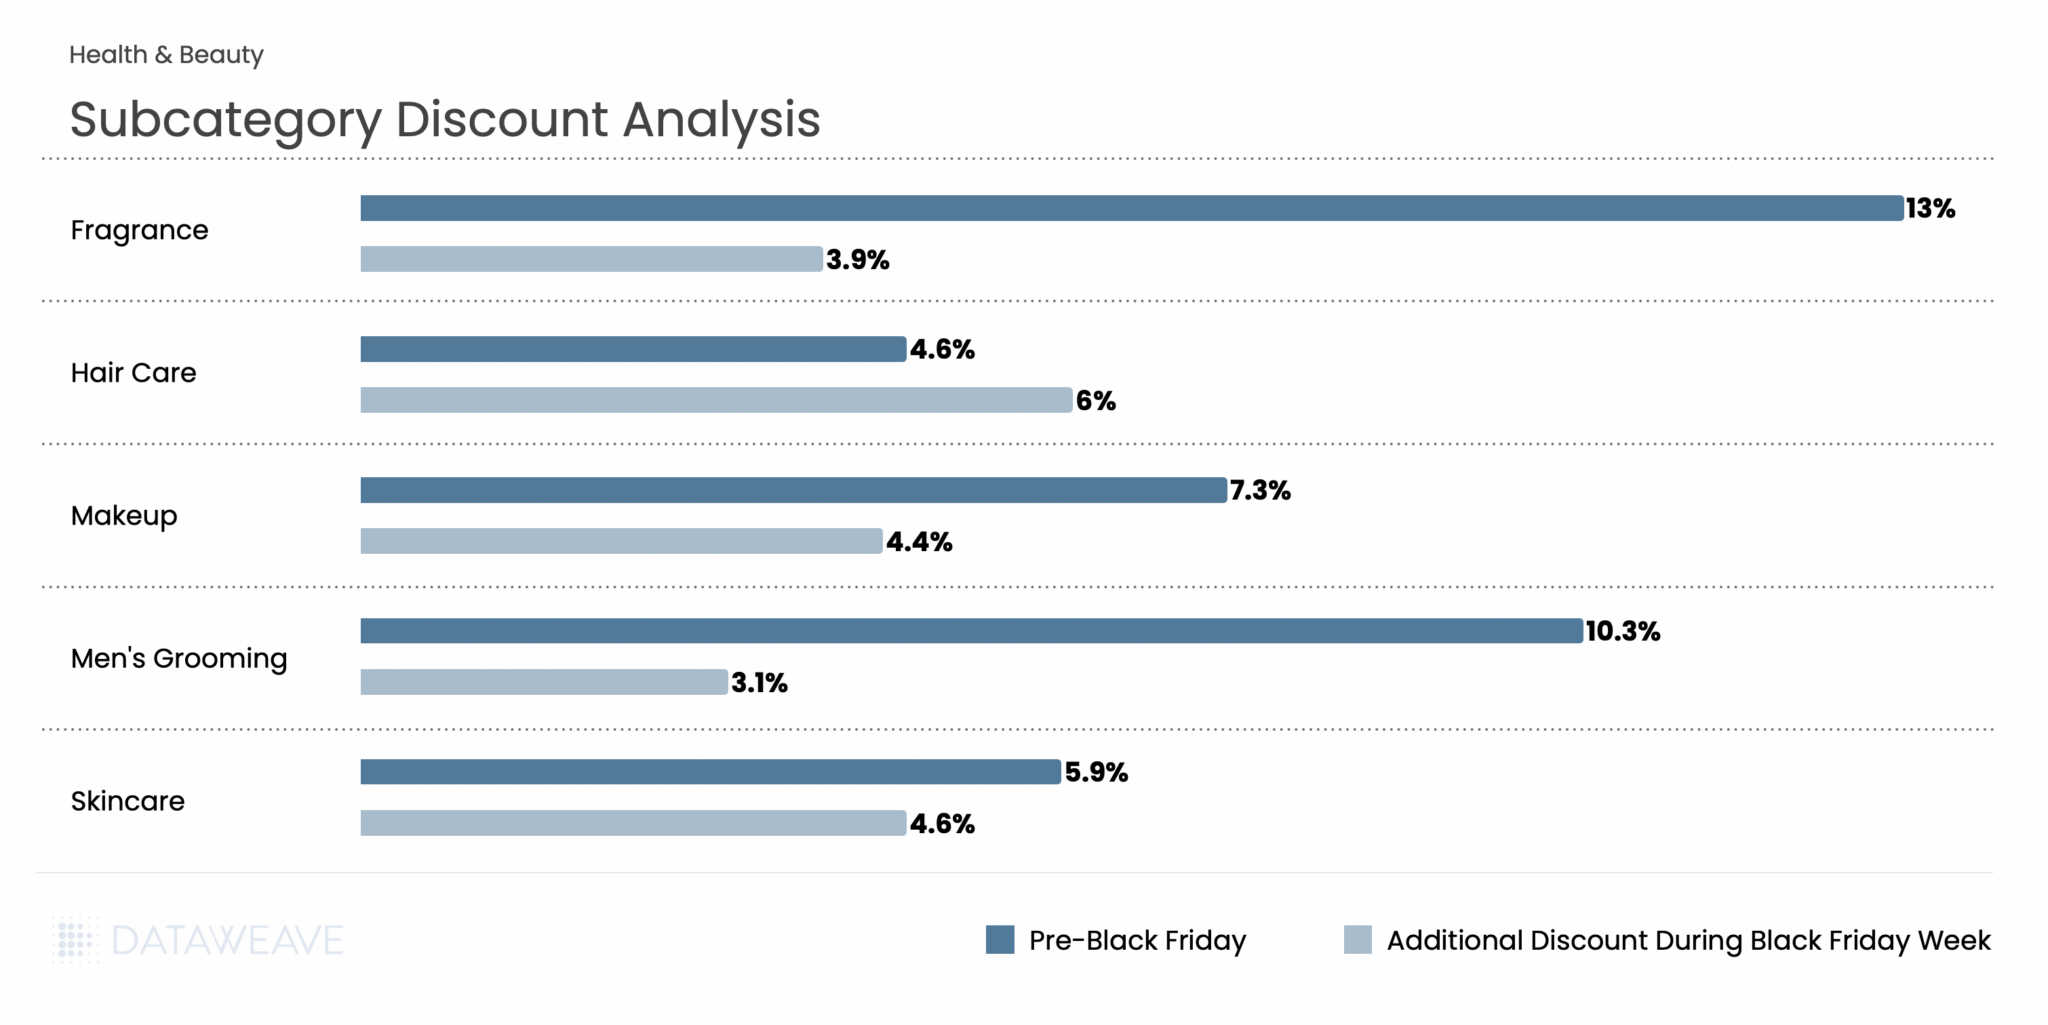
Subcategory Discount Analysis
Notable finding: Health & Beauty presented a unique discounting pattern compared to other categories. Pre-Black Friday discounts averaged just 7.1%, the second-lowest among all categories. But Black Friday Week discounts were relatively strong at 4.8%. This indicates the Beauty category held back more discounts for the main event.
Notably, Hair Care was the only subcategory across our entire analysis where Black Friday Week discounts (6%) exceeded Pre-Black Friday discounts (4.6%), suggesting retailers strategically saved their best hair care promotions for the big weekend. Fragrance led pre-sale discounts at 13%, making it an attractive early shopping category.
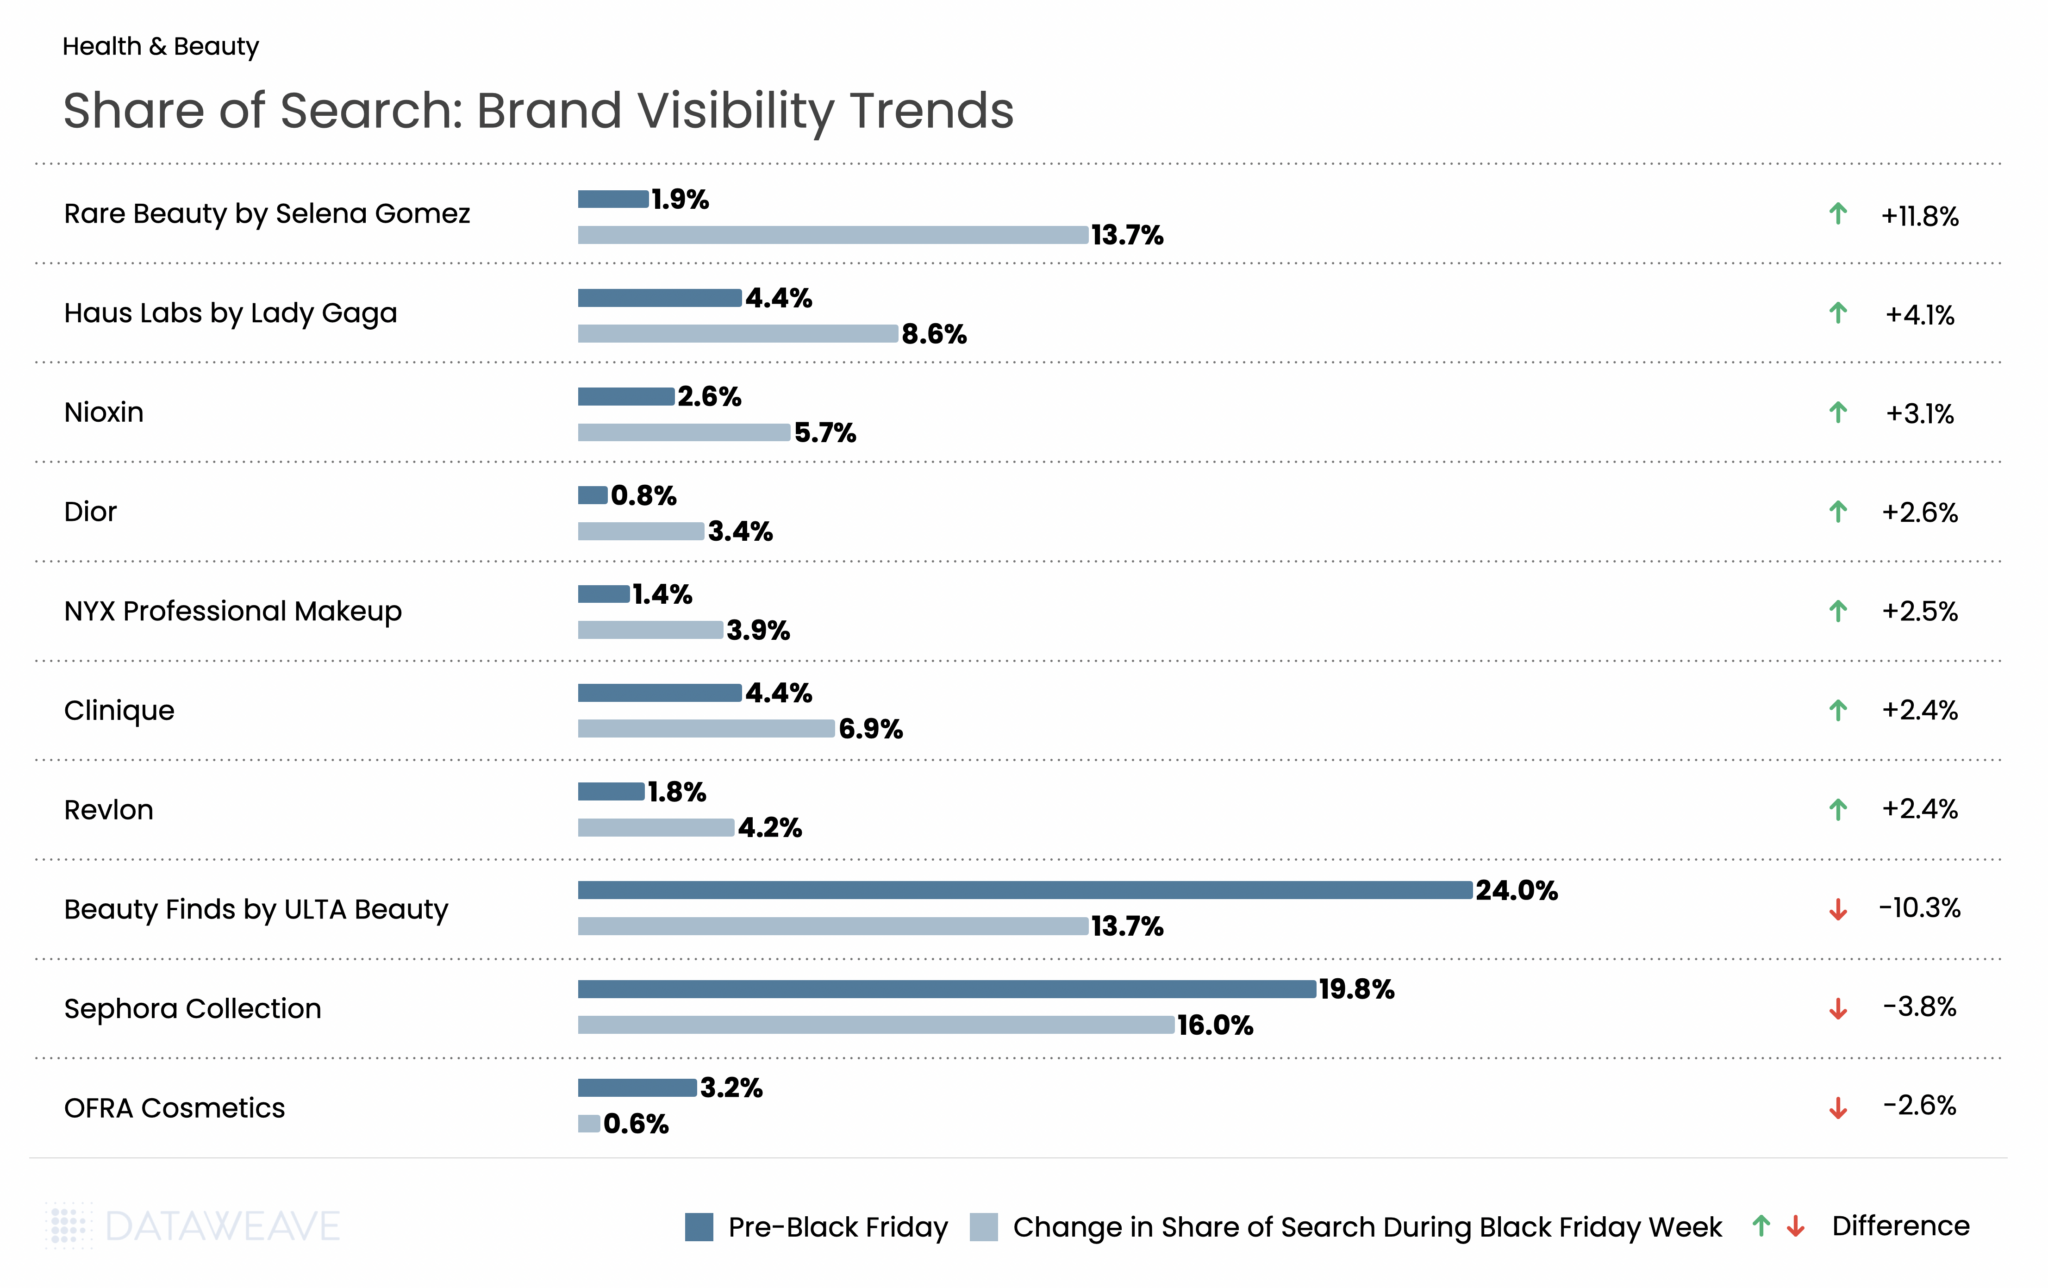
Share of Search: Brand Visibility Trends
Health & Beauty saw some of the most dramatic Share of Search swings in our analysis, driven largely by celebrity-backed brands. Rare Beauty by Selena Gomez exploded from just 1.9% to 13.7%, a whopping 11.8% gain that made it the biggest winner across all categories. Haus Labs by Lady Gaga also surged (+4.1%), while prestige brands like Dior (+2.6%) and Clinique (+2.4%) gained ground.
The flip side? Retailer private labels took a hit: Beauty Finds by ULTA Beauty collapsed from 24% to 13.7% (-10.3%), and Sephora Collection dropped from 19.8% to 16.0% (-3.8%).
Key Takeaway: The Beauty category tells a compelling story about the power of celebrity brands during Black Friday. The Share of Search shifts appear to reflect how retailers and brands recalibrated their promotional focus for Black Friday. Celebrity-driven lines rose sharply in visibility, suggesting stronger placement, promotion, or search prioritization during the sale period. At the same time, private-label ranges from ULTA and Sephora lost ground, indicating a pivot away from house-brand visibility in favor of more spotlighted national and prestige brands throughout the event.
Grocery
While Grocery typically sees more modest discounts compared to discretionary categories, the sector remains a critical part of Thanksgiving weekend shopping. According to the National Retail Federation, grocery stores and supermarkets ranked as the third most popular shopping destination during Thanksgiving weekend, with 40% of consumers making purchases there. Our analysis of 18,823 SKUs shows how retailers approached promotions across essential and indulgent subcategories.
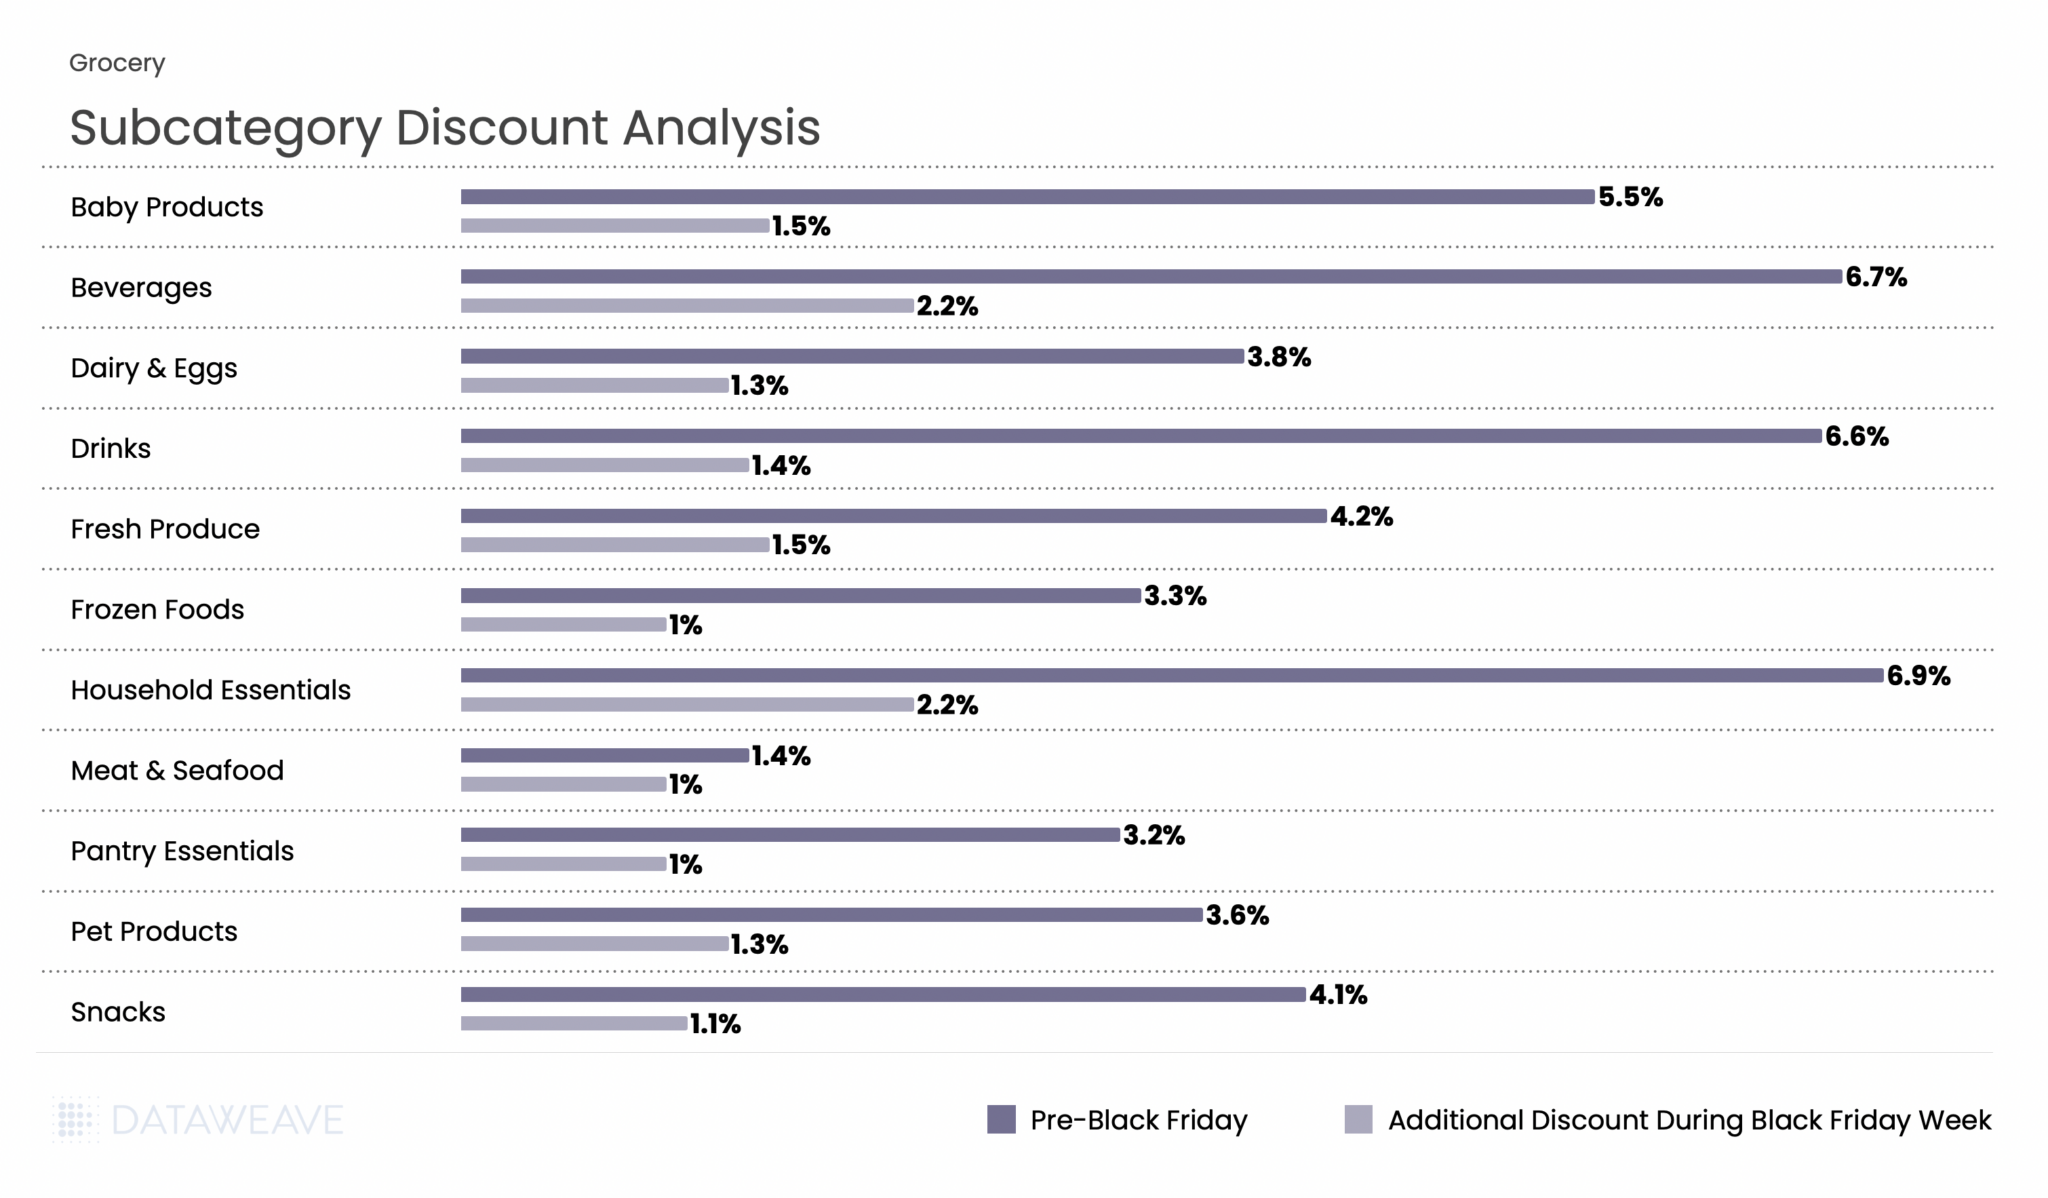
Subcategory Discount Analysis
Grocery had the lowest discounts across all categories, reflecting the already-thin margins in food retail. Pre-Black Friday discounts averaged just 5.2%, with Black Friday Week adding only 1.5%. Household Essentials and Beverages led pre-sale discounts at 6.9% and 6.7% respectively, and maintained their lead during Black Friday Week with 2.2% additional discounts each. Fresh categories like Meat & Seafood (1.4% pre-sale, 1% Black Friday Week) and Frozen Foods (3.3%, 1%) saw minimal promotional activity, consistent with perishable inventory constraints and tight margins.
Key Takeaway: Grocery discounting remains conservative, with shelf-stable and household items seeing the most promotional activity. The Beverages and Household Essentials subcategories, which have longer shelf life and higher margins, were the primary battleground for grocery promotions during BFCM 2025.
Share of Search: Brand Visibility Trends
The Grocery category saw some surprising Share of Search swings during Black Friday Week. Most notably, there was a dramatic divergence between beverage giants: Sprite surged from 1.7% to 6.8% (+5.1%), while Coca-Cola collapsed from 6% to just 0.1% (-5.9%). This stark contrast suggests vastly different promotional strategies or algorithmic visibility changes between the two brands. Private label 365 by Whole Foods Market continued its steady rise, gaining 3%, reflecting ongoing consumer interest in store brands as shoppers seek value.
The Sprite vs. Coca-Cola divergence is one of the most striking findings in our analysis. Additionally, brands like Amy’s (organic/natural foods) and McCormick (spices/seasonings) gained significant visibility.
Apparel
Apparel remains a Black Friday staple and performed strongly this year. Our analysis of 21,749 SKUs (the largest category in our study) reveals interesting patterns.
Subcategory Discount Analysis
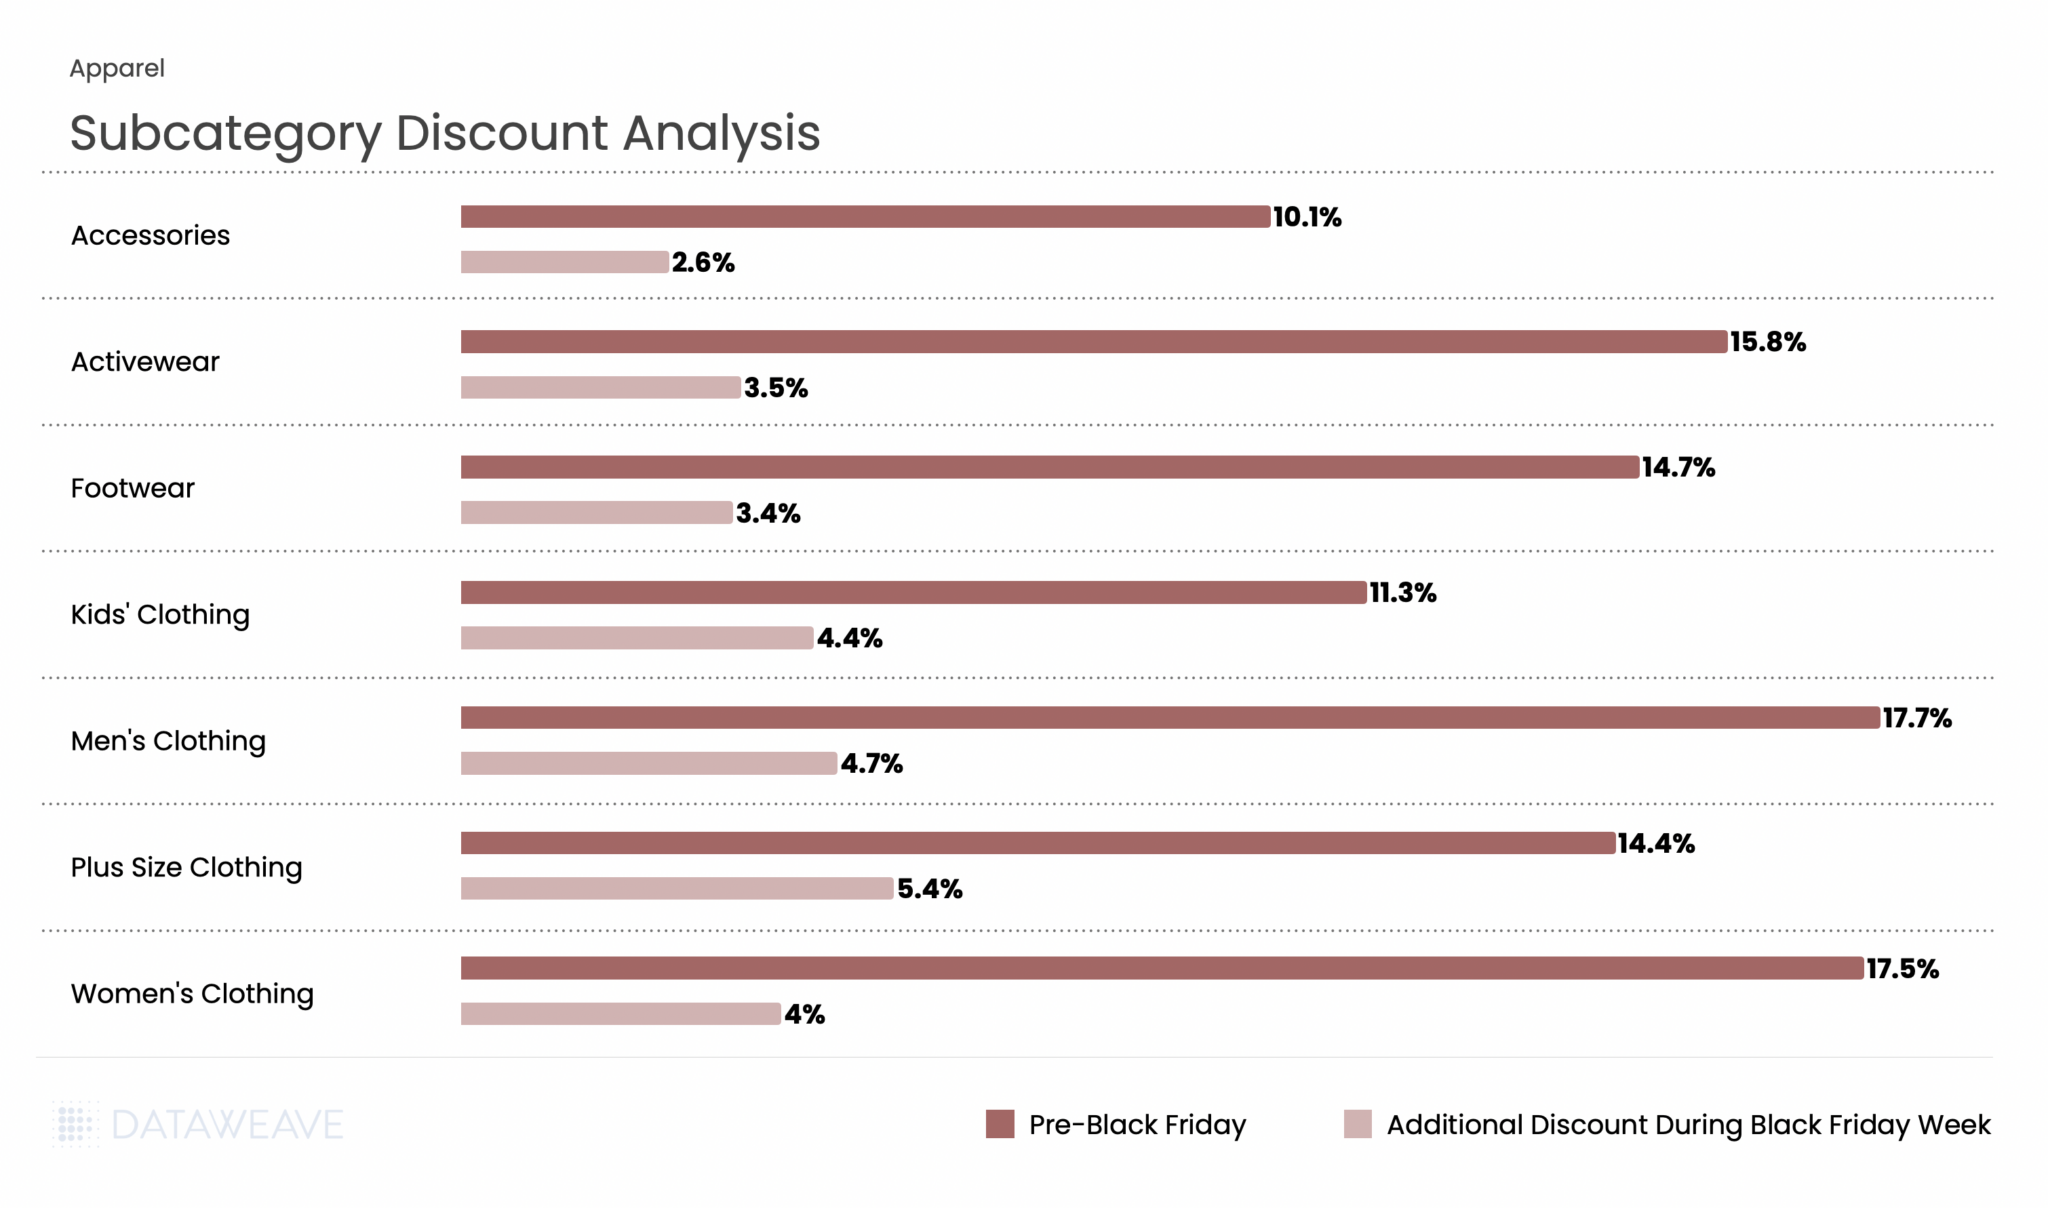
Apparel showed strong discounting activity throughout the BFCM period. Pre-Black Friday discounts averaged 13.8%, with Black Friday Week adding 3.8%, the highest additional discount among all five categories. Men’s Clothing and Women’s Clothing led pre-sale discounts at 17.7% and 17.5% respectively, reflecting aggressive early promotions on core apparel. Interestingly, Plus Size Clothing saw the highest Black Friday Week discount at 5.4%, suggesting retailers pushed harder during the main event to drive conversions in this segment. Kids’ Clothing also saw strong Black Friday Week discounts at 4.4%.
Share of Search: Brand Visibility Trends
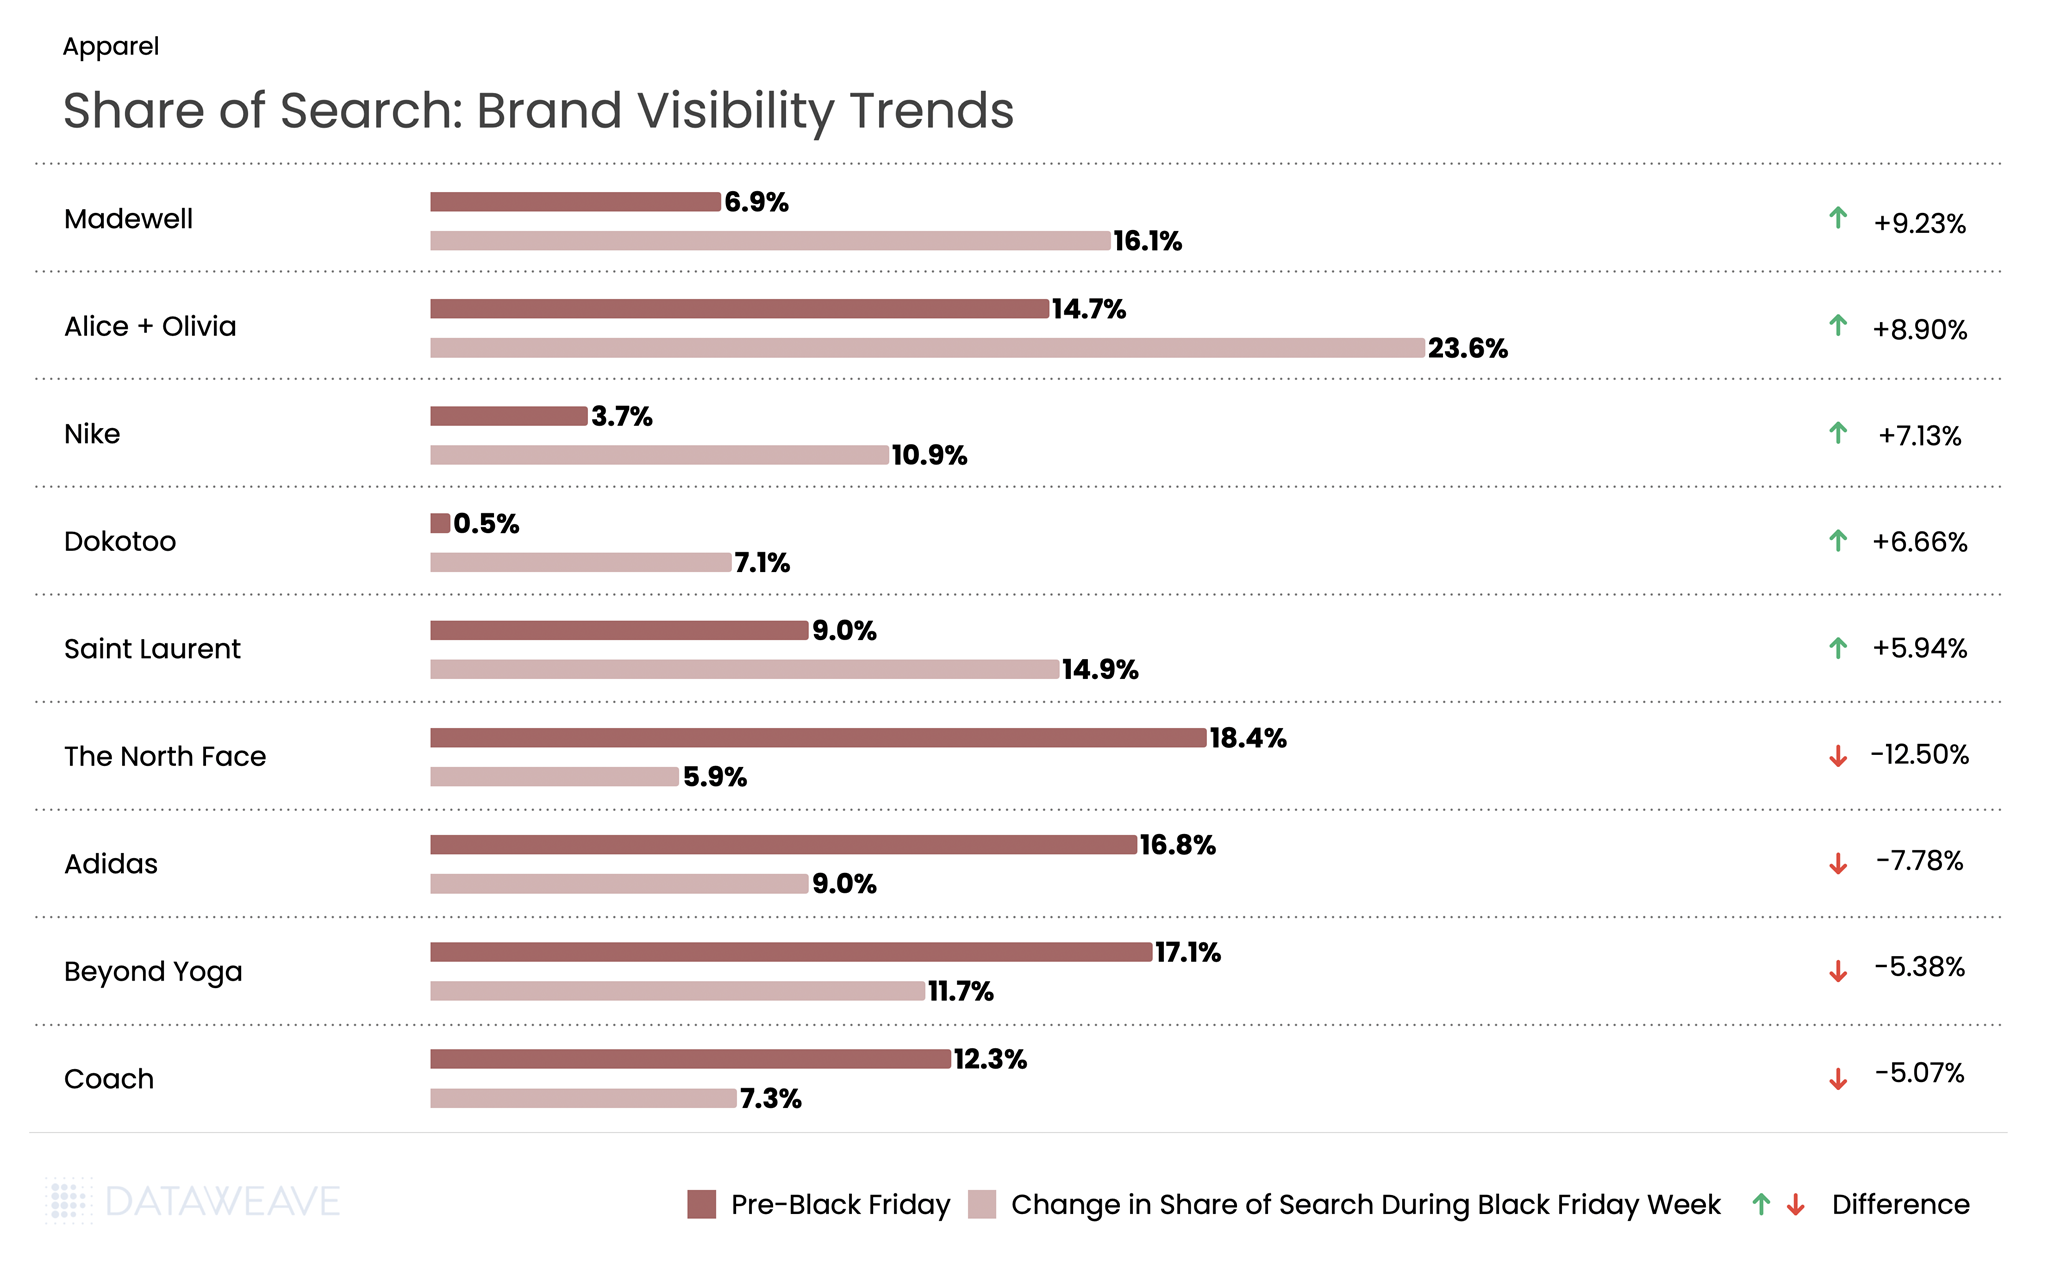
Apparel saw dramatic Share of Search movements during Black Friday Week. Fashion-forward brands dominated the gains: Madewell surged from 6.9% to 16.1% (+9.2%), while Alice + Olivia jumped from 14.7% to 23.6% (+8.9%). Nike also performed strongly with a 7.1% gain. Conversely, outdoor and athletic brands faced steep declines: The North Face dropped from 18.4% to 5.9%, a massive 12.5% decline, the largest in our entire analysis. Adidas fell 7.7%, Beyond Yoga declined 5.3%, and luxury brand Coach by 5%.
Key Takeaway: The data suggests fashion-forward and lifestyle brands (Madewell, Alice + Olivia, Saint Laurent) gained visibility at the expense of outdoor/athletic brands (The North Face, Adidas, Beyond Yoga). This could indicate that fashion brands invested more heavily in promotional visibility during the sale period.
Want to understand how DataWeave’s pricing intelligence platform can help your business make data-driven decisions during peak sales events? Contact us to learn more about competitive insights, price intelligence, assortment analytics, content analytics, and digital shelf analytics.
Follow our blog for more insights on retail pricing trends, brand visibility analysis, and data-driven commerce intelligence.
The Home & Furniture category continues to thrive, propelled by consumer interest in creating personalized and functional living spaces. In 2023, the U.S. furniture and home furnishings market was valued at approximately $641.7 billion in 2023 and is estimated to grow at a CAGR of 5.1% from 2024 to 2032. Black Friday and Cyber Monday play a crucial role in fueling this growth, offering consumers a mix of premium and affordable options across subcategories.
To better understand market trends and discount strategies this Black Friday, at DataWeave we tracked over 18,149 SKUs across major home & furniture retailers, including Amazon, Walmart, Target, Best Buy, Home Depot, and Overstock, from November 10 to 29, 2024. Using our AI-powered pricing intelligence platform, we focused on the top 500 products in subcategories like kitchenware, furniture, decor, lighting, outdoor items, and bedding.
In our analysis, the Absolute Discount represents the reduction of the selling price compared to the Manufacturer’s Suggested Retail Price (MSRP). The Additional Discount reflects how much lower the selling price is during Black Friday compared to its price a week before the Black Friday sale. This metric reveals the actual or effective value of the sale event, beyond the standard discounts typically offered.
Also check out our insights on discounts and pricing for the health & beauty category this Black Friday.
Retailer Performance: Who Led the Discount Race?
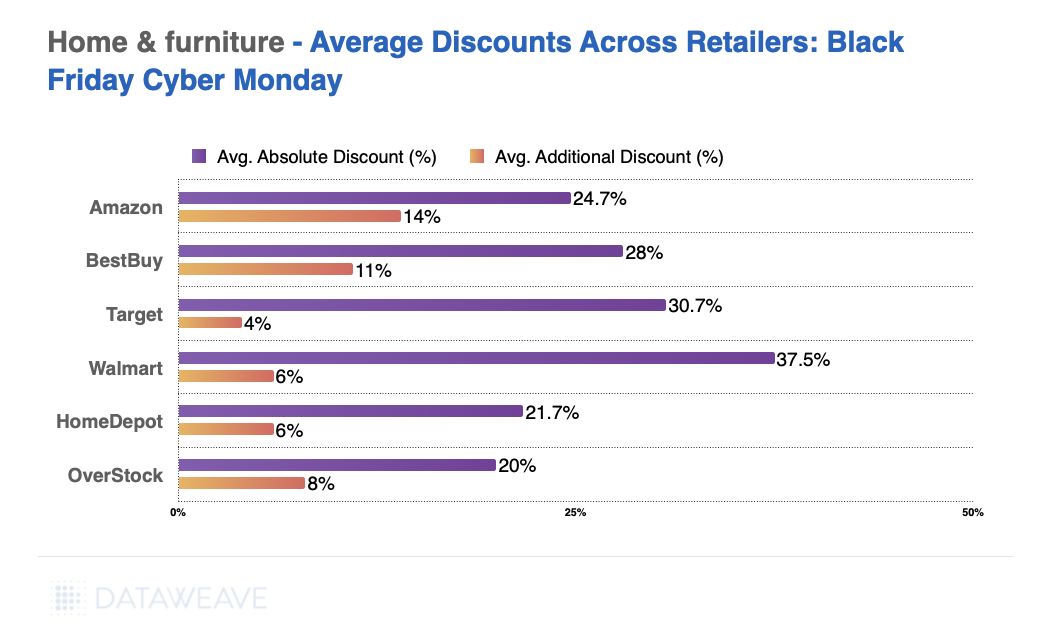
Retailers showed varying discount strategies for Home & Furniture products. Walmart emerged as the leader in absolute discounts (37.5%) while Amazon offered the highest additional discount of 14%. Best Buy maintained competitive pricing across all subcategories, while Overstock and Home Depot offered relatively modest discounts.
Subcategories in Focus
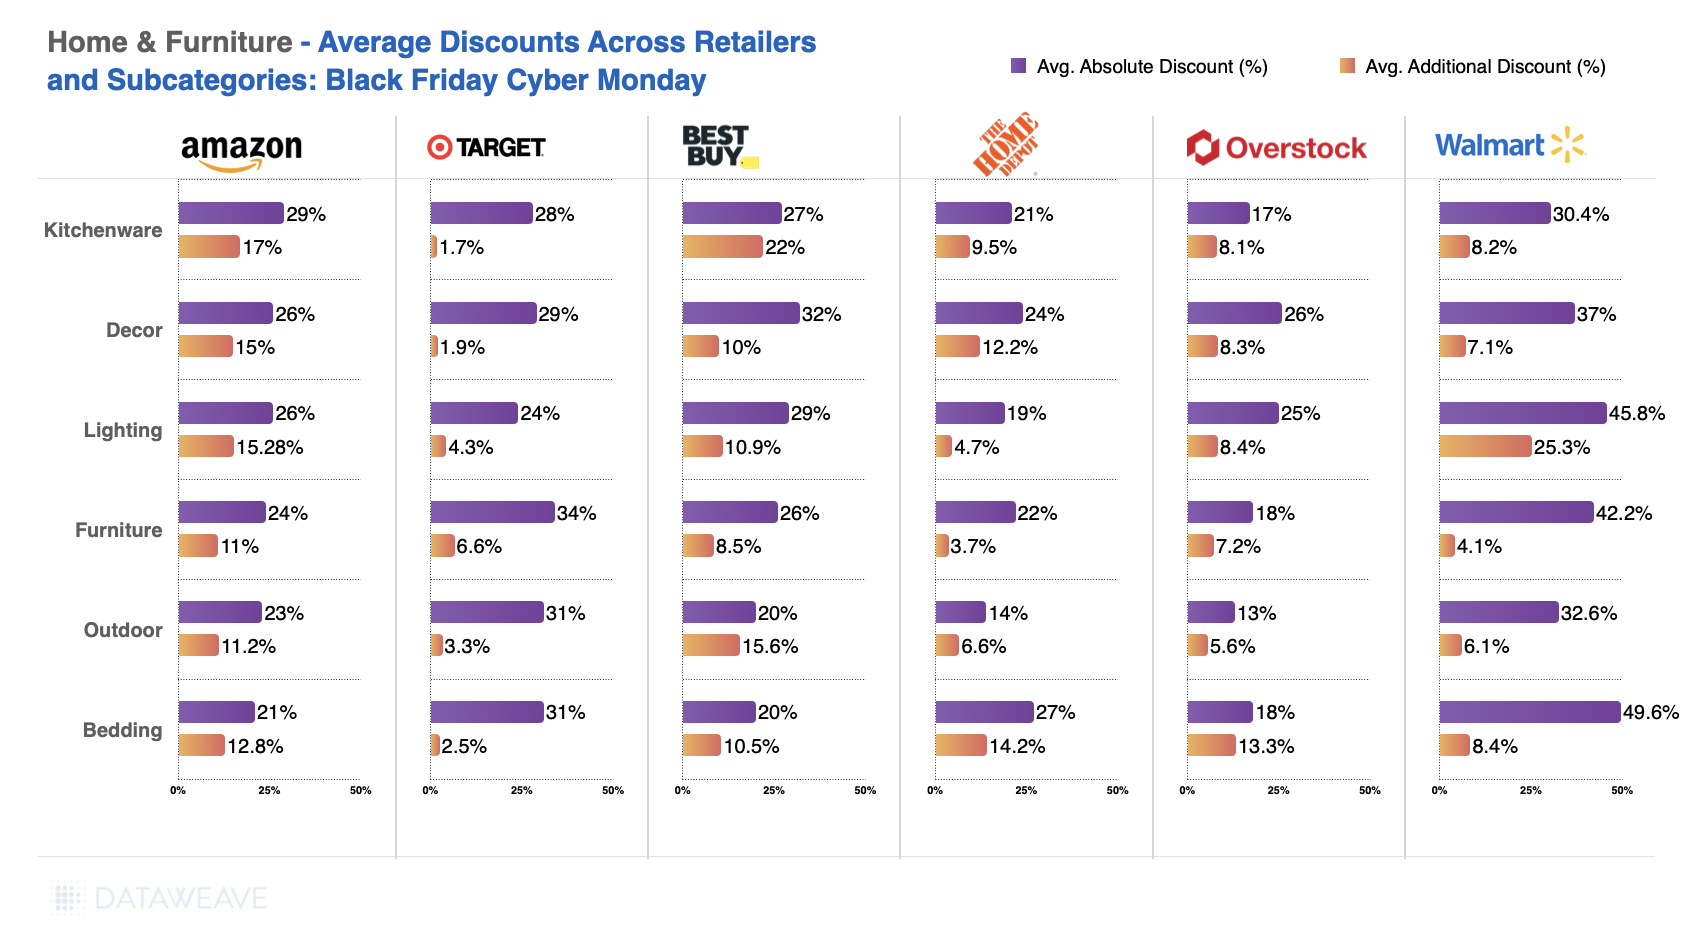
Breaking down the discounts by subcategory provides deeper insights into consumer priorities and retailer strategies:
Kitchenware saw strong competition, with Walmart (30.40% absolute discounts) and Amazon (29% absolute discounts) dominating.
Lighting became a discount hotspot, with Walmart offering up to 45.8% in absolute discounts and 25.3% additional markdowns.
Furniture remained a core focus for Target, delivering an impressive 34% average absolute discount.
Bedding stood out at Walmart, where discounts peaked at 49.6%.
Brand Spotlight: Who Stood Out?
Among top-performing brands, furniture brand Costway offered the highest discounts, with an average of 48.4%. Meanwhile, Adesso (lighting solutions), Mainstays and Safavieh (both home furnishings brands) balanced discounts and premium appeal.
Search Visibility: The Winners and Losers
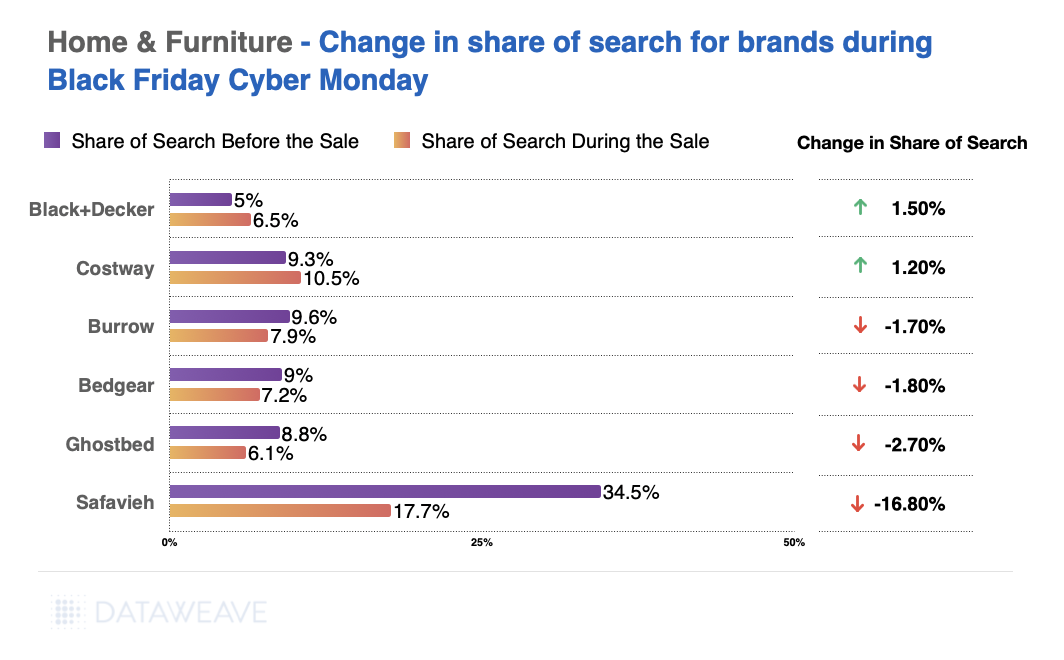
Share of search dynamics revealed significant shifts in brand visibility during Black Friday:
Furniture brand Costway (+1.2%) and home improvement player Black+Decker (+1.5%) gained visibility.
On the flip side, premium brands like Safavieh known for rugs and home furnishings (-16.8%) and furniture brand Burrow ( -1.7%) saw declines.
Who Offers the Lowest Prices?
In the previous analysis, we focused on the top 500 products within each subcategory for each retailer, showcasing the discount strategies for their highlighted or featured items. However, to identify which retailer offered the lowest or highest prices for the same set of products, it’s necessary to match items across retailers. For this, we analyzed a separate dataset of 735 matched products across Home & Furniture specific retailers to compare their pricing during Black Friday. This approach provides a clearer picture of price leadership and competitiveness across categories.
Here are the key takeaways from this analysis.
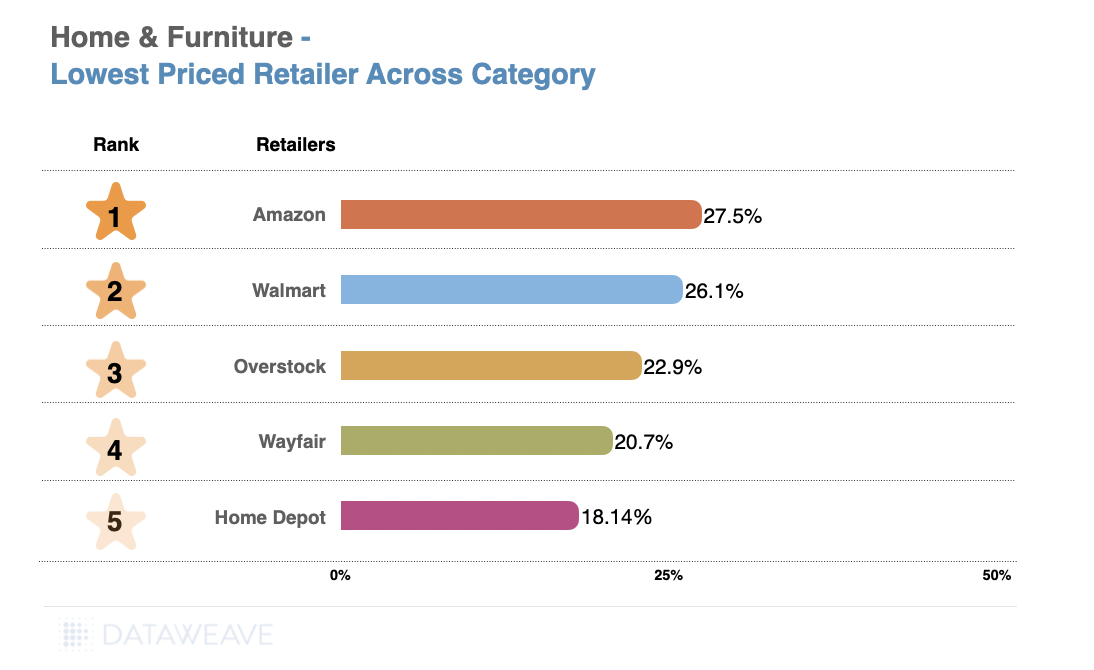
Category-Level Highlights
Amazon emerges as the lowest-priced retailer across Home & Furniture categories, with the highest average discount of 27.50%, closely followed by Walmart (26.09%).
Overstock and Wayfair trail with average discounts of 22.93% and 20.71%, respectively, while Home Depot offers the least aggressive pricing at 18.14%. This is notable, as all 3 players are known specialists in the category.
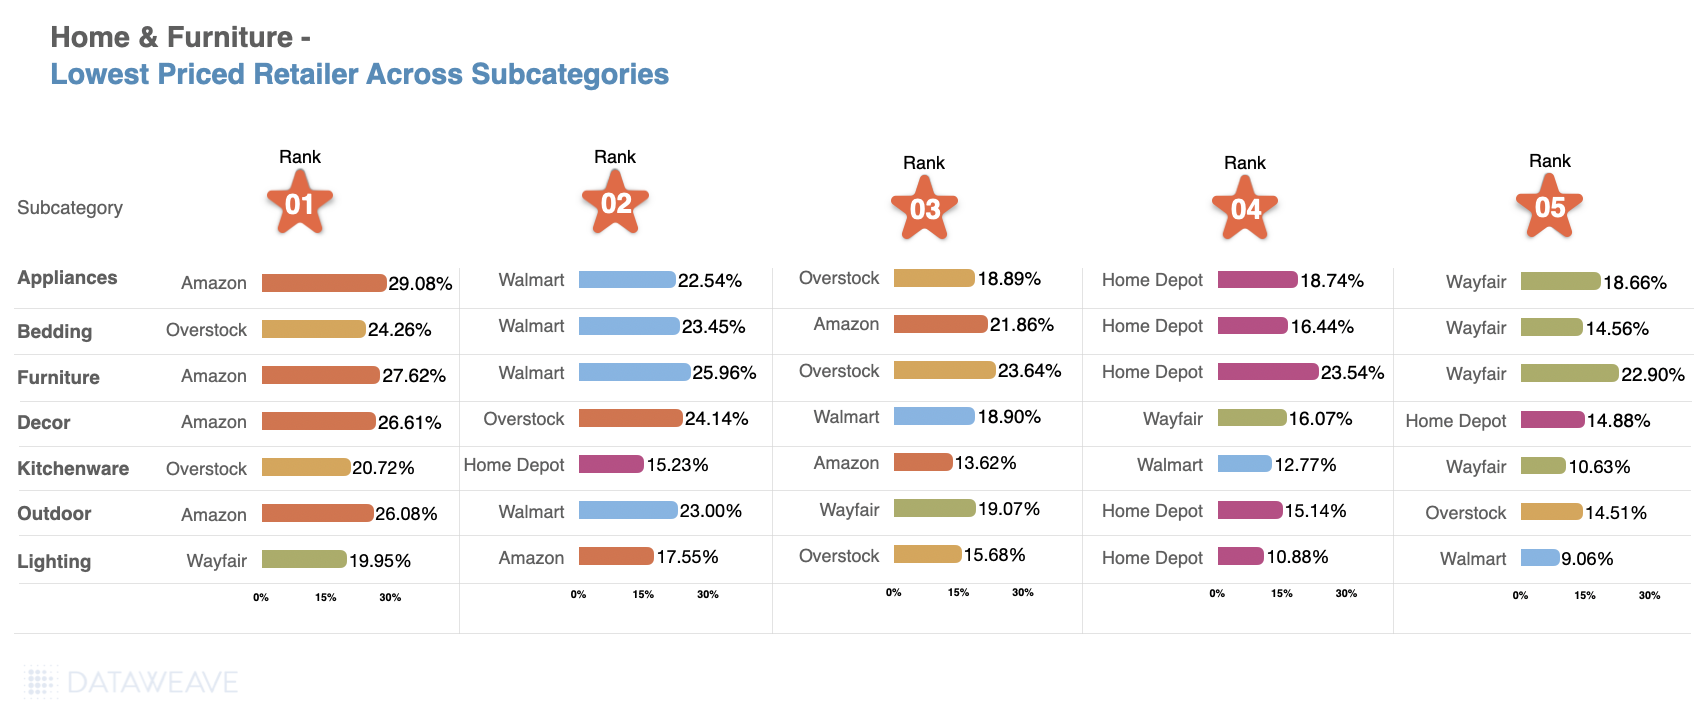
Subcategory Highlights
Amazon stands out as the leader in multiple subcategories, including Appliances, Furniture, Decor, and Outdoor, offering competitive average discounts of around 26-29%.
Overstock leads in Bedding and Kitchenware, with strong average discounts of 24.26% and 20.72%, respectively.
Wayfair is notable for Lighting, with an average discount of 19.95%, and is also competitive in Outdoor and Furniture categories.
Walmart consistently ranks high in several subcategories like Appliances and Bedding, providing solid discounts of around 22-23%.
What’s Next
For home & furniture retailers, driving maximum value during mega sale events like Black Friday involves offering bundles and sets to meet customer demands and trend expectations. Gaining insights into competitor discounts and pricing can help furniture retailers get an edge amid this environment.
Want to know how DataWeave’s intelligence platform can empower your business during peak sales events? Contact us to discover more about competitive insights, price intelligence, and data-driven decision-making. Stay tuned to our blog to see more coverage on Black Friday 2024.
Insider Intelligence‘s forecast of a 4.5% growth in US Holiday Sales this year has been validated by the sustained robust spending observed during Black Friday and Cyber Monday. Despite multiple challenges impacting consumer spending, such as escalating prices of everyday products and elevated interest rates, shoppers continued to spend significantly, aligning with these earlier predictions.
However, in response to these projections, retailers strategically adjusted their approach. Our analysis indicates substantial discounts prevalent in the Consumer Electronics and Home & Furniture segments during Cyber Week. Prominent retailers specializing in Home & Furniture, such as Wayfair, Overstock, and Home Depot, notably led the charge in offering attractive discounts.
At DataWeave, we harnessed the power of our proprietary data aggregation and analysis platform to track and analyze the prices and deals of home & furniture products across prominent retailers to uncover unique insights into their price competitiveness this BFCM, as well as understand how pricing strategies varied across diverse subcategories and brands.
We’ve also recently published our analysis of the Consumer Electronics and Apparel categories this Black Friday and Cyber Monday.
Our Methodology
For this analysis, we tracked the discounts offered by leading US retailers in the Home & Furniture category during the Thanksgiving weekend sale, including Black Friday and Cyber Monday. We noticed prices and discounts didn’t change significantly over the course of the weekend, and hence the average prices of products between the 24th and 27th of November are being reported. Our sample was chosen to encompass the top 500 ranked products in each product subcategory across leading retailers during the sale.
Sample size: 44,716 SKUs
Retailers tracked: Amazon, Walmart, Target, Best Buy, Overstock, Wayfair, Home Depot
Subcategories reported on: Dishwasher, Washer/Dryer, Mattresses, Beds, Dining Tables, Entertainment Units, Rugs, Luggage, Bookcases, Cabinets, Sofas, Coffee Tables
Timeline of analysis: 24 to 27 November 2023
Our Key Findings
Discounts Across Retailers
Wayfair led the pack with the highest average discount of 27.5%, covering an impressive 88% of its Home & Furniture inventory. This bold strategy positions Wayfair as a go-to destination for consumers seeking substantial savings on high-quality Home & Furniture items during Black Friday and Cyber Monday.
Home Depot offered an average discount of 17.5%, covering a substantial 69% of the products analyzed, choosing to cash in on the Cyber Week madness. Overstock followed next with an average discount of 16.6%.
Interestingly, Home & Furniture happens to be one of the few categories in which Amazon did not offer the highest discount among the analyzed retailers, choosing a moderate average discount of 13.8%.
Best Buy also maintained a competitive stance in the category, providing an average discount of 12.8% across 58% of their assortment. Target adopted a conservative markdown strategy, offering a relatively low average discount of 6.5%.
In summary, the Home & Furniture category exhibited a diverse range of discounting strategies among retailers, reflecting a balance between competitiveness and profit margins. Consumers could have chosen from a spectrum of discounts based on their preferences and budget considerations during Black Friday and Cyber Monday.
Average Discounts: Subcategories
Among subcategories, Amazon offered a moderate 8.3% average discount on 32.9% of its products in this Dishwasher category, while Best Buy took a more aggressive stance with a 14.7% average discount covering 55.9% of its products.
Home Depot emerged as a standout player in the Washer/Dryer category, providing a substantial 21.3% discount on 78.4% of its analyzed inventory. Best Buy closely followed with a 15.1% average discount targeting 67.6% of its products.
Wayfair grabbed attention with a generous 36.9% average discount on Mattresses, covering almost all (99%) of its analyzed products. In addition, Wafair led the discount war in Beds, Dining Tables, Cabinets, Sofas, Coffee Tables, and Entertainment Units. Overstock took an aggressive pricing stance on Rugs, offering a substantial 52.3% average discount, covering 100% of its Rugs inventory.
Average Discounts: Brands
Among brands, Signature Design by Ashley maintained a consistent presence with substantial discounts on both Best Buy (25.24%) and Overstock (16.19%). This could be indicative of the brand’s commitment to appealing to a diverse customer base through varied retail channels. Costway emerges as a standout brand offering exceptionally high discounts at both Target (61.6%) and Walmart (51.7%).
Home Decorators Collection, Home Depot’s in-house brand, offered a significant 30.9% discount at Home Depot. High-margin private label brands like these afford retailers the opportunity to offer markdowns while retaining significant margins.
Strategic positioning on specific platforms, as seen with Alwyn Home on Wayfair and Noble House at Home Depot, suggests brands tailor their approach to the strengths and customer demographics of each retailer. The data suggests a nuanced interplay between brand positioning, discount strategies, and the perceived value offered.
Share of Search For Home & Furniture Brands
The Share of Search data for the Home & Furniture category unveils intriguing insights into brand visibility and performance during the Black Friday and Cyber Monday events. In this competitive landscape, where consumer decisions are influenced not only by discounts but also by brand visibility, the dynamics of Share of Search become pivotal.
Samsung strategically increased its Share of Search during the sale, showcasing a 1.2% improvement. This suggests a deliberate effort to reinforce brand visibility and capture the attention of potential buyers actively searching for Home & Furniture products, in this case, Washer/Dryers and Dishwashers.
Bosch too experienced a notable surge in Share of Search by 1.1%. LG, meanwhile, maintained a consistent Share of Search, with a marginal decrease of 0.1%. American Tourister experienced a modest increase in Share of Search by 0.4%.
Like in the other categories analyzed, the dynamics of Share of Search in the Home & Furniture category reflect brand strategies aimed at not only offering discounts but also ensuring heightened visibility during the critical Black Friday and Cyber Monday shopping events. Positive shifts indicate effective marketing efforts, while stable performers demonstrate a resilient brand presence in a competitive online marketplace.
To explore how our insights can help retailers and brands boost their pricing strategies during sale events, reach out to us today!
For more in-depth analyses and trends across various shopping categories, stay tuned to our blog.
The home and furniture retail industry is going through a turbulent time. As inflation reared its head mid-2022, leading retailers in the category have been grappling with the higher costs associated with producing and distributing their products, as well as reduced shopper demand. The rising costs of raw materials, transportation, and labor have had a direct impact on the pricing dynamics within the industry. For example, reports indicate container rates soared to nearly 10 times pre-pandemic levels towards the end of 2021.
Furthermore, shoppers’ spending power has been constrained, while higher interest rates have suppressed demand. Retailers have had to adapt their assortment and pricing strategies to cater to a wider range of shopper preferences driven by changing lifestyles and a growing emphasis on sustainability. Post-pandemic, demand has been primarily driven by affluent shoppers.
Towards the end of 2021, due to supply delays and disruptions, retailers heavily stocked up on available products. However, when demand subsequently decreased in 2022, they were left with a significant amount of unsold stock that was purchased at high rates. This put them in a difficult situation, as they had an excess of products but were unable to sell them even at reduced prices without impacting their profit margins. Additionally, staying competitive in a rapidly changing market environment was equally important.
Given this context, it is crucial for home and furniture retailers to adopt a data-driven approach that utilizes competitive and market insights to consistently maintain or increase their online sell-through rates. DataWeave’s Commerce Intelligence solution offers exactly that, empowering retailers across various industry segments to stay updated on evolving consumer trends and competitor actions.
To gain a better understanding of the pricing strategies employed by leading home and furniture retailers throughout the past year, we leveraged our proprietary data aggregation and analysis platform to track and analyze the pricing of a wide range of products across multiple retailers and subcategories within the industry.
Our Research Methodology
Number of SKUs: 400,000+
Key retailers tracked: Amazon, Wayfair, Home Depot, Overstock, Target, Walmart
Key categories reported: Home and Office, Bed and Bath, Bathroom, Bedroom, Decorative, Dining Room, Kitchen, Garden & Patio, Hardware
Timeline of analysis: April 2022 to April 2023
Our Findings
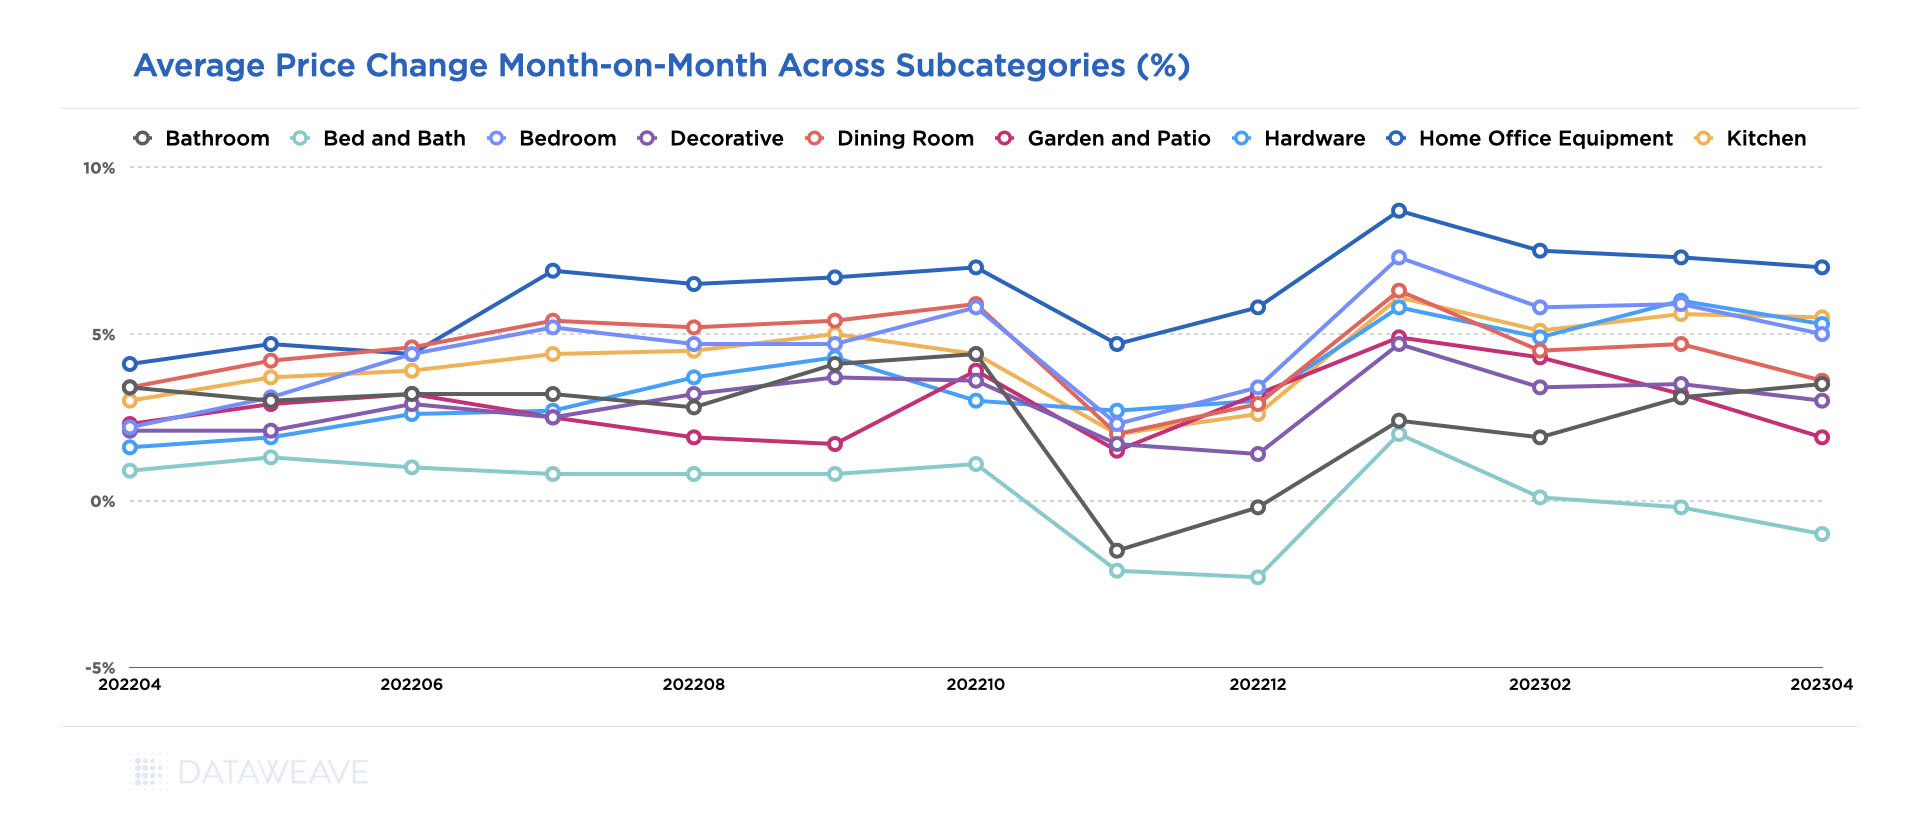
Interestingly, our analysis indicates that average prices in the home and furniture category rose by around 5% between March 2022 and April 2023. However, there have been seasonal fluctuations in the prices over the course of the year.
Among the various subcategories, the most substantial price surge was observed in home office equipment, with an uptick of 9.3% in January 2023 when compared to March 2022. The surge in demand for home office furniture, fueled by the widespread adoption of work from home arrangements, played a pivotal role in depleting inventories and consequently driving up prices. Additionally, the shift towards collaborative workspaces and the gradual expansion of office environments have contributed to the sustained demand for office furniture.
Avg. price changes MoM across home and furniture subcategories from April 2022-23.
While prices for several subcategories rose significantly, others experienced subdued growth, such as bed and bath. The subcategory experienced the lowest price increment, registering a modest 2.8% increase annually. This can be attributed to the impact of a subdued housing market and a decrease in first-time buyers, which may partly be due to the global recession and inflationary pressures.
Moreover, retailers overestimated the demand for home furniture during the holiday season, leading to an overstocking of inventory. Consequently, prices experienced a dip from October to December 2022. In fact, this was a common trend across all home and furniture subcategories. As retailers emerged from the holiday season, prices rose to their highest level in January 2023, and have stayed relatively stable since.
Some of these trends vary among retailers as each faces different challenges and responds in distinct ways.
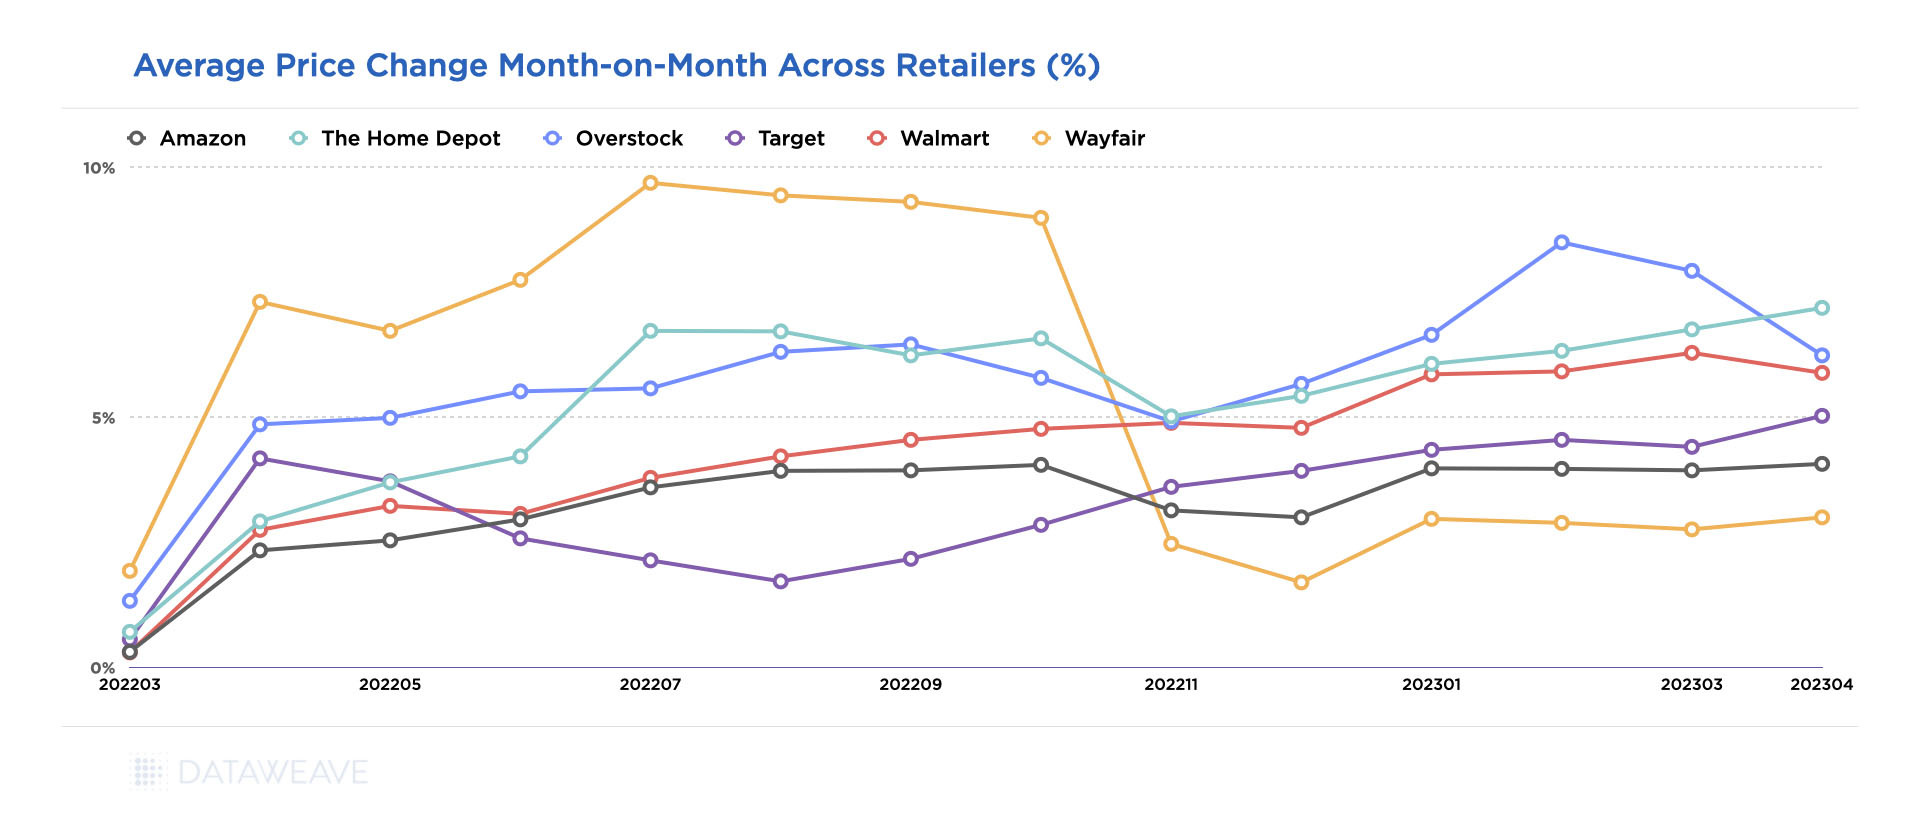
Wayfair, for example, shows a significant dip in pricing after October 2022, with prices stabilizing in 2023. This could be in response to the retailer’s shrinking consumer count, losing 5 million of its 1.3 billion consumers in 2022 due to declining demand.
Avg. price change MoM within the home and furniture sector across retailers from April 2022-23.
In fact, online furniture retailers like Wayfair and Overstock reported declines in annual revenue in 2022, as the furniture sector continued to normalize from the high spending seen during COVID-era lockdowns. Wayfair reported that its 2022 net revenue was $12.2 billion, down almost 11% from the year prior. The company also laid off 10% of its workforce in August 2022. Overstock’s reported annual net revenue in 2022 was $1.9 billion, a 30% decrease year-over-year.
Interestingly, both companies took contrasting approaches in response to this situation. Wayfair opted for aggressive cost-cutting measures, including layoffs and a reduced marketing budget. On the other hand, Overstock focused on attracting new customers through influencer marketing and improving their app, aiming to expand their customer base. With a strategy geared towards younger buyers, Overstock allocated a larger marketing budget than ever before. Our data supports the fact that Overstock did not rely on price reductions to entice shoppers.
Target has consistently maintained lower price increases compared to Walmart, defying the common perception of Walmart being more conservative in its pricing. Notably, Amazon also stood out minimal price increases throughout the year, being surpassed only by Wayfair since November 2022.
As price sensitive shoppers increasingly compare prices before making a purchase decision, retailers need to ensure they are priced competitively in the market on a consistent basis to liquidate stock and gain market share without compromising significantly on margins.
A Sophisticated and Versatile Product Matching Solution is Essential to Achieving Price Leadership
Product matching plays a vital role in monitoring competitive prices and analyzing price leadership. Within the home and furniture category, there is often a multitude of representations for the same product across various online platforms. Furthermore, eCommerce websites offer a wide array of options, including variations in size, color, material, and similar products. Without an accurate and comprehensive method of matching these products, it becomes impossible to track and compare prices effectively, especially on a large scale. Thus, a versatile product matching engine tailored to the unique requirements of the home and furniture sector becomes essential.
DataWeave offers an industry-leading product matching platform that harnesses advanced AI models specifically trained to identify and leverage multiple product attributes extracted from titles, descriptions, and images to accurately match products across websites. Additionally, our platform intelligently matches similar products based on a diverse range of extracted attributes. This empowers our retail partners to gain competitive pricing intelligence not only on exact product matches but also on similar and substitute products, as well as their respective variants.
With our competitive pricing intelligence solution, retailers in the home and furniture industry can confidently analyze and track prices, ensuring they stay at the forefront of price leadership in their market.