Black Friday 2025 marked another significant shopping event for Canadian consumers, with retailers deploying sophisticated pricing strategies to capture holiday spending. Online and in-store spending on Black Friday reached an estimated $865 million in Canada, which marked a 6% increase compared to last year.
At DataWeave, we analyzed Black Friday 2025 pricing dynamics across two major categories in the Canadian market: Consumer Electronics and Home & Furniture. Our AI-powered pricing intelligence platform tracked approximately 16,000 SKUs across leading Canadian retailers like Target, Walmart, Wayfair, Home Depot, Amazon, Best Buy, Loblaws, Metro and more, uncovering distinct patterns in how brands and retailers structured their promotional calendars this year.
Our Methodology
DataWeave monitored pricing and discount trends across Canadian retailers during two key timeframes:
Pre-Black Friday Period: Up to November 23, 2025 – establishing baseline promotional activity and early holiday deals
Black Friday Week: November 24 – December 1, 2025 – spanning Thanksgiving through Black Friday (November 28) and Cyber Monday (December 1)
Our dataset included top-performing products across multiple subcategories on major Canadian retail platforms. We also tracked Share of Search metrics, measuring brand prominence by analyzing which brand names appeared in the top 20 search results for high-value keywords during each period.
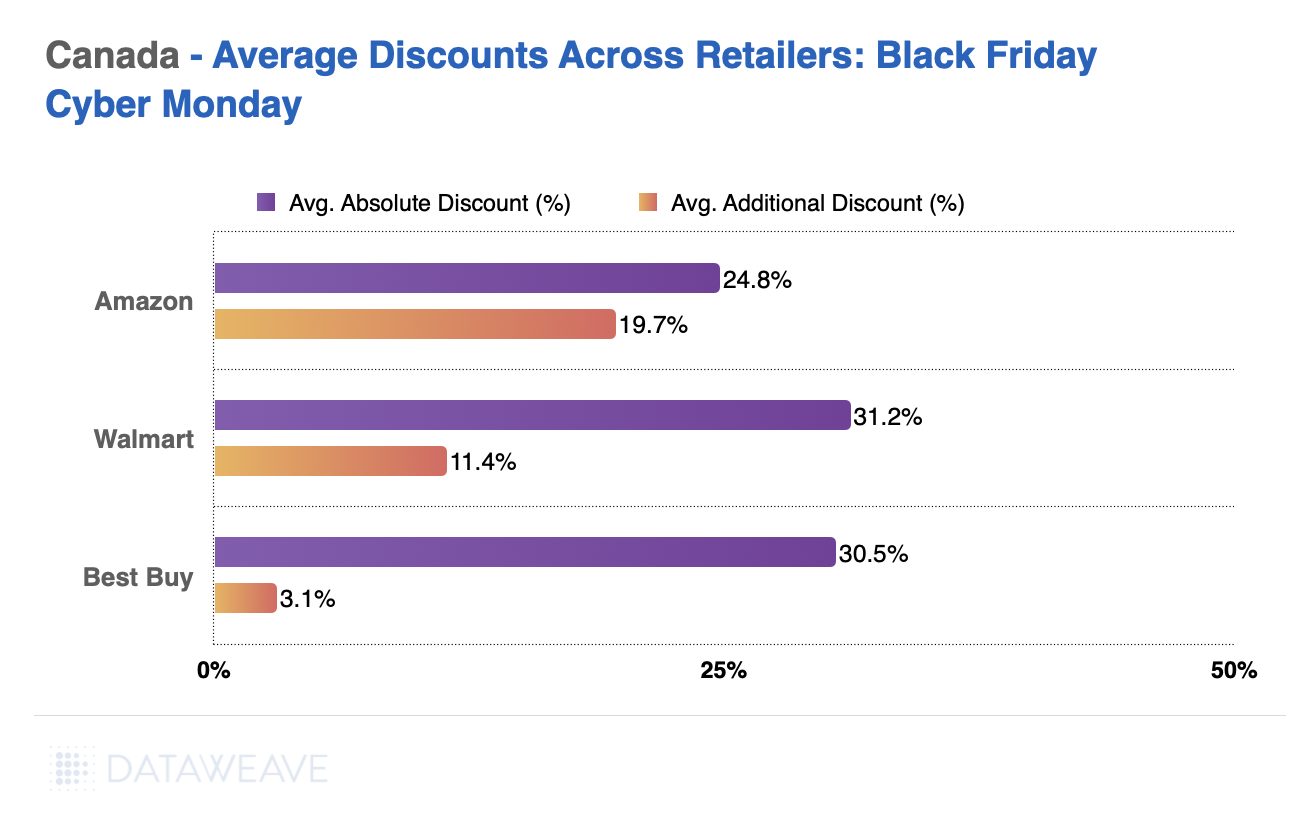
Black Friday 2025 Canada: Overview
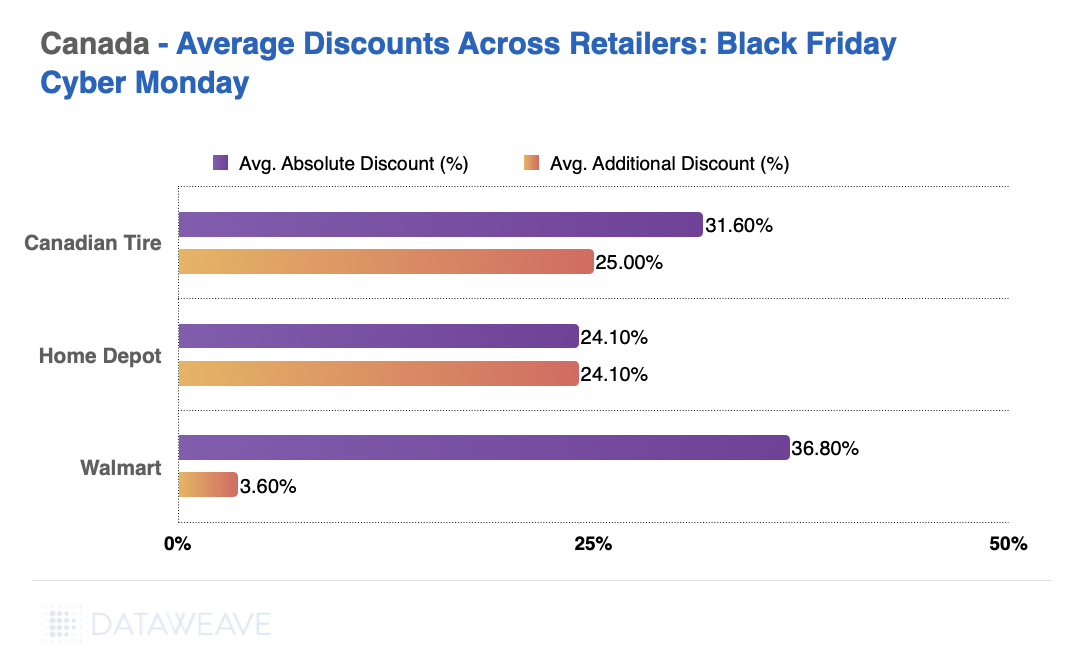
Here’s how average discounts compared between the Pre-Black Friday period and Black Friday Week:
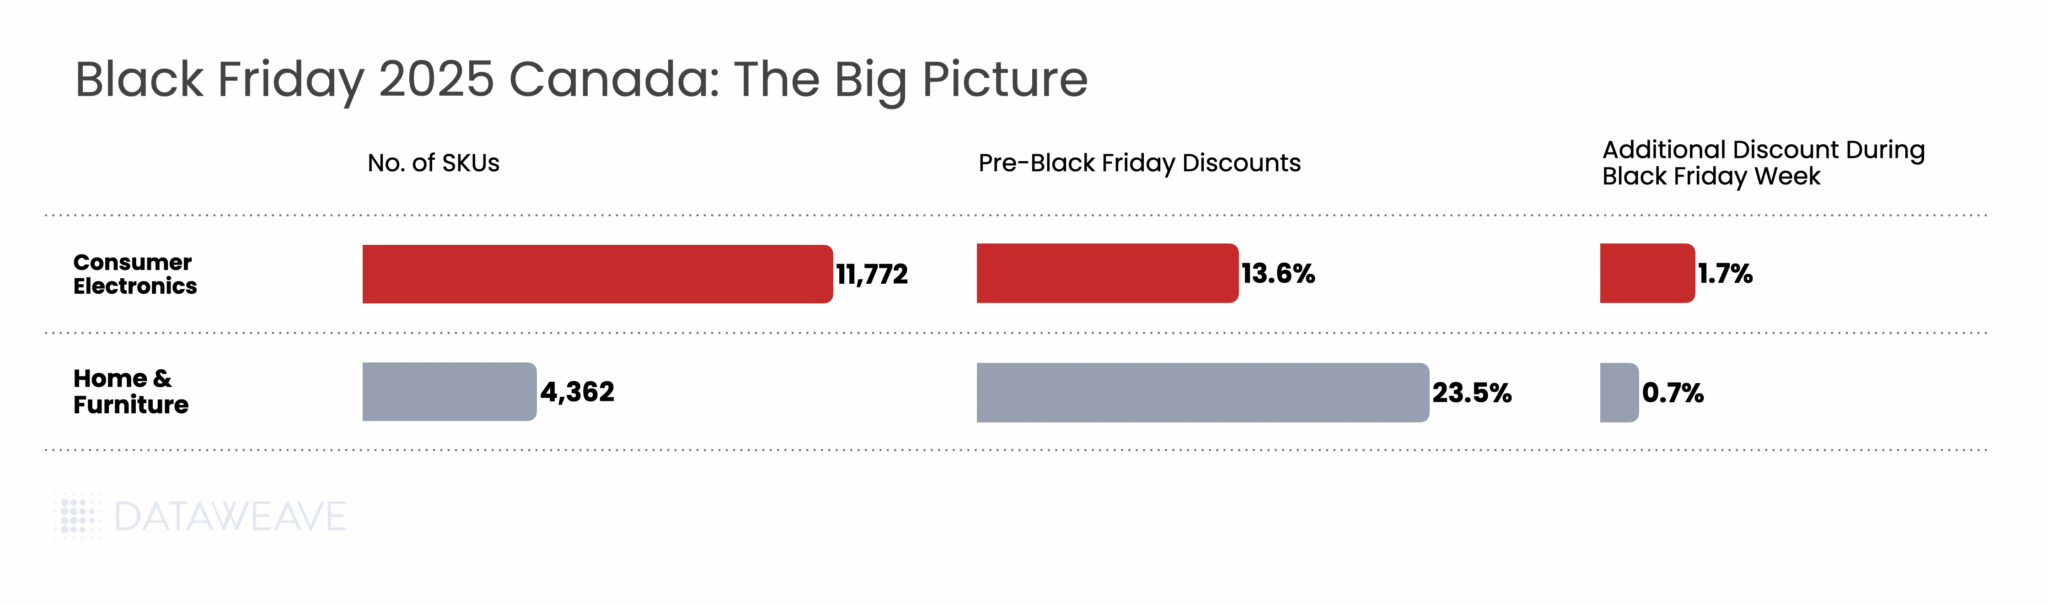
Key Finding: Canadian retailers front-loaded their promotional strategy significantly, with Pre-Black Friday discounts averaging 16.3% across categories. The additional lift during Black Friday Week was modest at 1.4%.
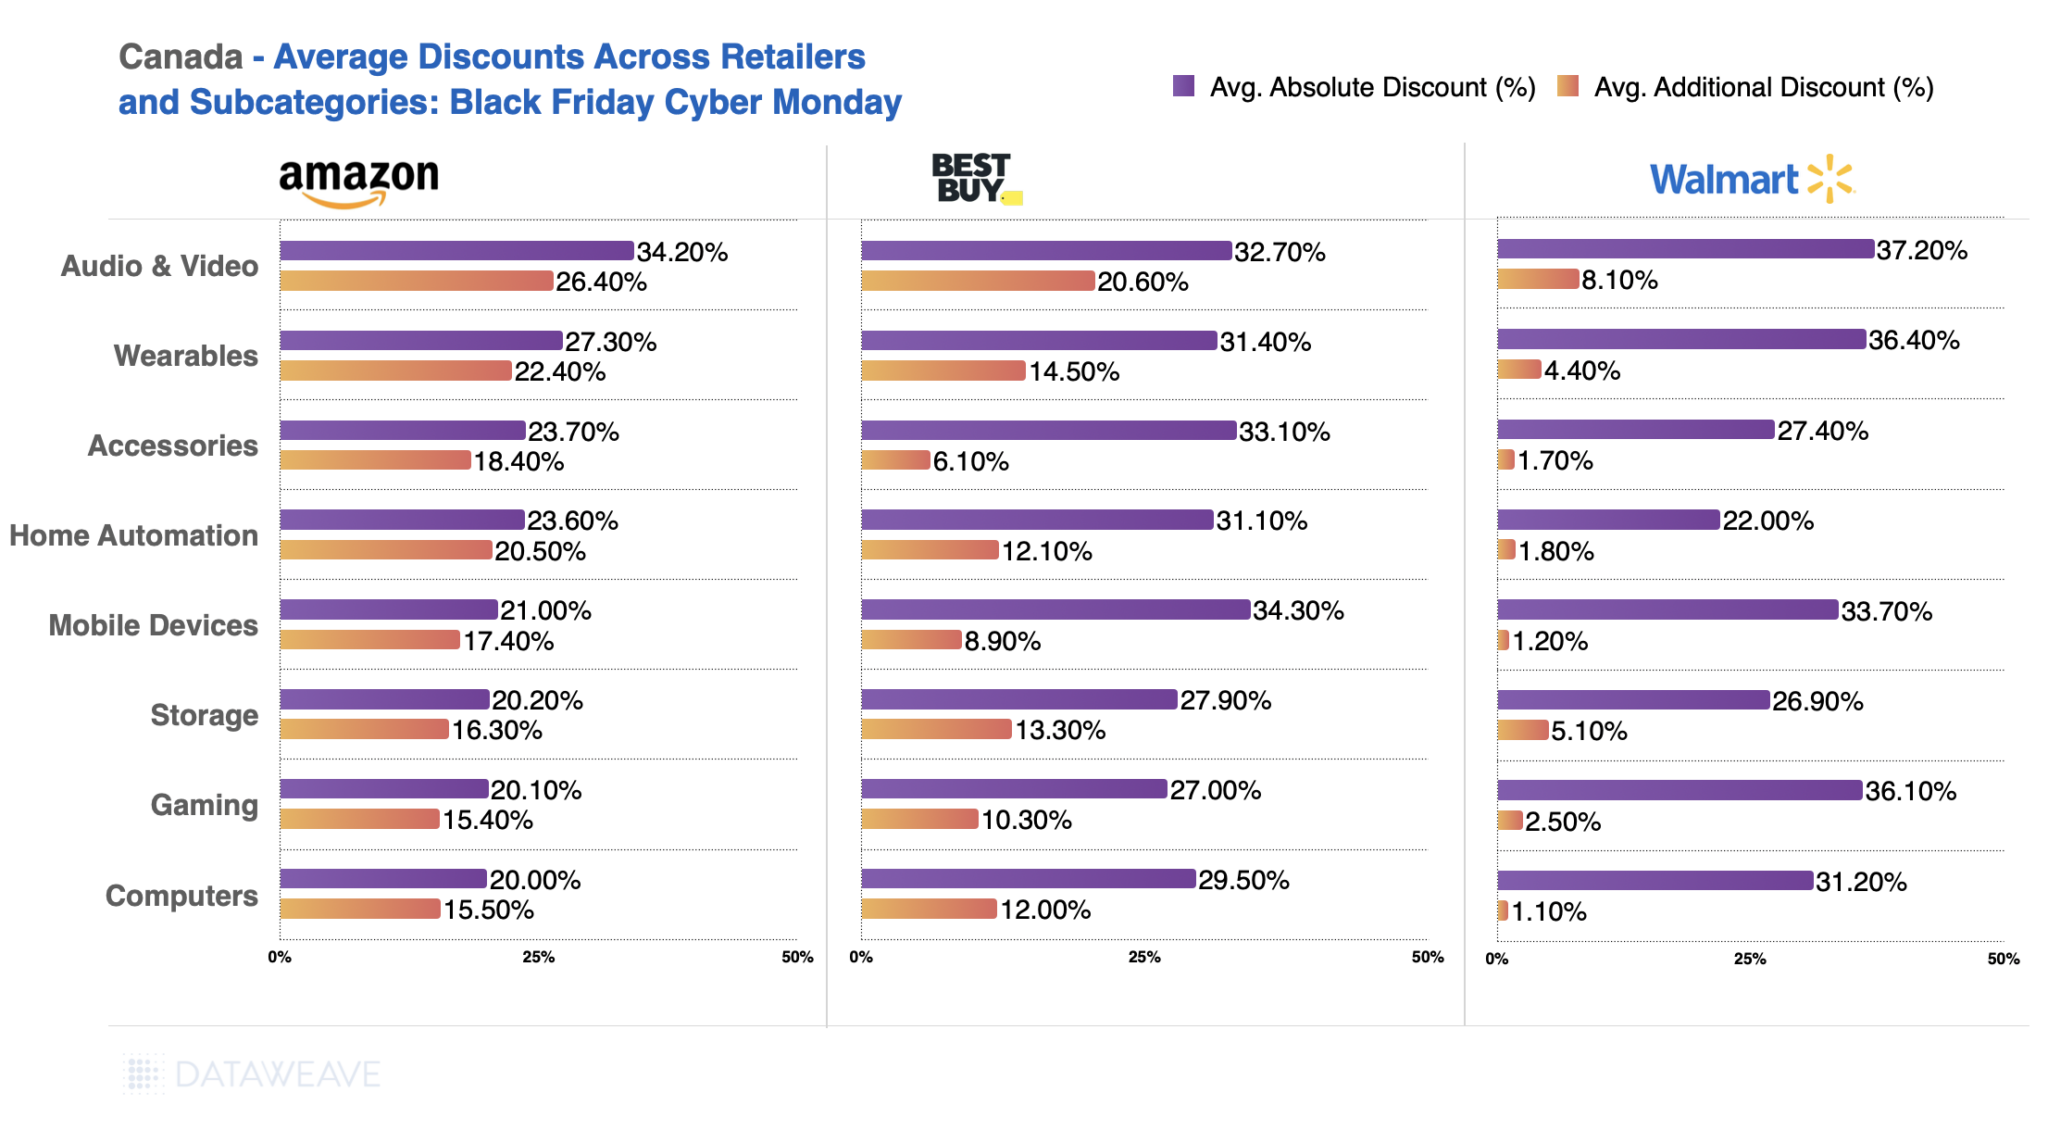
Consumer Electronics
Consumer electronics consistently drives Black Friday traffic, and Canadian retailers delivered compelling early-season value. Our analysis of 11,772 SKUs reveals nuanced subcategory performance.
Subcategory Discount Breakdown
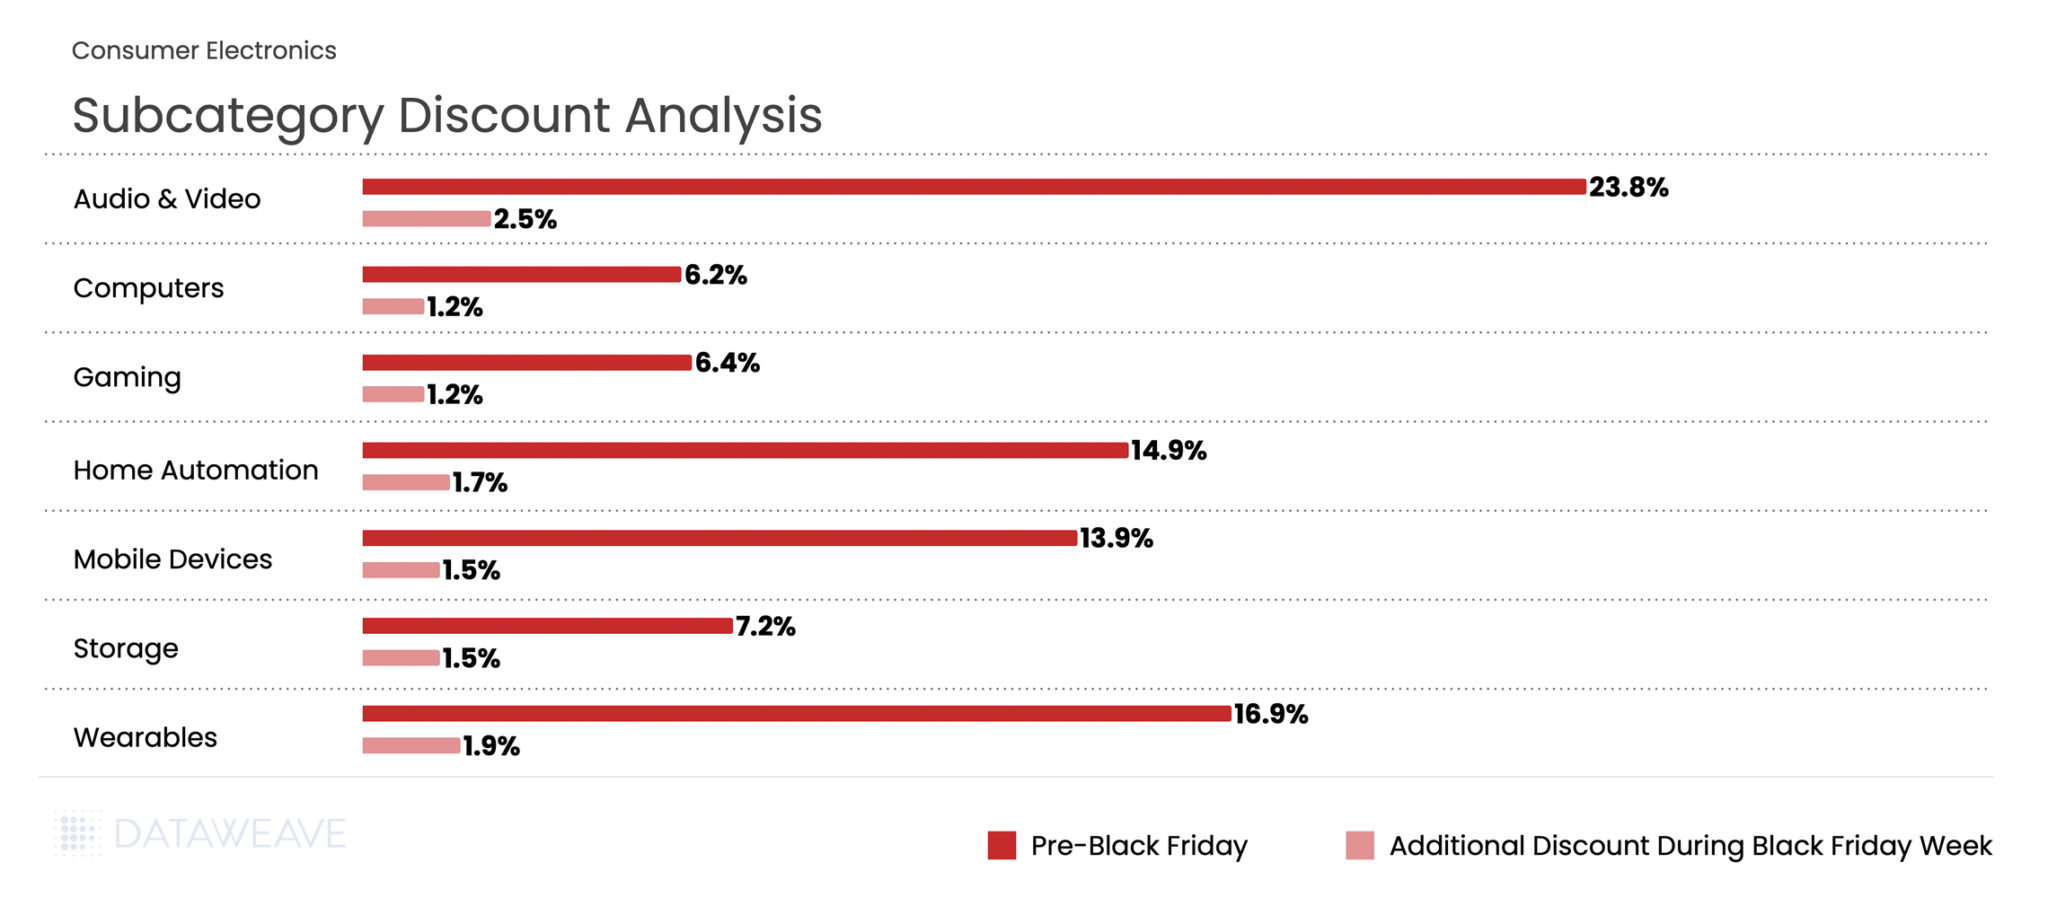
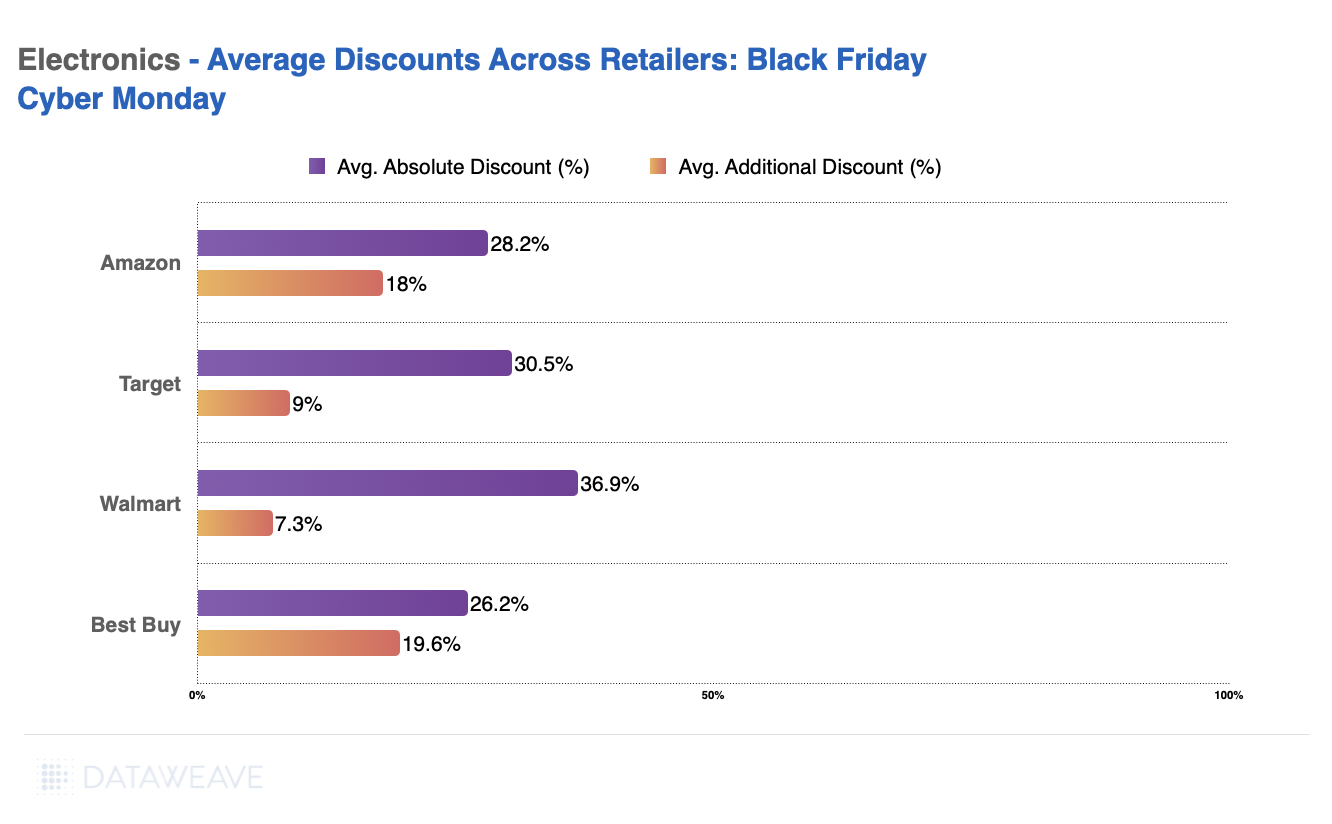
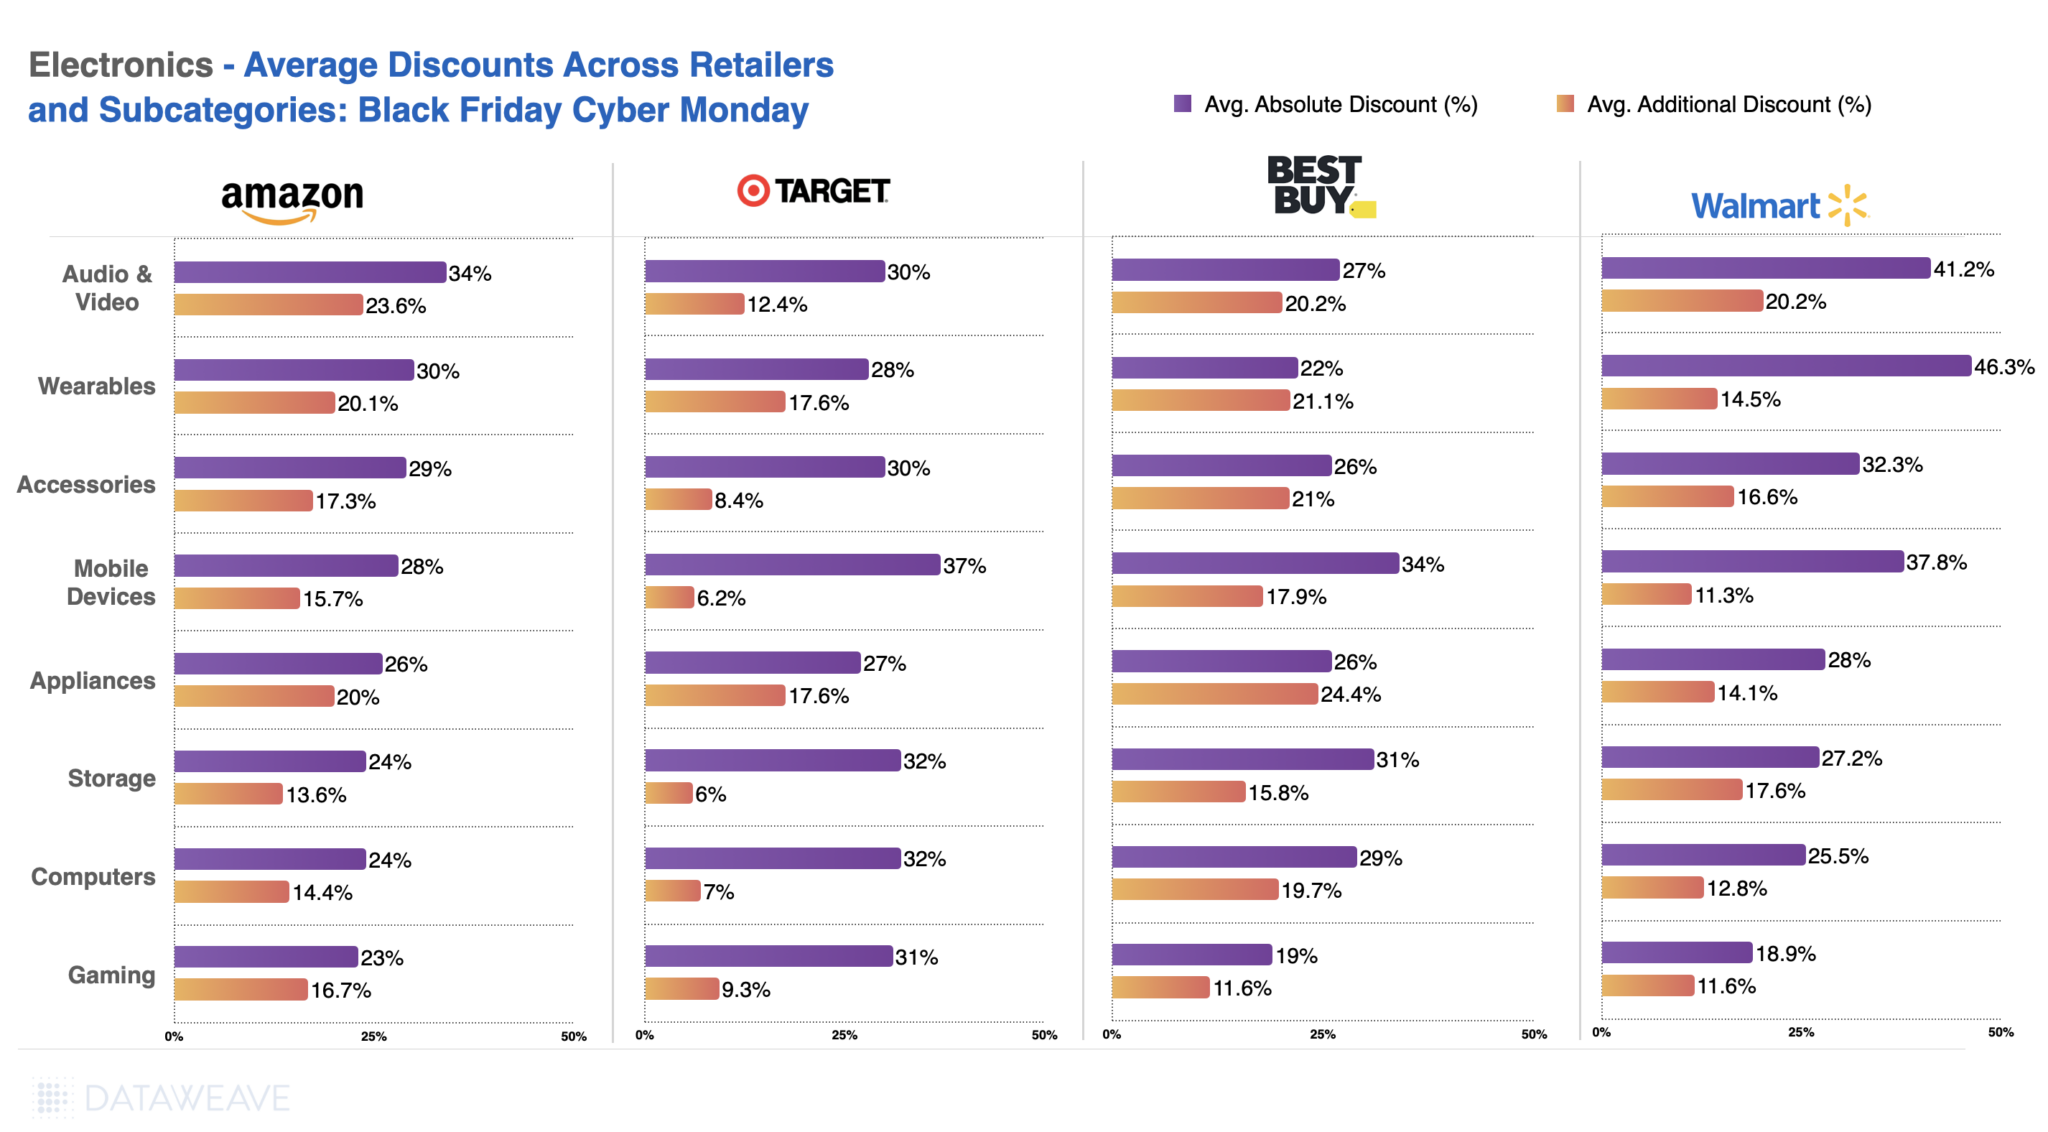
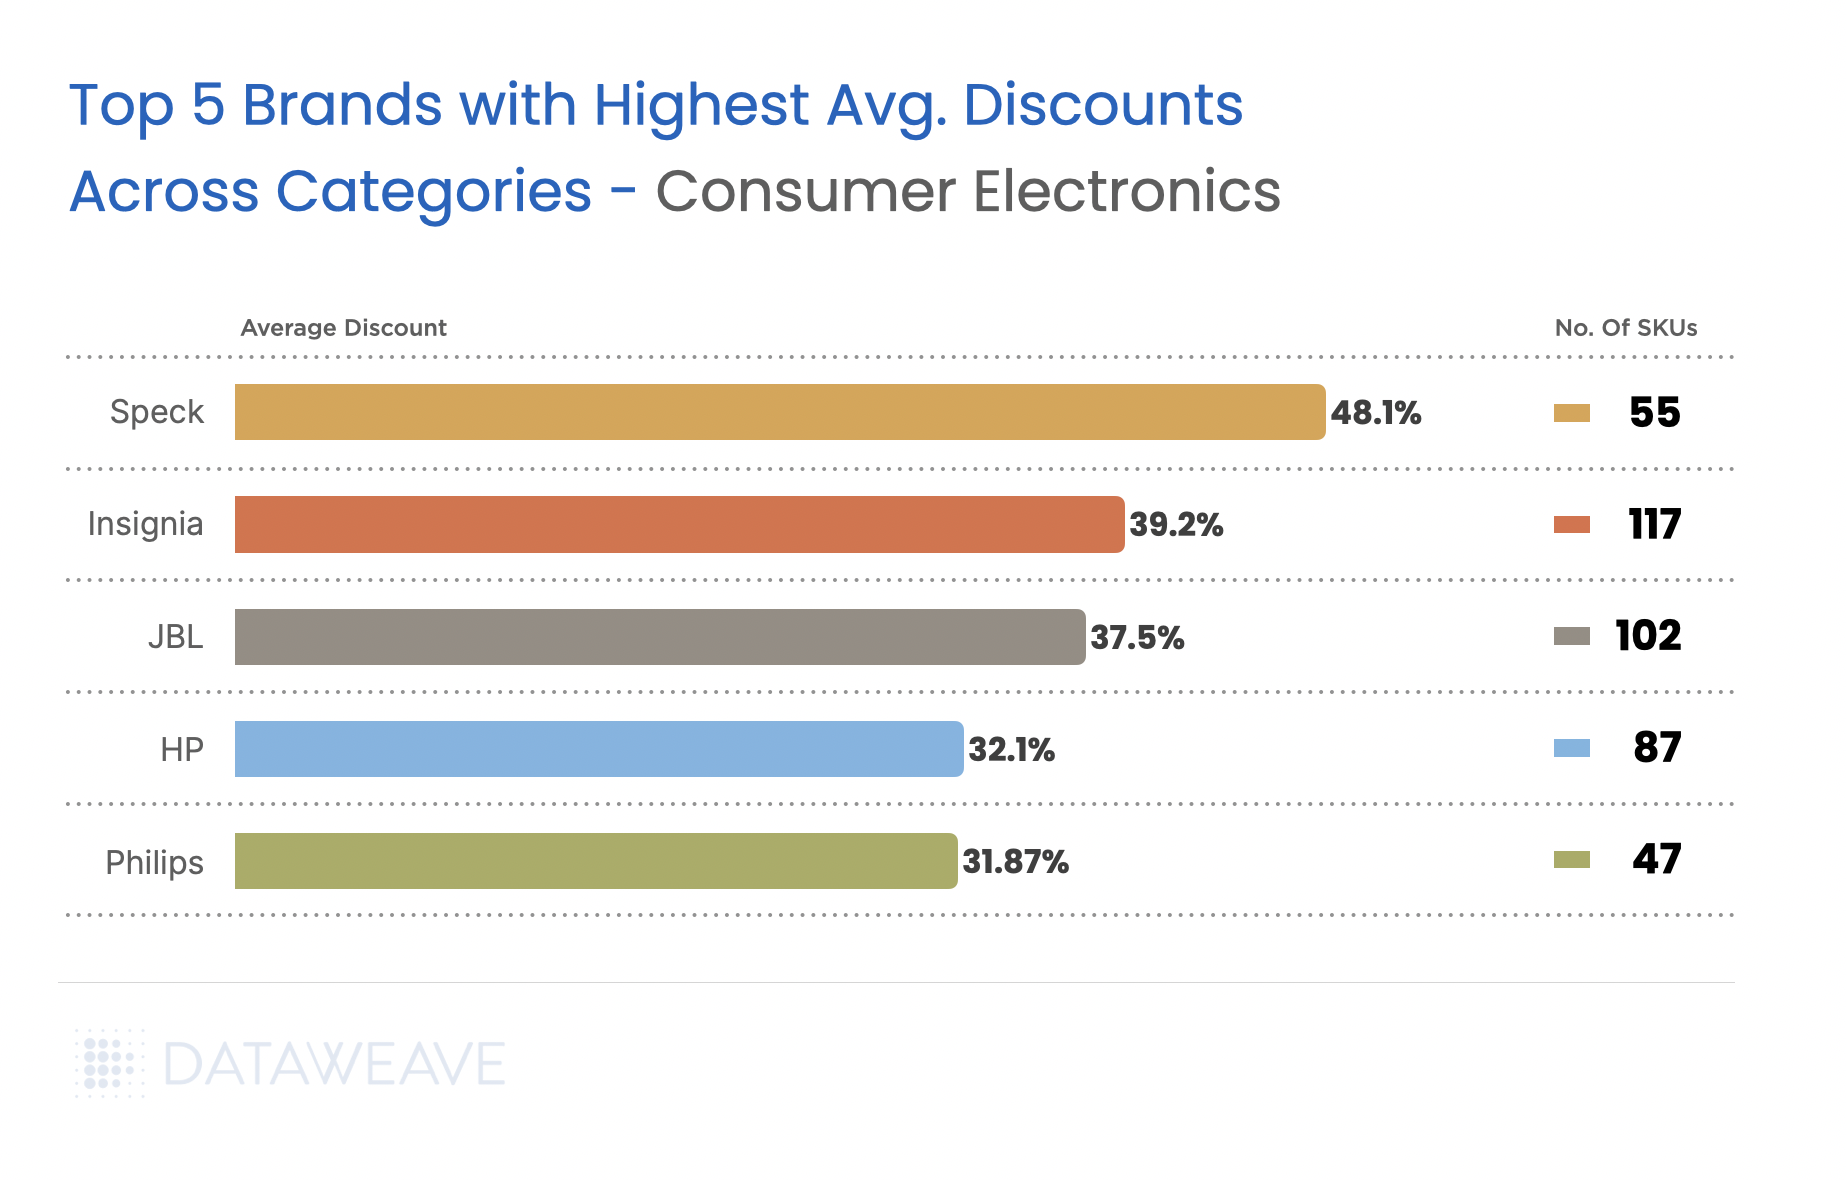
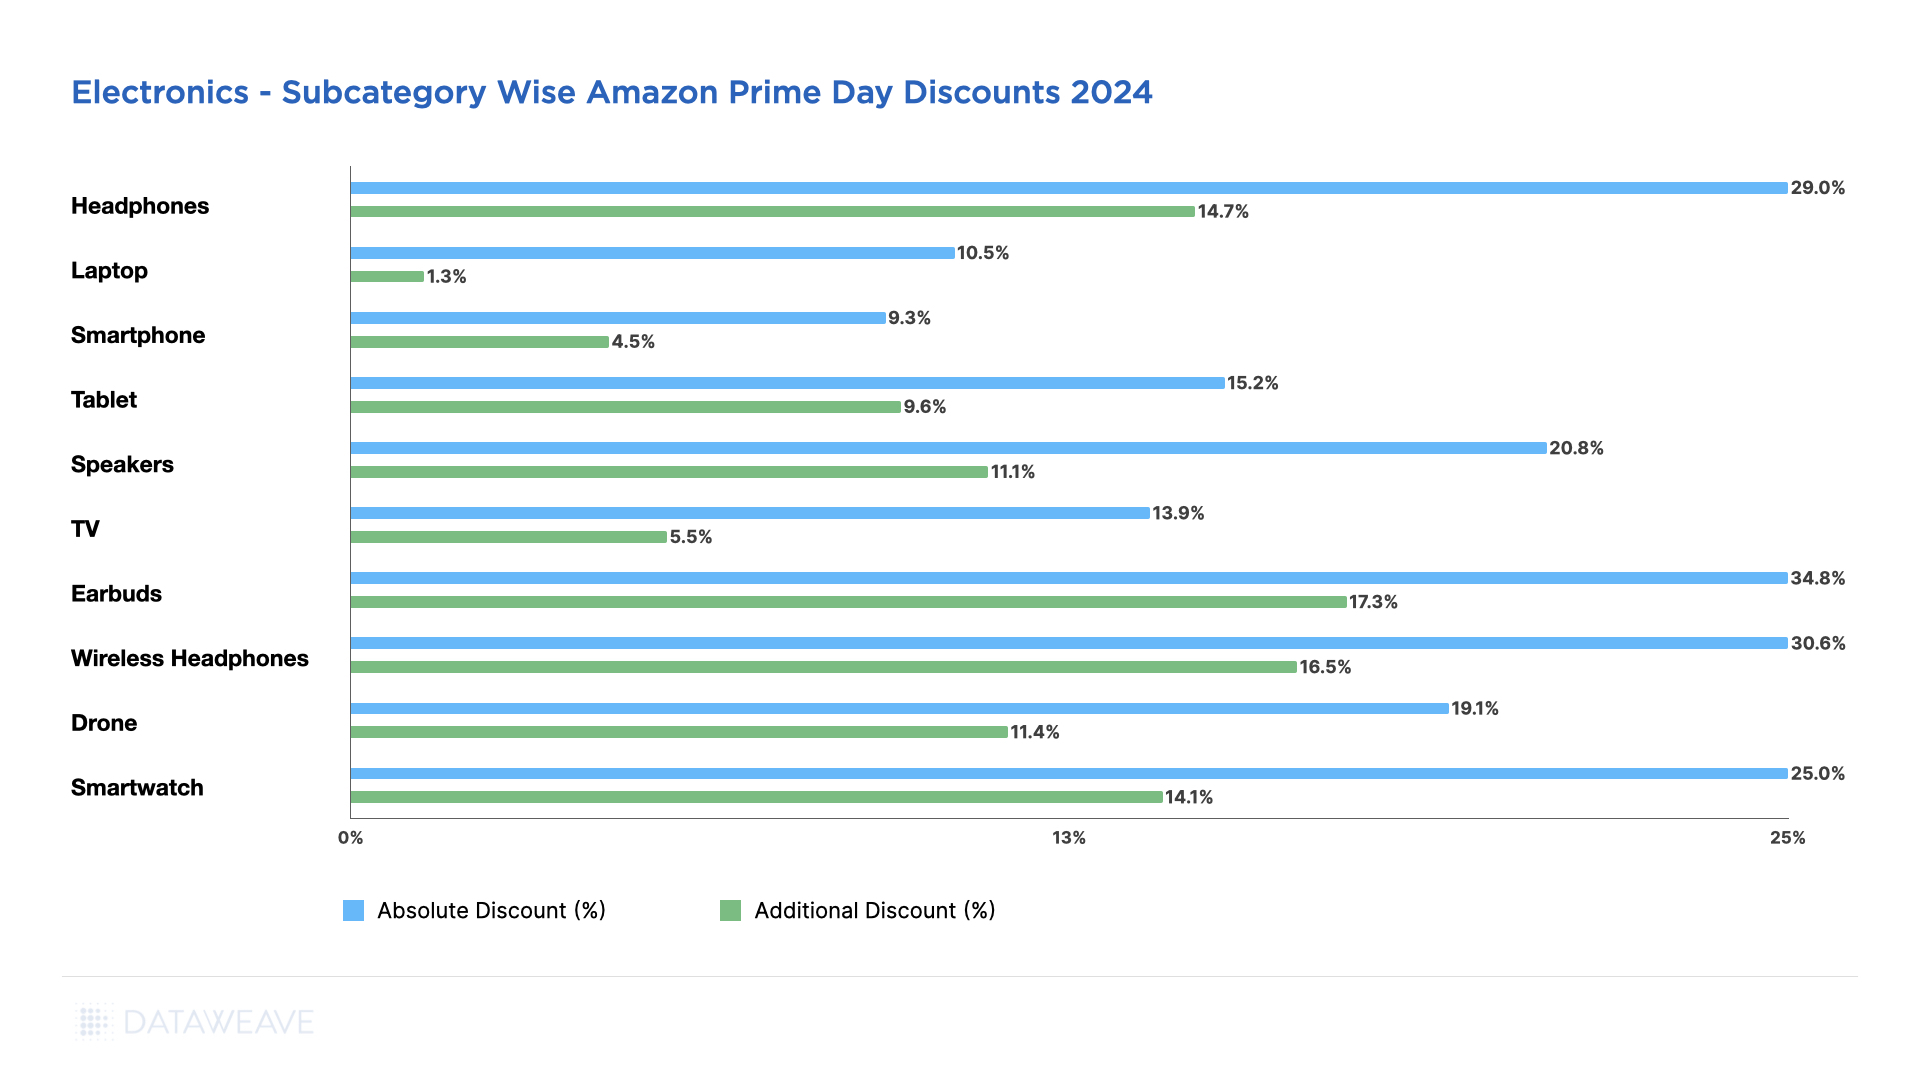
Consumer Electronics averaged 13.6% discounts in the Pre-Black Friday period, with Black Friday Week adding 1.7%. Audio & Video dominated early promotional activity at 23.8%, signalling retailers’ intent to clear inventory ahead of the main event. Wearables followed at 16.9%, likely timed to capture gift-buying momentum.
During Black Friday Week, Audio & Video maintained leadership with an additional 2.5% discount, the highest incremental lift in the category. Meanwhile, Computers and Gaming, already positioned at modest pre-sale discounts of 6.2% and 6.4%, saw minimal additional movement, suggesting constrained inventory or deliberate pricing discipline in these segments.
Share of Search: Brand Visibility Trends
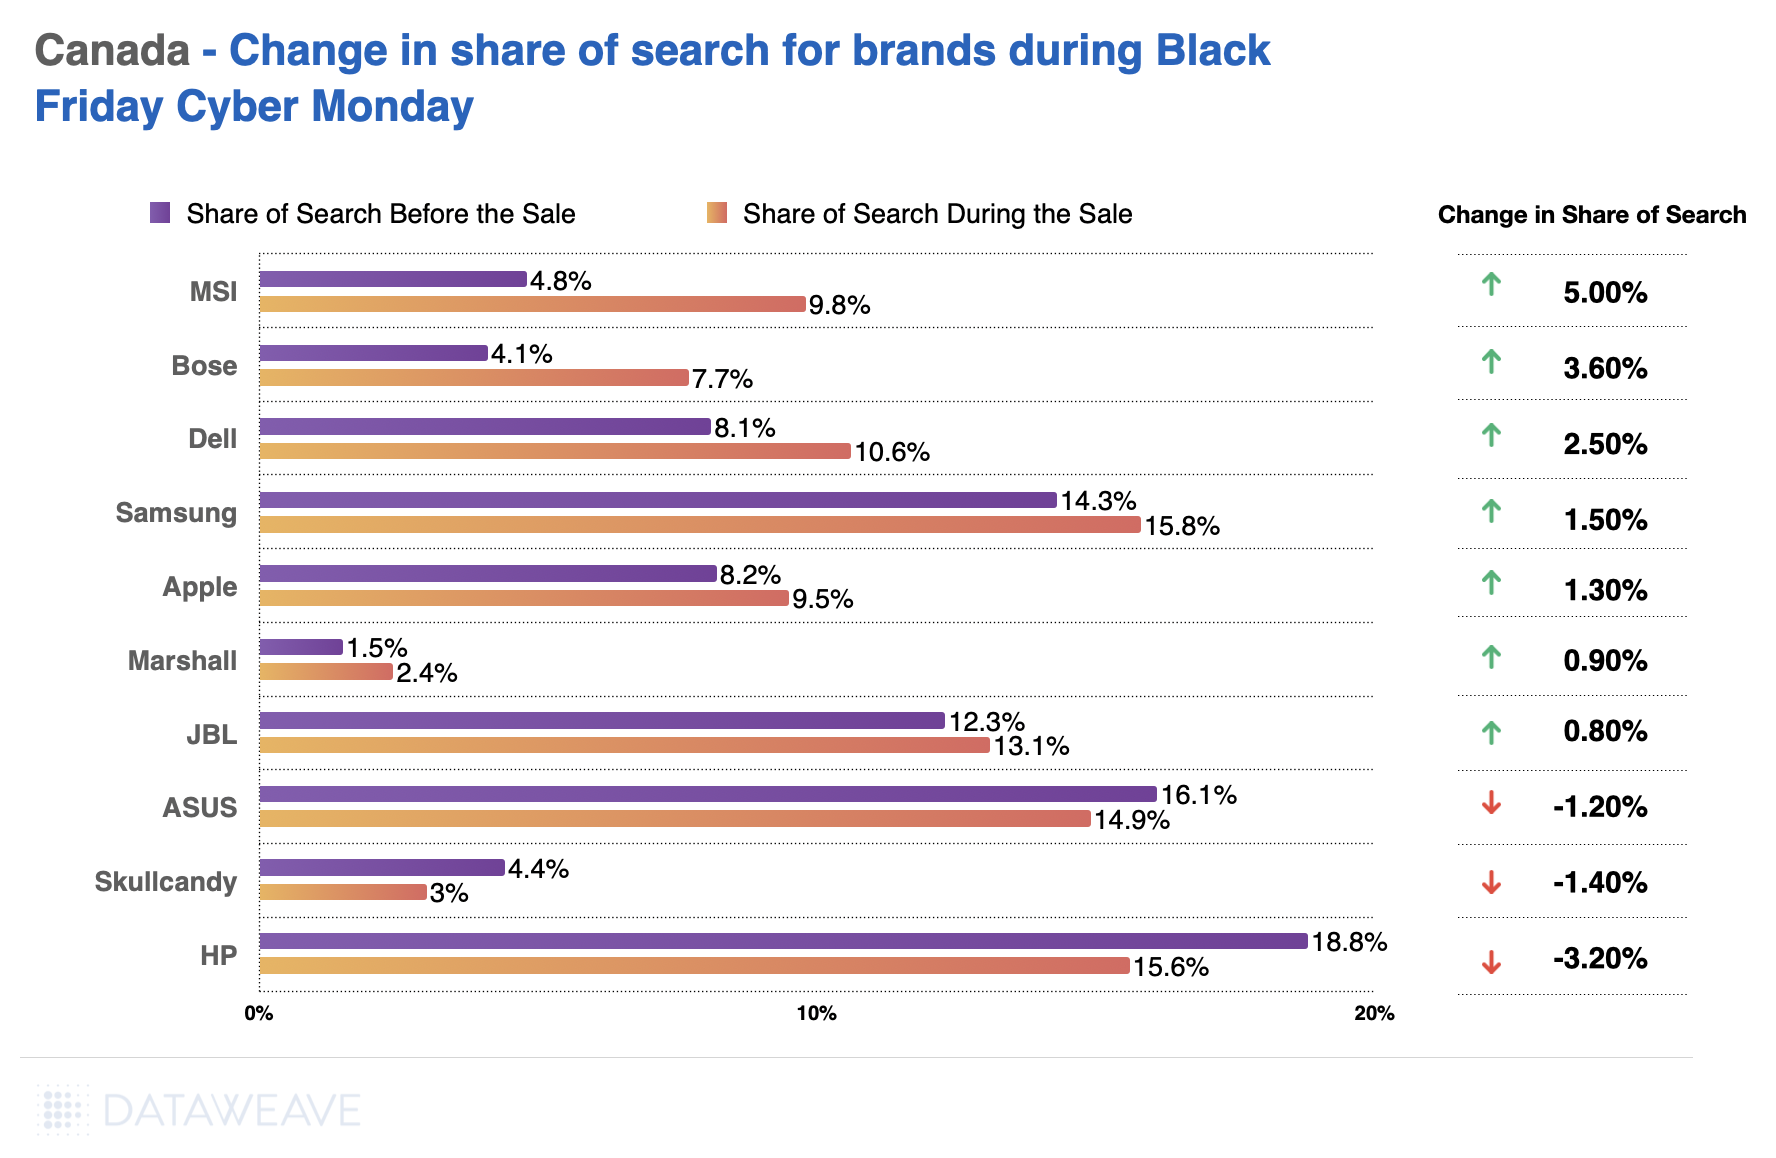
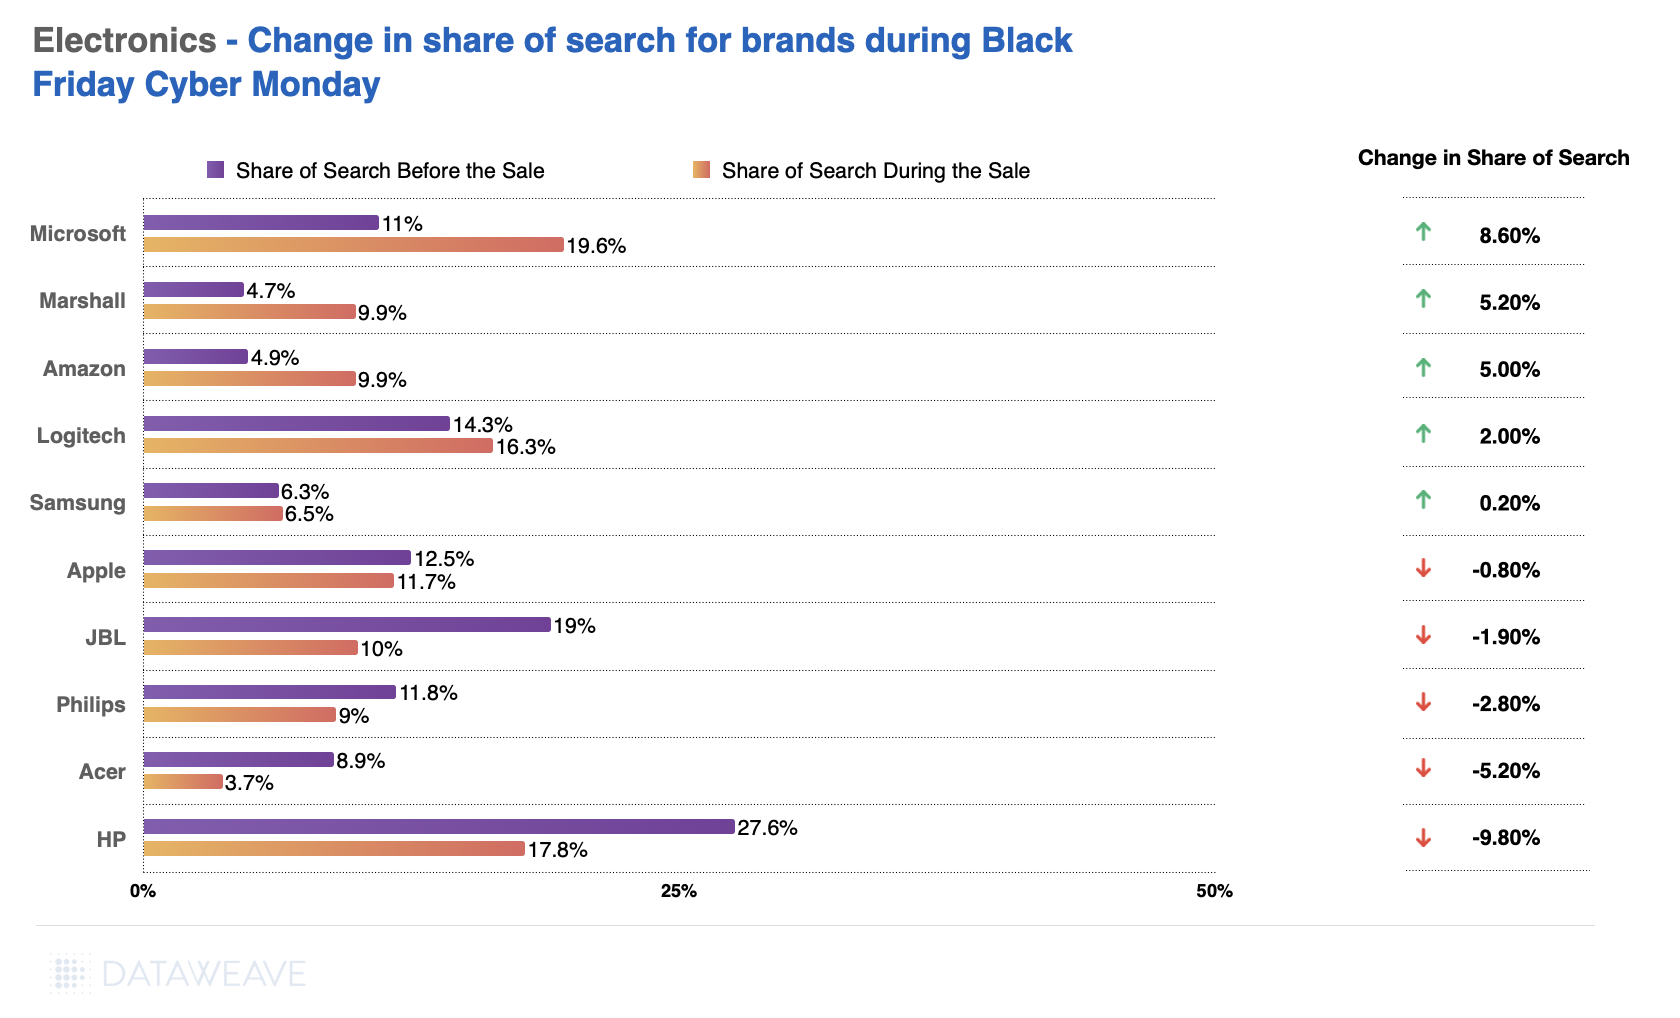
Our Share of Search data reveals which brands gained or lost prominence during Black Friday Week:
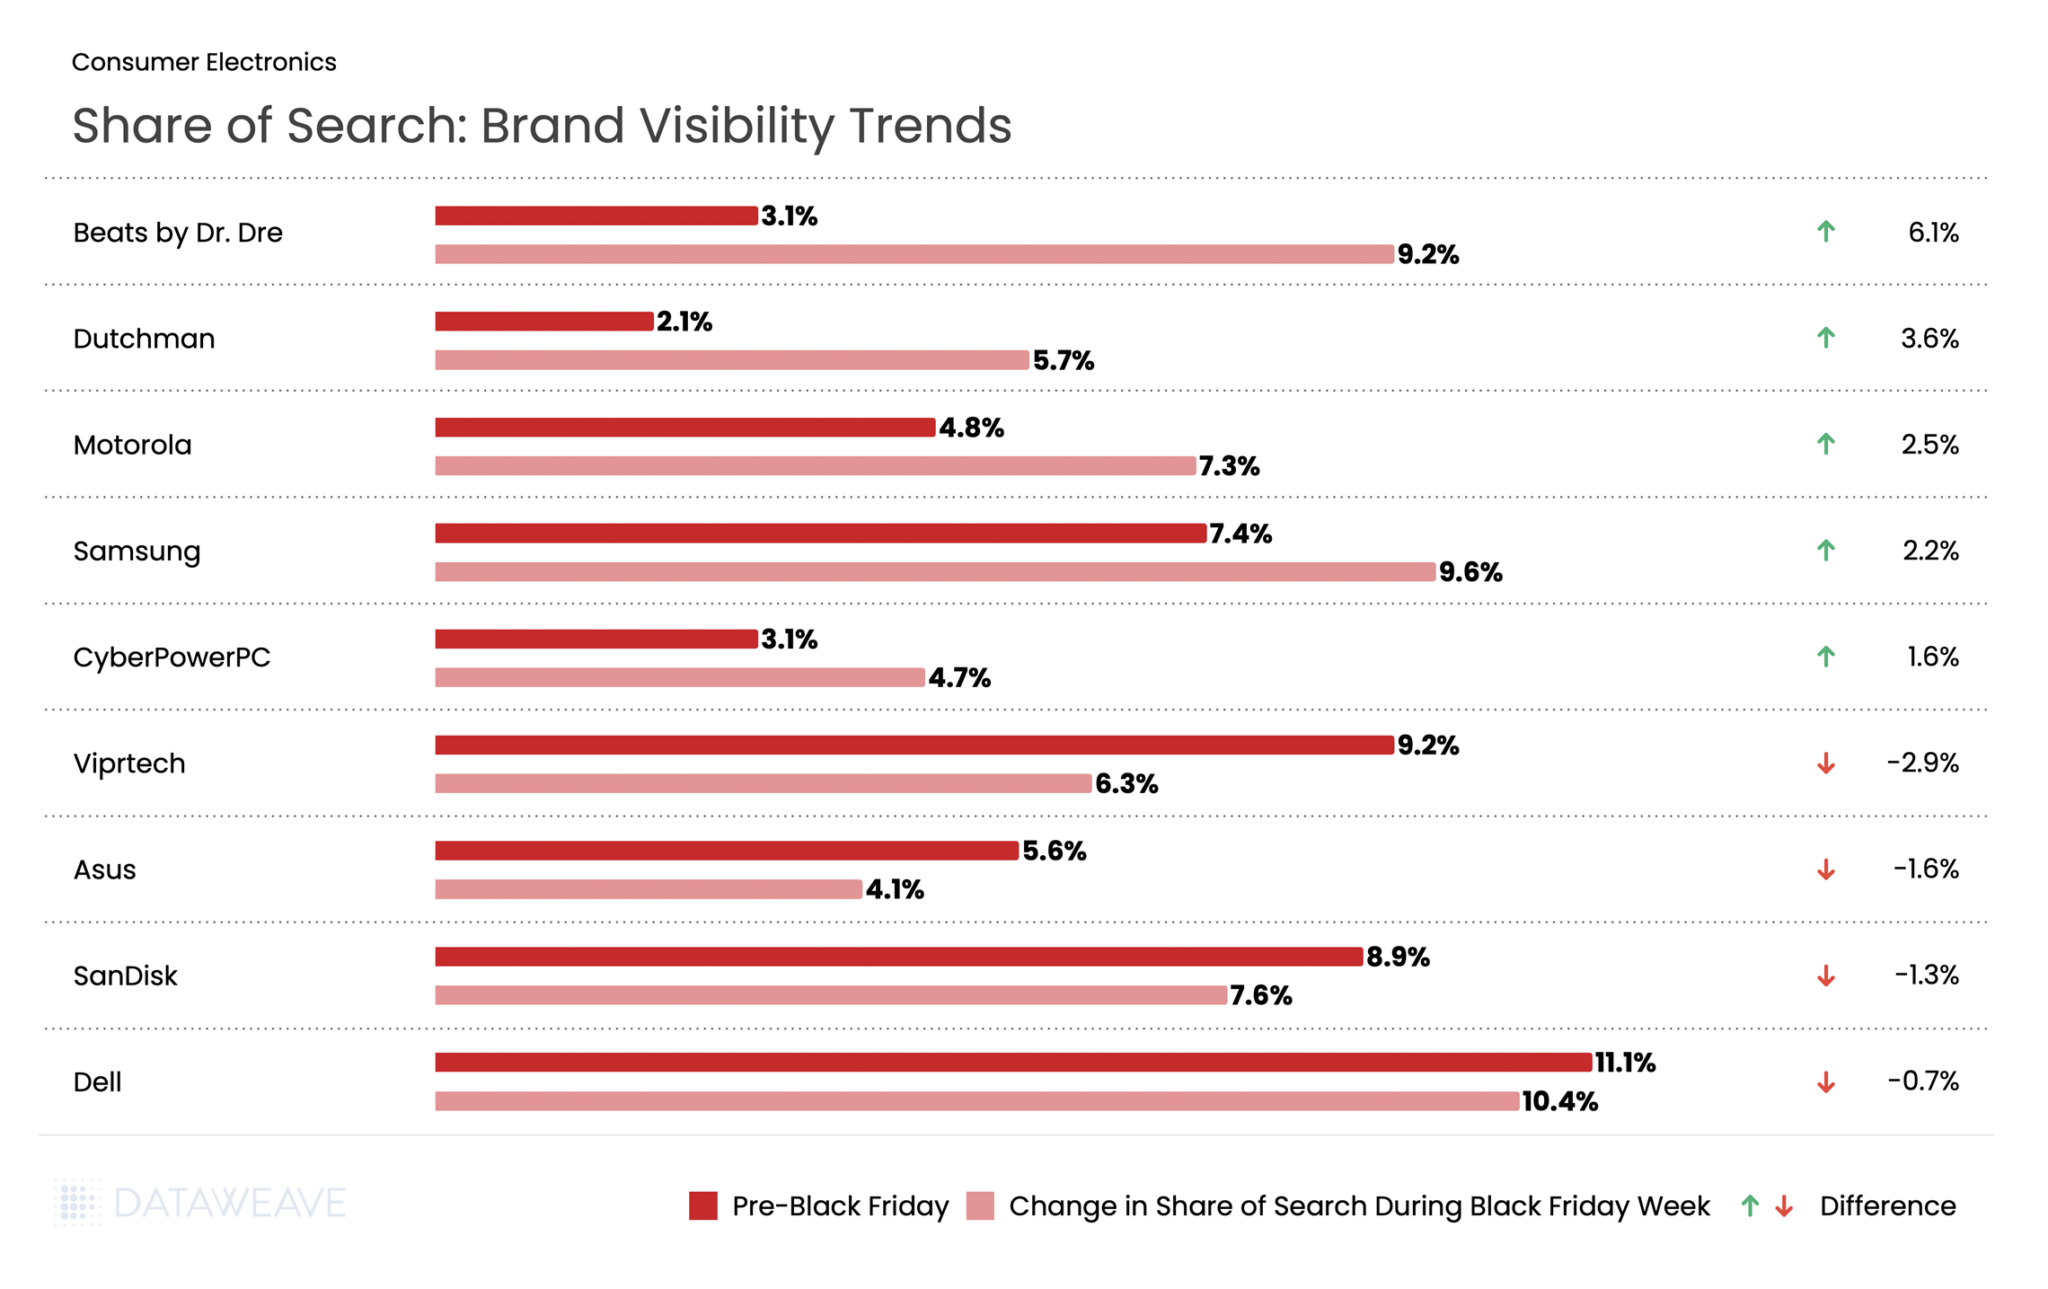
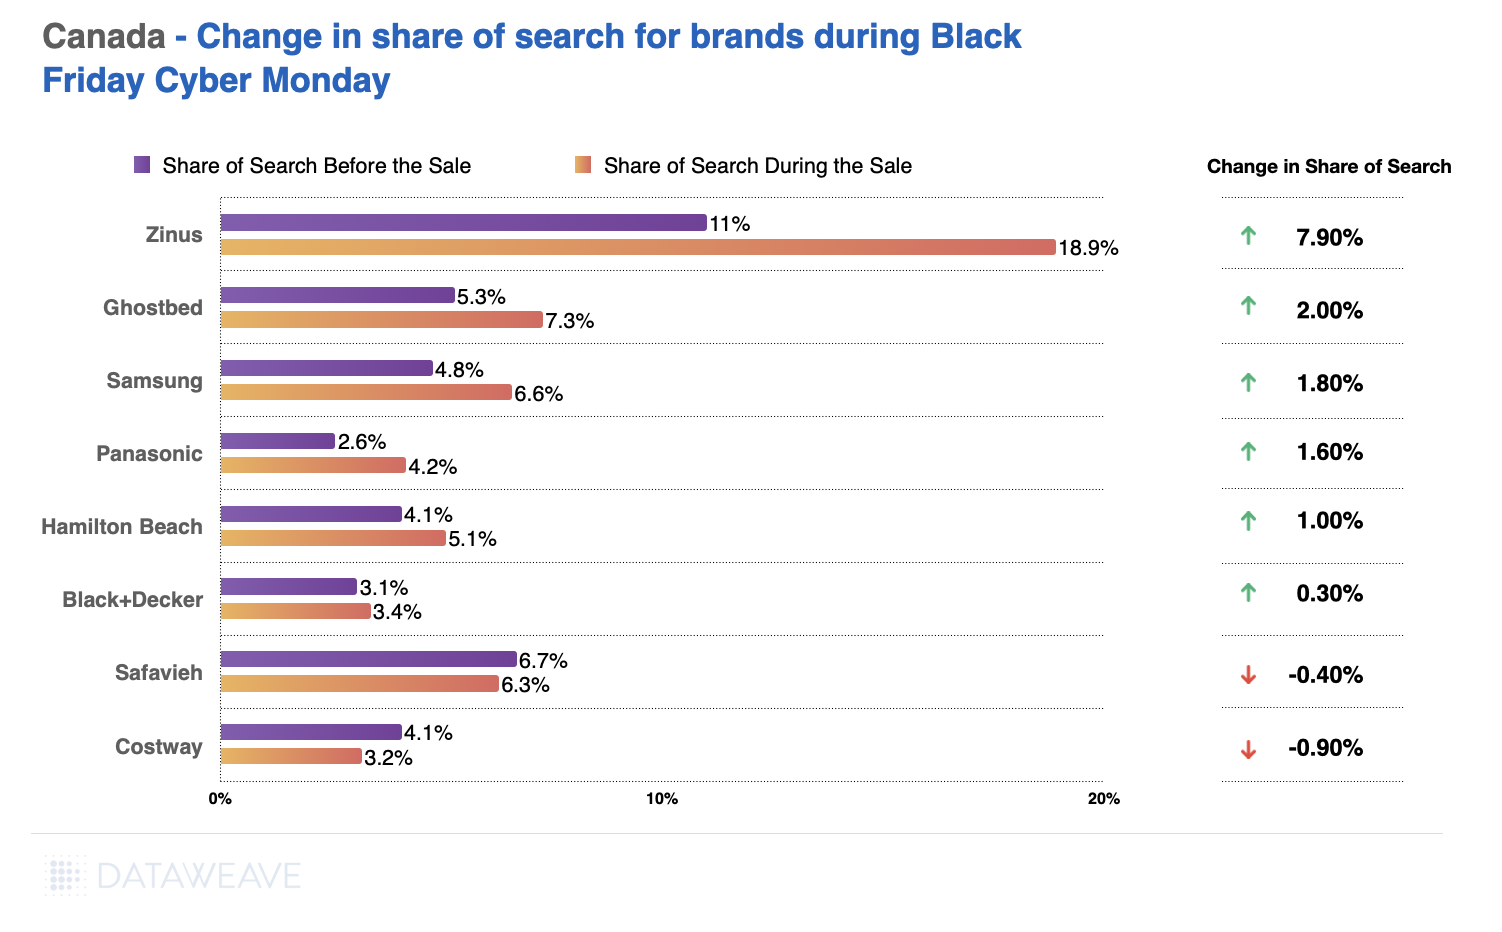
Audio brands dominated visibility gains during Black Friday Week. Beats by Dr. Dre nearly tripled its Share of Search from 3.1% to 9.2%, showing the strongest gains. Visibility for Dutchman climbed 3.6%. Motorola and Samsung also captured increased search prominence with gains of 2.5% and 2.2% respectively.
Conversely, some established tech brands experienced visibility declines. Gaming brand Viprtech by 2.9%. Asus declined by 1.6%, and SanDisk dropped by 1.3%.
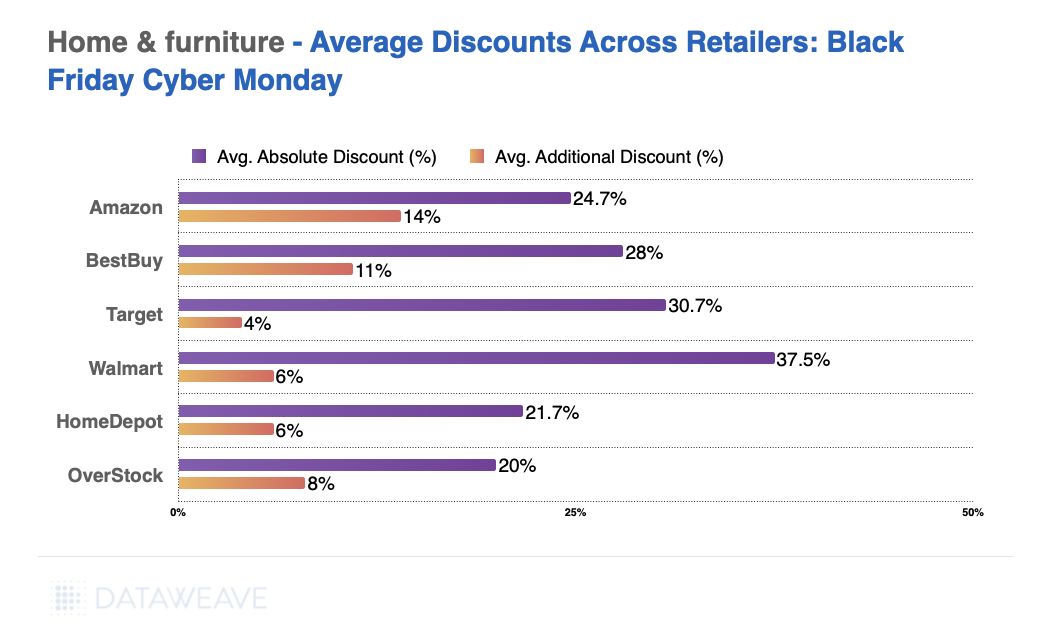
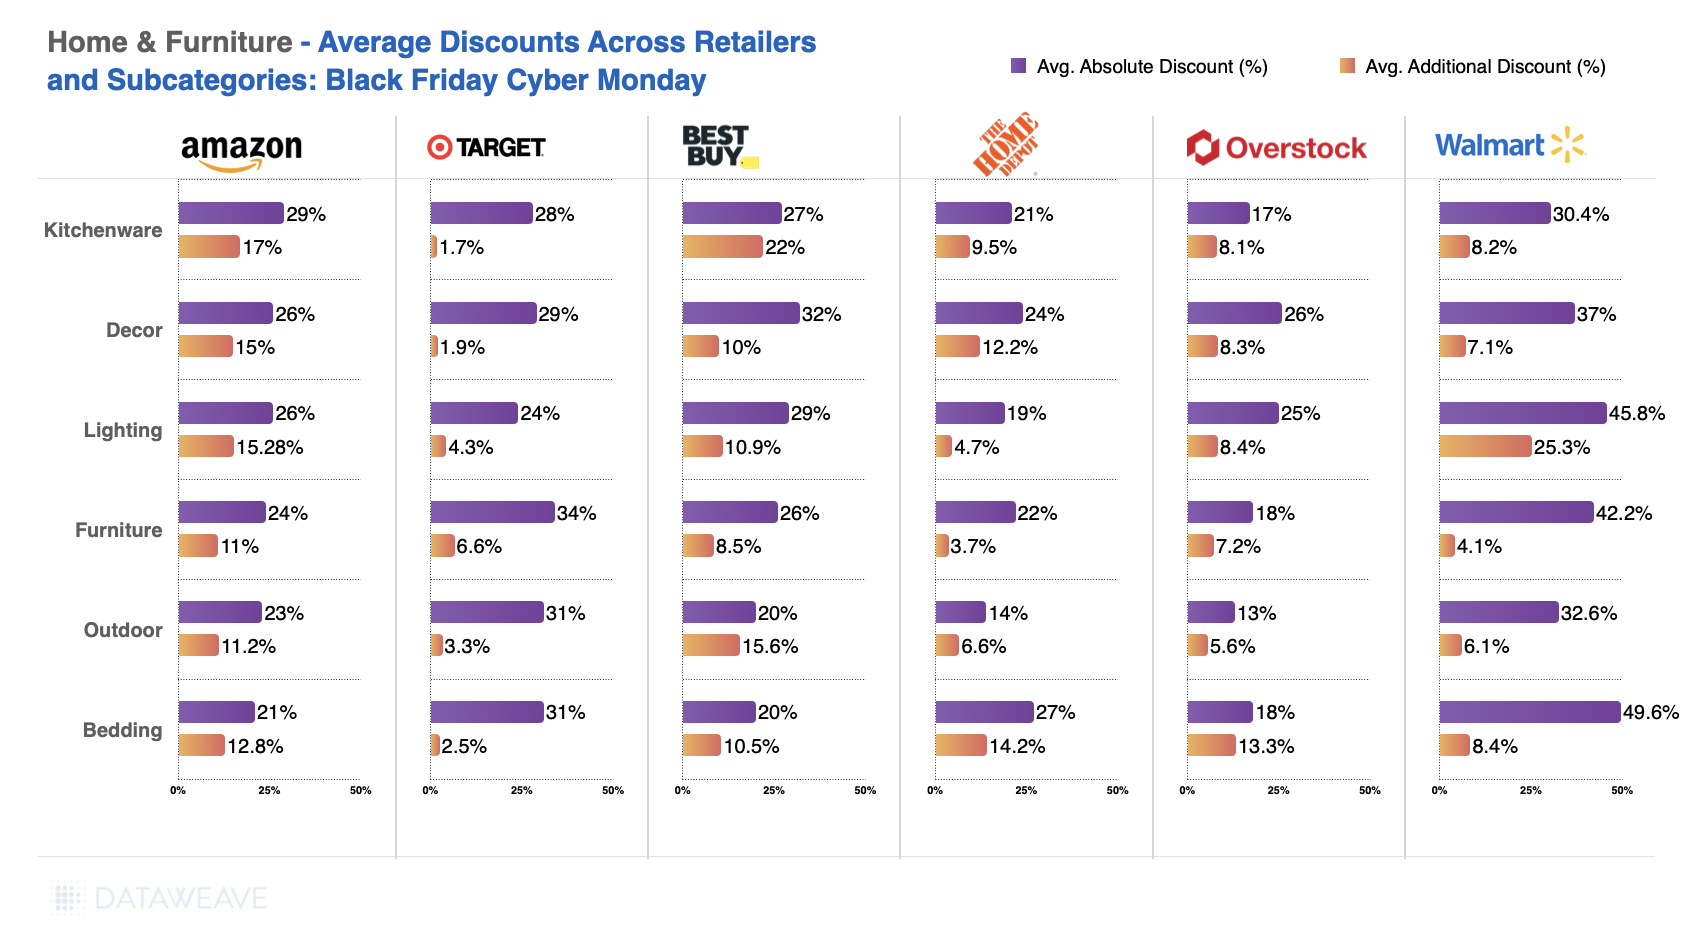
Home & Furniture
Home & Furniture showed the most aggressive early discounting of any category in our Canadian analysis. Tracking 4,362 SKUs, we found retailers heavily promoted home goods well before Black Friday weekend.
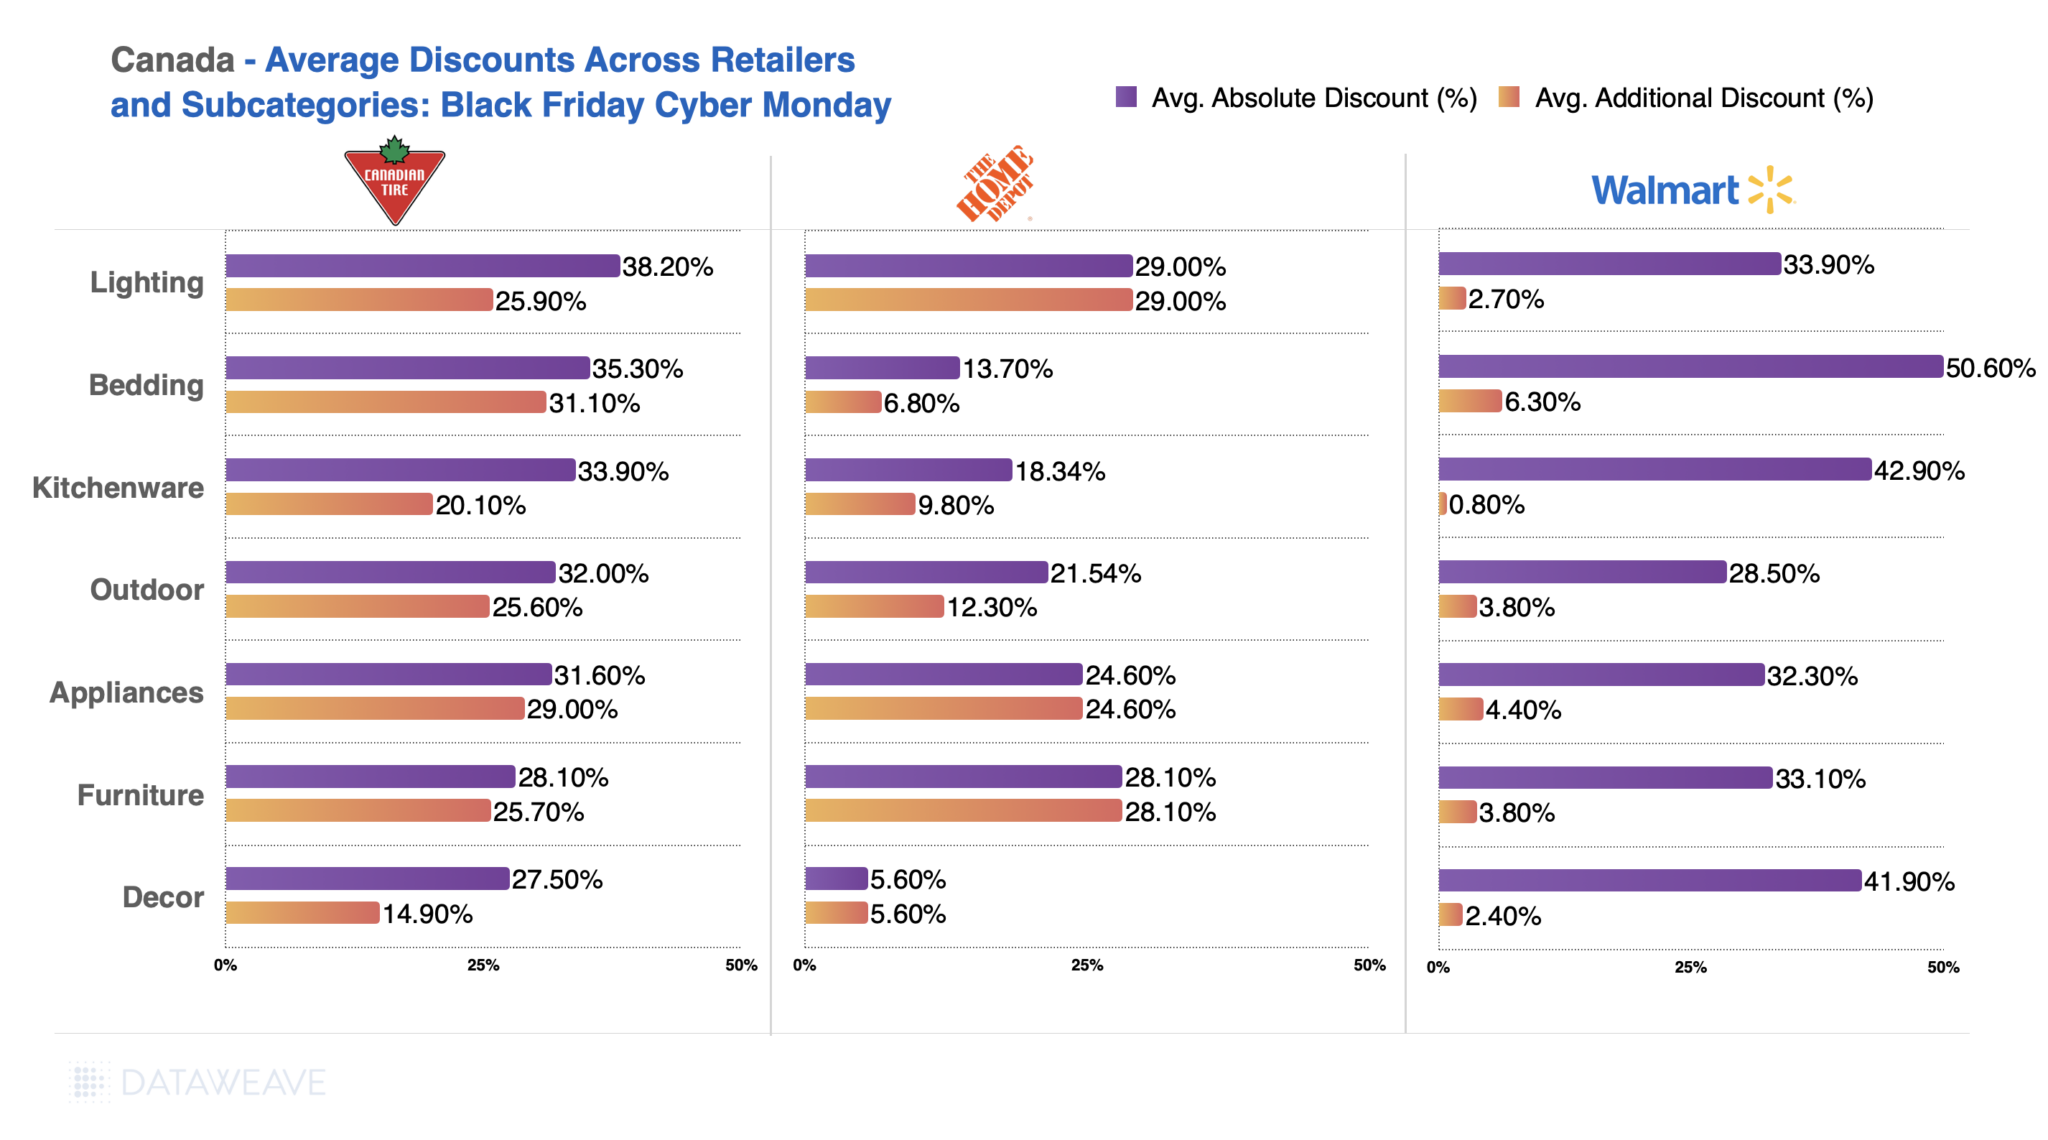
Subcategory Discount Breakdown
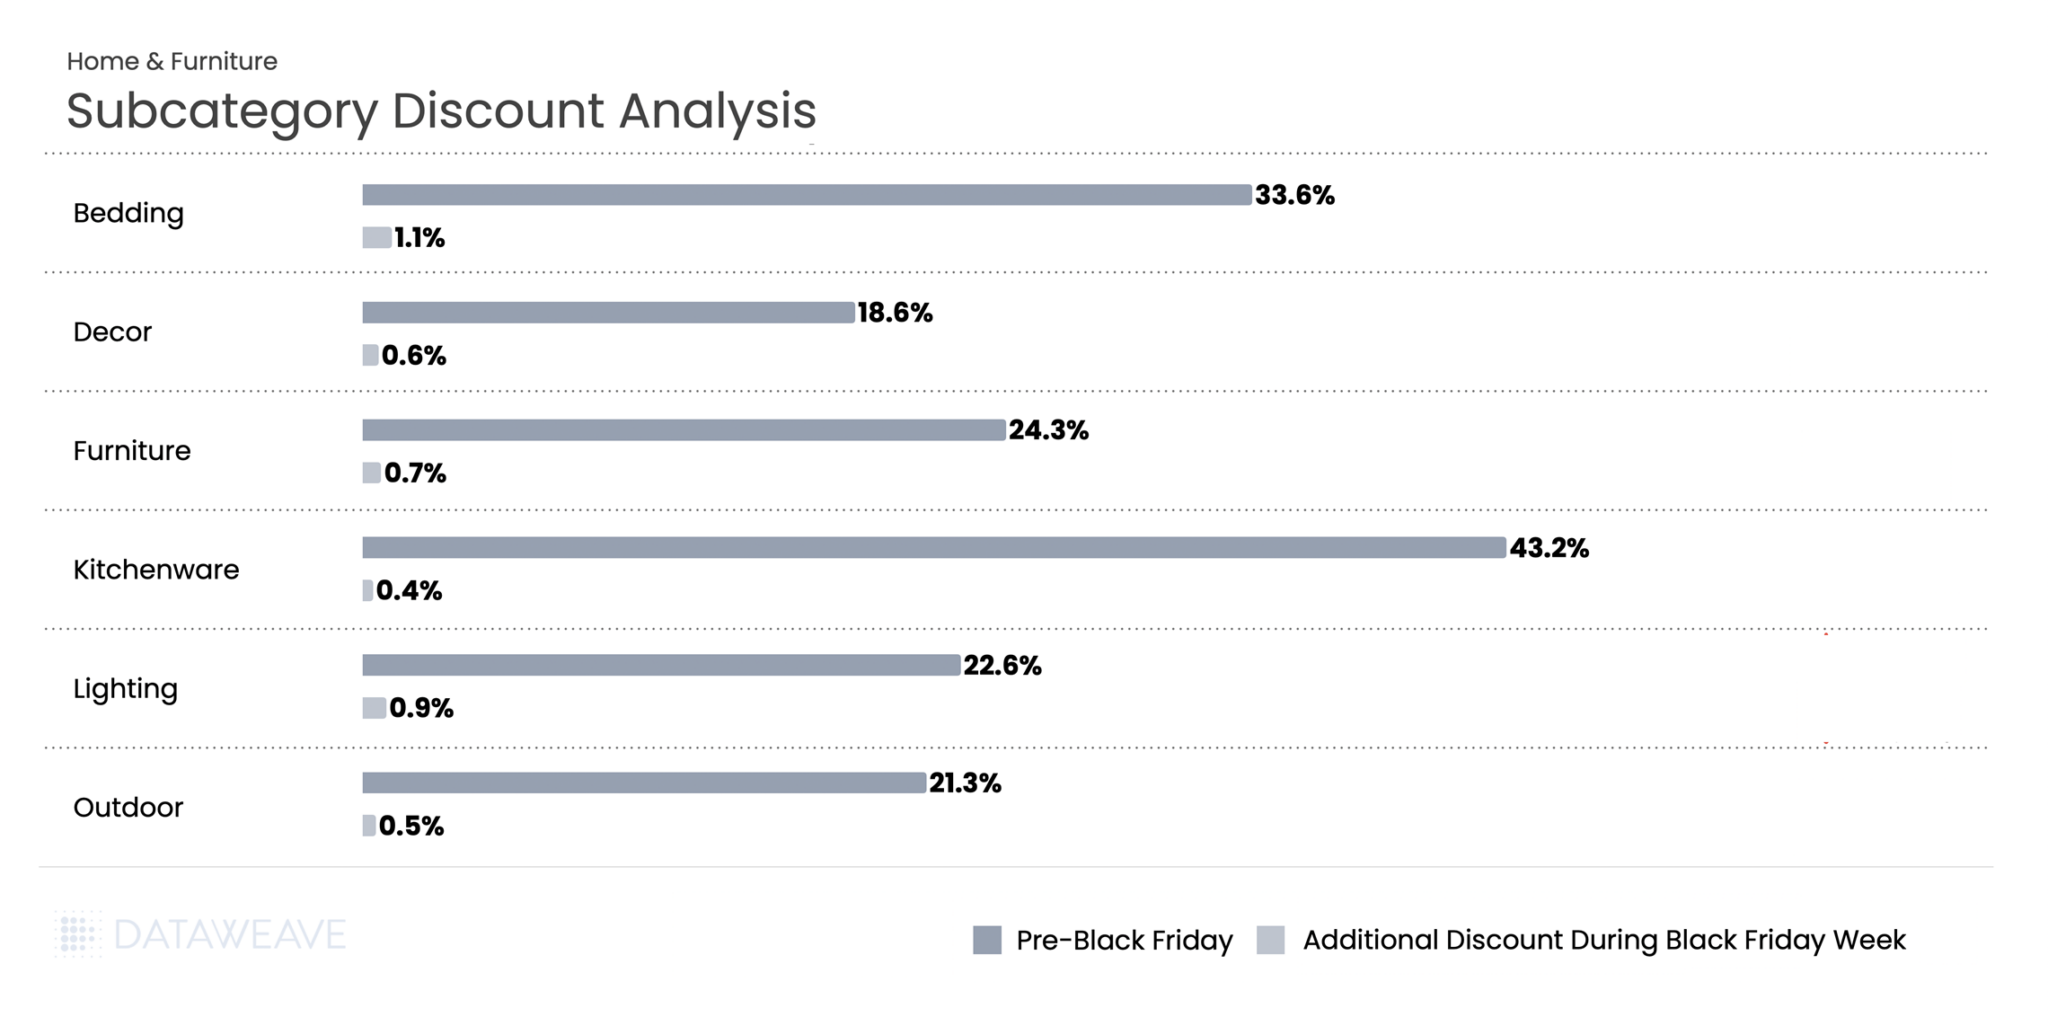
Home & Furniture led all categories with Pre-Black Friday discounts averaging 23.5%, but Black Friday Week added only 0.7%, the smallest incremental discount in our entire study. Kitchenware saw extraordinary pre-sale discounts of 43.2%, the highest in any subcategory we tracked. Bedding followed at 33.6%, while Furniture reached 24.3%. These deep early discounts likely aimed to drive early conversions and manage bulky inventory ahead of peak logistics constraints.
During Black Friday Week, additional discounting remained minimal across the board. Bedding posted the highest lift at 1.1%, while Kitchenware saw just 0.4%. The data suggests Canadian home goods retailers viewed the pre-sale period as their primary promotional window, with Black Friday serving more to sustain momentum than deliver new value.
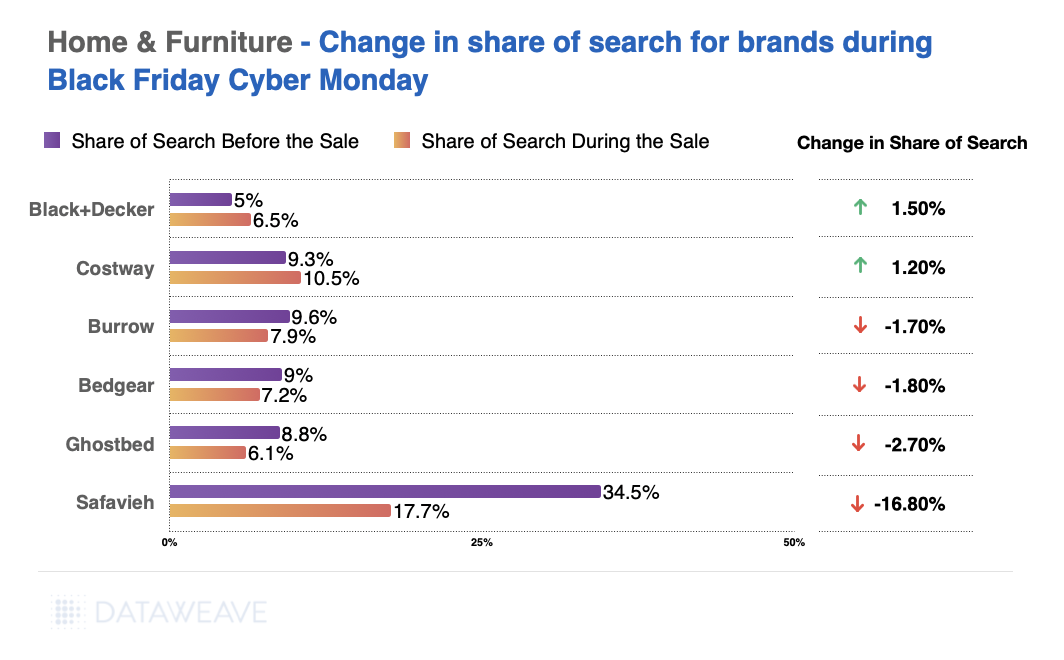
Share of Search: Brand Visibility Trends
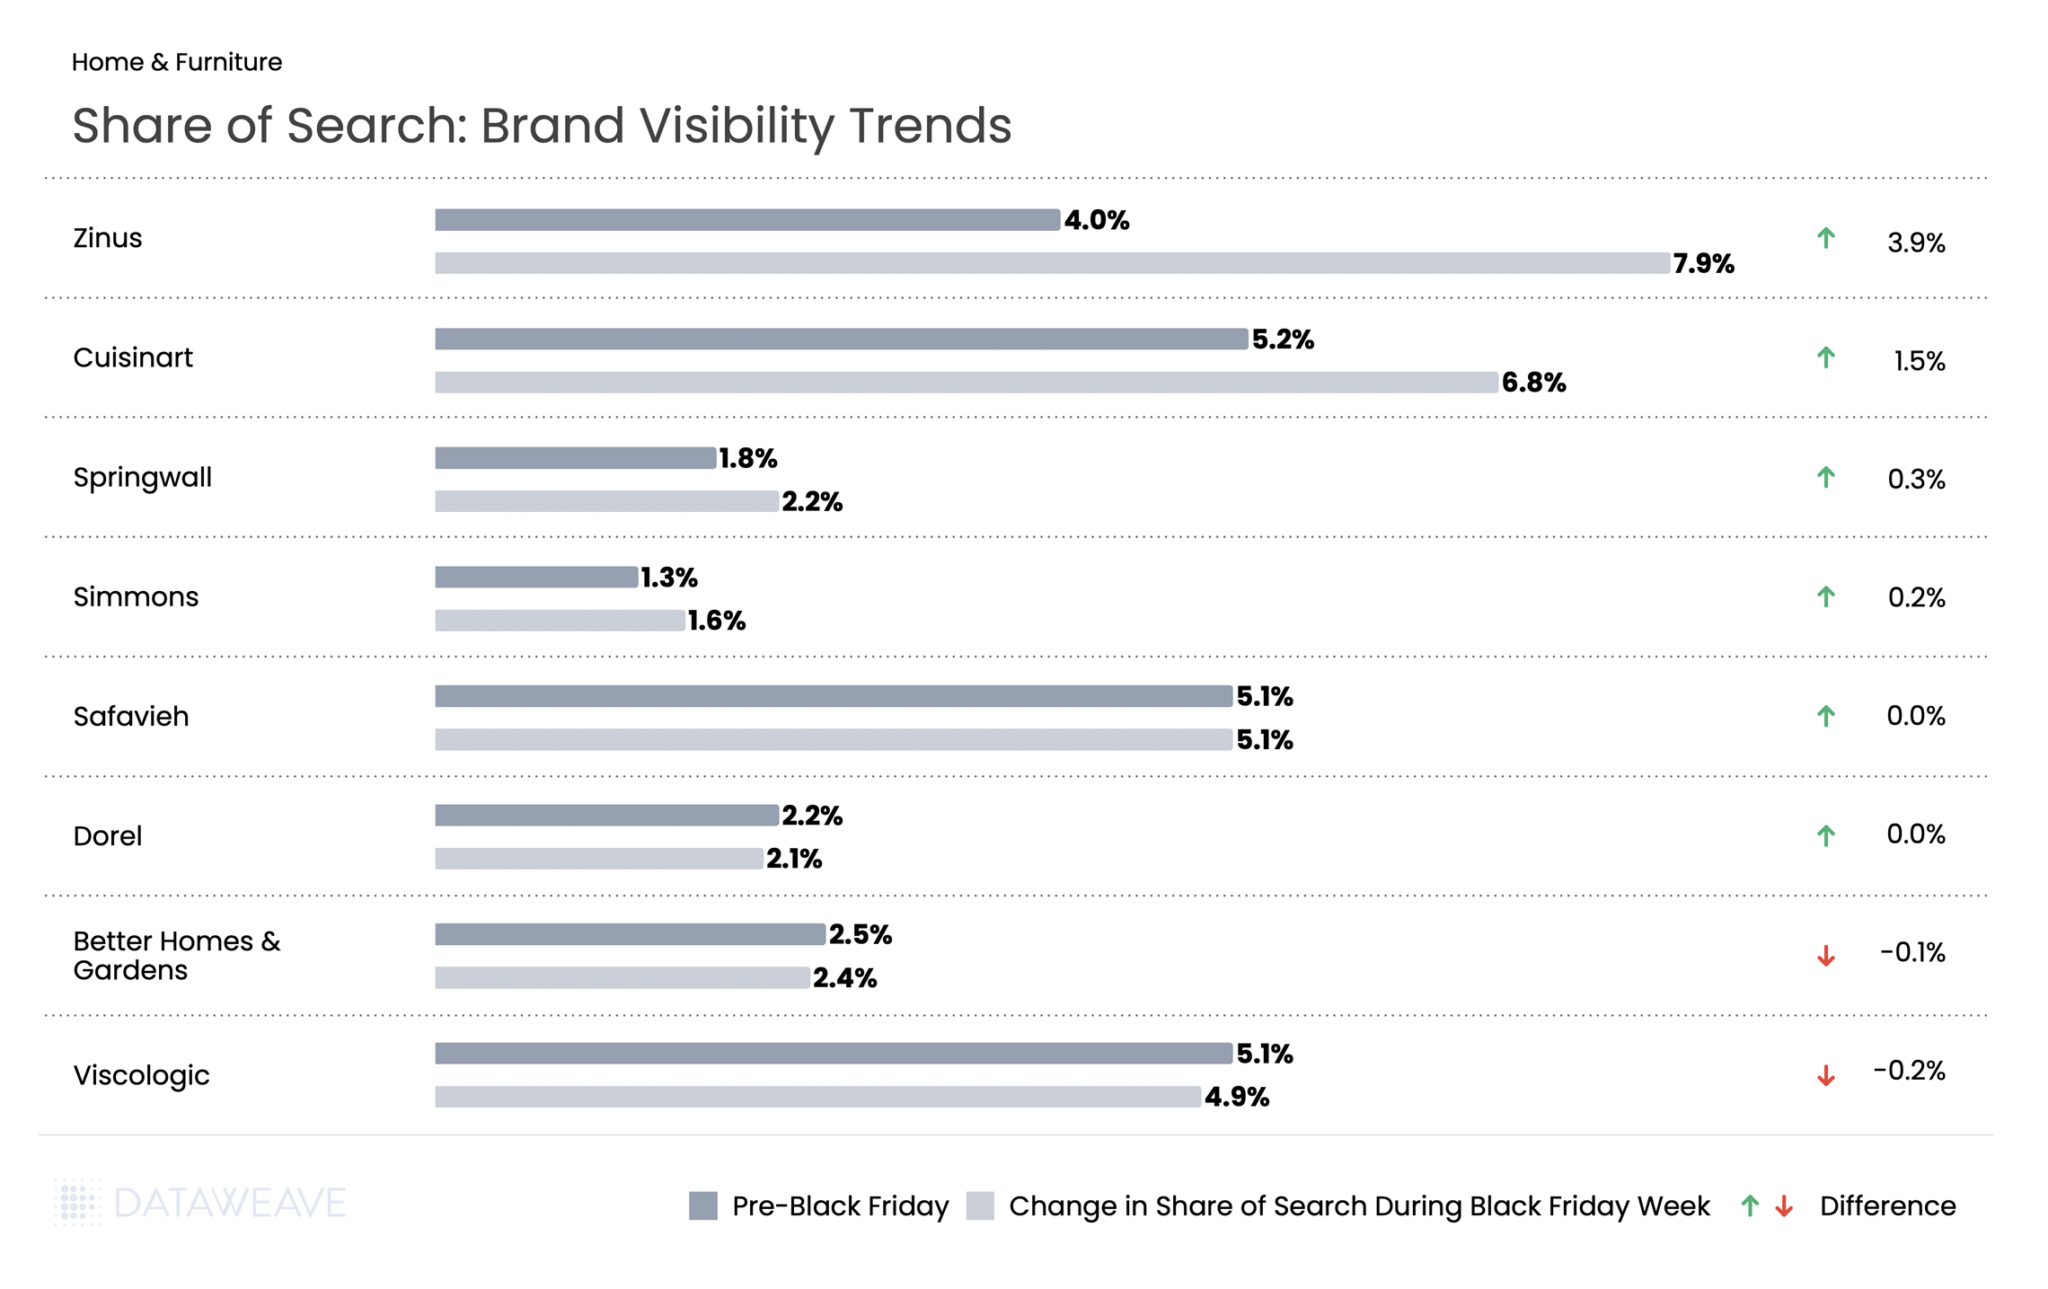
Mattress brand Zinus led gains with a 3.9% increase, positioning itself as a value-focused furniture leader during the sale period. Cuisinart climbed by 1.5%, suggesting strategic amplification of this established kitchenware brand.
Most home brands maintained relatively stable visibility throughout the sale period. Safavieh and Dorel showed essentially no change, while Better Homes & Gardens and Viscologic experienced only minor declines of 0.1% and 0.2% respectively.
Want to understand how DataWeave’s pricing intelligence platform can help your business make data-driven decisions during peak sales events? Contact us to learn more about competitive insights, price intelligence, assortment analytics, content analytics, and digital shelf analytics.
Check out our coverage on Black Friday 2025 across US, UK, and Germany. Follow our blog for more insights on retail pricing trends, brand visibility analysis, and data-driven commerce intelligence.
Black Friday 2025 shattered records once again. U.S. consumers spent a record $11.8 billion online on Black Friday, a 9.1% increase from 2024 and the first time online sales exceeded $11 billion. The National Retail Federation (NRF) projects holiday retail sales (November-December) to grow 3.7% to 4.2% over 2024, with total holiday spending expected to surpass $1 trillion for the first time ever. Against this backdrop of robust consumer spending, how did leading retailers and brands perform across key categories this Black Friday?
At DataWeave, we conducted a detailed analysis of Black Friday 2025 pricing trends across five major categories: Consumer Electronics, Home & Furniture, Health & Beauty, Grocery, and Apparel. Our AI-powered pricing intelligence platform monitored nearly 80,000 SKUs across leading U.S. retailers like Amazon, Walmart, Target, Macy’s, Home Depot, Sephora, and more, revealing interesting patterns in how retailers and brands approached this year’s sale season.
Our Methodology
For this analysis, DataWeave monitored average discounts across leading U.S. retailers during two distinct periods:
Pre-Black Friday: Up to November 23, 2025 – capturing early holiday deals and baseline pricing
Additional Discounts During Black Friday Week: November 24 – December 1, 2025 – covering Thanksgiving week through Black Friday (November 28) and Cyber Monday (December 1)
Our sample encompassed the top-ranked products across subcategories on major retail sites. We also analyzed Share of Search data, which measures brand visibility by monitoring which brand names appear in the top 20 search results for critical keywords.
Black Friday 2025: The Big Picture
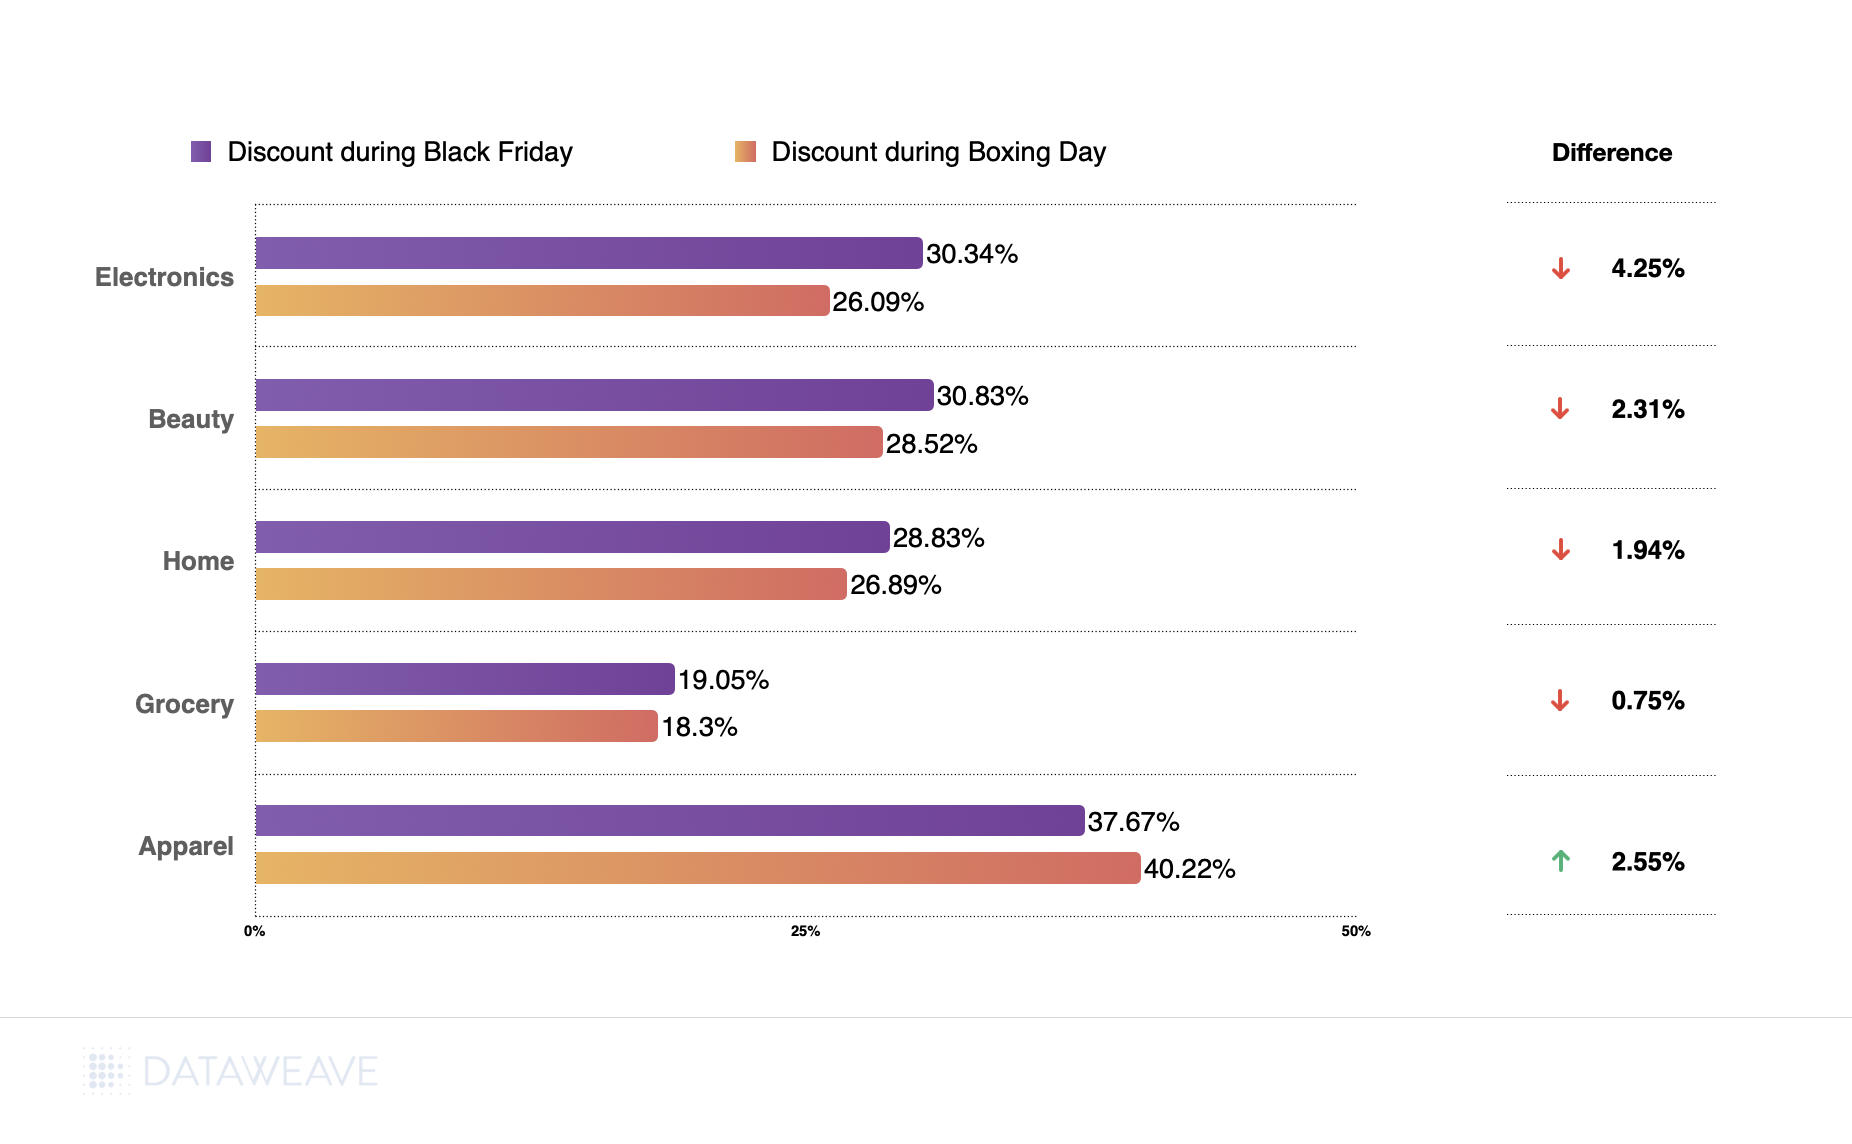
Here’s the snapshot of average discounts during the Pre-Black Friday period compared to Black Friday Week:
Key Insight: Pre-Black Friday discounts were significant across all categories. This suggests retailers front-loaded their promotions to capture early holiday shoppers, with additional discounts during Black Friday Week adding to the baseline discounts already in place.
Consumer Electronics
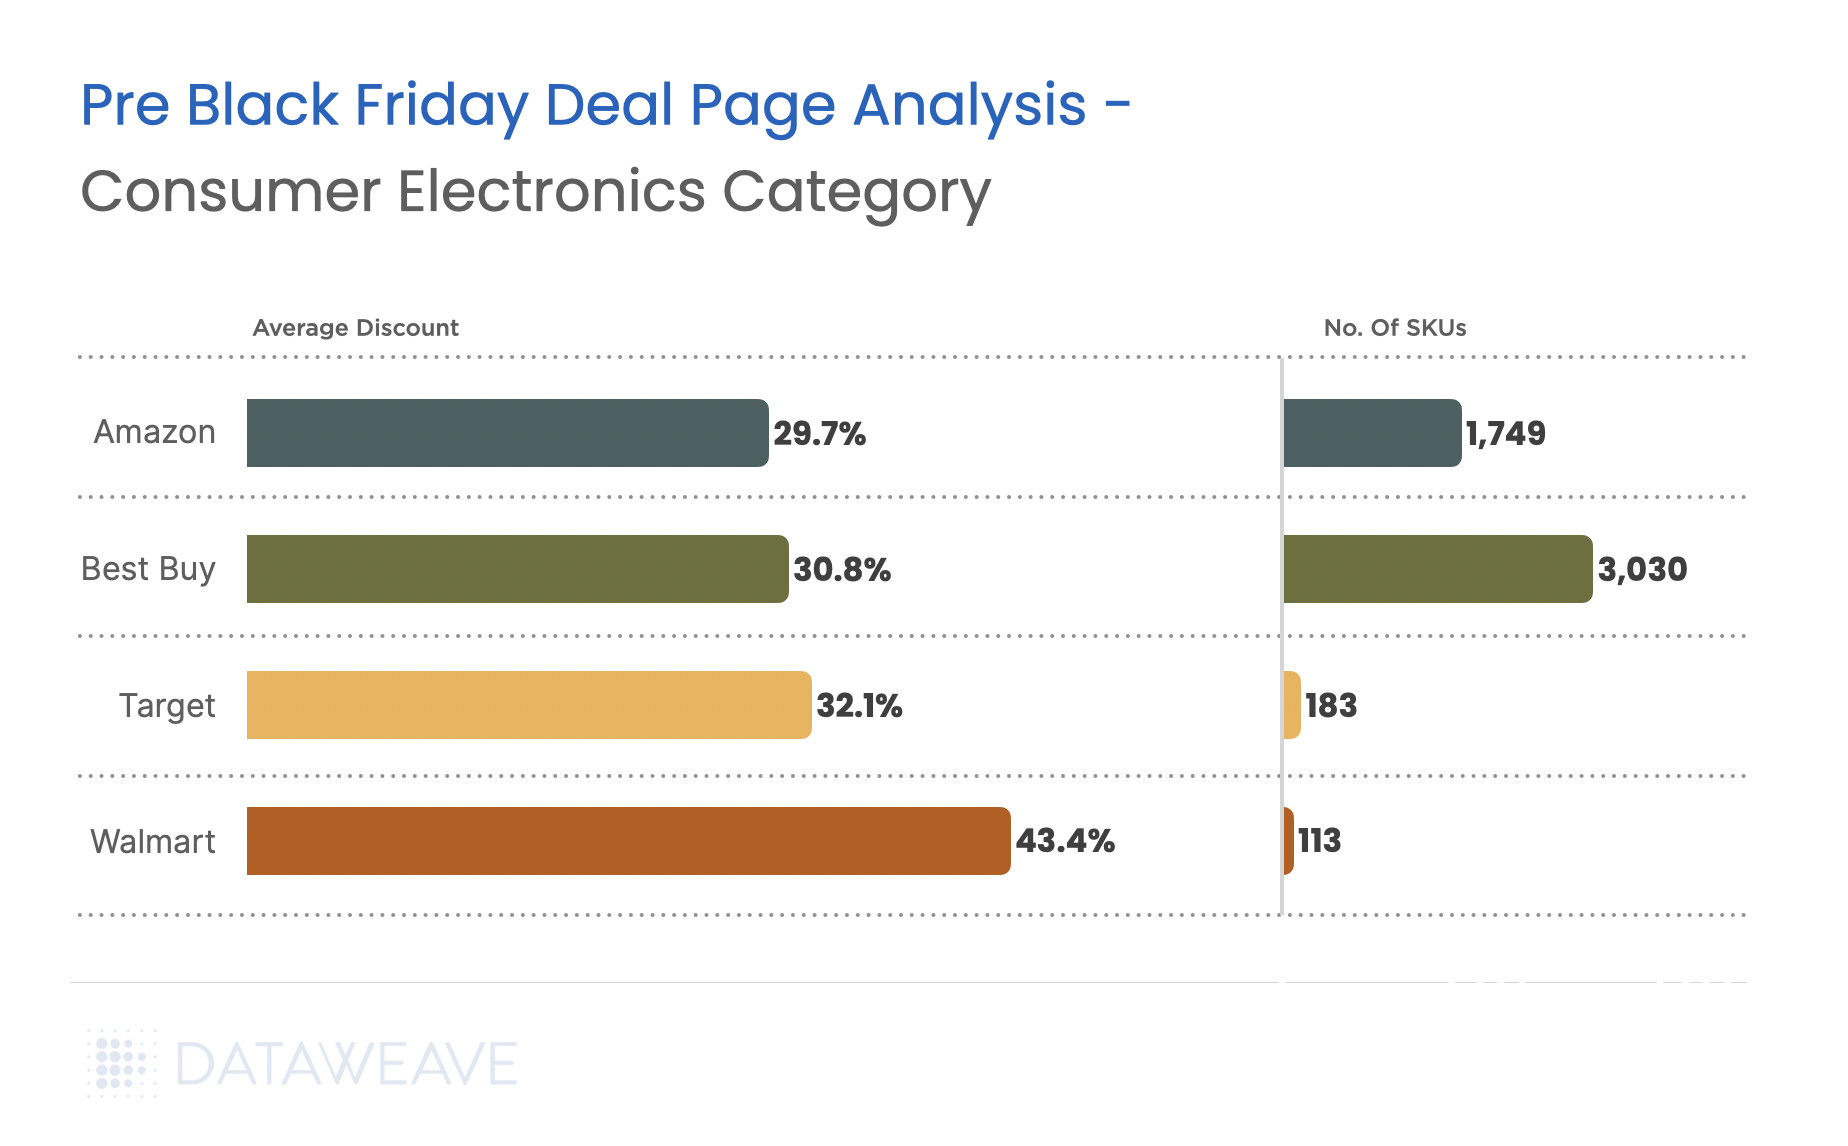
Consumer electronics remain one of the most anticipated categories during Black Friday and Cyber Monday. Notably, AI traffic to retail websites grew 805% year-over-year, with consumers using AI tools most frequently for video games, appliances, and electronics categories. Our analysis of 10,356 SKUs reveals how discounts varied across subcategories.
Subcategory Discount Analysis
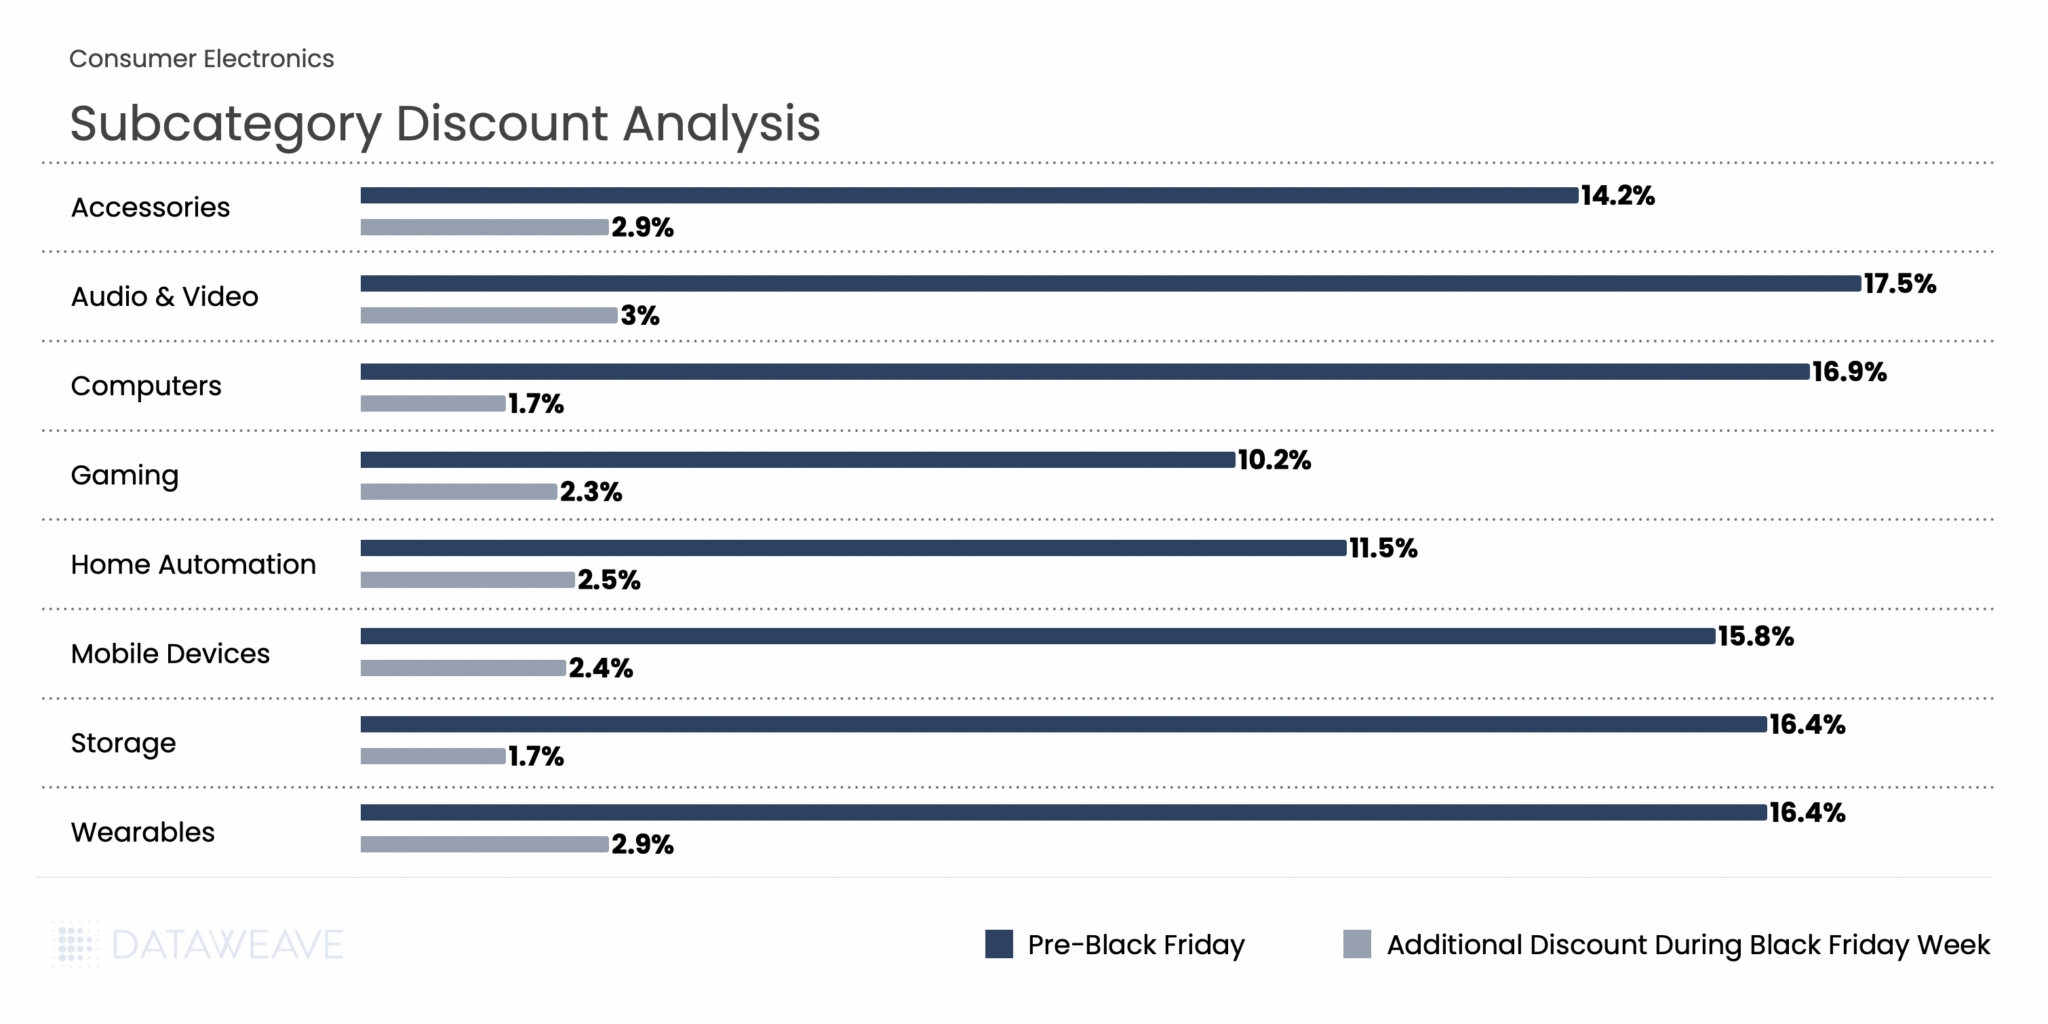
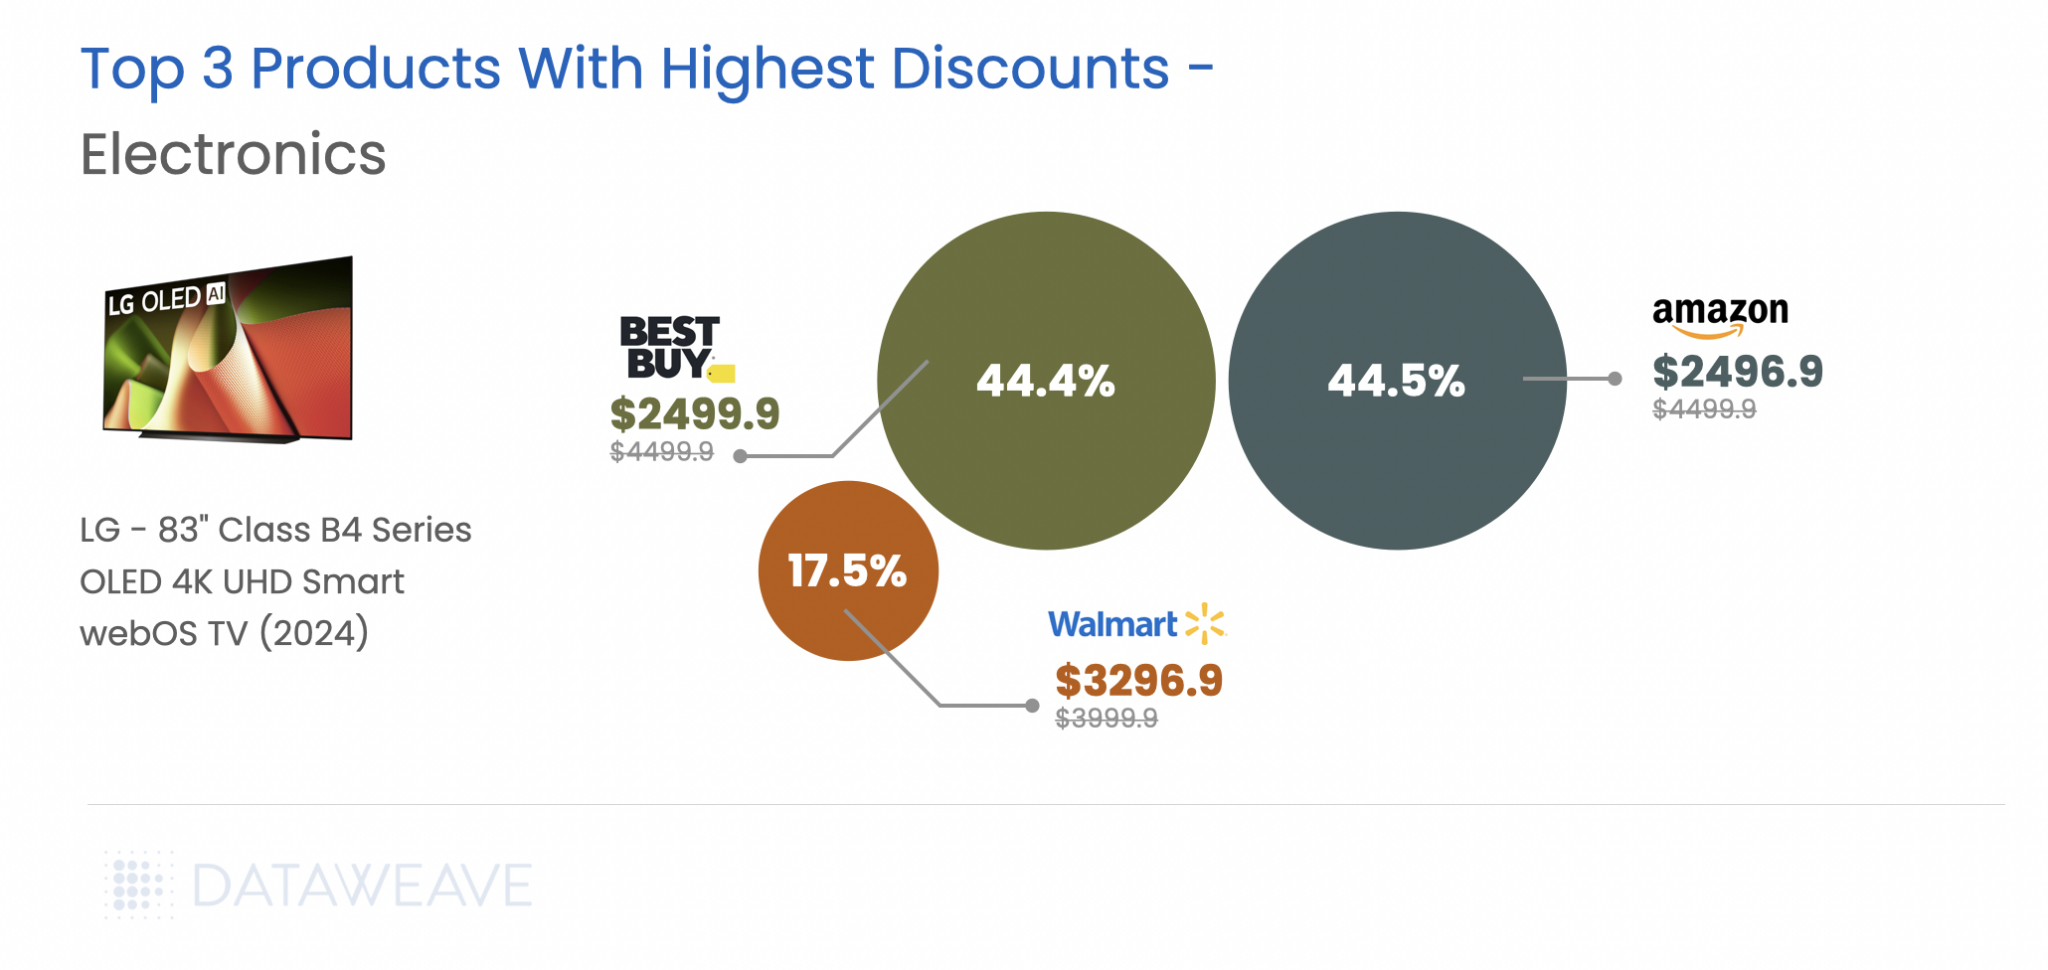
In Consumer Electronics, Pre-Black Friday discounts averaged 14.6% across subcategories, while Black Friday Week saw an additional 2.6% discount on average. Audio & Video products led the pre-sale discounting at 17.5%, indicating retailers were eager to move inventory early. During Black Friday Week, Audio & Video, Accessories, and Wearables saw the highest additional discounts (2.9-3 %), while Computers and Storage had already been heavily discounted pre-sale, leaving minimal room for further reductions during the main event.
Share of Search: Brand Visibility Trends
Our Share of Search analysis reveals significant shifts in brand visibility during Black Friday Week:
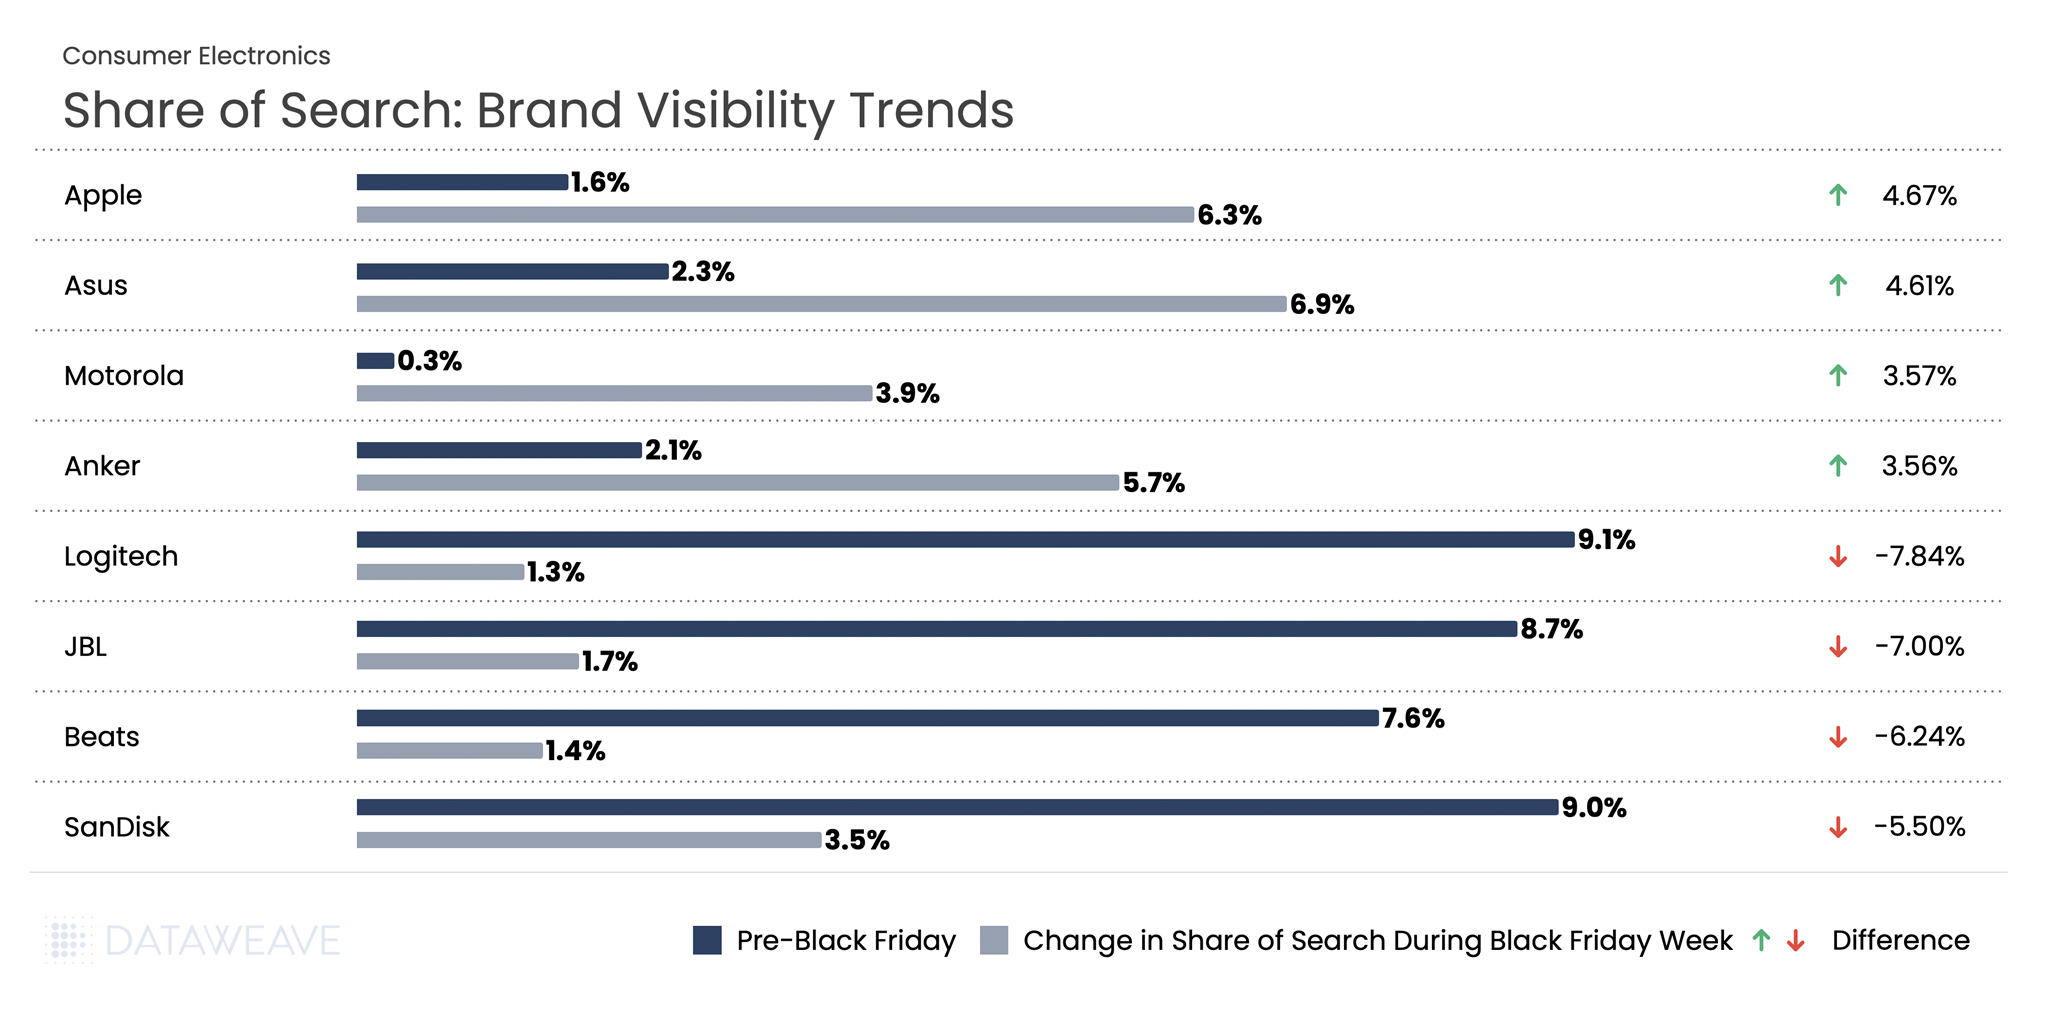
The Takeaway: Our analysis reveals significant shifts in brand visibility during Black Friday Week compared to the pre-sale period. Computing and mobile-focused brands like Apple and Asus gained substantial ground, while audio brands like Logitech, JBL, and Beats saw their visibility plummet. Apple’s Share of Search jumped from 1.58% to 6.2%, a gain of 4.6%, suggesting strong promotional activity or heightened consumer interest. Meanwhile, Logitech dropped nearly 8%, from 9.9% to just 1.2%.
Home & Furniture
The Home & Furniture category continues to be a consumer favorite during Black Friday. Our analysis of 12,610 SKUs shows how discounts were distributed across subcategories.
Subcategory Discount Analysis
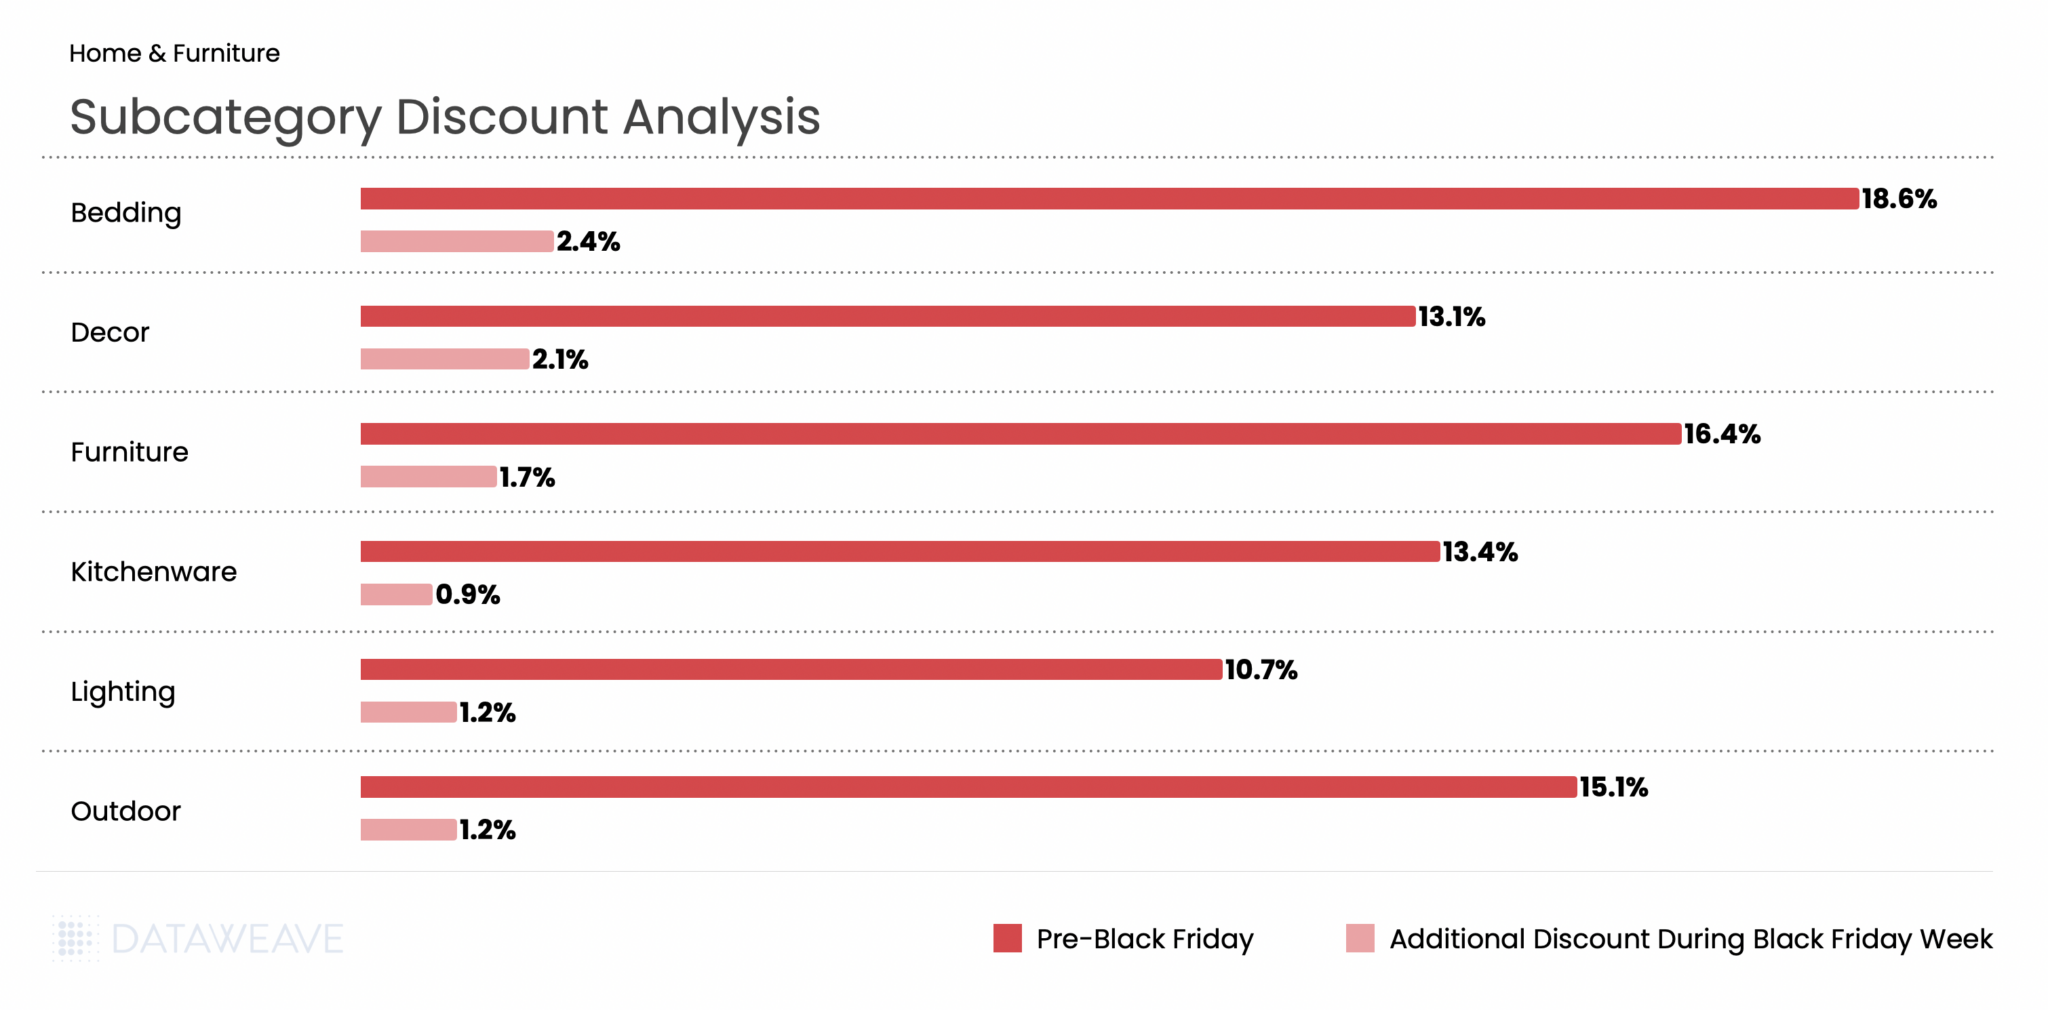
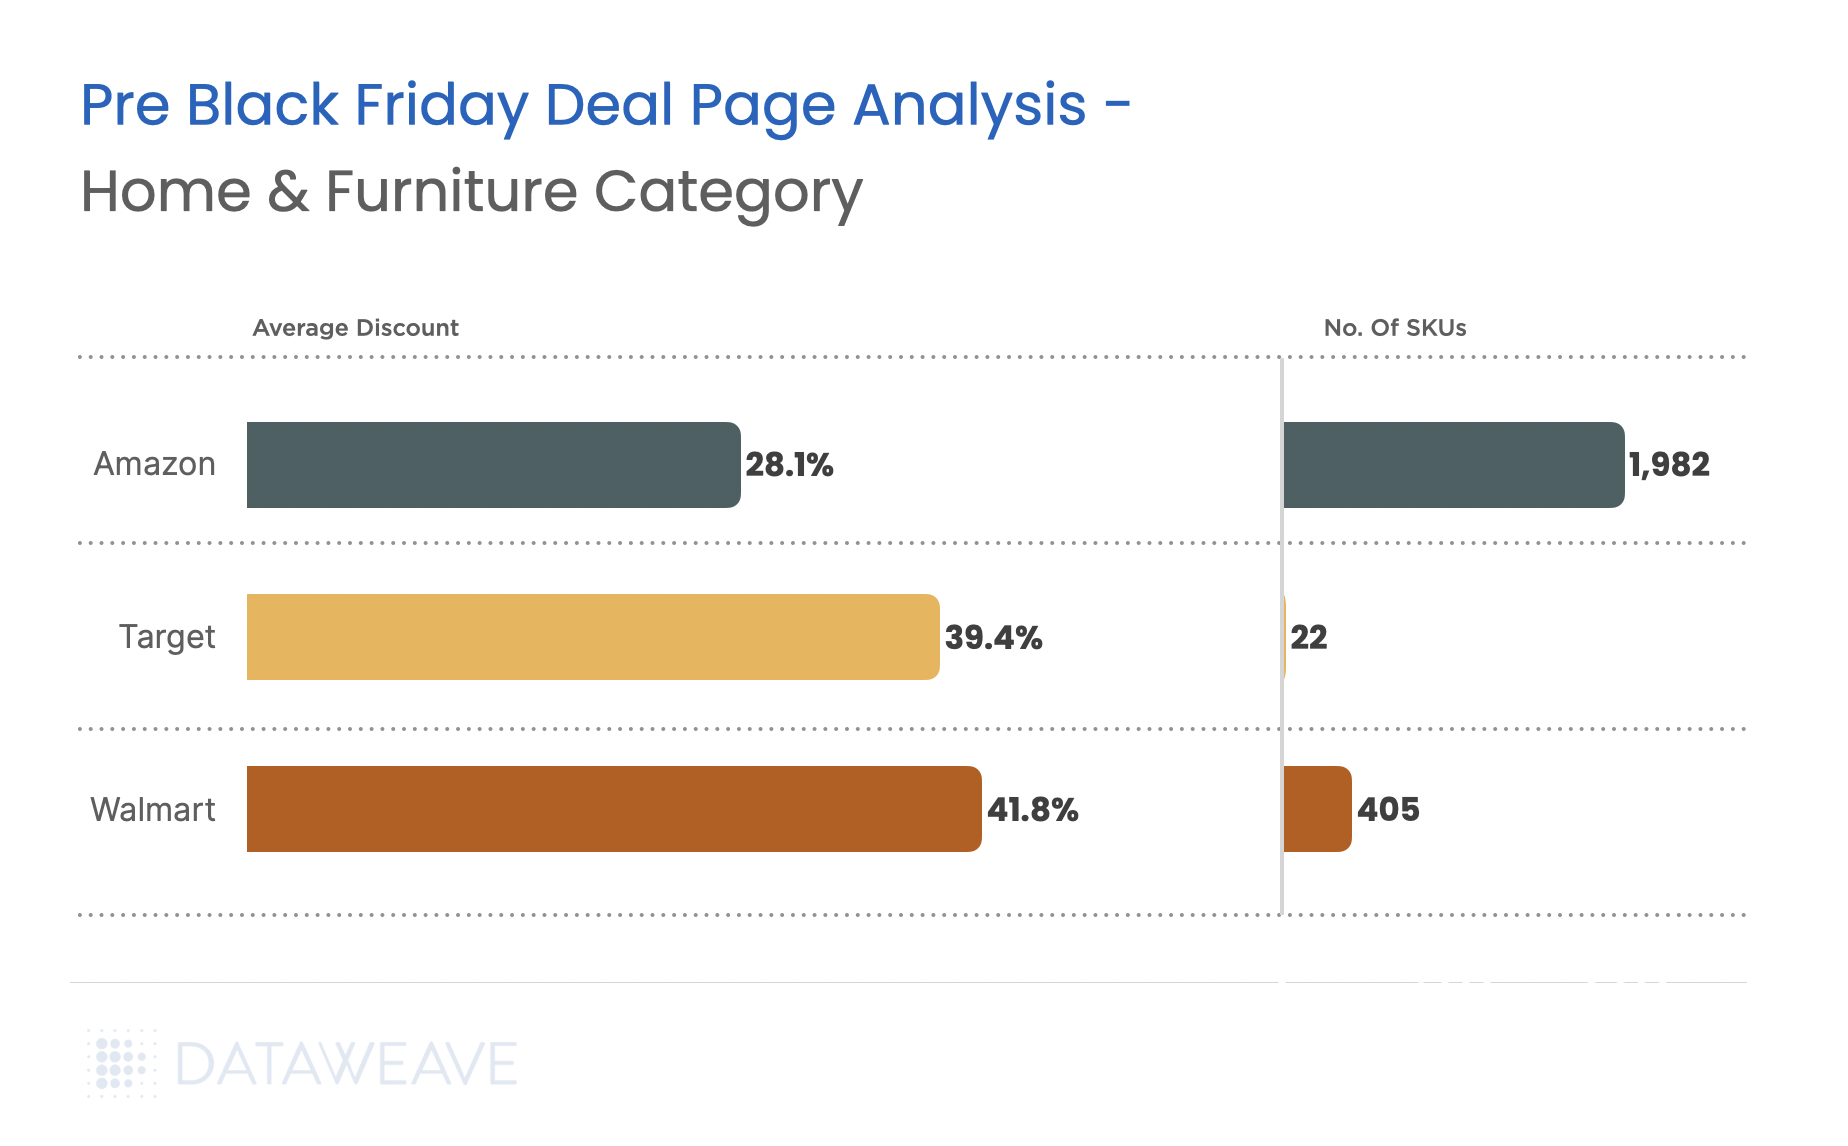
Home & Furniture saw Pre-Black Friday discounts averaging 13.9%, with Black Friday Week adding just 1.7% on average, the second-lowest additional discount among all categories. Bedding led pre-sale discounts at an impressive 18.6%, followed by Furniture at 16.4% and Outdoor at 15.1%. This suggests retailers aggressively promoted home goods early in the season to capture deal-seekers.
During Black Friday Week, Bedding maintained leadership with 2.4% additional discounts, while Kitchenware saw the smallest bump at just 0.9%, indicating early promotions had already captured most of the discount opportunity.
Share of Search: Brand Visibility Trends
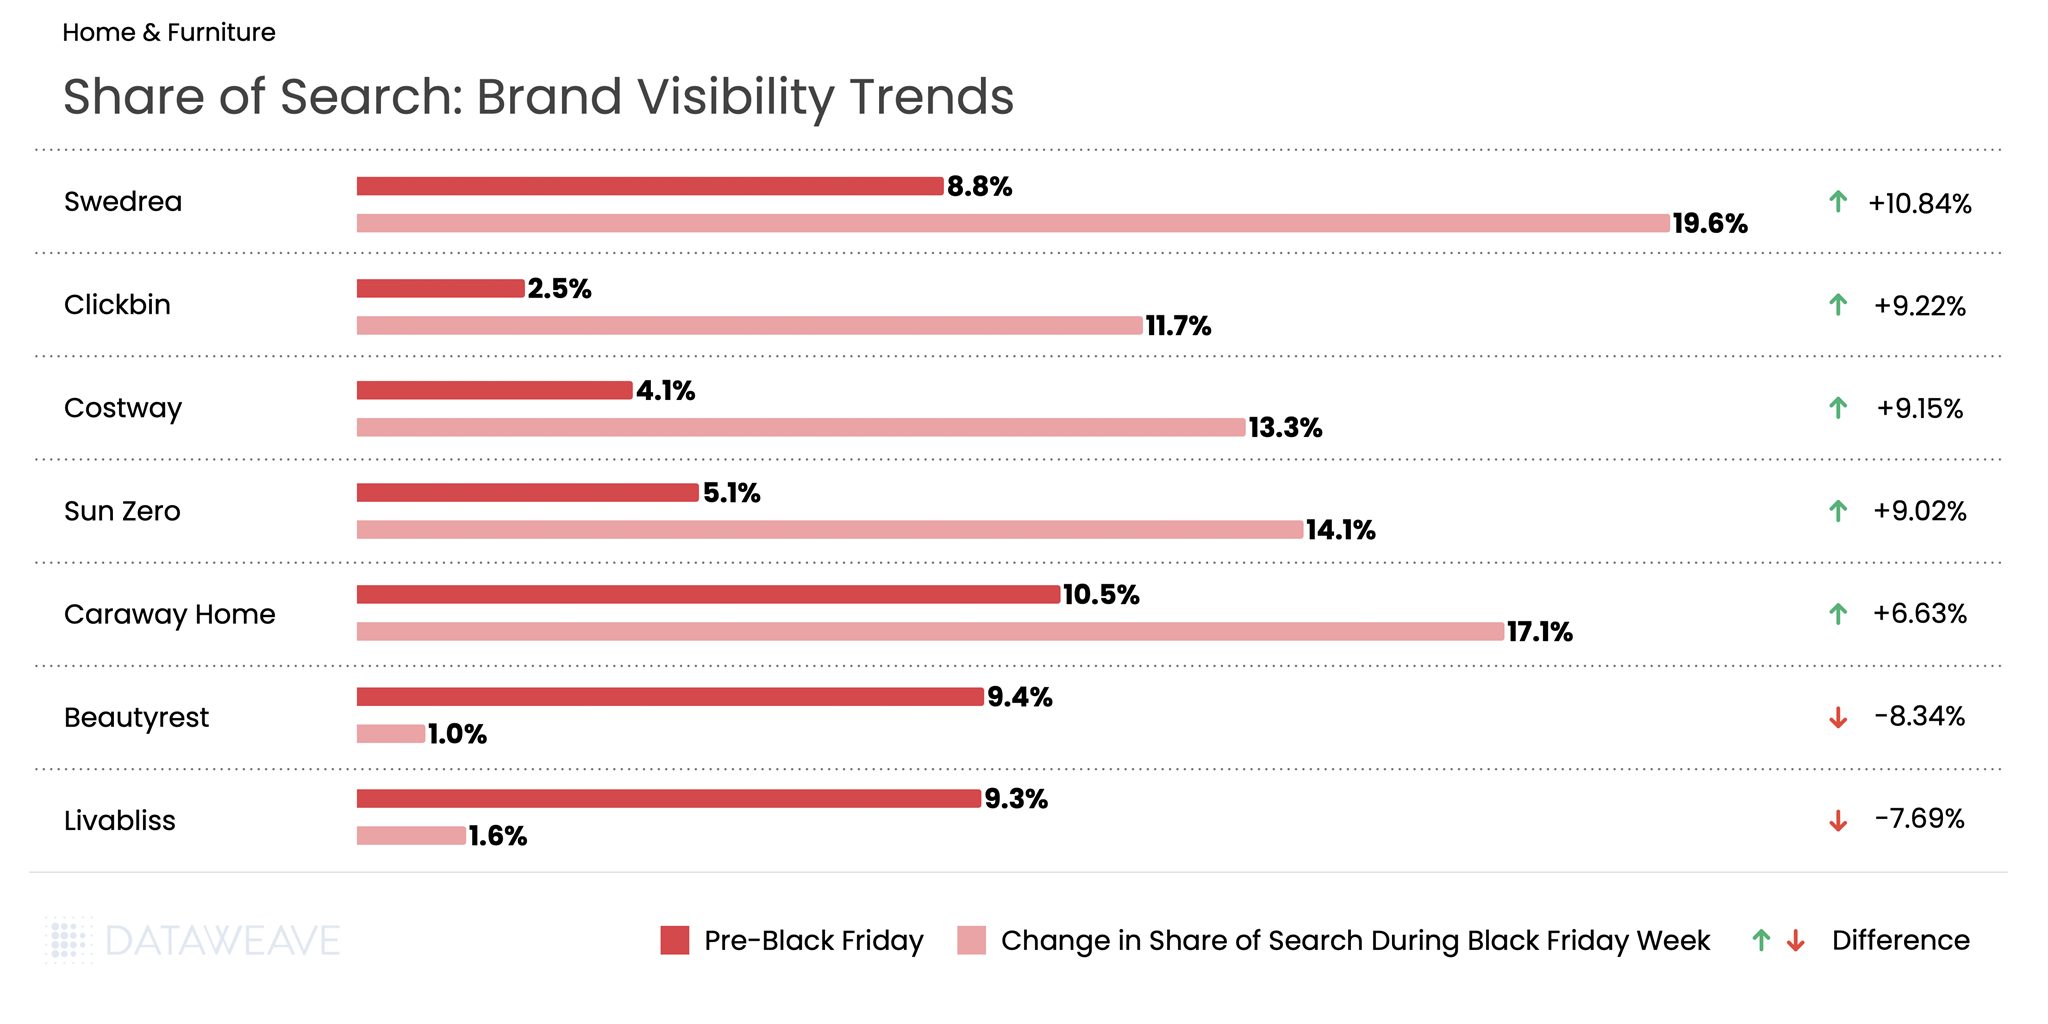
The Takeaway: The Home & Furniture category saw some of the most dramatic Share of Search swings in our entire analysis. Emerging and value-oriented brands dominated the gains, with Swedrea surging from 8.7% to 19.6%, a remarkable 10.8% increase. Similarly, Clickbin and Costway each gained over 9%. On the flip side, established premium brands like Beautyrest and Livabliss saw sharp visibility declines, dropping over 7-8%.
Health & Beauty
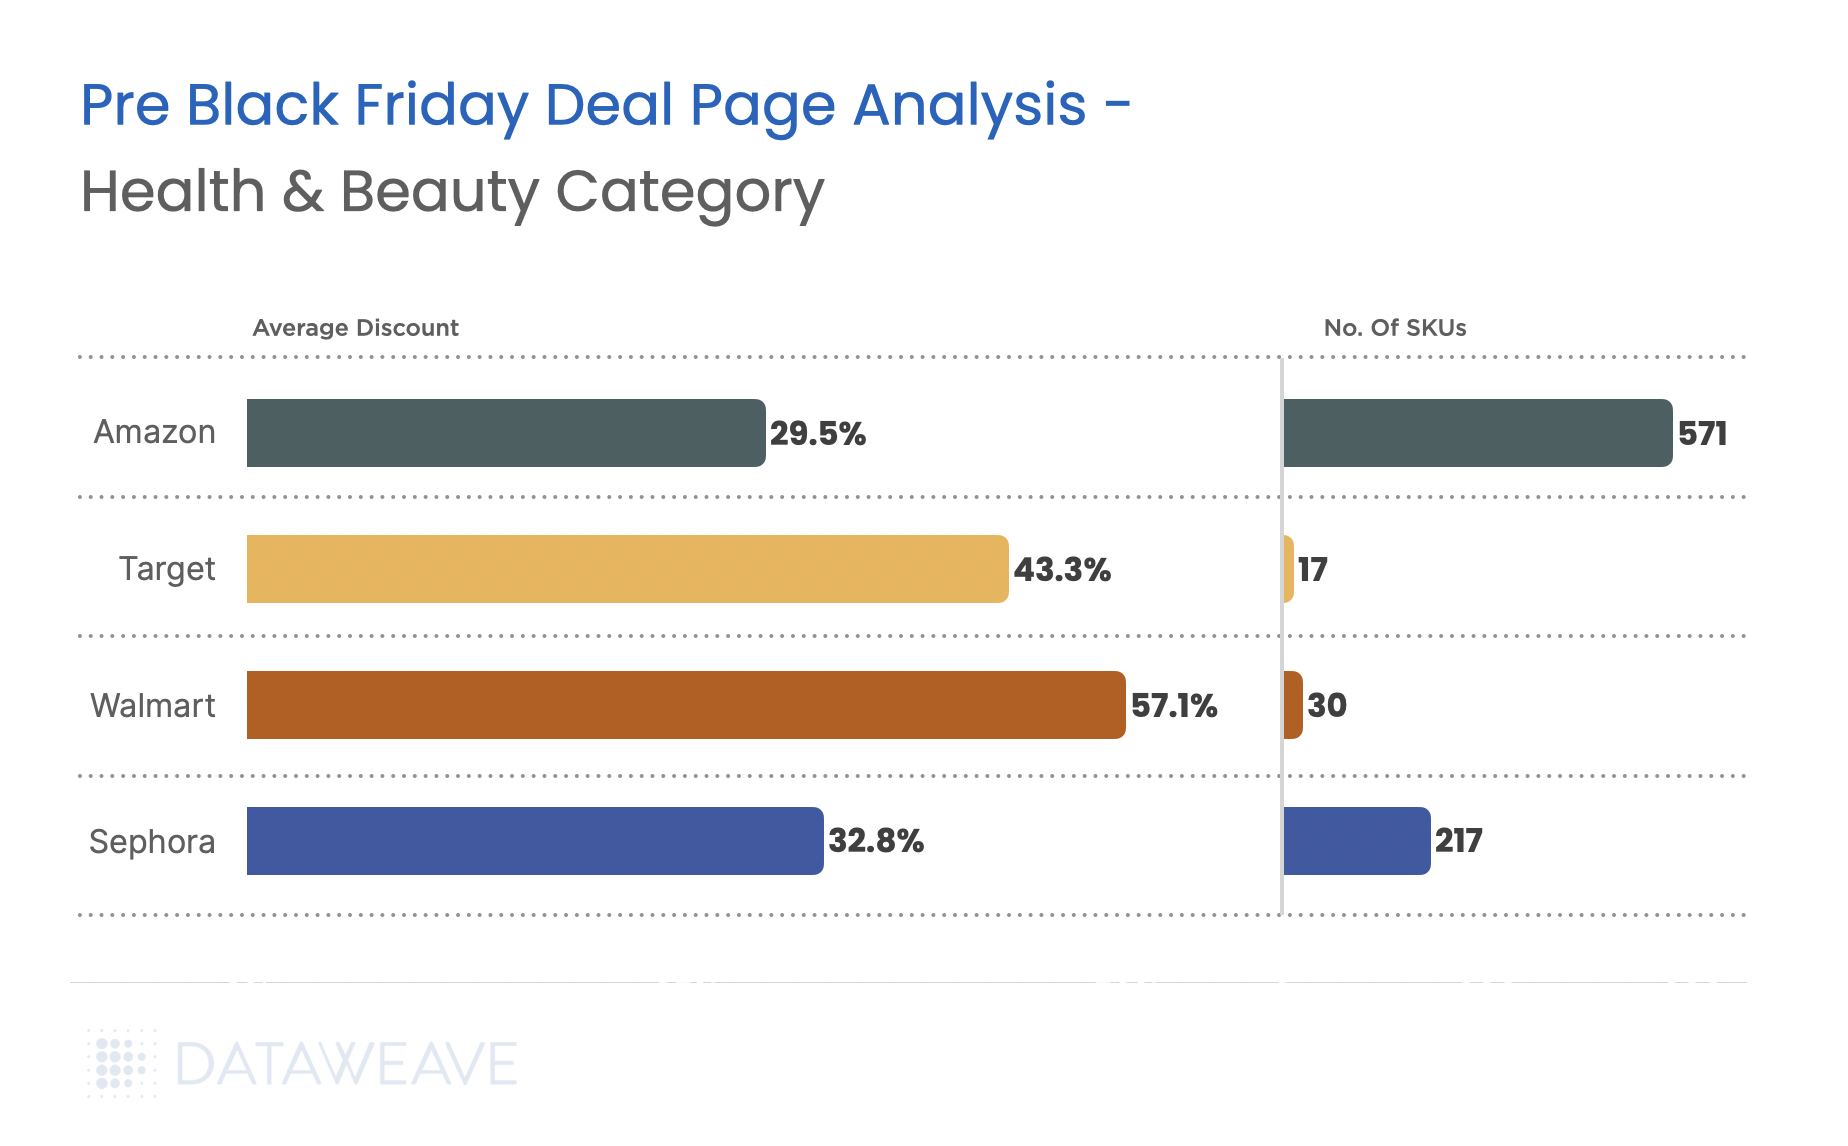
Health & Beauty has emerged as a growth engine during Black Friday. The beauty industry is projected to grow 5% annually through 2030 according to a McKinsey survey. Our analysis of 16,141 SKUs reveals subcategory-level insights.
Subcategory Discount Analysis
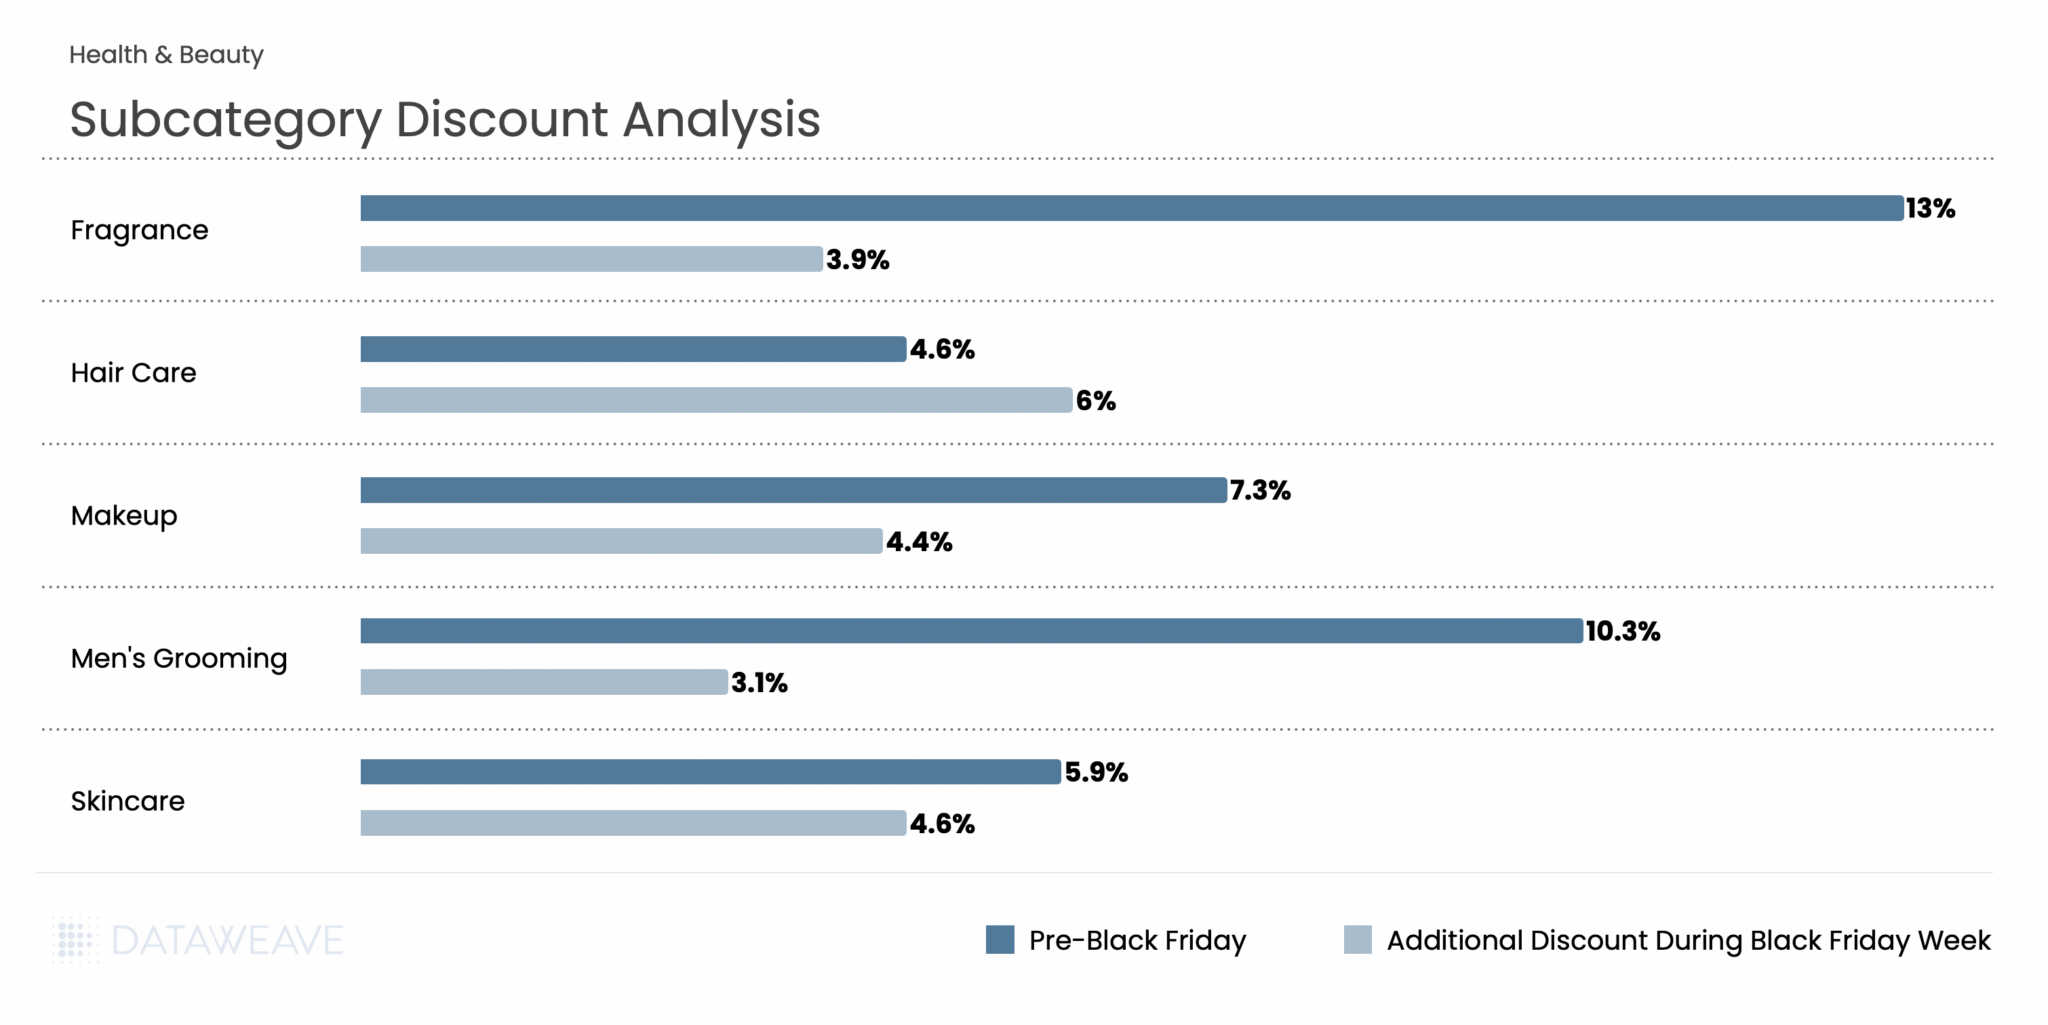
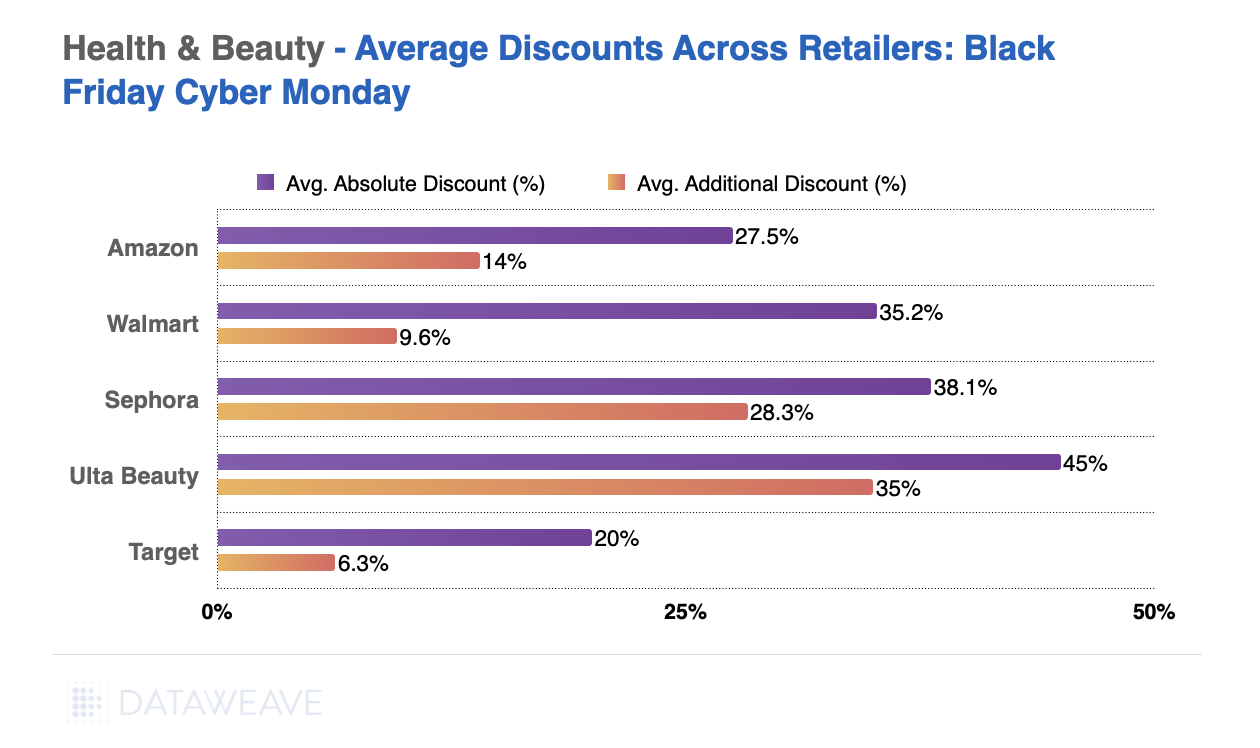
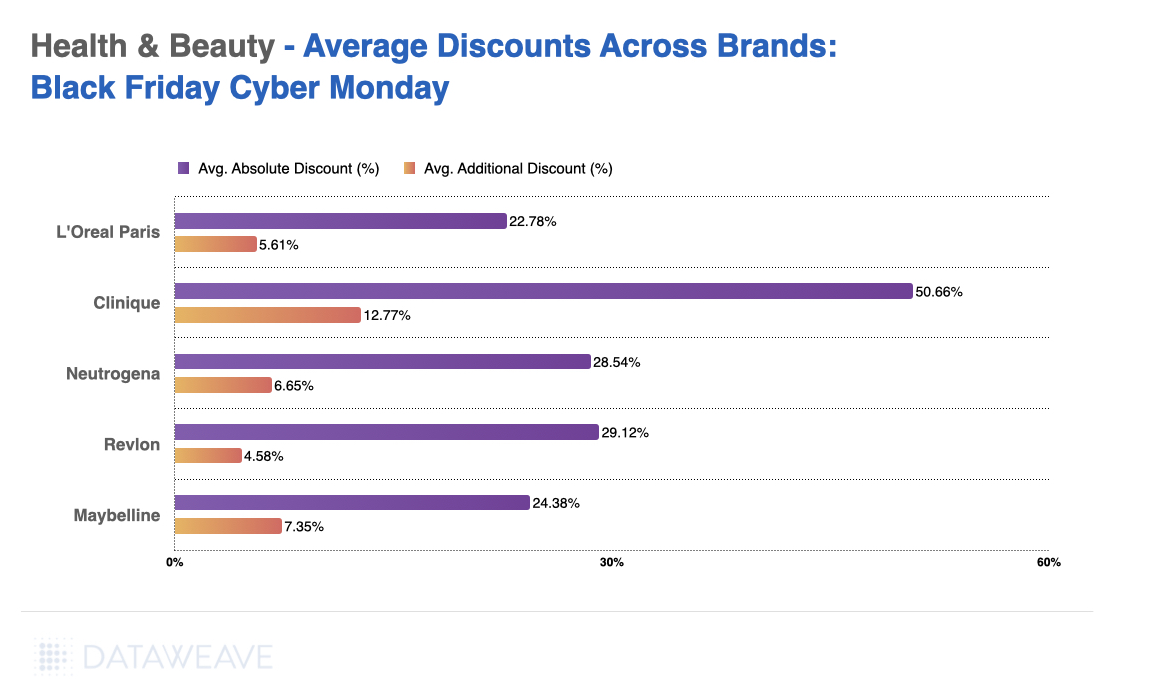
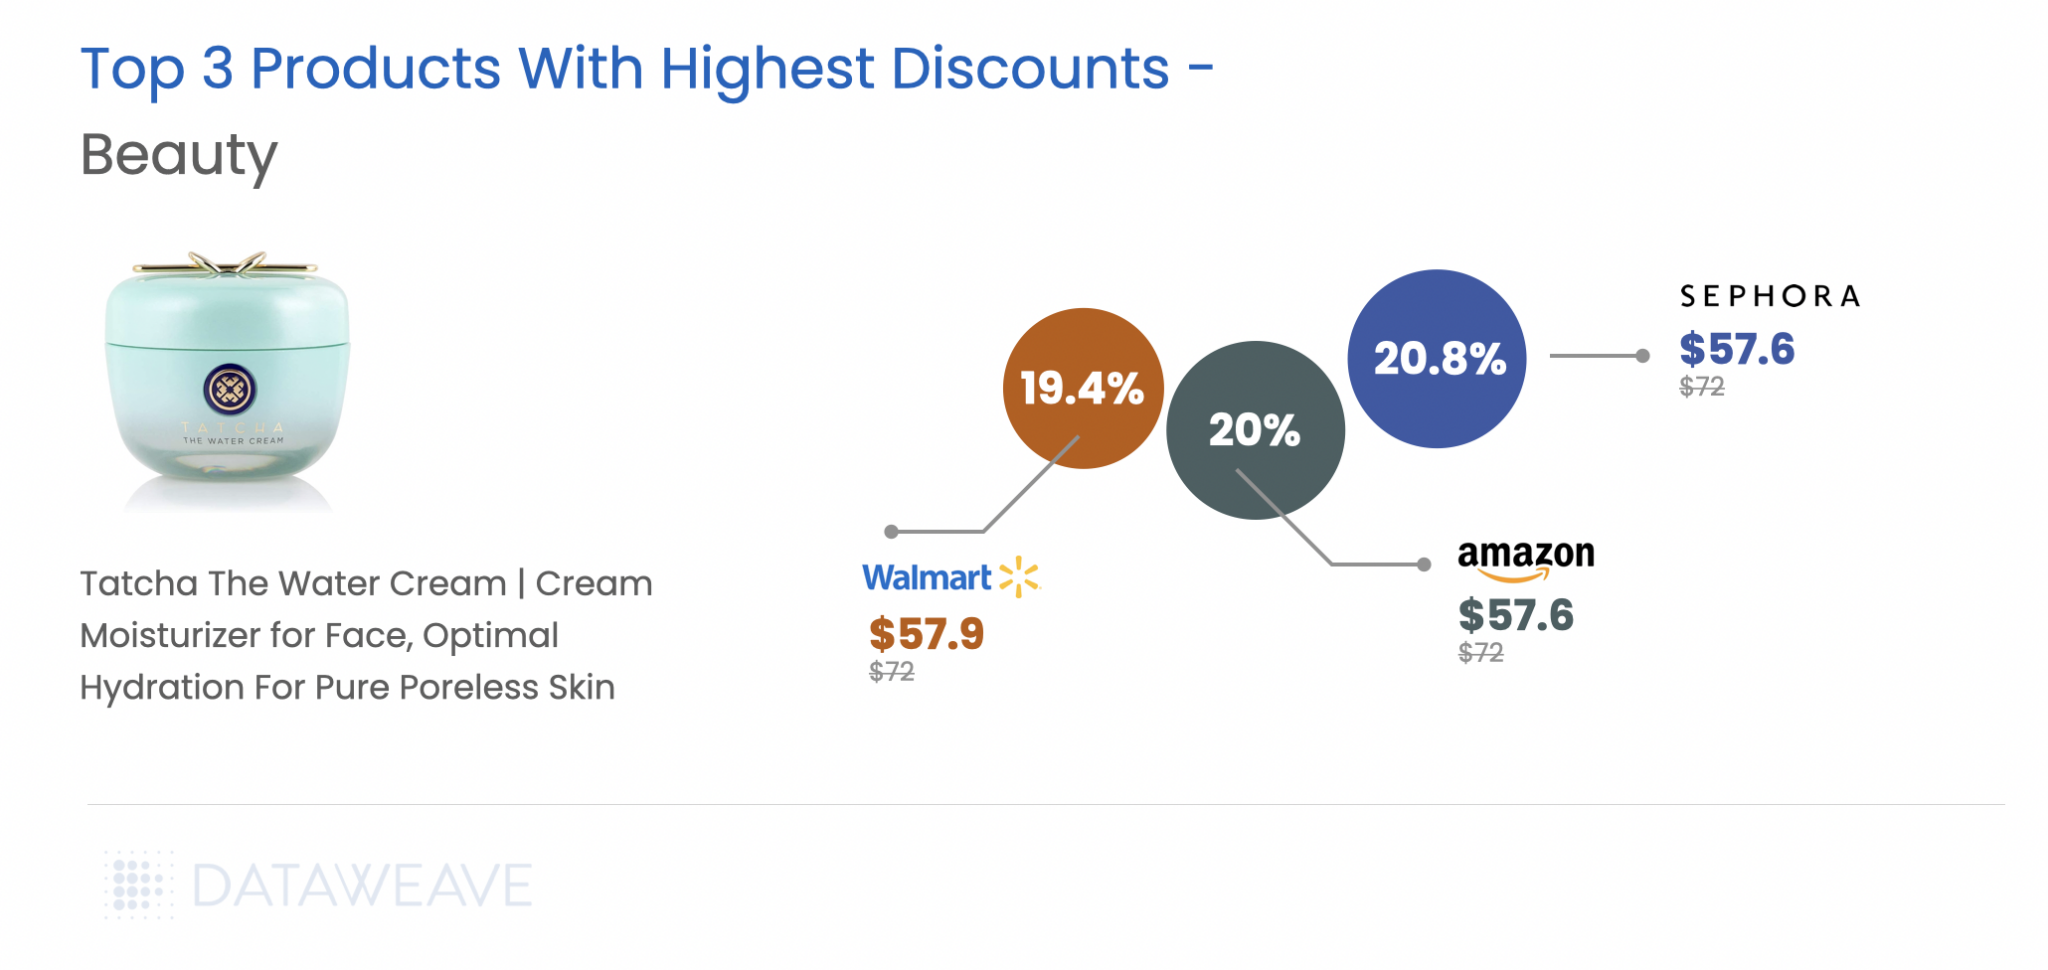
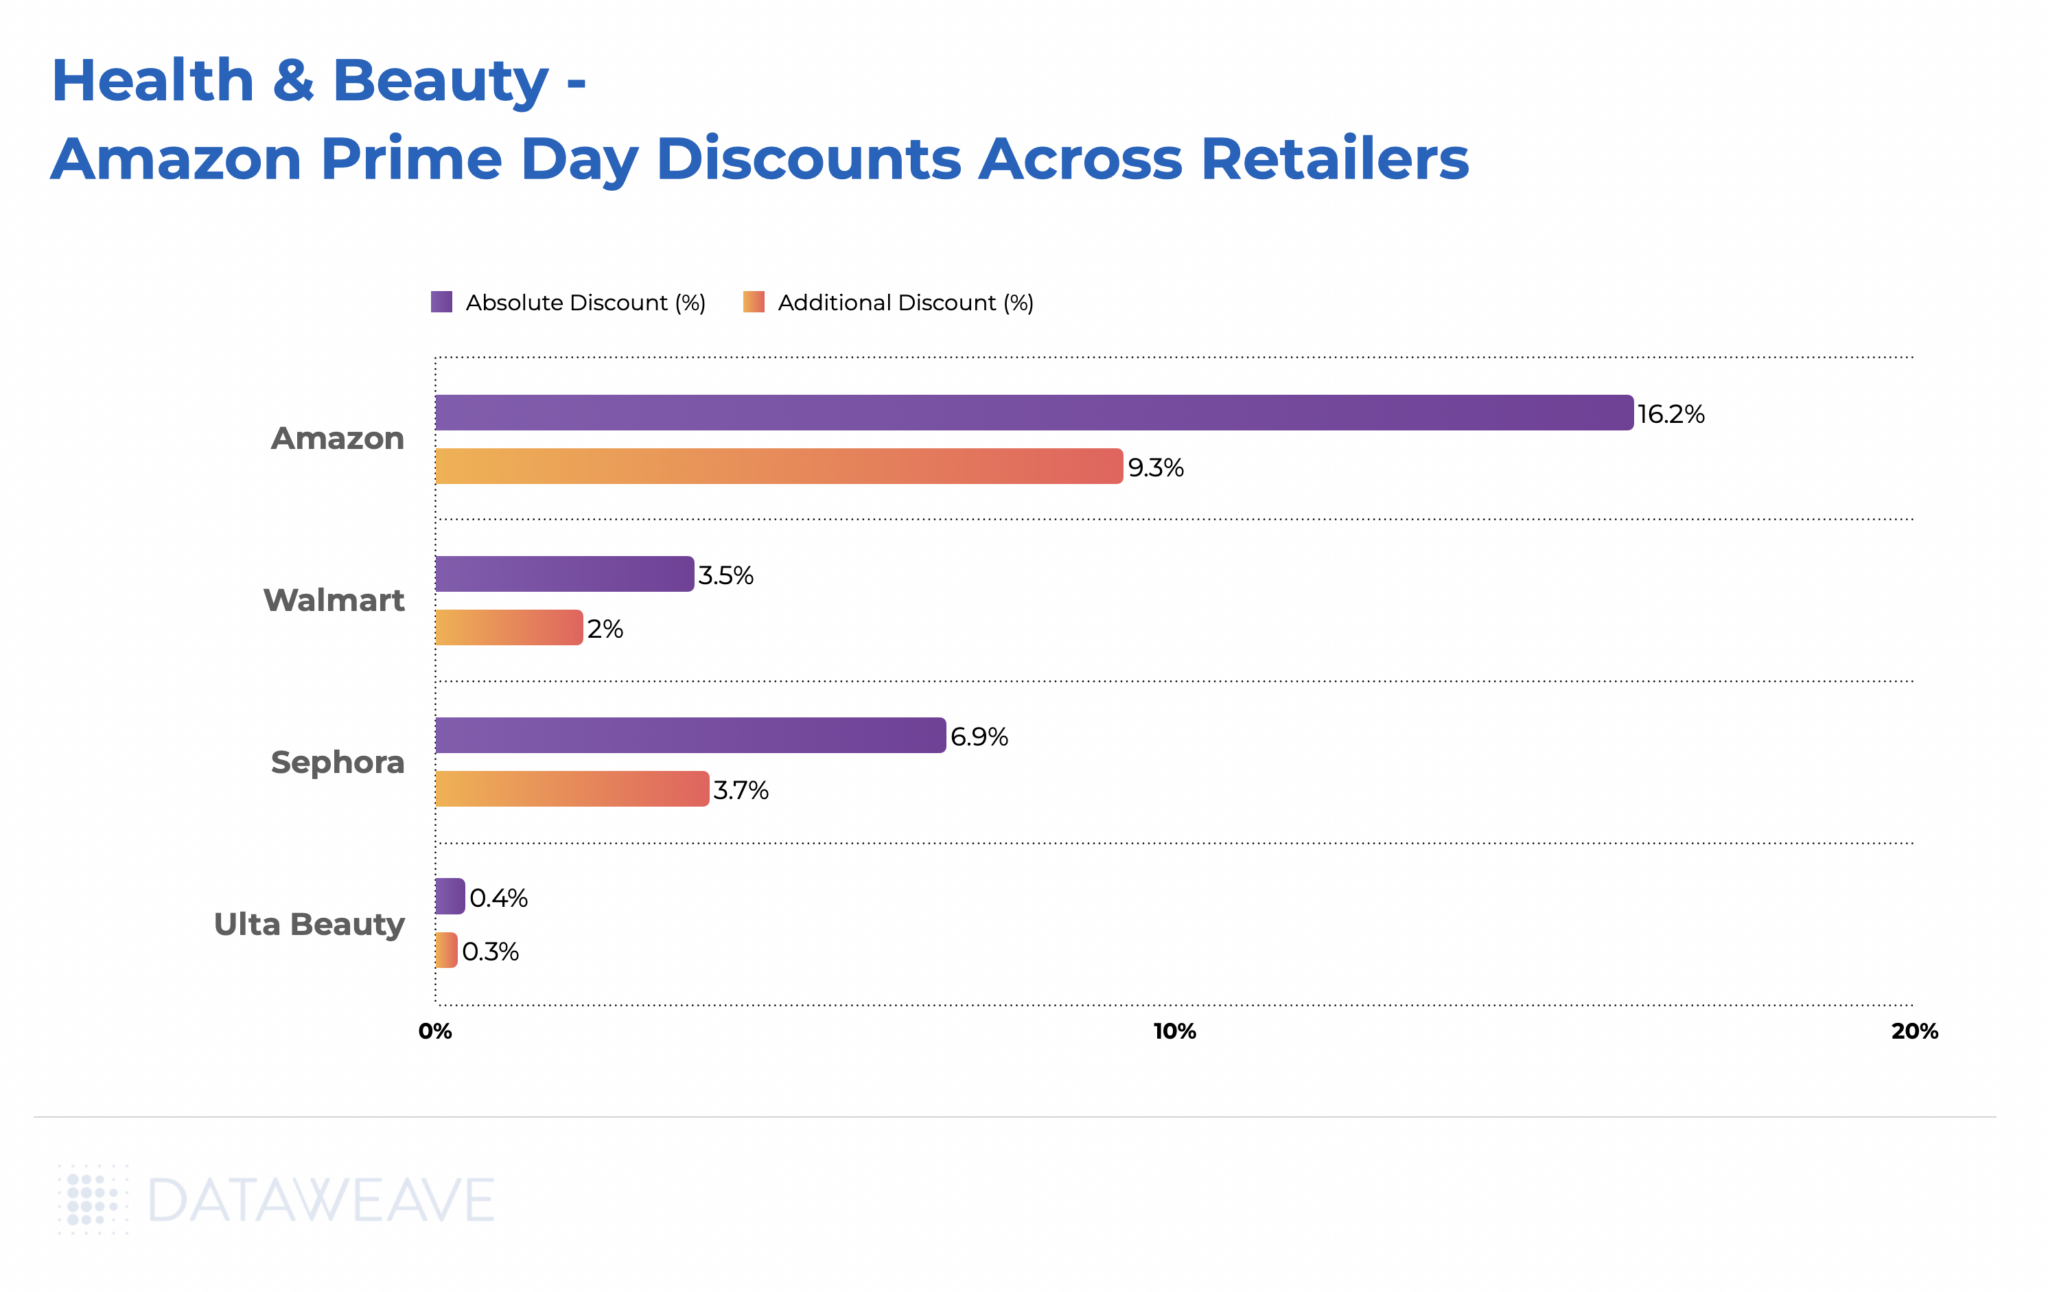
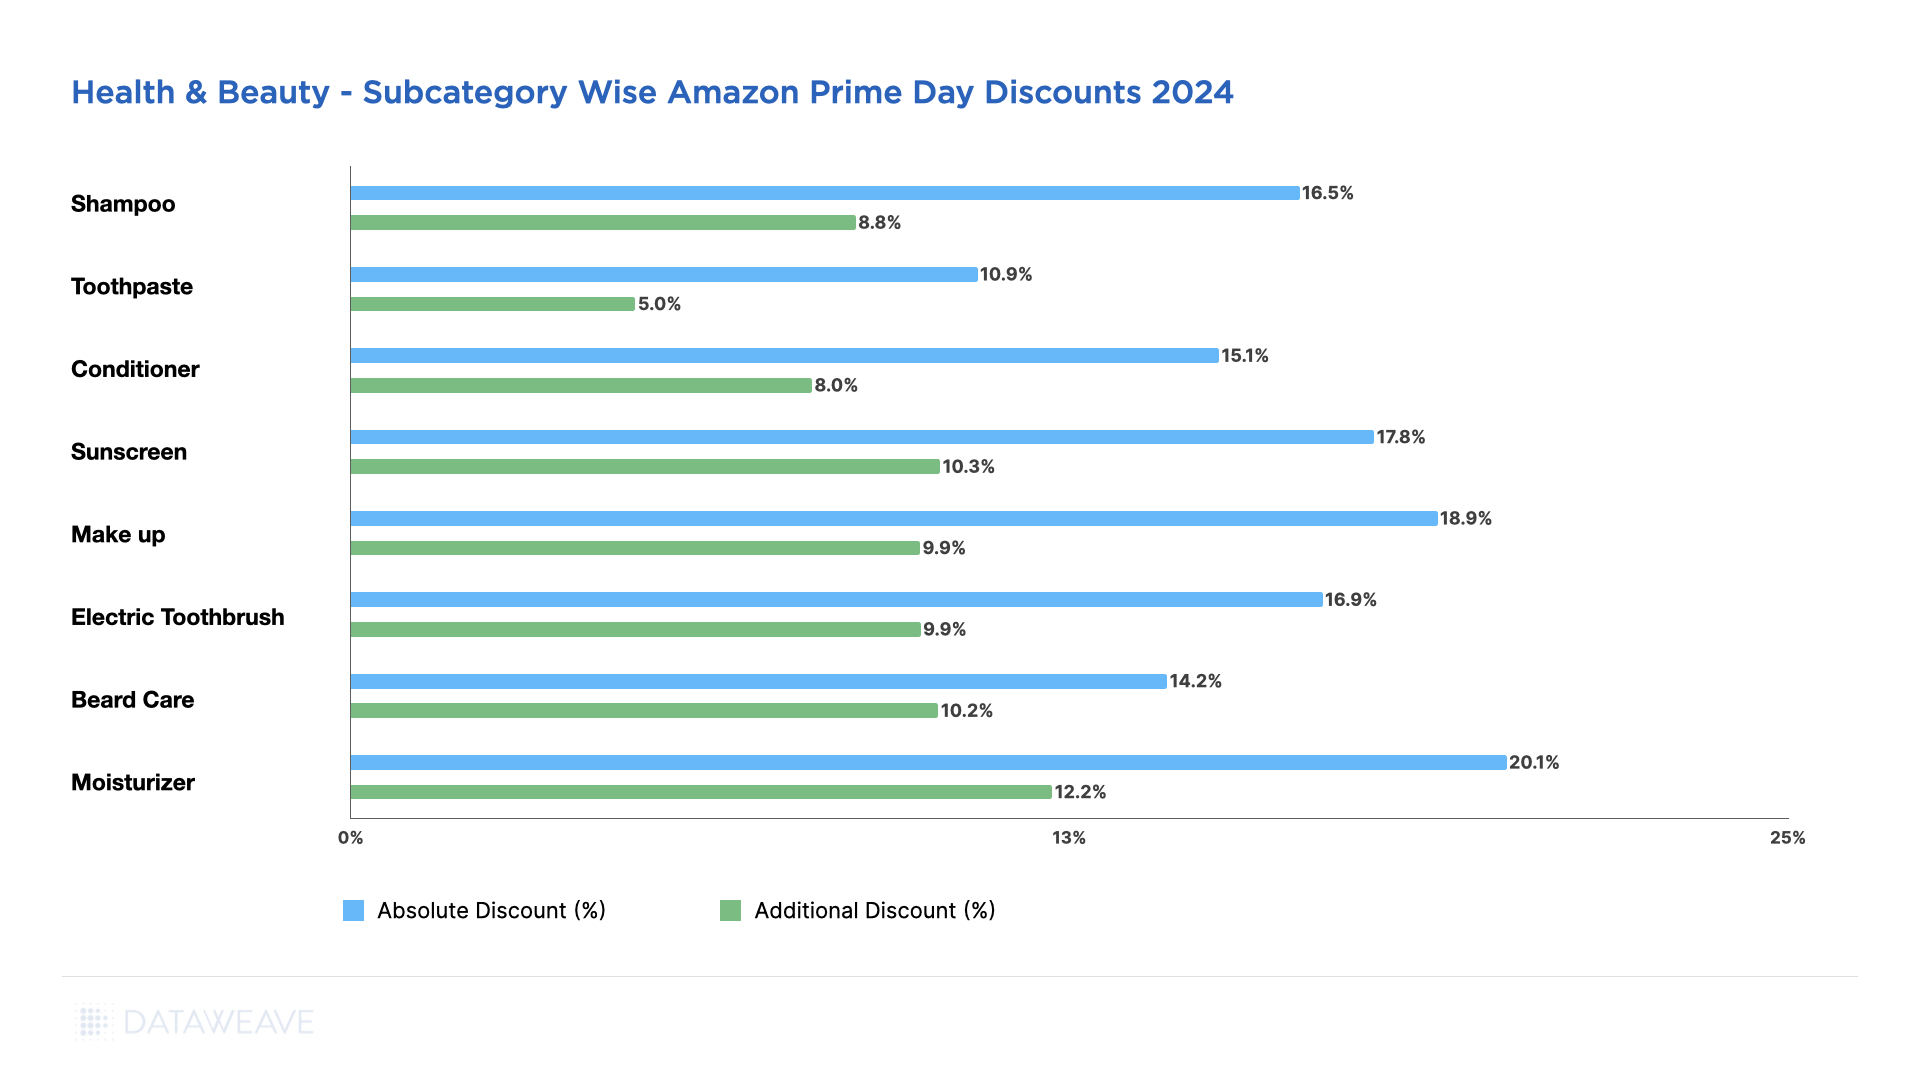
Notable finding: Health & Beauty presented a unique discounting pattern compared to other categories. Pre-Black Friday discounts averaged just 7.1%, the second-lowest among all categories. But Black Friday Week discounts were relatively strong at 4.8%. This indicates the Beauty category held back more discounts for the main event.
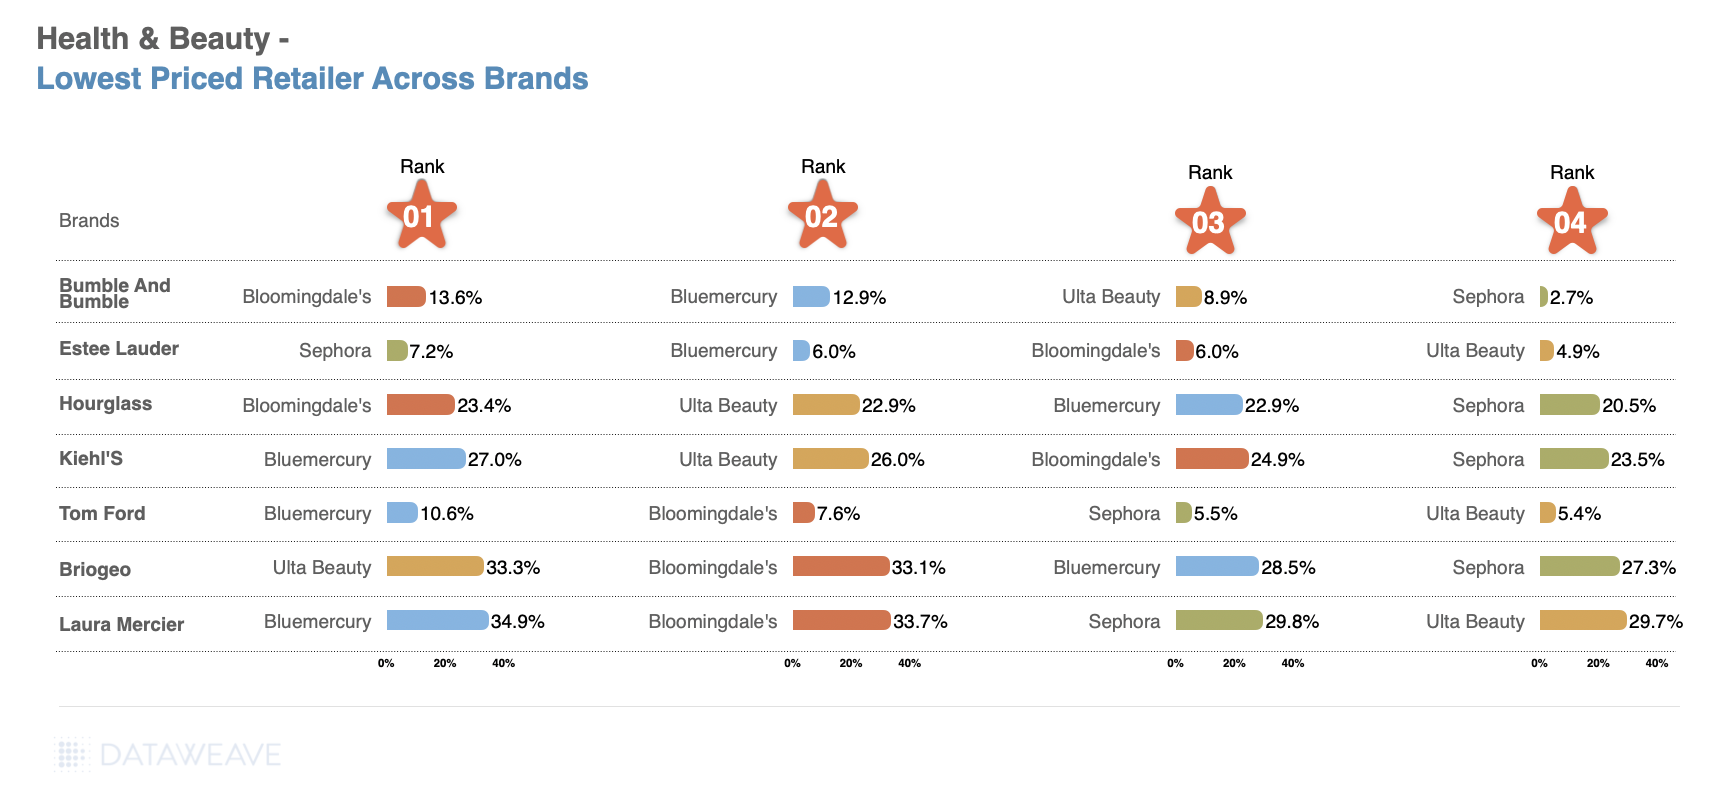
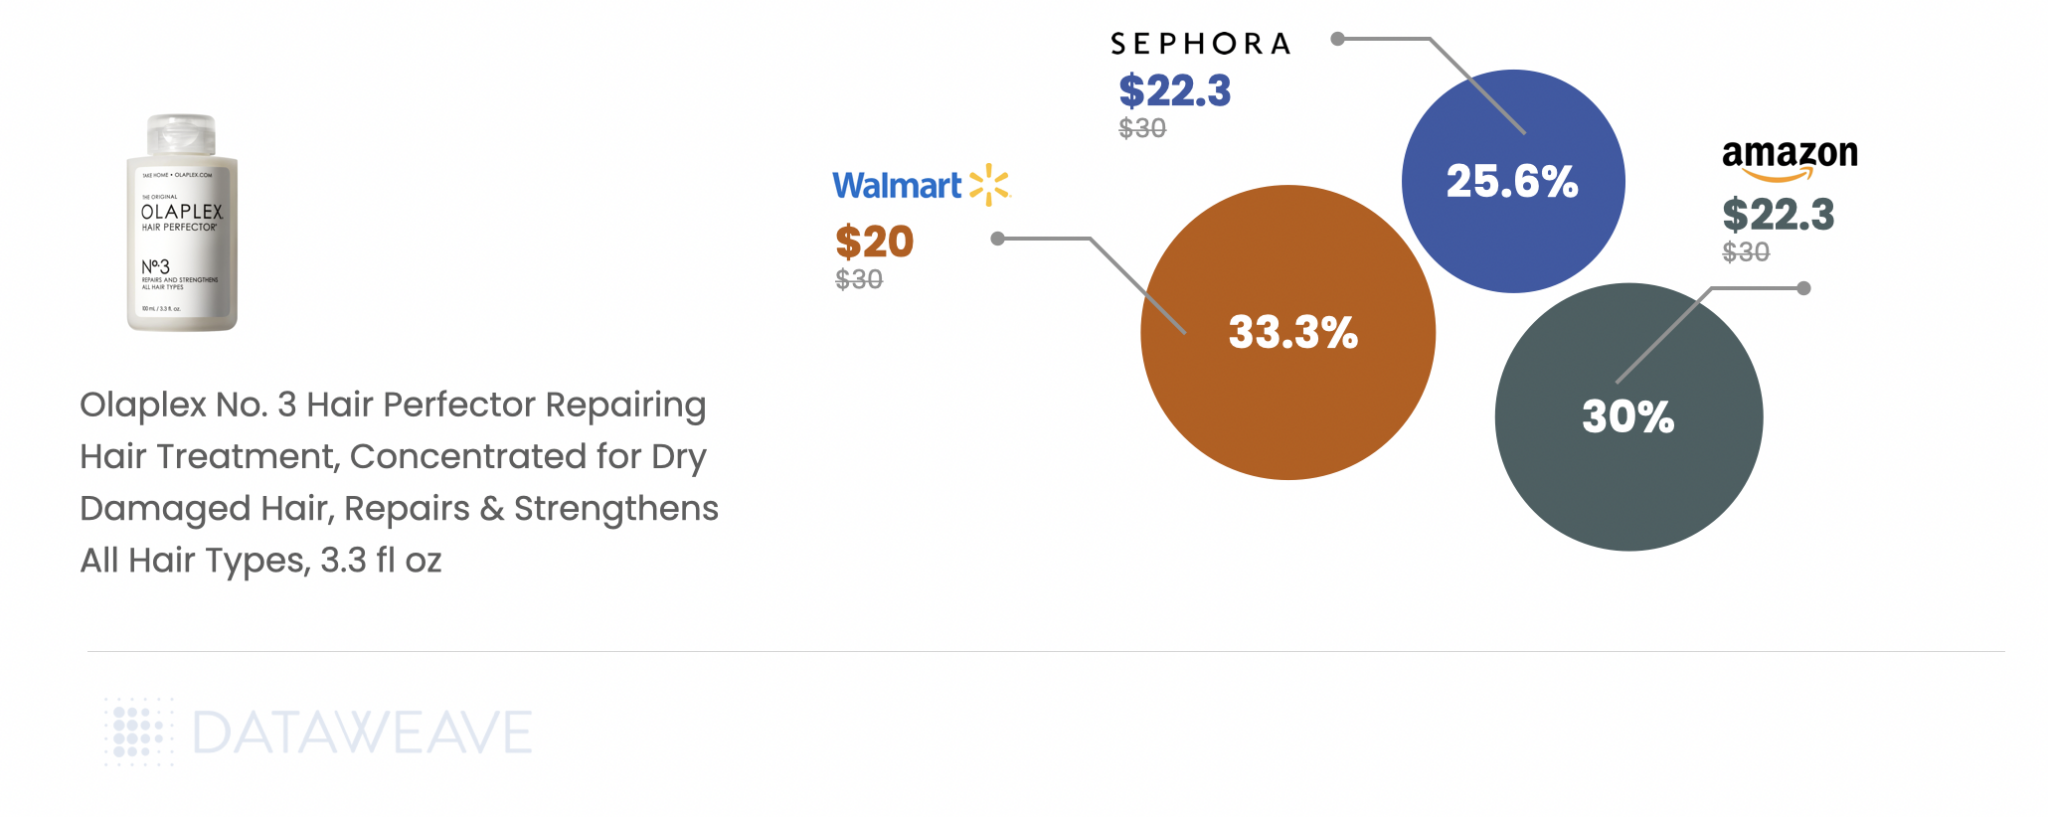
Notably, Hair Care was the only subcategory across our entire analysis where Black Friday Week discounts (6%) exceeded Pre-Black Friday discounts (4.6%), suggesting retailers strategically saved their best hair care promotions for the big weekend. Fragrance led pre-sale discounts at 13%, making it an attractive early shopping category.
Share of Search: Brand Visibility Trends
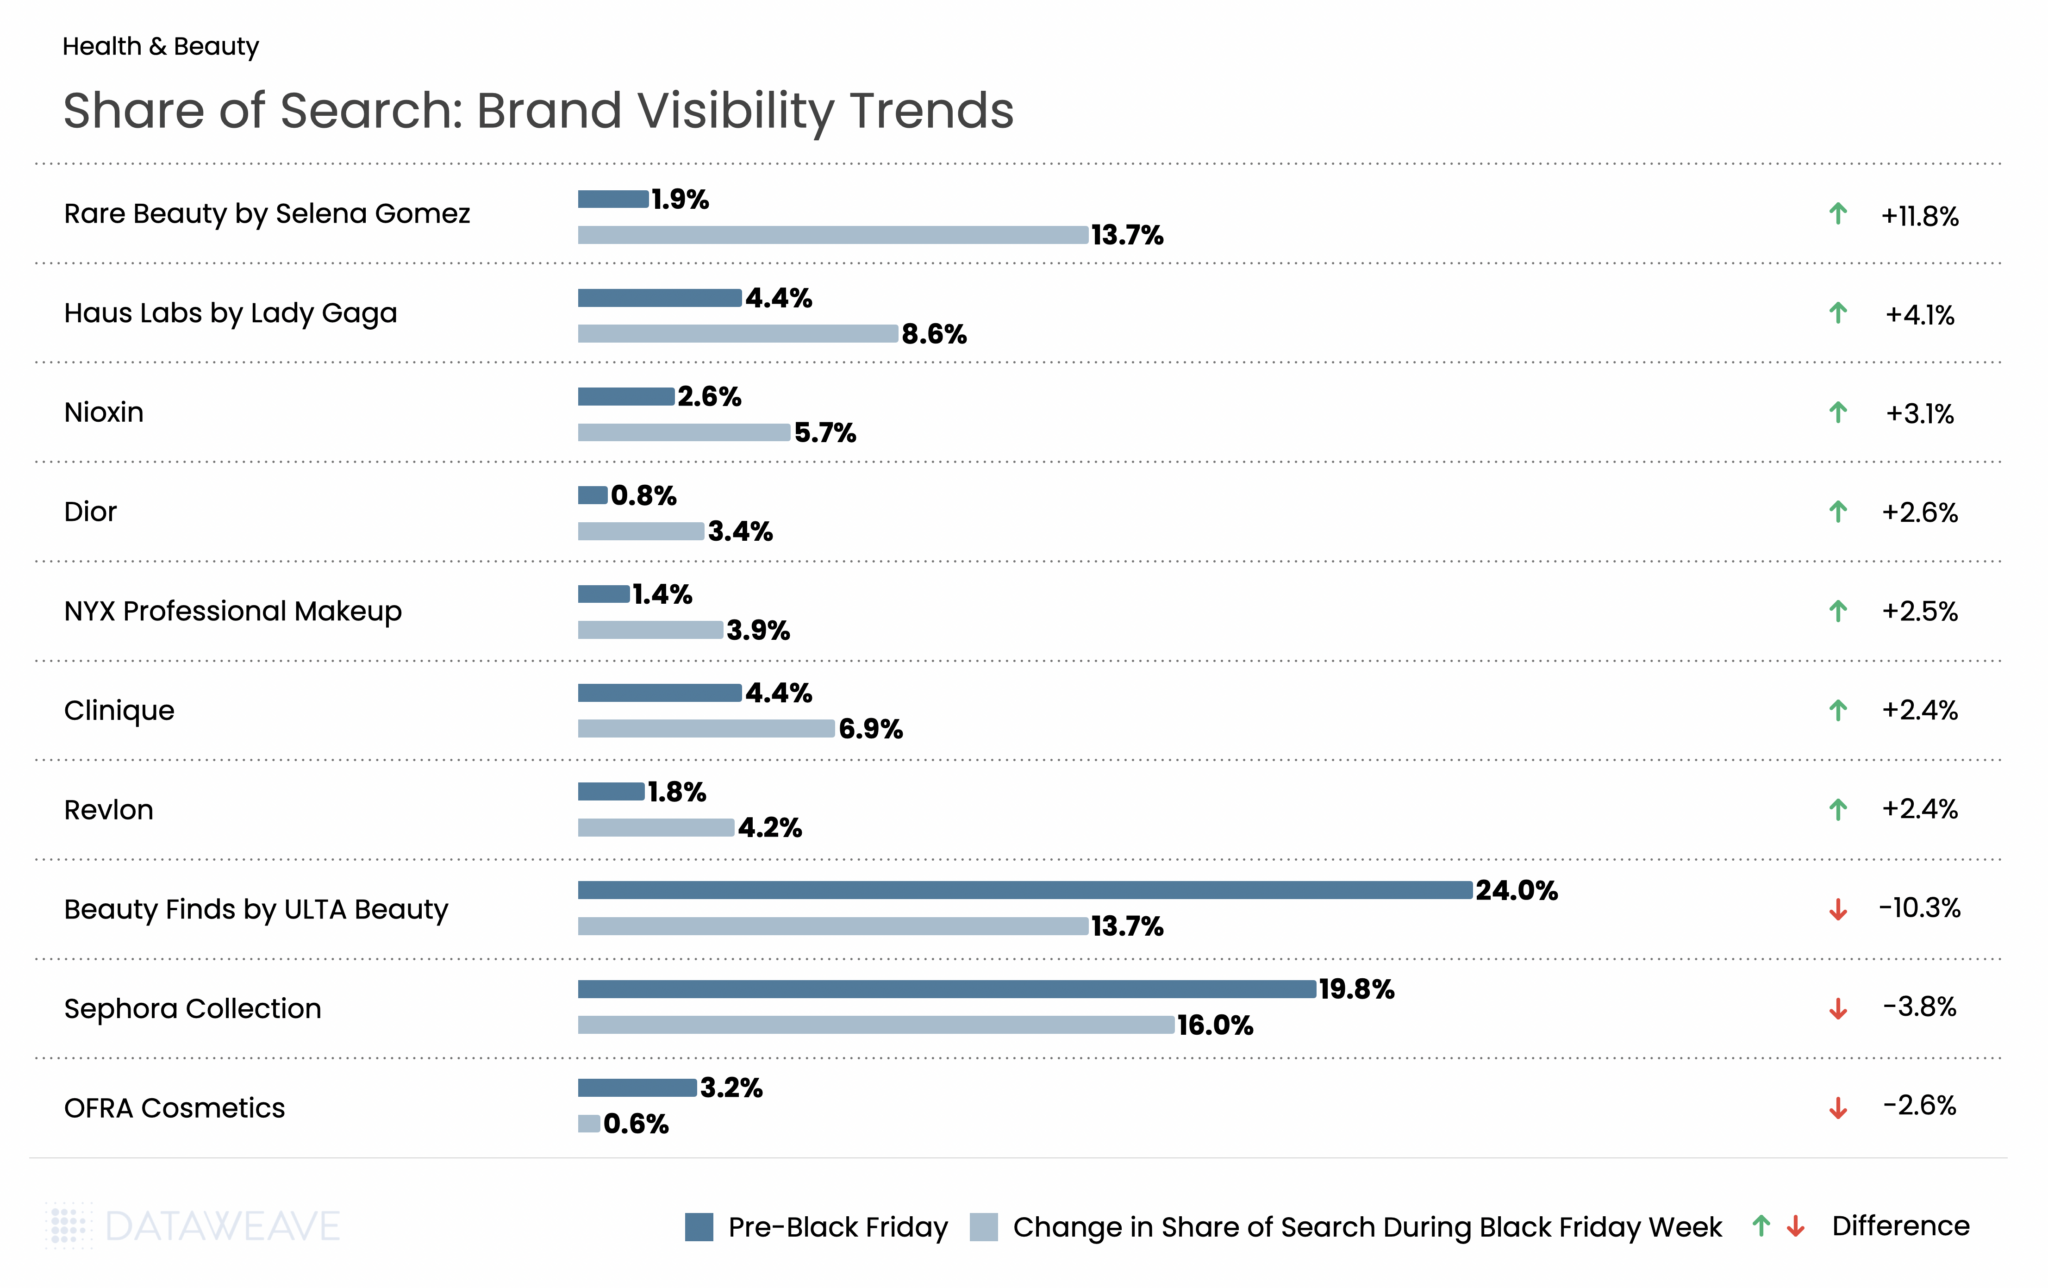
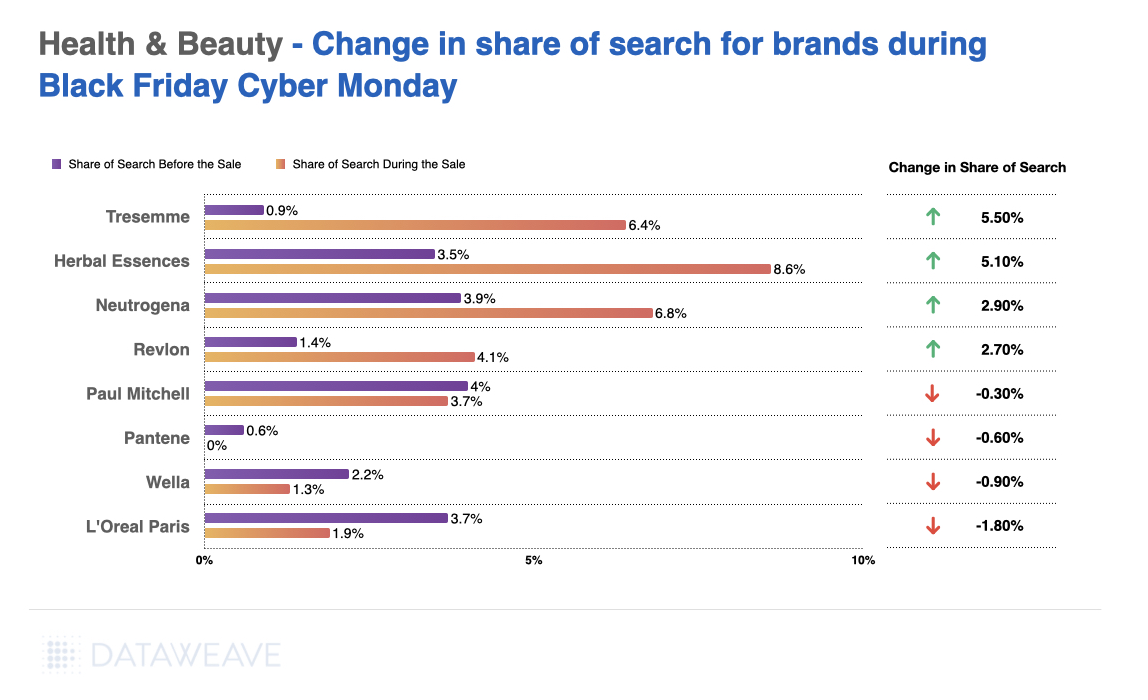
Health & Beauty saw some of the most dramatic Share of Search swings in our analysis, driven largely by celebrity-backed brands. Rare Beauty by Selena Gomez exploded from just 1.9% to 13.7%, a whopping 11.8% gain that made it the biggest winner across all categories. Haus Labs by Lady Gaga also surged (+4.1%), while prestige brands like Dior (+2.6%) and Clinique (+2.4%) gained ground.
The flip side? Retailer private labels took a hit: Beauty Finds by ULTA Beauty collapsed from 24% to 13.7% (-10.3%), and Sephora Collection dropped from 19.8% to 16.0% (-3.8%).
Key Takeaway: The Beauty category tells a compelling story about the power of celebrity brands during Black Friday. The Share of Search shifts appear to reflect how retailers and brands recalibrated their promotional focus for Black Friday. Celebrity-driven lines rose sharply in visibility, suggesting stronger placement, promotion, or search prioritization during the sale period. At the same time, private-label ranges from ULTA and Sephora lost ground, indicating a pivot away from house-brand visibility in favor of more spotlighted national and prestige brands throughout the event.
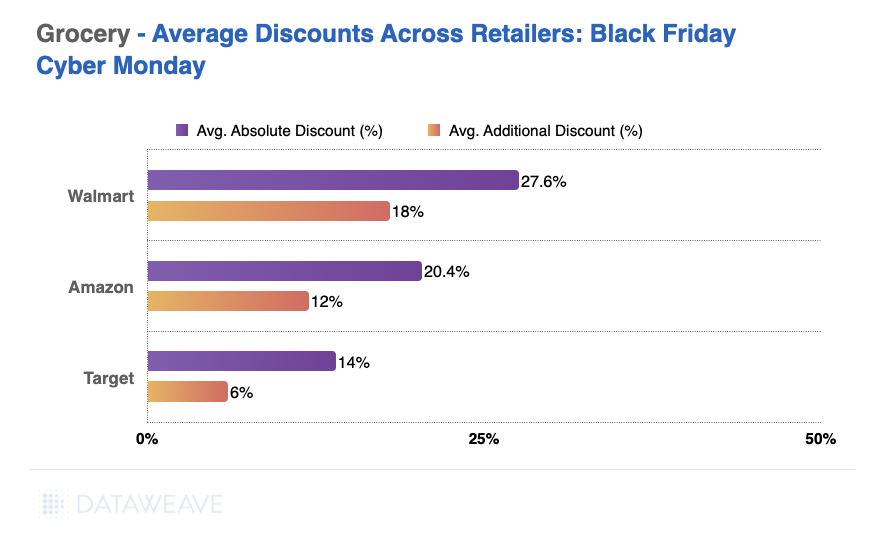
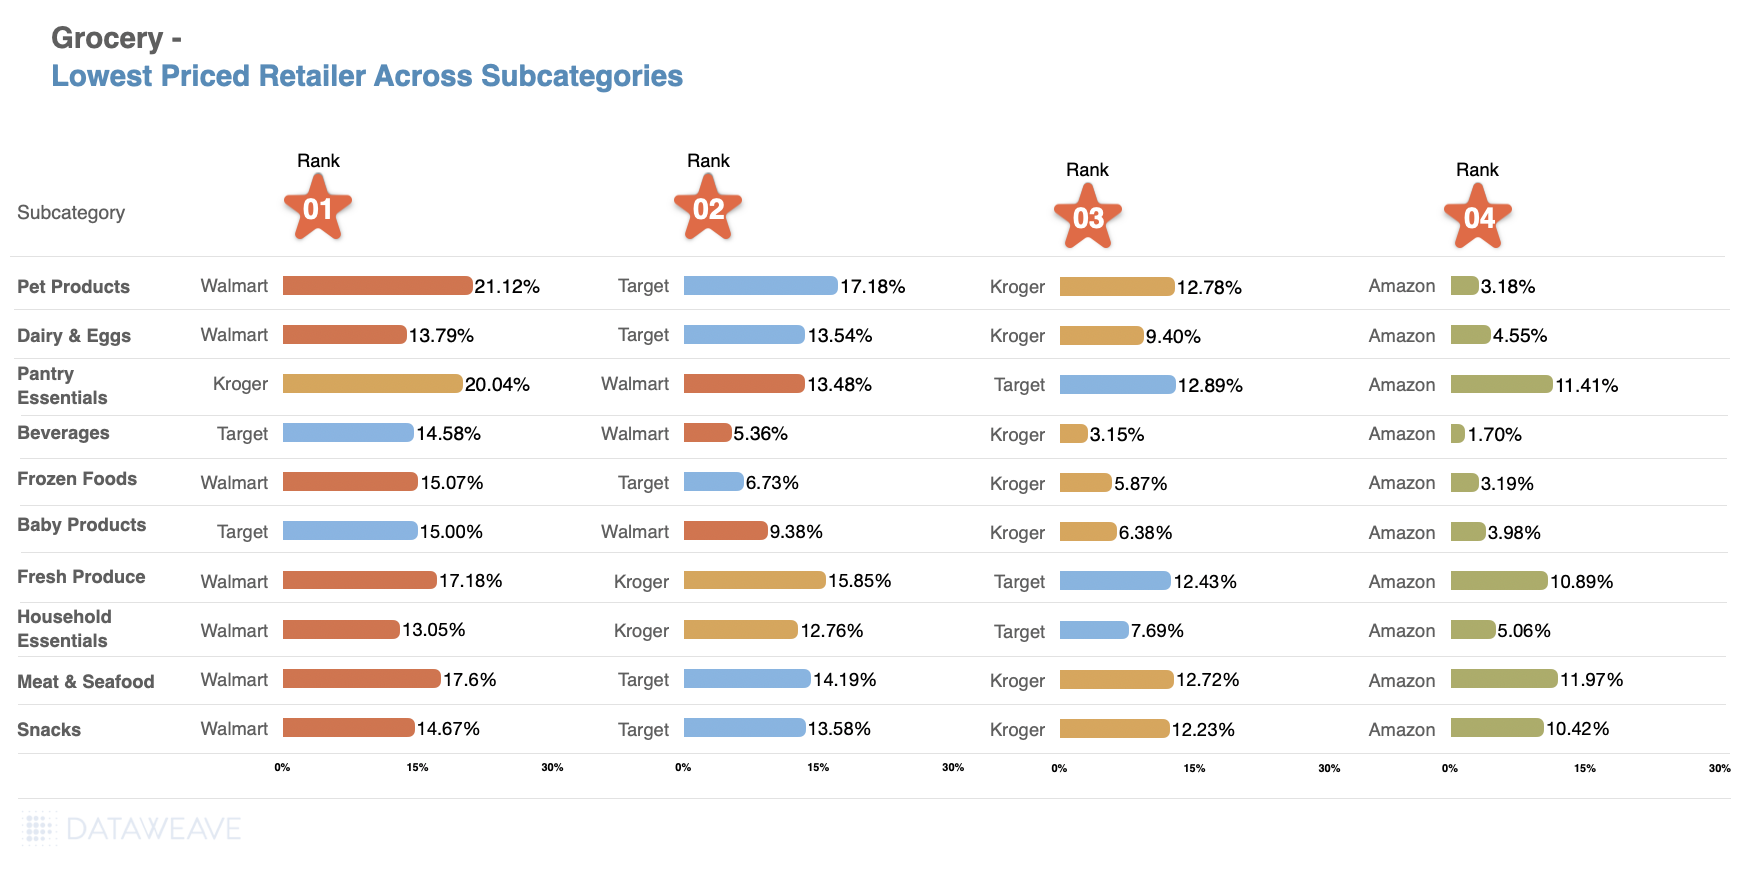
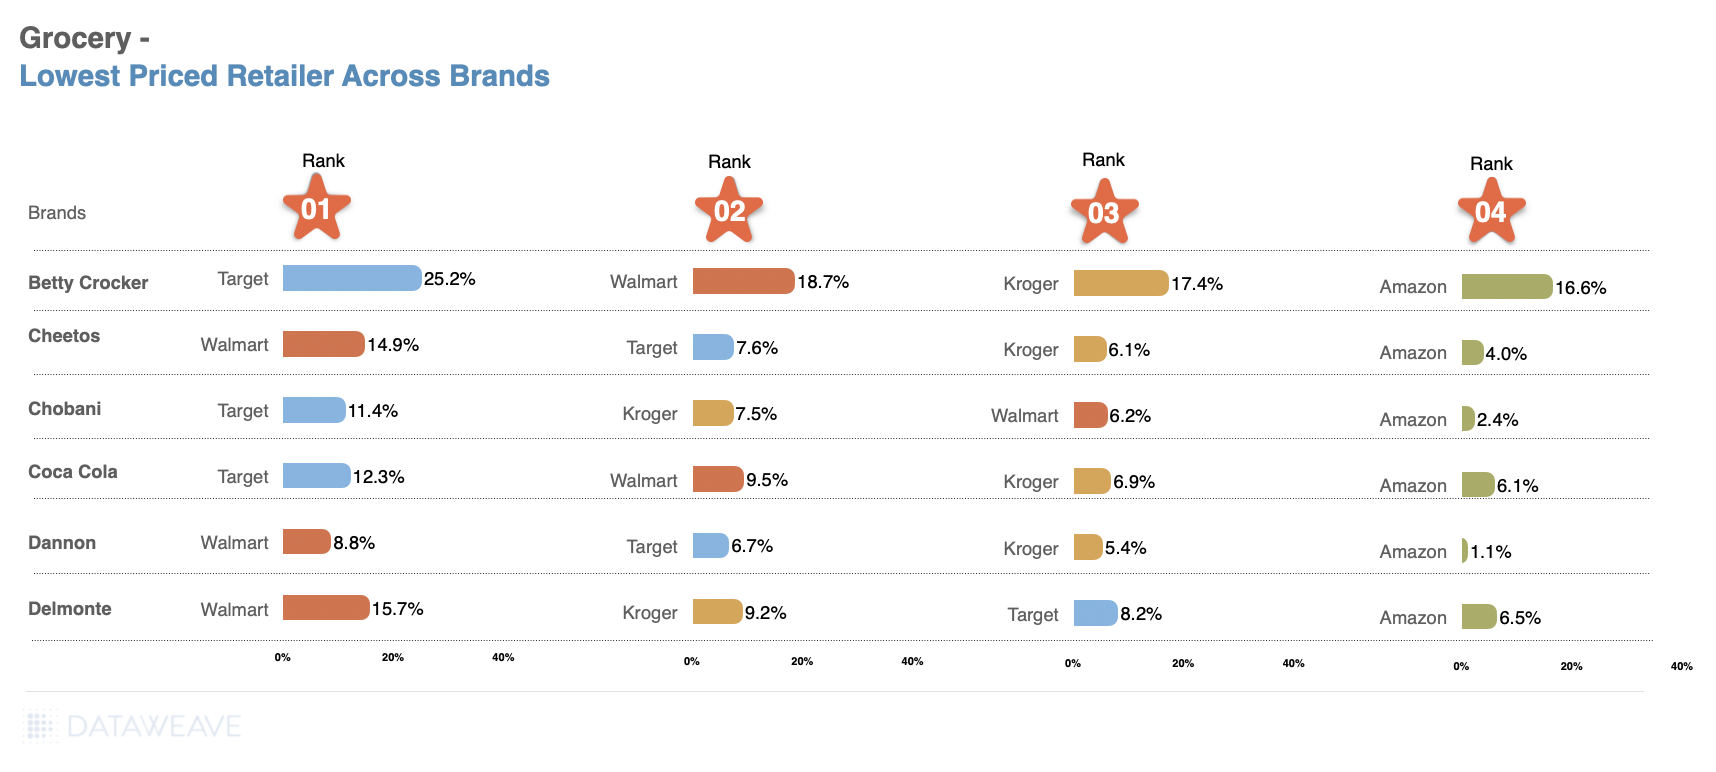
Grocery
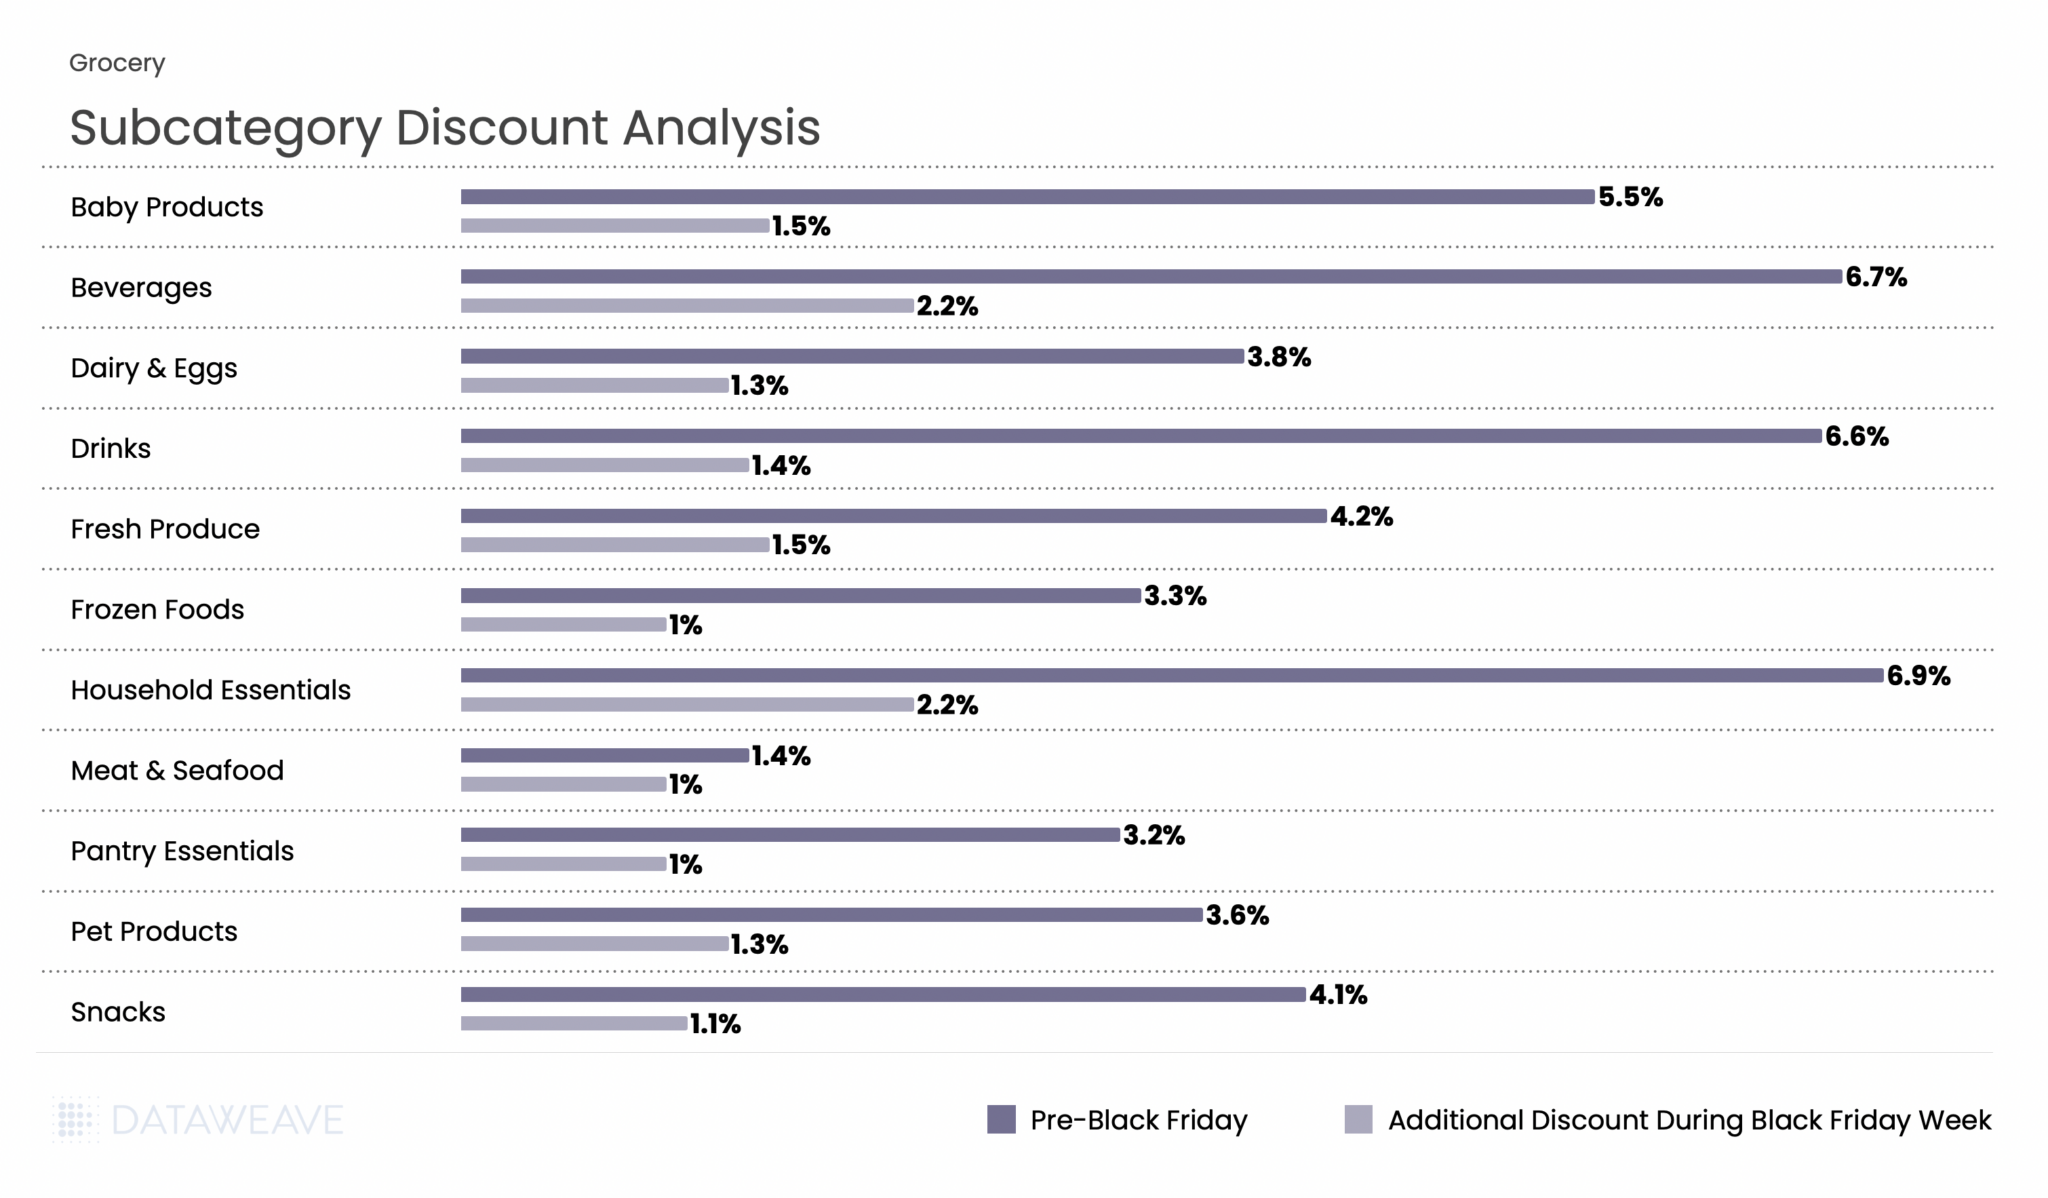
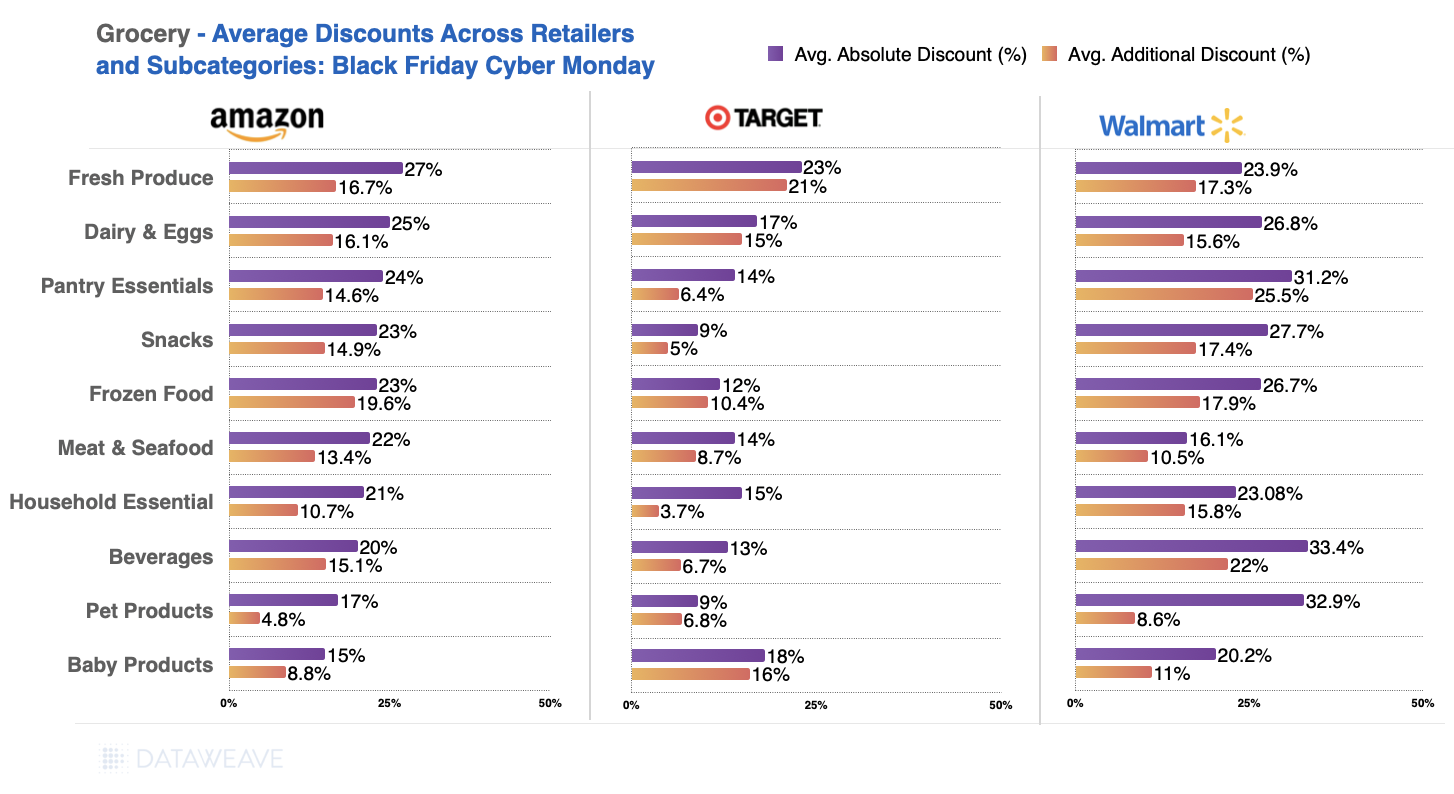
While Grocery typically sees more modest discounts compared to discretionary categories, the sector remains a critical part of Thanksgiving weekend shopping. According to the National Retail Federation, grocery stores and supermarkets ranked as the third most popular shopping destination during Thanksgiving weekend, with 40% of consumers making purchases there. Our analysis of 18,823 SKUs shows how retailers approached promotions across essential and indulgent subcategories.
Subcategory Discount Analysis
Grocery had the lowest discounts across all categories, reflecting the already-thin margins in food retail. Pre-Black Friday discounts averaged just 5.2%, with Black Friday Week adding only 1.5%. Household Essentials and Beverages led pre-sale discounts at 6.9% and 6.7% respectively, and maintained their lead during Black Friday Week with 2.2% additional discounts each. Fresh categories like Meat & Seafood (1.4% pre-sale, 1% Black Friday Week) and Frozen Foods (3.3%, 1%) saw minimal promotional activity, consistent with perishable inventory constraints and tight margins.
Key Takeaway: Grocery discounting remains conservative, with shelf-stable and household items seeing the most promotional activity. The Beverages and Household Essentials subcategories, which have longer shelf life and higher margins, were the primary battleground for grocery promotions during BFCM 2025.
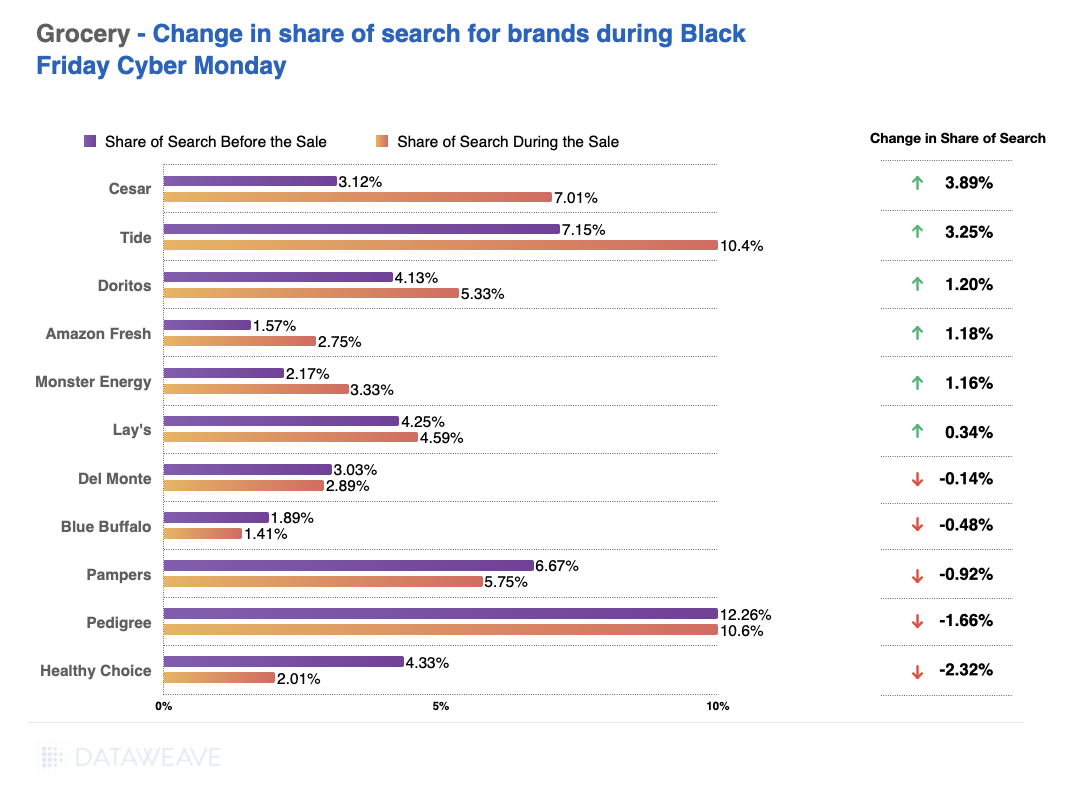
Share of Search: Brand Visibility Trends
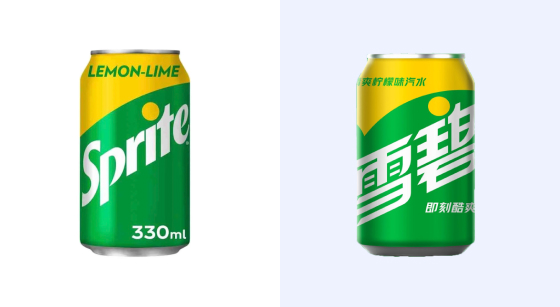
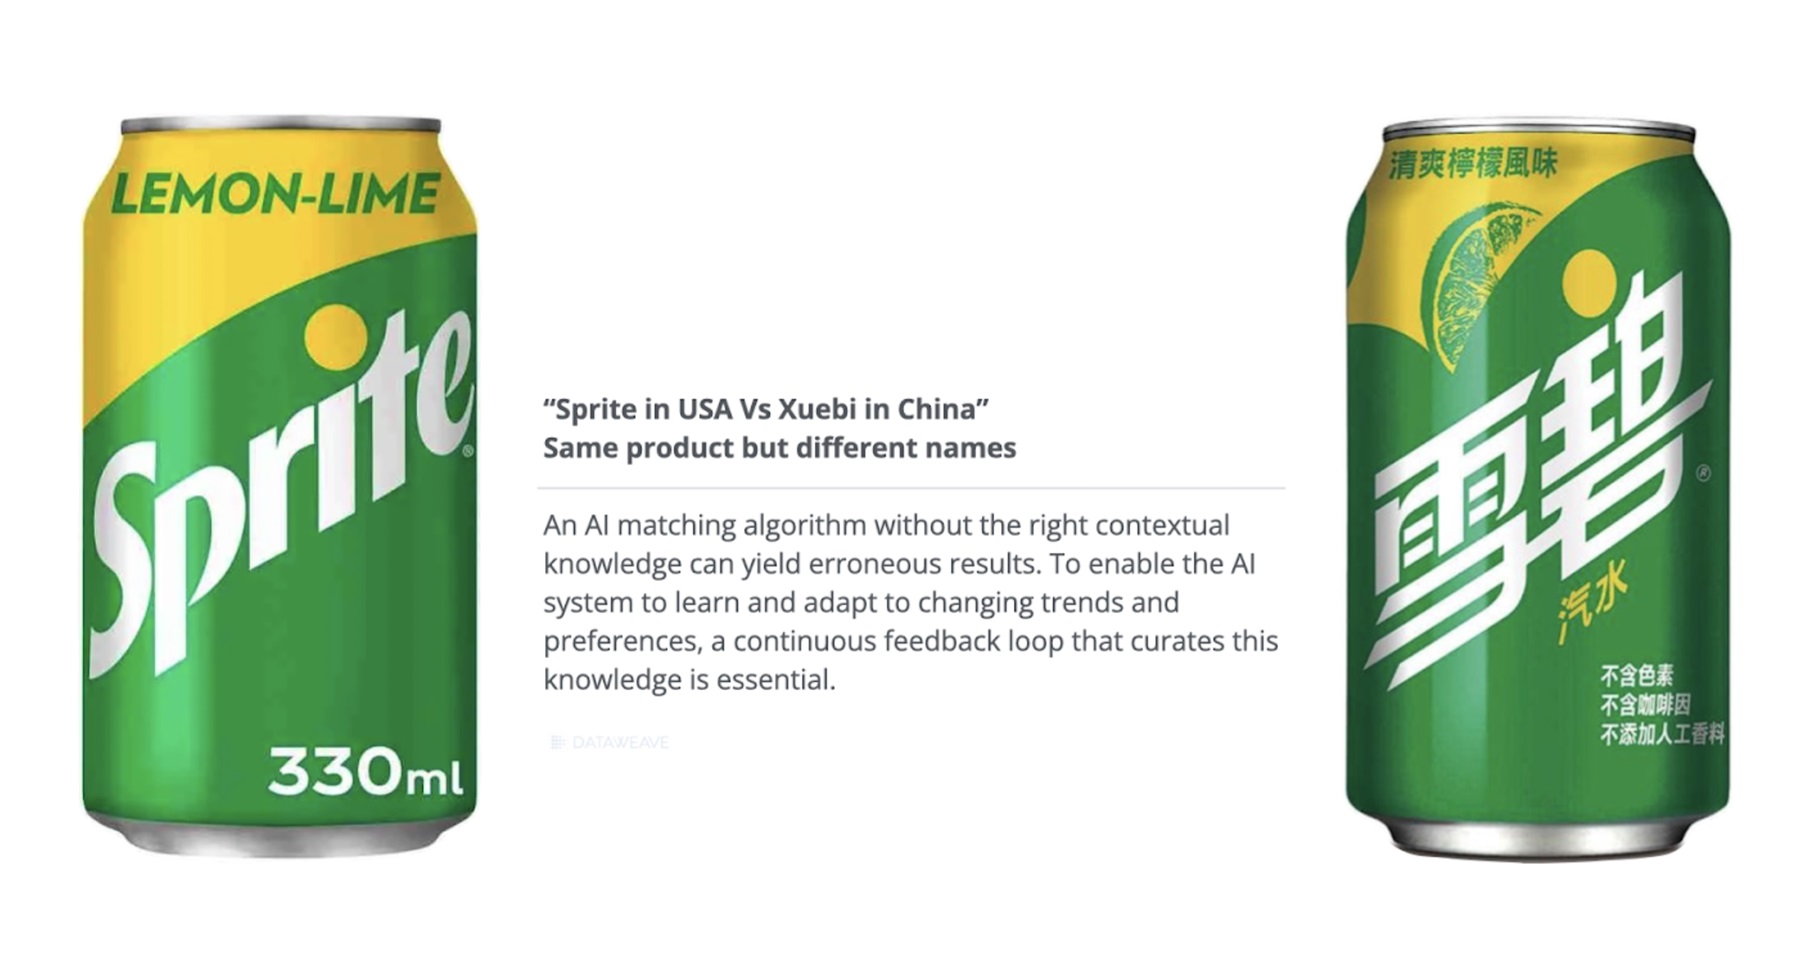
The Grocery category saw some surprising Share of Search swings during Black Friday Week. Most notably, there was a dramatic divergence between beverage giants: Sprite surged from 1.7% to 6.8% (+5.1%), while Coca-Cola collapsed from 6% to just 0.1% (-5.9%). This stark contrast suggests vastly different promotional strategies or algorithmic visibility changes between the two brands. Private label 365 by Whole Foods Market continued its steady rise, gaining 3%, reflecting ongoing consumer interest in store brands as shoppers seek value.
The Sprite vs. Coca-Cola divergence is one of the most striking findings in our analysis. Additionally, brands like Amy’s (organic/natural foods) and McCormick (spices/seasonings) gained significant visibility.
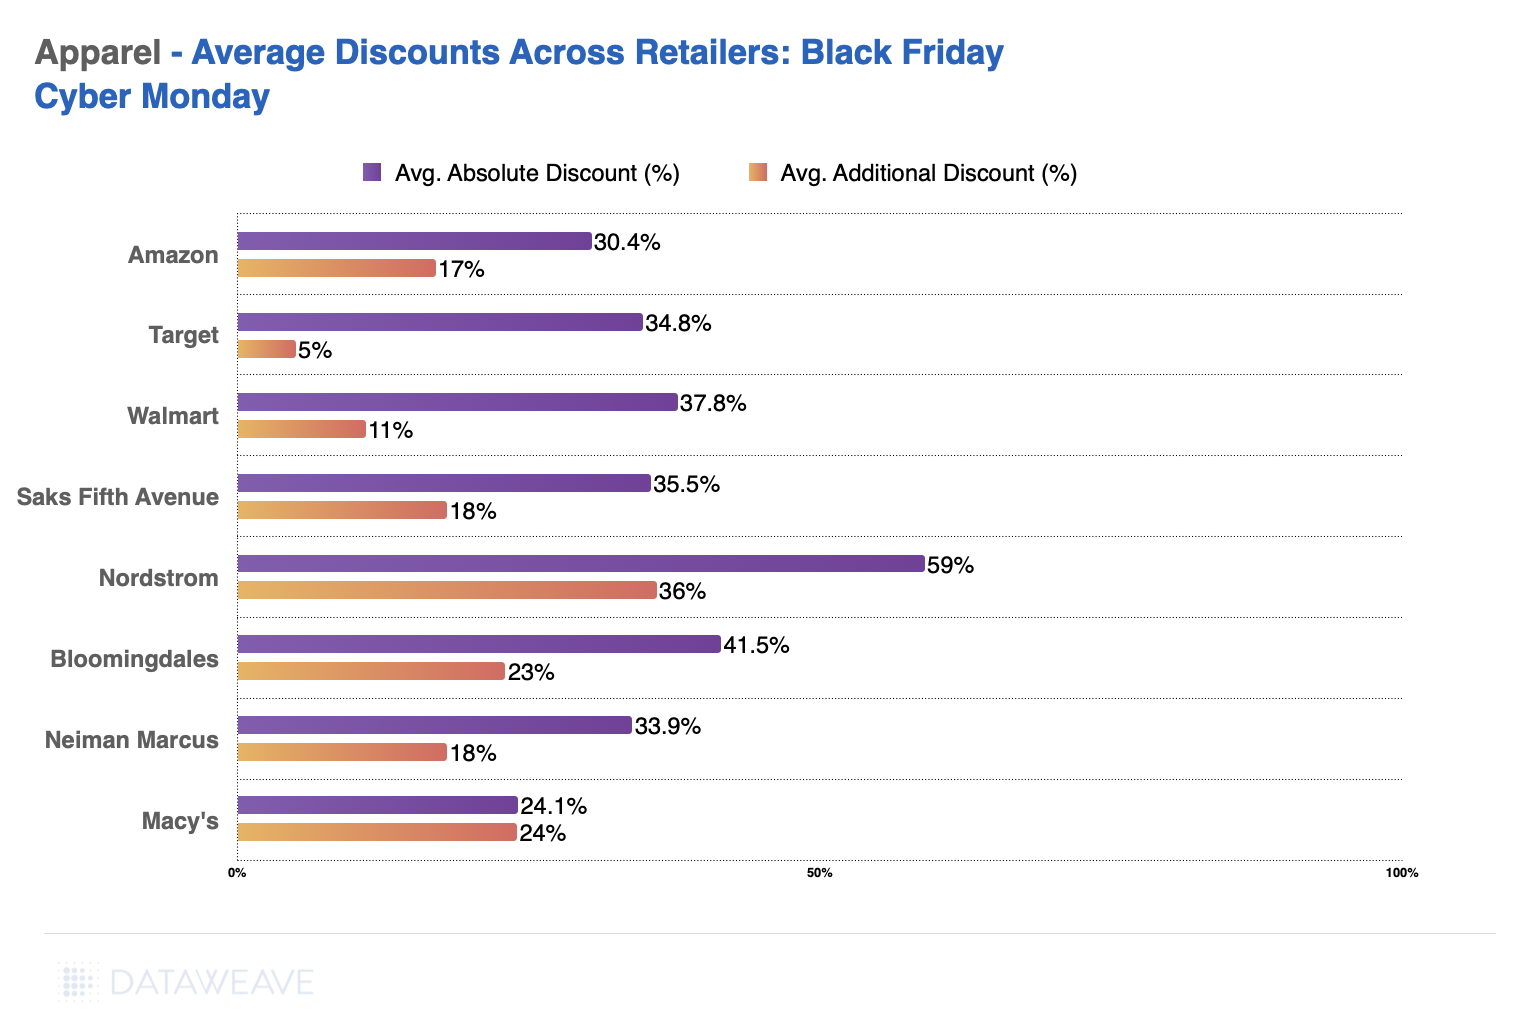
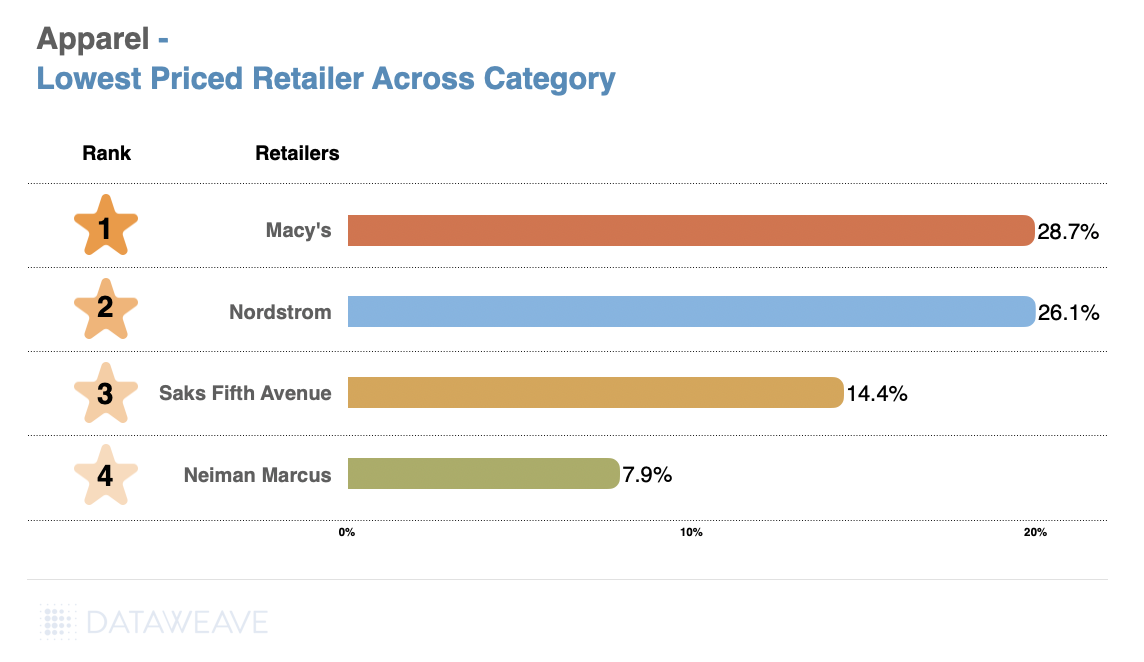
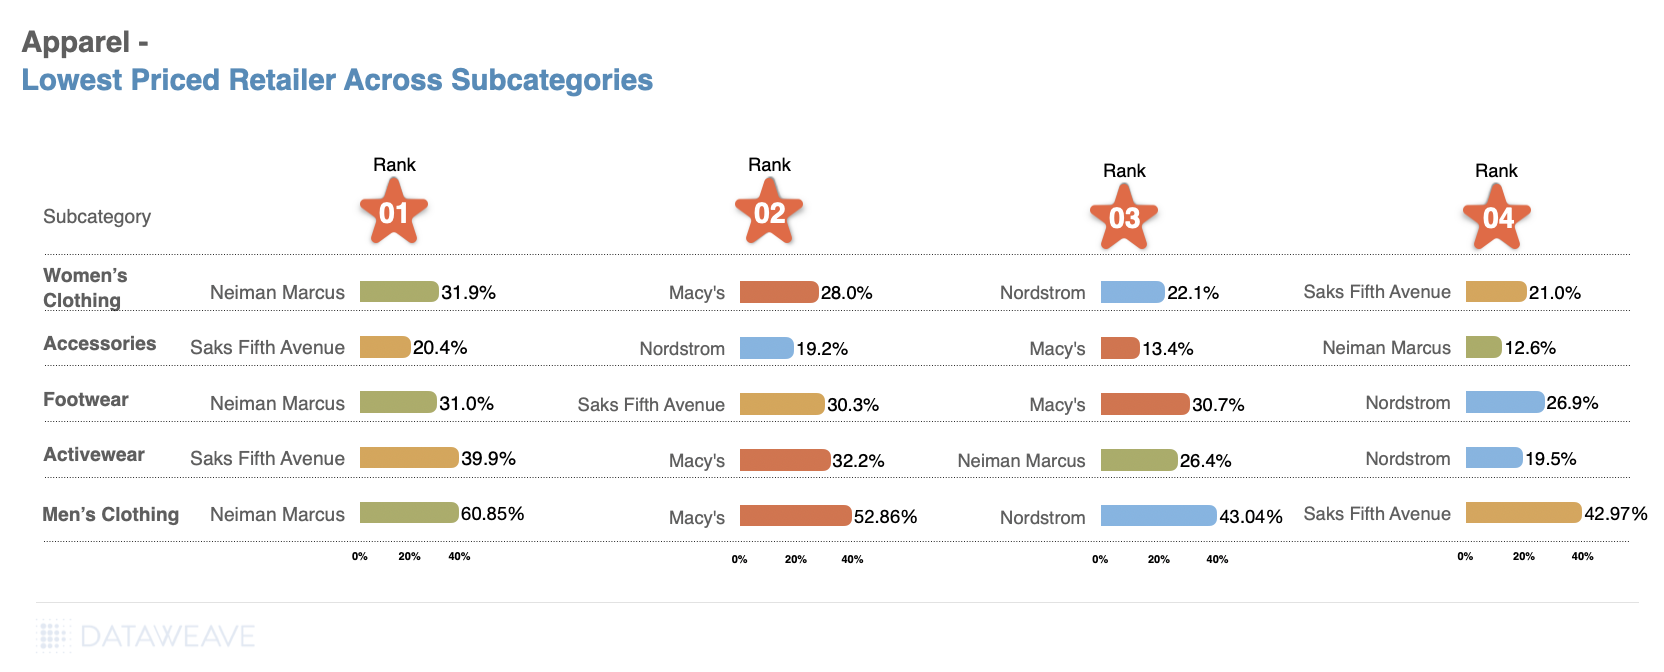
Apparel
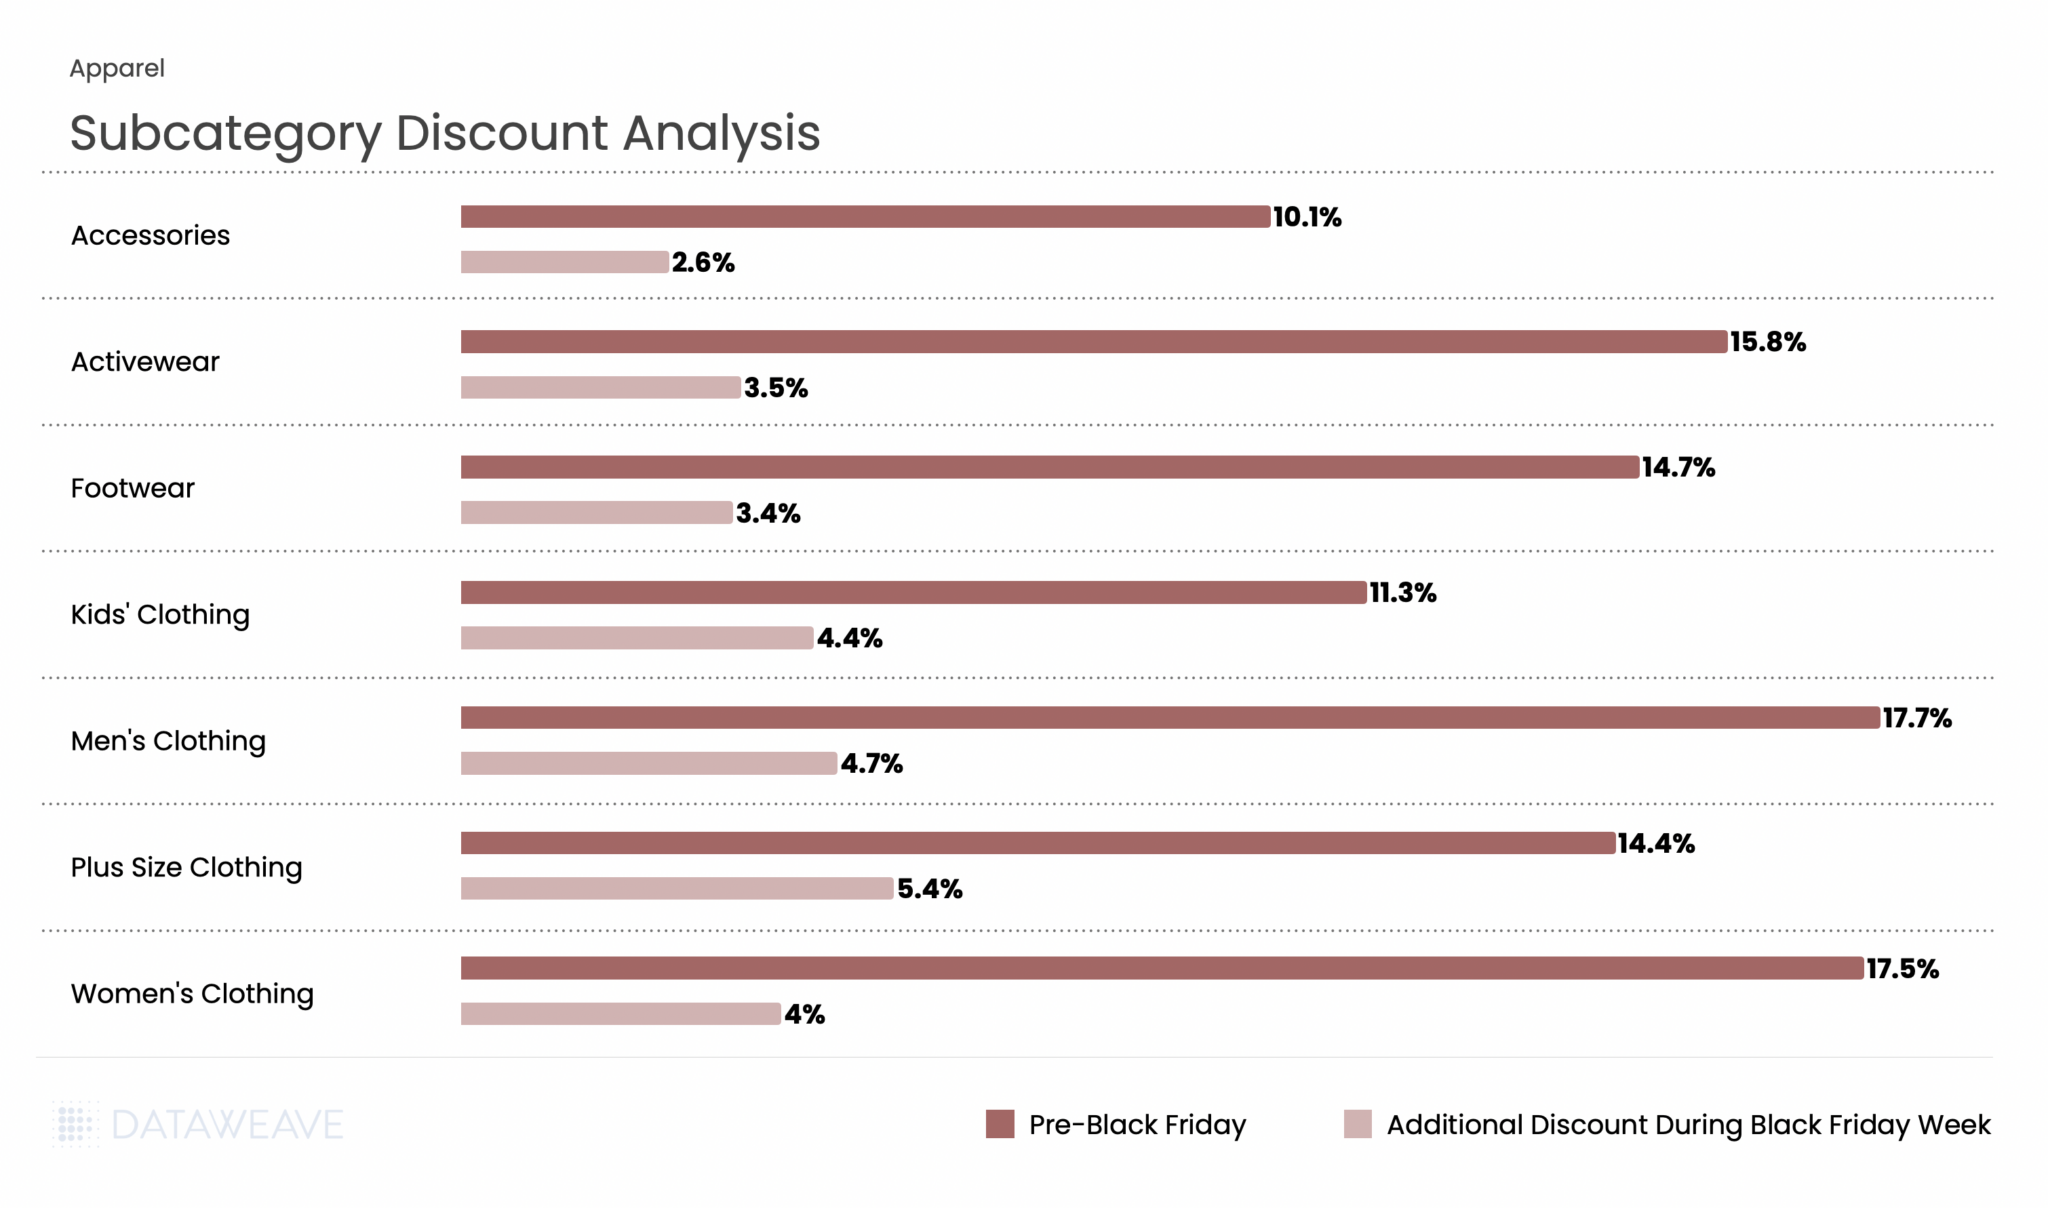
Apparel remains a Black Friday staple and performed strongly this year. Our analysis of 21,749 SKUs (the largest category in our study) reveals interesting patterns.
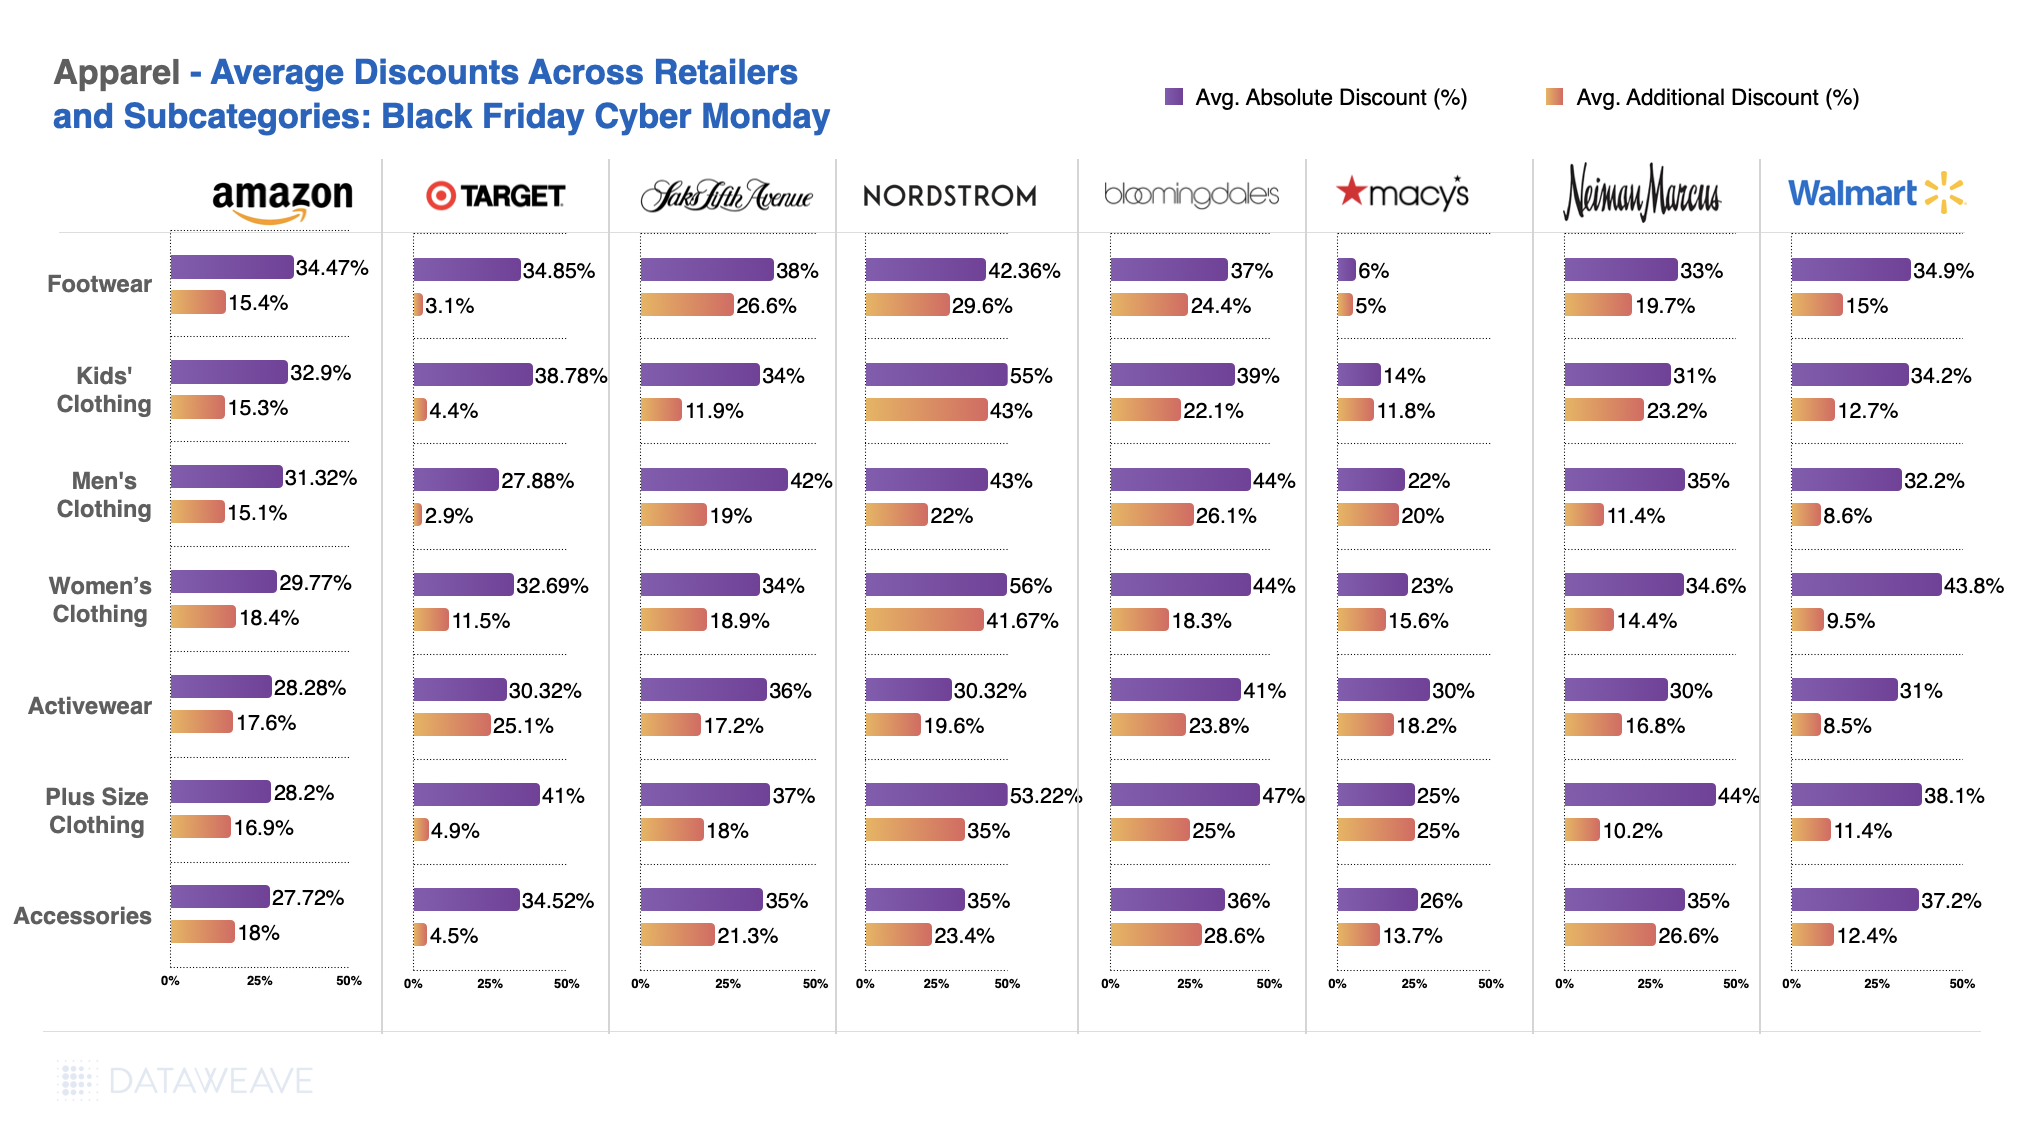
Subcategory Discount Analysis
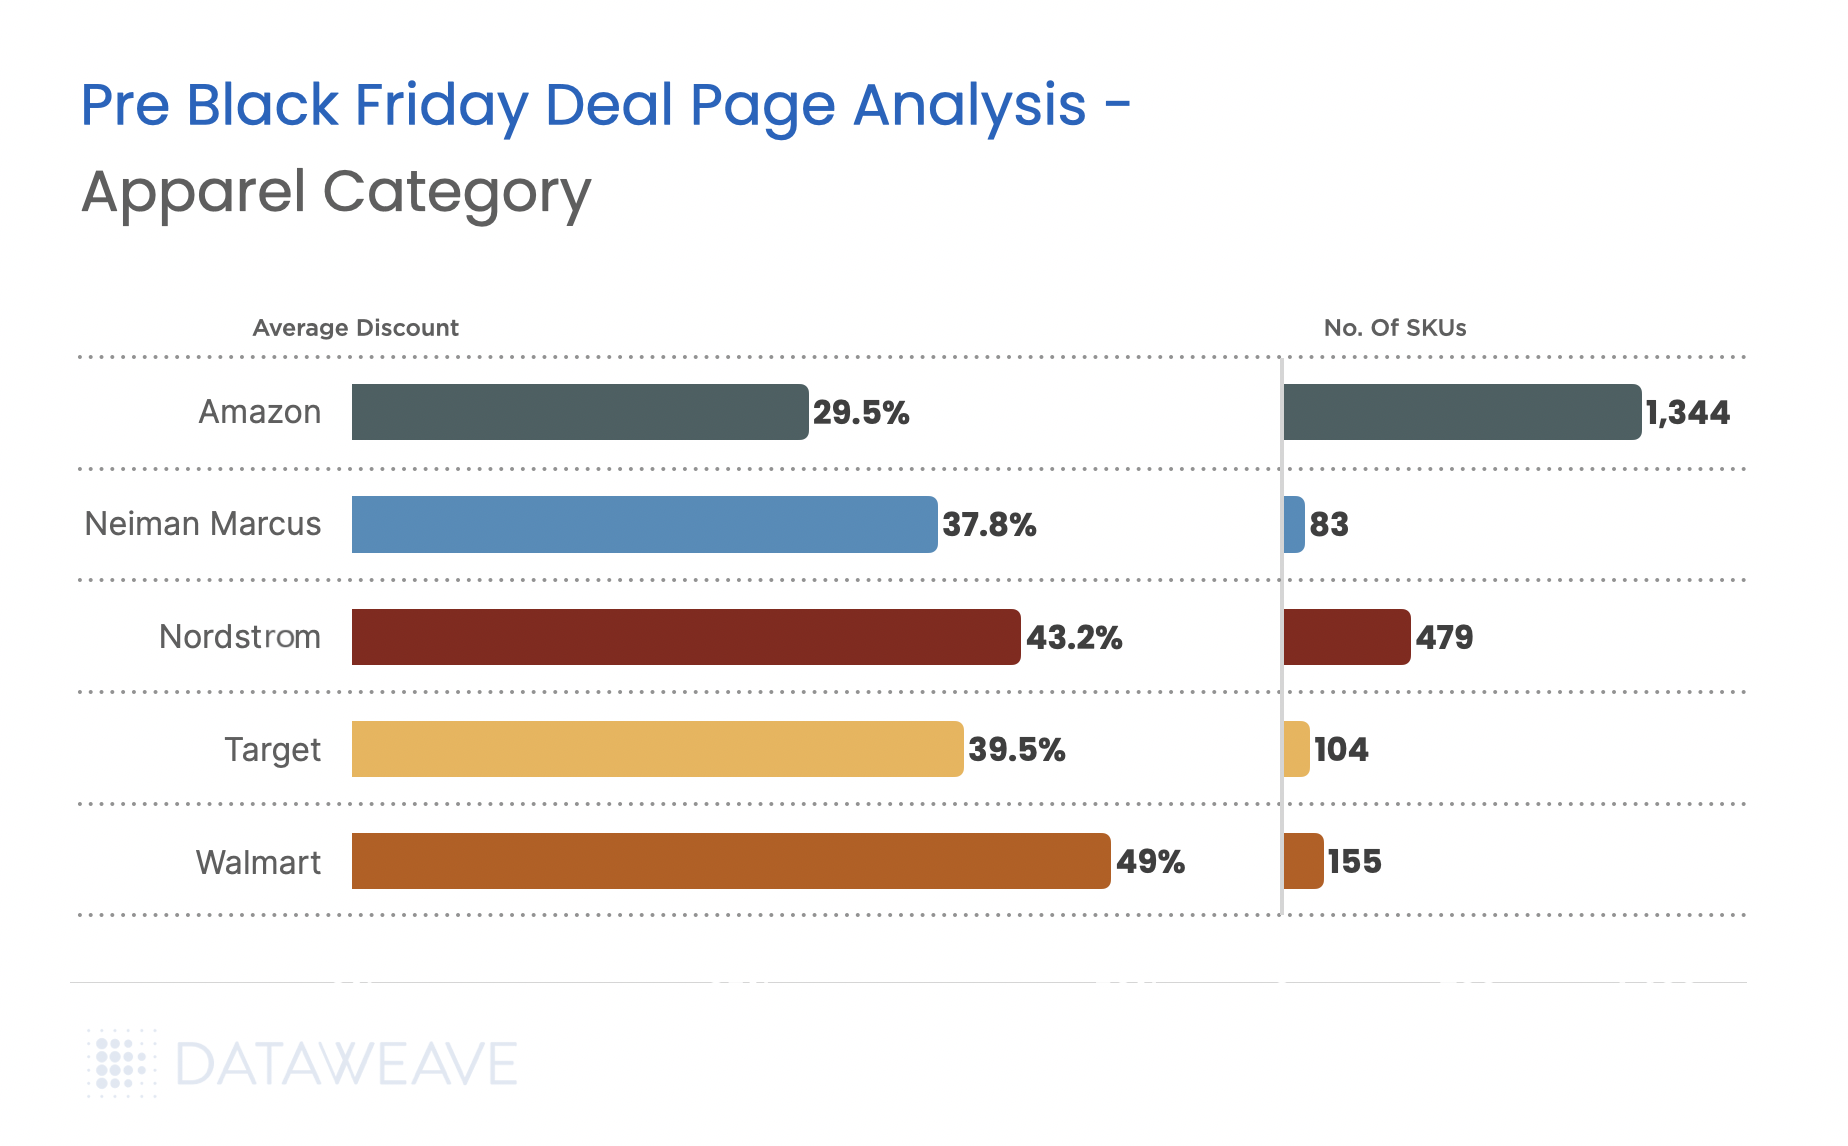
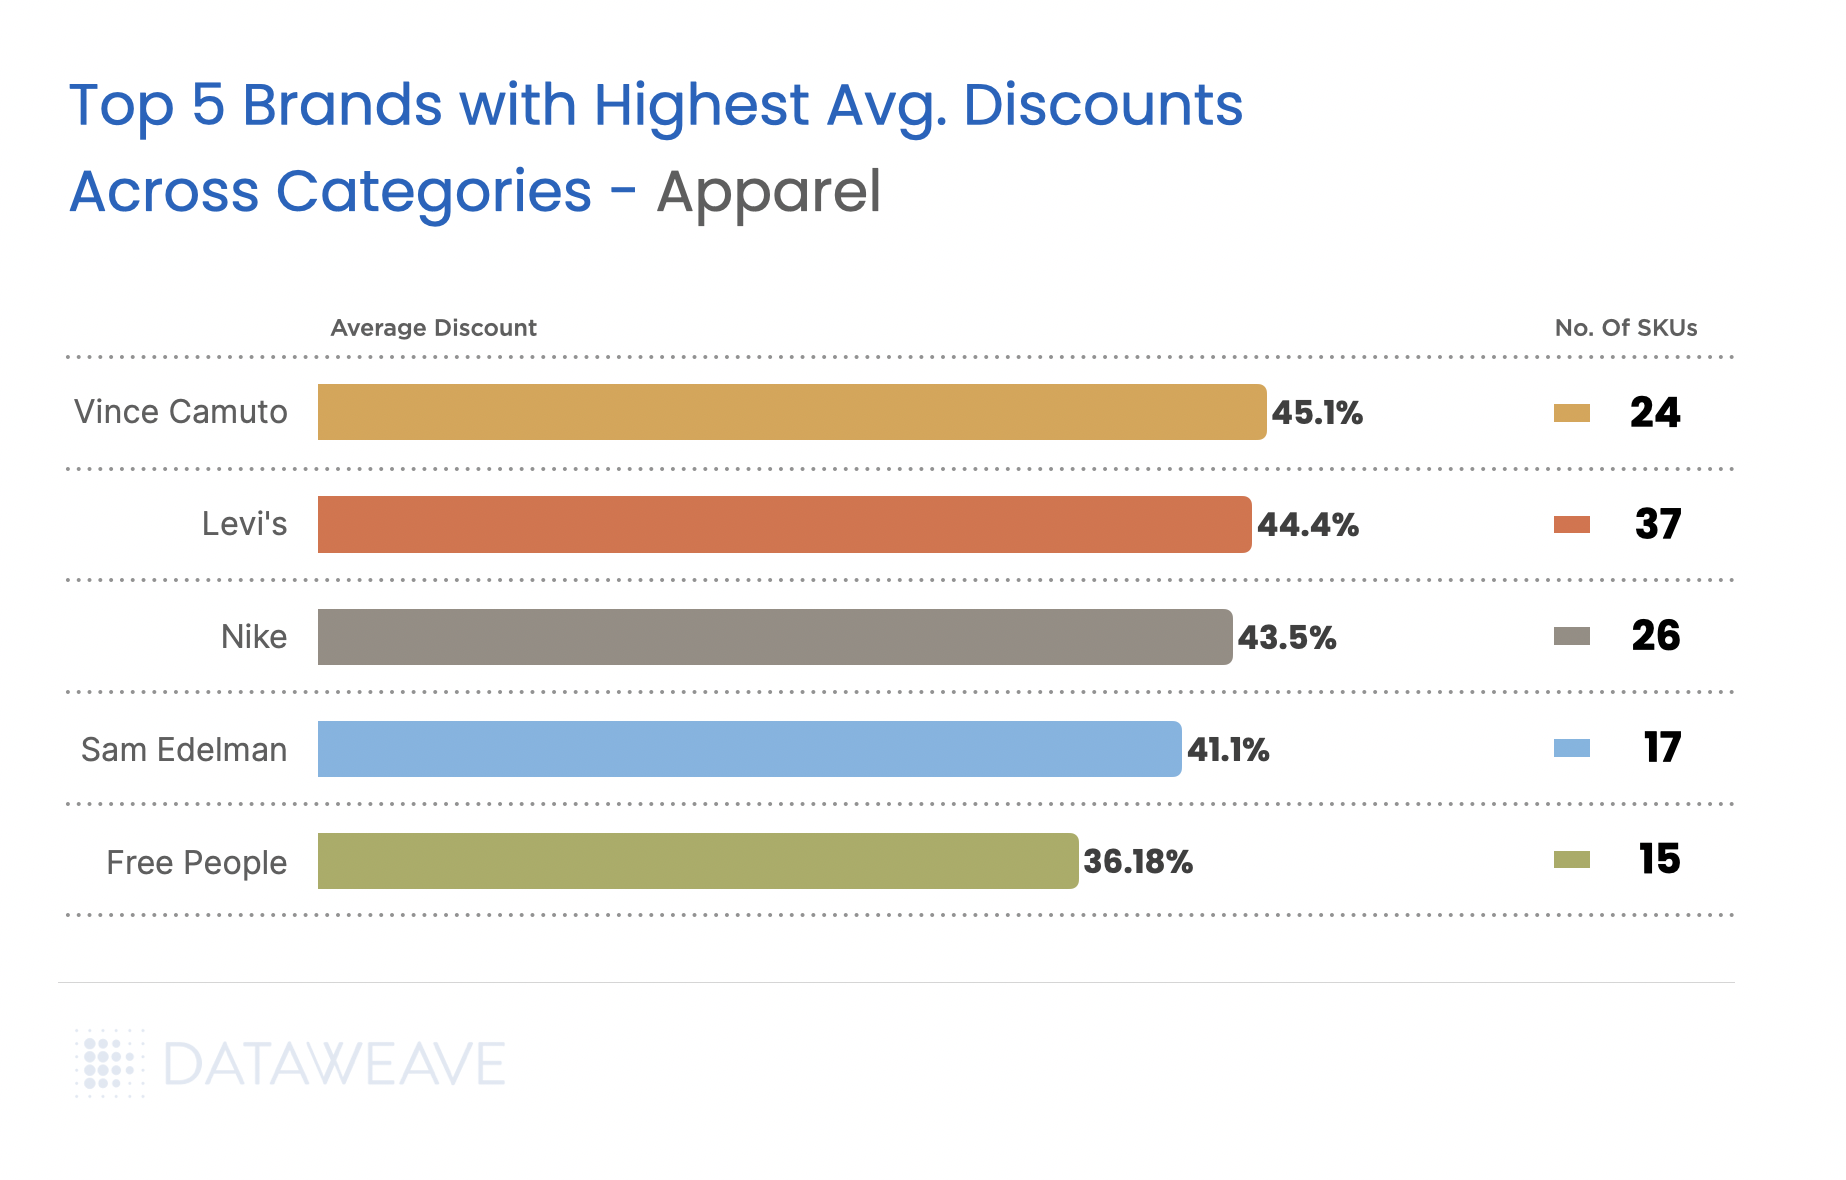
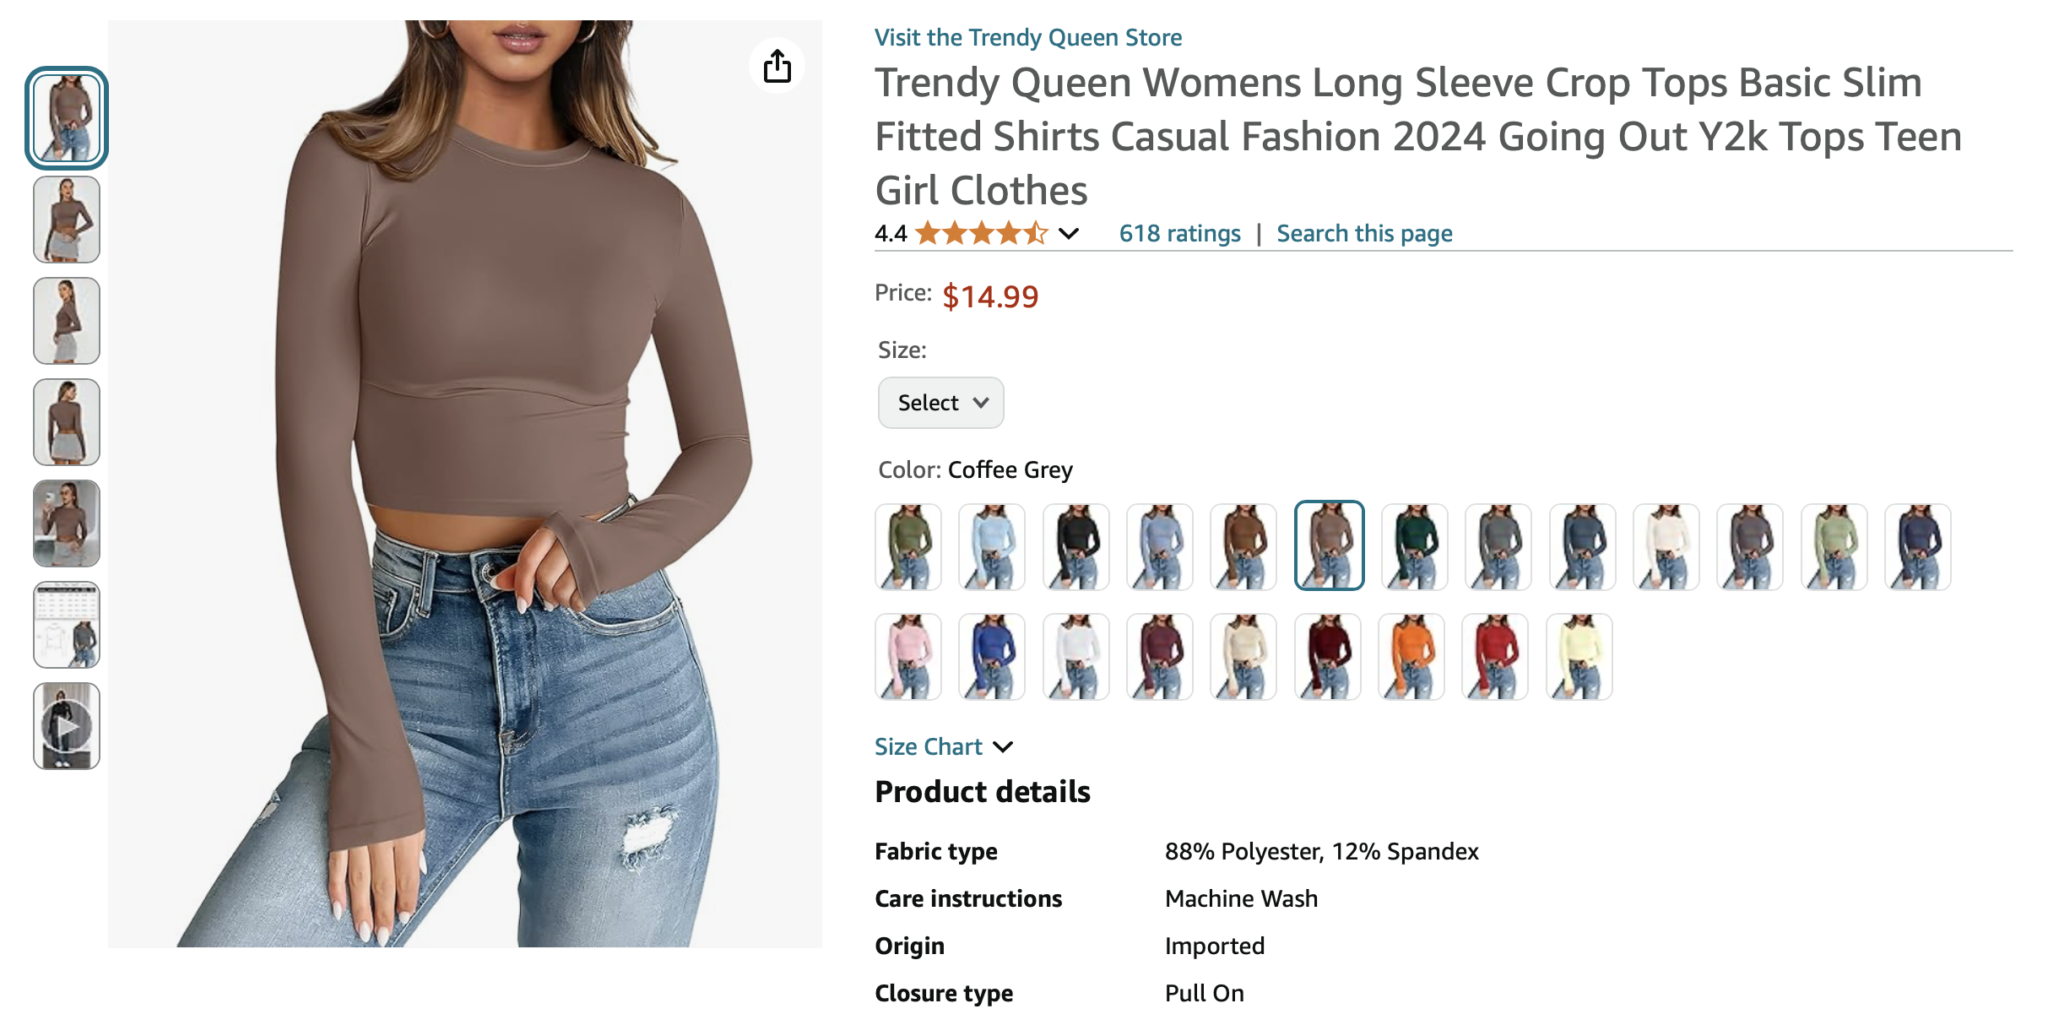
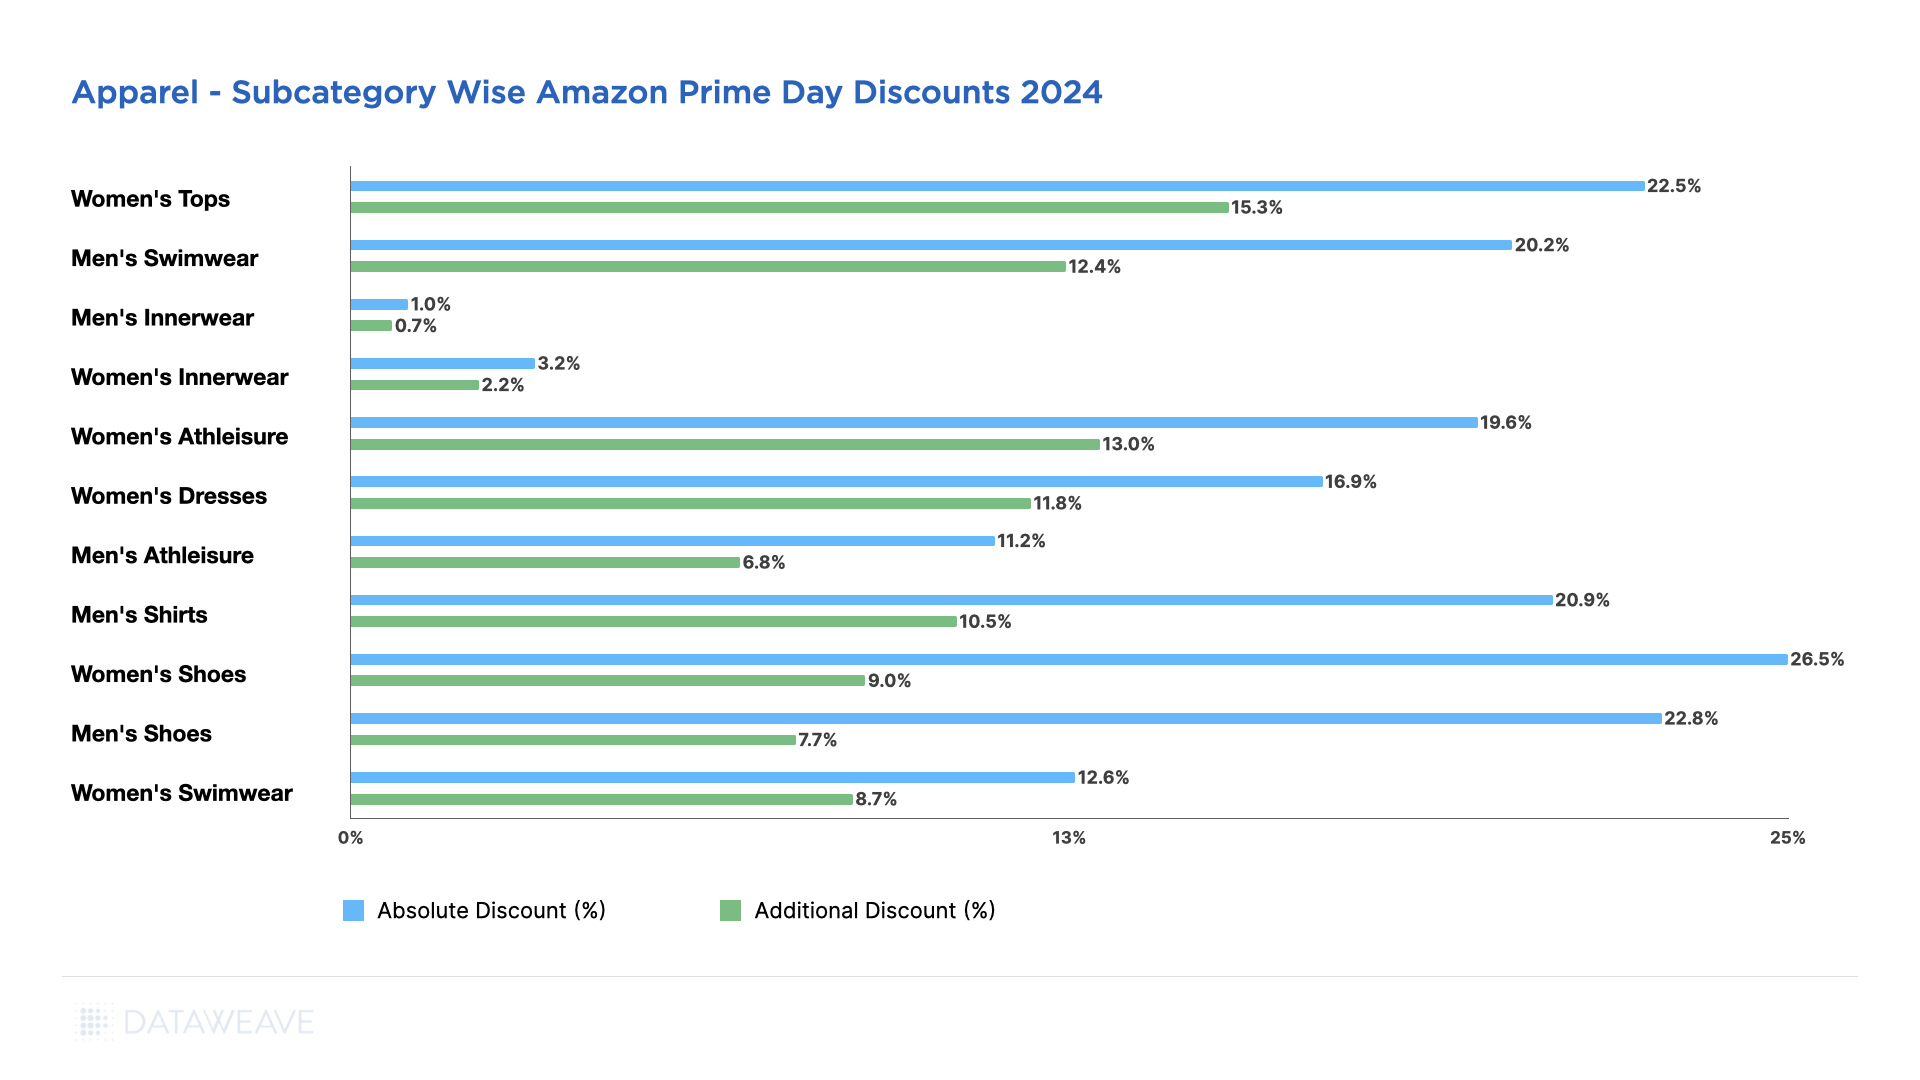
Apparel showed strong discounting activity throughout the BFCM period. Pre-Black Friday discounts averaged 13.8%, with Black Friday Week adding 3.8%, the highest additional discount among all five categories. Men’s Clothing and Women’s Clothing led pre-sale discounts at 17.7% and 17.5% respectively, reflecting aggressive early promotions on core apparel. Interestingly, Plus Size Clothing saw the highest Black Friday Week discount at 5.4%, suggesting retailers pushed harder during the main event to drive conversions in this segment. Kids’ Clothing also saw strong Black Friday Week discounts at 4.4%.
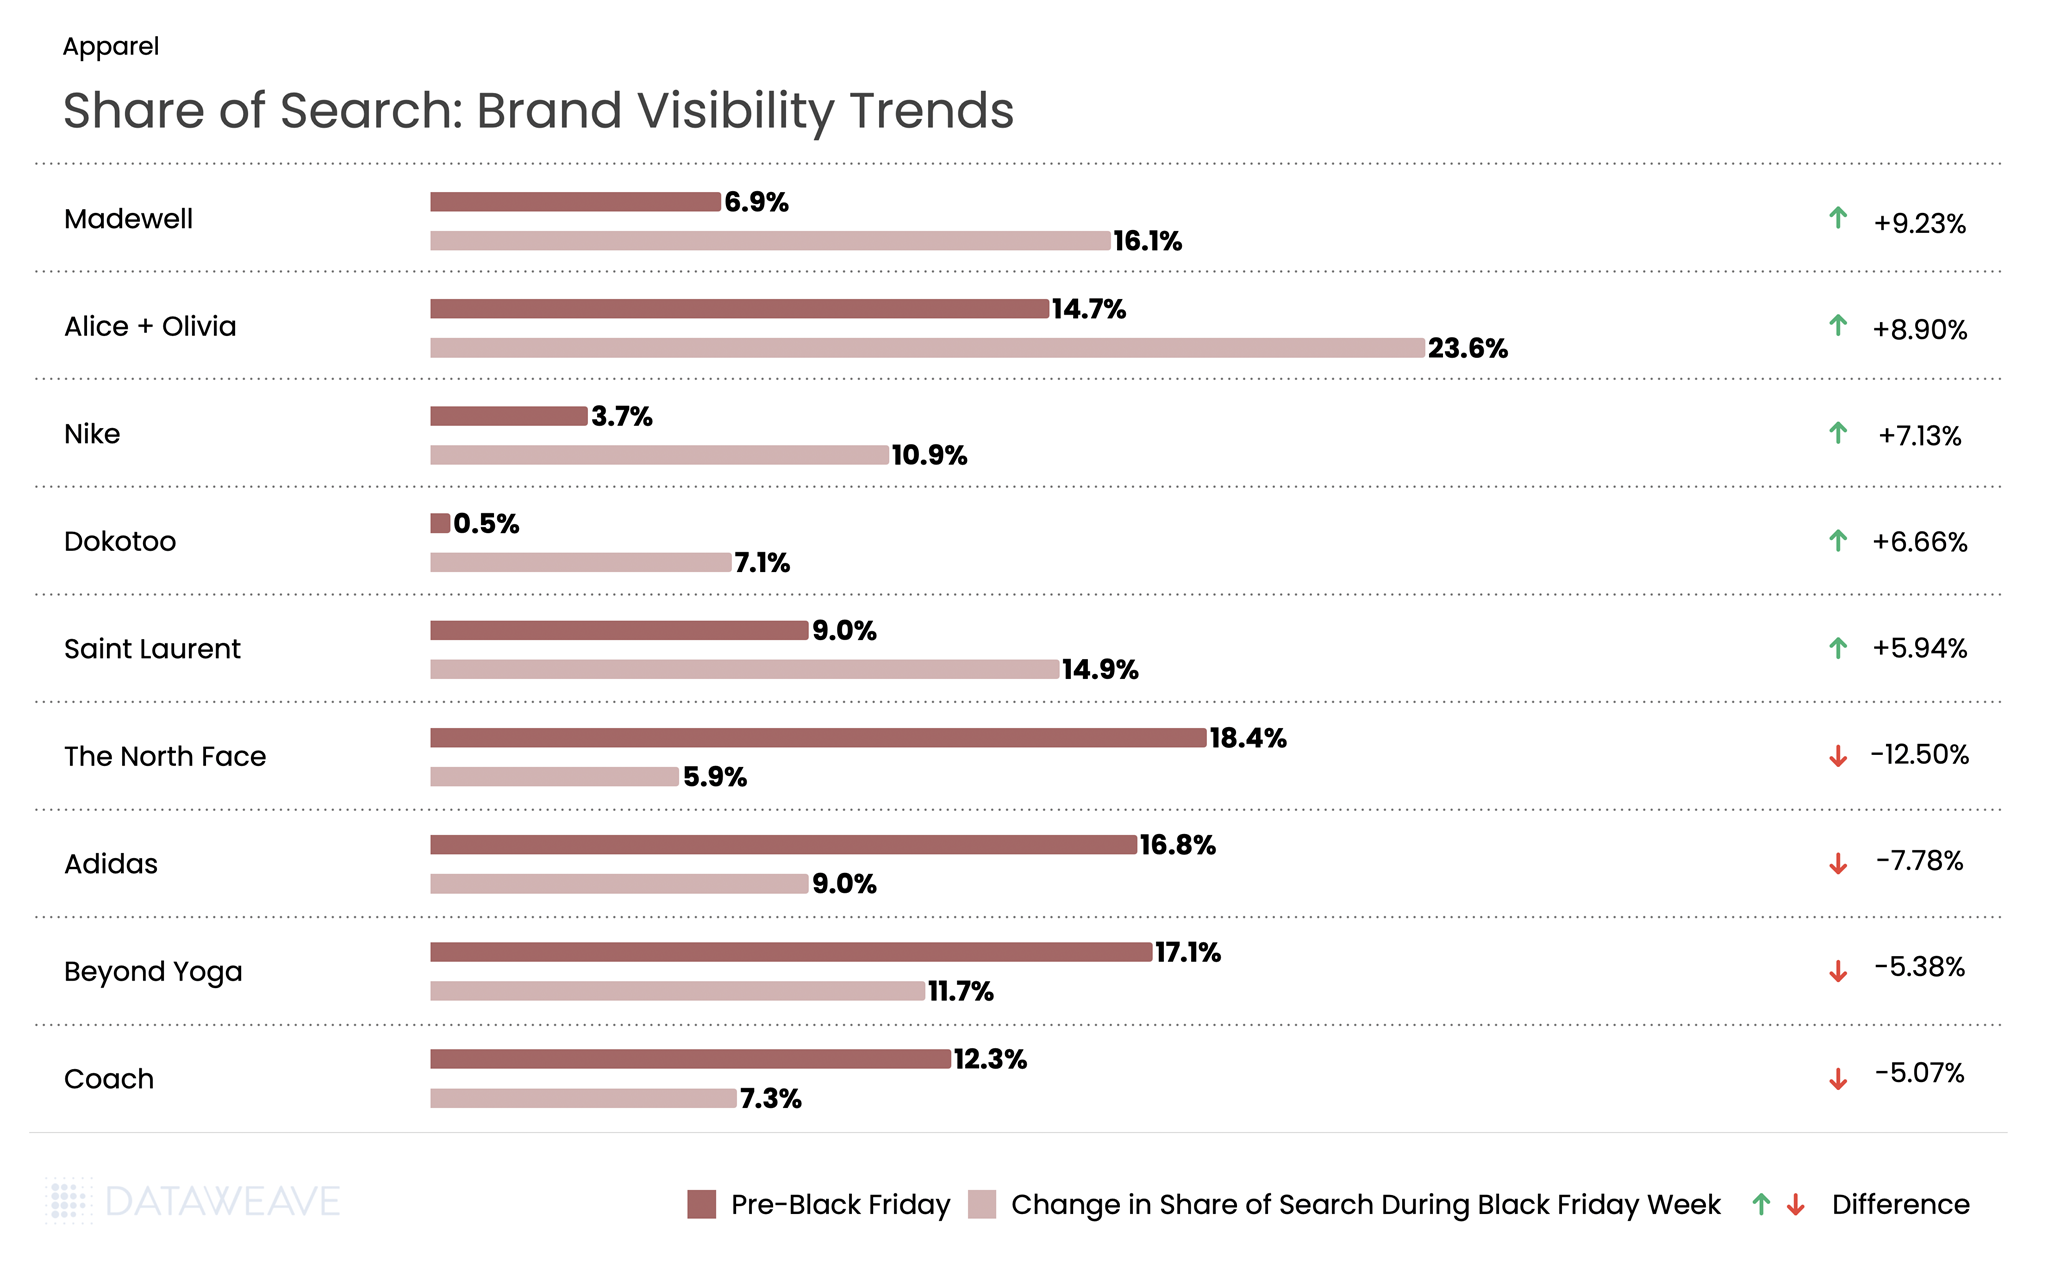
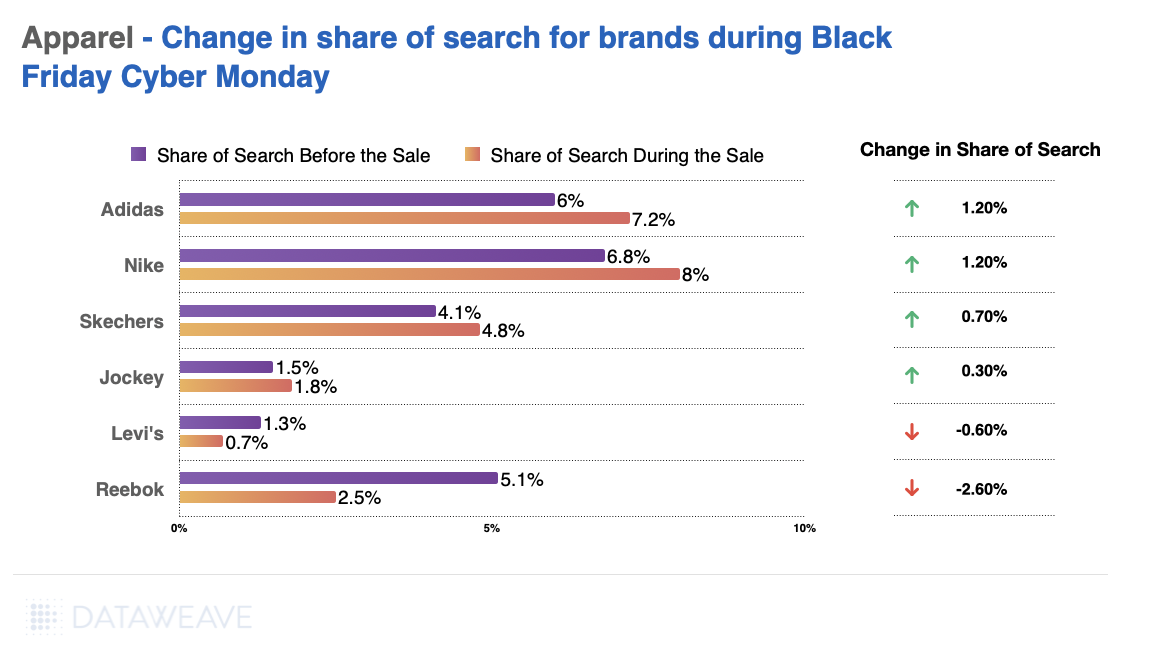
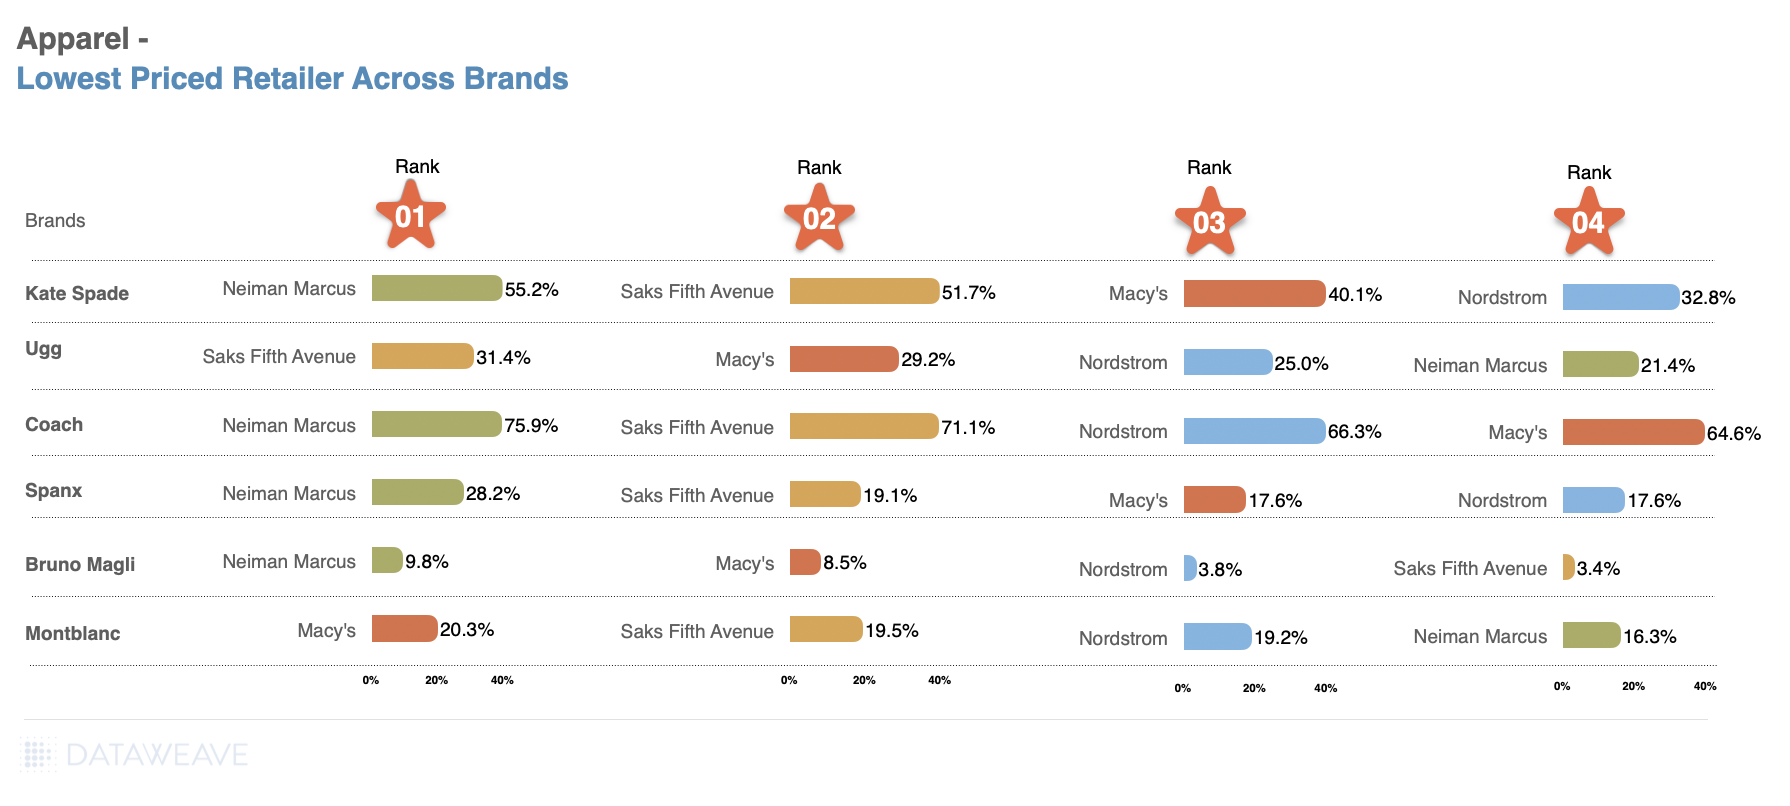
Share of Search: Brand Visibility Trends
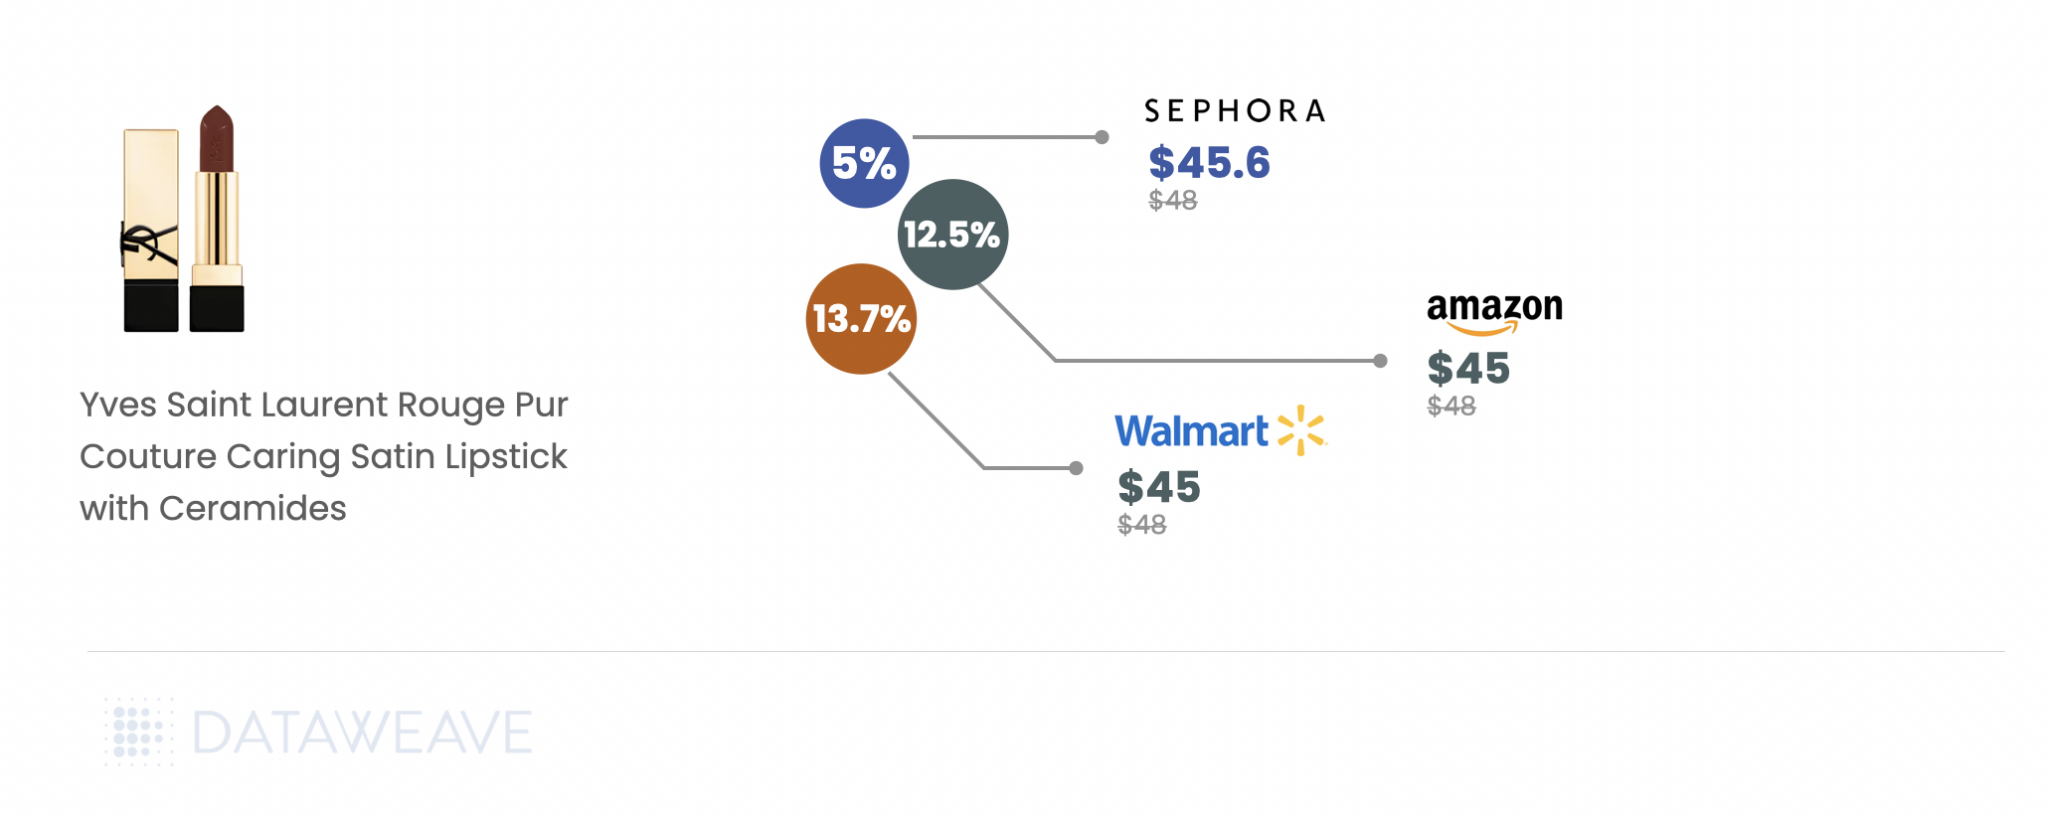
Apparel saw dramatic Share of Search movements during Black Friday Week. Fashion-forward brands dominated the gains: Madewell surged from 6.9% to 16.1% (+9.2%), while Alice + Olivia jumped from 14.7% to 23.6% (+8.9%). Nike also performed strongly with a 7.1% gain. Conversely, outdoor and athletic brands faced steep declines: The North Face dropped from 18.4% to 5.9%, a massive 12.5% decline, the largest in our entire analysis. Adidas fell 7.7%, Beyond Yoga declined 5.3%, and luxury brand Coach by 5%.
Key Takeaway: The data suggests fashion-forward and lifestyle brands (Madewell, Alice + Olivia, Saint Laurent) gained visibility at the expense of outdoor/athletic brands (The North Face, Adidas, Beyond Yoga). This could indicate that fashion brands invested more heavily in promotional visibility during the sale period.
Want to understand how DataWeave’s pricing intelligence platform can help your business make data-driven decisions during peak sales events? Contact us to learn more about competitive insights, price intelligence, assortment analytics, content analytics, and digital shelf analytics.
Follow our blog for more insights on retail pricing trends, brand visibility analysis, and data-driven commerce intelligence.
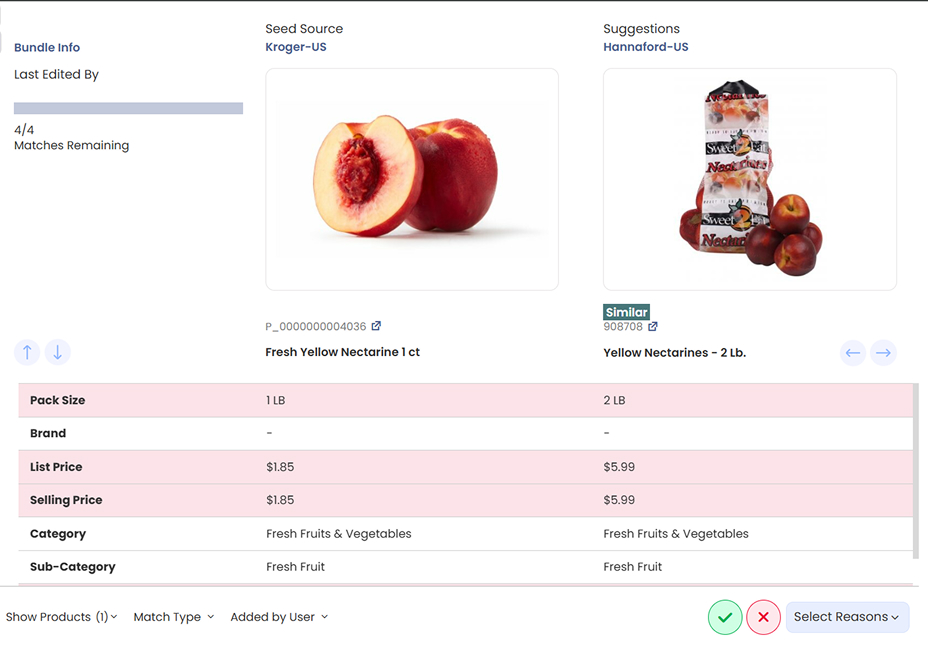
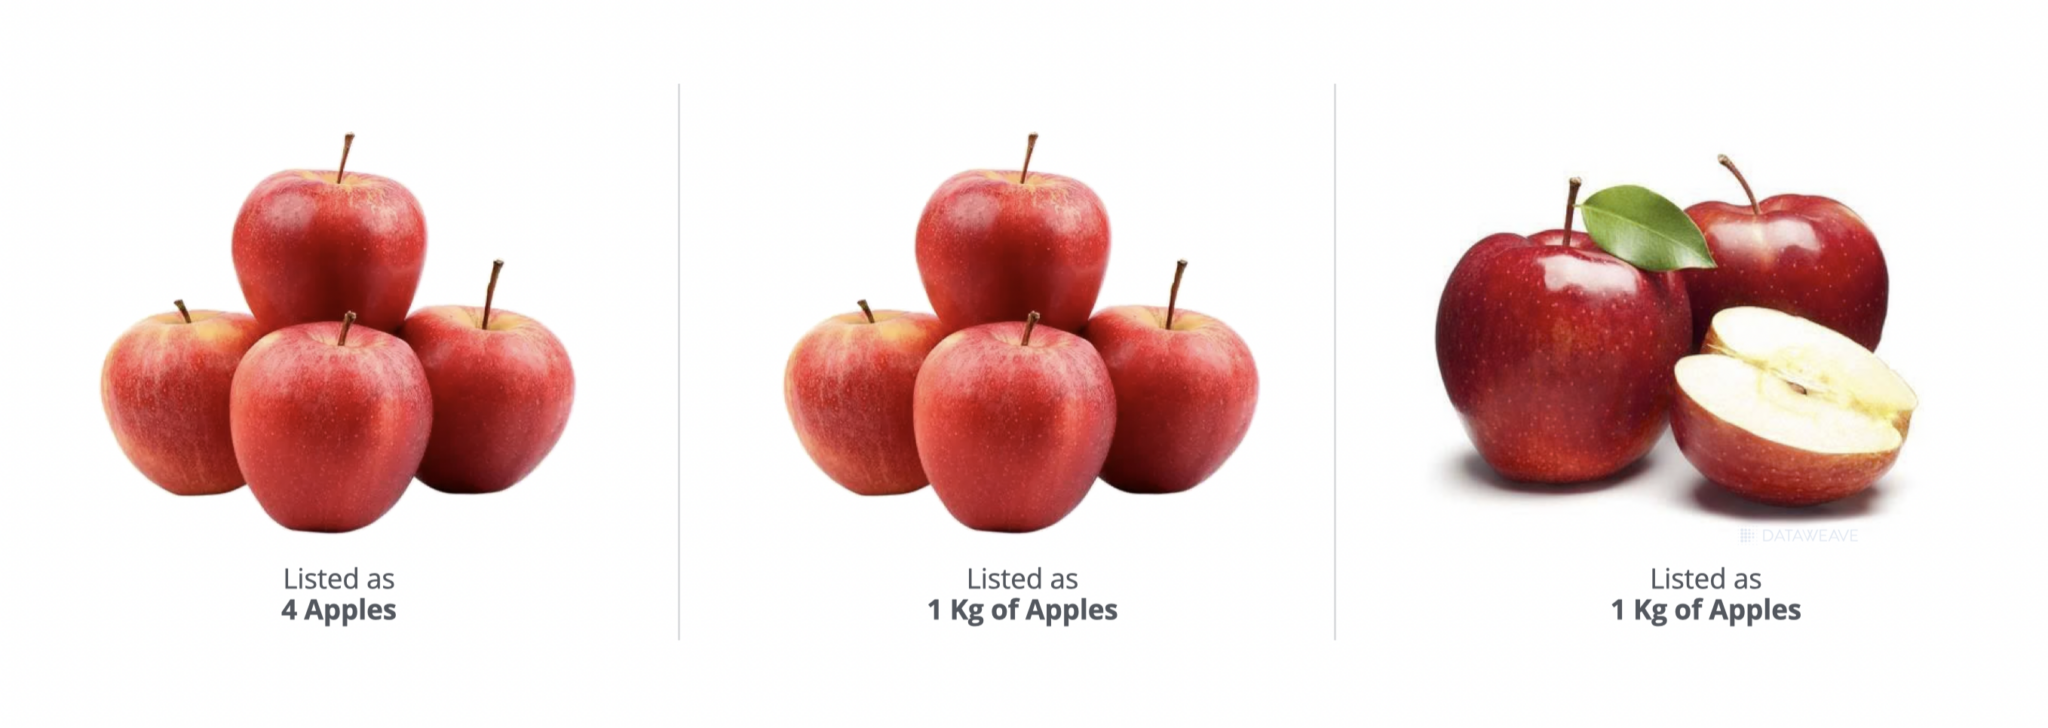
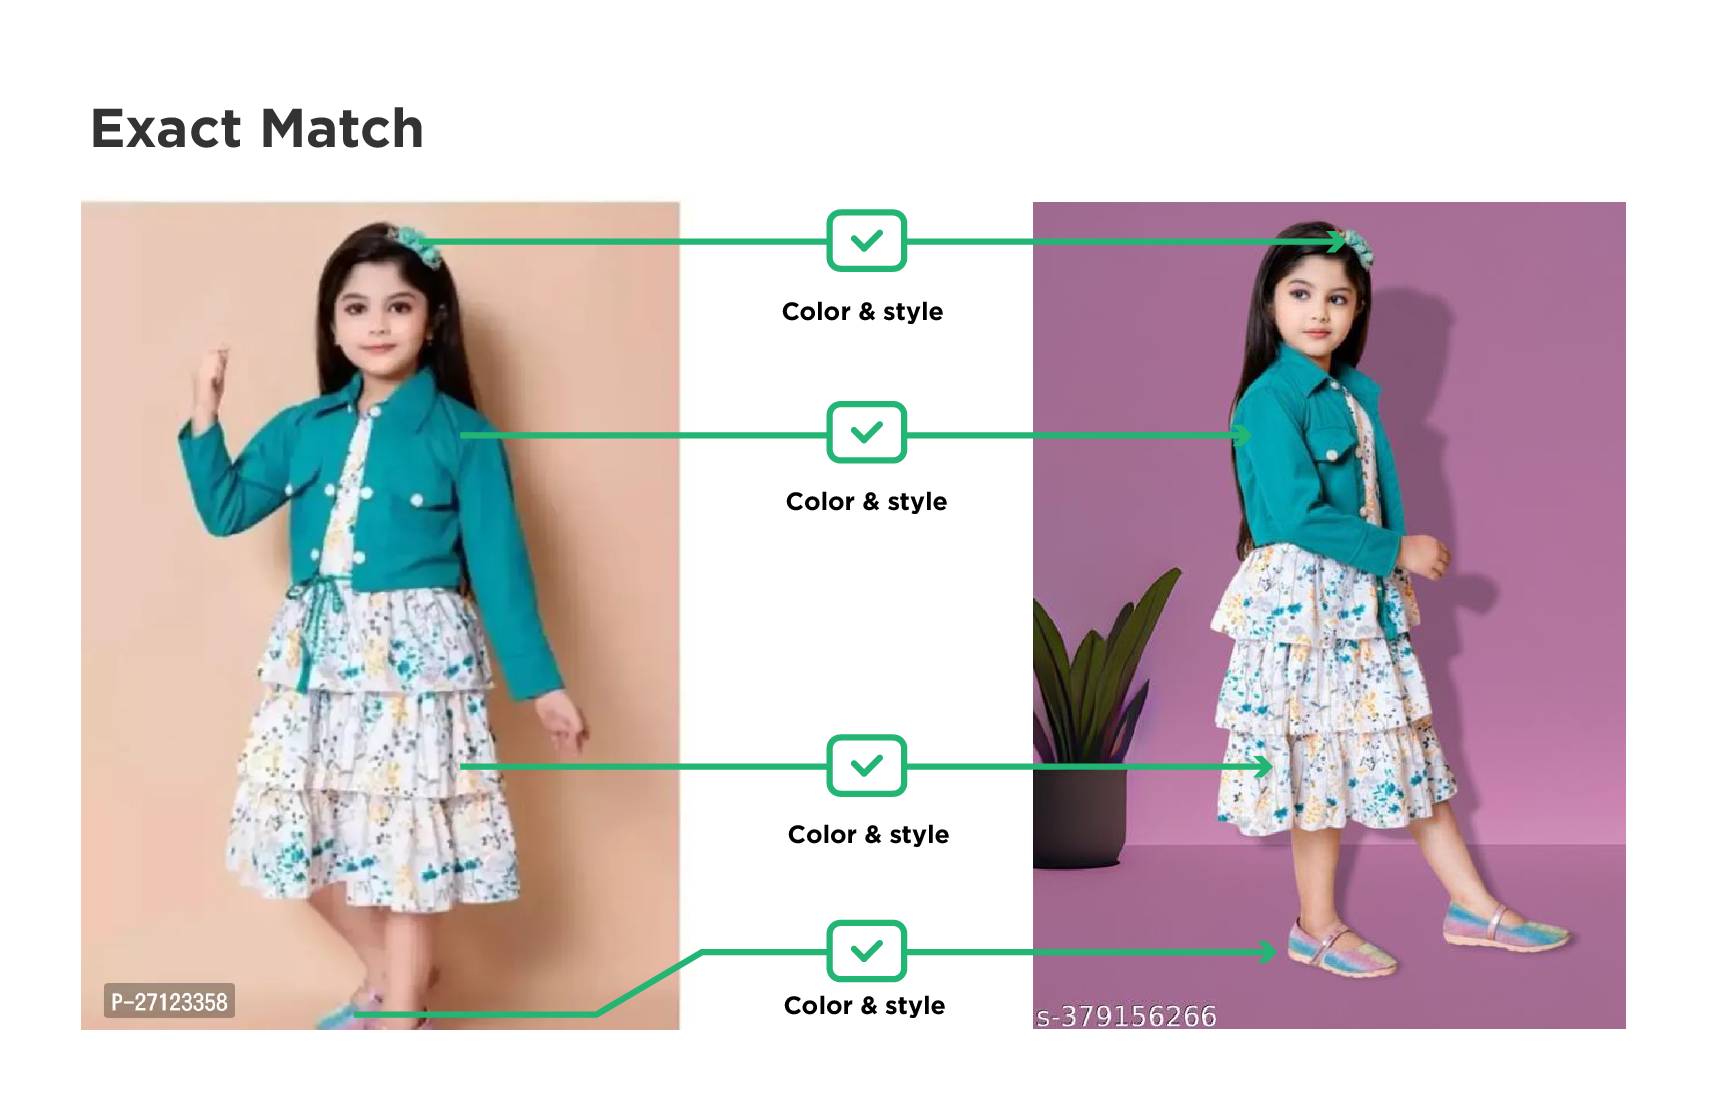
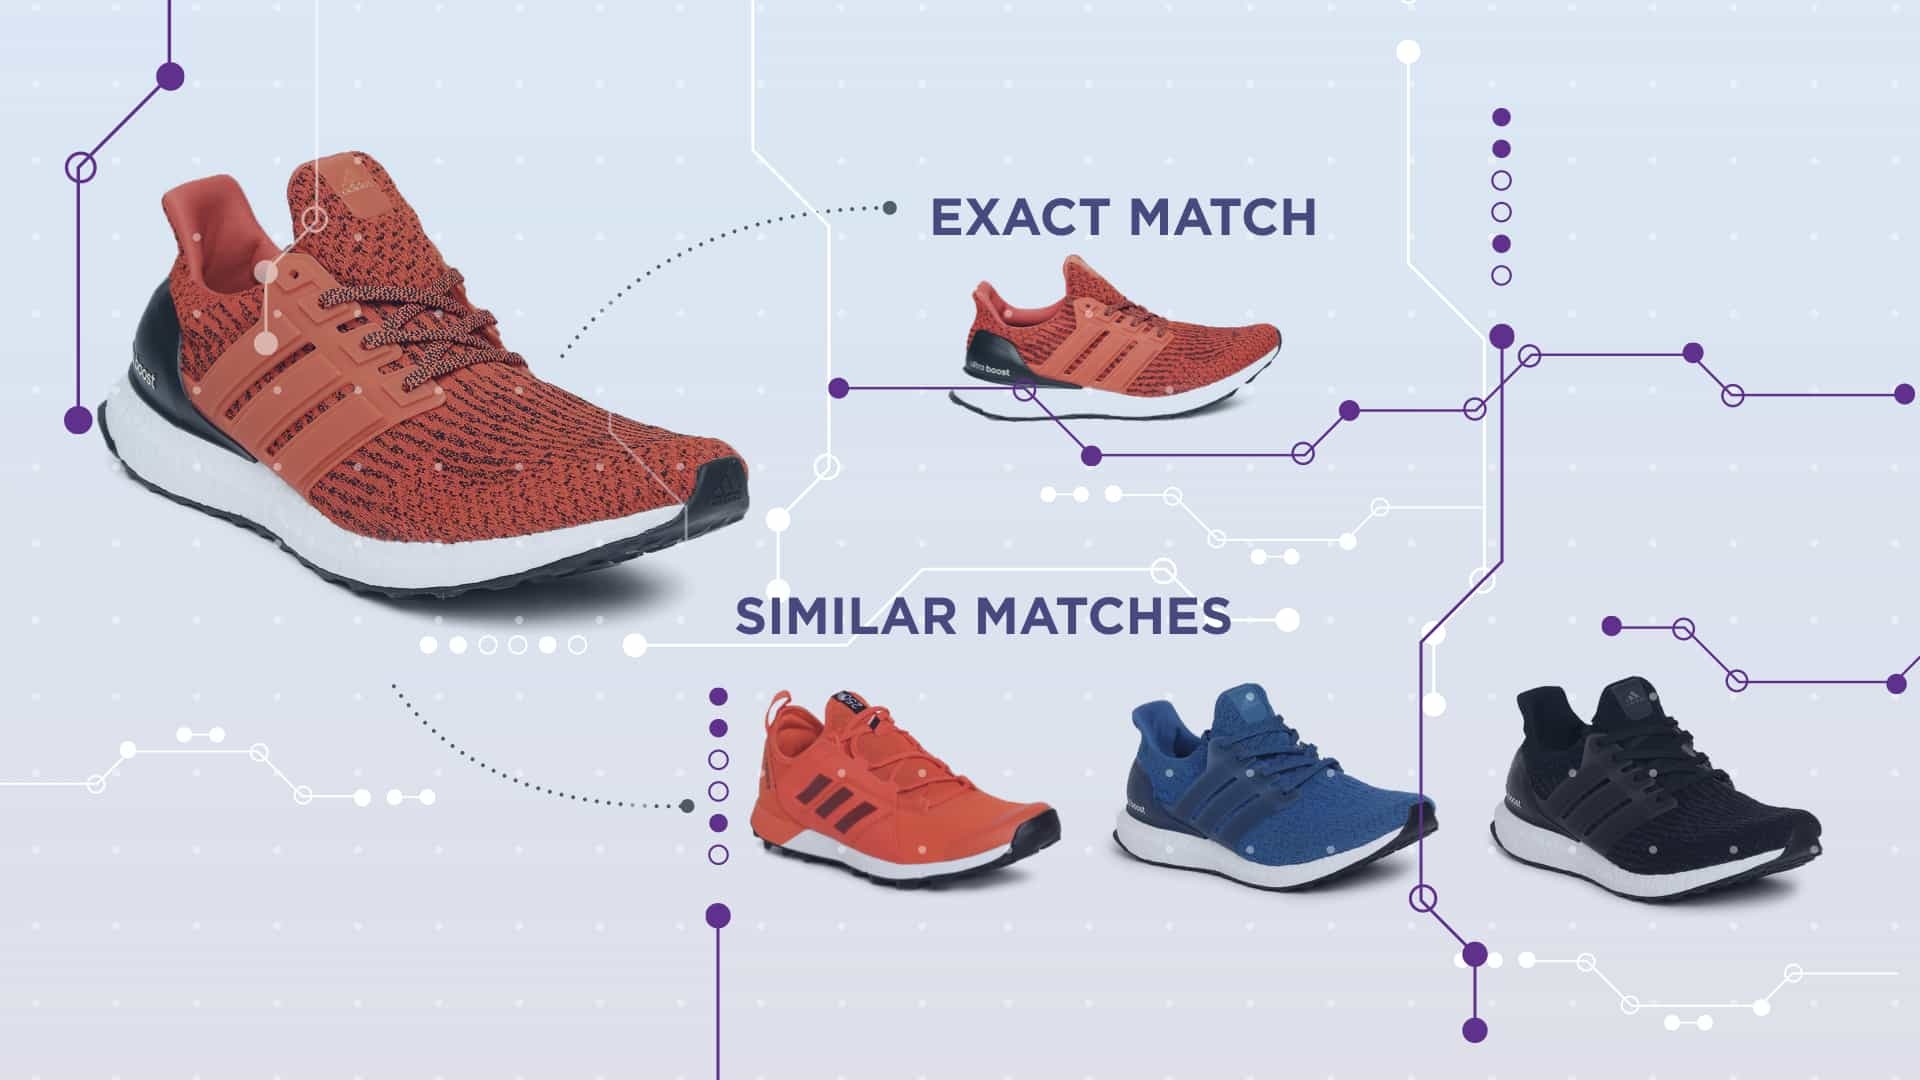
AI-powered product matching is the backbone of competitive pricing intelligence. Accurate matches help you compare prices correctly, identify meaningful assortment gaps, and optimize product content. Inaccurate matches distort every one of these insights. In some categories, a single mismatch can cause millions of dollars of lost revenue.
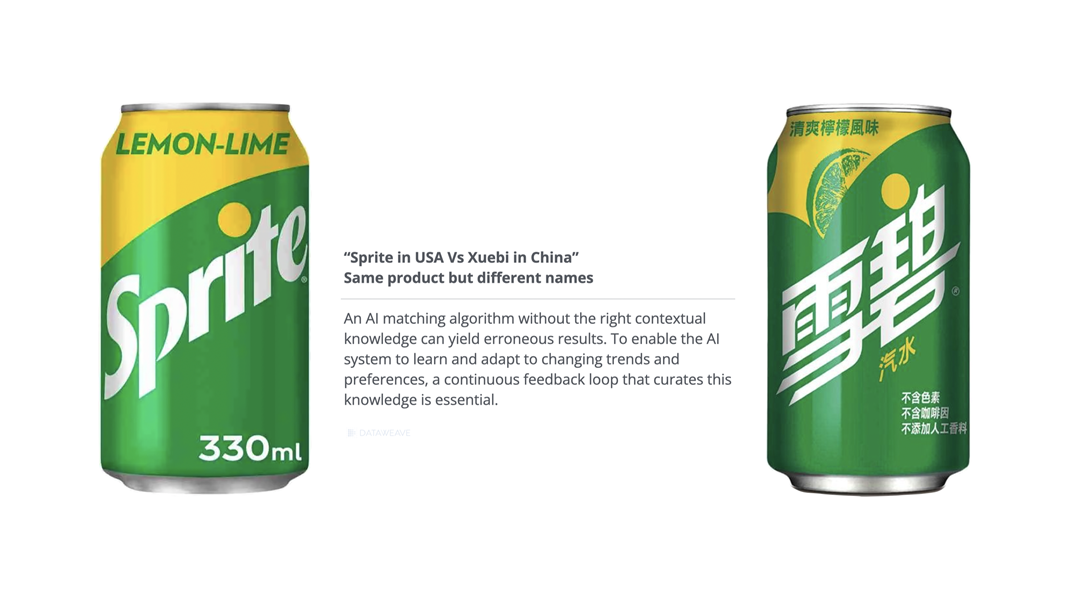
Retailers and brands know this problem well. Product catalogs are vast. Competitor assortments shift daily. Titles are inconsistent. Product codes are missing. Images vary by region or packaging. Basically, context matters, and AI alone often misses that context.
This is why a human-in-the-loop approach is essential. It allows product matches to be verified consistently, at scale, and with the context that only people can provide. Many retailers have also told us they want to take this a step further. They want the ability to control and define their own product matches.
Sometimes that is because they need to fix inevitable errors quickly. Other times, it is because their teams have deeper category knowledge and can make the right judgment calls when AI falls short.
To make that possible,DataWeave introduced User-Led Match Management. It combines the scale of AI with the judgment of experts within retail organizations. The platform does not just suggest matches. It gives your teams the tools to approve, reject, or refine them. This ensures your competitive intelligence reflects both machine precision and your unique business logic.
Why AI Matching Alone Falls Short
AI has changed the speed and scale of product matching. Algorithms can process millions of SKUs quickly. They can detect similarities in text, images, and metadata. But in retail, the stakes are too high to rely on AI alone.
Here is where AI sometimes falls short:
Category complexity: Matching rules that work in electronics may fail in fashion or grocery. An electronics SKU may depend on a model number. A fashion SKU may depend on seasonality. A grocery SKU may depend on pack size or whether it is a private label.
Data inconsistency: Titles vary. Images differ across regions. These gaps, when large, trip up algorithms.
Business context: Should a premium product ever be compared against a budget line? Should seasonal products match year-round items? AI may not know these boundaries.
Scale vs. accuracy: Automated systems optimize for coverage. That speed often limits accuracy for a small set of SKUs. Even a 1% error rate across millions of SKUs creates thousands of bad comparisons.
AI is critical for scale. But accuracy requires human input. DataWeave’s human-in-the-loop framework addresses this by allowing expert reviewers to validate and improve AI outputs. Our user-led match management takes this further by putting control directly into the hands of your business teams.
What DataWeave’s User-Led Match Management Delivers
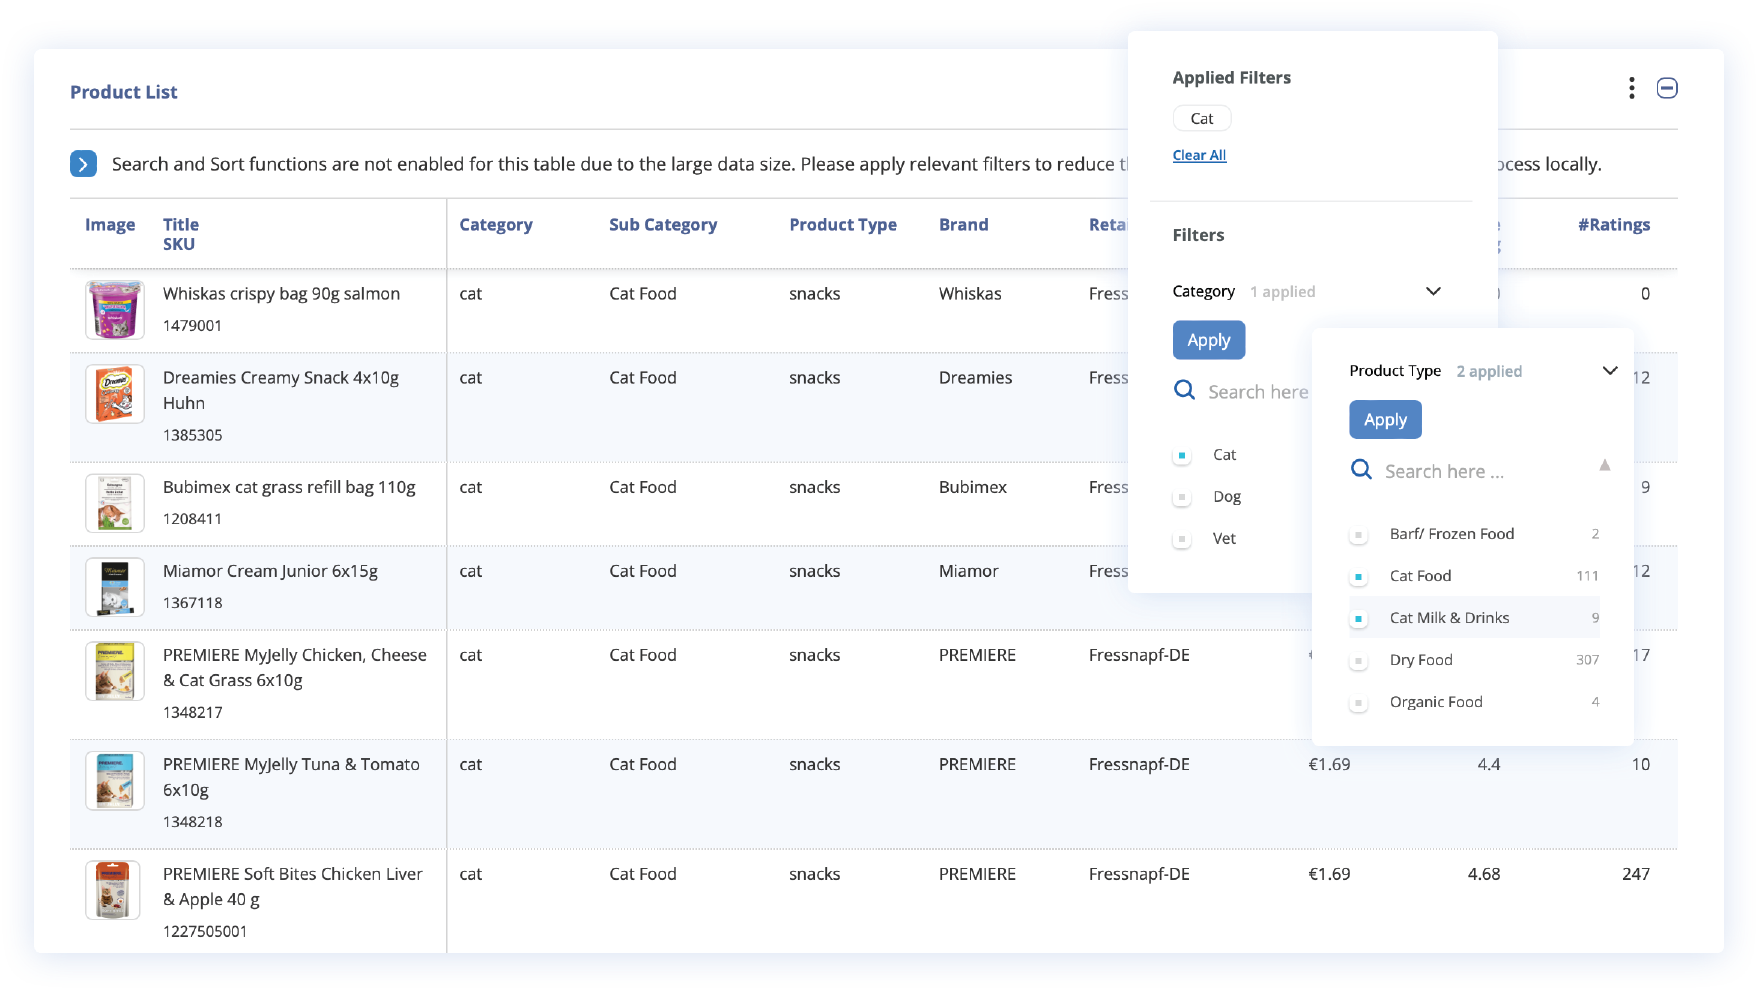
With User-Led Match Management, your team is not a passive reviewer. They become active participants in shaping the accuracy of your competitive intelligence.
Your teams can:
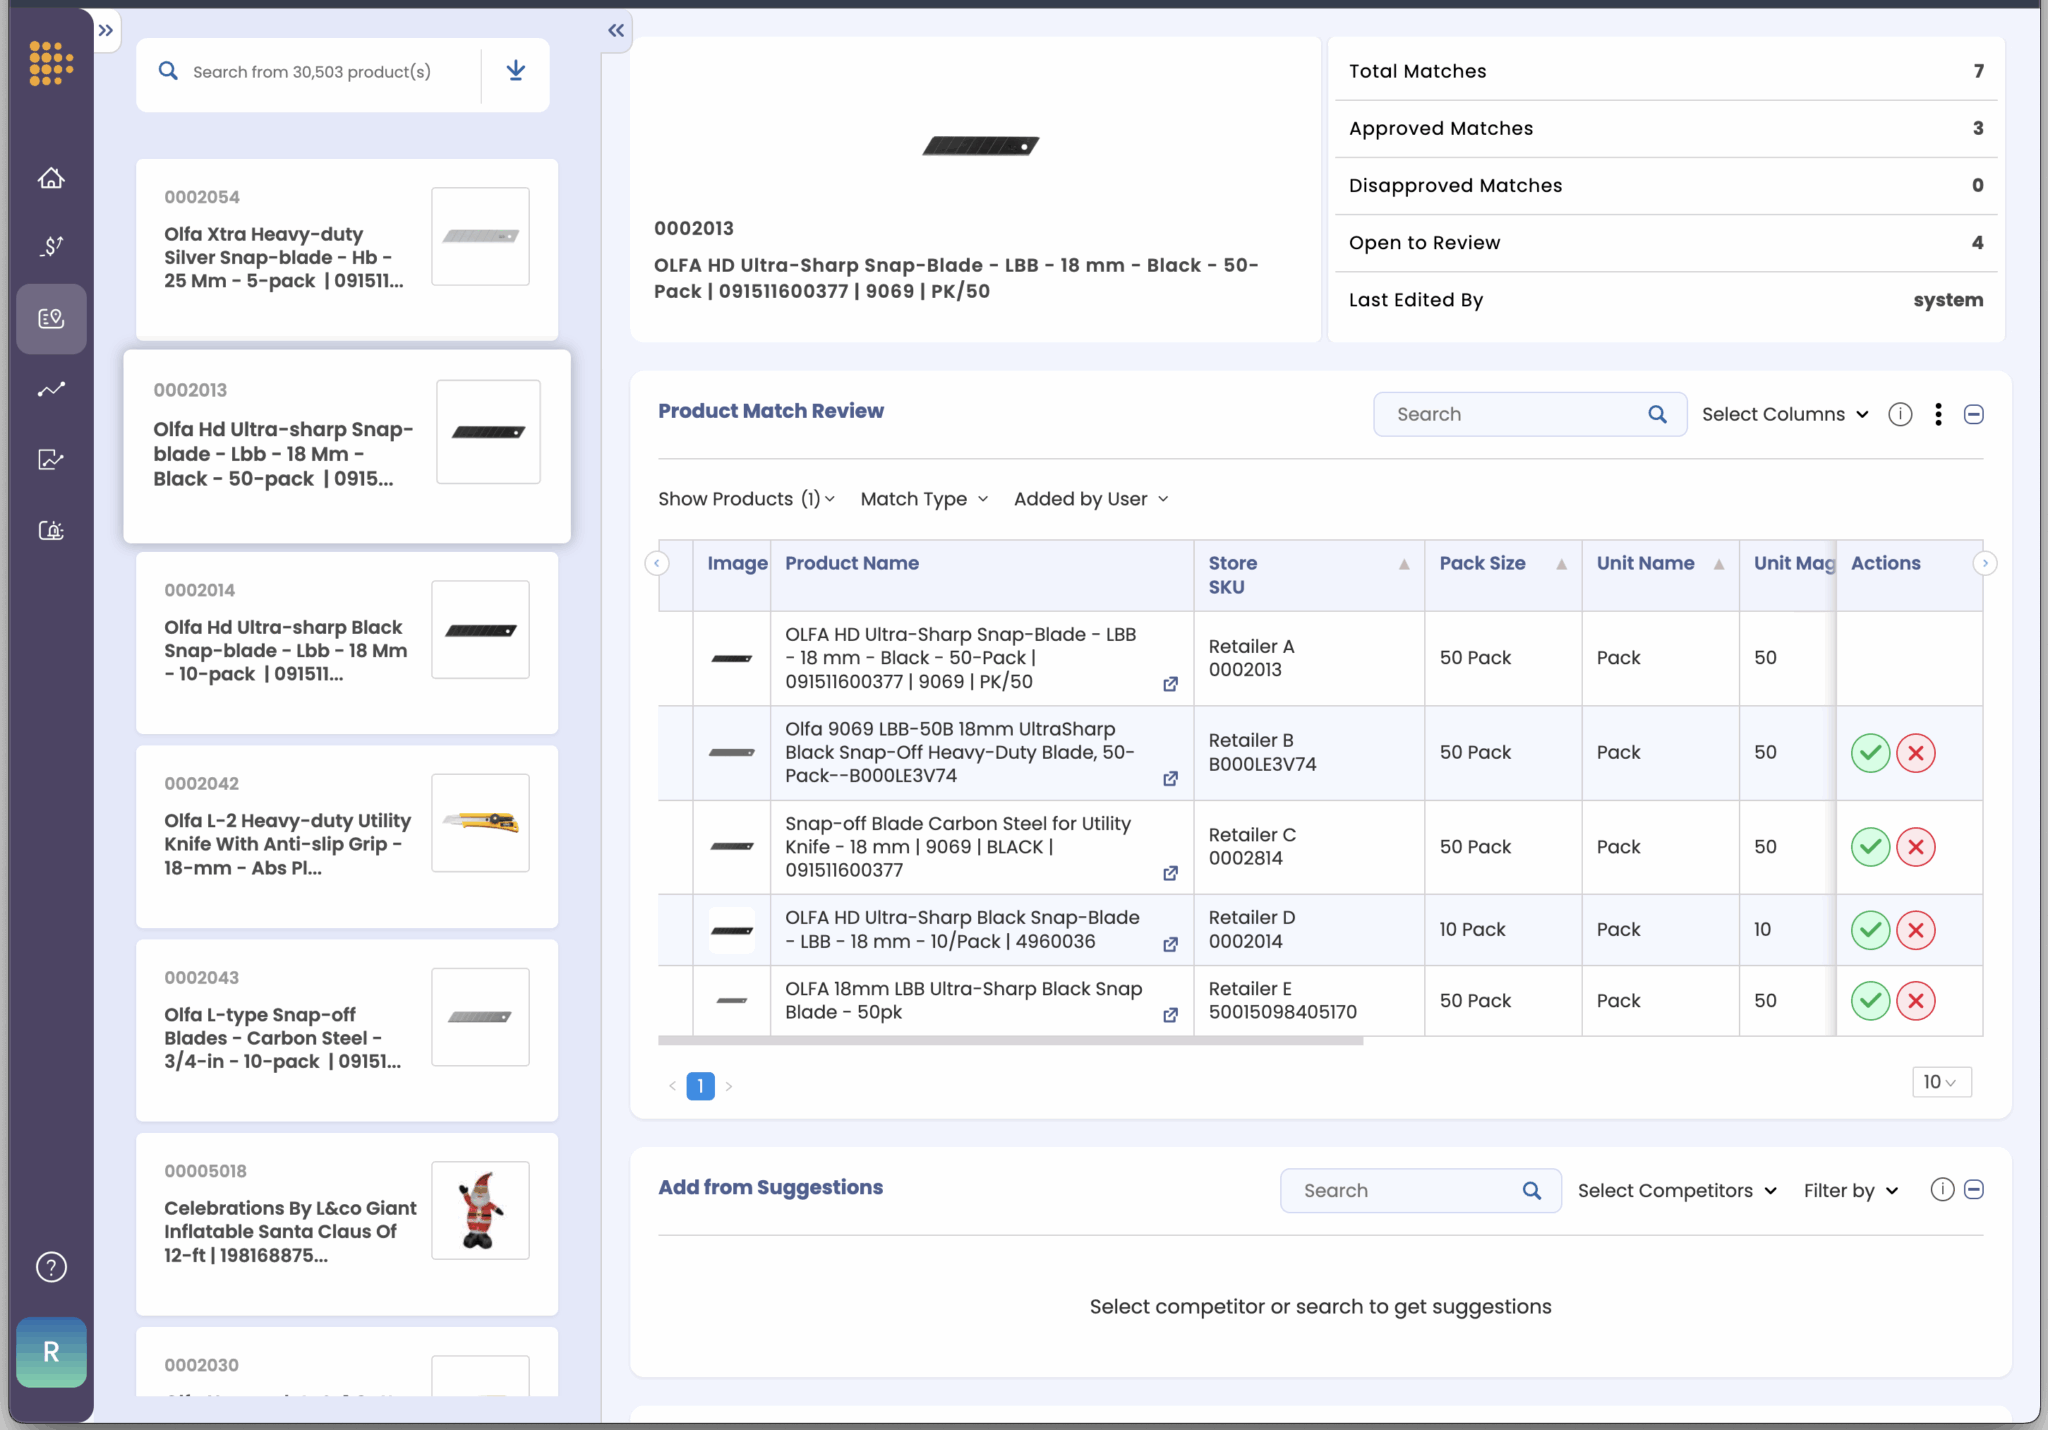
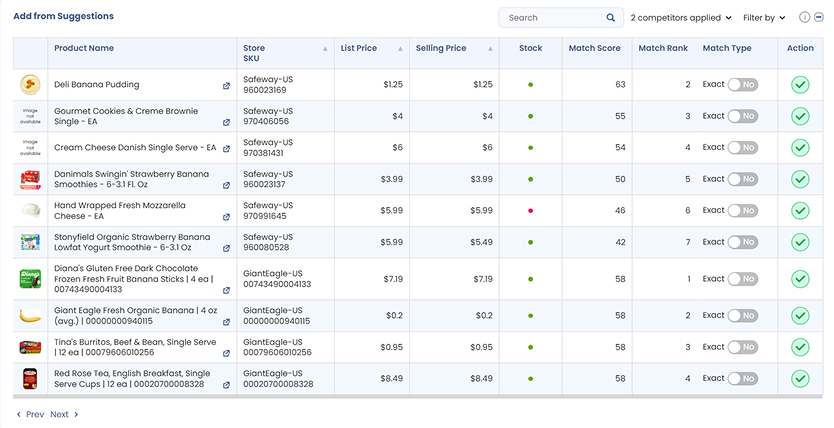
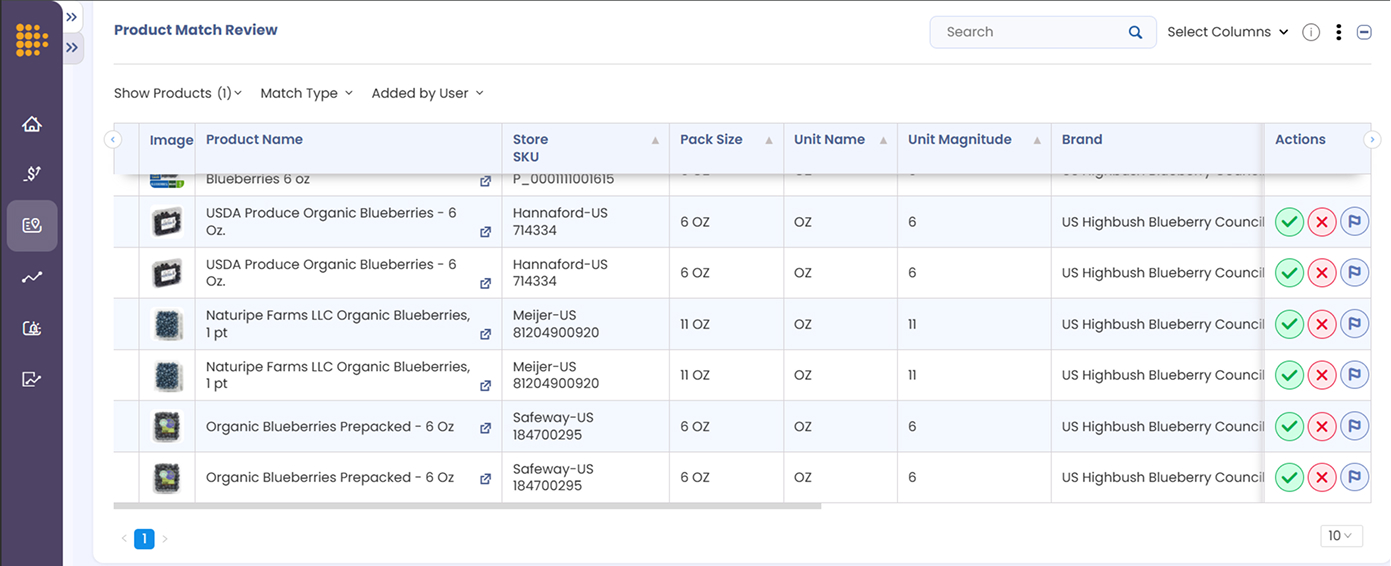
Approve, reject, or flag AI-suggested matches. Every suggestion comes with full visibility into why it was made. Your team can validate matches quickly, fix errors, and improve the dataset in real time.
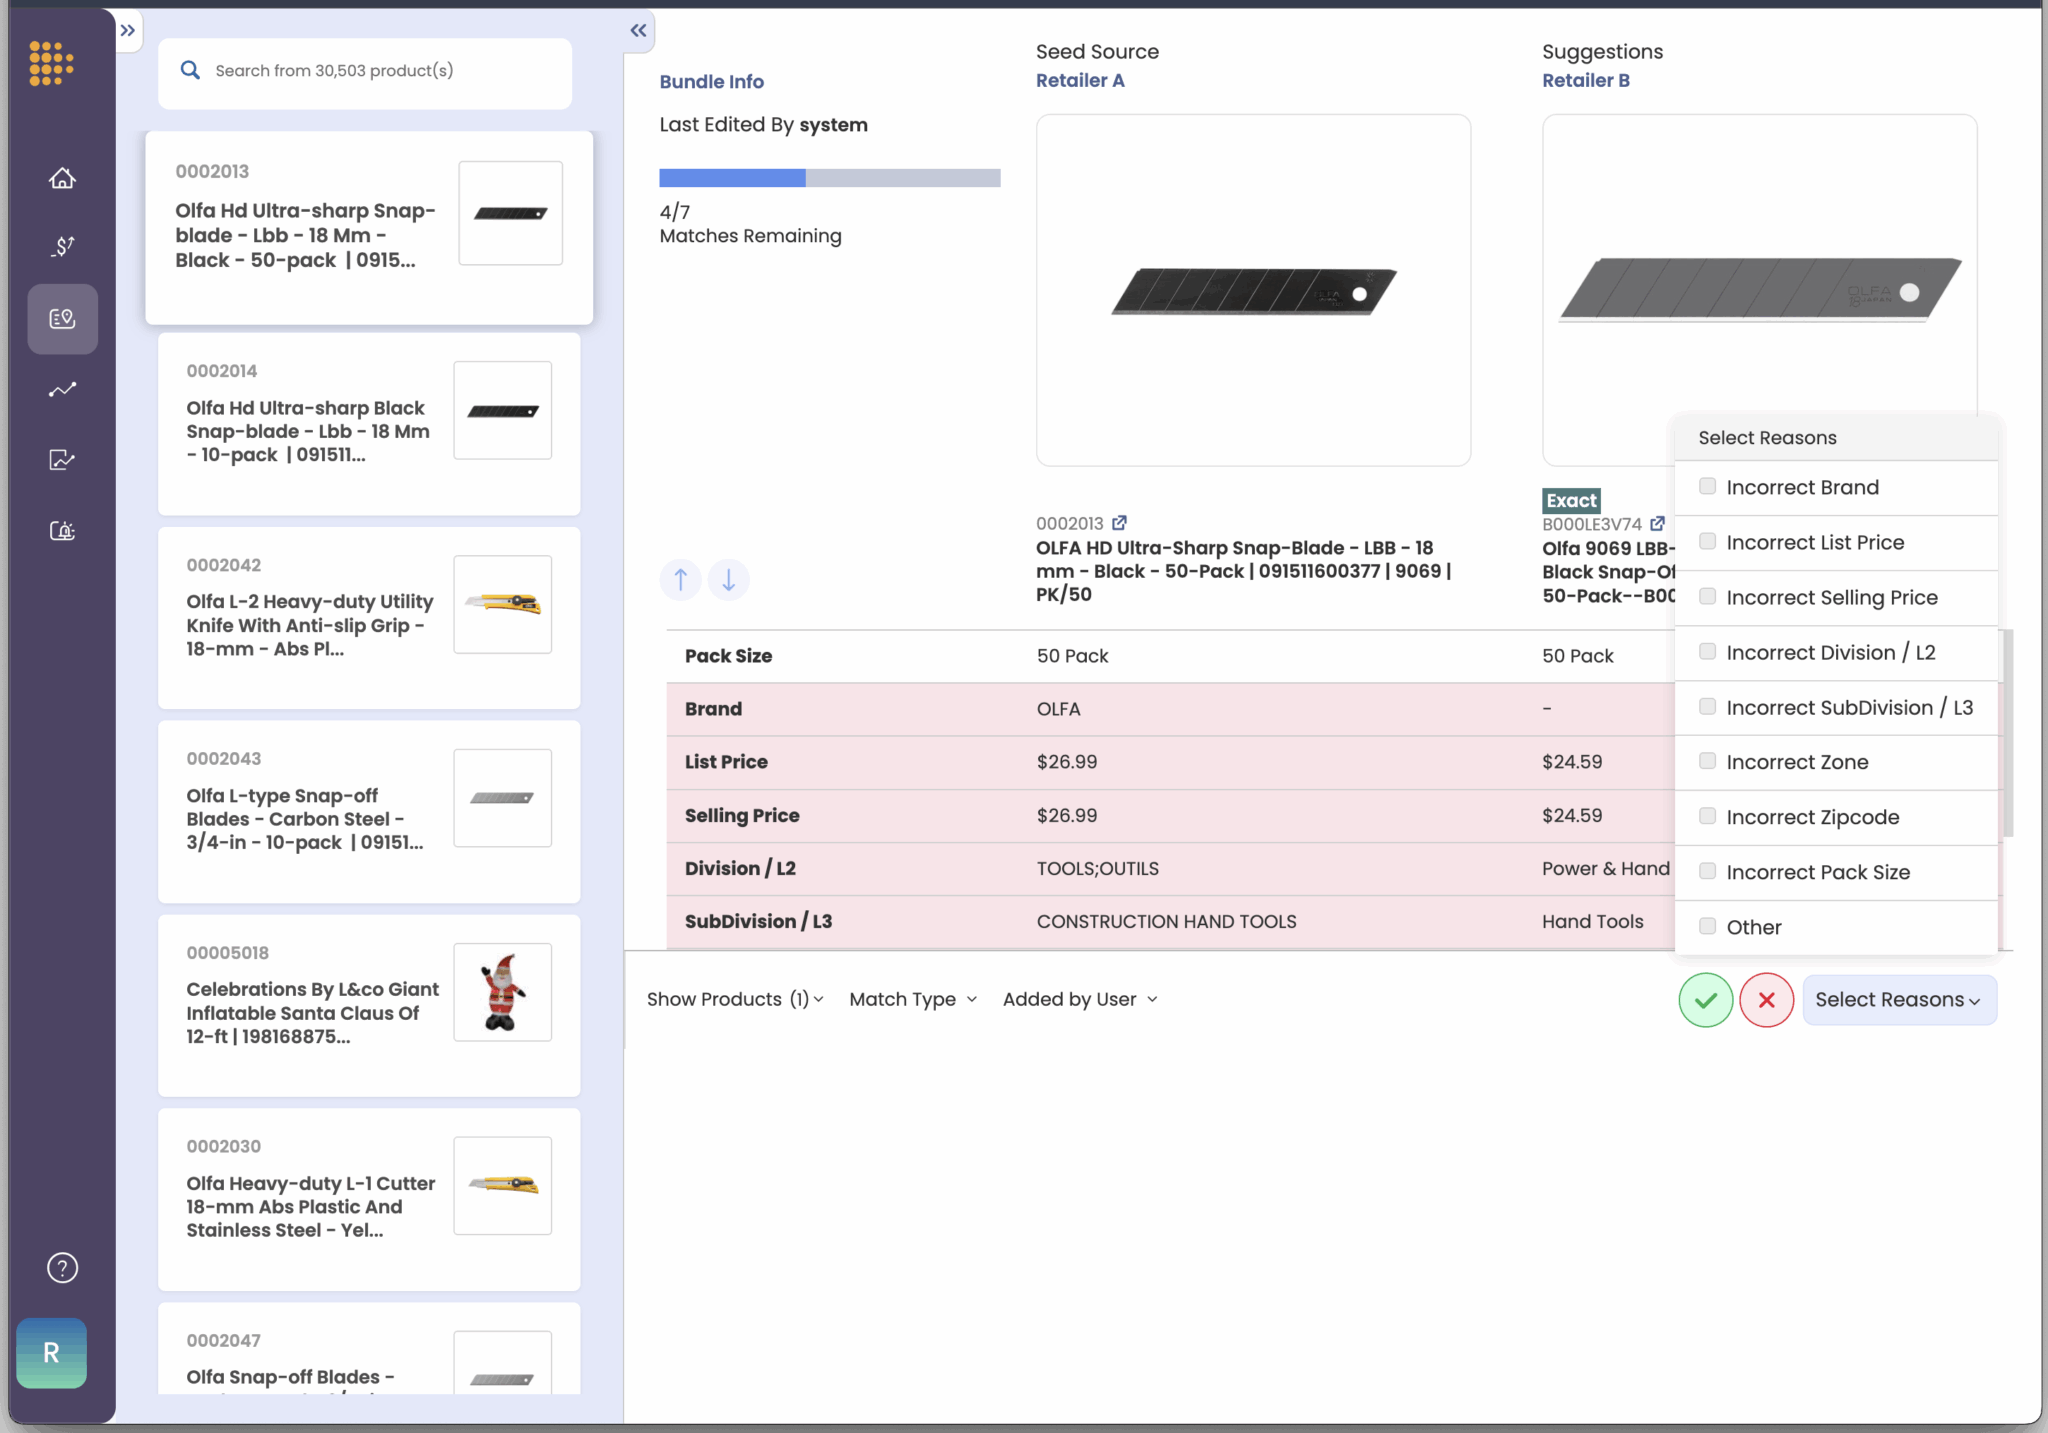
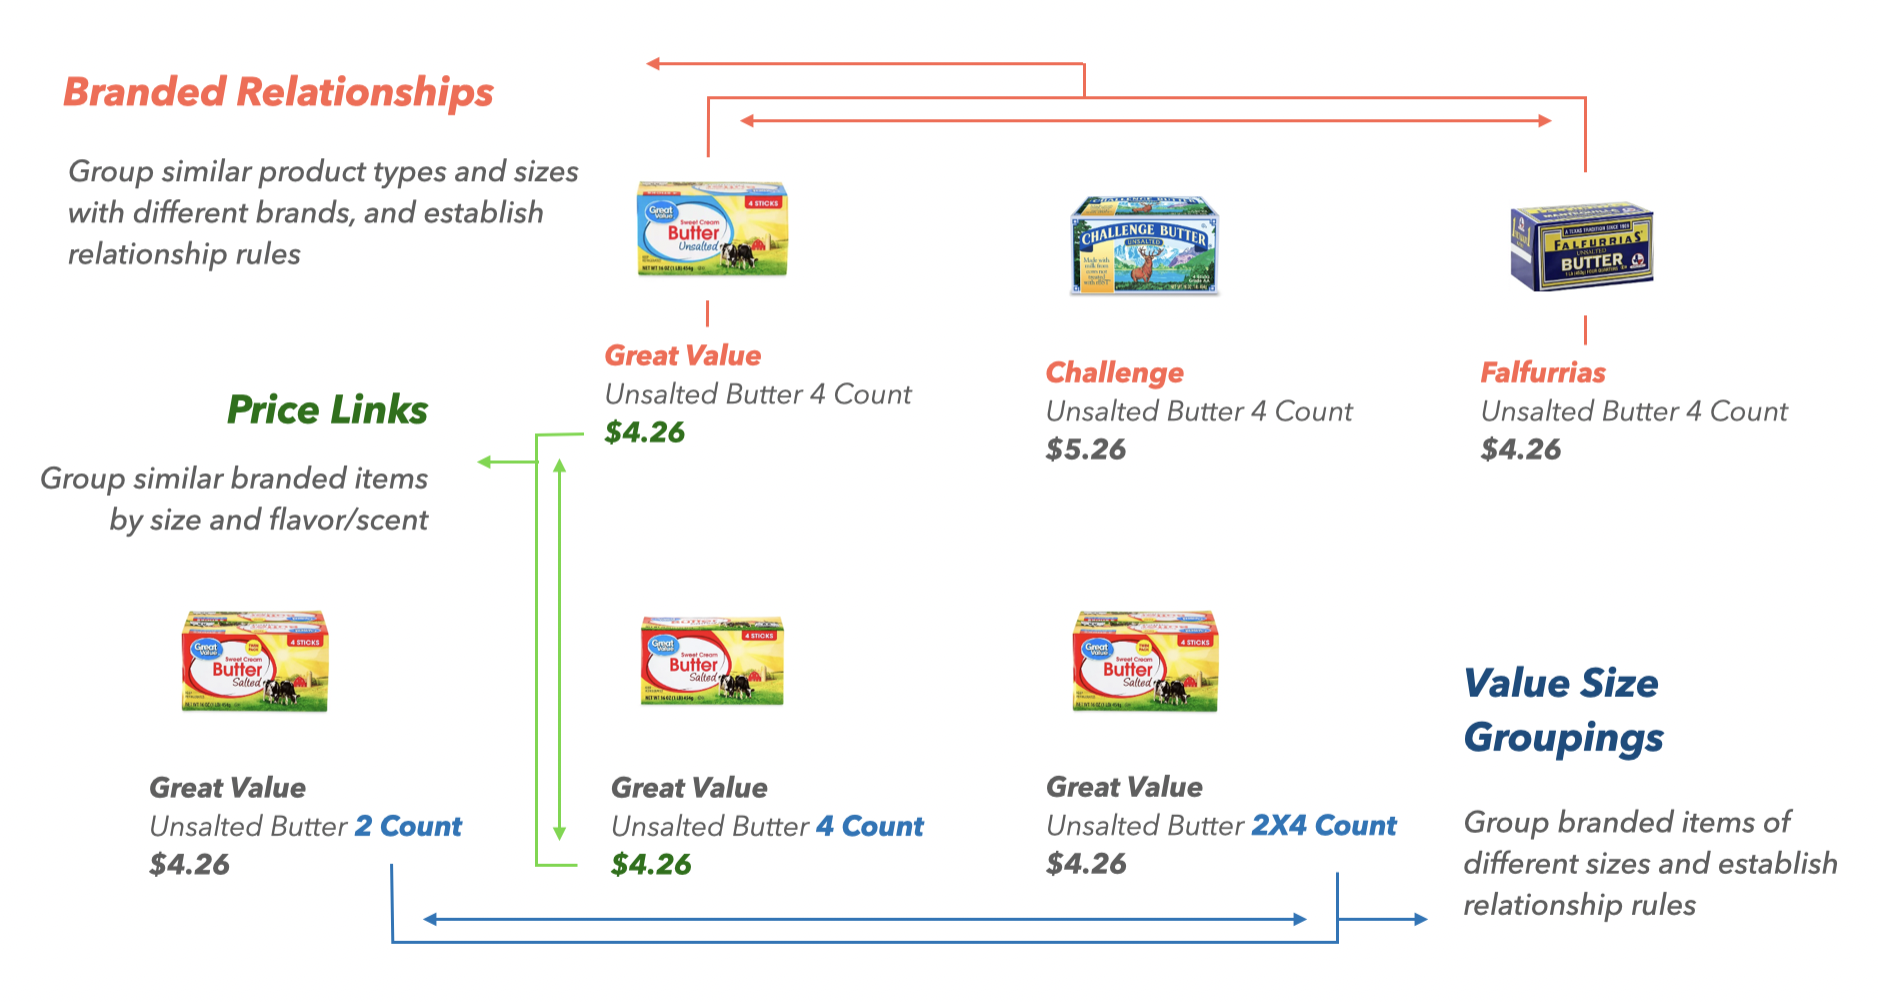
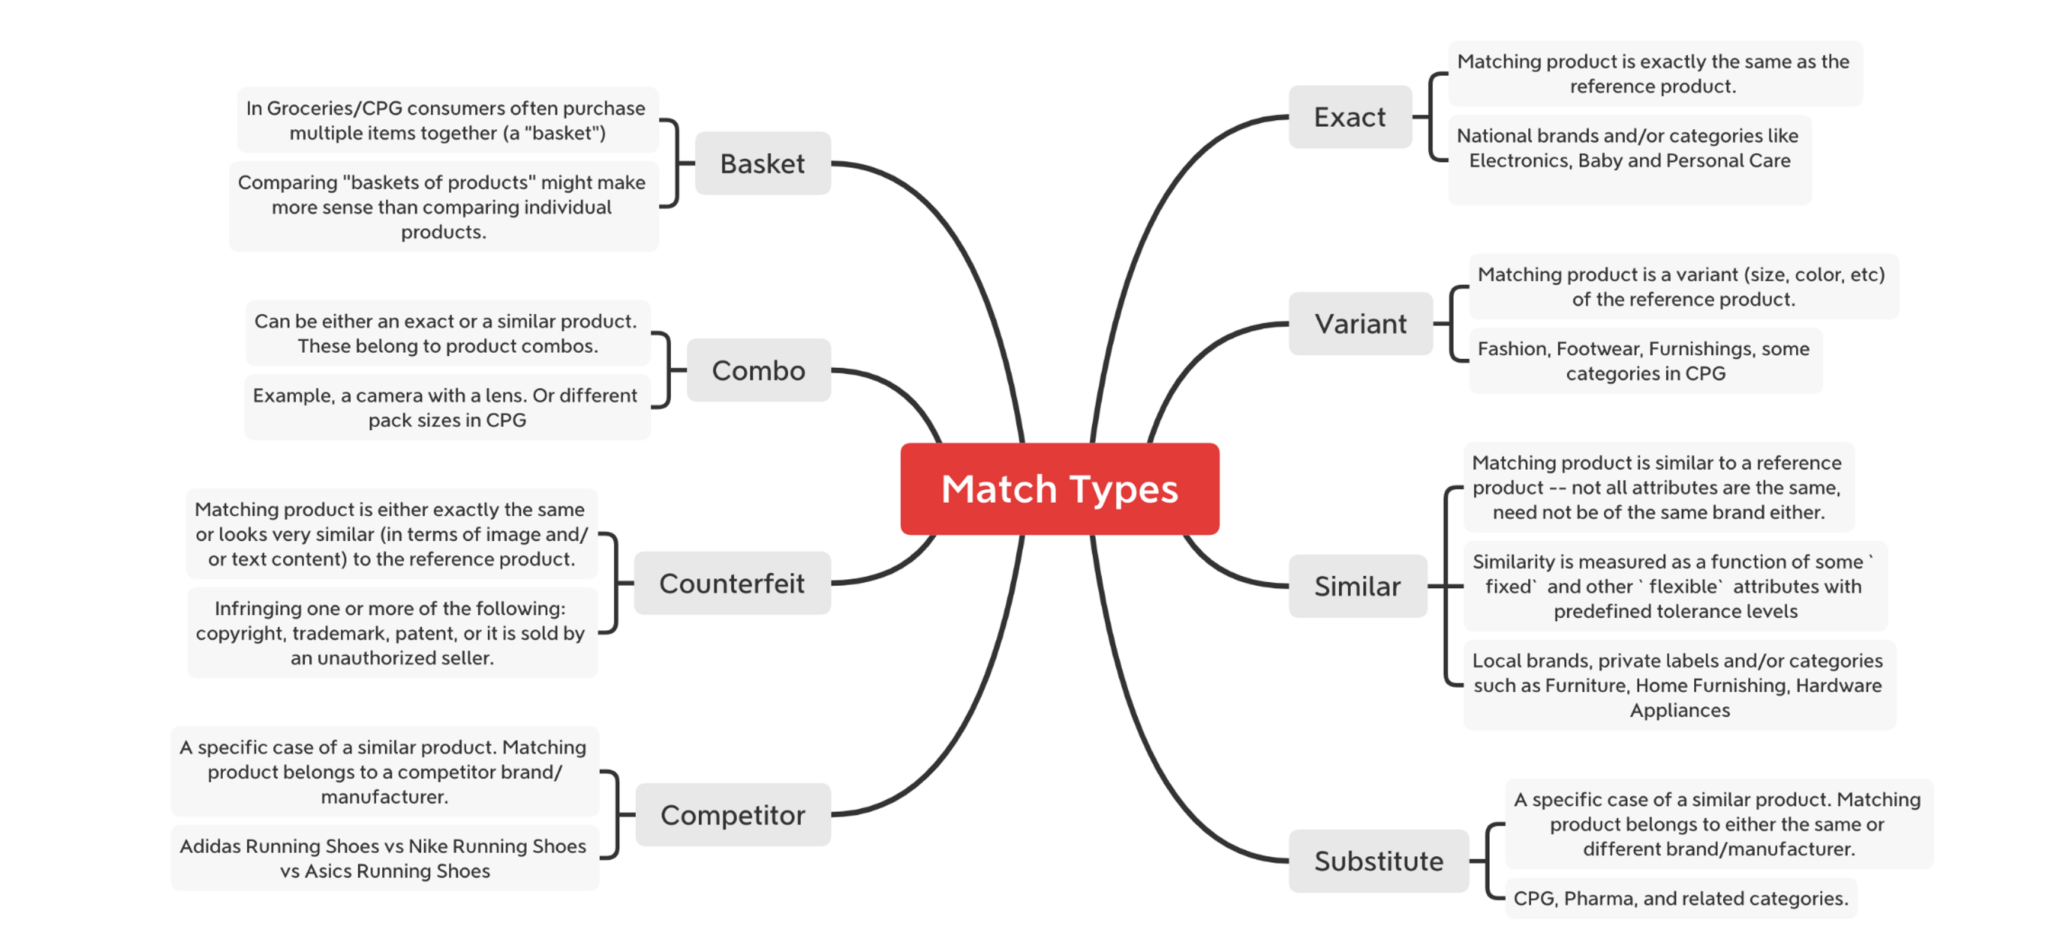
Define what “similar” means for your business. A retailer may want to compare multipacks against single packs. A brand may only care about comparing premium products to other premium products. With User-Led Match Management, your team sets tolerance levels that match your strategy.
Manually add or refine matches. When AI misses edge cases, your team can add them. This ensures coverage is complete and reflects the true competitive landscape.
This approach creates a loop where AI, complemented by DataWeave’s human-in-the-loop framework does the heavy lifting, and your teams can fine-tune the results. The outcome is both scale and accuracy.
Key Features
DataWeave designed User-Led Match Management to be simple, intuitive, and scalable:
Expert-Led Decision Making forms the heart of the system. Rather than trusting AI suggestions blindly, teams gain full visibility into matching logic and can leverage their contextual knowledge of products, categories, and retailers. When the system suggests matching a premium product against a basic alternative, human experts can reject the match and flag it for different criteria. This expertise is particularly valuable for new product launches, seasonal items, or products with complex positioning strategies.
Business Logic Integration: Teams can define matching parameters that reflect their specific strategic needs. A premium brand might establish rules that prevent matches against budget alternatives, while a value retailer might specifically seek those comparisons. Category managers can create different matching criteria for different product lines, ensuring that seasonal items, limited editions, and promotional products are handled appropriately.
Transparent Decision Making: Every match decision creates an audit trail capturing who made the decision, when it occurred, and the reasoning behind it. This transparency is crucial for enterprise environments where pricing decisions need to be defensible and strategies need to be consistent across teams and time periods.
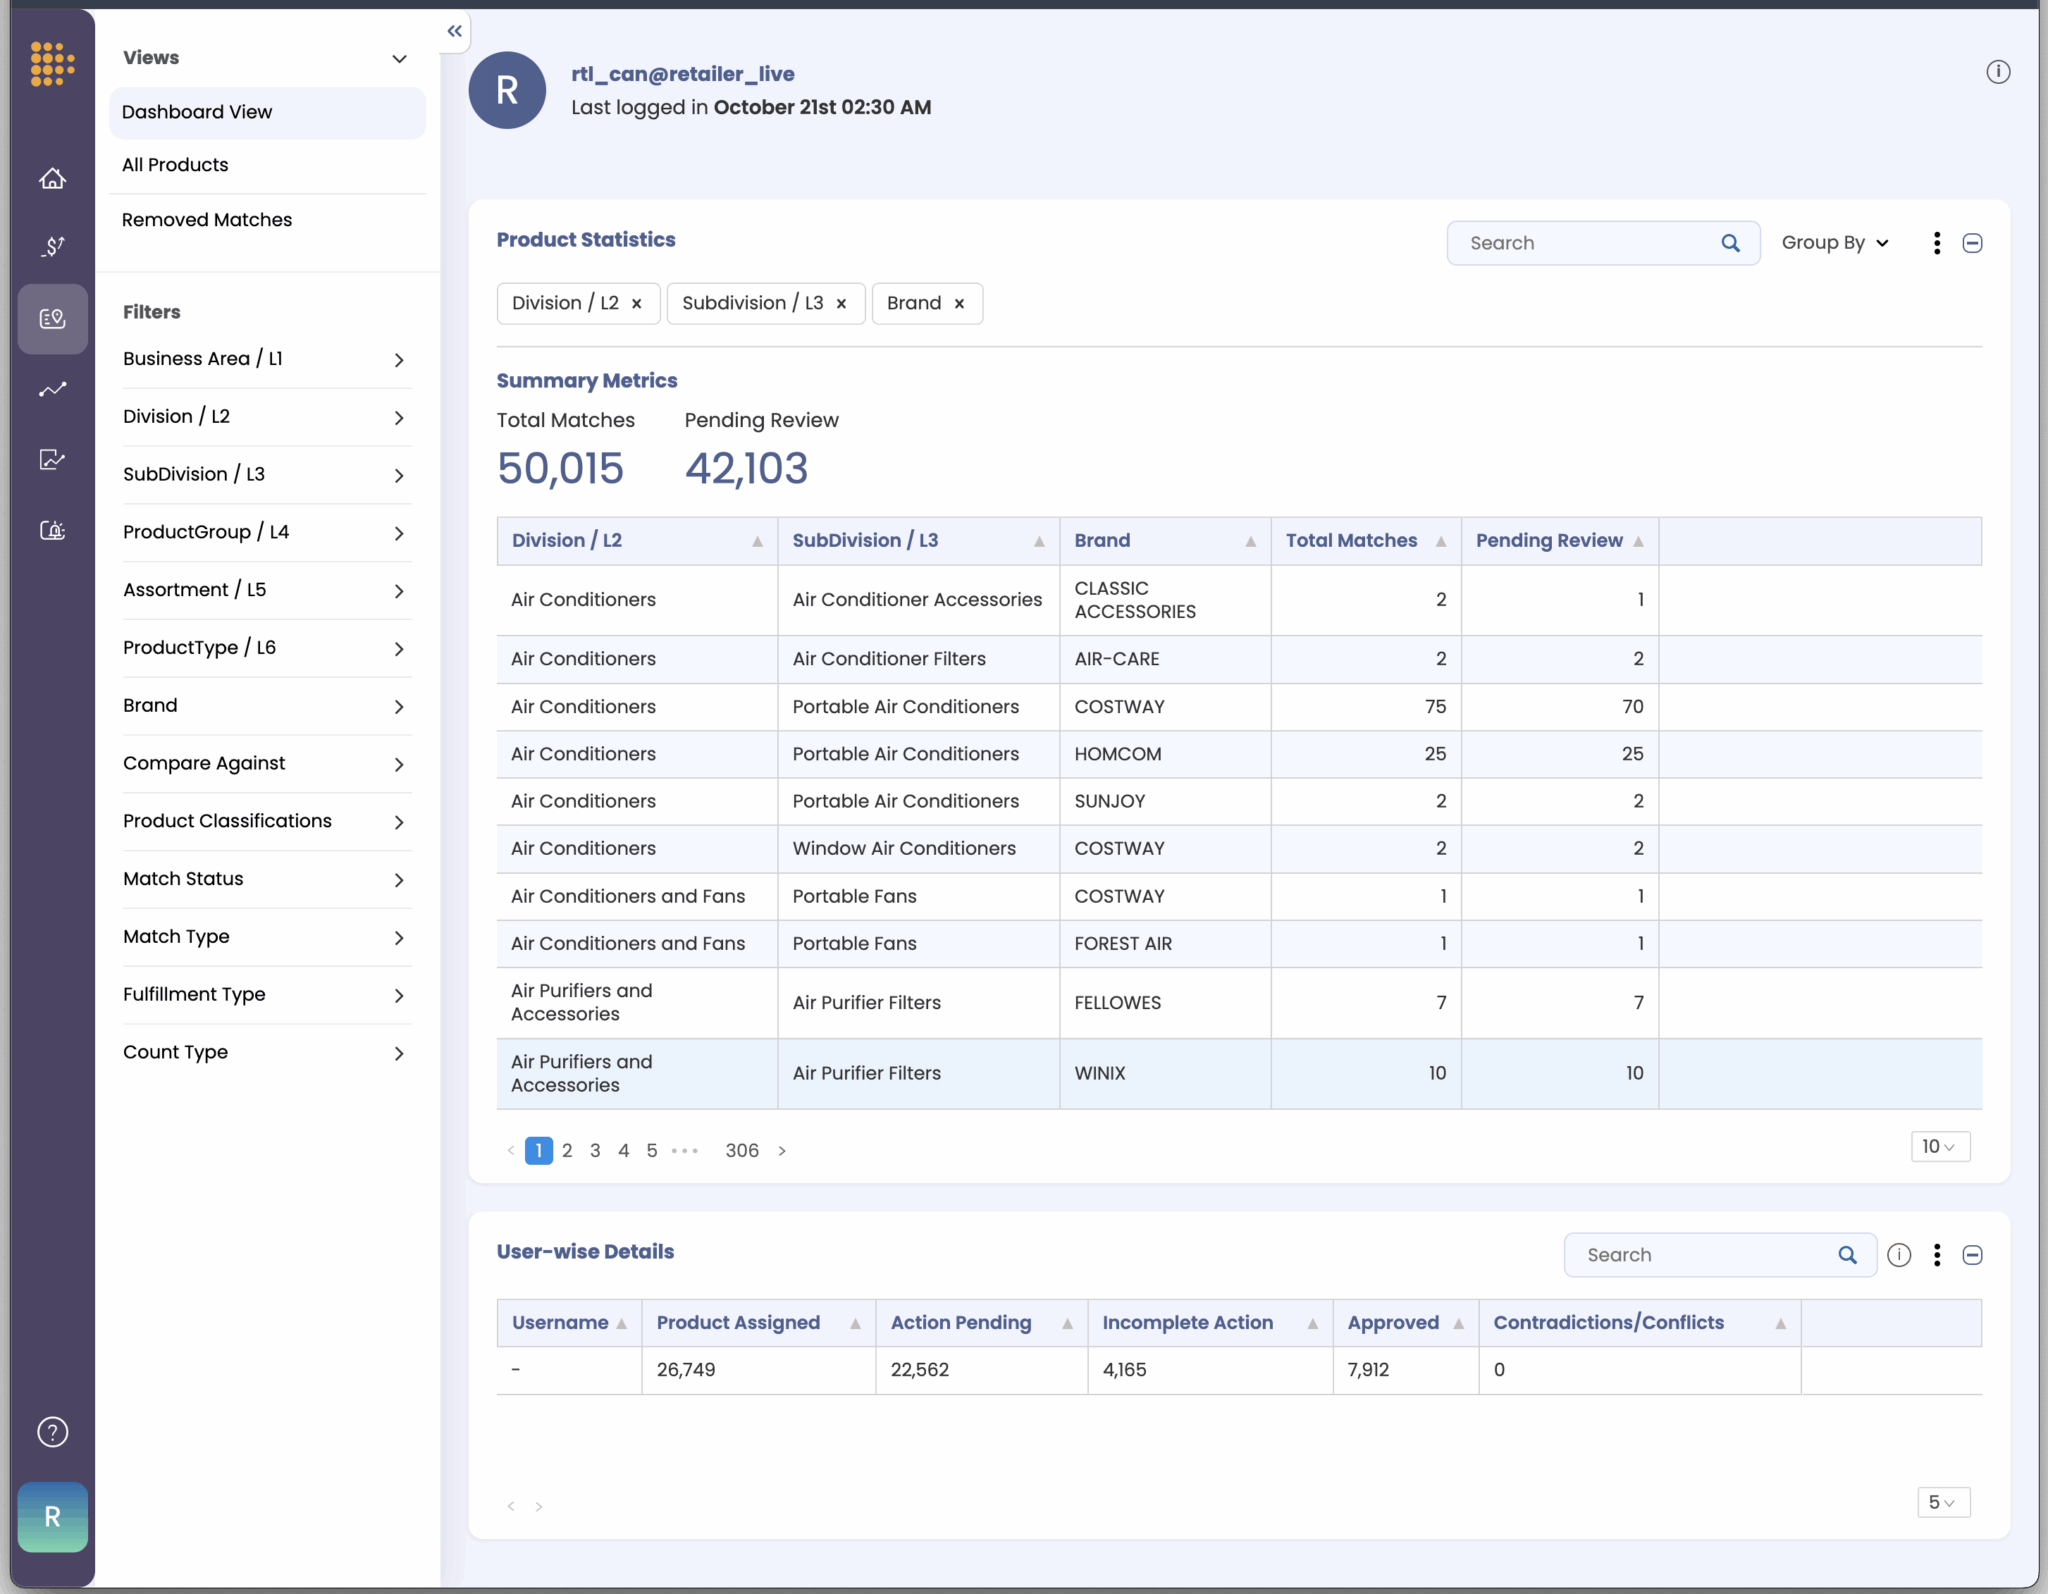
Scalable Validation: User-Led systems provide bulk operations for efficiency while maintaining oversight. Teams can upload thousands of matches for validation, use filtered views to focus on high-priority items, and leverage automated alerts for matches that fall outside established tolerance levels.
Each of these features reduces the friction between AI outputs and business-ready insights.
Technical Foundation
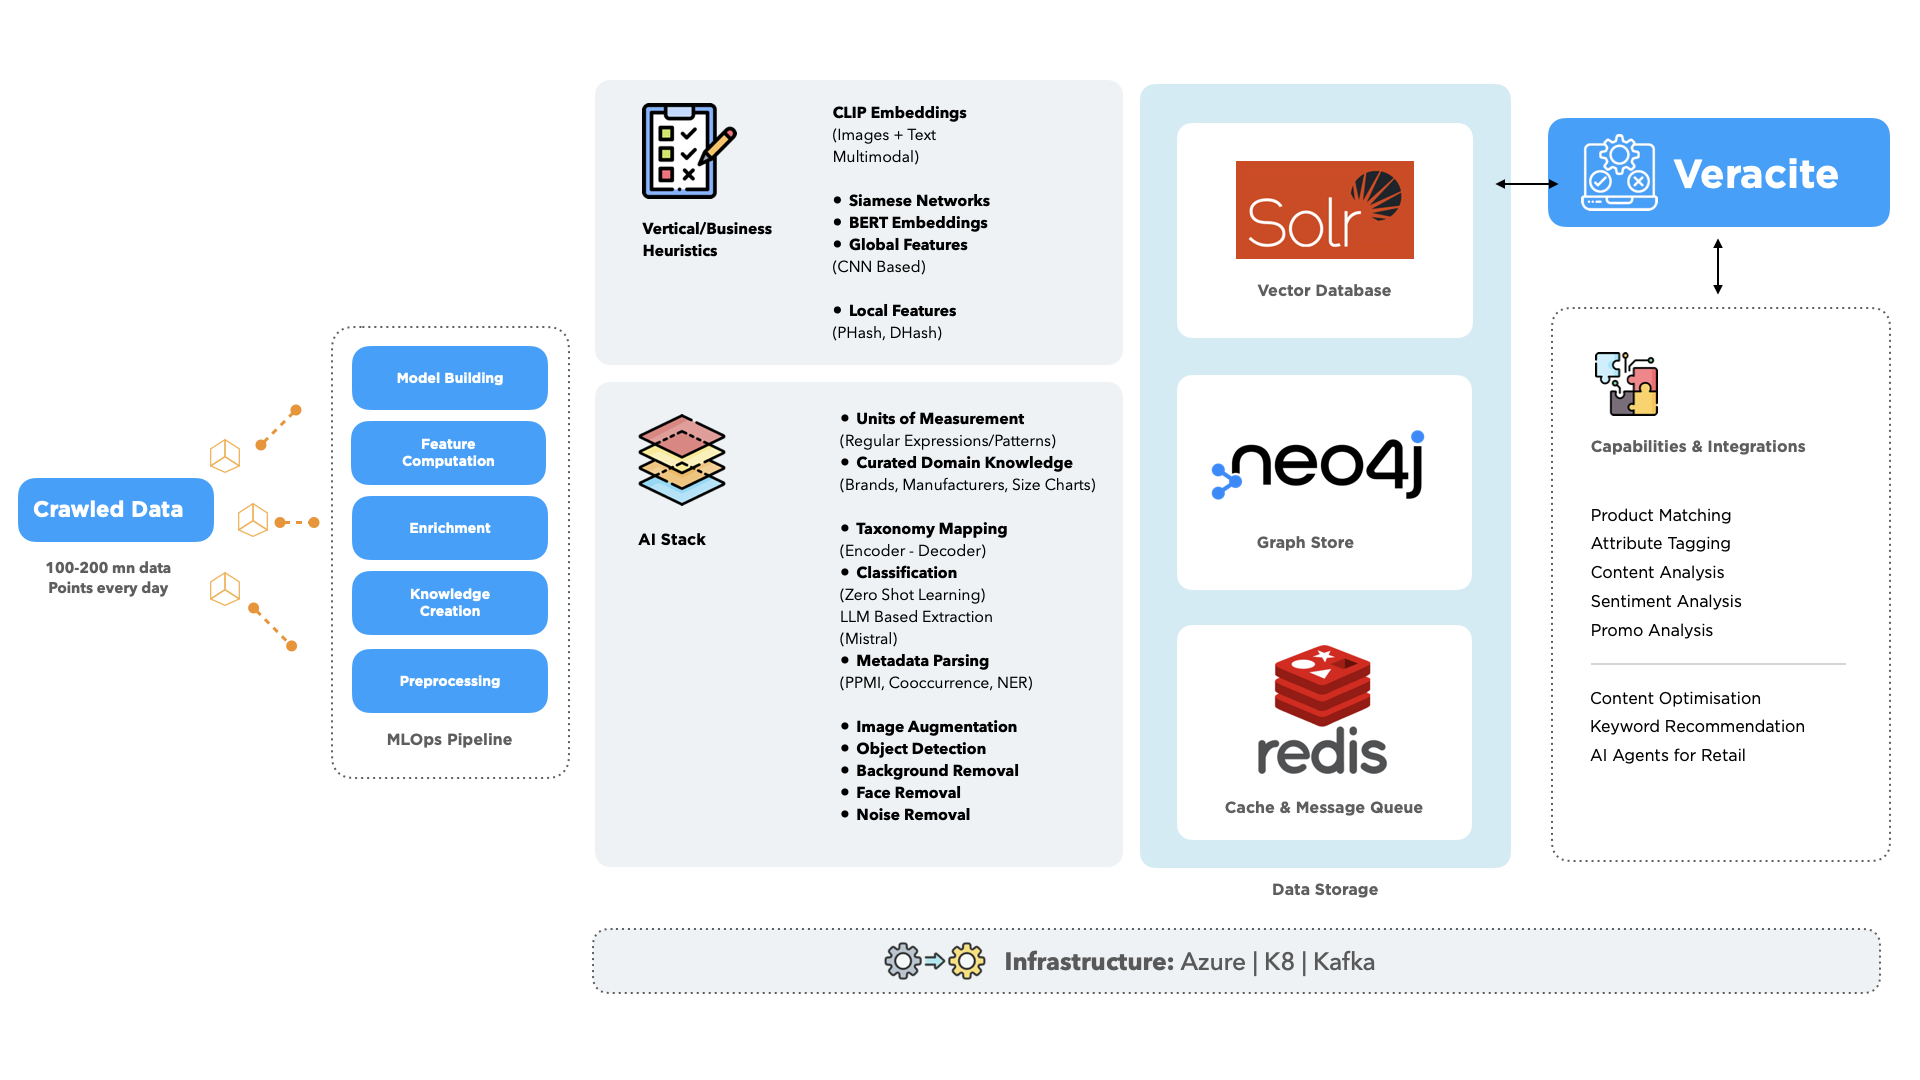
The AI foundation behind User-Led Match Management is built for precision and scale.
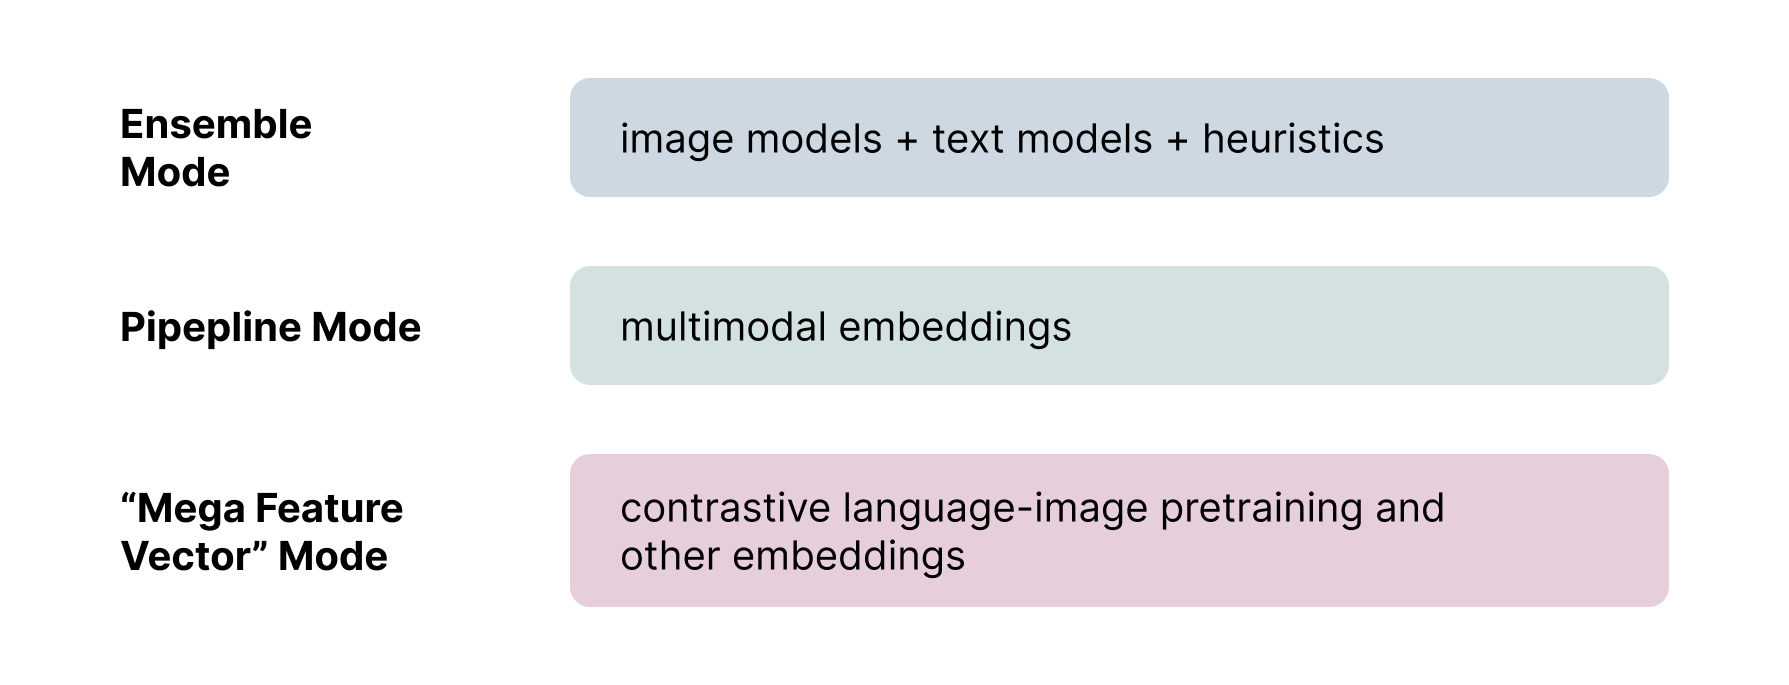
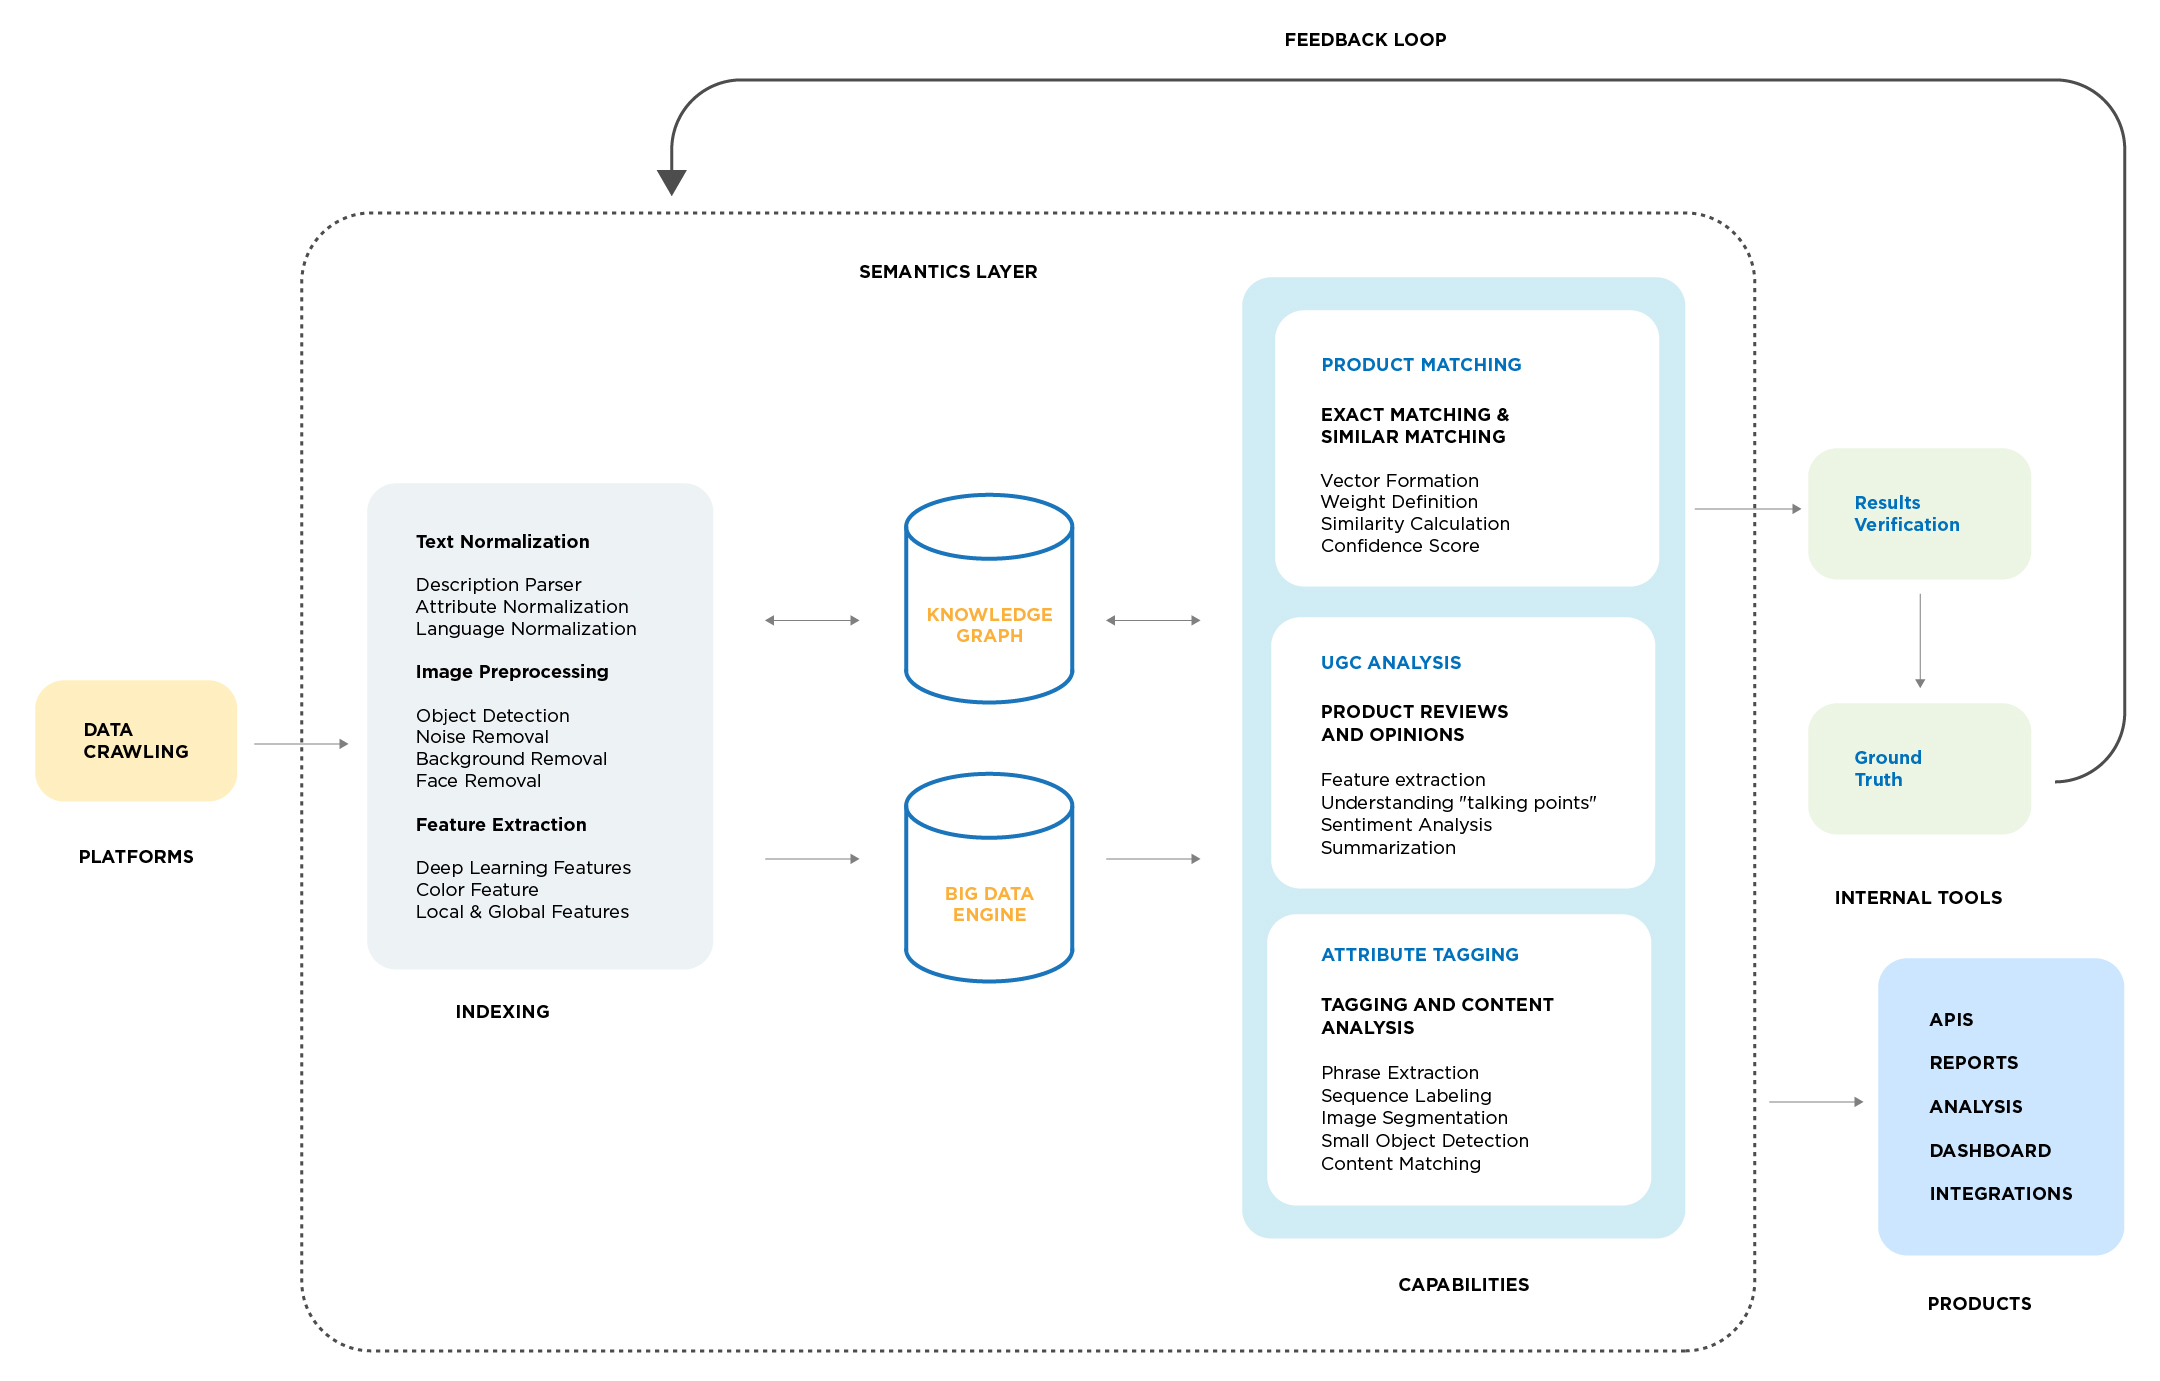
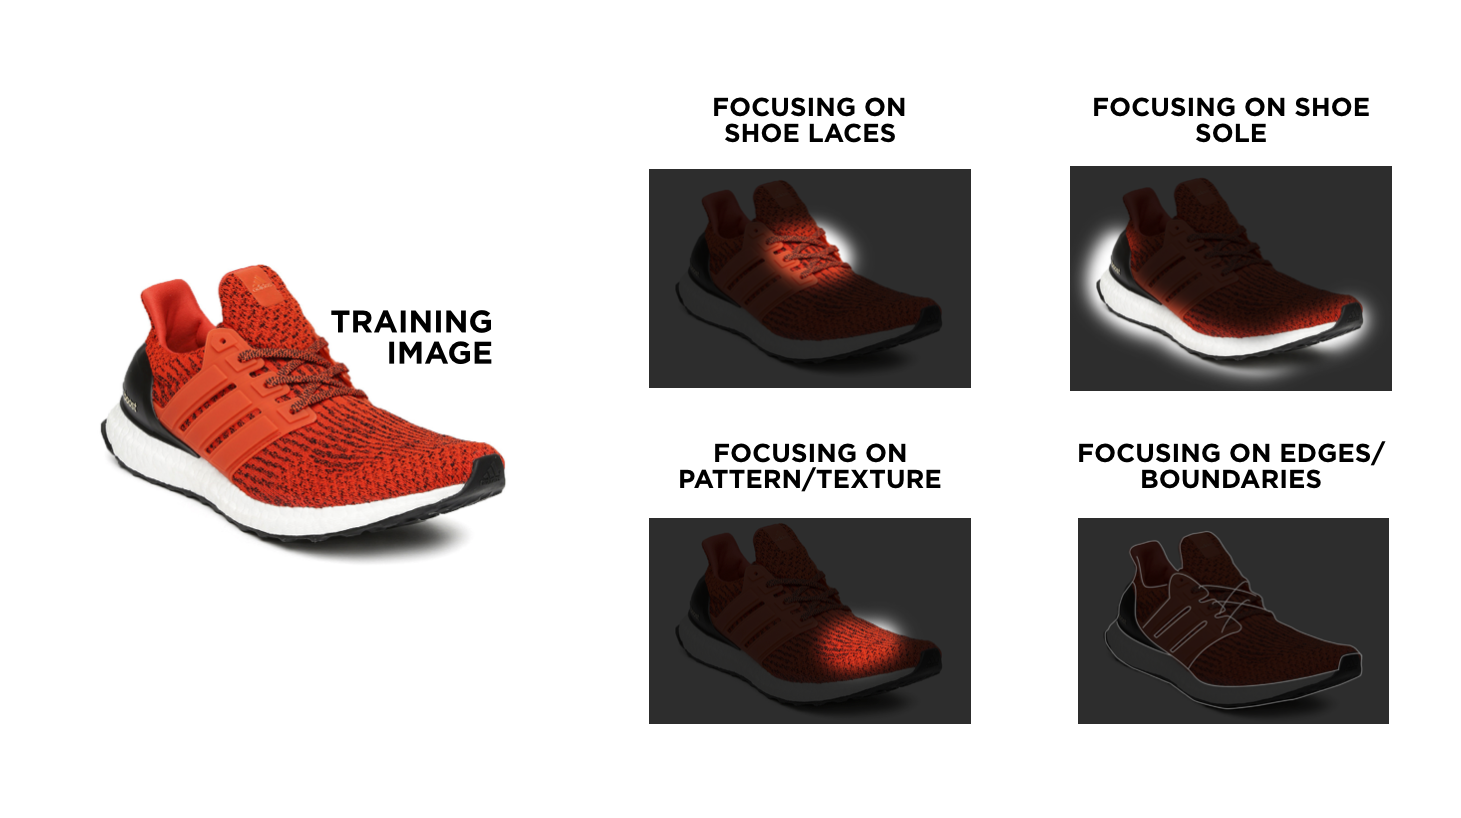
It uses multimodal AI that combines text, image, and metadata analysis to identify matches even when products are described or displayed differently across retailers.
Domain heuristics apply retail-specific logic, recognizing that “Large” means something different in apparel than in beverages, and that seasonal items require unique treatment.
Knowledge graphs link products across brands, categories, and regions to reveal true relationships even when surface attributes vary.
Through continuous learning, every human correction improves future AI suggestions, making the system smarter and more accurate over time.
With DataWeave, accurate and reliable product matching is the standard. Advanced algorithms and built-in quality checks deliver consistently high accuracy, reducing the risk of mismatched products and unreliable insights.
In the few cases where a match needs review, User-Led Match Management gives your team the ability to validate it quickly and easily. You get full visibility and control, while DataWeave ensures the integrity of the overall matching framework.
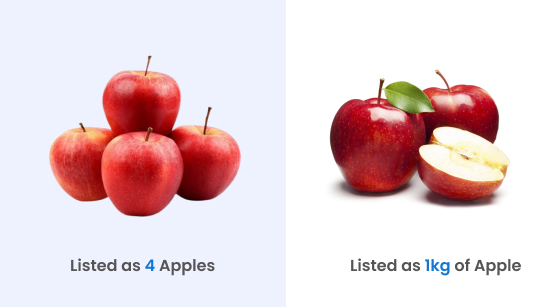
The outcome is true apples-to-apples price comparisons that protect margins, strengthen pricing strategies, and build trust in every decision.
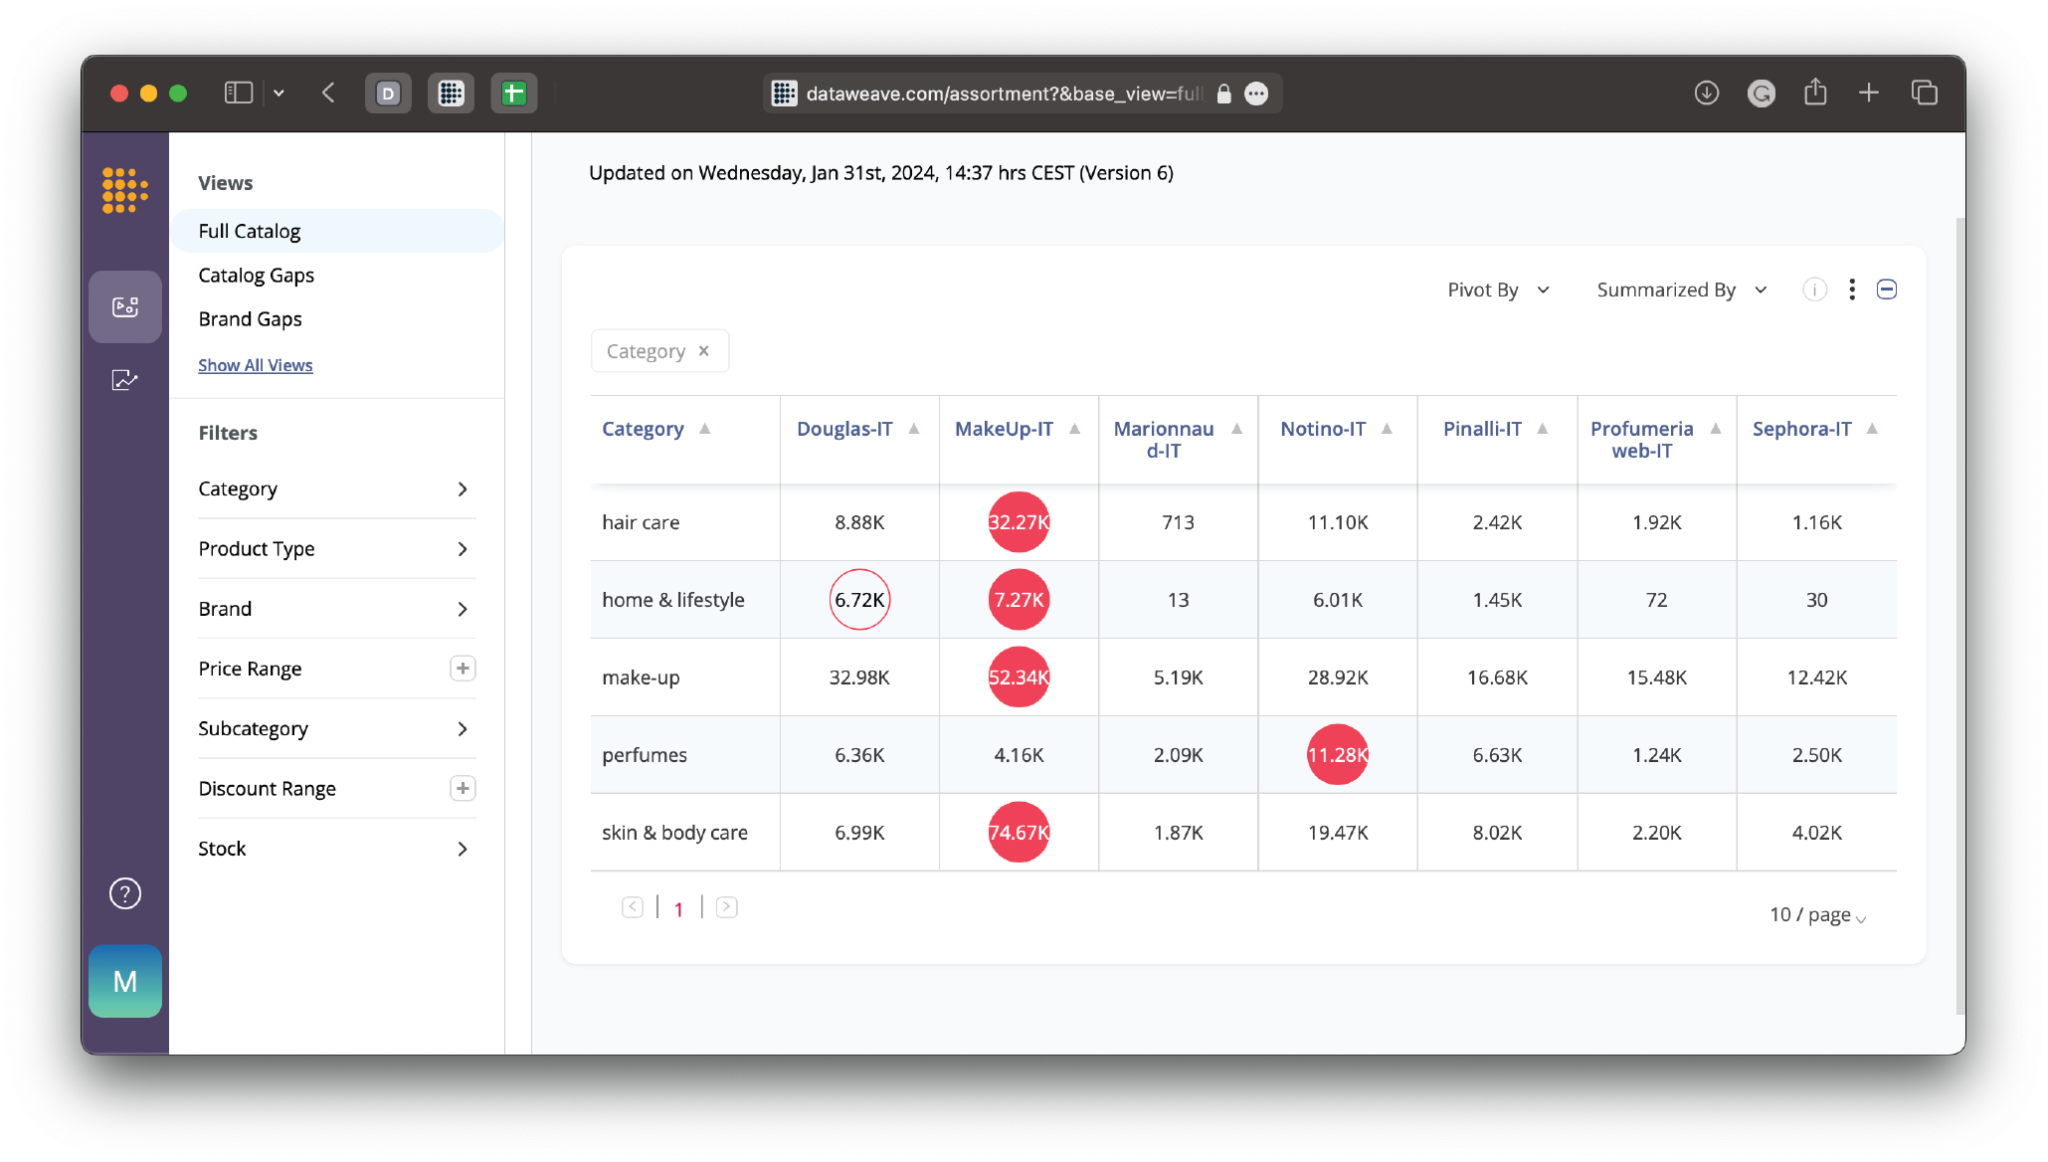
Assortment Analytics
Gaps and overlaps only matter when matches are accurate. To understand your true competitive landscape, you need to eliminate false gaps and phantom overlaps that distort assortment insights.
DataWeave’s advanced Match Management ensures precise product alignment across retailers, categories, and regions, giving you a clear view of your position in the market. At the same time, user-led oversight adds transparent validation, allowing your teams to confirm or refine matches based on their category knowledge.
The result is a complete and trustworthy view of category coverage that reflects reality, not noise. It helps you identify real opportunities to expand assortments, close gaps, and respond quickly to market changes.
Content Optimization
Digital shelf audits only deliver value when the comparisons are accurate. DataWeave ensures that every product is benchmarked against its true competitors so that your insights reflect the real dynamics of your category. For example, a luxury serum is never compared to a basic moisturizer, and a premium electronic device is never matched with an entry-level model.
With user-led control, your teams have transparent oversight of every match. They can review, validate, or adjust comparisons to make sure each audit aligns with your business standards. The result is a more reliable and actionable view of your digital shelf performance, helping you fine-tune content, optimize visibility, and strengthen conversion across channels.
Trust and Accountability
Leadership teams need complete confidence in the data they use to make decisions. User-Led Match Management delivers that confidence by combining the scale of AI with the assurance of human validation. Every match decision is transparent and traceable, giving teams clear visibility into how and why a product was matched.
This approach builds trust across departments, from analysts to executives. It ensures that every pricing, assortment, and content decision is backed by data that is both accurate and accountable.
Your Market, Your Rules, Your Insights
Retailers and brands today need more than fast data. They need data they can trust, shape, and act on with confidence. User-Led Match Management gives them that control. It turns product matching from a static, automated process into a dynamic, collaborative workflow that adapts to how real teams operate.
Category managers can fine-tune match rules instead of waiting on system updates. Pricing teams can validate critical SKUs in minutes, not days. Digital shelf teams can ensure their audits reflect real competitors, not algorithmic guesses. Executives gain visibility into decisions they can stand behind, supported by transparent data trails and measurable accuracy.
In short, User-Led Match Management puts control back where it belongs – in your hands. It helps every team move faster, compete smarter, and make decisions powered by data they can truly believe in.
Every major shift in commerce has been driven by data. A century ago, shopkeepers relied on ledgers to track sales. In the supermarket era, loyalty cards and barcodes turned transactions into insights. With the rise of eCommerce, clickstream data and online analytics reshaped how products were merchandised and sold.
Now, we are entering the next chapter: agentic commerce.
In this new paradigm, autonomous AI agents will handle the tasks that once required teams of analysts, merchandisers, and pricing specialists. Imagine an agent that monitors competitor prices across dozens of retailers, recommends adjustments, and pushes updates to a dynamic pricing engine, all in real time. Picture a shopper’s digital assistant scanning marketplaces for the right mix of price, delivery time, and customer reviews before making a purchase on their behalf.
These aren’t distant scenarios. They’re unfolding now. Industry analysts estimate the enterprise AI market at $24 billion in 2024, projected to grow to $155 billion by 2030 at nearly 38% CAGR . Meanwhile, 65% of organizations already use web data for AI and machine learning projects, and 93% plan to increase their budgets for it in 2024. The trajectory is undeniable: the next era of commerce will be built on AI-driven decision-making.
And what fuels those AI-driven decisions? Data. Reliable, structured, timely, and compliant data.
The Data Problem No One Can Ignore
Here’s the paradox: just as data has become most critical, it has also become harder to acquire.
For data and engineering leaders, the challenges are painfully familiar:
Old school scrapers that collapse whenever a site changes its HTML or introduces new interactivity.
Constant maintenance cycles, with engineering teams spending 20-40 hours a week debugging, rerunning, and patching scripts.
Low success rates, with in-house approaches succeeding just 60-70% of the time.
Complex infrastructure, from managing proxies to retry logic, pulls attention away from higher-value work.
But the costs go far beyond engineering frustration.
For retailers, broken pipelines mean competitive blind spots. A pricing team without reliable visibility into competitor moves can’t respond fast enough, risking lost margin or missed sales. Merchandising teams trying to optimize assortments are left with incomplete data, making poor stocking decisions inevitable.
For brands, unreliable data disrupts visibility into the digital shelf. Products might be misplaced in search rankings, content could be outdated or incomplete, and reviews could signal issues, but without continuous monitoring, those signals are missed until it’s too late.
For AI and ML teams, poor-quality training data means underperforming models. Without clean, consistent, and large-scale inputs, even the most sophisticated algorithms produce flawed predictions.
Finally for consulting firms and research providers, fragile collection systems can compromise credibility. Clients expect robust, evidence-backed recommendations. Data gaps erode trust.
The reality is stark: fragile pipelines don’t just waste engineering hours. They undermine competitive agility, customer experience, and business growth.
Enter the Data Collection API
DataWeave’s Data Collection API is a self-serve, enterprise-scale platform designed to deliver the data foundation today’s enterprises need, and tomorrow’s agentic AI systems will demand.
At its core, the API replaces brittle scrapers and ad hoc tools with a resilient, adaptive, and compliant data acquisition layer. It combines enterprise reliability with retail-specific intelligence to ensure that structured data is always available, accurate, and ready to power critical workflows.
Here’s what makes it different:
Enterprise-scale throughput: The API can process thousands of URLs in a single batch or handle continuous, high-frequency scrape. Whether you need daily pulses or near real-time monitoring, it scales with you.
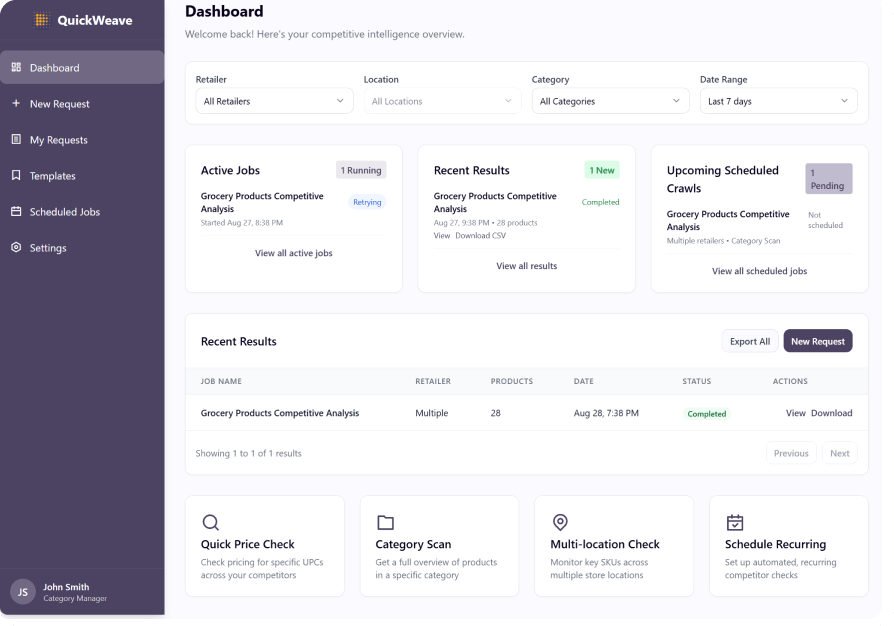
Flexible access modes: Technical teams can integrate directly into internal workflows via API, while business users can configure jobs through a no-code interface. Everyone gets what they need without bottlenecks.
Adaptive resilience: As websites evolve, the API adapts automatically. No frantic patching, no firefighting.
Structured outputs, your way: Clean JSON, CSV, or WARC formats are delivered directly into your environment – AWS S3, Snowflake, GCP, or wherever your data stack lives.
Built-in monitoring and self-healing: Automated retries, real-time logs, and usage dashboards keep teams in control without manual oversight.
Compliance by design: WARC-based archiving and SOC2 alignment ensure data pipelines are auditable, trustworthy, and enterprise-ready.
This isn’t about scraping pages. It’s about creating a reliable data utility, a system that transforms raw web inputs into structured, actionable data streams that enterprises can trust and scale on.
Who It’s Built For (And How They Use It)
The Data Collection API isn’t limited to one role or industry. It’s been designed with multiple stakeholders in mind, each of whom can apply it to solve pressing challenges:
Retailers and Consumer Brands
Retailers live and die by competitive awareness. With the API, pricing teams can monitor SKU-level prices and promotions across channels, ensuring they don’t leave margin on the table. Merchandising leaders can track assortment coverage, identifying gaps relative to competitors. Digital shelf teams can measure search rankings, share of voice, and content completeness. The result is faster responses, stronger category performance, and fewer blind spots in shopper experience.
AI & Machine Learning Teams
AI teams depend on data at scale. Whether training a natural language model to understand product descriptions or a computer vision system to analyze images, the Data Collection API delivers the structured, high-quality inputs they need. Reviews, ratings, attributes, and product images can all be captured and delivered at scale. For teams building predictive models, from demand forecasting to personalization, the difference between mediocre and world-class often comes down to input quality. This API ensures AI systems are always learning from the best data available.
Retail Intelligence & Pricing Platforms
Technology providers serving retailers and brands face unforgiving client expectations. Missed SLAs on data delivery can mean churn. By using the Data Collection API as their acquisition layer, platform providers gain enterprise reliability without rebuilding infrastructure from scratch. They can scale seamlessly with client needs while maintaining the integrity of the insights their customers rely on.
Marketing & Advertising Teams
For marketing leaders, competition is visible every time a shopper searches. The API enables teams to track keyword rankings, ad placements, and competitor promotions with consistency. Instead of anecdotal data or partial coverage, marketers get a full picture of their brand’s digital presence and the strategies competitors are using to capture share of voice.
Consulting Firms & Research Providers
Consultancies and market research agencies deliver strategy. But a strategy without evidence is just opinion. The API allows these firms to back every recommendation with structured, large-scale data. Whether advising on pricing, benchmarking performance, or publishing analyst research, firms can deliver trustworthy insights without taking on the cost or distraction of building fragile data pipelines.
The diversity of these use cases demonstrates why the API is a platform for collaboration across industries, ensuring every stakeholder, from engineers to strategists, has the reliable data foundation they need.
Why DataWeave, Why It Matters
Many vendors claim to deliver web data. Few can deliver it at enterprise scale, with commerce-specific expertise, and with proven ROI.
What sets DataWeave apart isn’t just that we provide data; it’s the way we do it, and the outcomes we enable.
Commerce expertise baked in: With 14+ years of experience powering the world’s leading retailers and brands, DataWeave brings domain-specific intelligence that generic scraping vendors simply can’t. Our schemas are designed for commerce. Our defaults are smarter because they’re informed by retail realities.
Adaptability without firefighting: Most tools break when websites evolve. Our API adapts automatically, minimizing the need for engineering intervention. Teams stay focused on innovation, not maintenance.
Accessible to everyone: Whether you’re a senior data engineer automating workflows or a business analyst configuring a quick scrape, the API meets you where you are with both API and no-code interfaces.
Enterprise-grade trust: Reliability and compliance are built in, not bolted on. With SLA-backed delivery, SOC2 alignment, and audit-ready archiving, the API is trusted by enterprises that can’t afford uncertainty.
This combination makes the Data Collection API not just a technical solution but a strategic partner for enterprises preparing for the age of agentic commerce.
A Foundation for the Future
The Data Collection API is more than an answer to today’s frustrating data problems. It represents a strategic foundation for tomorrow’s growth, designed to scale alongside the increasingly complex demands of commerce in the AI era.
At the heart of DataWeave’s vision is the Unified Commerce Intelligence Cloud, a layered ecosystem that transforms raw digital signals into strategic insights. The Data Collection API is the entry point, the essential first layer that ensures enterprises have a reliable supply of the most important raw material of the digital economy: data.
Collection: Enterprise-grade acquisition of web data at scale. From product pages and search results to reviews and promotions, enterprises can finally count on continuous, structured inputs without worrying about fragility or failure.
Processing: Once collected, data is normalized, enriched, and matched across sources. What was once noisy and inconsistent becomes clean, comparable, and immediately actionable.
Intelligence: On top of this foundation sits advanced analytics, solutions for pricing optimization, assortment planning, promotion tracking, and digital shelf visibility, enabling sharper decisions at the speed of the market.
This progression means enterprises don’t have to transform overnight. Many start small, solving urgent challenges like competitive price tracking or digital shelf monitoring. From there, they can expand naturally into richer intelligence capabilities, knowing that their data foundation is already strong enough to support more ambitious use cases.
And as agentic AI systems begin to take on a larger share of decision-making, the importance of that foundation grows exponentially. These autonomous systems cannot operate effectively without clean, continuous, and contextual data. Without it, even the most sophisticated AI will falter, making poor predictions or incomplete recommendations. With it, they can operate at full capacity, powering dynamic pricing, real-time demand forecasting, and personalized shopping experiences at scale.
The Data Collection API isn’t just about reducing engineering pain today. It’s about preparing enterprises to compete and win in an AI-driven marketplace that never sleeps.
Getting Started
For teams tired of fragile scrapers, this is a chance to reset. For enterprises preparing for the next era of commerce, it’s a chance to build a foundation that can scale with them.
If your teams are still struggling with generic and inflexible data scrapers, request a demo now to see the DataWeave’s Data Collection API in action.
The retail landscape has reached a point where traditional strategies are no longer enough. Tariff shocks are driving up costs in categories like electronics and apparel, while freight disruptions are extending lead times. Retail executives are now operating in an environment of unprecedented complexity.
In response, many of the world’s largest retailers and brands are shifting critical operations to Global Capability Centers (GCCs) in regions such as India, East Asia, and Africa. Once focused on back-office support, GCCs are rapidly evolving into strategic intelligence hubs powering high-impact decisions on pricing, assortment, content, analytics, and more. These decisions consistently influence both top-line growth and bottom-line performance for multibillion-dollar enterprises.
At DataWeave, we’ve been working closely with GCCs to help them achieve technical, tactical, and strategic advantages through actionable market intelligence. To further engage with the community and exchange ideas, we recently hosted our first GCC VIP Roundtable in Bengaluru. Leaders from organizations including JC Penney, Lowe’s, Kenvue, and ARKO joined us for a series of candid and insightful discussions on retail’s most pressing challenges and the evolving role of GCCs in driving leadership amid disruption.
In this article, we share the key themes, challenges, and solutions that emerged from these conversations.
Where GCCs Are Facing the Biggest Challenges
The Adoption Lag Challenge
A recurring concern among GCC leaders at the roundtable was the delay in translating insights into action. As one leader noted, “We have the data and insights at our fingertips, but it can take our internal teams an entire quarter to respond.” Others agreed with this sentiment, recognizing that such adoption lags create a competitive risk.
The pattern is consistent across organizations, while GCCs excel at generating insights, real-time responsiveness at the store level remains aspirational due to change management challenges and operational inertia.
The Integration Imperative
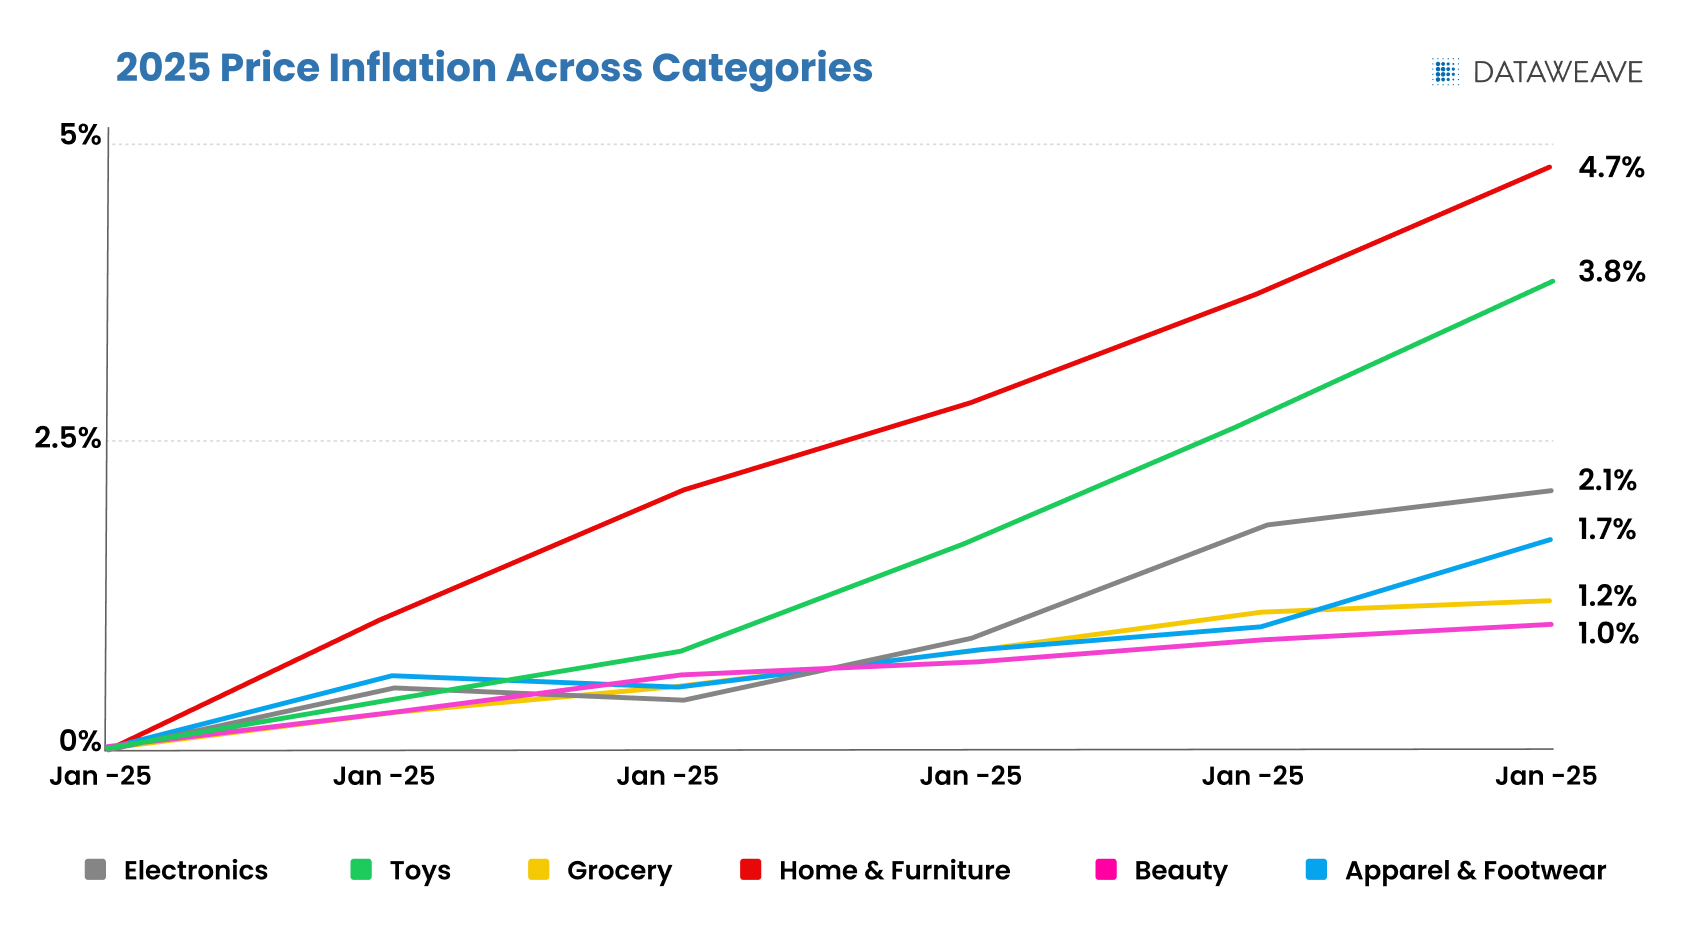
Our discussion with GCC leaders coincided with creeping evidence for the impact of tariffs across retail categories. Managing competitive intelligence is a difficult enough challenge. Now, pricing strategies must account for not just competitive positioning, but also rapid cost structure changes that vary dramatically by product origin and category.
Home & Furniture categories are experiencing the steepest price inflation trajectory, with increases reaching 4.7% by mid-2025.
Toys and Electronics follow closely at 3.8% and 2.1% respectively, both heavily dependent on international supply chains.
The Strategic Intelligence Evolution
Leading GCCs are responding by reimagining their role around critical capabilities:
Beyond Traditional Competitive Intelligence
Pricing and content strategies now require integration of multiple variables:
Category-specific trends
Tariff impacts
Competitive positioning
Broader macroeconomic factors
Traditional pricing models that worked in stable environments are proving inadequate for this new reality.
Real-Time Responsiveness as a Competitive Edge
The shift from periodic reporting to always-on intelligence systems emerged as a critical theme. GCC leaders discussed the need for:
Technical Infrastructure: Moving from batch processing to streaming data architectures, handling millions of SKUs daily
Analytical Capability: AI-driven data refinement, including computer vision and natural language processing
Organizational Agility: Breaking down silos between marketing, merchandising, and operations
Regional Complexity Management
The group highlighted a key gap in the competitive intelligence data they receive. Insights often overlook region-specific nuances such as local competitive landscapes, regulatory requirements, and consumer preferences. They stressed that effective pricing strategies must go beyond base pricing to also factor in card-linked offers, loyalty programs, and delivery options.
Operational Challenges
Several technical and operational issues emerged during discussions:
Data Quality and Accessibility: Questions around whether platforms provide pre-refined data or raw dumps, and the availability of implementation layers for easy visualization
Change Management: The persistent challenge of translating insights into action at operational levels
The Path Forward: Building Intelligence-Driven GCCs
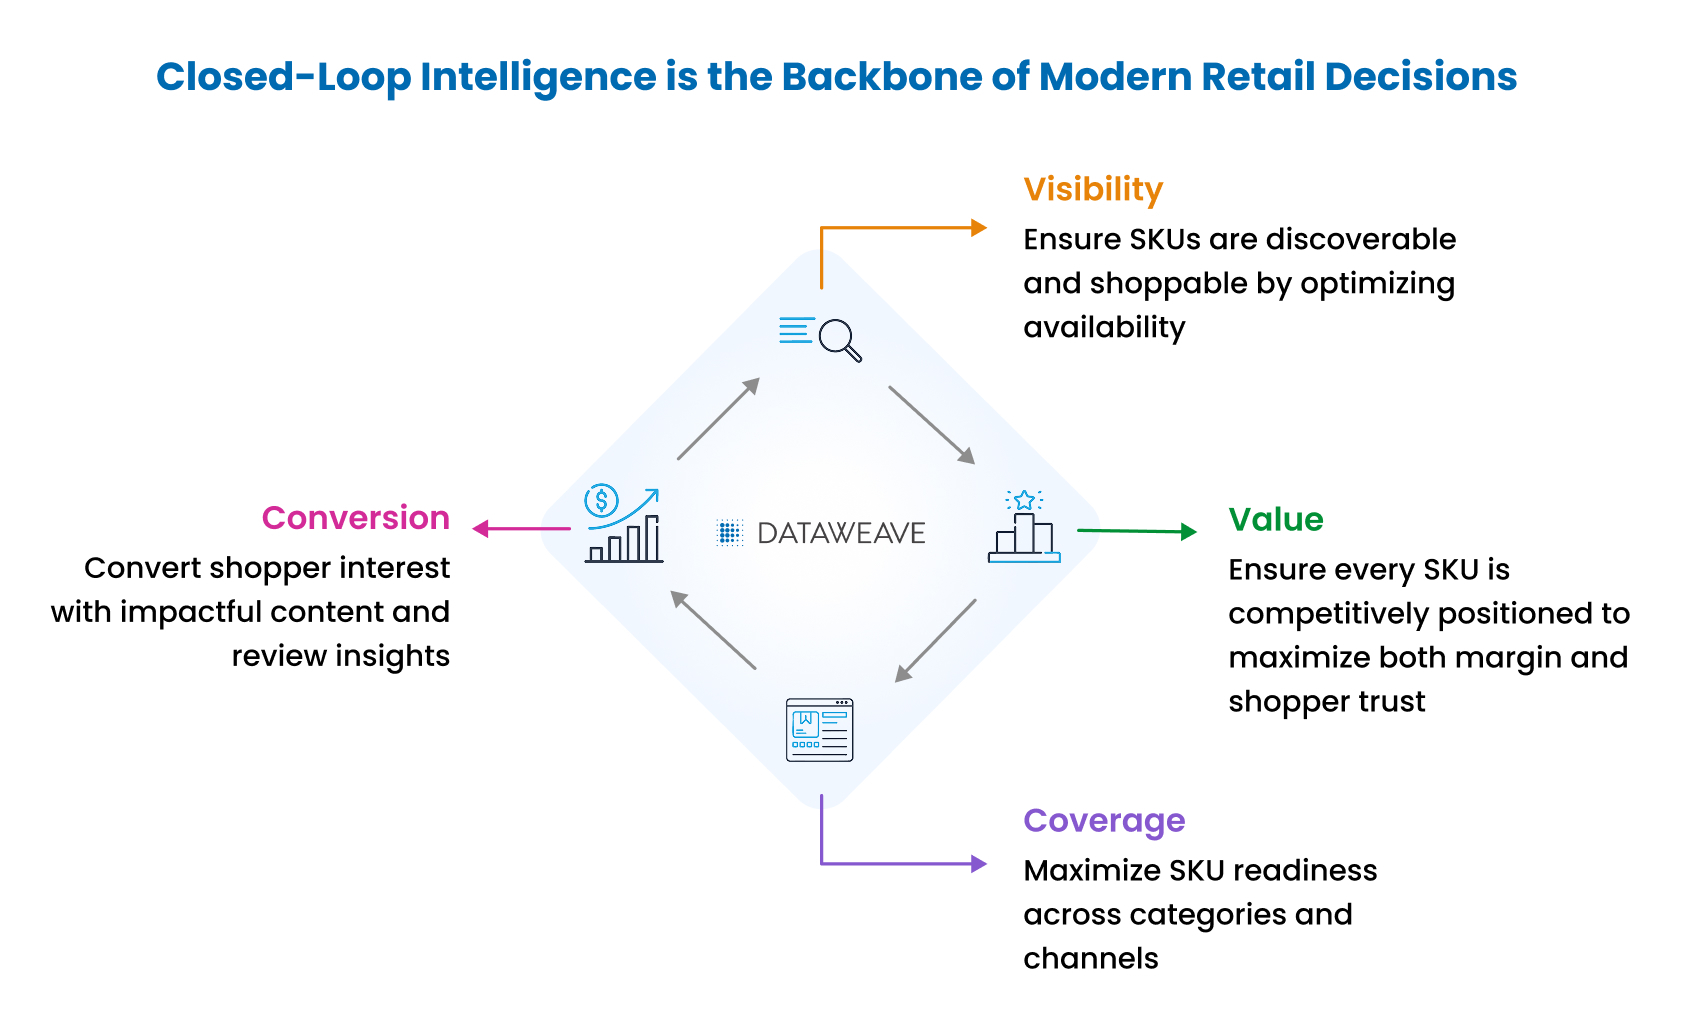
The most successful GCCs of the future will deliver what our attendees called “closed-loop intelligence.” These insights will not only inform decisions but also continuously improve through feedback and results tracking.
This is something that DataWeave excels in.
This requires investment in three core areas:
Data Acquisition: Comprehensive, timely product and pricing data collection across retail platforms
Intelligence Refinement: AI-powered transformation of raw data into meaningful relationships across retailers, brands, categories, and competitive landscapes
Insight Delivery: Flexible output capabilities serving everything from executive dashboards to automated pricing systems
Key Takeaways for GCC Leaders
Our roundtable revealed that successful GCCs share common characteristics:
Proactive Decision-Making: Moving beyond reactive responses to anticipate market changes
Integrated Intelligence Systems: Combining traditional competitive data with modern digital signals, including social media trends
Cross-Functional Impact: Establishing strategic partnerships with business units rather than transactional service relationships
Measurable ROI: Proving value through pricing strategies that demonstrably improve margins
The retail industry will likely become more complex, not less, in the coming years. The GCCs that invest in sophisticated competitive intelligence capabilities today will be the ones helping their organizations not just navigate this complexity, but thrive within it.
The depth of insight and openness in the discussions during the event underscored the value of bringing this community together. As we continue to strengthen our connections with GCC leaders, we look forward to hosting more such forums.
If you’d like to be part of the conversation, reach out to us today!
Amazon Prime Day 2025 generated a record-breaking $24.1 billion in US online sales during its extended four-day run (July 8–11, 2025). While the expanded format helped broaden participation, it also diluted the urgency and daily peaks that typically define Prime Day.
Beneath this record-setting performance lies a more complex reality. Persistent inflation, shifting consumer behavior, and rising pricing pressures created a retail environment very different from previous years, one where higher baseline prices often replaced the deep discounts shoppers expected.
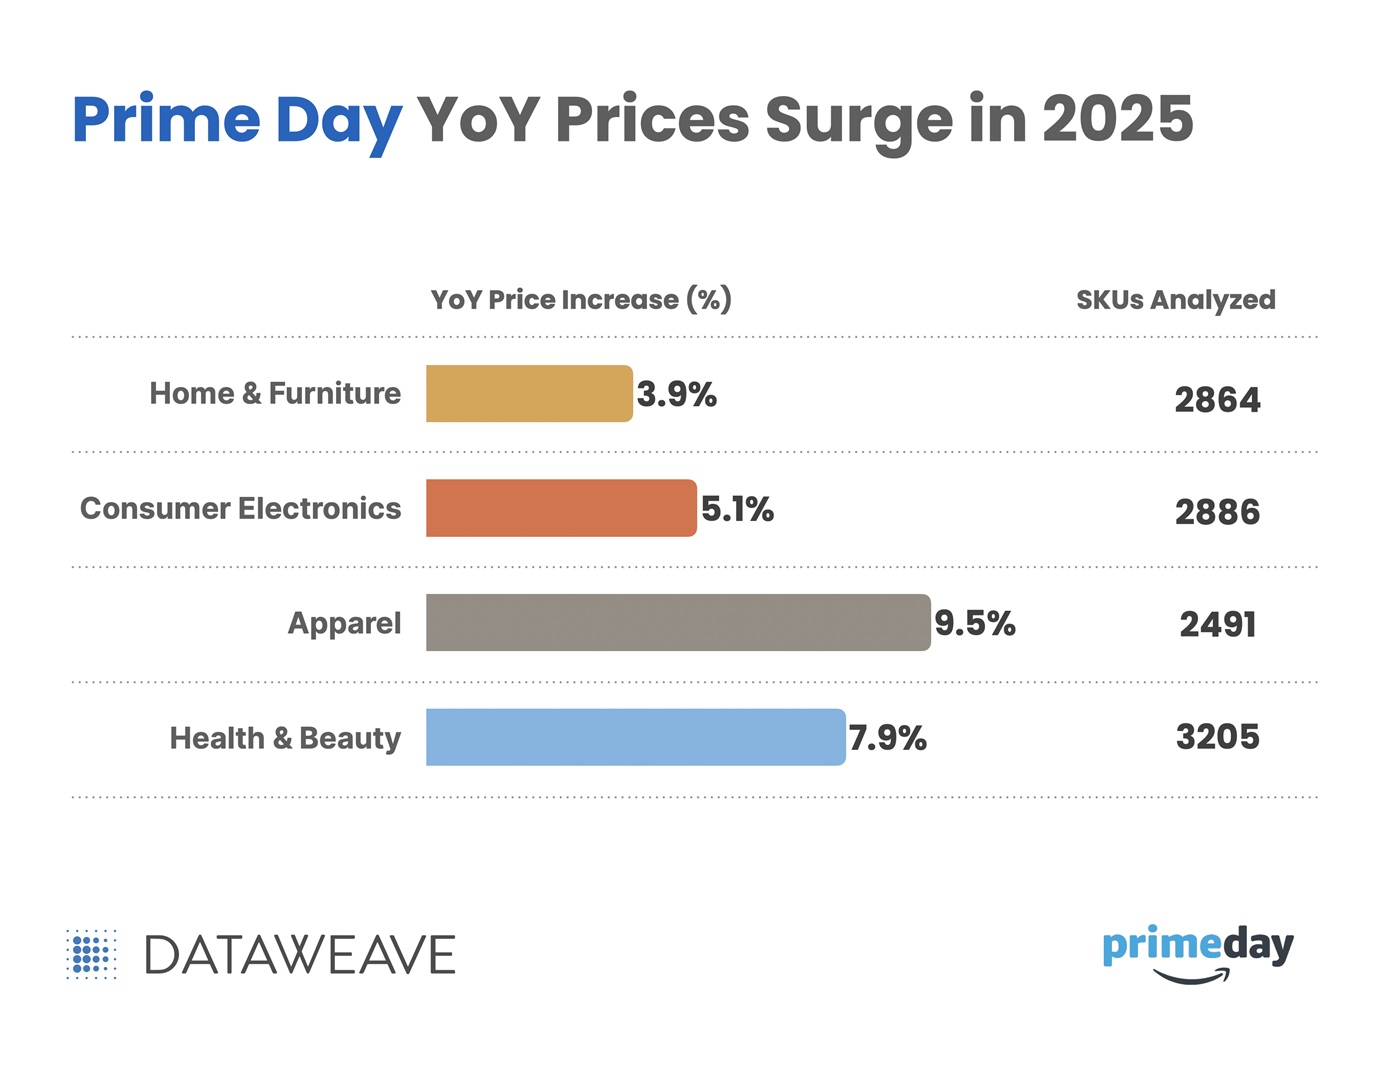
To understand these dynamics, DataWeave analyzed pricing and visibility trends across 11,495 products using our proprietary AI platform. The study focused on four major categories – Consumer Electronics, Apparel, Home & Furniture, and Health & Beauty – comparing identical SKUs from Prime Day 2024 and 2025, and tracking changes in both organic and sponsored share of search for leading brands.
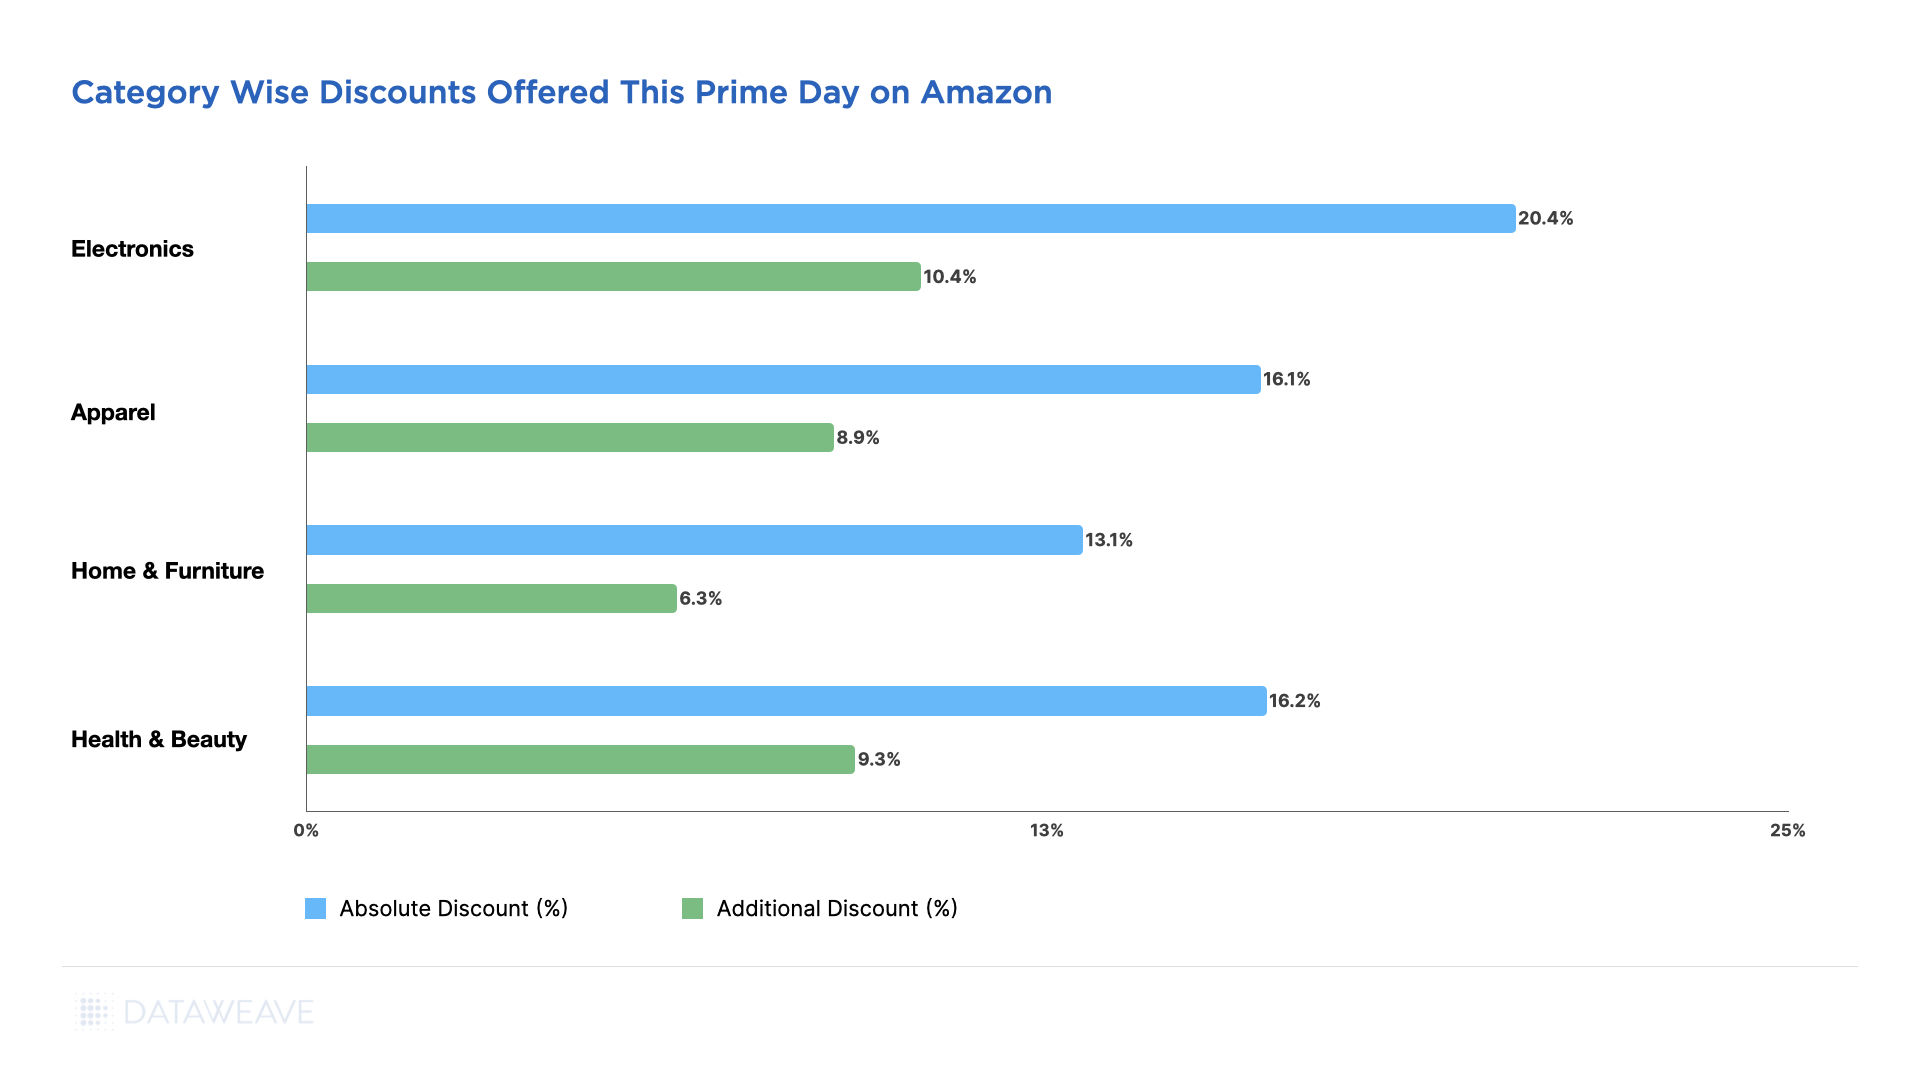
The results reveal clear year-over-year price increases: Apparel led with a 9.5% rise, followed by Health & Beauty (7.9%), Consumer Electronics (5.1%), and Home & Furniture (3.9%). In total, 47% of tracked products saw higher prices, indicating that this year’s record sales were achieved in an environment of elevated base pricing rather than deeper discounts.
Multiple converging forces shaped the retail landscape leading into Prime Day 2025, pushing baseline prices higher even before promotions began.
Supply Chain Pressures: Ongoing disruptions and elevated shipping and production costs continue to shape the cost structure across categories.
Trade Policy Factors: Recent tariff measures and trade regulations may be contributing to upward pricing trends in certain categories, particularly those with high import dependence such as electronics and home goods.
Labor and Operating Costs: Rising wages, transportation expenses, and general operating overhead are placing additional pressure on retailer margins and influencing pricing decisions.
Currency Fluctuations: Shifts in exchange rates continue to add variability to the cost of imported goods, especially in globally sourced categories like electronics and apparel.
These combined pressures created a pricing environment where brands had less room for deep discounting, shaping not just how products were priced, but also how aggressively they were promoted.
To better understand the impact, we compared Prime Day 2025 prices to those from Prime Day 2024 for the same SKUs across major categories. This year-over-year view highlights how elevated baseline prices, driven by the factors outlined above, shaped the shopping experience and promotional strategies.
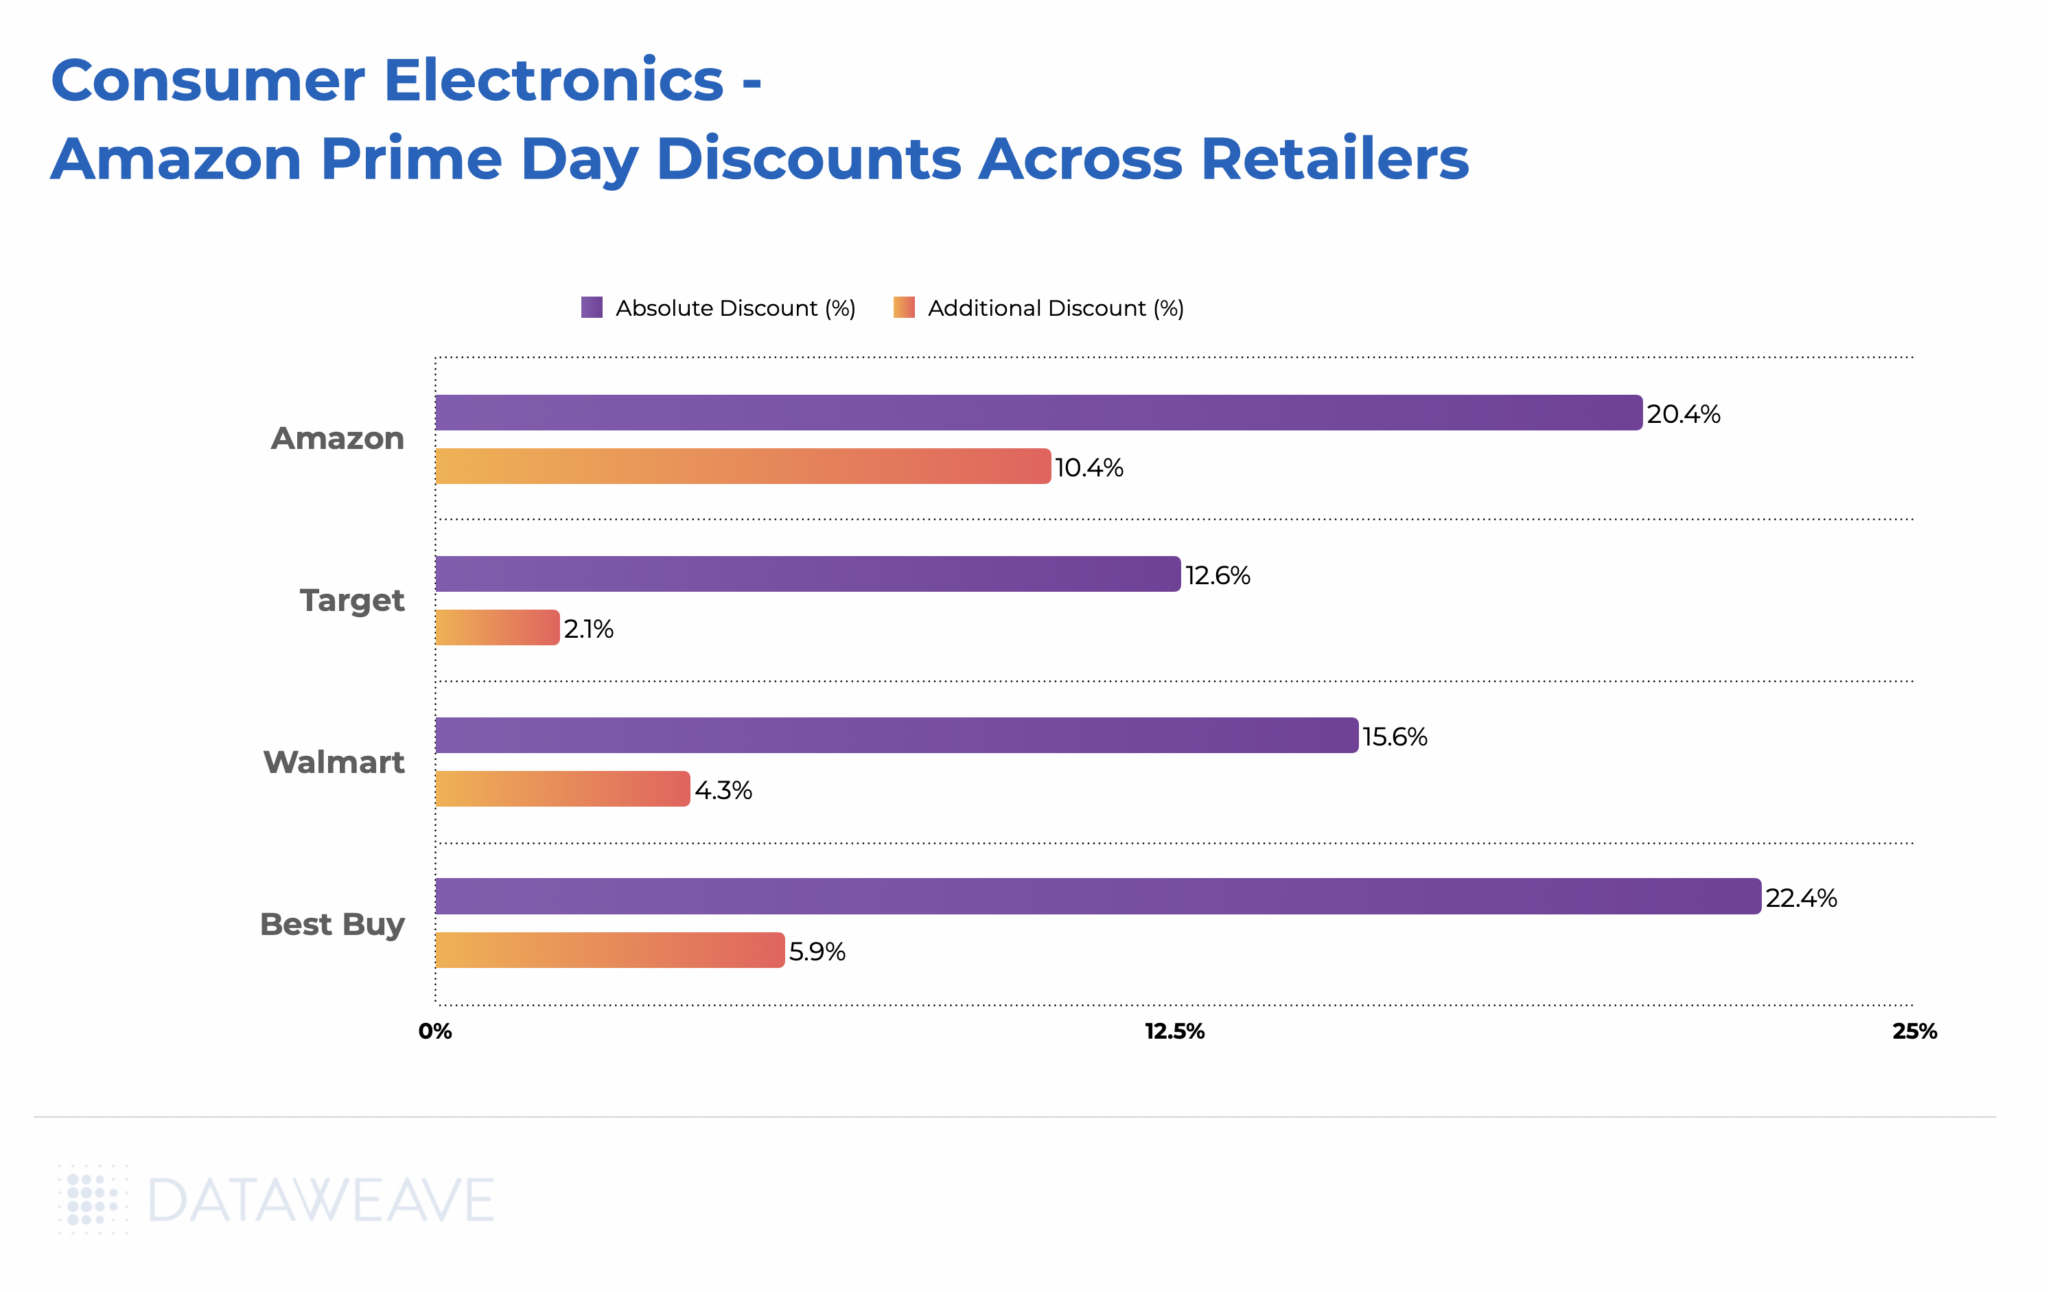
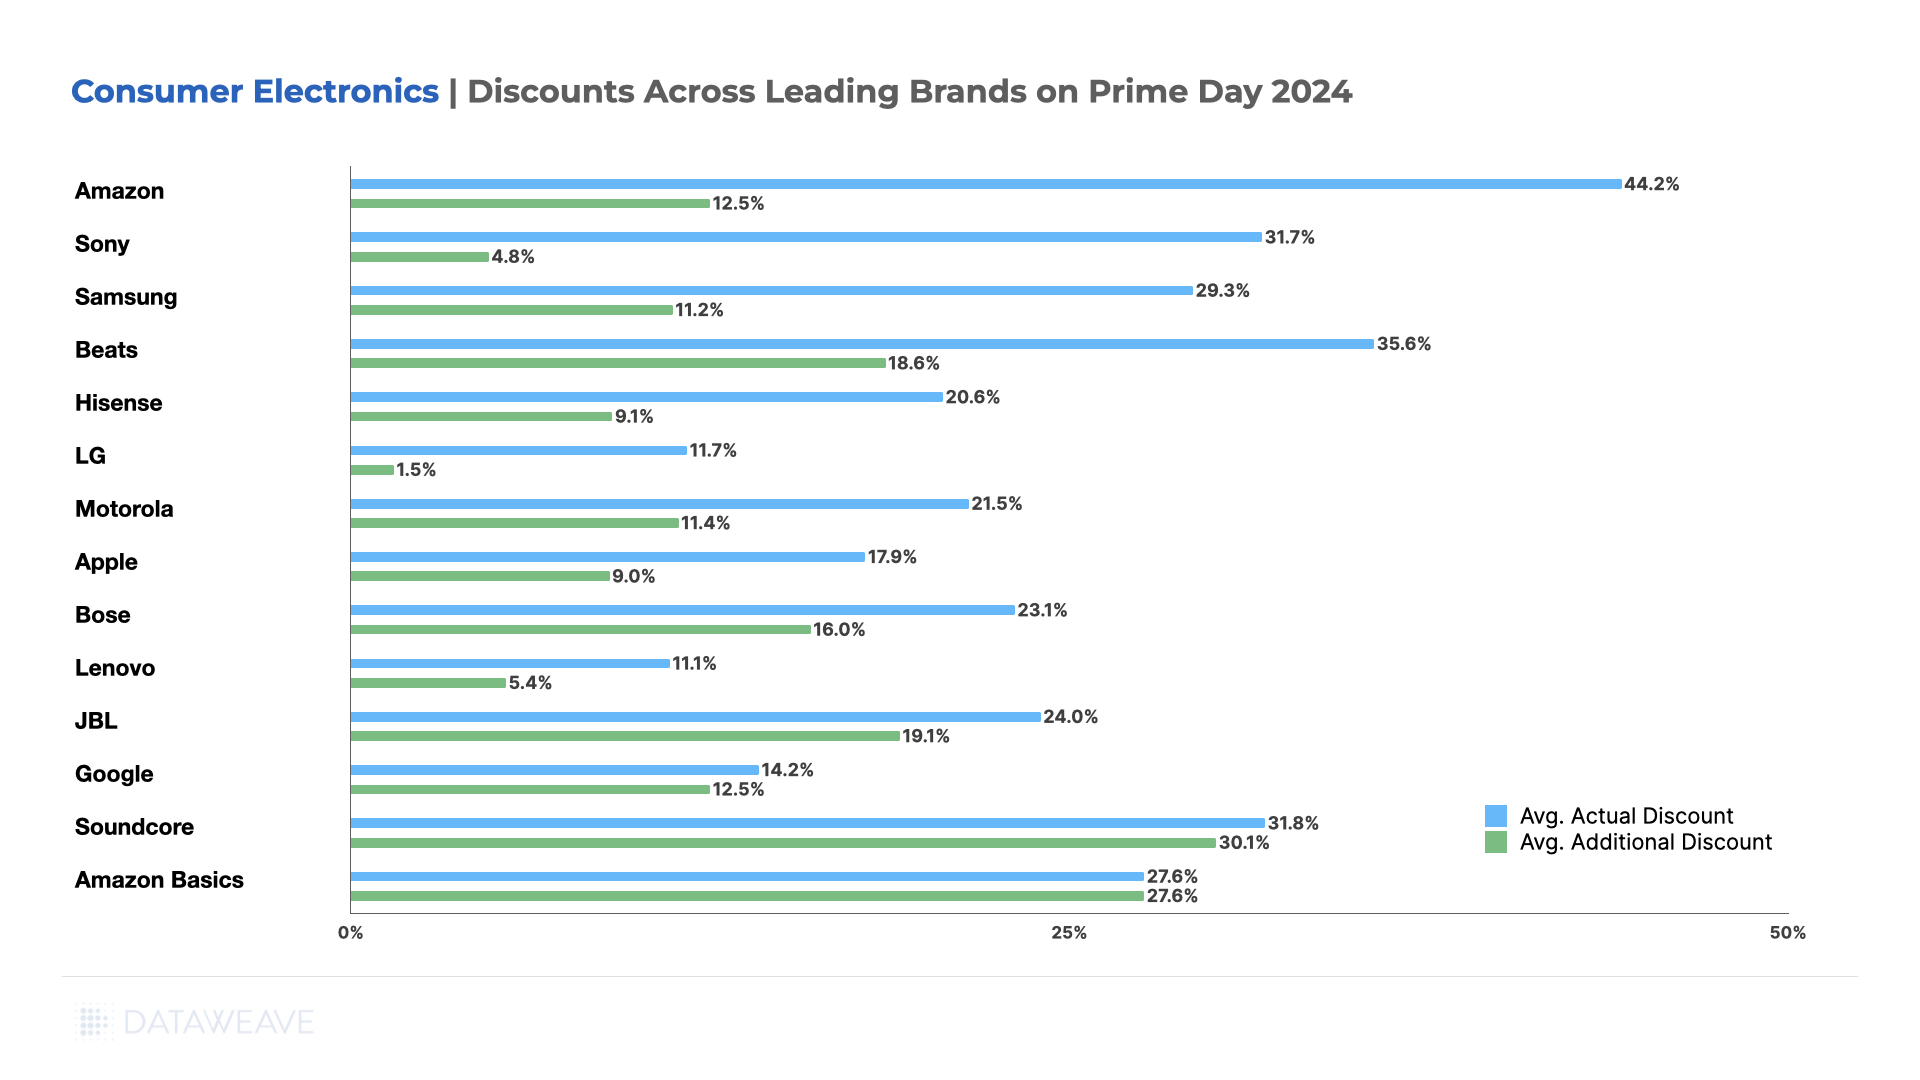
Consumer Electronics
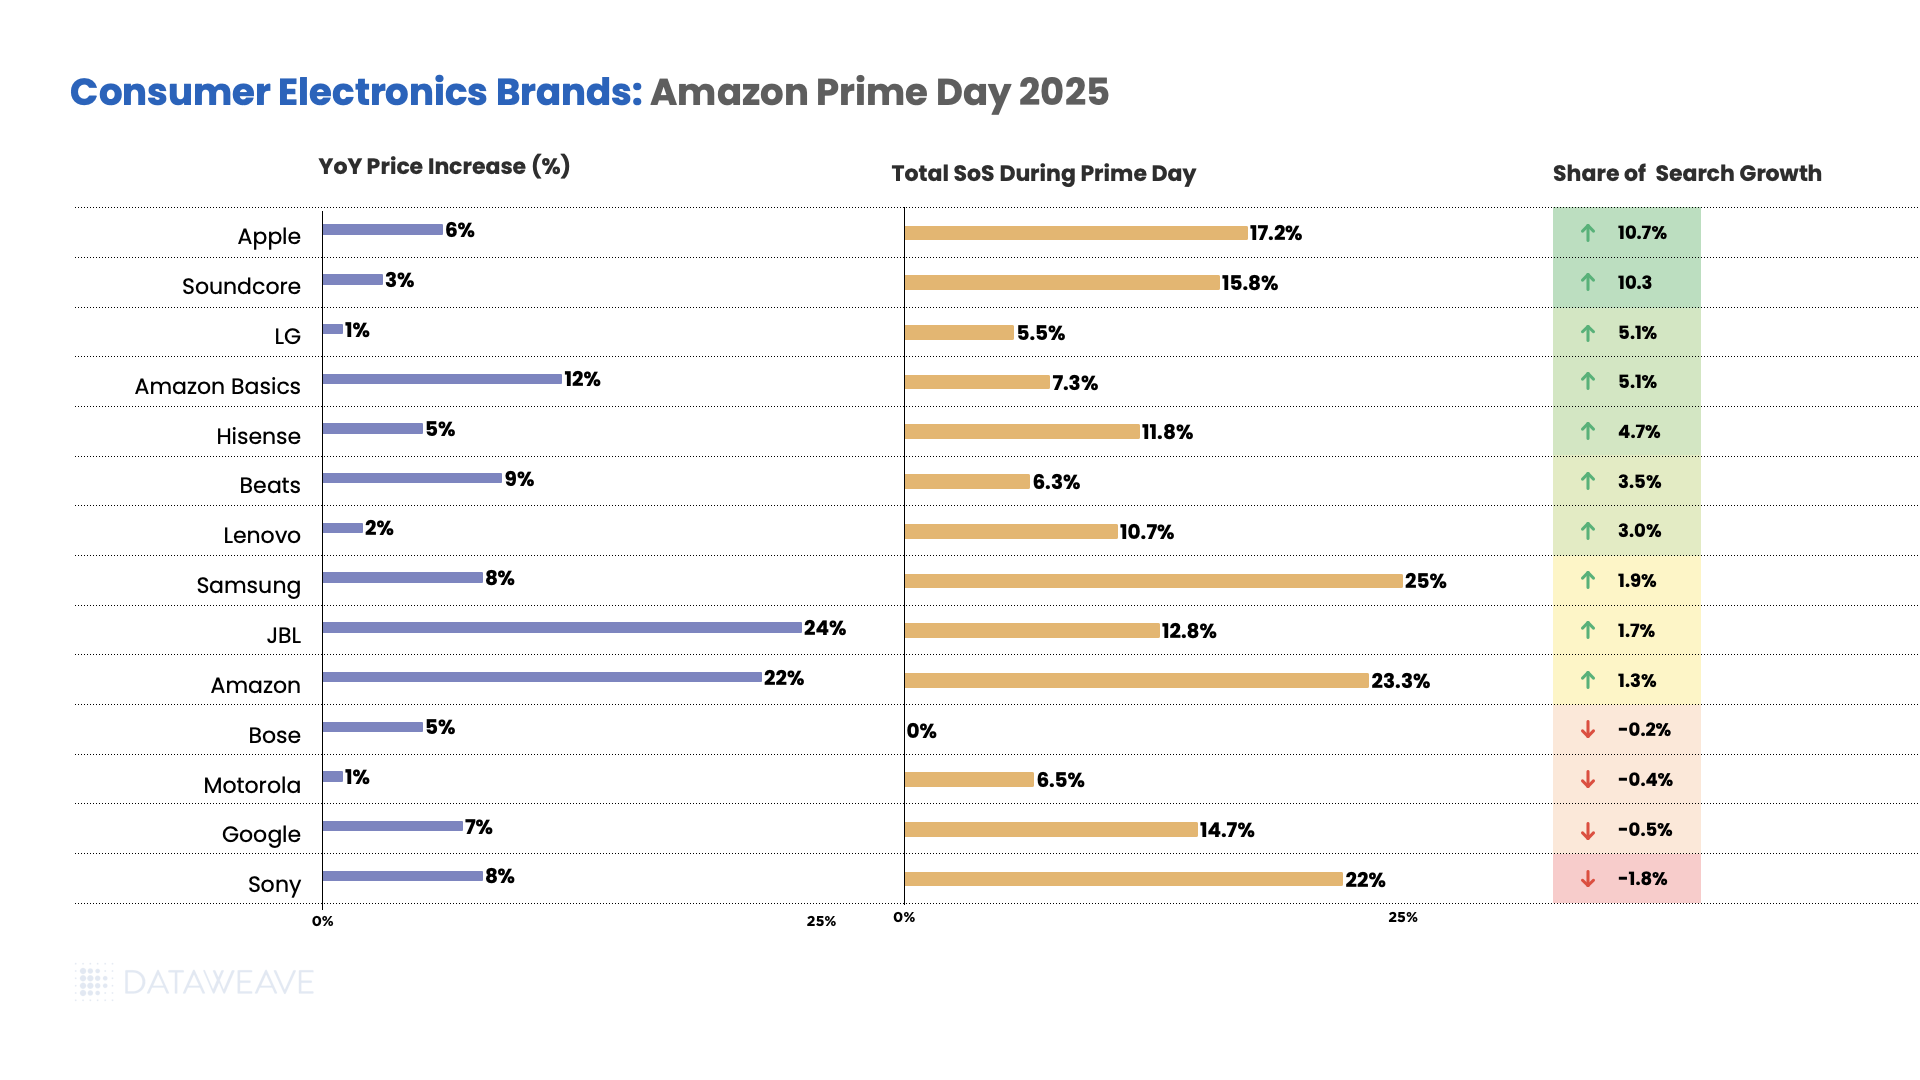
JBL prices increased 24% year-over-year, the highest among major electronics brands.
Amazon’s own brand saw prices increase by 22%.
Beats saw a significant 9% increase, while Sony and Samsung both experienced 8% price increases. Apple prices went up by 6%, and Google saw a 7% increase.
Meanwhile, other established brands like LG and Motorola maintained minimal increases at 1%, Lenovo at 2%, Soundcore at 3%, and Bose and Hisense both at 5%.
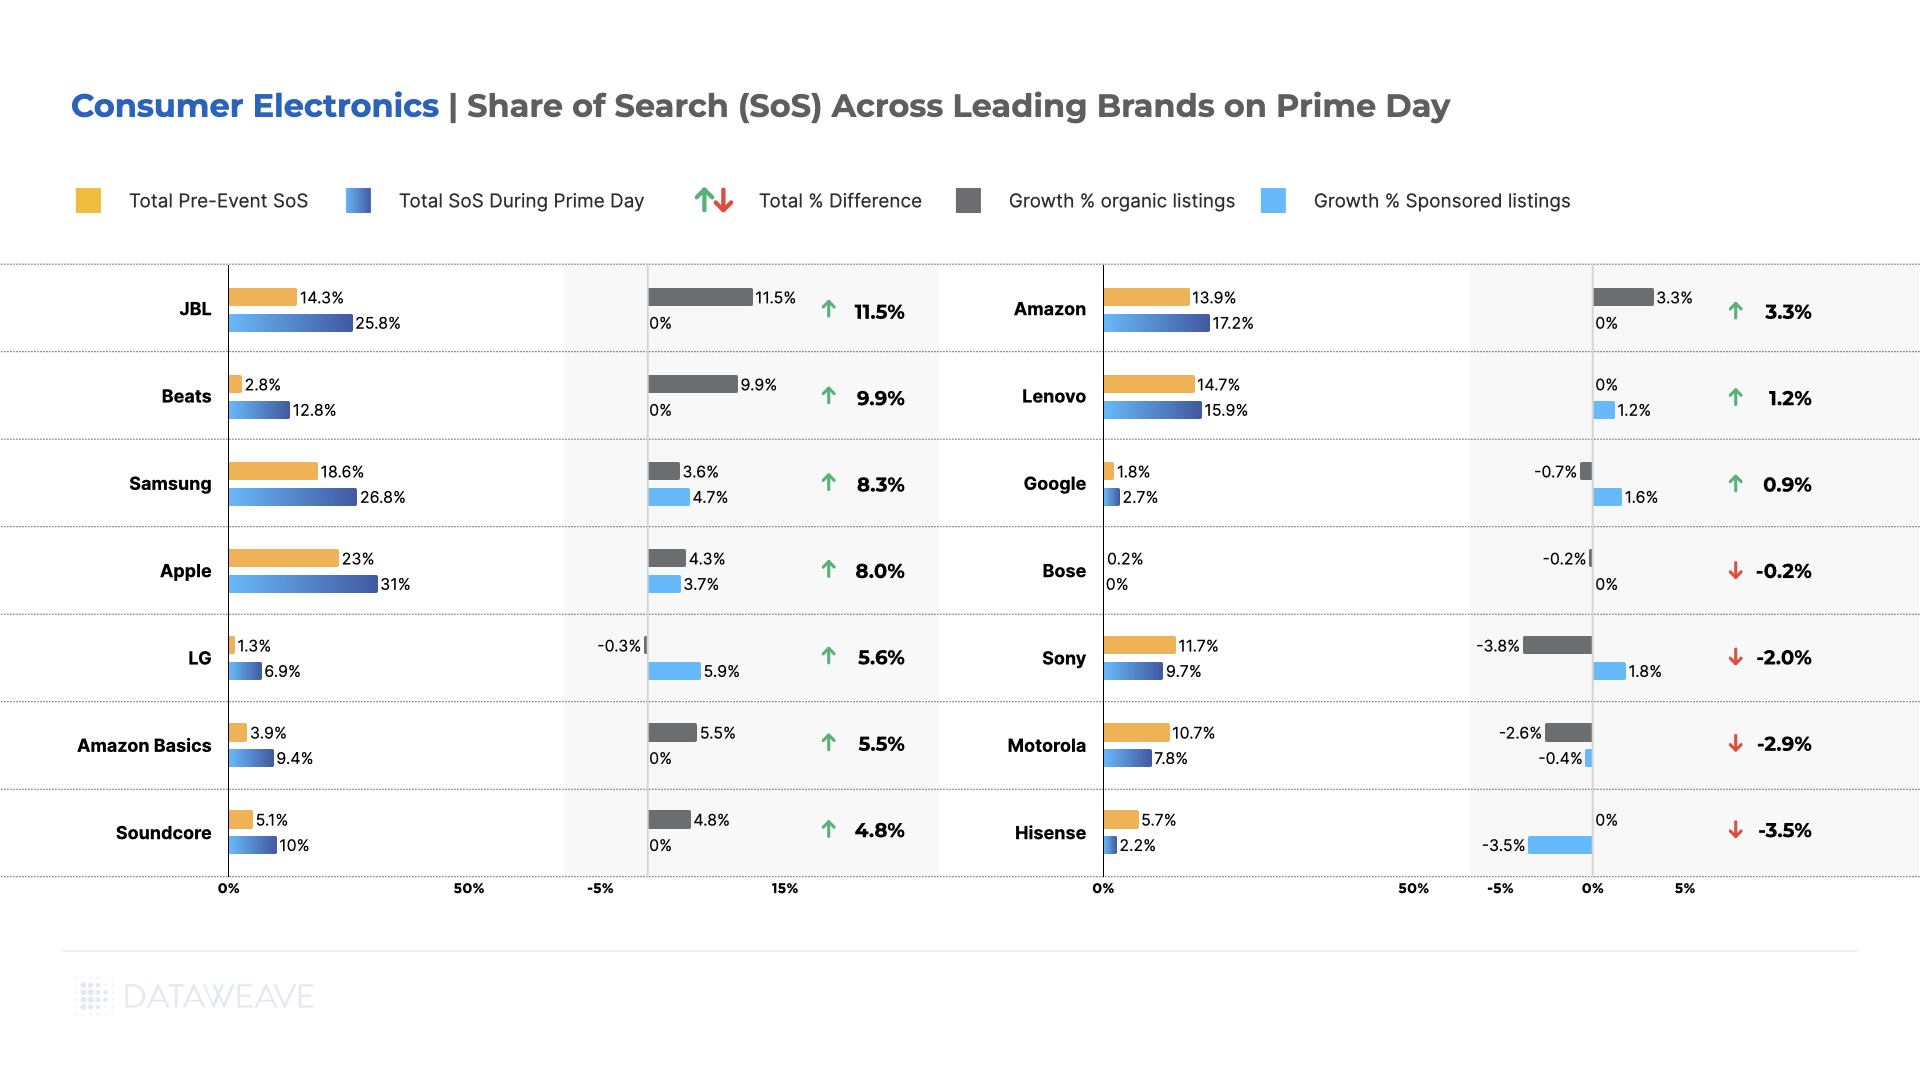
Apple dominated visibility gains, jumping to 17.2% share of search during Prime Day with a 10.7% growth, likely driven by promotional focus on premium devices. Soundcore also saw significant gains of 10.3%, reaching 15.8% share of search.
LG and Amazon Basics both achieved strong 5.1% growth. Hisense gained 4.7% share with 5% price increases. Samsung and Amazon maintained strong positions with modest gains of 1.9% and 1.3% respectively.
However, several brands lost ground, with Sony declining most significantly by 1.8% share despite its strong market position, followed by Google (-0.5%) and Motorola (-0.4%).
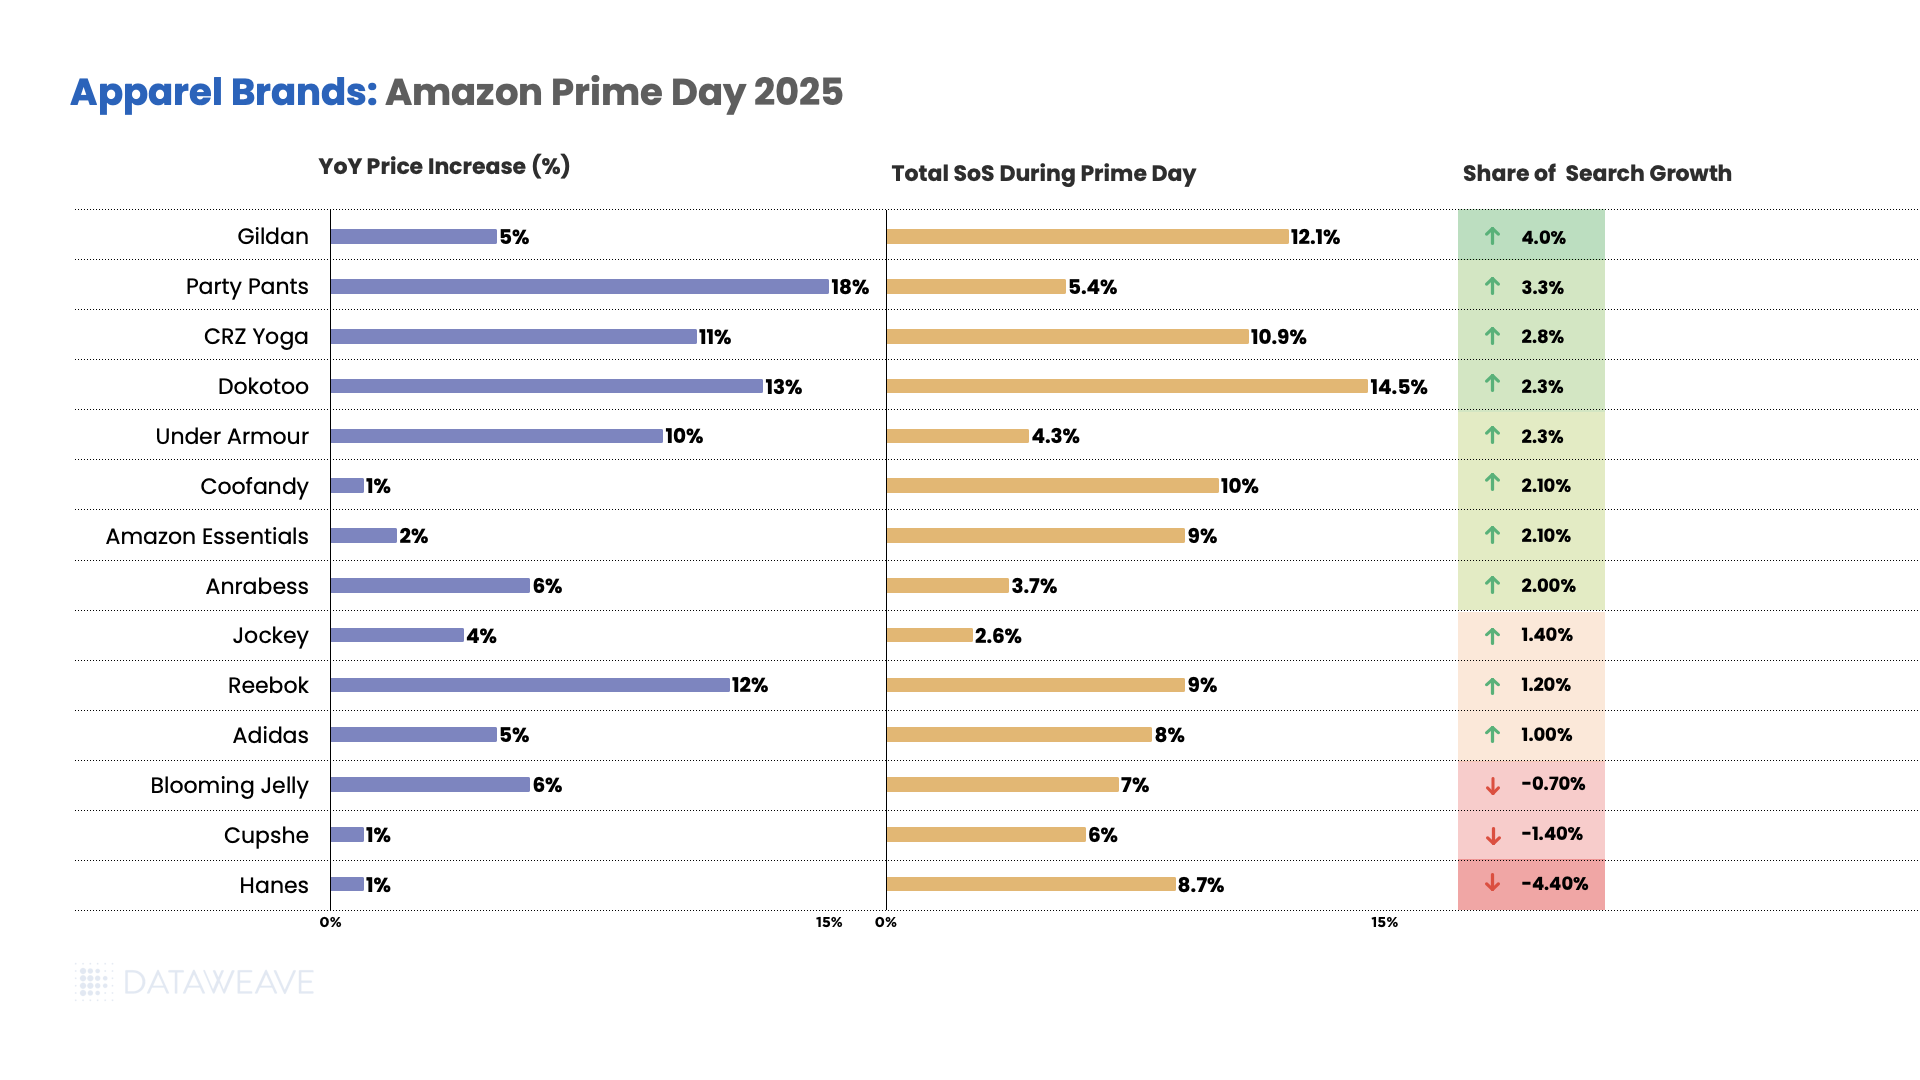
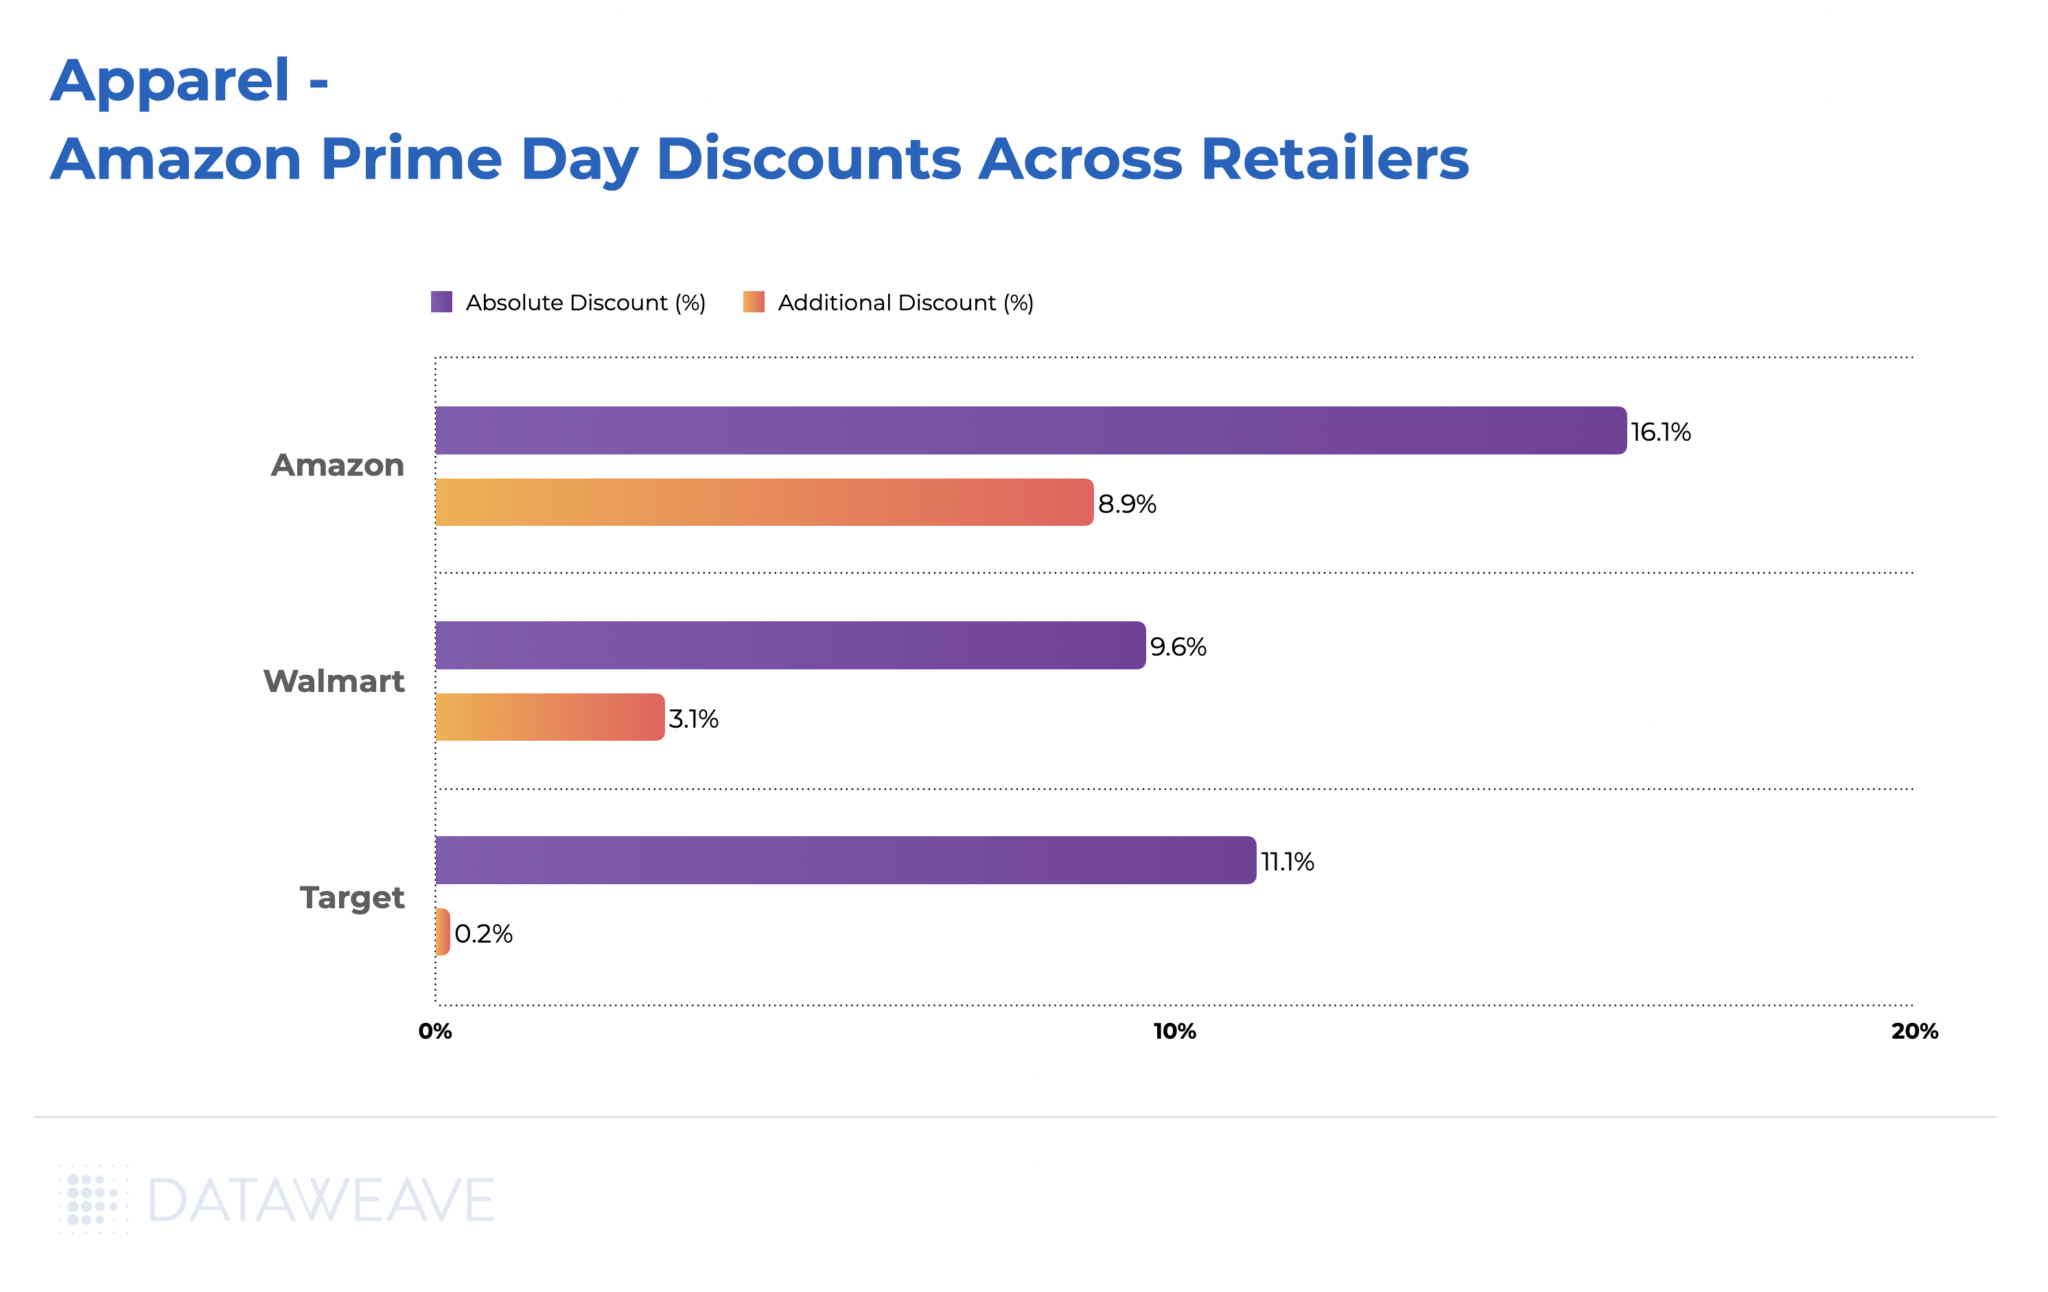
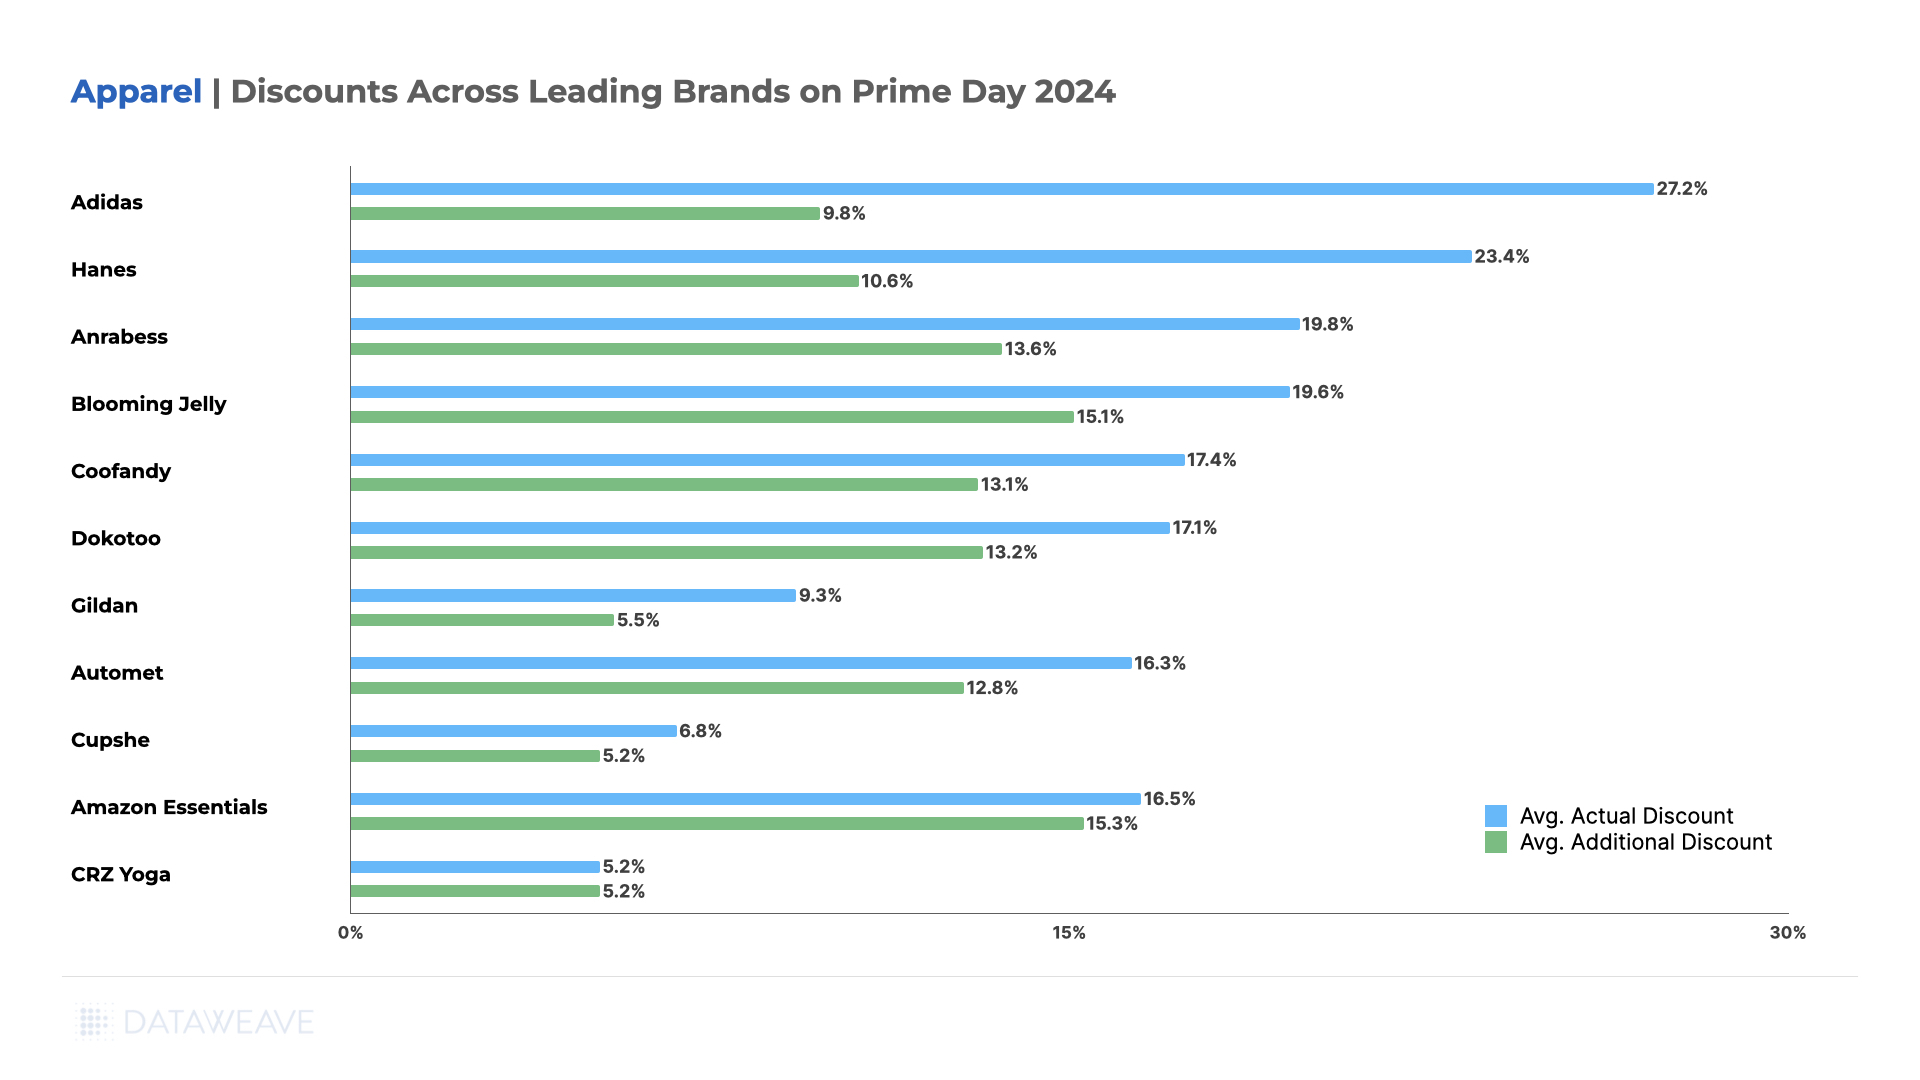
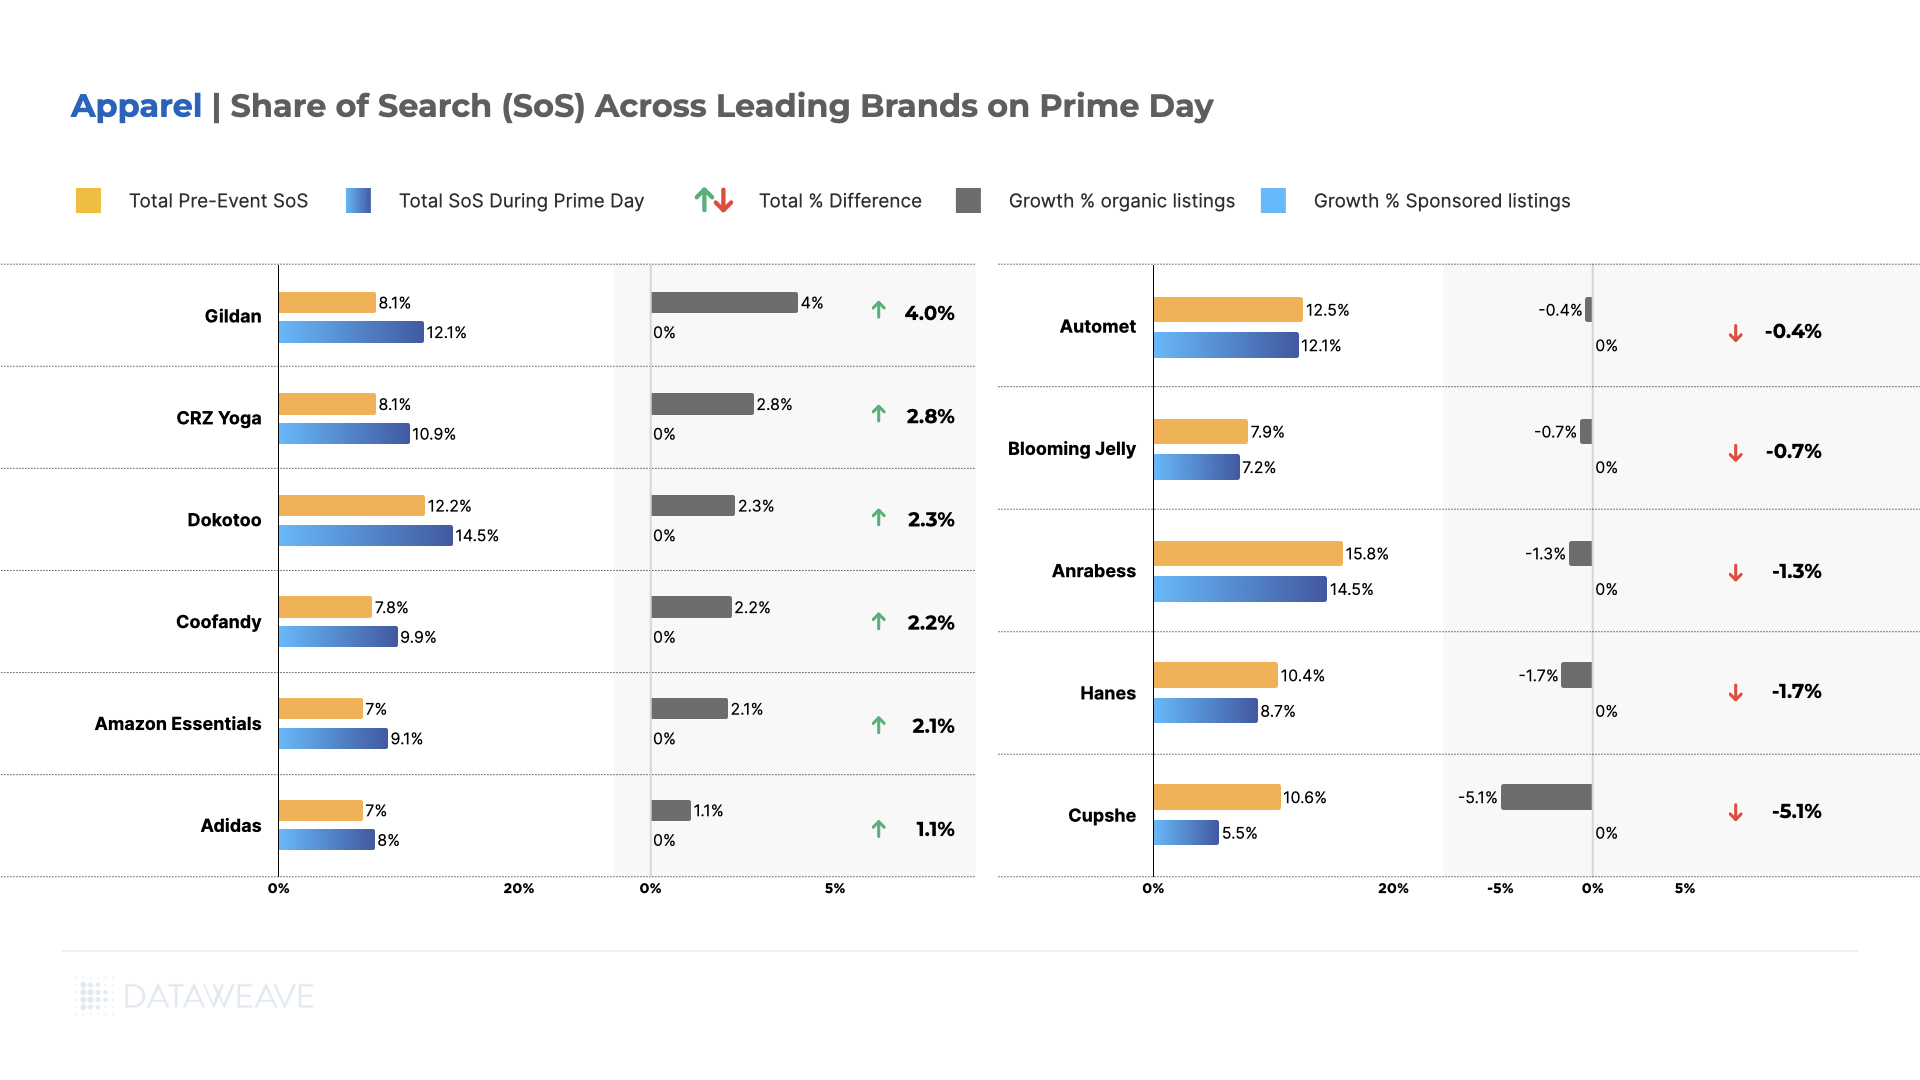
Apparel
Party Pants showed the highest price increases at 18% year-over-year, followed by casual wear brand Dokotoo at 13%.
Athleisure brand CRZ Yoga saw prices increasing by 11%, while Under Armour saw prices rise by 10%.
While Reebok experienced a significant 12% increase, Adidas saw 5% price increase.
Meanwhile, innerwear brands like Hanes and Cupshe saw minimal price increases at 1%, while Coofandy also saw minimal increases of 1%.
Amazon’s own Amazon Essentials maintained minimal price increases of 2%, and Jockey saw modest increases of 4%.
T-shirt brand Gildan led share of search gains with 4.0% growth along with a 5% price increase. Party Pants achieved 3.3% growth with 18% price increases, while CRZ Yoga gained 2.8% share and 11% price increases.
Amazon Essentials and Mens’ apparel brand Coofandy both improved share by 2.1%, with Amazon Essentials keeping price increases to just 2% and Coofandy at 1%. Under Armour gained 2.3% share with 10% price increase.
However, several brands lost ground, with Hanes declining significantly by 4.4% while keeping price increases to just 1%, followed by Cupshe (-1.4%) and Blooming Jelly (-0.7%).
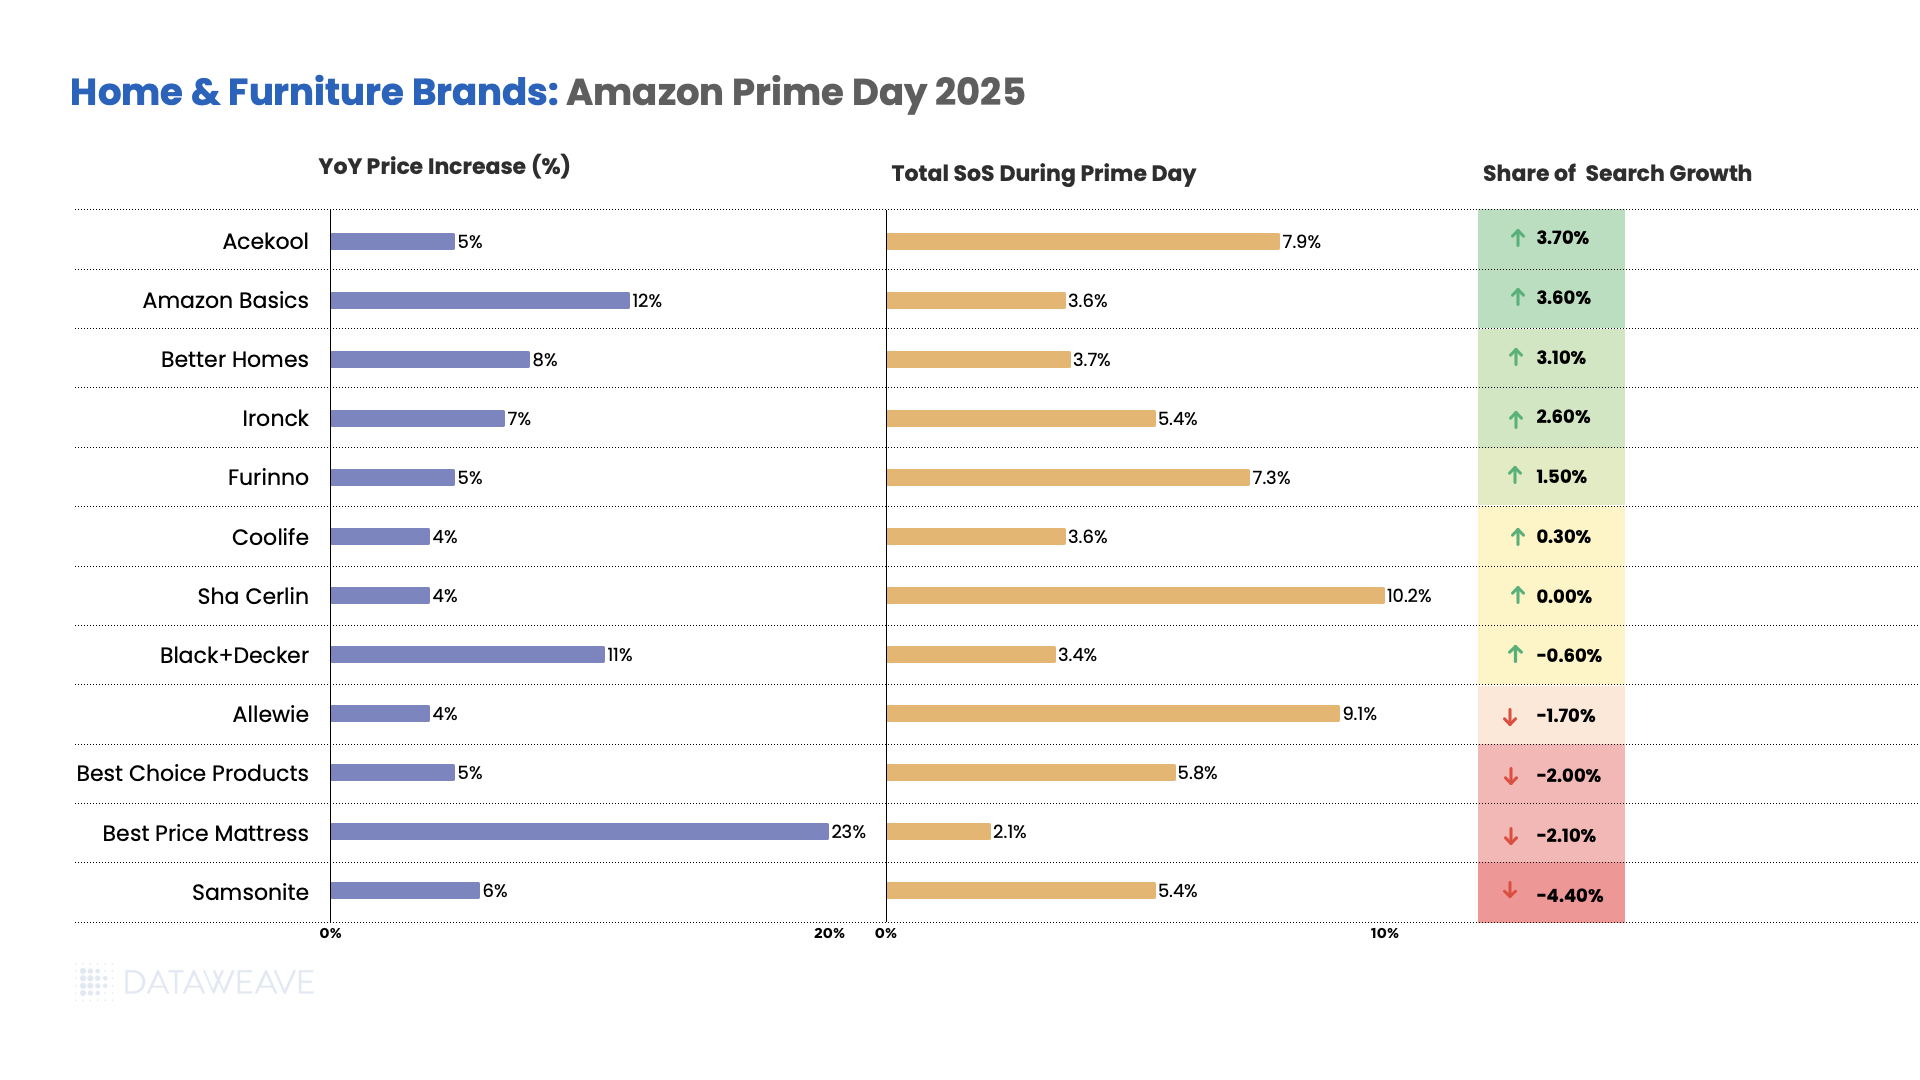
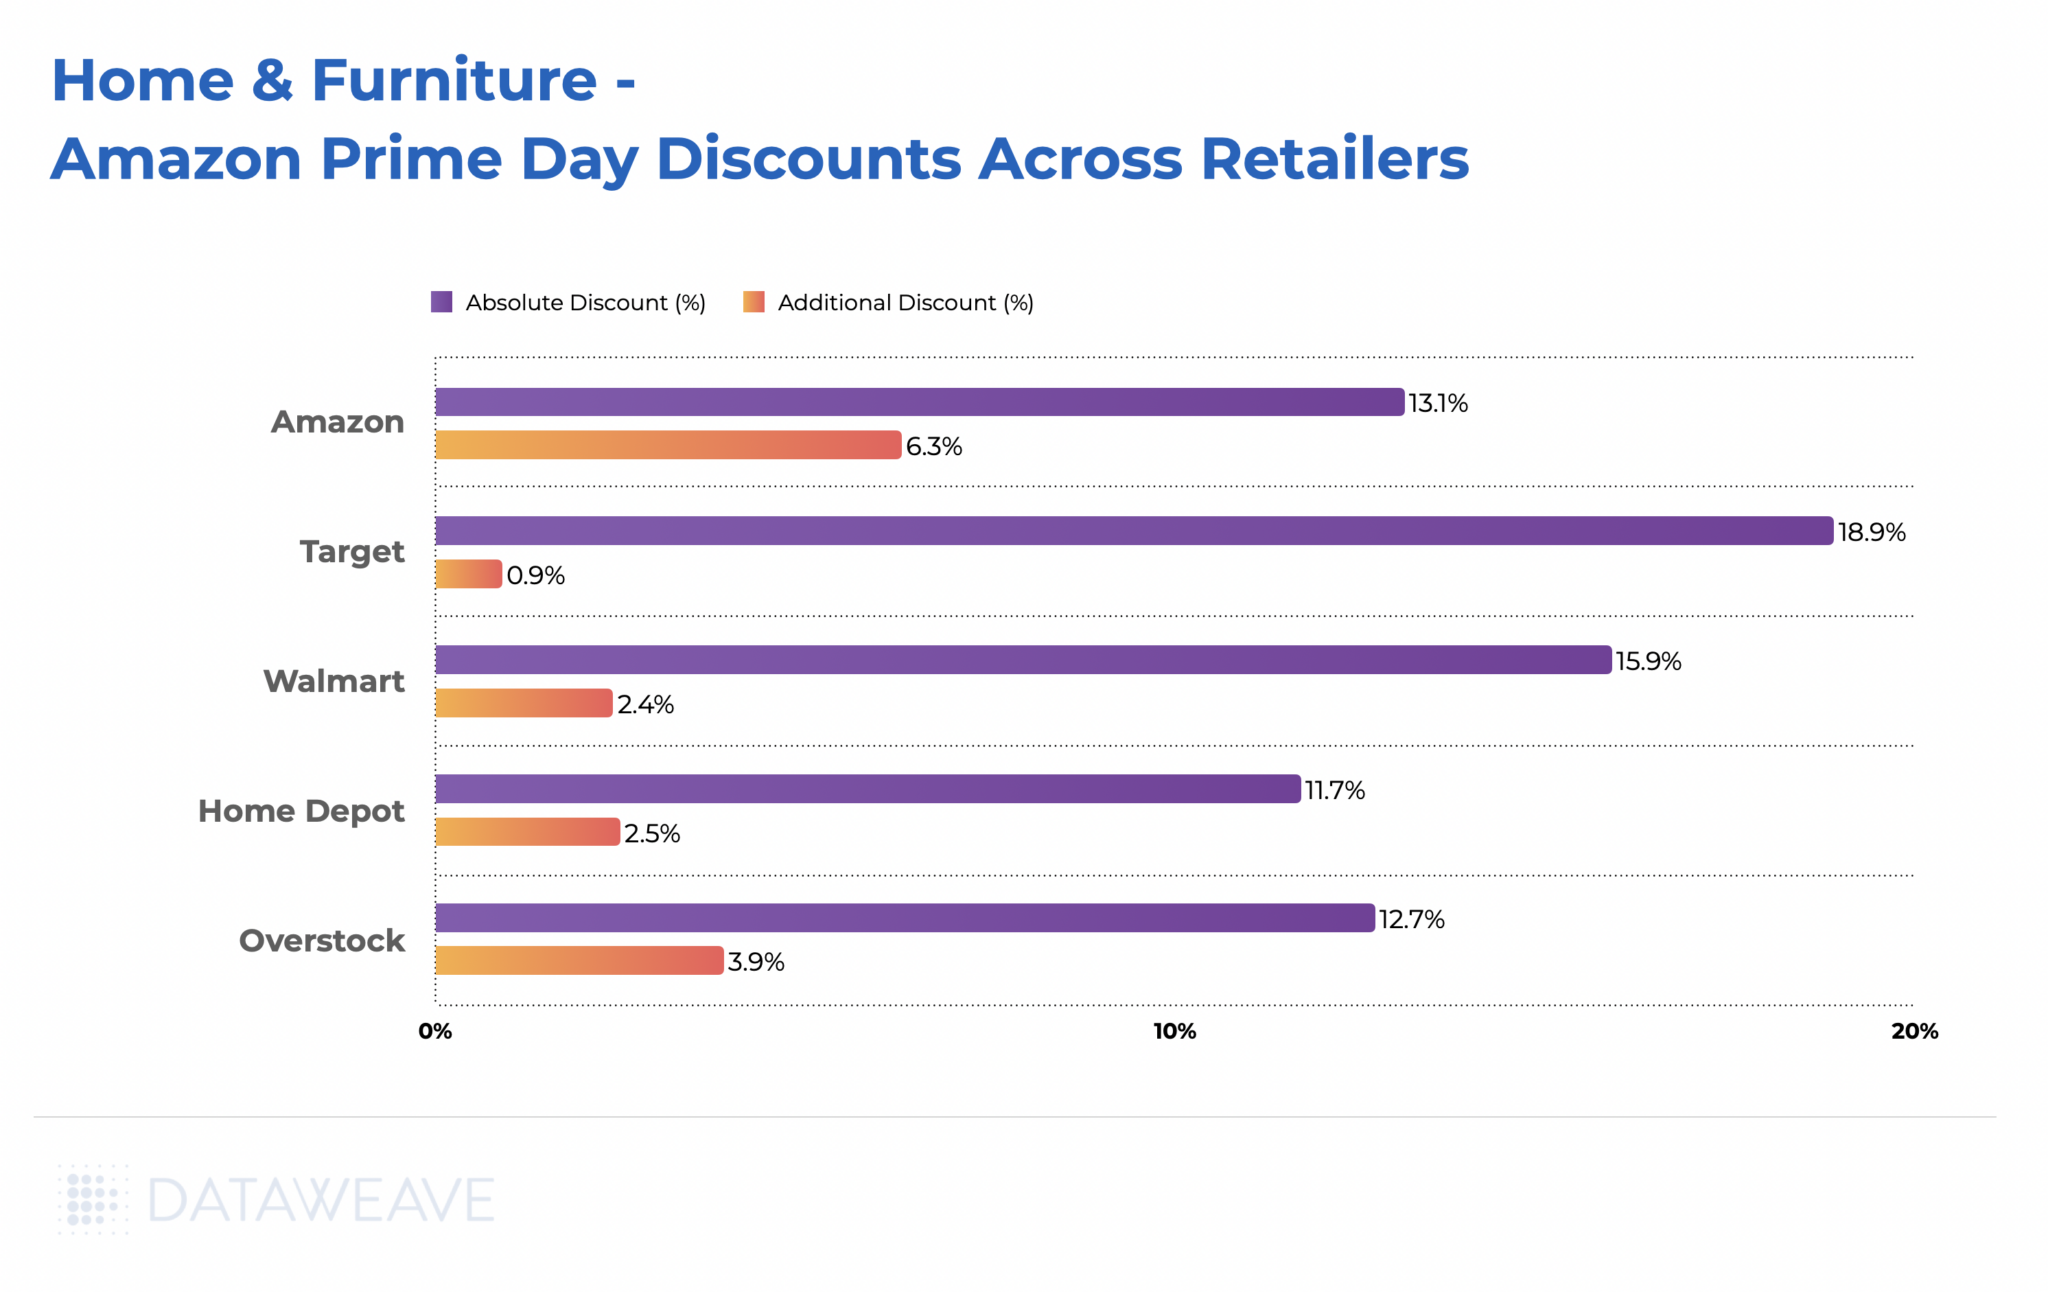
Home & Furniture
Mattress brand Best Price Mattress increased prices 23% year-over-year, the highest in the category.
Home Improvement and Appliances brand Black+Decker saw a pricing increase of 11%.
Better Homes saw an 8% increase, while most other brands saw price increases between 4-7%.
Appliance brand Acekool led visibility gains with 3.7% growth along with a 5% price increase. Amazon Basics improved significantly with a 3.6% share growth alongside its 12% price increases. Better Homes achieved 3.1% gains with 8% price increases.
Ironck gained 2.6% share with 7% price increases, and furniture brand Furinno improved by 1.5% with 5% price increases. However, several brands lost ground, with Samsonite declining most significantly by 4.4%, Best Price Mattress lost 2.1% share with its massive 23% price increase, and Allewie declined by 1.7% with 4% price increases.
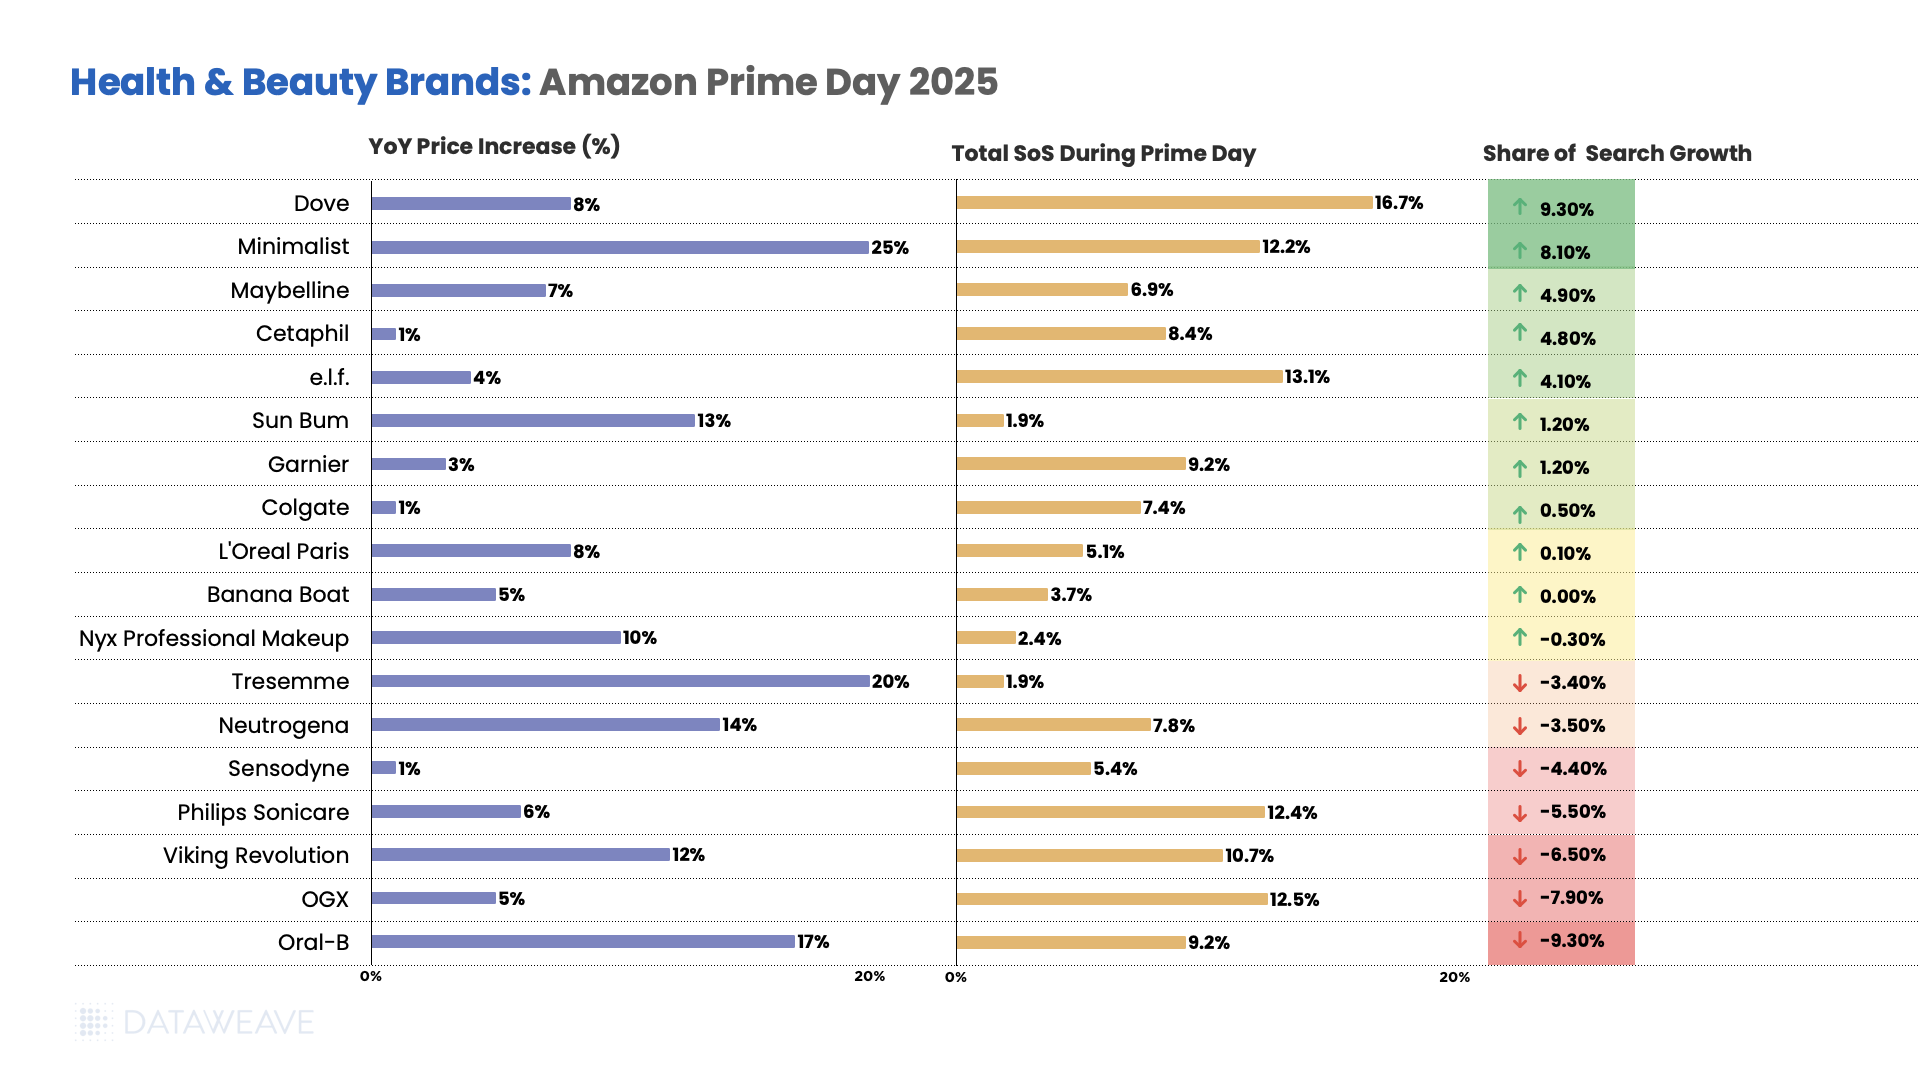
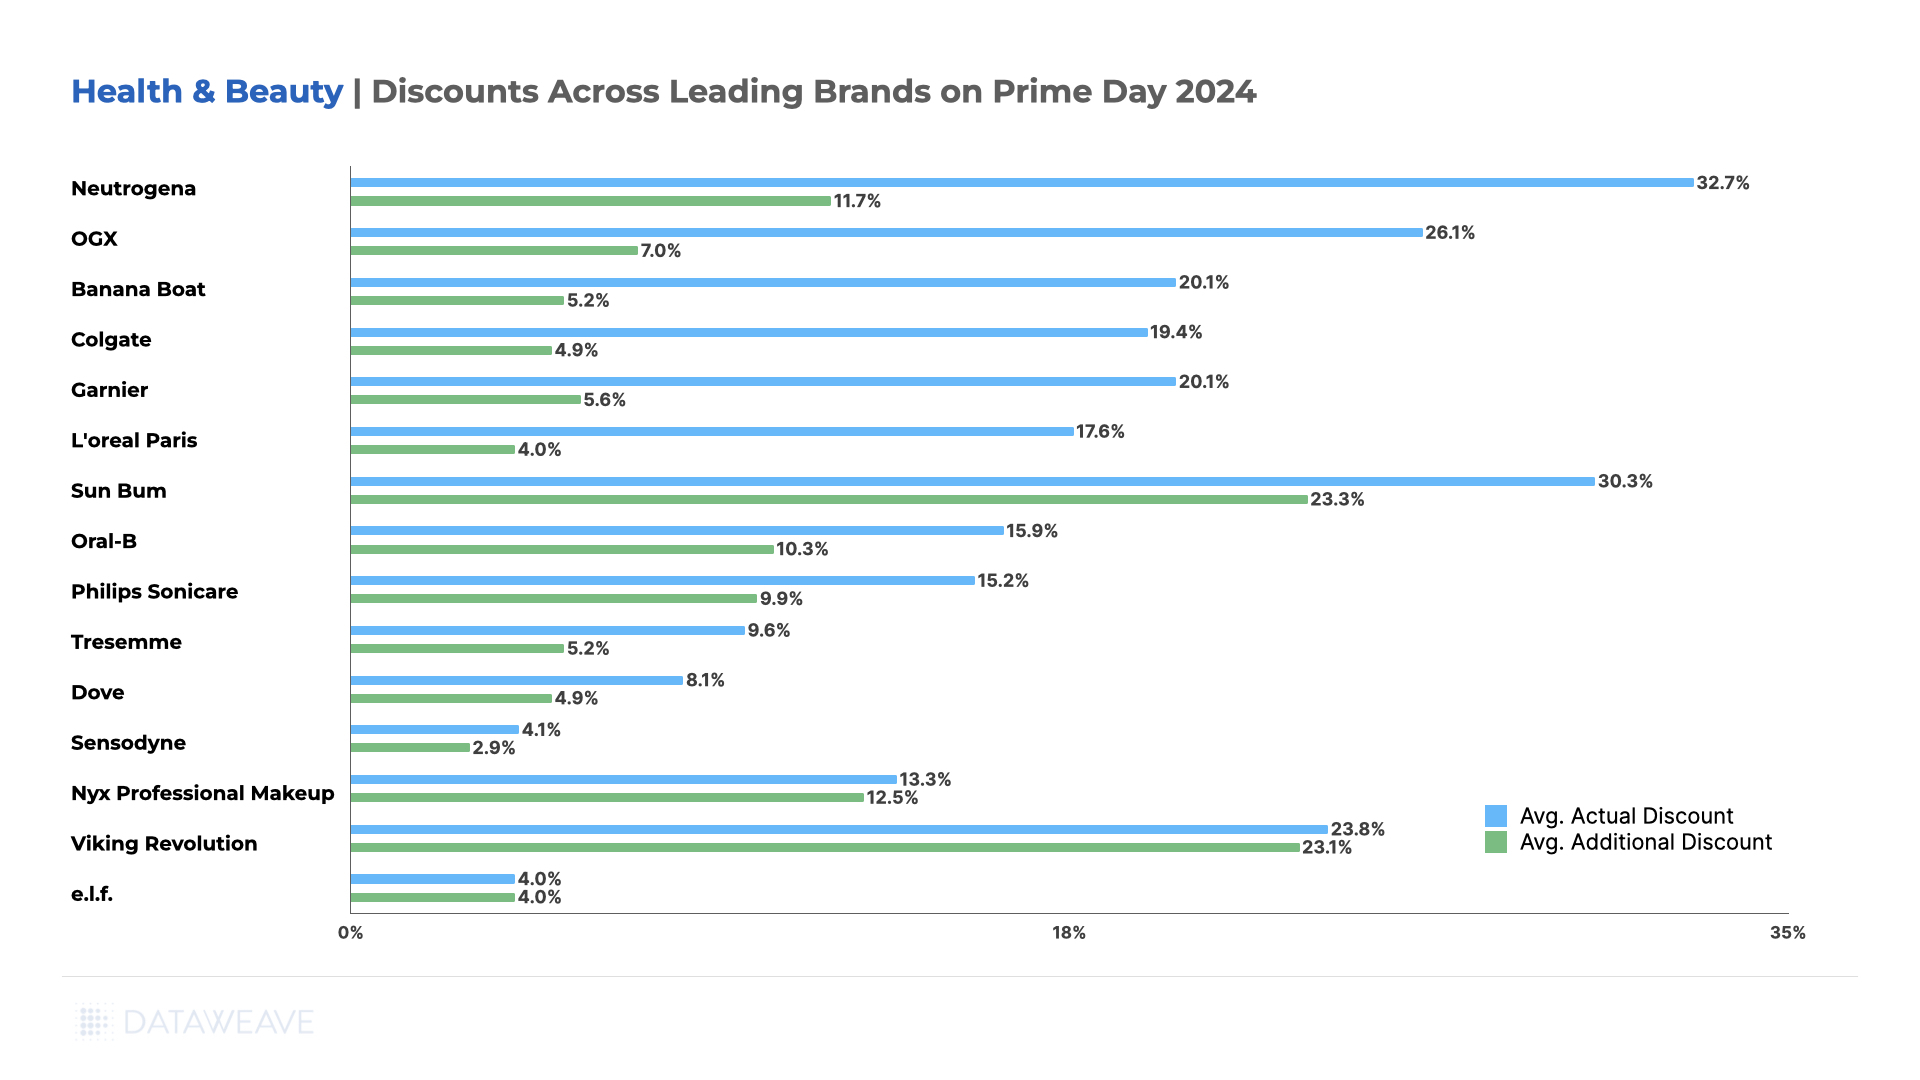
Minimalist saw prices increase 25% year-over-year, the highest in the category, followed by Tresemme at 20% and Oral-B at 17%.
Neutrogena increased pricing by 14%, while Sun Bum rose 13% and Viking Revolution 12%.
Nyx Professional Makeup saw price increases of 10%, Dove and L’Oréal Paris both at 8%, and Maybelline at 7%.
Value-positioned brands saw modest price increases, with Philips Sonicare (6%), OGX and Banana Boat (both 5%), e.l.f. (4%), and Garnier (3%).
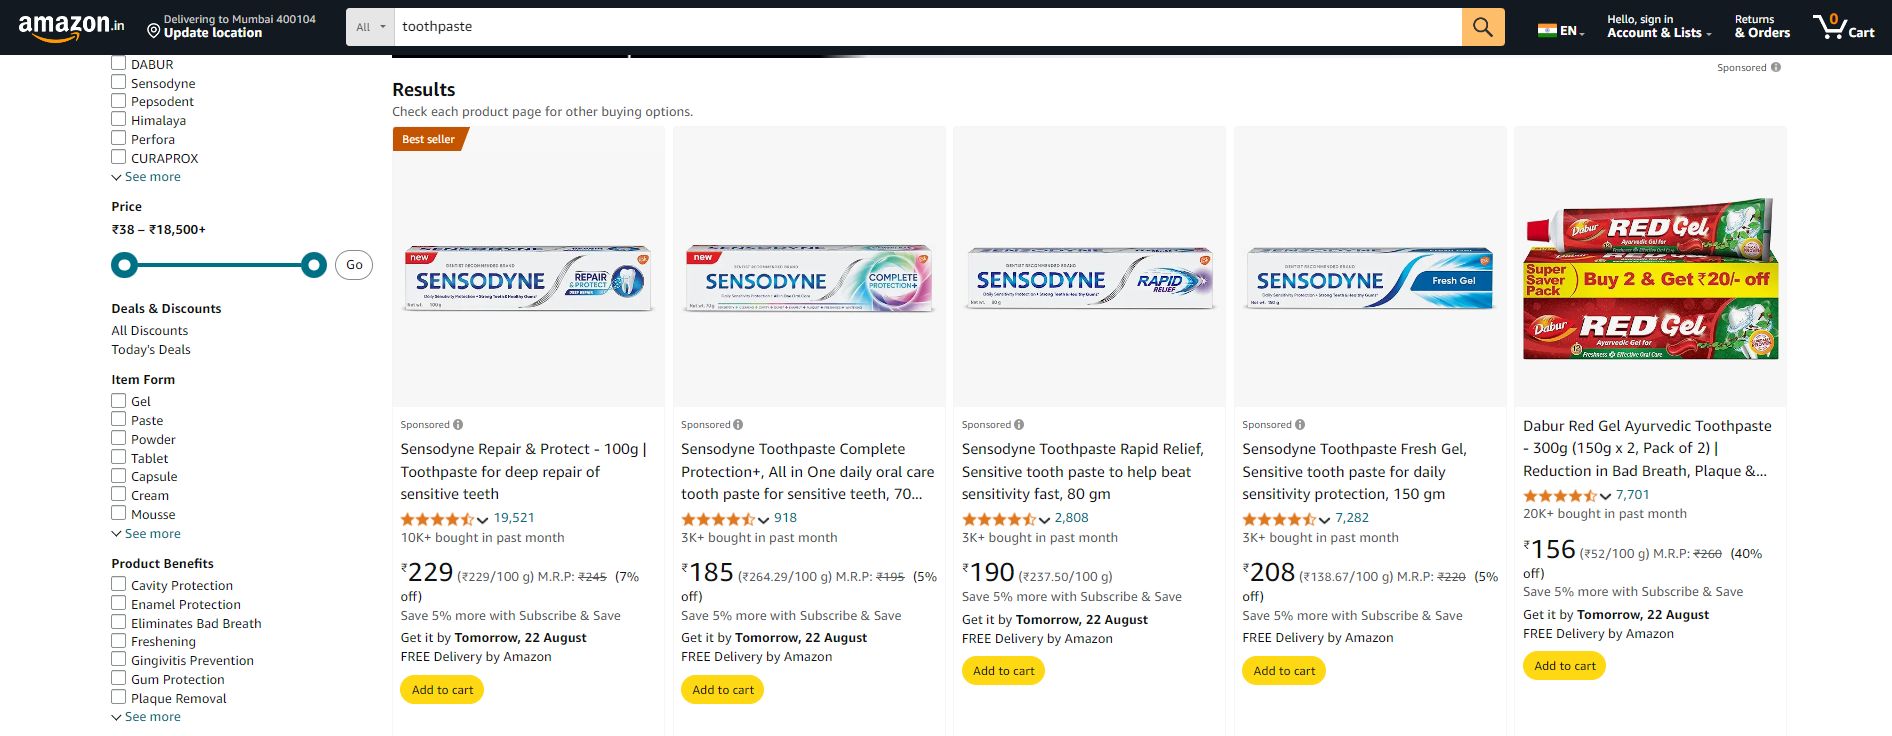
Notably, Cetaphil, Colgate, and Sensodyne all kept increases to just 1%.
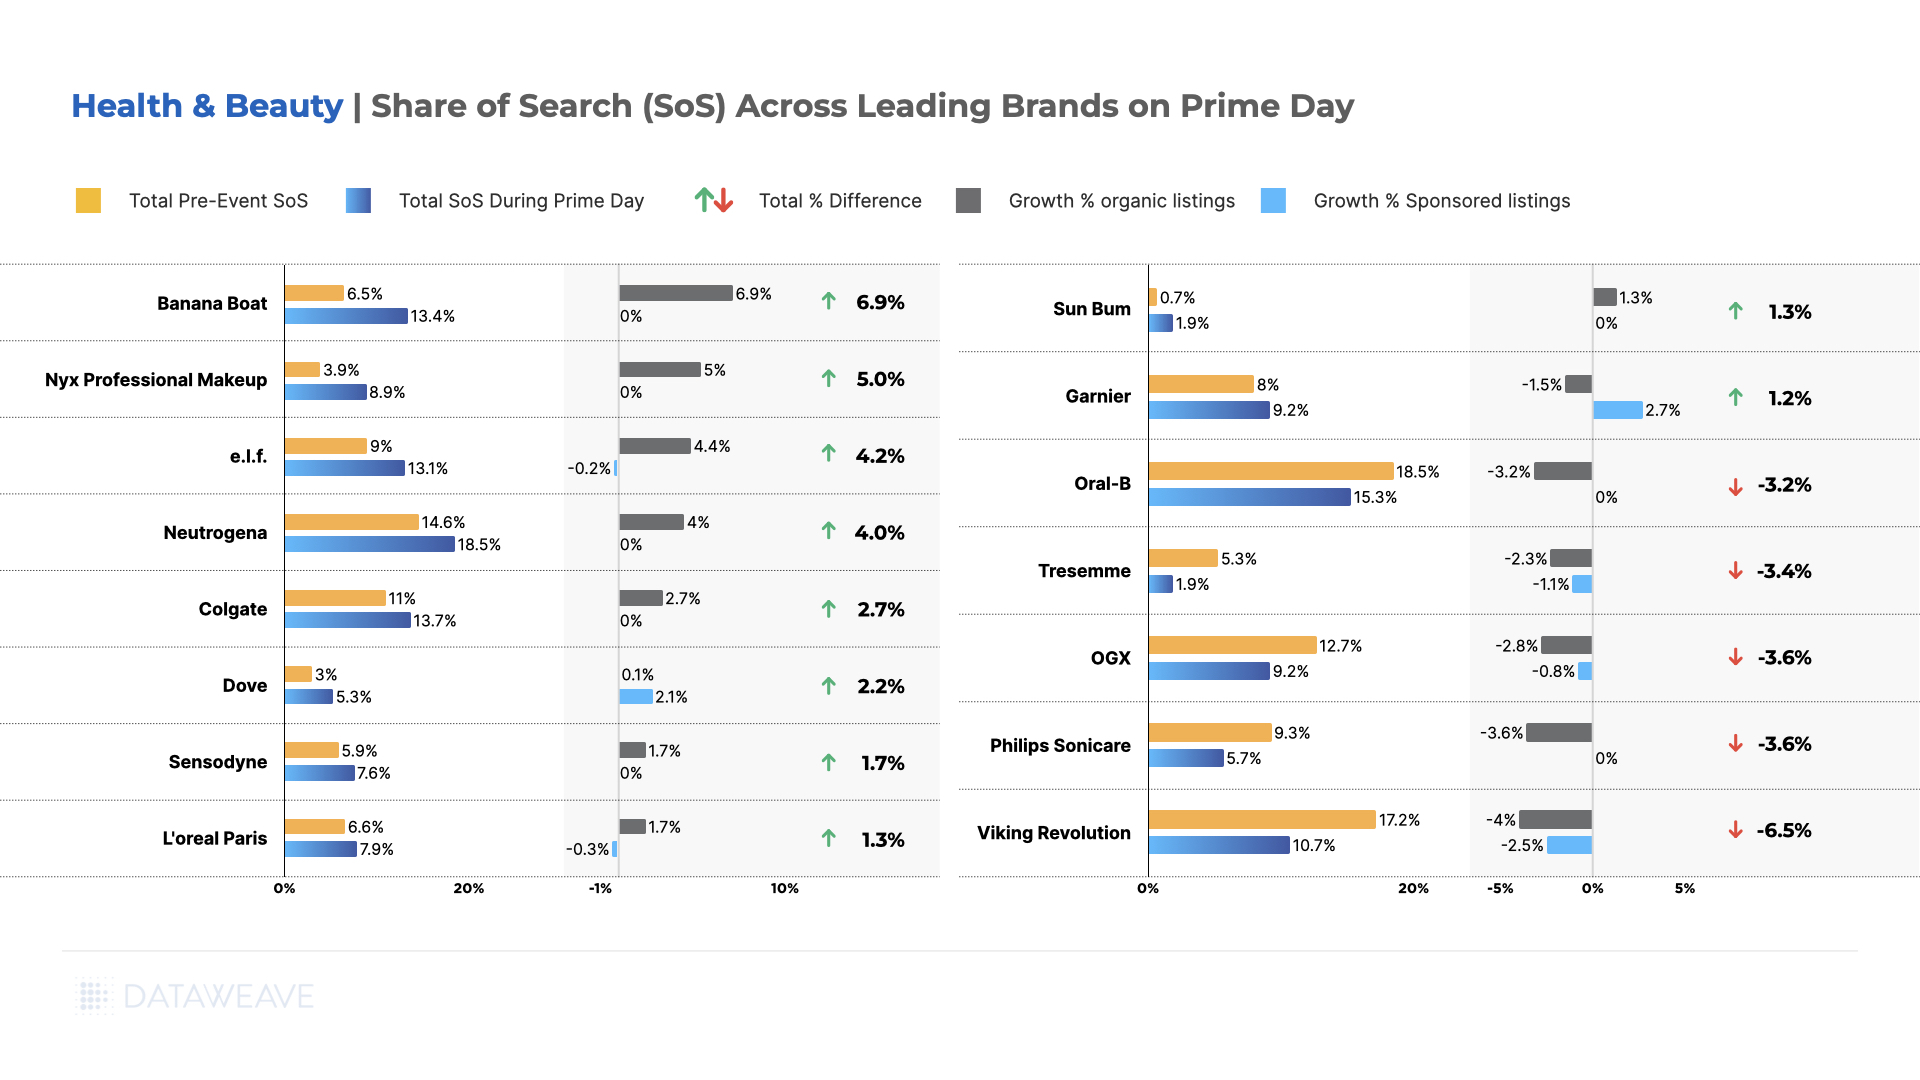
Dove led visibility gains with 9.3% growth along with 8% price increases. Minimalist achieved remarkable 8.1% growth even with the category’s highest 25% price increases, and Maybelline gained 4.9% share with 7% price increases.
Cetaphil improved by 4.8% with minimal 1% price increases, while e.l.f. gained 4.1% share with 4% price increases. However, several established brands lost share, with Oral-B declining most significantly by 9.3% along with 17% price increases, followed by OGX (-7.9%) with 5% price increases, Viking Revolution (-6.5%) with 12% increases, and Philips Sonicare (-5.5%) with 6% price increases.
In Conclusion
Prime Day 2025 underscores the shifting realities of retail, where persistent pricing pressures, evolving consumer behavior, and complex market forces are redefining how promotions are planned and executed. In this environment, success hinges on having the right intelligence at the right time, empowering brands to target promotions strategically, protect margins, and maintain visibility in a crowded marketplace.
As competition intensifies, the ability to anticipate trends and respond with precision will separate market leaders from the rest. At DataWeave, we equip retailers and brands with the insights needed to navigate these changes and make data-backed decisions that drive sustainable growth.
Stay connected to our blog for ongoing analysis of pricing, promotion, and visibility trends or reach out to us today to learn more.
Tariffs can spike landed costs overnight, regulations rewrite labelling rules, and competitors slash prices before your team finishes its daily stand-up. And yet, some consumer brands thrive.
The winning brands see changes early, decide quickly, and execute flawlessly across the digital shelf. This post blends three decades of pricing and merchandising expertise with timely digital shelf insights from DataWeave, offering a clear path forward for brands navigating today’s volatile retail environment.
From Cost Shock to Chronic Uncertainty
Tariffs are no longer just one-off headlines; they’ve become an unpredictable, ongoing variable in the global marketplace. The true challenge isn’t always the duty rate itself, but the constant whiplash of not knowing if, when, or how much that duty will change. This pervasive uncertainty is having a tangible impact:
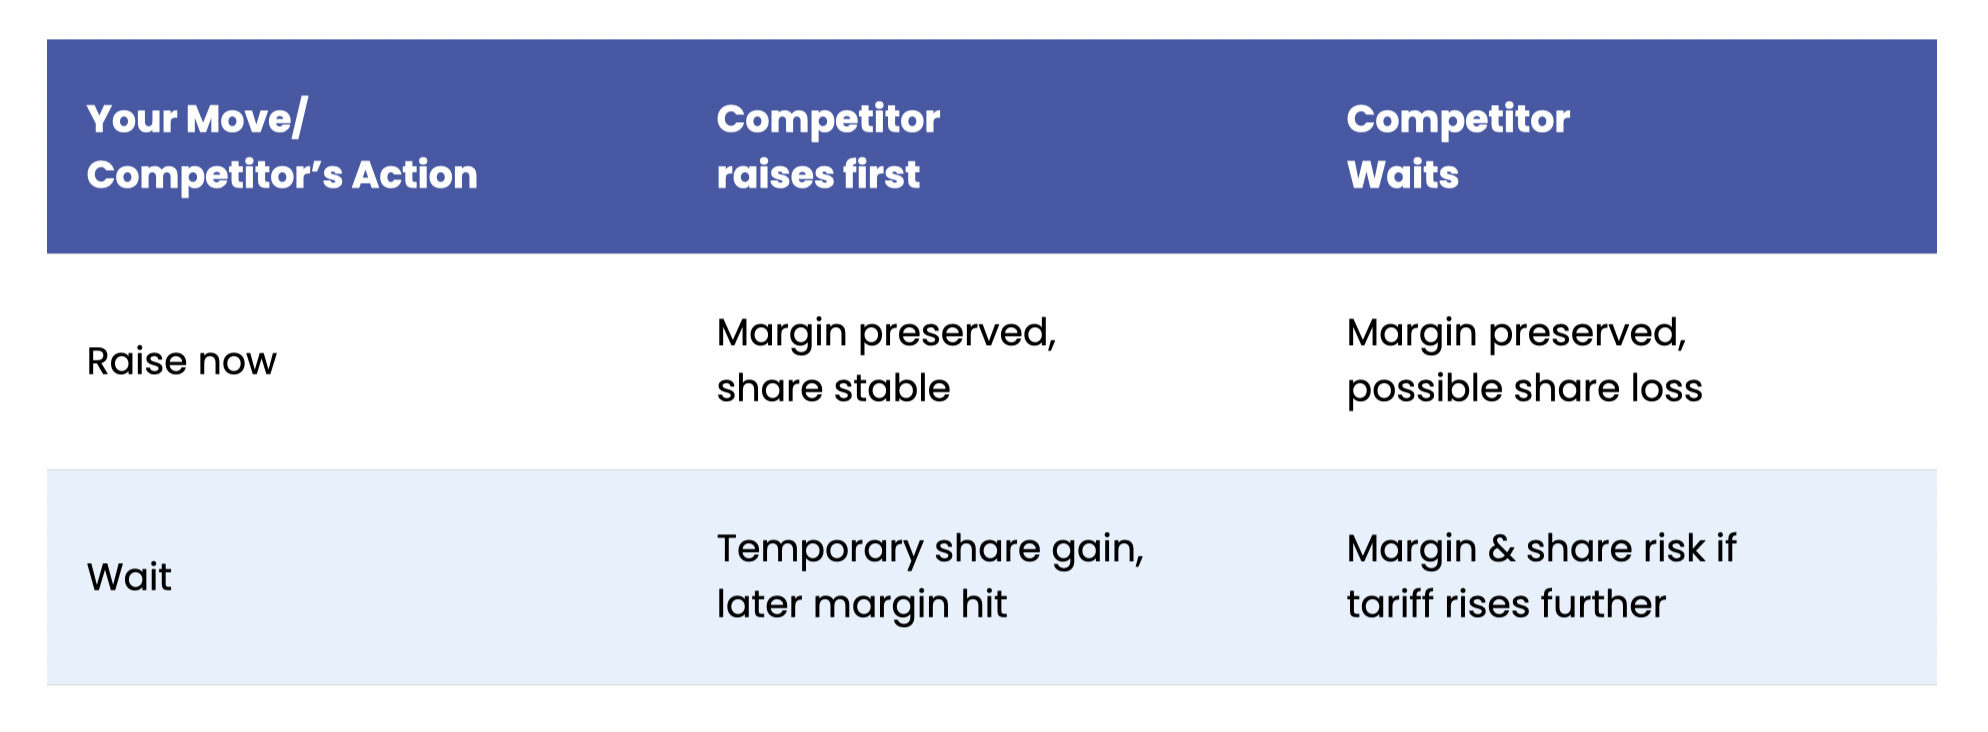
Unpredictable Competitive Response: Delaying price moves while watching competitors can erode margins as much as tariffs.
To stay ahead, pricing decisions must be stress-tested against multiple tariff scenarios and aligned with likely competitor reactions. Timing matters as much as accuracy, move too soon or too late, and margins suffer either way.
The Tariff Math No One Can Afford to Get Wrong
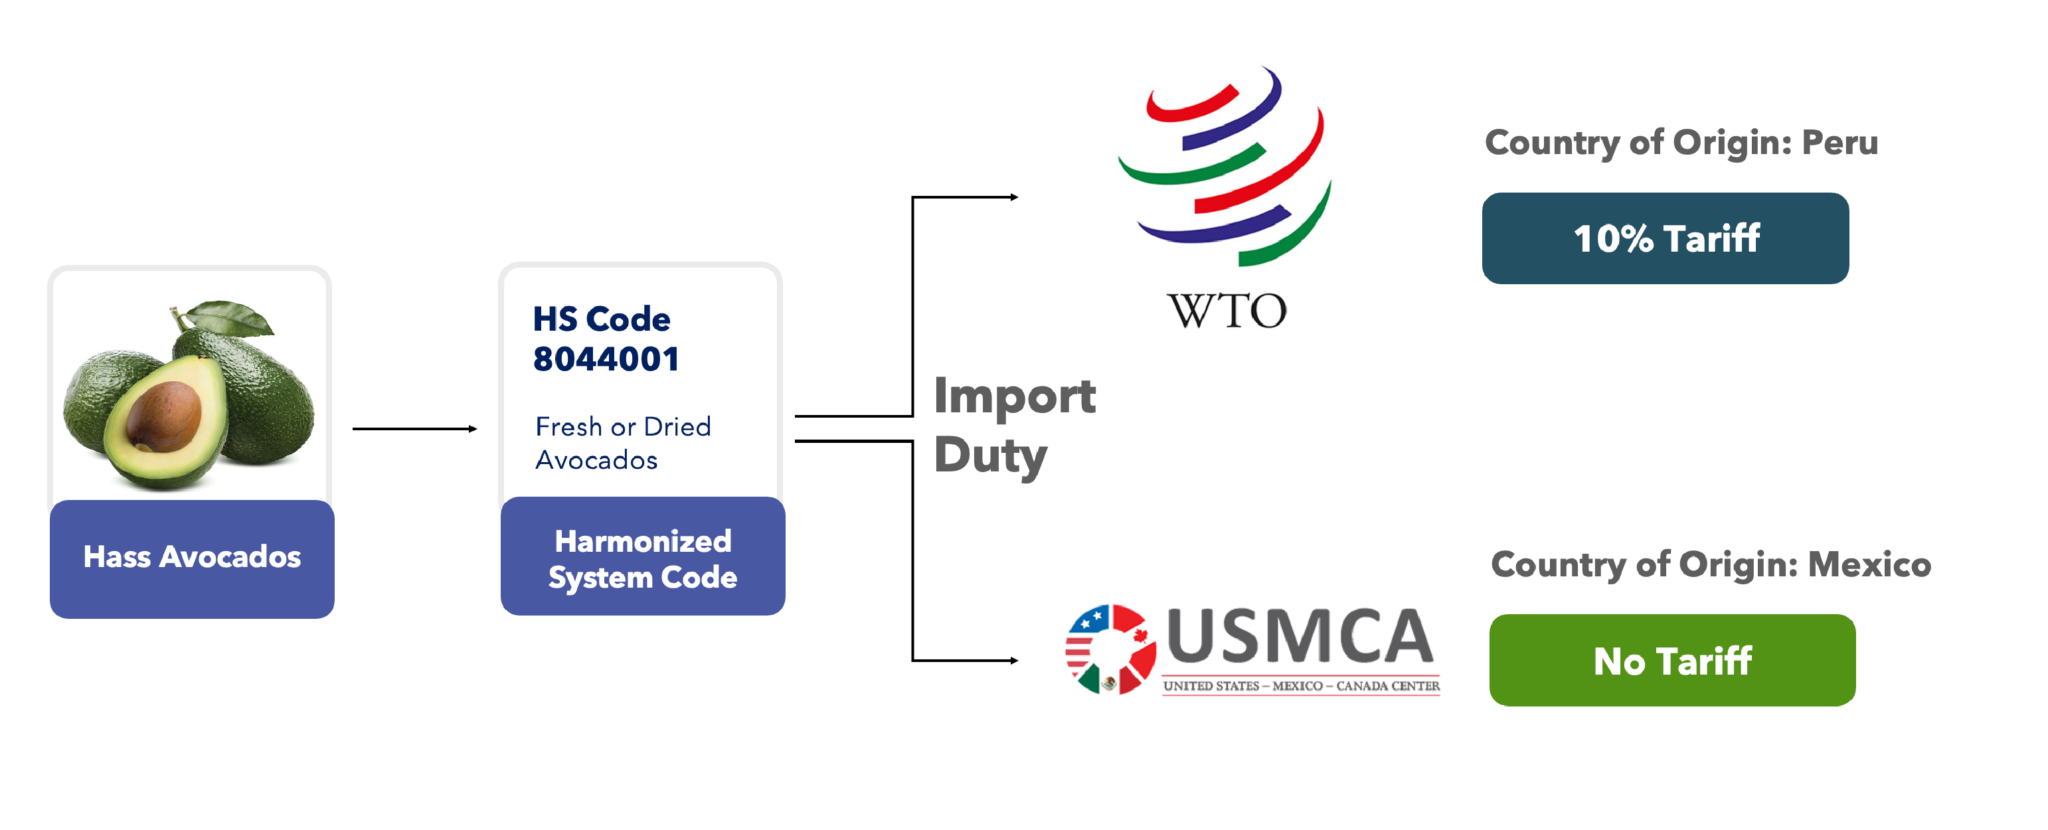
When it comes to tariff disruption, the difference between profit and loss often hinges on a precise understanding of a three-step process. Get any part of this chain wrong, and the financial ripple effect can undermine pricing and promotions. The duty you pay, therefore, is the direct result of the following three critical steps:
Step 1: Harmonized System (HS) Code
What it is: A six- to ten-digit classifier that drills down to product sub-types.
Why it matters: A single digit change can shift an item into a higher-tariff bracket.
Step 2: Country of Origin
What it is: The nation in which the imported item was made.
Why it matters: Mis-tagging the origin can lead to mis-pricing and inaccurate margin calculations.
Step 3: Trade-Agreement Overlay
What it is: Differentiation between the World Trade Organization (WTO) baseline tariffs and special trade agreements (e.g., USMCAUnited States-Mexico-Canada Agreement).
Why it matters: The same HS code can result in significantly different duties, up to a 10% swing, depending on the originating country (see the example below).
This isn’t just about paying the correct duty; it’s about safeguarding your bottom line in a global marketplace where every digit and every designation carries substantial weight.
The wrong origin, the wrong rule, the wrong margin.
Hard Numbers: Where Prices Are Already Climbing
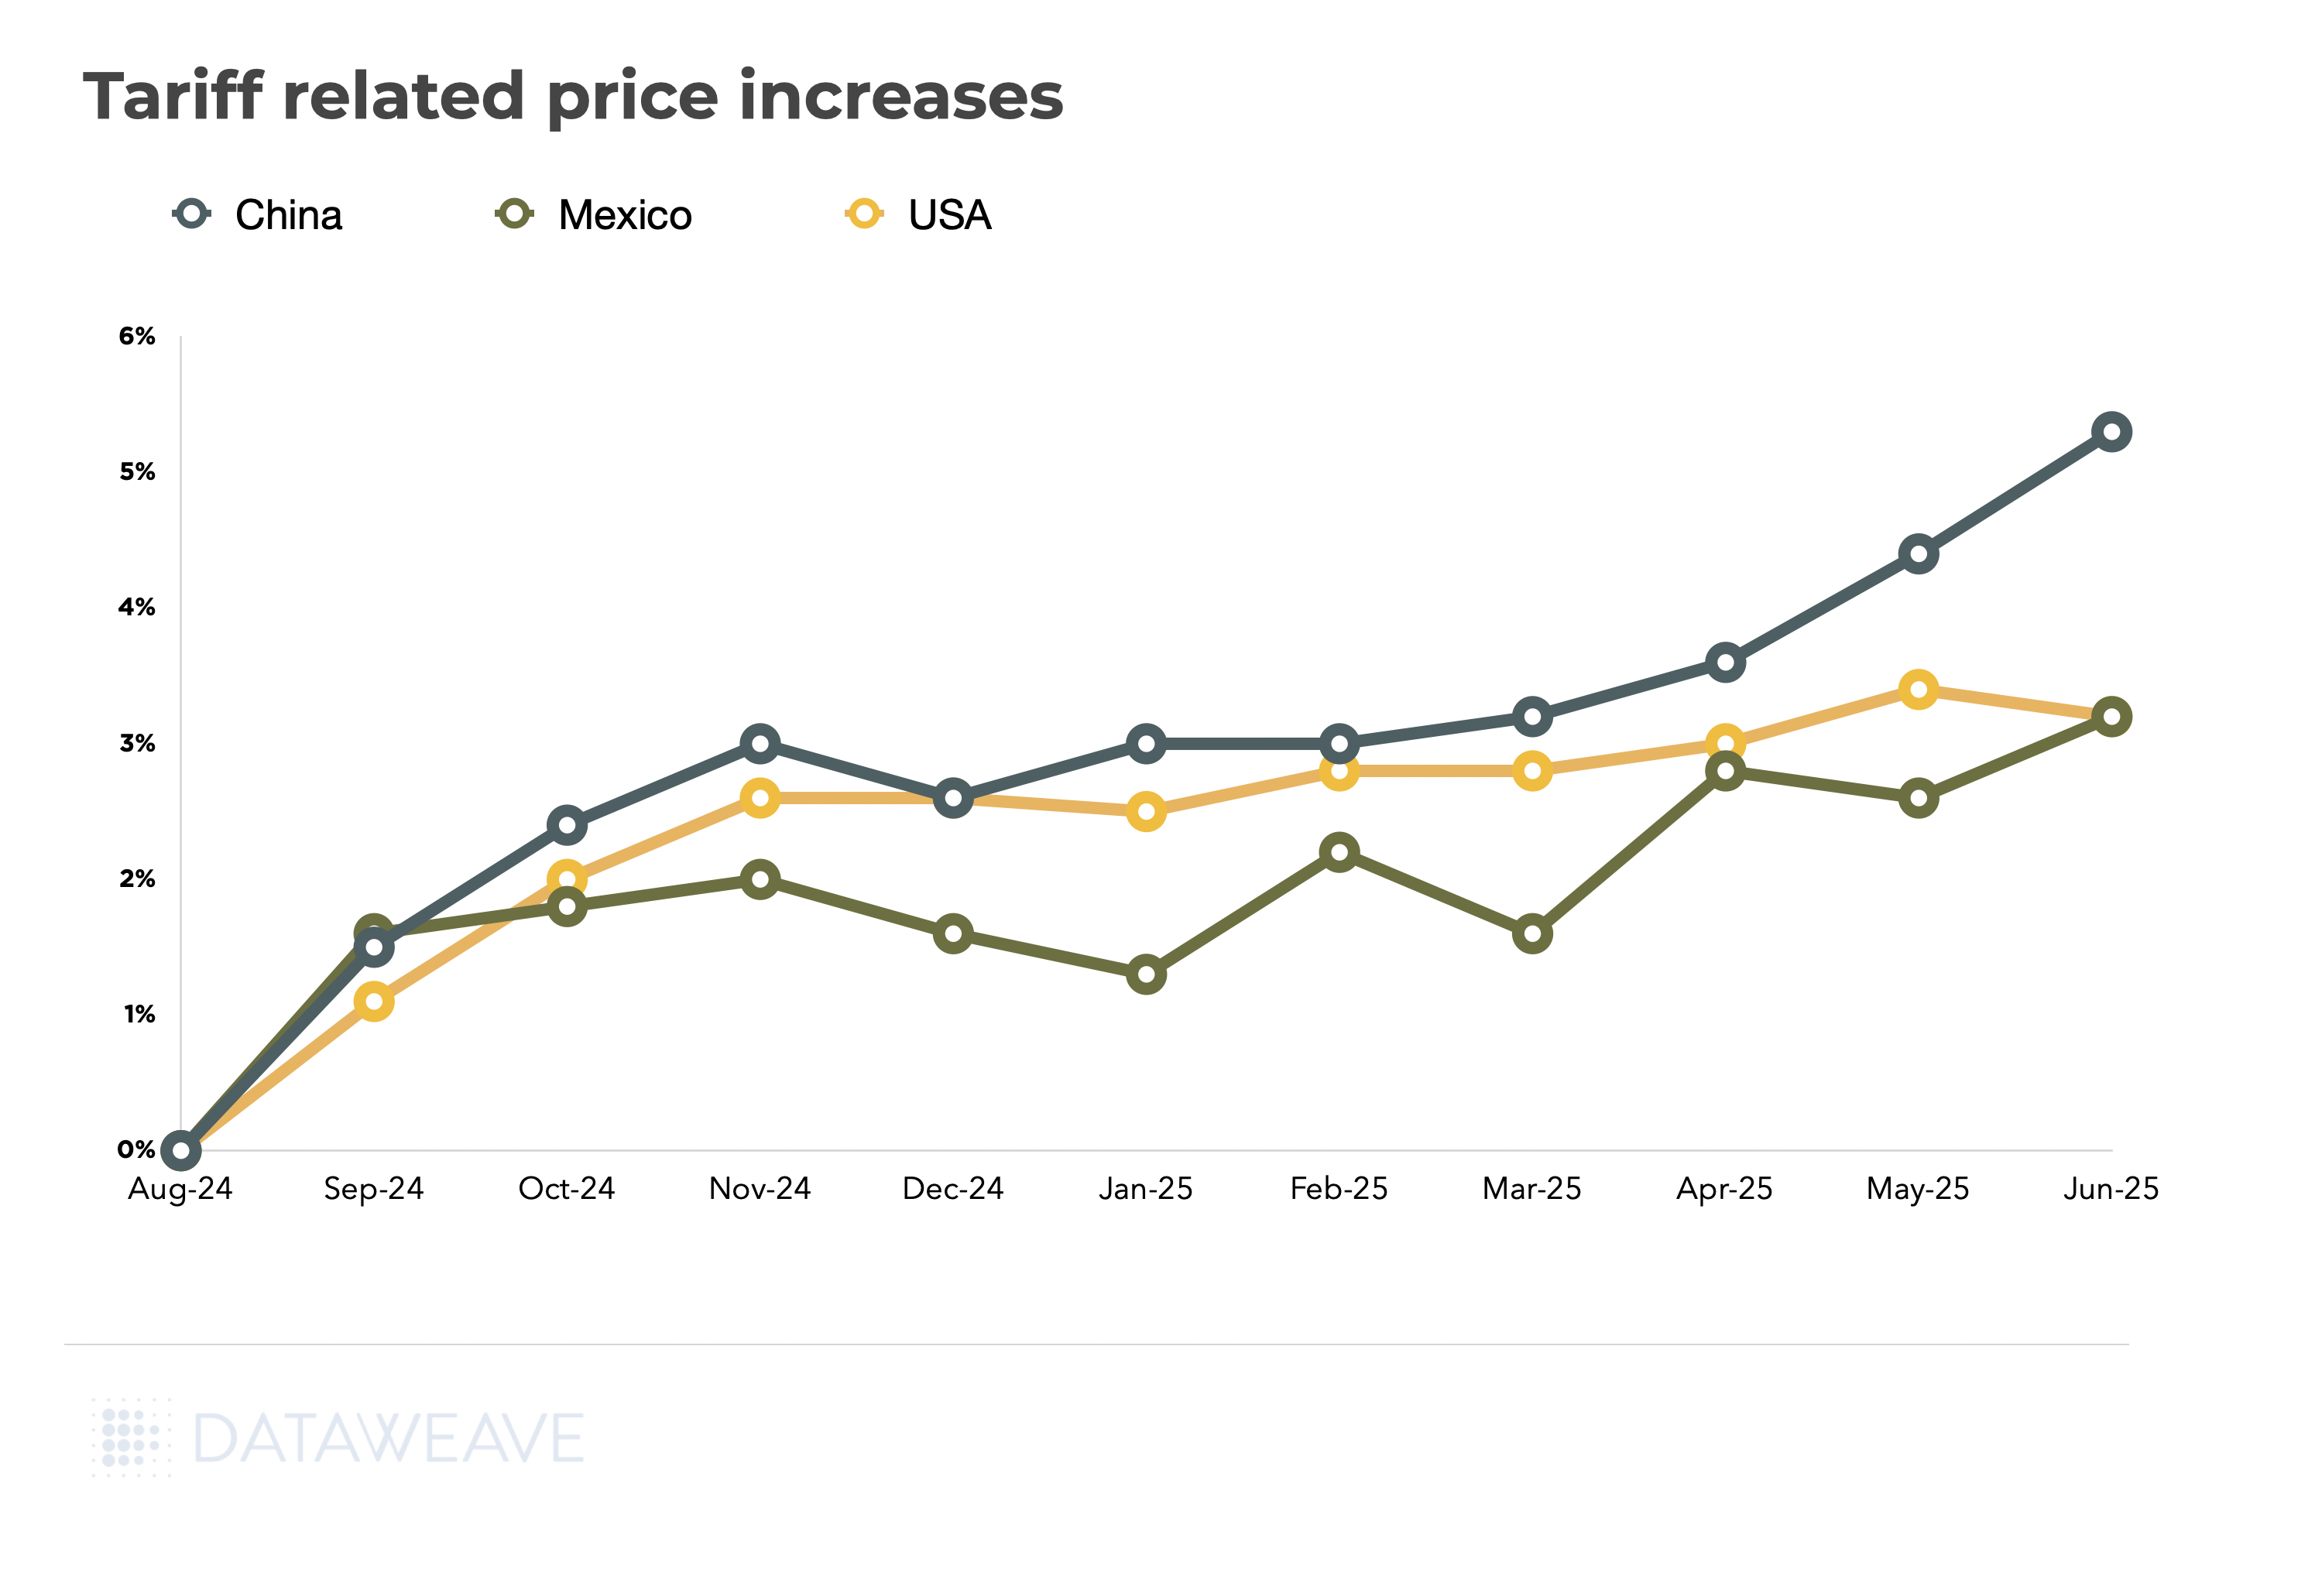
DataWeave’s latest digital shelf analysis shows import-driven price inflation diverging sharply by source country.
The intricate dance of HS codes, country of origin, and trade agreements directly translates into the prices consumers see. And the data doesn’t lie. Below, we delve into the hard numbers: where prices are already climbing, as illuminated by DataWeave’s latest digital shelf monitoring, showing significant import-driven price inflation by source country.
China: Products sourced from China are up 5%. This is largely attributable to the numerous tariffs currently imposed on Chinese goods.
Mexico: Prices for products from Mexico have risen by 3%.
United States: Interestingly, even U.S.-sourced products show a 3% increase.
This rise in U.S. product prices might seem counterintuitive if tariffs are solely focused on imports. However, the reality lies in the global supply chain for many products.
Consider guacamole as an example: While the final product might be “Made in the USA,” its components often come from various international sources. Avocados might be imported from Mexico, lime juice from Central America, and seasonings from India or China. Even packaging could originate in Asia. Each of these imported components can be subject to tariffs. Therefore, even if an item is assembled in the U.S., the tariffs on its constituent parts contribute to an overall price increase, explaining the rising rates for U.S.-sourced goods.
Action step: Map tariff exposure at both finished-goods and component-level to avoid “Made in USA” blind spots.
Timing Is a Competitive Weapon
With duty tables and competitor reactions changing fast, the question is: move first or follow? Early movers recoup cost fastest but risk overshooting if tariffs ease; laggards may enjoy a brief price advantage but suffer sudden margin compression.
The Strategic Dilemma
The table below illustrates this strategic choice and its potential outcomes:
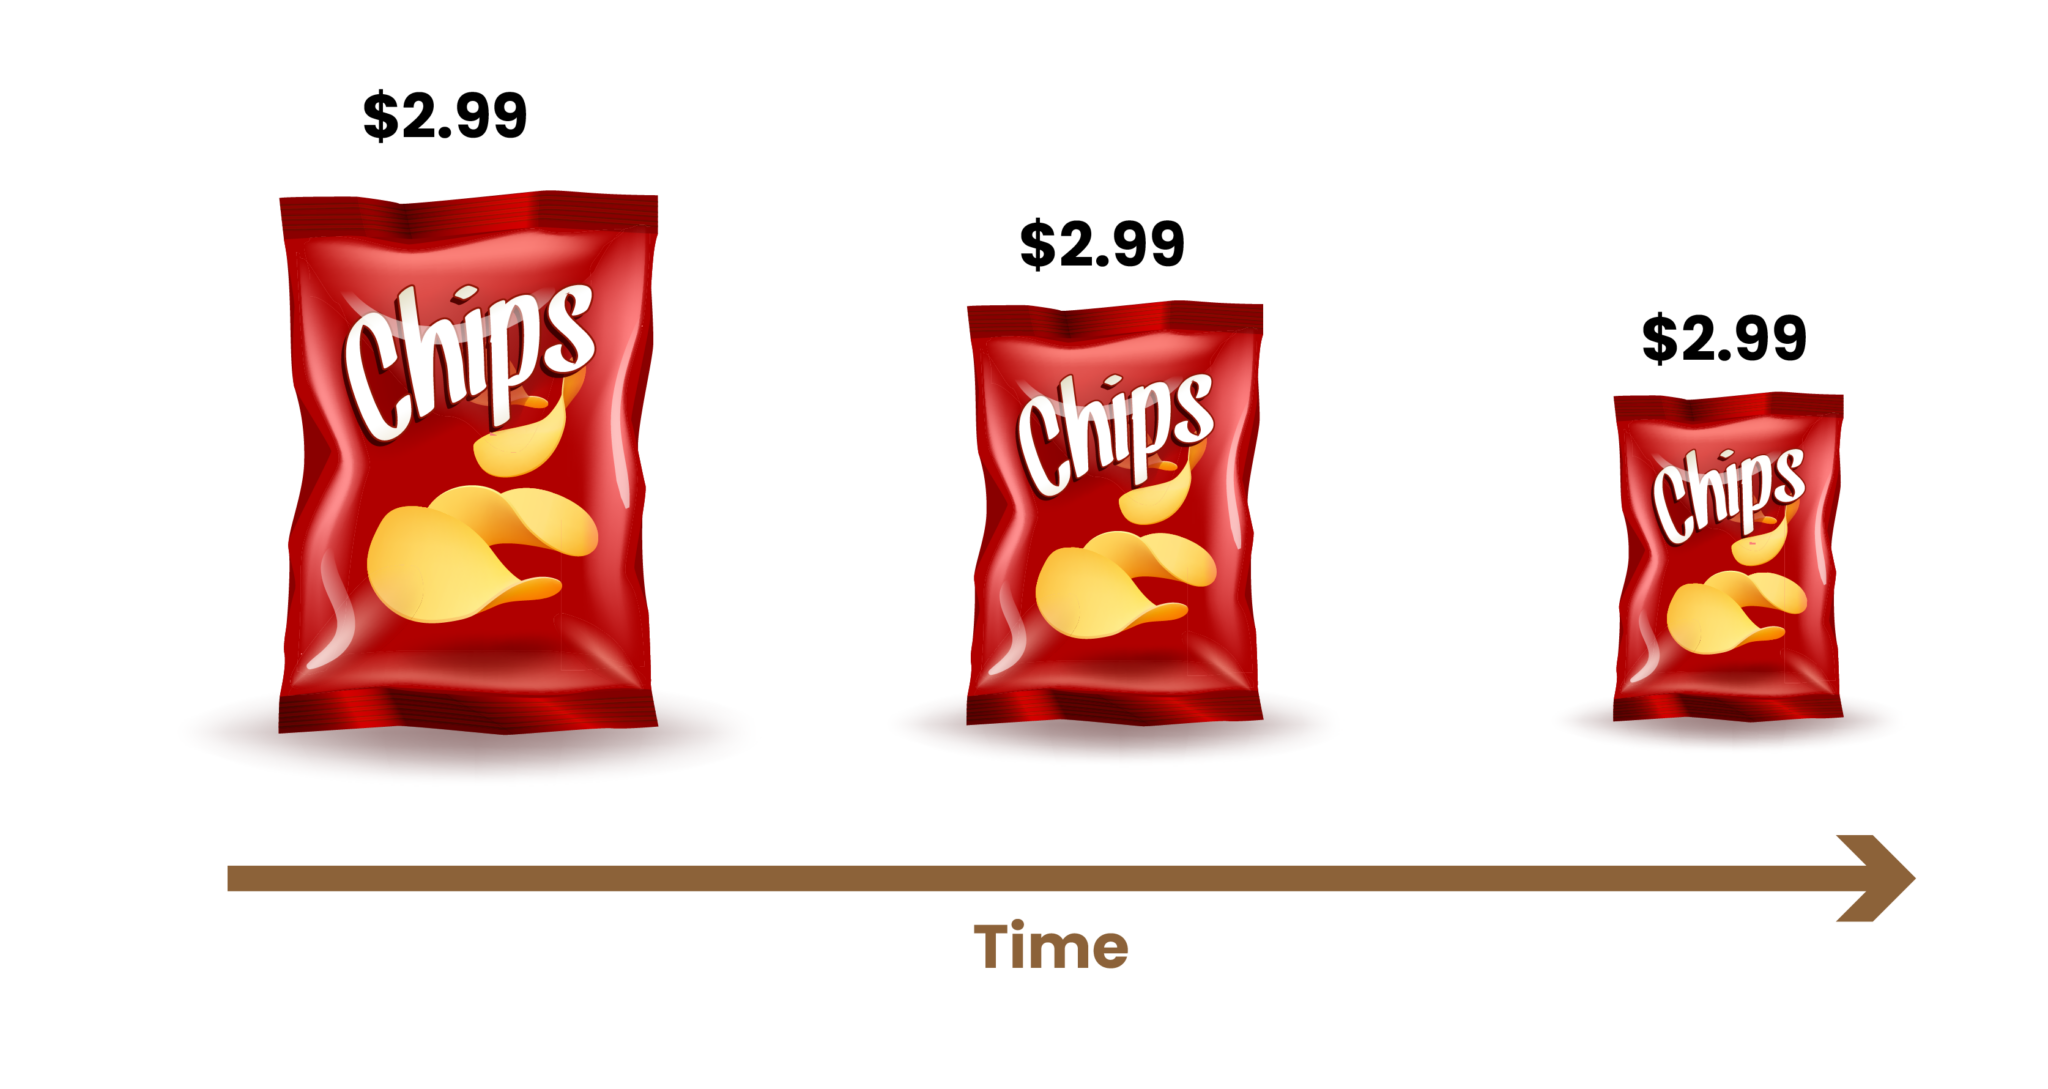
Shrinkflation: Margin Patch or Trust Erosion?
Beyond direct price adjustments, many brands are turning to shrinkflation to manage tariff-driven cost pressure, shaving net weight instead of hiking prices. DataWeave’s analysis reveals an average package reduction of 5 – 6%, with extreme cases reaching 15 – 25%, sometimes even coupled with a shelf-price increase.
While this can cushion immediate margin, it comes at a significant cost: brand credibility. Savvy shoppers quickly spot these changes, sharing “before-and-after” photos online and fueling consumer frustration. What begins as a margin patch can rapidly erode trust and damage long-term loyalty.
Ultimately, navigating this volatile environment requires dynamic intelligence and a holistic pricing strategy that balances profitability with market share and, crucially, consumer trust.
Price Hikes May be Inevitable, But You Can Still Run Your Digital Shelf
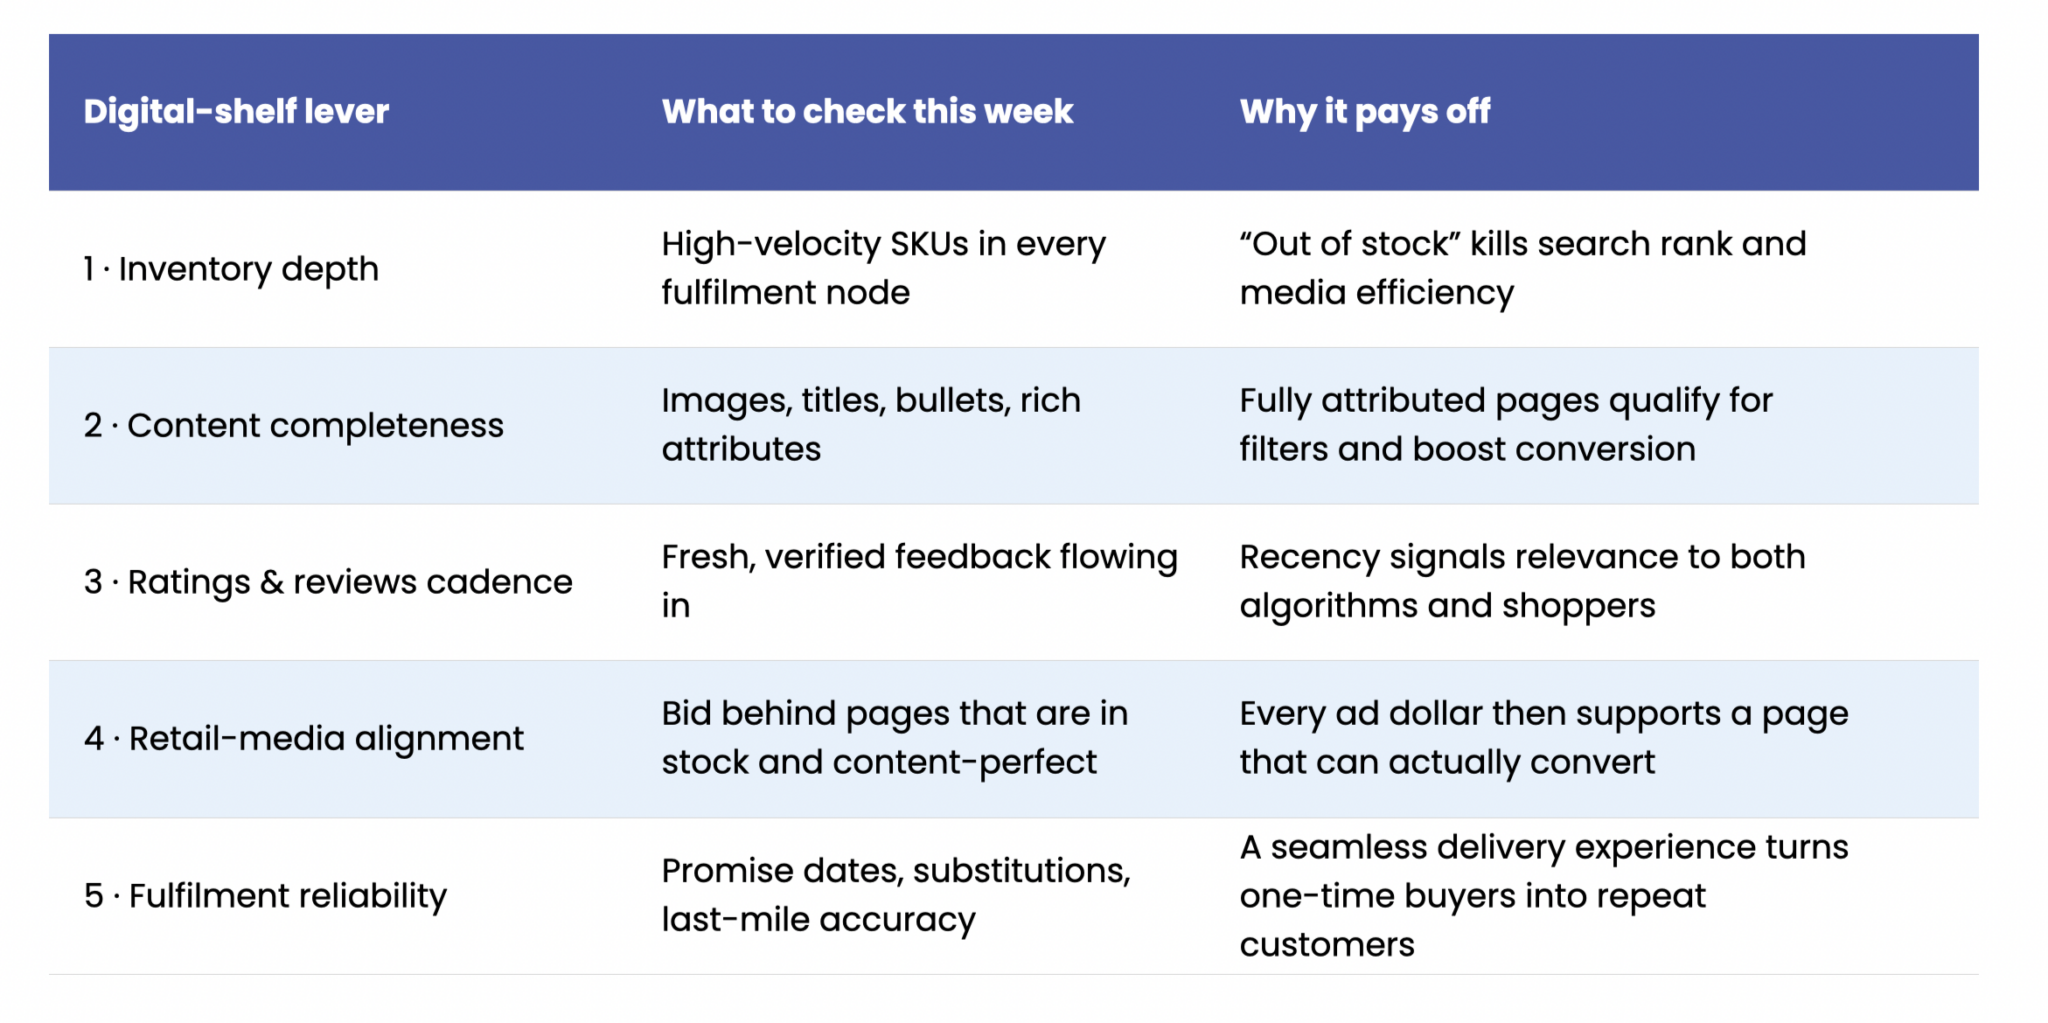
Tariff‑driven cost pressure can force list‑price increases, but it does not dictate how well your products show up, sell through, or satisfy shoppers online. Those outcomes still hinge on five levers that live entirely inside your control. Master them and you cushion margin hits while protecting (or even expanding) share.
The Five Levers of Digital‑Shelf Control
Inventory Depth – Maintain online in‑stock rates above 95 percent for high‑velocity SKUs and flag substitute logic when unavoidable out‑of‑stocks occur.
Content Quality & Accuracy – Keep titles keyword‑rich, imagery crisp, and attributes complete so search filters never bury you.
Ratings & Reviews Cadence – Proactively request fresh reviews to earn retailer search boosts and reassure value‑conscious shoppers.
Retail‑Media Precision – Bid where pages are healthy and in‑stock; pause spend on broken listings that leak conversion and ROAS.
Fulfillment Excellence – Monitor pick‑pack accuracy, on‑time delivery, and substitution rates; each one influences retailer algorithmic visibility.
Content Hygiene Keeps You Visible, Compliant, and Conversion-Ready
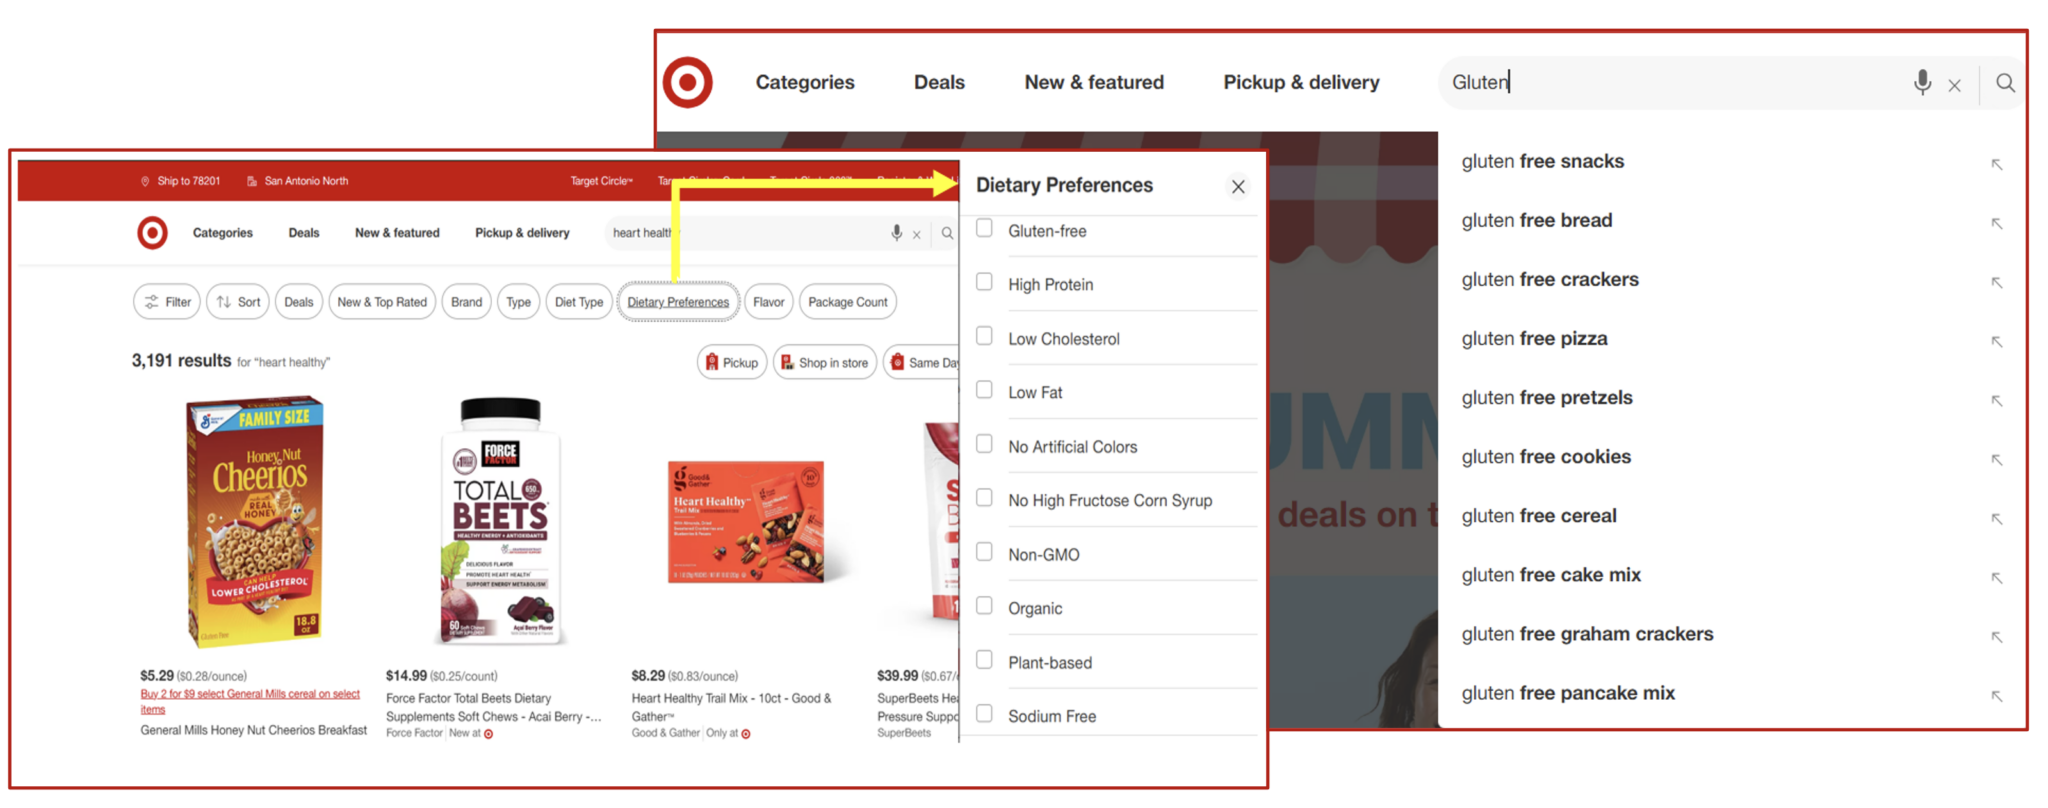
Missing or incorrect product attributes (e.g., “gluten-free,” “caffeine content”) can swiftly jeopardize both regulatory compliance and your product’s fundamental search visibility. Simply put, if it’s not labeled right, it won’t be found.
This impact plays out in two crucial areas:
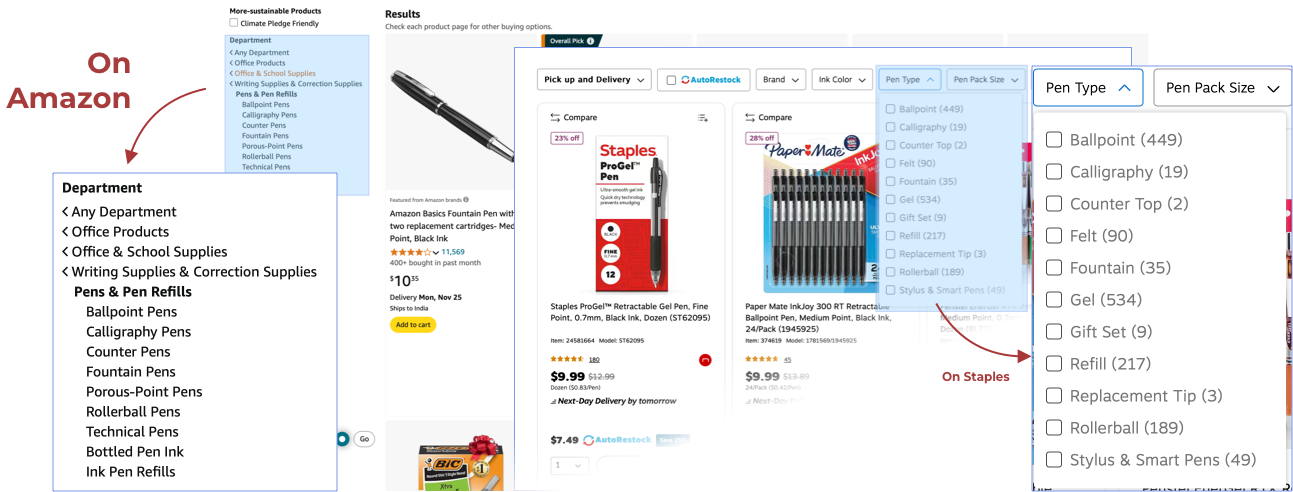
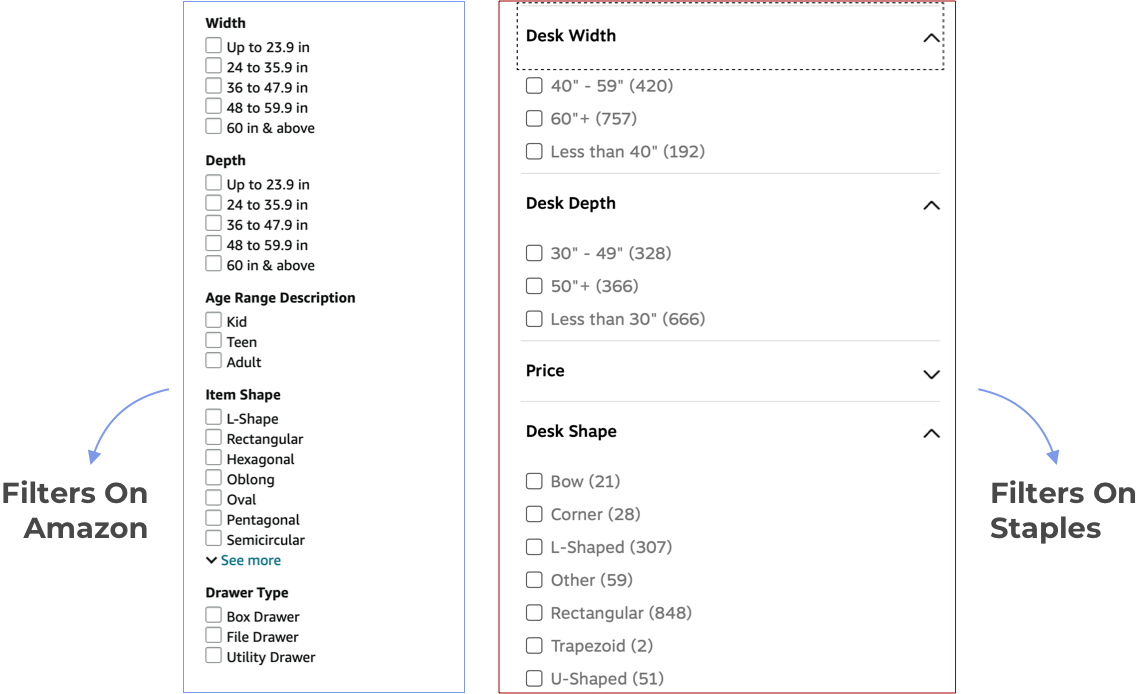
Retailer Search Visibility: Filter logic on major e-commerce platforms like Target.com, Walmart.com, and Instacart is increasingly driven by precise attribute tags (e.g., “gluten-free,” “BPA-free,” “0g added sugar”). Fail to provide or correctly format these claims, and your product will simply never appear when shoppers apply these critical search filters. You become invisible to a motivated audience.
Regulatory Compliance: Global regulatory bodies, including the U.S. FDA and EU authorities, now treat online product detail pages as officially regulated labeling space. This means that a single missing allergen statement or an inaccurate nutritional claim can trigger severe consequences, from product takedowns and hefty fines to a devastating “straight-to-zero” share of search. Non-compliance isn’t just a legal risk; it’s a direct threat to your market presence (see example below).
The Hygiene Playbook: Audit → Score → Fix → Grow
Your Product Detail Pages (PDPs) are your digital storefronts, and they need to be impeccable. Modern content-intelligence tools are like vigilant auditors, constantly scanning, structuring, and scoring every PDP across your retail network.
Tools like DataWeave do the heavy lifting by:
Surfacing critical gaps: They’ll pinpoint issues like blurry images, inaccurate titles, or missing nutrition information.
Optimizing for search: They ensure your product attributes align with live search filters, turning claims into clicks.
Flagging compliance risks: You’ll know about potential issues before regulators or retail partners ever do.
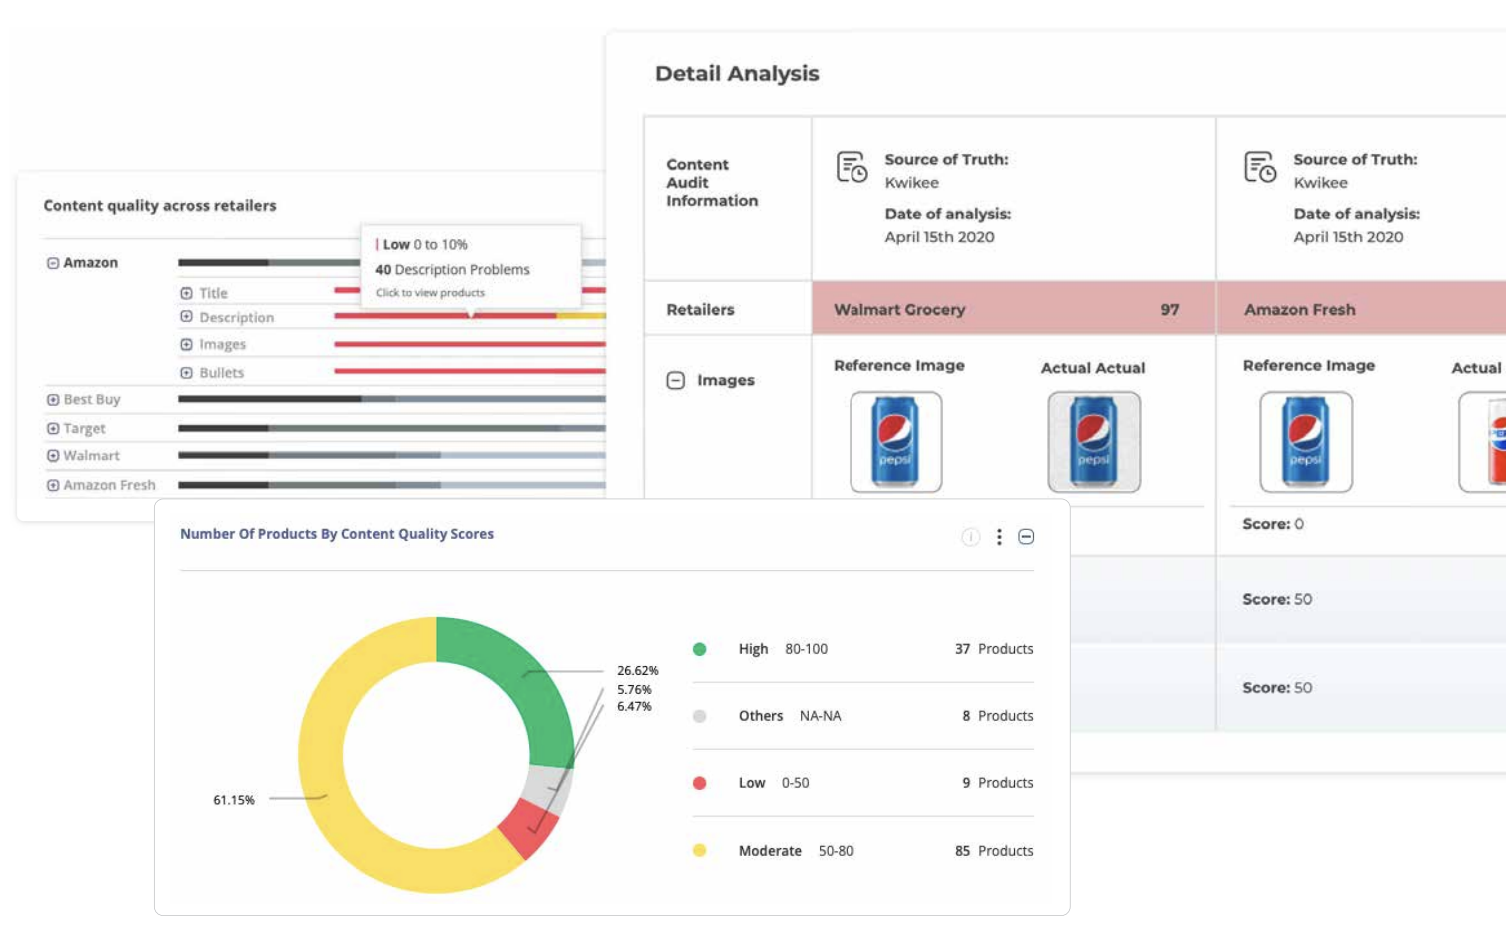
Quantifying your impact: Get a clear Content Quality Score that your teams can own and improve, week after week.
When you execute this well, it’s not just about tidying up; it’s a powerful growth engine. This proactive approach fuels every step of the digital customer journey – from getting found, to winning the click, converting the cart, and ultimately, capturing reviews that boost your search rankings.
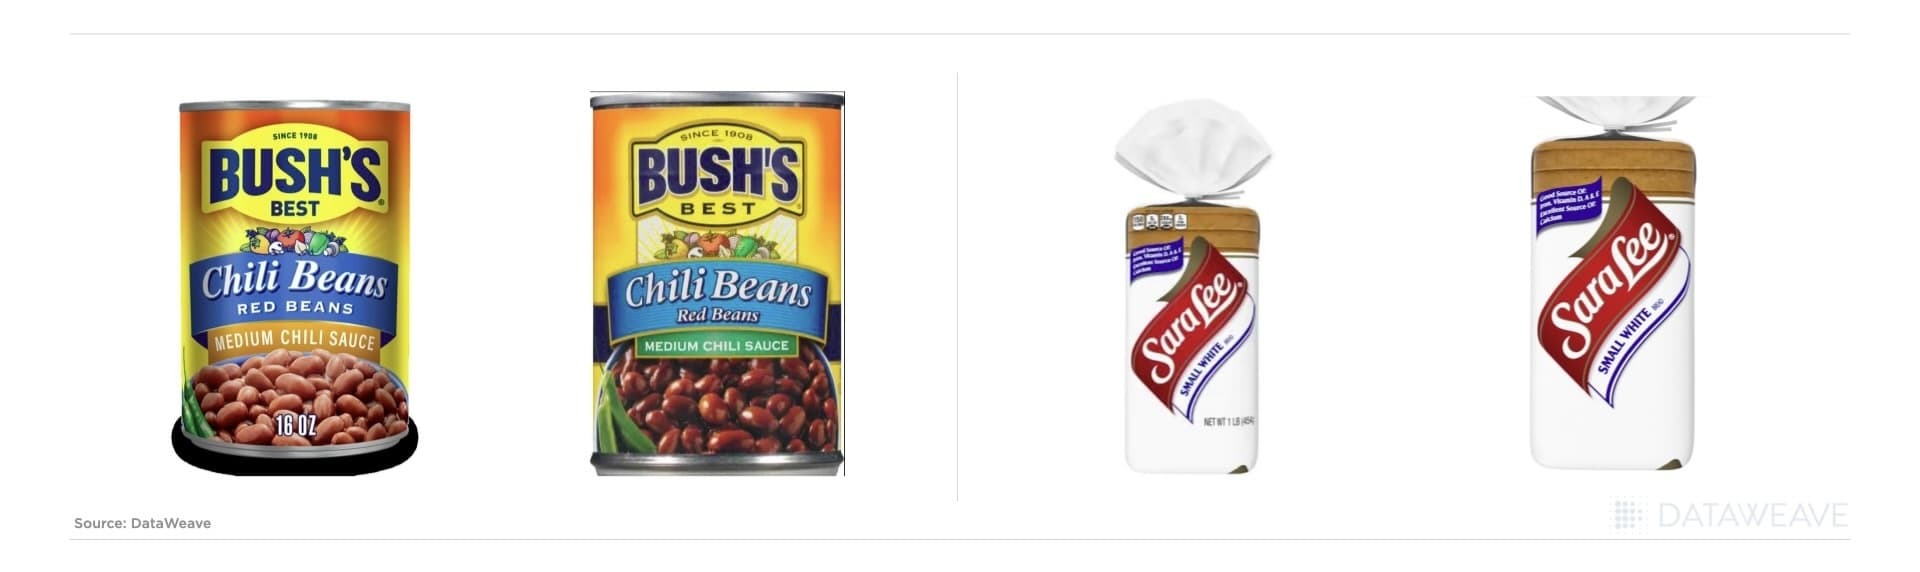
A Case Study: Bush’s Beans Converts Visibility into Revenue
Before Bush’s Beans achieved rapid success with their “audit → scorecard → rapid-fix” approach, they confronted a significant hurdle. Here’s how they overcame it to drive impressive revenue growth.
The Challenge
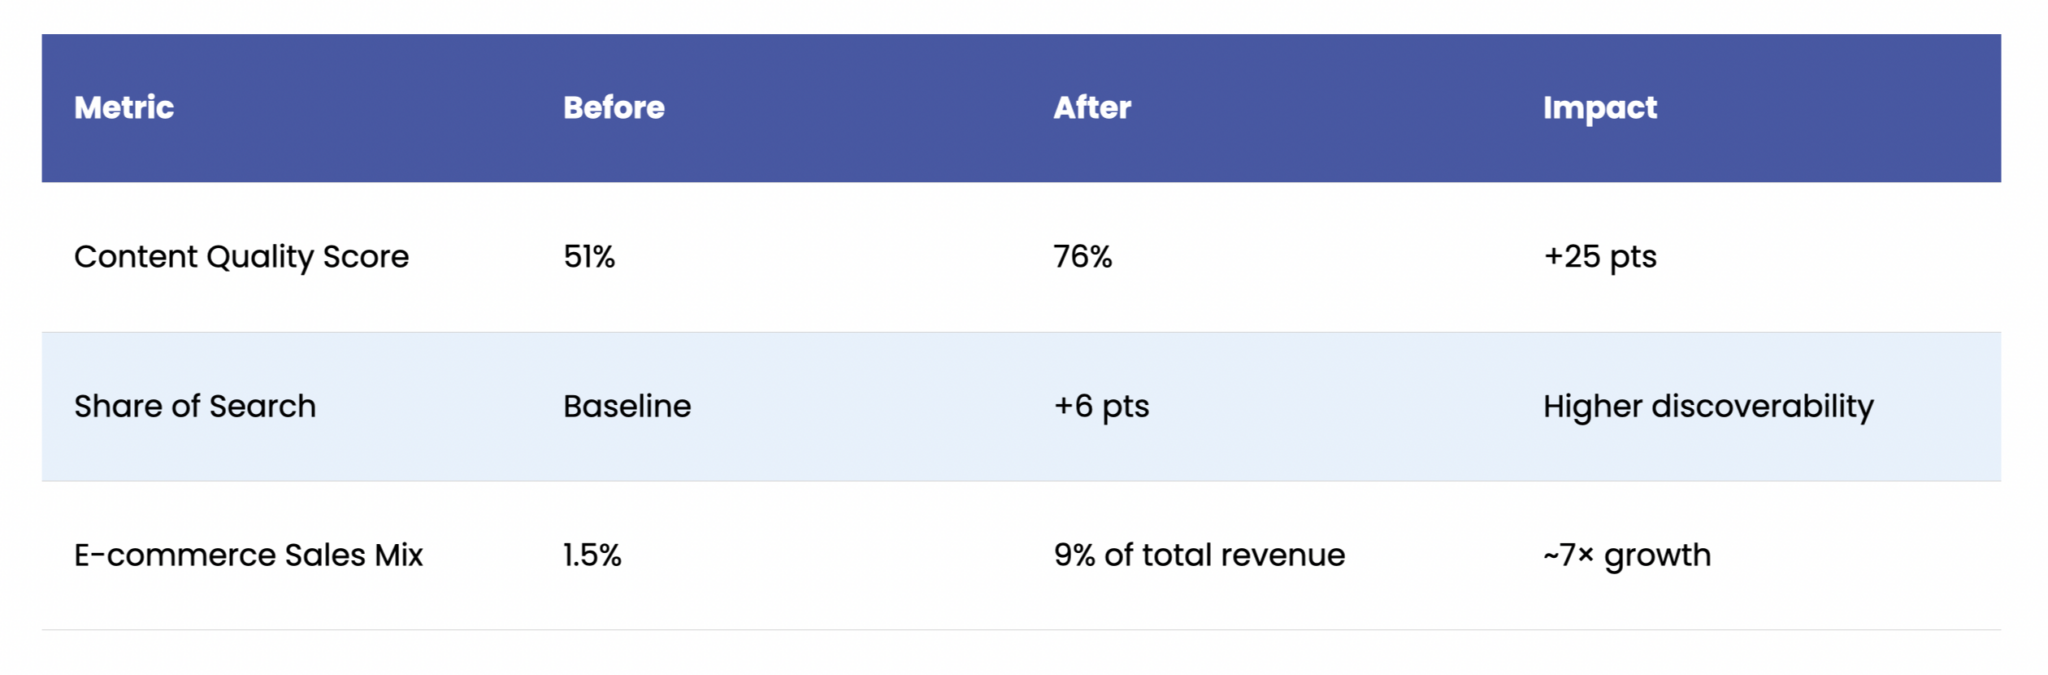
Bush’s Beans saw its e-commerce contribution stall at just 1.5 percent while competition in canned goods intensified. A quick audit revealed three root causes:
Dipping online sales that signalled slipping visibility and conversion.
Fragmented product content across major retailer sites as images, titles, and claims were inconsistent or missing altogether.
Heavier category competition making it harder to hold first-page search positions.
The Fix
The brand adopted DataWeave’s Digital Shelf Analytics to create a single source of truth for every PDP. A lean internal team then:
Ran content audits across priority retailers to surface incomplete or non-compliant attributes.
Prioritized quick wins focusing on high-velocity SKUs where simple edits (e.g., adding pack-size keywords or allergy statements) would unlock search filters.
Tracked progress weekly using an automated scorecard to keep everyone focused on the next set of fixes.
The Win
Twelve months later the numbers told the story:
Bush’s Beans transformed their product data into a strategic asset, significantly improving online visibility, safeguarding brand reputation, and driving sustained revenue growth. Accurate and complete product pages ensured compliance and boosted search rankings, directly increasing sales. While you can’t control external factors like tariffs, you can control the quality and compliance of your product pages and that control directly translates margin pressure into market share gains.
Unified Insight: Turning Signals into Sustained Advantage
Imagine one living dashboard where every digital shelf signal like timely price moves, share-of-search shifts, retail media spend, on-shelf availability gaps, compliance flags, MAP breaches, plus content and review health flows together. With that single lens, the “whose numbers are right?” debate disappears and cross-functional teams can act in minutes rather than days.
A consolidated feed lets you:
Build market awareness: Spot competitor price changes as they happen, understand who owns first-page search, and measure the true lift of retail media campaigns.
Mitigate emerging risks: Surface impending out-of-stocks before rank erodes, catch claim or label errors ahead of audits, and receive instant alerts when a seller breaks MAP.
Activate growth levers: Prioritize content edits that open search filters and use ratings and reviews trends to fine-tune messaging and assortment.
Brands that weave these signals into one workflow move faster than the disruption. That’s the connective tissue highlighted in our recent post on pairing Digital Shelf Analytics with Marketing-Mix Modelling: when granular shelf data sits beside strategic performance metrics, smarter decisions follow.
A platform like DataWeave brings the pieces together quietly ingesting millions of price checks, availability reads, and PDP audits each day, then presenting only the next best actions. The payoff is simple: sharper market awareness, lower operational risk, and growth that compounds with every iteration.
Keep Moving, Keep Winning
Tariffs, evolving regulations, and agile competitors are no longer storms; they are the climate. Brands that pair a clear, shared insight stream with rapid execution turn volatility into durable advantage. Keep your data united, keep iterating on the five digital-shelf levers, and every new headwind becomes another step ahead.
Marketing analytics has evolved dramatically over the past decade, yet many brands still struggle to connect their marketing investments to real business outcomes. While traditional analytics platforms provide valuable historical insights, they often miss the critical external factors that drive consumer behavior in today’s fast-moving digital marketplace.
The challenge isn’t just about measuring what happened. It’s about understanding why it happened and predicting what comes next. This is where Digital Shelf Impact Modeling becomes essential for smarter marketing investments.
The Critical Data Gap In Marketing Analytics
Traditional marketing analytics expose brands to considerable risk, especially in the CPG and retail space. The fundamental challenge lies in their reliance on lagging indicators for essential metrics like historical sales and ad spend. Data inputs may be months or quarters old before they’re used for strategic decision-making.
That’s like making million-dollar marketing decisions while only looking in the rearview mirror when you need to watch the road ahead simultaneously.
Most marketing analytics tools also typically overlook external market factors that can dramatically impact performance. In today’s retail landscape, where market conditions change rapidly, being blind to real-time competitive dynamics creates significant vulnerability. Key external factors that traditional analytics fail to capture include:
In fact, opaque data integration and siloed insights remain substantial barriers to actionable intelligence from marketing analytics tools. Most critically, old school approaches often miss vital such variables influencing consumer behavior.
These blind spots must be addressed to unlock the full value of marketing analytics investments and make truly informed marketing decisions.
How Digital Shelf Impact Modeling Completes The Picture
This is where Digital Shelf Impact Modeling plays a complementary role. Brands leveraging digital shelf analytics gain insights into actual market dynamics that traditional analytics alone cannot provide. However, brands using digital shelf insights in isolation often struggle to quantify how digital shelf improvements directly impact revenue. Answering questions like “Did better product content drive sales, or was it the influencer campaign?” remains challenging.
Bridging these disconnected platforms requires intentional integration and a solution that can feed intensively cleaned and organized data into existing analytics frameworks. With the right data inputs, companies establish a powerful feedback loop for agile, data-driven decisions.
A comprehensive DSA solution like DataWeave provides granular, actionable data on critical external variables such as:
Daily or weekly competitor pricing movements and promotional activity
Product content standardization and optimization across retailers
Review sentiment trends and potential reputation issues
Share of search/shelf performance relative to competitors
When merged with established analytics capabilities, digital shelf impact modeling creates a complete picture that fills the blind spots holding marketing teams back from maximizing ROI.
The Digital Shelf Advantage in Retail Media
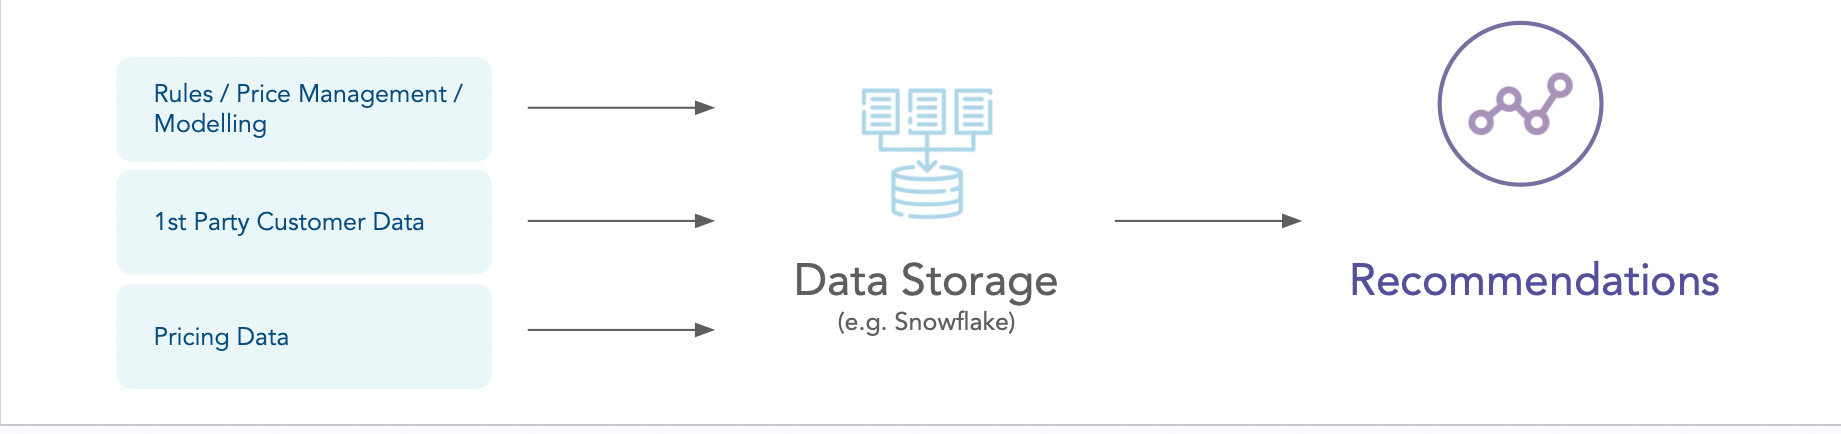
The popularity of retail media networks has further amplified the need for integrated digital shelf analytics approaches. These advertising platforms, operated by retailers, allow brands to display targeted ads to shoppers across digital properties based on first-party customer data and purchase insights.
The retail media revolution has transformed e-commerce pages into sophisticated search engines for product discovery. This evolution has been so impactful that retail media ad revenue surged 16.3% in 2023, reaching $43.7B in the U.S., with continued growth projected.
Major platforms like Walmart have expanded their retail media networks to capitalize on closed-loop attribution. Since retailers own the entire customer journey, they can track everything from ad impression to purchase on their e-commerce sites. This creates a significant advantage through accurate ROI measurement, unlike traditional advertising where attribution remains challenging.
How Digital Shelf Impact Modeling Enhances Retail Media Optimization
With retail media emerging as a top-performing sales channel, brands need sophisticated optimization strategies. Every brand wants to maximize visibility and performance across individual eCommerce sites, just as they optimize for Google or emerging AI platforms.
Integrating digital shelf analytics into marketing mix models enables brands to:
Allocate ad spend more intelligently using real-time competitive insights
Identify timely campaign activation opportunities in response to market changes
Monitor organic ranking trends to strategically time paid promotional activities
Measure true campaign impact on digital shelf performance metrics
For example, when a competitor launches an aggressive price drop in your category, Digital Shelf Impact Modeling provides immediate visibility into this change. This intelligence can trigger recommended campaign adjustments, such as increased sponsored ad bidding in affected categories. Traditional analytics alone cannot deliver this level of responsive optimization.
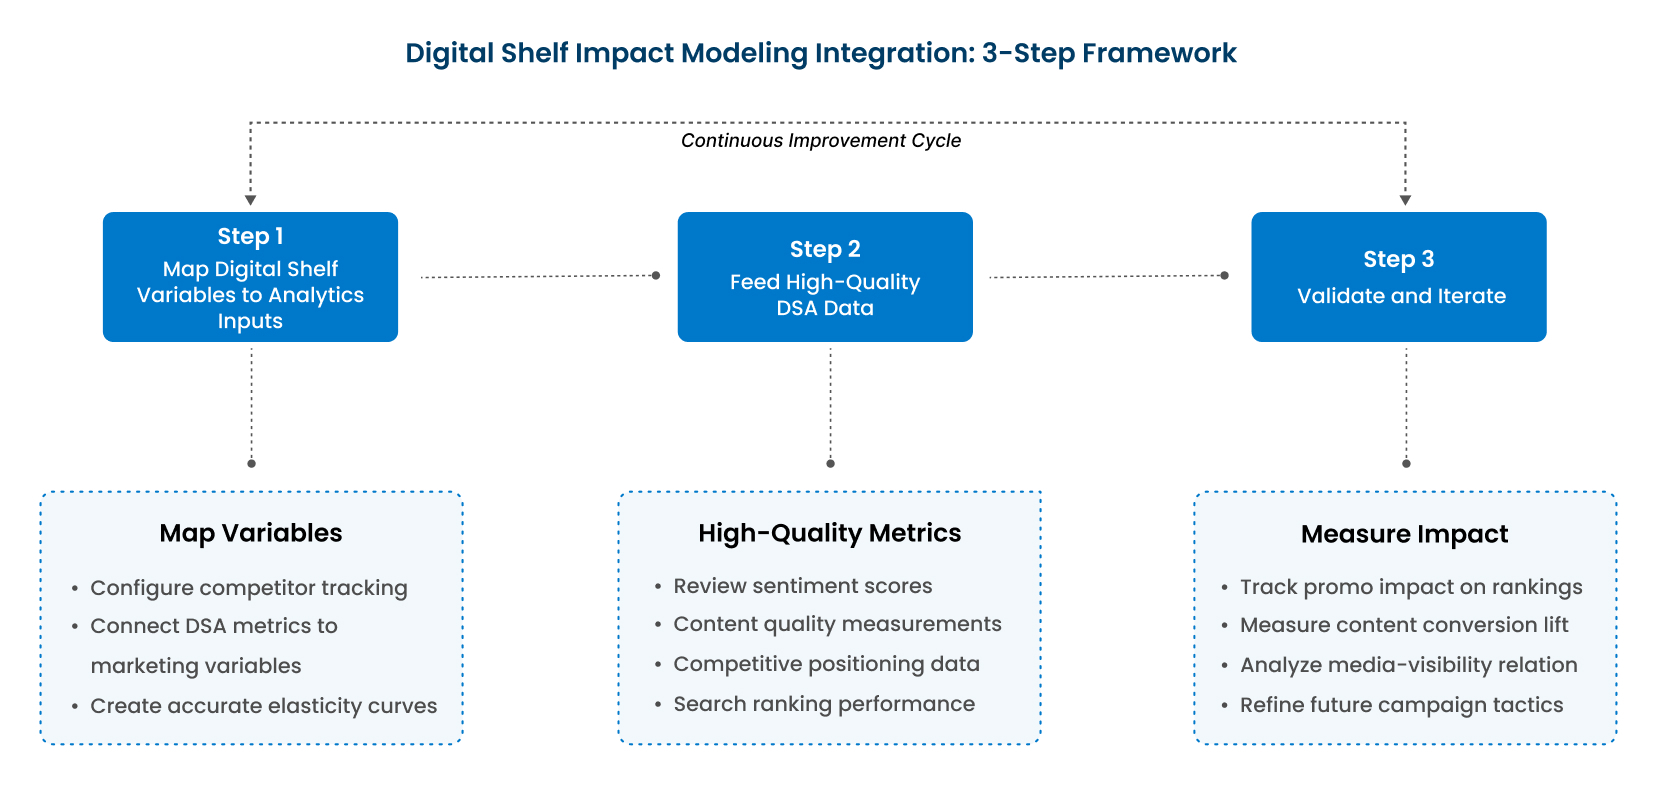
How to Integrate Digital Shelf Impact Modeling: A 3-Step Framework
Here’s how to integrate Digital Shelf Impact Modeling into your marketing strategy to start making better data-driven decisions for your brand.
Step 1: Map Digital Shelf Variables to Analytics Inputs
Begin by mapping specific digital shelf variables to your existing analytics inputs. Ensure that competitors are properly configured for monitoring in your digital shelf platform and that timely metrics like price changes and search ranking positions are linked with your marketing measurement systems.
This integration is crucial because traditional analytics rely exclusively on historical data for forecasting. Adding real-time inputs delivers several benefits:
More accurate elasticity curves reflecting current market conditions
Better understanding of root causes behind demand shifts
Prevention of misattributing sales changes to your marketing activities when external factors may be responsible
At DataWeave, our comprehensive coverage spans 500+ billion data points, 400,000 brands, and 1,500+ websites, ensuring brands never miss a competitor move and maintain complete visibility across the connected e-commerce landscape.
Step 2: Feed High-Quality Digital Shelf Data into Analytics Platforms
Next, integrate critical digital shelf metrics into your measurement framework:
Review and sentiment scores and trends
Content quality measurements
Competitive positioning data
Price gap analytics
Search ranking performance
DataWeave employs a rigorous data accuracy validation process to ensure teams work with the cleanest, most reliable data possible. Our sophisticated processing pipeline removes anomalies and standardizes information across retailers, providing the consistent, high-integrity data foundation that robust marketing mix modeling demands.
Step 3: Validate and Iterate
A powerful Digital Shelf Impact Modeling solution helps measure whether your marketing efforts achieved their intended impact on the digital shelf. Use your digital shelf platform to assess your campaigns’ actual effect on key performance indicators:
Do promo-driven sales lifts correlate with improved search rankings?
How do content improvements impact conversion rates?
What is the relationship between paid media and organic visibility?
It is no surprise to anyone that we are living through volatile times. Executives may be uncomfortable if they cannot provide their teams with strategic direction based on data or the tools they need to accelerate their workdays.
By integrating Digital Shelf Impact Modeling with existing analytics, companies gain early warning signals about market shifts, enabling smarter resource allocation during budget constraints. This integration helps organizations move from tactical execution to strategic direction by:
Providing cross-channel impact analysis to understand the full marketing ecosystem
Equipping category managers with tactical optimization tools that support broader strategic objectives
Identifying competitive threats before they impact sales
Forecasting potential ROI impacts across various spending scenarios
These capabilities help prevent wasted ad spend, missed opportunities, and lost sales.
Future-Proofing Your Marketing Strategy with Digital Shelf Impact Modeling
Several emerging trends highlight the growing importance of digital shelf-enhanced marketing analytics:
Trend 1: Navigating Economic Volatility – Brands can use Digital Shelf Impact Modeling to track how competitors adjust pricing in response to cost shocks like tariffs and inflation. This real-time intelligence directly improves demand forecasting accuracy.
Trend 2: AI-Powered Predictive Insights – Combining digital shelf trend detection (such as viral product reviews or sudden inventory fluctuations) with marketing performance metrics helps forecast demand spikes from otherwise unforeseen events.
Trend 3: Automated Optimization – Smart campaign activations and adjustments based on real-time digital shelf triggers drive efficiency. DataWeave’s vision includes an automated retail media intelligence layer that optimizes spend across channels based on integrated insights.
DataWeave’s Unique Advantage
At DataWeave, we’ve seen our digital shelf analytics customers significantly improve their organic search rankings because of better-sponsored ad campaigns. What makes DataWeave’s approach to Digital Shelf Impact Modeling uniquely powerful? Our platform is specifically designed to address the challenges of modern marketing measurement:
Superior data refresh rates ensure timely insights when they matter most
Unmatched marketplace coverage across more than 1,500 eCommerce sites globally
Advanced data normalization that standardizes metrics across disparate categories and retailers
API-first architecture enabling flexible data access and utilization
Conclusion – From Hindsight to Foresight
In the past, companies relied primarily on historical data for their marketing analytics. Today’s market leaders are incorporating Digital Shelf Impact Modeling to unlock superior insights, improve decision accuracy, and drive measurable ROI.
DataWeave serves as the essential bridge between traditional analytics systems and real-time, comprehensive market intelligence. When digital shelf analytics and marketing measurement work together, brands gain a complete picture: traditional analytics show precisely what happened, while Digital Shelf Impact Modeling explains why it happened. Together, they reveal what’s coming next.
Ready to transform your marketing analytics from hindsight to foresight? Contact us today to discover how our Digital Shelf Analytics can enhance your existing marketing investments and drive measurable business results.
The power to impose tariffs on foreign countries is one of the most impactful measures a government has at their disposal. The government can use this power for various reasons: to punish rivals, equalize trade, give domestic products a comparative advantage, or collect more funds for the federal government.
Whatever the reason, tariffs have real-world impacts on brands and retailers selling in a global economy. They effectively make products more expensive for some and comparatively cheaper for others. Since tariffs can be added or removed at the drop of a hat, retail executives, category managers, and pricing teams trying to keep up have their work cut out for them.
You’ve come to the right place if you’re wondering how to prepare for and respond to potential tariffs. The answer lies in technology that will make you flexible when you need to react to policy changes. Establishing workflows and processes embedded with pricing intelligence can help you stay competitive even when global politics intercepts your business.
Understanding Tariff Impact
Before diving into tariffs’ implications on pricing strategies, we need to understand how tariffs work and the current economic environment. Tariffs are a government’s tax on products a foreign country sells to domestic buyers. You might remember President Trump’s expanded tariff policy in September 2018. It placed a 10% tax on $200 billion worth of Chinese imports for three months before raising to a rate of 25% in January 2019. At that time, an American buyer would pay the original price of the goods plus the tax to the American government. Many additional tariffs and counter-tariffs by other countries were enacted during Trump’s first term in office, including the European Union, Canada, Mexico, Brazil, and Argentina, resulting in a trade war.
Announcements of when, where, and on what new tariffs will be imposed are unpredictable. The only predictable thing is that this type of market volatility is here to stay. Pricing teams should adjust their mindsets to assume that volatility may always be on the horizon. This is because tariffs have many cost implications. Besides the flat rate imposed by the government on a certain product, tariffs have historically raised the price of all goods.
In economic terms, tariffs create a multiplier effect. Consider a tariff placed on gasoline imported from Canada. This measure may encourage American drilling but will have immediate ripple effects throughout the economy. Everything that relies on ground transportation will increase in price, at least in the short term.
This means that a fashion brand that sources and manufactures its entire line domestically will incur more costs since transportation will be more expensive. If fashion companies act like most companies, they will pass that added tax burden on to the consumer through higher prices. The company will make this decision based on how sensitive its consumers are to price increases, i.e., the elasticity of demand. These interwoven relationships extend across industries and products, affecting most retailers somehow.
Of course, category exposure varies by industry and sector. Tariffs are known to impact specific industries more than others. For example, steel, electronics, and agriculture products are at risk of price fluctuations based on their reliance on imported components. These have high category exposure. Some industries reliant on domestic production with stable input costs are less prone to category exposure. These include domestic power grids, natural gas, real estate, and handmade goods. No matter which industry you’re in, however, expect some spill over.
Preparation Strategies
Forward-thinking leaders can help position their teams for success in the face of pricing volatility brought on by tariffs. The key is to enable teams to sense disruptions quickly and provide a way to take corrective action that doesn’t diminish sales. Here are three strategies you can implement ahead of time that will help keep you competitive during tariff disruption.
Cost Monitoring
Start by getting a firm handle on internal and external costs. Understand and analyze fluctuations in the cost of raw materials, production, and supply chain for your business to operate. Make sure that your products are priced with pre-defined logic so changes in price on one SKU don’t create confusion with another. For example, faux leather costs rise while genuine leather stays the same. In that case, a leather version of a product should be raised to reflect the price increase in the pleather variation, not to devalue the perception of luxury.
Next, you will want to understand historical pricing trends as well as pricing indexes across your categories. These insights can help your teams anticipate cost fluctuations before they even arise and mitigate the risk that economic shifts create, even unexpected tariffs.
Competition Tracking
Tracking your competition is likely already a strategy you have in mind. But how well are your teams executing this important task? If they’re trying to watch for market shifts and adjust pricing in real time without the help of technology, things are likely slipping through the cracks.
Competitive intelligence solutions help retailers discover all competitive SKUs across the e-commerce market, monitor for real-time pricing shifts, and take action to mitigate risk. You need an “always-on” competitive pricing strategy now so that the second a tariff is announced, you can see how it’s affecting your market. This way, you can maintain price competitiveness and avoid margin erosion when competitors’ pricing changes in response to a tariff or other market shift.
Consumer Impact Assessment
The multiplier effect is felt throughout the supply chain when tariffs are implemented. The effect can affect consumers in a number of ways and cause them to become spending averse in certain areas. Often, during times of economic hardship, grocery items remain relatively inelastic. This is because consumers continue to purchase essentials regardless of price changes. Conversely, the price of eating out or home delivery becomes more elastic since consumers cut back on dining expenses when costs rise across their shopping basket.
You need to establish clear visibility into the results of your pricing changes. The goal should be to monitor progress and measure the ROI on specific and broad pricing changes across your assortment. Conducting market share impact analysis will also help you determine if you are losing out on potential customers or whether a decline in sales is being felt across your competition. Impact analysis tools can help your company check actual deployed price changes in real time.
Response Framework
Once you’ve prepared your team with strategies and technologies to set them up for success, it’s time to think about what to do once a tariff is announced or implemented. Here are three real-time decision-making strategies you should consider before your feet are to the fire. Having these in your back pocket will help you avoid financial disruption.
Price Adjustment Strategies
Think about how you strategically adjust prices. These could include percentage increases, flat rate increases, or absorbed via other strategies like bundling. You should also determine a cost increase threshold that you’re willing to absorb before raising prices. Think about the importance of remaining price attractive to consumers and weigh the risk of increasing prices past consumers’ ability or willingness to pay.
Promotion Planning
Folding increased costs into value-added offerings for consumers can be a good way to retain customer sentiment and sales volume without negatively affecting profit margins. You can leverage discounts, promotions, or bundling options to sell more of an item to a customer at a lower per-unit cost.
What you don’t want to do is panic-adjust prices in response to tariffs of competitor moves. Instead, you can use a tool competitor intelligence solutions to watch if your competition is holding prices steady or adjusting. With full information about pricing at your disposal, you can make better decisions on your promotional strategy and not undercut yourself or lose customer loyalty.
Alternative Sourcing
Let’s face it: putting all your eggs in one basket is bad for business. Instead of relying solely on a single supplier for production, you should have a diverse set of suppliers ready and able to shift production when tariffs are announced. If a tariff impacts Chinese exports, having a backup supplier in Vietnam can prevent added costs entirely. You can also consider strategies like bulk pricing, set pricing, or shifting entirely to domestic suppliers.
Forward Buying
Proactively stockpile inventory by purchasing large quantities of at-risk products before tariffs take effect. This strategy locks in lower costs and ensures supply continuity during disruptions. However, balance this with careful demand forecasting to avoid overstocking, which ties up cash flow and incurs storage costs. Use historical sales data and tariff implementation timelines to optimize order volumes—this is especially effective for products with stable demand or long shelf lives.
Market Intelligence Requirements
Preparing your pricing teams and giving them a framework upon which to act when tariffs are announced doesn’t have to be complicated. You can get access to the right data on costs, competitors, and consumer behavior with DataWeave’s pricing intelligence capability.
We provide retailers with insights on pricing trends, category exposure, and competitor adjustments. Our AI-powered competitor intelligence solutions allow you to get timely alerts whenever a significant change happens. This can include changes to competitor pricing and category-level shifts that you’d otherwise react to when it’s too late.
These automated insights can also help you track historical pricing trends, elasticity, and margin impact to construct a clear response framework in an emergency. Additionally, our analytics capabilities can help you identify patterns to power pre-emptive pricing and promotional strategies.
Getting the right pricing intelligence strategy in place now can prevent disaster later. Think through your preparedness strategy and how you want your teams to respond in the event of a new tariff, and consider how much easier reacting accurately would be with all the data needed at your fingertips. Reach out to us to know more.
Many retailers view minimum advertised pricing (MAP) policies as a necessary evil since they present several challenges for competitive positioning. In an idealistic free market, there wouldn’t be a need for MAP policies, and healthy competition would do the work of setting the final advertised price.
However, MAP policies aren’t beneficial only for brands; they also greatly benefit retailers. This article will examine why MAP pricing can be a strategic advantage for both brands and retailers. We’ll also look at ways brand managers and retail pricing teams can navigate MAP requirements to maintain profitability and safeguard customer trust.
Understanding MAP Fundamentals
Minimum Advertised Price (MAP) is a policy set by brands that requires their sales channels to price the brand’s products at a minimum dollar value. Retailers are free to price the items higher, but the advertised price is never to exceed the minimum threshold.
This agreement is established at the outset of a relationship or new product launch and can change at the brand’s discretion. Consumers typically see only the minimum advertised price when they search for a product across competing retailers. This means retailers need to find other ways to differentiate themselves beyond offering the lowest price.
But a retailer can still effectively price the product at a lower cost to win sales away from the competition. This comes in the form of discounts applied at checkout, bundled deals, or other promotions that affect the final cart but not the advertised price. Only the advertised price must remain within MAP guidelines. This gives retailers a way to set themselves apart from the competition while still protecting the brand.
A minimum advertised price has three central values: one for the brand, one for the retailer, and one for both.
Brand or manufacturer: A MAP policy protects the brand’s value and prevents price erosion. If a retailer consistently undercuts a product’s price to make it more competitive, customers may begin to perceive the brand as lower in value over time. It can cause the brand to appear less premium than if prices hold steady. If a customer pays full price one day and then sees the same item advertised at a lower base price the next, it can weaken brand loyalty and cause dissatisfaction.
Retailer: Minimum advertised pricing policies prevent retailers from engaging in a pricing war with one another, driving the price of an item down and hurting margins. This race to the bottom is bad for business. Apart from reducing profits, it discourages sellers from investing in marketing and other activities that drive sales. It also means that smaller retailers can compete with larger retailers, effectively leveling the playing field across the market.
All parties: The issue of counterfeit and unauthorized sellers on the grey market plagues retailers and brands. One of the most straightforward ways to identify these sellers that undercut prices and damage brand perception is to track who is pricing products outside of agreements. Unauthorized or counterfeit sellers can be identified by establishing a MAP policy and monitoring who sells at the wrong price. Then, official legal action can be taken to prevent those merchants from selling the product.
Brand Perspective
Developing a clear and precise MAP policy is an important option for brands looking to stay competitive. Make sure you outline the minimum advertised price for each product for each sales channel and do so by geography. Write clear instructions on how discounts, promotions, and sales can be applied to the advertised price to avoid misunderstandings later. Ensure you work with your legal team to fill in any gaps before presenting them to retailers.
If you find sellers acting outside the MAP policy, you must act swiftly to enforce your MAP policy. Cease and desist orders are the most common enforcement strategy a brand can use on unauthorized sellers and counterfeiters. But there are legal considerations for authorized sellers, too. You may need to fine the retailer for damages, restrict inventory replenishment until prices have been adjusted, remove seller authorization by terminating the relationship entirely, or escalate to your legal team.
Open communication between the brand and retailer is in everyone’s best interest to ensure minimum pricing is being used. Have explanatory documents available for your retailers’ non-legal teams to reference while they set prices. These can take the form of checklists, video explainers, or even well-informed brand representatives working closely with retail pricing teams. It’s likely that some MAP violations will occur from time to time. The importance your retail partners place on fixing those errors will help you determine how much goodwill you will give them in the future.
Brands can consider rewarding retailers that consistently adhere to minimum advertised price policies. Rewards often take the form of more lenient promotion policies, especially during major holidays like Christmas, Prime Day, or Black Friday. However, it’s never advisable to relax the actual MAP policy to allow one retailer to advertise a lower price year-round.
Retailer Strategies
A retailer can take several approaches to complying with a brand’s MAP policy while still maximizing sales. First, you need a dedicated compliance process spearheaded by compliance specialists or, better yet, enabled by technology. Embedding a process that checks for MAP violations into daily or weekly operations will prevent problems before brands become aware.
Automated price tracking tools can help discover discrepancies so that you don’t accidentally violate a MAP agreement. Make sure MAP training extends beyond your pricing team and includes marketing. Anyone who participates in promotions or events should be made aware of the agreements made with specific brands. Determine if there are alternative promotion methods available to attract customers. You could offer free shipping on certain items, bundle giveaways, or apply cart-wide discounts at checkout.
Monitoring your competition in real time will also help you stay ahead. If you discover a competitor undercutting your prices, bring this to the attention of your brand representative. This can build loyalty with the brand and help prevent lost sales due to market share loss.
Digital Implementation for MAP Compliance
Pricing teams at brands and retailers manually attempting to manage MAP pricing will lag behind the competition without help. They must discover, monitor, and enforce MAP compliance simply and effectively.
Over the past several years, there has been a seemingly exponential proliferation of online sellers, complicating the industry and making it nearly impossible to find and discover all instances of every product you sell. It’s further complicated by marketplaces like Amazon, Walmart, and eBay, which are full of individual unauthorized sellers and resellers.
Implementing a digital tool is the first step to effectively discovering and monitoring MAP compliance, even across these marketplaces. This tool should monitor all competition for you and discover imbalances in pricing parity.
DataWeave’s MAP Violations Merchant Analytics solution has AI-backed software that scours the web for your products. It uses identifiers like UPCs and product titles and compares imagery to find where the product is sold. Our AI-powered image recognition capabilities are especially helpful in identifying inauthentic listings that may be counterfeit products or unauthorized sellers. It also has built-in geographic and channel-specific MAP monitoring capabilities to help with localized enforcement.
The tool can aggregate all this data and present dashboard views of your own and competitors’ pricing that are easy to digest and act on. After all, retailers need to monitor their own MAP compliance as well as the competition’s. Brands can also track competitor sellers’ networks to explore potential new retail partnerships and grow their network reach.
The MAP Violations Merchant Analytics solution has automated violation alerts and advanced reporting built into it. This means you can get real-time alerts instead of pouring through dashboards searching for exceptions each week. For deeper insights, the dashboards provide time-stamped proof of which sellers are undercutting MAP minimums, so you have all the information you need to make a case against them. Discovering repeat offenders is easy with historical trends dashboards that show which sellers have a history of violations.
With all this information on who is violating what—and when—enforcement becomes much more manageable. Send cease and desist orders to unauthorized sellers and start having conversations with authorized sellers acting outside of your agreement. Acting quickly will help prevent hits to your brand’s reputation, price erosion, and lost sales.
DataWeave’s MAP solution gives you the competitive edge to effectively discover MAP violations, monitor market activity, and act quickly when an issue is discovered.
Make MAP Compliance a Strategic Advantage
Basic MAP compliance and enforcement isn’t simply about setting pricing policies anymore. These policies are foundational to brand strategies, maintaining good relationships with retailers, and establishing long-term profitability for your business.
When you let MAP violations go unchecked, it can erode your margins, damage how your customers perceive your brand, and create confusion across channels. Discovering, monitoring, and acting on MAP violations is much easier with the help of tools like DataWeave’s AI-enabled MAP Violations Merchant Analytics.
Do you remember when the movie Super Size Me came out? If you missed it, it was about the harmful effects of eating fast food too often. One aspect of the film that stands out is McDonald’s clever use of pricing to encourage consumers to buy bigger—and therefore more expensive—meals.
Hungry patrons could upgrade their meal to a Super Size version for only a few cents more. In doing so, McDonald’s was able to capitalize on perceived value, i.e., getting more product for an apparent lower total price for the volume. It encouraged restaurant-goers to spend a little more while feeling like they got a great deal. It was a smart use of strategic pricing.
There are hundreds of pricing relationship types like this one that pricing leaders need to be aware of and can use to their advantage when creating their team’s pricing strategy and workflows. You need to maintain profitable and logical price relationships across your entire product portfolio while keeping up with the competition. After all, the gimmick to Super Size would never have worked if the upgrade had been of less value than just buying another burger, for example.
In this article, we’ll examine more real-world examples of pricing challenges so you can consider the best ways to manage complex price relationships. We’ll examine things like package sizes, brands, and product lines and how they’re intertwined in systematic price relationship management. Read on to learn how to prevent margin erosion, improve customer perception of your brand, and keep your pricing consistent and competitive.
The Price Relationship Challenge
Pricing is one of the most challenging aspects of managing a retail brand. This is especially true if you are dealing with a large assortment of products, including private label items, the same products of differing sizes, and hundreds, or even thousands, of competing products to link. Inconsistencies in your price relationship management can confuse customers, erode trust, and harm your bottom line.
Let’s take a look at a few common pitfalls in portfolio pricing that you might run into in real life to better understand the impact on customer perception, trust, and sales.
Private Label vs. Premium Product Pricing
Let’s consider a nuanced scenario where price relationships between a retailer’s private label and premium branded products create an unexpected customer perception. Imagine you’re in a supermarket, comparing prices on peanut butter. You’ve always opted for the store’s private-label brand, “Best Choice,” because it’s typically the more affordable option. Here’s what you find:
Best Choice (Private Label) 16 oz – $3.50
Jif (National Brand) 16 oz – $3.25
At first glance, this pricing feels off—shouldn’t the private label be the cheaper option? If a customer has been conditioned to expect savings with private-label products, seeing a national brand undercut that price could make them pause. This kind of pricing misalignment can erode trust in private-label value and even push customers toward the national brand. When price relationships don’t follow consumer expectations, they create friction in the shopping experience and may lead to lost sales for the retailer’s own brand.
Value Size Relationships
A strong value-size relationship ensures that customers receive logical pricing as they move between different sizes of the same product. When this relationship is misaligned, customers may feel confused or misled, which can lead to lost sales and eroded trust.
Let’s look at a real-world example using a well-known branded product—salad dressing. Imagine you’re shopping for Hidden Valley Ranch (HVR) dressing and see the following pricing on the shelf:
HVR 16 oz – $3.99
HVR 24 oz – $6.49
HVR 36 oz – $8.99
At first glance, you might assume that buying a larger size offers better value. However, a quick calculation shows that the price per ounce actually increases with size:
16 oz = $0.25 per ounce
24 oz = $0.27 per ounce
36 oz = $0.25 per ounce
Customers expecting a discount for buying in bulk may feel misled or frustrated when they realize the mid-size option (24 oz) is actually the most expensive per ounce. This mispricing could drive shoppers to purchase the smallest size instead of the intended larger, more profitable unit—or worse, lead them to a competitor with clearer pricing structures.
Retailers must maintain logical price progression by ensuring that price per unit decreases as the product size increases. This not only improves customer trust but also encourages higher-volume purchases, driving profitability while maintaining a fair value perception.
Price Link Relationships
A well-structured price link relationship ensures customers can easily compare similar offerings of the same product and size. When the pricing across different versions or variations of the same item isn’t clear or consistent, it can confuse customers and damage trust, ultimately leading to missed sales and a negative brand perception.
Let’s break this down with an example of a popular product—coffee. Imagine you’re shopping for a bag of Starbucks coffee and you see the following pricing on the shelf:
Starbucks Classic Coffee, 12 oz – $7.99
Starbucks Coffee, Mocha, 12 oz – $9.99
Starbucks Ground Coffee, Pumpkin Spice, 12 oz – $12.99
At first glance, the product is the same size (12 oz) across all options, but the prices vary significantly. One might assume that the price difference is due to differences in quality or features, but what if there’s no clear indication of why the different flavors are priced higher than the standard?
After investigating, you may realize that the only differences are related to different variants—like “Mocha” or “Pumpkin Spice” rather than any significant changes in the product’s core attributes. When customers realize they’re paying a premium for just different flavors, without any tangible difference in product quality, it can lead to feelings of confusion and frustration.
Retailers must ensure that price links between similar offerings are justifiable by clearly communicating what differentiates each product. This avoids the perception that customers are being charged extra for little added value, building trust and encouraging repeat purchases. By maintaining transparent price link relationships, businesses can foster customer loyalty, increase sales, and drive better overall satisfaction.
What is the Foundational Process to Tackle the Price Relationship Challenge?
Now that we’ve reviewed several challenges brands face when pricing their products, what can be done about them?
If you’re a pricing leader, you must create a robust pricing strategy that considers customer expectations, competitive data, sizing, and the overall value progressions of your product assortment. These are the three foundational steps to solve your price relationship challenges.
First, you need to group products together accurately.
Second, you need to establish price management rules around the group of related items.
Third, you should set in place a process to review your assortment each week to see if anything is out of tolerance.
This process is difficult, if not impossible, to manage manually. To effectively set up and execute these steps, you’ll need the help of an advanced pricing intelligence system.
Implementation Strategy
Want to know how to roll out a price relationship management strategy? Follow this implementation strategy for a practical way to get started.
Set up price relationship rules: Determine which of your products go together, such as same products with different sizes or color options. Assign different product assortment groups and determine tolerances for scaling prices based on volume or unit counts.
Monitoring and maintenance: Establish rules to alert the appropriate party when something is out of tolerance or a price change has been discovered with a competitive product.
Exception management: Only spend time actioning the exceptions instead of pouring through clean data each week, looking for discrepancies. This will save your team time and help address the most significant opportunities first.
Change management considerations: Think about the current processes you have in place. How will this affect the individuals on your team who have managed pricing operations? Establish a methodology for rolling this new strategy and technology out over select product assortments or brands one at a time to build trust with internal players.
DataWeave offers features specifically built to help pricing teams manage pricing strategies. These applications can help you optimize profit margins and improve your overall market positioning for long-term success. A concerted effort to create brand hierarchies within your own product assortment from the get-go, followed by routine monitoring and real-time updates, can make all the difference in your pricing efforts.
Within DataWeave, you can create price links between your products (value sizing) and those of the competition. These will alert you to exceptions when discrepancies are discovered outside your established tolerance levels. If a linked set of your products in different sizes shows inconsistent pricing based on scaled volumes, your team can quickly know how to make changes. If a competitor’s price drops significantly, you can react to that change before you lose sales.
DataWeave even offers AI-driven similar product matching capabilities, which can help you manage pricing for private label products by finding and analyzing similar products across the market.
Merchants make countless pricing decisions every day. Whether you’re a brand selling online, a traditional brick-and-mortar retailer, or another seller attempting to navigate the vast world of commerce, figuring out the most effective price intelligence strategy is essential. Having your plan in place will help you price your products in the sweet spot that enhances your price image and maximizes profits.
For the best chance of success, your overall pricing strategy must include competitive intelligence.
Many retailers focus their efforts on just collecting the data. But that’s only a portion of the puzzle. The real value lies in match accuracy and knowing exactly which competitor products to compare against. In this article, we will dive deeper into cutting-edge approaches that combine the traditional matching techniques you already leverage with AI to improve your match rates dramatically.
If you’re a pricing director, category manager, commercial leader, or anyone else who deals with pricing intelligence, this article will help you understand why competitive match rates matter and how you can improve yours.
Change your mindset from tactical to strategic and see the benefits in your bottom line.
The Match Rate Challenge
To the layman, tracking and comparing prices against the competition seems easy. Just match up two products and see which ones are the same! In reality, it’s much more challenging. There are thousands of products to discover, analyze, compare, and derive subjective comparisons from. Not only that, product catalogs across the market are constantly evolving and growing, so keeping up becomes a race of attrition with your competitors.
Let’s put it into focus. Imagine you’re trying to price a 12-pack of Coca-Cola. This is a well-known product that, hypothetically, should be easy to identify across the web. However, every retailer uses their own description in their listing. Some examples include:
Retailer A lists it as “Coca-Cola 12 Fl. Oz 12 Pack”
Retailer B shows “Coca Cola Classic Soda Pop Fridge Pack, 12 Fl. Oz Cans, 12-Pack”
Retailer C has “Coca-Cola Soda – 12pk/12 fl oz Cans”
While a human can easily deduce that these are the same product, the automated system you probably have in place right now is most likely struggling. It cannot tell the difference between the retailers’ unique naming conventions, including brand name, description, bundle, unit count, special characters, or sizing.
This has real-world business impacts if your tools cannot accurately compare the price of a Coca-Cola 12-pack across the market.
Why Match Rates Matter
If your competitive match rates are poor, you aren’t seeing the whole picture and are either overcharging, undercharging, or reacting to market shifts too slowly.
Overcharging can result in lost sales, while undercharging may result in out-of-stock due to spikes in demand you haven’t accounted for. Both are recipes to lose out on potential revenue, disappoint customers, and drive business to your competitors.
What you need is a sophisticated matching capability that can handle the tracking of millions of competitive prices each week. It needs to be able to compare using hundreds of possible permutations, something that is impossible for pricing teams to do manually, especially at scale. With technology to make this connection, you aren’t missing out on essential competitive intelligence.
The Business Impact
Besides the bottom-line savings, accurately matching competitor products for pricing intelligence has other business impacts that can help your business. Adding technology to your workflow to improve match rates can help identify blind spots, improve decision quality, and improve operational efficiency.
Pricing Blind Spots
Missing competitor prices on key products
Inability to detect competitive threats
Delayed response to market changes
Decision Quality
Incomplete competitive coverage leads to suboptimal pricing
Risk of pricing decisions based on wrong product comparisons
Operational Efficiency
Manual verification costs
Time spent reconciling mismatched products
Resources needed to maintain price position
Current Industry Challenges
As mentioned, the #1 reason businesses like yours probably aren’t already finding the most accurate matches is that not all sites carry comparable product codes. If every listing had a consistent product code, it would be very easy to match that code to your code base. In fact, most retailers currently only achieve 60-70% match rates using their traditional methods.
Different product naming conventions, constantly changing product catalogs, and regional product variations contribute to the industry challenges, not to mention the difficulty of finding brand equivalencies and private label comparisons across the competition. So, if you’re struggling, just know everyone else is as well. However, there is a significant opportunity to get ahead of your competition if you can improve your match rates with technology.
The Matching Hierarchy
Direct Code Matching: There are a number of ways to start finding matches across the market. The base tier of the hierarchy of most accurate approaches is Direct Code matching. Most likely, your team already has a process in place that can compare UPC to UPC, for example. When no standard codes are listed, your team is left with a blind spot. This poses limitations in modern retail but is an essential first step to identifying the “low-hanging fruit” to start getting matches.
Non-Code-Based Matching: The next level of the hierarchy is implementing non-code-based matching strategies. This is when there are no UPCs, DPCIs, ASINs, or other known codes that make it easy to do one-to-one comparisons. These tools can analyze complex metrics like direct size comparisons, unique product descriptions, and features to find more accurate matches. They can look deep into the listing to extract data points beyond a code, even going as far as analyzing images and video content to help find matches. Advanced technologies for competitive matching can help pricing teams by adding different comparison metrics to their arsenal beyond code-based.
Private Label Conversions: Up until this level of the hierarchy, comparisons relied on direct comparisons. Finding identical codes and features and naming similarities is excellent for figuring out one-to-one comparisons, but when there is no similar product to compare with for pricing intelligence, things get more complicated. This is the third tier of the matching hierarchy. It’s the ability to find similar product matches for ‘like’ products. This can be used for private label conversions and to create meaningful comparisons without direct matches.
Similar Size Mappings: This final rung on the matching hierarchy adds another layer of advanced calculations to the comparison capability. Often, retailers and merchants list a product with different sizing values. One may choose to bundle products, break apart packs to sell as single items or offer a special-sized product manufactured just for them.
While at the end of the day, the actual product is the same, when there are unusual size permutations, it can be hard to identify the similarities. Technology can help with value size relationships, package variation handling, size equalization, and unit normalization.
The AI Advantage
AI is the natural solution for efficiently executing competitive product matching at scale. DataWeave offers solutions for pricing teams to help them reach over 95% product match accuracy. The tools leverage the most modern Natural Language Processing models for ingesting and analyzing product descriptions. Image recognition capabilities apply methods such as object detection, background removal, and image quality enhancement to focus on an individual product’s key features to improve match accuracy.
Deep learning models have been trained on years of data to perform pattern recognition in product attributes and to learn from historical matches. All of these capabilities, and others, automate the attribute matching process, from code to image to feature description, to help pricing teams build the most accurate profile of products across the market for highly accurate pricing intelligence.
Implementation Strategy
We understand that moving away from manual product comparison methods can be challenging. Every organization is different, but some fundamental steps can be followed for success when leveling up your pricing teams’ workflow.
First, conduct a baseline assessment. Figure out where you are on the Matching hierarchy. Are you still only doing direct code-based comparisons? Has your team branched out to compare other non-code-based identifiers?
Next, establish clear match rate targets for yourself. If your current match rate is aligned with industry norms, strive to significantly improve it, aiming for a high alignment that supports maximizing the match rate. Break this down into achievable milestones across different stages of the implementation process.
Work with your vendor on quality control processes. It may be worth running your current process in tandem to be able to calculate the improvements in real time. With a veteran technology provider like DataWeave, you can rely on the most cutting-edge technology combined with human-in-the-loop checks and balances and a team of knowledgeable support personnel. Additionally, for teams wanting direct control, DataWeave’s Approve/Disapprove Module lets your team review and validate match recommendations before they go live, maintaining full oversight of the matching process.
The more data about your products it has, the better your match rates. DataWeave’s competitive intelligence tools also come with a built-in continuous improvement framework. Part of this is the human element that continually ensures high-quality matches, but another is the AI’s ‘learning’ capabilities. Every time the AI is exposed to a new scenario, it learns for the next time.
The final step, ensure cross-functional alignment is achieved. Every one from the C-Suite down should be able to access the synthesized information useful for their role without complex data to sift through. Customized dashboards and reports can help with this process.
Future-Proofing Match Rates
The world of retail is constantly evolving. If you don’t keep up, you’re going to be left behind. There are emerging retail channels, like the TikTok shop, and new product identification methods to leverage, like image comparisons. As more products enter the market along with new retailers, figuring out how to scale needs to be taken into consideration. It’s impossible to keep up with manual processes. Instead, think about maximizing your match rates every week and not letting them degrade over time. A combination of scale, timely action, and highly accurate match rates will help you price your products the most competitively.
Key Takeaways
Match rates are the foundation of pricing intelligence. You can evaluate how advanced your match rate strategy is based on the matching hierarchy. If you’re still early in your journey, you’re likely still relying on code-to-code matches. However, using a mix of AI and traditional methods, you can achieve a 95% accuracy rate on product matching, leading to overall higher competitive match rates. As a result, with continuous improvement, you will stay ahead of the competition even as the goalposts change and new variables are introduced to the competitive landscape.
Starting this process to add AI to your pricing strategy can be overwhelming. At DataWeave, we work with you to make the change easy. Talk to us today to know more.
Poor retail data is the bane of Chief Commercial Officers and VPs of Pricing. If you don’t have the correct inputs or enough of them in real time, you can’t make data-driven business decisions regarding pricing.
Retail data isn’t limited to your product assortment. Price data from your competition is as important as understanding your brand hierarchies and value size progressions. However, the vast and expanding nature of e-commerce means new competitors are around every corner, creating more raw data for your teams.
Think of competitive price data like crude oil. Crude or unrefined oil is an extremely valuable and sought-after commodity. But in its raw form, crude oil is relatively useless. Simply having it doesn’t benefit the owner. It must be transformed into refined oil before it can be used as fuel. This is the same for competitive data that hasn’t been transformed. Your competitive data needs to be refined into an accurate, consistent, and actionable form to power strategic insights.
So, how can retailers transform vast amounts of competitive pricing data into actionable business intelligence? Read this article to find out.
Poor Data Refinement vs. Good Refinement
Let’s consider a new product launch as an example of poor price data refinement vs. good data refinement, which affects most sellers across industries.
Retailer A
Imagine you’re launching a limited-edition sneaker. Sneakerheads online have highly anticipated the launch, and you know your competitors are watching you closely as go-live looms.
Now, imagine that your pricing data is outdated and unrefined when you go to price your new sneakers. You base your pricing assumptions on last year’s historical data and don’t have a way to account for real-time competitor movements. You price your new product the same as last year’s limited-edition sneaker.
Your competitor, having learned from last year, anticipates your new product’s price and has a sale lined up to go live mid-launch that undercuts you. Your team discovers this a week later and reacts with a markdown on the new product, fearing demand will lessen without action.
Customers who have already bought the much-anticipated sneakers feel like they’ve been overcharged now, and backlash on social media is swift. New buyers see the price reduction as proof that your sneakers aren’t popular, and demand decreases. This hurts your brand’s reputation, and the product launch is not deemed a success.
Retailer B
Imagine your company had refined competitive data to work with before launch. Your team can see trends in competitors’ promotional activity and can see that a line of sneakers at a major competitor is overdue for sale based on trends. Your team can anticipate that the competitor is planning to lower prices during your launch week in the hope of undercutting you.
Instead of needing to react retroactively with a markdown, your team comes up with clever ways to bundle accessories with a ‘deal’ during launch week to create value beyond just the price. During launch week, your competitor’s sneakers look like the lesser option while your new sneakers look like the premium choice while still being a good value. Customer loyalty improves, and buzz on social media is positive.
Here, we can see that refined data drives better decision-making and competitive advantage. It is the missing link in retail price intelligence and can set you ahead of the competition. However, turning raw competitive data into strategic insights is easier said than done. To achieve intelligence from truly refined competitive pricing data, pricing teams need to rely on technology.
The Hidden Cost of Unrefined Data
Technology is advancing rapidly, and more sellers are leveraging competitive pricing intelligence tools to make strategic pricing decisions. Retailers that continue to rely on old, manual pricing methods will soon be left behind.
You might consider your competitive data process to be quite extensive. Perhaps you are successfully gathering vast data about your competitors. But simply having the raw data is just as ineffective as having access to crude oil and making no plan to refine it. Collection alone isn’t enough—you need to transform it into a usable state.
Attempting to harmonize data using spreadsheets will waste time and give you only limited insights, which are often out of date by the time they’re discovered. Trying to crunch inflexible data will set your team up for failure and impact business decision quality.
The Two Pillars of Data Refinement
There are two foundational pillars in data refinement. Neither can truly be achieved manually, even with great effort.
Competitive Matches
There are always new sellers and new products being launched in the market. Competitive matching is the process of finding all these equivalent products across the web and tying them together with your products. It goes beyond matching UPCs to link identical products together. Instead, it involves matching products with similar features and characteristics, just as a shopper might decide to compare two similar products on the shelf. For instance private label brands are compared to legacy brands when consumers shop to discern value.
A retailer using refined competitive matches can quickly and confidently adjust its prices during a promotional event, know where to increase prices in response to demand and availability and stay attractive to sensitive shoppers without undercutting margins.
Internal Portfolio Matches
Product matching is a combination of algorithmic and manual techniques that work to recognize and link identical products. This can even be done internally across your product portfolio. Retailers selling thousands or even hundreds of thousands of products know the challenge of consistently pricing items with varying levels of similarity or uniformity. If you must sell a 12oz bottle of shampoo for $3.00 based on its costs, then a 16oz bottle of the same product should not sell for $2.75, even if that aligns with the competition.
Establishing a process for internal portfolio matching helps to eliminate inefficiencies caused by duplicated or misaligned product data. Instead of discovering discrepancies and having to fire-fight them one by one, an internal portfolio matching feature can help teams preempt this issue.
Leveraging AI for Enhanced Match Rates
As product SKUs proliferate and new sellers seem to enter the market at lightning speed, scaling is essential without hiring dozens more pricing experts. That’s where AI comes in. Not only can AI do the job of dozens of experts, but it also does it in a fraction of the time and at an improved match accuracy rate.
DataWeave’s AI-powered pricing intelligence and price monitoring offerings help retailers uncover gaps and opportunities to stay competitive in the dynamic world of e-commerce. It can gather competitive data from across the market and accurately match competitor products with internal catalogs. It can also internally match your product portfolio, identifying product family trees and setting tolerances to avoid pricing mismatches. The AI synthesizes all this data and links products into a usable format. Teams can easily access reports and dashboards to get their questions answered without manually attempting to refine the data first.
From Refinement to Business Value
Refined competitive price data is your team’s foundation to execute these essential pricing functions: price management, price reporting, and competitive intelligence.
Price Management
Refined data is the core of accurate price management and product portfolio optimization. Imagine you’re an electronics seller offering a range of laptops and personal computing devices marketed toward college students. Without refined competitive data, you might fail to account for pricing differences based on regionality for similar products. Demand might be greater in one city than in another. By monitoring your competition, you can match your forecasted demand assumptions with competitor pricing trends to better manage your prices and even offer a greater assortment where there is more demand.
Price Reporting
Leadership is always looking for new and better market positioning opportunities. This often revolves around how products are priced, whether you’re making a profit, and where. To effectively communicate across departments and with leadership, pricing teams need a convenient way to report on pricing and make changes or updates as new ad hoc requests come through. Spending hours constructing a report on static data will feel like a waste when the C-Suite asks for it again next week but with current metrics. Refined, constantly updated price data nips this problem in the bud.
Competitive Intelligence
Unrefined data can’t be used to discover competitive intelligence accurately. You might miss a new player, fail to account for a new competitive product line, or be unable to extract insights quickly enough to be helpful. This can lead to missed opportunities and misinformed strategies. As a seller, your competitive intelligence should be able to fuel predictive scenario modeling. For example, you should be able to anticipate competitor price changes based on seasonal trends. Your outputs will be wrong without the correct inputs.
Implementation Framework
As a pricing leader, you can take these steps to begin evaluating your current process and improve your strategy.
Assess your current data quality: Determine whether your team is aggregating data across the entire competitive landscape. Ask yourself if all attributes, features, regionality, and other metrics are captured in a single usable format for your analysts to leverage.
Setting refinement objectives: If your competitive data isn’t refined, what are your objectives? Do you want to be able to match similar products or product families within your product portfolio?
Measuring success through KPIs: Establish a set of KPIs to keep you on track. Measure things like match rate accuracy, how quickly you can react to price changes, assortment overlaps, and price parity.
Building cross-functional alignment: Create dashboards and establish methods to build ad hoc reports for external departments. Start the conversation with data to build trust across teams and improve the business.
What’s Next?
The time is now to start evaluating your current data refinement process to improve your ability to capture and leverage competitive intelligence. Work with a specialized partner like DataWeave to refine your competitive pricing data using AI and dedicated human-in-the-loop support.
Want help getting started refining your data fast? Talk to us to get a demo today!
Managing the endlessly growing competitive data from across your eCommerce landscape can feel like pushing a boulder uphill. The sheer volume can be overwhelming, and ensuring that data meets standards of high accuracy and quality, and the insights are actionable is a constant challenge.
This article explores the challenges eCommerce companies face in having sustained access to high-quality competitive data and how AI-driven solutions like DataWeave empower brands and retailers with reliable, comprehensive, and timely market intelligence.
The Data Quality Challenge for Retailers and Brands
Brands and retailers make innumerable daily business decisions relying on accurate competitive and market data. Pricing changes, catalog expansion, development of new products, and where to go to market are just a few. However, these decisions are only as good as the insights derived from the data. If the data is made up of inaccurate or low-quality inputs, the outputs will also be low-quality.
Managing eCommerce data at scale gets more complex every year. There are more market entrants, retailers, and copy-cats trying to sell similar or knock-off products. There are millions of SKUs from thousands of retailers in multiple markets. Not only that, the data is constantly changing. Amazon may add a new subcategory definition in an existing space, or Staples might decide to branch out into a new industry like “snack foods for the office”, an established brand might introduce new sizing options in their apparel, or shrinkflation might decrease the size of a product.
Given this, it is imperative that conventional data collection and validation methods need to be revised. Teams that rely on spreadsheets and manual auditing processes can’t keep up with the scale and speed of change. An algorithm that once could match products easily needs to be updated when trends, categories, or terminology change.
With SKU proliferation, visually matching product images against the competition becomes impossible. Knowing where to look for comprehensive data becomes impossible with so many new sellers in the market. Luckily, technology has advanced to a place where manual intervention isn’t the main course of action.
Advanced AI capabilities, like DataWeave’s, tackle these challenges to help gather, categorize, and extract insights that drive impactful business decisions. It performs the millions of actions that your team can’t accomplish with greater accuracy and in near real-time.
Improving the Accuracy of Product Matching
DataWeave’s product matching capabilities rely on an ensemble of text and image-based models with built-in loss functions to determine confidence levels in all insights. These loss functions measure precision and recall. They help in determining how accurate – both in terms of correctness and completeness – the results are so the system can learn and improve over time. The solution’s built-in scoring function provides a confidence metric that brands and retailers can rely on.
The product matching engine is configurable based on the type of products that we are matching. It uses a “pipelined mode” that first focuses on recall or coverage by maximizing the search space for viable candidates, followed by mechanisms to improve the precision.
How ‘Embeddings’ Enhance Scoring
Embeddings are like digital fingerprints. They are dense vector representations that capture the essence of a product in a way that makes it easy to identify similar products. With embeddings, we can codify a more nuanced understanding of the varied relationships between different products. Techniques used to create good embeddings are generic and flexible and work well across product categories. This makes it easier to find similarities across products even with complex terminology, attributes, and semantics.
These along with advanced scoring mechanisms used across DataWeave’s eCommerce offerings provide the foundation for:
Semantic Analysis: Embeddings identify subtle patterns and meanings in text and image data to better align with business contexts.
Multimodal Integration: A comprehensive representation of each SKU is created by incorporating embeddings from both text (product descriptions) and images or videos (product visuals)
Anomaly Detection: AI models leverage embeddings to identify outliers and inconsistencies to improve the overall score accuracy.
Vector Databases for Enhanced Accuracy
Vector databases play a central role in DataWeave’s AI ecosystem. These databases help with better storage, retrieval, and scoring of embeddings and serve to power real-time applications such as Verification. This process helps pinpoint the closest matches for products, attributes, or categories with the help of similarity algorithms. It can even operate when there is incomplete or noisy data. After identification, the system prioritizes data that exhibits high semantic alignment so that all recommendations are high-quality and relevant.
Evolution of Embeddings and Scoring: A Multimodal Perspective
Product listings undergo daily visual and text changes. DataWeave takes a multimodal approach in its AI to ensure that any content shown on a listing is accounted for, including visuals, videos, contextual signals, and text. DataWeave is continually evolving its embedding and scoring models to align with industry advancements and always works within an up-to-date context.
DataWeave’s AI framework can:
Handle Diverse Data Types: The framework captures a holistic view of the digital shelf by integrating insights from multiple sources.
Improve Matching Precision: Sophisticated scoring methods refine the accuracy of matches so that brands and retailers can trust the competitive intelligence.
Scale Across Markets: Additional, expansive datasets are easy for DataWeave’s capabilities, meaning brands and retailers can scale across markets without pausing.
Quantified Improvements: Model Accuracy and Stats
Since we deployed LLMs and CLIP Embeddings, Product Matching accuracy improved by > 15% from the previous baseline numbers in categories such as Home Improvement, Fashion, and CPG.
High precision in certain categories such as Electronics and Fashion. Upwards of 85%.
Close to 90% of matches are auto-processed (auto-verified or auto-rejected).
Attribute tagging accuracy > 75% and significant improvement for the top 5 categories.
Business Use Case: Multimodal Matching for Price Leadership
For example, if you’re a retailer selling consumer electronics, you probably want to maintain your price leadership across your key markets during peak times like Black Friday Cyber Monday. Doing so is a challenge, as all your competitors are changing prices several times a day to steal your sales. To get ahead of them, this retailer could use DataWeave’s multimodal embedding-based scoring framework to:
Detect Discrepancies: Isolate SKUs with price mismatches with your competition and take action before revenue is lost.
Optimize Coverage: Establish a process to capture complete data across the competition so you can avoid knowledge gaps.
Enable Timely Decisions: Address the ‘low-hanging fruit’ by prioritizing products that need pricing adjustments based on confidence scores on high-impact products. Leverage confidence metrics to prioritize pricing adjustments for high-impact products.
This approach helps retailers stay competitive even as eCommerce evolves around us. By acting fast on complete and reliable data, they can earn and sustain their competitive advantage.
DataWeave’s AI-Driven Data Quality Framework
Let’s look at how our AI can gather the most comprehensive data and output the highest-quality insights. Our framework evaluates three critical dimensions:
Accuracy: “Is my data correct?” – Ensuring reliable product matches and attribute tracking
Coverage: “Do I have the complete picture?” – Maintaining comprehensive market visibility
Freshness: “Is my data recent?” – Guaranteeing timely and current market insights
Scoring Data Quality
To maintain the highest levels of data quality, we rely on a robust scoring mechanism across our solutions. Every dataset that is evaluated is done so based on several key parameters. These can include things like accuracy, consistency, timeliness, and completeness of data. Scores are dynamically updated as new data flows in so that insights can be acted upon.
Accuracy: Compare gathered data with multiple trusted sources to reduce discrepancies.
Consistency: Detect and rectify variations or contradictions across the data with regular audits.
Timeliness: Scoring emphasizes data recency, especially for fast-changing markets like eCommerce.
Completeness: Ensure all essential data points are included and gaps in coverage are highlighted by analysis.
Apart from this, we also leverage an evolved quality check framework:
Statistical Process Control
DataWeave implements a sophisticated system of statistical process control that includes:
Anomaly Detection: Using advanced statistical techniques to identify and flag outlier data, particularly for price and stock variations
Intelligent Alerting: Automated system for notifying stakeholders of significant deviations
Continuous Monitoring: Real-time tracking of data patterns and trends
Error Correction: Systematic approach to addressing and rectifying data discrepancies
Transparent Quality Assurance
The platform provides complete visibility into data quality through:
Comprehensive Data Transparency & Statistics Dashboard: Offering detailed insights into match performance and data freshness
Match Distribution Analysis: Tracking both exact and similar matches across retailers and locations as required
Product Tracking Metrics: Visibility into the number of products being monitored
Autonomous Audit Mechanisms: Giving customers access to cached product pages for transparent, on-demand verification
Human-in-the-Loop Validation (Véracité)
DataWeave’s Véracité system combines AI capabilities with human expertise to ensure unmatched accuracy:
Expert Validation: Product category specialists who understand industry-specific similarity criteria
Continuous Learning: AI models that evolve through ongoing expert feedback
Adaptive Matching: Recognition that similarity criteria can vary by category and change over time
Detailed Documentation: Comprehensive reasoning for product match decisions
Together, these elements create a robust framework that delivers accurate, complete, and relevant product data for competitive intelligence. The system’s combination of automated monitoring, statistical validation, and human expertise ensures businesses can make decisions based on reliable, high-quality data.
In Conclusion
DataWeave’s AI-driven approach to data quality and coverage empowers retailers and brands to navigate the complexities of eCommerce with confidence. By leveraging advanced techniques such as multimodal embeddings, vector databases, and advanced scoring functions, businesses can ensure accurate, comprehensive, and timely competitive intelligence. These capabilities enable them to optimize pricing, improve product visibility, and stay ahead in an ever-evolving market. As AI continues to refine product matching and data validation processes, brands can rely on DataWeave’s technology to eliminate inefficiencies and drive smarter, more profitable decisions.
The evolution of AI in competitive intelligence is not just about automation—it’s about precision, scalability, and adaptability. DataWeave’s commitment to high data quality standards, supported by statistical process controls, transparent validation mechanisms, and human-in-the-loop expertise, ensures that insights remain actionable and trustworthy. In a digital landscape where data accuracy directly impacts profitability, investing in AI-powered solutions like DataWeave’s is not just an advantage—it’s a necessity for sustained eCommerce success.
When it comes to shopping events, Black Friday stands out as one of the most anticipated dates for scoring deals. Typically occurring the day after Thanksgiving, the weekend kicks off the holiday shopping season with a frenzy of discounts. But Boxing Day, celebrated on December 26, is also well-known for its post-Christmas clearance sales.
This Black Friday, US eCommerce sales increased by a hefty 14.6% in 2024, according to Mastercard SpendingPulse. While Black Friday leads in overall revenue generation for retailers, Boxing Day presents unique opportunities for clearing post-holiday inventory.
For a consumer, which sale event is likely to offer the most attractive deals?
At DataWeave, we analyzed discounts across retailers and categories to uncover the answer.
Our Methodology
For this analysis, we tracked pricing data across major retailers for Black Friday and Boxing Day. To provide a comprehensive analysis of Black Friday pricing strategies, we explored a matched products dataset, comparing identical 14,000+ SKUs across retailers within key categories.
Categories included: Consumer Electronics, Home & Furniture, Apparel, Health & Beauty, Grocery
Retailers included: Amazon, Target, Walmart, Sephora, Ulta Beauty, Overstock, Home Depot, Best Buy, Saks Fifth Ave, Nordstrom, Macy’s, Bloomingdale’s, Neiman Marcus
Timeline: November 26 (Black Friday), December 26 (Boxing Day)
Average Discounts: Black Friday vs Boxing Day
Our analysis reveals that Black Friday generally offered steeper discounts across most categories, although Boxing Day wasn’t far behind. Here’s a breakdown:
While Black Friday led in most categories, Apparel saw a slight edge on Boxing Day, with discounts averaging 40.22% compared to 37.67% on Black Friday. Electronics, Beauty, and Home, however, remained more lucrative during Black Friday.
Top 5 Products Higher Discounts on Black Friday
Diving deeper into specific products, here are our top 5 picks offering better discounts during Black Friday.
Appliances like an Immersion blender set offering a discount of 88.29%, significantly higher than its Boxing Day offer of 86.62%.
High-end electronics like the Microsoft Surface Pro 4 also saw substantial markdowns at 84.60%.
In beauty and fashion, both La Roche Posay’s retinol serum and Vera Bradley’s satchel offered discounts above 80%.
Even everyday essentials like paper towels enjoyed generous discounts, with markdowns reaching 82.35% during Black Friday compared to 76.47% on Boxing Day.
Top 5 Products With Higher Discounts on Boxing Day
Boxing Day revealed some remarkable deals across diverse categories, with certain products offering significantly better value than their Black Friday counterparts.
The JBL Go 2 portable speaker emerged as the standout, with an extraordinary 82% Boxing Day discount compared to just 20% on Black Friday—a dramatic 62% difference.
Home furnishings showed strong Boxing Day performance, with the Costway accent armchair set reaching 80.30% off.
In Conclusion
Black Friday reigns supreme in driving early holiday sales, offering deeper discounts and drawing larger crowds. However, Boxing Day remains critical for retailers to offload surplus inventory and attract post-holiday shoppers.
By combining insights from both events, retailers can refine their strategies to maximize revenue and enhance customer satisfaction. For shoppers, the decision comes down to timing—shop early for better deals or wait to capitalize on clearance markdowns. The products and categories with more attractive offers tend to vary between these two sale events. Hence, as a shopper, it’s a good idea to keep track of prices all through the holiday season to take advantage of the best deals.
For a deeper dive into the world of competitive pricing intelligence and to explore how our solutions can benefit apparel retailers and brands, reach out to us today!
At DataWeave, data security isn’t just about compliance—it’s about enabling peace of mind and better decision-making for our customers. Our customers rely on us not just for competitive and market intelligence but also for the seamless integration of critical data sources into their decision-making frameworks. To achieve this, we have built a security-first infrastructure that ensures organizations can confidently leverage both external and internal data without compromising privacy or protection.
Secure Data Integration: The Foundation of Smarter Decisions
Effective decision-making in today’s digital commerce landscape depends on combining multiple data sources—including first-party customer data, pricing intelligence, and business rules—into a unified framework. However, without the right security measures in place, businesses often struggle to operationalize this data effectively.
At DataWeave, we eliminate this challenge by offering:
Integration with Leading Data Storage Solutions: Our platform seamlessly connects with data lakes and warehouses like AWS S3 and Snowflake, ensuring that businesses can easily ingest and analyze our data in real time.
Support for Sandboxed Environments & Data Clean Rooms: Organizations can securely merge internal and external datasets without compromising confidentiality, unlocking deeper insights for pricing and business strategies.
Automated Data Ingestion & Management: We simplify the process of integrating first-party data alongside competitive insights, allowing customers to focus on execution rather than infrastructure management.
Our Purpose-Built Security Framework
Handling millions of data points daily demands a security framework that is not only robust but also scalable and adaptable to evolving threats. DataWeave’s multi-tenant architecture ensures seamless data security without compromising operational efficiency.
Multi-Tenant Architecture: Our system allows multiple customers to share the same application infrastructure while maintaining complete data isolation and security.
Tenants share infrastructure and computing resources but remain logically isolated.
Application-level controls ensure privacy while maximizing cost efficiency.
Centralized updates, maintenance, and easy scalability for new tenants.
End-to-End Encryption & Access Controls: Every piece of data is encrypted both in transit and at rest. Role-based access controls (RBAC) restrict visibility to only authorized personnel, ensuring minimal risk of unauthorized data access.
Active Monitoring & Automated Compliance Management: We leverage automated access controls that adjust permissions dynamically as organizational roles evolve, ensuring that compliance is continuously maintained.
Certifications That Inspire Confidence
Data security is at the core of everything we do. Our compliance with the highest industry standards ensures that businesses can trust us with their sensitive data.
SOC 2 Type II Certification: DataWeave’s SOC 2 compliance is a testament to our commitment to stringent security protocols. This certification guarantees that we adhere to strict standards in data protection, availability, and confidentiality.
We implement a phased approach to security improvement:
Prioritizing Critical Systems: To maximize impact, we prioritized systems that had the highest data security relevance and expanded the coverage thereafter. By addressing these priority areas, we were able to make meaningful security improvements early in the process.
Automating Monitoring and Compliance: Partnering with Sprinto streamlined the compliance journey by automating key processes. This included real-time monitoring of our cloud environments, automated generation of audit-ready evidence, and integration with critical systems like AWS, Bitbucket, and Jira. These enhancements ensured efficient management of compliance requirements while reducing the burden on our teams.
Fostering a Culture of Shared Responsibility: We conducted organization-wide training sessions to embed compliance as a shared responsibility across all teams. By educating employees on the importance of security practices and providing them with the tools to manage compliance autonomously, we established a security-first mindset throughout the company.
This systematic method allowed us to deliver immediate improvements while aligning long-term practices with industry’s best standards.
What This Means for Our Customers
By combining robust security with seamless data integration, DataWeave empowers businesses to:
Optimize Price Management & Modelling: With secure access to real-time data, organizations can make informed pricing decisions that enhance profitability and market competitiveness.
Run Advanced Simulations & Testing: Reliable, secure data enables businesses to model various pricing and assortment strategies before implementation, reducing risks and maximizing returns.
Uncompromised Data Security: SOC 2 Type II compliance ensures stringent protocols to protect your data at every stage.
Simplified Vendor Processes: Verified security certifications reduce friction during due diligence and onboarding, making it easier to partner with us.
Aligned Standards: Our adherence to industry benchmarks reflects our commitment to meeting your expectations as a trusted technology partner.
Scalable Operations: Expand across regions while maintaining full confidence in data privacy and security.
Secure Collaboration: Share insights across teams with tools designed to protect sensitive information.
Our customers are increasingly looking to integrate their internal datasets with the external competitive intelligence provided by DataWeave. This can be a complex and risky process without the right security measures in place. We remove these roadblocks by providing a secure, scalable infrastructure designed to help businesses unify data without security concerns.
By ensuring seamless compatibility with key data storage platforms, such as Snowflake and AWS S3, we enable organizations to consolidate valuable first-party data with timely market insights. This integration empowers businesses to refine their pricing, assortment, and digital shelf strategies, thereby driving superior customer experiences—without the headaches of data security risks.
Security remains a top priority in everything we do. Our SOC 2 Type II-certified framework enforces rigorous encryption, access controls, and real-time compliance monitoring. We take on the burden of data security so our customers can focus on innovation and growth.
With DataWeave, businesses can confidently leverage secure data-driven decision-making to unlock new opportunities, optimize operations, and scale without compromise.
Black Friday and Cyber Monday are major retail events in Canada, with 43% and 29% of the population making purchases during these sales respectively, according to a YouGov report. Consumer electronics continue to lead the Canadian retail market during these events, with 55% of surveyed shoppers choosing to buy tech products on Black Friday. Household appliances come in second, with 25% of shoppers opting for these items, while 18% prefer to shop for furniture deals.
These statistics highlight the importance of delivering value during the Thanksgiving sales week. Retailers must cater to shoppers’ expectations with competitive pricing, attractive deals, and a seamless shopping experience. So, what unique offerings did Canadian retailers present to shoppers this season?
To understand the pricing and discount dynamics during BFCM 2024 in Canada, DataWeave analyzed discounts across leading consumer electronics and home & furniture retailers. Using our AI-powered pricing intelligence platform, we analyzed 37,108 SKUs across these categories for major retailers including Amazon, Walmart, Best Buy, Home Depot, and Canadian Tire from the 10th to 29th November. We focused on the top 500 products ranked for each search keyword on each retail site, using targeted terms aligned with categories like “sofa” and “wearables”.
In the following insights, the Absolute Discount represents the reduction of the selling price compared to the Manufacturer’s Suggested Retail Price (MSRP). The Additional Discount reflects how much lower the selling price is during Black Friday compared to its price a week before the sale. This metric reveals the actual or effective value of the sale event, beyond the standard discounts typically offered.
Consumer electronics saw robust participation from major retailers, with Amazon, Best Buy, and Walmart leading the charge. Here’s how they stacked up in terms of discounts:
Best Buy emerged as the frontrunner in absolute discounts at 31.2%, while Amazon impressed with a notable 19.7% additional discount, indicating a strong Black Friday-specific markdown strategy.
Walmart offered steady competition, particularly in audio and video products, which reached an average absolute discount of 37.2%. However, it’s average additional discount was only 3.1%, indicating muted BFCM-specific price reductions in this category.
Subcategory Insights
Diving deeper into consumer electronics subcategories, we observed varied discounting strategies.
Audio & Video stood out as the most discounted subcategory, with Walmart leading at 37.2%.
In Wearables, Walmart again took the top spot with 36.4%, while Amazon offered higher additional discounts (22.4%).
Discounting for computers and gaming was less aggressive, highlighting strategic pricing to maintain profitability in these high-demand segments.
Brand Performance
Brand-level data highlighted how key players used Black Friday to drive visibility and sales.
Dell led in average absolute discounts (36.7%) followed by Samsung at 36.68%
Audio brand JBL offered significant absolute discounts at 35.9%.
Apple and Lenovo offered comparatively fewer discounts but maintained strong visibility, as seen in their increase in the Share of Search during the sale period.
MSI (laptop brand) and Bose (audio and earphone brand) experienced significant increases in visibility, with Share of Search increases of 5% and 3.6%, respectively.
Notably, HP faced a decline (-3.2%) in the Share of Search, suggesting missed opportunities to align promotions with consumer interest.
Home & Furniture
Retailers in Focus
The home and furniture category saw competitive discounting, with Walmart, Canadian Tire, and Home Depot vying for consumer attention.
Walmart took the lead with the highest absolute discounts at 36.8%. The retailer’s additional discounts were more conservative at 3.6%. This is similar to their discount levels in Consumer Electronics.
Canadian Tire offered stiff competition, providing 31.6% absolute discounts and 25% additional discounts.
Home Depot matched its absolute and additional discounts, maintaining consistency at 24.1%.
Subcategory Insights
Home and furniture subcategories revealed targeted discount strategies.
Bedding emerged as the most discounted subcategory at Walmart (50.6%) and Canadian Tire (35.3%).
Kitchenware saw competitive pricing, with Walmart leading at 42.9%, followed by Canadian Tire at 33.9%.
Canadian Tire focused on lighting, offering the highest absolute discounts in this subcategory (38.2%)
Brand Performance
Brand-level analysis revealed stark contrasts in discounting approaches.
Furniture brands Homcom led in absolute discounts (36.4%), while South Shore stood out with the highest additional discounts (30.2%).
Value-oriented brands like furnishings brand Mainstays and mattress and bedding brand Zinus offered more modest discounts, focusing on consistent affordability.
Zinus (mattresses and sofa brand) experienced a significant 7.9% increase in the Share of Search, driven by aggressive promotions.
Home furnishings brands like Costway and Safavieh faced declines, reflecting the importance of aligning promotional strategies with consumer expectations.
Insights for Retailers and Brands
This Black Friday, Canadian retailers effectively balanced deep discounts with category-specific strategies to maximize sales. However, the fluctuating Share of Search highlights the critical need for brands to align promotions with consumer interest.
For brands and retailers looking to stay ahead of the competition, DataWeave’s pricing intelligence platform offers unparalleled insights to refine discounting strategies and boost visibility. Contact us to learn how we can help you stay competitive in this dynamic retail landscape.
Americans spent a whopping total of $10.8 billion online this Black Friday. As Thanksgiving Week 2024 wraps up, one thing is clear: the consumer electronics category continues to dominate seasonal shopping trends. Fueled by a blend of enticing deals and high consumer demand, the sector delivered competitive discounts across subcategories like wearables, gaming, and mobile devices.
At DataWeave, we analyzed discounting trends in the U.S. consumer electronics market during this year’s sales events. Using our AI-powered pricing intelligence platform, we tracked pricing and promotions for 22383 SKUs across Amazon, Walmart, Target, and Best Buy from November 10 to 29. We focused on the top 500 products ranked for each search keyword on each retail site, using targeted terms aligned with categories like “gaming” and “apple.” Here’s what we uncovered.
Retailers Battle It Out with Competitive Discounts
Discount trends reveal clear leaders in terms of markdowns:
Walmart offered the deepest average absolute discounts at 36.9%.
Amazon and Target followed closely, highlighting a diverse range of deals designed to appeal to budget-conscious shoppers
Best Buy, the specialist consumer electronics retailer, offers the lowest discounts this Black Friday at 26.2%.
Note: The Absolute Discount represents the reduction of the selling price compared to the Manufacturer’s Suggested Retail Price (MSRP). The Additional Discount reflects how much lower the selling price is during Black Friday compared to its price a week before the sale. This metric reveals the actual or effective value of the sale event, beyond the standard discounts typically offered.
Subcategory Spotlight: Where the Best Deals Happened
From audio & video to wearables, each retailer carved out competitive advantages across subcategories.
Both Amazon and Walmart offered high discounts in audio & video and wearables, but Walmart led, with discounts up to 46.3%.
Best Buy, meanwhile, offered high absolute discounts on Mobile Devices(34%) and Storage (31%), followed by high discounts on wearables and Audio & Video.
Amazon maintained a balanced approach, excelling in audio & video and mobile devices.
Brand-Level Insights: HP and Samsung Dominate
The biggest winners this year were brands that strategically leveraged Black Friday discounts to boost visibility and sales:
HP took the top spot with average discounts of 36.9%, followed by Samsung at 31.4%.
Despite its premium reputation, Apple offered an average discount of 29.3%, signaling a shift in strategy to attract deal hunters.
Share of Search: Shifting Consumer Attention
Search trends reveal how discounts shaped brand visibility:
Microsoft saw the largest spike in share of search (+8.6%), thanks to aggressive pricing on gaming consoles and accessories.
Marshall and Amazon also saw significant gains in visibility.
Surprisingly, HP experienced a sharp decline (-9.8%), indicating missed opportunities despite steep discounts.
In the previous analysis, we focused on the top 500 products within each subcategory for each retailer, showcasing the discount strategies for their highlighted or featured items. However, to identify which retailer offered the lowest or highest prices for the same set of products, it’s necessary to match items across retailers. For this, we analyzed a separate dataset of 340 matched products across retailers to compare their pricing during Black Friday. This approach provides a clearer picture of price leadership and competitiveness across categories.
Here are the key takeaways from this analysis.
Category-Level Highlights
Amazon leads with the highest average discount (41.35%), offering the most value to consumers. It is followed by Target (39.37%) and Walmart (36.15%).
Best Buy, the specialist consumer electronics retailer, ranks last with an average discount of 31.53%, emphasizing a less aggressive pricing strategy compared to competitors.
Subcategory Highlights
Wearables: Amazon offers the steepest discounts (55.40%), followed by Best Buy (50.60%) and Walmart (45.75%).
Mobile Devices: Amazon also leads (37.94%), with Walmart (29.30%) in second place and Target trailing at 19.48%.
Gaming: Target takes the lead (37.47%), with Amazon and Best Buy offering similar discounts around 30%.
Computers: Target again emerges as the leader (39.18%), narrowly surpassing Walmart (36.13%).
Brand Highlights
Apple: Amazon dominates with 53.06%, closely followed by Walmart (50.55%), while Target and Best Buy hover around 43%.
Nintendo: Target edges out Amazon (37.62% vs. 36.54%), with Best Buy (33.21%) and Walmart (25.92%) trailing.
Beats by Dr. Dre: Amazon leads (46.07%), with Target (37.14%) as the runner-up. Best Buy and Walmart offer comparatively modest discounts around 25%.
Bose: Walmart emerges as the value leader (23.90%), surpassing Target (16.09%) and Best Buy (15.29%).
Cricut: Amazon sets a high benchmark (54.13%), with Target far behind (36.43%) for this viral portable printer brand. Best Buy (12.32%) and Walmart (10.79%) offer significantly lower discounts.
What This Means for Retailers and Brands
Retailers looking to stay competitive should focus on strategic discounting and enhanced brand visibility. Brands must align with consumer expectations by:
Leveraging platforms like DataWeave to analyze discount trends.
Optimizing pricing and assortment strategies for seasonal demand.
For more insights into consumer electronics pricing, contact DataWeave to discover how our AI-powered solutions can drive success in today’s fast-paced market. Stay tuned for more category-specific analyses in the coming weeks!
As the holiday shopping season kicked off, savvy shoppers embraced the spirit of the season, drawn by enticing deals. The apparel category is forecasted as the second highest earning category (Source: Statista), expected to generate revenues up to $43.9 billion, closely following consumer electronics. To understand the pricing strategies of top retailers amidst the sale season, DataWeave analyzed the pricing trends for the Apparel category this Black Friday.
We leveraged our AI-powered data platform to analyze the discounting across key retailers. Our analysis focused on the Apparel category, examining how Amazon, Walmart, Target, Saks Fifth Avenue, Nordstrom, Bloomingdales, Neiman Marcus and Macy’s differentiated themselves through their discounts.
For this analysis, we tracked the average discounts of apparel products among leading US retailers during the Thanksgiving weekend sale, including Black Friday. Our sample was chosen to encompass the top 500 ranked products in each product subcategory across during the sale.
Subcategories reported on: Footwear, Kid’s Clothing, Men’s Clothing, Women’s Clothing, Activewear, Plus Size Clothing, Accessories
Timeline of analysis: 10 to 29 November 2024
We focused on the top 500 products ranked for each search keyword on each retail site, using targeted terms aligned with categories like “athleisure” and “plus size clothing”. Our methodology distinguished between standard discounts and Black Friday-specific ‘additional discounts’ or price reductions during the sale compared to the week before, to reveal true consumer value.
Key Findings
This year’s fashion discounts were unprecedented. Let’s take a look.
Retailer Level Insights
Nordstrom leads with the highest average absolute discount at 59%, followed by Saks Fifth Avenue at 35.5% and Bloomingdale’s at 41.5%. Macy’s shows the lowest average discount at 24.1%, while Amazon has an average discount of 30.4%.
Amazon ranks lower in both average absolute and additional discounts compared to competitors, indicating a more conservative discounting strategy.
Subcategory Analysis
Kids’ Clothing saw the deep discounts (up to 55% at Nordstrom), reflecting growing pressure on family budgets and heightened competition to attract budget-conscious parents.
Plus-Size Clothing emerged as a major focus, with Nordstrom leading at 53.22% average absolute discounts, signaling that retailers are increasingly prioritizing size inclusivity and appealing to a broader consumer base.
Footwear experienced robust discounting, particularly at Bloomingdale’s with 37% average absolute discounts, showing a competitive approach to attract customers looking for seasonal footwear deals.
Activewear displayed substantial discounts, with Walmart offering up to 41% on average, aligning with the trend of consumers looking for practical and comfortable attire during the winter season.
Brand Level Insights
Apparel brands, meanwhile, also offer telling insights.
Top Discounting Brands: Aqua leads with an average absolute discount of 44.58%, followed by Boss at 42.33% and Burberry at 37.84%.
Lowest Discounts: Athletic Works shows the lowest average absolute discount at 31.23%, with a minimal additional discount of 3.73%.
Competitive Advantage: Brands like Ralph Lauren and Boss show strong discounts, indicating aggressive marketing during the sale.
Share of Search Insights
Top Gainers: Adidas and Nike each saw an increase of 1.20% in their share of search during Black Friday/Cyber Monday, highlighting their strong brand presence and consumer interest.
Top Losers: Reebok experienced a sharp decline, losing 2.60% in its share of search, while Levi’s also dropped by 0.60%.
Search Trends: The data suggests a strong consumer preference for activewear brands like Nike and Adidas and a decline in interest for traditional apparel brands like Levi’s.
Who Offered Most Value This Black Friday
In the previous analysis, we focused on the top 500 products within each subcategory for each retailer, showcasing the discount strategies for their highlighted or featured items. However, to identify which retailer offered the lowest or highest prices for the same set of products, it’s necessary to match items across retailers. For this, we analyzed a separate dataset of 418 matched products across Apparel specific retailers to compare their pricing during Black Friday. This approach provides a clearer picture of price leadership and competitiveness across categories.
Here are the key takeaways from this analysis.
Category-Level Analysis
At the overall category level, Macy’s emerged as the lowest-priced retailer, offering the highest average discount of 28.72%, followed closely by Nordstrom (26.06%). The steep decline in average discounts from Saks Fifth Avenue (14.42%) and Neiman Marcus (7.93%) highlights a clear gap in discounting strategies.
Macy’s and Nordstrom are aggressively competitive on pricing in the overall apparel category, likely capturing consumer attention with substantial discounts.
Saks Fifth Avenue and Neiman Marcus may rely more on brand perception and luxury positioning rather than heavy discounting.
Subcategory-Level Analysis
Neiman Marcus tops the ranking with an impressive 60.85% average discount, outperforming Macy’s (52.86%) and Nordstrom (43.04%) for Men’s Clothing. We see a similar trend with Neiman Marcus offering more value across Women’s Clothing as well, compared to other retailers.
The competition in footwear was intense, with Neiman Marcus narrowly securing the top spot at 31.03%, slightly ahead of Saks Fifth Avenue (30.28%) and Macy’s (30.07%).
Saks Fifth Avenue led by a significant margin in the Activewear category, offering 39.89% average discounts, indicating a strong push in this growing segment.
Macy’s followed at 32.16% in Activewear, while Neiman Marcus and Nordstrom had comparatively lower discounts of 26.40% and 19.52%, respectively.
Brand-Level Analysis
Kate Spade New York: Neiman Marcus leads with the highest discount of 55.23%, reflecting strong price leadership in premium fashion, closely followed by Saks Fifth Avenue at 51.66%.
Coach: Neiman Marcus dominates with a significant 75.85% discount, showcasing an aggressive promotional strategy for this luxury brand.
Spanx: While Neiman Marcus leads with 28.22%, discounts across other retailers like Saks Fifth Avenue, Macy’s, and Nordstrom are clustered within a competitive range of 17–19%.
Montblanc: Macy’s takes the lead with 20.32%, signaling its competitiveness even in high-end accessories, with Saks Fifth Avenue and Nordstrom closely behind.
Ugg: Saks Fifth Avenue leads with 31.42%, focusing on maintaining price leadership for this popular brand, while other retailers remain competitive with discounts around 25–30%.
What’s Next
To win over price-conscious shoppers, retailers need to stay competitive and consistently offer the lowest prices.
For a deeper dive into the world of competitive pricing intelligence and to explore how our solutions can benefit apparel retailers and brands, reach out to us today!
Stay tuned to our blog for more insights on different categories this Black Friday and Cyber Monday.
As shoppers flocked online and to stores during Black Friday and Cyber Monday, the grocery category stood out as a key battleground for retailers. With inflation affecting consumer spending, discounted groceries have become a critical driver for both shopper savings and retailer competitiveness.
In fact, according to the NRF, one of the top shopping destinations during Thanksgiving weekend were department stores (42%), online (42%),and grocery stores and supermarkets (40%). Clearly, consumers are looking to stock up in bulk on their groceries to maximize their savings.
To understand the pricing dynamics in the grocery category, DataWeave analyzed grocery discounts across leading grocers, uncovering significant trends that shaped consumer choices during this holiday shopping period.
Our research encompassed retailers like Amazon, Target, and Walmart, examining their discounting strategies across subcategories, alongside trends in share of search for leading CPG companies.
Key Grocery Market Stats for Black Friday-Cyber Monday 2024
Retailer Discounts: Walmart offered the highest average absolute discount at 27.6%, followed by Amazon at 20.4% and Target at 14.0%
Subcategory Insights: Beverages Category at Walmart saw the deepest discounts, with an average of 33.4%
Top Gaining Brands: Cesar experienced the largest increase in share of search during the sales period (+3.89%)
This blog will dive deeper into grocery discount trends and brand-level strategies, offering insights for retailers looking to stay competitive in the grocery sector.
Our Methodology
For this analysis, we tracked the average discounts offered by major U.S. grocery retailers during the Thanksgiving weekend, including Black Friday and Cyber Monday. We focused on key subcategories within the grocery segment, capturing trends in discounting strategies.
In the following insights, the Absolute Discount represents the reduction of the selling price compared to the Manufacturer’s Suggested Retail Price (MSRP). The Additional Discount reflects how much lower the selling price is during Black Friday compared to its price a week before the sale. This metric reveals the actual or effective value of the sale event, beyond the standard discounts typically offered.
Key Findings
Retailer-Level Insights
Walmart emerged as the leader in grocery discounting, offering the highest average absolute (27.6%) and additional (18%) discounts.
Amazon adopted a mid-tier discounting strategy, with average absolute discounts of 20.4%.
Target, while more conservative, maintained competitiveness in select subcategories like baby products.
Subcategory Insights
Pantry Essentials saw Walmart leading with an average discount of 31.2%, appealing to budget-conscious consumers stocking up for the holidays.
Fresh Produce showed consistent discounting across retailers, with Amazon slightly ahead at 27%.
Beverages stood out for significant discounting at Walmart, with an impressive 33.4% average discount.
Brand-Level Insights
Lay’s led in absolute discounts (37.52%) and additional discounts (26.23%) showcasing aggressive pricing in the snacks subcategory.
Good & Gather maintained its competitive edge with strong discounts, appealing to price-conscious consumers seeking value.
Brands like Blue Buffalo (pet food brand) offered significant absolute discounts, but with a low additional discount of just 2%, the overall impact of the sale event on effective value was limited.
Share of Search Insights
Cesar (dog food brand), Tide (laundry staple) and Doritos saw significant gains in share of search, reflecting successful promotional strategies.
Brands like Pampers (baby diapers brand), Healthy Choice, (frozen foods brand) and Pedigree (pet food brand) experienced a decline, indicating less effective engagement during the sale period.
Who offered the lowest prices?
In the previous analysis, we focused on the top 500 products within each subcategory for each retailer, showcasing the discount strategies for their highlighted or featured items. However, to identify which retailer offered the lowest or highest prices for the same set of products, it’s necessary to match items across retailers. For this, we analyzed a separate dataset of 1433 matched products across retailers to compare their pricing during Black Friday. This approach provides a clearer picture of price leadership and competitiveness across categories.
Here are the key takeaways from this analysis.
Category-Level Analysis
Walmart is the lowest priced retailer overall for the grocery category, with an impressive average discount of 44.60%. This significant discount advantage makes Walmart a leading option for value-seeking consumers.
Target follows with strong discounts of 36.73%, indicating solid pricing in comparison but less aggressive than Walmart.
Interestingly, Amazon was the most expensive in Grocery, with an average discount of only 6.3%.
Subcategory-Level Analysis
Walmart leads in various subcategories such as Pet Products (21.12%), Dairy & Eggs (13.79%), Household Essentials (13.05%), Frozen Foods (15.07%), and Meat & Seafood (17.60%), showcasing its extensive value across the board.
Target excels in Beverages (14.58%) and Baby Products (15.00%) with competitive discounts, standing out in these specific subcategories.
Kroger provides notable value in Pantry Essentials (20.04%) and Fresh Produce (15.85%), although its overall average discount is lower than Walmart’s.
Amazon consistently ranks lower in terms of average discounts across most subcategories, highlighting it as less competitive for consumers seeking the lowest prices.
Brand-Level Analysis
Walmart also holds the top position for several key brands like Cheetos (14.92%) and Dannon (8.81%), making it the best option for consumers looking for budget-friendly choices across popular brands.
Target takes the lead for brands like Betty Crocker (25.20%) and Chobani (11.37%), showing that it can offer value for specific products.
Kroger maintains strong discounts for brands such as Delmonte (9.19%), but it does not outpace Walmart in the overall grocery brand comparison.
Amazon generally lags behind in average discounts for most brands, with Dannon (1.12%) and Chobani (2.43%) showing significantly lower discounts.
Walmart is the lowest priced retailer in the grocery category and provides substantial value across a wide range of subcategories and popular brands. This ties in with Walmart’s ELDP pricing strategy. The retailer leads in overall average discounts and maintains its position as the go-to for price-conscious consumers. Target offers strong value in certain subcategories and brands but falls short of Walmart’s broad value based pricing advantages.
What’s Next
For grocery retailers, competitive pricing and targeted promotions are critical to driving sales during key shopping events. As consumers continue to prioritize value, staying ahead in the discounting game can significantly impact market share.
For detailed insights into grocery discounting strategies and to explore how DataWeave’s solutions can help retailers optimize their pricing, contact us today!
Stay tuned to our blog for further analyses of other categories during Black Friday and Cyber Monday.
The Home & Furniture category continues to thrive, propelled by consumer interest in creating personalized and functional living spaces. In 2023, the U.S. furniture and home furnishings market was valued at approximately $641.7 billion in 2023 and is estimated to grow at a CAGR of 5.1% from 2024 to 2032. Black Friday and Cyber Monday play a crucial role in fueling this growth, offering consumers a mix of premium and affordable options across subcategories.
To better understand market trends and discount strategies this Black Friday, at DataWeave we tracked over 18,149 SKUs across major home & furniture retailers, including Amazon, Walmart, Target, Best Buy, Home Depot, and Overstock, from November 10 to 29, 2024. Using our AI-powered pricing intelligence platform, we focused on the top 500 products in subcategories like kitchenware, furniture, decor, lighting, outdoor items, and bedding.
In our analysis, the Absolute Discount represents the reduction of the selling price compared to the Manufacturer’s Suggested Retail Price (MSRP). The Additional Discount reflects how much lower the selling price is during Black Friday compared to its price a week before the Black Friday sale. This metric reveals the actual or effective value of the sale event, beyond the standard discounts typically offered.
Also check out our insights on discounts and pricing for the health & beauty category this Black Friday.
Retailer Performance: Who Led the Discount Race?
Retailers showed varying discount strategies for Home & Furniture products. Walmart emerged as the leader in absolute discounts (37.5%) while Amazon offered the highest additional discount of 14%. Best Buy maintained competitive pricing across all subcategories, while Overstock and Home Depot offered relatively modest discounts.
Subcategories in Focus
Breaking down the discounts by subcategory provides deeper insights into consumer priorities and retailer strategies:
Kitchenware saw strong competition, with Walmart (30.40% absolute discounts) and Amazon (29% absolute discounts) dominating.
Lighting became a discount hotspot, with Walmart offering up to 45.8% in absolute discounts and 25.3% additional markdowns.
Furniture remained a core focus for Target, delivering an impressive 34% average absolute discount.
Bedding stood out at Walmart, where discounts peaked at 49.6%.
Brand Spotlight: Who Stood Out?
Among top-performing brands, furniture brand Costway offered the highest discounts, with an average of 48.4%. Meanwhile, Adesso (lighting solutions), Mainstays and Safavieh (both home furnishings brands) balanced discounts and premium appeal.
Search Visibility: The Winners and Losers
Share of search dynamics revealed significant shifts in brand visibility during Black Friday:
Furniture brand Costway (+1.2%) and home improvement player Black+Decker (+1.5%) gained visibility.
On the flip side, premium brands like Safavieh known for rugs and home furnishings (-16.8%) and furniture brand Burrow ( -1.7%) saw declines.
Who Offers the Lowest Prices?
In the previous analysis, we focused on the top 500 products within each subcategory for each retailer, showcasing the discount strategies for their highlighted or featured items. However, to identify which retailer offered the lowest or highest prices for the same set of products, it’s necessary to match items across retailers. For this, we analyzed a separate dataset of 735 matched products across Home & Furniture specific retailers to compare their pricing during Black Friday. This approach provides a clearer picture of price leadership and competitiveness across categories.
Here are the key takeaways from this analysis.
Category-Level Highlights
Amazon emerges as the lowest-priced retailer across Home & Furniture categories, with the highest average discount of 27.50%, closely followed by Walmart (26.09%).
Overstock and Wayfair trail with average discounts of 22.93% and 20.71%, respectively, while Home Depot offers the least aggressive pricing at 18.14%. This is notable, as all 3 players are known specialists in the category.
Subcategory Highlights
Amazon stands out as the leader in multiple subcategories, including Appliances, Furniture, Decor, and Outdoor, offering competitive average discounts of around 26-29%.
Overstock leads in Bedding and Kitchenware, with strong average discounts of 24.26% and 20.72%, respectively.
Wayfair is notable for Lighting, with an average discount of 19.95%, and is also competitive in Outdoor and Furniture categories.
Walmart consistently ranks high in several subcategories like Appliances and Bedding, providing solid discounts of around 22-23%.
What’s Next
For home & furniture retailers, driving maximum value during mega sale events like Black Friday involves offering bundles and sets to meet customer demands and trend expectations. Gaining insights into competitor discounts and pricing can help furniture retailers get an edge amid this environment.
Want to know how DataWeave’s intelligence platform can empower your business during peak sales events? Contact us to discover more about competitive insights, price intelligence, and data-driven decision-making. Stay tuned to our blog to see more coverage on Black Friday 2024.
The U.S. health and beauty retail sector shows remarkable resilience amid economic uncertainties, with the skincare market projected to hit $21.83 billion in 2024. Black Friday data reinforces this trend, with health and beauty products seeing a 14.6% surge in web traffic compared to last year.
At DataWeave, we conducted an in-depth analysis of Black Friday discounting trends in the U.S. health and beauty sector. DataWeave’s AI-powered pricing intelligence platform was used to monitor pricing and discounts across Sephora, Ulta Beauty, Walmart, Target, and Amazon during Black Friday 2024. The study covered 19985 SKUs from November 10-29. We focused on the top 500 products ranked for each search keyword on each retail site, using targeted terms aligned with categories like “skincare” and “fragrance”.
The results? Beauty leads across categories in discount depth this year, with some retailers offering significant markdowns.
The Beauty Boom: More Than Just Looking Good
If there’s one thing the pandemic taught us, it’s that self-care isn’t just a luxury – it’s a necessity. This Black Friday proved that beauty has become an indispensable part of consumers’ lives, with retailers offering unprecedented discounts and crafting strategic promotions to capture the growing demand.
The Absolute Discount represents the reduction of the selling price compared to the Manufacturer’s Suggested Retail Price (MSRP). The Additional Discount reflects how much lower the selling price is during Black Friday compared to its price a week before the sale. This metric reveals the actual or effective value of the sale event, beyond the standard discounts typically offered.
Ulta Beauty led with 45% average discounts, followed by Sephora at 38.1% and Walmart at 35.2%. In terms of additional Black Friday discounts, Ulta maintained dominance at 35%, with Sephora following at 28%.
Hair care emerged as the standout category, with Ulta Beauty offering up to 56% discounts, reflecting sustained demand for at-home beauty routines. Skincare saw fierce competition, with Sephora emphasizing premium discounts (37%) while Walmart focused on value pricing (32.5%).
Fragrance and Makeup attracted consumers with targeted promotions from Walmart and Ulta Beauty, signaling strong demand for gifting items.
Major beauty brands echoed the sentiment. Premium skincare brand Clinique leads with 50.6% average discounts. Meanwhile, drugstore staples like Revlon (29.1%) and Maybelline (24.4%) balanced accessibility and affordability, driving mass-market appeal. Popular beauty and makeup brand L’Oreal Paris also offered a modest 22.8% average discount, reinforcing its position as a value-oriented brand.
The more interesting story? The massive shift in brand visibility, as our share of search rankings denote:
Shampoo and hair care brand Tresemmé saw an unexpected 5.5% jump in the share of search results
Beauty brand Herbal Essences gained 5.1% in share of search well
Declines in share of search were noted for brands like L’Oreal Paris (-1.8%) and Pantene (-0.6%), indicating missed opportunities in promotional visibility.
Insight: What’s driving this beauty boom? TikTok and social media continue to fuel beauty purchases, with viral products driving significant search and sales spikes. Plus, the “skinification” of hair care has turned basic shampoo shopping into a full-blown beauty ritual.
Who Offered the Lowest Prices?
In the previous analysis, we focused on the top 500 products within each subcategory for each retailer, showcasing the discount strategies for their highlighted or featured items. However, to identify which retailer offered the lowest or highest prices for the same set of products, it’s necessary to match items across retailers. For this, we analyzed a separate dataset of 1133 matched products across Health & Beauty specific retailers to compare their pricing during Black Friday. This approach provides a clearer picture of price leadership and competitiveness across categories.
Here are the key takeaways from this analysis.
Bloomingdale’s emerges as the overall leader, offering the highest average discount of 14.87%, closely followed by Bluemercury (12.41%).
Ulta Beauty ranks third (10.94%), demonstrating competitiveness across key subcategories, while Sephora trails with the lowest average discount (7.33%), reflecting a more premium positioning.
Ulta Beauty leads in Hair Care with the highest discount (22.62%), while Bluemercury dominates in Skin Care (13.81%), Makeup (22.98%), and Fragrance (10.6%).
Sephora consistently offers the lowest discounts across all subcategories, reflecting their premium positioning.
Bluemercury offers the lowest prices for luxury brands like Kiehl (27.02%) and Laura Mercier (34.87%), with Bloomingdale’s closely trailing.
Bloomingdale’s leads for Bumble and Bumble (13.59%) and Hourglass (23.41%), showcasing strong promotional efforts.
Sephora maintains a more restrained discount strategy, with notable leadership only for Estée Lauder (7.18%).
Ulta Beauty shines in offering the steepest discount for Briogeo (33.26%), emphasizing competitiveness in key brands.
What’s Next for Holiday Discounting?
For retailers, the message is clear: traditional holiday playbooks need a serious update. For shoppers, it means unprecedented opportunities to score deals in categories that traditionally held firm on pricing.
Want to stay ahead of retail trends and optimize your holiday shopping strategy? DataWeave’s commerce intelligence platform helps brands and retailers strategically navigate these shifts. Contact us to learn more about how we can help you make data-driven decisions in this rapidly evolving retail landscape.
Stay tuned to our blog for forthcoming analyses on pricing and discounting trends across a spectrum of shopping categories, as we continue to unravel the intricacies of consumer behavior and market dynamics.
Black Friday, once confined to a single weekend, has evolved into a shopping season that now stretches well before Thanksgiving. With inflation hovering around 3% and consumer confidence showing signs of recovery, retailers are adapting their promotional calendars to capture early-bird shoppers and maintain a competitive edge.
Major retailers, including Amazon, Walmart, Target, and Best Buy, have capitalized on this trend by launching promotions weeks in advance, signaling the traditional holiday rush is now a month-long event. At DataWeave, we put these deals under a microscope.
Our Methodology
Using DataWeave’s advanced, AI-powered pricing intelligence platform, we tracked early Black Friday deals across Consumer Electronics, Home & Furniture, Health & Beauty, and Apparel categories. We monitored dedicated Black Friday deal pages on Amazon, Walmart, Target, Best Buy, Nordstrom, Neiman Marcus, and Sephora to gather and analyze discount data a week prior to Black Friday weekend.
Who’s Offering the Best Deals Across Categories?
Our pre- Black Friday analysis reveals a clear pattern of premium brands offering deeper discounts across categories ahead of the holiday. Here are some key findings around retail players:
Walmart emerges as the most aggressive discounter across categories, leading in Health & Beauty (57.07%), Apparel (48.97%), and Consumer Electronics (43.35%).
Amazon maintains consistent but lower discounts (28-29%) across categories, suggesting potential deeper cuts ahead.
Best Buy and Sephora, both category specialists, play it conservative compared to mass retail players.
Let’s look at each category more closely to get a detailed snapshot of the deals this Thanksgiving week:
Health & Beauty
Our analysis reveals that it’s not electronics, but the health & beauty category that leads with the widest discount range pre Black Friday, making it the category to watch out for.
Walmart takes the lead with an aggressive 57.1% average discount in this category, capitalizing on its value-oriented reputation.
Beauty specialist Sephora holds modest beauty discounts (32.81%) compared to other retailers.
Amazon offers the broadest range of SKUs (571) in the category.
Among the health & beauty brands we analyzed, cosmetics brand Tarte and viral K-Beauty skincare brand COSRX stand out with discounts above 40%, appealing to cost-conscious beauty enthusiasts.
Consumer Electronics
Our pre- Black Friday analysis reveals interesting insights about consumer electronics deals this season.
Walmart, once again, emerges as the frontrunner in the category with 43.4% average discounts.
Best Buy plays it conservative in electronics (30.75%), despite being a category specialist, but offers the most extensive SKU coverage (3030).
Amazon’s consistent 29.7% discount across 1,749 SKUs suggests they’re probably holding back their best deals for Prime members during Black Friday.
Brand-specific data for the category reveals significant deals on Speck (48.07%) and smart TV brand Insignia (39.22%), making accessories and mid-tier electronics attractive for early shoppers. Core computing (HP at 32.14%) and electronics brands maintain more conservative discounts. It remains to be seen if this changes on Black Friday or Cyber Monday.
Apparel
Our analysis of the apparel category reveals several highlights:
In the apparel category too, Walmart dominates with an impressive 49% average discount, effectively targeting price-sensitive shoppers in the fashion segment.
Nordstrom and Neiman Marcus, both known for apparel, offer significant discounts at 43.2% and 37.8% respectively.
Amazon’s expansive SKU coverage (1344) is countered by a modest 29.5% discount, showing its focus on variety over depth of discounts.
Premium fashion brands dominate the highest discounts this Black Friday in the apparel category. Vince Camuto leads with over 45.1% average discount. Notably, Levi and Nike’s aggressive 44.43% and 43.50% discounts suggests significant inventory positions or intent to capture market share.
Home & Furniture
Our analysis reveals an interesting trend across the category.
In the home & furniture category too, Walmart leads at 41.8% average discounts. Target follows closely, but with significantly lesser SKUs on offer.
Amazon’s 28.1% discount, though the lowest among major players, spans a substantial 1,982 SKUs, reinforcing its position as a marketplace for diverse needs.
Top 3 Products With the Highest Discounts Across Retailers
To provide a clearer picture of the early Black Friday landscape, we analyzed the top 3 products with the most substantial discounts in consumer electronics and health & beauty categories. These insights highlight how retailers are leveraging strategic discounts on high-value items to attract early shoppers.
Top Discounted Products in Consumer Electronics
Premium TVs dominate the discount scene, with LG’s 83″ OLED offering up to 44.5% off on Amazon, closely followed by a 44.4% discount on Best Buy, showcasing aggressive competition. The same product has much lower discounting on Walmart, but notably, the product is retailed at $3999.9, at least $1000 less than other retailers, highlighting Walmart’s commitment to offering lowest prices.
Gaming consoles, like the PlayStation 5 Slim Bundle, show moderate discounts (ranging from 15% on Walmart and Target to 25% at Best Buy), appealing to tech-savvy shoppers.
Notable competition is evident in price matching across major retailers, particularly in TVs and high-value electronics like the Nikon Z 8 camera, where Walmart offers the deepest discount at 13.75%, edging past Amazon and Best Buy.
Top Discounted Products in Health & Beauty
Viral skincare staples like Tatcha’s Water Cream show tight discounting consistency, with Walmart offering 19.47% off compared to Amazon’s 20% and Sephora’s 20.83%.
Trending haircare brand Olaplex displays greater disparity, with Walmart leading with a 33.33% discount, surpassing Amazon and Sephora. Luxury brand, Yves Saint Laurent’s Satin Lipstick is one of the highest discounted items across retailers.
Looking Ahead
Our analysis suggests that while some early deals offer genuine value, particularly in premium beauty and high-end electronics, many retailers might be holding their best discounts for Black Friday.
For shoppers, the key is being selective: jump on premium brand discounts now (since they’re likely to remain the same though the weekend), but wait on mid-range electronics and home goods where better deals are likely to emerge on Black Friday or Cyber Monday.
For retailers, the imperative is clear: dynamic pricing intelligence is crucial for maintaining a competitive edge while protecting margins. Competitive insights will be critical as the holiday season progresses to balance market share against profitability.
Stay tuned for our Black Friday Cyber Monday analysis next week, where we’ll track how these early discounts compare to the main event’s deals!
In online retail, success hinges on more than just offering quality products at competitive prices. As eCommerce catalogs expand and consumer expectations soar, businesses face an increasingly complex challenge: How do you effectively organize, categorize, and present your vast product assortments in a way that enhances discoverability and drives sales?
Having complete and correct product catalog data is key. Effective product attribute tagging—a crucial yet frequently undervalued capability—helps in achieving this accuracy and completeness in product catalog data. While traditional methods of tagging product attributes have long struggled with issues of scalability, consistency, accuracy, and speed, a new thinking and fundamentally new ways of addressing these challenges are getting established. These follow from the revolution brought in Large Language Models but they fashion themselves as Small Language Models (SLM) or more precisely as Domain Specific Language Models. These can be potentially considered foundational models as they solve a wide variety of downstream tasks albeit within specific domains. They are a lot more efficient and do a much better job in those tasks compared to an LLM. .
Retail Domain Language Models (RLMs) have the potential to transform the eCommerce customer journey. As always, it’s never a binary choice. In fact, LLMs can be a great starting point since they provide an enhanced semantic understanding of the world at large: they can be used to mine structured information (e.g., product attributes and values) out of unstructured data (e.g., product descriptions), create baseline domain knowledge (e.g, manufacturer-brand mappings), augment information (e.g., image to prompt), and create first cut training datasets.
Powered by cutting-edge Generative AI and RLMs, next-generation attribute tagging solutions are transforming how online retailers manage their product catalog data, optimize their assortment, and deliver superior shopping experiences. As a new paradigm in search emerges – based more on intent and outcome, powered by natural language queries and GenAI based Search Agents – the capability to create complete catalog information and rich semantics becomes increasingly critical.
In this post, we’ll explore the crucial role of attribute tagging in eCommerce, delve into the limitations of conventional tagging methods, and unveil how DataWeave’s innovative AI-driven approach is helping businesses stay ahead in the competitive digital marketplace.
Why Product Attribute Tagging is Important in eCommerce
As the eCommerce landscape continues to evolve, the importance of attribute tagging will only grow, making it a pertinent focus for forward-thinking online retailers. By investing in robust attribute tagging systems, businesses can gain a competitive edge through improved product comparisons, more accurate matching, understanding intent, and enhanced customer search experiences.
Taxonomy Comparison and Assortment Gap Analysis
Products are categorized and organized differently on different retail websites. Comparing taxonomies helps in understanding focus categories and potential gaps in assortment breadth in relation to one’s competitors: missing product categories, sizes, variants or brands. It also gives insights into the navigation patterns and information architecture of one’s competitors. This can help in making search and navigation experience more efficient by fine tuning product descriptions to include more attributes and/or adding additional relevant filters to category listing pages.
For instance, check out the different Backpack categories on Amazon and Staples in the images below.
Or look at the nomenclature of categories for “Pens” on Amazon (left side of the image) and Staples (right side of the image) in the image below.
Assortment Depth Analysis
Another big challenge in eCommerce is the lack of standardization in retailer taxonomy. This inconsistency makes it difficult to compare the depth of product assortments across different platforms effectively. For instance, to categorize smartphones,
Retailer A might organize it under “Electronics > Mobile Phones > Smartphones”
Retailer B could use “Technology > Phones & Accessories > Cell Phones”
Retailer C might opt for “Consumer Electronics > Smartphones & Tablets”
Inconsistent nomenclature and grouping create a significant hurdle for businesses trying to gain a competitive edge through assortment analysis. The challenge is exacerbated if you want to do an in-depth assortment depth analysis for one or more product attributes. For instance, look at the image below to get an idea of the several attribute variations for “Desks” on Amazon and Staples.
Custom categorization through attribute tagging is essential for conducting granular assortment comparisons, allowing companies to accurately assess their product offerings against those of competitors.
Enhancing Product Matching Capabilities
Accurate product matching across different websites is fundamental for competitive pricing intelligence, especially when matching similar and substitute products. Attribute tagging and extraction play a crucial role in this process by narrowing down potential matches more effectively, enabling matching for both exact and similar products, and tagging attributes such as brand, model, color, size, and technical specifications.
For instance, when choosing to match similar products in the Sofa category for 2-3 seater sofas from Wayfair and Overstock, tagging attributes like brand, color, size, and more is a must for accurate comparisons.
Taking a granular approach not only improves pricing strategies but also helps identify gaps in product offerings and opportunities for expansion.
Fix Content Gaps and improve Product Detail Page (PDP) Content
Attribute tagging plays a vital role in enhancing PDP content by ensuring adherence to brand integrity standards and content compliance guidelines across retail platforms. Tagging attributes allows for benchmarking against competitor content, identifying catalog gaps, and enriching listings with precise details.
This strategic tagging process can highlight missing or incomplete information, enabling targeted optimizations or even complete rewrites of PDP content to improve discoverability and drive conversions. With accurate attribute tagging, businesses can ensure each product page is fully optimized to capture consumer attention and meet retail standards.
Elevating the Search Experience
In today’s online retail marketplace, a superior search experience can be the difference between a sale and a lost customer. Through in-depth attribute tagging, vendors can enable more accurate filtering to improve search result relevance and facilitate easier product discovery for consumers.
By integrating rich product attributes extracted by AI into an in-house search platform, retailers can empower customers with refined and user-friendly search functionality. Enhanced search capabilities not only boost customer satisfaction but also increase the likelihood of conversions by helping shoppers find exactly what they’re looking for more quickly and with minimal effort.
Pitfalls of Conventional Product Tagging Methods
Traditional methods of attribute tagging, such as manual and rule-based systems, have been significantly enhanced by the advent of machine learning. While these approaches may have sufficed in the past, they are increasingly proving inadequate in the face of today’s dynamic and expansive online marketplaces.
Scalability
As eCommerce catalogs expand to include thousands or even millions of products, the limitations of machine learning and rule-based tagging become glaringly apparent. As new product categories emerge, these systems struggle to keep pace, often requiring extensive revisions to existing tagging structures.
Inconsistencies and Errors
Not only is reliance on an entirely human-driven tagging process expensive, but it also introduces a significant margin for error. While machine learning can automate the tagging process, it’s not without its limitations. Errors can occur, particularly when dealing with large and diverse product catalogs.
As inventories grow more complex to handle diverse product ranges, the likelihood of conflicting or erroneous rules increases. These inconsistencies can result in poor search functionality, inaccurate product matching, and ultimately, a frustrating experience for customers, drawing away the benefits of tagging in the first place.
Speed
When product information changes or new attributes need to be added, manually updating tags across a large catalog is a time-consuming process. Slow tagging processes make it difficult for businesses to quickly adapt to emerging market trends causing significant delays in listing new products, potentially missing crucial market opportunities.
How DataWeave’s Advanced AI Capabilities Revolutionize Product Tagging
Advanced solutions leveraging RLMs and Generative AI offer promising alternatives capable of overcoming these challenges and unlocking new levels of efficiency and accuracy in product tagging.
DataWeave automates product tagging to address many of the pitfalls of other conventional methods. We offer a powerful suite of capabilities that empower businesses to take their product tagging to new heights of accuracy and scalability with our unparalleled expertise.
Our sophisticated AI system brings an advanced level of intelligence to the tagging process.
RLMs for Enhanced Semantic Understanding
Semantic Understanding of Product Descriptions
RLMs analyze the meaning and context of product descriptions rather than relying on keyword matching. Example: “Smartphone with a 6.5-inch display” and “Phone with a 6.5-inch screen” are semantically similar, though phrased differently.
Attribute Extraction
RLMs can identify important product attributes (e.g., brand, size, color, model) even from noisy or unstructured data. Example: Extracting “Apple” as a brand, “128GB” as storage, and “Pink” as the color from a mixed description.
Identifying Implicit Relationships
RLMs find implicit relationships between products that traditional rule-based systems miss. Example: Recognizing that “iPhone 12 Pro” and “Apple iPhone 12” are part of the same product family.
Synonym Recognition in Product Descriptions
Synonym Matching with Context
RLMs identify when different words or phrases describe the same product. Examples: “Sneakers” = “Running Shoes”, “Memory” = “RAM” (in electronics) Even subtle differences in wording, like “rose gold” vs “pink” are interpreted correctly.
Overcoming Brand-Specific Terminology
Some brands use their own terminologies (e.g., “Retina Display” for Apple). RLMs can map proprietary terms to more generic ones (e.g., Retina Display = High-Resolution Display).
Dealing with Ambiguities
RLMs analyze surrounding text to resolve ambiguities in product descriptions. Example: Resolving “charger” to mean a “phone charger” when matched with mobile phones.
Contextual Understanding for Improved Accuracy and Precision
By leveraging advanced natural language processing (NLP), DataWeave’s AI can process and understand the context of lengthy product descriptions and customer reviews, minimizing errors that often arise at human touch points. The solution processes and interprets information to extract key information to dramatically improve the overall accuracy of product tags.
It excels at grasping the subtle differences between similar products, sizes, colors and identifying and tagging minute differences between items, ensuring that each product is uniquely and accurately represented in a retailer’s catalog.
This has a major impact on product and similarity-based matching that can even help optimize similar and substitute product matching to enhance consumer search. At the same time, our AI can understand that the same term might have different meanings in various product categories, adapting its tagging approach based on the specific context of each item.
This deep comprehension ensures that even nuanced product attributes are accurately captured and tagged for easy discoverability by consumers.
Case Study: Niche Jewelry Attributes
DataWeave’s advanced AI can assist in labeling the subtle attributes of jewelry by analyzing product images and generating prompts to describe the image. In this example, our AI identifies the unique shapes and materials of each item in the prompts.
The RLM can then extract key attributes from the prompt to generate tags. This assists in accurate product matching for searches as well as enhanced product recommendations based on similarities.
This multi-model approach provides the flexibility to adapt as product catalogs expand while remaining consistent with tagging to yield more robust results for consumers.
Unparalleled Scalability
DataWeave can rapidly scale tagging for new categories. The solution is built to handle the demands of even the largest eCommerce catalogs enabling:
Effortless management of extensive product catalogs: We can process and tag millions of products without compromising on speed or accuracy, allowing businesses to scale without limitations.
Automated bulk tagging: New product lines or entire categories can be tagged automatically, significantly reducing the time and resources required for catalog expansion.
Normalizing Size and Color in Fashion
Style, color, and size are the core attributes in the fashion and apparel categories. Style attributes, which include design, appearance, and overall aesthetics, can be highly specific to individual product categories.
Our product matching engine can easily handle color and sizing complexity via our AI-driven approach combined with human verification. By leveraging advanced technology to identify and normalize identical and similar products from competitors, you can optimize your pricing strategy and product assortment to remain competitive. Using Generative AI in normalizing color and size in fashion is key to powering competitive pricing intelligence at DataWeave.
Continuous Adaptation and Learning
Our solution evolves with your business, improving continuously through feedback and customization for retailers’ specific product categories. The system can be fine-tuned to understand and apply specialized tagging for niche or industry-specific product categories. This ensures that tags remain relevant and accurate across diverse catalogs and as trends emerge.
The AI in our platform also continuously learns from user interactions and feedback, refining its tagging algorithms to improve accuracy over time.
Stay Ahead of the Competition With Accurate Attribute Tagging
In the current landscape, the ability to accurately and consistently tag product attributes is no longer a luxury—it’s essential for staying competitive. With advancements in Generative AI, companies like DataWeave are revolutionizing the way product tagging is handled, ensuring that every item in a retailer’s catalog is presented with precision and depth. As shoppers demand a more intuitive, seamless experience, next-generation tagging solutions are empowering businesses to meet these expectations head-on.
DataWeave’s innovative approach to attribute tagging is more than just a technical improvement; it’s a strategic advantage in an increasingly competitive market. By leveraging AI to scale and automate tagging processes, online retailers can keep pace with expansive product assortments, manage content more effectively, and adapt swiftly to changes in consumer behavior. In doing so, they can maintain a competitive edge.
When egg prices surged 70% during the 2023 avian flu outbreak, grocery retailers faced a critical dilemma: maintain margins and risk losing customers, or absorb costs and watch profits evaporate. Similarly, rising olive oil and chocolate prices also had domino effects, cascading down from retailers to consumers. In each of these scenarios, those with sophisticated pricing intelligence systems adapted swiftly, finding the sweet spot between competitiveness and profitability. Others weren’t so fortunate.
This scenario continues to play out daily across thousands of products in the grocery sector. From breakfast cereals to fresh produce to bottled water, retailers must orchestrate pricing across a variety of categories – each with its own competitive dynamics, margin requirements, and price sensitivity patterns.
The Evolution of Grocery Pricing Intelligence
Imagine these scenarios in the grocery industry:
Milk prices spike during a supply shortage.
Your competitor drops egg prices by 20%.
Fresh produce costs fluctuate with an unseasonable frost.
For grocery retailers, these aren’t occasional challenges—they’re Tuesday. Reacting to each pricing crisis as it comes isn’t just exhausting—it’s a recipe for shrinking margins and missed opportunities.
Think of it this way: If you’re constantly playing defense with your pricing strategy, you’re already two steps behind. Commoditized items like milk and eggs face intense price competition, while seasonal products and fresh produce demand constant attention. Simply matching competitor prices or adjusting for cost changes isn’t enough anymore. What’s needed is a proactive approach that anticipates market shifts before they happen and turns pricing challenges into competitive advantages. This is where price management comes in.
Price management has transformed from simple competitor checks into a strategic power play that can make or break a retailer’s market position. Weekly manual adjustments have given way to a long-term strategic view, driven by data analytics and market intelligence. Here are the basics of how price management in grocery retail works today.
Three Pillars of Grocery Price Management
1. Smart Data Collection: Building Your Foundation
The journey begins with comprehensive data collection and storage across your entire product ecosystem. This means:
Complete Coverage Of All SKUs Across All Stores: Tracking prices for all SKUs across all stores, with particular attention to high-velocity items and volatile categories.
Dynamic Monitoring: Tracking prices across different time frequencies as grocery prices are highly volatile for different categories. So daily tracking for volatile items like dairy and produce, and weekly for more stable categories may be needed.
Competitive Intelligence: Gathering data not just on prices, but on promotions, pack sizes, and private label alternatives.
Infrastructure to Support Large Volumes of Data: Partnering with external data and analytics providers to bridge the gap when retailers struggle with the scale of digital infrastructure these data sets require.
2. Intelligent Data Refinement: Making Sense of the Numbers
Raw data alone isn’t enough—it needs context and structure to become actionable intelligence. This is called Data Refinement—the process of establishing meaningful relationships within the data to facilitate the extraction of valuable insights. This refinement stage is closely tied to the data collection strategy, as the quality and depth of the insights derived depend on the accuracy and coverage of the collected data.
Data refinement includes several key processes:
Advanced Product Matching
Picture this: You’re tracking a competitor’s pricing on organic apples. Simple, right? Not quite. Yes, Universal Product Codes (UPCs) and Price Lookup Codes (PLUs) are present in Grocery to standardize product identification across different retailers—unlike the fashion industry’s endless style variations. Still, product matching isn’t as straightforward as scanning barcodes.
Here’s the catch: many retailer websites don’t display them. Then there’s the private label puzzle—your “Store’s Best” organic apples need to match against competitors’ house brands, each with their own unique UPC. Throw in different sizes (4 Apples vs. 1Kg of Apples), regional product names (fancy naming for plain old arugula), and international brand variations (like the name for Sprite in the USA and China), and you’ve got yourself a complex matching challenge that would make conventional pricing intelligence providers sweat.
Custom Product Relationships for Consistent Pricing and Competitive Positioning
Think like a shopper browsing the dairy aisle. You regularly buy your family’s favorite organic yogurt, the 24oz tub. But today, you notice the larger 32oz size is on sale – except the 24oz isn’t. As you stand there, confused, you wonder: Is the sale only for the bigger size? Did I miss a promotion? Should I buy the 32oz even though it’s more than I need?
For shoppers, this inconsistent pricing across product variations creates a frustrating experience. Establishing clear relationships between related items in your catalog is essential for maintaining consistent pricing and a coherent competitive strategy.
Start by linking products based on attributes like size, brand, and packaging. That way, when you adjust the price of the 32oz yogurt, the 24oz version automatically updates too – no more scrambling to ensure uniform pricing across your assortment. Similarly, products of the same brand but with flavor variations should be connected to keep pricing consistent.
Taking this one step further, mapping your competitors’ exact and similar products is crucial for comprehensive competitive intelligence. Distinguishing between premium and private label tiers, national brands, and regional players gives you a holistic view of the landscape. With this understanding, you can hone your pricing strategies to maintain a clear, compelling position across your entire category lineup.
Consistent pricing, whether across your own product variations or against competitors, provides clarity and accuracy in your overall competitive positioning. By establishing these logical connections, you avoid the customer confusion of seemingly random, inconsistent discounts – and ensure your pricing strategies work in harmony, not disarray.
The Role of AI and Data Sciences in Data Refinement
On the surface, linking products based on attributes like size, brand, and packaging seems like a no-brainer. But developing and maintaining the systems to accurately and automatically identify these connections? That’s a whole different animal.
Think about it – you’re not just dealing with text-based product titles and UPCs. There are images, videos, regional variations, private labels, and a whole host of other data types and industry nuances to account for.
Luckily, DataWeave is one of the few companies that’s truly cracked the code. Our multimodal AI models are trained to process all those diverse data formats – from granular product specs to zany regional produce names. And it’s not just about technology; we also harness the power of human intelligence.
See, in the grocery world, category managers are the real decision makers. They know their shelves inside and out and can spot those tricky connections in product matching, especially when they are not UPC-based. That’s why DataWeave built in a Human-in-the-Loop (HITL) process, where their AI systems continuously learn from expert feedback. It’s a feedback loop that allows our customers to pitch in and keep product relationships accurate, reliable, and always adapting to new market realities.
So while product mapping may seem straightforward on the surface, the reality is it takes some serious horsepower to do it right. Thankfully, DataWeave has both the technical chops and the grocery industry know-how to make it happen. Because when it comes to pricing intelligence, getting those product connections right is half the battle.
3. Strategic Implementation: Turning Insights into Action
The true value of pricing intelligence (PI) is realized through its strategic application. Although many view PI as a technical function, its strategic significance is increasing, particularly in the context of recent economic pressures like inflation. Here’s why:
Tactical vs Strategic Use of Data: From Standard Reporting to Competitive Analysis
Pricing intelligence has come a long way from the days of simply reacting to daily price changes. These days, it’s not just about firefighting—it’s about driving long-term strategy.
You can use pricing data to make quick, tactical adjustments, like matching a competitor’s sudden price drop on milk. Or, you can leverage that same data to predict market trends, optimize your product lineup, and shape your overall pricing strategy. Retailers who take that strategic view can get out ahead of the curve, anticipating shifts instead of just chasing them.
DataWeave supports both of these approaches. Our Standard Reporting tools give pricing managers the nitty-gritty details they need—current practices, historical patterns, and operational KPIs. It’s all the insights you’d expect for making those tactical, day-to-day tweaks.
In addition, DataWeave offers something more powerful: Competitive analysis. This is where pricing intelligence becomes a true strategic weapon. By providing a high-level view of market positioning, competitor moves, and untapped opportunities, competitive analysis empowers leadership to make proactive, big-picture decisions.
Armed with this broader perspective, retailers can start taking a more surgical approach. Maybe you need to adjust pricing zones to better meet customer demands. Or rethink your overall strategies to stay ahead of the competition, not just keep pace. It’s the difference between constantly putting out fires and systematically fortifying your entire pricing fortress.
Beyond Pricing: Comprehensive Data for Broader Insights
Pricing intelligence is just the tip of the iceberg. When you really start to refine and harness your data, the possibilities for grocery retailers expand far beyond simple price comparisons. Think about it – all that information you’re collecting on products, markets, and consumer behavior? That’s a goldmine waiting to be tapped. Sure, you can use it to keep a pulse on competitor pricing. But why stop there?
What if you could leverage that data to optimize your product assortment, making sure you’re stocking the right mix to meet customer demands? Or tap into predictive analytics to get a glimpse of future market shifts, so you can get out ahead of the curve? How about using it to streamline your supply chain, identify availability inefficiencies, and get products to shelves faster?
Sure, pricing intelligence will always be mission-critical. But when you couple it with these other data-driven insights, that’s when grocery retailing gets really interesting. It’s about evolving from a price-matching robot to a true strategic visionary, armed with the intelligence to take your business to new heights.
Looking Ahead: The Future of Grocery Pricing Intelligence
The grocery pricing landscape continues to evolve, driven by:
Integration of AI and machine learning for predictive pricing
Enhanced focus on omnichannel pricing consistency
Growing importance of personalization in pricing strategies
Pricing intelligence isn’t just about having data—it’s about having the right data and knowing how to use it strategically. Success requires a comprehensive approach that combines robust data collection, sophisticated analysis, and strategic implementation.
By embracing modern pricing intelligence tools and strategies, grocery retailers can navigate market volatility, maintain competitive positioning, and drive sustainable growth. The key lies in building a pricing ecosystem that’s both sophisticated enough to handle complex data and flexible enough to adapt to changing market conditions.
Ready to transform your pricing strategy? Check out our grocery price tracker to get month-on-month updates on grocery prices in the real world. Contact us to learn how our advanced pricing intelligence solutions can help your business stay ahead in the competitive grocery market.
Today, the first name that comes to anybody’s mind when they hear about online shopping is Amazon. In the US alone, Amazon accounted for over 37.6 percent of total online retail sales in 2023 with the second place Walmart not even managing to win double-digit numbers on the same scale.
With such a phenomenal market share, it is not surprising that any retail brand would want to have their products listed on Amazon for sale. However, as enticing as the potential exposure could be, the overwhelming presence of brands selling similar products on Amazon is so huge that getting fair visibility for your products may require some heavy-lifting support.
Will the Same SEO You Use for Google Work with Amazon?
Unfortunately, no, as Google and Amazon have different objectives when it comes to search rankings on their respective customer platforms. Google makes the lion’s share of its revenue from search advertising, whereas Amazon makes money when customers buy products listed on its platform by sellers.
Relying on traditional search engine optimization (SEO) techniques may not get the desired results as they are more optimized for search engines like Google. Amazon embraces its unique DNA when it comes to product display rankings on its search option.
How Does SEO Work in Amazon?
Over the years, Amazon amassed data about shopping experiences that billions of customers globally had on its platform. With this data, they developed their custom search algorithm named A9. Contrary to the gazillion objectives that Google has for its intelligent search algorithms, Amazon has tasked A9 with just a simple straightforward target—when a customer keys in a search query, provide the best choice of products that they will most probably purchase, as search results.
A9 works to fulfill the mission of guiding shoppers to the right product without worrying about semantics, context, intent, mind mapping, etc. of the search query in contrast to what Google does. As with Google search, Amazon does have paid advertising and sponsored results options such as Amazon PPC, Headline ads, etc. but their SEO algorithms are aware of how to support and boost search rankings of genuine products and brands that have taken an effort to follow best practices in Amazon SEO as well as have a great offering with attractive prices.
As additional knowledge, Amazon also has clear guidelines on what it prioritizes for search rankings. Known in the SEO world as Amazon ranking signals, these are core factors that influence how a product is ranked for search queries. Some of the top Amazon ranking signals that carry heavy influence on search rankings include on-page signals, off-page signals, sales rank, best sellers rank, etc.
What Brands Need to Strategize to Master the Amazon SEO Algorithms
From a broad perspective, we can classify the actions brands need to take in this regard in 3 core stages:
Pre-Optimization
This deals with getting first-hand knowledge about both customers who are likely to purchase your product and the competitors who are vying for sales from these very same customers. Filtering your target customer or audience is essential to ensure that you get the most ROI from marketing initiatives and that sales cycles are accelerated. For example, if your product is a premium scented candle, there is no point in wasting advertising dollars trying to win attention from customers who are not likely to ever spend on luxury home décor items.
Knowing how your competitors are performing on Amazon search, the keywords, and SEO strategies they have adapted is critical to ensure that you stay one step ahead.
Product Listing Page Optimization
This includes strategies that a brand can adopt so that its product description page gets the much-needed content optimizations to sync with Amazon’s A9 algorithm. It has a mix of keyword-integrated content, relevant images, descriptions in easy-to-understand language, localized content flavors to resonate with target buyers, etc. For example, a kitchen tool like a grater might be used for different kinds of food preparation techniques in different regions of the same country.
The brand must ensure that the description adequately localizes the linguistic or usage preference representation of the target audience. If the grater is used for grating coconut shells to extract the fibrous pulp in the Midlands and for grating ginger skin in the Far East, both use cases should be part of the product description if the target customers are from both regions.
Sales Optimization
This deals with options that have more sales strategies integrated into their core. For example, blogs on popular websites with the Amazon purchase link embedded in the content, collaboration with social media influencers, paid advertising on Amazon itself as well as on search engines, video ads, banner and display ads, etc.
The key intent here is to drive organic and inorganic traffic to the Amazon product listing page and ultimately win sales.
How Can Your Products Rank High in Amazon Search Results? Top 10 Tactics
Now that you have a clear understanding of the strategies that help in mastering Amazon’s ranking algorithms, here are some great tips to help achieve higher search rankings for your products on Amazon search:
1. Target Relevant Keywords
You need to figure out the best keywords that match what customers put as queries into the Amazon search bar. Your brand needs to clearly understand customer behavior when they arrive on Amazon to search for a product or category of products. The best place to begin looking for the same would be on competitor pages on Amazon. The keywords that helped them rank well on Amazon can help you as well. Manually investigating such a large pool of competitors is nearly impossible but with the right tools, you can easily embrace capabilities to know which keywords can help you in mimicking the success of your competitors.
2. Focus on Product Titles
Every single part of the content in your brand’s Amazon storefront or product page needs dedicated focus. Beginning with the product titles, effort needs to be made to ensure that they include the brand name, key product category or features, and other relevant keyword information.
In other words, product titles must be optimized for searchability. This searchability for product titles needs to be optimized for both mobile and desktop screens.
3. Create Product Descriptions that Resonate with the Audience
For product descriptions on your Amazon webpage, you need to figure out the optimal quality levels needed for the intended audience. Effective content can help achieve better search ranking visibility and convince the incoming traffic of shoppers to make a purchase. It is important to periodically review and modify your page content to suit the interests of visitors from both web and mobile devices.
Leveraging solutions like DataWeave can help with regular content audits to ensure you are putting out the best product content that will delight shoppers and deliver on sales conversion targets.
4. Use High-Quality Media Assets like Images and Videos
Promoting your product doesn’t have to be restricted to just textual content in Amazon product description sections. You can use other multimedia assets of high quality. These include images, videos, brochure images, etc. Every content asset must aim to educate shoppers on why your product should be their number one choice. For example, look at this detailed product description for the viral K-Beauty product COSRX Mucin Essence.
Moreover, images can help attract more attention span from visitors, thereby increasing the probability of purchases.
5. Strengthen the Backend Keywords As Well
Amazon also supports hidden backend keywords that sellers add to their product listings. They help add more relevance to products similar to meta descriptions and titles in traditional SEO for search engines like Google. A typical backend keyword may comprise synonyms, misspelled keywords, textual variations, etc. However, knowing how to pick the right ones is crucial. By analyzing your keyword rankings against competitors and higher-ranking product results in search, the platform can help you consistently optimize your content backend to help grow visibility.
6. Focus on Reviews and Ratings
Reviews and ratings on product pages are key insights that help customers with their purchasing decisions. So, it is natural for brands to keep a close eye on how their products are faring in this regard. Reviews and ratings are a direct indication of the trustworthiness of your product. When previous buyers rate you high and leave favorable reviews on your product, it will directly promote trust and help you secure a better rapport with new customers.
This upfront advantage can help boost sales conversions better. Leveraging solutions like DataWeave can help you understand the sentiments that customers have for your products by intelligently analyzing reviews and ratings.
7. Implement Competitive Pricing Strategies
The goal of most customers when shopping online is to get their desired product at the most affordable prices. The eCommerce price wars every year are growing in scale today and getting your product pricing right is crucial for sales. However, there is a need to gain comprehensive insights into how your competitors are pricing their offerings and how the market responds to specific price ranges. Solutions like DataWeave help your brand access specific insights into pricing. By analyzing competitor pricing, you can create a winning price model that is sustainable for your brand and favorable for target customers.
8. Track Share of Search
Content and other SEO activities will help improve your search rankings on Amazon. However, it is equally important to know how well your products are performing periodically against your competitors for the same set of specific keyword searches. You need to understand the share of search that your products are achieving to formulate improvement strategies. DataWeave’s Digital Shelf Analytics solution provides share of search insights helping you uncover deep knowledge on your discoverability on Amazon (and other marketplaces) for your vital search keywords.
9. Ensure Stock Availability
To achieve better ranking results, brands need to ensure that the relevant products matching the search keywords are available for quick delivery at the desired ZIP codes where users are more likely to search and order them. Out-of-stock items seldom show up high on search results. Certain products, especially if they’re popular, can get stocked out frequently in certain locations. Keeping a close eye on your stock availability across the map can help minimize these scenarios.
10. Optimize Your Brand Presence
While optimizing content and other key areas within the Amazon webpage for your product is critical, there are other avenues to help boost search rankings. One such option includes registering in the Amazon Brand Registry, which provides more beneficial features like protection against counterfeits and ensuring that your brand page is optimized according to Amazon storefront standards.
The Bottom Line
Winning the top spot in Amazon search ranking is crucial for brands that aim to capitalize on online sales revenue to grow their business. Knowing your workaround for Amazon’s proprietary SEO frameworks and algorithms is the first step to succeeding. The key element of success is your ability to gain granular insights into the areas we covered in this blog post such as competitor prices, sentiments of customers, market preferences, and content optimization requirements.
This is where DataWeave’s Digital Shelf Analytics solution becomes the biggest asset for your eCommerce business. Contact us to explore how we can empower your business to build the most visible and discoverable Amazon storefront that guarantees higher search rankings and ultimately increased sales. Talk to us for a demo today.
Fashion is as dynamic a market as any—and more competitive than most others. Consumer trends and customer needs are always evolving, making it challenging for fashion and apparel brands to keep up.
Despite the inherent difficulties fashion and apparel sellers face, this industry is one of the largest grossing markets in the world, estimated at $1.79 trillion in 2024. Global revenue for apparel is expected to grow at an annual rate of about 3.3% over the next four years. That means companies in this space stand to make significant revenue if they can competitively price their products, keep up with the competition, and win customer loyalty with consistent product availability.
There are three main categories in fashion and apparel. These include:
Apparel and clothing (i.e., shirts, pants, dresses, and other apparel)
Footwear (i.e., sneakers, sandals, heels, and other products)
Accessories (i.e., bags, belts, watches, and so on)
If you look at all of these product types across all sorts of retailers, there is a massive amount of overlapping data based on product attributes like style and size that are difficult to normalize.
Fashion Attributes
Style, color, and size are the main attribute categories in fashion and apparel. Style attributes include things like design, look, and overall aesthetics of the product. They’re very dependent on the actual product category of fashion as well. A shirt might have a slim fit attribute associated with it, whereas a belt might have a length. All these different attributes are usually labeled within a product listing and affect the consumer’s decision-making process:
Color (red, blue, sea green, etc.)
Pattern (solid, striped, checked, floral, etc.)
Material (cotton, polyester, leather, denim, silk, etc.)
Fit (regular, slim, relaxed, oversized, tailored, etc.)
Type (casual, formal, sporty, vintage, streetwear)
Color Complexity in Fashion
Color is perhaps the most visually distinctive attribute in fashion, yet it presents unique challenges for retailers. This is because color naming can vary across retailers and marketplaces. There are several major differences in color convention:
A single color can be labeled differently across brands (e.g., “navy,” “midnight blue,” “deep blue”)
Seasonal color names (e.g., “summer sage” vs. “forest green”)
Marketing-driven names (e.g., “sunset coral” vs. “pale orange”)
Size: The Other Critical Dimension
Size in fashion refers to the dimensions or measurements that determine how fashion products fit. Depending on whether the product is a clothing item, shoes, or a hat, there will be different sizing options. Types of sizes include:
Standard sizes (XS, S, M, L, XL, XXL, XXL)
Custom sizes (based on brand, retailer, country, etc.)
A single type of product may have different sizing labels. For instance, one pants listing may use traditional S, M, L, XL sizing, while another pants listing may use 24, 25, or 26, to refer to the waist measurement.
Size is a dynamic attribute that changes based on current trends. For example, there has recently been a significant shift towards inclusive sizing. Size inclusivity refers to the practice of selling apparel in a wide range of sizes to accommodate people of all body types. Consumers are more aware of this trend and are demanding a broader range of sizing offerings from the brands they shop from.
In the US market, in particular, some 67% of American women wear a size 14 or above and may be interested in purchasing plus-size clothing. There is a growing demand in the plus-size market for more options and a wider selection. Many brands are considering expanding their sizes to accommodate more shoppers and tap into this growing revenue channel.
Pricing Based on Size and Color
Many fashion products are priced differently based on size and color. Let’s take a look at an example of what this can look like.
A popular beauty brand (see image) is known for its viral lip tint. While most of the color variants are priced at $9.90 on Amazon, a specific colorway option, featuring less pigmented options, is priced at $9.57. This price differential is driven by both material costs and market demand.
Different colorways (any of a range of combinations of colors in which a style or design is available) of the same product often command different prices also. This is based on:
Dye costs (some colors require more expensive processes)
Seasonal demand (traditional colors vs. trend colors)
Exclusivity (limited edition colors)
An example of price variations by size is a women’s shirt that is being sold on Amazon as shown below. For this product, there are no style attributes to choose from. The only parameter the shopper has to select is the size they’d like to purchase. They can choose from S to XL. On the top, we can see that the product in size S is ₹389. Below, the size XL version of this same shirt is ₹399. This price increase is correlated to the change in size.
So why are these same products priced differently? In an analysis of One Six, a plus-size clothing brand, several reasons for this difference in plus-size clothing were determined.
Extra material is needed, hence an increase in production costs
Extra stitching costs, hence an increase in production costs
Production of plus-size clothing often means acquiring specialized machinery
Smaller scale production runs for plus-size clothing means these initiatives often don’t benefit from cost savings
Some sizes are sold more than others, meaning that in-demand sizes for certain apparel can affect pricing as well. Brands want to be able to charge as much as possible for their listing without risking losing a sale to a competitor.
The Competitive Pricing Challenge: Normalizing Product Attributes Across Competitors in Apparel and Fashion
There are hundreds of possible attribute permutations for every single apparel product. Some retailers may only sell core sizes and basic colors; some may sell a mix of sizes for multiple style types. Most retailers also sell multiple color variants for all styles they have on catalog. Other retailers may only sell a single, in-demand size of the product. Also, when other retailers are selling the product, it’s unlikely that their naming conventions, color options, style options, and sizing match yours one-for-one.
In one analysis, it was found that there were 800+ unique values for heel sizes and 1000+ unique values for shirts and tops at a single retailer! If you’re looking to compare prices, the effort involved in setting up and managing lookup tables to identify discrepancies when one retailer uses European sizes and another uses USA sizes, for example, is simply too onerous to contemplate doing. Colors only add to the complexity – as similar colors may have new names in different regions and locations as well!
Even if you managed to find all the discrepancies between product attributes, you would still need to update them any time a competitor changed a convention.
Still, monitoring your competitors and strategically pricing your listings is essential to maintain and grow market share. So what do you do? You can’t simply eyeball your competitor’s website to check their pricing and naming conventions. Instead, you need advanced algorithms to scan the entire marketplace, identify individual products being sold, and normalize their data and attributes for analysis.
Getting Color and Size Level Pricing Intelligence
With DataWeave, size and color are just two of several dimensions of a product instead of an impossible big data problem for teams. Our product matching engine can easily handle color and sizing complexity via our AI-driven approach combined with human verification.
This works by using AI built on more than 10 years of product catalog data across thousands of retail websites. It matches common identifiers, like UPC, SKU code, and other attributes for harmonization before employing a large language model (LLM) prompts to normalize color variations and sizing to a single standard.
For example, if a competitor has the smallest size listed as Sm but has your smallest listing identified as S, DataWeave can match those two attributes using AI. Similar classification can be performed on color as well.
Complex LLM prompts are pre-established so that this process is fast and efficient, taking minutes rather than weeks of manual effort.
Harmonizing products along with their color and sizing data across different retailers for further analysis has several benefits. Most importantly, product matching helps teams conduct better competitive analysis, allowing them to stay informed about market trends, competitors’ offerings, and how those competitors are pricing various permutations of the same product. It helps ensure that you’re offering the most competitive assortment of sizing in several colors to win more market share as well. Overall, it’s easier for teams to gain insights and exploit their findings when all the data is clean and available at their fingertips.
Product Matching Size and Color in Apparel and Fashion
Color and size are crucial attributes for retailers and brands in the apparel and fashion industry. It adds a level of complexity that can’t be overstated. While it’s a necessity to win consumers (more colors and sizes will mean a wider potential reach), the more permutations you add to your listing, the more complicated it will be to track it against your competition. However, This challenge is worth undertaking as long as you have the right solutions at your disposal.
With a strategy backed by advanced technology to discover identical and similar products across the competitive landscape and normalize their color and sizing attributes, you can ensure that you are competitively pricing your products and offering the best assortment possible. Employing DataWeave’s AI technology to find competitor listings, match products across variants, and track pricing regularly is the way to go.
Interested in learning more about DataWeave? Click here to get in touch!
Fuel retailers today operate in a highly competitive and volatile market. Consumer behavior is increasingly driven by price sensitivity, particularly in industries like fuel where small changes in price can significantly influence where consumers choose to fill up. The stakes are even higher when you consider the razor-thin margins many fuel retailers work with, making every cent count.
For years, retailers have relied on third-party apps and services to provide them with location-based competitive fuel price data. These services collect pricing data based on customer transactions. While these platforms offer a convenient way for consumers to find cheaper fuel prices, their value to retailers is limited. The data they provide is often riddled with inaccuracies, lags, and incomplete coverage, leaving retailers vulnerable to missed pricing opportunities.
In this rapidly shifting landscape, retailers need data that is not only accurate but also real-time. Solving this involves directly tapping into retailers’ own data sources (first-party or 1P data) —such as websites and apps. This is believed to be the most comprehensive and reliable source of fuel price data in the market.
To validate this hypothesis, we conducted a comprehensive analysis comparing first-party and third-party (3P) fuel price data. Our analysis compared pricing (at the same time of the day) across more than 40 gas stations—including major players like Circle K, Costco, Speedway, and Wawa. The data was captured several times a day for over a week.
Accurate Pricing Matters More Than Ever
Our analysis revealed that nearly a quarter (24.4%) of the fuel pricing data provided by third-party sources was inaccurate when compared to first-party data. On average, these inaccuracies amounted to a price difference of 10.9%.
Such discrepancies, though seemingly minor, can significantly affect consumer behavior. Inaccurate prices could drive customers to competitors who are listed with lower prices—even if the real difference is negligible. For fuel retailers, this leads to lost revenue, missed opportunities, and reduced market share.
The implications are clear: relying on third-party competitive data alone puts retailers at risk. With inaccurate data, retailers may fail to adjust their prices in time to respond to market changes, losing customers to competitors.
The Core Challenges of Third-Party Data
Third-party data comes with inherent limitations. The way this data is collected presents significant challenges for fuel retailers looking to optimize pricing strategies. Here are the main issues:
Inconsistent Data Frequency: Third-party pricing data is often gathered through customer card transactions. As a result, pricing data updates only when and where transactions occur. This can lead to irregular data availability, particularly in stations with lower transaction volumes. For instance, in rural areas or during off-peak hours, fewer transactions lead to fewer updates. Retailers are left with outdated data, making it difficult to keep pace with real-time price fluctuations.
Limited Geographic Coverage: Regions with lower transaction volumes are particularly affected by data gaps. While urban centers may enjoy more frequent updates, rural and less-frequented stations often suffer from a lack of data. This limited geographic coverage creates blind spots, making it impossible for retailers in these regions to stay competitive.
Potential Data Inaccuracies Across Fuel Types: Our analysis showed that inaccuracies in third-party pricing data were most pronounced for Unleaded fuel, with errors occurring nearly 80% of the time. While Diesel prices fared slightly better, inaccuracies were still frequent. This inconsistency across fuel types further complicates the challenge for retailers relying on third-party data.
Leveraging First-Party Data
At DataWeave, our Fuel Pricing Intelligence solution leverages real-time 1P data directly from fuel retailers’ websites and mobile apps, ensuring that retailers always have access to the most up-to-the-minute and accurate pricing information.
Here’s why first-party data stands out:
Real-Time Updates: Our solution provides near-instantaneous updates across more than 30,000 ZIP codes, ensuring that retailers always have the most up-to-date pricing information. This real-time accuracy is essential for making dynamic pricing adjustments in a highly competitive market.
Wide Geographic Coverage: DataWeave’s first-party solution captures data across a broad geographic range, ensuring no blind spots in coverage. Retailers in rural or less-frequented areas benefit from the same level of insight as their urban counterparts, giving them the ability to optimize pricing in real-time.
Complementary to Existing Solutions: For retailers already using third-party data, DataWeave’s first-party solution can complement and enhance their current systems. By filling in data gaps and providing more frequent updates, our solution ensures that retailers are never left in the dark when it comes to competitive pricing.
Retailer-Wise Variances
Among the retailers analyzed, we found that some were more affected by third-party data inaccuracies than others. Speedway and Wawa, for instance, experienced inaccuracies in up to 28% of third-party price data. In contrast, Circle K exhibited fewer discrepancies, but even they were not immune to the challenges posed by third-party data.
For their competition, relying on third-party data alone presents a significant risk. By switching to first-party data sources, or complementing their existing third-party data with DataWeave’s first-party solution, retailers can ensure they stay competitive in the eyes of price-sensitive consumers.
In an industry as price-sensitive as fuel retail, accurate data is a strategic asset. Leveraging first-party data allows fuel retailers to:
Maximize Revenue: By using real-time, accurate data, retailers can avoid under- or over-pricing their fuel, ensuring they capitalize on high-demand periods while minimizing losses during low-demand times.
Enhance Margins: First-party data provides the precision needed to fine-tune margins, ensuring profitability even in fiercely competitive markets.
Boost Customer Retention: Competitive pricing fosters customer loyalty. With better data, retailers can maintain customer trust and retention, even during volatile market shifts.
Shift into High Gear with DataWeave
As the fuel retail industry becomes increasingly competitive, the need for accurate, real-time pricing data has never been more important. DataWeave’s Fuel Pricing Intelligence solution empowers retailers with the insights they need to stay ahead of the competition, optimize pricing strategies, and boost profitability.
With first-party data, fuel retailers can eliminate the blind spots and inaccuracies associated with third-party sources. This shift toward data-driven pricing strategies ensures that every price adjustment is backed by real-time insights, giving retailers the edge they need to succeed.
In retail, competition is fierce, and in its ever-evolving landscape, consumer expectations are higher than ever.
For years, our AI-driven solutions have been the foundation that empowers businesses to sharpen their competitive pricing and optimize digital shelf performance. But in today’s world, evolution is constant—so is innovation. We now find ourselves at the frontier of a new era in AI. With the dawn of Generative AI and the rise of Large Language Models (LLMs), the possibilities for eCommerce companies are expanding at an unprecedented pace.
These technologies aren’t just a step forward; they’re a leap—propelling our capabilities to new heights. The insights are deeper, the recommendations more precise, and the competitive and market intelligence we provide is sharper than ever. This synergy between our legacy of AI expertise and the advancements of today positions DataWeave to deliver even greater value, thus helping businesses thrive in a fast-paced, data-driven world.
This article marks the beginning of a series where we will take you through these transformative AI capabilities, each designed to give retailers and brands a competitive edge.
In this first piece, we’ll offer a snapshot of how DataWeave aggregates and analyzes billions of publicly available data points to help businesses stay agile, informed, and ahead of the curve. These fall into four broad categories:
Product Matching
Attribute Tagging
Content Analysis
Promo Banner Analysis
Other Specialized Use Cases
Product Matching
Dynamic pricing is an indispensable tool for eCommerce stores to remain competitive. A blessing—and a curse—of online shopping is that users can compare prices of similar products in a few clicks, with most shoppers gravitating toward the lowest price. Consequently, retailers can lose sales over minor discrepancies of $1–2 or even less.
All major eCommerce platforms compare product prices—especially their top selling products—across competing players and adjust prices to match or undercut competitors. A typical product undergoes 20.4 price changes annually, or roughly once every 18 days. Amazon takes it to the extreme, changing prices approximately every 10 minutes. It helps them maintain a healthy price perception among their consumers.
However, accurate product matching at scale is a prerequisite for the above, and that poses significant challenges. There is no standardized approach to product cataloging, so even identical products bear different product titles, descriptions, and attributes. Information is often incomplete, noisy, or ambiguous. Image data contains even more variability—the same product can be styled using different backgrounds, lighting, orientations, and quality; images can have multiple overlapping objects of interest or extraneous objects, and at times the images and the text on a single page might belong to completely different products!
DataWeave leverages advanced technologies, including computer vision, natural language processing (NLP), and deep learning, to achieve highly accurate product matching. Our pricing intelligence solution accurately matches products across hundreds of websites and automatically tracks competitor pricing data.
Here’s how it works:
Text Preprocessing
It identifies relevant text features essential for accurate comparison.
Metadata Parsing: Extracts product titles, descriptions, attributes (e.g., color, size), and other structured data elements from Product Description Pages (PDP) that can help in accurately identifying and classifying products.
Attribute-Value Normalization: Normalize attributes names (e.g. RAM vs Memory) and their values (e.g., 16 giga bytes vs 16 gigs vs 16 GB); brand names (e.g., Benetton vs UCB vs United Colors of Benetton); mapping category hierarchies a standard taxonomy.
Noise Removal: Removes stop words and other elements with no descriptive value; this focuses keyword extraction on meaningful terms that contribute to product identification.
Image Preprocessing
Image processing algorithms use feature extraction to define visual attributes. For example, when comparing images of a red T-shirt, the algorithm might extract features such as “crew neck,” “red,” or “striped.”
Image hashing techniques create a unique representation (or “hash”) of an image, allowing for efficient comparison and matching of product images. This process transforms an image into a concise string or sequence of numbers that captures its essential features even if the image has been resized, rotated, or edited.
Before we perform these activities there is a need to preprocess images to prepare them for downstream operations. These include object detection to identify objects of interest, background removal, face/skin detection and removal, pose estimation and correction, and so forth.
Embeddings
We have built a hybrid or a multimodal product-matching engine that uses image features, text features, and domain heuristics. For every product we process we create and store multiple text and image embeddings in a vector database. These include a combination of basic feature vectors (e.g. tf-idf based, colour histograms, share vectors) to more advanced deep learning algorithms-based embeddings (e.g., BERT, CLIP) to the latest LLM-based embeddings.
Classification
Classification algorithms enhance product attribute tagging by designating match types. For example, the product might be identified as an “exact match”, “variant”, “similar”, or “substitute.” The algorithm can also identify identical product combinations or “baskets” of items typically purchased together.
What is the Business Impact of Product Matching?
Pricing Intelligence: Businesses can strategically adjust pricing to remain competitive while maintaining profitability. High-accuracy price comparisons help businesses analyze their competitive price position, identify opportunities to improve pricing, and reclaim market share from competitors.
Similarity-Based Matching: Products are matched based on a range of similarity features, such as product type, color, price range, specific features, etc., leading to more accurate matches.
Counterfeit Detection: Businesses can identify counterfeit or unauthorized versions of branded products by comparing them against authentic product listings. This helps safeguard brand identity and enables brands to take legal action against counterfeiters.
Attribute Tagging
Attribute tagging involves assigning standardized tags for product attributes, such as brand, model, size, color, or material. These naming conventions form the basis for accurate product matching. Tagging detailed attributes, such as specifications, features, and dimensions, helps match products that meet similar criteria. For example, tags like “collar” or “pockets” for apparel ensure high-fidelity product matches for hard-to-distinguish items with minor stylistic variations.
Including tags for synonyms, variants, and long-tail keywords (e.g., “denim” and “jeans”) improves the matching process by recognizing different terms used for similar products. Metadata tags categorize similar items according to SKU numbers, manufacturer details, and other identifiers.
Altogether, these capabilities provide high-quality product matches and valuable metadata for retailers to classify their products and compare their product assortment to competitors.
User-Generated Content (UGC) Analysis
Customer reviews and ratings are rich sources of information, enabling brands to gauge consumer sentiment and identify shortcomings regarding product quality or service delivery. However, while informative, reviews constitute unstructured “noisy” data that is actionable only if parsed correctly.
Here’s where DataWeave’s UGC analysis capability steps in.
Feature Extractor: Automatically pulls specific product attributes mentioned in the review (e.g., “battery life,” “design” and “comfort”)
Feature Opinion Pair: Pairs each product attribute with a corresponding sentiment from the review (e.g., “battery life” is “excellent,” “design” is “modern,” and “comfort” is “poor”)
Calculate Sentiment: Calculates an overall sentiment score for each product attribute
The final output combines the information extracted from each of these features, which looks something like this:
Battery life is excellent
Design is modern
Not satisfied with the comfort
The algorithm also recognizes spammy reviews and distinguishes subjective reviews (i.e., those fueled by emotion) from objective ones.
Promo Banner Analysis
Our image processing tool can interpret promotional banners and extract information regarding product highlights, discounts, and special offers. This provides insights into pricing strategies and promotional tactics used by other online stores.
For example, if a competitor offers a 20% discount on a popular product, you can match or exceed this discount to attract more customers.
The banner reader identifies successful promotional trends and patterns from competitors, such as the timing of discounts, frequently promoted product categories or brands, and the duration of sales events. Ecommerce stores can use this information to optimize their promotion strategies, ensuring they launch compelling and timely offers.
Other Specialized Use Cases
While these generalized AI tools are highly useful in various industries, we’ve created other category—and attribute-specific capabilities for specialty goods (e.g., those requiring certifications or approval by federal agencies) and food items. These use cases help our customers adhere to compliance requirements.
Certification Mark Detector
This detector lets retailers match items based on official certification marks. These marks represent compliance with industry standards, safety regulations, and quality benchmarks.
Example:
USDA Organic: Certification for organic food production and handling
ISO 9001: Quality Management System Certification
By detecting these certification marks, the system can accurately match products with their certified counterparts. By identifying which competitor products are certified, retailers can identify products that may benefit from certification.
Nutrition Fact Table Reader
Product attributes alone are insufficient for comparing food items. Differences in nutrition content can influence product category (e.g., “health food” versus regular food items), price point, and consumer choice. DataWeave’s nutrition fact table reader scans nutrition information on packaging, capturing details such as calorie count, macronutrient distribution (proteins, fats, carbohydrates), vitamins, and minerals.
The solution ensures items with similar nutritional profiles are correctly identified and grouped based on specific dietary requirements or preferences. This helps with price comparisons and enables eCommerce stores to maintain a reliable database of product information and build trust among health-conscious consumers.
Building Next-Generation Competitive and Market Intelligence
Moving forward, breakthroughs in generative AI and LLMs have fueled substantial innovation, which has enabled us to introduce powerful new capabilities for our customers.
These include:
Building Enhanced Products, Solutions, and Capabilities: Generative AI and LLMs can significantly elevate the performance of existing solutions by improving the accuracy, relevance, and depth of insights. By leveraging these advanced AI technologies, DataWeave can enhance its product offerings, such as pricing intelligence, product matching, and sentiment analysis. These tools will become more intuitive, allowing for real-time updates and deeper contextual understanding. Additionally, AI can help create entirely new solutions tailored to specific use cases, such as automating competitive analysis or identifying emerging market trends. This positions DataWeave to remain at the forefront of innovation, offering cutting-edge solutions that meet the evolving needs of retailers and brands.
Reducing Turnaround Time (TAT) to Go-to-Market Faster: Generative AI and LLMs streamline data processing and analysis workflows, enabling faster decision-making. By automating tasks like data aggregation, sentiment analysis, and report generation, AI dramatically reduces the time required to derive actionable insights. This efficiency means that businesses can respond to market changes more swiftly, adjusting pricing or promotional strategies in near real-time. Faster insights translate into reduced turnaround times for product development, testing, and launch cycles, allowing DataWeave to bring new solutions to market quickly and give clients a competitive advantage.
Improving Data Quality to Achieve Higher Performance Metrics: AI-driven technologies are exceptionally skilled at cleaning, organizing, and structuring large datasets. Generative AI and LLMs can refine the data input process, reducing errors and ensuring more accurate, high-quality data across all touchpoints. Improved data quality enhances the precision of insights drawn from it, leading to higher performance metrics like better product matching, more accurate price comparisons, and more effective consumer sentiment analysis. With higher-quality data, businesses can make smarter, more informed decisions, resulting in improved revenue, market share, and customer satisfaction.
Augmenting Human Bandwidth with AI to Enhance Productivity: Generative AI and LLMs serve as powerful tools that augment human capabilities by automating routine, time-consuming tasks such as data entry, classification, and preliminary analysis. This allows human teams to focus on more strategic, high-value activities like interpreting insights, building relationships with clients, and developing new business strategies. By offloading these repetitive tasks to AI, human productivity is significantly enhanced. Employees can achieve more in less time, increasing overall efficiency and enabling teams to scale their operations without needing a proportional increase in human resources.
In our ongoing series, we will dive deep into each of these capabilities, exploring how DataWeave leverages cutting-edge AI technologies like Generative AI and LLMs to solve complex challenges for retailers and brands.
With pricing making headlines more frequently than ever, now is the perfect moment for retailers to take a step back and rethink their holiday strategy. The heightened focus on pricing—driven by economic uncertainties, inflationary pressures, and fluctuating supply chain dynamics—presents a unique opportunity for retailers to not only meet customer expectations but to exceed them by rebuilding trust. In today’s climate, where consumer confidence is often fragile, the perception of fair pricing can be a significant differentiator. This is especially true during the holiday season when shoppers are more budget-conscious, and every dollar counts.
Rather than focusing on the price of individual items, consumers are increasingly concerned with the total amount they spend at checkout. This means the overall basket cost, rather than the price tag on a single product, holds greater sway in determining whether a customer feels they’ve gotten a good deal. Retailers who can maintain steady, predictable basket pricing—despite external pressures such as supply chain disruptions or increased competition—will stand out as reliable and customer-centric.
Pricing Strategy for the Holiday Season
Your pricing strategy sets the tone for fostering and maintaining customer trust during the busy holiday season. From establishing initial prices to managing markdowns, having a stable, well-thought-out plan is crucial to balancing profitability with customer satisfaction. Below are several guiding principles to help you navigate this critical time frame:
Anchor Your Prices Early on Key Holiday Items
Identify the products that are likely to drive traffic and sales during the holiday period and set your prices strategically early on. Use these prices as a ceiling that you won’t exceed, allowing customers to trust that they’re getting consistent value. By establishing this anchor price, you create a sense of stability in an otherwise fluctuating market, helping your customers feel confident that they won’t face price hikes on essential holiday items.
Prepare for Competitive Moves
The holiday season is notorious for aggressive pricing tactics by competitors, so you’ll need to remain agile. Be prepared to make strategic price reductions when necessary, but ensure you stay below your anchored price to avoid eroding trust. Monitoring competitors closely and adjusting your strategy without undermining your overall value proposition will be key to maintaining a competitive edge.
To accomplish this, having reliable and timely competitor pricing data is essential. A sophisticated pricing intelligence platform like DataWeave’s can get the job done, which is equipped to handle the scale and speed demanded during the fast-paced holiday season.
Collaborate with Vendors on Promotions
Strong vendor relationships are crucial during the holiday season. By working closely with your suppliers, you can develop compelling promotions that not only attract customers but also ensure you have adequate inventory levels to support any reduced pricing strategies. Vendors may offer additional incentives or discounts during this period, and leveraging those to provide deeper savings can help retailers pass along better deals to customers without sacrificing margin.
Pre-Holiday Markdowns
Pre-holiday markdowns are an essential tool to clear out older inventory and make room for newer, more seasonal items. Get ahead of these markdowns by tracking trends and data from previous years. This will allow you to anticipate demand and address any overstocking issues early, ensuring that your shelves are stocked with the right products at the right time.
Post-Holiday Markdowns
Once the holiday rush subsides, differentiating between products is crucial. For “In and Out” items, which are seasonal or limited-time offers, your goal should be to clear through inventory as quickly as possible to free up valuable shelf space for upcoming product cycles. For products that are part of your regular planogram, the focus should shift to adjusting inventory levels back down to non-holiday norms, ensuring you’re not left with excess stock that could tie up cash flow in the slower months ahead.
Manage Markdowns at the Store/Item Level
Not all stores or products will move at the same pace, so it’s essential to manage markdowns on a granular level. Each store has different inventory turnover rates, and customer demand may vary from one location to another. Tailoring markdown strategies to the specific needs of individual stores and products allows for greater flexibility and ensures you’re maximizing sell-through while minimizing excess stock.
Managing the Rest of the Assortment
While holiday-specific items will undoubtedly capture much of the attention from customers due to the increased volume and seasonal demand, it’s essential to remember that the rest of the customer’s basket—comprised of non-holiday items—plays a pivotal role in their overall shopping experience. Retailers often focus heavily on optimizing prices for holiday items, but maintaining a consistent and customer-friendly pricing strategy across the entire assortment is equally important. Neglecting non-holiday items can erode trust and diminish the effectiveness of the overall holiday pricing strategy. Customers shop holistically, and their perception of your brand is shaped by the totality of their shopping experience, not just individual product categories.
While holiday promotions may attract traffic, it’s the consistency and transparency of your broader pricing strategy that will strengthen trust and encourage repeat business. After all, the holiday season is not just about winning a single transaction—it’s about building relationships that extend well into the new year.
A few critical factors to consider for your non-holiday assortment:
The holiday season is a delicate time when customers are highly sensitive to pricing. Sudden, unexpected price hikes, especially on everyday, non-seasonal items, can quickly erode the trust you’ve worked hard to build. Customers may forgive small fluctuations, but if they perceive a retailer is taking advantage of holiday demand or inflationary pressures to unnecessarily raise prices, that goodwill can evaporate. By maintaining steady pricing, you reinforce the idea that your brand prioritizes fairness over opportunism, especially in a period marked by heightened scrutiny around pricing practices.
Evaluate Price Gaps Between Product Tiers
A key element of pricing strategy that retailers should focus on is maintaining appropriate price gaps between product tiers, such as private label and national brands. Ensuring that the price difference between these tiers remains clear and consistent helps reinforce a value proposition for both types of customers: those who seek premium national brands and those who are value-oriented and gravitate toward private label options. If the price gap becomes too narrow, customers may be confused about the differentiation between products, leading to dissatisfaction or lost sales.
Ensure Accurate Value Sizing
One of the most effective ways to gain customer trust is through clear, transparent pricing, particularly when it comes to value sizing. Misleading unit pricing, whether intentional or accidental, can quickly frustrate customers, making them feel that they are being deceived. Ensure that unit pricing is visible, logical, and consistent across all product categories, allowing customers to make informed choices without feeling overwhelmed or misled. By offering transparency in this area, you can foster a sense of fairness and accountability, further building your reputation as a customer-first retailer.
Maintain Price Links Across Your Assortments
Consistency in pricing across various categories and product lines is crucial to managing customer expectations. Pricing disparities between similar products or across different stores in your chain can create confusion and frustration, leading to negative perceptions of your brand. Customers expect a seamless shopping experience, and this includes consistency in pricing, no matter what they buy or where they buy it. Establishing and maintaining price links within your assortment will ensure that your broader pricing strategy remains aligned with customer expectations, reinforcing reliability.
Trust is Your Greatest Currency
In a retail environment where customers are constantly bombarded with news about inflation, price hikes, and economic instability, trust is your greatest asset. Negative perceptions surrounding pricing, whether it’s from the media or personal experiences, can make customers wary and hesitant. By committing to a stable, transparent, and fair pricing strategy—not just for holiday items but across the entire assortment—you can differentiate yourself in the market and foster long-term loyalty. Stability and consistency in your pricing model allow customers to feel confident that they’re getting good value every time they shop with you, regardless of external economic pressures.
It’s important to prioritize the customer relationship above all else, even if that means sacrificing some immediate short-term gains. Retailers who opt for quick wins through aggressive price changes may see a temporary boost in profits but risk damaging long-term customer loyalty. On the other hand, by focusing on providing a consistent and fair experience, you position your brand as a reliable choice, one that customers will return to not just during the holidays but throughout the entire year.
In a season where every retailer is vying for the same holiday dollar, your approach to pricing must stand out by emphasizing trust, loyalty, and customer satisfaction. Pricing transparency and fairness are key differentiators, especially in an environment where many retailers will be tempted to capitalize on increased demand by raising prices or reducing promotions. Instead, leading with trust and focusing on stability will allow you to rise above the noise and deliver a superior customer experience.
In Summary: Stability Wins
This holiday season, the winning strategy isn’t about pushing for the highest possible margins or taking advantage of seasonal demand spikes. It’s about the bigger picture—building lasting customer relationships that extend well beyond the holidays. By prioritizing consistency in your pricing, maintaining transparency across your assortment, and leading with trust, you’ll not only achieve success during the holiday period but also set the stage for long-term customer loyalty.
In short, stability wins. Prioritize the customer experience, remain consistent in your approach, and lead with trust. Doing so will ensure that your customers not only choose you during the holidays but continue to choose you long into the future.
As summer winds down, families across the US have been gearing up for the annual back-to-school shopping season. The back-to-school season has always been a significant event in the retail calendar, but its importance has grown in recent years. With inflation still impacting many households, parents and guardians are more discerning than ever about their purchases, seeking the best value for their money.
The National Retail Federation has forecasted that this season could see one of the highest levels of spending in recent years, reaching up to $86.6 billion. As shoppers eagerly stock up on back-to-school and back-to-college essentials, it’s crucial for retailers and brands to refine their pricing strategies in order to capture a larger share of the market.
To understand how retailers are responding to the back-to-school rush this season, our proprietary analysis delves into pricing trends, discount strategies, and brand visibility across major US retailers, including Amazon, Walmart, Kroger, and Target. By examining 1000 exactly matching products in popular back-to-school categories, our analysis provides valuable insights into the pricing strategies adopted by leading retailers and brands this year.
Price Changes: A Tale of Moderation
The most notable trend in our analysis is the much smaller annual price increases this year, in contrast to last year’s sharp price hikes. This shift is a reaction to growing consumer frustration about rising prices. After enduring persistent inflation and steep price growth, which peaked last year, consumers have become increasingly frustrated. As a result, retailers have had to scale back and implement more moderate price increases this year.
Kroger led the pack with the highest price increases, showing a 5.3% increase this year, which follows a staggering 19.9% rise last year. Walmart’s dramatic price increase of 14.9% is now followed by a muted 3.1% hike. Amazon and Target demonstrated a similar pattern of slowing price hikes, with increases of 2.3% and 2.7% respectively in the latest period. This trend indicates that retailers are still adjusting to increased costs but are also mindful of maintaining customer loyalty in a competitive market.
When examining specific product categories, we observe diverse pricing trends. Electronics and apparel saw the largest price increases between 2022 and 2023, likely due to supply chain disruptions and volatile demand. However, the pace of these increases slowed in 2024, indicating a gradual return to more stable market conditions. Notably, backpacks remain an outlier, with prices continuing to rise sharply by 22%.
Interestingly, some categories, such as office organization and planners, experienced a price decline in 2024. This could signal an oversupply or shifting consumer preferences, presenting potential opportunities for both retailers and shoppers.
Brand Visibility: The Search for Prominence
In the digital age, a brand’s visibility in online searches can significantly impact its success during the back-to-school season. Our analysis of the share of search across major retailers provides valuable insights into brand prominence and marketing effectiveness.
Sharpie and Crayola emerged as the strongest performers overall, with particularly high visibility on Target. This suggests strong consumer recognition and demand for these traditional school supply brands. BIC showed strength on Amazon and Target but lagged on Kroger, while Pilot maintained a more balanced presence across most retailers.
The variation in brand visibility across retailers also hints at potential partnerships or targeted marketing strategies. For instance, Sharpie’s notably high visibility on Target (5.16% share of search) could indicate a specific partnership.
Talk to us to get more insights on the most prominent brands broken down by specific product categories.
Navigating the 2024 Back-to-School Landscape
As we look ahead to the 2024 back-to-school shopping season, several key takeaways emerge for retailers and brands:
Price sensitivity remains high, but the rate of increase is moderating. Retailers should carefully balance the need to cover costs with maintaining competitive pricing.
Strategic discounting can be a powerful tool, especially for lesser-known brands looking to gain market share. However, established brands would need to rely more on quality, visibility, and brand loyalty.
Online visibility is crucial. Brands should invest in strong SEO and retail media strategies, tailored to different retail platforms.
Category-specific strategies are essential. What works for backpacks may not work for writing instruments, so a nuanced approach is key.
Retailers and brands should be prepared for potential shifts in consumer behavior, such as increased demand for value-priced items or changes in category preferences.
By staying attuned to these trends and remaining flexible in their strategies, businesses can position themselves for success in the competitive back-to-school retail landscape of 2024. As always, the key lies in understanding and responding to consumer needs while maintaining a keen eye on market dynamics.
Stay tuned to our blog to know more about how retailers can stay aware of changing pricing trends. Reach out to us today to learn more.
As a leader with over 20 years of experience leading pricing strategy at a major US grocery chain, I deeply understand the complexities pricing teams face when trying to derive, quantify, and execute corporate pricing initiatives.
Providing insights into the competitive marketplace in order to ensure the overall success of directed pricing strategies is more than simple reporting.
That’s what many teams get wrong.
Reporting is a post-mortem, which is a valuable exercise, but not one that will help you achieve your pricing goals all by itself. After all, your pricing goals can change due to a number of reasons: macroeconomic challenges, regional competition, corporate objectives, along with several other factors.
Pricing teams need a well-defined process to devise and implement their pricing strategies. This process needs to holistically examine your product base to provide robust price management. It also needs to be backed up by technology powered by the latest advancements because you can be sure your competition is already thinking that way.
Let’s break down an effective and modern price management process for retailers.
Data Collection
The first aspect of any effective price management framework for retailers is a clearly defined product data collection. You need to understand your collection in terms of who to collect pricing data from, what data to collect, where to collect it from, and how often.
The who: Consists of both primary competition and others you’d like to keep tabs on
The what: Can range from targeted single items like Key Value Items (KVIs) or total portfolio
Where: Can range from targeted locations within your market or the total competitive network
How often: To be able to support your price management process and for reporting purposes, determining a cadence is essential.
Data is power and the more data you can acquire, the more insights you’ll gain. Make sure that your collection data is well thought out ahead of time. Leaning on a price management framework built for retailers that can aggregate all your data into representative prices can help.
For example, if you have multiple competitive stores in a single market, flattening pricing data into a defined representative price will help speed up your analysis. Don’t get confined to a single store when a comprehensive assortment view across your target markets will provide a more accurate understanding.
Data Refinement
Competitive Matched Items
Next, you need to examine your competitive-matched items. These are the products that you want to be priced in direct response to your competitors’ pricing. The goal is to remain closely aligned with their prices so as not to lose market share while simultaneously achieving your corporate strategies.
Your price management system needs to help you manage your overlapping items. Trying to do so manually will be inefficient and is almost impossible to execute across 100% of your product catalog.
The mapping needs to go beyond exact UPC / PLU matches to encompass other match criteria. It needs to be able to incorporate any number of derivatives, including competitor-specific item codes like Amazon’s ASINs or Target’s DPCIs. This will help you overcome the challenge of mapping exact items to a competitor when the competitor’s site doesn’t showcase a UPC. It will also help you map your own private-label items to your competitor’s private-label counterparts.
A good price management framework will also help you match the same items but with dissimilar sizes (e.g., Cheerios 18 OZ vs. Cheerios 20 OZ), either by letting you match directly within acceptable tolerances or by enabling you to compare prices on a per-unit basis.
We need to leverage GenAI to help facilitate matches beyond UPC / PLU exact matches, such as Exact Item with no Competitor Code, Exact Item with Competitive Specific Codes, Similarity Matching on Private Label, Similarity Matching on Size all need to leverage it.
If you’re playing in a vertical that doesn’t always have a unifying code (restaurants, apparel, etc.) you’ll need to leverage the latest GenAI tools to map items together for price management. The variables are simply too numerous and complex to do manually.
Unmatched Items and Internal Portfolio
Not every product will be included in your competitive-matched items collection. Competitive matches in your internal portfolio offer a proxy for building clear and concise price management strategies that are in line with your corporate initiatives.
However, your unmatched items still need to be factored into your price strategy. If you only manage your competitively priced items, you won’t have a holistic viewpoint of your total product catalog and pricing. It’s critical to ensure that internal portfolio items are effectively mapped and grouped in order to extend overall price management.
Here are three things you need to consider when managing the pricing of your internal product portfolio. A smart price management framework is your best bet for achieving these results:
Value Size Groupings Value size groupings allow for the same branded items of different sizes to be priced accordingly to ensure price parity. You don’t want to sell a private label gallon of milk for $4.00 while the half gallon is at $1.75, for example. You need certain mechanisms in place to alert you when price parity is off. This is especially true when some of your items are competitively matched, and others are not.
Relationships between Brands Relationships between brands are also critical to ensure price parity. There should be well-defined relationships between like-sized products that are from different brands. This will ensure that your private label program is priced ‘at a value’ compared with their national branded counterparts. You need to maintain the balance between different private label tiers along with different national brand tiers.
Price Links Price Links are also critical to keeping up to date from a consumer perspective. Your customers expect that certain items should be priced together and will be put off if they are not. For example, if you sell an item in different sizes or flavors and scents, their prices should be logically linked.
For your internal portfolio, there may be items that don’t have a competitive match or simply don’t fall into one of your internal portfolio groupings. These are unique items to your banner and should be considered margin drivers for your brand.
Leveraging Data for Action
Now that you have a complete line of sight into both competitively matched items and internal mappings, you can move to fully leveraging your data. Figuring out how to utilize these competitive insights to understand where your price positioning is compared with your competition can be a challenge without a playbook. An effective price management framework will help guide you to the best insights and help you understand how it relates to your corporate strategy.
If you don’t have a well-defined corporate pricing strategy (competitive or margin) or you need to update it to be more modern, the data sets provided by a price management framework can help you ascertain where you are in your pricing journey. They can also help you identify options for where you want to go.
Here are some other ways a price management framework can help you improve your pricing strategy:
Utilize Competitive Data Get competitive insights, identify competitive price zones, and understand your competitors’ pricing philosophy. Figure out if they’re using strategies like:
High-Low
Everyday Low Price (EDLP)
Cost Plus
Unravel Competitor Strategy See if you can unlock what your competition has planned for pricing strategy and promotions. Try relating what you see in corporate filings and tie back to what you see in your competitive data sets.
Assortment Analysis Try looking at the data not only from a pricing perspective but also from a competitive assortment, promotion, and supply chain perspective.
Proactive Alerts Establish alerts for your internal portfolio to ensure that you don’t exceed your tolerance based on price moves.
Leveraging a Price Management Framework Designed for Retailers
A price management system designed specifically for you as a retailer is a game changer. An effective one can be configured specifically for the price owners, whether you have a dedicated team for this function or the price is owned by the category management team.
For category managers, standard reporting offers a clear view of pricing performance and trends. Beyond that, competitive intelligence becomes crucial—using data from various sources like collected pricing data, market filings, social media insights, etc. to provide the senior leadership team with a deeper understanding of competitor strategies and actions. This empowers informed decision-making at the highest levels.
With these price management insights, retailers can gain a holistic view of the competitive marketplace, uncover gaps and opportunities, and scale their business more effectively. As someone with experience on the retailer’s side of the market, I know first-hand how valuable these insights can be.
We’d love to talk with you if you’re interested in learning more about DataWeave’s AI-powered price intelligence solution for retailers. Click here to schedule an introductory conversation.
As the retail landscape continues to evolve, events like Amazon Prime Day have become more than just shopping extravaganzas—they’ve transformed into strategic battlegrounds where retailers assert their market positions and brand identities. Prime Day 2024 was no exception, serving as a crucial moment for retailers to showcase their pricing prowess, customer loyalty programs, and category expertise.
In an era where consumer expectations for deals are at an all-time high, the impact of Prime Day extends far beyond Amazon’s ecosystem. Retailers like Walmart, known for its “everyday low prices,” Target with its emphasis on style and value, and Best Buy, the electronics specialist, have all adapted their strategies to compete. These companies didn’t just react to Prime Day; they proactively launched their own pre-emptive sales events, with Target Circle Week, Walmart July Deals and more, effectively extending the shopping bonanza and challenging Amazon’s dominance.
For Prime Day, we analyzed over 47,000 SKUs across major retailers and product categories to publish insights on Amazon’s pricing strategies as well as the performance of leading consumer brands. Here, we go further to delve into the discounts offered (or not offered) by Amazon’s competitors during Prime Day. Our analysis reveals that some retailers chose to compete on price during the sale for certain categories, while others did not.
Below, we highlight our findings for each product category. The Absolute Discount is the total discount offered by each retailer during Prime Day compared to the MSRP. These are the discounts consumers are familiar with, displayed on retail websites prominently during sale events. The Additional Discount, on the other hand, is the reduction in price during Prime Day compared to the week prior to the sale, revealing the level of price markdowns by the retailer specific to a sale event.
Consumer Electronics
In the Consumer Electronics category, Best Buy stood out as a strong competitor, offering an Additional Discount of 5.9%—the highest among all competitors analyzed. This is unsurprising, as Best Buy is well-known for its focus on consumer electronics and is likely aiming to reinforce its reputation for offering attractive deals in order to maintain its strong consumer perception in the category.
Walmart was a close second with a 4.3% Additional Discount while Target reduced its prices by only 2% during the sale.
Apparel
In the Apparel category, Walmart’s Additional Discount was 3.1%, demonstrating its willingness to be priced competitively on a small portion of its assortment during the sale, without compromising much on margins.
Target, on the other hand, opted out of competing with Amazon on price during the sale, choosing instead to maintain its Absolute Discount level of around 11%.
Home & Furniture
The Home & Furniture category showcased diverse strategies from retailers. Specialty furniture retailers such as Overstock and Home Depot provided Additional Discounts of 3.9% and 2.5%, respectively, compared to Amazon’s 6.9%. This indicates a clear intent to maintain market share and remain top-of-mind for consumers despite Amazon’s competitive pricing.
Although Target didn’t significantly lower its prices during the sale, its Absolute Discount remains substantial at 18.9%. This suggests that Target’s markdowns were already steep before the event, which could explain the lack of further reductions during the sale.
Health & Beauty
The Health & Beauty category saw minimal participation from Amazon’s competitors, with the exception of Sephora, which reduced prices by 3.7% during Prime Day.
Ulta Beauty chose not to adjust its prices, likely reflecting its strategy to uphold a premium brand image. Walmart, on the other hand, offered a modest Additional Discount of 2% on select items. Given Walmart’s generally affordable product range, its total discount remained relatively low, around 3.5%.
In Conclusion
During Prime Day, Walmart was the only major retailer that made an effort to compete, albeit modestly. Target, on the other hand, largely chose not to offer any additional markdowns. However, several category-specific retailers, such as Best Buy in Consumer Electronics, Overstock and Home Depot in Furniture, and Sephora in Health & Beauty, aimed to retain market share by providing notable discounts.
What this means for consumers is that even on Amazon’s Prime Day, it’s not a bad idea to compshop to identify the best deal.
For retailers, the key takeaway is the importance of quickly analyzing competitor pricing and making agile, data-driven decisions to improve both revenues and margins. By utilizing advanced pricing intelligence solutions like DataWeave, retailers can optimize their discount strategies, better navigate pricing complexities, and drive revenue growth — all while staying prepared for major shopping events and beyond.
Our world is increasingly going online. We work online, socialize online, and shop online every day. As a consumer brand, you need to ensure complete awareness of your brand’s online presence across eCommerce platforms, search engines, and media.
Only by deeply understanding the customer journey can you ensure that your product is reaching your ideal customers and maximizing your brand’s market share. You need data to intrinsically understand your customer journey and make changes where you’re lacking.
As the old adage goes: ‘You can’t manage what you don’t measure.’
You need digital shelf metrics to measure and start benchmarking your buyer’s journey. To find several of these types of key performance indicators (KPIs), you need a digital shelf analytics solution. These platforms allow you to track various metrics along the path to purchase from the awareness stage to the post-purchase phase across the entire internet, helping to inform online and offline sales strategies.
Digital shelf analytics will help you gain insights into how your brand is doing versus the competition, which areas are lagging behind in historical performance, and what activities are driving sales. There are innumerable ways in which you can leverage these valuable insights. But how do you know which KPIs to start tracking with your digital shelf analytics solution?
Here, we’ve summarized the top metric types your peers report, track and base their decisions on.
With these KPIs in hand, consumer brands like yours can ensure that their products are consistently visible and appealing to their target audience across online marketplaces, ultimately enhancing conversion rates, market share, and profitability.
Read this guide to learn more about the top digital shelf metrics consumer brands are tracking and how to use them in your own strategy.
1. Share of Search
Share of Search (SoS) is a KPI in digital shelf analytics that measures how frequently a consumer brand’s products appear in search results on eCommerce platforms relative to the competition for specific keywords. A good digital shelf analytics solution will be able to show this metric across all the top marketplaces and retailers, such as Amazon and Walmart, but also more niche marketplaces for industry-specific selling.
This metric provides brands with a quantifiable way to measure how frequently their products are being “served up” to customers on online marketplaces. Essentially, it measures visibility and discoverability.
With Share of Search on DataWeave, you can slice and dice your data in innumerable ways. These are a few important views you can see:
Aggregated SoS
Organic and Sponsored SoS scores
SoS scores across brands, retailers, keywords, cities
Historical SoS score trends
Once you have benchmarked your SoS and category presence relative to your competition, you need to start interpreting the data. Here are some questions you can ask yourself to help interpret your findings:
Which of my key categories have the lowest SoS score?
Which products feature low on search results because they are out of stock?
Are my competitors’ products faring better due to sponsored searches?
Is my SoS low due to poor content quality?
With insights in hand, you will know which actions to take to drive the biggest impact. For example, you could increase sponsored search results or improve organic reach by optimizing product pages.
Understanding your SoS is essential to maximizing the awareness phase of your customer journey. It will help you improve your brand visibility and increase product conversions through better search and category presence.
2. Share of Media
Share of Media (SoM) is a KPI that is just as impactful, if not more so, than the SoS metric. However, only a limited number of brands track it or use it to drive strategic action. This makes it a perfect opportunity for brands looking to get an edge on the competition.
But what is SoM in digital shelf analytics? Essentially, it’s a way of measuring retail media advertising activities like brand-sponsored banners, listings, videos, ads, and promotions that sometimes blend into search results. The main types of retail media advertising exist in two categories: banner advertising and sponsored listings.
Banner advertising involves strategically placing designed banners within websites and search listings. These banners raise brand awareness and drive traffic to online storefronts.
Sponsored listings are paid placements within search results on search engines or eCommerce platforms. They are prioritized based on the total bid amount and the product’s relevance. These paid listings are marked with “sponsored” or “ad.”
These listings serve to enhance your brand’s overall visibility, help you gain more precise reach, increase conversions, and drive better brand awareness and recall with your customers.
These efforts aren’t free, however, so measuring their effectiveness is critical not only to gain all the listed benefits but to also not waste your valuable marketing budget. The SoM KPI can help a consumer brand answer questions like:
Where are the opportunities to increase paid ads?
Which categories could benefit from a promotional boost or a strategic and streamlined allocation of ad spend?
Which of my competitors have active banners and what is their share of media by keyword?
How has my ad spend trended historically in comparison to my competitor?
DataWeave’s digital shelf analytics (DSA) is among the first providers to offer Share of Media KPI tracking and analysis. This is because it requires advanced, multi-modal AI to gather, view, and aggregate listings that encompass text, images, and video. With Share of Media tracking facilitated by DataWeave, consumer brands can track and analyze the effectiveness of their own promotional investments as well as those of their competitors.
3. Content Quality
The content quality metric measures how well your product content adheres to the retailer’s specific guidelines, which are in place to steer traffic and sales on their sites.
With the help of a DSA platform’s AI and ML capabilities, you can measure different elements of your product detail pages (PDPs), such as titles, descriptions, images, videos, and even customer reviews. You need to know which elements are missing, where they are missing, and which ones are negatively affecting sales so you can take corrective action.
Did you know that the average cart abandonment rate is 69.99%? The quality of your content can significantly impact this number. Ensuring that your content is high-quality will help influence product discoverability, customer engagement, and conversion rates. It will also help position you ahead of the competition. If your content quality is poor, you may find yourself with lower search rankings, a higher return rate, and more abandoned carts.
Here are some questions you can answer with the help of the content quality digital shelf metric:
Is my product content at a retail site exactly what was syndicated?
Are there any retailer initiated changes to my product content?
Are my product content updates reflected on the retailer platforms?
How well does my product content comply with the retailer guidelines?
How do I optimize my product content for enhanced discoverability and conversion?
DataWeave’s content quality digital shelf analysis helps consumer brands ensure that product content on eCommerce platforms is high-quality and benchmark their product listings against the competition. It does this through a combination of AI-driven quality analysis and by presenting brands with actionable recommendations. These optimized suggestions are based on the top-performing products so you can focus your valuable time on the areas that will drive the biggest impact.
4. Pricing & Promotions
Your customers can easily shop around to find the best price for the product you’re selling. If your competitor is selling it cheaper, you’ll lose that sale.
That’s why it’s essential to understand the pricing and promotional landscape for each of your products and categories. This can be a challenge, especially if it’s a common product or comes in multiple pack sizes or variants.
It’s equally important to track pricing and promotions even at individual, physical stores. Doing so will allow you to remain competitive and responsive to local market dynamics by tailoring your pricing strategies based on regional competition. You don’t want your products to be overpriced (lost sales) or underpriced (lost profit) in specific markets.
Harmonizing insights when operating an omnichannel consumer brand is extremely difficult without the aid of a digital shelf analytics solution. Insights need to be aggregated between desktop sites, mobile sites, and mobile applications, as well as from physical storefronts.
Questions you can answer with the help of the pricing & promotions digital shelf metric include:
How do my product prices and promotions compare to my competitors?
How consistent is my product pricing across retail websites?
How does my product pricing vary across regions, ZIPs, and stores?
How do price changes influence my sales numbers?
Are there regional differences in pricing and promotion effectiveness?
DataWeave’s digital shelf analytics platform stands out with its sophisticated location-aware capabilities, which enable the aggregation and analysis of localized pricing and promotions. The platform defines locations based on a range of identifiers, such as latitudes and longitudes, regions, states, ZIP codes, or specific store numbers.
The platform can also extract promotional information, such as credit card-based or volume-based promotions. You can see variances across retailers, split by price groups, brands, and competitors. DataWeave specializes in enabling brands to conduct in-depth analyses across a wide array of attributes so you can answer just about any pricing or promotional question you have.
5. Availability
The availability KPI in digital shelf analytics measures the in-stock and availability rates for a brand’s products across eCommerce and physical locations. Similar to the pricing and promotions metric, it relies heavily on location awareness, down to individual stores. Measuring both online availability and offline in-stock rates will help you understand the big picture and take more informed replenishment action.
When you start leveraging the availability KPI with the help of digital shelf analytics, you can improve inventory management, boost product discoverability, increase the frequency with which your online product listings convert, and generally drive more sales. This KPI is essential for ensuring your customers can always find and buy the products they want.
With the availability KPI, you can start answering questions like:
What is my overall in-stock rate?
Which of my products frequently go out of stock?
How does product availability vary across different regions and stores?
What is the impact of availability on my conversion rates?
Are there any seasonal trends in product availability that I need to address?
How quickly are we resolving stockout issues across different locations?
What are my biggest opportunities to reduce stockouts?
DataWeave enables consumer brands to track their product availability metric through automated data collection from various eCommerce platforms in conjunction with physical in-stock rates. The platform provides granular, store-level insights so you can understand regional stock variations and optimize inventory distribution. By tracking historical availability data, you can identify seasonal patterns and predict future demand to pre-empt stockout issues. All of this can be configured with automatic notifications to alert you when there has been a stockout event or when a low stock threshold has been passed, facilitating timely replenishment.
6. Ratings & Reviews
The final KPI in our guide is the ratings & reviews digital shelf metric. Consumers rely heavily on genuine feedback from their peers and refer to star ratings, posted comments, and uploaded pictures to inform their buying decisions. This KPI analyzes the impact of customer feedback and reviews on your products’ performance across eCommerce platforms so you can measure overall brand perception and isolate areas of opportunity.
This metric does something other digital shelf metrics don’t; it can inform your product strategy. It can help you identify repeat complaints that your product team can address with the manufacturer or use for the design of future products.
Some questions you can answer with this powerful KPI include:
What is the overall customer sentiment towards my products based on ratings and reviews?
Which product features are frequently mentioned positively or negatively by customers?
How do my product ratings and reviews compare to those of my competitors?
Are there common issues or complaints that need to be addressed to improve customer satisfaction?
Which products have the highest and lowest ratings, and why?
With DataWeave’s digital ratings and reviews feature, you can keep a pulse on customer sentiment to take short-term action as well as decide long-term strategy. You can leverage reviews to influence product perception, refine products, and enhance overall customer satisfaction.
DataWeave’s Digital Shelf Metrics
Each one of these metrics is interconnected and collectively influences a brand’s success. For instance, improving content quality and earning higher ratings can significantly enhance your product’s visibility in search results, thereby boosting the Share of Search digital shelf metric. By focusing on a comprehensive approach that integrates these metrics, brands can ensure their products are consistently visible, competitively priced, well-reviewed, and readily available.
DataWeave gives consumer brands the means to execute a holistic digital shelf strategy. From a single portal, track and improve digital shelf metrics like Share of Search, Share of Media, Pricing and promotions, Availability, and Ratings and Reviews.
Our solutions help audit and optimize the most critical KPIs that drive sales and market share for brands so you can stay competitive in a dynamic digital landscape and foster long-term customer satisfaction.
As consumer goods brands increasingly turn to eCommerce marketplaces as a source of profitable growth, it becomes harder for teams to grapple with the complexity of revenue growth management.
This complexity emerges from multiple fonts: there are hundreds, and even thousands, of competitors to consider when formulating strategies for managing pricing, promotion, and assortment changes. The world is currently experiencing a period of unprecedented supply chain instability, shifting more consumers away from traditional retail and into eCommerce shopping. And finally, consumer buying patterns, preferences, and trends are constantly shifting.
Revenue growth management (RGM) and net revenue management (NRM) were once less complex processes; but that is no longer the case. Now, some 80% of consumer brand CEOs report that they “aren’t satisfied with their RGM results.”
Gathering data, analyzing it, and acting on it quickly stand out as major challenges that businesses must overcome to grow their market share, earn more profits, and capitalize on market shifts in real time. In this article, we’ll dive into RGM and NRM, the obstacles business teams face, and explore how using technology for digital shelf analytics can help bridge the gap.
What is Net Revenue Management (NRM) or Revenue Growth Management (RGM)?
Every consumer goods company aims to increase profits and grow market share. This requires a concerted effort in RGM and net revenue management (NRM) strategy. Whether a company has a specific team dedicated to this task or relies on the abilities of business analysts or merchandisers, this function is crucial.
It’s worth mentioning that though the terms NRM and RGM are often used interchangeably, there are subtle differences. While both net revenue management and revenue growth management focus on maximizing overall revenue for the brand, NRM typically has a narrower focus and is specific to optimizing profitability through product pricing, promotion, product mix, and cost management. RGM strategies are a bit broader and tend to look at the top line to grow market share and expand the customer base.
The Challenges Revenue Teams Face
Differentiating between ‘good growth’ and ‘bad growth’ is central to NRM and RGM. Net revenue management and revenue growth management teams need the data and tools in place to determine if growth in one area is coming at the expense of another so as not to cannibalize business. Tracking and analyzing extensive data to successfully take action on opportunities and determine whether strategies are working as intended consumes a tremendous amount of mental bandwidth. The fact that these decisions are incredibly time-sensitive only compounds the issue.
To cope, many teams in charge of NRM or RGM employ digital shelf analytics strategies to help speed up data aggregation and analysis to make sure they’re capitalizing on potential opportunities.
eCommerce has added a whole new layer of complexity to consumer goods sales. Instead of a few relatively stable prices at big-box stores, a single item for sale may experience high price volatility, with dozens of minute pricing changes occurring online each day. In some cases, consumers become blind to price volatility, letting brands increase prices, but consumer sentiment, the overall price elasticity of the product, and dozens of other factors go into determining the final price of an online product. Net revenue teams need to modernize and adapt to changing eCommerce environments to competitively price, promote, and grow their revenue.
Here are the top three challenges standing in the way of net revenue management and revenue growth management teams and solutions to address these issues.
Challenge 1: Incomplete or Inaccurate Data
Incomplete and inaccurate data are critical for Net Revenue Management and Revenue Growth Management teams to get under control when attempting to modernize in a digital-centric selling environment. As more competitors enter the market, many brands find it hard to make strategic decisions without the complete picture.
Data may be incomplete or inaccurate because a brand is analyzing only part of the market, such as Amazon or another enterprise-scale eCommerce marketplace. Additionally, they might not be analyzing all types of online media, such as branded ads, sponsored search listings, or sponsored category listings.
Most importantly, another pitfall is the lack of hyperlocal data. Generalized data across regions, states, ZIPs, and stores can skew the decision-making process and result in poor outcomes.
Overcoming Incomplete or Inaccurate Data
In order to get the full picture, consumer brands need to ensure they have a view of the entire competitive landscape across their channels. This includes gathering data down to the case pack, the unique product identifier, and the geography, including ZIP and store. They also need the respective MSRP by SKU, the unit normalized price, and the selling price at a specific moment in time. This is done by aggregating brick-and-mortar store information available online, such as when stores list curbside pickup SKUs and pricing online.
Individual teams cannot manually gather all this detailed data. The growth in eCommerce means there is simply too much data to find and aggregate. Instead, they can employ digital shelf technology to get more data from more sites. Teams can leverage AI to better match product listings, ads, and even visuals to avoid missing data on listings that lack common attributes, such as UPCs for normalization.
To add to this, advanced pricing intelligence systems can cache URLs to help teams audit and verify their data, avoiding delays and confusion when ad hoc requests arise.
Challenge 2: Difficulty in Making Sense of the Competitive Landscape
Once net revenue management and revenue growth management teams have gathered all of the available data, it’s time to make sense of it. This is a monumental challenge, and ends up being the stage where most NRM and RGM teams flounder. Disparate marketplaces include different product attributes and images. This makes it extremely complicated to sync competitors’ data to ready it for analysis, especially if this analysis is carried out manually in Excel. These are some of the attributes that teams need to harmonize in order to make sense of the competitive landscape:
Product identifiers (UPC, SKU, Internal Code)
Size, case, pack, volume, bundled offerings
Language
Currency
Stock Status (Whether the product is available or not)
Platform-specific attributes such as ‘Amazon’s Choice,’ ‘Best Seller,’ etc.
Teams also need to group and classify various categories of promotions. These can include sponsored listings, banner ads, coupons, bank offers, and others. Each of these categories needs to be tracked separately. This vast array of data points across hundreds of sites creates a big data problem for teams.
Making Sense of the Competitive Landscape
The best way to overcome this challenge is to task a digital shelf analytics system with gathering and harmonizing data automatically across the consumer goods competitive landscape. Competitive and market intelligence tools can help break down an overwhelming amount of data, matching similar products across competing brands and analyzing their various strengths and weaknesses. Once the technology matches complex product attributes and identifiers, it becomes easier for teams to gain insights and exploit findings. In a sense, the data needs to be cleaned before analysis can occur.
Technology can gather data in multiple ways, and the best systems employ several methods to get the best matches. Data consumption modes include API integrations, CSV and Excel file uploads, and proprietary scrapers that view websites independently of direct inputs. Having all the data in a single place helps net revenue management and revenue growth management teams gain indicative insights on product popularity, pricing, and sales, on their own and competitor products.
Challenge 3: Lack of Timely Visibility
The final challenge that many net revenue management and revenue growth management teams face is something of a ‘silent killer’ — timeliness. Even if they successfully gather data across the entire competitive landscape and harmonize that data into a format for easy analysis, a lack of timeliness can render even the best actions irrelevant.
Speed is of the utmost importance when there are market changes. If a product goes viral and competitors raise prices in response to increased demand, without timely visibility, the trend may be over before a consumer goods brand can successfully increase its prices for the duration of the trend. This can mean lost margins.
Another example is analyzing data and incorporating lagging promotional and sales data into analyses. This can skew pricing strategies because timely data is not accessible to inform decision-making. Many teams waste time firefighting due to a lack of timely pricing and promotional intelligence data.
Get Near Real-Time Insights for Faster Decision Making
Using technology that allows for net revenue management and revenue growth management teams at consumer goods brands to establish update frequencies can be a game changer. Teams can set update frequencies based on their need. They can set up the system to check a fast-moving product daily, while a slow-moving item might only need to be checked weekly, monthly, or even quarterly. This allows teams to focus on the highest-impact products first and address the largest exceptions before they lose out on an opportunity. Managing exceptions with a digital shelf analytics platform saves teams significant time instead of poring over low-impact changes in the data.
Digital Shelf Analytics for Net Revenue Management
Modernizing a consumer goods brand’s net revenue management or revenue growth management processes requires advanced digital shelf analytics. DataWeave provides consumer goods companies with the technology they need for quick and accurate pricing, promotional, and assortment intelligence. By tracking over 200 million products each day, users can be sure they get the widest and most timely view of the competitive landscape. DataWeave’s deep industry knowledge is baked into every aspect of its platform.
Picture this: You wake up one morning to discover that your top competitor reduced their prices overnight. And now your shopper traffic has tanked and your sales have taken a hit.
Unfortunately, this is a common scenario because your customers can compare prices online in seconds—and loyalty lies with the budget.
So, how can you protect your business? Price monitoring.
Price monitoring solutions can help you keep abreast of competitor price changes—which, of course, will help you improve your pricing strategies, retain your customers, and maximize your profits.
How? In this article, we’ll explore:
What is price monitoring
The key benefits of price monitoring for retailers and brands
What a capable price monitoring solution can do
What Is Price Monitoring?
Price monitoring is the process of tracking and analyzing your competitor’s prices across various online and offline platforms. By monitoring competitors’ prices, you can understand market price trends and adjust your prices strategically—which, in turn, helps you remain competitive, increase margins, and improve customer retention.
5 Benefits of Price Monitoring
Competitor price monitoring can help you:
Gain a competitive edge: Competitor price tracking allows you to adjust your prices to remain attractive to consumers.
Maximize revenue: With timely pricing data, you’re empowered to identify optimum price points that strike a delicate balance between maximizing revenue and maintaining customer loyalty.
Retain customers: Consumers are looking for the most value for their dollar, so maintaining consistently competitive pricing is crucial for retaining loyal customers.
Understand promotional effectiveness: Price monitoring helps businesses evaluate the effectiveness of their promotions and discounts. By comparing the impact of different pricing strategies, businesses can refine their promotional tactics to maximize sales and customer engagement.
Understand market movements: By analyzing historical pricing data, you’re better positioned to anticipate future pricing changes — and adjust your strategies accordingly.
4 Essential Capabilities of Price Monitoring Software
Here are four capabilities to look for when choosing a price monitoring system.
1. AI-Driven Product Matching
Product matching is the process of identifying identical or similar products across different platforms to ensure accurate price comparisons.
If your price monitoring solution can’t reliably match your products with competitors’ across various sales channels at scale, you’ll end up with poor data. Inaccurate data will then lead you to make misinformed pricing decisions.
Product matching needs to be accurate and comprehensive, covering a wide range of products and product variations—even for including private label products.
For example, AI-driven product matching can recognize a specific brand and model of sneakers across multiple online stores—even if product descriptions and images differ. Here’s how it works in a nutshell:
Sophisticated algorithms and deep learning architecture enable AI to identify and match products that aren’t identical but share key characteristics and features.
Using unified systems for text and image recognition, the AI matches similar SKUs across hundreds of eCommerce stores and millions of products. The AI zeroes in on critical product elements in images, like a t-shirt’s shape, sleeve length, and color.
The AI also extracts unique signatures from photos for rapid, efficient identification and grouping across billions of indexed items.
DataWeave’s AI algorithm can initially match products with 80–90% accuracy. Then, humans can bring contextual judgement and make nuanced decisions that the AI might miss to correct errors quickly and push for accuracy closer to 100%. By integrating AI automation with human validation, you can achieve accurate and reliable product-matching coverage at scale.
2. Accurate and Comprehensive Data Collection and Aggregation
The insights you derive are only as good as the data you collect. However, capturing comprehensive pricing data is tough when your competitors operate on multiple platforms.
For truly effective price monitoring insights, you need consistent, comprehensive, and highly accurate data. This means your chosen price monitoring system should:
Scrape data from various sources, such as desktop and mobile sites and mobile applications.
Pull data from various online platforms like aggregators, omnichannel retailers, delivery intermediaries, online marketplaces, and more.
Handle data from different regions and languages.
Collect data at regular intervals to ensure timeliness.
DataWeave’s online price monitoring software covers all of these bases and more with a fast, automated data source configuration system. It also allows you to painlessly add new data sources to scrape.
Instead of incomplete or inaccurate data, you’ll have comprehensive and up-to-date data, allowing you to respond quickly to market changes with confidence.
3. Seamless Normalization of Product Measurement Units
You can’t compare apples to oranges—or price-per-kilogram to price-per-pound.
For price monitoring to be accurate, there must be a way to normalize measurement units—so that we’re always comparing price-per-gram to price-per-gram. If we compare prices without taking into account measurement units, our data will be misleading at best.
Let’s take a closer look. Say that your top competitor sells 12oz cans of beans for $3, and you sell 15oz cans for $3.20. At first glance, your larger cans of beans will appear more expensive—but that’s not true. If we normalize the measurement unit—in this example, an oz—the larger can of beans offers more value to customers.
Unit of measure normalization facilitates sound price adjustments based on accurate and reliable data. For this reason, every business needs a price tracking tool that can guarantee accurate comparisons by normalizing unit measurements—including weight, volume, and quantity.
4. Actionable Data and an Intuitive User Experience
Knowledge is only powerful when applied—and price monitoring insights are only useful when they’re accessible and actionable.
For this reason, the best price monitoring software doesn’t just provide insights based on accurate and comprehensive data, but it also provides several ways to understand and deploy those insights.
Ideal price monitoring solutions provide customized pricing alerts, intuitive dashboards, detailed reports, and visuals that are easy to interpret—all tailored to each particular team or a team member’s needs. These features should make it easy for team members to compare prices against those of competitors in specific categories and product groupings.
Your price tracking tool should also permit flexible API integrations and offer straightforward data export options. This way, you can integrate competitive pricing data with your pricing software, Business Intelligence (BI) tools, or Enterprise Resource Planning (ERP) system.
4 Ways Retailers Can Leverage Price Monitoring
Retailers can use price monitoring tools to remain competitive without compromising profitability—here’s how:
1. Track Competitors’ Prices
Competitor price monitoring helps you avoid being undercut—and, as a result, maintain market share. By tracking competitor prices in real-time, you can adjust prices to remain competitive, especially in dynamic markets. Ideally, you should monitor both direct competitors selling the same products and indirect competitors selling similar or alternative products. This way, you’ll have a complete picture of market prices and can make more informed pricing adjustments.
2. Understand Historical and Seasonal Price Trends
As a retailer, you may want to analyze historical data to identify price patterns and predict future price movements—especially in relation to holidays and seasonal products. Knowing what’s coming, you’re better positioned to plan for pricing changes and promotional campaigns.
3. Implement Dynamic Pricing
Dynamic pricing is the process of adjusting prices based on real-time market conditions, product demand, and competitors’ prices—allowing you to respond faster to market changes to maintain optimized prices.
4. Optimize Promotional Strategies
Price monitoring tools can track retail promotions across numerous online and offline sales avenues, providing insight into the nature and timing of competitors’ promotions. This data can help you determine which promotions are most effective—and which aren’t—allowing you to improve your own promotions and discounts, and allocate marketing resources where it matters most. This is especially beneficial during peak sales periods.
3 Ways Brands Can Employ Price Monitoring
Here are three ways brands can use price monitoring to remain profitable, protect brand equity, and gain a competitive edge.
1. Maintain Consistent Retail Prices
Minimum advertised price (MAP) policies are designed to prevent retailers from devaluing a brand while ensuring fair competition among retailers. Price monitoring applications allow your brand to track retailers’ prices to detect MAP policy violations. Data in hand, you can maintain consistent pricing across online sales channels, physical stores, and retail stores’ digital shelves — and, critically, protect your brand equity.
2. Improve Product and Brand Positioning
When you understand how your products’ prices compare to those of competitors, you can set prices to improve brand positioning. For example, if you want to position your brand as luxurious and high-quality, you need to set higher product prices than budget-friendly alternative products.
3. Ensure Product Availability
You can use a price monitoring solution to track product availability to ensure products are always in stock, even across different physical stores and online marketplaces. If a product is frequently sold out, you can adjust production levels or help retailers to improve their inventory management.
Key Takeaways: E-commerce Price Monitoring
Price monitoring software allows you to compare your products’ prices with competitors. This valuable data can help you:
Optimize revenue through timely price changes and dynamic pricing Avoid being undercut by competitors
Improve pricing strategies and promotions to increase sales and retain customers
Amazon Prime Day 2024 saw U.S. shoppers spending a staggering $14.2 billion online during the two-day event—an 11% increase from last year. This surge in spending reflects a significant shift in consumer behavior and presents a wealth of insights for brands and retailers alike.
Unlike last year’s focus on essentials, Prime Day 2024 saw Americans enthusiastically embracing both necessities and discretionary purchases. The Consumer Electronics and Health & Beauty categories, for example, experienced a notable uptick in interest, driven by major retailers slashing prices across CPG and Grocery segments, amid other reasons. Check out our first article in the Prime Day series 2024, analyzing retail insights across categories during the event.
This year, small businesses gained unprecedented visibility on Amazon, pushing relatively new brands into visibility.
At DataWeave, we recognize the critical importance of understanding these market dynamics for brands navigating the competitive eCommerce landscape. To provide actionable insights, we conducted an extensive analysis of over 47,000 SKUs across key categories before and during Amazon during Prime Day 2024. Our study delves into:
Pricing strategies: How did brands adjust their discounts to capitalize on the Prime Day frenzy?
Share of Search: Which brands achieved the highest visibility for major search keywords?
Dive into these insights below to uncover how brands performed during Amazon Prime Day 2024, and learn how you can leverage these findings to enhance your brand’s digital shelf performance.
Our Findings
Most brands offered substantial discounts before Prime Day, then added smaller discounts during the event. This strategy creates a perception of value while still allowing room for Prime Day-specific deals. To understand the real value offered by brands, we conducted an extensive analysis of brand performance, examining both pricing strategies and visibility on the platform. Our approach focuses on two key metrics:
Discounts: We analyzed both the Absolute Discount (total markdown relative to MSRP a week before Prime Day) and the Additional Discount (the price reduction during Prime Day compared to the week before).
Share of Search (SoS): We examined the visibility of brands in the top 20 search results. We also separately tracked this metric for organic and sponsored search results.
Let’s dive into the category and brand specific insights:
Consumer Electronics
Once again, in 2024, the Consumer Electronics category dominated discounts. Amazon’s own brands lead with the highest average Absolute Discount (44.2%) and a significant Additional Discount (12.5%), showcasing its aggressive push for Prime Day.
In a surprising twist, Amazon’s homepage wasn’t dominated by its own brands. Instead, tech giants like Apple and Samsung took centre stage. Despite this, Amazon’s own brands offered significant discounts across electronics products, including Amazon Kindle, Fire TVs, Fire TV Sticks, Echo Dot, and more, aiming to capture market share via markdowns.
Soundcore (earphone audio products brand) offered the highest discount during Prime Day, at 30.10%. Other headphone, earbuds, and wireless headphone brands including Sony, Beats, JBL, and more also offered significant discounts.
Premium brands like Apple (17.90% Absolute, 9.00% Additional) and Bose (23.10% Absolute, 16.00% Additional) offered relatively modest discounts, aligning with their brand positioning, but also taking advantage of the Prime Day frenzy.
Share of Search Insights in Consumer Electronics
JBL emerged as the standout performer, with the most significant increase in SoS, jumping from 14.3% pre-event to 25.8% during Prime Day, driven entirely by organic growth. Beats also saw a remarkable rise, increasing from 2.8% to 12.8%, again through organic listings only. Samsung maintained its strong presence, growing from 18.6% to 26.8%, with most of its growth influenced by increased ad spend.
Apple, despite already having a high pre-event SoS, managed to increase its share further from 23.0% to 31.0%, with some contribution via sponsored ads. LG saw a substantial increase from 1.3% to 6.9%, primarily through sponsored listings, opting for an inorganic approach to drive visibility during the sale.
Amazon and its AmazonBasics brand both saw notable increases in SoS, relying solely on organic growth. This is, of course, not surprising since Amazon controls its organic ranking algorithm.
Interestingly, some brands experienced decreases in SoS. Sony, Motorola, and Hisense all saw reductions in their share, with Hisense’s decline coming entirely from a reduction in sponsored listings.
Key Takeaway: Prime Day 2024 saw a significant reshuffling of brand visibility in the Consumer Electronics category. While some established brands like JBL, Beats, Samsung, and Apple strengthened their positions through a mix of organic and sponsored growth, others faced increased competition for consumer attention. The event highlighted the importance of a balanced approach to visibility, with successful brands leveraging both organic search optimization and strategic use of sponsored listings to maximize their presence during this high-traffic period.
Apparel
In the Apparel category, Adidas led with the highest Absolute Discount (27.2%) and a significant Additional Discount (9.8%). Value brands like Hanes (innerwear brand) and Anrabess offered substantial discounts, while Amazon Essentials maintained high discounts across the board (16.5% Absolute, 15.3% Additional).
Some brands like Cupshe (swimwear and vacation apparel brand) offered relatively lower additional markdowns. Meanwhile CRZ Yoga (athleisure brand) did not offer additional markdowns on Prime Day.
Share of Search Insights in Apparel
Gildan (activewear brand) emerged as the top performer in terms of SoS growth, increasing from 8.1% pre-event to 12.1% during Prime Day, driven entirely by organic growth. CRZ Yoga (an athleisure apparel brand) and Dokotoo (women’s casualwear brand) also saw significant increases in their SoS, rising by 2.8 and 2.3 percentage points respectively, again through organic listings only.
Amazon Essentials continued to perform well, increasing its visibility from 7.0% to 9.1%, aligning with its competitive pricing strategy. Coofandy also saw a notable increase, growing from 7.8% to 9.9%.
Interestingly, some brands that were previously highlighted for growth actually experienced decreases in SoS. Automet (clothing & accessories brand) saw a slight decline from 12.5% to 12.1%, while Anrabess (women’s fashion brand) dropped from 15.8% to 14.5%. Cupshe (swimwear brand) experienced the most significant decrease, falling from 10.6% to 5.5%.
Adidas, despite leading in discounts, saw only a modest increase in SoS from 7.0% to 8.0%. Notably, none of the brands visible in the top search results utilized sponsored listings, with all changes in SoS coming from organic growth or decline. This indicates a lack of maturity in this category in leveraging retail media.
Key Takeaway: Prime Day 2024 in the apparel category showcased the importance of organic search optimization. While some brands like Gildan and CRZ Yoga significantly improved their visibility, others faced challenges in maintaining their pre-event positions. The absence of sponsored listings across all brands highlights a unique dynamic in the apparel category, where organic search performance appears to be the primary driver of visibility during high-traffic events like Prime Day.
This suggests that Apparel brands may need to focus more on SEO strategies and organic content optimization to maximize their presence during major shopping events, rather than relying on paid promotions. On the other hand, smartly leveraging retail media to boost visibility can give apparel brands a competitive edge.
Health & Beauty
The Health & Beauty category this year got a push thanks to Amazon’s subscription offering. Prime members who subscribed for regular usage products like toothpaste and health aids or medicines availed higher discounts.
Amid Health & Beauty brands, Neutrogena led with the highest Absolute Discount (32.7%) and a significant Additional Discount (11.7%). Sun Bum moisturizers & sunscreen (23.3%) and Viking Revolution (23.1%) offered the highest Additional Discounts, indicating a strong Prime Day focus.
Premium brands like L’Oreal Paris and Philips Sonicare offered moderate discounts, balancing promotions with their intended brand image.
Share of Search Insights in Health & Beauty
Banana Boat (sunscreen brand) emerged as the standout performer, seeing the largest increase in SoS from 6.5% to 13.4%, achieved entirely through organic growth. Nyx Professional Makeup also saw a significant jump, rising from 3.9% to 8.9%, again solely through organic listings.
Contrary to previous analysis, e.l.f. actually experienced substantial growth, increasing from 9.0% to 13.1% SoS, with a strong focus on organic growth (4.4%) slightly offset by a minor decrease in sponsored listings (-0.2%).
Neutrogena maintained its strong performance, aligning with its aggressive discounting strategy, as its SoS increased from 14.6% to 18.5% through organic growth. Colgate also saw a notable increase from 11.0% to 13.7% SoS.
Interestingly, some brands employed a mixed strategy. Dove and Garnier saw overall increases in SoS, but achieved this through different means. Dove relied heavily on sponsored growth, while Garnier offset a decrease in organic listings with strong sponsored content growth.
Contrary to previous observations, Oral-B experienced a decrease in SoS from 18.5% to 15.3%, entirely in organic listings. Without any additional spend on sponsored listings to compensate, it lost significant ground in its visibility. Other brands facing significant declines include Tresemme, OGX, Philips Sonicare, and most notably, Viking Revolution, which dropped from 17.2% to 10.7% in its SoS.
Key Takeaway: The Health & Beauty category during Prime Day 2024 showcased a diverse range of strategies and outcomes. While some brands like Banana Boat and Nyx Professional Makeup achieved significant visibility gains through organic growth, others like Dove and Garnier relied more on sponsored content.
The success of e.l.f. and Neutrogena in aligning discounting strategies with increased visibility stands in contrast to the challenges faced by previously strong performers like Oral-B and Viking Revolution. This varied landscape shows the fierce competition in the category and the need for brands to employ multi-faceted strategies that balance organic optimization, sponsored content, and competitive pricing to succeed in high-stakes events like Prime Day.
Brand Strategies and Future Implications
Our analysis reveals several key trends:
Brand Positioning Matters: Premium brands like Apple and Bose maintained their positioning with modest discounts, while value-oriented brands like Soundcore and Hanes offered deeper cuts to attract price-sensitive shoppers.
Visibility vs. Discounting: Some brands, particularly in the Consumer Electronics category, prioritized increasing their visibility (Share of Search) over offering steep discounts. This strategy suggests a focus on long-term visibility and brand perception rather than short-term sales boosts.
Category-Specific Approaches: Apparel brands uniquely relied on organic search visibility, eschewing sponsored listings entirely. In contrast, several Health & Beauty brands leveraged sponsored content significantly to boost their presence.
Emerging Brand Opportunities: Lesser-known brands, especially in the Apparel and Health & Beauty categories, used Prime Day as a launchpad to increase their visibility, often outpacing established names in Share of Search growth.
Amazon’s Dual Strategy: As both a platform and a brand, Amazon showcased its ability to offer deep discounts on its own products while also providing a stage for other brands to shine.
Stay tuned to our blog for more in-depth analyses of brand and retailer performance and strategies across various retail events. Reach out to us today to learn how you can leverage data-driven insights to optimize your brand’s eCommerce strategy and performance.
Amazon Prime Day 2024 has once again shattered records, with more items sold during the two-day event than any previous Prime Day. Prime members worldwide saved billions across all categories, while independent sellers moved an impressive 200 million items.
At DataWeave, we conducted an extensive analysis of the discounts offered by Amazon across major categories. By examining over 47,000 SKUs, we’ve uncovered compelling insights into pricing strategies, competitive positioning, and emerging trends in the eCommerce space.
Since products on Amazon and other eCommerce websites are often sold at discounts even on normal days not linked to a sale event, we delved into the real value that Prime Day offers to shoppers by focusing on price reductions or the Additional Discount during the sale compared to the week before. As a result, our approach highlights the genuine benefits of the event for shoppers who count on lower prices during the sale. At the same time, our report also includes the Absolute Discounts offered during Prime Day, which represents the total markdown relative to the MSRP.
Amazon’s Cross-Category Discount Strategy
Our analysis reveals that the Electronics category saw the highest discounts with an average absolute discount of 20.4% and additional discounts on Prime Day amounting to 10.4%. Meanwhile the Home & Furniture had the lowest discount at 13.1%.
The Health & Beauty category saw significant additional discounts during Prime Day, at 9.26%. The Apparel category offered attractive absolute (16.10%) and additional (8.90%) discounts.
Category Deep Dive
Consumer Electronics
Still the star of the show, the electronics category saw the highest markdowns this Prime Day with absolute discounts at 20.40% and across 14.61% of their inventory.
Across Electronics subcategories, Earbuds had the highest markdowns at 34.80%, followed closely by Wireless Headphones at 30.60% and Headphones at 29.00%, with steep additional discounts during Prime Day as well. Apple AirPods Pro, for example, retailed at $168 (down from $249) at a 32% discount.
Meanwhile, smartphones had the lowest markdowns at 9.30%, followed by Laptops at 10.50%. Laptops also had the lowest additional discount during Prime Day at just 1.28%, significantly lower than other subcategories. Speakers (20.80%), Drones (19.10%), and Smartwatches (25.00%) offered moderate to high markdowns.
Notably, all Amazon products including Kindle, Echo, Echo Earbuds, Alexa, Fire TV, Fire TV Stick, and Fire Tablets, were aggressively discounted upwards of 30% this Prime Day. These products also came with the label “Climate Pledge Friendly.”
These aspects indicate Amazon’s push to promote its own ecosystem of products to the top, as well as cater to changing consumer preferences.
Apparel
Discounts offered this Prime Day increased from 13.2% in 2023 to 16.1% in 2024.
Amid apparel subcategories, Amazon appears to be pushing Women’s apparel categories more aggressively, particularly in Tops, Shoes, and Athleisure.
Women’s Shoes lead with the highest discounts at 26.50%, followed by Women’s Tops at 22.50% and Men’s Shoes at 22.80%. Women’s Tops also maintained the highest additional discount at 15.27%, followed by Women’s Athleisure at 13.03% and Men’s Swimwear at 12.44%.
Similar to 2023, Men’s Innerwear offered significantly lower discounts, with only 1% absolute discount and 0.72% additional discount. Women’s Innerwear also shows low discounts at 3.20% absolute and 2.23% additional.
Health & Beauty
Amid health & beauty subcategories, Moisturizes witnessed the highest markdowns at 20.10%, followed by Make Up at 18.90%. The Moisturizer subcategory also offers highest additional discounts at 12.20%, followed closely by Sunscreen at 10.25% and Beard Care at 10.22%.
The Toothpaste subcategory has the lowest discounts, at 10.90%. The lower discounts on everyday essentials like this might indicate a steady demand or an attempt to maintain margins on frequently purchased items.
Most Health & Beauty subcategories fall in the 15-18% range for actual discounts and 8-10% range for additional discounts. Electric Toothbrush (16.90% actual, 9.91% additional) and Shampoo (16.50% actual, 8.78% additional) represent the middle of the pack. There were a few highly attractive deals though, such as the Philips Sonicare toothbrush retailing at $122.96 (down from $199.99), with a 39% discount.
Amazon also offered significant discounts on Open Box products (products that are returned, but unused, out of mint condition boxes) to Prime members.
Home & Furniture
This category saw the lowest discounts for this Prime Day event at 13.1%. Across subcategories, Rugs lead with the highest average discount at 21.50%, closely followed by Luggage at 20.90%. Amazon seems to be pushing decorative and organizational items (Rugs, Bookcases) more aggressively, possibly due to higher margins. Rugs also stood out as the subcategory with the highest additional discount of 11.54%.
Sofas have the lowest additional discount at 2.76%, followed by Dining Tables at 3.21%. Items like Cabinets (15.80% absolute, 6.66% additional) and Coffee Tables (14.40% absolute, 6.25% additional) represent the middle range of discounts.
Watch Out For More
As the holiday season approaches, it’s clear that the retail landscape continues to evolve. While Amazon remains a formidable force, there are opportunities for savvy competitors to carve out their niches and attract deal-hungry shoppers. By analyzing these trends and adjusting strategies accordingly, retailers can position themselves for success in the high-stakes world of summer sales events.
Stay tuned to our blog for more insights on how Amazon’s competitors reacted to Prime Day, and how leading brands across categories fared in terms of their pricing and their visibility during the sale event. Reach out to us today to learn more.
Virtually every cuisine in the world uses eggs. They’re in your breakfast, lunch, dinner, and dessert — which is perhaps why the global egg market is expected to generate $130.70 billion in revenue in 2024 and is projected to grow to approximately $193.56 billion by 2029.
More specifically, the United States is the fourth-largest egg producer worldwide. The country’s egg market is projected to generate $15.75 billion in 2024 and increase to $22.51 billion by 2029.
Health-consciousness among consumers: Consumers value eggs for their essential nutrients and rich protein content.
Demand for convenience foods: Consumers’ preferences are shifting toward quick and easy foods, which drives demand for shell eggs and pre-packaged boiled or scrambled eggs.
Population Growth: A growing worldwide population increases the demand for eggs.
Affordability and accessibility: Eggs are an affordable and accessible nutrient-dense food source for many.
Despite these factors contributing to the U.S. egg market’s growth, recent times have seen egg prices fall dramatically.
Based on a sample of 450 SKUs, DataWeave discovered that egg prices in the U.S. fell by 6.7% between April 2023 and April 2024, dipping to its lowest (-12.6%) in December 2023.
So, what’s causing the decrease in egg prices?
The Rise and Fall of Egg Prices: A Recent History
In 2022, avian influenza severely impacted the United States. The disease affected wild birds in nearly every state and devastated commercial flocks in approximately half of the country.
The 2022 incident was the first major outbreak since 2015 and led to the culling of more than 52.6 million birds, mainly poultry, to prevent the disease from spreading uncontrollably.
With almost 12 million fewer egg-laying hens, the United States produced around 109.5 billion eggs in 2022 — a drop of nearly two billion from the previous year.
Consequently, the cost of eggs soared, peaking at $4.82 a dozen — more than double the price of eggs in the previous year.
The avian flu continues to affect egg-laying hens and other poultry birds across the United States. As of April 2024, farms have killed a total of 85 million poultry birds in an attempt to contain the disease.
Despite the disease’s effects, production facilities have made significant efforts to repopulate flocks, leading to a steady increase in supply – and a much anticipated decrease in egg prices.
According to the U.S. Bureau of Labor Statistics, there was an increase in producer egg prices in 2022, reaching a peak in November 2022, at which point they began to fall.
Retailer’s egg prices followed suit. The egg price chart below depicts retailers’ declining egg prices over one year, from April 2023 to April 2024, with Giant Eagle showing the most significant price reductions and Walmart the least.
What Does the Future Hold for Egg Prices?
The USDA reported recent severe avian flu outbreaks in June 2024. These outbreaks are estimated to have affected 6.23 million birds.
With a reduction in egg-laying hens, egg prices are likely to increase — time will tell.
Nonetheless, the annual per capita consumption of eggs in the U.S. is projected to reach 284.4 per person in 2024 from 281.3 per person in 2023. So for now, producers and retailers can rest assured of the growing demand for eggs.
How Can Retailers Adapt to the Unpredictability of Egg Prices?
Egg prices were down to $2.69 for a dozen in May 2024. However, they are still significantly higher than consumers were used to just a few years ago—eggs were, on average, $1.46 a dozen in early 2020.
Additionally, while the avian flu puts pressure on producers, inflation and supply chain disruptions exert pressure on retailers.
With such challenging egg market conditions, what can retailers do to maintain customer loyalty amid reduced consumer spending while maintaining profitability?
1. Give the Customer What They Want: Increase Offerings of Organic, Cage-Free, and Free-Range Eggs
As mentioned, Data Bridge Market Research’s trends and forecast report highlighted a significant increase in consumer health consciousness. Additionally, animal welfare increasingly influences consumers’ purchasing decisions when buying meat and dairy products.
DataWeave data shows that the prices of organic, cage-free, and free-range eggs—such as those by brands like Happy Eggs and Marketside—have fallen less than those of non-organic, caged egg brands.
2. Increase Private-Label Offerings
Private labels typically offer retailers higher margins than national brands. These margins can shield consumers from sudden wholesale egg price swings, helping to preserve brand trust and consumer loyalty without sacrificing profitability.
Moreover, eggs are particularly suited to private labeling, given their uniform appearance and taste and the lack of product innovation opportunities.
Undoubtedly, this is why sales of private-label eggs dwarf sales of national egg brands in the United States. Statista reports that across three months in 2024, private label egg sales amounted to $1.55 billion U.S. dollars, while the combined sales of the top nine national egg brands totaled just $617.88 million U.S. dollars.
3. Price Intelligently
With the current and predicted fluctuations in egg prices over the foreseeable future, price competitiveness is paramount to margin management and customer loyalty.
This is especially true when lower prices are the primary factor influencing the average consumer’s choice of supermarket for daily essentials purchases.
AI-driven pricing intelligence tools like DataWeave give retailers valuable highly granular and reliable insights on competitor pricing and market dynamics. In today’s data-motivated environment, these insights are necessary for competitiveness and profitability.
Final Thoughts
Egg prices have fluctuated significantly due to the impact of avian flu. Despite recent price drops, future egg price increases are possible due to ongoing outbreaks. Retailers should adapt to unstable egg prices by increasing organic, free-range, cage-free, and private-label egg offerings while leveraging AI-driven pricing tools to maintain margins and customer loyalty.
In 2025, both consumers and retailers continue to prioritize better health – albeit with evolving definitions and expectations.
The pandemic fundamentally transformed how consumers approach wellness, with this shift becoming entrenched in shopping behaviors years later. As shopping habits have permanently altered, retailers now face increased pressure to rapidly adapt their assortments with in-demand health and wellness products that enhance customer experience across various channels – online and offline.
Let’s explore how leading retailers are keeping consumers – and their own bottom lines – healthy by responding effectively to market trends to drive online sales and market share.
Health & Wellness Influence The Product Mix Across Categories
Consumption habits have changed dramatically since the onset of the pandemic. A McKinsey study shows that 82% and 73% of US, and UK consumers respectively now consider health & wellness a top priority. Typically shoppers adjust grocery shopping and meal planning at the start of the year, with many focusing on fresh, organic, and nutrient-rich foods.
The influential health and wellness mega-trend spans diverse retail channels, including grocery, pharmacy and mass. It extends across numerous categories like:
Food and beverage (natural, organic, vegan, plant-based food)
Health and personal care
Beauty
Cleaning products
Fitness equipment
Athleisure (apparel)
Consumer electronics like health wearables.
Today’s health movement is so powerful and compelling that retailers have revised their business strategies to better serve health-conscious consumers. For instance, drugstores are reinventing themselves as healthcare destinations, with CVS and Kroger expanding into personalized care delivery and value-based clinics to enhance their health offerings.
Major retailers like Amazon, Walmart, and Target report robust sales in health and wellness categories. For example, Walmart saw a 4.6% increase in comparable sales in early 2024, driven significantly by grocery, consumables, and health-related products.
New product categories are gaining traction:
Functional foods and beverages are seeing unprecedented growth, with Target launching over 2,000 wellness items in the category, including exclusive products priced under $10.
Personalized nutrition and mental health products are surging, including tailored dietary solutions and stress-reducing items.
Health wearables and wellness tech continue to rise in popularity, with over 150 new wellness tech items launched at Target this year, including innovative red-light therapy devices.
Transparency and sustainability certifications like organic, non-GMO, and vegan labels are increasingly driving purchasing decisions.
Clinically proven benefits offered by health & wellness products are gaining traction among Gen Z.
Retail’s Survival Of The Fittest Moves Online
As the omnichannel retail sector continues to grow, more shoppers now make purchase decisions within minutes using just a few clicks rather than physically visiting brick-and-mortar stores. In some cases, AI agents like Operator from Chat-GPT or Gemini (Google’s Chatbot) even make personalized, curated lists and reduce the time taken to make purchase decisions. Traditional retail paradigms are rapidly becoming obsolete as consumers grow savvier, more empowered, and better informed than ever before.
To stay competitive, more retailers are embracing AI-driven data insights to adjust their assortments to reflect consumer demand for health and wellness products.
According to industry experts, data insights have emerged as a critical retail strategy that continues to gain momentum. This is because retailers can no longer afford to guess how to approach their omnichannel strategy. They need the accuracy, clarity, and efficiency of data insights to guide their assortment and pricing decisions to outmaneuver competitors, maximize sales, and win market share as shopping evolves online.
Among its retail best practices, Bain & Company recommends retailers “lead with superior assortments that use a customer-centric lens to reduce complexity and increase space for the products customers love.” Insights can help retailers discover the optimal mix of national brands, private labels, limited-time offers, and value-added bundles.
“Lead with superior assortments … increase space for the products consumers love“ ~ Bain & Company
Determining the optimal mix of products also includes bestsellers and unique items that help retailers distinguish their offerings. Assortment insights help retail executives track competitors’ assortment changes and spot gaps in their own product assortment to adapt to emerging consumer trends and in-demand products.
Why Effective Assortment Planning Matters
Assortment planning sits at the heart of retail success, directly influencing profitability, customer satisfaction, and competitive differentiation. In today’s health-conscious market, getting your assortment right means:
Meeting Customer Expectations: Today’s health-conscious consumers expect relevant, high-quality products that match their wellness goals. A well-planned assortment signals that a retailer understands its customers’ evolving needs.
Optimizing Inventory Investment: Strategic assortment planning ensures capital is allocated to products with the highest return potential while minimizing investments in slow-moving items.
Creating Competitive Advantage: A distinctive assortment that includes popular health and wellness products alongside unique offerings helps retailers stand out in a crowded marketplace.
Reducing Lost Sales: Effective assortment planning minimizes the risk of stockouts on high-demand health and wellness items, preventing customers from shopping elsewhere.
Supporting Omnichannel Strategies: Well-executed assortment planning ensures consistency across physical and digital touchpoints, creating a seamless customer experience.
Improving Operational Efficiency: A thoughtfully curated assortment reduces complexity throughout the supply chain, from procurement to warehouse management to in-store operations.
As health and wellness continues to drive consumer spending, retailers who excel at assortment planning can capitalize on these trends more effectively than their competitors, turning market insights into tangible business results.
The synergy of AI and data analytics into retail assortment planning is changing how businesses approach inventory management. Retailers using AI-driven predictive analytics have achieved a 36% SKU reduction while increasing sales by 1-2%, showcasing the efficiency of data-driven approaches according to a McKinsey report.
Retailers face several challenges that can hinder strategic assortment planning:
Limited Understanding of Competition: Retailers struggle to gain comprehensive insights into their product assortments relative to competitors, often lacking visibility into their strengths and weaknesses across categories.
Data Overload: Assortment planning involves handling vast amounts of data, making it challenging for category managers to extract actionable insights without user-friendly tools and visualization.
Cross-Channel Consistency: With omnichannel retailing, ensuring consistency across physical stores, e-commerce, and other channels is complex. Misalignment can lead to customer dissatisfaction and loss of loyalty.
Adapting to Changing Market Trends: Identifying top-selling products and tracking consumer preferences is challenging. Balancing the right mix of products is crucial; without analytics, retailers risk lost sales or excess slow-moving inventory.
Scalability and Efficiency: As retailers expand into new markets or categories, scaling their assortment planning processes efficiently becomes a challenge. Legacy systems and manual methods often fail to support the agility needed for quick decision-making at scale.
DataWeave’s Assortment Analytics helps retailers address these challenges by providing a robust, easy-to-use platform that delivers actionable insights into product assortments and competitive positioning. With AI-driven, contextual insights and alerts, retailers can effortlessly identify high-demand, unique products, capitalize on catalog strengths, optimize pricing and promotions, improve stock availability, and refine assortments to maintain a competitive edge.
Beyond Data: Actionable Insights That Drive Results
DataWeave’s platform provides a comprehensive, insight-led view into assortments through several key dimensions:
Stock Insights: Monitor stock changes across retailers to stay updated on availability.
Category and Sub-Category Insights: Analyze assortment changes, identify newly introduced or discontinued categories, and track leading retailers in specific segments.
Brand Insights: Identify newly introduced, missing, or discontinued brands, as well as leading brands within chosen categories.
Product Insights: Identify bestsellers and evaluate their impact on your portfolio, analyzing pricing and promotions.
Personalized Recommendations: Receive suggestions tailored to your behavior and user profile to refine decision-making.
User-Configured Alerts: Stay informed with alerts designed to highlight significant changes or opportunities.
The platform addresses data overload by providing an intuitive, insight-driven view of your assortment. Category managers gain a comprehensive, bird’s-eye perspective of key changes within specified timeframes, allowing them to focus on what matters most.
Preparing for the Future of Retail Health
To avoid supply chain bottlenecks, inventory shortages, and out-of-stock scenarios, retailers are strategically using data insights to anticipate fluctuations in demand and proactively plan how to manage disruptions that could affect their assortments.
For variety that satisfies consumers’ diverse product needs, retailers are using data insights to determine whether to collaborate with nimble suppliers to promptly fill any gaps.
To further strengthen their assortments’ attractiveness, retailers are using AI-powered pricing analytics to offer the right product at the right price. These analytics help retailers know exactly how they compare to rivals’ pricing moves with relevant data so they can keep up with market fluctuations and stay competitive by earning consumer engagement, sales, and trust.
To Conclude…
Like nourishing habits that improve consumers’ health, data insights improve retailers’ e-commerce health. Advanced assortment and pricing analytics, powered by artificial intelligence, help retailers make better decisions faster to boost their agility, outmaneuver rivals, and fuel online growth.
In a retail landscape where consumer preferences for health and wellness continue to evolve rapidly, the retailers who thrive will be those who leverage data and AI to understand, anticipate, and meet these changing demands with the right products at the right time. Reach out to us to know more.
Olive oil, renowned for its complex flavor and myriad health benefits, holds a significant place in the global market, valued at $14.64 billion in 2023. It is anticipated to reach $19.77 billion by 2032, with a steady compound annual growth rate (CAGR) of 3.42%.
This growth is fueled by:
Increased consumer demand for healthier oils.
Olive oil’s rising popularity in skincare products.
Greater retail availability.
Interestingly, this market expansion occurs alongside rising olive oil prices, mainly due to a notable decrease in production. Eight European Union countries, which are the main producers, saw a dramatic drop in output from an average of 2.17 million tons to just 1.50 million tons in 2022—a 30.88% decline. Unfortunately, this drop in production comes as no surprise.
Erratic weather patterns, rising temperatures, and exacerbating drought conditions in the Mediterranean basin have taken their toll. These climate changes disrupt the growing cycles of olive trees, leading to poorer crop yields and lower-quality olives.
In the US, where olive oil constitutes 19% of all cooking oils sold and 40% of sales value due to its premium pricing, the market is expected to grow at an impressive CAGR of 11.31% between 2024 and 2032. This forecast is significant despite a recent dip in domestic consumption, which may further decline due to economic pressures. As a result, consumers must make difficult choices as they battle inflation, shrinkflation, and thin budgets.
DataWeave’s Analysis of Rising Olive Oil Prices
At DataWeave, we utilized our advanced AI-powered data aggregation and analysis platform to scrutinize the pricing trends of olive oils across key US retailers over the past year. Our analysis covered 130+ SKUs from major chains including Walmart, Kroger, Giant Eagle, and Target.
The data revealed a notable escalation in olive oil prices, with consumers facing a sharp 25.8% increase from April 2023 to April 2024.
This trend of rising costs was consistent across all analyzed retailers. Specifically, Walmart and Giant Eagle each reported a substantial 30% increase in their olive oil prices over the past year. In contrast, Target and Kroger experienced somewhat more modest hikes, at 20% and 15% respectively.
Further investigation into individual brands within our sample highlighted that no brand is immune to the impacts of the ongoing supply shortages. Walmart’s own Great Value brand saw an exceptional 60% surge in prices. Other prominent olive oil brands such as Carapelli, Terra Delysia, and Bertolli also faced significant price increases, ranging from 20% to 50%.
This across-the-board rise in prices underscores the widespread effect of supply constraints on the olive oil market, affecting both premium and private label brands alike.
What Strategies Can Retailers and Brands Employ?
In a market where consumer preferences and price sensitivities are rapidly evolving, retailers and brands must adopt versatile strategies without compromising on profit margins.
Diversifying Brand Selection
Retailers can enhance their appeal by offering a diverse range of olive oil brands, thereby stimulating competition among brands based on price, quality, innovation, and customer satisfaction. A well-curated selection that includes well-known brands like Filippo Berio and Bertolli, alongside emerging labels such as Terra Delyss, and premium options like Carapelli, allows retailers to meet a wide array of consumer preferences and budgets.
For premium outlets, it might be beneficial to introduce more economical options than typically offered to attract budget-conscious consumers. Employing advanced assortment intelligence tools can provide retailers with crucial data, helping them make informed decisions about which brands to stock and promote, ensuring they meet consumer demand effectively while managing inventory costs.
Data-driven Pricing
With rising olive oil prices, competitive pricing is more crucial than ever. Retailers must strive to balance competitiveness with margin preservation. It’s essential for retailers to not just passively respond to market price increases but to actively ensure that their offerings are competitively priced relative to the market.
This involves using sophisticated pricing intelligence tools, such as those provided by DataWeave, which track market trends and competitor pricing actions. These tools enable retailers to implement dynamic pricing strategies that respond promptly to market conditions and consumer demand shifts, helping to optimize sales and profitability.
Diversifying Sourcing
The traditional powerhouses of olive oil production, Spain and Italy, are now facing stiff competition from countries like Turkey and Tunisia. This shift is influenced by various factors, including currency fluctuations and changing trade policies, such as the imposition of tariffs on European olive oils by significant importers like the US. Retailers can take advantage of these changes by diversifying their sourcing strategies to include olive oil from non-traditional regions.
The 2022/2023 season saw remarkable production levels from countries outside the Mediterranean basin, with Iran and China setting new production records. By broadening their supply chains to incorporate these emerging markets, retailers can benefit from lower production costs and introduce unique products to their consumers, enhancing both competitiveness and profit margins.
Double Down on Private Labels
Large retailers have successfully used their scale to develop strong private-label brands that can buffer consumers from price hikes in the olive oil market. By focusing on expanding and promoting their private-label offerings, retailers can provide cost-effective alternatives to national brands.
Private labels generally have lower price points, making them particularly attractive during times of economic pressure and market volatility. Additionally, the development of private labels allows retailers to control more of their supply chain, from pricing to packaging, enabling them to offer high-quality products at competitive prices, thereby retaining customer loyalty and enhancing market share.
Navigating Market Pressures
High olive oil prices impact the entire supply chain, presenting varied challenges and opportunities:
Producers benefit from higher revenues but face increased pressure to maintain quality and yields in challenging climates. Adapting to these conditions with sustainable practices is crucial.
Exporters and Importers navigate tighter margins and greater risks due to tariffs and volume restrictions, requiring agility and strategic planning to adapt to market changes.
Retailers must carefully balance competitive pricing with rising procurement costs, affecting consumer affordability and potentially leading to shifts in buying patterns.
Consumers may seek cheaper alternatives or reduce their olive oil consumption, which influences overall market demand and pricing stability.
These dynamics underscore the necessity for retailers and brands to adopt innovative and proactive strategies to navigate the volatile olive oil market effectively. By focusing on adaptive pricing, diversified sourcing, and customer engagement, businesses can enhance their resilience and secure long-term success in this competitive landscape.
Retailers often compete on price to gain market share in high performance product categories. Brands too must ensure that their in-demand assortment is competitively priced across retailers. Commerce and digital shelf analytics solutions offer competitive pricing insights at both granular and SKU levels. Central to this intelligence gathering is a vital process: product matching.
Product matching or product mapping involves associating identical or similar products across diverse online platforms or marketplaces. The matching process leverages the capabilities of Artificial Intelligence (AI) to automatically create connections between various representations of identical or similar products. AI models create groups or clusters of products that are exactly the same or “similar” (based on some objectively defined similarity criteria) to solve different use cases for retailers and consumer brands.
Accurate product matching offers several key benefits for brands and retailers:
Competitive Pricing: By identifying identical products across platforms, businesses can compare prices and adjust their strategies to remain competitive.
Market Intelligence: Product matching enables brands to track their products’ performance across various retailers, providing valuable insights into market trends and consumer preferences.
Assortment Planning: Retailers can analyze their product range against competitors, identifying gaps or opportunities in their offerings.
Why Product Matching is Incredibly Hard
But product matching stands out as one of the most demanding technical processes for commerce intelligence tools. Here’s why:
Data Complexity
Product information comes in various (multimodal) formats – text, images, and sometimes video. Each format presents its own set of challenges, from inconsistent naming conventions to varying image quality.
Data Variance
The considerable fluctuations in both data quality and quantity across diverse product categories, geographical regions, and websites introduce an additional layer of complexity to the product matching process.
Industry Specific Nuances
Industry specific nuances introduce unique challenges to product matching. Exact matching may make sense in certain verticals, such as matching part numbers in industrial equipment or identifying substitute products in pharmaceuticals. But for other industries, exactly matched products may not offer accurate comparisons.
In the Fashion and Apparel industry, style-to-style matching, accommodating variants and distinguishing between core sizes and non-core sizes and age groups become essential for accurate results.
In Home Improvement, the presence of unbranded products, private labels, and the preference for matching sets rather than individual items complicates the process.
On the other hand, for grocery, product matching becomes intricate due to the distinction between item pricing and unit pricing. Managing the diverse landscape of different pack sizes, quantities, and packaging adds further layers of complexity.
Diverse Downstream Use Cases
The diverse downstream business applications give rise to various flavors of product matching tailored to meet specific needs and objectives.
In essence, while product matching is a critical component in eCommerce, its intricacies demand sophisticated solutions that address the above challenges.
To solve these challenges, at DataWeave, we’ve developed an advanced product matching system using Siamese Networks, a type of machine learning model particularly suited for comparison tasks.
Siamese Networks for Product Matching
Our methodology involves the use of ensemble deep learning architectures. In such cases, multiple AI models are trained and used simultaneously to ensure highly accurate matches. These models tackle NLP (natural language processing) and Computer Vision challenges specific to eCommerce. This technology helps us efficiently narrow down millions of product candidates to just 5-15 highly relevant matches.
The Tech Powering Siamese Networks
The key to our approach is creating what we call “embeddings” – think of these as unique digital fingerprints for each product. These embeddings are designed to capture the essence of a product in a way that makes similar products easy to identify, even when they look slightly different or have different names.
Our system learns to create these embeddings by looking at millions of product pairs. It learns to make the embeddings for similar products very close to each other while keeping the embeddings for different products far apart. This process, known as metric learning, allows our system to recognize product similarities without needing to put every product into a rigid category.
This approach is particularly powerful for eCommerce, where we often need to match products across different websites that might use different names or images for the same item. By focusing on the key features that make each product unique, our system can accurately match products even in challenging situations.
How Siamese Networks Work?
Imagine having a pair of identical twins who are experts at spotting similarities and differences. That’s essentially what a Siamese network is – a pair of identical AI systems working together to compare things.
How it works:
Twin AI systems: Two identical AI systems look at two different products.
Creating ‘fingerprints’ or ‘embedding’: Each system creates a unique ‘fingerprint’ of the product it’s looking at.
Comparison: These ‘fingerprints’ are then compared to see how similar the products are.
Architecture
The architecture of a Siamese network typically consists of three main components: the shared network, the similarity metric, and the contrastive loss function.
Shared Network: This is the ‘brain’ that creates the product ‘fingerprints’ or ‘embeddings.’ It is responsible for extracting meaningful feature representations from the input samples. This network is composed of layers of neural units that work together. Weight sharing between the twin networks ensures that the model learns to extract comparable features for similar inputs, providing a basis for comparison.
Similarity Metric: After the shared network processes the inputs, a similarity metric is employed. This decides how alike two ‘fingerprints’ or ‘embeddings’ are. The selection of a similarity metric depends on the specific task and characteristics of the input data. Frequently used similarity metrics include the Euclidean distance, cosine similarity, or correlation coefficient, each chosen based on its suitability for the given context and desired outcomes.
Loss Function: For training the Siamese network, a specialized loss function is used. This helps the system improve its comparison skills over time. It guides and trains the network to generate akin embeddings for similar inputs and disparate embeddings for dissimilar inputs.
This is achieved by imposing penalties on the model when the distance or dissimilarity between similar pairs surpasses a designated threshold, or when the distance between dissimilar pairs falls below another predefined threshold. This training strategy ensures that the network becomes adept at discerning and encoding the desired level of similarity or dissimilarity in its learned embeddings.
How DataWeave Uses Siamese Networks for Product Matching
At DataWeave, we use Siamese Networks to match products across different retailer websites. Here’s how it works:
Pre-processing (Image Preparation)
We collect product images from various websites.
We clean these images up to make them easier for our AI to understand.
We use techniques like cropping, flipping, and adjusting colors to help our AI recognize products even if the images are slightly different.
Training The AI
We show our AI system millions of product images, teaching it to recognize similarities and differences.
We use a special learning method called “Triplet Loss” to help our AI understand which products are the same and which are different.
We’ve tested different AI structures to find the one that works best for product matching, including ResNet, EfficientNet, NFNet, and ViT.
Image Retrieval
Once trained, our AI creates a unique “fingerprint” for each product image.
We store these fingerprints in a smart database.
When we need to find a match for a product, we:
Create a fingerprint for the new product.
Quickly search our database for the most similar fingerprints.
Return the top matching products.
Matches are then assigned a high or a low similarity score and segregated into “Exact Matches” or “Similar Matches.” For example, check out the image of this white shoe on the left. It has a low similarity score with the pink shoe (below) and so these SKUs are categorized as a “Similar Match.” Meanwhile, the shoe on the right is categorized as an “Exact Match.”
Similarly, in the following image of the dress for a young girl, the matched SKU has a high similarity score and so this pair is categorized as an “Exact Match.”
Siamese Networks play a pivotal role in DataWeave’s Product Matching Engine. Amid the millions of images and product descriptions online, our Siamese Networks act as an equalizing force, efficiently narrowing down millions of candidates to a curated selection of 10-15 potential matches.
In addition, these networks also find application in several other contexts at DataWeave. They are used to train our system to understand text-only data from product titles and joint multimodal content from product descriptions.
Leverage Our AI-Driven Product Matching To Get Insightful Data
In summary, accurate and efficient product matching is no longer a luxury – it’s a necessity. DataWeave’s advanced product matching solution provides brands and retailers with the tools they need to navigate this complex landscape, turning the challenge of product matching into a competitive advantage.
By leveraging cutting-edge technology and simplifying it for practical use, we empower businesses to make informed decisions, optimize their operations, and stay ahead in the ever-evolving eCommerce market. To learn more, reach out to us today!
For retailers, the breadth and relevance of their product assortment are critical for success. Amid a crowded market filled with countless products clamoring for consumer attention, retailers must find innovative ways to distinguish themselves. While pricing undeniably impacts purchasing decisions, the diversity and distinctiveness of a retailer’s product range can provide a crucial competitive advantage.
Creating an attractive and profitable assortment that resonates with your target audience requires more than intuition; it demands deep insights into both your own and your competitors’ offerings. A well-curated assortment aligned with current trends can drive higher conversions and foster customer loyalty. However, achieving this perfect balance is a formidable challenge without the right insights.
This is where a data-driven strategy becomes essential, enabling you to curate a product mix that captivates and converts.
However, retailers often encounter significant challenges when attempting to strategically plan their assortments:
Limited Competitive Insights: Gaining a clear understanding of your competitors’ assortment strengths and weaknesses across various categories is challenging. Without this visibility, it’s difficult to know where you have an edge or where you might be falling behind.
Tracking Demand Patterns: Identifying top-sellers and monitoring shifts in consumer demand can be a struggle. Without the ability to easily detect trends or changes in demand, you risk missing opportunities to stock trending items.
Attempting to navigate these challenges manually is not only arduous but also susceptible to substantial errors.
How Assortment Analytics Solutions Help
The ideal Assortment Analytics solution must offer a fact-based approach to:
Identify Strengths and Weaknesses: Understand how your assortment measures up against the competition.
Stay Trend-Responsive: Keep your product mix fresh and aligned with the latest consumer trends.
Boost Conversions: Create a relatively unique, customer-focused assortment that enhances conversions.
Many retailers attempt to analyze competitor assortments using manual, in-house methods, which inevitably leads to significant blind spots:
Variations in product classifications and taxonomies across competitors make meaningful comparisons challenging.
Gathering complete and accurate data across a vast competitive landscape is difficult.
Inconsistent titles and descriptions hinder reliable product matching without AI assistance.
Capturing and comparing detailed product attributes efficiently is nearly impossible without advanced tools.
To overcome these challenges, retailers need a scalable, accurate Assortment Analysis solution designed specifically for the complexities of modern retail needs.
DataWeave’s Assortment Analytics Solution
DataWeave addresses these challenges by providing retailers with a robust platform to gain actionable insights into their product assortments and the competitive landscape. Leveraging advanced analytics and AI-driven algorithms, Assortment Analytics empowers retailers to make informed assortment management decisions, optimize their product offerings, and stay competitive.
Armed with our insights, retailers can lead with their strengths and stock unique and in-demand products in their assortment. Further, by recognizing the strengths in their product catalog, they can craft effective pricing strategies and optimize their logistics, creating a more competitive and appealing shopping experience for their customers. Here are a few capabilities of DataWeave’s solution:
In-Depth Competitive Analysis Across Retailers
The solution offers detailed competitive analysis, revealing insights into competitors’ assortments. It maps competitor products to a common taxonomy, making comparisons accurate and meaningful. Retailers can visualize assortments at granular levels like category, sub-category, and product type.
The data for these insights is collected at configurable intervals, typically monthly or quarterly, and is consumed not only via dashboard summaries but also raw data files to enable in-depth analysis. Retailers have the flexibility to choose specific competitors, brands, products, and categories for tracking, allowing for a tailored and strategic approach to assortment optimization.
Brand and Category Views to Assess Your Portfolio
The solution provides a comprehensive evaluation of your product assortment through brand and category views. In brand views, your portfolio is assessed against competitors at the brand level, highlighting:
Newly Introduced Brands: Insights into recently introduced brands, revealing shifts in the brand landscape.
Absence or Limited Presence: Identification of brands lacking representation or with minimal presence compared to competitors, indicating areas for improvement.
Strong Presence and Exclusivity: Recognition of brands where you excel, including exclusive offerings, showcasing your competitive edge.
Identifying Top-Selling Competitive Products To Boost Assortment Strategy
Beyond just comparing assortment numbers, the DataWeave solution surfaces insights into which competitor products are actually performing well. It equips category and assortment managers with indicators that assess competitor products in terms of their popularity and shelf velocity.
It analyzes metrics like pricing fluctuations, ratings, customer reviews, search rankings, and replenishment rates to pinpoint hot sellers you may want to stock. With these insights, merchandizing managers can pinpoint top-selling products among competitors, enabling informed decisions to enhance their assortment in comparison.
Sophisticated Attribute Tagging and Analysis
Using AI-powered attribute tagging, the solution simplifies granular product analysis within specific categories. An Apparel retailer, for instance, can filter the data to compare assortments based on attributes like material, pattern, color, etc.
Retailers can select attributes relevant to their products and gain detailed insights. These custom filter attributes dynamically populate the panel, facilitating targeted data exploration. Category and merchandizing managers can delve into critical details swiftly, enabling strategic decision-making and comprehensive competitive analysis within their categories.
You can capitalize on opportunities by stocking in-demand, on-trend items and address assortment gaps quickly. At the same time, you can double down on your strengths by enhancing your exclusive or top-performing product sets.
In summary, DataWeave’s Assortment Analytics solution provides an invaluable competitive edge. The insights enable evidence-based decisions to attract more customers, encourage bigger baskets, and maximize the value of every assortment choice.
When your product pricing is sub-optimal, you leave money on the table. This is especially significant for eCommerce retailers who must contend with their consumers ‘shopping around’ for the best price before making a purchase. All eCommerce retailers experience some amount of cart abandonment. In fact, the average cart abandonment rate is estimated at 70.19%, and the reason is often that customers find a better price elsewhere, whether at other online stores or in traditional brick-and-mortar ones.
If you want to win the business of price-sensitive shoppers, you need a robust pricing strategy to keep up with changing competitor pricing. That’s one reason (among others) that retailers rely heavily on pricing intelligence solutions. With the right pricing intelligence solution, retailers can stay on top of market shifts, manage profit margins, maintain price perception, and of course, price their products competitively.
Unfortunately, adding a new pricing intelligence solution to a retailer’s tech stack is not without its challenges. But the good news is there are ways to overcome them.
In this post, we’ve rounded up six challenges most commonly cited by retailers and proposed strategies to overcome them. So if you’re considering a pricing intelligence solution that can get you closer to your business goals, read on to learn more.
1. Scalability Constraints
As access to the internet has expanded globally, the ratio of brick-and-mortar sales compared with eCommerce continues to narrow. A natural consequence of this is that more shoppers than ever before now browse and buy across diverse web environments, including mobile apps.
This means that retailers need to track pricing across not just websites and physical stores, but also across mobile apps — a sales channel that was largely sidelined before.
Modern pricing intelligence solutions need to consolidate data from:
Online storefronts
Mobile apps
… and also from delivery channels, which often have different assortments and pricing:
Standard home delivery
Expedited, same-day home delivery
Buy online, pickup in-store (BOPIS)
Subscription
Curbside pickup
In this context, imagine having to track the pricing of millions of SKUs compared against dozens of competitors each day. When new channels and devices are added, many pricing intelligence solutions in the market are unable to handle such data complexity and scale. They’re not built to continually grow and expand to meet changing needs. Even worse, some retailers opt for homegrown DIY systems, which struggle to keep the datasets updated, accurate, and current—activities that require significant cost and human effort.
How DataWeave Bridges This Gap:
What you need is a platform that can track millions of SKUs across dozens of competitors and geographies. No matter where the data is coming from or how vast the demand for the product is, an ideal solution should be able to synthesize huge amounts of complex data and generate meaningful insights.
Your competitors are continually changing their eCommerce setup, whether through subtle changes to their product attribute listings or broader changes to domains or apps. With DataWeave’s pricing intelligence solution designed to scale up as required, you never need to worry about the backend flexing to accommodate changes.
2. Inability to Match Products Without Clear UPC/EAN Identifiers
Another problem with many pricing intelligence solutions is their inability to match products if a UPC/EAN identifier is missing. Often, a competitor will list an identical product on their storefront and omit any clear identifiers. On Amazon, an ASIN might be listed or you might be able to bring in a DPCI from Target.com. However, without clear identifiers across eCommerce platforms, retailers struggle to aggregate every instance of the products, and as a result, are unable to achieve accurate pricing comparisons. They often face this challenge when they work with commoditized web scraping service providers who have very limited expertise or experience in refining the data into meaningful insights.
How DataWeave Bridges This Gap:
If you can’t match UPC/EAN codes, you need a solution that leverages artificial intelligence to match products based on other variables, such as product titles, descriptions, and images. AI, in combination with human expertise, can take on the task at a speed and accuracy that would be unfeasible for humans alone.
Artificial Intelligence is constantly learning and improving. At DataWeave, we accelerate this process by introducing new scenarios and datasets for the product to continually learn from. At the outset, our AI product matching is roughly 80-90% accurate every time. To improve this number to over 95%, we introduce human validation and nuanced judgments. Over the years, this feedback loop has continued to refine its algorithms, resulting in near-perfect data accuracy for retailers.
Our solution uses AI built on more than ten years of data to perform robust product matching for retailers at a massive scale. Using a unified platform with text and image recognition, DataWeave matches products from among hundreds of eCommerce websites and across millions of products.
3. Poor and Inconsistent Data
Retailers often complain that the data within their pricing intelligence solution isn’t accurate, is inconsistent, and may even be comprised of statistical smoothing and gap-plugging smokescreens. The root of this problem often lies in the inability of these tools to consistently track prices across diverse web environments. Poorly designed web scraping infrastructure fail when eCommerce websites change their underlying configuration and structure (which happens periodically). As a result, they don’t have enough data to see the market as a whole, and end up viewing synthetic or small sample-set data.
How DataWeave Bridges This Gap:
At DataWeave, transparency drives our approach to delivering insights. We only present real-world data in our data feeds and dashboards to customers. This is possible only due to the supreme confidence we have in our ability to consistently capture and present accurate data. We achieve this by using a combination of AI and sophisticated web scraping infrastructure developed and enhanced over a decade.
In fact, we are the first in the industry to launch a Data Statistics Dashboard that helps our customers scrutinize match rates, track data freshness, highlight any gaps in the data, and manage product matches independently.
4. Limited Integration Options with Internal Systems
Too often, a retailer will select a pricing intelligence solution that promises exceptional insights but then fails to offer a manageable workflow for day-to-day use. This usually happens because it doesn’t integrate with the retailer’s existing tech stack.
Without a convenient process that connects internal systems, your pricing intelligence solution is just another piece of technology that your team does not use to its full potential. You may require your competitor pricing data to flow into price optimization tools, price management tools, BI tools, ERP systems, or revenue management systems. Without this capability, you’ll see limited ROI and underwhelming results because all the insights in the world are of little use if you can’t consume them easily and put them into action.
How DataWeave Bridges This Gap:
At DataWeave, we understand the importance of being able to integrate external data with your internal tech stack. Our data can be accessed and extracted using plug-and-play APIs, enabling businesses to combine their external and internal data to generate predictive intelligence.
We also have other data feeds ready to be integrated, including FTP and Amazon S3. Our integration experts can work with you to create custom integrations to existing internal pricing platforms. Our ultimate goal here is to seamlessly elevate your pricing intelligence strategy with minimal change management.
5. Limited Custom Analysis Capabilities
Every retailer is unique. There are various geographies, languages, markets, product categories, and pricing strategies that differentiate one retailer from the next. Many retailers find it challenging to derive actionable insights from their pricing intelligence solution because the analysis and customization capabilities are too limited.
For example, some retailers might want to evaluate their competitiveness after applying coupons and promos to selling prices. Others may want to perform a one-time pricing analysis of just list prices across competitors. Some may want to view insights that help them take tactical decisions day-to-day, while others would like a historical view across multiple dimensions to help make strategic long-term pricing decisions.
Without the ability to customize their views or the underlying data, retailers could feel restricted in their ability to drive meaningful impact with their pricing intelligence.
How DataWeave Bridges This Gap:
What you need are foundational dashboards, reports, and visualizations in a web portal that can be tailored to your business needs. Then, you need the expertise and guidance of a team of business analysts who can help you configure custom reports and dashboards.
At DataWeave, we offer bespoke insights for each persona, enabling swift actions on relevant competitive intelligence. These include day-to-day tactical recommendations or inputs for long-term strategies. And because all DataWeave customers get access to our team of expert analysts, it’s simple and straightforward to configure unique reports and dashboards to suit your business.
6. Sloppy Support
No solution, at least not one that undertakes complex work, works optimally with a ‘set it and forget it’ approach. From time-to-time, you need human intervention to ensure your pricing intelligence is working in the way that it needs to for you. Unfortunately, one of the most common challenges retailers face with their pricing intelligence tool is a lack of support.
Unavailable or patchy customer support is a significant challenge that can result in low confidence, delayed resolutions, and even abandoned pricing actions.
How DataWeave Bridges This Gap:
Dataweave’s global team of pricing experts are available around the clock for support and guidance. Not only do we have tech experts and business analysts that you can consult at any point, we also have an exceptional team of customer success professionals to help you overcome any technical and strategic issue you might face.
As one customer puts it, with DataWeave you gain access to: “Excellent customer service, super collaborative staff, user-friendly interface.”
Another verified user from the consumer goods industry had this to say:
“Great platform and customer service! Our client service team is very helpful and always responds to ad-hoc requests in a very timely matter!”
As the competition heats up, retailers need to unlock every available opportunity to gain an edge and capture market share. At DataWeave, our AI-powered pricing intelligence software helps you uncover gaps quickly and build a pricing strategy that is as attractive as it is effective. Our ability to scale, match your products across the entire ecosystem with consistent accuracy, and slide right into your current operations to provide advanced analytics, makes us the preferred choice for many of the world’s leading retailers.
Want to start benefiting from actionable product matching and pricing intelligence? Request a demo today.
Cinco de Mayo is a vibrant celebration of Mexican-American and Hispanic heritage, marked by lively parades, festive tacos, and refreshing tequila across North America. For the service industry, brands, and retailers, this day offers a golden opportunity to roll out enticing promotions on beloved Mexican foods and beverages, drawing in large crowds and boosting sales.
Americans love to indulge in Mexican cuisine during Cinco de Mayo. Take avocados, for example: despite inflation, avocado sales soared to 52.3 million units this year, marking a 25% increase from last year, according to the Hass Avocado Board’s 2023 Holiday Report. Such festive events see a significant sales spike, largely driven by appealing discounts and special offers.
So, what discounts did retailers roll out this Cinco de Mayo?
At DataWeave, our cutting-edge data aggregation and analysis platform tracked and analyzed the prices and deals on Mexican food and alcohol products offered by leading retailers. Our in-depth analysis sheds light on their pricing competitiveness during Cinco de Mayo, revealing how pricing strategies differed across various subcategories and brands.
We conducted a similar analysis in 2022, allowing us to compare the prices of identical products this year versus last year. This comparison helps us understand the impact of inflation over the past two years on the prices offered today.
Our Methodology
For our analysis, we monitored the average discounts offered by major US retailers on over 2,000 food and beverage products during Cinco de Mayo, as well as in the days leading up to the event. Many retailers kick off their Cinco de Mayo promotions a week before, so we included the entire week leading up to May 5th in our analysis.
To truly demonstrate the value of Cinco de Mayo for shoppers, we concentrated on price reductions and additional discounts during the event. By comparing these with regular day discounts, we were able to highlight the genuine savings and benefits that Cinco de Mayo promotions offer to budget-conscious consumers.
Our Findings
Safeway led the pack with the highest average additional discount of 4.91%, covering 38.6% of their food inventory for Cinco de Mayo. Total Wine & More followed closely, offering an average discount of 3.46% across 70.8% of its tequila, whiskey, mezcal, and other spirit products during the Cinco de Mayo week.
In contrast, Target provided minimal additional discounts, averaging just 0.8% over a small fraction (11.6%) of its SKUs. Similarly, Kroger’s additional discounts were also 0.8%, but they were spread across over 60% of its tracked products. Walmart (1.4%) and Amazon Fresh (1.2%) offered relatively conservative discounts during the sale period.
During Cinco de Mayo, various brands rolled out attractive discounts to entice shoppers. Among beverage brands, The American Plains vodka led the way with the highest average discount of 20.80%. Coffee brands also joined the festivities with significant discounts: Death Wish Coffee at 14.30%, Dunkin’ at 11.10%, and Starbucks at 5.70%. Notably, Dunkin’ and Death Wish Coffee introduced complimentary beverages such as whiskey barrel-aged coffee and spiked coffee products to celebrate the event.
In the wine category, Erath stood out with a 10% additional discount. However, brands like Jose Cuervo and Franzia offered more modest discounts of 0.70% and 1.80%, respectively.
Food brands associated with traditional Mexican ingredients or products, such as tortillas, salsas, and spices, provided higher discounts compared to mainstream snack brands. For instance, McCormick (25%), El Monterey (13.3%), and La Tortilla Factory (16.7%)—known for ready-to-eat frozen foods, seasonings, and condiments—delivered the highest discounts. Other notable discounts included Jose Ole (12.5%), a frozen food brand, and Yucatan (8.3%), known for its guacamole.
Safeway’s private label brand, Signature Select, offered a 5.20% discount. Additionally, Safeway provided deep discounts on brands like Pace, Herdez, and Taco Bell, indicating an aggressive discounting strategy. In contrast, brands closely associated with Mexican or Tex-Mex cuisine, such as Old El Paso, Mission, Rosarita, and La Banderita, offered relatively modest discounts ranging from 0.5% to 3.3%.
The discount patterns varied between alcohol and food categories, with food brands generally offering higher discounts. This trend may be attributed to pricing being regulated in the alcohol industry. These differing discount levels highlight how brands navigated the balance between driving sales and maintaining profit margins during Cinco de Mayo, particularly in the context of inflation affecting costs.
Impact of Inflation on Cinco de Mayo Prices (2024 vs 2022)
To gauge the impact of inflation on popular Cinco de Mayo products, we analyzed the average prices at Walmart and Target between 2022 and 2024. These two retailers were chosen due to their prominence in the retail sector and the robustness of our sample data.
At Walmart, the Tex Mex category saw the highest average price increase, rising by 22.51%. Other notable subcategories with significant price hikes include Condiments (23.21%), Vegetables/Packaged Vegetables (21.22%), and Lasagne (14.10%). Categories like Dips & Spreads (13.77%), Pantry Staples (14.92%), and Salsa & Dips (8.23%) experienced relatively lower increases.
At Target, the Snacks subcategory had the steepest average price rise at 27.94%, followed by Meal Essentials (16.07%) and Deli Pre-Pack (8.82%). Categories such as Dairy (0.51%), Frozen Meals/Sides (7.11%), and Adult Beverages (7.41%) saw smaller price increases.
Brands associated with traditional Mexican or Tex-Mex cuisine faced higher price hikes. Examples include Old El Paso (24.59% at Walmart, 8.70% at Target), Tostitos (35.44% at Walmart, 11.41% at Target), Ortega (30.59% at Walmart, 19.69% at Target), and Rosarita (14.39% at Walmart).
In contrast, private label or store brands generally experienced lower price increases compared to national brands. For instance, Good & Gather (Target’s private label) saw a 9.55% increase, while Market Pantry (Walmart’s private label) had a 17.27% rise. This trend is understandable as retailers have more control over their costs with private label brands.
The data clearly indicates that both Walmart and Target have significantly raised prices across various categories and brands, reflecting the broader inflationary environment where the cost of goods and services has been steadily climbing.
Interestingly, we observed higher price increases at Walmart compared to Target. Although Walmart is renowned for its consumer-friendly pricing strategies, it too had to elevate grocery prices post-2022 to combat inflationary pressures. As consumers become more cost-conscious and reduce spending on discretionary items, Walmart and other retailers are now cutting prices across categories to align with shifting consumer behaviors.
Mastering Pricing Strategies During Sale Events
Our pricing analysis for Cinco de Mayo reveals compelling insights into the dynamics of retailer landscapes in the US. It highlights the enduring relevance of private label brands, even amidst fluctuating demand, showing the emergence of local, national, and small players vying for market share.
As retailers navigate inflationary pressures and evolving consumer behaviors, understanding these pricing dynamics becomes crucial for optimizing strategies and bolstering market competitiveness. This analysis offers actionable intelligence for retailers seeking to navigate the intricate terrain of sale event promotions while addressing shifting consumer preferences and economic challenges.
Access to reliable and timely pricing data equips retailers and brands with the tools needed to make informed decisions and drive profitable growth in an increasingly competitive environment. To learn more and gain guidance, reach out to us to speak to a DataWeave expert today!
Retailers and brands are constantly engaged in a fierce battle over prices and discounts. Whether it’s major events like Amazon Prime Day, brand-led sales, or everyday price wars, they depend on pricing intelligence and digital shelf analytics to fine-tune their strategies. With a variety of offers such as sales, promotions, and bundles, determining the actual cost to the customer becomes a complex task. The price set by the brand, the retailer’s offer, and the final amount paid by the customer often vary significantly.
In their analysis, retailers and brands frequently focus on the listed price or the final sale price, overlooking a critical factor: the “end-user price.” This includes all discounts, taxes, and shipping costs, providing a more accurate picture of what customers are truly willing to pay at checkout.
Grasping this end-user price is vital for both retailers and brands. For retailers, it helps them stay competitive and refine their promotional strategies. For brands, it offers insights into competitive positioning, net revenue management, and shaping customer price perception.
However, emphasizing the end-user price is challenging, as it involves comprehending all the intricate elements of pricing.
How end-user pricing is calculated
The list price, also known as the manufacturer’s recommended retail price (MSRP), is the initial price set by the brand. This may not always be displayed on marketplaces, especially in categories like grocery. The selling price, on the other hand, is the amount at which a retailer offers the product, often reduced from the list price. The end-user price is the actual amount the customer pays at checkout, which includes taxes, promotions, and other factors that affect the final cost.
The process involves 3 key stages:
Step 1: Identifying and categorizing promotional offers
The first critical step in calculating end-user pricing is to identify and categorize the various promotional offers available for a given product that can reduce the final amount paid by the consumer. These promotions span a wide range of types:
Bank Offers: Involving discounts or cash back incentives when paying with specific bank credit or debit cards. For instance, a customer may receive 10% cashback on their purchase by using a specific bank’s card.
Bundled Deals: Combining multiple products or services at a discounted bundle price. A common example is a smartphone bundle including the phone itself, a protective case, and earphones at a reduced total cost.
Promo Codes/Coupons: Customers can enter promo codes or coupons during checkout to unlock special discounted prices or percentage-off offers, like 20% off a hotel booking, or even a special brand discount personalized for their needs (think loyalty offers and in-app promotions).
Shipping Offers: These include free shipping or reduced shipping fees for certain products or orders, such as free delivery on orders above a set amount.
TPRs (Temporary Price Reductions): TPRs play a significant role in the strategies of most retailers. Brands and retailers use them to encourage shoppers to purchase more of a product or to try a new product they wouldn’t usually buy. A TPR involves reducing the price of a product by more than 5% from its regular shelf price.
By accurately identifying and classifying each type of promotion available, brands can then calculate the potential end-user pricing points.
Step 2: Accounting for location and fulfilment nuances (delivery, in-store pickup) that impact final pricing
Product pricing and promotional offers can vary based on the consumer’s location or ZIP code. Additionally, customers may opt for different fulfilment modes like delivery, shipping, or in-store pickup, which can further impact the final cost. Accurately calculating the end-user price necessitates considering these location-based pricing nuances as well as the chosen fulfilment method.
In the example below, the selling price is $4.32 for one retailer (on the left in the image) after a discount for online purchase. In another case with Meijer, the item total shows $17.91, but the consumer ends up paying $15.74 after taxes and fees are applied (on the right in the image).
Step 3: Applying each eligible promotion or offer to the selling price to determine potential end-user price points
With the various promotional offers and discounts categorized in the previous steps, retailers and brands can now apply each eligible promotion to the product’s selling price. This involves deducting percentages for bank cashback, implementing bundled pricing, applying coupon code discounts, and incorporating shipping promotions.
For retailers, this step allows them to calculate their true effective selling price to customers after all discounts and promotions. They can then compare this end-user price against competitors to ensure they remain competitively priced.
For brands, by systematically layering every applicable offer onto the baseline selling price, they can accurately calculate the multiple potential end-user price points a customer may pay at checkout for their products across different retailers and regions.
Why the end-user price matters
Optimizing pricing strategies using the end-user price can benefit retailers and brands in several ways:
Price Competitiveness: By monitoring end-user pricing, retailers can adjust for discounts and promotional offers to attract customers, while brands can refine their pricing models to stay ahead in the market.
Customer Acquisition and Loyalty: Offers, promotions, and discounts directly impact the final price paid by customers, playing a crucial role in attracting new customers and retaining existing ones. For example, Walmart’s competitive pricing in groceries boosts customer loyalty and repeat purchases.
Consumer Perception: End-user pricing significantly shapes how consumers perceive both retailers and brands. Competitive pricing and promotional transparency enhance reputation and conversion rates. Amazon, for instance, is known for its competitive pricing and fast deliveries, which strengthen its consumer perception and satisfaction.
Sales Volumes: The final checkout price influences affordability and perceived value, directly affecting sales volumes. Both retailers and brands benefit from understanding this, as it guides consumer purchasing decisions and drives revenue streams.
Brand Perception: Consistent and transparent pricing enhances the perception of both the retailer and the brand. This not only strengthens the value proposition but also builds consumer trust and fosters long-term loyalty.
While the listed and selling prices are readily available, calculating the true end-user price is quite complex. It involves meticulous tracking and application of various types of promotions, offers, location-based pricing nuances, and fulfillment costs – an uphill task without robust technological solutions.
Track and Analyze end-user prices with DataWeave
DataWeave’s end-user price tracking capability empowers retailers and brands with the insights and tools necessary to comprehend the complexities of pricing dynamics. For retailers, it offers the ability to monitor end-user pricing across various products and categories compared to competitors, ensuring competitiveness after all discounts and enabling optimization of promotional strategies. Brands benefit from informed pricing decisions, optimized strategies across retail channels, and a strengthened position within their industries.
Our intuitive dashboard presents classified promotions and corresponding end-user prices across retailers, providing both retailers and brands with a transparent, comprehensive view of the end-user pricing landscape.
Within the detailed product view of DataWeave’s dashboard, the Price and Promotions panel showcases diverse promotions available across different retailers for each product, along with the potential end-user price post-promotions.
Harness the power of DataWeave’s sophisticated Pricing Intelligence and Digital Shelf Analytics to gain an accurate, real-time understanding of your end-user pricing dynamics. Make data-driven pricing decisions that resonate with customers and propel your brand toward sustained success.
Find out how DataWeave can empower your eCommerce pricing strategy – get in touch with us today or write to us at contact@dataweave.com!
In today’s expansive omnichannel commerce landscape, pricing intelligence has become indispensable for retailers seeking to stay competitive and refine their pricing strategies. The sheer magnitude of eCommerce, spanning thousands of websites, billions of SKUs, and various form factors, adds layers of complexity. Consequently, ensuring the accuracy and reliability of competitive insights presents a formidable challenge for retailers aiming to leverage pricing data effectively.
At the core of any robust pricing intelligence system lies product matching. This process enables retailers to recognize identical or similar products across competitors. Once these matches are identified, tracking prices is a relatively more straightforward task, facilitating ongoing analysis and informed decision-making.
Accurate matching is crucial for meaningful price comparisons and tailoring product assortments. The challenge is matching products is often complicated, especially for non-local brands, niche categories, or items lacking consistent global identifiers. It becomes even trickier when trying to match very similar but not identical products. A comprehensive approach that compares and analyzes multiple attributes like product titles, descriptions, images and more is essential.
Artificial intelligence algorithms are commonly used to automate product matching, leveraging machine learning techniques to analyze patterns in images and text data. While AI can adapt and improve over time, the question remains: Can it fully address the complexities of product matching on its own?
The reality is that many retailers still struggle with incomplete, inaccurate, or outdated product data, despite these AI-powered product matching solutions. This can lead to suboptimal pricing decisions, missed opportunities, and reduced competitiveness.
Challenges in an ‘AI-only’ Approach to Product Matching
While AI plays a vital role in automated product matching solutions, there are complexities that AI alone cannot fully address:
Subjectivity in Matching Criteria
Some product categories have subjective or hard-to-quantify criteria for determining similarity. AI learns from historical data, so it may struggle with nuanced aspects like:
Aesthetics, style, and design: In the Fashion and Jewellery vertical, for example, products are matched according to attributes like style, aesthetics, design – all of which have some subjectivity involved.
Quantity/packaging variations: In the grocery sector, variations in product packaging and quantities can introduce complexities that require subjective decision-making. For example, apples may be sold in different packaging like a 0.5 kg bag or a pack of 4 individual apples. Determining if these different packaging options should be considered equivalent often involves making a qualitative judgment call, rather than a clear-cut objective decision.
Matching product sets: For categories like home furnishings, the focus is often on matching coordinated sets rather than individual items. For example, in the bedroom category, matching may involve grouping together an entire set of complementary furniture like a bed frame, dresser, and wardrobe based on their cohesive design and style. This goes beyond simply making one-to-one product associations, requiring more nuanced judgments about aesthetic coordination.
Contextual Factor
Products can have regional preferences, cultural differences, or evolving trends that impact how they are matched. AI may miss important context like Local/regional product names or distinct brand names across countries.
For instance, in the image we see Sprite (in the US) is branded Xubei in China. Continuous human curation is needed to help AI adapt to this context.
High Accuracy & Coverage Expectations
Retailers rely on AI powered and automated pricing adjustments based on product matching for insight. To ensure that pricing recommendations and updates are accurate, accurate product matching is crucial. For this, simply identifying similar top results is not enough – the process must comprehensively capture all relevant matches. While AI excels at finding the top groupings with around 80% accuracy, even small matching errors can have significant consequences.
As AI matching improves, customer expectations may rise even higher. If AI achieves 90% accuracy, for instance, SLAs may demand over 95%. Reaching such a high level of accuracy is very challenging for AI alone, especially when faced with incomplete data, contextual nuances, evolving trends, and subjective matching criteria across products and categories.
The solution is to combine the power of AI with human expertise. This is the key to achieving true data veracity – the accuracy, freshness, and comprehensive coverage required for precise and reliable product matching.
Human-in-the-Loop Approach for Elevated Product Matching
Human intelligence and quality testing can elevate the AI powered product matching process by addressing key challenges:
Matching Validation: AI algorithms may identify product matches with 80-90% accuracy initially. Having humans validate these AI-suggested matches allows for correcting errors and pushing the accuracy close to 100%. As humans flag issues, provide context, and re-label incorrect predictions, it allows the AI model to learn and enhance its reliability for complex, high-stakes decisions.
Applying Contextual Judgment: For subjective matching criteria like aesthetics, design, and categorizing product sets, human discernment is needed. Humans can make nuanced judgments beyond just quantitative rules, ensuring meaningful apples-to-apples product comparisons. Their contextual understanding augments AI’s capabilities.
Continuous Learning Via Feedback Loop: Product experts possess rich category knowledge across markets. Integrating this human insight through an iterative feedback loop helps AI models quickly learn and adapt to changing trends, preferences, and context. As humans explain their match assessments, the AI continuously enhances its precision over time.
By combining AI’s automation and scale with human validation, judgment, and knowledge curation, pricing intelligence solutions can achieve the accuracy and coverage demanded for actionable competitive pricing insights.
DataWeave’s Data Veracity Framework: A Scalable Workflow Combining AI and Human Expertise
Given the vast number of products, retailers, and brands that exist today, any product matching solution must be highly scalable. At DataWeave, we bring you such a scalable workflow to address these complexities by integrating human expertise with AI-driven automation. The image below outlines our approach for combining AI with human intelligence in a seamless, scalable workflow for accurate product matching:
Retailers and brands can benefit in several ways with this workflow, as listed below.
Several Rounds of Data Verification Due to Hierarchical Validation Teams
The workflow employs a hierarchical validation team of Leads and Executives to efficiently integrate human expertise without creating bottlenecks. Verification Leads play a pivotal role in managing the distribution of product matches identified by DataWeave’s AI model to the Verification Executives.
The Executives then meticulously validate these AI-suggested matches, adding any missing product associations and removing inaccurate matches. After validation, the matched product groups are sent back to the Leads, who perform random sampling checks to ensure quality.
Throughout this entire workflow, feedback and suggestions are continuously gathered from both the Executives and Leads. This curated input is then incorporated back into DataWeave’s AI model, allowing it to learn and improve its matching accuracy on an ongoing basis.
This hierarchical structure ensures that human validation seamlessly scales alongside the AI’s matching capabilities. Leveraging the respective strengths of AI automation and human expertise in an iterative feedback loop prevents operational bottlenecks while steadily elevating overall accuracy.
Confidence-based Distribution of Matched Articles for Validation
The AI model assigns confidence scores, differentiating high-confidence (>95%) and low-confidence matches. For high-confidence groups, executives simply remove incorrect matches – a quicker process. Low-confidence matches require more human effort in adding/removing matches.
As the AI model improves over time with feedback, the share of high-confidence matches increases, making validation more efficient and swift.
Automated, Standardized Process with Iterative Feedback Loop
The entire workflow is standardized and automated, with verification metrics seamlessly tracked. At each step, feedback captured from both leads and executives flows back into the AI, enhancing its matching accuracy and coverage iteratively.
DataWeave’s closed-loop system of AI automation with hierarchical human validation allows product matching to achieve comprehensive accuracy at a vast scale.
Unleash the Power Accurate and Comprehensive Product Matching
In summary, combining AI and human expertise in product matching is crucial for retailers navigating the complexities of omnichannel retail. While AI algorithms excel in automation, they often struggle with subjective criteria and contextual nuances. DataWeave’s approach integrates AI-driven automation with human validation, delivering the industry’s most accurate product matching capabilities, enabling actionable competitive pricing insights.
As we move into the second quarter of 2024, the US energy landscape is poised for notable shifts that will impact gasoline and diesel prices. The shift towards renewable energy sources, evolving consumer preferences, and volatile global market forces are all converging to reshape the fuel retail industry.
For fuel retailers, understanding these projections is crucial – changes in consumer demand and cost pressures can significantly affect their bottom line. In this article, we provide insights on the factors shaping the fuel pricing environment for the remainder of the year, covering a variety of fuel types.
Gasoline Prices: A Downward Trend Ahead
According to the January Short-Term Energy Outlook by the EIA, US retail gasoline prices are projected to decline in 2024. Similarly, the forecast also predicts reduced gasoline consumption in 2025. This is attributed to a significant increase in inventories, thanks to expanded refinery capacity. US operable refinery capacity has grown from 18.06 million barrels per day in January 2023 to 18.31 million barrels per day by December 2023.
Meanwhile, the World Bank reports that global trade growth in 2024-25 is expected to be only half the average in the decade before the pandemic, leading to reduced consumption and demand.
The increase in supply, coupled with this dip in demand and consumption expected in 2025, sets the stage for further price reductions. Such expansion not only enhances supply but also alleviates price pressures for consumers.
Diesel Dynamics: Supply Up, Prices Down
Similar supply-side dynamics are at play in the diesel market, with retail prices expected to fall in both 2024 and 2025. Despite a forecasted uptick in US diesel consumption in these two years, an increase in production capacity and easing inventory strains are likely to keep prices in check. This is particularly noteworthy, as diesel fuel plays a critical role in transportation and logistics, underpinning the movement of goods and services nationwide.
Crude Oil and Crack Spreads: The Refining Equation
Crude oil prices, a pivotal factor in the fuel price equation, are expected to mirror 2023 levels through 2024.
The anticipated decrease in gasoline and diesel prices is largely attributed to narrowing crack spreads—the differential between wholesale fuel prices and crude oil. A lower crack spread signifies reduced refining costs, a welcome development for both refiners and consumers. This expectation is grounded in the increasing availability of refinery capacity and, consequently, fuel supply, even as demand shows signs of tapering off.
Global Influences and Economic Implications
The outlook is further buoyed by new refinery capacities coming online internationally, particularly in the Middle East. This global increase in refined product supplies is poised to ease price pressures for consumers not just domestically but across international markets. Interestingly, this forecast comes at a time when gasoline consumption is expected to remain flat or slightly decrease, a rare occurrence in the context of positive economic growth. This decoupling of fuel consumption from economic expansion highlights evolving consumer behaviors and efficiency gains across the automotive sector.
Looking Ahead: Uncertainties and Transformations
While the projections offer a glimpse into a future of potentially lower fuel prices, they are not without uncertainties. Factors such as crude oil price fluctuations, refinery shutdowns, and logistical challenges could sway outcomes.
The projected decrease in US gasoline and diesel prices presents both opportunities and challenges.
For American consumers, lower fuel costs offer relief for household budgets and transportation expenses, potentially freeing up disposable income and stimulating broader economic activity.
However, these pricing trends pose a need for strategic planning and adaptation within the US energy sector. Companies must navigate shifting supply dynamics and the ongoing transition towards renewable energy sources – a pivotal chapter in the quest for sustainable and affordable solutions.
Energy firms will need to carefully analyze the implications, aligning their business models through refining capacity expansions, logistical optimizations, and a focus on renewable fuels.
Staying Ahead of Competition with Fuel Price Tracking
In this evolving landscape, closely tracking fuel prices and having access to up-to-date data is crucial for informed decision-making and staying competitive in the market for fuel retailers. While prices may go down in the long- to medium-term, ensuring short-term price competitiveness at a hyperlocal level is essential for gas stations and convenience stores navigating the changing tides.
DataWeave’s real-time fuel pricing data, covering a wide range of fuel types from gasoline to diesel and updated as frequently as every 30 minutes, empowers retailers to quickly adapt to market changes and remain strategically aligned with evolving consumer preferences.
By closely monitoring hyperlocal fuel price fluctuations across their coverage areas, retailers can quickly adapt their pricing strategies to remain competitive and align with shifting consumer behaviors.
Further, DataWeave’s real-time fuel pricing intelligence can help retailers understand the relationship between crude oil prices, crack spreads (the differential between wholesale fuel prices and crude oil), and their own pricing strategies. Our solution offers real-time insights and analytics to help retailers navigate the evolving fuel pricing landscape.
Visit our recently launched U.S. Fuel Price Interactive Dashboard which displays weekly fuel prices across 400+ unique ZIP codes, delivering insights into price changes by region, store, fuel type, and other dimensions.
To learn more about DataWeave’s solutions or to discuss how we can support your fuel retail business, reach out to our team today!
Brands are becoming increasingly proficient in monitoring and refining their presence on online marketplaces, utilizing Digital Shelf Analytics to gather and analyze data on their online performance. These tools offer invaluable insights into enhancing visibility, adjusting pricing strategies, and improving content quality on eCommerce sites.
Yet, as the retail landscape shifts towards a more integrated omnichannel approach, it’s crucial for brands, particularly those in CPG, to apply similar strategies to their offline channels. For brands that count physical stores among their primary sales channels, gaining localized insights is key to boosting in-store sales performance.
Collecting shelf data from offline channels presents more challenges than online. Traditional methods, such as physical store visits, often fall short in reliability, timeliness, scale, and level of coverage.
However, the world of eCommerce provides a solution. As part of the effort to facilitate options like buy-online-pickup-in-store (BOPIS) for shoppers, major retailers make store-specific product details available online. Consumers often go online and select their nearest store to make purchases digitally before choosing a fulfillment option like picking up at the store or direct delivery. Aggregating this store-level information offers brands critical insights into pricing and inventory across a vast network of stores, enabling them to make informed decisions that improve pricing strategies and supply chain efficiency, thus minimizing stockouts in crucial markets.
Further, as consumers increasingly seek flexibility in how they receive their purchases—be it through in-store pickup, delivery, or shipping—brands need to adeptly monitor pricing and availability for these different fulfilment options. Such granular insight empowers brands to adapt swiftly and maintain a competitive edge in today’s dynamic retail environment.
Why does monitoring pricing and availability data across stores matter to brands?
Hyperlocal Competitive Strategy: This allows brands to adjust their pricing strategies based on regional competition. By understanding the local market, brands can decide whether to position themselves as cost leaders or premium offerings. In particular, this is indispensable for Net Revenue Management (NRM) teams.
Targeted Marketing Initiatives: Understanding regional price and availability enables brands to customize their marketing efforts for specific markets. By aligning their strategies with local demand trends and inventory levels, brands can more effectively engage their target audiences.
Efficient Inventory Management: By keeping a close eye on store-level data, brands can better manage their stock, ensuring high-demand products are readily available while minimizing the risk of overstocking or running out of stock.
Minimum Advertised Price (MAP) Monitoring: While brands cannot directly control retail pricing, staying updated on pricing trends helps them adjust their MAP to reflect the competitive landscape, consumer expectations, cost considerations, and regional differences. A strategic approach to MAP management supports brand competitiveness and profitability in a fluctuating market.
DataWeave’s Digital Shelf Analytics solutions equip brands with the necessary data and insights to do all of the above.
DataWeave’s Digital Shelf Analytics is location-aware
DataWeave’s Digital Shelf Analytics platform stands out with its sophisticated location-aware capabilities, enabling the aggregation and analysis of localized pricing, promotions, and availability data. Our platform defines locations using a range of identifiers, including latitudes and longitudes, ZIP codes, or specific stores, and can aggregate this data for particular states or regions.
The strength of the platform lies in its robust data collection and processing framework, which operates seamlessly across thousands of stores and regions. This system is designed to operate at configurable intervals—daily, weekly, or monthly—allowing brands to keep a vigilant eye on product availability, pricing strategies, and delivery timelines based on the selected fulfillment option.
Unlike many other providers, who may provide limited insights from a sample of stores, our solution delivers exhaustive analytics from every storefront. This comprehensive approach grants brands a strategic edge, facilitating efficient inventory tracking, precise pricing adjustments, and rapid responses to fluctuating market dynamics. It cultivates brand consistency and loyalty by enabling brands to adapt proactively to the changing landscape.
Aggregated store-level digital shelf insights via DataWeave
In the summarized view shown above, a brand can track how its various products are positioned across stores and retailers like Walmart, Amazon, Meijer, and others in the US.
Using DataWeave, brands can easily see important metrics like availability levels, prices, and other metrics across these stores gaining immediate visibility without having to physically audit them. the brand can track the same metrics for products across competitor brands and inform its own pricing, stock, and assortment decisions.
Store-level availability insights
We provide a comprehensive view of product availability, highlighting the distribution of out-of-stock (OOS) scenarios across various retailers and pinpointing the availability status throughout a brand’s network of stores. This capability enables swift identification of widespread availability issues, offering a bird’s-eye view of where shortages are most pronounced. By simply hovering over a specific location, detailed information about stock status and pricing for individual stores becomes accessible.
Such insights are crucial for brands to adapt their strategies, mitigate risks, and ensure they meet consumer needs despite the ever-changing retail ecosystem.
Store-level pricing insights
Retailers often adopt different pricing strategies to deal with margin pressure, local competition, and surplus stock. Grasping these pricing dynamics at a hyperlocal level enables brands to tailor their strategies effectively to maintain a competitive edge.
Our platform offers an in-depth look at how prices vary among retailers, across different stores, and throughout various regions. This analysis reveals the nuanced pricing tactics employed by retailers on a regional scale.
For example, brands might see that some retailers, like Kroger and Walmart in the chart below, maintain consistent pricing across their outlets, demonstrating a uniform pricing strategy. In contrast, others, such as Meijer and Shoprite, might adjust their prices to match local market conditions, indicating a more localized approach to pricing.
With DataWeave, brands can dive deeper into the pricing landscape of a specific retailer, examining a price map that provides detailed information on pricing at the store level upon hovering over a given location.
By presenting a historical analysis of average selling prices across different retailers, we equip brands with the insights needed to understand past pricing strategies and anticipate future trends, helping them to strategize more effectively in an ever-evolving market.
Digital Shelf Analytics that work for both eCommerce and brick-and-mortar store data
While established brands have made strides in gathering online pricing and availability data through Digital Shelf Analytics solutions, integrating comprehensive insights from both brick-and-mortar and eCommerce channels often remains a challenge.
DataWeave stands out for its capacity to collect data across diverse digital platforms, including desktop sites, mobile sites, and mobile applications. This capability ensures that omnichannel brands can have a holistic view of their pricing, promotional, and inventory strategies across all locations and digital landscapes.
Leveraging localized Digital Shelf Analytics to understand the intricacies of pricing and availability at the store level allows brands to fine-tune their approaches, swiftly adapt to local market shifts, and uphold a unified brand presence across the digital and offline spheres. This strategic agility places them in a favorable competitive position, enhancing customer satisfaction and trust, which are crucial for sustained success.
Easter egg hunts just got more challenging for families this year as the price of chocolate and other candies has soared. The root of this price surge lies in a cocoa deficit, attributed to diseases affecting crops and the adverse effects of climate change on West African farms, which supplies over 70% of the world’s cocoa. This has resulted in a tripling of cocoa prices over the last year, causing a “cocoa crunch,” and severely impacted confectioners and chocolate makers.
Reuters recently reported that Iconic brands such as Hershey’s and Cadbury find themselves grappling with the need to adjust to escalating costs for raw materials. Given that Easter is one of the top three candy-purchasing occasions, these manufacturers are contemplating raising their prices to sustain their profit margins.
Despite the challenges posed by the cocoa shortfall and persistent inflation, the National Confectioners Association anticipates that Easter candy sales in the U.S. will match or even exceed last year’s figures, which amounted to approximately $5.4 billion. This expectation is predicated more on price increases than on a rise in sales volume.
At DataWeave, our ongoing analysis of pricing trends across various consumer categories among retailers has provided insight into the evolving landscape of chocolate and candy prices in 2023 and 2024.
Our Analysis of Inflation in Candy and Chocolate Prices
Our study encompassed a broad array of 3,300 products from leading U.S. retailers, Amazon, Target, Kroger, and Giant Eagle. As illustrated in the following chart, the trajectory of prices over the past 15 months was compared against the average prices in January 2023. Our tracking focused on two key price points: the selling price, which represents the final cost to consumers after applying any discounts or promotions, and the Manufacturer’s Suggested Retail Price (MSRP), as determined by the brands themselves.
The findings from our analysis indicate that the average selling price, primarily influenced by retailer decisions, has experienced a steady increase throughout 2023, reaching a peak at 16.2% above January 2023’s figures by December. As of March 2024, coinciding with the Easter season, the selling prices are approximately 10% higher than they were at the beginning of the previous year.
Simultaneously, the MSRP has seen a consistent uptick, driven by the climbing costs of cocoa. Brands have adjusted their suggested prices accordingly, with the current MSRP standing about 7% above its January 2023 level, after having peaked at a 7.6% increase by December 2023. This reflects the direct impact of rising cocoa costs on product pricing strategies.
Chocolate Candies Are Hit The Hardest
Across all candies, chocolate-based products have witnessed significantly sharper price increases than their non-chocolate counterparts. In the past 14 months, the selling prices of chocolate items have surged by 14.9%, a stark contrast to the modest 4% rise observed in non-chocolate candies.
This price escalation was particularly pronounced during the Christmas shopping period, a response to heightened demand, before experiencing a temporary decline in February.
The diminishing availability of cocoa, coupled with rising costs for packaging and transportation, has compelled brands and retailers alike to transfer these added expenses onto the consumer. This dynamic underpins the distinct pricing trends observed across the candy spectrum, with chocolate items bearing the brunt of these cost pressures.
Discounts Offered By Retailers and Brands to Entice Easter Shoppers
In our analysis, we delved deeper to identify the retailers and brands offering the most compelling prices for Easter-centric confections, including Chocolate Eggs, Chocolate Bunnies, and Easter-themed gift packs.
Kroger emerged as the frontrunner among the retailers we monitored, offering an impressive 19% discount on Easter candies. Giant Eagle followed with a solid 14% average markdown. Meanwhile, Amazon and Target provided more modest promotional discounts at 12% and 10%, respectively.
Kroger is making significant efforts to ensure consumers have access to attractively priced Easter treats. The retailer planned to keep its doors open throughout the Easter weekend, featuring baskets brimming with discounted items such as Russell Stover chocolate bunnies, Brach’s jelly beans, Reese’s eggs, and assorted bags of popular candies from Snickers, Twix, and Starburst, among others. Additionally, Kroger is enhancing its value proposition through gift card offers and exclusive Easter deals for its loyalty program members.
On the brand front, Starburst by Mars Wrigley leads with the steepest discount of 25%. Cadbury, under Mondelez, is not far behind, offering 21% off its mini eggs and other Easter treats, marking an increase from last year’s 17% discount. Ferrero Rocher is making a strong pricing move with an average 20% markdown on its Easter selections, including the chocolate bunny and squirrel figures.
The beloved Peeps marshmallow candies by Just Born are being offered at an 18% discount this year, slightly less than the 23% discount seen in 2023, likely reflecting the impact of rising sugar costs, given their sugar and corn composition.
Other notable brands, including M&M’s and the premium Swiss chocolatier Lindt, have elevated their average Easter discounts to 17% this year, up from the previous year’s discounts of 12%, and 10% respectively, showcasing a competitive pricing strategy to delight consumers this Easter season.
Coping With Inflation This Easter Season
Retailers and brands aiming to remain profitable and competitive in the current challenging environment can adopt a few strategic approaches:
Creative Product Bundling: Design innovative combo packs that mix chocolate and non-chocolate items. Such bundles can cater to diverse consumer preferences and budget ranges while preserving profit margins.
Encouragement of Bulk Purchases: Offer enticing discounts on larger quantities to promote bulk buying. This strategy can help amplify sales volumes, compensating for increased costs per item and fostering economies of scale.
Strategic Competitive Pricing: Keeping a vigilant eye on competitors’ pricing strategies is vital. Aim to capture market share through well-thought-out discount strategies that balance competitiveness with margin preservation. Leveraging advanced pricing intelligence, such as that offered by DataWeave, can provide invaluable insights for making informed pricing decisions.
Product Size Adjustments: Consider revising the size or weight of products as a cost management measure, a strategy known as “shrinkflation.” It’s crucial to approach this transparently, ensuring clear communication on packaging to uphold consumer trust.
Adopting these strategies—focusing on bundle offerings, incentivizing bulk purchases, optimizing pricing strategies based on competitive intelligence, and thoughtfully adjusting product sizes—will be pivotal for confectioners to navigate the challenges posed by the cocoa price surge.
For more information, reach out to us to speak to a DataWeave expert today!
As eCommerce increasingly becomes a prolific channel of sales for consumer brands, they find that maintaining a consistent and trustworthy brand image is a constant struggle. In an ecosystem filled with dozens of marketplaces and hundreds of third-party merchants, ensuring that customers see what aligns with a brand’s intended image is quite tricky. With many fakes and counterfeit products doing the rounds, brands may further struggle to get the right representation.
One way brands can track and identify inconsistencies in their brand representation across marketplaces is to use Digital Shelf Analytics solutions like DataWeave’s – specifically the Content Audit module.
This solution uses advanced AI models to identify image similarities and dissimilarities compared with the original brand image. Brands could then use their PIM platform or work with the retailer to replace inaccurate images.
But here’s the catch – AI can’t always accurately predict all the differences. Relying solely on scores given by these models poses a challenge in tracking the subtle differences between images. Often, image pairs with seemingly high match scores fail to catch important distinctions. Fake or counterfeit products and variations that slip past the AI’s scrutiny can lead to significant inaccuracies. Ultimately, it puts the reliability of the insights that brands depend on for crucial decisions at risk, impacting both top and bottom lines.
Dealing with this challenge means finding a balance between the number-based assessments of AI models and the human touch needed for accurate decision-making. However, giving auditors the ability to pinpoint variations precisely goes beyond simply sharing numerical values of the match scores with them. Visualizing model-generated scores is important as it provides human auditors with a tangible and intuitive understanding of the differences between two images. While numerical scores are comparable in the relative sense, they lack specificity. Visual interpretation empowers auditors to identify precisely where variations occur, aiding in efficient decision-making.
How AI-Powered Image Scoring Works
At DataWeave, our approach involves employing sophisticated computer vision models to conduct extensive image comparisons. Convolutional Neural Network (CNN) models such as Resnet-50 or YOLO, in conjunction with feature extraction models, analyze images quantitatively. This AI-powered image scoring process yields scores that indicate the level of similarity between images.
However, interpreting these scores and understanding the specific areas of difference can be challenging for human auditors. While computer vision models excel at processing vast amounts of data quickly, translating their output into actionable insights can be a stumbling block. A numerical score may not immediately convey the nature or extent of the differences between images
In the assessment of these images, all fall within the 70 to 80 range of scores (out of a maximum of 100). However, discerning the nature of differences—whether they are apparent or subtle—poses a challenge for the AI models and human auditors. For example, there are differences in the placement or type of images in the packaging, as well as packing text that are often in an extremely small font size. It is, of course, possible for human auditors to identify the differences in these images, but it’s a slow, error-prone, and tiring process, especially when auditors often have to check hundreds of image pairs each day.
So how do we ensure that we identify differences in images accurately? The answer lies in the process of visual highlighting.
How Visual Highlighting Works
Visual highlighting is a method that enhances our ability to comprehend differences in images by combining sophisticated algorithms with human understanding. Instead of relying solely on numerical scores, this approach introduces a visual layer, resembling a heatmap, guiding human auditors to specific areas where discrepancies are present.
Consider the scenario depicted in the images above: a computer vision model assigns a score of 70-85 for these images. While this score suggests relatively high similarity, it fails to uncover major differences between the images. Visual highlighting comes into play to overcome this limitation, precisely indicating regions where even subtle differences are seen.
Visual highlighting entails overlaying compared images and emphasizing areas of difference, achieved through techniques like color coding, outlining, or shading specific regions. The significance of the difference in a particular area determines the intensity of the visual highlight.
For instance, if there’s a change in the product’s color or a discrepancy in the packaging, these variations will be visually emphasized. This not only streamlines the auditing process but also enables human evaluators to make well-informed decisions quickly.
Benefits of Visual Highlighting
Intuitive Understanding: Visual highlighting offers an intuitive method for interpreting and acting upon the outcomes of computer vision models. Instead of delving into numerical scores, auditors can concentrate on the highlighted areas, enhancing the efficiency and accuracy of the decision-making process.
Accelerated Auditing: By bringing attention to specific regions of concern, visual highlighting speeds up the auditing process. Human evaluators can swiftly identify and address discrepancies without the need for exhaustive image analysis.
Seamless Communication: Visual highlighting promotes clearer communication between automated systems and human auditors. Serving as a visual guide, it enhances collaboration, ensuring that the subtleties captured by computer vision models are effectively conveyed.
The Way Forward
As technology continues to evolve, the integration of visual highlighting methodologies is likely to become more sophisticated. Artificial intelligence and machine learning algorithms may play an even more prominent role in not only detecting differences but also in refining the visual highlighting process.
The collaboration between human auditors and AI ensures a comprehensive approach to maintaining brand integrity in the ever-expanding digital marketplace. By visually highlighting differences in images, brands can safeguard their visual identity, foster consumer trust, and deliver a consistent and reliable online shopping experience. In the intricate dance between technology and human intuition, visual highlighting emerges as a powerful tool, paving the way for brands to uphold their image with precision and efficiency.
Consumer brands around the world increasingly recognize the vital role of tracking and optimizing their digital shelf KPIs, such as Content Quality, Share of Search, Availability, etc. These metrics play a crucial role in boosting eCommerce sales and securing a larger online market share. With the escalating requirements of brands, the sophistication of top Digital Shelf Analytics providers is also on the rise. Consequently, the adoption of digital shelf solutions has become an essential prerequisite for today’s leading brands.
As brands and vendors continue to delve further and deeper into the world of Digital Shelf Analytics, a significant and often overlooked aspect is the analysis of digital shelf data on mobile apps. The ability of solution providers to effectively track and analyze this mobile-specific data is crucial.
Why is this emphasis on mobile apps important?
Today, the battle for consumer attention unfolds not only on desktop web platforms but also within the palm of our hands – on mobile devices. As highlighted in a recent Insider Intelligence report, customers will buy more on mobile, exceeding 4 in 10 retail eCommerce dollars for the first time.
Moreover, thanks to the growth of delivery intermediaries like Instacart, DoorDash, Uber Eats, etc., shopping on mobile apps has received a tremendous organic boost. According to an eMarketer report, US grocery delivery intermediary sales are expected to reach $68.2 billion in 2025, from only $8.8 billion in 2019.
In essence, mobile is increasingly gaining share as the form factor of choice for consumers, especially in CPG. In fact, one of our customers, a leading multinational CPG company, revealed to us that it sees up to 70% of its online sales come through mobile apps. That’s a staggering number!
The surge in app usage reflects a fundamental change in consumer behavior, emphasizing the need for brands to adapt their digital shelf strategies accordingly.
Why Brands Need To Look at Apps and Desktop Data Differently
Conventionally, brands that leverage digital shelf analytics rely on data harnessed from desktop sites of online marketplaces. This is because capturing data reliably and accurately from mobile apps is inherently complex. Data aggregation systems designed to scrape data from web applications cannot easily be repurposed to capture data on mobile apps. It requires dedicated effort and exceptional tech prowess to pull off in a meaningful and consistent way.
In reality, it is extremely important for brands to track and optimize their mobile digital shelf. Several digital shelf metrics vary significantly between desktop sites and mobile apps. These differences are natural outcomes of differences in user behavior between the two form factors.
One of these metrics that has a huge impact on a brand’s performance on retail mobile apps is their search discoverability. Ecommerce teams are well aware of the adverse impact of the loss of even a few ranks on search results.
Anyone can easily test this. Searching something as simple as “running shoes” on the Amazon website and doing the same on its mobile app shows at least a few differences in product listings among the top 20-25 ranks. There are other variances too, such as the number of sponsored listings at the top, as well as the products being sponsored. These variations often result in significant differences in a brand’s Share of Search between desktop and mobile.
Share of Search is the share of a brand’s products among the top 20 ranked products in a category or subcategory, providing insight into a brand’s visibility on online marketplaces.
Picture a scenario in which a brand heavily depends on desktop digital shelf data, confidently assuming it holds a robust Share of Search based on reports from its Digital Shelf Analytics partner. However, unbeknownst to the team, the Share of Search on mobile is notably lower, causing a detrimental effect on sales.
To fully understand the scale of these differences, we decided to run a small experiment using our proprietary data analysis and aggregation platform. We restricted our analysis to just Amazon.com and Amazon’s mobile app. However, we did cover over 13,000 SKUs across several shopping categories to ensure the sample size is strong.
Below, we provide details of our key findings.
Share of Search on The Digital Shelf – App Versus Desktop
Our analysis focused on three popular consumer categories – Electronics, CPG, and Health & Beauty.
In the electronics category, brands like Apple, Motorola, and Samsung, known for their mobile phones, earbuds, headphones, and more, have a higher Share of Search on the Amazon mobile app compared to the desktop.
Meanwhile, Laptop brands like Dell, Acer, and Lenovo, as well as other leading brands like Google have a higher Share of Search on the desktop site compared to the app. This is the scenario that brands need to be careful about. When their Share of Search on mobile apps is lower, they might miss the chance to take corrective measures since they lack the necessary data from their provider.
In the CPG category, Ramen brand Samyang, with a lot of popularity on Tiktok and Instagram, shows a higher Share of Search on Amazon’s mobile app. Speciality brands like 365 By Whole Foods, pasta and Italian food brands La Moderna, Divinia, and Bauducco too have a significantly higher Share of Search on the app.
Cheese and dessert brands like Happy Belly, Atlanta Cheesecake Company, among others, have a lower Share of Search on the mobile app. Ramen brand Sapporo is also more easily discovered on Amazon’s desktop site. Here, we see a difference of more than 5% in the Share of Search of some brands, which is likely to have a huge impact on the brand’s mobile eCommerce sales levels and overall performance.
Lastly, in the Health & Beauty category, Shampoos and hair care brands like Olaplex, Dove, and Tresemme exhibited a higher Share of Search on the mobile app compared to the desktop.
On the other hand, body care brands like Neutrogena and Hawaiian Tropic, as well as Beardcare brand Viking Revolution displayed a higher Share of Search on Amazon’s desktop site.
Based on our data, it is clear that there are several examples of brands that do better in either one of Amazon’s desktop sites or mobile apps. In many cases, the difference is stark.
So What Must Brands Do?
Our findings emphasize the imperative for brands to move beyond a one-size-fits-all approach to digital shelf analytics. The striking variations in Share of Search between mobile apps and desktops conclusively demonstrate that relying solely on desktop data for digital shelf optimization is inadequate.
If brands see that they’re falling behind on the mobile digital shelf, there are a few things they can do to help boost their performance:
If a brand’s Share of Search is lower on the mobile app, they can divert their retail spend to mobile in order to inorganically compensate for this difference. This way, any short-term impact due to lower discoverability is mitigated. This is also likely to result in optimized budget allocation and ROAS.
Brands also need to ensure their content is optimized for the mobile form factor, with images that are easy to view on smaller screens, and tailored product titles that are shorter than on desktops, highlighting the most important product attributes from the consumer’s perspective. Not only will this help brands gain more clicks from mobile shoppers, but this will also gradually lead to a boost in their organic Share of Search on mobile.
CPG brands, specifically, need to optimize their digital shelf for delivery intermediary apps (along with marketplaces). The grocery delivery ecosystem is booming with companies like DoorDash, Delivery Hero, Uber Eats, Swiggy, etc. leading the way. Using Digital Shelf Analytics to optimize performance on delivery apps is quite an involved process with a lot of bells and whistles to consider. Read our recently published whitepaper that specifically details how brands can successfully boost their visibility and conversions on delivery apps.
But first, brands need to identify and work with a Digital Shelf Analytics partner that is able to capture and analyze mobile app data, enabling tailored optimization approaches for all eCommerce platforms.
DataWeave leads the way here, providing the world’s most comprehensive and sophisticated digital shelf analytics solution, rising above all other providers to provide digital shelf insights for both web applications and mobile apps. Our data aggregation platform successfully navigates the intricacies of capturing public data accurately and reliably from mobile apps, thereby delivering a comprehensive cross-device view of digital shelf KPIs to our brand customers.
So reach out to us today to find out more about our digital shelf solutions for mobile apps!
With thousands of products and hundreds of online retailers to choose from, the average modern-day shopper usually compares prices across several e-commerce sites effortlessly before often settling for the lowest priced option. As a result, retailers today are forced to execute millions of price changes per day in a never-ending race to be the lowest priced – without losing out on any potential margin.
Identifying, classifying, and matching products is the first step to comparing prices across websites. However, there is no standardization in the way products are represented across e-commerce websites, causing this process to be fairly complex.
Here’s an example:
What’s needed is a pricing intelligence solution that first matches products across several websites swiftly and accurately, and then enables automated tracking of competitor pricing data on an ongoing basis.
Pricing intelligence solutions already exist. What’s wrong with using them?
There are several challenges with the incumbent solutions in the market – the biggest one being that they don’t work in a timely manner. In essence, it’s like deferring the process of finding actionable information that helps retailers acquire a competitive advantage, and instead doing it in hindsight. Like an autopsy of sorts.
Here are the various solution types we have in the market today:
Internally developed systems – Solutions developed by retailers themselves often rely on heavy manual data aggregation and have poor product matching capabilities. Since these solutions have been developed by professionals not attuned to building data crunching machines, they pose significant operational challenges in the form of maintenance, updates, etc.
Web scraping solutions – These solutions have no data normalization or product matching capabilities, and lack the power to deliver relevant actionable insights. What’s more, it’s a struggle to scale them up to accommodate massive volumes of data during peak times such as promotional campaigns.
DIY solutions – These solutions require manual research and entry of data. It goes without saying that due to the level of human intervention and effort required, they’re expensive, difficult to scale, slow, and of questionable accuracy.
As common as it is nowadays, AI has the answer
DataWeave’s competitive pricing intelligence solution is designed to help retailers achieve precisely the competitive advantage they need by providing them with accurate, timely, and actionable pricing insights enabled by matching products at scale. We provide retailers with access to detailed pricing information on millions of products across competitors, as frequently as they need it.
Our technology stack broadly consists of the following.
1. Data Aggregation
At DataWeave, we can aggregate data from diverse web sources across complex web environments – consistently and at a very high accuracy. Having been in the industry for close to a decade, we’re sitting on a lot of data that we can use to train our product matching platform.
Our datasets include data points from tens of millions of products and have been collected from numerous geographies and verticals in retail. The datasets contain hierarchically arranged information based on retail taxonomy. At the root level, there’s information such as category and subcategory, and at the top level, we have product details such as title, description, and other <attribute, value> relationships. Our machine learning architectures and semi-automated training data building systems, augmented by the skills of a strong QA team, help us annotate the necessary information and create labeled datasets using proprietary tools.
2. AI for Product Matching
Product matching at DataWeave is done via a unified platform that uses both text and image recognition capabilities to accurately identify similar SKUs across thousands of e-commerce stores and millions of products. We use an ensemble deep learning architectures tailored to NLP and Computer Vision problems specific to us and heuristics pertinent to the Retail domain. Products are also classified based on their features, and a normalization layer is designed based on various text/image-based attributes.
Our semantics layer, while technically an integral part of the product matching process, deserves particular mention due to its powerful capabilities.
The text data processing consists of internal, deep pre-trained word embeddings. We use state-of-the-art, customized word representation techniques such as ELMO, BERT, and Transformer to capture deeply contextualized text with improved accuracy. A self-attention/intra-attention mechanism learns the correlation between the word in question and a previous part of the description.
Image data processing starts with object detection to identify the region of interest of a given product (for example, the upper body of a fashion model displaying a shirt). We then leverage deep learning architectures such as VggNet, Inception-V3, and ResNet, which we have trained using millions of labeled images. Next, we apply multiple pre-processing techniques such as variable background removal, face removal, skin removal, and image quality enhancing and extract image signatures via deep learning and machine learning-based algorithms to uniquely identify products across billions of indexed products.
Finally, we efficiently distribute billions of images across multiple stores for fast access, and to facilitate searches at a massive scale (in a matter of milliseconds, without the slightest compromise on accuracy) using our image matching engine.
3. Human Intelligence in the Loop
In scenarios where the confidence scores of the machine-driven matches are low, we have a team of Quality Assurance (QA) specialists who verify the output.
This team does three things:
Find out why the confidence score is low
Confirm the right product matches
Figure out a way to encode this knowledge into a rule and feed it back to the algorithm
In this way, we’ve built a self-improving feedback loop which, by its very nature, performs better over time. This system has accumulated knowledge over the 8 years of our operations, which is going to be hard for anyone to replicate. Essentially, this process enables us to match products at massive scale quickly and at very high levels of accuracy (usually over 95%).
4. Actionable Insights Via Data Visualization
Once the matching process is completed, the prices are aggregated at any frequency, enabling retailers to optimize their prices on an ongoing basis. Pricing insights are typically consumed via our SaaS-based web-portal, which consists of dashboards, reports, and visualizations.
Alternatively, we can integrate with internal analytics platforms through APIs or generate and deliver spreadsheet reports on a regular basis, depending on the preferences of our customers.
To summarize
The benefits of our solution are many. Detailed price improvement opportunity-related insights generated in a timely manner empower retailers to significantly enhance their competitive positioning across categories, product types, and brands, as well as ability to influence their price perception among consumers. These insights, when leveraged at a higher granularity over the long term, can help maximize revenue through price optimization at a large scale.
Our solution also helps drive process-based as well as operational optimizations for retailers. Such modifications help them better align themselves to effectively adopt a data-driven approach to pricing, in turn helping them achieve much smarter retail operations across the board.
All of this wouldn’t be possible if the product matching process, inherent to this system, was unreliable, expensive, or time-consuming.
If you would like to learn more about DataWeave’s proprietary product matching platform and the benefits it offers to eCommerce businesses and brands, talk to us now!
On Black Friday this year, Health & Beauty brands saw a significant increase with a 13% jump in foot traffic, according to a report by RetailNext. Despite caution from various sources, higher prices for everyday goods, and high interest rates, consumers chose to spend big this cyber week.
So what kind of deals did top retailers and brands offer in the Health & Beauty category this BFCM? At DataWeave, we harnessed the power of our proprietary data aggregation and analysis platform to track and analyze the prices and deals of Health & Beauty products across prominent retailers to uncover unique insights into their price competitiveness this BFCM, as well as understand how pricing strategies varied across diverse subcategories and brands.
For this analysis, we tracked the average discounts among leading US retailers in the Health & Beauty category during the Thanksgiving weekend sale, including Black Friday and Cyber Monday. We noticed prices and discounts didn’t change significantly over the course of the weekend, and hence the average prices of products between the 24th and 27th of November are being reported. Our sample was chosen to encompass the top 500 ranked products in each product subcategory across leading retailers during the sale.
Subcategories reported on: Shampoo, Toothpaste, Conditioner, Sunscreen, Makeup, Electric Toothbrush, Beard Care, Moisturizer
Timeline of analysis: 24 to 27 November 2023
Our Key Findings
Average Discounts Across Retailers
Amazon leads the pack with a huge margin, offering an average discount of 31.9%, covering 62% of its products analyzed. Target follows an 18.8% average discount across only 5% of its analyzed assortment. The other retailers aren’t even close.
Ulta Beauty was the next in line, providing a 9.2% average discount followed by Walmart with a 6.8% average discount. Sephora, known for its premium beauty offerings, adopted a more conservative approach with a 3.5% average discount, targeting only 9% of its top products
Across retailers, it is clear that Amazon led the charge by far this cyber week, with the other retailers choosing to markdown prices conservatively in the Health & Beauty category.
Average Discounts: Subcategories
Amazon offered high discounts on lower priced subcategories like Toothpaste (49.4%), Sunscreen (46.3%), Moisturizers (38.5%), and Conditioners (37.5%), highlighting its focus on products with high demand that consumers would look to stock up on. Ulta Beauty also focused its discounts on Toothpaste (15.6%), Moisturizers (14.9%), and Conditioners (12.6%), targeting skincare and grooming.
Sephora, meanwhile, offered the most attractive deals on the Makeup subcategory at 5.3% across 12.67% of its analyzed assortment, banking on the demand generated due to the brand’s popularity in this subcategory.
Target prioritized discounts on Toothpaste (22.5%), Shampoo (21.6%), and Moisturizers (18.9%). Walmart too offered significant discounts on Shampoo (21.6%) and Toothpaste (22.5%).
Retailers prioritized staple subcategories like Toothpaste and Moisturizer with substantial discounts during this Black Friday Cyber Monday, ensuring a broad consumer appeal. In contrast, discretionary items like Makeup may be less motivated by discounts alone, and hence saw lower discounts during the sale.
Average Discounts: Brands
Brands offered the most attractive deals on Amazon, with OGX leading the pack at 58.4% average discount. Neutrogena and Colgate followed with an average discount of 50.4% and 44%. This mirror’s Amazon’s subcategory focus on shampoos, conditioners, and toothpastes.
Other instances of brands offering attractive deals across retailers include Belif (27.9%) and Anastasia Beverly Hills (17.6%) on Sephora, Johnson’s (20%) and Philips Sonicare (18.8%) on Target, and Olay (12.2%) and Colgate (10.6%) on Walmart.
Ulta Beauty hosted several attractive deals by specific brands, including Moon (30.7%), Joico (24%), and Clinique (22.3%).
Share of Search For Health & Beauty Brands Across Subcategories
Our Share of Search analysis illuminates the strategic moves made by brands to enhance their visibility, playing a crucial role in influencing consumer choices during Black Friday and Cyber Monday.
Among some of the leading brands, Head & Shoulders and Oral-B increased their Share of Search by 2.3% and 1% respectively, reflecting a successful strategy to boost brand visibility during the Black Friday and Cyber Monday shopping events. On the other hand, L’Oreal Paris, Colgate, and Neutrogena faced marginal decreases in Share of Search.
Overall, since the difference in Share of Search values did not change dramatically, the visibility levels of leading brands across key subcategories remained consistent during the Thanksgiving weekend.
—
For deeper insights on pricing and discounting trends across a diverse range of shopping categories during Black Friday and Cyber Monday, check out our blog!
To learn more about our AI-powered Pricing Intelligence and Digital Shelf Analytics platform, contact us today!
Insider Intelligence‘s forecast of a 4.5% growth in US Holiday Sales this year has been validated by the sustained robust spending observed during Black Friday and Cyber Monday. Despite multiple challenges impacting consumer spending, such as escalating prices of everyday products and elevated interest rates, shoppers continued to spend significantly, aligning with these earlier predictions.
However, in response to these projections, retailers strategically adjusted their approach. Our analysis indicates substantial discounts prevalent in the Consumer Electronics and Home & Furniture segments during Cyber Week. Prominent retailers specializing in Home & Furniture, such as Wayfair, Overstock, and Home Depot, notably led the charge in offering attractive discounts.
At DataWeave, we harnessed the power of our proprietary data aggregation and analysis platform to track and analyze the prices and deals of home & furniture products across prominent retailers to uncover unique insights into their price competitiveness this BFCM, as well as understand how pricing strategies varied across diverse subcategories and brands.
We’ve also recently published our analysis of the Consumer Electronics and Apparel categories this Black Friday and Cyber Monday.
Our Methodology
For this analysis, we tracked the discounts offered by leading US retailers in the Home & Furniture category during the Thanksgiving weekend sale, including Black Friday and Cyber Monday. We noticed prices and discounts didn’t change significantly over the course of the weekend, and hence the average prices of products between the 24th and 27th of November are being reported. Our sample was chosen to encompass the top 500 ranked products in each product subcategory across leading retailers during the sale.
Sample size: 44,716 SKUs
Retailers tracked: Amazon, Walmart, Target, Best Buy, Overstock, Wayfair, Home Depot
Subcategories reported on: Dishwasher, Washer/Dryer, Mattresses, Beds, Dining Tables, Entertainment Units, Rugs, Luggage, Bookcases, Cabinets, Sofas, Coffee Tables
Timeline of analysis: 24 to 27 November 2023
Our Key Findings
Discounts Across Retailers
Wayfair led the pack with the highest average discount of 27.5%, covering an impressive 88% of its Home & Furniture inventory. This bold strategy positions Wayfair as a go-to destination for consumers seeking substantial savings on high-quality Home & Furniture items during Black Friday and Cyber Monday.
Home Depot offered an average discount of 17.5%, covering a substantial 69% of the products analyzed, choosing to cash in on the Cyber Week madness. Overstock followed next with an average discount of 16.6%.
Interestingly, Home & Furniture happens to be one of the few categories in which Amazon did not offer the highest discount among the analyzed retailers, choosing a moderate average discount of 13.8%.
Best Buy also maintained a competitive stance in the category, providing an average discount of 12.8% across 58% of their assortment. Target adopted a conservative markdown strategy, offering a relatively low average discount of 6.5%.
In summary, the Home & Furniture category exhibited a diverse range of discounting strategies among retailers, reflecting a balance between competitiveness and profit margins. Consumers could have chosen from a spectrum of discounts based on their preferences and budget considerations during Black Friday and Cyber Monday.
Average Discounts: Subcategories
Among subcategories, Amazon offered a moderate 8.3% average discount on 32.9% of its products in this Dishwasher category, while Best Buy took a more aggressive stance with a 14.7% average discount covering 55.9% of its products.
Home Depot emerged as a standout player in the Washer/Dryer category, providing a substantial 21.3% discount on 78.4% of its analyzed inventory. Best Buy closely followed with a 15.1% average discount targeting 67.6% of its products.
Wayfair grabbed attention with a generous 36.9% average discount on Mattresses, covering almost all (99%) of its analyzed products. In addition, Wafair led the discount war in Beds, Dining Tables, Cabinets, Sofas, Coffee Tables, and Entertainment Units. Overstock took an aggressive pricing stance on Rugs, offering a substantial 52.3% average discount, covering 100% of its Rugs inventory.
Average Discounts: Brands
Among brands, Signature Design by Ashley maintained a consistent presence with substantial discounts on both Best Buy (25.24%) and Overstock (16.19%). This could be indicative of the brand’s commitment to appealing to a diverse customer base through varied retail channels. Costway emerges as a standout brand offering exceptionally high discounts at both Target (61.6%) and Walmart (51.7%).
Home Decorators Collection, Home Depot’s in-house brand, offered a significant 30.9% discount at Home Depot. High-margin private label brands like these afford retailers the opportunity to offer markdowns while retaining significant margins.
Strategic positioning on specific platforms, as seen with Alwyn Home on Wayfair and Noble House at Home Depot, suggests brands tailor their approach to the strengths and customer demographics of each retailer. The data suggests a nuanced interplay between brand positioning, discount strategies, and the perceived value offered.
Share of Search For Home & Furniture Brands
The Share of Search data for the Home & Furniture category unveils intriguing insights into brand visibility and performance during the Black Friday and Cyber Monday events. In this competitive landscape, where consumer decisions are influenced not only by discounts but also by brand visibility, the dynamics of Share of Search become pivotal.
Samsung strategically increased its Share of Search during the sale, showcasing a 1.2% improvement. This suggests a deliberate effort to reinforce brand visibility and capture the attention of potential buyers actively searching for Home & Furniture products, in this case, Washer/Dryers and Dishwashers.
Bosch too experienced a notable surge in Share of Search by 1.1%. LG, meanwhile, maintained a consistent Share of Search, with a marginal decrease of 0.1%. American Tourister experienced a modest increase in Share of Search by 0.4%.
Like in the other categories analyzed, the dynamics of Share of Search in the Home & Furniture category reflect brand strategies aimed at not only offering discounts but also ensuring heightened visibility during the critical Black Friday and Cyber Monday shopping events. Positive shifts indicate effective marketing efforts, while stable performers demonstrate a resilient brand presence in a competitive online marketplace.
To explore how our insights can help retailers and brands boost their pricing strategies during sale events, reach out to us today!
For more in-depth analyses and trends across various shopping categories, stay tuned to our blog.
As Black Friday and Cyber Monday unfolded across the globe, there was a noticeable subdued atmosphere compared to previous years. TD Cowen brokerage adjusted its forecast for US holiday spending, revising it down from an initial 4-5% growth to a more conservative estimate of 2-3%.
Compounded by persistent inflation and elevated interest rates, many consumers find themselves financially strained, leading to the projection of the slowest growth in US holiday spending in five years.
In this context, it would be relevant to investigate whether this restrained reaction from consumers had an influence on the extent of attractive deals and discounts provided by top retailers and brands during the sale event.
At DataWeave, we harnessed the power of our proprietary data aggregation and analysis platform to track and analyze the prices and deals of consumer electronics products across prominent retailers to uncover unique insights into their price competitiveness this BFCM, as well as understand how pricing strategies varied across diverse subcategories and brands.
Keep an eye on our blog for insights on other shopping categories like Apparel, Home & Furniture, and Health & Beauty!
Our Methodology
For this analysis, we tracked the average discounts among leading US electronics retailers during the Thanksgiving weekend sale, including Black Friday and Cyber Monday. We noticed prices and discounts didn’t change significantly over the course of the weekend, and hence the average prices of products between the 24th and 27th of November are being reported. Our sample was chosen to encompass the top 500 ranked products in each product subcategory across leading retailers during the sale.
Sample size: 23,505 SKUs
Retailers tracked: Amazon, Walmart, Target, Best Buy
The observed Black Friday and Cyber Monday discount strategies reveal a distinct competitive landscape among major retailers. Amazon emerged as the frontrunner, offering the highest average discounts at 23.30%, spanning a significant 74% of their consumer electronics inventory. Best Buy closely followed, with an average discount of 19.40% across 76% of their products.
On the other hand, Target and Walmart adopted a more conservative stance, providing lower average discounts at 14.8% and 12%, respectively, with Target discounting 51% of its products and Walmart discounting 41%. This variation in discounting strategies highlights the diverse approaches retailers take to attract and retain Black Friday and Cyber Monday shoppers, balancing competitiveness with profit margins.
Average Discounts: Subcategories
In the Headphones subcategory, Amazon stands out with a substantial 31.40% average discount, targeting 84.69% of SKUs, showcasing an aggressive discounting strategy. Best Buy follows closely, demonstrating competitive pricing with a 21.80% average discount on 67.03% of products.
Meanwhile, in TVs, Best Buy offered a significant 17.9% average discount across 89% of its products, signaling a targeted effort to capture a broad market share in this subcategory.
In the Laptop subcategory, Target was highly conservative, with only a 4.1% average discount covering 14.3% of its products, while Walmart positioned itself with a moderate 9.5% average discount, targeting 39.8% of its inventory.
Among Smartphones, Amazon (14.7%) was third to Best Buy and Target, which offered average discounts of 20.5% and 18.1%, respectively. Walmart, with an average discount of only 9.9% in the subcategory opted for a relatively muted approach.
Average Discounts: Brands
The discount strategies across top electronics brands during Black Friday unveil distinct approaches. Samsung emerges as a focal point across Amazon, Best Buy, Walmart, and Target. The brand was most attractively priced on Best Buy, with an average discount of 25.3%, followed by Target (18.3%) and Amazon (17.9%).
Apple’s discounts were quite consistent across Amazon (17.6%), Best Buy (16.1%), and Target (17.8%), with the exception of Walmart (8.1%). JBL, interestingly, opted to discount very heavily on Best Buy, at an average of 38.8%, resulting in several attractive deals for shoppers on the website. Sony, too, offered impressive discounts at over 23% on Amazon and Best Buy, followed by 16% on Walmart. On Amazon, Amazon Renewed (13.9%) was among the most aggressively discounted products, highlighting an effort to further appeal to cost-conscious consumers.
Overall, our analysis throws light on the nuanced strategies employed by leading brands on Amazon, Best Buy, Walmart, and Target, reflecting a delicate interplay between brand positioning, pricing competitiveness, and customer appeal.
Share of Search For Consumer Electronics Brands Across Subcategories
The Share of Search data reflects intriguing shifts in brand strategies during the Black Friday and Cyber Monday events. During sale events, brands looking to entice shoppers don’t rely only on price but also on search visibility to help drive awareness and conversion. Share of Search is defined as the share of a brand’s products among the top 20 ranked products in a subcategory, thereby providing insight into a brand’s visibility on online marketplaces.
Some of the brands that improved their Share of Search the most include LG, Skullcandy, Asus, JBL, and Samsung. On the other hand, prominent brands like Sony and Apple actually lost ground on this metric by 0.4% and 2% respectively.
At DataWeave, our commitment to empowering retailers and brands with actionable competitive and digital shelf insights remains unwavering. Our AI-powered platform provides a comprehensive view of market dynamics for our customers, enabling informed decision-making. As a partner in your journey, we offer tailored solutions to enhance your competitive edge, drive sales, and elevate your brand presence. To find out more about our solution, reach out to us today!
To learn more about pricing and discounting trends during Black Friday and Cyber Monday across various other shopping categories, stay tuned to our blog!
Inflation, like an invisible force, silently shapes the dynamics of economies, gradually eroding the purchasing power of consumers and leaving its imprint on various industries. High costs, hiring lags, and stagnating earnings pose severe challenges to businesses. One industry segment that intimately feels the impact of inflation is grocery, where price increases can be extremely concerning for the average consumer.
Over the last 12-plus months, the US has experienced a notable rise in inflation, stirring up concerns and influencing the way we shop for everyday essentials. Rising costs of raw materials, transportation, and labor have all played a role in driving up prices. Additionally, disruptions in global supply chains and fluctuations in currency exchange rates have further exacerbated the situation, creating a complex web of interdependencies.
To understand the magnitude of this phenomenon across leading e-retailers, we delved into an in-depth analysis of four major retail giants: Walmart, Amazon, Target, and Kroger.
Each of these retailers possesses a unique business model and competitive strategy, as well as faces unique challenges. This leads to distinct approaches to managing inflationary pressures. Walmart for instance, expects operating income growth to outpace sales growth in 2023. Given the persistence of high prices and the potential for further macro pressures, the retailer is taking a cautious outlook. In 2022, Amazon’s eCommerce business swung to a net loss of $2.7 billion, compared to a profit of $33.4 billion the previous year.
Amid these challenging circumstances, understanding the grocery pricing trends and strategies becomes imperative for retailers, both online and in stores to adapt and thrive in the current economic landscape. By examining their pricing trends, we can gain valuable insights into how these companies navigate the turbulent waters of the grocery industry against the backdrop of inflation.
Our Research Methodology
The data collected for our analysis encompassed a diverse range of products, from pantry staples like flour and rice to perishable goods like dairy and produce – a basket of around 600 SKUs matched across Amazon, Kroger, Target and Walmart, between January 2022 to February 2023.
Further, we separately focused on the prices of a smaller subset of 30+ high-volume daily staples that are likely to yield higher sales and margins for these retailers.
Average Selling Price of a Broad Set of Grocery Items
Our analysis reveals that Walmart consistently offers the lowest prices, with an average of 8% below its closest competitor, Target, despite an annual price increase of about 5%. Walmart seems to prioritize a “stability and predictability” strategy over margin optimization. The retailer’s 8% growth last quarter indicates that this strategy is bearing fruit. However, it’s important to note that this approach may have its drawbacks as Walmart’s margins come under pressure.
Average selling price trend across a basket of 500+ SKUs across Target, Walmart, Kroger, Amazon in the grocery category from Jan ’22 to Feb ’23.
In order to weather inflationary pressures, Walmart may adopt a cautious approach to growth while also focusing on securing margins. Reports suggest that the retailer has been pushing back against consumer packaged goods (CPG) manufacturers following a series of price hikes to counter inflationary cost pressures in early 2023. One of the reasons behind Walmart’s growth and increased sales can be attributed to ‘non-traditional’ higher-income households now seeking deals and discounts at Walmart as their spending power declines.
Interestingly, Amazon emerges as the highest-priced retailer, followed by Kroger, which increased its prices by 10% throughout the year. Consumer perception commonly associates Amazon with the lowest prices, but the data tells a different story. In fact, Amazon has been charging 12% to 18% higher prices than Walmart for groceries and is still maintaining its success.
While the company’s online sales declined by 4%, it saw a significant 9% increase in revenue from third-party seller services, such as warehousing, packaging, and delivery, in 2022. Amazon’s strong logistics and same-day delivery services give it a competitive advantage over other retailers, contributing to its revenue growth and margins. Interestingly, this presents an opportunity for Walmart and other retailers to increase prices while maintaining their strong competitive price positions.
Kroger, on the other hand, seems to be aiming for a premium price perception, consistently raising prices almost every month. Kroger’s pricing strategy appears to be closer to Amazon’s.
Average Selling Price for High-Volume Daily Staples
Pricing strategies often change for different categories of products. To better understand this, we focused our analysis further on a small subset of 30+ high-volume staples across retailers. These include baked goods, popular beverages, canned food, frozen meals, dairy, cereals, detergents, and other similar items.
Average selling price trend of 30+ high-volume daily staples across Target, Walmart, Kroger, Amazon in the grocery category from Jan ’22 to Feb ’23.
Walmart, possibly overestimating the impact of inflation, has continued to keep its prices the lowest, potentially aiming to increase margins through volume.
The level of price disparity across retailers is expectedly lower here, with Amazon and Kroger closely tracking Walmart’s average prices.
Target’s pricing strategy stands out as it consistently emerges as the highest-priced retailer for daily staples, despite being one of the lower-priced retailers for a broader basket of grocery items. This suggests that Target’s underlying technology may not be as optimized to address market dynamics compared to other leading retailers. In our opinion, Target may want to strengthen its efforts to track pricing more intensely for this sub-category.
A Data-fuelled Approach is the Need of the Hour
In the challenging economic landscape, retailers and grocery stores are under pressure to maintain their revenues and margins. Adopting a comprehensive and dynamic pricing strategy is crucial. Understanding which product categories are experiencing price increases among competitors can help retailers make informed decisions on pricing at both the category and product level.
Retailers should consider their balancing margin performance with consumers’ willingness to pay, rather than implementing broad price increases that may harm customer trust. Price increases can be challenging for both customers and merchants. Retailers who employ a data-driven and insight-based approach are more likely to succeed.
Keep an eye on the DataWeave blog for analysis on pricing, discounting, stock availability, discoverability, and more, across retailers and brands from other industry segments as well.
Counterfeits pose a dangerous threat to any retail brand. Since every single sale is a pivotal branding opportunity, especially for young, burgeoning eCommerce brands, an online marketplace flooded with counterfeits can be particularly dangerous. One in five customers will boycott a brand after mistakenly purchasing a counterfeit product, and that’s not the kind of ratio that any retailer –– from the smallest Direct-to-Consumer (DTC) site to the behemoths like Amazon –– can afford to ignore.
In the age of online reviews, it’s especially dangerous to have counterfeits floating around. Customers that have a bad experience with a counterfeit can take to the internet to disparage your brand without ever actually interacting with your company or trying your product. That’s why consistent and thorough content audits are paramount to ensuring your brand’s authentic products are highly discoverable, and brand protection and governance processes are in place to safeguard brand integrity across all applicable eCommerce websites.
The Holiday Counterfeit Boom
The holidays are a time when customers search for gifts for their friends and family, which means exploring brands outside of their usual fare. Many consumers will be exposed to your brand’s Digital Shelf for the first time over the holiday season, creating an opportunity for brand growth. But if you don’t have eCommerce brand protection initiatives in place, the holidays can be detrimental to brand positioning, customer trust, and your bottom line.
As consumers boost their online spending and web traffic increases over the holidays, so does the likelihood of them purchasing counterfeit goods online. eMarketer predicts that retail eCommerce sales will comprise almost 20 percent of total holiday retail sales this year. As such, there will also be a surge in counterfeit inventory. So, this is an ideal time to invest in a brand protection solution to help you stay ahead of unauthorized sellers entering the marketplace.
Brand Integrity Helps Suppliers Save
Implementing a solution to mitigate the risks of counterfeit products should be at the top of every retailer’s “To-Do” list this year. However, for many retailers, this means manually reviewing numerous websites and third-party marketplaces for violations. Not only is manually reviewing content, images, and seller authenticity a time-consuming process, but it also leaves a lot of room for human error – making it possible for counterfeits to slip through the cracks and into the hands of unsuspecting customers. Not to mention your time should be spent fulfilling orders and increasing customer satisfaction during the high-traffic holiday season, not distracted by monitoring counterfeits.
Fortunately, that’s not the only way to identify counterfeits and protect your brand online. An effective content auditing tool can help you monitor, detect, and determine systems to identify and act on identified violations, saving time and labor hours normally spent on manual auditing processes. Content audit software also often contains helpful features to help you run your business more strategically by monitoring online hygiene factors like product titles and description. It works across all online channels by highlighting content gaps, which can then be remedied to improve product visibility and conversions. Through online content optimization, you can save money (in unnecessary labor costs), improve your Share of Search, and increase sales and share, with a modest up-front investment.
Brand Value Protection Boosts Consumer Confidence
Brand image protection doesn’t just protect retailers, it also protects customers from unintentionally buying dangerous counterfeit goods. Counterfeiting has skyrocketed during the pandemic. The International Chamber of Commerce reports that, by 2022, counterfeit goods will be a $4.2 trillion industry, and global damage from counterfeit goods is projected to exceed $323 billion. Studies show one in four customers has unknowingly purchased a counterfeit item online.
As counterfeits increase in number, so does the risk of counterfeit consumption by unwitting consumers. Counterfeit goods are as dangerous as they are ubiquitous. Customs and Border Patrol has found ingredients such as cadmium, arsenic, lead, and cyanide inside of counterfeit cosmetics. Consumers are aware of these risks. So, as a retailer, you need to be able to reassure customers that they can trust the authenticity of the goods they are purchasing at your online store.
A counterfeit detection tool can help you identify fakes and image replicas across multiple online marketplaces, so you can get fake products delisted. Automated counterfeit solutions can increase customer satisfaction in their purchasing experience, since they know they’re getting an authentic product right off the bat. This type of online brand protection creates increased brand loyalty over time, as well as more positive first-time product interactions.
Making a Measurable Impact: A Counterfeit Detection Case Study
Classic Accessories is a leading manufacturer of high-quality furnishings and accessories. The company’s investment in a counterfeit detection tool paid off in spades for their organization. After noticing a surge in counterfeit versions of their goods being sold via online, global marketplaces, they decided they needed to change their manual counterfeit and image violation detection process to an automated one to proactively respond to concerned activity in a timely manner.
Their goal was to achieve streamlined, actionable insights across all retail websites to account for varied violation submission processes, and to reduce the timespan in which insights were generated, ultimately eliminating the need to conduct daily, manual audits. They partnered with DataWeave, who built out a fully customized program to automate Classic Accessories’ content inventory management process, and identified SKU-level violations by matching names and images in diverse online marketplaces.
During the first three months of onboarding, Classic Accessories was able to detect more than 25,000 violations, submitting notices to each marketplace, and even achieved a 100% removal rate across all Amazon sources. Additionally, they also achieved their goal of saving time (22 hours per week) in automation processes, translating to a $68,000 savings opportunity in labor costs.
Closing Thoughts
Prioritizing your online brand protection strategy is imperative to growing your online presence and achieving customer satisfaction and brand loyalty. Fortunately, there are options like DataWeave’s brand protection tool available to help curate your online content, provide consistency across online channels, and improve consumer confidence by addressing and removing counterfeit violations. Implementing the right solution can help find counterfeit products in real-time to keep your brand safe –– and your reputation intact –– throughout the 2021 holiday season. The right brand protection software will provide both Brand Protection and Content Audits, so your brand is optimized from every possible angle for truly competitive results.