Brands are investing millions of dollars in digital retail media to make their products stand out amid unrelenting competition.
The ad spend on digital retail media worldwide was estimated at USD 114.4 billion in 2022, and the current projections indicate that it will grow to USD 176 billion by 2028. This amounts to a 54% increase in just six years.
The current surge in digital retail media advertising has led brands to find an effective way to monitor the efficacy of their ad spend. While Share of Search has long been used to measure brand visibility effectively, the metrics often missed tracking ads on retail sites.
DataWeave’s Share of Media solution helps solve this problem.
What is the Share of Media?
At DataWeave, Share of Media is a metric used to measure a brand’s presence in sponsored listings and banner ads on eCommerce platforms. It captures how often a brand appears in paid promotions compared to competitors, offering insights into advertising visibility and effectiveness.
These days most marketplaces seamlessly blend banner ads and sponsored listings into organic search results. Let’s take a closer look.
Banner Advertising
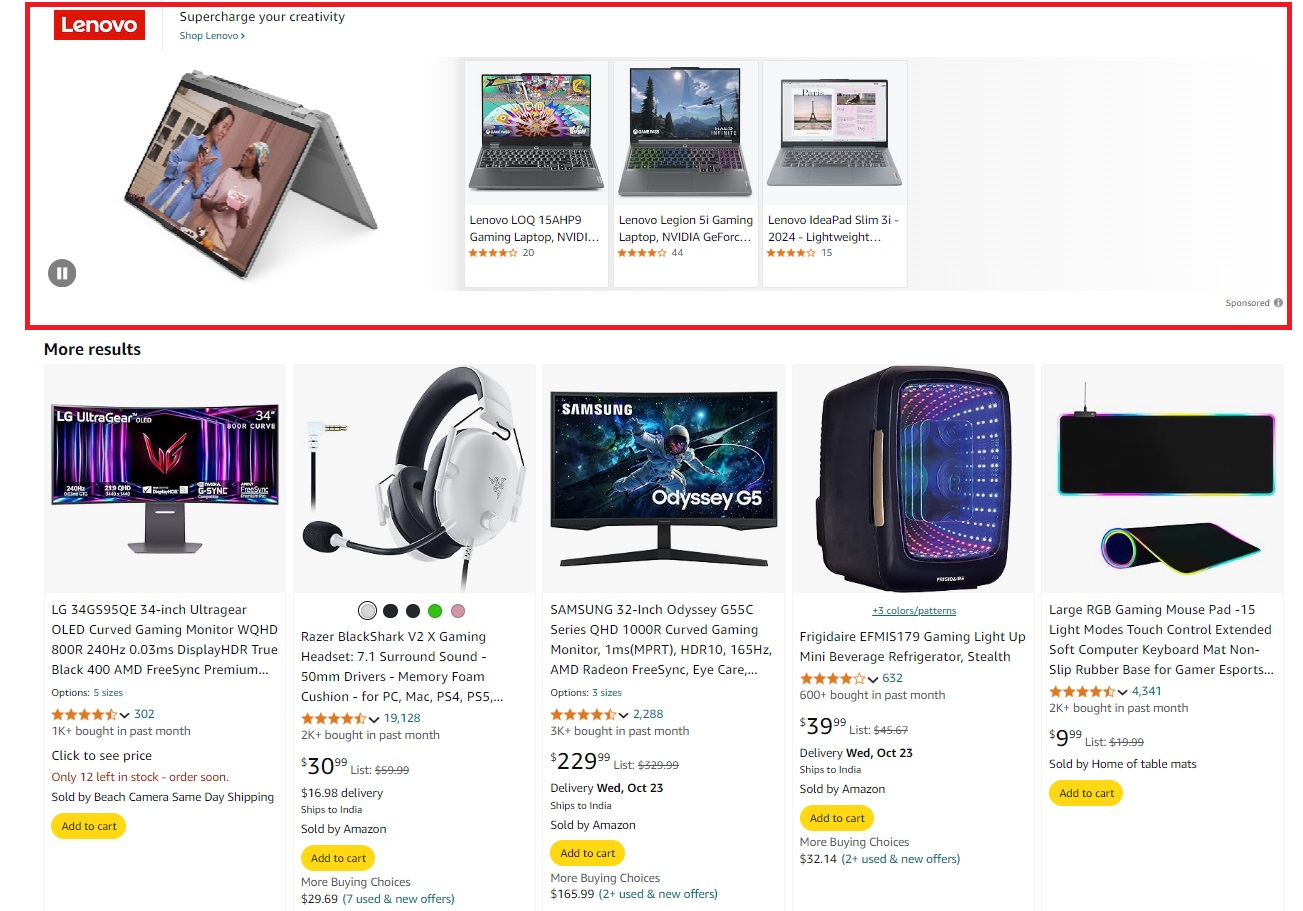
Banner advertising strategically places creative banners across websites—often at the top, bottom, or sides. Some eCommerce platforms also integrate these banners into product search listings.
What makes banner ads so special is the unique ability to allow marketers to use various types of media in a single ad, such as images, auto-play videos, and animations. Brands can also present curated collections of products. This flexibility provides marketers with creative opportunities to differentiate from competitors, capture customer interest, and encourage conversions.
Sponsored Listings
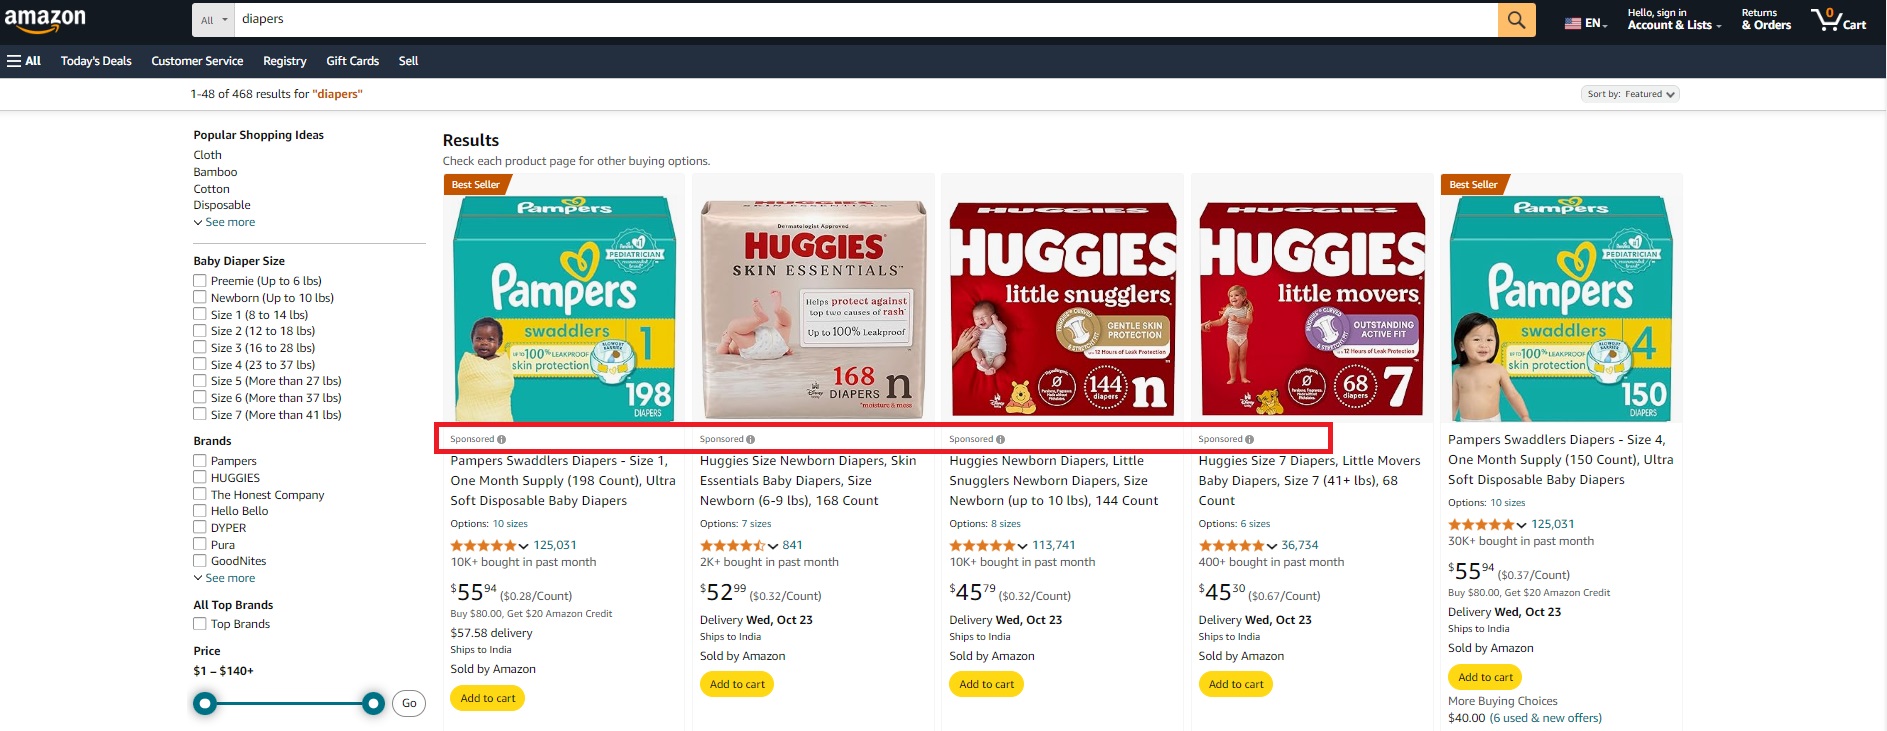
Sponsored listings are paid placements within search engine results or eCommerce platforms. They are usually marked as ‘sponsored’ or ‘ad,’ and they often appear at the top of search results and alongside organic product listing results.
Unlike organic search results, sponsored listings are prioritized based on the advertiser’s bid amount and relevance to users’ search queries.
Sponsored listings offer a strategic advantage by enabling businesses to connect directly with consumers who are actively searching for their products. This targeted approach ensures that marketing efforts are focused on individuals with high intent of making a purchase, maximizing the potential return on investment.
The Power of Banner Ads and Sponsored Listings
Banner ads and sponsored listings are great choices for boosting customer engagement and product sales. Here are four key advantages they offer:
Enhanced Visibility: Digital retail media strategically places your brand where it will stand out—outshining competitors and grabbing the attention of high-purchase-intent consumers.
Precision in Reach: These ads target specific keywords or categories, allowing for highly focused advertising based on demographics and search intent.
Minimal Conversion Friction: Smooth transitions from ads to a brand’s native store or product listing on the marketplace keep conversion friction to a minimum.
Brand Awareness and Recall: Consistent exposure to your brand through banner ads and sponsored product listings can leave lasting impressions and build brand recognition.
The bottom line is that it’s increasingly important for brands to monitor their Share of Media.
How to Monitor Your Brand’s Share of Media
DataWeave’s Digital Shelf Analytics (DSA) platform extends beyond the traditional Share of Search metrics and provides robust support for monitoring the Share of Media.
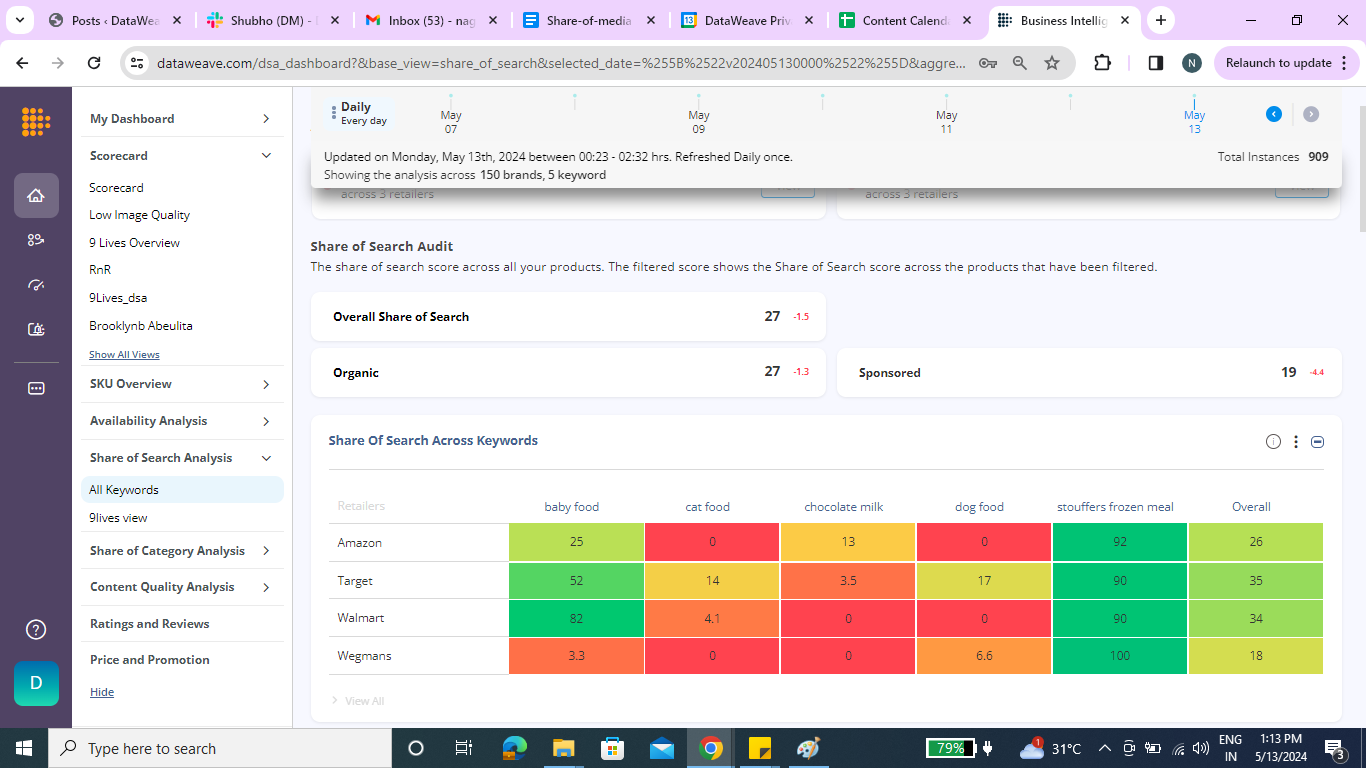
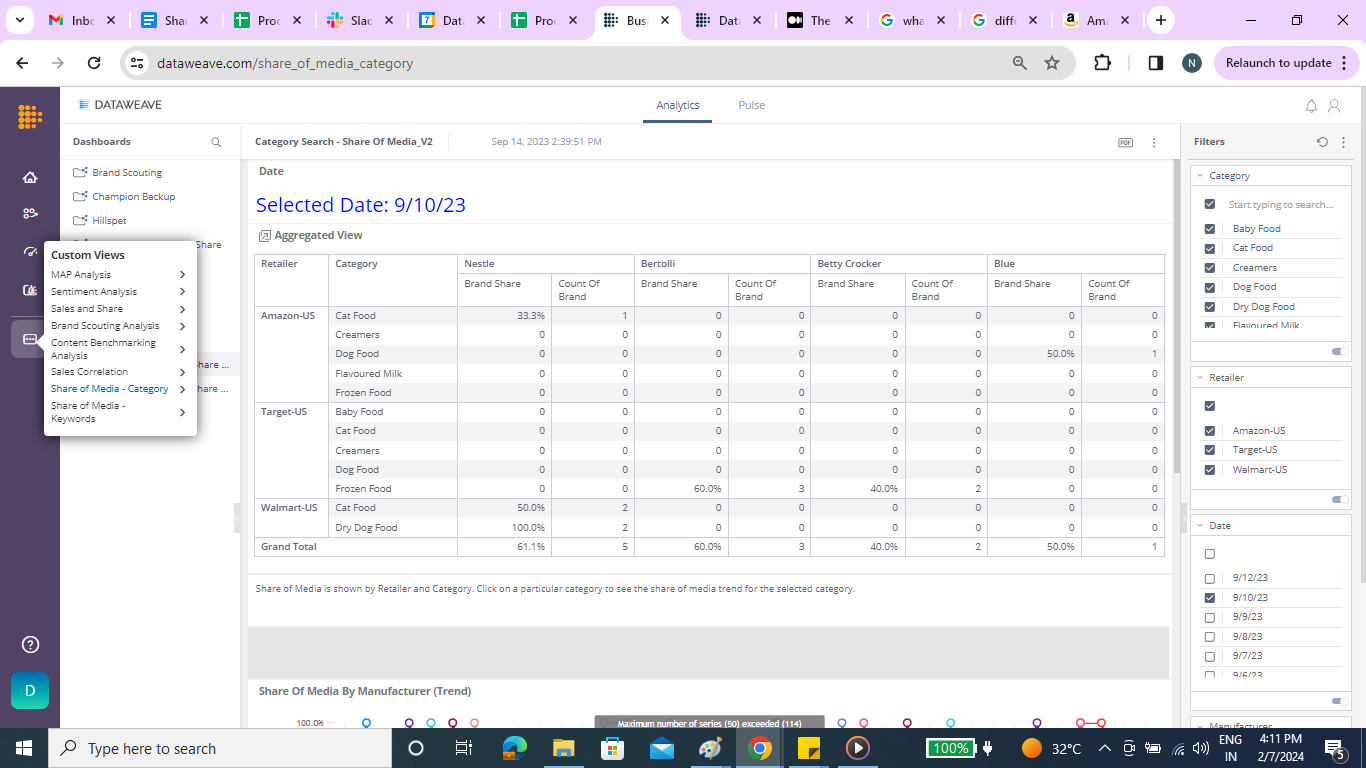
DataWeave monitors the Share of Media in two ways: keywords and product categories. Users can view Share of Media insights through aggregated views, trend charts, and detailed tables. The views are designed to show brand visibility and the overall competitive landscape. For example, the screenshot below, taken from DataWeave’s dashboard, showcases the Share of Media across keywords, categories, and retailers.
Share of Media by Keyword
The Share of Media metric captures a brand’s advertising presence within search listings for a designated keyword. This provides a comprehensive view of a brand’s visibility and promotional efforts across retail platforms, helping brands validate and gauge the effectiveness of their ad spend.
For example, the screenshot below shows the trend of manufacturer’s Share of Media by keyword—‘baby food.’
Share of Media by Category
The Share of Media metric measures the presence of brands’ banner ads and sponsored listings across product categories on retail sites. This helps brands see which product categories require more investment, making it easier for them to spend their ad budget wisely.
The screenshot below illustrates manufacturers’ Share of Media by category across retailers.
Share of Media: An Essential Ecommerce Metric
As retail media continues to evolve, our analytics must follow—after all, knowledge is a competitive advantage. In the dynamic world of eCommerce, where competition is fierce and consumer attention is scarce, understanding your share of media is crucial.
Analyzing the Share of Media can give brands a competitive edge. By regularly monitoring and analyzing this metric, you can make data-driven decisions to improve your brand’s visibility, attract more customers, and ultimately drive sales growth. With a deeper understanding of their target audience and market dynamics, brands can refine promotional efforts to drive more effective results and optimize return on ad spend (ROAS).
For more information on how Digital Shelf Analytics can enhance your brand’s digital shelf presence, request a demo or contact us at contact@dataweave.com.
As the dust settles on Amazon’s 8th Prime Day extravaganza in India, held on July 20-21, 2024, the eCommerce giant has once again shattered records. This year’s event saw unprecedented engagement, with 24% more Prime members participating compared to 2023, marking the highest-ever Prime member involvement in the sale’s history.
At DataWeave, we’ve conducted an extensive analysis of this landmark event, examining over 47,000 SKUs across major categories for Flipkart and Amazon to uncover compelling insights into pricing strategies, competitive positioning, and emerging trends in the Indian eCommerce space. This follows our comprehensive analysis of Prime Day in the USA across categories and brands, which readers can explore for a global perspective on Amazon’s strategies.
Key Highlights:
Tier-2 Cities Drive Growth: This year’s exponential growth was notably fueled by orders from tier-2 cities, highlighting the expanding reach of eCommerce in India.
Swift Deliveries: Most Prime members’ orders from metros were delivered the same day or the next, while tier-2 cities saw deliveries in less than 2 days, highlighting the importance of delivery time when it comes to purchase decisions.
Brand Participation: Over 450 top Indian and global brands participated, including Intel, Samsung, OnePlus, and Puma, alongside 3,200 new product launches from small and medium Indian businesses. This highlights Amazon’s policy to promote small, local businesses globally in 2024.
Premium Products in Demand: Despite modest discounts across electronics and similar offerings, consumers chose to purchase premium products during Prime Day. With financial flexibility and no-cost EMI options, Indian consumers, especially Gen Z and millennials, are now ready to invest in premium products and experiences.
Our analysis focused on both the Additional Discounts offered during Prime Day (calculated relative to prices the week prior to the event), highlighting the event’s genuine benefits, and the Absolute Discounts offered during Prime Day, representing the total markdown relative to the MRP.
Cross-Category Discount Strategy
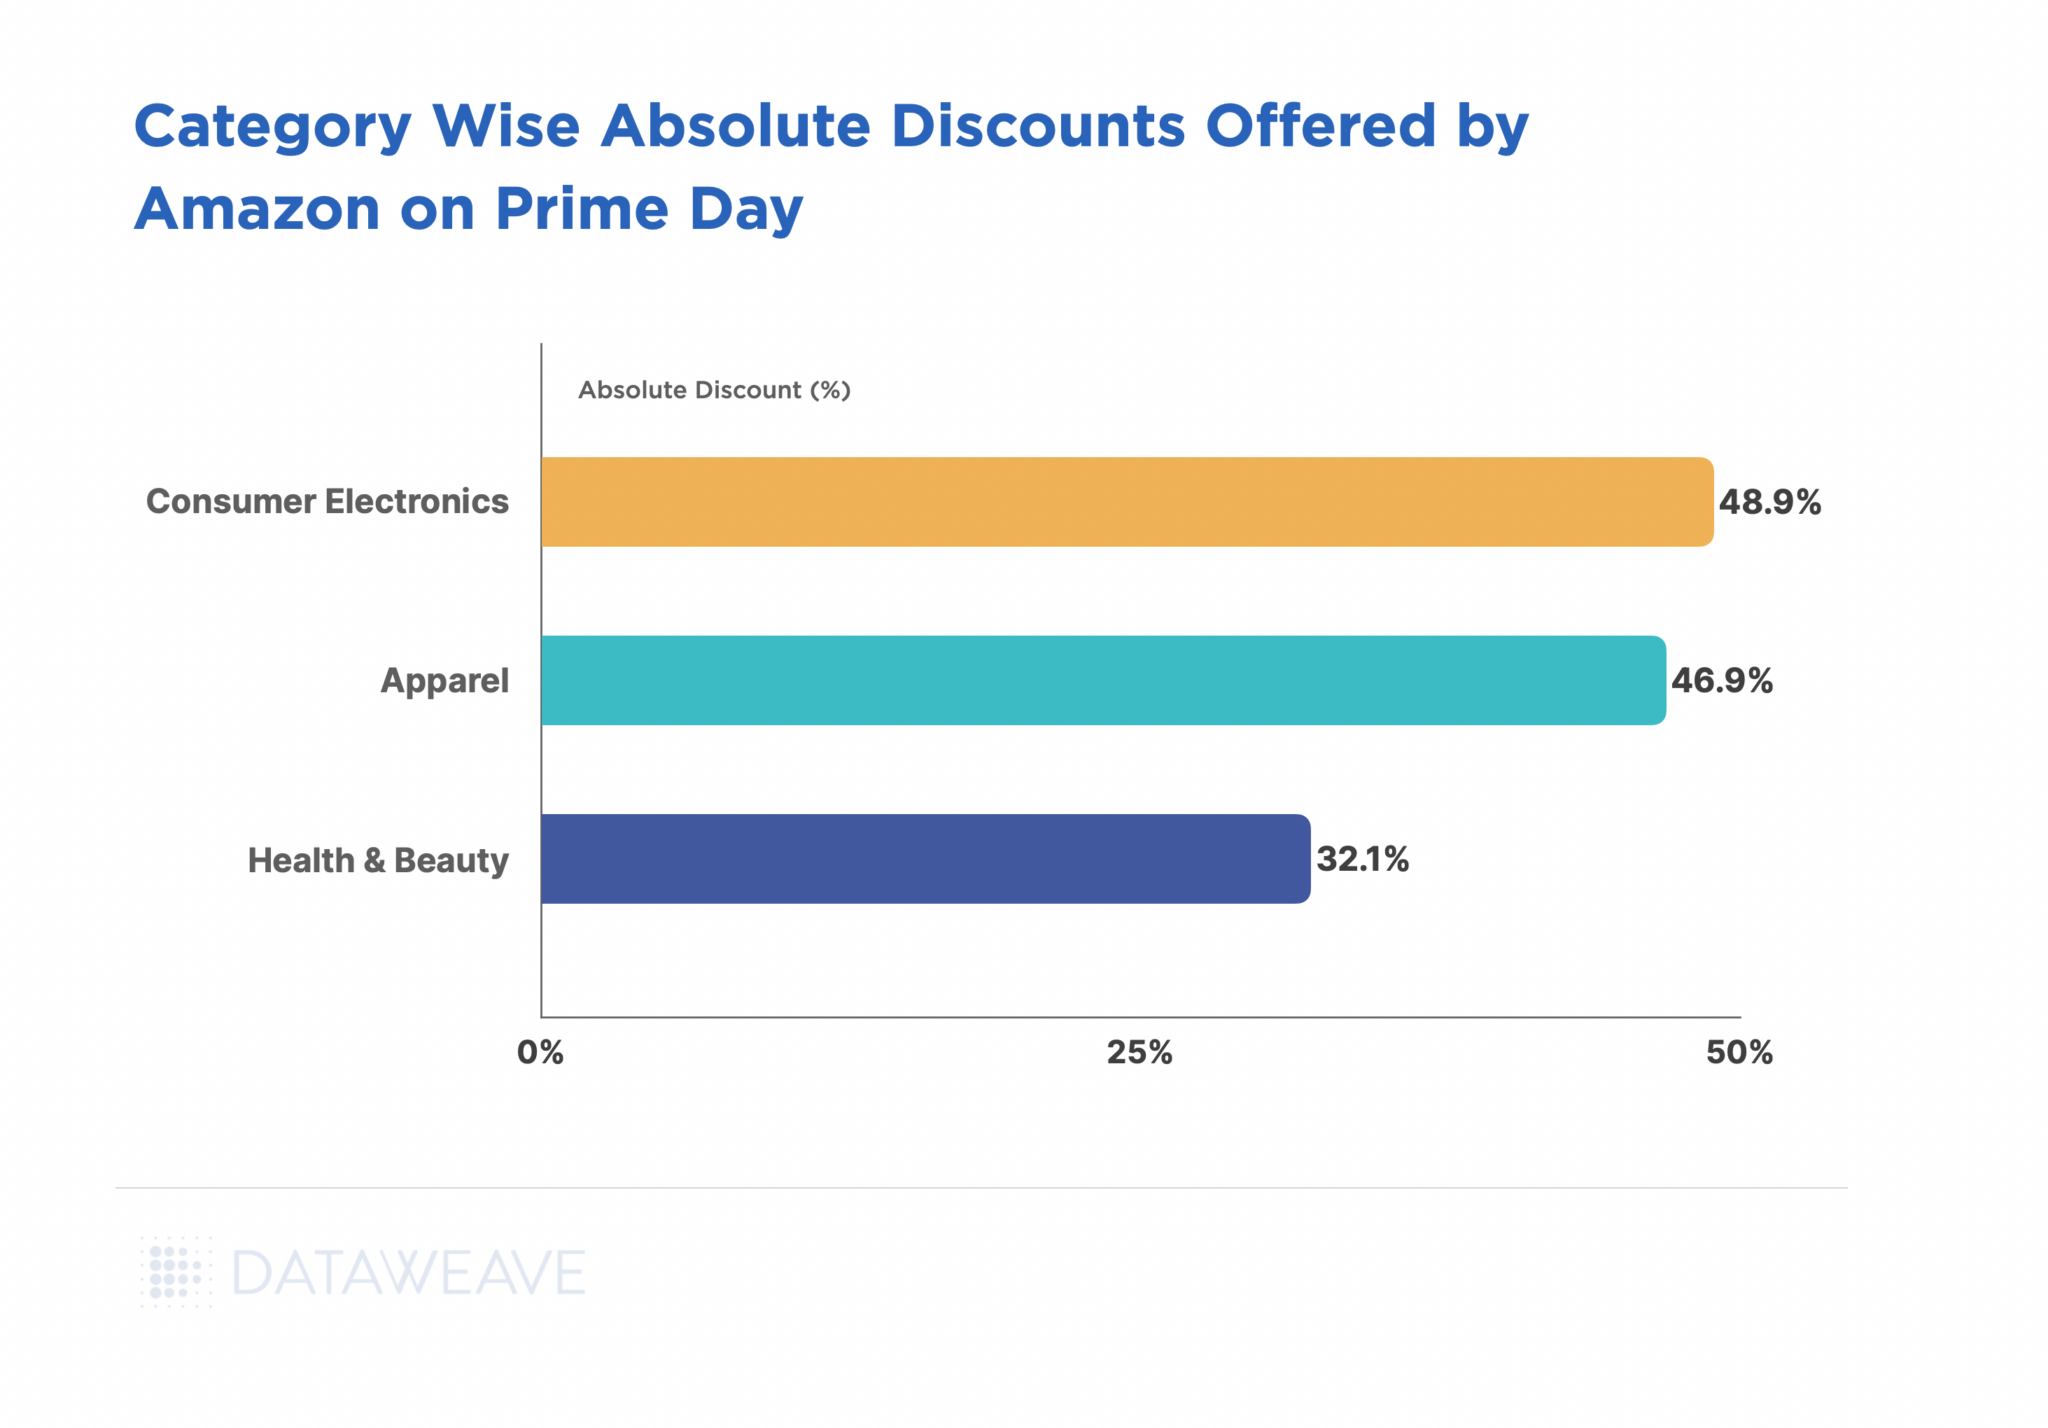
Our analysis this year reveals that the Consumer Electronics category saw the highest Absolute Discounts with an average of 48.9%, closely followed by Apparel at 46.9%. The Health & Beauty category had the lowest Absolute Discount at 32.1%.
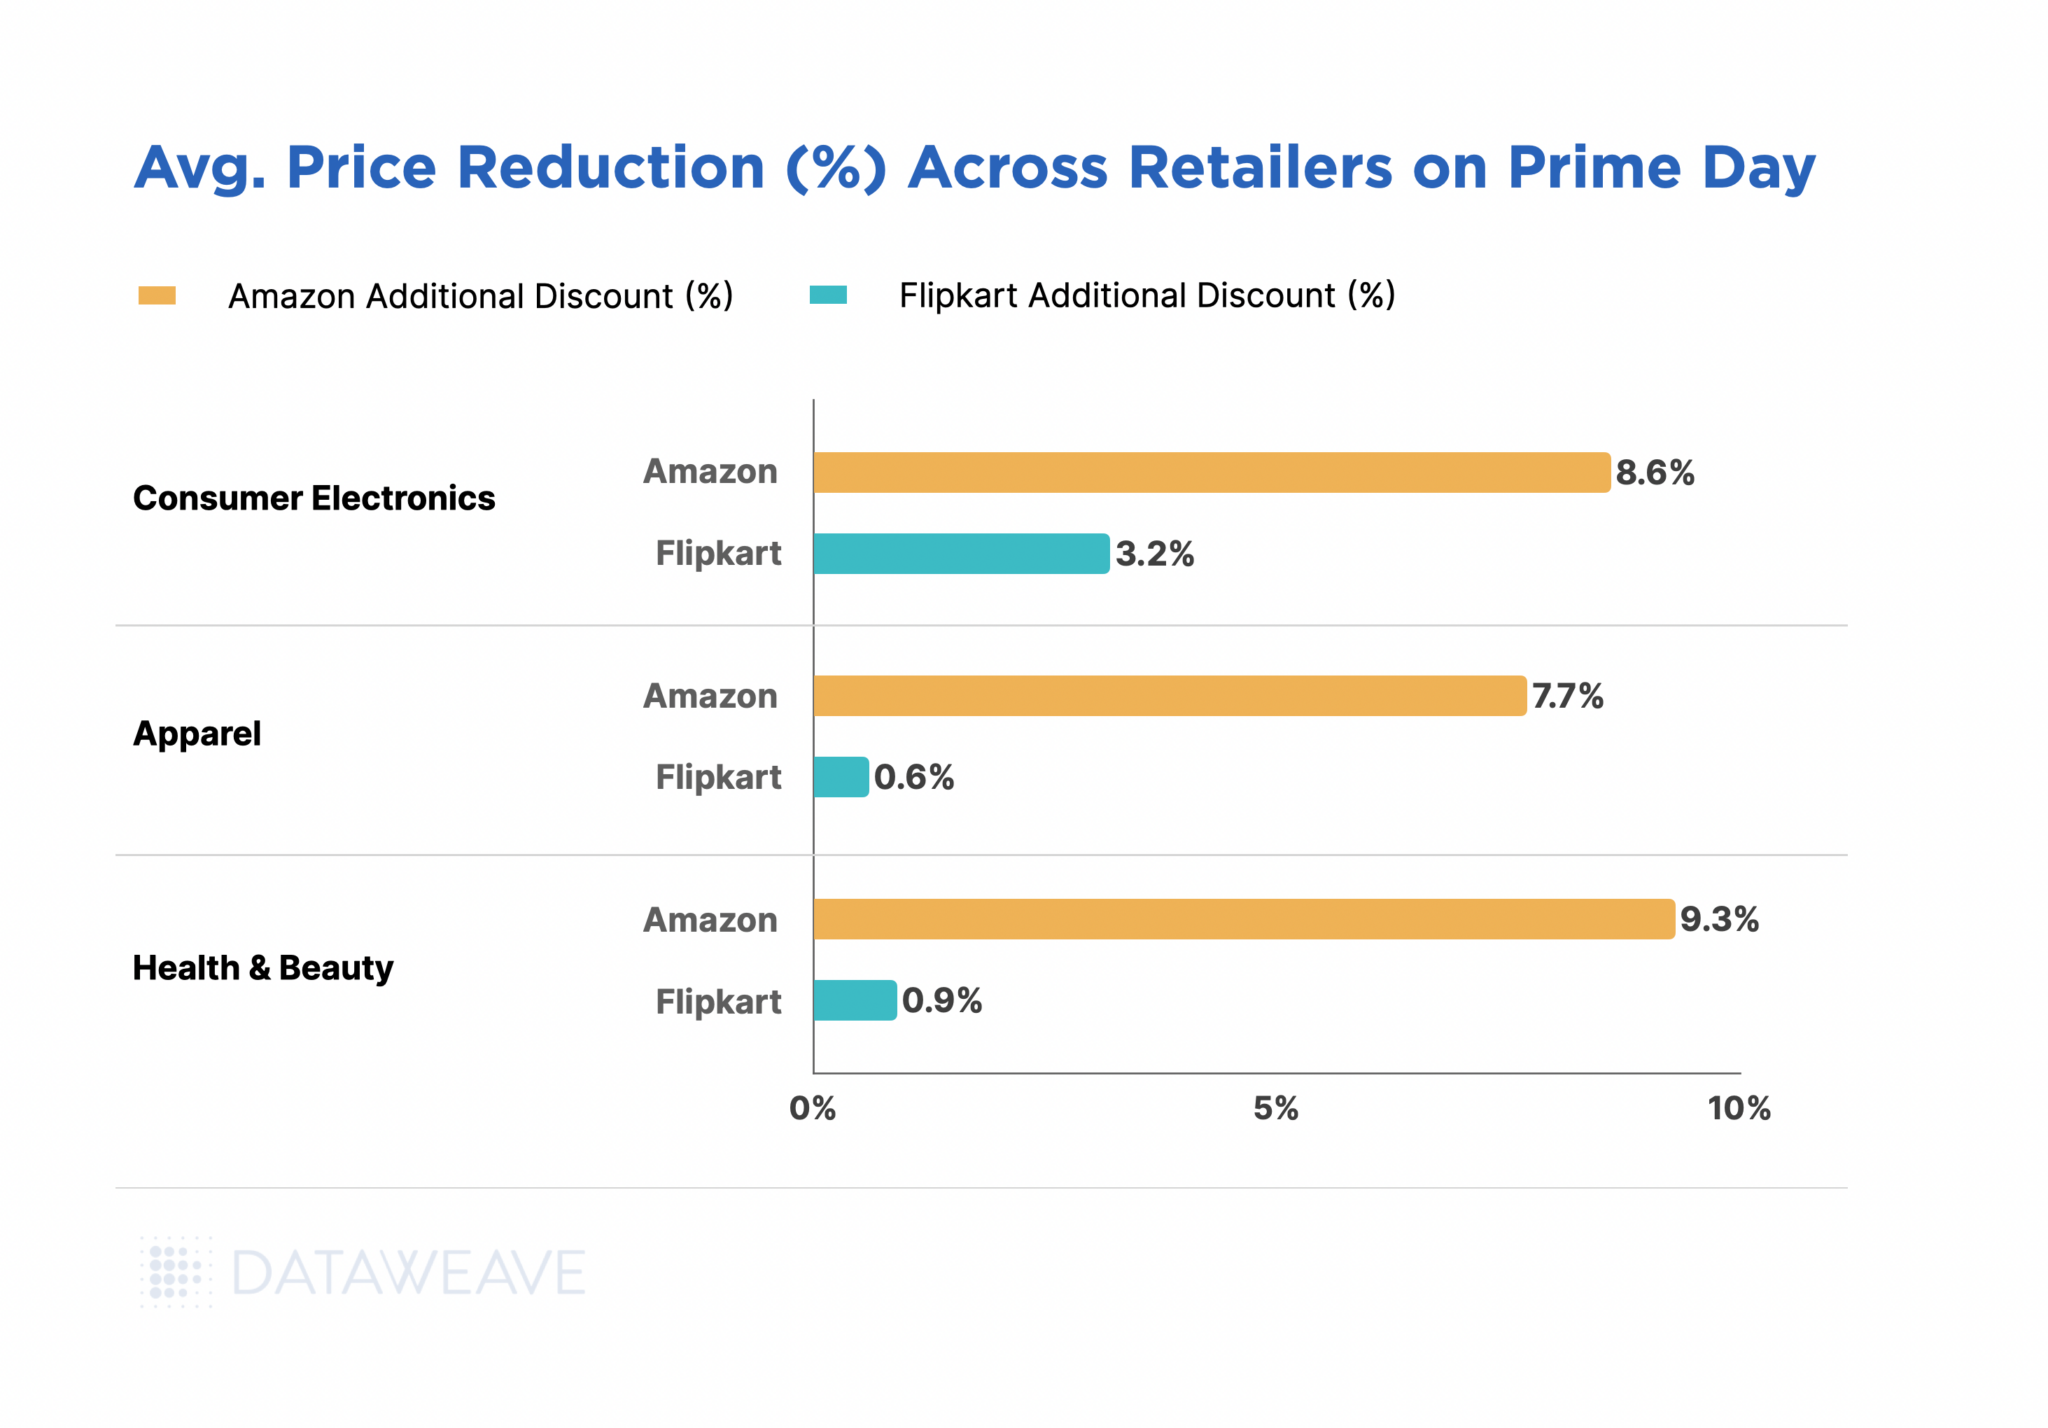
However, Amazon offered the highest Additional Discount in Health & Beauty at 9.3%. Electronics and Apparel had additional discounts of 8.6% and 7.7% respectively.
Overall, Flipkart chose to not compete aggressively with Amazon during Prime Day this year. Only in Electronics did Flipkart offer an additional discount of 3.2% during the sale. Price changes in Apparel and Health & Beauty were negligible.
Category Deep Dive
Consumer Electronics
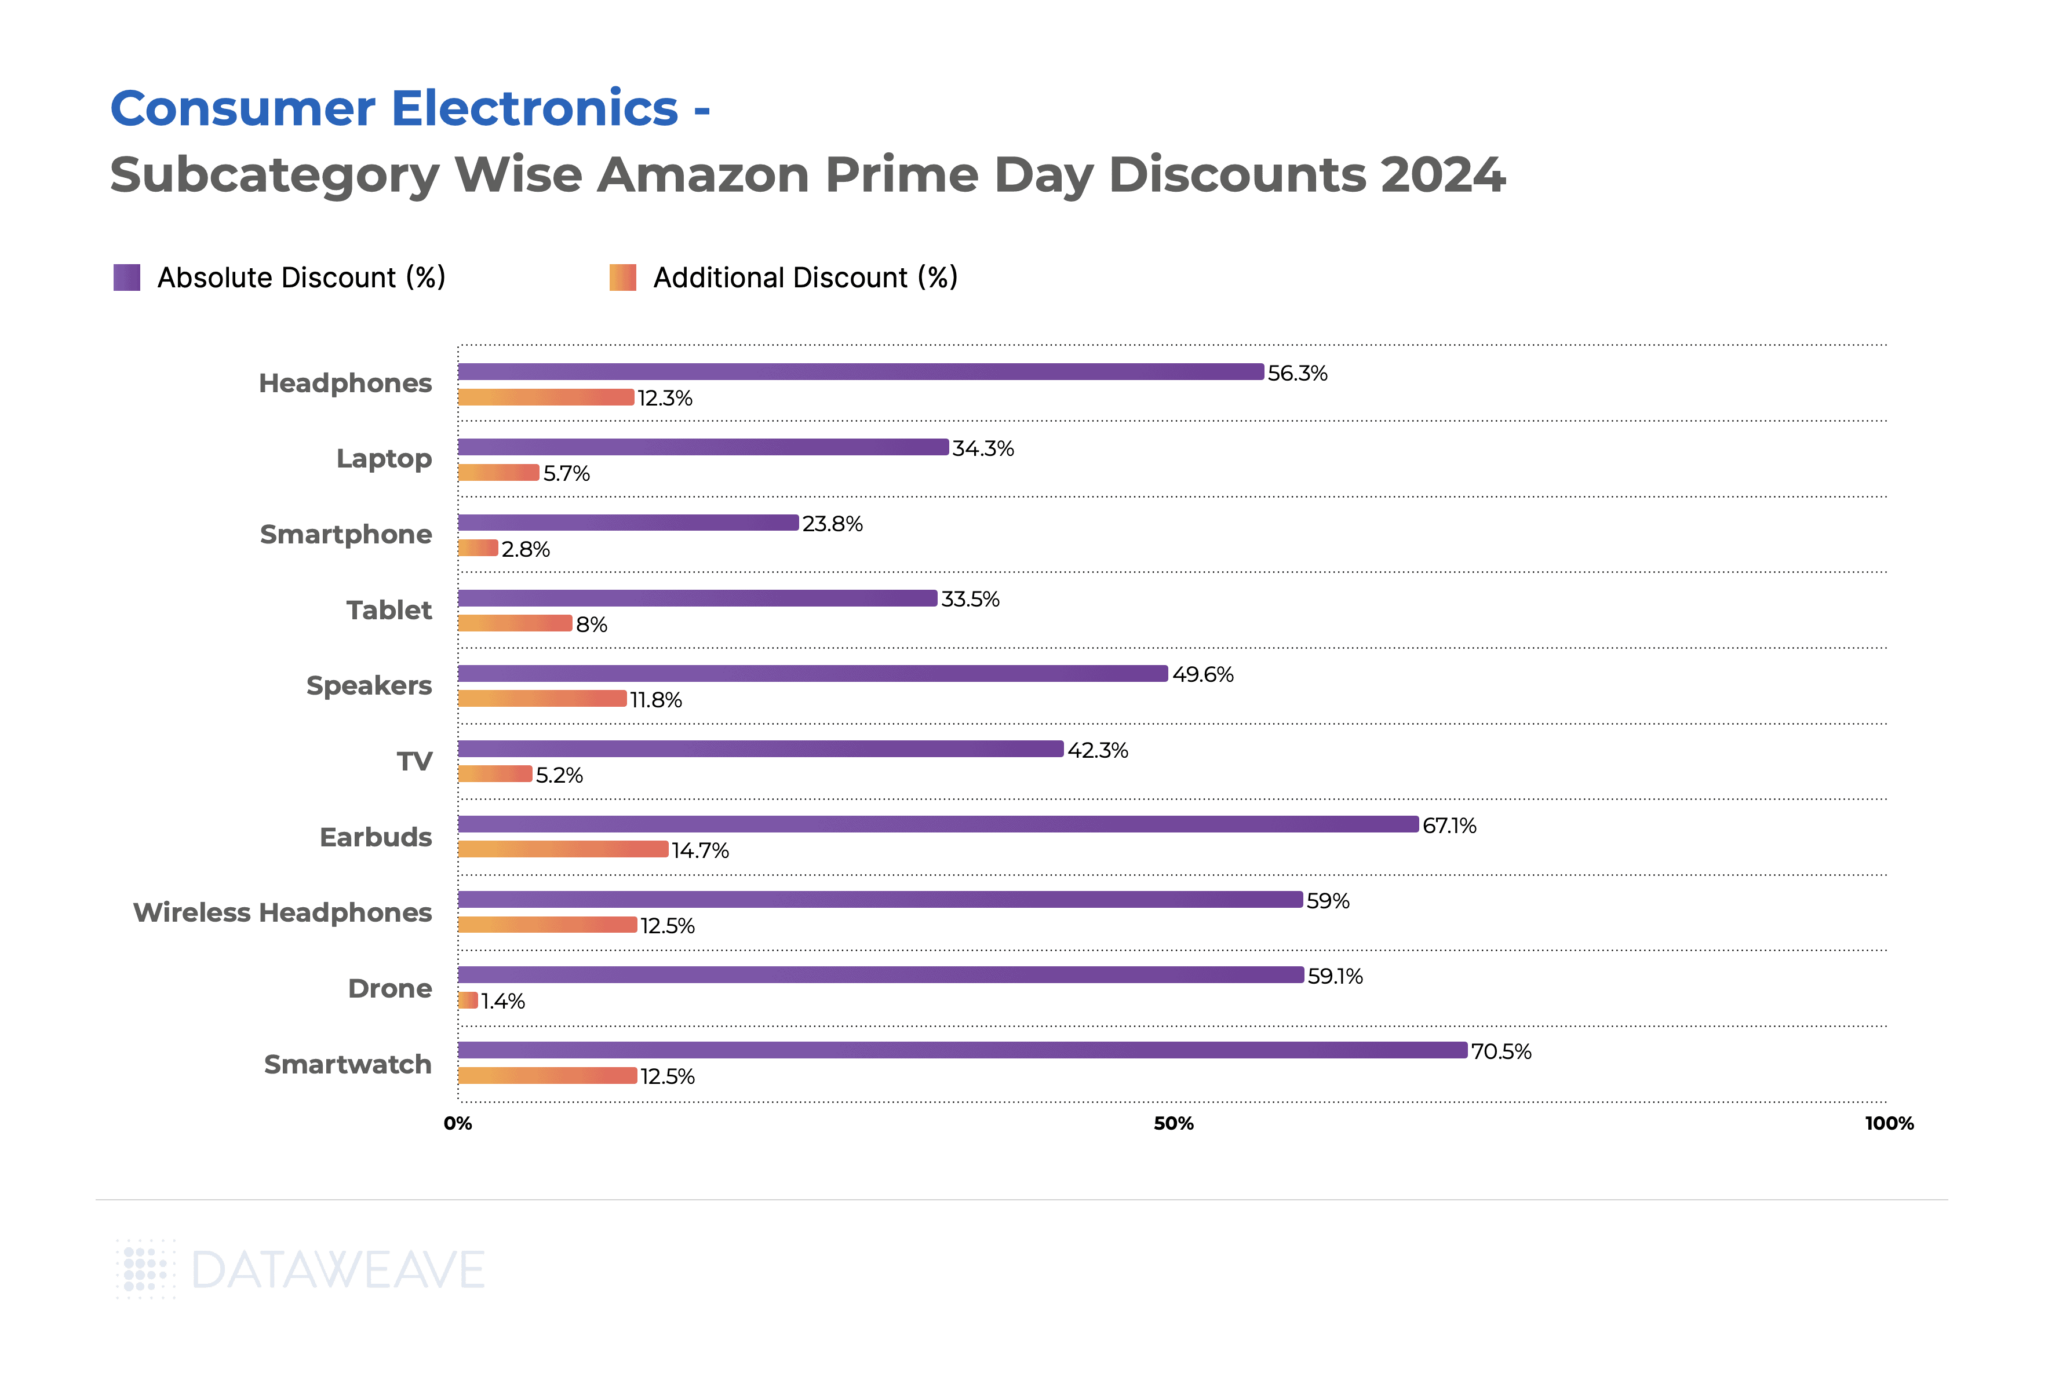
In Electronics, Earbuds (14.7%) and Wireless Headphones (12.5%) saw the highest Additional Discounts on Amazon, likely due to high demand for personal audio devices. Smartwatches followed closely at 12.5%, indicating a strong push in the wearable technology sector.
Larger electronic appliances like TVs saw more modest Additional Discounts (5.2%), despite a significant Absolute Discount (42.3%).
Smartphones, interestingly, had the lowest Additional Discount (2.8%) among the subcategories, potentially due to their already competitive pricing or brand-specific strategies.
Brand-level Insights in Consumer Electronics
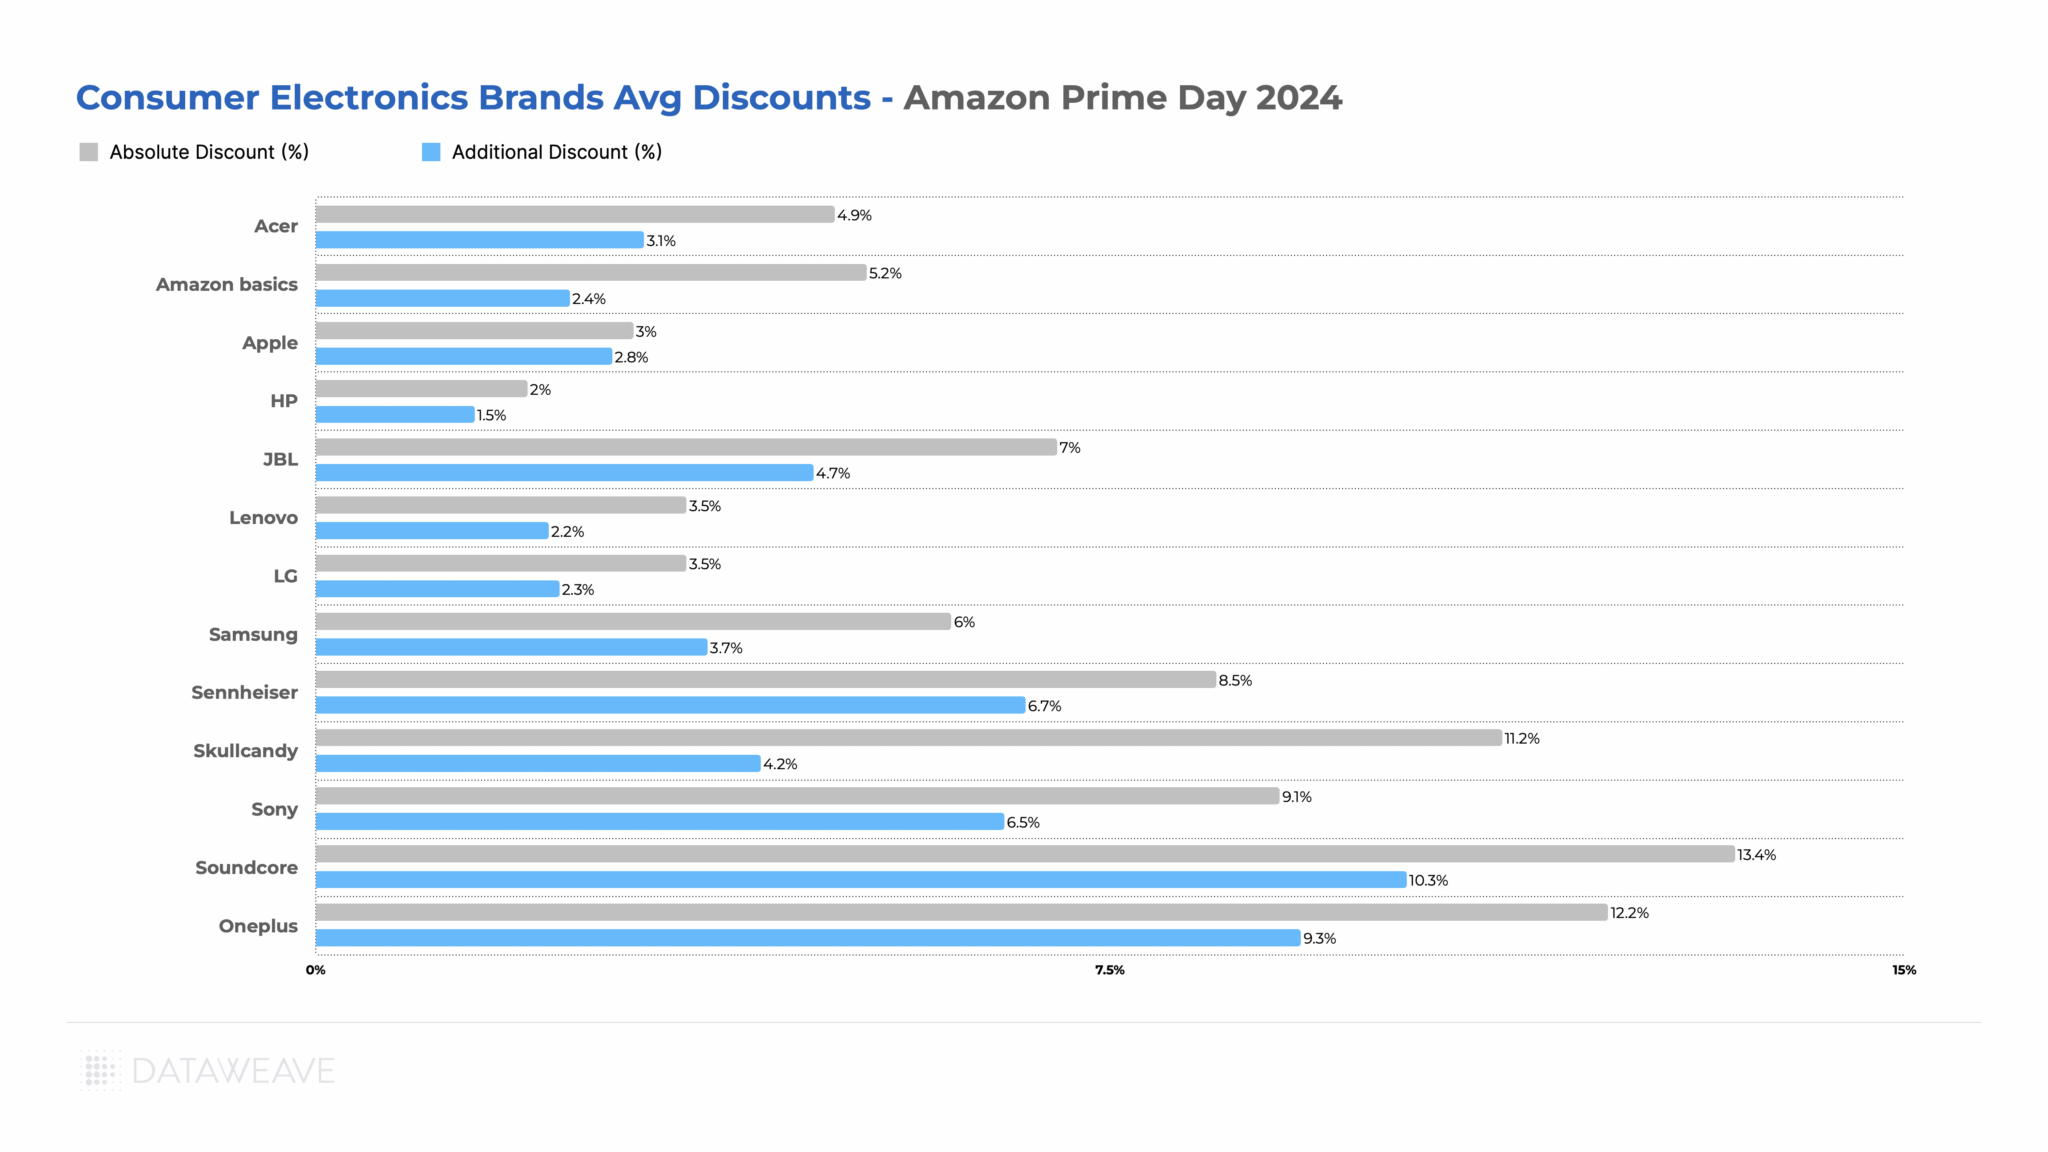
During the sale event, Soundcore (headphone and earphone brand from Anker) led with the highest Additional Discount of 10.3%, followed closely by OnePlus at 9.3%. These brands clearly leveraged Prime Day to drive sales and potentially gain market share.
Sennheiser and Sony also offered significant additional discounts, indicating aggressive promotional strategies during the event.
Notably, some well-known brands like Apple and HP offered more conservative discounts, possibly due to their established market positions or differing promotional strategies.
Despite modest discounts though, Amazon revealed that the iPhone 13 and OnePlus 12R were among the top premium smartphones customers bought this Prime Day. Prime members shopped from top brands such as LG, IFB, Bosch, and Haier and upgraded to premium appliances through affordability options of no cost EMI, Bank discounts and exchange offers, claims Amazon.
These learnings offer valuable insight into the mindset of the modern Indian consumer, who is ready to purchase premium products. Brands can leverage more detailed market intelligence to drive their positioning in India.
Share of Search Analysis
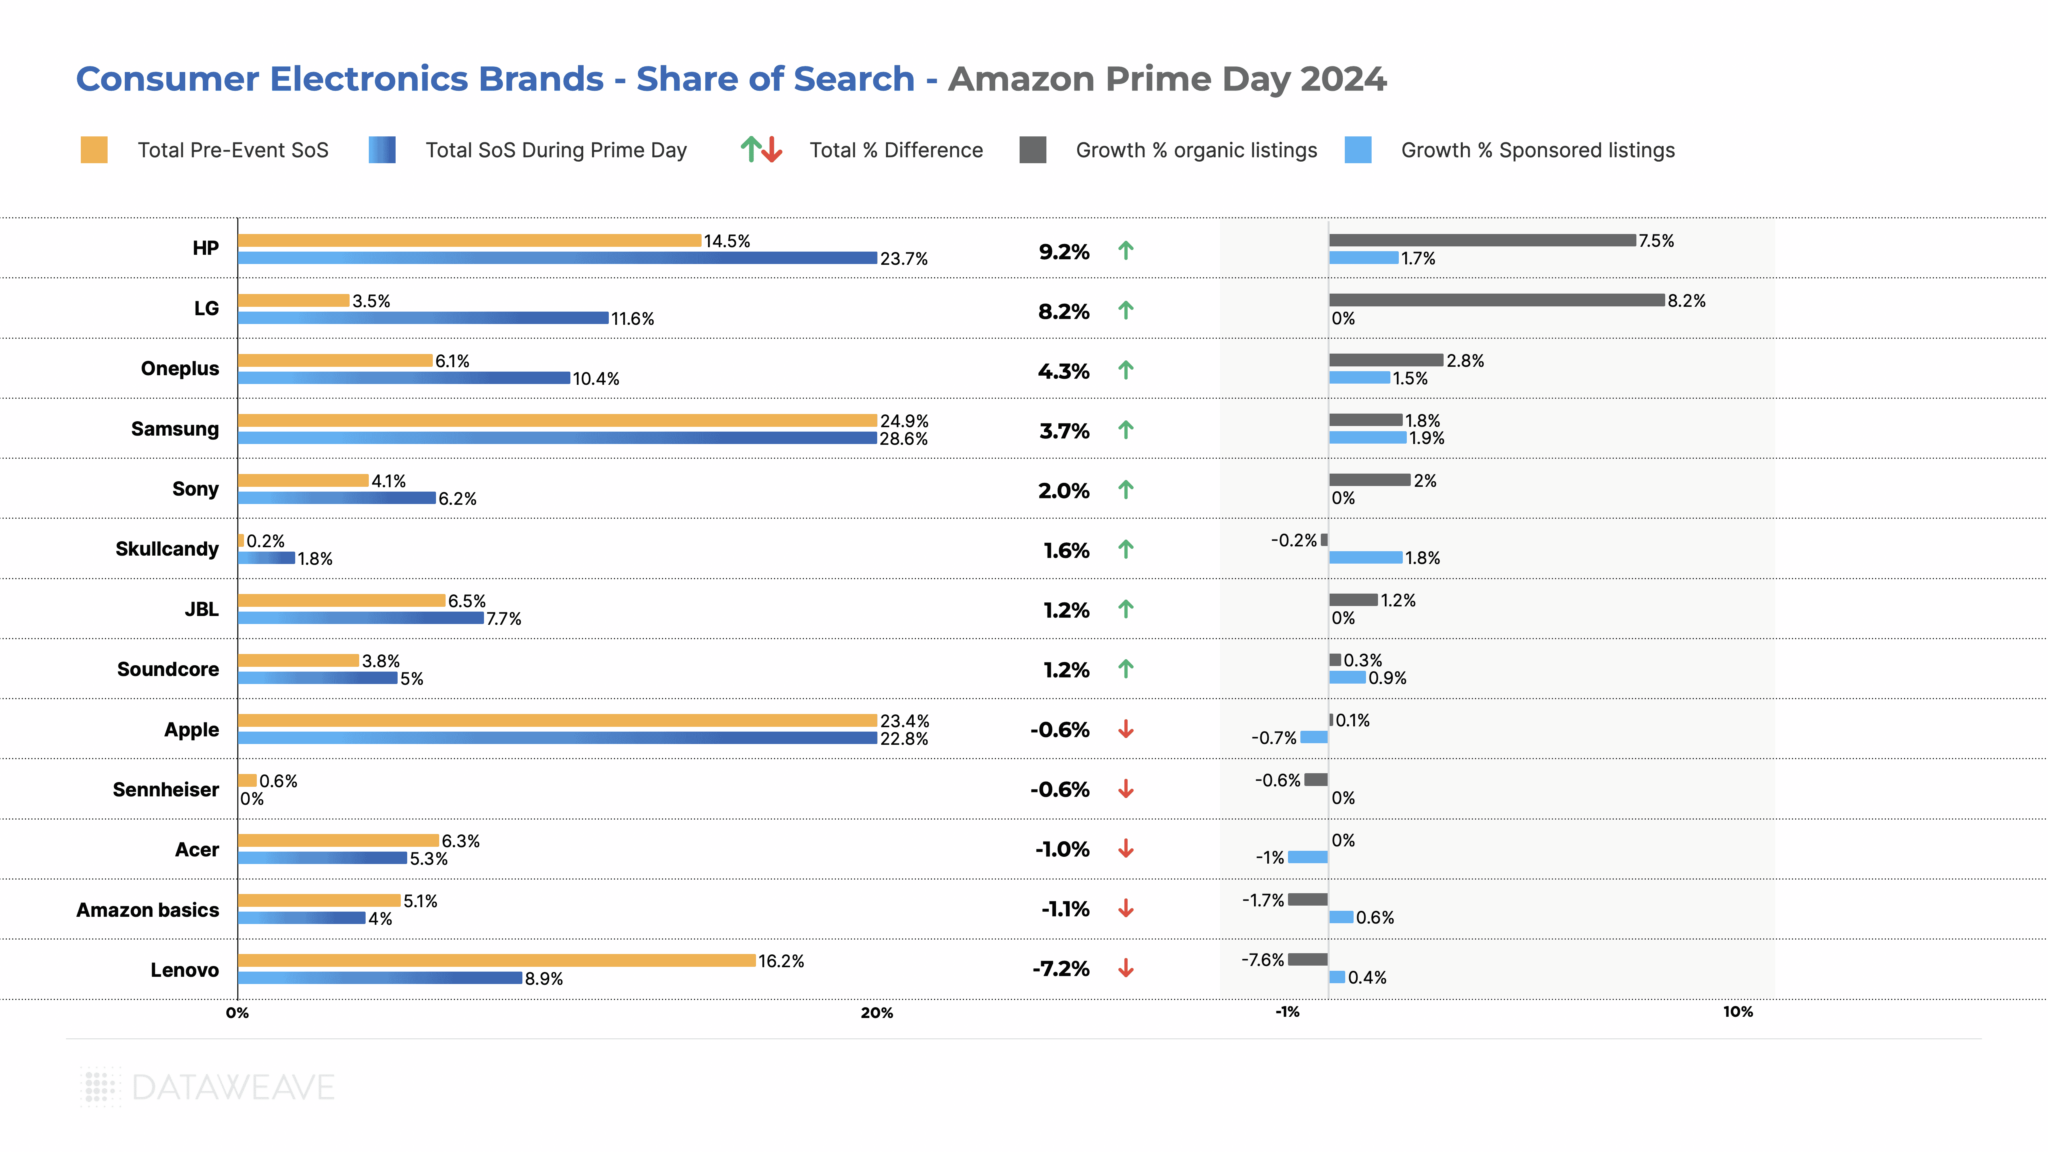
The Share of Search (SoS) for a brand represents the number of its products in the top 20 search results for relevant search keywords on Amazon, relative to that of its competitors. It provides insights into a brand’s visibility during the sale event.
HP saw the most significant improvement in its Share of Search during Prime Day, gaining 9.2%, with strong growth in both organic (7.5%) and sponsored (1.7%) listings. LG also made substantial gains of 8.2% and 5.3% respectively. Both brands offered significant markdowns on laptops and accessories.
Surprisingly, some popular brands like Apple (-0.6%) and Acer (-1.0%) experienced slight decreases in their SoS. Lenovo notably lost 7.2% of its visibility share, with a significant decline in organic listings (-7.6%). Samsung maintained its strong position with an increase in SoS (3.7%).
Key Takeaways:
While some brands like Soundcore and OnePlus used aggressive discounting to drive sales, others like HP and LG focused on improving their search visibility. The data suggests that a combination of attractive discounts and improved search visibility was key to success during the event. Brands that managed to balance these factors effectively, like HP and Samsung, seemed to perform particularly well. Interestingly, some brands with lower discounts (like HP) still managed to significantly increase their SoS, indicating that factors beyond pricing played a role in visibility during the event.
Apparel
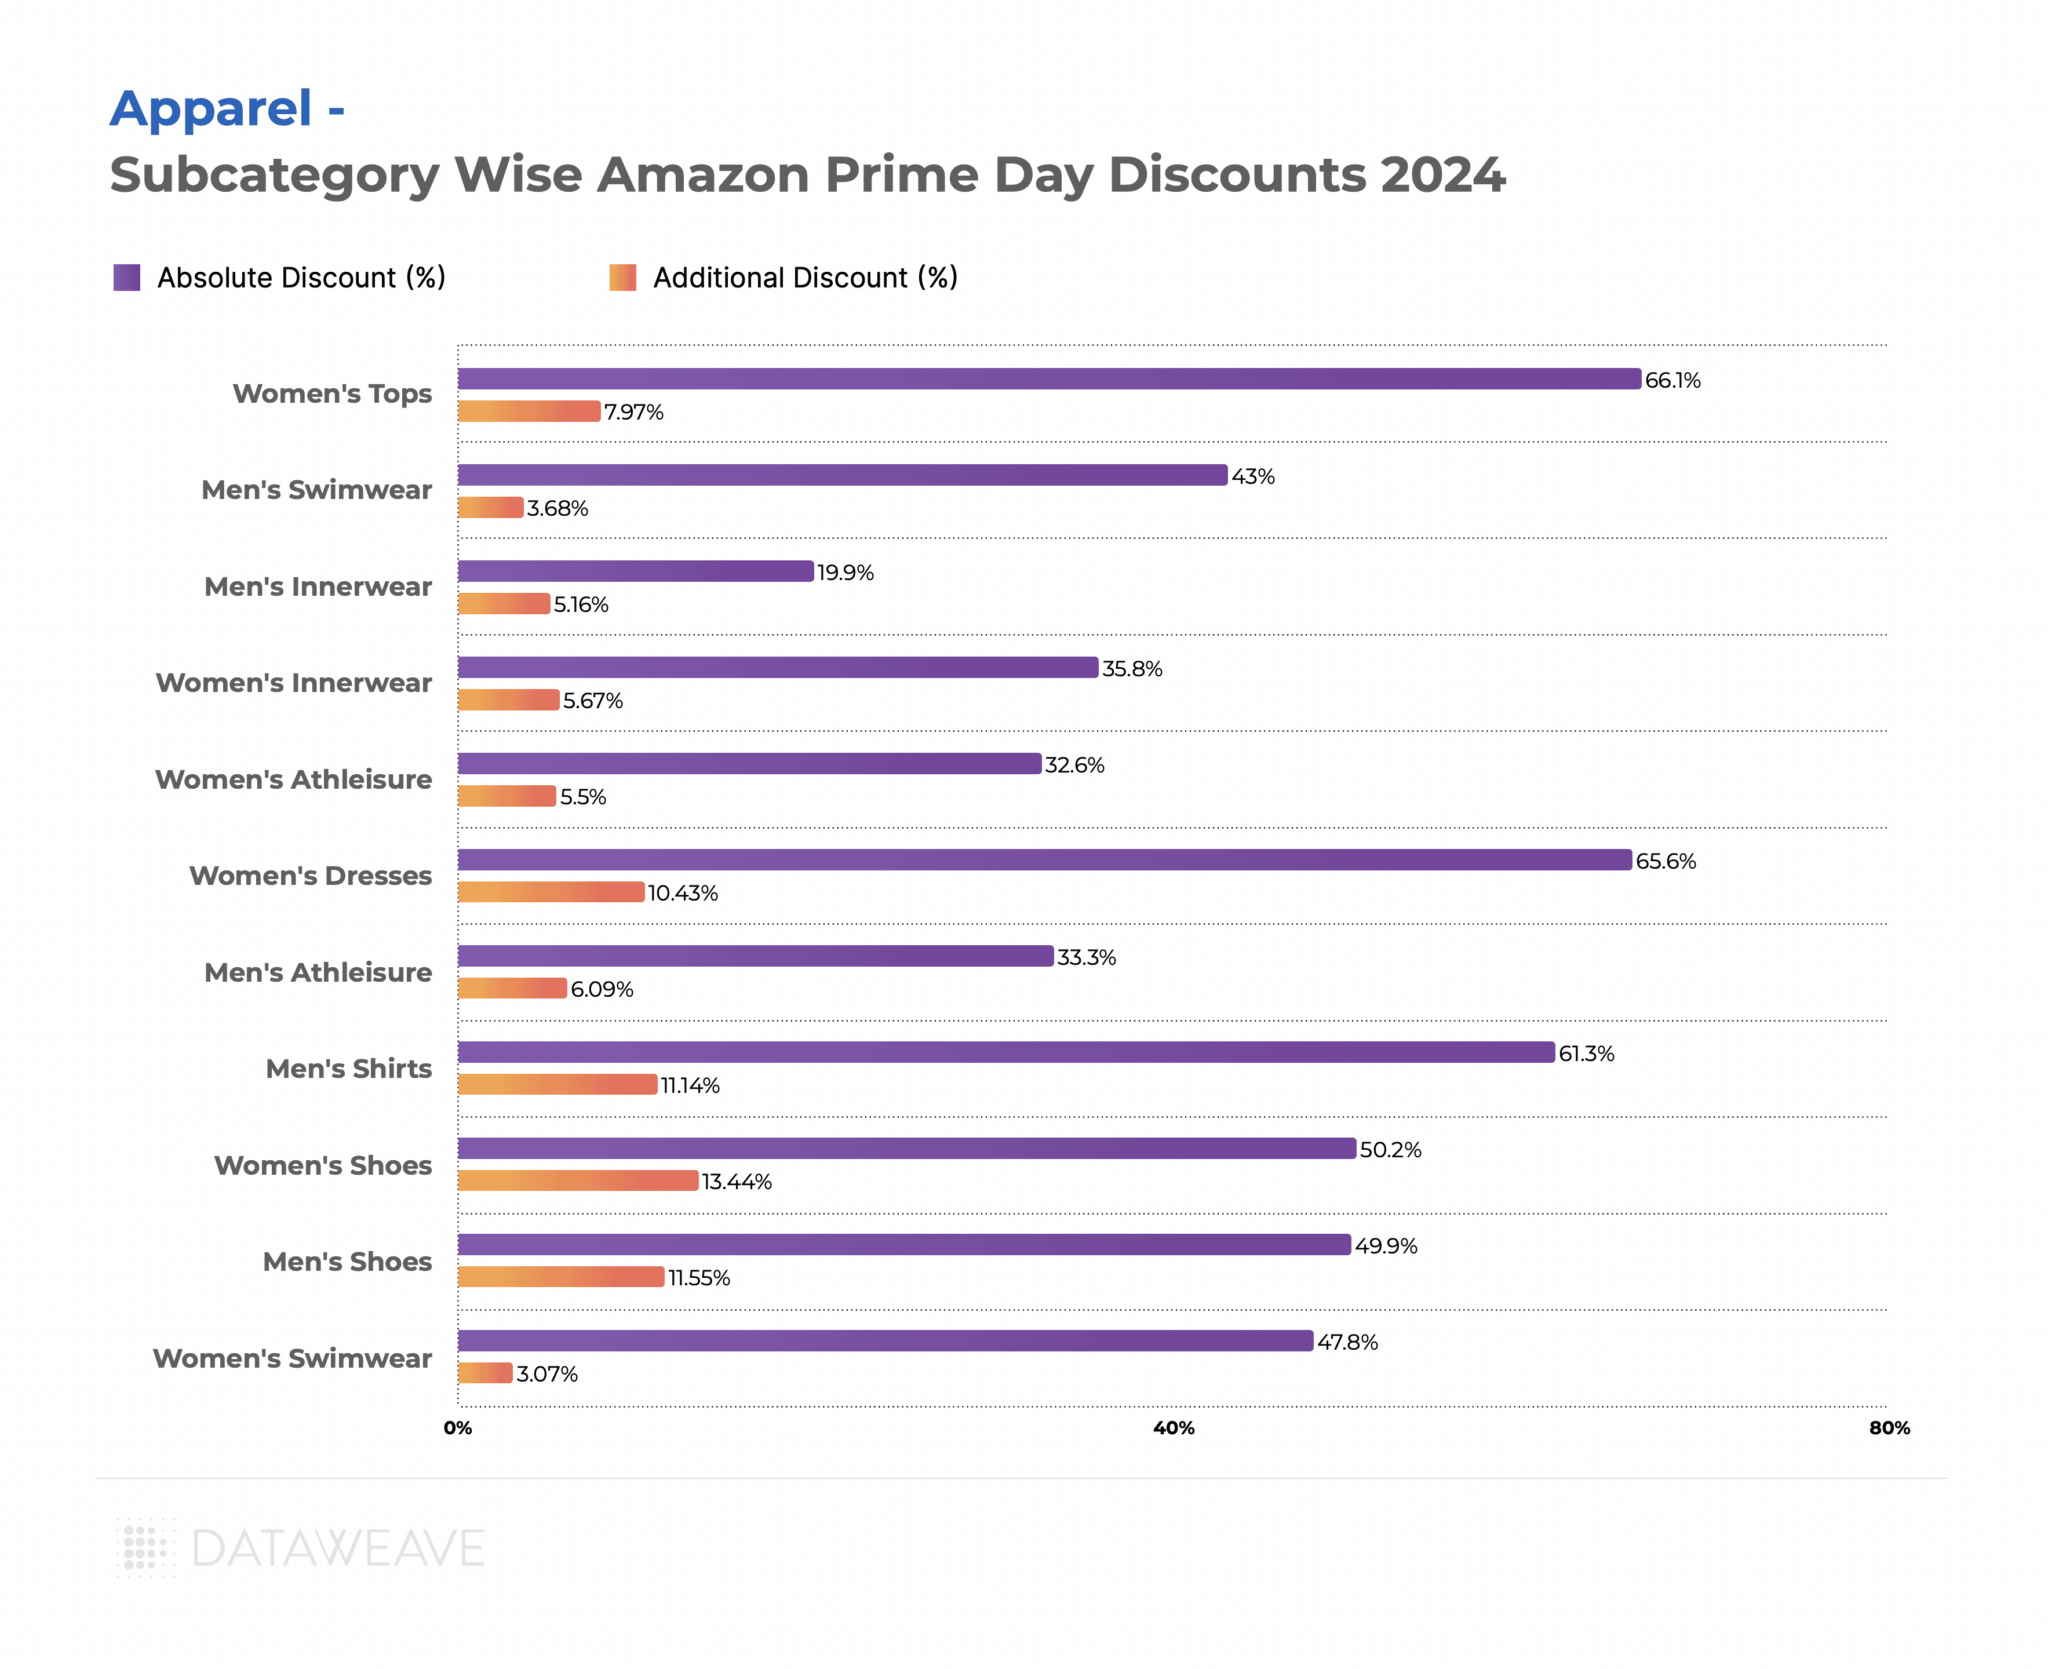
Within the subcategories analyzed, Women’s Shoes (13.4%) and Men’s Shoes (11.6%) saw the highest Additional Discounts on Amazon, indicating a strong focus on footwear during the event. Men’s Shirts followed closely at 11.1%
Women’s Tops had a more modest Additional Discount of 7.9% despite a high Absolute Discount before the event. Similarly, Women’s Dresses showed substantial Additional Discounts (10.4%).
Swimwear for both men and women saw low Additional Discounts (3.7% and 3.0% respectively). Innerwear categories for both men and women had more conservative discounts, with Men’s Innerwear showing the lowest Absolute Discount (19.9%) among all subcategories.
Brand-level Insights in Apparel
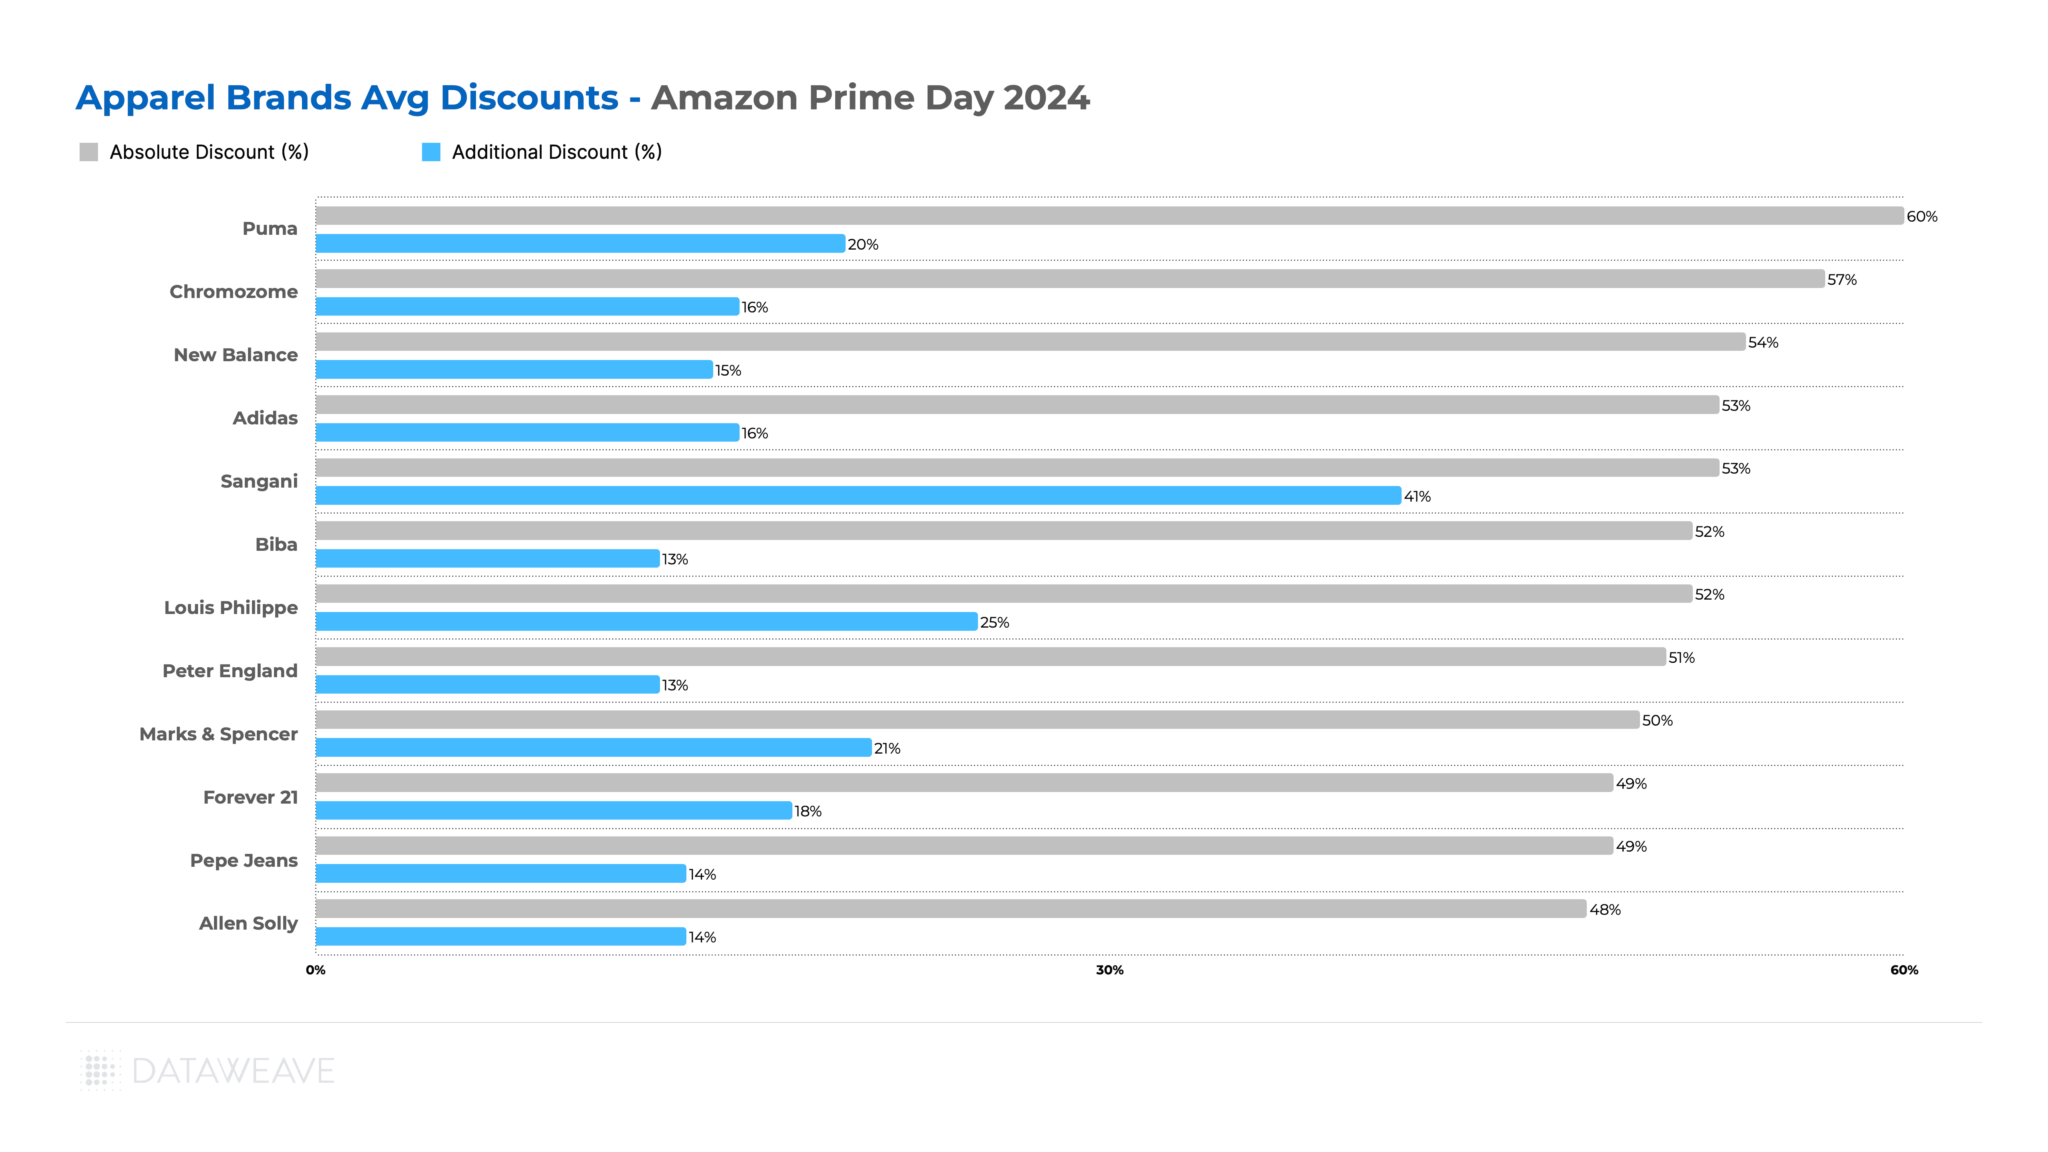
During the sale event, Sangani (innerwear brand) led with the highest Additional Discount of 41%, followed by Louis Philippe at 25%. These brands clearly leveraged Prime Day to drive sales and gain market share.
Puma offered the highest Absolute Discount at 60% with a significant Additional Discount of 20%, indicating a consistently aggressive promotional strategy. Chromozome (men’s innerwear brand) and Bacca Bucci (homegrown shoe brand of Shark Tank India fame) also offered substantial Absolute Discounts (57% and 56% respectively), but their Additional Discounts varied significantly (16% and 6% respectively).
Again, some well-known brands like Adidas, and Pepe Jeans offered more moderate Additional Discounts, possibly due to their established market positions.
Share of Search Analysis
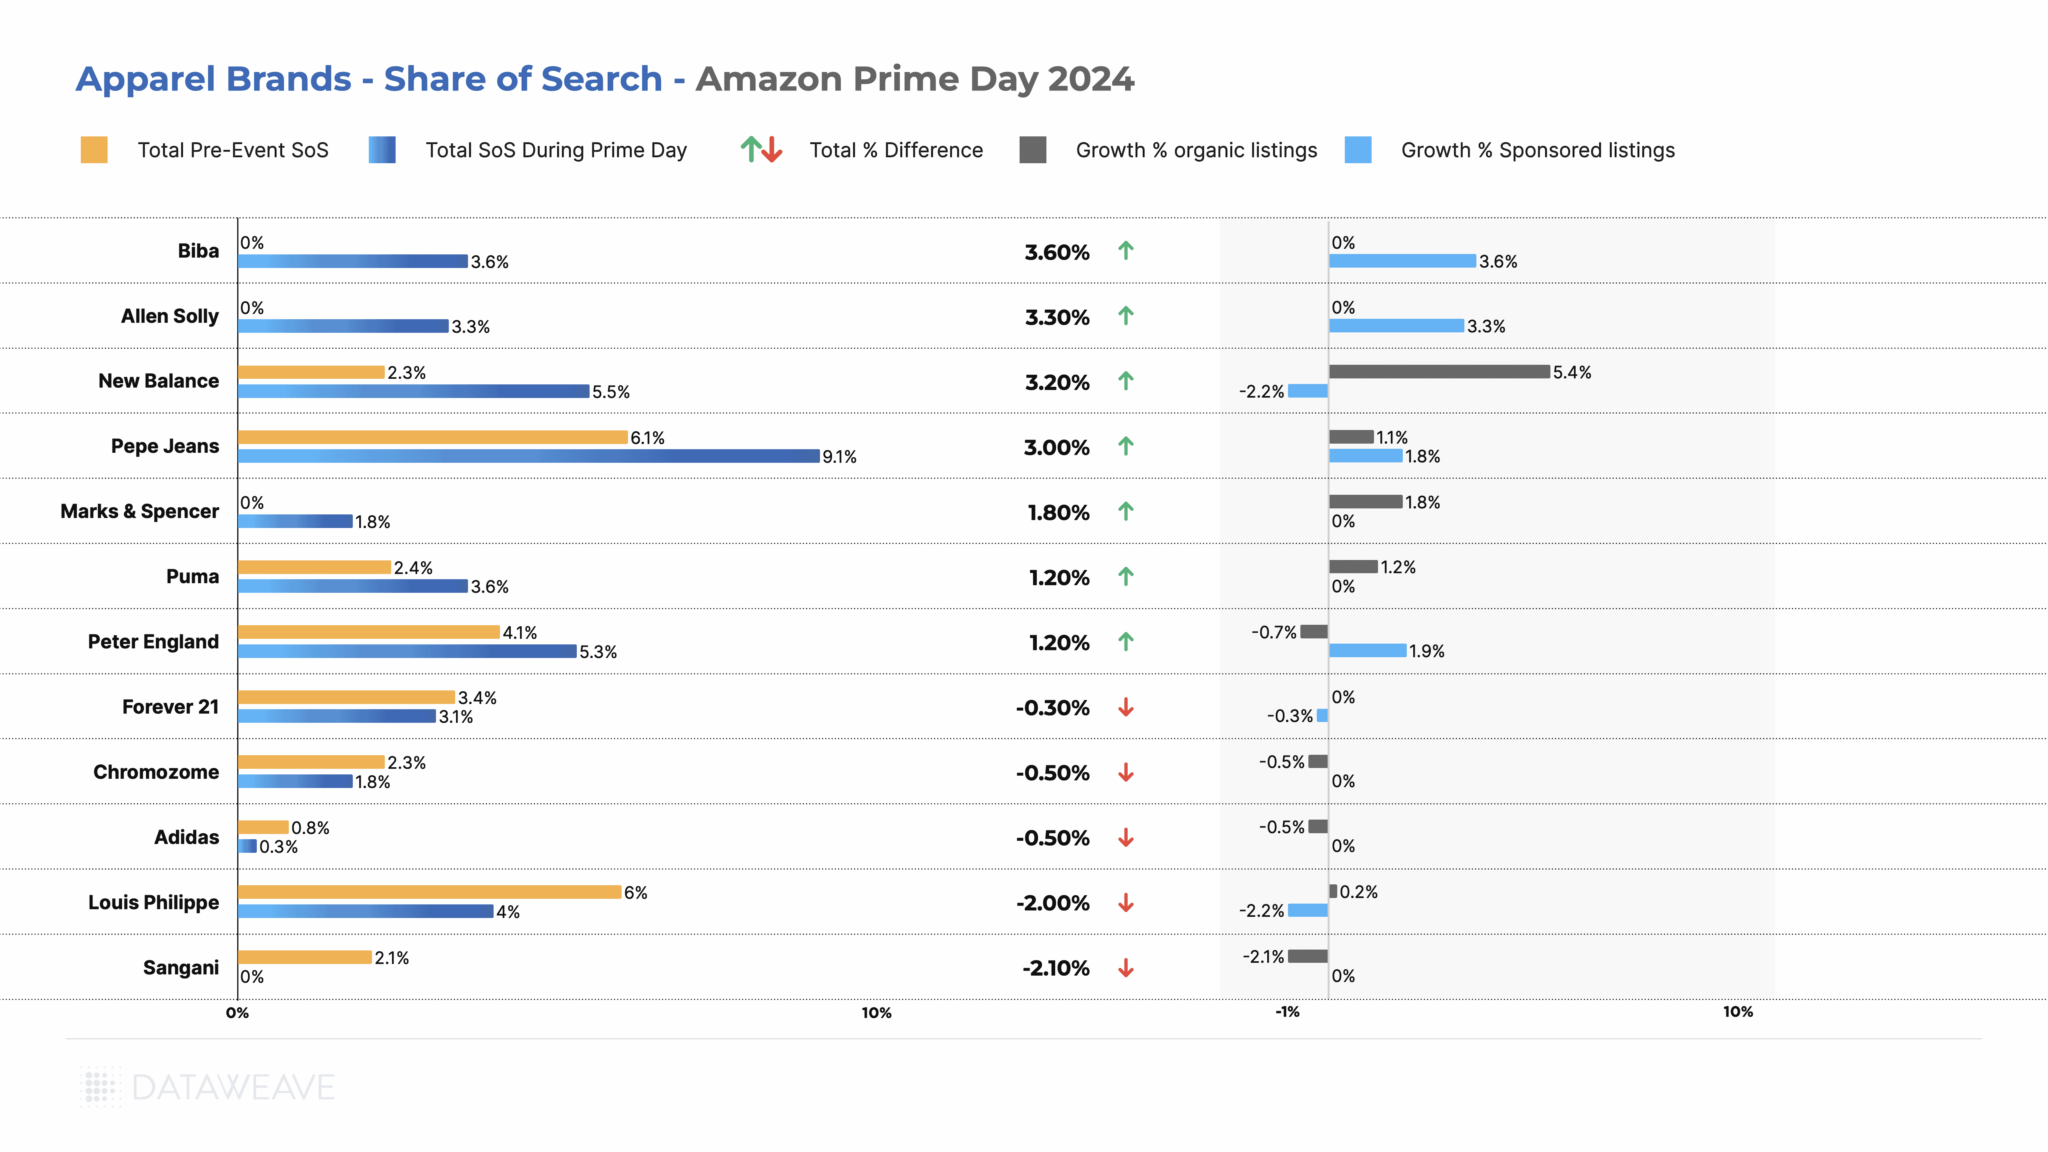
Biba (women’s ethnic wear brand) saw the most significant improvement in its SoS, gaining 3.60%, entirely through investments in sponsored listings. Allen Solly and New Balance (shoe brand) also made substantial gains of 3.3% and 3.2% respectively.
Surprisingly, some popular brands like Louis Philippe (-2.00%) and Sangani (-2.10%) experienced decreases in their SoS. Louis Philippe lost its share due to a roll back of its sponsored listings, while Sangini lost ground organically.
Key Takeaways:
While some brands like Sangani and Louis Philippe used aggressive discounting to drive sales, others like Biba and Allen Solly focused on improving their search visibility through sponsored listings.
Some brands with high discounts (like Sangani) saw a decrease in SoS, while others with more modest discounts (like Biba) significantly increased their visibility. This indicates that factors beyond pricing played a crucial role in brand performance during the event.
The significant use of sponsored listings by some brands highlights the importance of paid advertising in gaining visibility during competitive events like Prime Day.
Health & Beauty
Health & Beauty emerged as a standout category during Amazon Prime Day India 2024, with significant discounts and competitive strategies at play.
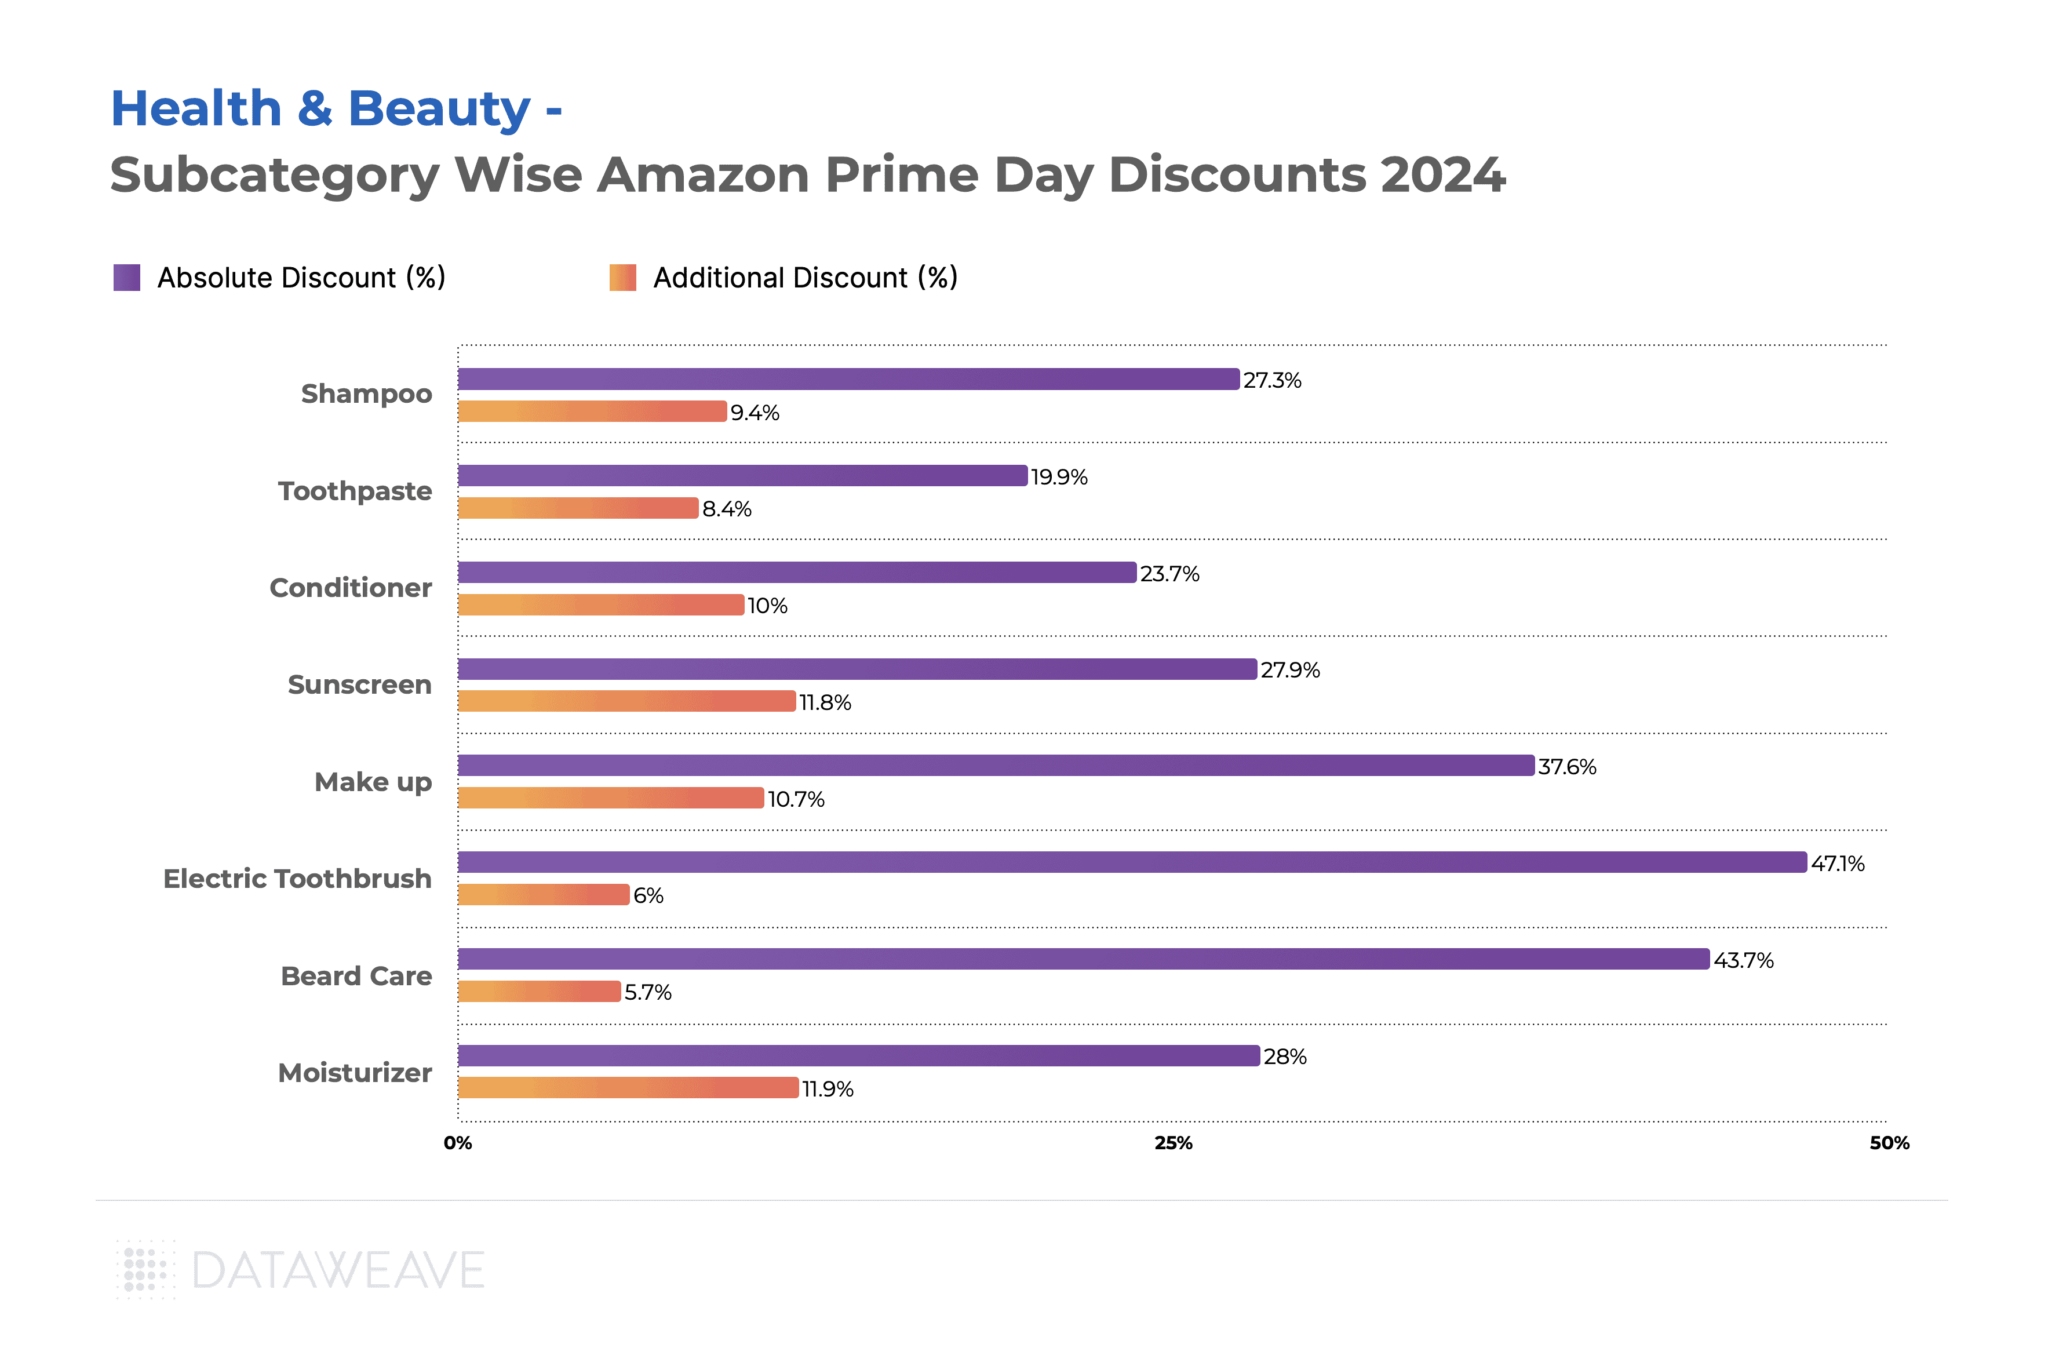
Within the subcategories we analyzed, Moisturizer (11.9%) and Sunscreen (11.8%) saw the highest additional price reductions on Amazon, likely due to seasonal demand during Prime Days. Make-up followed closely at 10.6%.
Electric Toothbrushes had the highest Absolute Discount at 47.1%, but a lower Additional Discount of 6.0%, highlighting that these products were already significantly discounted before the event. Similarly, Beard Care products showed high Absolute Discounts (43.7%) but lower Additional Discounts (5.7%) during Prime Day.
Everyday essentials like Toothpaste saw more modest discounts (19.9% Absolute, 8.4% Additional), reflecting steady demand for these products.
Brand-level Insights in Health & Beauty
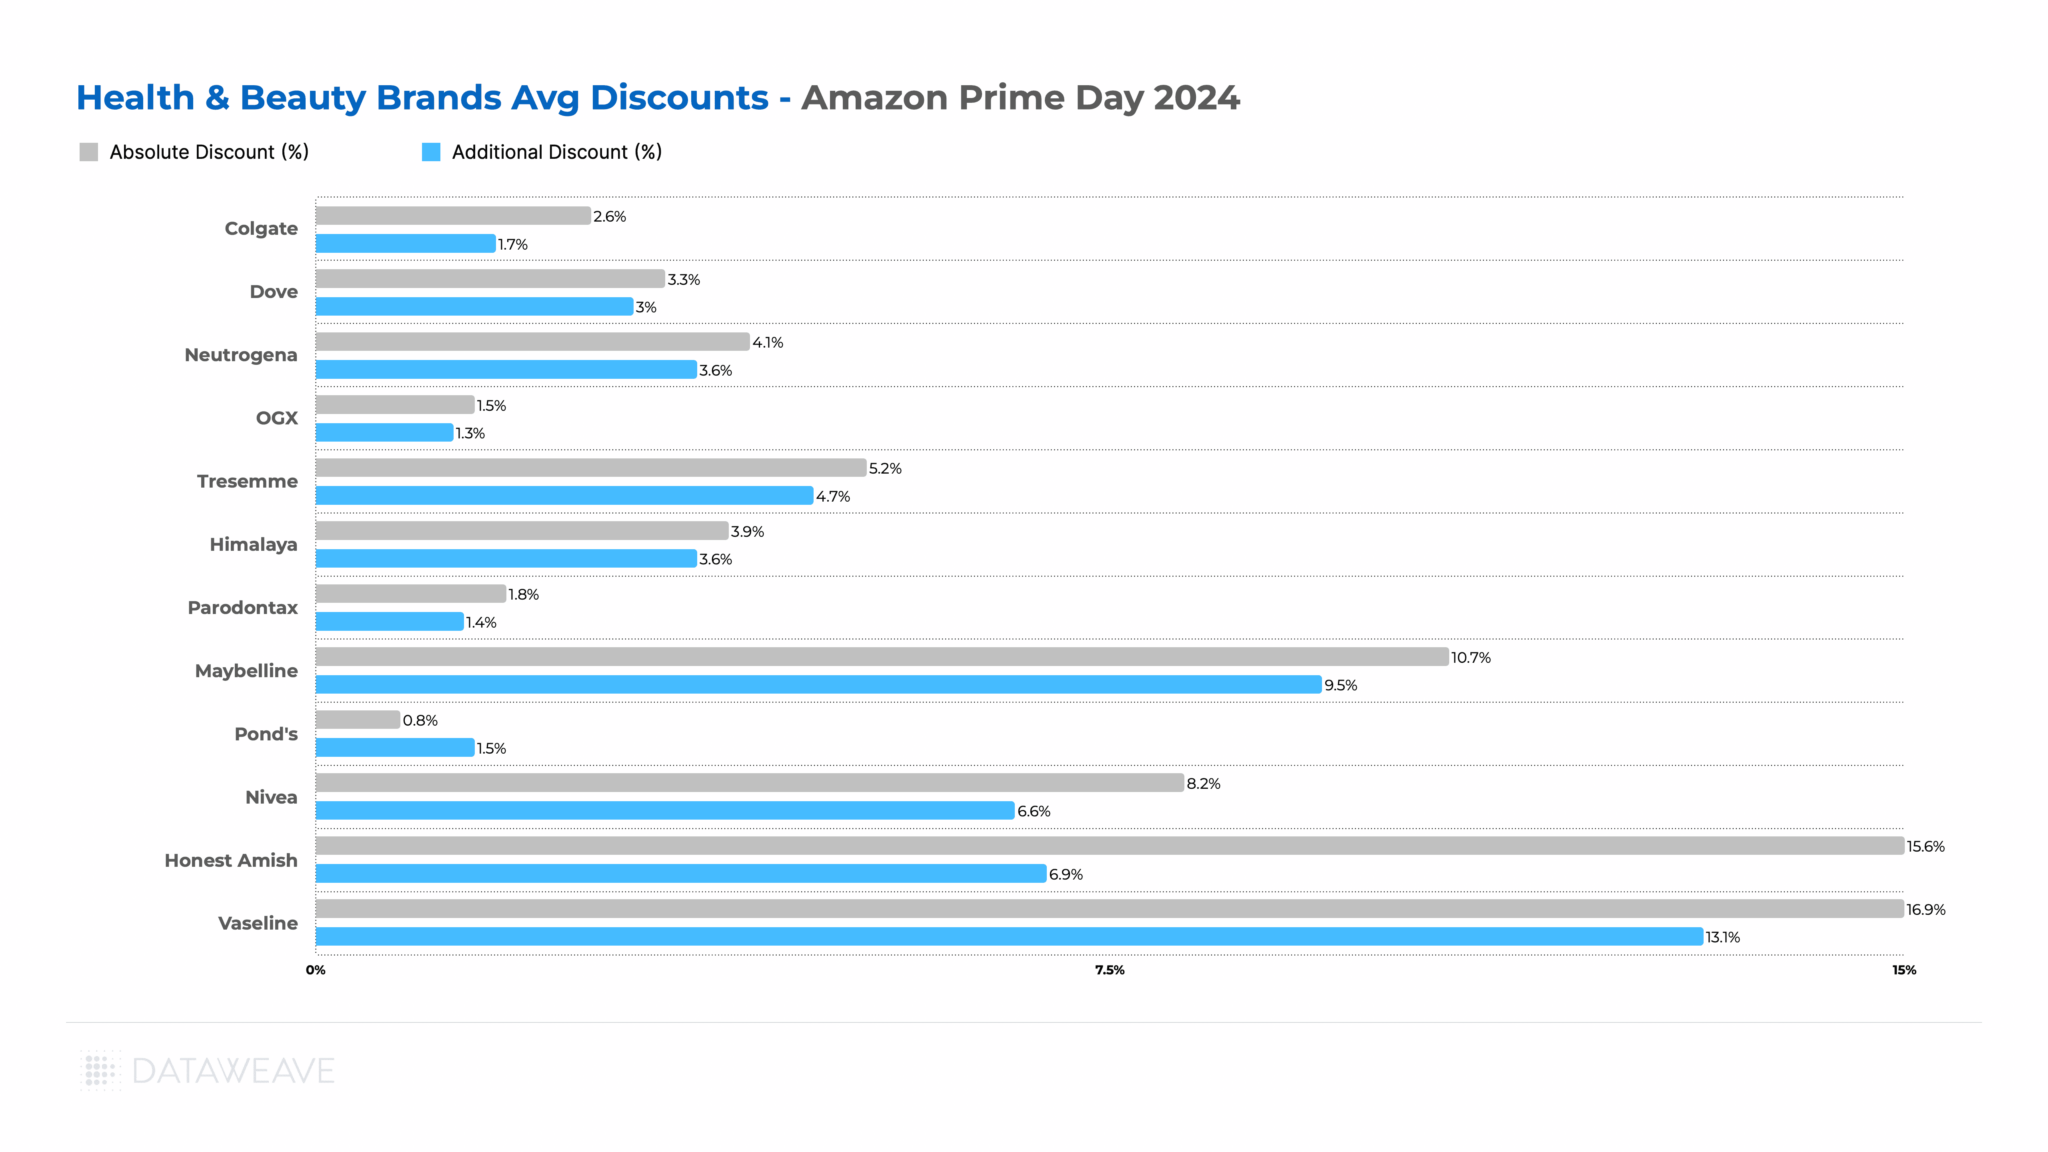
Vaseline led with the highest Additional Discount of 13.1%, followed by Maybelline at 9.5%. These brands clearly leveraged Prime Day to drive sales and potentially gain market share.
Honest Amish (beard care brand) and Nivea also offered substantial Absolute Discounts (15.6% and 8.2% respectively), but their Additional Discounts were lower, indicating pre-existing promotional strategies.
Once again, some well-known brands like Colgate, Dove, and Neutrogena offered more conservative discounts, possibly due to their established market positions or differing promotional strategies.
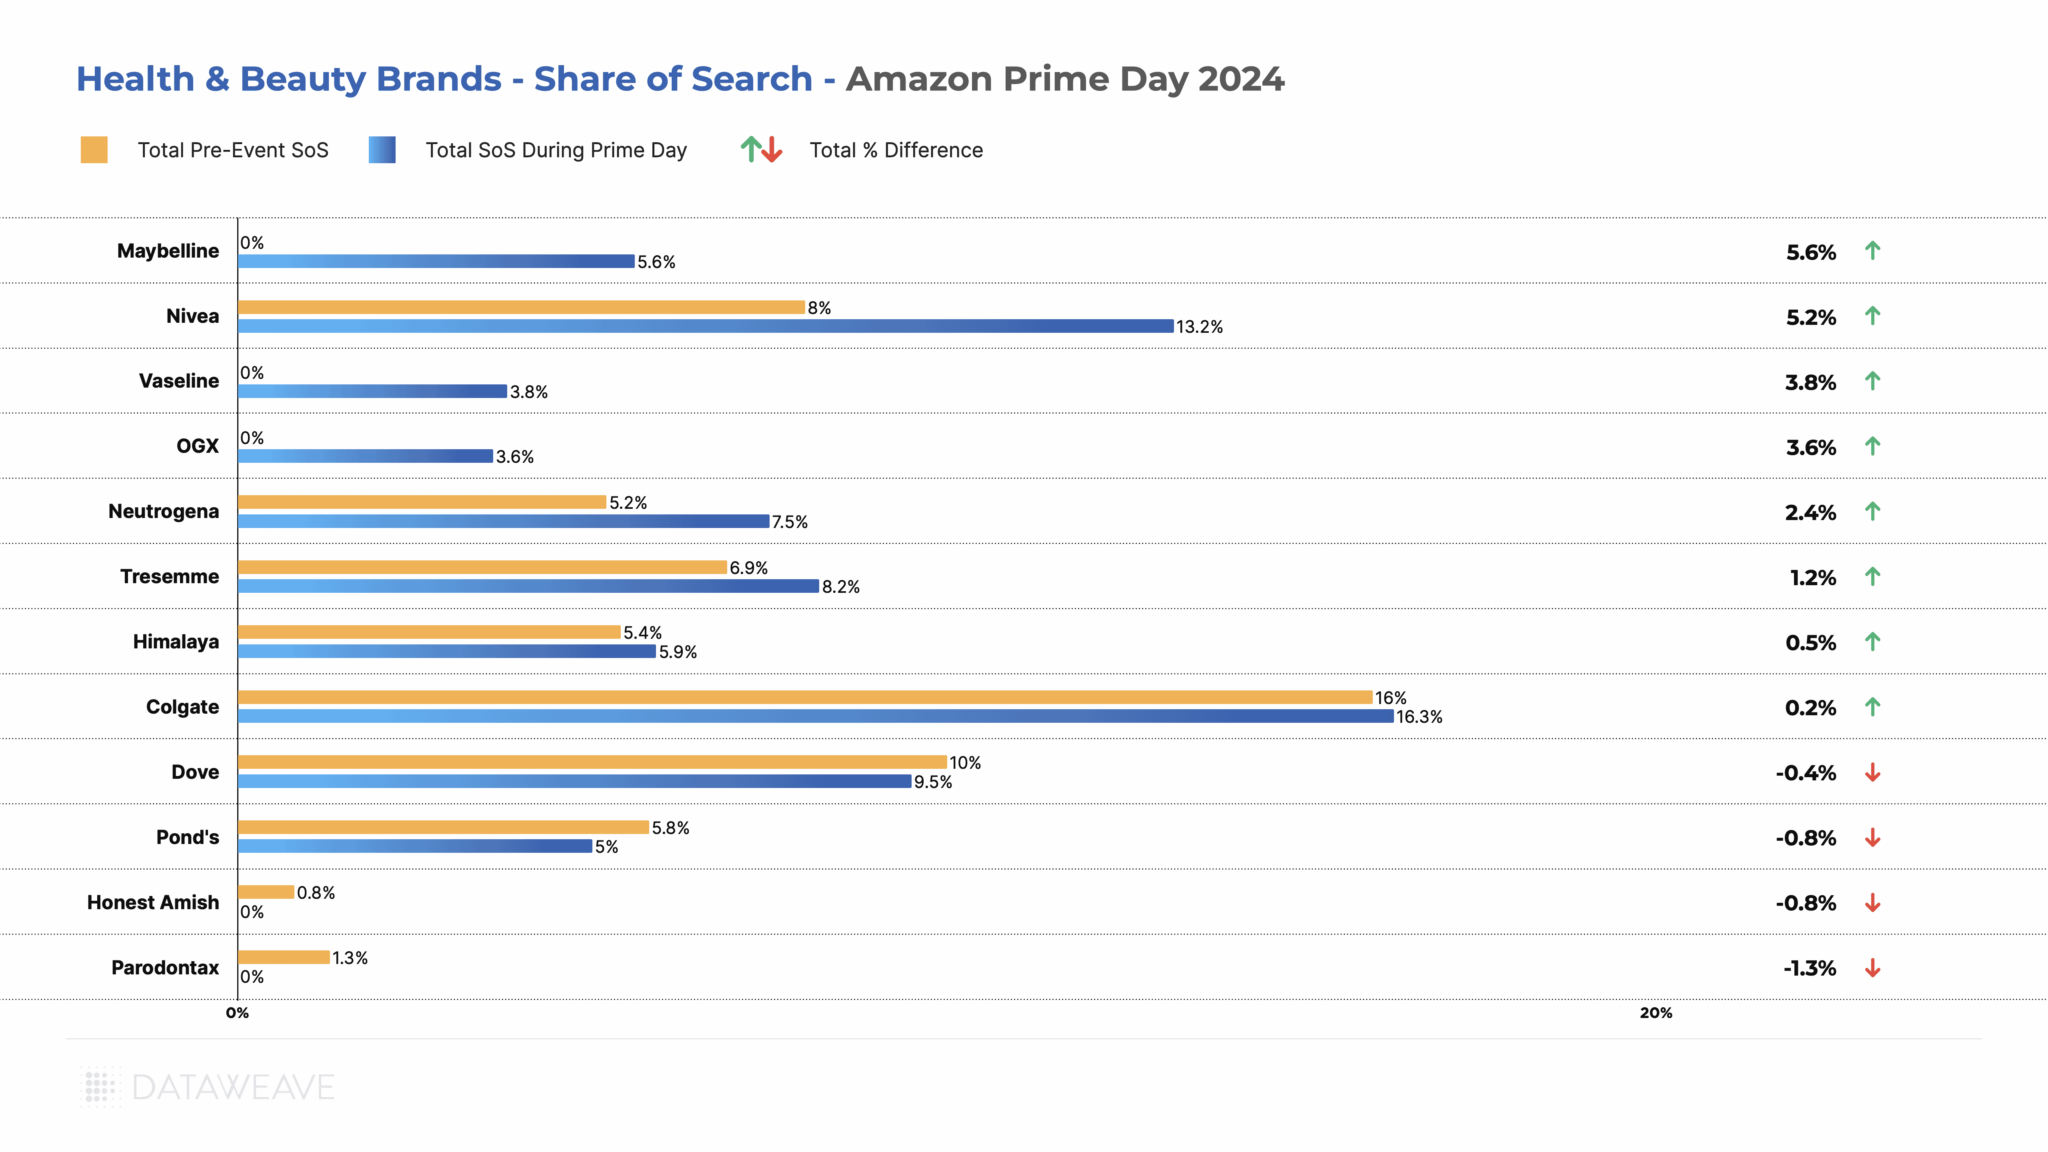
Share of Search Analysis
Maybelline saw the most significant improvement, gaining 5.6% in SoS, all through organic listings. The brand has been aggressively increasing market share with several new product launches and influencer campaigns. Nivea and Vaseline also made substantial gains of 5.2% and 3.8% respectively.
In this category as well, some popular brands like Dove (-0.4%), Pond’s (-0.8%), and Honest Amish (-0.8%) experienced slight decreases in their SoS. Parodontax (toothpaste brand) notably lost 1.3% SoS, with most of the decline in sponsored listings. Colgate maintained its strong position with a slight increase in SoS (0.2%), reflecting its dominant market presence.
Key Takeaways:
While some brands like Vaseline and Maybelline used aggressive discounting and improved visibility to drive sales, others like Colgate and Dove relied more on their established market positions.
None of the brands made any significant strides in sponsored listings, revealing that brands in this category are not yet fully leveraging retail media to help manage and boost their visibility on online marketplaces.
Final Thoughts
Amazon Prime Day 2024 has redefined the eCommerce landscape in India, yet again, showcasing diverse strategies employed by brands to maximize their impact. By understanding and leveraging these insights, brands and retailers can better navigate future sales events, optimizing their eCommerce strategies to achieve sustained growth and success.
Stay tuned to our blog for more in-depth analyses of brand and retailer performance across various retail events.
Reach out to us today to learn how you can leverage data-driven insights to optimize your eCommerce strategy.
Amazon Prime Day 2024 saw U.S. shoppers spending a staggering $14.2 billion online during the two-day event—an 11% increase from last year. This surge in spending reflects a significant shift in consumer behavior and presents a wealth of insights for brands and retailers alike.
Unlike last year’s focus on essentials, Prime Day 2024 saw Americans enthusiastically embracing both necessities and discretionary purchases. The Consumer Electronics and Health & Beauty categories, for example, experienced a notable uptick in interest, driven by major retailers slashing prices across CPG and Grocery segments, amid other reasons. Check out our first article in the Prime Day series 2024, analyzing retail insights across categories during the event.
This year, small businesses gained unprecedented visibility on Amazon, pushing relatively new brands into visibility.
At DataWeave, we recognize the critical importance of understanding these market dynamics for brands navigating the competitive eCommerce landscape. To provide actionable insights, we conducted an extensive analysis of over 47,000 SKUs across key categories before and during Amazon during Prime Day 2024. Our study delves into:
Pricing strategies: How did brands adjust their discounts to capitalize on the Prime Day frenzy?
Share of Search: Which brands achieved the highest visibility for major search keywords?
Dive into these insights below to uncover how brands performed during Amazon Prime Day 2024, and learn how you can leverage these findings to enhance your brand’s digital shelf performance.
Our Findings
Most brands offered substantial discounts before Prime Day, then added smaller discounts during the event. This strategy creates a perception of value while still allowing room for Prime Day-specific deals. To understand the real value offered by brands, we conducted an extensive analysis of brand performance, examining both pricing strategies and visibility on the platform. Our approach focuses on two key metrics:
Discounts: We analyzed both the Absolute Discount (total markdown relative to MSRP a week before Prime Day) and the Additional Discount (the price reduction during Prime Day compared to the week before).
Share of Search (SoS): We examined the visibility of brands in the top 20 search results. We also separately tracked this metric for organic and sponsored search results.
Let’s dive into the category and brand specific insights:
Consumer Electronics
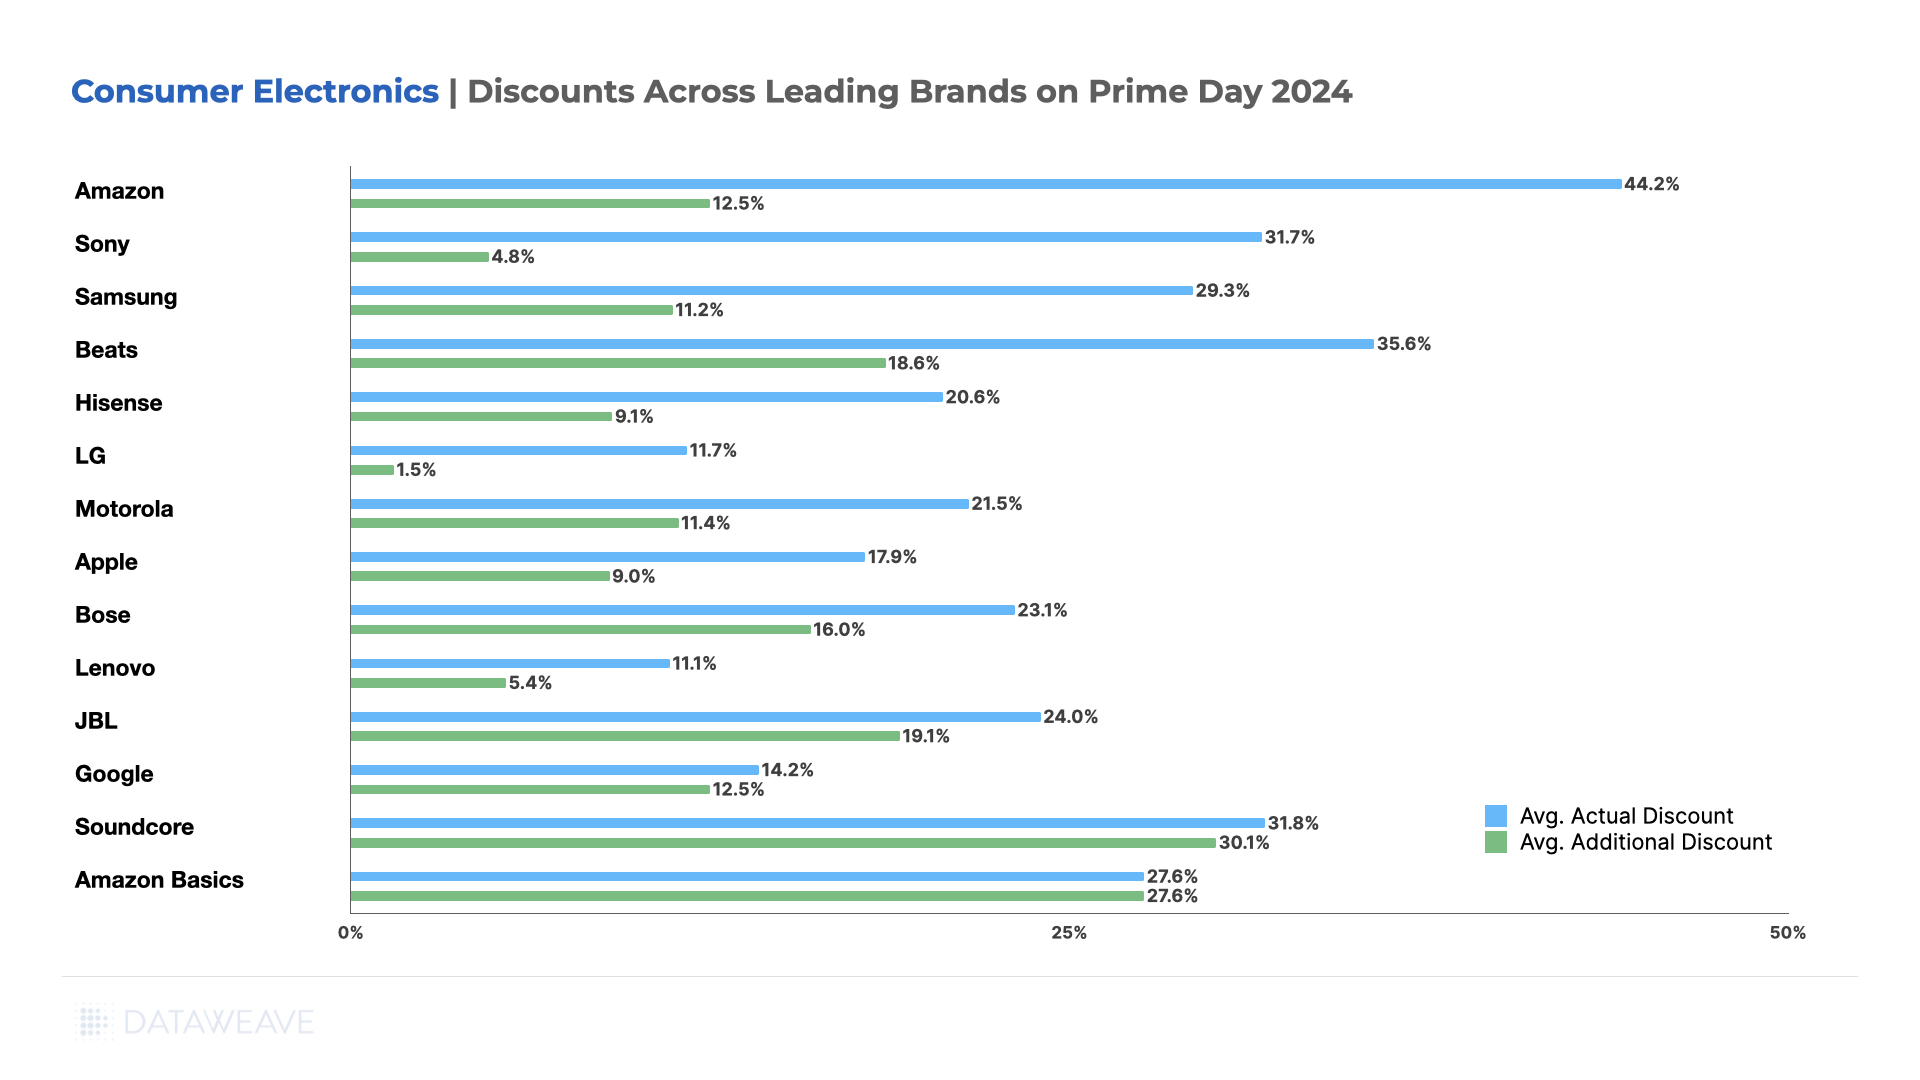
Once again, in 2024, the Consumer Electronics category dominated discounts. Amazon’s own brands lead with the highest average Absolute Discount (44.2%) and a significant Additional Discount (12.5%), showcasing its aggressive push for Prime Day.
In a surprising twist, Amazon’s homepage wasn’t dominated by its own brands. Instead, tech giants like Apple and Samsung took centre stage. Despite this, Amazon’s own brands offered significant discounts across electronics products, including Amazon Kindle, Fire TVs, Fire TV Sticks, Echo Dot, and more, aiming to capture market share via markdowns.
Soundcore (earphone audio products brand) offered the highest discount during Prime Day, at 30.10%. Other headphone, earbuds, and wireless headphone brands including Sony, Beats, JBL, and more also offered significant discounts.
Premium brands like Apple (17.90% Absolute, 9.00% Additional) and Bose (23.10% Absolute, 16.00% Additional) offered relatively modest discounts, aligning with their brand positioning, but also taking advantage of the Prime Day frenzy.
Share of Search Insights in Consumer Electronics
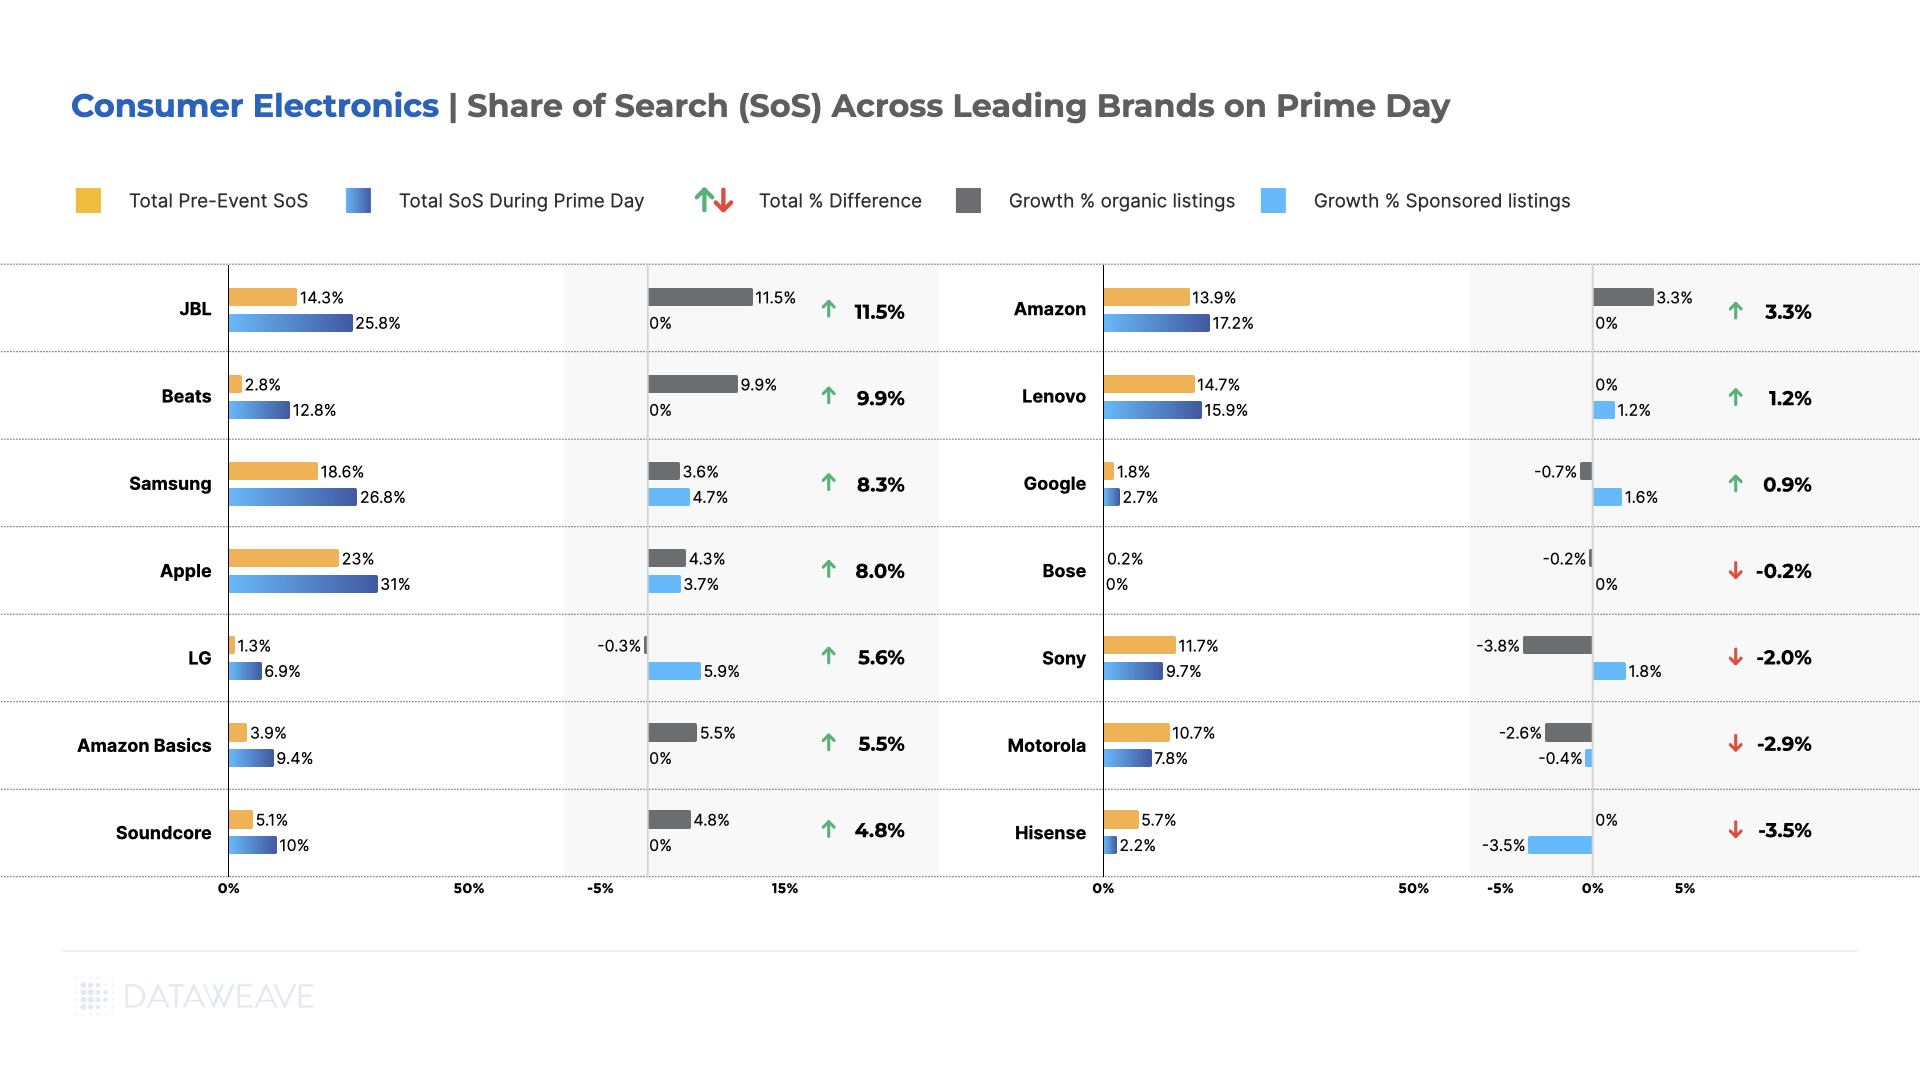
JBL emerged as the standout performer, with the most significant increase in SoS, jumping from 14.3% pre-event to 25.8% during Prime Day, driven entirely by organic growth. Beats also saw a remarkable rise, increasing from 2.8% to 12.8%, again through organic listings only. Samsung maintained its strong presence, growing from 18.6% to 26.8%, with most of its growth influenced by increased ad spend.
Apple, despite already having a high pre-event SoS, managed to increase its share further from 23.0% to 31.0%, with some contribution via sponsored ads. LG saw a substantial increase from 1.3% to 6.9%, primarily through sponsored listings, opting for an inorganic approach to drive visibility during the sale.
Amazon and its AmazonBasics brand both saw notable increases in SoS, relying solely on organic growth. This is, of course, not surprising since Amazon controls its organic ranking algorithm.
Interestingly, some brands experienced decreases in SoS. Sony, Motorola, and Hisense all saw reductions in their share, with Hisense’s decline coming entirely from a reduction in sponsored listings.
Key Takeaway: Prime Day 2024 saw a significant reshuffling of brand visibility in the Consumer Electronics category. While some established brands like JBL, Beats, Samsung, and Apple strengthened their positions through a mix of organic and sponsored growth, others faced increased competition for consumer attention. The event highlighted the importance of a balanced approach to visibility, with successful brands leveraging both organic search optimization and strategic use of sponsored listings to maximize their presence during this high-traffic period.
Apparel
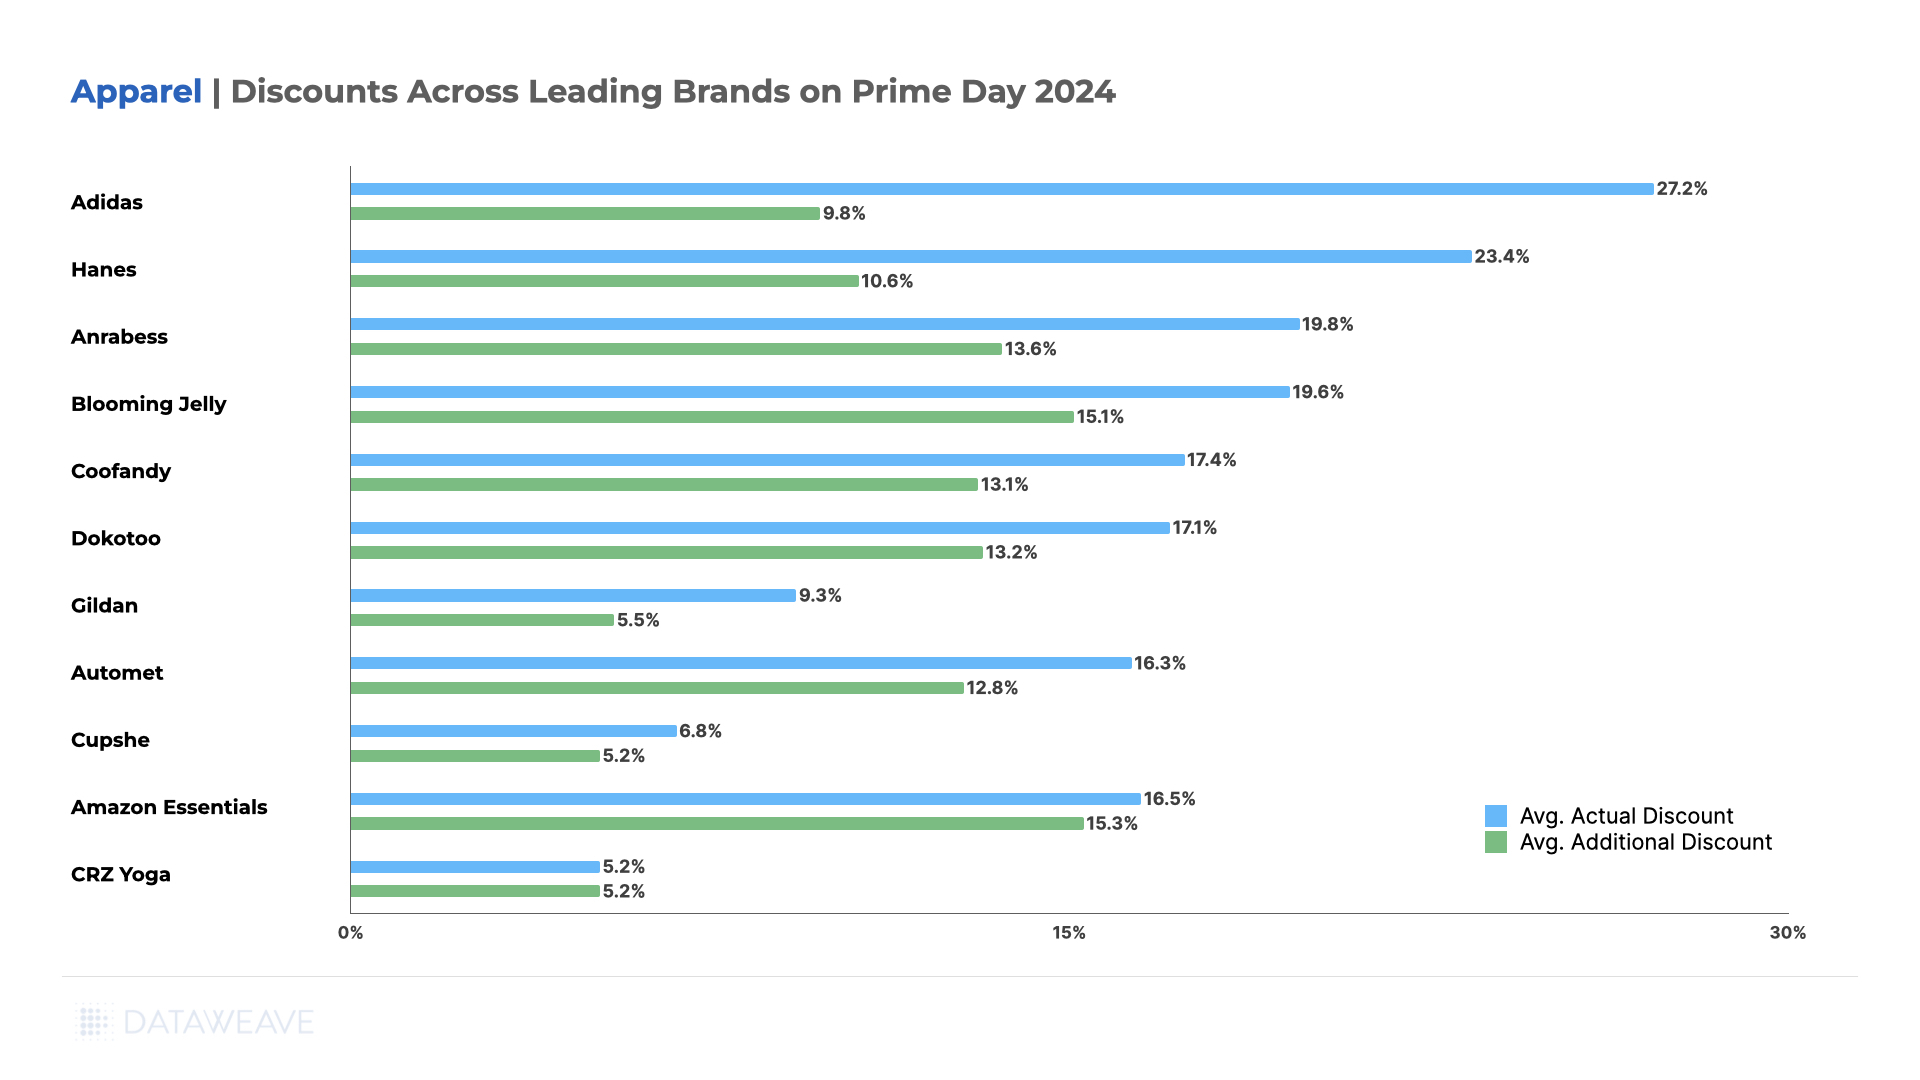
In the Apparel category, Adidas led with the highest Absolute Discount (27.2%) and a significant Additional Discount (9.8%). Value brands like Hanes (innerwear brand) and Anrabess offered substantial discounts, while Amazon Essentials maintained high discounts across the board (16.5% Absolute, 15.3% Additional).
Some brands like Cupshe (swimwear and vacation apparel brand) offered relatively lower additional markdowns. Meanwhile CRZ Yoga (athleisure brand) did not offer additional markdowns on Prime Day.
Share of Search Insights in Apparel
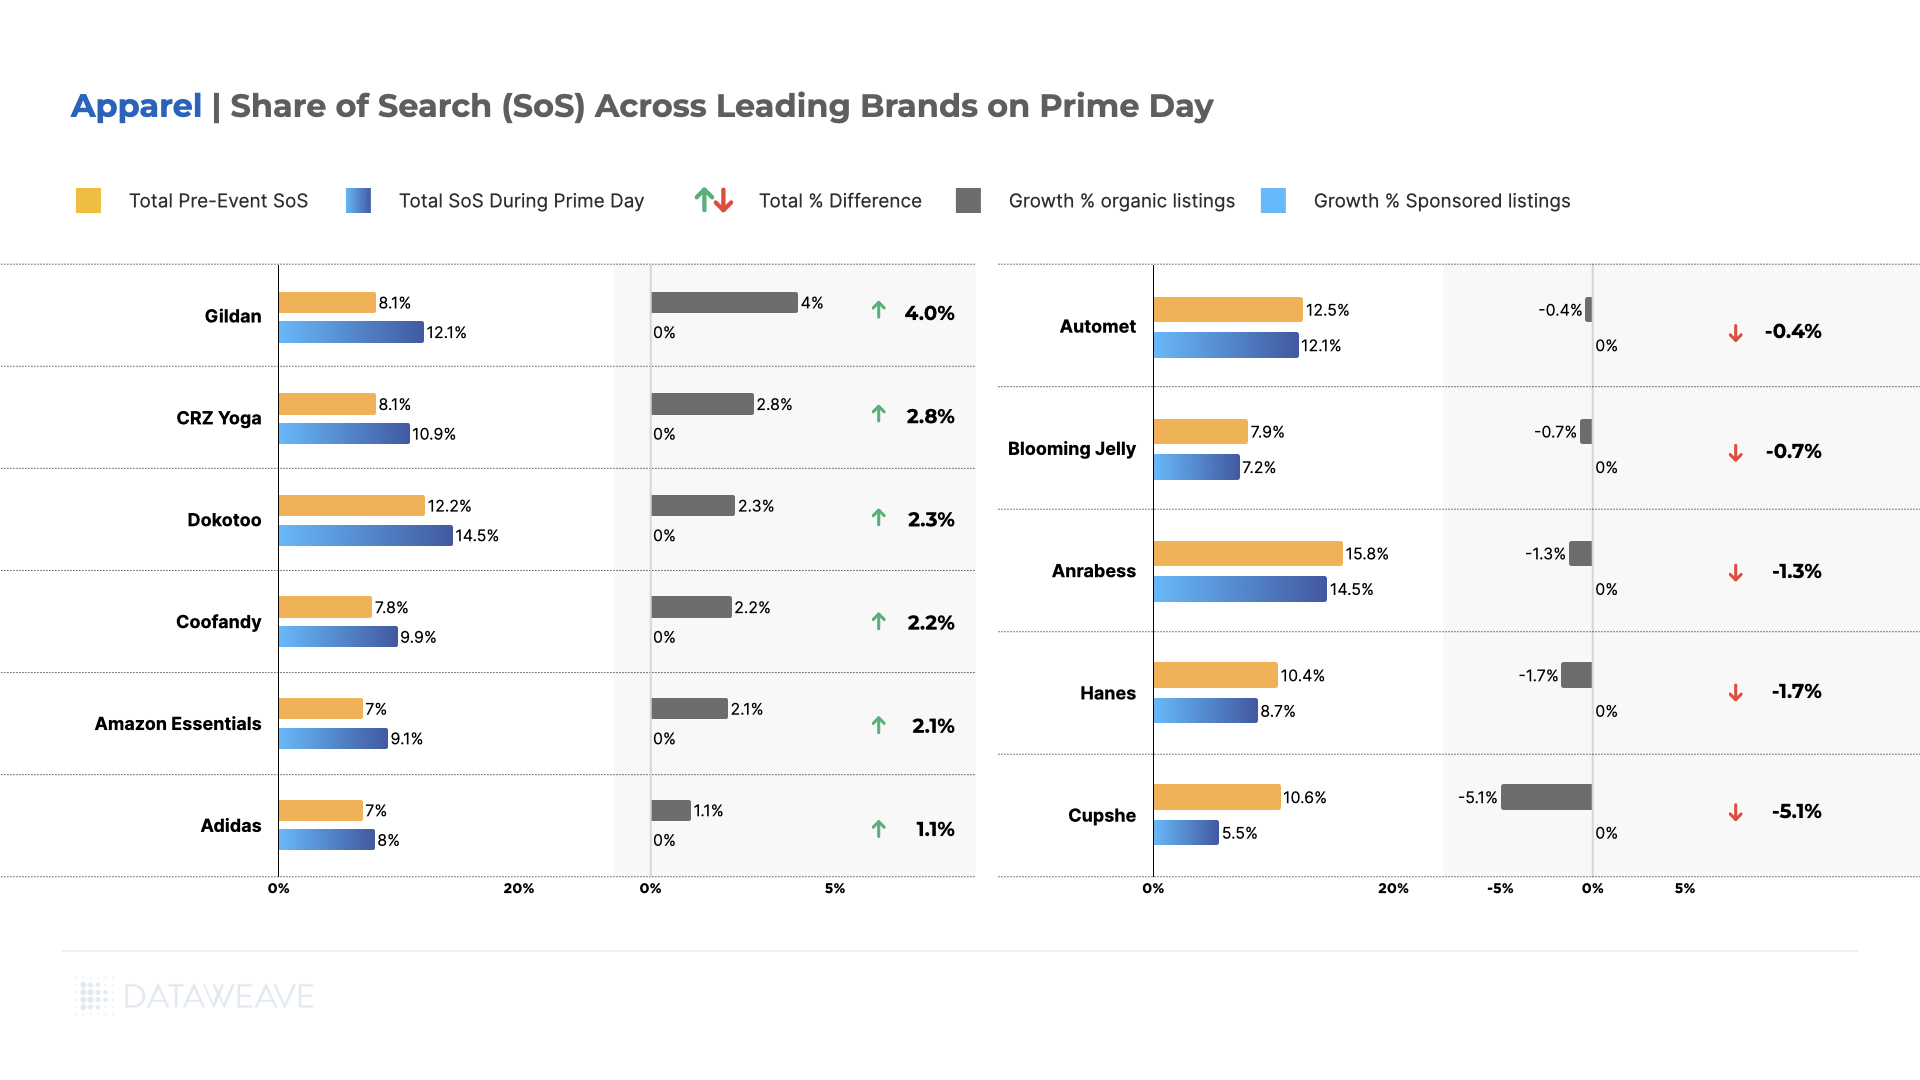
Gildan (activewear brand) emerged as the top performer in terms of SoS growth, increasing from 8.1% pre-event to 12.1% during Prime Day, driven entirely by organic growth. CRZ Yoga (an athleisure apparel brand) and Dokotoo (women’s casualwear brand) also saw significant increases in their SoS, rising by 2.8 and 2.3 percentage points respectively, again through organic listings only.
Amazon Essentials continued to perform well, increasing its visibility from 7.0% to 9.1%, aligning with its competitive pricing strategy. Coofandy also saw a notable increase, growing from 7.8% to 9.9%.
Interestingly, some brands that were previously highlighted for growth actually experienced decreases in SoS. Automet (clothing & accessories brand) saw a slight decline from 12.5% to 12.1%, while Anrabess (women’s fashion brand) dropped from 15.8% to 14.5%. Cupshe (swimwear brand) experienced the most significant decrease, falling from 10.6% to 5.5%.
Adidas, despite leading in discounts, saw only a modest increase in SoS from 7.0% to 8.0%. Notably, none of the brands visible in the top search results utilized sponsored listings, with all changes in SoS coming from organic growth or decline. This indicates a lack of maturity in this category in leveraging retail media.
Key Takeaway: Prime Day 2024 in the apparel category showcased the importance of organic search optimization. While some brands like Gildan and CRZ Yoga significantly improved their visibility, others faced challenges in maintaining their pre-event positions. The absence of sponsored listings across all brands highlights a unique dynamic in the apparel category, where organic search performance appears to be the primary driver of visibility during high-traffic events like Prime Day.
This suggests that Apparel brands may need to focus more on SEO strategies and organic content optimization to maximize their presence during major shopping events, rather than relying on paid promotions. On the other hand, smartly leveraging retail media to boost visibility can give apparel brands a competitive edge.
Health & Beauty
The Health & Beauty category this year got a push thanks to Amazon’s subscription offering. Prime members who subscribed for regular usage products like toothpaste and health aids or medicines availed higher discounts.
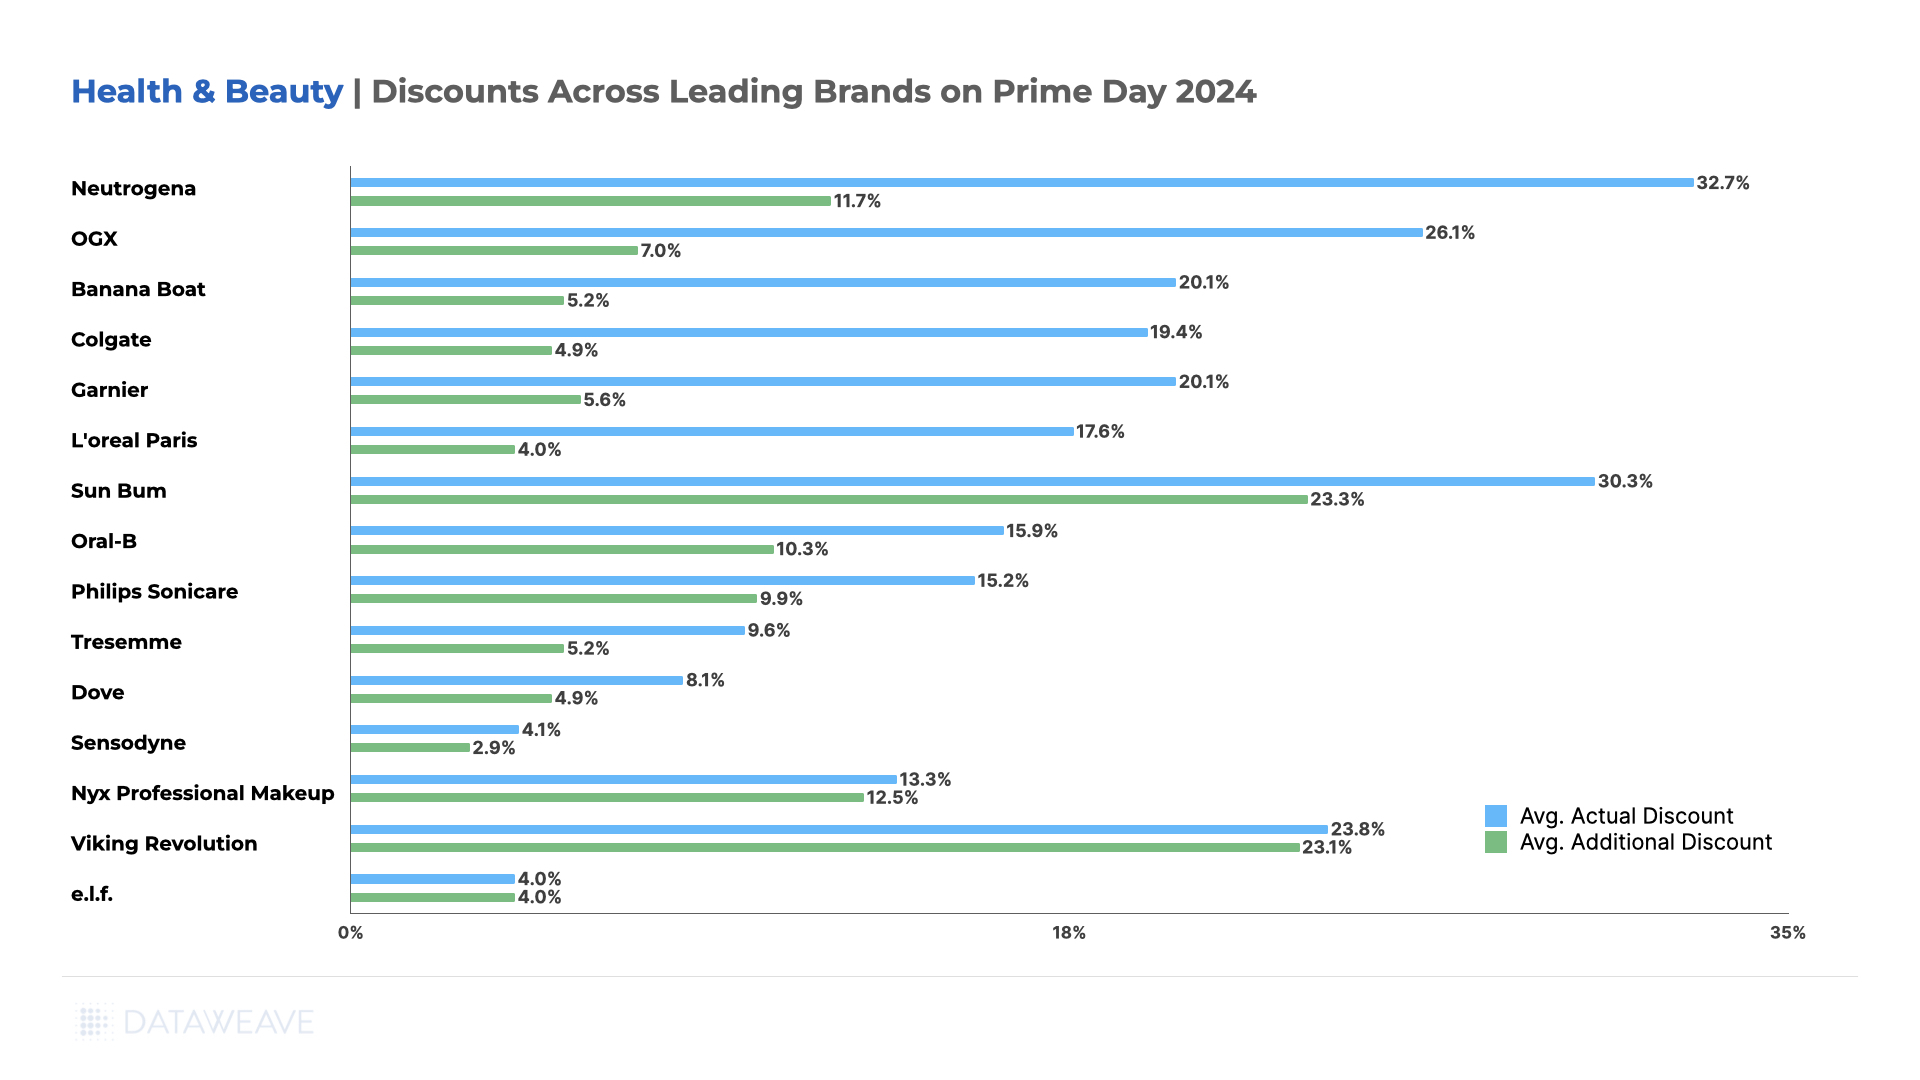
Amid Health & Beauty brands, Neutrogena led with the highest Absolute Discount (32.7%) and a significant Additional Discount (11.7%). Sun Bum moisturizers & sunscreen (23.3%) and Viking Revolution (23.1%) offered the highest Additional Discounts, indicating a strong Prime Day focus.
Premium brands like L’Oreal Paris and Philips Sonicare offered moderate discounts, balancing promotions with their intended brand image.
Share of Search Insights in Health & Beauty
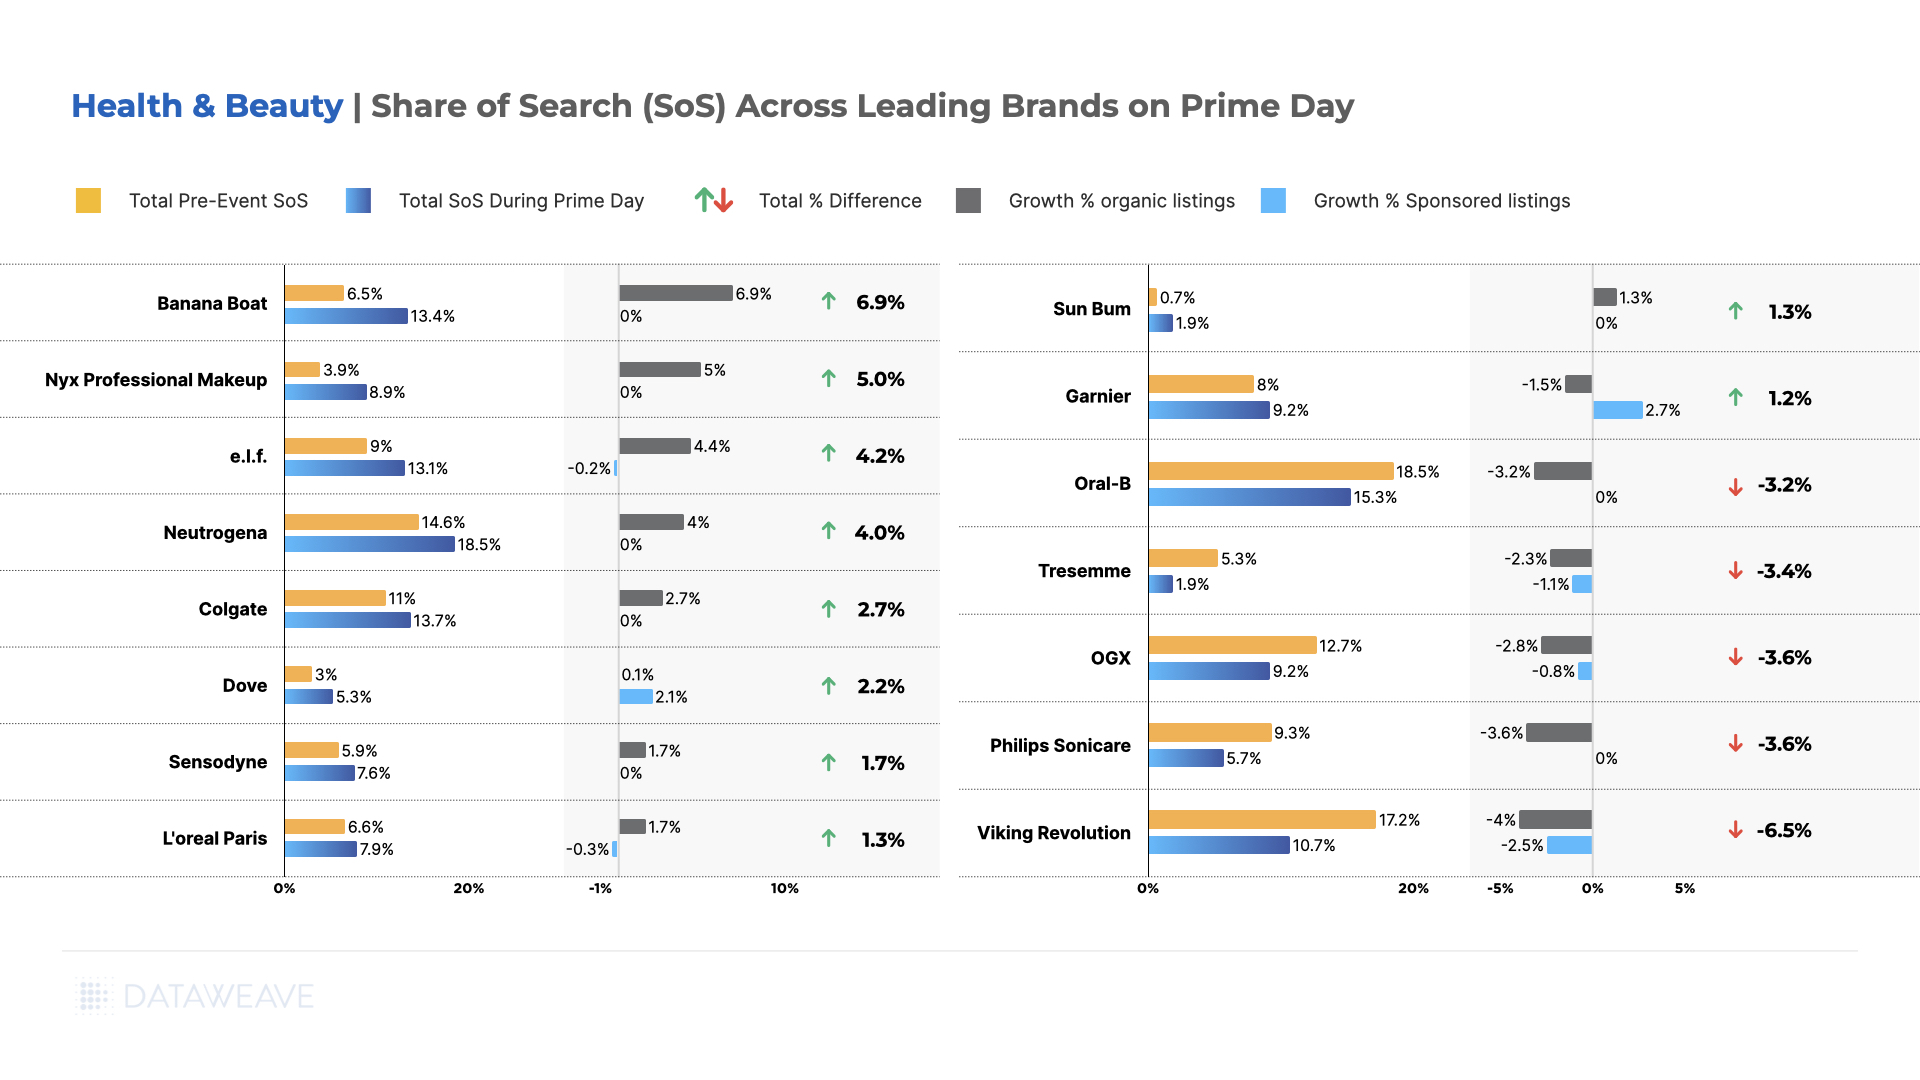
Banana Boat (sunscreen brand) emerged as the standout performer, seeing the largest increase in SoS from 6.5% to 13.4%, achieved entirely through organic growth. Nyx Professional Makeup also saw a significant jump, rising from 3.9% to 8.9%, again solely through organic listings.
Contrary to previous analysis, e.l.f. actually experienced substantial growth, increasing from 9.0% to 13.1% SoS, with a strong focus on organic growth (4.4%) slightly offset by a minor decrease in sponsored listings (-0.2%).
Neutrogena maintained its strong performance, aligning with its aggressive discounting strategy, as its SoS increased from 14.6% to 18.5% through organic growth. Colgate also saw a notable increase from 11.0% to 13.7% SoS.
Interestingly, some brands employed a mixed strategy. Dove and Garnier saw overall increases in SoS, but achieved this through different means. Dove relied heavily on sponsored growth, while Garnier offset a decrease in organic listings with strong sponsored content growth.
Contrary to previous observations, Oral-B experienced a decrease in SoS from 18.5% to 15.3%, entirely in organic listings. Without any additional spend on sponsored listings to compensate, it lost significant ground in its visibility. Other brands facing significant declines include Tresemme, OGX, Philips Sonicare, and most notably, Viking Revolution, which dropped from 17.2% to 10.7% in its SoS.
Key Takeaway: The Health & Beauty category during Prime Day 2024 showcased a diverse range of strategies and outcomes. While some brands like Banana Boat and Nyx Professional Makeup achieved significant visibility gains through organic growth, others like Dove and Garnier relied more on sponsored content.
The success of e.l.f. and Neutrogena in aligning discounting strategies with increased visibility stands in contrast to the challenges faced by previously strong performers like Oral-B and Viking Revolution. This varied landscape shows the fierce competition in the category and the need for brands to employ multi-faceted strategies that balance organic optimization, sponsored content, and competitive pricing to succeed in high-stakes events like Prime Day.
Brand Strategies and Future Implications
Our analysis reveals several key trends:
Brand Positioning Matters: Premium brands like Apple and Bose maintained their positioning with modest discounts, while value-oriented brands like Soundcore and Hanes offered deeper cuts to attract price-sensitive shoppers.
Visibility vs. Discounting: Some brands, particularly in the Consumer Electronics category, prioritized increasing their visibility (Share of Search) over offering steep discounts. This strategy suggests a focus on long-term visibility and brand perception rather than short-term sales boosts.
Category-Specific Approaches: Apparel brands uniquely relied on organic search visibility, eschewing sponsored listings entirely. In contrast, several Health & Beauty brands leveraged sponsored content significantly to boost their presence.
Emerging Brand Opportunities: Lesser-known brands, especially in the Apparel and Health & Beauty categories, used Prime Day as a launchpad to increase their visibility, often outpacing established names in Share of Search growth.
Amazon’s Dual Strategy: As both a platform and a brand, Amazon showcased its ability to offer deep discounts on its own products while also providing a stage for other brands to shine.
Stay tuned to our blog for more in-depth analyses of brand and retailer performance and strategies across various retail events. Reach out to us today to learn how you can leverage data-driven insights to optimize your brand’s eCommerce strategy and performance.