Tag: Sale Event Reports

Our proprietary data aggregation and analysis platform affords us the ability to capture unique insights on the pricing and product strategies of retailers and consumers brands during sale events. View our latest reports on sale events from around the world.

  • Boxing Day Sale: How UK’s Top Retailers and Brands Fared

    Boxing Day Sale: How UK’s Top Retailers and Brands Fared

    Following a successful Black Friday in November, the United Kingdom geared up for the 2017 Christmas season in December. Analysts estimate the total splurge in December at about £45 billion, beating last December’s record of £43 billion.

    Online sales hit £1.03billion, passing the £1billion threshold for the first time and up 7.9 percent on 2016’s £954million, according to the Centre for Retail Research. The rise of online shopping together with the timing of Christmas in 2017 meant shopper footfall in physical stores was lower than in previous years as people increasingly moved to shopping online.

    Total shopper numbers were 4.5 percent down on the previous year, according to research group Springboard, which may reflect the growing strength and reliability of online’s product range and delivery responsiveness.

    Major online retailers though continued to pull out the big discount guns across categories in an effort to attract online shoppers on Boxing Day, the biggest sale event in December.

    At DataWeave, we focused our proprietary data aggregation and analysis platform to analyze the top 500 ranked products in over 20 product categories across electronics and fashion retailers in the UK. Our analysis included several top UK retailers, which include Amazon, Argos, Currys, Tesco, Asos, Marks & Spencer, and Topshop.

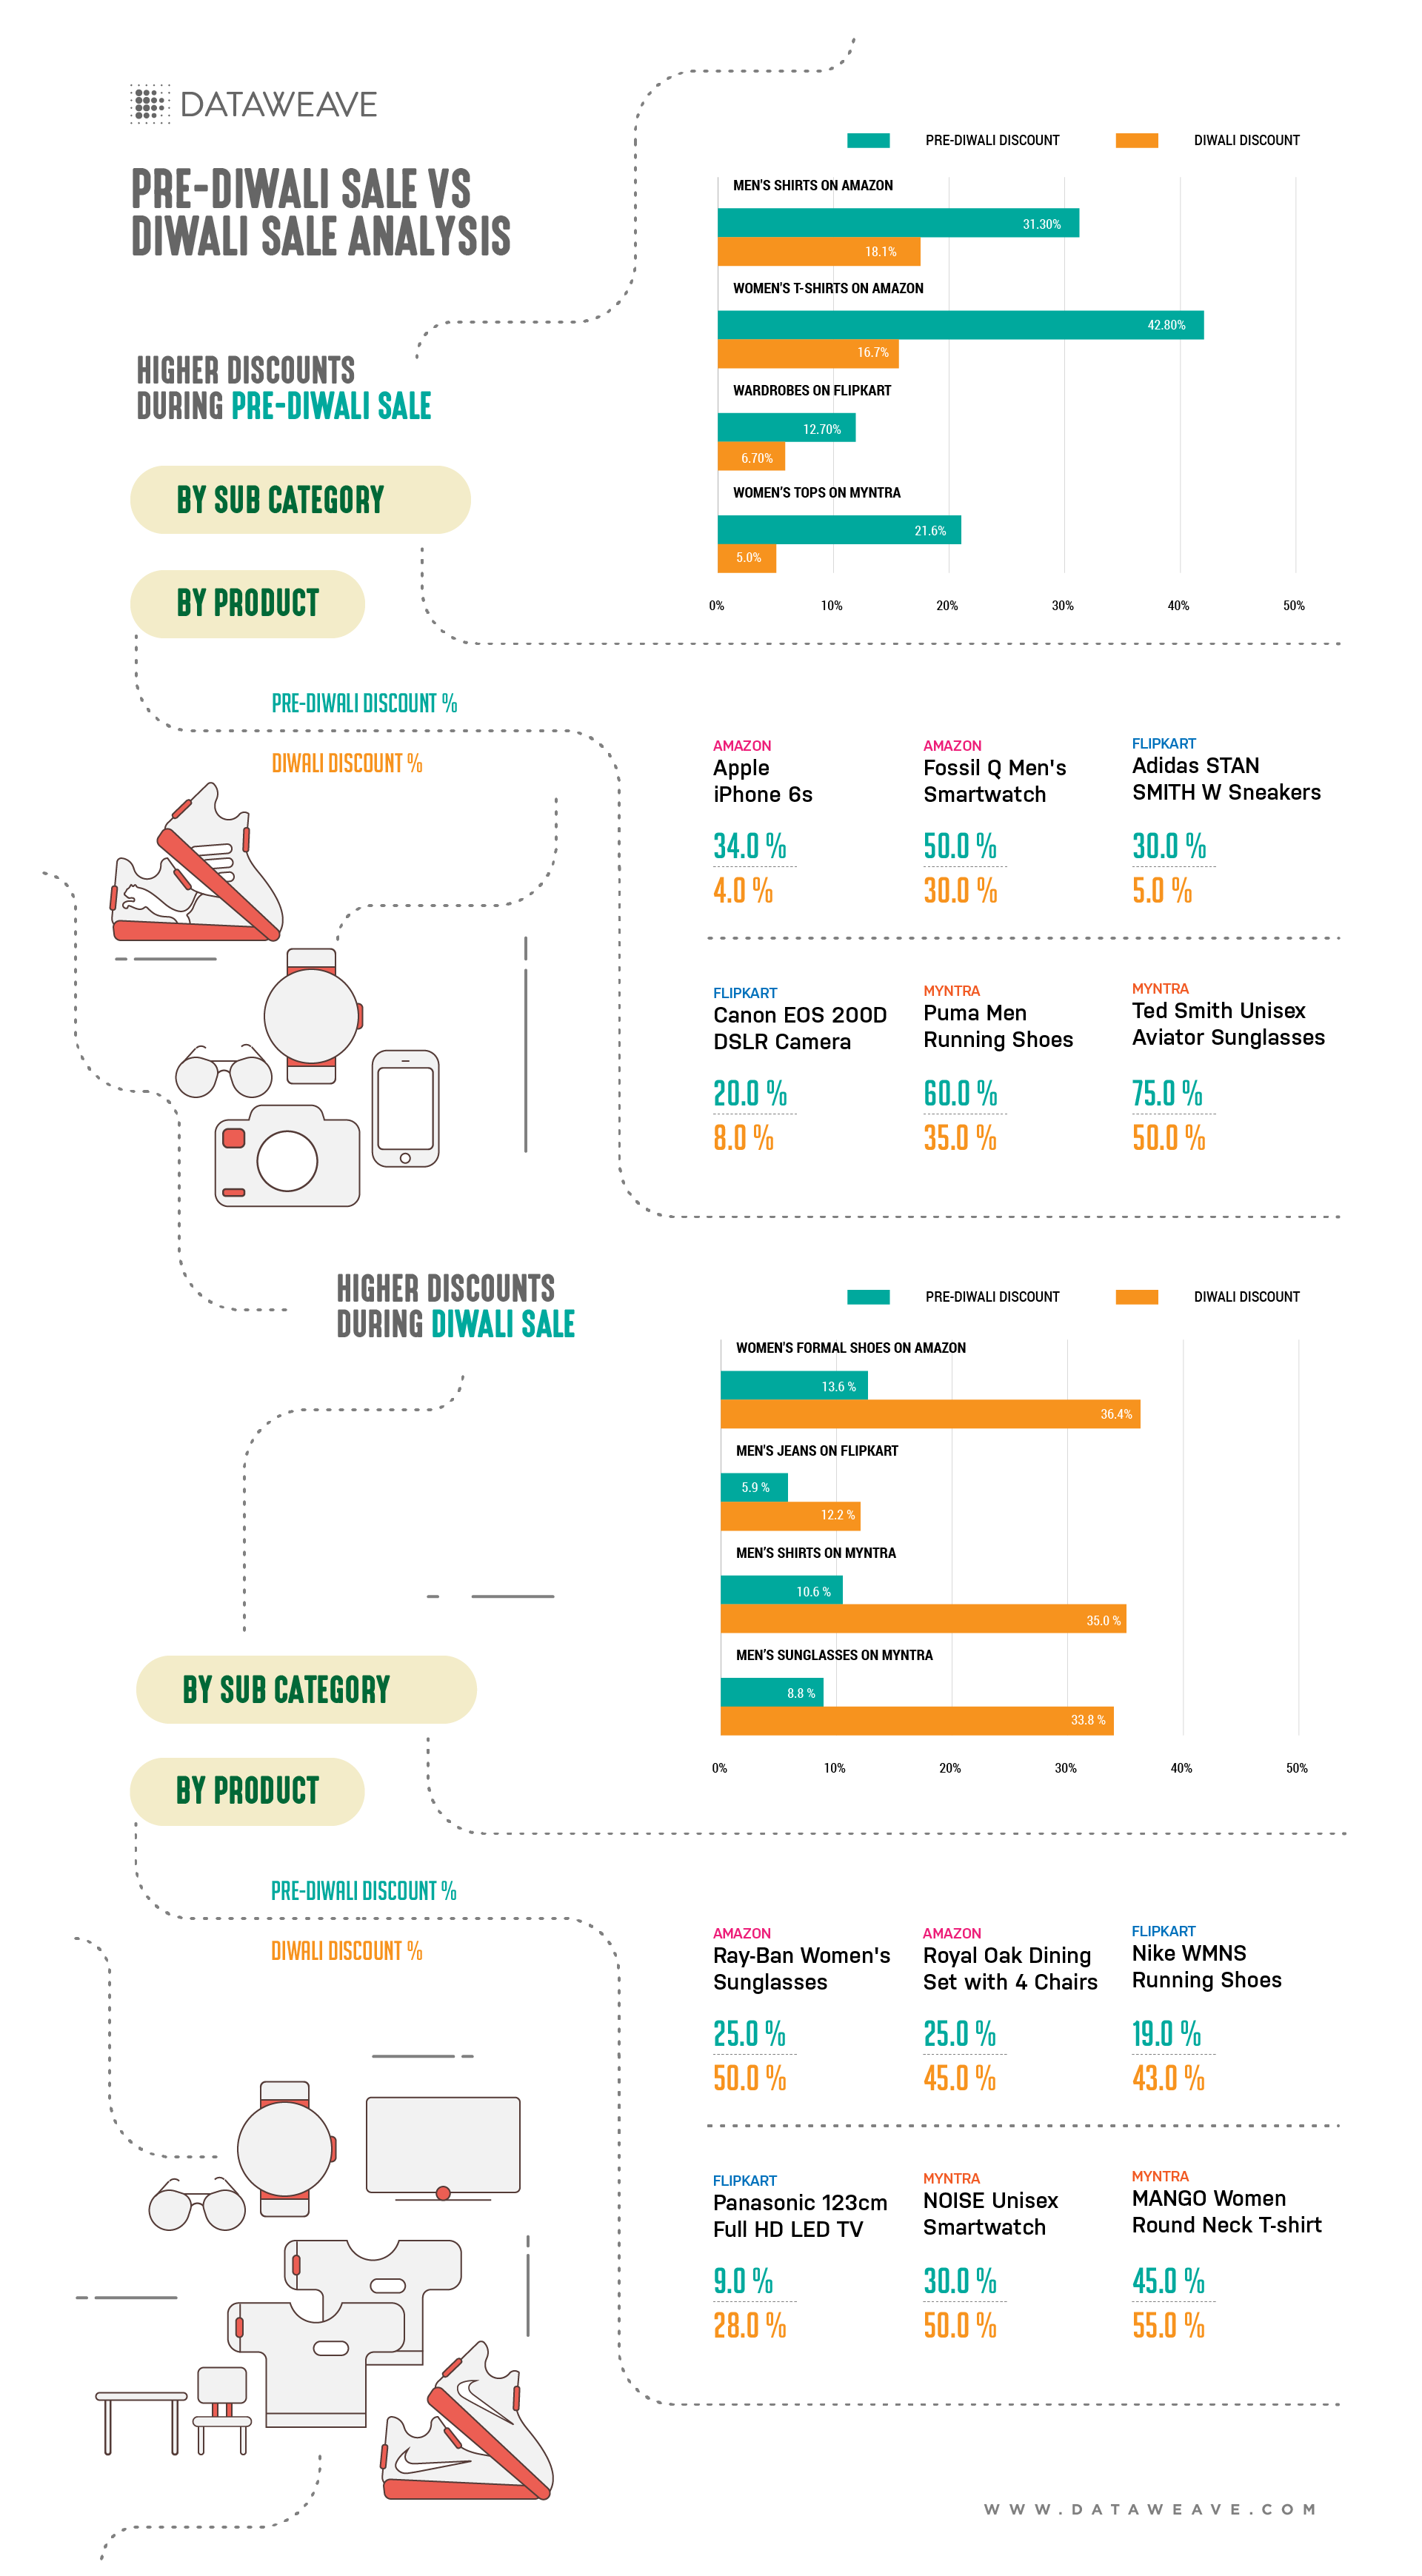
    The discounts in the infographic below indicate the magnitude of reduction in prices during the sale (26th Dec), compared to before the sale (19th Dec), in order to best represent the additional value derived from the sale for shoppers.


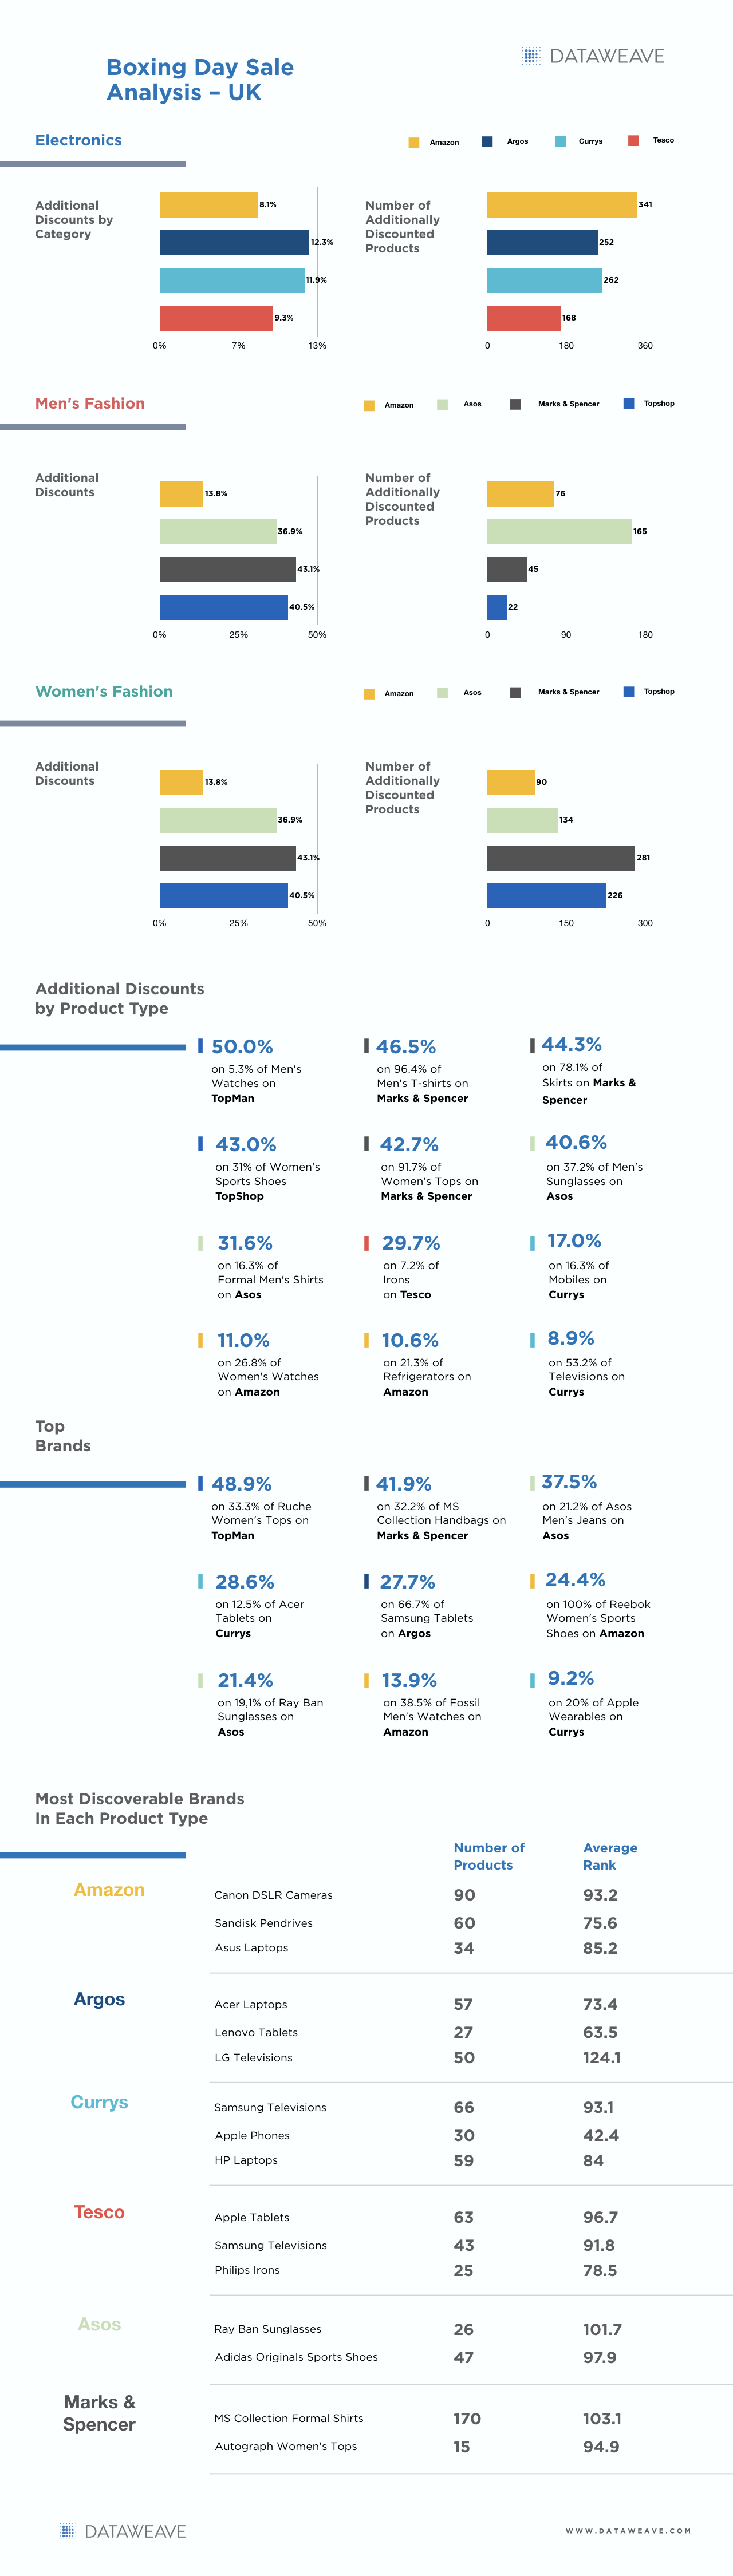
    Boxing Day Sale Highlights

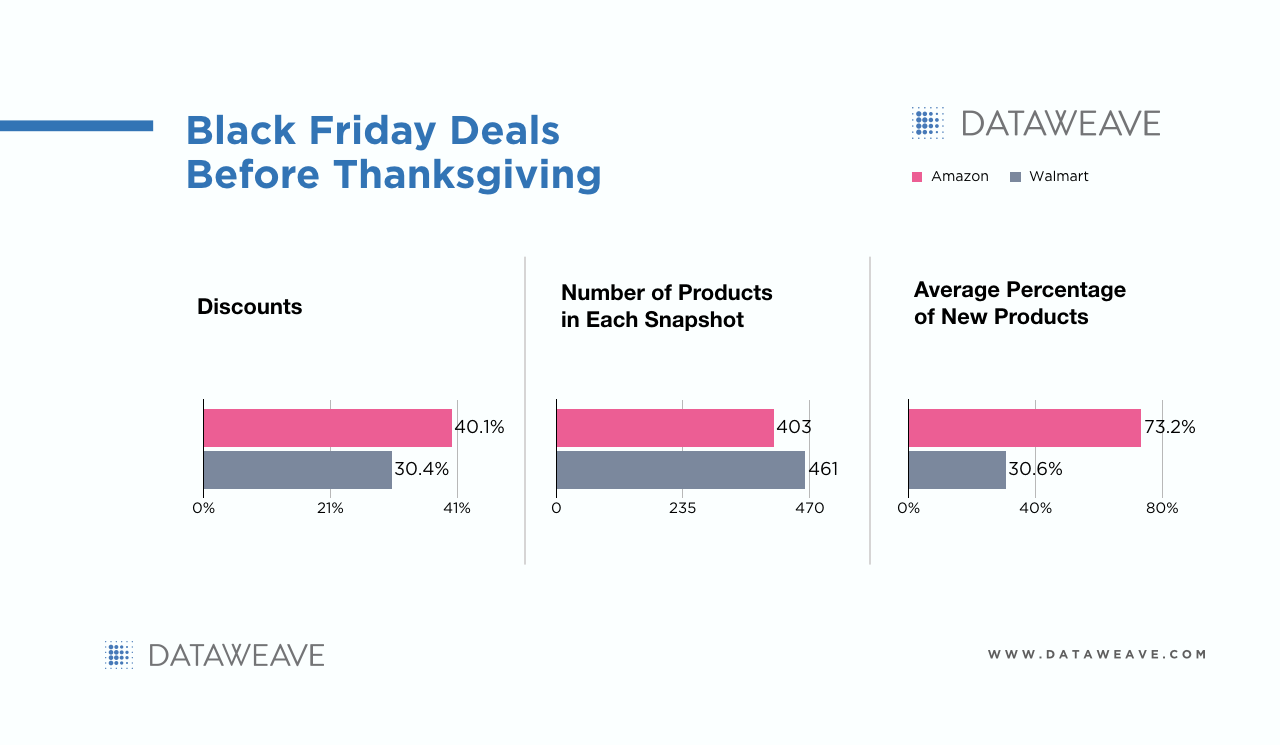
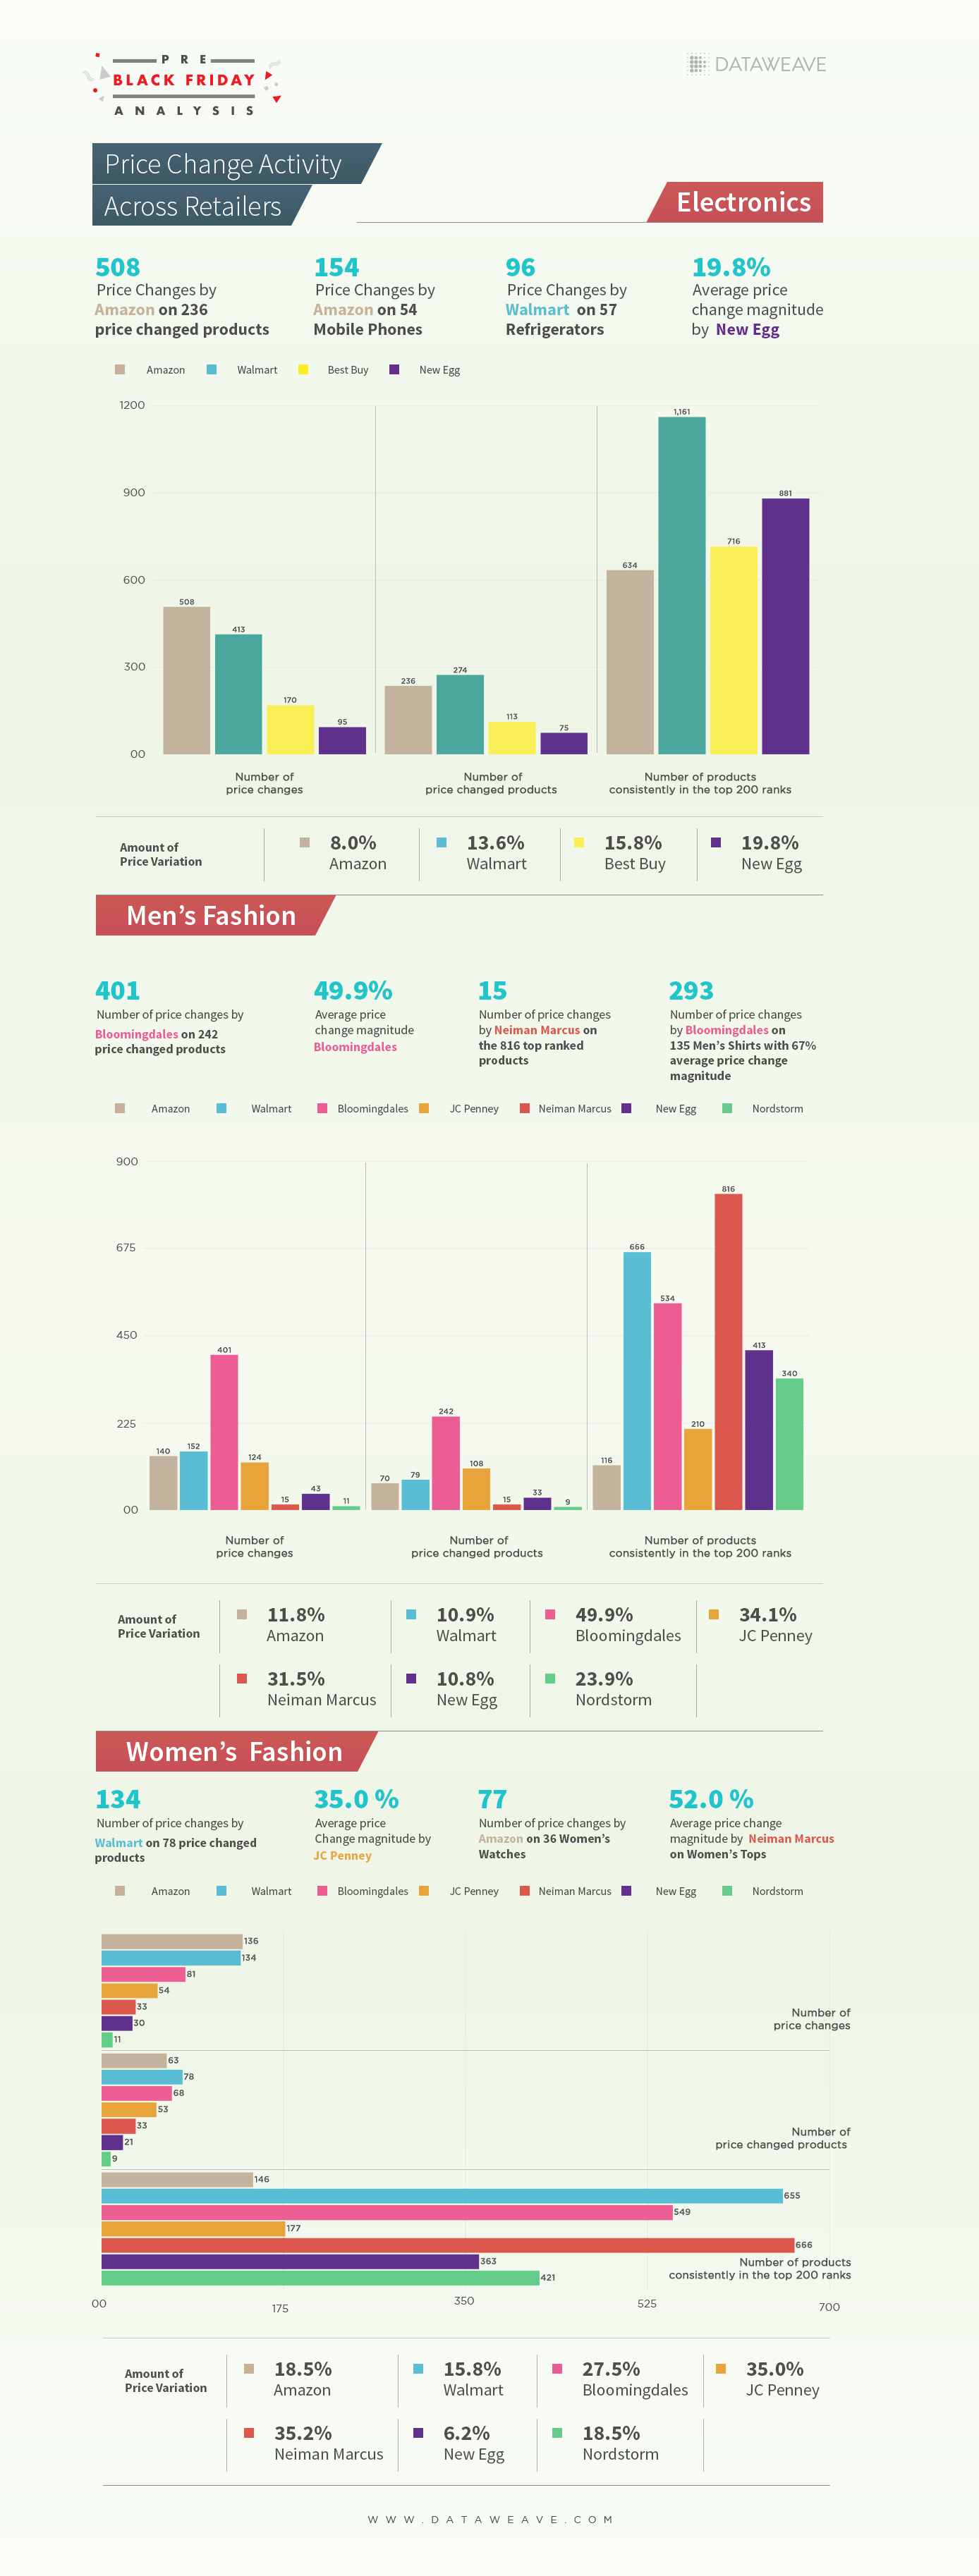
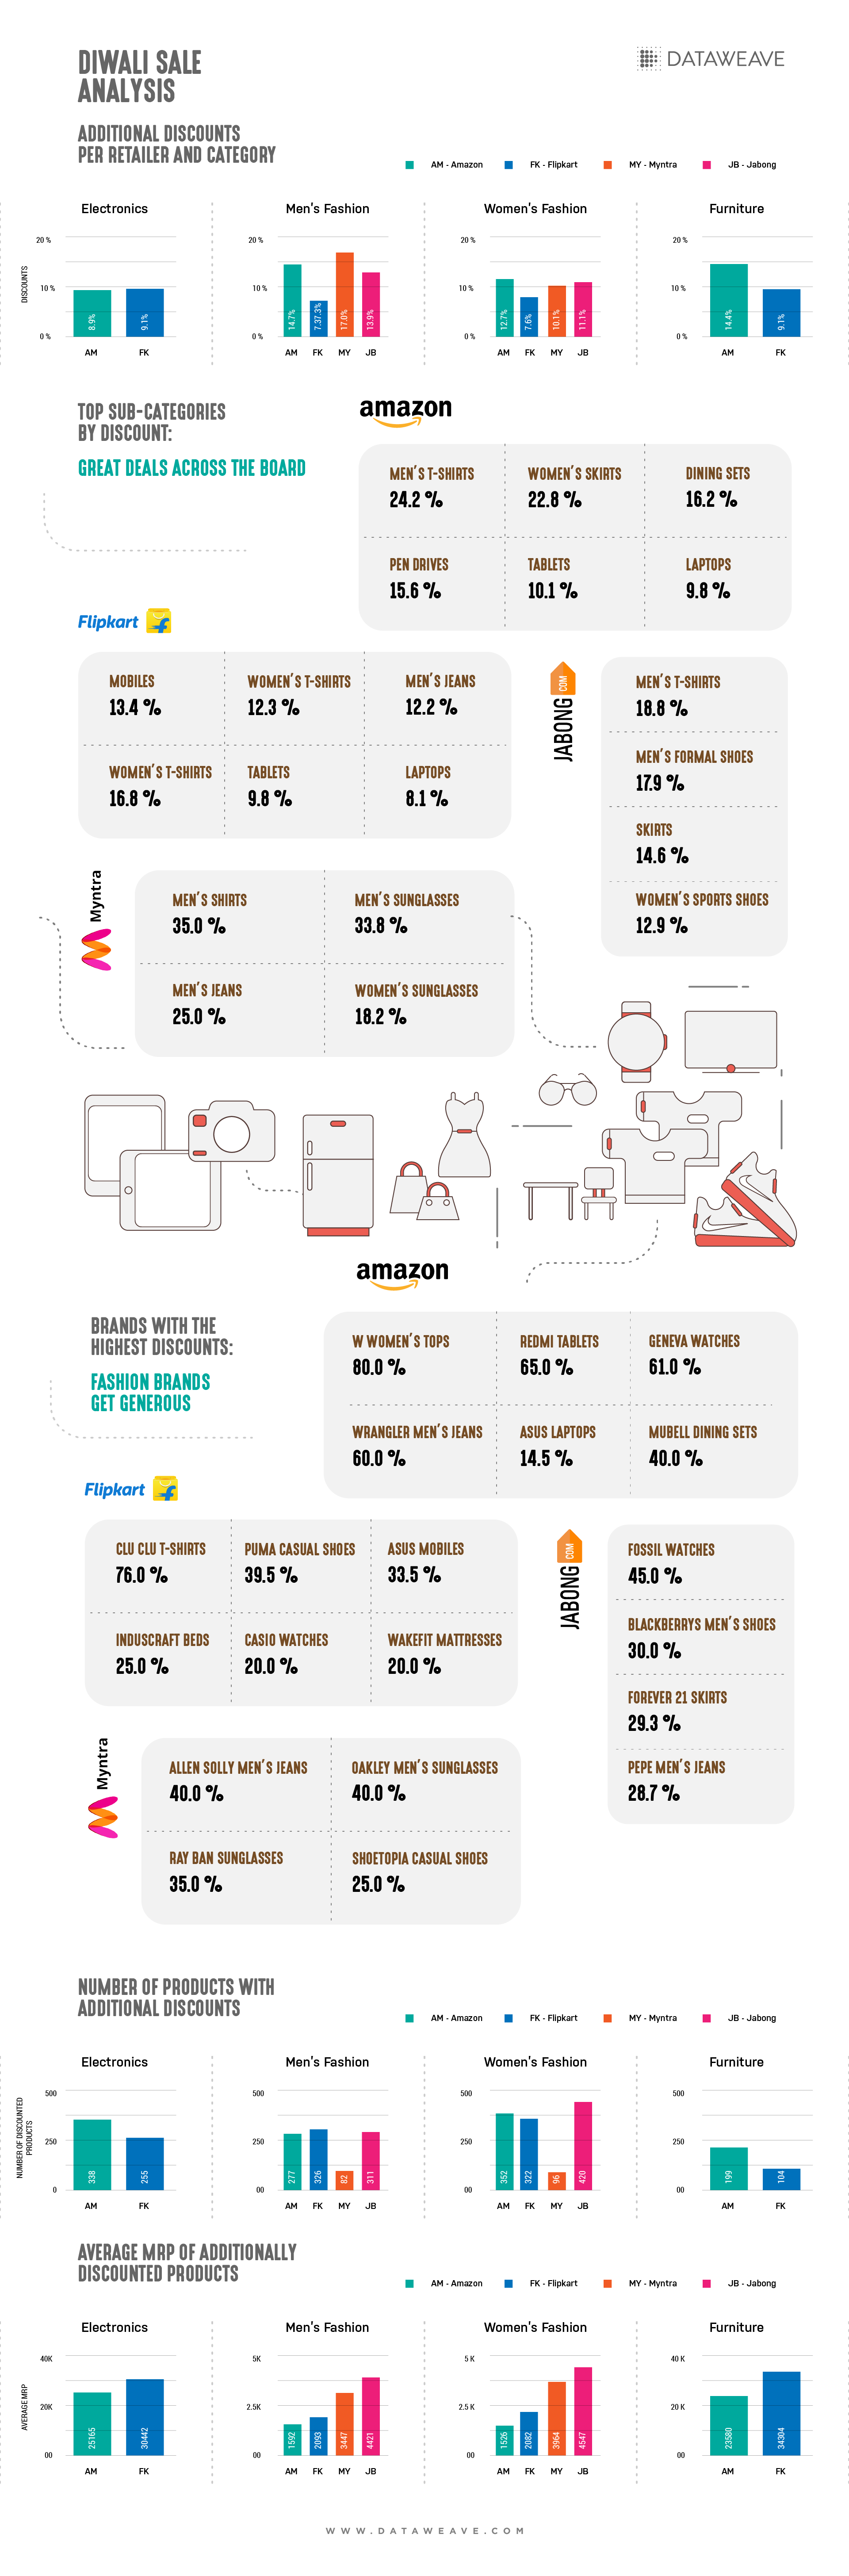
    In electronics, while Amazon offered discounts on the most number of products, Argos was aggressive in the average size of its additional discounts.

    Surprisingly, Amazon appeared to be much more conservative in the Men’s Fashion category with an average additional discount of 13.8 percent, spanning 341 products. Here, Asos deployed the most aggressive combination of high average additional discounts (36.9 percent) on a large number of products (165).

    Marks & Spencer focused their targeted discounts (43.1 percent) on a tight set of Men’s Fashion products (45), while interestingly, the story almost reverses in Women’s Fashion, where both M&S (43.1 percent, 281 products) and Topshop (40.5 percent, 226 products) were aggressive in what turned out to be a critical battleground category.

    Leading brands weren’t left out of the discounting action either, with the largest discount on offer going to Ruche (48.9 percent on 33.3 percent) women’s tops, closely followed by M S Collection (41.9 percent on 32.3 percent) handbags and Asos’ (37.5 percent on 21.2 percent) men’s jeans.

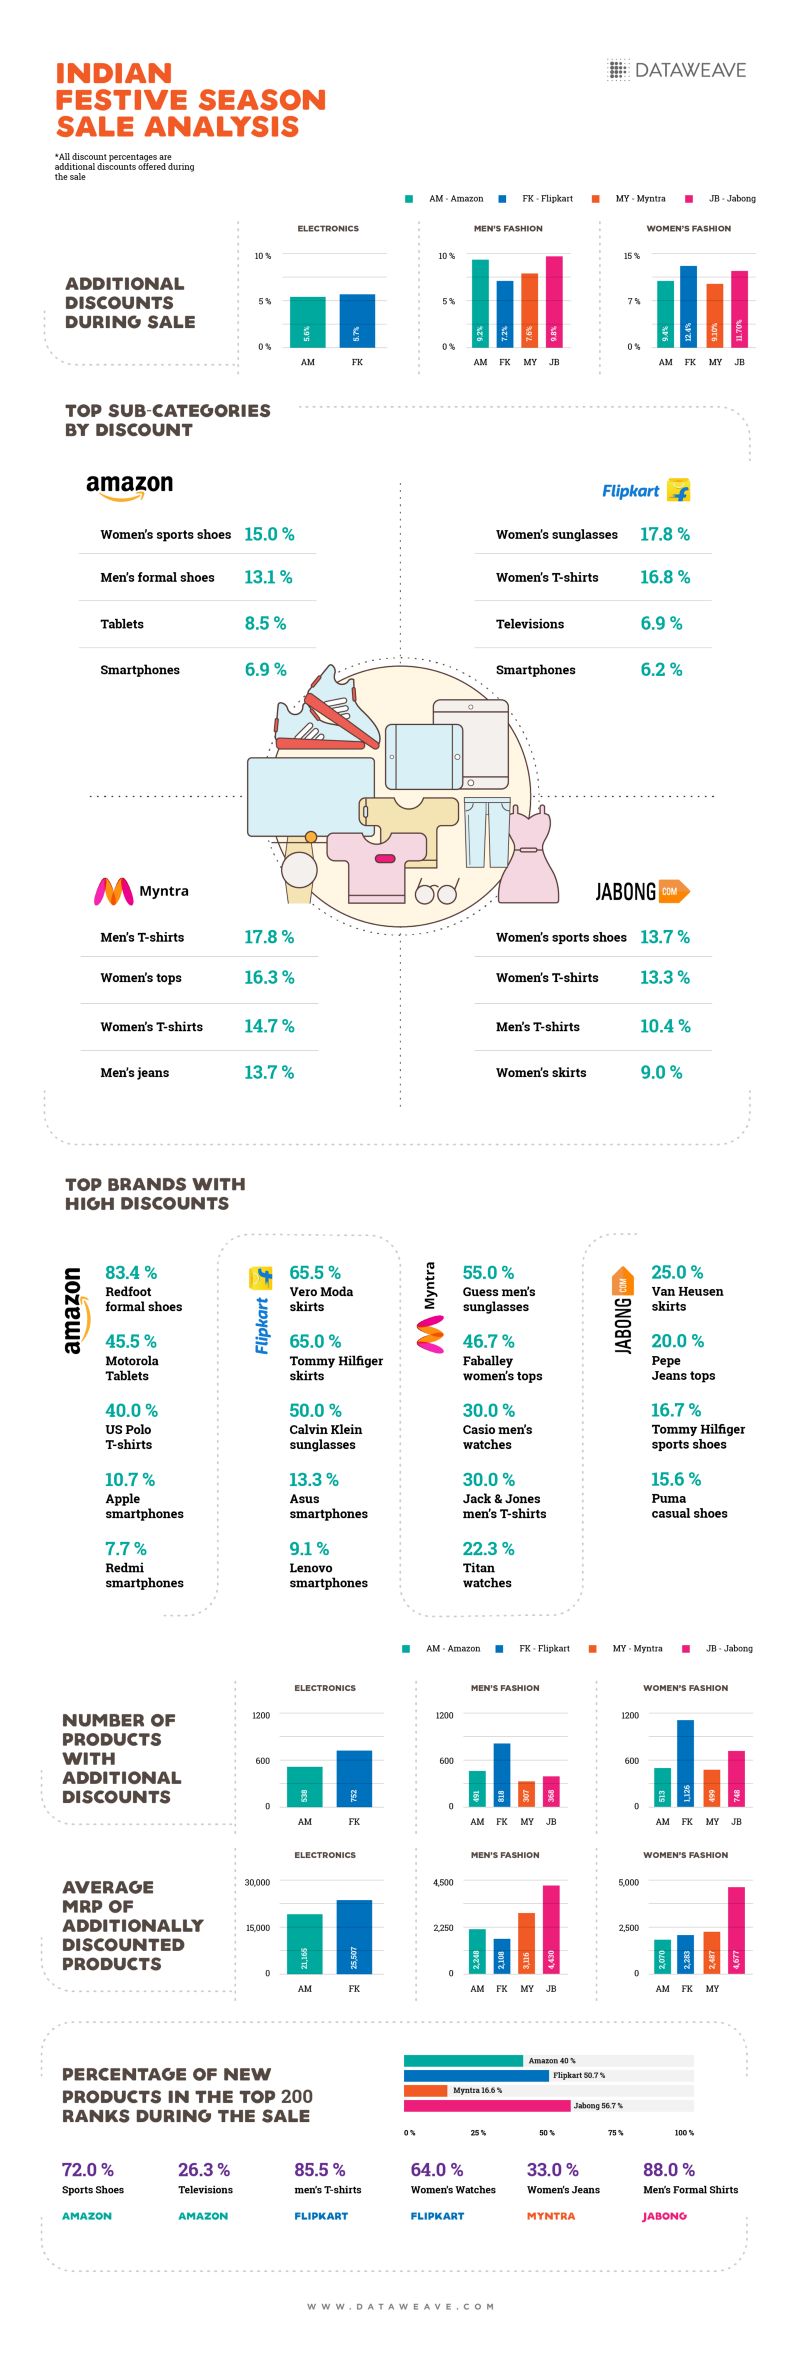
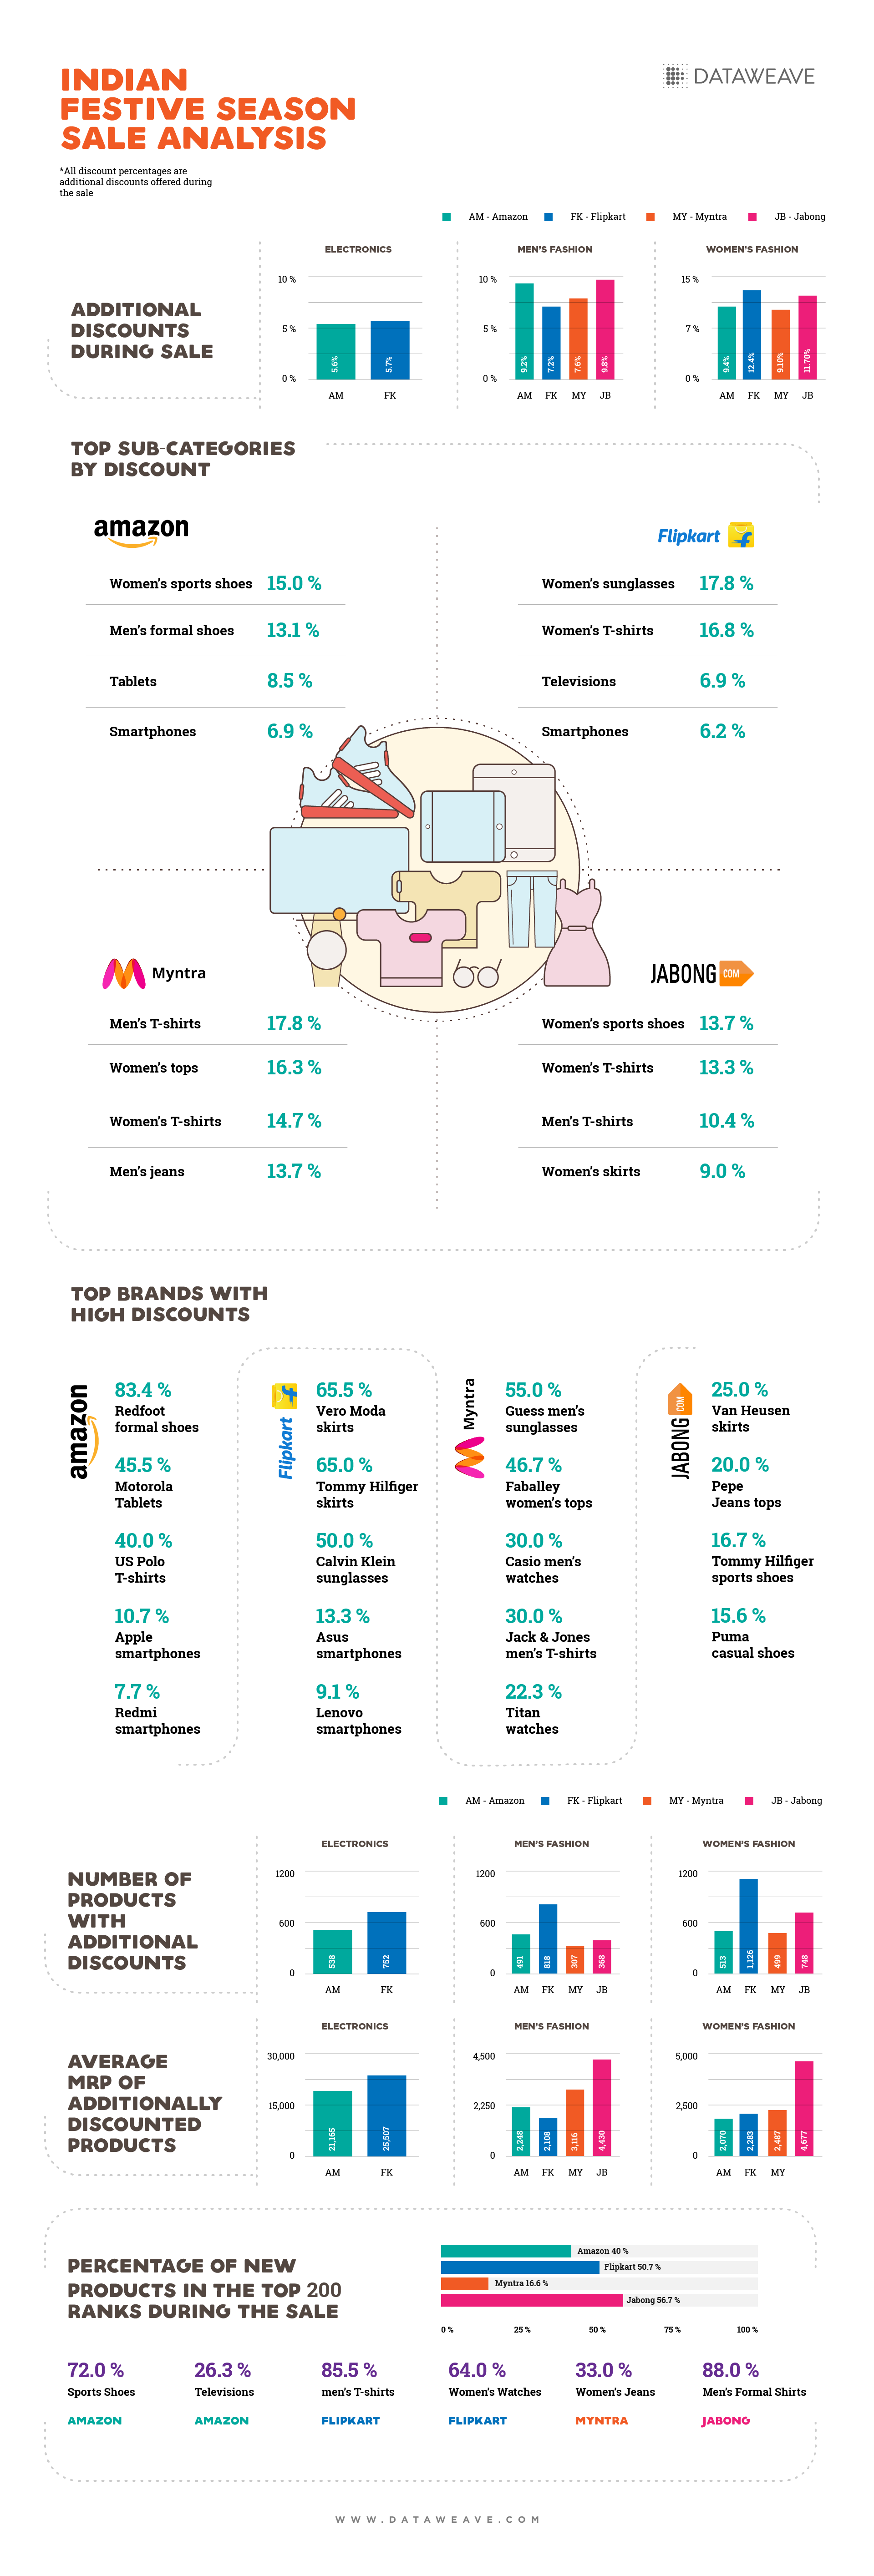
    Most Discoverable Brands

    We also analysed the most discoverable brands in each product type. This was measured as a combination of the number of the brand’s products present in the Top 500 ranks of a product type, as well as the average rank (lower the number, higher is the discoverability).

    It was no surprise that Canon DSLR cameras were highly discoverable on Amazon with 90 products, along with an average ranking of 93.2, while 34 Asus laptops recorded an average ranking of 85.2. At Argos, 57 Acer laptops recorded an average ranking of 73.4 while 50 LG televisions delivered an average ranking of 124.1.

    Other highly discoverable brands included MS Collection in Marks & Spencer, Apple iPhones and Tablets on Curry’s and Tesco.

    The Online Retail March Continues

    If we look at sales results across the world, from the United Kingdom to the United States, to Asia in countries such as India, Singapore and Indonesia through to Australia, online retail is aggressively cannibalizing traditional bricks and mortar in-store retail sales. Online retail’s demonstrated superiority in exploiting competitive intelligence and a sophisticated suite of analytics that accompany digital transactions, is surfacing in its agile discounting strategies, and its ability to continuously refresh product lines during key sales periods.

    This Boxing Day in the UK, fashion proved to reveal divergent discounting strategies between retailers, while only marginal differences in approach were visible in electronics — both high volume categories around Christmas season.

    Overall, December 2017 in UK marked a strong validation of online retail’s influence and we can expect a continuation of it’s ability to harness discounting with extensive product offerings, in order to lure shoppers away from in-store.

    If you’re interested in DataWeave technology, and how we deliver Competitive Intelligence as a Service to retailers and consumer brands, check out our website!
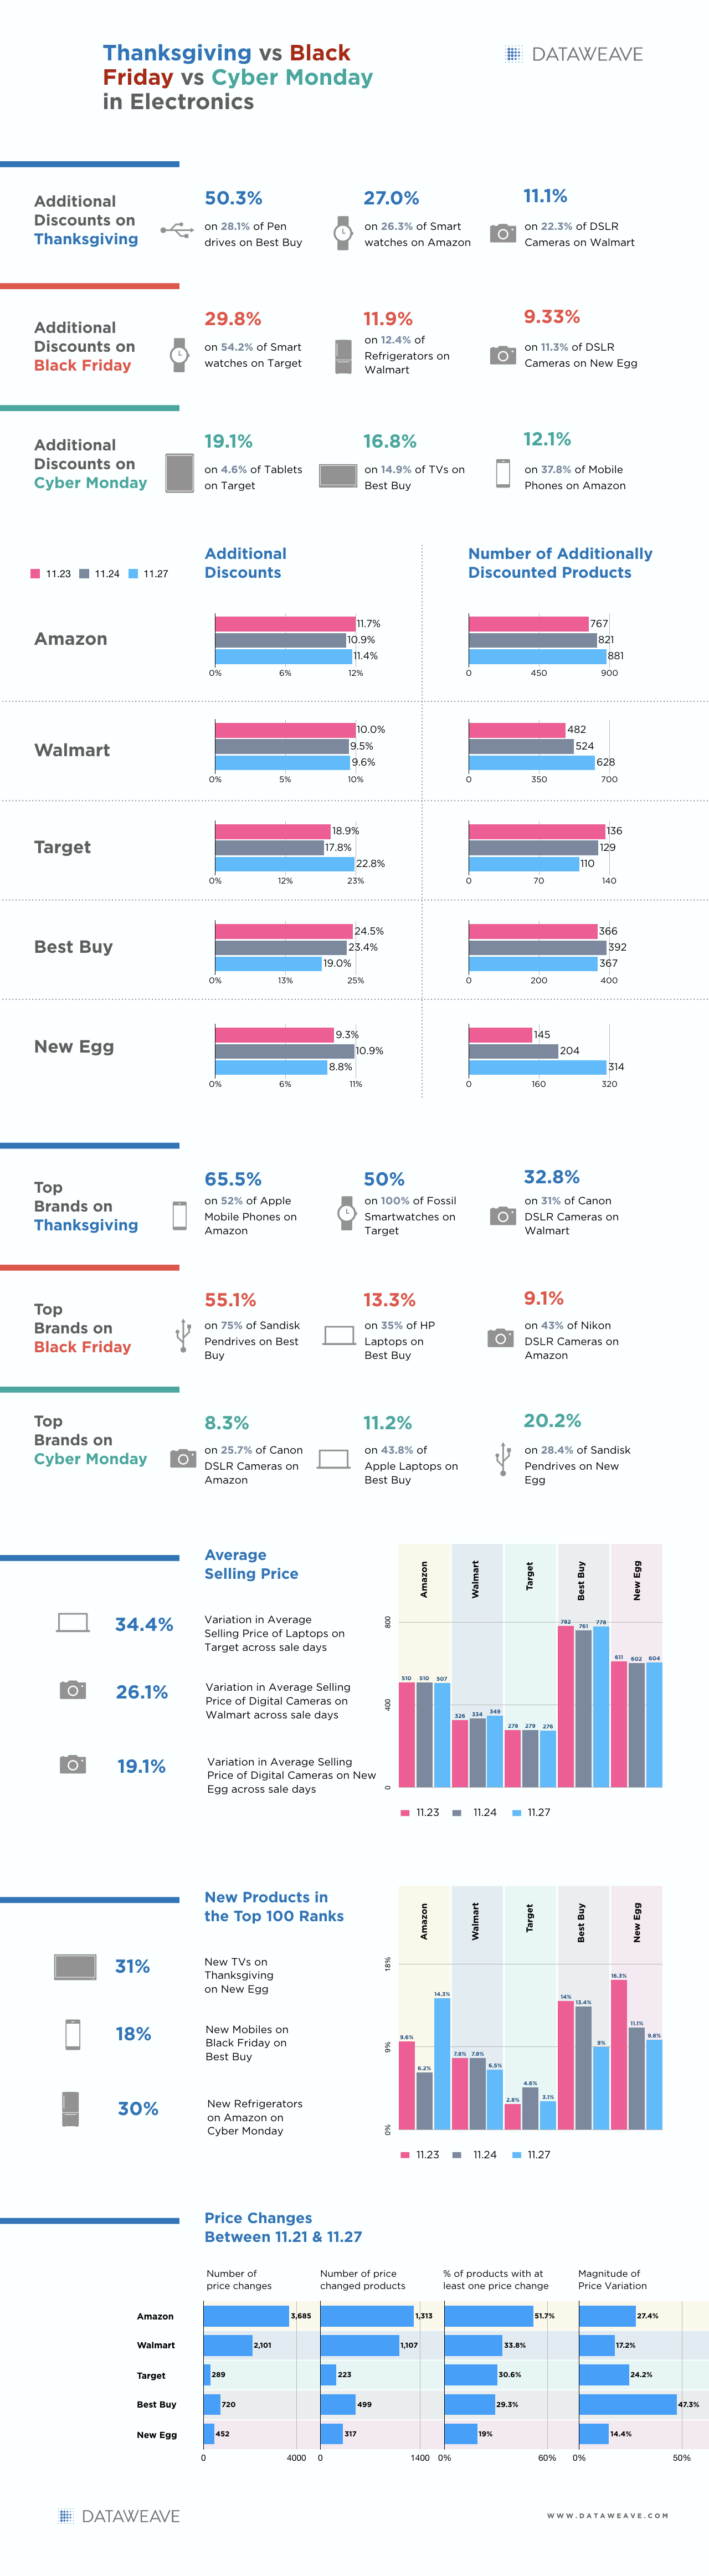
     

  • Myntra Leads End of Year Promotions in Fashion

    Myntra Leads End of Year Promotions in Fashion

    Following three back-to-back mega-sale events leading up to Diwali, India’s eCommerce companies once again opened the discount floodgates heralding Christmas and New Year. This time around, Fashion was the battleground category of focus for Indian e-retailers.

    Myntra launched its End of Reason Sale held between 22nd and 25th December. eCommerce behemoth Amazon too announced its own grand Amazon Fashion Wardrobe Refresh Sale on the same days, while Flipkart hit the market with its End of Year Bonanza held on the 24th and 25th of December. Paytm and Snapdeal held sale events as well, starting 23rd December. All competing sale events promised consumers up to 80 percent discounts across a range of products, especially in Fashion.

    At DataWeave, we analyzed and reported on the competing pricing strategies of Amazon, Flipkart, Myntra, Paytm, and Snapdeal. In the following infographic, we look specifically only at additional discounts offered on the top 500 ranked products of over 15 product types during the sale, compared to those before the sale events went live.

    Myntra Gets Aggressive

    Myntra elected to discount over 84 percent of its Top 500 ranked Fashion products encompassing each product category, with an average additional discount percentage of over 25 percent offered during the sale.

    A prime example of this discounting approach was the sports shoe segment, which received an aggressive additional discount of 28 percent on over 93 percent of the Top 500 ranked sports shoes. Similarly, Myntra’s additional discounts ranged from between 22 percent and 25 percent across most product types, including T-shirts, Shirts, Handbags, Jeans, Skirts, Sunglasses, and Watches. The fashion e-retailer’s private label brands enjoyed attractive reductions in prices, which include Hrx and Roadster, along with other brands like Red Tape, Nike, and Puma.

    Amazon Discounts To A Different Beat

    Amazon discounted 35 percent of its Top 500 ranked Fashion products in each product type, with an average additional discount percentage of 12.5 percent during the sale. Given Amazon’s track record of dynamic pricing, this was relatively conservative.

    Overall, additional discounts on Amazon ranged between 4 percent and 16 percent across all product types in Fashion. Top brands discounted on Amazon included Adidas, Fastrack, Hush Puppies and Ray-Ban.

    Flipkart Joins The Party

    Flipkart too joined the End of Year discount action with several attractively positioned offers, exceeding those featured on Amazon. Flipkart discounted over 65 percent of its Top 500 ranked Fashion products in each product type, with an average additional discount percentage of over 14 percent during the sale.

    Additional discounts promoted on Flipkart ranged between 8 percent and 22 percent across all Fashion product types, while some of the top discounting brands included Dkny, Metronaut and United Colors of Benetton.

    Conspicuously, other Indian e-retailers like Paytm and Snapdeal chose not to join in the price war. Snapdeal, especially, has consistently offered only moderate additional discounts during recent sale events, choosing to focus more on other areas of improving the user experience for their shoppers.

    Strategic Focus On Profitability

    In contrast to the profit-sapping Diwali sale season, characterized by steep discounts across all product categories, this end of year sale was more concentrated, largely honing in on Fashion. From a strategic and shareholder perspective, limiting the discounting action to Fashion insulated the retailers’ bottom line from another major profit hit.

    Myntra determinedly reaffirmed its leadership status in the Fashion category, with its highly aggressive discounting strategy. This was well received by shoppers, who spent a staggering ₹5 crore in only the first five minutes of the sale.

    Flipkart opted to double down this time around with attractive offers on its own eCommerce platform as well. The e-retailer, currently locked in a battle with Amazon for leadership in India’s eCommerce sector, had acquired Myntra in 2014 in a bid to strengthen its position in the fashion category.

    Amazon, intriguingly, opted for a more conservative approach to its end of year sale than we are used to witnessing from the eCommerce giant. As we enter the new year, and kickstart yet another cycle of aggressive e-retail promotions in India, there will be ample opportunities to see if this is evidence of a rethink in Amazon’s approach to pricing in India.

    If you’d like to know more about DataWeave’s technology, and how we provide Competitive Intelligence as a Service to retailers and consumer brands, check out our website!


  • Tracing Lazada’s Pricing Across the Month-Long Online Revolution Sale

    Tracing Lazada’s Pricing Across the Month-Long Online Revolution Sale

    Commencing on the 11th of November and ending just a few days ago on the 12th of December, Southeast Asia’s biggest sale event, the Lazada Online Revolution sale rewrote the record books.

    This mega-shopping event is held simultaneously across six Southeast Asian countries, spanning Singapore, Malaysia, Thailand, Indonesia, the Philippines and Vietnam and was bookended by its two biggest sale days, on 11.11 and 12.12.

    In an earlier blog post, we published a highly detailed analysis of the sale on 11.11, using DataWeave’s proprietary data aggregation and analysis platform. This post zoomed in on the pricing and product strategies of Lazada and its competitors in Singapore and Indonesia.

    On the 12th December, Southeast Asian shoppers shattered all retailing expectations by reportedly spending a record-breaking $250 million. This was double both this year’s 11.11 sale and last year’s 12.12 sale. According to Forbes, the 12.12 sales became such a hit that Indonesia even designated the day to be its National Online Shopping Day, or Harlbonas.

    At the end of the sale event on 12th December, DataWeave assimilated all the data we collated throughout the Online Revolution sale and examined pricing trends across the entire span of four weeks, exploring each retailer’s strategy by brand, by category, and by product type.

    We aggregated pricing information on the Top 500 ranked products of over 20 product types featured on each website (Lazada, ListQoo10, and Blibli), spread across the critical Electronics and Fashion categories, covering over 120,000 products in total.

    Online Revolution — Singapore

    Interestingly, one of the trends that became immediately apparent, was the relatively stable track of the average absolute discounts in Electronics, Men’s Fashion, and Women’s Fashion. No significant spikes or drops were evident throughout the duration of the entire sale season.

    Similarly, the number of discounted products remained relatively stable. However, in Electronics, there was a conspicuous dip in the number of discounted products, which occurred on the 21st of November. Aside from this anomaly, even the number of products discounted remained relatively stable. The other interesting phenomenon was an uptick in the number of discounted products on the 15th of December, after the Online Revolution sale — something counterintuitive.


    When we explored the behaviour of the average MRP of discounted products, we noticed a sharp dip on the 21st of November. Clearly, prices were increased specifically on higher-priced electronic products.

    Comparing these numbers with those of ListQoo10’s, who were forced to adopt a more aggressive stance on pricing to stay competitive through this period, we once again see a very consistent discount percentage throughout this period. The average discount in men’s fashion, however, showed a slight upward trend during this period.

    ListQoo10’s number of discounted products in Electronics dipped as well on the 21st of November, demonstrating the retailer’s ability to dynamically react to competitor strategies. This can be evidence of a robust market monitoring system.

    Returning to Lazada, DataWeave identified several product types displaying a significant variation in average discounts through this period. These included men’s shorts, women’s shoes, men’s Jeans, Laptops, DSLR Cameras, and women’s T-shirts.


    Once again, our analysis pointed to substantial competitive activity around the 21st of November, together with a second significant dip in discounts on men’s shirts in the period around 5th December. Discounts on women’s shoes, by contrast, proved to be a roller coaster throughout the entire sale period.

    Some of the brands with high variation through this period were Lenovo Laptops, Levi’s T-shirts, Adidas Women’s Shoes, Seiko Watches, and Sony Phones.


    Discounting activity by these brands appeared to be all over the place during this period, without any discernible pattern or structure. While Sony predictably lowered discounts on its phones after 12.12, Levi’s increased its discounts in the same period

    Online Revolution — Indonesia

    Moving on to Indonesia, we once again witnessed a similar approach to average discounting by category as we saw emerge in Singapore. At a category level, the retailer evidently opted for trading within a narrow discount band across the sale period rather than attempting to inject an overly dynamic discounting approach into their sale execution.


    This is not to say there were not some surprises in store with the number of discounted products in Indonesia. In electronics, there was a noticeable dip in the number of discounted products just ahead of the 12.12 sale. The number of discounted products then surprisingly surged after the 12.12 sale, in combination with a slight reduction in average discount percentage during the period.

    In comparing Blilbi, Lazada’s main competitor in Indonesia, we see a fairly consistent discounting level throughout the sale period, although markedly lower than those rolled out by Lazada across its three core categories.

    This approach held true even for the number of discounted products. Blibli seems to have been content to take a backseat to Lazada during the heavily promoted Online Revolution sale period, rather than attempting to compete aggressively in any single category.

    It will be interesting to see if Blilbi is content to repeat this strategy in 2018 as it effectively surrenders the discounting high ground to Lazada during the peak sales period. While this strategy may yet be proven to have paid off in terms of profitability, it may have undesirable consequences for Blilbi’s brand and share performance in the longer term.

    Returning our focus to Lazada in Indonesia, some product types showed major variation through the sale period, specifically DSLR Cameras, which dipped significantly approximately a week out from the 12.12 sale. However, compared to Singapore, Indonesian discounts by product types appeared relatively more stable, except a few dips prior to 12.12.

    Three distinct discounting strategies appears to have been adopted by participating brands. Some, such as Electrolux (Refrigerators), opted for a comparatively stable discounting approach. Others, like Apple, increased prices through the sale period, while Alienware, reduced prices through the sale period.

    In particular, Apple’s pricing approach to its iPhones was surprising, given its strong partnership with Lazada during this Online Revolution sale. Yet another example where the marketing hype failed to translate into an aggressive discounting strategy.

    More Talk Than Walk

    For Lazada, the Online Revolution sale proved to be a triumph, effectively extending its record-breaking streak with USD 250 million in sales on 12.12 alone. However, on parsing through the pricing across the entire month of the sale, there is clearly no dramatic increase in discounts either on 11.11 or on 12.12 — some anomalies notwithstanding.

    This goes to show that much of the sales is driven by hype, more than the additional value of discounts. To be fair, 11.11 and 12.12 hosted discounts on some of the more premium products in the assortment, while discounts on most of the mid-range products remained consistent. While some competitors like ListQoo10 chose to stay competitive, so as not to lose out significantly on their customer base and market share, others like Blilbli chose to sit and watch, and pick up on what’s left after the sale.

    This year’s Online Revolution has set the bar high for South East Asian retail, and going by how the event has grown over the last few years, few would be surprised if we witness another record braking sale in 2018.

    If you’re interested in DataWeave’s technology, and how we provide Competitive Intelligence as a Service to retailers and consumer brands, check us out on our website!


  • Consumer Packaged Goods Join The Black Friday Blitz

    Consumer Packaged Goods Join The Black Friday Blitz

    While the Thanksgiving weekend sale, which includes Black Friday and Cyber Monday, is famous for attractive offers across all consumer categories, it remains better known for its discounts on Electronics and Fashion. Consumer goods, traditionally, have evaded much the hype.

    This year, notwithstanding notoriously slim margins, consumer goods and grocery retailers and brands joined Electronics and Fashion in offering sharp discounts on select products in an attempt to carve out increased market share.

    In the past, discounts on consumer packed products have been to drive increased store traffic during the holiday season. Increasingly, however, Thanksgiving has emerged as a viable opportunity for grocers to recruit online shoppers as well and build out their franchise.

    Online Grocers Make Their Move

    Faced with the holiday rush, large numbers of shoppers are proving to be relaxed about trusting the retailer to bag up and deliver their holiday feasts and treats. Grocers themselves have taken the strategic decision to boost their online shopping presence this year.

    They geared up to support their new holiday presence with aggressive price cuts designed to cut through the holiday sales clutter and make direct appeals to a newly-in-play online shopper pool. So transparent was this commercial decision, that many retailers experienced sharp drops in their share prices as industry analysts anticipated the retailers’ new discount-driven strategy.

    Tracking The Numbers

    At DataWeave, using our proprietary data aggregation and analysis platform, we have been tracking, through November, pricing and product information of the Top 1,000 ranked consumer goods products in over 10 product types featured on Amazon Prime, Walmart, Target, Costco, Kroger, Safeway, and Whole Foods, across up to six zip codes each, distributed across the country.

    DataWeave’s major focus was to compare the three main days of the Thanksgiving weekend; Thanksgiving Day, Black Friday, and Cyber Monday. We performed an in-depth analysis of discounts offered across product types and brands, together with how aggressively dynamic retailers were in both their pricing strategy and in the products they displayed.

    In analyzing this major sale event, we observed an extensive range of products enjoying high absolute discounts, but with no additional discounts during the sale, i.e. prices remained unchanged between the period prior to the sale and during each day of the sale, even though high discounts were advertised. The following infographic highlights some of the products where this phenomenon was observed.

    As a result, we focused our analysis only on the additional discounts offered on each day of the sale, compared to the period prior to the sale (we considered 11.21), in order to accurately illustrate the true value shoppers enjoyed during these sale days.

    The following infographic reveals some interesting highlights from our analysis, including the level of additional discounts offered to shoppers, the top brands featured, and the number of dynamic price changes implemented during the sale. All prices analysed are in USD, and all discount percentages represent average values across all zip codes, analyzed for individual retailers.

    In contrast to Amazon Prime, Costco, and Kroger who opted to run with deep discounts on a limited range of products, retailers such as Target and Walmart chose to offer only marginally higher additional discounts but across a large number of products. Others like Safeway adopted a safer approach, combining low discounts on a modest range of products.

    Overall, our analysis discovered little variation in discounts offered across each of the three sale days, with the only enduring trend being a marginally higher discount percentage implemented on Cyber Monday across all retailers.

    Categories significantly discounted across retailers included Personal Care, Deli, Dairy & Eggs, and Babycare products. Stove Top, Martinelli, Colgate, Dove and Hillshire Farm emerged as the leading brands to adopt a more aggressive discount approach.

    While most of the products offered across each of the three peak holiday sale days were comparatively constant (few new products featured amongst the Top 500 ranks), there were a number of conspicuous exceptions. Amazon Prime (19 percent on Cyber Monday), Whole Foods (15 percent on Thanksgiving), and Kroger (12 percent and 11 percent on the first two days of sale respectively), elected to refresh a significant portion of their Top 500 ranked product assortment.

    Across the entire Thanksgiving week, we saw Target, Amazon Prime, and Kroger all highly active in changing prices to stay competitive. Our analysis of these retailers showed more than 1.6 price changes for each price-changed product. While these were implemented on roughly 20 percent of their assortment, itself a significant proportion, the average price variation for each of these retailers was also on the higher side of expectations. In contrast, the other retailers adopted a far more conservative approach to dynamic pricing.

    Consumer Goods Walk The Discount Talk

    In a year when Amazon acquired Whole Foods to forever merge the dynamics of offline and online grocery retail, aggressive discounting by several retailers in specific product categories, combined with high visibility brands, has carved out a new profile for CPG retail.

    Grocers are eyeing a future where online shopping becomes a prime feature of their retail franchise. Amazon for its part demonstrated its prowess in discounting strategy, and its ability to implement a dynamic pricing strategy in tandem with a refreshed Top 500 product assortment.

    Other retailers are not far behind, as the use of market and competitive intelligence technologies pick up steam across the board. In today’s digital economy, data can be the biggest competitive advantage for a retailer, and retail technology providers like DataWeave have upped their game to deliver highly unique and sophisticated data and insights to meet this demand.

    Visit our website, if you’re interested in DataWeave and how we provide zip-code level Competitive Intelligence as a Service to retailers and consumer brands.

  • Thanksgiving, Black Friday and Cyber Monday Parade Discounts in Fashion

    Thanksgiving, Black Friday and Cyber Monday Parade Discounts in Fashion

    Fashion has always been one of the great engines of retail, and two of its iconic sale events are Thanksgiving and Black Friday. While Black Friday was traditionally an in-store shopping event, a large number of shoppers have migrated online taking much of the sales action with them.

    Despite shoppers typically liking to be able to touch and feel fashion and apparel products prior to purchasing them, the convenience of online shopping combined with time-poor shoppers returning to work after their Thanksgiving break has triggered changes to consumer behavior. Today, the retail narrative has shifted to focus on online, with this year’s Thanksgiving weekend turnover up 6.8 percent from last year.

    At DataWeave, using our proprietary data aggregation and analysis platform, we have been tracking the pricing and product information of the Top 500 ranked Fashion products across 15 product types on Amazon, Walmart, Target, Bloomingdales, JC Penney, Macy’s, Neiman Marcus, and Nordstrom.

    Our primary focus was to compare the three key days of the Thanksgiving weekend: Thanksgiving Day, Black Friday, and Cyber Monday. We performed an in-depth analysis of discounts offered across product types and brands, together with how dynamic retailers were in both their pricing strategy and products displayed.

    (Read also: Thanksgiving vs Black Friday vs Cyber Monday: The Electronics Price War Heats Up)

    In analyzing these monster sale events, we observed a range of products sneaking through to enjoy high absolute discounts, but offer no additional discounts during the sale, i.e. prices remained unchanged between before the sale and during each day of the sale, even though high discounts were advertised. The following infographic highlights some of the products where this phenomenon was observed.


    Having identified the aggressive use of high but unchanged absolute discounts among the retailers during the sale, we focused our analysis on the additional discounts offered on each of the days of the sale, compared to before the sale (we considered 11.21), in order to more accurately reflect the true value these sale events deliver to American shoppers.

    The following infographic provides some interesting insights from our analysis along several perspectives, including additional discounts offered, top brands, quality of product assortment, number of price changes, and more. All indicated prices are in USD.


    Our analysis illustrated how aggressive Target was in its strategy for discounting fashion, compared to most other retailers, especially on Thanksgiving and Black Friday. Interestingly, while Macy’s offered reasonably attractive discounts across all product types, it chose to offer them on a much larger product set than any other retailer.

    Overall, the level of discounts, together with the number of products they were offered on, shows no dramatic change for each retailer over the three-day sale period.

    With Neiman Marcus however, we observed a unique pattern. Sharp discounts were offered on Thanksgiving and Black Friday, which were subsequently rolled back completely on Cyber Monday. This represents a clear holiday pricing and discount strategy, albeit conducted on a comparatively compact and highly targeted set of products.

    Other sales discounting phenomena we observed include major discounts on Sunglasses, Shoes, Skirts, and T-shirts across all retailers, clearly representing battleground categories, while some of the top brands offering attractive discounts include Ray Ban, Oakley, Levi’s and Nike.

    Another relatively constant factor across each of the sale days was the average selling price of respective retailers. This parameter indicates how premium each retailer’s product mix is, providing another perspective on each retailer’s customer segment targeting strategy.

    As expected, Target, Walmart and JC Penney housed the more affordable set of products (average selling prices of $25, $31, and $45 respectively). At the other end of the premium spectrum, Neiman Marcus — home to luxury brands and products — adopted a more premium product assortment (average selling price between $820 and $914).

    In fashion, presenting a fresh assortment consistently is key to customer retention, and Amazon leads the pack in this regard, with a product churn rate of 50% in the top 100 ranks each day. Contrast that with Walmart and Target, who follow a more traditional approach, with a largely static set of options to choose from in its top ranks.

    Most of the retailers we analysed implemented several price changes to large percentages of their product sets. Macy’s and Walmart were at the forefront of this dynamic pricing activity. While Bloomingdales too made over 1,300 price changes, the average magnitude of these changes proved to be very high, at 206 percent.

    Fashion Fast-Forwards Its Online Sales

    While the memories of frantic shoppers tussling over fashion and apparel items on Black Friday still linger, they are fast receding as online fashion sales turnover goes from strength to strength. Shoppers are firmly placing long, winding queues in their rearview mirror and embracing the digital shopping cart more with each passing year, as spotlighted this Thanksgiving sale weekend.

    Sunglasses, Shoes, Skirts, and T-shirts emerged as key battleground categories for retailers over the weekend, while individual retailers displayed diverse approaches to capturing and retaining market share with their target demographic — quite assuredly while using modern retail technologies that help develop and execute on competitive strategies.

    As retailers move into the Christmas sales phase it will be fascinating to discover how they are evolving their ability to dynamically change pricing, refresh product categories and focus their shopper promotions.

    Visit our website, if you’re interested in DataWeave’s technology and how we provide Competitive Intelligence as a Service to retailers and consumer brands.


  • [INFOGRAPHIC] Thanksgiving vs Black Friday vs Cyber Monday: The Electronics Price War Heats Up

    [INFOGRAPHIC] Thanksgiving vs Black Friday vs Cyber Monday: The Electronics Price War Heats Up

    Alibaba may have raked in some $25 billion on Singles’ Day in the largest one-day sales turnover ever. In the Western world, however, Black Friday remains an economic force.

    This Black Friday, American shoppers spent a record $5 billion online in just 24 hours, representing a 16.9 percent increase in dollars spent online compared with last year.

    The sale period, though, comprises of Thanksgiving Day and Cyber Monday as well — each generating over a billion and half dollars in online sales this year.

    Cyber Monday has especially been a popular day for buying online, as people head back to work after the long weekend, making a physical visit to the stores to pick up deals less manageable during the day.

    However, the idea of the Thanksgiving weekend as a single shopping event was laid to rest this year.

    It’s Now Black November

    Online sales from November 1st through the 22nd totalled almost $30.4 billion this year, driven by deals available throughout the month on eCommerce platforms. In fact, every single day in November so far saw over $1 billion in online sales, creating a new paradigm for both shoppers and retailers, in stark contrast to the brick-and-mortal retail driven Black Friday sale events of the past.

    Several online retailers began offering attractive discounts from the beginning of November, specifically on “Black Friday Deals” pages of their websites.

    At DataWeave, using our proprietary data aggregation and analysis platform, we have been tracking, through November, pricing and product information of the Top 500 ranked Electronics products across 10 products types on Amazon, Walmart, Target, Best Buy, and New Egg.

    (Read also: Black Friday Sales Season: How US Retailers Are Gearing Up)

    We also took a few snapshots of the products and discounts offered on the “Black Friday Deals” pages of Amazon and Walmart. We saw both websites offering deep absolute discounts in Electronics (40.1 percent on Amazon, 30.4 percent on Walmart) on over 400 products each day.


    Moreover, these discounts weren’t restricted to static product sets. 73.2 percent (Amazon) and 30.6 percent (Walmart) churn of products was observed on these pages each day, providing shoppers with a steady stream of attractive discounts on new products every day.

    Our major focus, though, was to compare the three main sale days of the Thanksgiving weekend. We performed an in-depth analysis of discounts offered across product types and brands, as well as how dynamic retailers were in both the pricing and products displayed — all of these, across Thanksgiving (11.23), Black Friday (11.24) and Cyber Monday (11.27).

    We looked specifically only at additional discounts offered on each of the days of the sale, compared to before the sale (represented by products and its prices on 11.21).

    Overall, we discovered that the level of discounts, together with the number of products they were offered on, does not change dramatically across all 3 days. Some exceptions include –

    • Higher number of additionally discounted products on Amazon and Walmart on Cyber Monday
    • Lower additional discounts offered by Best Buy on Cyber Monday
    • Lower number of products additionally discounted on New Egg on Thanksgiving and Black Friday.

    Discounting strategies across most retailers converged on significant discounts on Pendrives, Smartwatches, DSLR Cameras, and Mobile Phones, while some of the top brands that offered attractive discounts include Apple, Fossil, Canon, Nikon, Sandisk, and HP — across a range of product types.

    While the average selling price (indicative of how premium the product mix is) for each retailer did not change significantly across each of the featured sale days, there was some variation at a product type level, with Laptops and Digital Cameras displaying some variation in average assortment value across Target, Walmart, and New Egg.

    Perhaps the most interesting insight provided by the analysis is just how different each retailer is in its approach to changing its prices. Over the entire week (11.21 to 11.27), Amazon made over 3,600 price changes on over 50 percent of its consistently-top-ranked products. Compare that to Target’s 289 price changes on 30 percent of its products.

    While the average magnitude of price change on Amazon is 27 percent, Best Buy has been far more aggressive with the magnitude of its price adjustments (47 percent), even if it has implemented fewer price changes. Amazon clearly leads the industry here, with its continual focus on employing advanced retail technologies that enable automated, optimized price changes designed to ensure its products are competitively priced.

    How Strategic Is Retail Pricing?

    Another aspect DataWeave explored was whether e-retailers sometimes increase their prices in the lead-up to a sale, only to reduce them during the sale, enabling them to advertise larger discounts. We did observe that all e-retailers effectively increased their prices on a discrete and small set of products prior to their sale. For the purposes of our analysis, price increases before the sale was calculated as an increase in price between 11.14 and 11.21.


    Highlights of our analysis include the discovery that Best Buy increased its prices in Electronics significantly on a small selection (3.5 percent) of its product range prior to the sale, only to reduce those prices immediately during the Thanksgiving weekend sale.

    While Amazon proved not to be as aggressive in the magnitude of this activity as Best Buy, this phenomenon was observed across a larger portion of Amazon’s assortment (6.7 percent)

    Online is Now More Important Than Ever

    While the legend and aura of past Black Friday sale events, complete with long overnight queues and highly publicized stampedes, is ebbing away, in lock-step with the dwindling numbers of store footfall this year (down 2 percent), the Thanksgiving sale season is set for a new transformation, following the growing number of shoppers preferring to shop online.

    A survey by the National Retail Federation found that 59 percent of shoppers plan to shop online this year, marking the first time that online has emerged as the most popular choice for America’s shoppers.

    With an extended sales season to offer discounts, and moving into Christmas, it has become increasingly important for retailers to monitor and react dynamically to their competitors’ pricing, product and promotional activities. Without the ability to track, react, and tweak in real time, retailers risk having their competitive position eroded, dramatically impacting both sales and retail margins.

    Leading eCommerce retailers such as Amazon, and evolving retailers like Walmart have embedded these systems into their overarching strategy and operations, while others are condemned to play catch up.

    As this fascinating cycle of the sale season ends, and retailers crunch their numbers to assess their comparative performance, sights are now set on Christmas to extend this sale extravaganza.

    Visit our website, if you’re interested in DataWeave’s technology and how we provide Competitive Intelligence as a Service to retailers and consumer brands.


  • Alibaba’s Singles Day Sale: Decoding the World’s Biggest Shopping Festival

    Alibaba’s Singles Day Sale: Decoding the World’s Biggest Shopping Festival

    $17.5 million every 60 seconds.

    That’s the volume of sales Alibaba generated on 11.11, or Singles Day. This mammoth event, decisively the world’s biggest shopping day, dwarfed last years’ Black Friday and Cyber Monday combined.

    This year, the anticipation around Singles Day was all-pervasive, and the sale was widely expected to break all records, as more than 60,000 global brands queued up to participate. By the end of the day, sales topped $25.3 billion, while shattering last year’s record by lunchtime.

    It’s an astonishing feat of retailing, eight years in the making. When Alibaba first started 11.11 in 2009, they set out strategically to try and convert shopping into a sport, infusing it with a strong element of entertainment. “Retail as entertainment” is a unique central theme for 11.11 and this year Alibaba leveraged its media and eCommerce platforms in concert to create an entirely immersive experience for viewers and consumers alike.

    From a technology perspective, the “See Now, Buy Now” fashion show and the pre-sale gala seamlessly merged offline and online shopping so viewers tuning in to both shows can watch them while simultaneously shopping via their phones or saving the items for a later date.

    The eCommerce giant also collaborated with roughly 50 shopping malls in China to set up pop-up shops, eventually extending its shopper reach to span 12 cities.

    Of course, attractive discounts on its eCommerce platforms were on offer as well.

    Deciphering Taobao.com

    At DataWeave, we have been analyzing the major sale events of several eCommerce companies from around the world. During Singles Day, when we trained our data aggregation and analysis platform on Taobao.com (Alibaba’s B2C eCommerce arm), and its competitors JD.com and Amazon.ch, our technology platform and analysts had to overcome two primary challenges:

    1. All text on these websites were in Chinese

    All information — names of products, brands, and categories — were displayed in Chinese. However, our technology platform is truly language agnostic, capable of processing data drawn from websites featuring all international languages. Several of our customers have benefited strategically from this unique capability.

    2.  Discounted prices were embedded in images on Taobao.com

    While it’s normal for sale prices to be represented in text on a website (relatively easy to capture by our advanced data aggregation system), Taobao chose to display these prices as part of its product images — like the one shown in the adjacent image.

    However, our technology stack comprises of an AI-powered, state-of-the-art image processing and analytics platform, which quickly extracted the selling prices embedded in the images at very high accuracy.

    We analyzed the Top 150 ranked products of over 20 product types , spread across Electronics, Men’s Fashion, and Women’s Fashion, representing over 25,000 products in total, each day, between 8.11 and 12.11.

    In the following infographic, we analyze the absolute discounts offered by Taobao on 11.11, compared to 8.11 (based on pricing information extracted from the product images using our image analytics platform), together with an insight into the level of premium products included in their mix for each product type, between the two days of comparison.

    Unexpectedly, we noticed that each day, ALL the products in the Top 150 ranks differed from the previous day — a highly unique insight into Taobao’s unique assortment strategy.

    Counter-intuitively, absolute discounts across all categories were considerably higher on 8.11 than on 11.11, even if it were for a marginally fewer number of products. The number of discounted Electronics products on sale rose on 11.11 compared to 8.11 (124 versus 102 respectively), while there was little movement in the number of discounted Men’s Fashion(55 versus 57) and Women’s Fashion (35 verses 27) products.

    Taobao targeted the mobile phone and tablets segment with aggressive discounts (21.0 percent and 18.2 percent respectively), compared to the average Electronics discount level of 7.7 percent.

    Interestingly, the average selling price drifted up for Electronics on 11.11 compared to 8.11 (¥4040 versus ¥3330). Men’s Fashion dropped to ¥584 from ¥604 while prices for Women’s Fashion was stable.

    It’s clear that even with all the fanfare, Singles Day didn’t produce the level of discounts that one might have expected, indicating that purchases were driven as much by the hype surrounding the event as anything else.

    How did Alibaba’s Competitors Fare?

    While Taobao was widely expected to offer discounts during Alibaba’s major sale event, we looked at how its competitors JD.com and Amazon.ch reacted to Taobao’s strategy.

    As over 80 percent of top-ranked products were consistently present in the Top 150 ranks of each product type on these websites, we analyzed the additional discounts offered during 11.11, compared to prices on 8.11.

    Broadly speaking, both Amazon.ch and JD.com appear to have elected not to go head to head with Taobao on specific segments. JD.com’s discount strategy was spearheaded by Sports Shoes (22.1 percent) and Refrigerators (14.8 percent) while Amazon.ch featured TVs (15.3 percent) and Mobile Phones (10.2 percent).

    The average additional discounts offered by Amazon.ch and JD.com in Electronics (8.4 percent) was slightly above Taobao’s overall absolute discount (7.7 percent). TCL was aggressive with its pricing on both websites, offering over 20% discount on almost its entire assortment.

    Surprisingly, JD.com swamped Amazon.ch’s number of additionally discounted products, across all three featured categories although this may be partially explained by Amazon.ch electing to adopt a significantly more premium price position in both Men’s and Women’s Fashions compared to JD.com, while remaining roughly line ball on Electronics.

    Jack Ma’s “New Retail”

    Interestingly, JD.com wasn’t far behind Taobao in terms of sales, clocking up $20 billion in revenue, and sparking an interesting public debate between the two eCommerce giants extolling their respective performances.

    Singles Day is one of the pillars of Jack Ma’s vision of a “New Retail” represented by the merging of entertainment and consumption. Ma’s vision sees the boundary between offline and online commerce disappearing as the focus shifts dramatically to fulfilling the personalized needs of individual customers.

    Hence, Alibaba’s Global Shopping Festival should be understood as not just a one-day event that produces massive revenue, but as a demonstrable tour de force of Alibaba’s vision for the future of retail. One thing is certain — as competition heats up between Chinese retailers, we can be prepared for another Singles Day shoot-out sale next year that one-ups the staggering sales volumes this year.

    If you’re intrigued by DataWeave’s technology, check out our website to learn more about how we provide Competitive Intelligence as a Service to retailers and consumer brands globally.


  • Under the Microscope: Lazada’s 11.11 Online Revolution Sale

    Under the Microscope: Lazada’s 11.11 Online Revolution Sale

    Lazada’s signature event, Online Revolution, is a month-long sale extravaganza that commenced with a Mega Sale on 11 November, and culminates in an End-Of-Year sale on 12 December. The shopping event is held across six southeast Asian countries — Singapore, Malaysia, Thailand, Indonesia, the Philippines and Vietnam — making it the region’s biggest retail event.

    Lazada Group’s chief executive officer Maximilian Bittner observed, “We aim to provide Southeast Asia’s rapidly growing middle-class the access to a wide range of products with deals and discounts that were previously available only abroad or in the capital cities.”

    On 11.11, the first Mega Sale, shoppers took advantage of great deals, ordering 6.5 million items (nearly doubling last year’s tally), resulting in sales of US$123m, annihilating last year’s takings by a whopping 191 percent.

    At DataWeave, our proprietary data aggregation and analysis platform enabled us to seamlessly analyze and compare Lazada’s discounts during 11.11 with those of its competitors. We focussed specifically on two markets — Singapore and Indonesia. While the sale itself is Lazada’s, we looked at its immediate competitors as well, to study how competitively they position themselves during Lazada’s sale.

    For our analysis, we aggregated pricing information on the Top 500 ranked products of over 20 product types on each website, spread across Electronics and Fashion, covering over 120,000 products in total.

    11.11 — Singapore

    In our analysis, we scrutinized the additional discounts offered by Lazada, ListQoo10, and Zalora during the sale period, compared to prices leading up to the sale. As today’s shoppers often encounter deep discounts on several products even on normal days, our analysis of additional discounts offered during the sale more accurately reflects the true value of the sale event to shoppers.

    In the following infographic, all prices are in Singapore Dollars, and additional discounts are the percentage reduction in price on 11.11 compared to 10.11.

    Lazada’s discounting strategy was more focused on Fashion rather than Electronics. However, Lazada didn’t have it all its own way with Zalora providing comparably high discounts, enabling it to compete effectively, especially in Women’s Fashion (16.2 percent on 406 products).

    Zalora actually exceeded Lazada in the number of additionally discounted products on offer (Zalora 406, Lazada 347). ListQoo10 did not match either Lazada or Zalora’s level of discounting.

    While Lazada held a more premium, high-value product mix in Electronics compared to ListQoo10, it chose to target the more affordable segment in Fashion, with both ListQoo10 and Zalora displaying a higher average selling price in each category.

    Interestingly, Lazada refreshed very few of its Top 500 products during the sale, limiting new options to choose from for its shoppers. On the other hand, Zalora refreshed 22.5 and 22.8 percent of its products in men’s and women’s fashion respectively.

    11.11 — Indonesia

    Using a similar methodology to our Singapore analysis, we analyzed Lazada’s promotions against Blibli and Zalora, three of the top eCommerce websites in the region. In the following infographic, all currencies are in Indonesian Rupiah.

    As with its Singapore strategy, Lazada targeted Fashion as the lead category for discounts in Indonesia. It offered steep discounts in both Men’s and Women’s Fashion (around 18 percent in each) across a large number of products (550 and 776 respectively). While Zalora matched and occasionally exceeded the discounts offered by Lazada, it did so across a significantly smaller range of additionally discounted products.

    Surprisingly, Electronics were de-emphasised in Indonesia (4.1 percent compared to 9 percent in Singapore).

    Compared to the market leaders Lazada and Zalora, Blibli struggled to be competitive from both an absolute discount level and a product assortment perspective.

    Like in Singapore, Lazada looked to be targeting the affordable value end of the product mix spectrum across all categories, and introduced very few new products in its Top 500 ranks.

    Zalora had a healthier churn rate of 14.6 percent and 18.1 percent in Men’s and Women’s Fashion, compared to Lazada’s 9.1 percent (Electronics), 10.7 percent (Men’s Fashion) and 10.8 percent (Women’s Fashion).

    It’s Not Just About Discounts

    Lazada’s ‘Fashion First’ targeting strategy creates an effective tie-in to its broader model of surfing the convergence wave between entertainment and eCommerce, something unique to southeast Asia.

    Together with sumptuously attractive discounts, major sale events in South East Asia are fast becoming characterized by entertainment. By launching Southeast Asia’s first star-studded eCommerce TV show, Lazada continues to be the region’s eCommerce innovator, following in the footsteps of its pioneering parent company, Alibaba.

    While time will tell how effective Lazada’s strategy ultimately proves to be, together with Alibaba, it has set up a fascinating and uniquely Asian retail sale model. No doubt another milestone will be set on 12.12 when the Online Revolution Mega Sale returns with even greater deals. At DataWeave, we’ll be sure to analyze that sale as well and bring you all its highlights.

  • Black Friday Sales Season: How US Retailers Are Gearing Up

    Black Friday Sales Season: How US Retailers Are Gearing Up

    In today’s rapidly evolving online and mobile worlds, few things encapsulate the competitive nature of the online retail battlefield like the Black Friday sales season. With this year’s Black Friday and Cyber Monday sale events just around the corner, 2017 promises another titanic tussle between contenders.

    The holiday shopping season commences on Black Friday, November 24, and continues through much of December. Anticipating the sales season, many retailers are already offering discounts on several key categories and anchor products, providing a sneak peek into what we can expect towards the end of the month.

    While traditionally, Black Friday sales were dominated by brick and mortar retail stores, with the odd shopper stampede not unheard of, retail dynamics have changed in the recent past. Online sales now consume a larger proportion of Black Friday spending, and for the first time, consumers are expected to spend more online in the 2017 holiday season than in-store.

    In anticipation of this mammoth sale event, we at DataWeave trained our proprietary data aggregation and analysis platform on several major US retailers to understand the competitive market environment before the sales kick off.

    Between the 15th and 29th of October, we tracked the prices of the top 200 ranked products each day in the Electronics and Fashion categories across several major retailers. For Electronics, we analyzed Amazon, Walmart, Best Buy, and New Egg, while Amazon, Walmart, Bloomingdales, Nordstrom, Neiman Marcus, New Egg, and JC Penney provided our insights into the pivotal Fashion category. Product types analyzed include mobile phones, tablets, televisions, wearables techs, digital cameras, DSLRs, irons, USB drives, and refrigerators in Electronics, and T-shirts, shirts, shoes, jeans, sunglasses, watches, skirts, and handbags in Fashion.

    Automated Competitive Pricing Is the New Norm

    With the accelerated evolution of online commerce, retailers have increasingly harnessed the power of competitive data to drive changes on the go to their pricing, product assortment, and promotional strategy. During sale events, however, these numbers spike significantly. Amazon famously made 80 million price changes each day during 2014’s Christmas Season sale. Similarly, even on normal days some retailers have adopted the tactics of changing their product pricing more frequently than others, in their quest to stay competitive and build their desired price perception amongst shoppers.

    In our analysis of price changes, we considered the set of products that ranked consistently in the Top 200 from the 20th to the 25th of October. We identified the number of price changes together with the number of products affected by price changes that were implemented by the retailers.

    As anticipated, Amazon led the way with 508 price changes on 236 products in the Electronics category during the period compared to Walmart’s 413. By comparison, New Egg’s 95 price changes trailed the field by a significant margin and illustrate the tactical advantage Amazon’s dynamic pricing technology confers. However, the price variation (8.0%) of Amazon’s was also the lowest of the four retailers included in the study, showing that Amazon makes short, sharp tweaks to its pricing at a higher frequency than its competitors.

    By comparison, the Fashion category demonstrated a much lower level of price changes than Electronics, albeit with significantly higher price variations. Walmart leads the pack, adopting an order of magnitude greater number of price changes across a significantly larger number of products compared to the majority of its competitors.

    Product Mix Suited to Target Market Segments

    While competitive pricing is one strategy for attracting new customers and retaining existing ones, the selection of products featured in a retailer’s inventory is just as important. Ensuring a disciplined product assortment, which caters exclusively to a retailer’s target market segments is key. While some retailers such as Walmart choose to house a more affordable range of products, Neiman Marcus and Bloomingdales target the more premium segment of shoppers.

    It is clear from the data that Walmart has aligned its pricing strategy to support its affordability pitch to its shopper base, while Neiman Marcus and Nordstrom use pricing to juggle the demands of a more premium inventory with perceptions of price competitiveness.

    Product Movement In The Top 200

    Much of a retailer’s sales performance comes down to how effectively it maintains the optimal mix of reassuring bestsellers complemented by attractive new arrivals. Sound product assortment clearly provides shoppers with a variety of options each time they visit the retailer’s website. To achieve this balance, retailers typically employ their own, unique algorithm that ranks products in their listings based on several factors, including price range, discount offered, review ratings, popularity and promotions by brands.

    To study this, we evaluated the average percentage of products that were replaced in the Top 200 ranks for each product type of each website.

    Amazon has clearly adopted a strategy of offering new options to its shoppers each day, with an average of 60% new products in the Top 200 ranks of the Fashion category. Contrast that with Walmart which appears to be more conservative in its approach to churning its Top 200 products. In the case of Neiman Marcus however, the reason for the lower volume of product pricing movements in its Top 200 ranks may be due to the relatively high value of its premium product assortment, which imposes the internal constraints of having a smaller pool of new products to choose from.

    Online-First, This Black Friday Sale Season

    Amazon continues to demonstrate its dominance as a pacesetter in US retail, largely due to its progressive online pricing and merchandising strategies. These embrace the power of big data in its approach to online retail.

    Research shows online is consistently outperforming in-store along critical customer satisfaction dimensions spanning: product quality, selection and/or variety, availability of hard-to-find and unique products, ease of searching and delivery options.

    According to global consultancy Deloitte, for the first time ever, American shoppers will purchase more online than they buy offline in the 2017 holiday shopping season — 51 percent, up from 47 percent in 2016. With Black Friday looming in the next few weeks, it will be interesting to see how US retailers push to seize a larger piece of this growing pie.

    Check out our website to learn more about how DataWeave provides Competitive Intelligence as a Service to retailers and consumer brands globally.

  • Our Analysis of Diwali Season Sales

    Our Analysis of Diwali Season Sales

    As the battle of the Indian eCommerce heavyweights continues to accelerate, we have witnessed three separate sale events compressed into the last four weeks of this festive season. Flipkart has come out with all guns blazing following its multi-billion-dollar funding round, leaving Amazon with little choice but to follow suit with its own aggressive promotions. At this stage of a highly competitive eCommerce cycle, market share is a prize worth its weight in gold and neither Flipkart nor Amazon are prepared to blink first.

    At DataWeave, our proprietary data aggregation and analysis platform enables us to seamlessly analyze these sale events, focusing on multiple dimensions, including website, category, sub-category, brand, prices, discounts, and more. Over the past six weeks, we have been consistently monitoring the prices of the top 200 ranked products spread over sub-categories spanning electronics, fashion, and furniture. In total, we amassed data on over 65,000 products during this period.

    The first of these pivotal sale events was held between the 20th and 24th September, which we earlier analyzed in detail. Another major sale soon followed, contested by Amazon, Flipkart and Myntra for varying periods between the 4th and 9th of October. Lastly, was the Diwali season sale held by Amazon, Flipkart, and Myntra between the 14th and 18th of October, joined by Jabong between the 12th and 15th of October.

    In analyzing these significant sale events for all eCommerce websites, we observed an extensive range of products enjoying high absolute discounts, but with no additional discounts during the sale, i.e. prices remained unchanged between the day before the sale and the first day of the sale. The following infographic highlights some of the sub-categories and products where this phenomenon was more pronounced during the recently concluded Diwali season sale. Here, discount percentages are average absolute discounts of products with unchanged discounts during the sale.

    Having identified the aggressive use of high but unchanged absolute discounts amongst eCommerce heavyweights during the sale, we focused our analysis on the additional discounts offered during the sale, to more accurately reflect the value these sale events deliver to Indian consumers.

    Several categories, sub-categories and brands emerged as enjoying substantial additional discounts. The following infographic details our analysis:

    Amazon and Flipkart continue to stand toe to toe on discounts in Electronics, although Amazon offered discounts across a greater number of products. Flipkart adopted a more premium brand assortment in the Electronics category with an average MRP of INR 30,442 for additionally discounted products.

    What stands out in our analysis is Amazon’s consistently aggressive discounting in fashion compared to Flipkart. As anticipated, Jabong and Myntra continued to offer attractive discounts in a large number of fashion products, seeking to maintain their grip in their niche. Furniture, too, is a category where Amazon out-discounted Flipkart, albeit through a less premium assortment mix (average MRP of INR 23,580 compared to Flipkart’s INR 34,304).

    Several big brands elected to dig deep into their pockets during the sales to offer very high discounts. These included attractive discounts from Redmi, Asus, and Acer in Electronics, and W, Wrangler, Levi’s, Puma, Fossil, and Ray Ban in Fashion.

    Which Sale Delivered Greater Value For Consumers?

    Since DataWeave has extensive data on both the pre-Diwali sale (held between 4th and 9th of October), and the Diwali season sale (held between 12th and 18th October), we compared prices to identify which of the sale events offered more attractive discounts across categories, sub-categories and products.

    While the discount levels were generally consistent across most sub-categories, only varying by a few percentage points, we identified several sub-categories and products that displayed a large variation in the absolute level of discount offered.

    As the infographic above shows, Amazon identified women’s formal shoes as a key category in its discounting strategy, which saw its level of discounting triple during the Diwali sale. By comparison, Flipkart doubled its discount in men’s jeans, and Myntra tripled its discounts on Men’s shirts and sunglasses.

    Similarly, during the Diwali sale Amazon, Flipkart and Myntra all offered selected products with an aggressive 40% to 50% discount level.

    Interestingly, Amazon, Flipkart and Myntra all elected to reduce the level of discounts offered on specific products as well. One of the biggest discount moves was Amazon’s reduction on iPhone 6s from 34% to only 4%. Flipkart recorded a similar price move on Adidas originals Stan Smith sneakers (30% to 5%) and Canon EOS 200D DSLR cameras (20% to 8%).

    Market Share Reigns Supreme

    Based on our analysis of the festive season sales, Flipkart’s aggressive approach powered by its multi-billion-dollar funding round enabled it to stave off Amazon’s discounting strategy in the annual eCommerce festive season sales this year, increasing its lead over Amazon India in a market where the total sales is believed to have surged by up to 40 percent over 2016’s sales.

    Based on several reports, Flipkart’s share of total festive season sales appears to have increased from 45 percent in 2016 to 50 percent this year, capturing much of the market up for grabs from a now relegated Snapdeal. Amazon’s market share during a festive sales period that stretched over a month is estimated to have remained steady at 35 percent, though the company reported it saw a 50 percent share in other metrics such as order volume and active customers.

    The key question for both industry analysts and consumers alike is, how much deeper are retailers willing to go in their quest to capture market share at the expense of operating margins?

    If you’re interested in DataWeave’s data aggregation and analysis platform, and how we provide Competitive Intelligence as a Service to retailers and brands, visit our website!

  • Festive Season Sale: Who’s Winning the Great Indian eCommerce Battle?

    Festive Season Sale: Who’s Winning the Great Indian eCommerce Battle?

    In the lead up to October’s Diwali celebrations, almost all major Indian e-retailers had announced mammoth sale events for last week. Resuming the epic battle of India’s online shopping carts during festival seasons, Flipkart, together with Jabong and Myntra, kicked off their five-day-long “Big Billion Days” sales on September 20, while Amazon India‘s “Great Indian Festival” launched the next day.

    The stakes were high as Amazon and Flipkart are more evenly matched this year than ever before, making predicting an eventual winner of these dueling discounters a lot tougher than in previous years.

    At DataWeave, our proprietary data aggregation and analysis platform enabled us to easily assess which e-retailer offered better deals and discounts. Over the last two weeks, we have been consistently monitoring the prices of the top 200 ranked products in Amazon, Flipkart, Myntra, and Jabong, across several sub-categories of Electronics, Men’s Fashion, and Women’s Fashion, encompassing over 35,000 products in total.

    Divergent Discount Strategies

    In our analysis, we bring focus to the additional discounts offered by competing e-retailers during the sale, compared to prices before the sale. This is key, as today’s shoppers often encounter deep discounts on several products even on normal days, which could potentially dampen the value suggested by the large discounts advertised during the sale.

    Based on our analysis, Flipkart clearly adopted a more aggressive pricing strategy this year, establishing a lead over Amazon in average discount percentage for Electronics and Women’s Fashion. Moreover, Flipkart launched additional discounts on a larger number of products across categories. Amazon, though, offered 6.9 percent additional discounts on smartphones compared to Flipkart (6.2 percent), led by 10.7 percent discount on Apple and 7.7 percent discount on Redmi smartphones.

    Flipkart has already reported a doubling of revenue from the sale (which includes sales volumes of Myntra and Jabong) compared to last year, and claimed it accounted for 70 percent of eCommerce sales during these five days — beating Amazon by a considerable margin. Amazon, for its part, reported a “2.5X growth in smartphone sales, 4X increase in large appliances and 7X in fashion sales.”

    The difference in discounting strategies between Amazon and Flipkart is starkly illustrated by their respective highest discounts. Flipkart led the way with a 65.5 percent discount on Vero Moda skirts, a 65 percent discount on Tommy Hilfiger skirts, and 50 percent off Calvin Klein sunglasses.

    By contrast, Amazon’s greatest discounts were an 83.4 percent discount on Redfoot formal shoes, 45.5 percent on Motorola Tablets, a 40 percent on US Polo T-shirts, and a 25.1 percent discount on Puma sports shoes.

    Also, Flipkart hosted a more premium range of products in its assortment compared to Amazon, evidenced by a higher average MRP for its discounted products. Surprisingly, Amazon’s spread of discounted products has the least average MRP in Electronics and Women’s Fashion, compared to all other competitors.

    New Products Break Through the Top 200

    What’s fascinating in this battle of the e-retail giants is the correlation we uncovered between prices and rank. During the sale, as prices dropped on hundreds of products across the board, newer products successfully broke through into the Top 200 ranks for each sub-category. New products in the top 200 ranks had higher discount levels than the ones they replaced.

    This trend was especially pronounced in fashion, where we observed an almost complete overhaul of products filling the Top 200 during the sale period, led by sports shoes in Amazon, Men’s shirts in Flipkart, and Men’s formal shirts in Jabong.

    What About Pre-Sale Prices?

    Another angle we explored was whether (like most of us suspect) e-retailers increase their prices before a sale, only to reduce them during the sale, so they can advertise higher discounts. We observed that all e-retailers did increase their prices for an albeit small set of products before the sale.

    While the number of products where the prices increased for each website prior to the sales is small, it is interesting to observe that certain brands choose to perform the oldest trick in the retail book even today — raising prices to accentuate the degree of discount during the sale period, something shoppers need to keep an eye out for.

    A Sign of Things to Come?

    Based on our analysis, Flipkart has recognized the threat from Amazon and has approached this year’s “Big Billion Days” sale aggressively. It has dug deep into its freshly funded pockets, and offered better discounts for a larger set of products across most categories, in its attempt to lock down a greater market share in the burgeoning Indian eCommerce space.

    Amazon, though, has continued to maintain a firm grip on the Indian consumer, having achieved tremendous growth in specific categories during the sale.

    What’ll be interesting now is to see how these pricing strategies impact company revenues and margins, and how this will shape the soon-to-follow Diwali sales in mid-October.

    If you’re intrigued by DataWeave’s data aggregation and analysis technology, and would like to learn more about how we help retailers and brands build and maintain a competitive edge, please visit our website.


  • Was Amazon’s Prime Day Sale Really That Big a Deal?

    Was Amazon’s Prime Day Sale Really That Big a Deal?

    Hint: Only in some product categories

    Amazon’s Prime Day sale, the first-of-its-kind in India, made a conspicuous splash across the media a couple of weeks ago, with several stories of the sale’s dramatic success doing the rounds. For 30 hours spread over 10th and 11th of July, the online retail giant rolled out deals as frequently as every five minutes, exclusively for Amazon Prime subscribers. And online shoppers lapped it up.

    According to Amazon India, more customers signed up for Prime on the day of the sale and in the week leading up to it, than on any other month since Prime’s launch in India last year. To boot, Prime subscribers shopped three-times more during the sale compared to other days.

    The discounts offered on several products were quite frequently in the range of 60–70% and beyond, with some products reaching absurd discount levels of up to 85%. However, for a retailer as competitively priced as Amazon, what’s interesting to explore is how much additional discount was offered during the sale. After all, even on normal days, Amazon discounts aggressively on its top 20% selling SKUs, in order to reinforce the commonly held perception that the company is the lowest priced retailer around.

    More Than Meets the Eye

    At DataWeave, our AI-based technology platform aggregates and analyzes publicly accessible data on the Web, at large scale, to deliver insights on competitors to retailers and consumer brands. We collected pricing and discount information for the Electronics and Fashion categories on Amazon during the sale, and compared it to numbers from before the sale. Thus, we evaluated just how much additional value Prime subscribers could’ve potentially drawn from this sale.

    We performed a similar analysis on Flipkart as well, to examine how competing e-commerce websites react to big-ticket sale events.

    The infographic below lists out some of the more interesting bits of our analysis.

    Unsurprisingly, Amazon strengthened its grip in the electronics category by offering, on average, 3.9% higher discount than Flipkart, even with a higher-value assortment mix. Subsequently, Amazon reported a 5X increase in sales of smartphones and an 8X increase in sales of televisions during Prime Day.

    While Apple discounted its phones by 8.5% during the sale, Sanyo was among the top discounting brands (10%) in Televisions, with the company reporting a 4X jump in television sales. TCL offered 20% additional discount, the highest for televisions.

    What stands out from this analysis, though, is that Flipkart beat Amazon on price definitively in the fashion for women category, by extending 6.8% more discount than Amazon on a significantly higher-value assortment mix.

    It’s not uncommon to see e-commerce companies lowering their prices across the board to take advantage of the hype surrounding a competing e-commerce website’s promotional activity. Clearly, it’s a good idea for shoppers to always compare prices across websites before buying any product online.

    The New Age of Retail

    That shoppers today can easily compare products and prices across different e-commerce websites has brought about greater competition among online retailers. With the consequent margin pressure, comes the need for retailers to be able to react to price changes by their competitors in near-real-time.

    And it’s no mean task. Amazon has been found to effect over 80 million price changes a day during holiday season, and retailer-driven sale events like the Prime Day Sale are here to stay. Consequently, retailers look to Competitive Intelligence providers like DataWeave for easily consumable competitive information that enables them to react effectively and compete profitably.

    DataWeave’s AI-powered technology platform aggregates, compiles, and presents millions of data points to provide e-commerce companies with actionable competitive insights. With our solutions, retailers can effect profitable price changes, implement high-value assortment expansion, and proactively monitor and respond to promotional campaigns by competitors.

    Find what we do interesting? Visit our website to find out more about how modern retailers benefit from using DataWeave’s Competitive Intelligence as a Service.