Electronics have never been hotter.
This year’s COVID-19 pandemic created a seismic shift towards tech, directly affecting retailers’ Black Friday and Cyber Monday pricing strategies for electronics. Prime Day 2020’s new fall date also inevitably influenced pricing and purchasing patterns. If consumers pampered themselves with a 75-inch TV in October, what are the odds they’re in the market for another big-screen TV in late November?
Consumer electronics are perennial holiday bestsellers because they make gift-giving easy, whether we buy them for others or for personal indulgence. Continuous innovation also means a comparatively shorter product lifecycle, making electronics an exciting, progressive retail category.
To determine which retailers’ pricing strategies offered the most generous discounts on electronic products, we examined electronics pricing at Amazon, Best Buy, Overstock, Target and Walmart. We compared during the pre-sale period (November 24-26) to the holiday sales period (Black Friday on November 27 through Cyber Monday on November 30) for a glimpse of retailers’ pricing strategies to stay competitive in 2020.
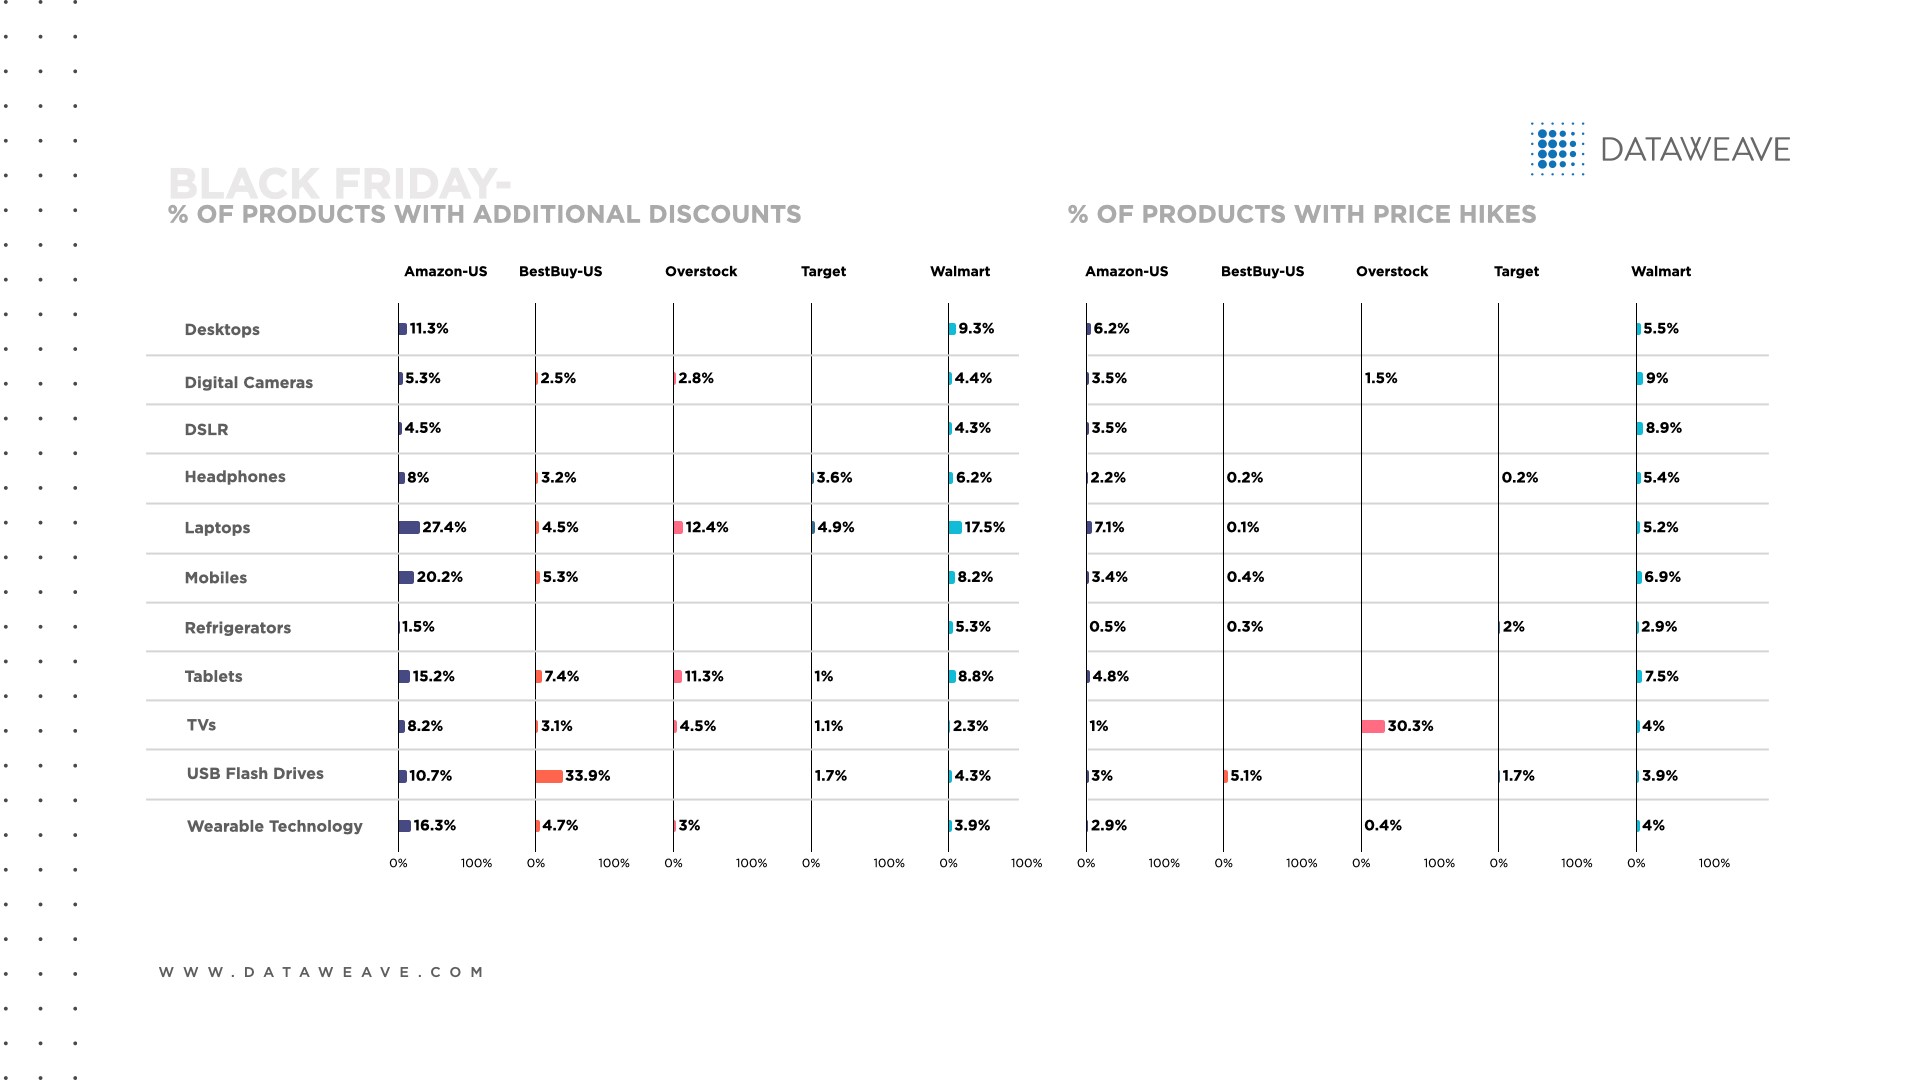
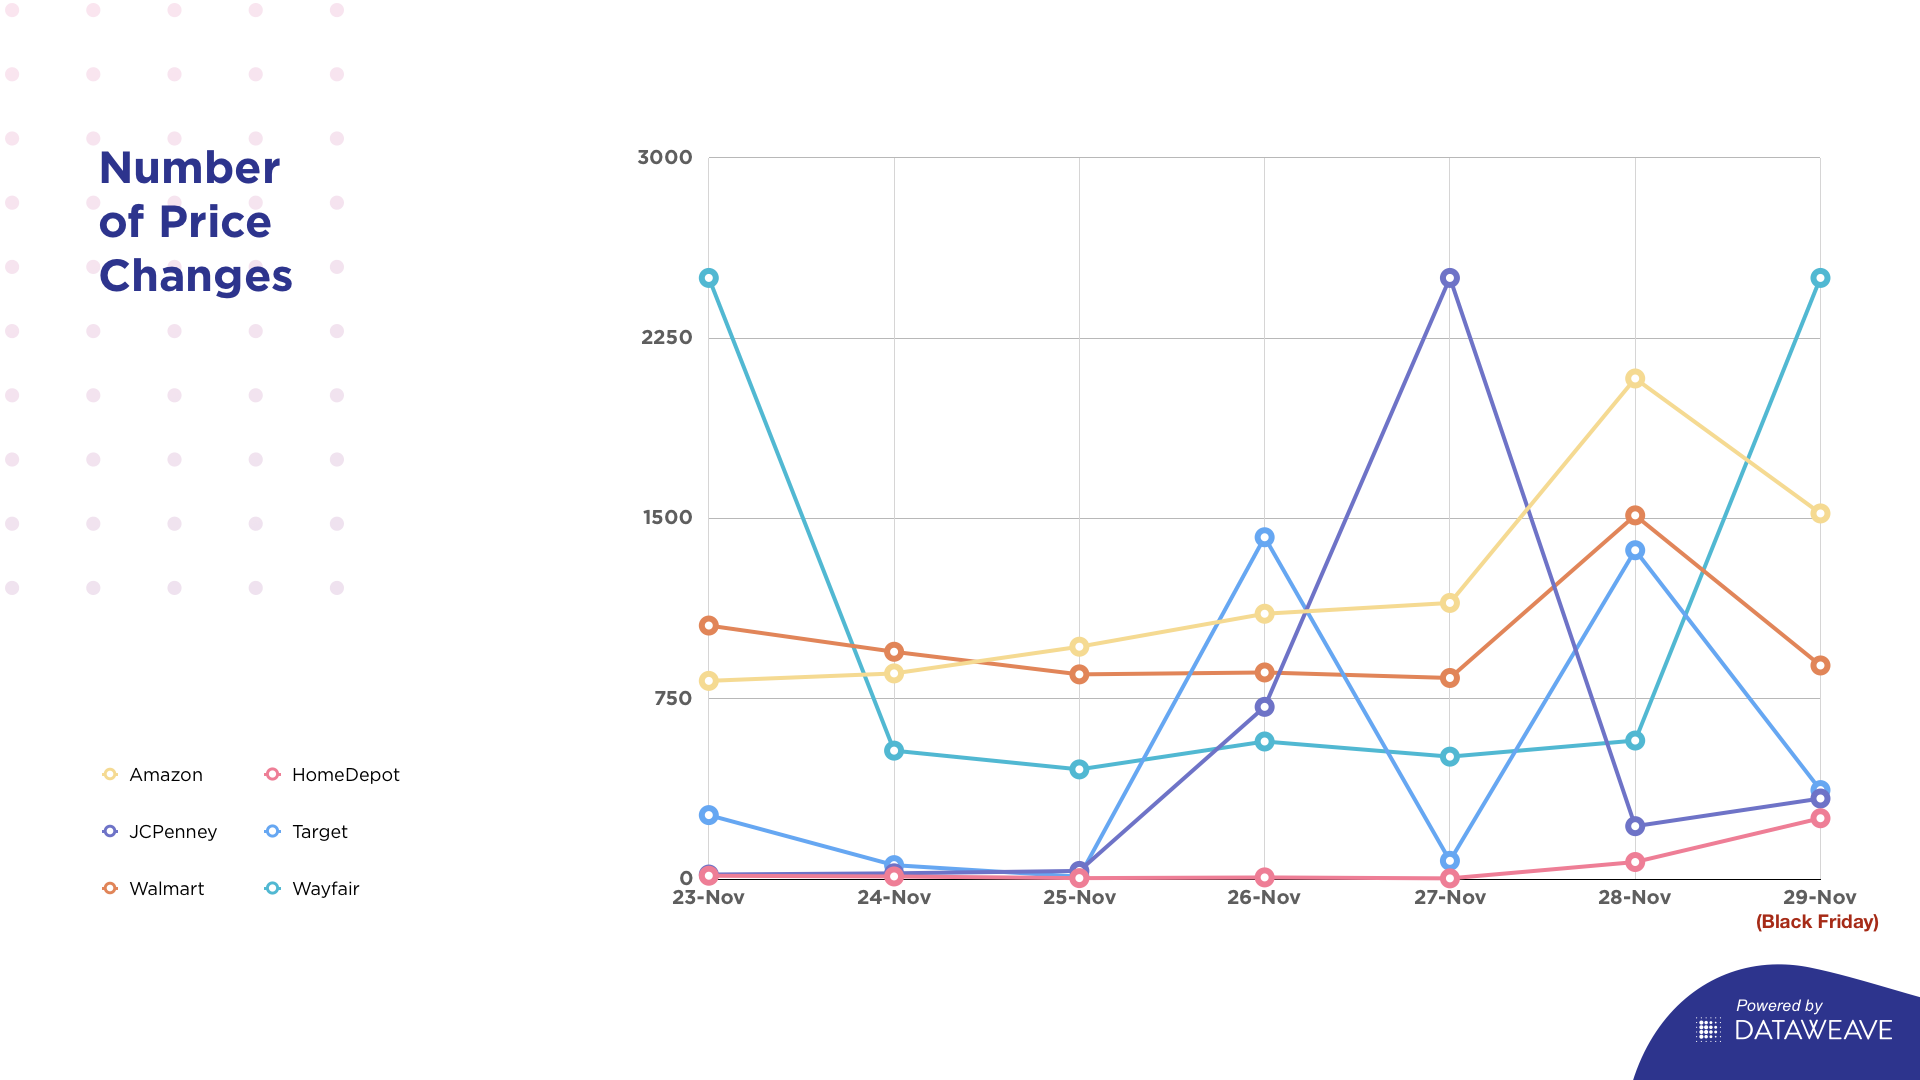
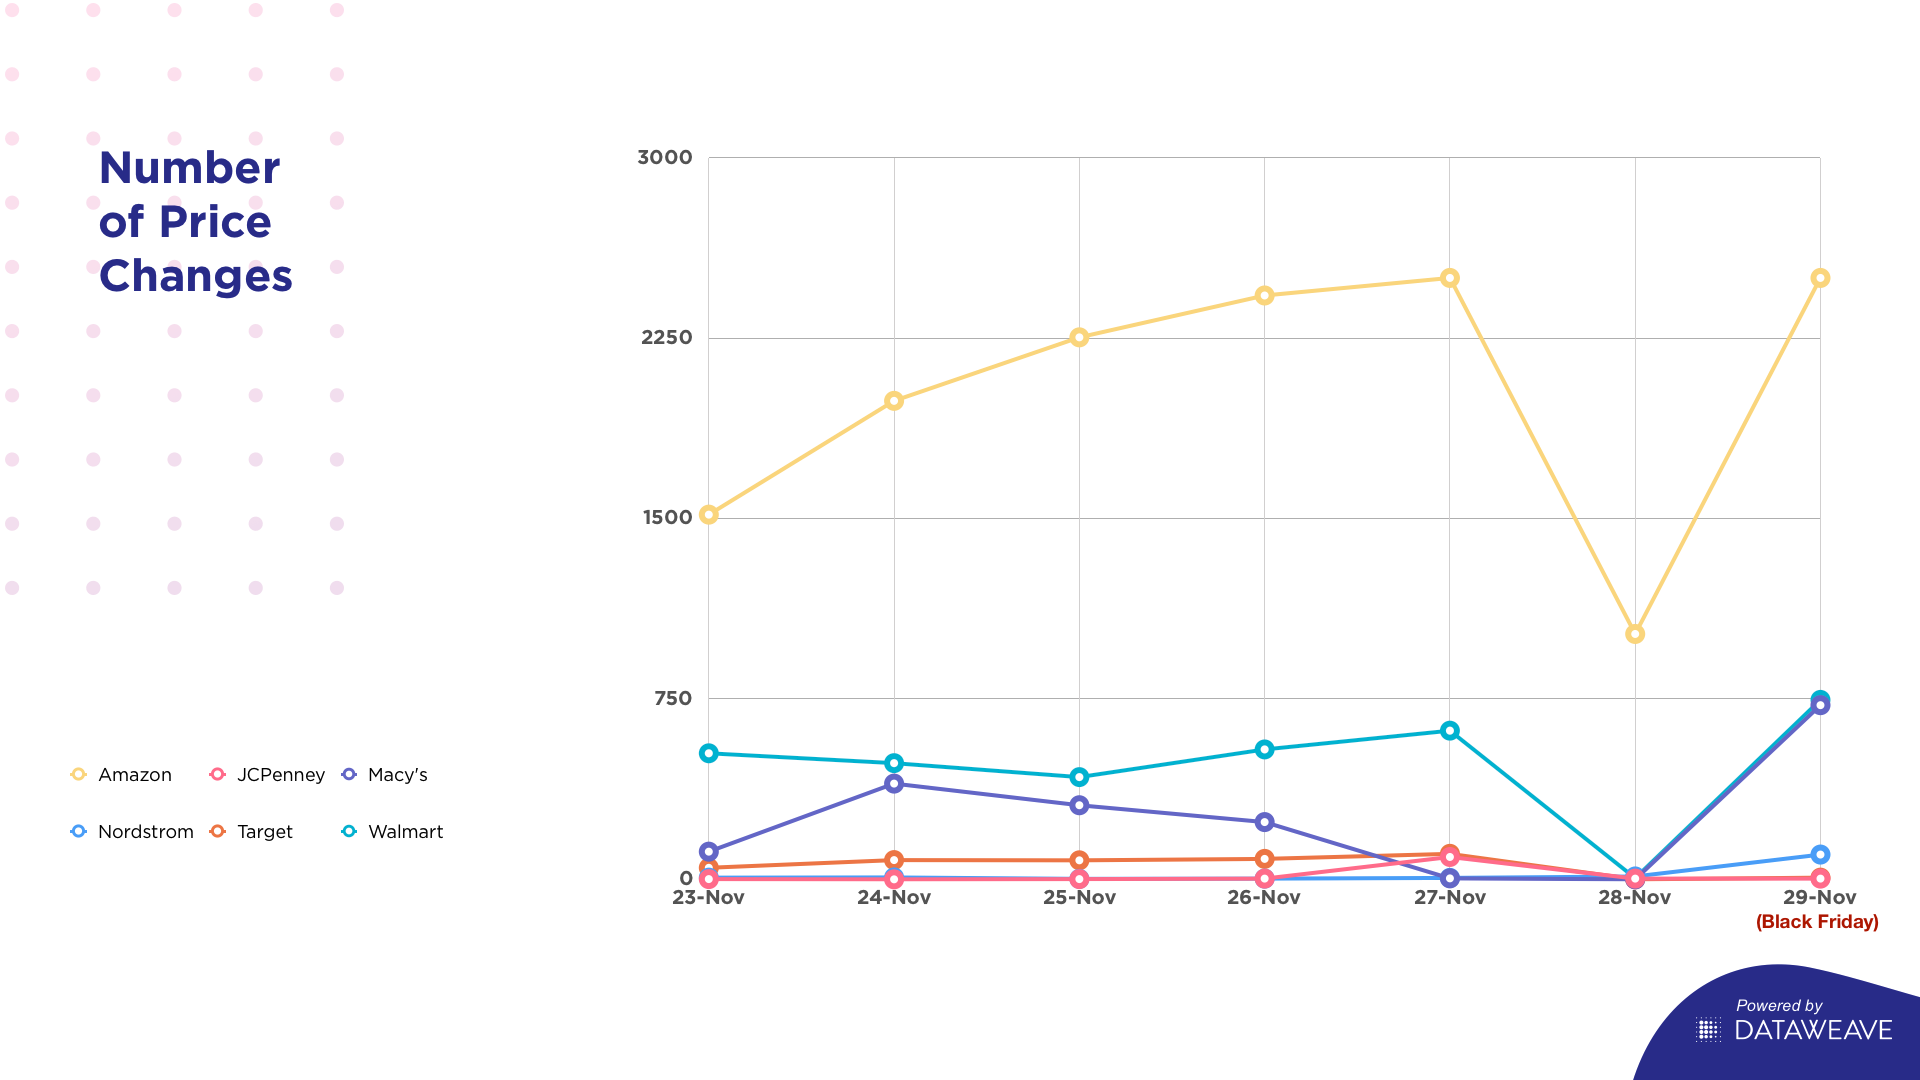
For competitive pricing insights, we tracked three scenarios before and during 2020’s traditional holiday sales season: whether prices decreased, increased or remained the same. Most strikingly, the overwhelming majority of electronics products (89.8%) maintained the same prices during the pre-sale and sales periods. For instance, Target kept a whopping 98.0% of its electronics prices the same during the period.
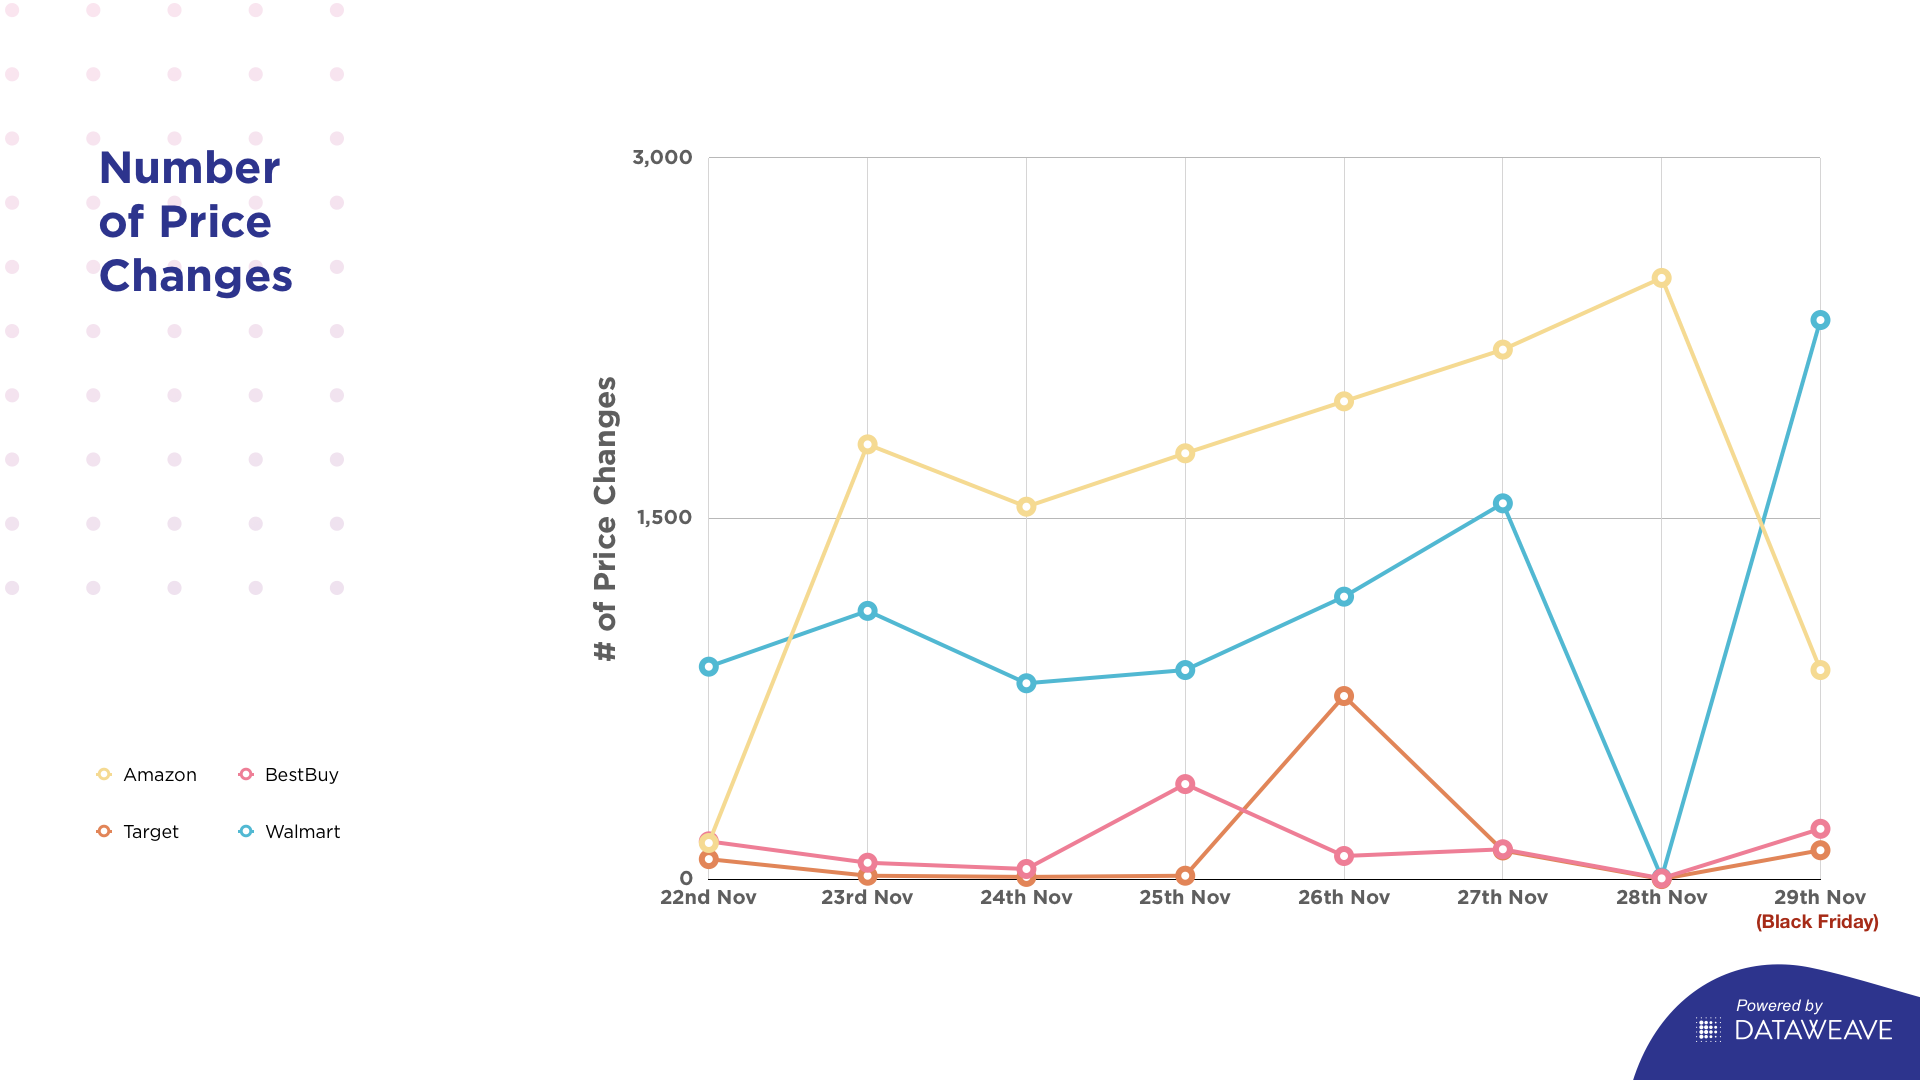
Amazon had the greatest proportion of electronics products that offered a price decrease (11.7%), particularly on laptops, mobiles and wearable technology. These results also suggest Amazon wants to reach more consumers by making more electronics affordable with discounts. Target offered the lowest proportion of electronics with price decreases (2.5%).
Overstock had the greatest proportion of electronics products that offered a price increase (10.7%) with 30.3% of TVs increasing in price. Best Buy offered the lowest proportion of electronics with price increases (1.2%).
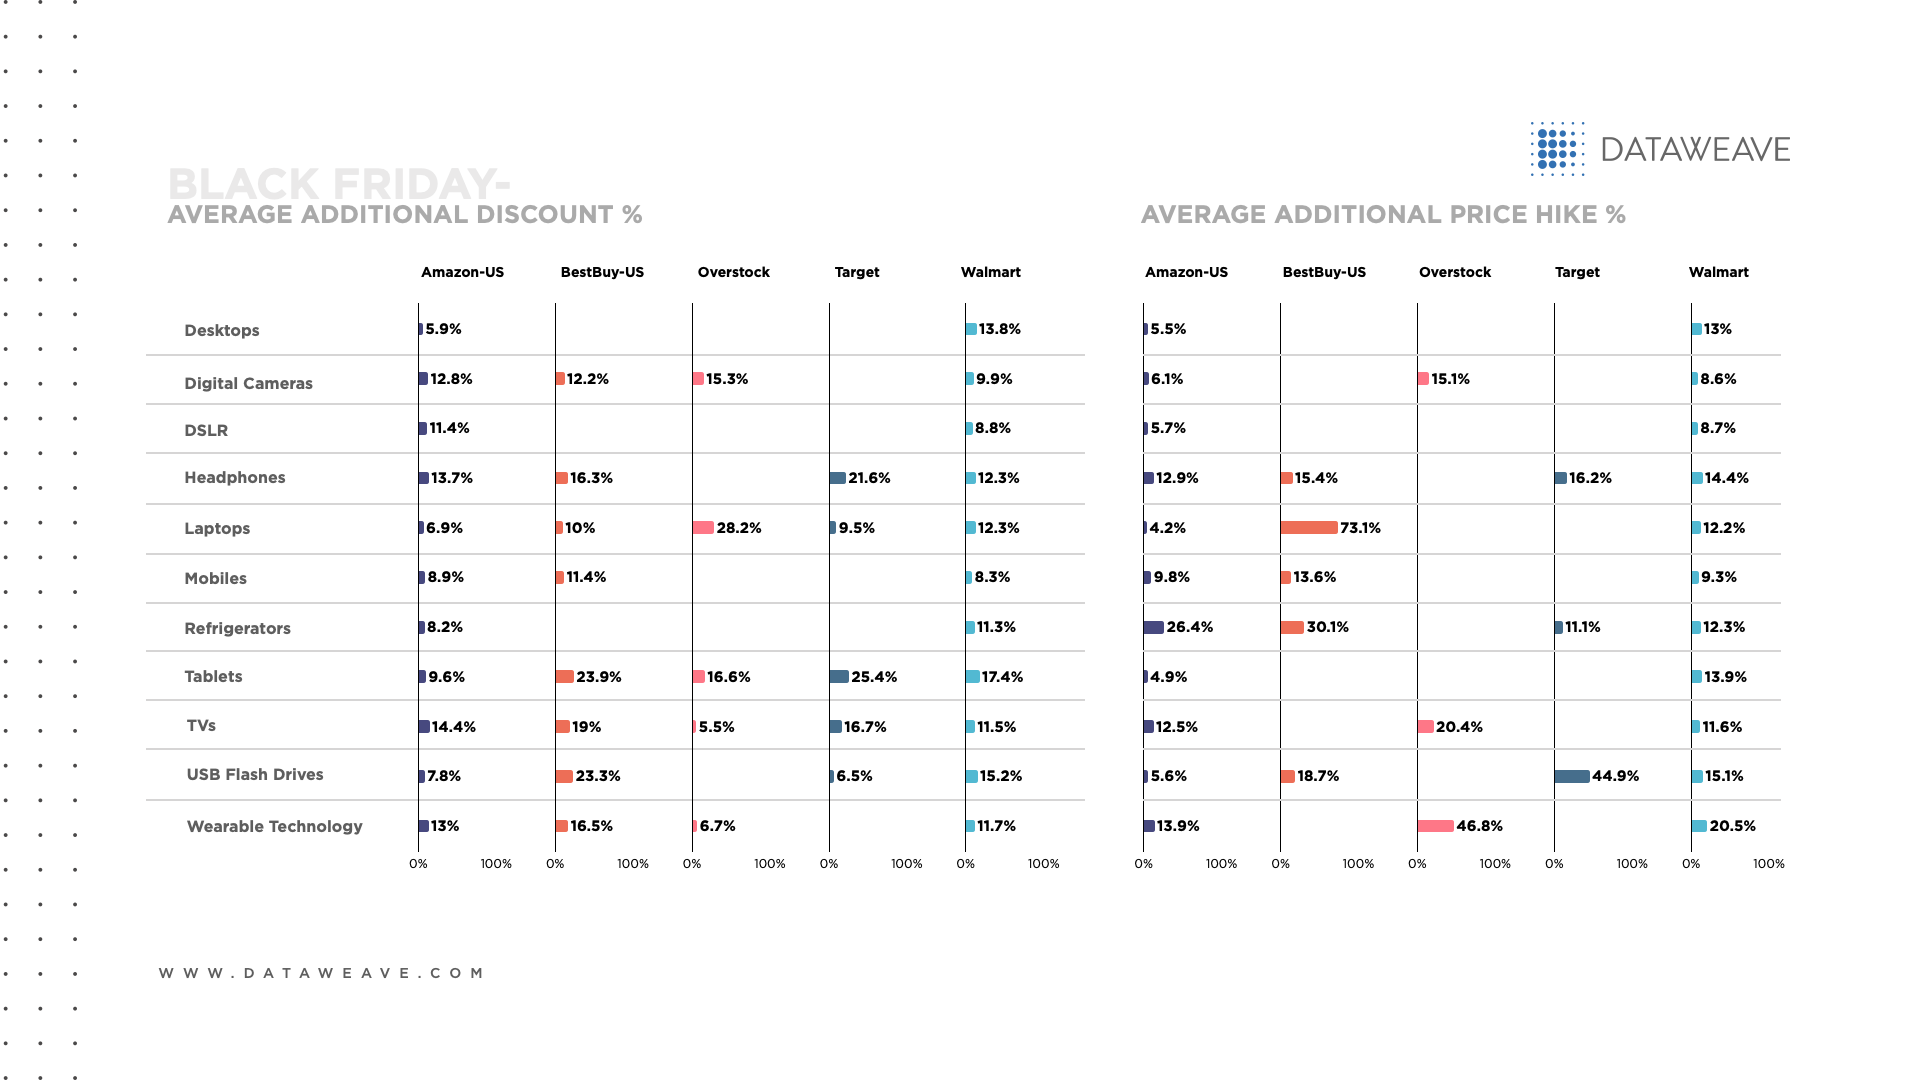
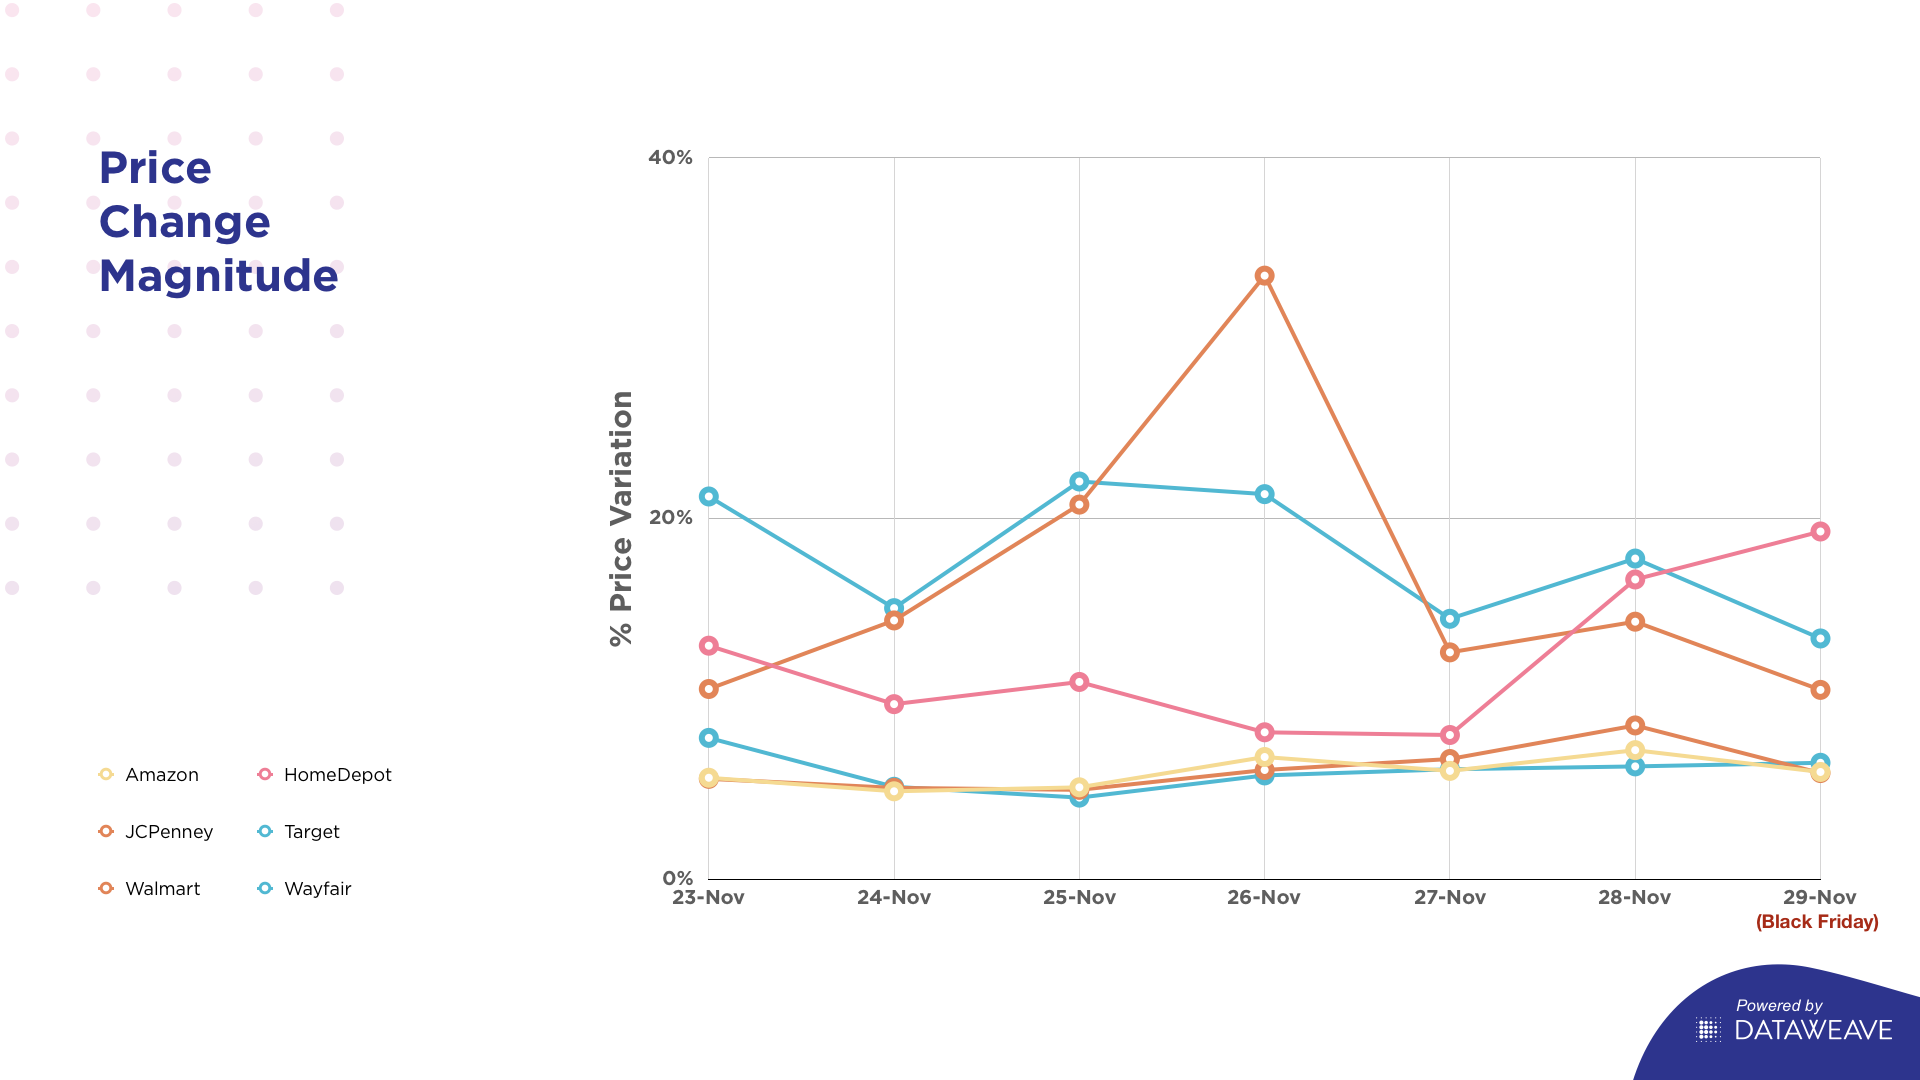
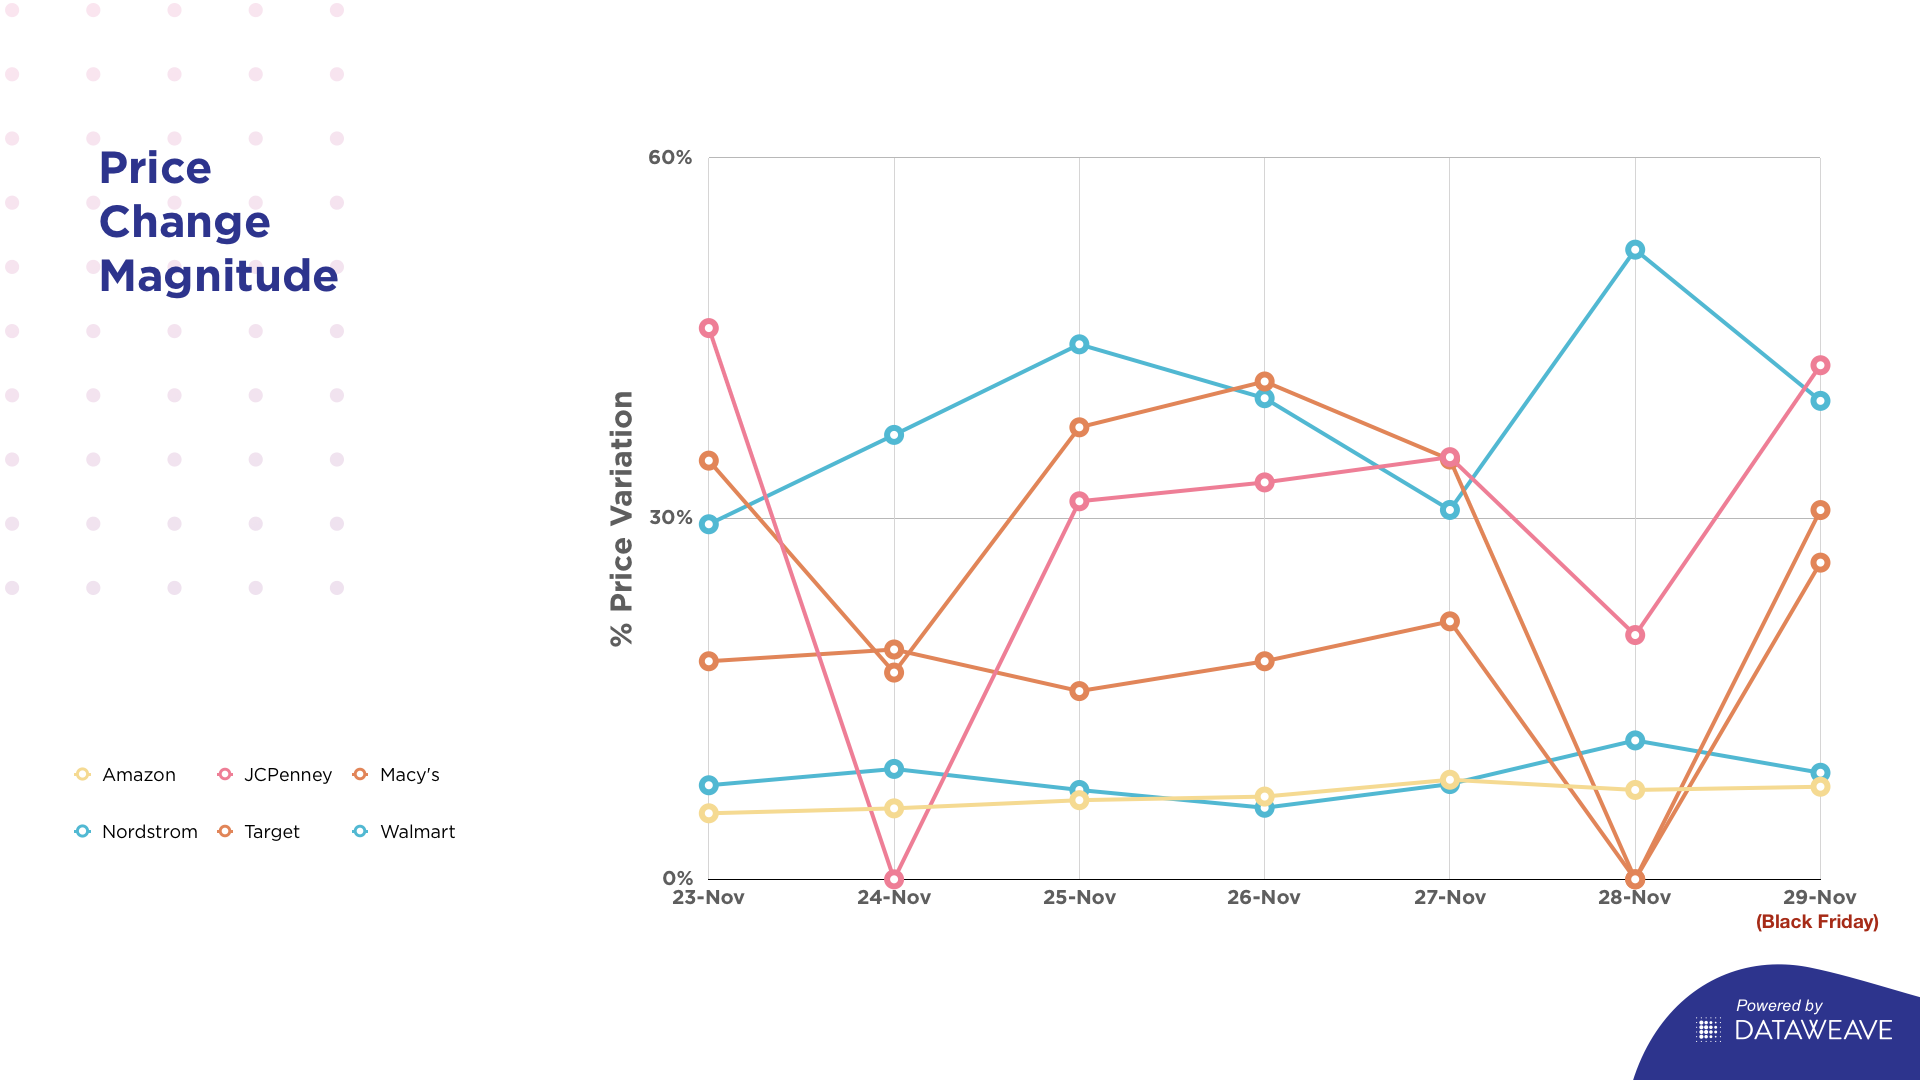
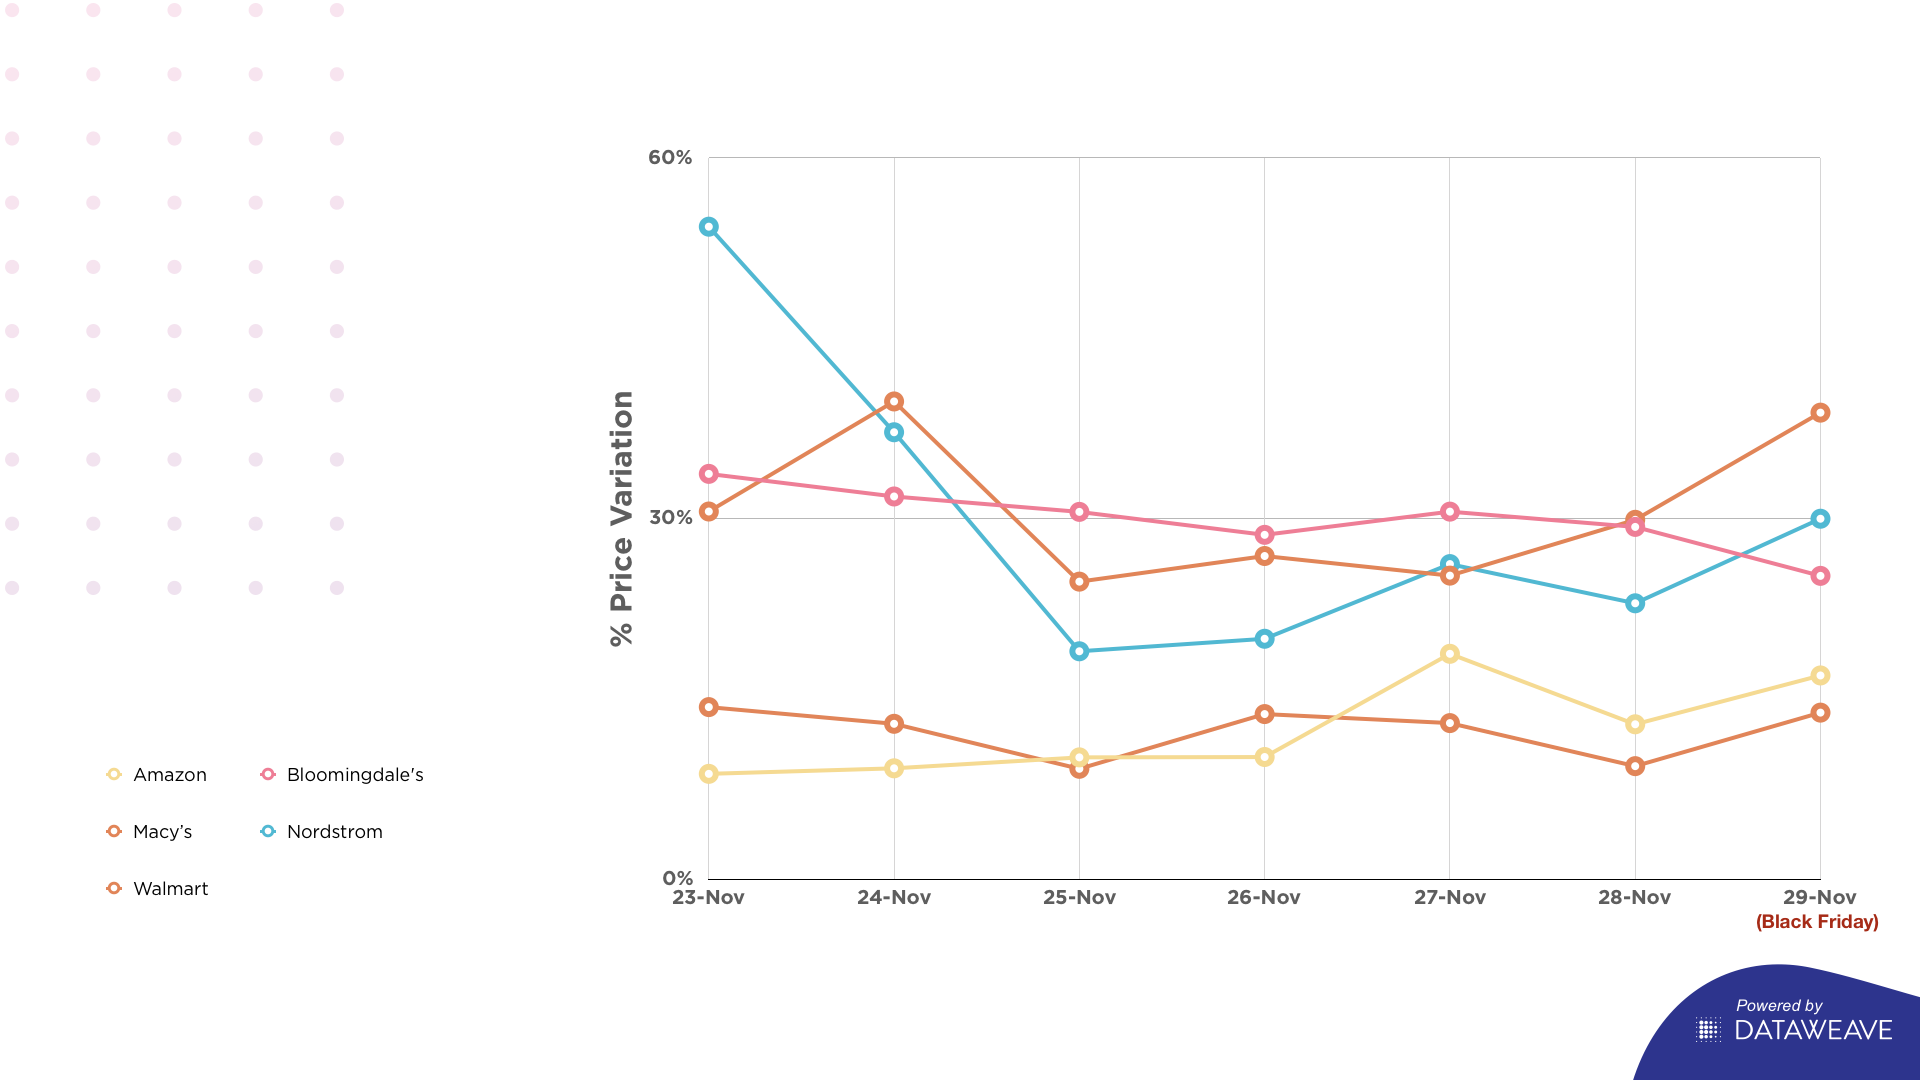
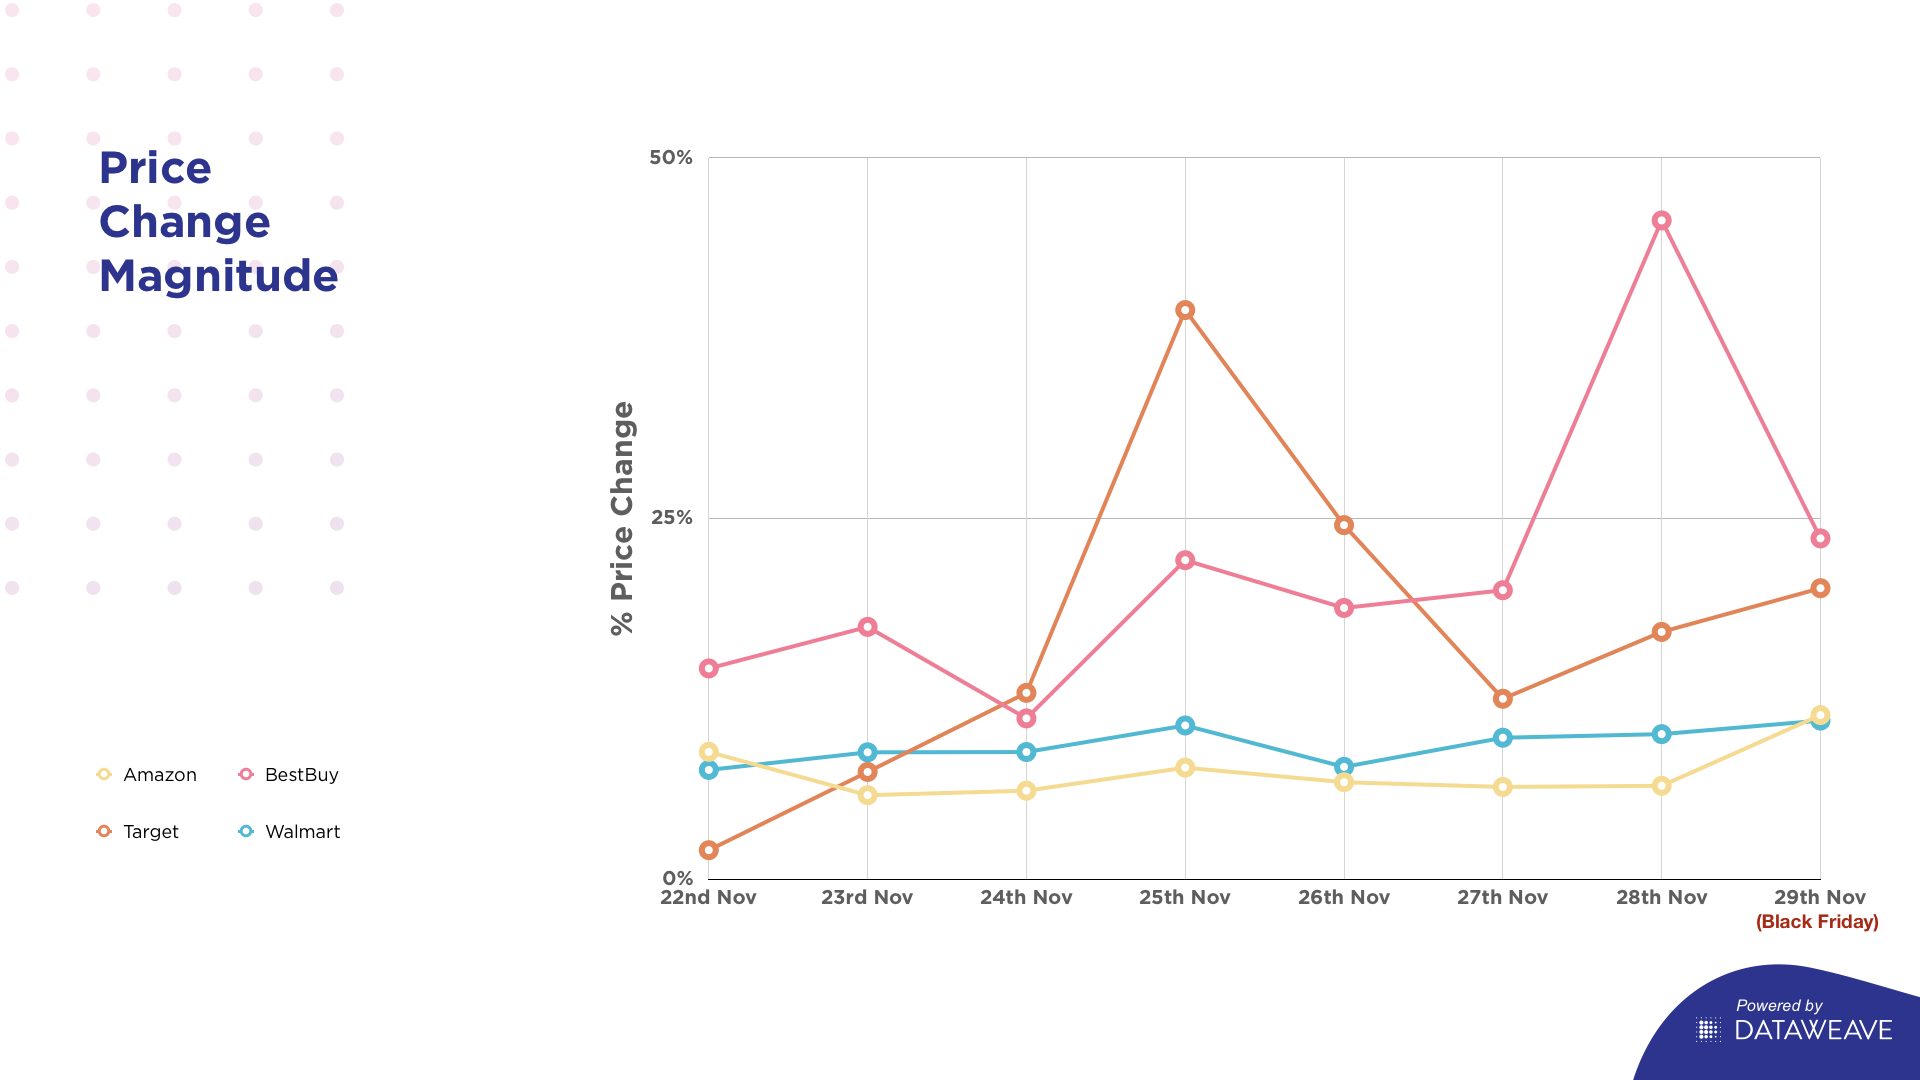
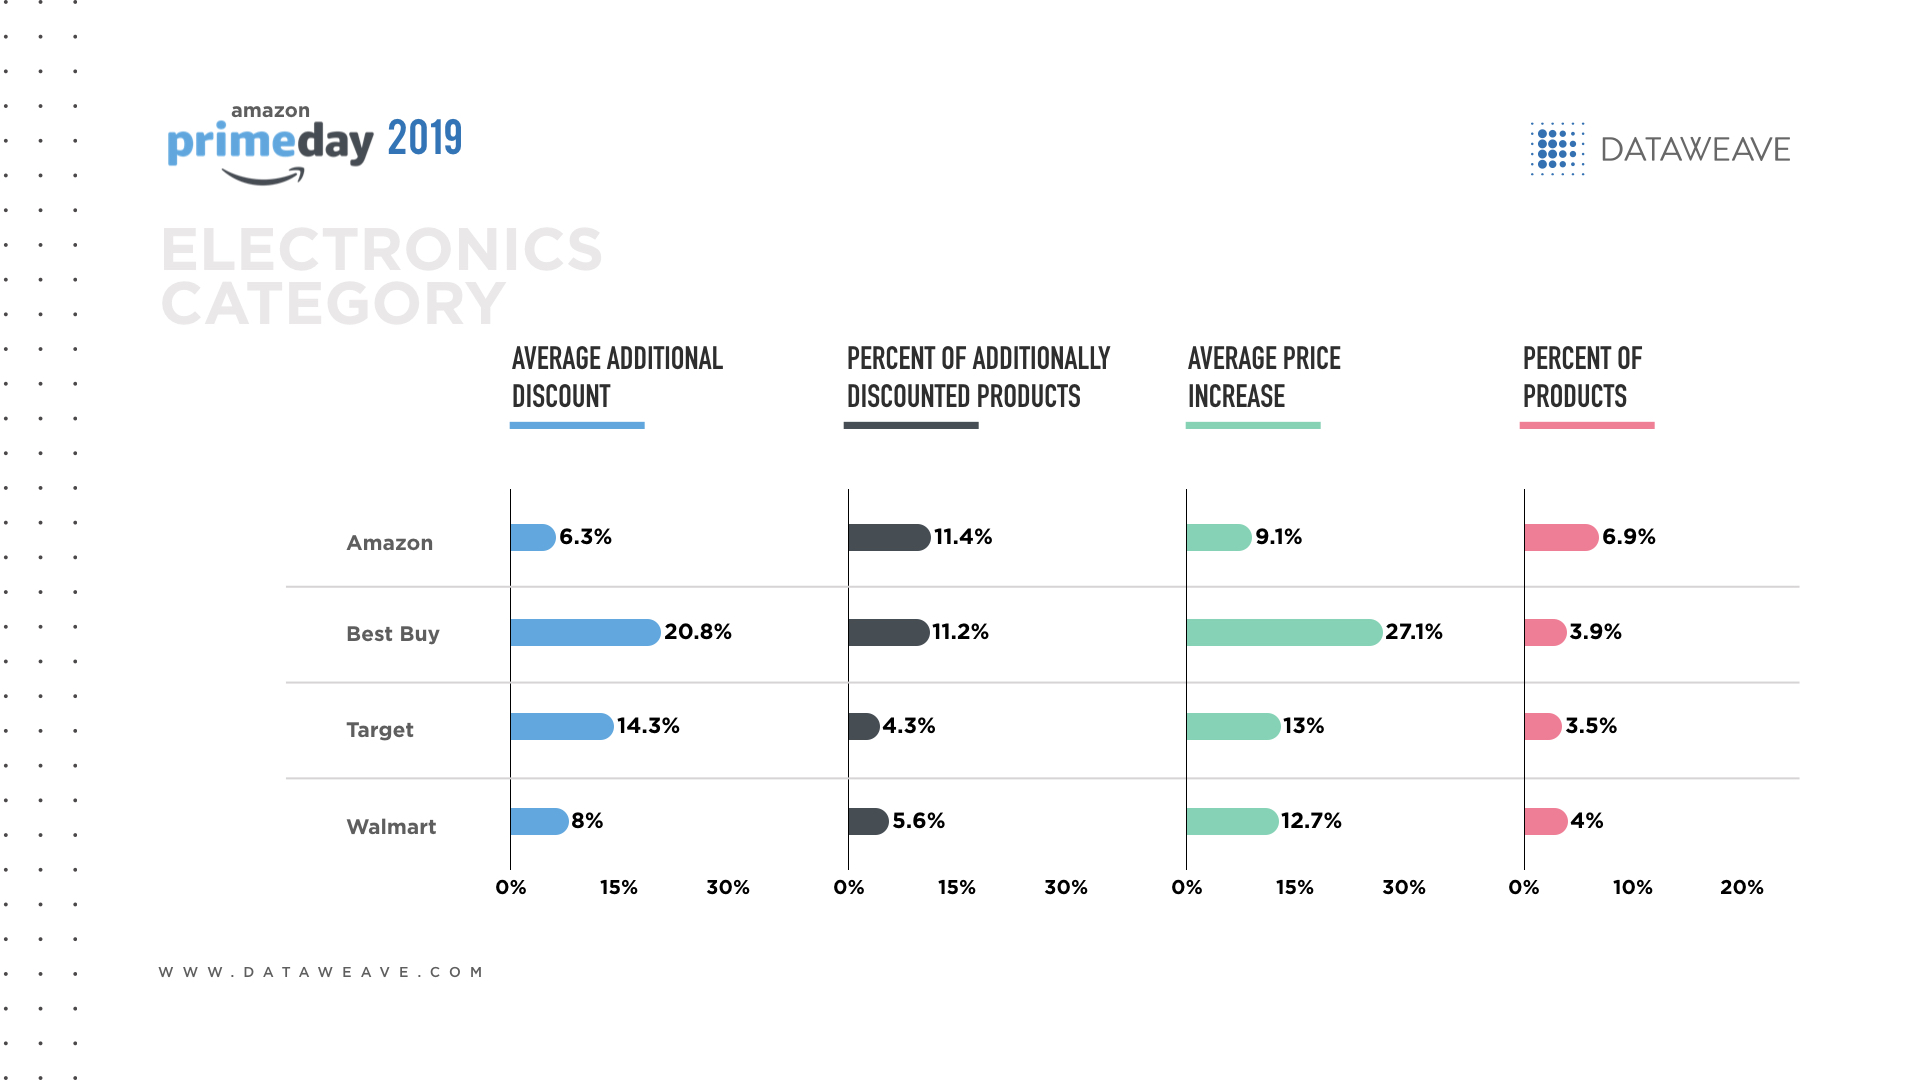
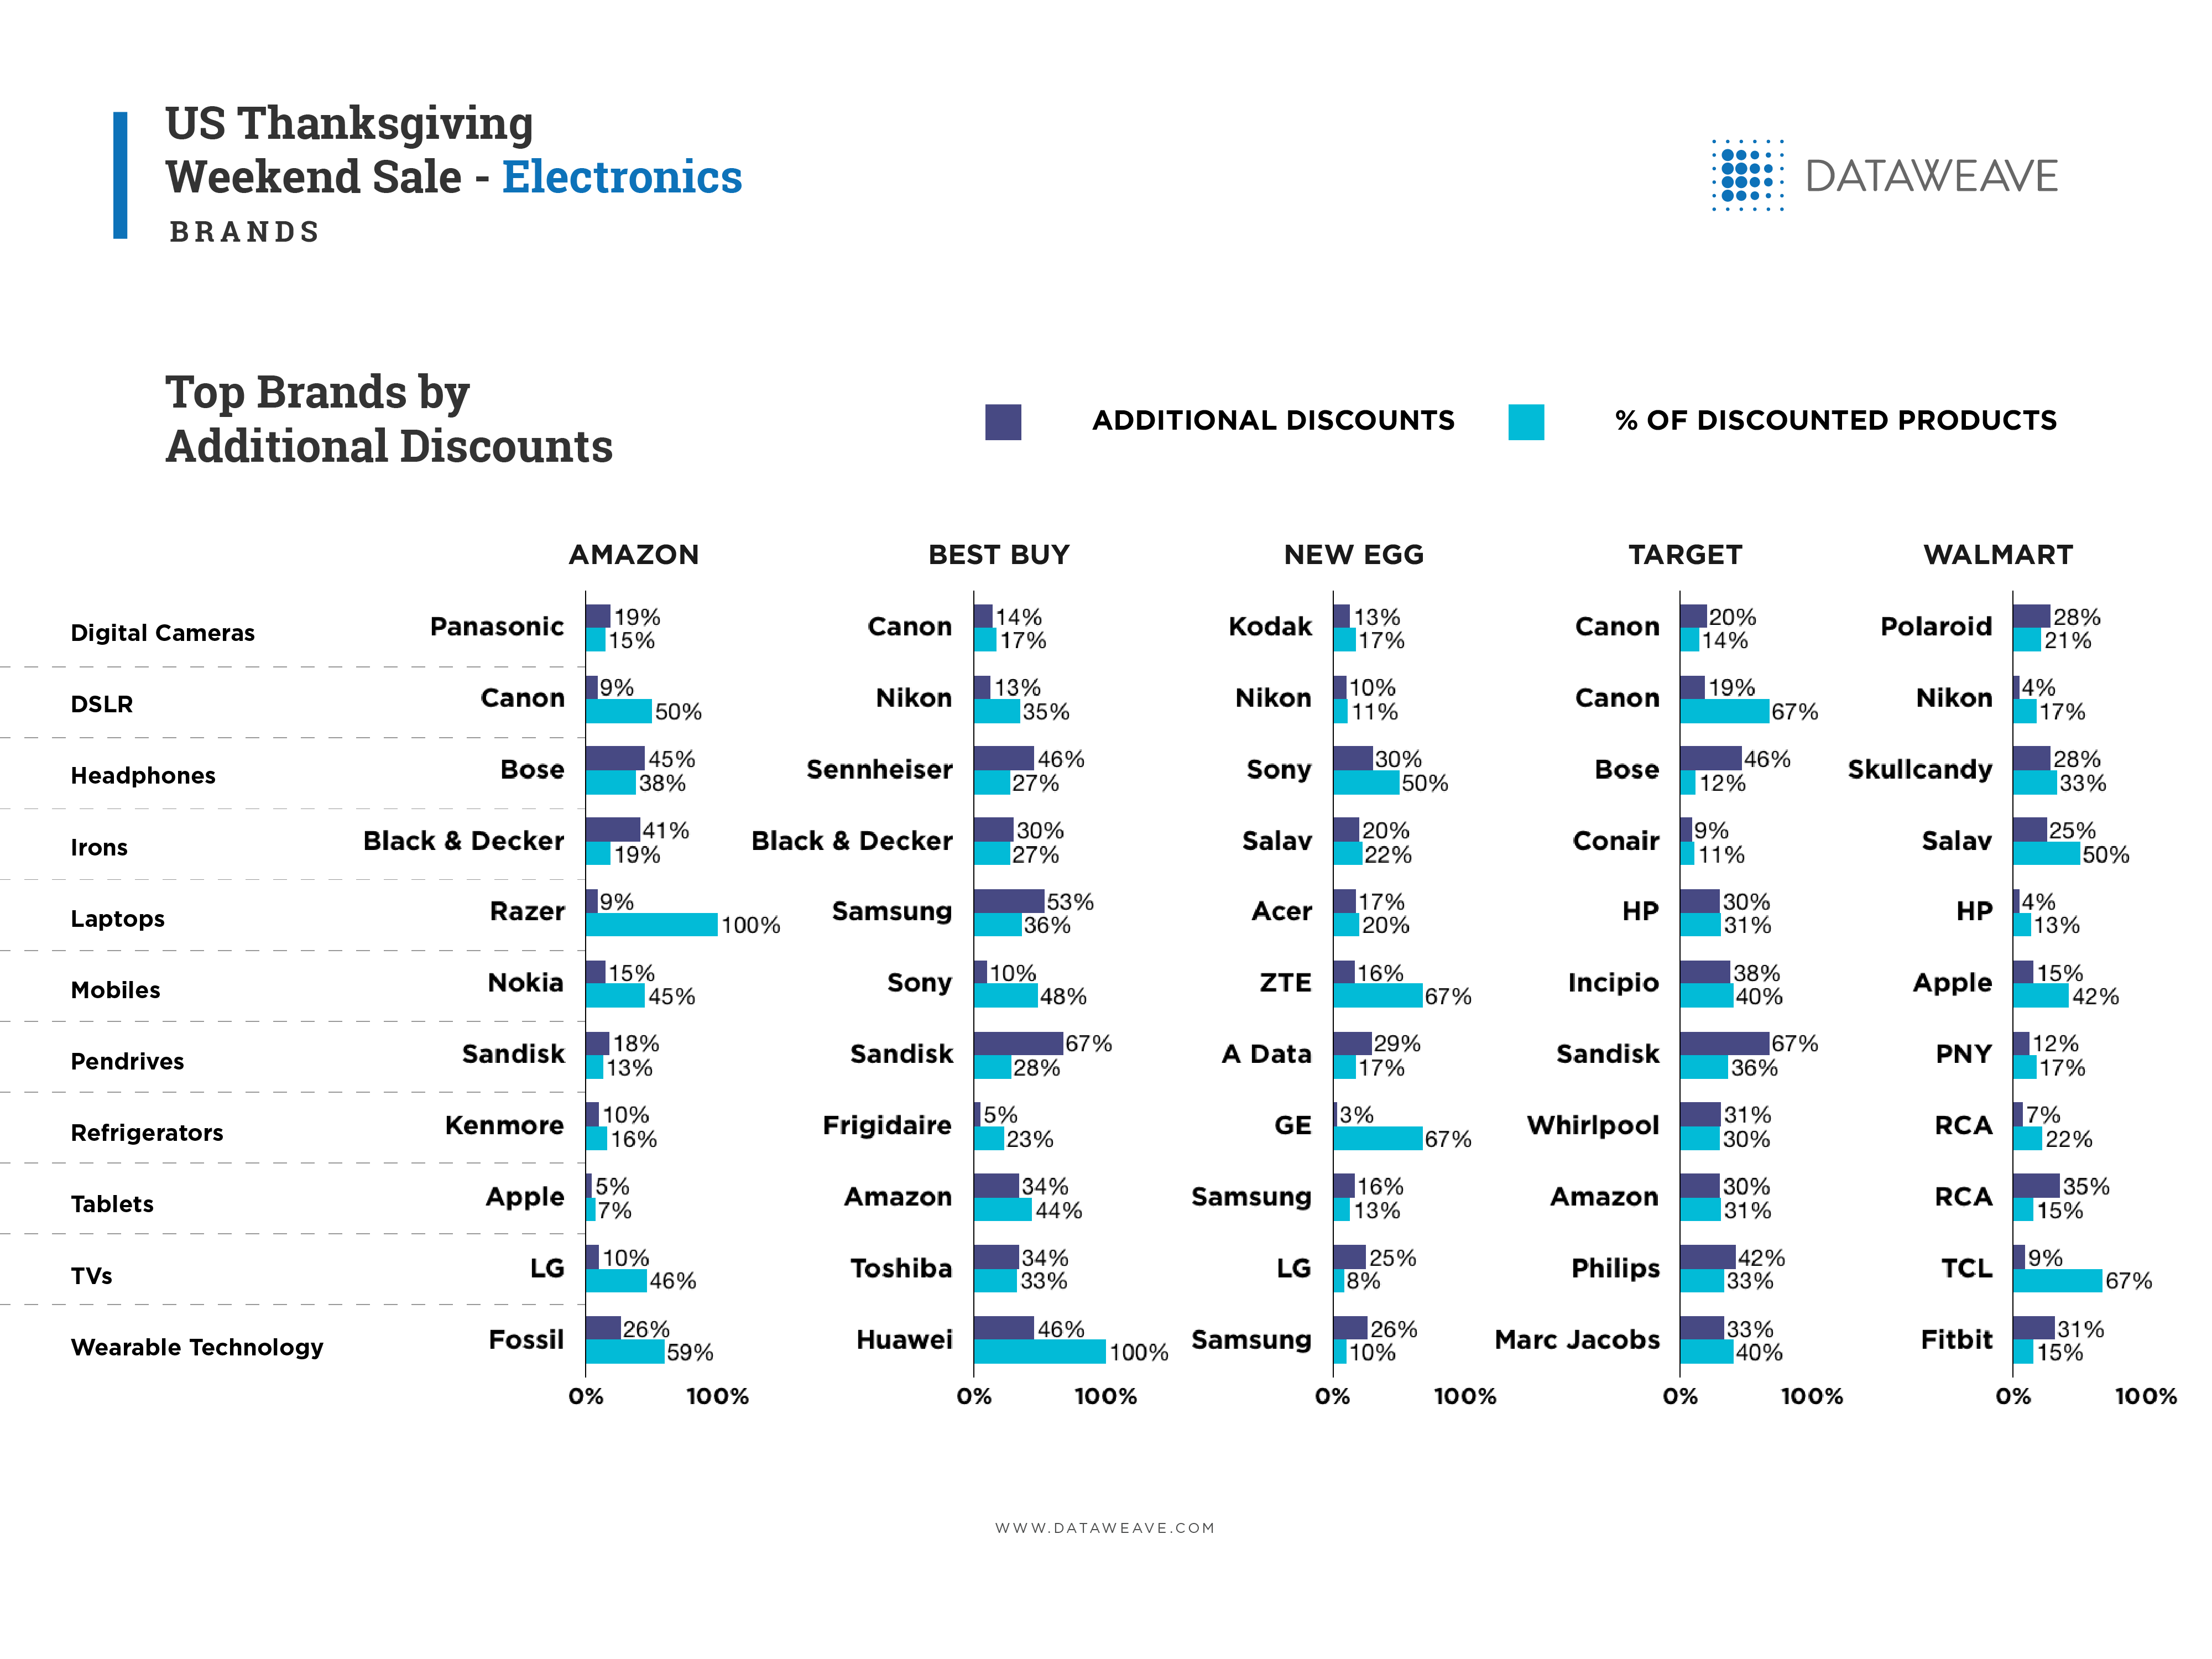
Among electronics products with price decreases on Black Friday, Best Buy offered the highest average discount (16.6%) and Amazon offered the lowest (10.2%). Among all the retailers, the types of electronics with the highest average discount included tablets, headphones, laptops and TVs.
Among electronics products with price increases on Black Friday, Best Buy had the highest average price hike (30.2%) and Amazon offered the lowest (9.8%). That said, Best Buy increased the price of one laptop by 73.1% whereas Amazon increased the price of 44 laptops by an average of 4.2%.
These findings show that Best Buy aggressively protected its market share in this competitive category by offering the most generous discounts.
Black Friday vs. Cyber Monday
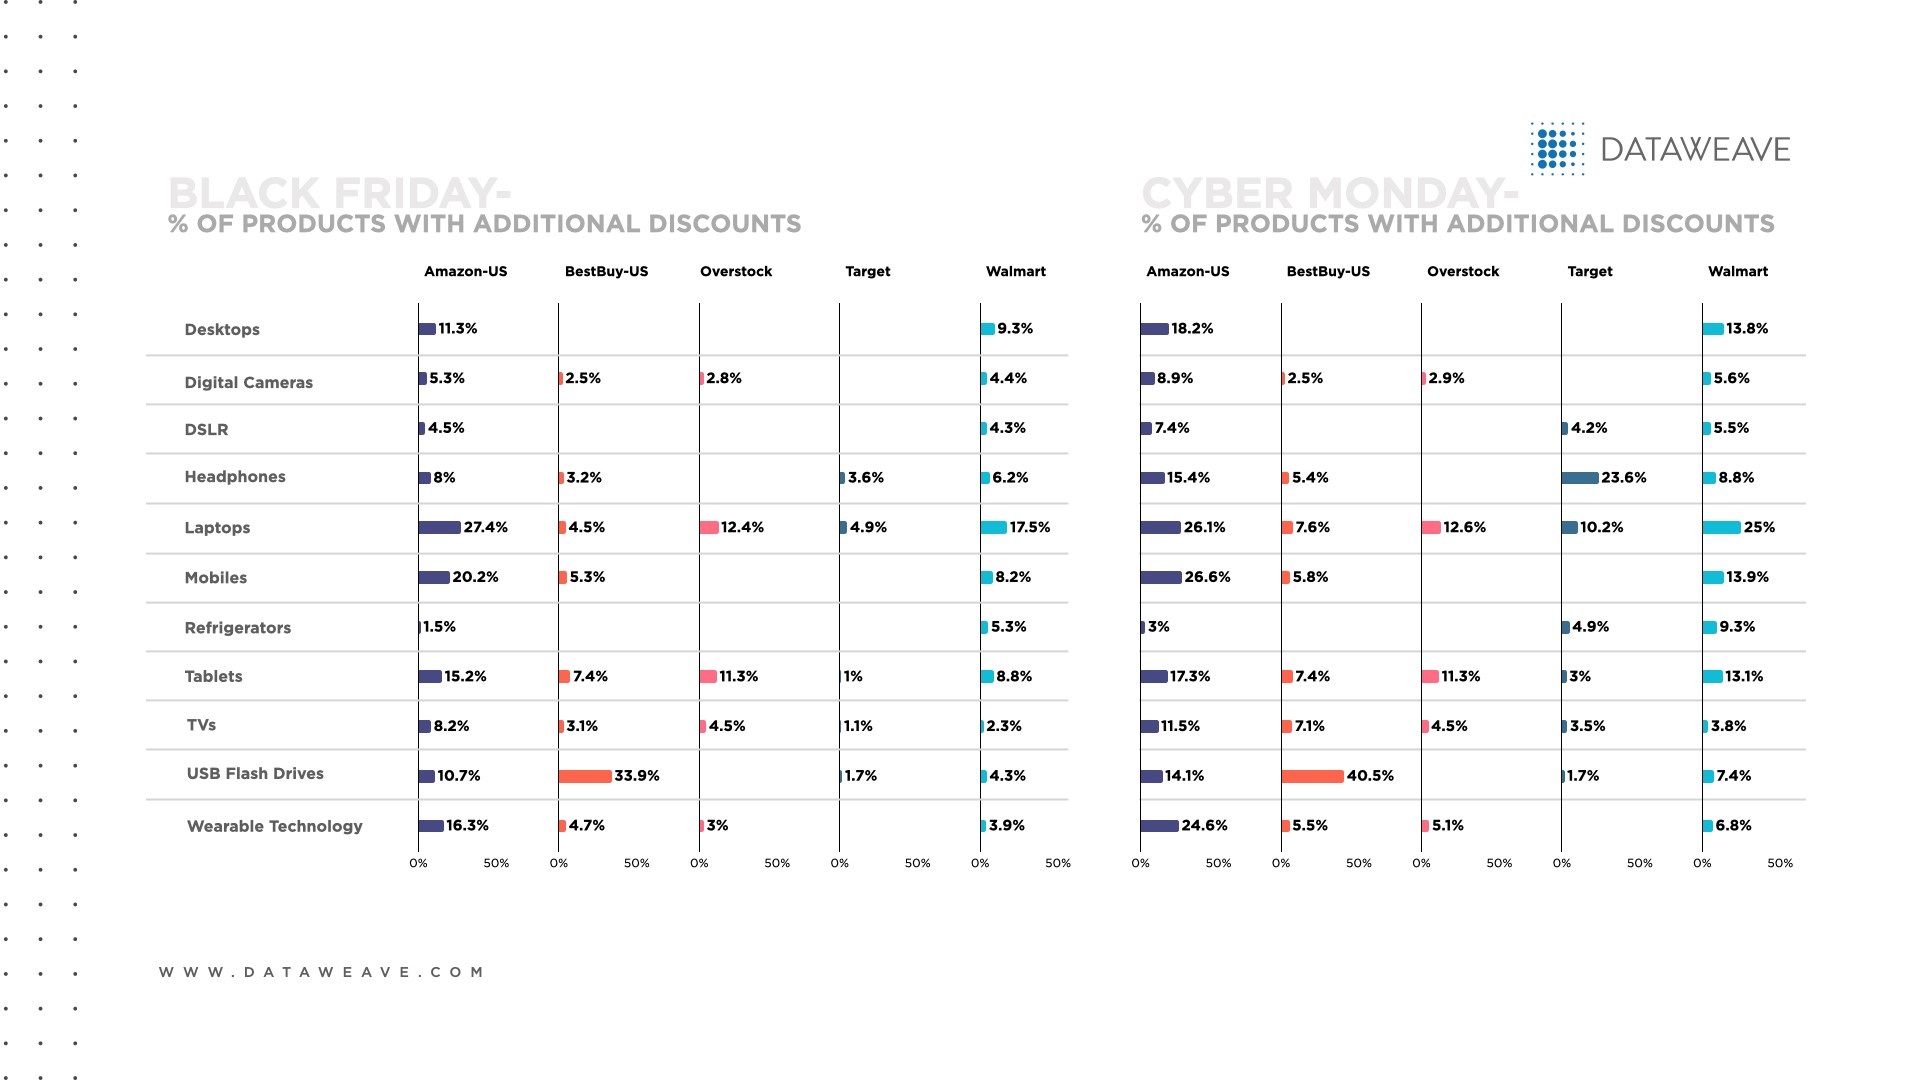
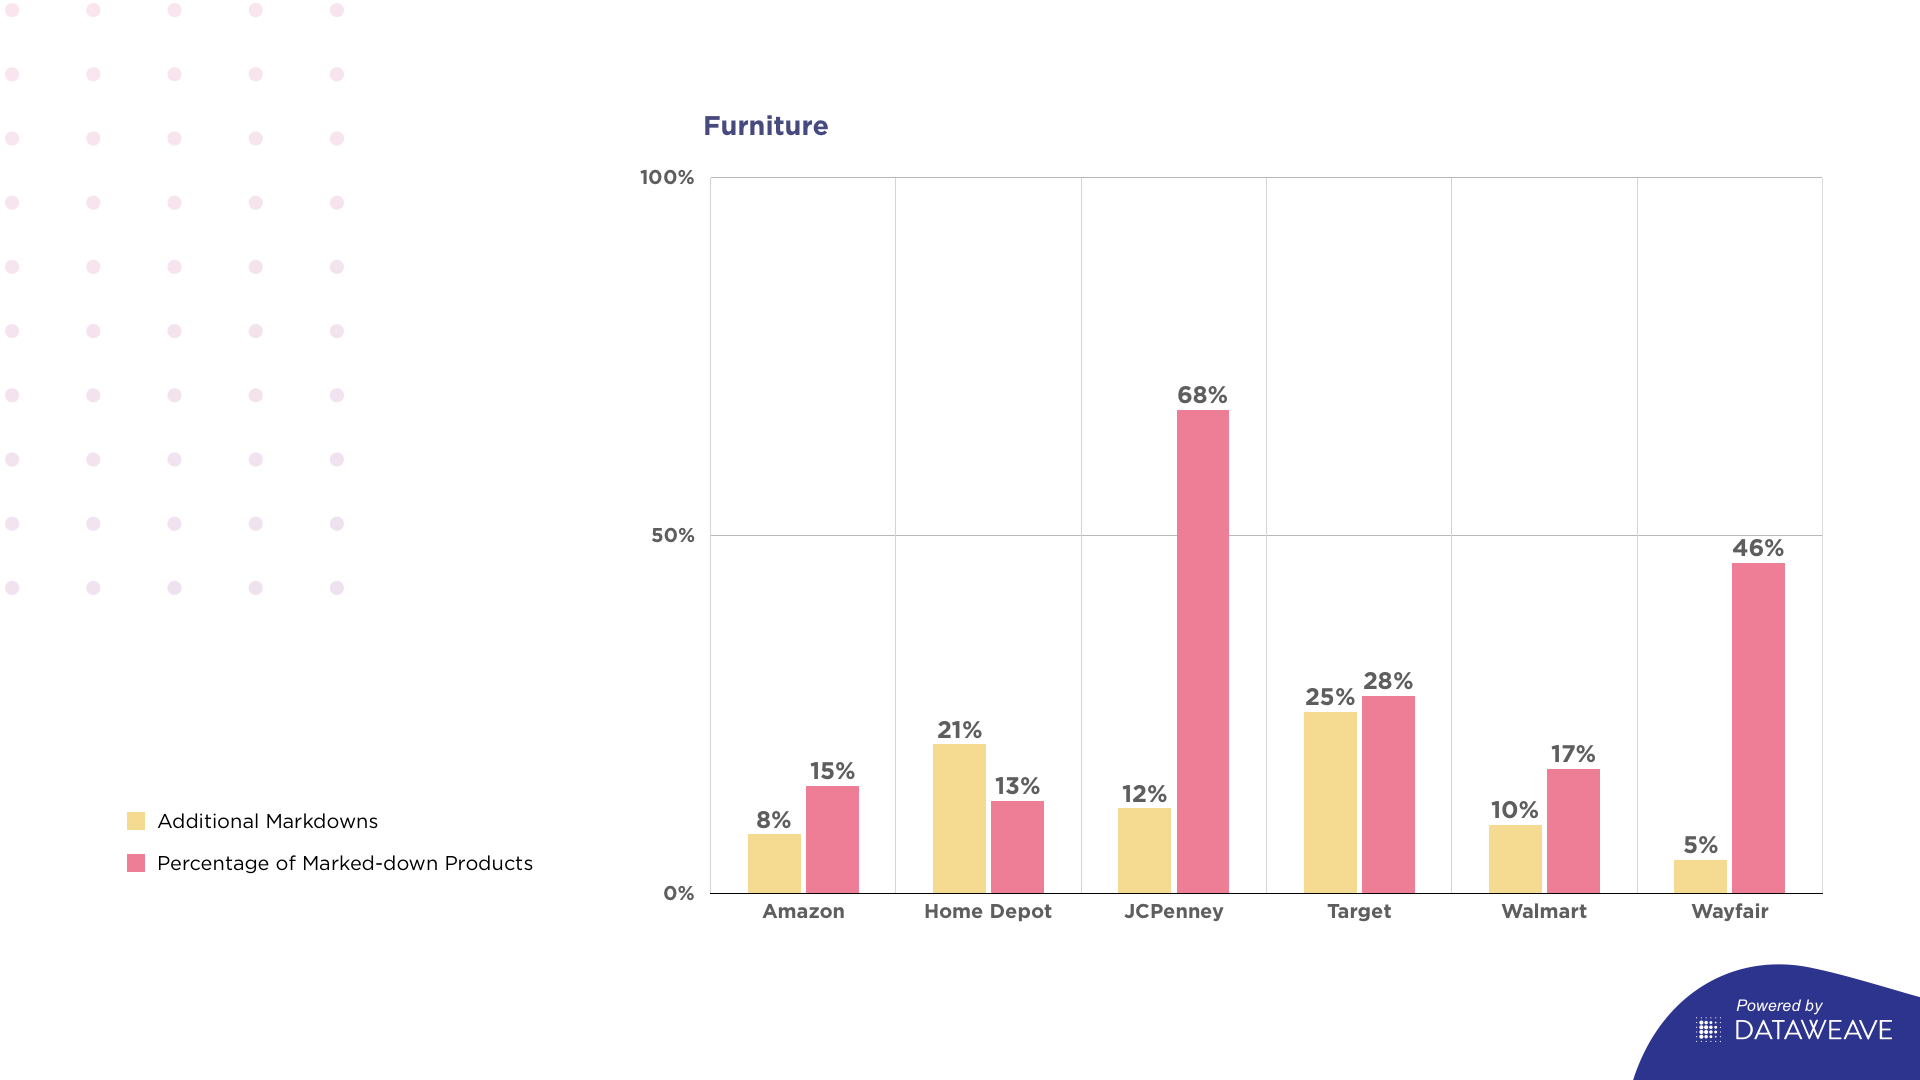
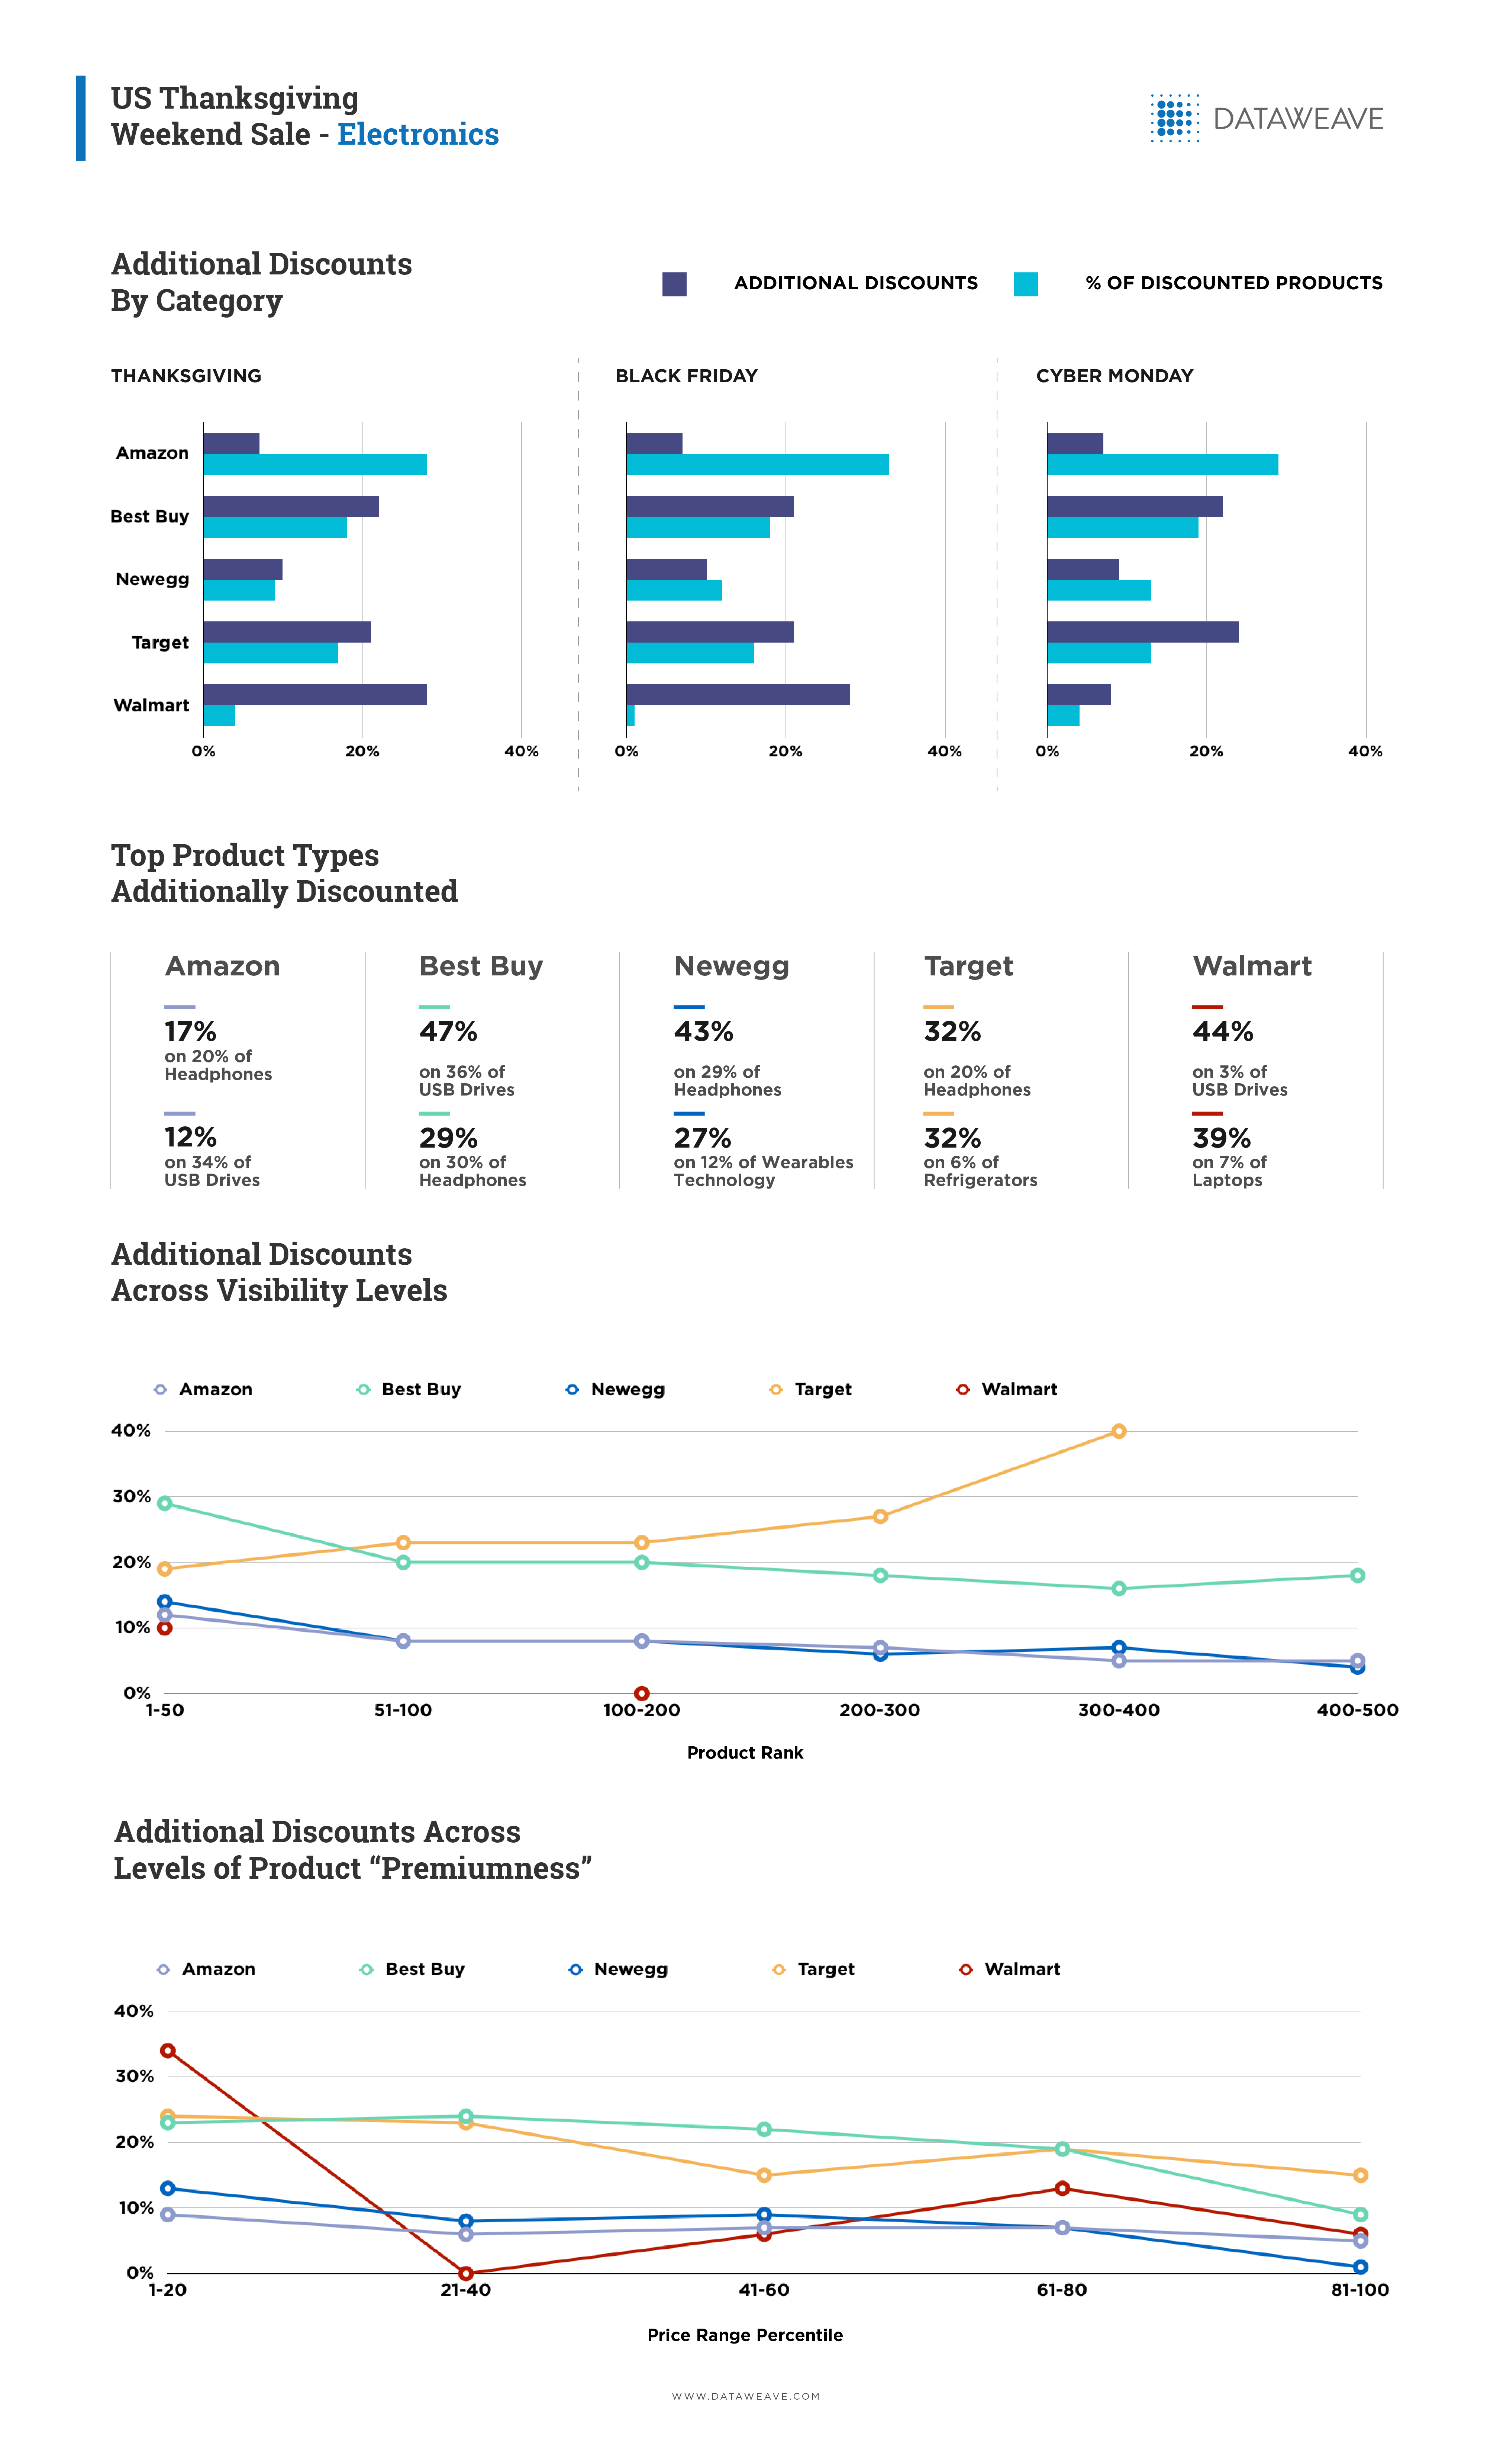
Without exception, the retailers offered more additional discounts across the electronics category on Cyber Monday than on Black Friday. Retailers may have wanted to clear out their inventory to make room for new, innovative products in their assortments.
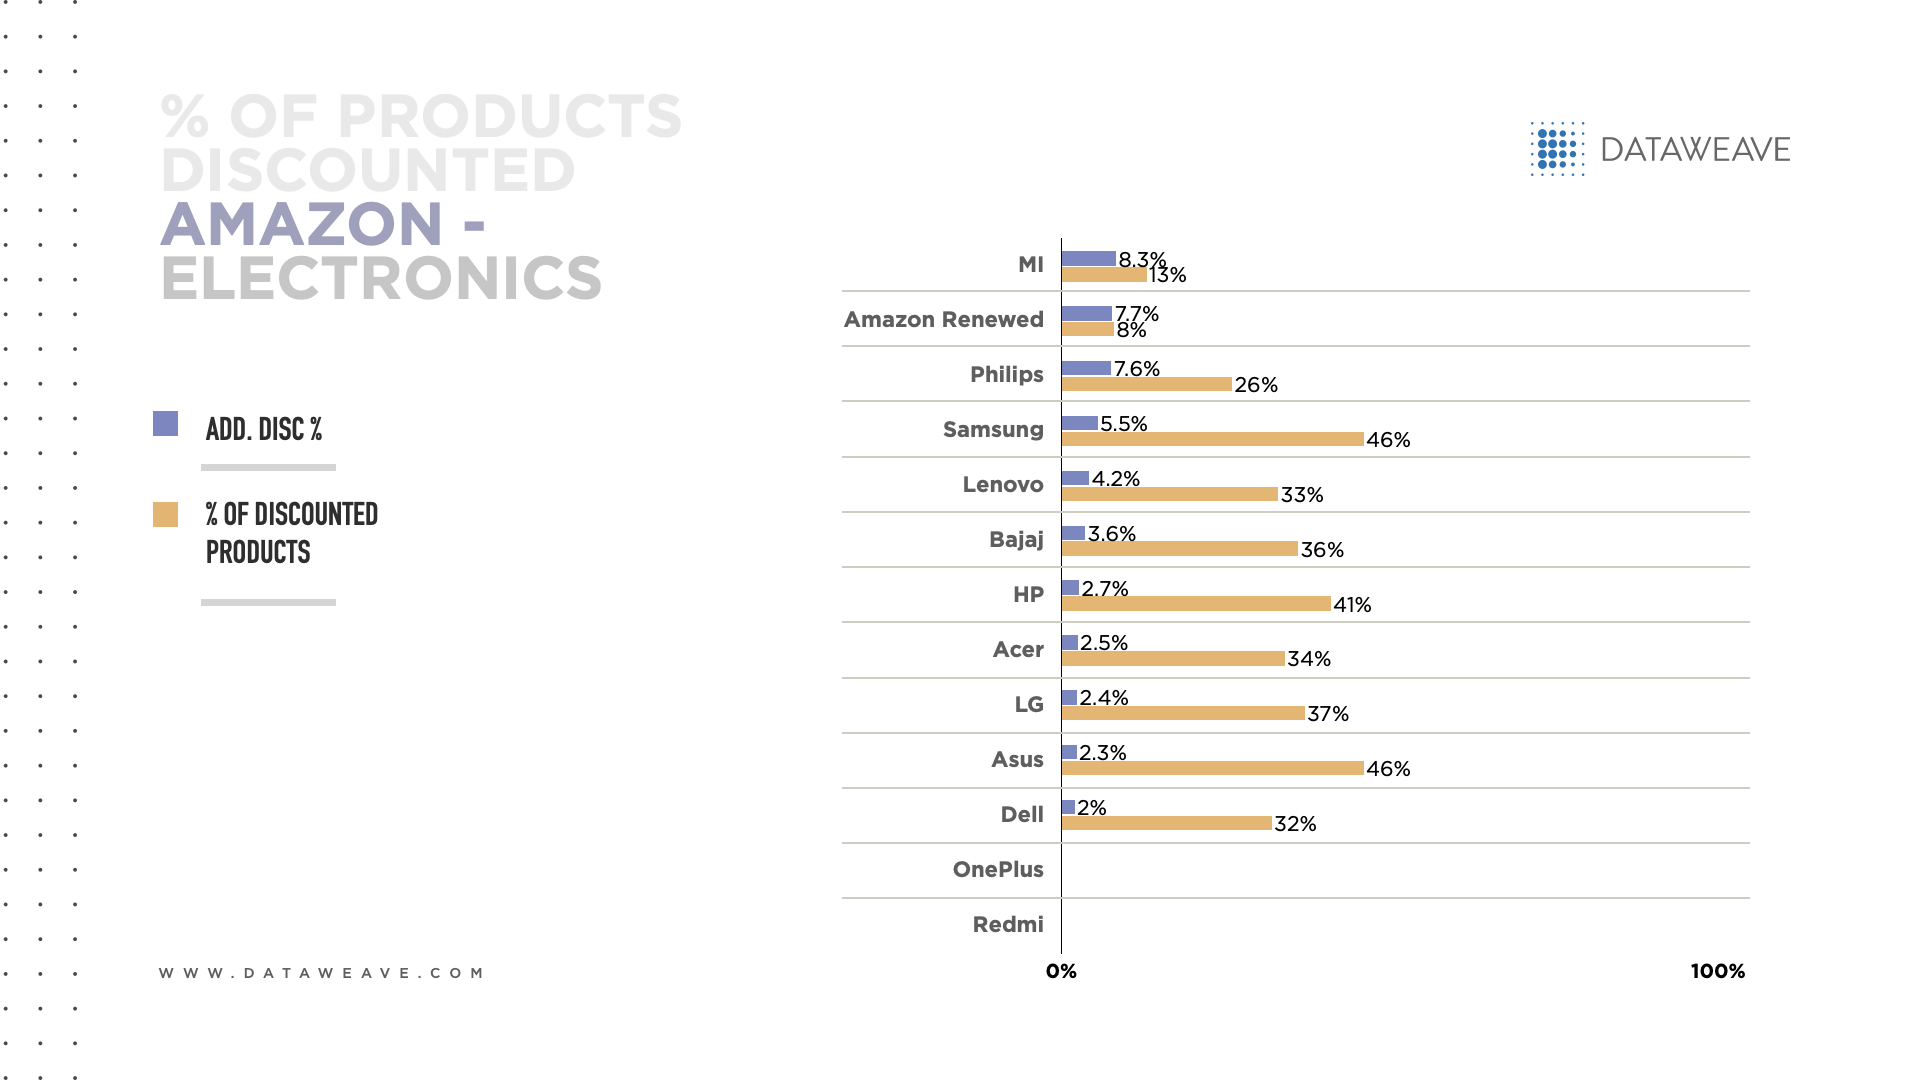
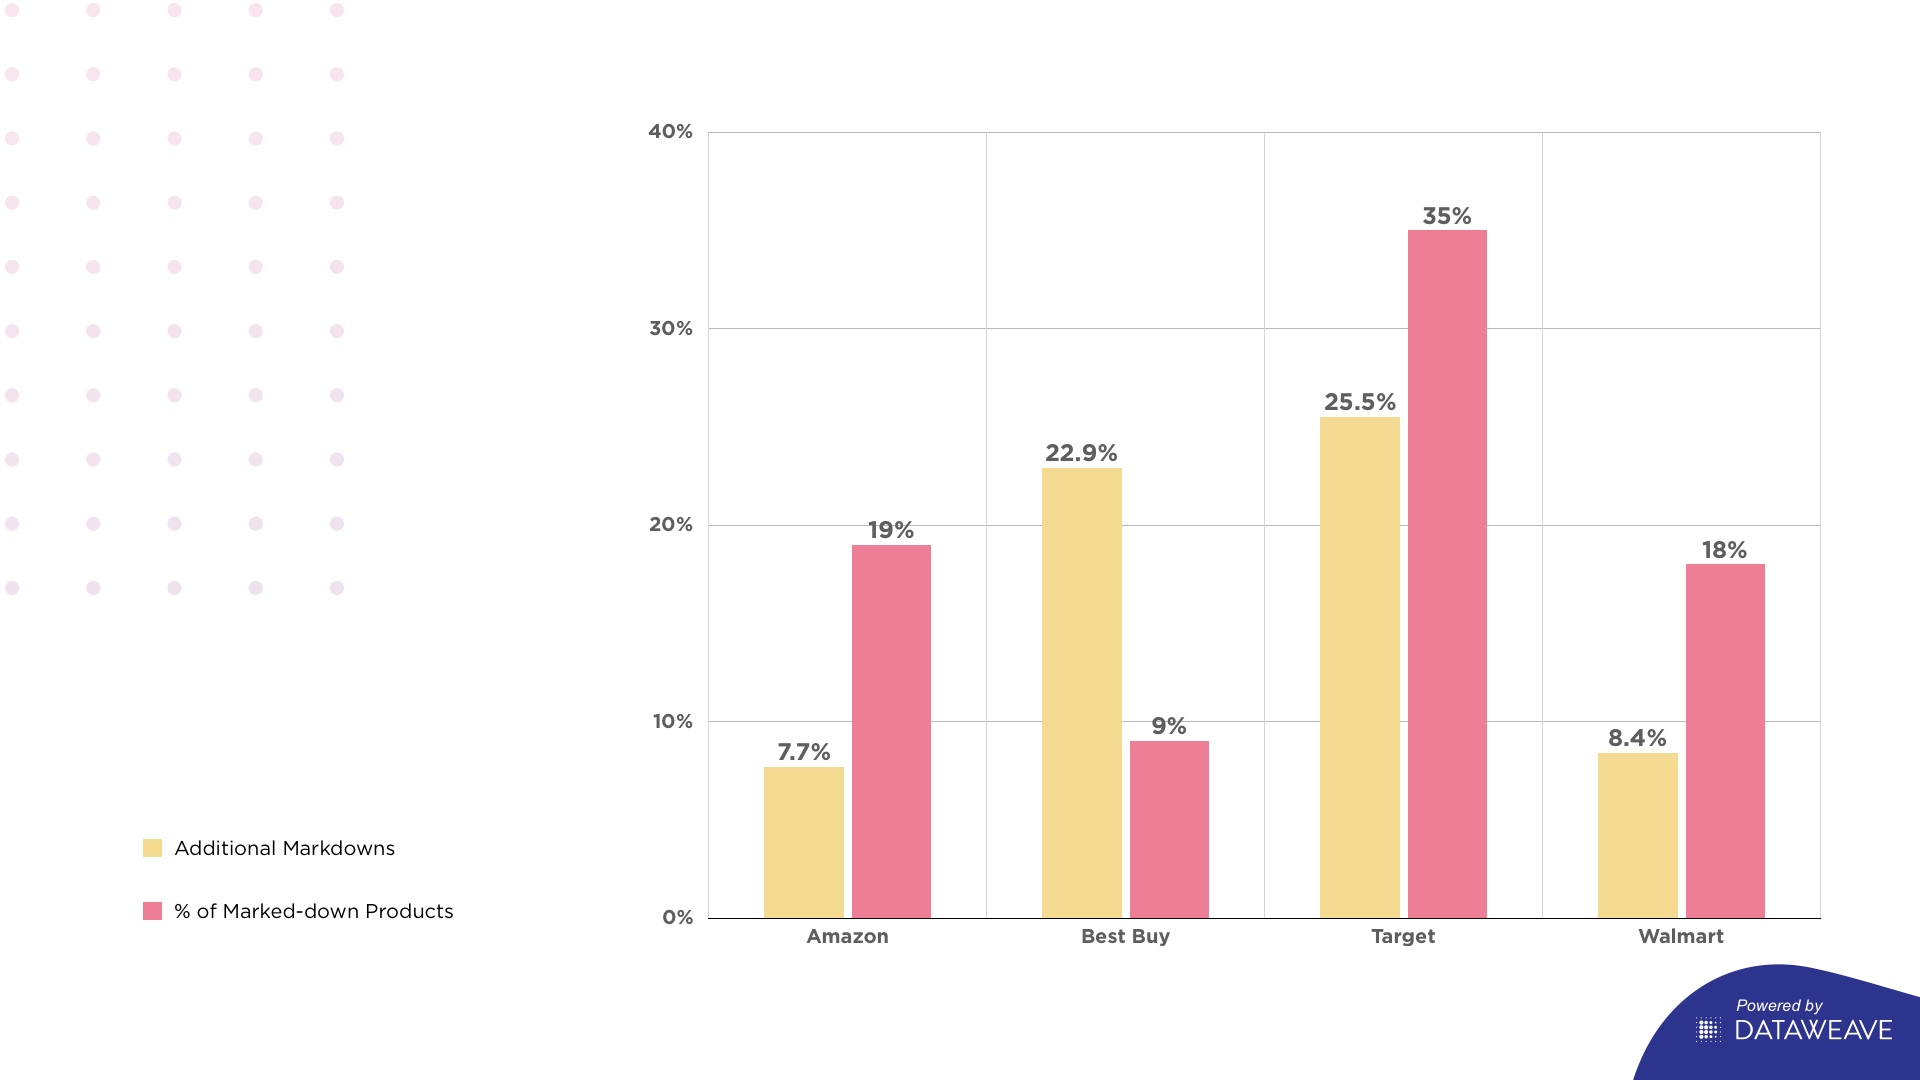
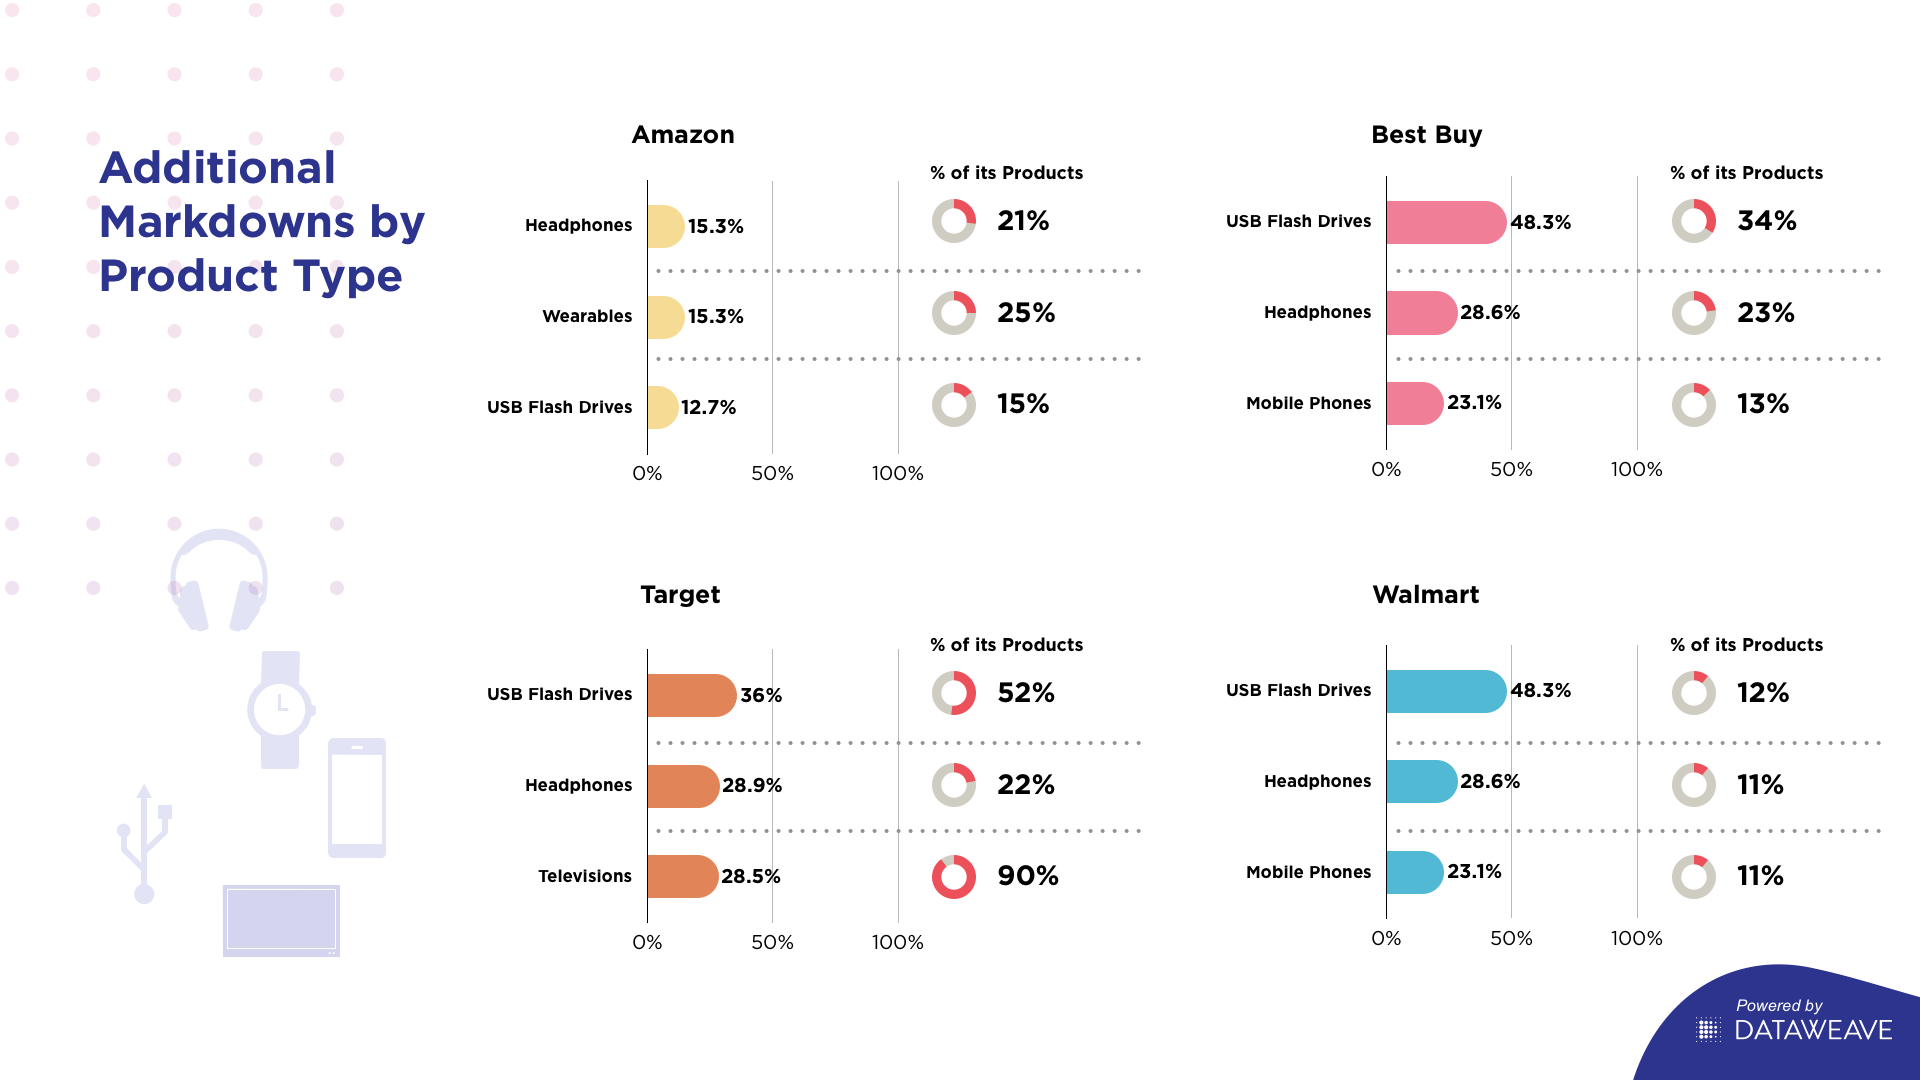
Amazon had the greatest proportion of electronics with additional discounts on Cyber Monday (15.7%, which is more than double the 7.3% each for Overstock and Target). Amazon’s additional discounts focused on mobiles, laptops and wearable technology.
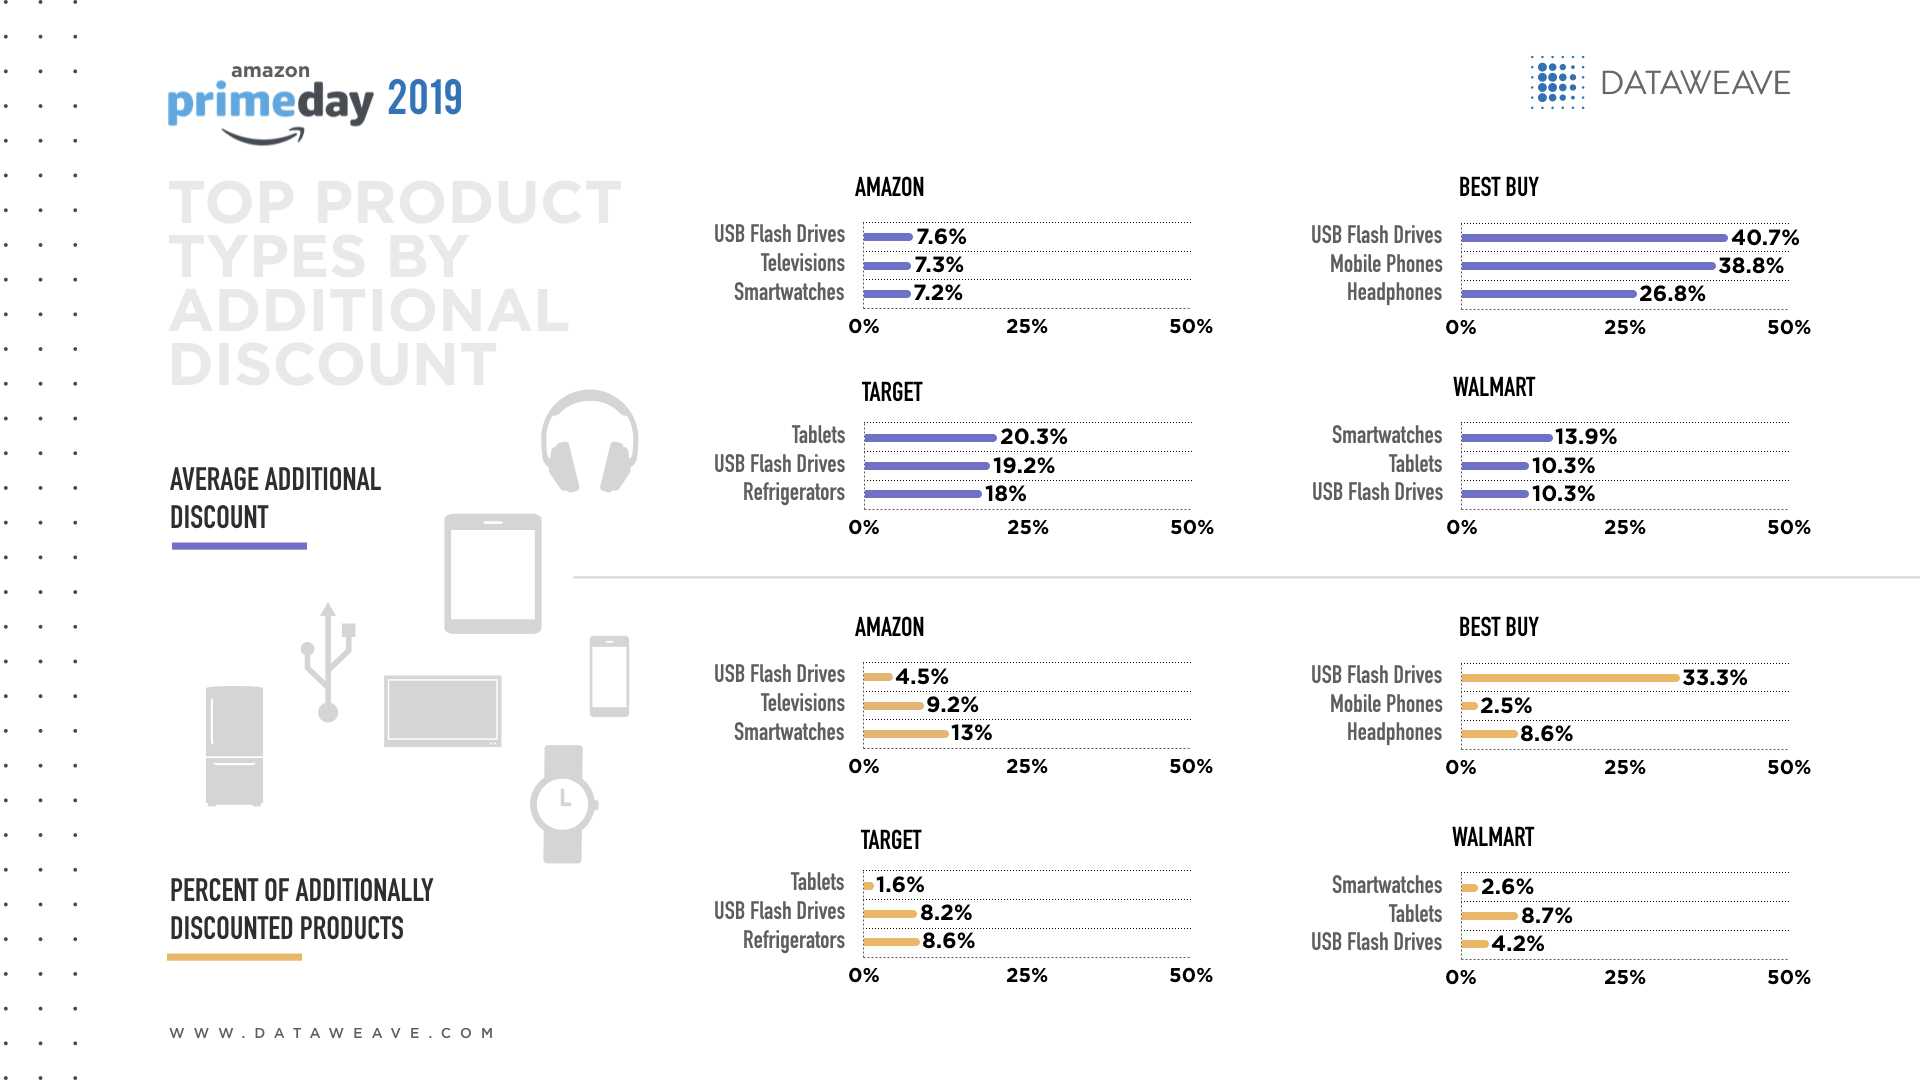
Overall, the greatest proportion of additional discounts on electronics on Cyber Monday focused on laptops, desktops and USB flash drives.
While most retailers offered deeper discounts on electronics on Cyber Monday than Black Friday, Overstock was the sole exception.
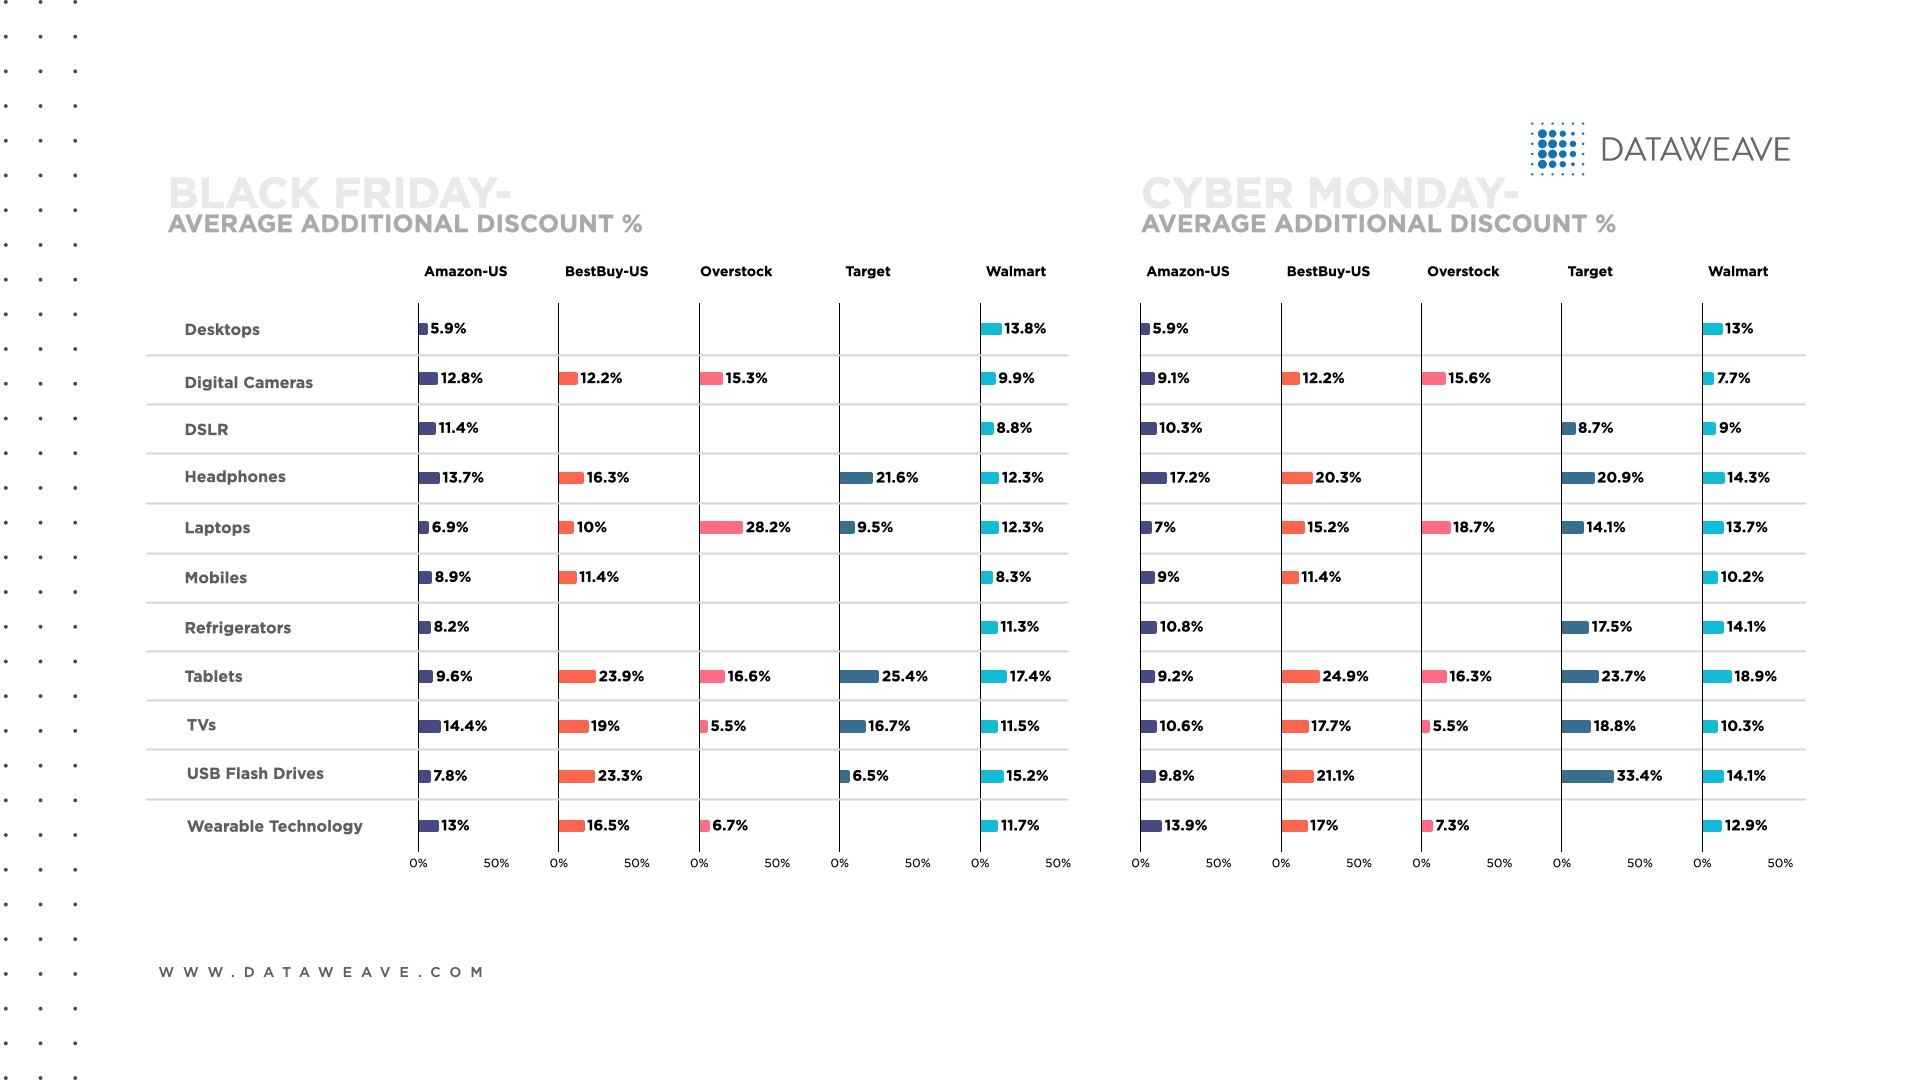
On Cyber Monday, Target offered the most generous average additional discounts (19.6% vs. 10.2% for Amazon); however, Target’s discounts applied to 260 electronics products compared to 924 for Amazon.
Overall, the types of electronics with the deepest discounts on Cyber Monday on electronics were USB flash drives, tablets and headphones.
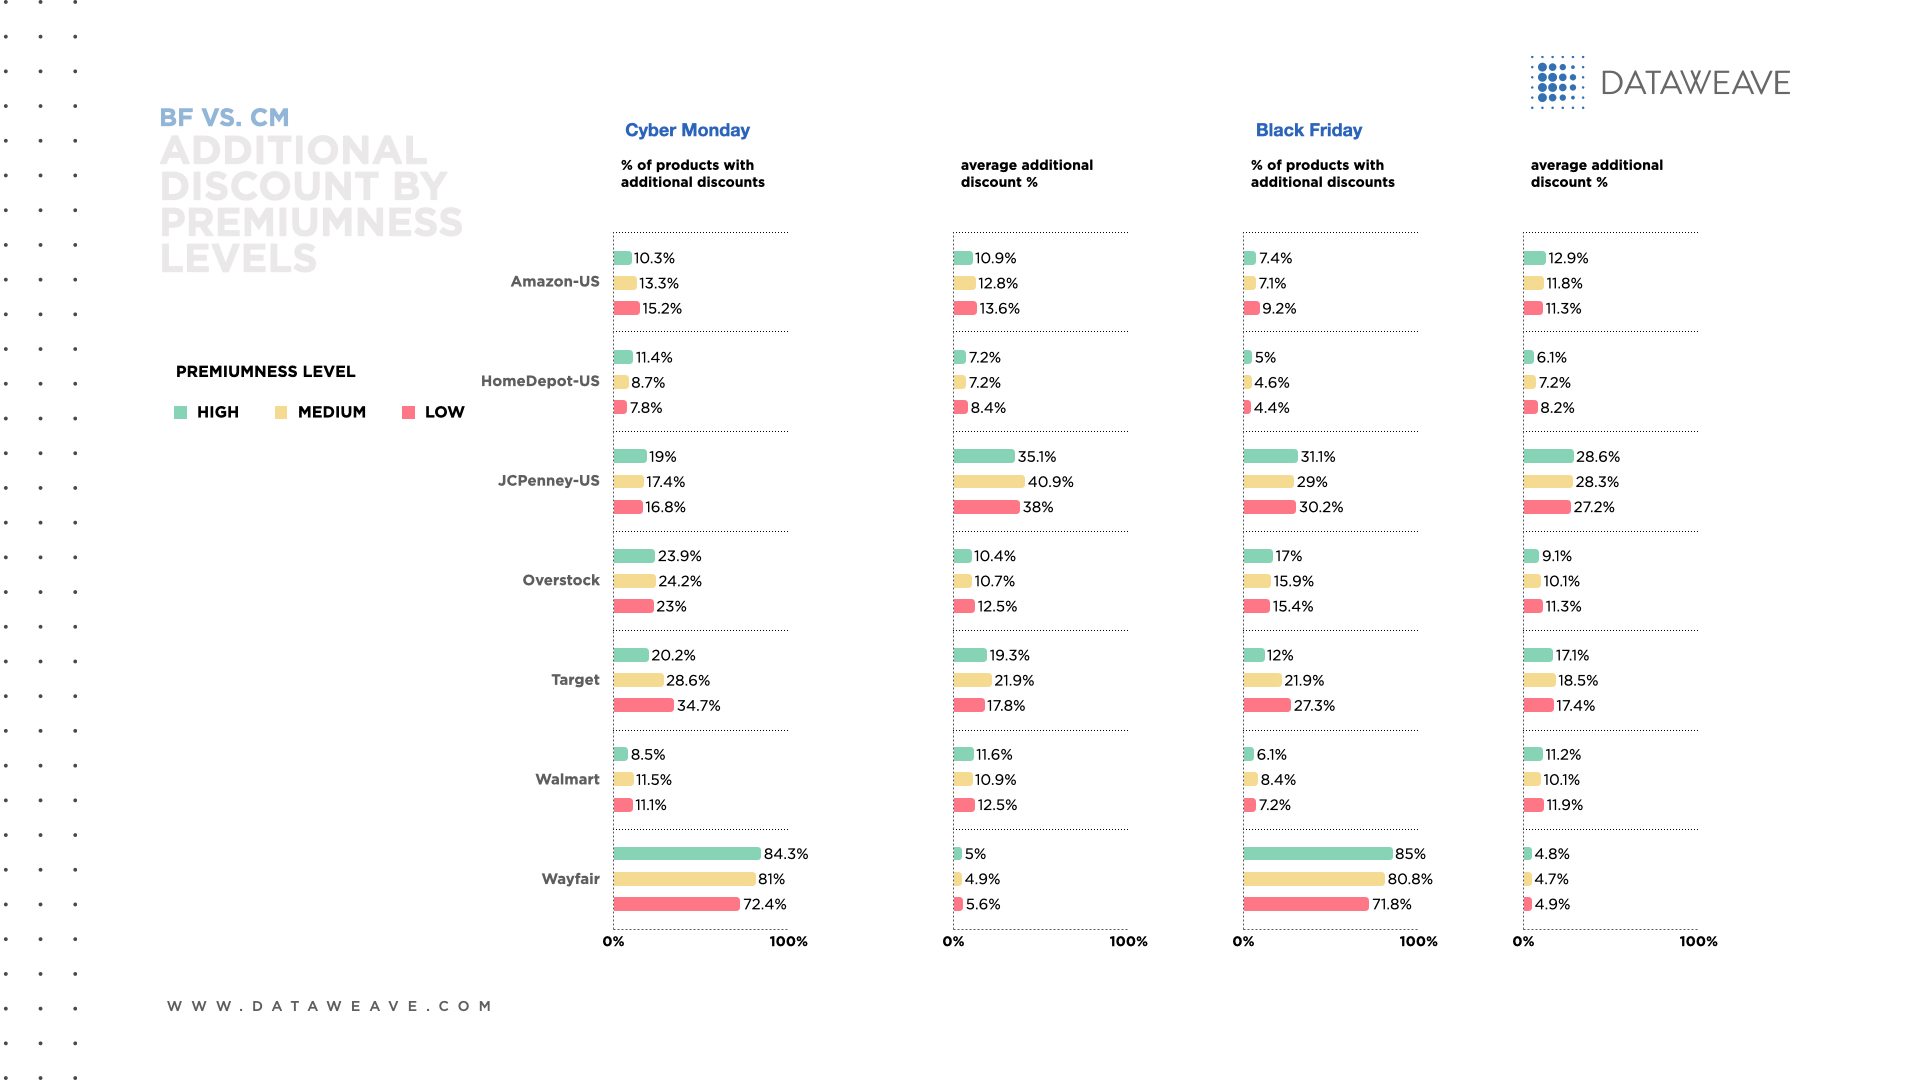
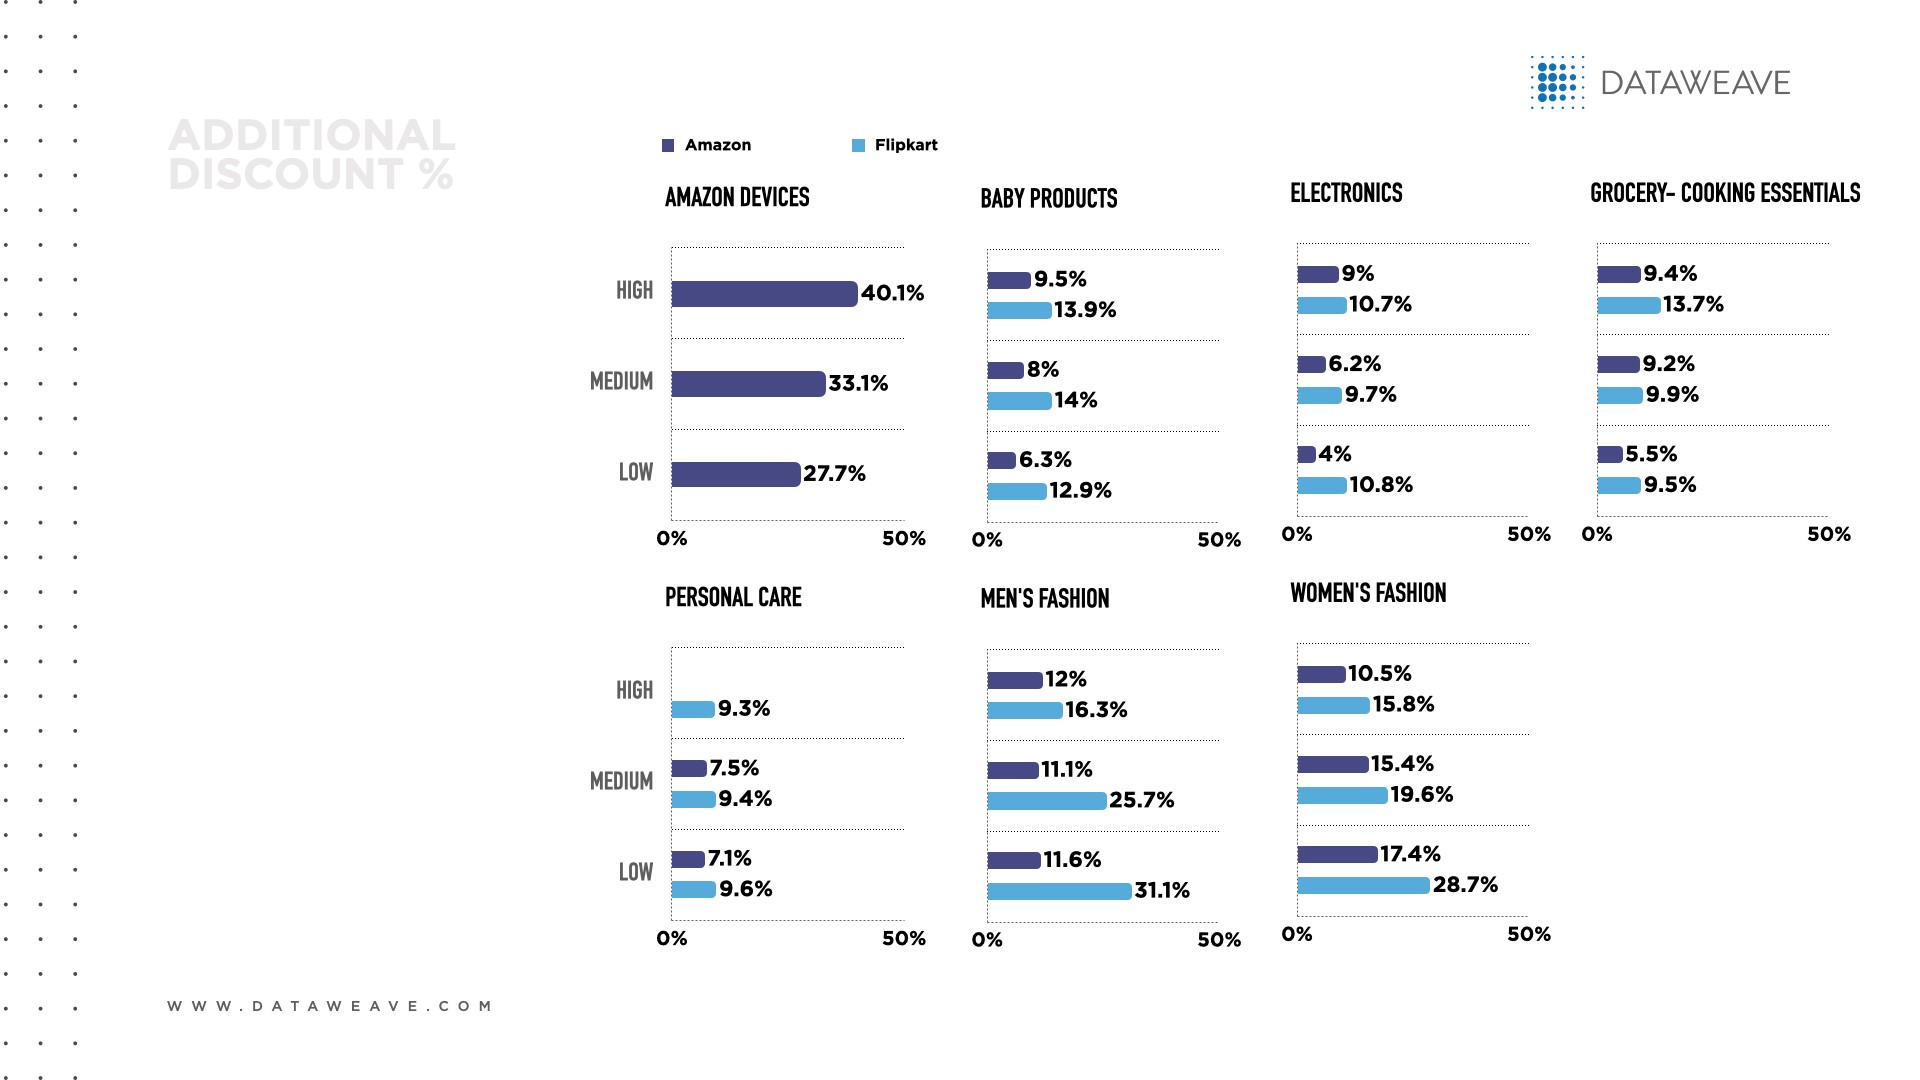
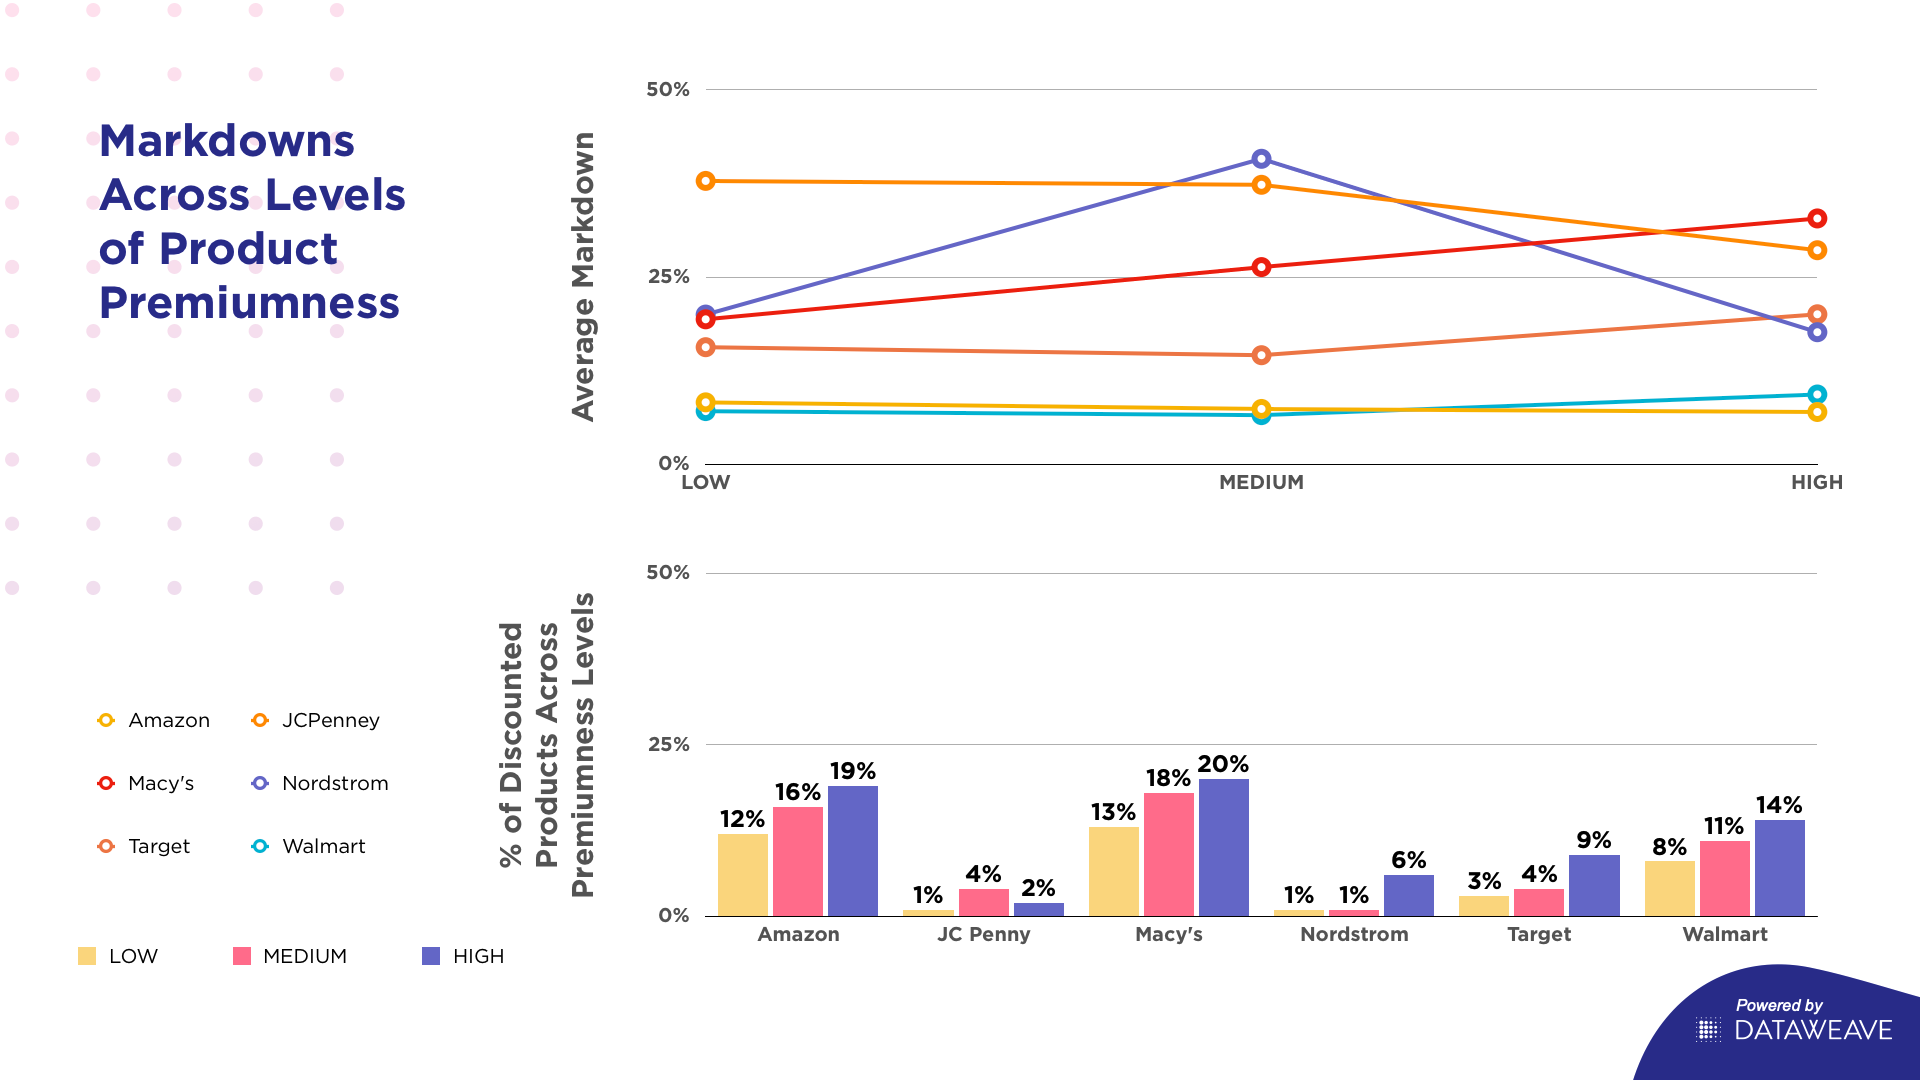
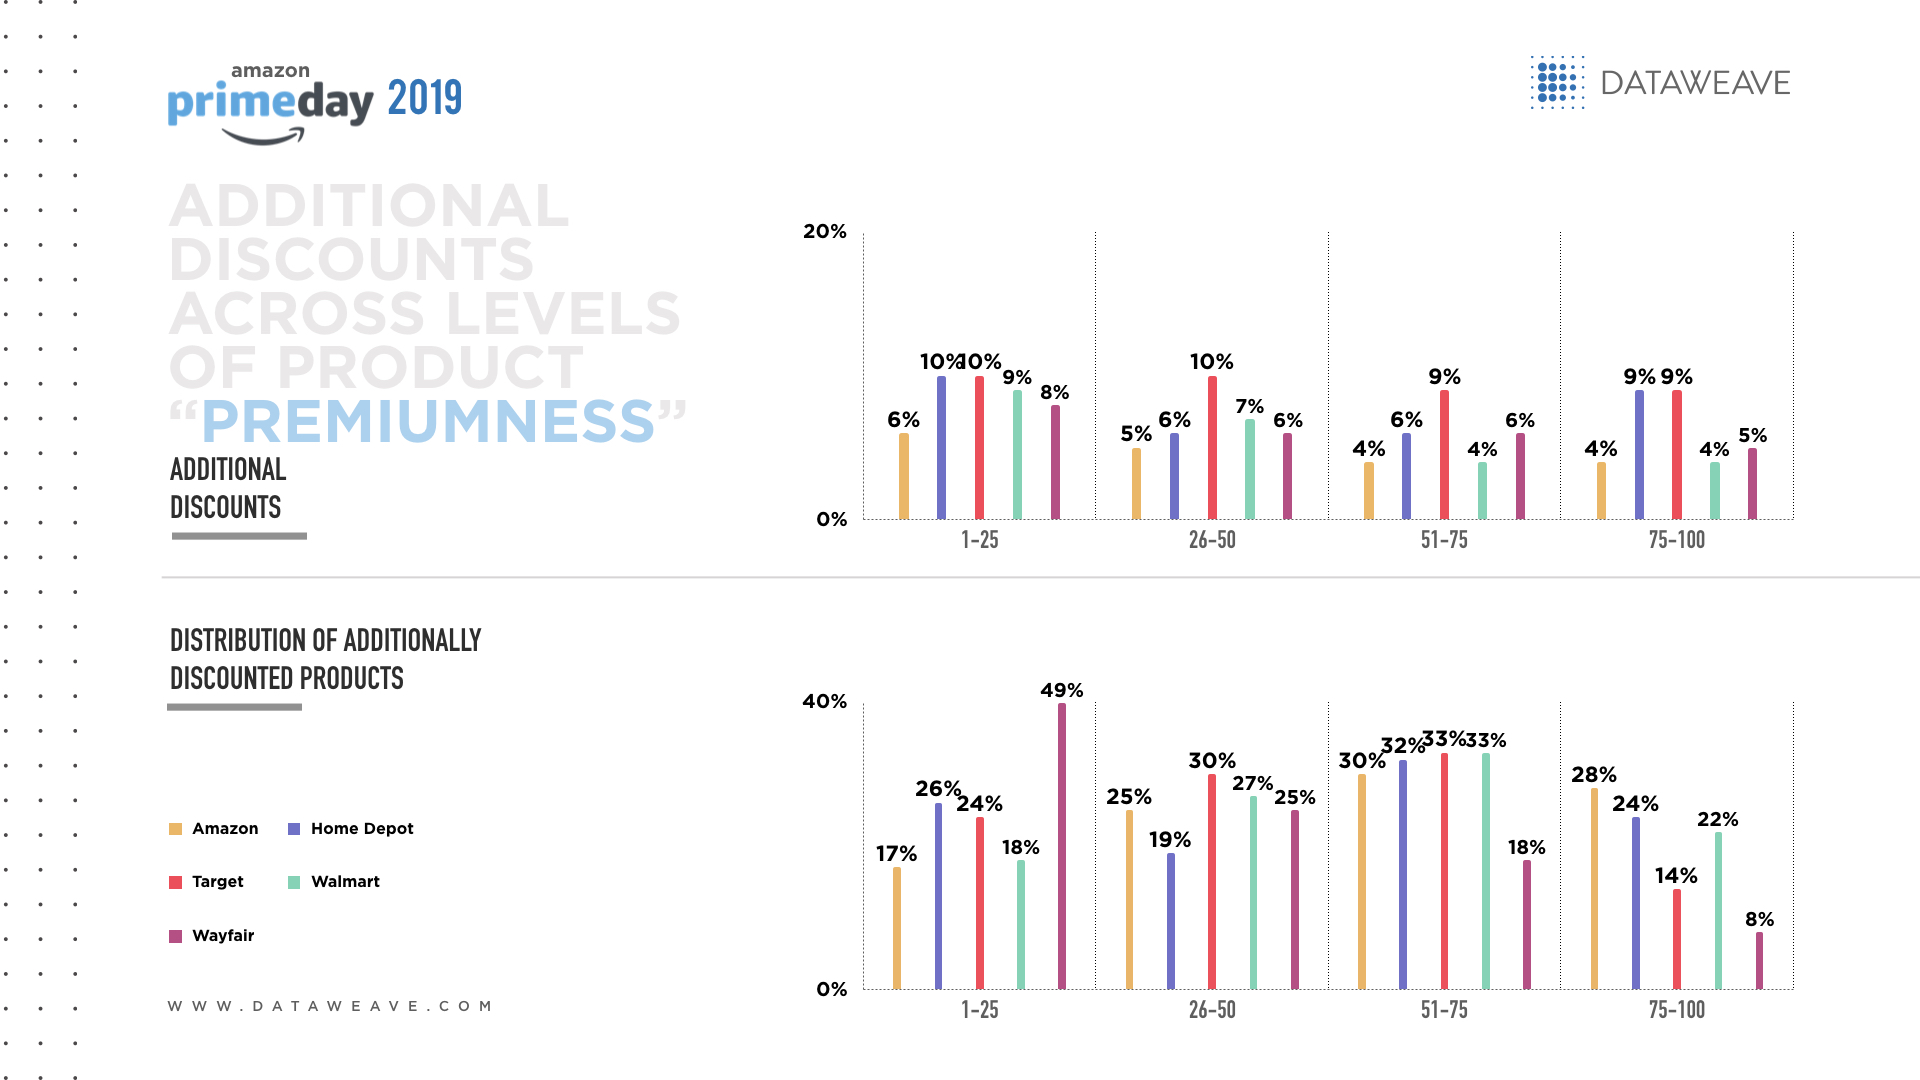
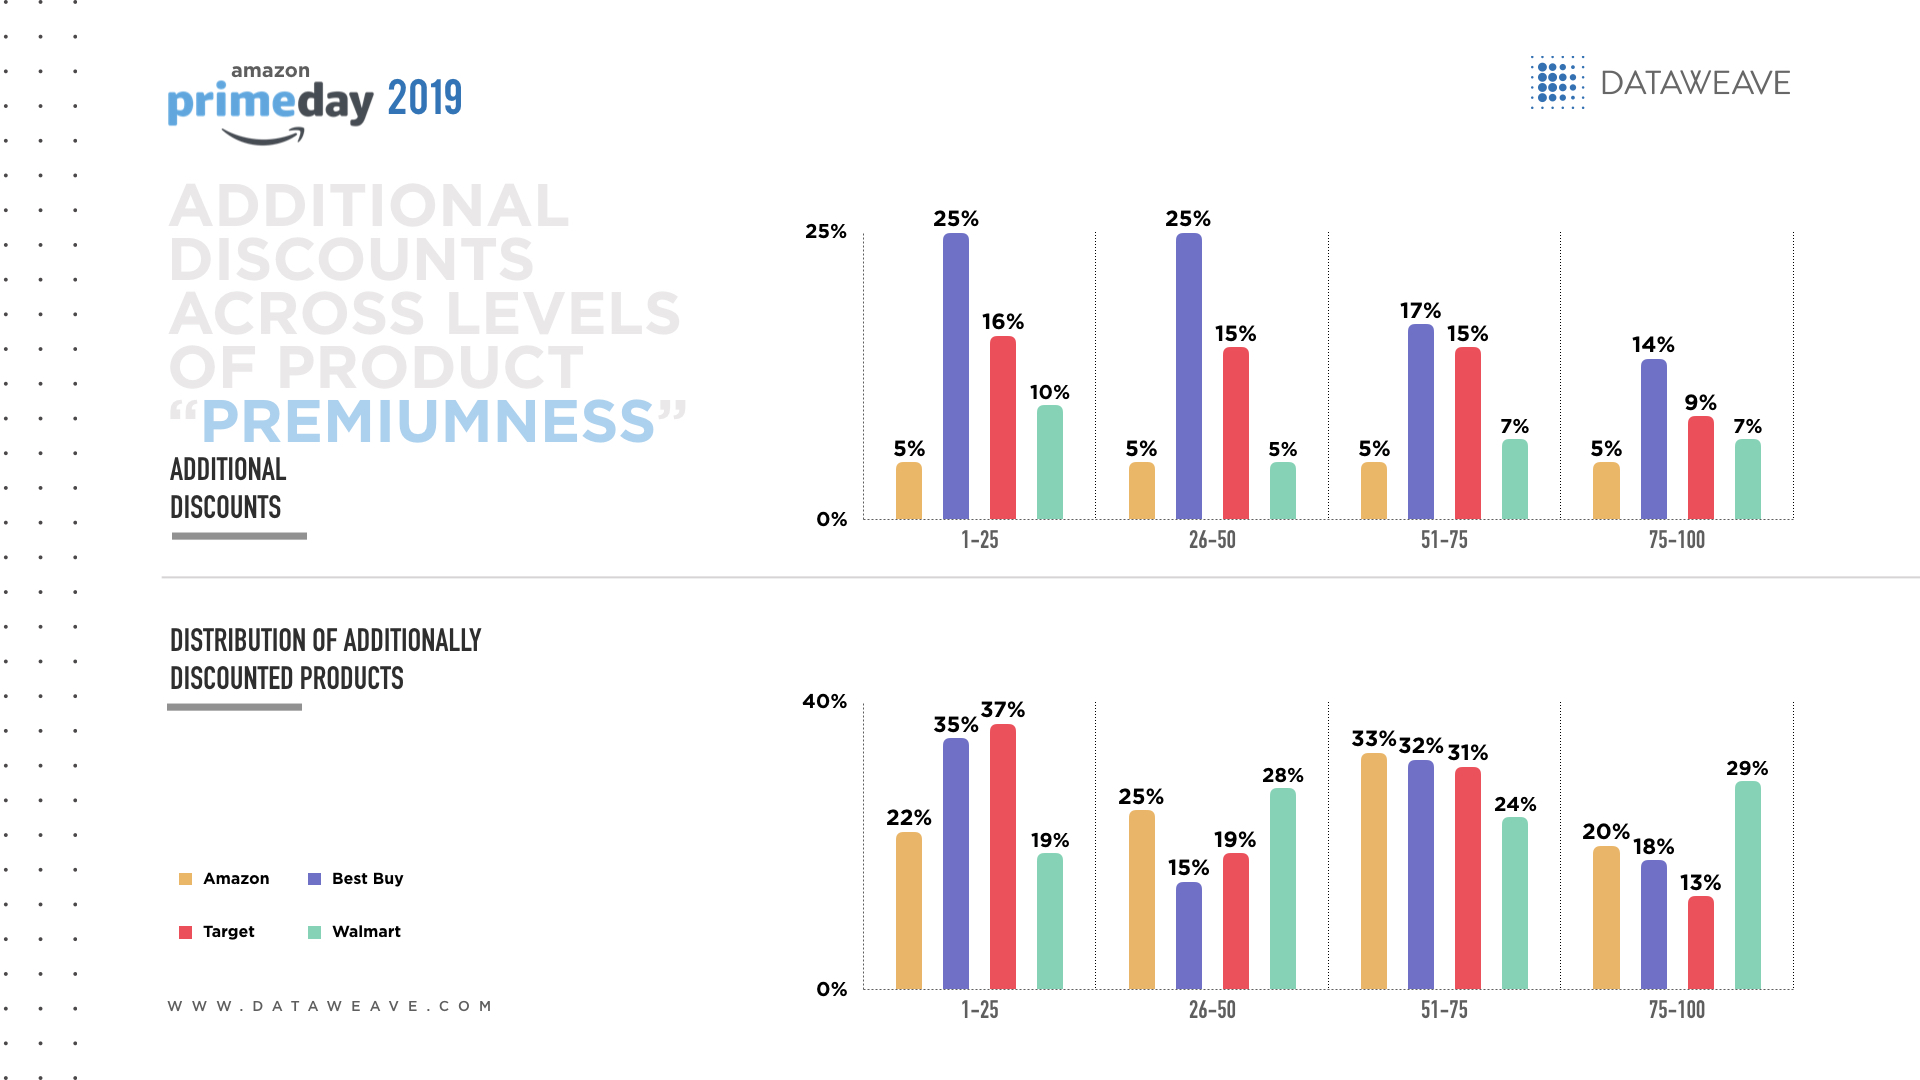
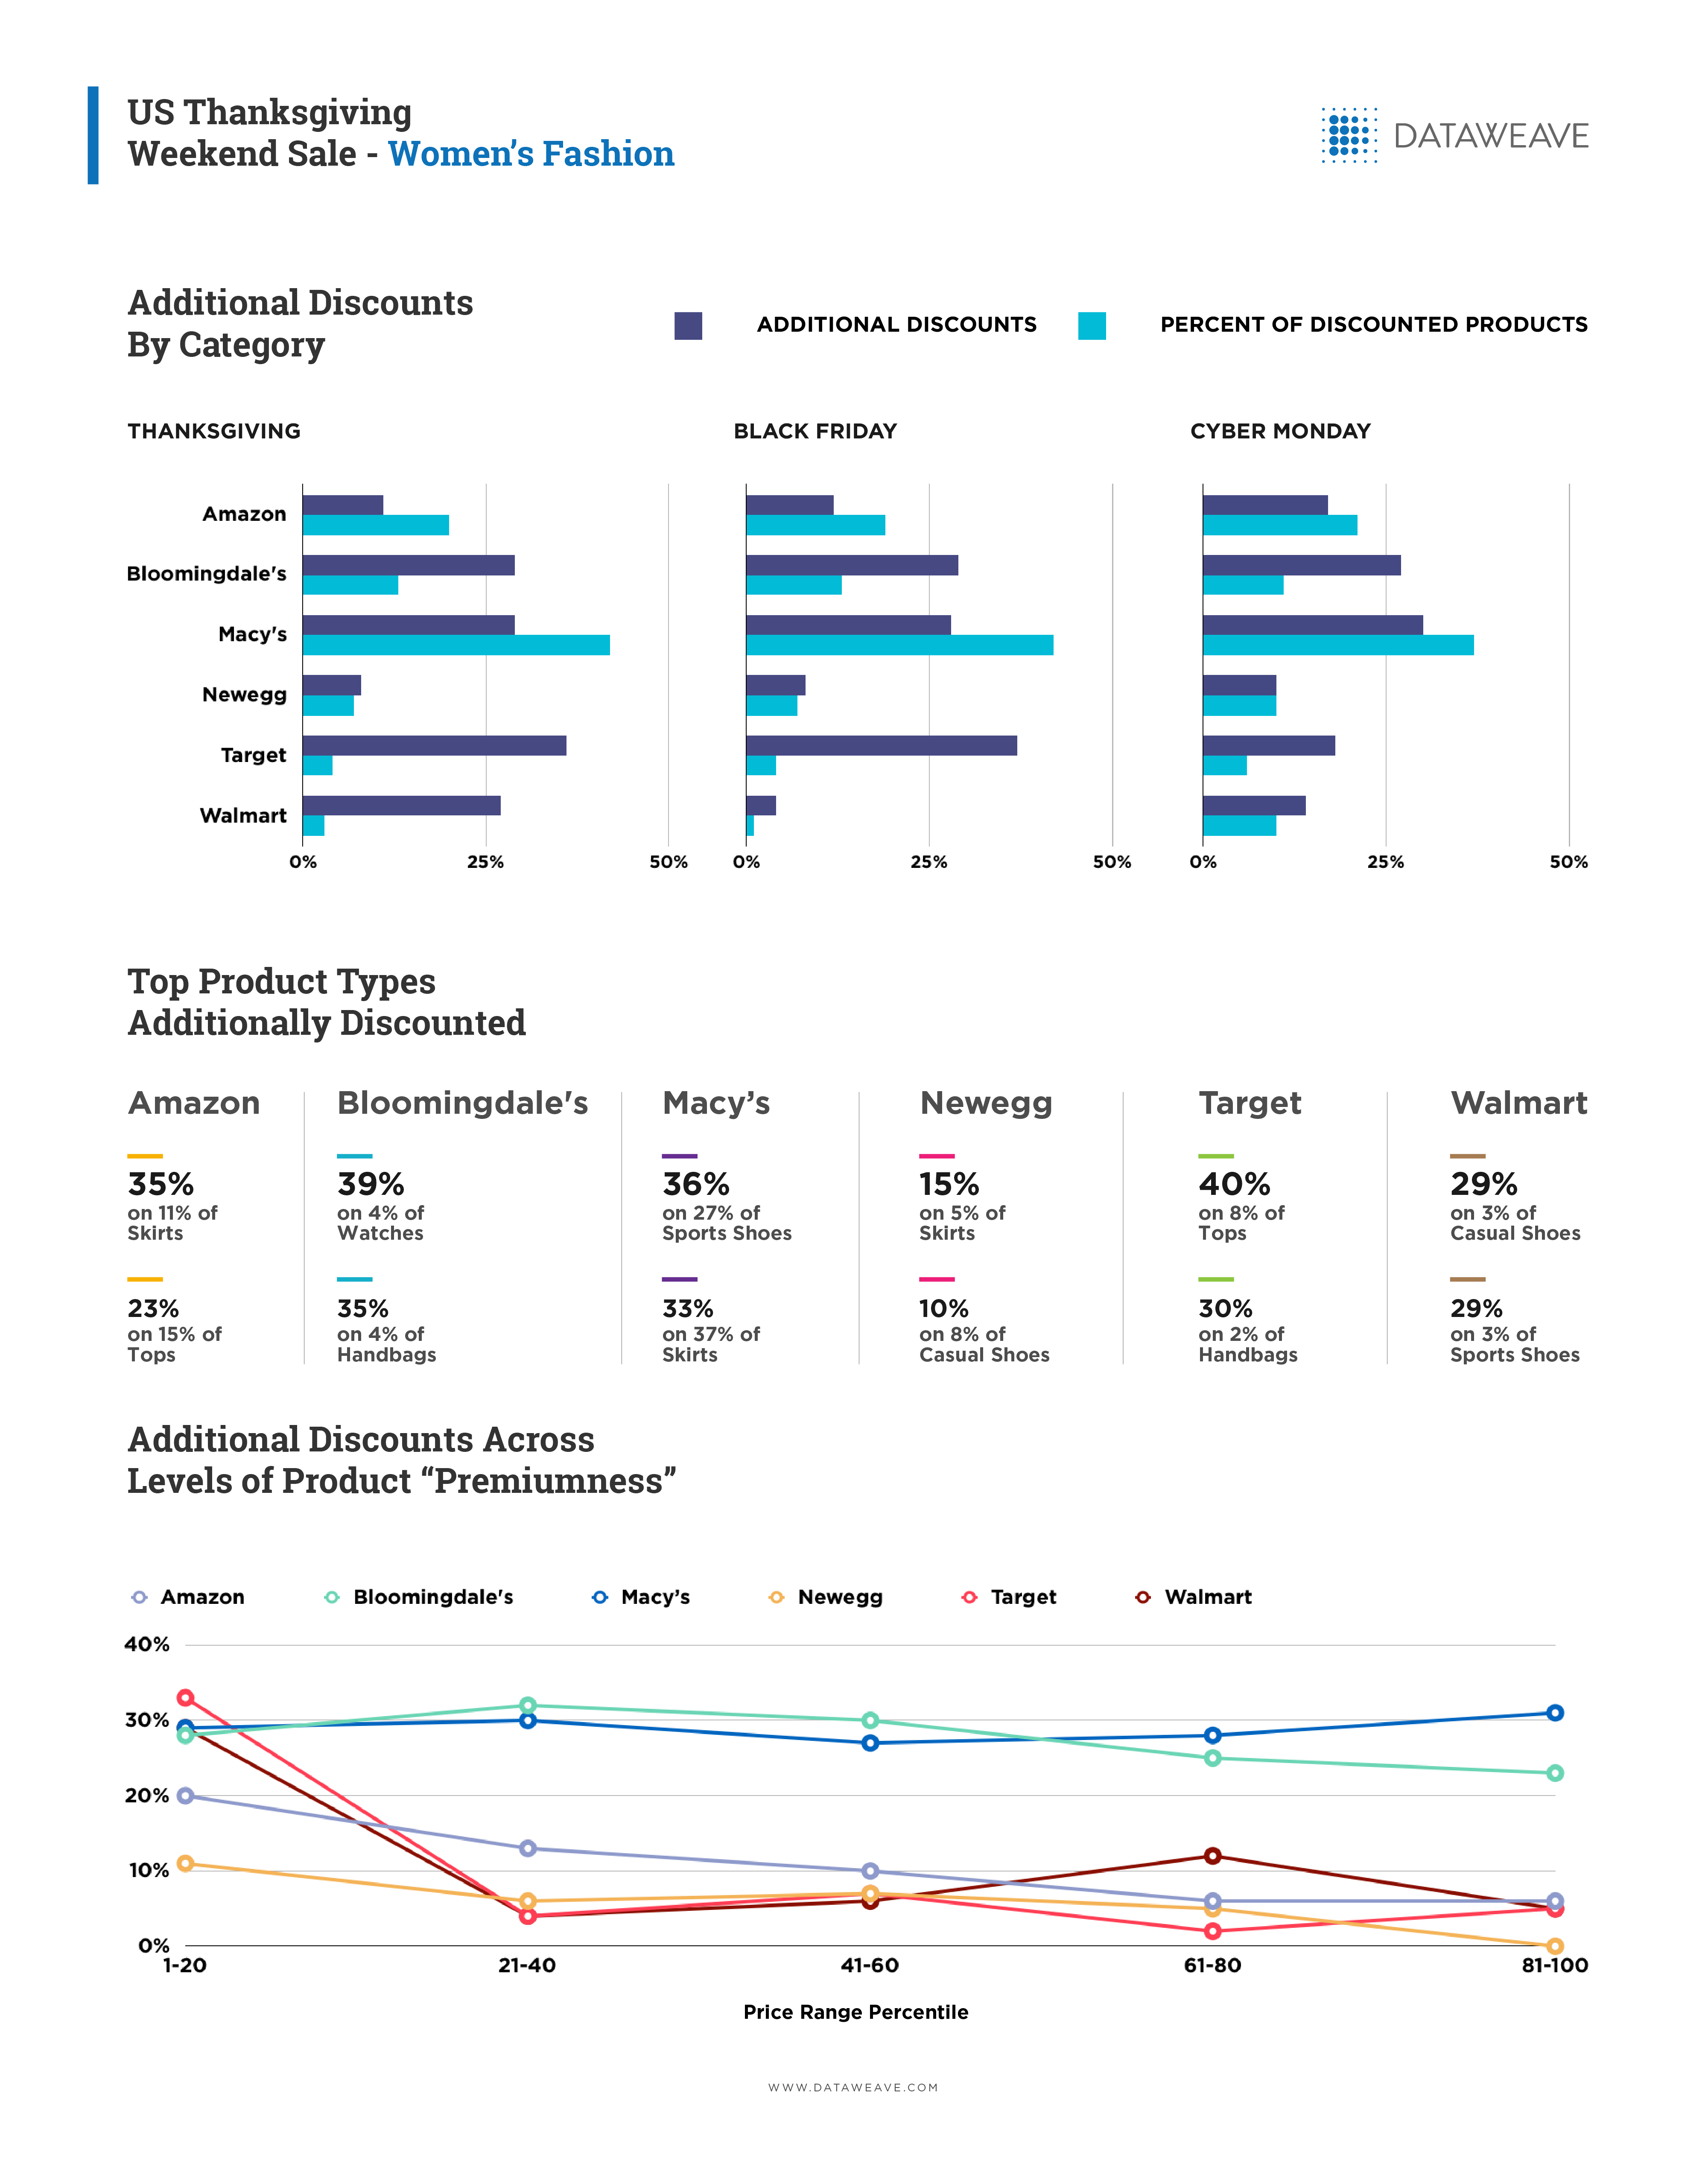
Additional discounts across products by “premiumness” level
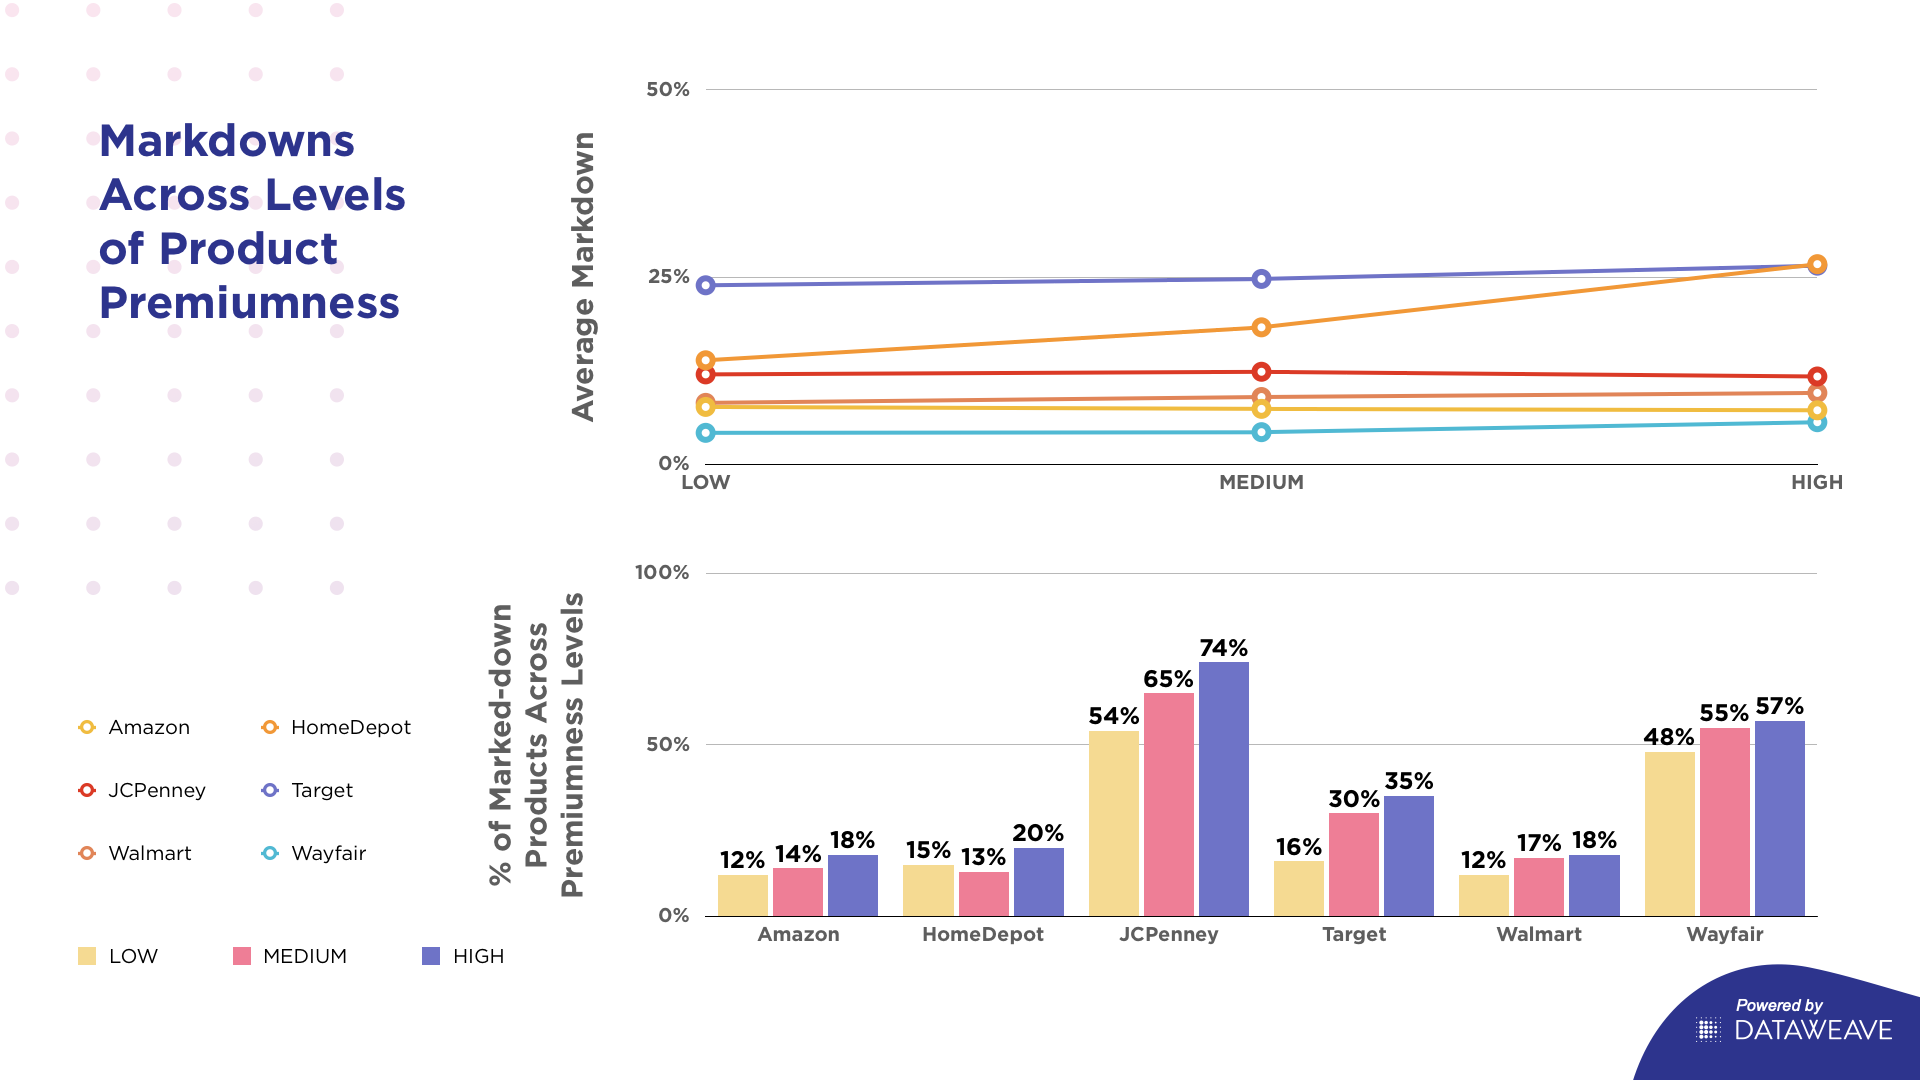
When we examine electronics’ additional discounts according to the products’ premium level, several patterns stand out.
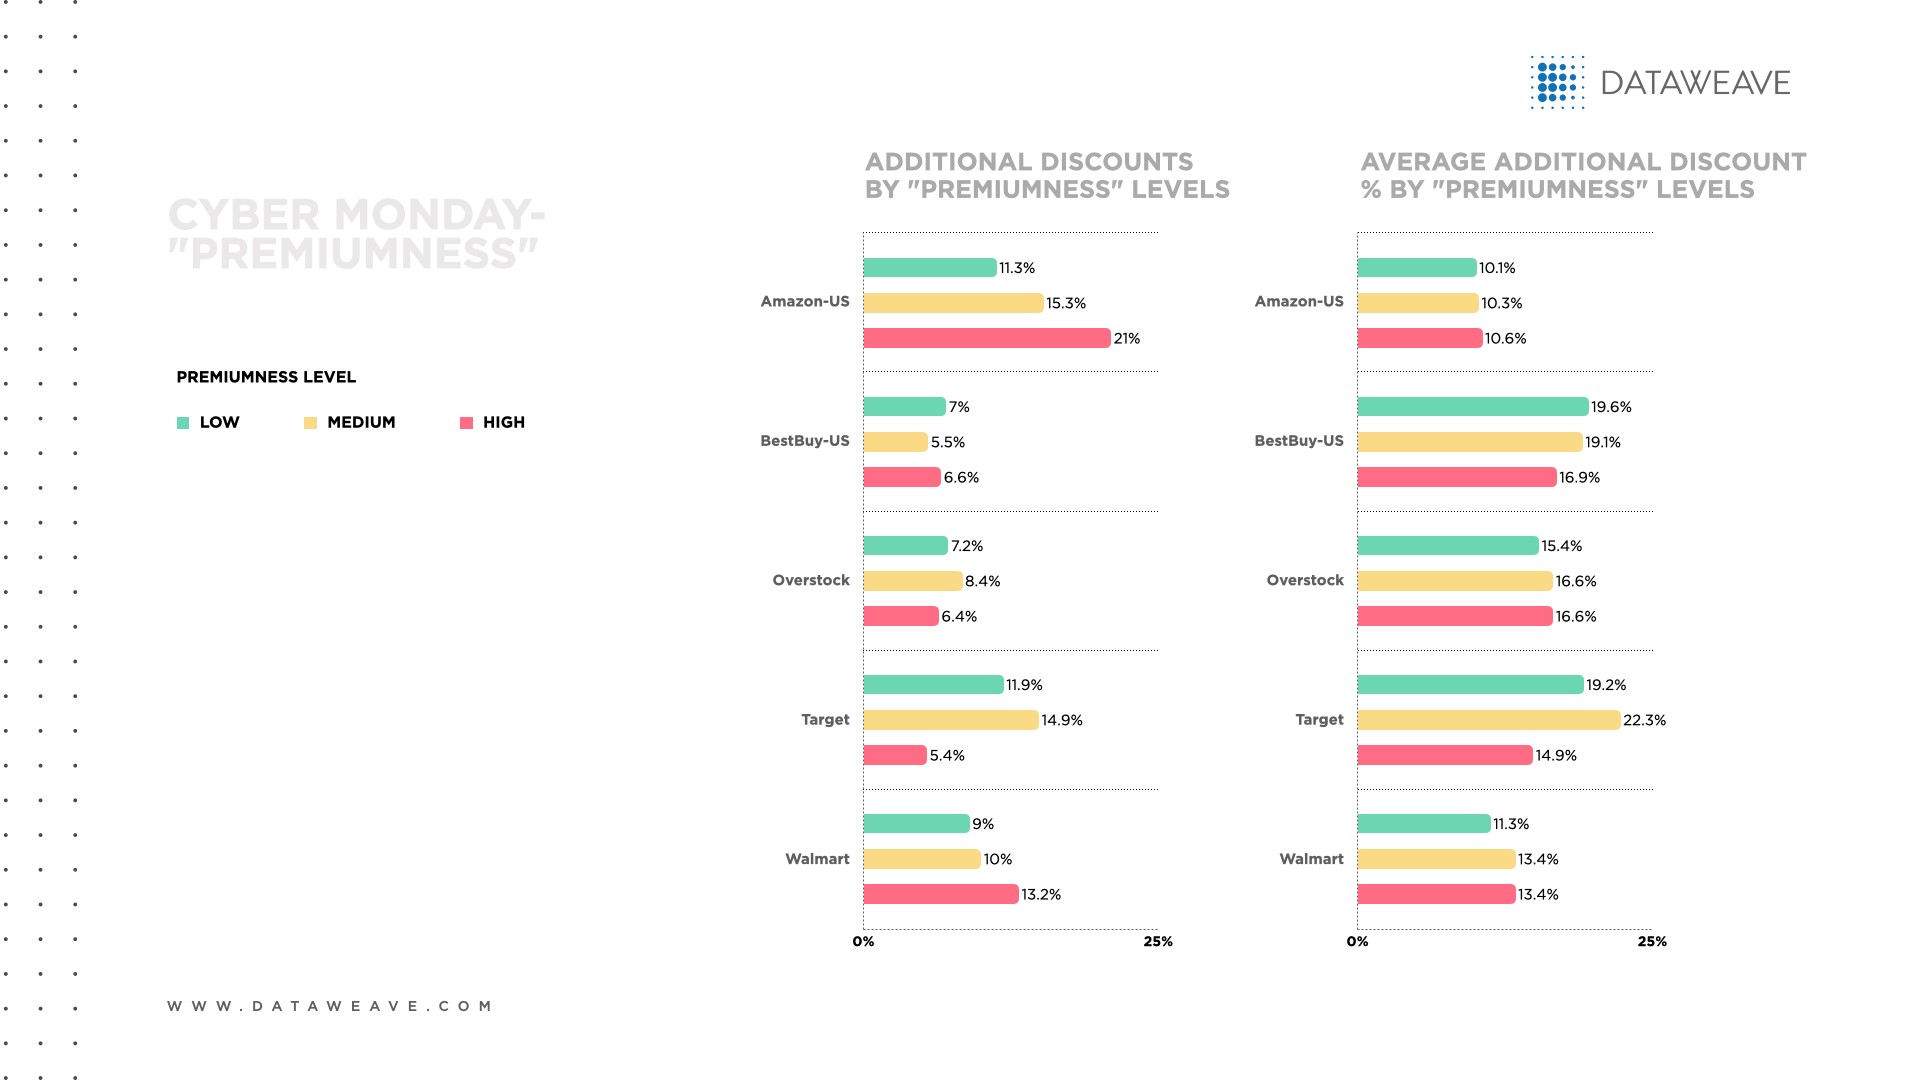
Most apparent is that every retailer offered a higher proportion of additional discounts on Cyber Monday compared to Black Friday, ranging from 15.9% for Amazon to 6.4% for Best Buy.
With only one exception, Amazon offered the greatest proportion of additional discounts across all premium levels. Only Target offered a slightly higher proportion among low premium electronics (11.9% vs. 11.3% for Amazon). This approach could help Amazon make more electronics products more affordable to more consumers and boost its reach in this competitive category.
Among electronic items at the high premium level, Amazon was most aggressive in allocating additional discounts (21.0% vs. 5.4% for Target), which could help the e-commerce giant earn top-of-mind status among affluent shoppers in the market for big-ticket electronics.
Most retailers (Amazon, Best Buy and Walmart) offered deeper discounts on Cyber Monday than Black Friday. By contrast, Overstock and Target were more generous on Black Friday.
Interestingly, Target’s average additional discount on Cyber Monday (18.8%) was still more generous than those of the other retailers.
Among moderately premium items, Target’s average additional discount was 22.3%, more than double Amazon’s 10.3%. Target may have tried to make mid-market electronics more affordable to its core audience of value-seeking shoppers.
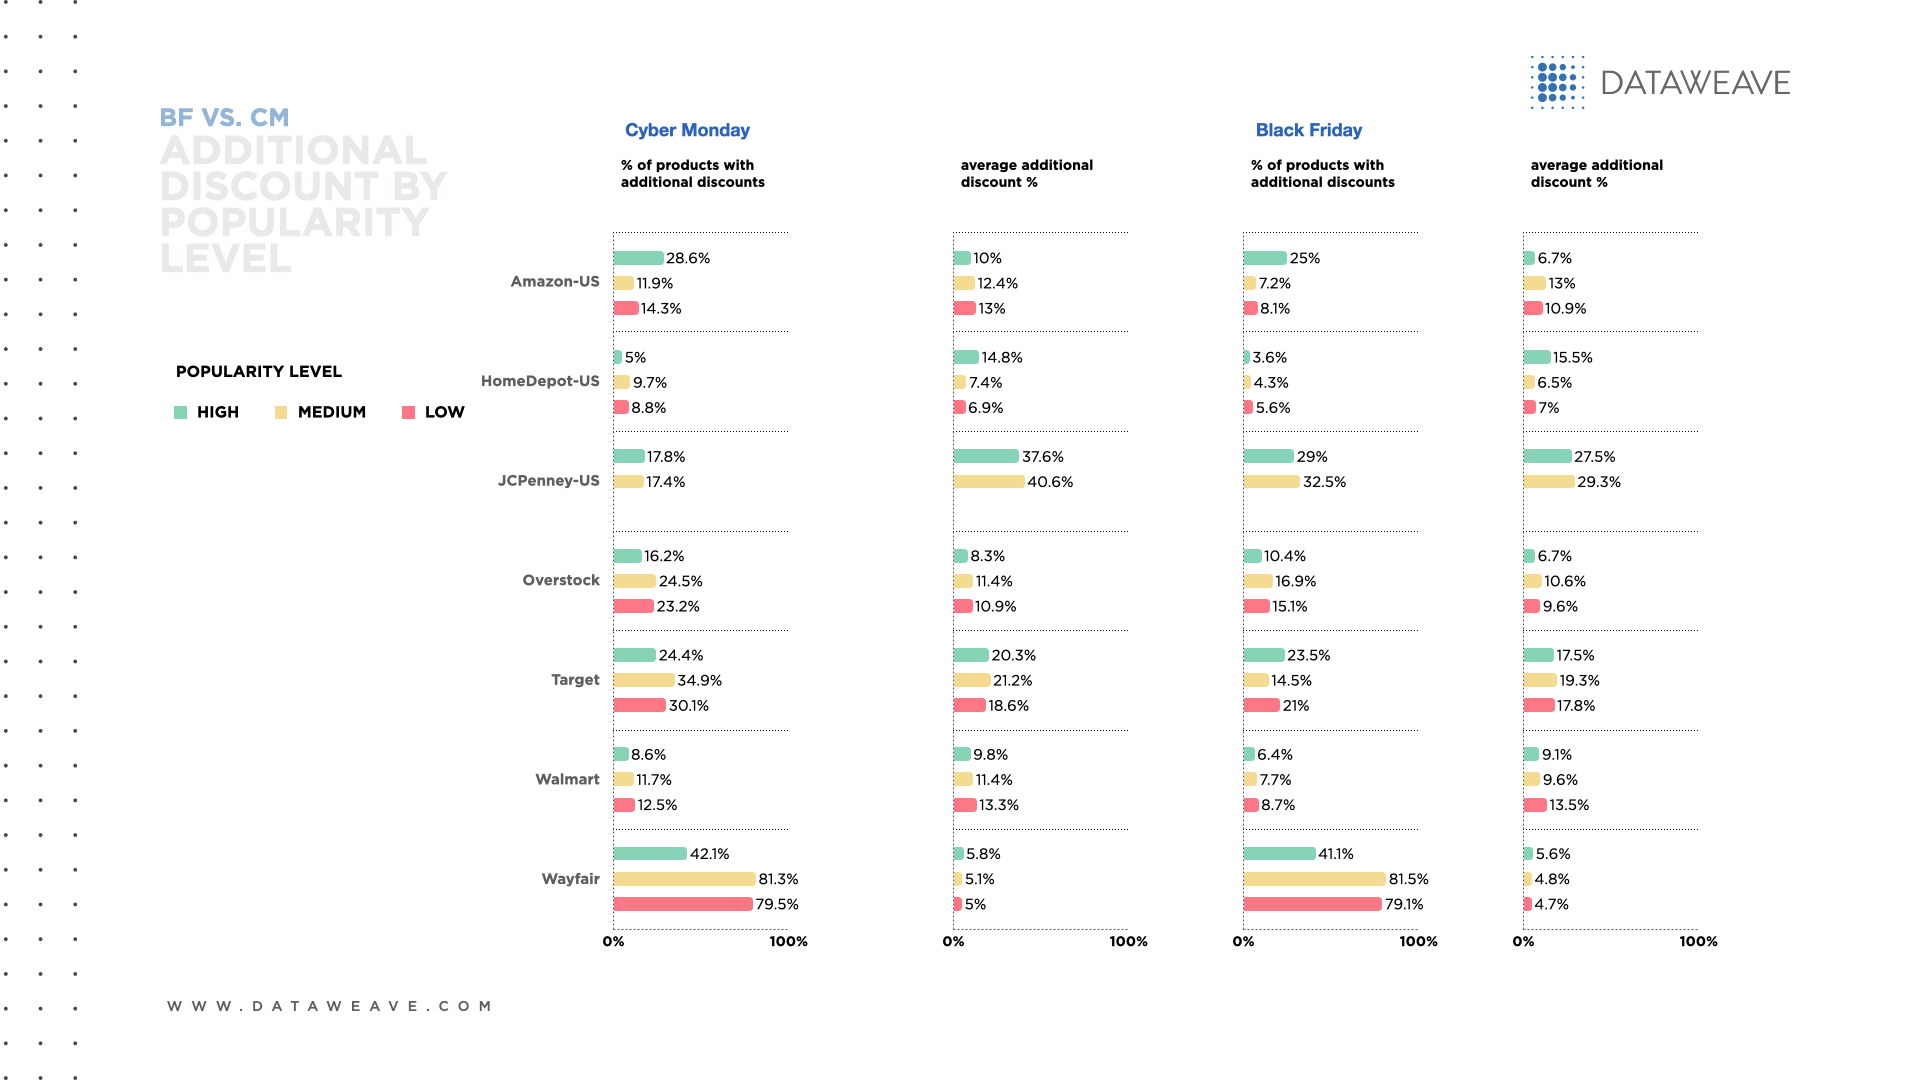
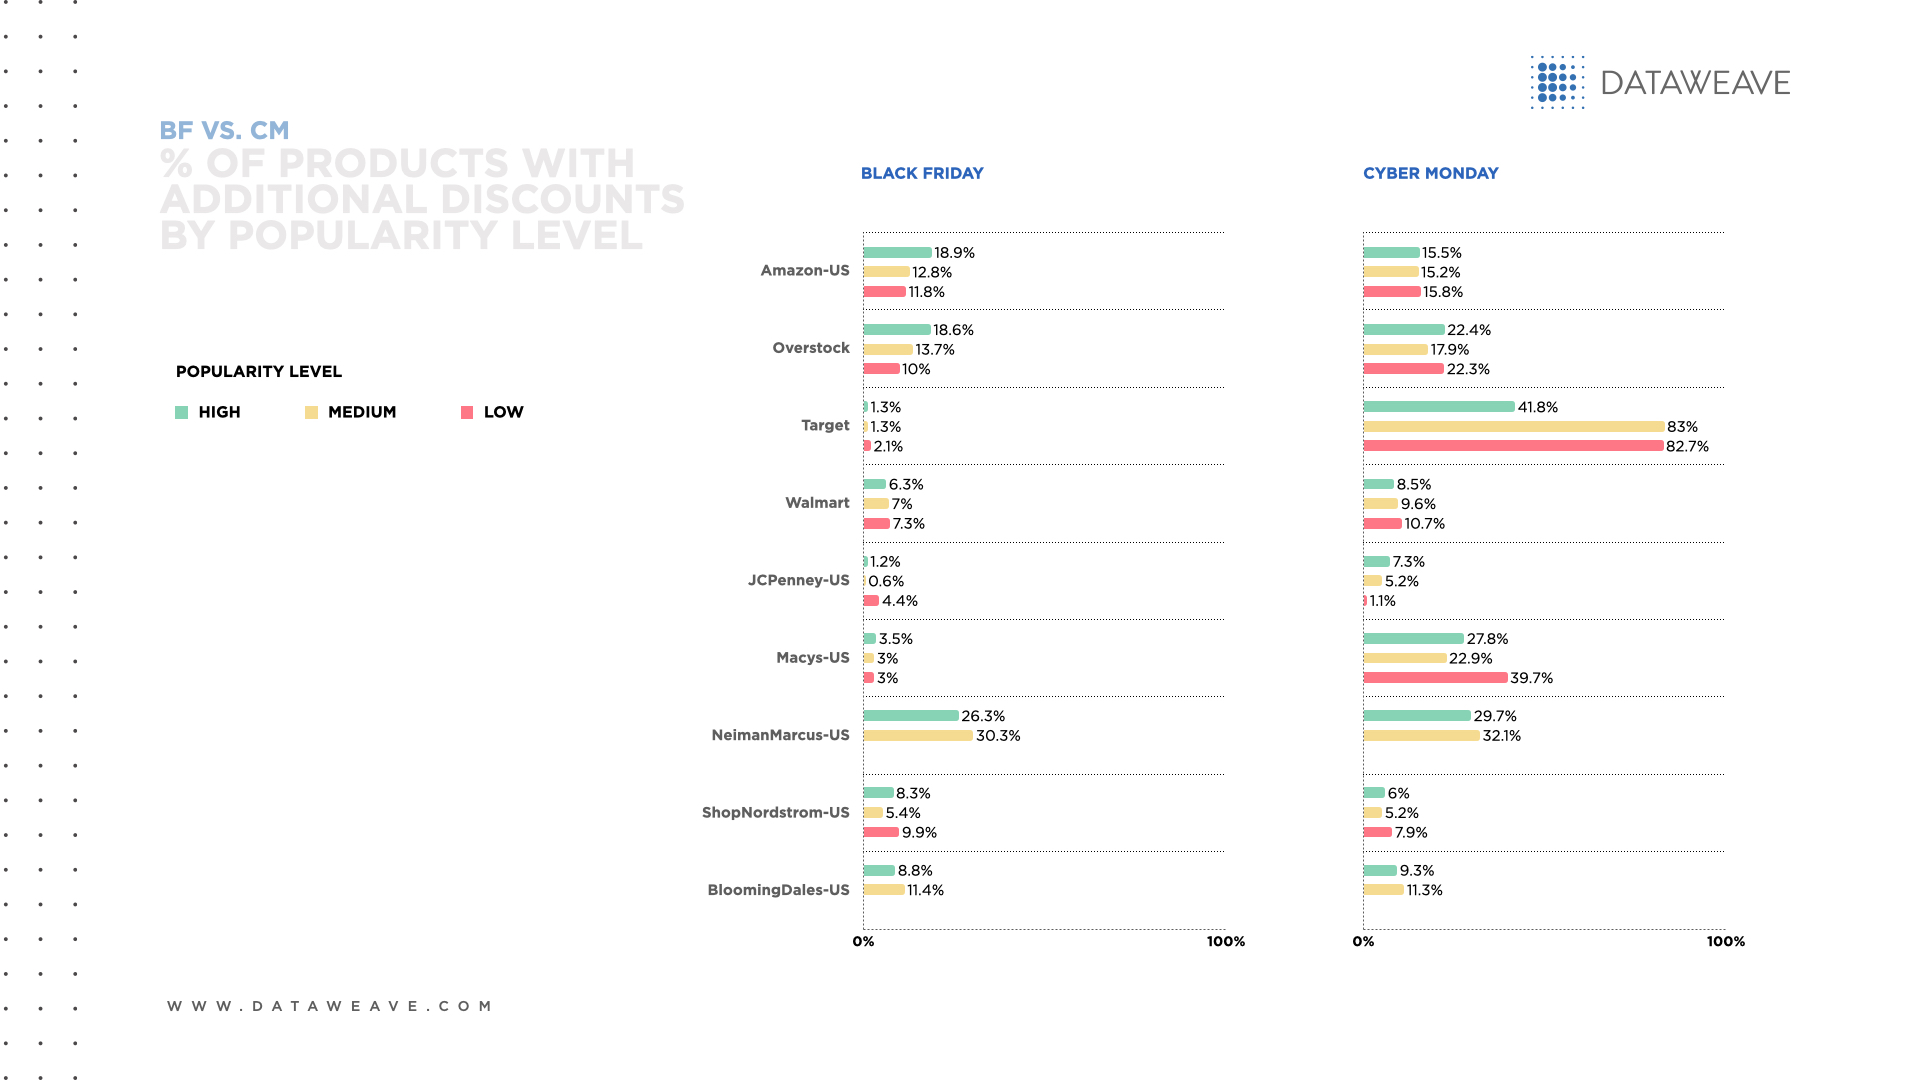
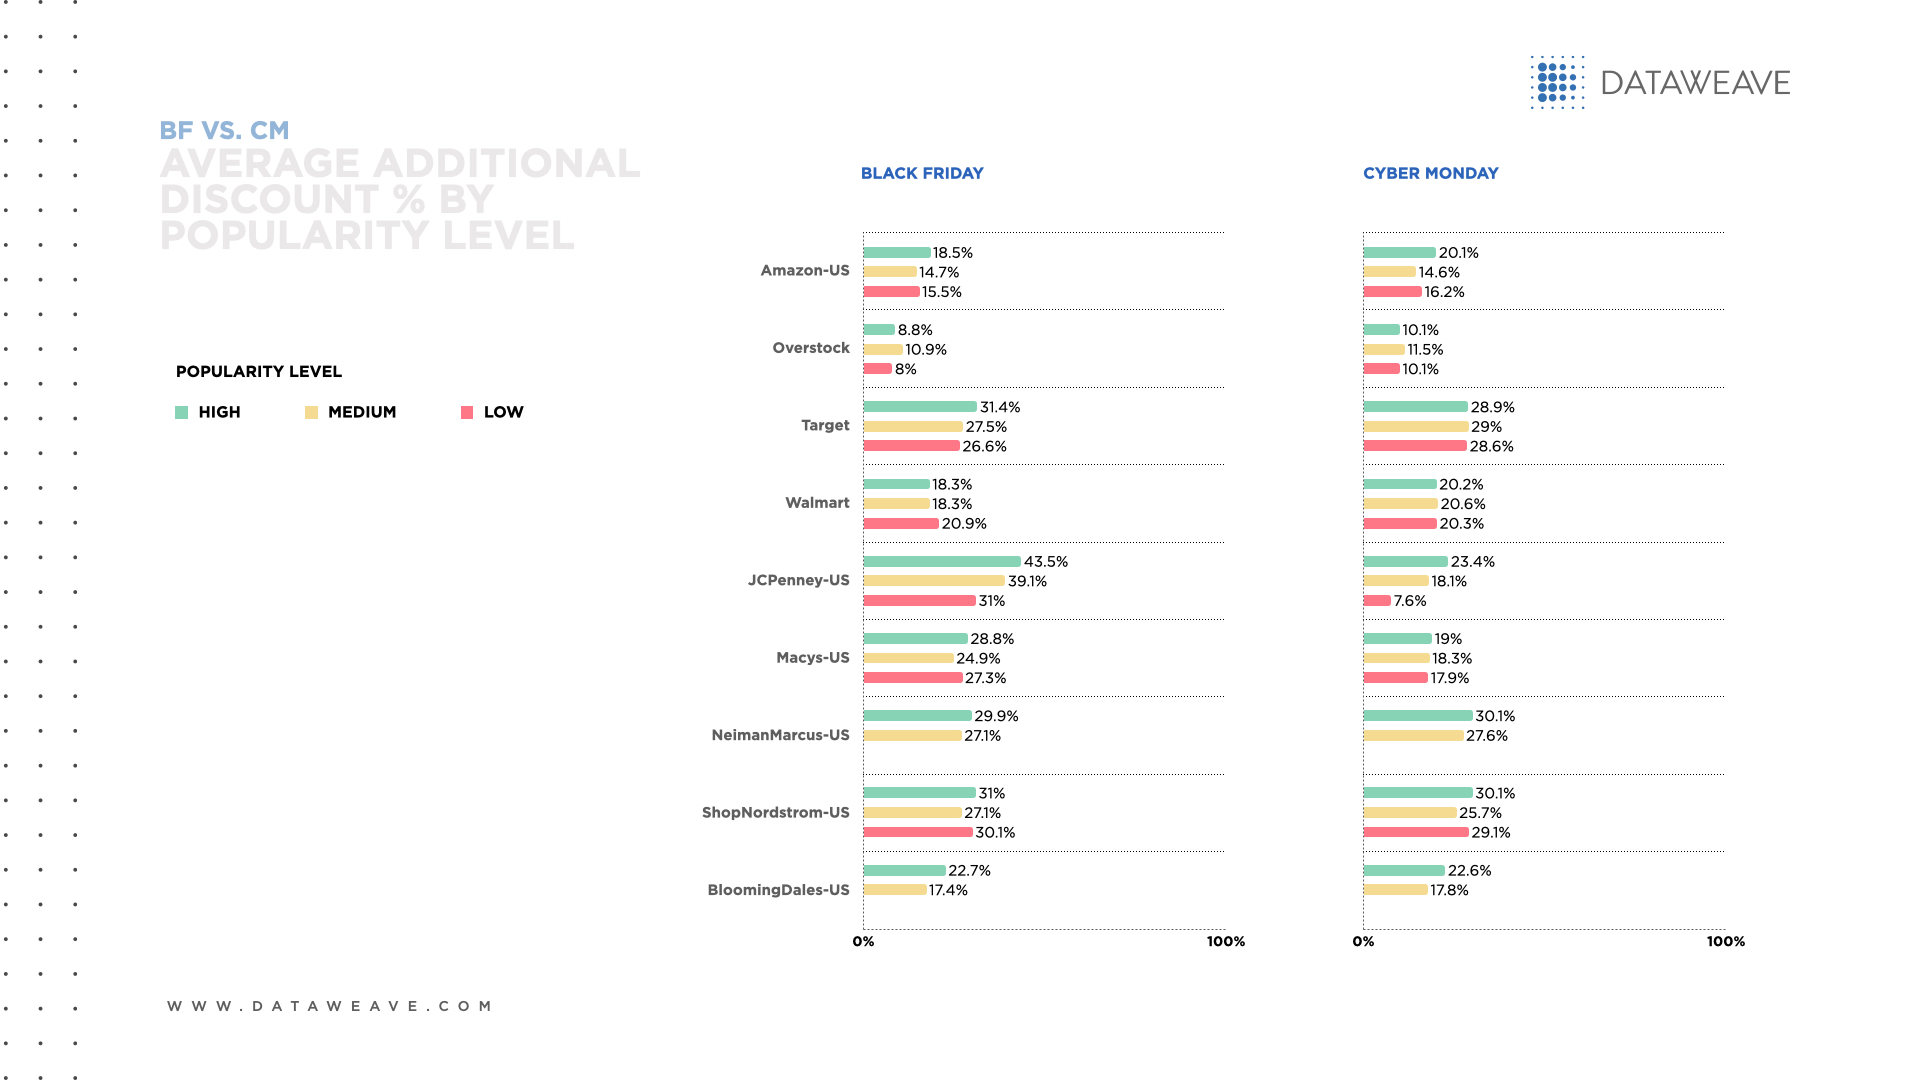
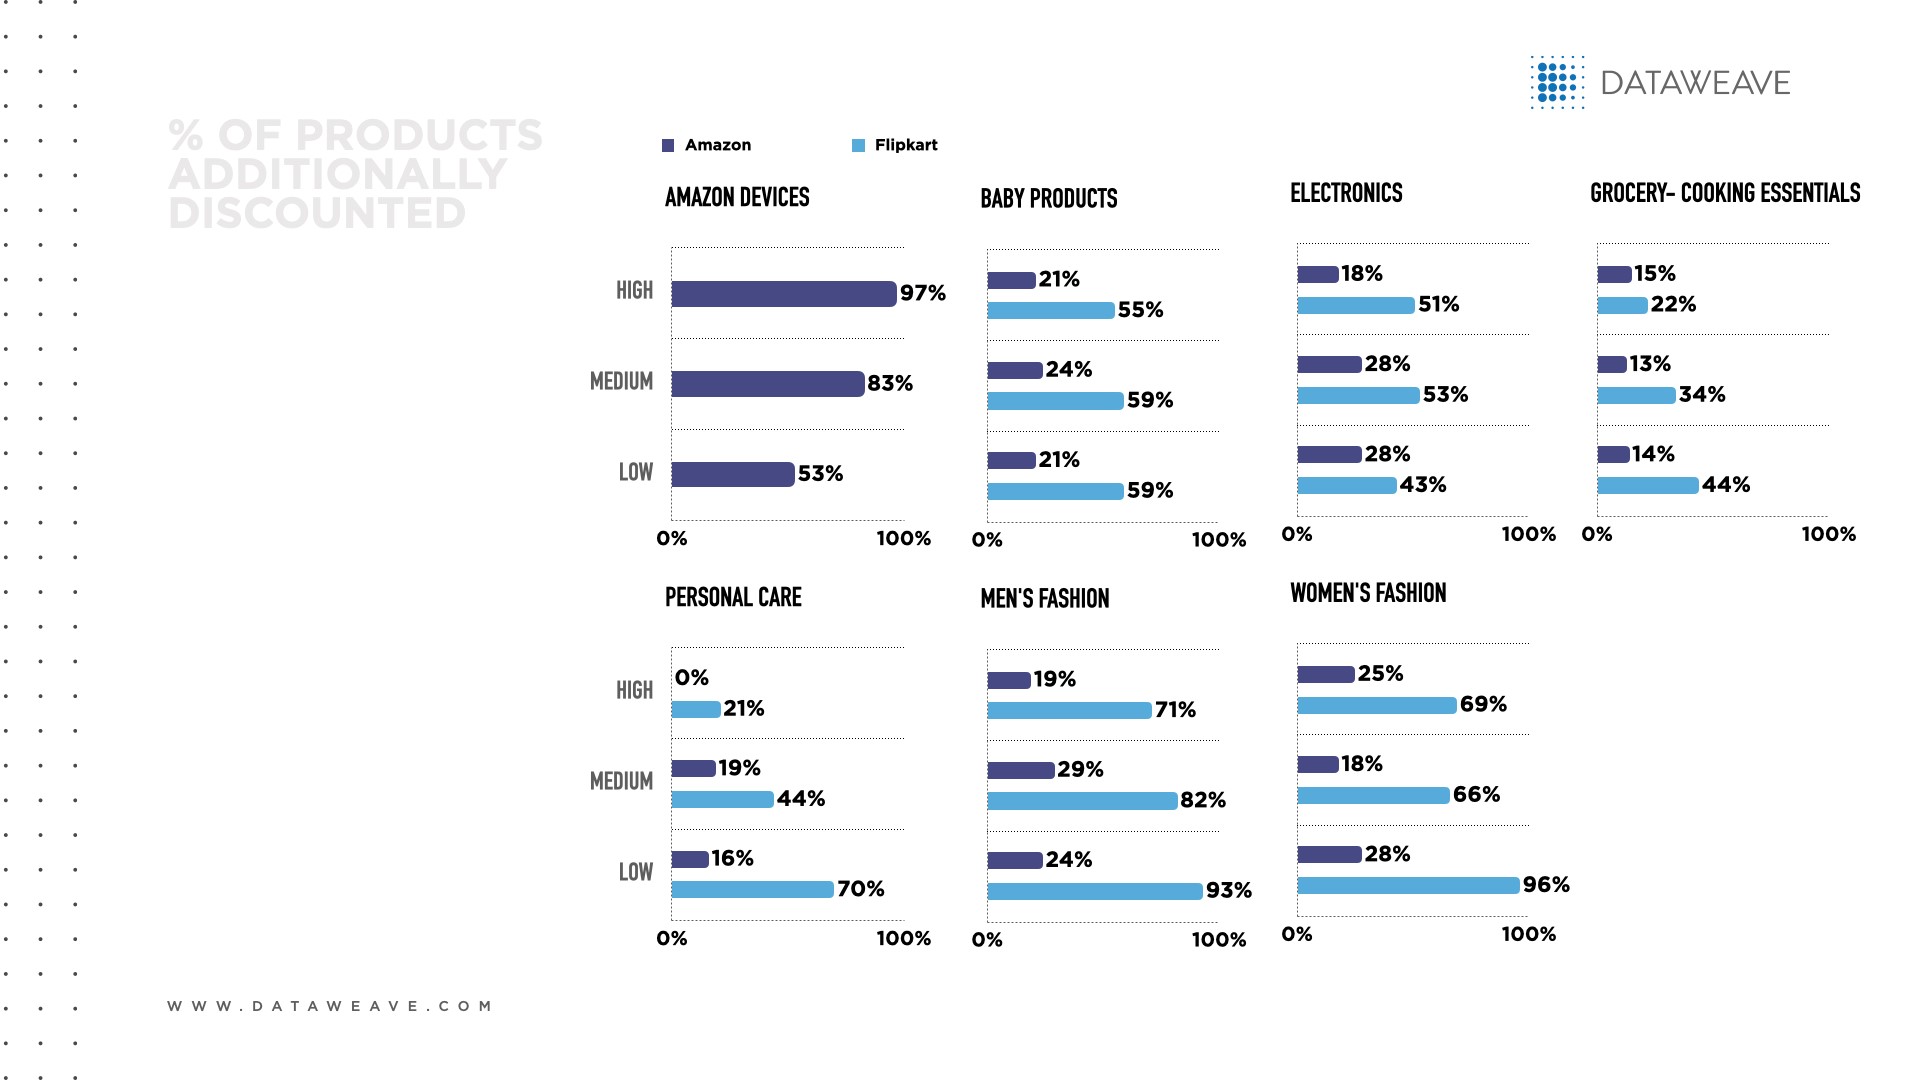
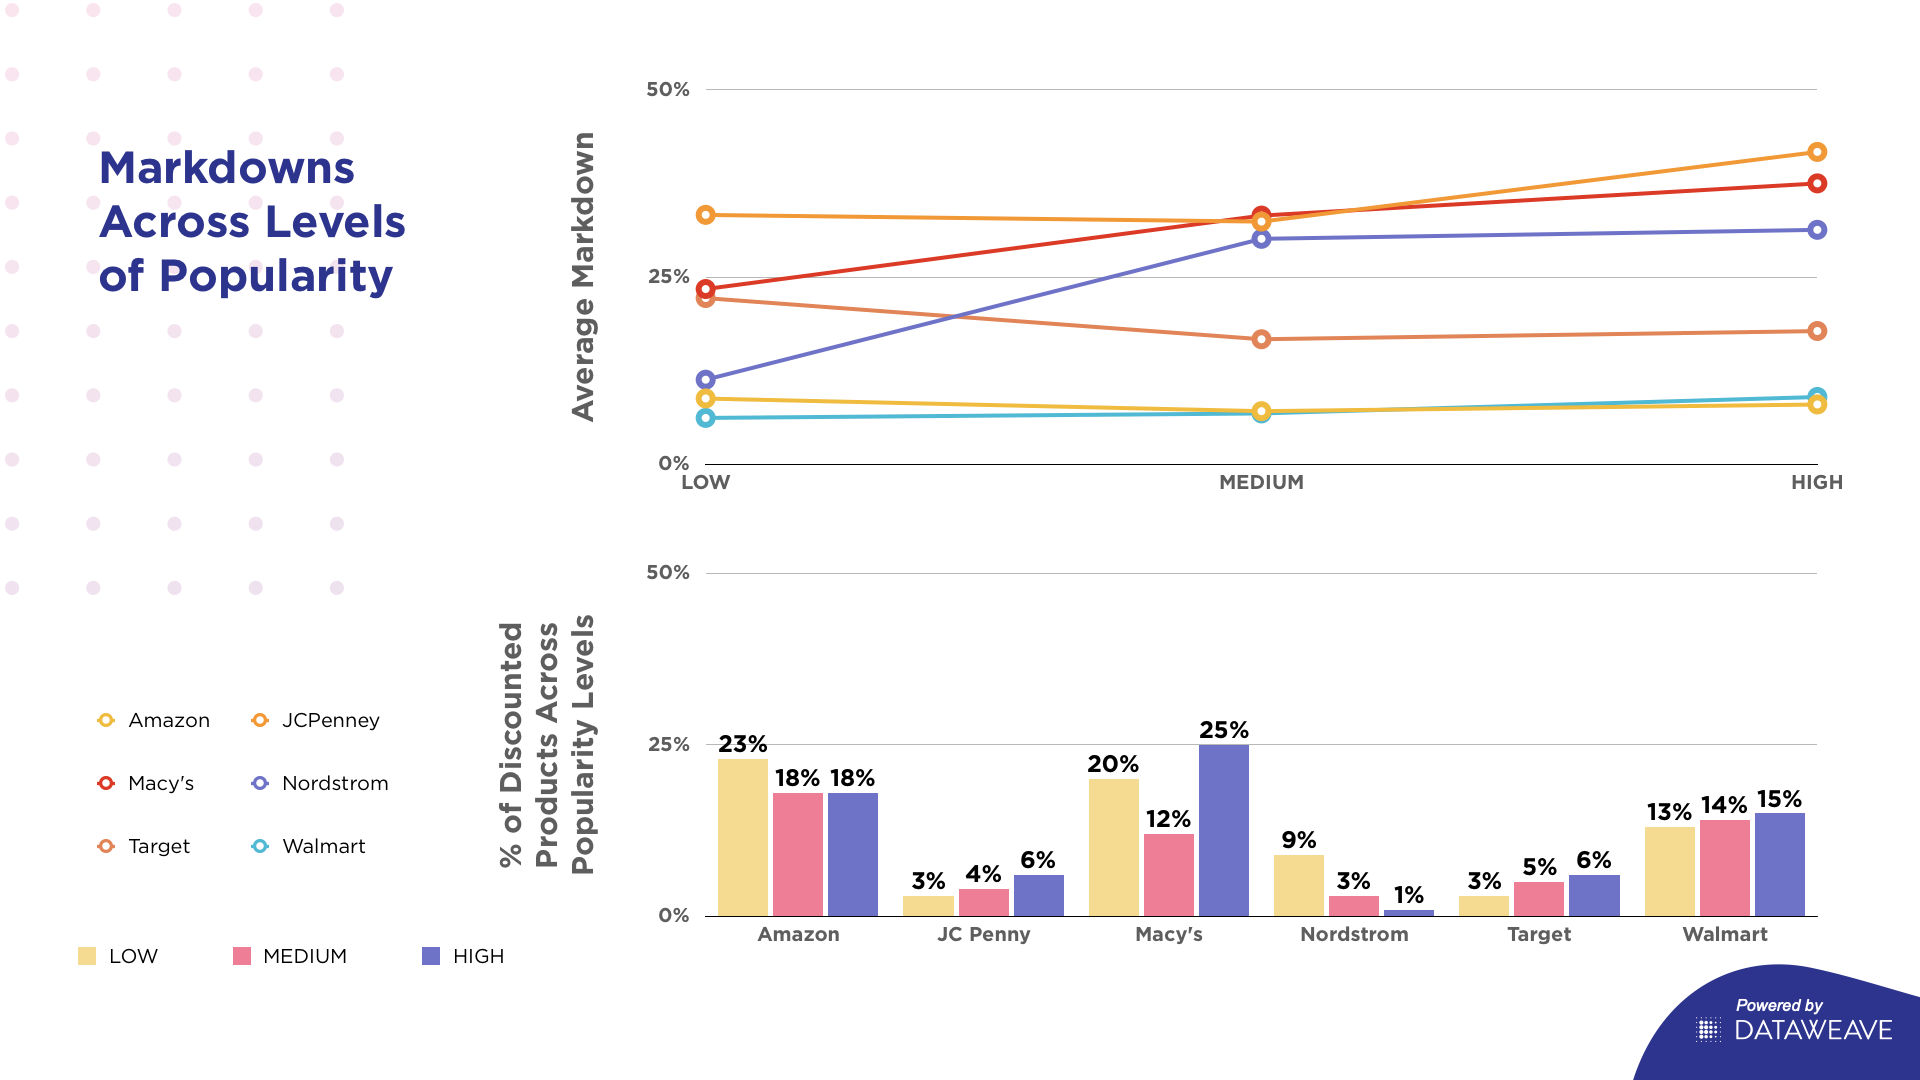
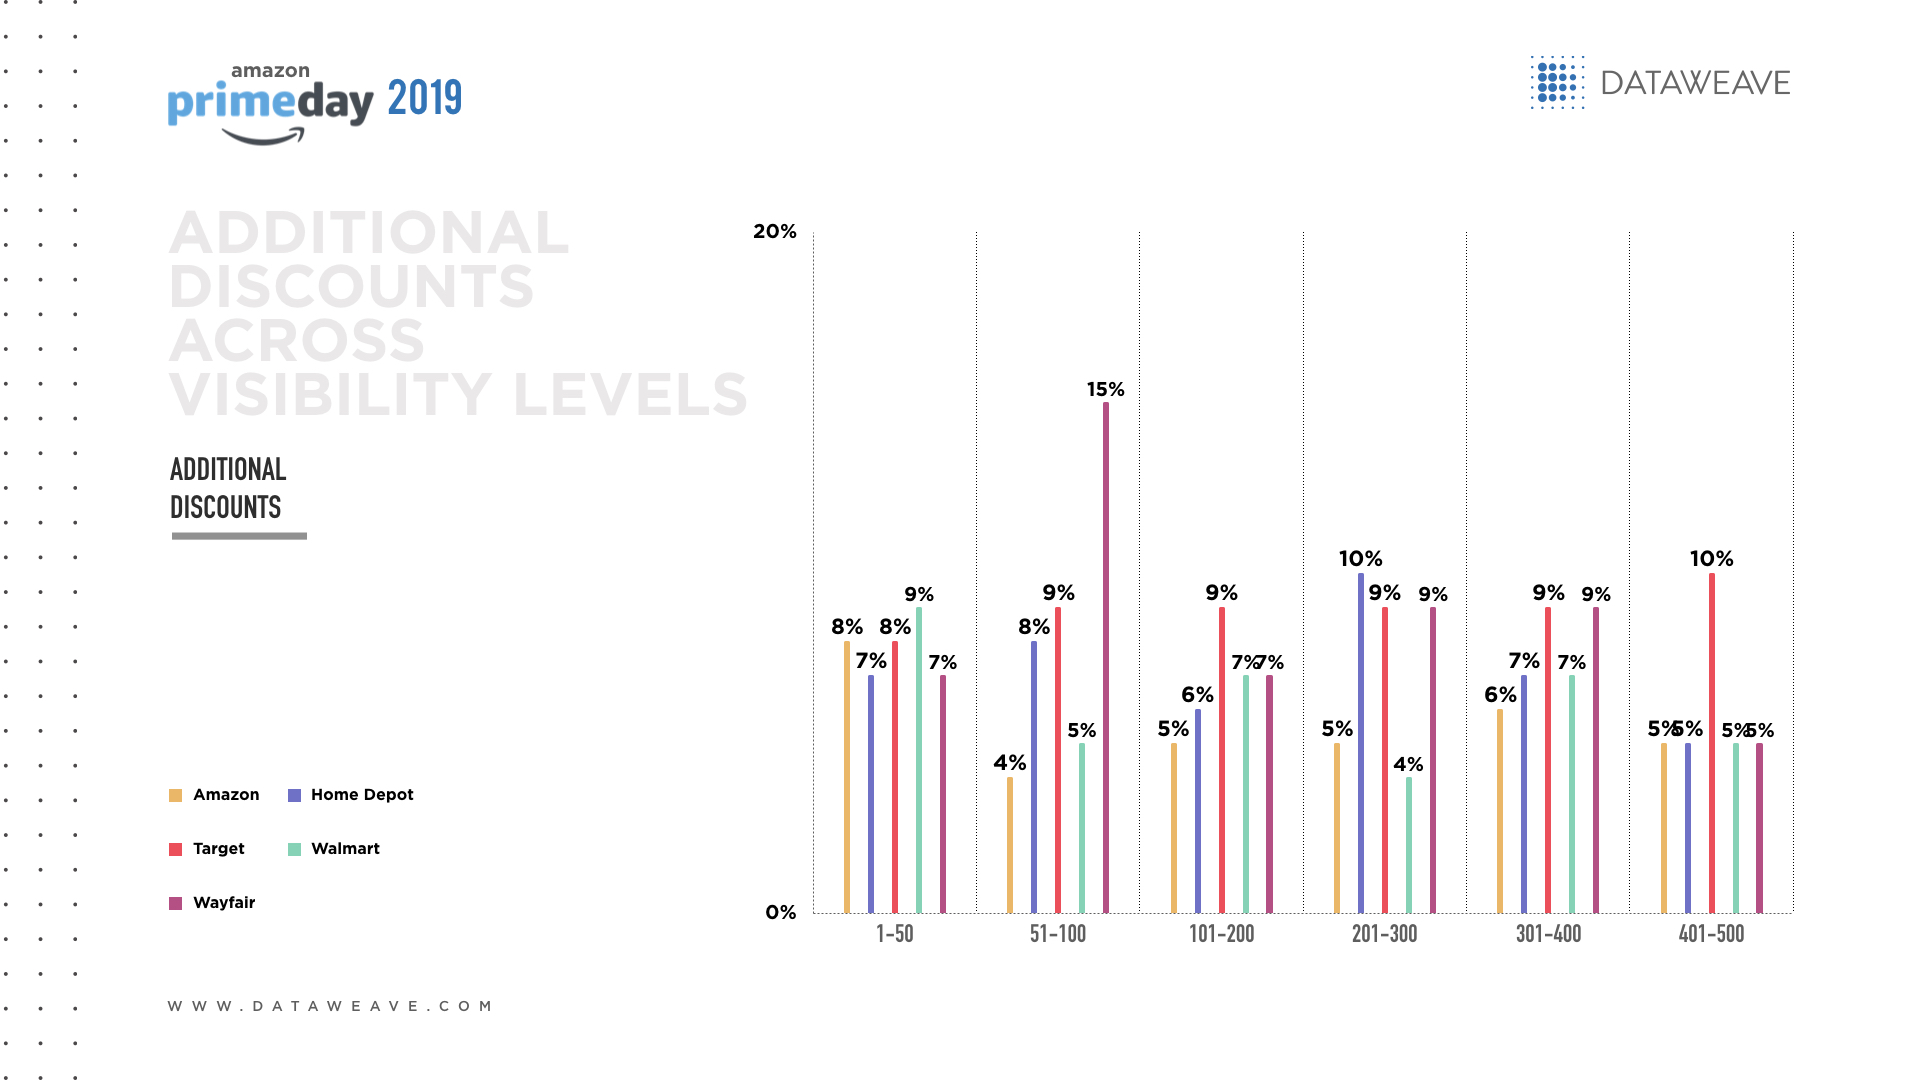
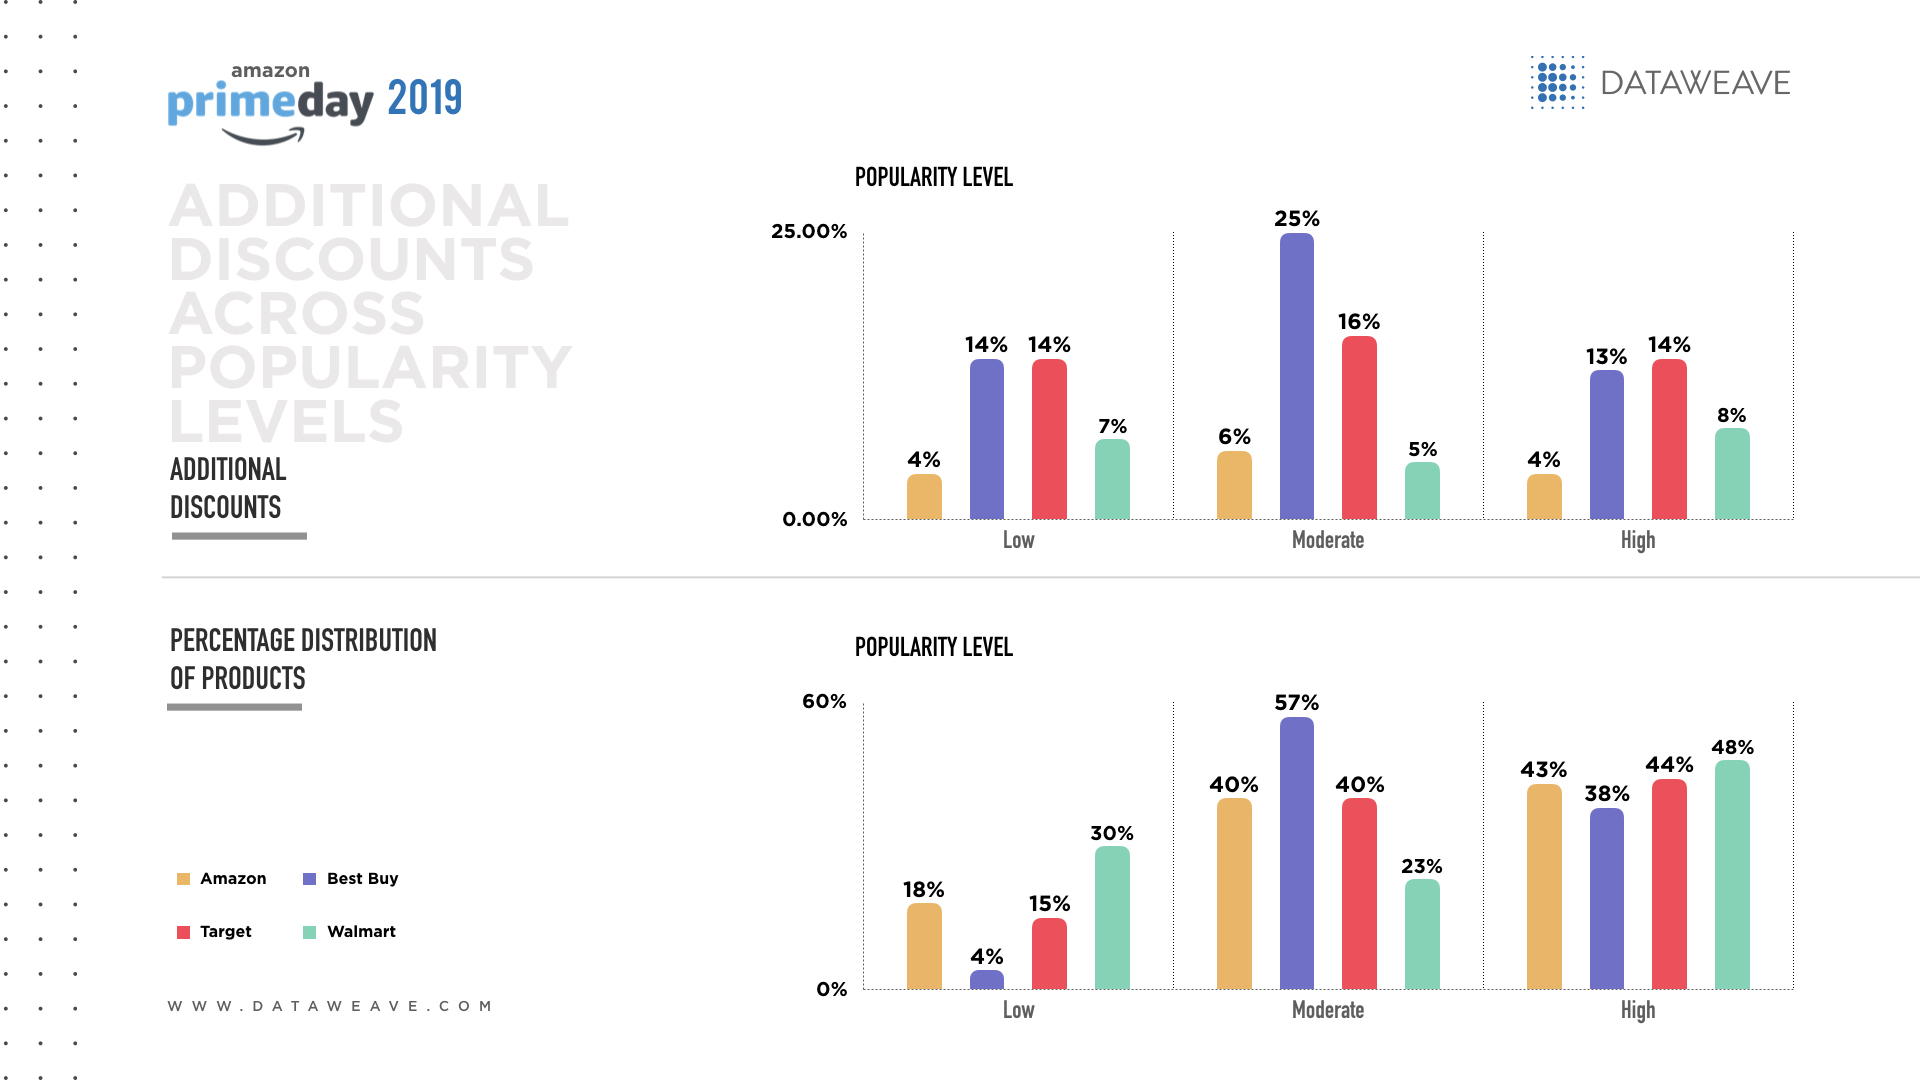
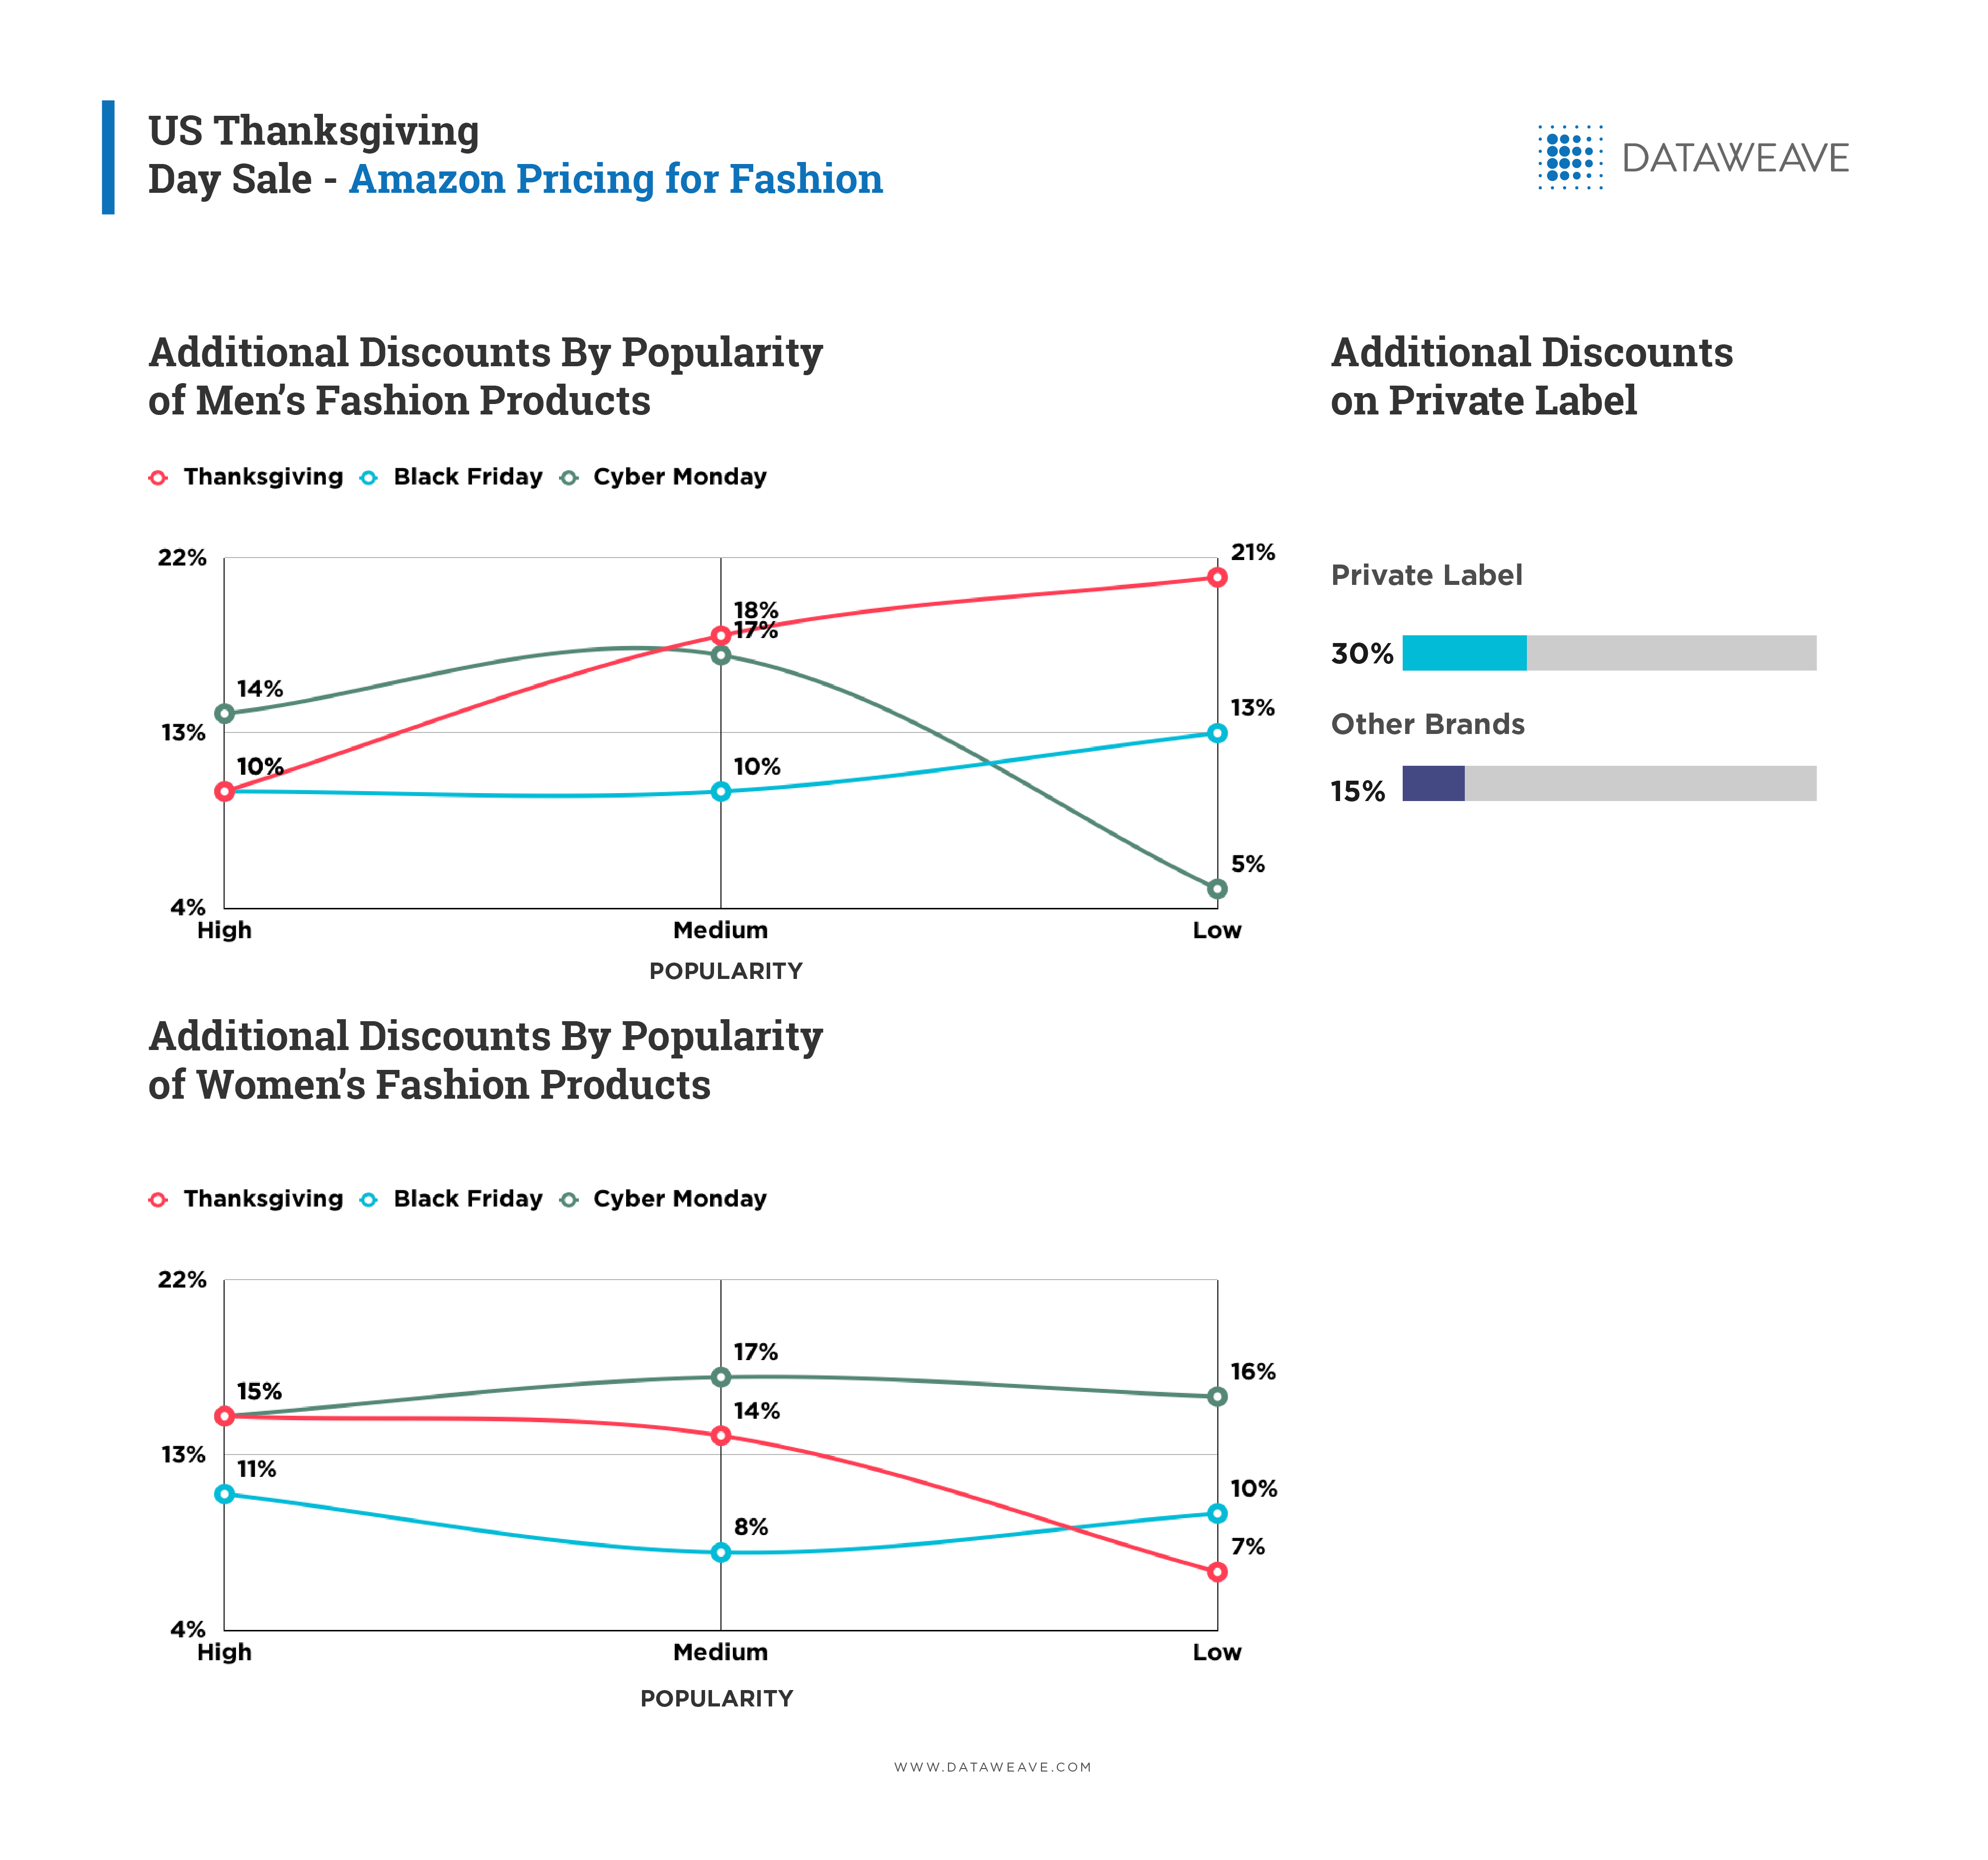
Additional discounts across products by “popularity” level
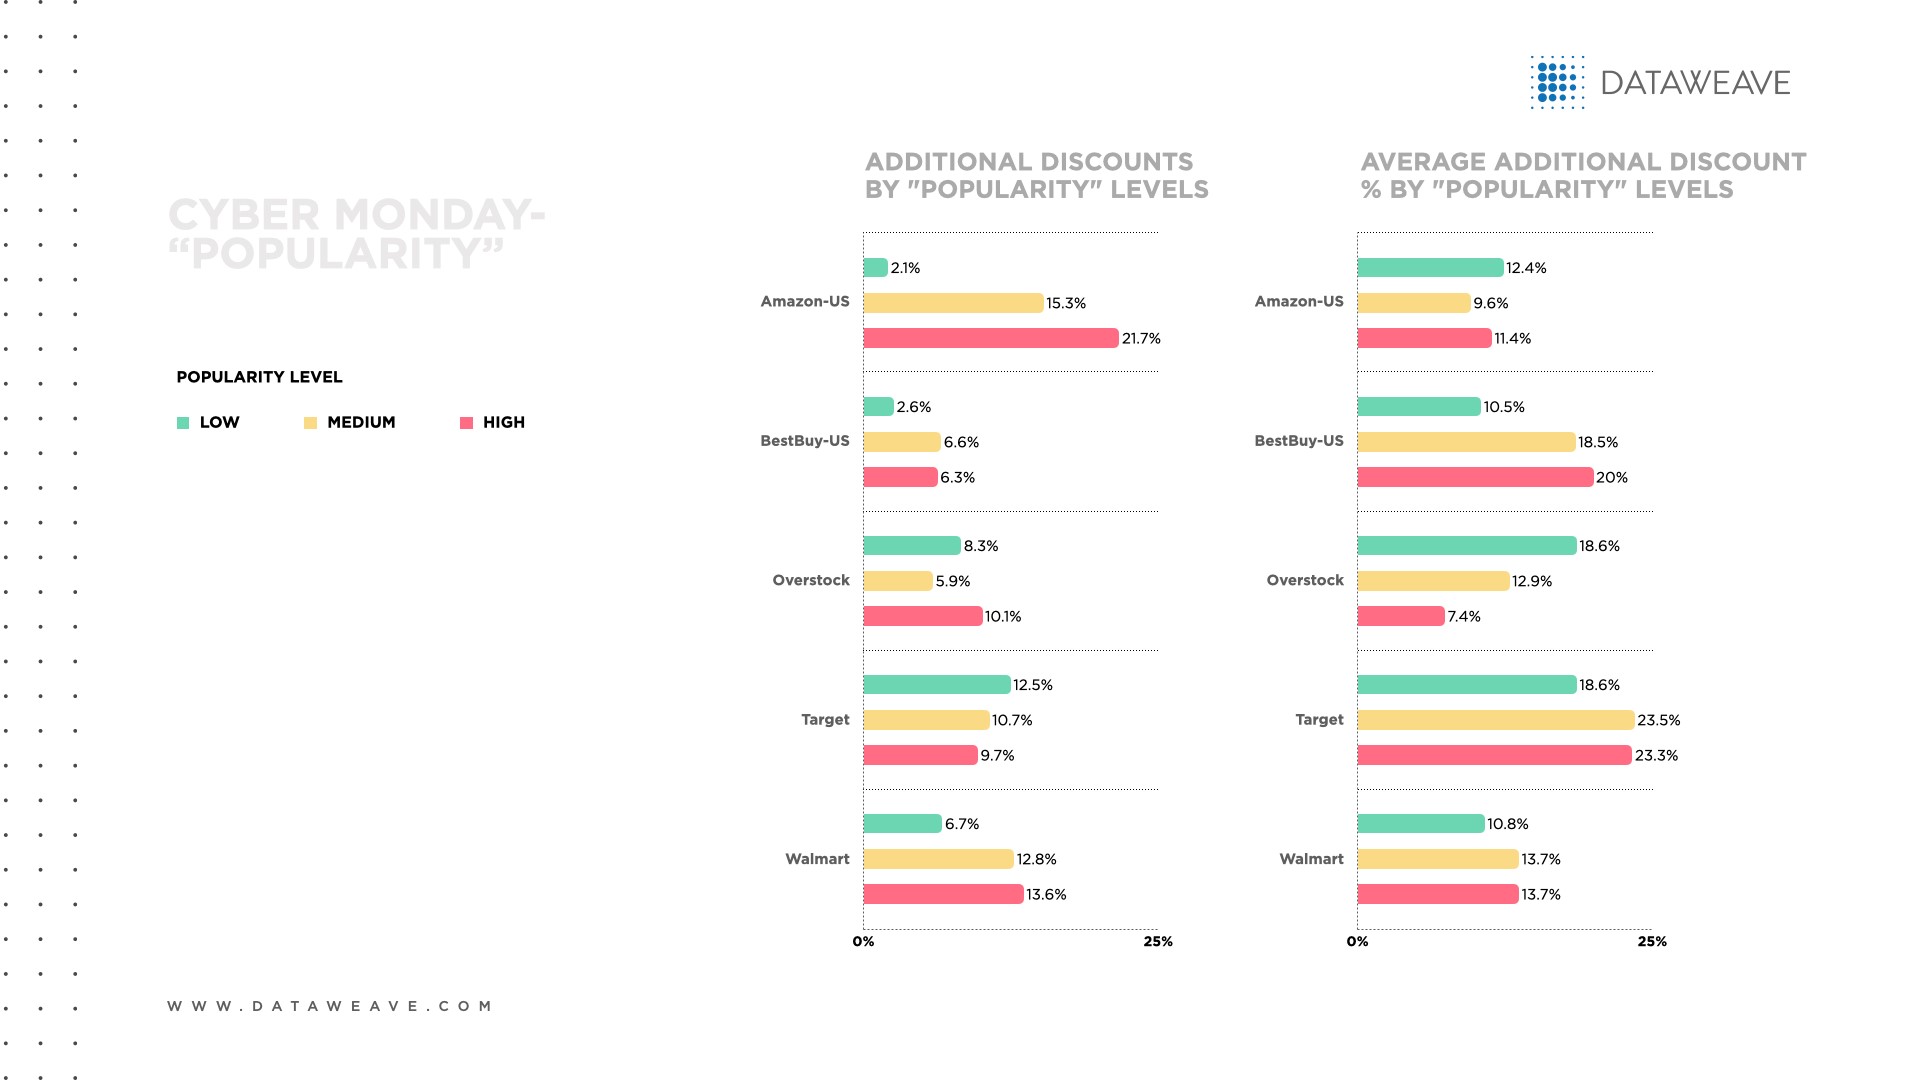
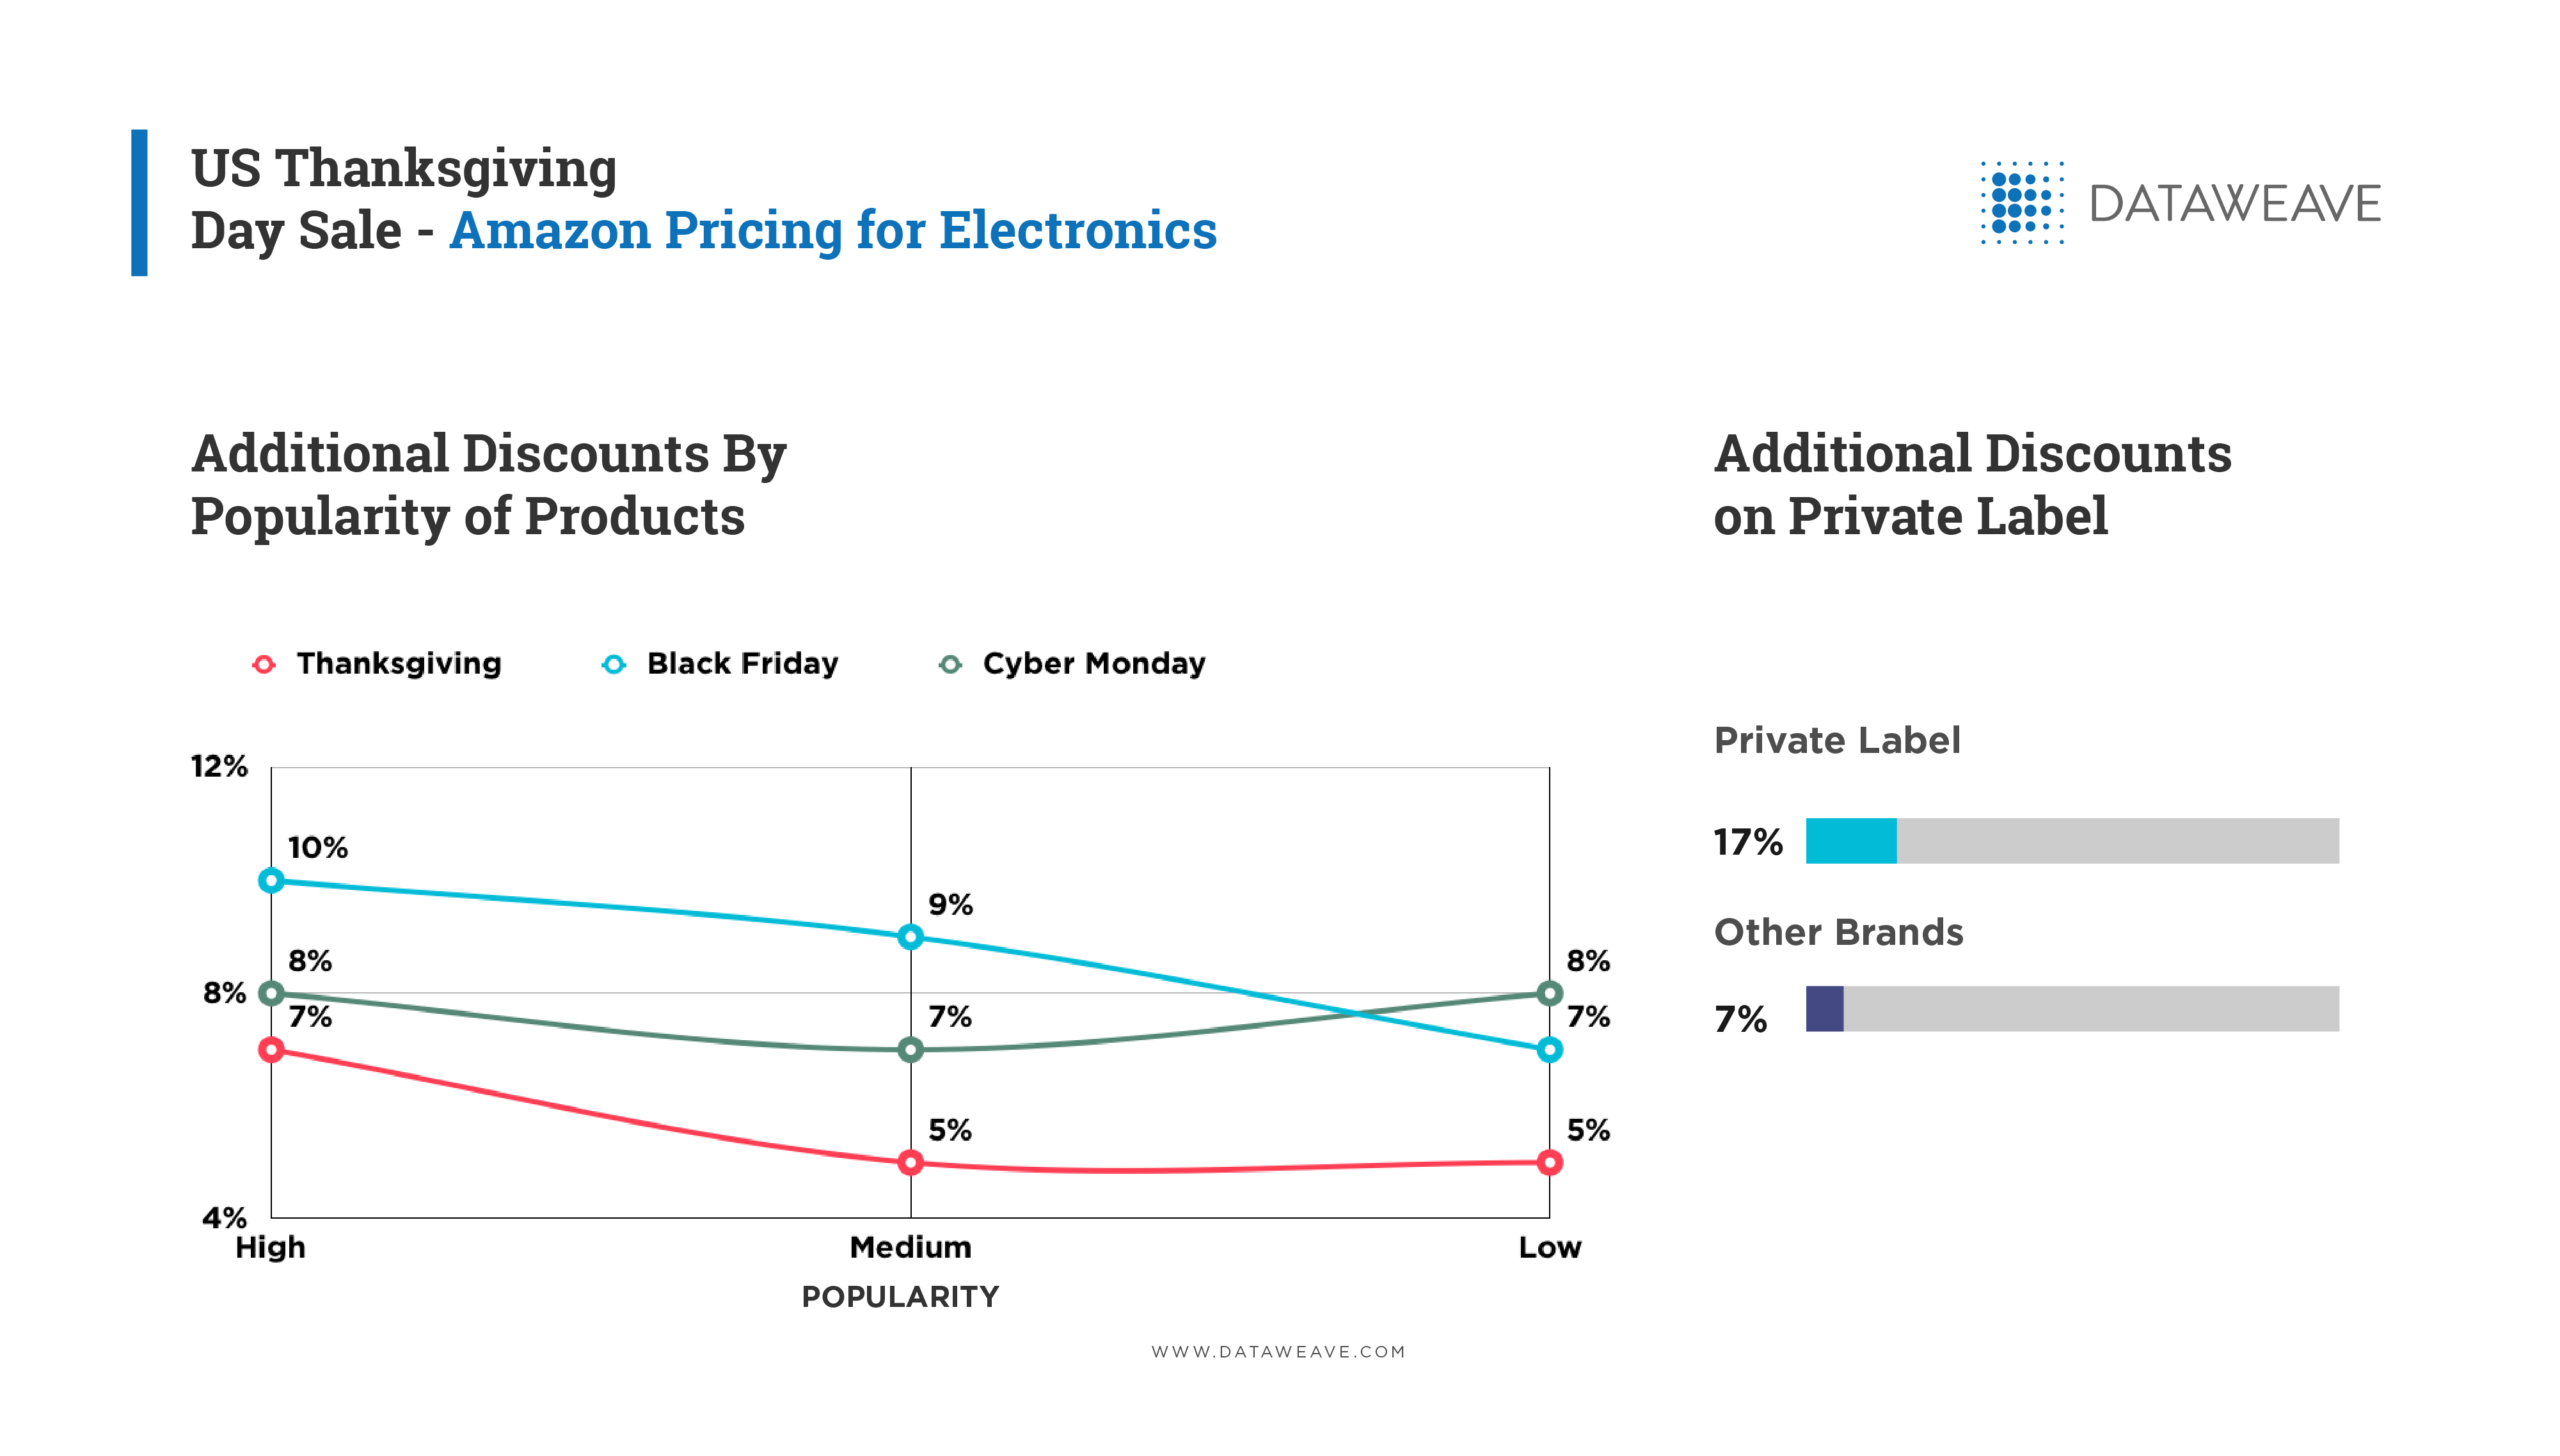
A review of retailers’ additional discounts by electronics’ popularity level reveals that most retailers allocated a bigger proportion of discounts on Cyber Monday than on Black Friday. Overstock was the exception. Again, clearing out 2020 inventory before year-end likely influenced retailers’ pricing strategies.
Overall, on Cyber Monday retailers showed a direct relationship between additional discounts and electronics’ popularity levels. For instance, Amazon offered additional discounts on 21.7% of highly popular electronics and 15.3% on moderately popular electronics. Since Amazon strives to be “The Everything Store,” it makes sense to make more products more appealing and affordable to more consumers. Meanwhile, Target offered nearly double the proportion of additional discounts of less popular electronics than discount rival Walmart (12.5% vs. 6.7%) to tempt value-seekers with deals.
Most retailers (Amazon, Best Buy, Target and Walmart) offered deeper discounts on Cyber Monday than Black Friday. Overstock was more generous on Black Friday.
On Cyber Monday, Target’s average additional discount (21.8%) was the most generous of all the retailers, nearly double that of Amazon (11.1%). However, Target’s discounts applied to 259 electronics products. vs. 903 for Amazon.
Both Amazon and Overstock gave their most generous discounts to less-popular electronics, possibly to clear out their inventory to make room for more popular or higher-margin items.
Black Friday & Cyber Monday 2020 Electronics Pricing Strategies
This year, the pandemic jolted consumers to focus on digital technology to stay connected to work, school and retail, which heightened demand for electronics.
In response, retailers’ 2020 pricing strategies for Black Friday and Cyber Monday suggest a desire to extend their reach beyond their core audience to maximize their brand appeal and steal rivals’ market share.
The Cyber Monday findings, in particular, suggest retailers decluttered their assortments to make space for the latest and highest-margin tech gadgets in time for Christmas.
Click here for more Black Friday and Cyber Monday 2020 analysis for greater clarity on the evolving pricing positions of retail rivals across top e-commerce categories.