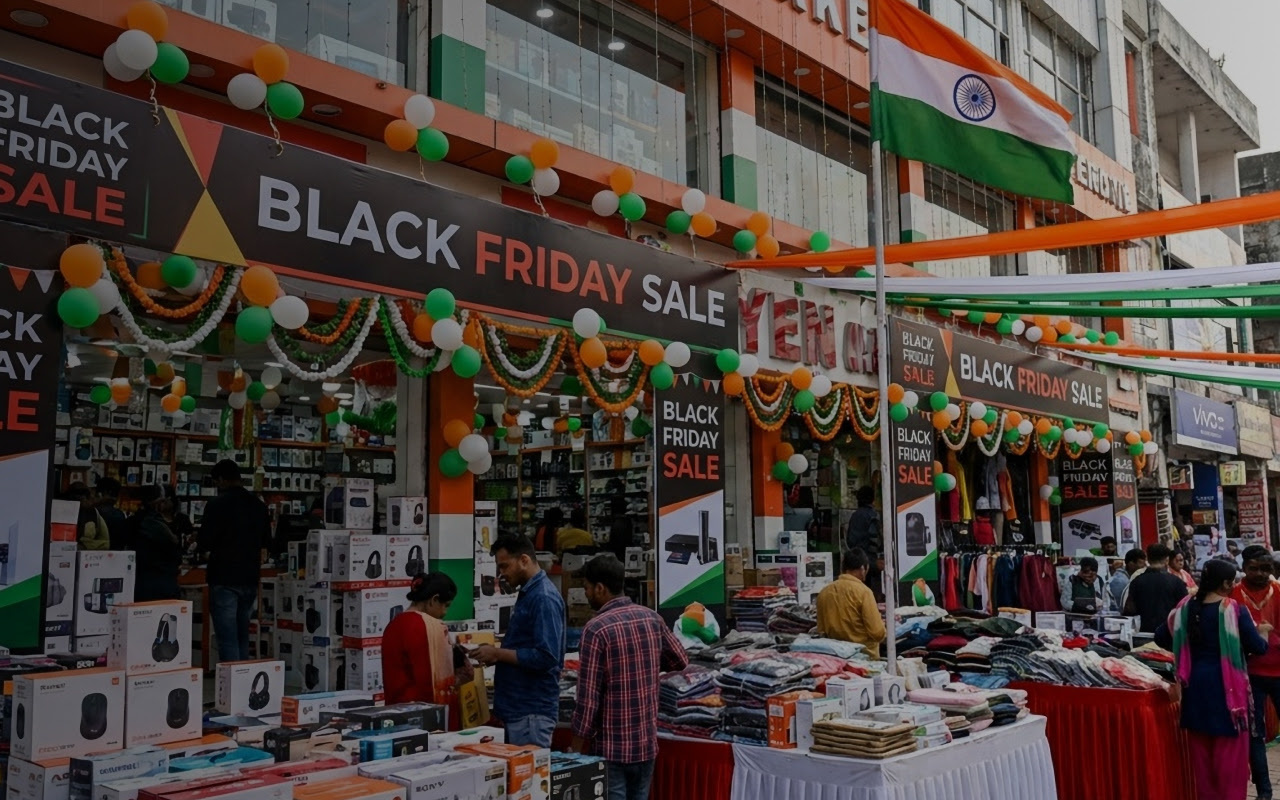
Black Friday has evolved from a purely Western retail phenomenon into a global shopping event. India is no exception. While the country celebrates its own mega sale events like the Great Indian Festival and Big Billion Days, Black Friday has carved out its own space in the Indian retail calendar. E-commerce in India is expected to reach $325 billion by 2030, with festive shopping seasons driving significant portions of that growth.
So how did Indian retailers and brands navigate Black Friday 2025? At DataWeave, we analyzed pricing trends across four major categories: Consumer Electronics, Home & Furniture, Health & Beauty, and Apparel. Our AI-powered retail intelligence platform tracked nearly 128,000 SKUs across leading platforms including Amazon India, Flipkart, Myntra, and others, revealing how the Indian market approached discounting and brand visibility during this high-stakes shopping period.
Our Methodology
DataWeave monitored average discount percentages across major Indian e-commerce platforms during two distinct periods:
- Pre-Black Friday: Up to November 23, 2025 – capturing early promotional activity and baseline pricing
- Black Friday Week: November 24 – December 1,2025 – spanning Thanksgiving week through Black Friday (November 28) and Cyber Monday (December 1)
We analyzed top-ranked products across subcategories on major retail sites, alongside Share of Search data, a metric that measures brand visibility by tracking which brand names appear in the top 20 search results for high-intent keywords.
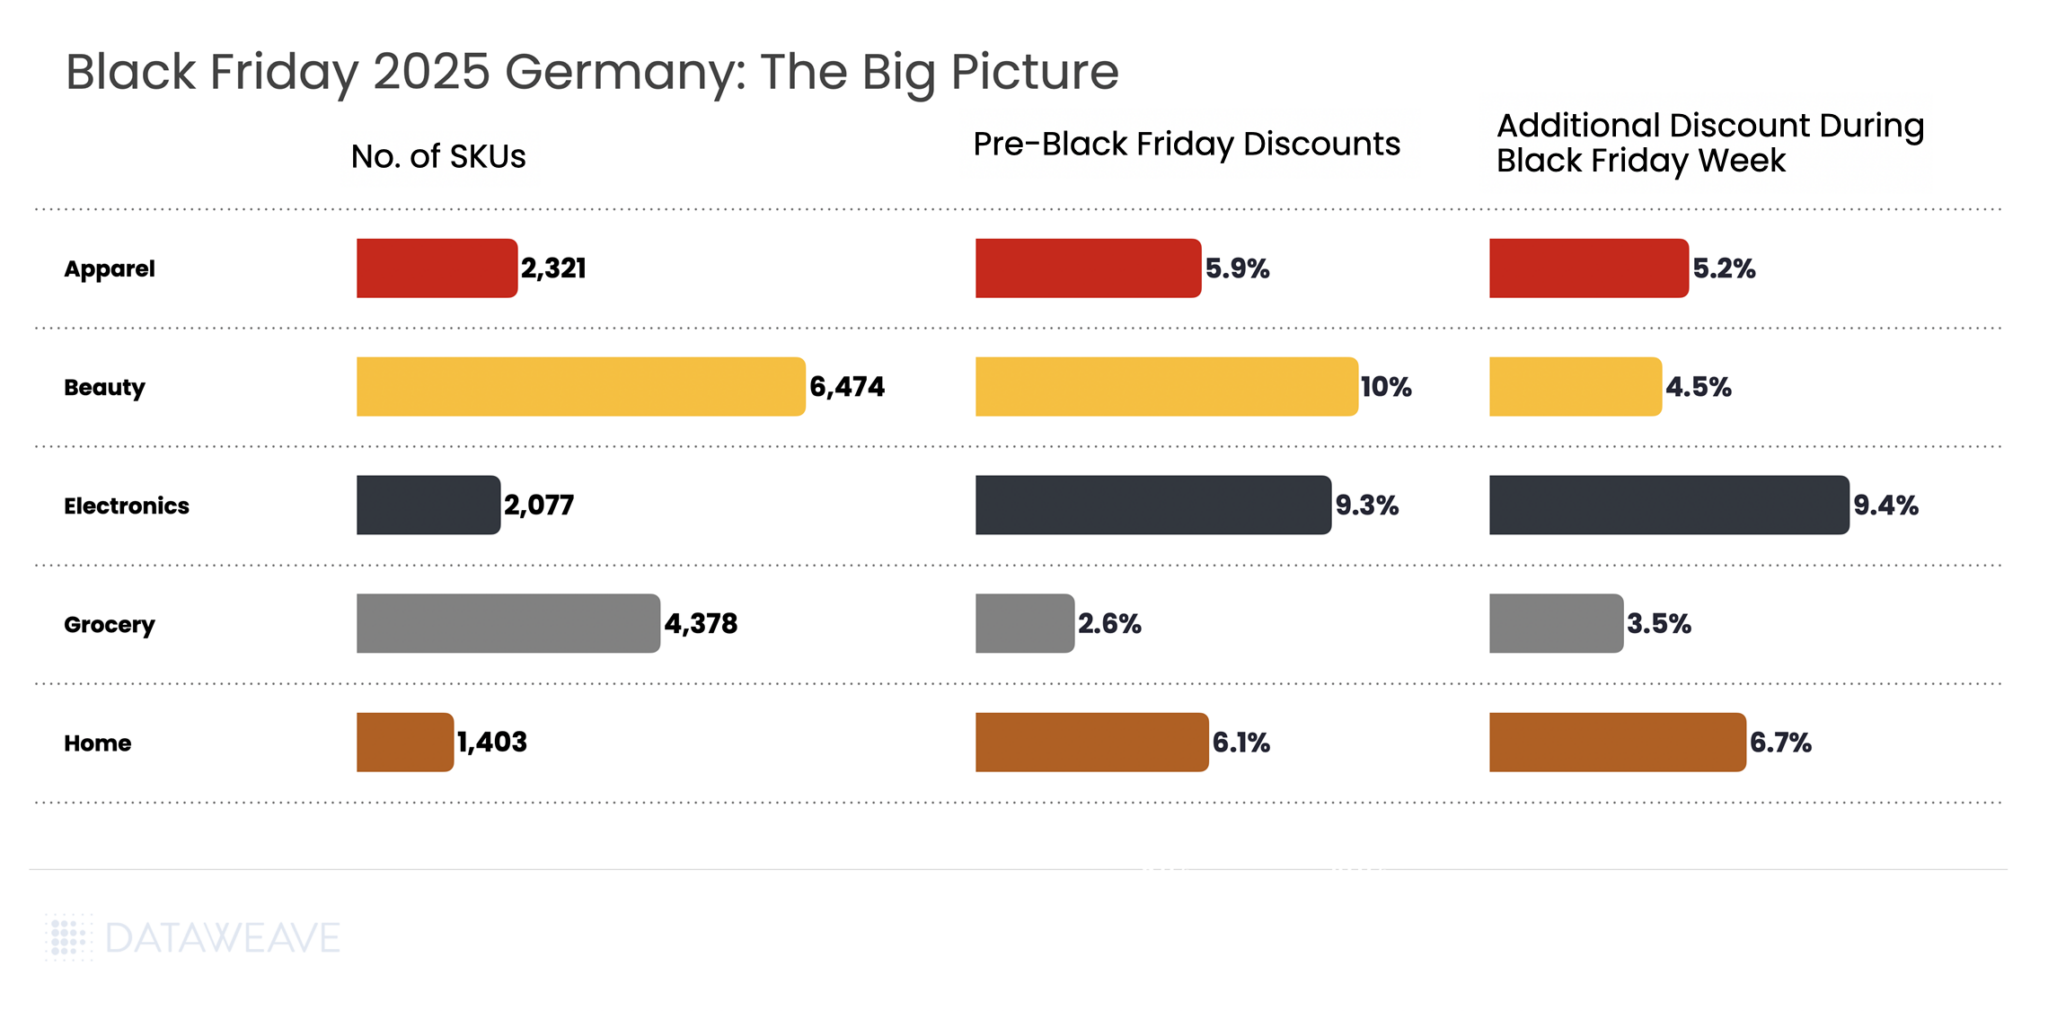
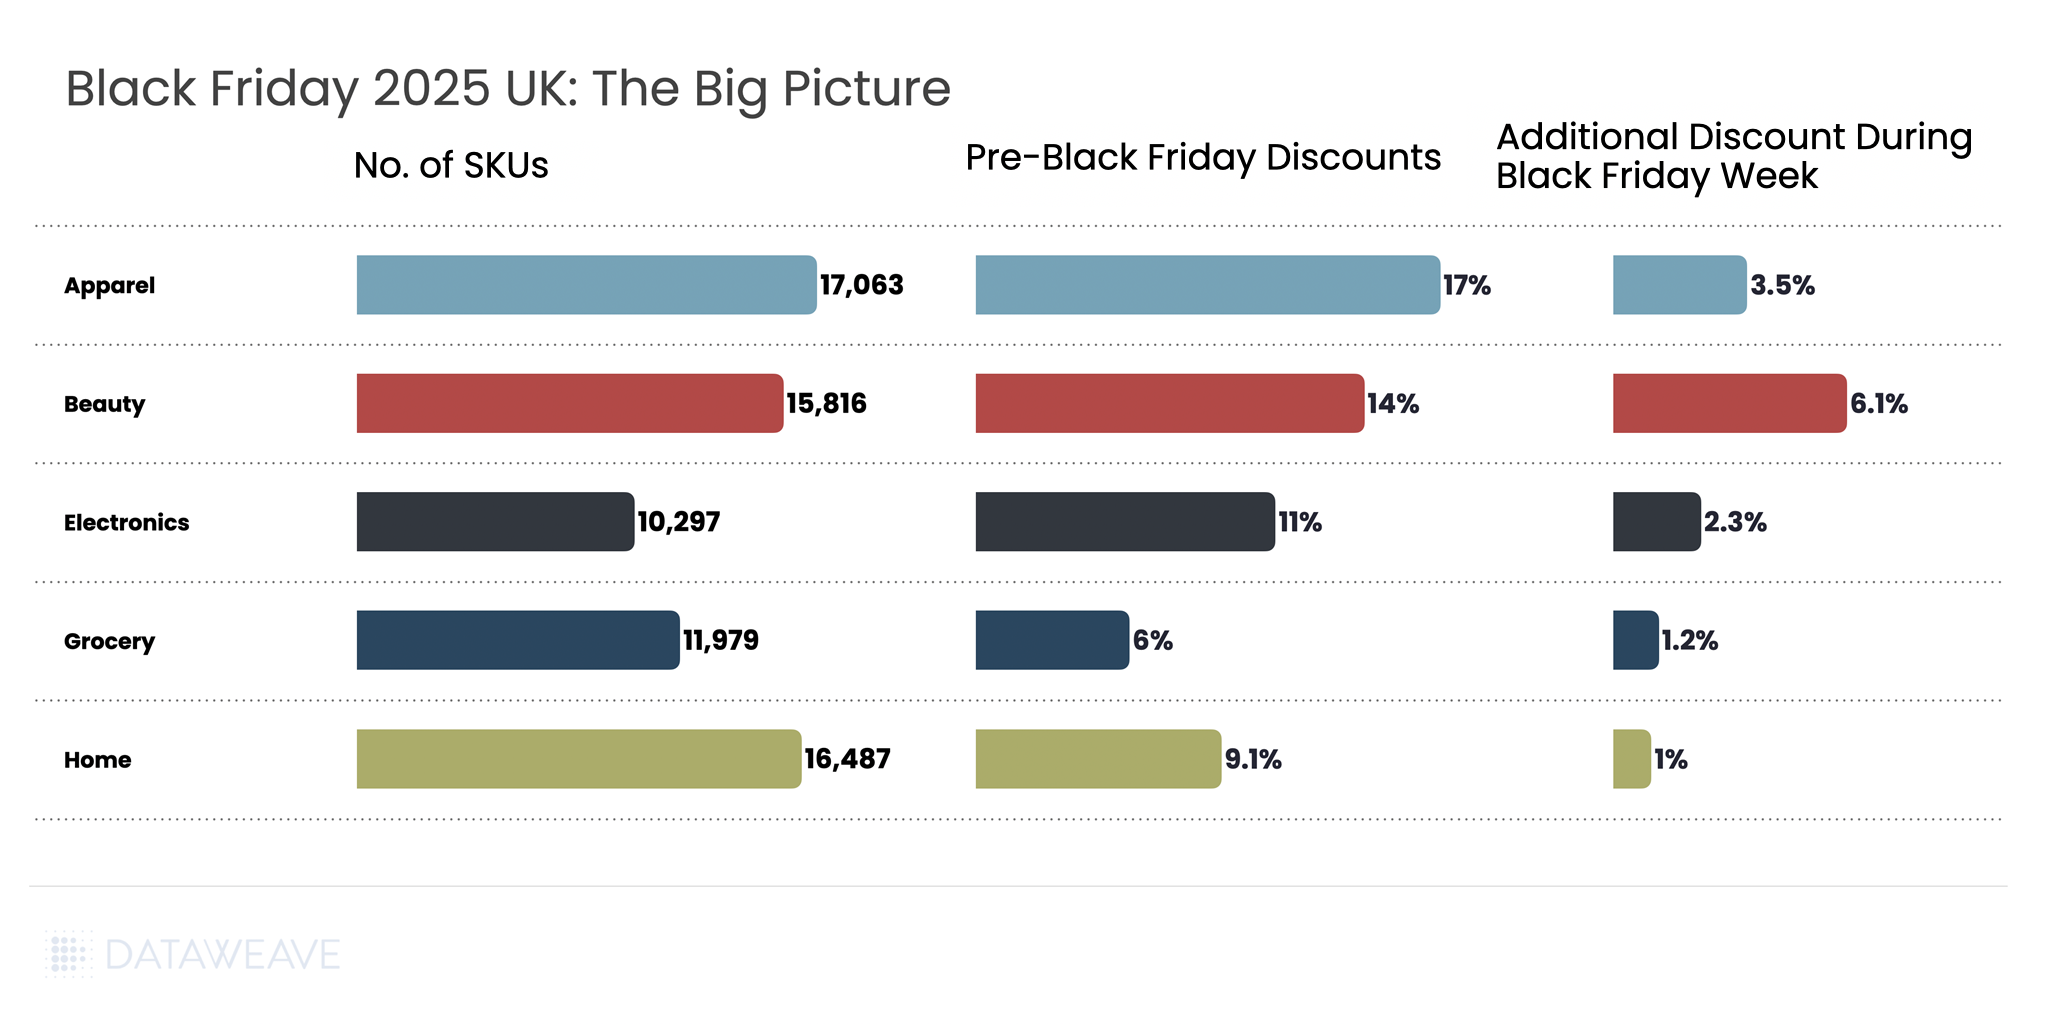
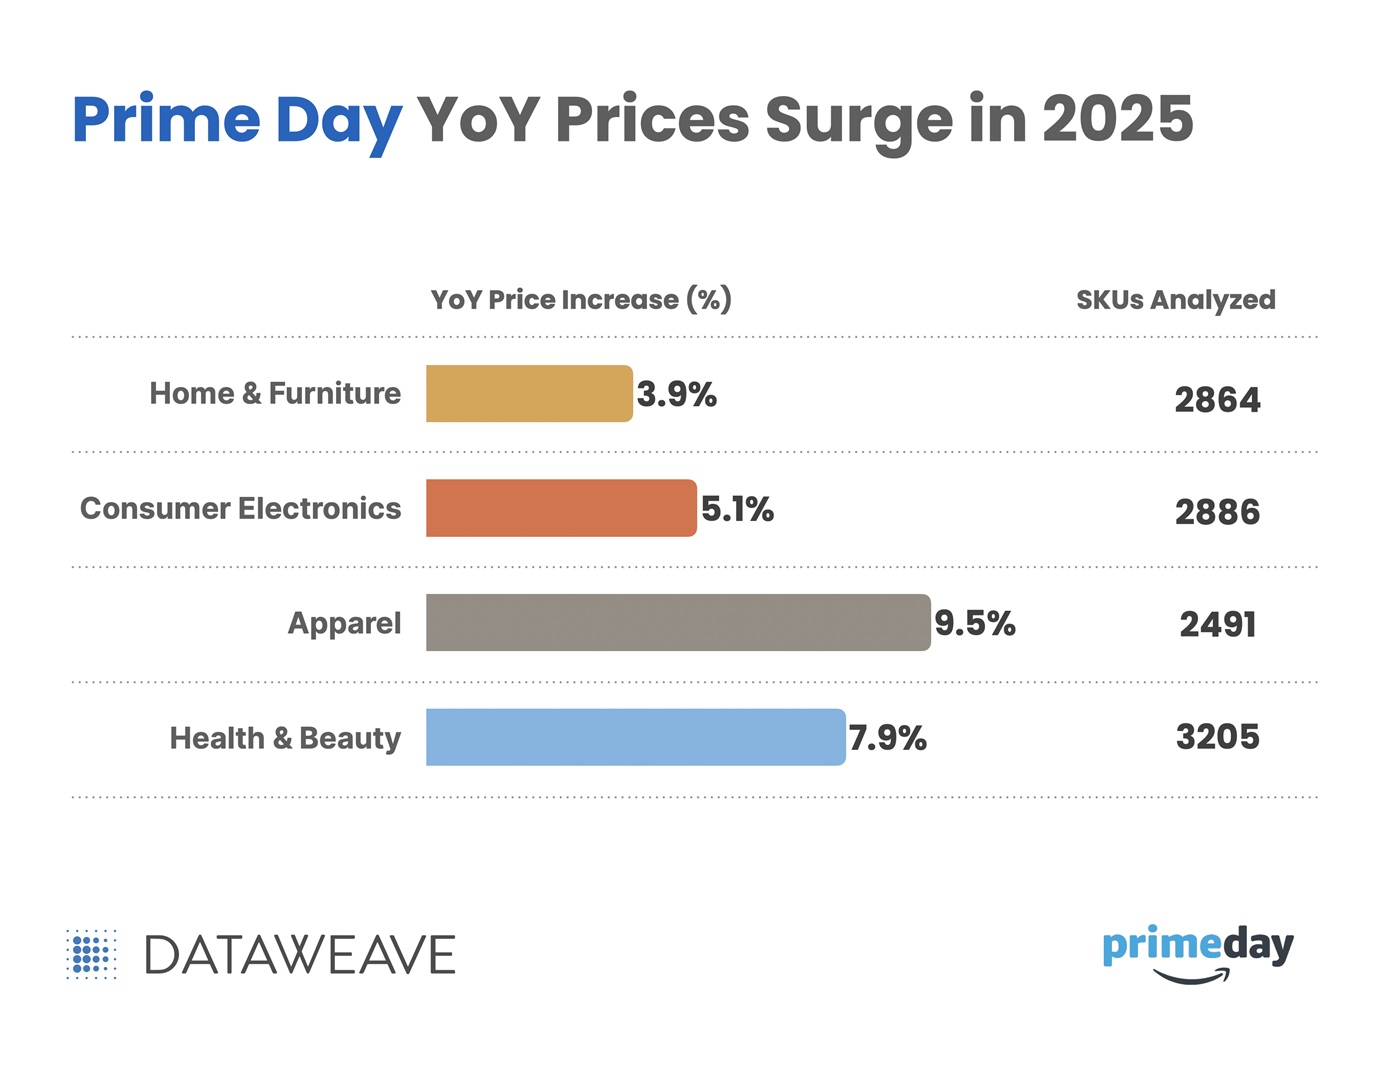
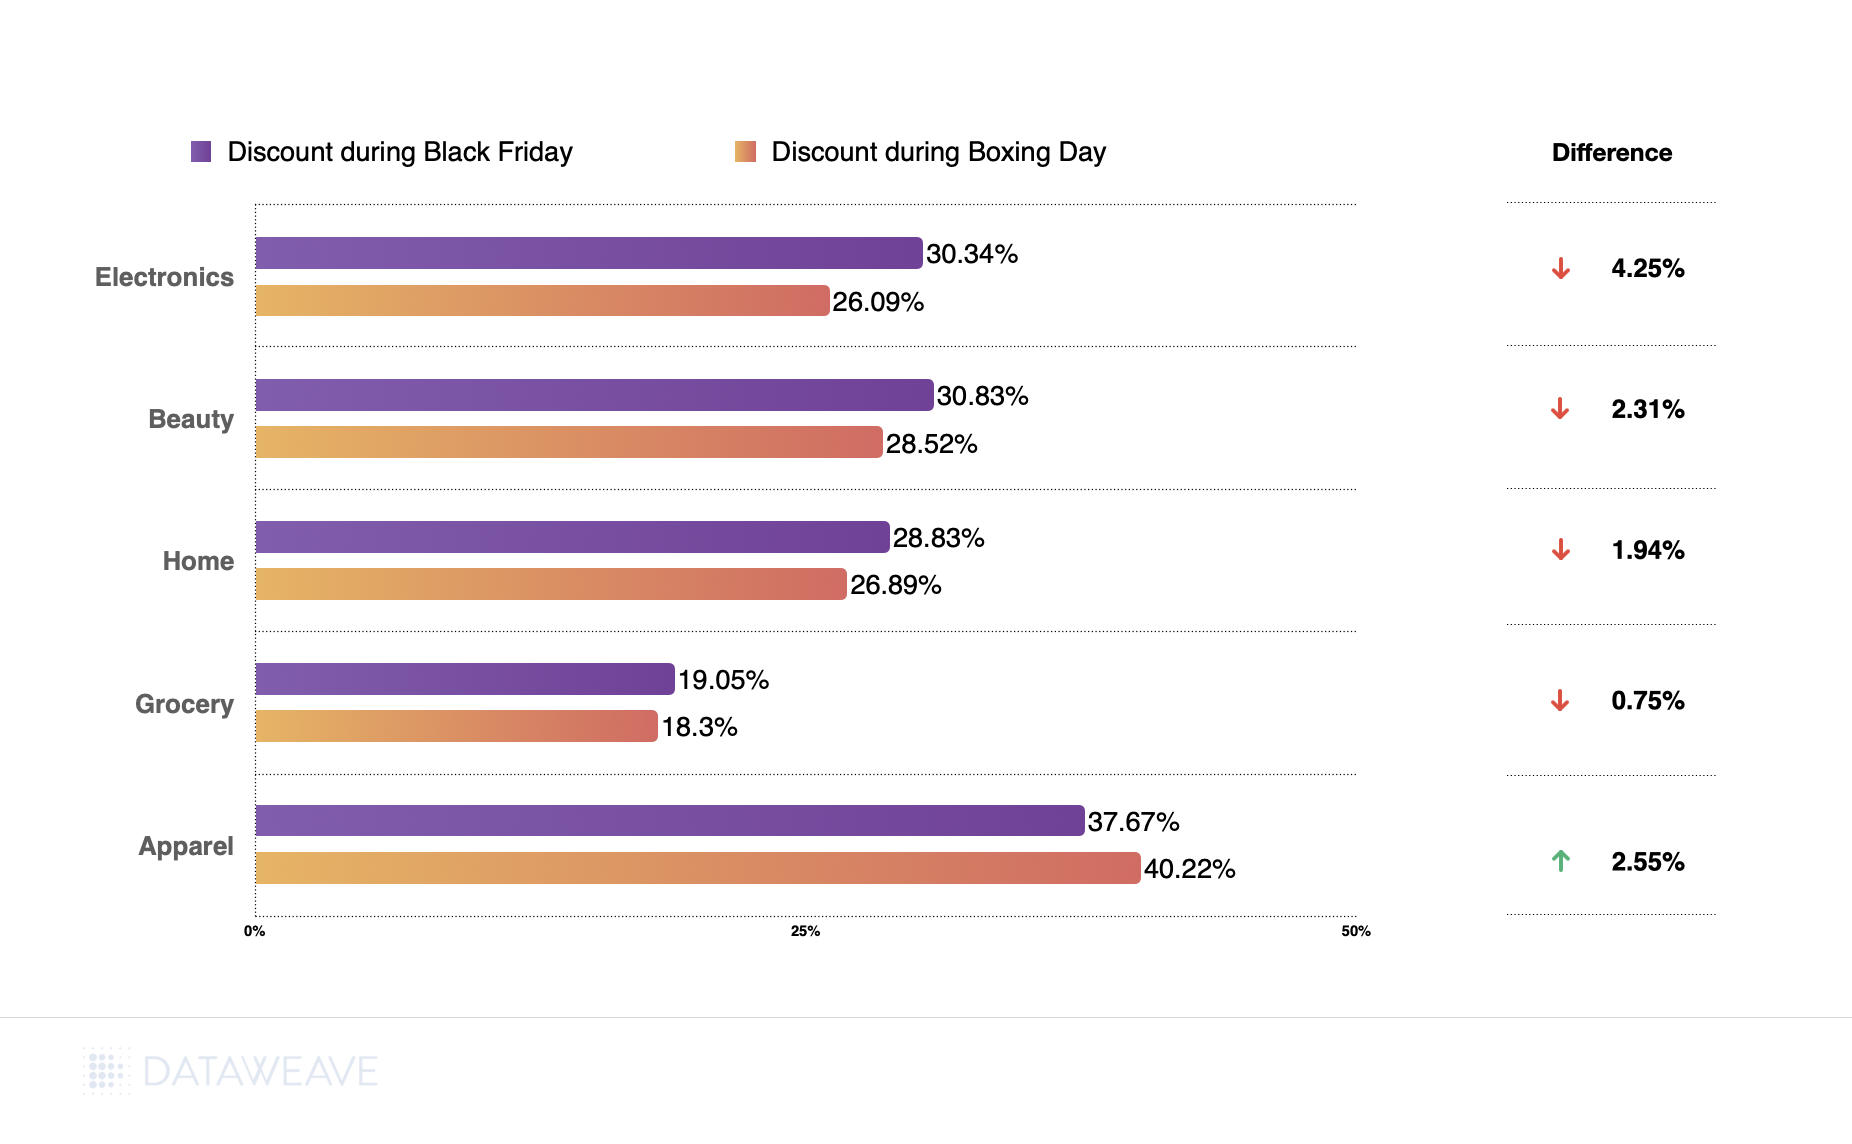
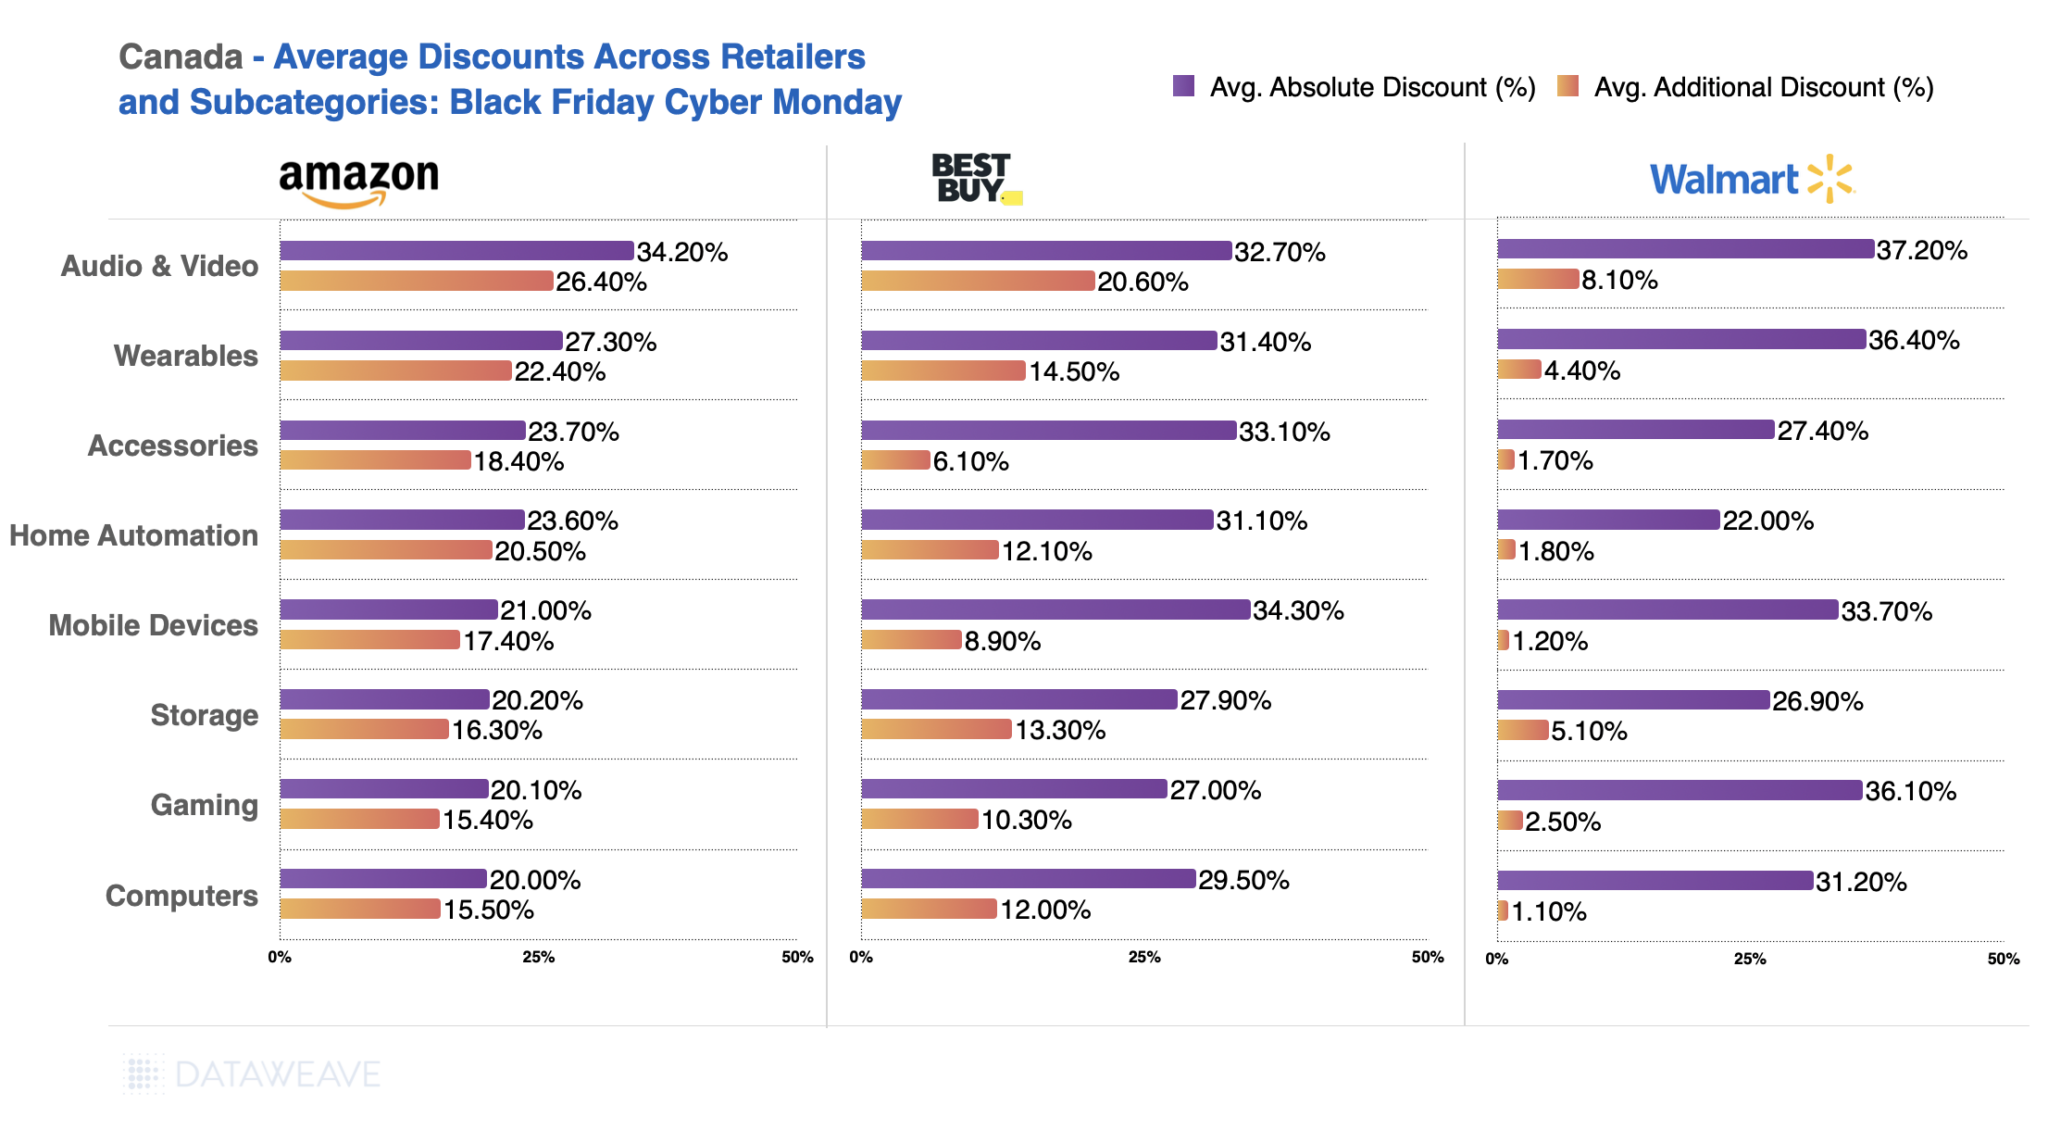
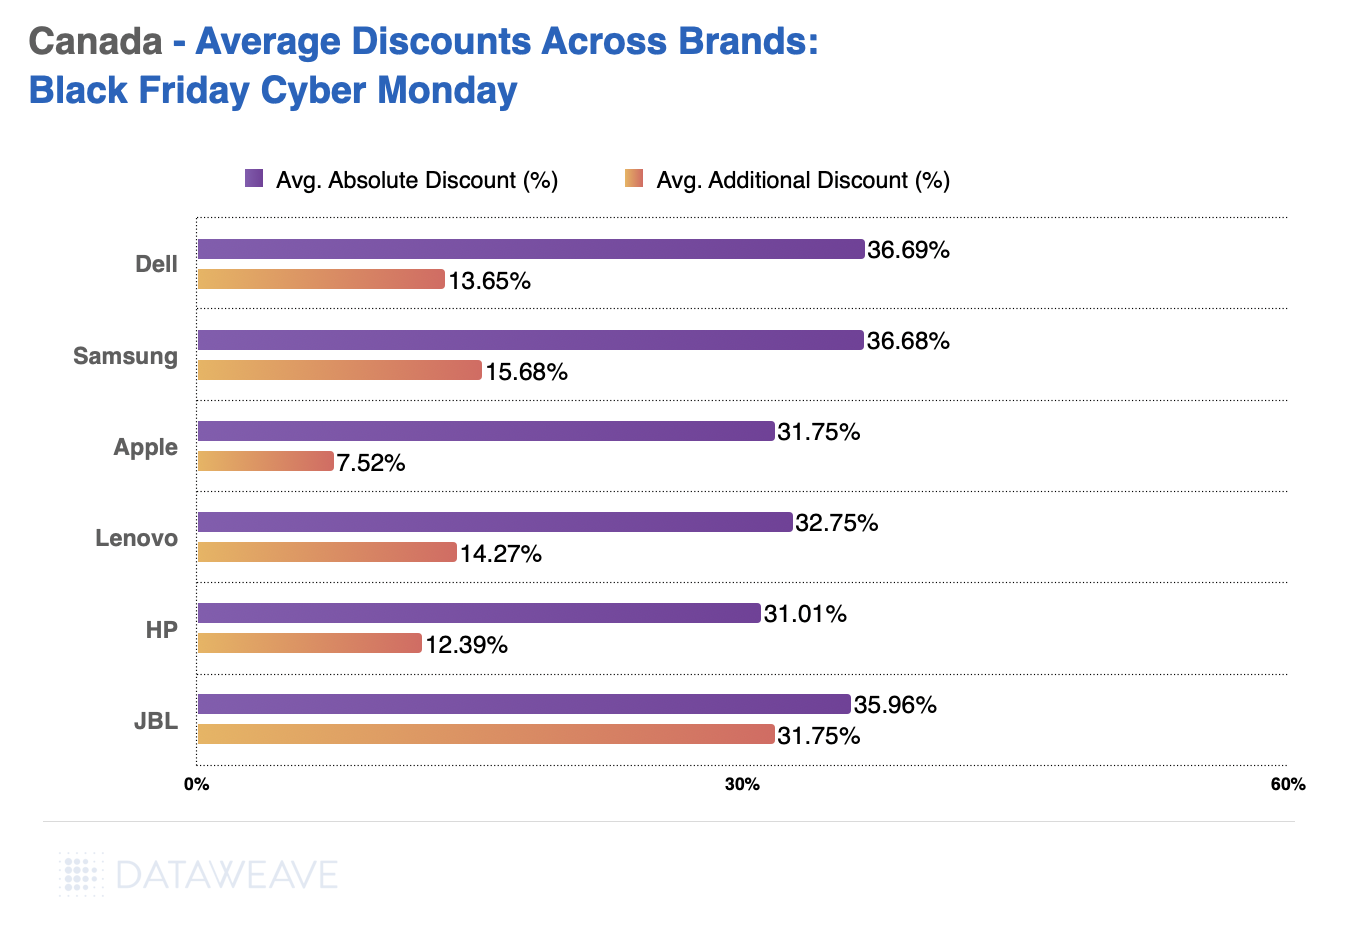
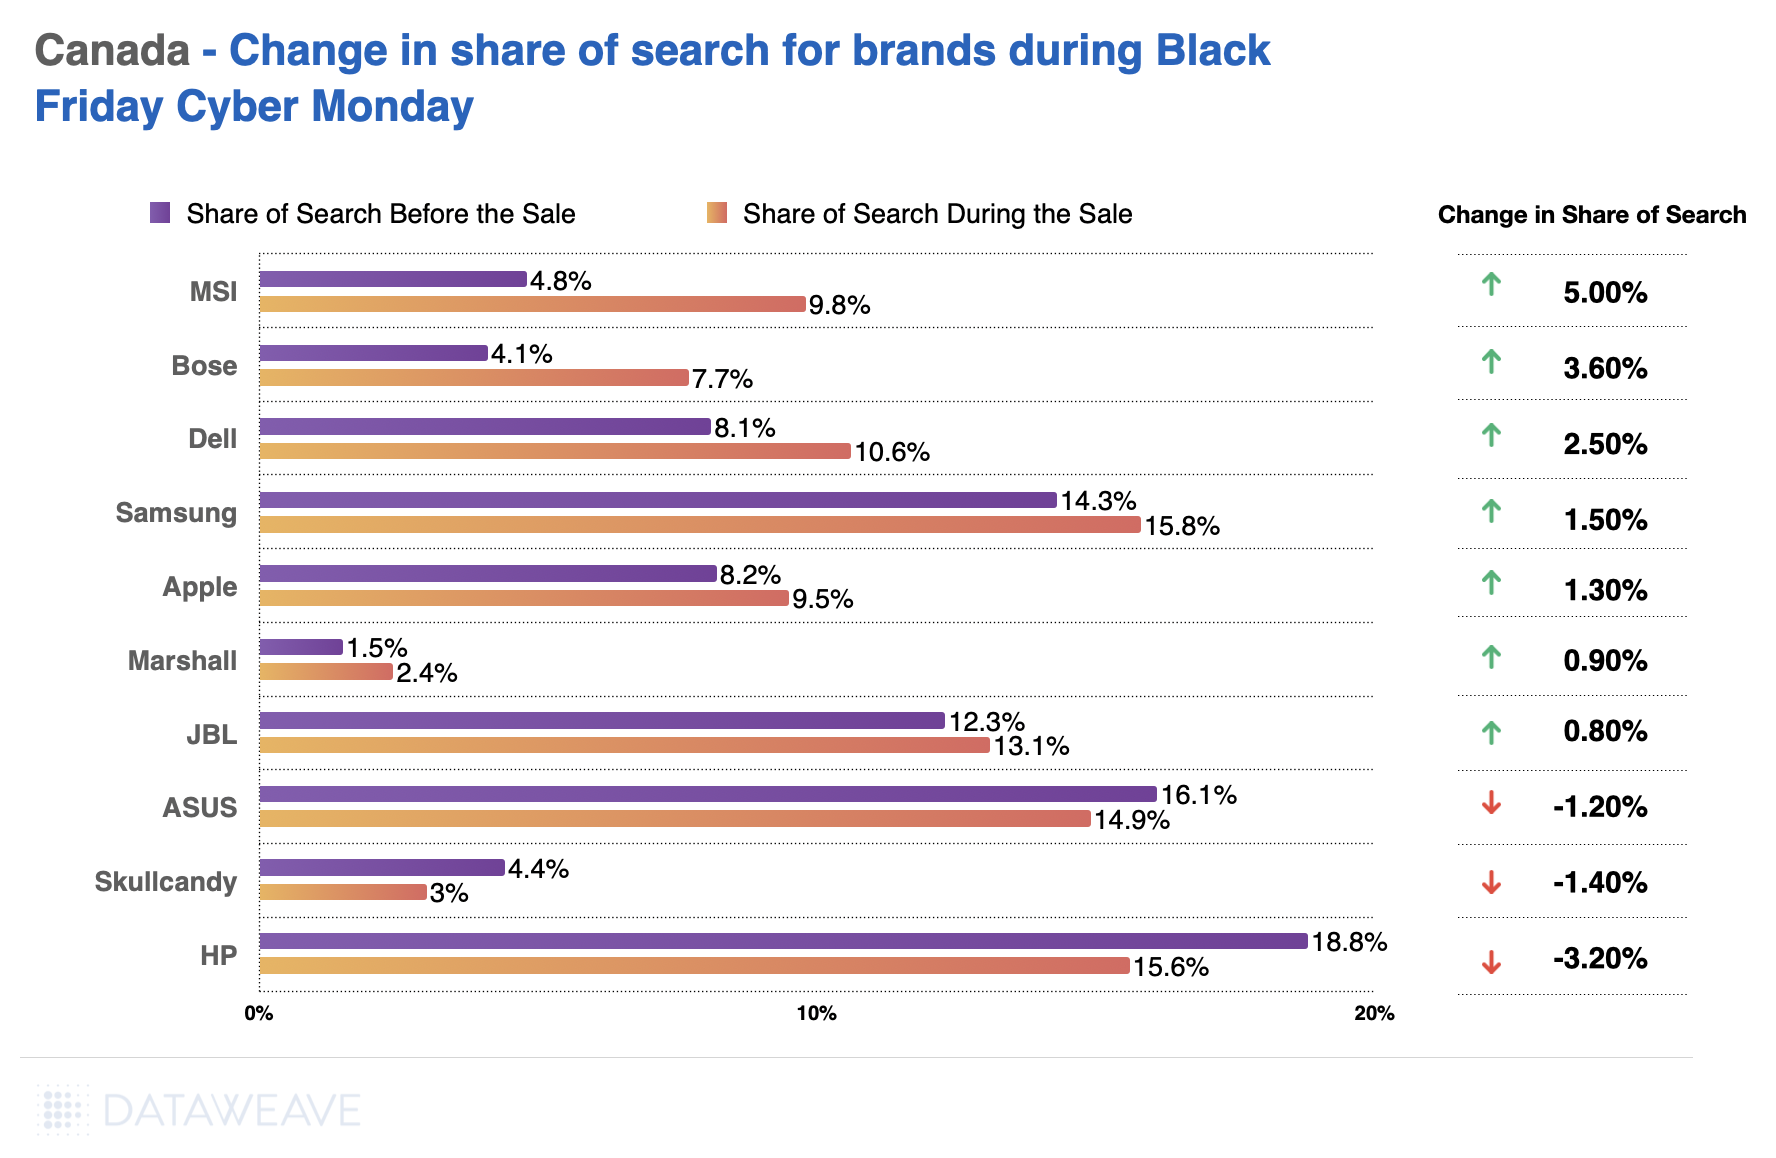
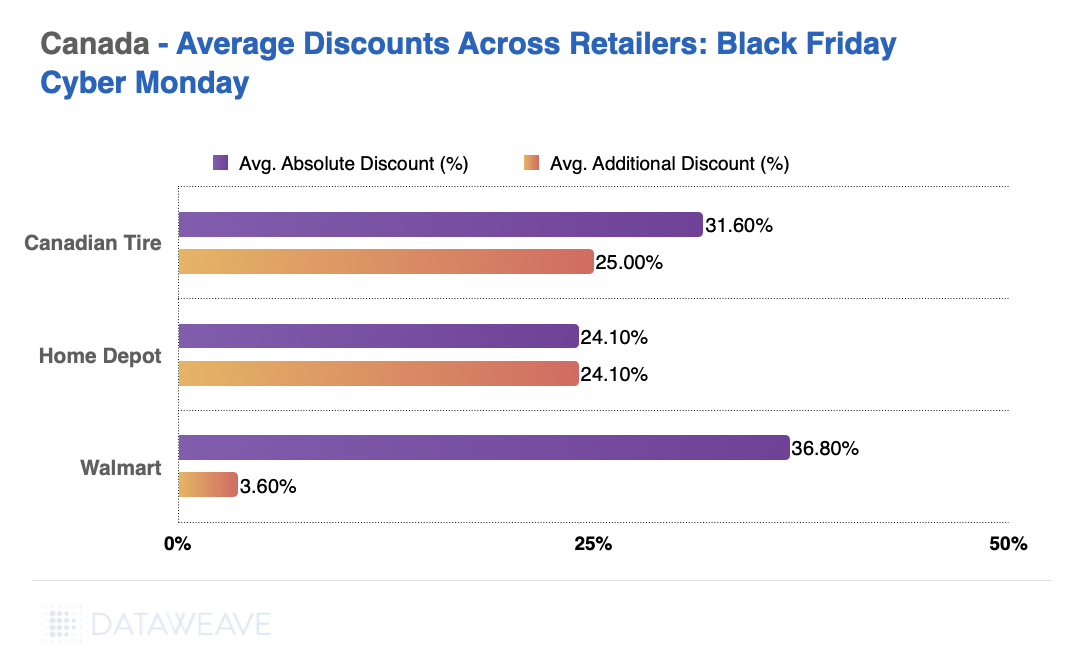
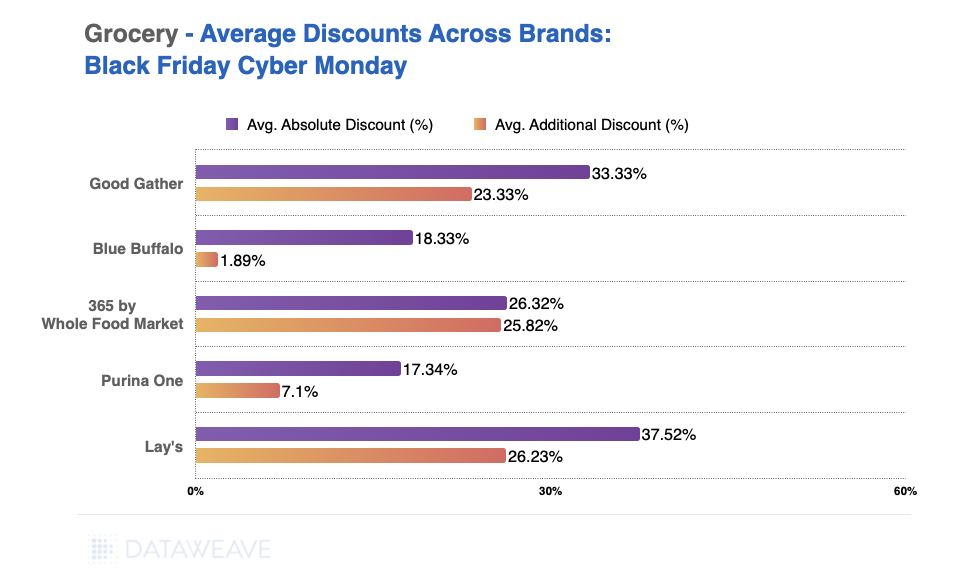
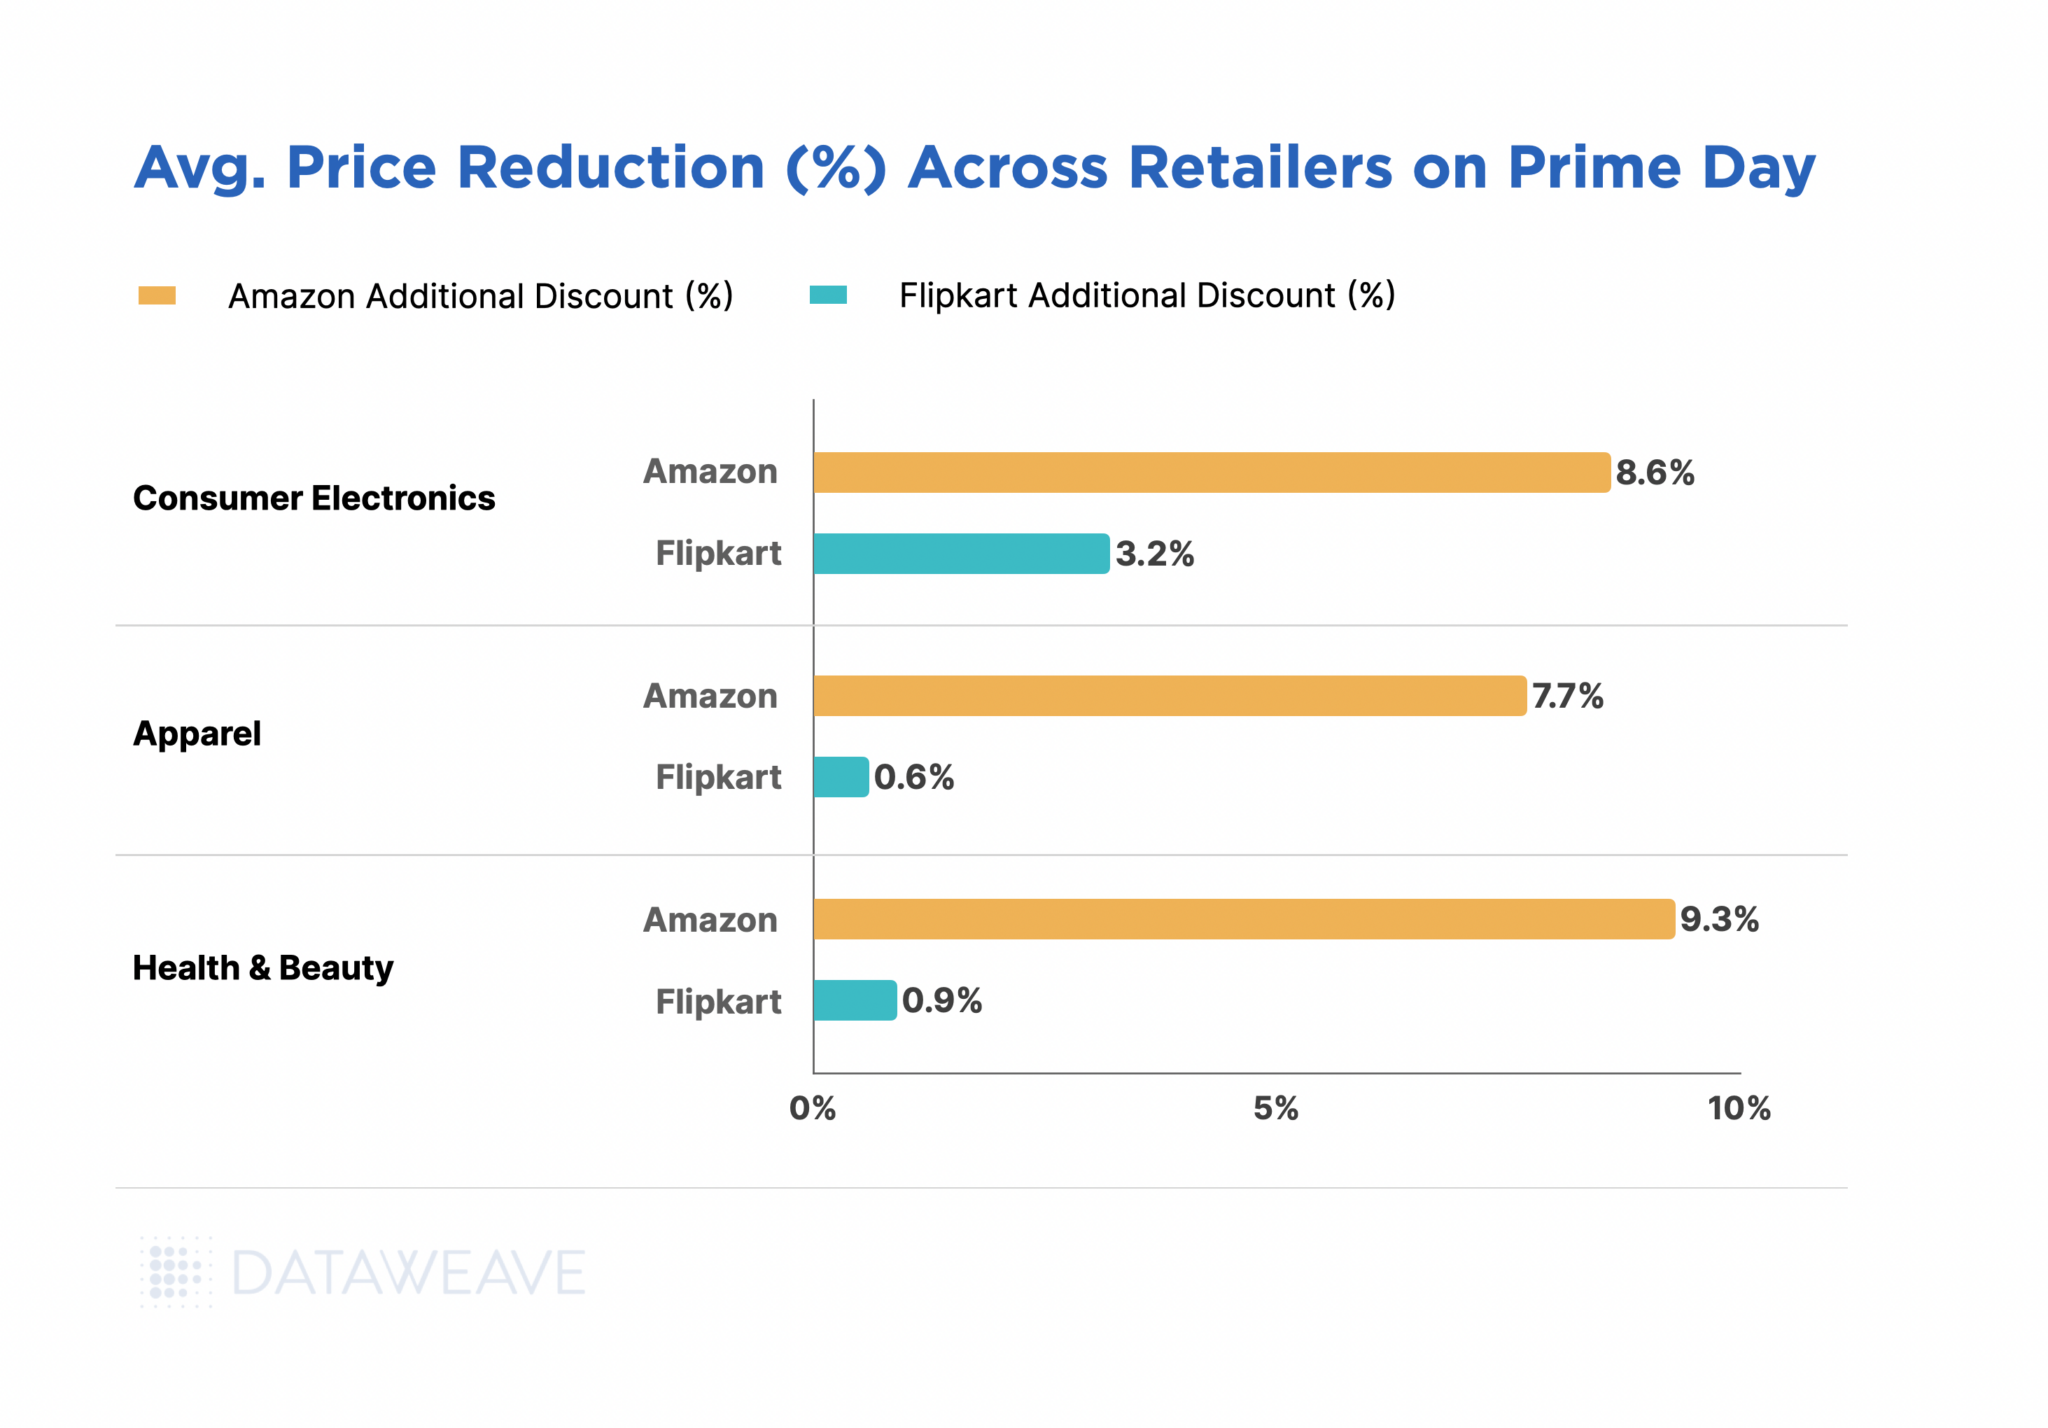
Here’s a quick look at the overall discounts this Black Friday in India:
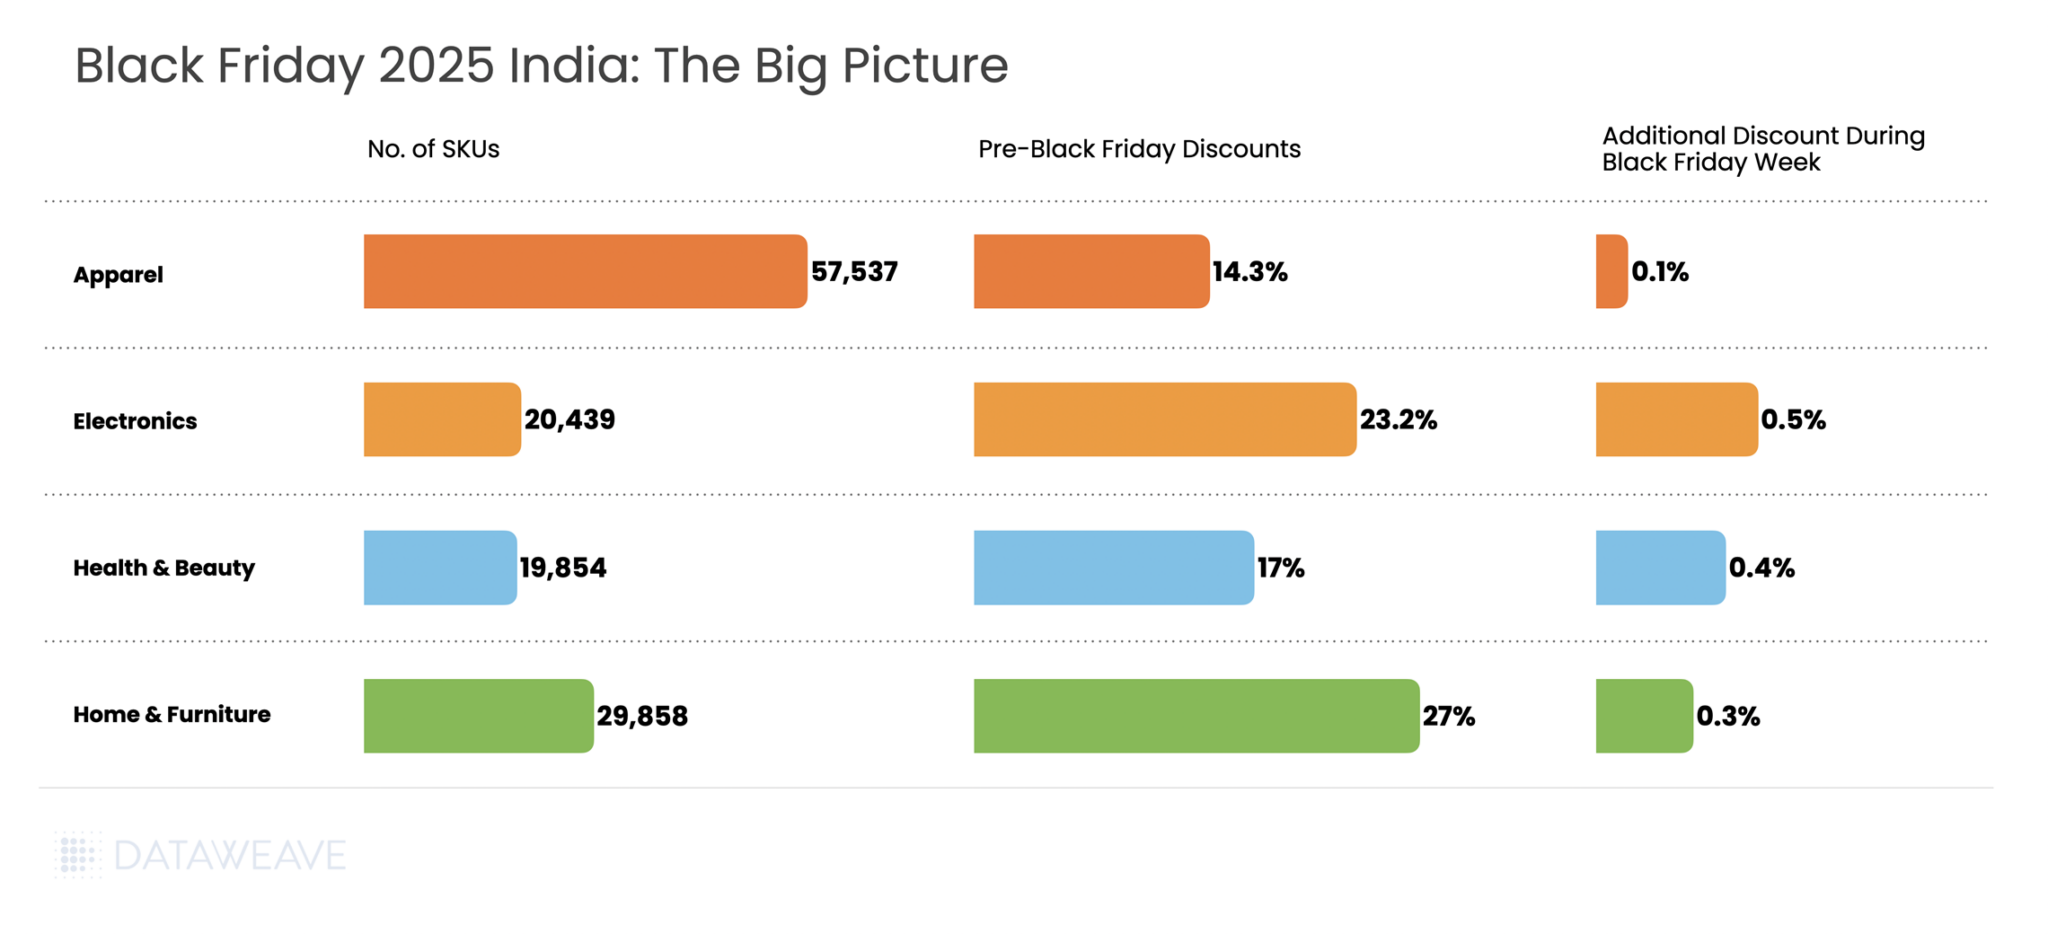
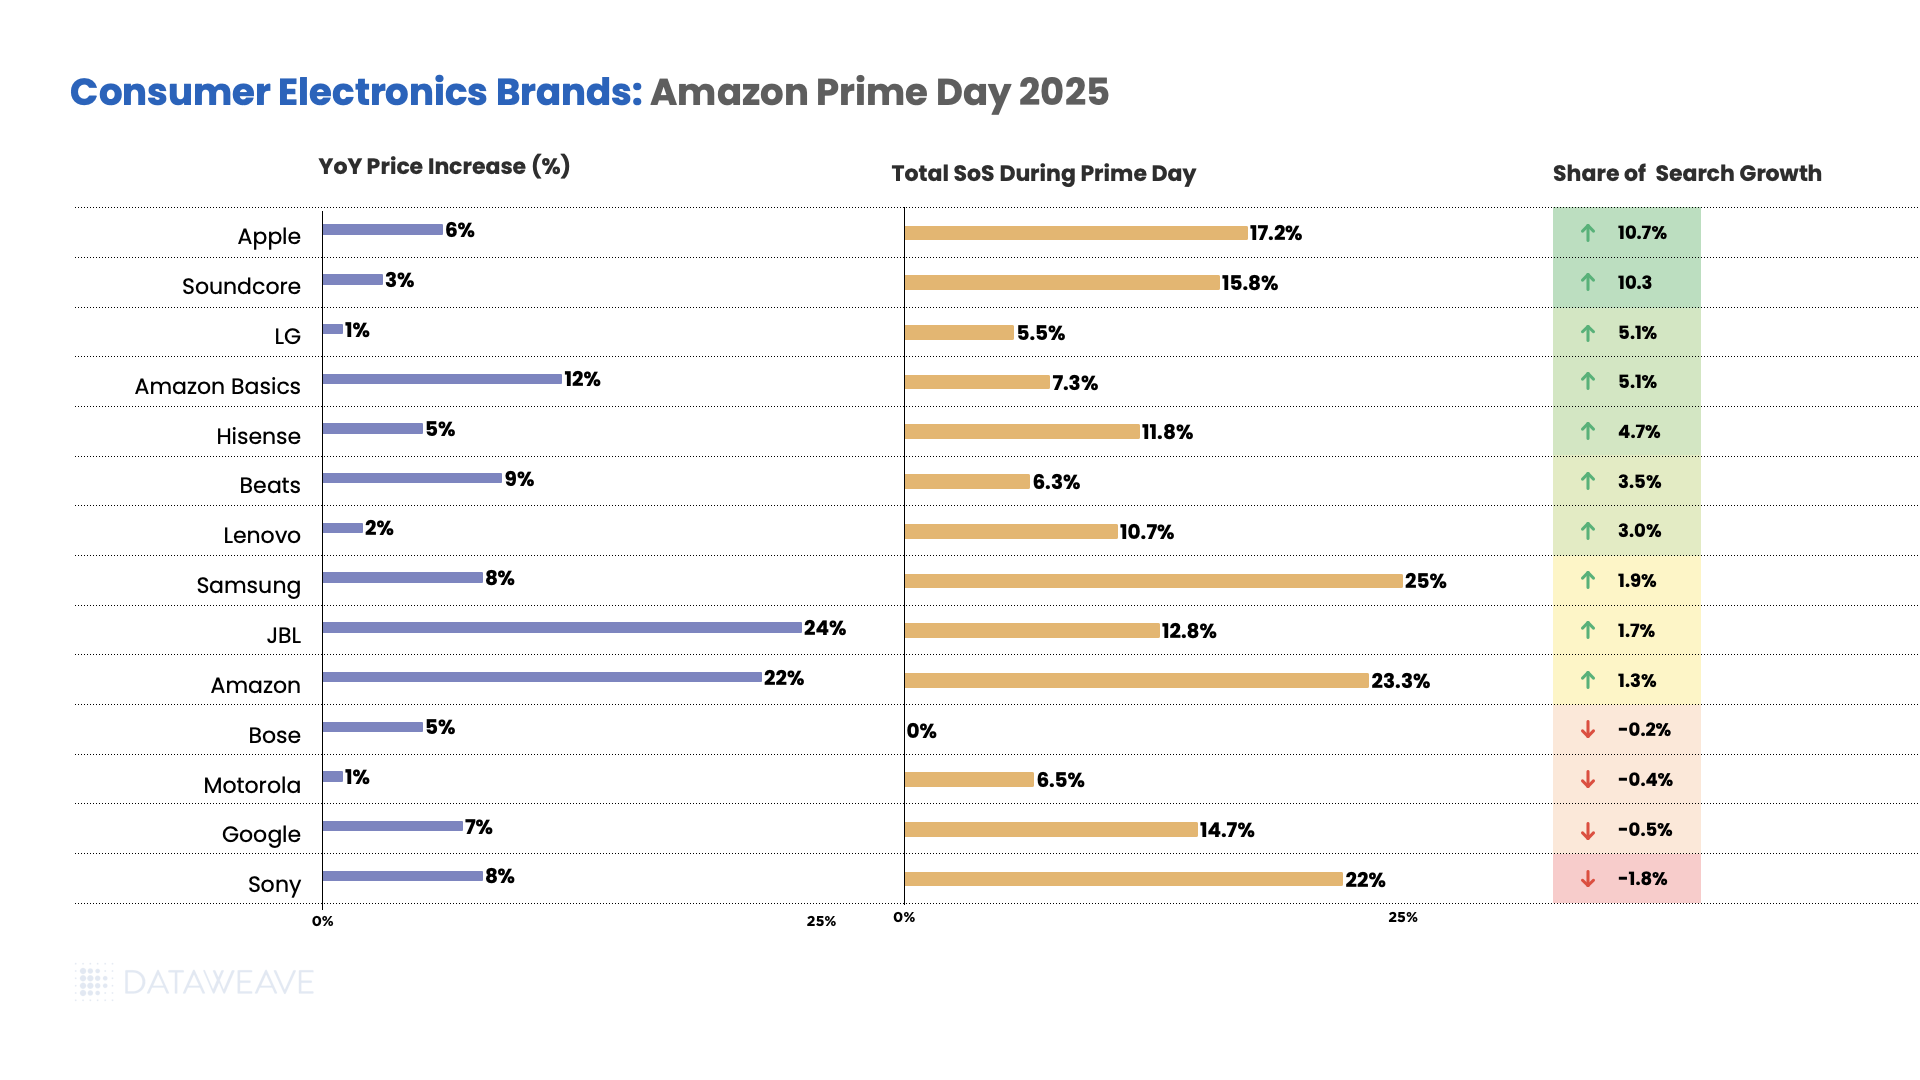
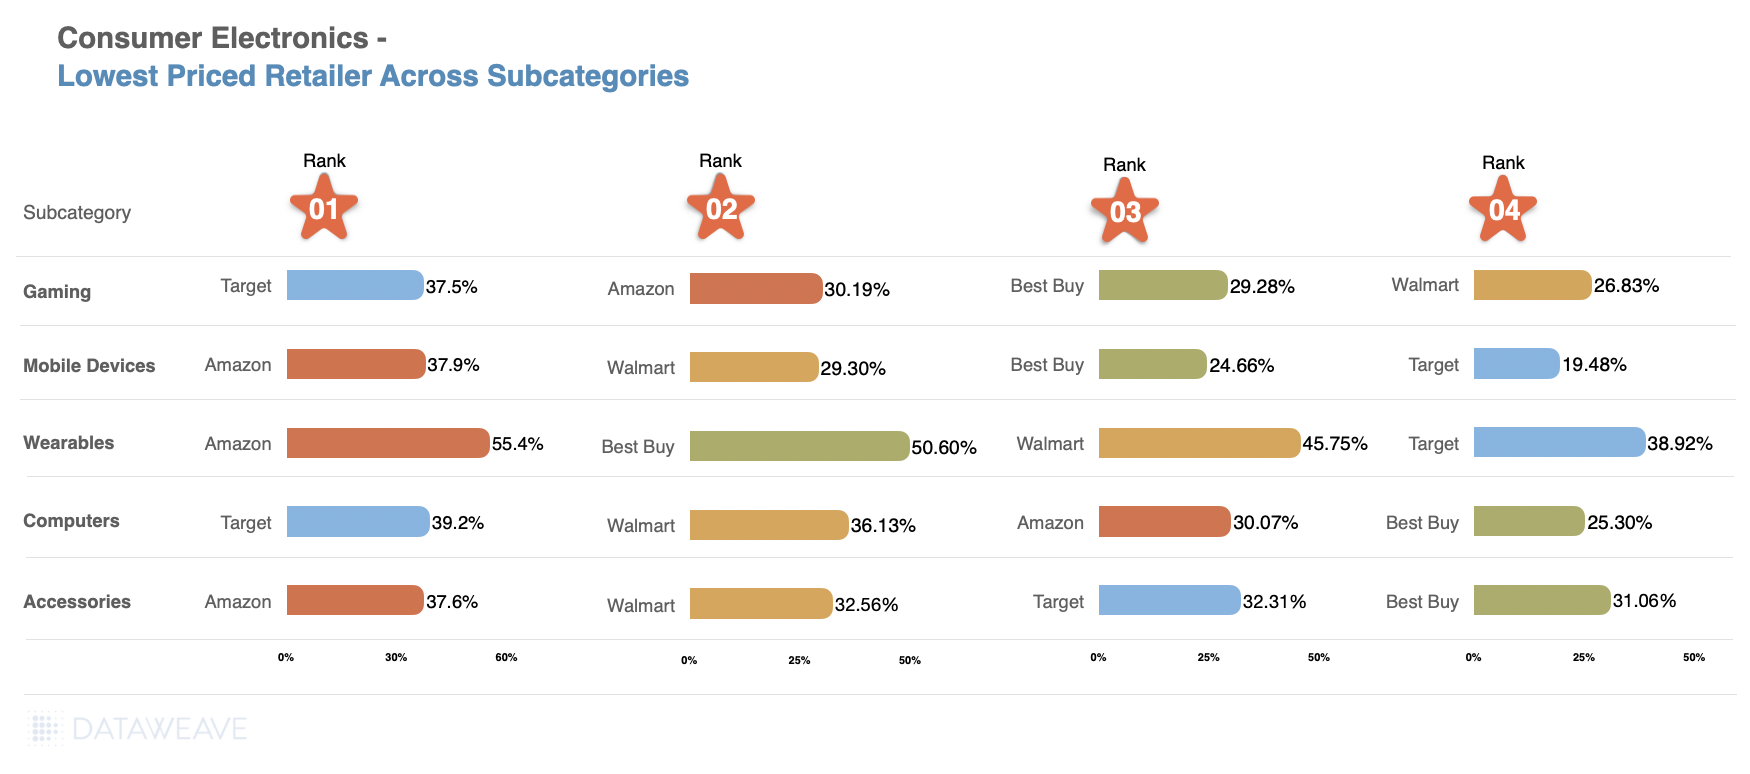
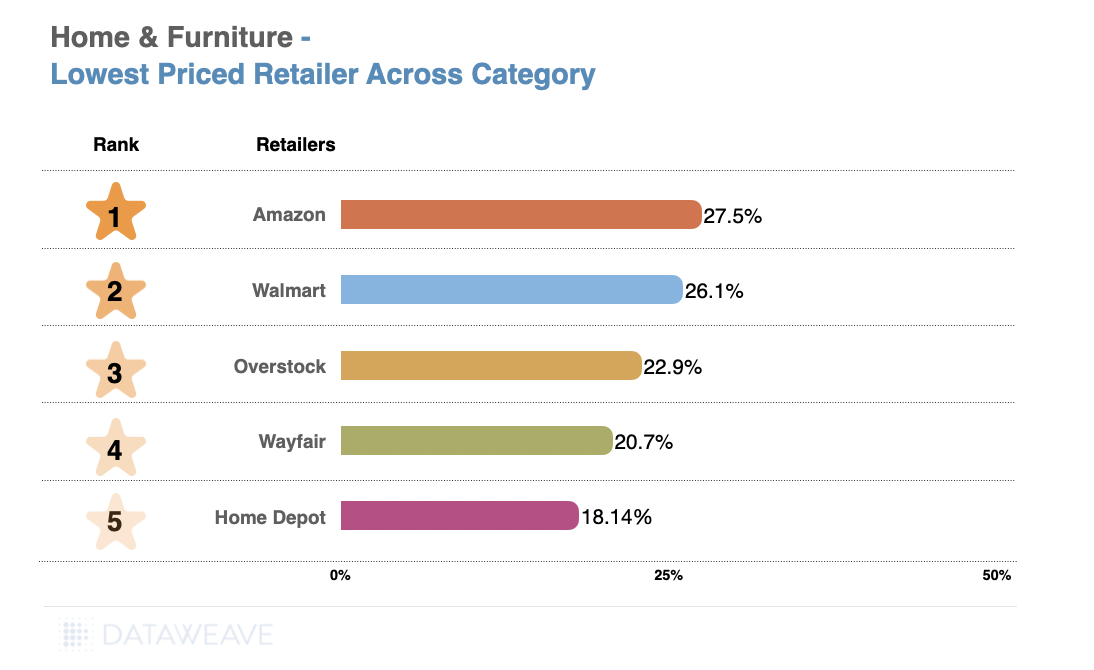
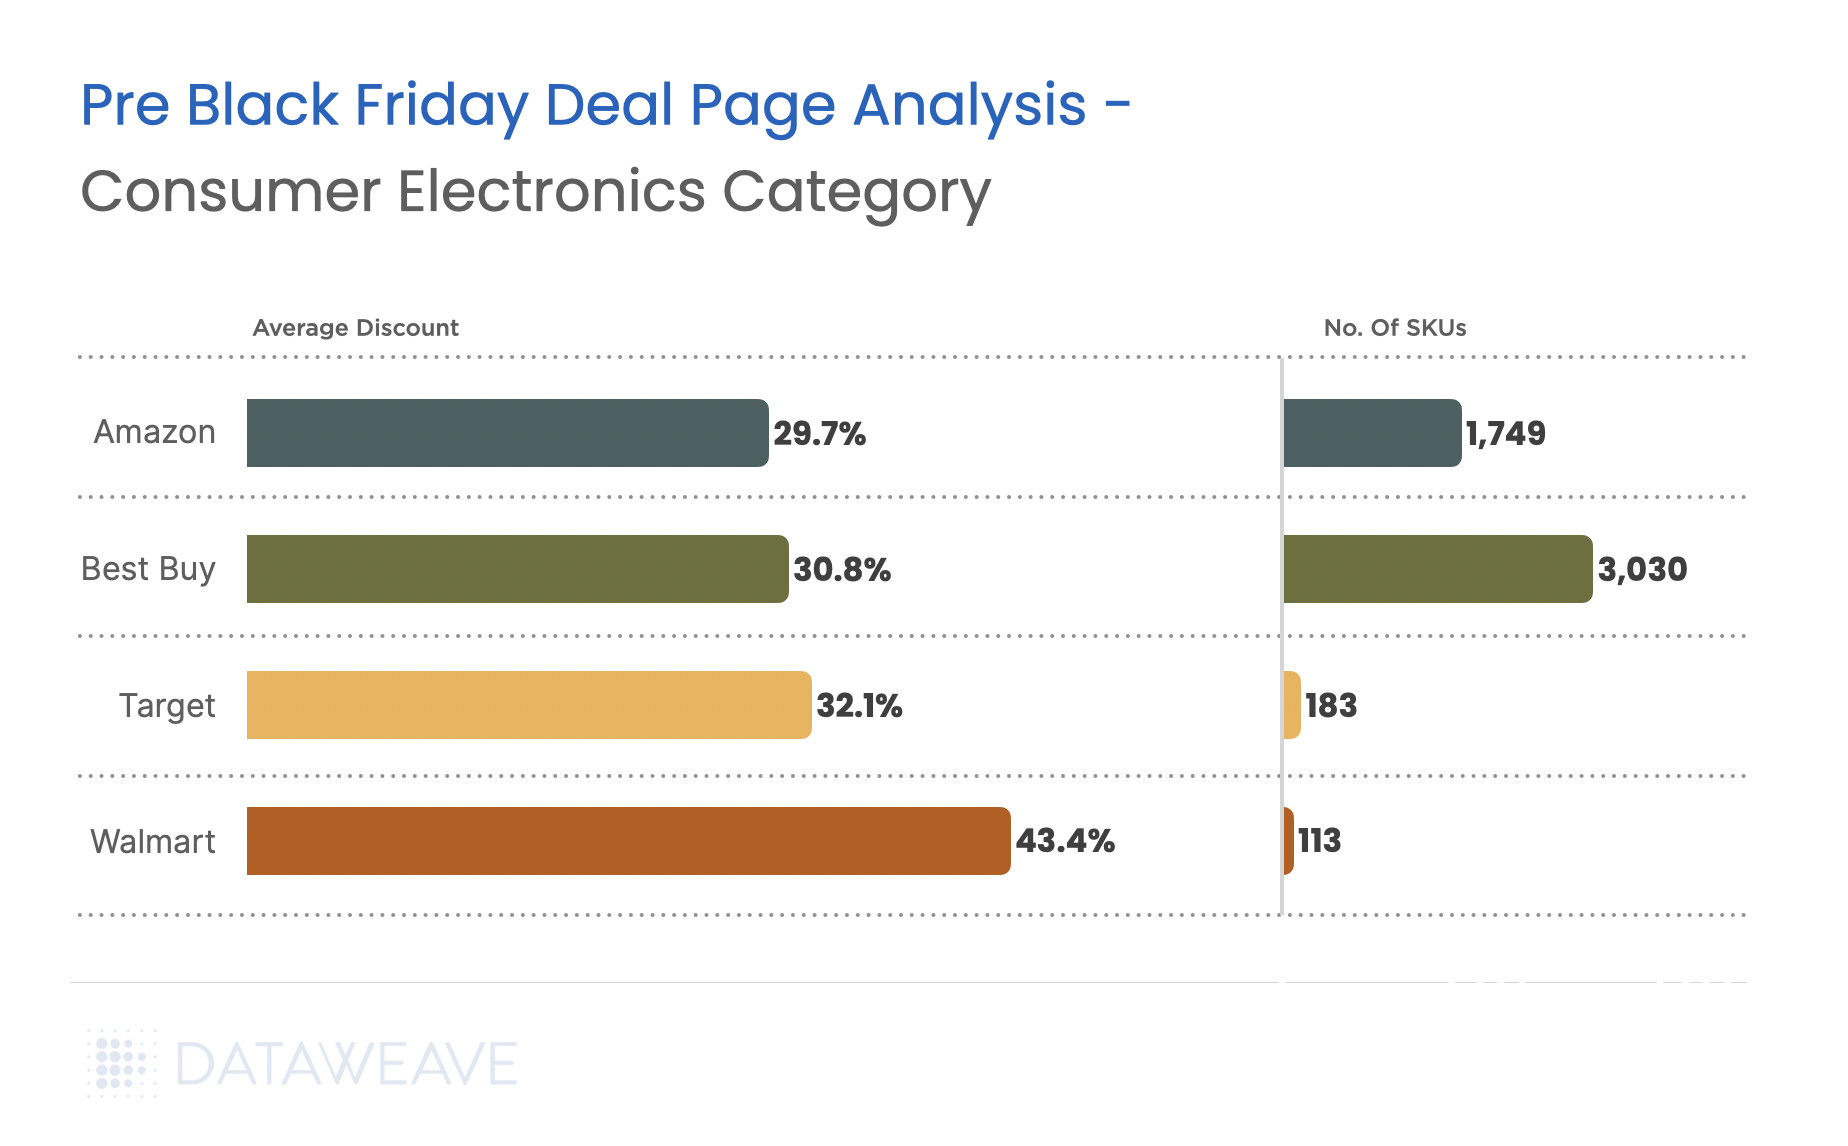
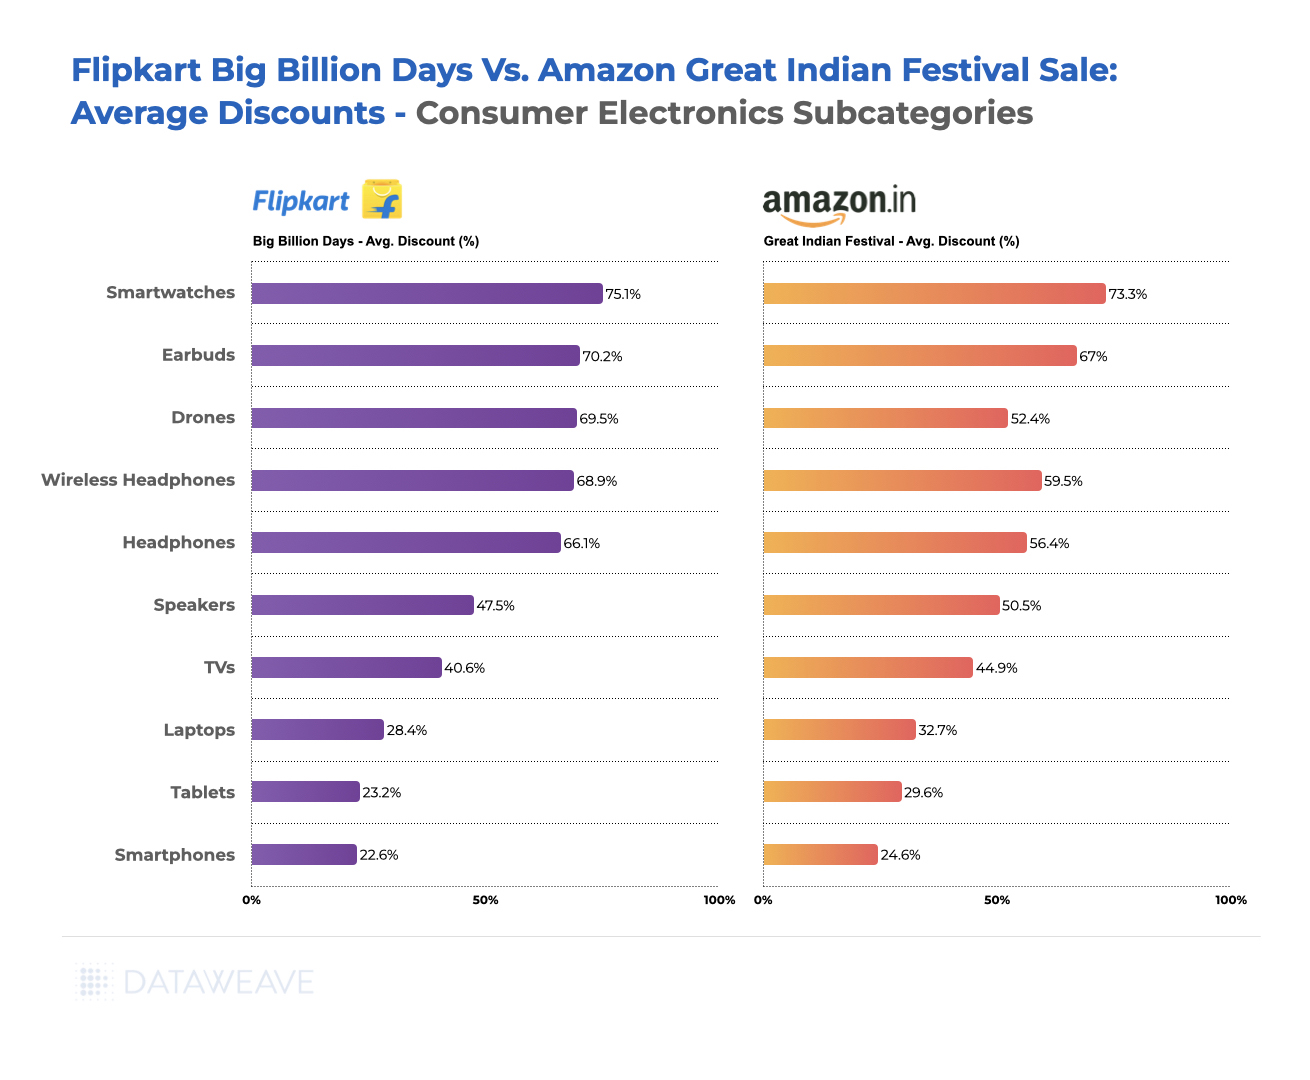
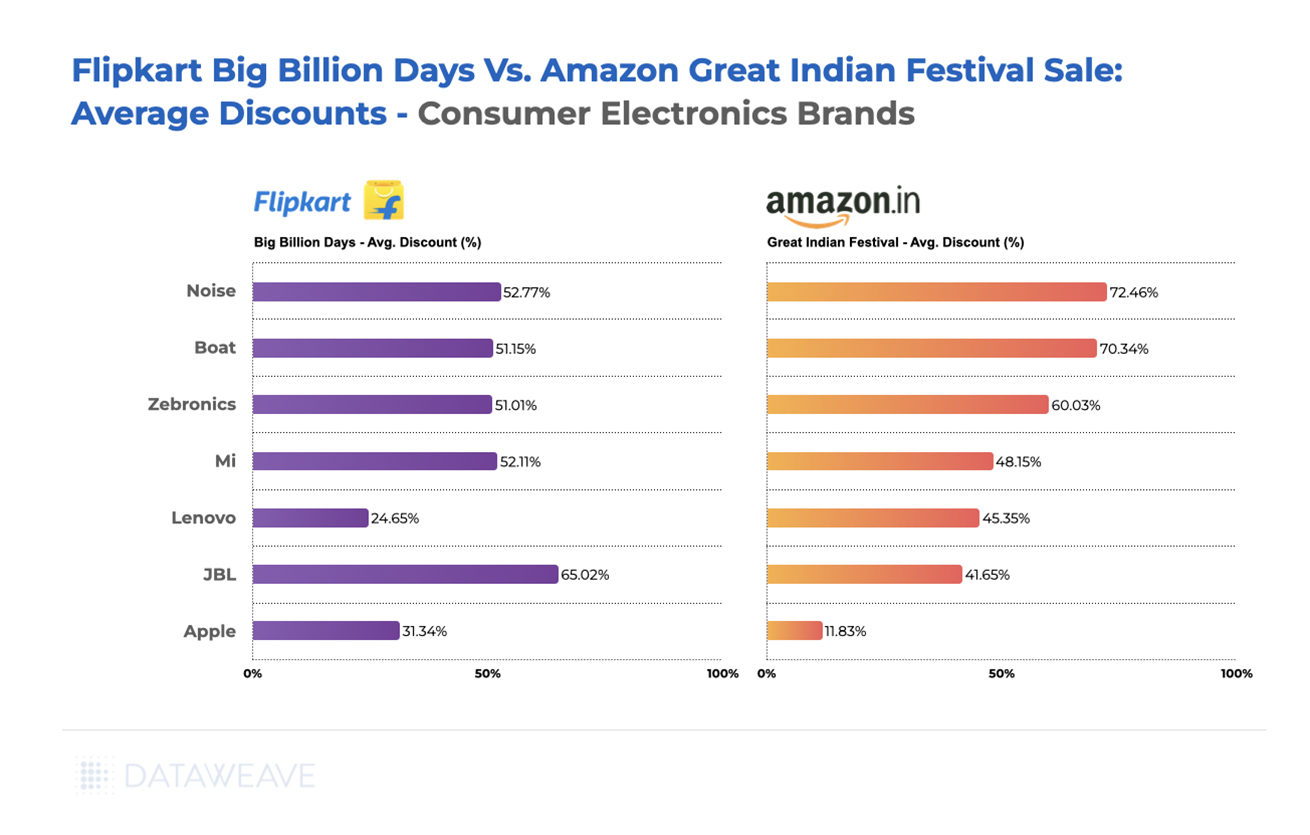
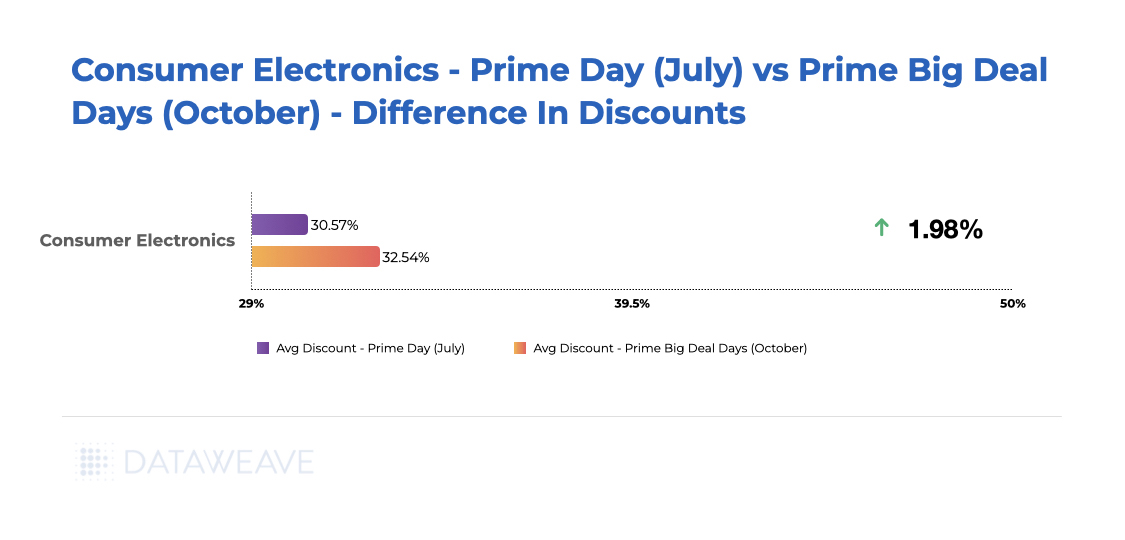
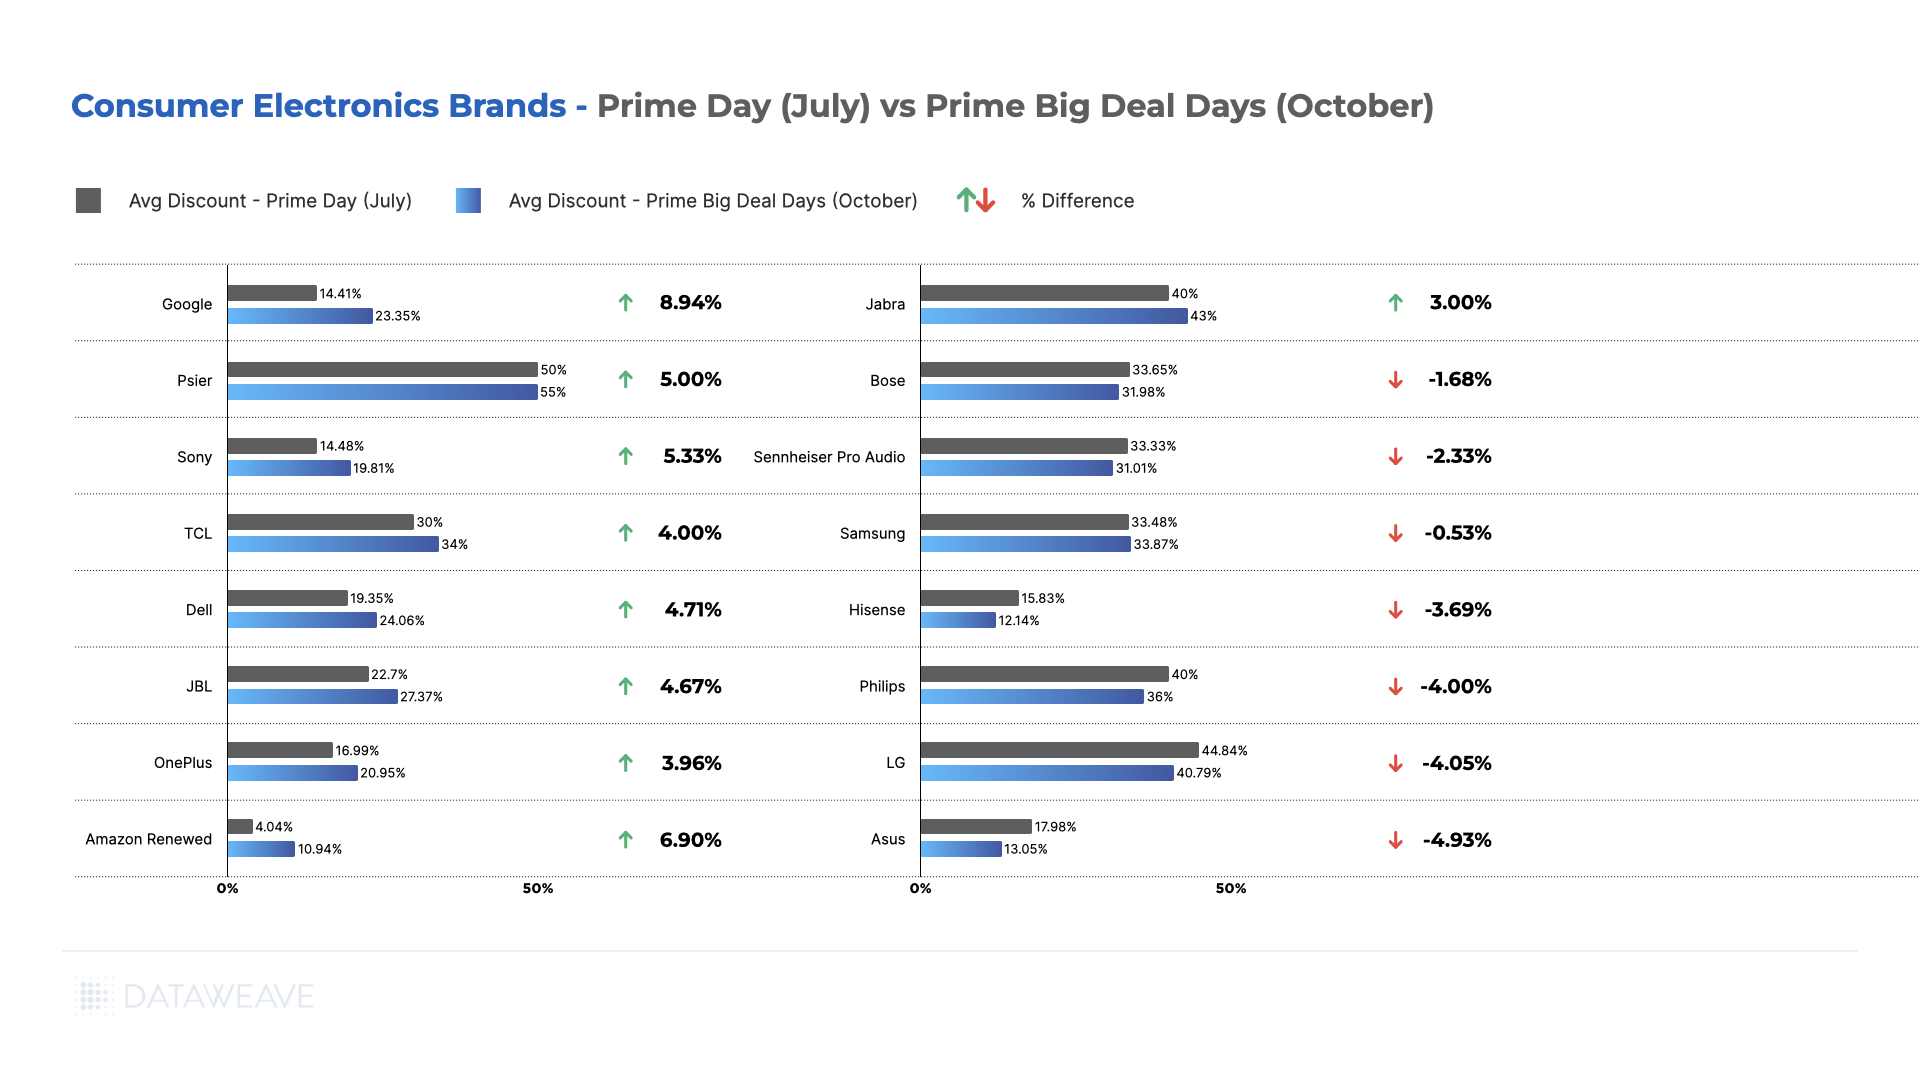
Consumer Electronics
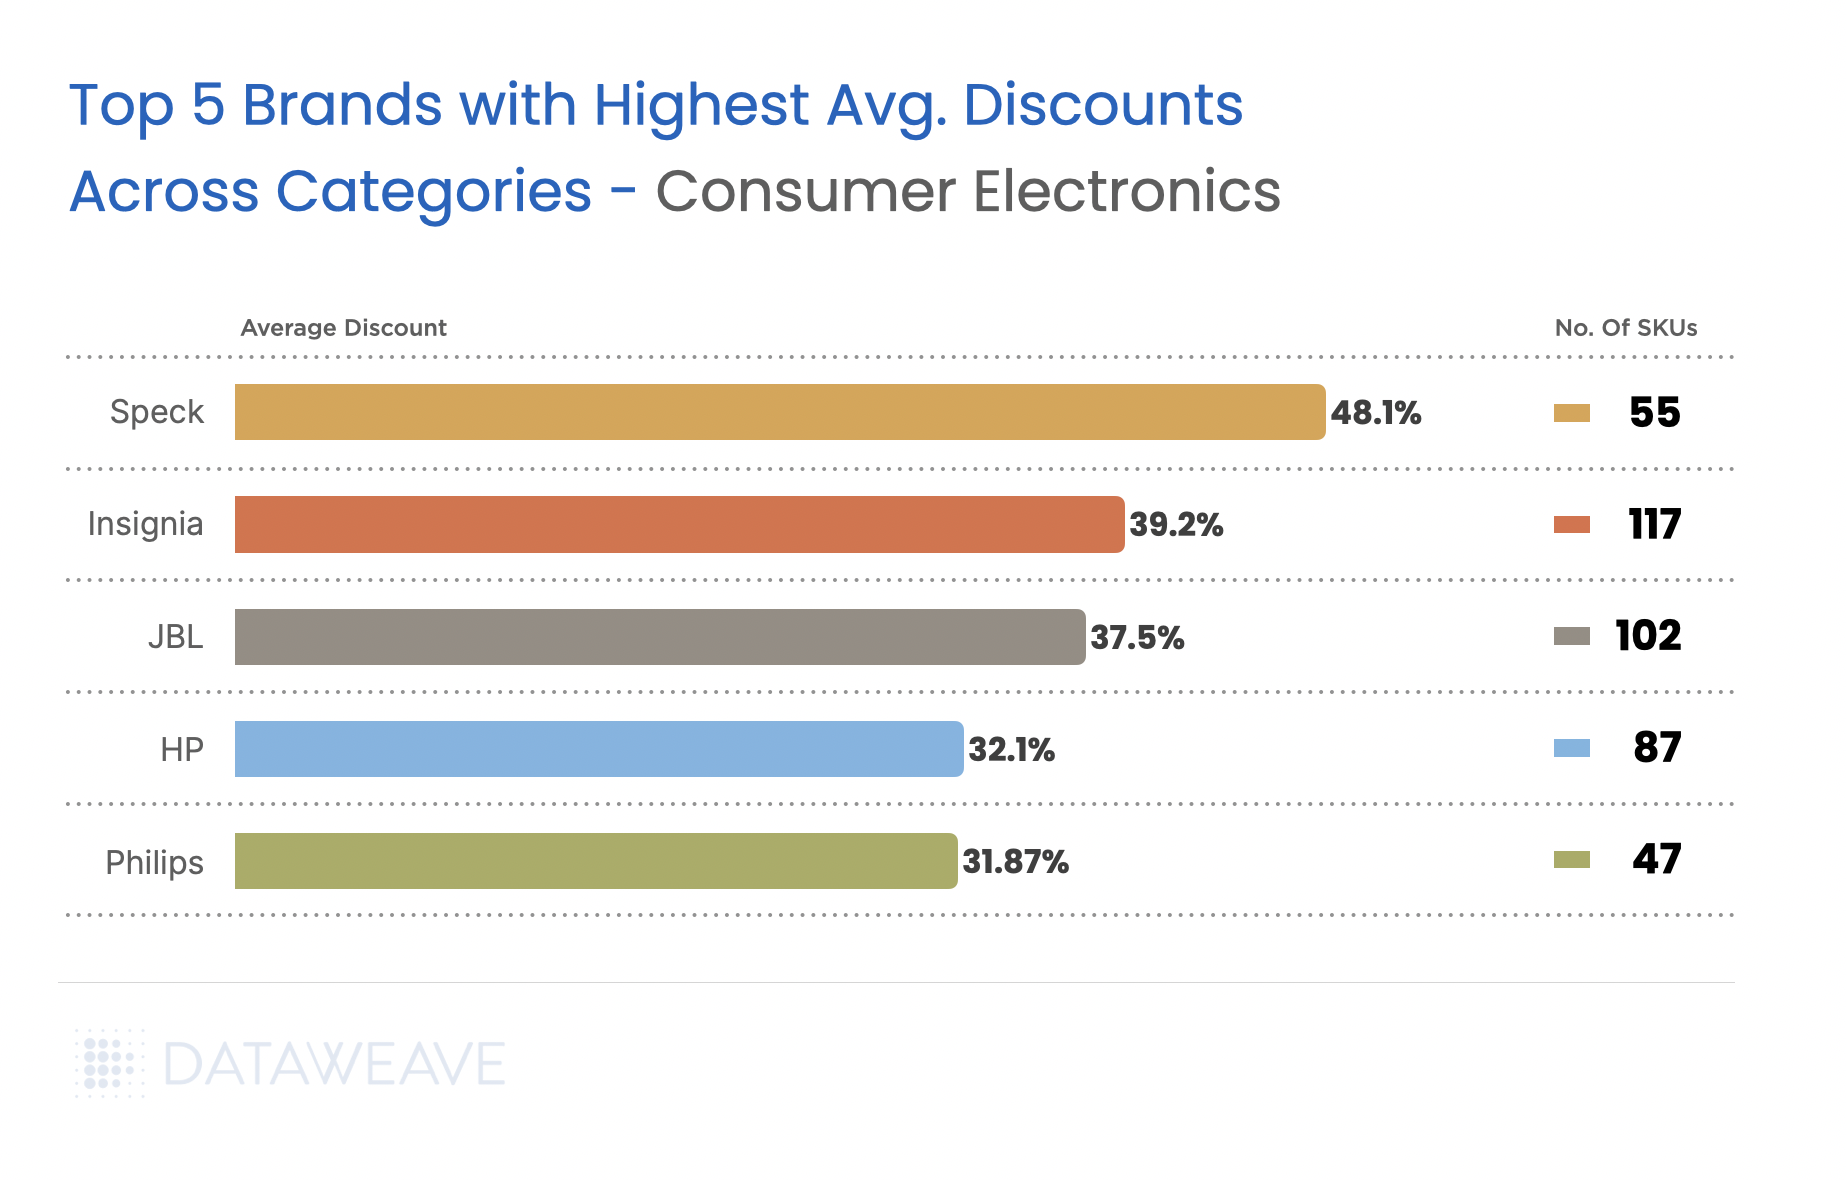
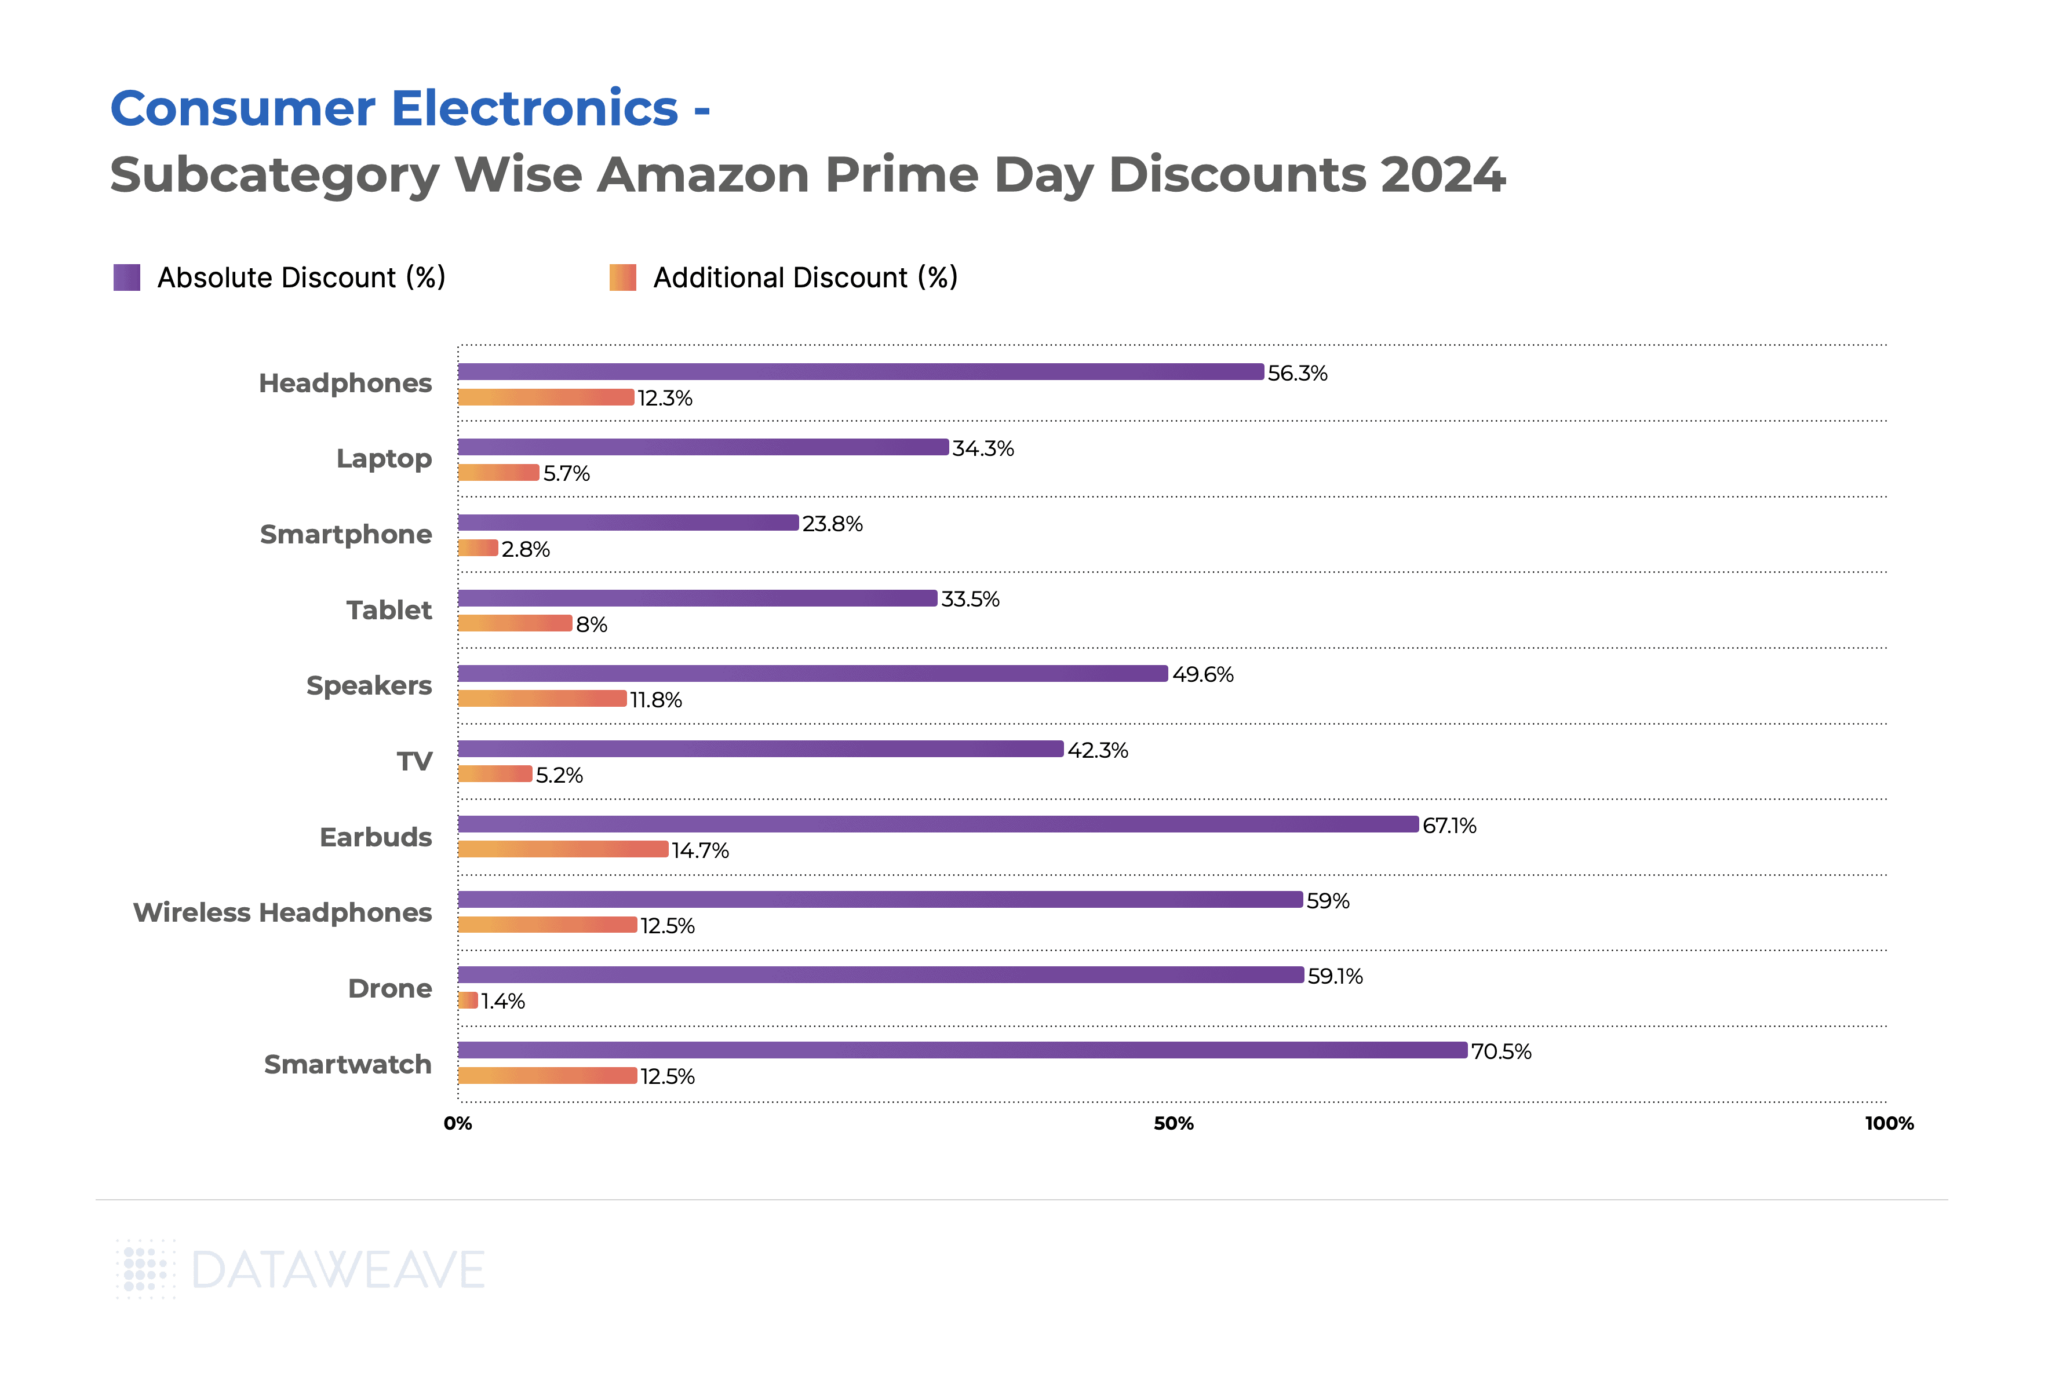
Consumer electronics remain a cornerstone of Black Friday shopping in India, with smartphones and laptops driving significant online sales. Our analysis of 20,439 SKUs reveals distinctive discount patterns across subcategories.
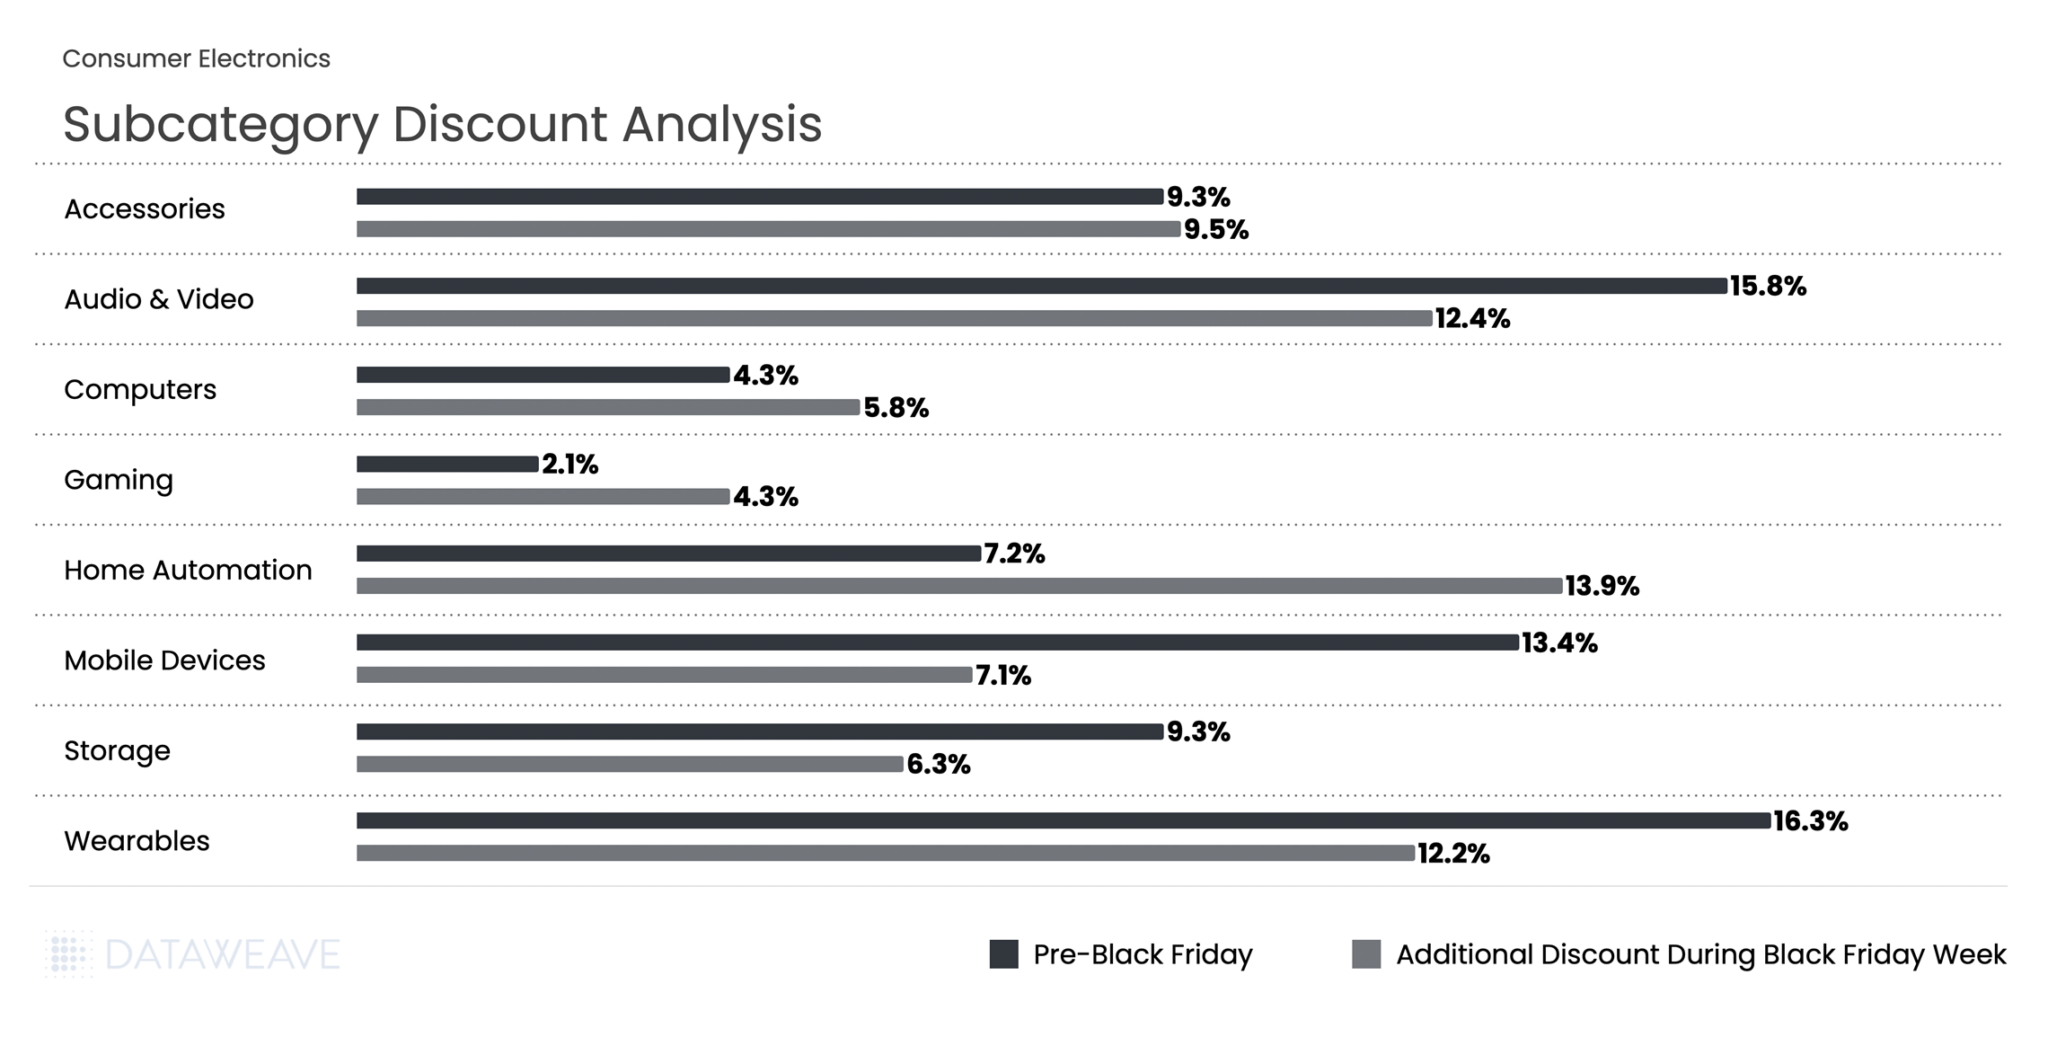
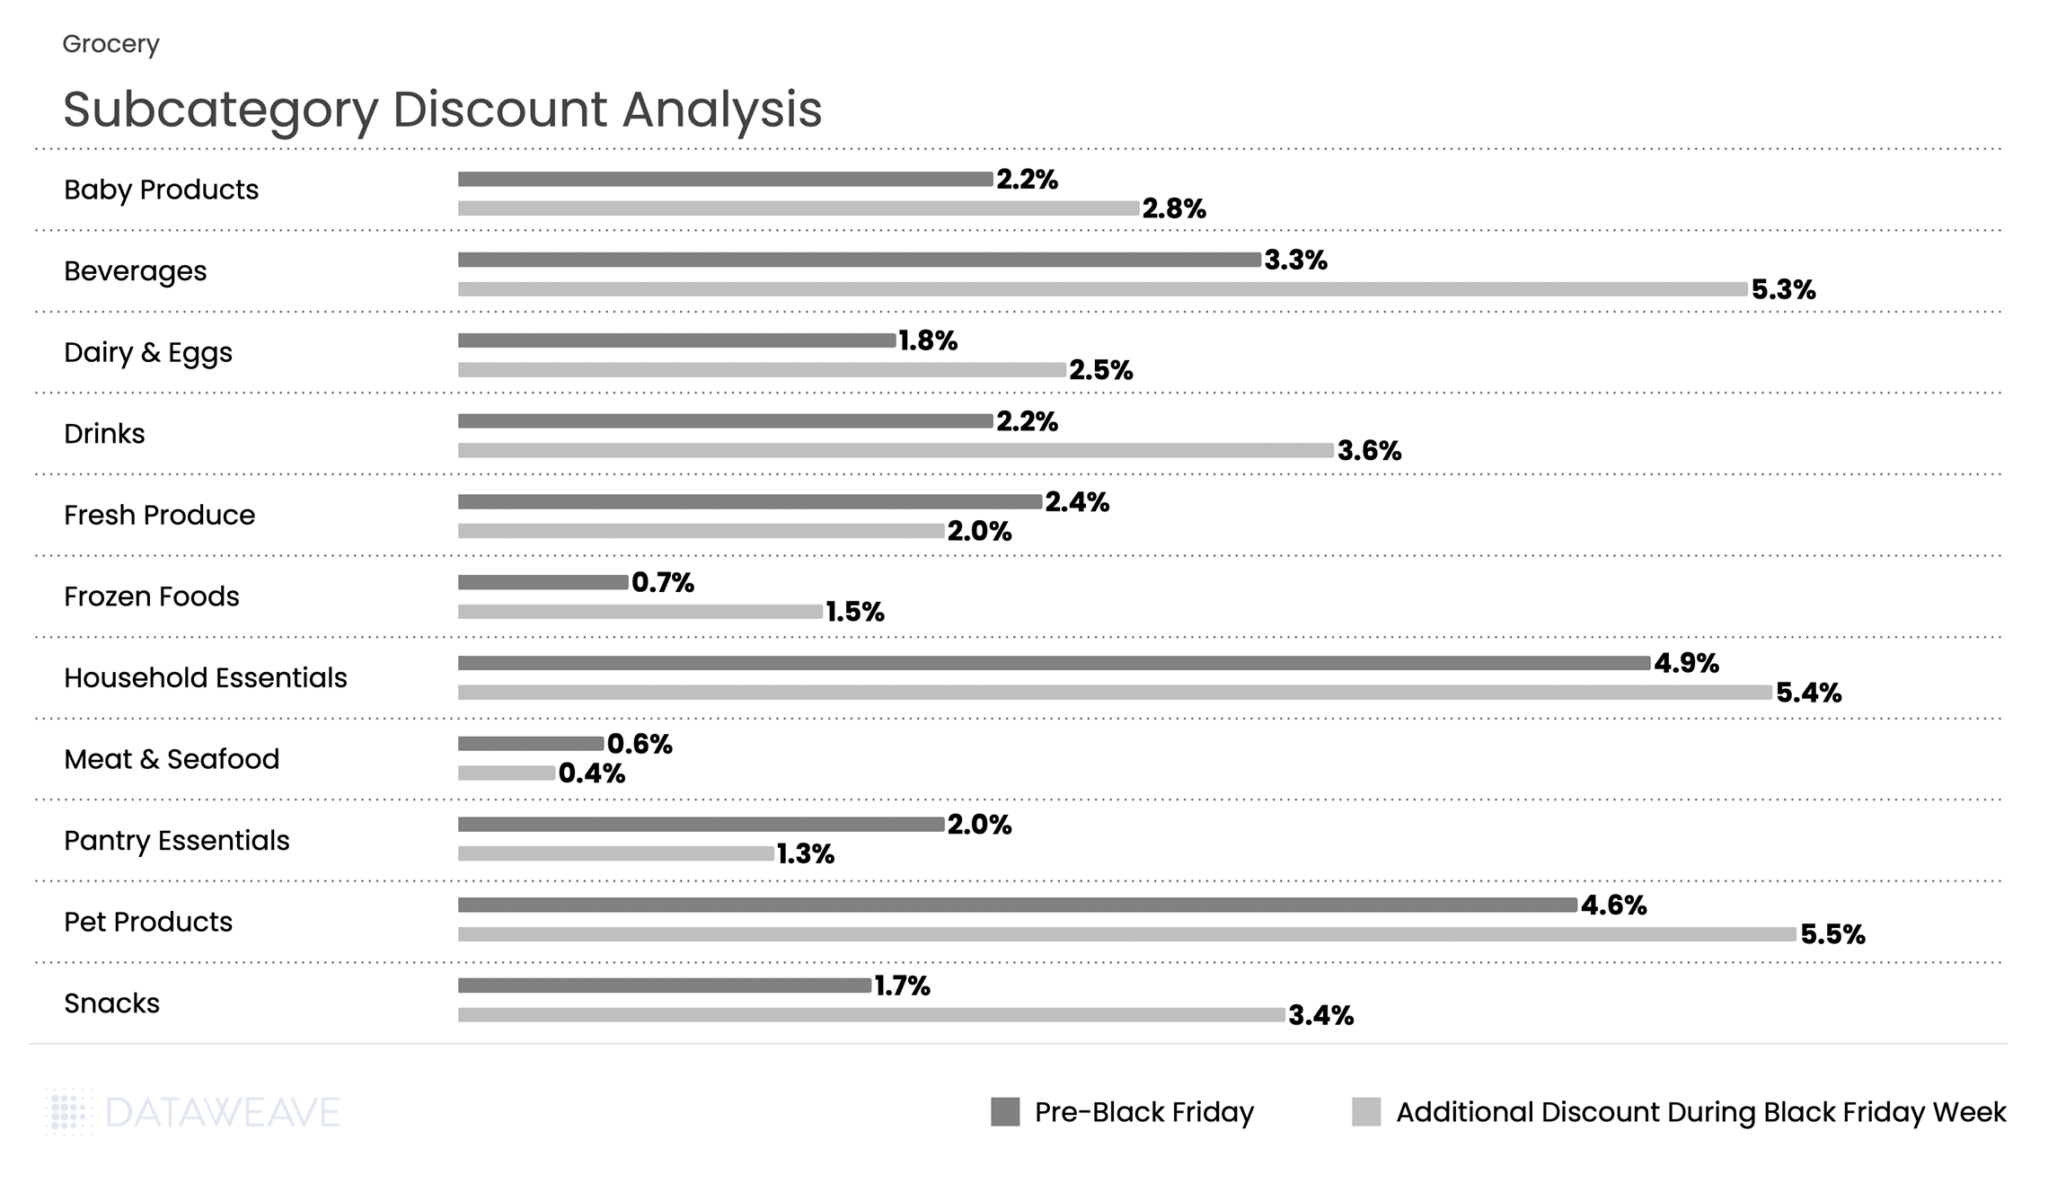
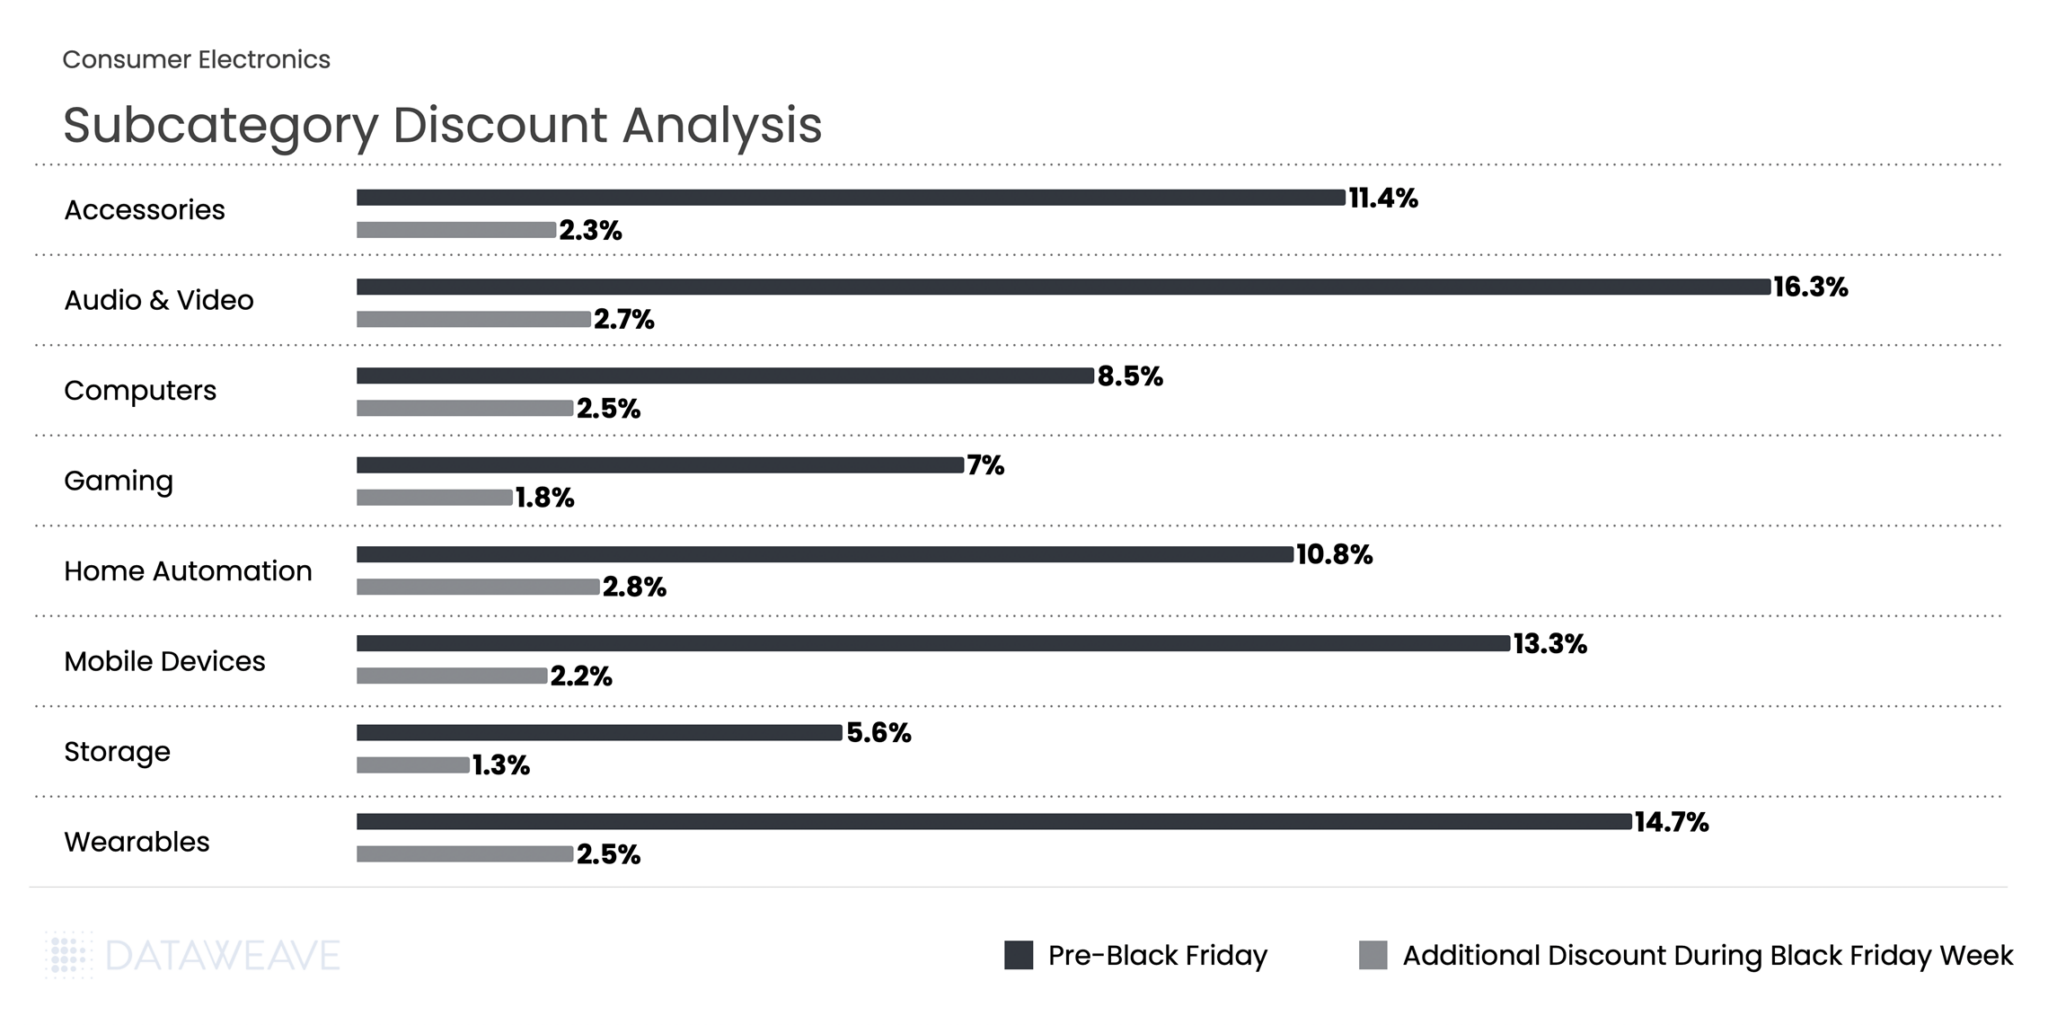
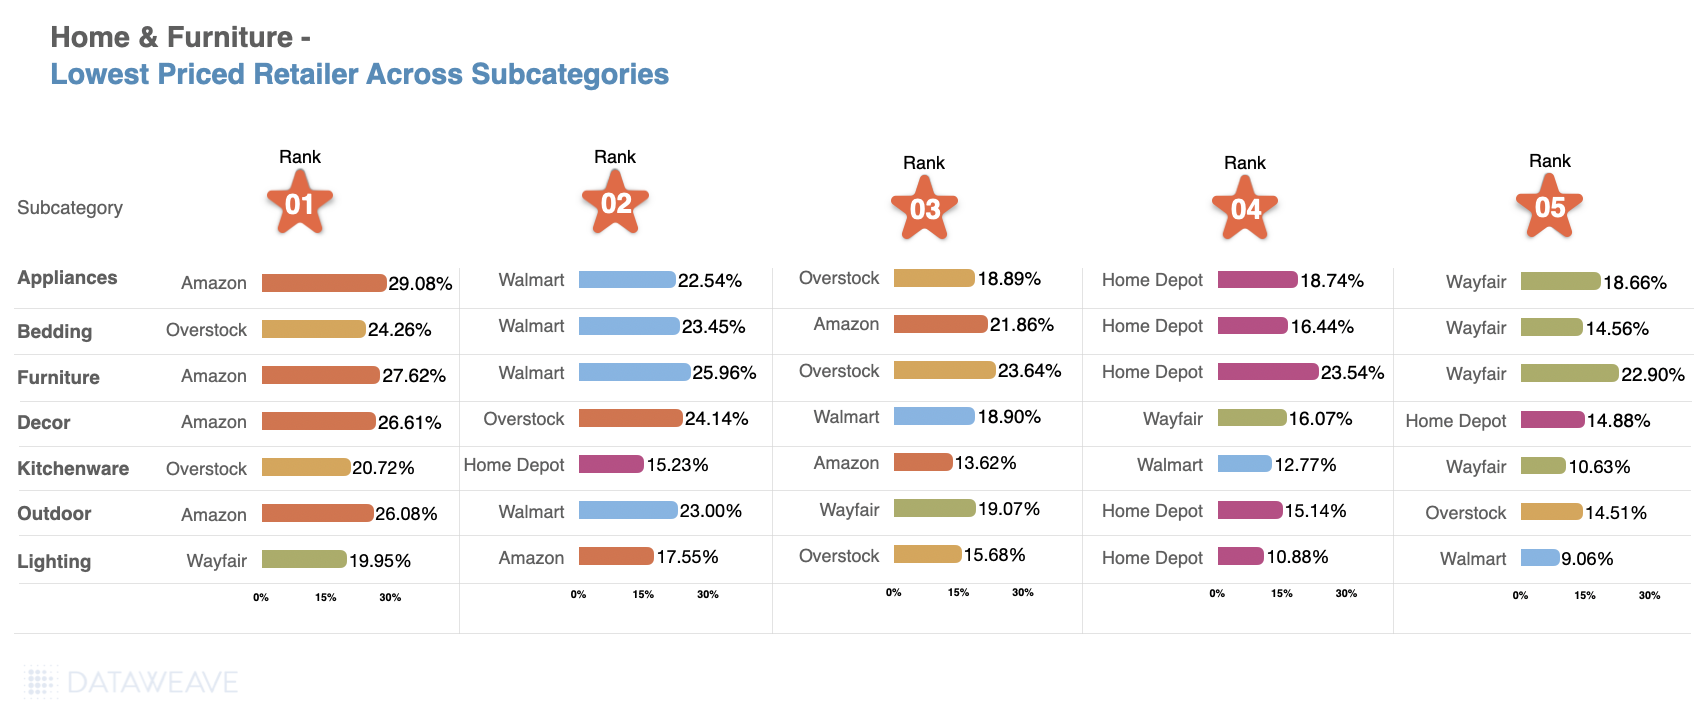
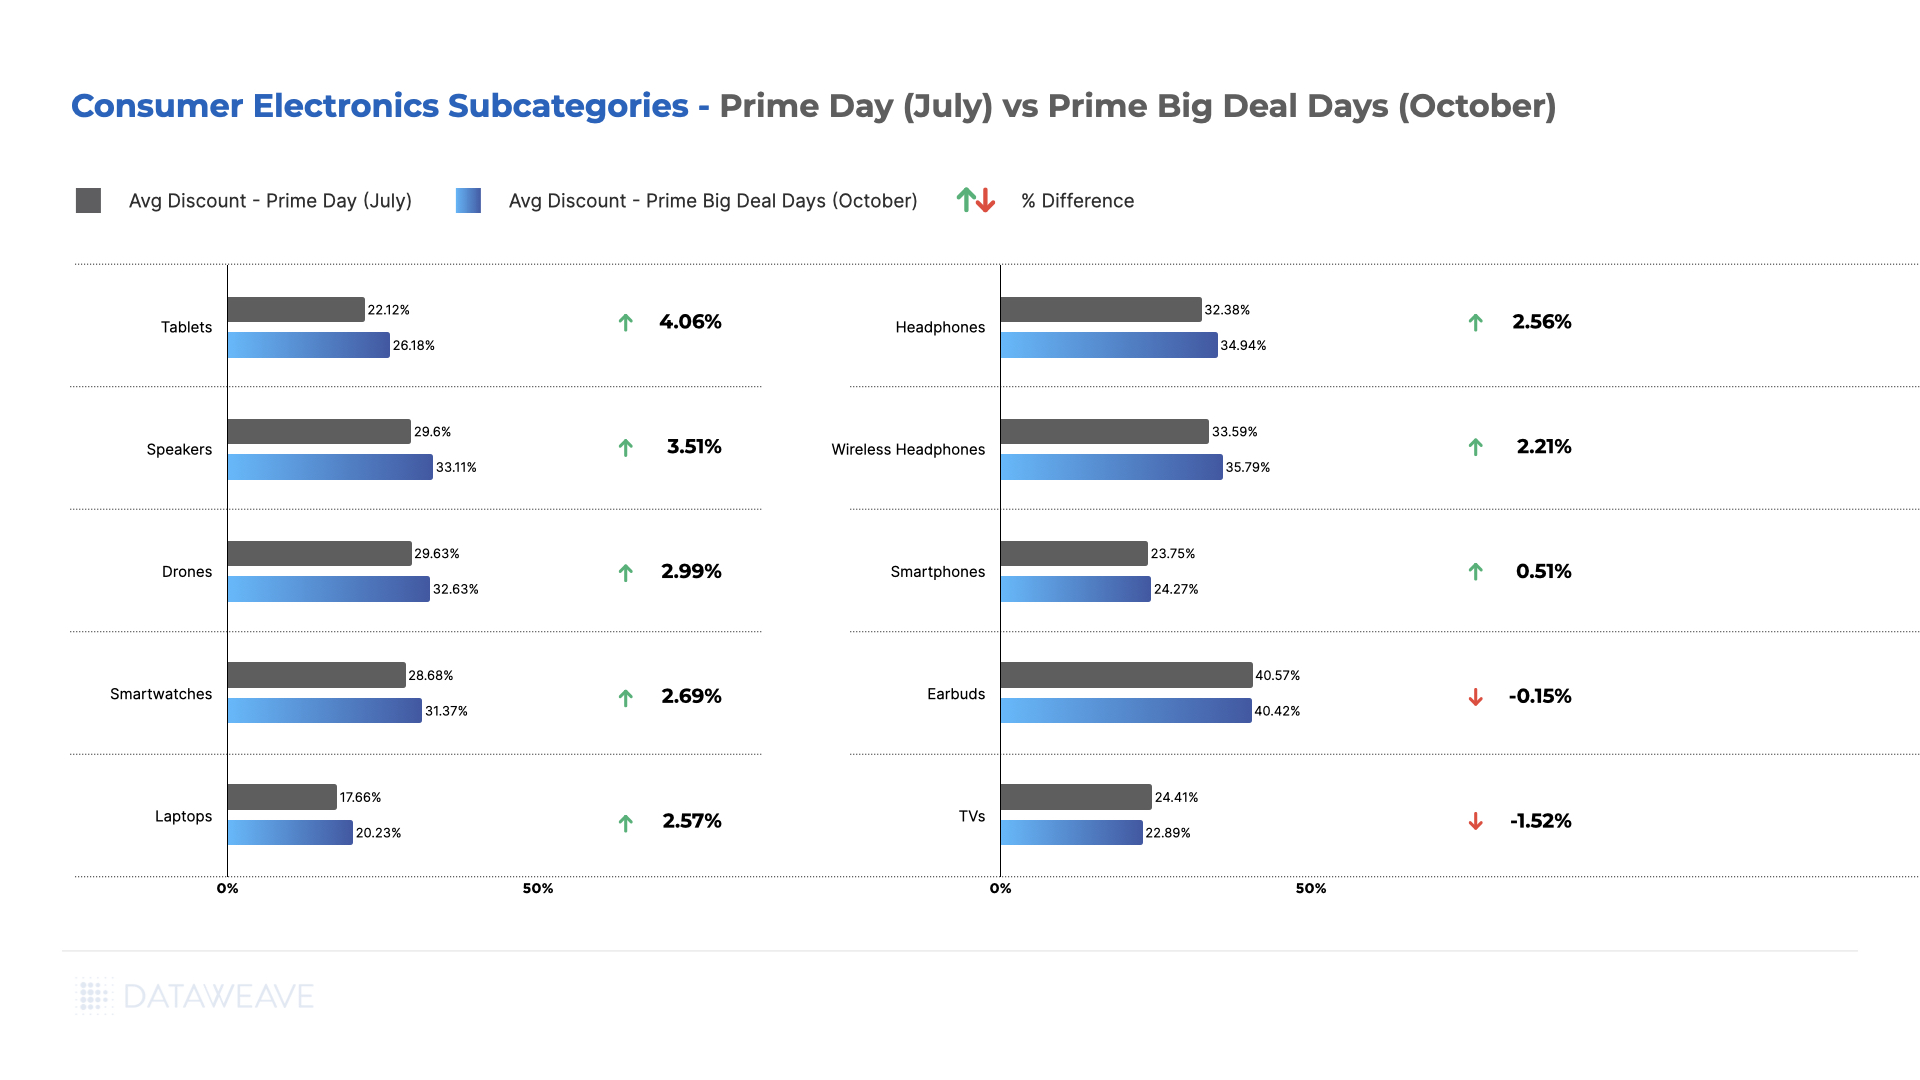
Subcategory Discount Analysis
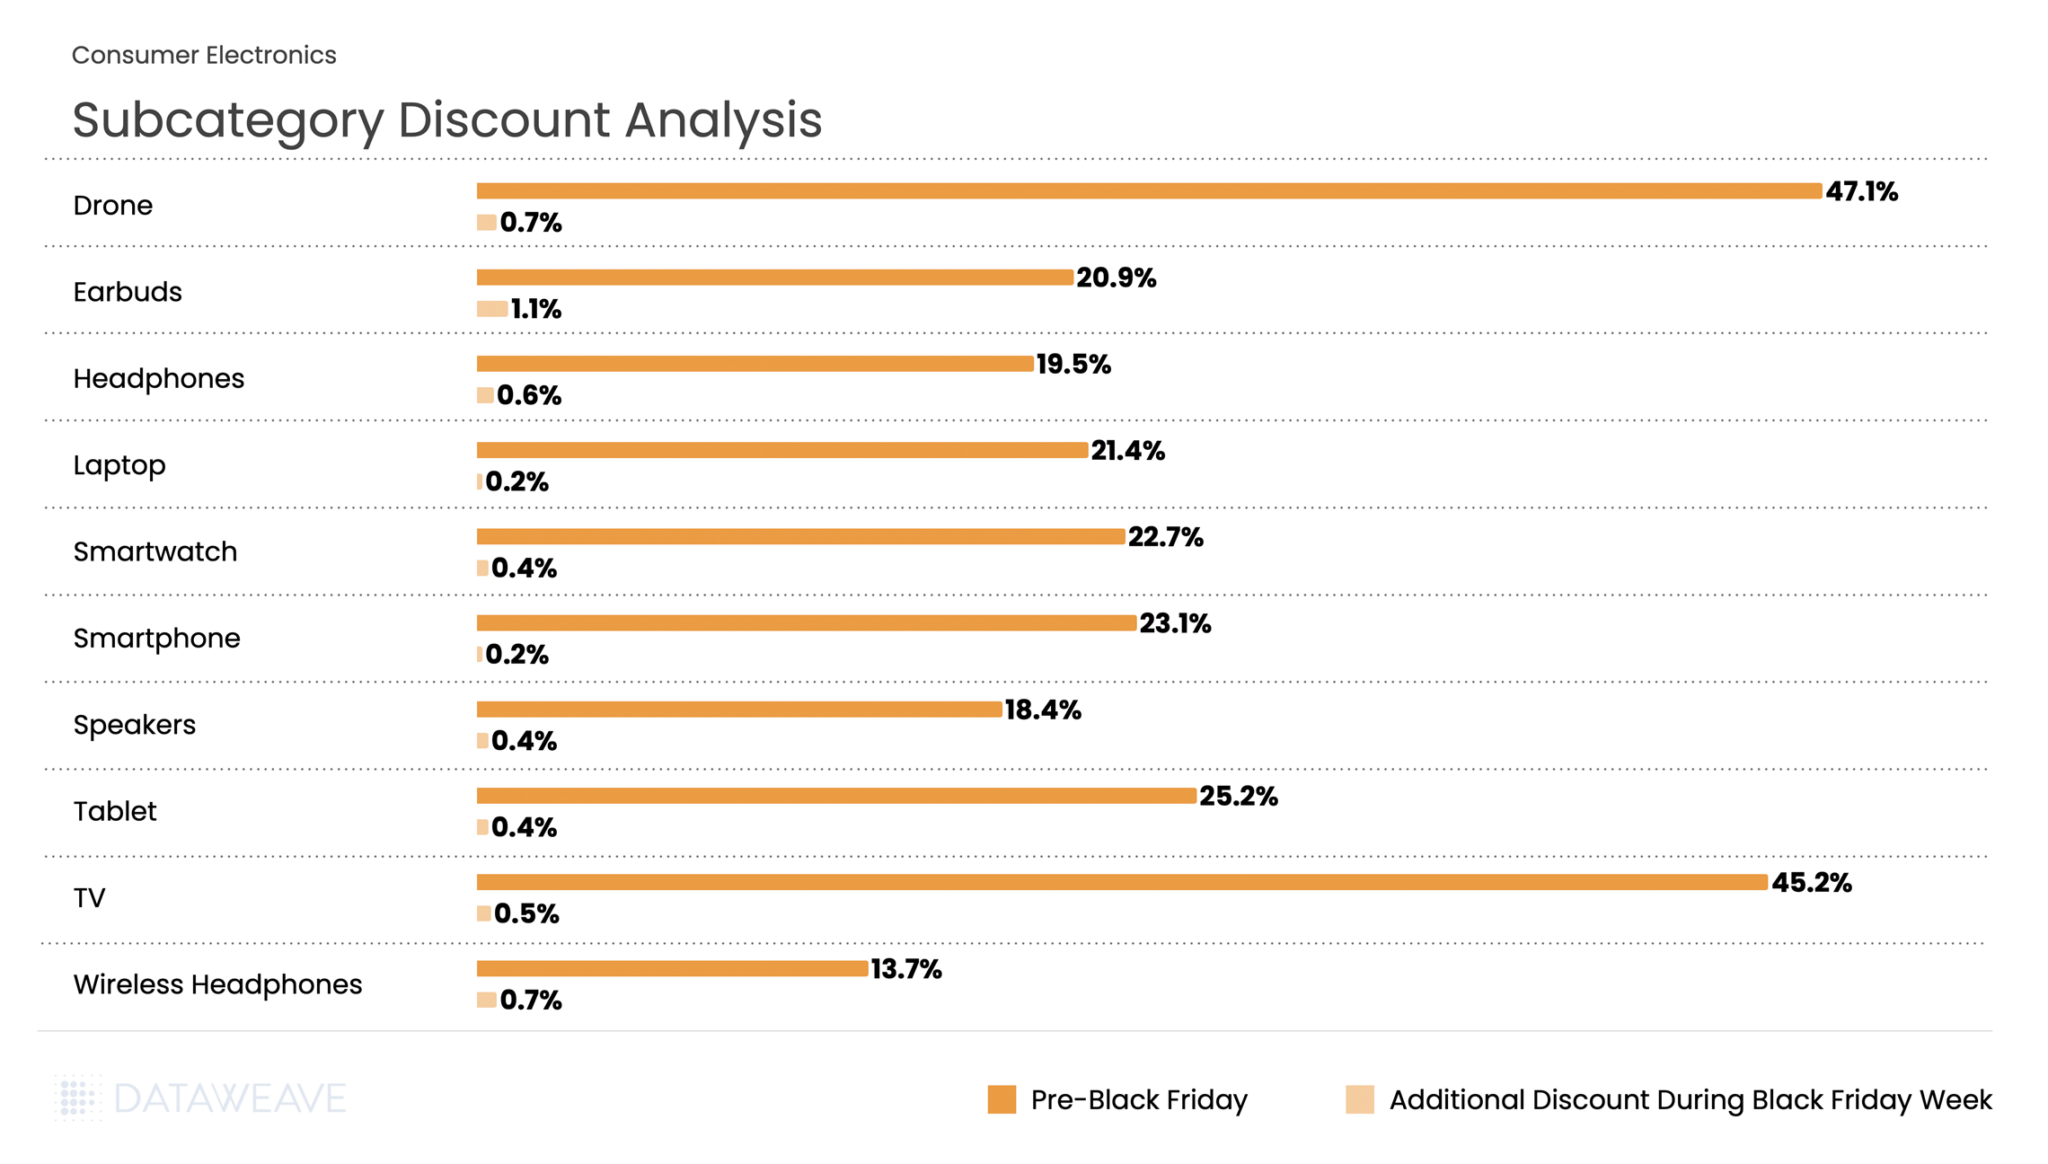
The category averaged 23.2% pre-Black Friday discounts with an additional 0.5% during Black Friday Week. Drones and TVs led pre-sale discounting at 47.1% and 45.2% respectively, suggesting retailers wanted to clear high-ticket inventory ahead of the main event. Tablets (25.2%) also saw aggressive pre-sale pricing. During Black Friday Week, Earbuds saw the most substantial additional discounts at 1.1%, while categories like Laptops and Smartphones, already heavily discounted, had minimal incremental price cuts at 0.2%.
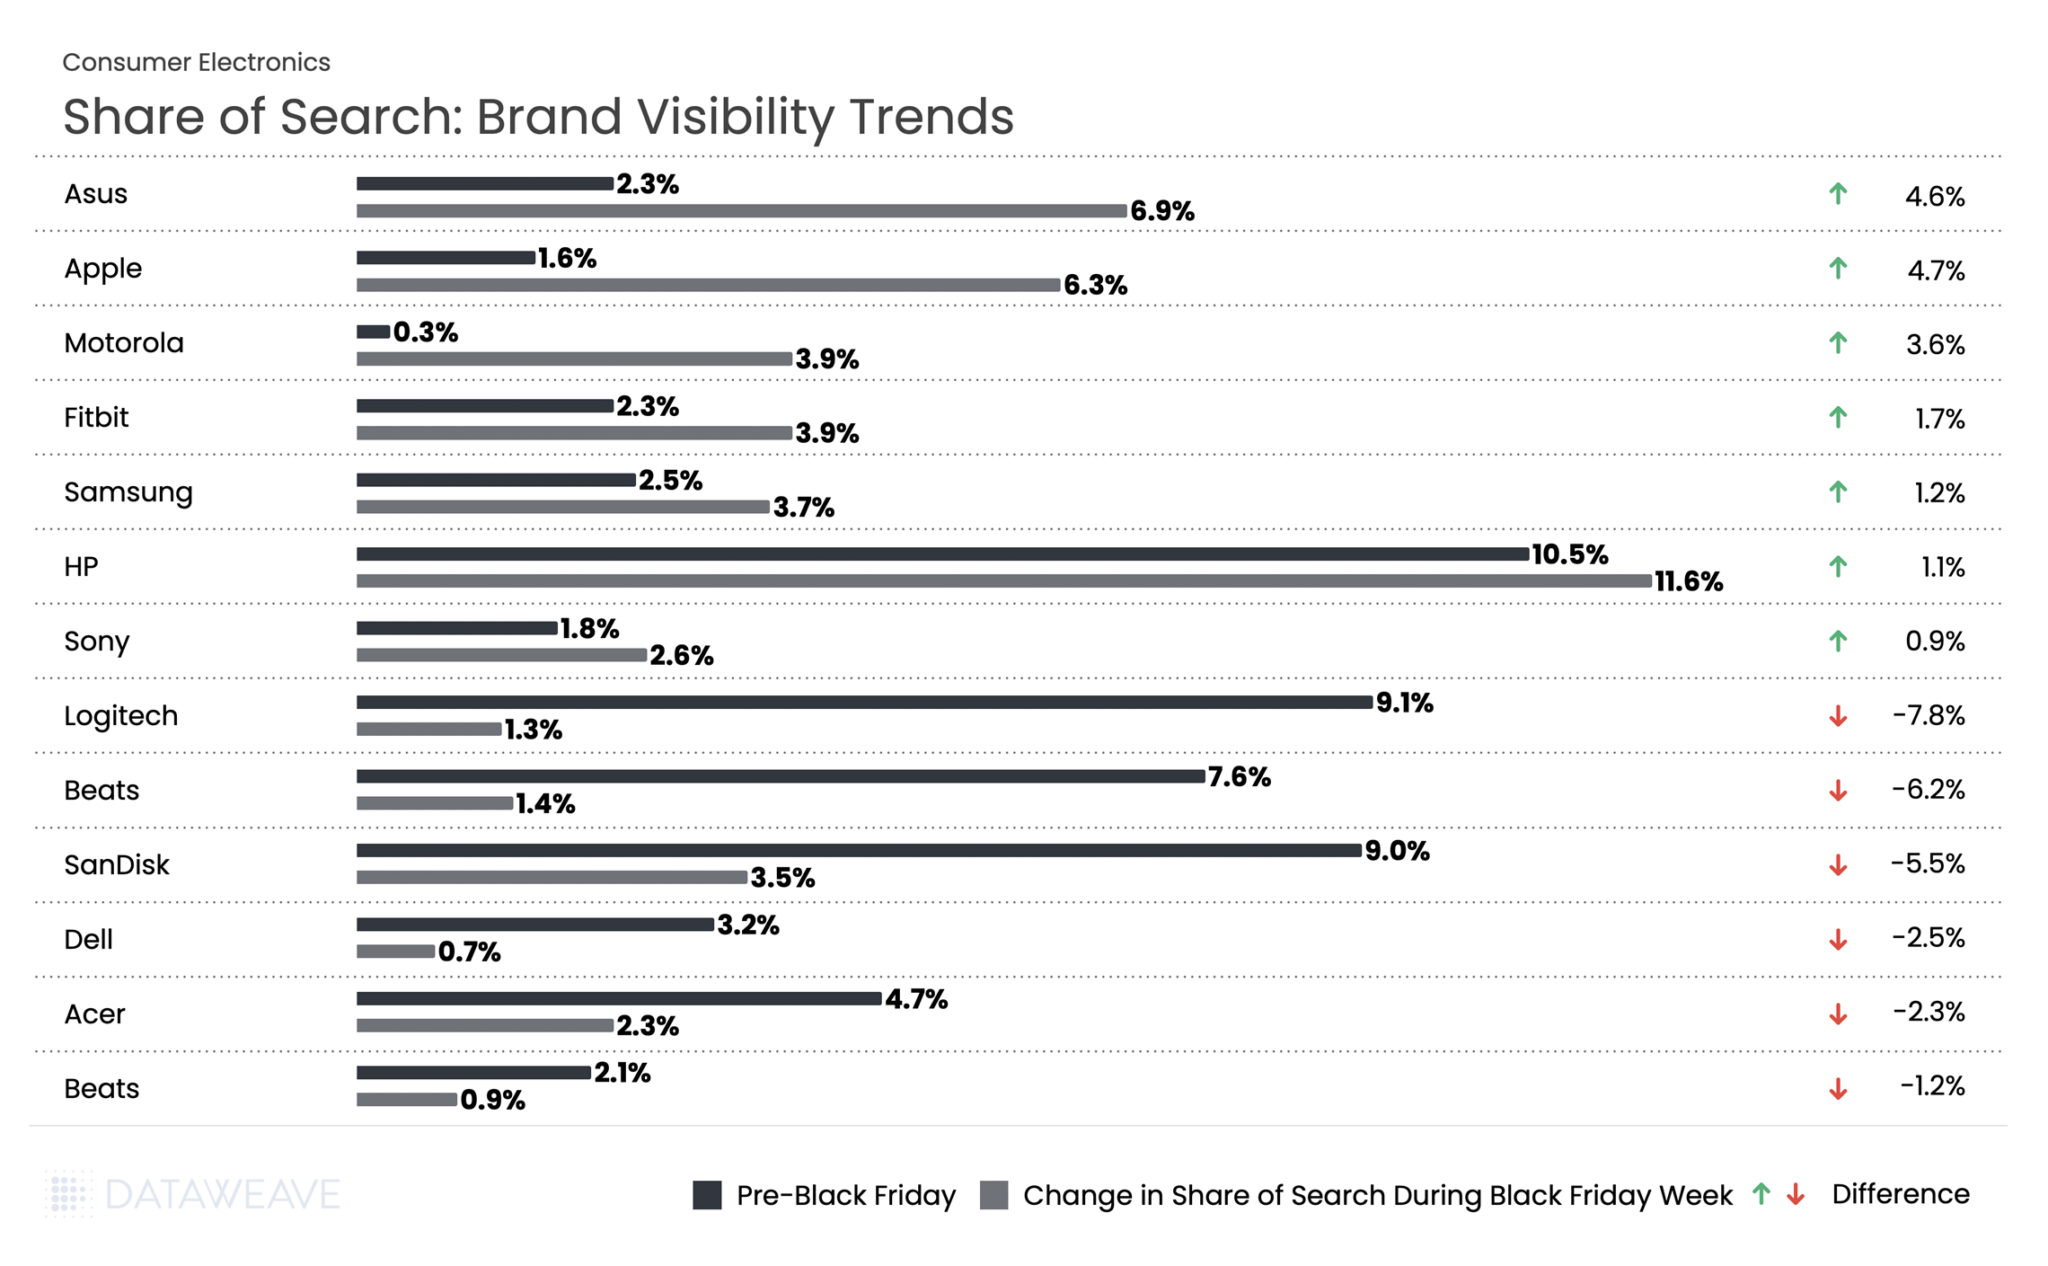
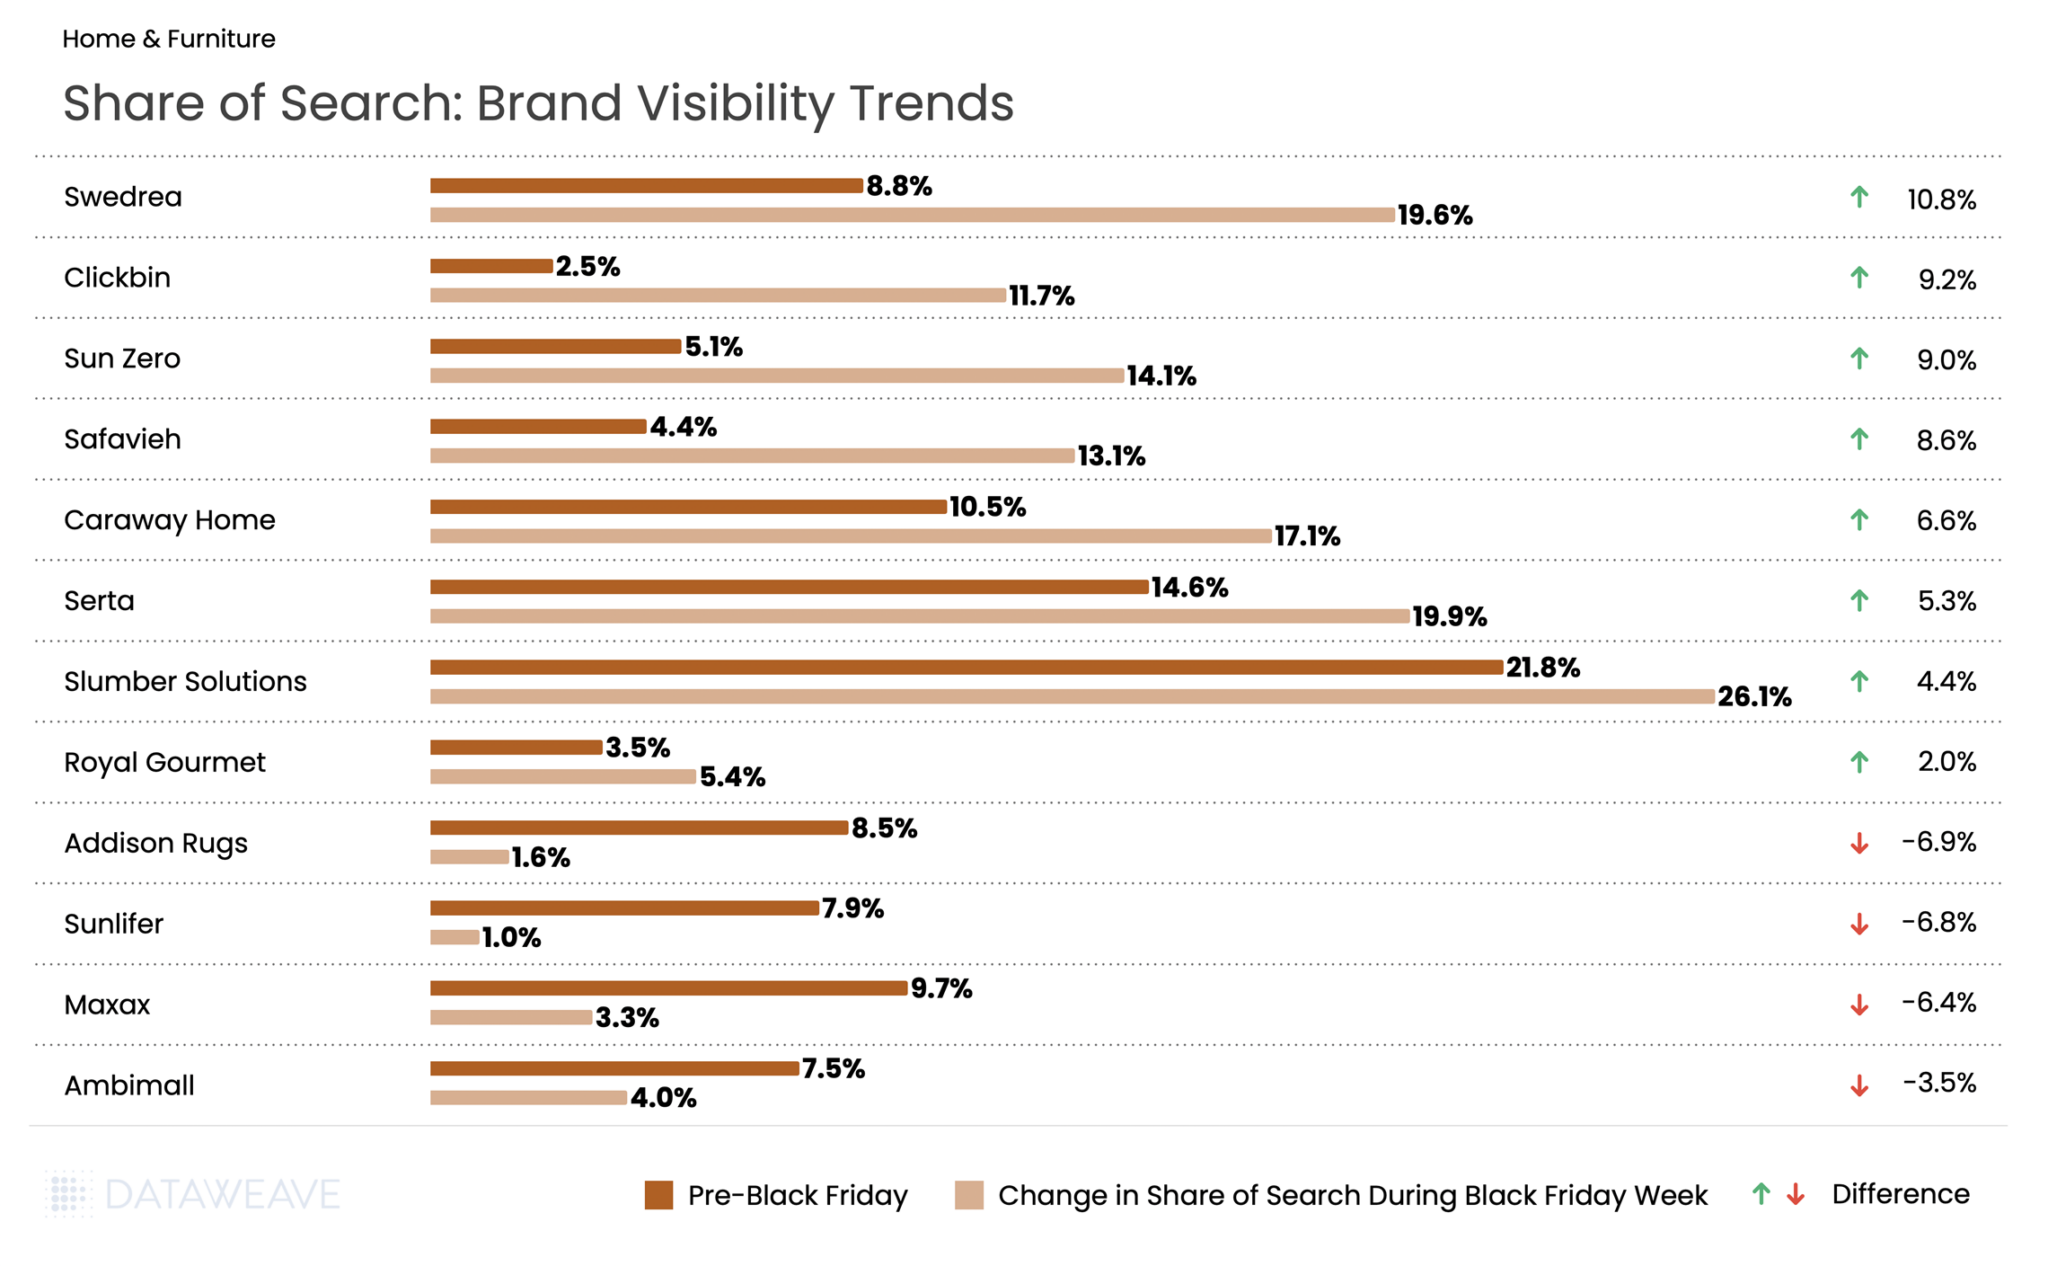
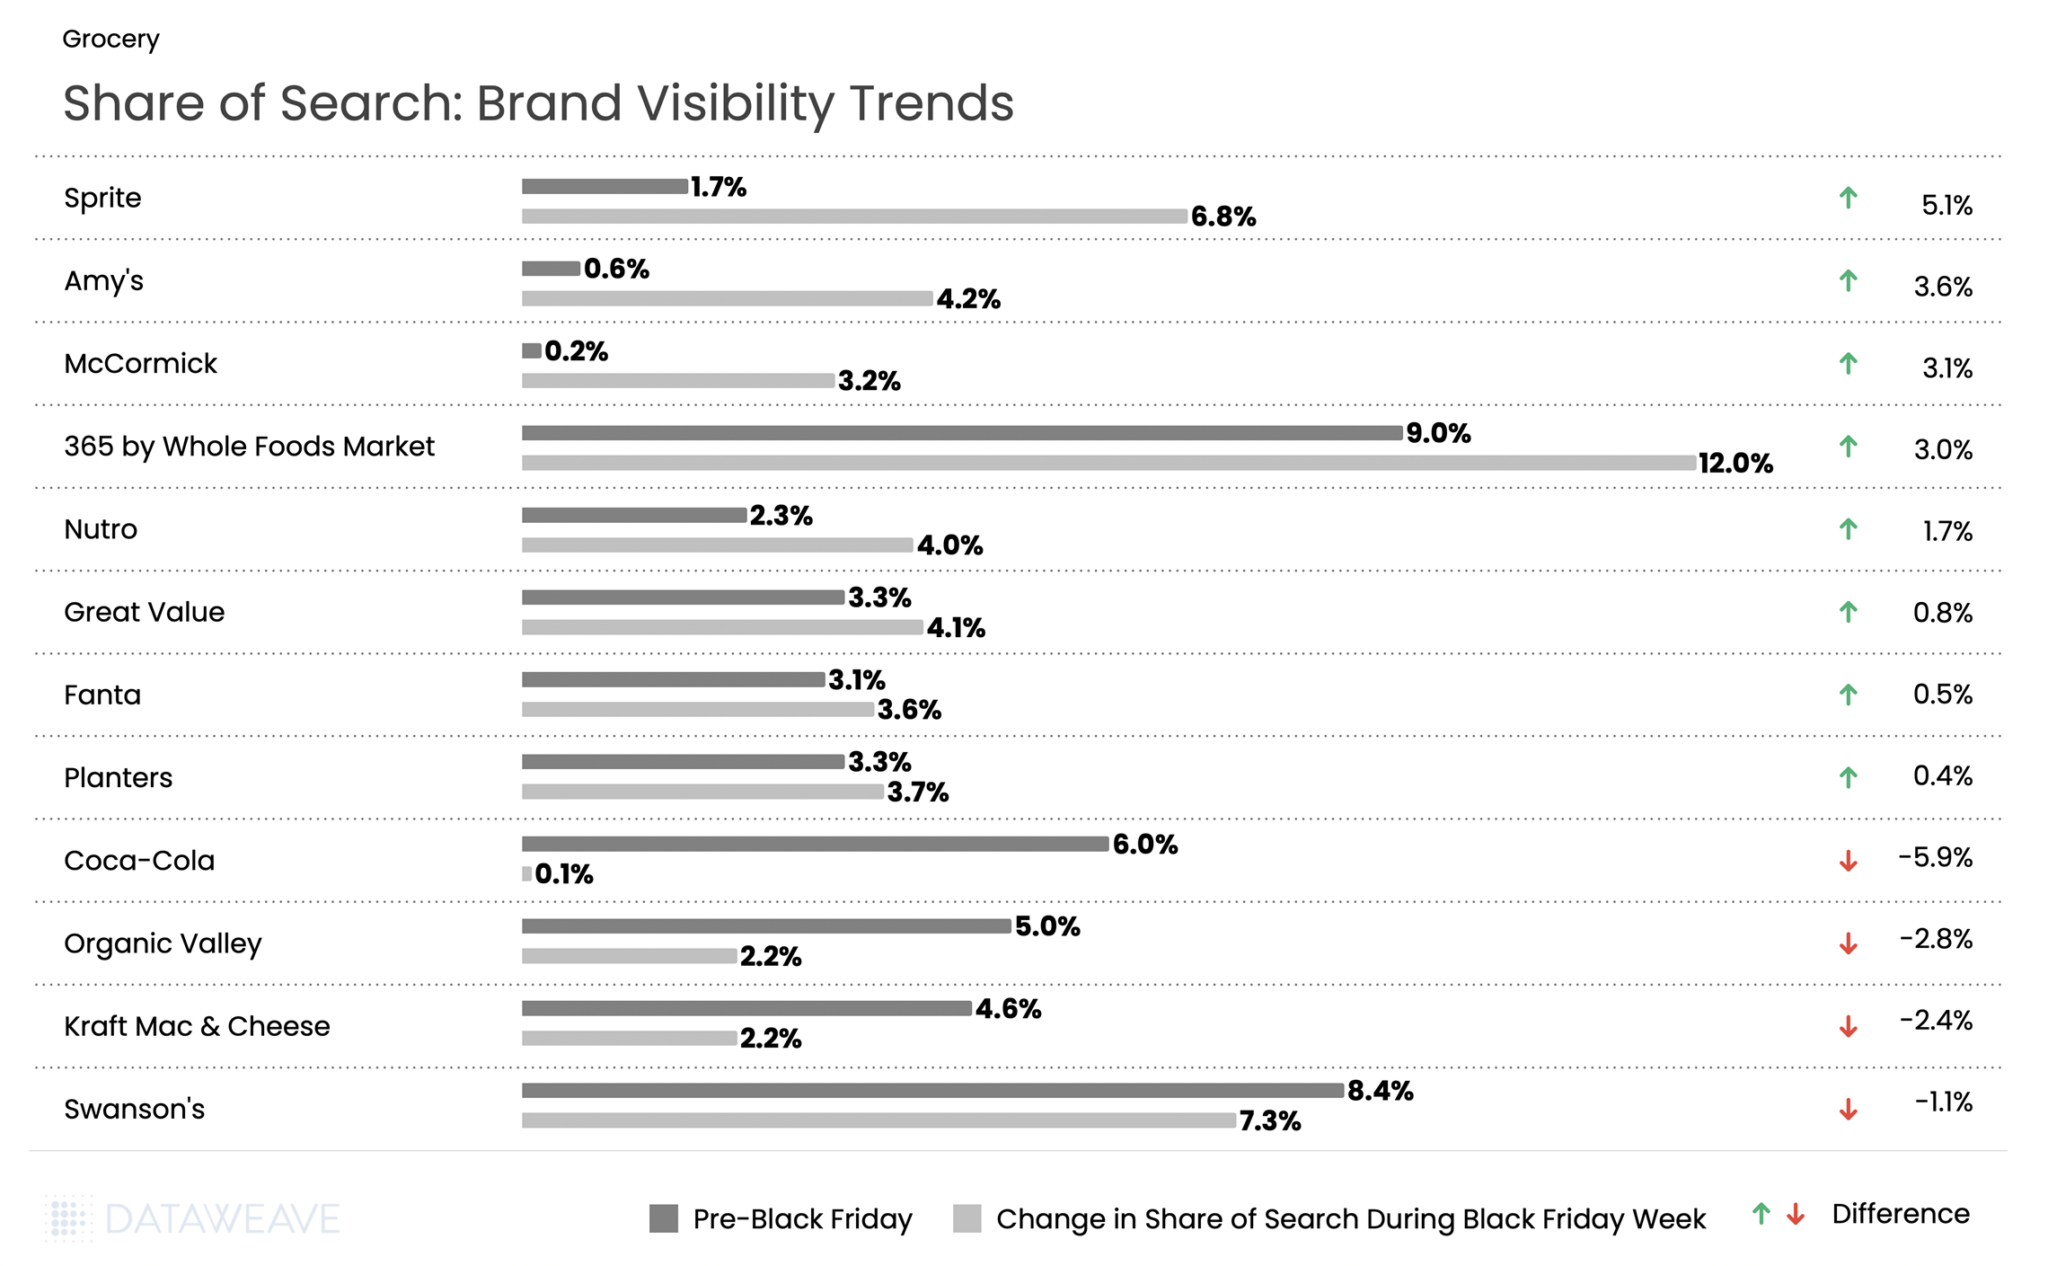
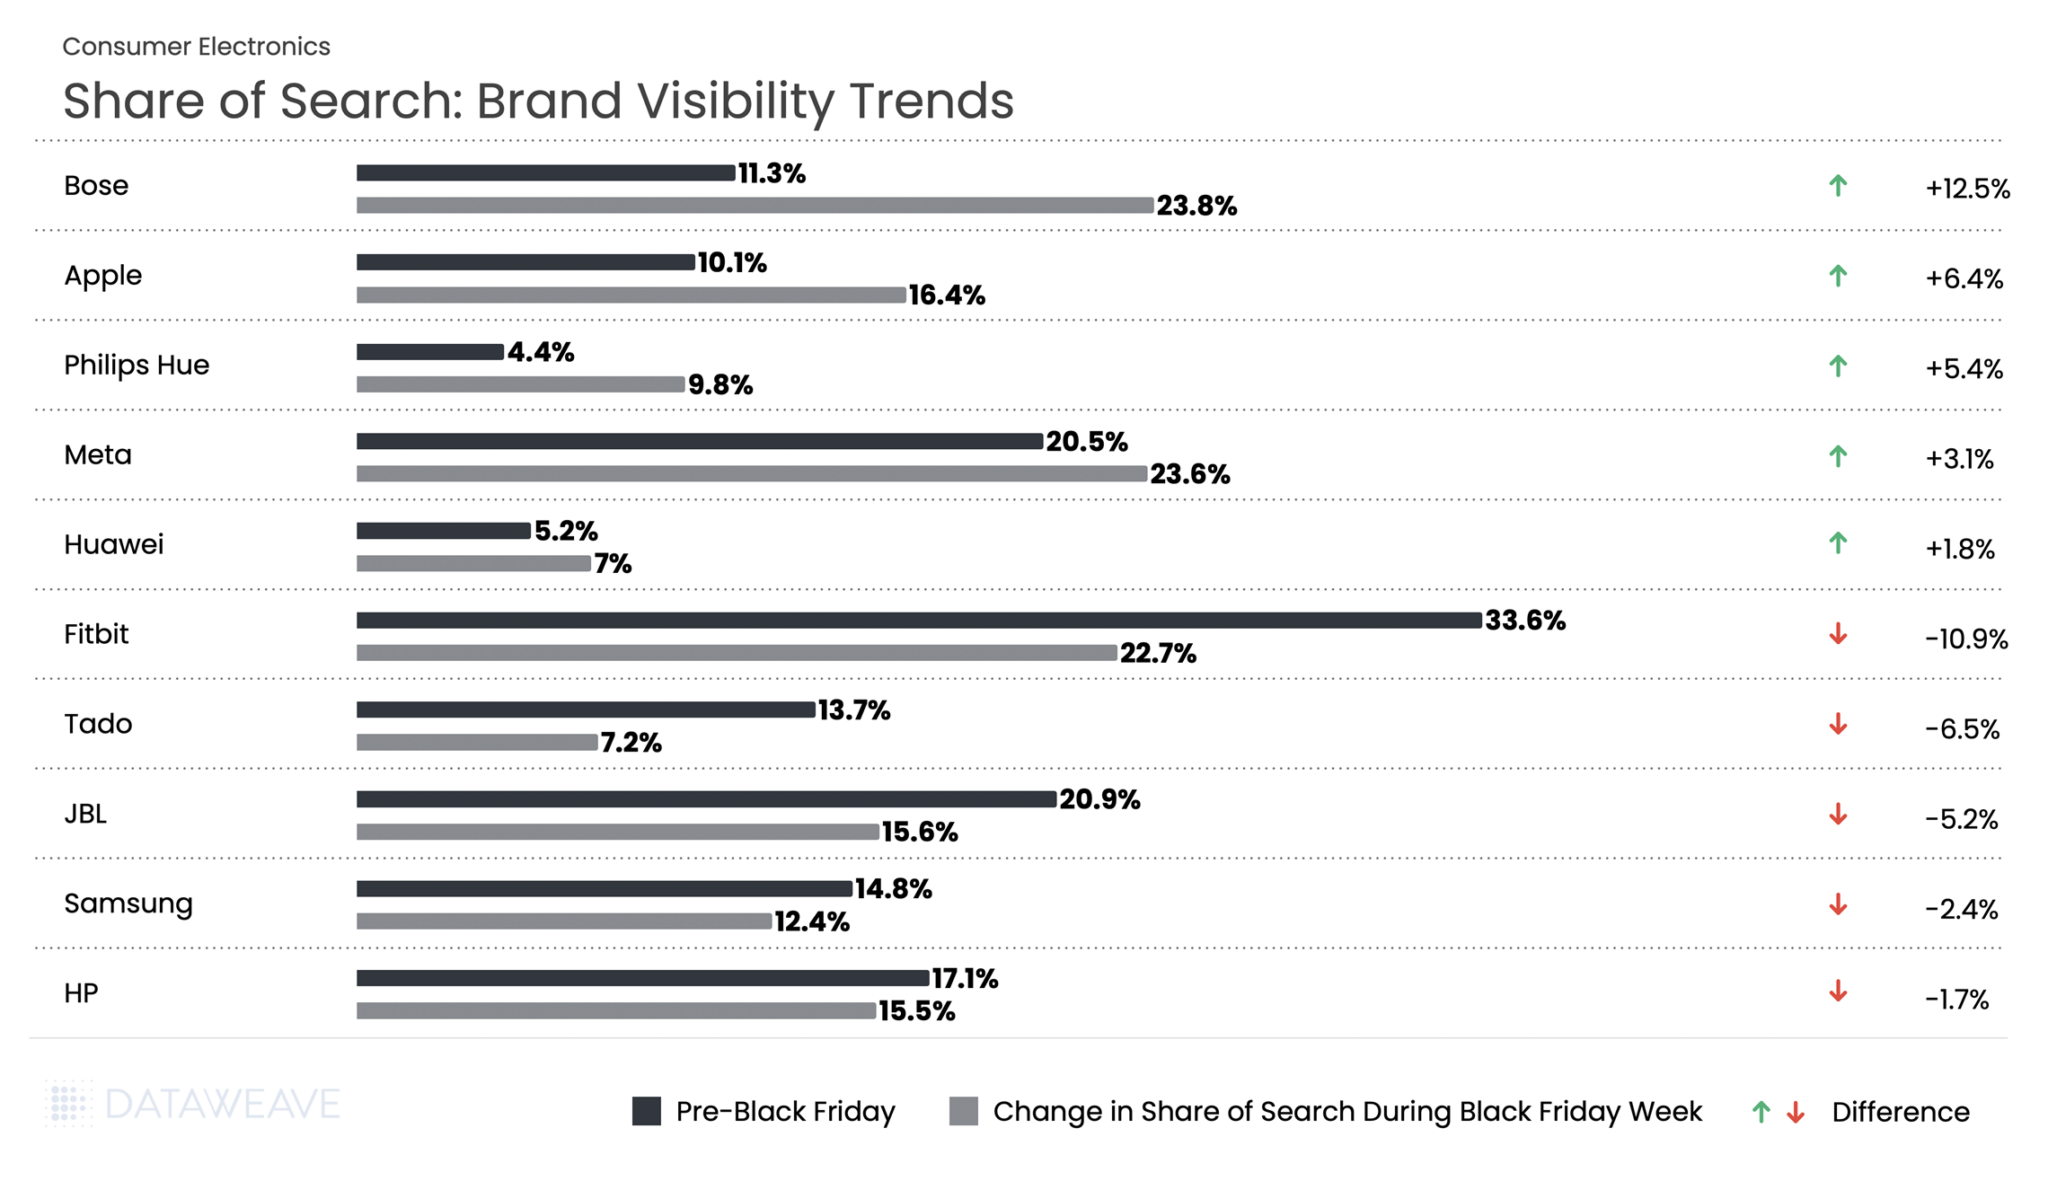
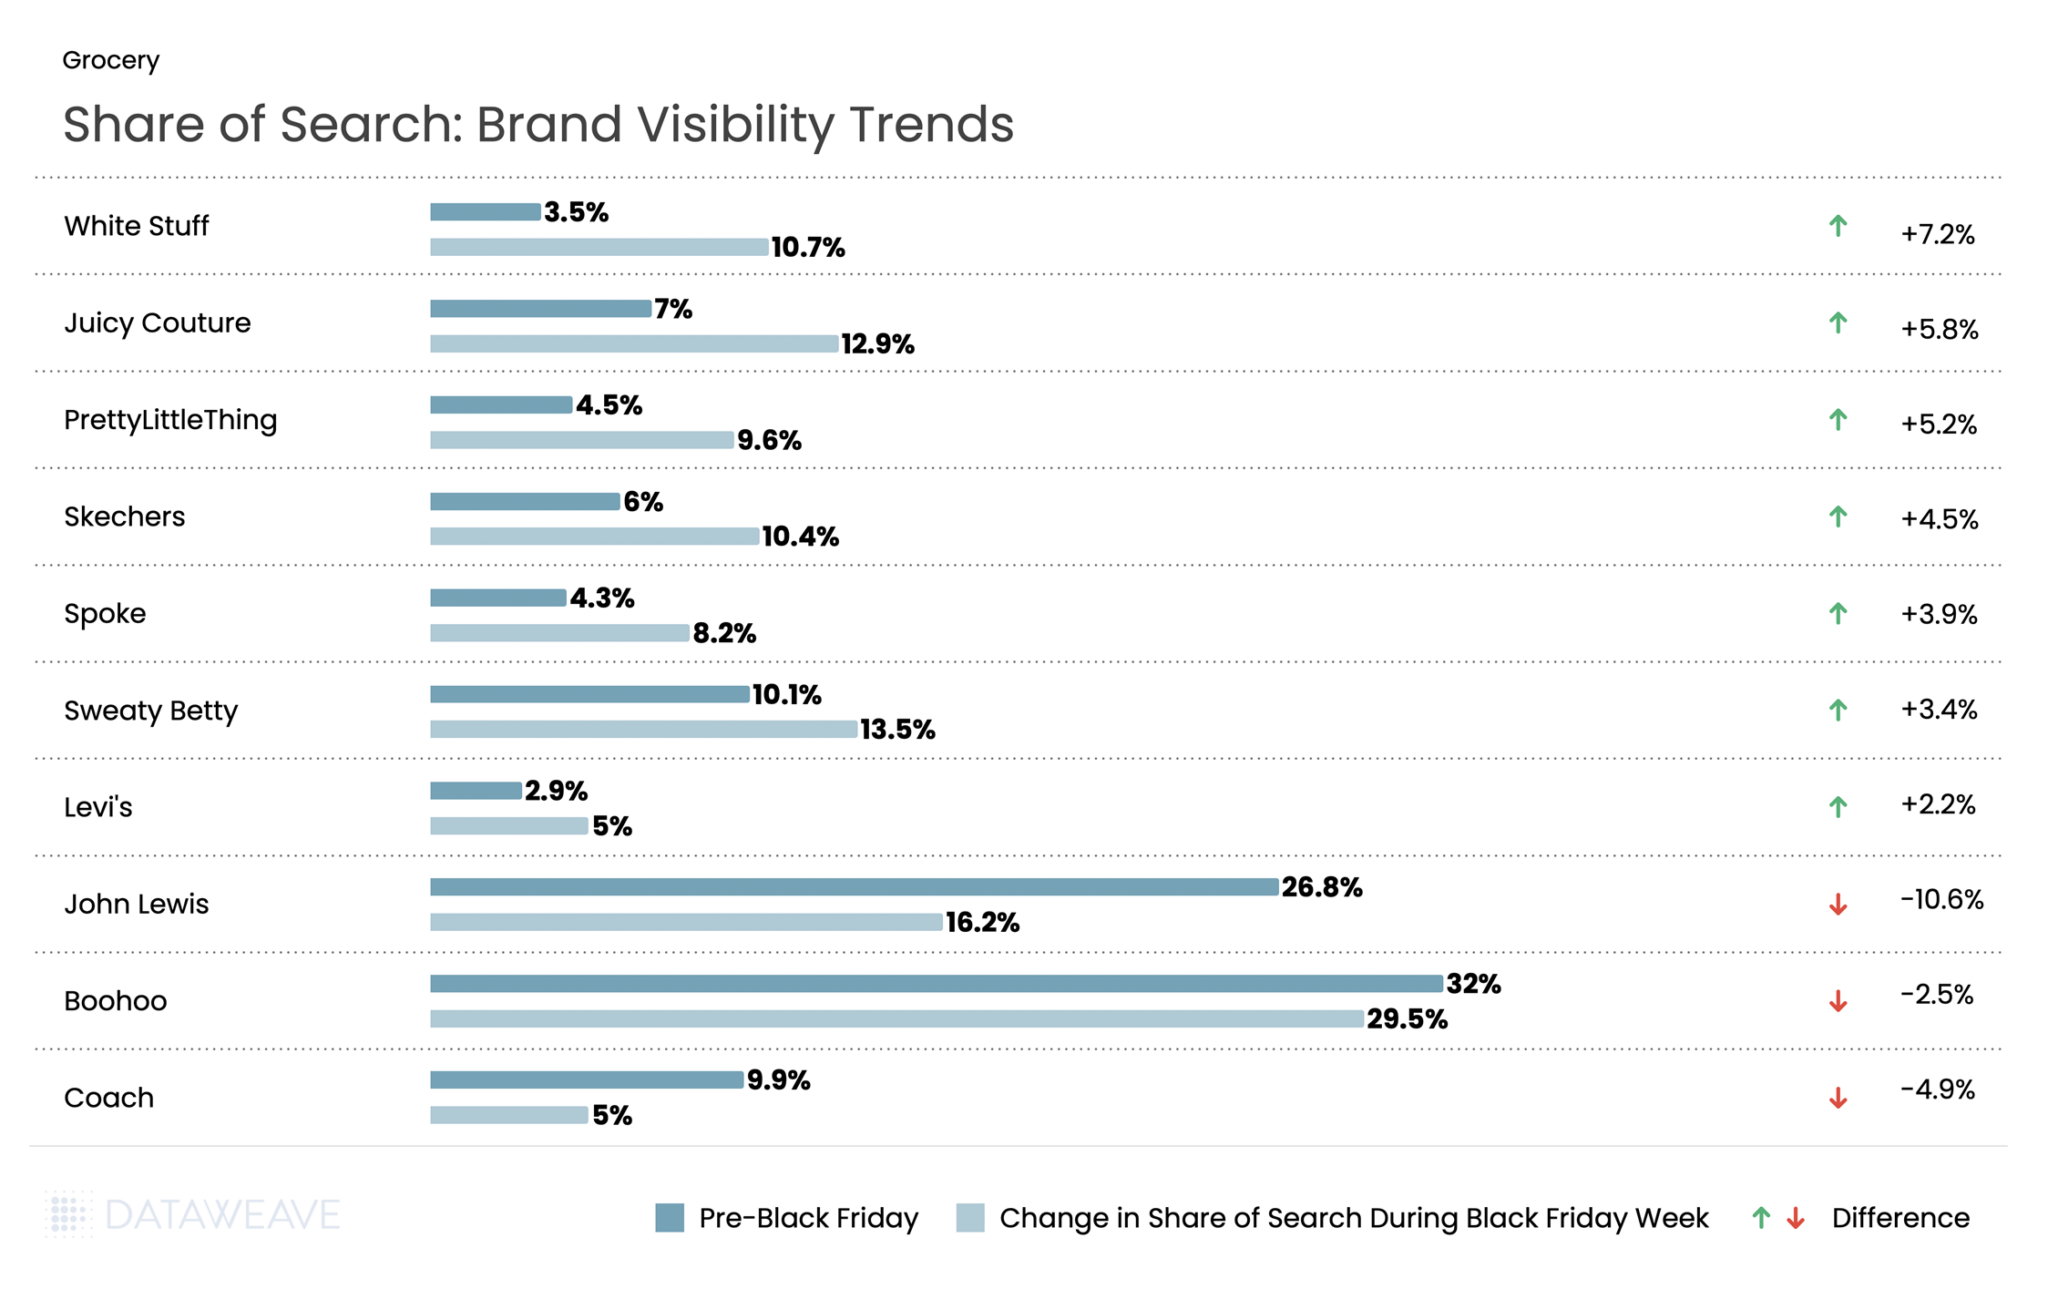
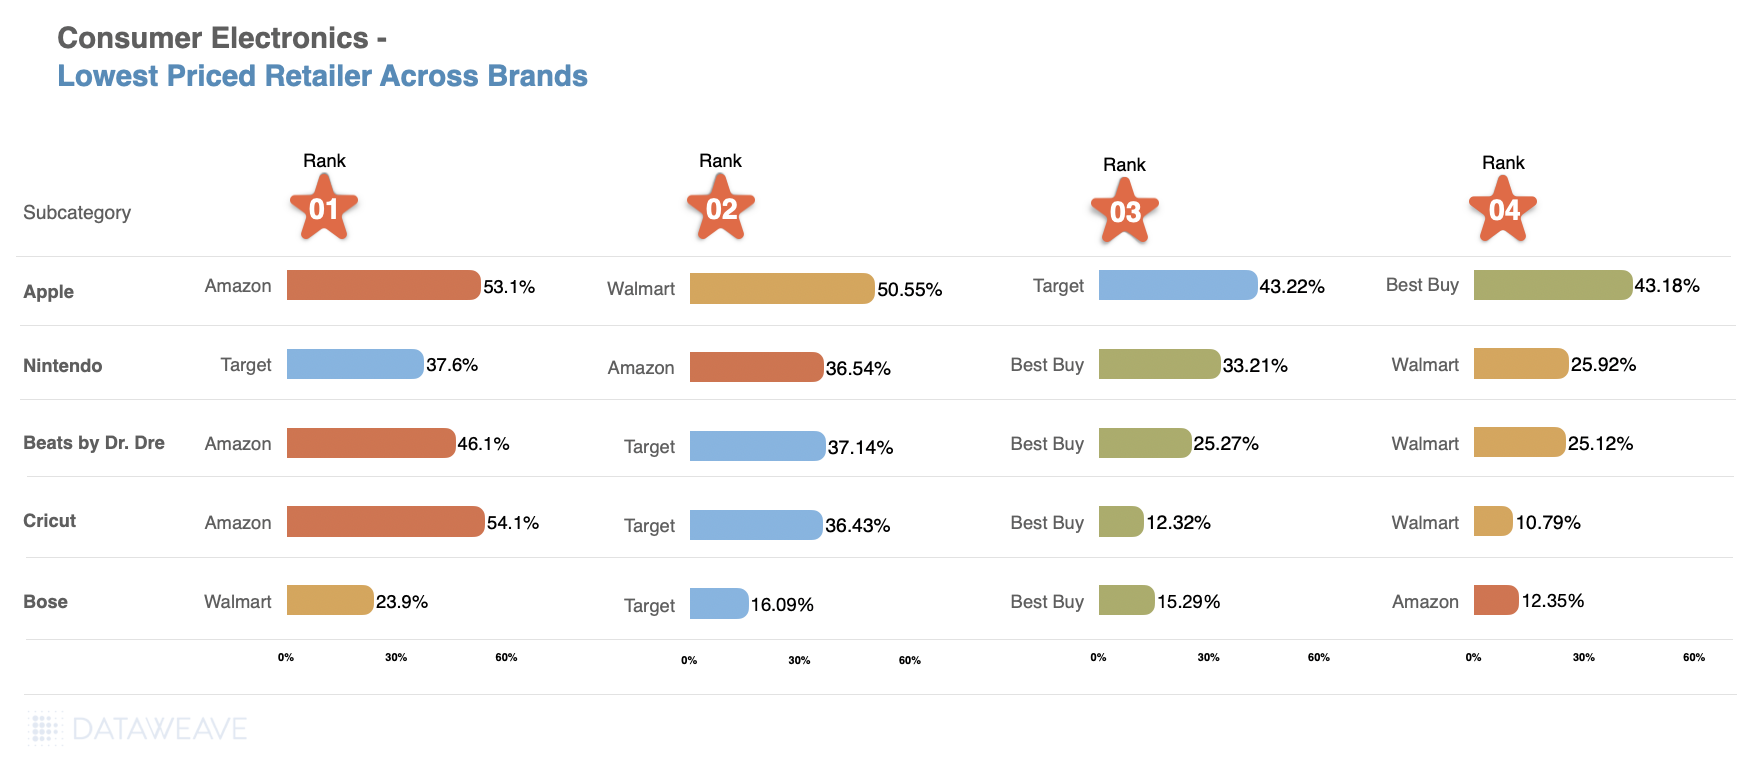
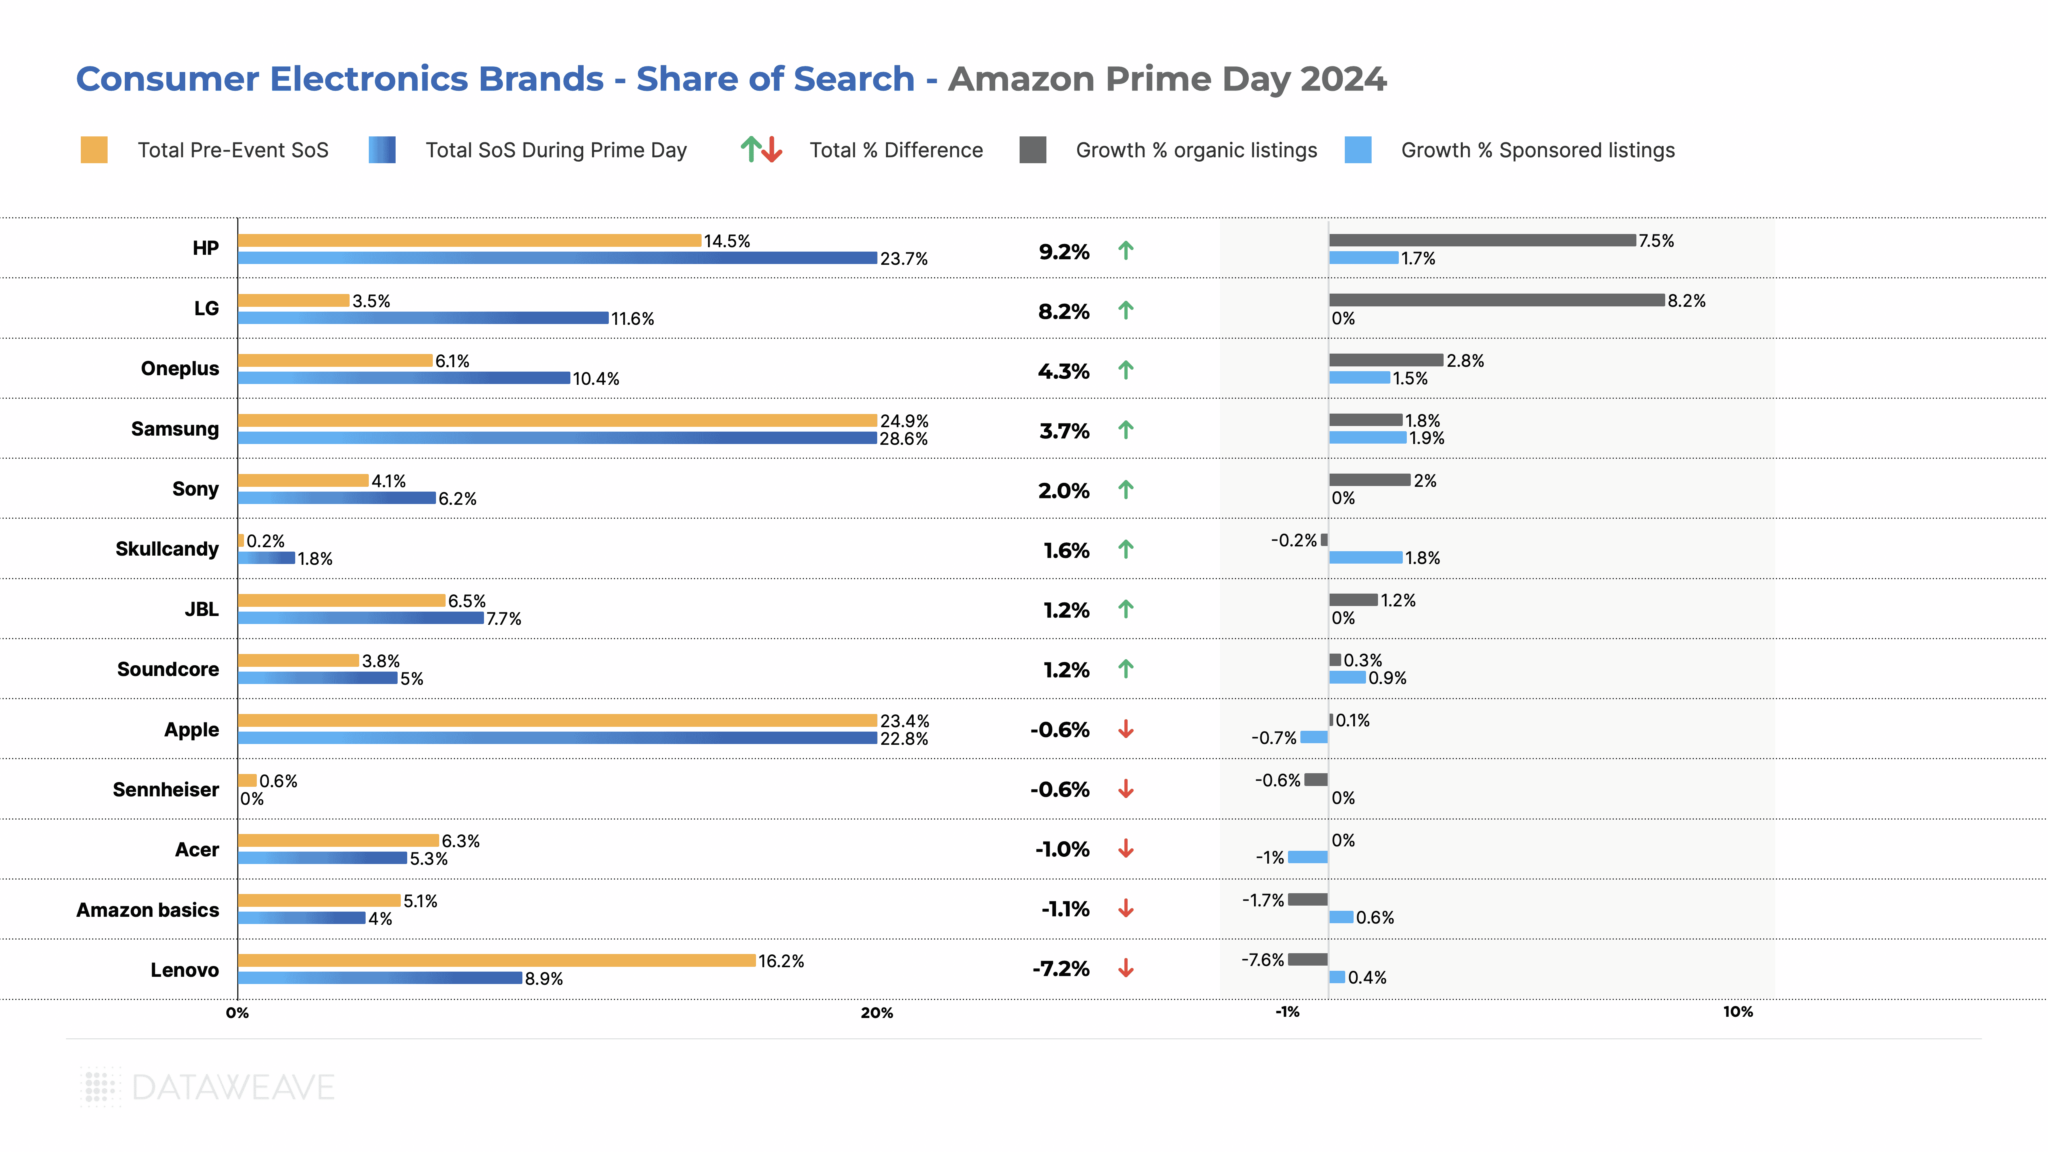
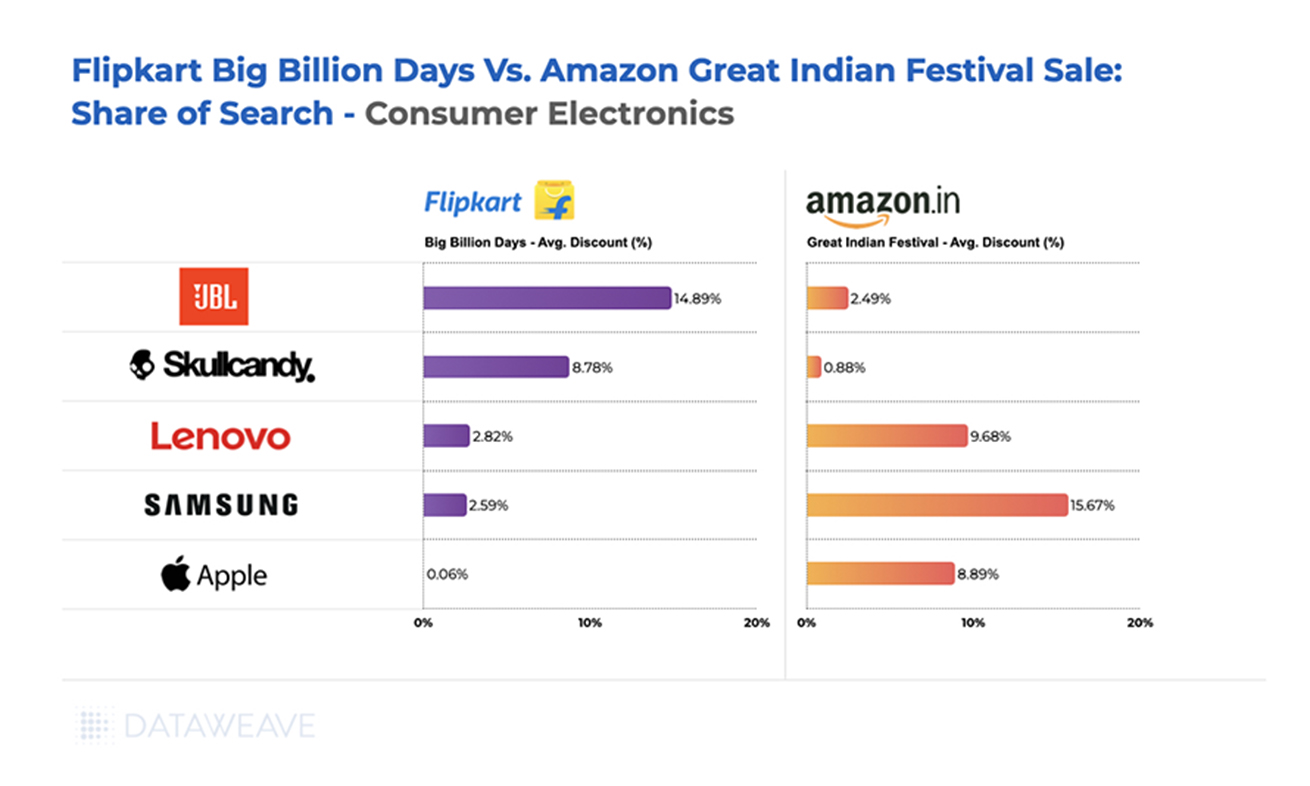
Share of Search: Brand Visibility Trends
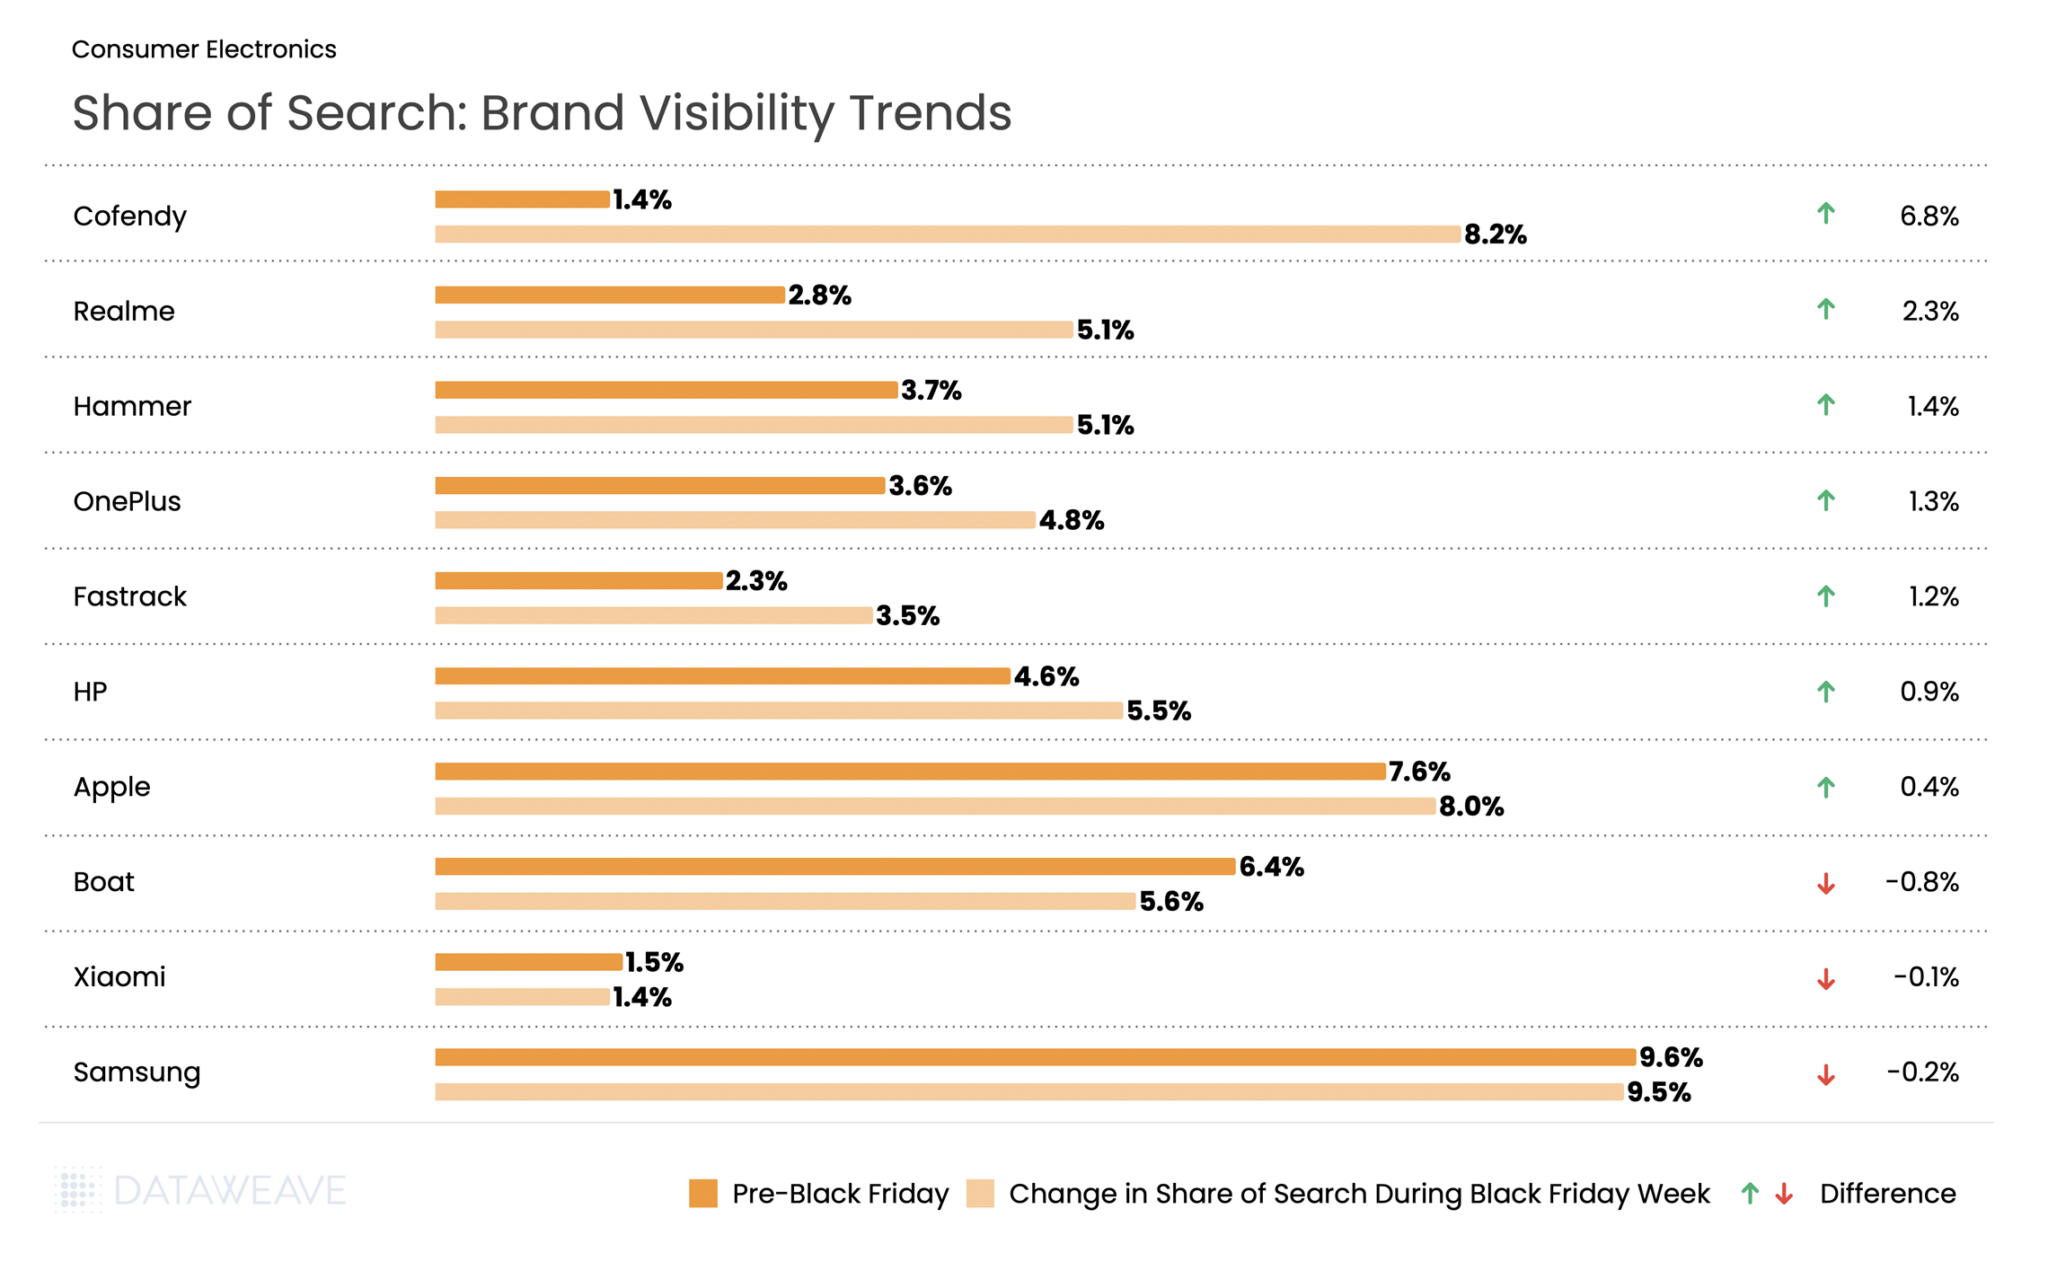
The most notable is Cofendy, electronics accessories and speaker brand, that saw the share of search rise from 1.4% pre Black Friday to 8.2% during the event. Realme followed with a solid 2.3% gain, reinforcing its position as a rising smartphone brand. Smart gadget brand Hammer also saw visibility increase by 1.4% at par with OnePlus, Fastrack, HP and Asus.
Samsung saw the highest brand visibility with share of search at 9.6% pre-event and 9.5% during Black Friday week, despite seeing a small drop in visibility. Audio brand Boat saw a visibility drop by 0.8%, while Xiaomi saw the share of search drop by 0.1%. This shift suggests that Indian consumers were drawn to newer brands and compelling deals across computing and mobile devices during the sale period.
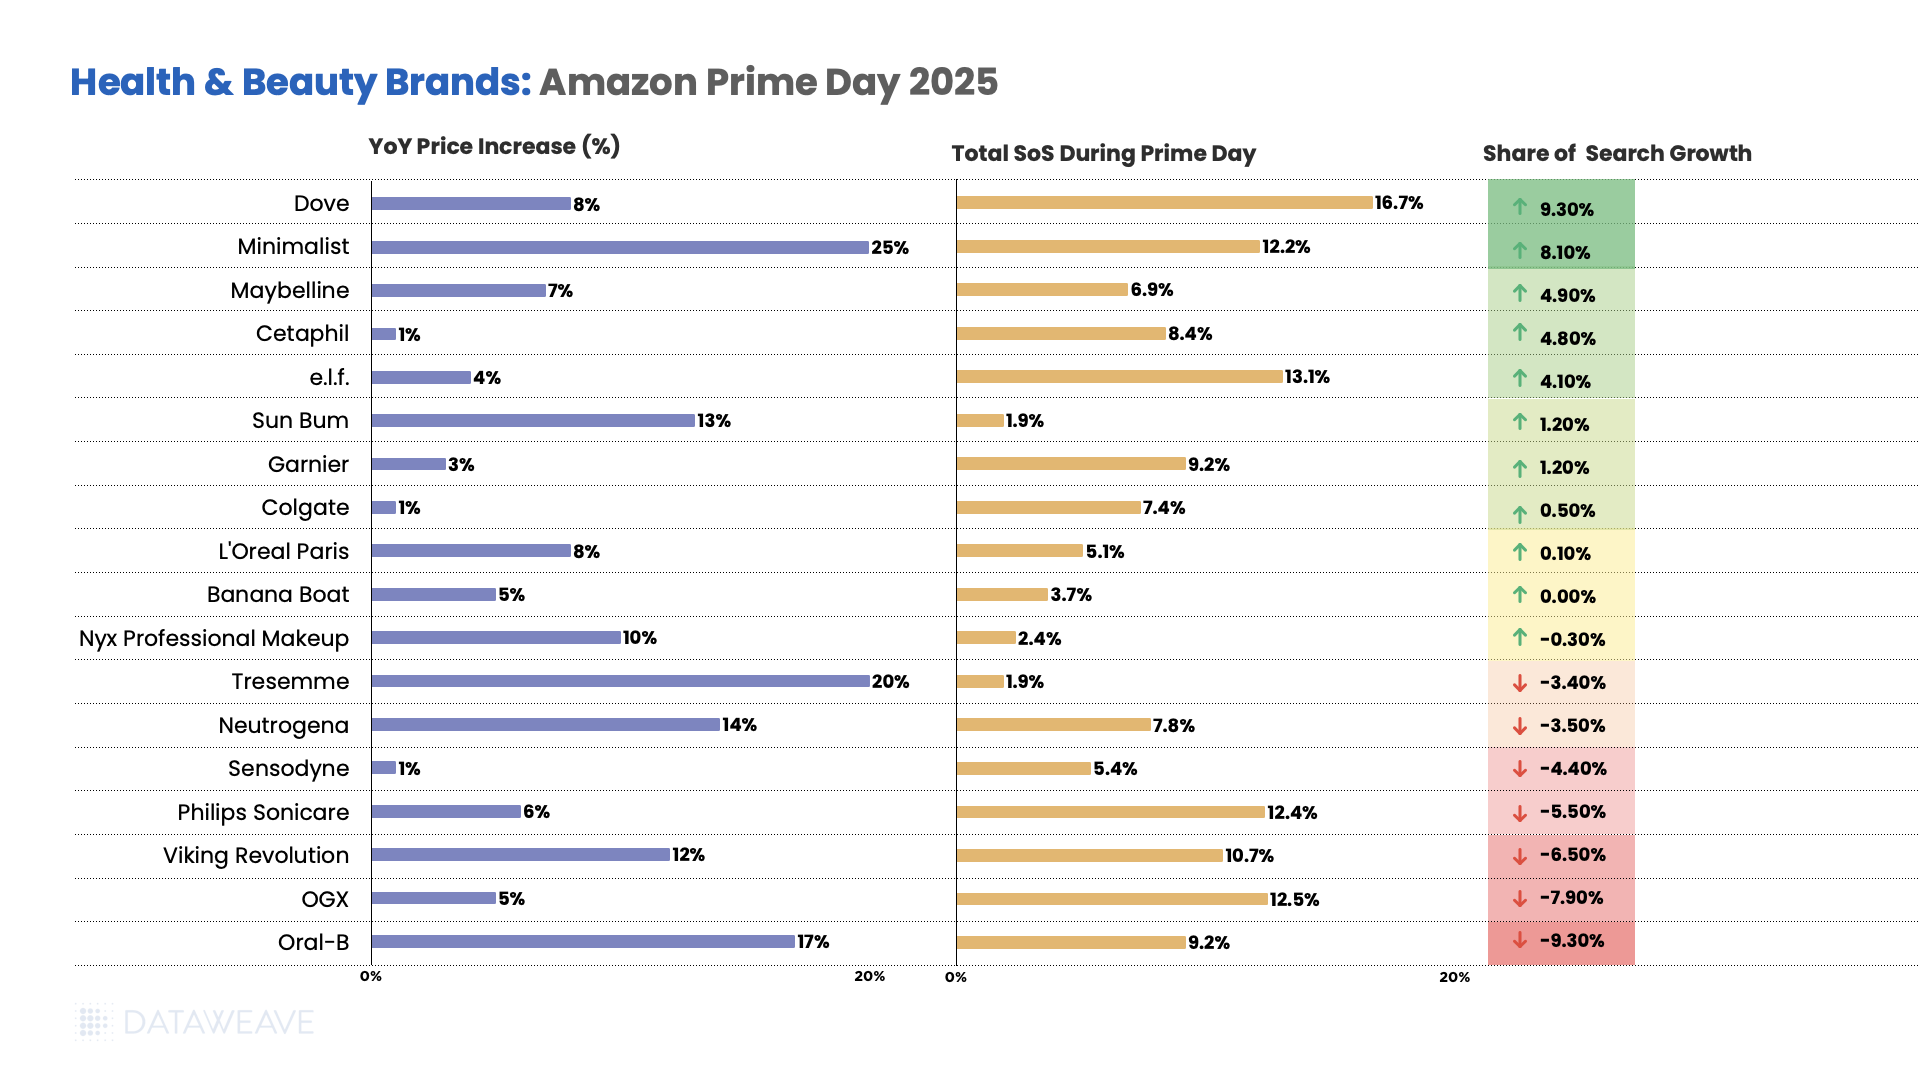
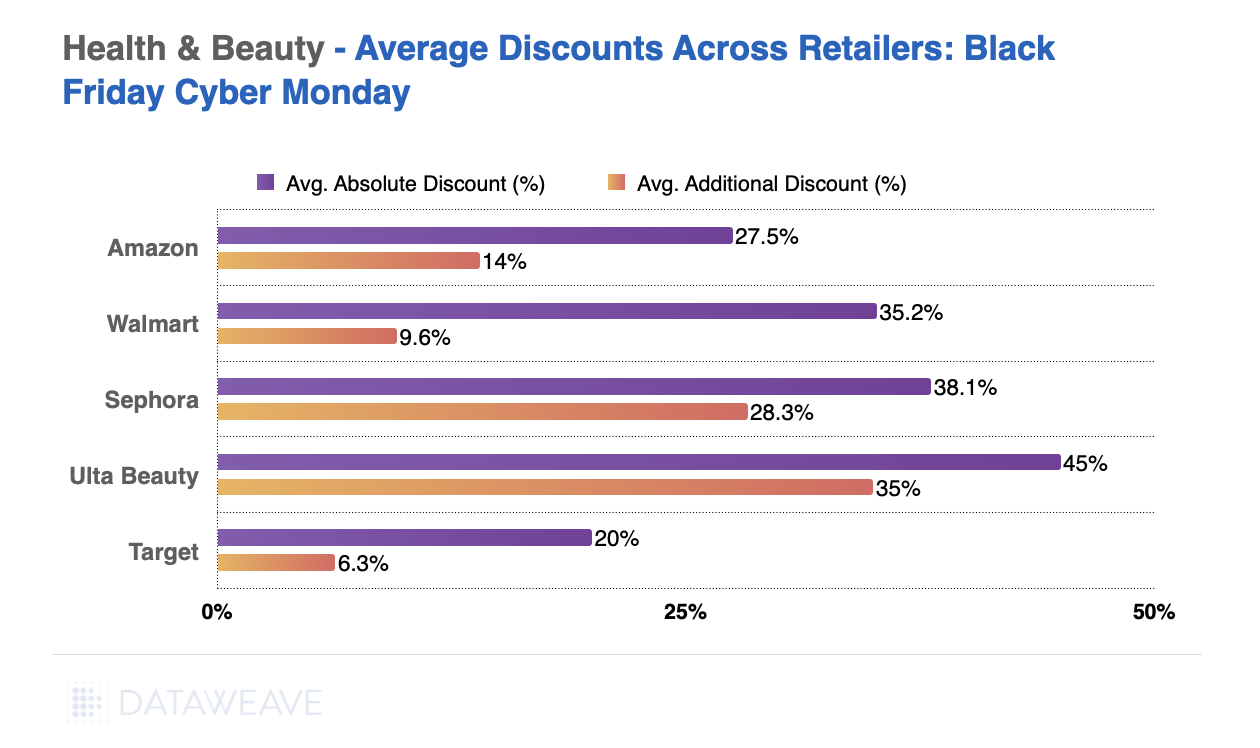
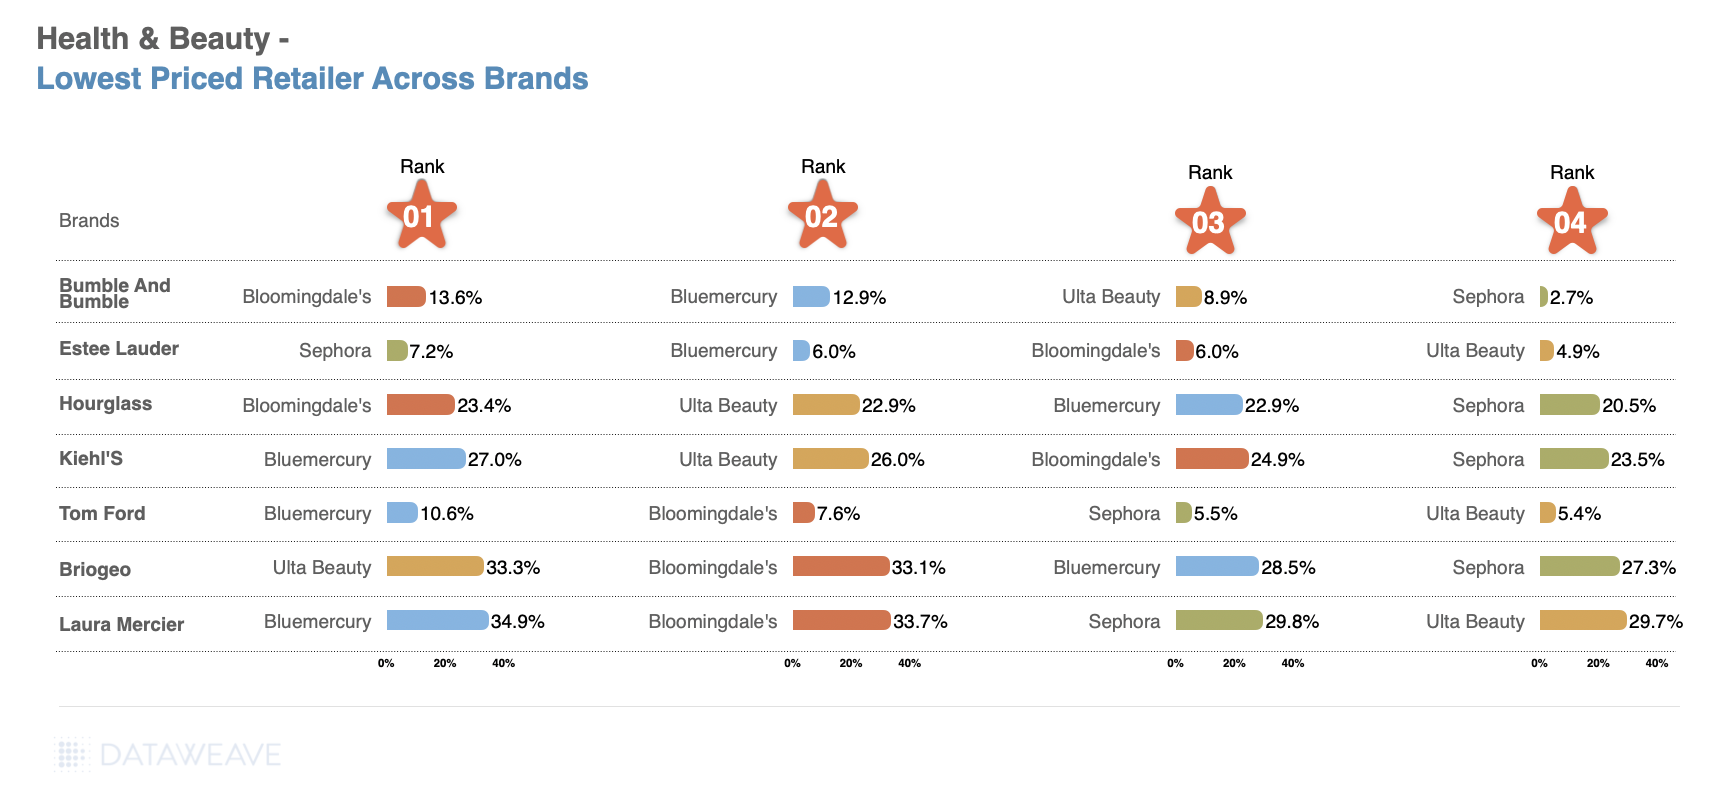
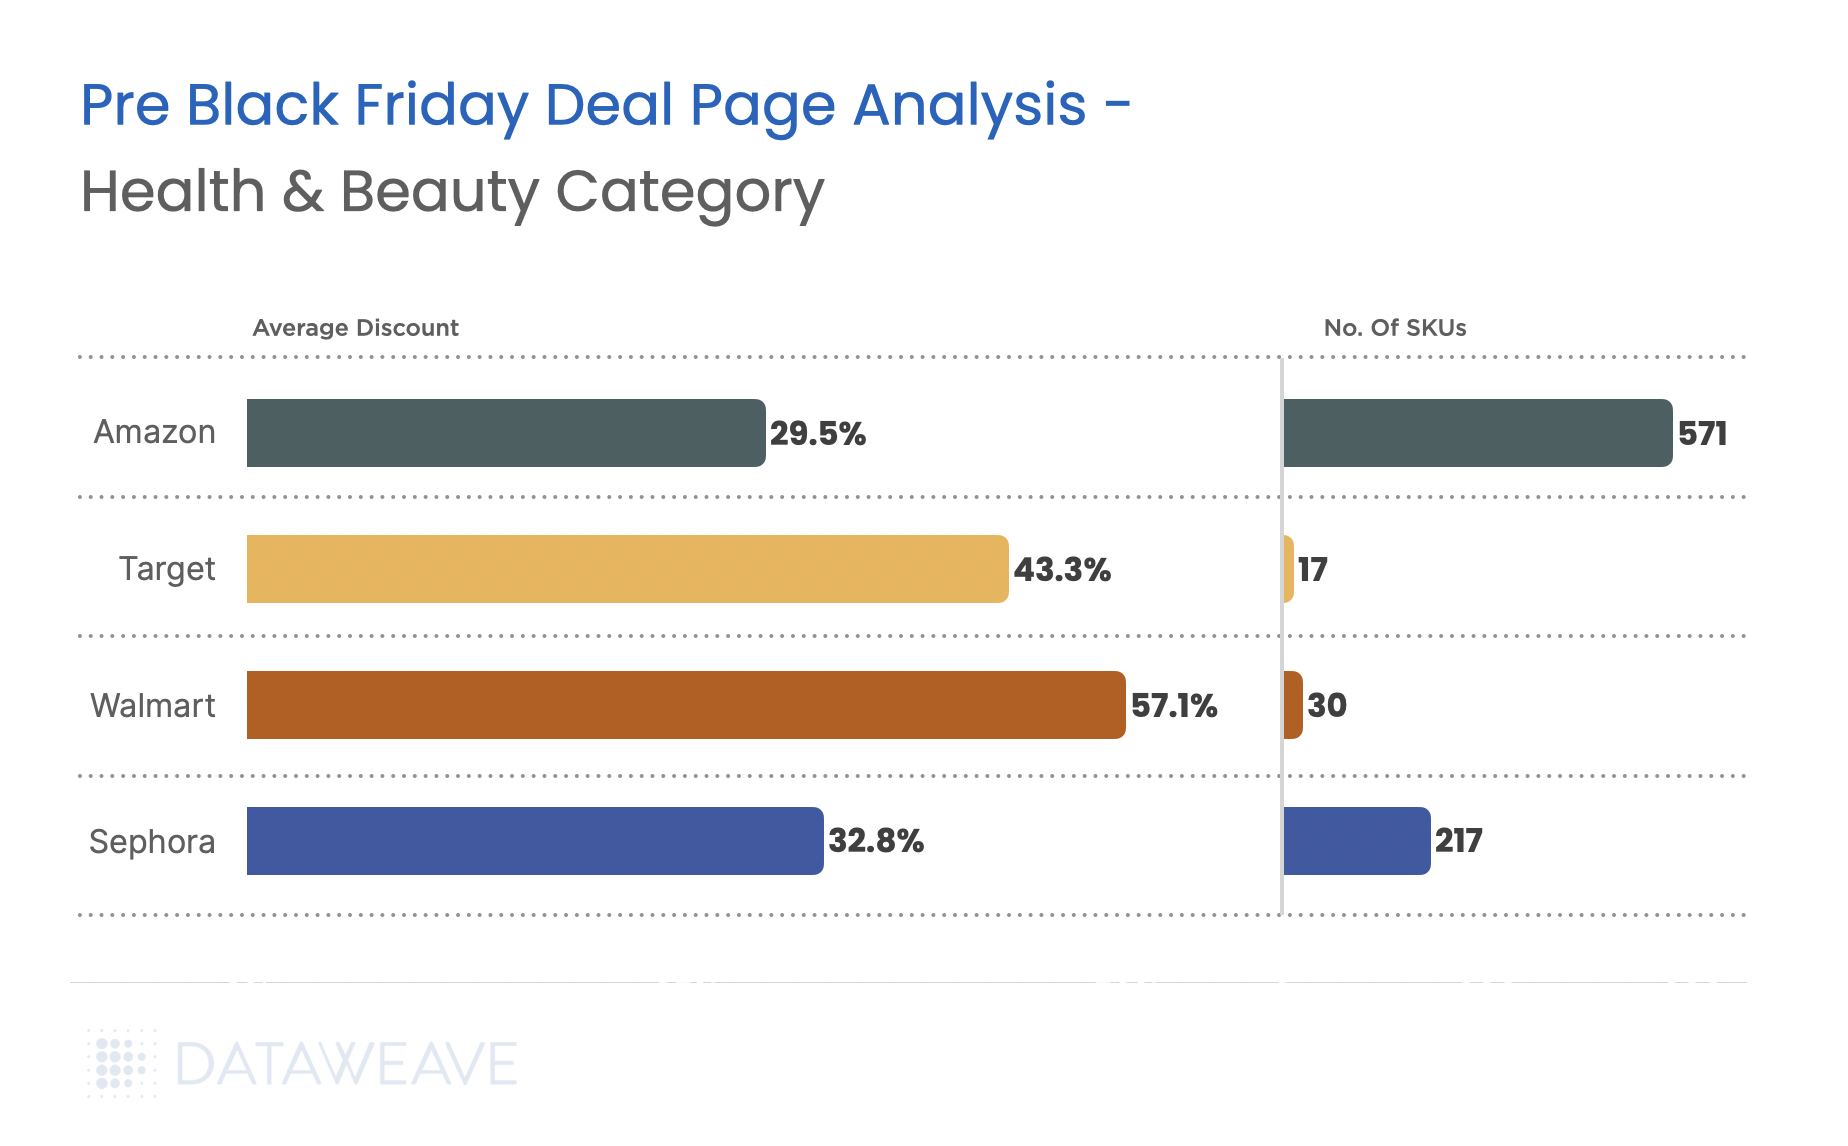
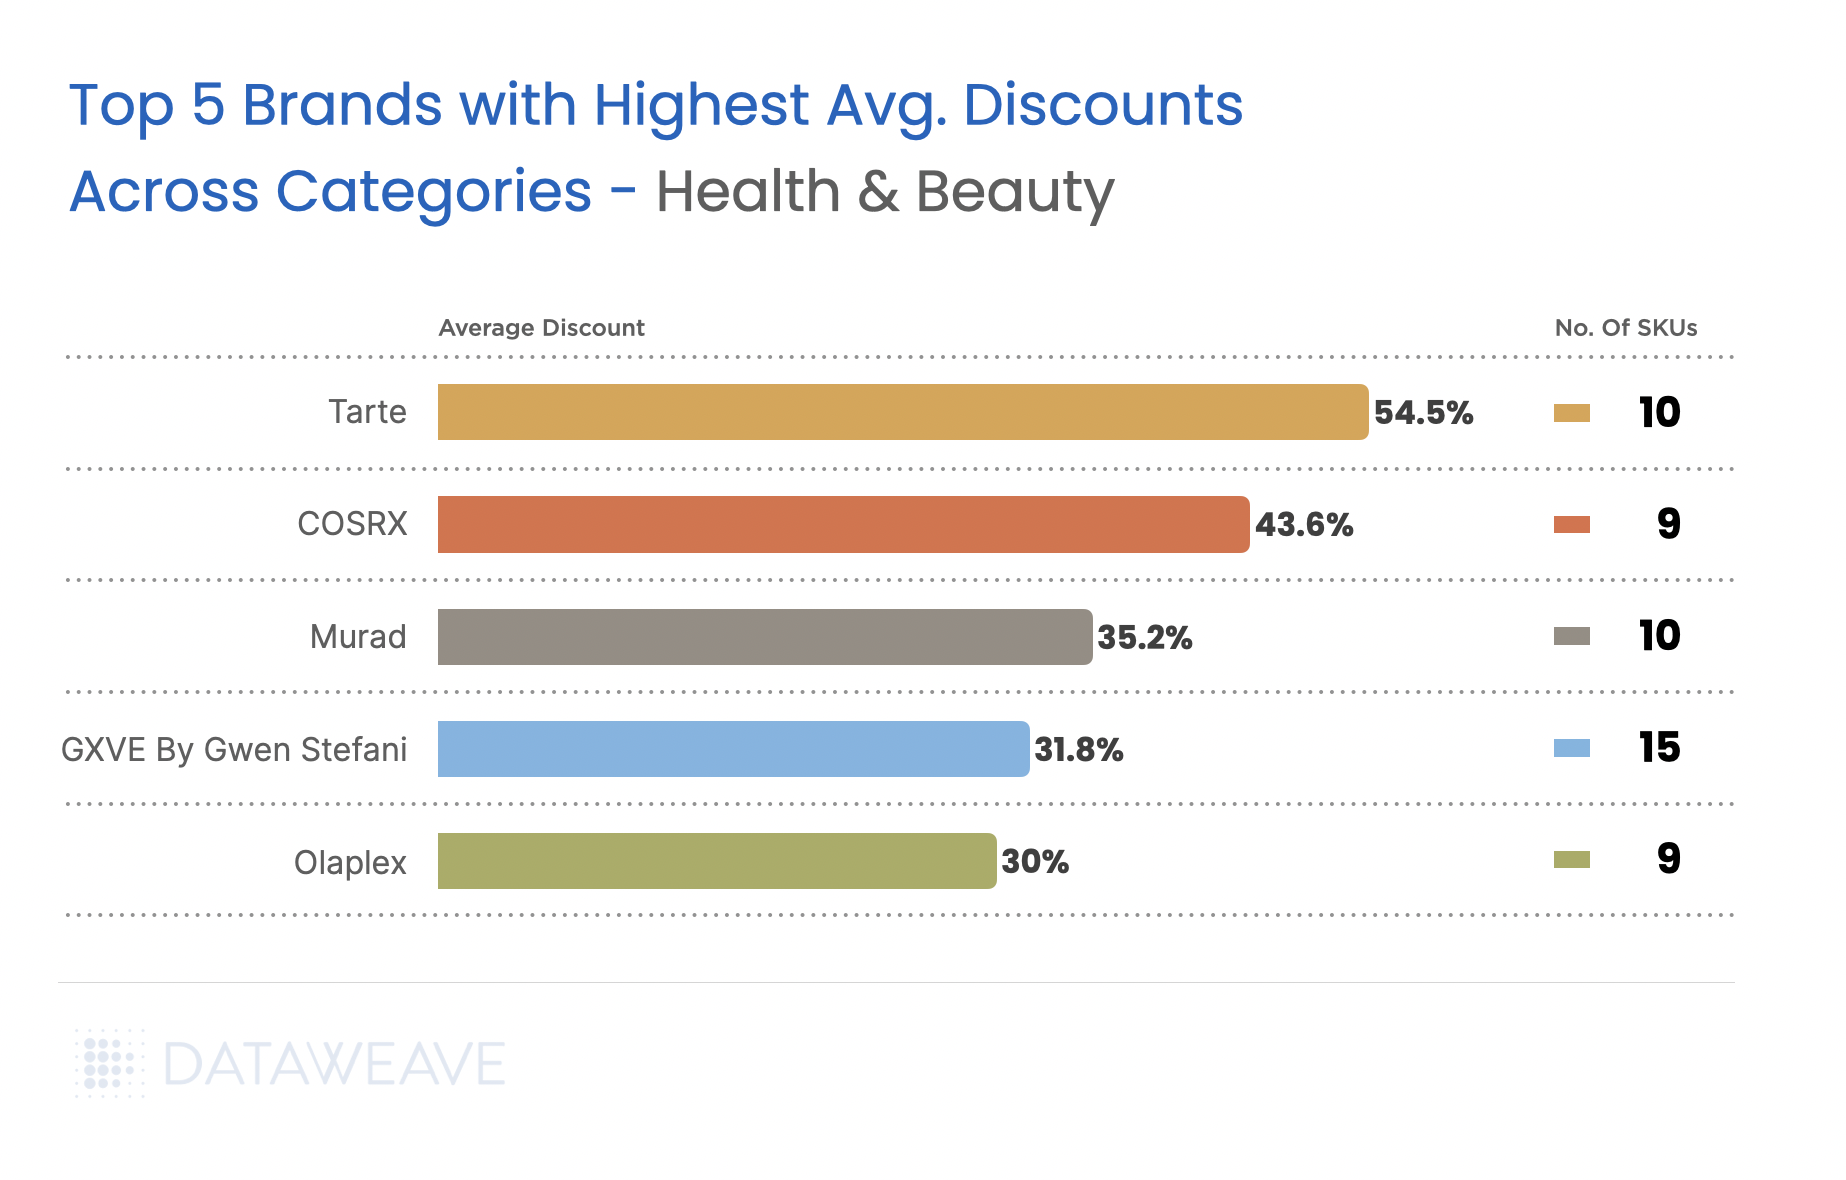
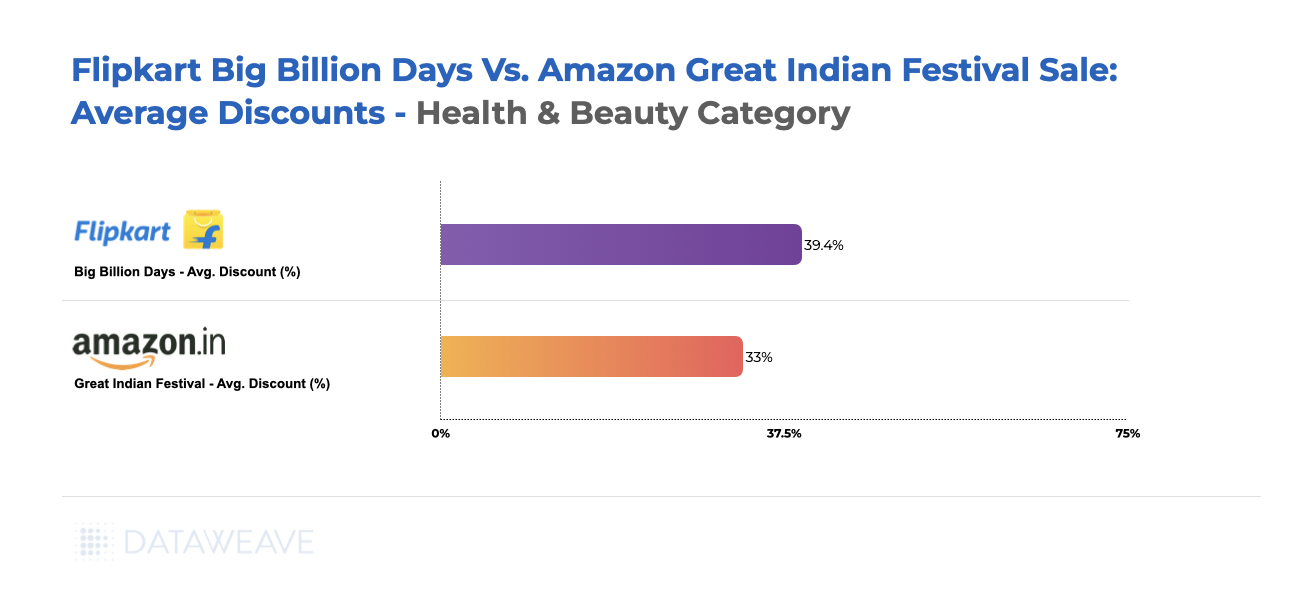
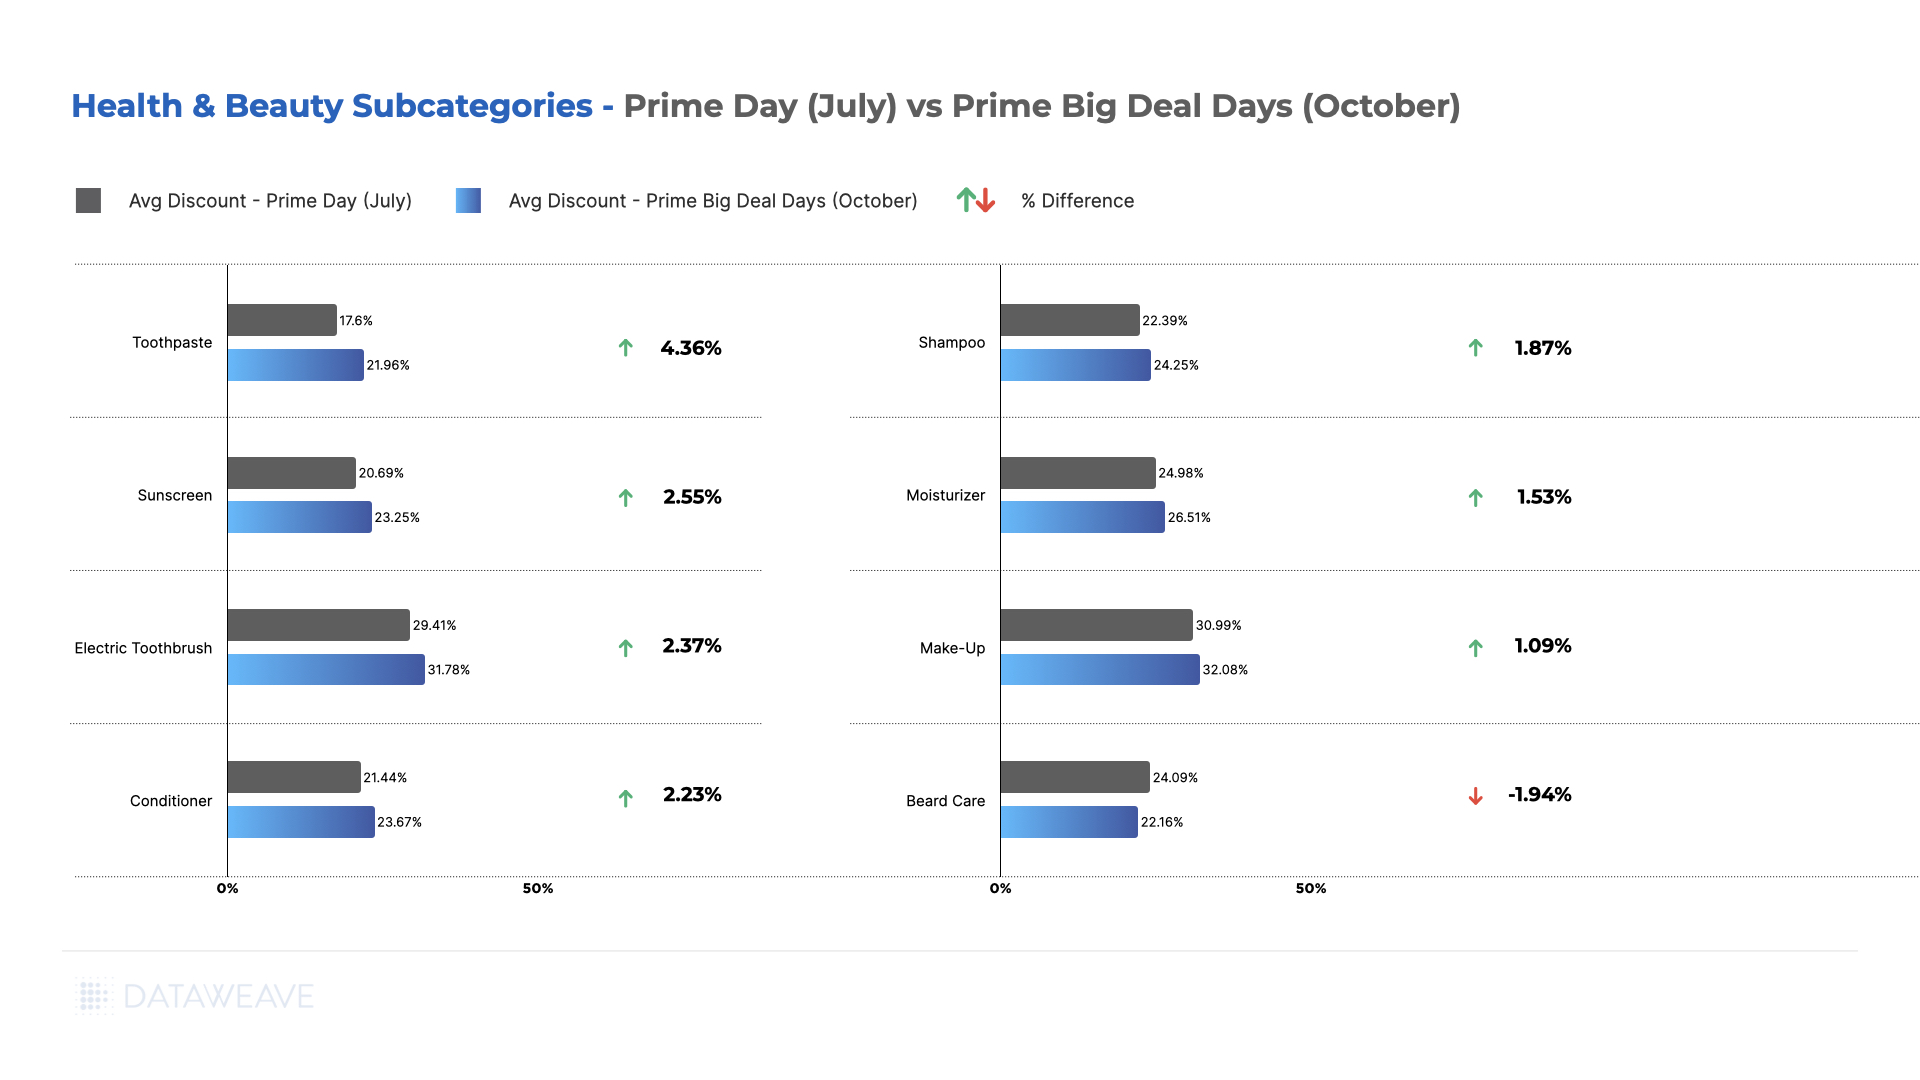
Health & Beauty
The Indian beauty and personal care market is experiencing rapid growth, expected to reach $30 billion by 2027. Black Friday has become an important sales window for beauty brands and retailers. Our analysis of 19,854 SKUs reveals distinct patterns.
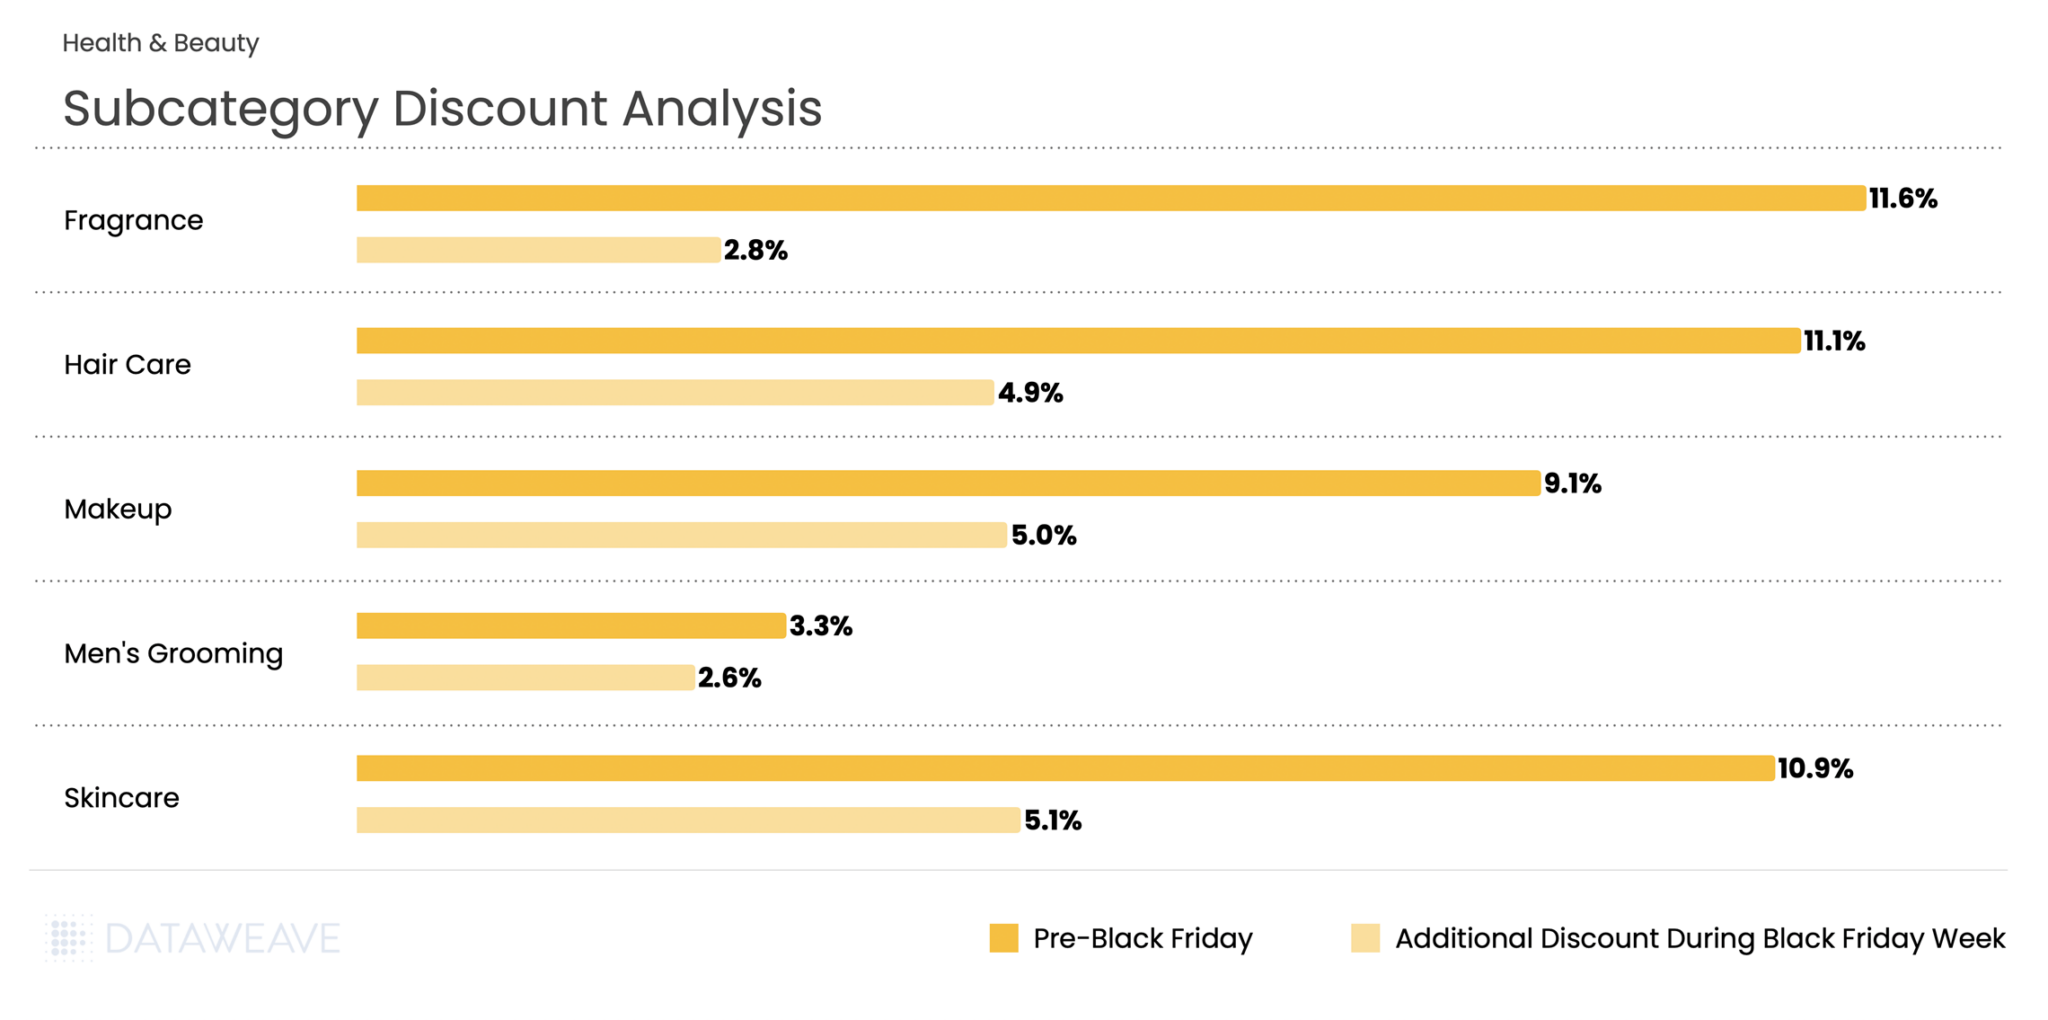
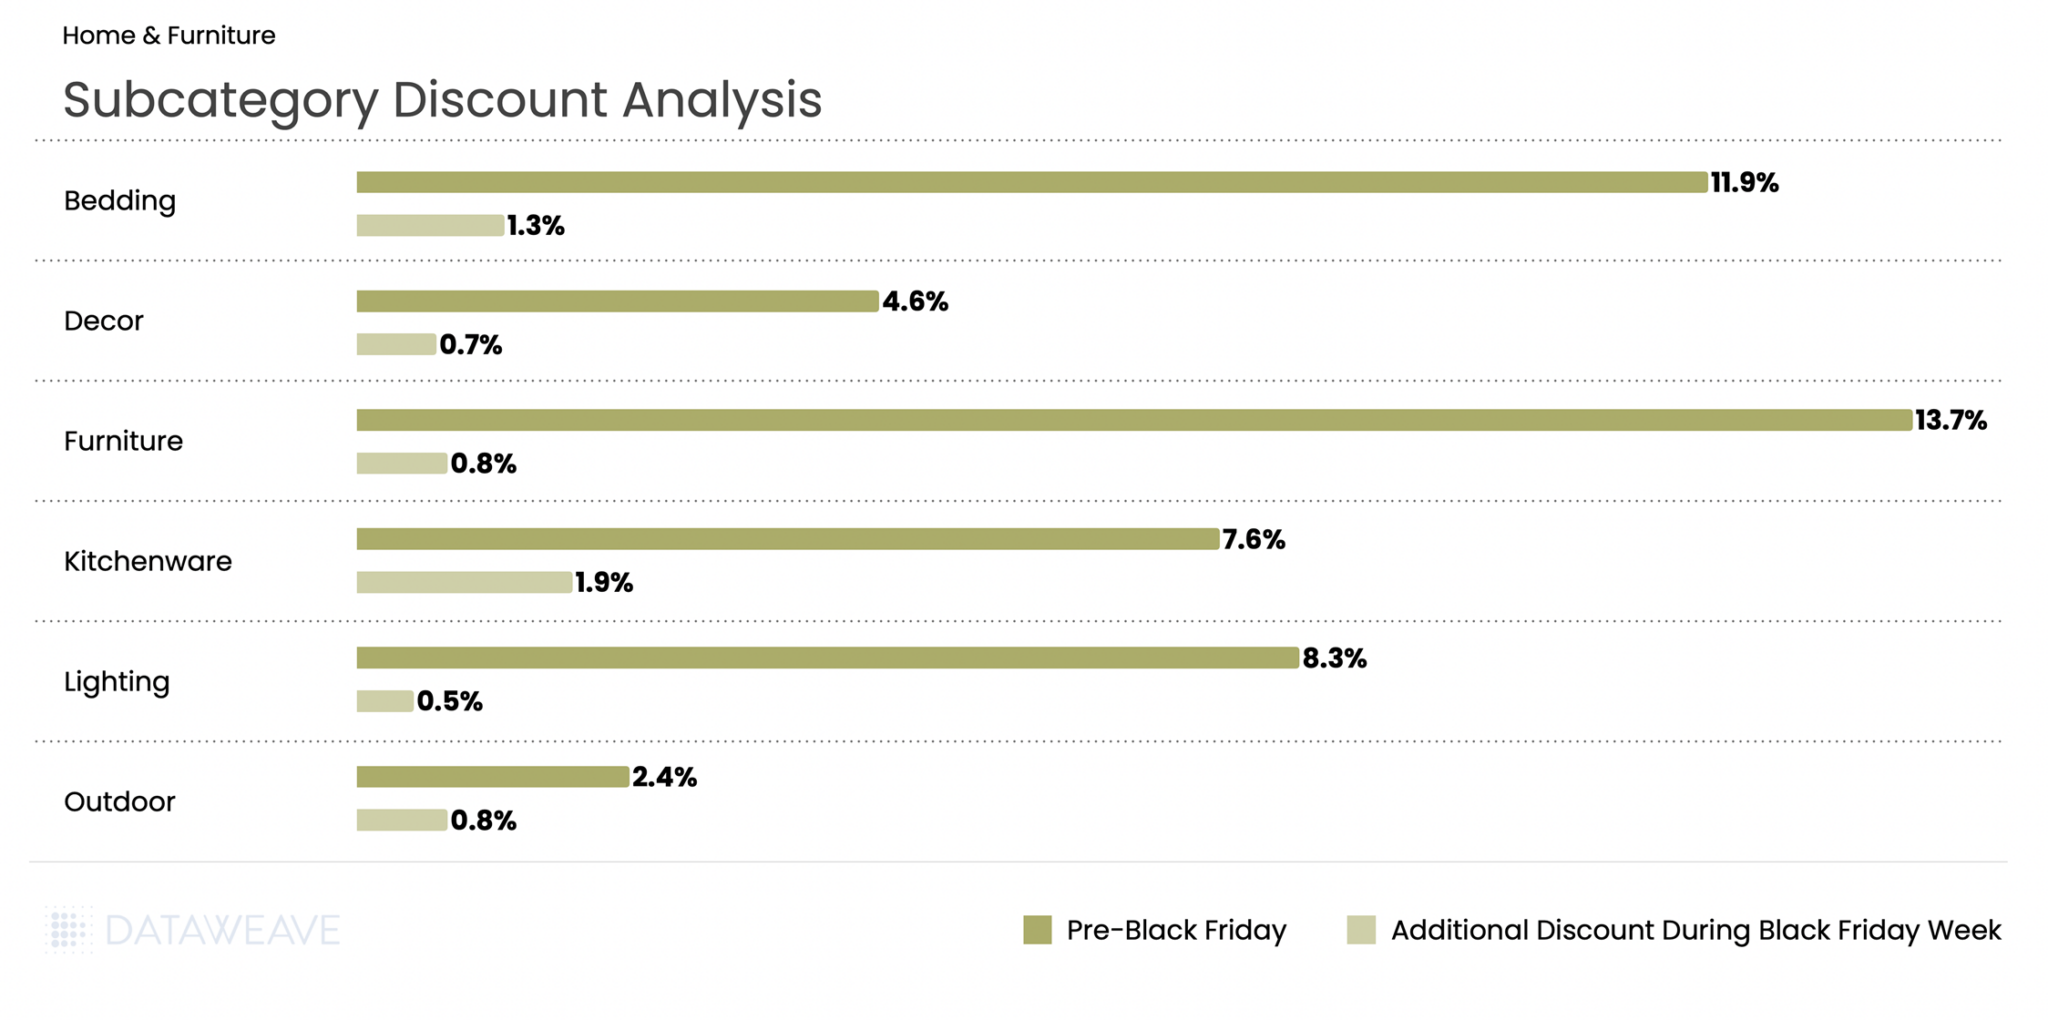
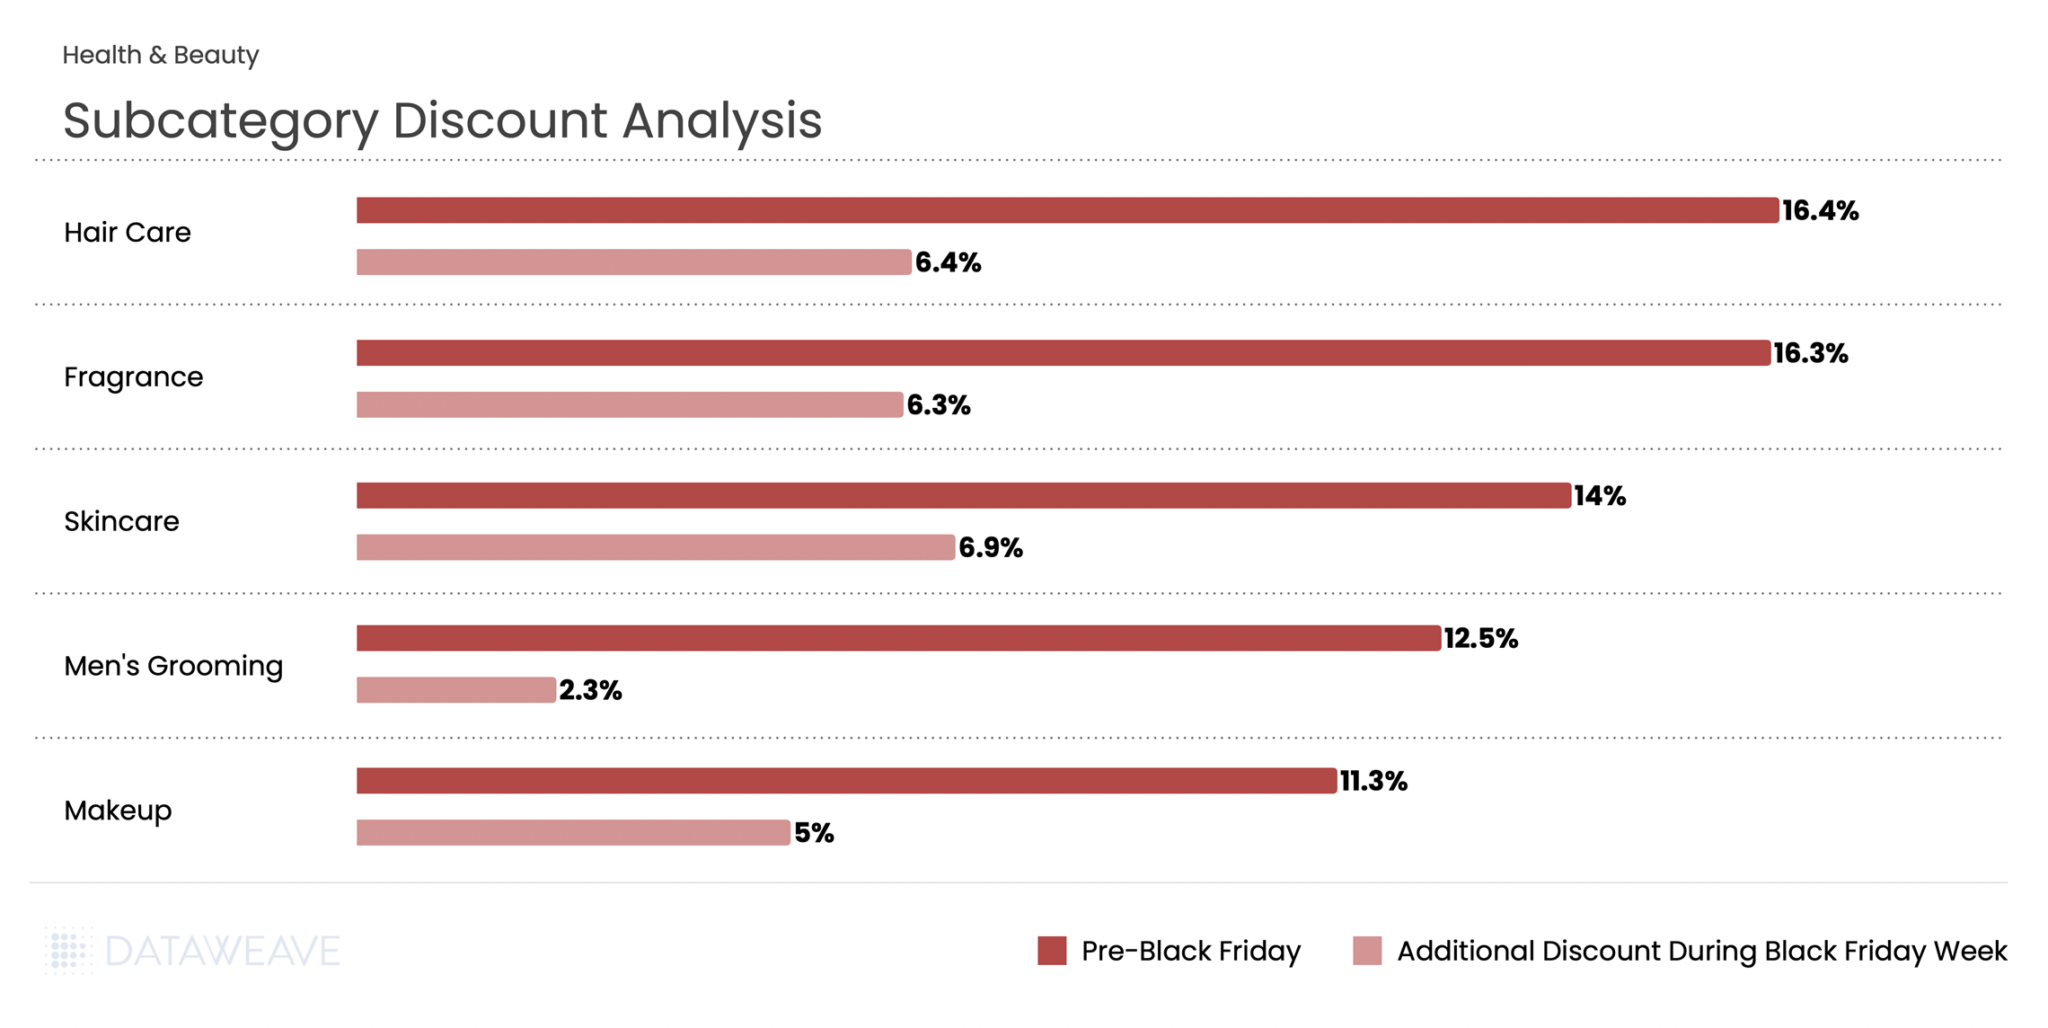
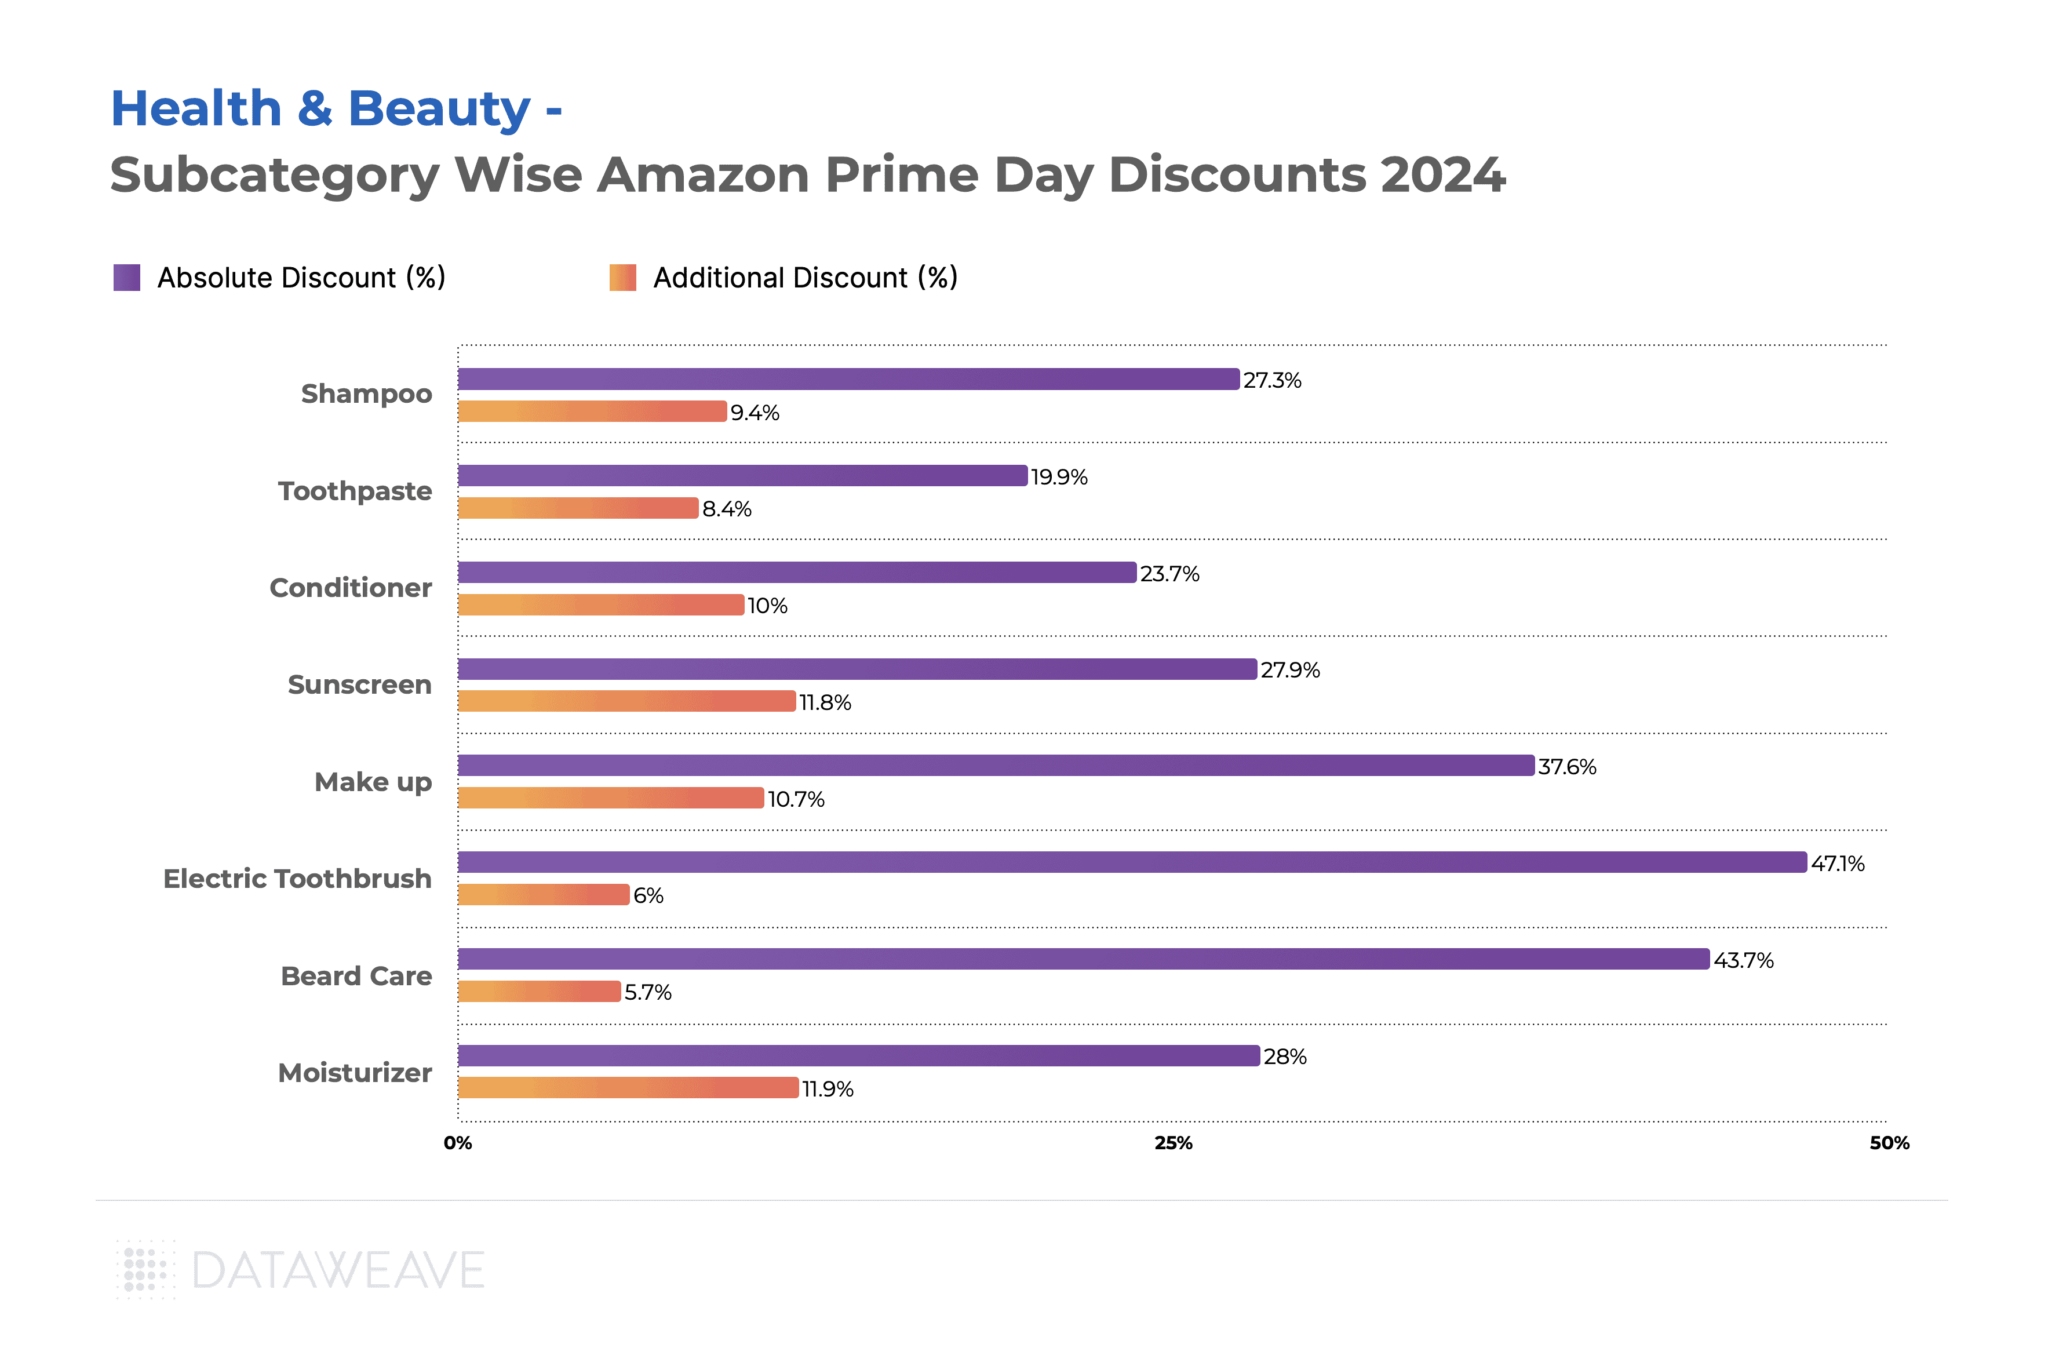
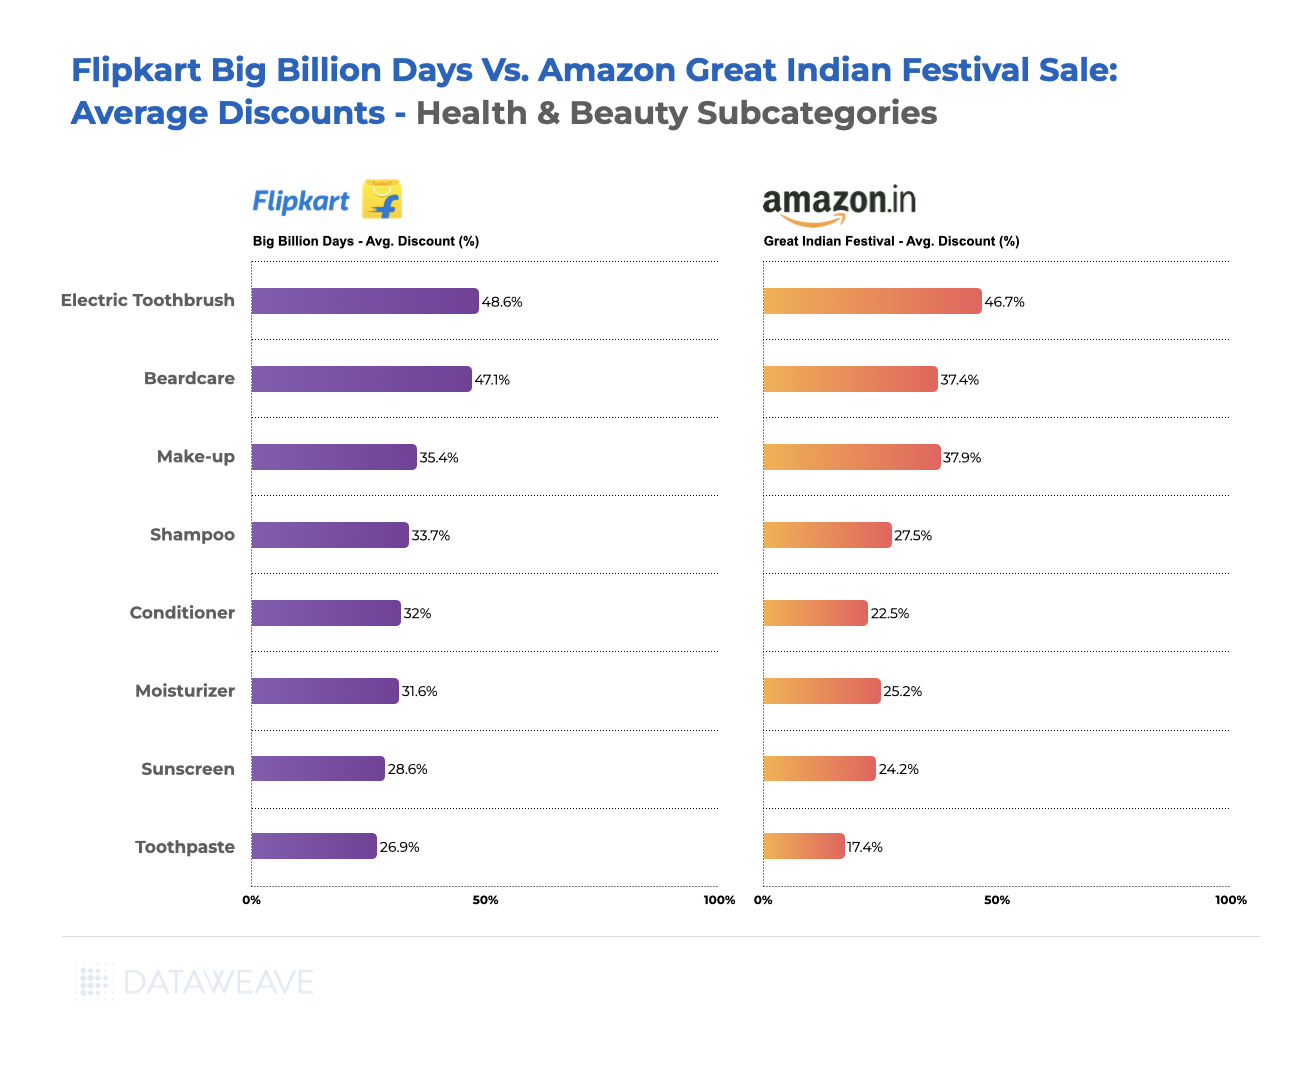
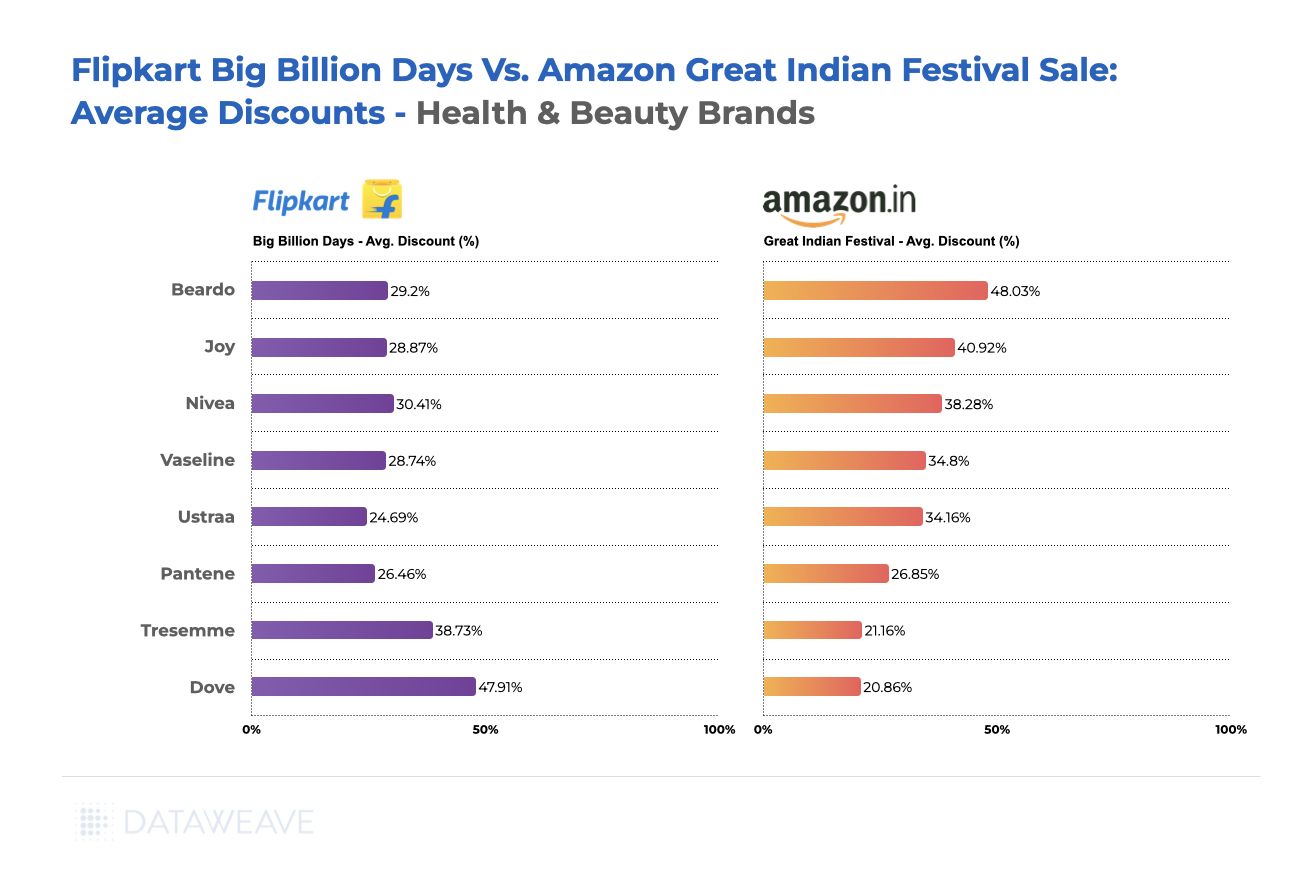
Subcategory Discount Analysis
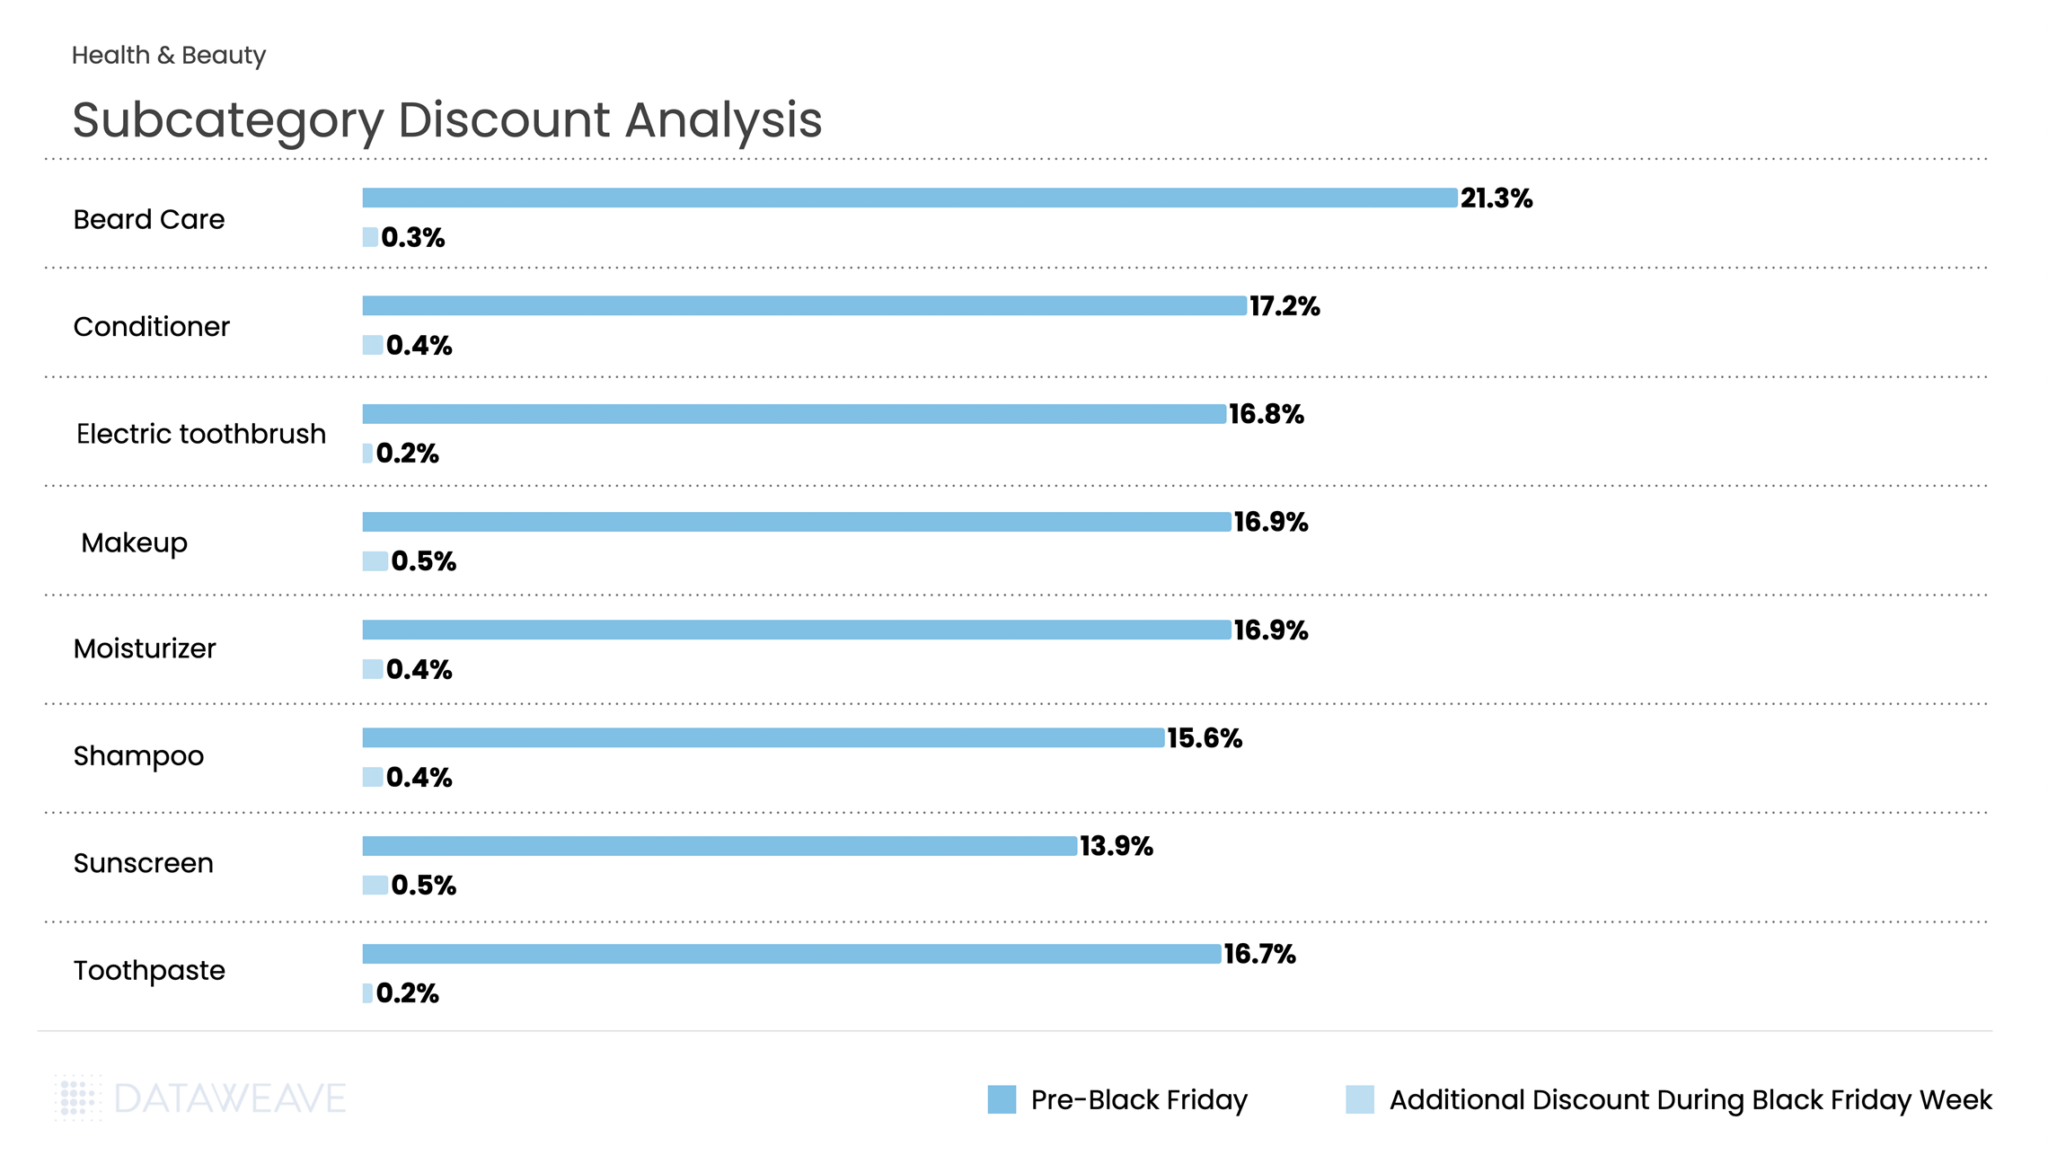
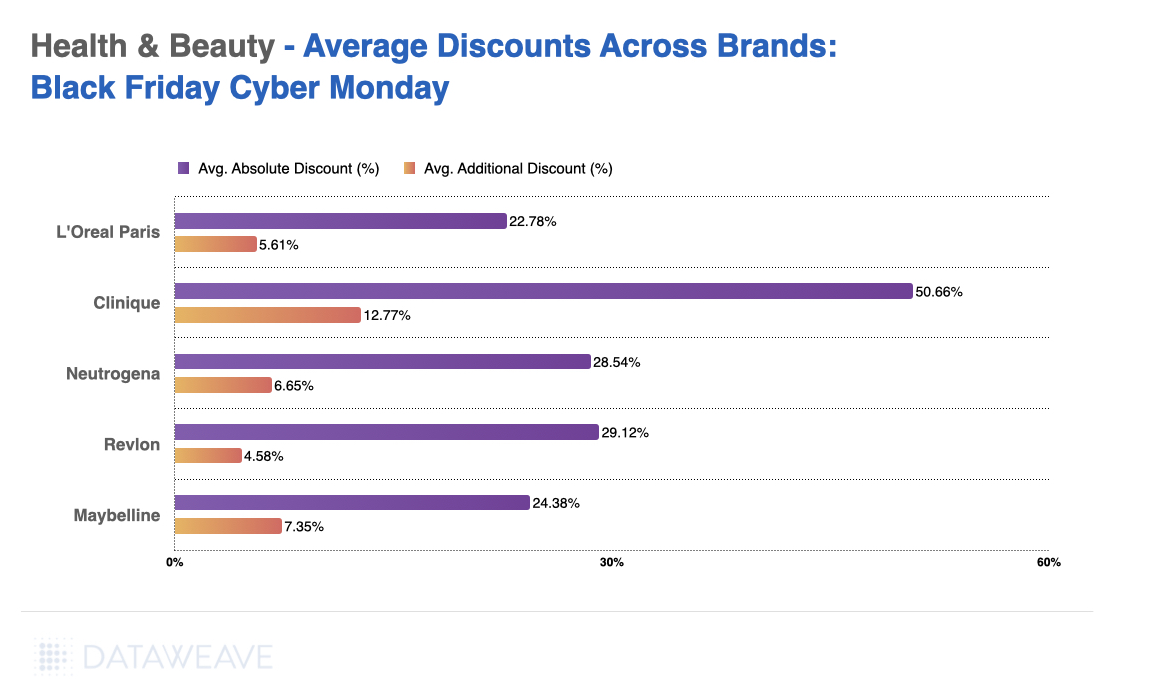
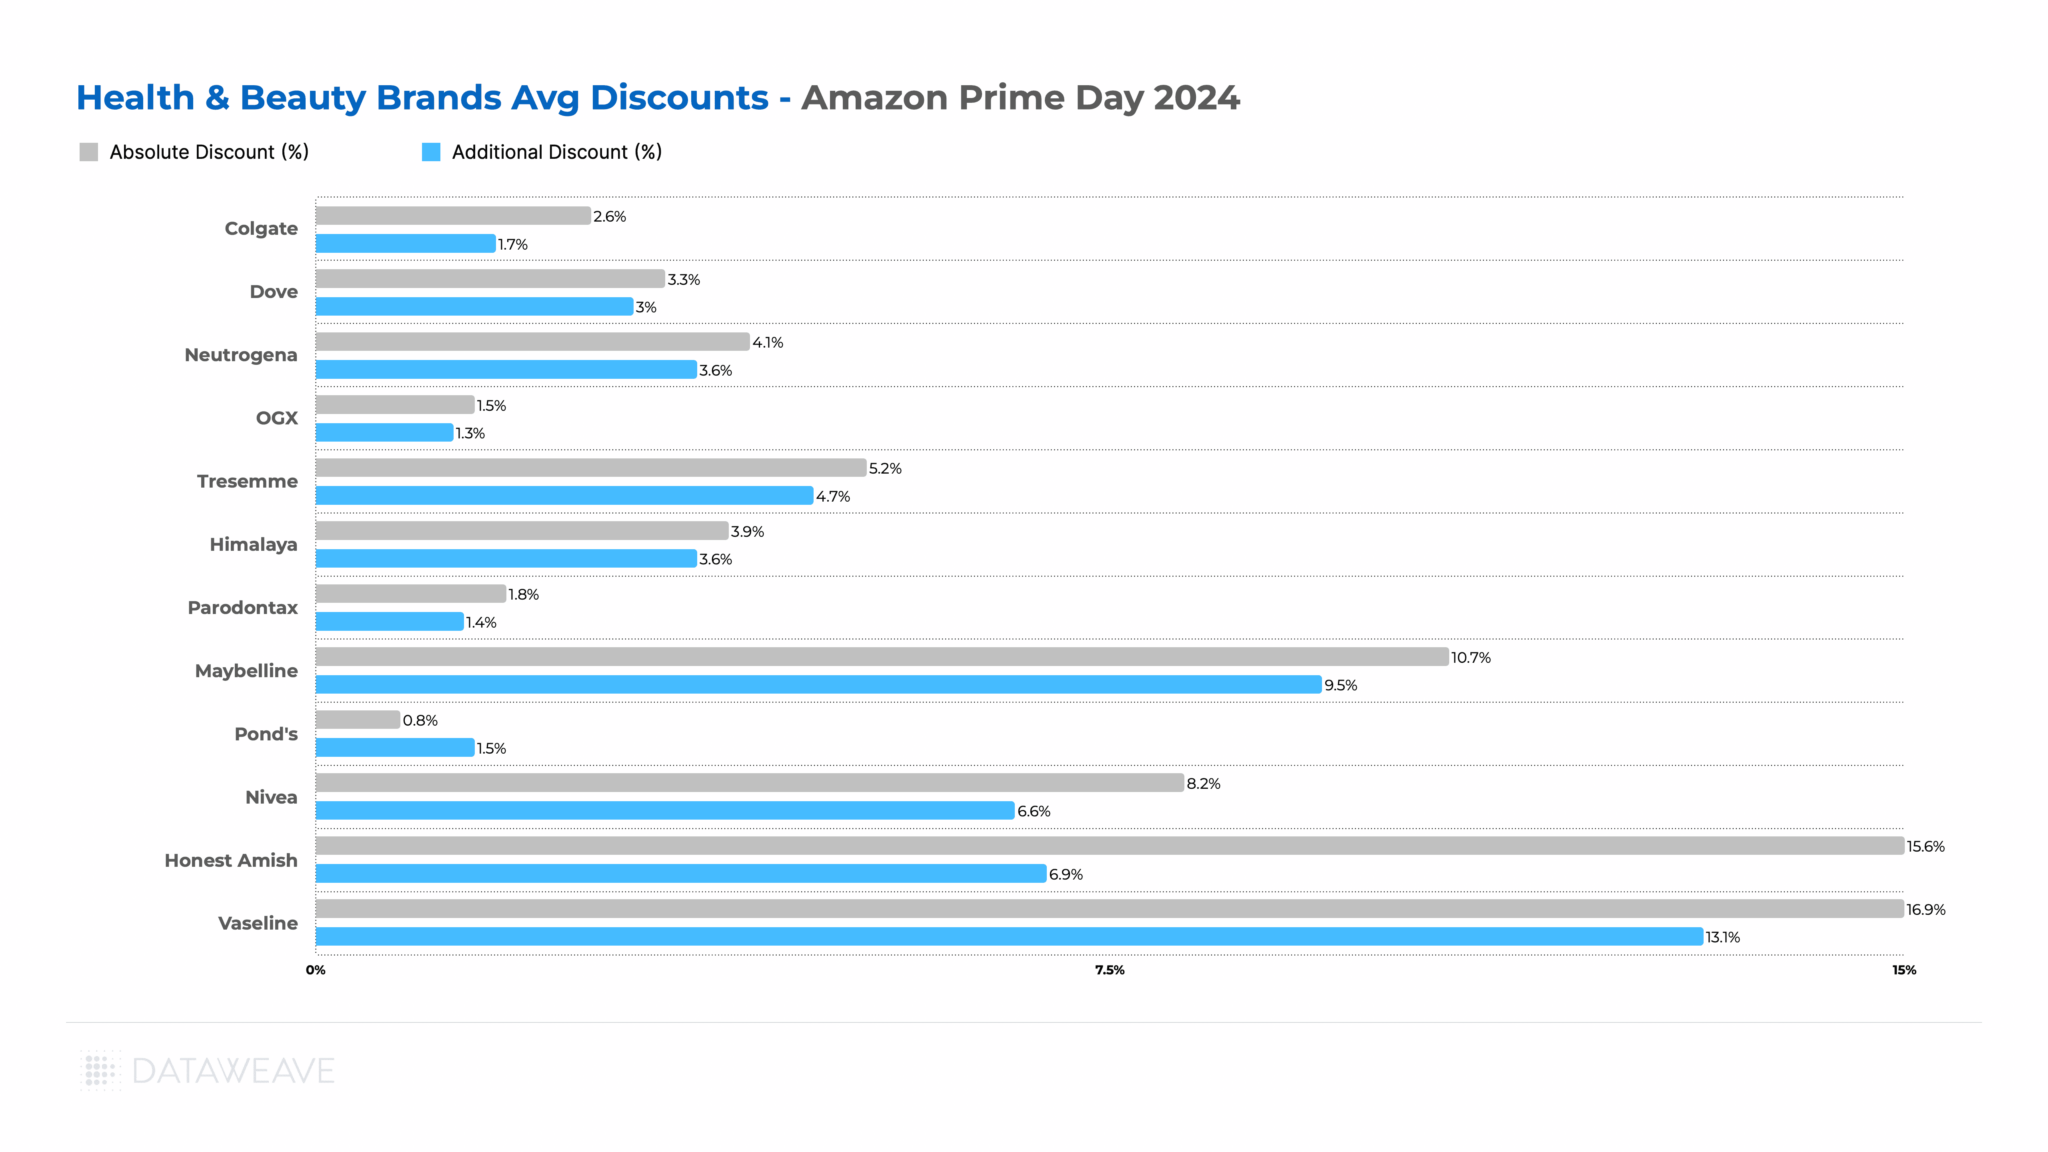
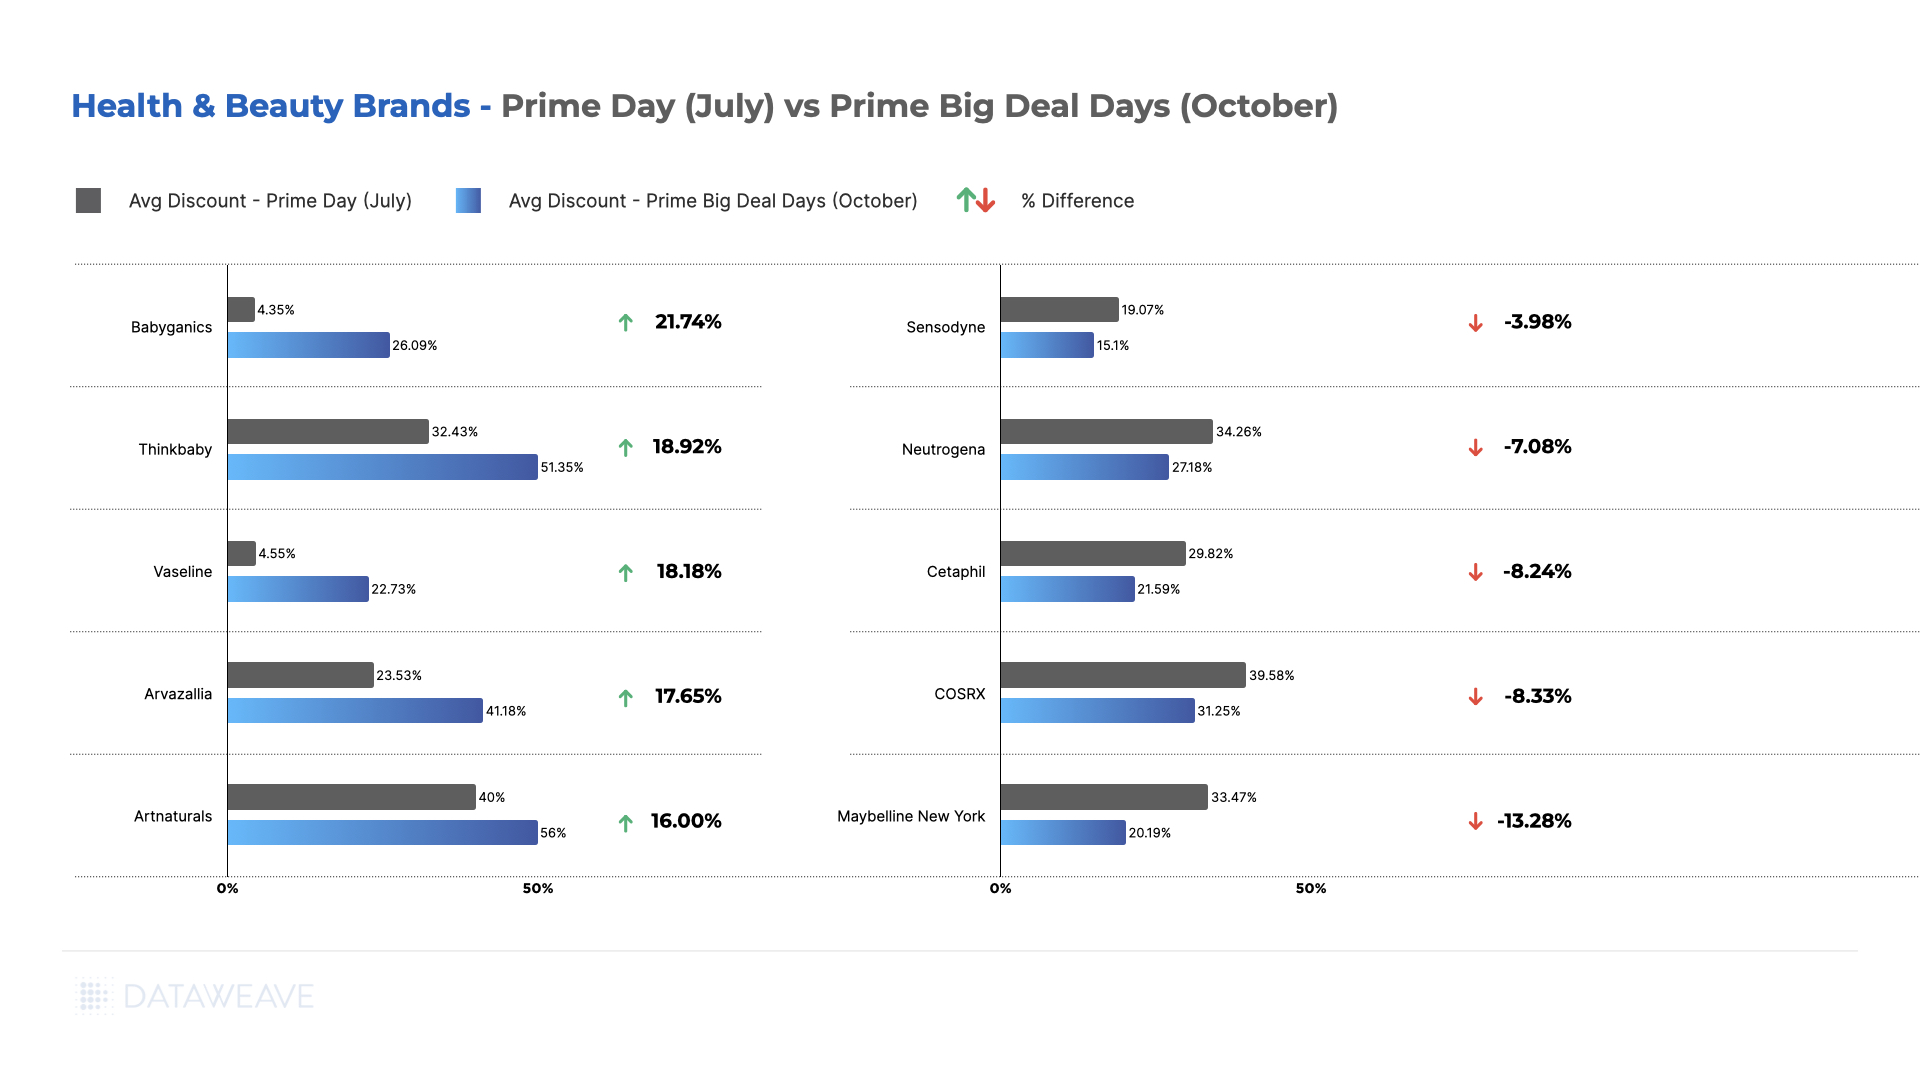
The category averaged 17% pre-Black Friday discounts with an additional 0.4% during Black Friday Week. Beard Care led early discounting at 21.3%, reflecting strong pre-sale positioning in men’s grooming. Conditioner (17.2%), Makeup (16.9%), and Moisturizer (16.9%) also saw solid baseline promotions. During Black Friday Week, Makeup and Sunscreen saw the highest additional discounts at 0.5% each, while Electric Toothbrush and Toothpaste maintained modest incremental discounts at 0.2%.
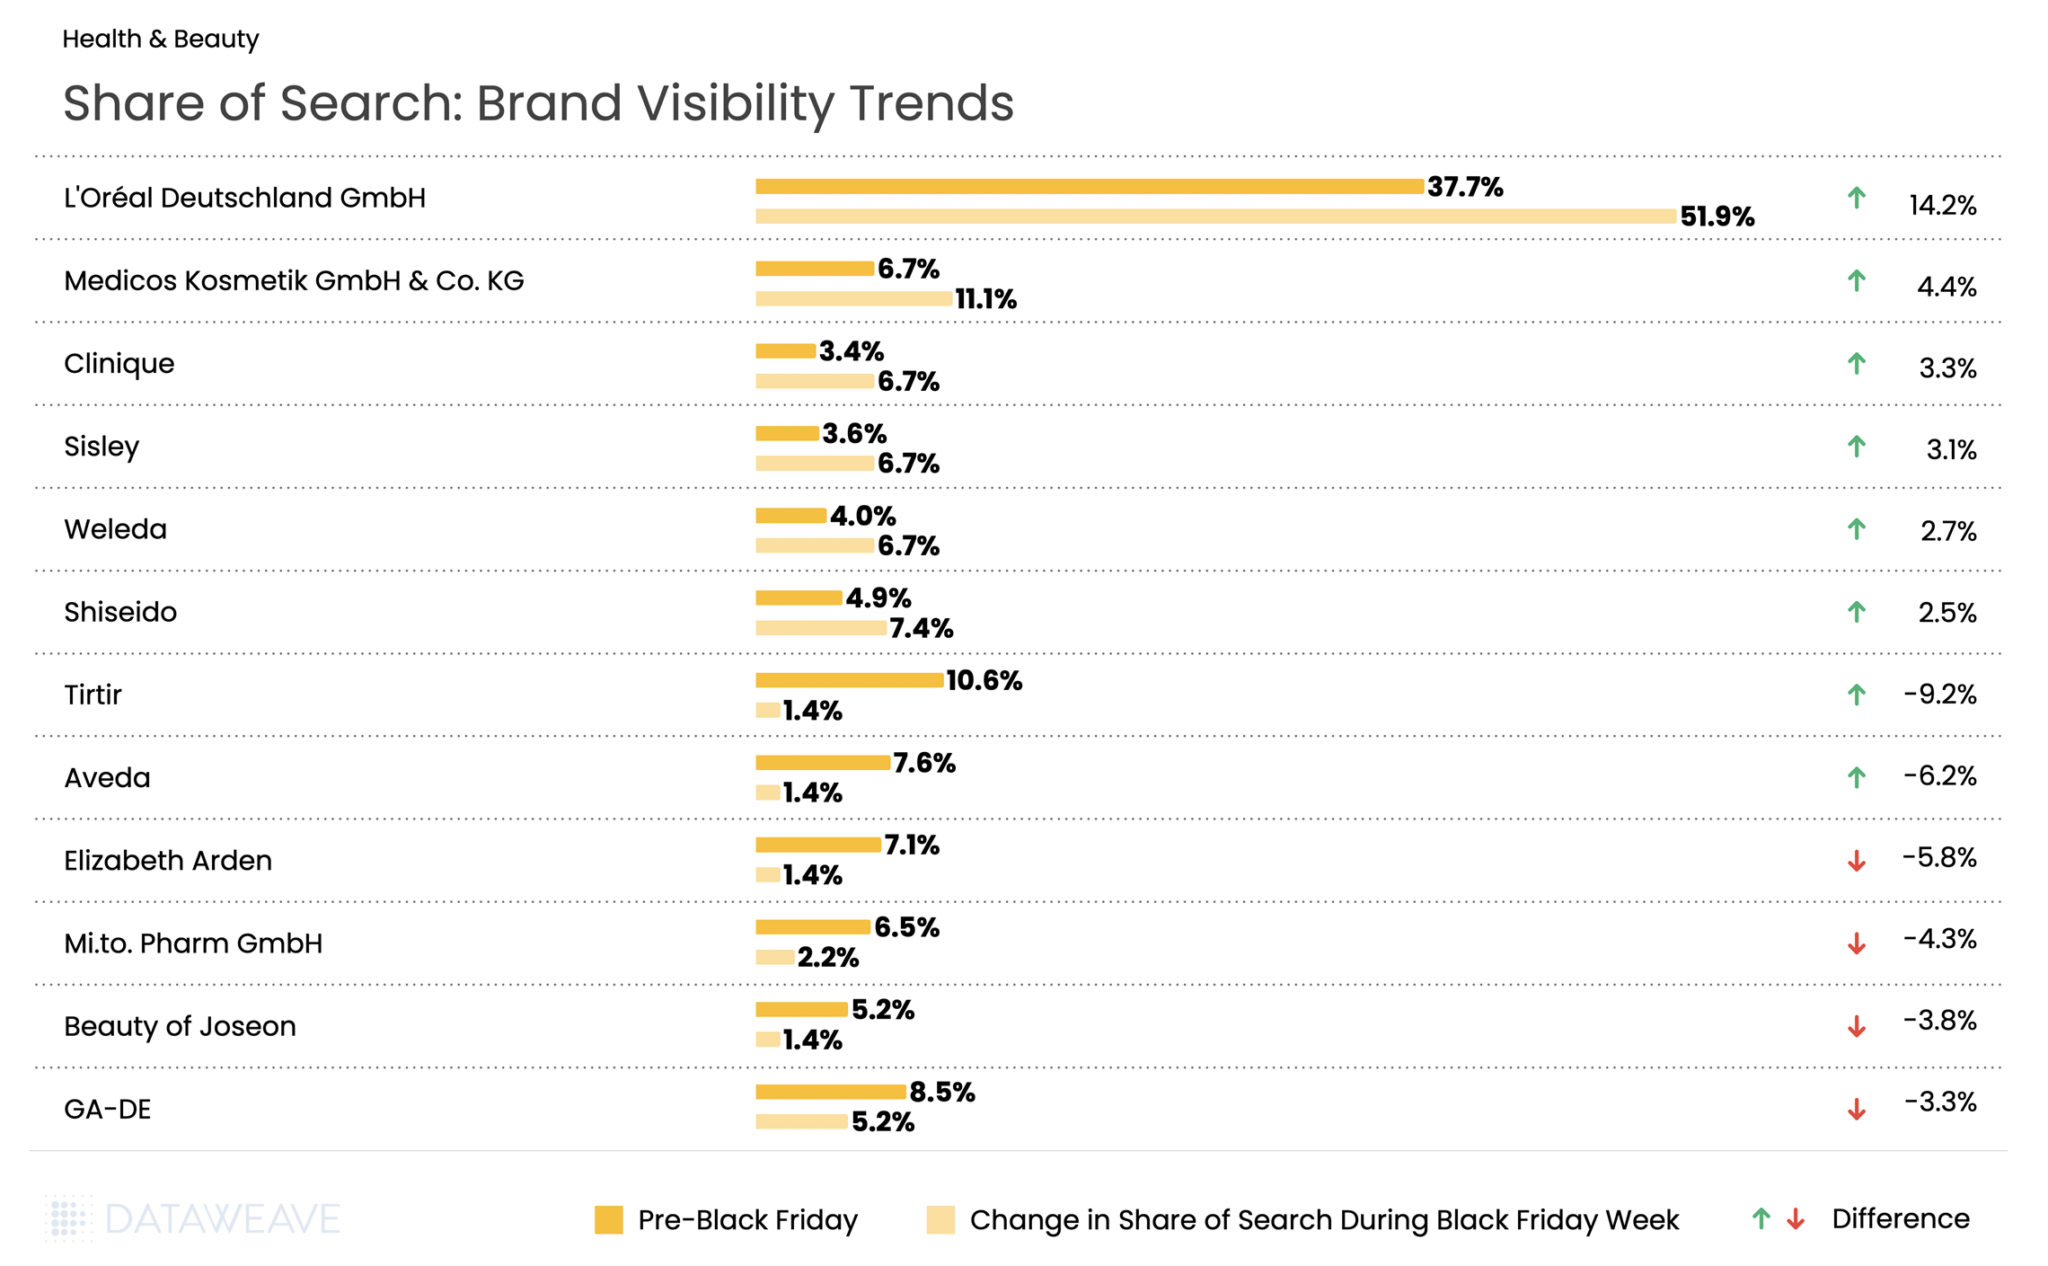
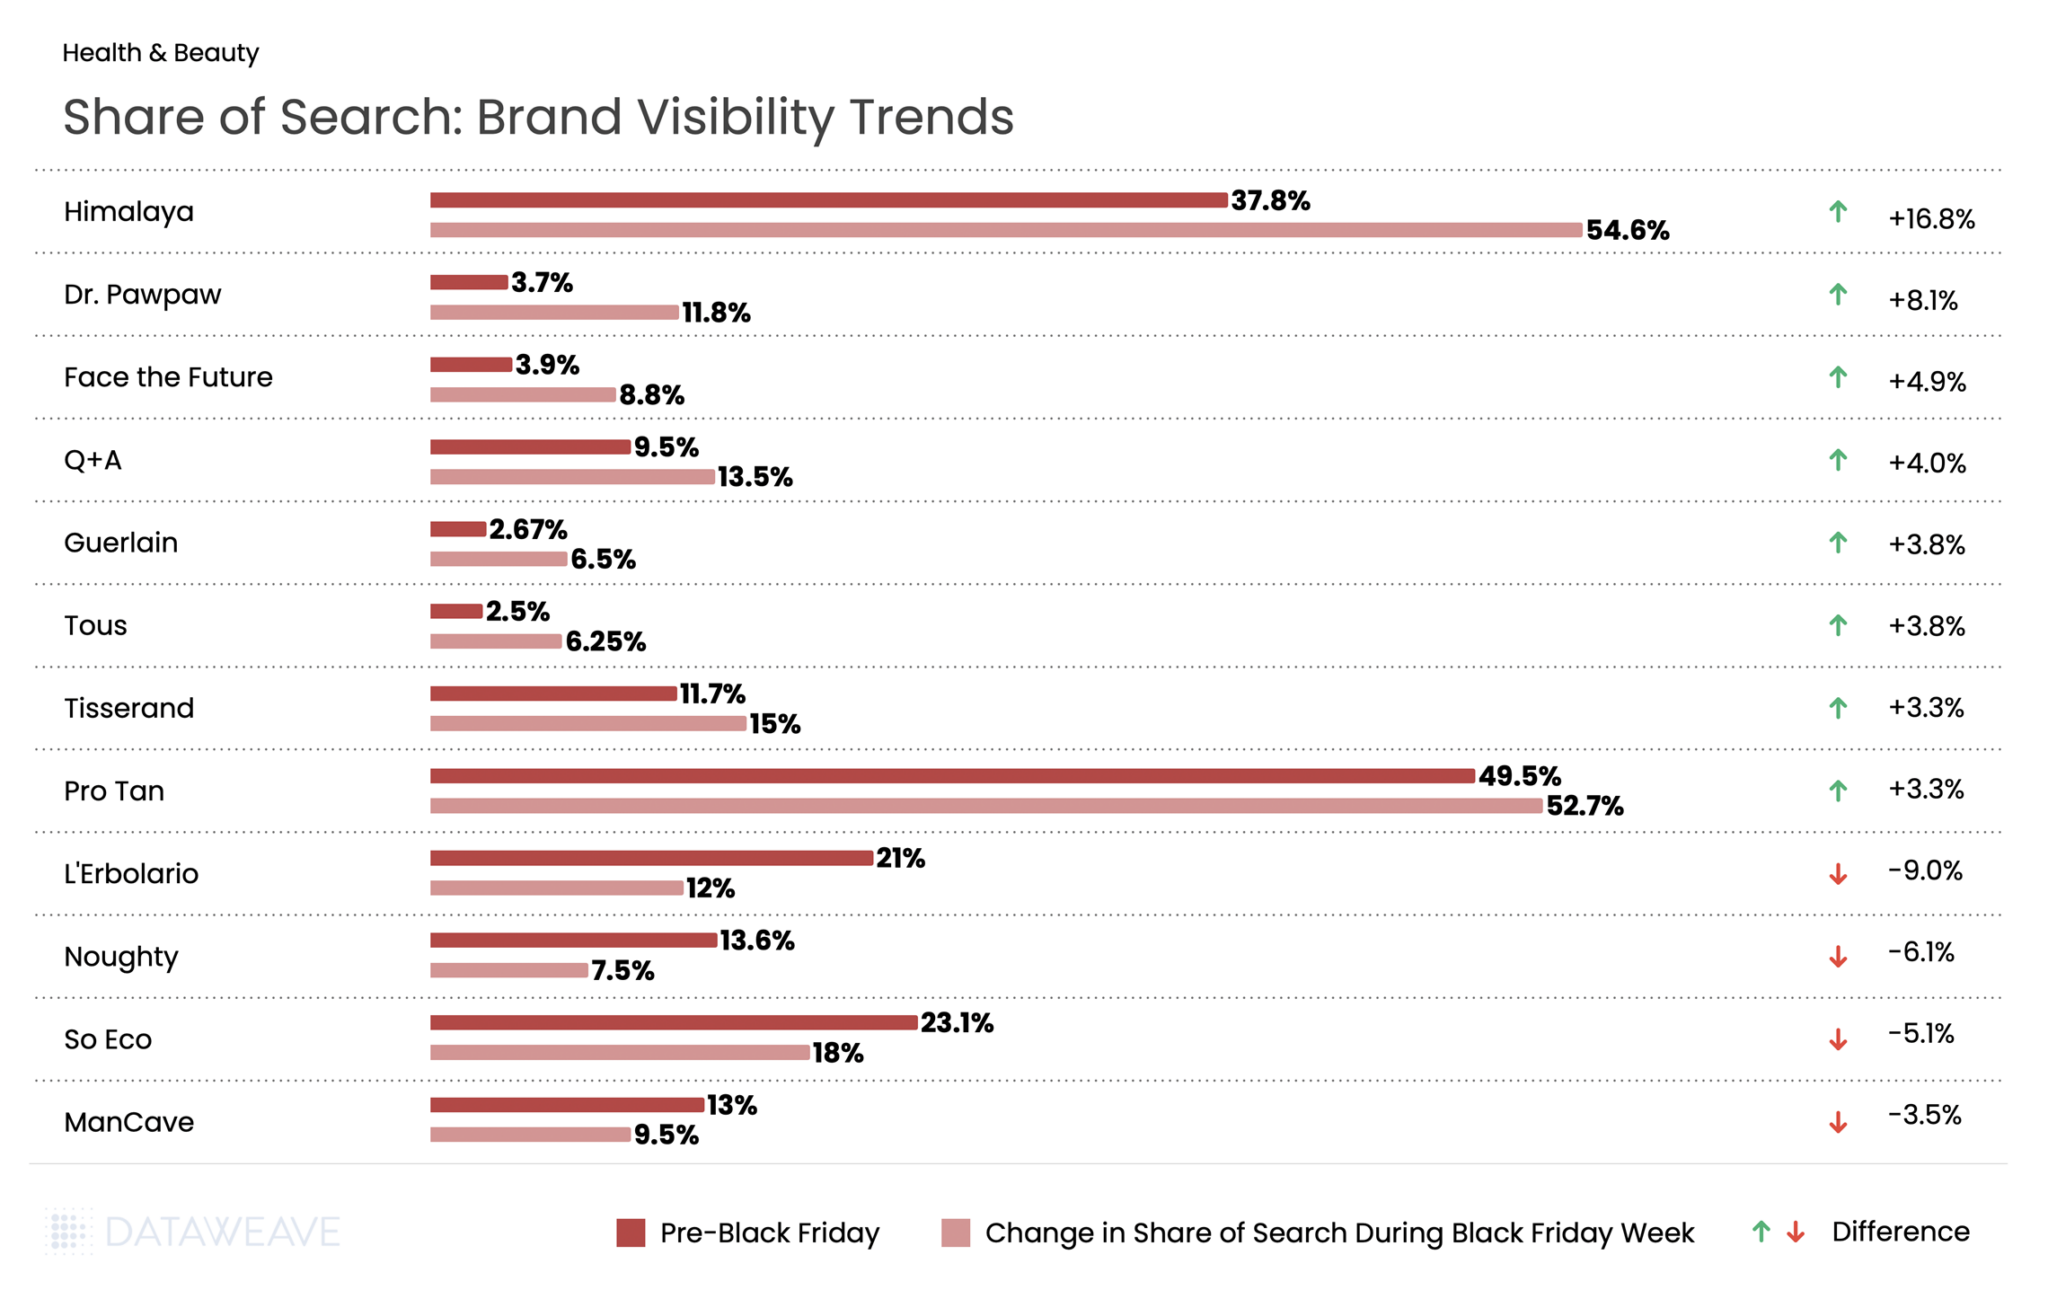
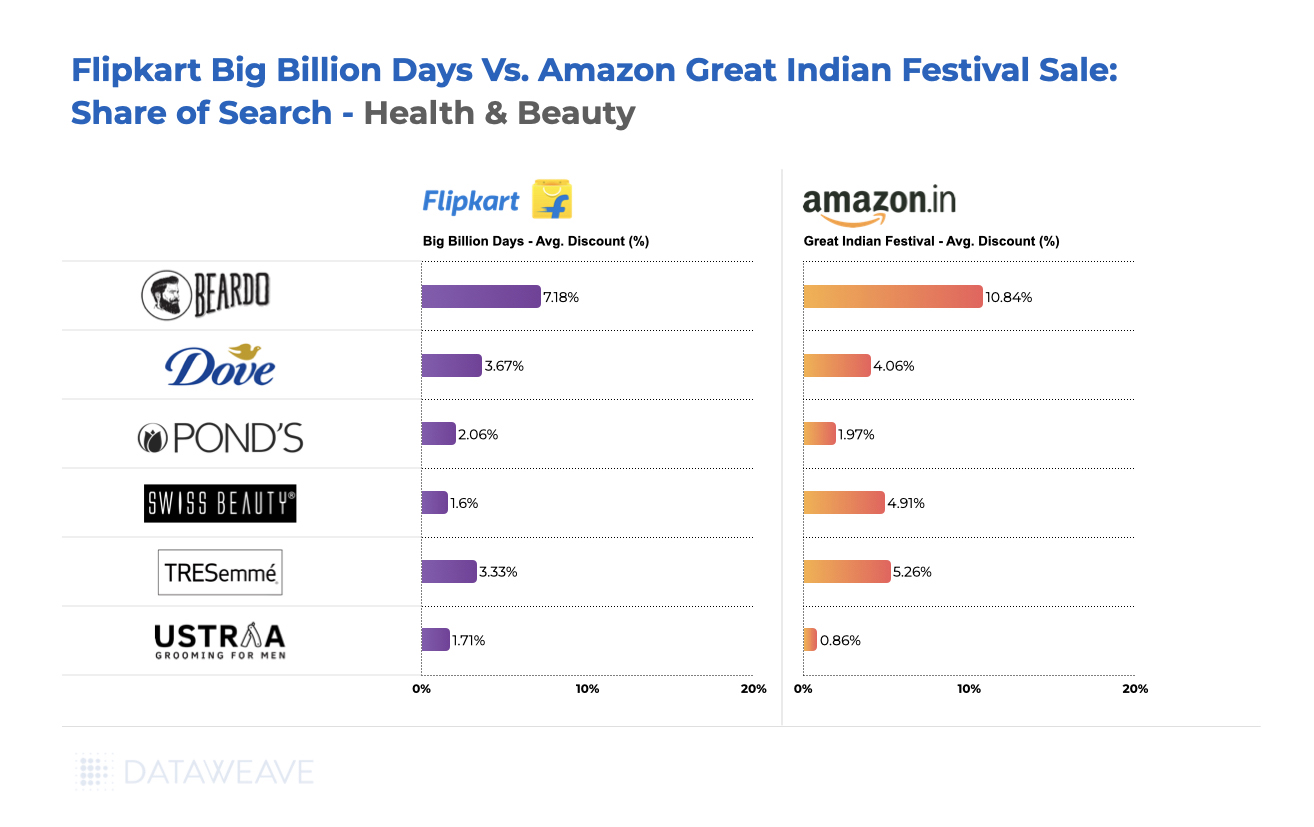
Share of Search: Brand Visibility Trends
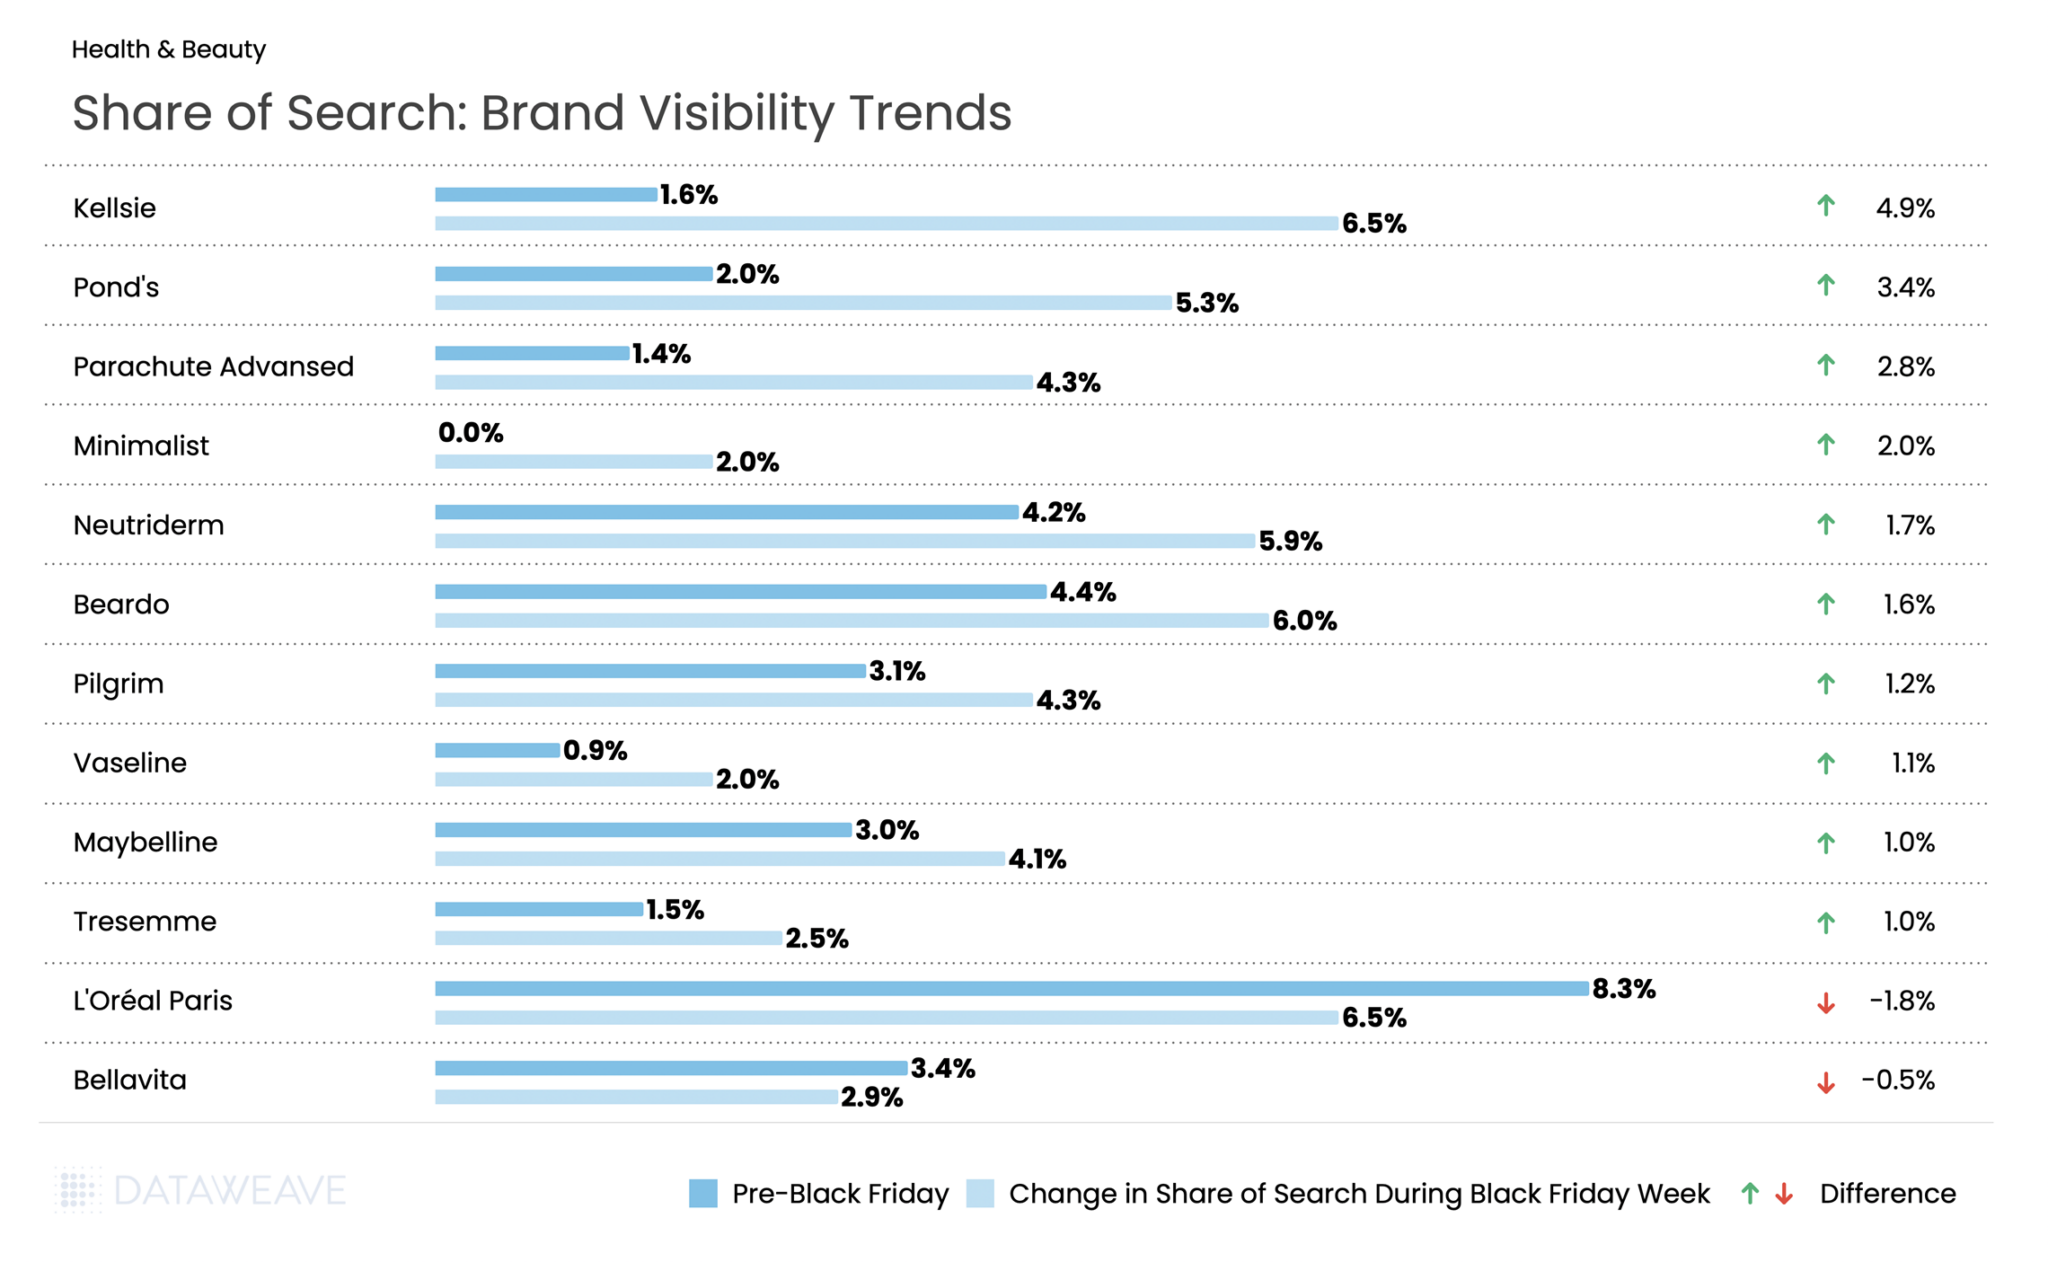
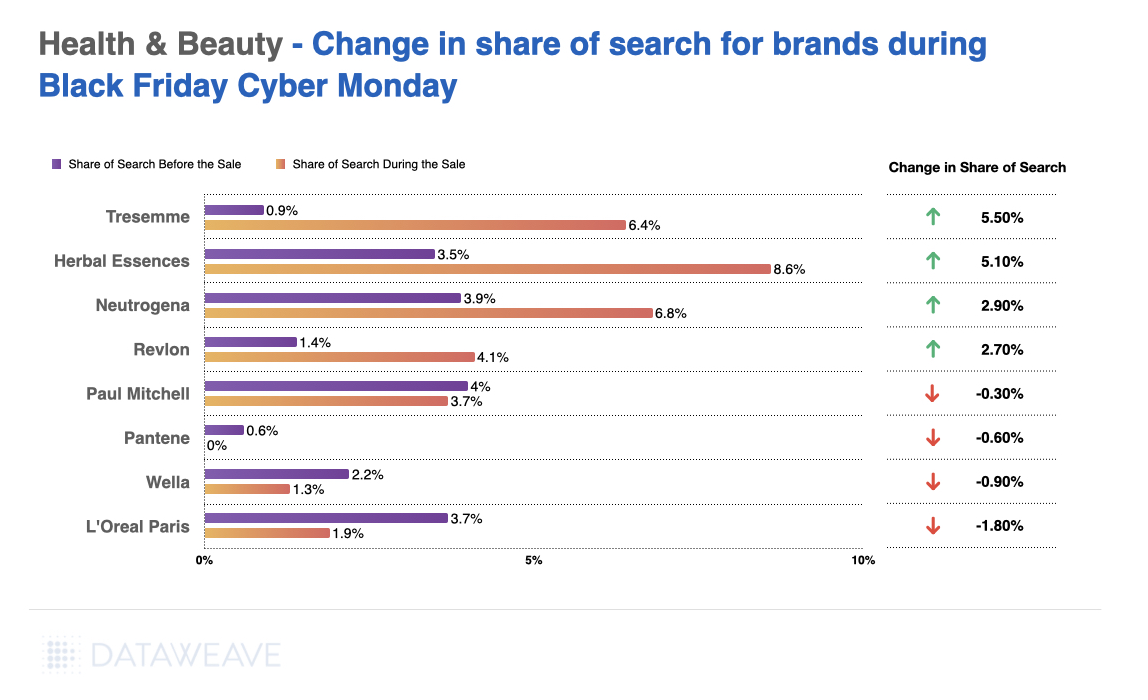
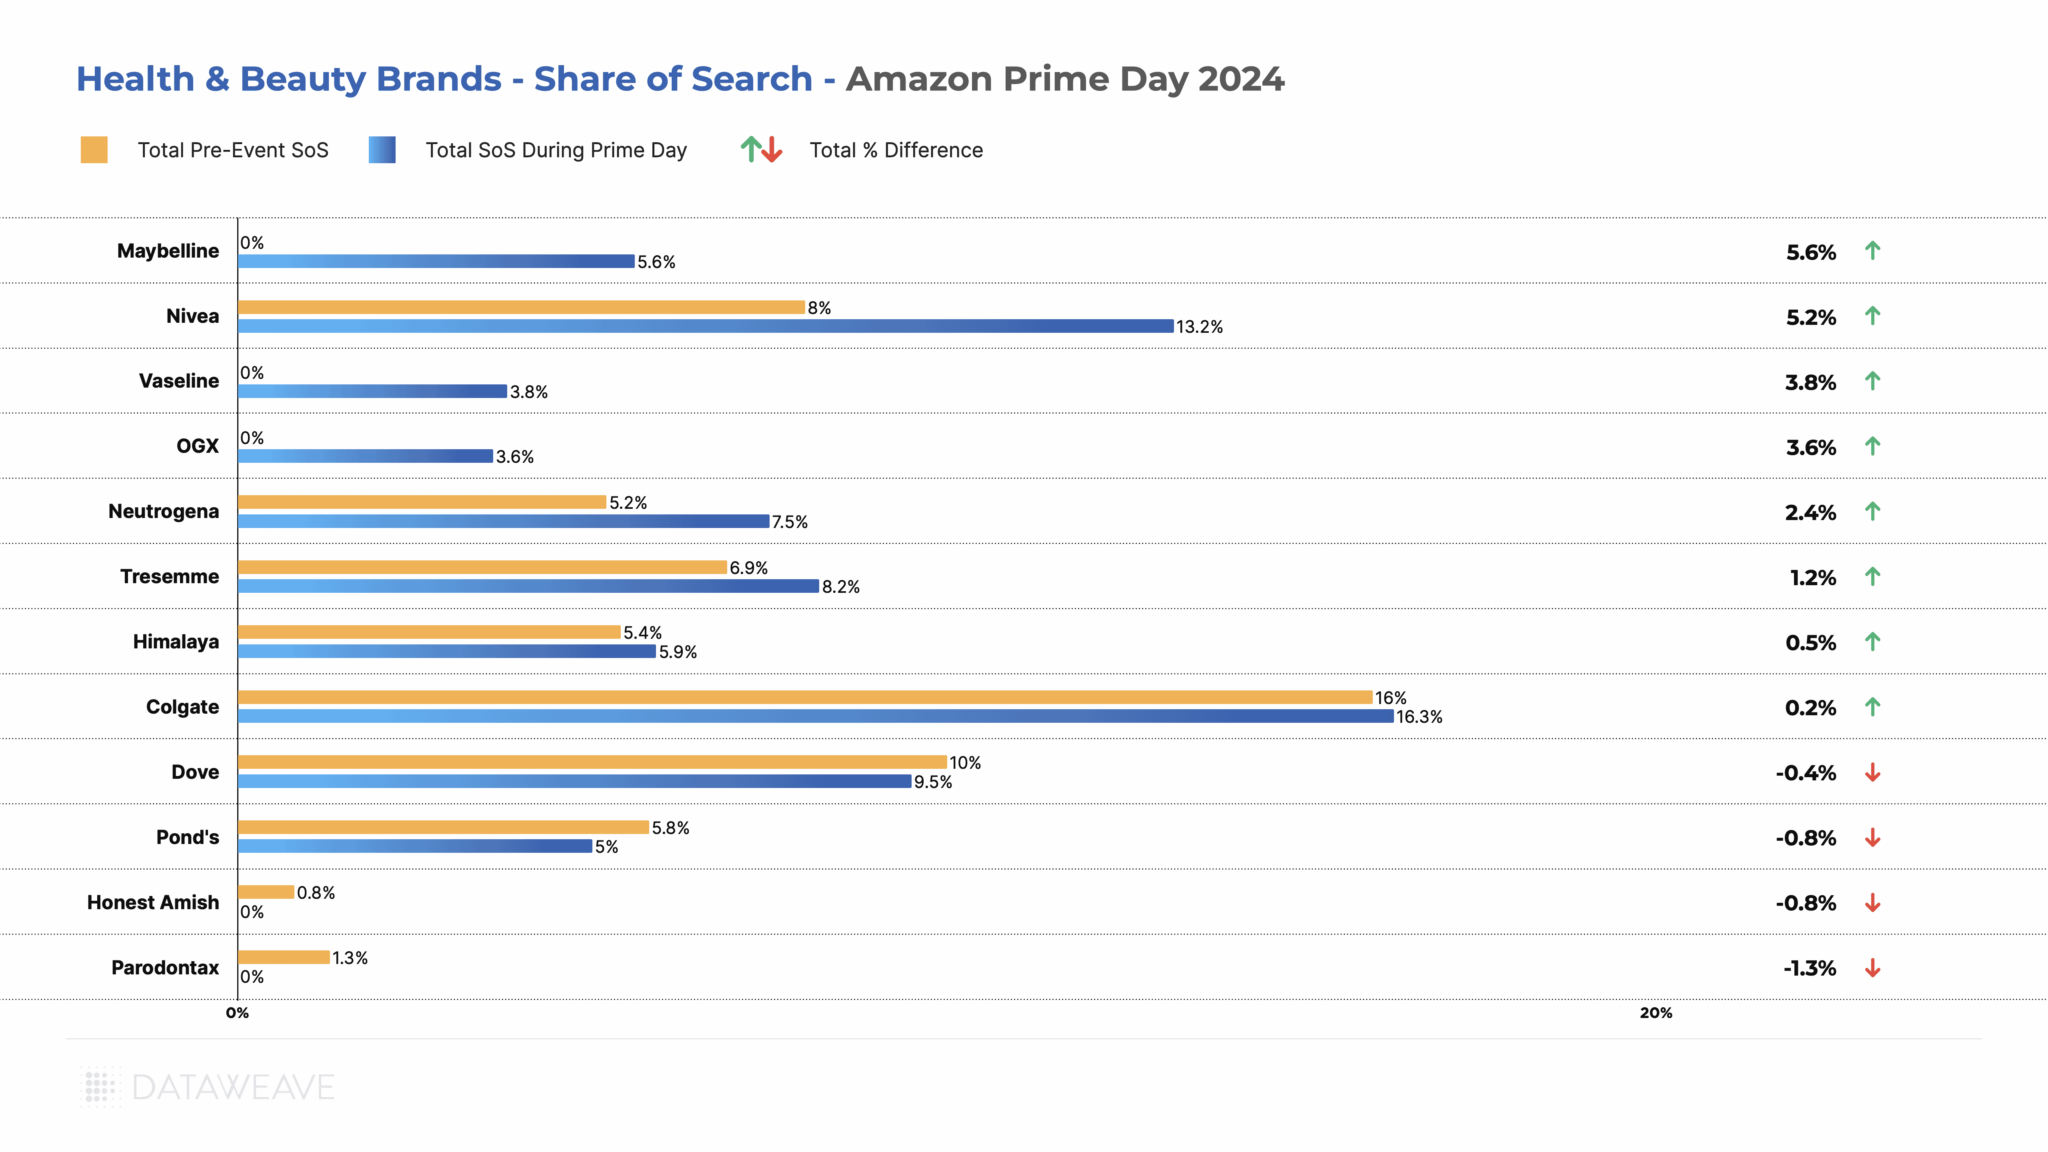
Affordable and emerging beauty brands dominated during Black Friday in India. Kellsie (beauty tools brand) surged from 1.6% to 6.5%. Classic mass-market brands like Pond’s (+3.4%) and Parachute Advanced (+2.8%) also performed strongly, alongside men’s grooming favorite Beardo (+1.6%). Other popular brands like Maybelline, Tresemme, Vaseline, all saw share of search and visibility increase during Black Friday.
Skincare brand Minimalist made a notable entry, jumping from 0% to 2.0% visibility. The flip side? Premium international brand L’Oréal Paris dropped from 8.3% to 6.5%, losing visibility during Black Friday.
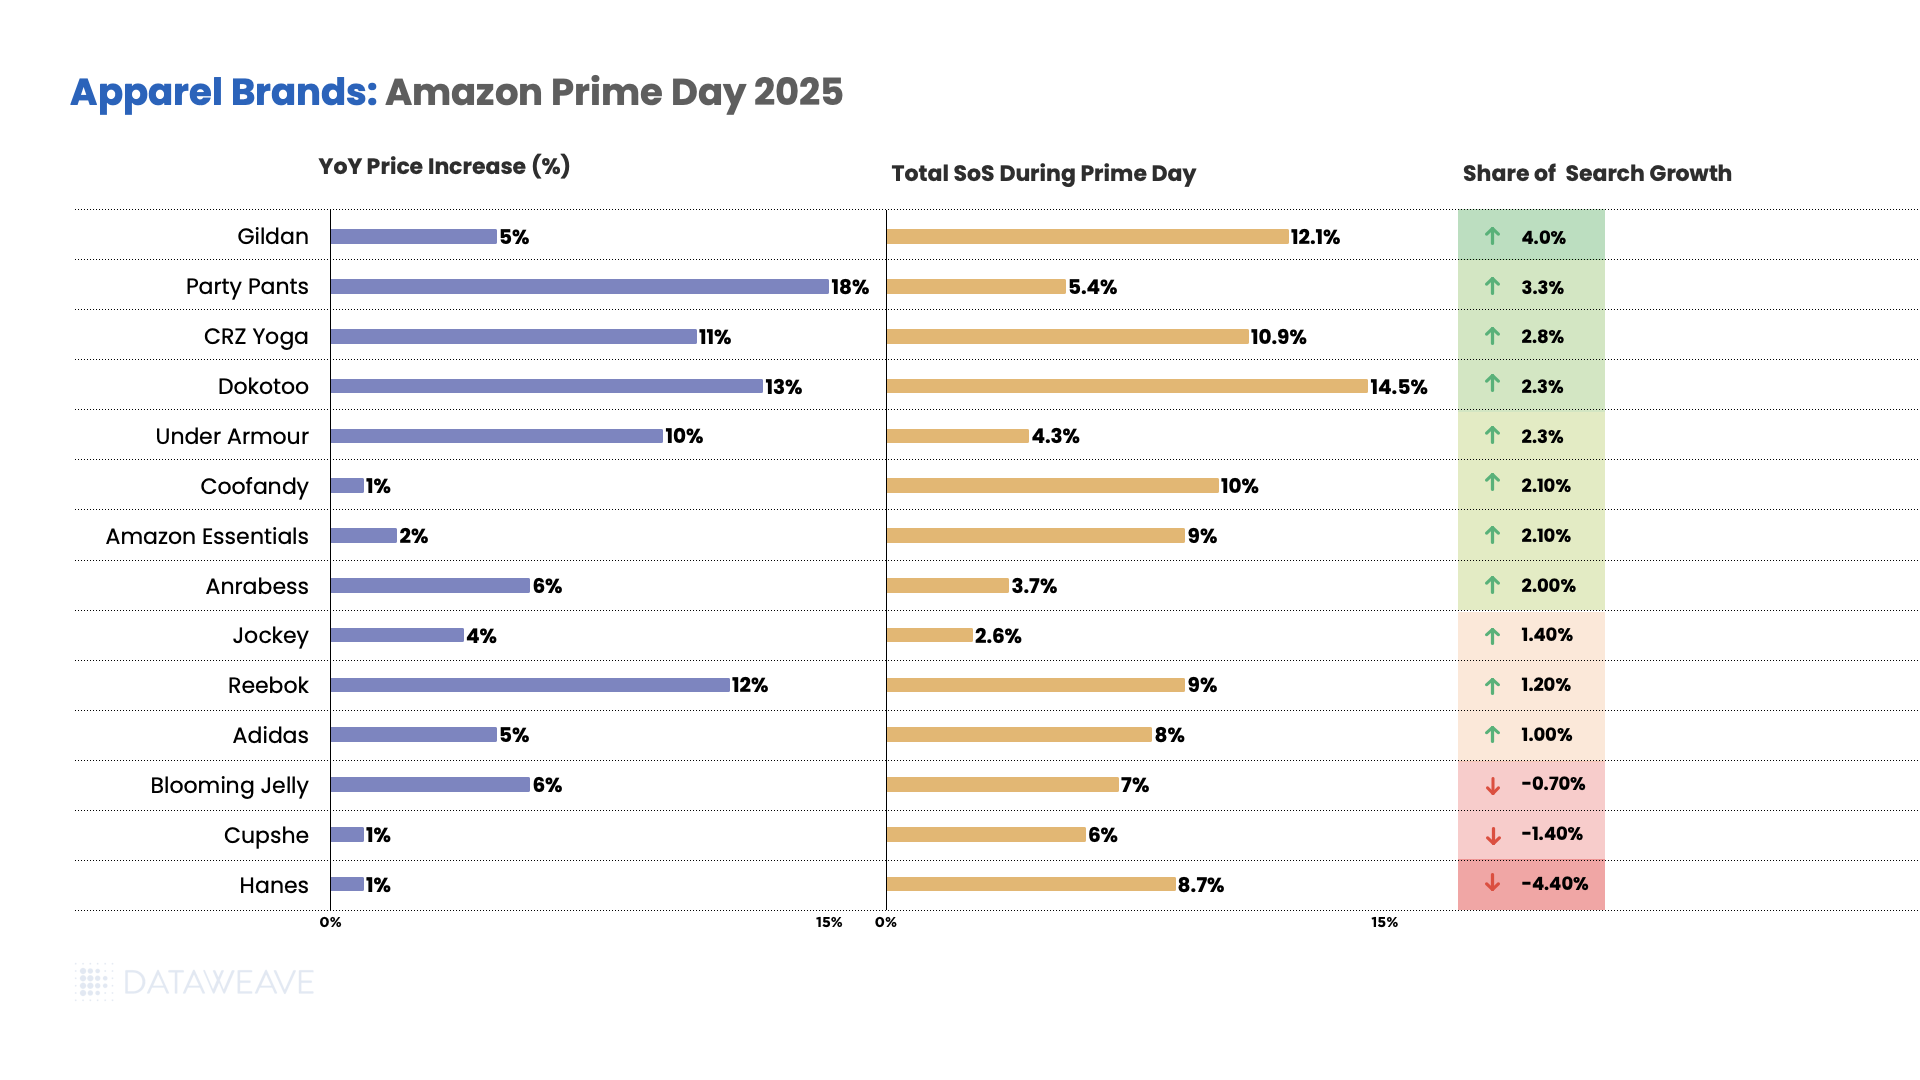
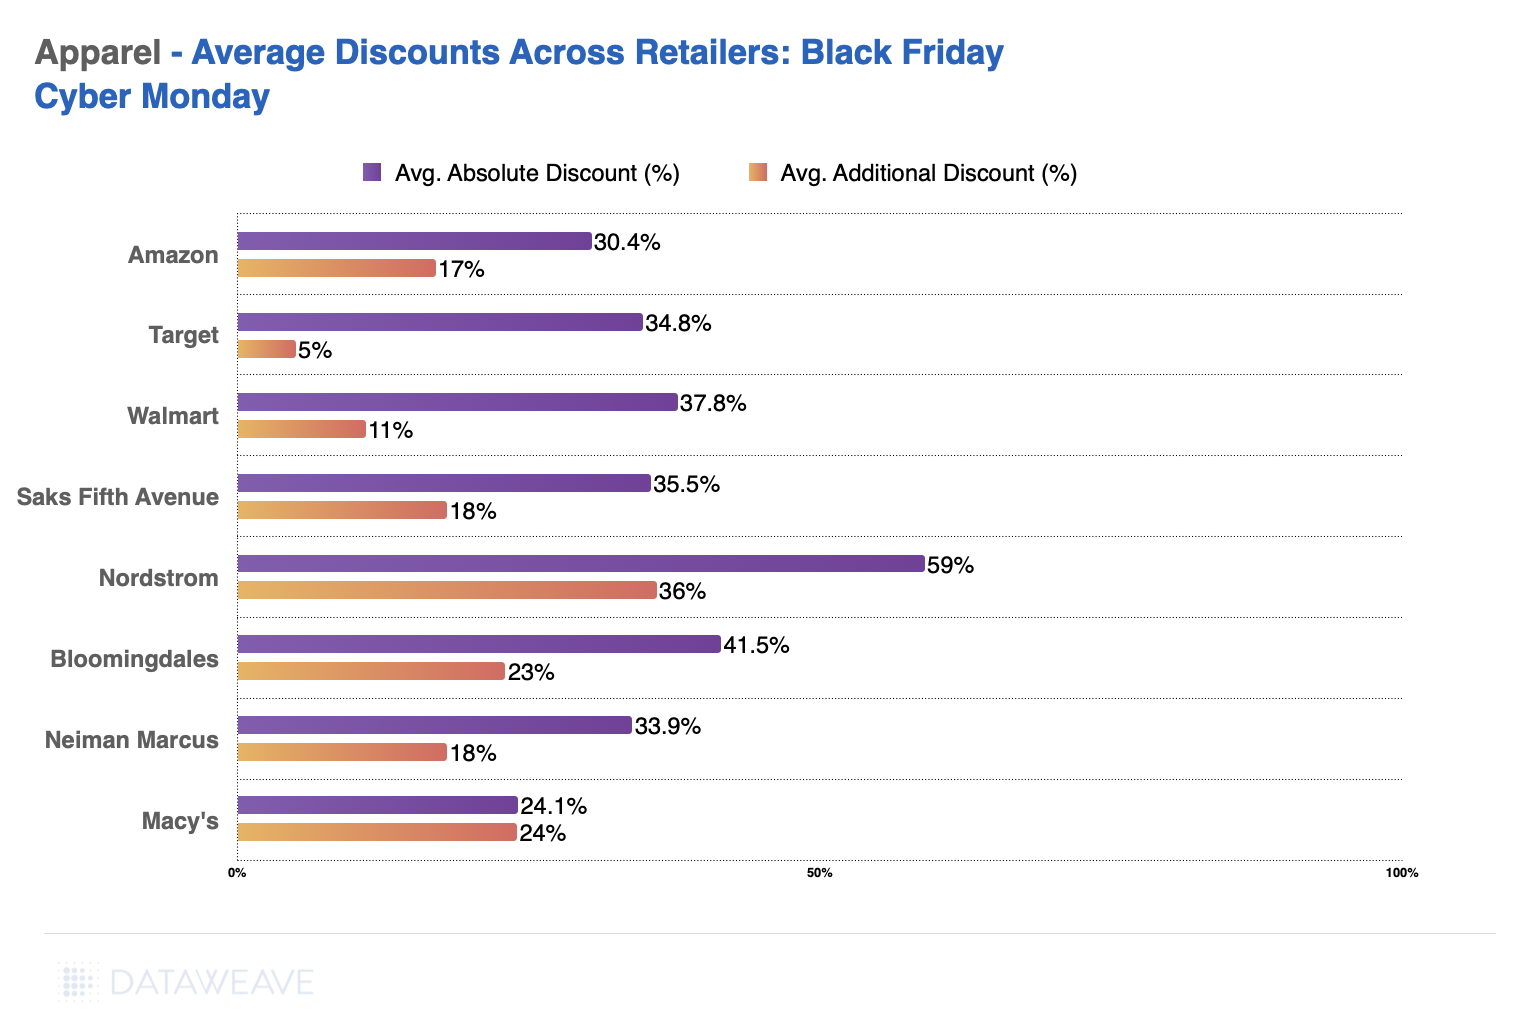
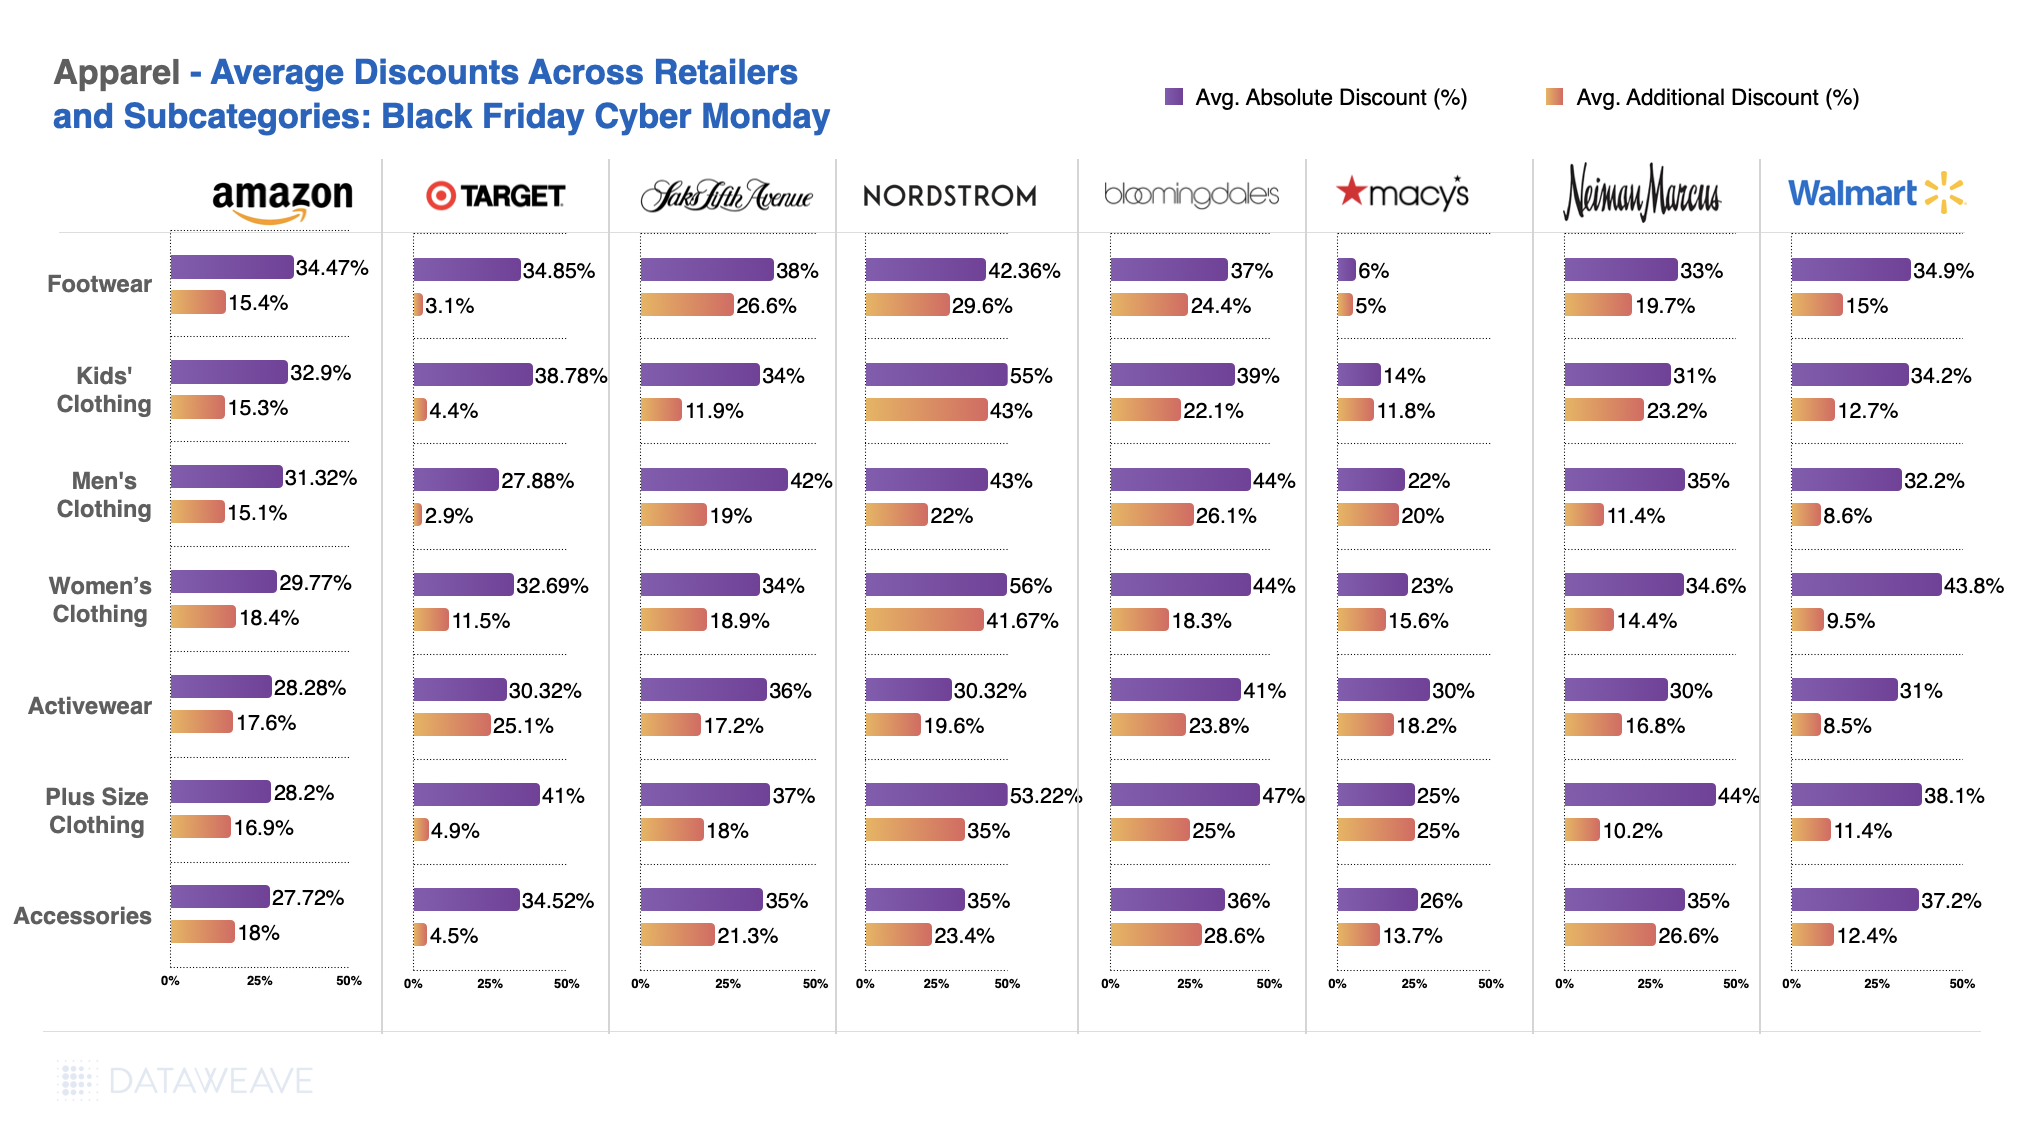
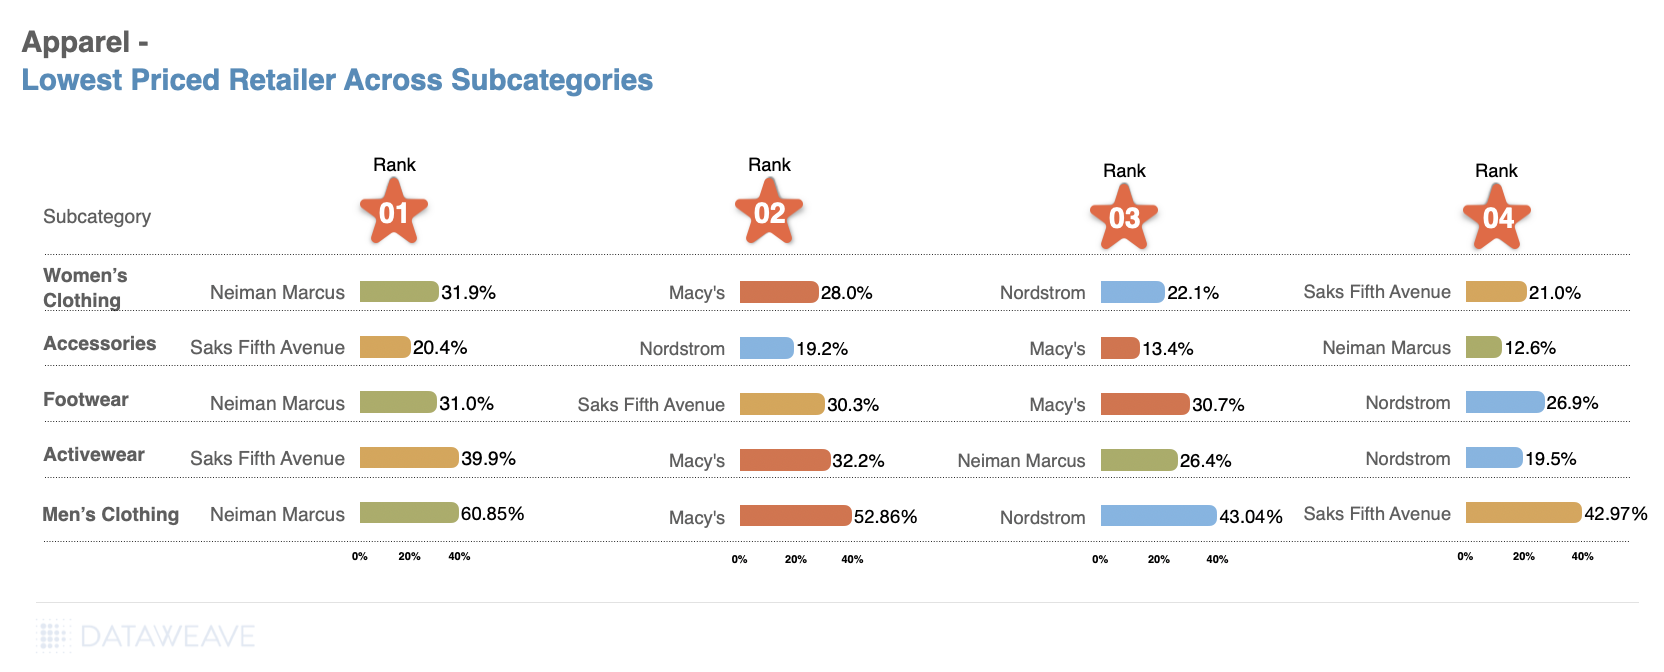
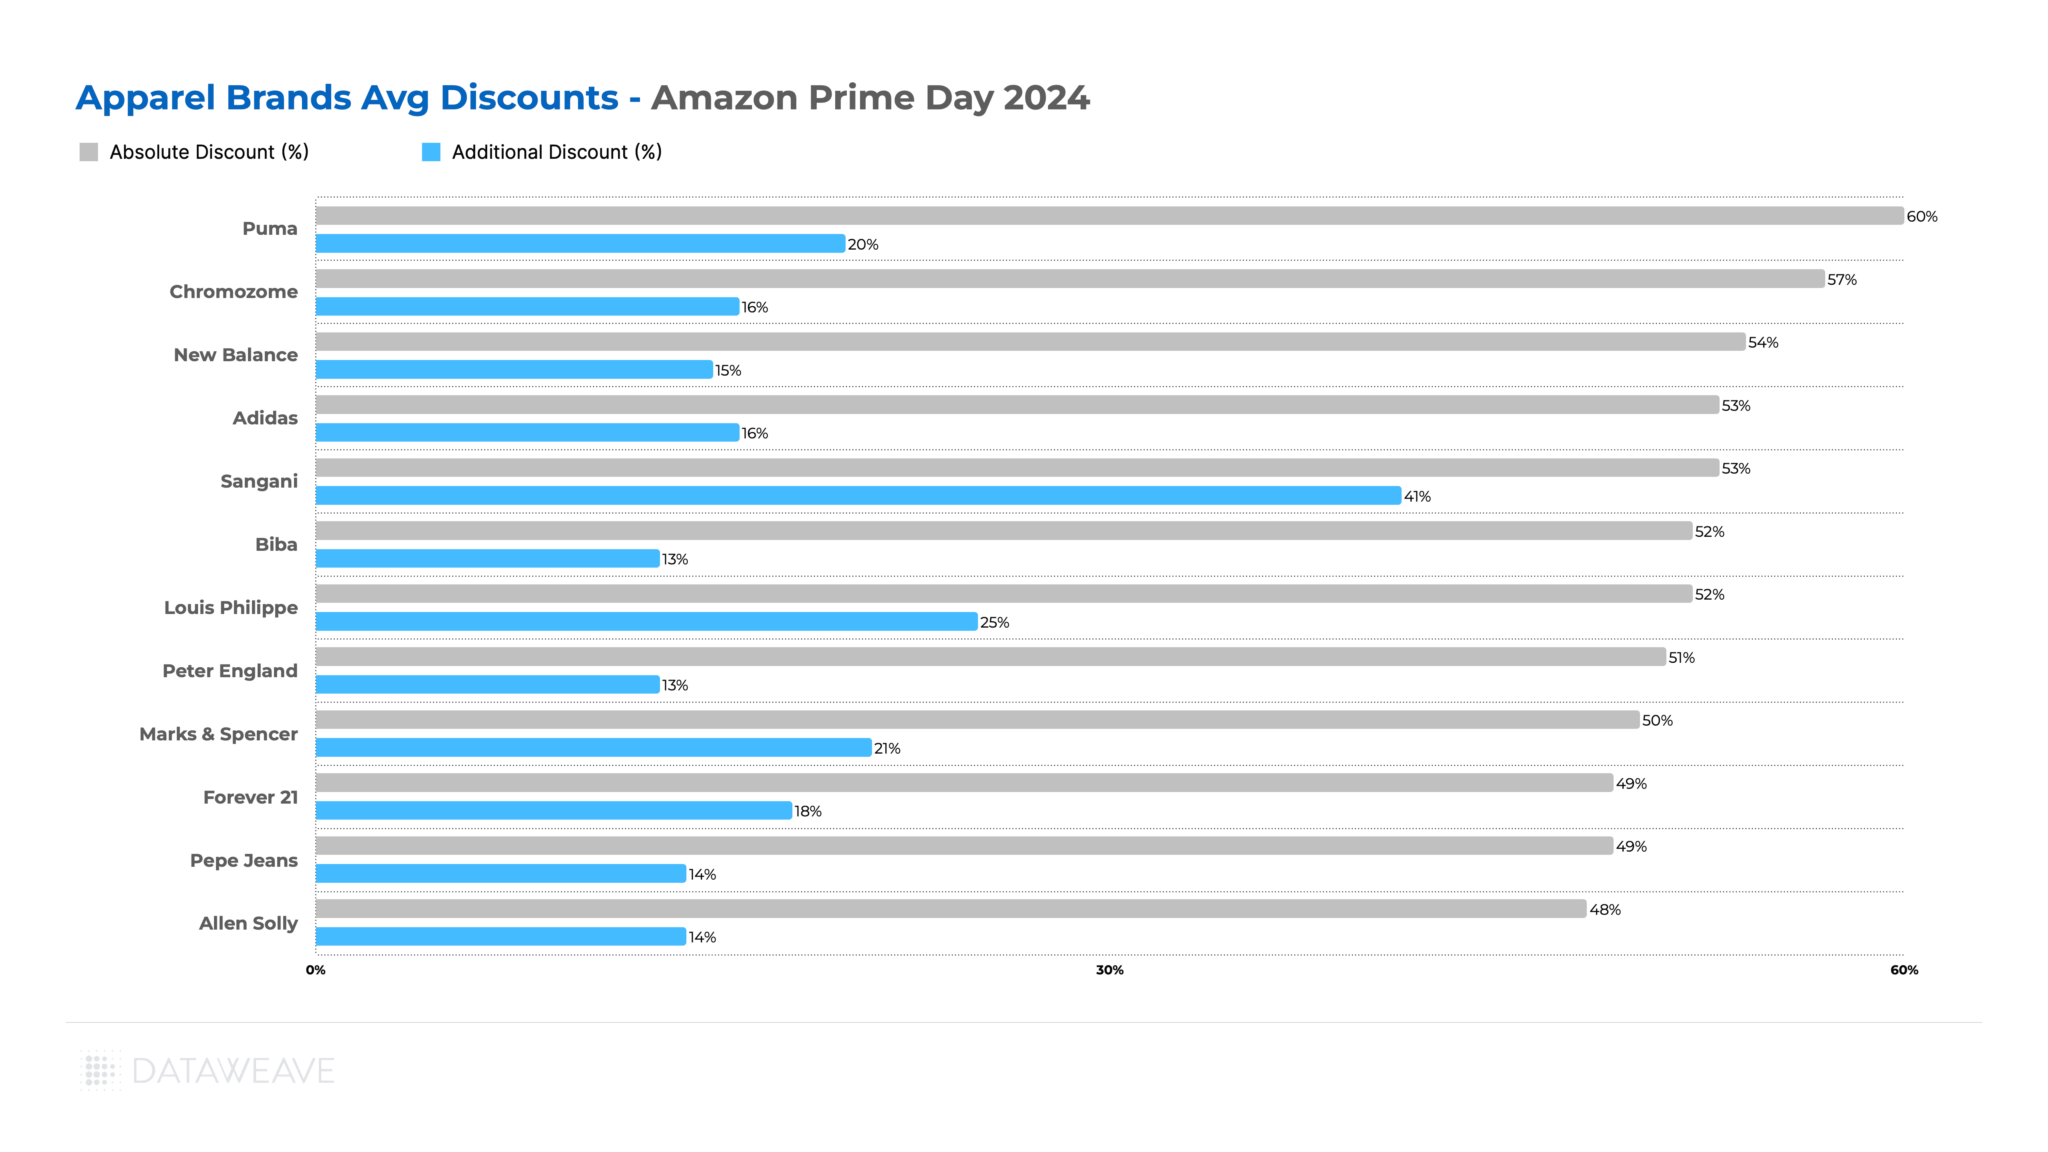
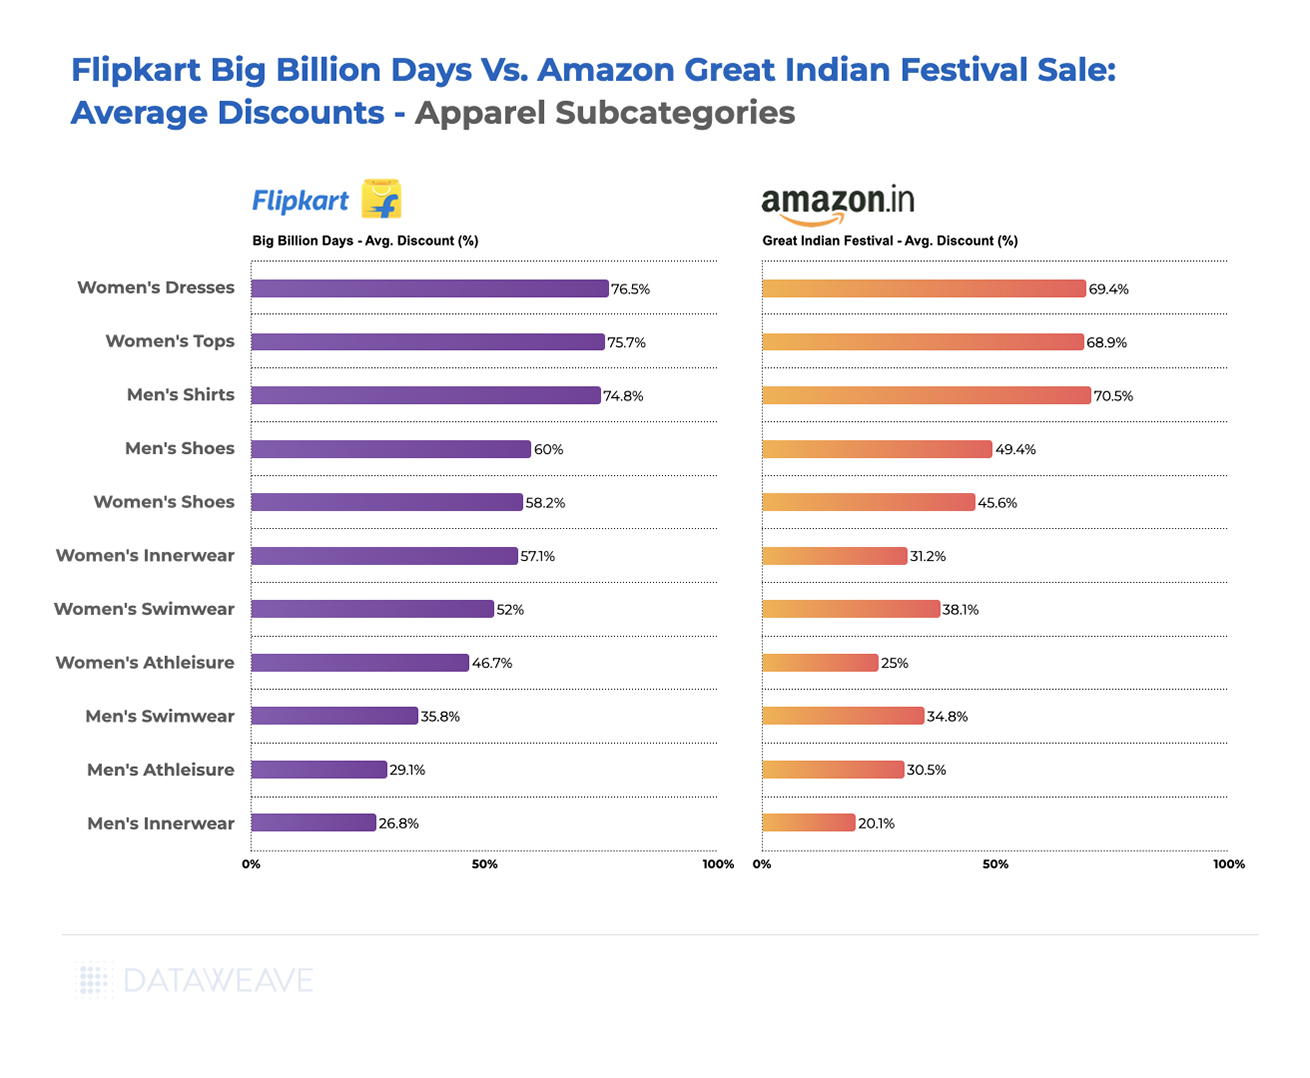
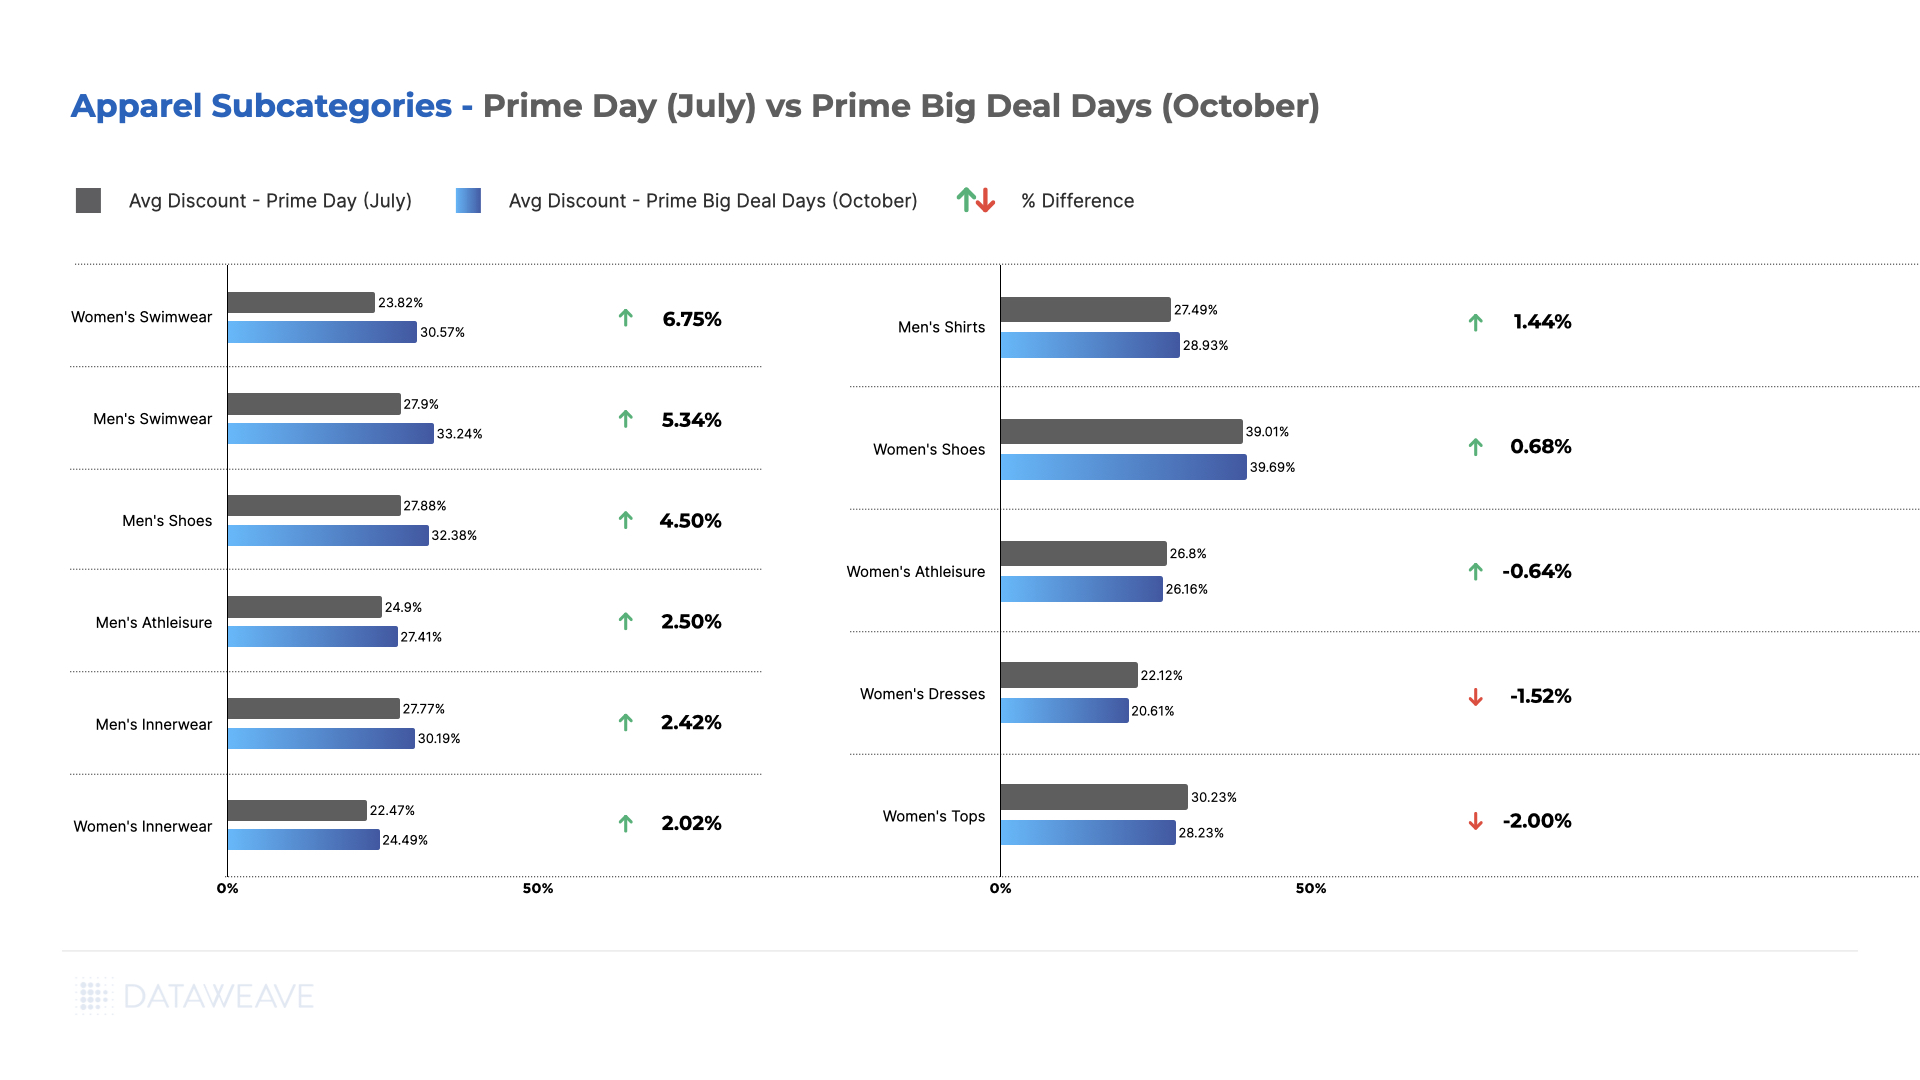
Apparel
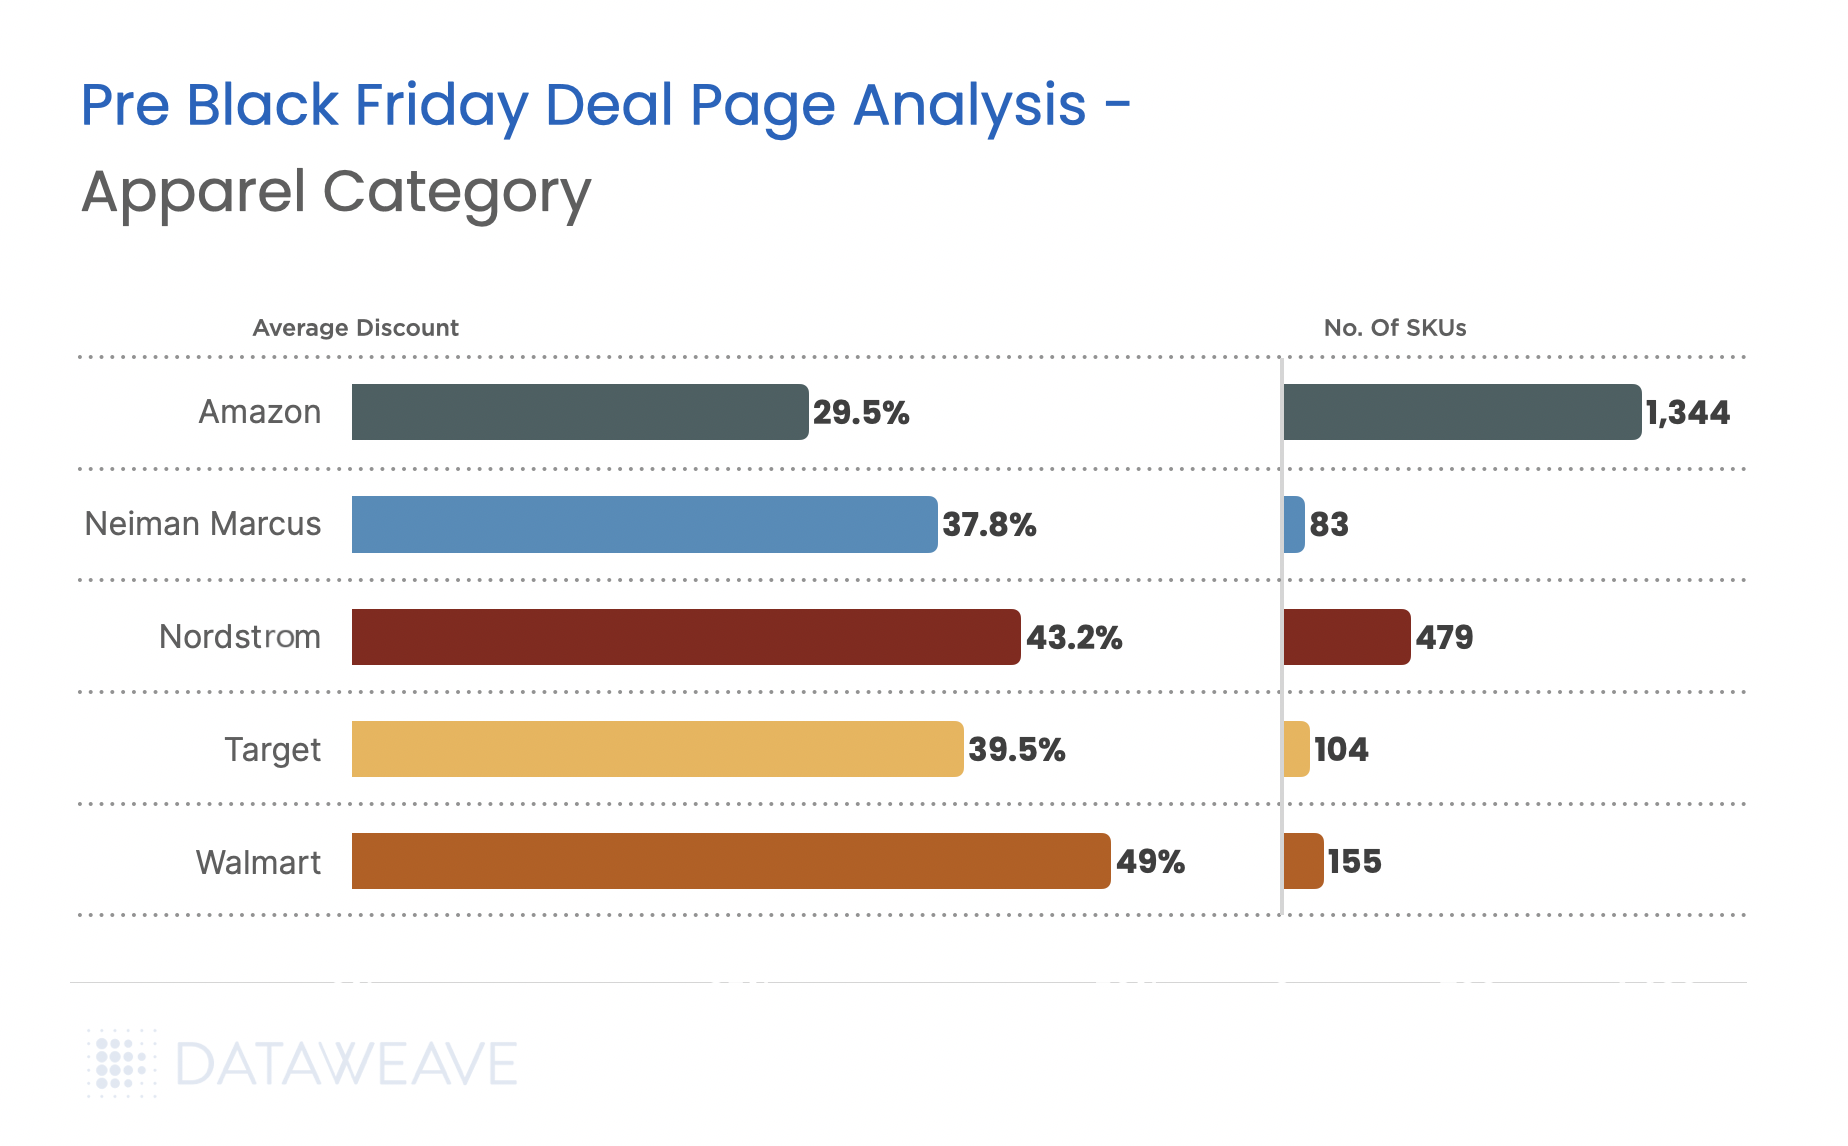
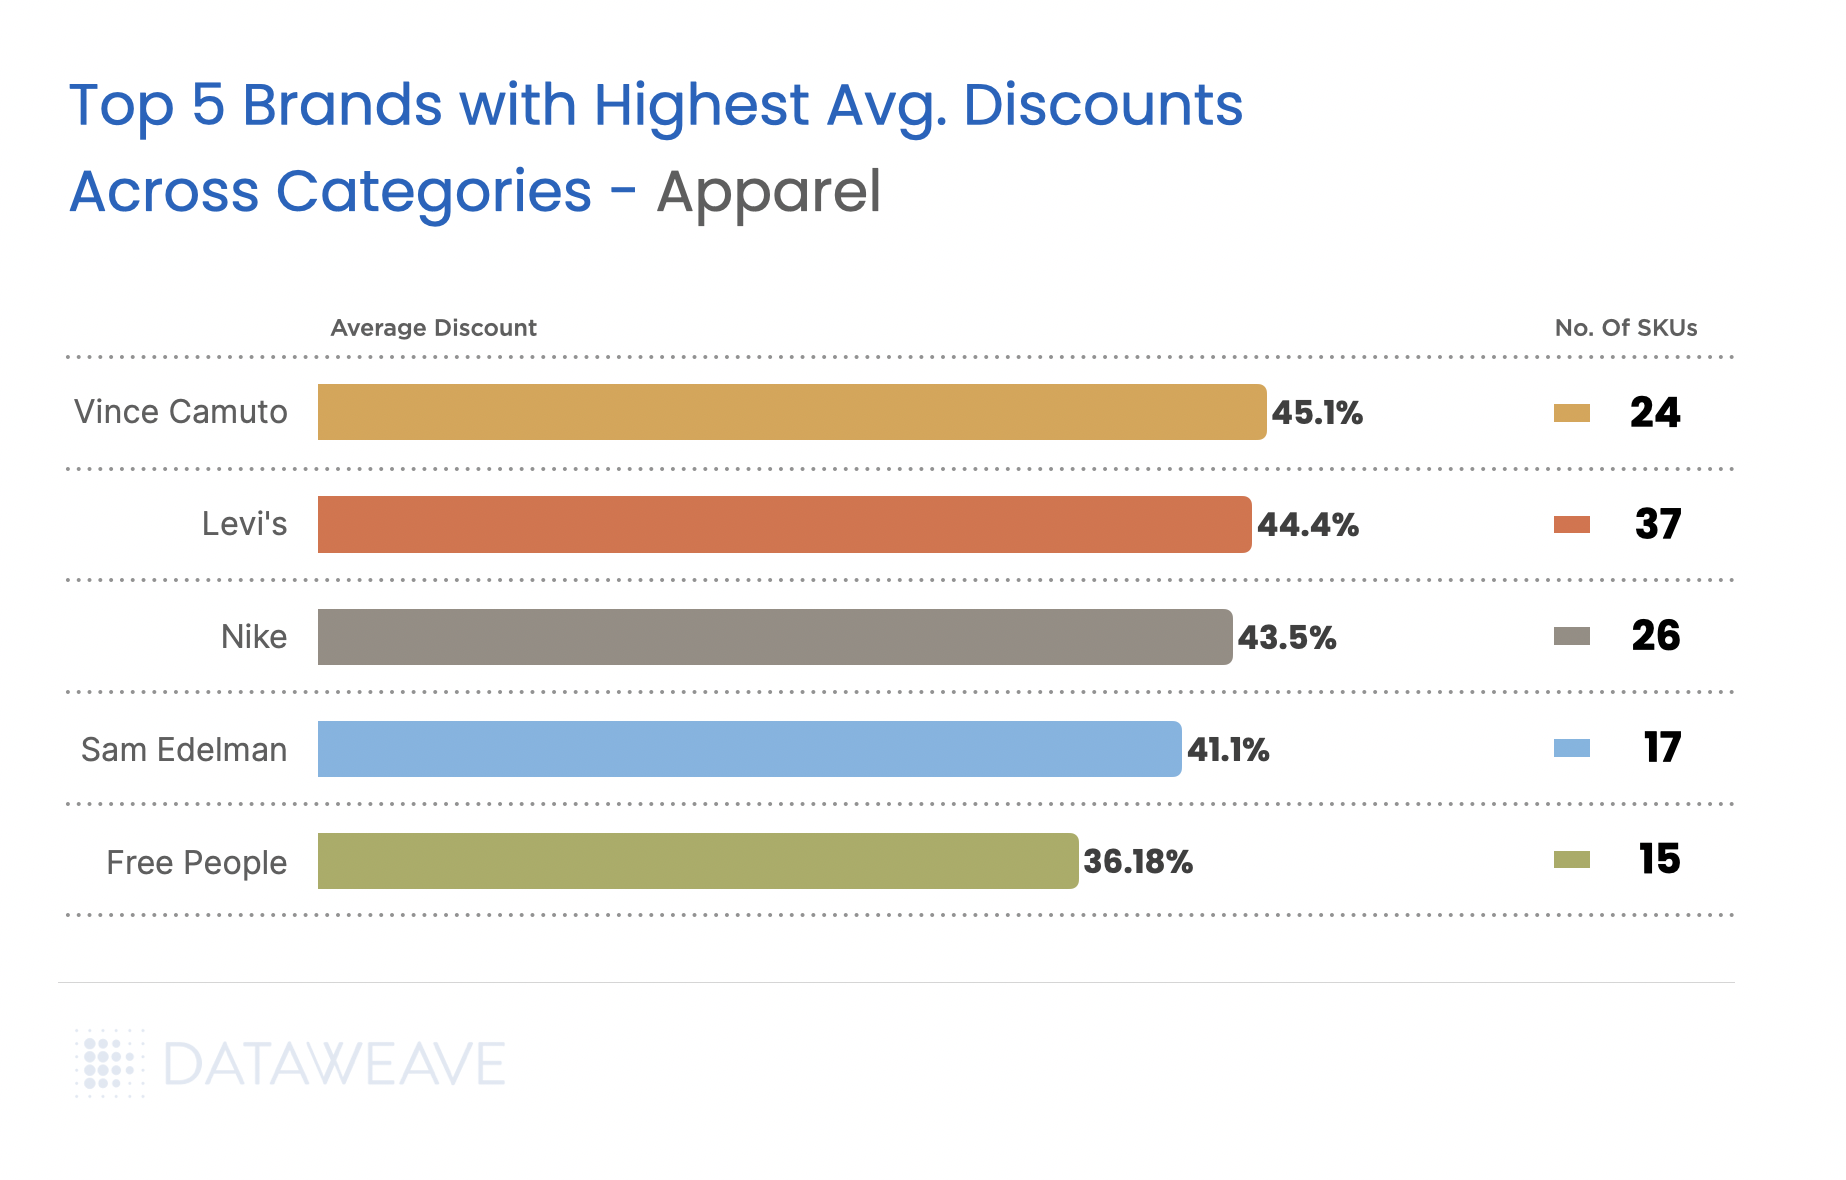
Our analysis of 57,537 SKUs reveals interesting discount dynamics.
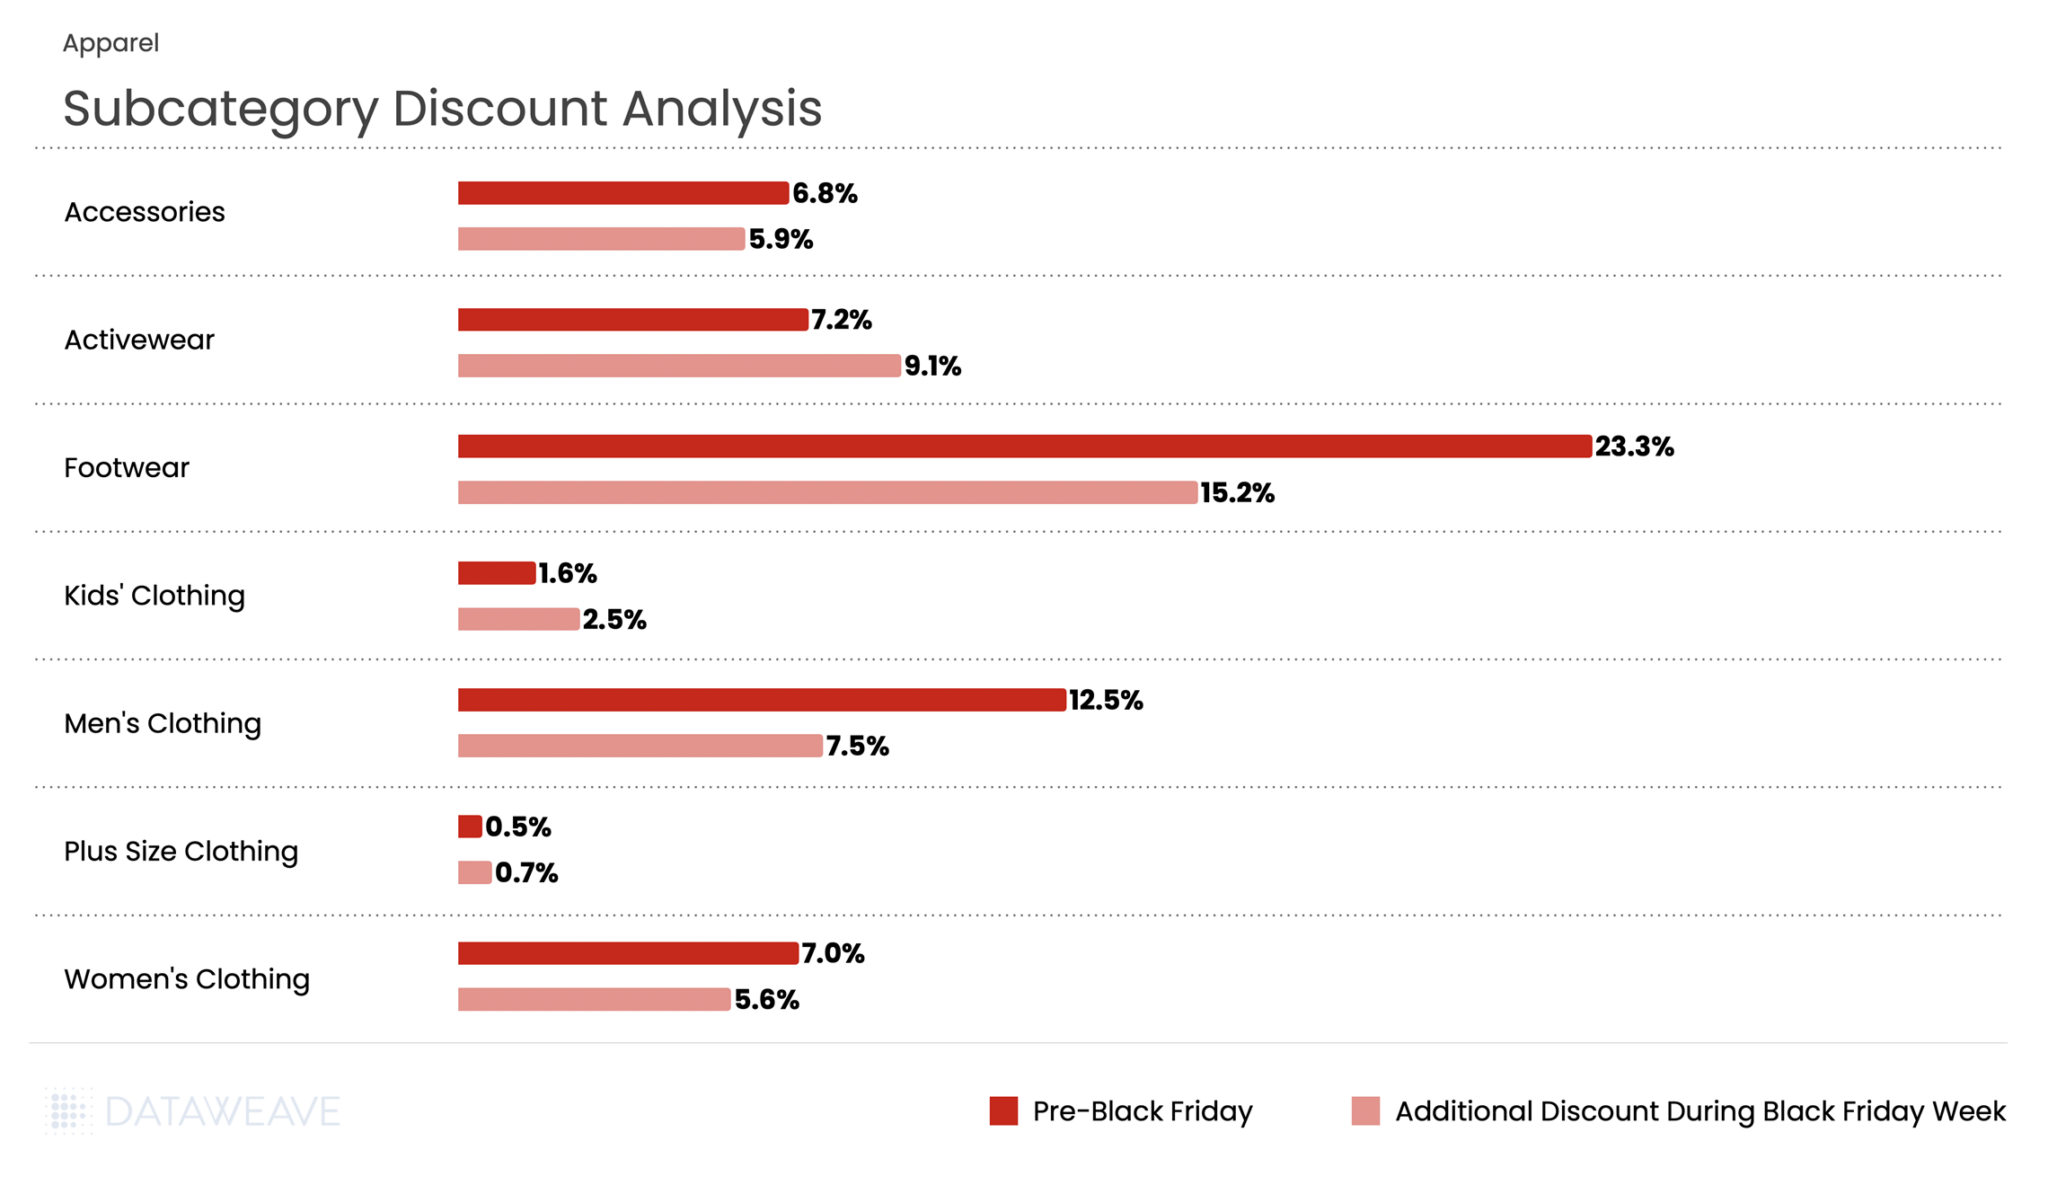
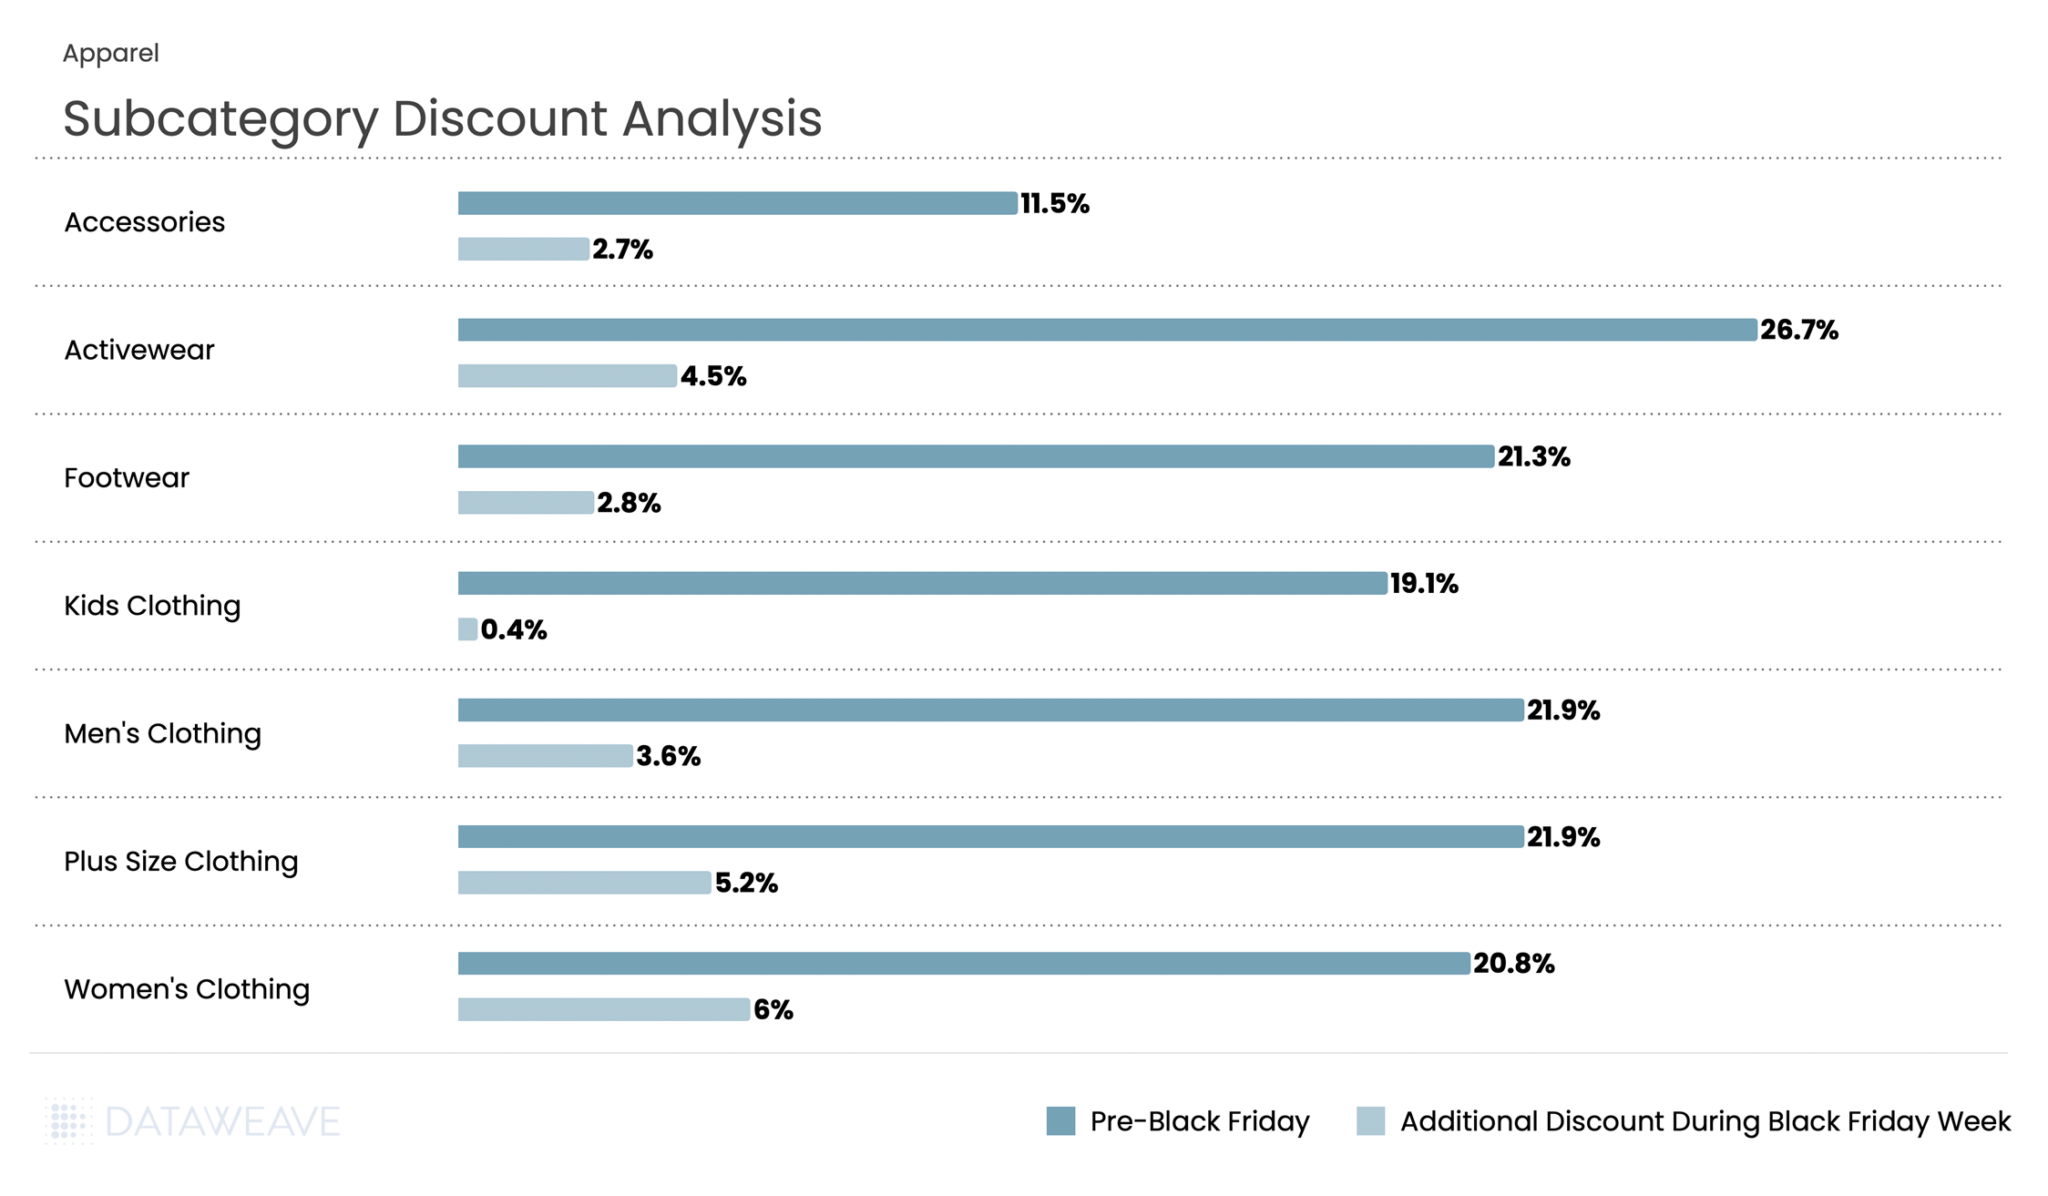
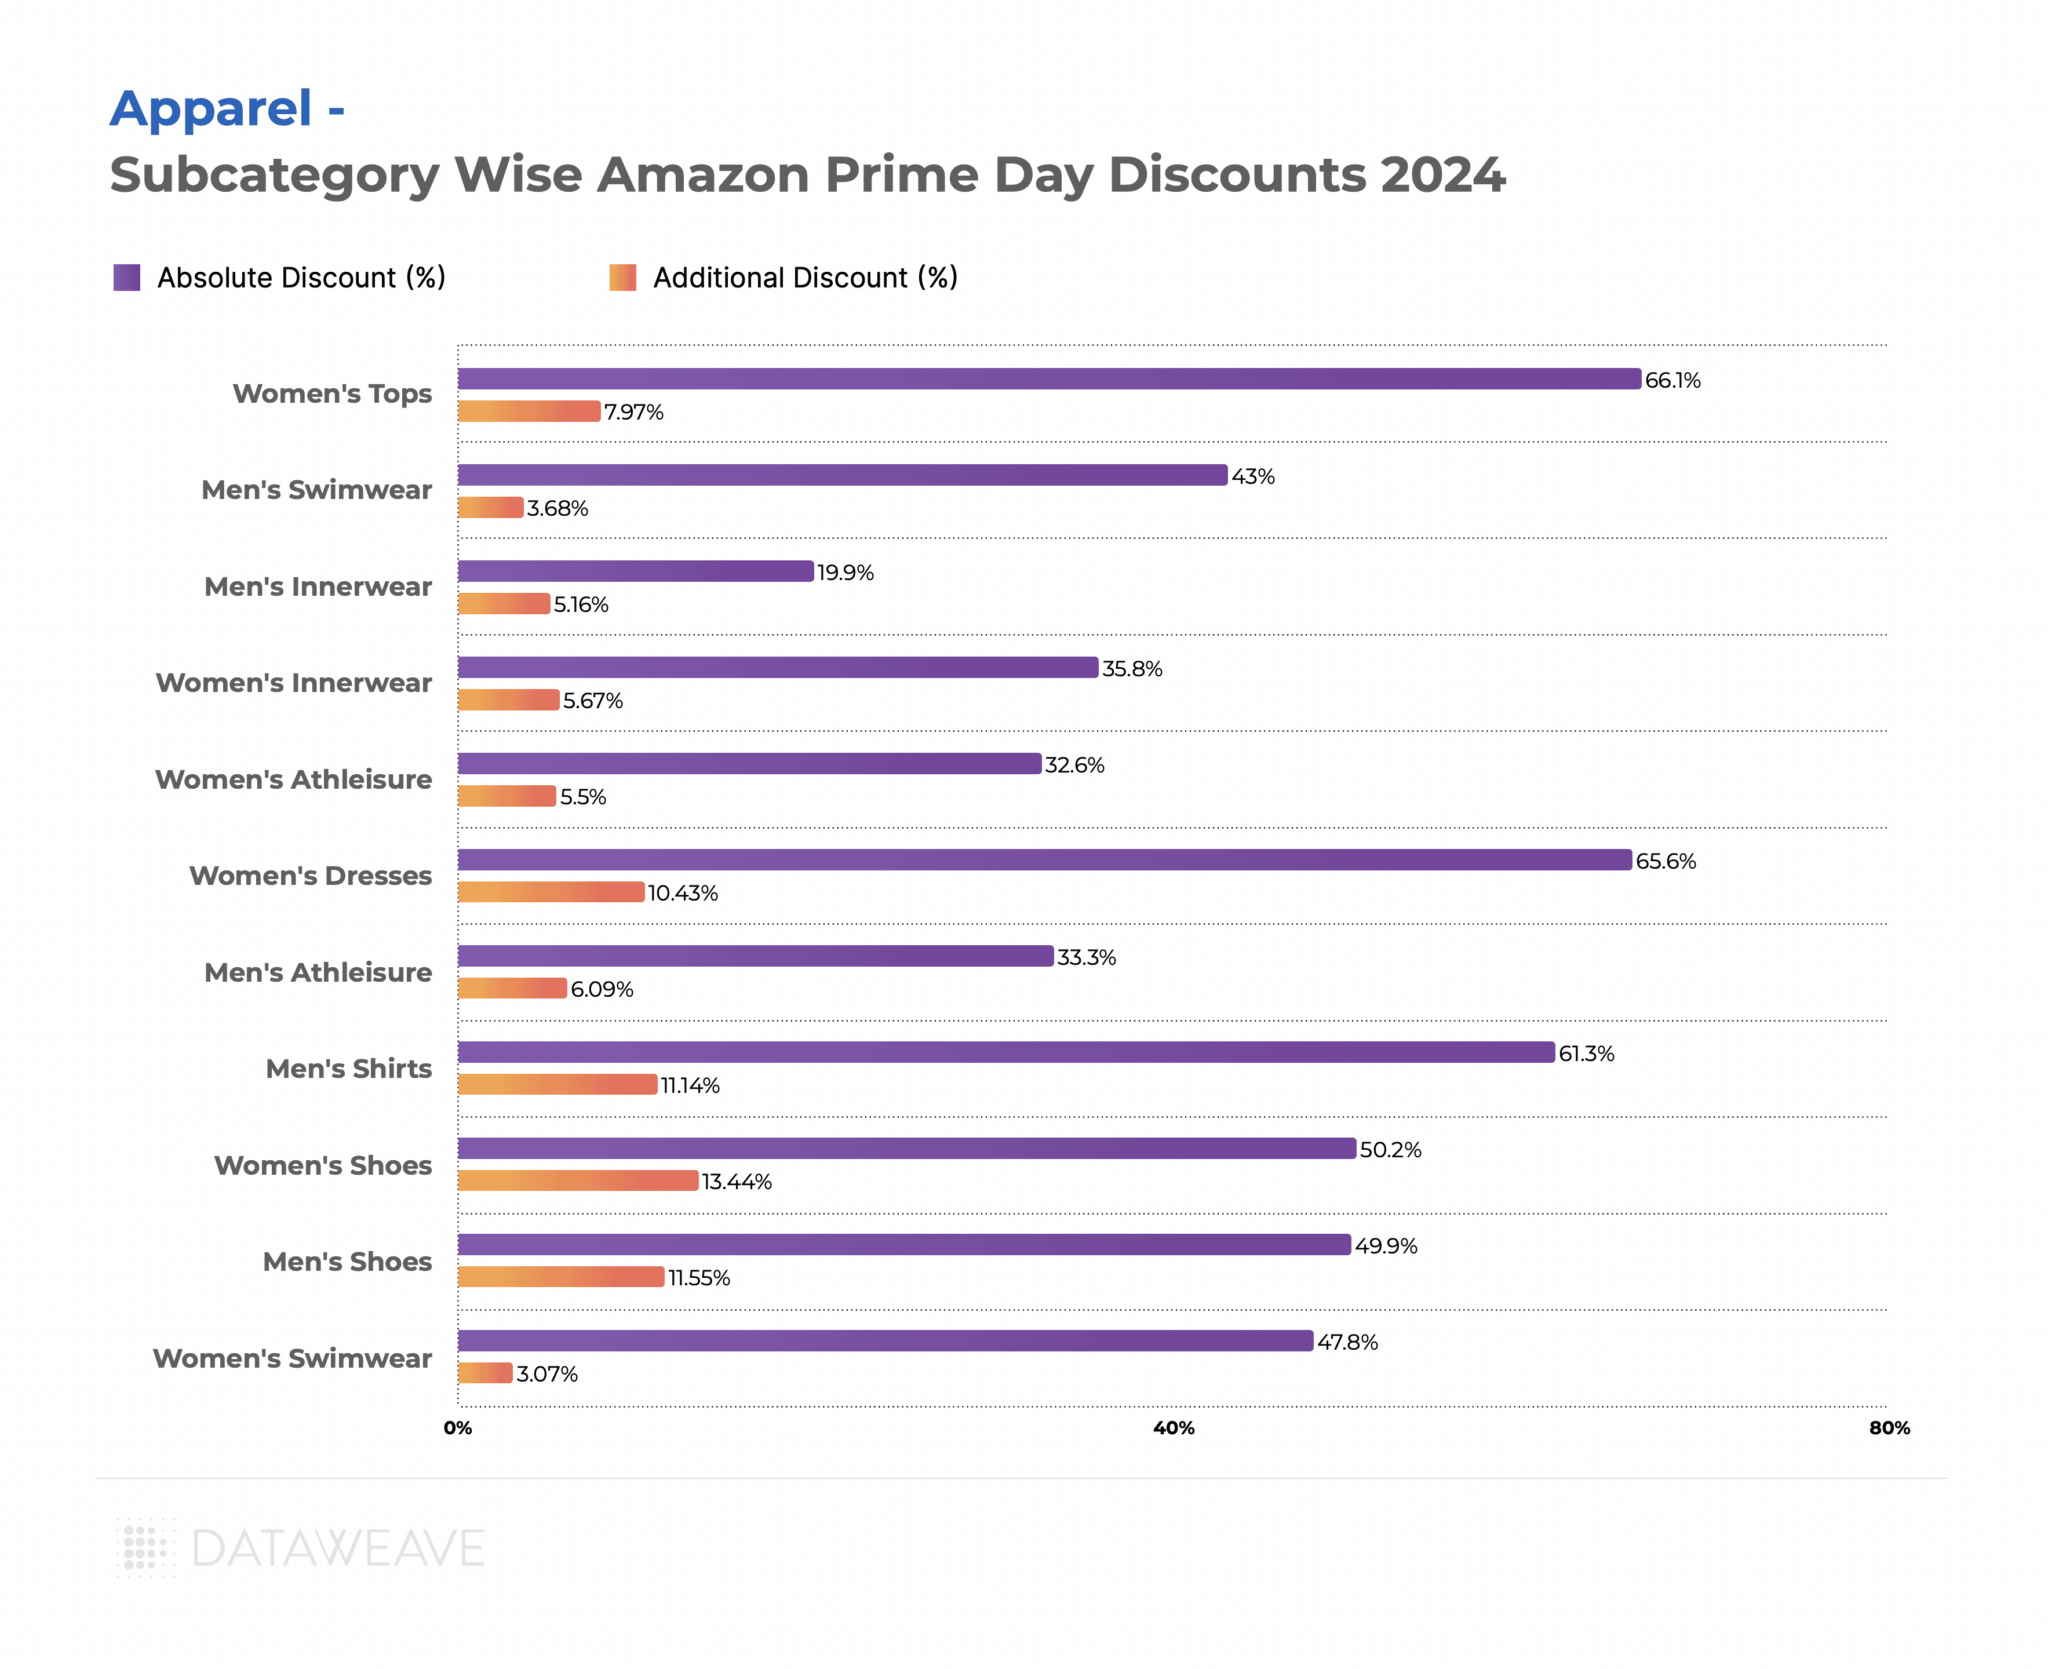
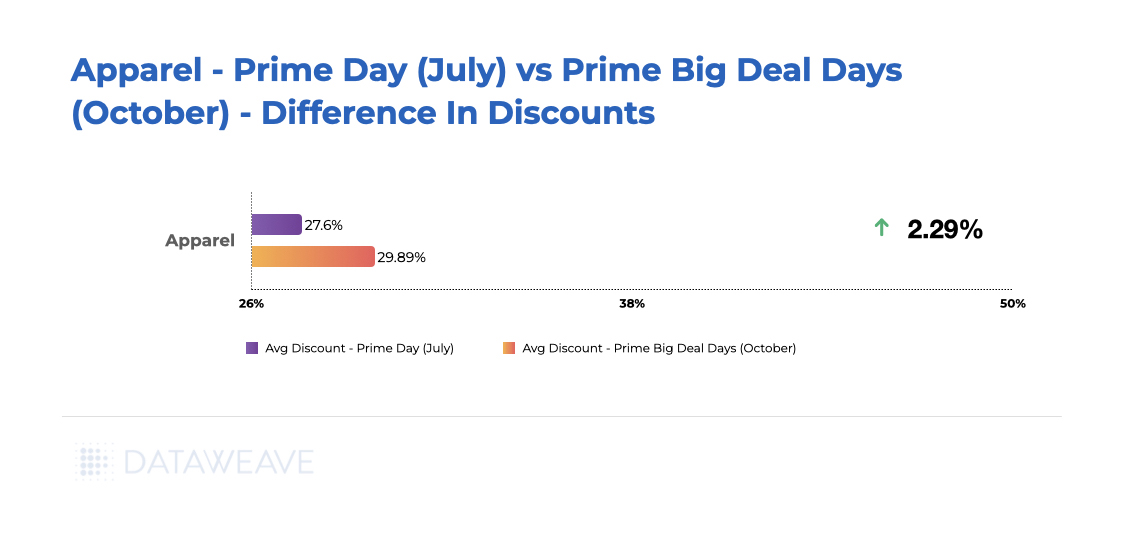
Subcategory Discount Analysis
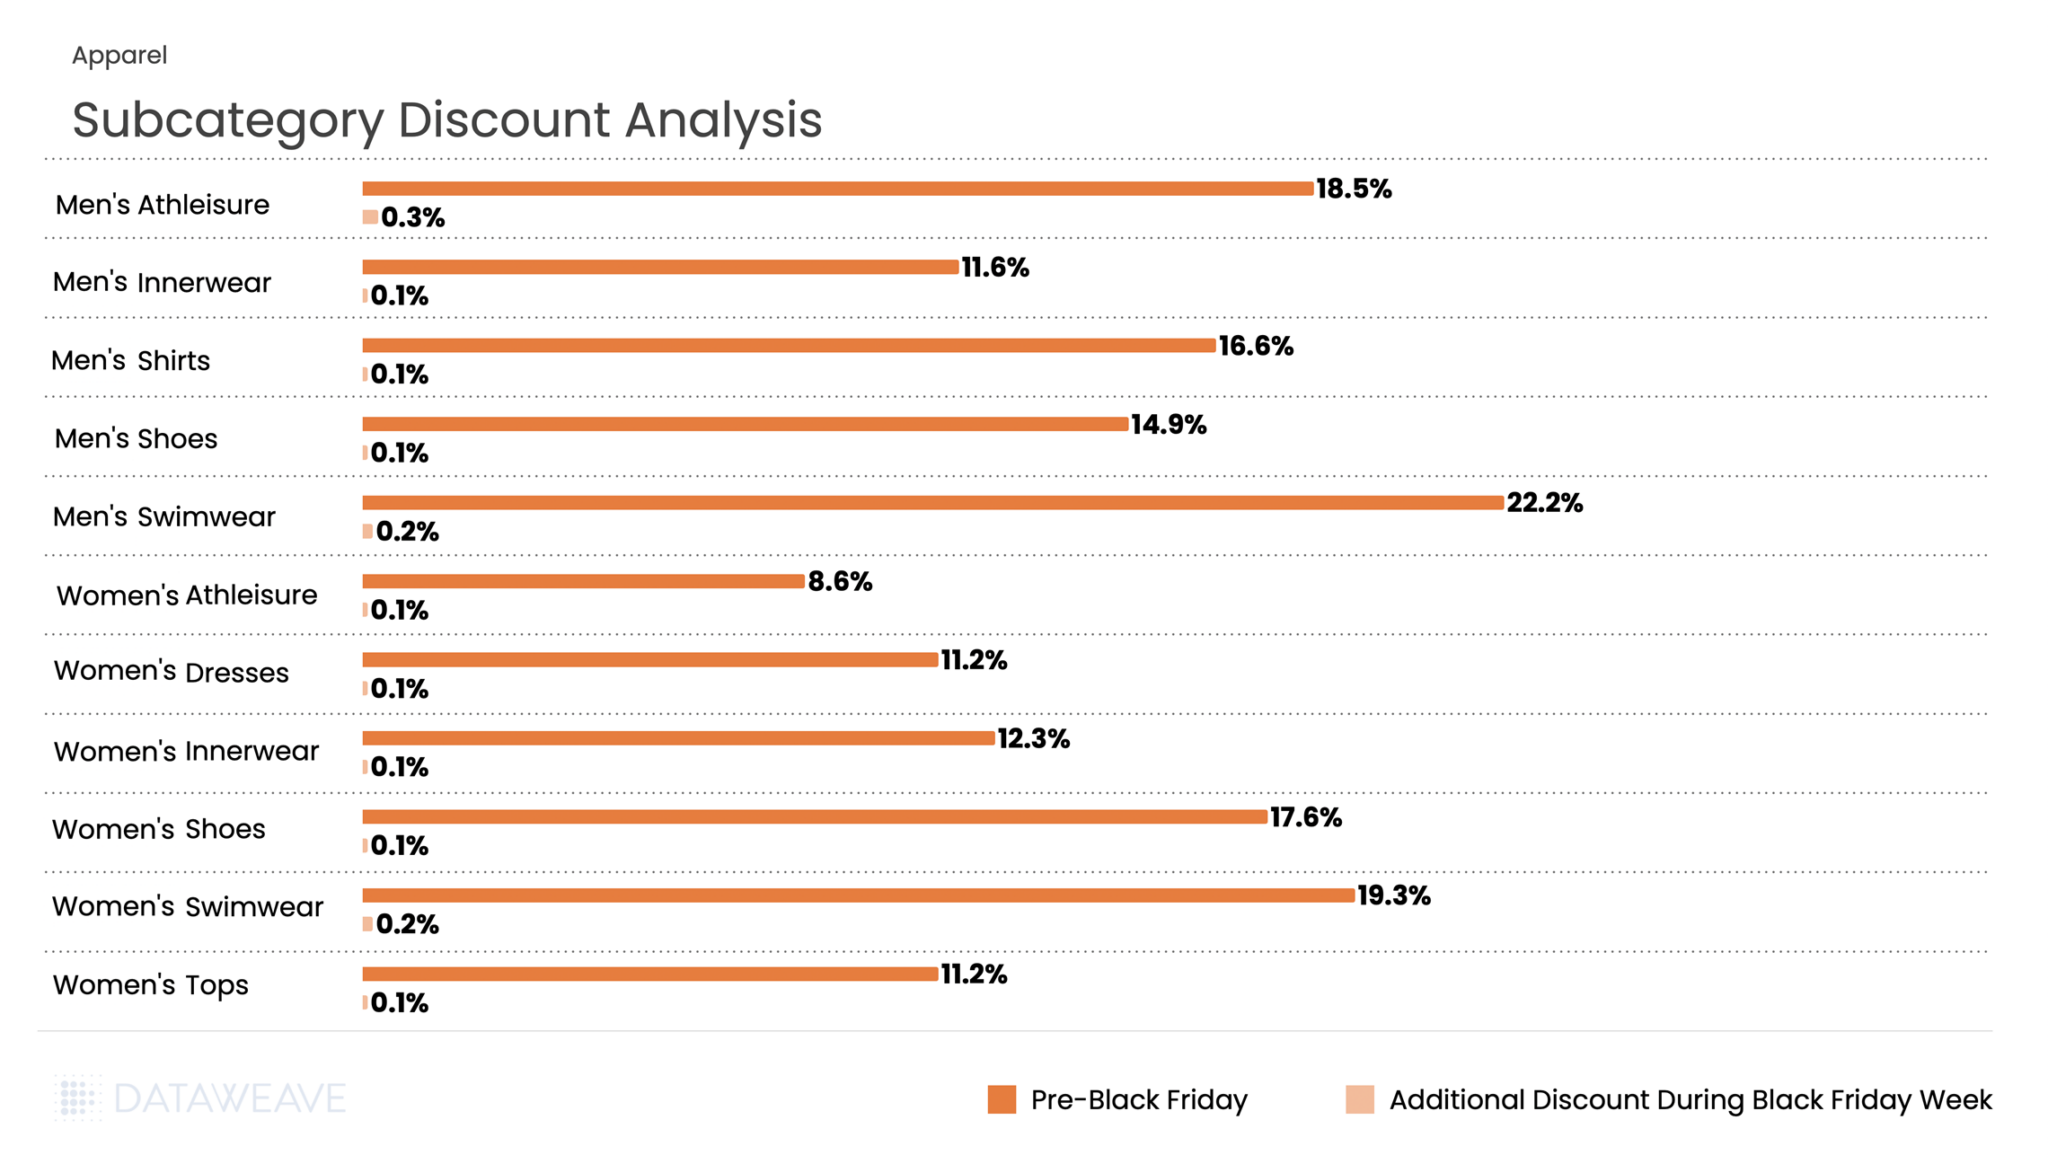
The category averaged 14.3% pre-Black Friday discounts with an additional 0.1% during Black Friday Week. Men’s Swimwear and Men’s Athleisure led pre-sale promotions at 22.2% and 18.5% respectively, while Women’s Swimwear and Women’s Shoes also saw strong pre event discounts at 19.3% and 17.6%.
Black Friday Week saw minimal incremental discounting across all subcategories, with most adding just 0.1-0.3%. The relatively subdued incremental discounting indicates that early birds captured the best deals, or that margins were already stretched from pre-sale promotions.
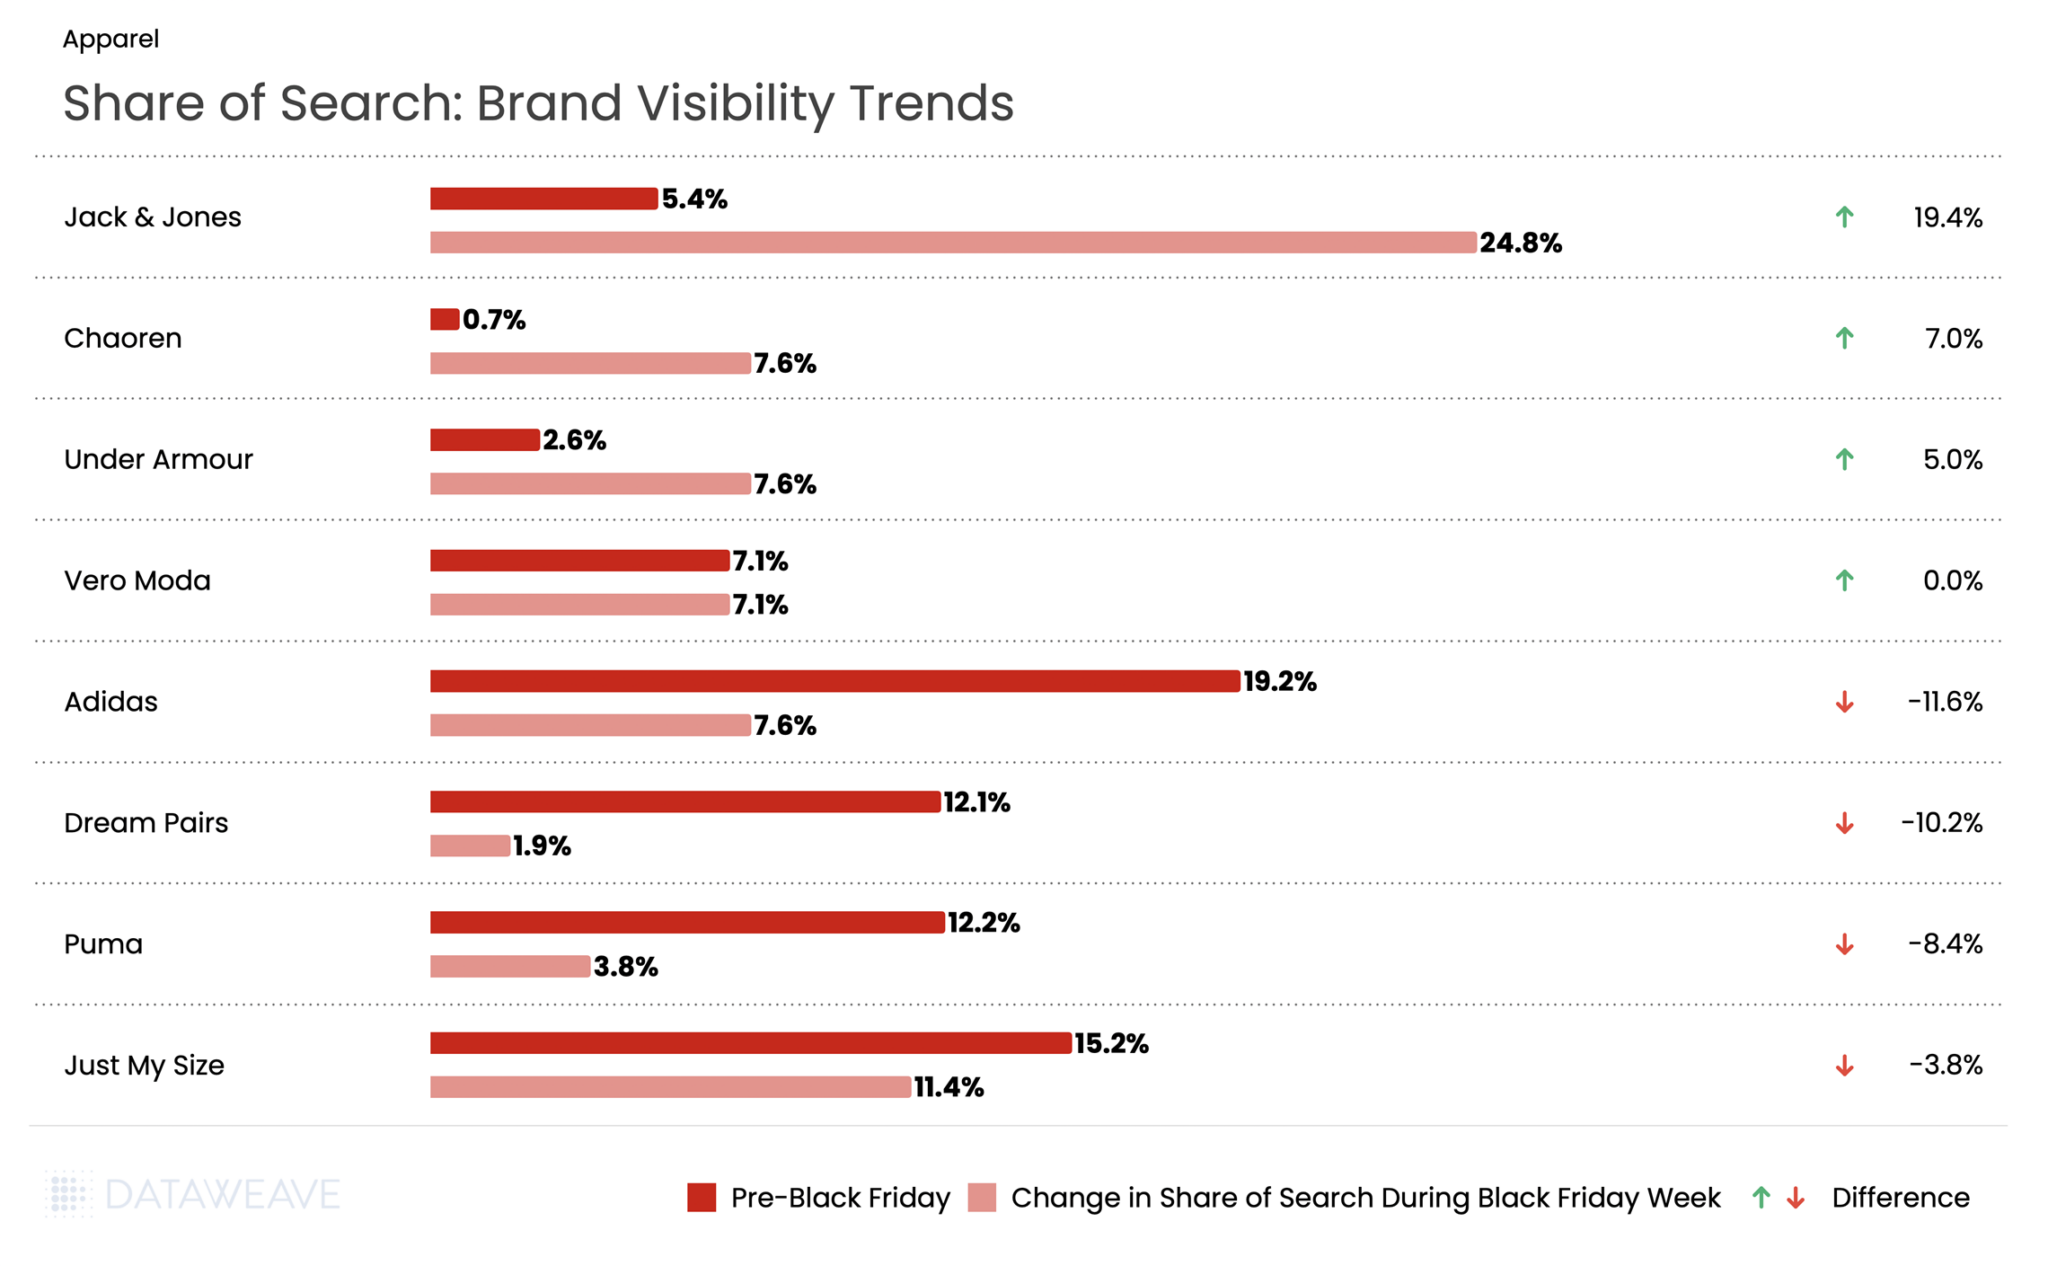
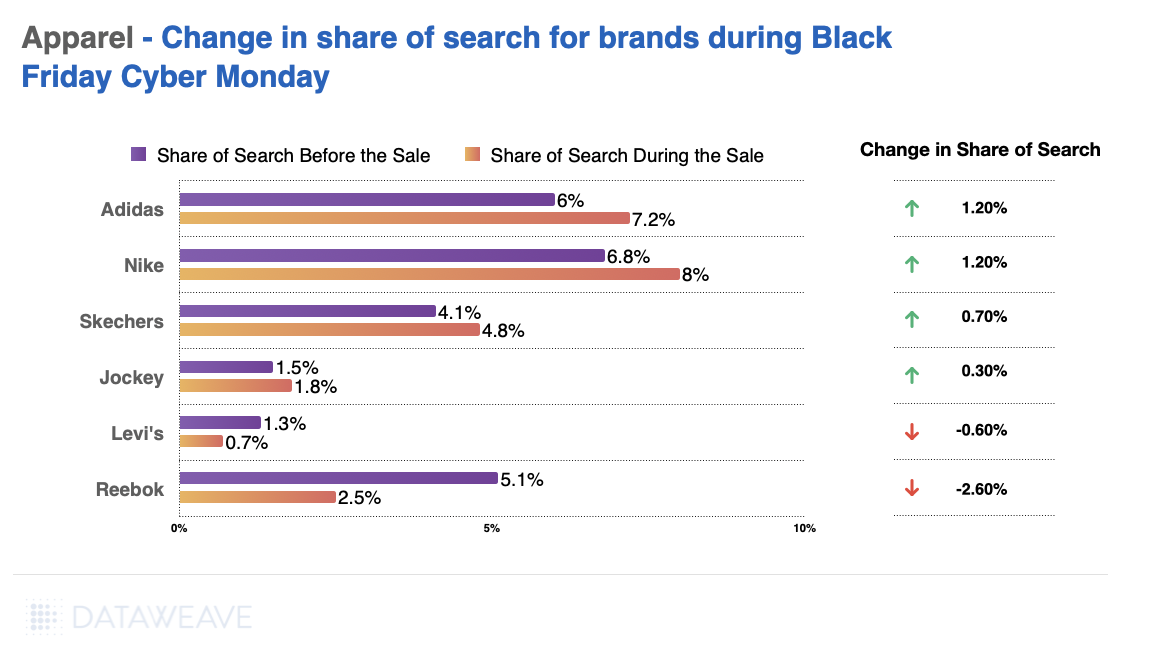
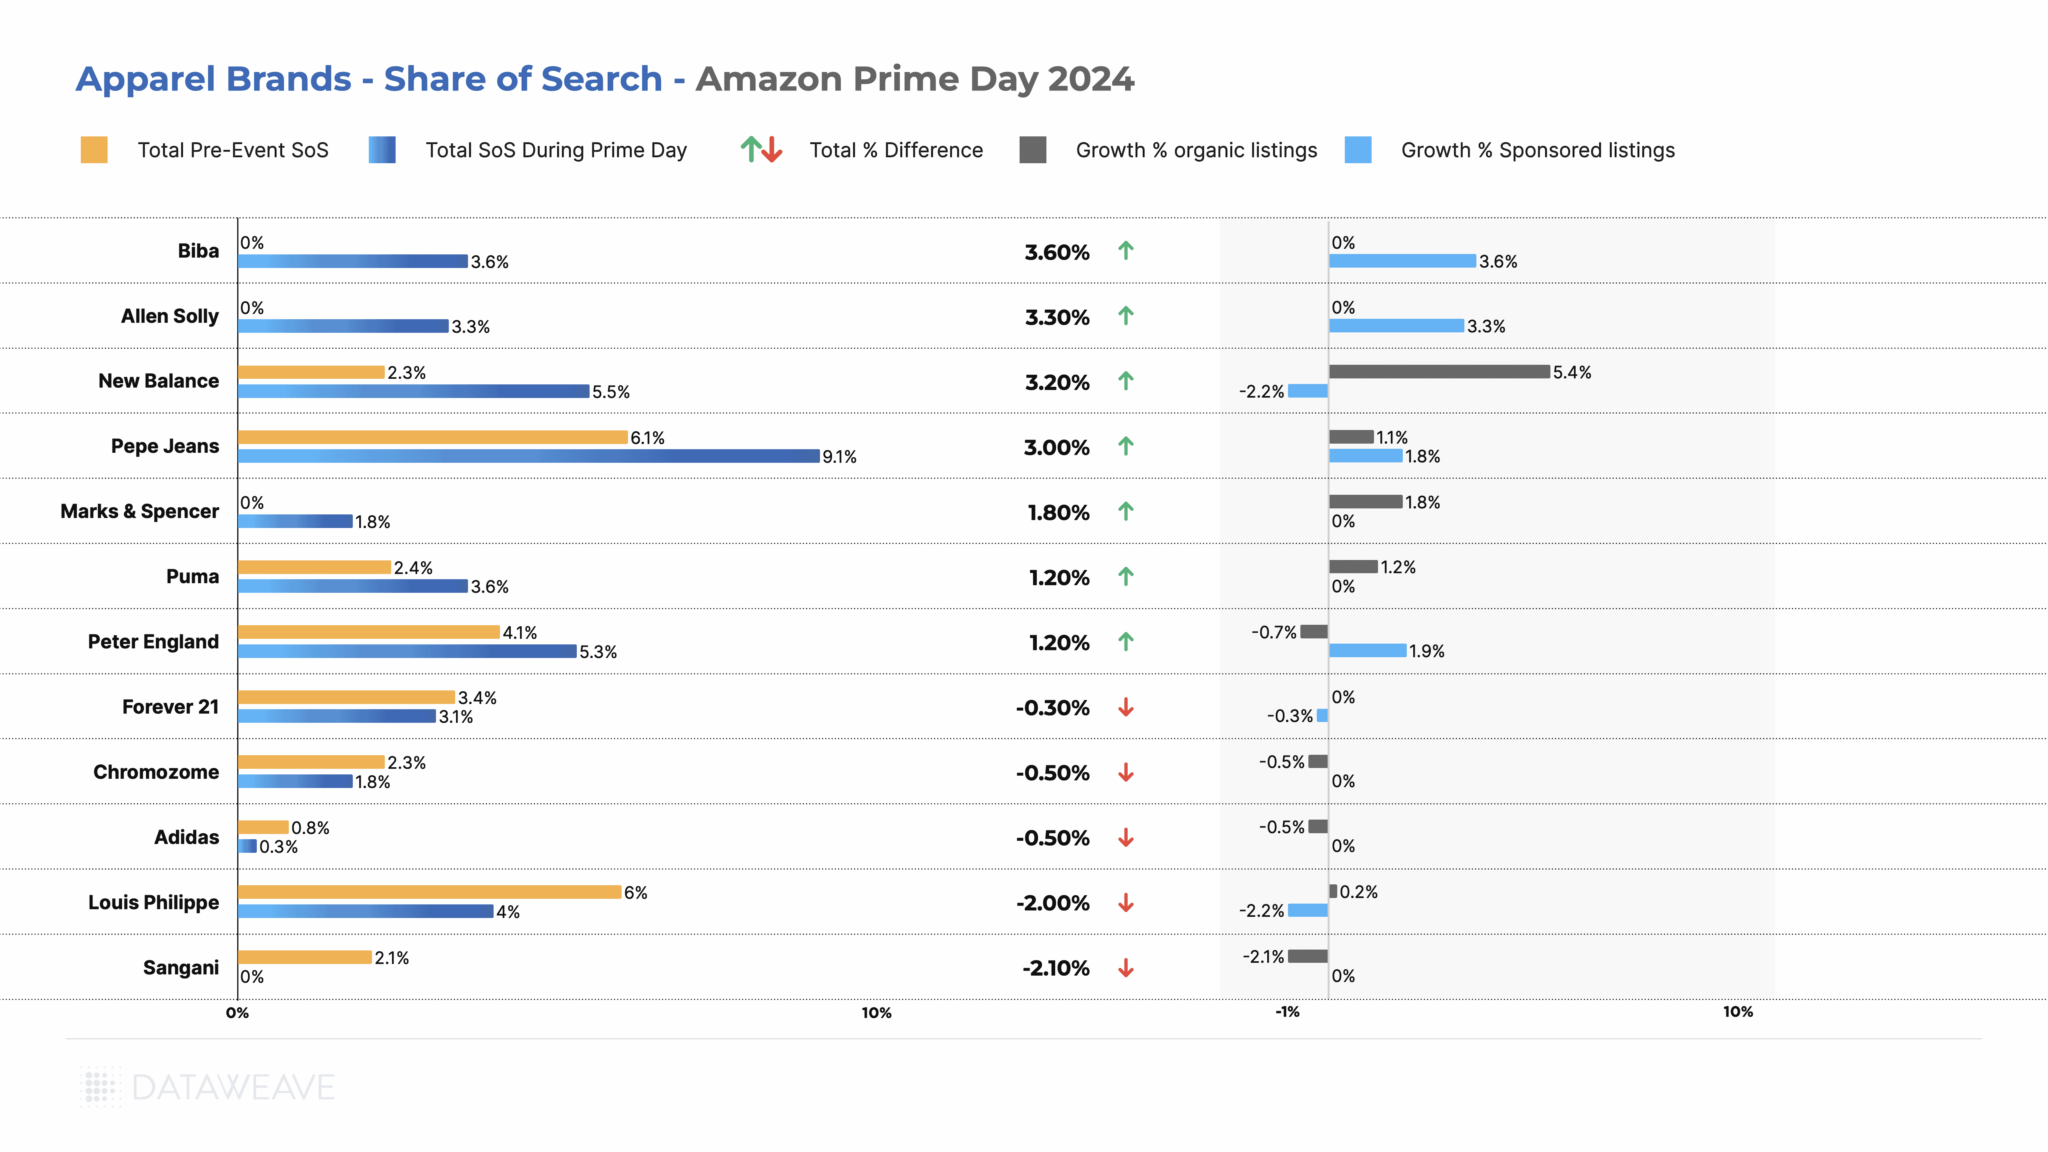
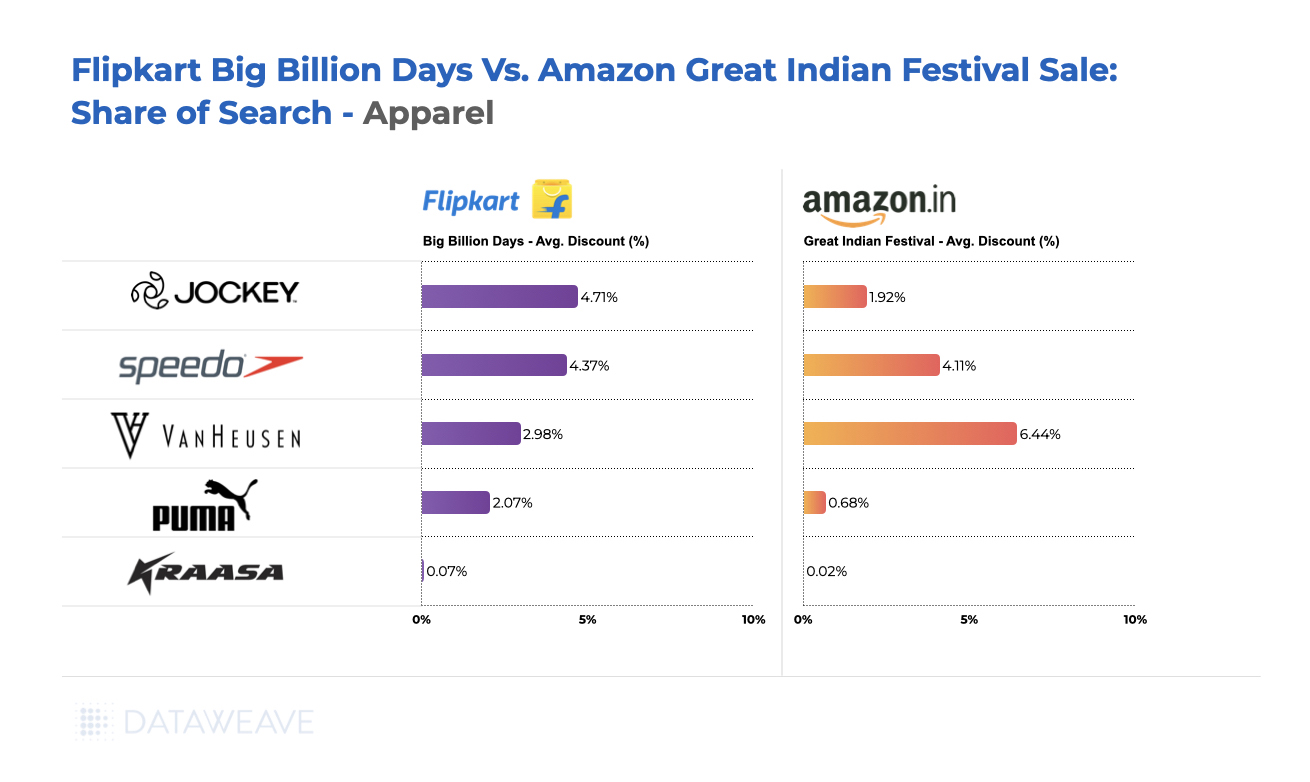
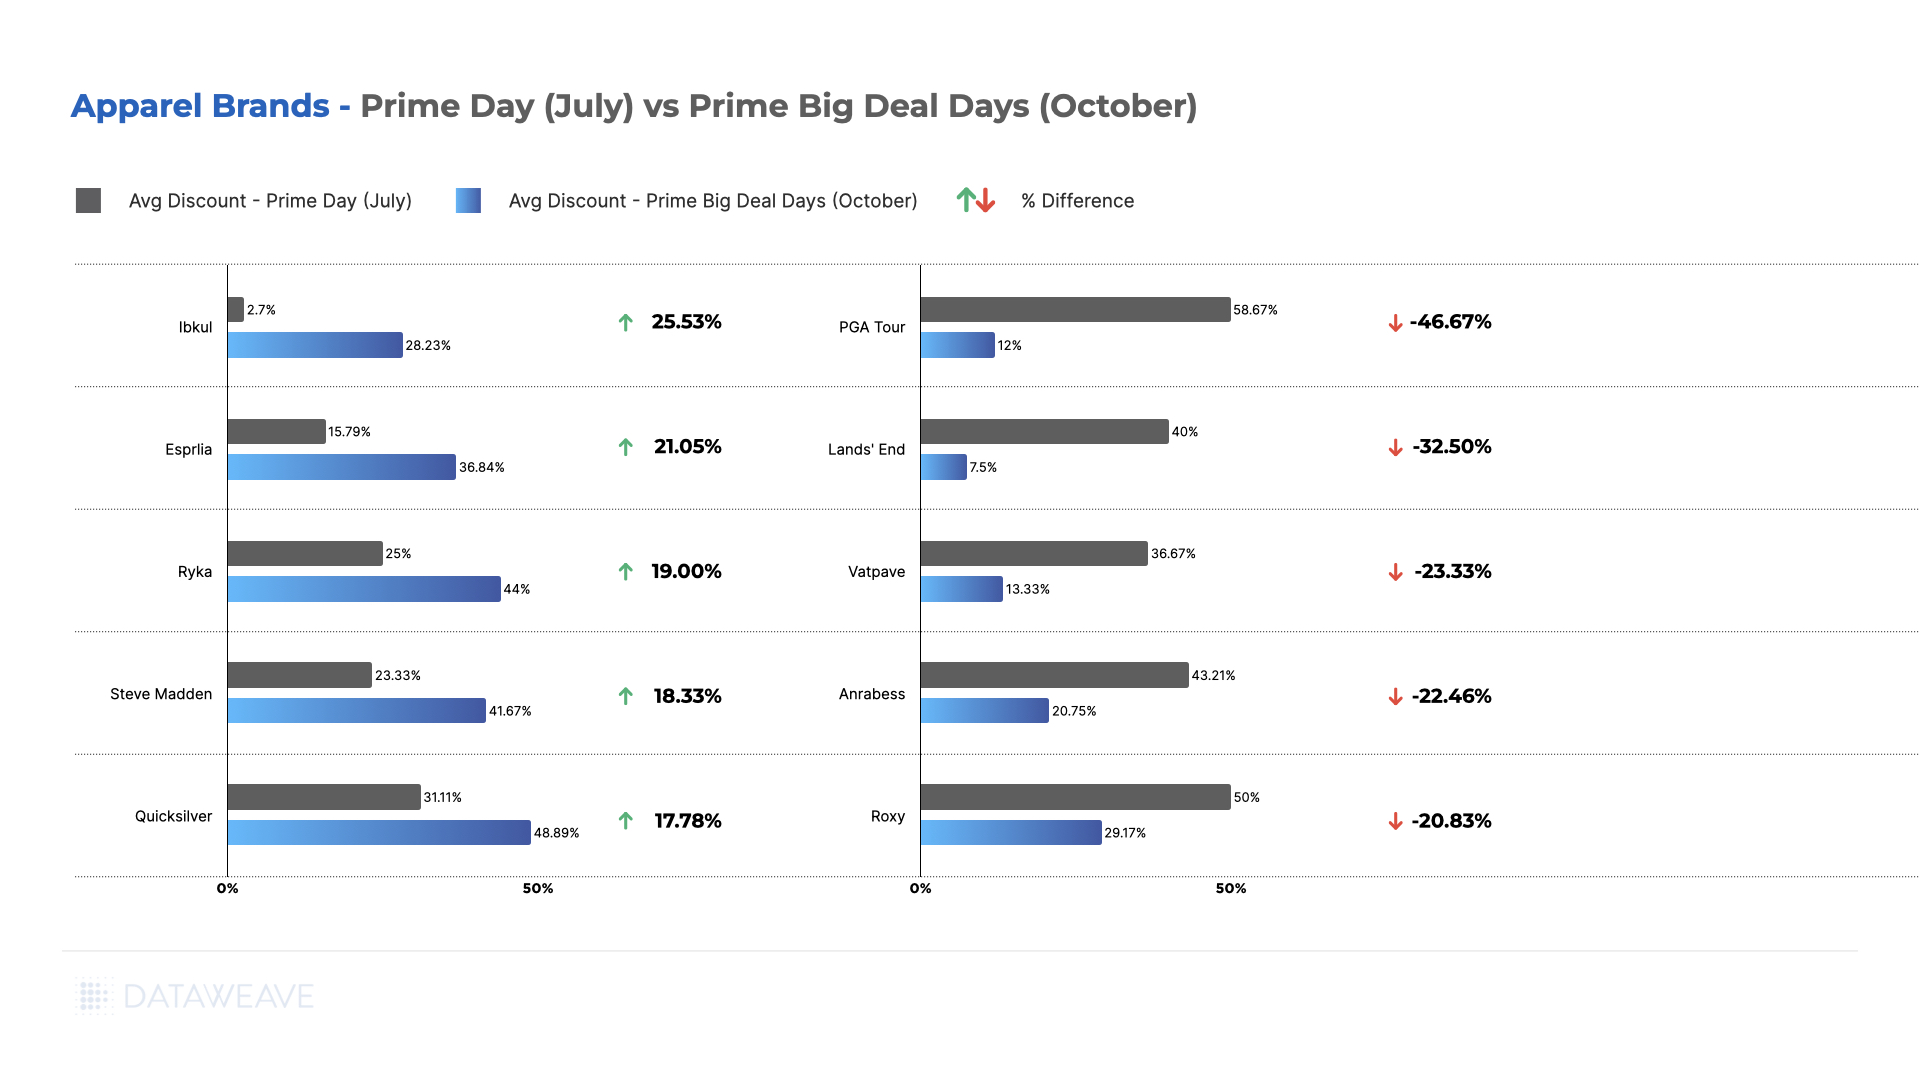
Share of Search: Brand Visibility Trends
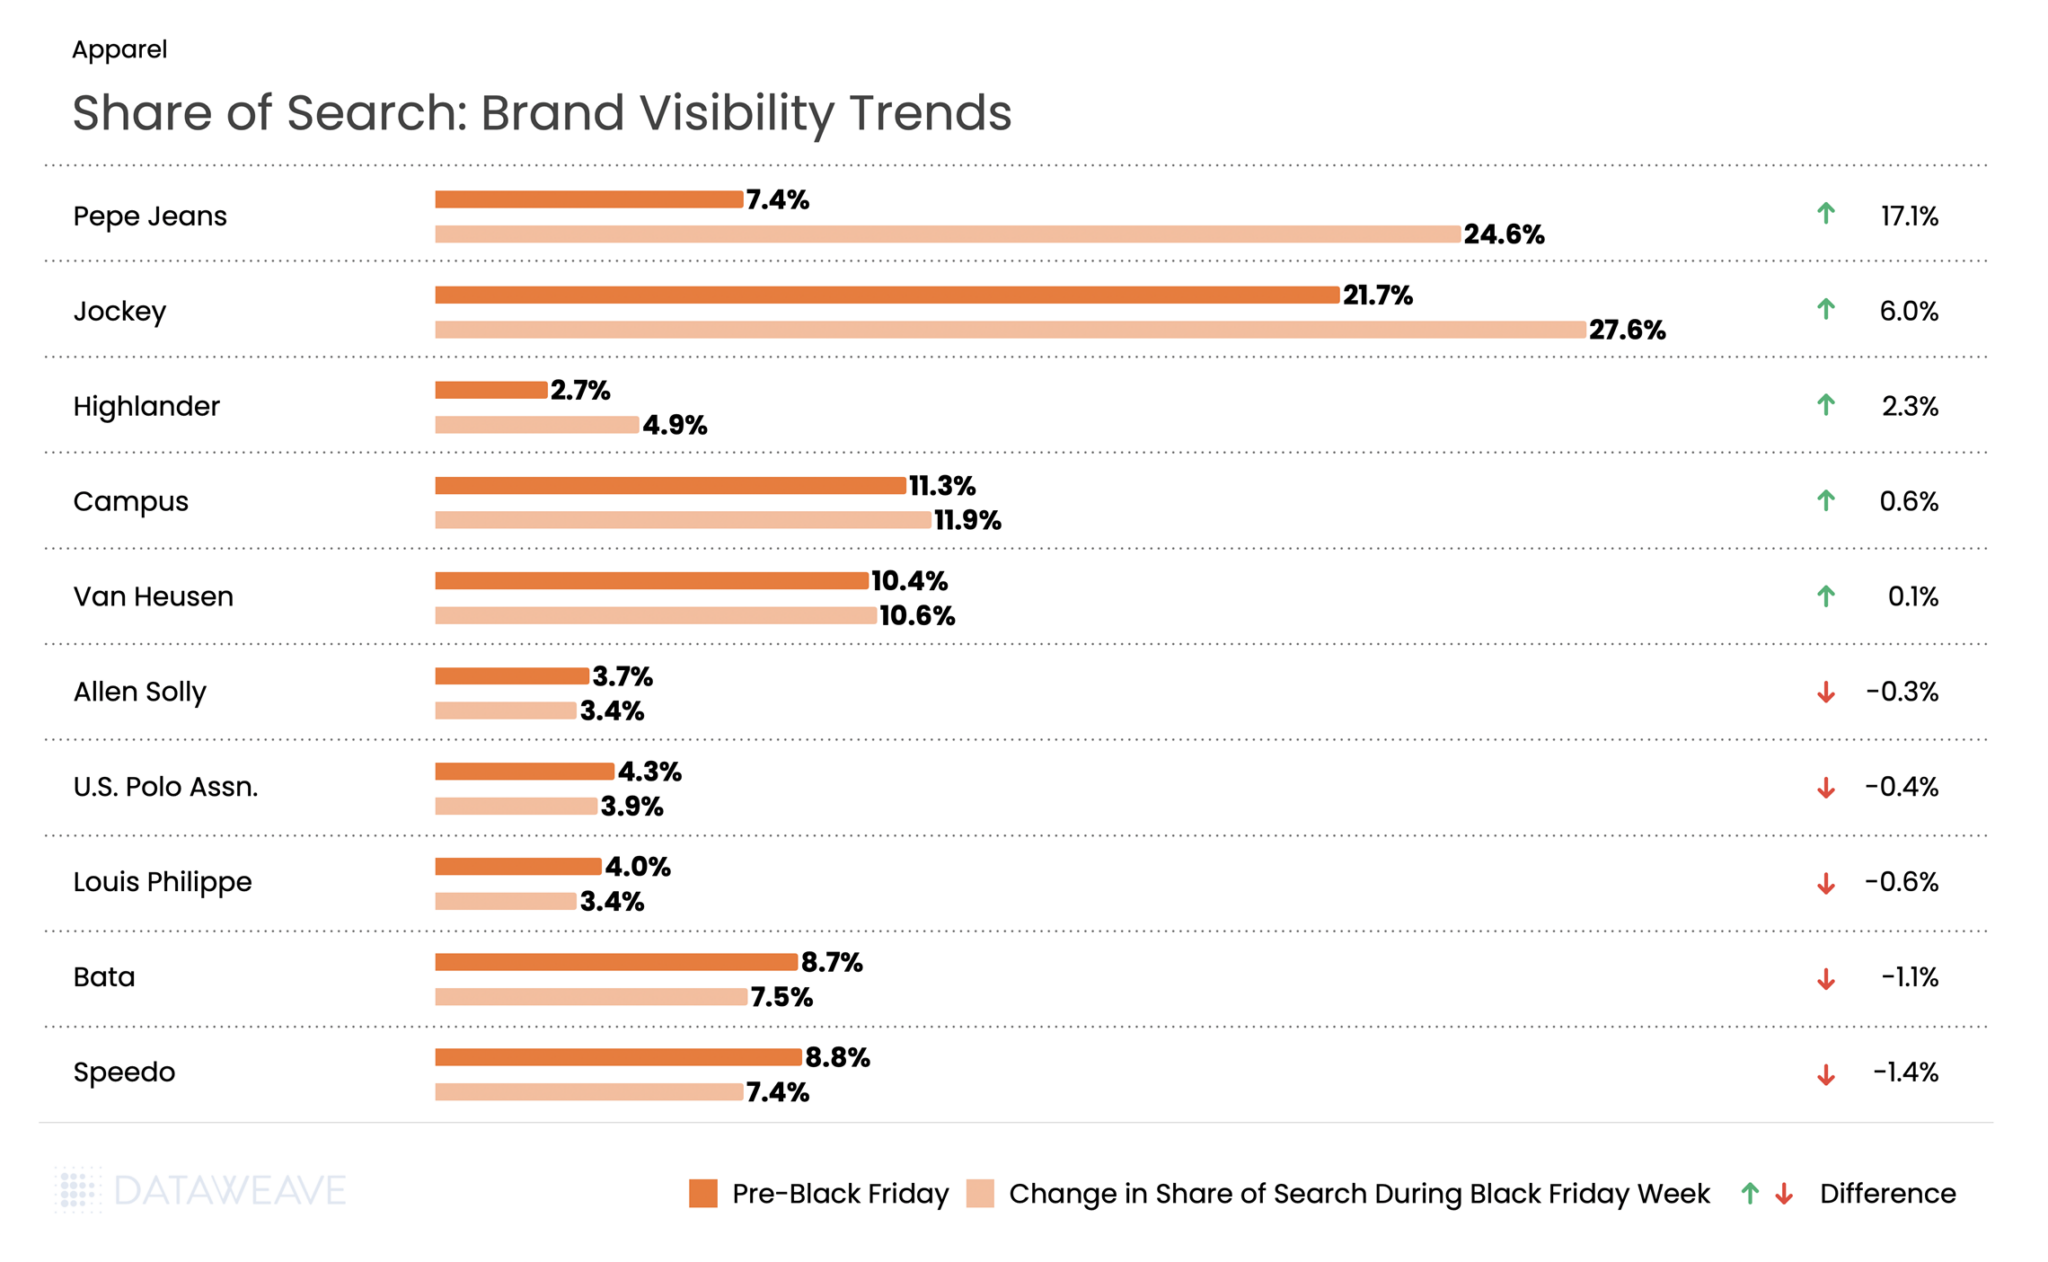
Pepe Jeans dominated visibility, surging from 7.4% to 24.6%, a staggering gain that represents the largest visibility increase across all categories. Jockey also performed strongly with a 6% gain, solidifying its position in innerwear.
On the flip side, athletic and footwear stalwarts faced headwinds: Speedo dropped 1.4% and Bata fell 1.1%. This data suggests that during Black Friday 2025 in India, denim and lifestyle fashion brands invested heavily in promotional visibility, capturing massive mindshare at the expense of traditional athletic and footwear brands.
For brands and retailers navigating India’s increasingly competitive e-commerce landscape, the 2025 Black Friday data reveals a critical insight: pre-sale positioning matters more than Black Friday Week discounting. Early promotional investment and visibility campaigns delivered far greater returns than late-stage price drops, fundamentally reshaping how brands should approach this shopping event.
Want to understand how DataWeave’s retail intelligence platform can help your business make data-driven decisions during peak sales events? Contact us to learn more about competitive insights, price intelligence, assortment analytics, content analytics, and digital shelf analytics.
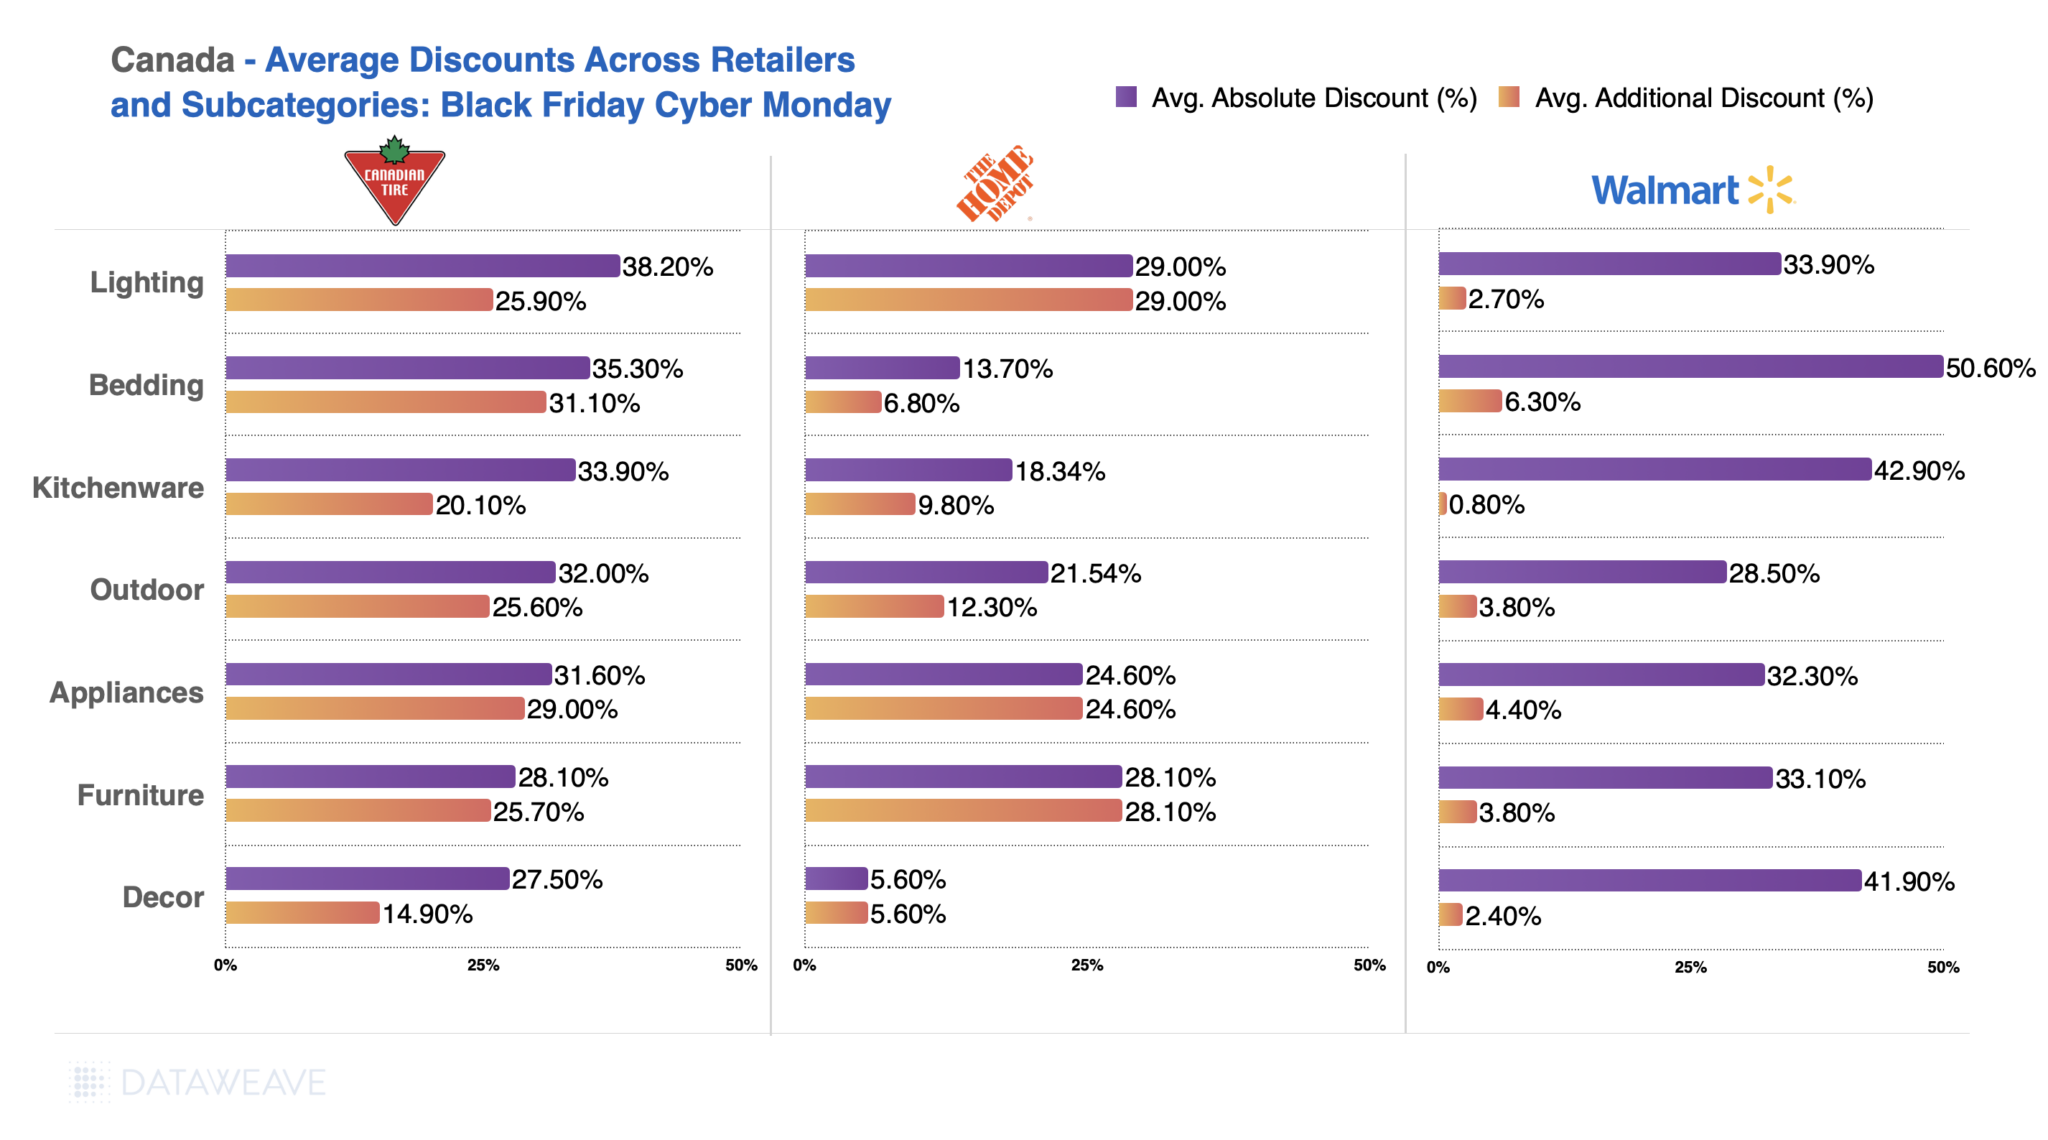
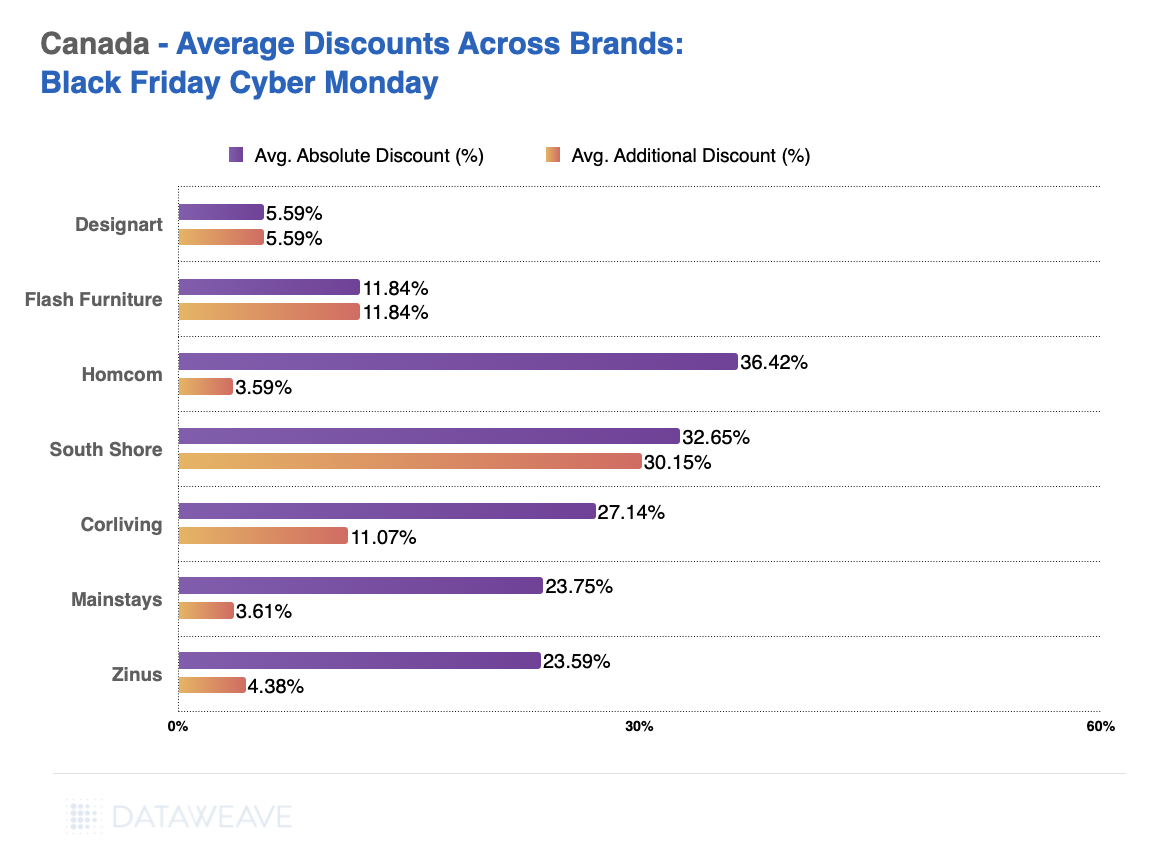
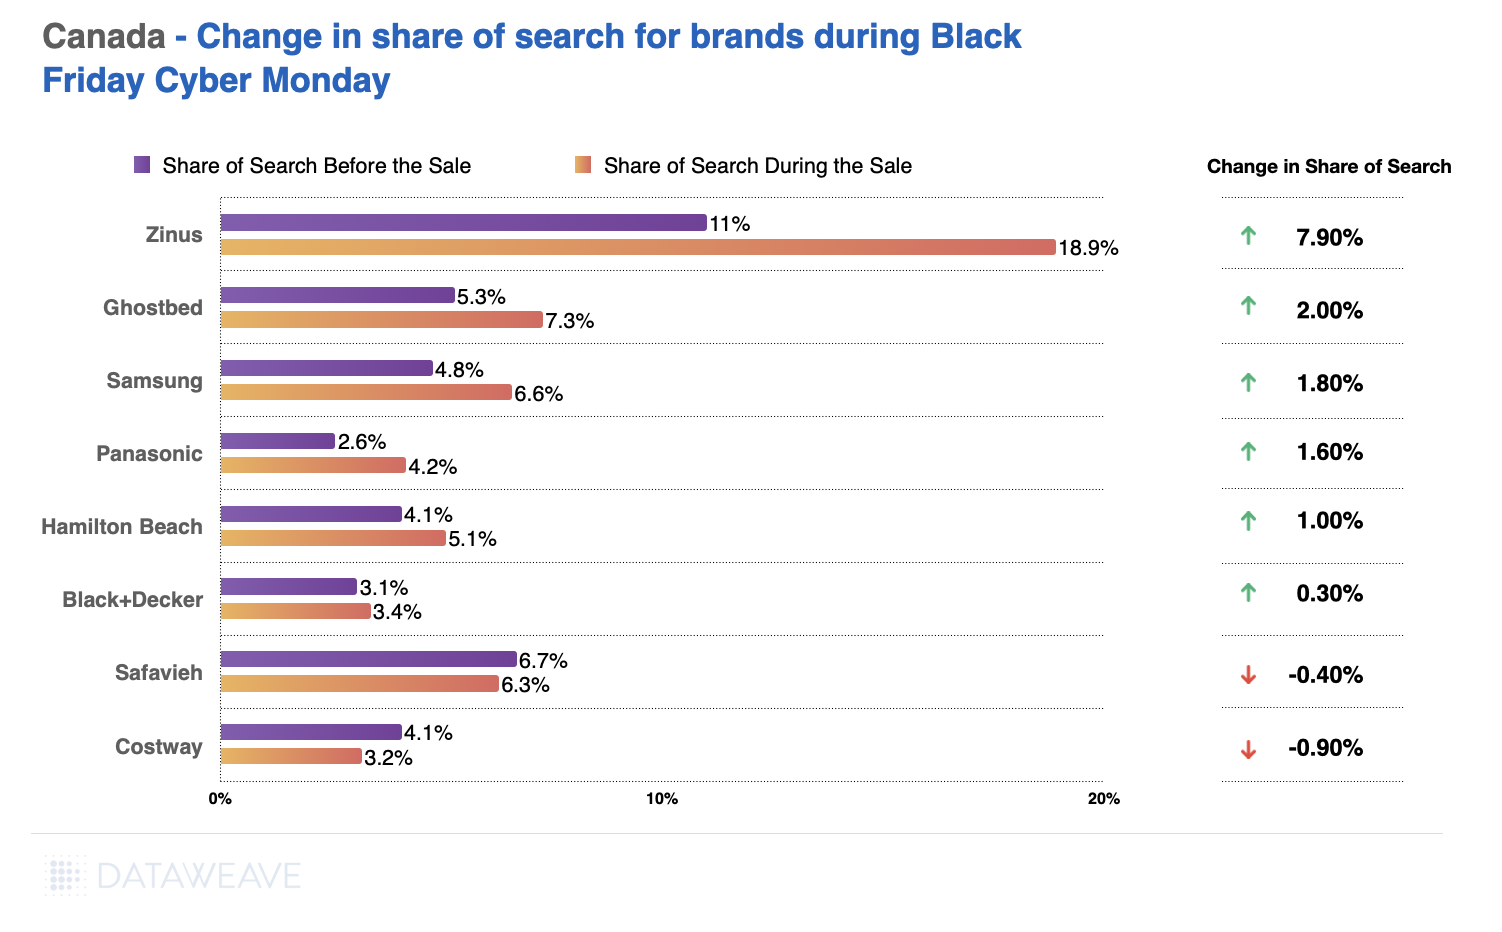
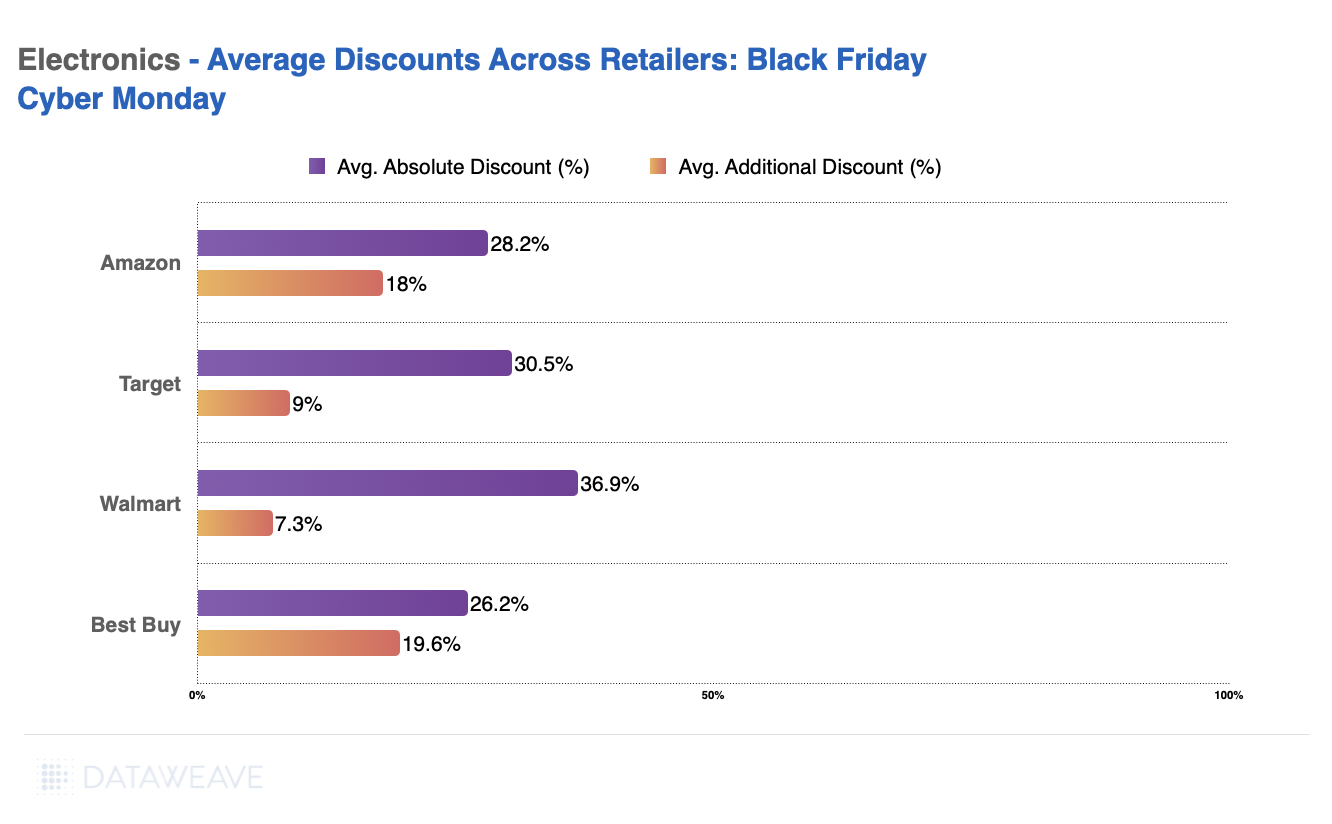
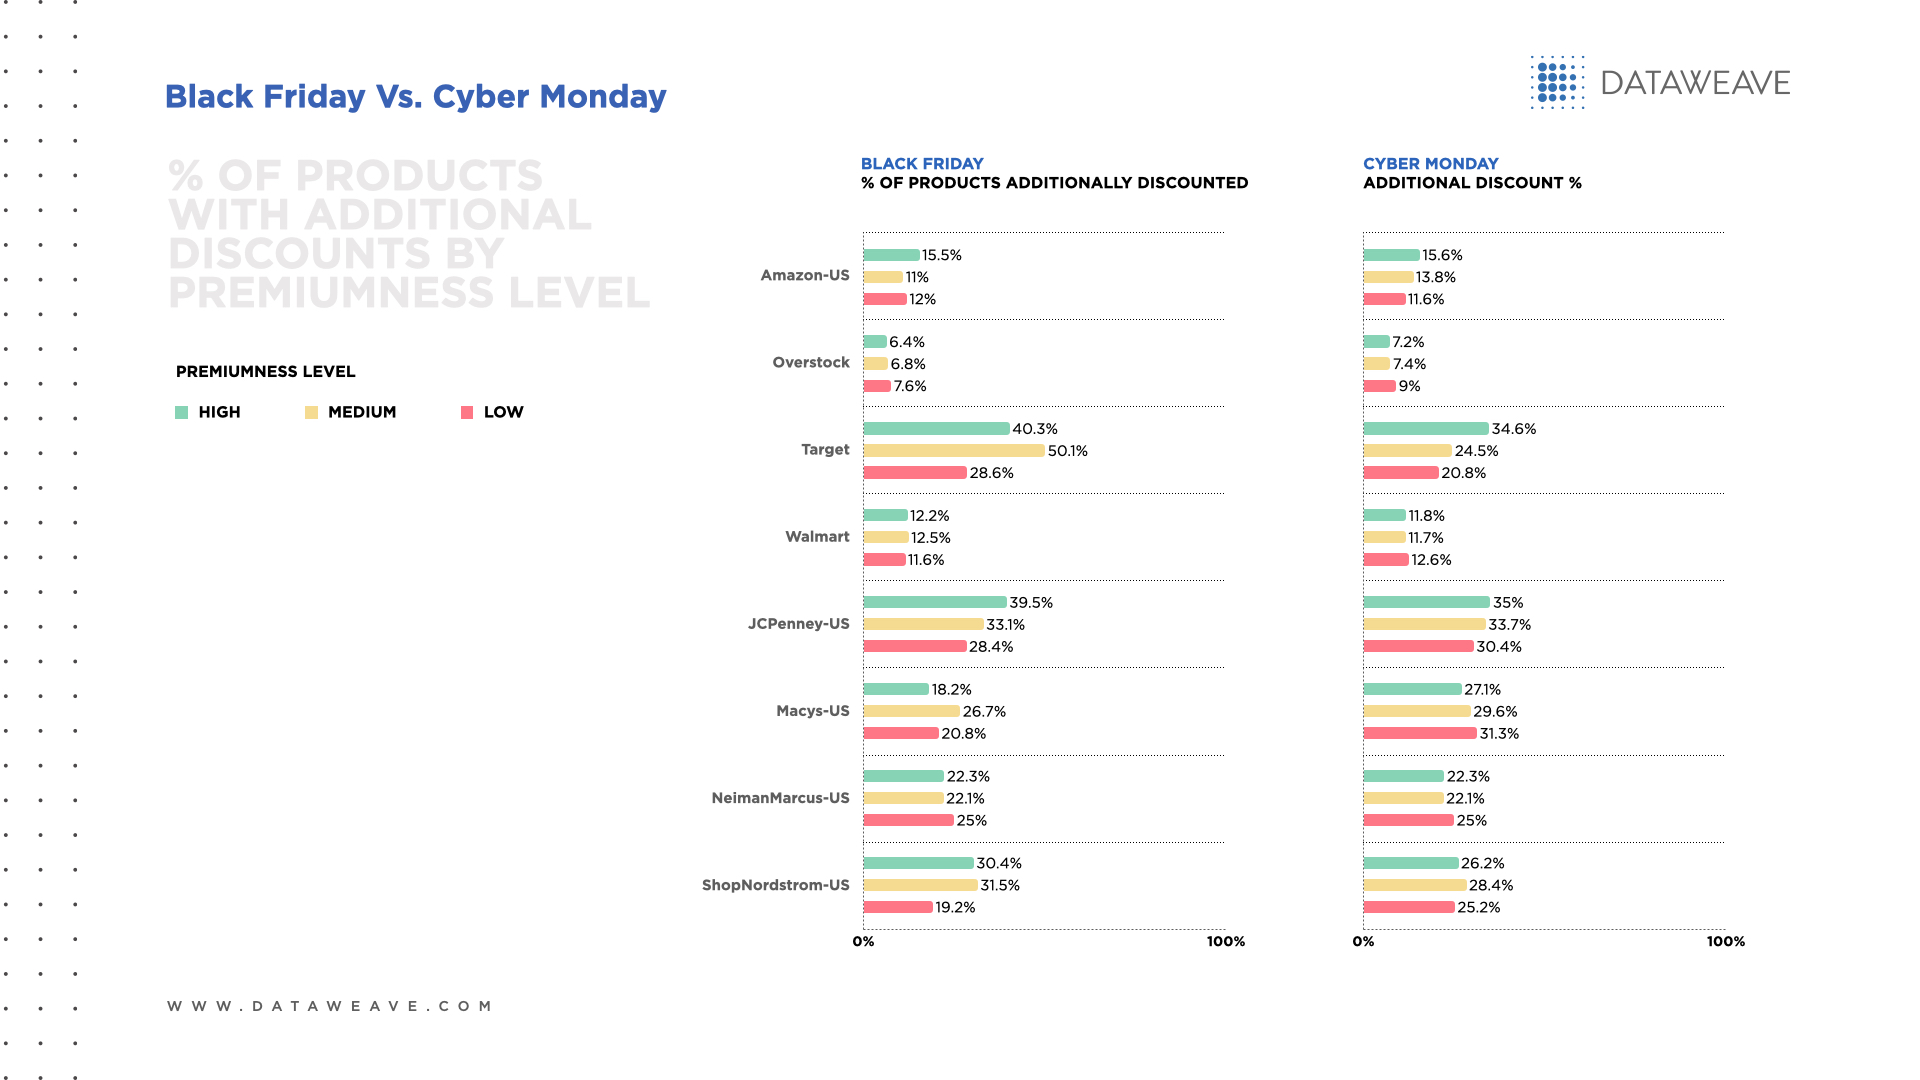
Check out our analysis on Black Friday 2025 Pricing and Discount trends in the USA, Canada, UK, and Germany. Follow our blog for more insights on retail pricing trends, brand visibility analysis, and data-driven commerce intelligence.