Tag: Retailers

  • Why Strategic Competitive Insights Are Key to Optimizing Your Product Assortment

    Why Strategic Competitive Insights Are Key to Optimizing Your Product Assortment

    For retailers, the breadth and relevance of their product assortment are critical for success. Amid a crowded market filled with countless products clamoring for consumer attention, retailers must find innovative ways to distinguish themselves. While pricing undeniably impacts purchasing decisions, the diversity and distinctiveness of a retailer’s product range can provide a crucial competitive advantage.

    Creating an attractive and profitable assortment that resonates with your target audience requires more than intuition; it demands deep insights into both your own and your competitors’ offerings. A well-curated assortment aligned with current trends can drive higher conversions and foster customer loyalty. However, achieving this perfect balance is a formidable challenge without the right insights.

    This is where a data-driven strategy becomes essential, enabling you to curate a product mix that captivates and converts.

    However, retailers often encounter significant challenges when attempting to strategically plan their assortments:

    • Limited Competitive Insights: Gaining a clear understanding of your competitors’ assortment strengths and weaknesses across various categories is challenging. Without this visibility, it’s difficult to know where you have an edge or where you might be falling behind.
    • Tracking Demand Patterns: Identifying top-sellers and monitoring shifts in consumer demand can be a struggle. Without the ability to easily detect trends or changes in demand, you risk missing opportunities to stock trending items.

    Attempting to navigate these challenges manually is not only arduous but also susceptible to substantial errors.

    How Assortment Analytics Solutions Help

    The ideal Assortment Analytics solution must offer a fact-based approach to:

    • Identify Strengths and Weaknesses: Understand how your assortment measures up against the competition.
    • Stay Trend-Responsive: Keep your product mix fresh and aligned with the latest consumer trends.
    • Boost Conversions: Create a relatively unique, customer-focused assortment that enhances conversions.

    Many retailers attempt to analyze competitor assortments using manual, in-house methods, which inevitably leads to significant blind spots:

    • Variations in product classifications and taxonomies across competitors make meaningful comparisons challenging.
    • Gathering complete and accurate data across a vast competitive landscape is difficult.
    • Inconsistent titles and descriptions hinder reliable product matching without AI assistance.
    • Capturing and comparing detailed product attributes efficiently is nearly impossible without advanced tools.

    To overcome these challenges, retailers need a scalable, accurate Assortment Analysis solution designed specifically for the complexities of modern retail needs.

    DataWeave’s Assortment Analytics Solution

    DataWeave addresses these challenges by providing retailers with a robust platform to gain actionable insights into their product assortments and the competitive landscape. Leveraging advanced analytics and AI-driven algorithms, Assortment Analytics empowers retailers to make informed assortment management decisions, optimize their product offerings, and stay competitive.

    Armed with our insights, retailers can lead with their strengths and stock unique and in-demand products in their assortment. Further, by recognizing the strengths in their product catalog, they can craft effective pricing strategies and optimize their logistics, creating a more competitive and appealing shopping experience for their customers. Here are a few capabilities of DataWeave’s solution:

    In-Depth Competitive Analysis Across Retailers

    The solution offers detailed competitive analysis, revealing insights into competitors’ assortments. It maps competitor products to a common taxonomy, making comparisons accurate and meaningful. Retailers can visualize assortments at granular levels like category, sub-category, and product type.

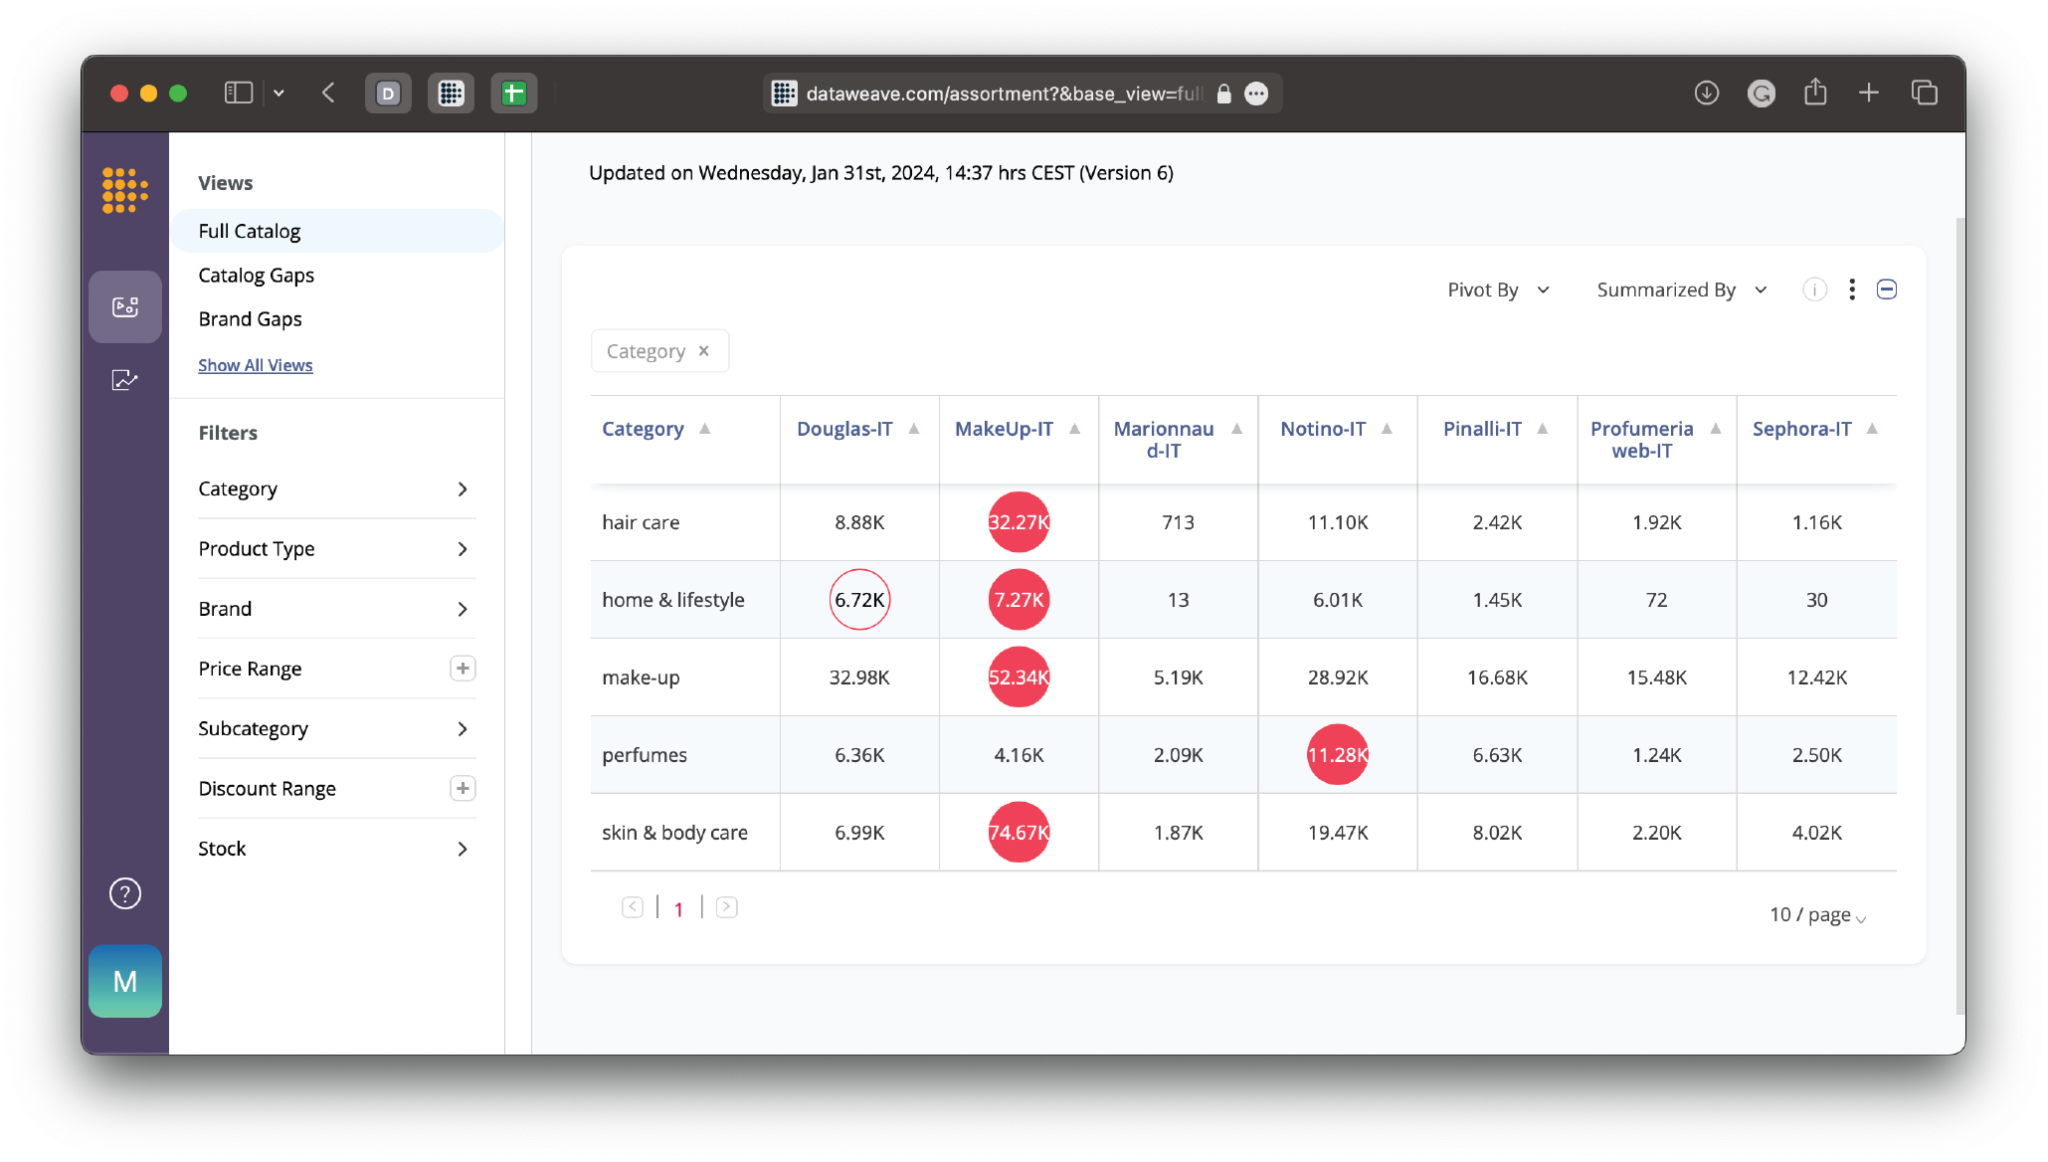
    The data for these insights is collected at configurable intervals, typically monthly or quarterly, and is consumed not only via dashboard summaries but also raw data files to enable in-depth analysis. Retailers have the flexibility to choose specific competitors, brands, products, and categories for tracking, allowing for a tailored and strategic approach to assortment optimization.

    Brand and Category Views to Assess Your Portfolio

    The solution provides a comprehensive evaluation of your product assortment through brand and category views. In brand views, your portfolio is assessed against competitors at the brand level, highlighting:

    • Newly Introduced Brands: Insights into recently introduced brands, revealing shifts in the brand landscape.
    • Absence or Limited Presence: Identification of brands lacking representation or with minimal presence compared to competitors, indicating areas for improvement.
    • Strong Presence and Exclusivity: Recognition of brands where you excel, including exclusive offerings, showcasing your competitive edge.

    Identifying Top-Selling Competitive Products To Boost Assortment Strategy

    Beyond just comparing assortment numbers, the DataWeave solution surfaces insights into which competitor products are actually performing well. It equips category and assortment managers with indicators that assess competitor products in terms of their popularity and shelf velocity.

    It analyzes metrics like pricing fluctuations, ratings, customer reviews, search rankings, and replenishment rates to pinpoint hot sellers you may want to stock. With these insights, merchandizing managers can pinpoint top-selling products among competitors, enabling informed decisions to enhance their assortment in comparison.

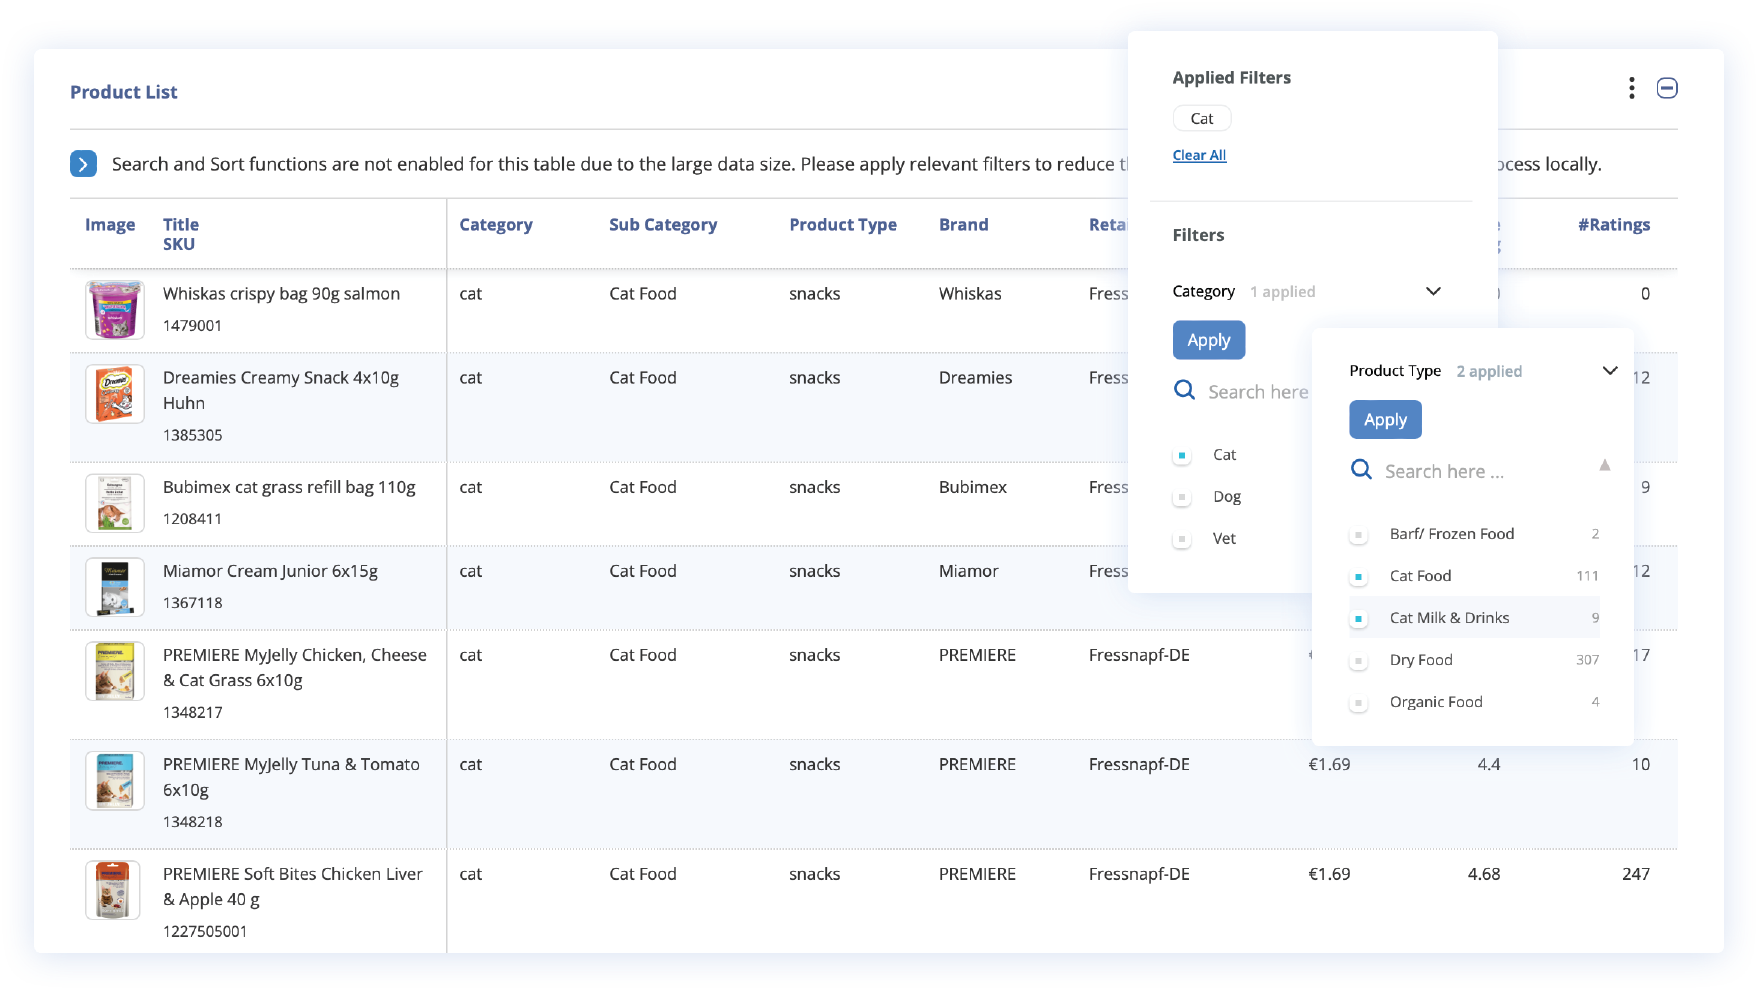
    Sophisticated Attribute Tagging and Analysis

    Using AI-powered attribute tagging, the solution simplifies granular product analysis within specific categories. An Apparel retailer, for instance, can filter the data to compare assortments based on attributes like material, pattern, color, etc.

    Retailers can select attributes relevant to their products and gain detailed insights. These custom filter attributes dynamically populate the panel, facilitating targeted data exploration. Category and merchandizing managers can delve into critical details swiftly, enabling strategic decision-making and comprehensive competitive analysis within their categories.

    You can capitalize on opportunities by stocking in-demand, on-trend items and address assortment gaps quickly. At the same time, you can double down on your strengths by enhancing your exclusive or top-performing product sets.

    In summary, DataWeave’s Assortment Analytics solution provides an invaluable competitive edge. The insights enable evidence-based decisions to attract more customers, encourage bigger baskets, and maximize the value of every assortment choice.

    To learn more, read our detailed product guide here or get on a exploratory call with one of our experts today!

  • Revolutionizing Fuel Pricing: How Fuel Retailers and Convenience Stores Can Gain a Winning Edge with DataWeave

    Revolutionizing Fuel Pricing: How Fuel Retailers and Convenience Stores Can Gain a Winning Edge with DataWeave

    Consider this scenario: A retailer establishes its fuel prices using pricing data that’s a few days old, only to subsequently discover that a nearby competitor is offering substantially lower prices. The result? Lost customers, decreased foot traffic, and diminished sales. This serves as a stark reality that retailers must confront and address today.

    In the fiercely competitive realm of retail, where every decision holds weight, maintaining a competitive edge is paramount. The fuel category, frequently underestimated, has the potential to significantly impact a retailer’s revenue stream. This challenge is not unique; retailers worldwide, particularly in North America, grapple with a common hurdle: mastering the intricate art of real-time fuel pricing.

    The Quest For Reliable, Real-Time Fuel Pricing Data

    For retailers, traditional methods for procuring and analyzing fuel price data have proven to be both expensive and error-prone, often relying on manual data collection or third-party data providers. These outdated approaches yield frustrating delays, inaccuracies, and missed opportunities. When it comes to obtaining timely fuel pricing intelligence, the majority of fuel retailers grapple with three central challenges:

    • Low Accuracy: Ensuring that fuel pricing information remains up-to-date, dependable, and actionable, even when sourced from complex web-based platforms.
    • Less Coverage: Acquiring comprehensive data that encompasses all of North America, spanning across retailers, convenience stores, fuel stations, and beyond.
    • High Cost: Effectively managing the substantial costs associated with acquiring and processing this vital information.

    DataWeave’s Fuel Pricing Intelligence Solution

    Comprehensive, accurate, and real-time fuel pricing intelligence can play a huge role in the profitability of retailers throughout North America. DataWeave takes the forefront in delivering this transformative Data-as-a-Service (DaaS) solution to some of the most prominent retailers in the region, including the top 20 fuel retail behemoths.

    With a rich and extensive history spanning over a decade in the realm of competitive intelligence, DataWeave boasts an impressive track record of empowering well-informed decision-making in retail. We leverage state-of-the-art technology to bring an unparalleled level of accuracy, timeliness, and coverage to fuel pricing intelligence.

    The following are some compelling advantages offered by our solution:

    Accurate and Real-Time First Party Data

    We deliver retailers an unparalleled advantage through real-time, first-party fuel price data. Our data originates directly from the retailer’s own channels, encompassing websites and mobile apps, rendering it the industry’s foremost and most reliable source.

    Imagine having access to fuel pricing information that updates as frequently as every 30 minutes. This rapid update cadence guarantees that you, as a retailer, constantly possess the latest pricing insights at your fingertips, empowering you to respond swiftly to market fluctuations and competitor manoeuvres. Our comprehensive data spans a wide spectrum of fuel types, including:

    • Gasoline: Be it regular, mid-grade, super, premium, ethanol-free, ethanol blends, methanol blends, or reformulated gasoline, we have got you covered.
    • Diesel: Our data encompasses biodiesel, biodiesel off-road, biodiesel blends, biodiesel ultra-low sulfur (ULS), diesel ultra-low sulfur (ULS), diesel off-road, standard diesel, and premium diesel.

    Armed with our real-time, first-party data, you can make pricing decisions with unwavering confidence, secure in the knowledge that you possess access to the most current, authoritative, and extensive fuel pricing intelligence in North America.

    The data points we capture directly from relevant web sources include: gas station postal code, store name and code, location, city, state, ZIP code, fuel type, competitor name, regular price, member price (if available), time and date of data capture, and more.

    Click here if you wish to access a sample report of our fuel pricing data.

    Unrivaled Geographical Coverage

    Our extensive coverage of fuel data spans over 30,000 ZIP codes and encompasses the top 100 retailers across the western, mid-western, and eastern regions of the United States.

    Retailers benefit from the flexibility to configure and tailor the solution to their precise needs, whether it involves adding more locations or selectively acquiring specific segments of the data. This far-reaching coverage guarantees that retailers, whether situated in bustling urban centers or remote areas, can readily access the essential data required to maintain their competitive edge.

    Moreover, if you currently source your fuel pricing data from alternative providers, our solution seamlessly integrates, amplifies, and complements your existing array of data sources, ensuring a harmonious and unified approach to data acquisition.

    Optimization of Dynamic Pricing Strategies

    In the world of retail, the importance of timing cannot be overstated. Even a mere difference of a few cents can translate into millions of dollars in revenue impact. With DataWeave, retailers gain the capability to make data-driven decisions that provide them with a competitive edge around the clock, every single day.

    Our platform empowers you to unearth margin gaps by pinpointing opportunities to raise prices while maintaining your competitive pricing position. It also identifies instances where you may be substantially overpriced, prompting necessary price adjustments to ensure competitiveness within the market. All these valuable insights are available at a hyperlocal level, facilitating pricing efficiency and optimization across your various regions of coverage. Equipped with this real-time data, you can swiftly adapt to ever-changing market conditions.

    Furthermore, our comprehensive competitive data seamlessly integrates into your existing pricing systems through APIs, facilitating quick and informed pricing actions based on robust data.

    Reliable and Customer-First Tech Platform

    Our platform boasts a remarkable level of sophistication when it comes to data aggregation, normalization, visualization, and integration capabilities. It stands as a massively scalable system with the capacity to aggregate billions of data points daily, spanning thousands of web sources. This includes the intricate handling of sources like mobile apps and websites known for frequently altering their site structures, among others.

    What truly sets us apart is our proficiency in addressing these challenges through a blend of human expertise and large-scale machine learning. Additionally, our commitment to delivering unmatched service extends to round-the-clock, 24/7 support. This comprehensive approach makes our fuel pricing intelligence solution not only effective but also cost-efficient in meeting your fuel data requirements.

    We also provide a variety of options for you to consume our data, which includes receiving our reports via email, SFTP, S3 buckets, data lakes like Snowflake, and APIs.

    Enhance your Fuel Pricing Strategies with DataWeave

    In the ever-competitive world of retail, staying ahead is not just a goal; it’s a necessity. The fuel pricing landscape, often overlooked, holds immense power to impact a retailer’s profitability. DataWeave’s real-time, comprehensive, and accurate fuel pricing intelligence solution is the key to securing this advantage. Retailers and convenience stores now have a powerful platform at their disposal, offering unparalleled precision, comprehensive coverage, and the agility needed to navigate this landscape.

    Join the ranks of industry leaders who have already harnessed the potential of DataWeave. Reach out to us today to redefine your approach to fuel pricing and propel your business to new heights!

  • Are Your Digital Shelves Prepared for Green Monday?

    Are Your Digital Shelves Prepared for Green Monday?

    Traditionally, retailers have staged multiple promotions between Black Friday and before Christmas Day to keep consumers excited about holiday shopping, so it’s easy to see why one more promotional day might fall into relative obscurity. As if ‘Early Start’ offers to Black Friday and extended ‘Cyber Weekend’ promotions weren’t enough to plan for, eBay added another day into the mix called ‘Green Monday’, much to the benefit of consumers, as it furthers the window of opportunity to secure a bargain during the holiday season. 

    Green Monday falls on the second Monday of December and has historically been one of the greatest sales days of the year for eBay, often attracting last-minute shoppers or those searching for last-minute deals. However, because of the 2021 Global Shipping Crisis, there is speculation that Green Monday may be the last chance this year to have items delivered in time for Christmas. For this reason, we believe it could turn into quite a fruitful event for participating retailers if it encourages procrastinating shoppers that traditionally spend closer to December 25th to buy earlier in the season.

    This isn’t the first year retailers outside of eBay have offered Green Monday promotions, however. Our team has been actively monitoring activity on this day from 2017 through present, to not only assess which retailers participate in the event, but also to understand how the discounts may change surrounding the event. The categories monitored include Apparel (Clothing, Shoes & Jewelry), Bed and Bath, and Home and Garden, and we’ve identified products offered on discount by comparing each applicable product’s price on Green Monday versus the most commonly seen price for the product offered throughout the month of December.

    Better Promotions Than Boxing Day

    Taking a closer look at 2020 Green Monday discounts within the categories and retailers analyzed, apart from Wayfair.com, we see all offered more SKUs on discount on Green Monday versus the days leading up to and out of the event. Kohls.com led the pack with around 93% of SKUs offered on discount, followed by Macys.com with 95%, and Wayfair.com with 83%. Overall, the number of SKUs on discount on Green Monday were greater than the SKUs offered on discount on Boxing Day, which is traditionally known as a great day to bargain shop.

    Source: DataWeave Commerce Intelligence – Promotional Insights tracking Apparel, Bed & Bath, and Home & Garden category product’s online price on Green Monday 2020 in the US versus regular prices for the same products in the month of December each year.

    What’s in Store for Green Monday 2021?

    The insights we’ve tracked over the last four years have not indicated any signs to an end for Green Monday any time soon. As we see it, for consumers it is an extremely convenient time to order holiday gifts, and for retailers it is a good time to build brand trust and loyalty by fulfilling last minute orders at a great value, in time for the holidays.

    Our prediction for the categories analyzed is to expect to see more retailers participate in Green Monday 2021 to a greater degree (more SKUs on sale and enhanced promotions). For retailers in this analysis, we would anticipate HomeDepot.com to enhance the number of offers to match 2020 competitive activity, and for Wayfair.com to look at increasing the number of offers on Green Monday versus the period leading into the event.

    If you are interested in learning more about the details behind this analysis or our Promotional Insights solution, be sure to contact us. We can help you evaluate the effectiveness of your holiday promotional spend with access to near real-time marketplace insights on the brands, categories, and products your rivals promote, including discounts, campaign frequency and duration and more.

  • How Brands Boost Sales & Satisfaction on Walmart.com

    How Brands Boost Sales & Satisfaction on Walmart.com

    The explosive growth of online shopping has forced brands to re-examine their e-commerce processes to stay competitive and profitable. In particular, out-of-stocks are a common, costly retail challenge, as product shortages frustrate online shoppers – and even prompt them to leave brands.

    According to McKinsey & Company, forty-eight percent of consumers switched to a different brand in 2020 because those products were in stock. Among these consumers, seventy-three percent plan to keep using the new brands, linking product availability gaps to the erosion of sales and loyalty. Conversely, brands with effective inventory planning and replenishment can keep items in stock, drive sales and improve the customer experience.

    Retailers like Walmart, collaborating with these brands to meet customer demand, are still facing inventory challenges but, as noted in 2021 Q3 earnings, inventory was up almost twelve percent year-over-year as they worked to stay ahead of increased holiday demand. They have also adjusted in-store operations to accommodate ever-growing e-commerce demands, especially within grocery-centric categories, as digital grocery buyers now amount to more than half the U.S. population.

    Maximizing Conversions with Category Insights

    Walmart’s dot-com strategy is paying off in spades, considering they surpassed Amazon as the leading U.S. grocery e-commerce retailer in 2020 and grew another forty-one percent in Q3, 2021. Our team has been actively tracking digital shelf analytic KPIs on Walmart.com to identify inventory and promotional performance improvement opportunities at a category level to support brands in capitalizing on these digital growth opportunities.

    The latest analysis is summarized below, reviewing average category availability and discount trends occurring each week of the month, from May to August 2021, at a category level. A recent report found the 29th of each month to be the busiest day for online sales because consumers often get paid at the end of the month, which made DataWeave analysts wonder:

    • Which categories are maximizing their growth potential on Walmart.com and where are the greatest opportunities for improvement during periods of increased demand?
    • How do increased demand periods (like payday) impact category online availability?
    • Are category promotions offered at the right times throughout the month to best support demand?

    When Seasonal Demand for Groceries and Payday Merge

    Across all Walmart.com food categories tracked, Week 5 – where payday commonly falls for most consumers, had the lowest average product availability, while Week 4 had the highest average product availability for all categories except Deli and Fruits and Vegetables. These findings may inspire Walmart’s brand partners to rethink their inventory and assortment planning, replenishment and even pricing efforts to maintain a healthy stock closer toward the end of the month to match higher demand.

    The categories with the greatest difference in average availability during Week 5 versus the rest of the month were Snacks & Candy, Beverages and Alcohol, indicating consumers consistently made these types of purchases closest to payday, when income was highest throughout the month. Seasonality is a secondary factor that influenced demand for these items given events like Memorial Day, Fourth of July, Summer Break, and Back-to-School shopping all took place during our analysis. Additionally, most holidays overlapped payday, which also furthered Week 5 demand.

    Source: DataWeave Digital Shelf Analytics for Brands – Category average availability percentages from May to August 2021 between Week 1 (the 1st to the 7th day of the month) and Week 5 (the 29th, 30th and 31st day of the month).

    Coupling availability with discounts allows us to consider whether consumers buy more in Week 5 due to high discounts or increased purchasing power, or both. In reviewing the average category discounts offered within the same grocery-centric categories analyzed above, we found almost every grocery category showed a higher discount in Week 5 compared to the rest of the month, except for Bread & Bakery and Alcohol.

    Source: DataWeave Digital Shelf Analytics for Brands – Category average discount percentages from May to August 2021 between Week 1 (the 1st to the 7th day of the month) and Week 5 (the 29th, 30th and 31st day of the month).

    Regarding Alcohol, during Week 4, when average availability was the highest, the average discounts offered were the lowest. This can indicate inventory was primed for payday shoppers (and the holidays of course). Bread & Bakery offers the greatest average discounts when inventory levels are lowest on average, indicating Week 3 is a great time to stock up, while Week 4 might be a great time to buy the freshest inventory.

    The greatest average discounts in Week 5 were in Snacks & Candy, Pantry and Fruits & Vegetables. Deeper discounts for Snacks & Candy in Week 5 may have helped brands compete for consumers’ disposable income despite being a discretionary category. Pantry brands’ discounts may have reflected a need to compete for shoppers’ attention. During this period, consumers were out of the house more and less likely to use these grocery staples compared to earlier lockdown periods and cooler months.

    Making Specialty Categories and Health a Priority for Online Shoppers

    Interestingly, the only two categories where inventory was higher in Week 5 versus all other weeks each month were ‘Special Diets’ foods and ‘Summer Flavors’, although ‘Special Diets’ foods consistently maintained the lowest level of average availability each week across all food categories analyzed. This consistent lack of inventory could indicate a great opportunity for brands to increase inventory for dietary products sold on Walmart.com.

    Source: DataWeave Digital Shelf Analytics for Brands – Category average availability percentages from May to August 2021 between Week 1 (the 1st to the 7th day of the month) and Week 5 (the 29th, 30th and 31st day of the month).

    The average availability for ‘Summer Flavors’ foods verifies brands are maintaining a solid replenishment strategy for these seasonal items, and a high likelihood consumers will happily find what they need to plan their Summer gatherings on Walmart.com. One alarming factor we found was the change in average discounts offered during Week 5 versus Weeks 1 through 4, indicating promotions surrounding payday may be driving sales volume versus organic demand.

    Source: DataWeave Digital Shelf Analytics for Brands – Category average discount percentages from May to August 2021 between Week 1 (the 1st to the 7th day of the month) and Week 5 (the 29th, 30th and 31st day of the month).

    Digital Growth Opportunity in Meal Kits and Kids’ Meals

    Two categories primed for growth, according to Statista, are meal kits and kids’ food and beverages. Their research indicates retail sales for kids’ food has grown steadily year-over-year since 2013, and a recent report also indicates meal kit sales are expected to more than double 2017 sales in 2022, reaching $11.6 billion in the U.S., spurred by pandemic-induced demand. A concerning find in our research indicates both categories, ‘Easy Meal Solutions’ and ‘Kid Friendly Foods’ on Walmart.com, showed great volatility when it comes to in-stock availability. For example, in Week 1, ‘Easy Meal Solutions’ had an average availability nearly half the average of the rest of the month (around nineteen percent versus nearly thirty-eight percent), and in Week 5, payday week, ‘Kid Friendly Foods’ saw the biggest drop in average availability compared to Weeks 1 through 4 (over sixty-seven percent versus seventy-five percent) indicating supply may not be keeping up with the heightened demand.

    Source: DataWeave Digital Shelf Analytics for Brands – Category average availability percentages from May to August 2021 between Week 1 (the 1st to the 7th day of the month) and Week 5 (the 29th, 30th and 31st day of the month).

    The heightened average discounts offered during Week 5 for ‘Baby’ and ‘Pets’ items indicate two categories consumers will most likely stock up on during payday.

    Source: DataWeave Digital Shelf Analytics for Brands – Category average discount percentages from May to August 2021 between Week 1 (the 1st to the 7th day of the month) and Week 5 (the 29th, 30th and 31st day of the month).

    Back to School Stock-Outs

    U.S. retail sales unexpectedly increased in August, likely boosted by back-to-school shopping and child tax credit payments. Meanwhile, product shortages and other supply chain issues slowed 2021’s back-to-school sales, possibly affecting school supplies’ and clothing availability on Walmart.com. According to our analysis, the average product availability in Walmart.com’s school supplies category fell from over sixty-two percent during Weeks 1 through 4 to nearly forty-two percent in Week 5.

    Warmer weather, seasonal events, reduced lockdowns, and vaccination efforts led more Americans to resume in-person socializing, giving reason to update their spring and summer wardrobes. In July, Forbes shared that three-quarters of shoppers are purchasing apparel, accessories and shoes the most. On average, only around sixty-three percent of clothing items were available on Walmart.com during Weeks 1 through 4. However, in Week 5, that figure plummeted to just over thirty-eight percent, the most significant drop among all categories.

    Source: DataWeave Digital Shelf Analytics for Brands – Category average availability percentages from May to August 2021 between Week 1 (the 1st to the 7th day of the month) and Week 5 (the 29th, 30th and 31st day of the month).

    Demand for new fashion remained high throughout this period, seemingly fueled organically, as only moderate additional discounts took place in Week 5, and although the average discount on school supplies was only around twenty-seven percent during Weeks 1 through 4, it surged to just over forty-seven percent in Week 5. Generous additional discounts in Week 5 may have inspired online shoppers to shift spending from clothing to school supplies in late July and August ahead of students’ return to the classroom.

    Source: DataWeave Digital Shelf Analytics for Brands – Category average discount percentages from May to August 2021 between Week 1 (the 1st to the 7th day of the month) and Week 5 (the 29th, 30th and 31st day of the month).

    Prioritizing Product Availability with Digital Advertising Strategies

    Seventy-eight percent of B2C marketers increased their 2021 digital advertising spend to fuel online product discoverability (Share of Search), and sales and market share, but out-of-stock experiences simultaneously surged 172% this year from pre-pandemic levels. Paying for ads that drive traffic to your out-of-stock products can be as detrimental to your brand as a bad user experience. Our review of the ‘Featured Products’ sold on Walmart.com show consistent, low-levels of product availability each week throughout the months reviewed.

    Source: DataWeave Digital Shelf Analytics for Brands – Category average availability percentages from May to August 2021 between Week 1 (the 1st to the 7th day of the month) and Week 5 (the 29th, 30th and 31st day of the month).

    Additionally, the average discount offered on these products tended to be higher than most other categories reviewed, indicating brands participating in the featured product section of the website were not only investing in digital ads, but also doubling down with promotional activity as well.

    Source: DataWeave Digital Shelf Analytics for Brands – Category average discount percentages from May to August 2021 between Week 1 (the 1st to the 7th day of the month) and Week 5 (the 29th, 30th and 31st day of the month).

    How Brands can Replenish Their Digital Shelf

    It is well known just how important it is to have products available during the right time of day, week, month, or season to improve customer satisfaction rates, but with your e-commerce store open 24/7 and omnichannel fulfillment strategies in place, it drastically changes the way in which strategic execution is prioritized for a retailer to reduce basket abandonment and for brands to build loyalty.

    Our greatest takeaway from this analysis is realizing how crucial it is for brands to proactively track product availability and competitive pricing insights to stay ahead of the curve and achieve their digital growth goals. Early visibility to stock replenishment could help brands align with heightened cyclical and seasonal demand to avoid out-of-stocks and grow e-commerce sales.

    This is why more leading brands now rely on our Digital Shelf Analytics solutions, including Pricing and Availability insights, to keep eCommerce planning agile, to maximize online conversions, and ultimately maintain shopper satisfaction and loyalty.

  • How Brands Can Outperform Rivals With Next-Gen Digital Shelf Analytics

    How Brands Can Outperform Rivals With Next-Gen Digital Shelf Analytics

    As eCommerce grows in complexity, brands need new ways to grow sales and market share. Right now, brands face urgent market pressures like out-of-stocks, an influx of new competition and rising inflation, all of which erode profitability. As online marketplaces mature, more brands need to make daily changes to their digital marketing strategies in response to these market pressures, shifts in demand, and competitive trends.

    eMarketer forecasts 2021 U.S. eCommerce will rise nearly 18% year-over-year (vs. 6.3% for brick-and-mortar), led by apparel and accessories, furniture, food and beverage, and health and personal care. The eCommerce industry is also undergoing fundamental changes with newer entities emerging and traditional business models evolving to adapt to the changed environment. For example, sales for delivery intermediaries such as Doordash, Instacart, Shipt, and Uber have gone from $8.8 billion in 2019 to an estimated $35.3 billion by the end of 2021. Similarly, many brands have established or are building out a Direct to Consumer (D2C) model so they can fully own and control their customer’s experiences.

    In response, DataWeave has launched the next generation of our Digital Shelf Analytics suite to help brands across retail categories directly address today’s costly market risks to drive eCommerce growth and gain a competitive advantage.

    Our new enhancements help brands improve online search rank visibility and quantify the impact of digital investments – especially in time for the busy holiday season.”  
    ~ Karthik Bettadapura, CEO and co-founder, DataWeave

    The latest product enhancements provide brands access to tailored dashboard views that track KPI achievements and trigger actionable alerts to improve online search rank visibility, protect product availability and optimize share of search 24/7. Dataweave’s Digital Shelf Analytics platform works seamlessly across all forms of eCommerce platforms and models – marketplaces, D2C websites and delivery intermediaries.

    Dashboard for Multiple Functions

    While all brands share a common objective of increasing sales and market share, their internal teams are often challenged to communicate and collaborate, given differing needs for competitive and performance data across varying job functions. As a result, teams face pressure to quickly grasp market trends and identify what’s holding their brands back.

    In response, DataWeave now offers executive-level and customized scorecard views, tailored to each user’s job function, with the ability to measure and assess marketplace changes across a growing list of online retail channels for metrics that matter most to each user. This enhancement enables data democratization and internal alignment to support goal achievement, such as boosting share of category and content effectiveness. The KPIs show aggregated trends, plus granular reasons that help to explain why and where brands can improve.

    Brands gain versatile insights serving users from executives to analysts and brand and customer managers.

    Prioritized, Actionable Insights

    As brands digitize more of their eCommerce and digital marketing processes, they accumulate an abundance of data to analyze to uncover actionable insights. This deluge of data makes it a challenge for brands to know exactly where to begin, create a strategy and determine the right KPIs to set to measure goal accomplishment.

    DataWeave’s Digital Shelf Analytics tool enables brands to effectively build a competitive online growth strategy. To boost online discoverability (Share of Search), brands can define their own product taxonomies across billions of data points aggregated across thousands of retailer websites. They can also create customized KPIs that track progress toward goal accomplishment, with the added capability of seeing recommended courses of action to take via email alerts when brands need to adjust their eCommerce plans for agility.

    “Brands need an integrated view of how to improve their discoverability
    and share of search by considering all touchpoints in the digital commerce ecosystem.”

    ~ Karthik Bettadapura, CEO and co-founder, DataWeave

    Of vital importance, amid today’s global supply chain challenges, brands gain detailed analysis on product inventory and availability, as well as specific insights and alerts that prompt them to solve out-of-stocks faster, which Deloitte reports is a growing concern of consumers (75% are worried about out-of-stocks) this holiday season.

    User and system generated alerts provide clarity to actionable steps to improving eCommerce effectiveness.
    You also have visibility to store-level product availability, and are alerted to recurring out-of-stock experiences.

    Scalable Insights – From Bird’s Eye to Granular Views

    DataWeave’s Digital Shelf Analytics allows brands to achieve data accuracy at scale, including reliable insights from a top-down and bottom-up perspective. For example, you can see a granular view of one SKUs product content alongside availability, or you can monitor a group of SKUs, say your best selling ones, at a higher level view with the ability to drill down into more detail.

    Brands can access flexible insights, ranging from strategic overviews to finer details explaining performance results.

    Many brands struggle with an inability to scale from a hyper-local eCommerce strategy to a global strategy. Most tools available on the market solve for one or the other, addressing opportunities at either a store-level basis or top-down basis – but not both.

    According to research by Boston Consulting Group and Google, advanced analytics and AI can drive more than 10% of sales growth for consumer packaged goods (CPG) companies, of which 5% comes directly from marketing. With DataWeave’s advanced analytics, AI and scalable insights, brands can set and follow global strategies while executing changes at a hyper-local level, using root-cause analysis to drill deeper into problems to find out why they are occurring.

    As more brands embrace eCommerce and many retailers localize their online assortment strategies, the need for analytical flexibility and granular visibility to insights becomes increasingly important. Google reports that search terms “near me” and “where to buy” have increased by more than 200% among mobile users in the last few years, as consumers seek to buy online locally.

    e-Retailers are now fine-tuning merchandising and promotional strategies at a hyper-local level based on differences seen in consumer’s localized search preferences, and DataWeave’s Digital Shelf Analytics solution provides brands visibility to retailer execution changes in near real-time.

    Competitive Benchmarking

    Brand leaders cannot make sound decisions without considering external factors in the competitive landscape, including rival brands’ pricing, promotion, content, availability, ratings and reviews, and retailer assortment. Dataweave’s Digital Shelf Analytics solution allows you to monitor share of search, search rankings and compare content (assessing attributes like number of images, presence of video, image resolution, etc.) across all competitors, which helps brands make more informed marketing decisions.

    Brands are also provided visibility into competitive insights at a granular level, allowing them to make actionable changes to their strategies to stay ahead of competitors’ moves. A new module called ‘Sales and Share’ now enables brands to benchmark sales performance alongside rivals’ and measure market share changes over time to evaluate and improve competitive positioning.

    Monitor competitive activity, spot emerging threats and immediately see how your performance compares to all rivals’, targeting ways to outmaneuver the competition.

    Sales & Market Share Estimates Correlated with Digital Shelf KPIs

    In a brick-and-mortar world, brands often use point of sale (POS) based measurement solutions from third party providers, such as Nielsen, to estimate market share. In the digital world, it is extremely difficult to get such estimates given the number of ways online orders are fulfilled by retailers and obtained by consumers. Dataweave’s Digital Shelf Analytics solution now provides sales and market share estimates via customer defined taxonomy, for large retailers like Amazon. Competitive sales and market share estimates can also be obtained at a SKU level so brands can easily benchmark their performance results.

    Additionally, sales and market share data can also be correlated with digital shelf KPIs. This gives an easy way for brands to check the effect of changes made to attributes, such as content and/or product availability, and how the changes impact sales and market share. Similarly, brands can see how modified search efforts, both organic and sponsored, correspond to changes in sales and market share estimates.

    Take Your Digital Shelf Growth to the Next Level

    The importance of accessing flexible, actionable insights and responding in real-time is growing exponentially as online is poised to account for an increasing proportion of brands’ total sales. With 24/7 digital shelf accessibility among consumers comes 24/7 visibility and the responsibility for brands to address sales and digital marketing opportunities in real-time to attract and serve online shoppers around the clock.

    Brands are turning to data analytics to address these new business opportunities, enhance customer satisfaction and loyalty, drive growth and gain a competitive advantage. Companies that adopt data-driven marketing strategies are six times more likely to be profitable year-over-year, and DataWeave is here to help your organization adopt these practices. To capitalize on the global online shopping boom, brands must invest in a digital shelf analytics solution now to effectively build their growth strategies and track measurable KPIs.

    DataWeave’s next-gen Digital Shelf Analytics enhancements now further a brand’s ability to monitor, analyze, and determine systems that enable faster and smarter decision-making and sales performance optimization. The results delight consumers by helping them find products they’re searching for, which boosts brand trust.

    Connect with us to learn how we can scale with your brand’s analytical needs. No project or region is too big or small, and we can start where you want and scale up to help you stay agile and competitive.

  • Online Halloween Shopping Is Here to Stay – Winning Share of Search

    Online Halloween Shopping Is Here to Stay – Winning Share of Search

    Lessons from Kroger, Albertson’s, and Safeway’s Optimized Online Positioning   

    As consumers continue their migration to online shopping through and after the pandemic, Halloween shopping is no exception. 

    If that’s the new paradigm, what clues should retailers and brands be looking for to enhance their sales? With Halloween around the corner, the analyst team at DataWeave wanted to see how successfully grocers are partnering with brands to prepare for the influx of online Halloween shoppers. We tracked insights from September 14 to 24, 2021, using data from Kroger, Albertson’s, and Safeway websites to understand the preparedness of each retailer, their partnered brands, and how their online strategies compare with one another.

    There are hundreds of ways for a consumer to search for a brand’s products online and of critical importance, almost 50 percent of traffic across the top 1000 retailers come through search. At the same time, consumers are becoming less brand conscious. This is a significant development, and there are significant ramifications to consumers searching for products using generic category specific keywords without including brand names in the search.  Consequently, we can’t sufficiently stress how understanding online channel experiences is critical to successful outcomes. Retailers and brands alike need an integrated view of how to improve their discoverability and share of search by considering all touchpoints in the digital commerce ecosystem.

    The Importance of Product Descriptions, Assortment, Sizes, Price Points

    With 75 percent of people never scrolling past the first page of a website when searching for the goods they desire, getting products to page one is imperative to a brand’s success. While in-store, festive displays will help drive traffic and availability awareness, the ‘digital shelf’ is a totally different locus of opportunity. Here, brands rely on proper product descriptions, the right assortment, sizes, and competitive price points to stand out among the crowd and modify their positioning, given each retailer’s consumer base and assorted competitive brands.

    Optimizing the Digital Shelf and leading Share of Search for page one across all retail websites isn’t achievable overnight, but it is never too early or too late to start, given the 24/7 visibility your products have online. When it comes to Halloween candies, confectionery brands must consider many factors when differentiating their online positioning, such as finding the ‘sweet spot’ for pricing, size, and variety within each product offered, and knowing the right and wrong times to drive promotions. Additional elements to consider when introducing seasonal candies include cannibalization of non-holiday inventory, which can increase spoilage for aged inventory, or if holiday items are successful, could cause an abundance of markdown items to be sold before replacement inventory can be ordered.

    To better understand what retailers are doing—or should be doing—to optimize their Halloween holiday sales, we turned to our DataWeave Digital Shelf Analytics data to answer these questions:

    • Which brands and products are dominating “Share of Search” page one results across all three retailer websites?
    • How do discounts and promotions vary among candy brands and retailers?
    • How does each retailer use Halloween-specific and ‘variety’ labeling within the product descriptor to differentiate their holiday season assortment?
    • What sizes of candy packages is each retailer offering, and how does this play out in online positioning?

    Winning Candy Brands

    Which Halloween candies are people searching for—and presumably buying? Our data shows that Hershey’s branded candies achieved the greatest page one ‘Share of Search’ results across all three retailers’ websites—Albertson’s, Kroger and Safeway. This was unsurprising, given their total SKU count as well as the brand loyalty Hershey’s steadily maintains throughout the year. There is a high likelihood of consumers buying what they see on page one, so in our analysis, Hershey’s has the best chance of ‘winning’ this holiday season within all three of these retail channels. 

    That said, looking more specifically at how candy items are labeled and bundled adds another layer of insight to how candy brands are performing at each of these retailers.

    Historically speaking, Snickers is almost always within the top five confectionery brands sold during the Halloween season, but with the migration of more consumers shopping online, Mars may be leaving opportunity on the table this year. Our data shows that Snickers had the lowest Share of Search percentage on page one results on Safeway.com and Albertson’s.com for brands carrying 8 or more SKUs each, indicating they will most likely not make the first page results—and therefore may end up as a clearance item after Halloween if relying on online promotional efforts to achieve sales goals.

    Source: DataWeave’s Digital Shelf Analytics Solution: Data aggregated from 9/14/21-9/24/21 for Albertson’s.com and Kroger.com, and 9/17-9/24 for Safeway.com; Analysis was conducted reviewing product information for items falling within the ‘Halloween Candy’ listing category

    What Size Candy Packages Are Retailers Carrying/Betting On?

    For example, Albertsons.com and Safeway.com’s assortment includes 124 SKUs and 108 SKUs respectively with most of those items falling within the 5 to 16-ounce (averaging 25 percent) and 32 to 64-ounce (averaging 29 percent) sizes, Kroger.com is betting on a ‘smaller is better’ strategy, with a majority (63 percent) of their candies sold in the 5 to 16-ounce package size. 

    The average Hershey candies available through all three retailers happen to be much greater in size and price point, on average, than other top ranked items, and while these larger items appear to mostly be variety packs, a majority are not labeled as ‘Halloween’ candy.

    Source: DataWeave’s Digital Shelf Analytics Solution: Data aggregated from 9/14/21-9/24/21 for Albertson’s.com and Kroger.com, and 9/17-9/24 for Safeway.com; Analysis was conducted reviewing product information for items falling within the ‘Halloween Candy’ listing category

    How Important Is Halloween-Specific Branding?

    Our data shows that Kroger.com included the name ‘Halloween’ within the product description for most (around 80 percent) of the candies sized 16 ounces or smaller, and overall have labeled more than two-thirds of their total candy items sold as ‘Halloween.’ This indicates they are staged well for the peak of the seasonal demand and anticipate their shoppers to buy smaller unit sizes, comparatively speaking.

    Source: DataWeave’s Digital Shelf Analytics Solution: Data aggregated from 9/14/21-9/24/21 for Albertson’s.com and Kroger.com, and 9/17-9/24 for Safeway.com; Analysis was conducted reviewing product information for items falling within the ‘Halloween Candy’ listing category

    Taking a closer look at all items positioned as ‘Halloween’ across the three retailer websites, Hershey’s brand Reese’s is set for success at Kroger.com for total Share of Search percentage, considering they carry eight Reese’s, non-variety SKUs. Competing in the audience of others leading with variety packs indicates the weight the Reese’s brand carries and also indicates they will also have a great likelihood of success for increased sales this Halloween season. 

    Mars M&M’s brand came out on top at Safeway.com and Albertsons.com within the ‘Halloween’ labeled SKUs, but a majority (around 70 percent) of these are variety packs that leads with the M&M’s brand versus an M&M’s only bag.

    Source: DataWeave’s Digital Shelf Analytics Solution: Data aggregated from 9/14/21-9/24/21 for Albertson’s.com and Kroger.com, and 9/17-9/24 for Safeway.com; Analysis was conducted reviewing product information for items falling within the ‘Halloween Candy’ listing category

    How Much (Less) Are People Paying for Halloween Candy?

    To determine whether candy promotions are increasing Share of Search, DataWeave measured the average promotional discount these retailers and top candy brands are offering online. When looking only at brands offering discounts on 100% of the SKUs they carry within each retailer, Brach’s brand is performing best on Albertson’s.com, and Hershey products are positioned at the top for Kroger.com and Safeway.com. 

    Source: DataWeave’s Digital Shelf Analytics Solution: Data aggregated from 9/14/21-9/24/21 for Albertson’s.com and Kroger.com, and 9/17-9/24 for Safeway.com; Analysis was conducted reviewing product information for items falling within the ‘Halloween Candy’ listing category

    Do Consumers Search For ‘Variety’ Candy Bags, or One-Product-Only Bags?

    DataWeave tagged the word ‘variety’ and found that across all three retailers’ websites, non-variety candy bags take up a greater overall Share of Search than ‘variety’ bags. Either this isn’t an important search word or retailers could try adding ‘variety’ to product descriptions to increase Share of Search.

    Source: DataWeave’s Digital Shelf Analytics Solution: Data aggregated from 9/14/21-9/24/21 for Albertson’s.com and Kroger.com, and 9/17-9/24 for Safeway.com; Analysis was conducted reviewing product information for items falling within the ‘Halloween Candy’ listing category

    Time to Make a Change

    Getting products to page one on retailers’ websites can improve sales by as much as 50 percent, but determining the right levers to pull to get there is no easy feat. Based on our preliminary analysis of Halloween insights, our advice to confectionery brands this Halloween season is to invest now to increase visibility to the fast-changing market, to get orders right and on time, establish effective pricing and promotional plans, and get the right candies in stock, to the right locations. Retailers able to get an end-to-end view of the online competitive landscape will be able to make calculated marketing decisions that stand to help generate growth and profitability.

    We are now within the prime Halloween shopping season, given that 55 percent of candy sales usually happen in the last two weeks of October (According to Timothy LeBel, President of U.S. Sales for Mars Wrigley). With online sales still growing as consumers have shifted their comfort level in buying more online, retailers should be looking for ways to optimize their product positioning, increase their Share of Search, to improve the likelihood of consumers ordering their brand’s candy to ply those Trick-or-Treaters knocking on their doors.

    About DataWeave

    DataWeave is a leading provider of advanced sales optimization solutions for e-commerce businesses, consumer brands and marketplaces. The AI-driven proprietary technology and language-agnostic platform aggregates consumable and actionable Competitive Intelligence across 500+ billion data points globally, in 25+ languages, with insights to performance for more than 400,000 brands across 1,500+ websites tracked across 20+ verticals, to ensure online performance is always optimized.