Tag: Retail Analytics

  • Redefining Product Attribute Tagging With AI-Powered Retail Domain Language Models

    Redefining Product Attribute Tagging With AI-Powered Retail Domain Language Models

    In online retail, success hinges on more than just offering quality products at competitive prices. As eCommerce catalogs expand and consumer expectations soar, businesses face an increasingly complex challenge: How do you effectively organize, categorize, and present your vast product assortments in a way that enhances discoverability and drives sales?

    Having complete and correct product catalog data is key. Effective product attribute tagging—a crucial yet frequently undervalued capability—helps in achieving this accuracy and completeness in product catalog data. While traditional methods of tagging product attributes have long struggled with issues of scalability, consistency, accuracy, and speed, a new thinking and fundamentally new ways of addressing these challenges are getting established. These follow from the revolution brought in Large Language Models but they fashion themselves as Small Language Models (SLM) or more precisely as Domain Specific Language Models. These can be potentially considered foundational models as they solve a wide variety of downstream tasks albeit within specific domains. They are a lot more efficient and do a much better job in those tasks compared to an LLM. .

    Retail Domain Language Models (RLMs) have the potential to transform the eCommerce customer journey. As always, it’s never a binary choice. In fact, LLMs can be a great starting point since they provide an enhanced semantic understanding of the world at large: they can be used to mine structured information (e.g., product attributes and values) out of unstructured data (e.g., product descriptions), create baseline domain knowledge (e.g, manufacturer-brand mappings), augment information (e.g., image to prompt), and create first cut training datasets.

    Powered by cutting-edge Generative AI and RLMs, next-generation attribute tagging solutions are transforming how online retailers manage their product catalog data, optimize their assortment, and deliver superior shopping experiences. As a new paradigm in search emerges – based more on intent and outcome, powered by natural language queries and GenAI based Search Agents – the capability to create complete catalog information and rich semantics becomes increasingly critical.

    In this post, we’ll explore the crucial role of attribute tagging in eCommerce, delve into the limitations of conventional tagging methods, and unveil how DataWeave’s innovative AI-driven approach is helping businesses stay ahead in the competitive digital marketplace.

    Why Product Attribute Tagging is Important in eCommerce

    As the eCommerce landscape continues to evolve, the importance of attribute tagging will only grow, making it a pertinent focus for forward-thinking online retailers. By investing in robust attribute tagging systems, businesses can gain a competitive edge through improved product comparisons, more accurate matching, understanding intent, and enhanced customer search experiences.

    Taxonomy Comparison and Assortment Gap Analysis

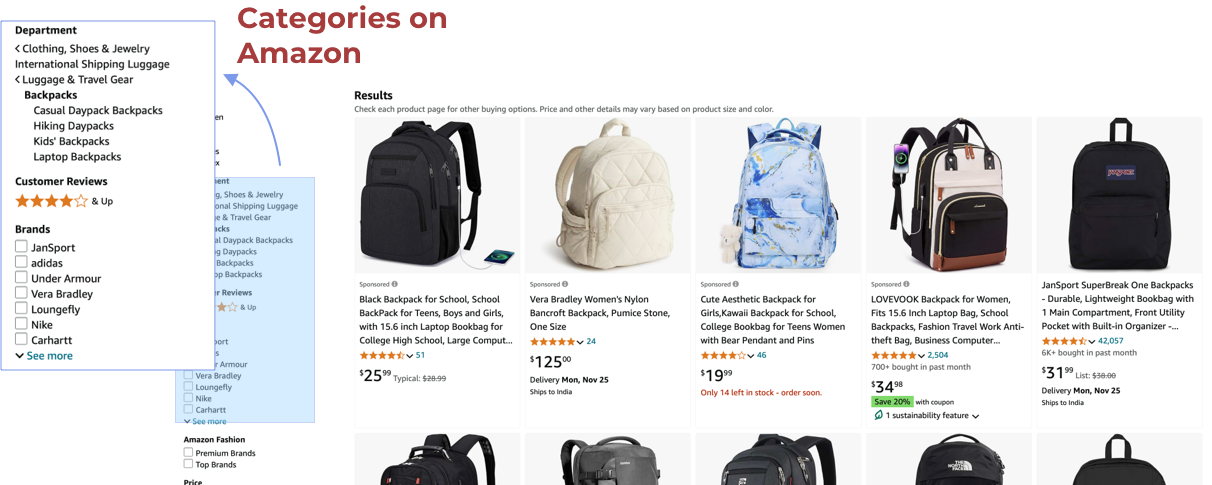
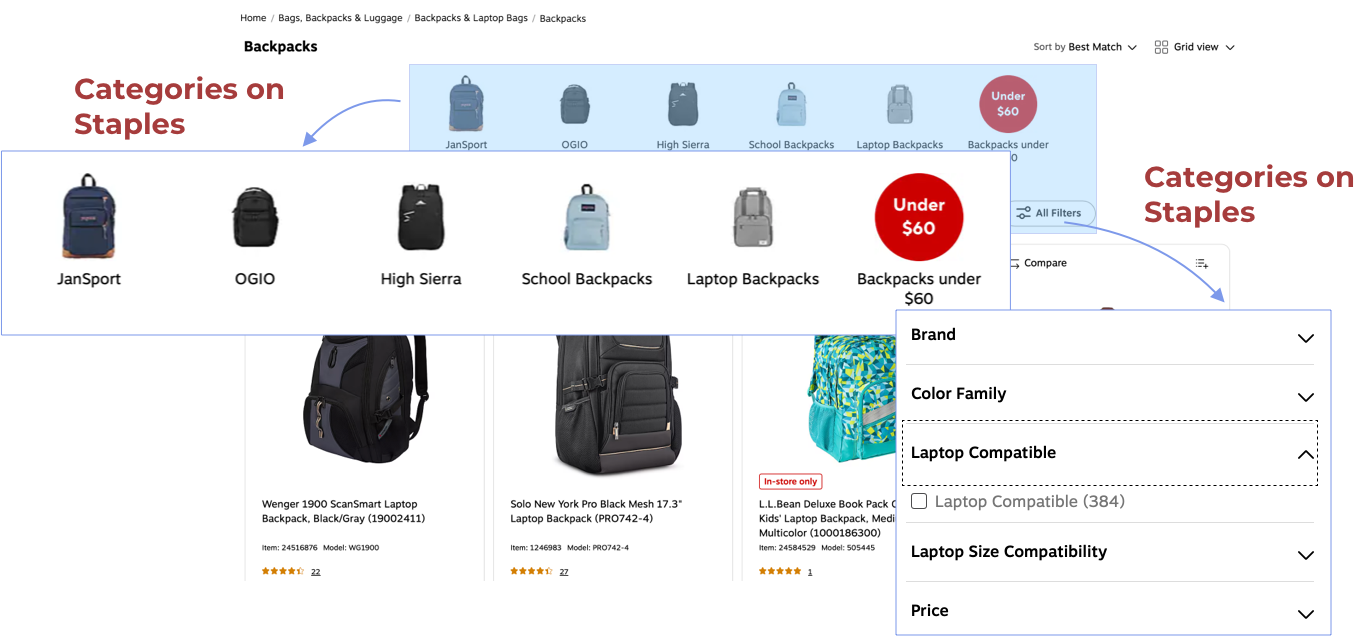
    Products are categorized and organized differently on different retail websites. Comparing taxonomies helps in understanding focus categories and potential gaps in assortment breadth in relation to one’s competitors: missing product categories, sizes, variants or brands. It also gives insights into the navigation patterns and information architecture of one’s competitors. This can help in making search and navigation experience more efficient by fine tuning product descriptions to include more attributes and/or adding additional relevant filters to category listing pages.

    For instance, check out the different Backpack categories on Amazon and Staples in the images below.

    Product Names and Category Names Differ on Different eCommerce Platforms - Here's an Amazon Example
    Product Names and Category Names Differ on Different eCommerce Platforms - Here's a Staples Example

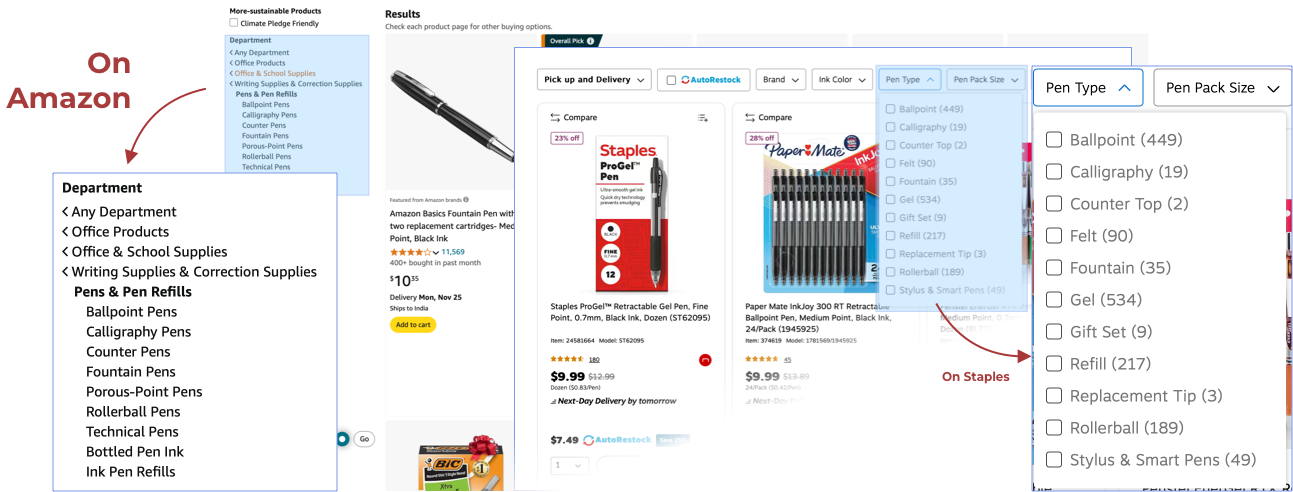
    Or look at the nomenclature of categories for “Pens” on Amazon (left side of the image) and Staples (right side of the image) in the image below.

    Product Names and Category Names Differ on Different eCommerce Platforms -Here's how Staples Vs. Amazon Categories look for Pens

    Assortment Depth Analysis

    Another big challenge in eCommerce is the lack of standardization in retailer taxonomy. This inconsistency makes it difficult to compare the depth of product assortments across different platforms effectively. For instance, to categorize smartphones,

    • Retailer A might organize it under “Electronics > Mobile Phones > Smartphones”
    • Retailer B could use “Technology > Phones & Accessories > Cell Phones”
    • Retailer C might opt for “Consumer Electronics > Smartphones & Tablets”

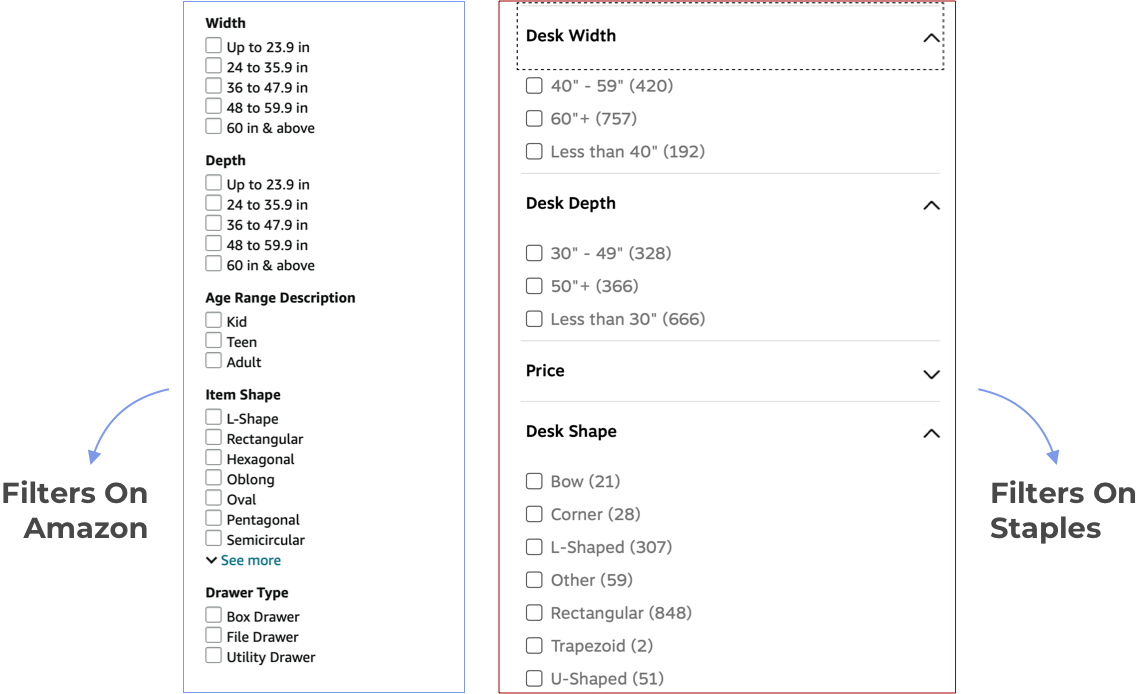
    Inconsistent nomenclature and grouping create a significant hurdle for businesses trying to gain a competitive edge through assortment analysis. The challenge is exacerbated if you want to do an in-depth assortment depth analysis for one or more product attributes. For instance, look at the image below to get an idea of the several attribute variations for “Desks” on Amazon and Staples.

    With Multiple Attributes Named in a Variety of Ways, Attribute Tagging is Essential to Ensure Accurate Product Matching

    Custom categorization through attribute tagging is essential for conducting granular assortment comparisons, allowing companies to accurately assess their product offerings against those of competitors.

    Enhancing Product Matching Capabilities

    Accurate product matching across different websites is fundamental for competitive pricing intelligence, especially when matching similar and substitute products. Attribute tagging and extraction play a crucial role in this process by narrowing down potential matches more effectively, enabling matching for both exact and similar products, and tagging attributes such as brand, model, color, size, and technical specifications.

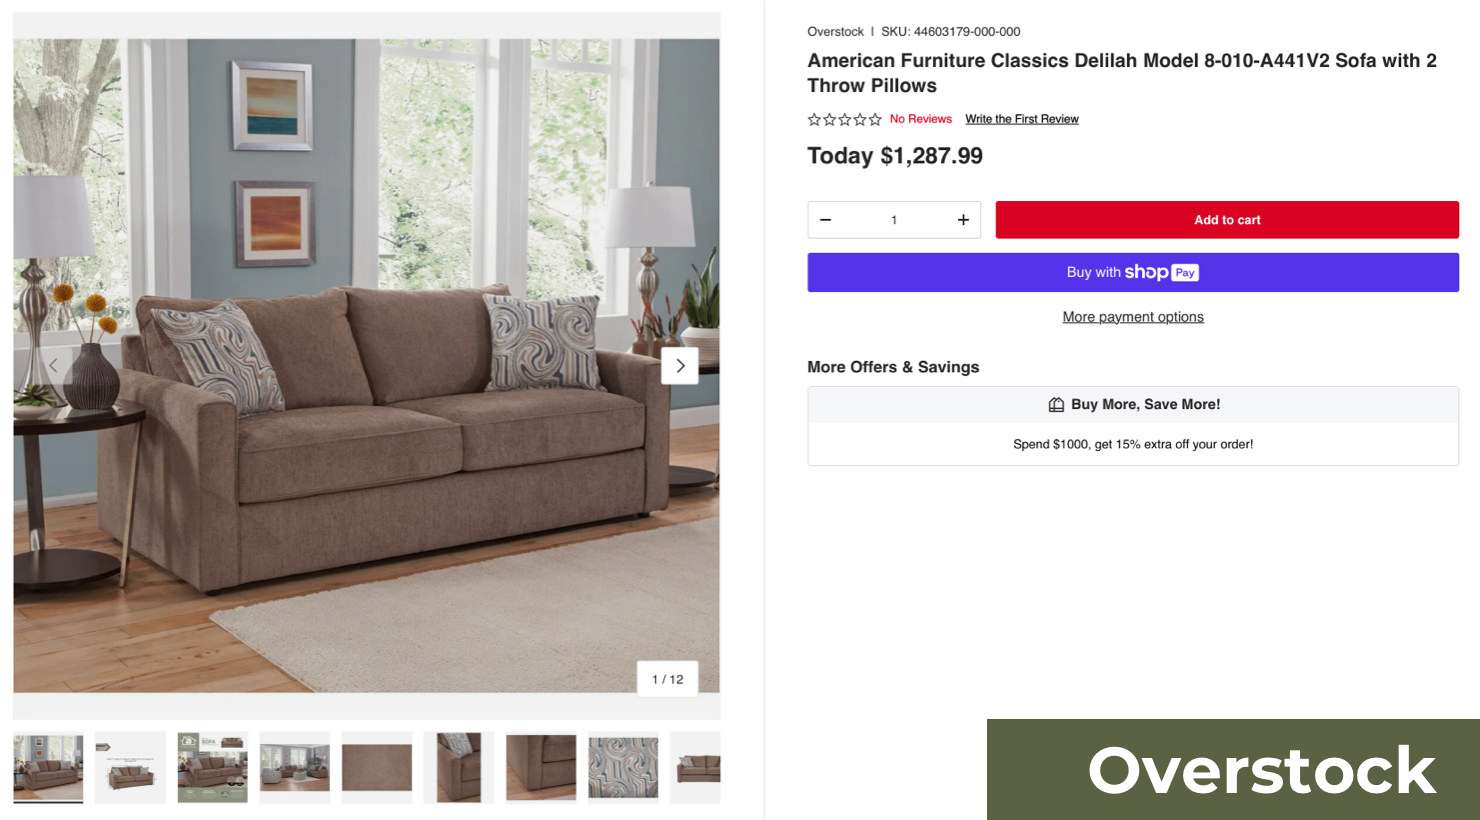
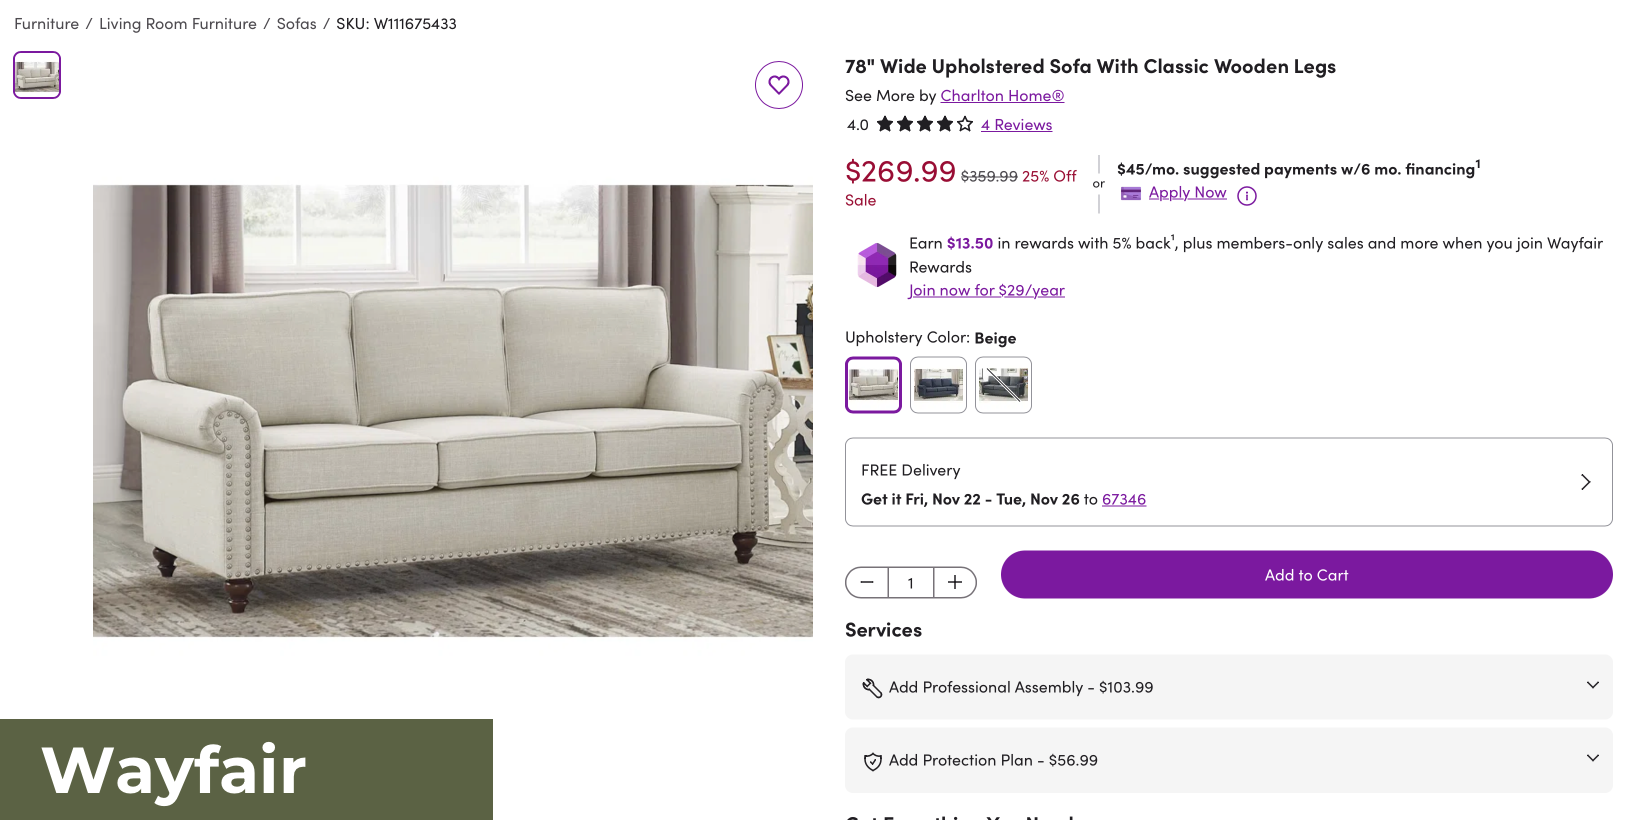
    For instance, when choosing to match similar products in the Sofa category for 2-3 seater sofas from Wayfair and Overstock, tagging attributes like brand, color, size, and more is a must for accurate comparisons.

    Attribute Tagging for Home & Furniture Categories Like Sofas Helps Improve Matching Accuracy
    Attribute Tagging for Home & Furniture Categories Like Sofas Helps Improve Matching Accuracy

    Taking a granular approach not only improves pricing strategies but also helps identify gaps in product offerings and opportunities for expansion.

    Fix Content Gaps and improve Product Detail Page (PDP) Content

    Attribute tagging plays a vital role in enhancing PDP content by ensuring adherence to brand integrity standards and content compliance guidelines across retail platforms. Tagging attributes allows for benchmarking against competitor content, identifying catalog gaps, and enriching listings with precise details.

    This strategic tagging process can highlight missing or incomplete information, enabling targeted optimizations or even complete rewrites of PDP content to improve discoverability and drive conversions. With accurate attribute tagging, businesses can ensure each product page is fully optimized to capture consumer attention and meet retail standards.

    Elevating the Search Experience

    In today’s online retail marketplace, a superior search experience can be the difference between a sale and a lost customer. Through in-depth attribute tagging, vendors can enable more accurate filtering to improve search result relevance and facilitate easier product discovery for consumers.

    By integrating rich product attributes extracted by AI into an in-house search platform, retailers can empower customers with refined and user-friendly search functionality. Enhanced search capabilities not only boost customer satisfaction but also increase the likelihood of conversions by helping shoppers find exactly what they’re looking for more quickly and with minimal effort.

    Pitfalls of Conventional Product Tagging Methods

    Traditional methods of attribute tagging, such as manual and rule-based systems, have been significantly enhanced by the advent of machine learning. While these approaches may have sufficed in the past, they are increasingly proving inadequate in the face of today’s dynamic and expansive online marketplaces.

    Scalability

    As eCommerce catalogs expand to include thousands or even millions of products, the limitations of machine learning and rule-based tagging become glaringly apparent. As new product categories emerge, these systems struggle to keep pace, often requiring extensive revisions to existing tagging structures.

    Inconsistencies and Errors

    Not only is reliance on an entirely human-driven tagging process expensive, but it also introduces a significant margin for error. While machine learning can automate the tagging process, it’s not without its limitations. Errors can occur, particularly when dealing with large and diverse product catalogs.

    As inventories grow more complex to handle diverse product ranges, the likelihood of conflicting or erroneous rules increases. These inconsistencies can result in poor search functionality, inaccurate product matching, and ultimately, a frustrating experience for customers, drawing away the benefits of tagging in the first place.

    Speed

    When product information changes or new attributes need to be added, manually updating tags across a large catalog is a time-consuming process. Slow tagging processes make it difficult for businesses to quickly adapt to emerging market trends causing significant delays in listing new products, potentially missing crucial market opportunities.

    How DataWeave’s Advanced AI Capabilities Revolutionize Product Tagging

    Advanced solutions leveraging RLMs and Generative AI offer promising alternatives capable of overcoming these challenges and unlocking new levels of efficiency and accuracy in product tagging.

    DataWeave automates product tagging to address many of the pitfalls of other conventional methods. We offer a powerful suite of capabilities that empower businesses to take their product tagging to new heights of accuracy and scalability with our unparalleled expertise.

    Our sophisticated AI system brings an advanced level of intelligence to the tagging process.

    RLMs for Enhanced Semantic Understanding

    Semantic Understanding of Product Descriptions

    RLMs analyze the meaning and context of product descriptions rather than relying on keyword matching.
    Example: “Smartphone with a 6.5-inch display” and “Phone with a 6.5-inch screen” are semantically similar, though phrased differently.

    Attribute Extraction

    RLMs can identify important product attributes (e.g., brand, size, color, model) even from noisy or unstructured data.
    Example: Extracting “Apple” as a brand, “128GB” as storage, and “Pink” as the color from a mixed description.

    Identifying Implicit Relationships

    RLMs find implicit relationships between products that traditional rule-based systems miss.
    Example: Recognizing that “iPhone 12 Pro” and “Apple iPhone 12” are part of the same product family.

    Synonym Recognition in Product Descriptions

    Synonym Matching with Context

    RLMs identify when different words or phrases describe the same product.
    Examples: “Sneakers” = “Running Shoes”, “Memory” = “RAM” (in electronics)
    Even subtle differences in wording, like “rose gold” vs “pink” are interpreted correctly.

    Overcoming Brand-Specific Terminology

    Some brands use their own terminologies (e.g., “Retina Display” for Apple).
    RLMs can map proprietary terms to more generic ones (e.g., Retina Display = High-Resolution Display).

    Dealing with Ambiguities

    RLMs analyze surrounding text to resolve ambiguities in product descriptions.
    Example: Resolving “charger” to mean a “phone charger” when matched with mobile phones.

    Contextual Understanding for Improved Accuracy and Precision

    By leveraging advanced natural language processing (NLP), DataWeave’s AI can process and understand the context of lengthy product descriptions and customer reviews, minimizing errors that often arise at human touch points. The solution processes and interprets information to extract key information to dramatically improve the overall accuracy of product tags.

    It excels at grasping the subtle differences between similar products, sizes, colors and identifying and tagging minute differences between items, ensuring that each product is uniquely and accurately represented in a retailer’s catalog.

    This has a major impact on product and similarity-based matching that can even help optimize similar and substitute product matching to enhance consumer search. At the same time, our AI can understand that the same term might have different meanings in various product categories, adapting its tagging approach based on the specific context of each item.

    This deep comprehension ensures that even nuanced product attributes are accurately captured and tagged for easy discoverability by consumers.

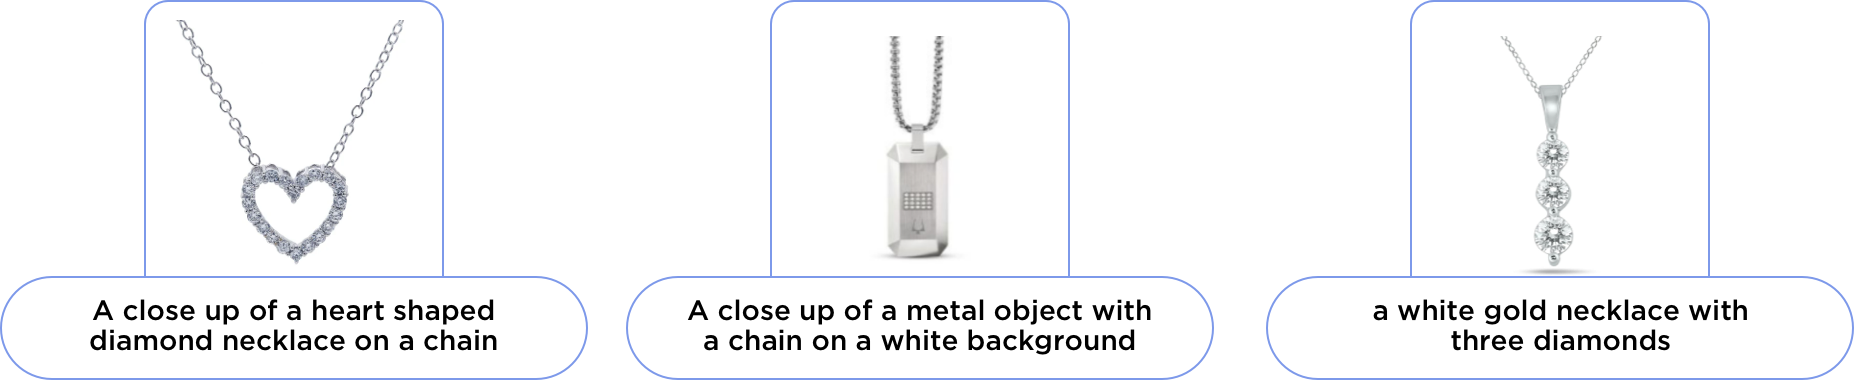
    Case Study: Niche Jewelry Attributes

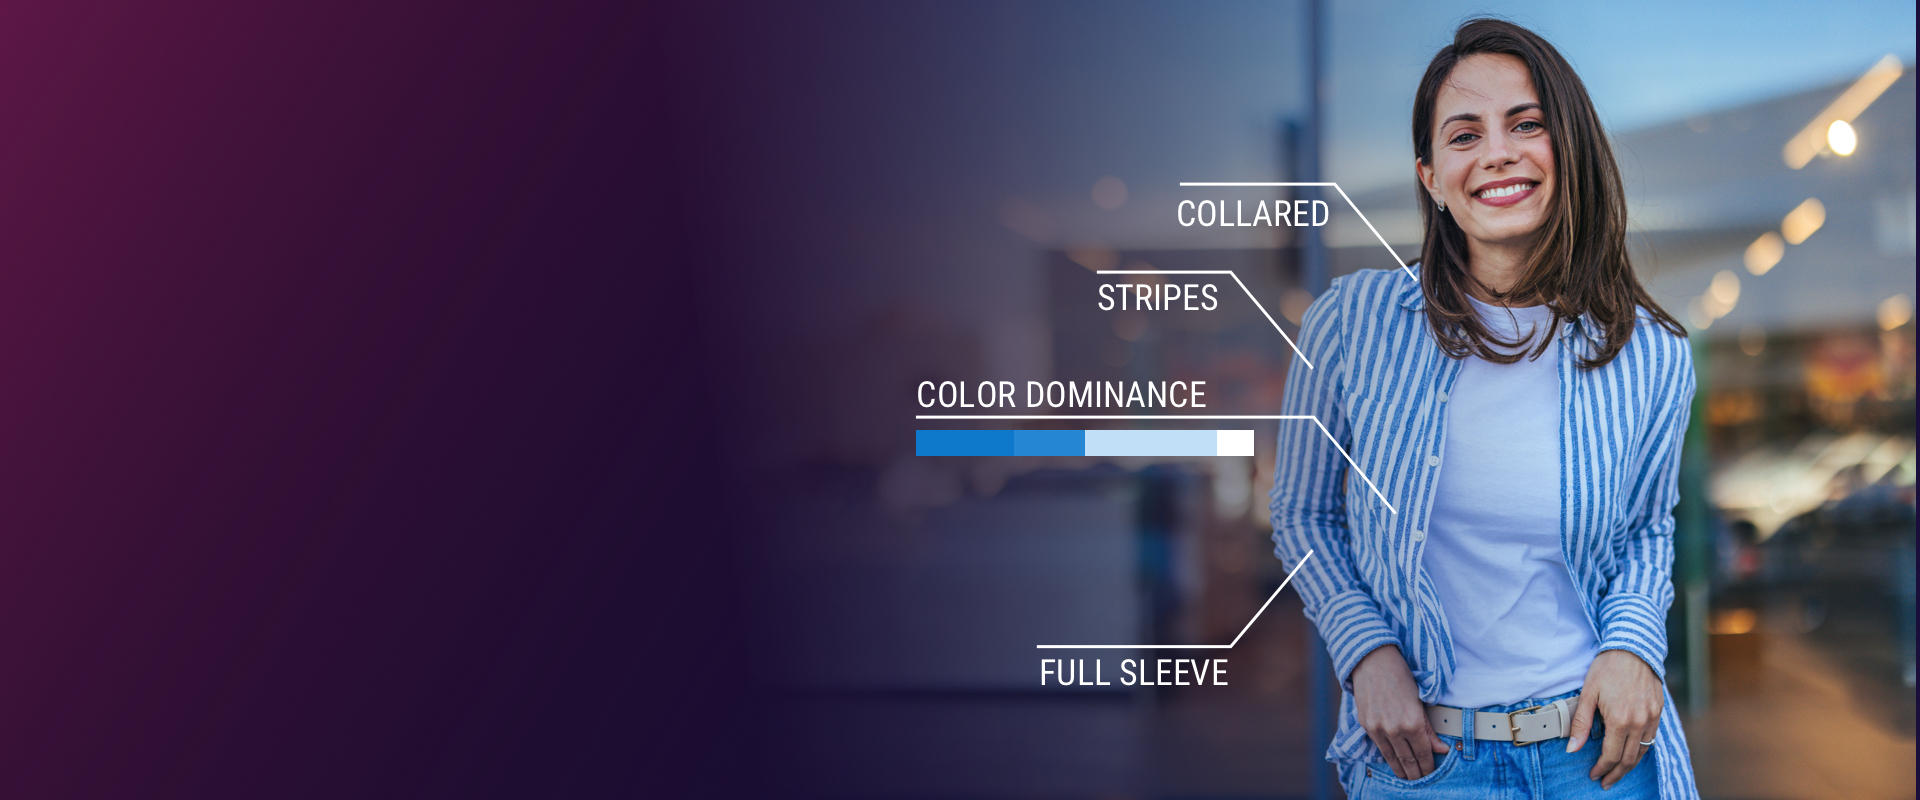
    DataWeave’s advanced AI can assist in labeling the subtle attributes of jewelry by analyzing product images and generating prompts to describe the image. In this example, our AI identifies the unique shapes and materials of each item in the prompts.

    The RLM can then extract key attributes from the prompt to generate tags. This assists in accurate product matching for searches as well as enhanced product recommendations based on similarities.

    DataWeave's AI assists in extracting contextual attributes for accuracy in product matching

    This multi-model approach provides the flexibility to adapt as product catalogs expand while remaining consistent with tagging to yield more robust results for consumers.

    Unparalleled Scalability

    DataWeave can rapidly scale tagging for new categories. The solution is built to handle the demands of even the largest eCommerce catalogs enabling:

    • Effortless management of extensive product catalogs: We can process and tag millions of products without compromising on speed or accuracy, allowing businesses to scale without limitations.
    • Automated bulk tagging: New product lines or entire categories can be tagged automatically, significantly reducing the time and resources required for catalog expansion.

    Normalizing Size and Color in Fashion

    Style, color, and size are the core attributes in the fashion and apparel categories. Style attributes, which include design, appearance, and overall aesthetics, can be highly specific to individual product categories.

    Normalizing Size and Color in Fashion for Product Matching

    Our product matching engine can easily handle color and sizing complexity via our AI-driven approach combined with human verification. By leveraging advanced technology to identify and normalize identical and similar products from competitors, you can optimize your pricing strategy and product assortment to remain competitive. Using Generative AI in normalizing color and size in fashion is key to powering competitive pricing intelligence at DataWeave.

    Continuous Adaptation and Learning

    Our solution evolves with your business, improving continuously through feedback and customization for retailers’ specific product categories. The system can be fine-tuned to understand and apply specialized tagging for niche or industry-specific product categories. This ensures that tags remain relevant and accurate across diverse catalogs and as trends emerge.

    The AI in our platform also continuously learns from user interactions and feedback, refining its tagging algorithms to improve accuracy over time.

    Stay Ahead of the Competition With Accurate Attribute Tagging

    In the current landscape, the ability to accurately and consistently tag product attributes is no longer a luxury—it’s essential for staying competitive. With advancements in Generative AI, companies like DataWeave are revolutionizing the way product tagging is handled, ensuring that every item in a retailer’s catalog is presented with precision and depth. As shoppers demand a more intuitive, seamless experience, next-generation tagging solutions are empowering businesses to meet these expectations head-on.

    DataWeave’s innovative approach to attribute tagging is more than just a technical improvement; it’s a strategic advantage in an increasingly competitive market. By leveraging AI to scale and automate tagging processes, online retailers can keep pace with expansive product assortments, manage content more effectively, and adapt swiftly to changes in consumer behavior. In doing so, they can maintain a competitive edge.

    To learn more, talk to us today!

  • The Complete Guide to Competitive Pricing Strategies in Retail and E-commerce

    The Complete Guide to Competitive Pricing Strategies in Retail and E-commerce

    Your budget-conscious customers are hunting for value and won’t hesitate to switch brands or shop at other retailers.

    In saturated and fiercely competitive markets, how can you retain customers? And better yet, how can you attract more customers and grow your market share? One thing you can do as a brand or retailer is to set the right prices for your products.

    Competitive or competition-based pricing can help you get there.

    So what exactly is competitive pricing? Let’s dive into this strategy, its advantages and disadvantages, and how it can be used to stay ahead of the competition.

    What is Competitive Pricing?

    Competitive or competition-based pricing is a strategy where brands and retailers set product prices based on what their competitors charge. This method focuses entirely on the market landscape and sets aside the cost of production or consumer demand.

    It is a good pricing model for businesses operating in saturated markets, such as consumer packaged goods (CPGs) or retail.

    Competitive Pricing Models

    Competitive pricing isn’t a one-size-fits-all strategy. The approach includes various pricing models that can be customized to fit your business goals and market positioning.

    Here’s a closer look at five of the most common competition-based pricing models:

    Price Skimming

    If you have a new product entering the market, you can initially set a high price. Price skimming allows you to maximize margins when competition is minimal.

    This strategy taps into early adopters’ willingness to pay a premium for new project categories. As competitors enter the market, you can gradually reduce the price to maintain competitiveness.

    Premium Pricing

    Premium pricing lets you position your product as high-quality or luxurious goods.

    When you charge more than your competitors, you’re not just selling a product—you’re selling status and an experience. This strategy is effective when your offering is of superior quality or has unique features that justify a higher price point.

    Price Matching

    Price matching—also known as parity pricing—is a defensive pricing tactic.

    By consistently matching your competitors’ prices, you can retain customers who might otherwise, be tempted to switch to an alternative.

    This approach signals your customers that they don’t need to look elsewhere for what they need and can feel comfortable remaining loyal to your brand.

    Penetration Pricing

    Penetration pricing is when you set a low price for a new product to gain market share quickly. The opposite of price skimming, this strategy can be particularly effective in price-sensitive or highly competitive industries.

    By attracting customers early, you can also deter some competitors from entering the market. This bold move can establish your product as a market leader from the get-go.

    Loss Leader Pricing

    Loss leader pricing is a strategic sacrifice that can lead to greater gains in the long run.

    By offering a product at a low price—sometimes even below cost—you can attract new customers to your brand and strengthen your current customers’ loyalty.

    Eventually, you can cross-sell other higher-margin products to your loyal customer base to cover the loss from your loss leader pricing and increase sales of other more profitable products.

    Key Advantages of Competitive Pricing

    Although it’s not the only pricing strategy available, competitive pricing has some significant advantages.

    It is Responsive

    Agility is synonymous with profit in industries where consumer preferences and market conditions shift rapidly.

    Competitive pricing allows you to adapt quickly—if a competitor lowers their prices, you can respond promptly to maintain your positioning.

    It is Simple to Execute and Manage

    Competitive pricing is straightforward, unlike cost-based pricing, which requires complex calculations and spans various factors and facets.

    By closely monitoring competitors’ prices and adjusting your prices accordingly, you can implement this pricing strategy with relative ease and speed.

    It Can Be Combined with Other Pricing Strategies

    Competitive pricing is not a standalone strategy—it’s a versatile approach that can easily be combined with other pricing strategies. For example, say you want to use competitive pricing without losing money on a product. In this case, you could use cost-plus pricing to determine a base price that you won’t go below, then use competitive pricing as long as the price stays above your base price.

    Key Disadvantages of Competitive Pricing

    While competition-based pricing has its advantages, it’s not without its pitfalls. Here are some potential disadvantages of competitive pricing.

    It De-emphasizes Consumer Demand

    If you focus solely on what competitors are charging, you could overlook consumer demand.

    For example, you could underprice items that consumers could be willing to purchase for more. Or, you might overprice items that consumers perceive as low-value, which can reduce sales.

    You Risk Price Wars

    If you and your competition undercut each other for customer acquisition and loyalty, you will eventually erode profit margins and harm the industry’s overall profitability. It’s a slippery slope where everyone loses in the end.

    There’s Potential for Complacency

    When you base your prices on beating those of competitors, you might neglect to differentiate your offerings through innovation and product improvements. Over time, this can weaken your brand’s position and lead to a loss of market share. Staying competitive means more than just matching prices—it means continuously evolving and adding value for the consumer.

    4 Tips for a Successful Competitive Pricing Strategy in Retail

    Here are four competition-based pricing tips for retailers:

    Retailer Tip #1. Know Where to Position Your Products in the Market

    For competitive pricing to work, you must understand your optimal product positioning in the overall market. To gain this understanding, you must regularly compare your offerings and prices with those of your key competitors, especially for high-demand products.

    Then, you can decide which competition-based pricing model is suitable for you.

    Retailer Tip #2. Price Dynamically

    Dynamic pricing is a tactic with which you automatically adjust prices on your chosen variables, such as market conditions, competitor actions, or consumer demand.

    When it comes to competitive pricing, a dynamic pricing system can track your competitors’ price changes and update yours in lockstep.

    Price-monitoring tools like DataWeave allow you to stay ahead of the game with seasonal and historical pricing trend data.

    Retailer Tip #3. Combine Competitive Pricing with Other Pricing Strategies

    Competitive pricing can be powerful, but it doesn’t have to stand alone. You can enhance its benefits with complementary marketing tactics.

    To illustrate, you can bundle products to offer greater value than what your competitors are offering. You can also leverage loyalty programs to offer exclusive discounts or rewards so customers keep returning, even when your competitors offer them lower prices.

    Retailer Tip #4. Stay in Tune with Consumer Demand

    Competition-based pricing aligns you with your competitor, but don’t lose sight of what your customers want. Routinely test your pricing strategy against consumer behavior to ensure that your prices reflect the actual value of your offerings.

    5 Tips for a Successful Competitive Pricing Strategy for Consumer Brands

    If you’re thinking about how to create a competitive pricing strategy for your brand, consider these five tips:

    Brand Tip #1. Identify Competing Products for Accurate Comparisons

    The first step in competitive pricing is to know the value of what you’re selling and how it compares to that of your competitors’ products. This extends to private-label products, similar but not identical products, and use-case products.

    Product matching ensures your pricing decisions are based on accurate like-for-like comparisons, allowing you to compete effectively.

    Brand Tip #2. Understand Your Product’s Relative Value

    Knowing how your product competes on value is key to setting the right price. If your product offers higher value, price it higher; if it offers less, price it accordingly. This ensures your pricing strategy reflects your product’s market placement.

    Brand Tip #3. Consider Brand Perception

    Even if your product is virtually the same as a competitor’s, your brand’s perceived value may be different, which plays a crucial role in pricing.

    If your brand is perceived as premium, you can justify higher prices. Conversely, if customers perceive you as a value brand, your pricing should reflect affordability.

    Brand Tip #4. Leverage Value-Based Differentiation

    When your prices are similar to competitors’, you must differentiate your products by expressing your product value through branding, packaging, quality, or something else entirely.

    This differentiation will compel consumers to choose your product over other similarly priced options.

    Brand Tip #5. Stay Vigilant with Price Monitoring

    Your competitors will update their pricing repeatedly, and you will, too.

    It can be difficult and time-consuming to monitor your competitive pricing, so you’ll need a system like DataWeave to monitor competitors’ pricing and manage dynamic pricing changes.

    This vigilance ensures your brand remains competitive and relevant in real time.

    4 Essential Capabilities You Need to Implement Successful Competition-Based Pricing

    You’ll need four key capabilities to implement a competitive pricing strategy effectively.

    AI-Driven Product Matching

    Product matching means you’ll compare many products (sometimes tens or hundreds) with varying details across multiple platforms. Accurate product matching at that scale requires AI.

    For instance, AI can identify similar smartphones to yours by analyzing features like screen size and processor type. DataWeave’s AI product matches start with 80–90% matching accuracy, and then human oversight can fine-tune the data for near-perfect matches.

    You can make informed pricing decisions once you know which competing products to base your prices on.

    Accurate and Comprehensive Data

    A successful competition-based pricing strategy depends on high-quality, comprehensive product and pricing data from many retailers and eCommerce marketplaces.

    By tracking prices on large online platforms and niche eCommerce sites across certain regions, you’ll gain a more comprehensive market view, which enables you to make quick and confident price changes.

    Normalized Measurement Units

    Accurate price comparisons are dependent on normalized unit measurements.

    For example, comparing laundry detergent sold in liters to laundry detergent sold in ounces requires converting either or both products to a common base like price-per-liter or price-per-ounce.

    This normalization ensures accurate pricing analysis.

    Timely Actionable Insights

    Timely and actionable pricing insights empower you to make informed pricing decisions.

    With top-tier competitive pricing intelligence systems, you get customized alerts, intuitive dashboards, and detailed reports to help your team quickly act on insights.

    In Conclusion

    Competitive pricing or competition-based pricing is a powerful strategy for businesses navigating crowded markets, but you must balance competitive pricing with your brand’s unique value proposition.

    Competitive pricing should complement innovation and customer-centric strategies, not replace them. To learn more, talk to us today!

  • From Data to Dollars: How Digital Shelf Analytics Drives Tangible Business Impact and ROI for Brands

    From Data to Dollars: How Digital Shelf Analytics Drives Tangible Business Impact and ROI for Brands

    For consumer brands, the digital marketplace presents an unparalleled landscape of opportunities for engaging with consumers and expanding their market presence. Within this dynamic environment, Digital Shelf Analytics has emerged as a crucial pillar in a brand’s eCommerce strategy. This technology provides valuable insights into a brand’s organic and paid visibility on marketplaces, content quality, pricing strategies, promotional efforts, and product availability. These insights help brands gain a comprehensive understanding of their competitive positioning and overall market performance.

    Nevertheless, many brands often grapple with the question of whether this understanding translates into tangible actions that drive real business impact and return on investment (ROI). This uncertainty stems from a lack of clarity about the direct correlation between digital shelf insights and key metrics such as enhanced sales conversions.

    Nonetheless, there is compelling evidence that when these insights are effectively harnessed and strategic actions are taken, brands can realize significant, measurable benefits.

    So, the question arises: does Digital Shelf Analytics genuinely deliver on its promises?

    At DataWeave, we’ve partnered with numerous brands to fuel their eCommerce growth through the application of digital shelf analytics. In this article, we will delve into these insights, uncovering the concrete and quantifiable results that brands can achieve through their investments in digital shelf analytics.

    Digital Shelf KPIs and Their Impact

    Digital Shelf Analytics is a robust system that analyzes specific key performance indicators (KPIs) about the digital shelf, furnishing brands with precise recommendations to not only bolster these KPIs but also to monitor the enhancements over time. The following is a brief explanation of digital shelf KPis and their expected impact areas:

    Product Availability: Ensuring Shoppers Never Hear “Out of Stock” Again

    Timely insights on the availability of products ensures brands reduce replenishment times at scale, which can significantly impact sales, creating an unbreakable link between product availability and revenue. With Digital Shelf Analytics, procurement and replenishment teams can set up notifications to promptly identify low or out-of-stock items and take swift action. This can also be done for specific ZIP codes or individual stores. In addition, availability plays a crucial role in a brand’s Share of Search and search rankings, as online marketplaces often ensure only in-stock products are shown among the top ranks.

    Share of Search: Dominating the Digital Aisles

    If a product isn’t visible, does it even exist? In fact, 70% of consumers never go beyond the first page of search results on major online marketplaces. Therefore, as a brand, the visibility of your products for relevant search keywords and their appearance on the first page can heavily determine your awareness metrics. This is where the concept of Share of Search comes into play. Think of it as securing prime shelf space in a physical store. Digital shelf insights and benchmarking with category leaders for Share of Search help ensure your products command relevant attention on the digital shelf.

    Content Quality: Crafting the Perfect Product Story

    Creating engaging product descriptions and visuals is akin to giving your products a megaphone in a crowded marketplace. By enhancing content quality, including product names, titles, descriptions, and images, brands can climb the search result rankings, leading to increased visibility and subsequently, more sales.

    Ratings and Reviews: The Power of Social Proof

    Public opinion holds immense sway. Research indicates that a single positive review can trigger a 10% surge in sales, while a multitude of favorable reviews can propel your product to a 44% higher trajectory. The correlation between ratings and sales is not surprising—each step up the rating ladder can translate to substantial revenue growth.

    While it’s reasonable to anticipate a connection between these KPIs and downstream impact metrics such as impressions, clicks, and conversions, we were driven to explore this correlation through the lens of real-world data. To do so, we meticulously monitored the digital shelf KPIs for one of our clients and analyzed the improvements in these metrics.

    It’s essential to acknowledge that not all observed impact areas can be solely attributed to enhancements in digital shelf KPIs. Still, it’s evident that a robust correlation exists. The following section presents an in-depth case study, shedding light on the results of this analysis.

    A Success Story: Real-World Impact of Digital Shelf Analytics

    Let’s dive into the journey of one of our clients – a prominent CPG brand specializing in the sale of baked goods and desserts. Through their experience, we will illustrate the transformative impact of our DataWeave Digital Shelf Analytics product suite.

    Over a period of one year, from August 2022 to July 2023, the brand leveraged several key modules of Digital Shelf Analytics for Amazon, including Share of Search, Share of Category, Availability, Ratings and Reviews, and Content Audit. Each of these digital shelf KPIs played a vital role in shaping the brand’s performance across various stages of the buyer’s journey.

    The buyer’s journey is typically delineated into three key stages:

    • Awareness: At this stage, shoppers peruse multiple product options presented on search and category listing pages, gaining an initial understanding of the available choices.
    • Consideration: Here, shoppers narrow down their selections and evaluate a handful of products, moving closer to a purchase decision.
    • Conversion: In this final stage, shoppers make their ultimate product choice and proceed to complete the purchase.

    Let’s now examine the data to understand how digital shelf KPIs helped drive tangible ROI on Amazon for the brand across the stages of the buyer journey.

    Stage 1: Raising Awareness

    Enhancing Share of Search and Share of Category can help brands boost product visibility and raise brand awareness. The following chart demonstrates the steady, incremental improvements in our client’s Share of Search and Share of Category (in the top 20 ranks of each listing page) throughout the analyzed period. These enhancements were achieved through various measures, including product sponsorship, content enhancement, price optimization, promotional initiatives, and more.

    This amplified Share of Search and Share of Category directly translates into improved product discoverability, as evident from the surge in impressions depicted in the chart below.

    Stage 2: All Things Considered

    In the consideration stage, shoppers make their product selections by clicking on items that meet their criteria, which may include factors like average rating, number of ratings, price, product title, and images. For brands, this underscores the importance of crafting meticulously detailed product content and accumulating a substantial number of ratings.

    The subsequent chart illustrates the year-long trend in both average ratings and the number of ratings, both of which have displayed steady improvement over time.

    The enhancements in the number of ratings and the average rating have a direct and positive impact on product consideration. This, in turn, has led to a noticeable year-over-year increase in page views, as indicated in the chart below.

    These improvements are likely to have also been influenced by the overall enhancement of content quality, which is detailed separately in the section below.

    Stage 3: Driving Decisions

    As buyers progress to the next stage, they reach the pivotal point of making a purchase decision. This decision is influenced by multiple factors, including product availability, content quality, and the quality of reviews, reflecting customer sentiment.

    Our client effectively harnessed our Availability insights, significantly reducing the likelihood of potential out-of-stock scenarios and enhancing replenishment rates, as highlighted in the chart below. The same chart also indicates improvements in content quality, measured by the degree to which the content on Amazon aligns with the brand’s ideal content standards.

    Below, you’ll find the year-over-year growth in conversion rates for the brand on Amazon. This metric stands as the ultimate measure of business impact, directly translating into increased revenue for brands.

    As the data uncovers, growth in key digital shelf KPIs cumulatively had a strong correlation with impressions, page views, and conversion rates.

    It is also important to note that the effect of each KPI cannot be viewed in isolation, since they are often interdependent. For example, improvement in content and availability could boost Share of Search. Accurate content could also influence more positive customer feedback. Brands need to consider optimizing digital shelf KPIs holistically to create sustained business impact.

    Impact on eCommerce Sales

    After the implementation of digital shelf analytics, the results spoke for themselves. Sales consistently outperformed the previous year’s records month after month. As shown in the chart below, the diligent application of DataWeave’s recommendations paved the way for an impressive 8.5% year-over-year increase in sales, leaving an indelible mark on the brand’s eCommerce success.

    From boosting product visibility to catapulting conversion rates, Digital Shelf Analytics serves as the key to unlocking unparalleled online success.

    While the success story detailed above does not establish a direct causation between Digital Shelf Analytics and sales revenue, there is undoubtedly a strong correlation. It’s evident that digital shelf KPIs play a pivotal role in optimizing a brand’s eCommerce performance across all stages of the buyer journey. Hence, for brands, it is vital that they collaborate with the right partner and harness digital shelf insights to fine-tune their eCommerce strategies and tactics.

    That said, the eCommerce landscape is in a constant state of flux, and there is still much to learn about how each digital shelf KPI influences brand performance in the online realm. With more data and an increasing number of brands embracing Digital Shelf Analytics, it’s only a matter of time before a direct causation is firmly established.

    Reach out to us today to know more about how your brand can leverage Digital Shelf Analytics to drive higher sales and market share in eCommerce.

  • Revolutionizing Fuel Pricing: How Fuel Retailers and Convenience Stores Can Gain a Winning Edge with DataWeave

    Revolutionizing Fuel Pricing: How Fuel Retailers and Convenience Stores Can Gain a Winning Edge with DataWeave

    Consider this scenario: A retailer establishes its fuel prices using pricing data that’s a few days old, only to subsequently discover that a nearby competitor is offering substantially lower prices. The result? Lost customers, decreased foot traffic, and diminished sales. This serves as a stark reality that retailers must confront and address today.

    In the fiercely competitive realm of retail, where every decision holds weight, maintaining a competitive edge is paramount. The fuel category, frequently underestimated, has the potential to significantly impact a retailer’s revenue stream. This challenge is not unique; retailers worldwide, particularly in North America, grapple with a common hurdle: mastering the intricate art of real-time fuel pricing.

    The Quest For Reliable, Real-Time Fuel Pricing Data

    For retailers, traditional methods for procuring and analyzing fuel price data have proven to be both expensive and error-prone, often relying on manual data collection or third-party data providers. These outdated approaches yield frustrating delays, inaccuracies, and missed opportunities. When it comes to obtaining timely fuel pricing intelligence, the majority of fuel retailers grapple with three central challenges:

    • Low Accuracy: Ensuring that fuel pricing information remains up-to-date, dependable, and actionable, even when sourced from complex web-based platforms.
    • Less Coverage: Acquiring comprehensive data that encompasses all of North America, spanning across retailers, convenience stores, fuel stations, and beyond.
    • High Cost: Effectively managing the substantial costs associated with acquiring and processing this vital information.

    DataWeave’s Fuel Pricing Intelligence Solution

    Comprehensive, accurate, and real-time fuel pricing intelligence can play a huge role in the profitability of retailers throughout North America. DataWeave takes the forefront in delivering this transformative Data-as-a-Service (DaaS) solution to some of the most prominent retailers in the region, including the top 20 fuel retail behemoths.

    With a rich and extensive history spanning over a decade in the realm of competitive intelligence, DataWeave boasts an impressive track record of empowering well-informed decision-making in retail. We leverage state-of-the-art technology to bring an unparalleled level of accuracy, timeliness, and coverage to fuel pricing intelligence.

    The following are some compelling advantages offered by our solution:

    Accurate and Real-Time First Party Data

    We deliver retailers an unparalleled advantage through real-time, first-party fuel price data. Our data originates directly from the retailer’s own channels, encompassing websites and mobile apps, rendering it the industry’s foremost and most reliable source.

    Imagine having access to fuel pricing information that updates as frequently as every 30 minutes. This rapid update cadence guarantees that you, as a retailer, constantly possess the latest pricing insights at your fingertips, empowering you to respond swiftly to market fluctuations and competitor manoeuvres. Our comprehensive data spans a wide spectrum of fuel types, including:

    • Gasoline: Be it regular, mid-grade, super, premium, ethanol-free, ethanol blends, methanol blends, or reformulated gasoline, we have got you covered.
    • Diesel: Our data encompasses biodiesel, biodiesel off-road, biodiesel blends, biodiesel ultra-low sulfur (ULS), diesel ultra-low sulfur (ULS), diesel off-road, standard diesel, and premium diesel.

    Armed with our real-time, first-party data, you can make pricing decisions with unwavering confidence, secure in the knowledge that you possess access to the most current, authoritative, and extensive fuel pricing intelligence in North America.

    The data points we capture directly from relevant web sources include: gas station postal code, store name and code, location, city, state, ZIP code, fuel type, competitor name, regular price, member price (if available), time and date of data capture, and more.

    Click here if you wish to access a sample report of our fuel pricing data.

    Unrivaled Geographical Coverage

    Our extensive coverage of fuel data spans over 30,000 ZIP codes and encompasses the top 100 retailers across the western, mid-western, and eastern regions of the United States.

    Retailers benefit from the flexibility to configure and tailor the solution to their precise needs, whether it involves adding more locations or selectively acquiring specific segments of the data. This far-reaching coverage guarantees that retailers, whether situated in bustling urban centers or remote areas, can readily access the essential data required to maintain their competitive edge.

    Moreover, if you currently source your fuel pricing data from alternative providers, our solution seamlessly integrates, amplifies, and complements your existing array of data sources, ensuring a harmonious and unified approach to data acquisition.

    Optimization of Dynamic Pricing Strategies

    In the world of retail, the importance of timing cannot be overstated. Even a mere difference of a few cents can translate into millions of dollars in revenue impact. With DataWeave, retailers gain the capability to make data-driven decisions that provide them with a competitive edge around the clock, every single day.

    Our platform empowers you to unearth margin gaps by pinpointing opportunities to raise prices while maintaining your competitive pricing position. It also identifies instances where you may be substantially overpriced, prompting necessary price adjustments to ensure competitiveness within the market. All these valuable insights are available at a hyperlocal level, facilitating pricing efficiency and optimization across your various regions of coverage. Equipped with this real-time data, you can swiftly adapt to ever-changing market conditions.

    Furthermore, our comprehensive competitive data seamlessly integrates into your existing pricing systems through APIs, facilitating quick and informed pricing actions based on robust data.

    Reliable and Customer-First Tech Platform

    Our platform boasts a remarkable level of sophistication when it comes to data aggregation, normalization, visualization, and integration capabilities. It stands as a massively scalable system with the capacity to aggregate billions of data points daily, spanning thousands of web sources. This includes the intricate handling of sources like mobile apps and websites known for frequently altering their site structures, among others.

    What truly sets us apart is our proficiency in addressing these challenges through a blend of human expertise and large-scale machine learning. Additionally, our commitment to delivering unmatched service extends to round-the-clock, 24/7 support. This comprehensive approach makes our fuel pricing intelligence solution not only effective but also cost-efficient in meeting your fuel data requirements.

    We also provide a variety of options for you to consume our data, which includes receiving our reports via email, SFTP, S3 buckets, data lakes like Snowflake, and APIs.

    Enhance your Fuel Pricing Strategies with DataWeave

    In the ever-competitive world of retail, staying ahead is not just a goal; it’s a necessity. The fuel pricing landscape, often overlooked, holds immense power to impact a retailer’s profitability. DataWeave’s real-time, comprehensive, and accurate fuel pricing intelligence solution is the key to securing this advantage. Retailers and convenience stores now have a powerful platform at their disposal, offering unparalleled precision, comprehensive coverage, and the agility needed to navigate this landscape.

    Join the ranks of industry leaders who have already harnessed the potential of DataWeave. Reach out to us today to redefine your approach to fuel pricing and propel your business to new heights!

  • 2021 Cost-Push Inflationary Trends Ran Rampant, Impacting Holiday Discounts

    2021 Cost-Push Inflationary Trends Ran Rampant, Impacting Holiday Discounts

    Business has been anything but usual this holiday season, especially in the digital retail world. The holiday hustle and bustle historically seen in stores was once again occurring online, but not as anticipated given the current strength of consumer demand and the reemergence of COVID-19 limiting in-store traffic. While ‘Cyber Weekend’, Thanksgiving through Cyber Monday, continues to further its importance to retailers and brands, this year’s performance fell short of expectation due to product shortages and earlier promotions that pulled forward holiday demand.

    Holiday promotions were seen beginning as early as October in order to compete with 2020 Prime Day sales, but discounting, pricing and availability took an opposite direction from usual. This shift influenced our team to get a jump start on our 2021 digital holiday analysis to assess how drastic the changes were versus 2020 activity, and to understand how much of this change has been influenced by inflationary pressures and product scarcity.

    Scarcity Becomes a Reality

    Our initial analysis started by reviewing year-over-year product availability and pricing changes from January through September 2021, leading up to the holiday season, as detailed in our 2021 Cyber Weekend Preliminary Insights blog. We reviewed popular holiday categories like apparel, electronics, and toys, to have a broad sense of notable trends seen consistently throughout various, applicable marketplaces. What we found was a consistent decline in product availability over the last six months compared to last year, alongside an increase in prices.

    Although retailers significantly improved stock availability in November and early December 2021, even digital commerce giants like Amazon and Target were challenged to maintain consistent product availability on their website as seen below. While small in magnitude, there is also a declining trend occurring again closer toward the end of our analysis period, post Cyber Weekend, across all websites included in our analysis.

    Inventory Availability 2021 Holidays
    Source: Commerce Intelligence – Product Availability insights for Home & Garden, Jewelry & Watches, Clothing & Shoes, Bed N Bath, Lighting & Ceiling Fans categories

    Greater Discounts, Higher Prices?

    With inflation at a thirty-nine year high, retailers and manufacturers have realized they can command higher prices without impacting demand as consumers have shown their willingness to pay the price, especially when threatened by product scarcity. Our assessment is that while some products and categories have responded drastically, manufacturers’ suggested retail prices (MSRPs) have increased nearly seven percent on average from January to December 2021. MSRP adjustments are not taken lightly either, as this is an indication increased prices will be part of a longer-term shift in product strategy.

    2021 MoM Retail Inflation Tracker
    Source: Commerce Intelligence – Pricing Insights for Bed & Bath, Electronics, Furniture, Healthy & Beauty, and Fashion categories on Amazon.com & Target.com each month in 2021 comparing price increases from January 2021 base

    Our 2021 pre-Cyber Weekend analysis reviewed MSRP changes for select categories (Bed & Bath, Electronics, Furniture, Healthy & Beauty, and Fashion) on Amazon and Target.com, and found around forty-eight percent of products on Amazon and thirty-five percent of products on Target.com have increased their MSRPs year-over-year, but kept pre-holiday discount percentages the same.

    Looking more specifically as to what year-over-year changes occurred on Black Friday in 2021, we observed MSRPs increasing across the board for all categories at various magnitudes. This indicates why 2021 discounts appeared to be greater than or equivalent to 2020 for many categories, when in reality consumers paid a higher price than they would have in 2020 for the same items.

    2021 Black Friday MSRP Increases
    Source: Commerce Intelligence – MSRP Pricing Insights for Bed & Bath, Electronics, Furniture, Healthy & Beauty, and Fashion categories on Black Friday November 27th, 2021, versus average MSRP pricing for the same SKU count from November 20-26th 2021

    On Amazon.com, categories like health & beauty have already increase MSRPs by a much greater percentage and magnitude versus Target.com leading up to and during Black Friday 2021, while other categories like furniture have increased MSRPs evenly on average across both retail websites. The below chart cites a few specific examples of year-over-year SKU-level MSRP, promotional price, and discount changes within found within the electronics, furniture, fashion, and health & beauty categories.

    Black Friday 2021 vs. 2020 SKU-level Price Changes
    Source: Commerce Intelligence – MSRP Pricing Insights for Bed & Bath, Electronics, Furniture, Healthy & Beauty, and Fashion categories on Black Friday November 27th, 2021, versus average MSRP pricing for the same SKUs on Black Friday November 26th, 2020.

    Fewer, but Deeper Discounts

    From October through early November 2021, fewer products were discounted compared to this same period in 2020, and the few that were saw much deeper discounts apart from the home improvement category. The most extreme example we saw in discounts offered was within furniture where only three percent of SKUs were on discount in 2021 compared to twenty-six percent in 2020. Interestingly, the magnitude of discount was also higher pre-Cyber Weekend 2021 versus 2020, but this trend was not exclusive to furniture and was also seen within electronics, health & beauty, and home improvement.

    Pre-Black Friday 2021 and 2020 SKUs on Discount and Magnitude
    Source: Commerce Intelligence – Pricing Insights for Bed & Bath, Electronics, Furniture, Healthy & Beauty, and Fashion categories on Amazon.com & Target.com Pre-Black Friday average selling price during November 20-26th 2021 versus average selling price from November 13-19th 2021 compared to Pre-Black Friday average selling price during November 19-25th 2020 versus average selling price from November 12-18th, 2020.

    Within the furniture category, the subcategories offering the greatest number of SKUs with price decreases on Black Friday 2021 were rugs by a wide margin, followed by cabinets, bed and bath, and entertainment units, but the magnitude of discounts offered were all under twenty percent.

    2021 Black Friday Furniture Category Price Decreases
    Source: Commerce Intelligence – Pricing Insights for Bed & Bath, Electronics, Furniture, Healthy & Beauty, and Fashion categories on Amazon.com and Target.com on Black Friday November 27th, 2021, versus average pricing for the same SKUs from Pre-Black Friday November 20-26th 2021 and Black Friday November 26th, 2020, versus average pricing for the same SKUs from Pre-Black Friday November 19th-25th 2020

    Accounting for this phenomenon could have been retailers’ attempts to clear inventory for SKUs which hadn’t sold even during the period of severe supply chain shortages. With more products selling at higher prices this year, retailers were also able to use fewer SKUs with greater discounts to attract buyer in hopes of filling their digital baskets with more full-priced goods, helping to protect margins heading in to Cyber Weekend. Scarcity threats also encouraged consumers to buy early, even when not on promotion, to ensure they would have gifts in time for the holidays.

    The same trends seen pre-Cyber Weekend 2021 were also seen on Black Friday with a year-over-year decrease in the percentage of SKUs offered on discount versus 2020, and steeper price reductions for the discounted products which can also be attributed to the increase in MSRPs.

    Black Friday 2021 and 2020 SKUs on Discount and Magnitude
    Source: Commerce Intelligence – Pricing Insights for Bed & Bath, Electronics, Furniture, Healthy & Beauty, and Fashion categories on Amazon.com and Target.com on Black Friday November 27th, 2021, versus average pricing for the same SKUs from Pre-Black Friday November 20-26th 2021 and Black Friday November 26th, 2020, versus average pricing for the same SKUs from Pre-Black Friday November 19th-25th 2020

    2021 Black Friday Price Increases?

    We all know Black Friday is all about price reductions, discounts and deals and so it’s rare to see actual price increases, yet for Black Friday 2021, trends ran counter to this. We observed price increases across all categories for around thirteen to nineteen percent of SKUs, with an average price increase of around fifteen percent in 2021 versus an average of only two percent in 2020.

    SKUs with Price Increases Black Friday 2021 and 2020
    Source: Commerce Intelligence – Pricing Insights for Bed & Bath, Electronics, Furniture, Healthy & Beauty, and Fashion categories on Amazon.com and Target.com on Black Friday November 27th, 2021, versus pricing for the same SKUs from Pre-Black Friday November 20-26th 2021 and Black Friday November 26th, 2020, versus average pricing for the same SKUs from Pre-Black Friday November 19th-25th 2020

    At an account level, we noticed a few interesting differences happening on Black Friday 2021 versus 2020 regarding category price changes. On Target.com, almost ninety percent of the bed and bath SKUs analyzed had a price change on Black Friday in 2021 versus 2020 with eighty-two percent presenting a higher price year-over-year versus only around seven percent showing a decrease, where on Amazon nearly forty-four percent of bed and bath SKUs showed an increase in price and around thirty-eight percent showed a decrease. Except for the health and beauty category on Target.com, more than half of the SKUs in each category saw a price increase on Black Friday versus a price decrease.

    2021 YoY Price Changes on Black Friday
    Source: Commerce Intelligence – Pricing Insights for Bed & Bath, Electronics, Furniture, Healthy & Beauty, and Fashion categories on Amazon.com and Target.com on Black Friday November 27th, 2021, versus average pricing for the same SKUs on Black Friday November 26th, 2020.

    The magnitude of year-over-year price changes seen on Black Friday 2021 was significant across all categories, but the magnitude of price increases found on Amazon.com within the health and beauty category outpaced the rest by far. We reviewed three hundred and sixty-five SKUs on Amazon.com within the health & beauty category and saw almost eighty-three percent of them had a price change with around thirty-one percent decreasing prices and around fifty-two percent increasing prices. This means that within the health & beauty category on Amazon.com, more than fifty percent of the SKUs tracked were sold at a one hundred and seventy-six percent higher price on average during Black Friday 2021 versus 2020.

    Magnitude of Black Friday 2021 Price Increases
    Source: Commerce Intelligence – Pricing Insights for Bed & Bath, Electronics, Furniture, Healthy & Beauty, and Fashion categories on Amazon.com and Target.com on Black Friday November 27th, 2021, versus average pricing for the same SKUs on Black Friday November 26th, 2020.

    The subcategories offering the greatest number of SKUs with price increases on Black Friday 2021 were cameras, followed by men’s fragrances, laptops, and desktops & accessories, but the magnitude of discounts offered were all under ten percent.

    2021 Subcategories with Price Increases during Black Friday
    Source: Commerce Intelligence – Pricing Insights for Bed & Bath, Electronics, Furniture, Healthy & Beauty, and Fashion categories on Amazon.com and Target.com on Black Friday November 27th, 2021, versus pricing for the same SKUs from Pre-Black Friday November 20-26th 2021 and Black Friday November 26th, 2020, versus average pricing for the same SKUs from Pre-Black Friday November 19th-25th 2020

    The Aftermath Post-2021 Cyber Weekend

    Extending this analysis beyond the holiday weekend, we analyzed price change activity from December third through the ninth across the top US retailers (chart below) and found that price decreases have been very minimal, comparatively speaking. Though there was a spike in number of price decreases from December 8th to the 9th, the percentage of SKUs with price decreases was still very low (less than three percent). We anticipate this trend will continue into 2022.

    SKUs with Price Decrease Post Cyber Weekend 2021
    Source: Commerce Intelligence – Pricing insights for Home & Garden, Jewelry & Watches, Clothing & Shoes, Bed N Bath, Lighting & Ceiling Fans categories

    A Sign of Things to Come

    A confluence of inflationary trends, product shortages and consumer liquidity have driven many marketplace changes to occur simultaneously. Government programs in the form of stimulus checks, have put extra money in consumers’ hands, and so they’ve been more willing to spend. That, coupled with the shock in the supply chain, has motivated people to buy far ahead of the 2021 holiday season. Hence, retailers have needed to rely much less on across-the-board discounts. Promotions have been more strategic – we’ve seen deeper discounts over fewer products, likely used to draw consumers in to buy certain items, and once they’re there, customers are buying everything else at a non-discount level. When these factors once again normalize, we could see a return to the “race to the bottom” that has occurred since the financial crisis of 2008-2009, but for once, retailers may be able to maintain some pricing power as the 2021 holiday shopping season played out.

    Even though performance was not as anticipated and holiday sales did not grow as rapidly as they did in 2020, Cyber Monday was still the greatest online shopping day in 2021. Through it all, retailers managed to keep their digital shelves stocked and orders filled in time for the holidays for the most part, running the risk of housing aged inventory if goods didn’t arrive in time. Despite predictions for steep promotions in January 2022, with supply chains still challenged and inflationary pressures still full steam ahead, we don’t anticipate much in the way of enhanced discounts to continue beyond the holidays.

    Access to these types of real-time digital marketplace insights can enable retailers and brands to make strategic decisions like how and when to address inflationary pressures, while also supporting many other day-to-day operations and help drive profitable growth in an intensifying competitive environment. Continue to follow us in the coming weeks for a detailed 2021 year-end review across more retailers and categories. Be sure to reach out to our Retail Analytics experts for access to more details regarding the above analysis.         

  • How Brands Can Outperform Rivals With Next-Gen Digital Shelf Analytics

    How Brands Can Outperform Rivals With Next-Gen Digital Shelf Analytics

    As eCommerce grows in complexity, brands need new ways to grow sales and market share. Right now, brands face urgent market pressures like out-of-stocks, an influx of new competition and rising inflation, all of which erode profitability. As online marketplaces mature, more brands need to make daily changes to their digital marketing strategies in response to these market pressures, shifts in demand, and competitive trends.

    eMarketer forecasts 2021 U.S. eCommerce will rise nearly 18% year-over-year (vs. 6.3% for brick-and-mortar), led by apparel and accessories, furniture, food and beverage, and health and personal care. The eCommerce industry is also undergoing fundamental changes with newer entities emerging and traditional business models evolving to adapt to the changed environment. For example, sales for delivery intermediaries such as Doordash, Instacart, Shipt, and Uber have gone from $8.8 billion in 2019 to an estimated $35.3 billion by the end of 2021. Similarly, many brands have established or are building out a Direct to Consumer (D2C) model so they can fully own and control their customer’s experiences.

    In response, DataWeave has launched the next generation of our Digital Shelf Analytics suite to help brands across retail categories directly address today’s costly market risks to drive eCommerce growth and gain a competitive advantage.

    Our new enhancements help brands improve online search rank visibility and quantify the impact of digital investments – especially in time for the busy holiday season.”  
    ~ Karthik Bettadapura, CEO and co-founder, DataWeave

    The latest product enhancements provide brands access to tailored dashboard views that track KPI achievements and trigger actionable alerts to improve online search rank visibility, protect product availability and optimize share of search 24/7. Dataweave’s Digital Shelf Analytics platform works seamlessly across all forms of eCommerce platforms and models – marketplaces, D2C websites and delivery intermediaries.

    Dashboard for Multiple Functions

    While all brands share a common objective of increasing sales and market share, their internal teams are often challenged to communicate and collaborate, given differing needs for competitive and performance data across varying job functions. As a result, teams face pressure to quickly grasp market trends and identify what’s holding their brands back.

    In response, DataWeave now offers executive-level and customized scorecard views, tailored to each user’s job function, with the ability to measure and assess marketplace changes across a growing list of online retail channels for metrics that matter most to each user. This enhancement enables data democratization and internal alignment to support goal achievement, such as boosting share of category and content effectiveness. The KPIs show aggregated trends, plus granular reasons that help to explain why and where brands can improve.

    Brands gain versatile insights serving users from executives to analysts and brand and customer managers.

    Prioritized, Actionable Insights

    As brands digitize more of their eCommerce and digital marketing processes, they accumulate an abundance of data to analyze to uncover actionable insights. This deluge of data makes it a challenge for brands to know exactly where to begin, create a strategy and determine the right KPIs to set to measure goal accomplishment.

    DataWeave’s Digital Shelf Analytics tool enables brands to effectively build a competitive online growth strategy. To boost online discoverability (Share of Search), brands can define their own product taxonomies across billions of data points aggregated across thousands of retailer websites. They can also create customized KPIs that track progress toward goal accomplishment, with the added capability of seeing recommended courses of action to take via email alerts when brands need to adjust their eCommerce plans for agility.

    “Brands need an integrated view of how to improve their discoverability
    and share of search by considering all touchpoints in the digital commerce ecosystem.”

    ~ Karthik Bettadapura, CEO and co-founder, DataWeave

    Of vital importance, amid today’s global supply chain challenges, brands gain detailed analysis on product inventory and availability, as well as specific insights and alerts that prompt them to solve out-of-stocks faster, which Deloitte reports is a growing concern of consumers (75% are worried about out-of-stocks) this holiday season.

    User and system generated alerts provide clarity to actionable steps to improving eCommerce effectiveness.
    You also have visibility to store-level product availability, and are alerted to recurring out-of-stock experiences.

    Scalable Insights – From Bird’s Eye to Granular Views

    DataWeave’s Digital Shelf Analytics allows brands to achieve data accuracy at scale, including reliable insights from a top-down and bottom-up perspective. For example, you can see a granular view of one SKUs product content alongside availability, or you can monitor a group of SKUs, say your best selling ones, at a higher level view with the ability to drill down into more detail.

    Brands can access flexible insights, ranging from strategic overviews to finer details explaining performance results.

    Many brands struggle with an inability to scale from a hyper-local eCommerce strategy to a global strategy. Most tools available on the market solve for one or the other, addressing opportunities at either a store-level basis or top-down basis – but not both.

    According to research by Boston Consulting Group and Google, advanced analytics and AI can drive more than 10% of sales growth for consumer packaged goods (CPG) companies, of which 5% comes directly from marketing. With DataWeave’s advanced analytics, AI and scalable insights, brands can set and follow global strategies while executing changes at a hyper-local level, using root-cause analysis to drill deeper into problems to find out why they are occurring.

    As more brands embrace eCommerce and many retailers localize their online assortment strategies, the need for analytical flexibility and granular visibility to insights becomes increasingly important. Google reports that search terms “near me” and “where to buy” have increased by more than 200% among mobile users in the last few years, as consumers seek to buy online locally.

    e-Retailers are now fine-tuning merchandising and promotional strategies at a hyper-local level based on differences seen in consumer’s localized search preferences, and DataWeave’s Digital Shelf Analytics solution provides brands visibility to retailer execution changes in near real-time.

    Competitive Benchmarking

    Brand leaders cannot make sound decisions without considering external factors in the competitive landscape, including rival brands’ pricing, promotion, content, availability, ratings and reviews, and retailer assortment. Dataweave’s Digital Shelf Analytics solution allows you to monitor share of search, search rankings and compare content (assessing attributes like number of images, presence of video, image resolution, etc.) across all competitors, which helps brands make more informed marketing decisions.

    Brands are also provided visibility into competitive insights at a granular level, allowing them to make actionable changes to their strategies to stay ahead of competitors’ moves. A new module called ‘Sales and Share’ now enables brands to benchmark sales performance alongside rivals’ and measure market share changes over time to evaluate and improve competitive positioning.

    Monitor competitive activity, spot emerging threats and immediately see how your performance compares to all rivals’, targeting ways to outmaneuver the competition.

    Sales & Market Share Estimates Correlated with Digital Shelf KPIs

    In a brick-and-mortar world, brands often use point of sale (POS) based measurement solutions from third party providers, such as Nielsen, to estimate market share. In the digital world, it is extremely difficult to get such estimates given the number of ways online orders are fulfilled by retailers and obtained by consumers. Dataweave’s Digital Shelf Analytics solution now provides sales and market share estimates via customer defined taxonomy, for large retailers like Amazon. Competitive sales and market share estimates can also be obtained at a SKU level so brands can easily benchmark their performance results.

    Additionally, sales and market share data can also be correlated with digital shelf KPIs. This gives an easy way for brands to check the effect of changes made to attributes, such as content and/or product availability, and how the changes impact sales and market share. Similarly, brands can see how modified search efforts, both organic and sponsored, correspond to changes in sales and market share estimates.

    Take Your Digital Shelf Growth to the Next Level

    The importance of accessing flexible, actionable insights and responding in real-time is growing exponentially as online is poised to account for an increasing proportion of brands’ total sales. With 24/7 digital shelf accessibility among consumers comes 24/7 visibility and the responsibility for brands to address sales and digital marketing opportunities in real-time to attract and serve online shoppers around the clock.

    Brands are turning to data analytics to address these new business opportunities, enhance customer satisfaction and loyalty, drive growth and gain a competitive advantage. Companies that adopt data-driven marketing strategies are six times more likely to be profitable year-over-year, and DataWeave is here to help your organization adopt these practices. To capitalize on the global online shopping boom, brands must invest in a digital shelf analytics solution now to effectively build their growth strategies and track measurable KPIs.

    DataWeave’s next-gen Digital Shelf Analytics enhancements now further a brand’s ability to monitor, analyze, and determine systems that enable faster and smarter decision-making and sales performance optimization. The results delight consumers by helping them find products they’re searching for, which boosts brand trust.

    Connect with us to learn how we can scale with your brand’s analytical needs. No project or region is too big or small, and we can start where you want and scale up to help you stay agile and competitive.

  • Top 10 Retail Analytics that You Must Know

    Top 10 Retail Analytics that You Must Know

    Customers expect personalization. Unless they have a seamless experience on your online channels, they’ll leave for a different retailer. Retail analytics can solve these problems for merchants looking to increase customer satisfaction and sales. It provides insights into inventory, sales, customers, and other essential aspects crucial for decision-making. Retail analytics also encompasses several granular fields to create a broad picture of a retail business’s health and sales, along with improvement areas.

    Big data analytics in the retail market
    Big data analytics in the retail market

    Big data analytics in the retail market is expected to reach USD 13.26 billion by the end of 2026, registering a CAGR of 21.20% during the forecast period (2021-2026). The growth of analytics in retail depicts how it can help companies run businesses more efficiently, make data-backed choices, and deliver improved customer service.

    In this blog, we’ll discuss the top 10 analytics that retailers are using to gain a competitive advantage in accurately evaluating business & market performance.

    Top 10 of Retail Analytics You Must Know
    Top 10 of Retail Analytics You Must Know

    1. Assortment

    Assortment planning allows retailers to choose the right breadth (product categories) and depth (product variation within each category) for their retail or online stores. Assortment management has grown beyond simple performance metrics like total sales or rotation numbers. Instead, retail analytics offers a comprehensive analysis of product merchandise and an estimated number of units at the push of a button. Retailers that effectively apply assortment analytics can enjoy increased gross margins and prevent significant losses from overstocks sold at discounted prices or out-of-stock inventory leading their customers to buy from competitors. 

    It also helps retailers gain insights into the trendy and discoverable brands and products on all e-commerce websites across the globe. They can boost sales by making sure they have an in-demand product assortment. They can also track pricing information and attributes common across popular products to drive their pricing and promotion strategies.

    2. Inventory Management

    An inadequately maintained inventory is every retailer’s worst nightmare. It represents a poor indicator of inadequate demand for a product and leads to a loss in sales. Data can help companies answer issues like what to store and what to discard. It’s beneficial to discard or increase offers on products that are not generating sales and keep replenished stocks of popular items. 

    Worldwide Inventory Distribution

    In 2020, the estimated value for out-of-stock items ($1.14 trillion) was double that of overstock items ($626 billion). A similar trend was especially prominent in grocery stores, where out-of-stock items were worth five times more than overstock items.

    Unavailability of high-selling products can lead to reduced sales, ultimately generating incorrect data for future forecasting and producing skewed demand and supply insights. Retailers can now use analytics to identify which products are in demand, which are moving slowly, and which ones contribute to dead stock. They can know in real-time if a high-demand product is unavailable at a specific location and take action to increase the stock. Retailers can use this historical data to predict what to stock, at what place, time, and cost to maintain and optimize revenue. It helps satisfy consumer needs, prevents loss of sales, reduces inventory cost, and streamlines the complete supply chain.

    3. Competitive Intelligence

    Market intelligence & Competitive Insights
    Market intelligence & Competitive Insights

    The ability to accurately predict trends after the global pandemic and with an unknown economic future is becoming the cornerstone for successful retailers. Smart retailers know how important it is to Pandemic-Proof their retail strategy with Market Intelligence & Competitive Insights 

    With 90% of Fortune 500 companies using competitive intelligence, it’s an essential tool to gain an advantage over industry competitors. Competitive Intelligence allows you to gather and analyze information about your competitors and understand the market–providing valuable insights that you can apply to your own business. A more strategic competitor analysis will explain brand affinities and provide insights on what to keep in stock and when to start promotions. Customer movement data will also give you access to where your customers are shopping.

    4. Fraud Detection

    Fraud Detection
    Fraud Detection

    Retailers have been in a constant struggle with fraud detection and prevention since time immemorial. Fraudulent products lead to substantial financial losses and damage the reputation of both brands and retailers. Every $1 of fraud now costs U.S. retail and eCommerce merchants $3.60, a 15% growth since the pre-Covid study in 2019, which was $3.13. Retail Analytics acts as a guardian against fraudsters by constantly monitoring, identifying, and flagging fraud products and sellers. 

    5. Campaign Management

    Some of the challenges of the retail industry are that it’s seasonal, promotion-based, highly competitive, and fast-moving. In today’s competitive marketplace, consumers compare prices and expect personalized shopping experiences. Campaign management allows marketing teams to plan, track, and analyze marketing strategies for promoting products and attracting audiences. Retail analytics can help businesses predict consumer behavior, improve decision-making across the company, and determine the ROI of their marketing efforts. 

    According to Invesp, 64% of marketing executives “strongly agree” that data-driven marketing is crucial in the economy. Retail analytics can help businesses analyze their data to learn about their customers with target precision. With predictive analysis, retailers can design campaigns that encourage consumers to interact with the brand, move down the sales funnel, and ultimately convert.

    6. Behavioral Analytics

    Retail firms often look to improve customer conversion rates, personalize marketing campaigns to increase revenue, predict and avoid customer churn, and lower customer acquisition costs. Data-driven insights on customer shopping behaviors can help companies tackle these challenges. However, several interaction points like social media, mobile, e-commerce sites, stores, and more, cause a substantial increase in the complexity and diversity of data to accumulate and analyze. 

    Insider Intelligence forecasts that m-eCommerce volume will rise at 25.5% (CAGR) until 2024, hitting $488 billion in sales, or 44% of all e-commerce transactions. 

    Data can provide valuable insights, for example, recognizing your high-value customers, their motives behind the purchase, their buying patterns, behaviors, and which are the best channels to market to them and when. Having these detailed insights increases the probability of customer acquisition and perhaps drives their loyalty towards you. 

    7. Pricing

    competitive pricing in retail
    Competitive pricing in retail

    Market trends fluctuate at an unprecedented pace, and pricing has become as competitive as it’s ever been. The only way to keep up with competitive pricing in retail is to use retail analytics that enables retailers to drive more revenue & margin by pricing products competitively

    A report from Inside Big Data found companies experience anywhere from 0.5% up to 17.1% in margin loss purely because of pricing errors. Pricing analytics provides companies with the tools and methods to perceive better, interpret and predict pricing that matches consumer behavior. Appropriate pricing power comes from understanding what your consumers want, which offers they respond to, how and where they shop, and how much they will pay for your products. 

    In 2021, the price optimization segment is anticipated to own the largest share of the overall retail analytics market. Retailers can identify gaps and set alerts to track changes across crucial SKUs or products with pricing analytics. Knowing your customer’s price perception will increase sales and also allow you to design promotions that’ll attract customers. Pricing analytics also accounts for factors like demographics, weather forecasting, inventory levels, real-time sales data, product movement, purchase history, and much more to arrive at an excellent price.  

    8. Sales and Demand Forecasting

    Sales and demand forecasting allow retailers to plan for levels of granularity—monthly, weekly, daily, or even hourly—and use the insights in their marketing campaigns and business decisions. The benefits of a granular forecast are apparent since retailers don’t have to bank on historical data of previous clients and customers to predict revenues. Retailers can plan their strategies and promotions that suit their customer’s demands. 

    With sales and demand forecasting, retailers can also consider the most recent, historical, and real-time data to predict potential future revenue. Sales and demand analytics can predict buying patterns and market trends based on socioeconomic and demographic conditions. 

    9. Customer Service and Experience

    With the development of eCommerce, more and more customers prefer to browse and interact with the product before purchasing online. They look for better deals and discounts across stores and platforms. 3 out of 5 consumers say retail’s investment in technology is improving their online and in-store shopping experiences. To enhance merchandising and marketing strategies, retailers can gather data on customer buying journeys to understand their in-store and online experiences. 

    Retailers can run test campaigns to know the impact on sales and use historical data to predict consumers’ needs based on their demographics, buying patterns, and interests. Retail analytics help retailers to bring more efficiency in promotions and drive impulsive purchases and cross-selling.

    10. Promotion

    Analyze competitors' promotions
    Analyze Competitors’ Promotions

    Promotions are potent sales drivers and need to be cleverly targeted towards specific customers with precise deals to generate outstanding sales. Retail analytics allows companies to study their customers and competitors to a vastly elevated level. 

    To be an industry leader, retail companies not only have to understand their customers, but they must also analyze competitors’ promotions to improve their marketing strategies. Analyzing your competitor’s promotional banners, ads, and marketing campaigns are no more associated with imitation. 

    With data analytics and AI, retailers can watch their competitors’ commercialization strategies. It can uncover vital information about their target audience, sales volume fluctuations, popular seasonal product types, product attributes of popular items, and significant industry trends.  Knowing exactly which products and brands are popular among your competitor’s campaigns can help retailers improve their promotional strategies. 

    Conclusion

    The benefits of retail analytics are spread across various verticals, from merchandising, assortment, inventory management, and marketing to reducing losses. The need for analytics has become even more apparent considering the growing eCommerce platforms, changing customer buying journeys, and the complexity of the industry. Understanding which products sell best among which customers will help retailers to deliver an optimized shopping experience.

    Want to drive profitable growth by making smarter pricing, promotions, and product merchandising decisions using real-time retail insights? DataWeave’s AI-powered Competitive Intelligence can help! Reach out to our Retail Analytics experts to know more.