Business has been anything but usual this holiday season, especially in the digital retail world. The holiday hustle and bustle historically seen in stores was once again occurring online, but not as anticipated given the current strength of consumer demand and the reemergence of COVID-19 limiting in-store traffic. While ‘Cyber Weekend’, Thanksgiving through Cyber Monday, continues to further its importance to retailers and brands, this year’s performance fell short of expectation due to product shortages and earlier promotions that pulled forward holiday demand.
Holiday promotions were seen beginning as early as October in order to compete with 2020 Prime Day sales, but discounting, pricing and availability took an opposite direction from usual. This shift influenced our team to get a jump start on our 2021 digital holiday analysis to assess how drastic the changes were versus 2020 activity, and to understand how much of this change has been influenced by inflationary pressures and product scarcity.
Scarcity Becomes a Reality
Our initial analysis started by reviewing year-over-year product availability and pricing changes from January through September 2021, leading up to the holiday season, as detailed in our 2021 Cyber Weekend Preliminary Insights blog. We reviewed popular holiday categories like apparel, electronics, and toys, to have a broad sense of notable trends seen consistently throughout various, applicable marketplaces. What we found was a consistent decline in product availability over the last six months compared to last year, alongside an increase in prices.
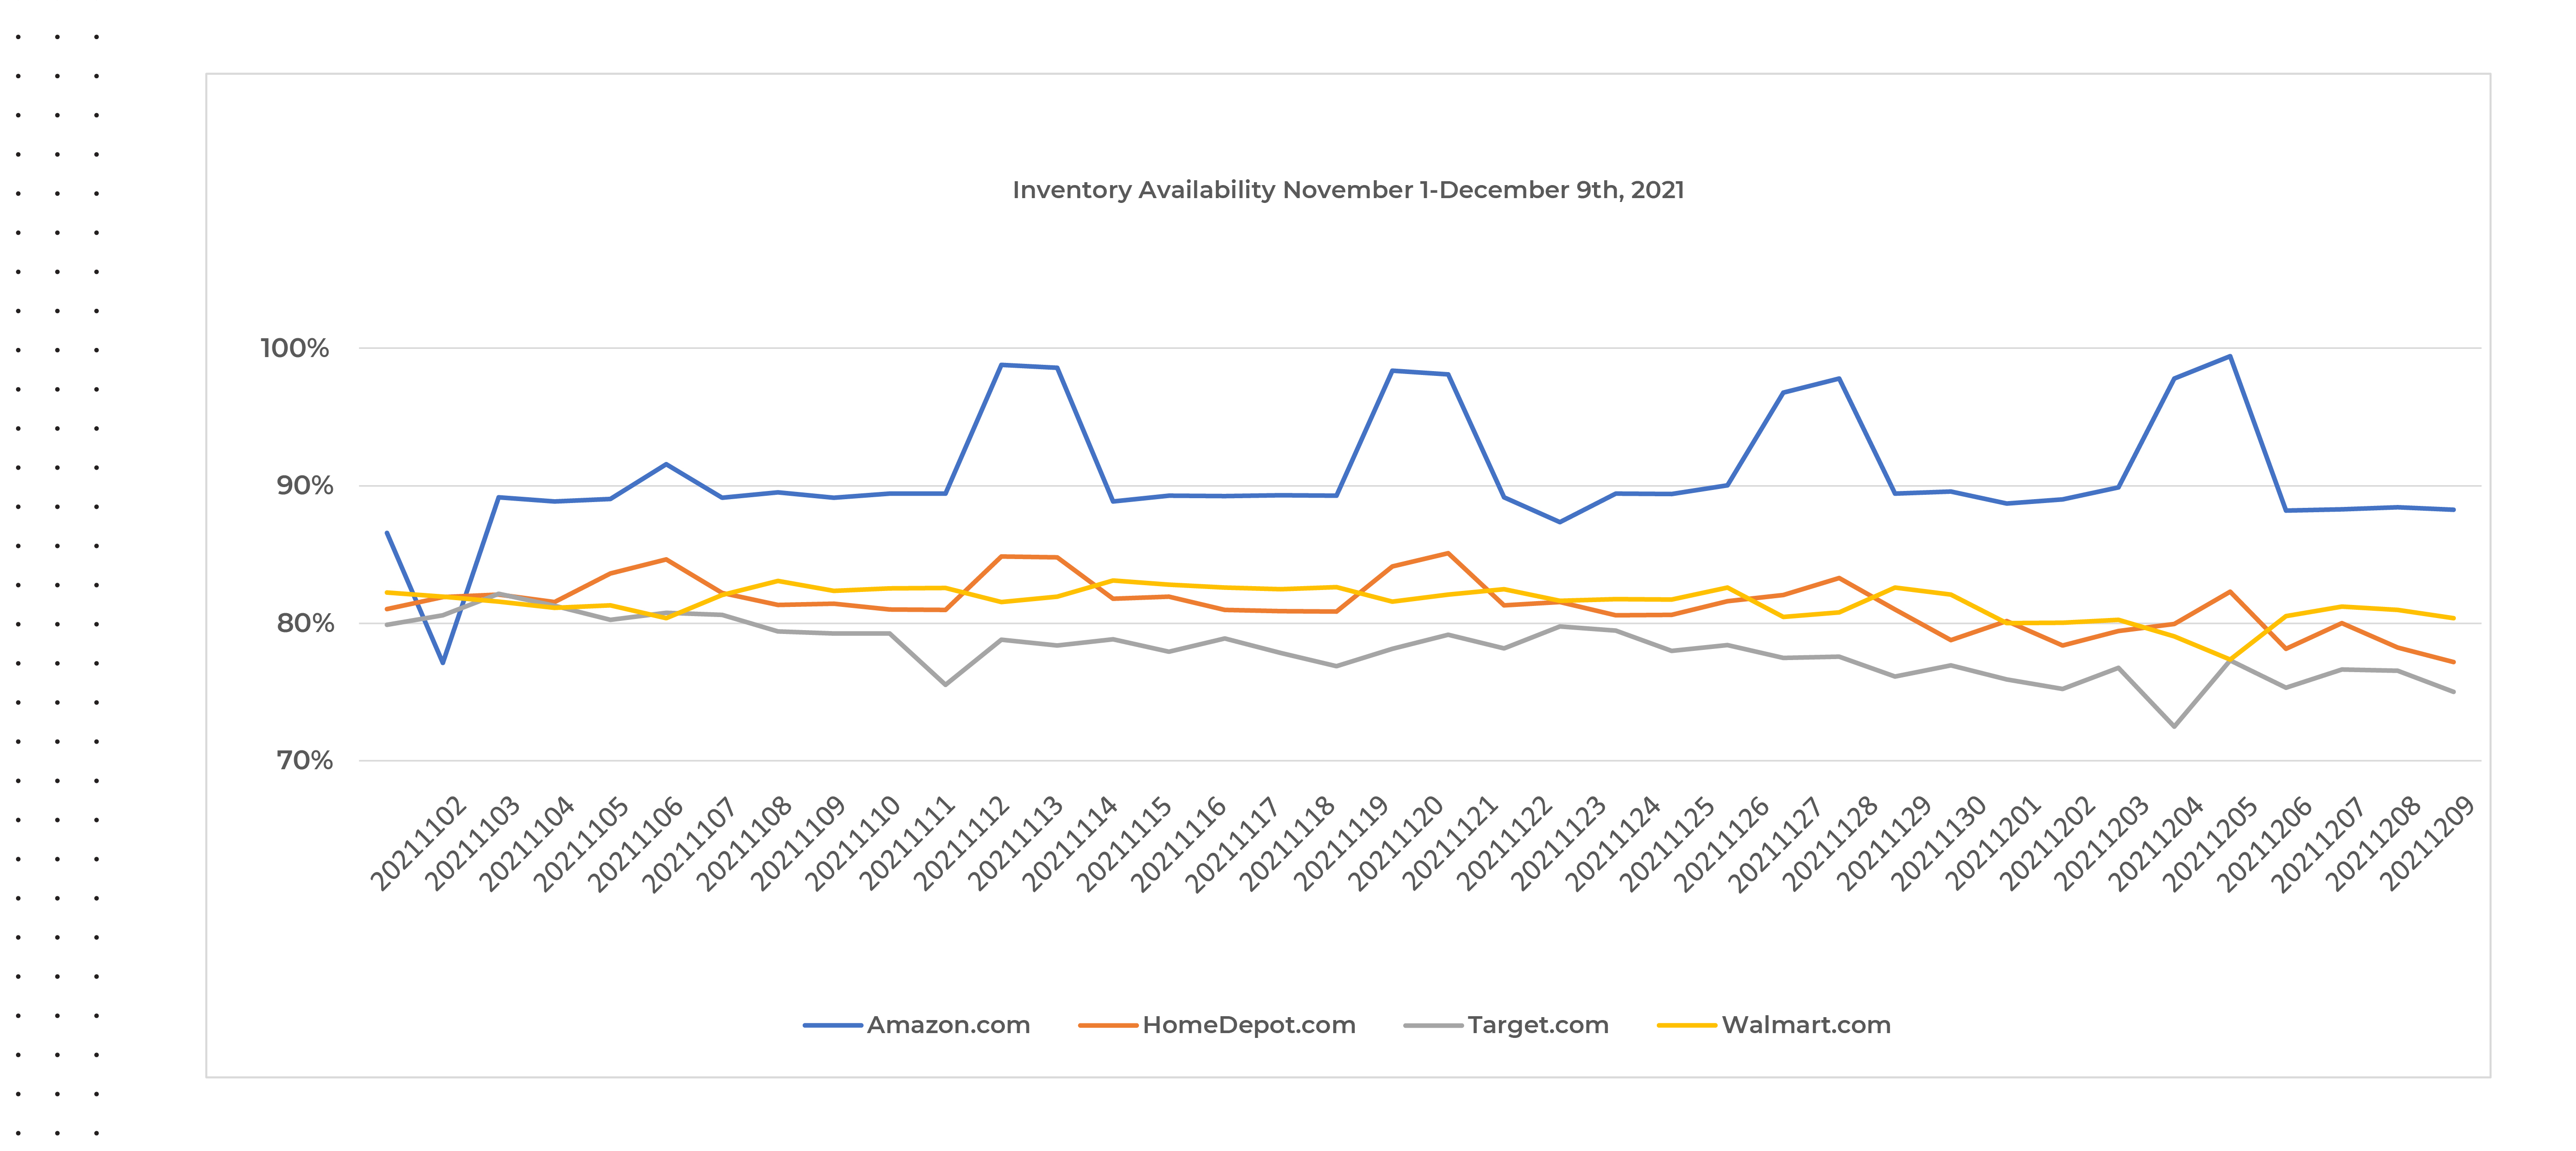
Although retailers significantly improved stock availability in November and early December 2021, even digital commerce giants like Amazon and Target were challenged to maintain consistent product availability on their website as seen below. While small in magnitude, there is also a declining trend occurring again closer toward the end of our analysis period, post Cyber Weekend, across all websites included in our analysis.
Source: Commerce Intelligence – Product Availability insights for Home & Garden, Jewelry & Watches, Clothing & Shoes, Bed N Bath, Lighting & Ceiling Fans categories
Greater Discounts, Higher Prices?
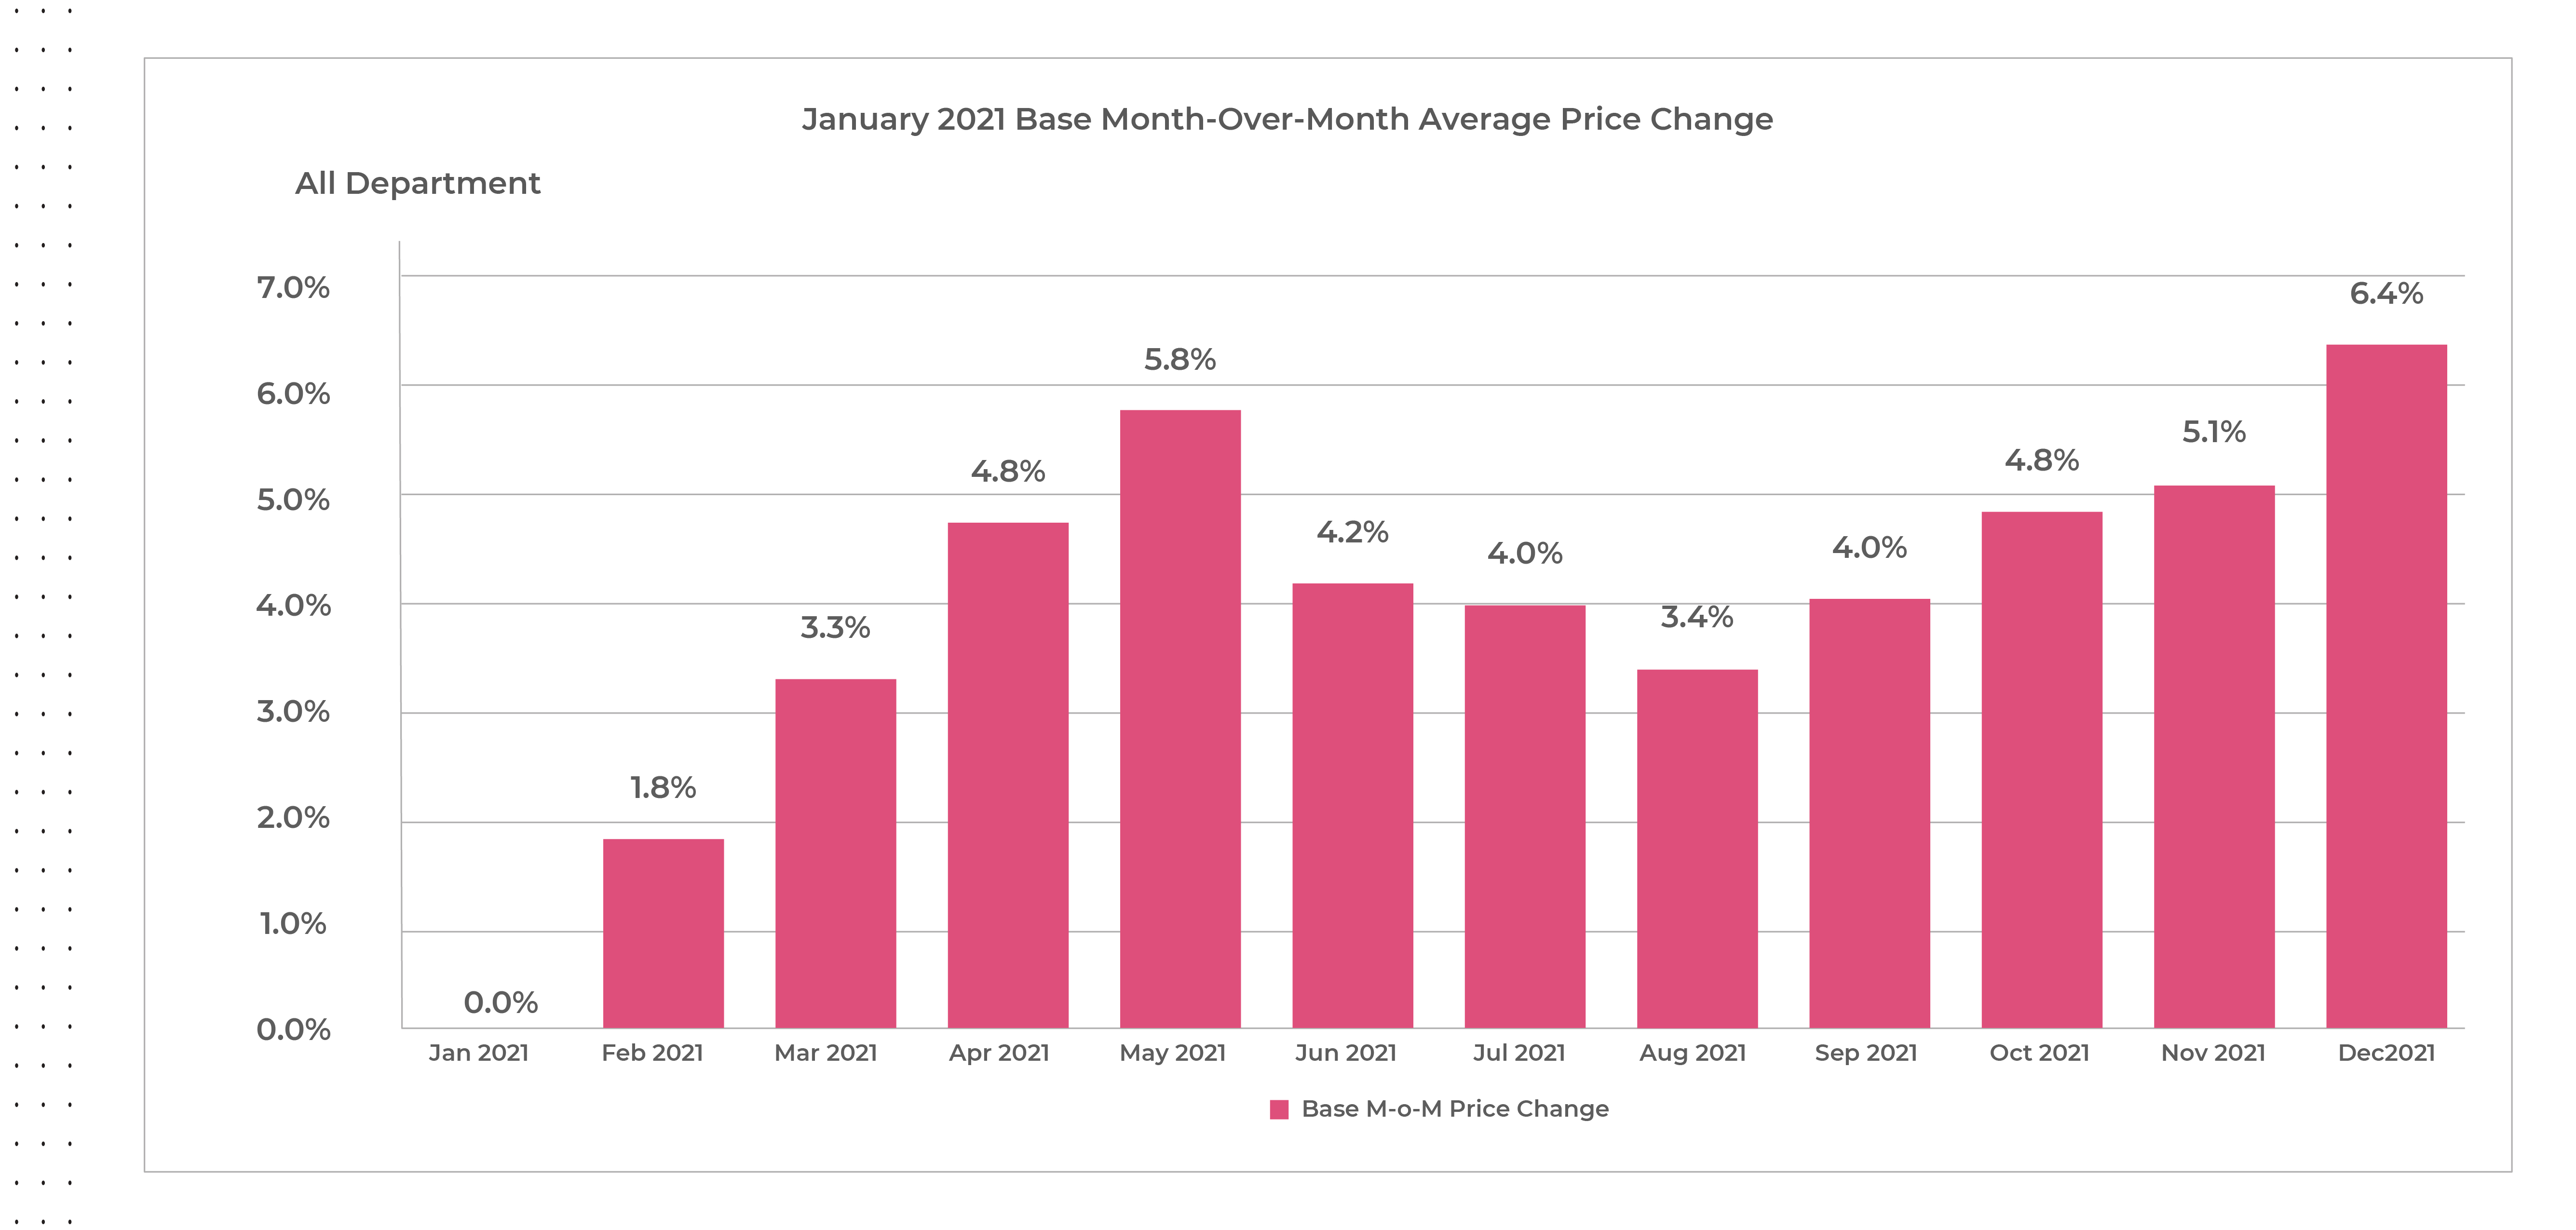
With inflation at a thirty-nine year high, retailers and manufacturers have realized they can command higher prices without impacting demand as consumers have shown their willingness to pay the price, especially when threatened by product scarcity. Our assessment is that while some products and categories have responded drastically, manufacturers’ suggested retail prices (MSRPs) have increased nearly seven percent on average from January to December 2021. MSRP adjustments are not taken lightly either, as this is an indication increased prices will be part of a longer-term shift in product strategy.
Source: Commerce Intelligence – Pricing Insights for Bed & Bath, Electronics, Furniture, Healthy & Beauty, and Fashion categories on Amazon.com & Target.com each month in 2021 comparing price increases from January 2021 base
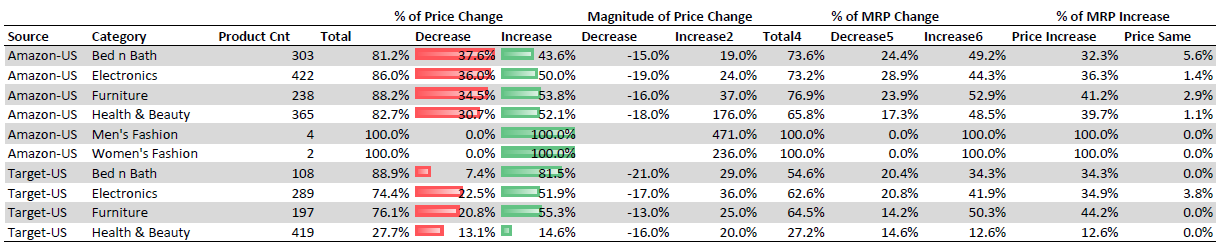
Our 2021 pre-Cyber Weekend analysis reviewed MSRP changes for select categories (Bed & Bath, Electronics, Furniture, Healthy & Beauty, and Fashion) on Amazon and Target.com, and found around forty-eight percent of products on Amazon and thirty-five percent of products on Target.com have increased their MSRPs year-over-year, but kept pre-holiday discount percentages the same.
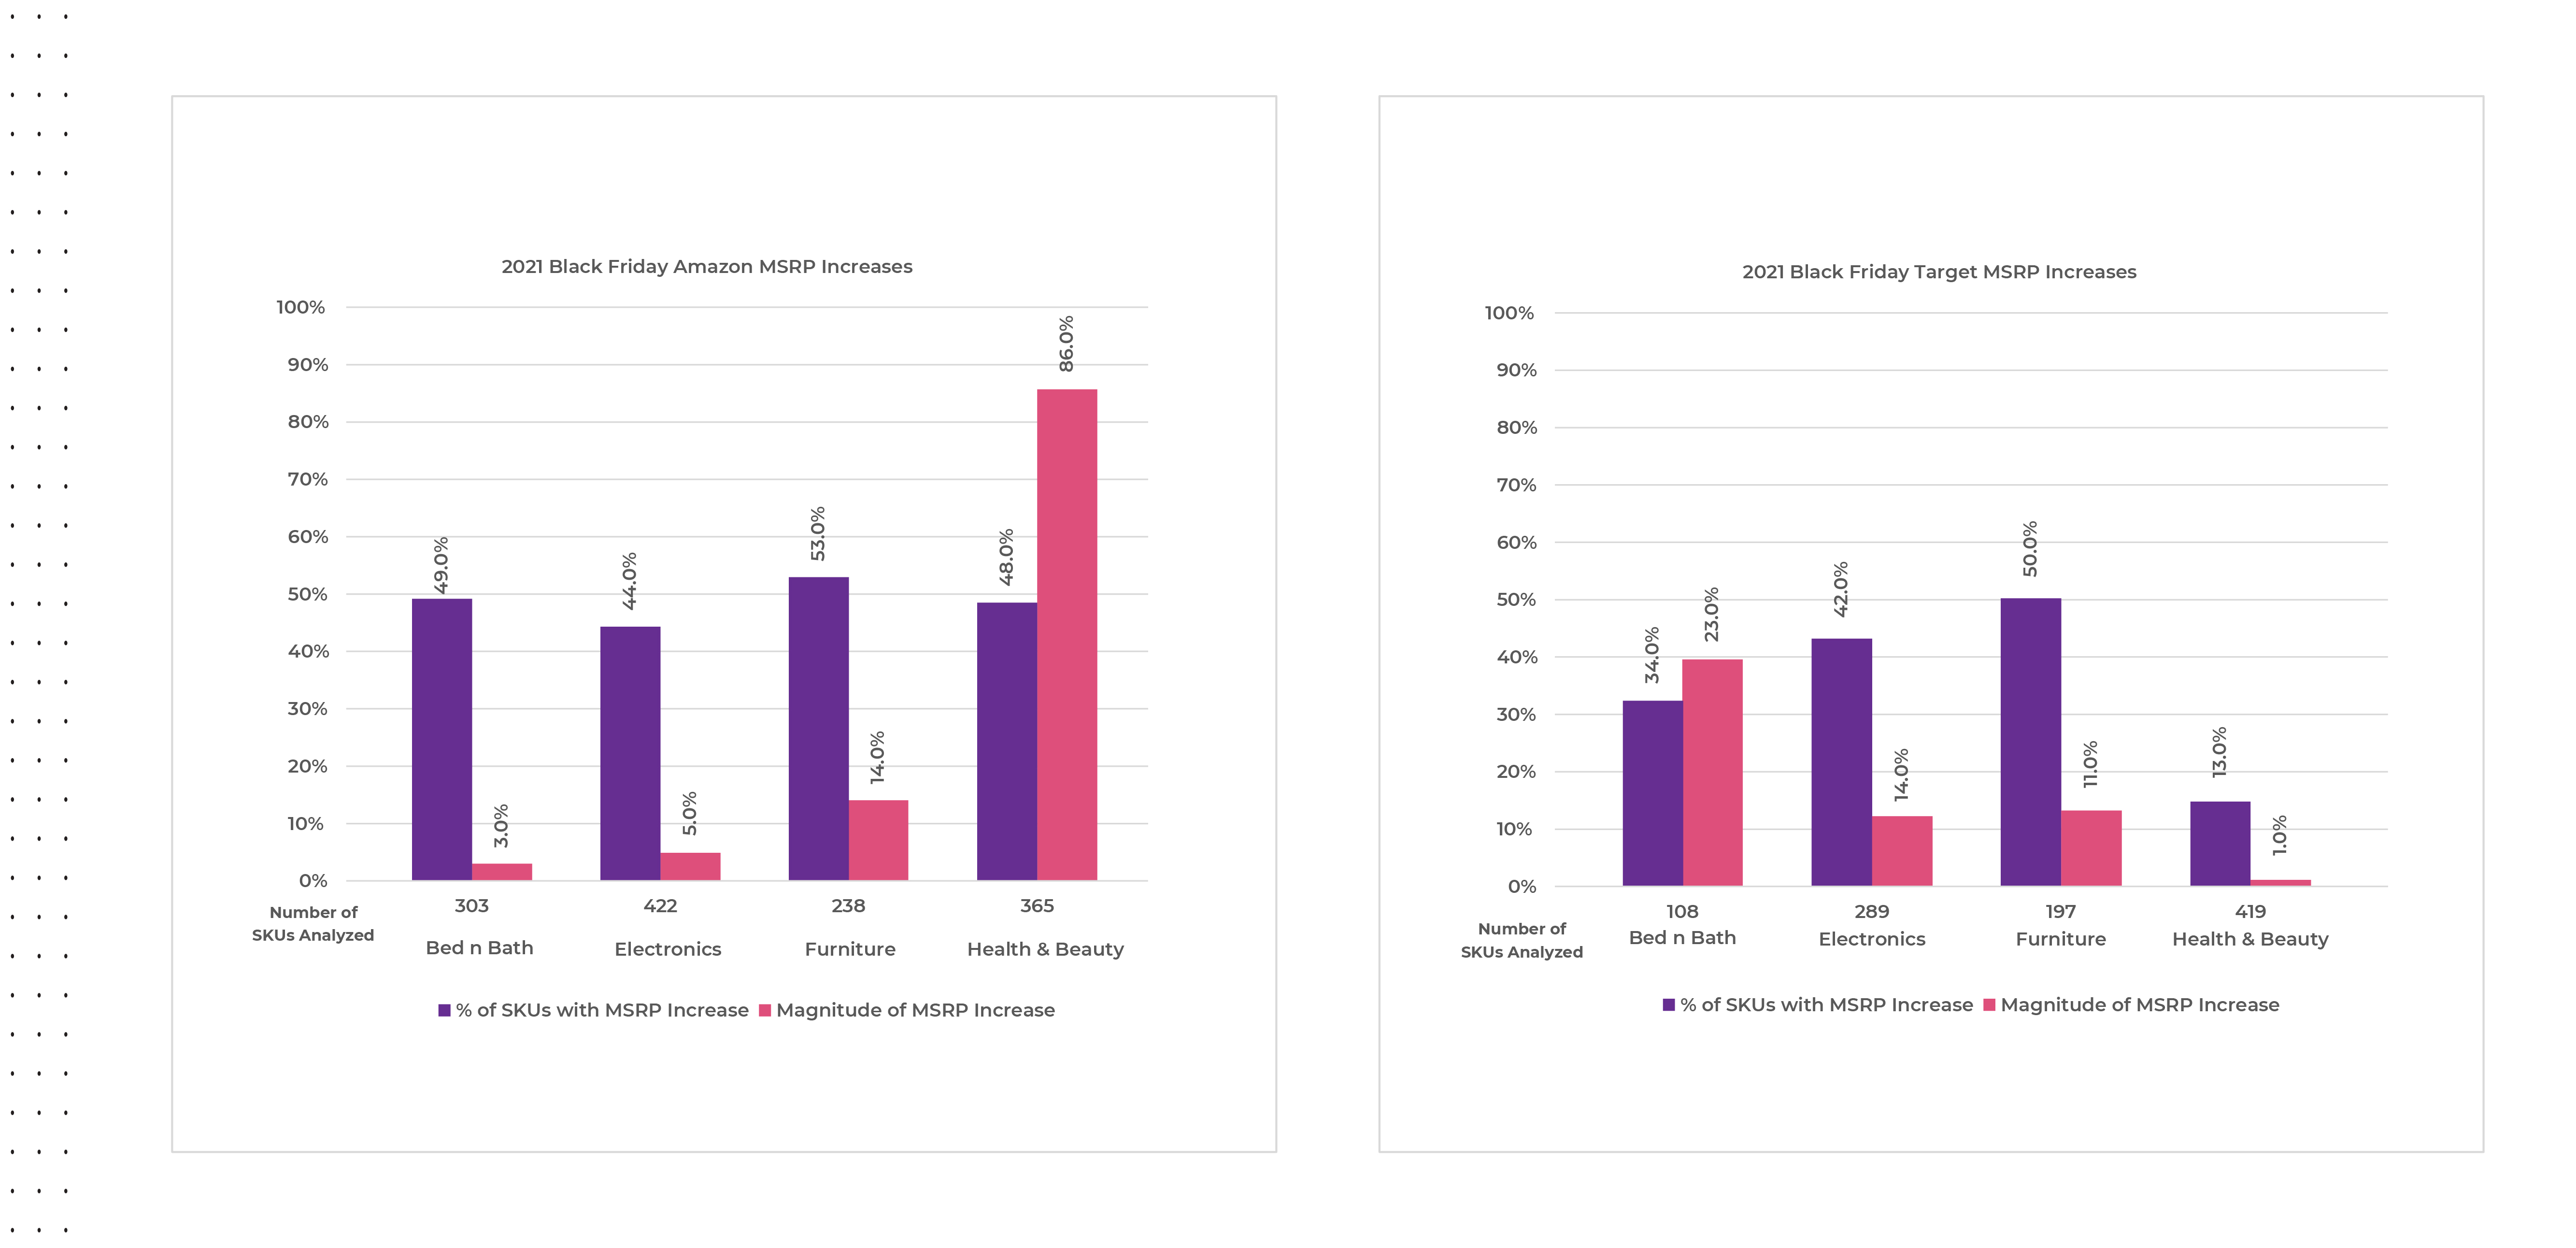
Looking more specifically as to what year-over-year changes occurred on Black Friday in 2021, we observed MSRPs increasing across the board for all categories at various magnitudes. This indicates why 2021 discounts appeared to be greater than or equivalent to 2020 for many categories, when in reality consumers paid a higher price than they would have in 2020 for the same items.
Source: Commerce Intelligence – MSRP Pricing Insights for Bed & Bath, Electronics, Furniture, Healthy & Beauty, and Fashion categories on Black Friday November 27th, 2021, versus average MSRP pricing for the same SKU count from November 20-26th 2021
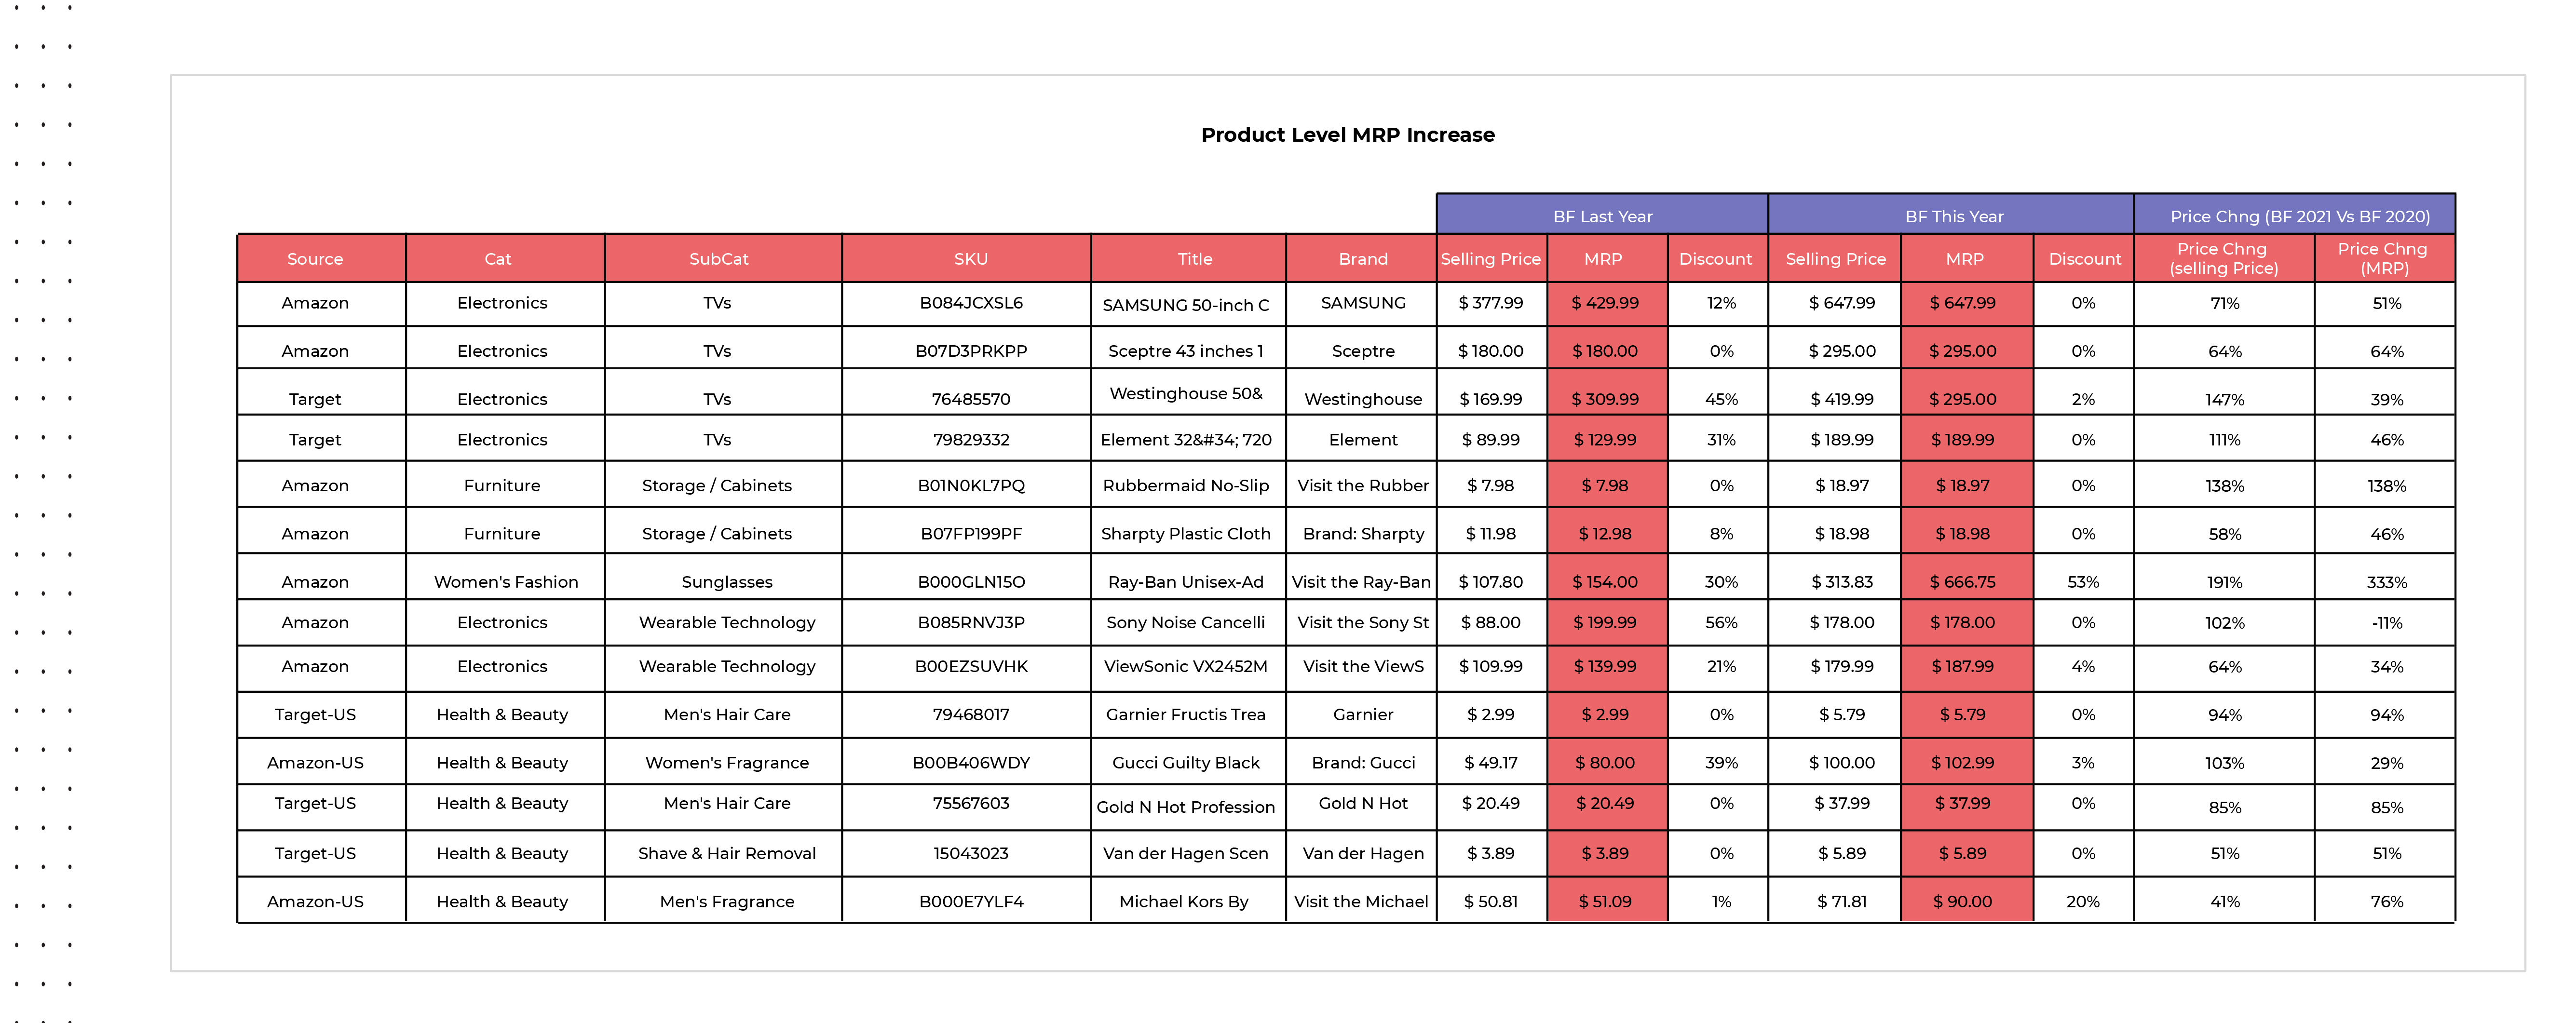
On Amazon.com, categories like health & beauty have already increase MSRPs by a much greater percentage and magnitude versus Target.com leading up to and during Black Friday 2021, while other categories like furniture have increased MSRPs evenly on average across both retail websites. The below chart cites a few specific examples of year-over-year SKU-level MSRP, promotional price, and discount changes within found within the electronics, furniture, fashion, and health & beauty categories.
Source: Commerce Intelligence – MSRP Pricing Insights for Bed & Bath, Electronics, Furniture, Healthy & Beauty, and Fashion categories on Black Friday November 27th, 2021, versus average MSRP pricing for the same SKUs on Black Friday November 26th, 2020.
Fewer, but Deeper Discounts
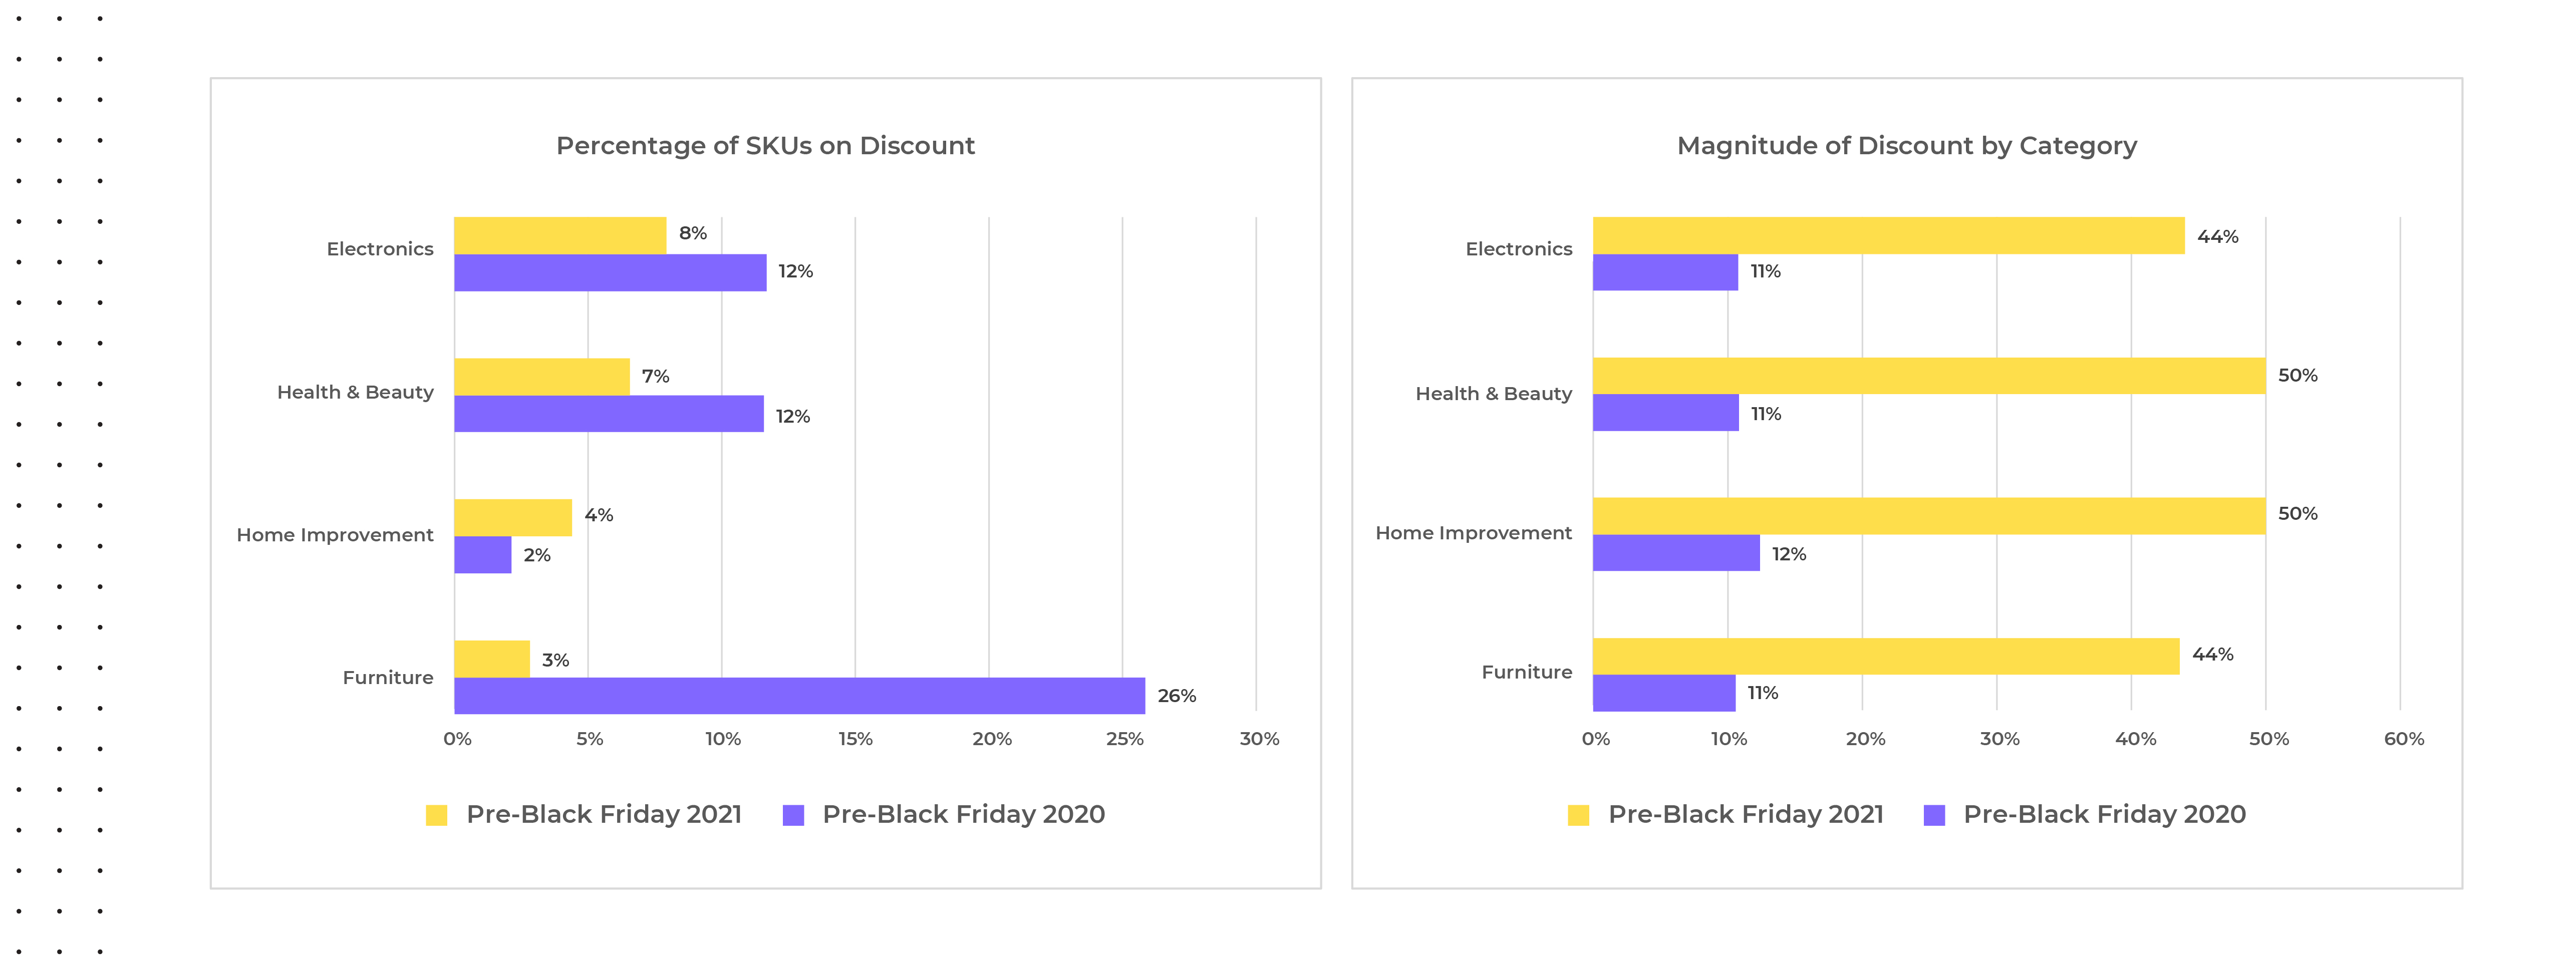
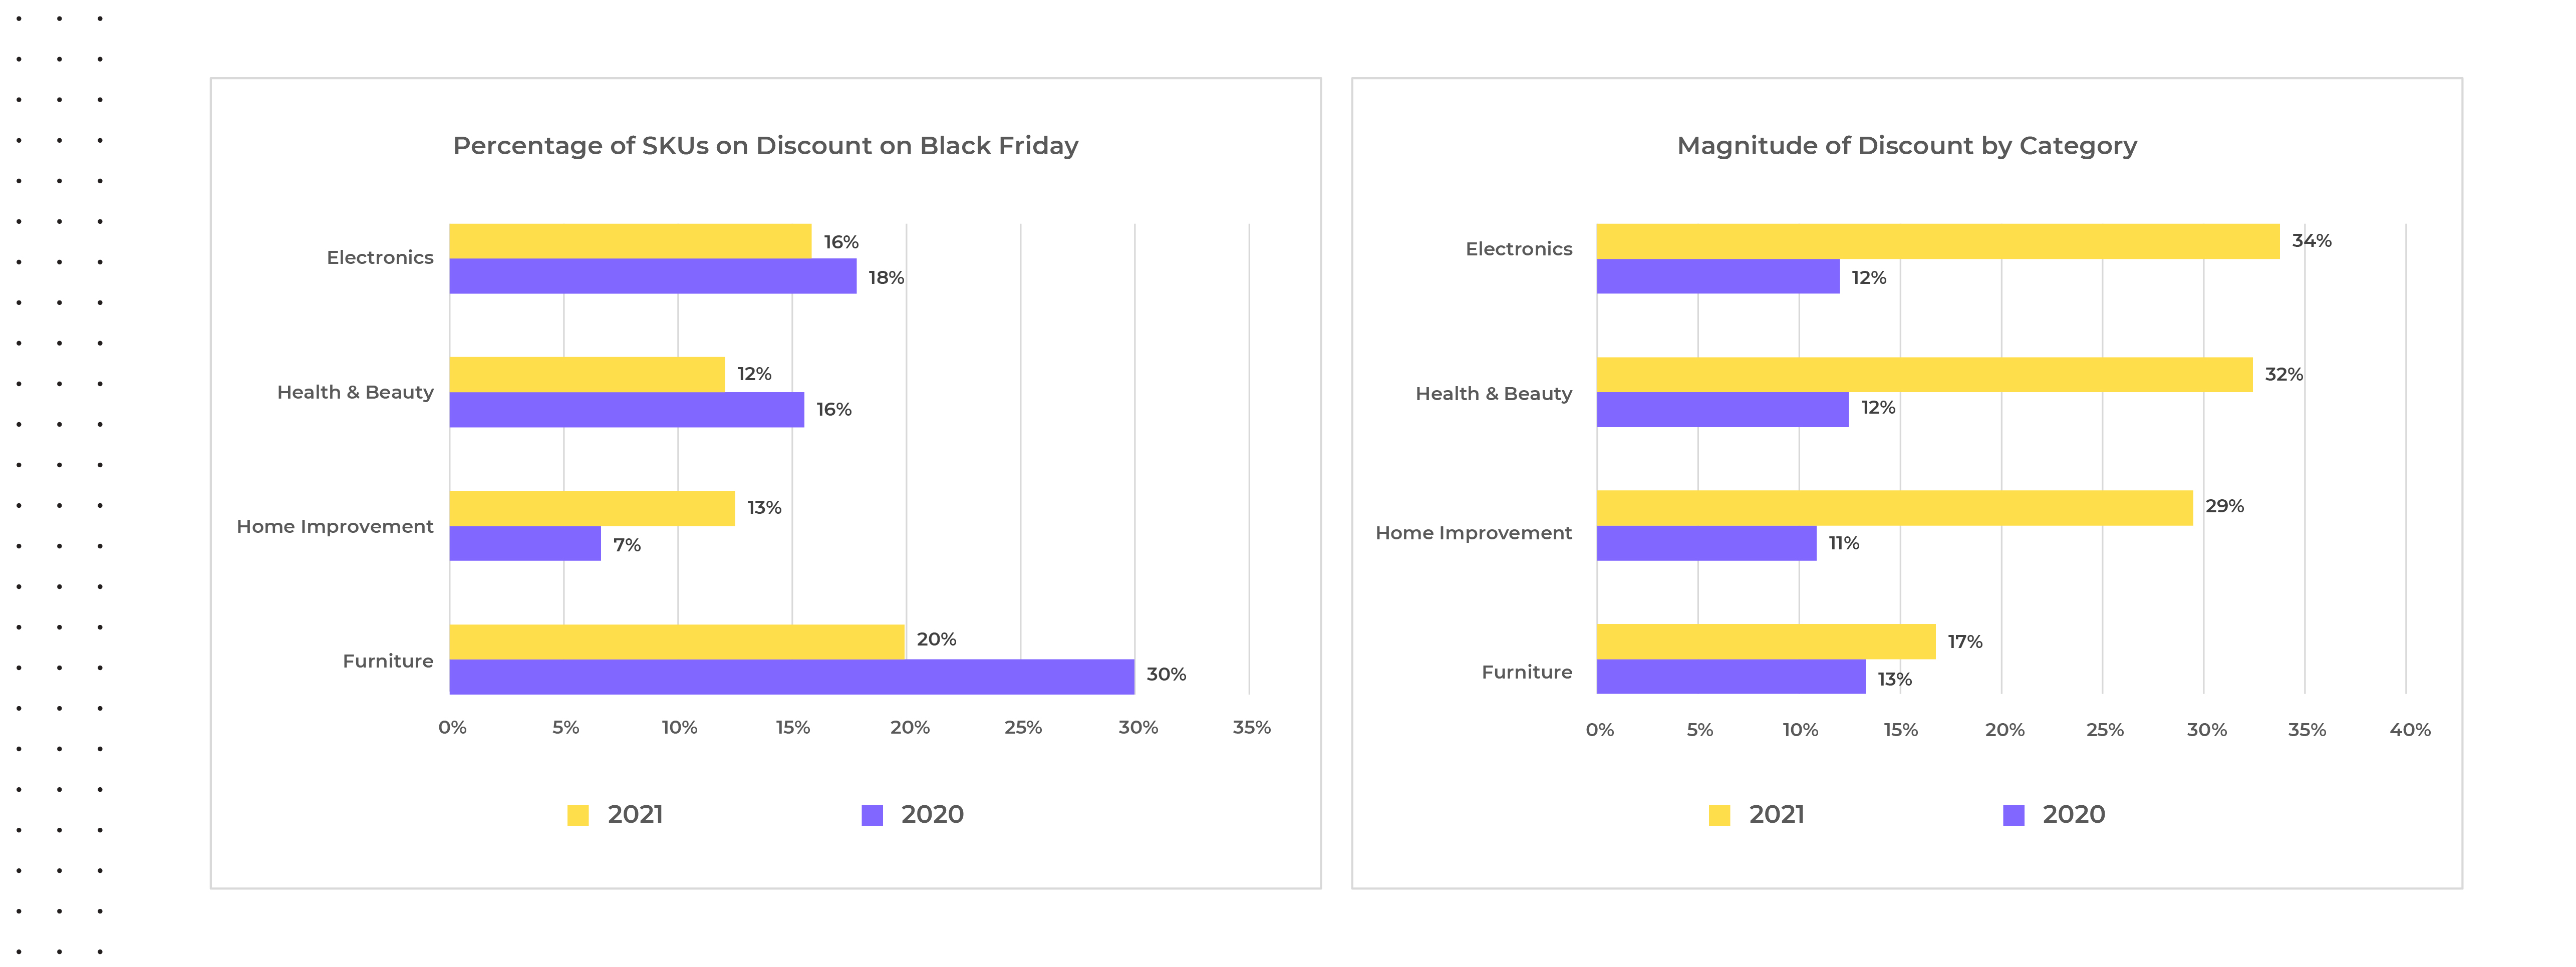
From October through early November 2021, fewer products were discounted compared to this same period in 2020, and the few that were saw much deeper discounts apart from the home improvement category. The most extreme example we saw in discounts offered was within furniture where only three percent of SKUs were on discount in 2021 compared to twenty-six percent in 2020. Interestingly, the magnitude of discount was also higher pre-Cyber Weekend 2021 versus 2020, but this trend was not exclusive to furniture and was also seen within electronics, health & beauty, and home improvement.
Source: Commerce Intelligence – Pricing Insights for Bed & Bath, Electronics, Furniture, Healthy & Beauty, and Fashion categories on Amazon.com & Target.com Pre-Black Friday average selling price during November 20-26th 2021 versus average selling price from November 13-19th 2021 compared to Pre-Black Friday average selling price during November 19-25th 2020 versus average selling price from November 12-18th, 2020.
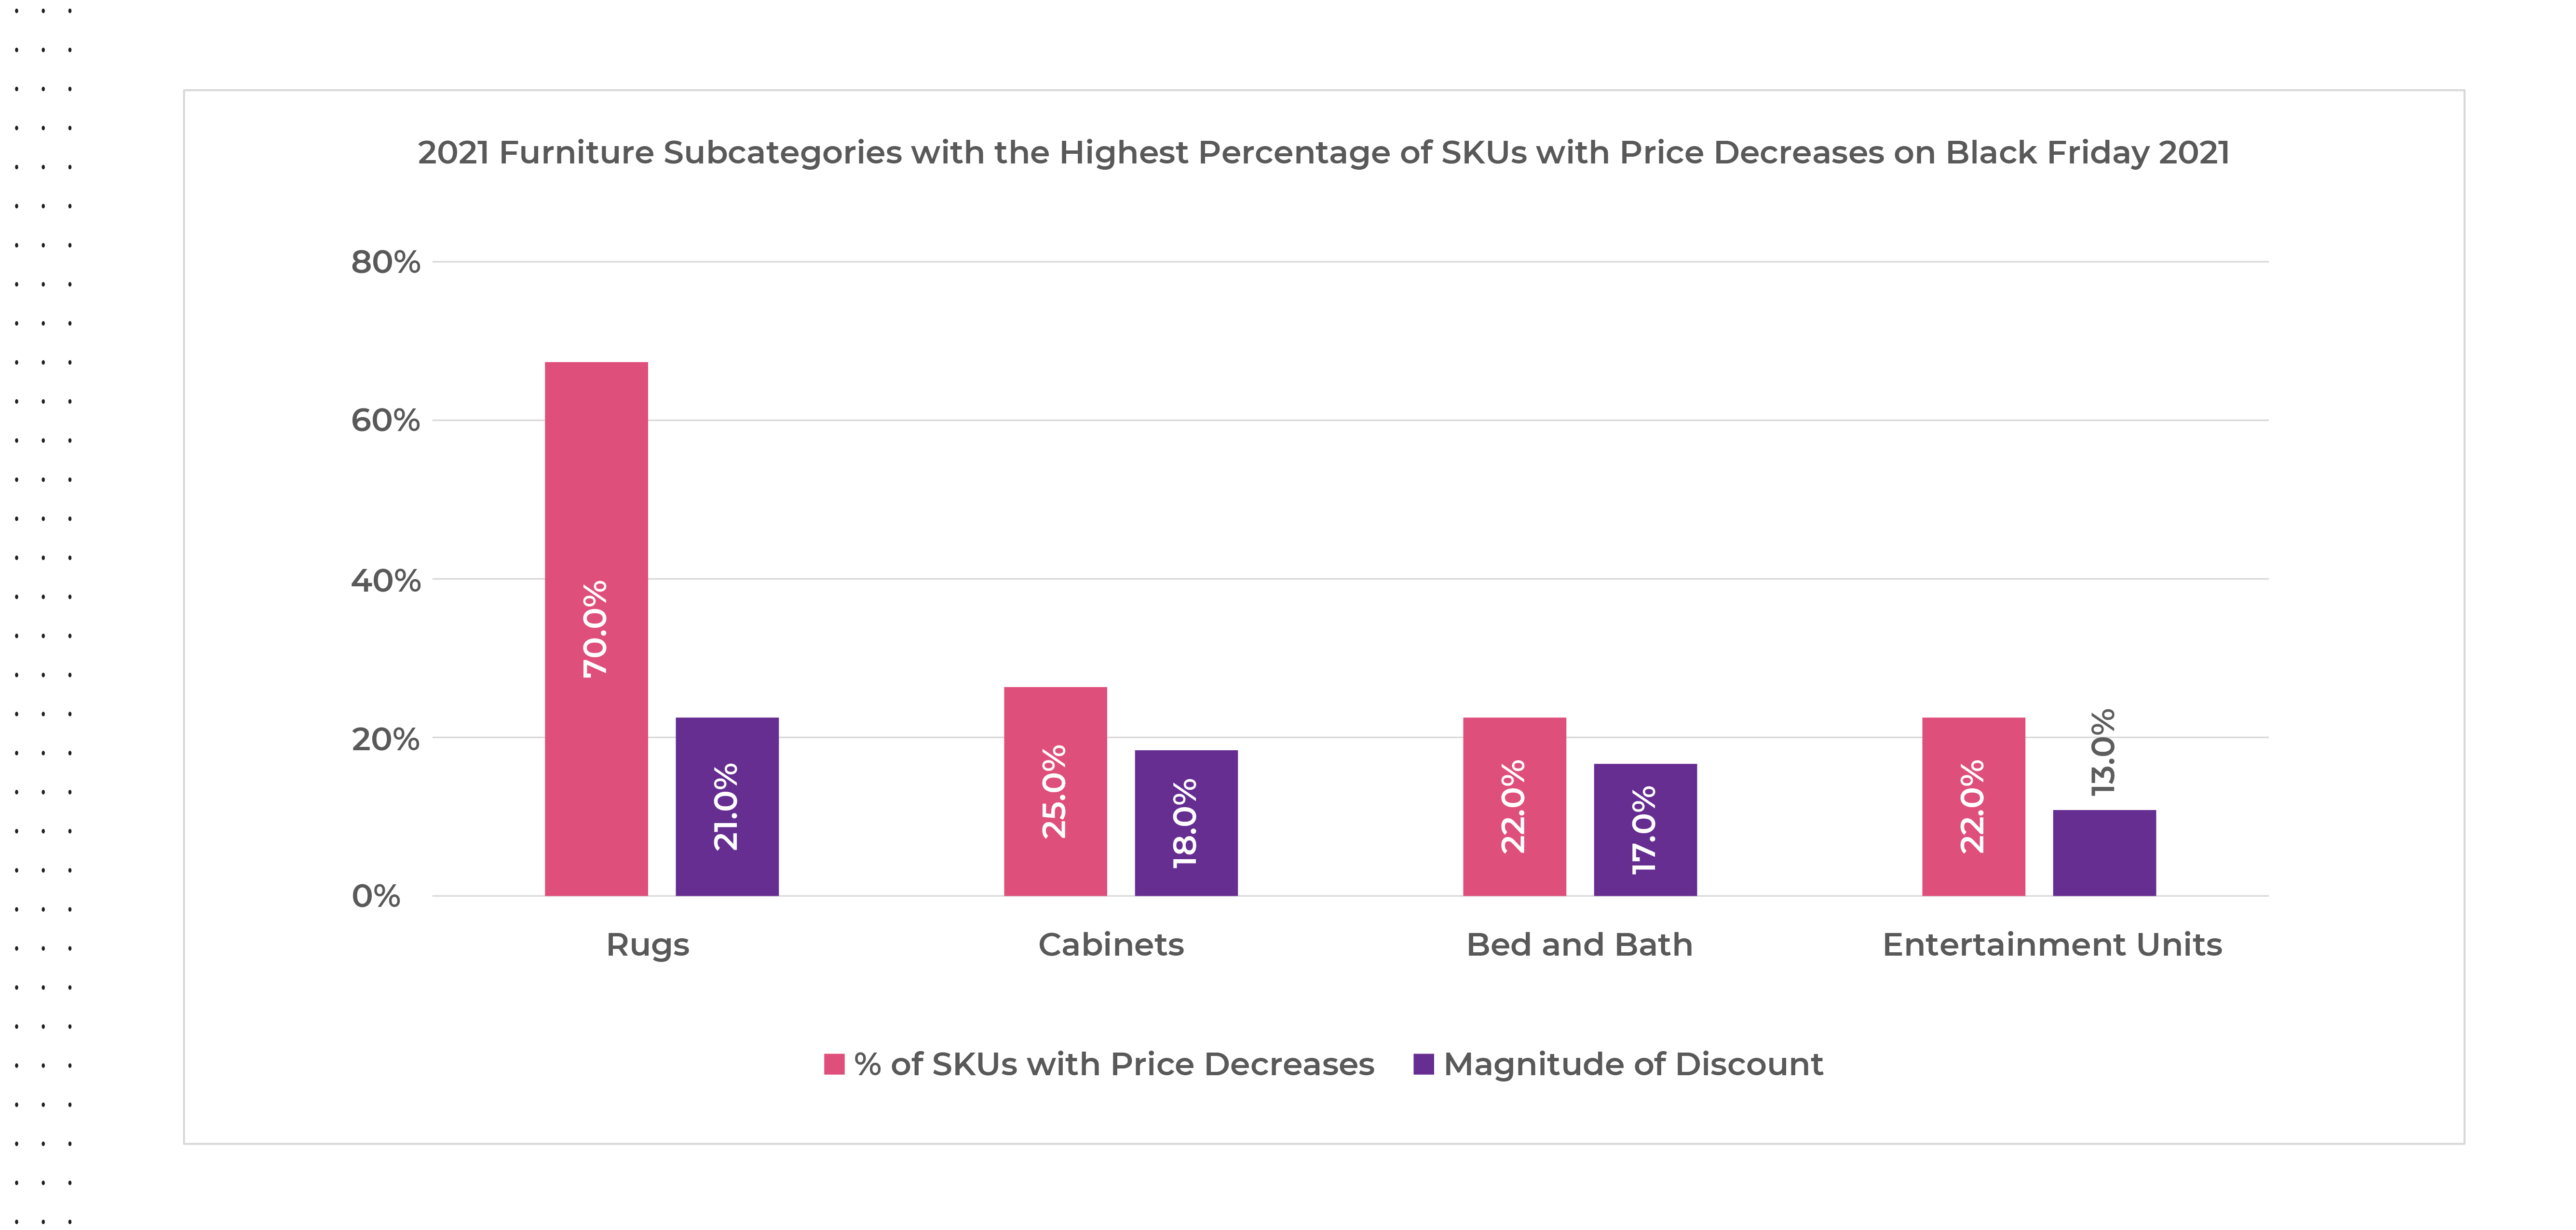
Within the furniture category, the subcategories offering the greatest number of SKUs with price decreases on Black Friday 2021 were rugs by a wide margin, followed by cabinets, bed and bath, and entertainment units, but the magnitude of discounts offered were all under twenty percent.
Source: Commerce Intelligence – Pricing Insights for Bed & Bath, Electronics, Furniture, Healthy & Beauty, and Fashion categories on Amazon.com and Target.com on Black Friday November 27th, 2021, versus average pricing for the same SKUs from Pre-Black Friday November 20-26th 2021 and Black Friday November 26th, 2020, versus average pricing for the same SKUs from Pre-Black Friday November 19th-25th 2020
Accounting for this phenomenon could have been retailers’ attempts to clear inventory for SKUs which hadn’t sold even during the period of severe supply chain shortages. With more products selling at higher prices this year, retailers were also able to use fewer SKUs with greater discounts to attract buyer in hopes of filling their digital baskets with more full-priced goods, helping to protect margins heading in to Cyber Weekend. Scarcity threats also encouraged consumers to buy early, even when not on promotion, to ensure they would have gifts in time for the holidays.
The same trends seen pre-Cyber Weekend 2021 were also seen on Black Friday with a year-over-year decrease in the percentage of SKUs offered on discount versus 2020, and steeper price reductions for the discounted products which can also be attributed to the increase in MSRPs.
Source: Commerce Intelligence – Pricing Insights for Bed & Bath, Electronics, Furniture, Healthy & Beauty, and Fashion categories on Amazon.com and Target.com on Black Friday November 27th, 2021, versus average pricing for the same SKUs from Pre-Black Friday November 20-26th 2021 and Black Friday November 26th, 2020, versus average pricing for the same SKUs from Pre-Black Friday November 19th-25th 2020
2021 Black Friday Price Increases?
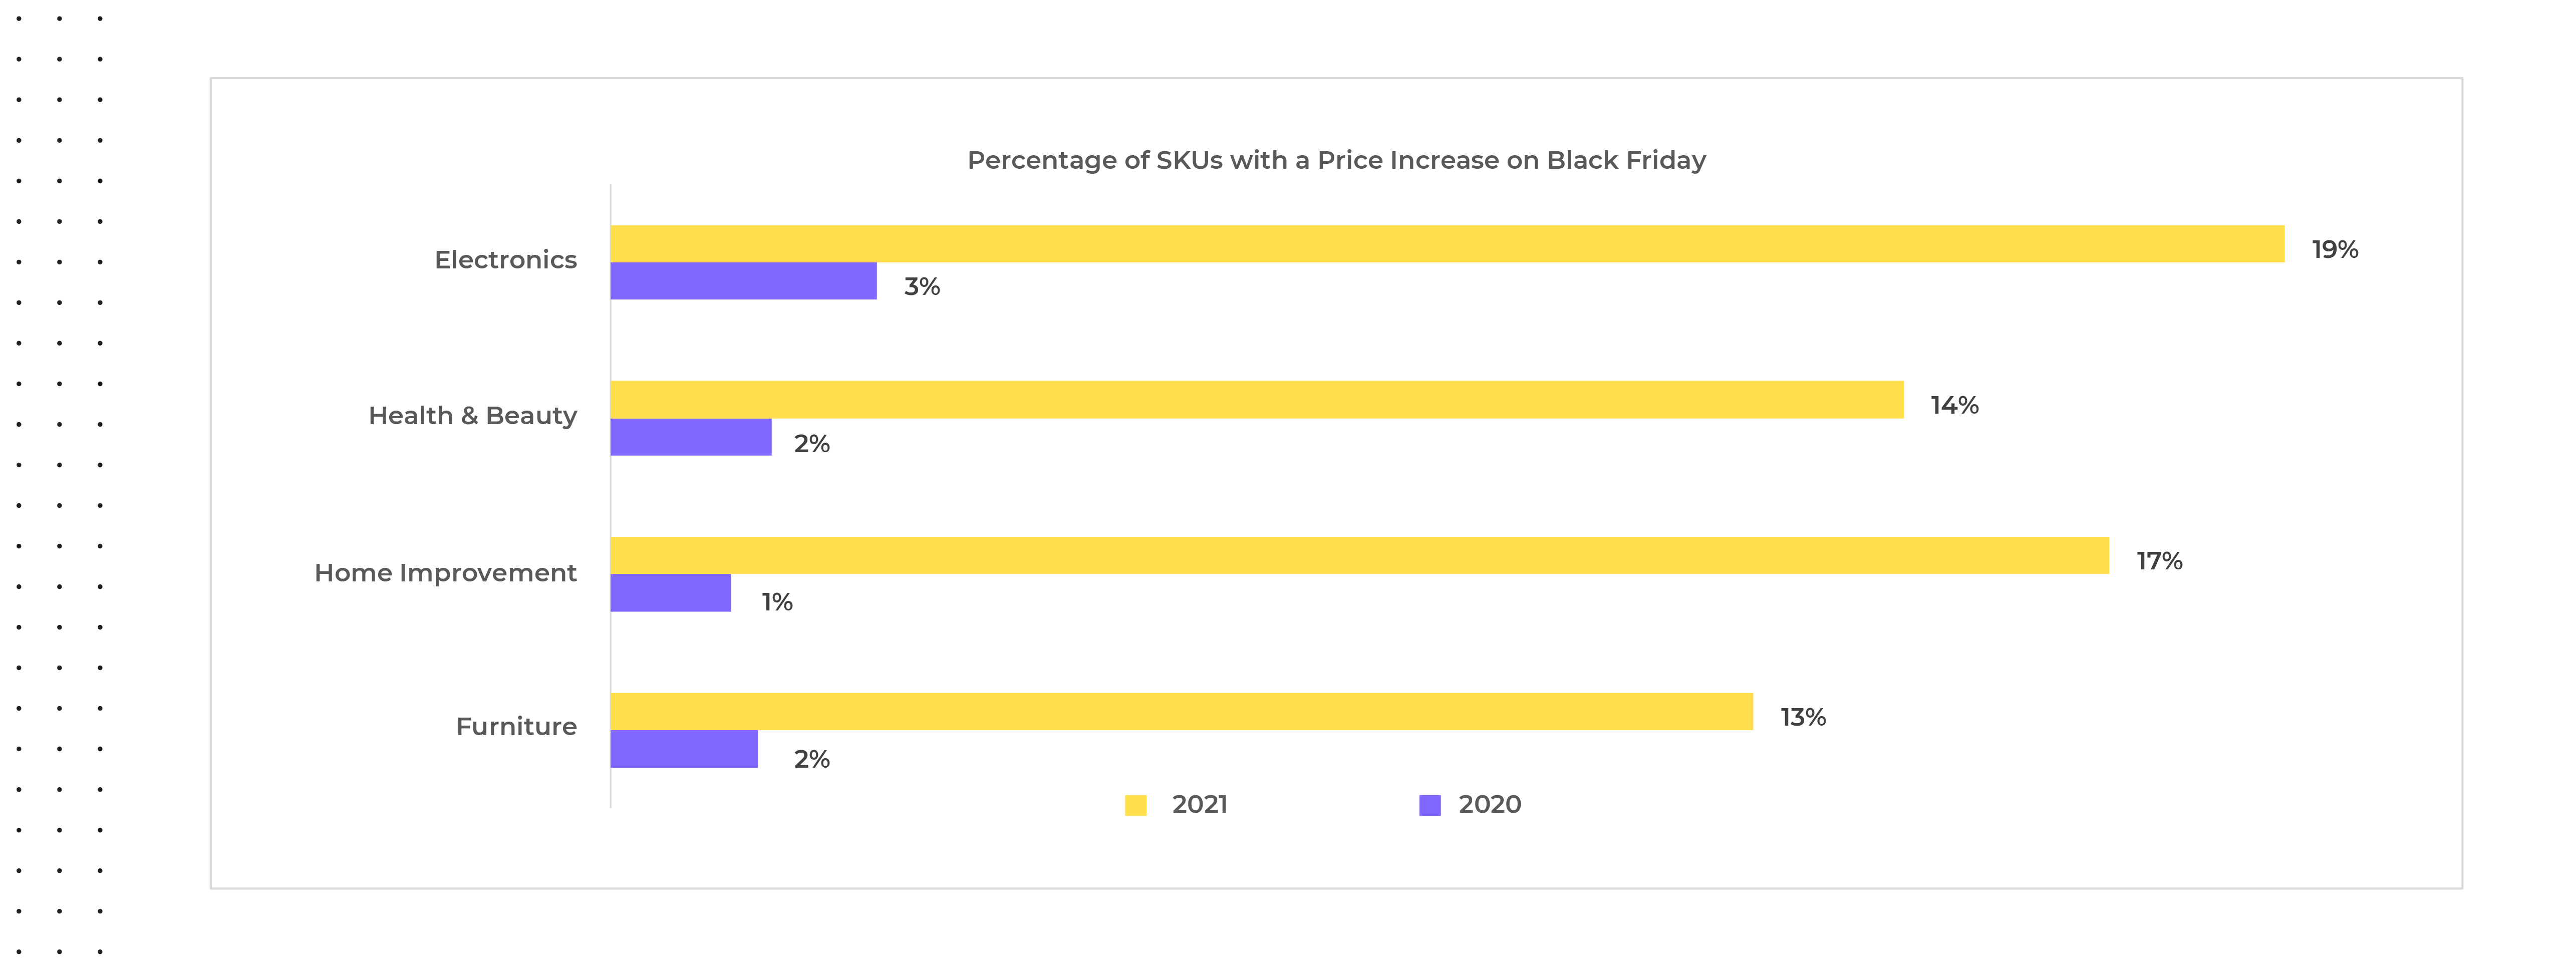
We all know Black Friday is all about price reductions, discounts and deals and so it’s rare to see actual price increases, yet for Black Friday 2021, trends ran counter to this. We observed price increases across all categories for around thirteen to nineteen percent of SKUs, with an average price increase of around fifteen percent in 2021 versus an average of only two percent in 2020.
Source: Commerce Intelligence – Pricing Insights for Bed & Bath, Electronics, Furniture, Healthy & Beauty, and Fashion categories on Amazon.com and Target.com on Black Friday November 27th, 2021, versus pricing for the same SKUs from Pre-Black Friday November 20-26th 2021 and Black Friday November 26th, 2020, versus average pricing for the same SKUs from Pre-Black Friday November 19th-25th 2020
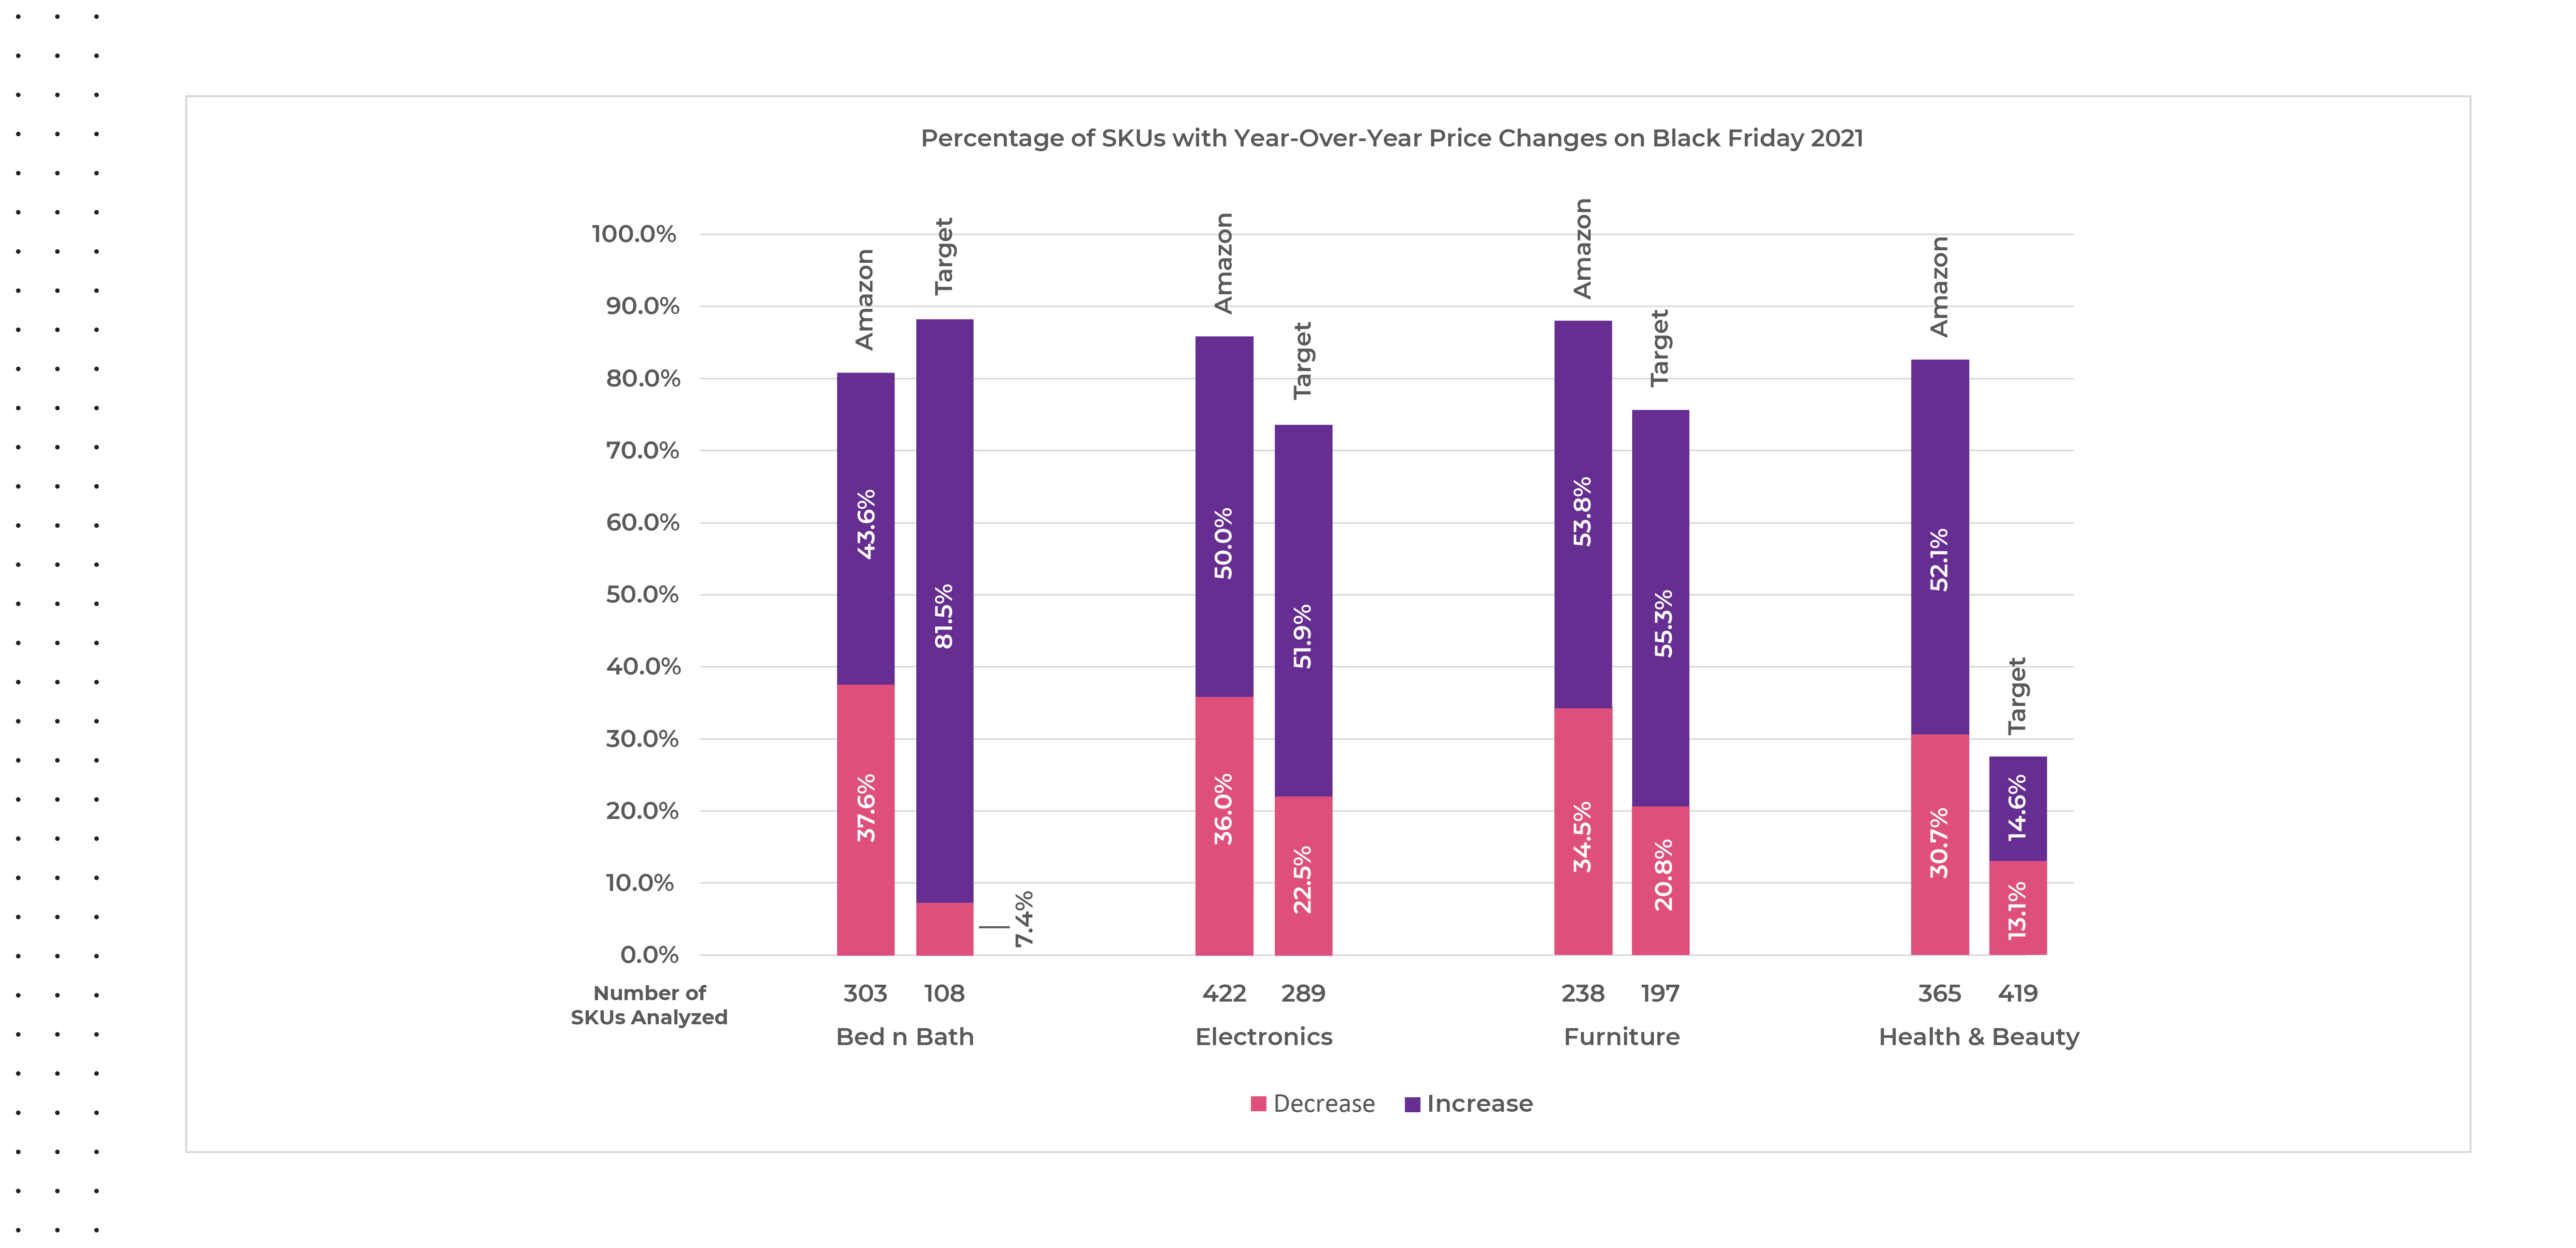
At an account level, we noticed a few interesting differences happening on Black Friday 2021 versus 2020 regarding category price changes. On Target.com, almost ninety percent of the bed and bath SKUs analyzed had a price change on Black Friday in 2021 versus 2020 with eighty-two percent presenting a higher price year-over-year versus only around seven percent showing a decrease, where on Amazon nearly forty-four percent of bed and bath SKUs showed an increase in price and around thirty-eight percent showed a decrease. Except for the health and beauty category on Target.com, more than half of the SKUs in each category saw a price increase on Black Friday versus a price decrease.
Source: Commerce Intelligence – Pricing Insights for Bed & Bath, Electronics, Furniture, Healthy & Beauty, and Fashion categories on Amazon.com and Target.com on Black Friday November 27th, 2021, versus average pricing for the same SKUs on Black Friday November 26th, 2020.
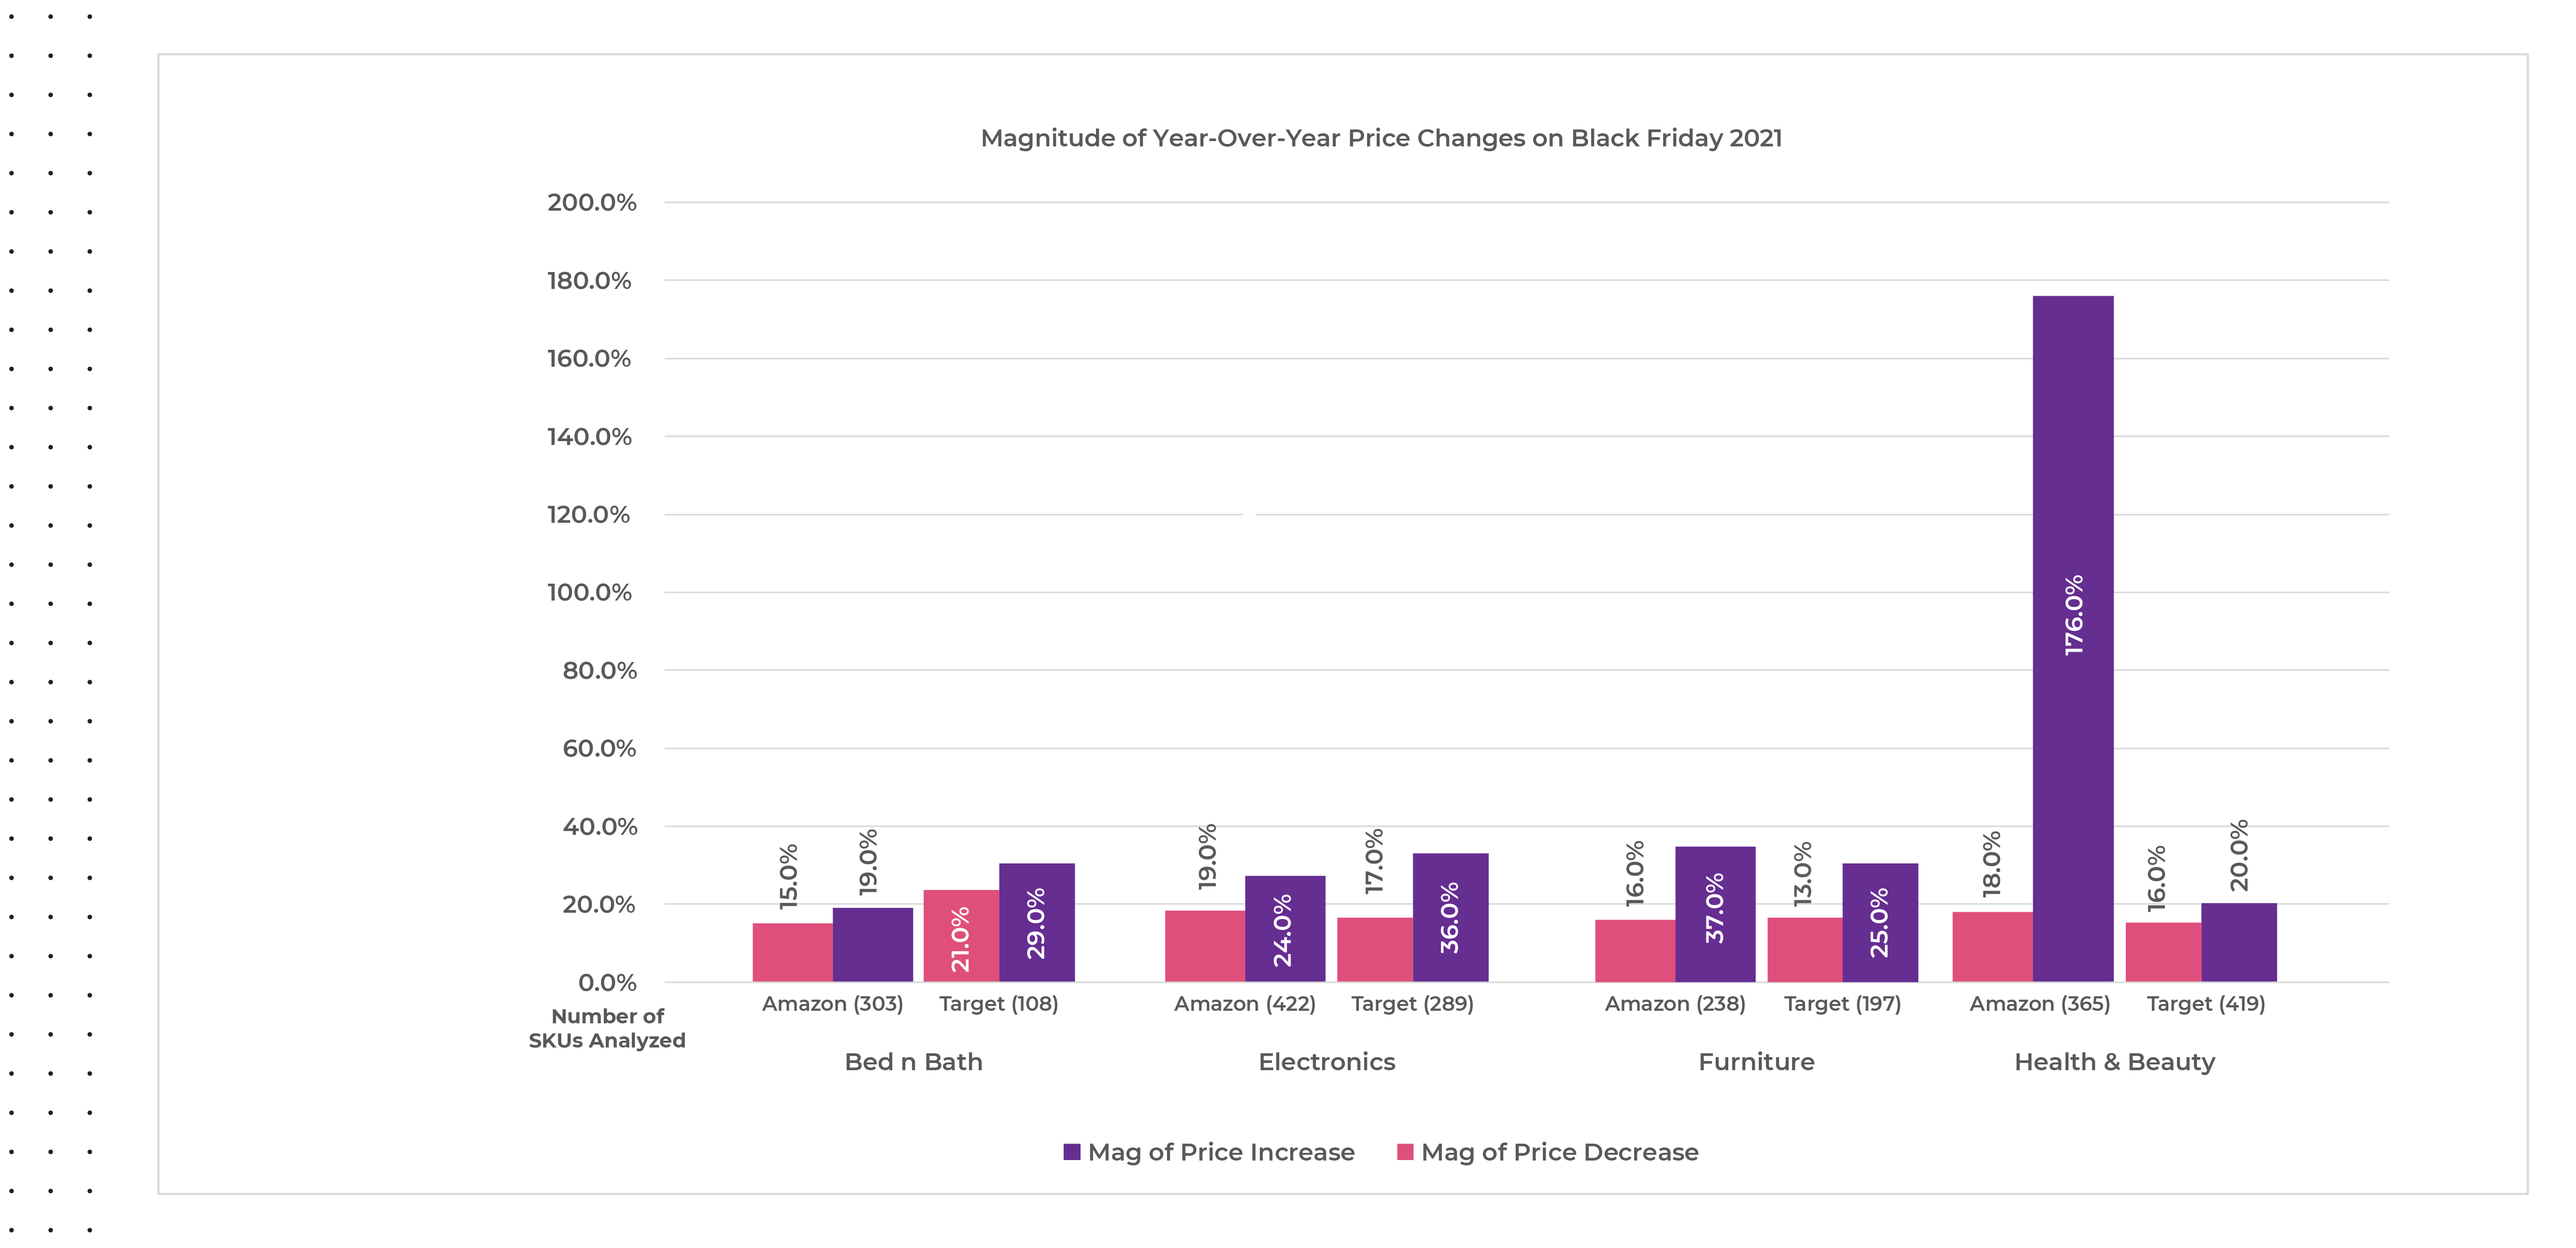
The magnitude of year-over-year price changes seen on Black Friday 2021 was significant across all categories, but the magnitude of price increases found on Amazon.com within the health and beauty category outpaced the rest by far. We reviewed three hundred and sixty-five SKUs on Amazon.com within the health & beauty category and saw almost eighty-three percent of them had a price change with around thirty-one percent decreasing prices and around fifty-two percent increasing prices. This means that within the health & beauty category on Amazon.com, more than fifty percent of the SKUs tracked were sold at a one hundred and seventy-six percent higher price on average during Black Friday 2021 versus 2020.
Source: Commerce Intelligence – Pricing Insights for Bed & Bath, Electronics, Furniture, Healthy & Beauty, and Fashion categories on Amazon.com and Target.com on Black Friday November 27th, 2021, versus average pricing for the same SKUs on Black Friday November 26th, 2020.
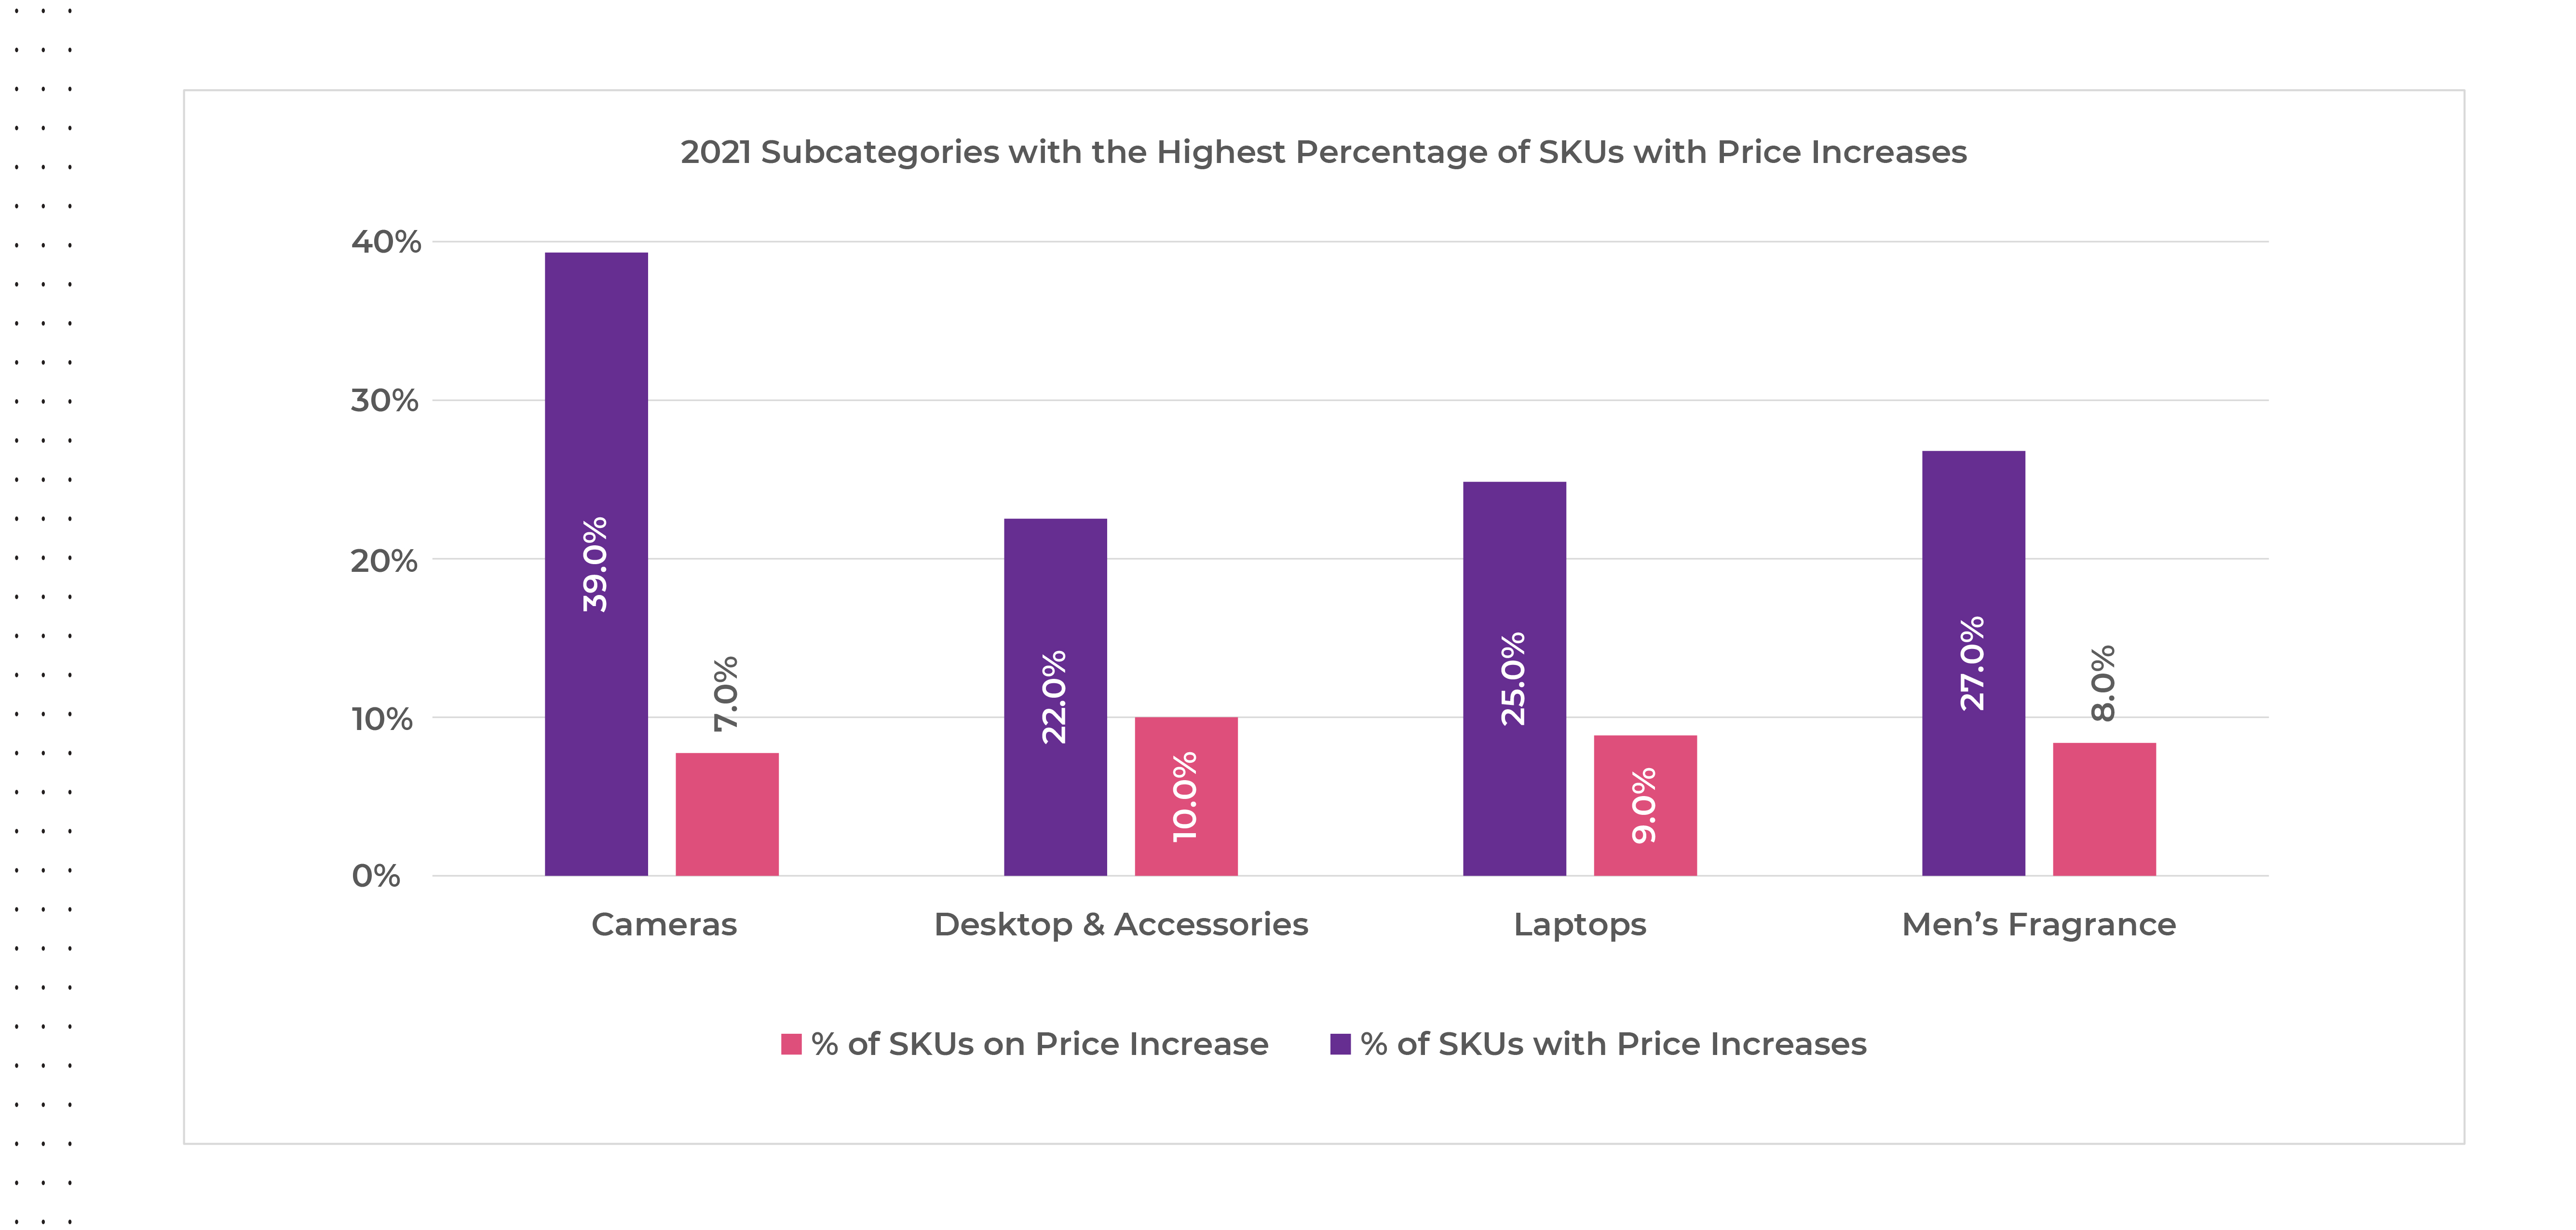
The subcategories offering the greatest number of SKUs with price increases on Black Friday 2021 were cameras, followed by men’s fragrances, laptops, and desktops & accessories, but the magnitude of discounts offered were all under ten percent.
Source: Commerce Intelligence – Pricing Insights for Bed & Bath, Electronics, Furniture, Healthy & Beauty, and Fashion categories on Amazon.com and Target.com on Black Friday November 27th, 2021, versus pricing for the same SKUs from Pre-Black Friday November 20-26th 2021 and Black Friday November 26th, 2020, versus average pricing for the same SKUs from Pre-Black Friday November 19th-25th 2020
The Aftermath Post-2021 Cyber Weekend
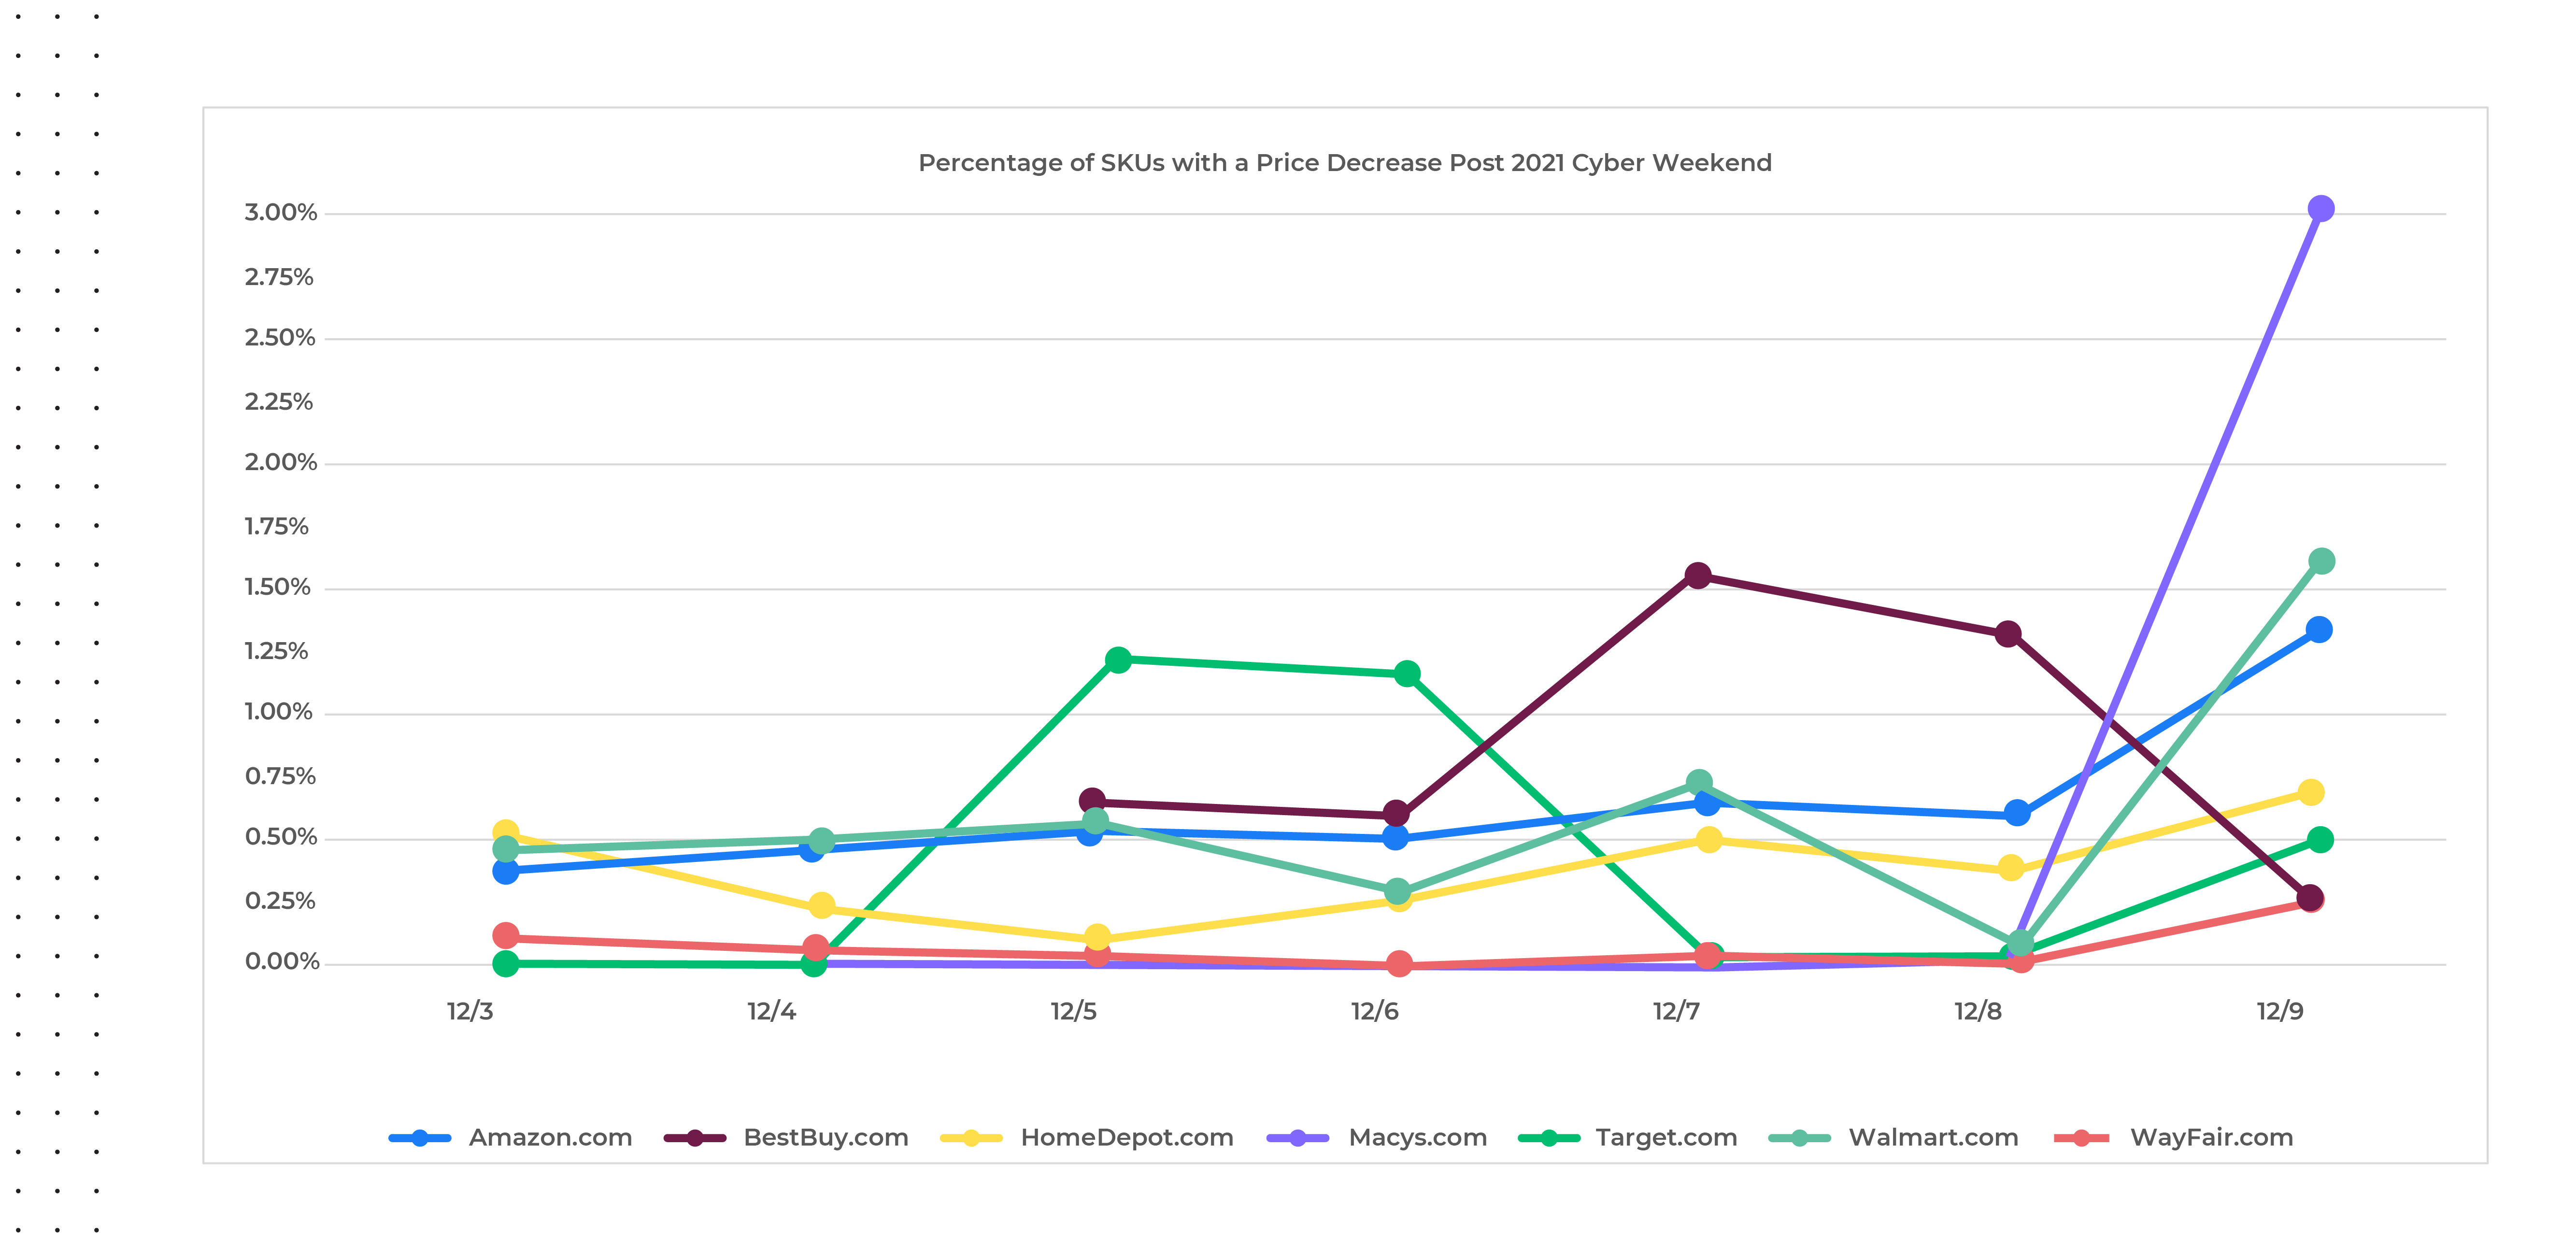
Extending this analysis beyond the holiday weekend, we analyzed price change activity from December third through the ninth across the top US retailers (chart below) and found that price decreases have been very minimal, comparatively speaking. Though there was a spike in number of price decreases from December 8th to the 9th, the percentage of SKUs with price decreases was still very low (less than three percent). We anticipate this trend will continue into 2022.
Source: Commerce Intelligence – Pricing insights for Home & Garden, Jewelry & Watches, Clothing & Shoes, Bed N Bath, Lighting & Ceiling Fans categories
A Sign of Things to Come
A confluence of inflationary trends, product shortages and consumer liquidity have driven many marketplace changes to occur simultaneously. Government programs in the form of stimulus checks, have put extra money in consumers’ hands, and so they’ve been more willing to spend. That, coupled with the shock in the supply chain, has motivated people to buy far ahead of the 2021 holiday season. Hence, retailers have needed to rely much less on across-the-board discounts. Promotions have been more strategic – we’ve seen deeper discounts over fewer products, likely used to draw consumers in to buy certain items, and once they’re there, customers are buying everything else at a non-discount level. When these factors once again normalize, we could see a return to the “race to the bottom” that has occurred since the financial crisis of 2008-2009, but for once, retailers may be able to maintain some pricing power as the 2021 holiday shopping season played out.
Even though performance was not as anticipated and holiday sales did not grow as rapidly as they did in 2020, Cyber Monday was still the greatest online shopping day in 2021. Through it all, retailers managed to keep their digital shelves stocked and orders filled in time for the holidays for the most part, running the risk of housing aged inventory if goods didn’t arrive in time. Despite predictions for steep promotions in January 2022, with supply chains still challenged and inflationary pressures still full steam ahead, we don’t anticipate much in the way of enhanced discounts to continue beyond the holidays.
Access to these types of real-time digital marketplace insights can enable retailers and brands to make strategic decisions like how and when to address inflationary pressures, while also supporting many other day-to-day operations and help drive profitable growth in an intensifying competitive environment. Continue to follow us in the coming weeks for a detailed 2021 year-end review across more retailers and categories. Be sure to reach out to our Retail Analytics experts for access to more details regarding the above analysis.
Traditionally, retailers have staged multiple promotions between Black Friday and before Christmas Day to keep consumers excited about holiday shopping, so it’s easy to see why one more promotional day might fall into relative obscurity. As if ‘Early Start’ offers to Black Friday and extended ‘Cyber Weekend’ promotions weren’t enough to plan for, eBay added another day into the mix called ‘Green Monday’, much to the benefit of consumers, as it furthers the window of opportunity to secure a bargain during the holiday season.
Green Monday falls on the second Monday of December and has historically been one of the greatest sales days of the year for eBay, often attracting last-minute shoppers or those searching for last-minute deals. However, because of the 2021 Global Shipping Crisis, there is speculation that Green Monday may be the last chance this year to have items delivered in time for Christmas. For this reason, we believe it could turn into quite a fruitful event for participating retailers if it encourages procrastinating shoppers that traditionally spend closer to December 25th to buy earlier in the season.
This isn’t the first year retailers outside of eBay have offered Green Monday promotions, however. Our team has been actively monitoring activity on this day from 2017 through present, to not only assess which retailers participate in the event, but also to understand how the discounts may change surrounding the event. The categories monitored include Apparel (Clothing, Shoes & Jewelry), Bed and Bath, and Home and Garden, and we’ve identified products offered on discount by comparing each applicable product’s price on Green Monday versus the most commonly seen price for the product offered throughout the month of December.
Better Promotions Than Boxing Day
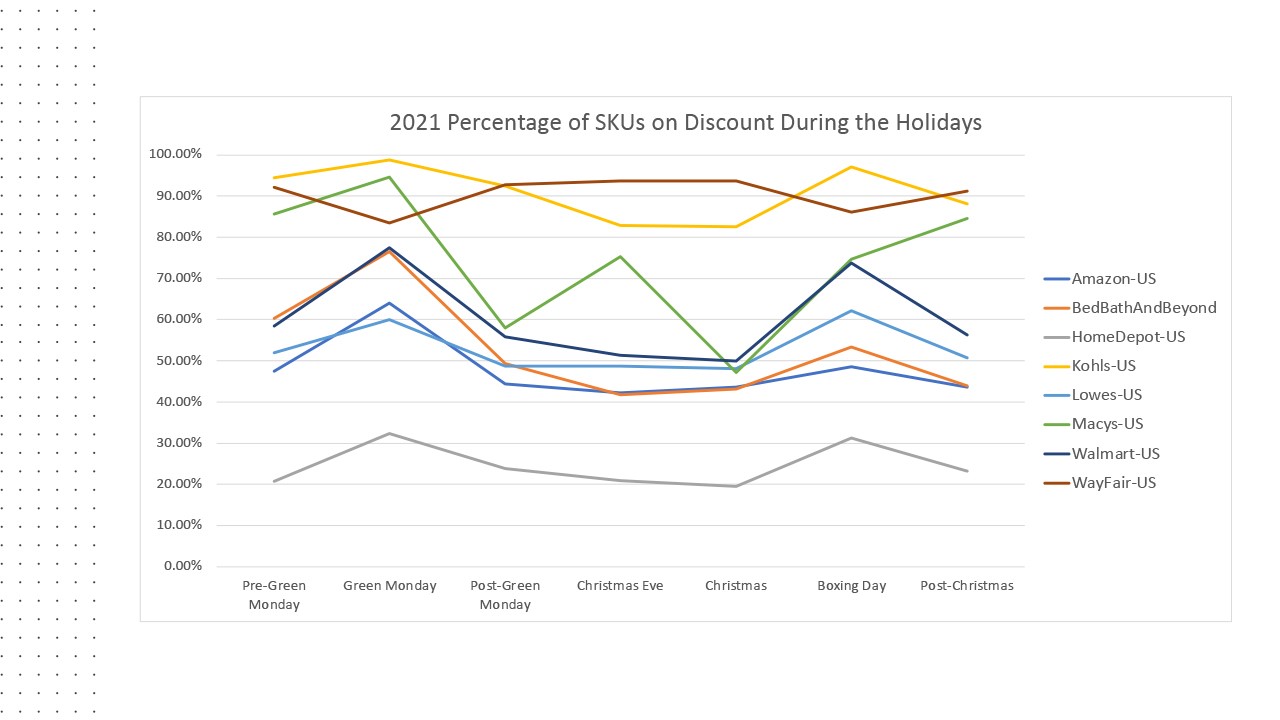
Taking a closer look at 2020 Green Monday discounts within the categories and retailers analyzed, apart from Wayfair.com, we see all offered more SKUs on discount on Green Monday versus the days leading up to and out of the event. Kohls.com led the pack with around 93% of SKUs offered on discount, followed by Macys.com with 95%, and Wayfair.com with 83%. Overall, the number of SKUs on discount on Green Monday were greater than the SKUs offered on discount on Boxing Day, which is traditionally known as a great day to bargain shop.
Source: DataWeave Commerce Intelligence – Promotional Insights tracking Apparel, Bed & Bath, and Home & Garden category product’s online price on Green Monday 2020 in the US versus regular prices for the same products in the month of December each year.
What’s in Store for Green Monday 2021?
The insights we’ve tracked over the last four years have not indicated any signs to an end for Green Monday any time soon. As we see it, for consumers it is an extremely convenient time to order holiday gifts, and for retailers it is a good time to build brand trust and loyalty by fulfilling last minute orders at a great value, in time for the holidays.
Our prediction for the categories analyzed is to expect to see more retailers participate in Green Monday 2021 to a greater degree (more SKUs on sale and enhanced promotions). For retailers in this analysis, we would anticipate HomeDepot.com to enhance the number of offers to match 2020 competitive activity, and for Wayfair.com to look at increasing the number of offers on Green Monday versus the period leading into the event.
If you are interested in learning more about the details behind this analysis or our Promotional Insights solution, be sure to contact us. We can help you evaluate the effectiveness of your holiday promotional spend with access to near real-time marketplace insights on the brands, categories, and products your rivals promote, including discounts, campaign frequency and duration and more.
As eCommerce grows in complexity, brands need new ways to grow sales and market share. Right now, brands face urgent market pressures like out-of-stocks, an influx of new competition and rising inflation, all of which erode profitability. As online marketplaces mature, more brands need to make daily changes to their digital marketing strategies in response to these market pressures, shifts in demand, and competitive trends.
eMarketer forecasts 2021 U.S. eCommerce will rise nearly 18% year-over-year (vs. 6.3% for brick-and-mortar), led by apparel and accessories, furniture, food and beverage, and health and personal care. The eCommerce industry is also undergoing fundamental changes with newer entities emerging and traditional business models evolving to adapt to the changed environment. For example, sales for delivery intermediaries such as Doordash, Instacart, Shipt, and Uber have gone from $8.8 billion in 2019 to an estimated $35.3 billion by the end of 2021. Similarly, many brands have established or are building out a Direct to Consumer (D2C) model so they can fully own and control their customer’s experiences.
In response, DataWeave has launched the next generation of our Digital Shelf Analytics suite to help brands across retail categories directly address today’s costly market risks to drive eCommerce growth and gain a competitive advantage.
“Our new enhancements help brands improve online search rank visibility and quantify the impact of digital investments – especially in time for the busy holiday season.” ~ Karthik Bettadapura, CEO and co-founder, DataWeave
The latest product enhancements provide brands access to tailored dashboard views that track KPI achievements and trigger actionable alerts to improve online search rank visibility, protect product availability and optimize share of search 24/7. Dataweave’s Digital Shelf Analytics platform works seamlessly across all forms of eCommerce platforms and models – marketplaces, D2C websites and delivery intermediaries.
Dashboard for Multiple Functions
While all brands share a common objective of increasing sales and market share, their internal teams are often challenged to communicate and collaborate, given differing needs for competitive and performance data across varying job functions. As a result, teams face pressure to quickly grasp market trends and identify what’s holding their brands back.
In response, DataWeave now offers executive-level and customized scorecard views, tailored to each user’s job function, with the ability to measure and assess marketplace changes across a growing list of online retail channels for metrics that matter most to each user. This enhancement enables data democratization and internal alignment to support goal achievement, such as boosting share of category and content effectiveness. The KPIs show aggregated trends, plus granular reasons that help to explain why and where brands can improve.
Brands gain versatile insights serving users from executives to analysts and brand and customer managers.
Prioritized, Actionable Insights
As brands digitize more of their eCommerce and digital marketing processes, they accumulate an abundance of data to analyze to uncover actionable insights. This deluge of data makes it a challenge for brands to know exactly where to begin, create a strategy and determine the right KPIs to set to measure goal accomplishment.
DataWeave’s Digital Shelf Analytics tool enables brands to effectively build a competitive online growth strategy. To boost online discoverability (Share of Search), brands can define their own product taxonomies across billions of data points aggregated across thousands of retailer websites. They can also create customized KPIs that track progress toward goal accomplishment, with the added capability of seeing recommended courses of action to take via email alerts when brands need to adjust their eCommerce plans for agility.
“Brands need an integrated view of how to improve their discoverability and share of search by considering all touchpoints in the digital commerce ecosystem.” ~ Karthik Bettadapura, CEO and co-founder, DataWeave
Of vital importance, amid today’s global supply chain challenges, brands gain detailed analysis on product inventory and availability, as well as specific insights and alerts that prompt them to solve out-of-stocks faster, which Deloitte reports is a growing concern of consumers (75% are worried about out-of-stocks) this holiday season.
User and system generated alerts provide clarity to actionable steps to improving eCommerce effectiveness.You also have visibility to store-level product availability, and are alerted to recurring out-of-stock experiences.
Scalable Insights – From Bird’s Eye to Granular Views
DataWeave’s Digital Shelf Analytics allows brands to achieve data accuracy at scale, including reliable insights from a top-down and bottom-up perspective. For example, you can see a granular view of one SKUs product content alongside availability, or you can monitor a group of SKUs, say your best selling ones, at a higher level view with the ability to drill down into more detail.
Brands can access flexible insights, ranging from strategic overviews to finer details explaining performance results.
Many brands struggle with an inability to scale from a hyper-local eCommerce strategy to a global strategy. Most tools available on the market solve for one or the other, addressing opportunities at either a store-level basis or top-down basis – but not both.
According to research by Boston Consulting Group and Google, advanced analytics and AI can drive more than 10% of sales growth for consumer packaged goods (CPG) companies, of which 5% comes directly from marketing. With DataWeave’s advanced analytics, AI and scalable insights, brands can set and follow global strategies while executing changes at a hyper-local level, using root-cause analysis to drill deeper into problems to find out why they are occurring.
As more brands embrace eCommerce and many retailers localize their online assortment strategies, the need for analytical flexibility and granular visibility to insights becomes increasingly important. Google reports that search terms “near me” and “where to buy” have increased by more than 200% among mobile users in the last few years, as consumers seek to buy online locally.
e-Retailers are now fine-tuning merchandising and promotional strategies at a hyper-local level based on differences seen in consumer’s localized search preferences, and DataWeave’s Digital Shelf Analytics solution provides brands visibility to retailer execution changes in near real-time.
Competitive Benchmarking
Brand leaders cannot make sound decisions without considering external factors in the competitive landscape, including rival brands’ pricing, promotion, content, availability, ratings and reviews, and retailer assortment. Dataweave’s Digital Shelf Analytics solution allows you to monitor share of search, search rankings and compare content (assessing attributes like number of images, presence of video, image resolution, etc.) across all competitors, which helps brands make more informed marketing decisions.
Brands are also provided visibility into competitive insights at a granular level, allowing them to make actionable changes to their strategies to stay ahead of competitors’ moves. A new module called ‘Sales and Share’ now enables brands to benchmark sales performance alongside rivals’ and measure market share changes over time to evaluate and improve competitive positioning.
Monitor competitive activity, spot emerging threats and immediately see how your performance compares to all rivals’, targeting ways to outmaneuver the competition.
Sales & Market Share Estimates Correlated with Digital Shelf KPIs
In a brick-and-mortar world, brands often use point of sale (POS) based measurement solutions from third party providers, such as Nielsen, to estimate market share. In the digital world, it is extremely difficult to get such estimates given the number of ways online orders are fulfilled by retailers and obtained by consumers. Dataweave’s Digital Shelf Analytics solution now provides sales and market share estimates via customer defined taxonomy, for large retailers like Amazon. Competitive sales and market share estimates can also be obtained at a SKU level so brands can easily benchmark their performance results.
Additionally, sales and market share data can also be correlated with digital shelf KPIs. This gives an easy way for brands to check the effect of changes made to attributes, such as content and/or product availability, and how the changes impact sales and market share. Similarly, brands can see how modified search efforts, both organic and sponsored, correspond to changes in sales and market share estimates.
Take Your Digital Shelf Growth to the Next Level
The importance of accessing flexible, actionable insights and responding in real-time is growing exponentially as online is poised to account for an increasing proportion of brands’ total sales. With 24/7 digital shelf accessibility among consumers comes 24/7 visibility and the responsibility for brands to address sales and digital marketing opportunities in real-time to attract and serve online shoppers around the clock.
Brands are turning to data analytics to address these new business opportunities, enhance customer satisfaction and loyalty, drive growth and gain a competitive advantage. Companies that adopt data-driven marketing strategies are six times more likely to be profitable year-over-year, and DataWeave is here to help your organization adopt these practices. To capitalize on the global online shopping boom, brands must invest in a digital shelf analytics solution now to effectively build their growth strategies and track measurable KPIs.
DataWeave’s next-gen Digital Shelf Analytics enhancements now further a brand’s ability to monitor, analyze, and determine systems that enable faster and smarter decision-making and sales performance optimization. The results delight consumers by helping them find products they’re searching for, which boosts brand trust.
Connect with us to learn how we can scale with your brand’s analytical needs. No project or region is too big or small, and we can start where you want and scale up to help you stay agile and competitive.
The exponential growth of eCommerce has forever changed holiday shopping as we know it. What was once led by the launch of Cyber Monday in 2005, has since expanded to ‘Cyber Five’ in 2018, now spans beyond an eight-week period, and is collectively the busiest digital shopping period of the year. Most retail websites have launched a ‘Thanksgiving Comes Early’ sales event for a mosaic of products, causing one to wonder how this ‘early start’ to holiday shopping will impact the traditional promotional cadence consumers have grown to expect to see launch closer to the holidays. Given today’s environmental challenges, threats of scarcity are also encouraging consumers to buy early, which could also impact traffic on the shopping days that have traditionally seen the highest sales volume from digital shoppers.
In the current environment, the onus will be on consumers to keep a watch for their categories of interest and buy them as and when they appear on sale in their favorite store, because there is no guarantee of sustained availability. Of course, they might return and buy at a different store if a better deal comes up, but there’s a time cost for the dollars saved. More broadly, there has been enough noise made about deals and discounts to keep consumer interest and curiosity going.
The early promotional start and heightened demand has influenced our team to get a jump start on our 2021 Black Friday analysis to look deeper at trends seen pre-Black Friday 2021 versus 2020. With this assessment, we can track how promotional prices and product availability rates may have changed throughout the event leading in to 2021 Cyber Five, and compare it to last year’s activity to understand how 2021 holiday sales may be impacted.
We reviewed popular holiday categories like apparel, electronics, and toys (for kids and pets), to have a broad sense of notable trends seen consistently throughout various, applicable marketplaces. What we found is a consistent decline in product availability over the last six months and as compared to last year, alongside an increase in prices.
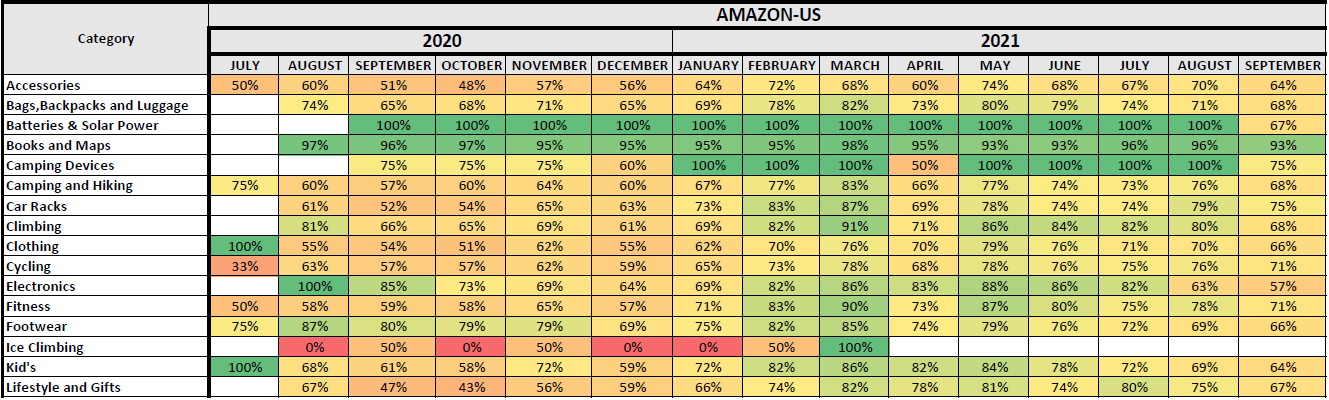
We first analyzed availability changes for popular categories on Amazon, noted in the chart below, to understand how inventory may have changed throughout the year, and also compared to 2020. With the exception of batteries and solar power goods and books and maps, there appears to be consistency in greater product availability in 2021 versus 2020, but a slow decline in availability throughout 2021, leading into the holiday season.
Source: DataWeave Commerce Intelligence – Product Availability in-stock percentage from July 2020 through September 2021 for a sample size of 1000+ products on Amazon.com
When it came to our pricing analysis, we reviewed select categories on Amazon and Target.com, and found around fifty percent of products on both websites to have seen a price increase year-over-year, while only thirty-seven percent and sixteen percent of products saw a price decrease on Amazon and Target.com, respectively. We also see an increase in the manufacturer’s retail price (MRP) in 2021 versus 2020 for a very high proportion of products (forty-eight percent of products on Amazon and thirty-five percent of products on Target.com), but the discount percentages have remained the same.
Source: DataWeave Commerce Intelligence – Pricing Intelligence: MRP and promotional pricing for 1000+ products on Amazon and Target.com were analyzed from November 13th – 15th, 2021 versus Pre-Black Friday November 24th & 25th 2020
This indicates 2021 discounts may appear to be greater than or equivalent to 2020, but in reality, consumers will end up paying higher prices than they would have for the same items in 2020. The remainder of this article highlights our key findings found within each key category reviewed – Electronics, Apparel and Toys.
Electronics Category Analysis
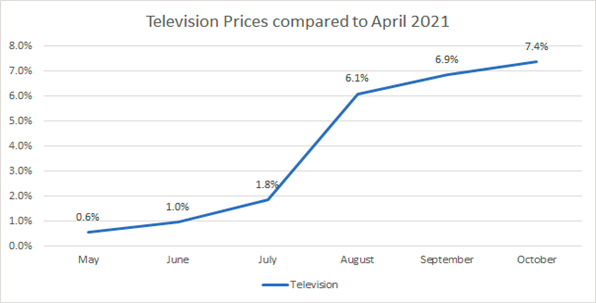
The television category showcases a great example of how pricing fluctuations impact holiday promotional cadences. Based on our analysis, we found the average television price to have increased around seven percent from April to October 2021, as seen below and as noted within our analysis conducted with NerdWallet.
Source: DataWeave Commerce Intelligence – Pricing Intelligence: The change in average price captured for televisions sold on Amazon from May 2021 through October 2021.
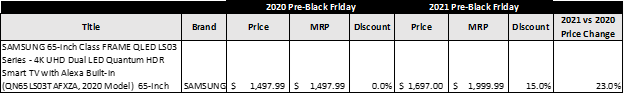
In fact, on Amazon and Target.com, we see around eighty-four percent of the SKUs listed show both an MRP and promotional price increase in 2021 versus 2020 during pre-Black Friday times. One specific example found on Amazon is noted below for Samsung TV model QN65LS03TAFXZA, a 65 inch QLED TV that was priced at $1697 during this analysis at a fifteen percent discount from MRP, but was priced last year at $1497 without a discount from MRP. In essence, even though the TV offers a greater discount this year, it is actually more expensive than it was in 2020 at this same time of year.
Source: DataWeave Commerce Intelligence – Pricing Intelligence: MRP and promotional pricing analysis on Amazon.com comparing prices from November 13th – 15th, 2021 versus Pre-Black Friday November 24th & 25th 2020
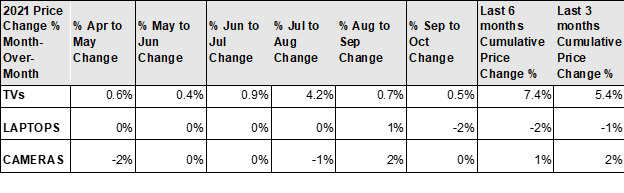
Unlike TVs, the price of laptops has experienced a decrease over time based on our analysis conducted during the same timeframe, indicating these are a great buy for consumers this holiday season versus promotional offers seen in 2020.
Source: DataWeave Commerce Intelligence – Pricing Intelligence: The month-over-month change in average price captured for televisions sold on Amazon from April 2021 through September 2021.
Overall, our prediction is that within the electronics category, promotions during Cyber Five may be equivalent to last year’s offers, however, supply will be limited and the total spend versus last year will be greater to the consumer outside of Doorbuster deals offered on select models.
Apparel Category Analysis
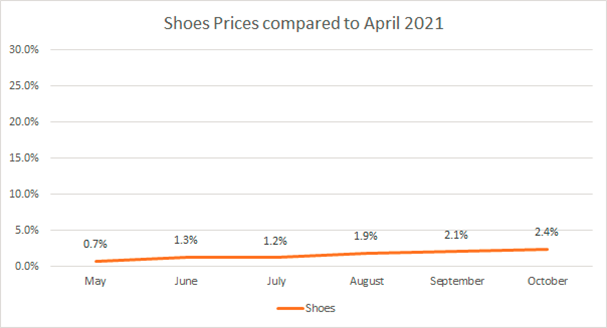
The Luxury market is seeing a Roaring 20s-like feeling this season given the Covid-induced changes in work and lifestyle and higher disposable income. Therefore, our prediction is that prices for these goods are likely to remain flat, or offer very little discounts this season both due to supply constraints as well as higher demand. For example, our analysis on shoe pricing changes shows relative stability from April to October 2021.
Source: DataWeave Commerce Intelligence – Pricing Intelligence: The change in average price captured for shoes sold on Amazon from May 2021 through October 2021.
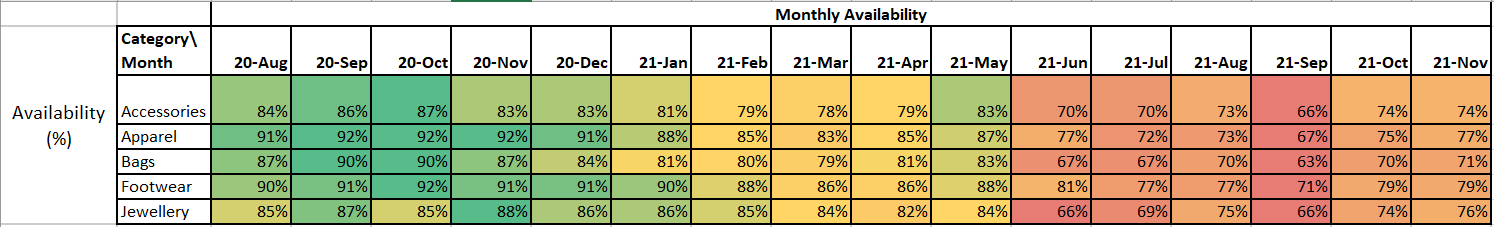
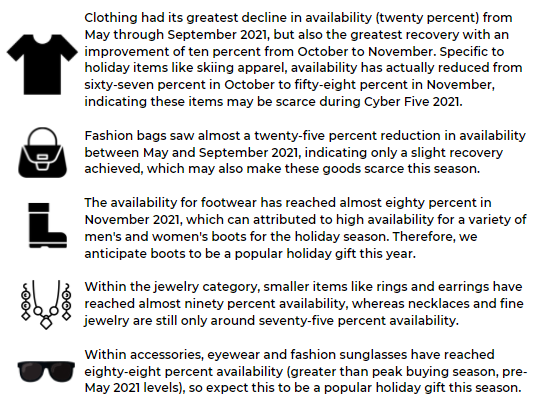
Given heightened demand and the Global shipping crisis, we anticipate luxury apparel categories to face out-of-stock challenges this holiday season, and therefore we also anticipate seeing less promotional activity for these items as well during Cyber Five 2021. To dive deeper into the severity of the impact, we looked at availability for clothing, accessories, and footwear categories from August 2020 until present to verify our thesis.
Focusing only on clothing, accessories, and footwear, these categories followed the same downward trending pattern regarding product availability decreases this year with a decline from June (seventy-six percent versus eighty-six percent in May 2021) to September 2021 (the lowest rate seen at sixty-eight percent availability), followed by a partial recovery in October and November (achieving seventy-seven percent availability).
Source: DataWeave’s Commerce Intelligence – Product Availability: 10k SKUs tracked across 11 retailers US websites (Farfetch, Brownsfashion, NetAPorter, EndClothing, 24s, Selfridges, Ssense, Harrods, Luisaviaroma, MyTheresa, MrPorter) tracked daily stock status in apparel categories; Availability is calculated as percent of instances when product is in stock against all instances tracked.
Not all recoveries were the same however, and given this, we predict accessories to have the lowest availability rate and greatest risk of facing out of stocks heading into Cyber Five. From May through November 2021, accessories availability continued to decline significantly from month to month, beginning at eighty-three percent in May and ending at seventy-four percent in November. Given this continued decline and with Black Friday right around the corner, we don’t anticipate inventory levels to increase enough to meet the increased holiday demand.
Source: DataWeave’s Commerce Intelligence – Product Availability: 10k SKUs tracked across 11 retailers US websites (Farfetch, Brownsfashion, NetAPorter, EndClothing, 24s, Selfridges, Ssense, Harrods, Luisaviaroma, MyTheresa, MrPorter) tracked daily stock status in apparel categories; Availability is calculated as percent of instances when product is in stock against all instances tracked.
Toys & Games Category Analysis
As noted by DigitalCommerce360, we also anticipate toys to be one of the greatest impacted categories this holiday season given the continued decline in overall availability for these items on Amazon.com, as one great example. Within our category analysis, we saw a steady decline in availability from March 2021 through June (eighty percent to sixty-one percent), followed by a period of stability from June through August (approximately sixty percent), followed by another decline from September through October, finally reaching the lowest availability of fifty-six percent (down twenty-four percent from March 2021).
Source: DataWeave’s Commerce Intelligence – Product Availability – hundreds of Toys & Games SKUs tracked on Amazon.com on a weekly basis from March 2021-October 2021
The biggest sub-category within the toys department on Amazon, Sports and Outdoor Play, followed the same trend as Toys and Games overall through June 2021, also reaching its lowest availability of fifty-six percent. Instead of continuing along that pattern, Sports and Outdoor Play started on a recovery path, ending at a relatively high availability level of sixty-seven percent in October, which is only five percent lower than its highest availability (seventy-two percent in March 2021). Games and Accessories, the second largest sub-category in Toys and Games, had a continuous decline starting with eighty-nine percent in March 2021, reaching its lowest availability of fifty-four percent in October.
Source: DataWeave’s Commerce Intelligence – Product Availability – hundreds of Toys & Games SKUs tracked on Amazon.com on a weekly basis from March 2021-October 2021
The sub-category Tricycles, Scooters and Wagons interestingly had its highest availability from July to September 2021 (around eighty percent), unlike other sub-categories which as a whole, had their lowest availability during the same timeframe. From September through October, there was a significant decline (fourteen percent), reaching its lowest availability of sixty-seven percent. The sub-category Babies & Toddlers started on a continuous decline from its highest availability of eighty percent in April to its lowest availability of fifty-six percent in October.
Source: DataWeave’s Commerce Intelligence – Product Availability – hundreds of Toys & Games SKUs tracked on Amazon.com on a weekly basis from March 2021-October 2021
*Please reach out to our Retail Analytics experts for access to sub-category details available within the above analysis on the Toys and Games category on Amazon.com.
Pet Toys Category Analysis
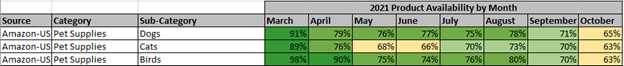
When it comes to in demand holiday toys, you can’t forget about the needs for gifts for our furry friends and family. We also tracked sub-categories such as dog, cat, and bird toys, following the same methodology as tracked within Toys and Games to track pet toy availability changes.
Source: DataWeave’s Commerce Intelligence – Product Availability – hundreds of Pet Toys SKUs tracked on Amazon.com on a weekly basis from March 2021-October 2021
Dog toys, the biggest sub-category out of the three pet toys analyzed, had high availability – ninety percent in March 2021, but started to decline reaching a low of sixty-five percent in October. There was a period of stability from April to August (averaging seventy-seven percent), followed by a significant decline of over thirteen percent in from September to October. Cat toys, the second largest sub-category, also had its highest availability in March (eighty-nine percent) followed by a steady decline to sixty-six percent in June, a recovery from July to August (achieving seventy-three percent), followed by another decline during September and October, reaching its lowest availability of sixty-three percent (down twenty-six percent from eighty-one percent in March). Interestingly, dog toys which has a product count eight times greater than cat toys, had higher availability than cat toys during each of the months considered during the analysis.
Source: DataWeave’s Commerce Intelligence – Product Availability – hundreds of Pet Toys SKUs tracked on Amazon.com on a weekly basis from March 2021-October 2021
In Conclusion
If we consider discounts and availability to be a good indicator of sales for the 2021 holiday season, with the Global shipping crisis looming over this year’s event, we expect retailers to have trouble keeping their inventory well stocked, which might affect growth rates. That being said, while discounts may be muted and popular items may come on very limited sales given constraints, we believe digital sales on Black Friday will see the highest year-over-year growth to date, given a number of supporting factors: scarcity threats increasing demand and the reason to buy, and consumers waiting to see if holiday offers surpass those see in the early start promotions, followed by the sudden rush to buy on Black Friday so as not to risk a given product being out of stock beyond this time period.
We also anticipate seeing a continued decline in product availability day-to-day as we progress throughout Cyber Five 2021. Given the analysis conducted on 2020 trends, (we tracked nearly a one percent decline in availability on Black Friday 2020 vs. Thanksgiving Day, followed by a two percent decline on Cyber Monday), our data indicates products went out-of-stock at a faster rate then also.
Ultimately only the digital-savvy retailers and brands will thrive during these opportune times, while others will continue to be in catch-up mode. Access to real-time marketplace insights can enable a first-to-market strategy, while having access to historical patterns can also help react faster to commonly seen future market factors, such as another pandemic or Global shipping crisis. These types of insights also support day-to-day operations, enabling retailers and brands to accelerate eCommerce growth, determine systems to distinguish their online strategies, discover efficiencies and drive profitable growth in an intensifying competitive environment.
Continue to follow us in the coming weeks to see the insights we track through Cyber Five 2021, and be sure to reach out to our Retail Analytics experts for access to more details regarding the above analysis.