Tag: Pricing Trends

  • How Retailers and Brands Can Navigate Skyrocketing Olive Oil Prices in 2024

    How Retailers and Brands Can Navigate Skyrocketing Olive Oil Prices in 2024

    Olive oil, renowned for its complex flavor and myriad health benefits, holds a significant place in the global market, valued at $14.64 billion in 2023. It is anticipated to reach $19.77 billion by 2032, with a steady compound annual growth rate (CAGR) of 3.42%.

    This growth is fueled by:

    • Increased consumer demand for healthier oils.
    • Olive oil’s rising popularity in skincare products.
    • Greater retail availability.

    Interestingly, this market expansion occurs alongside rising olive oil prices, mainly due to a notable decrease in production. Eight European Union countries, which are the main producers, saw a dramatic drop in output from an average of 2.17 million tons to just 1.50 million tons in 2022—a 30.88% decline. Unfortunately, this drop in production comes as no surprise.

    Erratic weather patterns, rising temperatures, and exacerbating drought conditions in the Mediterranean basin have taken their toll. These climate changes disrupt the growing cycles of olive trees, leading to poorer crop yields and lower-quality olives.

    In the US, where olive oil constitutes 19% of all cooking oils sold and 40% of sales value due to its premium pricing, the market is expected to grow at an impressive CAGR of 11.31% between 2024 and 2032. This forecast is significant despite a recent dip in domestic consumption, which may further decline due to economic pressures. As a result, consumers must make difficult choices as they battle inflation, shrinkflation, and thin budgets.

    DataWeave’s Analysis of Rising Olive Oil Prices

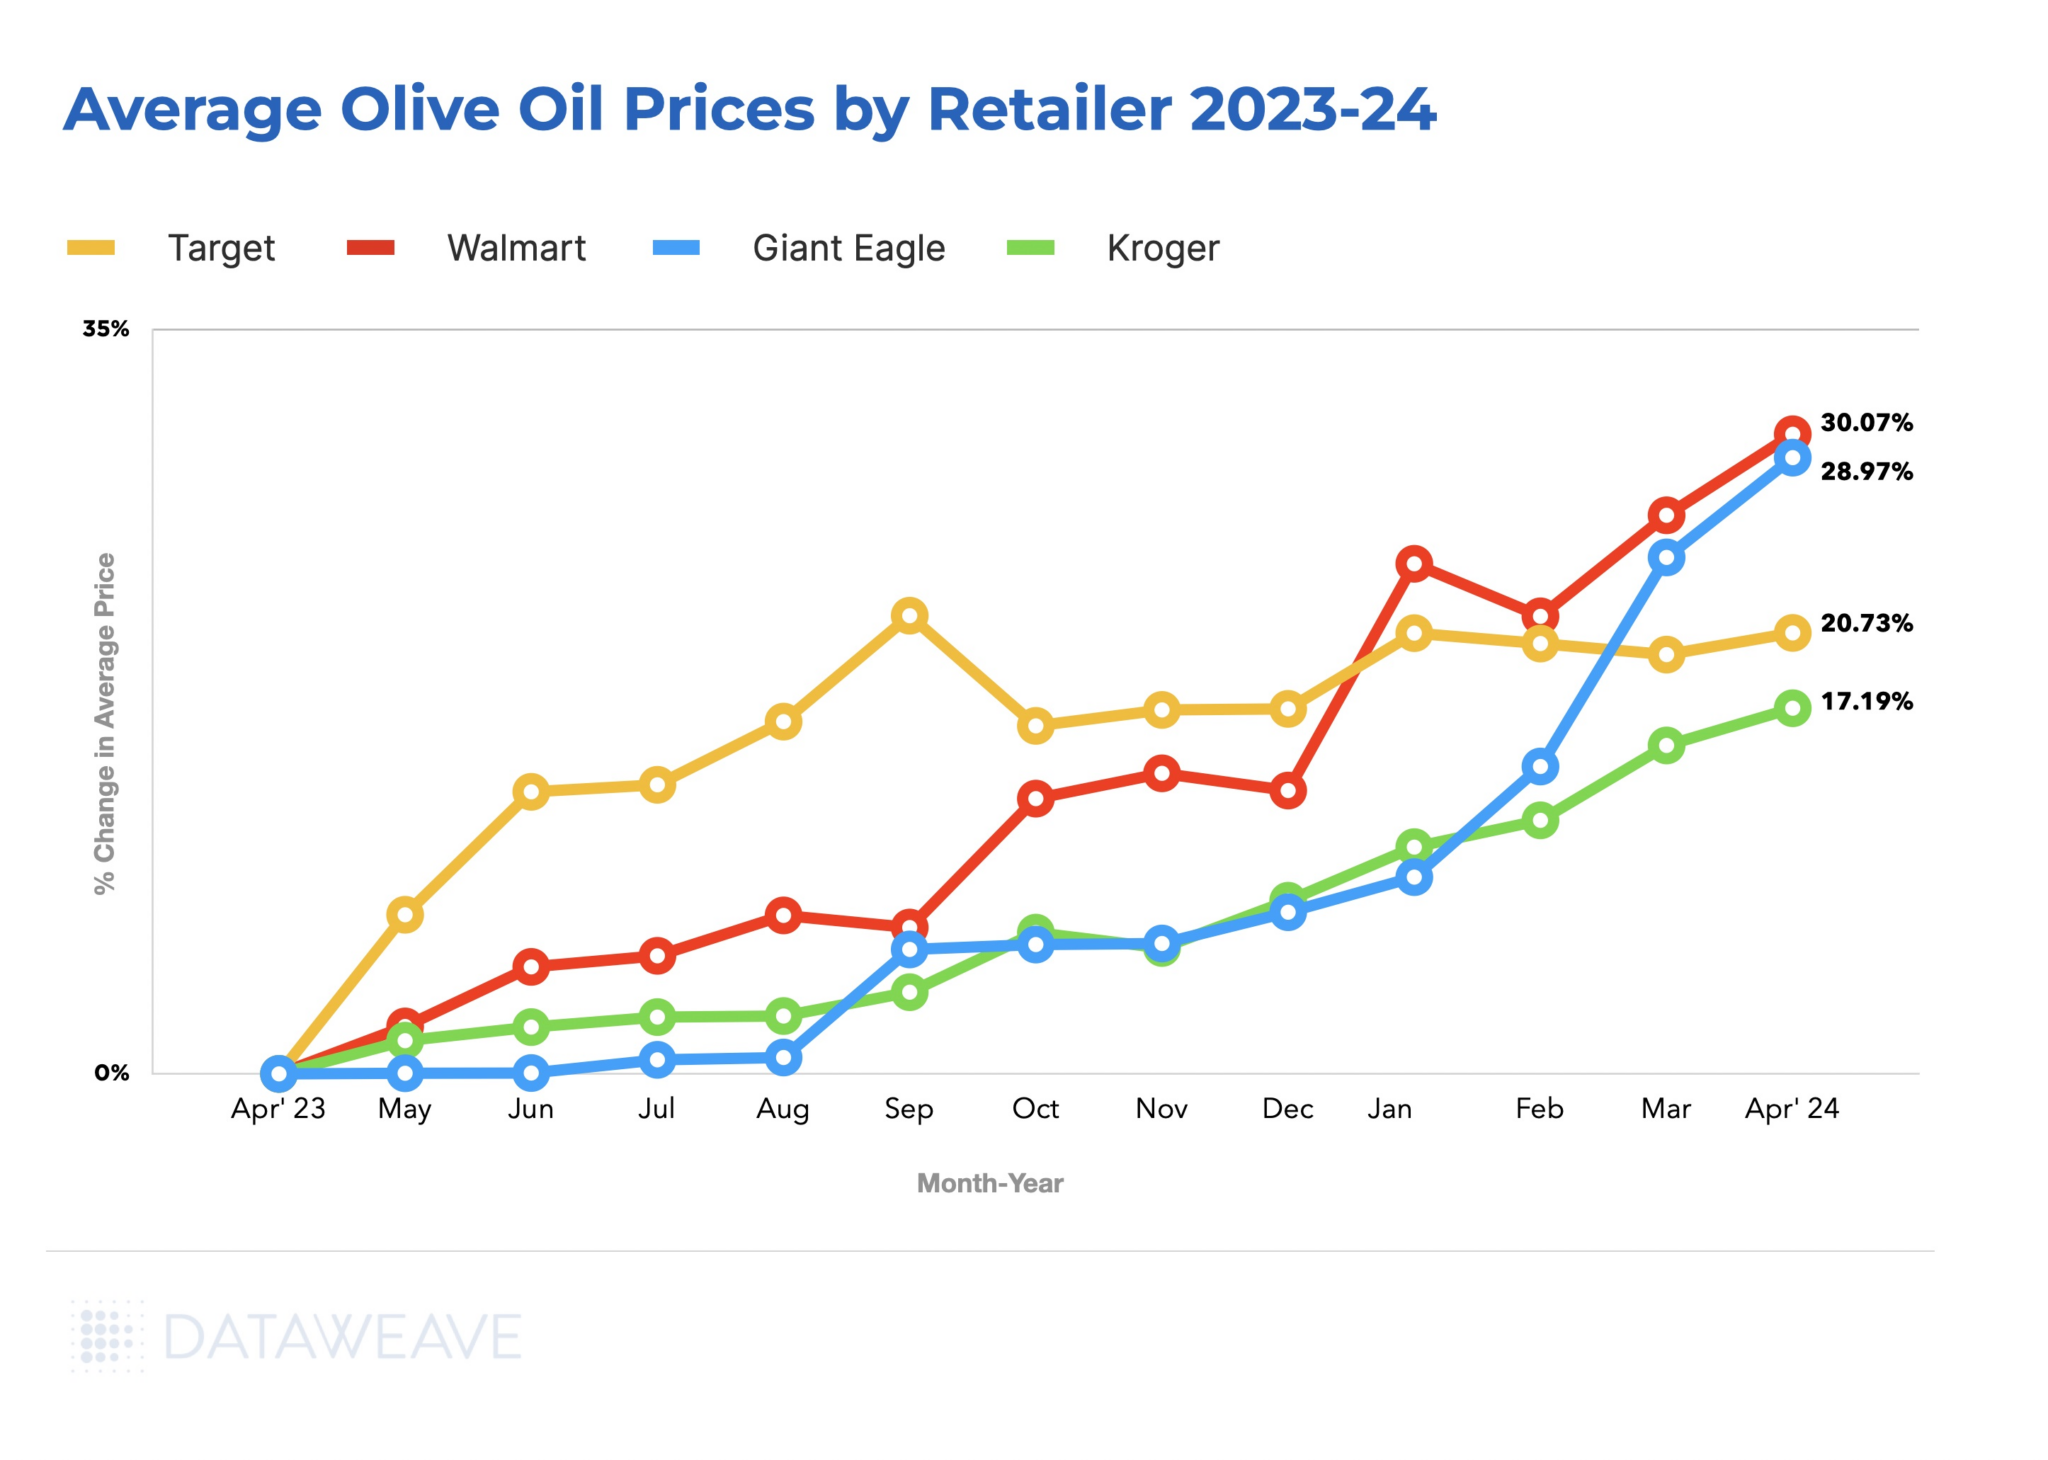
    At DataWeave, we utilized our advanced AI-powered data aggregation and analysis platform to scrutinize the pricing trends of olive oils across key US retailers over the past year. Our analysis covered 130+ SKUs from major chains including Walmart, Kroger, Giant Eagle, and Target.

    The data revealed a notable escalation in olive oil prices, with consumers facing a sharp 25.8% increase from April 2023 to April 2024.

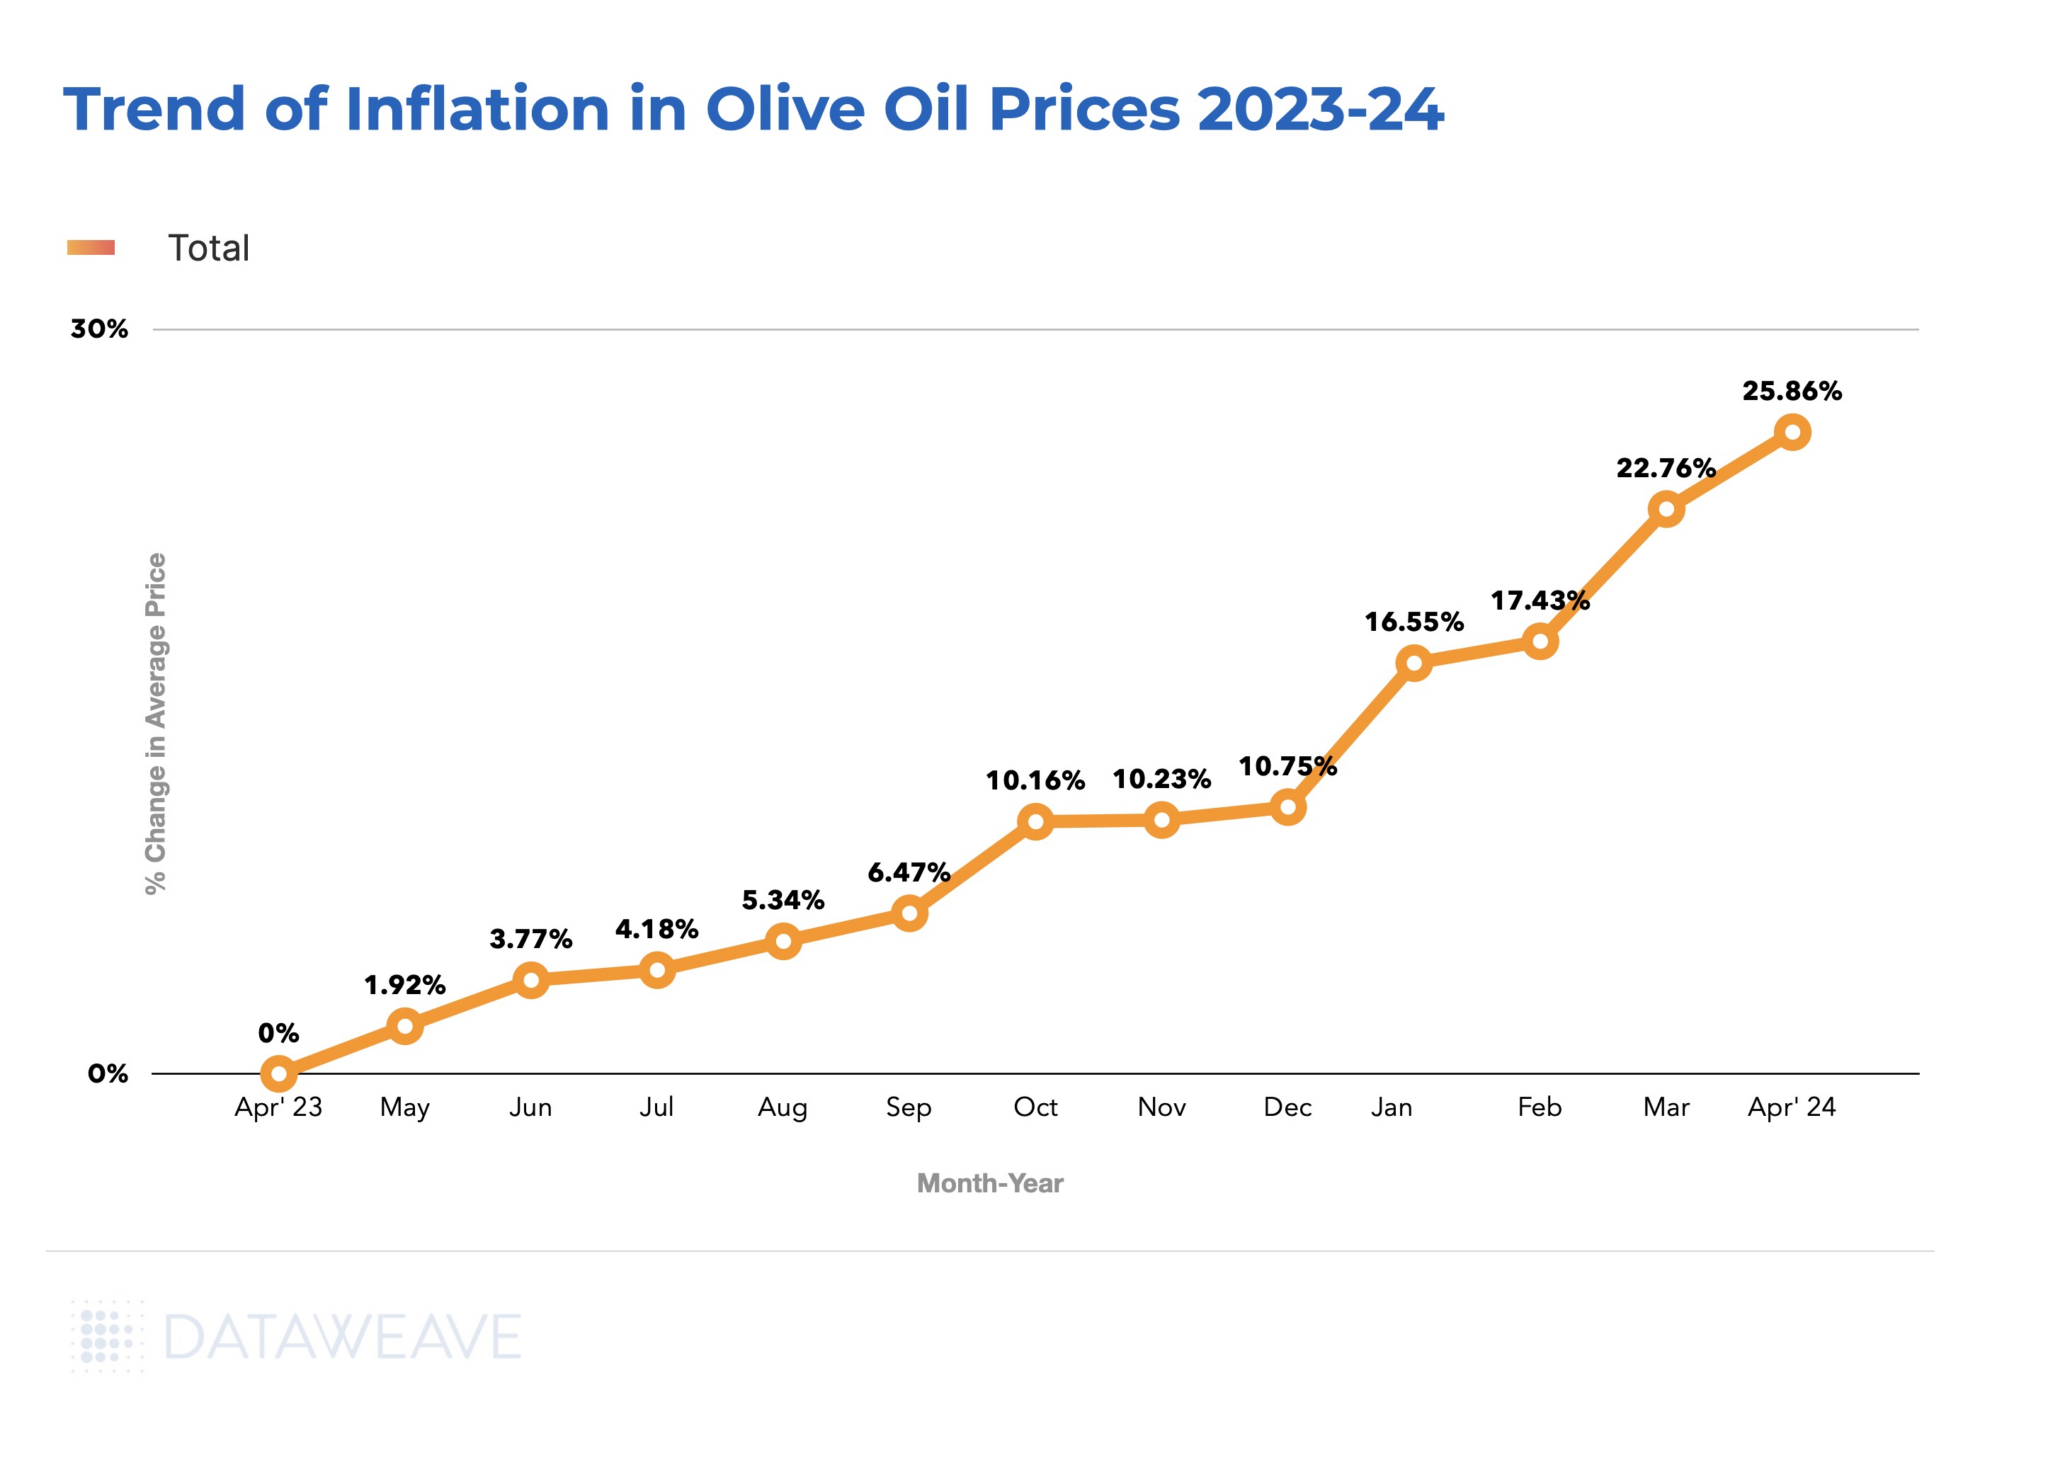
    This trend of rising costs was consistent across all analyzed retailers. Specifically, Walmart and Giant Eagle each reported a substantial 30% increase in their olive oil prices over the past year. In contrast, Target and Kroger experienced somewhat more modest hikes, at 20% and 15% respectively.

    Further investigation into individual brands within our sample highlighted that no brand is immune to the impacts of the ongoing supply shortages. Walmart’s own Great Value brand saw an exceptional 60% surge in prices. Other prominent olive oil brands such as Carapelli, Terra Delysia, and Bertolli also faced significant price increases, ranging from 20% to 50%.

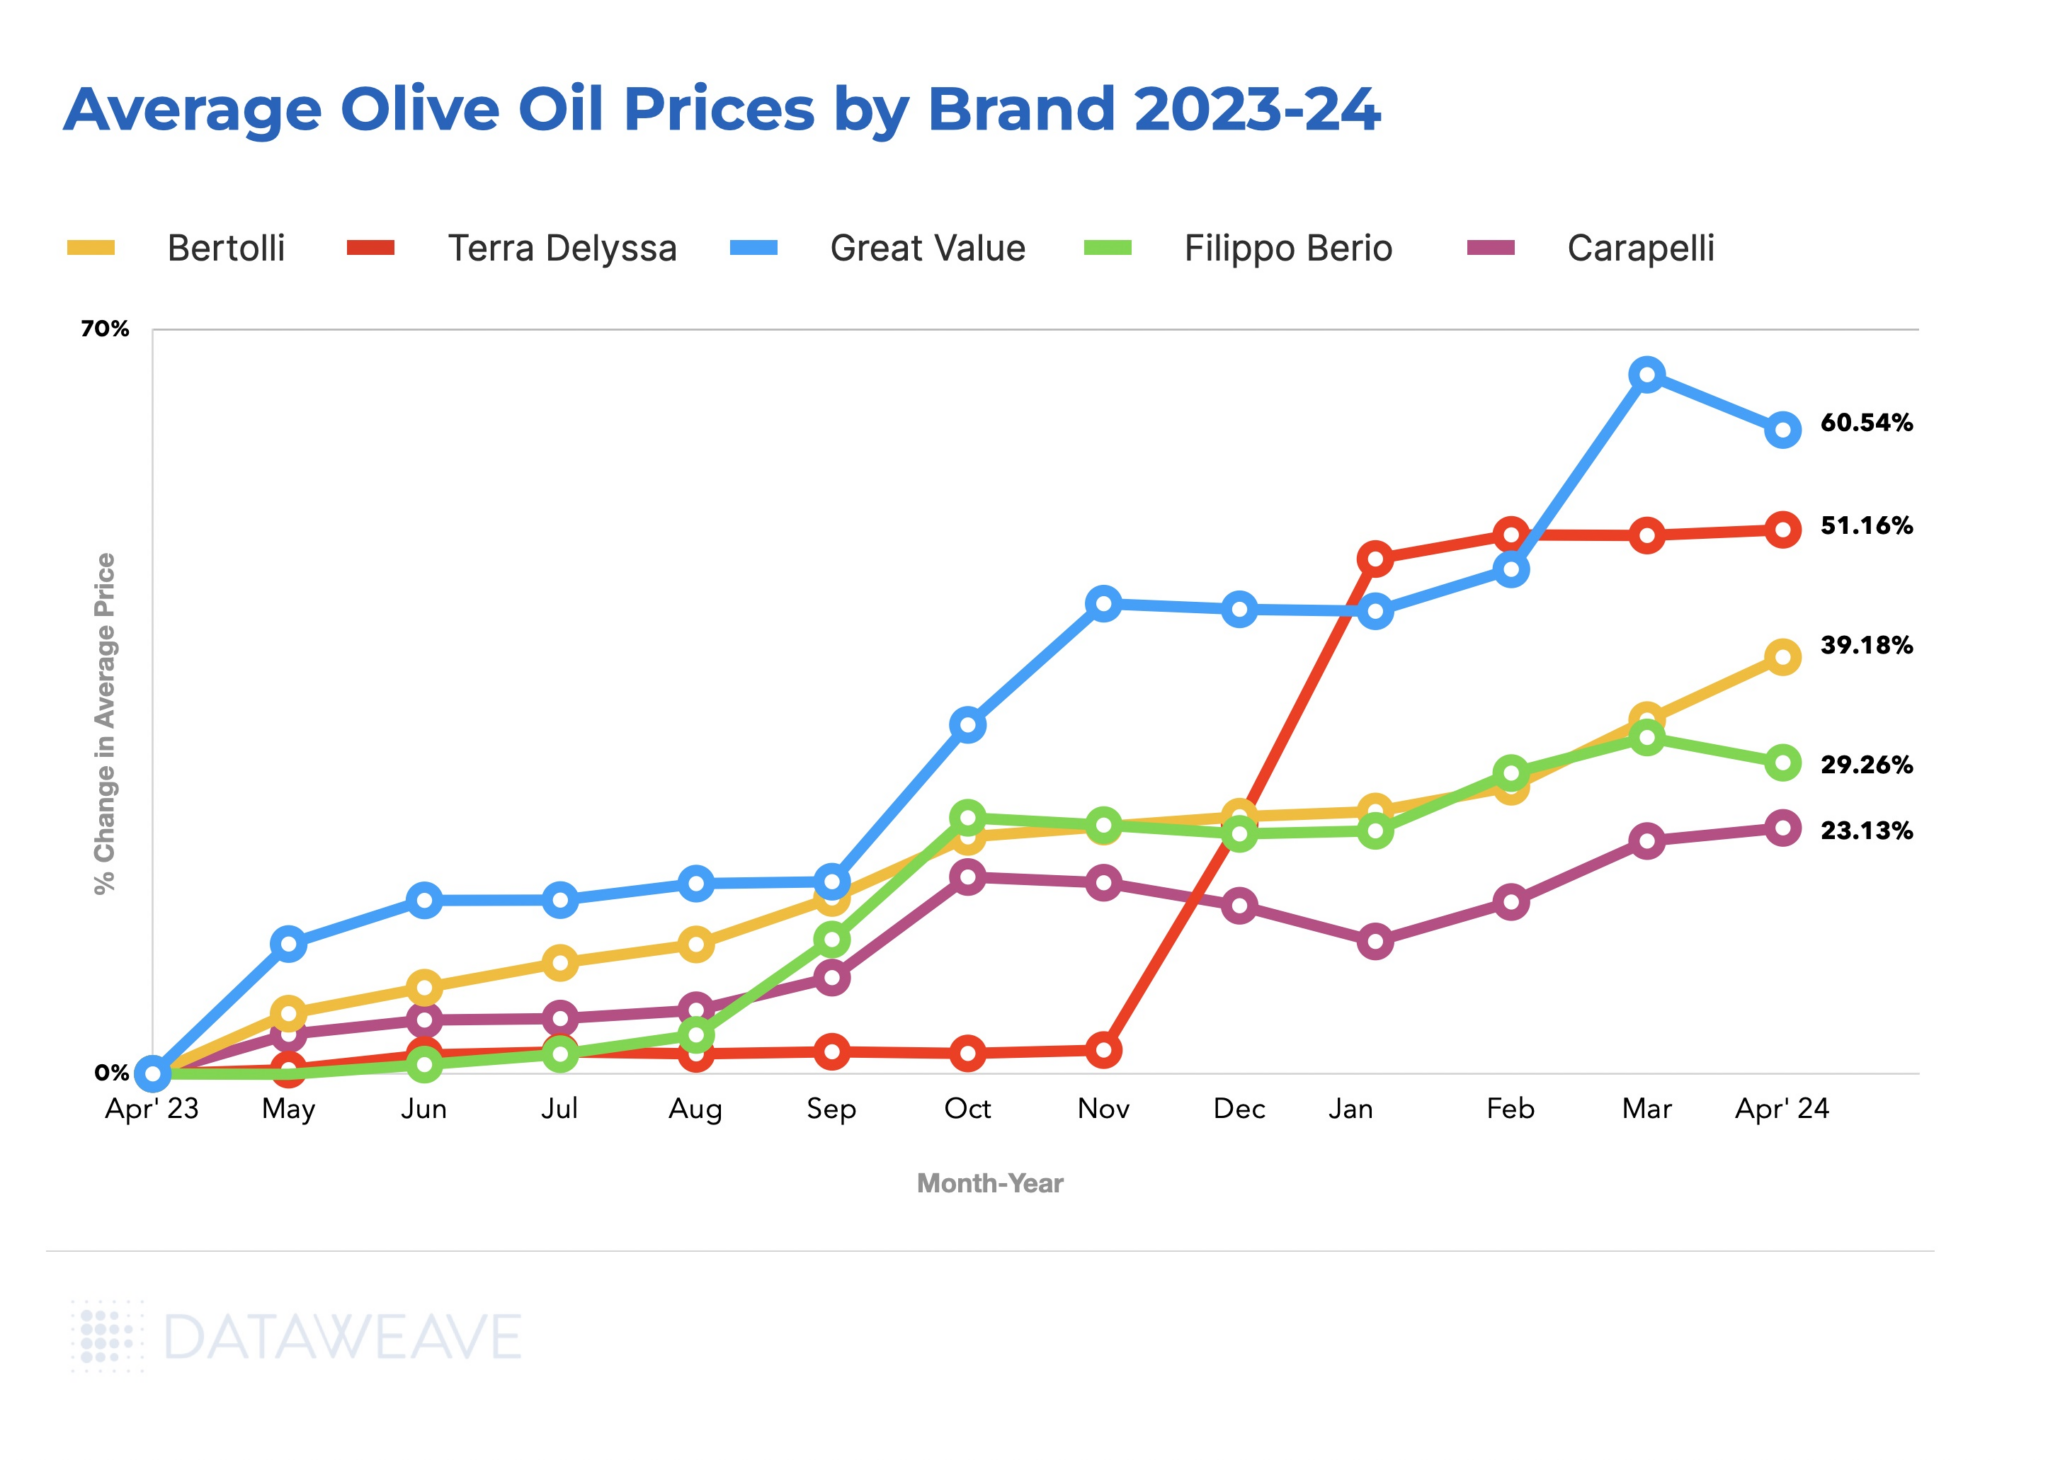
    This across-the-board rise in prices underscores the widespread effect of supply constraints on the olive oil market, affecting both premium and private label brands alike.

    What Strategies Can Retailers and Brands Employ?

    In a market where consumer preferences and price sensitivities are rapidly evolving, retailers and brands must adopt versatile strategies without compromising on profit margins.

    Diversifying Brand Selection

    Retailers can enhance their appeal by offering a diverse range of olive oil brands, thereby stimulating competition among brands based on price, quality, innovation, and customer satisfaction. A well-curated selection that includes well-known brands like Filippo Berio and Bertolli, alongside emerging labels such as Terra Delyss, and premium options like Carapelli, allows retailers to meet a wide array of consumer preferences and budgets.

    For premium outlets, it might be beneficial to introduce more economical options than typically offered to attract budget-conscious consumers. Employing advanced assortment intelligence tools can provide retailers with crucial data, helping them make informed decisions about which brands to stock and promote, ensuring they meet consumer demand effectively while managing inventory costs.

    Data-driven Pricing

    With rising olive oil prices, competitive pricing is more crucial than ever. Retailers must strive to balance competitiveness with margin preservation. It’s essential for retailers to not just passively respond to market price increases but to actively ensure that their offerings are competitively priced relative to the market.

    This involves using sophisticated pricing intelligence tools, such as those provided by DataWeave, which track market trends and competitor pricing actions. These tools enable retailers to implement dynamic pricing strategies that respond promptly to market conditions and consumer demand shifts, helping to optimize sales and profitability.

    Diversifying Sourcing

    The traditional powerhouses of olive oil production, Spain and Italy, are now facing stiff competition from countries like Turkey and Tunisia. This shift is influenced by various factors, including currency fluctuations and changing trade policies, such as the imposition of tariffs on European olive oils by significant importers like the US. Retailers can take advantage of these changes by diversifying their sourcing strategies to include olive oil from non-traditional regions.

    The 2022/2023 season saw remarkable production levels from countries outside the Mediterranean basin, with Iran and China setting new production records. By broadening their supply chains to incorporate these emerging markets, retailers can benefit from lower production costs and introduce unique products to their consumers, enhancing both competitiveness and profit margins.

    Double Down on Private Labels

    Large retailers have successfully used their scale to develop strong private-label brands that can buffer consumers from price hikes in the olive oil market. By focusing on expanding and promoting their private-label offerings, retailers can provide cost-effective alternatives to national brands.

    Private labels generally have lower price points, making them particularly attractive during times of economic pressure and market volatility. Additionally, the development of private labels allows retailers to control more of their supply chain, from pricing to packaging, enabling them to offer high-quality products at competitive prices, thereby retaining customer loyalty and enhancing market share.

    Navigating Market Pressures

    High olive oil prices impact the entire supply chain, presenting varied challenges and opportunities:

    • Producers benefit from higher revenues but face increased pressure to maintain quality and yields in challenging climates. Adapting to these conditions with sustainable practices is crucial.
    • Exporters and Importers navigate tighter margins and greater risks due to tariffs and volume restrictions, requiring agility and strategic planning to adapt to market changes.
    • Retailers must carefully balance competitive pricing with rising procurement costs, affecting consumer affordability and potentially leading to shifts in buying patterns.
    • Consumers may seek cheaper alternatives or reduce their olive oil consumption, which influences overall market demand and pricing stability.

    These dynamics underscore the necessity for retailers and brands to adopt innovative and proactive strategies to navigate the volatile olive oil market effectively. By focusing on adaptive pricing, diversified sourcing, and customer engagement, businesses can enhance their resilience and secure long-term success in this competitive landscape.

    To learn more, talk to us today!

  • Easter Candy Pricing Trends 2024: Winning Strategies for Retailers and Brands Amid Cocoa Price Surge

    Easter Candy Pricing Trends 2024: Winning Strategies for Retailers and Brands Amid Cocoa Price Surge

    Easter egg hunts just got more challenging for families this year as the price of chocolate and other candies has soared. The root of this price surge lies in a cocoa deficit, attributed to diseases affecting crops and the adverse effects of climate change on West African farms, which supplies over 70% of the world’s cocoa. This has resulted in a tripling of cocoa prices over the last year, causing a “cocoa crunch,” and severely impacted confectioners and chocolate makers.

    Reuters recently reported that Iconic brands such as Hershey’s and Cadbury find themselves grappling with the need to adjust to escalating costs for raw materials. Given that Easter is one of the top three candy-purchasing occasions, these manufacturers are contemplating raising their prices to sustain their profit margins.

    Despite the challenges posed by the cocoa shortfall and persistent inflation, the National Confectioners Association anticipates that Easter candy sales in the U.S. will match or even exceed last year’s figures, which amounted to approximately $5.4 billion. This expectation is predicated more on price increases than on a rise in sales volume.

    At DataWeave, our ongoing analysis of pricing trends across various consumer categories among retailers has provided insight into the evolving landscape of chocolate and candy prices in 2023 and 2024.

    Our Analysis of Inflation in Candy and Chocolate Prices

    Our study encompassed a broad array of 3,300 products from leading U.S. retailers, Amazon, Target, Kroger, and Giant Eagle. As illustrated in the following chart, the trajectory of prices over the past 15 months was compared against the average prices in January 2023. Our tracking focused on two key price points: the selling price, which represents the final cost to consumers after applying any discounts or promotions, and the Manufacturer’s Suggested Retail Price (MSRP), as determined by the brands themselves.

    The findings from our analysis indicate that the average selling price, primarily influenced by retailer decisions, has experienced a steady increase throughout 2023, reaching a peak at 16.2% above January 2023’s figures by December. As of March 2024, coinciding with the Easter season, the selling prices are approximately 10% higher than they were at the beginning of the previous year.

    Simultaneously, the MSRP has seen a consistent uptick, driven by the climbing costs of cocoa. Brands have adjusted their suggested prices accordingly, with the current MSRP standing about 7% above its January 2023 level, after having peaked at a 7.6% increase by December 2023. This reflects the direct impact of rising cocoa costs on product pricing strategies.

    Chocolate Candies Are Hit The Hardest

    Across all candies, chocolate-based products have witnessed significantly sharper price increases than their non-chocolate counterparts. In the past 14 months, the selling prices of chocolate items have surged by 14.9%, a stark contrast to the modest 4% rise observed in non-chocolate candies.

    This price escalation was particularly pronounced during the Christmas shopping period, a response to heightened demand, before experiencing a temporary decline in February.

    The diminishing availability of cocoa, coupled with rising costs for packaging and transportation, has compelled brands and retailers alike to transfer these added expenses onto the consumer. This dynamic underpins the distinct pricing trends observed across the candy spectrum, with chocolate items bearing the brunt of these cost pressures.

    Discounts Offered By Retailers and Brands to Entice Easter Shoppers

    In our analysis, we delved deeper to identify the retailers and brands offering the most compelling prices for Easter-centric confections, including Chocolate Eggs, Chocolate Bunnies, and Easter-themed gift packs.

    Kroger emerged as the frontrunner among the retailers we monitored, offering an impressive 19% discount on Easter candies. Giant Eagle followed with a solid 14% average markdown. Meanwhile, Amazon and Target provided more modest promotional discounts at 12% and 10%, respectively.

    Kroger is making significant efforts to ensure consumers have access to attractively priced Easter treats. The retailer planned to keep its doors open throughout the Easter weekend, featuring baskets brimming with discounted items such as Russell Stover chocolate bunnies, Brach’s jelly beans, Reese’s eggs, and assorted bags of popular candies from Snickers, Twix, and Starburst, among others. Additionally, Kroger is enhancing its value proposition through gift card offers and exclusive Easter deals for its loyalty program members.

    On the brand front, Starburst by Mars Wrigley leads with the steepest discount of 25%. Cadbury, under Mondelez, is not far behind, offering 21% off its mini eggs and other Easter treats, marking an increase from last year’s 17% discount. Ferrero Rocher is making a strong pricing move with an average 20% markdown on its Easter selections, including the chocolate bunny and squirrel figures.

    The beloved Peeps marshmallow candies by Just Born are being offered at an 18% discount this year, slightly less than the 23% discount seen in 2023, likely reflecting the impact of rising sugar costs, given their sugar and corn composition.

    Other notable brands, including M&M’s and the premium Swiss chocolatier Lindt, have elevated their average Easter discounts to 17% this year, up from the previous year’s discounts of 12%, and 10% respectively, showcasing a competitive pricing strategy to delight consumers this Easter season.

    Coping With Inflation This Easter Season

    Retailers and brands aiming to remain profitable and competitive in the current challenging environment can adopt a few strategic approaches:

    • Creative Product Bundling: Design innovative combo packs that mix chocolate and non-chocolate items. Such bundles can cater to diverse consumer preferences and budget ranges while preserving profit margins.
    • Encouragement of Bulk Purchases: Offer enticing discounts on larger quantities to promote bulk buying. This strategy can help amplify sales volumes, compensating for increased costs per item and fostering economies of scale.
    • Strategic Competitive Pricing: Keeping a vigilant eye on competitors’ pricing strategies is vital. Aim to capture market share through well-thought-out discount strategies that balance competitiveness with margin preservation. Leveraging advanced pricing intelligence, such as that offered by DataWeave, can provide invaluable insights for making informed pricing decisions.
    • Product Size Adjustments: Consider revising the size or weight of products as a cost management measure, a strategy known as “shrinkflation.” It’s crucial to approach this transparently, ensuring clear communication on packaging to uphold consumer trust.

    Adopting these strategies—focusing on bundle offerings, incentivizing bulk purchases, optimizing pricing strategies based on competitive intelligence, and thoughtfully adjusting product sizes—will be pivotal for confectioners to navigate the challenges posed by the cocoa price surge.

    For more information, reach out to us to speak to a DataWeave expert today!


  • The Indian E-Commerce Showdown: Unveiling the Price War Between Flipkart’s Big Billion Days and Amazon’s Great Indian Festival

    The Indian E-Commerce Showdown: Unveiling the Price War Between Flipkart’s Big Billion Days and Amazon’s Great Indian Festival

    India’s homegrown eCommerce giant Flipkart, now backed by Walmart, reported a record 1.4 Billion customer visits during the early access phase and throughout the seven days of its premier shopping event, the Big Billion Days, launched on 8th October 2023. Competing with Flipkart, Amazon’s Great Indian Festival sale event started on October 8th as well and saw a whopping 95 Million customer visits to the website within the first 48 hours of the event.

    For consumers, the most pressing question was, “Who offered more attractive deals and lower prices during these sale events?”

    To answer this question, we leveraged our proprietary data aggregation and analysis platform and analyzed the prices and discounts on Amazon and Flipkart across key product categories..

    The details of our sample are mentioned below:

    • Number of SKUs Analyzed: 30,000+
    • Websites: Amazon.com and Flipkart.com
    • Categories: Apparel, Home & Furniture, Electronics, Health & Beauty
    • Dates: 7th Oct 2023 to 22nd Oct 2023

    Key Findings

    Based on our analysis, the Big Billion Days by Flipkart showcased relatively higher price reductions across categories compared to the Great Indian Festival sale by Amazon. The Apparel category on Flipkart saw the highest average discount at 50.6%. The Health & Beauty category had the lowest discount across Flipkart at 39.4% and Amazon at 33%.

    Overall, Flipkart offered higher discounts in each product category. It is clear that the retailer invested heavily in leveraging its supplier partnerships with key brands or sellers to enable them to offer higher discounts, thereby attracting more customers.

    Next, let’s take a closer look at each product category.

    Apparel

    While a majority of retailers expected demand for apparel and clothing to dip this festive season in India, eCommerce giants like Amazon and Flipkart are likely to recognize the strong consumer inclination towards apparel during this period.

    In the detailed assessment of Apparel sub-categories, Women’s Dresses, Women’s Tops, Men’s Shirts, Men’s Shoes, and Women’s Innerwear emerged as the segments showcasing the most substantial discounts during the sale events. While Flipkart offered higher average discounts across all sub-categories, Amazon offered competitive discounts as well.

    We observed significant differences in the average discounts across brands between Flipkart’s Big Billion Days and Amazon’s Great Indian Festival. Reinforcing the significant discounts on the Shoes subcategory, brands like Red Tape, Arrow, Adidas, Reebok, Nike, and more offered extensive discounts on both Flipkart and Amazon. Notably, Adidas and Reebok offered better deals on Amazon’s Great Indian Festival as compared to Flipkart.

    One8 by Virat Kohli had a significantly lower discount on Amazon compared to Flipkart, indicating an exclusive partnership.

    For brands, however, reducing prices is just one approach to entice shoppers. They must also guarantee their prominent presence and easy discoverability within Amazon and Flipkart search results. To gain insight into this, we monitored brands’ Share of Search across various frequently used search terms in addition to the discounts they provided. The Share of Search denotes the portion of a brand’s products within the top 20 search results for a specific search query.

    Our data indicates that Jockey and Speedo gained in Share of Search on Flipkart, but reduced discoverability on Amazon. Van Heusen fell behind in search results on Flipkart but showed a higher Share of Search on Amazon.

    Home & Furniture

    With demand for home and furniture products picking up in October, right before the festive season, Amazon and Flipkart offered significant discounts in this category.

    Discounts on both Amazon and Flipkart hovered around 50%. Across a few subcategories, Flipkart offered slightly lower discounts compared to Amazon. Only Luggage, Rugs, Sofas, and Entertainment Units saw lower markdowns on Flipkart during the Big Billion Days. 

    Dishwashers and Washer/ Dryers saw higher discounts on Amazon compared to Flipkart. The significant discounts on these products on Amazon possibly point to changing consumer preferences, as demand for these products is traditionally low in India, but seems to be growing.

    When it comes to Home & Furniture brands, Nasher Miles, Safari, Aristocrat, VIP, and American Tourister, luggage brands mostly, offered higher discounts on Flipkart, followed closely by Amazon.

    In terms of Share of Search, Skybags had high discoverability on both Flipkart and Amazon. The brand leveraged a strategy of offering big discounts this festive season as well as ensuring prominent placement in search results. Wildcraft lost out on its discoverability on Flipkart in contrast to its prominence on Amazon. Duroflex saw lower searchability on Amazon compared to Flipkart’s Big Billion Days.

    Consumer Electronics

    The Consumer Electronics and Appliances Manufacturers Association (CEAMA) expected an uptick in sales of consumer electronics products this festive season in India. With more consumers buying premium products using credit cards and EMIs, demand for expensive, high-end electronics was expected to increase.

    Again, average discounts in this category hovered around 50% on Flipkart and Amazon.

    Across electronics subcategories, Smartwatches, Earbuds, and Drones had the highest markdowns with Flipkart leading the pack during the Big Billion Days. Amazon offered relatively higher discounts at 44.9% on the TV subcategory, compared to Flipkart’s 40.6%.

    Speakers, Laptops, Smartphones, and Tablets also saw lower markdowns on Amazon compared to Flipkart. Amazon was the official partner for the launch of many high-level smartphones and products in September-October, contributing to the higher markdowns in the subcategory.

    Across brands, Lenovo’s discounts were the most differentiated between the two sites, with the brand offering higher discounts on Amazon (45.4%) compared to Flipkart (24.7%). Noise offered the highest discounts at 72.5% on Amazon and 52.8% on Flipkart. Brands like Boat and Zebronics, also saw lower discounts on Flipkart.

    Mi and JBL offered deeper discounts on Flipkart’s Big Billion Days. Apple meanwhile stands out with only 11.83% discounts on Amazon, but the brand offered impressive 31.4% discounts on Flipkart.

    Samsung dominated the Share of Search on Amazon at 15.7%, compared to only 2.6% on Flipkart. Apple and Lenovo also saw higher discoverability on Amazon. On Flipkart, JBL and Skullcandy stand out as brands with high search visibility.

    Health & Beauty

    The Health & Beauty category saw the lowest markdowns with only 39.4% discounts on Flipkart and 33% on Amazon.

    In the subcategories analyzed, Electric Toothbrushes had relatively high markdowns across both sites. Staple and lower priced subcategories like Toothpaste had the lowest markdowns across both sale events, with Amazon offering only 17.4% average discounts.

    Across brands, Beardo, a leading beard care brand, offered significantly higher discounts on Amazon compared to Flipkart. Most other well-known brands, including Nivea and Vaseline, saw higher discounts on Amazon compared to Flipkart. Only Tresmme and Dove were exceptions with higher discounts on Flipkart.

    In terms of Share of Search, once again, Beardo was the most discoverable brand in this category. Brands like Dove, Pond’s, Swiss Beauty, and Tresemme saw a lower Share of Search on Flipkart compared to Amazon.

    Navigating the Competitive Landscape: How To Thrive During Sale Events

    Amazon and Flipkart’s strategic pricing during the Big Billion Days and the Great Indian Festival Sale reflects a balance of profitability, inventory, and competition. Competitive pricing insights empower retailers to make informed decisions, optimize strategies, and thrive during high-stakes sale events with timely and relevant insights at a massive scale.

    To learn more about how you can leverage competitive pricing insights to stay ahead of the game during sale events, reach out to us today!

  • Why Unit of Measure Normalization is Critical For Accurate and Actionable Competitive Pricing Intelligence

    Why Unit of Measure Normalization is Critical For Accurate and Actionable Competitive Pricing Intelligence

    Competitive pricing intelligence is pivotal for retailers seeking to analyze their product pricing in relation to competitors. This practice is essential for ensuring that their product range maintains a competitive edge, meeting both customer expectations and market demands consistently.

    Product matching serves as a foundational element within any competitive pricing intelligence solution. Products are frequently presented in varying formats across different websites, featuring distinct titles, images, and descriptions. Undertaking this process at a significant scale is highly intricate due to numerous factors. One such complication arises from the fact that products are often displayed with differing units of measurement on various websites.

    The Challenge of Varying Units

    In certain product categories, retailers often offer the same item in varying volumes, quantities, or weights. For instance, a clothing item might be available as a single piece or in packs of 2 or 3, while grocery brands commonly sell eggs in counts of 6, 12, or 24.

    Consider this example: a quick glance might suggest that an 850g pack of Kellogg’s Corn Flakes priced at $5 is a better deal than a 980g pack of Nestle Cornflakes priced at $5.2. However, this assumption can be deceptive. In reality, the latter offers better value for your money, a fact that only becomes evident through price comparisons after standardizing the units.

    This issue is particularly relevant due to the prevalence of “shrinkflation,” where brands adjust packaging sizes or quantities to offset inflation while keeping prices seemingly low. When quantities, pack sizes, weight, etc. reduce instead of prices increasing, it’s important that this change is considered while analyzing competitive pricing.

    Normalizing Units of Measure

    In order to effectively compare prices among different competitors, retailers must standardize the diverse units of measurement they encounter. This standardization (or normalization) is crucial because price comparisons should extend beyond individual product SKUs to accommodate variations in package sizes and quantities. It’s essential to normalize units, ranging from “each” (ea) for individual items to “dozen” (dz) for sets, and from “pounds” (lb), “kilograms” (kg), “liters” (ltr), to “gallons” (gal) for various product types.

    For example, a predetermined base unit of measure, such as 100 grams for a specific product like cornflakes, serves as the reference point. The unit-normalized price for any cornflake product would then be the price per 100 grams. In the example provided, this reveals that Kellogg’s is priced at $0.59 per 100 grams, while Nestle is priced at $0.53 per 100 grams.

    Various Categories of Unit Normalization

    1. Weight Normalization

    Retailers frequently feature products with weight measurements expressed in grams (g), kilograms (kg), pounds (lbs), or ounces (oz).

    2. Quantity or Pack Size Normalization

    Products are also often featured with varying pick sizes or quantities in each SKU.

    mounting hardware kit

    3. Volume or Capacity Normalization

    Products can also vary in volumes or capacities with units like liters (L) or fluid ounces (fl oz).

    DataWeave’s Unit Normalized Pricing Intelligence Solution

    DataWeave’s highly sophisticated product matching engine can match the same or similar products and normalize their units of measurement, leading to highly accurate and actionable competitive pricing insights. It standardizes different units of measurement, like weight, quantity, and volume, ensuring fair comparisons across similar and exact matched products.

    Retailers have the flexibility to view pricing insights either with retailer units or normalized units. This capability empowers retailers and analysts to perform accurate, in-depth analyses of pricing information at a product level.

    In some scenarios, analyzing unit normalized pricing reflects pricing trends and competitiveness more accurately than retail price alone. This is particularly true for categories like CPG, where products are sold in diverse units of measure. For instance, in the example shown here, we can view a comparison of price position trends for the category of Fruits and Vegetables based on both retail price and unit price.

    The difference is striking: the original retail price based analysis shows a stagnation in price position, whereas unit normalized pricing analysis reflects a more dynamic pricing scenario.

    With DataWeave, retailers can specify which units to compare, ensuring that comparisons are made accurately. For example, a retailer can specify that unit price comparisons apply only to 8, 12, or 16-ounce packs, as well as 1 or 3-pound packs, but not to 10 and 25-pound bags. This precision ensures that products are matched correctly, and prices are represented for appropriately normalized units, leading to more accurate pricing insights.

    To learn more about this capability, write to us at contact@dataweave.com or visit our website today!

  • DataWeave Launches PricingPulse: Empowering Retail Leaders With Comprehensive and Strategic Pricing Insights

    DataWeave Launches PricingPulse: Empowering Retail Leaders With Comprehensive and Strategic Pricing Insights

    In the evolving retail landscape, success often hinges on a singular focal point: pricing. A recent Statista survey revealed that 70% of US online users prioritize competitive pricing in their digital shopping choices. In this cutthroat arena, where surpassing rivals is paramount, a deep comprehension of pricing nuances is no longer just an edge, but a necessity.

    Retailers are increasingly adopting pricing intelligence solutions that meticulously dissect competitor pricing data in comparison to their own, down to the SKU level. This analysis empowers their pricing teams with the insights they need to price their products competitively on a day-to-day basis.

    However, in a landscape where a staggering 50 million price changes occur daily, reliance on a reactive pricing intelligence solution, though effective in many ways, often falls short. To develop a strategic and predictive pricing engine, retailers also need the ability to track historical pricing relative to market conditions, competitor actions, seasonality, promptness of competitor pricing actions, and more. This would be particularly useful for senior retail pricing and business unit leaders as they look to gain a strategic perspective on their competitive pricing health. However, even today’s leading providers of retail pricing intelligence solutions lack in this area. This results in a relatively myopic view of competitive pricing even in large retail organizations.

    Introducing DataWeave’s PricingPulse

    DataWeave’s PricingPulse helps retail leaders better understand their competitive pricing strategies in comparison to relevant market dynamics over time. The capability bridges the gap between day-to-day competitive pricing operations and long-term strategic pricing analysis and actions, enabling senior retail pricing leaders to untangle the complexities of their pricing strategies. Delivered as a dashboard, the view offers an elevated vantage point for industry-wide pricing dynamics, empowering retailers with the foresight needed to navigate market shifts, predict vulnerabilities, and capitalize on new opportunities.

    PricingPulse is provided to all DataWeave retail customers as an add-on to our Pricing Intelligence solution.

    The insights offered by PricingPulse enable retailers to answer pivotal questions about competitor pricing behaviors, price leadership across categories, timing of price changes, and the effectiveness of capitalizing on price improvement opportunities. Some of the questions that PricingPulse offers answers to include:

    • How frequently are my competitors changing prices and for which products?
    • How does my price leadership vary across key product categories?
    • Which day of the week or month do my competitors change their pricing most and least frequently?
    • How well do I seize on price improvement opportunities over time?

    Strategic Pricing Views Via PricingPulse

    In the following section, we share a few views available to retail leaders via our PricingPulse dashboard. For a complete list of insights available on the dashboard, request a demo today.

    Competitive Price Leadership Across Retailers and Categories

    This view provides retailers with an overview of the price leaders across various product categories and how it changes with time. More often than not, retailers would aim to gain price leadership in certain categories, while maintaining healthy margins in others.

    Retailers can also gauge their consistency and effectiveness in maintaining a competitive edge for key categories over time. They can fortify areas of strength and identify opportunity areas to optimize their pricing.

    In addition, the dashboard tracks a retailer’s price index across categories, a measure that determines its price competitiveness.

    The price index is determined by dividing the retailer’s price by the lowest price offered by any of its competitors. A ratio lesser than 1 indicates that the retailer is the lowest priced in the market. This measure is also presented for competitors, providing insights into competitors that are most attractively priced in the market. A timeline trend of this metric helps track how price leadership among retailers changes over time.

    Price Change Trends

    This view provides a summary of the level of price changes by a retailer and its competitors over a period of time, which includes the average magnitude of price changes as well as the proportion of the retailer’s assortment that underwent these price changes.

    In addition, the number of price changes each month are provided for each retailer. This is further broken down into the total number of price changes during each day of the week.

    These insights help retailers determine which competitors are most and least active in their pricing activities, how aggressive the pricing actions are, and if there are any specific price change patterns followed in terms of the days of the week or month.

    Price Improvement Opportunities and Actions

    The dashboard actively reports on price improvement opportunities, which could include either a price increase opportunity or a price decrease opportunity, for a retailer and its competitors across categories over time. A price increase opportunity occurs when a product is significantly under priced (by more than 2%) and a price decrease opportunity occurs when a product is significantly overpriced (by more than 2%).

    Further, the retailer gains insight into how many price improvement opportunities were actually acted on within 15 days of the opportunity presenting itself. This “action rate” helps retailers quantify how well they seize on price improvement opportunities, which eventually result in higher sales and margins. The dashboard also reports on the average number of days it took for a retailer to act on a price improvement opportunity, thereby quantifying the responsiveness and agility of pricing teams.

    This is especially useful for pricing leaders to “audit” or evaluate the performance of their pricing teams. When similar insights are viewed for a set of competitors as well, retailers can better understand the level of sophistication of their competitors’ pricing operations.

    Ready to Elevate Your Pricing Game?

    The launch of DataWeave’s PricingPulse marks a significant advancement in the realm of pricing solutions for retail leaders. As the retail landscape undergoes continuous transformation, the significance of precise pricing strategies cannot be overstated. PricingPulse is the first and only pricing view in the industry to bridge the gap between tactical pricing decisions and comprehensive strategic analysis.

    In a world where agility and foresight are crucial, PricingPulse equips retail leaders with the ability to predict competitor actions, optimize pricing strategies, and stay ahead of the competition.

    If you are a senior pricing leader or retail business unit head, reach out to us today to either sign up or learn more!

  • Navigating the Turbulent Home and Furniture eCommerce Market in 2023 with the Power of Competitive Intelligence

    Navigating the Turbulent Home and Furniture eCommerce Market in 2023 with the Power of Competitive Intelligence

    The home and furniture retail industry is going through a turbulent time. As inflation reared its head mid-2022, leading retailers in the category have been grappling with the higher costs associated with producing and distributing their products, as well as reduced shopper demand. The rising costs of raw materials, transportation, and labor have had a direct impact on the pricing dynamics within the industry. For example, reports indicate container rates soared to nearly 10 times pre-pandemic levels towards the end of 2021.

    Furthermore, shoppers’ spending power has been constrained, while higher interest rates have suppressed demand. Retailers have had to adapt their assortment and pricing strategies to cater to a wider range of shopper preferences driven by changing lifestyles and a growing emphasis on sustainability. Post-pandemic, demand has been primarily driven by affluent shoppers.

    Towards the end of 2021, due to supply delays and disruptions, retailers heavily stocked up on available products. However, when demand subsequently decreased in 2022, they were left with a significant amount of unsold stock that was purchased at high rates. This put them in a difficult situation, as they had an excess of products but were unable to sell them even at reduced prices without impacting their profit margins. Additionally, staying competitive in a rapidly changing market environment was equally important.

    Given this context, it is crucial for home and furniture retailers to adopt a data-driven approach that utilizes competitive and market insights to consistently maintain or increase their online sell-through rates. DataWeave’s Commerce Intelligence solution offers exactly that, empowering retailers across various industry segments to stay updated on evolving consumer trends and competitor actions.

    To gain a better understanding of the pricing strategies employed by leading home and furniture retailers throughout the past year, we leveraged our proprietary data aggregation and analysis platform to track and analyze the pricing of a wide range of products across multiple retailers and subcategories within the industry.

    Our Research Methodology

    • Number of SKUs: 400,000+
    • Key retailers tracked: Amazon, Wayfair, Home Depot, Overstock, Target, Walmart
    • Key categories reported: Home and Office, Bed and Bath, Bathroom, Bedroom, Decorative, Dining Room, Kitchen, Garden & Patio, Hardware
    • Timeline of analysis: April 2022 to April 2023

    Our Findings

    Interestingly, our analysis indicates that average prices in the home and furniture category rose by around 5% between March 2022 and April 2023. However, there have been seasonal fluctuations in the prices over the course of the year.

    Among the various subcategories, the most substantial price surge was observed in home office equipment, with an uptick of 9.3% in January 2023 when compared to March 2022. The surge in demand for home office furniture, fueled by the widespread adoption of work from home arrangements, played a pivotal role in depleting inventories and consequently driving up prices. Additionally, the shift towards collaborative workspaces and the gradual expansion of office environments have contributed to the sustained demand for office furniture.

    Avg. price changes MoM across home and furniture subcategories from April 2022-23.

    While prices for several subcategories rose significantly, others experienced subdued growth, such as bed and bath. The subcategory experienced the lowest price increment, registering a modest 2.8% increase annually. This can be attributed to the impact of a subdued housing market and a decrease in first-time buyers, which may partly be due to the global recession and inflationary pressures.

    Moreover, retailers overestimated the demand for home furniture during the holiday season, leading to an overstocking of inventory. Consequently, prices experienced a dip from October to December 2022. In fact, this was a common trend across all home and furniture subcategories. As retailers emerged from the holiday season, prices rose to their highest level in January 2023, and have stayed relatively stable since.

    Some of these trends vary among retailers as each faces different challenges and responds in distinct ways.

    Wayfair, for example, shows a significant dip in pricing after October 2022, with prices stabilizing in 2023. This could be in response to the retailer’s shrinking consumer count, losing 5 million of its 1.3 billion consumers in 2022 due to declining demand.

    Avg. price change MoM within the home and furniture sector across retailers from April 2022-23.

    In fact, online furniture retailers like Wayfair and Overstock reported declines in annual revenue in 2022, as the furniture sector continued to normalize from the high spending seen during COVID-era lockdowns. Wayfair reported that its 2022 net revenue was $12.2 billion, down almost 11% from the year prior. The company also laid off 10% of its workforce in August 2022. Overstock’s reported annual net revenue in 2022 was $1.9 billion, a 30% decrease year-over-year.

    Interestingly, both companies took contrasting approaches in response to this situation. Wayfair opted for aggressive cost-cutting measures, including layoffs and a reduced marketing budget. On the other hand, Overstock focused on attracting new customers through influencer marketing and improving their app, aiming to expand their customer base. With a strategy geared towards younger buyers, Overstock allocated a larger marketing budget than ever before. Our data supports the fact that Overstock did not rely on price reductions to entice shoppers.

    Target has consistently maintained lower price increases compared to Walmart, defying the common perception of Walmart being more conservative in its pricing. Notably, Amazon also stood out minimal price increases throughout the year, being surpassed only by Wayfair since November 2022.

    As price sensitive shoppers increasingly compare prices before making a purchase decision, retailers need to ensure they are priced competitively in the market on a consistent basis to liquidate stock and gain market share without compromising significantly on margins.

    A Sophisticated and Versatile Product Matching Solution is Essential to Achieving Price Leadership

    Product matching plays a vital role in monitoring competitive prices and analyzing price leadership. Within the home and furniture category, there is often a multitude of representations for the same product across various online platforms. Furthermore, eCommerce websites offer a wide array of options, including variations in size, color, material, and similar products. Without an accurate and comprehensive method of matching these products, it becomes impossible to track and compare prices effectively, especially on a large scale. Thus, a versatile product matching engine tailored to the unique requirements of the home and furniture sector becomes essential.

    DataWeave offers an industry-leading product matching platform that harnesses advanced AI models specifically trained to identify and leverage multiple product attributes extracted from titles, descriptions, and images to accurately match products across websites. Additionally, our platform intelligently matches similar products based on a diverse range of extracted attributes. This empowers our retail partners to gain competitive pricing intelligence not only on exact product matches but also on similar and substitute products, as well as their respective variants.

    With our competitive pricing intelligence solution, retailers in the home and furniture industry can confidently analyze and track prices, ensuring they stay at the forefront of price leadership in their market.

    To learn more, reach out to us today!

  • Fashion eCommerce 2023: Leveraging Pricing Intelligence to Stay Competitive Despite Reduced Demand

    Fashion eCommerce 2023: Leveraging Pricing Intelligence to Stay Competitive Despite Reduced Demand

    The fashion industry is currently undergoing a period of stabilization after facing significant disruptions in recent years. Fashion retailers find themselves navigating not only changing consumer preferences but also the challenges brought about by inflation and supply chain issues that are remnants of the COVID-19 era.

    The effects of inflation have raised concerns regarding overabundance, rise of sustainable and pre-used fashion and declining sales, creating a mismatch between supply and demand within the market. As consumers scale back on spending due to rising prices, fashion retailers are left grappling with surplus inventory, heightened storage costs, and reduced profit margins.

    Consequently, these market dynamics have significantly impacted the pricing strategies employed by fashion retailers, resulting in dynamic shifts in pricing and competitiveness across different time periods, subcategories, and individual retailers.

    Counteracting this impact requires fashion retailers to adopt a data-driven approach that leverages competitive and market insights. They must adopt agile and versatile pricing strategies that enable advanced pricing and assortment management. By understanding their market position and the competitive landscape, retailers can effectively react to reduced demand and inflationary pressures without compromising heavily on their top line and profitability.

    At DataWeave, we harnessed the power of our proprietary data aggregation and analysis platform to track and analyze the prices of prominent fashion retailers to uncover unique insights into their price competitiveness over the past year, as well as understand how pricing strategies varied across diverse subcategories.

    Our Methodology

    For this analysis, we tracked the average price changes among leading US fashion retailers over 12 months to understand how their pricing across several fashion subcategories altered in response to supply chain inefficiencies, inflationary pressures, seasonal effects, and changing consumer preferences.

    • Sample: 88,000+ SKUs matched across 5 leading retailers
    • Retailers tracked: Amazon, Walmart, Target, Macy’s, Zappos
    • Key subcategories reported on: Boots, Bottoms, Coats, Denims, Flats, Heels, Jackets, Kids
    • Timeline of analysis: April 2022 to April 2023

    Our Analysis

    While prices have generally been rising in several industry segments, such as groceries, due to inflation, the fashion sector has experienced relatively stable prices, with even a few periods of price drops. In fact, average prices in April 2023 are 1.2% lower than those in April 2022. The main reason for this trend is that consumers have become cautious about discretionary spending on fashion in order to prioritize other necessities, resulting in lower demand and overstocking by retailers.

    In the first quarter of 2022, clothing accounted for only 3.9% of total expenditure by US consumers, down from 4.3% in 2019 before the pandemic. Additionally, in March 2023, 60% of fashion retailers in the US still had surplus goods, accounting for almost 20% of their entire stock. As demand decreased, fashion retailers started offering freebies with purchases, bundling products, giving away unwanted items, and notably, slashing prices.

    Subcategory level analysis of Average Price Change Month-on-Month between April 2022 – April 2023

    Our analysis at a subcategory level reveals that in winter 2022, seasonal demand led to the largest price increases of 6-11% in coats, boots, and jackets. However, these prices quickly declined afterward. In 2023, stabilization of raw material costs and a continuing decline in demand for non-essential apparel and fashion accessories are factors contributing to a significant drop in prices.

    Some of these trends vary among retailers as each faces different challenges and responds in distinct ways. Our data indicates that some retailers have chosen to increase their prices from Q3 2022 due to mounting pressure on profit margins, while others have further lowered prices due to increasing inventory levels.

    Average Price Change Month-on-Month Across Amazon, Macy’s, Walmart, Target, and Zappos between April 2022 – April 2023

    _____________

    Capability Spotlight

    Matching products across competitor websites is an essential part of tracking competitive prices and analyzing price leadership. In fashion, matching exact products is no mean feat. Websites often host a slew of variants in terms of size, color, material, etc. without any form of standardization in the way the products are represented. So fashion retailers often struggle with simply unusable pricing insights resulting from inaccurate and incomplete product matching. 

    DataWeave’s industry-leading product matching algorithm recognizes and leverages dozens of product attributes extracted from product titles, descriptions, and images to match products at very high levels of accuracy and coverage. What’s more, our platform can also match similar products based on a large variety of parameters, so our customers can benefit from a comprehensive competitive perspective.

    _____________

    For example, in August, Target reported a 90% plunge in profits during the second quarter of 2022, as shoppers concerned about inflation reduced spending on nonessential items. The company stated that its price cuts did not have the desired impact, resulting in a 1.5% increase in inventory compared to three months prior. As a result, we can see that Target’s average fashion prices spiked in August 2022 and have remained steady since then. Walmart also faced similar challenges and increased its prices in October 2022.

    However, during the same period in August 2022, Macy’s announced increased discounts to clear out excess inventory in preparation for the holiday shopping season. In the same announcement, Macy’s highlighted how the rising cost of groceries, which had experienced a double-digit increase, was impacting consumers’ budgets, changing their behaviors, and increasing the need for discounts. Our data reflects this, showing a significant drop in prices from October 2022 to January 2023.

    However, in January 2023, Macy’s successfully managed its inventory levels, reducing them from $6.4 billion in October 2022 to $4.3 billion in January 2023. As a result, average prices at Macy’s have started to rise.

    _____________

    For today’s fashion retailers, achieving a balance between expansion goals and profitability is crucial. It requires a meticulous examination of competitive and market insights on a regular basis to mitigate competitive pressures and navigate through these challenging times successfully.

    DataWeave’s platform offers retailers the insights they need to gain a competitive advantage. With access to accurate, timely, and actionable pricing and assortment insights, retailers can make informed decisions and stay ahead of the competition. To learn more, reach out to us today!

  • Impact of Inflation on Grocery: Pricing Insights on Leading US Retailers

    Impact of Inflation on Grocery: Pricing Insights on Leading US Retailers

    Inflation, like an invisible force, silently shapes the dynamics of economies, gradually eroding the purchasing power of consumers and leaving its imprint on various industries. High costs, hiring lags, and stagnating earnings pose severe challenges to businesses. One industry segment that intimately feels the impact of inflation is grocery, where price increases can be extremely concerning for the average consumer.

    Over the last 12-plus months, the US has experienced a notable rise in inflation, stirring up concerns and influencing the way we shop for everyday essentials. Rising costs of raw materials, transportation, and labor have all played a role in driving up prices. Additionally, disruptions in global supply chains and fluctuations in currency exchange rates have further exacerbated the situation, creating a complex web of interdependencies.

    To understand the magnitude of this phenomenon across leading e-retailers, we delved into an in-depth analysis of four major retail giants: Walmart, Amazon, Target, and Kroger.

    Each of these retailers possesses a unique business model and competitive strategy, as well as faces unique challenges. This leads to distinct approaches to managing inflationary pressures. Walmart for instance, expects operating income growth to outpace sales growth in 2023. Given the persistence of high prices and the potential for further macro pressures, the retailer is taking a cautious outlook. In 2022, Amazon’s eCommerce business swung to a net loss of $2.7 billion, compared to a profit of $33.4 billion the previous year.

    Amid these challenging circumstances, understanding the grocery pricing trends and strategies becomes imperative for retailers, both online and in stores to adapt and thrive in the current economic landscape. By examining their pricing trends, we can gain valuable insights into how these companies navigate the turbulent waters of the grocery industry against the backdrop of inflation.

    Our Research Methodology

    The data collected for our analysis encompassed a diverse range of products, from pantry staples like flour and rice to perishable goods like dairy and produce – a basket of around 600 SKUs matched across Amazon, Kroger, Target and Walmart, between January 2022 to February 2023.

    Further, we separately focused on the prices of a smaller subset of 30+ high-volume daily staples that are likely to yield higher sales and margins for these retailers.

    Average Selling Price of a Broad Set of Grocery Items

    Our analysis reveals that Walmart consistently offers the lowest prices, with an average of 8% below its closest competitor, Target, despite an annual price increase of about 5%. Walmart seems to prioritize a “stability and predictability” strategy over margin optimization. The retailer’s 8% growth last quarter indicates that this strategy is bearing fruit. However, it’s important to note that this approach may have its drawbacks as Walmart’s margins come under pressure.

    Average selling price trend across a basket of 500+ SKUs across Target, Walmart, Kroger, Amazon in the grocery category from Jan ’22 to Feb ’23.

    In order to weather inflationary pressures, Walmart may adopt a cautious approach to growth while also focusing on securing margins. Reports suggest that the retailer has been pushing back against consumer packaged goods (CPG) manufacturers following a series of price hikes to counter inflationary cost pressures in early 2023. One of the reasons behind Walmart’s growth and increased sales can be attributed to ‘non-traditional’ higher-income households now seeking deals and discounts at Walmart as their spending power declines.

    Interestingly, Amazon emerges as the highest-priced retailer, followed by Kroger, which increased its prices by 10% throughout the year. Consumer perception commonly associates Amazon with the lowest prices, but the data tells a different story. In fact, Amazon has been charging 12% to 18% higher prices than Walmart for groceries and is still maintaining its success.

    While the company’s online sales declined by 4%, it saw a significant 9% increase in revenue from third-party seller services, such as warehousing, packaging, and delivery, in 2022. Amazon’s strong logistics and same-day delivery services give it a competitive advantage over other retailers, contributing to its revenue growth and margins. Interestingly, this presents an opportunity for Walmart and other retailers to increase prices while maintaining their strong competitive price positions.

    Kroger, on the other hand, seems to be aiming for a premium price perception, consistently raising prices almost every month. Kroger’s pricing strategy appears to be closer to Amazon’s.

    Average Selling Price for High-Volume Daily Staples

    Pricing strategies often change for different categories of products. To better understand this, we focused our analysis further on a small subset of 30+ high-volume staples across retailers. These include baked goods, popular beverages, canned food, frozen meals, dairy, cereals, detergents, and other similar items.

    Average selling price trend of 30+ high-volume daily staples across Target, Walmart, Kroger, Amazon in the grocery category from Jan ’22 to Feb ’23.

    Walmart, possibly overestimating the impact of inflation, has continued to keep its prices the lowest, potentially aiming to increase margins through volume.

    The level of price disparity across retailers is expectedly lower here, with Amazon and Kroger closely tracking Walmart’s average prices.

    Target’s pricing strategy stands out as it consistently emerges as the highest-priced retailer for daily staples, despite being one of the lower-priced retailers for a broader basket of grocery items. This suggests that Target’s underlying technology may not be as optimized to address market dynamics compared to other leading retailers. In our opinion, Target may want to strengthen its efforts to track pricing more intensely for this sub-category.

    A Data-fuelled Approach is the Need of the Hour

    In the challenging economic landscape, retailers and grocery stores are under pressure to maintain their revenues and margins. Adopting a comprehensive and dynamic pricing strategy is crucial. Understanding which product categories are experiencing price increases among competitors can help retailers make informed decisions on pricing at both the category and product level.

    Retailers should consider their balancing margin performance with consumers’ willingness to pay, rather than implementing broad price increases that may harm customer trust. Price increases can be challenging for both customers and merchants. Retailers who employ a data-driven and insight-based approach are more likely to succeed.

    Keep an eye on the DataWeave blog for analysis on pricing, discounting, stock availability, discoverability, and more, across retailers and brands from other industry segments as well.

    For immediate insights, subscribe to our interactive grocery price tracking dashboard. Better still, reach out to us to speak to a DataWeave expert today!