Tag: pricing intelligence

  • How Monitoring and Analyzing  End-User Prices can Help Retailers and Brands Gain a Competitive Edge

    How Monitoring and Analyzing  End-User Prices can Help Retailers and Brands Gain a Competitive Edge

    Retailers and brands are constantly engaged in a fierce battle over prices and discounts. Whether it’s major events like Amazon Prime Day, brand-led sales, or everyday price wars, they depend on pricing intelligence and digital shelf analytics to fine-tune their strategies. With a variety of offers such as sales, promotions, and bundles, determining the actual cost to the customer becomes a complex task. The price set by the brand, the retailer’s offer, and the final amount paid by the customer often vary significantly.

    In their analysis, retailers and brands frequently focus on the listed price or the final sale price, overlooking a critical factor: the “end-user price.” This includes all discounts, taxes, and shipping costs, providing a more accurate picture of what customers are truly willing to pay at checkout.

    Grasping this end-user price is vital for both retailers and brands. For retailers, it helps them stay competitive and refine their promotional strategies. For brands, it offers insights into competitive positioning, net revenue management, and shaping customer price perception.

    However, emphasizing the end-user price is challenging, as it involves comprehending all the intricate elements of pricing.

    How end-user pricing is calculated

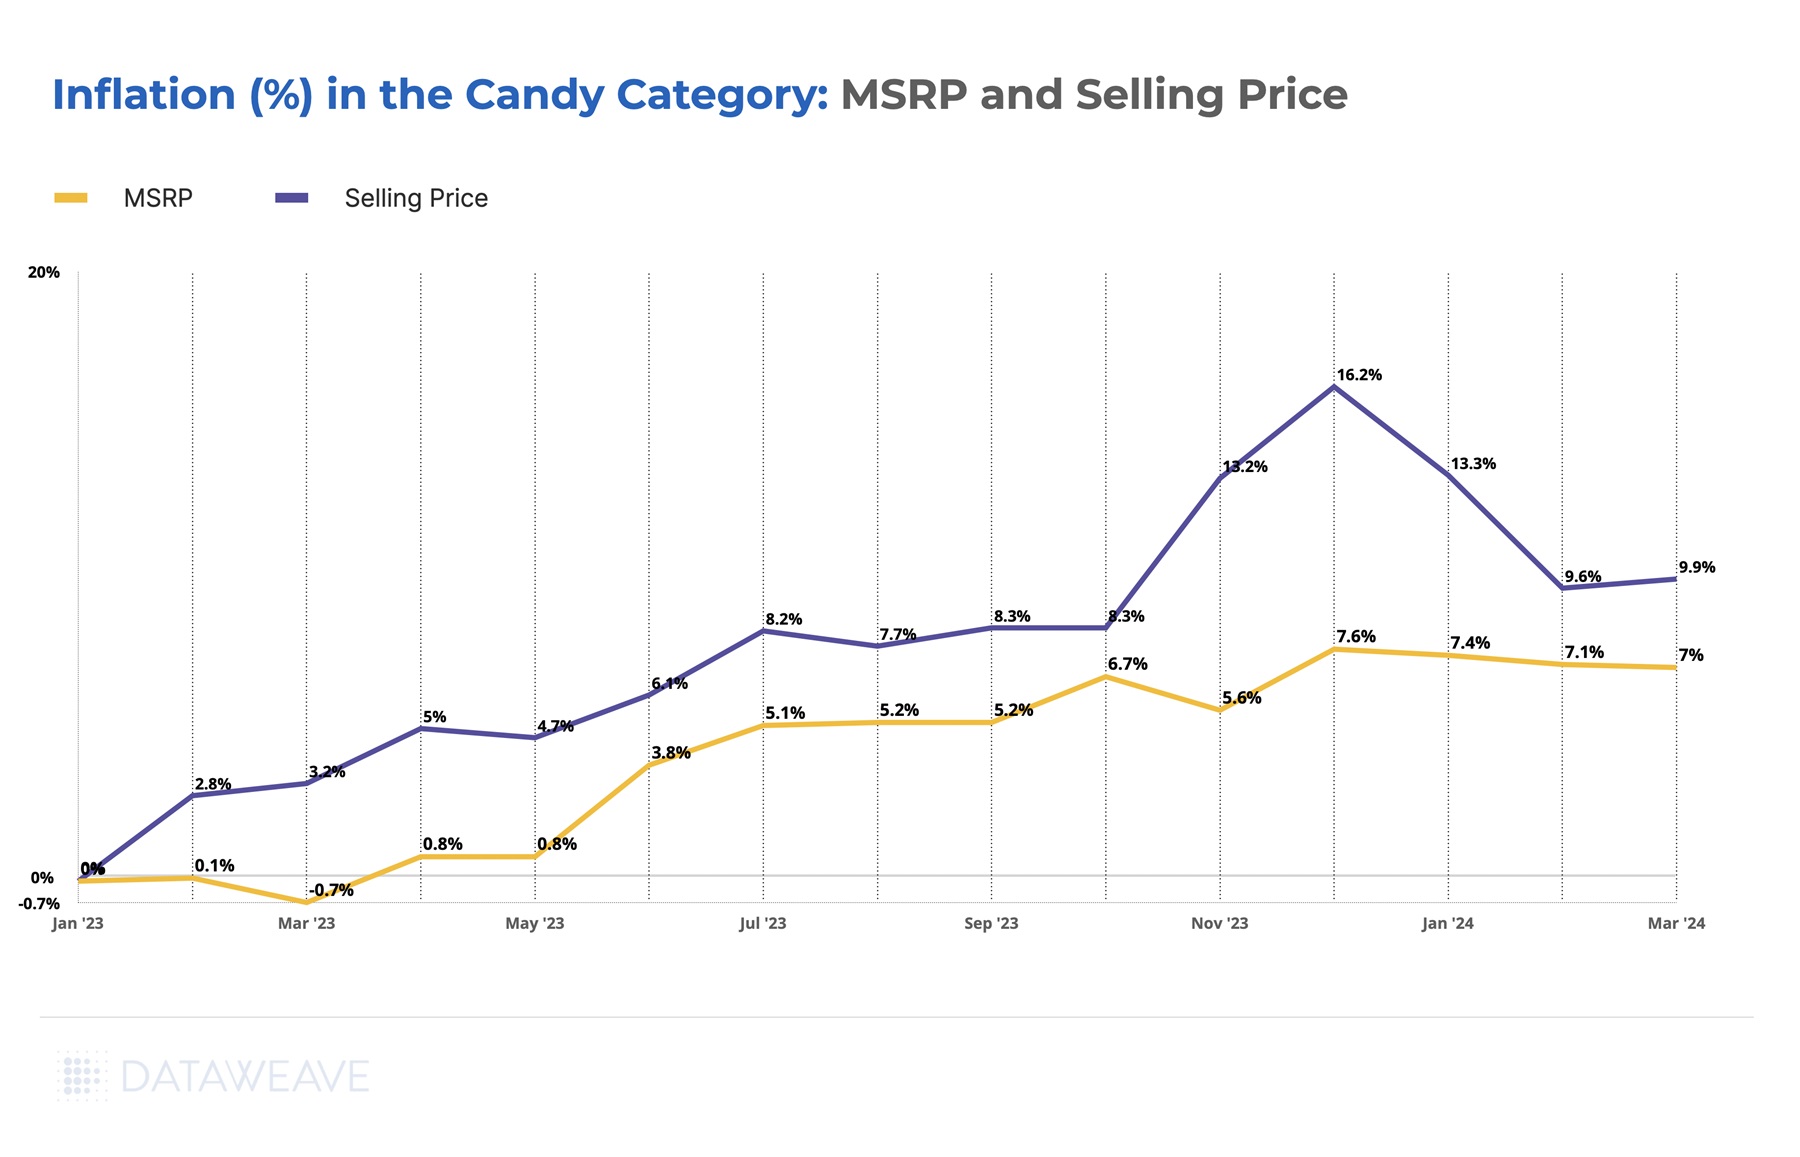
    The list price, also known as the manufacturer’s recommended retail price (MSRP), is the initial price set by the brand. This may not always be displayed on marketplaces, especially in categories like grocery. The selling price, on the other hand, is the amount at which a retailer offers the product, often reduced from the list price. The end-user price is the actual amount the customer pays at checkout, which includes taxes, promotions, and other factors that affect the final cost.

    The process involves 3 key stages:

    Step 1: Identifying and categorizing promotional offers

    The first critical step in calculating end-user pricing is to identify and categorize the various promotional offers available for a given product that can reduce the final amount paid by the consumer. These promotions span a wide range of types:

    • Bank Offers: Involving discounts or cash back incentives when paying with specific bank credit or debit cards. For instance, a customer may receive 10% cashback on their purchase by using a specific bank’s card.
    • Bundled Deals: Combining multiple products or services at a discounted bundle price. A common example is a smartphone bundle including the phone itself, a protective case, and earphones at a reduced total cost.
    • Promo Codes/Coupons: Customers can enter promo codes or coupons during checkout to unlock special discounted prices or percentage-off offers, like 20% off a hotel booking, or even a special brand discount personalized for their needs (think loyalty offers and in-app promotions).
    • Shipping Offers: These include free shipping or reduced shipping fees for certain products or orders, such as free delivery on orders above a set amount.
    • TPRs (Temporary Price Reductions): TPRs play a significant role in the strategies of most retailers. Brands and retailers use them to encourage shoppers to purchase more of a product or to try a new product they wouldn’t usually buy. A TPR involves reducing the price of a product by more than 5% from its regular shelf price.

    By accurately identifying and classifying each type of promotion available, brands can then calculate the potential end-user pricing points.

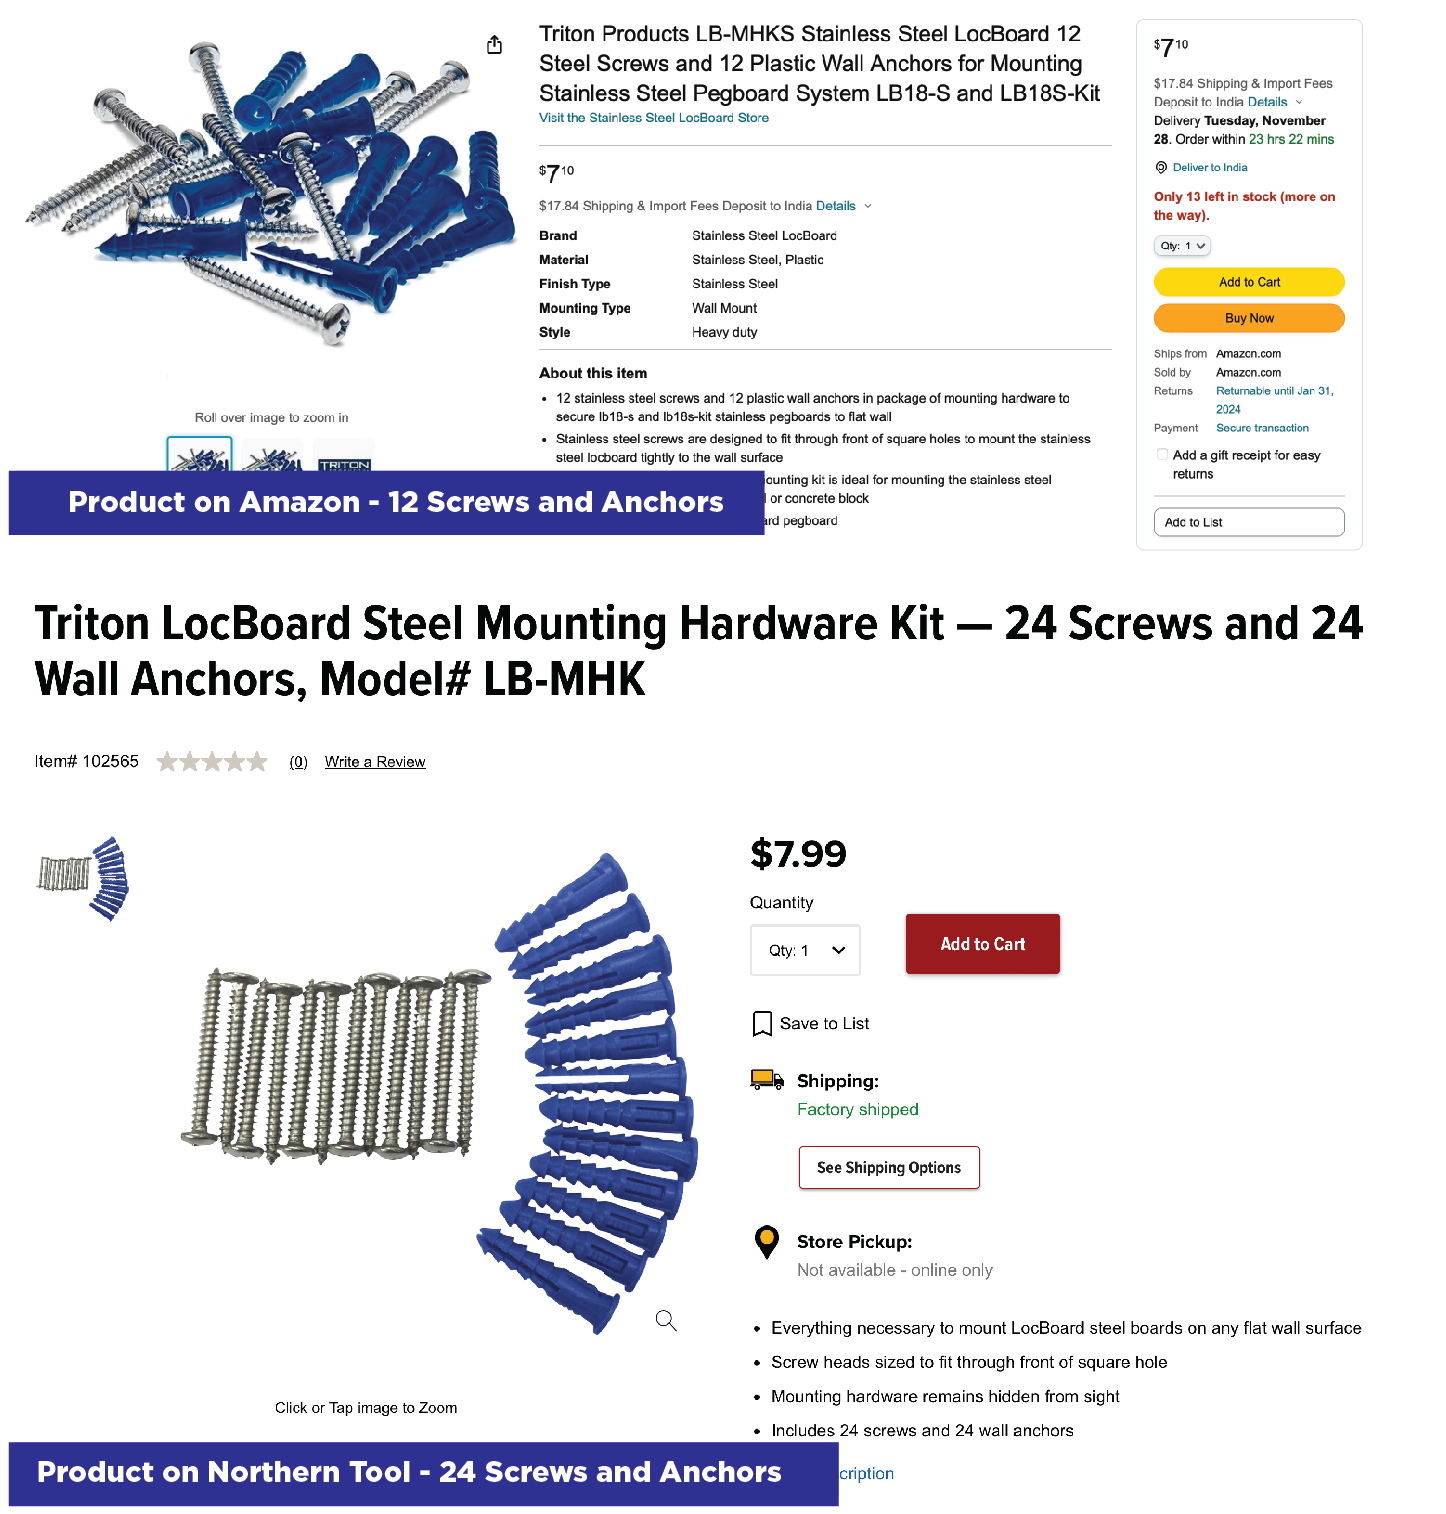
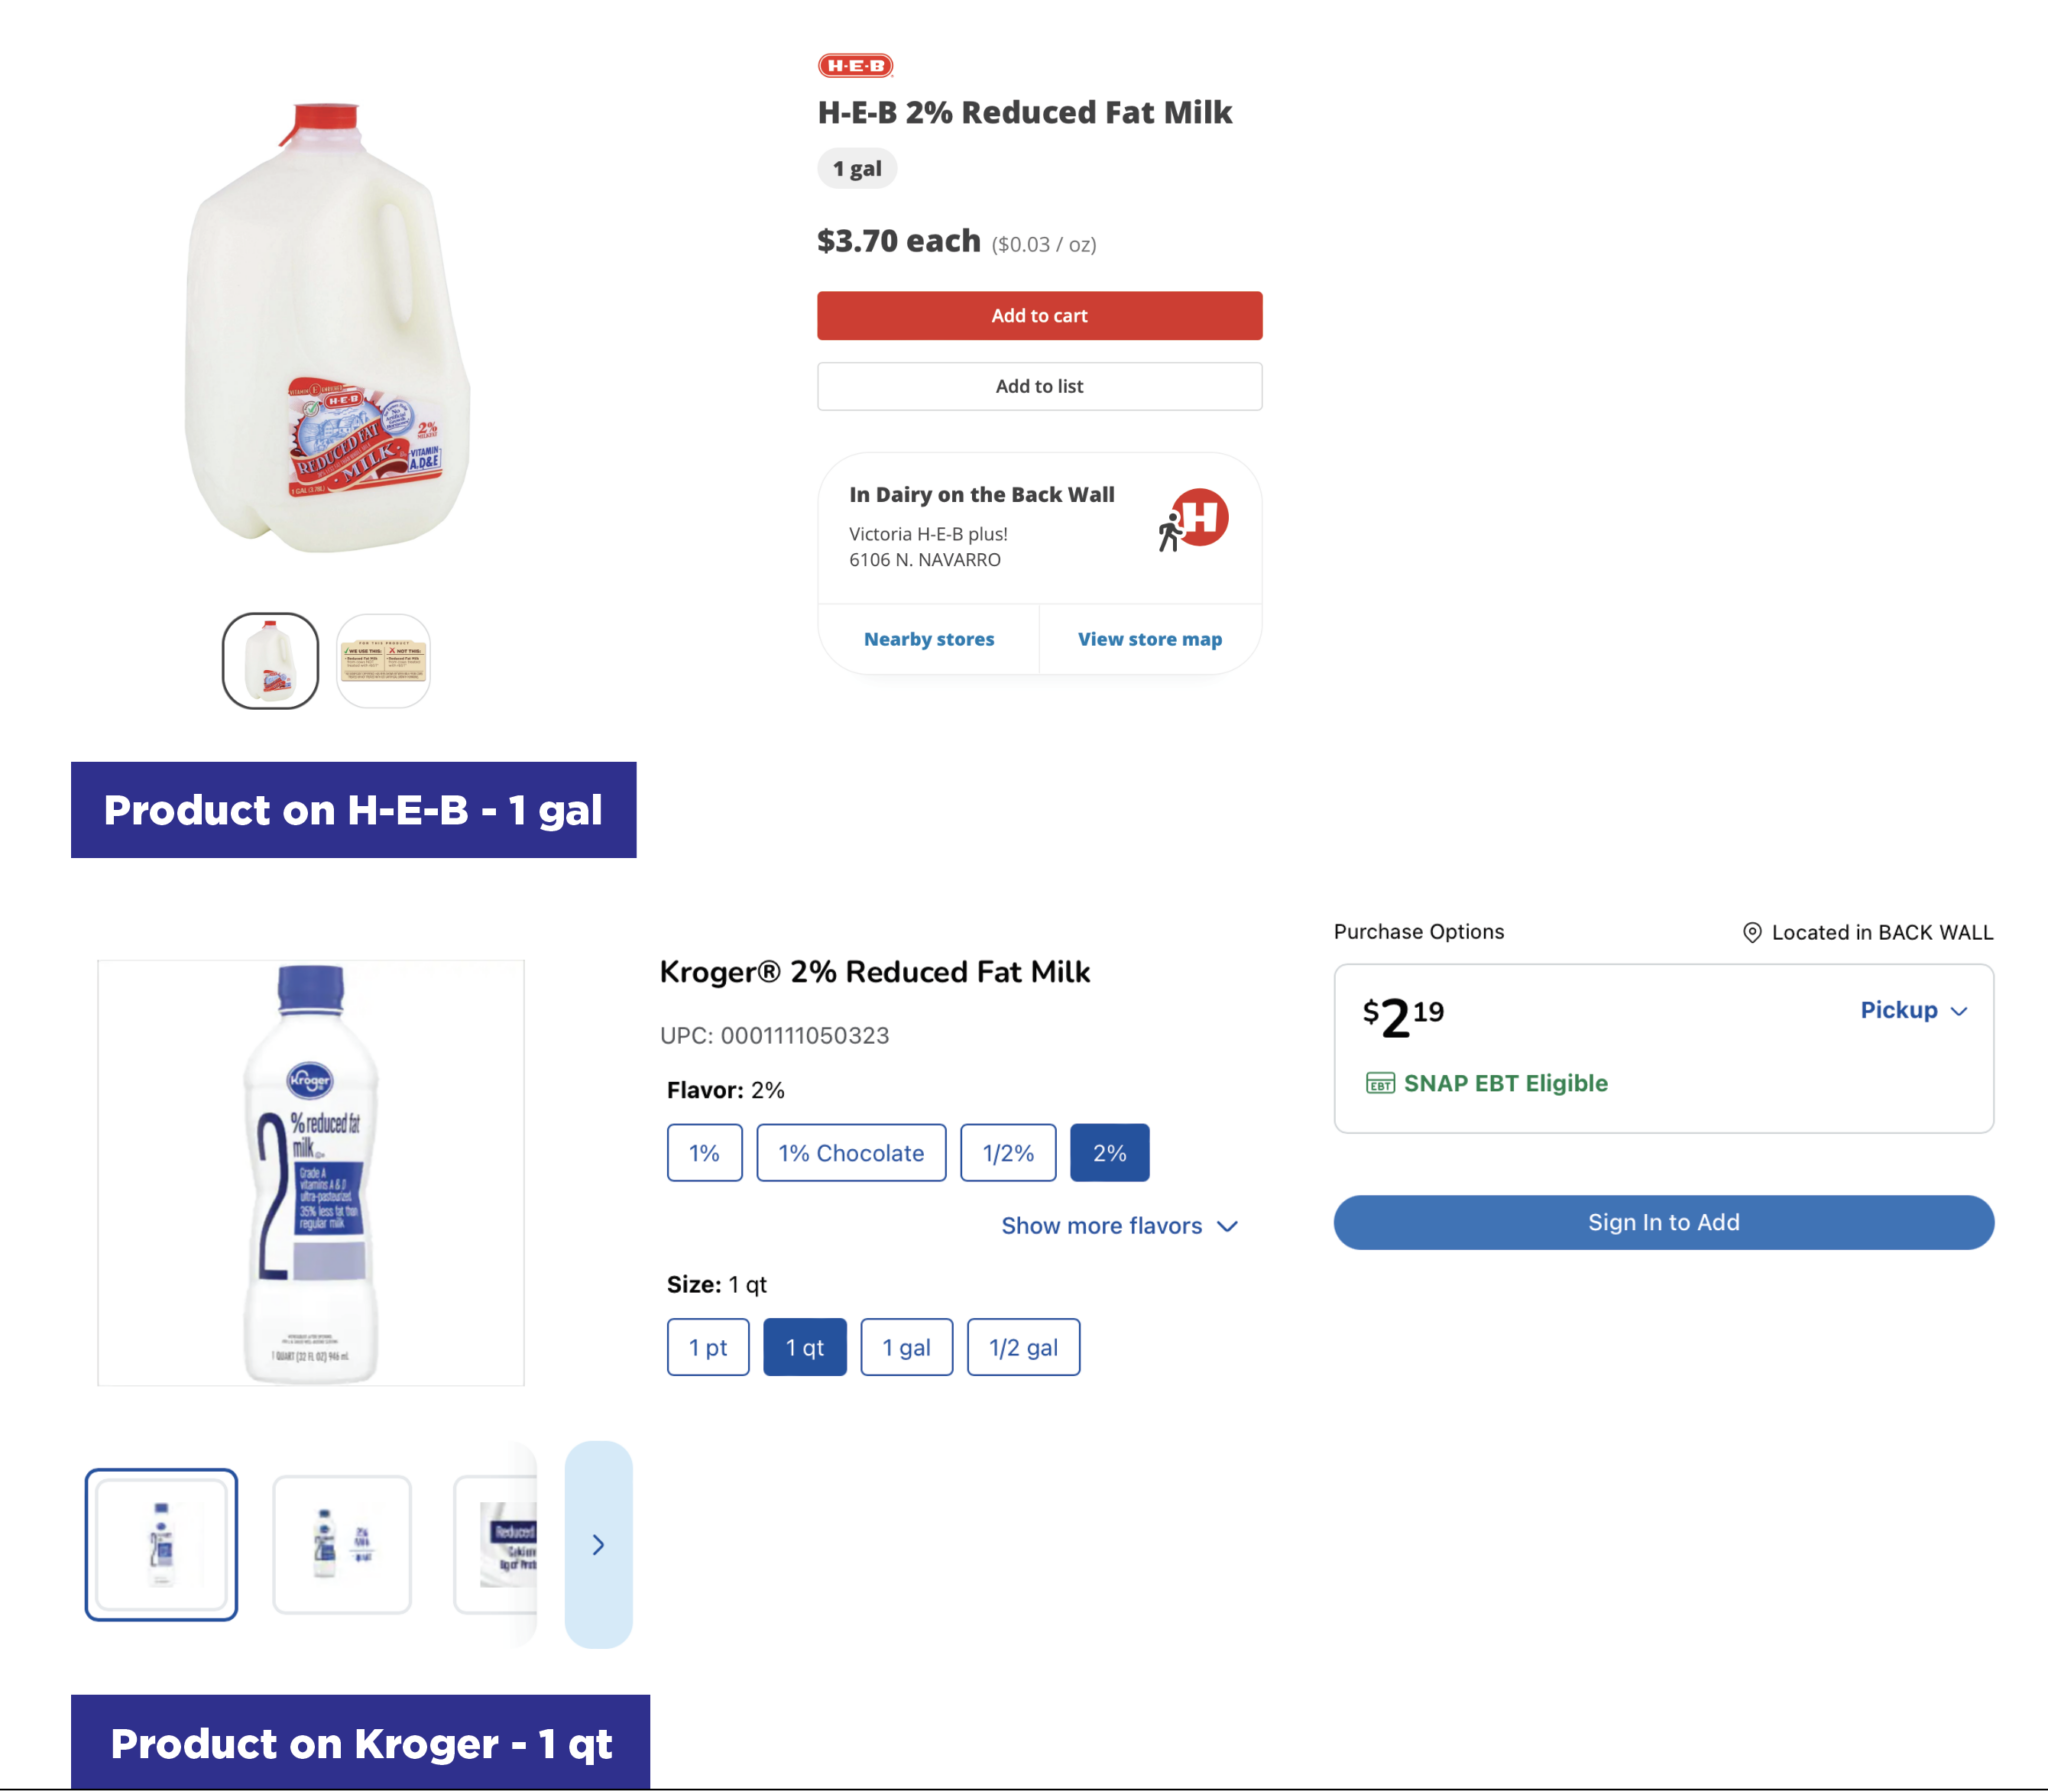
    Step 2: Accounting for location and fulfilment nuances (delivery, in-store pickup) that impact final pricing

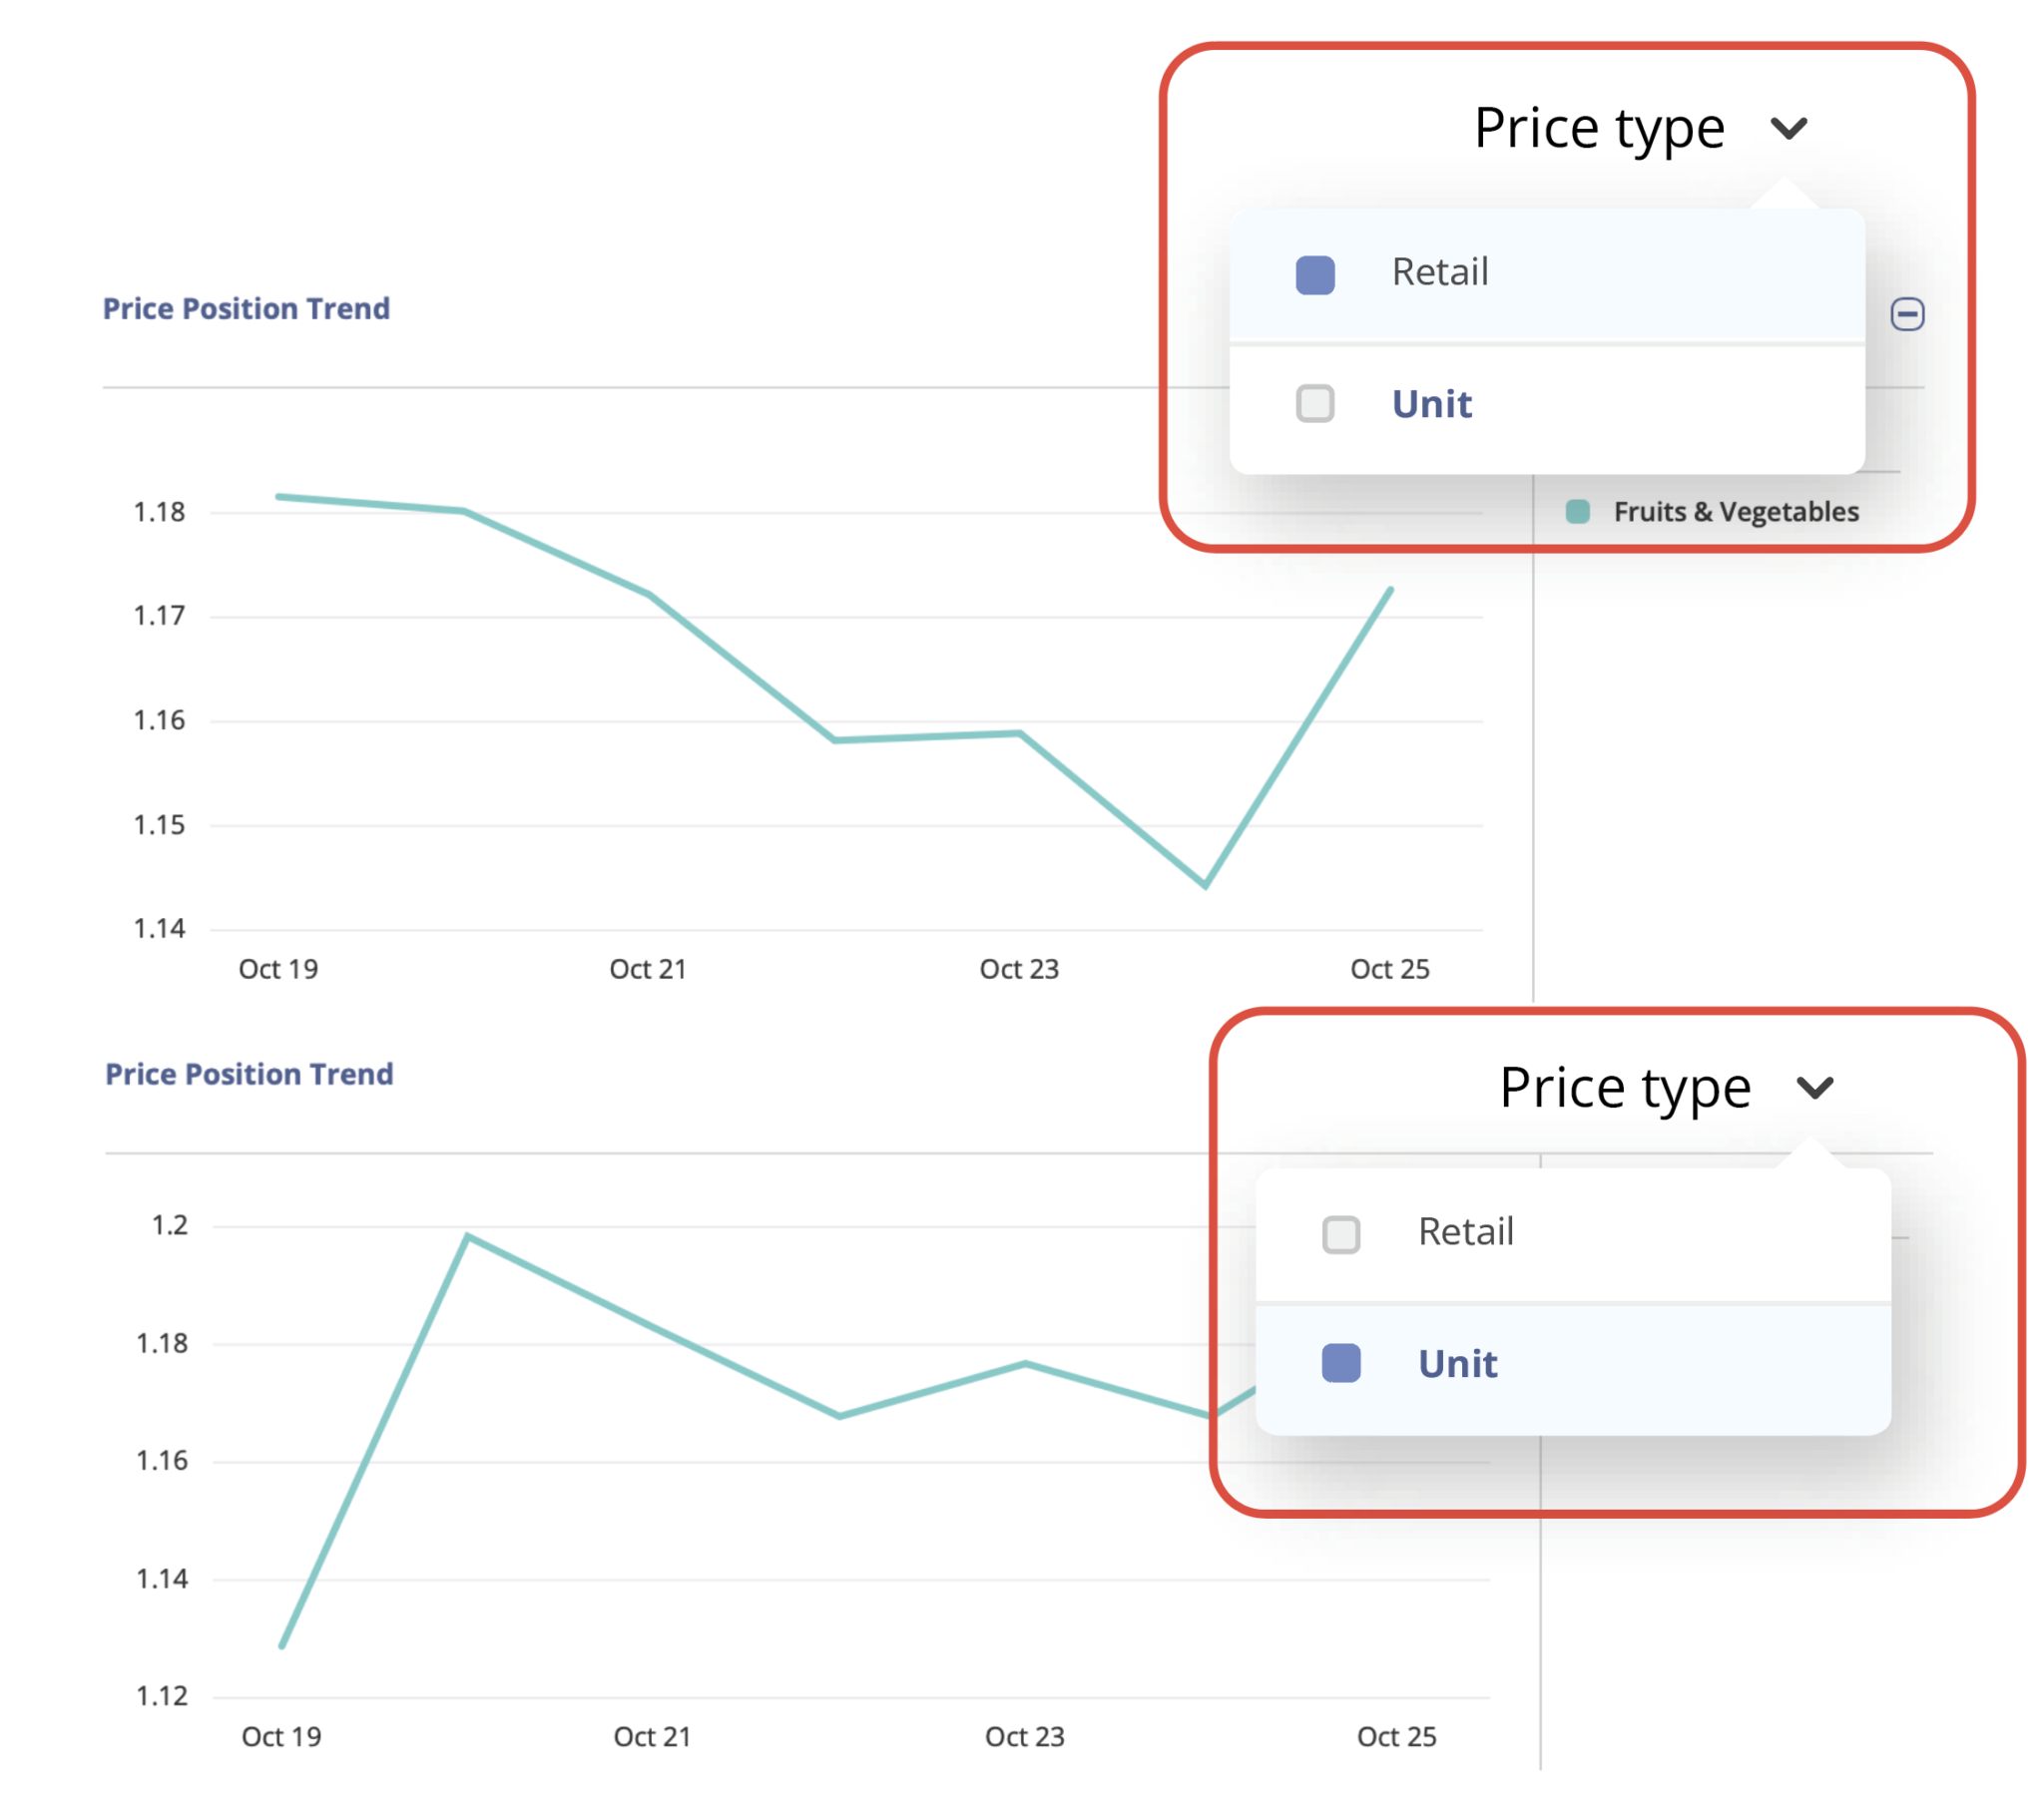
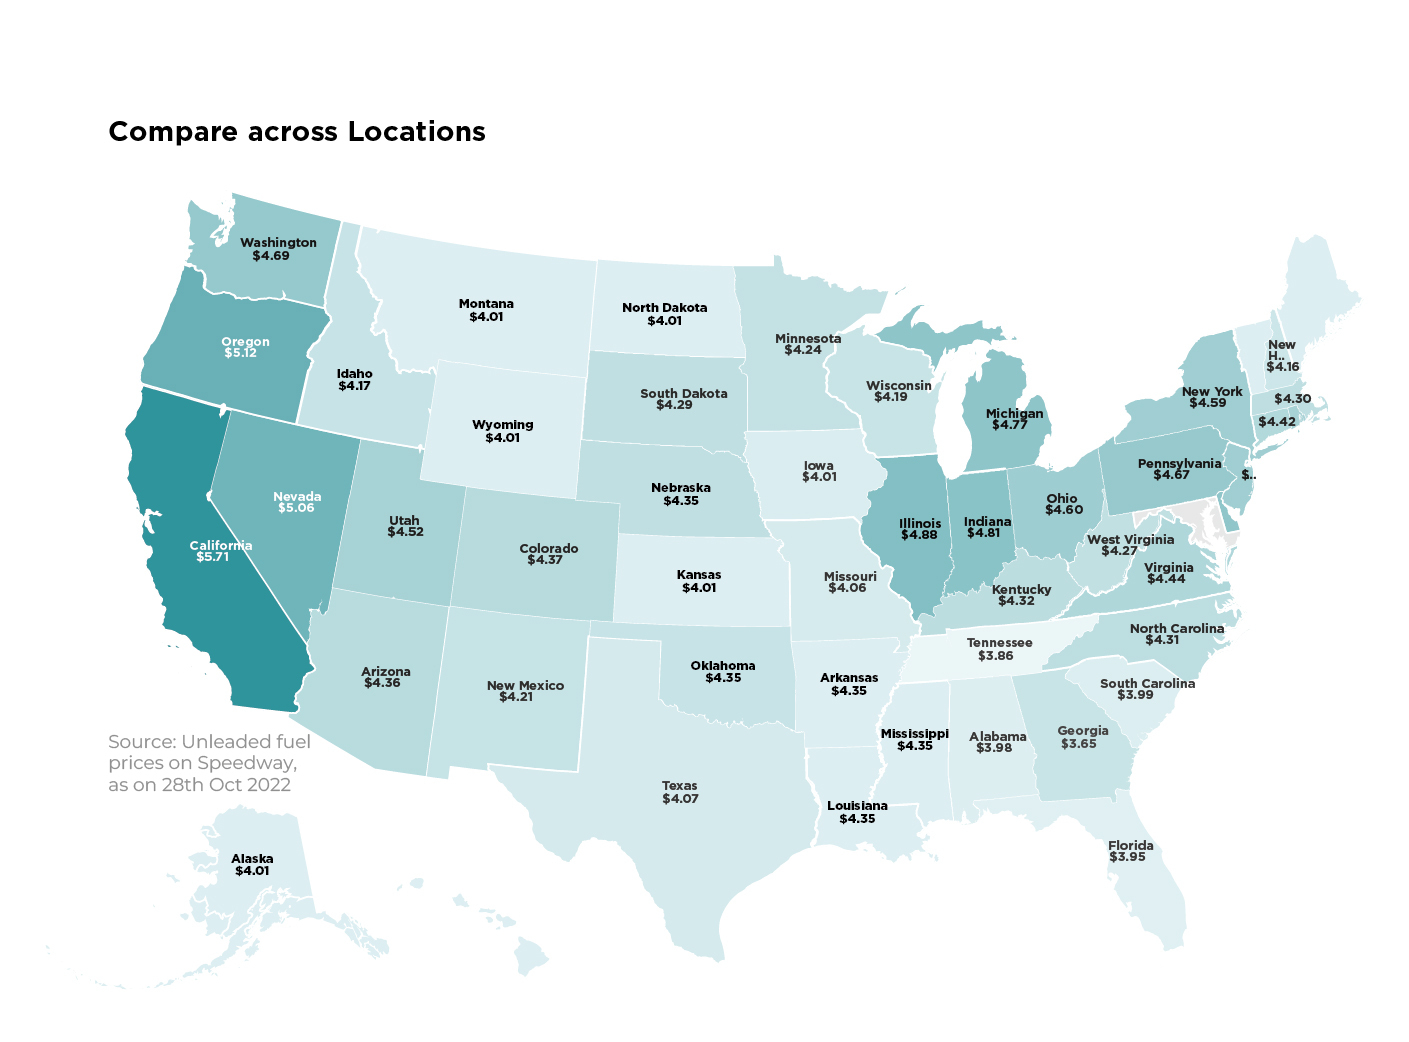
    Product pricing and promotional offers can vary based on the consumer’s location or ZIP code. Additionally, customers may opt for different fulfilment modes like delivery, shipping, or in-store pickup, which can further impact the final cost. Accurately calculating the end-user price necessitates considering these location-based pricing nuances as well as the chosen fulfilment method.

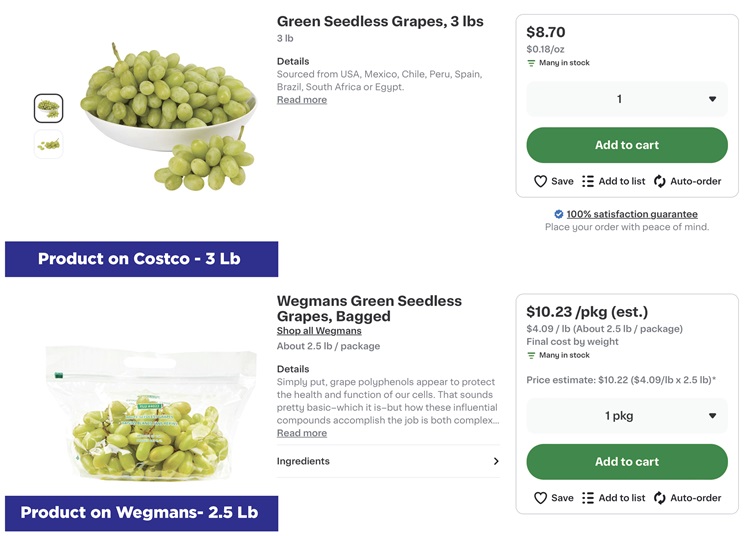
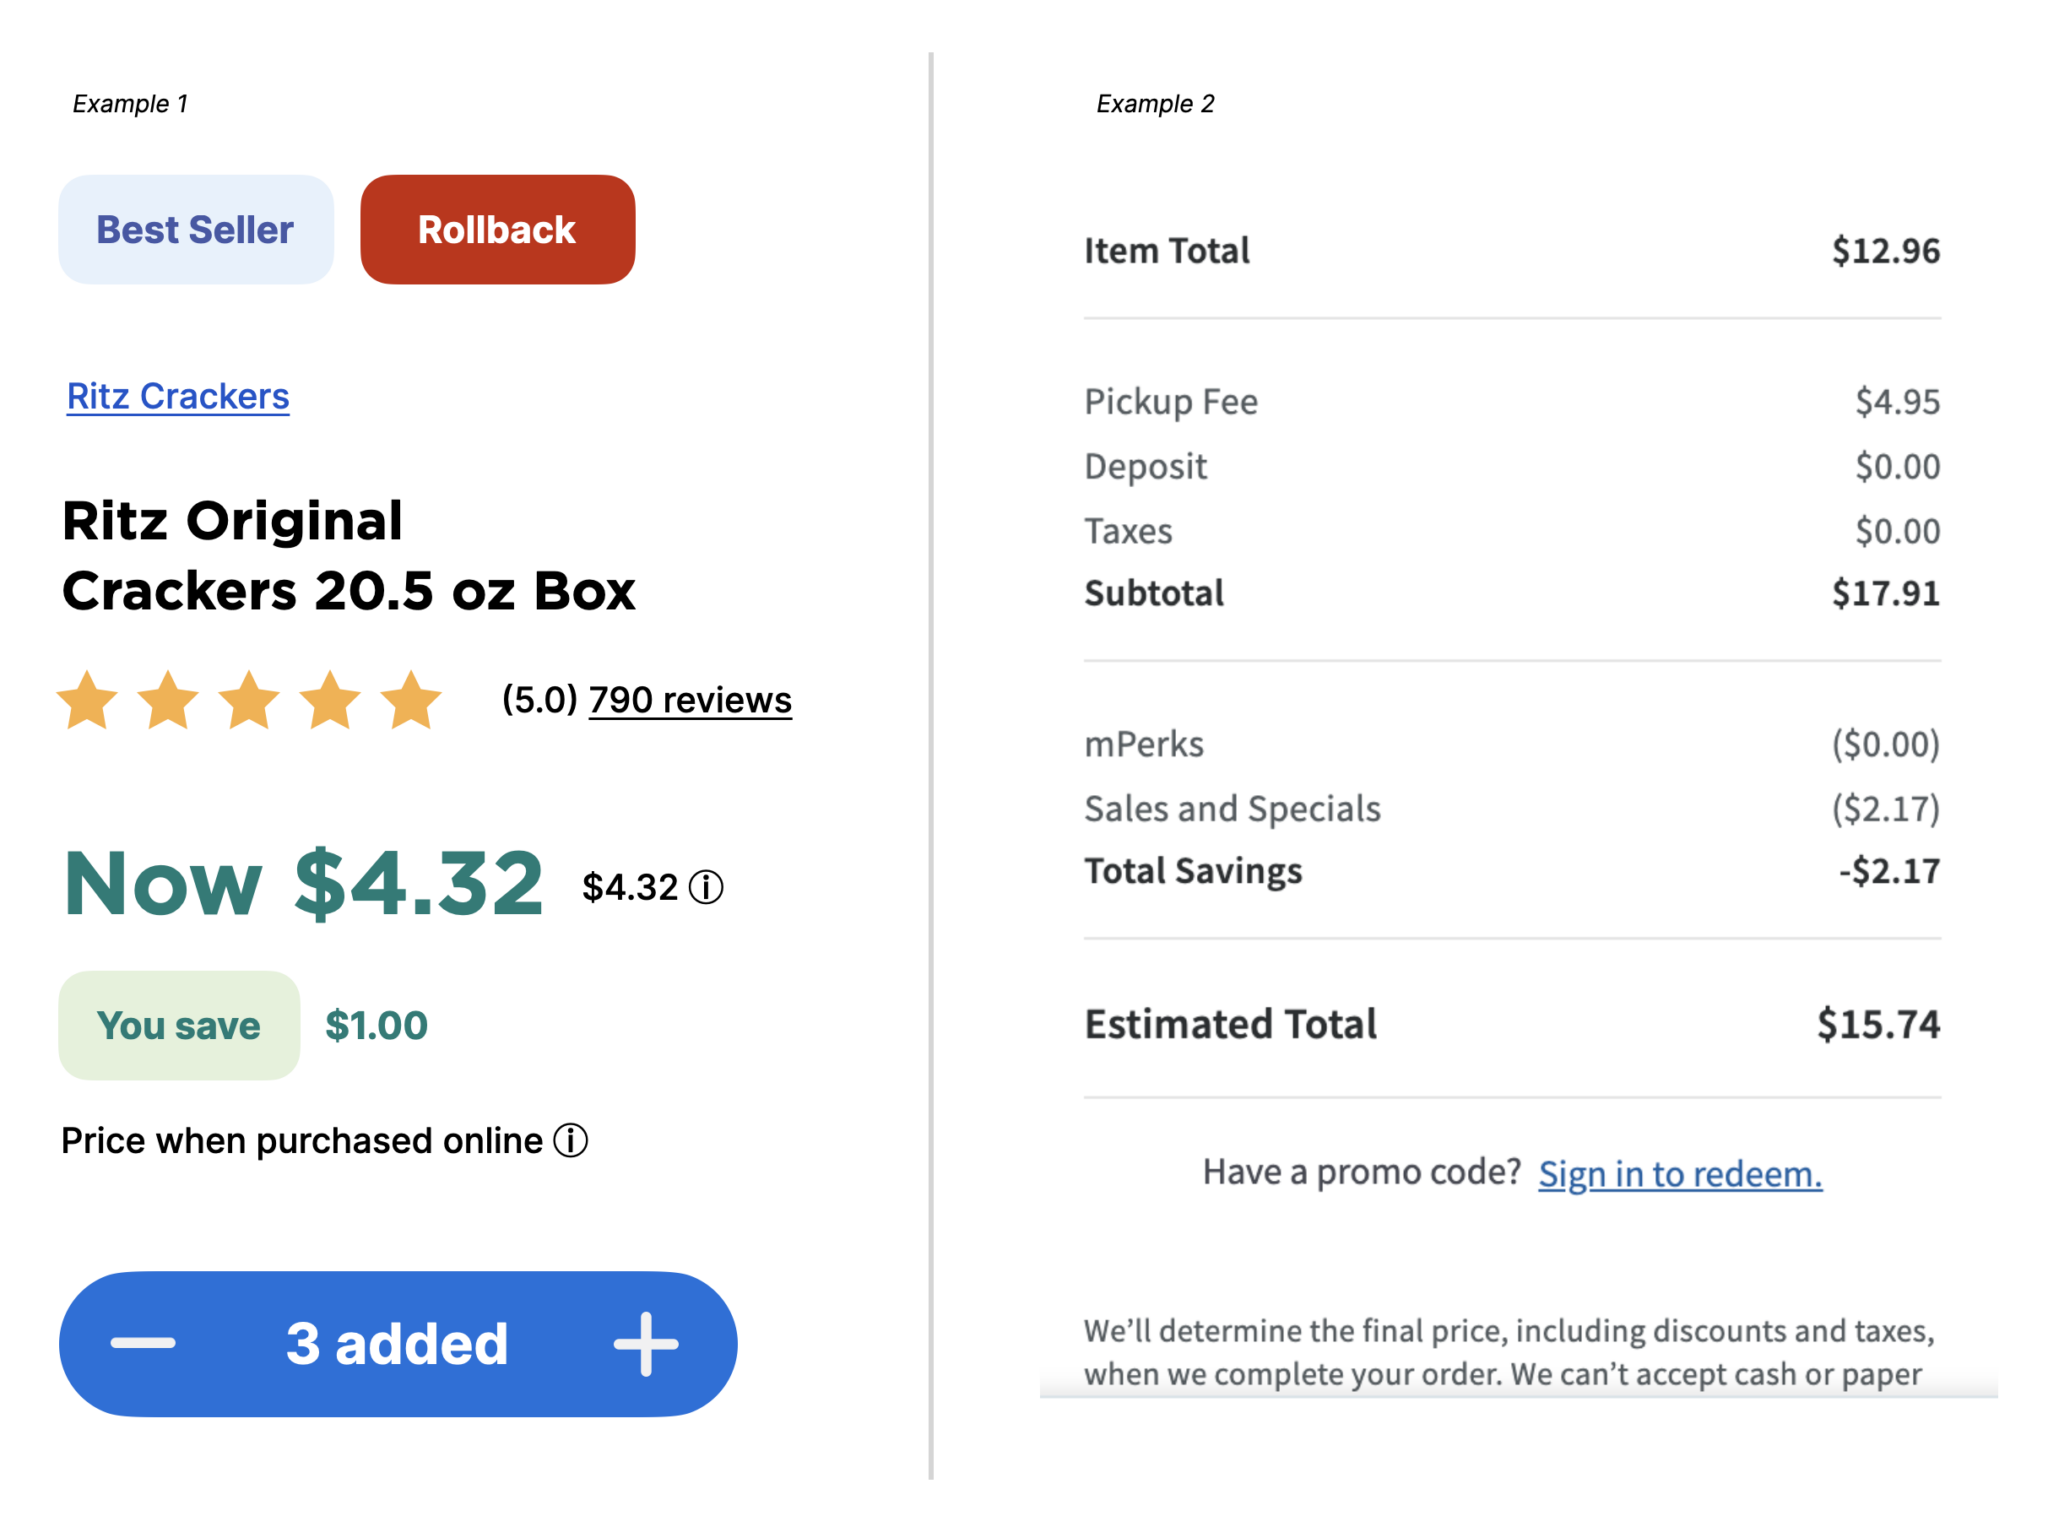
    In the example below, the selling price is $4.32 for one retailer (on the left in the image) after a discount for online purchase. In another case with Meijer, the item total shows $17.91, but the consumer ends up paying $15.74 after taxes and fees are applied (on the right in the image).

    Step 3: Applying each eligible promotion or offer to the selling price to determine potential end-user price points

    With the various promotional offers and discounts categorized in the previous steps, retailers and brands can now apply each eligible promotion to the product’s selling price. This involves deducting percentages for bank cashback, implementing bundled pricing, applying coupon code discounts, and incorporating shipping promotions.

    For retailers, this step allows them to calculate their true effective selling price to customers after all discounts and promotions. They can then compare this end-user price against competitors to ensure they remain competitively priced.

    For brands, by systematically layering every applicable offer onto the baseline selling price, they can accurately calculate the multiple potential end-user price points a customer may pay at checkout for their products across different retailers and regions.

    Why the end-user price matters

    Optimizing pricing strategies using the end-user price can benefit retailers and brands in several ways:

    • Price Competitiveness: By monitoring end-user pricing, retailers can adjust for discounts and promotional offers to attract customers, while brands can refine their pricing models to stay ahead in the market.
    • Customer Acquisition and Loyalty: Offers, promotions, and discounts directly impact the final price paid by customers, playing a crucial role in attracting new customers and retaining existing ones. For example, Walmart’s competitive pricing in groceries boosts customer loyalty and repeat purchases.
    • Consumer Perception: End-user pricing significantly shapes how consumers perceive both retailers and brands. Competitive pricing and promotional transparency enhance reputation and conversion rates. Amazon, for instance, is known for its competitive pricing and fast deliveries, which strengthen its consumer perception and satisfaction.
    • Sales Volumes: The final checkout price influences affordability and perceived value, directly affecting sales volumes. Both retailers and brands benefit from understanding this, as it guides consumer purchasing decisions and drives revenue streams.
    • Brand Perception: Consistent and transparent pricing enhances the perception of both the retailer and the brand. This not only strengthens the value proposition but also builds consumer trust and fosters long-term loyalty.

    While the listed and selling prices are readily available, calculating the true end-user price is quite complex. It involves meticulous tracking and application of various types of promotions, offers, location-based pricing nuances, and fulfillment costs – an uphill task without robust technological solutions.

    Track and Analyze end-user prices with DataWeave

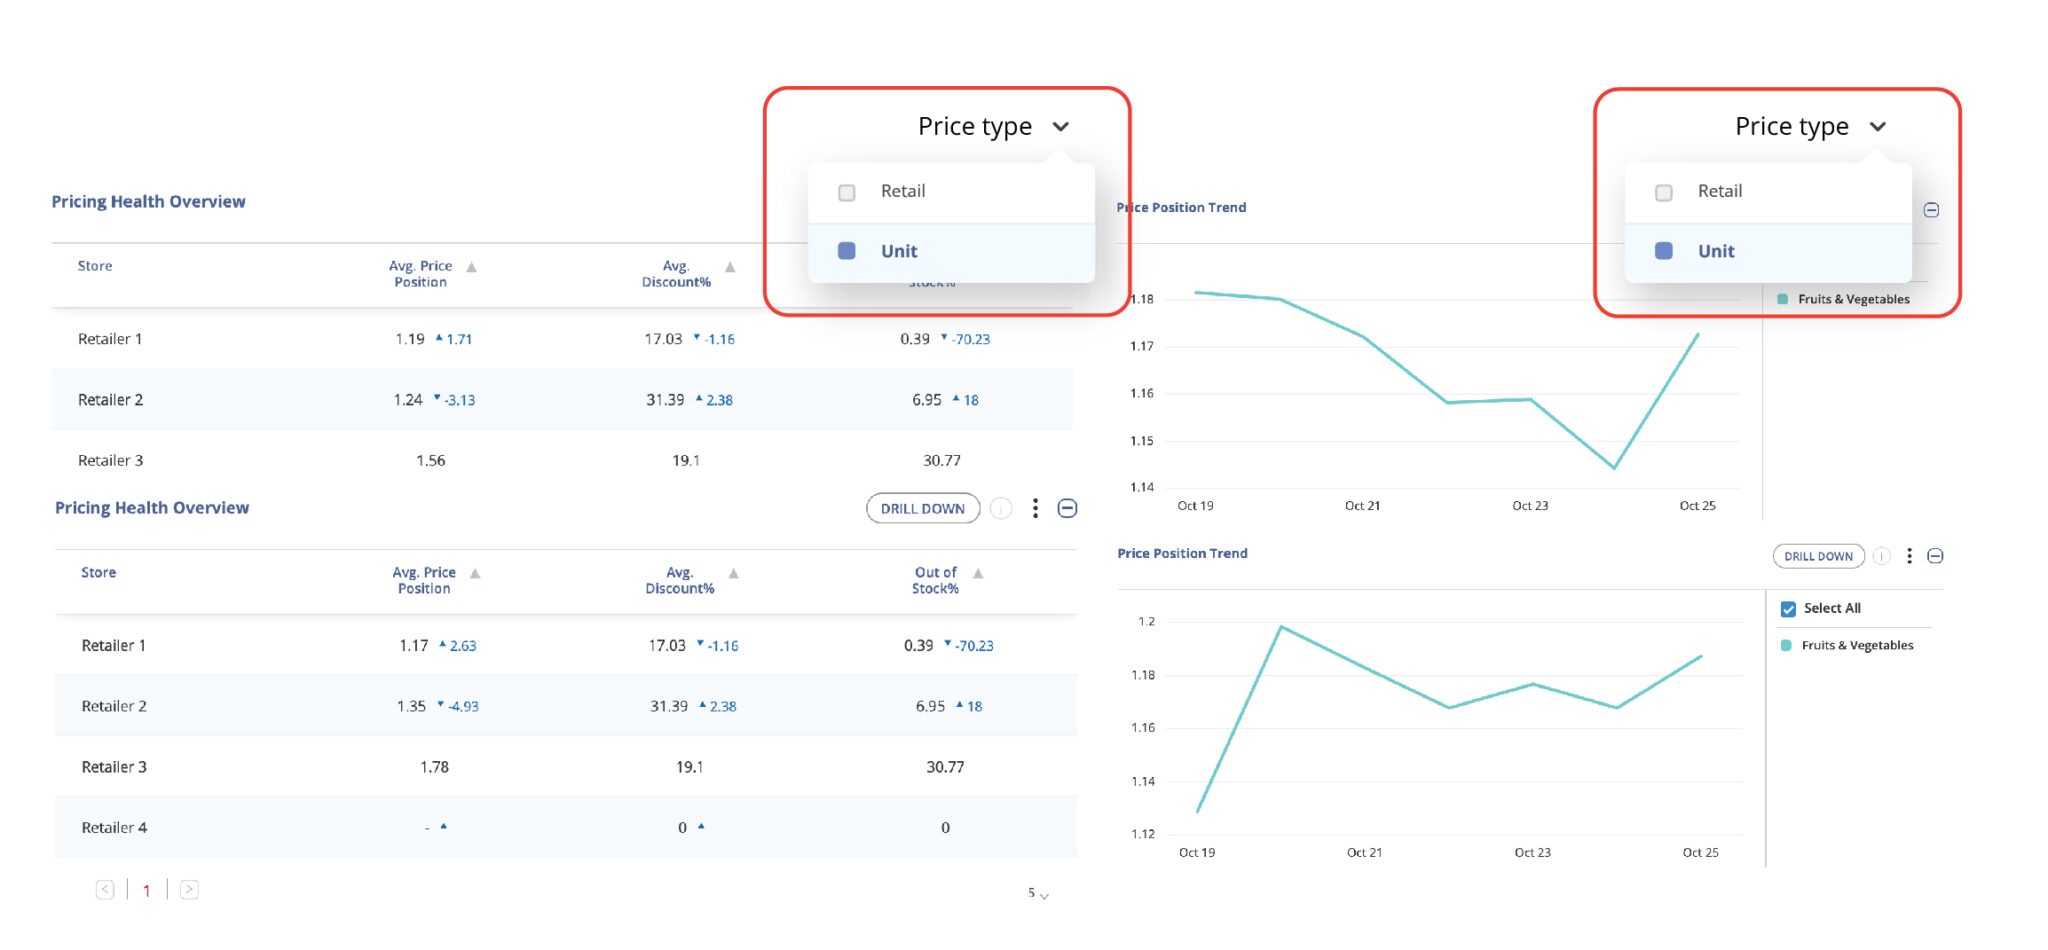
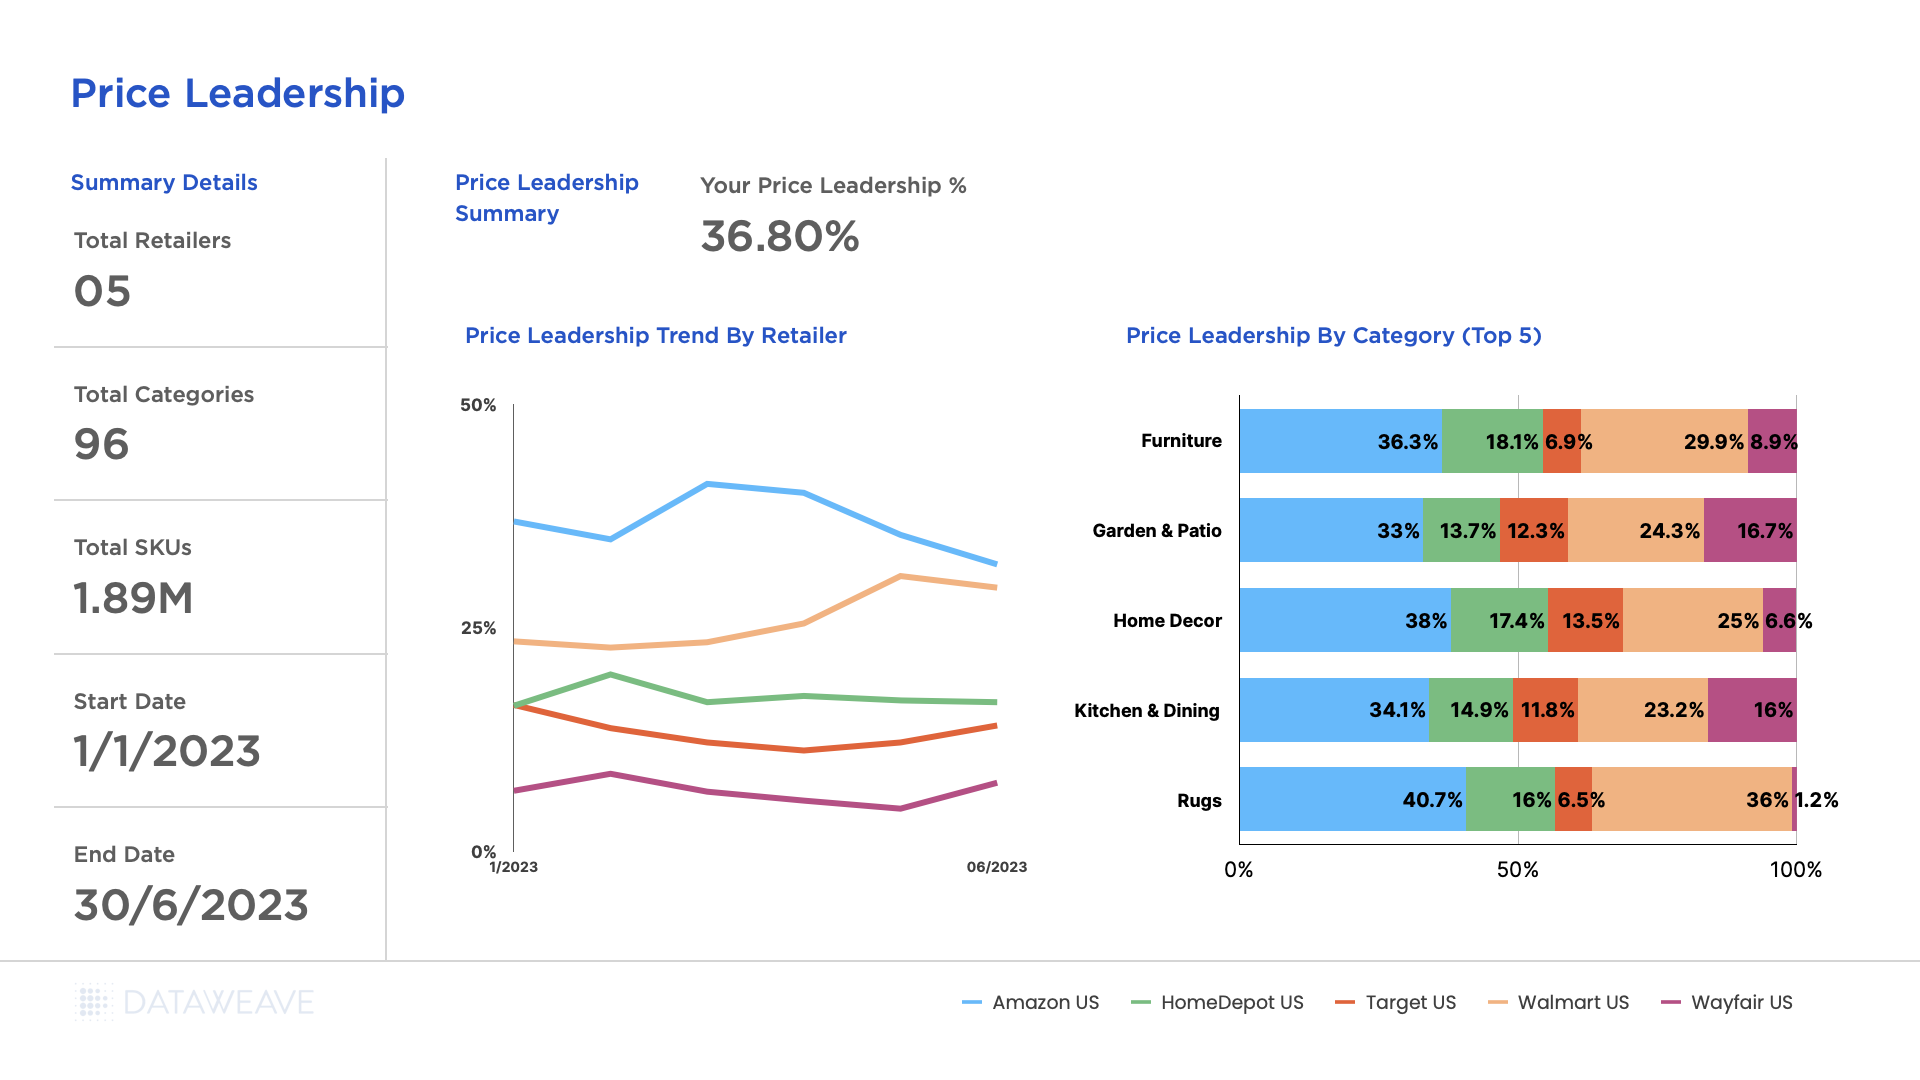
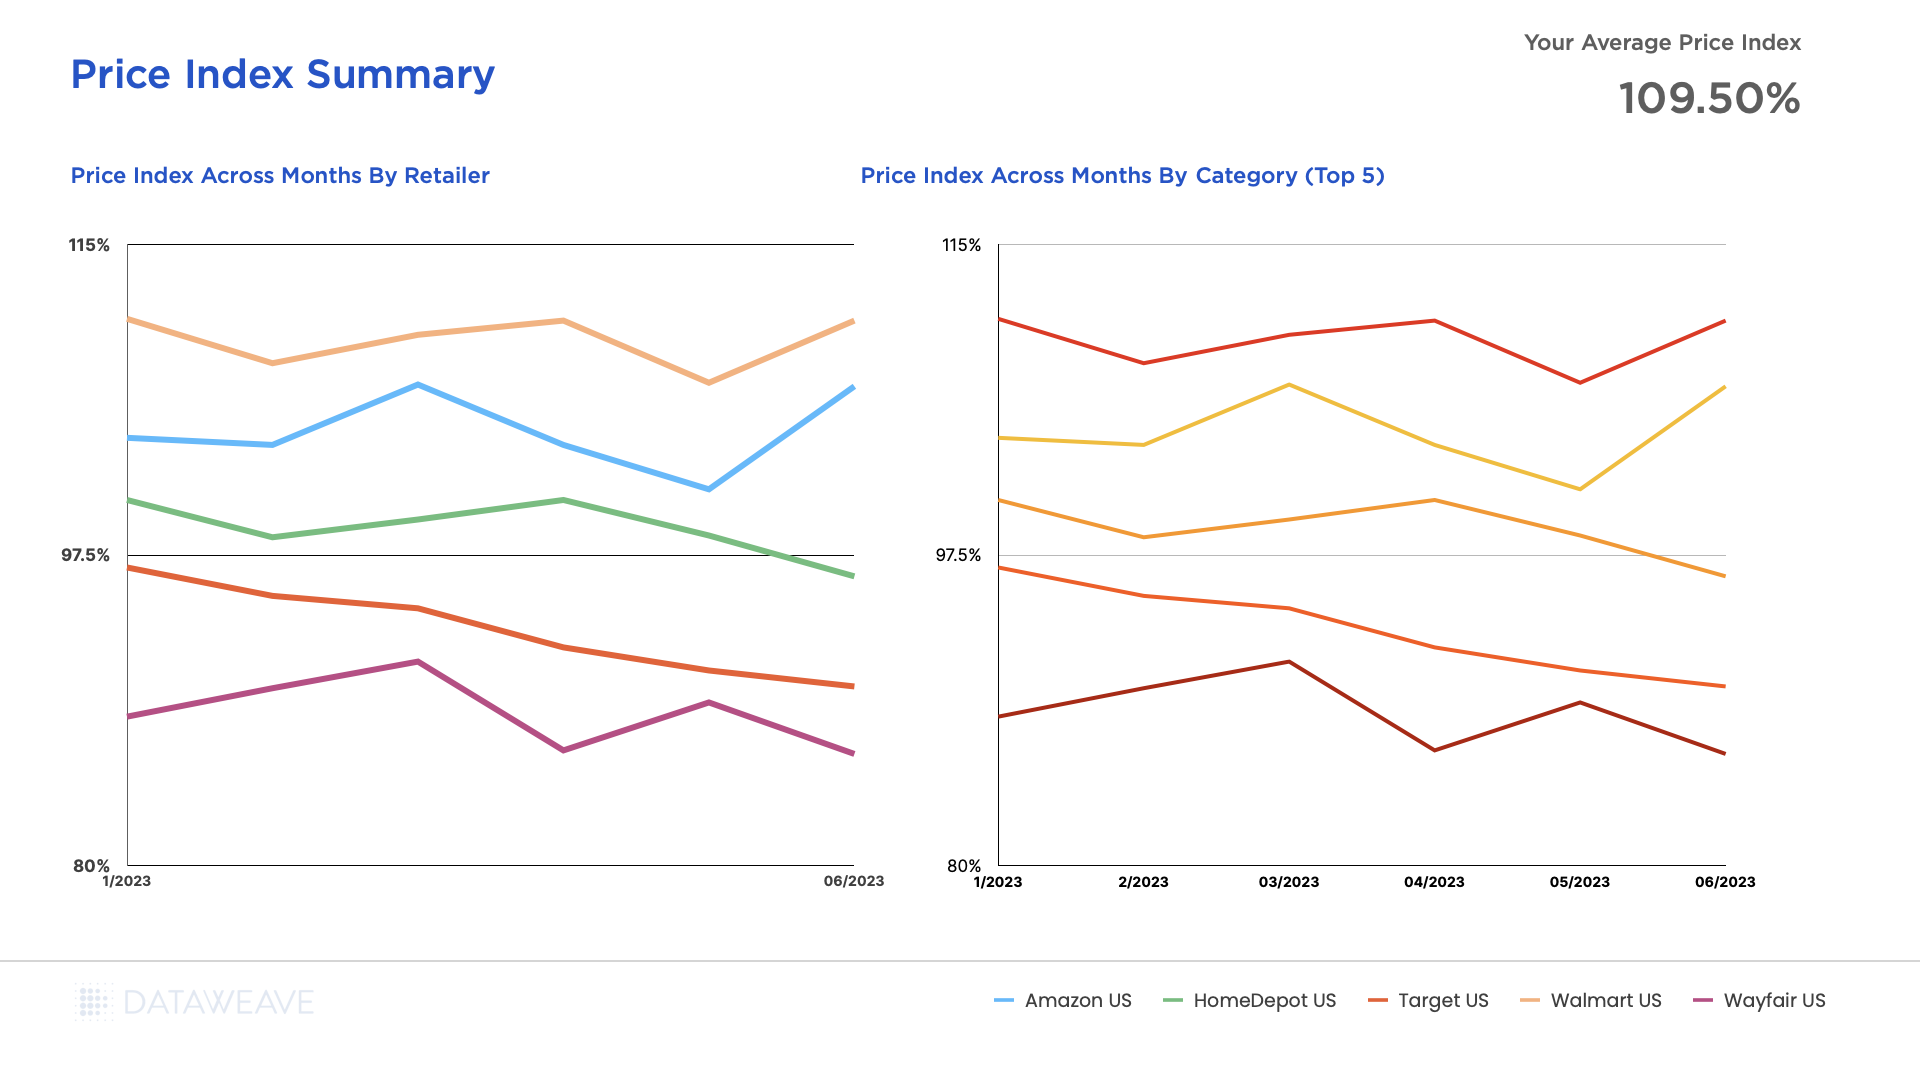
    DataWeave’s end-user price tracking capability empowers retailers and brands with the insights and tools necessary to comprehend the complexities of pricing dynamics. For retailers, it offers the ability to monitor end-user pricing across various products and categories compared to competitors, ensuring competitiveness after all discounts and enabling optimization of promotional strategies. Brands benefit from informed pricing decisions, optimized strategies across retail channels, and a strengthened position within their industries.

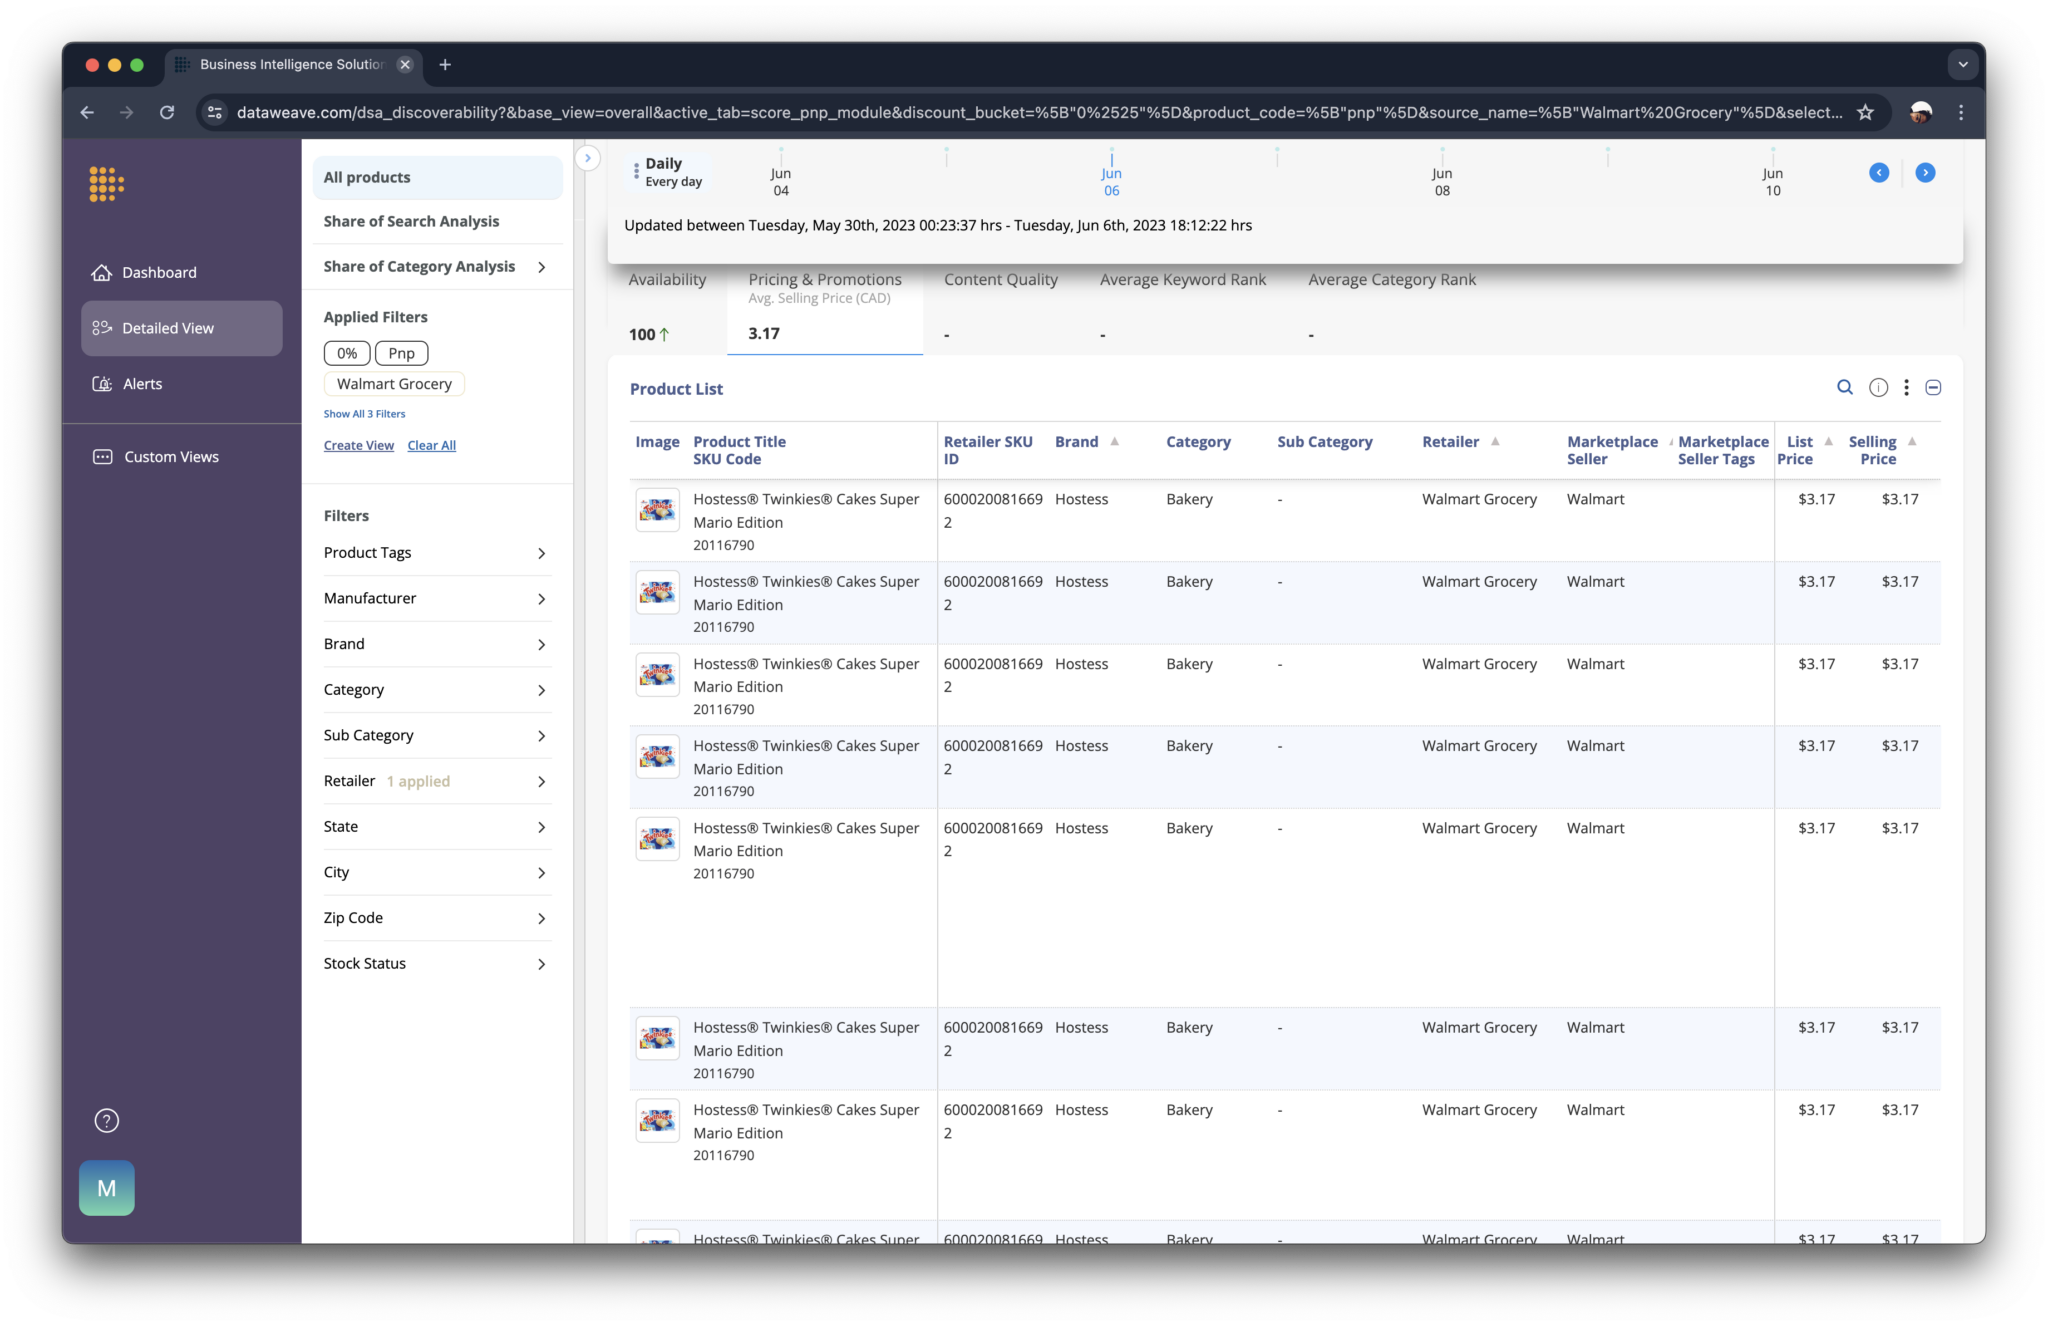
    Our intuitive dashboard presents classified promotions and corresponding end-user prices across retailers, providing both retailers and brands with a transparent, comprehensive view of the end-user pricing landscape.

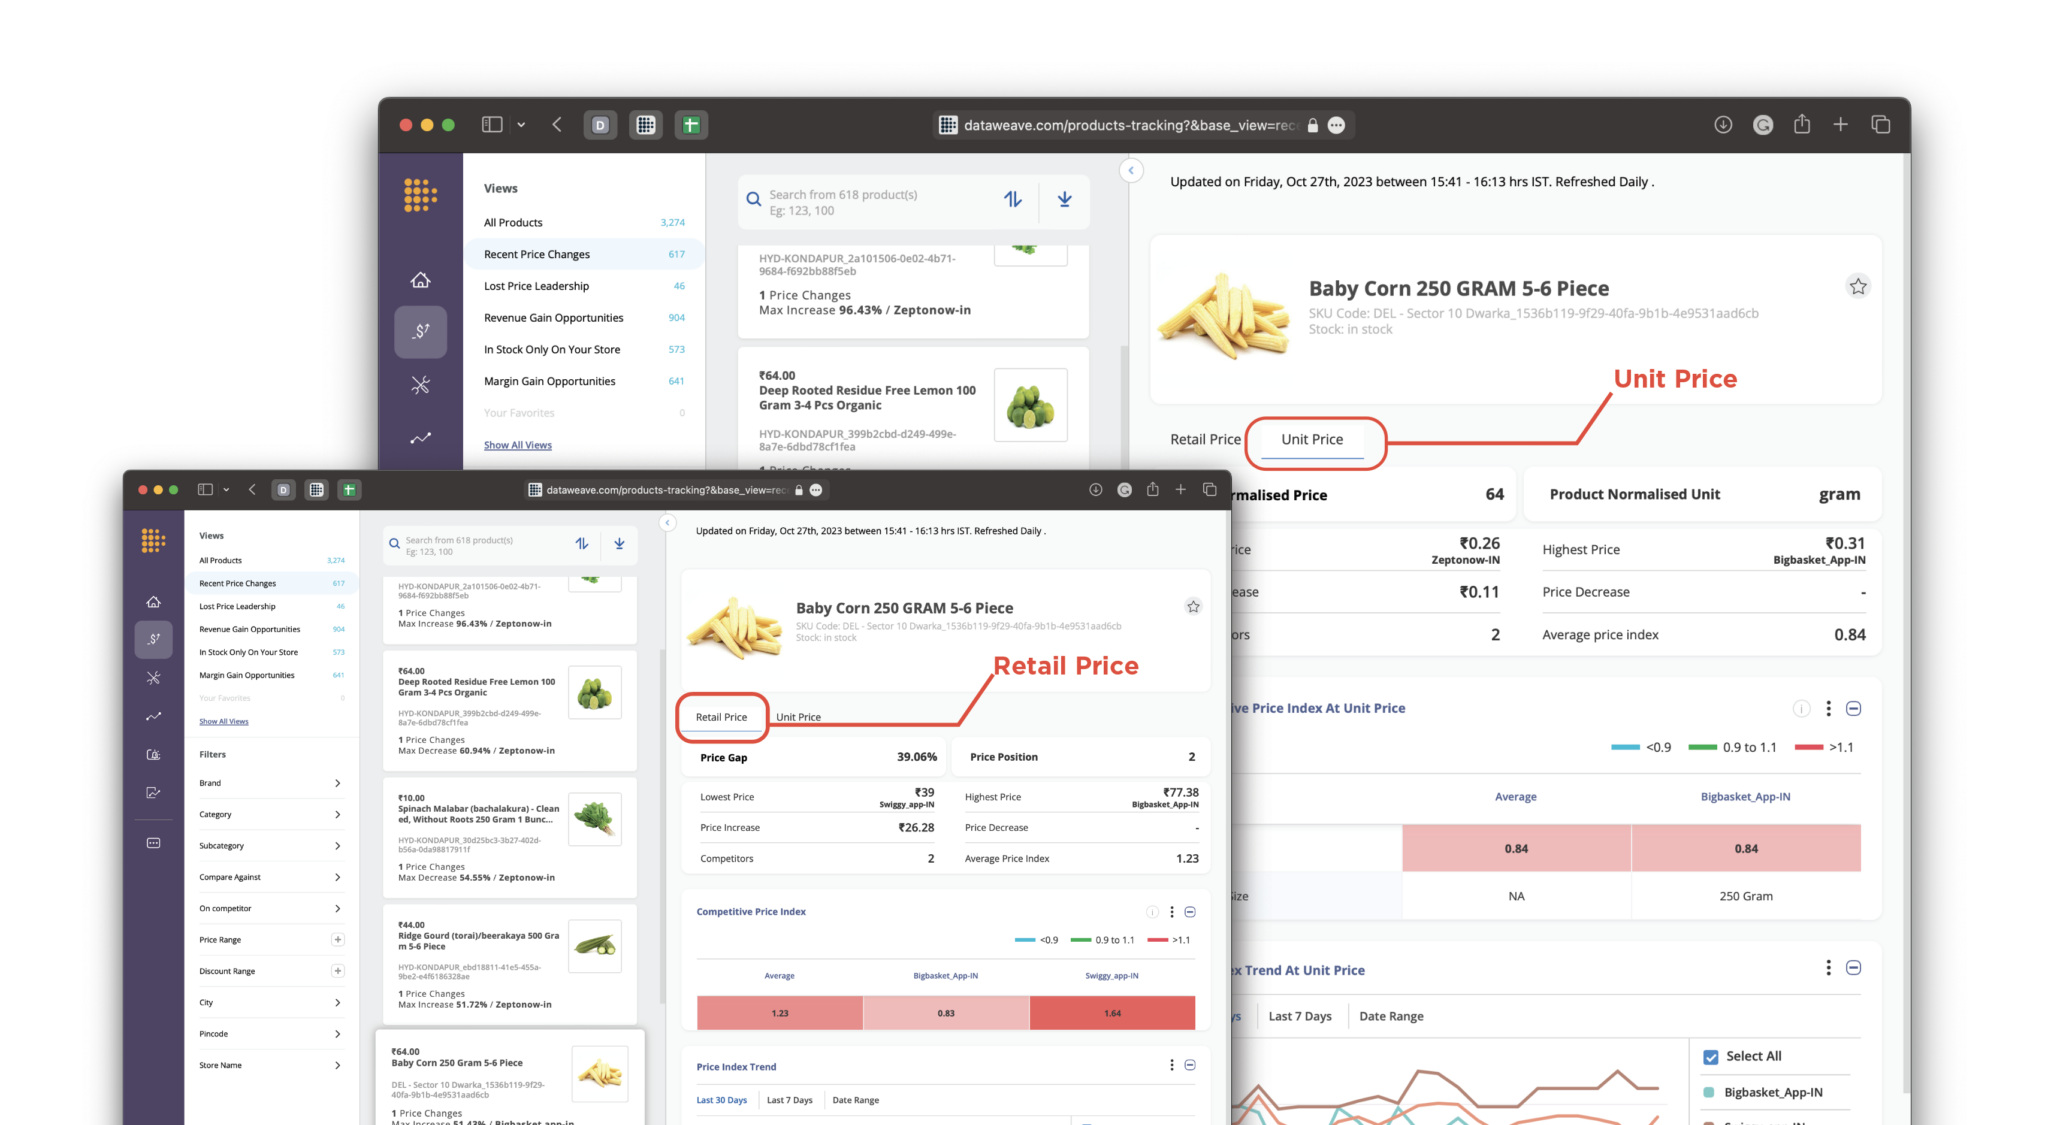
    Within the detailed product view of DataWeave’s dashboard, the Price and Promotions panel showcases diverse promotions available across different retailers for each product, along with the potential end-user price post-promotions.

    Harness the power of DataWeave’s sophisticated Pricing Intelligence and Digital Shelf Analytics to gain an accurate, real-time understanding of your end-user pricing dynamics. Make data-driven pricing decisions that resonate with customers and propel your brand toward sustained success.

    Find out how DataWeave can empower your eCommerce pricing strategy – get in touch with us today or write to us at contact@dataweave.com!

  • Easter Candy Pricing Trends 2024: Winning Strategies for Retailers and Brands Amid Cocoa Price Surge

    Easter Candy Pricing Trends 2024: Winning Strategies for Retailers and Brands Amid Cocoa Price Surge

    Easter egg hunts just got more challenging for families this year as the price of chocolate and other candies has soared. The root of this price surge lies in a cocoa deficit, attributed to diseases affecting crops and the adverse effects of climate change on West African farms, which supplies over 70% of the world’s cocoa. This has resulted in a tripling of cocoa prices over the last year, causing a “cocoa crunch,” and severely impacted confectioners and chocolate makers.

    Reuters recently reported that Iconic brands such as Hershey’s and Cadbury find themselves grappling with the need to adjust to escalating costs for raw materials. Given that Easter is one of the top three candy-purchasing occasions, these manufacturers are contemplating raising their prices to sustain their profit margins.

    Despite the challenges posed by the cocoa shortfall and persistent inflation, the National Confectioners Association anticipates that Easter candy sales in the U.S. will match or even exceed last year’s figures, which amounted to approximately $5.4 billion. This expectation is predicated more on price increases than on a rise in sales volume.

    At DataWeave, our ongoing analysis of pricing trends across various consumer categories among retailers has provided insight into the evolving landscape of chocolate and candy prices in 2023 and 2024.

    Our Analysis of Inflation in Candy and Chocolate Prices

    Our study encompassed a broad array of 3,300 products from leading U.S. retailers, Amazon, Target, Kroger, and Giant Eagle. As illustrated in the following chart, the trajectory of prices over the past 15 months was compared against the average prices in January 2023. Our tracking focused on two key price points: the selling price, which represents the final cost to consumers after applying any discounts or promotions, and the Manufacturer’s Suggested Retail Price (MSRP), as determined by the brands themselves.

    The findings from our analysis indicate that the average selling price, primarily influenced by retailer decisions, has experienced a steady increase throughout 2023, reaching a peak at 16.2% above January 2023’s figures by December. As of March 2024, coinciding with the Easter season, the selling prices are approximately 10% higher than they were at the beginning of the previous year.

    Simultaneously, the MSRP has seen a consistent uptick, driven by the climbing costs of cocoa. Brands have adjusted their suggested prices accordingly, with the current MSRP standing about 7% above its January 2023 level, after having peaked at a 7.6% increase by December 2023. This reflects the direct impact of rising cocoa costs on product pricing strategies.

    Chocolate Candies Are Hit The Hardest

    Across all candies, chocolate-based products have witnessed significantly sharper price increases than their non-chocolate counterparts. In the past 14 months, the selling prices of chocolate items have surged by 14.9%, a stark contrast to the modest 4% rise observed in non-chocolate candies.

    This price escalation was particularly pronounced during the Christmas shopping period, a response to heightened demand, before experiencing a temporary decline in February.

    The diminishing availability of cocoa, coupled with rising costs for packaging and transportation, has compelled brands and retailers alike to transfer these added expenses onto the consumer. This dynamic underpins the distinct pricing trends observed across the candy spectrum, with chocolate items bearing the brunt of these cost pressures.

    Discounts Offered By Retailers and Brands to Entice Easter Shoppers

    In our analysis, we delved deeper to identify the retailers and brands offering the most compelling prices for Easter-centric confections, including Chocolate Eggs, Chocolate Bunnies, and Easter-themed gift packs.

    Kroger emerged as the frontrunner among the retailers we monitored, offering an impressive 19% discount on Easter candies. Giant Eagle followed with a solid 14% average markdown. Meanwhile, Amazon and Target provided more modest promotional discounts at 12% and 10%, respectively.

    Kroger is making significant efforts to ensure consumers have access to attractively priced Easter treats. The retailer planned to keep its doors open throughout the Easter weekend, featuring baskets brimming with discounted items such as Russell Stover chocolate bunnies, Brach’s jelly beans, Reese’s eggs, and assorted bags of popular candies from Snickers, Twix, and Starburst, among others. Additionally, Kroger is enhancing its value proposition through gift card offers and exclusive Easter deals for its loyalty program members.

    On the brand front, Starburst by Mars Wrigley leads with the steepest discount of 25%. Cadbury, under Mondelez, is not far behind, offering 21% off its mini eggs and other Easter treats, marking an increase from last year’s 17% discount. Ferrero Rocher is making a strong pricing move with an average 20% markdown on its Easter selections, including the chocolate bunny and squirrel figures.

    The beloved Peeps marshmallow candies by Just Born are being offered at an 18% discount this year, slightly less than the 23% discount seen in 2023, likely reflecting the impact of rising sugar costs, given their sugar and corn composition.

    Other notable brands, including M&M’s and the premium Swiss chocolatier Lindt, have elevated their average Easter discounts to 17% this year, up from the previous year’s discounts of 12%, and 10% respectively, showcasing a competitive pricing strategy to delight consumers this Easter season.

    Coping With Inflation This Easter Season

    Retailers and brands aiming to remain profitable and competitive in the current challenging environment can adopt a few strategic approaches:

    • Creative Product Bundling: Design innovative combo packs that mix chocolate and non-chocolate items. Such bundles can cater to diverse consumer preferences and budget ranges while preserving profit margins.
    • Encouragement of Bulk Purchases: Offer enticing discounts on larger quantities to promote bulk buying. This strategy can help amplify sales volumes, compensating for increased costs per item and fostering economies of scale.
    • Strategic Competitive Pricing: Keeping a vigilant eye on competitors’ pricing strategies is vital. Aim to capture market share through well-thought-out discount strategies that balance competitiveness with margin preservation. Leveraging advanced pricing intelligence, such as that offered by DataWeave, can provide invaluable insights for making informed pricing decisions.
    • Product Size Adjustments: Consider revising the size or weight of products as a cost management measure, a strategy known as “shrinkflation.” It’s crucial to approach this transparently, ensuring clear communication on packaging to uphold consumer trust.

    Adopting these strategies—focusing on bundle offerings, incentivizing bulk purchases, optimizing pricing strategies based on competitive intelligence, and thoughtfully adjusting product sizes—will be pivotal for confectioners to navigate the challenges posed by the cocoa price surge.

    For more information, reach out to us to speak to a DataWeave expert today!


  • The Indian E-Commerce Showdown: Unveiling the Price War Between Flipkart’s Big Billion Days and Amazon’s Great Indian Festival

    The Indian E-Commerce Showdown: Unveiling the Price War Between Flipkart’s Big Billion Days and Amazon’s Great Indian Festival

    India’s homegrown eCommerce giant Flipkart, now backed by Walmart, reported a record 1.4 Billion customer visits during the early access phase and throughout the seven days of its premier shopping event, the Big Billion Days, launched on 8th October 2023. Competing with Flipkart, Amazon’s Great Indian Festival sale event started on October 8th as well and saw a whopping 95 Million customer visits to the website within the first 48 hours of the event.

    For consumers, the most pressing question was, “Who offered more attractive deals and lower prices during these sale events?”

    To answer this question, we leveraged our proprietary data aggregation and analysis platform and analyzed the prices and discounts on Amazon and Flipkart across key product categories..

    The details of our sample are mentioned below:

    • Number of SKUs Analyzed: 30,000+
    • Websites: Amazon.com and Flipkart.com
    • Categories: Apparel, Home & Furniture, Electronics, Health & Beauty
    • Dates: 7th Oct 2023 to 22nd Oct 2023

    Key Findings

    Based on our analysis, the Big Billion Days by Flipkart showcased relatively higher price reductions across categories compared to the Great Indian Festival sale by Amazon. The Apparel category on Flipkart saw the highest average discount at 50.6%. The Health & Beauty category had the lowest discount across Flipkart at 39.4% and Amazon at 33%.

    Overall, Flipkart offered higher discounts in each product category. It is clear that the retailer invested heavily in leveraging its supplier partnerships with key brands or sellers to enable them to offer higher discounts, thereby attracting more customers.

    Next, let’s take a closer look at each product category.

    Apparel

    While a majority of retailers expected demand for apparel and clothing to dip this festive season in India, eCommerce giants like Amazon and Flipkart are likely to recognize the strong consumer inclination towards apparel during this period.

    In the detailed assessment of Apparel sub-categories, Women’s Dresses, Women’s Tops, Men’s Shirts, Men’s Shoes, and Women’s Innerwear emerged as the segments showcasing the most substantial discounts during the sale events. While Flipkart offered higher average discounts across all sub-categories, Amazon offered competitive discounts as well.

    We observed significant differences in the average discounts across brands between Flipkart’s Big Billion Days and Amazon’s Great Indian Festival. Reinforcing the significant discounts on the Shoes subcategory, brands like Red Tape, Arrow, Adidas, Reebok, Nike, and more offered extensive discounts on both Flipkart and Amazon. Notably, Adidas and Reebok offered better deals on Amazon’s Great Indian Festival as compared to Flipkart.

    One8 by Virat Kohli had a significantly lower discount on Amazon compared to Flipkart, indicating an exclusive partnership.

    For brands, however, reducing prices is just one approach to entice shoppers. They must also guarantee their prominent presence and easy discoverability within Amazon and Flipkart search results. To gain insight into this, we monitored brands’ Share of Search across various frequently used search terms in addition to the discounts they provided. The Share of Search denotes the portion of a brand’s products within the top 20 search results for a specific search query.

    Our data indicates that Jockey and Speedo gained in Share of Search on Flipkart, but reduced discoverability on Amazon. Van Heusen fell behind in search results on Flipkart but showed a higher Share of Search on Amazon.

    Home & Furniture

    With demand for home and furniture products picking up in October, right before the festive season, Amazon and Flipkart offered significant discounts in this category.

    Discounts on both Amazon and Flipkart hovered around 50%. Across a few subcategories, Flipkart offered slightly lower discounts compared to Amazon. Only Luggage, Rugs, Sofas, and Entertainment Units saw lower markdowns on Flipkart during the Big Billion Days. 

    Dishwashers and Washer/ Dryers saw higher discounts on Amazon compared to Flipkart. The significant discounts on these products on Amazon possibly point to changing consumer preferences, as demand for these products is traditionally low in India, but seems to be growing.

    When it comes to Home & Furniture brands, Nasher Miles, Safari, Aristocrat, VIP, and American Tourister, luggage brands mostly, offered higher discounts on Flipkart, followed closely by Amazon.

    In terms of Share of Search, Skybags had high discoverability on both Flipkart and Amazon. The brand leveraged a strategy of offering big discounts this festive season as well as ensuring prominent placement in search results. Wildcraft lost out on its discoverability on Flipkart in contrast to its prominence on Amazon. Duroflex saw lower searchability on Amazon compared to Flipkart’s Big Billion Days.

    Consumer Electronics

    The Consumer Electronics and Appliances Manufacturers Association (CEAMA) expected an uptick in sales of consumer electronics products this festive season in India. With more consumers buying premium products using credit cards and EMIs, demand for expensive, high-end electronics was expected to increase.

    Again, average discounts in this category hovered around 50% on Flipkart and Amazon.

    Across electronics subcategories, Smartwatches, Earbuds, and Drones had the highest markdowns with Flipkart leading the pack during the Big Billion Days. Amazon offered relatively higher discounts at 44.9% on the TV subcategory, compared to Flipkart’s 40.6%.

    Speakers, Laptops, Smartphones, and Tablets also saw lower markdowns on Amazon compared to Flipkart. Amazon was the official partner for the launch of many high-level smartphones and products in September-October, contributing to the higher markdowns in the subcategory.

    Across brands, Lenovo’s discounts were the most differentiated between the two sites, with the brand offering higher discounts on Amazon (45.4%) compared to Flipkart (24.7%). Noise offered the highest discounts at 72.5% on Amazon and 52.8% on Flipkart. Brands like Boat and Zebronics, also saw lower discounts on Flipkart.

    Mi and JBL offered deeper discounts on Flipkart’s Big Billion Days. Apple meanwhile stands out with only 11.83% discounts on Amazon, but the brand offered impressive 31.4% discounts on Flipkart.

    Samsung dominated the Share of Search on Amazon at 15.7%, compared to only 2.6% on Flipkart. Apple and Lenovo also saw higher discoverability on Amazon. On Flipkart, JBL and Skullcandy stand out as brands with high search visibility.

    Health & Beauty

    The Health & Beauty category saw the lowest markdowns with only 39.4% discounts on Flipkart and 33% on Amazon.

    In the subcategories analyzed, Electric Toothbrushes had relatively high markdowns across both sites. Staple and lower priced subcategories like Toothpaste had the lowest markdowns across both sale events, with Amazon offering only 17.4% average discounts.

    Across brands, Beardo, a leading beard care brand, offered significantly higher discounts on Amazon compared to Flipkart. Most other well-known brands, including Nivea and Vaseline, saw higher discounts on Amazon compared to Flipkart. Only Tresmme and Dove were exceptions with higher discounts on Flipkart.

    In terms of Share of Search, once again, Beardo was the most discoverable brand in this category. Brands like Dove, Pond’s, Swiss Beauty, and Tresemme saw a lower Share of Search on Flipkart compared to Amazon.

    Navigating the Competitive Landscape: How To Thrive During Sale Events

    Amazon and Flipkart’s strategic pricing during the Big Billion Days and the Great Indian Festival Sale reflects a balance of profitability, inventory, and competition. Competitive pricing insights empower retailers to make informed decisions, optimize strategies, and thrive during high-stakes sale events with timely and relevant insights at a massive scale.

    To learn more about how you can leverage competitive pricing insights to stay ahead of the game during sale events, reach out to us today!

  • Black Friday Cyber Monday 2023: Unveiling Health & Beauty Pricing and Discount Trends

    Black Friday Cyber Monday 2023: Unveiling Health & Beauty Pricing and Discount Trends

    On Black Friday this year, Health & Beauty brands saw a significant increase with a 13% jump in foot traffic, according to a report by RetailNext. Despite caution from various sources, higher prices for everyday goods, and high interest rates, consumers chose to spend big this cyber week.

    So what kind of deals did top retailers and brands offer in the Health & Beauty category this BFCM? At DataWeave, we harnessed the power of our proprietary data aggregation and analysis platform to track and analyze the prices and deals of Health & Beauty products across prominent retailers to uncover unique insights into their price competitiveness this BFCM, as well as understand how pricing strategies varied across diverse subcategories and brands.

    Also check out our insights on discounts and pricing for Consumer Electronics, Apparel, and Home & Furniture categories this Black Friday and Cyber Monday.

    Our Methodology

    For this analysis, we tracked the average discounts among leading US retailers in the Health & Beauty category during the Thanksgiving weekend sale, including Black Friday and Cyber Monday. We noticed prices and discounts didn’t change significantly over the course of the weekend, and hence the average prices of products between the 24th and 27th of November are being reported. Our sample was chosen to encompass the top 500 ranked products in each product subcategory across leading retailers during the sale.

    • Sample size: 15,253 SKUs
    • Retailers tracked: Amazon, Walmart, Target, Sephora, Ulta Beauty
    • Subcategories reported on: Shampoo, Toothpaste, Conditioner, Sunscreen, Makeup, Electric Toothbrush, Beard Care, Moisturizer
    • Timeline of analysis: 24 to 27 November 2023

    Our Key Findings

    Average Discounts Across Retailers

    Amazon leads the pack with a huge margin, offering an average discount of 31.9%, covering 62% of its products analyzed. Target follows an 18.8% average discount across only 5% of its analyzed assortment. The other retailers aren’t even close.

    Ulta Beauty was the next in line, providing a 9.2% average discount followed by Walmart with a 6.8% average discount. Sephora, known for its premium beauty offerings, adopted a more conservative approach with a 3.5% average discount, targeting only 9% of its top products

    Across retailers, it is clear that Amazon led the charge by far this cyber week, with the other retailers choosing to markdown prices conservatively in the Health & Beauty category.

    Average Discounts: Subcategories

    Amazon offered high discounts on lower priced subcategories like Toothpaste (49.4%), Sunscreen (46.3%), Moisturizers (38.5%), and Conditioners (37.5%), highlighting its focus on products with high demand that consumers would look to stock up on. Ulta Beauty also focused its discounts on Toothpaste (15.6%), Moisturizers (14.9%), and Conditioners (12.6%), targeting skincare and grooming.

    Sephora, meanwhile, offered the most attractive deals on the Makeup subcategory at 5.3% across 12.67% of its analyzed assortment, banking on the demand generated due to the brand’s popularity in this subcategory.

    Target prioritized discounts on Toothpaste (22.5%), Shampoo (21.6%), and Moisturizers (18.9%). Walmart too offered significant discounts on Shampoo (21.6%) and Toothpaste (22.5%).

    Retailers prioritized staple subcategories like Toothpaste and Moisturizer with substantial discounts during this Black Friday Cyber Monday, ensuring a broad consumer appeal. In contrast, discretionary items like Makeup may be less motivated by discounts alone, and hence saw lower discounts during the sale.

    Average Discounts: Brands

    Brands offered the most attractive deals on Amazon, with OGX leading the pack at 58.4% average discount. Neutrogena and Colgate followed with an average discount of 50.4% and 44%. This mirror’s Amazon’s subcategory focus on shampoos, conditioners, and toothpastes.

    Other instances of brands offering attractive deals across retailers include Belif (27.9%) and Anastasia Beverly Hills (17.6%) on Sephora, Johnson’s (20%) and Philips Sonicare (18.8%) on Target, and Olay (12.2%) and Colgate (10.6%) on Walmart.

    Ulta Beauty hosted several attractive deals by specific brands, including Moon (30.7%), Joico (24%), and Clinique (22.3%).

    Share of Search For Health & Beauty Brands Across Subcategories

    Our Share of Search analysis illuminates the strategic moves made by brands to enhance their visibility, playing a crucial role in influencing consumer choices during Black Friday and Cyber Monday.

    Among some of the leading brands, Head & Shoulders and Oral-B increased their Share of Search by 2.3% and 1% respectively, reflecting a successful strategy to boost brand visibility during the Black Friday and Cyber Monday shopping events. On the other hand, L’Oreal Paris, Colgate, and Neutrogena faced marginal decreases in Share of Search.

    Overall, since the difference in Share of Search values did not change dramatically, the visibility levels of leading brands across key subcategories remained consistent during the Thanksgiving weekend.

    For deeper insights on pricing and discounting trends across a diverse range of shopping categories during Black Friday and Cyber Monday, check out our blog!

    To learn more about our AI-powered Pricing Intelligence and Digital Shelf Analytics platform, contact us today!

  • Black Friday Cyber Monday 2023 Insights: A Report on Pricing and Discounts in Apparel

    Black Friday Cyber Monday 2023 Insights: A Report on Pricing and Discounts in Apparel

    As the highly anticipated shopping season approached, industry analysts, including Deloitte, had forewarned consumer spending caution owing to persistent inflationary pressures tightening budgets. Despite these concerns, the holiday spirit was buoyed by sensational deals that delighted bargain-hunting shoppers.

    According to the National Retail Federation (NRF), over 200 million consumers participated in both in-store and online shopping activities over the Thanksgiving weekend. This marked an almost 2% uptick from the previous year, surpassing the NRF’s initial estimates of 182 million and showcasing a robust start to the holiday shopping season.

    So what was all the hype about this Black Friday and Cyber Monday? How did top retailers react to reports of possibly decreased consumer spending? At DataWeave, we harnessed the power of our proprietary data aggregation and analysis platform to track and analyze the prices and deals of products across prominent retailers and categories to uncover unique insights into their price competitiveness this BFCM, as well as understand how pricing strategies varied across diverse subcategories and brands.

    In this article, we focus on the pricing and discounting strategies of Amazon, Walmart, and Target in the Apparel category.

    (Read Also: Black Friday Cyber Monday 2023: Insights on Pricing and Discounts in Consumer Electronics)

    Stay tuned to our blog for insights on other shopping categories like Home & Furniture, and Health & Beauty!

    Our Methodology

    For this analysis, we tracked the average discounts of apparel products among leading US retailers during the Thanksgiving weekend sale, including Black Friday and Cyber Monday. We noticed prices and discounts didn’t change significantly over the course of the weekend, and hence the average prices of products between the 24th and 27th of November are being reported. Our sample was chosen to encompass the top 500 ranked products in each product subcategory across during the sale.

    • Sample size: 17,981 SKUs
    • Retailers tracked: Amazon, Walmart, Target
    • Subcategories reported on: Women’s Tops, Men’s Swimwear, Men’s Innerwear, Women’s Innerwear, Women’s Athleisure, Women’s Dresses, Men’s Athleisure, Men’s Shirts, Women’s Shoes, Men’s Shoes, Women’s Swimwear
    • Timeline of analysis: 24 to 27 November 2023

    Our Key Findings

    Average Discounts Across Retailers

    Amazon offered the most attractive deals, showcasing an average discount of 19.5%, applying to a substantial 61% of their apparel inventory.

    Trailing closely behind was Target, offering an average discount of 14.8% across 52% of the products analyzed. Walmart, however, took a more conservative approach, providing an average discount of 8.5%, applicable to 29% of its products.

    The contrast in discounting strategies highlights the diverse tactics employed by retailers to entice Black Friday and Cyber Monday shoppers within the Apparel category. Amazon remains the forerunner, balancing competitive discounts with a significant coverage of discounted items.

    Target follows suit with a competitive stance, while Walmart opts for a more reserved markdown approach, given that the retailer tends to carry a large number of products in the affordable price ranges.

    Average Discounts: Subcategories

    Examining the Black Friday and Cyber Monday discount landscape within the Apparel category reveals intriguing patterns among major retailers. Amazon led the charge, boasting an impressive 24.9% average discount on Women’s Tops, covering a substantial 76.5% of its products. In the same subcategory, Target competed fiercely with a 25.1% average discount, covering 87.5% of its products. Walmart, taking a measured approach, presented a 14.6% average discount across 45.1% of its Women’s Tops inventory.

    Notably, Men’s Swimwear at Target has no discounts. Meanwhile, Amazon remained aggressive across various subcategories, particularly in Women’s Shoes and Women’s Tops, aiming to capture a significant market share through both competitive pricing and a broad coverage of discounted items.

    Average Discounts: Brands

    Across brands, Tommy Hilfiger and Jockey took the lead on Amazon with an enticing average discount of 28.3% and 24.6% respectively, appealing to savvy shoppers. Calvin Klein followed closely with a 17.3% discount, offering a balance of style and affordability.

    In Walmart, Crocs stood out with a 39.9% average discount, followed by Reebok (15.7%) and Hanes (14.9%) Xhilaration, Target’s in-house brand, stole the spotlight on the retailer platform with an impressive 50% average discount. Reebok (32.3%) and Levi’s (22.9%) maintained competitive discounts, appealing to diverse tastes.

    Our analysis sheds light on the dynamic landscape of apparel discounts, showcasing how brands adopt varying pricing strategies to position themselves competitively for Black Friday and Cyber Monday shoppers.

    Share of Search For Apparel Brands Across Subcategories

    The dynamics of Black Friday and Cyber Monday extend beyond price reductions, with brands strategically vying for increased visibility through Share of Search metrics. This metric signifies a brand’s prominence among the top 20 ranked products in a given subcategory, offering valuable insights into their online marketplace visibility.

    Among the standout performers in the Apparel category, Jockey experienced a significant surge in Share of Search, leaping from 1.70% before the event to an impressive 13.30% during the Black Friday and Cyber Monday sales. Speedo, in the Women’s Swimwear subcategory, demonstrated a substantial increase from 4.40% to 13.30%, solidifying its presence and gaining an 8.90% boost in Share of Search.

    Tommy Hilfiger and Adidas also exhibited notable gains in Share of Search, increasing by 5.30% and 5.60%, respectively. However, some brands experienced a slight dip, with Speedo in the Men’s Swimwear subcategory seeing a 2.50% dip in their search visibility, and Reebok in Men’s Shoes witnessing a 3.3% decrease.

    These fluctuations highlight the dynamic nature of brand strategies during Black Friday and Cyber Monday in the Apparel category, where gaining visibility also proves to be crucial alongside offering competitive discounts.

    For a deeper dive into the world of competitive pricing intelligence and to explore how our solutions can benefit apparel retailers and brands, reach out to us today!

    Stay tuned to our blog for forthcoming analyses on pricing and discounting trends across a spectrum of shopping categories, as we continue to unravel the intricacies of consumer behavior and market dynamics.

  • Black Friday Cyber Monday 2023: Insights on Pricing and Discounts in Consumer Electronics

    Black Friday Cyber Monday 2023: Insights on Pricing and Discounts in Consumer Electronics

    As Black Friday and Cyber Monday unfolded across the globe, there was a noticeable subdued atmosphere compared to previous years. TD Cowen brokerage adjusted its forecast for US holiday spending, revising it down from an initial 4-5% growth to a more conservative estimate of 2-3%.

    Compounded by persistent inflation and elevated interest rates, many consumers find themselves financially strained, leading to the projection of the slowest growth in US holiday spending in five years.

    In this context, it would be relevant to investigate whether this restrained reaction from consumers had an influence on the extent of attractive deals and discounts provided by top retailers and brands during the sale event.

    At DataWeave, we harnessed the power of our proprietary data aggregation and analysis platform to track and analyze the prices and deals of consumer electronics products across prominent retailers to uncover unique insights into their price competitiveness this BFCM, as well as understand how pricing strategies varied across diverse subcategories and brands.

    Keep an eye on our blog for insights on other shopping categories like Apparel, Home & Furniture, and Health & Beauty!

    Our Methodology

    For this analysis, we tracked the average discounts among leading US electronics retailers during the Thanksgiving weekend sale, including Black Friday and Cyber Monday. We noticed prices and discounts didn’t change significantly over the course of the weekend, and hence the average prices of products between the 24th and 27th of November are being reported. Our sample was chosen to encompass the top 500 ranked products in each product subcategory across leading retailers during the sale.

    • Sample size: 23,505 SKUs
    • Retailers tracked: Amazon, Walmart, Target, Best Buy
    • Subcategories reported on: Headphones, Laptops, Smartphones, Tablets, Speakers, TVs, Earbuds, Wireless Headphones, Drones, Smartwatches
    • Timeline of analysis: 24 to 27 November 2023

    Our Key Findings

    Average Discounts Across Retailers

    The observed Black Friday and Cyber Monday discount strategies reveal a distinct competitive landscape among major retailers. Amazon emerged as the frontrunner, offering the highest average discounts at 23.30%, spanning a significant 74% of their consumer electronics inventory. Best Buy closely followed, with an average discount of 19.40% across 76% of their products.

    On the other hand, Target and Walmart adopted a more conservative stance, providing lower average discounts at 14.8% and 12%, respectively, with Target discounting 51% of its products and Walmart discounting 41%. This variation in discounting strategies highlights the diverse approaches retailers take to attract and retain Black Friday and Cyber Monday shoppers, balancing competitiveness with profit margins.

    Average Discounts: Subcategories

    In the Headphones subcategory, Amazon stands out with a substantial 31.40% average discount, targeting 84.69% of SKUs, showcasing an aggressive discounting strategy. Best Buy follows closely, demonstrating competitive pricing with a 21.80% average discount on 67.03% of products.

    Meanwhile, in TVs, Best Buy offered a significant 17.9% average discount across 89% of its products, signaling a targeted effort to capture a broad market share in this subcategory.

    In the Laptop subcategory, Target was highly conservative, with only a 4.1% average discount covering 14.3% of its products, while Walmart positioned itself with a moderate 9.5% average discount, targeting 39.8% of its inventory.

    Among Smartphones, Amazon (14.7%) was third to Best Buy and Target, which offered average discounts of 20.5% and 18.1%, respectively. Walmart, with an average discount of only 9.9% in the subcategory opted for a relatively muted approach.

    Average Discounts: Brands

    The discount strategies across top electronics brands during Black Friday unveil distinct approaches. Samsung emerges as a focal point across Amazon, Best Buy, Walmart, and Target. The brand was most attractively priced on Best Buy, with an average discount of 25.3%, followed by Target (18.3%) and Amazon (17.9%).

    Apple’s discounts were quite consistent across Amazon (17.6%), Best Buy (16.1%), and Target (17.8%), with the exception of Walmart (8.1%). JBL, interestingly, opted to discount very heavily on Best Buy, at an average of 38.8%, resulting in several attractive deals for shoppers on the website. Sony, too, offered impressive discounts at over 23% on Amazon and Best Buy, followed by 16% on Walmart. On Amazon, Amazon Renewed (13.9%) was among the most aggressively discounted products, highlighting an effort to further appeal to cost-conscious consumers.

    Overall, our analysis throws light on the nuanced strategies employed by leading brands on Amazon, Best Buy, Walmart, and Target, reflecting a delicate interplay between brand positioning, pricing competitiveness, and customer appeal.

    Share of Search For Consumer Electronics Brands Across Subcategories

    The Share of Search data reflects intriguing shifts in brand strategies during the Black Friday and Cyber Monday events. During sale events, brands looking to entice shoppers don’t rely only on price but also on search visibility to help drive awareness and conversion. Share of Search is defined as the share of a brand’s products among the top 20 ranked products in a subcategory, thereby providing insight into a brand’s visibility on online marketplaces.

    Some of the brands that improved their Share of Search the most include LG, Skullcandy, Asus, JBL, and Samsung. On the other hand, prominent brands like Sony and Apple actually lost ground on this metric by 0.4% and 2% respectively.

    At DataWeave, our commitment to empowering retailers and brands with actionable competitive and digital shelf insights remains unwavering. Our AI-powered platform provides a comprehensive view of market dynamics for our customers, enabling informed decision-making. As a partner in your journey, we offer tailored solutions to enhance your competitive edge, drive sales, and elevate your brand presence. To find out more about our solution, reach out to us today!

    To learn more about pricing and discounting trends during Black Friday and Cyber Monday across various other shopping categories, stay tuned to our blog!

  • Which Amazon Sale Offered Better Deals: Prime Day in July or Big Deal Days in October?

    Which Amazon Sale Offered Better Deals: Prime Day in July or Big Deal Days in October?

    Amazon reported a record-breaking Prime Day this July, marking it as the biggest sales event in the company’s history. So when the eCommerce giant announced the Prime Big Deal Days this fall, we were curious to find out how big a deal it really is.

    The Prime Big Deal Days, similar in magnitude to the Summer Prime Day, promised to present substantial savings across a diverse range of categories, including electronics, toys, home, fashion, beauty, and Amazon products.

    However, for a shopper, an important question is: Does the Prime Big Deal Days in October offer lower prices than Amazon’s mega Prime Day event in July?

    To answer this question, we turned our data aggregation and analysis platform to focus on these two sale events and analyzed which event offered better deals across key categories and brands.

    TL;DR: Surprisingly, the Prime Big Deal Days in October offered, on average, 2.02% higher discounts than its counterpart event in July.

    Read on for details on how we went about our analysis and how discounts vary across categories, sub-categories, and brands.

    Our Methodology

    We tracked the prices and discounts of a large sample of products during both Prime Day events. The following are some relevant details about our sample:

    • Number of products analyzed: 1500+
    • Categories: Apparel, Consumer Electronics, Home & Furniture, Health & Beauty
    • Prime Day Sale Analysis: 11-12 July 2023
    • Prime Big Deal Days Analysis: 10-11 Oct 2023
    • Website: Amazon.com

    Our analysis focused on the differences in the prices and discount levels of products between the two sale events.

    Our Key Findings

    The average discount during the Prime Big Deal Days in October was 29.44%, which was 2.02% higher than the average discount during the Prime Day sale in July (27.42%). Interestingly, the October event offered better deals across each product category analyzed, albeit at slightly varying levels.

    By offering deeper discounts in October, Amazon may have aimed to encourage early holiday shopping, thereby capturing a larger share of the consumer wallet before competitors intensify their promotional activities closer to the festive season.

    As other retailers and online marketplaces gear up for their own holiday promotional events, Amazon’s decision to provide heightened discounts in October could serve as a preemptive move to secure customer loyalty and drive sales momentum before the onset of the peak shopping period.

    Additionally, Amazon’s strategic push to amplify the visibility of its diverse product offerings, including exclusive launches and partnerships during the October event might have contributed to the higher discounts.

    Next, let’s take a closer look at each product category.

    Apparel

    During October’s Prime Big Deal Days, the Apparel category experienced a notable uptick, boasting a 2.29% increase in discounts compared to the earlier Prime Day event in July.

    In the detailed assessment of Apparel sub-categories, Men’s and Women’s Swimwear, alongside Men’s Shoes, Innerwear, and Athleisure, emerged as the segments showcasing the most substantial average discounts during October. Fall also brought about more affordable prices for Women’s Innerwear and Men’s Shirts. However, Women’s Athleisure, Dresses, and Tops displayed diminished average discounts during this Prime Big Deal Days event.

    Delving into brand-specific analyses revealed intriguing trends. Athleisure brands such as Ibkul, Esprlia, and Ryka notably escalated their discounts in October after minimal markdowns during the Summer Prime Day sale.

    Steve Madden, witnessing heightened discounts in October, hinted at a growing demand for boots and footwear in the Autumn and Winter seasons. For instance, the Steve Madden Men’s Fenta Fashion Sneaker was priced at $46 during the Summer Prime Day, and only at $35 during the Prime Big Deal Days in October.

    Conversely, brands like PGA Tour, Land’s End, Roxy, and Anrabess offered more substantial discounts during the Summer compared to the October event.

    Consumer Electronics

    The Consumer Electronics segment during October’s Prime Big Deal Days showcased an average price decrease of 1.98% compared to the Prime Day event in July.

    Nearly all scrutinized subcategories experienced heightened discounts during the Fall Prime Big Deal Days in October. Tablets, Speakers, Drones, and Smartwatches notably presented higher discounts of 4.06%, 3.51%, 2.99%, and 2.69%, respectively, in October. However, more enticing deals were found on Earbuds and TVs during July’s event.

    Examining consumer electronics brands, Google stood out by offering the most compelling deals in October, boasting an average discount of 23.35%, marking an 8.94% increase from the Summer Prime Days’ 14.41%. Psier, Sony, and OnePlus also featured significantly reduced prices during the Fall. For example, the OnePlus 10 Pro | 8GB+128GB was $500 during the sale in July and only $440 during the Prime Big Deal Days in October.

    Conversely, prominent brands such as Bose, Sennheiser, Samsung, LG, and Asus opted to offer heavier discounts in July. Notably, the Samsung All-in-One Soundbar w/Dolby 5.1 was priced at $218 in October but only $168 in July.

    Home & Furniture

    During October’s Prime Big Deal Days, the Home & Furniture category experienced a notable 1.59% increase in average discounts compared to the Prime Day event held in July.

    Notably, Entertainment Units, Rugs, and Coffee Tables emerged as standout sub-categories that were more attractively priced in October, exhibiting price differences of 7.73%, 5.33%, and 4.80%, respectively.

    Interestingly, among the scrutinized sub-categories, only Luggage showed a lower price during the Prime Day sale in July compared to the October event. This shift likely reflects evolving consumer demand as the holiday season approaches, with items like rugs and entertainment units becoming increasingly sought-after categories for purchase.

    If you’re keen to explore how these trends vary across brands within this category, reach out to us for more insights.

    Health & Beauty

    During October’s Prime Big Deal Days, the Health & Beauty category showcased products at an average of 1.99% lower prices compared to the Prime Day event held in July.

    Our analysis of Health & Beauty reveals that a majority of the subcategories presented higher discounts during the October Big Deal Days event. Essential items such as Toothpaste, Sunscreen, and Electric Toothbrushes notably stood out as significantly more affordable during the Fall event, reflecting not only consistent demand but also a seasonal emphasis on these products. For instance, the Oral B iO Series 3 Limited Edition Electric Toothbrush, priced at $140 during the summer Prime Days, was further discounted to $120 in the fall event.

    Interestingly, Beard Care emerged as an exception, displaying higher discounts during the Prime Day sale in Summer compared to Fall’s Prime Big Deal Days.

    Examining brands within the category, Babyganics, Thinkbaby, and Vaseline showcased substantial increases in average additional discounts during October’s Prime Big Deal Days.

    Conversely, prominent brands like Maybelline, Neutrogena, and Cetaphil offered lower discounts during the fall event.

    Competitive Insights to Drive Optimized Sale Event Pricing

    At DataWeave, we understand the pivotal role of competitive pricing insights in empowering retailers and brands to gain a competitive edge, especially during significant events like Prime Day. Our commitment lies in providing retailers with precise and extensive competitor price tracking on a large scale. This empowers them to devise impactful pricing strategies and consistently uphold a competitive stance in the market. To learn more about how this can be done, talk to us today!

  • Why Unit of Measure Normalization is Critical For Accurate and Actionable Competitive Pricing Intelligence

    Why Unit of Measure Normalization is Critical For Accurate and Actionable Competitive Pricing Intelligence

    Competitive pricing intelligence is pivotal for retailers seeking to analyze their product pricing in relation to competitors. This practice is essential for ensuring that their product range maintains a competitive edge, meeting both customer expectations and market demands consistently.

    Product matching serves as a foundational element within any competitive pricing intelligence solution. Products are frequently presented in varying formats across different websites, featuring distinct titles, images, and descriptions. Undertaking this process at a significant scale is highly intricate due to numerous factors. One such complication arises from the fact that products are often displayed with differing units of measurement on various websites.

    The Challenge of Varying Units

    In certain product categories, retailers often offer the same item in varying volumes, quantities, or weights. For instance, a clothing item might be available as a single piece or in packs of 2 or 3, while grocery brands commonly sell eggs in counts of 6, 12, or 24.

    Consider this example: a quick glance might suggest that an 850g pack of Kellogg’s Corn Flakes priced at $5 is a better deal than a 980g pack of Nestle Cornflakes priced at $5.2. However, this assumption can be deceptive. In reality, the latter offers better value for your money, a fact that only becomes evident through price comparisons after standardizing the units.

    This issue is particularly relevant due to the prevalence of “shrinkflation,” where brands adjust packaging sizes or quantities to offset inflation while keeping prices seemingly low. When quantities, pack sizes, weight, etc. reduce instead of prices increasing, it’s important that this change is considered while analyzing competitive pricing.

    Normalizing Units of Measure

    In order to effectively compare prices among different competitors, retailers must standardize the diverse units of measurement they encounter. This standardization (or normalization) is crucial because price comparisons should extend beyond individual product SKUs to accommodate variations in package sizes and quantities. It’s essential to normalize units, ranging from “each” (ea) for individual items to “dozen” (dz) for sets, and from “pounds” (lb), “kilograms” (kg), “liters” (ltr), to “gallons” (gal) for various product types.

    For example, a predetermined base unit of measure, such as 100 grams for a specific product like cornflakes, serves as the reference point. The unit-normalized price for any cornflake product would then be the price per 100 grams. In the example provided, this reveals that Kellogg’s is priced at $0.59 per 100 grams, while Nestle is priced at $0.53 per 100 grams.

    Various Categories of Unit Normalization

    1. Weight Normalization

    Retailers frequently feature products with weight measurements expressed in grams (g), kilograms (kg), pounds (lbs), or ounces (oz).

    2. Quantity or Pack Size Normalization

    Products are also often featured with varying pick sizes or quantities in each SKU.

    mounting hardware kit

    3. Volume or Capacity Normalization

    Products can also vary in volumes or capacities with units like liters (L) or fluid ounces (fl oz).

    DataWeave’s Unit Normalized Pricing Intelligence Solution

    DataWeave’s highly sophisticated product matching engine can match the same or similar products and normalize their units of measurement, leading to highly accurate and actionable competitive pricing insights. It standardizes different units of measurement, like weight, quantity, and volume, ensuring fair comparisons across similar and exact matched products.

    Retailers have the flexibility to view pricing insights either with retailer units or normalized units. This capability empowers retailers and analysts to perform accurate, in-depth analyses of pricing information at a product level.

    In some scenarios, analyzing unit normalized pricing reflects pricing trends and competitiveness more accurately than retail price alone. This is particularly true for categories like CPG, where products are sold in diverse units of measure. For instance, in the example shown here, we can view a comparison of price position trends for the category of Fruits and Vegetables based on both retail price and unit price.

    The difference is striking: the original retail price based analysis shows a stagnation in price position, whereas unit normalized pricing analysis reflects a more dynamic pricing scenario.

    With DataWeave, retailers can specify which units to compare, ensuring that comparisons are made accurately. For example, a retailer can specify that unit price comparisons apply only to 8, 12, or 16-ounce packs, as well as 1 or 3-pound packs, but not to 10 and 25-pound bags. This precision ensures that products are matched correctly, and prices are represented for appropriately normalized units, leading to more accurate pricing insights.

    To learn more about this capability, write to us at contact@dataweave.com or visit our website today!

  • Revolutionizing Fuel Pricing: How Fuel Retailers and Convenience Stores Can Gain a Winning Edge with DataWeave

    Revolutionizing Fuel Pricing: How Fuel Retailers and Convenience Stores Can Gain a Winning Edge with DataWeave

    Consider this scenario: A retailer establishes its fuel prices using pricing data that’s a few days old, only to subsequently discover that a nearby competitor is offering substantially lower prices. The result? Lost customers, decreased foot traffic, and diminished sales. This serves as a stark reality that retailers must confront and address today.

    In the fiercely competitive realm of retail, where every decision holds weight, maintaining a competitive edge is paramount. The fuel category, frequently underestimated, has the potential to significantly impact a retailer’s revenue stream. This challenge is not unique; retailers worldwide, particularly in North America, grapple with a common hurdle: mastering the intricate art of real-time fuel pricing.

    The Quest For Reliable, Real-Time Fuel Pricing Data

    For retailers, traditional methods for procuring and analyzing fuel price data have proven to be both expensive and error-prone, often relying on manual data collection or third-party data providers. These outdated approaches yield frustrating delays, inaccuracies, and missed opportunities. When it comes to obtaining timely fuel pricing intelligence, the majority of fuel retailers grapple with three central challenges:

    • Low Accuracy: Ensuring that fuel pricing information remains up-to-date, dependable, and actionable, even when sourced from complex web-based platforms.
    • Less Coverage: Acquiring comprehensive data that encompasses all of North America, spanning across retailers, convenience stores, fuel stations, and beyond.
    • High Cost: Effectively managing the substantial costs associated with acquiring and processing this vital information.

    DataWeave’s Fuel Pricing Intelligence Solution

    Comprehensive, accurate, and real-time fuel pricing intelligence can play a huge role in the profitability of retailers throughout North America. DataWeave takes the forefront in delivering this transformative Data-as-a-Service (DaaS) solution to some of the most prominent retailers in the region, including the top 20 fuel retail behemoths.

    With a rich and extensive history spanning over a decade in the realm of competitive intelligence, DataWeave boasts an impressive track record of empowering well-informed decision-making in retail. We leverage state-of-the-art technology to bring an unparalleled level of accuracy, timeliness, and coverage to fuel pricing intelligence.

    The following are some compelling advantages offered by our solution:

    Accurate and Real-Time First Party Data

    We deliver retailers an unparalleled advantage through real-time, first-party fuel price data. Our data originates directly from the retailer’s own channels, encompassing websites and mobile apps, rendering it the industry’s foremost and most reliable source.

    Imagine having access to fuel pricing information that updates as frequently as every 30 minutes. This rapid update cadence guarantees that you, as a retailer, constantly possess the latest pricing insights at your fingertips, empowering you to respond swiftly to market fluctuations and competitor manoeuvres. Our comprehensive data spans a wide spectrum of fuel types, including:

    • Gasoline: Be it regular, mid-grade, super, premium, ethanol-free, ethanol blends, methanol blends, or reformulated gasoline, we have got you covered.
    • Diesel: Our data encompasses biodiesel, biodiesel off-road, biodiesel blends, biodiesel ultra-low sulfur (ULS), diesel ultra-low sulfur (ULS), diesel off-road, standard diesel, and premium diesel.

    Armed with our real-time, first-party data, you can make pricing decisions with unwavering confidence, secure in the knowledge that you possess access to the most current, authoritative, and extensive fuel pricing intelligence in North America.

    The data points we capture directly from relevant web sources include: gas station postal code, store name and code, location, city, state, ZIP code, fuel type, competitor name, regular price, member price (if available), time and date of data capture, and more.

    Click here if you wish to access a sample report of our fuel pricing data.

    Unrivaled Geographical Coverage

    Our extensive coverage of fuel data spans over 30,000 ZIP codes and encompasses the top 100 retailers across the western, mid-western, and eastern regions of the United States.

    Retailers benefit from the flexibility to configure and tailor the solution to their precise needs, whether it involves adding more locations or selectively acquiring specific segments of the data. This far-reaching coverage guarantees that retailers, whether situated in bustling urban centers or remote areas, can readily access the essential data required to maintain their competitive edge.

    Moreover, if you currently source your fuel pricing data from alternative providers, our solution seamlessly integrates, amplifies, and complements your existing array of data sources, ensuring a harmonious and unified approach to data acquisition.

    Optimization of Dynamic Pricing Strategies

    In the world of retail, the importance of timing cannot be overstated. Even a mere difference of a few cents can translate into millions of dollars in revenue impact. With DataWeave, retailers gain the capability to make data-driven decisions that provide them with a competitive edge around the clock, every single day.

    Our platform empowers you to unearth margin gaps by pinpointing opportunities to raise prices while maintaining your competitive pricing position. It also identifies instances where you may be substantially overpriced, prompting necessary price adjustments to ensure competitiveness within the market. All these valuable insights are available at a hyperlocal level, facilitating pricing efficiency and optimization across your various regions of coverage. Equipped with this real-time data, you can swiftly adapt to ever-changing market conditions.

    Furthermore, our comprehensive competitive data seamlessly integrates into your existing pricing systems through APIs, facilitating quick and informed pricing actions based on robust data.

    Reliable and Customer-First Tech Platform

    Our platform boasts a remarkable level of sophistication when it comes to data aggregation, normalization, visualization, and integration capabilities. It stands as a massively scalable system with the capacity to aggregate billions of data points daily, spanning thousands of web sources. This includes the intricate handling of sources like mobile apps and websites known for frequently altering their site structures, among others.

    What truly sets us apart is our proficiency in addressing these challenges through a blend of human expertise and large-scale machine learning. Additionally, our commitment to delivering unmatched service extends to round-the-clock, 24/7 support. This comprehensive approach makes our fuel pricing intelligence solution not only effective but also cost-efficient in meeting your fuel data requirements.

    We also provide a variety of options for you to consume our data, which includes receiving our reports via email, SFTP, S3 buckets, data lakes like Snowflake, and APIs.

    Enhance your Fuel Pricing Strategies with DataWeave

    In the ever-competitive world of retail, staying ahead is not just a goal; it’s a necessity. The fuel pricing landscape, often overlooked, holds immense power to impact a retailer’s profitability. DataWeave’s real-time, comprehensive, and accurate fuel pricing intelligence solution is the key to securing this advantage. Retailers and convenience stores now have a powerful platform at their disposal, offering unparalleled precision, comprehensive coverage, and the agility needed to navigate this landscape.

    Join the ranks of industry leaders who have already harnessed the potential of DataWeave. Reach out to us today to redefine your approach to fuel pricing and propel your business to new heights!

  • DataWeave Launches PricingPulse: Empowering Retail Leaders With Comprehensive and Strategic Pricing Insights

    DataWeave Launches PricingPulse: Empowering Retail Leaders With Comprehensive and Strategic Pricing Insights

    In the evolving retail landscape, success often hinges on a singular focal point: pricing. A recent Statista survey revealed that 70% of US online users prioritize competitive pricing in their digital shopping choices. In this cutthroat arena, where surpassing rivals is paramount, a deep comprehension of pricing nuances is no longer just an edge, but a necessity.

    Retailers are increasingly adopting pricing intelligence solutions that meticulously dissect competitor pricing data in comparison to their own, down to the SKU level. This analysis empowers their pricing teams with the insights they need to price their products competitively on a day-to-day basis.

    However, in a landscape where a staggering 50 million price changes occur daily, reliance on a reactive pricing intelligence solution, though effective in many ways, often falls short. To develop a strategic and predictive pricing engine, retailers also need the ability to track historical pricing relative to market conditions, competitor actions, seasonality, promptness of competitor pricing actions, and more. This would be particularly useful for senior retail pricing and business unit leaders as they look to gain a strategic perspective on their competitive pricing health. However, even today’s leading providers of retail pricing intelligence solutions lack in this area. This results in a relatively myopic view of competitive pricing even in large retail organizations.

    Introducing DataWeave’s PricingPulse

    DataWeave’s PricingPulse helps retail leaders better understand their competitive pricing strategies in comparison to relevant market dynamics over time. The capability bridges the gap between day-to-day competitive pricing operations and long-term strategic pricing analysis and actions, enabling senior retail pricing leaders to untangle the complexities of their pricing strategies. Delivered as a dashboard, the view offers an elevated vantage point for industry-wide pricing dynamics, empowering retailers with the foresight needed to navigate market shifts, predict vulnerabilities, and capitalize on new opportunities.

    PricingPulse is provided to all DataWeave retail customers as an add-on to our Pricing Intelligence solution.

    The insights offered by PricingPulse enable retailers to answer pivotal questions about competitor pricing behaviors, price leadership across categories, timing of price changes, and the effectiveness of capitalizing on price improvement opportunities. Some of the questions that PricingPulse offers answers to include:

    • How frequently are my competitors changing prices and for which products?
    • How does my price leadership vary across key product categories?
    • Which day of the week or month do my competitors change their pricing most and least frequently?
    • How well do I seize on price improvement opportunities over time?

    Strategic Pricing Views Via PricingPulse

    In the following section, we share a few views available to retail leaders via our PricingPulse dashboard. For a complete list of insights available on the dashboard, request a demo today.

    Competitive Price Leadership Across Retailers and Categories

    This view provides retailers with an overview of the price leaders across various product categories and how it changes with time. More often than not, retailers would aim to gain price leadership in certain categories, while maintaining healthy margins in others.

    Retailers can also gauge their consistency and effectiveness in maintaining a competitive edge for key categories over time. They can fortify areas of strength and identify opportunity areas to optimize their pricing.

    In addition, the dashboard tracks a retailer’s price index across categories, a measure that determines its price competitiveness.

    The price index is determined by dividing the retailer’s price by the lowest price offered by any of its competitors. A ratio lesser than 1 indicates that the retailer is the lowest priced in the market. This measure is also presented for competitors, providing insights into competitors that are most attractively priced in the market. A timeline trend of this metric helps track how price leadership among retailers changes over time.

    Price Change Trends

    This view provides a summary of the level of price changes by a retailer and its competitors over a period of time, which includes the average magnitude of price changes as well as the proportion of the retailer’s assortment that underwent these price changes.

    In addition, the number of price changes each month are provided for each retailer. This is further broken down into the total number of price changes during each day of the week.

    These insights help retailers determine which competitors are most and least active in their pricing activities, how aggressive the pricing actions are, and if there are any specific price change patterns followed in terms of the days of the week or month.

    Price Improvement Opportunities and Actions

    The dashboard actively reports on price improvement opportunities, which could include either a price increase opportunity or a price decrease opportunity, for a retailer and its competitors across categories over time. A price increase opportunity occurs when a product is significantly under priced (by more than 2%) and a price decrease opportunity occurs when a product is significantly overpriced (by more than 2%).

    Further, the retailer gains insight into how many price improvement opportunities were actually acted on within 15 days of the opportunity presenting itself. This “action rate” helps retailers quantify how well they seize on price improvement opportunities, which eventually result in higher sales and margins. The dashboard also reports on the average number of days it took for a retailer to act on a price improvement opportunity, thereby quantifying the responsiveness and agility of pricing teams.

    This is especially useful for pricing leaders to “audit” or evaluate the performance of their pricing teams. When similar insights are viewed for a set of competitors as well, retailers can better understand the level of sophistication of their competitors’ pricing operations.

    Ready to Elevate Your Pricing Game?

    The launch of DataWeave’s PricingPulse marks a significant advancement in the realm of pricing solutions for retail leaders. As the retail landscape undergoes continuous transformation, the significance of precise pricing strategies cannot be overstated. PricingPulse is the first and only pricing view in the industry to bridge the gap between tactical pricing decisions and comprehensive strategic analysis.

    In a world where agility and foresight are crucial, PricingPulse equips retail leaders with the ability to predict competitor actions, optimize pricing strategies, and stay ahead of the competition.

    If you are a senior pricing leader or retail business unit head, reach out to us today to either sign up or learn more!

  • Fashion eCommerce 2023: Leveraging Pricing Intelligence to Stay Competitive Despite Reduced Demand

    Fashion eCommerce 2023: Leveraging Pricing Intelligence to Stay Competitive Despite Reduced Demand

    The fashion industry is currently undergoing a period of stabilization after facing significant disruptions in recent years. Fashion retailers find themselves navigating not only changing consumer preferences but also the challenges brought about by inflation and supply chain issues that are remnants of the COVID-19 era.

    The effects of inflation have raised concerns regarding overabundance, rise of sustainable and pre-used fashion and declining sales, creating a mismatch between supply and demand within the market. As consumers scale back on spending due to rising prices, fashion retailers are left grappling with surplus inventory, heightened storage costs, and reduced profit margins.

    Consequently, these market dynamics have significantly impacted the pricing strategies employed by fashion retailers, resulting in dynamic shifts in pricing and competitiveness across different time periods, subcategories, and individual retailers.

    Counteracting this impact requires fashion retailers to adopt a data-driven approach that leverages competitive and market insights. They must adopt agile and versatile pricing strategies that enable advanced pricing and assortment management. By understanding their market position and the competitive landscape, retailers can effectively react to reduced demand and inflationary pressures without compromising heavily on their top line and profitability.

    At DataWeave, we harnessed the power of our proprietary data aggregation and analysis platform to track and analyze the prices of prominent fashion retailers to uncover unique insights into their price competitiveness over the past year, as well as understand how pricing strategies varied across diverse subcategories.

    Our Methodology

    For this analysis, we tracked the average price changes among leading US fashion retailers over 12 months to understand how their pricing across several fashion subcategories altered in response to supply chain inefficiencies, inflationary pressures, seasonal effects, and changing consumer preferences.

    • Sample: 88,000+ SKUs matched across 5 leading retailers
    • Retailers tracked: Amazon, Walmart, Target, Macy’s, Zappos
    • Key subcategories reported on: Boots, Bottoms, Coats, Denims, Flats, Heels, Jackets, Kids
    • Timeline of analysis: April 2022 to April 2023

    Our Analysis

    While prices have generally been rising in several industry segments, such as groceries, due to inflation, the fashion sector has experienced relatively stable prices, with even a few periods of price drops. In fact, average prices in April 2023 are 1.2% lower than those in April 2022. The main reason for this trend is that consumers have become cautious about discretionary spending on fashion in order to prioritize other necessities, resulting in lower demand and overstocking by retailers.

    In the first quarter of 2022, clothing accounted for only 3.9% of total expenditure by US consumers, down from 4.3% in 2019 before the pandemic. Additionally, in March 2023, 60% of fashion retailers in the US still had surplus goods, accounting for almost 20% of their entire stock. As demand decreased, fashion retailers started offering freebies with purchases, bundling products, giving away unwanted items, and notably, slashing prices.

    Subcategory level analysis of Average Price Change Month-on-Month between April 2022 – April 2023

    Our analysis at a subcategory level reveals that in winter 2022, seasonal demand led to the largest price increases of 6-11% in coats, boots, and jackets. However, these prices quickly declined afterward. In 2023, stabilization of raw material costs and a continuing decline in demand for non-essential apparel and fashion accessories are factors contributing to a significant drop in prices.

    Some of these trends vary among retailers as each faces different challenges and responds in distinct ways. Our data indicates that some retailers have chosen to increase their prices from Q3 2022 due to mounting pressure on profit margins, while others have further lowered prices due to increasing inventory levels.

    Average Price Change Month-on-Month Across Amazon, Macy’s, Walmart, Target, and Zappos between April 2022 – April 2023

    _____________

    Capability Spotlight

    Matching products across competitor websites is an essential part of tracking competitive prices and analyzing price leadership. In fashion, matching exact products is no mean feat. Websites often host a slew of variants in terms of size, color, material, etc. without any form of standardization in the way the products are represented. So fashion retailers often struggle with simply unusable pricing insights resulting from inaccurate and incomplete product matching. 

    DataWeave’s industry-leading product matching algorithm recognizes and leverages dozens of product attributes extracted from product titles, descriptions, and images to match products at very high levels of accuracy and coverage. What’s more, our platform can also match similar products based on a large variety of parameters, so our customers can benefit from a comprehensive competitive perspective.

    _____________

    For example, in August, Target reported a 90% plunge in profits during the second quarter of 2022, as shoppers concerned about inflation reduced spending on nonessential items. The company stated that its price cuts did not have the desired impact, resulting in a 1.5% increase in inventory compared to three months prior. As a result, we can see that Target’s average fashion prices spiked in August 2022 and have remained steady since then. Walmart also faced similar challenges and increased its prices in October 2022.

    However, during the same period in August 2022, Macy’s announced increased discounts to clear out excess inventory in preparation for the holiday shopping season. In the same announcement, Macy’s highlighted how the rising cost of groceries, which had experienced a double-digit increase, was impacting consumers’ budgets, changing their behaviors, and increasing the need for discounts. Our data reflects this, showing a significant drop in prices from October 2022 to January 2023.

    However, in January 2023, Macy’s successfully managed its inventory levels, reducing them from $6.4 billion in October 2022 to $4.3 billion in January 2023. As a result, average prices at Macy’s have started to rise.

    _____________

    For today’s fashion retailers, achieving a balance between expansion goals and profitability is crucial. It requires a meticulous examination of competitive and market insights on a regular basis to mitigate competitive pressures and navigate through these challenging times successfully.

    DataWeave’s platform offers retailers the insights they need to gain a competitive advantage. With access to accurate, timely, and actionable pricing and assortment insights, retailers can make informed decisions and stay ahead of the competition. To learn more, reach out to us today!

  • The Rapid Rise of Alcohol eCommerce in the UK

    The Rapid Rise of Alcohol eCommerce in the UK

    Alcohol eCommerce has been rapidly growing over the years, and like a lot of other industries, the pandemic accelerated its growth. Convenience, safety & home delivery became important criteria for customers in the post pandemic era and so the sale of alcohol via eCommerce went up. Kantar reported that UK booze sales were up £261m & online and convenience stores were the biggest winners. The latest IWSR Drinks Market Analysis Report 2022 reported on another interesting trend – when ordering alcohol online, consumers prefer using websites v/s apps in most parts of the world except China and Brazil. In the UK the largest chunk of online alcohol purchases happens on a retailer website instead of an app. 

    Platform used for last online alcohol purchase. Source

    To get a better understanding of this, we tracked 2 grocery retailers and 3 grocery Q-Commerce apps in the UK to get insights into Alcohol sales, pricing, trends & more! 

    Methodology

    • Data Scrape time period: Feb 2022 – June 2022
    • Grocery Retailers tracked: Tesco & Ocado
    • Grocery Apps trackedGorillasWeezy & Getir
    • Category tracked: Alcohol

    Which retailer was the Price Leader in the alcohol category? 

    Before the pandemic Tesco was the only Big 4 retailer to increase their alcohol market share & Waitrose was the biggest loser, with its share of booze sales falling from 5.4% to 4.7%. Maintaining Price Leadership is a critical element and plays a big role in increasing sales & market share because consumers will buy the most competitively priced product. We wanted to track and see which retailer was the Price Leader in the alcohol category – i.e., had the most number of lower-priced items in the alcohol category. We also wanted to see if & how Tesco’s position had changed post pandemic. 

    Price Leadership
    • Tesco enjoyed price leadership in the Alcohol category from Feb – June 2022 with 38.9% products priced the lowest. This, followed by Ocado at 33.8%. Gorillas had price leadership for the least amount of products in the alcohol category at 5.6%. Tesco was the clear winner! 
    • Tesco’s Price Leadership kept declining through the months though – at the beginning of the year in Feb, Tesco had 44% products priced the lowest but by June, that number fell to a little over 36%. Ocado showed a reverse trend – in Feb they had price leadership on 32% items and by June that number rose to 35.3%.
    • One player Tesco could’ve potentially lost price leadership to was Getir. In Feb, Getir had price leadership on only 8.2% products but that increased gradually over the months to land on 14.5% in June. 

    Which retailers focused on Discounts to perk up alcohol sales? 

    Discounts are a great way to draw in inflation-hit shoppers. Loyalty card discounts, reward vouchers, and other promotional strategies retailers offer help make their products more competitive & attractive to customers. To stay competitive, retailers need to be aware of the discounts their competition is offering. They also need to understand the risk of deep discounting and the impact on margins. We wanted an insight into alcohol related discounts in the UK so we dug into our data. Here’s what we saw. 

    Average discounts across months by retailers
    • A host of European and UK based startups like Jiffy, Dija, Weezy, Zapp, Getir & Gorillas launched with the promise of delivering groceries the fastest & cheapest
    • Our data showed that Gorillas offered discounts in line with the competition, however, Getir likely went the deep discounting route. 
    • Getir offered the highest discounts across all months. And in the month of April they offered almost 9% more discount than Ocado – the retailer with the 2nd highest discounts. 
      Like we discussed above, Getir gained price Leadership from Feb to June. Deep discounting could have potentially played a role. 
    • Gorillas on the other hand had the lowest, almost non-existent discounts.

    Let’s look at Price Index trends across 5 months 

    We tracked the Price Index (PI) across these 5 retailers to measure how alcohol prices changed over a 5 month period from Feb – June 2022. 

    Note: Retailers selling at the 100% mark were selling at an optimal price & did not undercut the market. The pricing sweet spot is 95% – 105%. Anything lower would compromise margins, and higher would mean the retailer was not competitive. 

    Price Index across months by retailers
    • Weezy had a Price Index that was the most optimal, sitting in the 100% – 102% range.
    • Gorillas had the lowest Price Index, between 89% – 91%.
    • Getir had a low price index in Feb (96.1%) but slowly kept increasing to cross 110% in April, May & June.
    • What was interesting to see was the competition between the 2 retail giants Ocado & Tesco. Ocado had a lower price index at the start of the year at 105.1%, while Tesco was at 109.8%. In the subsequent months, Ocado kept increasing prices to be competitive with Tesco and Tesco decreased prices to likely match Ocado’s pricing. By June BOTH Tesco & Ocado had the exactly the same price index – 108.7%

    Which retailers were the quickest to make price changes?

    Competitive pricing is critical to eCommerce success. Competitive pricing involves tracking your competitor’s pricing & strategically tweaking your own prices without hurting margins. We tracked the month-wise average Price change from Feb – June across all 5 retailers to see which retailer was making price changes and at what frequency. 

    Average price change across months by retailers
    • Most retailers did not make massive prices changes, they were ballpark competitive with each other from a pricing standpoint. 
    • However, Gorillas made significant changes in the month of March when they dropped prices by 3.8% and in May when they increased prices by 5.5%!
    • In May, the same month Gorillas made a big price hike, Weezy dropped their prices significantly by 10% widening the gap between the 2 retailers. 

    Which retailers avoided lost sales by maintaining stock availability?

    Having a near real time view on stock availability is crucial to driving sales. Customers can buy products only when they’re available! So, we went ahead, looked into our data to see how each of these retailers managed stock availability from Feb to June.

    Average availability across months by retailers
    • Our data showed varying availability levels across retailers with Ocado having the highest availability across all 5 months. They had a robust stock at the beginning of the year at 100% but kept dwindling through the months to land at 95.8% by June. 
    • Tesco had a sharp drop in availability in May & June – from 97% at the beginning of the year to the 92-93% range.
    • Gorillas had the lowest availability across months between 90 & 94%.
    • Weezy consistently maintained availability at 95% across all 5 months.

    Conclusion

    For the most part, the UK market has a positive outlook towards buying alcohol online thanks to changes to shopper behavior arising from the pandemic. As per the IWSR Drinks Market Analysis Report 2022 in website-led markets, such as the UK, breadth of product range is important to customers along with price. These 2 play a key factor in purchase decisions. By contrast, consumers in app-driven markets have different preferences. While price matters, it is less important than convenience and speed. 

    As an alcohol retailer, if you need help tracking your competitor prices, discounts and product assortment, reach out to the team at DataWeave to learn how we can help!

  • U.S. Prime Day Deals 2022: Promotion Intelligence First Look

    U.S. Prime Day Deals 2022: Promotion Intelligence First Look

    As inflation hits another 40-year high at 9.1 percent, U.S. consumers geared up for their first sign of hope and relief in the form of anticipated discount buys – 2022 Amazon Prime Days, or so we thought. While Prime Days have grown to become a promotional period almost as important as Black Friday to digital shoppers, the combination of economic uncertainty, inflationary pressures, and supply chain challenges seemed to alter the discount strategy expected given activity seen during 2021 Prime Days.

    Our analyst team has been hard at work aiming to provide a ‘first look’ at 2022 Prime Day Promotional Insights, tracking discounts offered across 46,000+ SKUs within key categories like Electronics, Clothing, Health & Beauty and Home, on seven major retailer websites – Amazon, Target, Best Buy, Sephora, Ulta, Lowe’s and Home Depot. Our analysis compares prices seen during Amazon Prime Day 2022 on July 12th, to pre-Prime Day maximum value prices seen in the ten days leading up to Prime Days, to determine the average change in discounts offered during the promotional period. Below is a summary of our findings.

    Competitive Promotions Give Amazon a Run for their Money

    Amazon offered the greatest average discount enhancements for Electronics at 5.6 percent followed by Health & Beauty items at 5.1 percent, and Home products at 4.2 percent versus pre-Prime Day discounts seen across the categories considered within our analysis. The only category reviewed where average discounts were greater on a competitor’s website was on Target.com within the Clothing category. As seen below, Clothing on Target.com average discounts were 6.8 percent greater than pre-Prime Day offers, which was 2.6 percent higher than the average discounts offered for Clothing on Amazon.

    Target Capitalizes on Growth Opportunity in Clothing Category

    Diving deeper into the details of where Target won within the Clothing category, you can see a majority of their promotional activity took place within Women’s Accessories where discounts offered were 18.5 percent greater than those seen pre-Prime Day 2022, which was almost 15 percent greater than the discount enhancements seen on Amazon for Women’s Accessories. In fact, Women’s Shoes and Sneakers were the only two categories where the average discounts offered were greater on Amazon than on Target.com.

    Overall, the discounts offered on Target.com within the Clothing category were primarily concentrated within items priced $40 and lower, but what was most interesting is that within the $10 and under price bucket, Target offered average discounts of over 11 percent whereas Amazon increased prices for these items on average by over 9 percent.

    While most of the Clothing available on both Amazon and Target.com during Prime Days 2022 were offered without a price change, the greatest discount percentages tracked were within the range of 10-25 percent off on Amazon whereas Target chose to offer the bulk of their promotions at 25 percent off an up.

    Strategic Promotional Strategies Defined at the Electronics Subcategory Level

    When it comes to the Electronics category on Prime Day, the big question is always who will win the battle of the brands. Below shows the difference in average pricing and promotions discounts offered between products manufactured by Samsung versus Apple across each retailer platform, noting discounts were almost 3 percent greater on average for Apple versus Samsung products on Amazon, and Apple discounts were almost 5 percent greater on Amazon versus than those seen on Target.com.

    Amazon wasn’t going all in on Apple however, as we saw ‘Alexa’ devices (Amazon products) available on Best Buy and Target websites also, but the discounts were almost 4 percent greater on Amazon versus Target and over 7 percent greater than the discounts seen on BestBuy.com.

    While the average discounts offered within the Electronics category were greatest on Amazon (5.6 percent) versus Best Buy (3.9 percent) and Target (3.4 percent) as noted within the first chart of this blog and across brands and technologies considered above, the discounts offered on Amazon were strategically focused between 10-25 percent as seen below.

    Amazon’s Electronics promotions were also targeted at smaller price points, items priced between $20-500, whereas Best Buy and Target offered greater promotions for electronics priced $500 and up than Amazon.

    Below is a snapshot of price buckets tracked for Electronics available on BestBuy.com, highlighting where most of the promotional activity was targeted at products priced $50 and up during Prime Days 2022, with discounts ranging from 10 percent up to greater than 25 percent greater than pre-Prime day prices.

    The standout categories were TVs on Target.com with discounts averaging nearly 12 percent greater than those seen pre-Prime day, and smartphones on BestBuy.com with discounts averaging just over 11 percent greater than those seen pre-Prime Day. The category with the greatest average discount enhancements seen on Amazon during Prime Days 2022 was for Wireless Headphones with an average discount of 8.7 percent.

    Home is Where Amazon’s Heart Was on Prime Day

    Amazon dominated offers within the Home categories, especially for products within mid ($40-100) and higher price ranges (items priced $200-500), with the bulk of the discounts offered between 10-25 percent. There was little to no promotional activity seen across all price points on Lowe’s or Home Depot’s websites within the categories we tracked, and most other competitive offers on Home products were seen on BestBuy.com for products priced from $50-500. Even a subcategory like Tools offered deeper average discounts on Amazon (4.7 percent) than discounts seen on HomeDepot.com (1.1 percent) or Lowes.com (0 percent).

    For Large Appliances, Amazon was the only retailer to off any significant discount across each major subcategory with the greatest average discount being on Ovens at 6 percent, followed by Refrigerators at 4 percent. One caveat with this category, when we reviewed Large Appliance prices two weeks prior to Prime Days, we saw average price increases around 16.7 percent occurring on Amazon.

    During Prime Days 2022 however, Amazon also offered top average discounts for small appliances, except for on Instant Pots which appeared to have greater average discounts on Target.com (5.9 percent versus 4.2 percent on Amazon), and Vacuum Cleaners which appeared to have the best promotion of appliances small and large at 13.8 percent average discount on BestBuy.com. Another subcategory deeply discounted on BestBuy.com was weighted blankets, which averaged discounts around 18.5 percent versus Amazon’s average discount at only 6.2 percent.

    Health & Beauty Retailer Pricing Strategies Revealed

    Given the importance Health & Beauty Brands placed on Prime Day sales last year, we had anticipated to see more offers, especially within pure-play beauty retail channels, than we did for this booming category.

    Amazon drove most of the Health & Beauty offers seen averaging 5.1% discounts versus other retailers only offering less than 1% on average, but discounts were aimed at a targeted group of SKUs on Amazon, bringing the average discount lower overall. Most of the promotions offered on Amazon fell within mid-range price points ($20-50) and were discounted between 10-25 percent versus pre-Prime Day prices.

    Target.com offered the most comparable discounts to Amazon for Health & Beauty products on average, but their strategy primarily focused on items within the $20 and lower price range with discounts ranging primarily between 10-25 percent.

    More 2022 Prime Day Insights Coming Soon

    We know the significance visibility to critical pricing and promotional insights play in enabling retailers and brands to offer the right discounts to stay competitive, especially during promotional periods like Prime Days. While this blog is intended to provide a ‘sneak peek’ into 2022 Prime Day insights for the U.S. market, we will be providing more extensive, global coverage and will proactively share new insights with the marketplace as they become available throughout the month of July.

    Be sure to also check out our Press page for access to the latest media coverage on Prime Day insights and more. Don’t hesitate to reach out to our team if there is any particular category you are interested in seeing in more detail, or for access to more information on our Commerce Intelligence and Digital Shelf solutions.

  • Feminine Hygiene Products Face Supply Chain Shortage and Price Increases

    Feminine Hygiene Products Face Supply Chain Shortage and Price Increases

    Last week the DataWeave analytics team identified the states most impacted by the baby formula shortage, only to see feminine hygiene products following similar trends with price increases occurring alongside a supply chain shortage. In this analysis, the team has identified over four hundred feminine hygiene products made available across eighteen retailer and delivery intermediary websites from August 2021 through June 2022, to see how product availability and price changes correlated.

    Within the feminine care products analyzed, both tampons and sanitary pads show to have under 58% availability as of June 2022. For sanitary pads, June 2022 shows the lowest level of product availability at around 58%, which has steadily declined each month from August 2021 where product availability started around 69%. Tampons however, reached their lowest level of availability in April 2022 at 45%, and appear to be slowly recovering each month, now reaching around 53% availability in June 2022.

    Product Availability for Feminine Care Products - June 2022
    Product Availability for Feminine Care Products – June 2022

    The Evolution of the Tampon Shortage by Retailer

    Looking at tampons in more detail and at a retail level, we can see how much and how often product availability fluctuated from August 2021 through June 2022 across Kroger, Meijer, Baker’s Plus, Target and Walmart websites. Baker’s Plus, for example, shows the lowest product availability, maintaining an average of around 39% from October 2021 through June 2022. Kroger appears to be a notable exception only facing stock availability issues in March and April 2022, achieving nearly 78% availability in June 2022, which is 16% greater than the other retailers analyzed.

    Product Availability for Tampons by Retailer - June 2022
    Product Availability for Tampons by Retailer – June 2022

    Feminine Care Product Price Changes Over Time

    When looking at Pricing Intelligence insights and average price changes occurring alongside declining product availability for tampons and sanitary pads combined, we see a very different story. Tampons have seen steep price hikes from December 2021 onward, increasing the most in June 2022, up 6% compared to prices seen in November 2021. This steep price increase could be attributed to consistently low availability for tampons that has been seen in recent months.

    To the contrary, sanitary pads have seen a price reduction of around 1.25% as of June 2022 compared to average prices seen in November 2021. While prices are lower in June 2022 for sanitary pads, the percentage by which they are lower is shrinking in recent months, potentially for the same reasons related to decreasing product availability.

    Price Change for Feminine Care Products - June 2022
    Price Change for Feminine Care Products – June 2022

    When looking at month-over-month average price changes for tampons only, we can clearly identify which months had the biggest price changes, noting price hikes that lead to the currently high prices seen in June 2022. In March and May 2022, over 10% of tampons offered had seen a price increase, and around 8% had seen significant price increases of more than 10%.

    Month-Over-Month Price Changes for Tampons - June 2022
    Month-Over-Month Price Changes for Tampons – June 2022

    eCommerce Intelligence Provides Early Visibility to Evolving Trends

    Price increases don’t seem to be stopping anytime soon given there was a 3.6% price hike seen on average in May 2022 versus April, with June seeing yet another .6% increase from May’s prices. That being said, as the market evolves and feminine hygiene products stabilize, our team will continue to provide visibility to critical pricing and product availability changes to enable our clients to stay ahead of the curve.

    From a baby formula shortage to a tampon shortage, what category will be next to follow the supply chain shortage trend? Follow our blog for access to the latest insights and be sure to reach out to our team if there is any particular category you are interested in tracking next, or for access to more information on our Commerce Intelligence and Digital Shelf solutions.

  • Baby Formula Shortage Continues Alongside National Price Increases – June 2022

    Baby Formula Shortage Continues Alongside National Price Increases – June 2022

    As the baby formula shortage continues, retailers and brands are working quickly to meet evolving consumer demand, considering supply chain driven headwinds, a baby formula recall, and inflationary-driven impacts. The DataWeave analytics team has actively tracked marketplace changes, alongside reports from the FDA, for the baby formula category at a state-level, and has shared the latest snapshot of product availability through June 7th, 2022, below.

    Average Baby Formula Product Availability by State - June 2022
    Average Baby Formula Product Availability by State – June 2022

    While the U.S. has reached an average of 84% baby formula availability the first week of June 2022, given recent news headlines related to the baby formula shortage, and tracking out of stock encounters by state, we see a continued decline in availability throughout the Midwest versus product availability levels seen in May 2022.

    Wisconsin, Michigan, Illinois, Indiana, Ohio, and Kentucky all show average availability for baby formula to be less than 50%, with Wisconsin being impacted the most at less than 18% average availability. While Texas shows an average availability improvement of 3.5% from the first two weeks of May 2022 to the first week of June 2022 as noted in the below chart, availability is also very low overall at less than 60%.

    Average Change in Baby Formula Product Availability by State: May-June 2022
    Average Change in Baby Formula Product Availability by State – May 2022 to June 2022

    Outside of the Midwest and Texas, the other states for consumers to be cautious in are California, Virginia, and South Carolina as their month-over-month average change in availability also declined 4%, 12.6% and 8.2% respectively. Below is a snapshot of where the baby formula availability average started as of May 1st through the 15th, 2022.

    Average Baby Formula Product Availability by State - May 2022
    Average Baby Formula Product Availability by State – May 2022

    Baby Formula Product Availability Changes – March 2021 through May 2022

    At an aggregated level overall, the availability for baby formula was relatively stable across all retailers considered within our analysis from March 2021 through September 2021, but has been on a steady decline ever since, starting at 81.7% availability in September and ending at 53.8% availability in May 2022 as noted in the below chart.

    Monthly Average Availability for Baby Formula Across Major Retailer Websites
    Monthly Average Availability for Baby Formula Across Major Retailer Websites

    Looking at baby formula availability at a retail level, we saw yet again not all availability challenges were alike, by month or retailer. Costco.com lead the other retailers within our analysis for greatest average availability from March 2021 through May 2022, but had one of the lowest availability percentages at 62.7% in May 2021, and dropped to the lowest availability of the group in May 2022 at 37.5%.

    Average Availability for Baby Formula Across Major Retailer Websites
    Average Availability for Baby Formula Across Major Retailer Websites

    Baby Formula Prices Increase as Availability Changes

    While unnecessary price gouging is prohibited, price increases are still happening at a slow and steady rate across all the accounts included within our Pricing Intelligence analysis given external market factors outside of baby formula recall related stockout scenarios.

    Kroger.com experienced the greatest average price increases overall, with the peak being in May 2022 at a 19% increase, 8% higher than other retailers on average, versus prices seen in March 2021 for the same baby formula products. The most significant price hike occurred on Kroger.com from December 2021 to January 2022. Other retailers like H-E-B, Target and Wegman’s have had minimal price changes from March 2021 through May 2022. 

    Average Price Inflation for Baby Formula, Indexed to March 2021
    Average Price Inflation for Baby Formula, Indexed to March 2021

    Address the Baby Formula Shortage With eCommerce Intelligence

    As the market continues to evolve and baby formula supply works its way to catching back up to demand, our team will continue providing critical pricing, merchandising, and competitive insights at scale, to enable retailers and brands to develop data-driven growth strategies that directly influence their eCommerce performance, accelerate revenue growth and drive profitability.

    Be sure to reach out to our Retail Analytics experts for access to more details regarding the above analysis, or for more information on our Commerce Intelligence and Digital Shelf solutions, and let us know what other category insights you’d be interested in seeing this year.

  • Valentine’s Day eCommerce Insights

    Valentine’s Day eCommerce Insights

    Access to these types of real-time digital marketplace insights can enable retailers and brands to make strategic decisions and help drive profitable growth in an intensifying competitive environment. Be sure to reach out to our Retail Analytics experts for access to more details regarding the above analysis.         

  • 2021 Cost-Push Inflationary Trends Ran Rampant, Impacting Holiday Discounts

    2021 Cost-Push Inflationary Trends Ran Rampant, Impacting Holiday Discounts

    Business has been anything but usual this holiday season, especially in the digital retail world. The holiday hustle and bustle historically seen in stores was once again occurring online, but not as anticipated given the current strength of consumer demand and the reemergence of COVID-19 limiting in-store traffic. While ‘Cyber Weekend’, Thanksgiving through Cyber Monday, continues to further its importance to retailers and brands, this year’s performance fell short of expectation due to product shortages and earlier promotions that pulled forward holiday demand.

    Holiday promotions were seen beginning as early as October in order to compete with 2020 Prime Day sales, but discounting, pricing and availability took an opposite direction from usual. This shift influenced our team to get a jump start on our 2021 digital holiday analysis to assess how drastic the changes were versus 2020 activity, and to understand how much of this change has been influenced by inflationary pressures and product scarcity.

    Scarcity Becomes a Reality

    Our initial analysis started by reviewing year-over-year product availability and pricing changes from January through September 2021, leading up to the holiday season, as detailed in our 2021 Cyber Weekend Preliminary Insights blog. We reviewed popular holiday categories like apparel, electronics, and toys, to have a broad sense of notable trends seen consistently throughout various, applicable marketplaces. What we found was a consistent decline in product availability over the last six months compared to last year, alongside an increase in prices.

    Although retailers significantly improved stock availability in November and early December 2021, even digital commerce giants like Amazon and Target were challenged to maintain consistent product availability on their website as seen below. While small in magnitude, there is also a declining trend occurring again closer toward the end of our analysis period, post Cyber Weekend, across all websites included in our analysis.

    Inventory Availability 2021 Holidays
    Source: Commerce Intelligence – Product Availability insights for Home & Garden, Jewelry & Watches, Clothing & Shoes, Bed N Bath, Lighting & Ceiling Fans categories

    Greater Discounts, Higher Prices?

    With inflation at a thirty-nine year high, retailers and manufacturers have realized they can command higher prices without impacting demand as consumers have shown their willingness to pay the price, especially when threatened by product scarcity. Our assessment is that while some products and categories have responded drastically, manufacturers’ suggested retail prices (MSRPs) have increased nearly seven percent on average from January to December 2021. MSRP adjustments are not taken lightly either, as this is an indication increased prices will be part of a longer-term shift in product strategy.

    2021 MoM Retail Inflation Tracker
    Source: Commerce Intelligence – Pricing Insights for Bed & Bath, Electronics, Furniture, Healthy & Beauty, and Fashion categories on Amazon.com & Target.com each month in 2021 comparing price increases from January 2021 base

    Our 2021 pre-Cyber Weekend analysis reviewed MSRP changes for select categories (Bed & Bath, Electronics, Furniture, Healthy & Beauty, and Fashion) on Amazon and Target.com, and found around forty-eight percent of products on Amazon and thirty-five percent of products on Target.com have increased their MSRPs year-over-year, but kept pre-holiday discount percentages the same.

    Looking more specifically as to what year-over-year changes occurred on Black Friday in 2021, we observed MSRPs increasing across the board for all categories at various magnitudes. This indicates why 2021 discounts appeared to be greater than or equivalent to 2020 for many categories, when in reality consumers paid a higher price than they would have in 2020 for the same items.

    2021 Black Friday MSRP Increases
    Source: Commerce Intelligence – MSRP Pricing Insights for Bed & Bath, Electronics, Furniture, Healthy & Beauty, and Fashion categories on Black Friday November 27th, 2021, versus average MSRP pricing for the same SKU count from November 20-26th 2021

    On Amazon.com, categories like health & beauty have already increase MSRPs by a much greater percentage and magnitude versus Target.com leading up to and during Black Friday 2021, while other categories like furniture have increased MSRPs evenly on average across both retail websites. The below chart cites a few specific examples of year-over-year SKU-level MSRP, promotional price, and discount changes within found within the electronics, furniture, fashion, and health & beauty categories.

    Black Friday 2021 vs. 2020 SKU-level Price Changes
    Source: Commerce Intelligence – MSRP Pricing Insights for Bed & Bath, Electronics, Furniture, Healthy & Beauty, and Fashion categories on Black Friday November 27th, 2021, versus average MSRP pricing for the same SKUs on Black Friday November 26th, 2020.

    Fewer, but Deeper Discounts

    From October through early November 2021, fewer products were discounted compared to this same period in 2020, and the few that were saw much deeper discounts apart from the home improvement category. The most extreme example we saw in discounts offered was within furniture where only three percent of SKUs were on discount in 2021 compared to twenty-six percent in 2020. Interestingly, the magnitude of discount was also higher pre-Cyber Weekend 2021 versus 2020, but this trend was not exclusive to furniture and was also seen within electronics, health & beauty, and home improvement.

    Pre-Black Friday 2021 and 2020 SKUs on Discount and Magnitude
    Source: Commerce Intelligence – Pricing Insights for Bed & Bath, Electronics, Furniture, Healthy & Beauty, and Fashion categories on Amazon.com & Target.com Pre-Black Friday average selling price during November 20-26th 2021 versus average selling price from November 13-19th 2021 compared to Pre-Black Friday average selling price during November 19-25th 2020 versus average selling price from November 12-18th, 2020.

    Within the furniture category, the subcategories offering the greatest number of SKUs with price decreases on Black Friday 2021 were rugs by a wide margin, followed by cabinets, bed and bath, and entertainment units, but the magnitude of discounts offered were all under twenty percent.

    2021 Black Friday Furniture Category Price Decreases
    Source: Commerce Intelligence – Pricing Insights for Bed & Bath, Electronics, Furniture, Healthy & Beauty, and Fashion categories on Amazon.com and Target.com on Black Friday November 27th, 2021, versus average pricing for the same SKUs from Pre-Black Friday November 20-26th 2021 and Black Friday November 26th, 2020, versus average pricing for the same SKUs from Pre-Black Friday November 19th-25th 2020

    Accounting for this phenomenon could have been retailers’ attempts to clear inventory for SKUs which hadn’t sold even during the period of severe supply chain shortages. With more products selling at higher prices this year, retailers were also able to use fewer SKUs with greater discounts to attract buyer in hopes of filling their digital baskets with more full-priced goods, helping to protect margins heading in to Cyber Weekend. Scarcity threats also encouraged consumers to buy early, even when not on promotion, to ensure they would have gifts in time for the holidays.

    The same trends seen pre-Cyber Weekend 2021 were also seen on Black Friday with a year-over-year decrease in the percentage of SKUs offered on discount versus 2020, and steeper price reductions for the discounted products which can also be attributed to the increase in MSRPs.

    Black Friday 2021 and 2020 SKUs on Discount and Magnitude
    Source: Commerce Intelligence – Pricing Insights for Bed & Bath, Electronics, Furniture, Healthy & Beauty, and Fashion categories on Amazon.com and Target.com on Black Friday November 27th, 2021, versus average pricing for the same SKUs from Pre-Black Friday November 20-26th 2021 and Black Friday November 26th, 2020, versus average pricing for the same SKUs from Pre-Black Friday November 19th-25th 2020

    2021 Black Friday Price Increases?

    We all know Black Friday is all about price reductions, discounts and deals and so it’s rare to see actual price increases, yet for Black Friday 2021, trends ran counter to this. We observed price increases across all categories for around thirteen to nineteen percent of SKUs, with an average price increase of around fifteen percent in 2021 versus an average of only two percent in 2020.

    SKUs with Price Increases Black Friday 2021 and 2020
    Source: Commerce Intelligence – Pricing Insights for Bed & Bath, Electronics, Furniture, Healthy & Beauty, and Fashion categories on Amazon.com and Target.com on Black Friday November 27th, 2021, versus pricing for the same SKUs from Pre-Black Friday November 20-26th 2021 and Black Friday November 26th, 2020, versus average pricing for the same SKUs from Pre-Black Friday November 19th-25th 2020

    At an account level, we noticed a few interesting differences happening on Black Friday 2021 versus 2020 regarding category price changes. On Target.com, almost ninety percent of the bed and bath SKUs analyzed had a price change on Black Friday in 2021 versus 2020 with eighty-two percent presenting a higher price year-over-year versus only around seven percent showing a decrease, where on Amazon nearly forty-four percent of bed and bath SKUs showed an increase in price and around thirty-eight percent showed a decrease. Except for the health and beauty category on Target.com, more than half of the SKUs in each category saw a price increase on Black Friday versus a price decrease.

    2021 YoY Price Changes on Black Friday
    Source: Commerce Intelligence – Pricing Insights for Bed & Bath, Electronics, Furniture, Healthy & Beauty, and Fashion categories on Amazon.com and Target.com on Black Friday November 27th, 2021, versus average pricing for the same SKUs on Black Friday November 26th, 2020.

    The magnitude of year-over-year price changes seen on Black Friday 2021 was significant across all categories, but the magnitude of price increases found on Amazon.com within the health and beauty category outpaced the rest by far. We reviewed three hundred and sixty-five SKUs on Amazon.com within the health & beauty category and saw almost eighty-three percent of them had a price change with around thirty-one percent decreasing prices and around fifty-two percent increasing prices. This means that within the health & beauty category on Amazon.com, more than fifty percent of the SKUs tracked were sold at a one hundred and seventy-six percent higher price on average during Black Friday 2021 versus 2020.

    Magnitude of Black Friday 2021 Price Increases
    Source: Commerce Intelligence – Pricing Insights for Bed & Bath, Electronics, Furniture, Healthy & Beauty, and Fashion categories on Amazon.com and Target.com on Black Friday November 27th, 2021, versus average pricing for the same SKUs on Black Friday November 26th, 2020.

    The subcategories offering the greatest number of SKUs with price increases on Black Friday 2021 were cameras, followed by men’s fragrances, laptops, and desktops & accessories, but the magnitude of discounts offered were all under ten percent.

    2021 Subcategories with Price Increases during Black Friday
    Source: Commerce Intelligence – Pricing Insights for Bed & Bath, Electronics, Furniture, Healthy & Beauty, and Fashion categories on Amazon.com and Target.com on Black Friday November 27th, 2021, versus pricing for the same SKUs from Pre-Black Friday November 20-26th 2021 and Black Friday November 26th, 2020, versus average pricing for the same SKUs from Pre-Black Friday November 19th-25th 2020

    The Aftermath Post-2021 Cyber Weekend

    Extending this analysis beyond the holiday weekend, we analyzed price change activity from December third through the ninth across the top US retailers (chart below) and found that price decreases have been very minimal, comparatively speaking. Though there was a spike in number of price decreases from December 8th to the 9th, the percentage of SKUs with price decreases was still very low (less than three percent). We anticipate this trend will continue into 2022.

    SKUs with Price Decrease Post Cyber Weekend 2021
    Source: Commerce Intelligence – Pricing insights for Home & Garden, Jewelry & Watches, Clothing & Shoes, Bed N Bath, Lighting & Ceiling Fans categories

    A Sign of Things to Come

    A confluence of inflationary trends, product shortages and consumer liquidity have driven many marketplace changes to occur simultaneously. Government programs in the form of stimulus checks, have put extra money in consumers’ hands, and so they’ve been more willing to spend. That, coupled with the shock in the supply chain, has motivated people to buy far ahead of the 2021 holiday season. Hence, retailers have needed to rely much less on across-the-board discounts. Promotions have been more strategic – we’ve seen deeper discounts over fewer products, likely used to draw consumers in to buy certain items, and once they’re there, customers are buying everything else at a non-discount level. When these factors once again normalize, we could see a return to the “race to the bottom” that has occurred since the financial crisis of 2008-2009, but for once, retailers may be able to maintain some pricing power as the 2021 holiday shopping season played out.

    Even though performance was not as anticipated and holiday sales did not grow as rapidly as they did in 2020, Cyber Monday was still the greatest online shopping day in 2021. Through it all, retailers managed to keep their digital shelves stocked and orders filled in time for the holidays for the most part, running the risk of housing aged inventory if goods didn’t arrive in time. Despite predictions for steep promotions in January 2022, with supply chains still challenged and inflationary pressures still full steam ahead, we don’t anticipate much in the way of enhanced discounts to continue beyond the holidays.

    Access to these types of real-time digital marketplace insights can enable retailers and brands to make strategic decisions like how and when to address inflationary pressures, while also supporting many other day-to-day operations and help drive profitable growth in an intensifying competitive environment. Continue to follow us in the coming weeks for a detailed 2021 year-end review across more retailers and categories. Be sure to reach out to our Retail Analytics experts for access to more details regarding the above analysis.         

  • 6 Promotional Strategies for the Holiday Season

    6 Promotional Strategies for the Holiday Season

    For eCommerce companies, holidays are the busiest season of the year. Whether creating brand awareness with your marketing campaigns or freshening up your landing pages or finding new ways to segment & understand your customers, the list of tasks seems endless. It’s the time of the year when most people look forward to shopping for friends and family. 

    The holiday shopping season begins with Black Friday and Cyber Monday and leads to the December holidays, including Christmas and New Year. Consequently, proper planning and marketing are essential for a successful holiday season. 

    In fact, holiday sales during November and December are forecasted to be between $843.4B – $859B, up 10.5% over 2020, according to the National Retail Federation (NRF). For online stores specifically, sales are predicted to increase between 11% – 15% to a total of between $218.3B and $226.2B driven by online purchases.

    This guide will share eight promotional strategies retailers can use during the holiday season. We will also discuss how data analytics can help retailers improve their promotional strategies. 

    Using data analytics to guide promotional strategies

    Promotional Strategies
    Promotional Strategies

    Data is the foundation of every successful marketing campaign. Data analysis helps companies understand which graphics worked well and campaigns that generated the most revenue. Gathering data and running analysis helps companies improve their next marketing campaign. Retailers can also get deeper insights into campaigns/channels with the highest conversion rate or average order value (AOV).

    With data analytics, retailers can prioritize campaigns and channels that resonate the most with their customers this holiday season. But, it would be best to try more than one promotional strategy to ensure you double down on what works without placing all of your eggs in one Christmas-themed basket. 

    Here are four ways that data analytics can help guide promotional strategies:

    a. Customized alerts for listing pages

    Data analysis helps retailers determine if certain products are out of stock on their rival’s website and adjust their own pricing accordingly. It allows retailers to grab market share for trending items. For example, if you get an out-of-stock alert for a particular product at competitors’ stores, you can invest more in advertising that product on your online store. In addition, customized alerts keep retailers informed about their inventory status, allowing them to plan promotions and ads. They can see which products are becoming commoditized due to intense competition and which ones offer better revenue opportunities. 

    Learn how DataWeave can help retailers track their competitor’s stock and inventory status.

    b. Maximize conversions by tracking product trends

    Assortment Analytics
    Assortment Analytics

    Customers are always looking for products that are currently trending. With assortment analytics, eCommerce companies can get insights into hot trends, allowing them to stock in-demand categories and products. Integrating assortment analytics with AI-powered image analytics can also provide insights into attributes that are popular among customers. By filling gaps in their current assortments, retailers can improve conversion rates and increase revenue. 

    Here’s a case study on how DataWeave helped Douglas, a luxury beauty retailer in Germany boost sales by building an in-demand product assortment 

    c. Monitor competitor promotions

    Promotional Insights
    Promotional Insights

    With increased competition and consumer demand for deals, it has become important for retailers to monitor their competitor’s promotions. Monitoring promotions helps retailers to optimize their ad spend accordingly. AI-powered image analysis tools can capture important information from competitors’ ad banners and deliver insights into metrics that are working to deliver sales. 

    Here’s how DataWeave can help retailers make their marketing magnetic with competitive promotional insights

    d. Optimize margins with a data-driven pricing strategy 

    Pricing Intelligence
    Pricing Intelligence

    It has become challenging to price products in recent years since digital tools enable price transparency across channels. Although this trend is excellent for consumers, it makes competition fierce for retailers. A data-driven pricing strategy incorporates a variety of factors, including industry needs, competitor analysis, consumer demand, production costs, and profit margins. 

    With data-driven competitive pricing, retailers can keep pace with the changing eCommerce environment with real-time pricing updates. It also helps them optimize margins and quickly respond to changes in prices on rival stores. 

    Promotional Strategies for the Holiday Season

    a. Virtual Webrooms

    When customers want to see a product in-person, they go to a store showroom. It helps them make a purchase decision. However, with the Internet, eCommerce companies can bring this tactic online. The only difference between showrooming and webrooming is that the former takes in-person, whereas the latter happens digitally. Webrooming grew in popularity during the COVID-19 pandemic. Instead of spending weekends browsing stores, consumers took to the Internet for most of their product research.

    A webroom allows customers to explore products from every angle, providing them with the complete in-person showroom experience online. Webrooming is a powerful holiday marketing strategy, especially regarding expensive purchases. Customers prefer to understand how the product will look. However, building a webroom is extensive and requires retailers to hire developers and professional photographers.

    Webrooms allow retailers to share their collections, schedule virtual appointments, share 3D product images, set up virtual fitting rooms for clothing products, and accept purchase orders. For example, in 2015, Tommy Hilfiger launched its first digital showroom in Amsterdam to improve sustainability and minimize its carbon footprint. Through remote wholesale selling and digital product creation, a digital showroom helped Tommy Hilfiger transform the buying journey and retail value chain.

    b. Loyalty-rewarding sales and perks

    Loyalty Rewarding
    Customer Loyalty

    Consider building customer loyalty during your holiday promotions. First, encourage your holiday shoppers to become loyal customers by offering bonus rewards, contests, or giveaways when they sign up for your loyalty program. You can encourage them to purchase right away by providing instant discount coupons or points for a reward to redeem on their next purchase. For maximum impact, you should run this promotion throughout the holiday season. 

    Second, you should attract your current loyalty program members with discount codes. Offer free shipping or provide a one-day-only discount code to ensure your customers choose you during their last-minute purchases. With these rewards, you’ll attract customers who are window shopping and simultaneously bring your loyal customers back throughout the holiday season.

    c. Charitable Tie-Ins

    AmazonSmile
    AmazonSmile

    Research shows that customers are four times more likely to purchase from brands with a strong sense of purpose. With the festive season being the time of giving, working with a charity and giving back to your community is a great way to reach out to customers. 

    After a tough one and half years because of the pandemic, people want to give back and help those in need this holiday season. You can partner with a non-profit and run campaigns that allow customers to give back. It’s also great for sharing your brand mission with your customers. For instance, Amazon allows customers to shop from AmazonSmile, which donates 0.5% of their eligible Charity List purchases to a selected charity, at no extra cost to the customers. 

    Consider partnering with an organization within your industry. For example, you can pair up with a non-profit that collects and gives clothes to the needy if you sell clothes. You can involve customers by asking them to exchange old dresses for coupons or cash discounts. 

    d. Omni-channel customer experience

    Omni-channel marketing provides customers with a seamless, consistent, and cohesive experience over multiple marketing channels. Omnichannel marketing aims to provide a meaningful and cohesive experience that inspires your customers to make a purchase. Unlike multichannel marketing, this strategy puts the customer at the center of marketing campaigns and elevates the cross-channel customer experience. 

    Omnichannel shoppers spend 10% more money and purchase 15% more items than the original shoppers. eCommerce companies can use historical data to analyze successful channels and create a more transparent marketing strategy for the holiday season. Omnichannel analytics will provide a holistic picture of customer data that will help retailers to better meet the customer’s requirements and predict inventory. 

    e. Buy now, pay later (BNPL)

    Buy Now Pay Later
    Buy Now Pay Later (BNPL)

    Technically, buy now, pay later isn’t a promotional idea since your customers will still be paying the full price. However, BNPL allows them to delay their payments and not pay in full right away at checkout. Buy now, pay later needs to be on every eCommerce company’s holiday promotions plans. Various retailers, including Walmart, offer affordable monthly payments at the pace of 3 to 24 months with Affirm. Target also has a similar scheme with Sezzle and Affirm. Whereas Sephora and Macy’s offer 4 interest-free payments with Klarna.

    BNPL is especially popular with millennials and Gen Z shoppers and will factor into their 2021 holiday shopping plans. Research showed 62% growth in the use of buy now, pay later service in consumers aged 18 to 24. Giving customers a means to manage their budgets during holidays while still taking home their purchases will attract more customers. While the customer doesn’t pay the full price right away for their purchase, businesses still get the total worth of the item. In the eCommerce industry—nearly 50% of BNPL users say they use it while shopping online, and among them, 45% use the service frequently.

    f. Buy One, Get One

    The last promotional idea is a classic buy one, get one offer. Everyone likes a good BOGO promotional offer. In fact, 66% of shoppers from a survey preferred BOGO over other promotions. It’s a win-win promotional strategy for retailers and customers. With this offer, people shop and stock up on gifts for their friends and family, while retailers make a more significant profit than 50% off sales. People prefer to get 100% off on a product over 50% on two items. 

    BOGO sales are best to move inventory by giving shoppers a deal they can’t pass up. If you have stocked up extra items during Black Friday, you can move those last-minute gifts as end-of-year BOGO sales, making room for new merchandise in January.

    Conclusion

    In this post, you saw that there’s more to holiday marketing than a few social media posts. eCommerce companies can use these holiday promotional ideas to offer Loyalty-rewarding sales and perks, buy now pay later service, and an omnichannel customer experience. Regardless of which strategies you’re using, remember that historical data analytics and early planning will play a significant role in increasing your sales and revenue. 

    Proper planning backed by insights into key metrics will help your team develop a one-of-a-kind holiday marketing strategy to drive your holiday sales upward. From sharing gratitude to offering personalized experiences, retailers have various options for promoting business this holiday season.

    Learn how DataWeave can help make sense of your and your competitor’s pricing, promotional, and assortment data this holiday season. Sign up for a demo with our team to know more.

  • How Brands Boost Sales & Satisfaction on Walmart.com

    How Brands Boost Sales & Satisfaction on Walmart.com

    The explosive growth of online shopping has forced brands to re-examine their e-commerce processes to stay competitive and profitable. In particular, out-of-stocks are a common, costly retail challenge, as product shortages frustrate online shoppers – and even prompt them to leave brands.

    According to McKinsey & Company, forty-eight percent of consumers switched to a different brand in 2020 because those products were in stock. Among these consumers, seventy-three percent plan to keep using the new brands, linking product availability gaps to the erosion of sales and loyalty. Conversely, brands with effective inventory planning and replenishment can keep items in stock, drive sales and improve the customer experience.

    Retailers like Walmart, collaborating with these brands to meet customer demand, are still facing inventory challenges but, as noted in 2021 Q3 earnings, inventory was up almost twelve percent year-over-year as they worked to stay ahead of increased holiday demand. They have also adjusted in-store operations to accommodate ever-growing e-commerce demands, especially within grocery-centric categories, as digital grocery buyers now amount to more than half the U.S. population.

    Maximizing Conversions with Category Insights

    Walmart’s dot-com strategy is paying off in spades, considering they surpassed Amazon as the leading U.S. grocery e-commerce retailer in 2020 and grew another forty-one percent in Q3, 2021. Our team has been actively tracking digital shelf analytic KPIs on Walmart.com to identify inventory and promotional performance improvement opportunities at a category level to support brands in capitalizing on these digital growth opportunities.

    The latest analysis is summarized below, reviewing average category availability and discount trends occurring each week of the month, from May to August 2021, at a category level. A recent report found the 29th of each month to be the busiest day for online sales because consumers often get paid at the end of the month, which made DataWeave analysts wonder:

    • Which categories are maximizing their growth potential on Walmart.com and where are the greatest opportunities for improvement during periods of increased demand?
    • How do increased demand periods (like payday) impact category online availability?
    • Are category promotions offered at the right times throughout the month to best support demand?

    When Seasonal Demand for Groceries and Payday Merge

    Across all Walmart.com food categories tracked, Week 5 – where payday commonly falls for most consumers, had the lowest average product availability, while Week 4 had the highest average product availability for all categories except Deli and Fruits and Vegetables. These findings may inspire Walmart’s brand partners to rethink their inventory and assortment planning, replenishment and even pricing efforts to maintain a healthy stock closer toward the end of the month to match higher demand.

    The categories with the greatest difference in average availability during Week 5 versus the rest of the month were Snacks & Candy, Beverages and Alcohol, indicating consumers consistently made these types of purchases closest to payday, when income was highest throughout the month. Seasonality is a secondary factor that influenced demand for these items given events like Memorial Day, Fourth of July, Summer Break, and Back-to-School shopping all took place during our analysis. Additionally, most holidays overlapped payday, which also furthered Week 5 demand.

    Source: DataWeave Digital Shelf Analytics for Brands – Category average availability percentages from May to August 2021 between Week 1 (the 1st to the 7th day of the month) and Week 5 (the 29th, 30th and 31st day of the month).

    Coupling availability with discounts allows us to consider whether consumers buy more in Week 5 due to high discounts or increased purchasing power, or both. In reviewing the average category discounts offered within the same grocery-centric categories analyzed above, we found almost every grocery category showed a higher discount in Week 5 compared to the rest of the month, except for Bread & Bakery and Alcohol.

    Source: DataWeave Digital Shelf Analytics for Brands – Category average discount percentages from May to August 2021 between Week 1 (the 1st to the 7th day of the month) and Week 5 (the 29th, 30th and 31st day of the month).

    Regarding Alcohol, during Week 4, when average availability was the highest, the average discounts offered were the lowest. This can indicate inventory was primed for payday shoppers (and the holidays of course). Bread & Bakery offers the greatest average discounts when inventory levels are lowest on average, indicating Week 3 is a great time to stock up, while Week 4 might be a great time to buy the freshest inventory.

    The greatest average discounts in Week 5 were in Snacks & Candy, Pantry and Fruits & Vegetables. Deeper discounts for Snacks & Candy in Week 5 may have helped brands compete for consumers’ disposable income despite being a discretionary category. Pantry brands’ discounts may have reflected a need to compete for shoppers’ attention. During this period, consumers were out of the house more and less likely to use these grocery staples compared to earlier lockdown periods and cooler months.

    Making Specialty Categories and Health a Priority for Online Shoppers

    Interestingly, the only two categories where inventory was higher in Week 5 versus all other weeks each month were ‘Special Diets’ foods and ‘Summer Flavors’, although ‘Special Diets’ foods consistently maintained the lowest level of average availability each week across all food categories analyzed. This consistent lack of inventory could indicate a great opportunity for brands to increase inventory for dietary products sold on Walmart.com.

    Source: DataWeave Digital Shelf Analytics for Brands – Category average availability percentages from May to August 2021 between Week 1 (the 1st to the 7th day of the month) and Week 5 (the 29th, 30th and 31st day of the month).

    The average availability for ‘Summer Flavors’ foods verifies brands are maintaining a solid replenishment strategy for these seasonal items, and a high likelihood consumers will happily find what they need to plan their Summer gatherings on Walmart.com. One alarming factor we found was the change in average discounts offered during Week 5 versus Weeks 1 through 4, indicating promotions surrounding payday may be driving sales volume versus organic demand.

    Source: DataWeave Digital Shelf Analytics for Brands – Category average discount percentages from May to August 2021 between Week 1 (the 1st to the 7th day of the month) and Week 5 (the 29th, 30th and 31st day of the month).

    Digital Growth Opportunity in Meal Kits and Kids’ Meals

    Two categories primed for growth, according to Statista, are meal kits and kids’ food and beverages. Their research indicates retail sales for kids’ food has grown steadily year-over-year since 2013, and a recent report also indicates meal kit sales are expected to more than double 2017 sales in 2022, reaching $11.6 billion in the U.S., spurred by pandemic-induced demand. A concerning find in our research indicates both categories, ‘Easy Meal Solutions’ and ‘Kid Friendly Foods’ on Walmart.com, showed great volatility when it comes to in-stock availability. For example, in Week 1, ‘Easy Meal Solutions’ had an average availability nearly half the average of the rest of the month (around nineteen percent versus nearly thirty-eight percent), and in Week 5, payday week, ‘Kid Friendly Foods’ saw the biggest drop in average availability compared to Weeks 1 through 4 (over sixty-seven percent versus seventy-five percent) indicating supply may not be keeping up with the heightened demand.

    Source: DataWeave Digital Shelf Analytics for Brands – Category average availability percentages from May to August 2021 between Week 1 (the 1st to the 7th day of the month) and Week 5 (the 29th, 30th and 31st day of the month).

    The heightened average discounts offered during Week 5 for ‘Baby’ and ‘Pets’ items indicate two categories consumers will most likely stock up on during payday.

    Source: DataWeave Digital Shelf Analytics for Brands – Category average discount percentages from May to August 2021 between Week 1 (the 1st to the 7th day of the month) and Week 5 (the 29th, 30th and 31st day of the month).

    Back to School Stock-Outs

    U.S. retail sales unexpectedly increased in August, likely boosted by back-to-school shopping and child tax credit payments. Meanwhile, product shortages and other supply chain issues slowed 2021’s back-to-school sales, possibly affecting school supplies’ and clothing availability on Walmart.com. According to our analysis, the average product availability in Walmart.com’s school supplies category fell from over sixty-two percent during Weeks 1 through 4 to nearly forty-two percent in Week 5.

    Warmer weather, seasonal events, reduced lockdowns, and vaccination efforts led more Americans to resume in-person socializing, giving reason to update their spring and summer wardrobes. In July, Forbes shared that three-quarters of shoppers are purchasing apparel, accessories and shoes the most. On average, only around sixty-three percent of clothing items were available on Walmart.com during Weeks 1 through 4. However, in Week 5, that figure plummeted to just over thirty-eight percent, the most significant drop among all categories.

    Source: DataWeave Digital Shelf Analytics for Brands – Category average availability percentages from May to August 2021 between Week 1 (the 1st to the 7th day of the month) and Week 5 (the 29th, 30th and 31st day of the month).

    Demand for new fashion remained high throughout this period, seemingly fueled organically, as only moderate additional discounts took place in Week 5, and although the average discount on school supplies was only around twenty-seven percent during Weeks 1 through 4, it surged to just over forty-seven percent in Week 5. Generous additional discounts in Week 5 may have inspired online shoppers to shift spending from clothing to school supplies in late July and August ahead of students’ return to the classroom.

    Source: DataWeave Digital Shelf Analytics for Brands – Category average discount percentages from May to August 2021 between Week 1 (the 1st to the 7th day of the month) and Week 5 (the 29th, 30th and 31st day of the month).

    Prioritizing Product Availability with Digital Advertising Strategies

    Seventy-eight percent of B2C marketers increased their 2021 digital advertising spend to fuel online product discoverability (Share of Search), and sales and market share, but out-of-stock experiences simultaneously surged 172% this year from pre-pandemic levels. Paying for ads that drive traffic to your out-of-stock products can be as detrimental to your brand as a bad user experience. Our review of the ‘Featured Products’ sold on Walmart.com show consistent, low-levels of product availability each week throughout the months reviewed.

    Source: DataWeave Digital Shelf Analytics for Brands – Category average availability percentages from May to August 2021 between Week 1 (the 1st to the 7th day of the month) and Week 5 (the 29th, 30th and 31st day of the month).

    Additionally, the average discount offered on these products tended to be higher than most other categories reviewed, indicating brands participating in the featured product section of the website were not only investing in digital ads, but also doubling down with promotional activity as well.

    Source: DataWeave Digital Shelf Analytics for Brands – Category average discount percentages from May to August 2021 between Week 1 (the 1st to the 7th day of the month) and Week 5 (the 29th, 30th and 31st day of the month).

    How Brands can Replenish Their Digital Shelf

    It is well known just how important it is to have products available during the right time of day, week, month, or season to improve customer satisfaction rates, but with your e-commerce store open 24/7 and omnichannel fulfillment strategies in place, it drastically changes the way in which strategic execution is prioritized for a retailer to reduce basket abandonment and for brands to build loyalty.

    Our greatest takeaway from this analysis is realizing how crucial it is for brands to proactively track product availability and competitive pricing insights to stay ahead of the curve and achieve their digital growth goals. Early visibility to stock replenishment could help brands align with heightened cyclical and seasonal demand to avoid out-of-stocks and grow e-commerce sales.

    This is why more leading brands now rely on our Digital Shelf Analytics solutions, including Pricing and Availability insights, to keep eCommerce planning agile, to maximize online conversions, and ultimately maintain shopper satisfaction and loyalty.

  • How Brands Can Outperform Rivals With Next-Gen Digital Shelf Analytics

    How Brands Can Outperform Rivals With Next-Gen Digital Shelf Analytics

    As eCommerce grows in complexity, brands need new ways to grow sales and market share. Right now, brands face urgent market pressures like out-of-stocks, an influx of new competition and rising inflation, all of which erode profitability. As online marketplaces mature, more brands need to make daily changes to their digital marketing strategies in response to these market pressures, shifts in demand, and competitive trends.

    eMarketer forecasts 2021 U.S. eCommerce will rise nearly 18% year-over-year (vs. 6.3% for brick-and-mortar), led by apparel and accessories, furniture, food and beverage, and health and personal care. The eCommerce industry is also undergoing fundamental changes with newer entities emerging and traditional business models evolving to adapt to the changed environment. For example, sales for delivery intermediaries such as Doordash, Instacart, Shipt, and Uber have gone from $8.8 billion in 2019 to an estimated $35.3 billion by the end of 2021. Similarly, many brands have established or are building out a Direct to Consumer (D2C) model so they can fully own and control their customer’s experiences.

    In response, DataWeave has launched the next generation of our Digital Shelf Analytics suite to help brands across retail categories directly address today’s costly market risks to drive eCommerce growth and gain a competitive advantage.

    Our new enhancements help brands improve online search rank visibility and quantify the impact of digital investments – especially in time for the busy holiday season.”  
    ~ Karthik Bettadapura, CEO and co-founder, DataWeave

    The latest product enhancements provide brands access to tailored dashboard views that track KPI achievements and trigger actionable alerts to improve online search rank visibility, protect product availability and optimize share of search 24/7. Dataweave’s Digital Shelf Analytics platform works seamlessly across all forms of eCommerce platforms and models – marketplaces, D2C websites and delivery intermediaries.

    Dashboard for Multiple Functions

    While all brands share a common objective of increasing sales and market share, their internal teams are often challenged to communicate and collaborate, given differing needs for competitive and performance data across varying job functions. As a result, teams face pressure to quickly grasp market trends and identify what’s holding their brands back.

    In response, DataWeave now offers executive-level and customized scorecard views, tailored to each user’s job function, with the ability to measure and assess marketplace changes across a growing list of online retail channels for metrics that matter most to each user. This enhancement enables data democratization and internal alignment to support goal achievement, such as boosting share of category and content effectiveness. The KPIs show aggregated trends, plus granular reasons that help to explain why and where brands can improve.

    Brands gain versatile insights serving users from executives to analysts and brand and customer managers.

    Prioritized, Actionable Insights

    As brands digitize more of their eCommerce and digital marketing processes, they accumulate an abundance of data to analyze to uncover actionable insights. This deluge of data makes it a challenge for brands to know exactly where to begin, create a strategy and determine the right KPIs to set to measure goal accomplishment.

    DataWeave’s Digital Shelf Analytics tool enables brands to effectively build a competitive online growth strategy. To boost online discoverability (Share of Search), brands can define their own product taxonomies across billions of data points aggregated across thousands of retailer websites. They can also create customized KPIs that track progress toward goal accomplishment, with the added capability of seeing recommended courses of action to take via email alerts when brands need to adjust their eCommerce plans for agility.

    “Brands need an integrated view of how to improve their discoverability
    and share of search by considering all touchpoints in the digital commerce ecosystem.”

    ~ Karthik Bettadapura, CEO and co-founder, DataWeave

    Of vital importance, amid today’s global supply chain challenges, brands gain detailed analysis on product inventory and availability, as well as specific insights and alerts that prompt them to solve out-of-stocks faster, which Deloitte reports is a growing concern of consumers (75% are worried about out-of-stocks) this holiday season.

    User and system generated alerts provide clarity to actionable steps to improving eCommerce effectiveness.
    You also have visibility to store-level product availability, and are alerted to recurring out-of-stock experiences.

    Scalable Insights – From Bird’s Eye to Granular Views

    DataWeave’s Digital Shelf Analytics allows brands to achieve data accuracy at scale, including reliable insights from a top-down and bottom-up perspective. For example, you can see a granular view of one SKUs product content alongside availability, or you can monitor a group of SKUs, say your best selling ones, at a higher level view with the ability to drill down into more detail.

    Brands can access flexible insights, ranging from strategic overviews to finer details explaining performance results.

    Many brands struggle with an inability to scale from a hyper-local eCommerce strategy to a global strategy. Most tools available on the market solve for one or the other, addressing opportunities at either a store-level basis or top-down basis – but not both.

    According to research by Boston Consulting Group and Google, advanced analytics and AI can drive more than 10% of sales growth for consumer packaged goods (CPG) companies, of which 5% comes directly from marketing. With DataWeave’s advanced analytics, AI and scalable insights, brands can set and follow global strategies while executing changes at a hyper-local level, using root-cause analysis to drill deeper into problems to find out why they are occurring.

    As more brands embrace eCommerce and many retailers localize their online assortment strategies, the need for analytical flexibility and granular visibility to insights becomes increasingly important. Google reports that search terms “near me” and “where to buy” have increased by more than 200% among mobile users in the last few years, as consumers seek to buy online locally.

    e-Retailers are now fine-tuning merchandising and promotional strategies at a hyper-local level based on differences seen in consumer’s localized search preferences, and DataWeave’s Digital Shelf Analytics solution provides brands visibility to retailer execution changes in near real-time.

    Competitive Benchmarking

    Brand leaders cannot make sound decisions without considering external factors in the competitive landscape, including rival brands’ pricing, promotion, content, availability, ratings and reviews, and retailer assortment. Dataweave’s Digital Shelf Analytics solution allows you to monitor share of search, search rankings and compare content (assessing attributes like number of images, presence of video, image resolution, etc.) across all competitors, which helps brands make more informed marketing decisions.

    Brands are also provided visibility into competitive insights at a granular level, allowing them to make actionable changes to their strategies to stay ahead of competitors’ moves. A new module called ‘Sales and Share’ now enables brands to benchmark sales performance alongside rivals’ and measure market share changes over time to evaluate and improve competitive positioning.

    Monitor competitive activity, spot emerging threats and immediately see how your performance compares to all rivals’, targeting ways to outmaneuver the competition.

    Sales & Market Share Estimates Correlated with Digital Shelf KPIs

    In a brick-and-mortar world, brands often use point of sale (POS) based measurement solutions from third party providers, such as Nielsen, to estimate market share. In the digital world, it is extremely difficult to get such estimates given the number of ways online orders are fulfilled by retailers and obtained by consumers. Dataweave’s Digital Shelf Analytics solution now provides sales and market share estimates via customer defined taxonomy, for large retailers like Amazon. Competitive sales and market share estimates can also be obtained at a SKU level so brands can easily benchmark their performance results.

    Additionally, sales and market share data can also be correlated with digital shelf KPIs. This gives an easy way for brands to check the effect of changes made to attributes, such as content and/or product availability, and how the changes impact sales and market share. Similarly, brands can see how modified search efforts, both organic and sponsored, correspond to changes in sales and market share estimates.

    Take Your Digital Shelf Growth to the Next Level

    The importance of accessing flexible, actionable insights and responding in real-time is growing exponentially as online is poised to account for an increasing proportion of brands’ total sales. With 24/7 digital shelf accessibility among consumers comes 24/7 visibility and the responsibility for brands to address sales and digital marketing opportunities in real-time to attract and serve online shoppers around the clock.

    Brands are turning to data analytics to address these new business opportunities, enhance customer satisfaction and loyalty, drive growth and gain a competitive advantage. Companies that adopt data-driven marketing strategies are six times more likely to be profitable year-over-year, and DataWeave is here to help your organization adopt these practices. To capitalize on the global online shopping boom, brands must invest in a digital shelf analytics solution now to effectively build their growth strategies and track measurable KPIs.

    DataWeave’s next-gen Digital Shelf Analytics enhancements now further a brand’s ability to monitor, analyze, and determine systems that enable faster and smarter decision-making and sales performance optimization. The results delight consumers by helping them find products they’re searching for, which boosts brand trust.

    Connect with us to learn how we can scale with your brand’s analytical needs. No project or region is too big or small, and we can start where you want and scale up to help you stay agile and competitive.