Tag: inflation grocery

  • Cracking the Code: How Retailers Can Adapt to Plummeting Egg Prices in 2024

    Cracking the Code: How Retailers Can Adapt to Plummeting Egg Prices in 2024

    Virtually every cuisine in the world uses eggs. They’re in your breakfast, lunch, dinner, and dessert — which is perhaps why the global egg market is expected to generate $130.70 billion in revenue in 2024 and is projected to grow to approximately $193.56 billion by 2029.

    More specifically, the United States is the fourth-largest egg producer worldwide. The country’s egg market is projected to generate $15.75 billion in 2024 and increase to $22.51 billion by 2029.

    This growth is driven by several factors, most notably:

    • Health-consciousness among consumers: Consumers value eggs for their essential nutrients and rich protein content.
    • Demand for convenience foods: Consumers’ preferences are shifting toward quick and easy foods, which drives demand for shell eggs and pre-packaged boiled or scrambled eggs.
    • Population Growth: A growing worldwide population increases the demand for eggs.
    • Affordability and accessibility: Eggs are an affordable and accessible nutrient-dense food source for many.

    Despite these factors contributing to the U.S. egg market’s growth, recent times have seen egg prices fall dramatically.

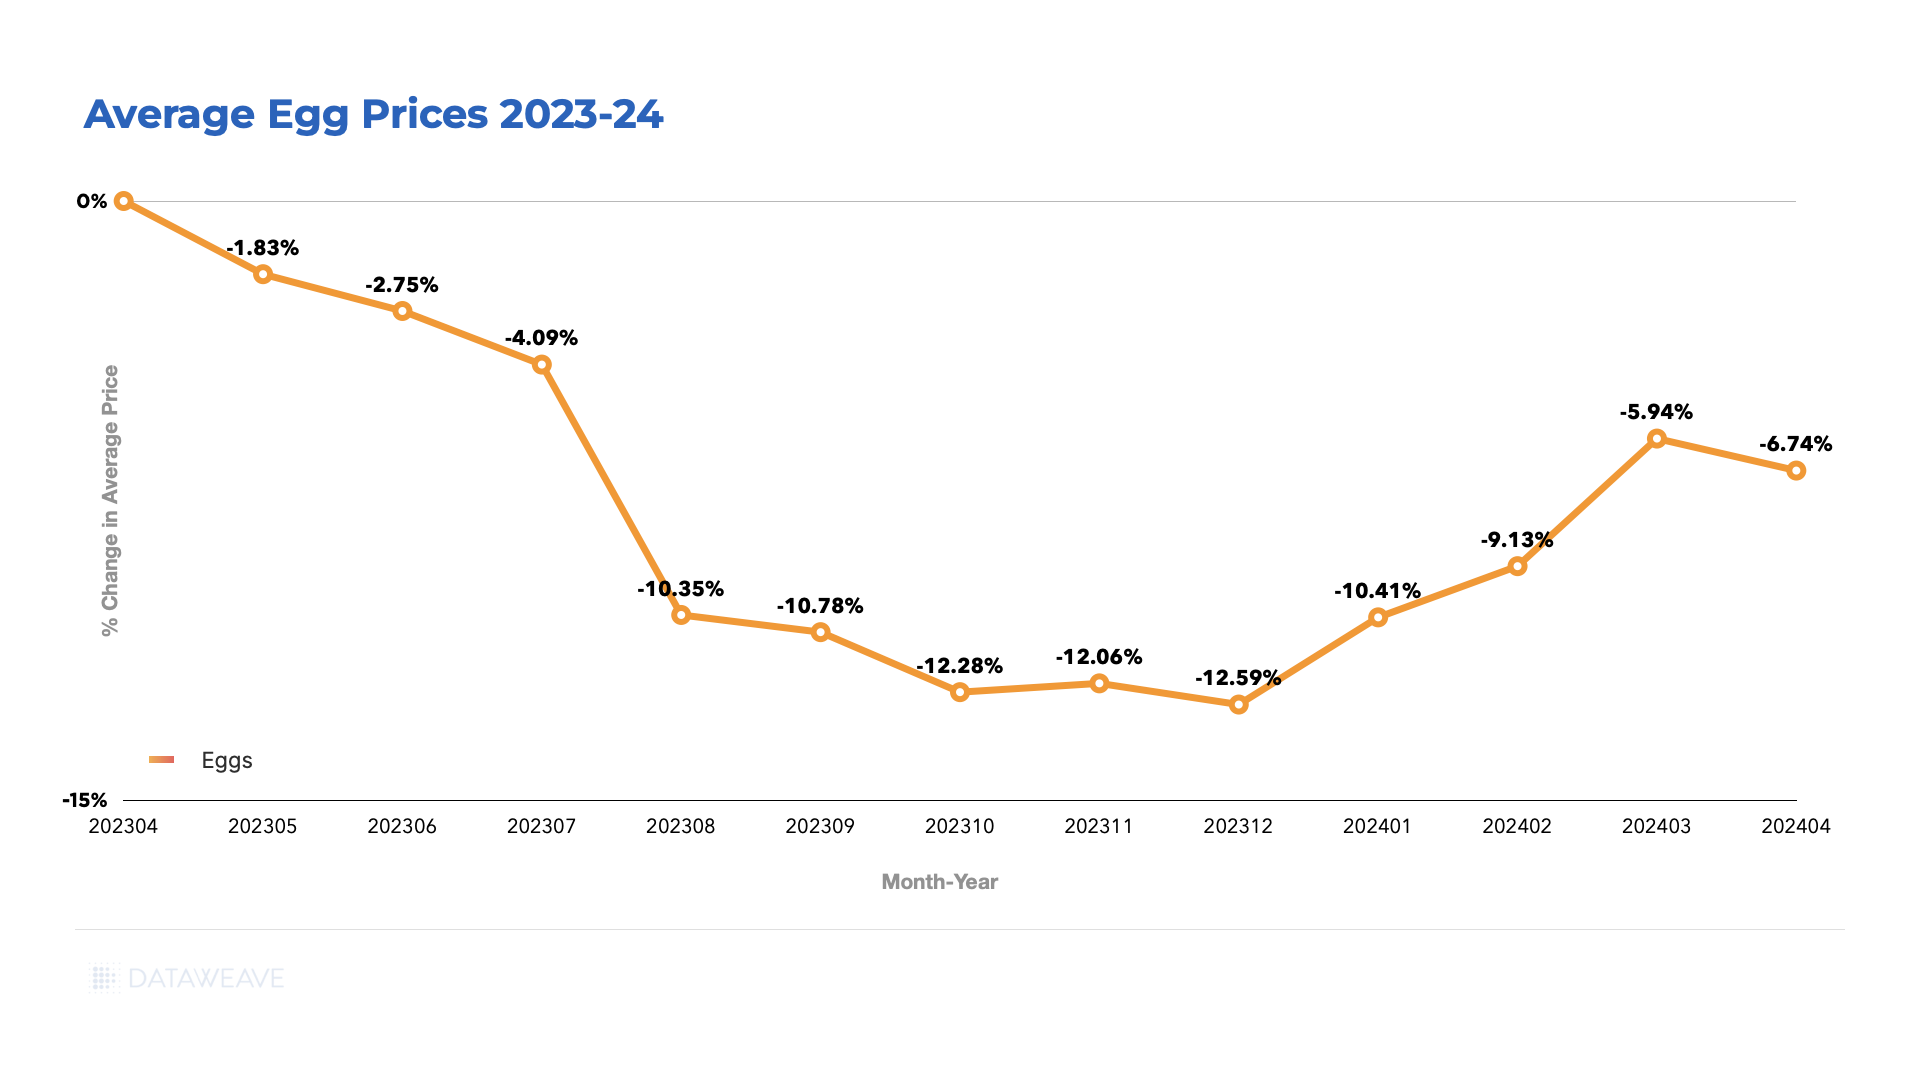
    Based on a sample of 450 SKUs, DataWeave discovered that egg prices in the U.S. fell by 6.7% between April 2023 and April 2024, dipping to its lowest (-12.6%) in December 2023.

    Egg Price Chart: Egg Prices USA Going Down 98.95% between April 2023 and April 2024

    So, what’s causing the decrease in egg prices?

    The Rise and Fall of Egg Prices: A Recent History

    In 2022, avian influenza severely impacted the United States. The disease affected wild birds in nearly every state and devastated commercial flocks in approximately half of the country.

    The 2022 incident was the first major outbreak since 2015 and led to the culling of more than 52.6 million birds, mainly poultry, to prevent the disease from spreading uncontrollably.

    With almost 12 million fewer egg-laying hens, the United States produced around 109.5 billion eggs in 2022 — a drop of nearly two billion from the previous year.

    Consequently, the cost of eggs soared, peaking at $4.82 a dozen — more than double the price of eggs in the previous year.

    The avian flu continues to affect egg-laying hens and other poultry birds across the United States. As of April 2024, farms have killed a total of 85 million poultry birds in an attempt to contain the disease.

    Despite the disease’s effects, production facilities have made significant efforts to repopulate flocks, leading to a steady increase in supply – and a much anticipated decrease in egg prices.

    According to the U.S. Bureau of Labor Statistics, there was an increase in producer egg prices in 2022, reaching a peak in November 2022, at which point they began to fall.

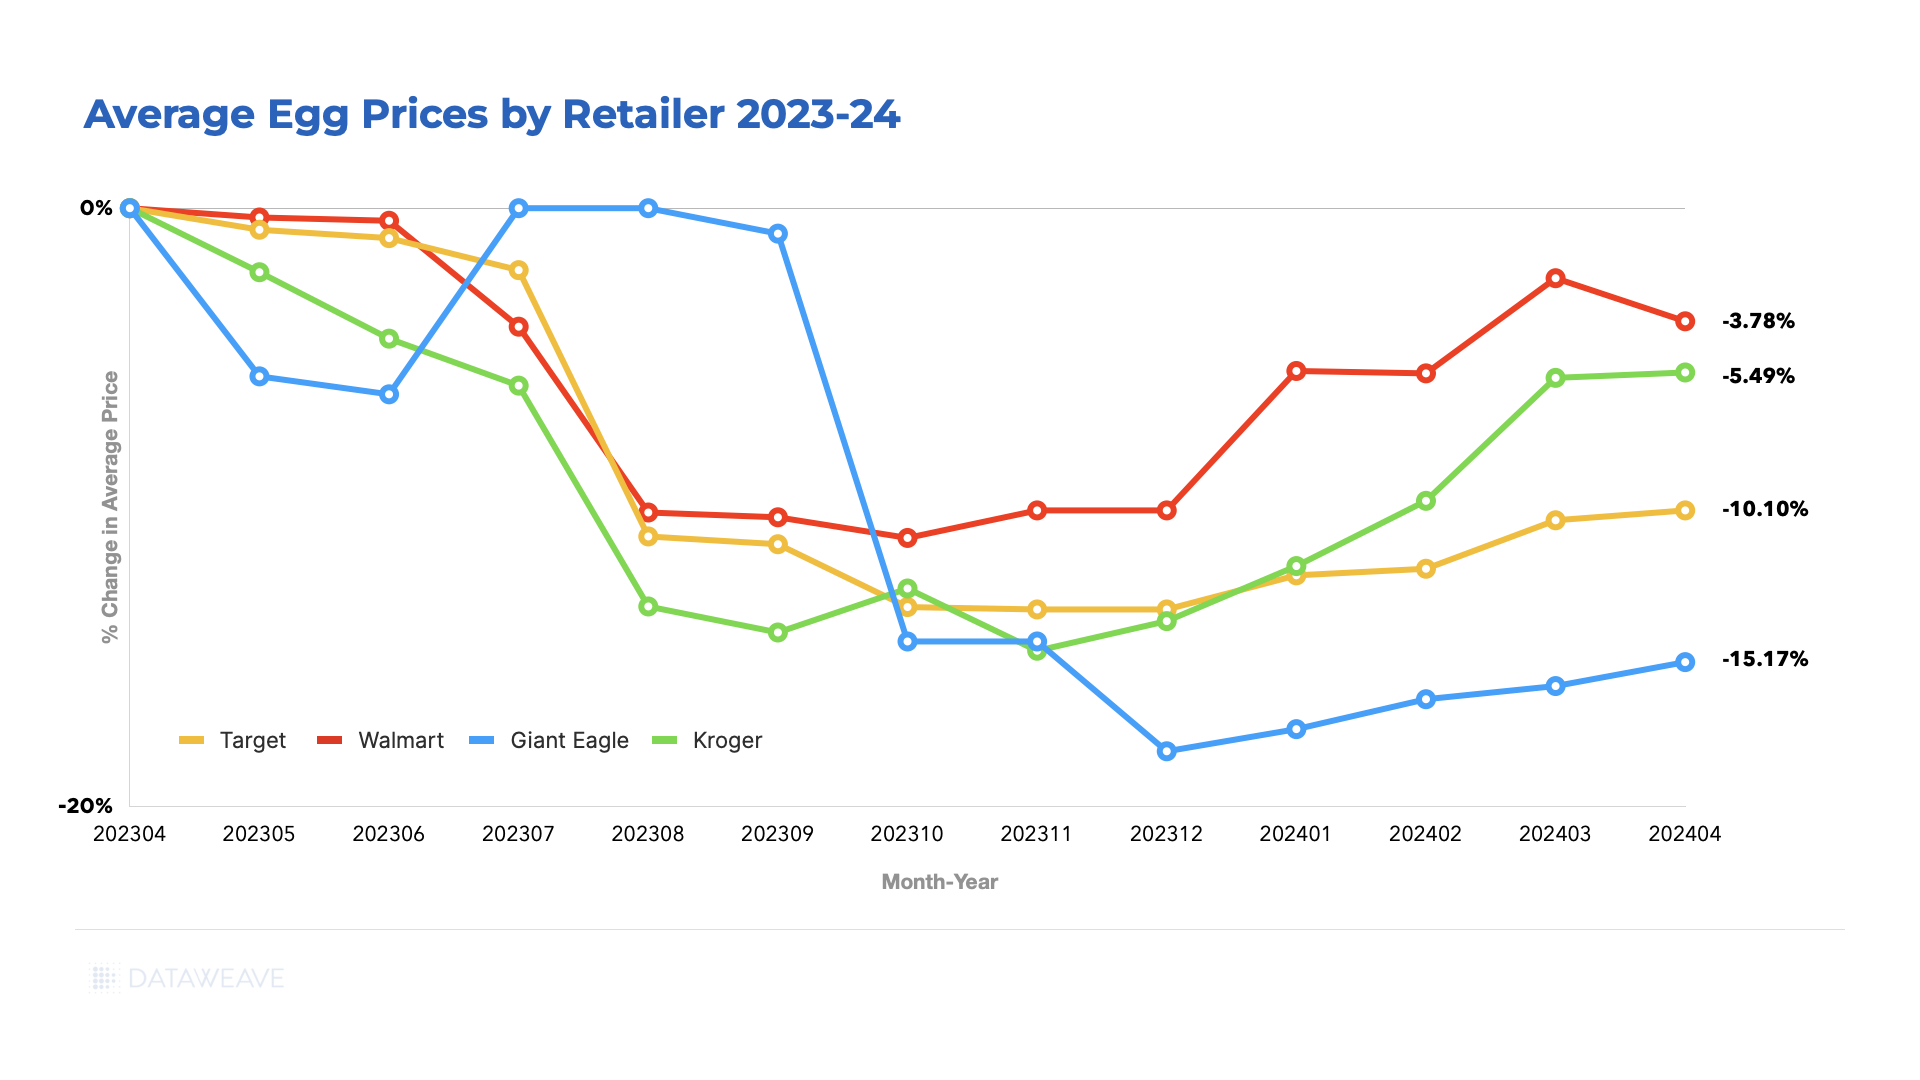
    Retailer’s egg prices followed suit. The egg price chart below depicts retailers’ declining egg prices over one year, from April 2023 to April 2024, with Giant Eagle showing the most significant price reductions and Walmart the least.

    Egg Price Chart Featuring Leading Retailers 2023-2024

    What Does the Future Hold for Egg Prices?

    The USDA reported recent severe avian flu outbreaks in June 2024. These outbreaks are estimated to have affected 6.23 million birds.

    With a reduction in egg-laying hens, egg prices are likely to increase — time will tell.

    Nonetheless, the annual per capita consumption of eggs in the U.S. is projected to reach 284.4 per person in 2024 from 281.3 per person in 2023. So for now, producers and retailers can rest assured of the growing demand for eggs.

    How Can Retailers Adapt to the Unpredictability of Egg Prices?

    Egg prices were down to $2.69 for a dozen in May 2024. However, they are still significantly higher than consumers were used to just a few years ago—eggs were, on average, $1.46 a dozen in early 2020.

    Additionally, while the avian flu puts pressure on producers, inflation and supply chain disruptions exert pressure on retailers.

    With such challenging egg market conditions, what can retailers do to maintain customer loyalty amid reduced consumer spending while maintaining profitability?

    1. Give the Customer What They Want: Increase Offerings of Organic, Cage-Free, and Free-Range Eggs

    As mentioned, Data Bridge Market Research’s trends and forecast report highlighted a significant increase in consumer health consciousness. Additionally, animal welfare increasingly influences consumers’ purchasing decisions when buying meat and dairy products.

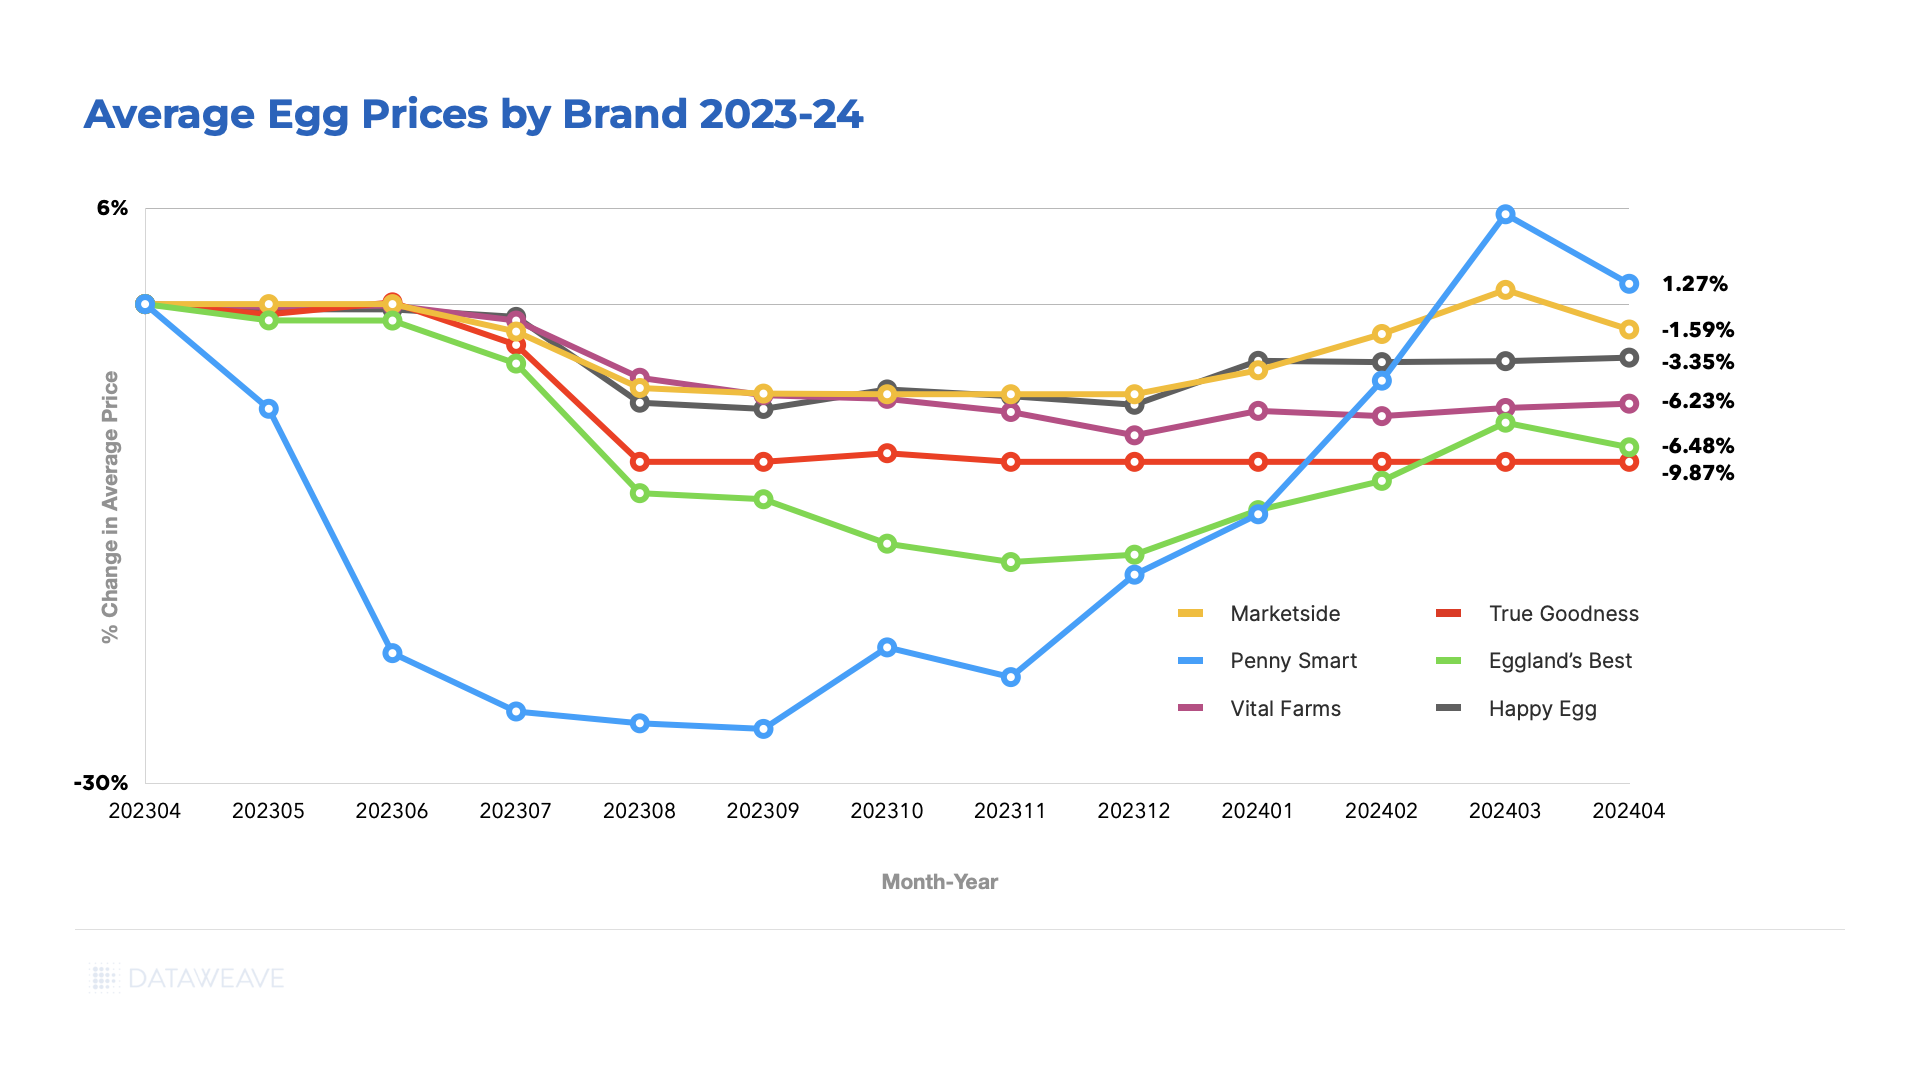
    DataWeave data shows that the prices of organic, cage-free, and free-range eggs—such as those by brands like Happy Eggs and Marketside—have fallen less than those of non-organic, caged egg brands.

    Egg Price Chart Featuring Leading Egg Brand Prices 2023-2024

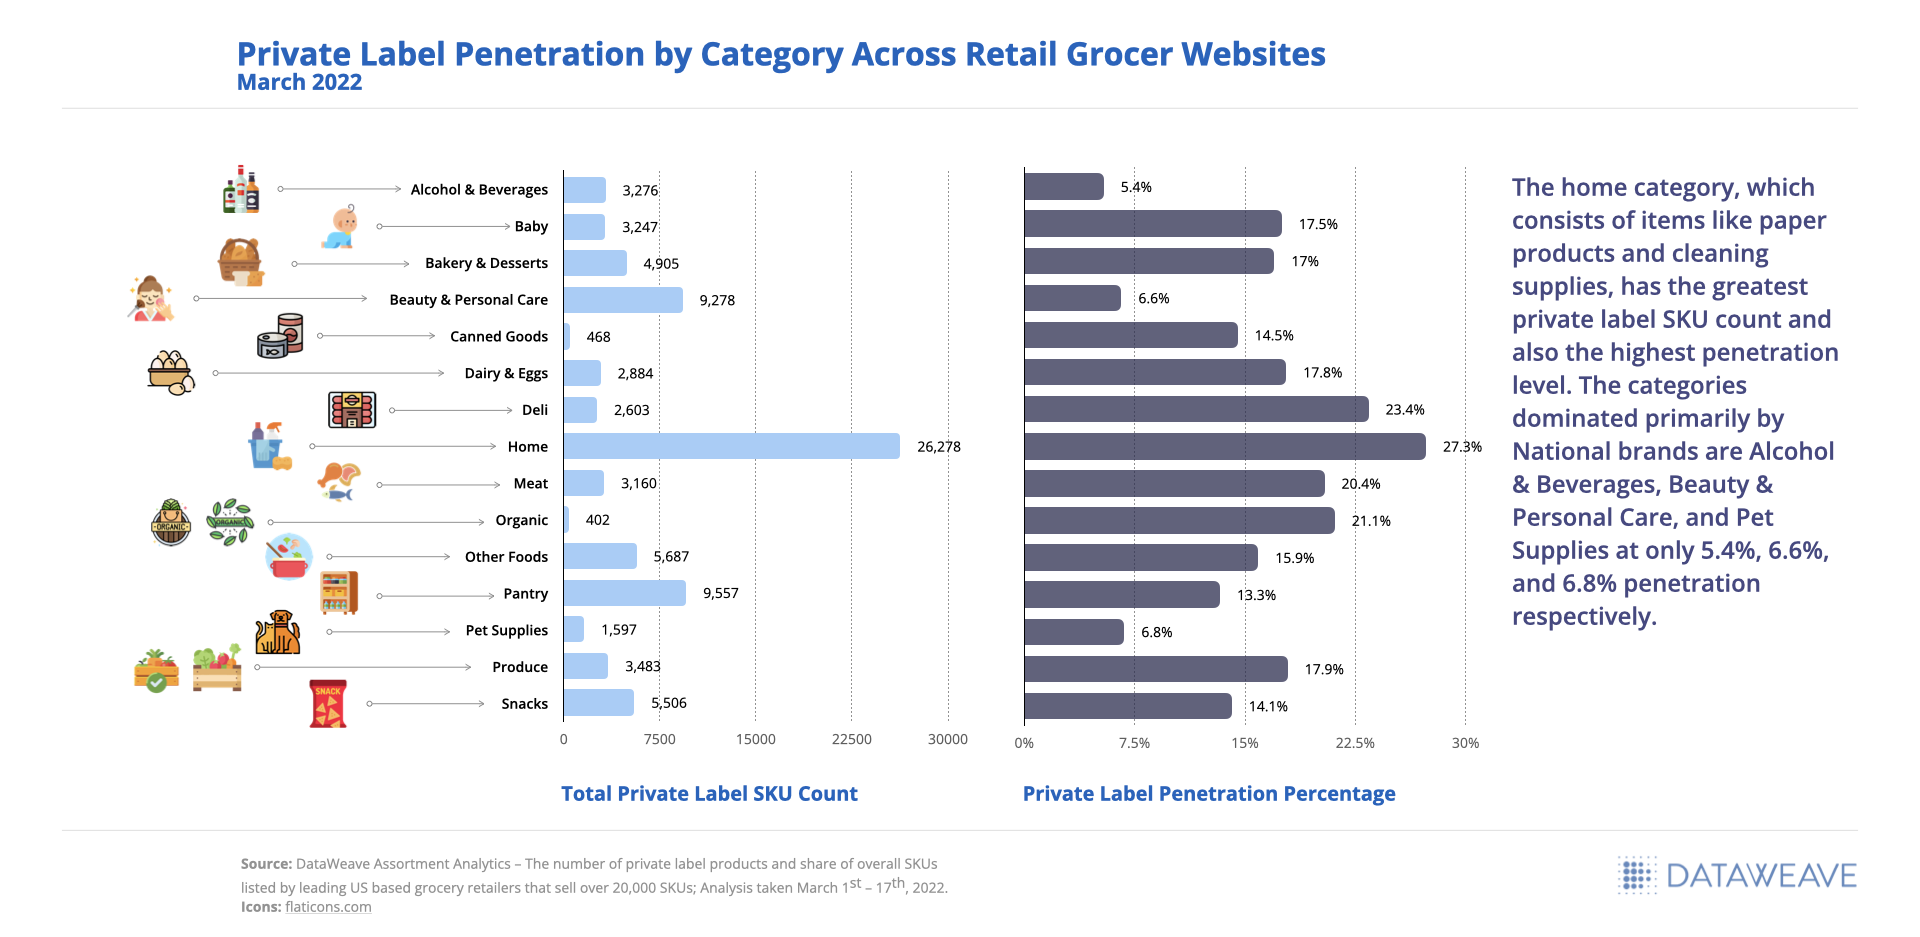
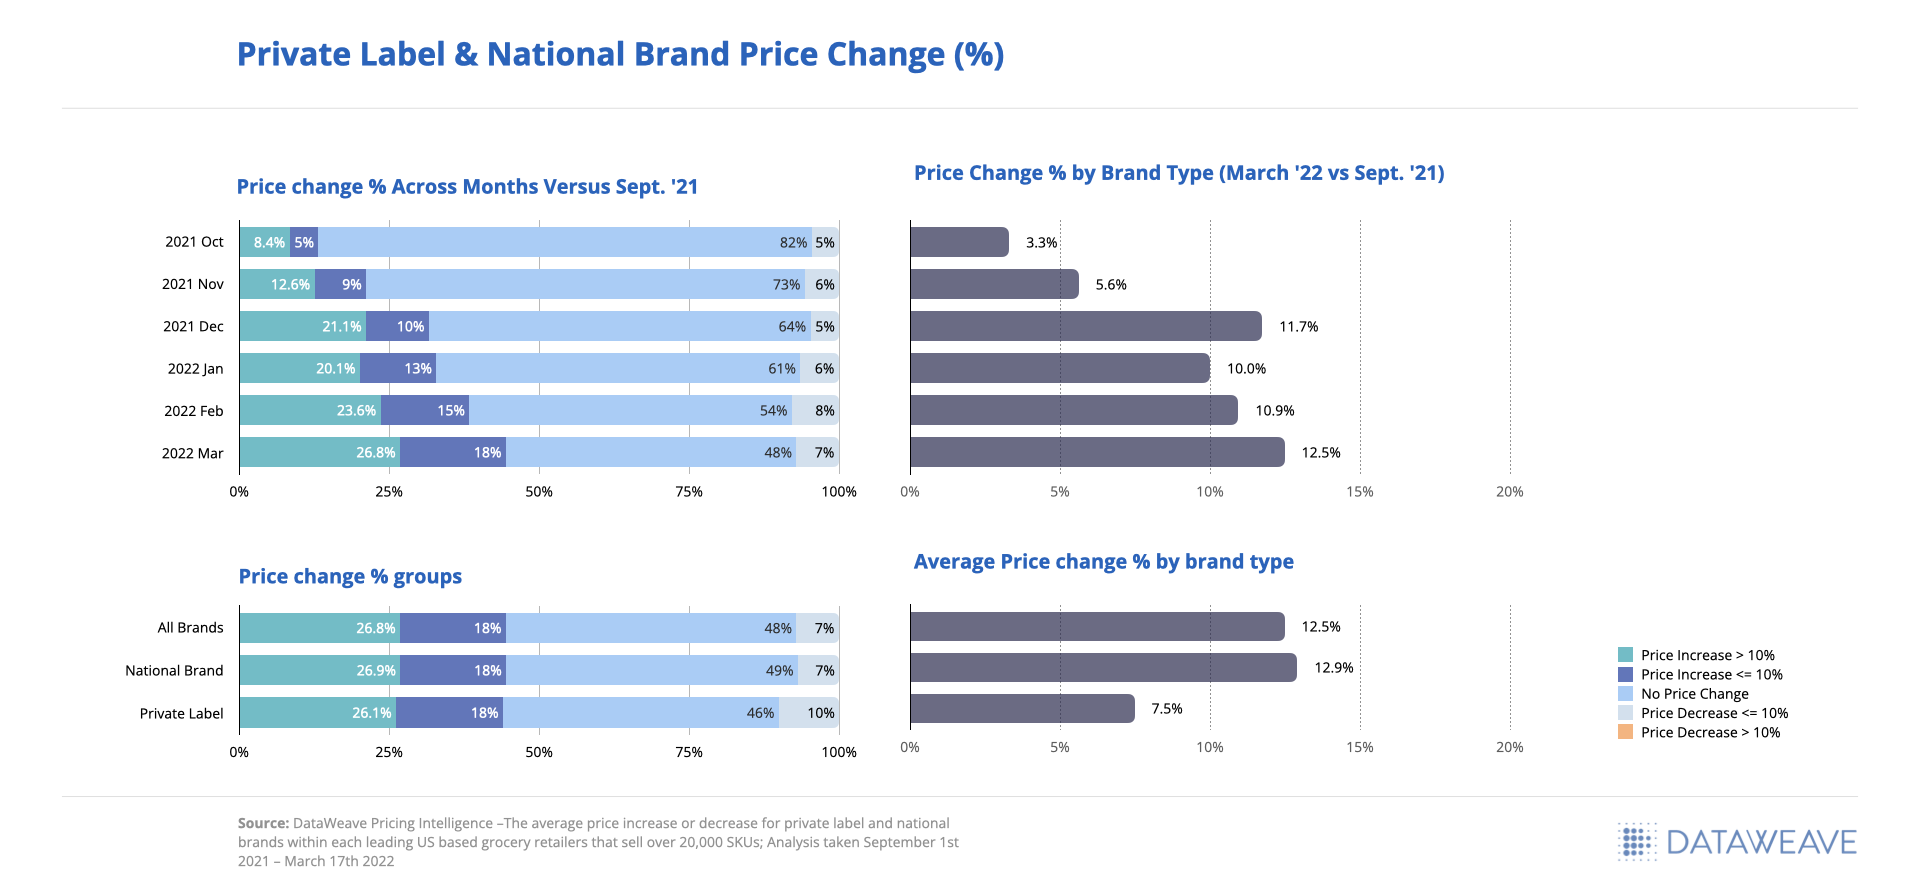
    2. Increase Private-Label Offerings

    Private labels typically offer retailers higher margins than national brands. These margins can shield consumers from sudden wholesale egg price swings, helping to preserve brand trust and consumer loyalty without sacrificing profitability.

    Moreover, eggs are particularly suited to private labeling, given their uniform appearance and taste and the lack of product innovation opportunities.

    Undoubtedly, this is why sales of private-label eggs dwarf sales of national egg brands in the United States. Statista reports that across three months in 2024, private label egg sales amounted to $1.55 billion U.S. dollars, while the combined sales of the top nine national egg brands totaled just $617.88 million U.S. dollars.

    3. Price Intelligently

    With the current and predicted fluctuations in egg prices over the foreseeable future, price competitiveness is paramount to margin management and customer loyalty.

    This is especially true when lower prices are the primary factor influencing the average consumer’s choice of supermarket for daily essentials purchases.

    AI-driven pricing intelligence tools like DataWeave give retailers valuable highly granular and reliable insights on competitor pricing and market dynamics. In today’s data-motivated environment, these insights are necessary for competitiveness and profitability.

    Final Thoughts

    Egg prices have fluctuated significantly due to the impact of avian flu. Despite recent price drops, future egg price increases are possible due to ongoing outbreaks. Retailers should adapt to unstable egg prices by increasing organic, free-range, cage-free, and private-label egg offerings while leveraging AI-driven pricing tools to maintain margins and customer loyalty.

    Speak to us today to learn more!

  • Impact of Inflation on Grocery: Pricing Insights on Leading US Retailers

    Impact of Inflation on Grocery: Pricing Insights on Leading US Retailers

    Inflation, like an invisible force, silently shapes the dynamics of economies, gradually eroding the purchasing power of consumers and leaving its imprint on various industries. High costs, hiring lags, and stagnating earnings pose severe challenges to businesses. One industry segment that intimately feels the impact of inflation is grocery, where price increases can be extremely concerning for the average consumer.

    Over the last 12-plus months, the US has experienced a notable rise in inflation, stirring up concerns and influencing the way we shop for everyday essentials. Rising costs of raw materials, transportation, and labor have all played a role in driving up prices. Additionally, disruptions in global supply chains and fluctuations in currency exchange rates have further exacerbated the situation, creating a complex web of interdependencies.

    To understand the magnitude of this phenomenon across leading e-retailers, we delved into an in-depth analysis of four major retail giants: Walmart, Amazon, Target, and Kroger.

    Each of these retailers possesses a unique business model and competitive strategy, as well as faces unique challenges. This leads to distinct approaches to managing inflationary pressures. Walmart for instance, expects operating income growth to outpace sales growth in 2023. Given the persistence of high prices and the potential for further macro pressures, the retailer is taking a cautious outlook. In 2022, Amazon’s eCommerce business swung to a net loss of $2.7 billion, compared to a profit of $33.4 billion the previous year.

    Amid these challenging circumstances, understanding the grocery pricing trends and strategies becomes imperative for retailers, both online and in stores to adapt and thrive in the current economic landscape. By examining their pricing trends, we can gain valuable insights into how these companies navigate the turbulent waters of the grocery industry against the backdrop of inflation.

    Our Research Methodology

    The data collected for our analysis encompassed a diverse range of products, from pantry staples like flour and rice to perishable goods like dairy and produce – a basket of around 600 SKUs matched across Amazon, Kroger, Target and Walmart, between January 2022 to February 2023.

    Further, we separately focused on the prices of a smaller subset of 30+ high-volume daily staples that are likely to yield higher sales and margins for these retailers.

    Average Selling Price of a Broad Set of Grocery Items

    Our analysis reveals that Walmart consistently offers the lowest prices, with an average of 8% below its closest competitor, Target, despite an annual price increase of about 5%. Walmart seems to prioritize a “stability and predictability” strategy over margin optimization. The retailer’s 8% growth last quarter indicates that this strategy is bearing fruit. However, it’s important to note that this approach may have its drawbacks as Walmart’s margins come under pressure.

    Average selling price trend across a basket of 500+ SKUs across Target, Walmart, Kroger, Amazon in the grocery category from Jan ’22 to Feb ’23.

    In order to weather inflationary pressures, Walmart may adopt a cautious approach to growth while also focusing on securing margins. Reports suggest that the retailer has been pushing back against consumer packaged goods (CPG) manufacturers following a series of price hikes to counter inflationary cost pressures in early 2023. One of the reasons behind Walmart’s growth and increased sales can be attributed to ‘non-traditional’ higher-income households now seeking deals and discounts at Walmart as their spending power declines.

    Interestingly, Amazon emerges as the highest-priced retailer, followed by Kroger, which increased its prices by 10% throughout the year. Consumer perception commonly associates Amazon with the lowest prices, but the data tells a different story. In fact, Amazon has been charging 12% to 18% higher prices than Walmart for groceries and is still maintaining its success.

    While the company’s online sales declined by 4%, it saw a significant 9% increase in revenue from third-party seller services, such as warehousing, packaging, and delivery, in 2022. Amazon’s strong logistics and same-day delivery services give it a competitive advantage over other retailers, contributing to its revenue growth and margins. Interestingly, this presents an opportunity for Walmart and other retailers to increase prices while maintaining their strong competitive price positions.

    Kroger, on the other hand, seems to be aiming for a premium price perception, consistently raising prices almost every month. Kroger’s pricing strategy appears to be closer to Amazon’s.

    Average Selling Price for High-Volume Daily Staples

    Pricing strategies often change for different categories of products. To better understand this, we focused our analysis further on a small subset of 30+ high-volume staples across retailers. These include baked goods, popular beverages, canned food, frozen meals, dairy, cereals, detergents, and other similar items.

    Average selling price trend of 30+ high-volume daily staples across Target, Walmart, Kroger, Amazon in the grocery category from Jan ’22 to Feb ’23.

    Walmart, possibly overestimating the impact of inflation, has continued to keep its prices the lowest, potentially aiming to increase margins through volume.

    The level of price disparity across retailers is expectedly lower here, with Amazon and Kroger closely tracking Walmart’s average prices.

    Target’s pricing strategy stands out as it consistently emerges as the highest-priced retailer for daily staples, despite being one of the lower-priced retailers for a broader basket of grocery items. This suggests that Target’s underlying technology may not be as optimized to address market dynamics compared to other leading retailers. In our opinion, Target may want to strengthen its efforts to track pricing more intensely for this sub-category.

    A Data-fuelled Approach is the Need of the Hour

    In the challenging economic landscape, retailers and grocery stores are under pressure to maintain their revenues and margins. Adopting a comprehensive and dynamic pricing strategy is crucial. Understanding which product categories are experiencing price increases among competitors can help retailers make informed decisions on pricing at both the category and product level.

    Retailers should consider their balancing margin performance with consumers’ willingness to pay, rather than implementing broad price increases that may harm customer trust. Price increases can be challenging for both customers and merchants. Retailers who employ a data-driven and insight-based approach are more likely to succeed.

    Keep an eye on the DataWeave blog for analysis on pricing, discounting, stock availability, discoverability, and more, across retailers and brands from other industry segments as well.

    For immediate insights, subscribe to our interactive grocery price tracking dashboard. Better still, reach out to us to speak to a DataWeave expert today!

  • eCommerce Performance Analytics for CPG Private Label

    eCommerce Performance Analytics for CPG Private Label

    The combination of economic uncertainty, inflation, and perceived affordability has increased consumer’s willingness to buy and try more private label products, challenging National brands to differentiate their eCommerce strategies, especially those related to price positioning, in other ways.

    Our previously released report, Inflation Accelerates Private Label Share and Penetration, confirmed 8 out of 10 brands with the highest SKU count carried across all grocery retailer websites to be private label, signaling the strength of their digital Share of Voice. Given the growing shift in consumer preference toward private label brands, we are providing access to the latest trends seen from September 2021 through March 2022. Below you will find a summary of what the data revealed about the growing presence of private label brands on the Digital Shelf.

    Private Label Account and Category Penetration

    We analyzed private label penetration at an account level to understand which private label brands have the greatest presence on retailer digital shelves, and to see which retailers may be leaving product assortment opportunities on the table.

    Private Label Penetration Across Retail Grocer Websites

    As a retailer, it is important to understand how your private label penetration stacks up against the industry average at a category level, especially given the performance tracked for retailers included within our analysis and the vast number of SKUs they offer online (over 20,000).

    Private Label Penetration by Category Across Retail Grocer Websites

    The Private Label and National Brand Price Gap Widens

    Private label brands tried out of necessity mid-pandemic increased in popularity as grocery prices continued to rise, providing an opportunity for retailers to increase brand affinity and loyalty for their online shoppers. Retailers alike were able to keep affordability at the forefront of their strategies and maintain a price gap of 23% or more, despite inflationary pressures to increase prices.

    Private Label / National Brand Price Gap by Retailer

    Looking at the results at a category level, we can see that Meat is the only category found within our analysis where private label brands are priced higher than National brands at an average of 8% greater. The Alcohol & Beverages category tends to always see the greatest price gap between private label and National brands given the price variances by unit (ranging from under $10 to over $100), in this case averaging a 148% price gap.

    Private Label & National Brand Price Gap by Category

    Private Label Total Basket Value Comparison Across Retailers

    While SKU-level pricing is extremely important to product strategy, for a retailer, it is equally as important to be as mindful of the total basket value even more so now as consumers further their private label loyalty across various categories. A few SKU-level missteps in pricing decisions can exacerbate cart abandonment and negatively impact shopper loyalty in a world where prices can be compared instantly in the palm of your hand.

    Based on our analysis, Walmart and H-E-B private label products offered the lowest priced total basket of goods at $42.90 and $45.06 respectively, whereas AmazonFresh and Safeway offered the highest total at $73.19 and $69.52 respectively.

    Private Label Item Level Price Comparison by Retailer

    Inflation-driven Price Changes are on the Rise with Room to Grow

    Based on the 20,000+ SKUs analyzed, we saw a continual price increase every month since September 2021 when comparing future monthly prices to those we tracked in September. The greatest price increase happened in March 2022 at 12.5% on average, however, there are still 48% of SKUs that have yet to see a price increase even as inflationary pressures rise.

    When viewing the split between National and private label brand price increases in March 2022 versus September 2021, we saw National brands increased prices on average by 13% where private label brand prices only increased an average of 7%.

    Private Label & National Brand Price Change
    Private Label & National Brand Price Change (%)

    Price decreases are still occurring across all categories, despite inflation, but to varying degrees ranging from 5% for Deli items to 17% for Dairy & Eggs. Within the Dairy & Eggs and Pantry categories, private label brands reduced prices for an additional 10% of total SKUs compared to National brands.

    The greatest category of opportunity for price increases within private label were found within Beauty & Personal Care with 67% of private label products yet to see a price change since September 2021.

    Price Change (%) by Category and Brand Type

    Private Label Price Change Correlation to Product Availability

    The category with the greatest magnitude of price increase seen within private label brands occurred within Baby at 16.3% followed by Home at 14.3% on average. Private label products within Home and Baby categories were also showing the lowest availability rates, 75.9% and 79.5% respectively, indicating a high demand for these items even as prices increased.

    The private label categories with the smallest price increase on average were Dairy & Eggs at 2.4% and Other Foods and Pantry at 3.4% and 3.6%, respectively.

    Private Label Price Change Magnitude & Availability
    Private Label Price Change Magnitude & Availability

    While in many accounts both private label and National brands struggled with stock availability in March 2022, National brand availability is much lower (around 10% on average) than private label availability.

    H-E-B had the lowest overall product availability at 76% across both private label and National brands on average. Only Walmart had lower availability for Private Label at 75% compared to 93% for National brands, but they also had the greatest price gap between private label and National brands.

    Private Label & National Brand Product Stock Availability

    The Future of eCommerce Growth for Private Label

    Our greatest learning from this analysis is that it’s time for retailers to start thinking and planning more like the National brands they carry when it comes to positioning their private label brands for success. Successful retailers are taking this time to reset their private-label strategies and transfer short-term switching behavior into long-term customer loyalty.

    Retailers playing catch up have the opportunity to address some of the gaps highlighted throughout this analysis, for example, relative to pricing and assortment changes. Below are some of the highlighted opportunities:

    • Though inflation is driving price hikes, more than 50% of products analyzed have yet to see a price increase indicating an opportunity to protect margin
    • Narrowing the price gap between a store’s brand and National brands should not be the only focus as competitive private label brands are becoming a greater threat at a category and basket level
    • Modifying and expanding assortments as demand increases for private label can improve customer retention and loyalty, especially for cross-shopping consumers

    According to The Food Industry Association (FMI), only 20% of food retailers currently promote private brands on their homepages, and only 48% include detailed product descriptions indicating even more opportunities left on the table for retailers to optimize private label digital performance.

    Many leading retailers are leveraging real-time digital marketplace insights and eCommerce analytics solutions like ours to further their online brand presence and optimize sales performance. This report highlights only a small sample of the types of near real-time insights we provide our clients to effectively build competing strategies, make smarter pricing and merchandising decisions, and accomplish eCommerce growth goals. Be sure to reach out to our Retail Analytics experts for access to more details regarding the above analysis.

    For access to a previously recorded webinar presented in partnership with the Private Label Manufacturers Association and conducted by DataWeave’s President and COO, Krish Thyagarajan, click here.