Virtually every cuisine in the world uses eggs. They’re in your breakfast, lunch, dinner, and dessert — which is perhaps why the global egg market is expected to generate $130.70 billion in revenue in 2024 and is projected to grow to approximately $193.56 billion by 2029.
More specifically, the United States is the fourth-largest egg producer worldwide. The country’s egg market is projected to generate $15.75 billion in 2024 and increase to $22.51 billion by 2029.
Health-consciousness among consumers: Consumers value eggs for their essential nutrients and rich protein content.
Demand for convenience foods: Consumers’ preferences are shifting toward quick and easy foods, which drives demand for shell eggs and pre-packaged boiled or scrambled eggs.
Population Growth: A growing worldwide population increases the demand for eggs.
Affordability and accessibility: Eggs are an affordable and accessible nutrient-dense food source for many.
Despite these factors contributing to the U.S. egg market’s growth, recent times have seen egg prices fall dramatically.
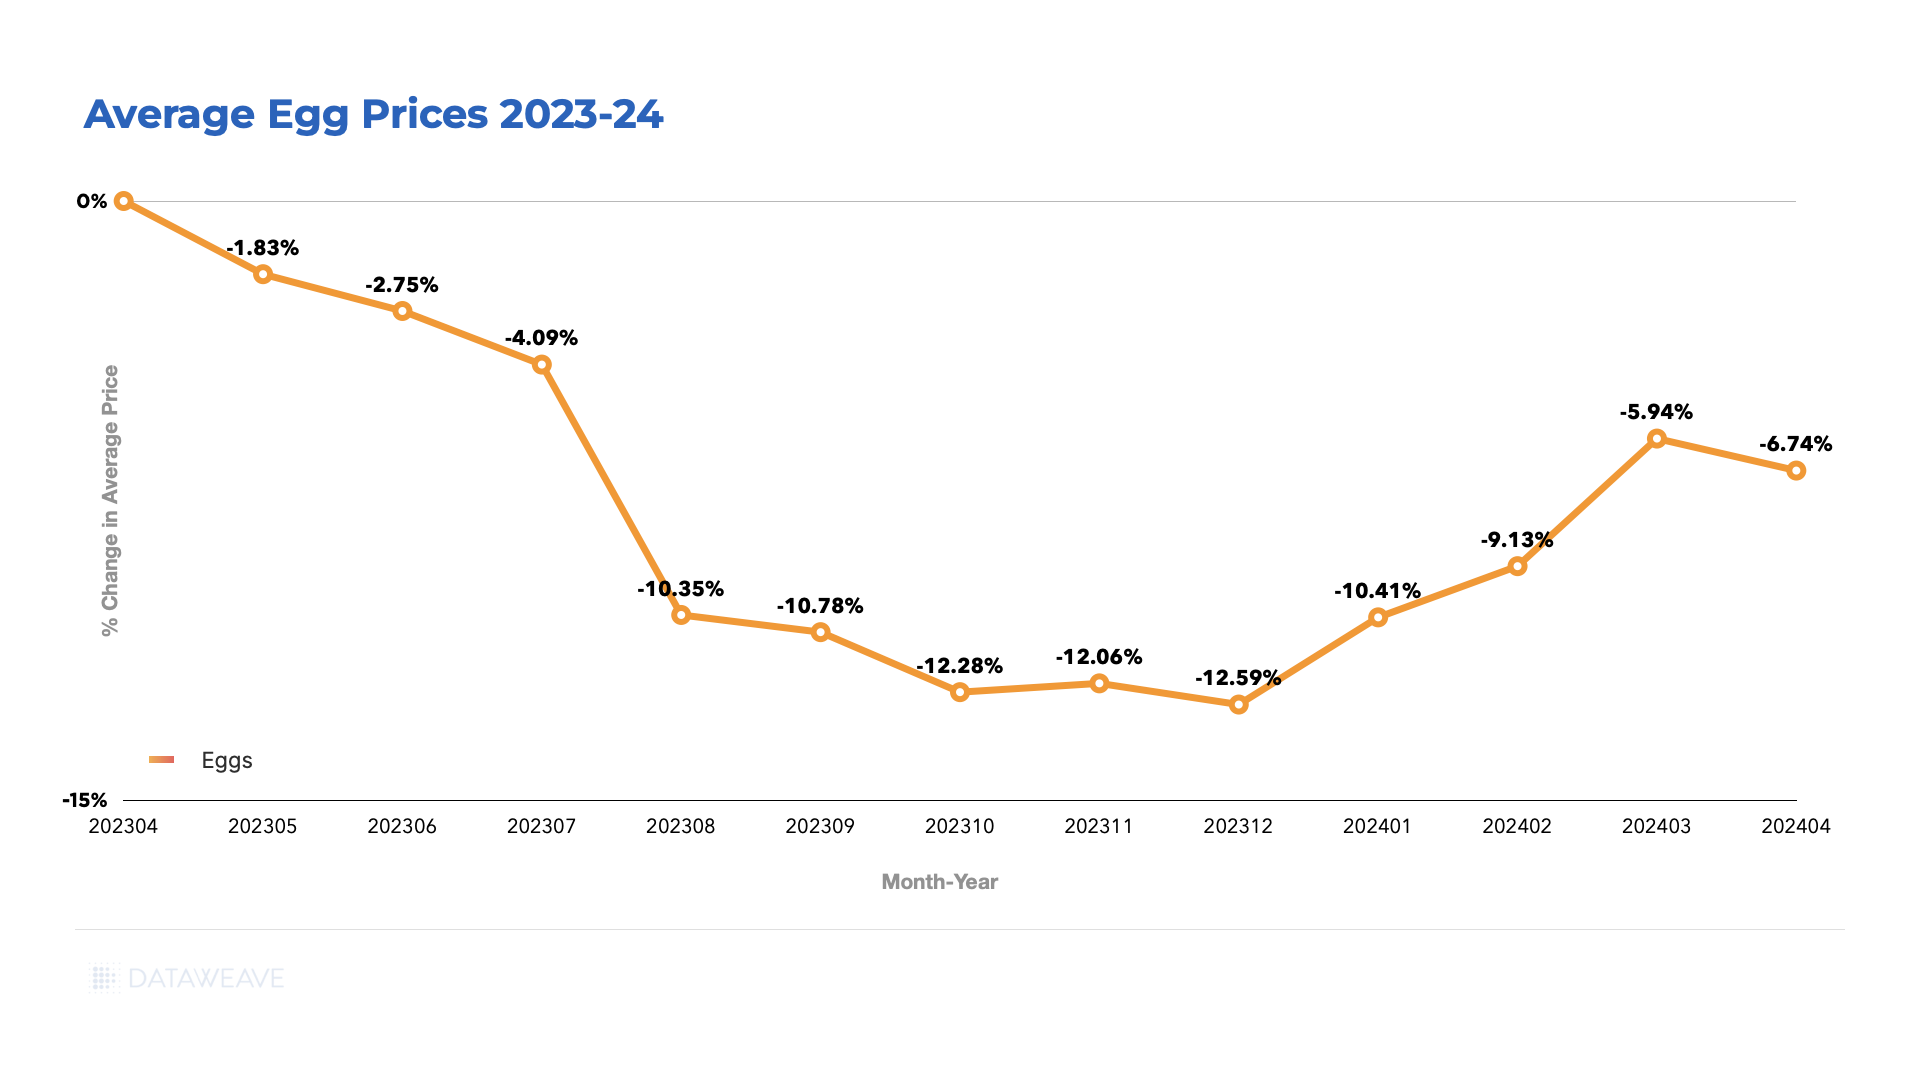
Based on a sample of 450 SKUs, DataWeave discovered that egg prices in the U.S. fell by 6.7% between April 2023 and April 2024, dipping to its lowest (-12.6%) in December 2023.
So, what’s causing the decrease in egg prices?
The Rise and Fall of Egg Prices: A Recent History
In 2022, avian influenza severely impacted the United States. The disease affected wild birds in nearly every state and devastated commercial flocks in approximately half of the country.
The 2022 incident was the first major outbreak since 2015 and led to the culling of more than 52.6 million birds, mainly poultry, to prevent the disease from spreading uncontrollably.
With almost 12 million fewer egg-laying hens, the United States produced around 109.5 billion eggs in 2022 — a drop of nearly two billion from the previous year.
Consequently, the cost of eggs soared, peaking at $4.82 a dozen — more than double the price of eggs in the previous year.
The avian flu continues to affect egg-laying hens and other poultry birds across the United States. As of April 2024, farms have killed a total of 85 million poultry birds in an attempt to contain the disease.
Despite the disease’s effects, production facilities have made significant efforts to repopulate flocks, leading to a steady increase in supply – and a much anticipated decrease in egg prices.
According to the U.S. Bureau of Labor Statistics, there was an increase in producer egg prices in 2022, reaching a peak in November 2022, at which point they began to fall.
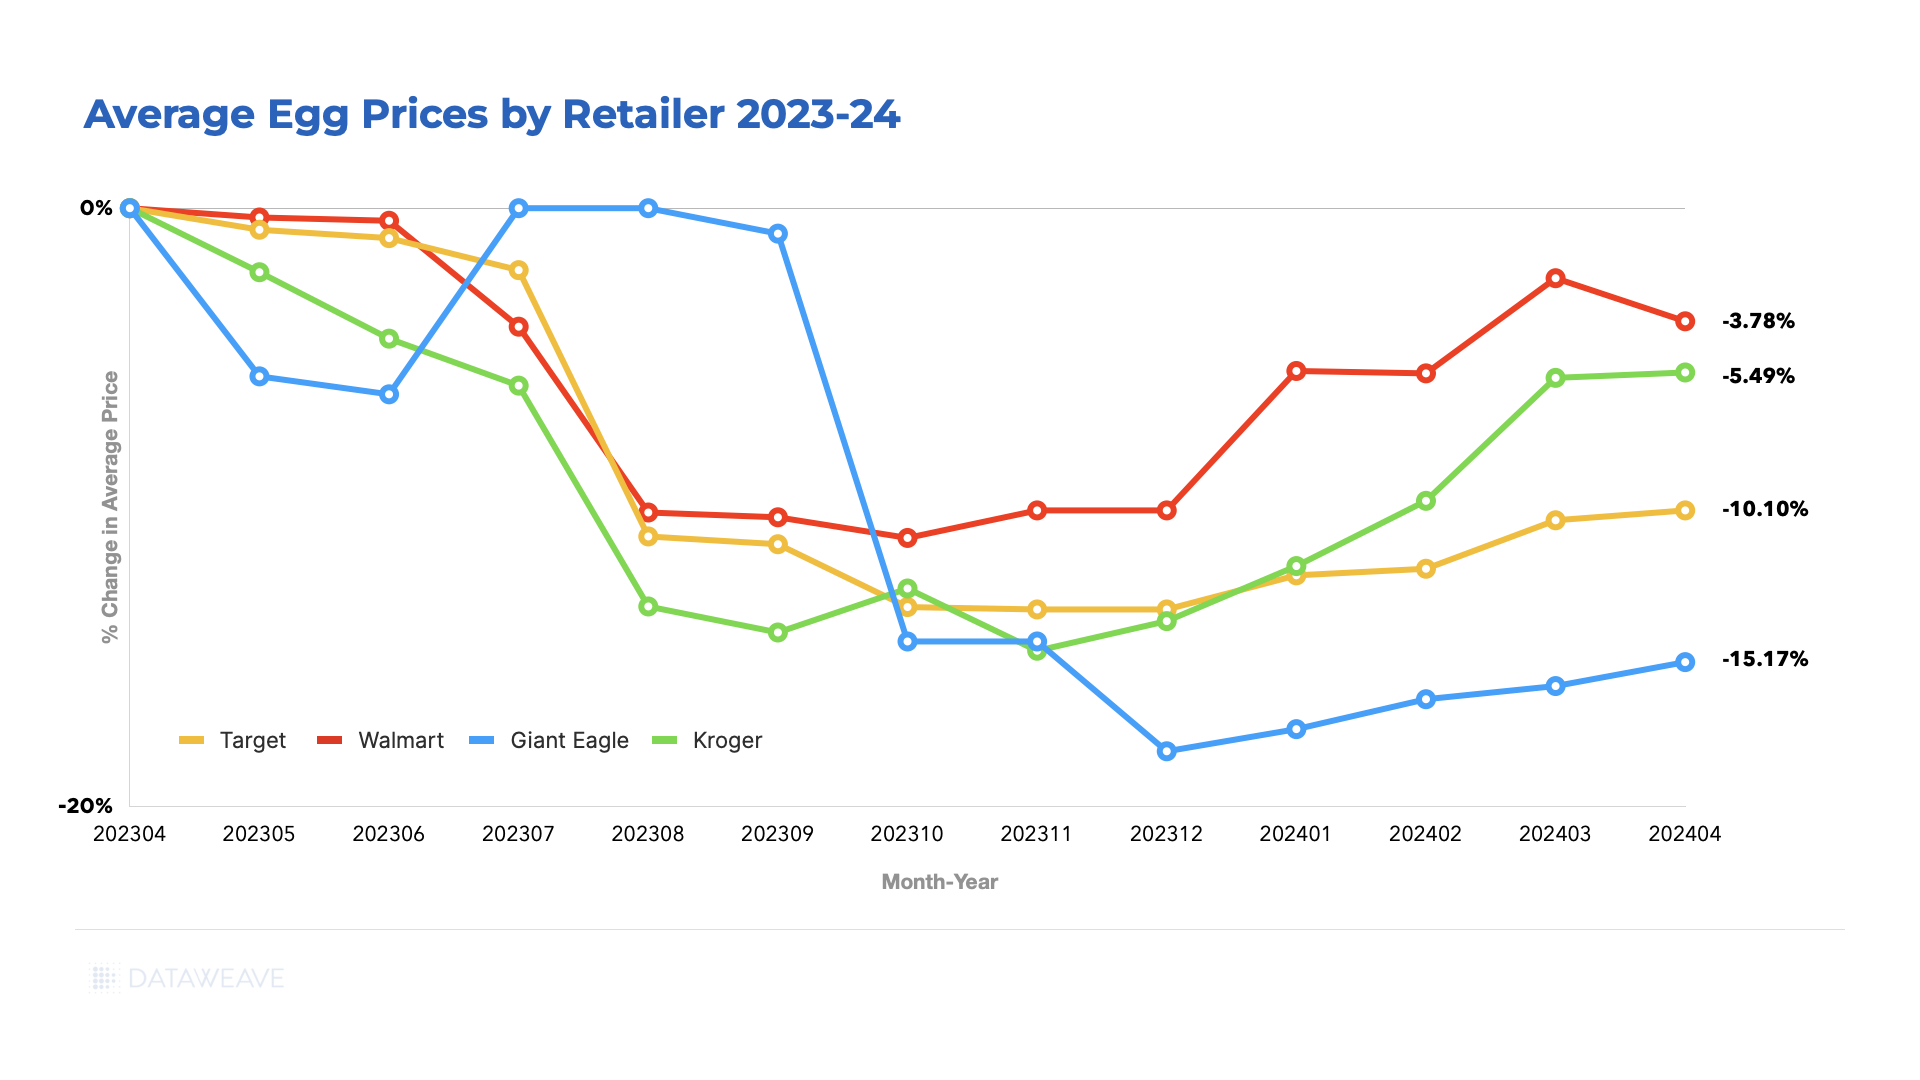
Retailer’s egg prices followed suit. The egg price chart below depicts retailers’ declining egg prices over one year, from April 2023 to April 2024, with Giant Eagle showing the most significant price reductions and Walmart the least.
What Does the Future Hold for Egg Prices?
The USDA reported recent severe avian flu outbreaks in June 2024. These outbreaks are estimated to have affected 6.23 million birds.
With a reduction in egg-laying hens, egg prices are likely to increase — time will tell.
Nonetheless, the annual per capita consumption of eggs in the U.S. is projected to reach 284.4 per person in 2024 from 281.3 per person in 2023. So for now, producers and retailers can rest assured of the growing demand for eggs.
How Can Retailers Adapt to the Unpredictability of Egg Prices?
Egg prices were down to $2.69 for a dozen in May 2024. However, they are still significantly higher than consumers were used to just a few years ago—eggs were, on average, $1.46 a dozen in early 2020.
Additionally, while the avian flu puts pressure on producers, inflation and supply chain disruptions exert pressure on retailers.
With such challenging egg market conditions, what can retailers do to maintain customer loyalty amid reduced consumer spending while maintaining profitability?
1. Give the Customer What They Want: Increase Offerings of Organic, Cage-Free, and Free-Range Eggs
As mentioned, Data Bridge Market Research’s trends and forecast report highlighted a significant increase in consumer health consciousness. Additionally, animal welfare increasingly influences consumers’ purchasing decisions when buying meat and dairy products.
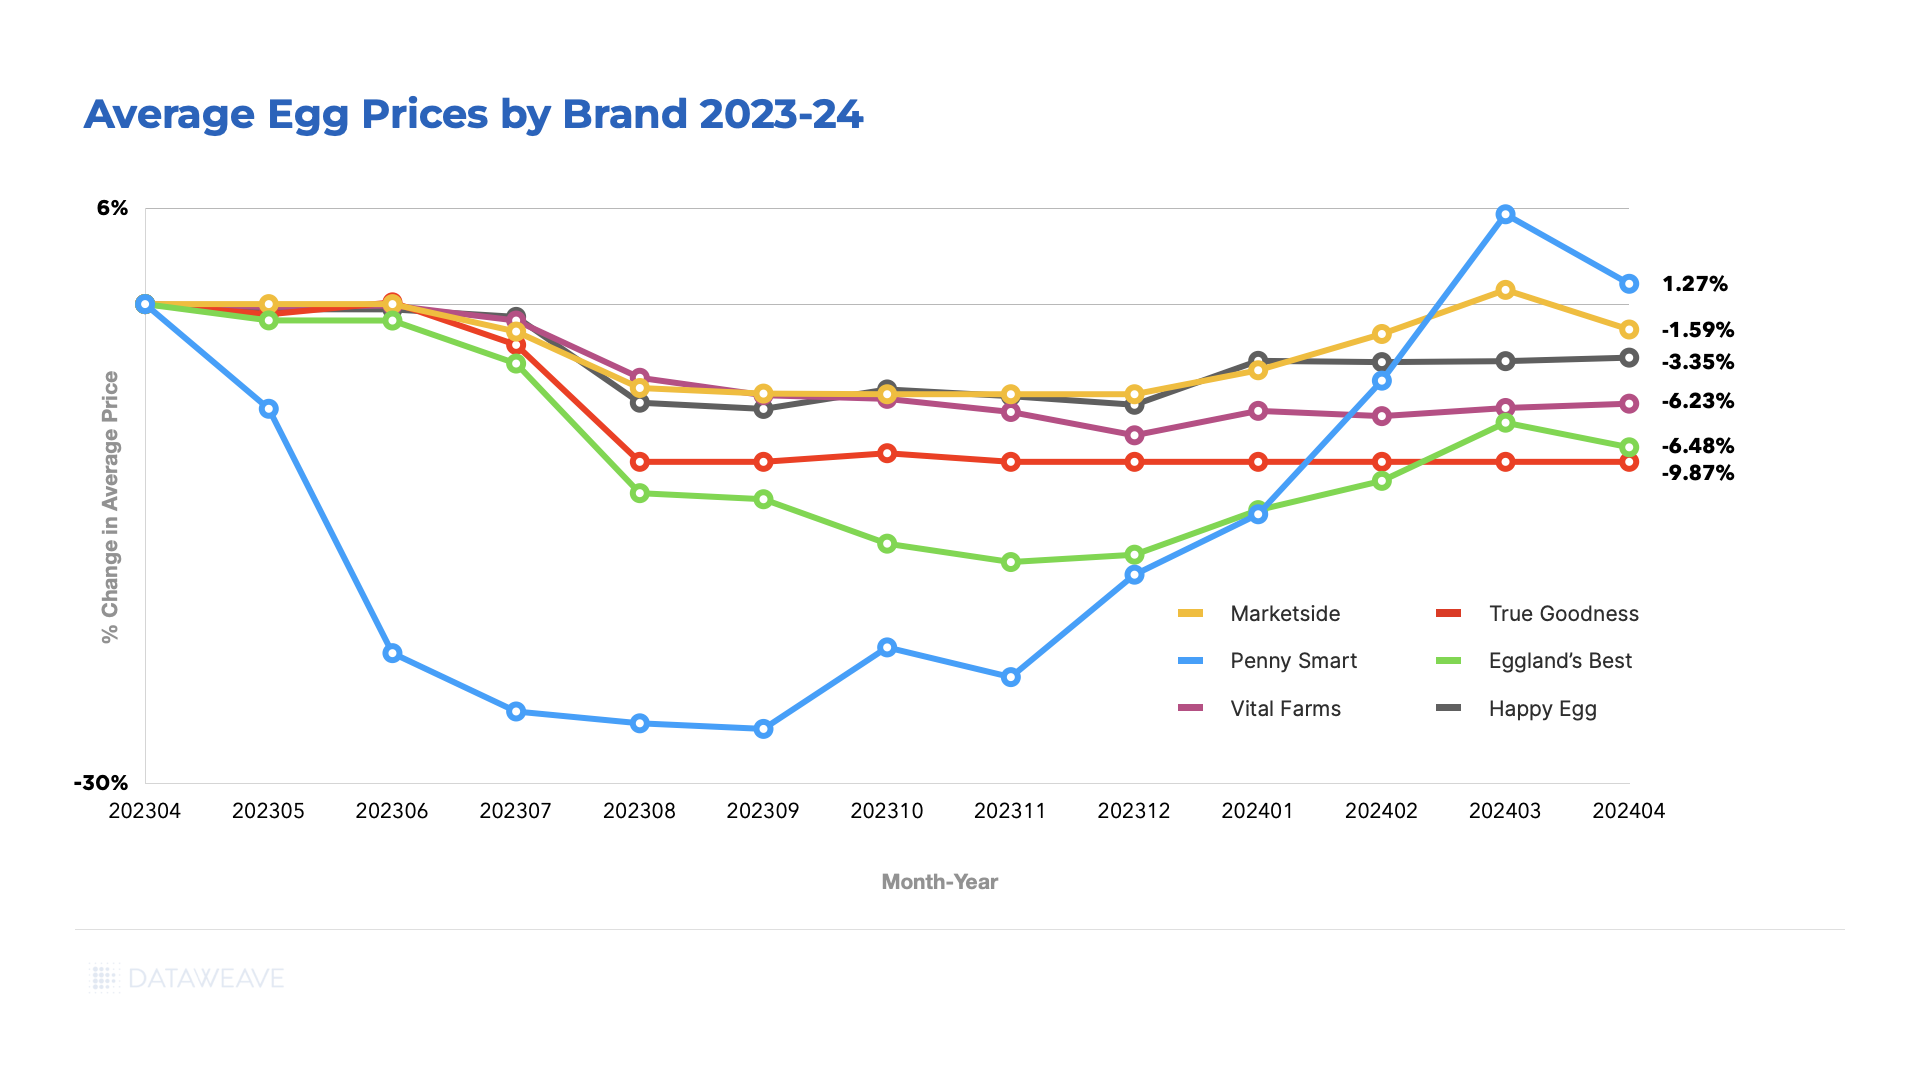
DataWeave data shows that the prices of organic, cage-free, and free-range eggs—such as those by brands like Happy Eggs and Marketside—have fallen less than those of non-organic, caged egg brands.
2. Increase Private-Label Offerings
Private labels typically offer retailers higher margins than national brands. These margins can shield consumers from sudden wholesale egg price swings, helping to preserve brand trust and consumer loyalty without sacrificing profitability.
Moreover, eggs are particularly suited to private labeling, given their uniform appearance and taste and the lack of product innovation opportunities.
Undoubtedly, this is why sales of private-label eggs dwarf sales of national egg brands in the United States. Statista reports that across three months in 2024, private label egg sales amounted to $1.55 billion U.S. dollars, while the combined sales of the top nine national egg brands totaled just $617.88 million U.S. dollars.
3. Price Intelligently
With the current and predicted fluctuations in egg prices over the foreseeable future, price competitiveness is paramount to margin management and customer loyalty.
This is especially true when lower prices are the primary factor influencing the average consumer’s choice of supermarket for daily essentials purchases.
AI-driven pricing intelligence tools like DataWeave give retailers valuable highly granular and reliable insights on competitor pricing and market dynamics. In today’s data-motivated environment, these insights are necessary for competitiveness and profitability.
Final Thoughts
Egg prices have fluctuated significantly due to the impact of avian flu. Despite recent price drops, future egg price increases are possible due to ongoing outbreaks. Retailers should adapt to unstable egg prices by increasing organic, free-range, cage-free, and private-label egg offerings while leveraging AI-driven pricing tools to maintain margins and customer loyalty.
Easter egg hunts just got more challenging for families this year as the price of chocolate and other candies has soared. The root of this price surge lies in a cocoa deficit, attributed to diseases affecting crops and the adverse effects of climate change on West African farms, which supplies over 70% of the world’s cocoa. This has resulted in a tripling of cocoa prices over the last year, causing a “cocoa crunch,” and severely impacted confectioners and chocolate makers.
Reuters recently reported that Iconic brands such as Hershey’s and Cadbury find themselves grappling with the need to adjust to escalating costs for raw materials. Given that Easter is one of the top three candy-purchasing occasions, these manufacturers are contemplating raising their prices to sustain their profit margins.
Despite the challenges posed by the cocoa shortfall and persistent inflation, the National Confectioners Association anticipates that Easter candy sales in the U.S. will match or even exceed last year’s figures, which amounted to approximately $5.4 billion. This expectation is predicated more on price increases than on a rise in sales volume.
At DataWeave, our ongoing analysis of pricing trends across various consumer categories among retailers has provided insight into the evolving landscape of chocolate and candy prices in 2023 and 2024.
Our Analysis of Inflation in Candy and Chocolate Prices
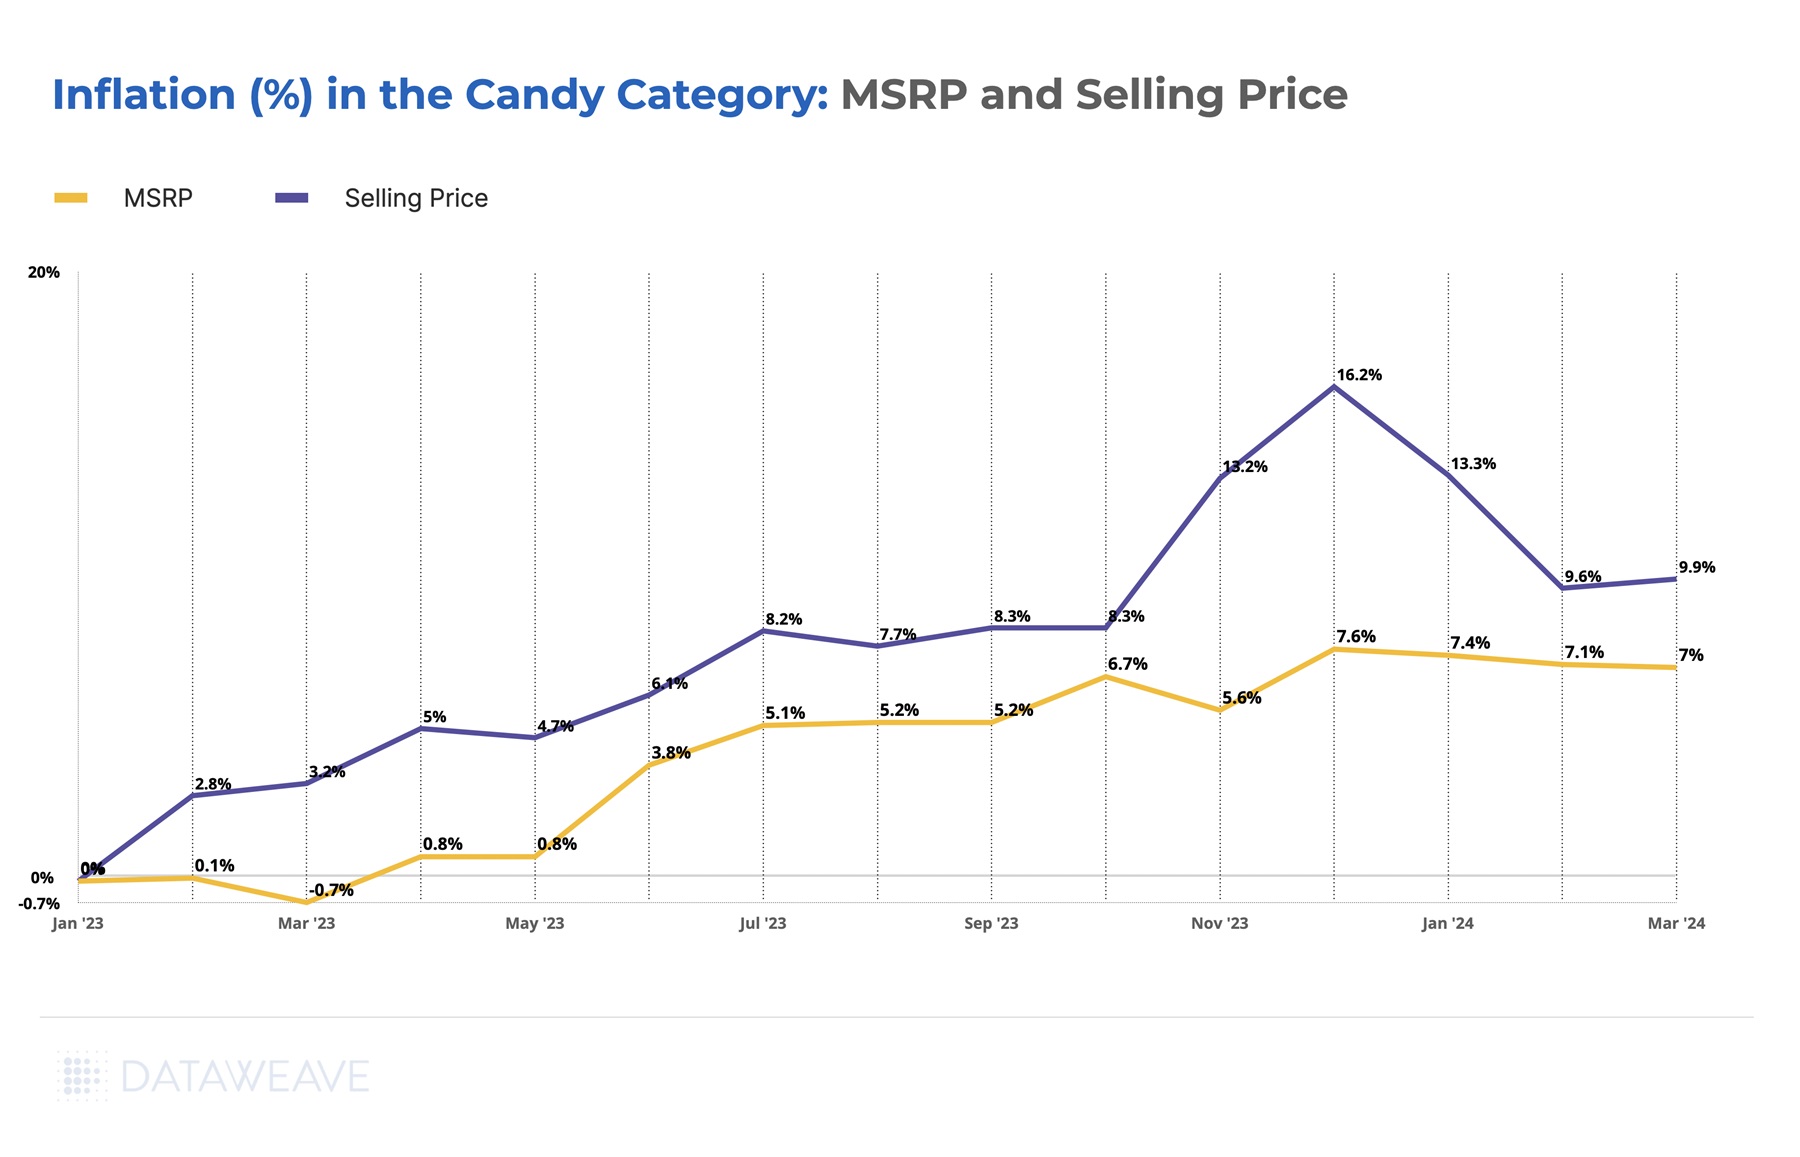
Our study encompassed a broad array of 3,300 products from leading U.S. retailers, Amazon, Target, Kroger, and Giant Eagle. As illustrated in the following chart, the trajectory of prices over the past 15 months was compared against the average prices in January 2023. Our tracking focused on two key price points: the selling price, which represents the final cost to consumers after applying any discounts or promotions, and the Manufacturer’s Suggested Retail Price (MSRP), as determined by the brands themselves.
The findings from our analysis indicate that the average selling price, primarily influenced by retailer decisions, has experienced a steady increase throughout 2023, reaching a peak at 16.2% above January 2023’s figures by December. As of March 2024, coinciding with the Easter season, the selling prices are approximately 10% higher than they were at the beginning of the previous year.
Simultaneously, the MSRP has seen a consistent uptick, driven by the climbing costs of cocoa. Brands have adjusted their suggested prices accordingly, with the current MSRP standing about 7% above its January 2023 level, after having peaked at a 7.6% increase by December 2023. This reflects the direct impact of rising cocoa costs on product pricing strategies.
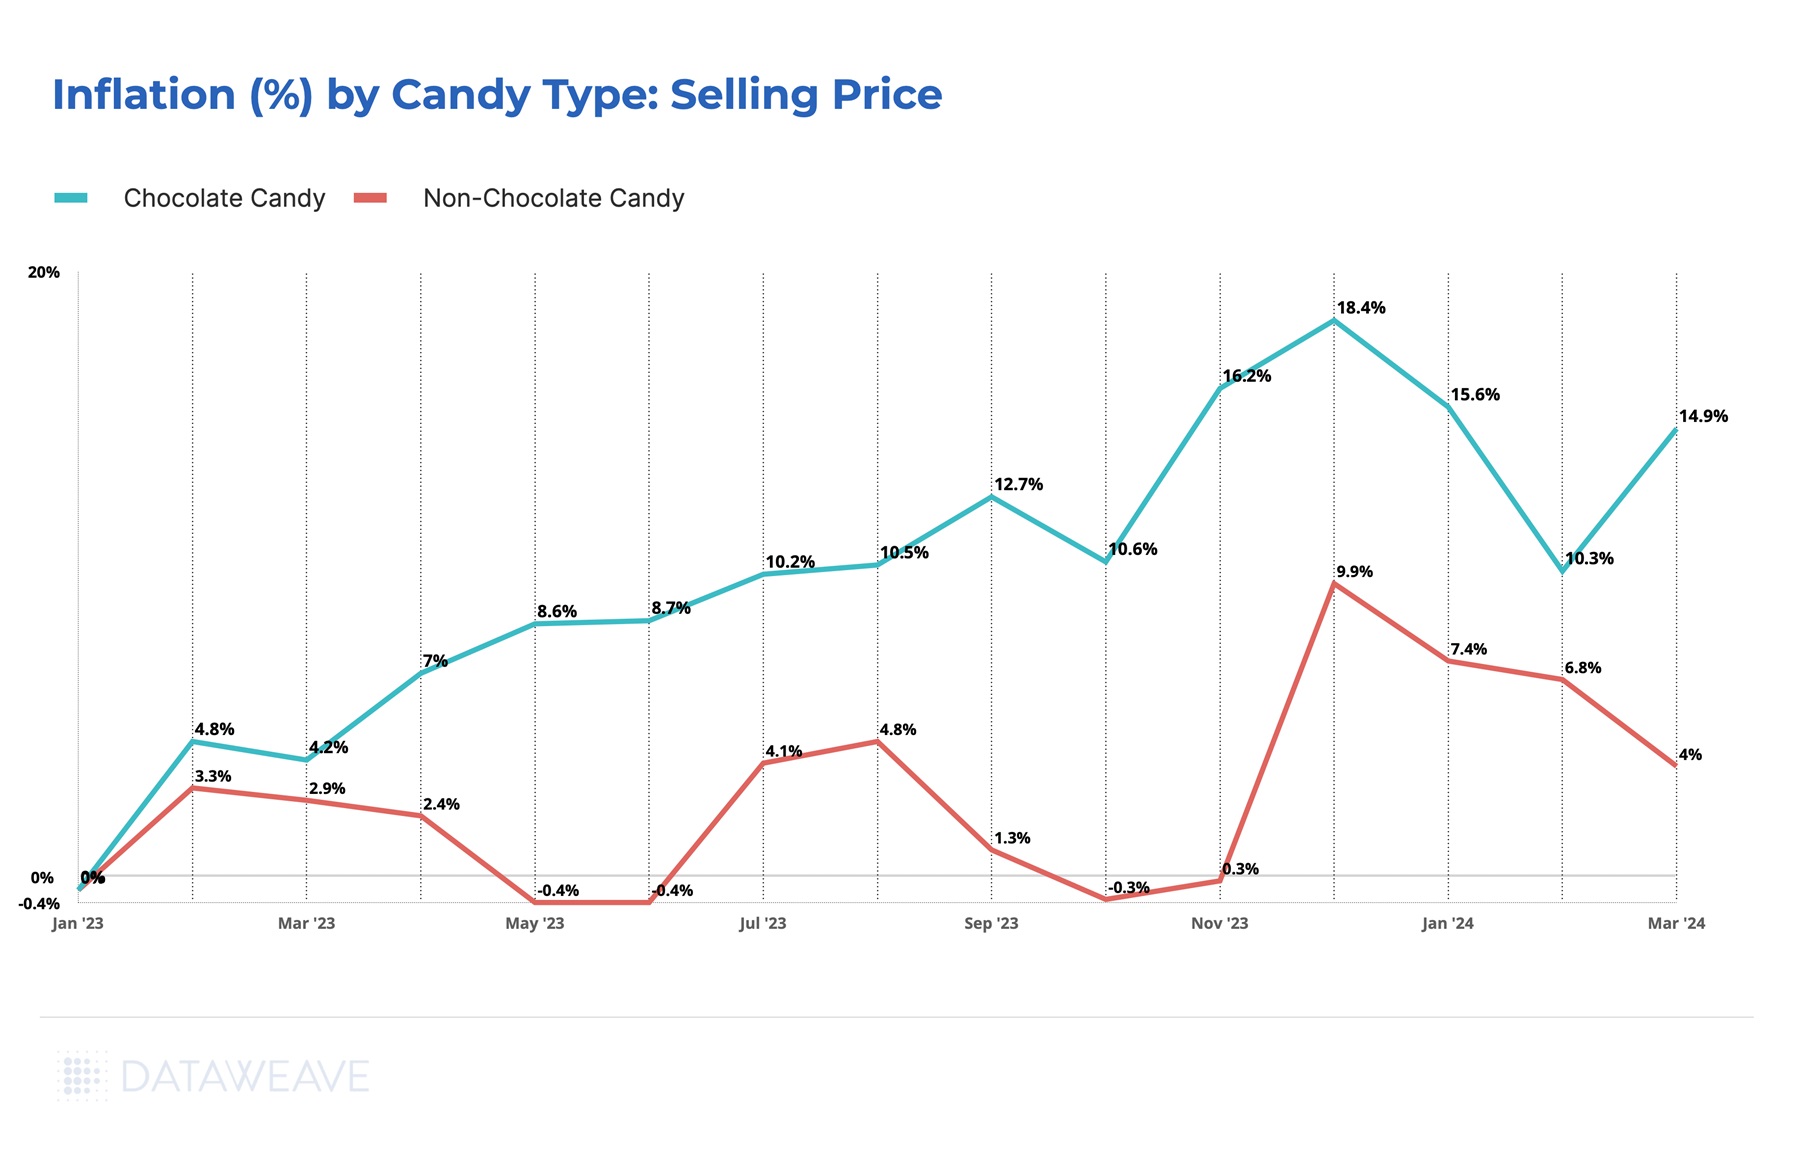
Chocolate Candies Are Hit The Hardest
Across all candies, chocolate-based products have witnessed significantly sharper price increases than their non-chocolate counterparts. In the past 14 months, the selling prices of chocolate items have surged by 14.9%, a stark contrast to the modest 4% rise observed in non-chocolate candies.
This price escalation was particularly pronounced during the Christmas shopping period, a response to heightened demand, before experiencing a temporary decline in February.
The diminishing availability of cocoa, coupled with rising costs for packaging and transportation, has compelled brands and retailers alike to transfer these added expenses onto the consumer. This dynamic underpins the distinct pricing trends observed across the candy spectrum, with chocolate items bearing the brunt of these cost pressures.
Discounts Offered By Retailers and Brands to Entice Easter Shoppers
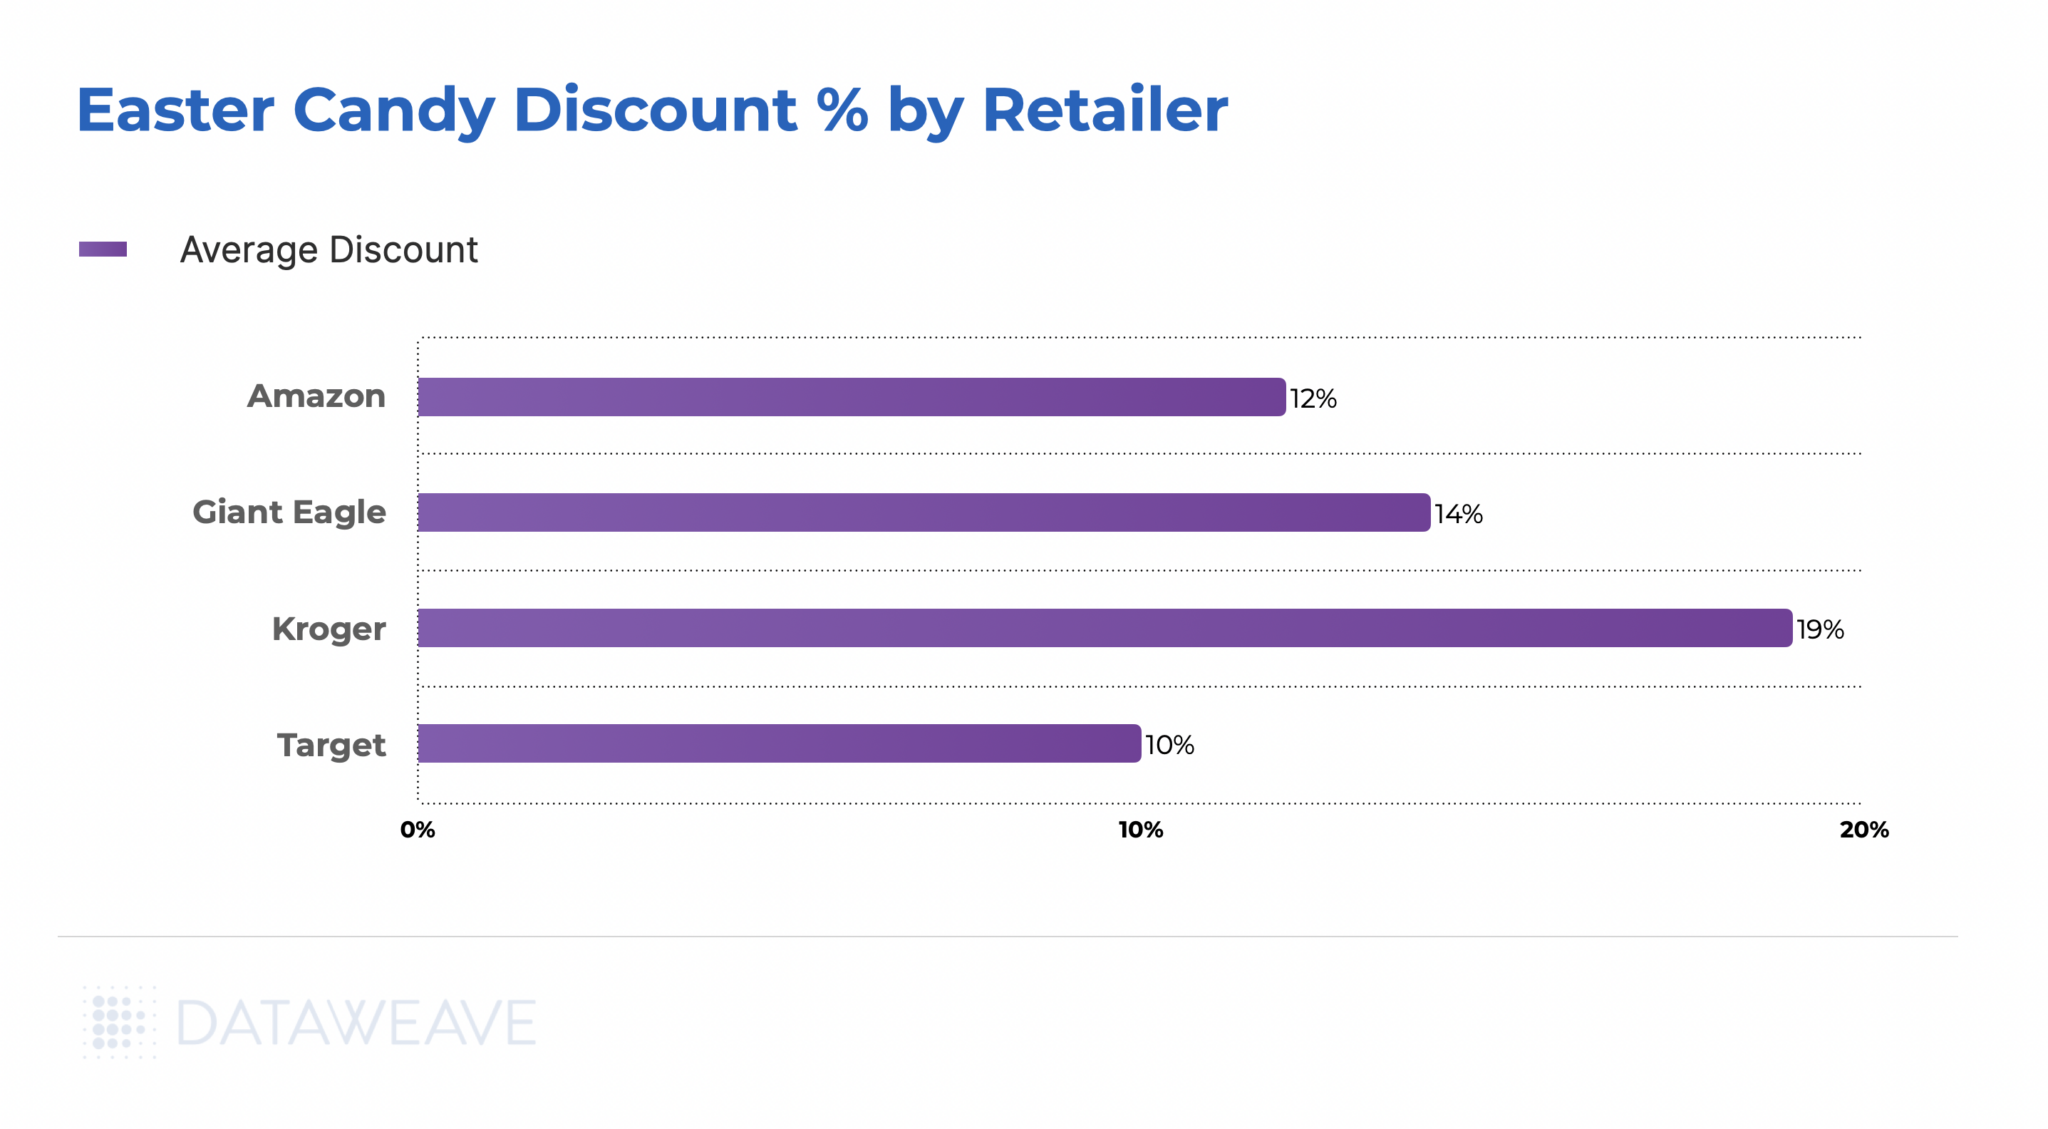
In our analysis, we delved deeper to identify the retailers and brands offering the most compelling prices for Easter-centric confections, including Chocolate Eggs, Chocolate Bunnies, and Easter-themed gift packs.
Kroger emerged as the frontrunner among the retailers we monitored, offering an impressive 19% discount on Easter candies. Giant Eagle followed with a solid 14% average markdown. Meanwhile, Amazon and Target provided more modest promotional discounts at 12% and 10%, respectively.
Kroger is making significant efforts to ensure consumers have access to attractively priced Easter treats. The retailer planned to keep its doors open throughout the Easter weekend, featuring baskets brimming with discounted items such as Russell Stover chocolate bunnies, Brach’s jelly beans, Reese’s eggs, and assorted bags of popular candies from Snickers, Twix, and Starburst, among others. Additionally, Kroger is enhancing its value proposition through gift card offers and exclusive Easter deals for its loyalty program members.
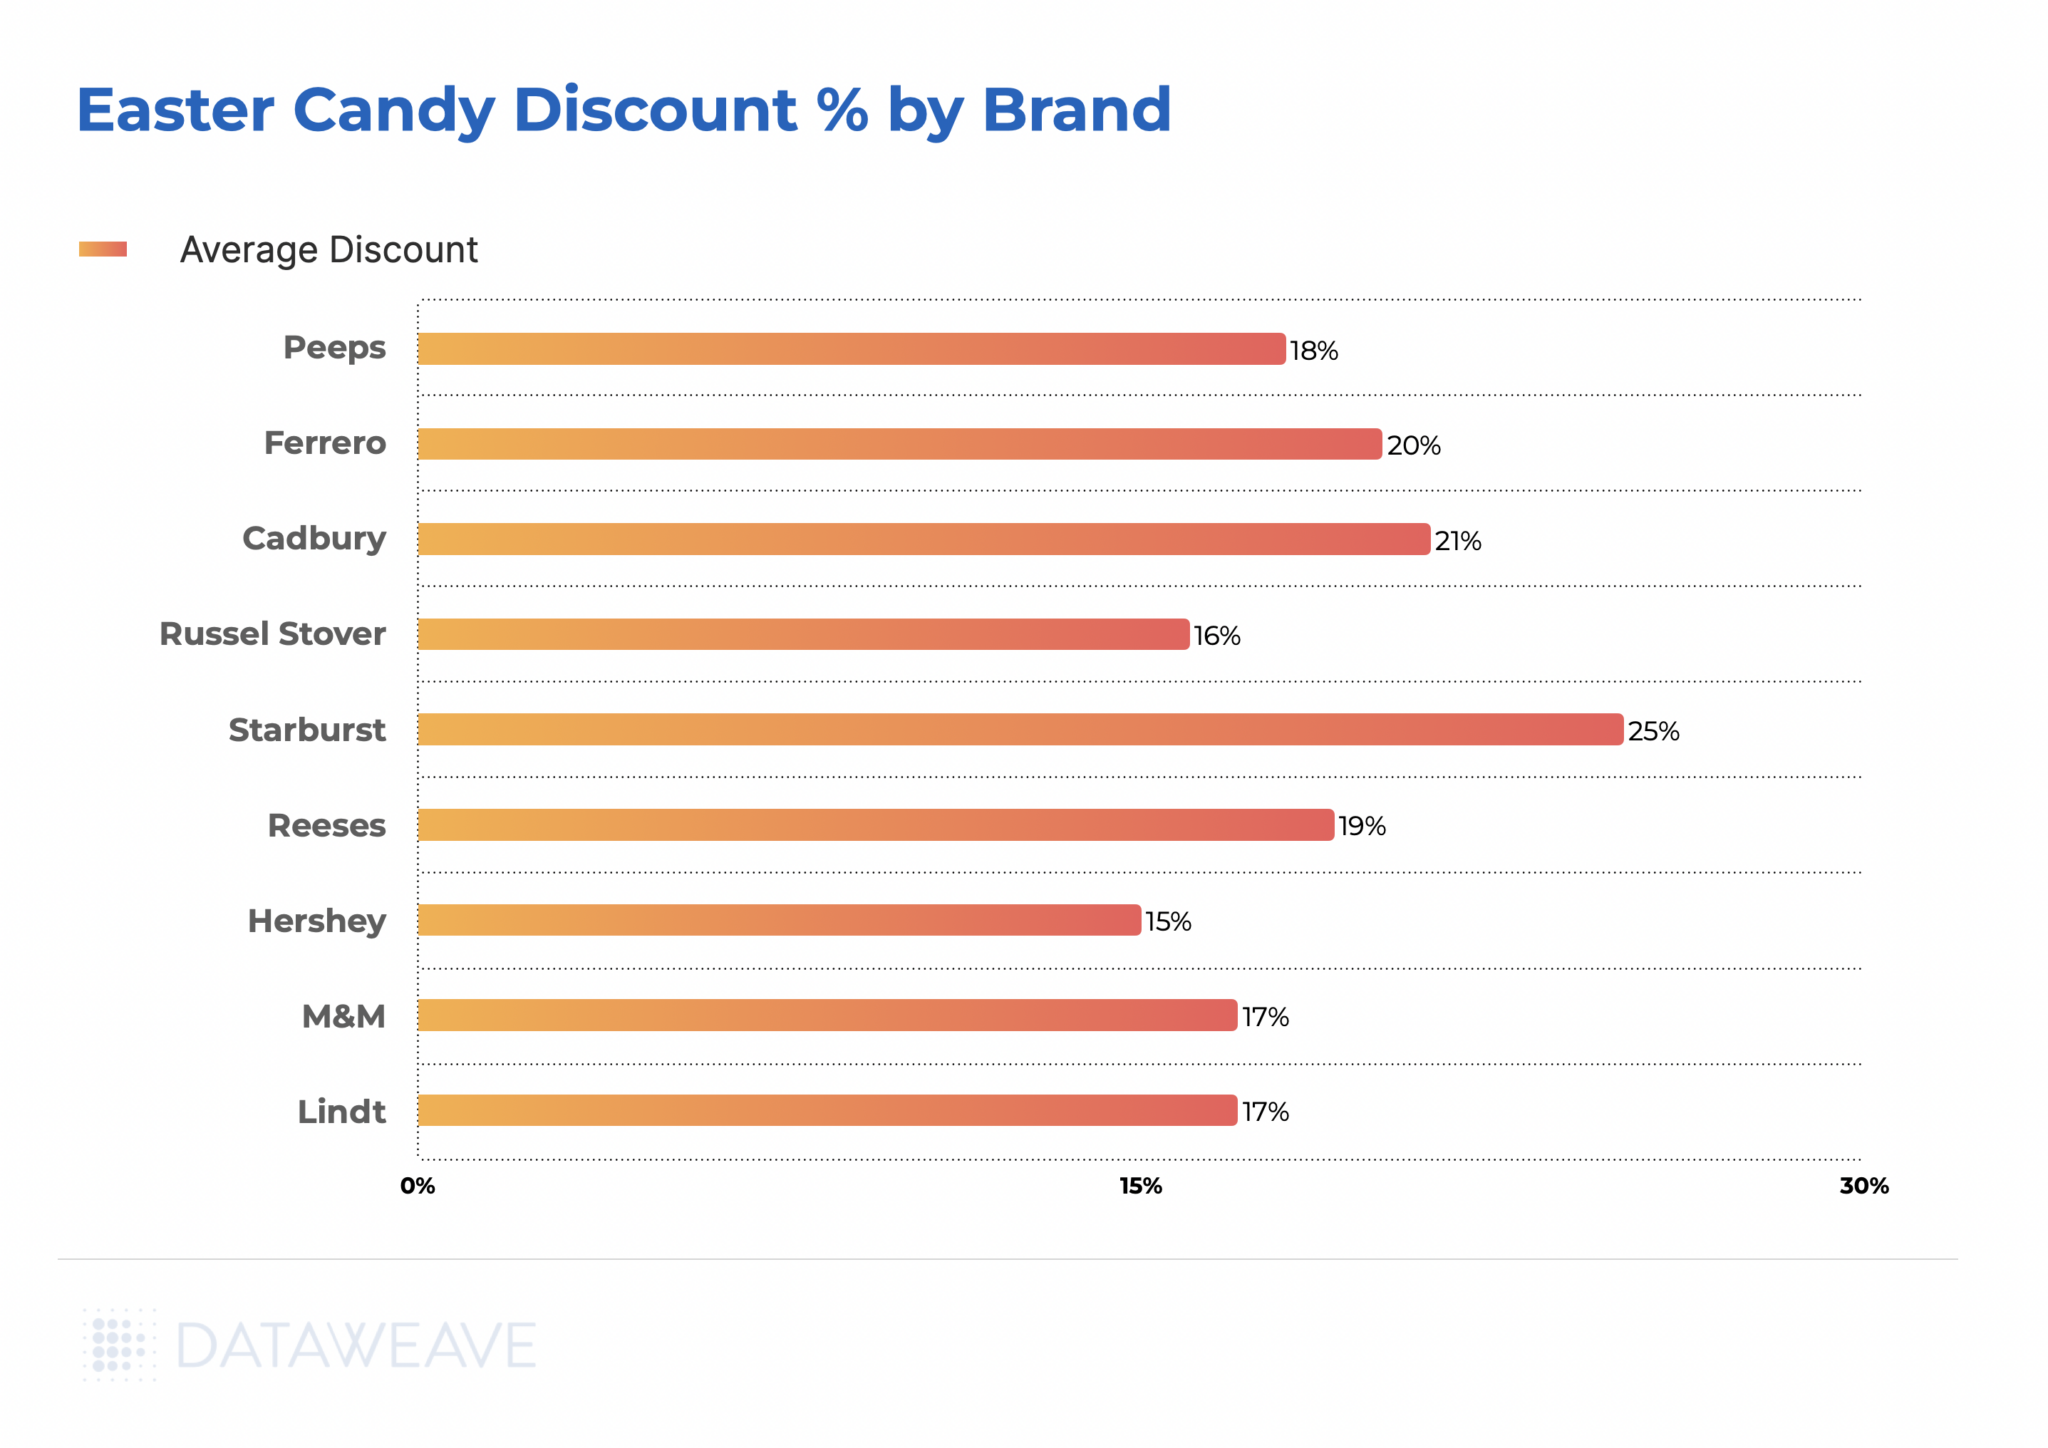
On the brand front, Starburst by Mars Wrigley leads with the steepest discount of 25%. Cadbury, under Mondelez, is not far behind, offering 21% off its mini eggs and other Easter treats, marking an increase from last year’s 17% discount. Ferrero Rocher is making a strong pricing move with an average 20% markdown on its Easter selections, including the chocolate bunny and squirrel figures.
The beloved Peeps marshmallow candies by Just Born are being offered at an 18% discount this year, slightly less than the 23% discount seen in 2023, likely reflecting the impact of rising sugar costs, given their sugar and corn composition.
Other notable brands, including M&M’s and the premium Swiss chocolatier Lindt, have elevated their average Easter discounts to 17% this year, up from the previous year’s discounts of 12%, and 10% respectively, showcasing a competitive pricing strategy to delight consumers this Easter season.
Coping With Inflation This Easter Season
Retailers and brands aiming to remain profitable and competitive in the current challenging environment can adopt a few strategic approaches:
Creative Product Bundling: Design innovative combo packs that mix chocolate and non-chocolate items. Such bundles can cater to diverse consumer preferences and budget ranges while preserving profit margins.
Encouragement of Bulk Purchases: Offer enticing discounts on larger quantities to promote bulk buying. This strategy can help amplify sales volumes, compensating for increased costs per item and fostering economies of scale.
Strategic Competitive Pricing: Keeping a vigilant eye on competitors’ pricing strategies is vital. Aim to capture market share through well-thought-out discount strategies that balance competitiveness with margin preservation. Leveraging advanced pricing intelligence, such as that offered by DataWeave, can provide invaluable insights for making informed pricing decisions.
Product Size Adjustments: Consider revising the size or weight of products as a cost management measure, a strategy known as “shrinkflation.” It’s crucial to approach this transparently, ensuring clear communication on packaging to uphold consumer trust.
Adopting these strategies—focusing on bundle offerings, incentivizing bulk purchases, optimizing pricing strategies based on competitive intelligence, and thoughtfully adjusting product sizes—will be pivotal for confectioners to navigate the challenges posed by the cocoa price surge.
For more information, reach out to us to speak to a DataWeave expert today!
This year’s back-to-school shopping season has presented a considerable challenge for inflation-weary parents in the US. Despite chatter about alleviating inflation rates, the reality of rising prices tells a different story.
As families hunt for school supplies, apparel, and other essential items for the academic year, the financial strain remains palpable. Experts note that elevated prices coupled with extensive shopping lists have compelled many parents to be more discerning about their purchases, expenditure thresholds, and preferred shopping venues. Essentially, shoppers are looking for more value for their money with every purchase. According to the National Retail Federation’s 2023 projection, this back-to-school season is poised to be the most financially demanding one to date. The forecast anticipates total spending exceeding $135 billion, marking an increase of over $24 billion compared to the previous year.
At DataWeave, we continually monitor and analyze pricing activity among retailers across popular shopping categories. Our recent study delved into the pricing trends in the back-to-school category, which includes backpacks, fundamental school supplies, binders, planners, writing instruments, and more. The aim was to understand how the costs of back-to-school essentials have shifted in 2023 in comparison to 2022.
Pricing of Back-to-School Products in 2023
Our analysis, spanning 1200 products across major retailers such as Amazon, Walmart, Kroger, and Target reveals an average price surge of 9.8% in 2023 compared to the previous year.
This upward pricing trend can be attributed to retailers’ strategic efforts to guarantee product availability and uphold quality during a period of heightened demand. As the back-to-school season sparks a surge in shopping activity, retailers like Kroger, Amazon, and Walmart are likely adjusting prices strategically to align with the expenses incurred in securing adequate supplies, managing logistics, and meeting operational demands.
Kroger led the way with a 12.1% price hike, the most significant among the scrutinized retailers. It was followed by Amazon with an average increase of 10.5% and Target with 7.8%. Walmart remains the outlier, with the smallest price increases for back-to-school products in 2023.
Pricing across Categories and Subcategories
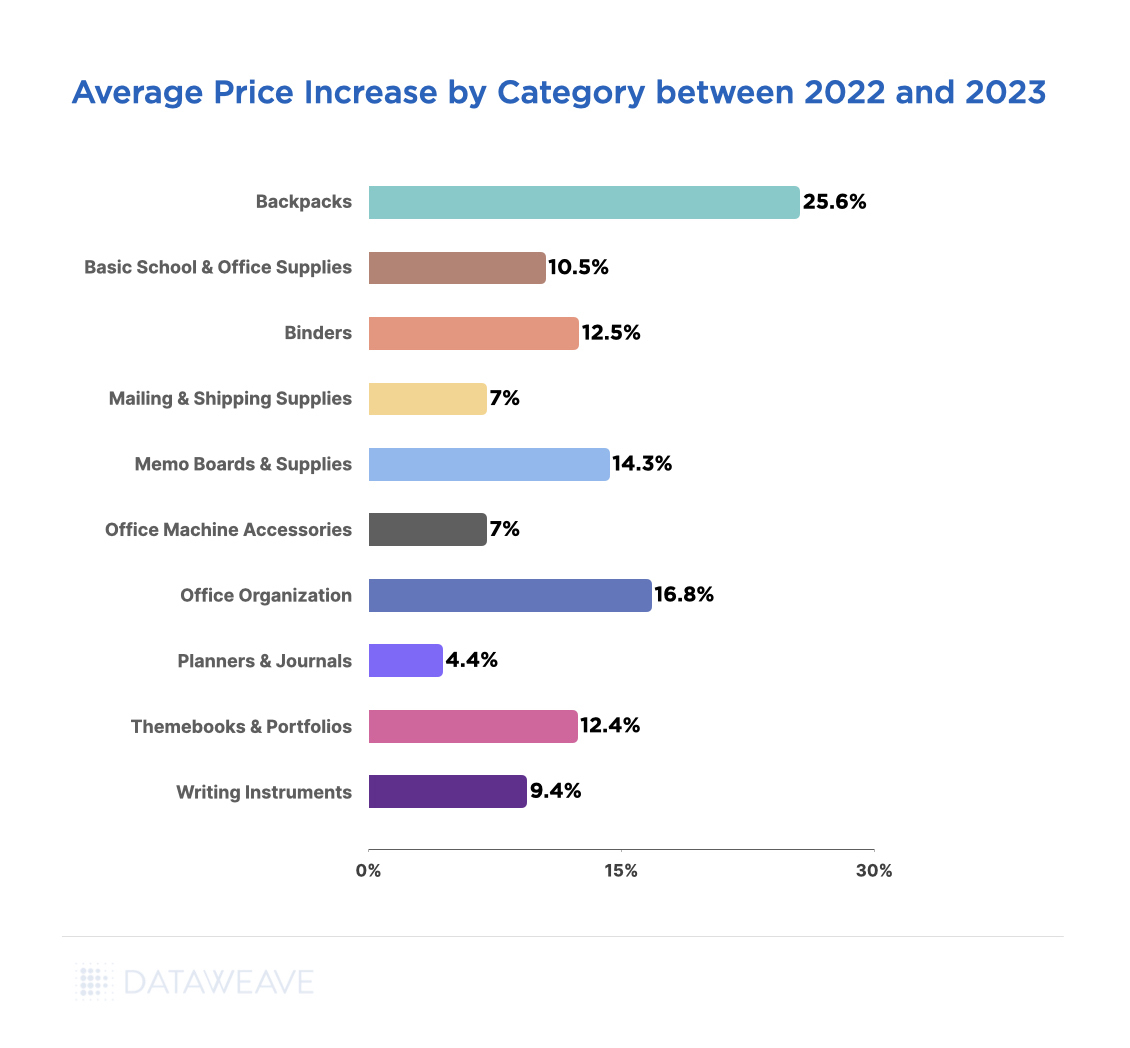
Among the various categories examined, backpacks have experienced the most pronounced escalation, with prices soaring by a substantial 25%. Within the top 10 highest priced backpacks we looked at, the most substantial price hikes were observed for brands like The North Face (44%) and Fjallraven (33%).
The Office Organization category also witnessed a significant price surge of 16.8%, attributed to subcategories like File Folders and Desk Accessories, which saw respective price hikes of 31.3% and 25.2%.
Categories like Memo Boards & Supplies (14.3%), Binders (12.5%), and Themebooks & Portfolios (12.4%) have likewise encountered notable price hikes. On the other end of the spectrum, Planners and Journals saw a modest rise of 4.4%, while Mailing and Shipping Supplies and Office Machine Accessories experienced comparatively lower price increases at 7% each.
Interestingly, while items like Journals and Writing Instruments maintain popularity year-round, Backpacks and Memo Boards are particularly sought after during the back-to-school season, contributing to more substantial price hikes in these categories.
On the other hand, consumers are consistently on the lookout for cost savings and deals from retailers, especially as they deal with inflationary pressures. In response, Kroger, Target, and Walmart have introduced back-to-school savings initiatives. For instance, Kroger is offering more than 250 items for less than $3 and some items for just $1, encompassing essentials such as paper, pencils, and glue sticks. Lower price increases across categories like journals and writing essentials could be attributed to these initiatives.
Brands with the Highest Price Increases across Categories
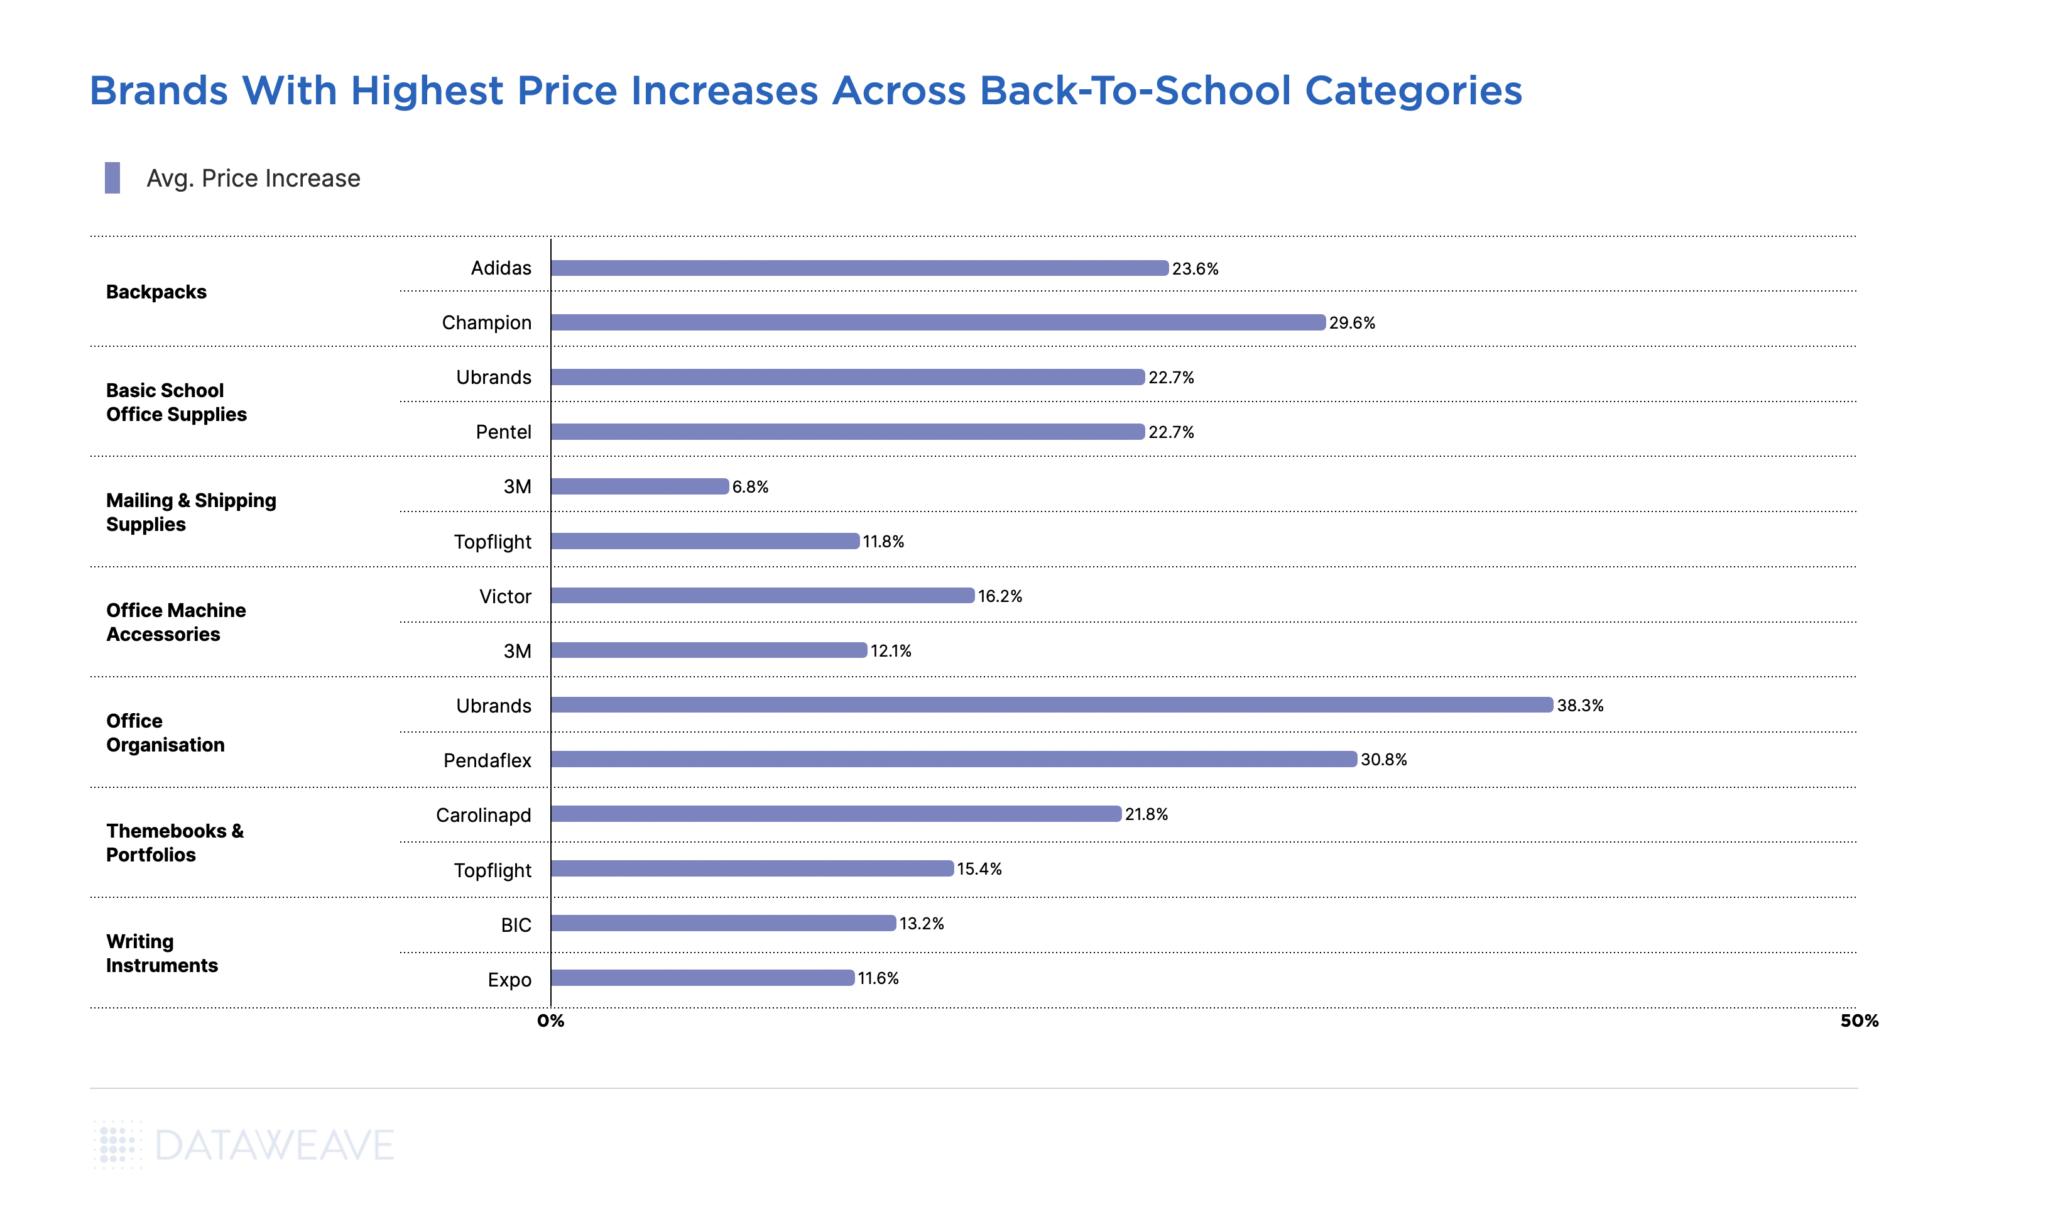
Across various back-to-school categories, some brands stand out with significant price increases. For instance, in the Office Organization category, Ubrands leads the pack with a substantial 38.30% surge, followed by Pendaflex at 30.80%. Meanwhile the Backpacks category sees Champion and Adidas recording significant price jumps of 29.6% and 23.6%, respectively.
Ubrands and Pentel from Basic School and Office Supplies Category also record high price increases at 22.70%, followed by Carolinapd from the Themebooks & Portfolios Category at 21.08%. 3M in Mailing in Shipping Supplies shows the lowest price increase at 6.80%.
Interestingly, the ever popular Writing Instruments category showcases BIC at the forefront, exhibiting the most notable price escalation of 13.2%. Expo trails closely at 11.6%, while Uniball demonstrates an 11.4% increase. Even Sharpie, a beloved writing brand, displays a modest price uptick of 9.3%.
The average price increments seen across brands mirror the overarching trend of increased costs throughout back-to-school categories.
Navigating the Competitive Pricing Landscape During the Back-To -School Season
Given the challenging pricing landscape during the back-to-school season, retailers would be wise to provide lower-cost alternatives alongside popular brand names. This allows parents to easily make substitutions while adhering to a school supplies list.
With our competitive pricing intelligence solution, retailers can confidently analyze and monitor their prices relative to competition, ensuring they maintain a leadership position in pricing within their desired set of products, while posturing for margins with other products.
The home and furniture retail industry is going through a turbulent time. As inflation reared its head mid-2022, leading retailers in the category have been grappling with the higher costs associated with producing and distributing their products, as well as reduced shopper demand. The rising costs of raw materials, transportation, and labor have had a direct impact on the pricing dynamics within the industry. For example, reports indicate container rates soared to nearly 10 times pre-pandemic levels towards the end of 2021.
Furthermore, shoppers’ spending power has been constrained, while higher interest rates have suppressed demand. Retailers have had to adapt their assortment and pricing strategies to cater to a wider range of shopper preferences driven by changing lifestyles and a growing emphasis on sustainability. Post-pandemic, demand has been primarily driven by affluent shoppers.
Towards the end of 2021, due to supply delays and disruptions, retailers heavily stocked up on available products. However, when demand subsequently decreased in 2022, they were left with a significant amount of unsold stock that was purchased at high rates. This put them in a difficult situation, as they had an excess of products but were unable to sell them even at reduced prices without impacting their profit margins. Additionally, staying competitive in a rapidly changing market environment was equally important.
Given this context, it is crucial for home and furniture retailers to adopt a data-driven approach that utilizes competitive and market insights to consistently maintain or increase their online sell-through rates. DataWeave’s Commerce Intelligence solution offers exactly that, empowering retailers across various industry segments to stay updated on evolving consumer trends and competitor actions.
To gain a better understanding of the pricing strategies employed by leading home and furniture retailers throughout the past year, we leveraged our proprietary data aggregation and analysis platform to track and analyze the pricing of a wide range of products across multiple retailers and subcategories within the industry.
Our Research Methodology
Number of SKUs: 400,000+
Key retailers tracked: Amazon, Wayfair, Home Depot, Overstock, Target, Walmart
Key categories reported: Home and Office, Bed and Bath, Bathroom, Bedroom, Decorative, Dining Room, Kitchen, Garden & Patio, Hardware
Timeline of analysis: April 2022 to April 2023
Our Findings
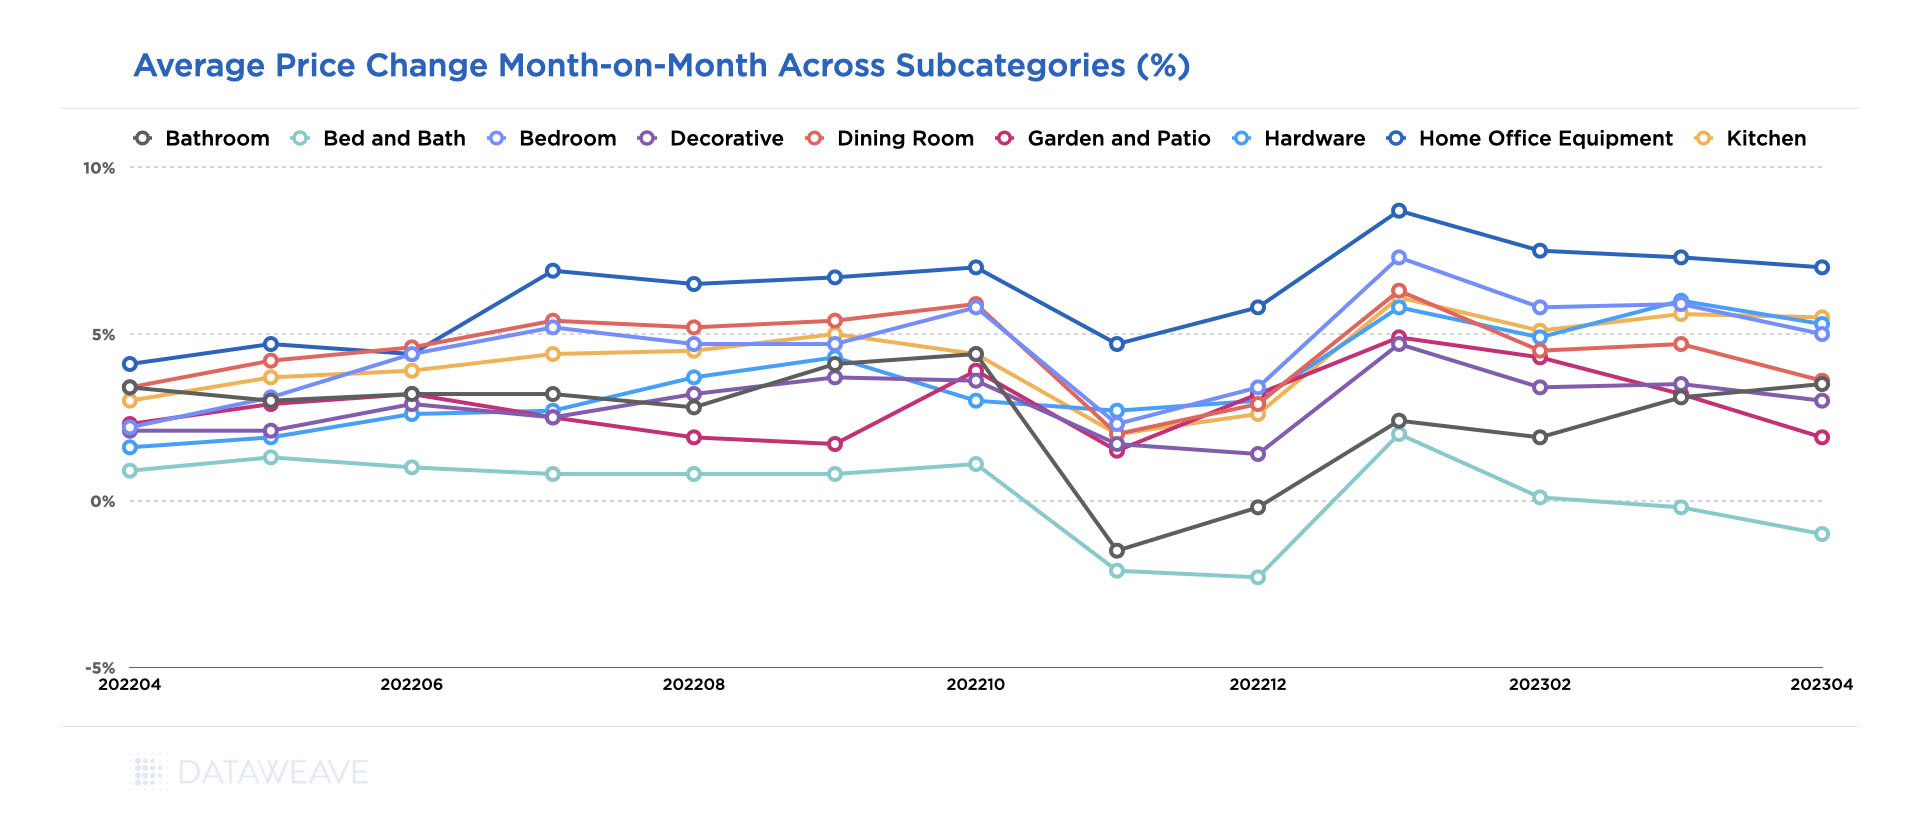
Interestingly, our analysis indicates that average prices in the home and furniture category rose by around 5% between March 2022 and April 2023. However, there have been seasonal fluctuations in the prices over the course of the year.
Among the various subcategories, the most substantial price surge was observed in home office equipment, with an uptick of 9.3% in January 2023 when compared to March 2022. The surge in demand for home office furniture, fueled by the widespread adoption of work from home arrangements, played a pivotal role in depleting inventories and consequently driving up prices. Additionally, the shift towards collaborative workspaces and the gradual expansion of office environments have contributed to the sustained demand for office furniture.
Avg. price changes MoM across home and furniture subcategories from April 2022-23.
While prices for several subcategories rose significantly, others experienced subdued growth, such as bed and bath. The subcategory experienced the lowest price increment, registering a modest 2.8% increase annually. This can be attributed to the impact of a subdued housing market and a decrease in first-time buyers, which may partly be due to the global recession and inflationary pressures.
Moreover, retailers overestimated the demand for home furniture during the holiday season, leading to an overstocking of inventory. Consequently, prices experienced a dip from October to December 2022. In fact, this was a common trend across all home and furniture subcategories. As retailers emerged from the holiday season, prices rose to their highest level in January 2023, and have stayed relatively stable since.
Some of these trends vary among retailers as each faces different challenges and responds in distinct ways.
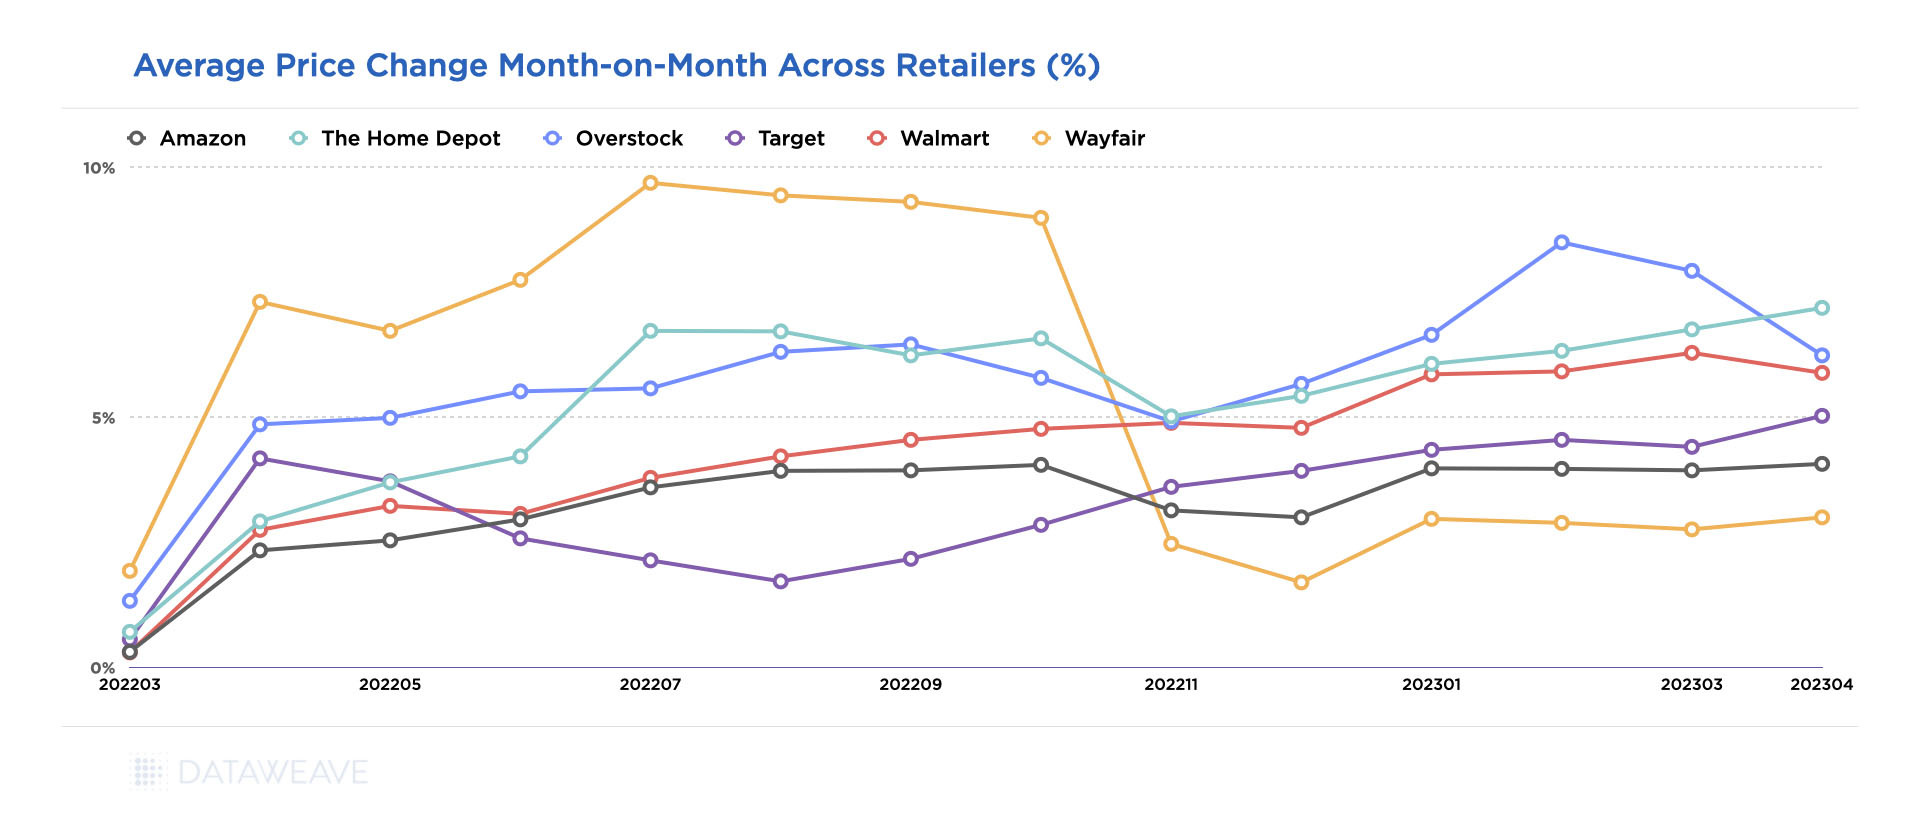
Wayfair, for example, shows a significant dip in pricing after October 2022, with prices stabilizing in 2023. This could be in response to the retailer’s shrinking consumer count, losing 5 million of its 1.3 billion consumers in 2022 due to declining demand.
Avg. price change MoM within the home and furniture sector across retailers from April 2022-23.
In fact, online furniture retailers like Wayfair and Overstock reported declines in annual revenue in 2022, as the furniture sector continued to normalize from the high spending seen during COVID-era lockdowns. Wayfair reported that its 2022 net revenue was $12.2 billion, down almost 11% from the year prior. The company also laid off 10% of its workforce in August 2022. Overstock’s reported annual net revenue in 2022 was $1.9 billion, a 30% decrease year-over-year.
Interestingly, both companies took contrasting approaches in response to this situation. Wayfair opted for aggressive cost-cutting measures, including layoffs and a reduced marketing budget. On the other hand, Overstock focused on attracting new customers through influencer marketing and improving their app, aiming to expand their customer base. With a strategy geared towards younger buyers, Overstock allocated a larger marketing budget than ever before. Our data supports the fact that Overstock did not rely on price reductions to entice shoppers.
Target has consistently maintained lower price increases compared to Walmart, defying the common perception of Walmart being more conservative in its pricing. Notably, Amazon also stood out minimal price increases throughout the year, being surpassed only by Wayfair since November 2022.
As price sensitive shoppers increasingly compare prices before making a purchase decision, retailers need to ensure they are priced competitively in the market on a consistent basis to liquidate stock and gain market share without compromising significantly on margins.
A Sophisticated and Versatile Product Matching Solution is Essential to Achieving Price Leadership
Product matching plays a vital role in monitoring competitive prices and analyzing price leadership. Within the home and furniture category, there is often a multitude of representations for the same product across various online platforms. Furthermore, eCommerce websites offer a wide array of options, including variations in size, color, material, and similar products. Without an accurate and comprehensive method of matching these products, it becomes impossible to track and compare prices effectively, especially on a large scale. Thus, a versatile product matching engine tailored to the unique requirements of the home and furniture sector becomes essential.
DataWeave offers an industry-leading product matching platform that harnesses advanced AI models specifically trained to identify and leverage multiple product attributes extracted from titles, descriptions, and images to accurately match products across websites. Additionally, our platform intelligently matches similar products based on a diverse range of extracted attributes. This empowers our retail partners to gain competitive pricing intelligence not only on exact product matches but also on similar and substitute products, as well as their respective variants.
With our competitive pricing intelligence solution, retailers in the home and furniture industry can confidently analyze and track prices, ensuring they stay at the forefront of price leadership in their market.
The fashion industry is currently undergoing a period of stabilization after facing significant disruptions in recent years. Fashion retailers find themselves navigating not only changing consumer preferences but also the challenges brought about by inflation and supply chain issues that are remnants of the COVID-19 era.
The effects of inflation have raised concerns regarding overabundance, rise of sustainable and pre-used fashion and declining sales, creating a mismatch between supply and demand within the market. As consumers scale back on spending due to rising prices, fashion retailers are left grappling with surplus inventory, heightened storage costs, and reduced profit margins.
Consequently, these market dynamics have significantly impacted the pricing strategies employed by fashion retailers, resulting in dynamic shifts in pricing and competitiveness across different time periods, subcategories, and individual retailers.
Counteracting this impact requires fashion retailers to adopt a data-driven approach that leverages competitive and market insights. They must adopt agile and versatile pricing strategies that enable advanced pricing and assortment management. By understanding their market position and the competitive landscape, retailers can effectively react to reduced demand and inflationary pressures without compromising heavily on their top line and profitability.
At DataWeave, we harnessed the power of our proprietary data aggregation and analysis platform to track and analyze the prices of prominent fashion retailers to uncover unique insights into their price competitiveness over the past year, as well as understand how pricing strategies varied across diverse subcategories.
Our Methodology
For this analysis, we tracked the average price changes among leading US fashion retailers over 12 months to understand how their pricing across several fashion subcategories altered in response to supply chain inefficiencies, inflationary pressures, seasonal effects, and changing consumer preferences.
Sample: 88,000+ SKUs matched across 5 leading retailers
While prices have generally been rising in several industry segments, such as groceries, due to inflation, the fashion sector has experienced relatively stable prices, with even a few periods of price drops. In fact, average prices in April 2023 are 1.2% lower than those in April 2022. The main reason for this trend is that consumers have become cautious about discretionary spending on fashion in order to prioritize other necessities, resulting in lower demand and overstocking by retailers.
In the first quarter of 2022, clothing accounted for only 3.9% of total expenditure by US consumers, down from 4.3% in 2019 before the pandemic. Additionally, in March 2023, 60% of fashion retailers in the US still had surplus goods, accounting for almost 20% of their entire stock. As demand decreased, fashion retailers started offering freebies with purchases, bundling products, giving away unwanted items, and notably, slashing prices.
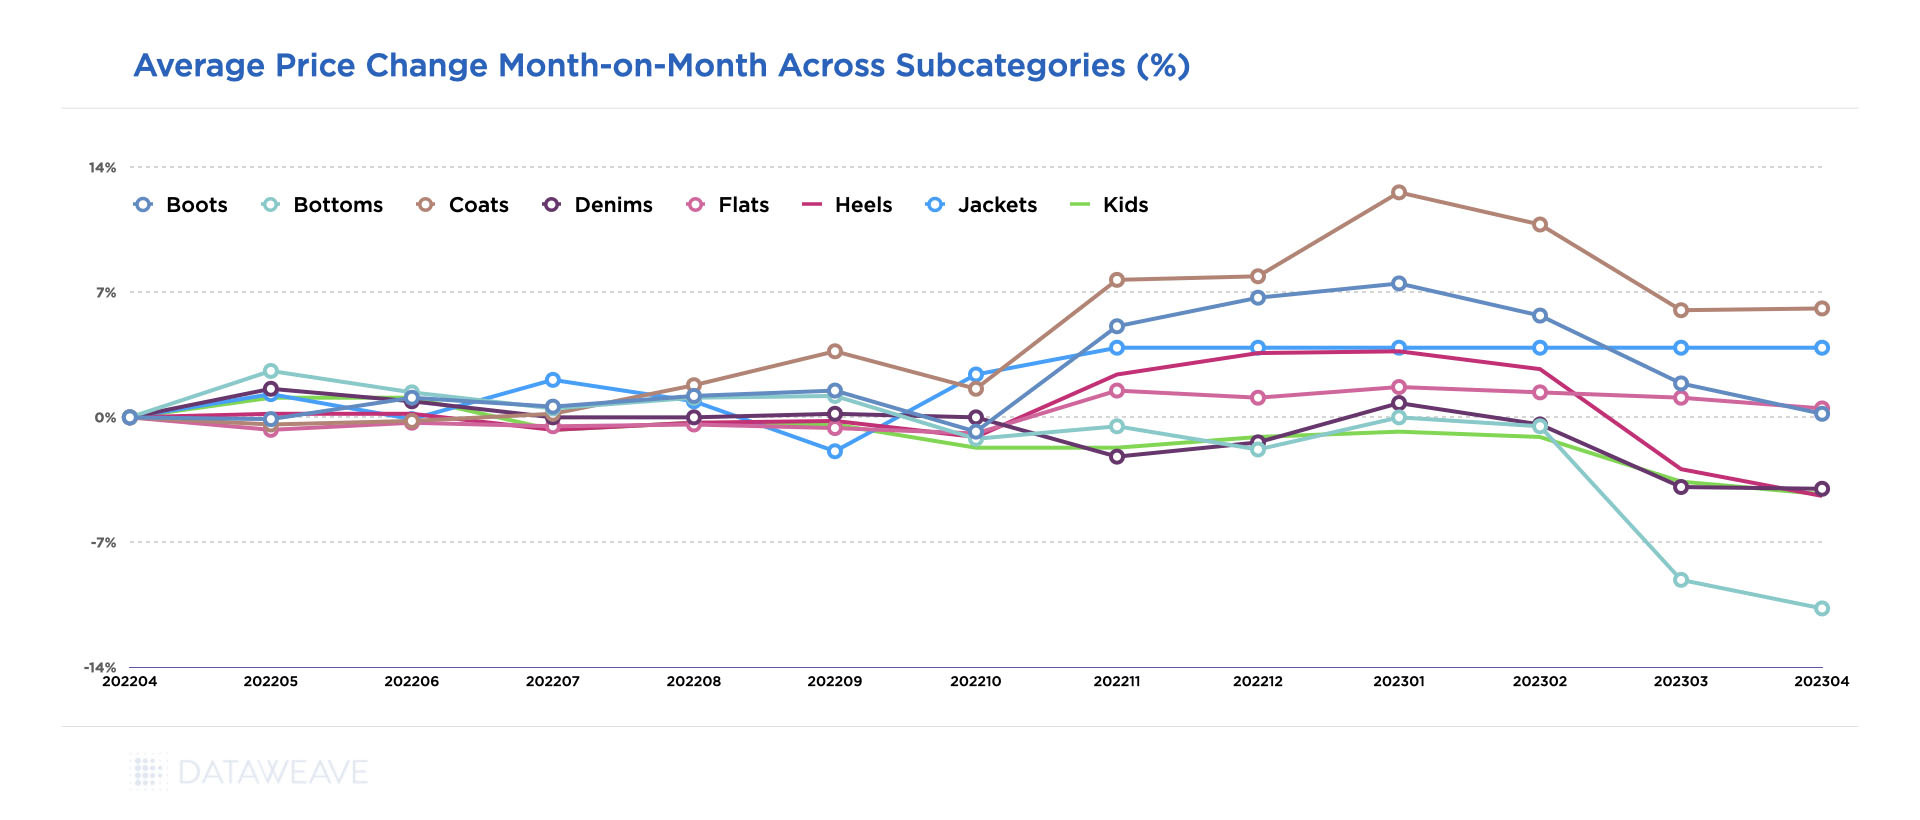
Subcategory level analysis of Average Price Change Month-on-Month between April 2022 – April 2023
Our analysis at a subcategory level reveals that in winter 2022, seasonal demand led to the largest price increases of 6-11% in coats, boots, and jackets. However, these prices quickly declined afterward. In 2023, stabilization of raw material costs and a continuing decline in demand for non-essential apparel and fashion accessories are factors contributing to a significant drop in prices.
Some of these trends vary among retailers as each faces different challenges and responds in distinct ways. Our data indicates that some retailers have chosen to increase their prices from Q3 2022 due to mounting pressure on profit margins, while others have further lowered prices due to increasing inventory levels.
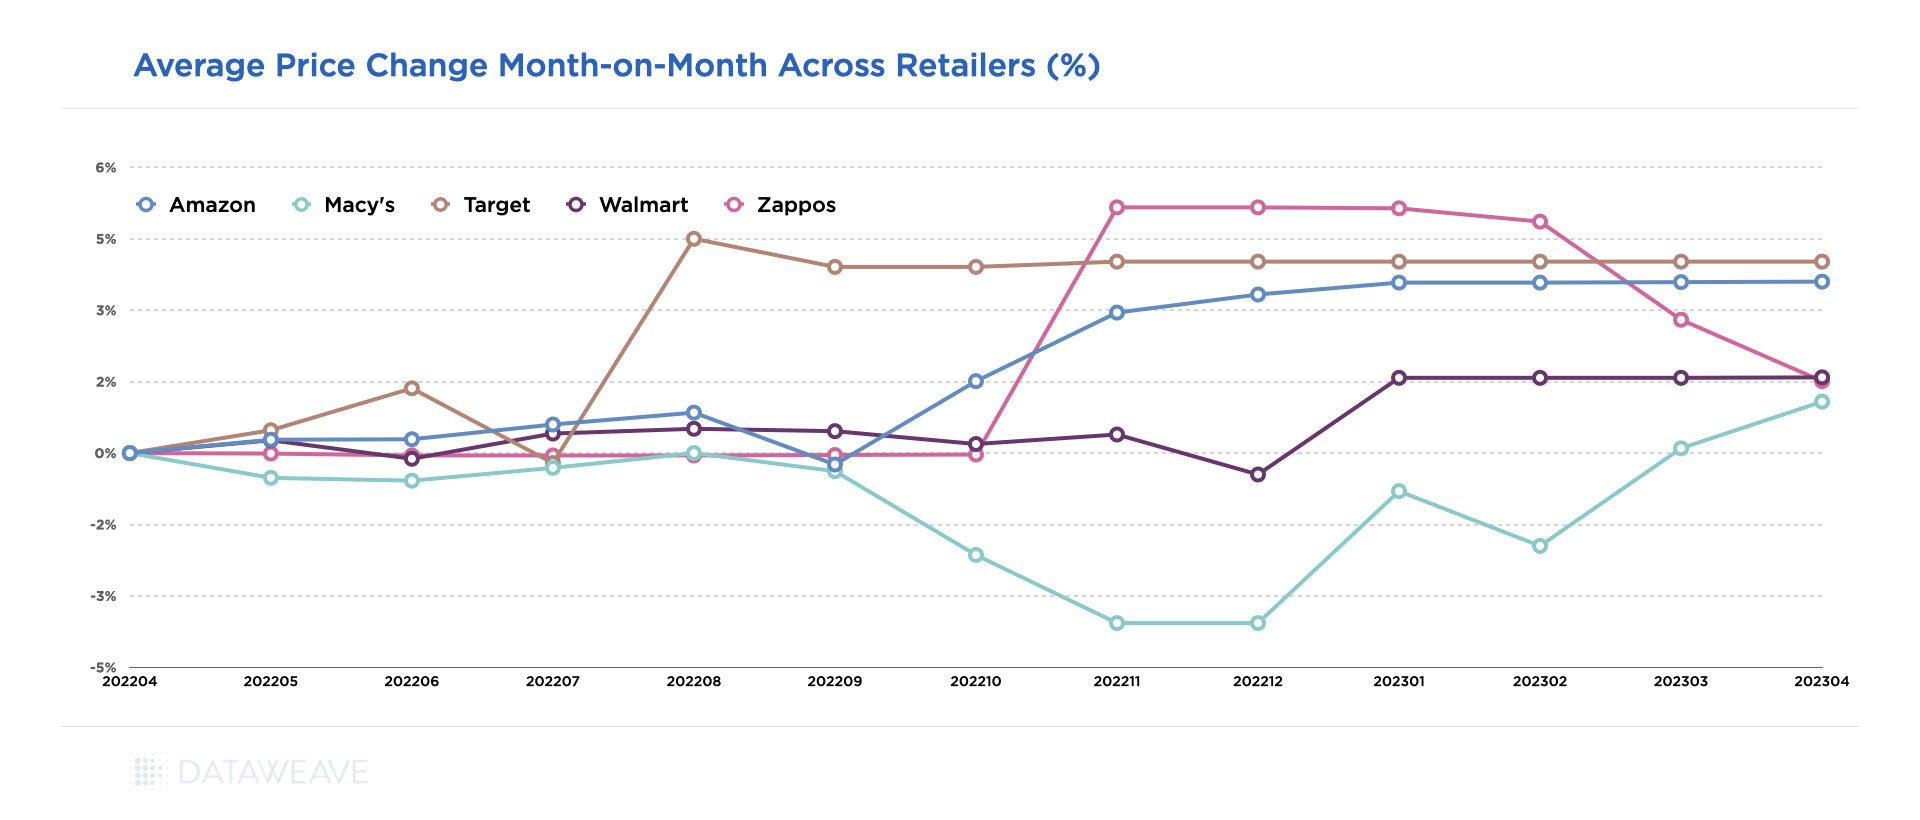
Average Price Change Month-on-Month Across Amazon, Macy’s, Walmart, Target, and Zappos between April 2022 – April 2023
_____________
Capability Spotlight
Matching products across competitor websites is an essential part of tracking competitive prices and analyzing price leadership. In fashion, matching exact products is no mean feat. Websites often host a slew of variants in terms of size, color, material, etc. without any form of standardization in the way the products are represented. So fashion retailers often struggle with simply unusable pricing insights resulting from inaccurate and incomplete product matching.
DataWeave’s industry-leading product matching algorithm recognizes and leverages dozens of product attributes extracted from product titles, descriptions, and images to match products at very high levels of accuracy and coverage. What’s more, our platform can also match similar products based on a large variety of parameters, so our customers can benefit from a comprehensive competitive perspective.
_____________
For example, in August, Target reported a 90% plunge in profits during the second quarter of 2022, as shoppers concerned about inflation reduced spending on nonessential items. The company stated that its price cuts did not have the desired impact, resulting in a 1.5% increase in inventory compared to three months prior. As a result, we can see that Target’s average fashion prices spiked in August 2022 and have remained steady since then. Walmart also faced similar challenges and increased its prices in October 2022.
However, during the same period in August 2022, Macy’s announced increased discounts to clear out excess inventory in preparation for the holiday shopping season. In the same announcement, Macy’s highlighted how the rising cost of groceries, which had experienced a double-digit increase, was impacting consumers’ budgets, changing their behaviors, and increasing the need for discounts. Our data reflects this, showing a significant drop in prices from October 2022 to January 2023.
However, in January 2023, Macy’s successfully managed its inventory levels, reducing them from $6.4 billion in October 2022 to $4.3 billion in January 2023. As a result, average prices at Macy’s have started to rise.
_____________
For today’s fashion retailers, achieving a balance between expansion goals and profitability is crucial. It requires a meticulous examination of competitive and market insights on a regular basis to mitigate competitive pressures and navigate through these challenging times successfully.
DataWeave’s platform offers retailers the insights they need to gain a competitive advantage. With access to accurate, timely, and actionable pricing and assortment insights, retailers can make informed decisions and stay ahead of the competition. To learn more, reach out to us today!
Inflation, like an invisible force, silently shapes the dynamics of economies, gradually eroding the purchasing power of consumers and leaving its imprint on various industries. High costs, hiring lags, and stagnating earnings pose severe challenges to businesses. One industry segment that intimately feels the impact of inflation is grocery, where price increases can be extremely concerning for the average consumer.
Over the last 12-plus months, the US has experienced a notable rise in inflation, stirring up concerns and influencing the way we shop for everyday essentials. Rising costs of raw materials, transportation, and labor have all played a role in driving up prices. Additionally, disruptions in global supply chains and fluctuations in currency exchange rates have further exacerbated the situation, creating a complex web of interdependencies.
To understand the magnitude of this phenomenon across leading e-retailers, we delved into an in-depth analysis of four major retail giants: Walmart, Amazon, Target, and Kroger.
Each of these retailers possesses a unique business model and competitive strategy, as well as faces unique challenges. This leads to distinct approaches to managing inflationary pressures. Walmart for instance, expects operating income growth to outpace sales growth in 2023. Given the persistence of high prices and the potential for further macro pressures, the retailer is taking a cautious outlook. In 2022, Amazon’s eCommerce business swung to a net loss of $2.7 billion, compared to a profit of $33.4 billion the previous year.
Amid these challenging circumstances, understanding the grocery pricing trends and strategies becomes imperative for retailers, both online and in stores to adapt and thrive in the current economic landscape. By examining their pricing trends, we can gain valuable insights into how these companies navigate the turbulent waters of the grocery industry against the backdrop of inflation.
Our Research Methodology
The data collected for our analysis encompassed a diverse range of products, from pantry staples like flour and rice to perishable goods like dairy and produce – a basket of around 600 SKUs matched across Amazon, Kroger, Target and Walmart, between January 2022 to February 2023.
Further, we separately focused on the prices of a smaller subset of 30+ high-volume daily staples that are likely to yield higher sales and margins for these retailers.
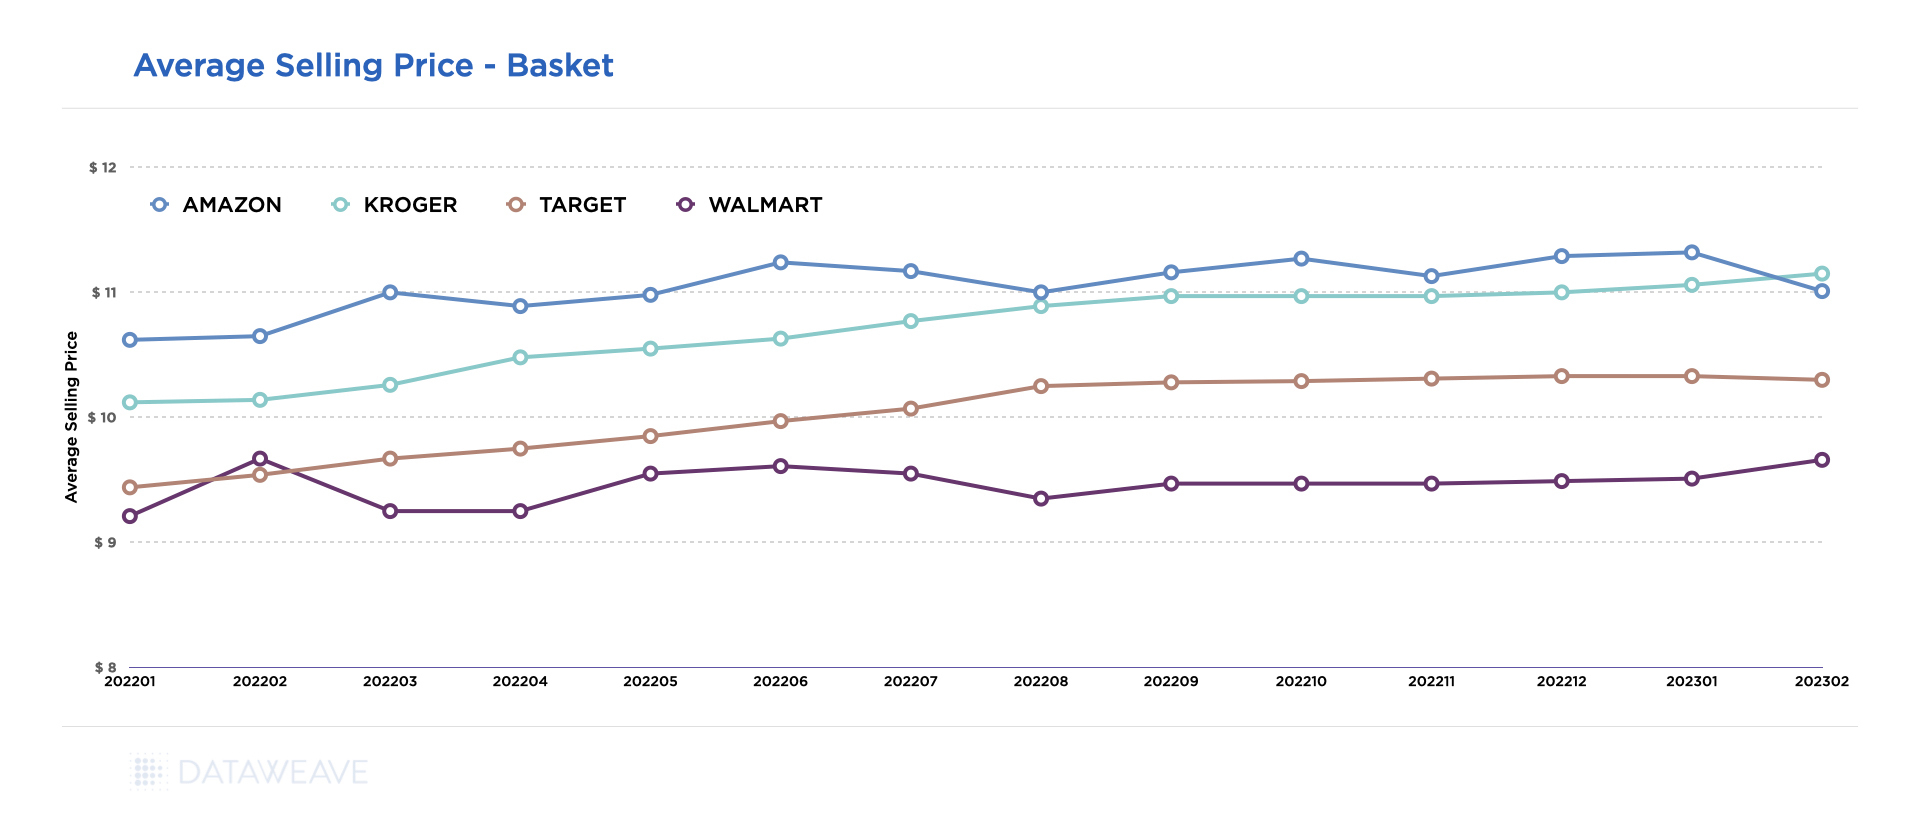
Average Selling Price of a Broad Set of Grocery Items
Our analysis reveals that Walmart consistently offers the lowest prices, with an average of 8% below its closest competitor, Target, despite an annual price increase of about 5%. Walmart seems to prioritize a “stability and predictability” strategy over margin optimization. The retailer’s 8% growth last quarter indicates that this strategy is bearing fruit. However, it’s important to note that this approach may have its drawbacks as Walmart’s margins come under pressure.
Average selling price trend across a basket of 500+ SKUs across Target, Walmart, Kroger, Amazon in the grocery category from Jan ’22 to Feb ’23.
In order to weather inflationary pressures, Walmart may adopt a cautious approach to growth while also focusing on securing margins. Reports suggest that the retailer has been pushing back against consumer packaged goods (CPG) manufacturers following a series of price hikes to counter inflationary cost pressures in early 2023. One of the reasons behind Walmart’s growth and increased sales can be attributed to ‘non-traditional’ higher-income households now seeking deals and discounts at Walmart as their spending power declines.
Interestingly, Amazon emerges as the highest-priced retailer, followed by Kroger, which increased its prices by 10% throughout the year. Consumer perception commonly associates Amazon with the lowest prices, but the data tells a different story. In fact, Amazon has been charging 12% to 18% higher prices than Walmart for groceries and is still maintaining its success.
While the company’s online sales declined by 4%, it saw a significant 9% increase in revenue from third-party seller services, such as warehousing, packaging, and delivery, in 2022. Amazon’s strong logistics and same-day delivery services give it a competitive advantage over other retailers, contributing to its revenue growth and margins. Interestingly, this presents an opportunity for Walmart and other retailers to increase prices while maintaining their strong competitive price positions.
Kroger, on the other hand, seems to be aiming for a premium price perception, consistently raising prices almost every month. Kroger’s pricing strategy appears to be closer to Amazon’s.
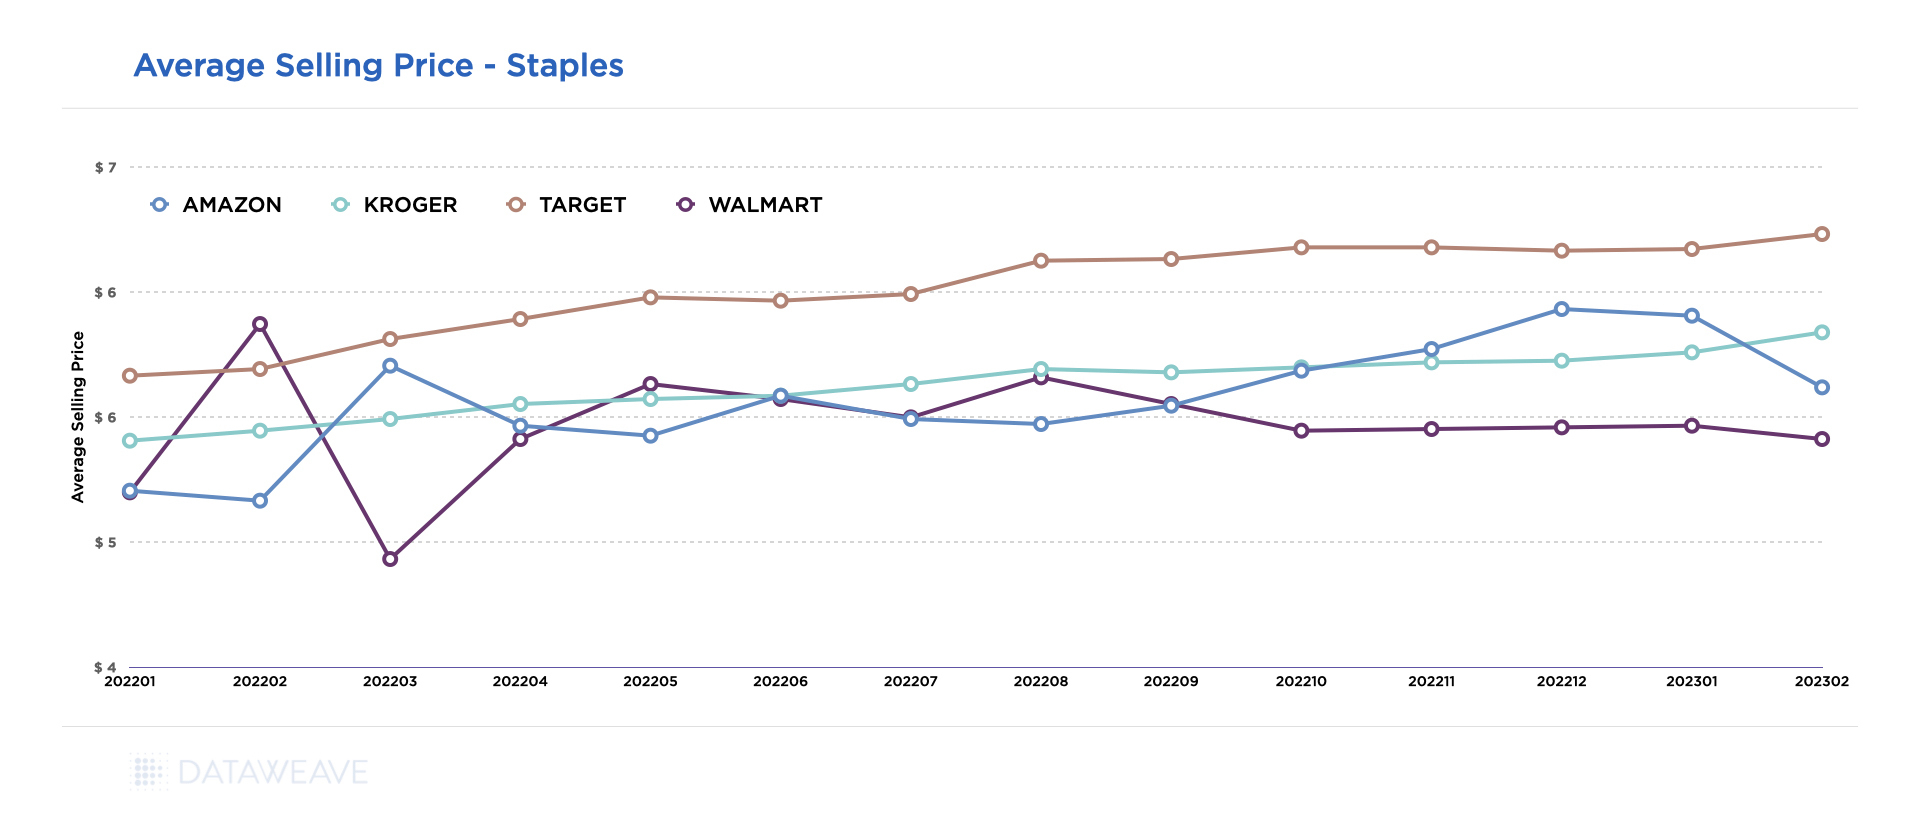
Average Selling Price for High-Volume Daily Staples
Pricing strategies often change for different categories of products. To better understand this, we focused our analysis further on a small subset of 30+ high-volume staples across retailers. These include baked goods, popular beverages, canned food, frozen meals, dairy, cereals, detergents, and other similar items.
Average selling price trend of 30+ high-volume daily staples across Target, Walmart, Kroger, Amazon in the grocery category from Jan ’22 to Feb ’23.
Walmart, possibly overestimating the impact of inflation, has continued to keep its prices the lowest, potentially aiming to increase margins through volume.
The level of price disparity across retailers is expectedly lower here, with Amazon and Kroger closely tracking Walmart’s average prices.
Target’s pricing strategy stands out as it consistently emerges as the highest-priced retailer for daily staples, despite being one of the lower-priced retailers for a broader basket of grocery items. This suggests that Target’s underlying technology may not be as optimized to address market dynamics compared to other leading retailers. In our opinion, Target may want to strengthen its efforts to track pricing more intensely for this sub-category.
A Data-fuelled Approach is the Need of the Hour
In the challenging economic landscape, retailers and grocery stores are under pressure to maintain their revenues and margins. Adopting a comprehensive and dynamic pricing strategy is crucial. Understanding which product categories are experiencing price increases among competitors can help retailers make informed decisions on pricing at both the category and product level.
Retailers should consider their balancing margin performance with consumers’ willingness to pay, rather than implementing broad price increases that may harm customer trust. Price increases can be challenging for both customers and merchants. Retailers who employ a data-driven and insight-based approach are more likely to succeed.
Keep an eye on the DataWeave blog for analysis on pricing, discounting, stock availability, discoverability, and more, across retailers and brands from other industry segments as well.
As the baby formula shortage continues, retailers and brands are working quickly to meet evolving consumer demand, considering supply chain driven headwinds, a baby formula recall, and inflationary-driven impacts. The DataWeave analytics team has actively tracked marketplace changes, alongside reports from the FDA, for the baby formula category at a state-level, and has shared the latest snapshot of product availability through June 7th, 2022, below.
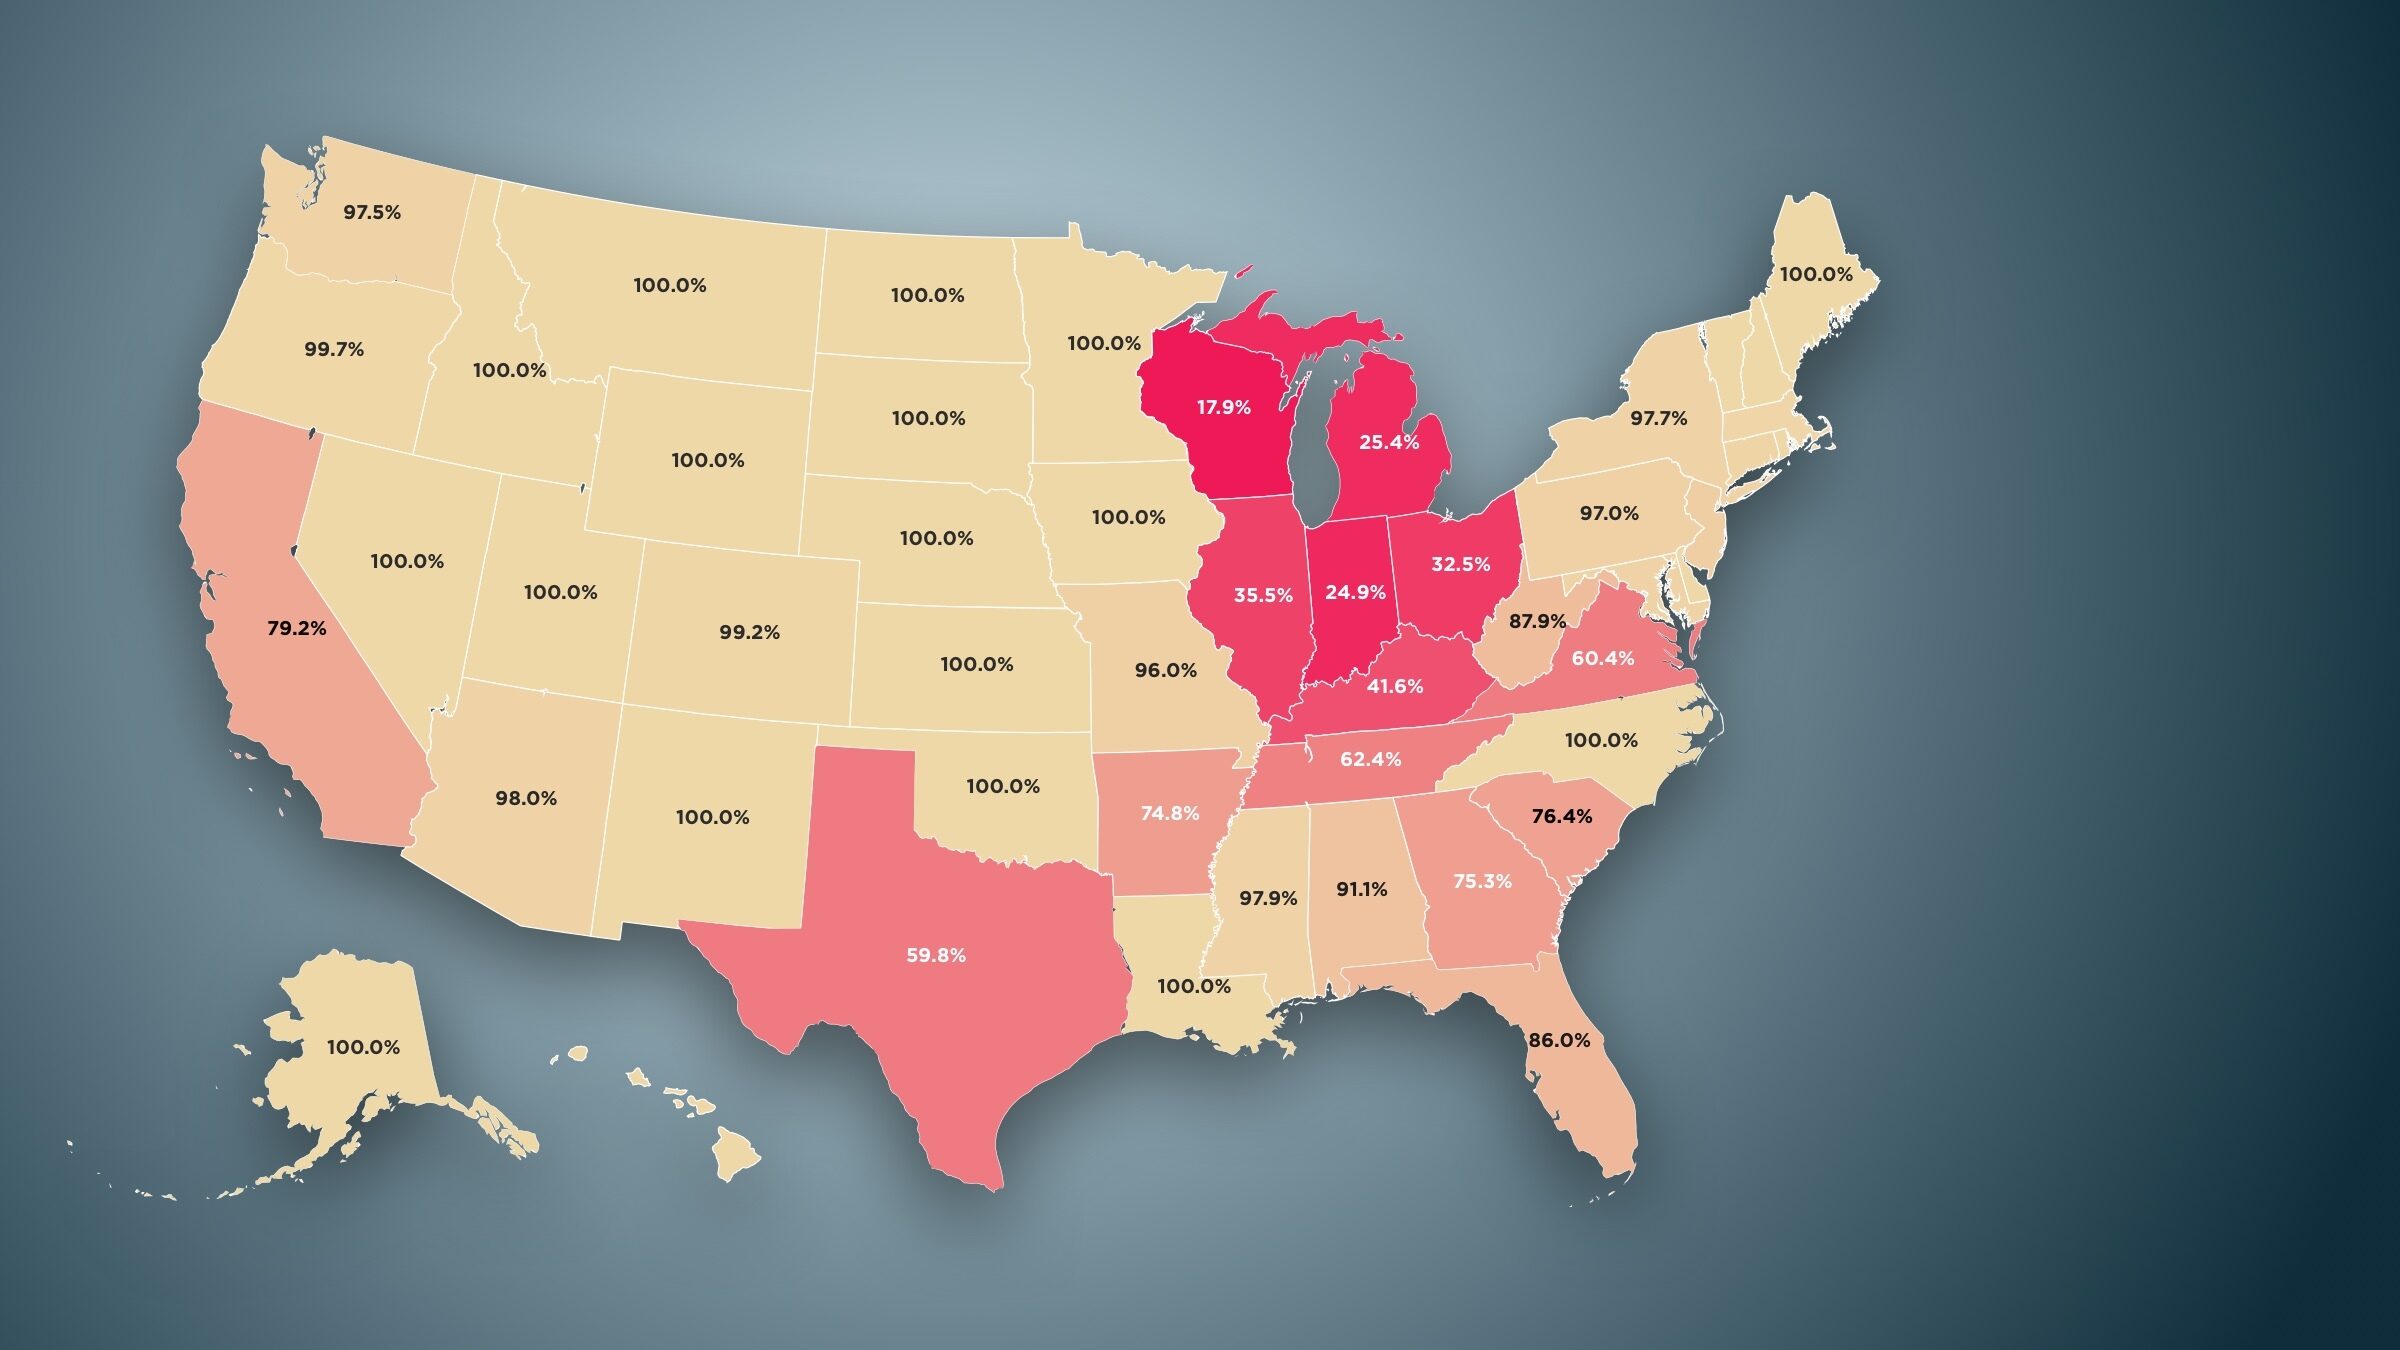
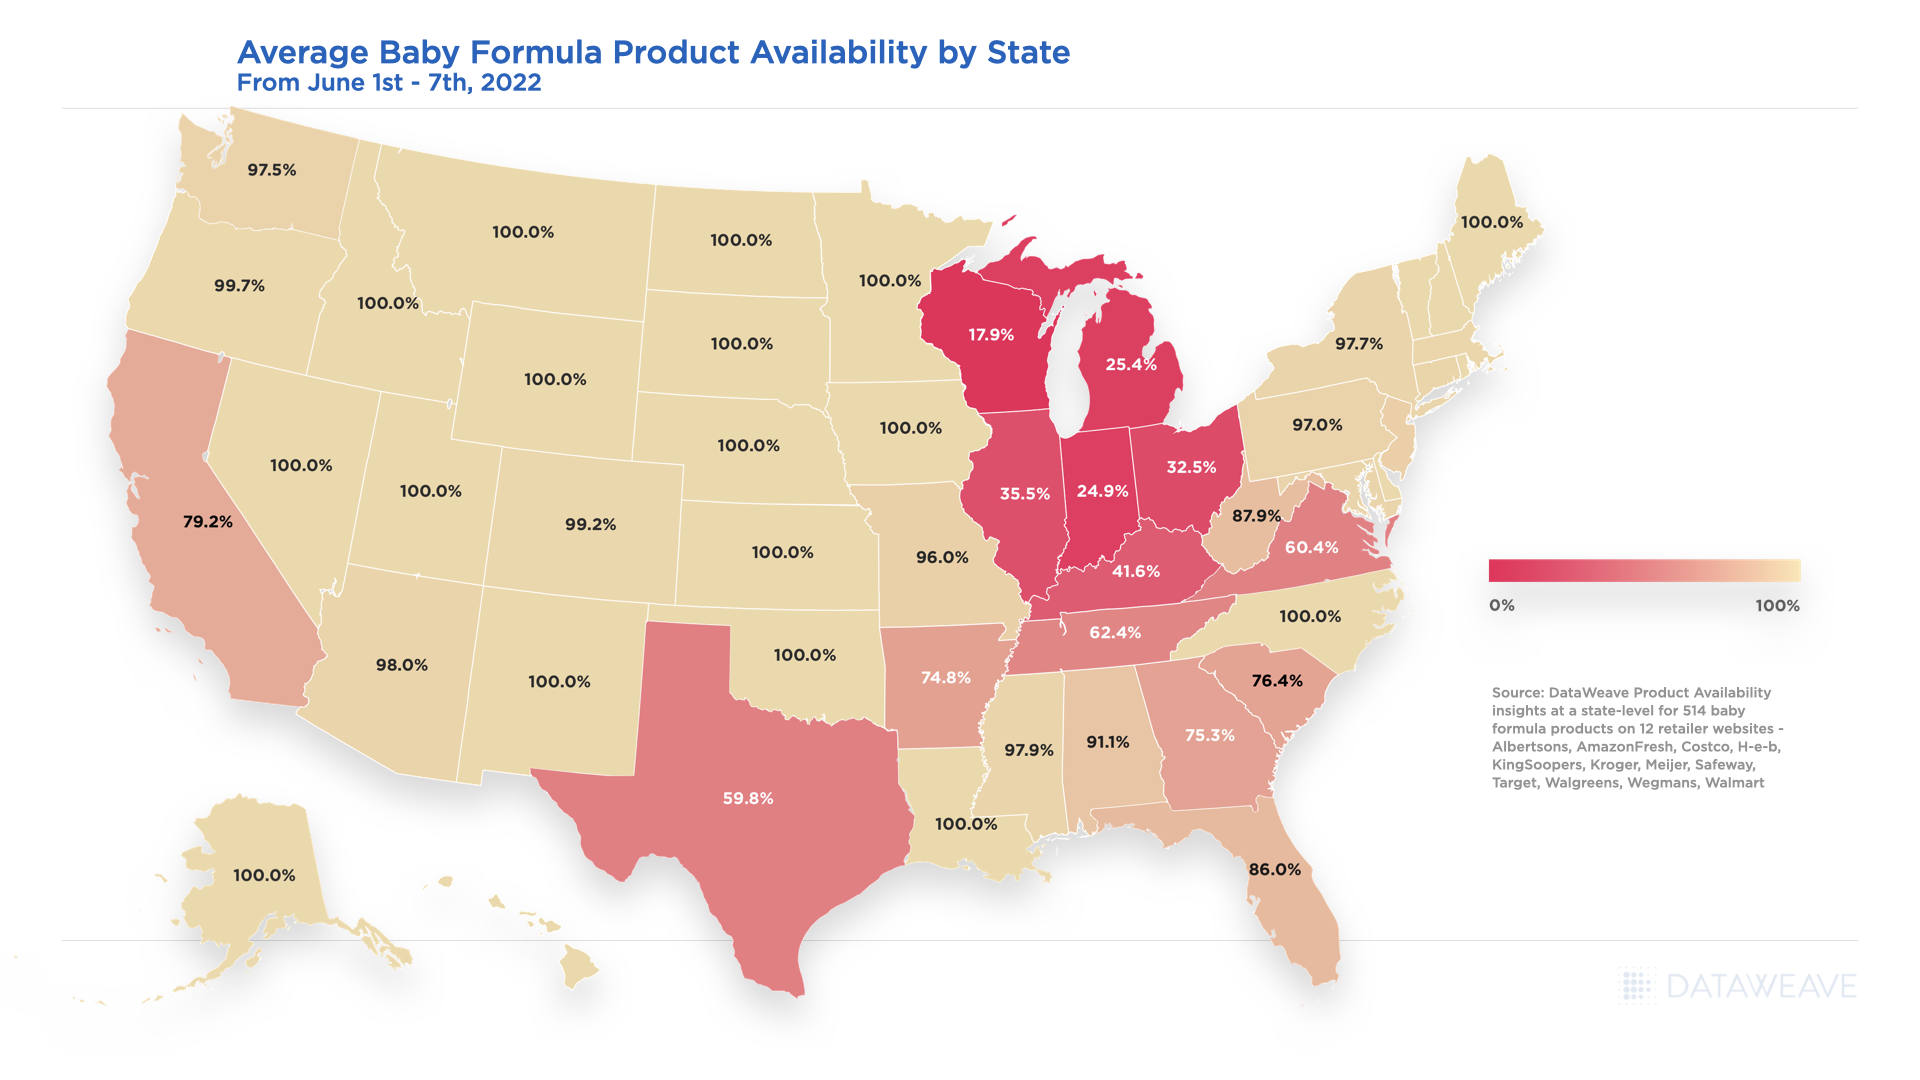
Average Baby Formula Product Availability by State – June 2022
While the U.S. has reached an average of 84% baby formula availability the first week of June 2022, given recent news headlines related to the baby formula shortage, and tracking out of stock encounters by state, we see a continued decline in availability throughout the Midwest versus product availability levels seen in May 2022.
Wisconsin, Michigan, Illinois, Indiana, Ohio, and Kentucky all show average availability for baby formula to be less than 50%, with Wisconsin being impacted the most at less than 18% average availability. While Texas shows an average availability improvement of 3.5% from the first two weeks of May 2022 to the first week of June 2022 as noted in the below chart, availability is also very low overall at less than 60%.
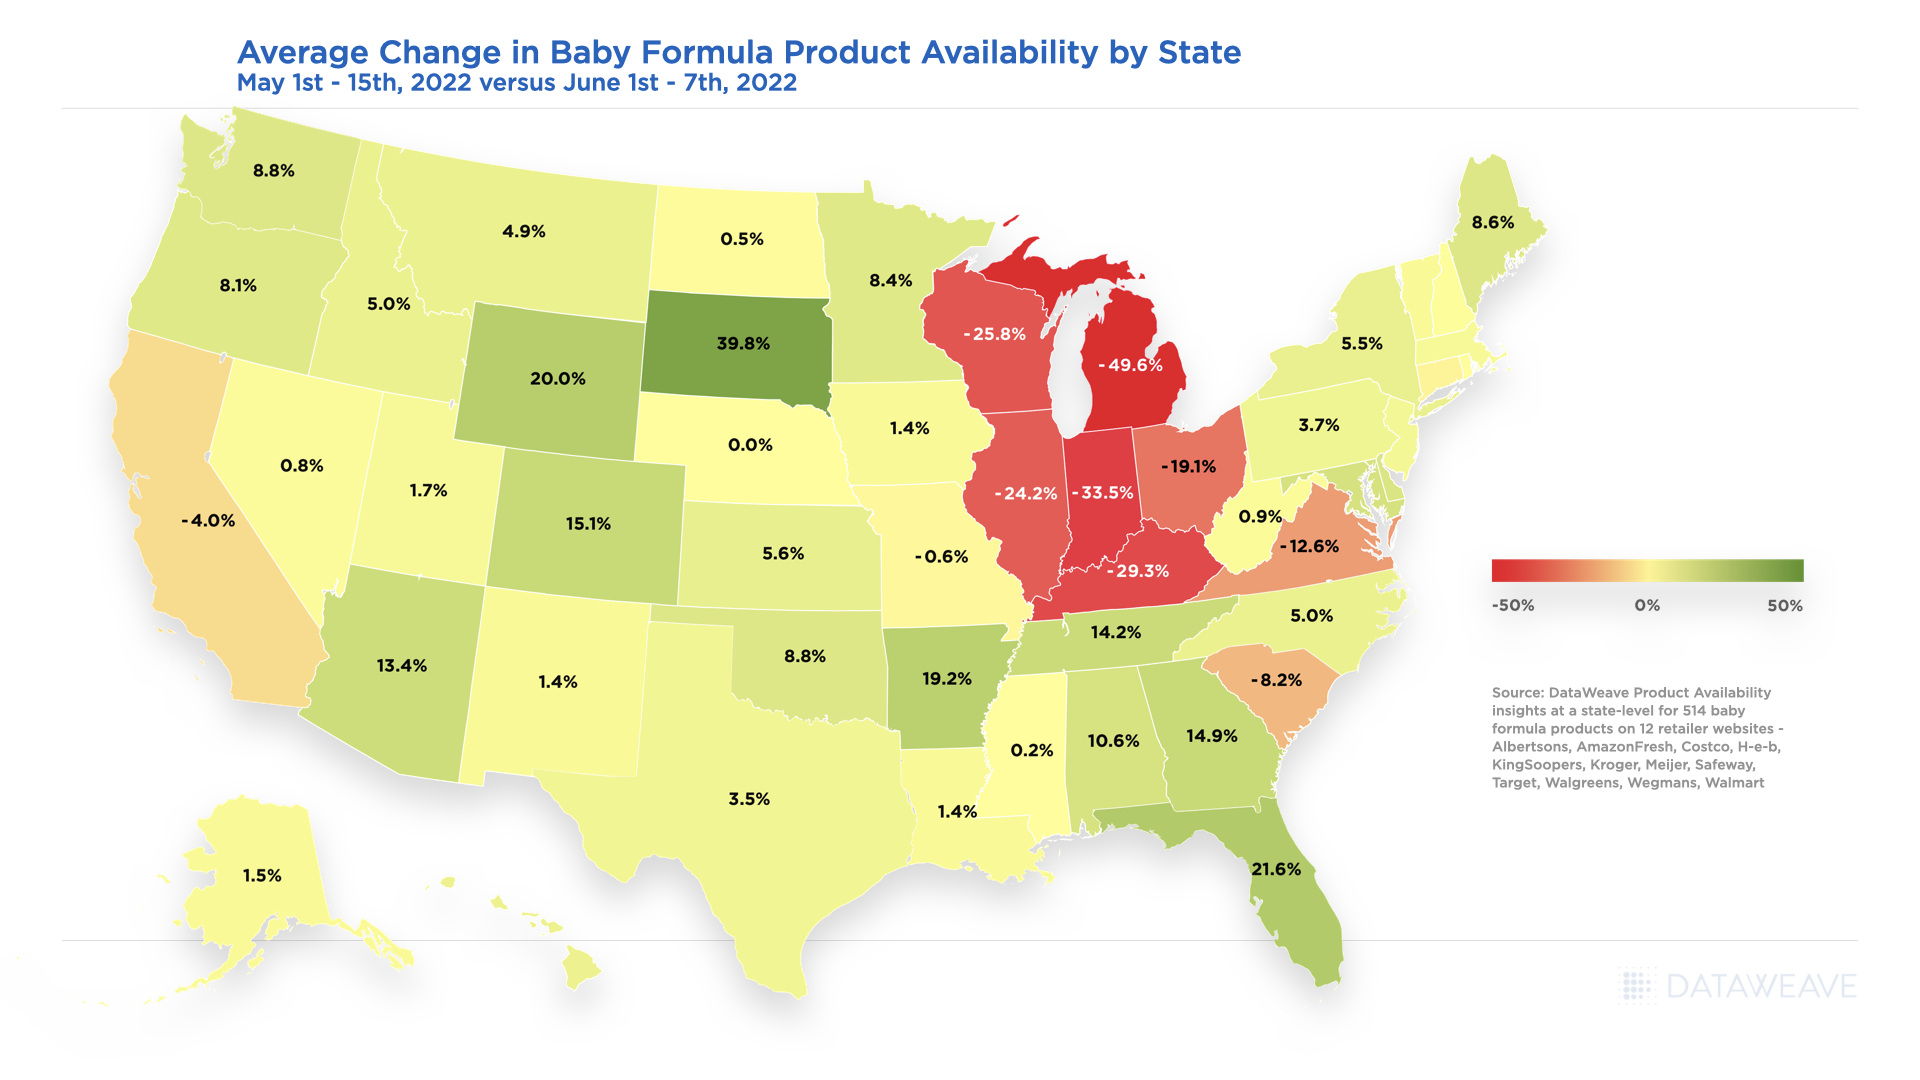
Average Change in Baby Formula Product Availability by State – May 2022 to June 2022
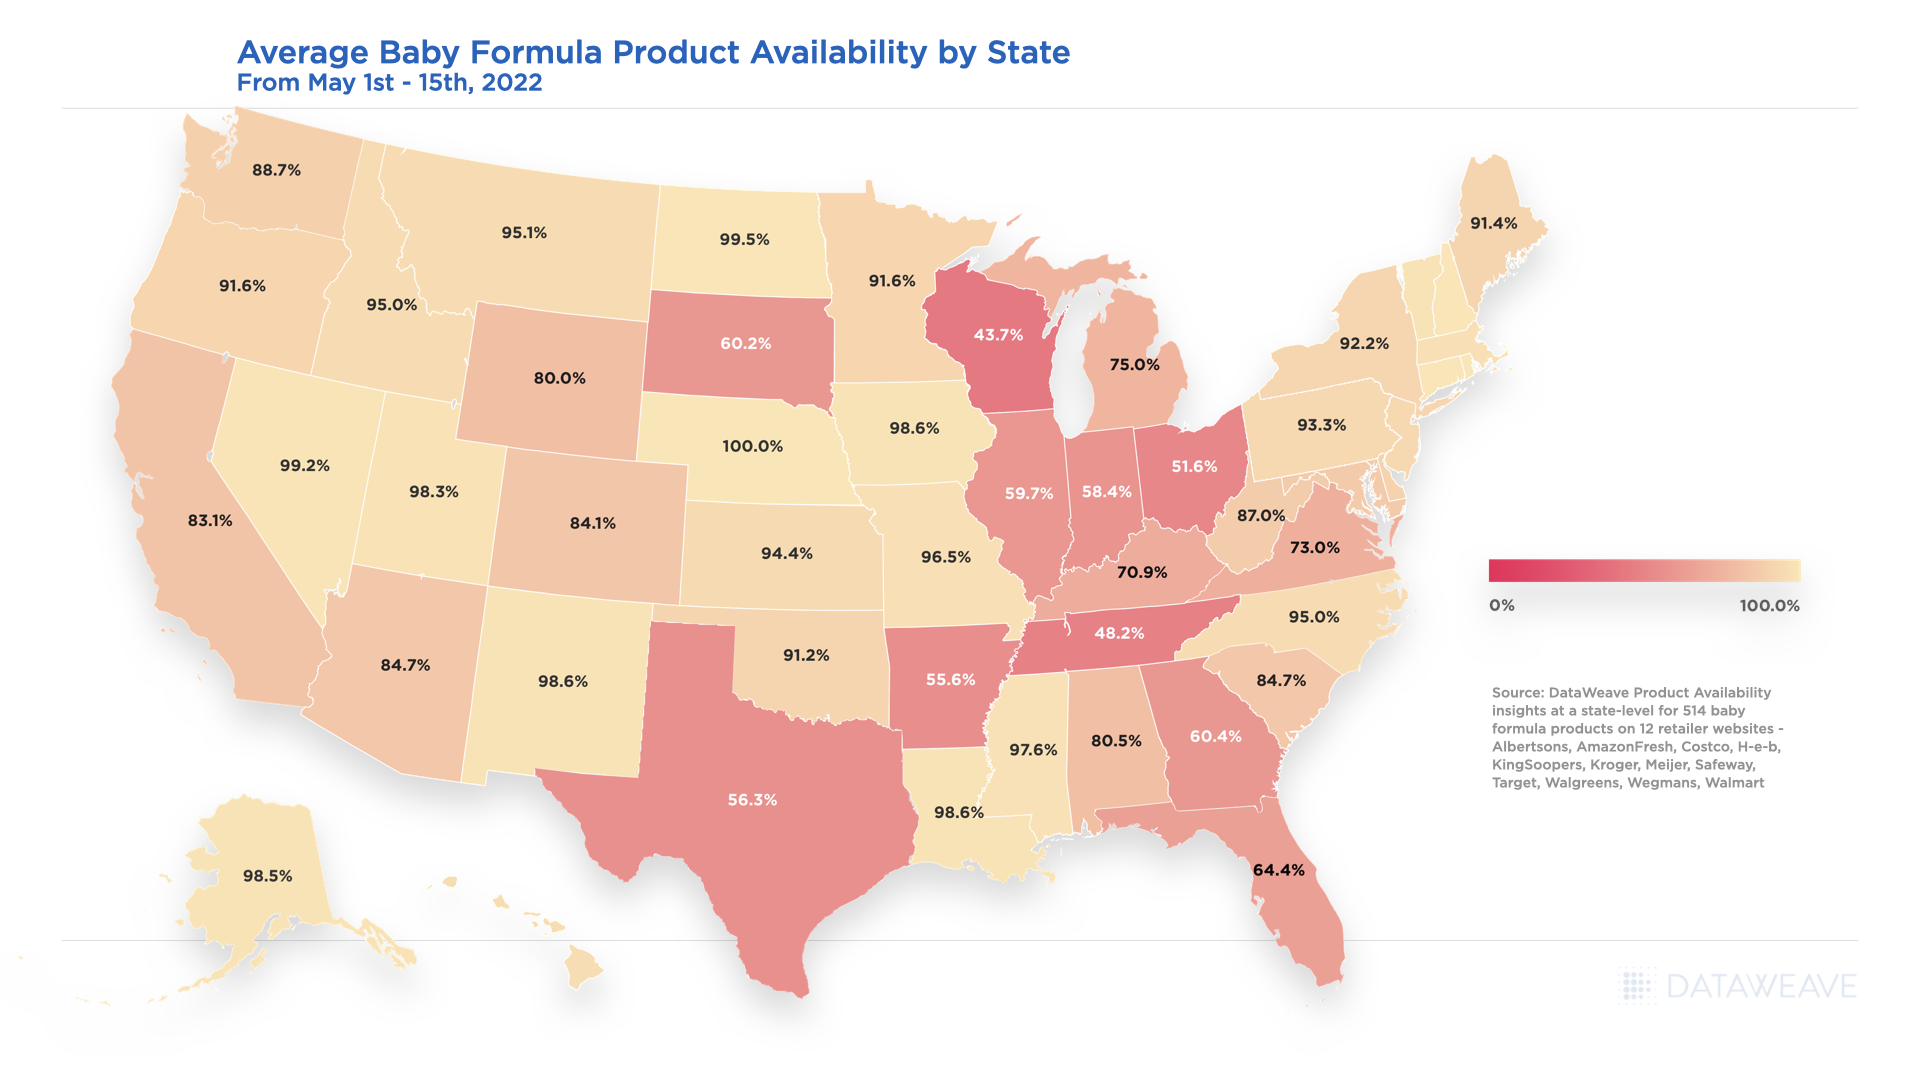
Outside of the Midwest and Texas, the other states for consumers to be cautious in are California, Virginia, and South Carolina as their month-over-month average change in availability also declined 4%, 12.6% and 8.2% respectively. Below is a snapshot of where the baby formula availability average started as of May 1st through the 15th, 2022.
Average Baby Formula Product Availability by State – May 2022
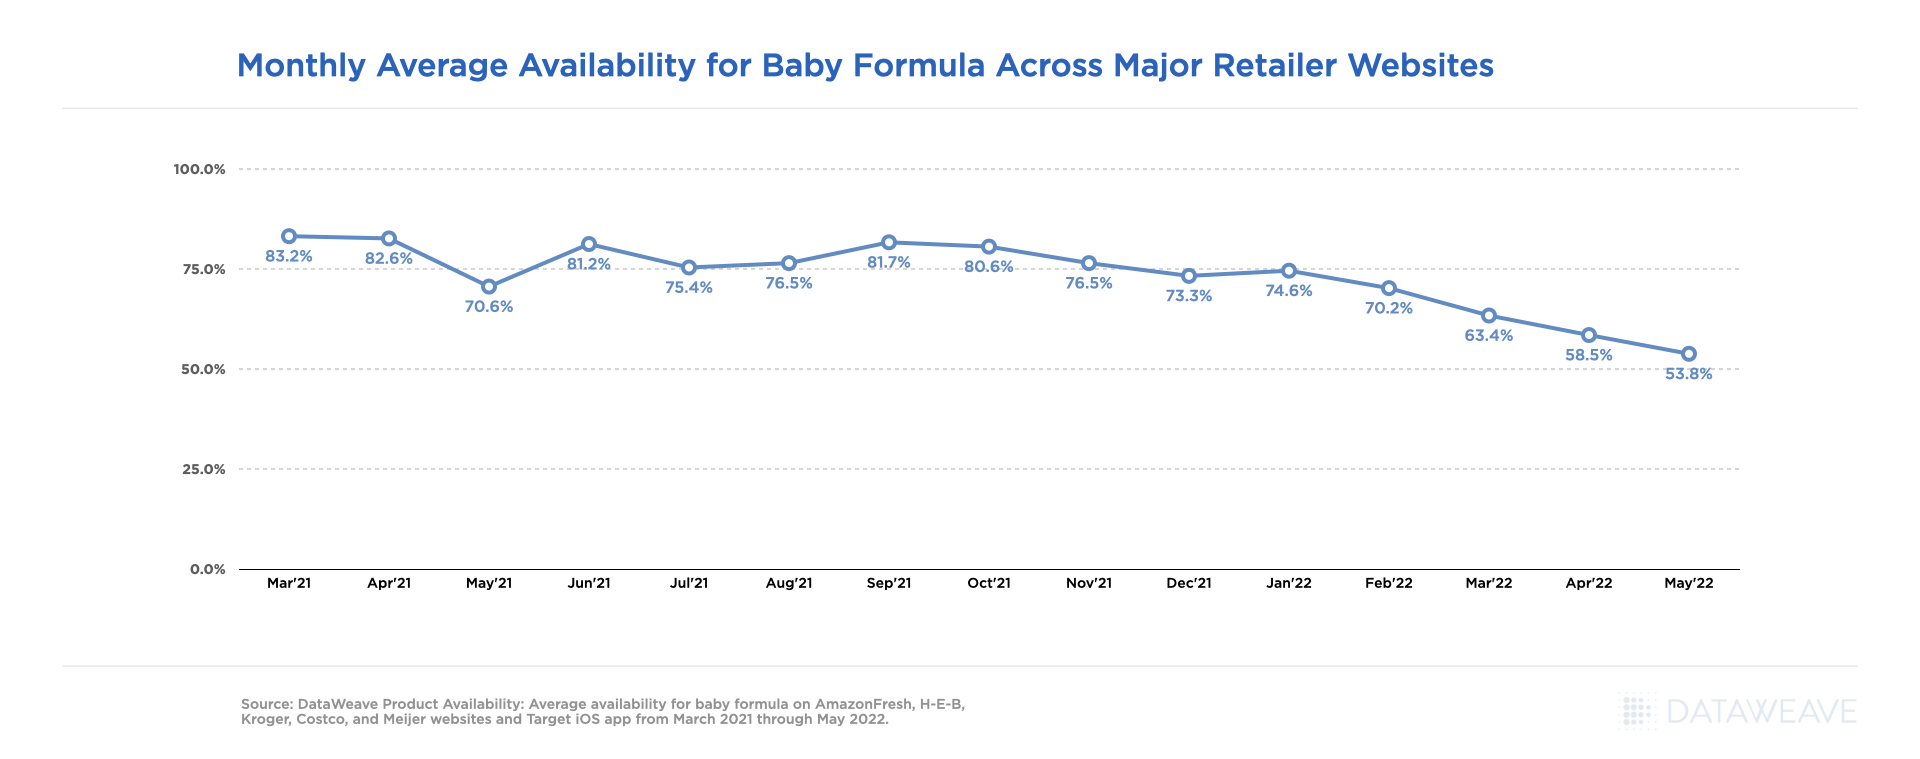
Baby Formula Product Availability Changes – March 2021 through May 2022
At an aggregated level overall, the availability for baby formula was relatively stable across all retailers considered within our analysis from March 2021 through September 2021, but has been on a steady decline ever since, starting at 81.7% availability in September and ending at 53.8% availability in May 2022 as noted in the below chart.
Monthly Average Availability for Baby Formula Across Major Retailer Websites
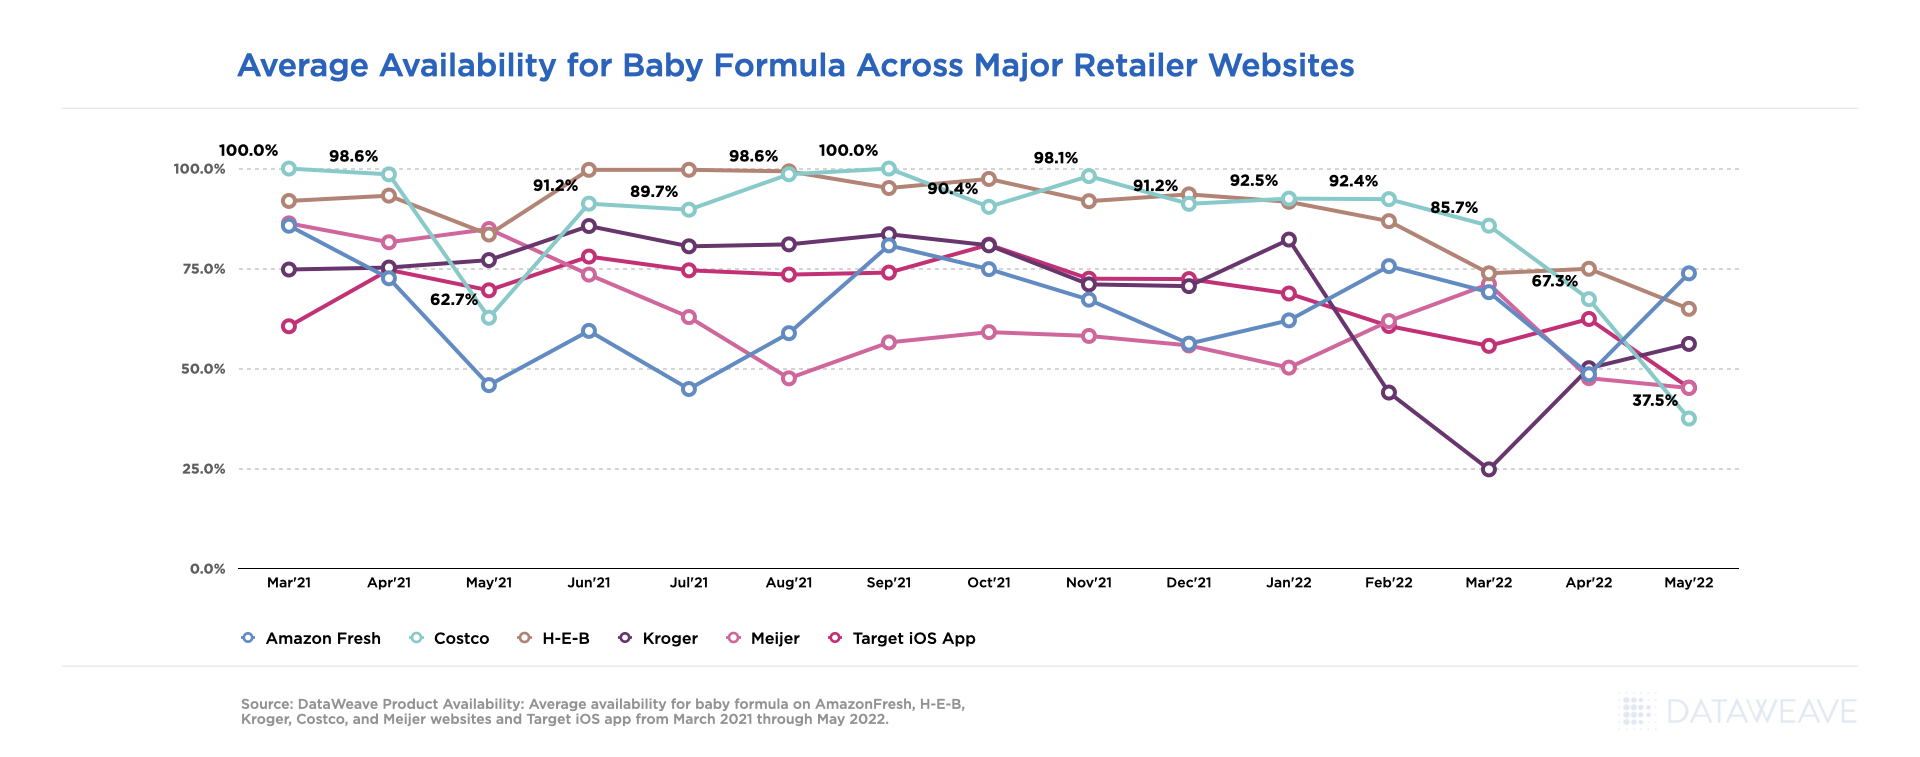
Looking at baby formula availability at a retail level, we saw yet again not all availability challenges were alike, by month or retailer. Costco.com lead the other retailers within our analysis for greatest average availability from March 2021 through May 2022, but had one of the lowest availability percentages at 62.7% in May 2021, and dropped to the lowest availability of the group in May 2022 at 37.5%.
Average Availability for Baby Formula Across Major Retailer Websites
Baby Formula Prices Increase as Availability Changes
While unnecessary price gouging is prohibited, price increases are still happening at a slow and steady rate across all the accounts included within our Pricing Intelligence analysis given external market factors outside of baby formula recall related stockout scenarios.
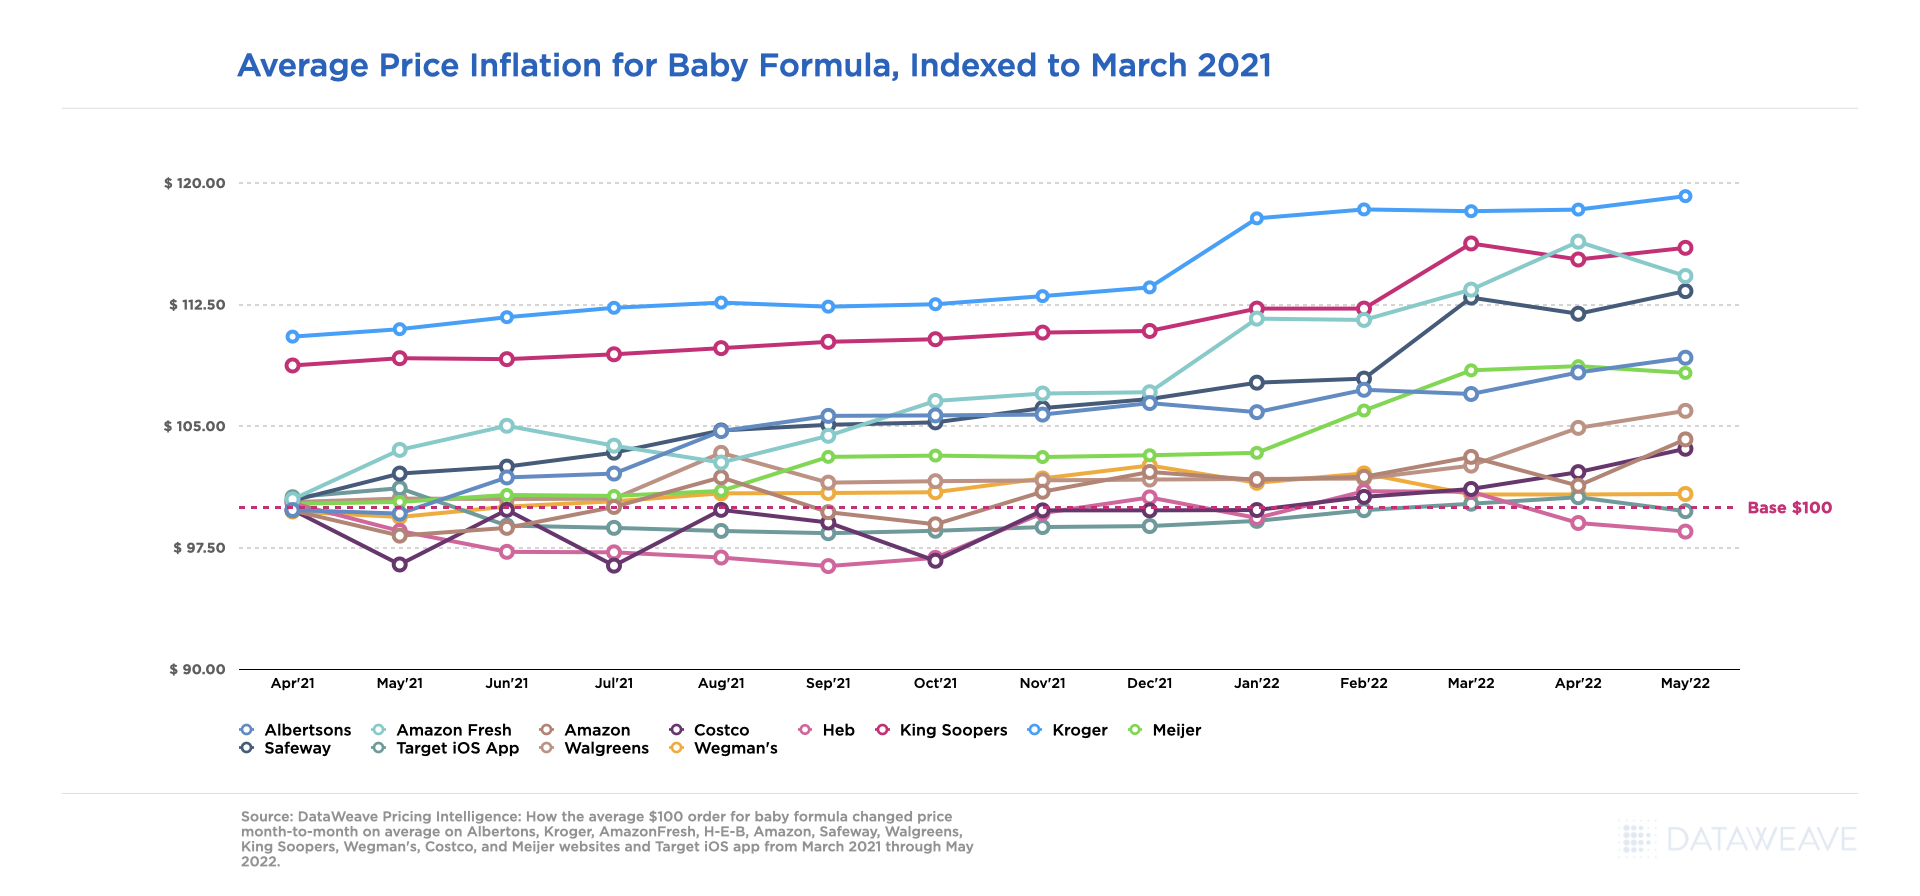
Kroger.com experienced the greatest average price increases overall, with the peak being in May 2022 at a 19% increase, 8% higher than other retailers on average, versus prices seen in March 2021 for the same baby formula products. The most significant price hike occurred on Kroger.com from December 2021 to January 2022. Other retailers like H-E-B, Target and Wegman’s have had minimal price changes from March 2021 through May 2022.
Average Price Inflation for Baby Formula, Indexed to March 2021
Address the Baby Formula Shortage With eCommerce Intelligence
As the market continues to evolve and baby formula supply works its way to catching back up to demand, our team will continue providing critical pricing, merchandising, and competitive insights at scale, to enable retailers and brands to develop data-driven growth strategies that directly influence their eCommerce performance, accelerate revenue growth and drive profitability.
Be sure to reach out to our Retail Analytics experts for access to more details regarding the above analysis, or for more information on our Commerce Intelligence and Digital Shelf solutions, and let us know what other category insights you’d be interested in seeing this year.
The combination of economic uncertainty, inflation, and perceived affordability has increased consumer’s willingness to buy and try more private label products, challenging National brands to differentiate their eCommerce strategies, especially those related to price positioning, in other ways.
Our previously released report, Inflation Accelerates Private Label Share and Penetration, confirmed 8 out of 10 brands with the highest SKU count carried across all grocery retailer websites to be private label, signaling the strength of their digital Share of Voice. Given the growing shift in consumer preference toward private label brands, we are providing access to the latest trends seen from September 2021 through March 2022. Below you will find a summary of what the data revealed about the growing presence of private label brands on the Digital Shelf.
Private Label Account and Category Penetration
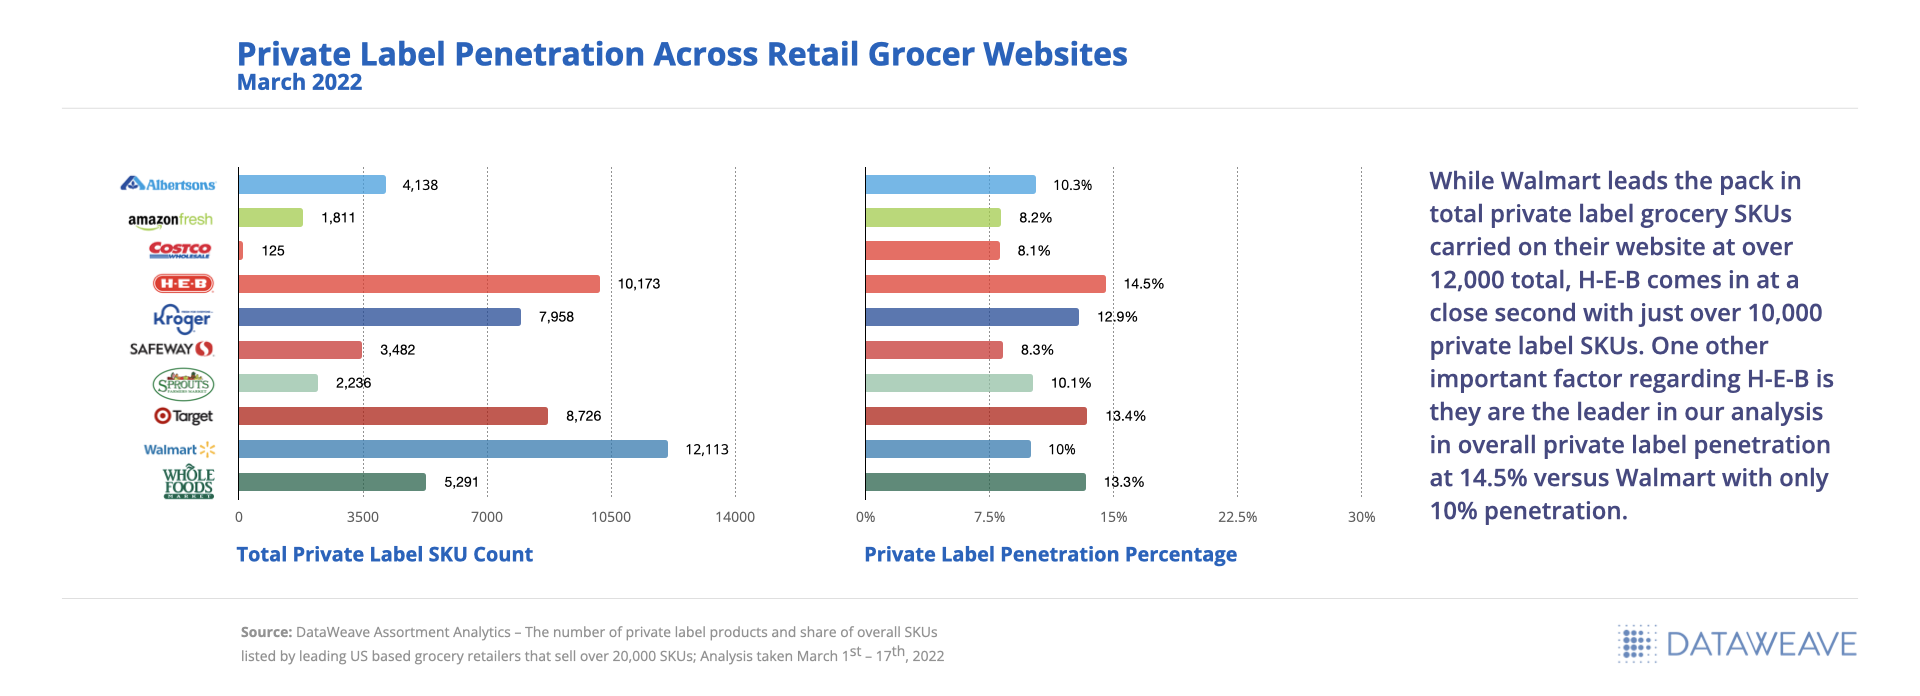
We analyzed private label penetration at an account level to understand which private label brands have the greatest presence on retailer digital shelves, and to see which retailers may be leaving product assortment opportunities on the table.
Private Label Penetration Across Retail Grocer Websites
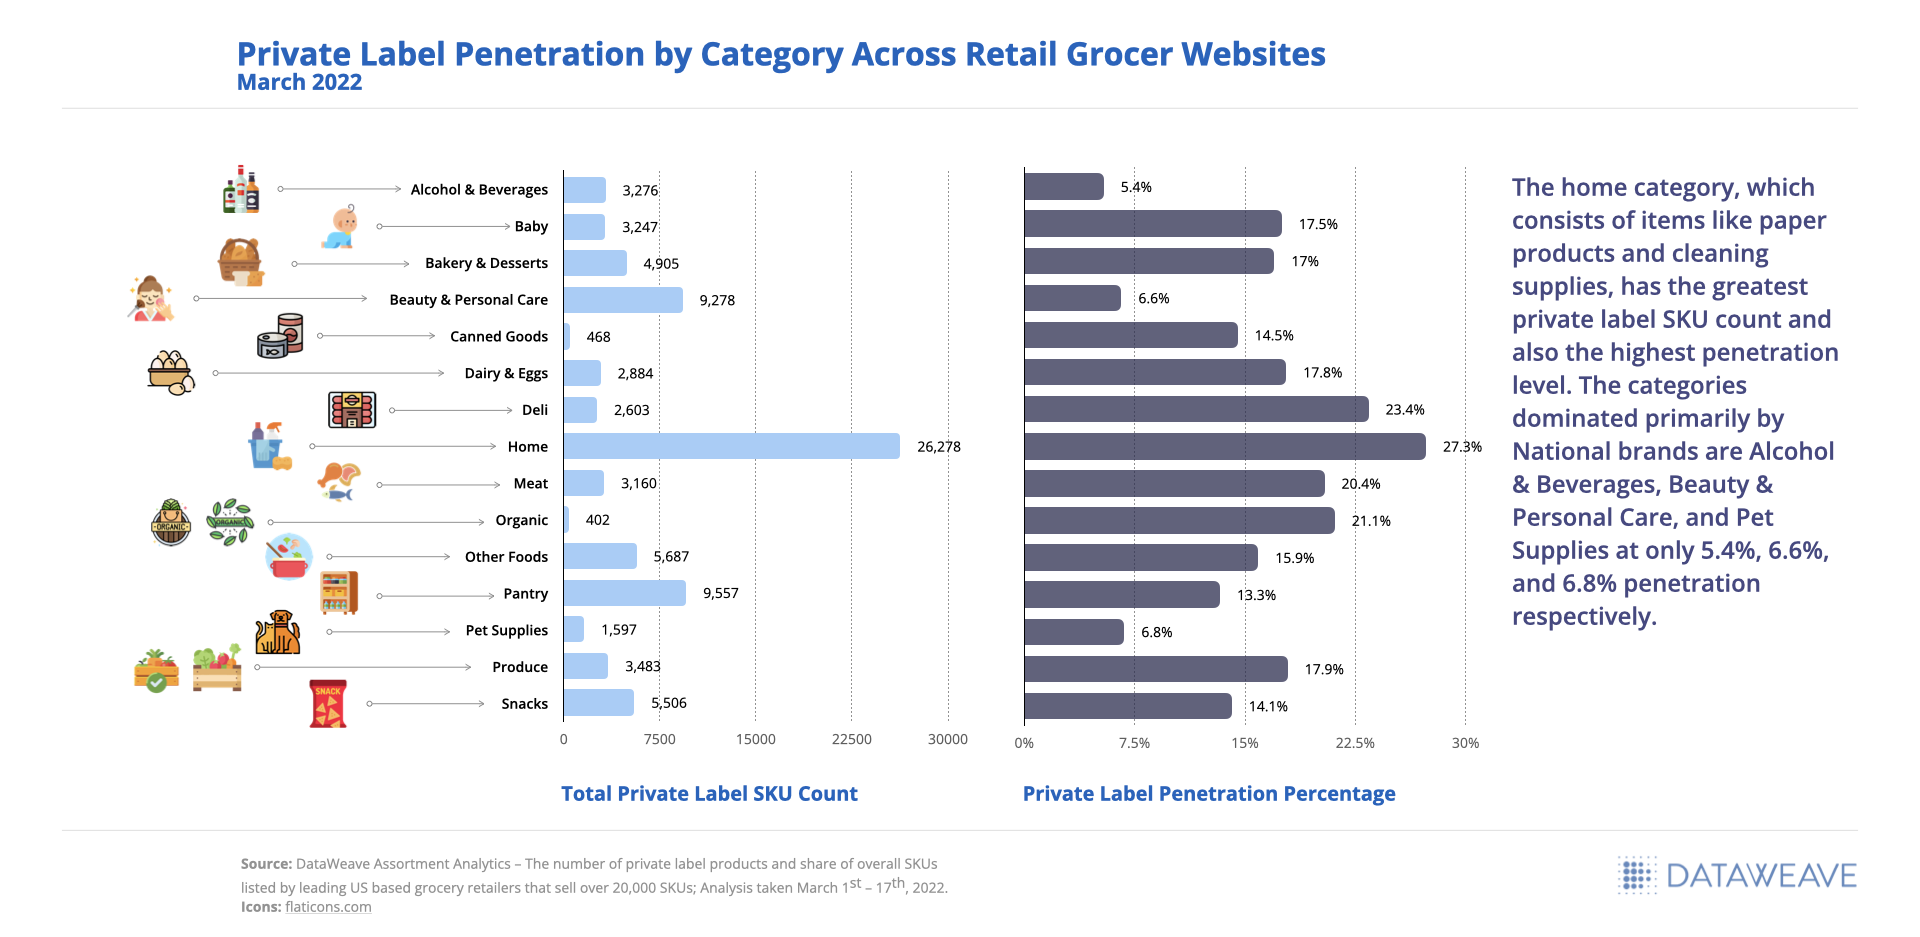
As a retailer, it is important to understand how your private label penetration stacks up against the industry average at a category level, especially given the performance tracked for retailers included within our analysis and the vast number of SKUs they offer online (over 20,000).
Private Label Penetration by Category Across Retail Grocer Websites
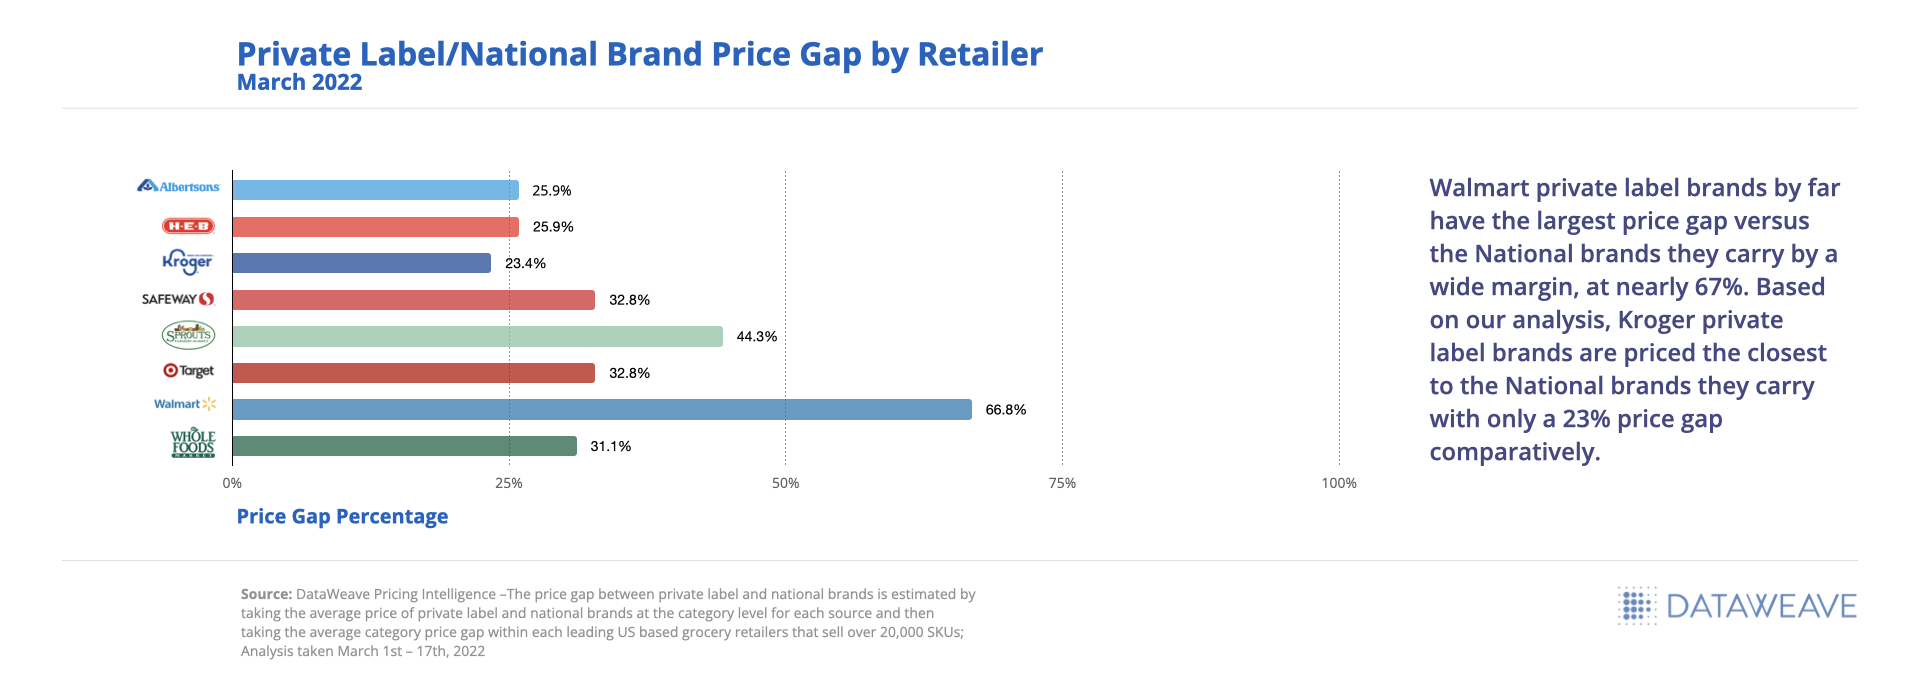
The Private Label and National Brand Price Gap Widens
Private label brands tried out of necessity mid-pandemic increased in popularity as grocery prices continued to rise, providing an opportunity for retailers to increase brand affinity and loyalty for their online shoppers. Retailers alike were able to keep affordability at the forefront of their strategies and maintain a price gap of 23% or more, despite inflationary pressures to increase prices.
Private Label / National Brand Price Gap by Retailer
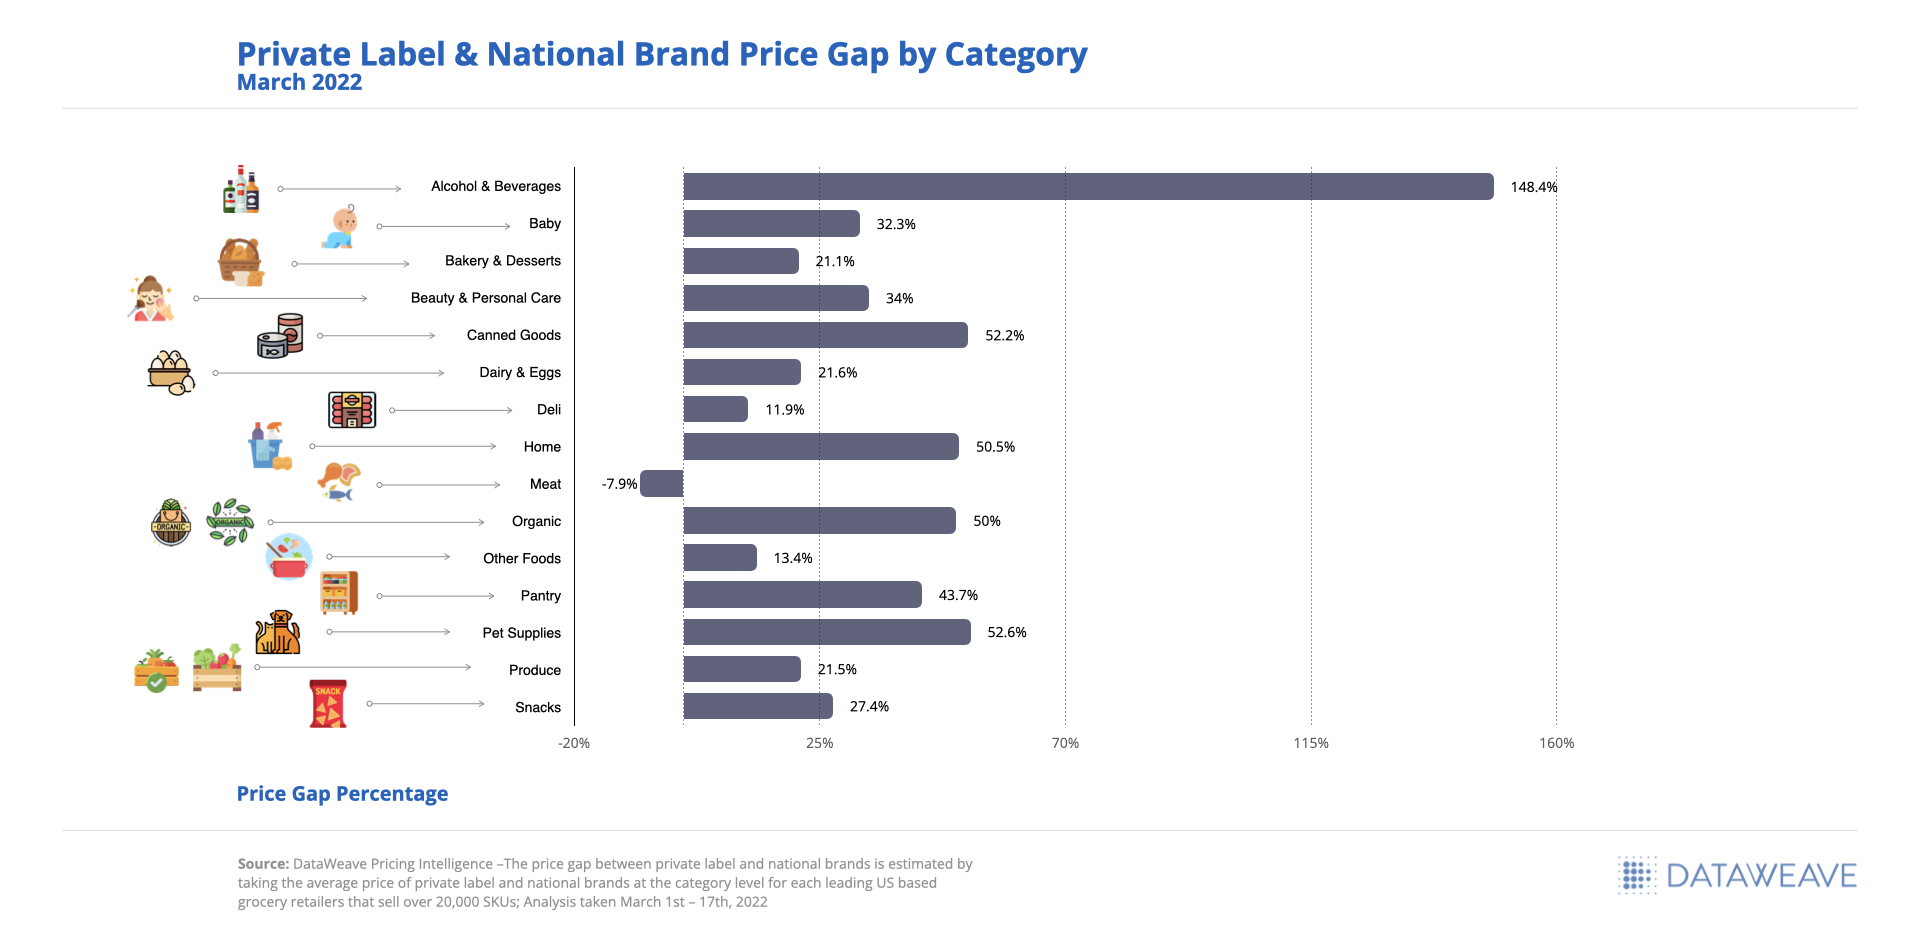
Looking at the results at a category level, we can see that Meat is the only category found within our analysis where private label brands are priced higher than National brands at an average of 8% greater. The Alcohol & Beverages category tends to always see the greatest price gap between private label and National brands given the price variances by unit (ranging from under $10 to over $100), in this case averaging a 148% price gap.
Private Label & National Brand Price Gap by Category
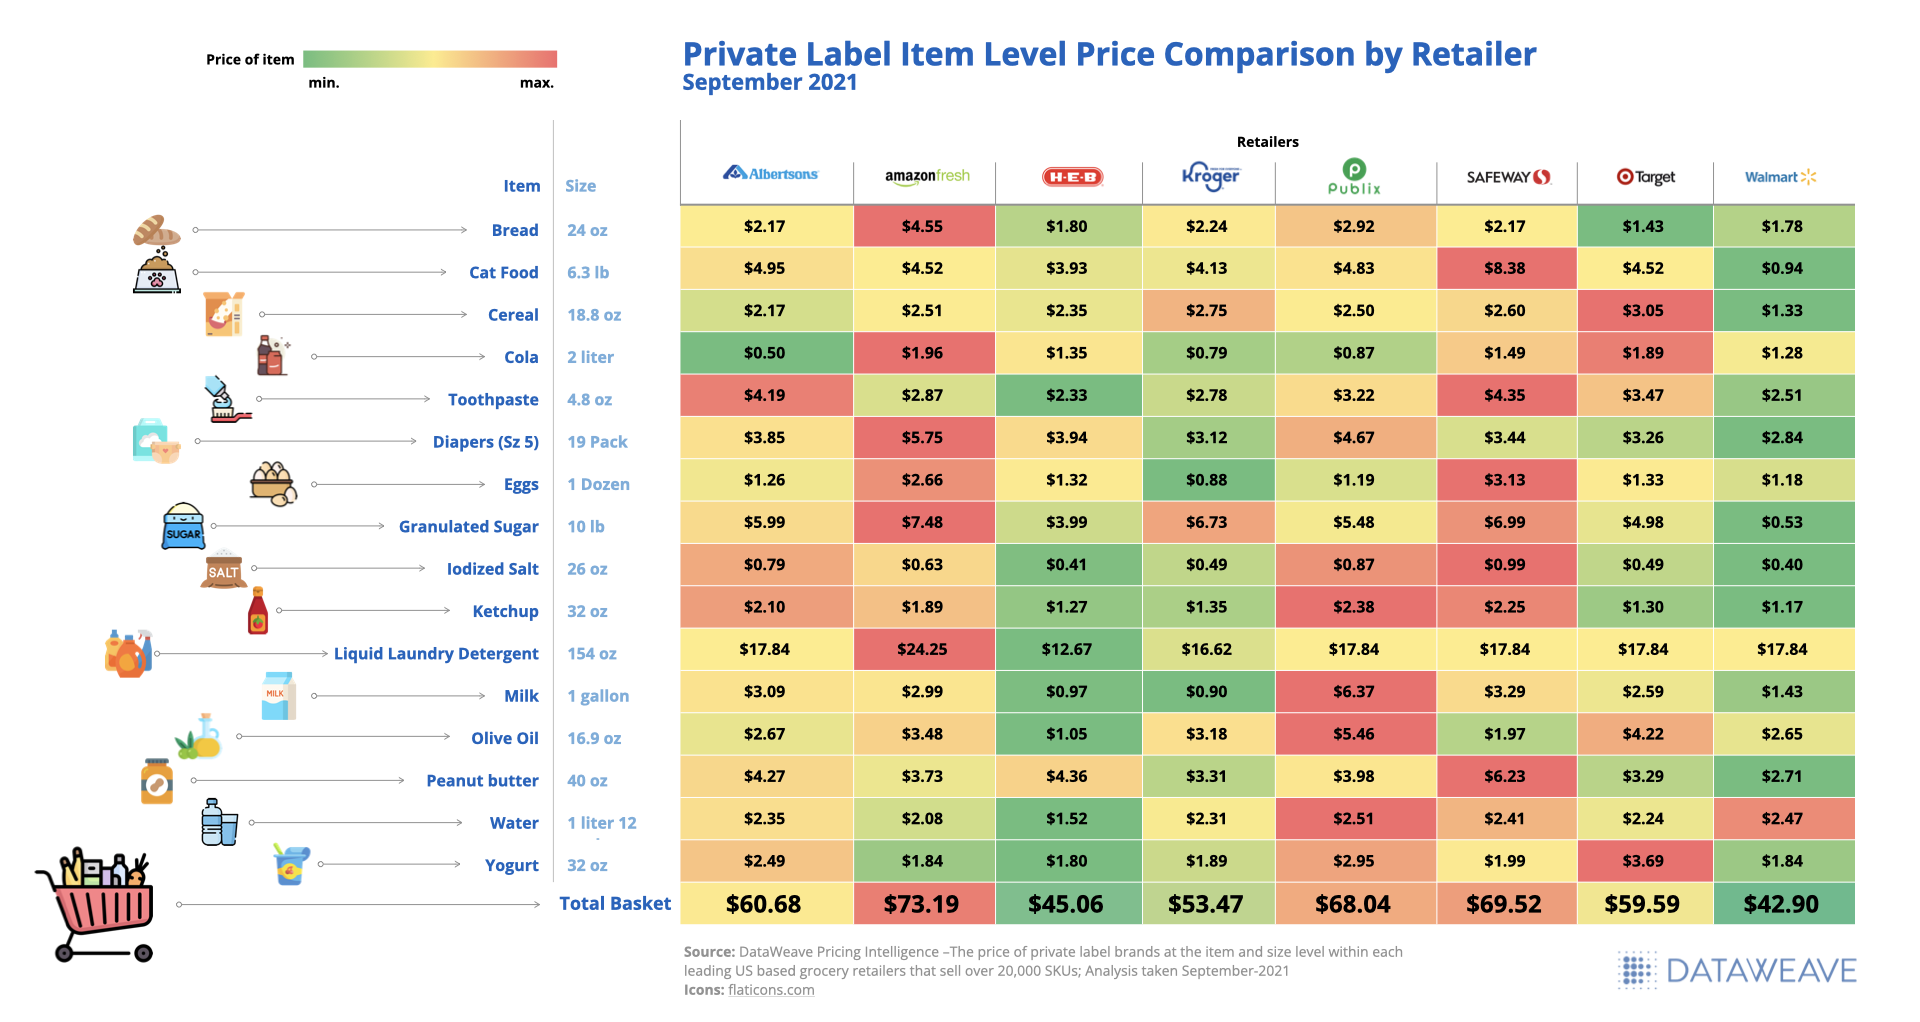
Private Label Total Basket Value Comparison Across Retailers
While SKU-level pricing is extremely important to product strategy, for a retailer, it is equally as important to be as mindful of the total basket value even more so now as consumers further their private label loyalty across various categories. A few SKU-level missteps in pricing decisions can exacerbate cart abandonment and negatively impact shopper loyalty in a world where prices can be compared instantly in the palm of your hand.
Based on our analysis, Walmart and H-E-B private label products offered the lowest priced total basket of goods at $42.90 and $45.06 respectively, whereas AmazonFresh and Safeway offered the highest total at $73.19 and $69.52 respectively.
Private Label Item Level Price Comparison by Retailer
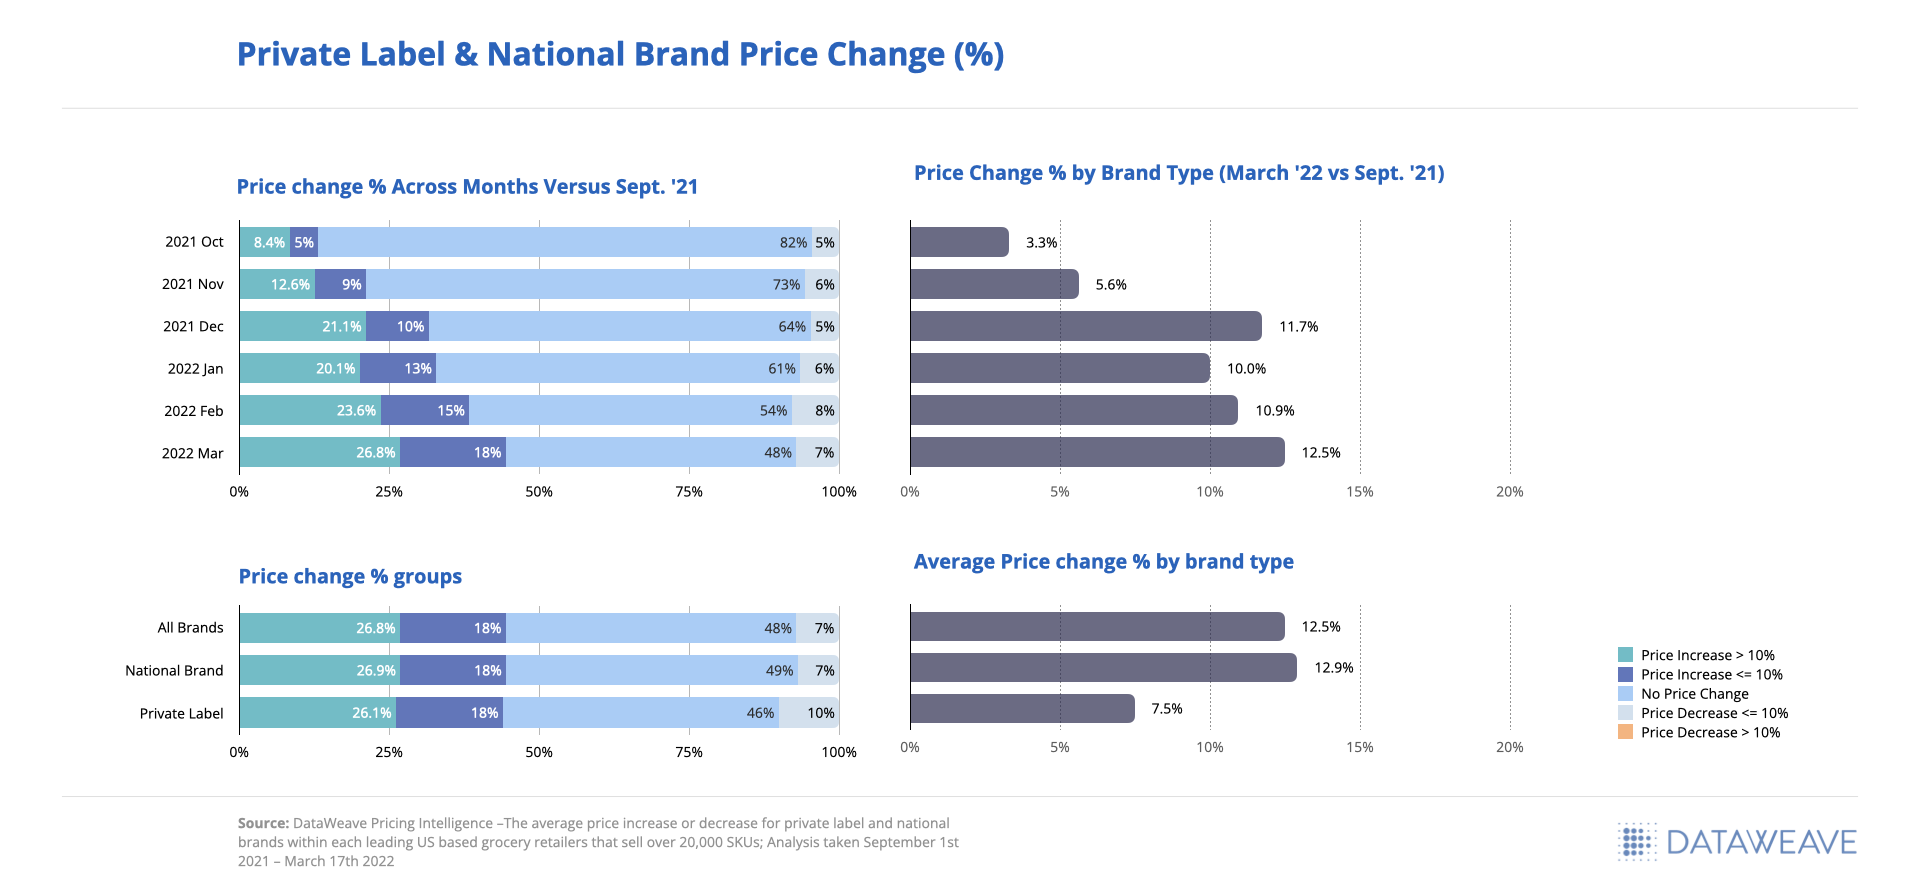
Inflation-driven Price Changes are on the Rise with Room to Grow
Based on the 20,000+ SKUs analyzed, we saw a continual price increase every month since September 2021 when comparing future monthly prices to those we tracked in September. The greatest price increase happened in March 2022 at 12.5% on average, however, there are still 48% of SKUs that have yet to see a price increase even as inflationary pressures rise.
When viewing the split between National and private label brand price increases in March 2022 versus September 2021, we saw National brands increased prices on average by 13% where private label brand prices only increased an average of 7%.
Private Label & National Brand Price Change (%)
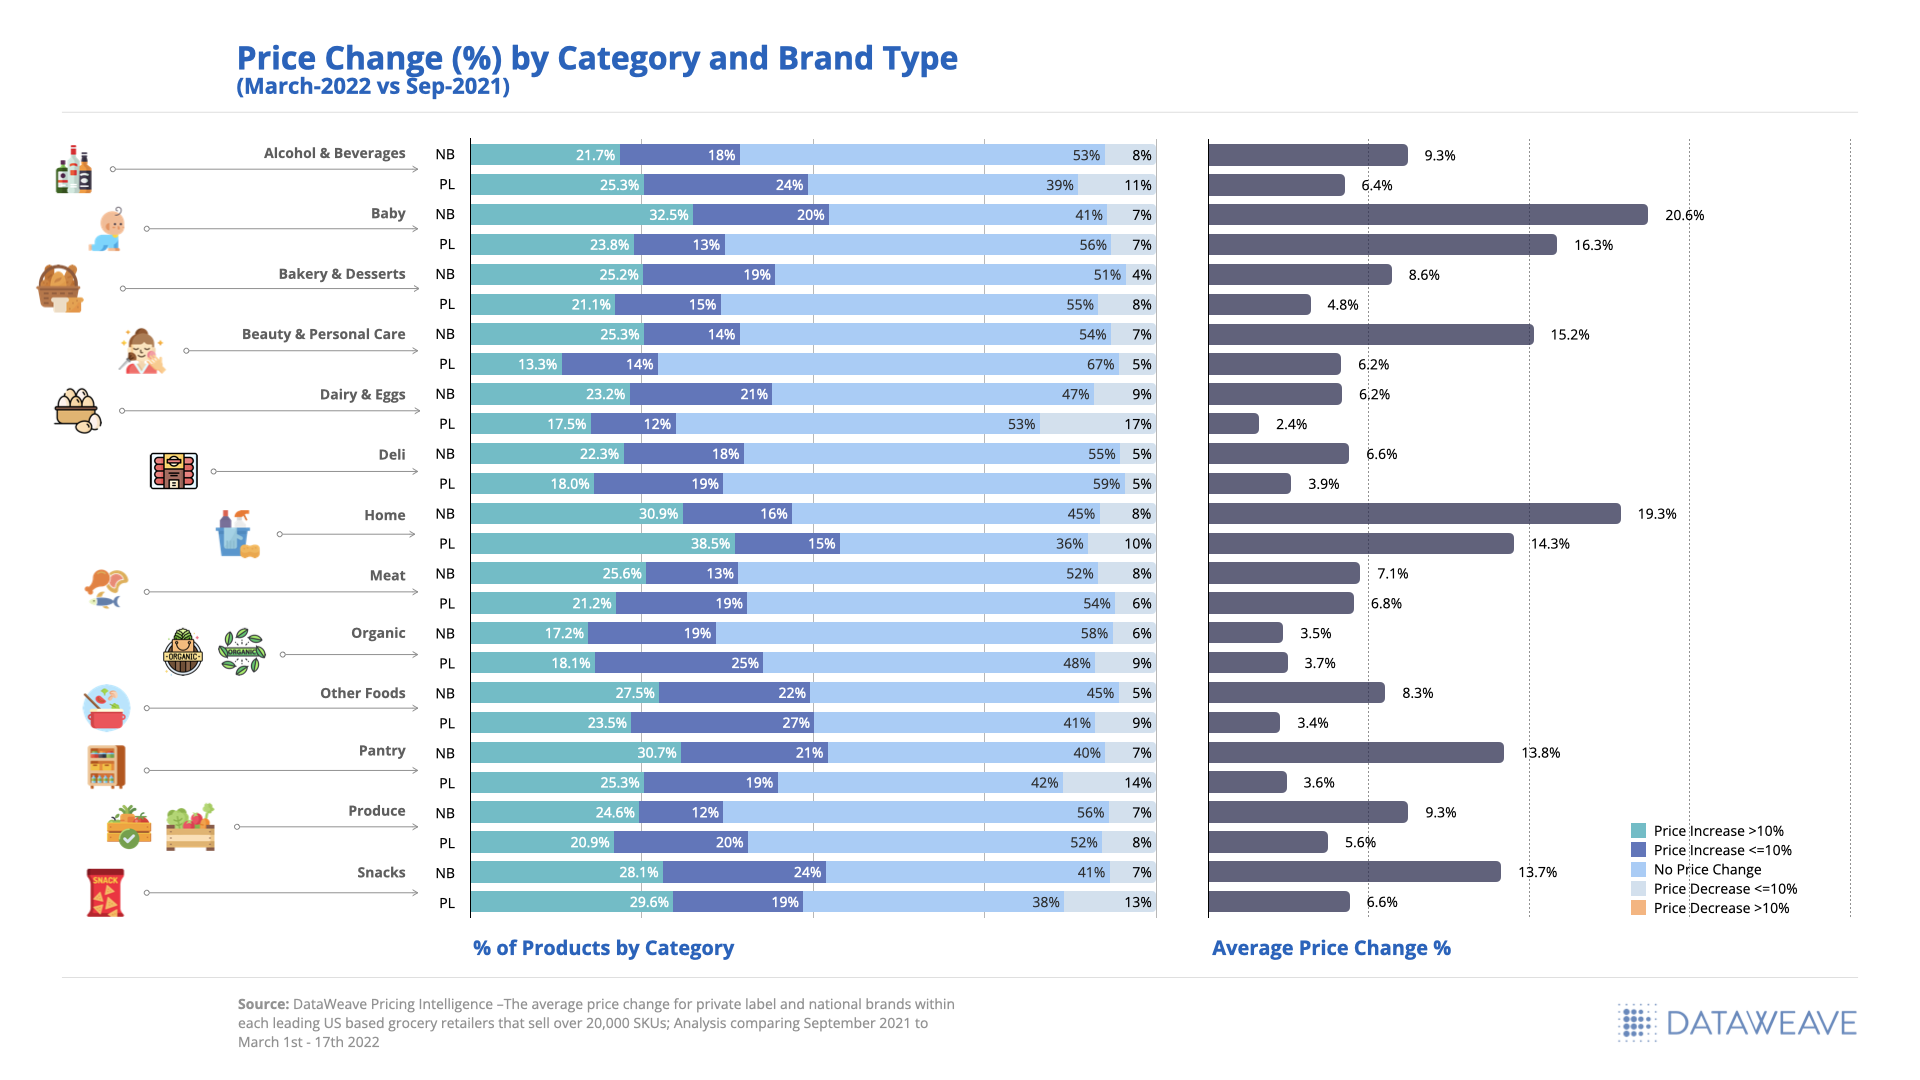
Price decreases are still occurring across all categories, despite inflation, but to varying degrees ranging from 5% for Deli items to 17% for Dairy & Eggs. Within the Dairy & Eggs and Pantry categories, private label brands reduced prices for an additional 10% of total SKUs compared to National brands.
The greatest category of opportunity for price increases within private label were found within Beauty & Personal Care with 67% of private label products yet to see a price change since September 2021.
Price Change (%) by Category and Brand Type
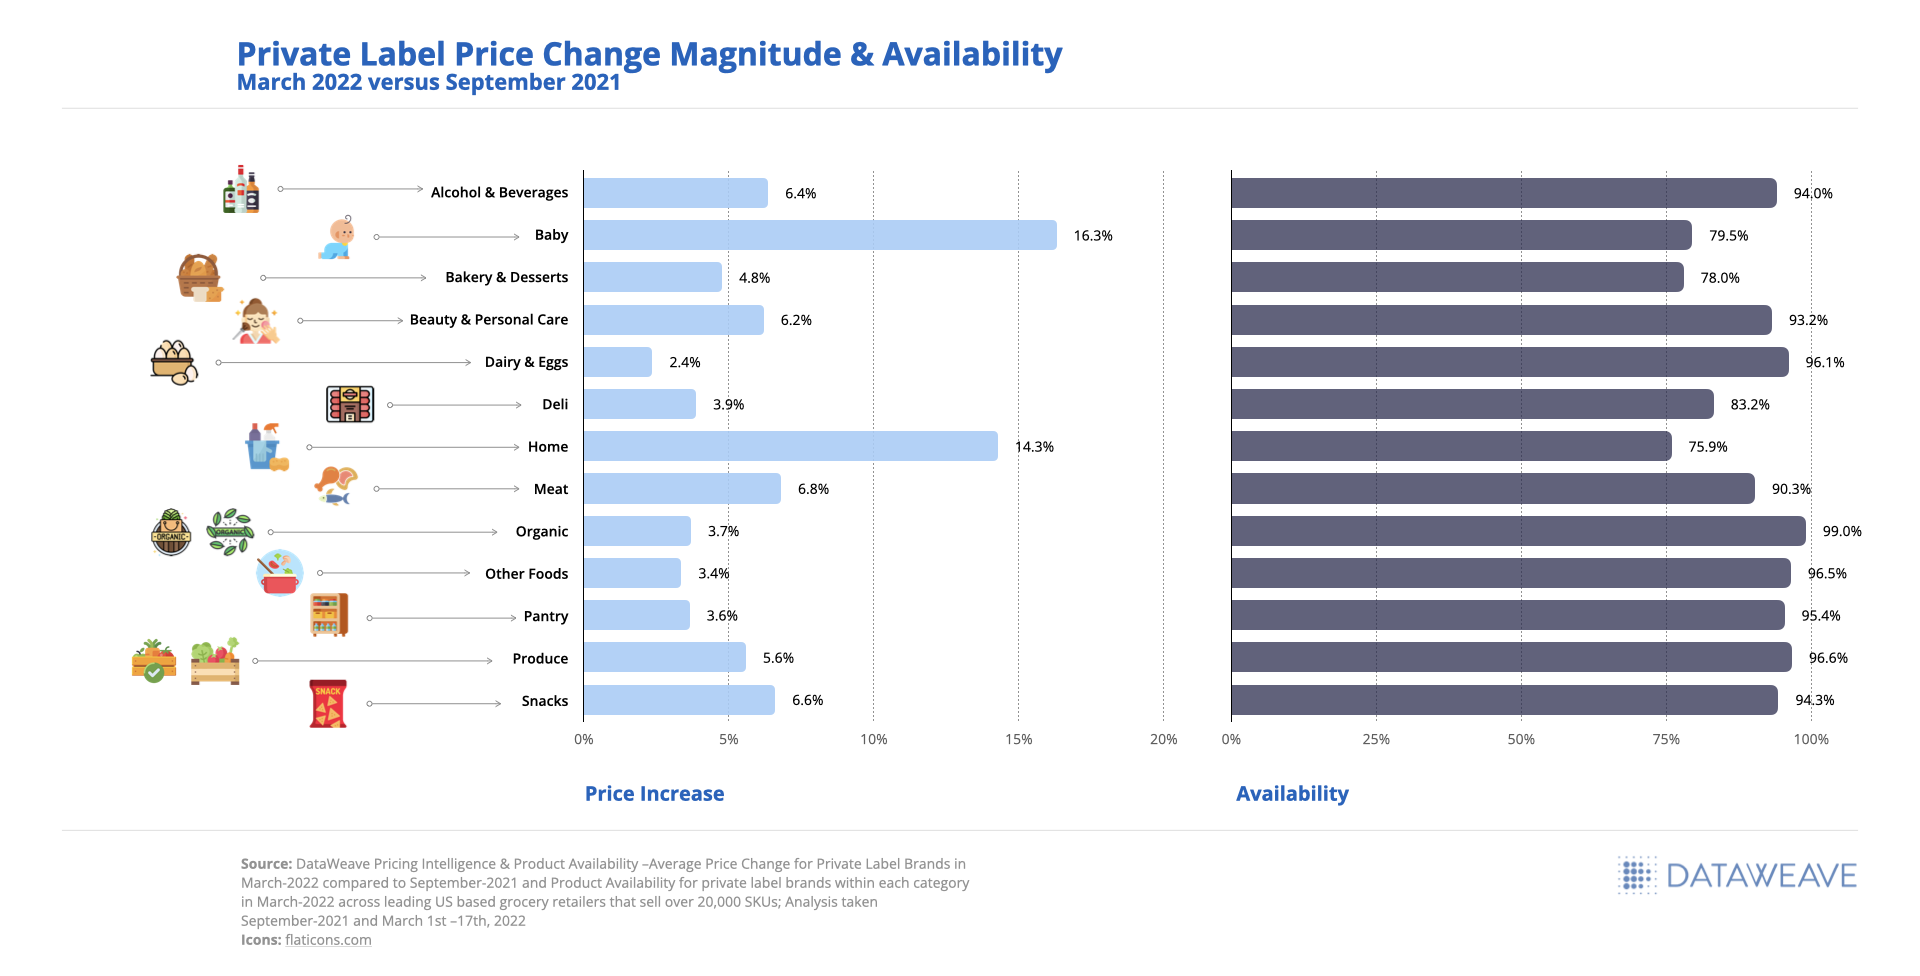
Private Label Price Change Correlation to Product Availability
The category with the greatest magnitude of price increase seen within private label brands occurred within Baby at 16.3% followed by Home at 14.3% on average. Private label products within Home and Baby categories were also showing the lowest availability rates, 75.9% and 79.5% respectively, indicating a high demand for these items even as prices increased.
The private label categories with the smallest price increase on average were Dairy & Eggs at 2.4% and Other Foods and Pantry at 3.4% and 3.6%, respectively.
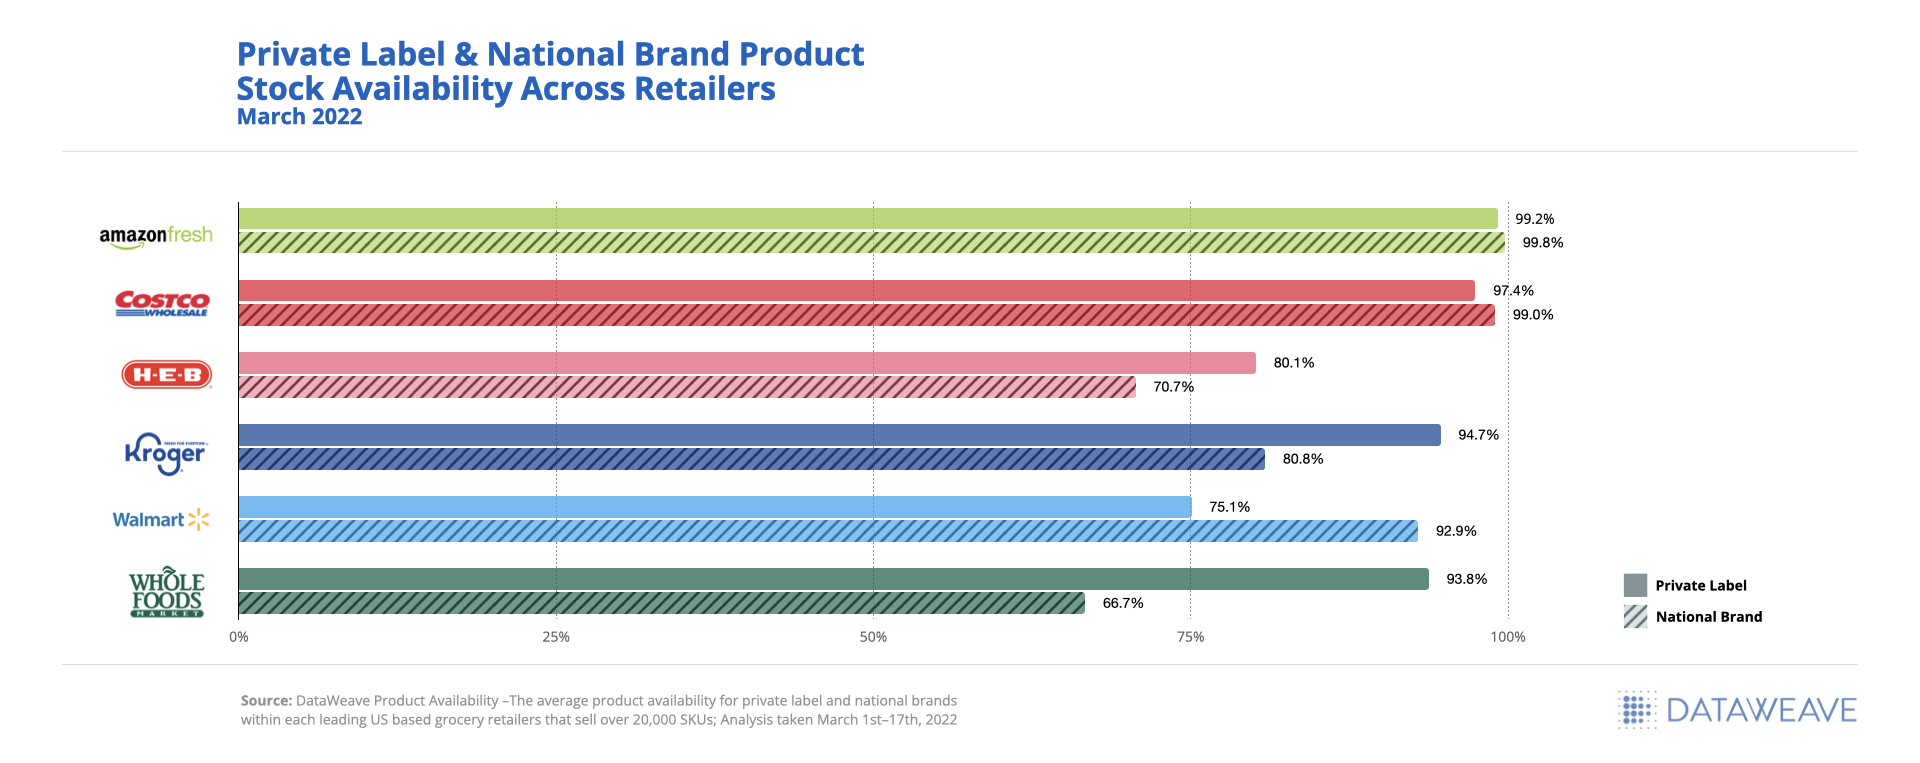
While in many accounts both private label and National brands struggled with stock availability in March 2022, National brand availability is much lower (around 10% on average) than private label availability.
H-E-B had the lowest overall product availability at 76% across both private label and National brands on average. Only Walmart had lower availability for Private Label at 75% compared to 93% for National brands, but they also had the greatest price gap between private label and National brands.
Private Label & National Brand Product Stock Availability
The Future of eCommerce Growth for Private Label
Our greatest learning from this analysis is that it’s time for retailers to start thinking and planning more like the National brands they carry when it comes to positioning their private label brands for success. Successful retailers are taking this time to reset their private-label strategies and transfer short-term switching behavior into long-term customer loyalty.
Retailers playing catch up have the opportunity to address some of the gaps highlighted throughout this analysis, for example, relative to pricing and assortment changes. Below are some of the highlighted opportunities:
Though inflation is driving price hikes, more than 50% of products analyzed have yet to see a price increase indicating an opportunity to protect margin
Narrowing the price gap between a store’s brand and National brands should not be the only focus as competitive private label brands are becoming a greater threat at a category and basket level
Modifying and expanding assortments as demand increases for private label can improve customer retention and loyalty, especially for cross-shopping consumers
According to The Food Industry Association (FMI), only 20% of food retailers currently promote private brands on their homepages, and only 48% include detailed product descriptions indicating even more opportunities left on the table for retailers to optimize private label digital performance.
Many leading retailers are leveraging real-time digital marketplace insights and eCommerce analytics solutions like ours to further their online brand presence and optimize sales performance. This report highlights only a small sample of the types of near real-time insights we provide our clients to effectively build competing strategies, make smarter pricing and merchandising decisions, and accomplish eCommerce growth goals. Be sure to reach out to our Retail Analytics experts for access to more details regarding the above analysis.
For access to a previously recorded webinar presented in partnership with the Private Label Manufacturers Association and conducted by DataWeave’s President and COO, Krish Thyagarajan, click here.
Business has been anything but usual this holiday season, especially in the digital retail world. The holiday hustle and bustle historically seen in stores was once again occurring online, but not as anticipated given the current strength of consumer demand and the reemergence of COVID-19 limiting in-store traffic. While ‘Cyber Weekend’, Thanksgiving through Cyber Monday, continues to further its importance to retailers and brands, this year’s performance fell short of expectation due to product shortages and earlier promotions that pulled forward holiday demand.
Holiday promotions were seen beginning as early as October in order to compete with 2020 Prime Day sales, but discounting, pricing and availability took an opposite direction from usual. This shift influenced our team to get a jump start on our 2021 digital holiday analysis to assess how drastic the changes were versus 2020 activity, and to understand how much of this change has been influenced by inflationary pressures and product scarcity.
Scarcity Becomes a Reality
Our initial analysis started by reviewing year-over-year product availability and pricing changes from January through September 2021, leading up to the holiday season, as detailed in our 2021 Cyber Weekend Preliminary Insights blog. We reviewed popular holiday categories like apparel, electronics, and toys, to have a broad sense of notable trends seen consistently throughout various, applicable marketplaces. What we found was a consistent decline in product availability over the last six months compared to last year, alongside an increase in prices.
Although retailers significantly improved stock availability in November and early December 2021, even digital commerce giants like Amazon and Target were challenged to maintain consistent product availability on their website as seen below. While small in magnitude, there is also a declining trend occurring again closer toward the end of our analysis period, post Cyber Weekend, across all websites included in our analysis.
Source: Commerce Intelligence – Product Availability insights for Home & Garden, Jewelry & Watches, Clothing & Shoes, Bed N Bath, Lighting & Ceiling Fans categories
Greater Discounts, Higher Prices?
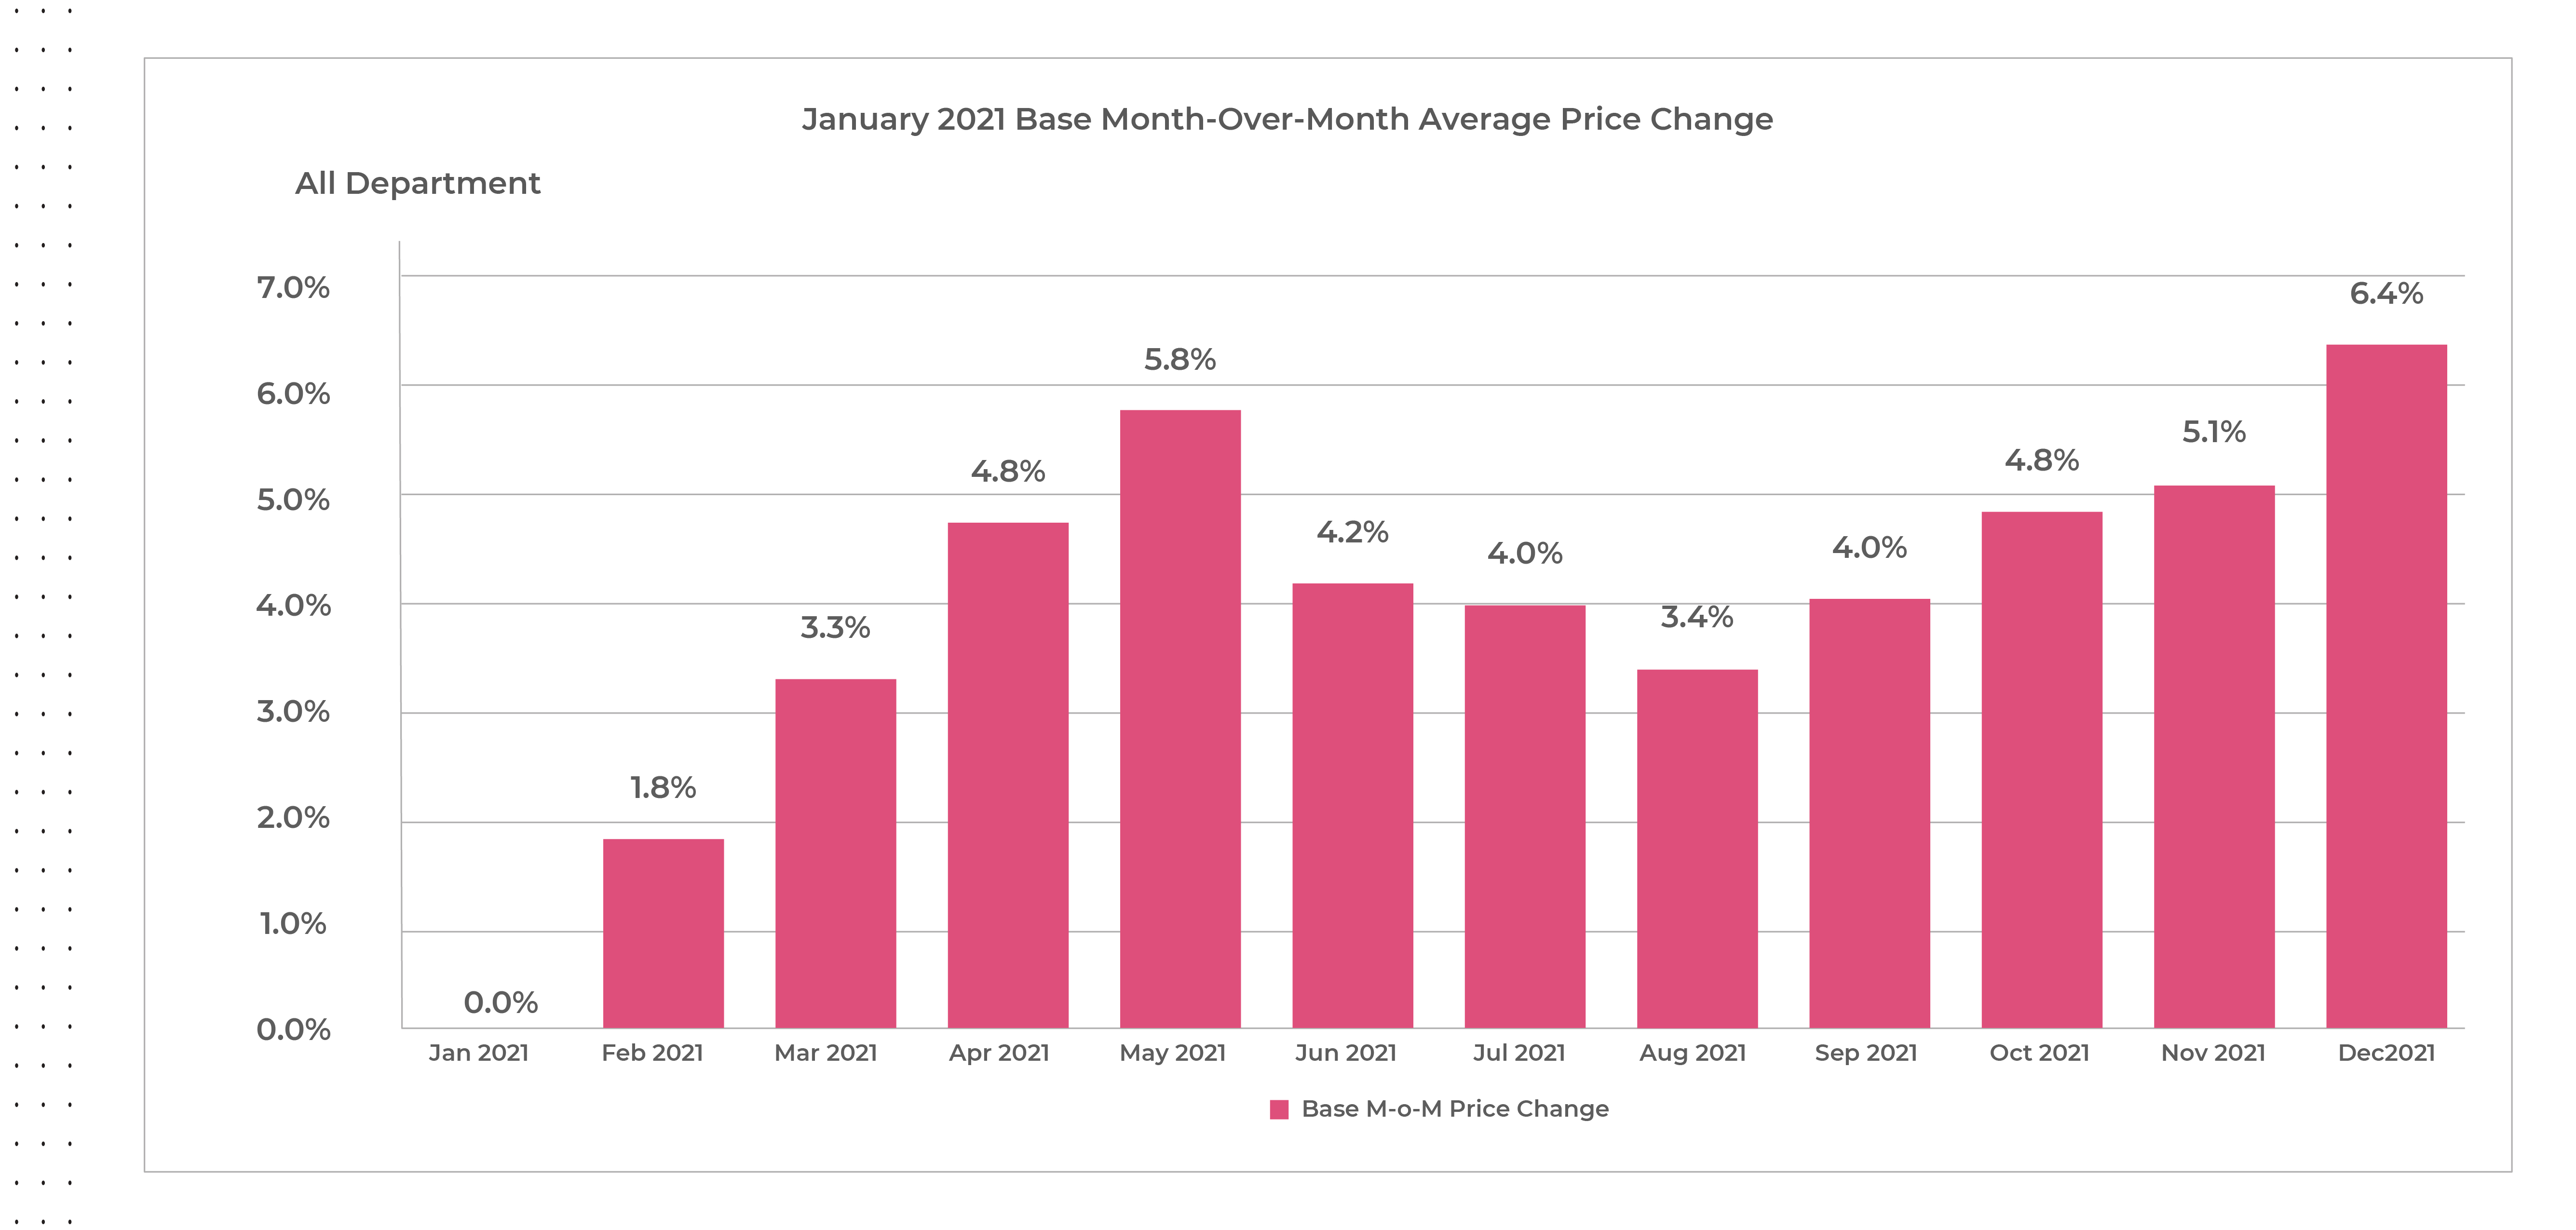
With inflation at a thirty-nine year high, retailers and manufacturers have realized they can command higher prices without impacting demand as consumers have shown their willingness to pay the price, especially when threatened by product scarcity. Our assessment is that while some products and categories have responded drastically, manufacturers’ suggested retail prices (MSRPs) have increased nearly seven percent on average from January to December 2021. MSRP adjustments are not taken lightly either, as this is an indication increased prices will be part of a longer-term shift in product strategy.
Source: Commerce Intelligence – Pricing Insights for Bed & Bath, Electronics, Furniture, Healthy & Beauty, and Fashion categories on Amazon.com & Target.com each month in 2021 comparing price increases from January 2021 base
Our 2021 pre-Cyber Weekend analysis reviewed MSRP changes for select categories (Bed & Bath, Electronics, Furniture, Healthy & Beauty, and Fashion) on Amazon and Target.com, and found around forty-eight percent of products on Amazon and thirty-five percent of products on Target.com have increased their MSRPs year-over-year, but kept pre-holiday discount percentages the same.
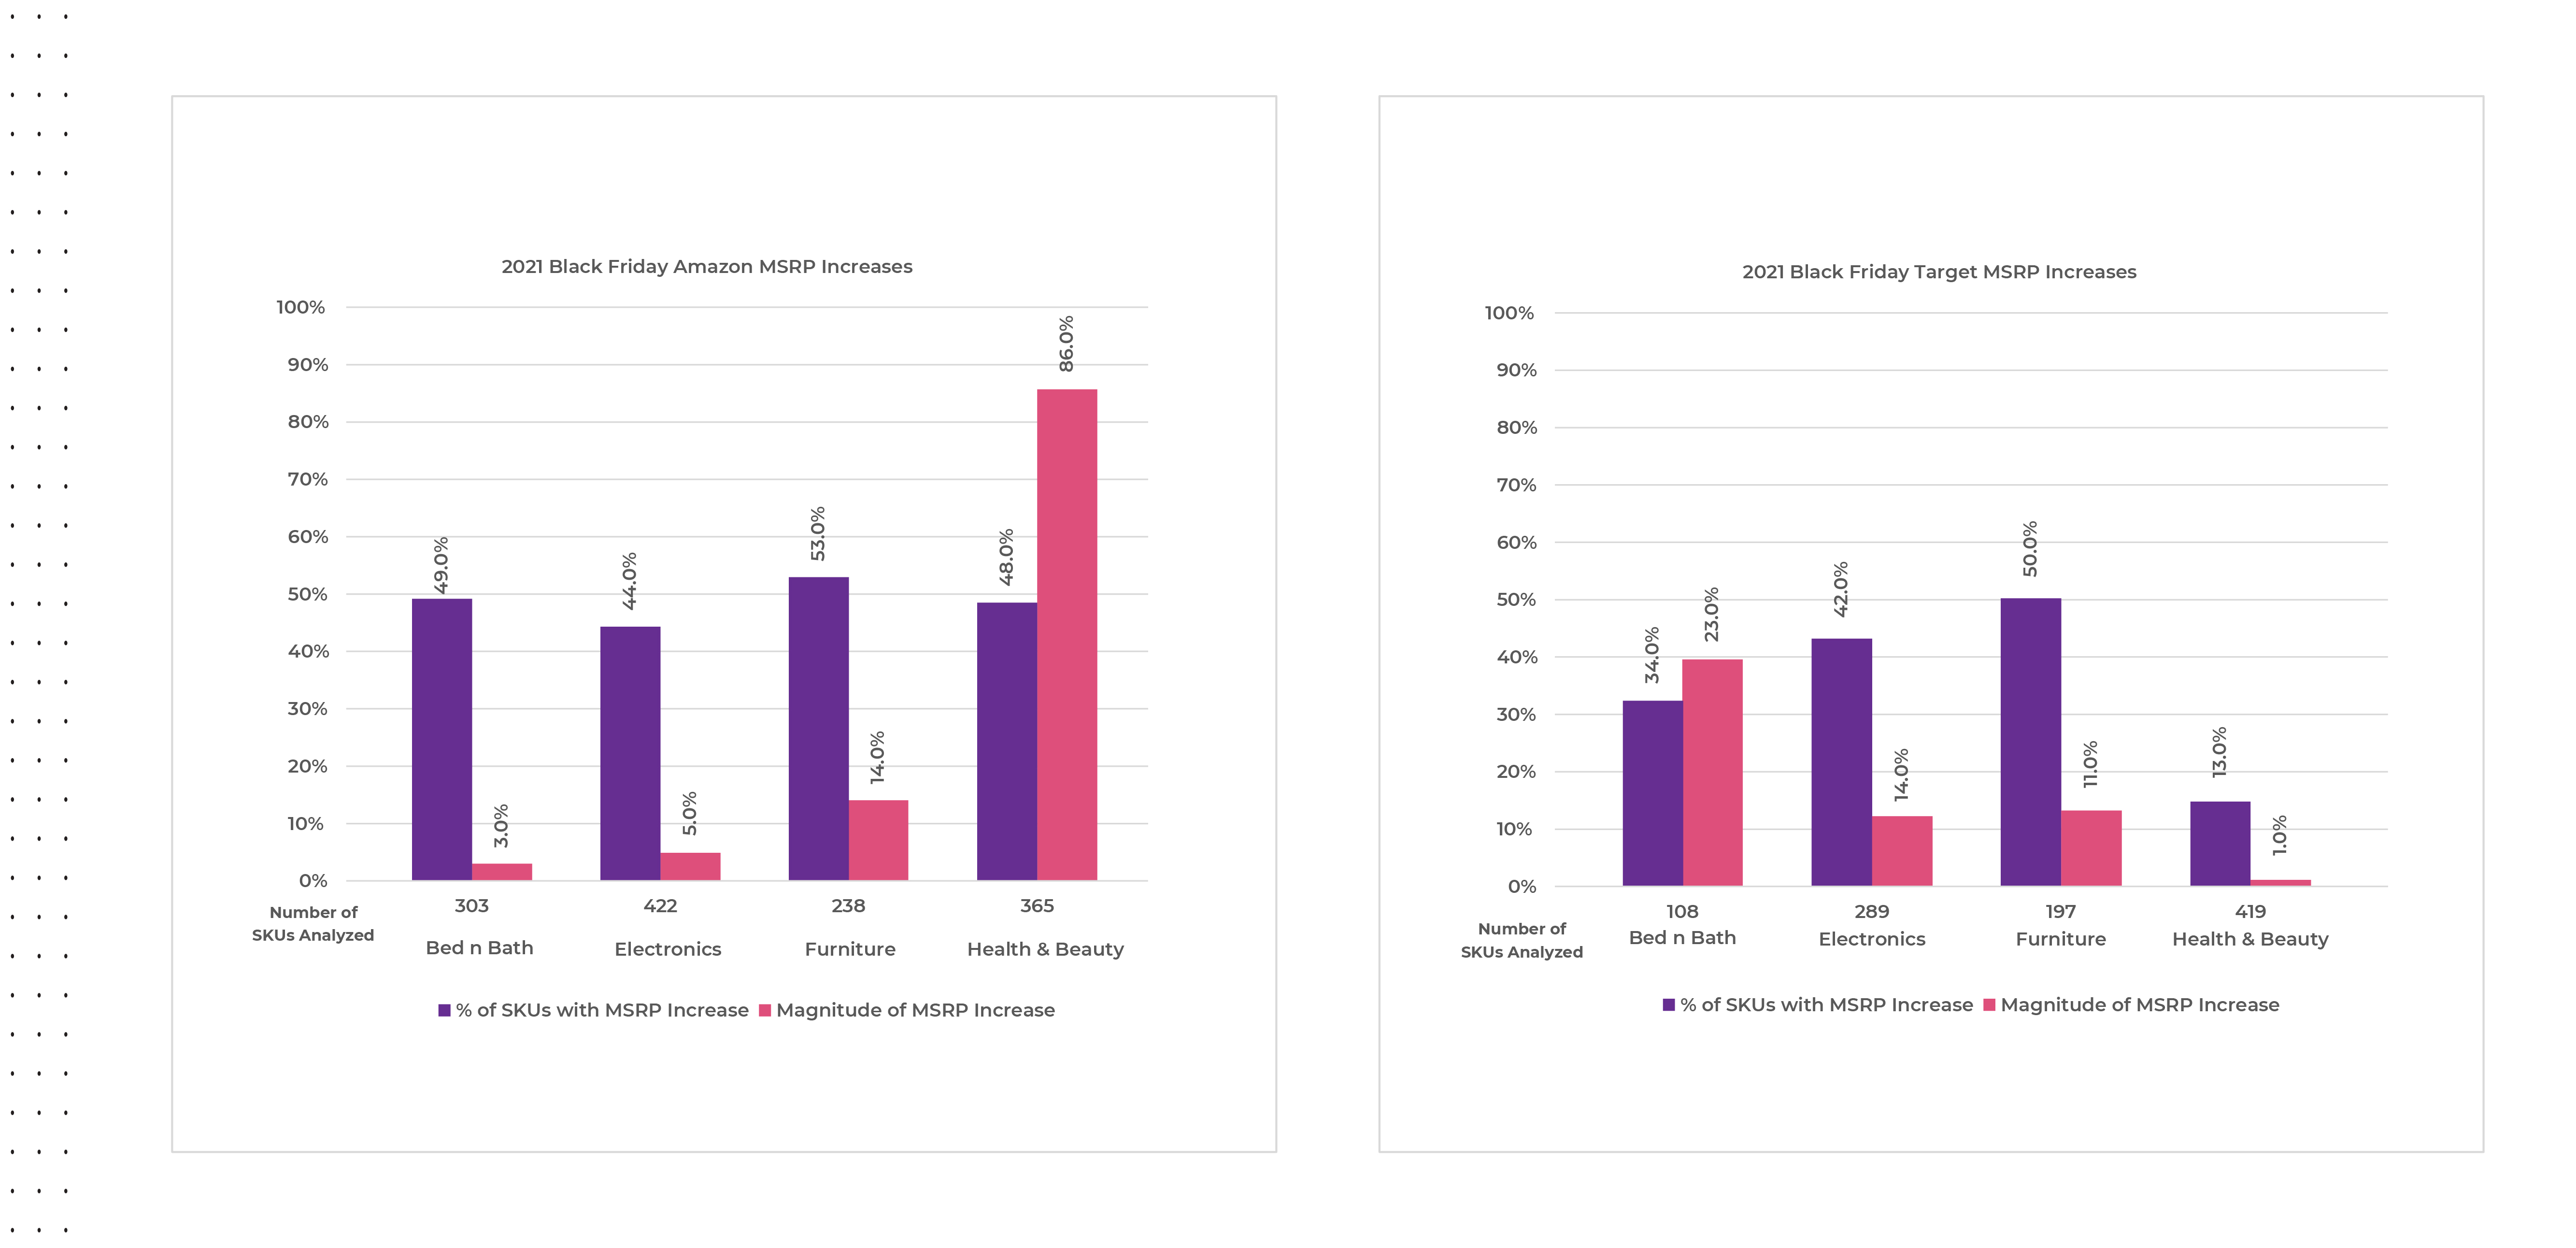
Looking more specifically as to what year-over-year changes occurred on Black Friday in 2021, we observed MSRPs increasing across the board for all categories at various magnitudes. This indicates why 2021 discounts appeared to be greater than or equivalent to 2020 for many categories, when in reality consumers paid a higher price than they would have in 2020 for the same items.
Source: Commerce Intelligence – MSRP Pricing Insights for Bed & Bath, Electronics, Furniture, Healthy & Beauty, and Fashion categories on Black Friday November 27th, 2021, versus average MSRP pricing for the same SKU count from November 20-26th 2021
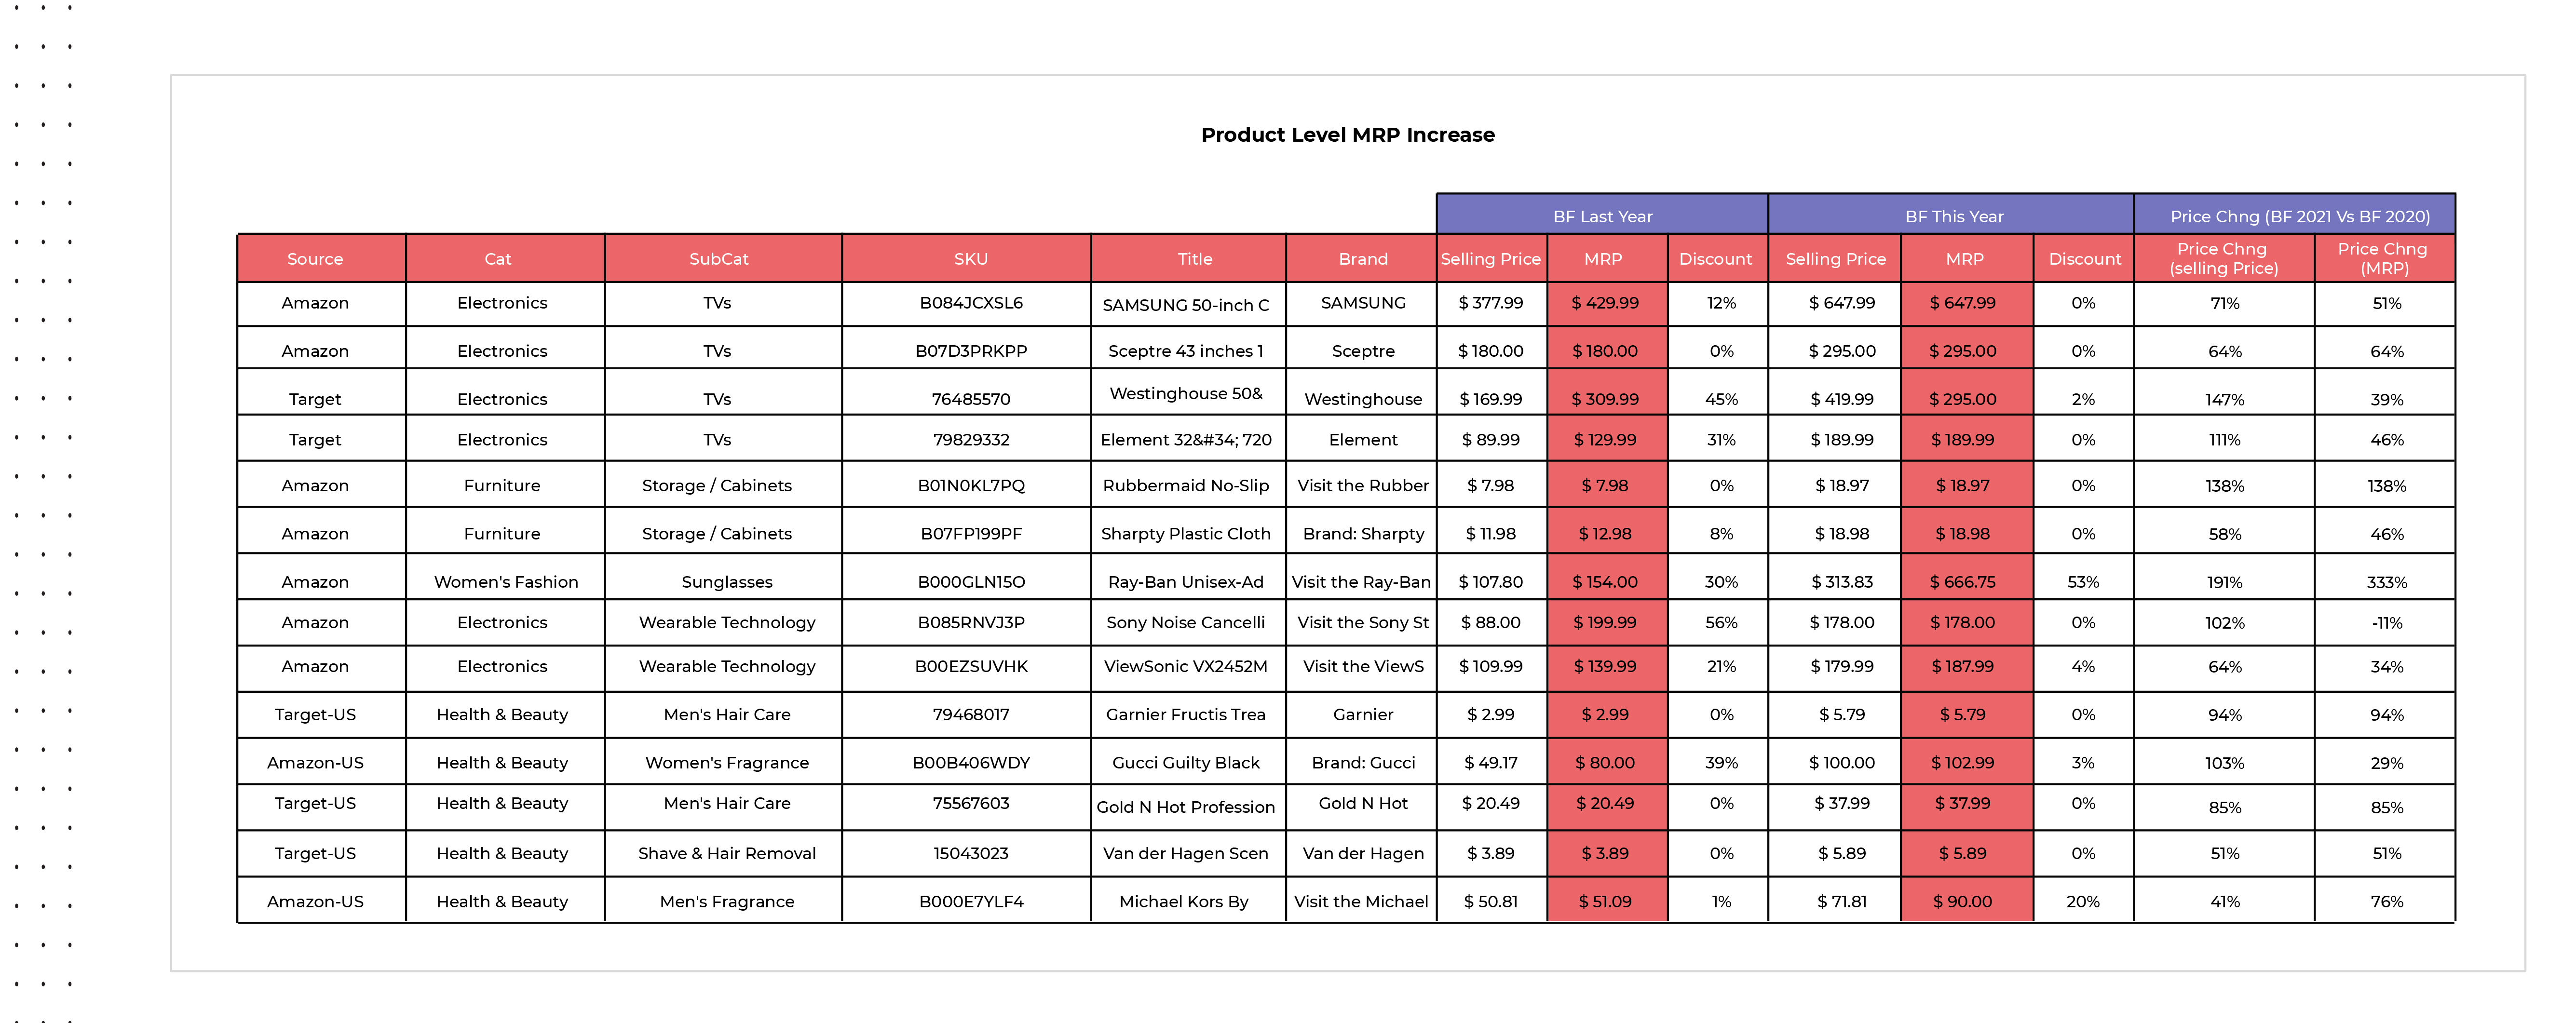
On Amazon.com, categories like health & beauty have already increase MSRPs by a much greater percentage and magnitude versus Target.com leading up to and during Black Friday 2021, while other categories like furniture have increased MSRPs evenly on average across both retail websites. The below chart cites a few specific examples of year-over-year SKU-level MSRP, promotional price, and discount changes within found within the electronics, furniture, fashion, and health & beauty categories.
Source: Commerce Intelligence – MSRP Pricing Insights for Bed & Bath, Electronics, Furniture, Healthy & Beauty, and Fashion categories on Black Friday November 27th, 2021, versus average MSRP pricing for the same SKUs on Black Friday November 26th, 2020.
Fewer, but Deeper Discounts
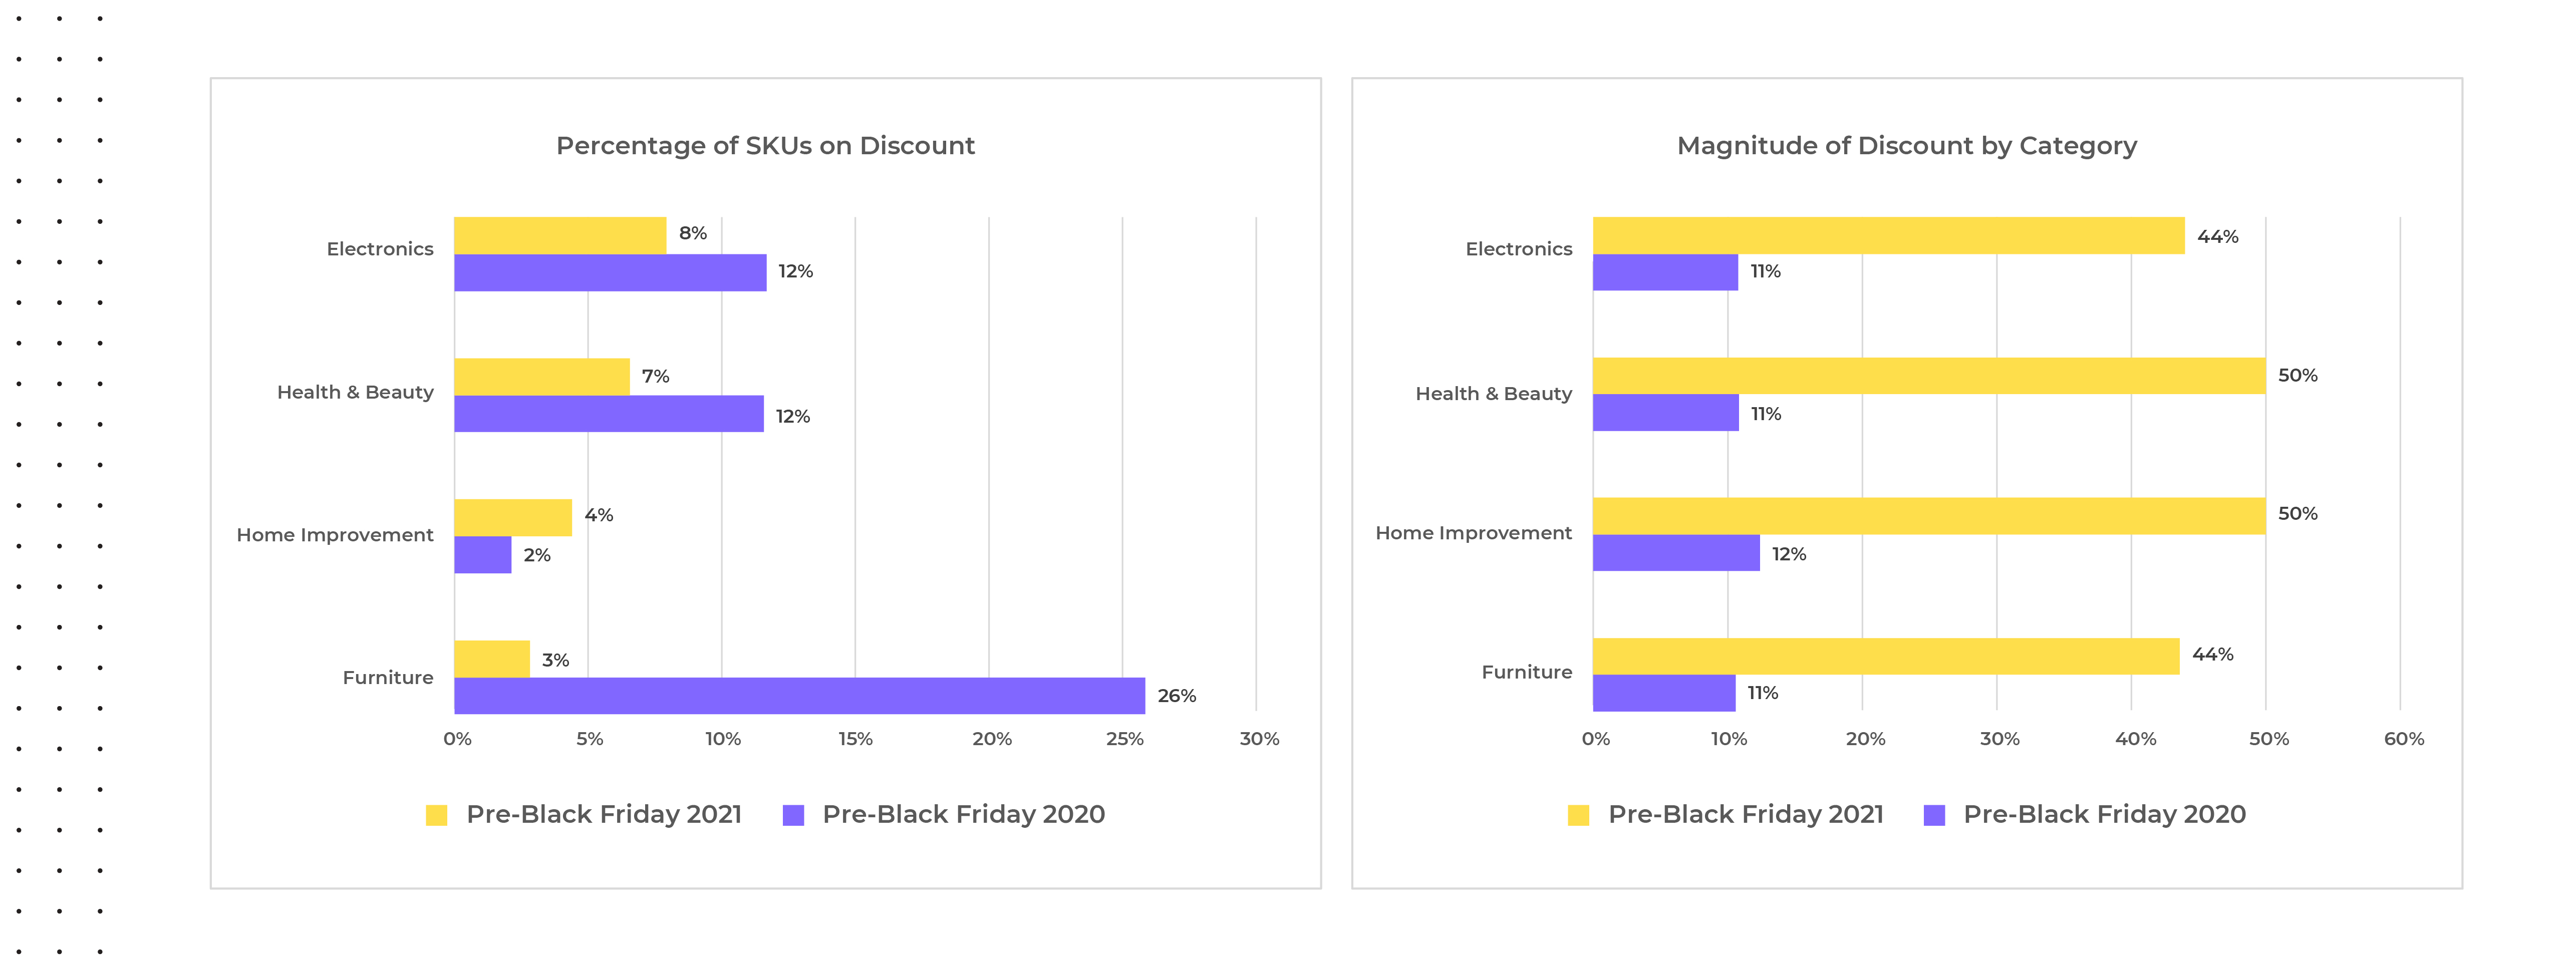
From October through early November 2021, fewer products were discounted compared to this same period in 2020, and the few that were saw much deeper discounts apart from the home improvement category. The most extreme example we saw in discounts offered was within furniture where only three percent of SKUs were on discount in 2021 compared to twenty-six percent in 2020. Interestingly, the magnitude of discount was also higher pre-Cyber Weekend 2021 versus 2020, but this trend was not exclusive to furniture and was also seen within electronics, health & beauty, and home improvement.
Source: Commerce Intelligence – Pricing Insights for Bed & Bath, Electronics, Furniture, Healthy & Beauty, and Fashion categories on Amazon.com & Target.com Pre-Black Friday average selling price during November 20-26th 2021 versus average selling price from November 13-19th 2021 compared to Pre-Black Friday average selling price during November 19-25th 2020 versus average selling price from November 12-18th, 2020.
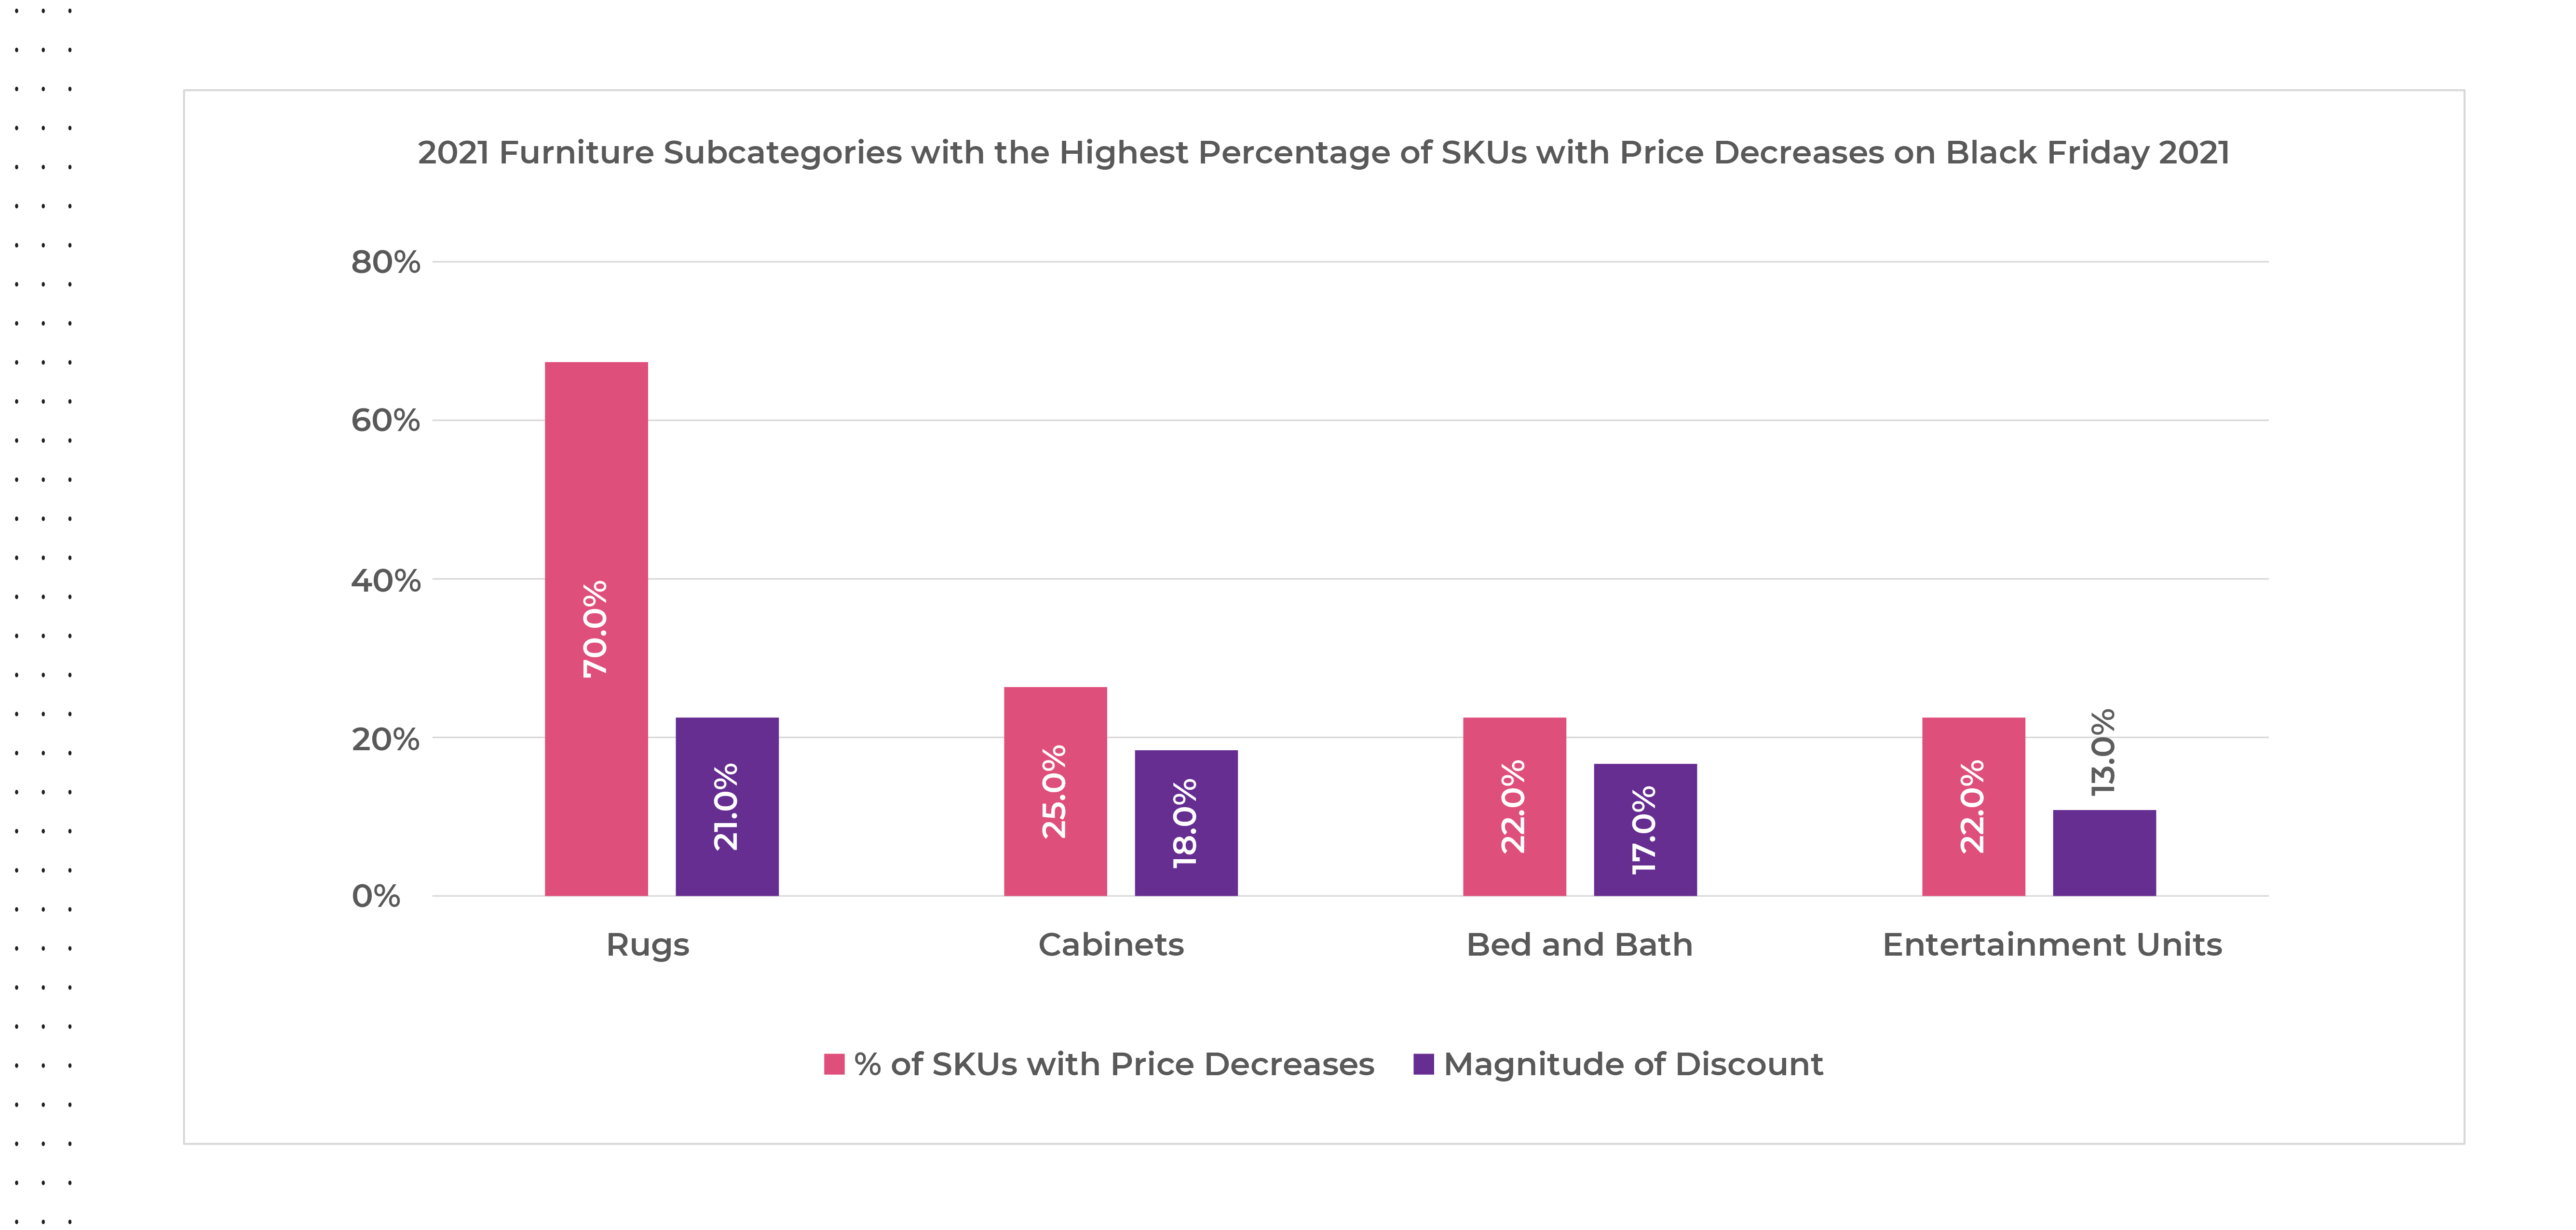
Within the furniture category, the subcategories offering the greatest number of SKUs with price decreases on Black Friday 2021 were rugs by a wide margin, followed by cabinets, bed and bath, and entertainment units, but the magnitude of discounts offered were all under twenty percent.
Source: Commerce Intelligence – Pricing Insights for Bed & Bath, Electronics, Furniture, Healthy & Beauty, and Fashion categories on Amazon.com and Target.com on Black Friday November 27th, 2021, versus average pricing for the same SKUs from Pre-Black Friday November 20-26th 2021 and Black Friday November 26th, 2020, versus average pricing for the same SKUs from Pre-Black Friday November 19th-25th 2020
Accounting for this phenomenon could have been retailers’ attempts to clear inventory for SKUs which hadn’t sold even during the period of severe supply chain shortages. With more products selling at higher prices this year, retailers were also able to use fewer SKUs with greater discounts to attract buyer in hopes of filling their digital baskets with more full-priced goods, helping to protect margins heading in to Cyber Weekend. Scarcity threats also encouraged consumers to buy early, even when not on promotion, to ensure they would have gifts in time for the holidays.
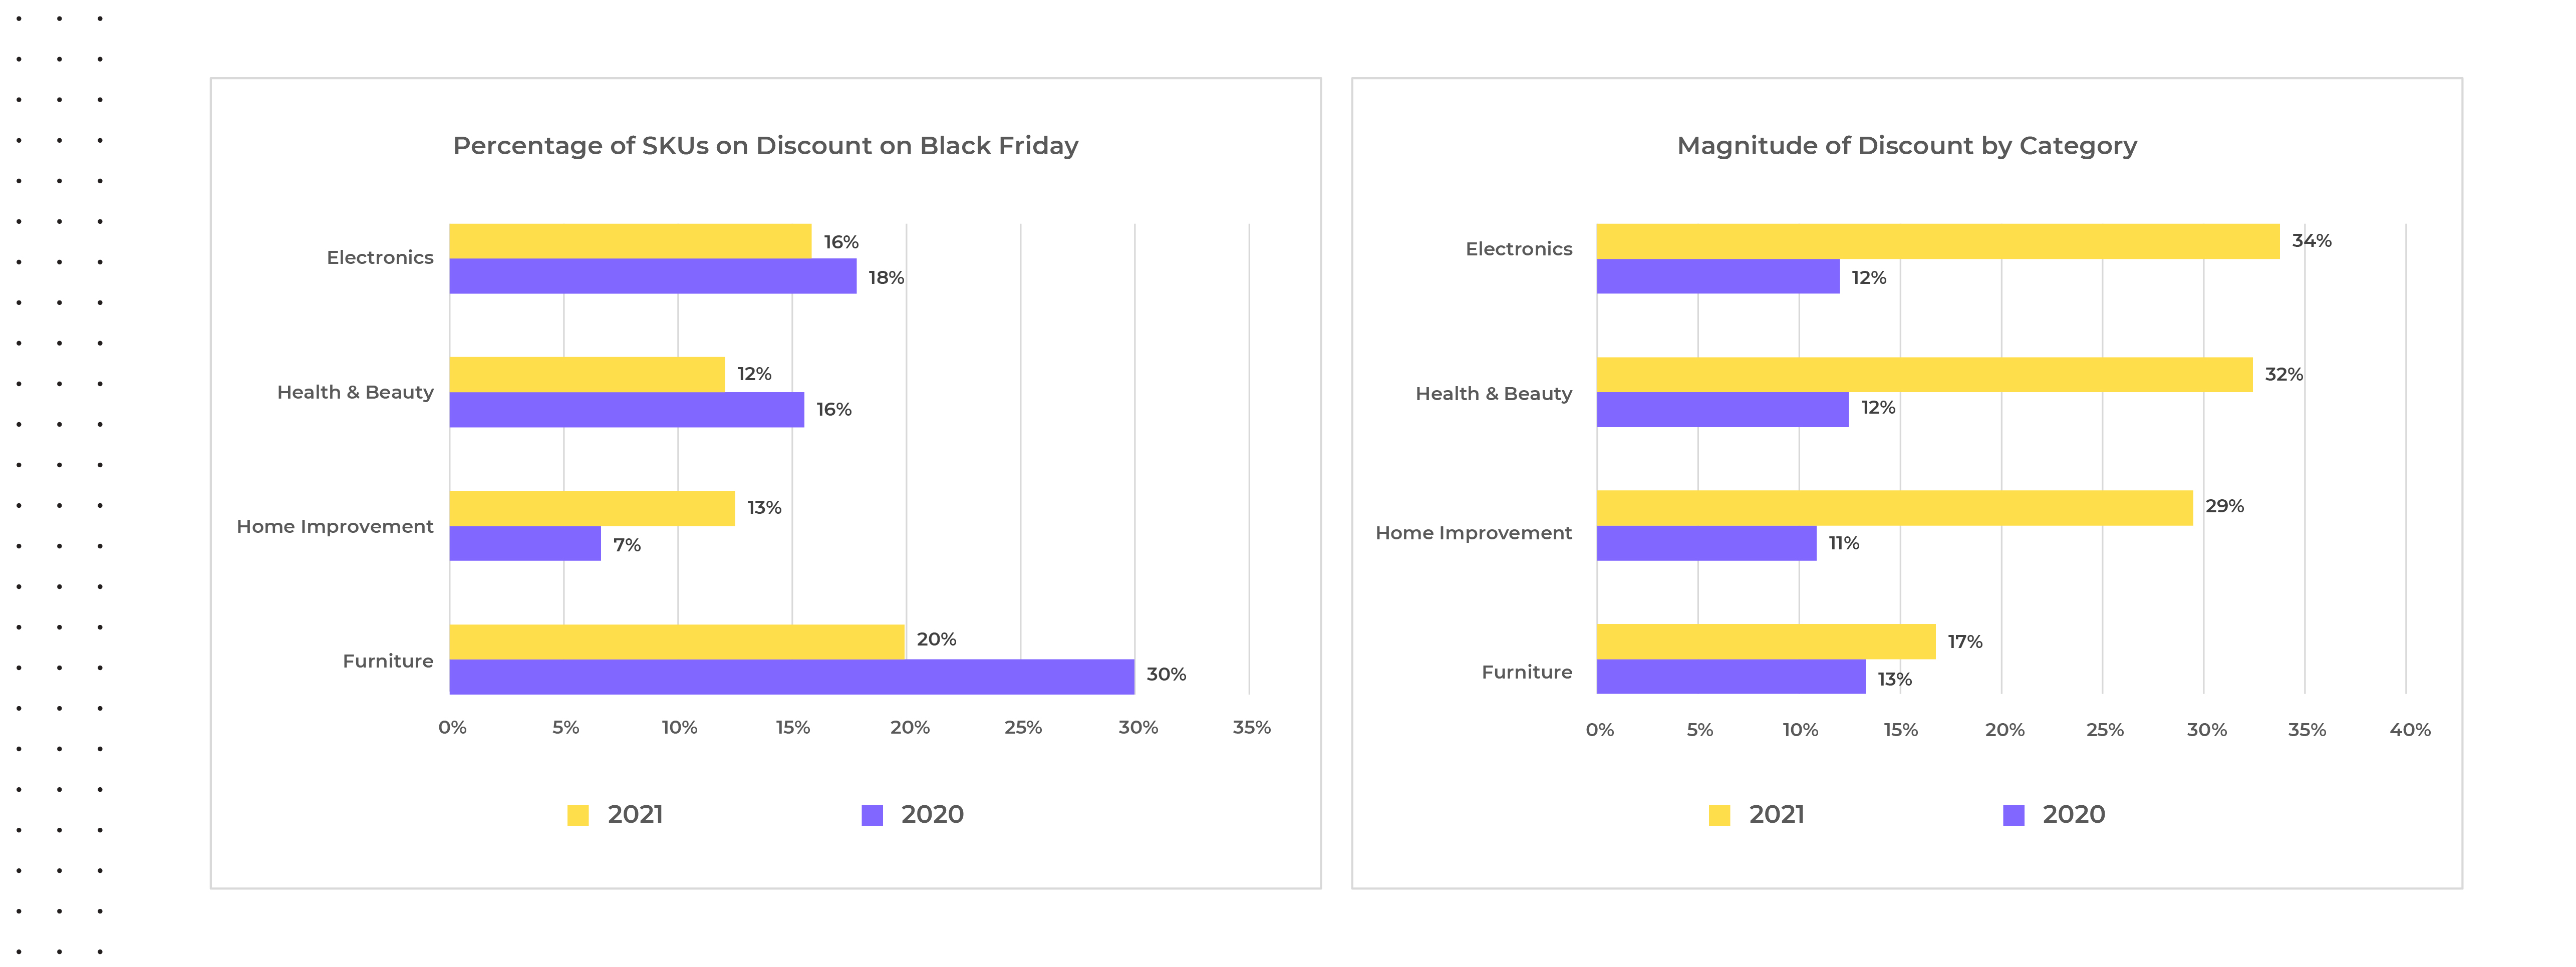
The same trends seen pre-Cyber Weekend 2021 were also seen on Black Friday with a year-over-year decrease in the percentage of SKUs offered on discount versus 2020, and steeper price reductions for the discounted products which can also be attributed to the increase in MSRPs.
Source: Commerce Intelligence – Pricing Insights for Bed & Bath, Electronics, Furniture, Healthy & Beauty, and Fashion categories on Amazon.com and Target.com on Black Friday November 27th, 2021, versus average pricing for the same SKUs from Pre-Black Friday November 20-26th 2021 and Black Friday November 26th, 2020, versus average pricing for the same SKUs from Pre-Black Friday November 19th-25th 2020
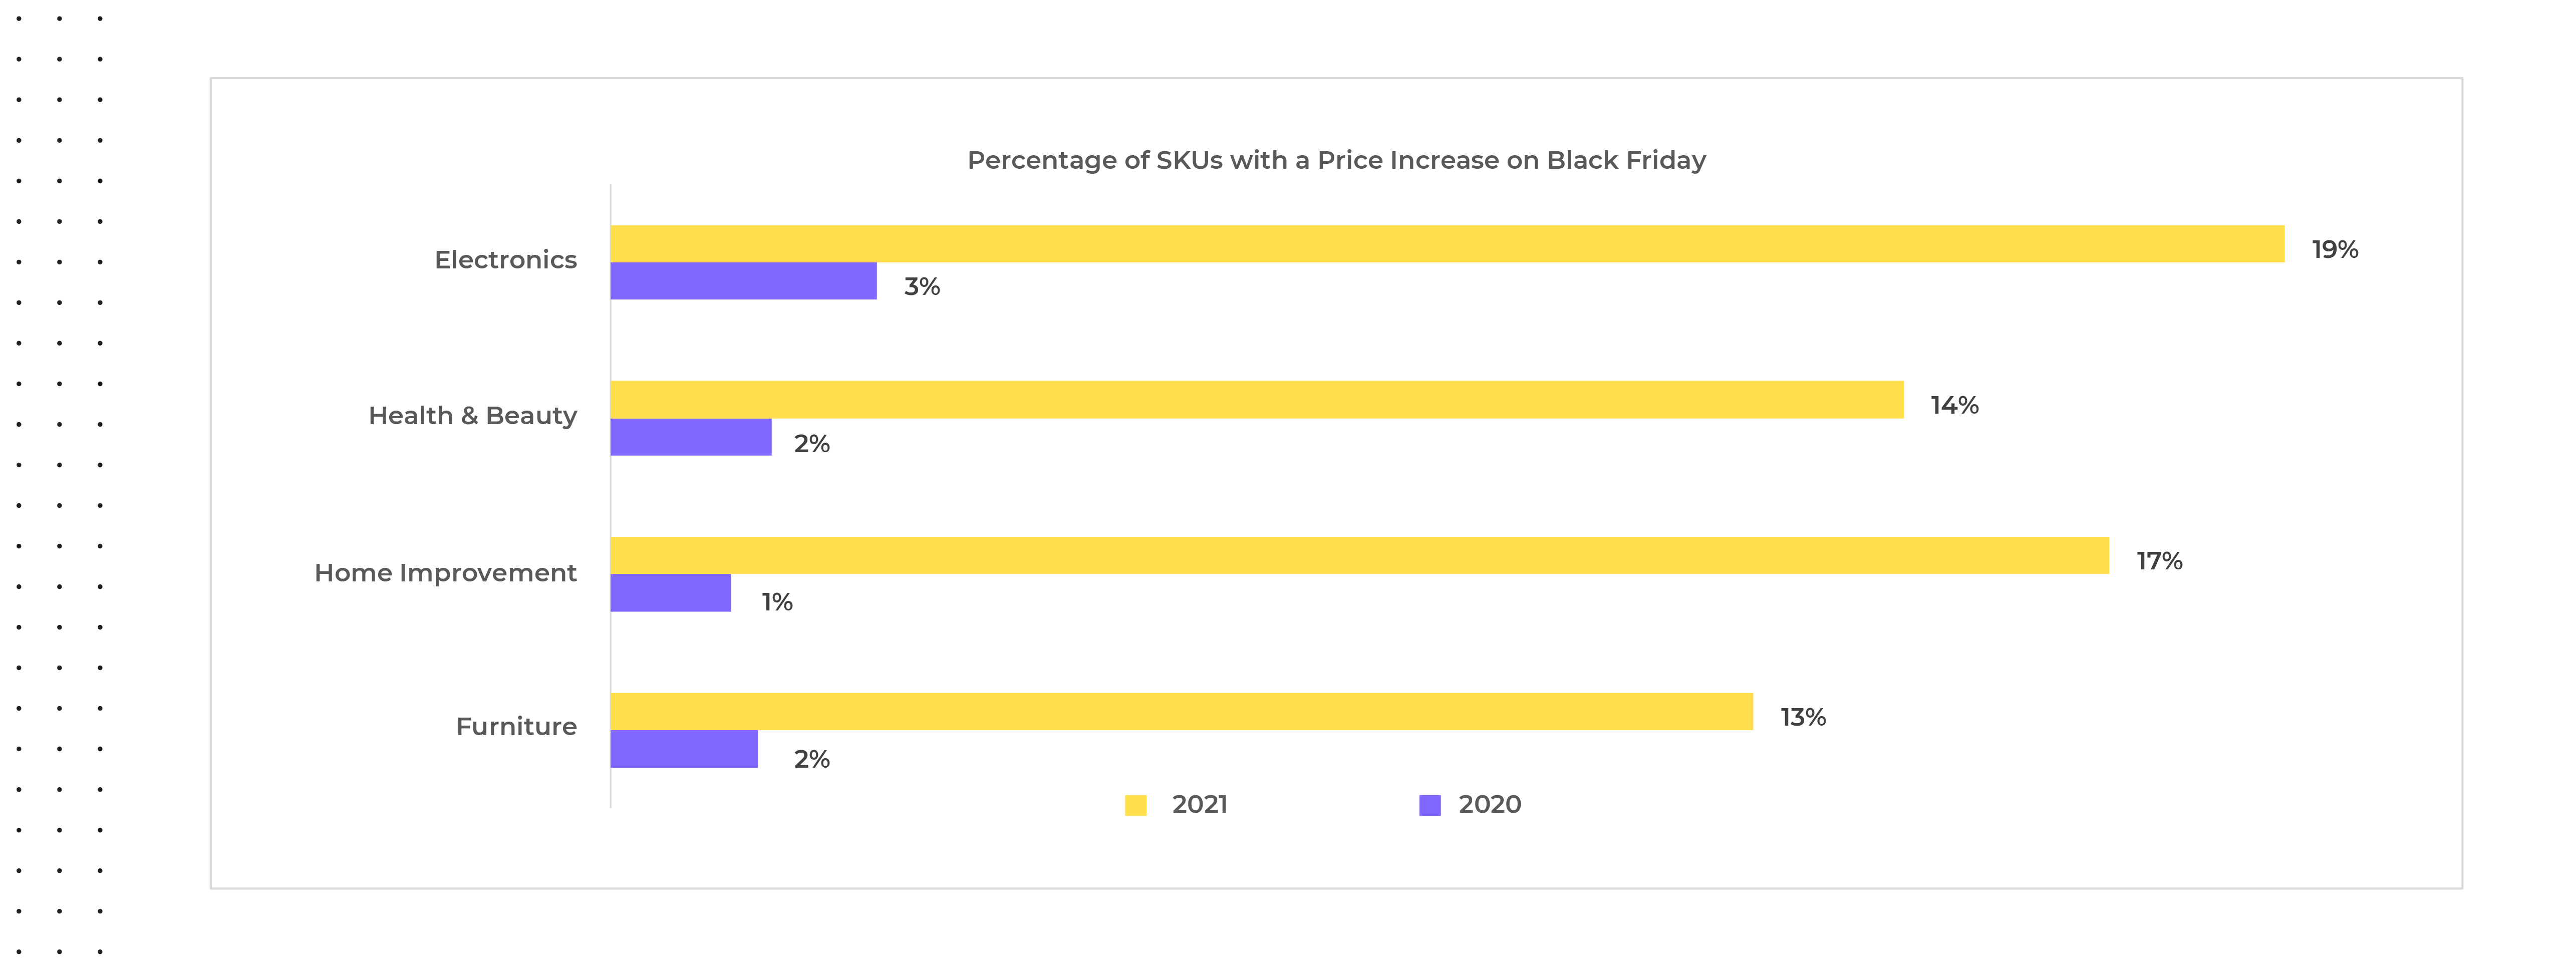
2021 Black Friday Price Increases?
We all know Black Friday is all about price reductions, discounts and deals and so it’s rare to see actual price increases, yet for Black Friday 2021, trends ran counter to this. We observed price increases across all categories for around thirteen to nineteen percent of SKUs, with an average price increase of around fifteen percent in 2021 versus an average of only two percent in 2020.
Source: Commerce Intelligence – Pricing Insights for Bed & Bath, Electronics, Furniture, Healthy & Beauty, and Fashion categories on Amazon.com and Target.com on Black Friday November 27th, 2021, versus pricing for the same SKUs from Pre-Black Friday November 20-26th 2021 and Black Friday November 26th, 2020, versus average pricing for the same SKUs from Pre-Black Friday November 19th-25th 2020
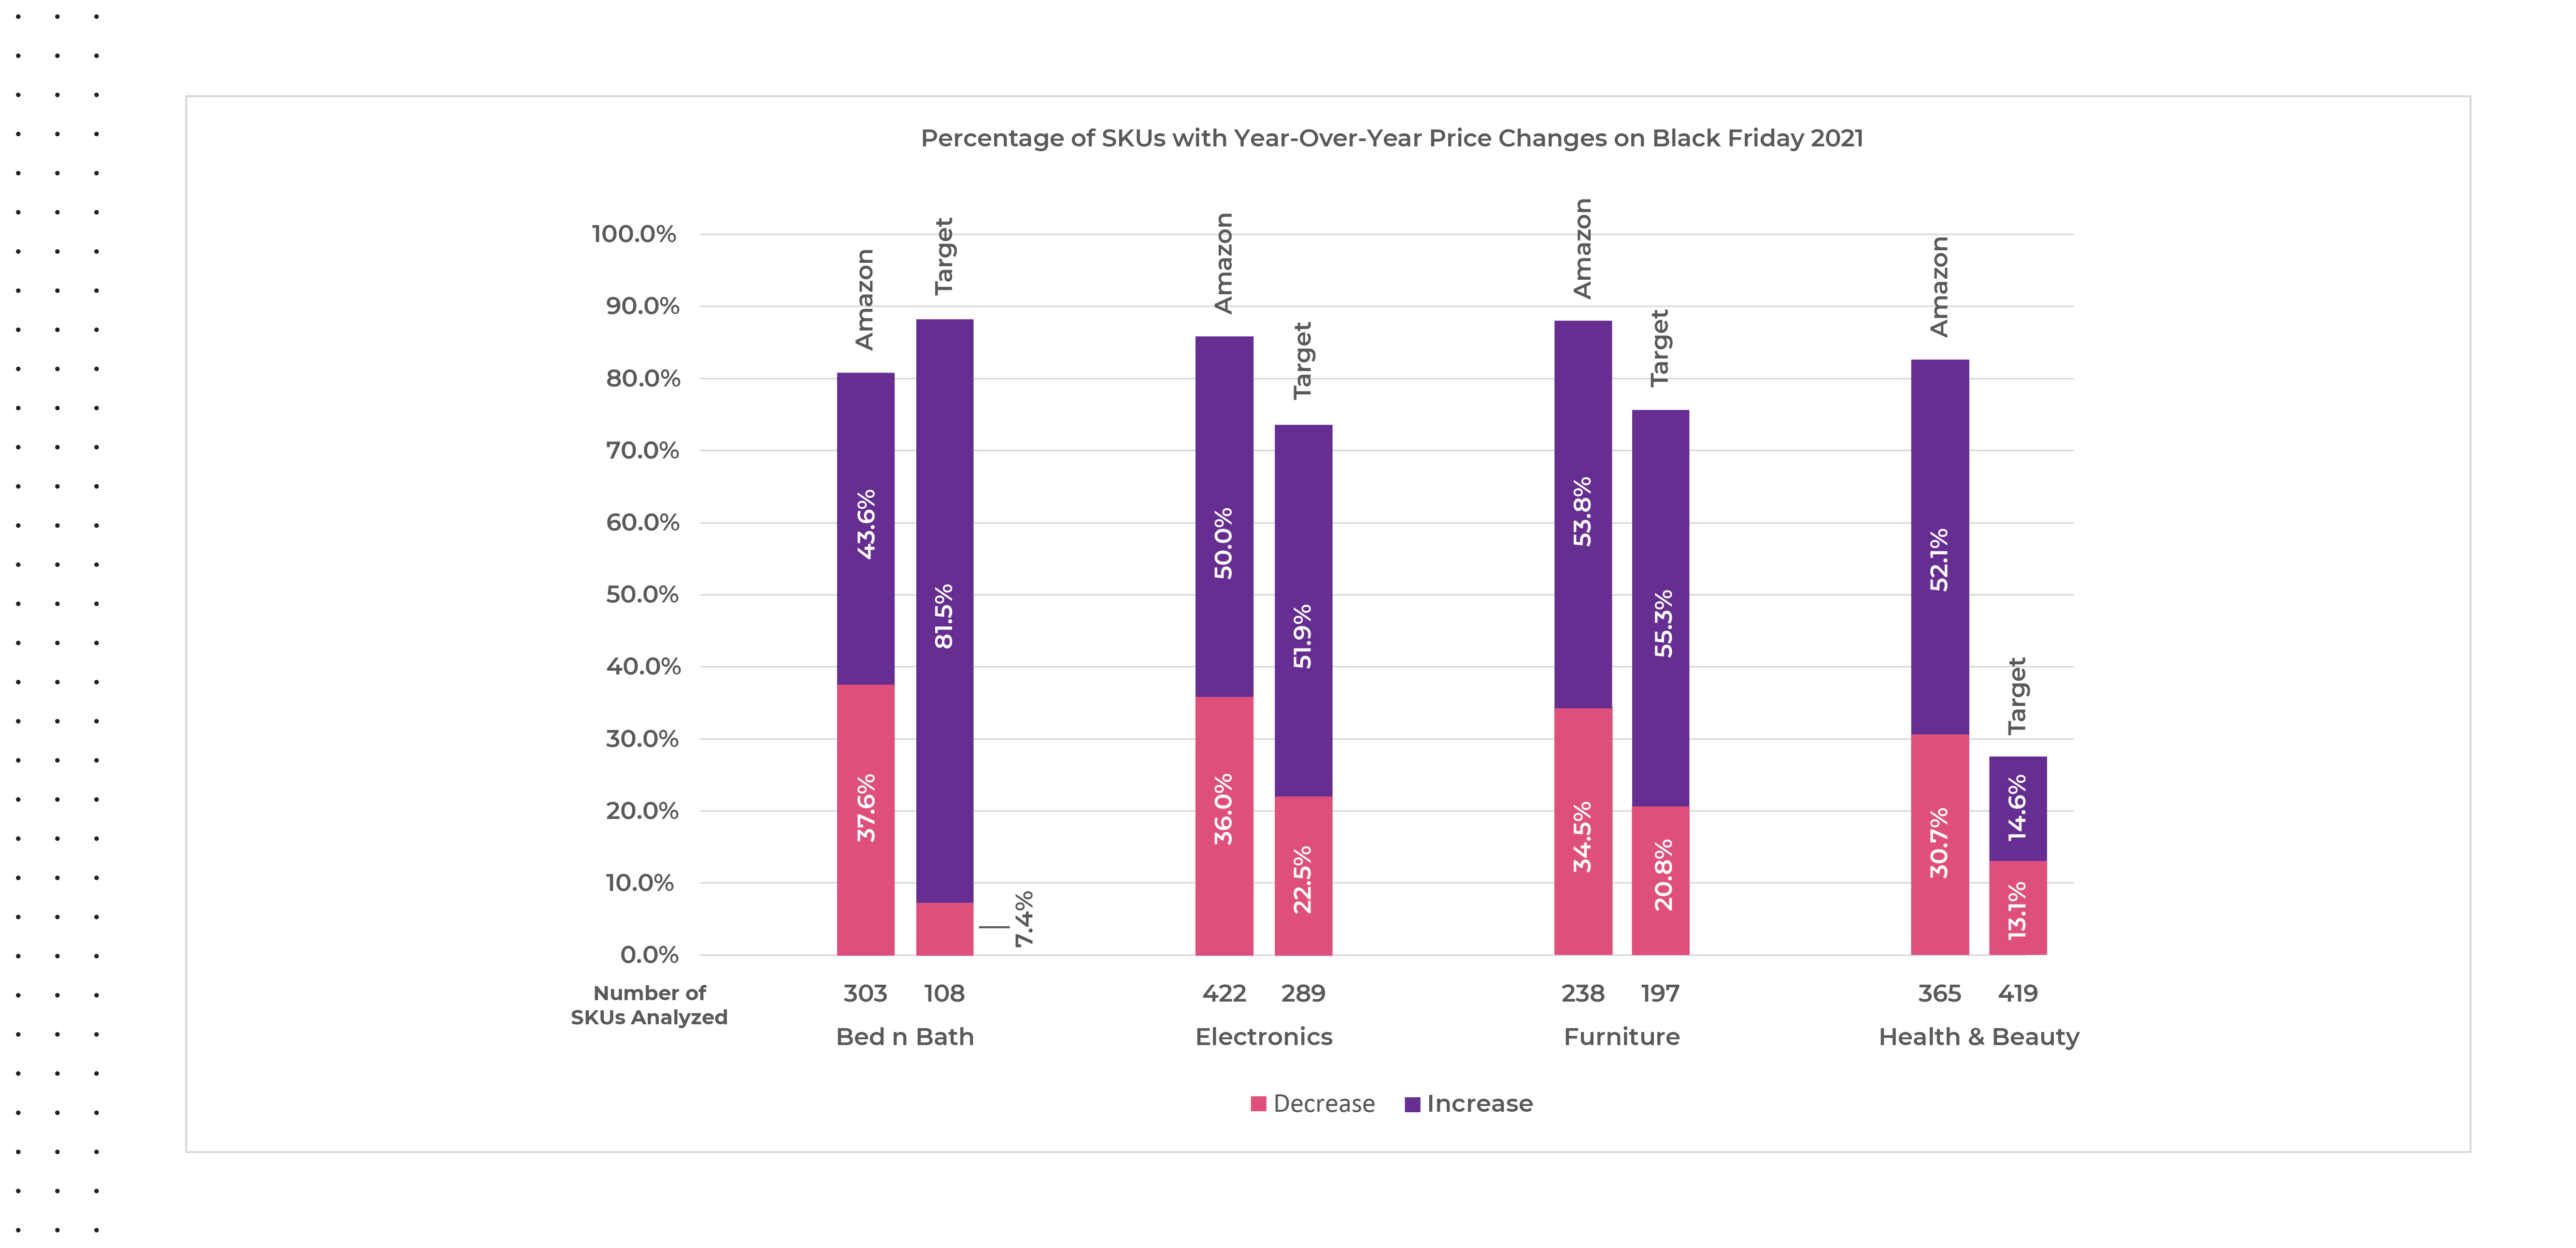
At an account level, we noticed a few interesting differences happening on Black Friday 2021 versus 2020 regarding category price changes. On Target.com, almost ninety percent of the bed and bath SKUs analyzed had a price change on Black Friday in 2021 versus 2020 with eighty-two percent presenting a higher price year-over-year versus only around seven percent showing a decrease, where on Amazon nearly forty-four percent of bed and bath SKUs showed an increase in price and around thirty-eight percent showed a decrease. Except for the health and beauty category on Target.com, more than half of the SKUs in each category saw a price increase on Black Friday versus a price decrease.
Source: Commerce Intelligence – Pricing Insights for Bed & Bath, Electronics, Furniture, Healthy & Beauty, and Fashion categories on Amazon.com and Target.com on Black Friday November 27th, 2021, versus average pricing for the same SKUs on Black Friday November 26th, 2020.
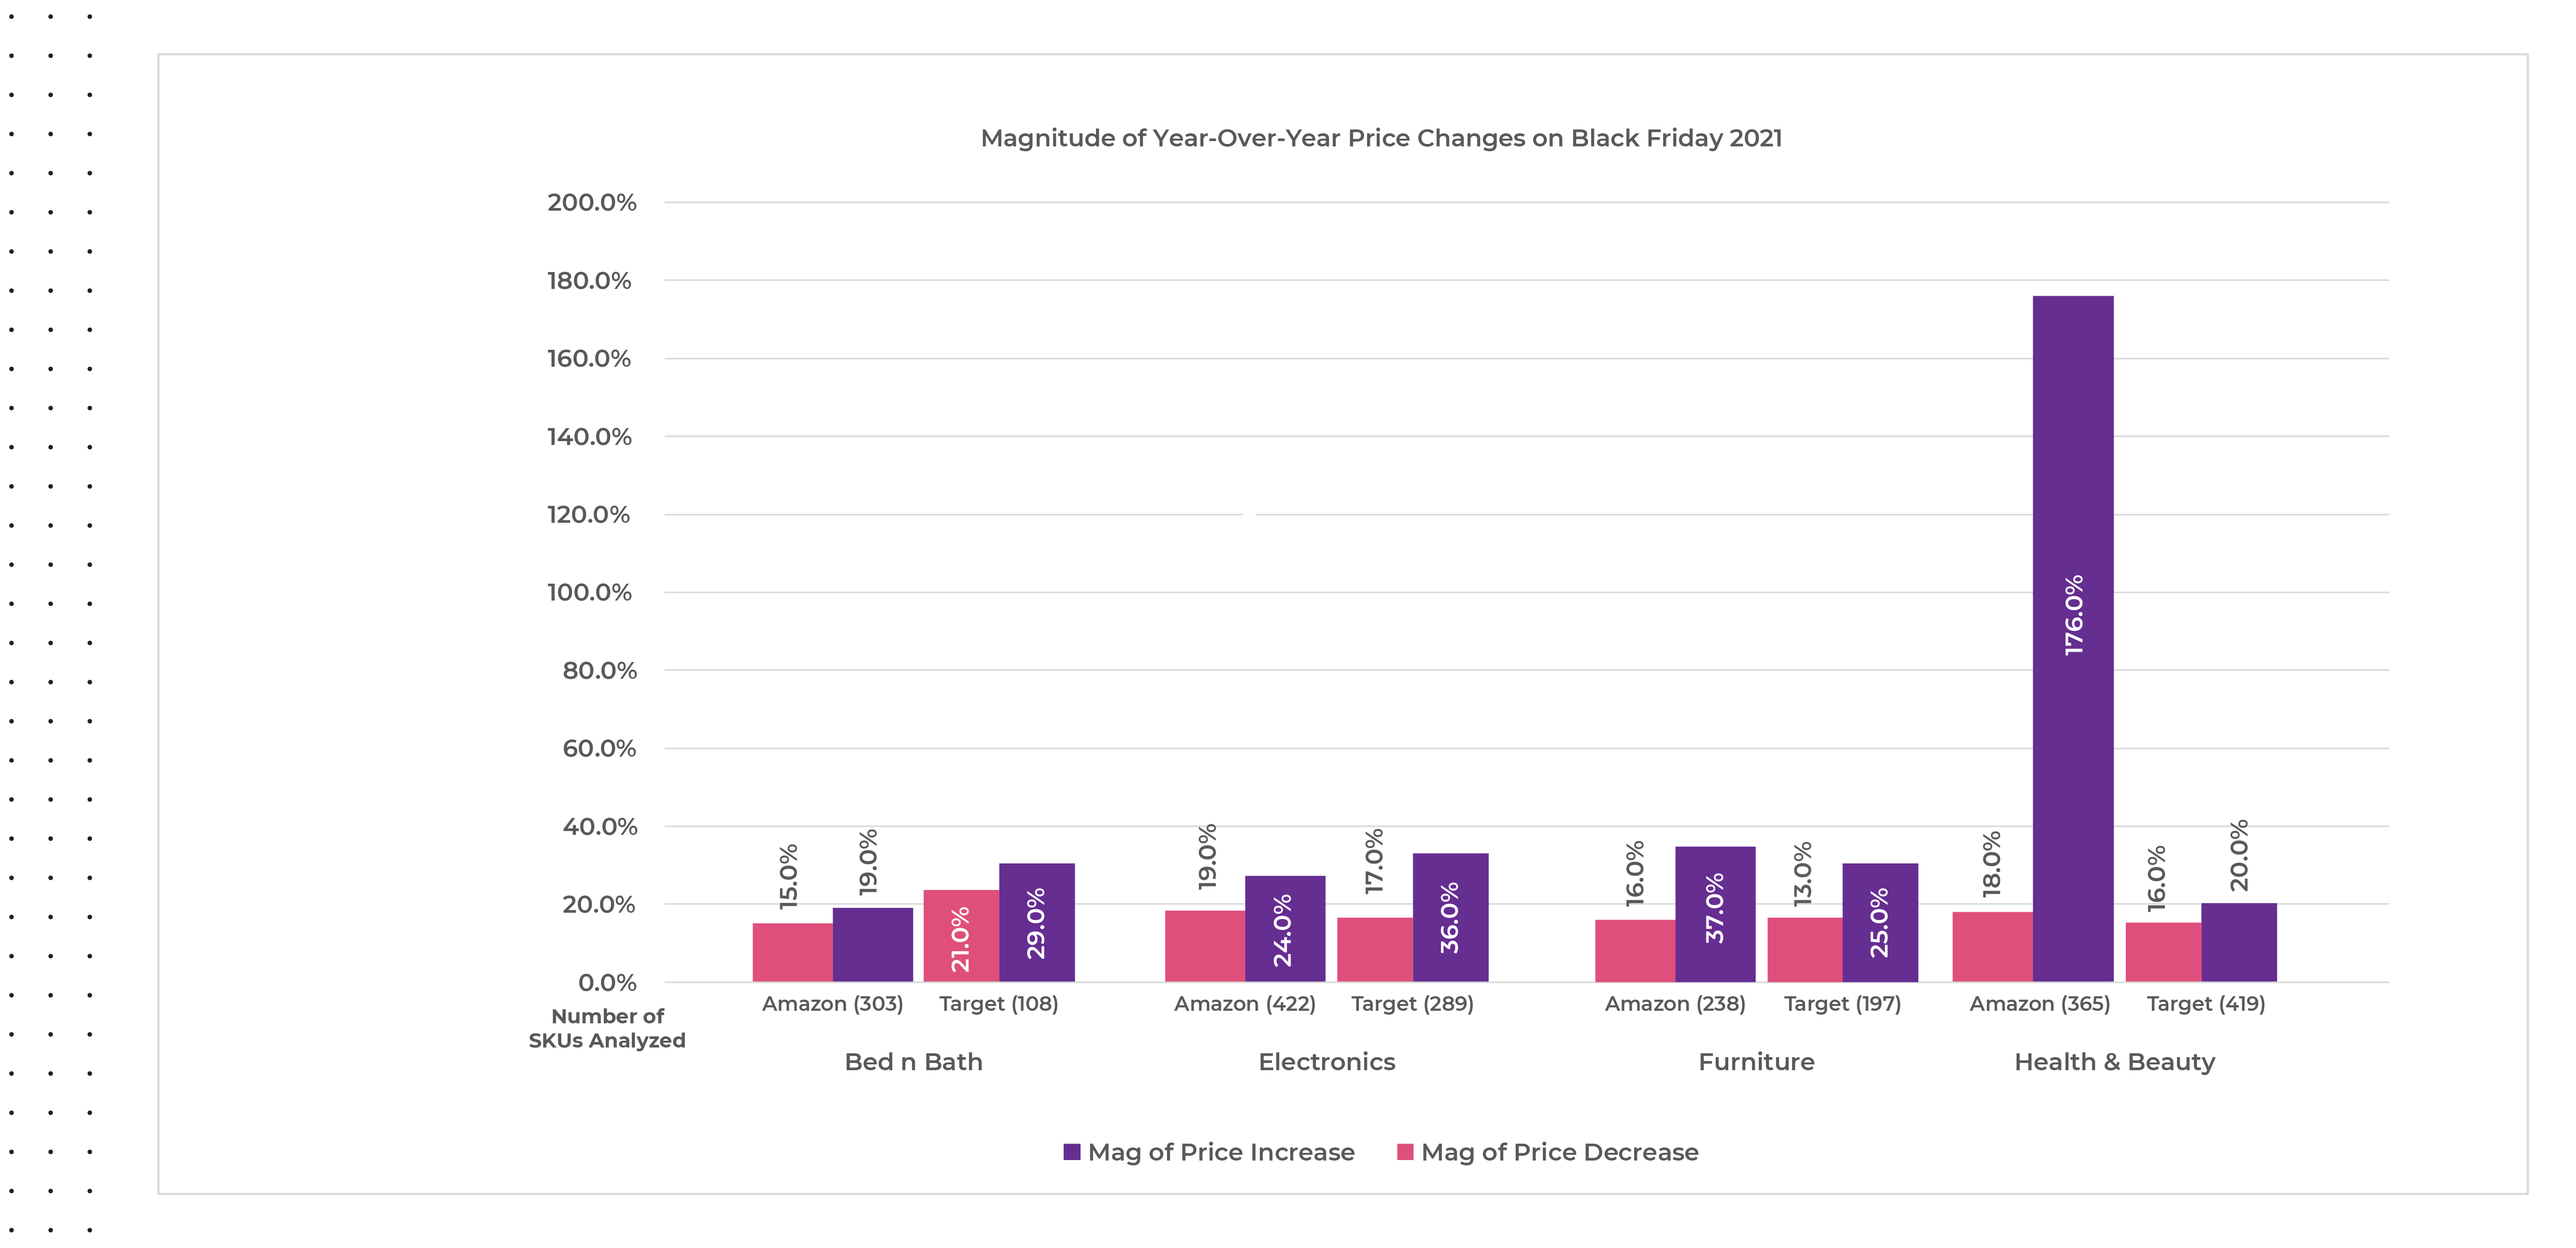
The magnitude of year-over-year price changes seen on Black Friday 2021 was significant across all categories, but the magnitude of price increases found on Amazon.com within the health and beauty category outpaced the rest by far. We reviewed three hundred and sixty-five SKUs on Amazon.com within the health & beauty category and saw almost eighty-three percent of them had a price change with around thirty-one percent decreasing prices and around fifty-two percent increasing prices. This means that within the health & beauty category on Amazon.com, more than fifty percent of the SKUs tracked were sold at a one hundred and seventy-six percent higher price on average during Black Friday 2021 versus 2020.
Source: Commerce Intelligence – Pricing Insights for Bed & Bath, Electronics, Furniture, Healthy & Beauty, and Fashion categories on Amazon.com and Target.com on Black Friday November 27th, 2021, versus average pricing for the same SKUs on Black Friday November 26th, 2020.
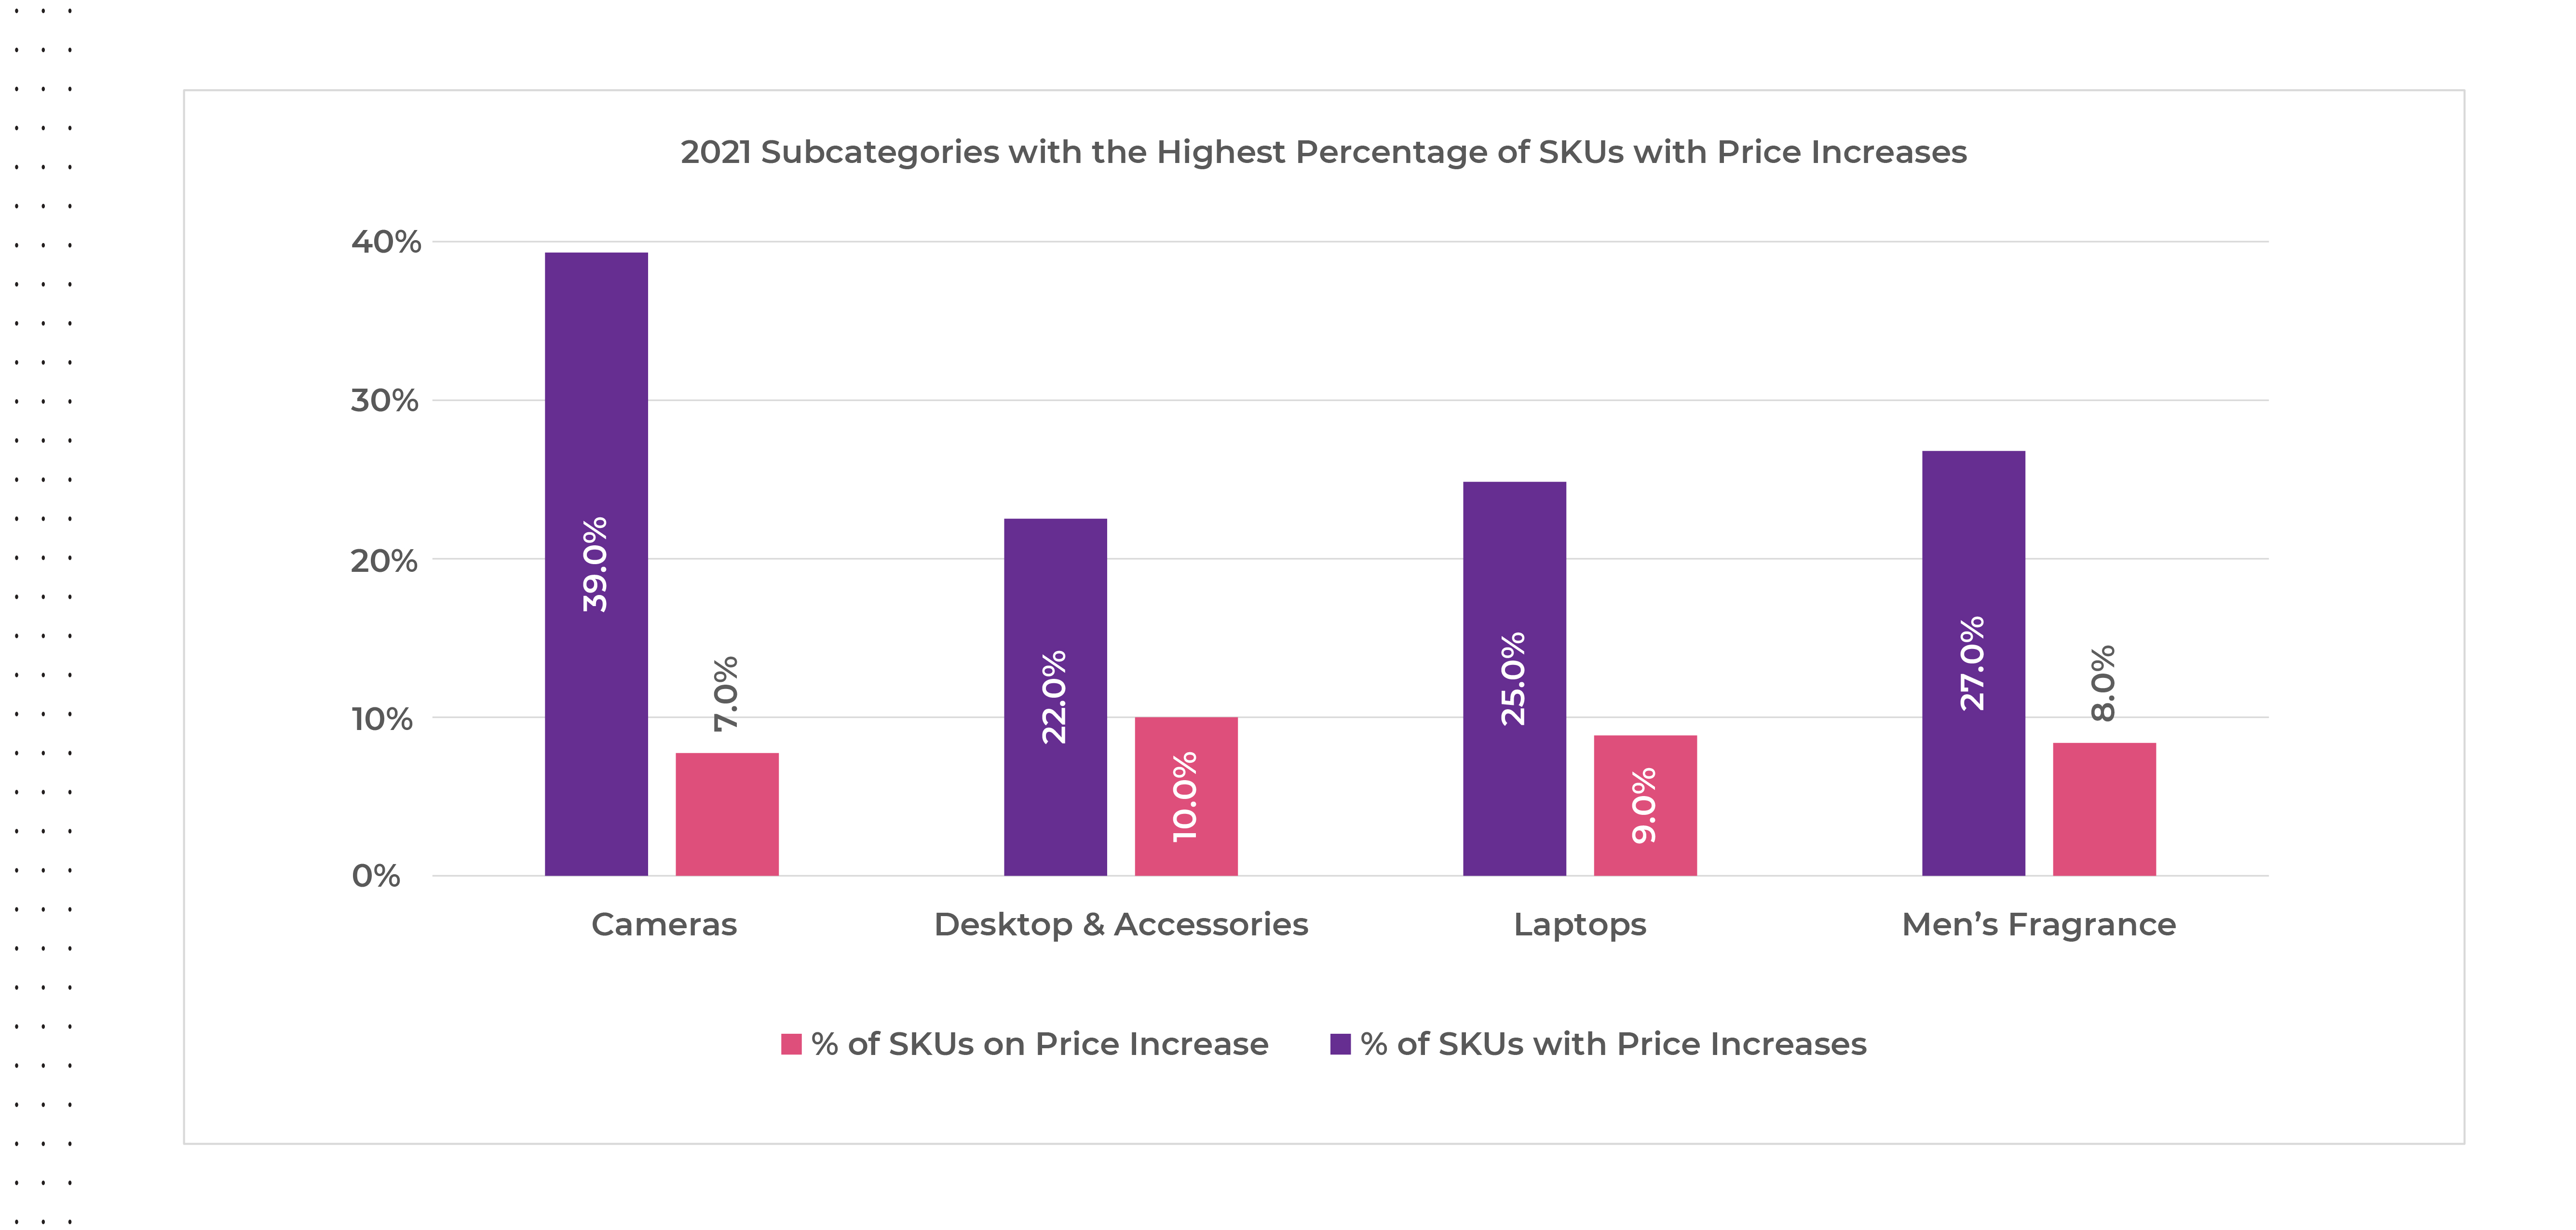
The subcategories offering the greatest number of SKUs with price increases on Black Friday 2021 were cameras, followed by men’s fragrances, laptops, and desktops & accessories, but the magnitude of discounts offered were all under ten percent.
Source: Commerce Intelligence – Pricing Insights for Bed & Bath, Electronics, Furniture, Healthy & Beauty, and Fashion categories on Amazon.com and Target.com on Black Friday November 27th, 2021, versus pricing for the same SKUs from Pre-Black Friday November 20-26th 2021 and Black Friday November 26th, 2020, versus average pricing for the same SKUs from Pre-Black Friday November 19th-25th 2020
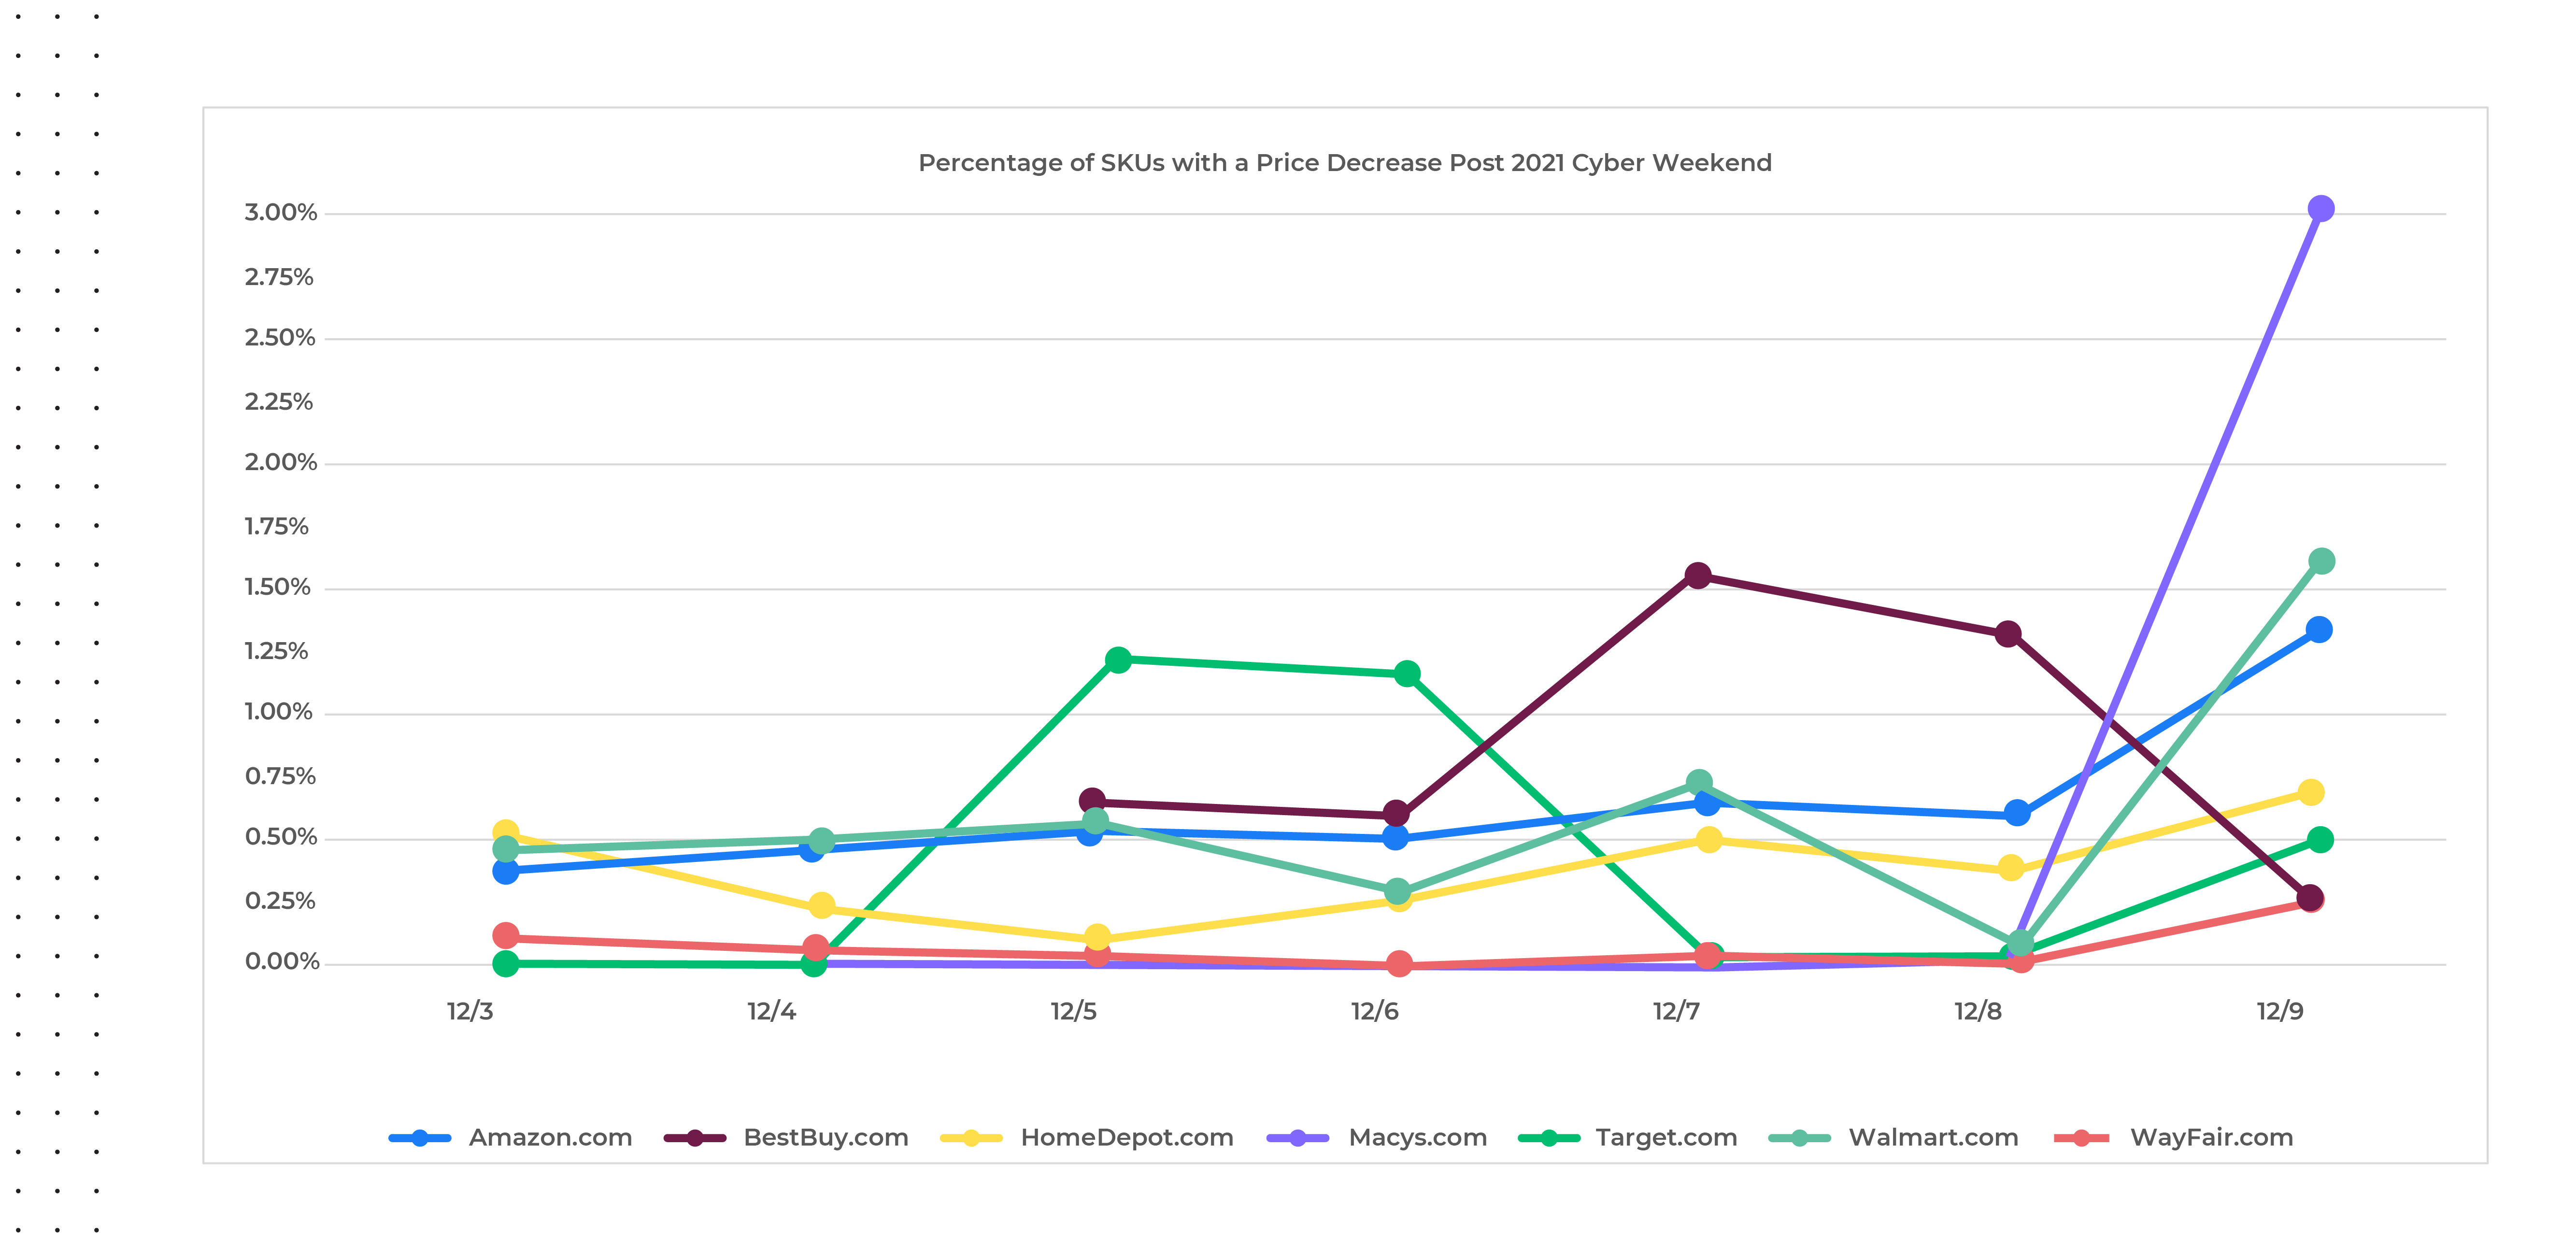
The Aftermath Post-2021 Cyber Weekend
Extending this analysis beyond the holiday weekend, we analyzed price change activity from December third through the ninth across the top US retailers (chart below) and found that price decreases have been very minimal, comparatively speaking. Though there was a spike in number of price decreases from December 8th to the 9th, the percentage of SKUs with price decreases was still very low (less than three percent). We anticipate this trend will continue into 2022.
Source: Commerce Intelligence – Pricing insights for Home & Garden, Jewelry & Watches, Clothing & Shoes, Bed N Bath, Lighting & Ceiling Fans categories
A Sign of Things to Come
A confluence of inflationary trends, product shortages and consumer liquidity have driven many marketplace changes to occur simultaneously. Government programs in the form of stimulus checks, have put extra money in consumers’ hands, and so they’ve been more willing to spend. That, coupled with the shock in the supply chain, has motivated people to buy far ahead of the 2021 holiday season. Hence, retailers have needed to rely much less on across-the-board discounts. Promotions have been more strategic – we’ve seen deeper discounts over fewer products, likely used to draw consumers in to buy certain items, and once they’re there, customers are buying everything else at a non-discount level. When these factors once again normalize, we could see a return to the “race to the bottom” that has occurred since the financial crisis of 2008-2009, but for once, retailers may be able to maintain some pricing power as the 2021 holiday shopping season played out.
Even though performance was not as anticipated and holiday sales did not grow as rapidly as they did in 2020, Cyber Monday was still the greatest online shopping day in 2021. Through it all, retailers managed to keep their digital shelves stocked and orders filled in time for the holidays for the most part, running the risk of housing aged inventory if goods didn’t arrive in time. Despite predictions for steep promotions in January 2022, with supply chains still challenged and inflationary pressures still full steam ahead, we don’t anticipate much in the way of enhanced discounts to continue beyond the holidays.
Access to these types of real-time digital marketplace insights can enable retailers and brands to make strategic decisions like how and when to address inflationary pressures, while also supporting many other day-to-day operations and help drive profitable growth in an intensifying competitive environment. Continue to follow us in the coming weeks for a detailed 2021 year-end review across more retailers and categories. Be sure to reach out to our Retail Analytics experts for access to more details regarding the above analysis.