Your budget-conscious customers are hunting for value and won’t hesitate to switch brands or shop at other retailers.
In saturated and fiercely competitive markets, how can you retain customers? And better yet, how can you attract more customers and grow your market share? One thing you can do as a brand or retailer is to set the right prices for your products.
Competitive or competition-based pricing can help you get there.
So what exactly is competitive pricing? Let’s dive into this strategy, its advantages and disadvantages, and how it can be used to stay ahead of the competition.
What is Competitive Pricing?
Competitive or competition-based pricing is a strategy where brands and retailers set product prices based on what their competitors charge. This method focuses entirely on the market landscape and sets aside the cost of production or consumer demand.
It is a good pricing model for businesses operating in saturated markets, such as consumer packaged goods (CPGs) or retail.
Competitive Pricing Models
Competitive pricing isn’t a one-size-fits-all strategy. The approach includes various pricing models that can be customized to fit your business goals and market positioning.
Here’s a closer look at five of the most common competition-based pricing models:
Price Skimming
If you have a new product entering the market, you can initially set a high price. Price skimming allows you to maximize margins when competition is minimal.
This strategy taps into early adopters’ willingness to pay a premium for new project categories. As competitors enter the market, you can gradually reduce the price to maintain competitiveness.
Premium Pricing
Premium pricing lets you position your product as high-quality or luxurious goods.
When you charge more than your competitors, you’re not just selling a product—you’re selling status and an experience. This strategy is effective when your offering is of superior quality or has unique features that justify a higher price point.
Price Matching
Price matching—also known as parity pricing—is a defensive pricing tactic.
By consistently matching your competitors’ prices, you can retain customers who might otherwise, be tempted to switch to an alternative.
This approach signals your customers that they don’t need to look elsewhere for what they need and can feel comfortable remaining loyal to your brand.
Penetration Pricing
Penetration pricing is when you set a low price for a new product to gain market share quickly. The opposite of price skimming, this strategy can be particularly effective in price-sensitive or highly competitive industries.
By attracting customers early, you can also deter some competitors from entering the market. This bold move can establish your product as a market leader from the get-go.
Loss Leader Pricing
Loss leader pricing is a strategic sacrifice that can lead to greater gains in the long run.
By offering a product at a low price—sometimes even below cost—you can attract new customers to your brand and strengthen your current customers’ loyalty.
Eventually, you can cross-sell other higher-margin products to your loyal customer base to cover the loss from your loss leader pricing and increase sales of other more profitable products.
Key Advantages of Competitive Pricing
Although it’s not the only pricing strategy available, competitive pricing has some significant advantages.
It is Responsive
Agility is synonymous with profit in industries where consumer preferences and market conditions shift rapidly.
Competitive pricing allows you to adapt quickly—if a competitor lowers their prices, you can respond promptly to maintain your positioning.
It is Simple to Execute and Manage
Competitive pricing is straightforward, unlike cost-based pricing, which requires complex calculations and spans various factors and facets.
By closely monitoring competitors’ prices and adjusting your prices accordingly, you can implement this pricing strategy with relative ease and speed.
It Can Be Combined with Other Pricing Strategies
Competitive pricing is not a standalone strategy—it’s a versatile approach that can easily be combined with other pricing strategies. For example, say you want to use competitive pricing without losing money on a product. In this case, you could use cost-plus pricing to determine a base price that you won’t go below, then use competitive pricing as long as the price stays above your base price.
Key Disadvantages of Competitive Pricing
While competition-based pricing has its advantages, it’s not without its pitfalls. Here are some potential disadvantages of competitive pricing.
It De-emphasizes Consumer Demand
If you focus solely on what competitors are charging, you could overlook consumer demand.
For example, you could underprice items that consumers could be willing to purchase for more. Or, you might overprice items that consumers perceive as low-value, which can reduce sales.
You Risk Price Wars
If you and your competition undercut each other for customer acquisition and loyalty, you will eventually erode profit margins and harm the industry’s overall profitability. It’s a slippery slope where everyone loses in the end.
There’s Potential for Complacency
When you base your prices on beating those of competitors, you might neglect to differentiate your offerings through innovation and product improvements. Over time, this can weaken your brand’s position and lead to a loss of market share. Staying competitive means more than just matching prices—it means continuously evolving and adding value for the consumer.
4 Tips for a Successful Competitive Pricing Strategy in Retail
Here are four competition-based pricing tips for retailers:
Retailer Tip #1. Know Where to Position Your Products in the Market
For competitive pricing to work, you must understand your optimal product positioning in the overall market. To gain this understanding, you must regularly compare your offerings and prices with those of your key competitors, especially for high-demand products.
Then, you can decide which competition-based pricing model is suitable for you.
Retailer Tip #2. Price Dynamically
Dynamic pricing is a tactic with which you automatically adjust prices on your chosen variables, such as market conditions, competitor actions, or consumer demand.
When it comes to competitive pricing, a dynamic pricing system can track your competitors’ price changes and update yours in lockstep.
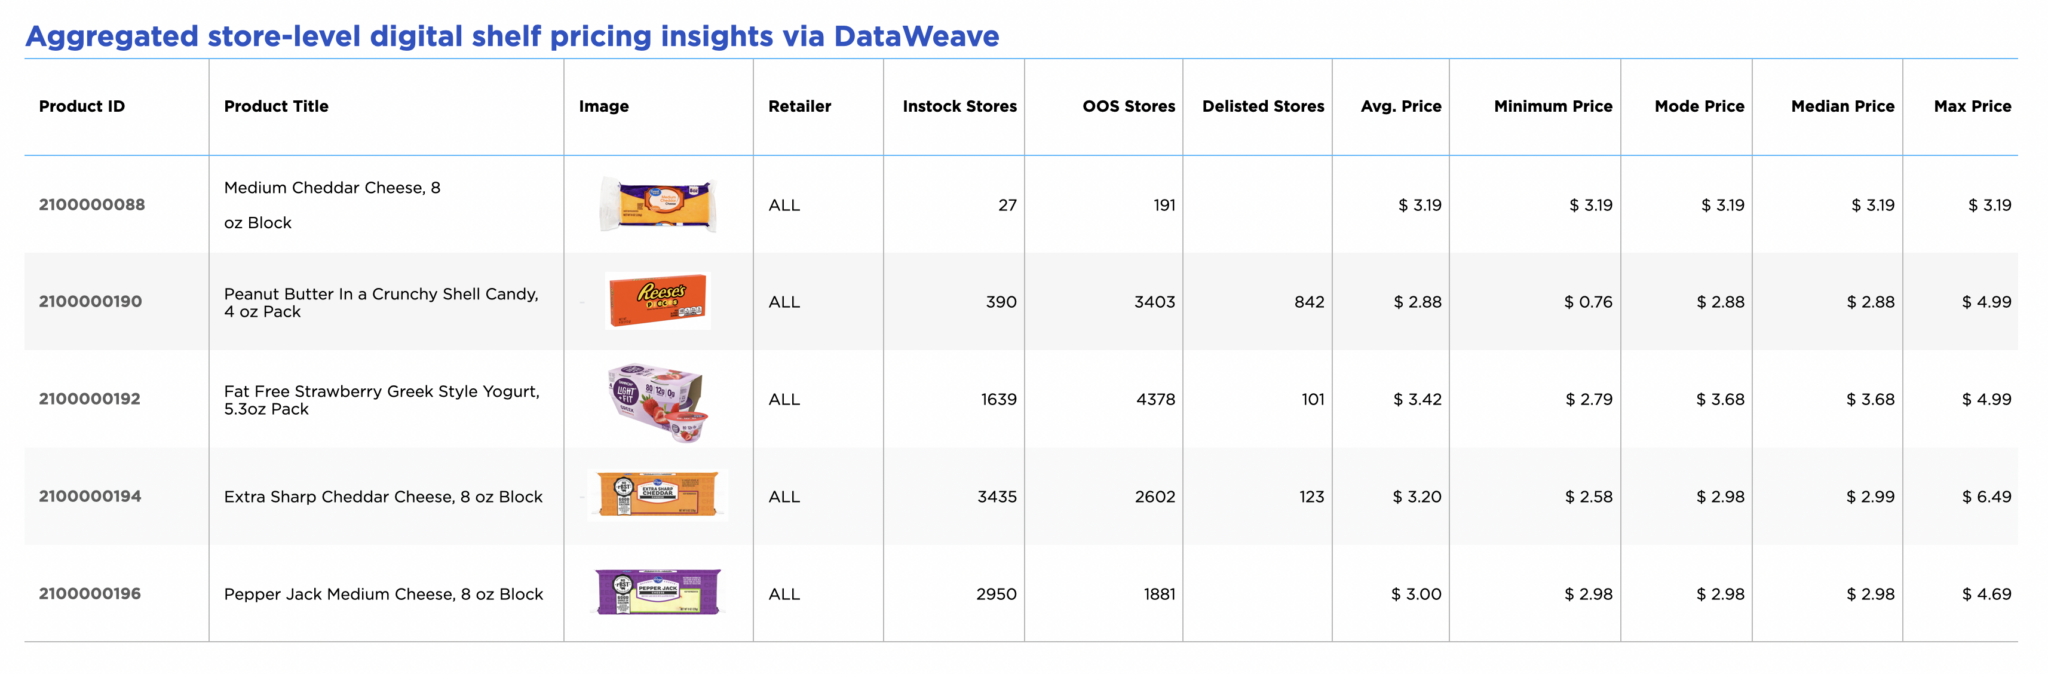
Price-monitoring tools like DataWeave allow you to stay ahead of the game with seasonal and historical pricing trend data.
Retailer Tip #3. Combine Competitive Pricing with Other Pricing Strategies
Competitive pricing can be powerful, but it doesn’t have to stand alone. You can enhance its benefits with complementary marketing tactics.
To illustrate, you can bundle products to offer greater value than what your competitors are offering. You can also leverage loyalty programs to offer exclusive discounts or rewards so customers keep returning, even when your competitors offer them lower prices.
Retailer Tip #4. Stay in Tune with Consumer Demand
Competition-based pricing aligns you with your competitor, but don’t lose sight of what your customers want. Routinely test your pricing strategy against consumer behavior to ensure that your prices reflect the actual value of your offerings.
5 Tips for a Successful Competitive Pricing Strategy for Consumer Brands
If you’re thinking about how to create a competitive pricing strategy for your brand, consider these five tips:
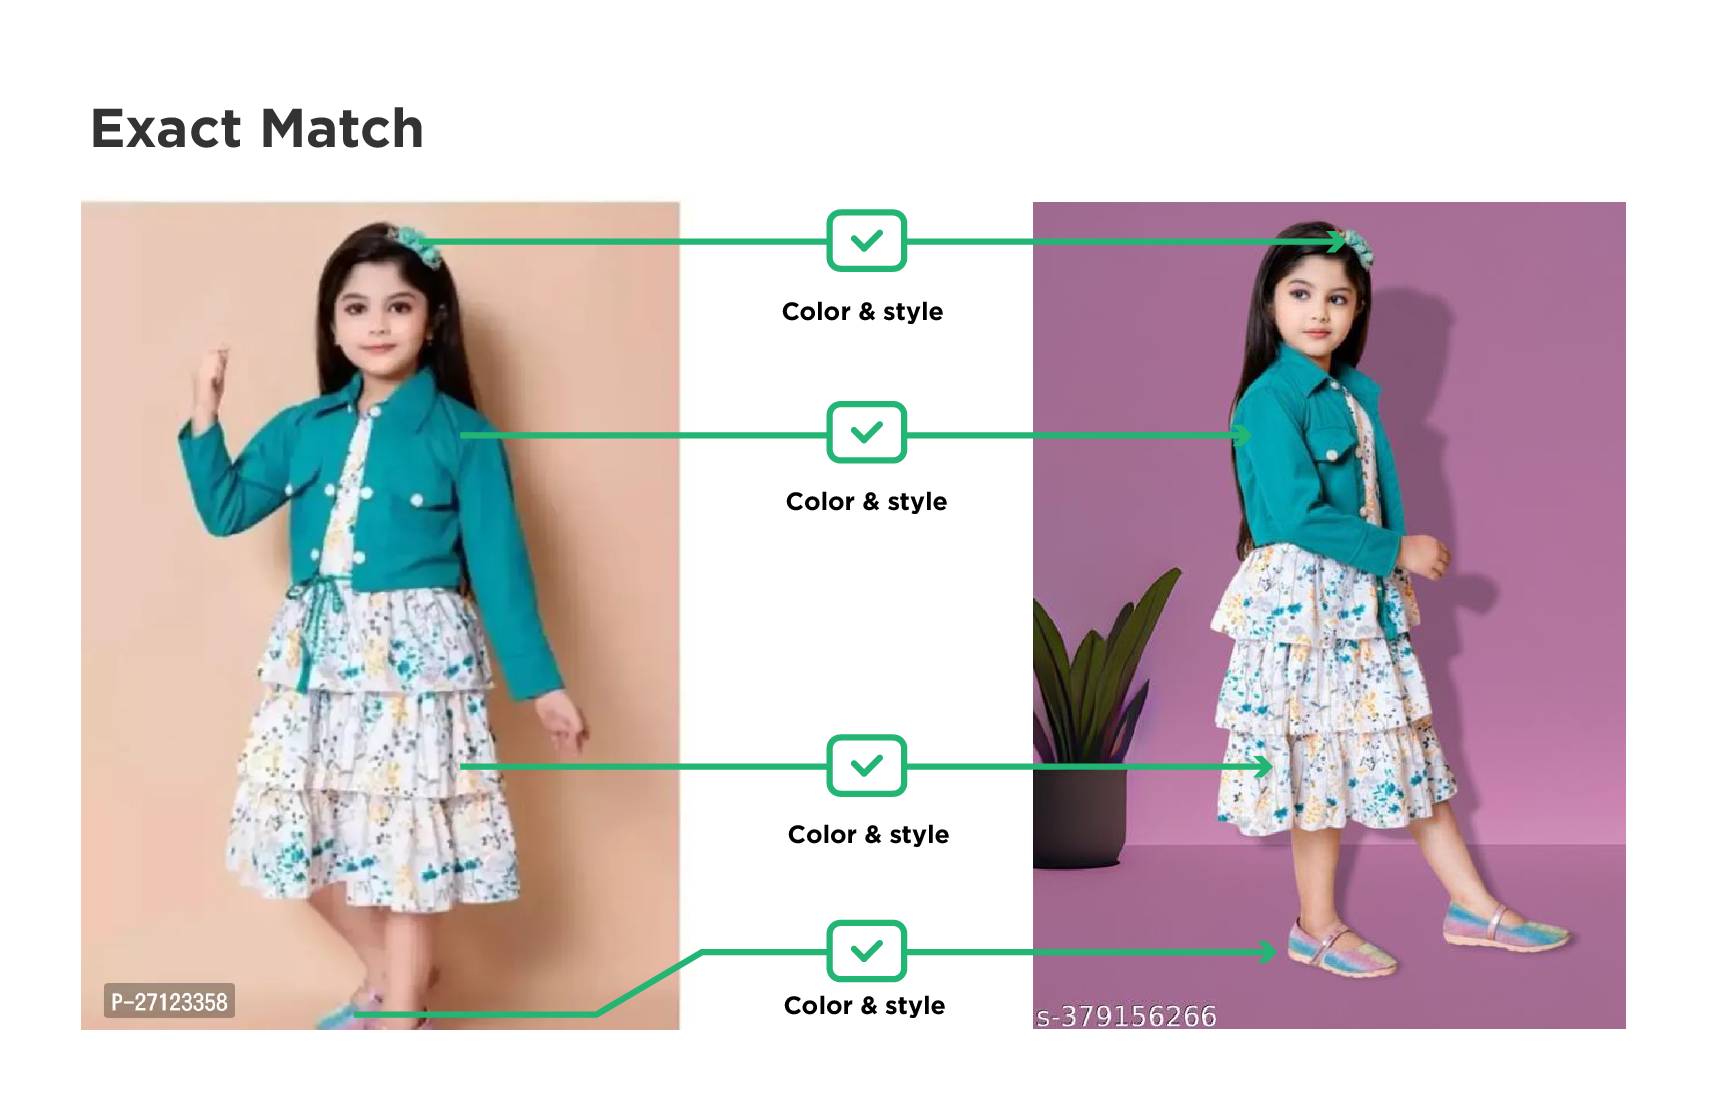
Brand Tip #1. Identify Competing Products for Accurate Comparisons
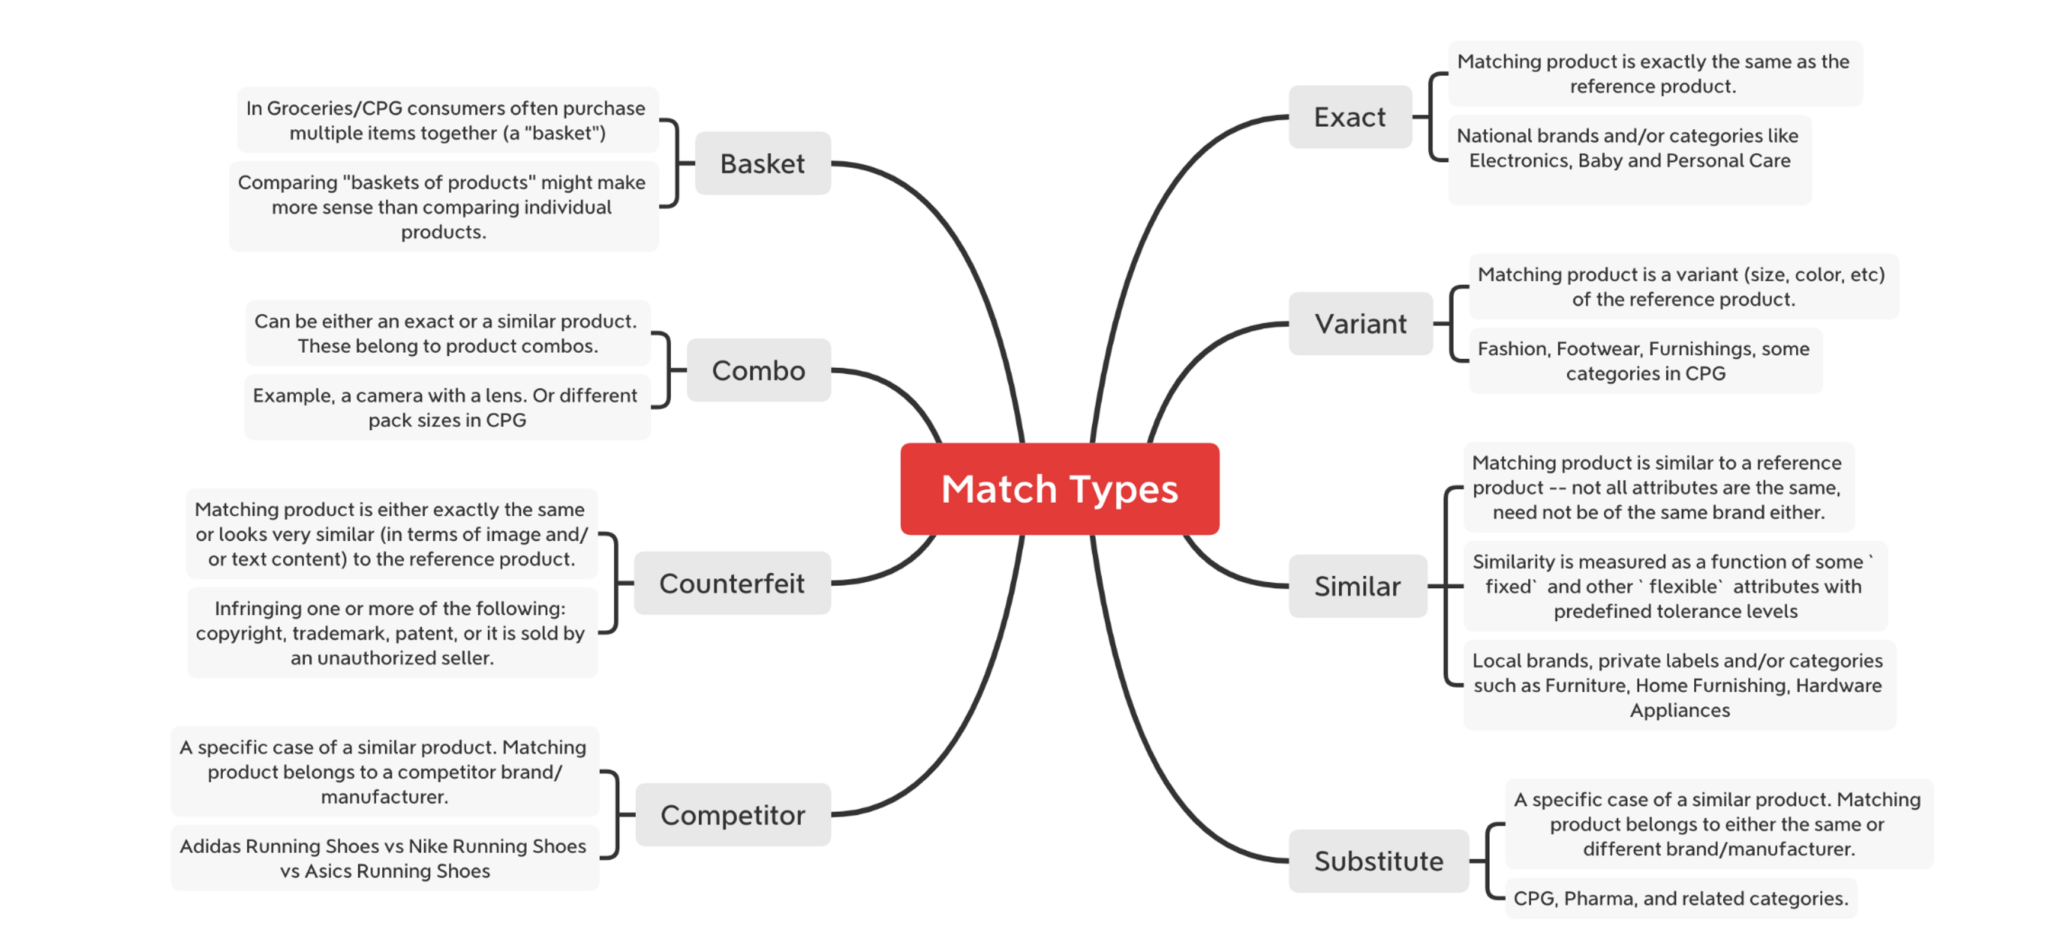
The first step in competitive pricing is to know the value of what you’re selling and how it compares to that of your competitors’ products. This extends to private-label products, similar but not identical products, and use-case products.
Product matching ensures your pricing decisions are based on accurate like-for-like comparisons, allowing you to compete effectively.
Brand Tip #2. Understand Your Product’s Relative Value
Knowing how your product competes on value is key to setting the right price. If your product offers higher value, price it higher; if it offers less, price it accordingly. This ensures your pricing strategy reflects your product’s market placement.
Brand Tip #3. Consider Brand Perception
Even if your product is virtually the same as a competitor’s, your brand’s perceived value may be different, which plays a crucial role in pricing.
If your brand is perceived as premium, you can justify higher prices. Conversely, if customers perceive you as a value brand, your pricing should reflect affordability.
Brand Tip #4. Leverage Value-Based Differentiation
When your prices are similar to competitors’, you must differentiate your products by expressing your product value through branding, packaging, quality, or something else entirely.
This differentiation will compel consumers to choose your product over other similarly priced options.
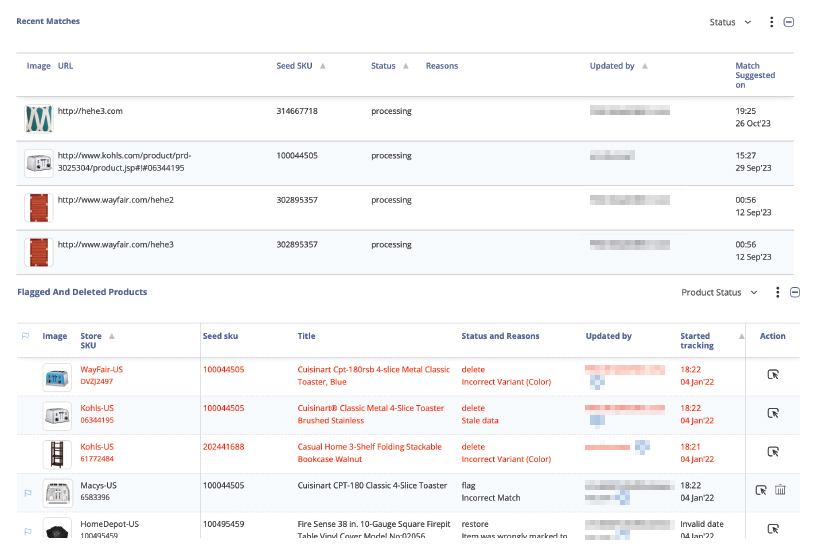
Brand Tip #5. Stay Vigilant with Price Monitoring
Your competitors will update their pricing repeatedly, and you will, too.
It can be difficult and time-consuming to monitor your competitive pricing, so you’ll need a system like DataWeave to monitor competitors’ pricing and manage dynamic pricing changes.
This vigilance ensures your brand remains competitive and relevant in real time.
4 Essential Capabilities You Need to Implement Successful Competition-Based Pricing
You’ll need four key capabilities to implement a competitive pricing strategy effectively.
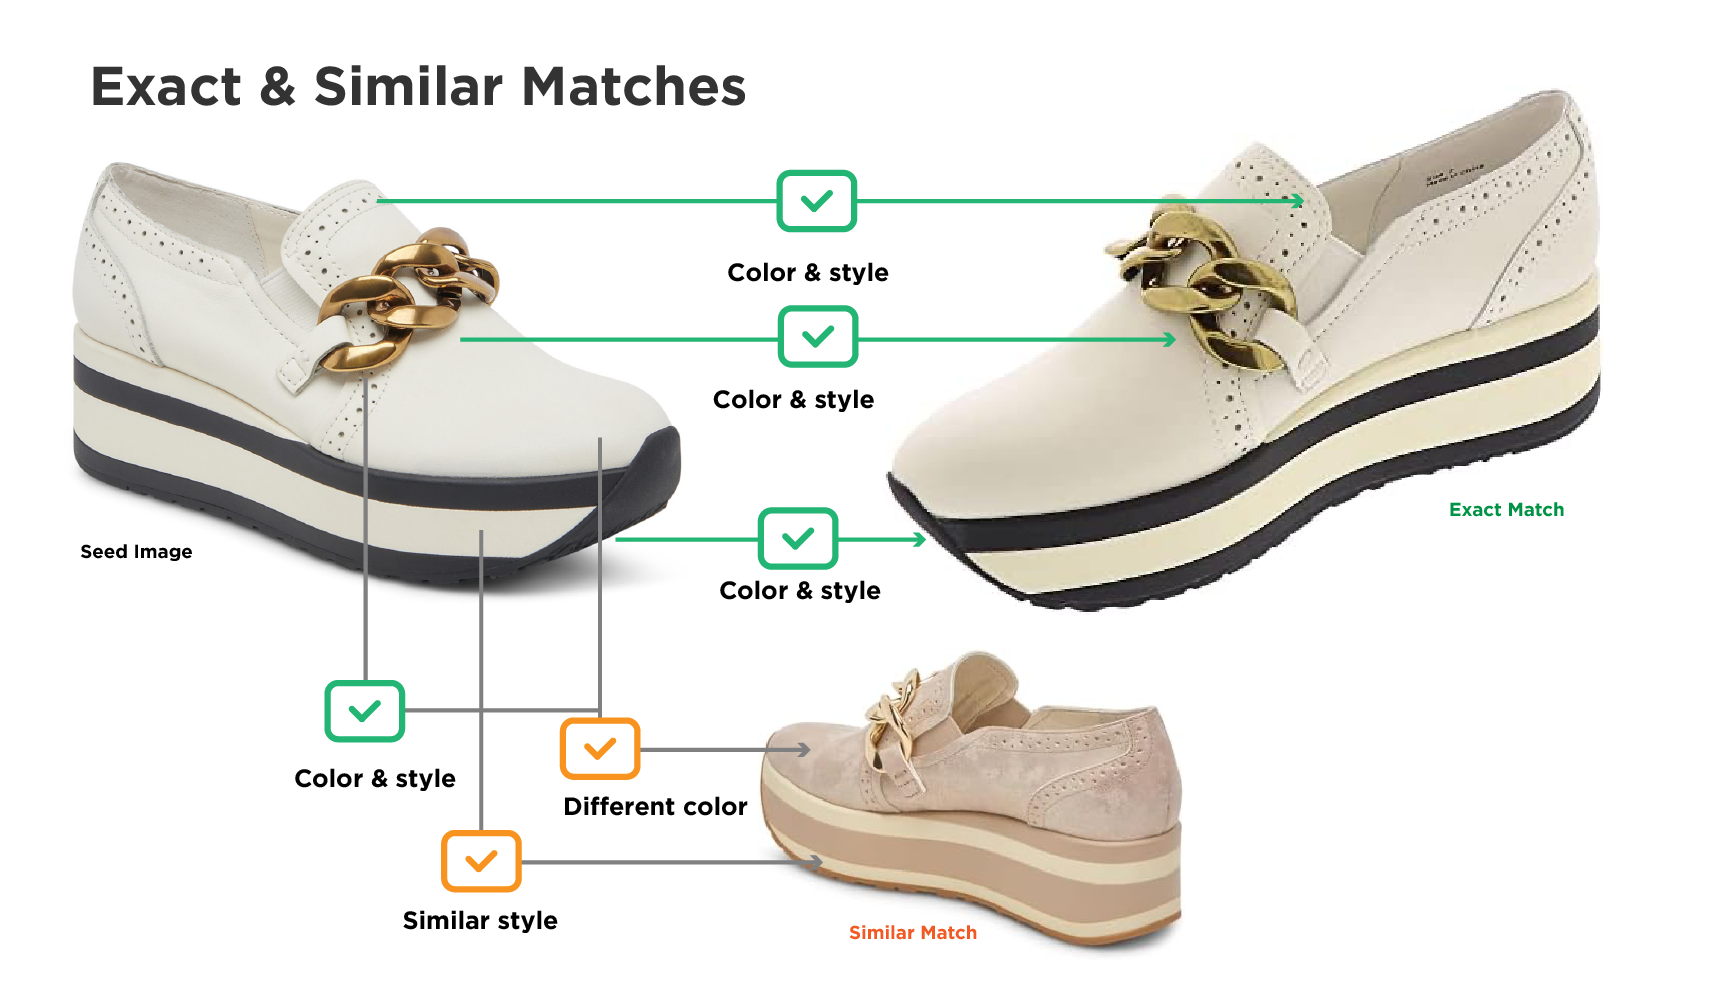
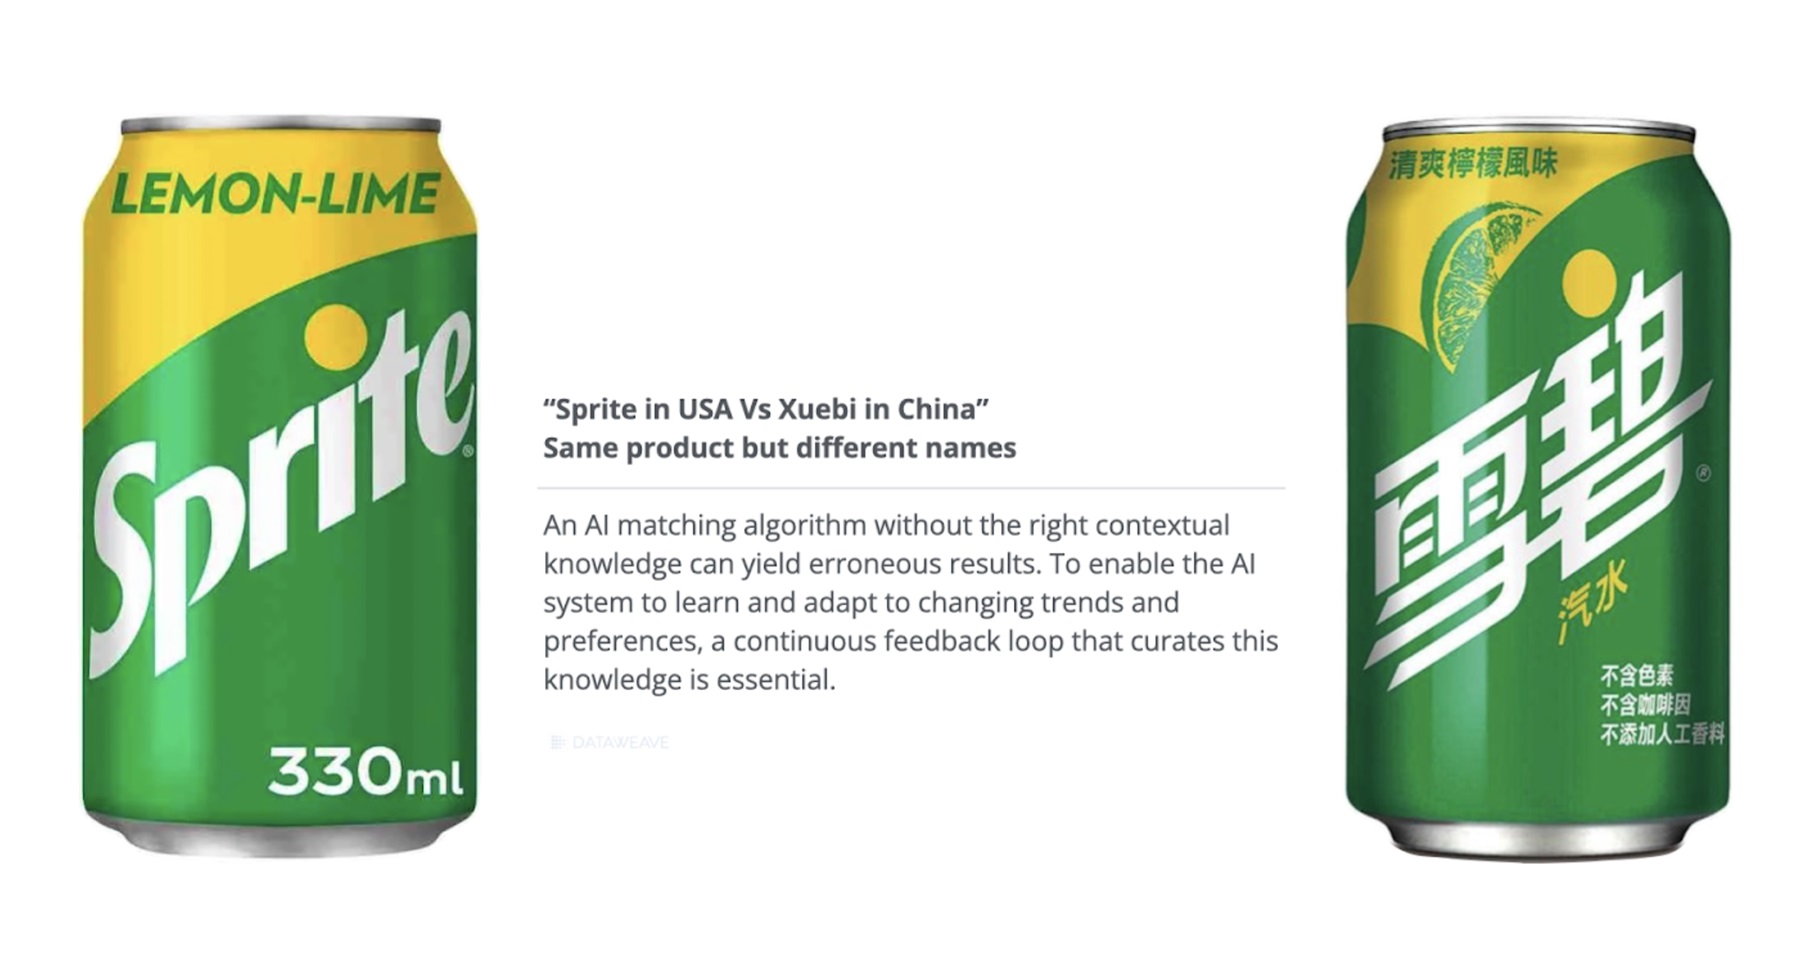
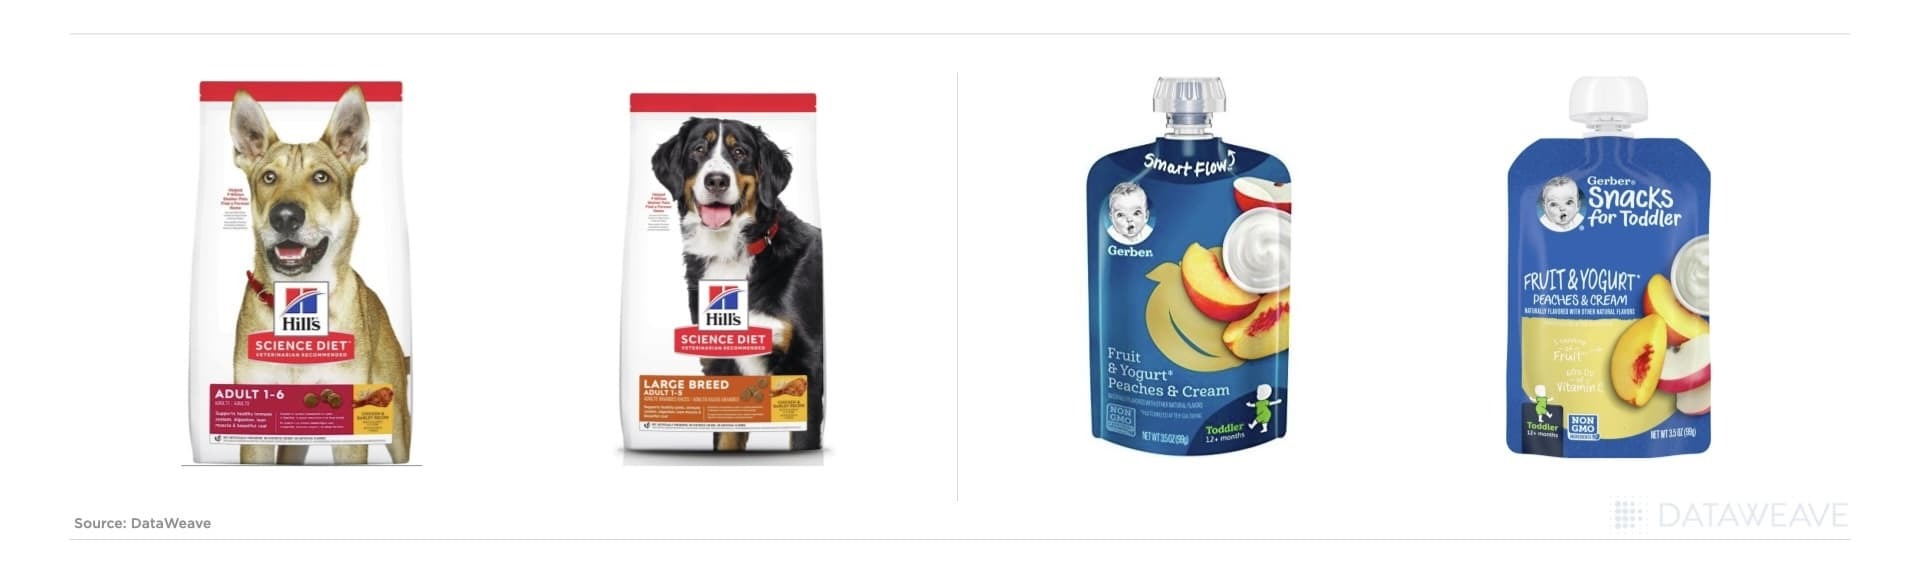
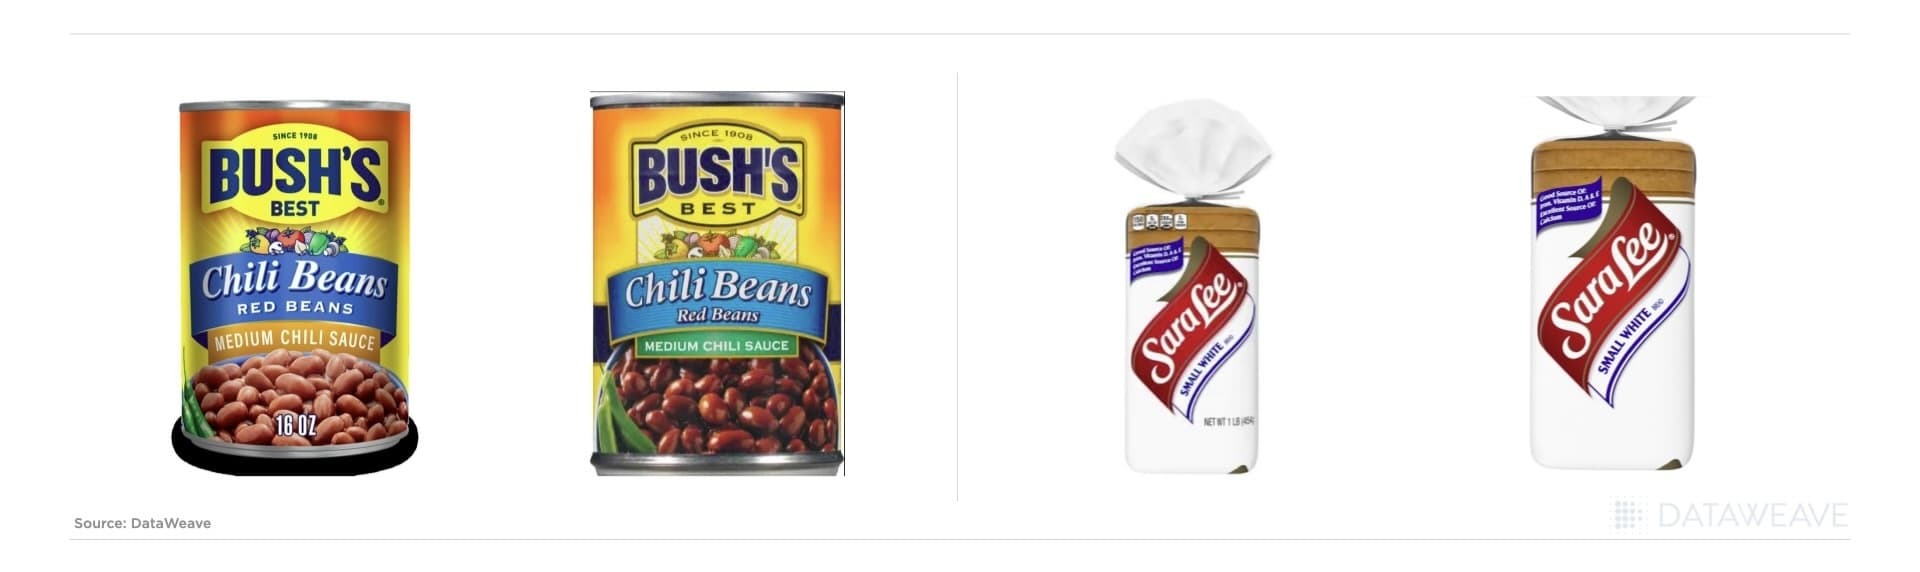
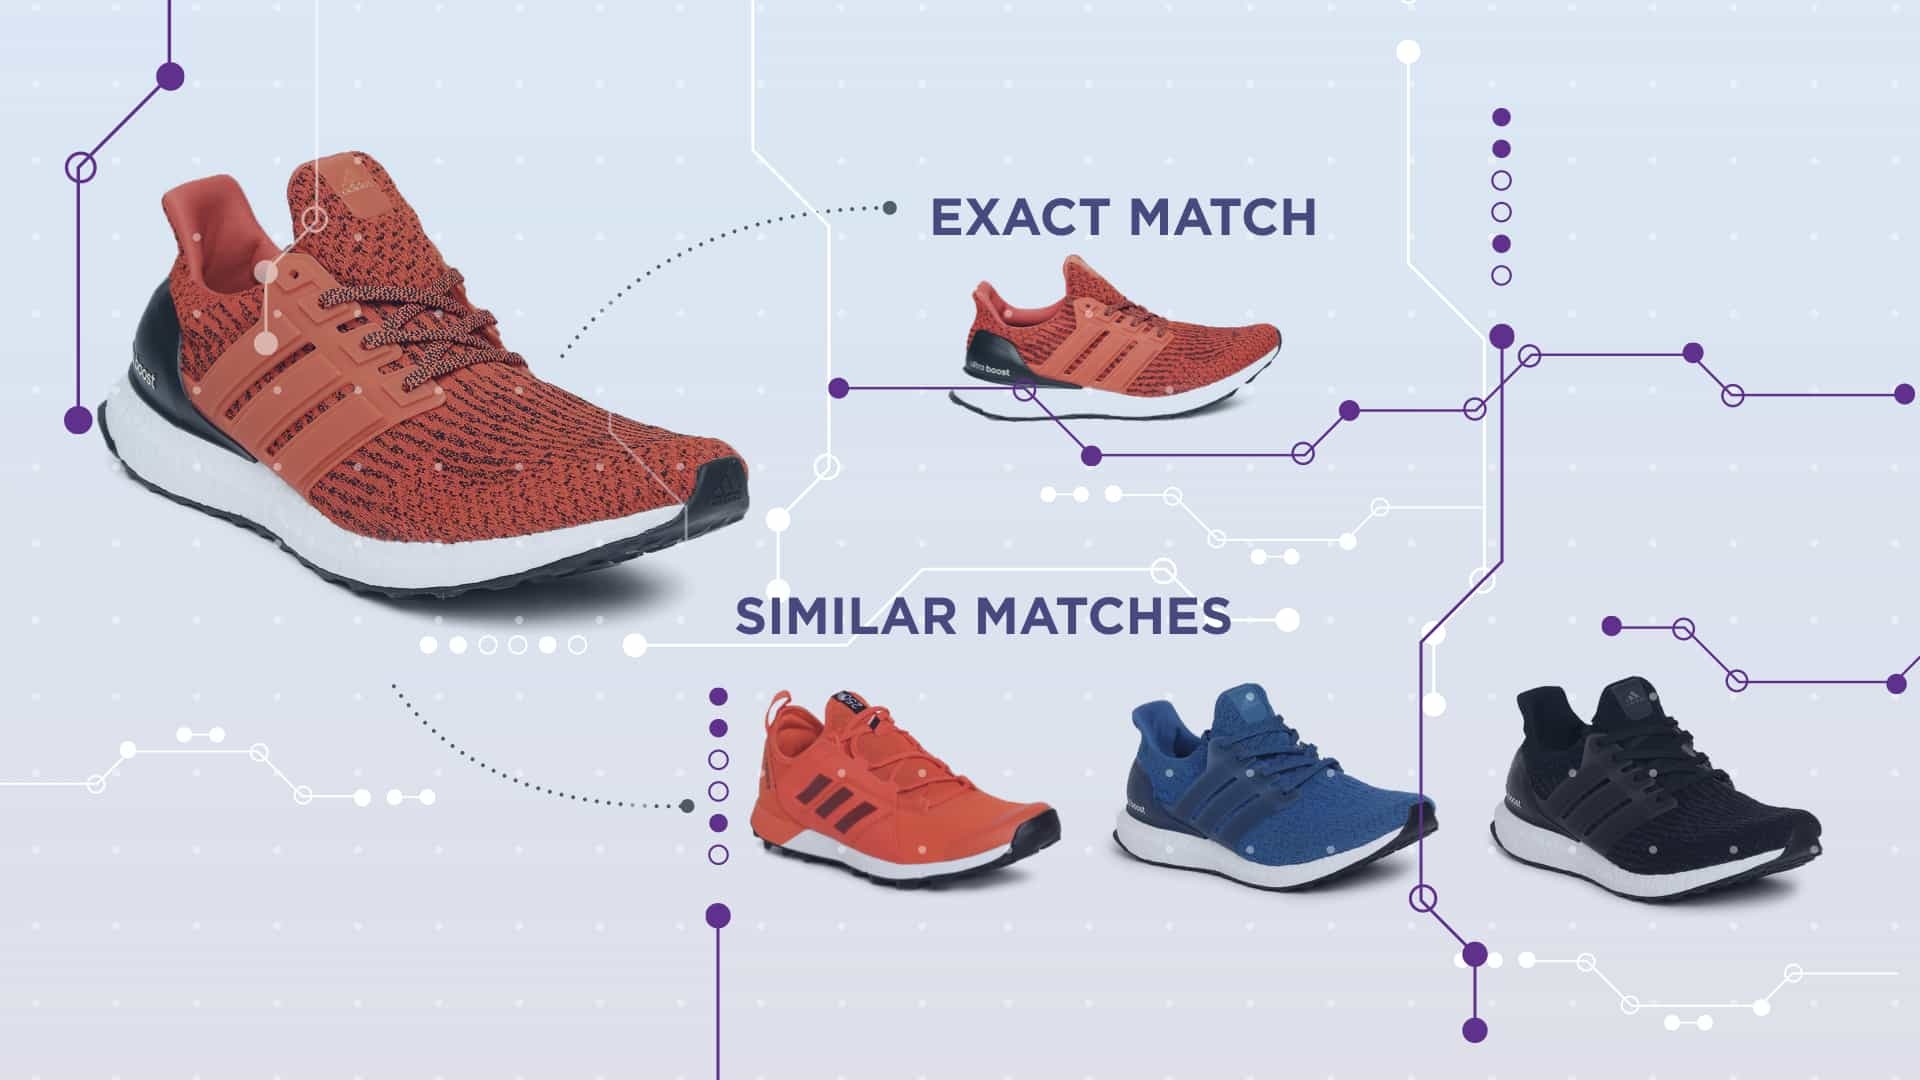
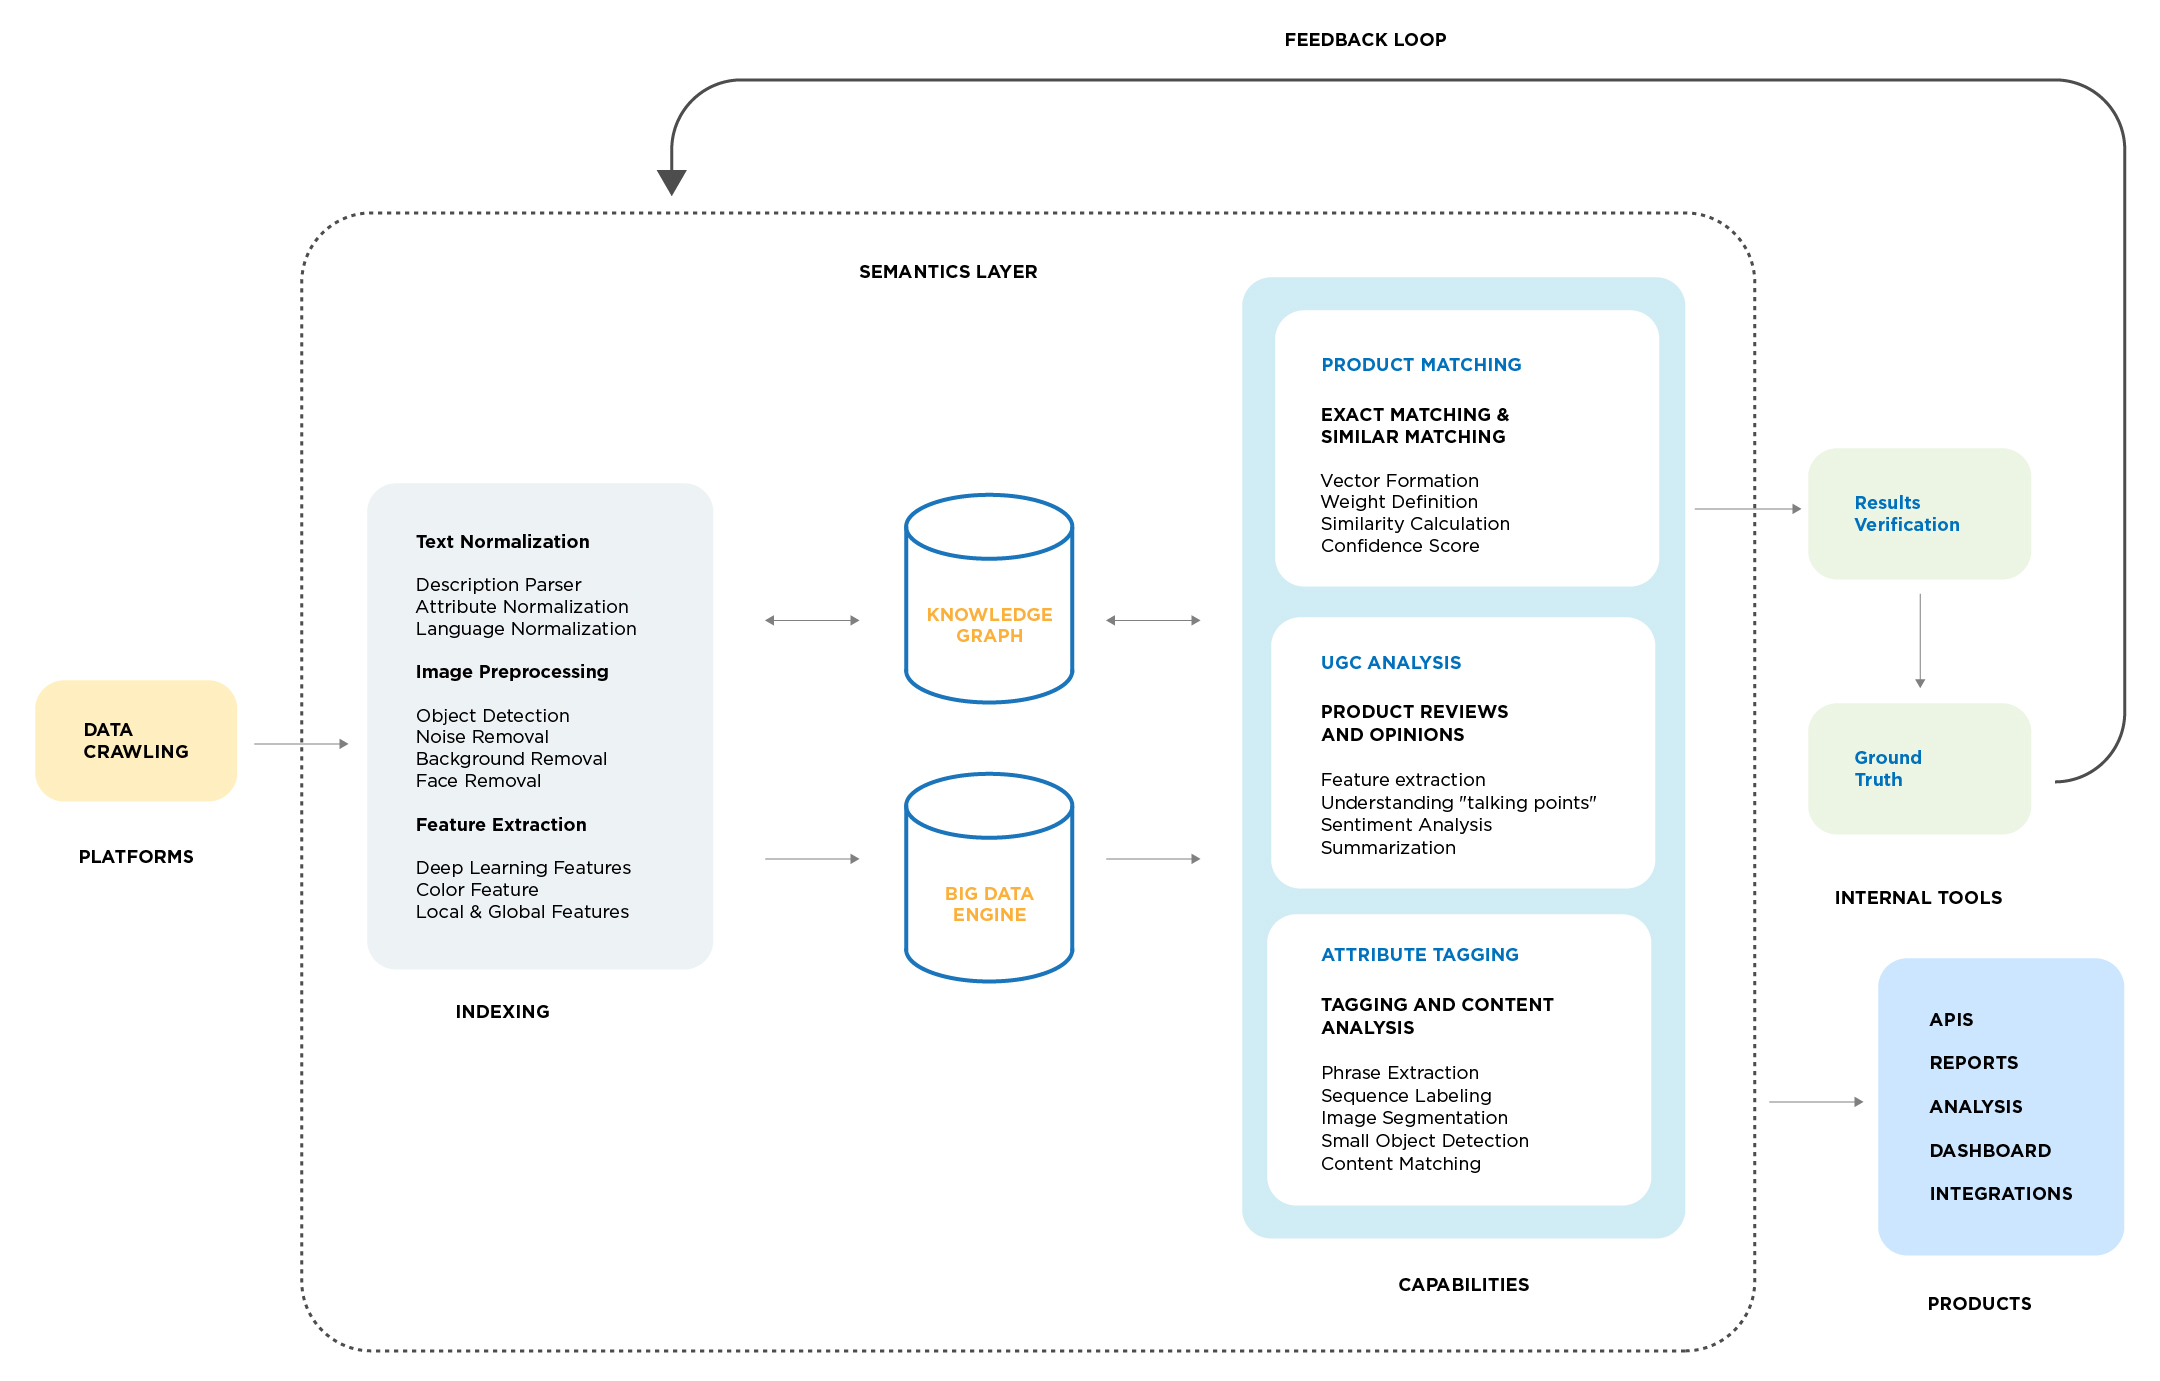
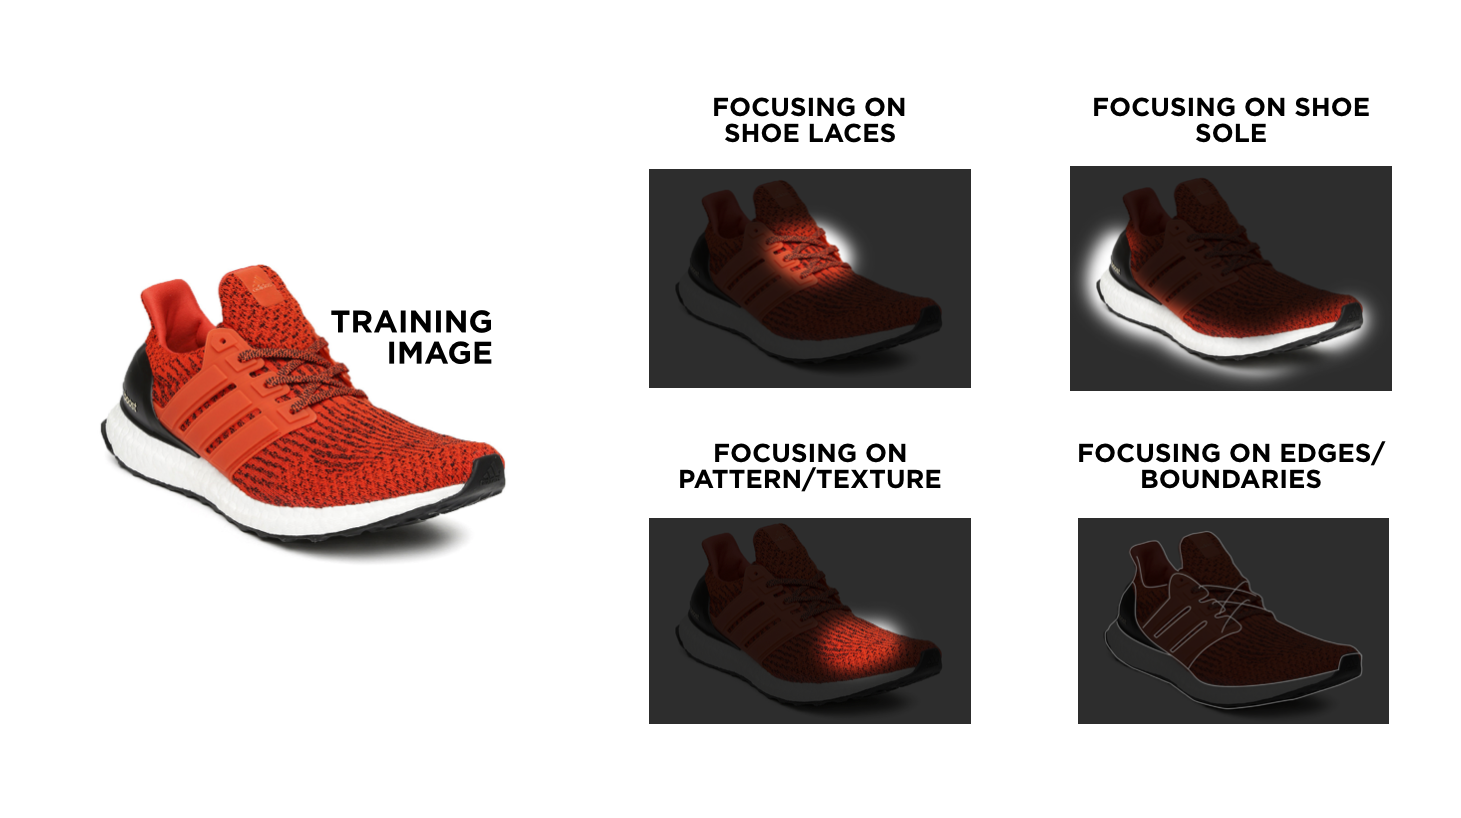
AI-Driven Product Matching
Product matching means you’ll compare many products (sometimes tens or hundreds) with varying details across multiple platforms. Accurate product matching at that scale requires AI.
For instance, AI can identify similar smartphones to yours by analyzing features like screen size and processor type. DataWeave’s AI product matches start with 80–90% matching accuracy, and then human oversight can fine-tune the data for near-perfect matches.
You can make informed pricing decisions once you know which competing products to base your prices on.
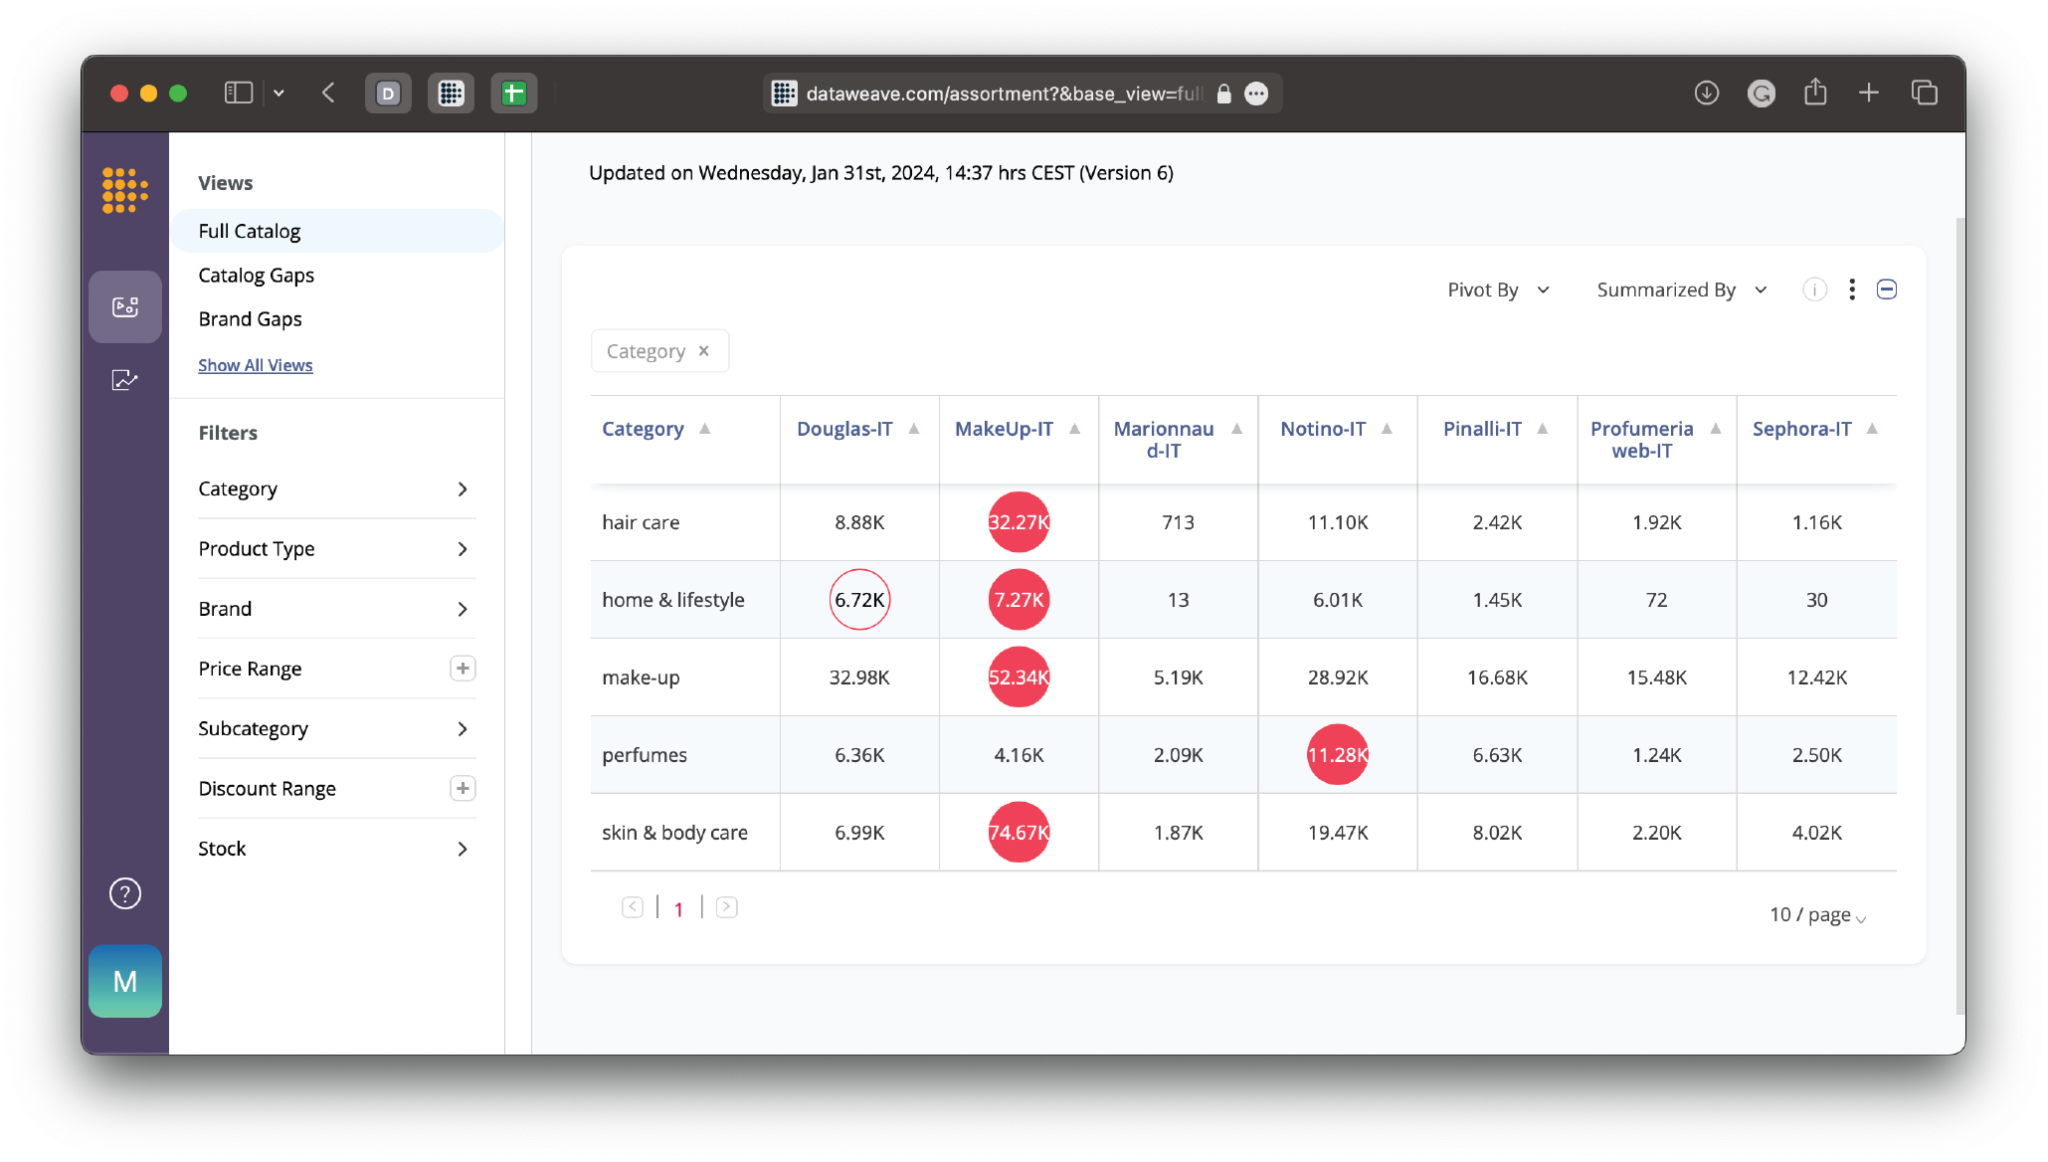
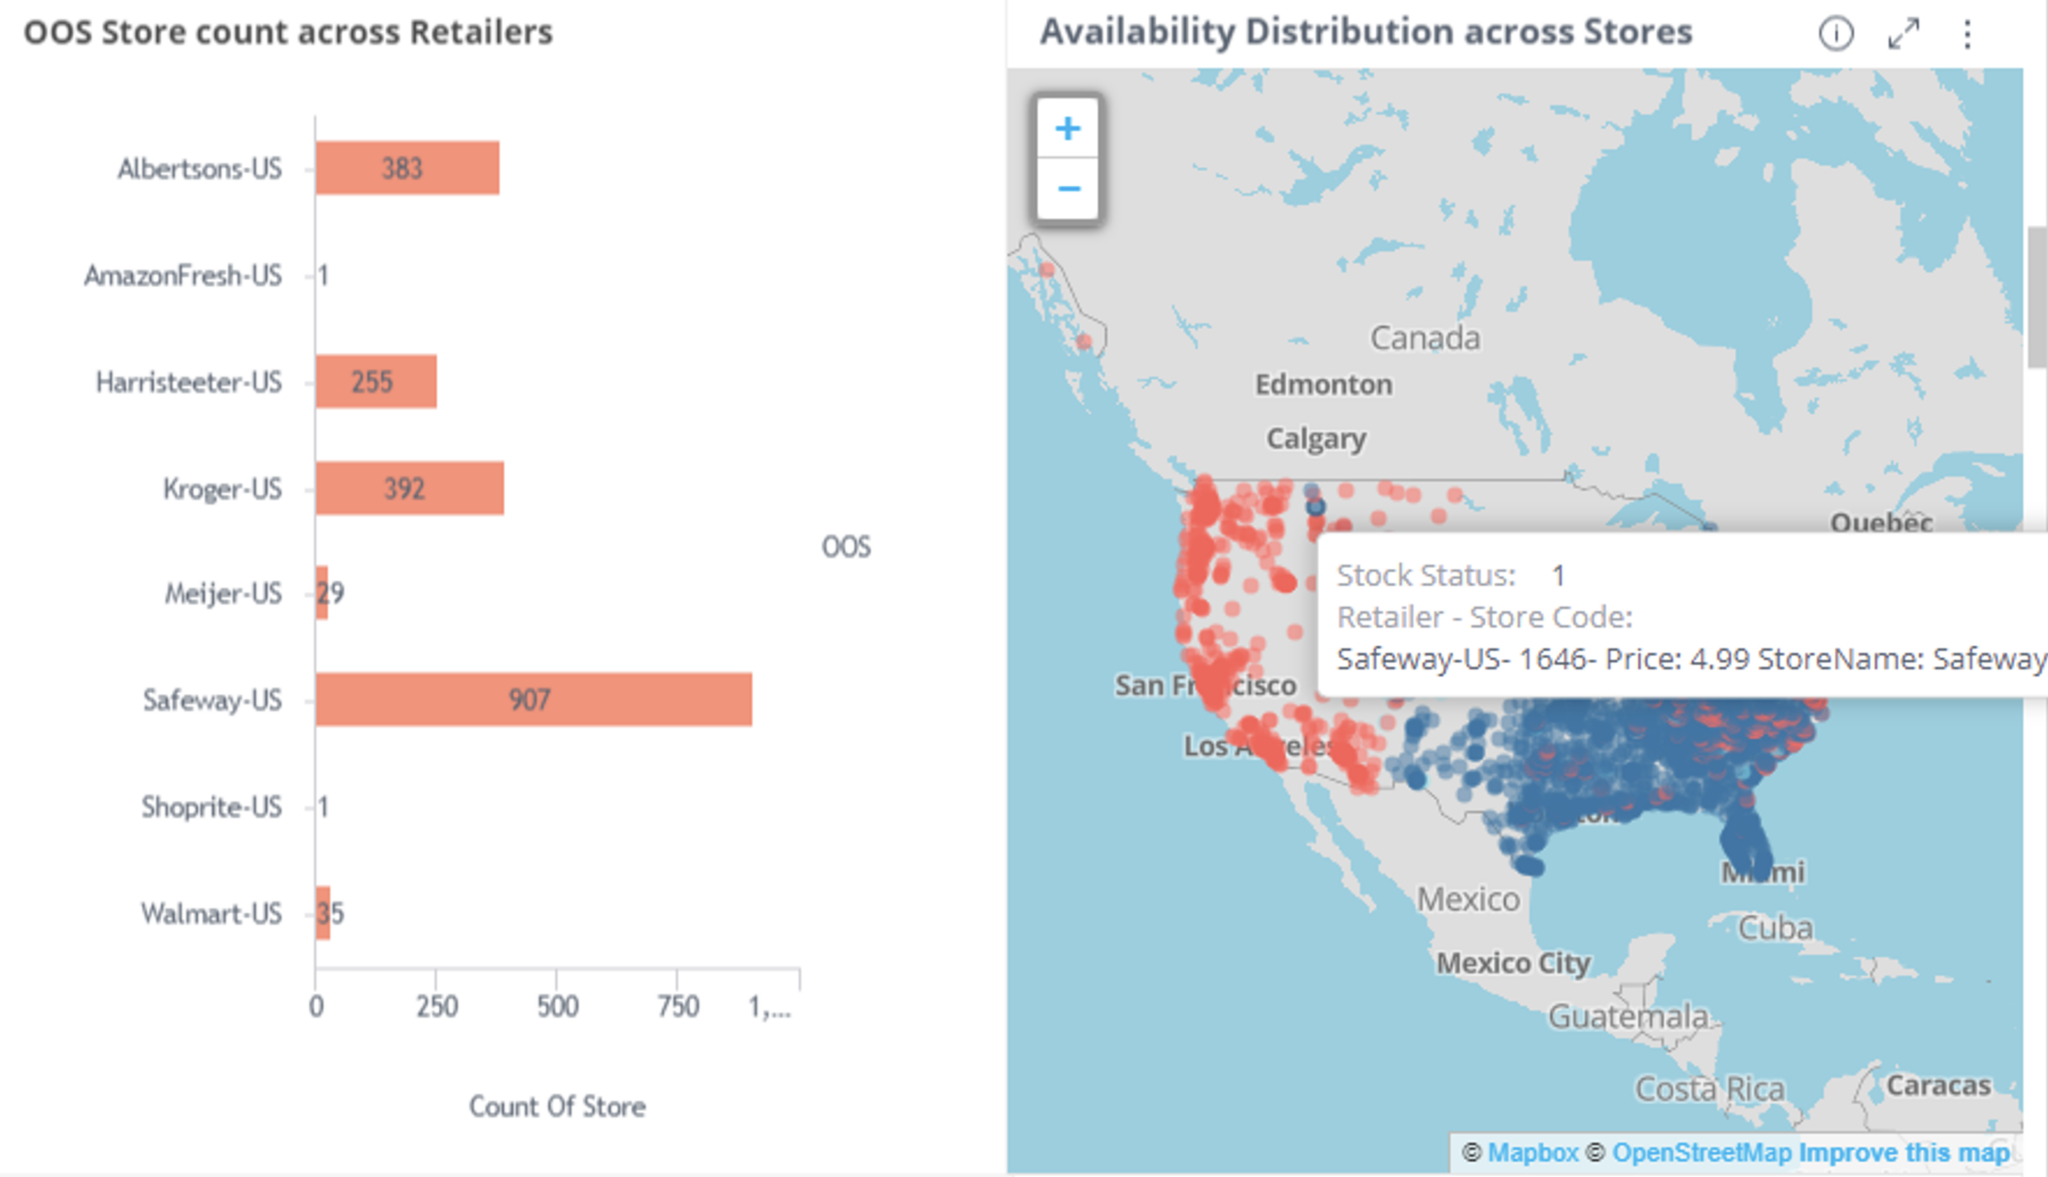
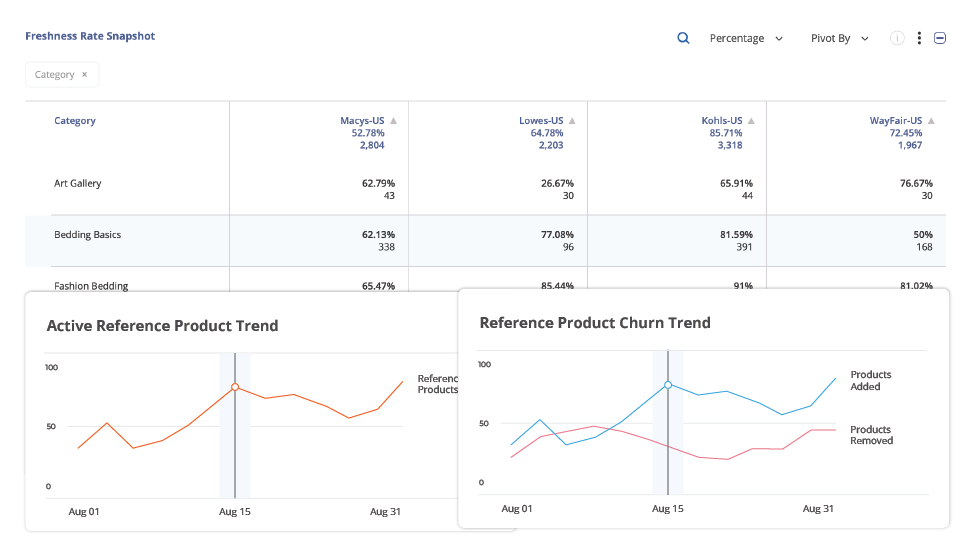
Accurate and Comprehensive Data
A successful competition-based pricing strategy depends on high-quality, comprehensive product and pricing data from many retailers and eCommerce marketplaces.
By tracking prices on large online platforms and niche eCommerce sites across certain regions, you’ll gain a more comprehensive market view, which enables you to make quick and confident price changes.
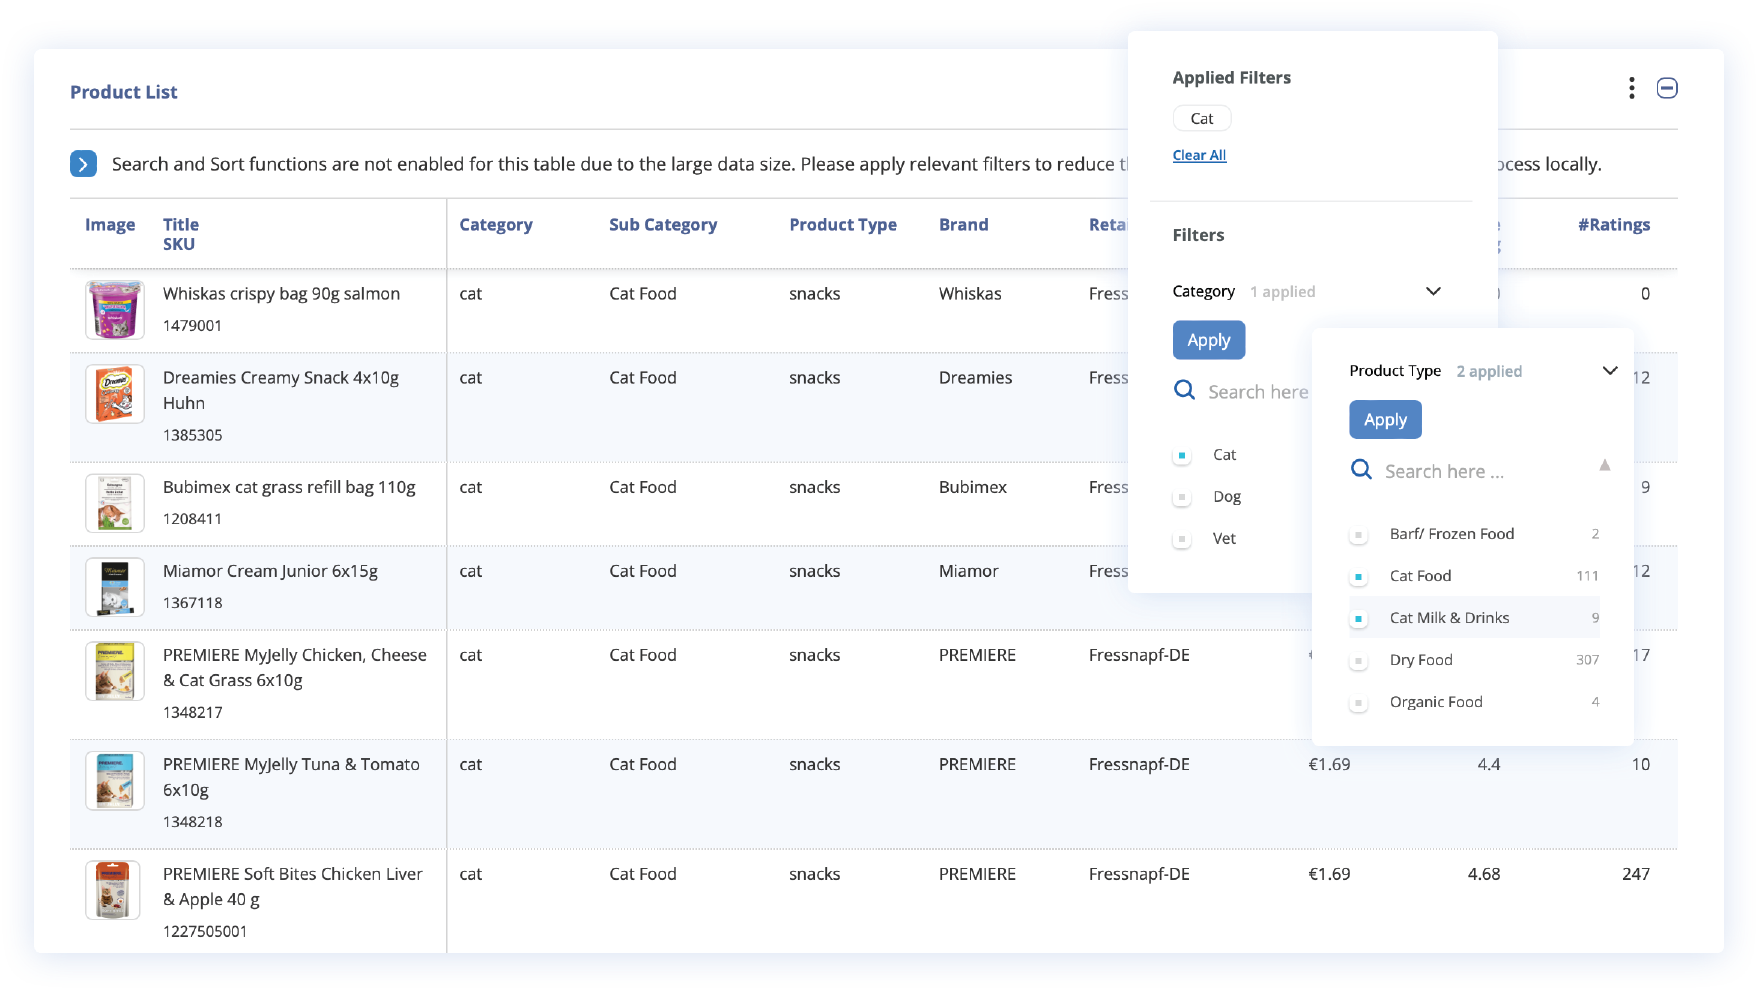
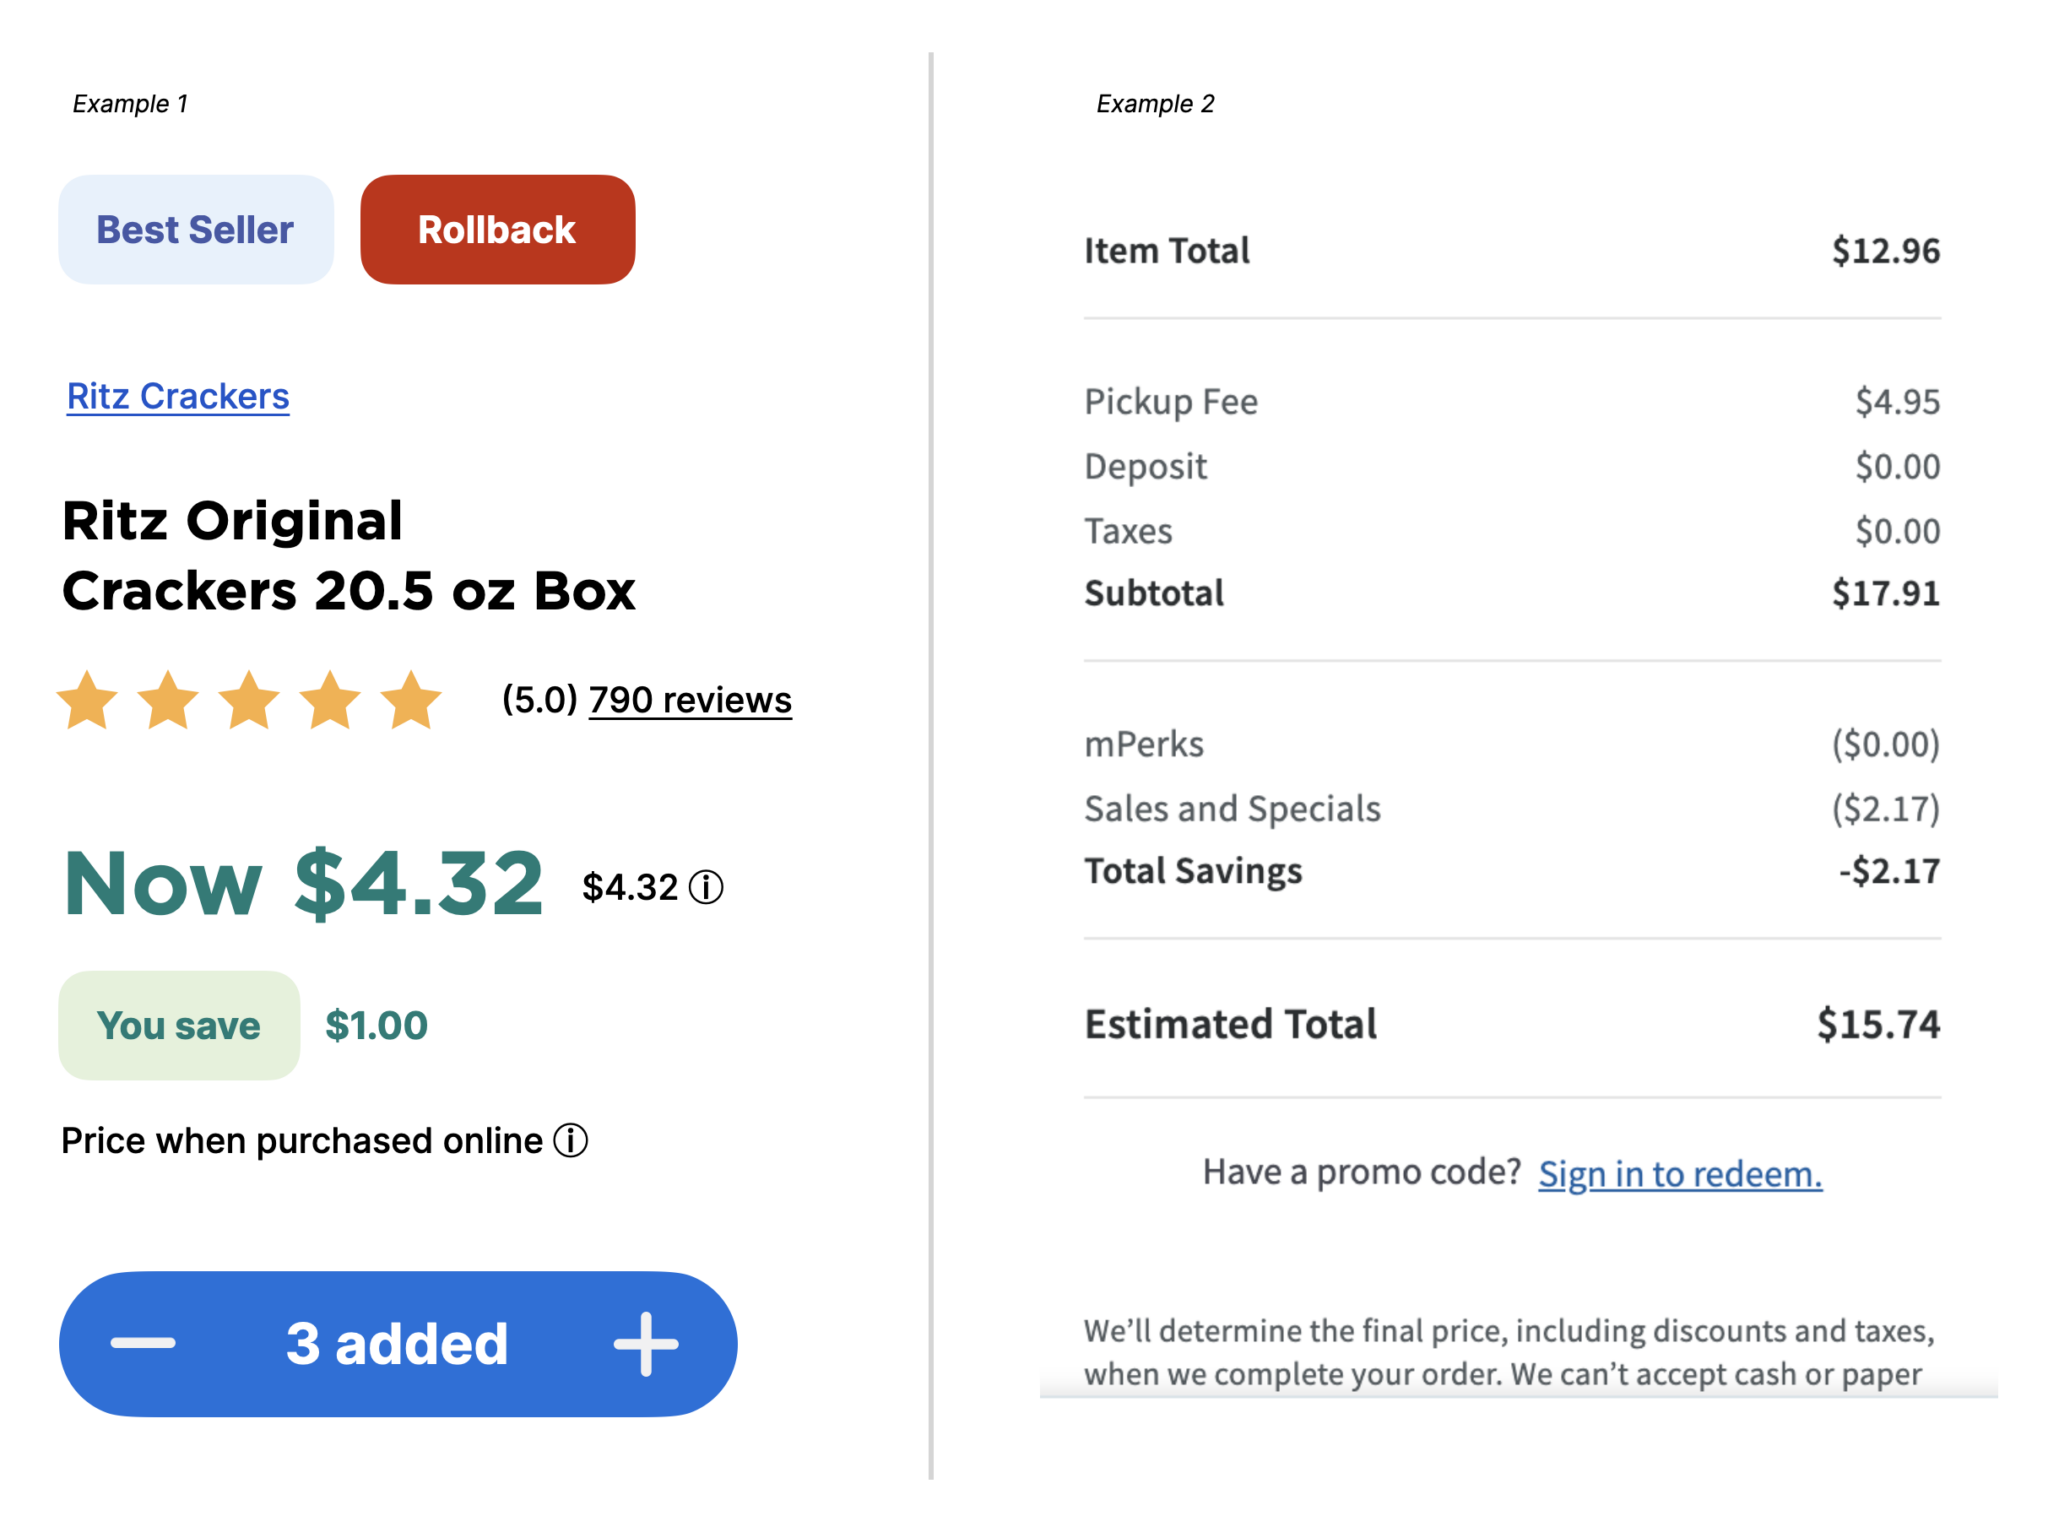
Normalized Measurement Units
Accurate price comparisons are dependent on normalized unit measurements.
For example, comparing laundry detergent sold in liters to laundry detergent sold in ounces requires converting either or both products to a common base like price-per-liter or price-per-ounce.
This normalization ensures accurate pricing analysis.
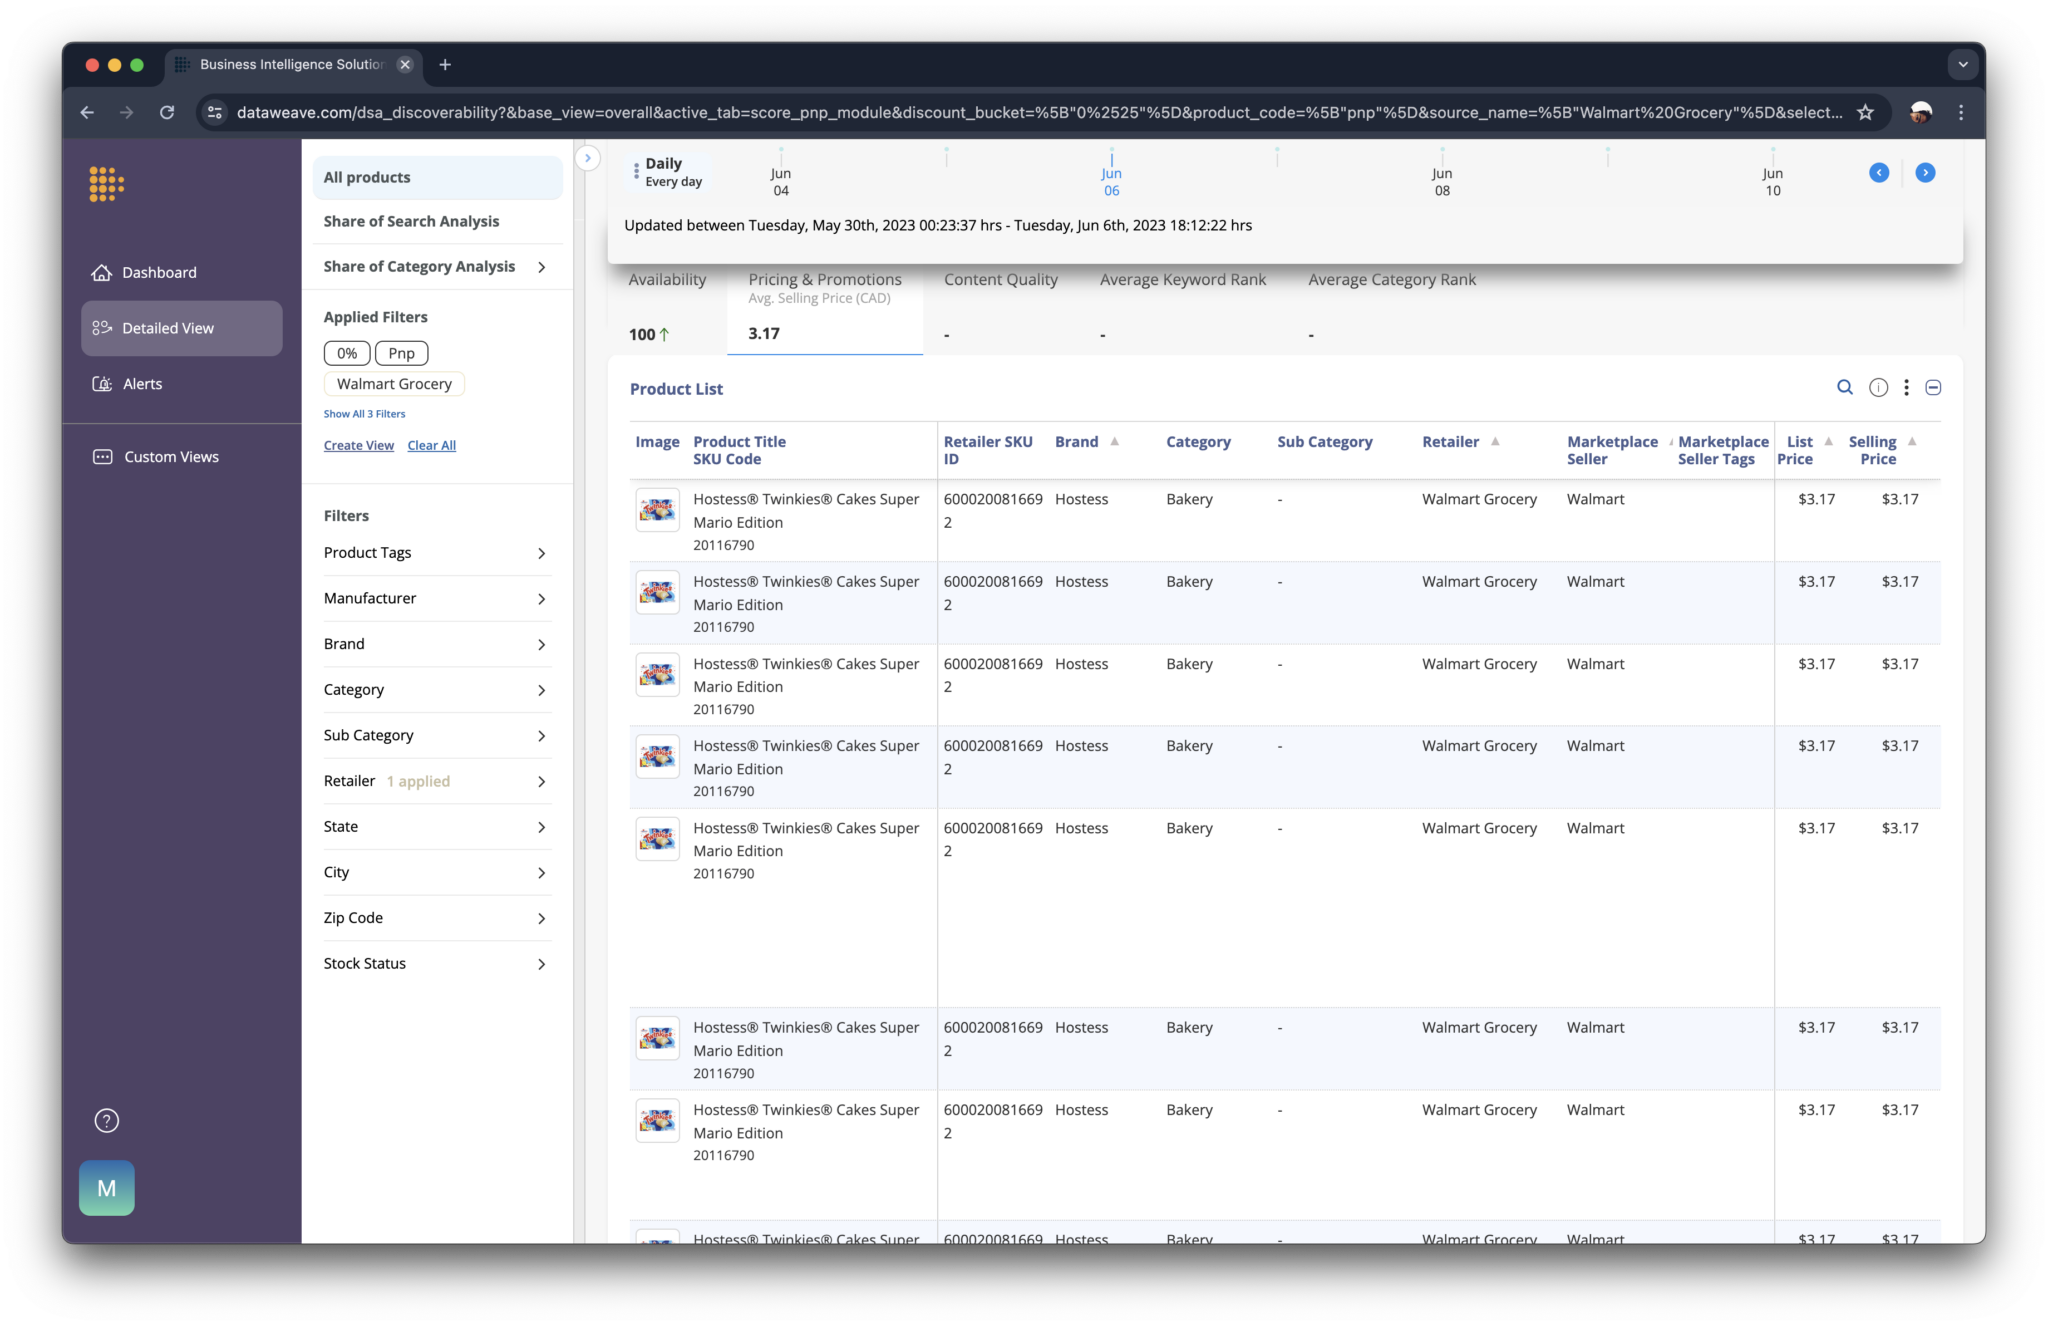
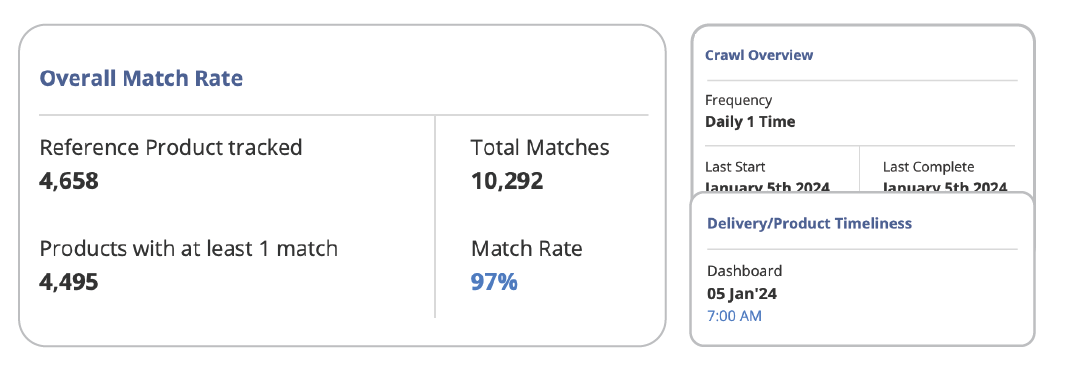
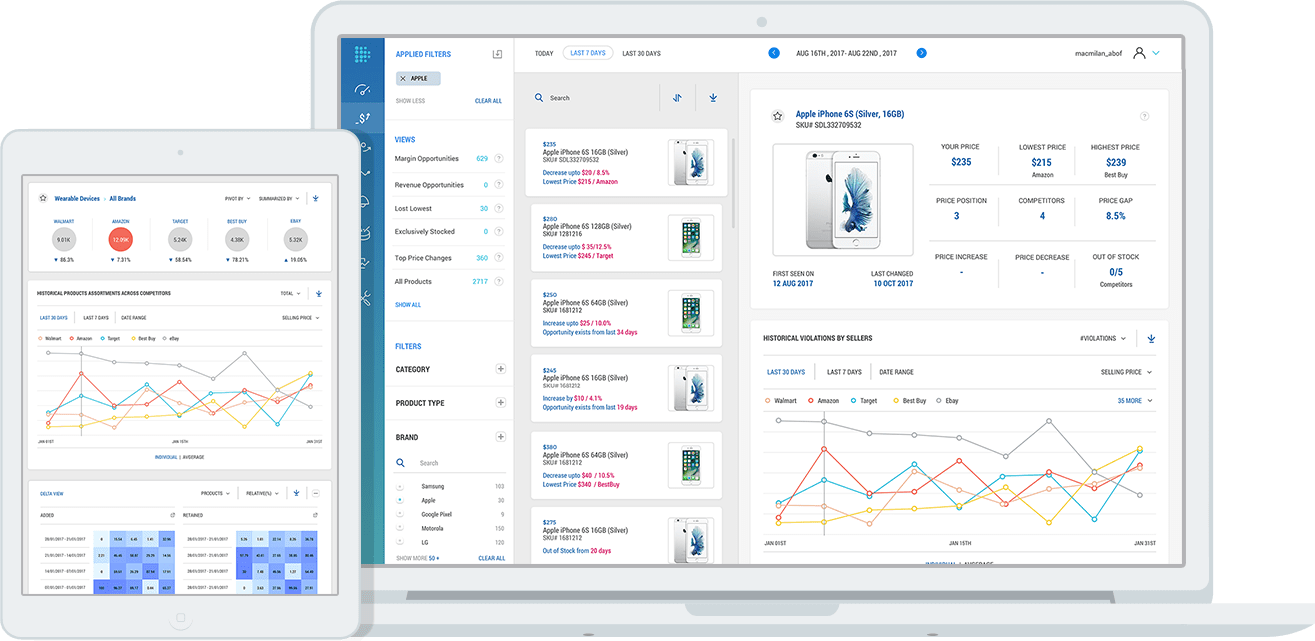
Timely Actionable Insights
Timely and actionable pricing insights empower you to make informed pricing decisions.
With top-tier competitive pricing intelligence systems, you get customized alerts, intuitive dashboards, and detailed reports to help your team quickly act on insights.
In Conclusion
Competitive pricing or competition-based pricing is a powerful strategy for businesses navigating crowded markets, but you must balance competitive pricing with your brand’s unique value proposition.
Competitive pricing should complement innovation and customer-centric strategies, not replace them. To learn more, talk to us today!