Tag: Furniture Stories

  • Navigating the Turbulent Home and Furniture eCommerce Market in 2023 with the Power of Competitive Intelligence

    Navigating the Turbulent Home and Furniture eCommerce Market in 2023 with the Power of Competitive Intelligence

    The home and furniture retail industry is going through a turbulent time. As inflation reared its head mid-2022, leading retailers in the category have been grappling with the higher costs associated with producing and distributing their products, as well as reduced shopper demand. The rising costs of raw materials, transportation, and labor have had a direct impact on the pricing dynamics within the industry. For example, reports indicate container rates soared to nearly 10 times pre-pandemic levels towards the end of 2021.

    Furthermore, shoppers’ spending power has been constrained, while higher interest rates have suppressed demand. Retailers have had to adapt their assortment and pricing strategies to cater to a wider range of shopper preferences driven by changing lifestyles and a growing emphasis on sustainability. Post-pandemic, demand has been primarily driven by affluent shoppers.

    Towards the end of 2021, due to supply delays and disruptions, retailers heavily stocked up on available products. However, when demand subsequently decreased in 2022, they were left with a significant amount of unsold stock that was purchased at high rates. This put them in a difficult situation, as they had an excess of products but were unable to sell them even at reduced prices without impacting their profit margins. Additionally, staying competitive in a rapidly changing market environment was equally important.

    Given this context, it is crucial for home and furniture retailers to adopt a data-driven approach that utilizes competitive and market insights to consistently maintain or increase their online sell-through rates. DataWeave’s Commerce Intelligence solution offers exactly that, empowering retailers across various industry segments to stay updated on evolving consumer trends and competitor actions.

    To gain a better understanding of the pricing strategies employed by leading home and furniture retailers throughout the past year, we leveraged our proprietary data aggregation and analysis platform to track and analyze the pricing of a wide range of products across multiple retailers and subcategories within the industry.

    Our Research Methodology

    • Number of SKUs: 400,000+
    • Key retailers tracked: Amazon, Wayfair, Home Depot, Overstock, Target, Walmart
    • Key categories reported: Home and Office, Bed and Bath, Bathroom, Bedroom, Decorative, Dining Room, Kitchen, Garden & Patio, Hardware
    • Timeline of analysis: April 2022 to April 2023

    Our Findings

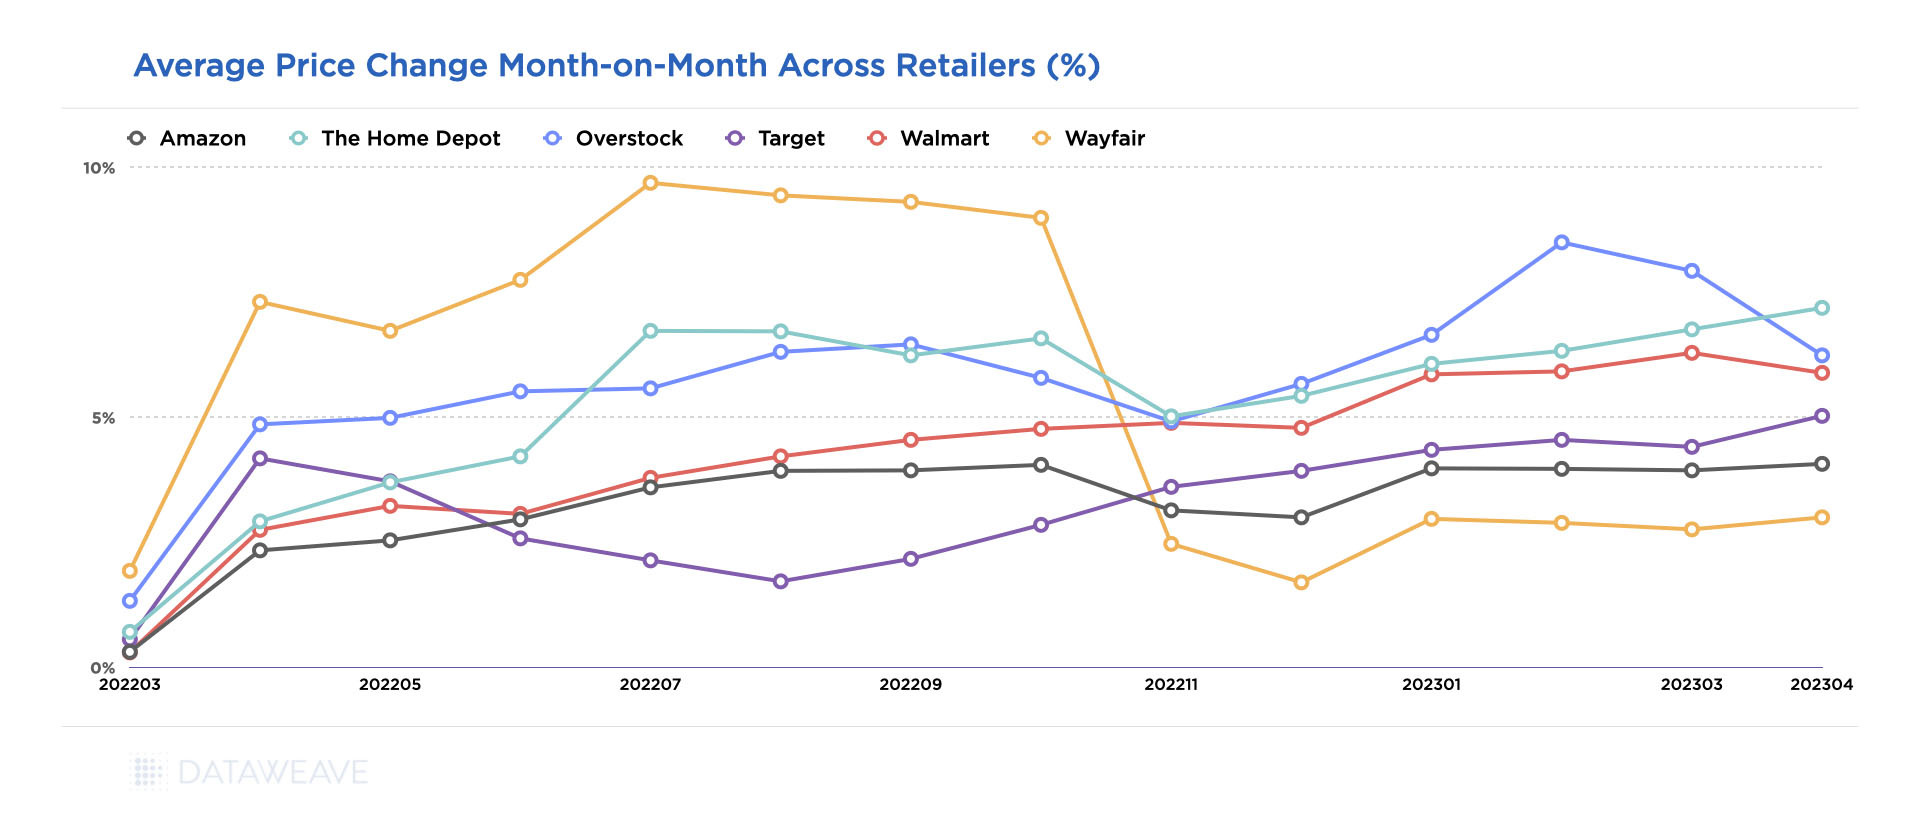
    Interestingly, our analysis indicates that average prices in the home and furniture category rose by around 5% between March 2022 and April 2023. However, there have been seasonal fluctuations in the prices over the course of the year.

    Among the various subcategories, the most substantial price surge was observed in home office equipment, with an uptick of 9.3% in January 2023 when compared to March 2022. The surge in demand for home office furniture, fueled by the widespread adoption of work from home arrangements, played a pivotal role in depleting inventories and consequently driving up prices. Additionally, the shift towards collaborative workspaces and the gradual expansion of office environments have contributed to the sustained demand for office furniture.

    Avg. price changes MoM across home and furniture subcategories from April 2022-23.

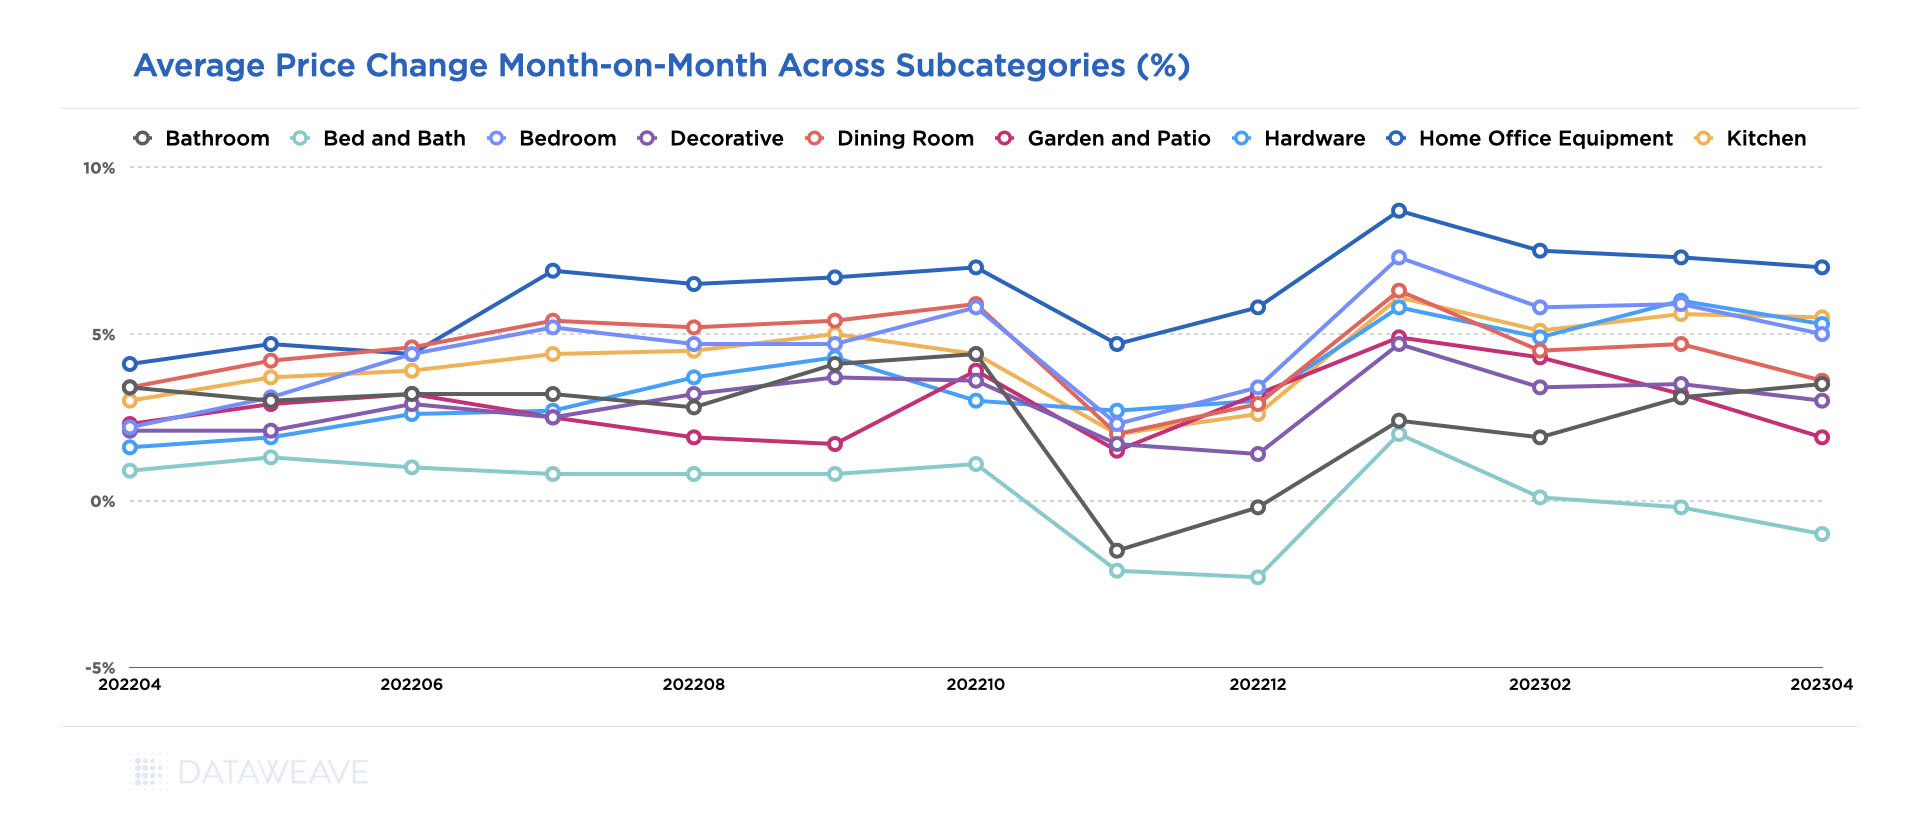
    While prices for several subcategories rose significantly, others experienced subdued growth, such as bed and bath. The subcategory experienced the lowest price increment, registering a modest 2.8% increase annually. This can be attributed to the impact of a subdued housing market and a decrease in first-time buyers, which may partly be due to the global recession and inflationary pressures.

    Moreover, retailers overestimated the demand for home furniture during the holiday season, leading to an overstocking of inventory. Consequently, prices experienced a dip from October to December 2022. In fact, this was a common trend across all home and furniture subcategories. As retailers emerged from the holiday season, prices rose to their highest level in January 2023, and have stayed relatively stable since.

    Some of these trends vary among retailers as each faces different challenges and responds in distinct ways.

    Wayfair, for example, shows a significant dip in pricing after October 2022, with prices stabilizing in 2023. This could be in response to the retailer’s shrinking consumer count, losing 5 million of its 1.3 billion consumers in 2022 due to declining demand.

    Avg. price change MoM within the home and furniture sector across retailers from April 2022-23.

    In fact, online furniture retailers like Wayfair and Overstock reported declines in annual revenue in 2022, as the furniture sector continued to normalize from the high spending seen during COVID-era lockdowns. Wayfair reported that its 2022 net revenue was $12.2 billion, down almost 11% from the year prior. The company also laid off 10% of its workforce in August 2022. Overstock’s reported annual net revenue in 2022 was $1.9 billion, a 30% decrease year-over-year.

    Interestingly, both companies took contrasting approaches in response to this situation. Wayfair opted for aggressive cost-cutting measures, including layoffs and a reduced marketing budget. On the other hand, Overstock focused on attracting new customers through influencer marketing and improving their app, aiming to expand their customer base. With a strategy geared towards younger buyers, Overstock allocated a larger marketing budget than ever before. Our data supports the fact that Overstock did not rely on price reductions to entice shoppers.

    Target has consistently maintained lower price increases compared to Walmart, defying the common perception of Walmart being more conservative in its pricing. Notably, Amazon also stood out minimal price increases throughout the year, being surpassed only by Wayfair since November 2022.

    As price sensitive shoppers increasingly compare prices before making a purchase decision, retailers need to ensure they are priced competitively in the market on a consistent basis to liquidate stock and gain market share without compromising significantly on margins.

    A Sophisticated and Versatile Product Matching Solution is Essential to Achieving Price Leadership

    Product matching plays a vital role in monitoring competitive prices and analyzing price leadership. Within the home and furniture category, there is often a multitude of representations for the same product across various online platforms. Furthermore, eCommerce websites offer a wide array of options, including variations in size, color, material, and similar products. Without an accurate and comprehensive method of matching these products, it becomes impossible to track and compare prices effectively, especially on a large scale. Thus, a versatile product matching engine tailored to the unique requirements of the home and furniture sector becomes essential.

    DataWeave offers an industry-leading product matching platform that harnesses advanced AI models specifically trained to identify and leverage multiple product attributes extracted from titles, descriptions, and images to accurately match products across websites. Additionally, our platform intelligently matches similar products based on a diverse range of extracted attributes. This empowers our retail partners to gain competitive pricing intelligence not only on exact product matches but also on similar and substitute products, as well as their respective variants.

    With our competitive pricing intelligence solution, retailers in the home and furniture industry can confidently analyze and track prices, ensuring they stay at the forefront of price leadership in their market.

    To learn more, reach out to us today!

  • Black Friday 2019 Pricing for Online Furniture

    Black Friday 2019 Pricing for Online Furniture

    For today’s shoppers, instant gratification is the need of the hour. It’s, therefore, no surprise that furniture e-retail has been picking up steam over the last decade. What was once a norm to physically touch and feel before making a purchase, is now just a few clicks away. Retailers have bridged the gap by making the purchase process as seamless as possible – easy finance options, hassle-free returns and variety.

    While several factors play a role in driving consumers to shop furniture goods online, price is the primary motivator, as is the case with most popular product categories sold online.

    During Black Friday 2019, DataWeave performed an analysis on a sample of 23,000+ products across six of the top furniture retailers – Amazon, Home Depot, JCPenney, Target, Walmart and Wayfair. Ten product types were covered in the furniture category (such as Beds, Bookcases, Mattresses, Sofas, etc.) and the analysis focused on the top 500 ranked products of each product type.

    To get an accurate depiction of the additional markdowns during the sale, we took the mode of the prices for the preceding week and compared them with that during the sale.

    Additional markdowns

    Target (25%) and Home Depot (21%) marked down their prices most aggressively during the sale.  JCPenney and Wayfair stood out for offering additional markdowns on the highest portions of their ranges (67% and 46% respectively), even though the average markdown percentage was fairly conservative. Amazon and Walmart were steady as usual, with additional markdowns of 8% and 10% on 15% and 17% of their assortment, respectively.

    Premiumness

    To further understand the furniture pricing strategies of these retailers, we categorized their products into buckets of how expensive or cheap the product is (High, Medium, and Low in terms of price), relative to the rest of the products hosted by the retailer, and studied how the additional markdowns varied across these buckets. Where the MRP was not displayed, the most expensive price of the product during the holiday period prior to Black Friday was considered to define the “premiumness” of the product.

    Two patterns clearly stand out from this analysis. Most of the retailers remained relatively equitable between their premium categories with nothing significant to report in terms of varying markdowns. Home Depot and and JCPenney are the only exceptions here, but not by much.  The other interesting insight is that the percentage of marked-down products had a near unanimous pattern of the high level being the most covered, followed by the medium and then low.

    Therefore, while there wasn’t a significant variation in the average markdown across premiumness levels, a larger portion of the high-premium goods were consistently offered at a discount across all retailers.

    Popularity

    Much like our premiumness categorization, we investigated products based on their popularity levels as well. We’ve defined popularity using a combination of the average review rating and the number of reviews for each product, condensed to a scale of low, medium and high.

    We observe slightly different furniture pricing strategies adopted by retailers across popularity levels. While Home Depot, Amazon, and Wayfair chose to provide higher markdowns on their more popular products, Target, JCPenney, Walmart chose to provide higher markdowns on their least popular products. In addition, a larger portion of the least popular products were consistently offered on discount by almost all retailers.

    In combination with our findings across premiumness levels, we can surmise that part of the strategy of most retailers was to liquidate their stock of expensive and unpopular products during the sale.

    Price Change Activity

    As part of our analysis, we also tracked the level of pricing activity across retailers over the last week of November, in terms of the number of price changes made as well as the average price variation for each retailer.

    In general, we can see that Amazon and Walmart  consistently made several price changes through the week, though the average magnitudes of these price changes were relatively low. This echoes the pattern we’ve observed through our analysis of other product categories during the sale event, as well.

    Also, we see an almost coordinated increase in the number of price changes and the average magnitude across the 27th and 28th of November. This is likely an attempt by the retailers to get a head start on Black Friday deals.

    An unusual and interesting pattern was observed with Wayfair, which started out the week with the most changes at 2500. It then tanked the next day and hovered around 500 till the 28th, only to spike to 2500 again. All these changes though, had their variation in and around 5%.

    In summary, its interesting to observe how different retailers approached the much-anticipated holiday season sale events differently. As one might expect, there are significant variations among retailers in the aggressiveness of discounting activity as they approached Black Friday, and on Black Friday itself. Contrasting pricing strategies for popular and premium goods were also observed.

    If you would like to learn more about the pricing of top U.S. retailers across other product categories like consumer electronics, fashion, and beauty & health, check out our series of articles on Black Friday 2019.

  • Online Furniture Pricing Strategies on 2019 Prime Day

    Online Furniture Pricing Strategies on 2019 Prime Day

    Just as with electronics, other retailers actually offered far better discounts than Amazon during Prime Day 2019.

    Online furniture sales have risen significantly since the 2000s, driven largely by a growing array of products, and even more so by the convenience of avoiding travel and crowded stores. According to Statista, online furniture and homeware sales were estimated to reach approximately $190 billion in 2018, with China and the United States accounting for over $60 billion in revenue each.

    Thus, furniture has quickly become a key product category during sale events globally – and Prime Day was no different. At DataWeave, we got down to figuring out exactly how plum those deals were this year.

    Our Methodology

    We tracked the pricing of several leading retailers selling home and furniture products to assess their pricing and product strategies during the sale events. Our analysis was focused on additional discounts offered during the sale to estimate the true value that the sale represented to its customers. We calculated this by comparing product prices on Prime Day versus the same prices prior to the sale. Our sample consisted of the top 1,000 ranked products across 10 popular product types, including beds, dining table sets, sofas, entertainment units, and coffee tables – analyzed for five retailers (Amazon, Home Depot, Target, Walmart, and Wayfair).

    The Verdict

    As we found in the electronics category, there were surprising price spikes in this category too – with Target reporting an average increase as high as 14.7%, and Amazon clocking a still moderately high 9.4%. Target also reported the highest distribution of products with price markups. Home Depot indicated the lowest price increase at 4.6%.

    When it came to additional discounts, Amazon fell short of expectations – at 4.7%, it offered the lowest average among its competitors. Target, on the other hand, was extremely aggressive both in terms of additional discounts and volume of discounted products.

    To conclude, all the retailers observed seemed to be keeping a close watch on their margins by countering price reductions with nearly equivalent surges elsewhere in their assortment.

    While there was no single product type that was found to be popular across all five retailers, it was clear that Target was again the most aggressive at offering discounts. It also had among the largest product ranges on discount.

    Amazon chose to follow a very moderate route both in terms of average discount and discounted product volume.

    Additional discounts across popularity levels

    We determined popularity using a combination of average review rating and number of reviews, and the resulting scores were categorized as low, moderate, and high.

    There doesn’t seem to have been much of a focus on low-popularity products in terms of additional discounts. Most of the attention was focused on products with moderate popularity, since there isn’t much of a need to be aggressive on price for highly popular products, and products with lower popularity aren’t really worth promoting.

    The only retailer that offered a higher discount on its most popular products was Home Depot. Walmart, too, seemed reluctant to let go of the opportunity to capitalize on popularity – it chose to offer the same discount on moderately as well as highly popular products.

    Interestingly, Walmart seems to have a disproportionately large share of products in its low popularity category – something it should possibly evaluate in the future in terms of brand quality, products, and service.

    The percentage distribution of products mostly indicated a linear relationship, with the highest distribution usually being offered for highly popular products. The exception was Wayfair, which offered a much larger array in its moderately popular category.

    Additional discounts across product “premiumness” levels

    Premiumness was calculated as the average selling price before the sale event. This was divided into four percentile blocks, with higher percentile blocks indicating higher selling prices.

    Most of the discounting activity seems to have occurred in the lower end of the premium spectrum, with a view to protect margin – despite a largely healthy distribution of products across percentile ranges. This indicates a clear strategy to protect margins, while also promoting attractive offers to draw traffic.

    However, there are a couple of exceptions – Target was consistent throughout the “premiumness” spectrum, resulting in the highest overall discounting activity. Home Depot too was aggressive, but selectively so – it chose attractive pricing for the lower and higher ends of its assortment.

    As expected, many retailers showed higher discounting activity in the higher ranks of their listing pages. As usual, though, there are a few exceptions here too. Home Depot and Wayfair indicated unusual patterns – perhaps relying on search results as opposed to organic listing page results. On the other hand, Target again indicated a consistent pattern, with mostly similar discounts across visibility levels.

    Overall, across all parameters analyzed, both the Electronics and Furniture categories have been treated quite similarly in terms of pricing activity by most retailers. Is Prime Day really all about its marketing hype, or will it live up to its promise in at least one segment? Stay with us to find out as we follow through with our series of articles analyzing various product categories on this year’s Prime Day.

  • Decoding Alibaba’s Singles Day Sales

    Decoding Alibaba’s Singles Day Sales

    An average of $11.7 million per second was the rate at which Alibaba clocked $1 billion in sales during the first 85 seconds of Singles’ Day. As Alibaba’s annual sale event continues to grow in scale, referring to it as a global retail phenomenon is an understatement. Alibaba closed the day having shipped 1.04 billion express packages based on sales of merchandize worth 213.5 billion yuan ($30.67 billion).

    This performance shredded any lingering concerns analysts may have harbored about the prospects of this year’s sale, given the international backdrop of the ongoing trade skirmish between the US and China.

    Along with attractive discounts across a range of product categories, Singles’ Day also promised an integrated experience fusing entertainment, digital and shopping, in stark contrast to other large global sale events like Black Friday, which focus predominantly on discounts.

    At DataWeave, we set out to investigate if all the hype resulted in actual price benefits to the shoppers and how the various categories and brands performed in terms of sales during the event. To do this, we leveraged our proprietary data aggregation and analysis platform to capture a range of diverse data points on Tmall Global, covering unit sales (reported by the website) and pricing associated with Tmall Global’s major categories over the Singles’ Day period.

    Our Methodology

    We captured 5 separate snapshots of data from Tmall.com during the period between October 25 and November 14, encompassing over 15,000 unique products each time, across 15 product categories.

    To calculate the average discount rate, we considered the percentage difference between the maximum retail price and the available price of each product. We also looked at the additional discount rate, for which we compared the available price during Singles’ Day to the available price from before the sale. This metric reflects the truest value to the shopper during Singles’ Day in terms of price.

    Our AI-powered technology platform is also capable of capturing prices embedded in an image. For example, the offer price of ¥4198 was extracted accurately from the accompanying image by our algorithms and attributed as the available price while ¥100 from the same image was ignored.

    This technology was employed across hundreds of products using DataWeave’s proprietary Computer Vision technology.

    Domestic Appliances and Digital/Computer Categories Powered Turnover

    The Domestic Appliances and Digital/Computer categories dominated the Singles Day Sale in terms of absolute sales turnover. This isn’t surprising, since the average order value for these categories are typically much higher compared to the other categories analyzed.

    What clearly stands out in the above infographic is that the two largest categories in terms of sales turnover had average additional discounts of only 2 per cent and 0 per cent — a rather surprising insight. In general, with the exceptions of Women’s skincare, Men’s skincare, and Women’s bags (11 per cent, 10 per cent, and 9 per cent respectively), all other categories saw low additional discounts during Singles’ Day.

    However, the absolute discounts across the board were consistently high, with only Luggage (6 per cent), Digital/Computer (9 per cent) and Women’s wear (12 per cent) staying significantly below the 20 per cent mark. In fact, eight categories enjoyed absolute discounts greater than 30 per cent.

    Among common categories between Men and Women, the Men clocked more sales in Men’s wear, shoes, and bags. Only skincare proved to be an exception, where Women’s skincare generated twice the turnover of their Men’s equivalent.

    The Infants category was another intriguing sector to emerge during the sale. Both Diapers (38 per cent) and Infant’s Formula (25 per cent) were substantially discounted, despite only receiving low additional discounts of 2 per cent and 0 per cent respectively – indicating aggressive pricing strategies in this category even during non-sale time periods.

    The biggest takeaway from our analysis is the lack of any correlation between sales turnover and additional discounts, or even the absolute discounts.

    International Brands Make Gains

    International brands continue to penetrate the Chinese market showing up amongst the Top 5 brands of 13 of the 16 categories on sale.

    In the Diaper category, Pampers delivered nearly twice the sales turnover of its next biggest competitor. As expected, Apple and Huawei battled it out for honors in the Digital/Computer category although Xiaomi enjoyed pleasing results, nearly matching Huawei’s sales to go with its sales leadership of the Domestic Appliances category. Local brands, though, swept the Domestic Appliances, Furniture and Women’s Wear categories.

    The challenge posed by Chinese brands was illustrated by Nike’s spot in the second place in the highly competitive Men’s Shoes category after Anta.

    International brands topped only five of the 16 categories and Top 3 positions in ten categories. Still, there’s a growing presence of international brands in China’s eCommerce.

    Gillette won handsomely over its competition in the Personal Care category while Skechers enjoyed a similar result in Women’s Shoes, racking up nearly twice the retail sales of its nearest competitor. Another category dominated by international brands was the Women’s Cosmetics category where international brands accounted for 4 of the Top 5 brands.

    Similarly, Samsonite’s acquisition of American Tourister gave it two top 5 brands in the Luggage category. Other global brands to make the cut during the Singles’ Day sale included L’Oréal, Canada’s Hershel, Playboy, South Korea’s Innisfree and Japan’s Uniqlo.

    It’s Not All About Price On Singles’ Day

    The dramatic rise in shopping during Singles’ Day is not driven solely by price reductions. Alibaba’s commitment to its “New Retail” strategic model has led the Chinese giant to channel its impressive resources to focus on bringing together the online elements of its business with the more traditional offline aspects of its retail distribution. This is combined with entertainment to create a larger story based around the shopper’s overall “experience” rather than just driving “attractive prices” as a short-term retail hook.

    Alibaba is betting big on erasing the line between online and offline and its futuristic vision of structuring retail around the way people actually want to shop. Based on the consistently impressive results of Singles’ Day year after year, “New Retail” has a promising future.

    If you wish to know more about how DataWeave aggregates data from online sources to provide actionable insights to retailers and consumer brands, check out our website!

  • Prime Day Sale: Unraveling the Highs and Lows of Amazon’s Flagship Event

    Prime Day Sale: Unraveling the Highs and Lows of Amazon’s Flagship Event

    Another year, another round of media frenzy, and another set of records broken.

    In only three years, Amazon’s Prime Day has evolved into one of the landmark sale events of the shopper’s calendar. Reports indicate that this year’s sale made a major splash, raking in over $4.2 billion in sales — a 33% increase compared to last year. Also, the retail behemoth shipped over 100 million products during the 36-hour sale. Amazon stated that they “welcomed more new Prime members on July 16 than on any other previous day in Prime history.”

    The much talked about website outage added some spice and drama to the proceedings during the first hour. However, this was fixed quickly.

    This year is also the first Prime Day with Whole Foods, Amazon’s most expensive acquisition, giving US shoppers unprecedented incentives to shop at the physical stores of the grocery retailer.

    However, Prime Day is not just about the US, but a truly global event. In India, as part of its promotions for Prime Day, Amazon leveraged VR to have people experience the products in their true form factor at select malls.

    At DataWeave, our proprietary data aggregation and analysis platform enabled us to keep an eye on the pricing and discounts of products during the sale. We tracked Amazon.com, Amazon.co.uk, and Amazon.in before (14th July) and during the sale (16th July) and monitored several product types in Electronics, Men’s Fashion, Women’s Fashion and Furniture categories. We captured information on the price, brand, rank on the category page, whether Prime was offered or not, etc. and analyzed the top 200 ranks in each product type listing page. To best indicate the additional value to shoppers during the sale, we focused our analysis only on additional discounts on products between the 14th and 16th of July.

    Scrutinizing the data yielded some rather interesting insights:

    Amazon UK was more aggressive with its discounts than the US and India across most categories, with Furniture being the only exception (highest discounts in the US).

    In the US, Women’s Fashion observed the steepest discounts (12%), though there were discounts available on a larger number of Men’s Fashion products (5% additional discount on 20% of products).

    While disparity between discounts on Prime products vs non-Prime was quite evident, it was surprisingly low for many categories. In fact, the Electronics category in the UK and the Furniture category in India witnessed sharper discounts for non-Prime products than Prime.

    Top categories by additional discount include Women’s Handbags, Sports Shoes, and Pendrives in the US, Sunglasses and Tablets in the UK, and Women’s Tops, Men’s Jeans, Women’s Sunglasses, and Refrigerators in India. Top brands include Nike, Amazon Essentials, Sandisk, and 1home in the US, Oakley, Toshiba, Belledorm, and rfiver in the UK, and Adidas, Sony, UCB, and Red Tape in India.

    As indicated in the following infographic, some of the most discoverable brands during the sale include Canon, Apple, Nike and Casio in the US, Sandisk, Amazon, Levi’s, and Ray Ban in the UK, and Nikon, UCB, Whirlpool, and HP in India. Discoverability here is measured as a combination of the number of the brand’s products in the top 100 ranks and the average rank of all products of the brand. Also in the infographic, is a set of products with high additional discounts during the sale.


    Amazon’s competitors though aren’t ones that simply roll with the punches.

    Flipkart, Amazon’s largest competitor in India (recently acquired by Walmart), announced its own Big Shopping Days sale between July 16 and July 19. On Prime Day, the company joined in with some attractive offers:

    • 8%, 10%, and 7% additional discounts on 11%, 29%, and 16% of Electronics, Men’s Fashion, and Women’s Fashion categories, respectively.
    • 35% off on Perfect Homes 3-seater Sofa
    • 27% additional discount on Acer Predator Helios Gaming Laptop
    • 25% additional discount on Sandisk 16GB Pen Drive

    Propelling the Amazon Flywheel

    While Amazon clearly benefits in the short-term with this sale, the long-term effect of feeding its famous flywheel is evident as well.

    Amazon’s flywheel is a framework through which the company looks to build a self-feeding platform that accelerates growth over time. Attractive discounts and a broad selection of products improves customer experience, which increases traffic to the website, which attracts more merchants on its platform, who in turn broaden the selection of available products.

    Sale events like Prime Day create the sort of hype needed to draw a lot of traffic to Amazon’s website, generating momentum that has a compounding effect on Amazon’s growth. Not surprisingly, more than half of the people surveyed in the US by Cowen last December said they lived in a household with at least one Prime subscription.

    As Amazon’s stock traded at an all time high following Prime Day, it’s only a matter of time before the company becomes the world’s first trillion dollar company.

    Check us out, if you’re interested in learning more about our technology and how we provide Competitive Intelligence as a Service to retailers and consumer brands.

  • Study of Brand Inconsistency in Furniture eCommerce

    Study of Brand Inconsistency in Furniture eCommerce

    From initially lagging well behind early high-penetration categories such as consumer electronics, books, and apparel, furniture is now emerging as a key growth category.

    Online furniture purchases are growing at a rapid clip, estimated to currently be around 14 percent rate annually and is anticipated to reach 7.6 percent of total category sales in 2018.

    Savvy furniture brands are becoming increasingly aware of this shift in consumer shopping patterns and are taking steps to embrace the importance of creating a seamless online customer experience consistent across all eCommerce websites.

    Selling furniture online remains logistically complex. It requires the disciplined coordination across an ecosystem teeming with bricks and mortar stores, salespeople, warehouses merchants, and a network of delivery systems.

    All this complexity poses challenges for brands looking to deliver a consistent brand experience for consumers across multiple eCommerce websites.

    One frequent outcome of this complex ecosystem is the emergence of white labeling.

    The Invasion of White Labeling in the Furniture Category

    A white label product is one that is manufactured by one company only to be bundled and sold by other online merchants using different brand names. The end product is positioned as having been manufactured by the brand marketer.

    These white label products are frequently sold at a significant discount, compared to more mainstream name brands in the category.

    Electronics brands have often been victims of this phenomenon. Typical electronic white label products now commonplace range from radios and DVD players to computer mice and keyboards, through to TV remote controls.

    Increasingly, the furniture vertical is no longer a stranger to white label packaging and marketing as well.

    At DataWeave, using our proprietary data aggregation and analysis platform, we analyzed a range of factors of the furniture vertical, specifically the emerging phenomenon of white labeling.

    Our analysis spanned a sample set of over 20,000 products that we tracked across the websites of two of our eCommerce customers (whom we don’t wish to name) that have a large assortment of furniture products. Let’s call these eCommerce companies Retailer A and Retailer B.

    We identified white labeled products as being those that featured the exact same image between the two retailers but were sold under different brand names. Here, our AI-powered advanced image analytics platform matched the images of various products at an accuracy of more than 95%.

    The following infographic summarizes our analysis.

    Clearly, not only is white labeling quite prevalent here, but in almost every instance, we identified price variation. Some of the white labeled products were sold by lesser-known brands with significantly lower price points. This pricing strategy could potentially damage the customer experience for well-established consumer brand franchises in several ways.

    The shopper sees through the branding exercise where the same product is repackaged and presented as having been “produced” by a different brand, potentially eroding brand loyalty.

    As some 71 percent of the products studied were identified as white labeled products, this exposes the category as a whole to this risk.

    The shopper may be confused by the price difference as well, undermining the brand’s carefully constructed pricing perception. The average spread of 21 percent between competing white labeled products is potentially a major source of consumer dissonance and confusion.

    A Closer Look at Pricing

    While the inconsistent experience potentially created by widespread white labeling is almost characteristic of the furniture vertical, other eCommerce areas such as pricing and promotion have also been demonstrated as being key influencers of the shopping experience.

    Today, brands have little control over how their products are priced on eCommerce websites and are susceptible to pricing decisions taken by either the merchant selling the product or retailers themselves. Here, price change decisions have little to do with providing a consistent brand experience, as it’s not really a priority for merchants and retailers.

    In a hyper-competitive retail environment, retailers often discount heavily or change prices frequently to drive sales and margins. The following infographic summarizes the differences in pricing approaches between the two retailers we analyzed.

    Both retailers demonstrated quite divergent approaches in their pricing strategies. The key point of difference appeared to be Retailer B’s discount execution, which proved more aggressive than Retailer A’s, routinely exceeding the latter by five percent or more.

    This discounting strategy is focused on the 40+ percentile (by price, with 100 percentile being the most expensive product), and above price bands, while both retailers displaying similar strategies to their Top 20 and Top 20 to 40 percentile ranges.

    We also observe how Retailer B is more inclined to offer higher discounts on products with higher review ratings, compared to Retailer B’s strategy — a play on developing a “low price” perception among shopper.

    The Consumer Experience Matters

    Today, consumers expect a truly seamless shopping experience right across a brand’s entire integrated retail community, regardless of whether it is physical or digital. Consumers have evolved beyond being merely time poor and have emerged as a group of impatient shoppers, unforgiving of inconsistencies in their experience.

    With retail evolving to embrace multiple consumer touch points with a brand, the practice of white labelling represents a dangerous source of potential confusion and disillusionment. This raises the degree of difficulty involved in converting website visitors into buyers. Further, inconsistent pricing between eCommerce websites, due to dissimilar pricing strategies adopted by each website, only compounds the problem for furniture brands.

    Technologies like DataWeave’s Competitive Intelligence as a Service, that can provide furniture brands with timely insights on white labelled products, unauthorized merchants, and price disparity between ecommerce websites, can assist furniture brands in their efforts to better manage their online channel.

    Visit our website to find out more on how we help consumer brands protect their brand equity and optimize the experience delivered to their customers on eCommerce websites!