Tag: Fashion Stories

  • Black Friday Sales Season: How US Retailers Are Gearing Up

    Black Friday Sales Season: How US Retailers Are Gearing Up

    In today’s rapidly evolving online and mobile worlds, few things encapsulate the competitive nature of the online retail battlefield like the Black Friday sales season. With this year’s Black Friday and Cyber Monday sale events just around the corner, 2017 promises another titanic tussle between contenders.

    The holiday shopping season commences on Black Friday, November 24, and continues through much of December. Anticipating the sales season, many retailers are already offering discounts on several key categories and anchor products, providing a sneak peek into what we can expect towards the end of the month.

    While traditionally, Black Friday sales were dominated by brick and mortar retail stores, with the odd shopper stampede not unheard of, retail dynamics have changed in the recent past. Online sales now consume a larger proportion of Black Friday spending, and for the first time, consumers are expected to spend more online in the 2017 holiday season than in-store.

    In anticipation of this mammoth sale event, we at DataWeave trained our proprietary data aggregation and analysis platform on several major US retailers to understand the competitive market environment before the sales kick off.

    Between the 15th and 29th of October, we tracked the prices of the top 200 ranked products each day in the Electronics and Fashion categories across several major retailers. For Electronics, we analyzed Amazon, Walmart, Best Buy, and New Egg, while Amazon, Walmart, Bloomingdales, Nordstrom, Neiman Marcus, New Egg, and JC Penney provided our insights into the pivotal Fashion category. Product types analyzed include mobile phones, tablets, televisions, wearables techs, digital cameras, DSLRs, irons, USB drives, and refrigerators in Electronics, and T-shirts, shirts, shoes, jeans, sunglasses, watches, skirts, and handbags in Fashion.

    Automated Competitive Pricing Is the New Norm

    With the accelerated evolution of online commerce, retailers have increasingly harnessed the power of competitive data to drive changes on the go to their pricing, product assortment, and promotional strategy. During sale events, however, these numbers spike significantly. Amazon famously made 80 million price changes each day during 2014’s Christmas Season sale. Similarly, even on normal days some retailers have adopted the tactics of changing their product pricing more frequently than others, in their quest to stay competitive and build their desired price perception amongst shoppers.

    In our analysis of price changes, we considered the set of products that ranked consistently in the Top 200 from the 20th to the 25th of October. We identified the number of price changes together with the number of products affected by price changes that were implemented by the retailers.

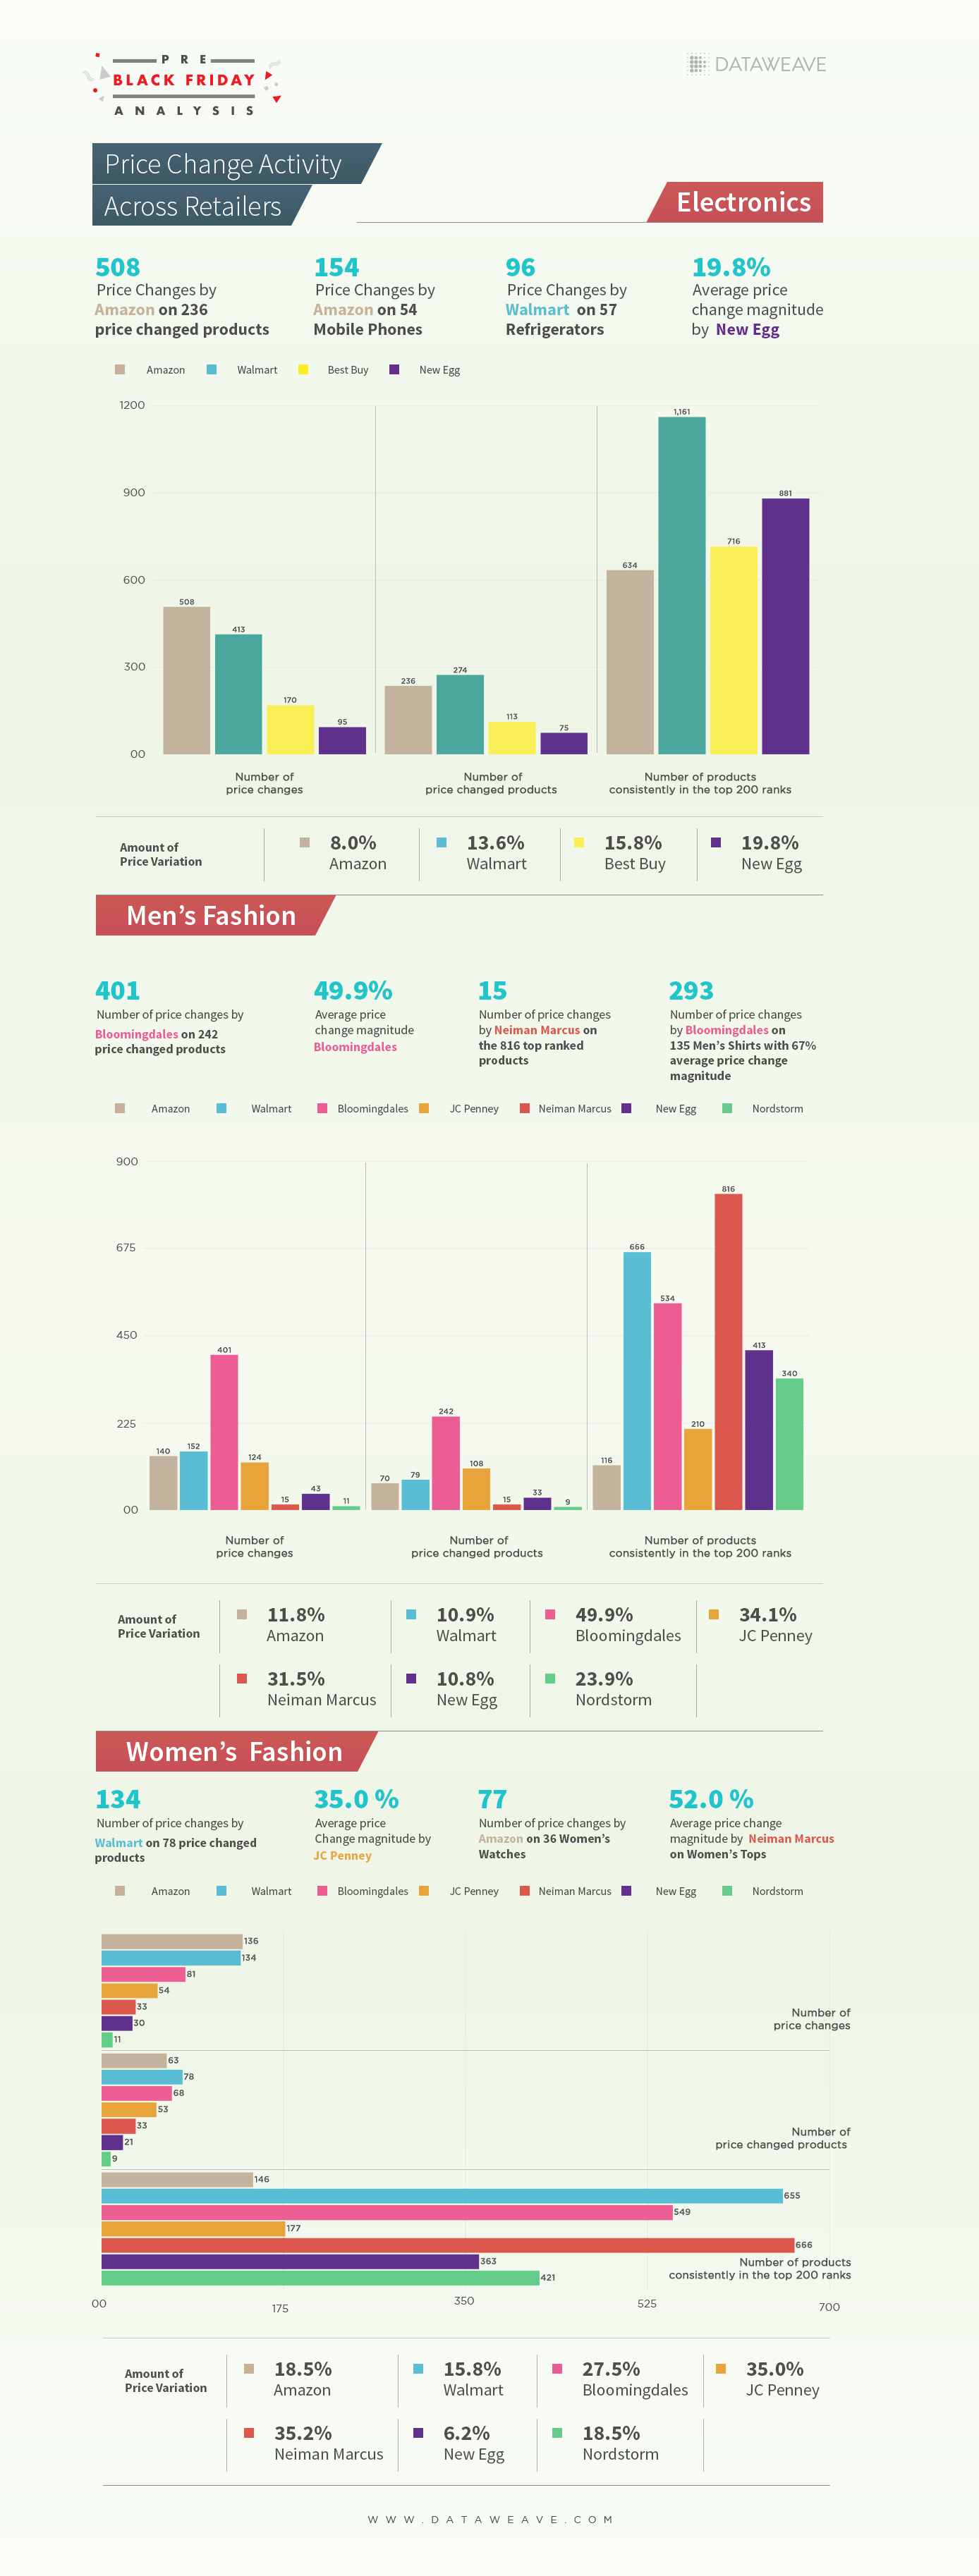
    As anticipated, Amazon led the way with 508 price changes on 236 products in the Electronics category during the period compared to Walmart’s 413. By comparison, New Egg’s 95 price changes trailed the field by a significant margin and illustrate the tactical advantage Amazon’s dynamic pricing technology confers. However, the price variation (8.0%) of Amazon’s was also the lowest of the four retailers included in the study, showing that Amazon makes short, sharp tweaks to its pricing at a higher frequency than its competitors.

    By comparison, the Fashion category demonstrated a much lower level of price changes than Electronics, albeit with significantly higher price variations. Walmart leads the pack, adopting an order of magnitude greater number of price changes across a significantly larger number of products compared to the majority of its competitors.

    Product Mix Suited to Target Market Segments

    While competitive pricing is one strategy for attracting new customers and retaining existing ones, the selection of products featured in a retailer’s inventory is just as important. Ensuring a disciplined product assortment, which caters exclusively to a retailer’s target market segments is key. While some retailers such as Walmart choose to house a more affordable range of products, Neiman Marcus and Bloomingdales target the more premium segment of shoppers.

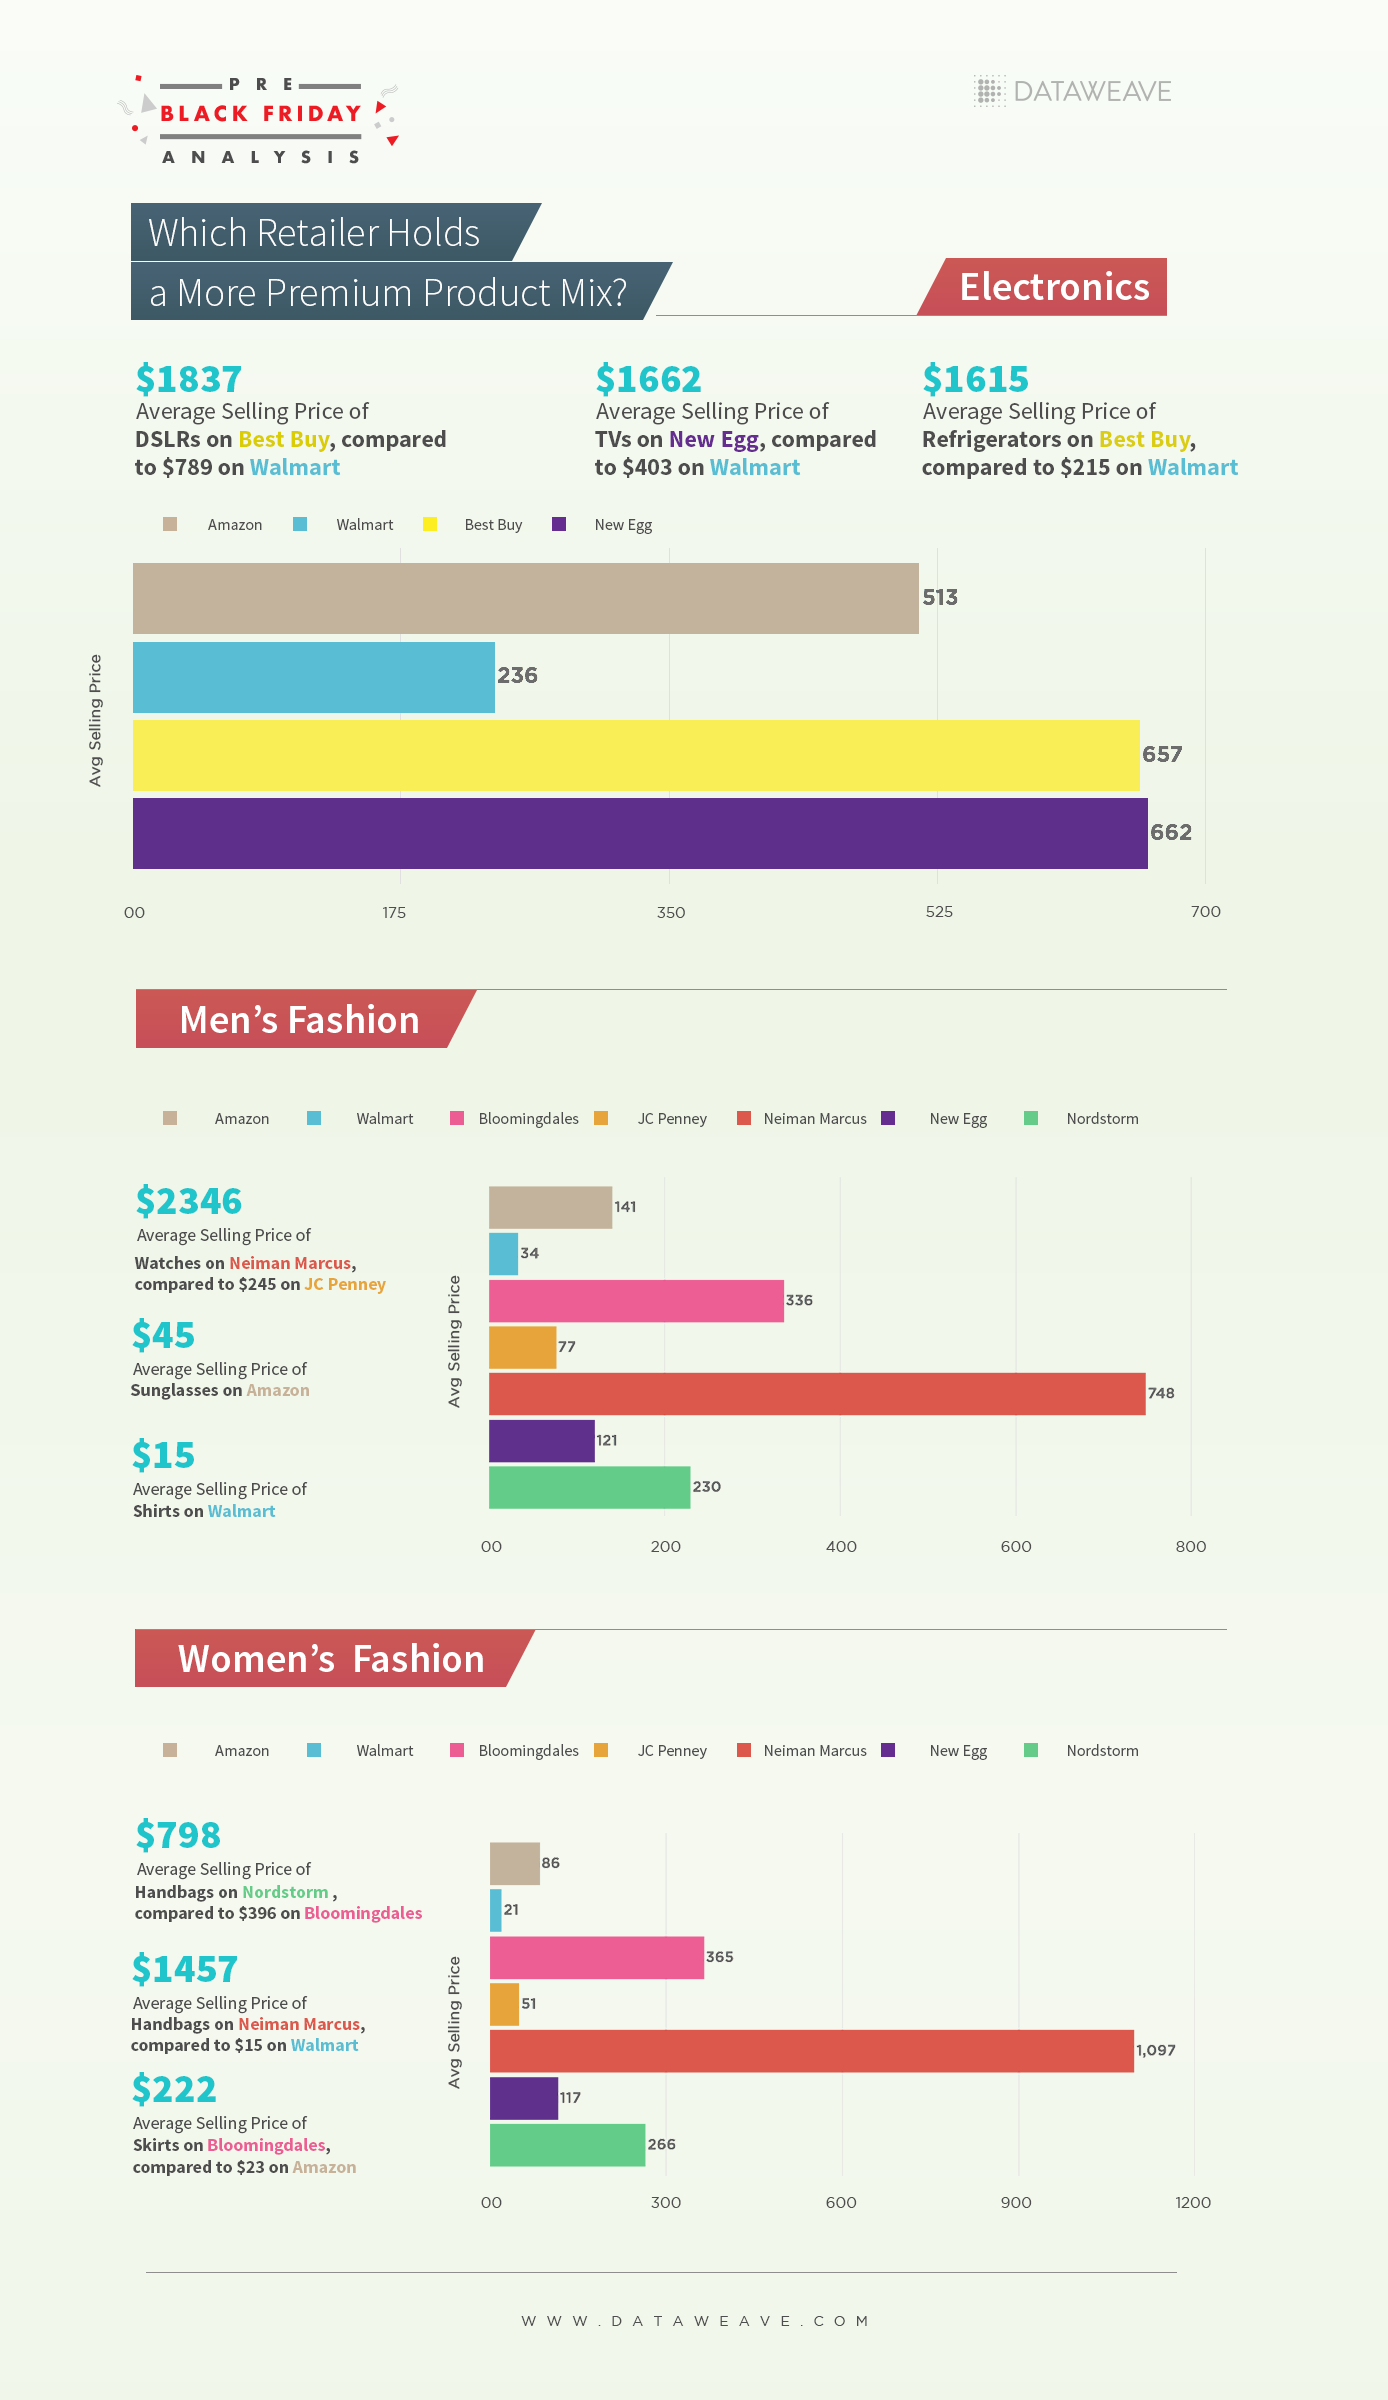
    It is clear from the data that Walmart has aligned its pricing strategy to support its affordability pitch to its shopper base, while Neiman Marcus and Nordstrom use pricing to juggle the demands of a more premium inventory with perceptions of price competitiveness.

    Product Movement In The Top 200

    Much of a retailer’s sales performance comes down to how effectively it maintains the optimal mix of reassuring bestsellers complemented by attractive new arrivals. Sound product assortment clearly provides shoppers with a variety of options each time they visit the retailer’s website. To achieve this balance, retailers typically employ their own, unique algorithm that ranks products in their listings based on several factors, including price range, discount offered, review ratings, popularity and promotions by brands.

    To study this, we evaluated the average percentage of products that were replaced in the Top 200 ranks for each product type of each website.

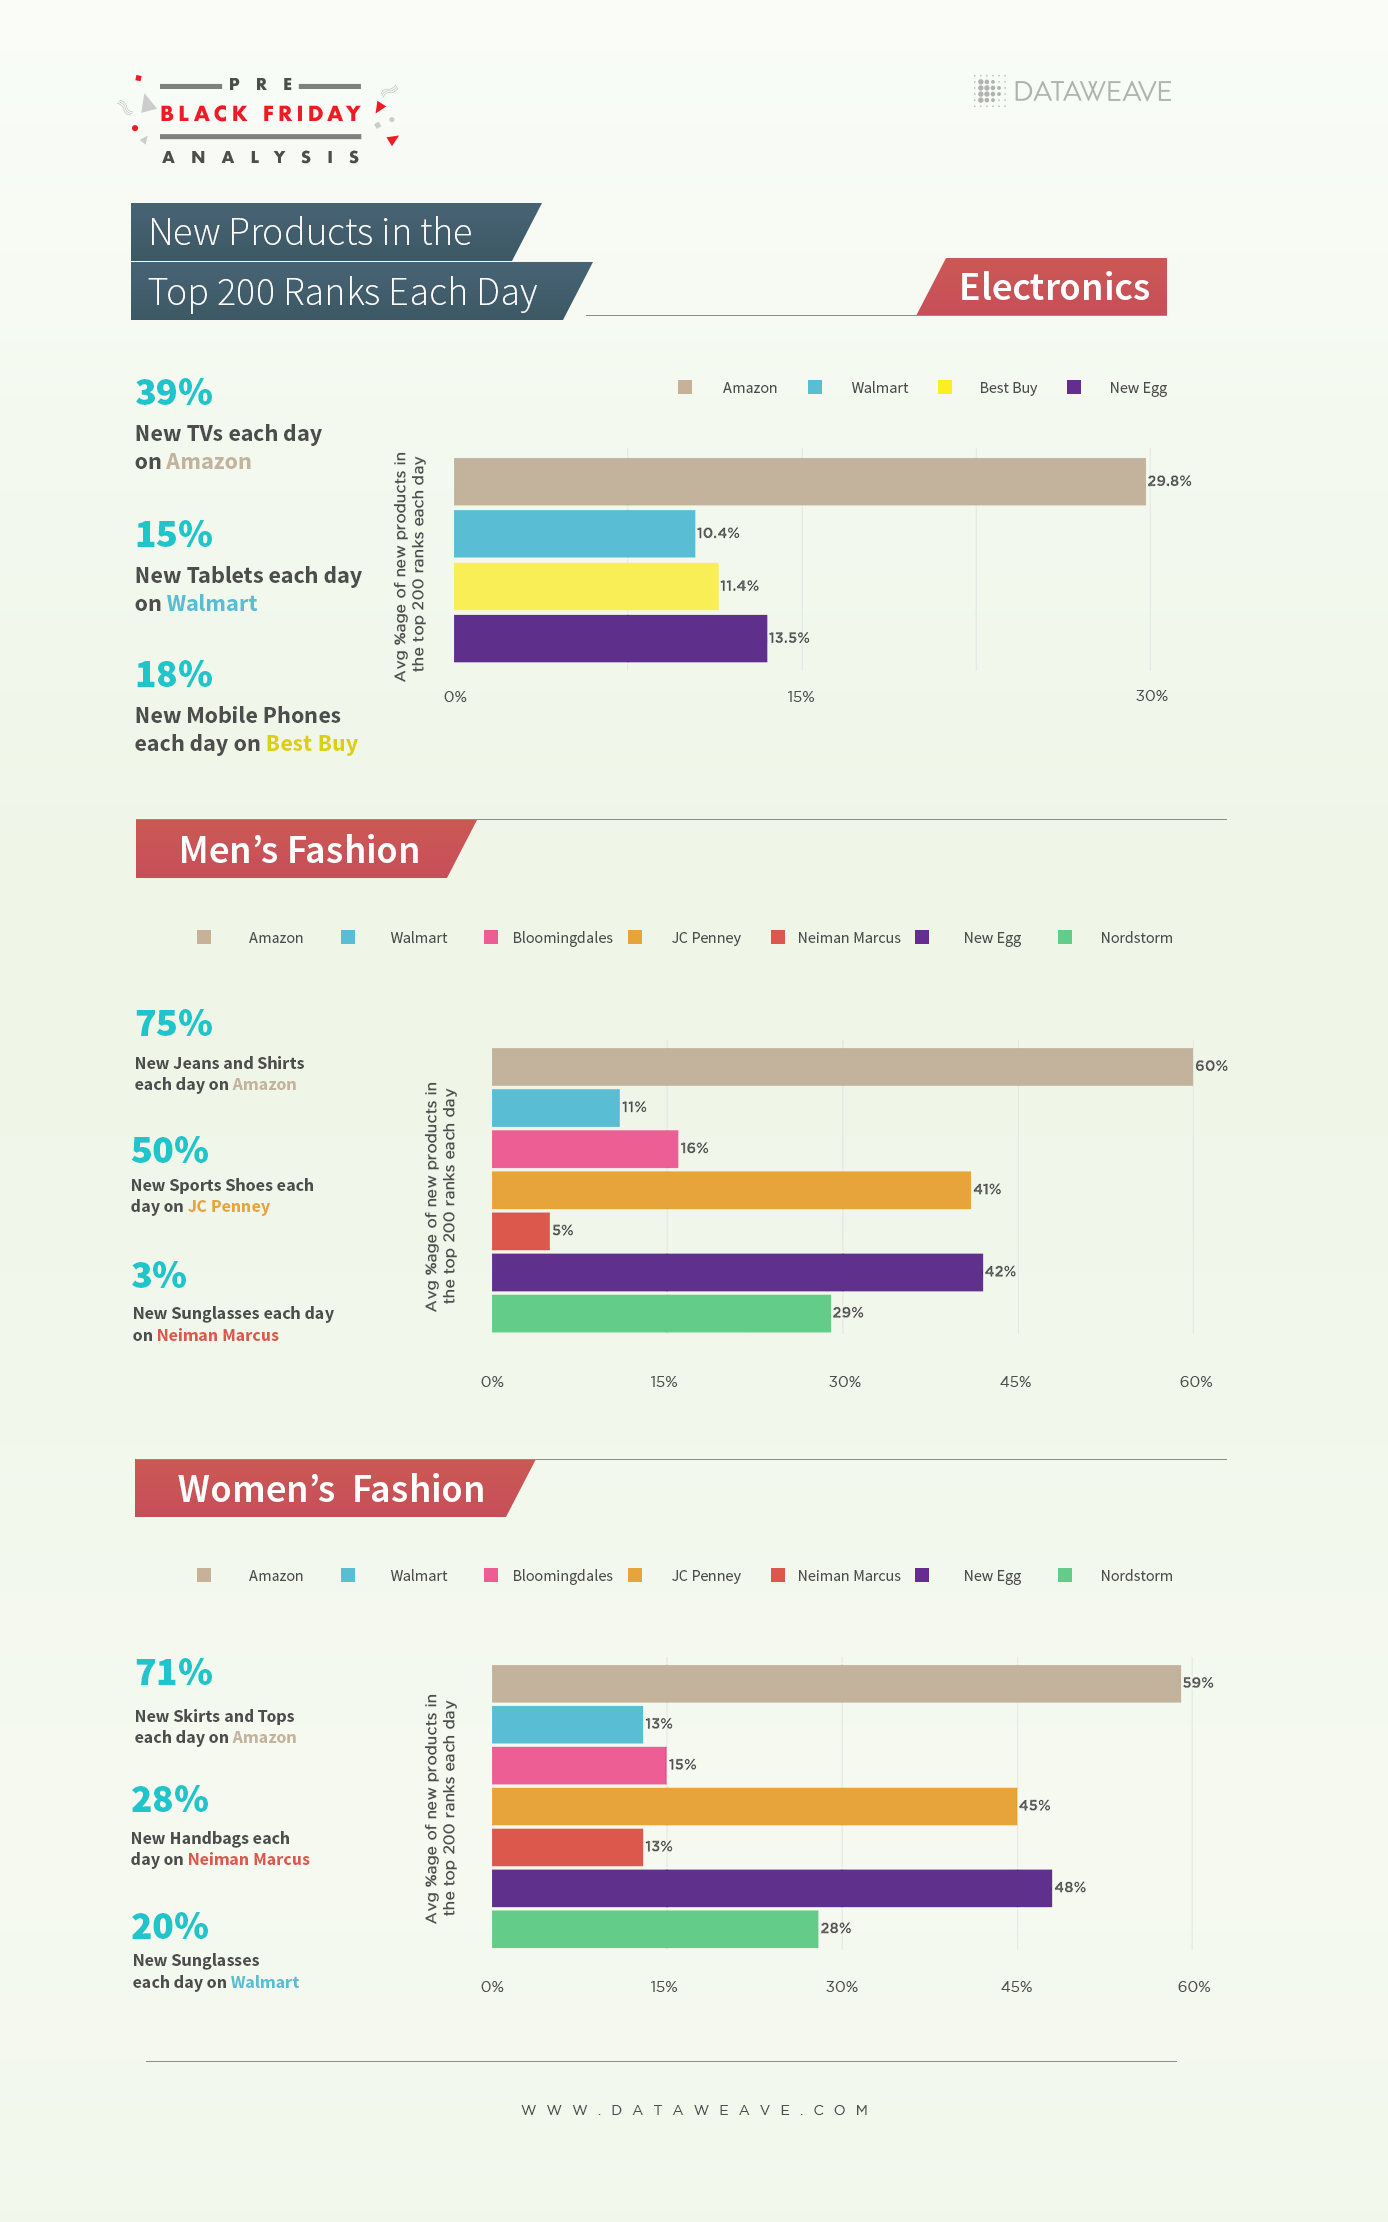
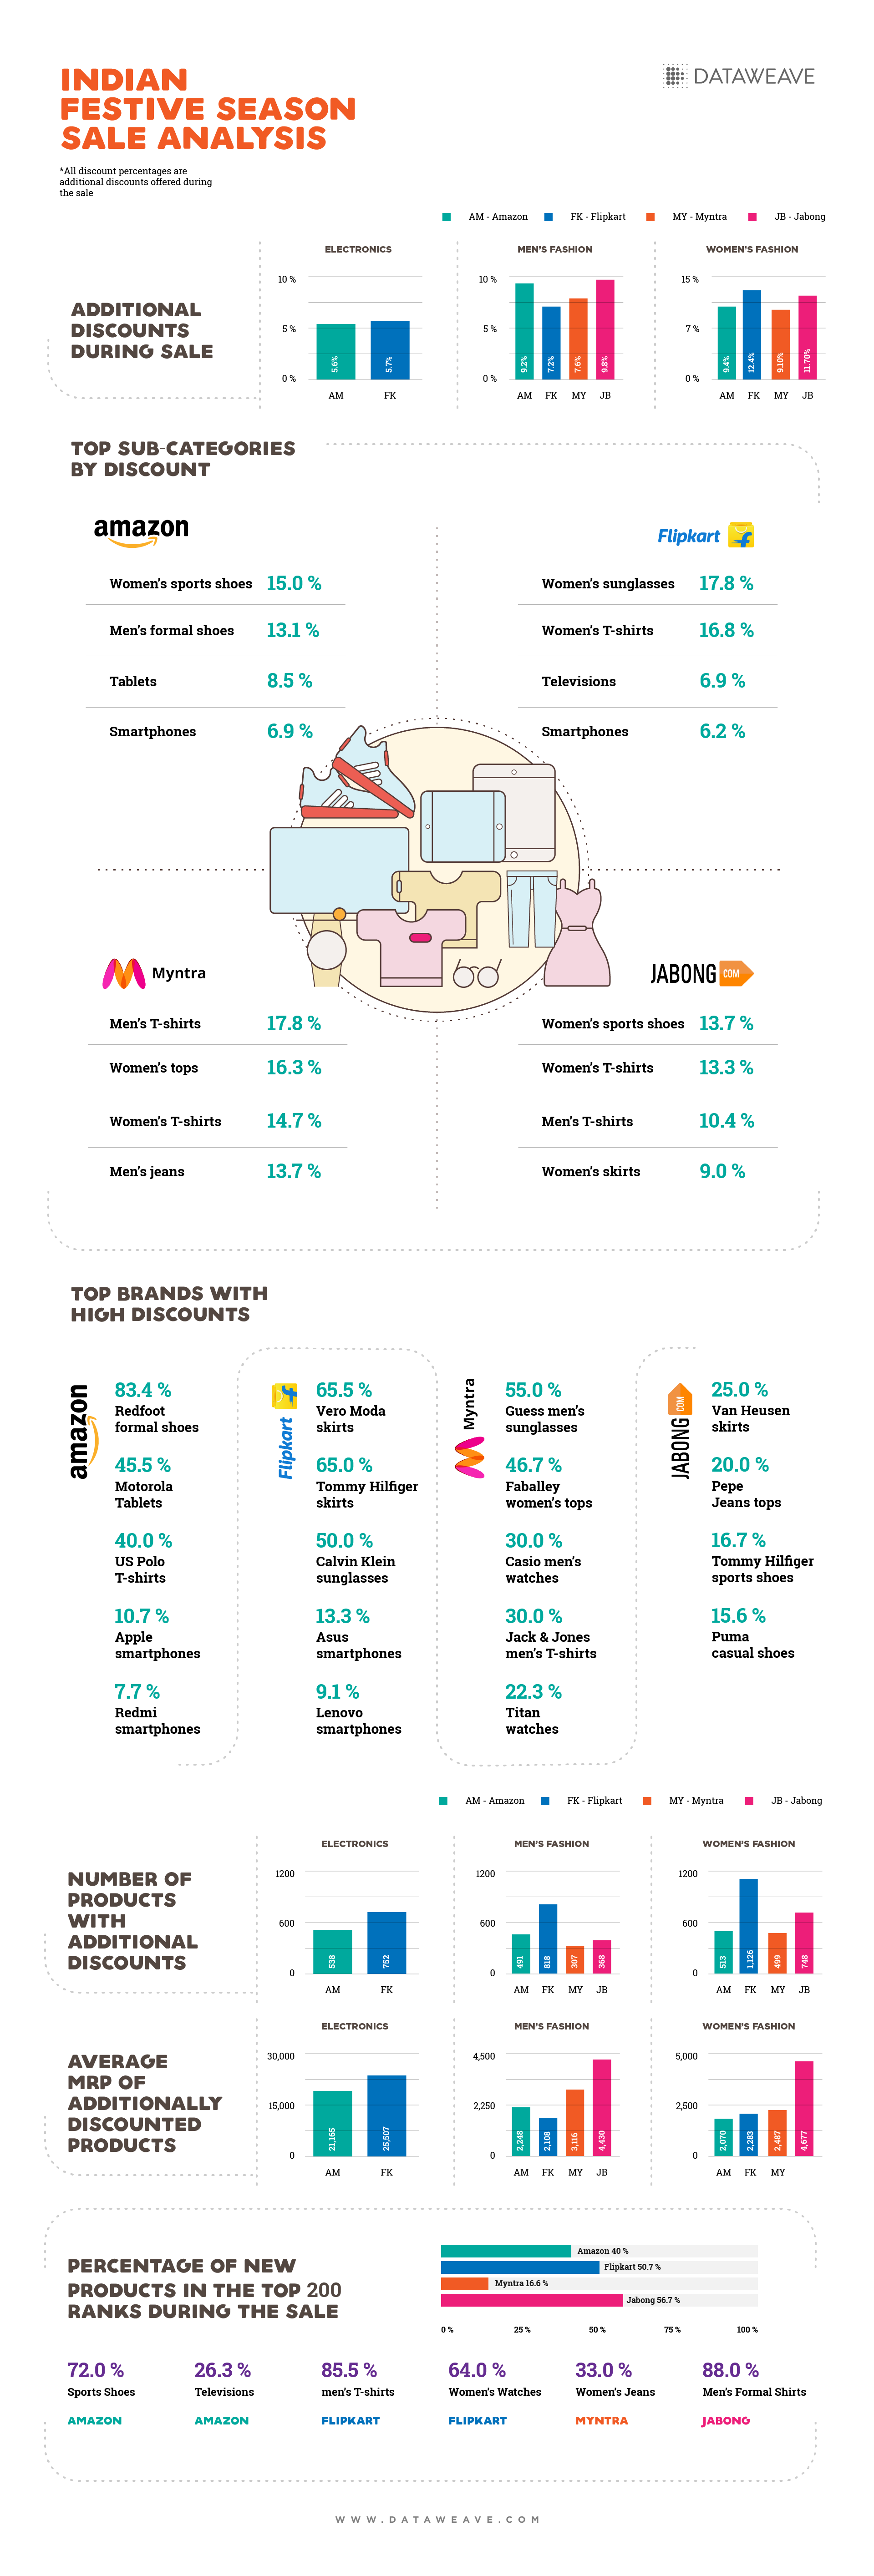
    Amazon has clearly adopted a strategy of offering new options to its shoppers each day, with an average of 60% new products in the Top 200 ranks of the Fashion category. Contrast that with Walmart which appears to be more conservative in its approach to churning its Top 200 products. In the case of Neiman Marcus however, the reason for the lower volume of product pricing movements in its Top 200 ranks may be due to the relatively high value of its premium product assortment, which imposes the internal constraints of having a smaller pool of new products to choose from.

    Online-First, This Black Friday Sale Season

    Amazon continues to demonstrate its dominance as a pacesetter in US retail, largely due to its progressive online pricing and merchandising strategies. These embrace the power of big data in its approach to online retail.

    Research shows online is consistently outperforming in-store along critical customer satisfaction dimensions spanning: product quality, selection and/or variety, availability of hard-to-find and unique products, ease of searching and delivery options.

    According to global consultancy Deloitte, for the first time ever, American shoppers will purchase more online than they buy offline in the 2017 holiday shopping season — 51 percent, up from 47 percent in 2016. With Black Friday looming in the next few weeks, it will be interesting to see how US retailers push to seize a larger piece of this growing pie.

    Check out our website to learn more about how DataWeave provides Competitive Intelligence as a Service to retailers and consumer brands globally.

  • Our Analysis of Diwali Season Sales

    Our Analysis of Diwali Season Sales

    As the battle of the Indian eCommerce heavyweights continues to accelerate, we have witnessed three separate sale events compressed into the last four weeks of this festive season. Flipkart has come out with all guns blazing following its multi-billion-dollar funding round, leaving Amazon with little choice but to follow suit with its own aggressive promotions. At this stage of a highly competitive eCommerce cycle, market share is a prize worth its weight in gold and neither Flipkart nor Amazon are prepared to blink first.

    At DataWeave, our proprietary data aggregation and analysis platform enables us to seamlessly analyze these sale events, focusing on multiple dimensions, including website, category, sub-category, brand, prices, discounts, and more. Over the past six weeks, we have been consistently monitoring the prices of the top 200 ranked products spread over sub-categories spanning electronics, fashion, and furniture. In total, we amassed data on over 65,000 products during this period.

    The first of these pivotal sale events was held between the 20th and 24th September, which we earlier analyzed in detail. Another major sale soon followed, contested by Amazon, Flipkart and Myntra for varying periods between the 4th and 9th of October. Lastly, was the Diwali season sale held by Amazon, Flipkart, and Myntra between the 14th and 18th of October, joined by Jabong between the 12th and 15th of October.

    In analyzing these significant sale events for all eCommerce websites, we observed an extensive range of products enjoying high absolute discounts, but with no additional discounts during the sale, i.e. prices remained unchanged between the day before the sale and the first day of the sale. The following infographic highlights some of the sub-categories and products where this phenomenon was more pronounced during the recently concluded Diwali season sale. Here, discount percentages are average absolute discounts of products with unchanged discounts during the sale.

    Having identified the aggressive use of high but unchanged absolute discounts amongst eCommerce heavyweights during the sale, we focused our analysis on the additional discounts offered during the sale, to more accurately reflect the value these sale events deliver to Indian consumers.

    Several categories, sub-categories and brands emerged as enjoying substantial additional discounts. The following infographic details our analysis:

    Amazon and Flipkart continue to stand toe to toe on discounts in Electronics, although Amazon offered discounts across a greater number of products. Flipkart adopted a more premium brand assortment in the Electronics category with an average MRP of INR 30,442 for additionally discounted products.

    What stands out in our analysis is Amazon’s consistently aggressive discounting in fashion compared to Flipkart. As anticipated, Jabong and Myntra continued to offer attractive discounts in a large number of fashion products, seeking to maintain their grip in their niche. Furniture, too, is a category where Amazon out-discounted Flipkart, albeit through a less premium assortment mix (average MRP of INR 23,580 compared to Flipkart’s INR 34,304).

    Several big brands elected to dig deep into their pockets during the sales to offer very high discounts. These included attractive discounts from Redmi, Asus, and Acer in Electronics, and W, Wrangler, Levi’s, Puma, Fossil, and Ray Ban in Fashion.

    Which Sale Delivered Greater Value For Consumers?

    Since DataWeave has extensive data on both the pre-Diwali sale (held between 4th and 9th of October), and the Diwali season sale (held between 12th and 18th October), we compared prices to identify which of the sale events offered more attractive discounts across categories, sub-categories and products.

    While the discount levels were generally consistent across most sub-categories, only varying by a few percentage points, we identified several sub-categories and products that displayed a large variation in the absolute level of discount offered.

    As the infographic above shows, Amazon identified women’s formal shoes as a key category in its discounting strategy, which saw its level of discounting triple during the Diwali sale. By comparison, Flipkart doubled its discount in men’s jeans, and Myntra tripled its discounts on Men’s shirts and sunglasses.

    Similarly, during the Diwali sale Amazon, Flipkart and Myntra all offered selected products with an aggressive 40% to 50% discount level.

    Interestingly, Amazon, Flipkart and Myntra all elected to reduce the level of discounts offered on specific products as well. One of the biggest discount moves was Amazon’s reduction on iPhone 6s from 34% to only 4%. Flipkart recorded a similar price move on Adidas originals Stan Smith sneakers (30% to 5%) and Canon EOS 200D DSLR cameras (20% to 8%).

    Market Share Reigns Supreme

    Based on our analysis of the festive season sales, Flipkart’s aggressive approach powered by its multi-billion-dollar funding round enabled it to stave off Amazon’s discounting strategy in the annual eCommerce festive season sales this year, increasing its lead over Amazon India in a market where the total sales is believed to have surged by up to 40 percent over 2016’s sales.

    Based on several reports, Flipkart’s share of total festive season sales appears to have increased from 45 percent in 2016 to 50 percent this year, capturing much of the market up for grabs from a now relegated Snapdeal. Amazon’s market share during a festive sales period that stretched over a month is estimated to have remained steady at 35 percent, though the company reported it saw a 50 percent share in other metrics such as order volume and active customers.

    The key question for both industry analysts and consumers alike is, how much deeper are retailers willing to go in their quest to capture market share at the expense of operating margins?

    If you’re interested in DataWeave’s data aggregation and analysis platform, and how we provide Competitive Intelligence as a Service to retailers and brands, visit our website!

  • Festive Season Sale: Who’s Winning the Great Indian eCommerce Battle?

    Festive Season Sale: Who’s Winning the Great Indian eCommerce Battle?

    In the lead up to October’s Diwali celebrations, almost all major Indian e-retailers had announced mammoth sale events for last week. Resuming the epic battle of India’s online shopping carts during festival seasons, Flipkart, together with Jabong and Myntra, kicked off their five-day-long “Big Billion Days” sales on September 20, while Amazon India‘s “Great Indian Festival” launched the next day.

    The stakes were high as Amazon and Flipkart are more evenly matched this year than ever before, making predicting an eventual winner of these dueling discounters a lot tougher than in previous years.

    At DataWeave, our proprietary data aggregation and analysis platform enabled us to easily assess which e-retailer offered better deals and discounts. Over the last two weeks, we have been consistently monitoring the prices of the top 200 ranked products in Amazon, Flipkart, Myntra, and Jabong, across several sub-categories of Electronics, Men’s Fashion, and Women’s Fashion, encompassing over 35,000 products in total.

    Divergent Discount Strategies

    In our analysis, we bring focus to the additional discounts offered by competing e-retailers during the sale, compared to prices before the sale. This is key, as today’s shoppers often encounter deep discounts on several products even on normal days, which could potentially dampen the value suggested by the large discounts advertised during the sale.

    Based on our analysis, Flipkart clearly adopted a more aggressive pricing strategy this year, establishing a lead over Amazon in average discount percentage for Electronics and Women’s Fashion. Moreover, Flipkart launched additional discounts on a larger number of products across categories. Amazon, though, offered 6.9 percent additional discounts on smartphones compared to Flipkart (6.2 percent), led by 10.7 percent discount on Apple and 7.7 percent discount on Redmi smartphones.

    Flipkart has already reported a doubling of revenue from the sale (which includes sales volumes of Myntra and Jabong) compared to last year, and claimed it accounted for 70 percent of eCommerce sales during these five days — beating Amazon by a considerable margin. Amazon, for its part, reported a “2.5X growth in smartphone sales, 4X increase in large appliances and 7X in fashion sales.”

    The difference in discounting strategies between Amazon and Flipkart is starkly illustrated by their respective highest discounts. Flipkart led the way with a 65.5 percent discount on Vero Moda skirts, a 65 percent discount on Tommy Hilfiger skirts, and 50 percent off Calvin Klein sunglasses.

    By contrast, Amazon’s greatest discounts were an 83.4 percent discount on Redfoot formal shoes, 45.5 percent on Motorola Tablets, a 40 percent on US Polo T-shirts, and a 25.1 percent discount on Puma sports shoes.

    Also, Flipkart hosted a more premium range of products in its assortment compared to Amazon, evidenced by a higher average MRP for its discounted products. Surprisingly, Amazon’s spread of discounted products has the least average MRP in Electronics and Women’s Fashion, compared to all other competitors.

    New Products Break Through the Top 200

    What’s fascinating in this battle of the e-retail giants is the correlation we uncovered between prices and rank. During the sale, as prices dropped on hundreds of products across the board, newer products successfully broke through into the Top 200 ranks for each sub-category. New products in the top 200 ranks had higher discount levels than the ones they replaced.

    This trend was especially pronounced in fashion, where we observed an almost complete overhaul of products filling the Top 200 during the sale period, led by sports shoes in Amazon, Men’s shirts in Flipkart, and Men’s formal shirts in Jabong.

    What About Pre-Sale Prices?

    Another angle we explored was whether (like most of us suspect) e-retailers increase their prices before a sale, only to reduce them during the sale, so they can advertise higher discounts. We observed that all e-retailers did increase their prices for an albeit small set of products before the sale.

    While the number of products where the prices increased for each website prior to the sales is small, it is interesting to observe that certain brands choose to perform the oldest trick in the retail book even today — raising prices to accentuate the degree of discount during the sale period, something shoppers need to keep an eye out for.

    A Sign of Things to Come?

    Based on our analysis, Flipkart has recognized the threat from Amazon and has approached this year’s “Big Billion Days” sale aggressively. It has dug deep into its freshly funded pockets, and offered better discounts for a larger set of products across most categories, in its attempt to lock down a greater market share in the burgeoning Indian eCommerce space.

    Amazon, though, has continued to maintain a firm grip on the Indian consumer, having achieved tremendous growth in specific categories during the sale.

    What’ll be interesting now is to see how these pricing strategies impact company revenues and margins, and how this will shape the soon-to-follow Diwali sales in mid-October.

    If you’re intrigued by DataWeave’s data aggregation and analysis technology, and would like to learn more about how we help retailers and brands build and maintain a competitive edge, please visit our website.


  • The Role of Competitive Intelligence in Modern Retail

    The Role of Competitive Intelligence in Modern Retail

    When retailers today look to compete in the cutthroat world of online commerce, they face several challenges unique to the nature of modern retail. It is now significantly harder for retailers to benchmark their pricing, assortment, and promotions against their competition, as the online world is highly dynamic and significantly more complex than before.

    Trends like the growing adoption of mobile shopping apps, the rising influence of customer reviews in buying behavior, hyperlocal e-commerce websites differentiating themselves by fulfilling deliveries in a matter of hours — the list goes on — have only added to this complexity.

    However, this complexity also presents an opportunity for retailers to incorporate layers of external competitive information into their merchandising strategies to deliver more value to customers and personalize their experience.

    Vipul Mathur, Chief Branding and Merchandising Officer at Aditya Birla Online Fashion, recently published an article highlighting some of the areas in which Competitive Intelligence providers like DataWeave can strategically influence modern merchandising.

    “The consumer is often driven by the aesthetics of a product, more so in the fashion and lifestyle industries than others. Hence, the choices of buyers are hard to interpret. However, innovative modern technologies are helping us understand these decisions,” says Vipul.

    He provides an example of how using AI-based tools (like DataWeave’s) to unearth the sentiments behind thousands of online reviews can help retailers better channel and message their online promotions.

    “Deciphering the consumers’ comments and converting them into tangible insights is incredible proof of the refinement possible with data analysis tools. It’s like knowing that consumers are delighted by the quality of the soles of a pair of Adidas running shoes. Using this, marketing communication can be modified to highlight this specific product feature,” explains Vipul.

    And it’s not just merchandising. This data can percolate across multiple functions in retail, enabling greater efficiency in operations. “If we have data on the best-selling styles across websites, including other attributes like pricing, region/locality (through pin-code mapping), and possibly even rate of sales, it’s up to our supply-chain systems to ensure that the supply is in accordance with demand.”

    DataWeave’s Retail Intelligence offers global retailers and e-commerce websites with these benefits and more. Our AI-powered technology platform aggregates and analyzes vast volumes of online competitive data and presents them in an easily consumable and actionable form, aiding quick, data-driven merchandising decisions.

    “DataWeave, our partner, has helped us refine our merchandising decisions, saving cost and creating value,” sums up Vipul.

    Read the entire article here, and if you’re intrigued by what DataWeave can do for retail businesses and wish to learn more, visit our website!


  • Was Amazon’s Prime Day Sale Really That Big a Deal?

    Was Amazon’s Prime Day Sale Really That Big a Deal?

    Hint: Only in some product categories

    Amazon’s Prime Day sale, the first-of-its-kind in India, made a conspicuous splash across the media a couple of weeks ago, with several stories of the sale’s dramatic success doing the rounds. For 30 hours spread over 10th and 11th of July, the online retail giant rolled out deals as frequently as every five minutes, exclusively for Amazon Prime subscribers. And online shoppers lapped it up.

    According to Amazon India, more customers signed up for Prime on the day of the sale and in the week leading up to it, than on any other month since Prime’s launch in India last year. To boot, Prime subscribers shopped three-times more during the sale compared to other days.

    The discounts offered on several products were quite frequently in the range of 60–70% and beyond, with some products reaching absurd discount levels of up to 85%. However, for a retailer as competitively priced as Amazon, what’s interesting to explore is how much additional discount was offered during the sale. After all, even on normal days, Amazon discounts aggressively on its top 20% selling SKUs, in order to reinforce the commonly held perception that the company is the lowest priced retailer around.

    More Than Meets the Eye

    At DataWeave, our AI-based technology platform aggregates and analyzes publicly accessible data on the Web, at large scale, to deliver insights on competitors to retailers and consumer brands. We collected pricing and discount information for the Electronics and Fashion categories on Amazon during the sale, and compared it to numbers from before the sale. Thus, we evaluated just how much additional value Prime subscribers could’ve potentially drawn from this sale.

    We performed a similar analysis on Flipkart as well, to examine how competing e-commerce websites react to big-ticket sale events.

    The infographic below lists out some of the more interesting bits of our analysis.

    Unsurprisingly, Amazon strengthened its grip in the electronics category by offering, on average, 3.9% higher discount than Flipkart, even with a higher-value assortment mix. Subsequently, Amazon reported a 5X increase in sales of smartphones and an 8X increase in sales of televisions during Prime Day.

    While Apple discounted its phones by 8.5% during the sale, Sanyo was among the top discounting brands (10%) in Televisions, with the company reporting a 4X jump in television sales. TCL offered 20% additional discount, the highest for televisions.

    What stands out from this analysis, though, is that Flipkart beat Amazon on price definitively in the fashion for women category, by extending 6.8% more discount than Amazon on a significantly higher-value assortment mix.

    It’s not uncommon to see e-commerce companies lowering their prices across the board to take advantage of the hype surrounding a competing e-commerce website’s promotional activity. Clearly, it’s a good idea for shoppers to always compare prices across websites before buying any product online.

    The New Age of Retail

    That shoppers today can easily compare products and prices across different e-commerce websites has brought about greater competition among online retailers. With the consequent margin pressure, comes the need for retailers to be able to react to price changes by their competitors in near-real-time.

    And it’s no mean task. Amazon has been found to effect over 80 million price changes a day during holiday season, and retailer-driven sale events like the Prime Day Sale are here to stay. Consequently, retailers look to Competitive Intelligence providers like DataWeave for easily consumable competitive information that enables them to react effectively and compete profitably.

    DataWeave’s AI-powered technology platform aggregates, compiles, and presents millions of data points to provide e-commerce companies with actionable competitive insights. With our solutions, retailers can effect profitable price changes, implement high-value assortment expansion, and proactively monitor and respond to promotional campaigns by competitors.

    Find what we do interesting? Visit our website to find out more about how modern retailers benefit from using DataWeave’s Competitive Intelligence as a Service.