Tag: Fashion Stories

  • The Apparel Market: A Closer Look at Black Friday Discounts

    The Apparel Market: A Closer Look at Black Friday Discounts

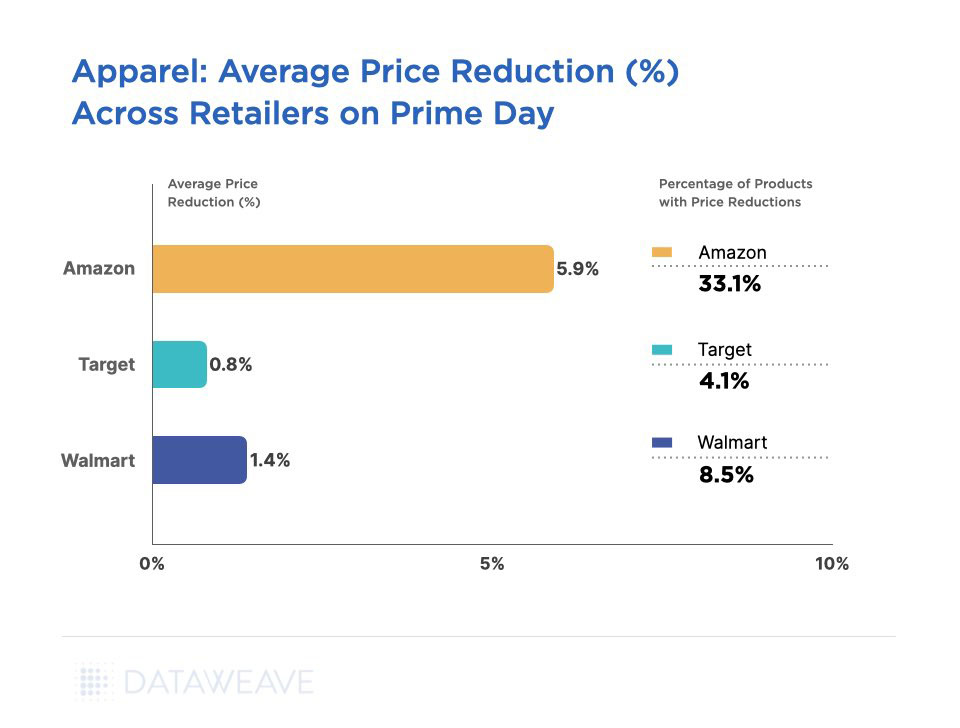
    As the holiday shopping season kicked off, savvy shoppers embraced the spirit of the season, drawn by enticing deals. The apparel category is forecasted as the second highest earning category (Source: Statista), expected to generate revenues up to $43.9 billion, closely following consumer electronics. To understand the pricing strategies of top retailers amidst the sale season, DataWeave analyzed the pricing trends for the Apparel category this Black Friday.

    We leveraged our AI-powered data platform to analyze the discounting across key retailers. Our analysis focused on the Apparel category, examining how Amazon, Walmart, Target, Saks Fifth Avenue, Nordstrom, Bloomingdales, Neiman Marcus and Macy’s differentiated themselves through their discounts.

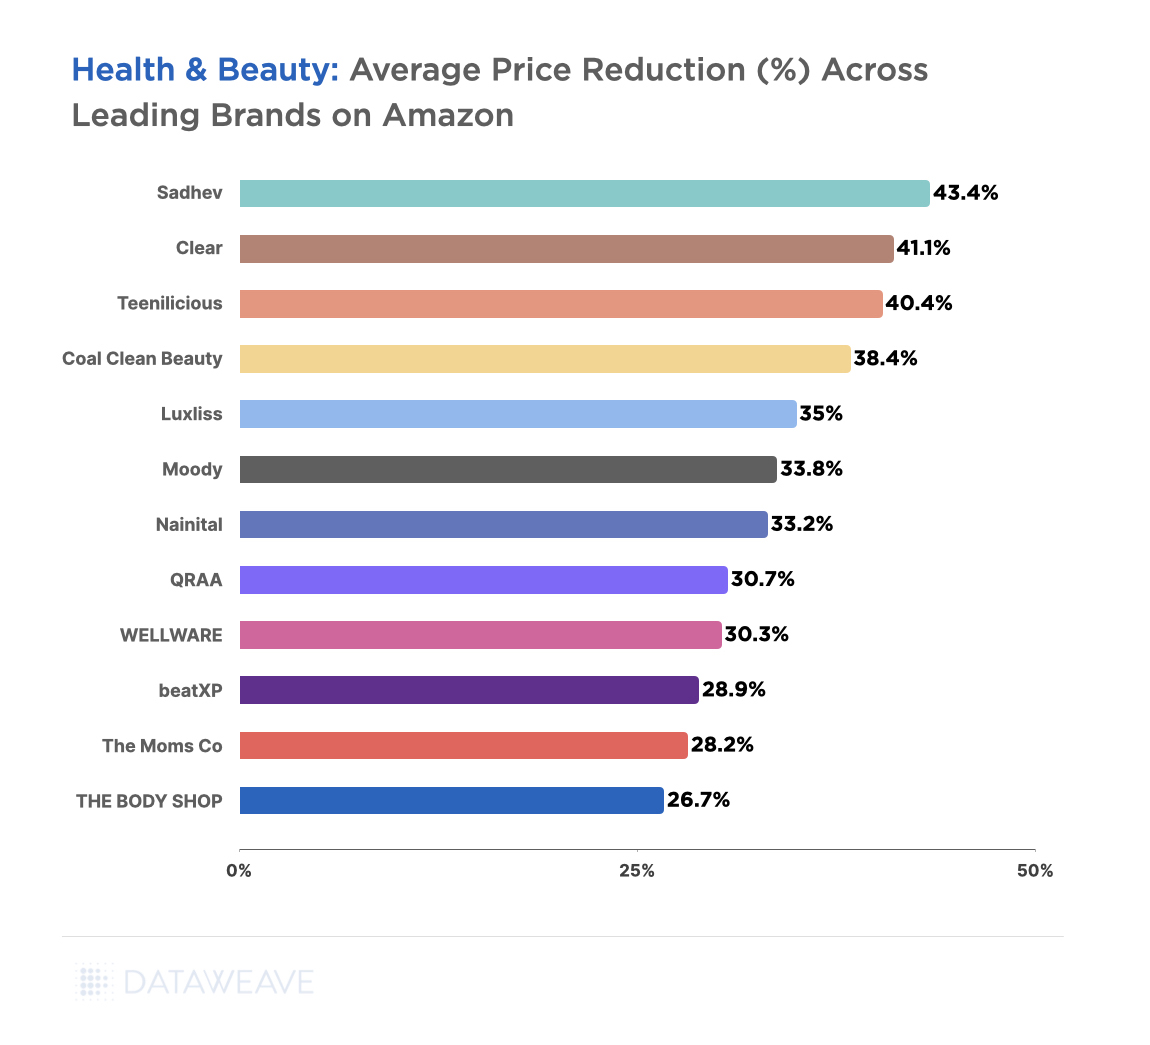
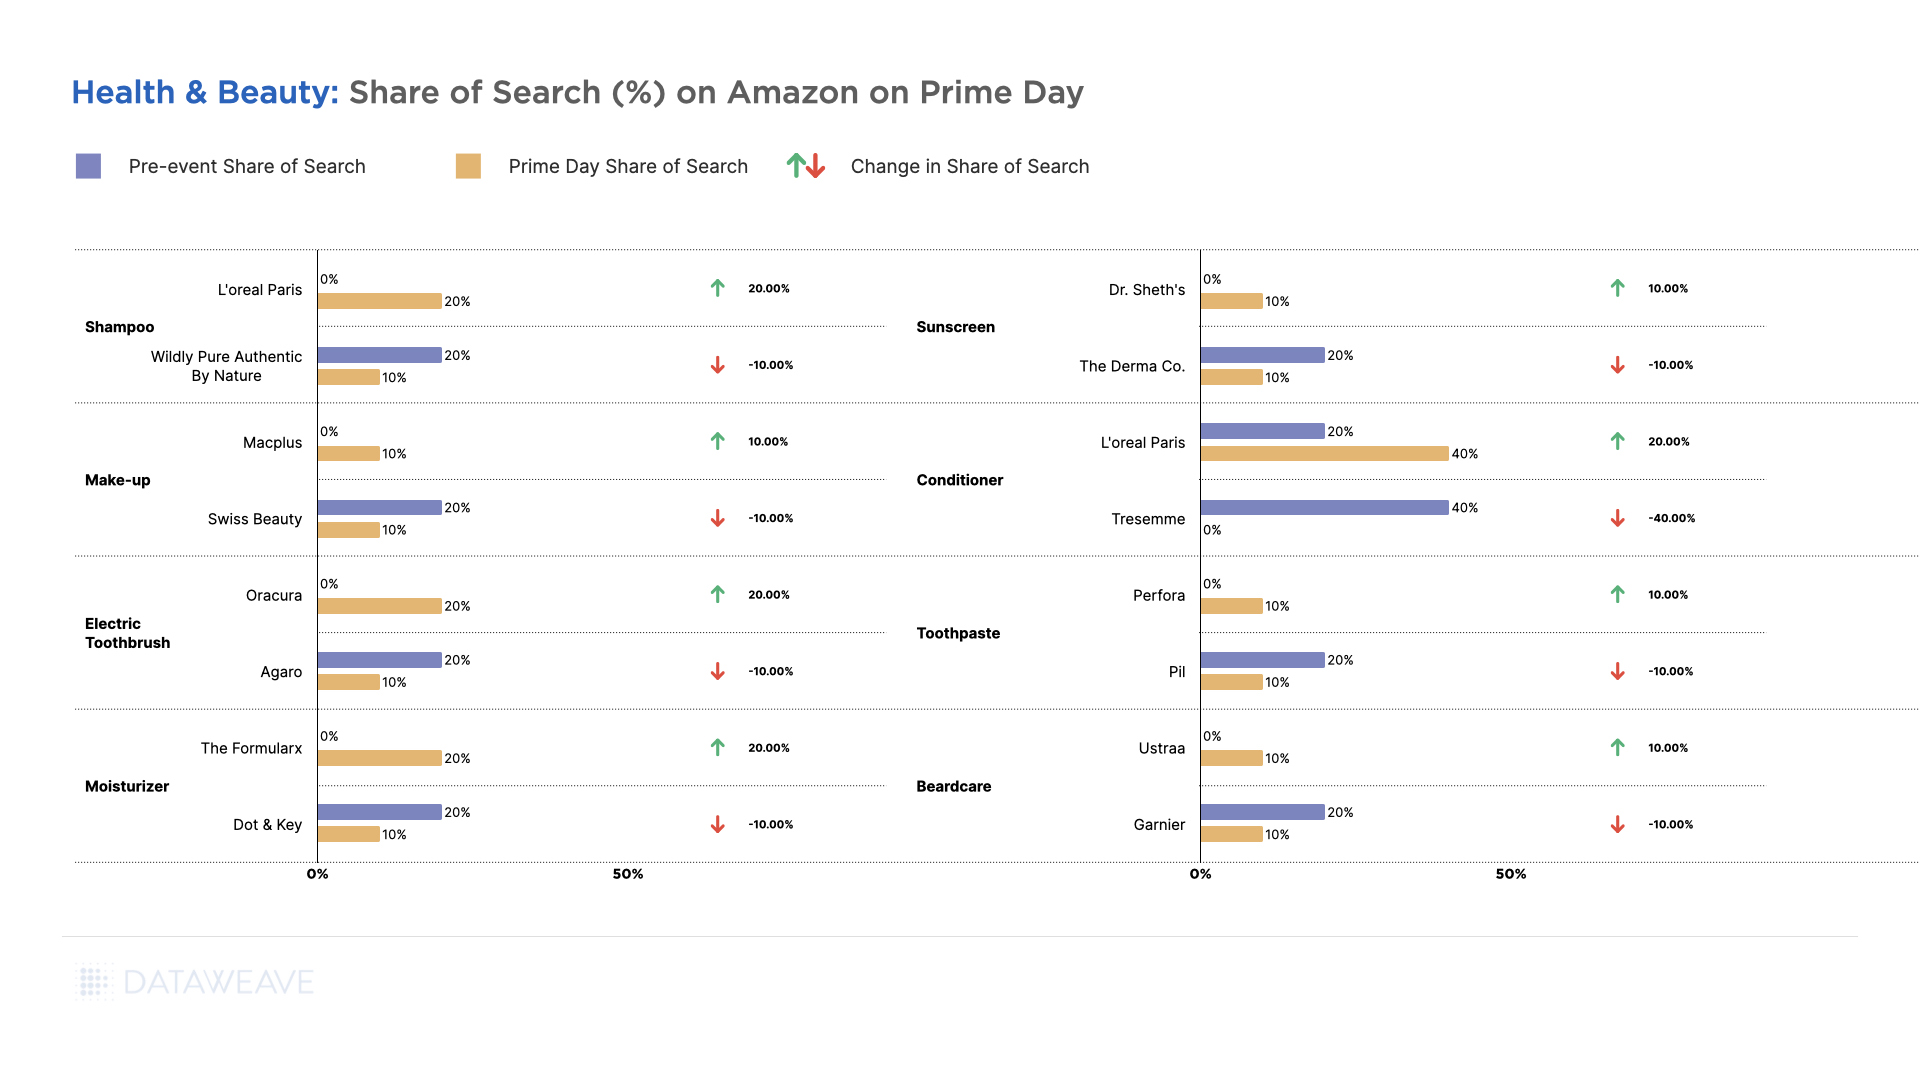
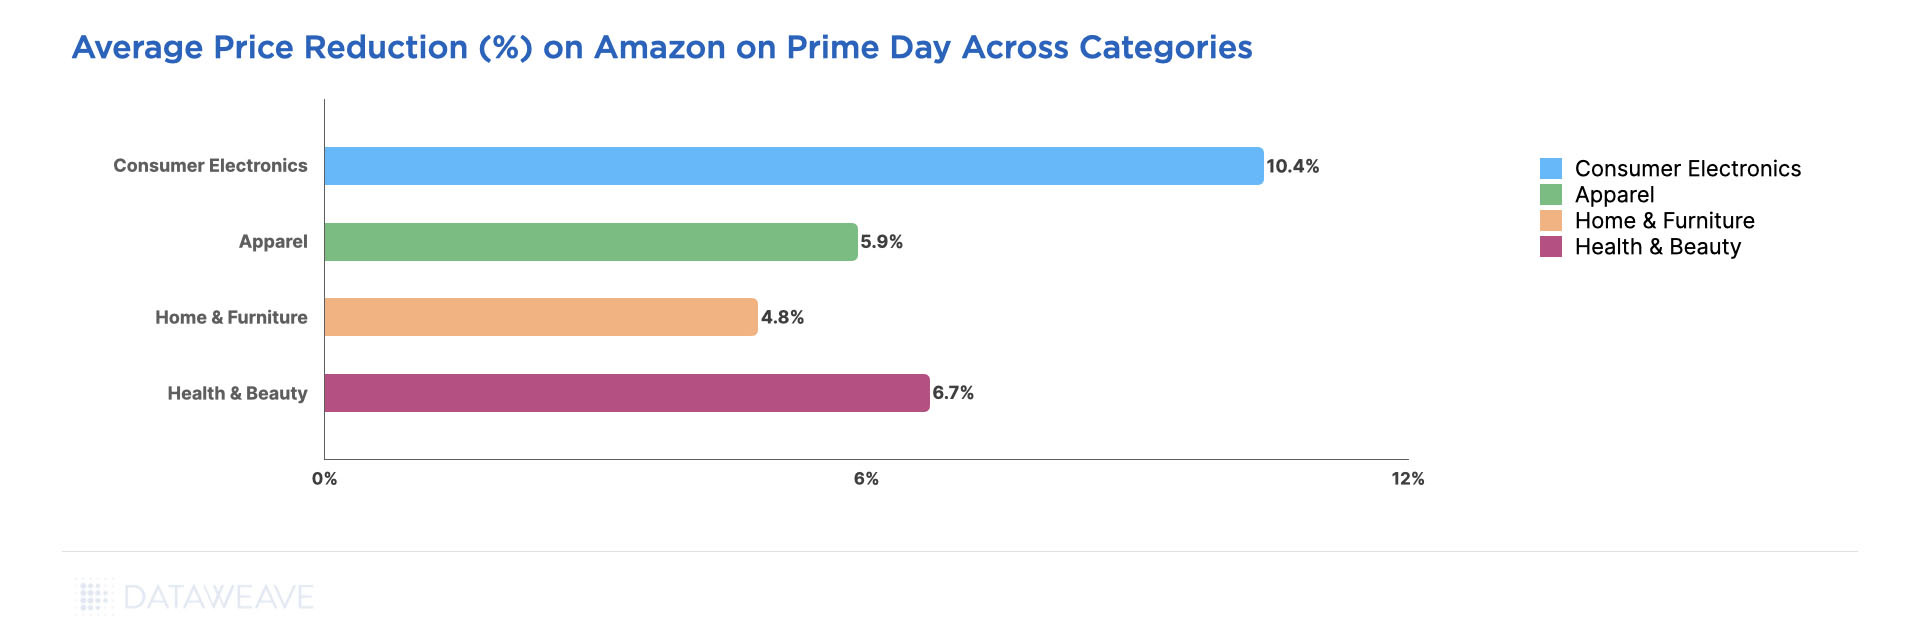
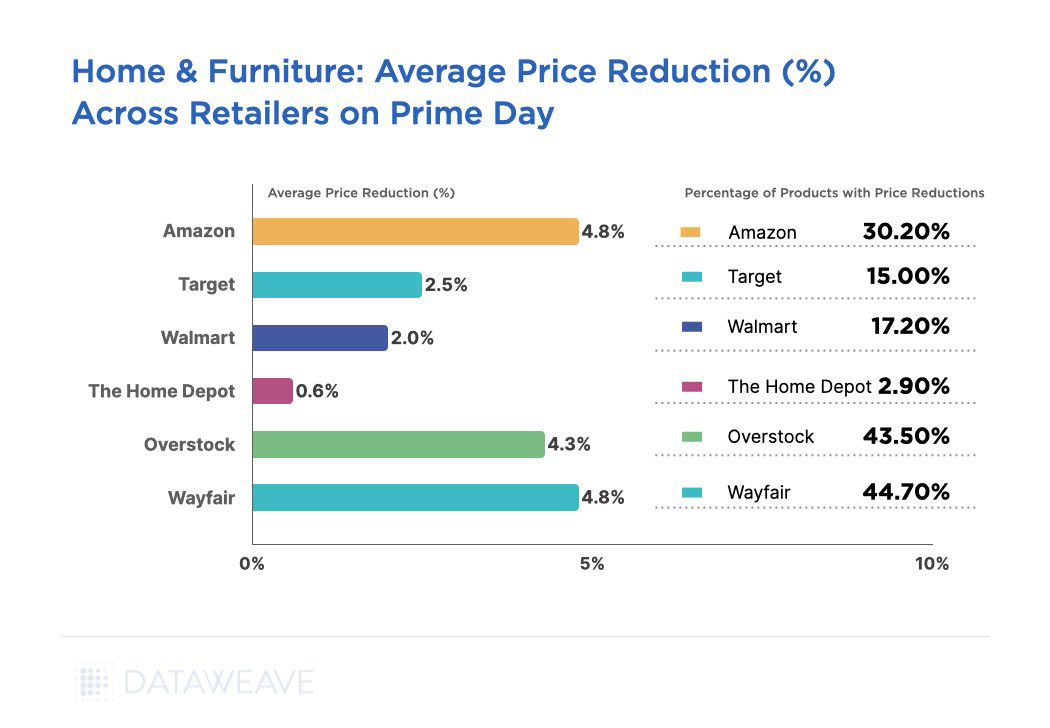
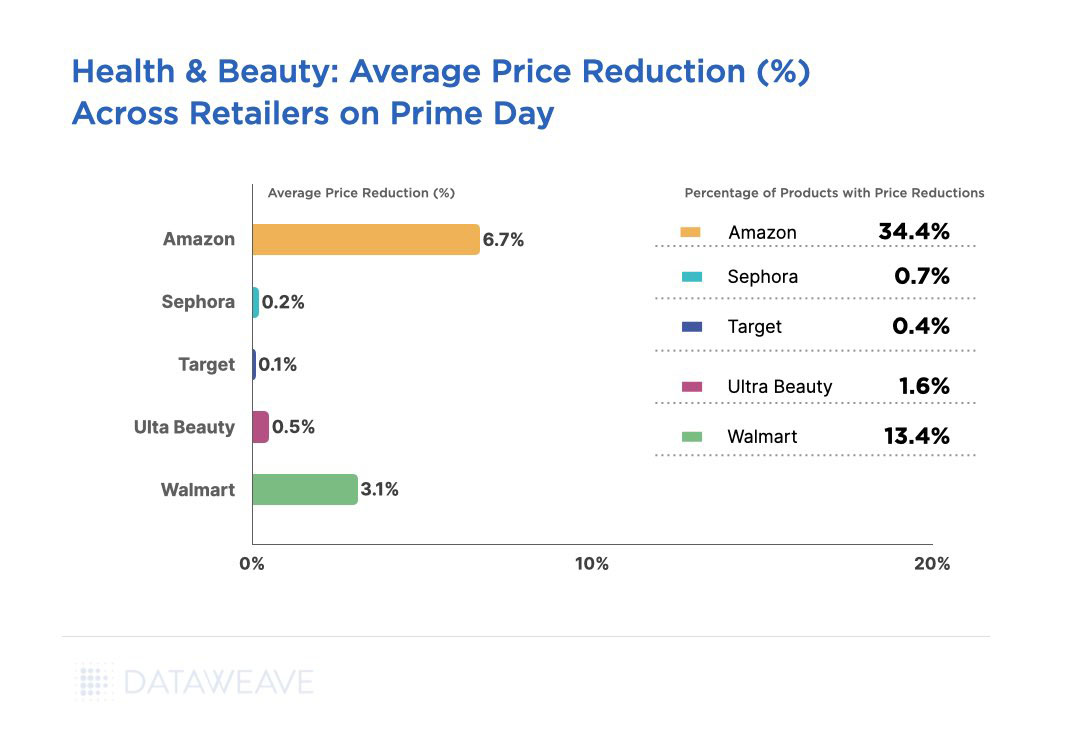
    Also check out our in-depth insights on discounts and pricing for health & beauty, grocery, and home & furniture categories this Black Friday.

    Our Methodology

    For this analysis, we tracked the average discounts of apparel products among leading US retailers during the Thanksgiving weekend sale, including Black Friday. Our sample was chosen to encompass the top 500 ranked products in each product subcategory across during the sale.

    • Sample size: 37,666 SKUs
    • Retailers tracked: Amazon, Walmart, Target, Nordstrom, Macy’s, Bloomingdale’s, Saks Fifth Avenue, Neiman Marcus
    • Subcategories reported on: Footwear, Kid’s Clothing, Men’s Clothing, Women’s Clothing, Activewear, Plus Size Clothing, Accessories
    • Timeline of analysis: 10 to 29 November 2024

    We focused on the top 500 products ranked for each search keyword on each retail site, using targeted terms aligned with categories like “athleisure” and “plus size clothing”. Our methodology distinguished between standard discounts and Black Friday-specific ‘additional discounts’ or price reductions during the sale compared to the week before, to reveal true consumer value.

    Key Findings

    This year’s fashion discounts were unprecedented. Let’s take a look.

    Retailer Level Insights

    Discounts Across Leading Apparel Retailers - Black Friday 2024
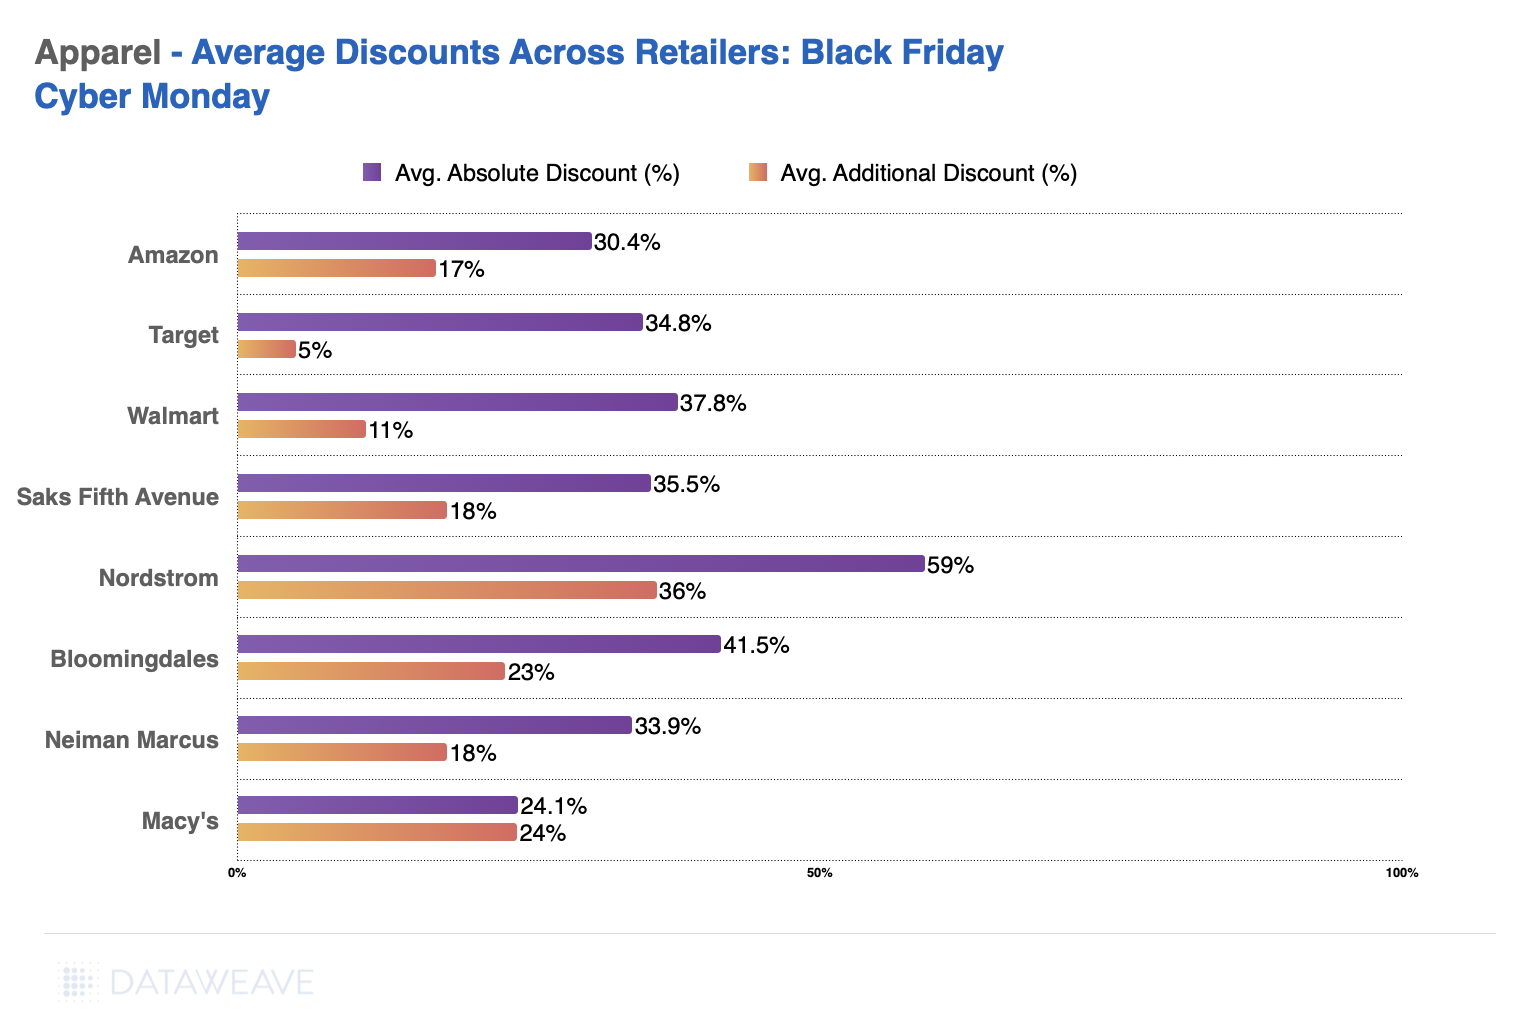
    • Nordstrom leads with the highest average absolute discount at 59%, followed by Saks Fifth Avenue at 35.5% and Bloomingdale’s at 41.5%. Macy’s shows the lowest average discount at 24.1%, while Amazon has an average discount of 30.4%.
    • Amazon ranks lower in both average absolute and additional discounts compared to competitors, indicating a more conservative discounting strategy.

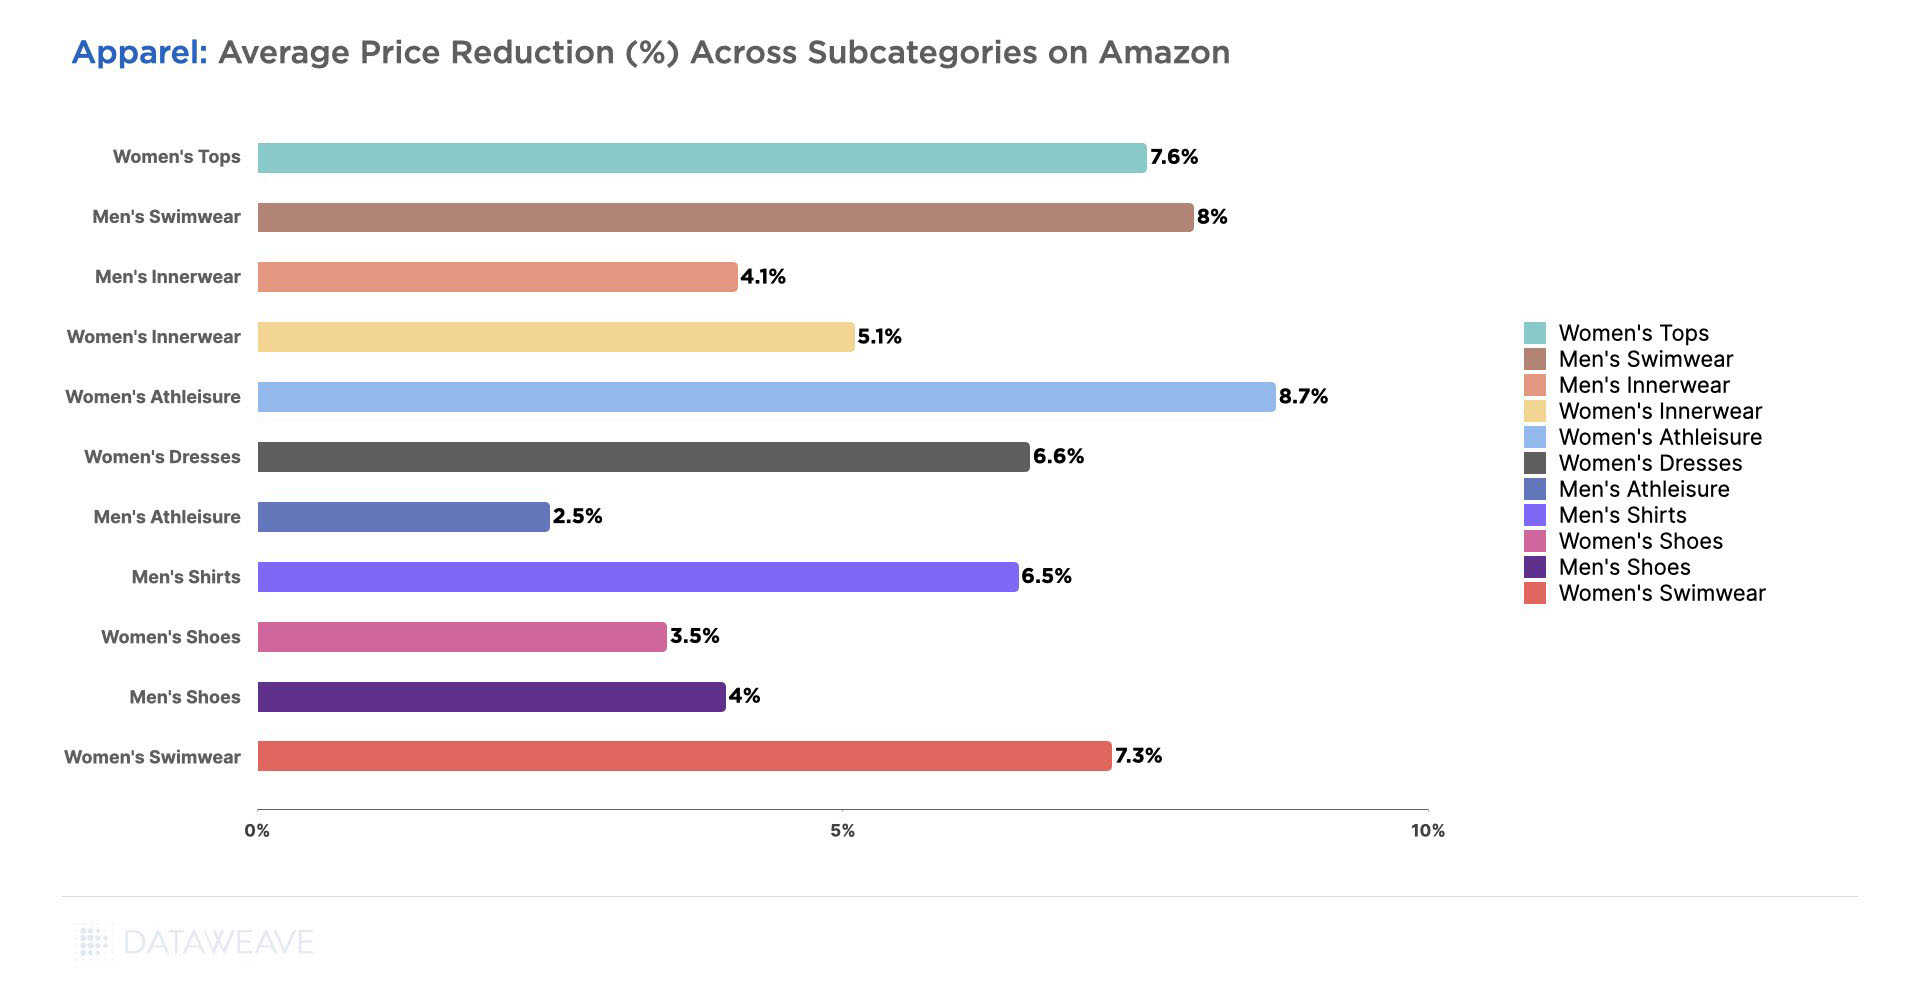
    Subcategory Analysis

    Discounts Across Leading Apparel Retailers - Subcategories - Black Friday 2024
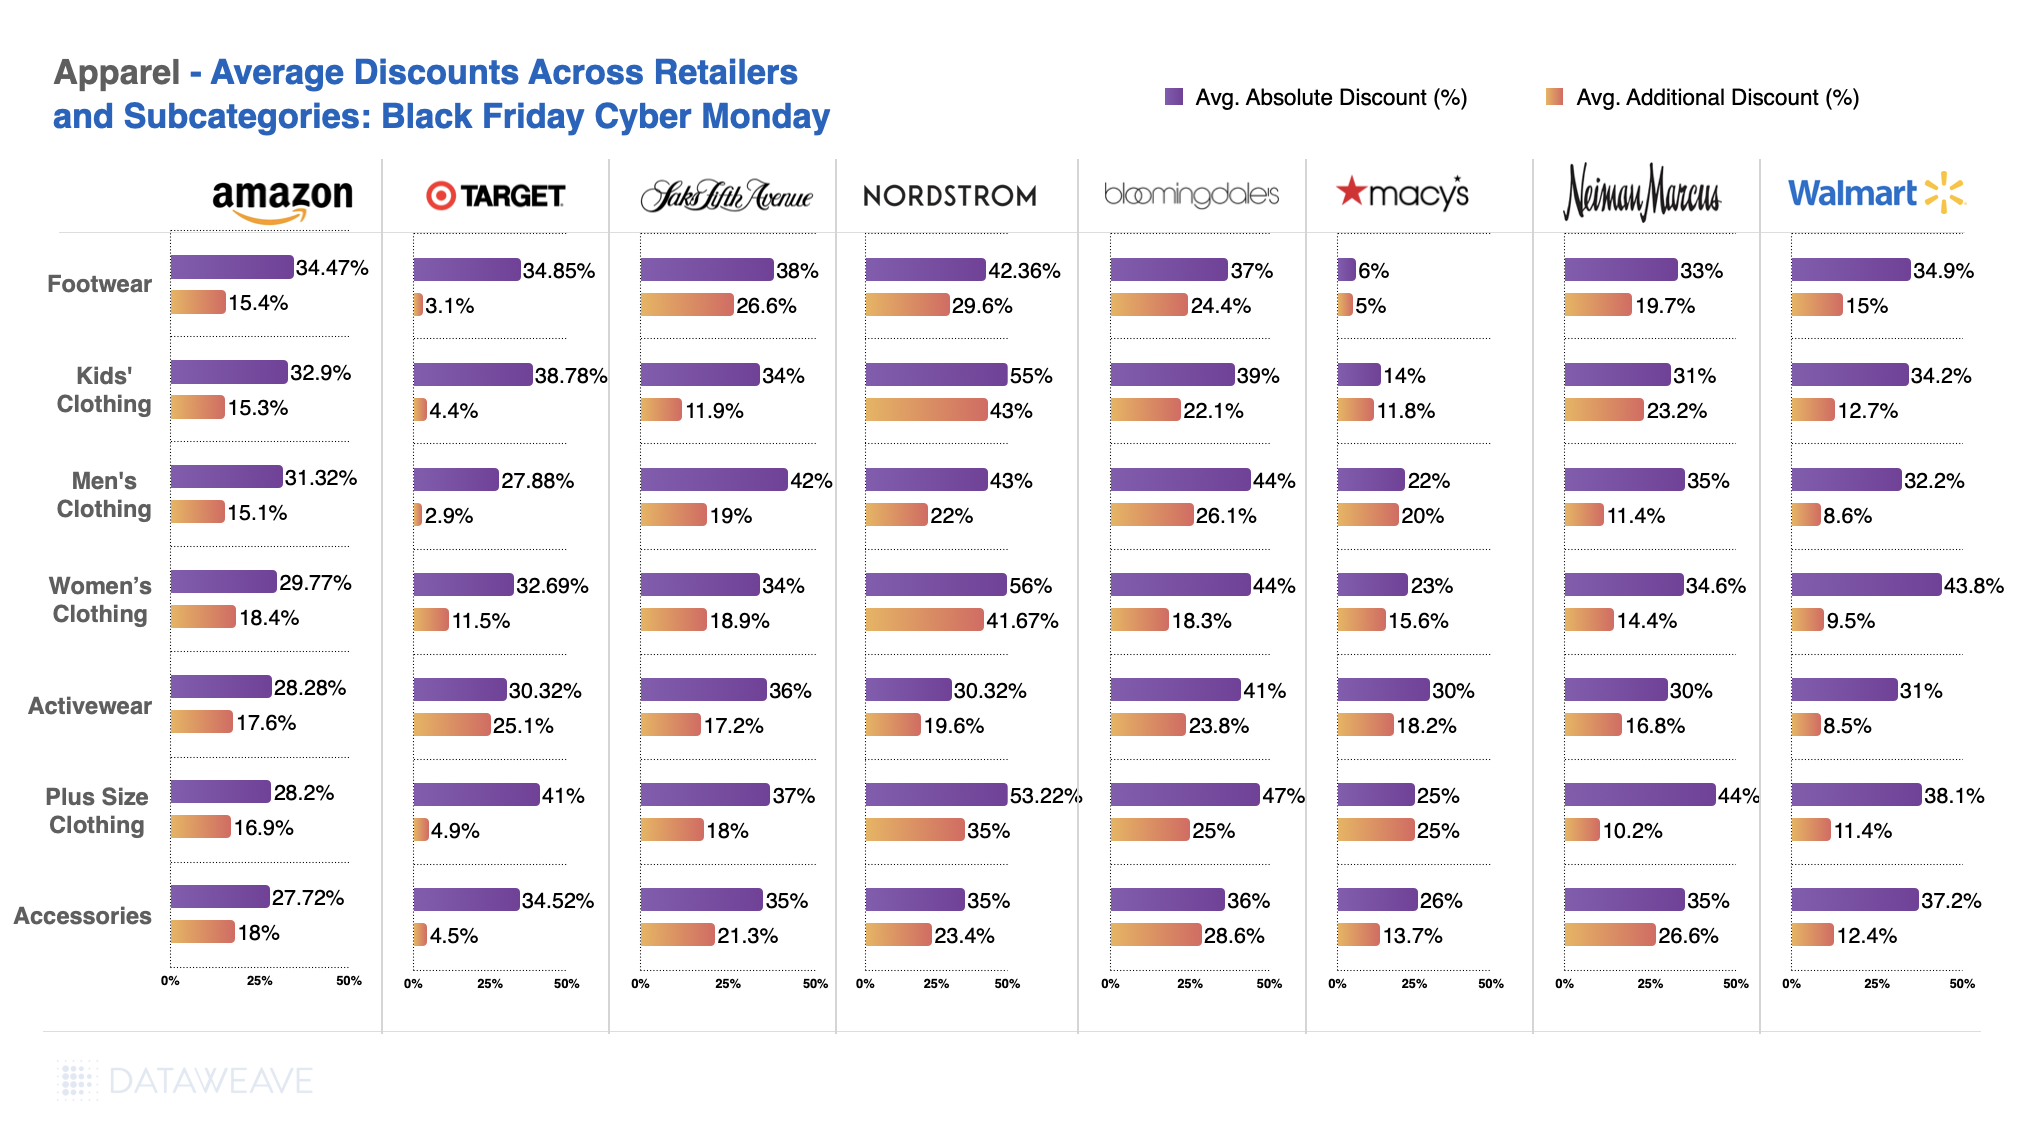
    • Kids’ Clothing saw the deep discounts (up to 55% at Nordstrom), reflecting growing pressure on family budgets and heightened competition to attract budget-conscious parents.
    • Plus-Size Clothing emerged as a major focus, with Nordstrom leading at 53.22% average absolute discounts, signaling that retailers are increasingly prioritizing size inclusivity and appealing to a broader consumer base.
    • Footwear experienced robust discounting, particularly at Bloomingdale’s with 37% average absolute discounts, showing a competitive approach to attract customers looking for seasonal footwear deals.
    • Activewear displayed substantial discounts, with Walmart offering up to 41% on average, aligning with the trend of consumers looking for practical and comfortable attire during the winter season.

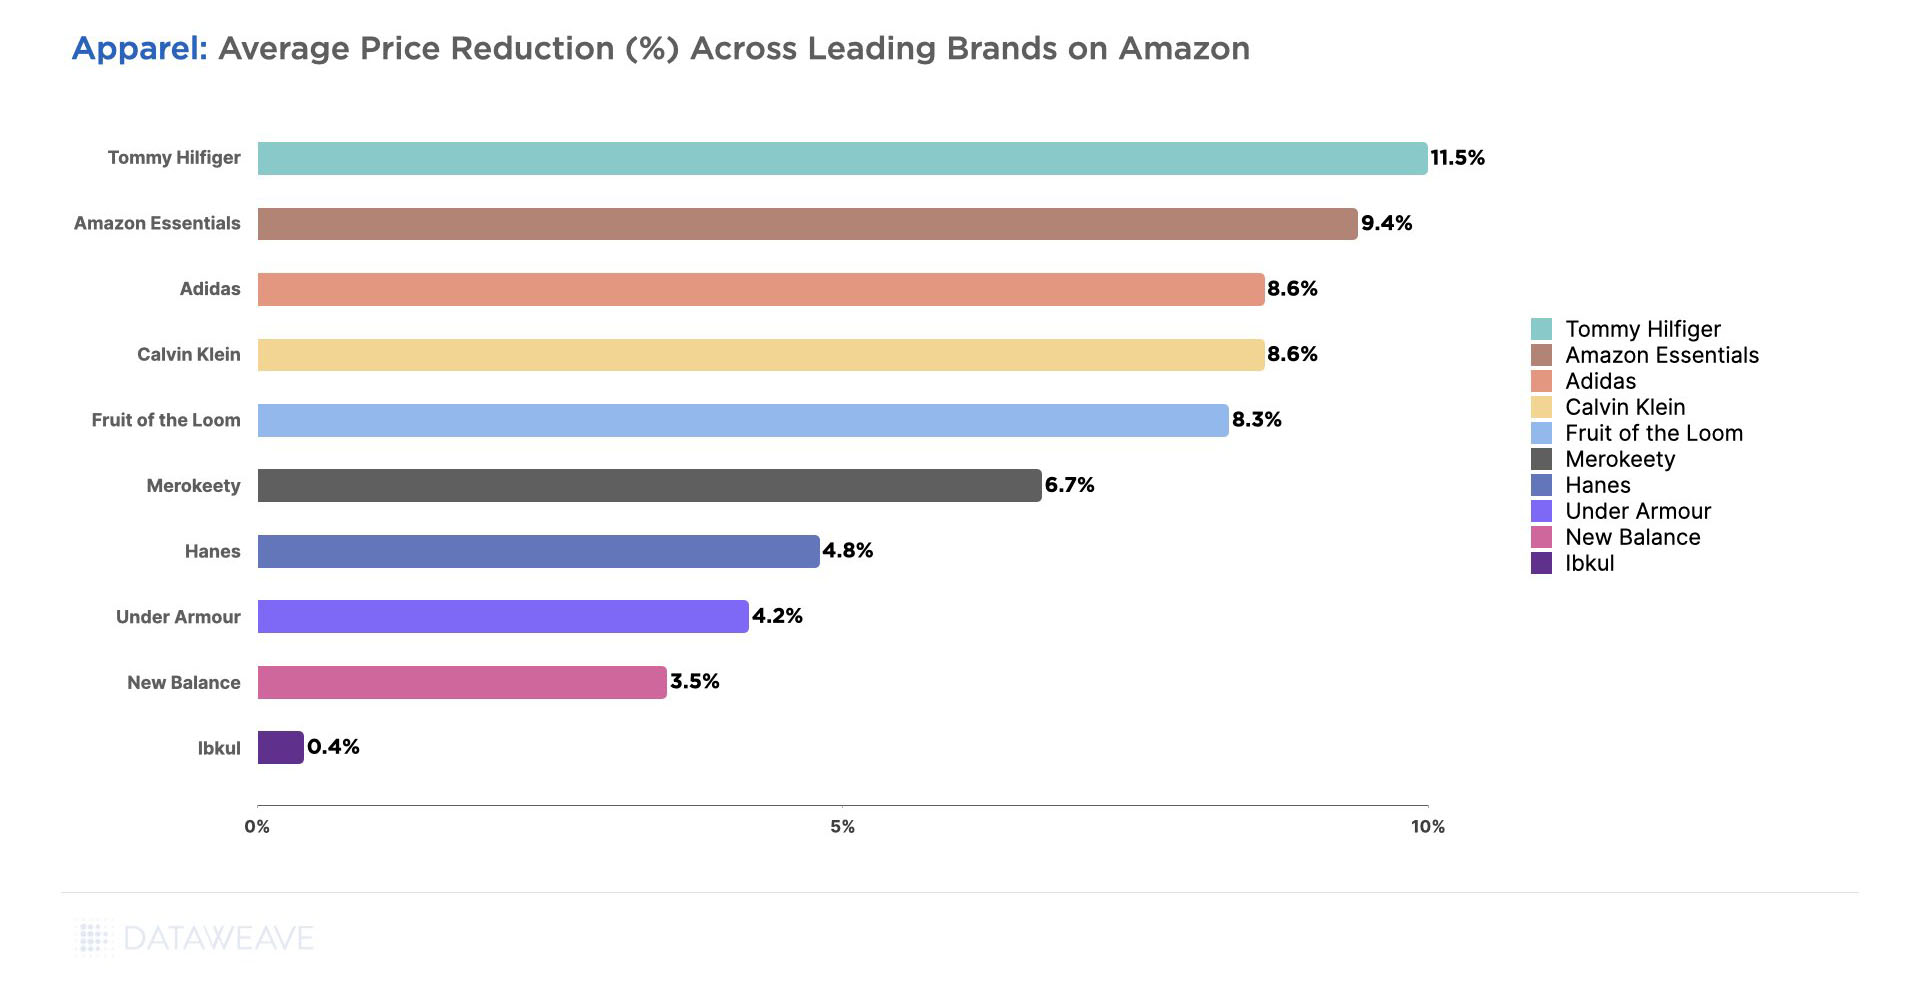
    Brand Level Insights

    Apparel brands, meanwhile, also offer telling insights.

    Discounts Across Leading Apparel Brands - Black Friday 2024
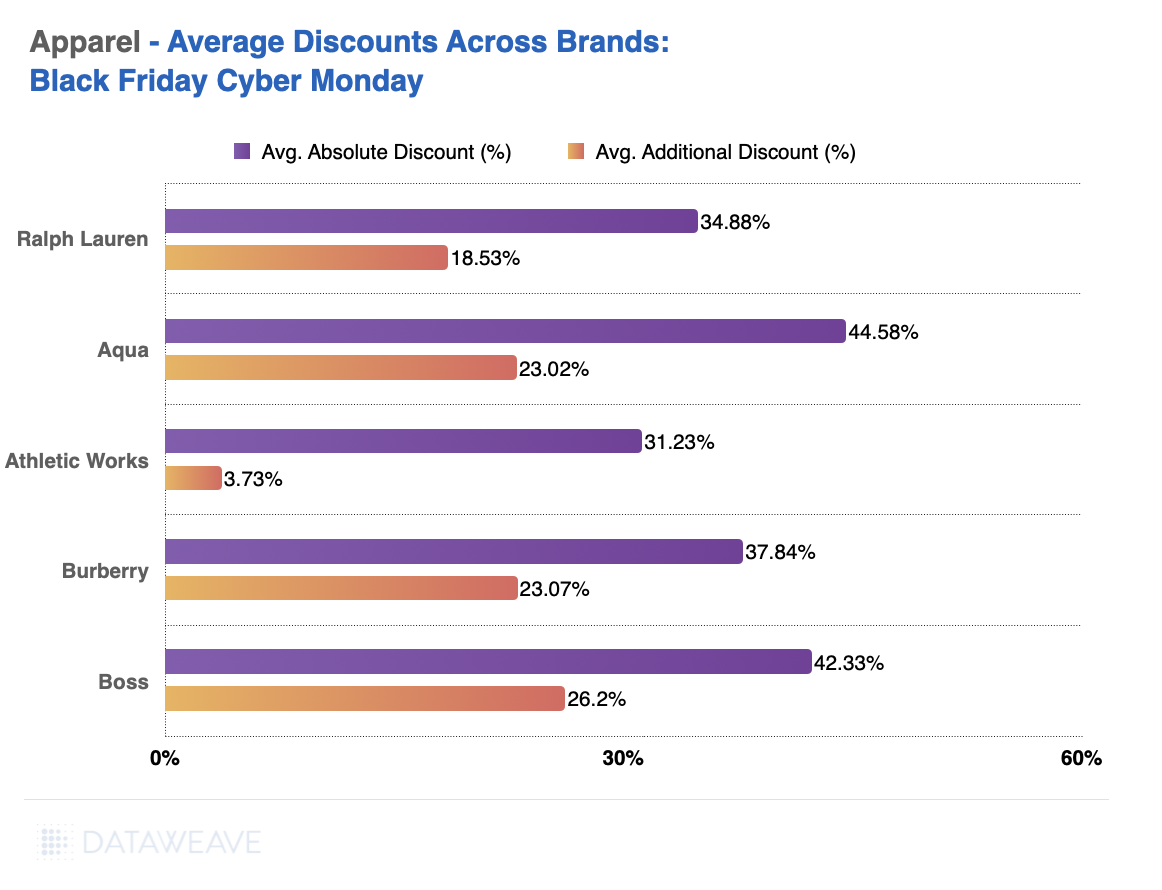
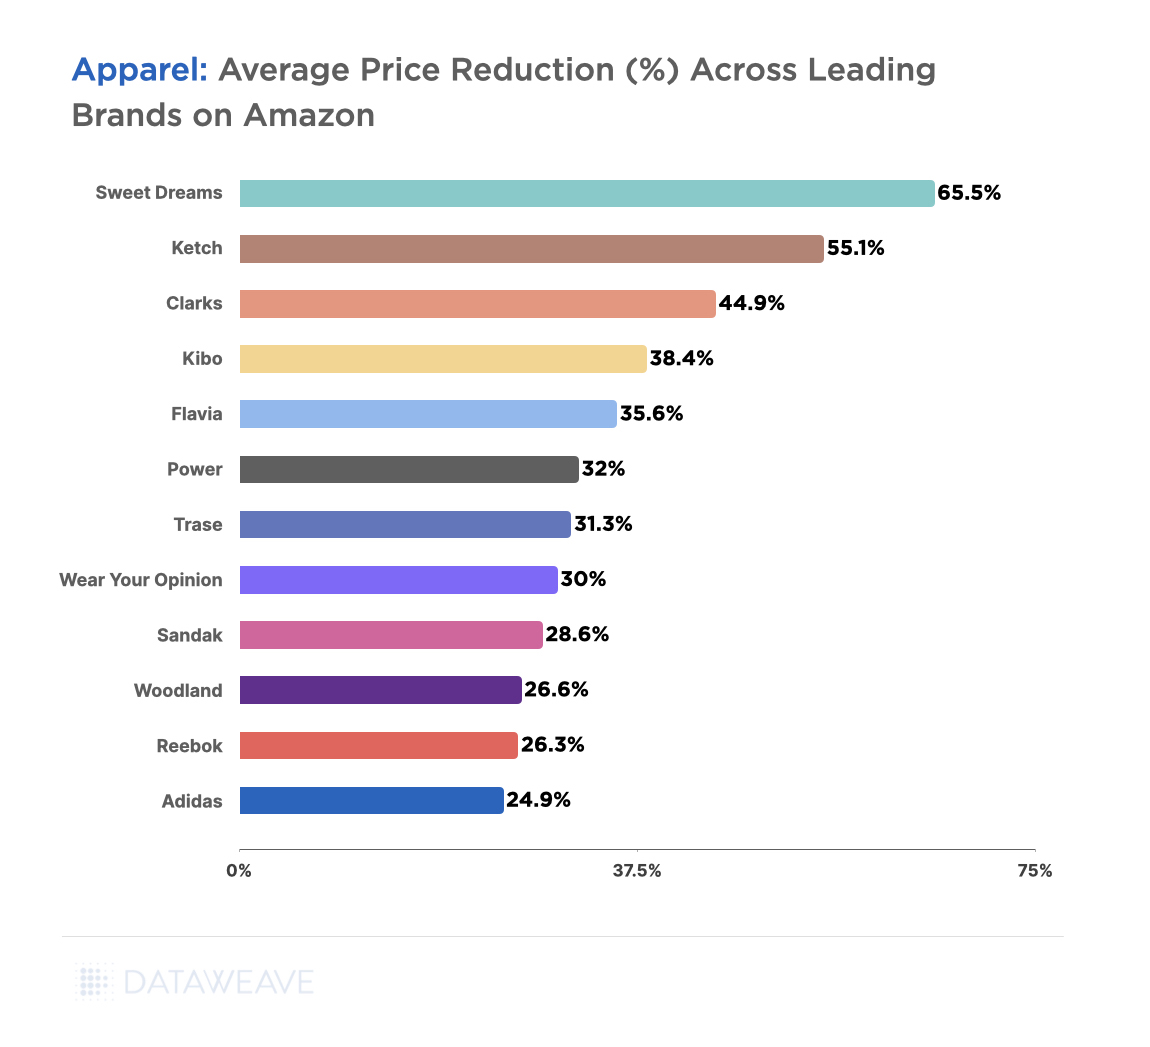
    • Top Discounting Brands: Aqua leads with an average absolute discount of 44.58%, followed by Boss at 42.33% and Burberry at 37.84%.
    • Lowest Discounts: Athletic Works shows the lowest average absolute discount at 31.23%, with a minimal additional discount of 3.73%.
    • Competitive Advantage: Brands like Ralph Lauren and Boss show strong discounts, indicating aggressive marketing during the sale.

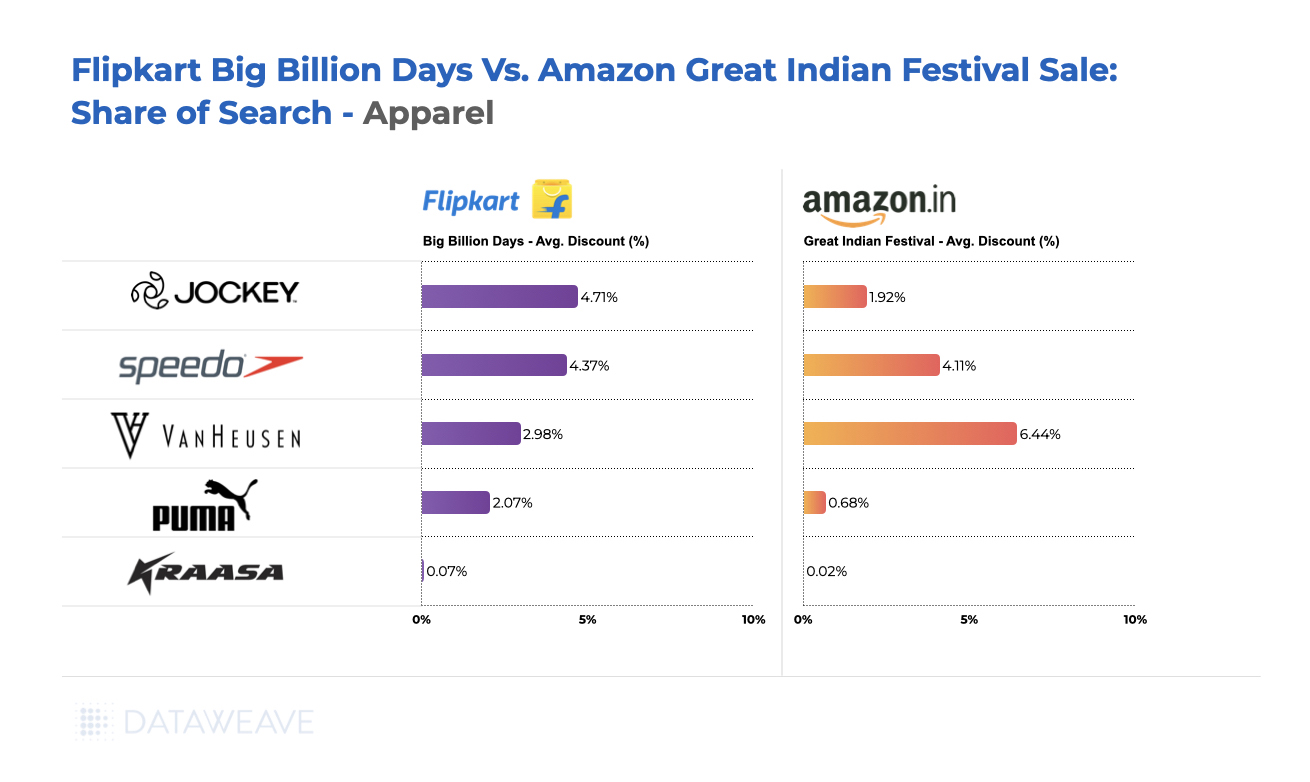
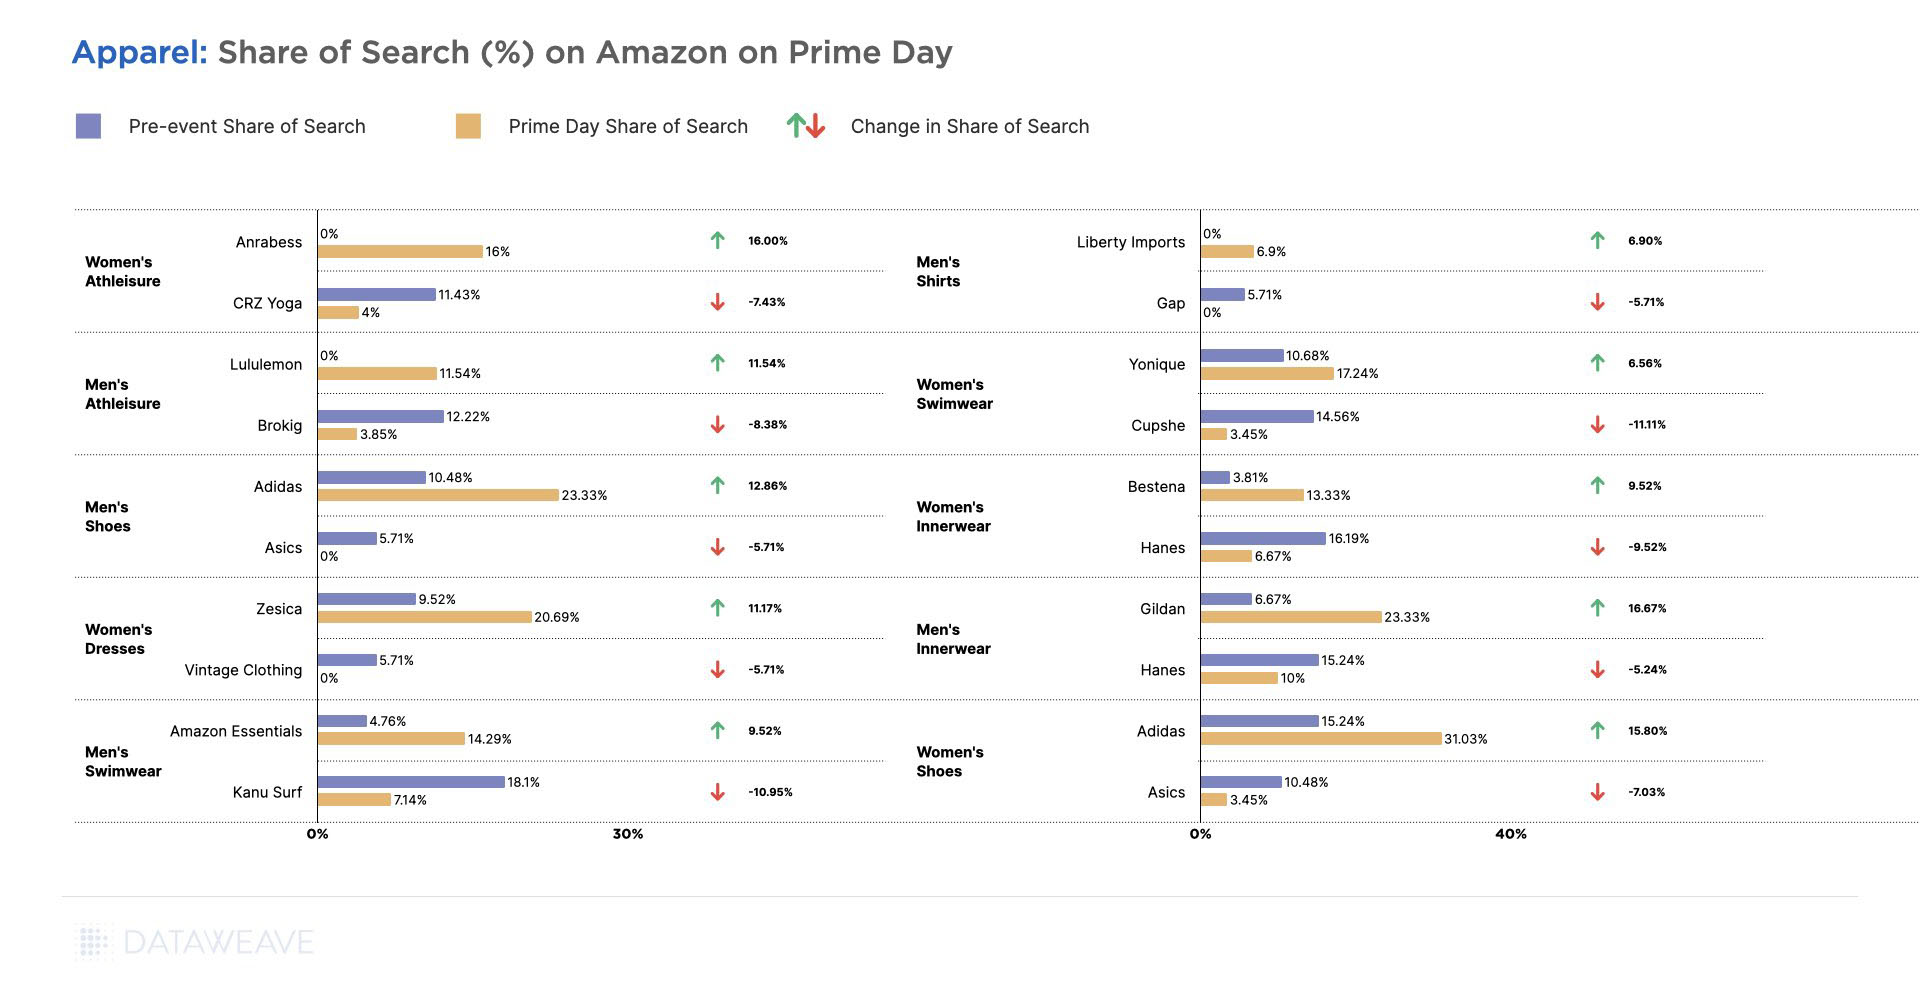
    Share of Search Insights

    Visibility - Share of Search Trend Across Leading Apparel Retailers - Black Friday 2024
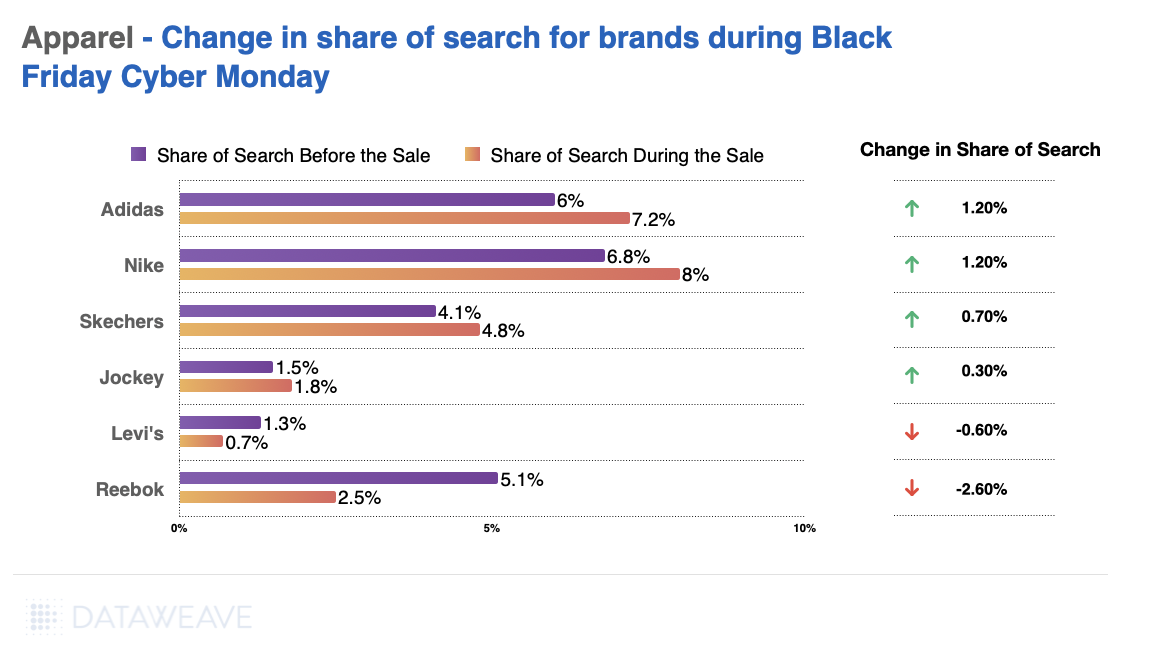
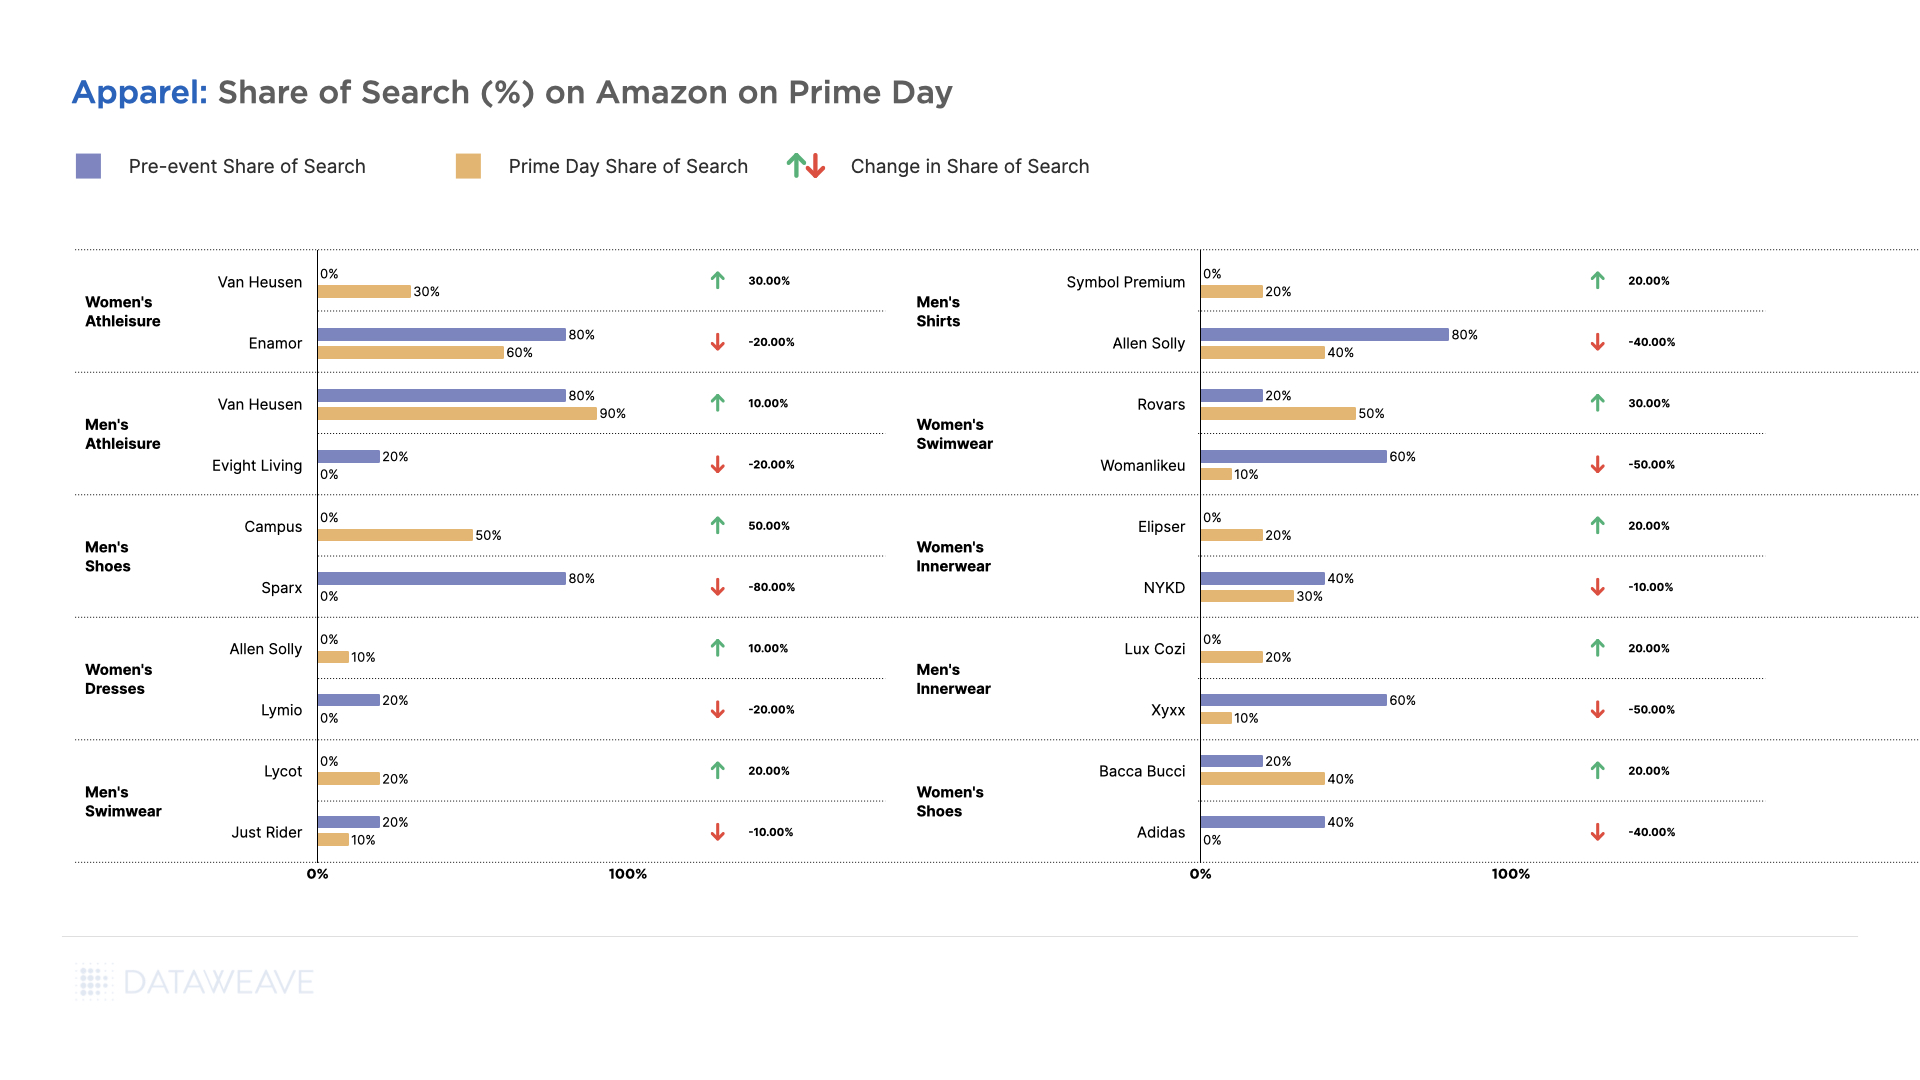
    • Top Gainers: Adidas and Nike each saw an increase of 1.20% in their share of search during Black Friday/Cyber Monday, highlighting their strong brand presence and consumer interest.
    • Top Losers: Reebok experienced a sharp decline, losing 2.60% in its share of search, while Levi’s also dropped by 0.60%.
    • Search Trends: The data suggests a strong consumer preference for activewear brands like Nike and Adidas and a decline in interest for traditional apparel brands like Levi’s.

    Who Offered Most Value This Black Friday

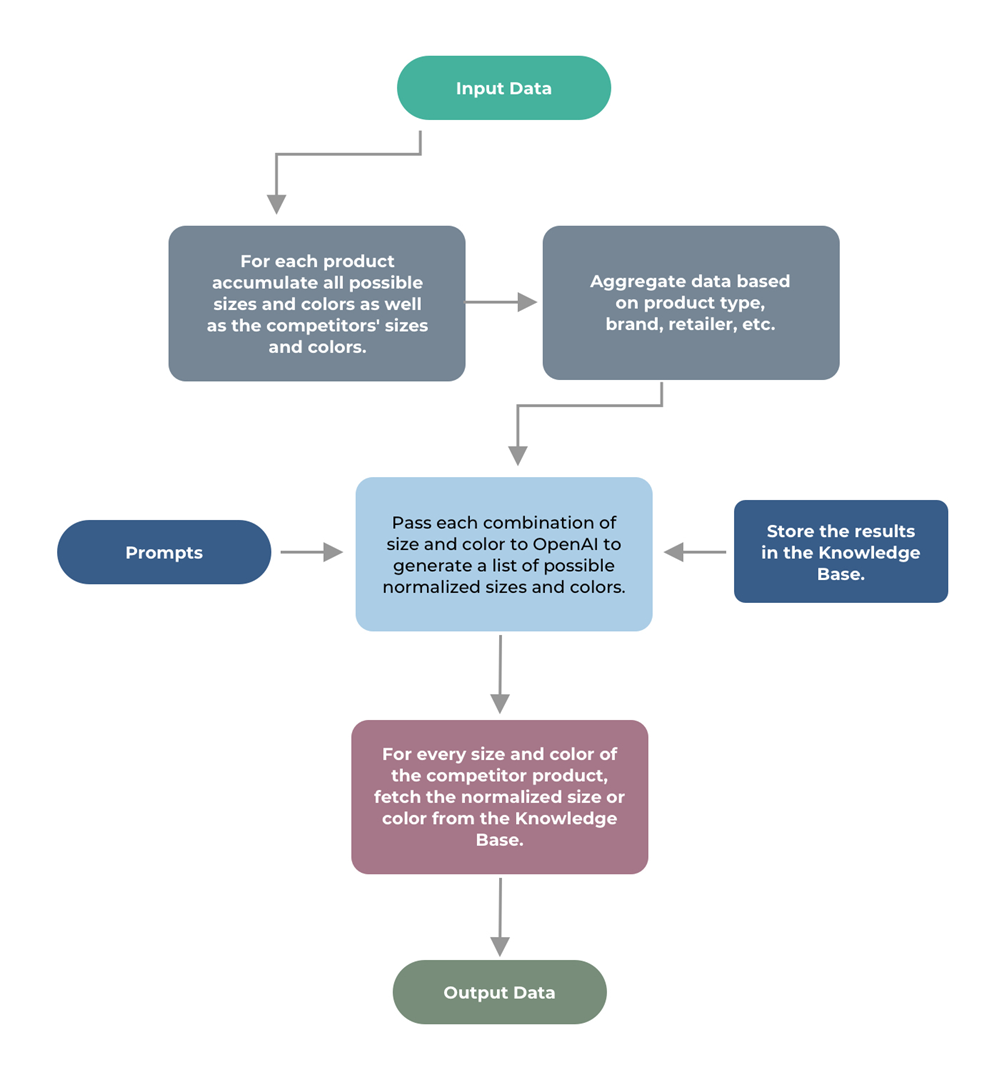
    In the previous analysis, we focused on the top 500 products within each subcategory for each retailer, showcasing the discount strategies for their highlighted or featured items. However, to identify which retailer offered the lowest or highest prices for the same set of products, it’s necessary to match items across retailers. For this, we analyzed a separate dataset of 418 matched products across Apparel specific retailers to compare their pricing during Black Friday. This approach provides a clearer picture of price leadership and competitiveness across categories.

    Here are the key takeaways from this analysis.

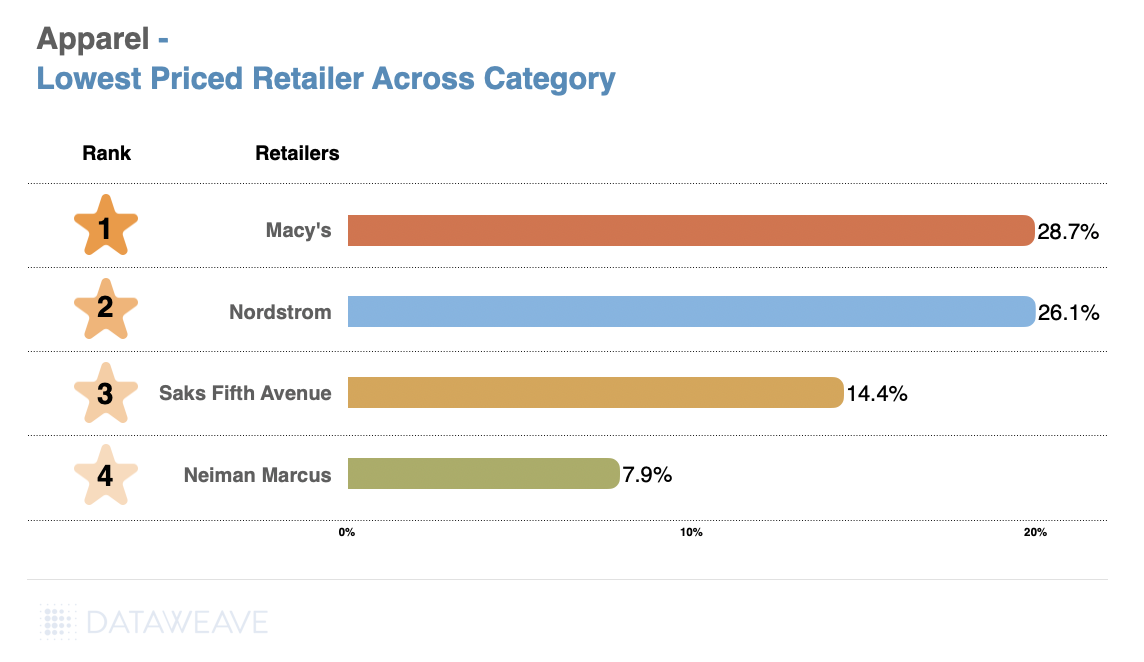
    Category-Level Analysis

    At the overall category level, Macy’s emerged as the lowest-priced retailer, offering the highest average discount of 28.72%, followed closely by Nordstrom (26.06%). The steep decline in average discounts from Saks Fifth Avenue (14.42%) and Neiman Marcus (7.93%) highlights a clear gap in discounting strategies.

    • Macy’s and Nordstrom are aggressively competitive on pricing in the overall apparel category, likely capturing consumer attention with substantial discounts.
    • Saks Fifth Avenue and Neiman Marcus may rely more on brand perception and luxury positioning rather than heavy discounting.
    Retailers Offering Most Value - Lowest Priced - Apparel - Black Friday 2024

    Subcategory-Level Analysis

    Lowest Priced Retailer Across Major Subcategories- Apparel - Black Friday 2024
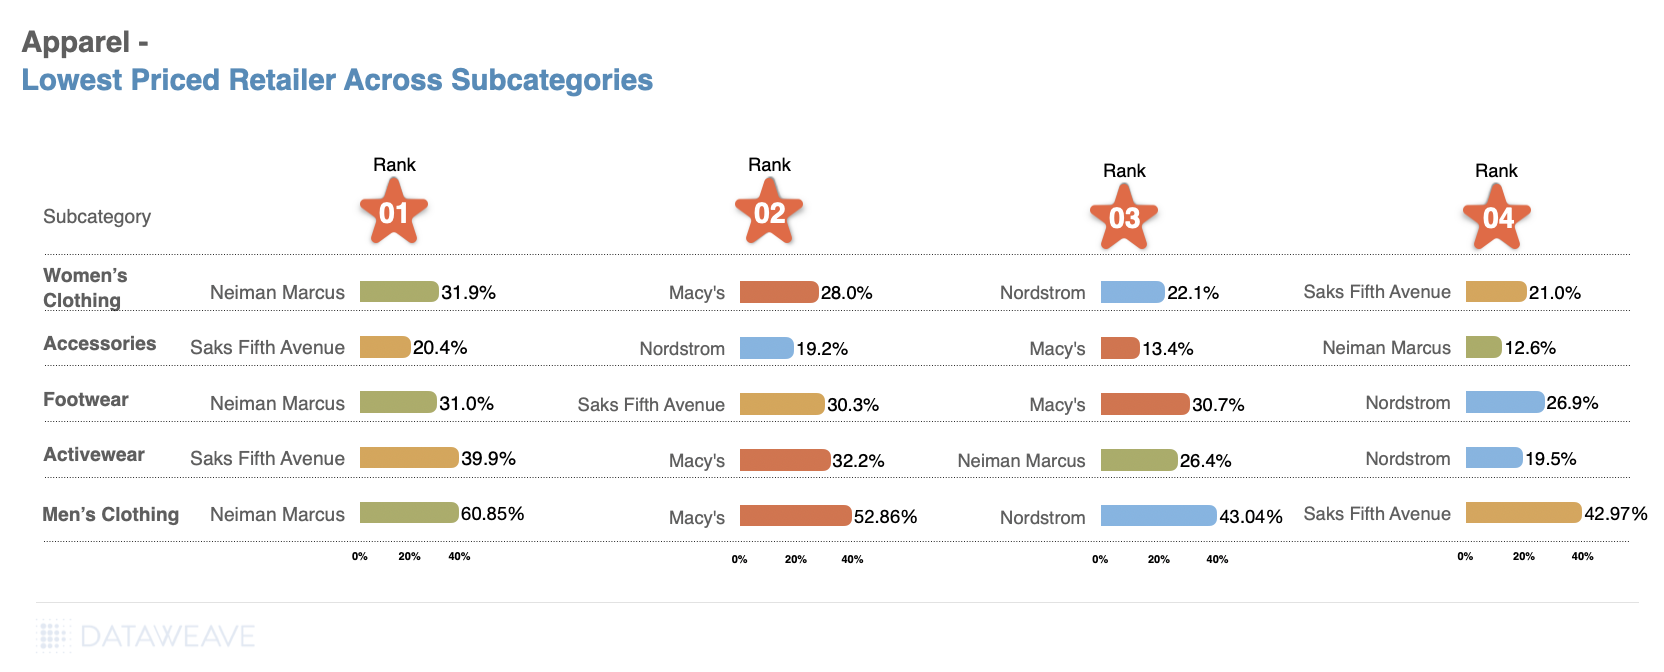
    • Neiman Marcus tops the ranking with an impressive 60.85% average discount, outperforming Macy’s (52.86%) and Nordstrom (43.04%) for Men’s Clothing. We see a similar trend with Neiman Marcus offering more value across Women’s Clothing as well, compared to other retailers.
    • The competition in footwear was intense, with Neiman Marcus narrowly securing the top spot at 31.03%, slightly ahead of Saks Fifth Avenue (30.28%) and Macy’s (30.07%).
    • Saks Fifth Avenue led by a significant margin in the Activewear category, offering 39.89% average discounts, indicating a strong push in this growing segment.
    • Macy’s followed at 32.16% in Activewear, while Neiman Marcus and Nordstrom had comparatively lower discounts of 26.40% and 19.52%, respectively.

    Brand-Level Analysis

    Lowest Priced Retailer Across Leading Brands- Apparel - Black Friday 2024
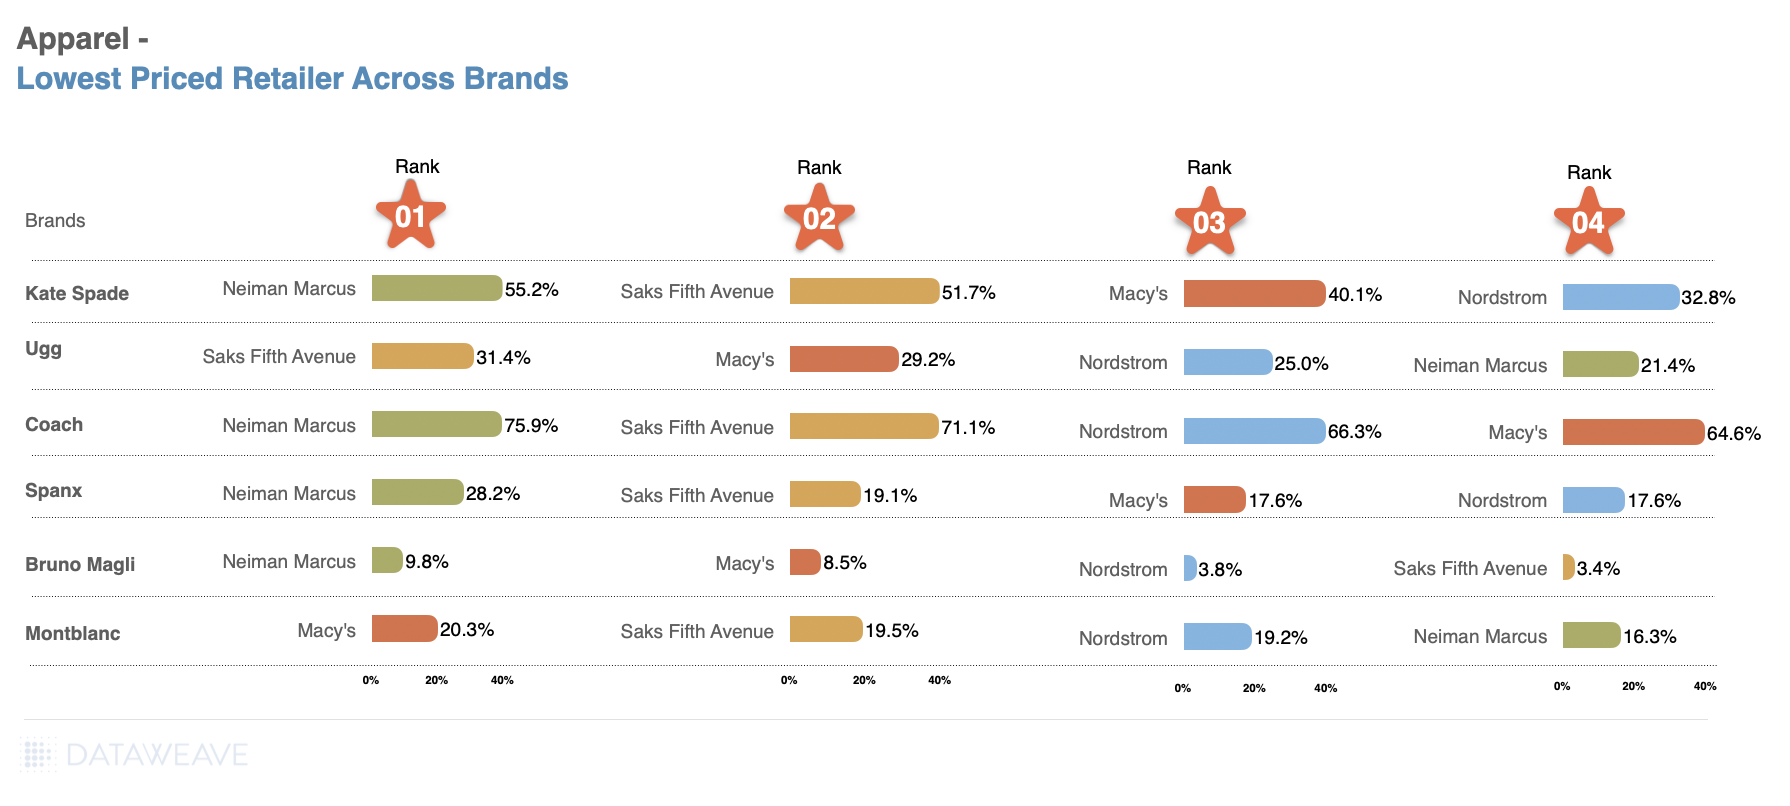
    • Kate Spade New York: Neiman Marcus leads with the highest discount of 55.23%, reflecting strong price leadership in premium fashion, closely followed by Saks Fifth Avenue at 51.66%.
    • Coach: Neiman Marcus dominates with a significant 75.85% discount, showcasing an aggressive promotional strategy for this luxury brand.
    • Spanx: While Neiman Marcus leads with 28.22%, discounts across other retailers like Saks Fifth Avenue, Macy’s, and Nordstrom are clustered within a competitive range of 17–19%.
    • Montblanc: Macy’s takes the lead with 20.32%, signaling its competitiveness even in high-end accessories, with Saks Fifth Avenue and Nordstrom closely behind.
    • Ugg: Saks Fifth Avenue leads with 31.42%, focusing on maintaining price leadership for this popular brand, while other retailers remain competitive with discounts around 25–30%.

    What’s Next

    To win over price-conscious shoppers, retailers need to stay competitive and consistently offer the lowest prices.

    For a deeper dive into the world of competitive pricing intelligence and to explore how our solutions can benefit apparel retailers and brands, reach out to us today!

    Stay tuned to our blog for more insights on different categories this Black Friday and Cyber Monday.


  • The Indian E-Commerce Showdown: Unveiling the Price War Between Flipkart’s Big Billion Days and Amazon’s Great Indian Festival

    The Indian E-Commerce Showdown: Unveiling the Price War Between Flipkart’s Big Billion Days and Amazon’s Great Indian Festival

    India’s homegrown eCommerce giant Flipkart, now backed by Walmart, reported a record 1.4 Billion customer visits during the early access phase and throughout the seven days of its premier shopping event, the Big Billion Days, launched on 8th October 2023. Competing with Flipkart, Amazon’s Great Indian Festival sale event started on October 8th as well and saw a whopping 95 Million customer visits to the website within the first 48 hours of the event.

    For consumers, the most pressing question was, “Who offered more attractive deals and lower prices during these sale events?”

    To answer this question, we leveraged our proprietary data aggregation and analysis platform and analyzed the prices and discounts on Amazon and Flipkart across key product categories..

    The details of our sample are mentioned below:

    • Number of SKUs Analyzed: 30,000+
    • Websites: Amazon.com and Flipkart.com
    • Categories: Apparel, Home & Furniture, Electronics, Health & Beauty
    • Dates: 7th Oct 2023 to 22nd Oct 2023

    Key Findings

    Based on our analysis, the Big Billion Days by Flipkart showcased relatively higher price reductions across categories compared to the Great Indian Festival sale by Amazon. The Apparel category on Flipkart saw the highest average discount at 50.6%. The Health & Beauty category had the lowest discount across Flipkart at 39.4% and Amazon at 33%.

    Overall, Flipkart offered higher discounts in each product category. It is clear that the retailer invested heavily in leveraging its supplier partnerships with key brands or sellers to enable them to offer higher discounts, thereby attracting more customers.

    Next, let’s take a closer look at each product category.

    Apparel

    While a majority of retailers expected demand for apparel and clothing to dip this festive season in India, eCommerce giants like Amazon and Flipkart are likely to recognize the strong consumer inclination towards apparel during this period.

    In the detailed assessment of Apparel sub-categories, Women’s Dresses, Women’s Tops, Men’s Shirts, Men’s Shoes, and Women’s Innerwear emerged as the segments showcasing the most substantial discounts during the sale events. While Flipkart offered higher average discounts across all sub-categories, Amazon offered competitive discounts as well.

    We observed significant differences in the average discounts across brands between Flipkart’s Big Billion Days and Amazon’s Great Indian Festival. Reinforcing the significant discounts on the Shoes subcategory, brands like Red Tape, Arrow, Adidas, Reebok, Nike, and more offered extensive discounts on both Flipkart and Amazon. Notably, Adidas and Reebok offered better deals on Amazon’s Great Indian Festival as compared to Flipkart.

    One8 by Virat Kohli had a significantly lower discount on Amazon compared to Flipkart, indicating an exclusive partnership.

    For brands, however, reducing prices is just one approach to entice shoppers. They must also guarantee their prominent presence and easy discoverability within Amazon and Flipkart search results. To gain insight into this, we monitored brands’ Share of Search across various frequently used search terms in addition to the discounts they provided. The Share of Search denotes the portion of a brand’s products within the top 20 search results for a specific search query.

    Our data indicates that Jockey and Speedo gained in Share of Search on Flipkart, but reduced discoverability on Amazon. Van Heusen fell behind in search results on Flipkart but showed a higher Share of Search on Amazon.

    Home & Furniture

    With demand for home and furniture products picking up in October, right before the festive season, Amazon and Flipkart offered significant discounts in this category.

    Discounts on both Amazon and Flipkart hovered around 50%. Across a few subcategories, Flipkart offered slightly lower discounts compared to Amazon. Only Luggage, Rugs, Sofas, and Entertainment Units saw lower markdowns on Flipkart during the Big Billion Days. 

    Dishwashers and Washer/ Dryers saw higher discounts on Amazon compared to Flipkart. The significant discounts on these products on Amazon possibly point to changing consumer preferences, as demand for these products is traditionally low in India, but seems to be growing.

    When it comes to Home & Furniture brands, Nasher Miles, Safari, Aristocrat, VIP, and American Tourister, luggage brands mostly, offered higher discounts on Flipkart, followed closely by Amazon.

    In terms of Share of Search, Skybags had high discoverability on both Flipkart and Amazon. The brand leveraged a strategy of offering big discounts this festive season as well as ensuring prominent placement in search results. Wildcraft lost out on its discoverability on Flipkart in contrast to its prominence on Amazon. Duroflex saw lower searchability on Amazon compared to Flipkart’s Big Billion Days.

    Consumer Electronics

    The Consumer Electronics and Appliances Manufacturers Association (CEAMA) expected an uptick in sales of consumer electronics products this festive season in India. With more consumers buying premium products using credit cards and EMIs, demand for expensive, high-end electronics was expected to increase.

    Again, average discounts in this category hovered around 50% on Flipkart and Amazon.

    Across electronics subcategories, Smartwatches, Earbuds, and Drones had the highest markdowns with Flipkart leading the pack during the Big Billion Days. Amazon offered relatively higher discounts at 44.9% on the TV subcategory, compared to Flipkart’s 40.6%.

    Speakers, Laptops, Smartphones, and Tablets also saw lower markdowns on Amazon compared to Flipkart. Amazon was the official partner for the launch of many high-level smartphones and products in September-October, contributing to the higher markdowns in the subcategory.

    Across brands, Lenovo’s discounts were the most differentiated between the two sites, with the brand offering higher discounts on Amazon (45.4%) compared to Flipkart (24.7%). Noise offered the highest discounts at 72.5% on Amazon and 52.8% on Flipkart. Brands like Boat and Zebronics, also saw lower discounts on Flipkart.

    Mi and JBL offered deeper discounts on Flipkart’s Big Billion Days. Apple meanwhile stands out with only 11.83% discounts on Amazon, but the brand offered impressive 31.4% discounts on Flipkart.

    Samsung dominated the Share of Search on Amazon at 15.7%, compared to only 2.6% on Flipkart. Apple and Lenovo also saw higher discoverability on Amazon. On Flipkart, JBL and Skullcandy stand out as brands with high search visibility.

    Health & Beauty

    The Health & Beauty category saw the lowest markdowns with only 39.4% discounts on Flipkart and 33% on Amazon.

    In the subcategories analyzed, Electric Toothbrushes had relatively high markdowns across both sites. Staple and lower priced subcategories like Toothpaste had the lowest markdowns across both sale events, with Amazon offering only 17.4% average discounts.

    Across brands, Beardo, a leading beard care brand, offered significantly higher discounts on Amazon compared to Flipkart. Most other well-known brands, including Nivea and Vaseline, saw higher discounts on Amazon compared to Flipkart. Only Tresmme and Dove were exceptions with higher discounts on Flipkart.

    In terms of Share of Search, once again, Beardo was the most discoverable brand in this category. Brands like Dove, Pond’s, Swiss Beauty, and Tresemme saw a lower Share of Search on Flipkart compared to Amazon.

    Navigating the Competitive Landscape: How To Thrive During Sale Events

    Amazon and Flipkart’s strategic pricing during the Big Billion Days and the Great Indian Festival Sale reflects a balance of profitability, inventory, and competition. Competitive pricing insights empower retailers to make informed decisions, optimize strategies, and thrive during high-stakes sale events with timely and relevant insights at a massive scale.

    To learn more about how you can leverage competitive pricing insights to stay ahead of the game during sale events, reach out to us today!

  • Amazon India’s Pricing and Discounts on Prime Day 2023: A Deep Dive Analysis Across Leading Categories and Brands

    Amazon India’s Pricing and Discounts on Prime Day 2023: A Deep Dive Analysis Across Leading Categories and Brands

    Amazon’s India Prime Day 2023 shattered previous records with a peak of 22,190 orders received in a minute. An important aspect of Amazon’s India Prime Day was the benefits it offers to Prime Members. Thousands of sellers, brands, and bank partners collaborated to help Prime members save a staggering sum of over Rs. 300 Crores. The 2 day (July 15-16) event even witnessed strong growth in Prime membership, with 14% more members shopping than last year’s Prime Day event. 45,000+ new products were launched by over 400+ top Indian and global brands.

    However, our analysis reveals that Amazon was able to make a huge splash despite adopting a relatively modest discounting strategy for the event.

    Pricing and Discounts on Prime Day 2023

    While Prime Day is Amazon’s showstopper, bringing huge benefits to partner brands and sellers, it’s interesting to also see how Flipkart responded to such a massive sale by its biggest competitor. Therefore, we leveraged our proprietary data aggregation and analysis platform to analyze the prices and discounts of Amazon and Flipkart across key product categories – Apparel, Home & Furniture, Consumer Electronics, and Health & Beauty – during Prime Day.

    Since products on Amazon and other eCommerce websites are often sold at discounts even on normal days not linked to a sale event, we delved into the real value that Prime Day offers to shoppers by focusing on price reductions or additional discounts during the sale compared to the week before. As a result, our approach highlights the genuine benefits of the event for shoppers who count on lower prices during the sale.

    Research Methodology

    For our analysis, we tracked the prices of a large number of products across Amazon and Flipkart during Prime Day as well as the week prior to the event. The details of our sample are mentioned below:

    • Number of SKUs: 85,000+
    • Retailers: Amazon, Flipkart
    • Categories: Apparel, Home & Furniture, Consumer Electronics, Health & Beauty
    • Pre-event Analysis:10-14 July 2023
    • Prime Day Analysis: 15-16 July 2023

    Our Findings

    Based on our analysis, Prime Day showcased relatively higher price reductions in the Health and Beauty category, offering an average additional discount of 5.3%. In comparison, the Apparel category had lower discounts at 4.90%, followed by the Home & Furniture category at 2.50% during the sale event.

    Average price reduction on Amazon on Prime Day across categories.

    The Consumer Electronics category, known for attractive prices during sale events, featured only 0.9% price reductions. This is due to the fact that the category was already being sold at a very high average discount of around 44.8% the week prior to Prime Day.

    Below, we delve deeper into our analysis of each category to better understand how price reductions were distributed across key subcategories on Amazon. We also report on the degree to which Flipkart responded to Amazon’s pricing actions during the event.

    Apparel

    As Amazon grappled with heightened costs and reduced profit margins in apparel (like most other retailers), its average discount before Prime Day was already at 36.5%. Then, on Prime Day, Amazon’s apparel deals were tempered at around 4.9% average price reduction across 43.7% of its assortment.

    Flipkart, on the other hand, offered only a modest additional discount of 1.8% across 17.7% of its Apparel assortment. It’s clear that while Flipkart took steps to compete against Amazon in this category, it was done to a lower extent on fewer products than Amazon.

    Apparel average price reduction across retailers on Prime Day.

    Across all the apparel subcategories we analyzed, Men’s Shoes (11.6%), Women’s Shoes (9.5%), and Men’s Shirts (8.7%) were among the ones with the highest price reductions. On the other hand, Men’s and Women’s Swimwear (2.3%), Women’s Innerwear (2.9%), and Women’s Athleisure (3.3%) had conservative markdowns.

    Apparel average price reduction across subcategories on Amazon.

    Pricing choices within different subcategories likely stemmed from a range of factors, such as inventory quantities, trends in demand, and the aim to harmonize competitive deals with the maintenance of viable profit margins. These decisions reflect Amazon’s attempt to cater to a consumer base that is particularly conscious of pricing.

    Across all apparel subcategories, leading brands that offered the highest markdowns were Sweet Dreams (65.5%), Ketch (55.1%), Clarks (44.9%), and Kibo (38.4%). Meanwhile, Reebok and Adidas offered significant additional discounts at 26.3% and 24.9%, respectively, as well.

    Apparel average price reduction across leading brands on Amazon.

    For brands, however, reducing prices is just one approach to entice shoppers. They must also guarantee their prominent presence and easy discoverability within Amazon’s search results. This significantly amplifies their potential to generate higher clicks and conversions. In our analysis, we monitored brands’ Share of Search across various frequently used search terms in addition to the discounts they provided. The Share of Search denotes the portion of a brand’s products within the top 20 search results for a specific search query.

    Our data indicates that certain brands gained ground in their discoverability during Prime Day, while others fell behind. Van Heusen in Women’s Athleisure (30%), Campus in Men’s Shoes (50%), and Rovar’s (30%) in Women’s Swimwear among others, improved their Share of Search by significant levels during Prime Day.

    Apparel share of search on Amazon on Prime Day.

    On the other hand, brands like Sparkx in Men’s Shoes, Xyxx in Men’s Innerwear, WomanLikeU in Women’s Swimwear, and Adidas in Women’s Shoes lost around 40%-80% in their Share of Search during the event. This is likely to have impacted their sales volumes adversely.

    Home & Furniture

    The Home & Furniture industry faced challenges of reduced demand and overstocked inventory over the past year. Therefore, even before Prime Day, discounts offered in this category on Amazon averaged a staggering 45.3%. Consequently, on Amazon Prime Day, additional discounts averaged only 2.5% on Amazon, offered across 33.3% of its assortment. Flipkart opted, in effect, not to compete with Amazon in this category, offering a negligible additional discount of 0.8% across 14.70% of its assortment.

    Home & furniture average price reduction across retailers on Prime Day.

    Of all the Home & Furniture subcategories we analyzed, Luggage (5.1%), Beds (3.9%), and Coffee Tables (3.1%) had high price reductions, while Rugs (0.6%), Bookcases (1.5%), and Washer/Dryers (1.2%) had lower markdowns. This highlights the difference in consumer preferences across geographies, with rugs being more discretionary in India but staple in the US.

    Home & furniture average price reduction across subcategories on Amazon.

    The Home & Furniture category is not known for its brand loyalty among shoppers. Therefore, brands often rely on attractive pricing to gain shopper interest. This Prime Day, brands that offered the highest markdowns in this category include It Luggage (40%), Couch Culture (25.8%), Story@Home (23.3%), and Verage (21.2%).

    Home & furniture average price reduction across leading brands on Amazon.

    In terms of Share of Search, Wudparadise in Entertainment Units gained the highest (50%). Solimo (an Amazon Brand) in Beds (40%), Sofas (30%), and Coffee Tables (10%) gained significant ground in its respective categories too. In contrast, About Space in Bookcases (-60%), Anika in Entertainment Units (-40%), and Sleepyhead in Mattresses (-40%) lost out on their discoverability in their respective categories during the event.

    Home & furniture share of search on Amazon on Prime Day.

    To gain a competitive edge during sale events like Prime Day, brands need to monitor their Share of Search closely, especially in categories like Home & Furniture with low brand loyalty.

    Consumer Electronics

    This Prime Day, five smartphones got sold every second with 70% of the demand coming from Tier 2 & 3 cities in India, largely comprising of foldable smartphones and newly launched smartphones (OnePlus Nord 3 5G, Samsung Galaxy M34 5G, Motorola Razr 40 Series, Realme Narzo 60 Series and iQOO Neo 7 Pro 5G). Multiple new products were launched this Prime Day, by brands such as OnePlus, iQOO, Realme Narzo, Samsung, Motorola, boAt, Sony, and more in India.

    Consumer electronics average price reduction across retailers on Prime Day.

    Despite the high demand and new product launches, Amazon’s price reductions in the Consumer Electronics category averaged only 0.9% across 27% of its assortment. Similar to what we observed in the Home & Furniture category, this can be attributed to the prevailing high average discount of 44.8% the week prior to Prime Day. Essentially, in Consumer Electronics, shoppers needn’t always wait till sale events like Prime Day to view the most attractive deals. Several are offered even during the days leading up to the sale.

    Across subcategories, Earbuds (2.4%), Wireless Headphones (1.6%), and TVs (1.3%) received the highest price reductions due to their popularity and high sales volumes during sales events. On the other hand, Smartwatches (0.6%), Drones (0.4%), and Smartphones (0.3%) had lower markdowns.

    Consumer electronics average price reduction across subcategories on Amazon.

    In terms of price reductions across brands, Da Capo (52.6%), Muzen (33.3%), JLab (23.6%), and Earboss (21.5%) offered the most attractive deals in the Consumer Electronics category. Notably, Amazon Basics also offered modestly attractive deals (12.2%), highlighting Amazon’s strategy of promoting in-house brands.

    Consumer electronics average price reduction across leading brands on Amazon.

    The Consumer Electronics category has a loyal shopper base, but generic search keywords like earbuds, headphones, and tablets remain essential for attracting high-intent shoppers and increasing brand awareness. So when it comes to Share of Search, Noise in Smartwatches, Samsung in Smartphones and Tablets, and HP in Laptops, all made strong strides in building their discoverability on Amazon during Prime Day.

    Consumer electronics share of search on Amazon on Prime Day.

    Xiaomi in Laptops, Ekko in Earbuds, OnePlus in Smartphones and Apple in Tablets, lost out to other brands during the sale.

    Health & Beauty

    Health & Beauty emerged as the top-performing category in terms of additional discounts during Prime Day in India. Our data shows that Amazon offered an average additional discount of 5.3% on almost half of its products (46.8%) in this category. Competing head to head with Amazon in this category, Flipkart offered 5.5% additional discounts across 35.8% of its assortment.

    Health & beauty average price reduction across retailers on Prime Day.

    Within all the subcategories we analyzed, Sunscreen (7.5%), Make-Up (7.2%), Shampoo (6.6%), and Moisturiser (6.4%) saw the highest price reductions on Amazon. Conversely, staple items like Toothpaste (3.%) and Beardcare (3.6%) had lower markdowns.

    Health & beauty average price reduction across subcategories on Amazon.

    During the sale event, brands like Sadhev (43.4%), Clear (41.1%), Teenilicious (40.4%), and Coal Clean Beauty (38.4%), offered the most attractive deals.

    Health & beauty average price reduction across leading brands on Amazon.

    In terms of significant gains in Share of Search for brands, L’Oreal Paris in Shampoo and Conditioner led the pack along with Oracura in Electric toothbrushes and The Formularx in Moisturiser. Perfora in Toothpastes and Ustraa in Beardcare also gained more than 10% in their Share of Search during the sale event.

    Health & beauty share of search on Amazon on Prime Day.

    Other popular brands like Tresemme in Conditioners, and Swiss Beauty in Make-Up surprisingly had reduced visibility among the top search results for relevant subcategories.

    Navigating the Competitive Landscape: How To Thrive During Sale Events

    Amazon’s strategic pricing during Prime Day reflects a balance of profitability, inventory, and competition. Competitive pricing insights empower retailers to make informed decisions, optimize strategies, and thrive during high-stakes events. Prime Day serves as a crucial opportunity to drive sales, attract new customers, and boost loyalty. Therefore, monitoring competitor prices accurately, at scale, is essential for impactful pricing strategies.

    For more insights on staying ahead during sale events, reach out to us today!

    If you’d like to learn about Amazon’s pricing and discounts during Prime Day 2023 in the US, check out our analysis here.

  • Amazon US Prime Day 2023: Insights on Pricing and Discounts Across Popular Categories and Brands

    Amazon US Prime Day 2023: Insights on Pricing and Discounts Across Popular Categories and Brands

    Amazon’s Prime Day this year proved to be a record-breaking success, becoming the largest Prime Day event in the company’s history. Over the two-day extravaganza, shoppers in the US spent a staggering $12.7 billion, a 6.1% increase from the previous year. Amid inflationary pressures and supply chain disruptions, Amazon adopted a bold discounting strategy, offering steeper discounts compared to Prime Day 2022.

    An interesting aspect of Amazon’s approach is their loyalty based offerings. In the weeks leading to Prime Day on July 11-12, members of the loyalty program were given access to “invite-only deals” where shoppers could request invites to specific products that they were looking to purchase on deals. Overall, Amazon’s pricing and discount strategies during Prime Day were carefully designed to create a buzz among shoppers, generate increased sales, and maintain a competitive advantage in the market.

    While Prime Day is Amazon’s showstopper, it’s interesting to also see how other leading retailers respond to such a massive sale by their biggest competitor. Do they also lower their prices during the event, or are they happy to take a backseat? To answer these questions, we leveraged our proprietary data aggregation and analysis platform to analyze the prices and discounts of Amazon and its leading competitors across key product categories – Apparel, Home & Furniture, Consumer Electronics, and Health & Beauty – during Prime Day.

    Since products on Amazon and other eCommerce websites are often sold at discounts even on normal days not linked to a sale event, we delved into the real value that Prime Day offers to shoppers by focusing on price reductions or additional discounts during the sale compared to the week before. As a result, our approach highlights the genuine benefits of the event for shoppers who count on lower prices during the sale.

    Research & Methodology

    For our analysis, we tracked the prices of a large number of products across several leading retailers during Prime Day as well as the week prior to the event. The details of our sample are mentioned below:

    • Number of SKUs: 110,000+
    • Websites: Amazon, Walmart, Target, Overstock, The Home Depot, Wayfair, Ulta Beauty, Sephora
    • Categories: Apparel, Home & Furniture, Electronics, Health & Beauty
    • Pre-event Analysis: 4-10 July 2023
    • Prime Day Analysis: 11-12 July 2023

    Our Key Findings

    Our data reveals that Amazon’s price reductions were most aggressive in the Consumer Electronics category, with an average price reduction of 10.4% on Prime Day, due to the category’s popularity and high demand.

    The Health & Beauty (6.7%), Apparel (5.9%), and Home & Furniture (4.8%) categories offered relatively modest deals during the sale event.

    The Health & Beauty (6.7%), Apparel (5.9%), and Home & Furniture (4.8%) categories offered relatively modest deals during the sale event.

    Below, we delve deeper into our analysis of each category to better understand how price reductions were distributed across key subcategories on Amazon as well as the discounting strategies of Amazon’s leading competitors.

    Apparel

    As Amazon grappled with surplus inventory, heightened storage costs, and reduced profit margins in apparel (like most other retailers), its average discount before Prime Day was already as high as 13.3%. Then, on Prime Day, Amazon’s apparel deals were tempered at around 5.9% across an impressive 33.1% of its assortment, while Target and Walmart chose not to compete in a meaningful way.

    Unlike Prime Day 2022, when Target competed with Amazon with high discounts, the retailer offered only 0.8% additional discount across 4.4% of its assortment in this category. Walmart, too, reduced its prices by only 1.4% on 8.5% of its assortment during Prime Day.

    Check out our latest analysis on fashion pricing trends across 2022-23 to better understand the pricing dynamics in this category in greater detail.

    Across all the apparel subcategories we analyzed, Women’s Athleisure (8.7%), Men’s Swimwear (8%), and Women’s Tops (7.6%) were among the ones with the highest price reductions. On the other hand, Men’s Athleisure (2.5%), Women’s Shoes (3.5%), and Men’s Innerwear (4.1%) had conservative markdowns.

    Pricing decisions across the various subcategories are likely to have been influenced by several factors like inventory levels, demand patterns, and the need to balance competitive offers with maintaining reasonable profit margins, as Amazon tried to cater to a more price-sensitive consumer.

    Across all apparel subcategories, leading brands that offered the highest markdowns were Tommy Hilfiger (11.5%), Amazon Essentials (9.4%), Adidas (8.6%), and Calvin Klein (8.6%).

    For brands, however, lowering prices is only one lever to attract and convert shoppers. They also need to ensure they’re highly visible and discoverable on Amazon’s search listings. This exponentially improves their chances of driving more clicks and conversions. In our analysis, we tracked the Share of Search of brands across several popular search keywords. Share of Search for a brand is defined as the proportion of the brand’s products in the top 20 search results for a search query.

    Our data indicates that several brands gained impressive ground in their discoverability during Prime Day, while others fell behind. Gildan in Men’s Innerwear, Adidas in Men’s and Women’s Shoes, Anrabess in Women’s Athleisure, and Lululemon in Men’s Athleisure, among others, improved their Share of Search by significant levels during Prime Day.

    On the other hand, brands like Hanes in Men’s and Women’s Innerwear, Kanu Surf in Men’s Swimwear, Cupshe in Women’s Swimwear, and others lost around 10% in their Share of Search during the event. This is likely to have impacted their sales volumes adversely.

    Home & Furniture

    The Home & Furniture industry has been challenged with reduced demand due to inflationary pressures over the past year or so. Leading retailers in the category overestimated the demand, leading to overstocking of inventory. As a result, Home & Furniture is one of the few categories that saw Amazon’s competitors participate at a significant level on Prime Day in order to ensure they don’t fall behind on liquidating their stock.

    Amazon’s additional discounts averaged 4.8% across 30.2% of its assortment. Wayfair and Overstock too reduced their prices by 4.8% and 4.3% on around 44% of their respective assortments. Wayfair’s move is likely a part of their strategy to attract new customers and expand their market share, in response to a decline in their consumer base. Last year, Wayfair experienced a loss of 5 million out of its 1.3 billion consumers due to weakening demand.

    Target and Walmart did offer additional discounts, but they were not at a competitive level. The Home Depot effectively opted not to compete at all during the sale event. Overall, the pricing actions of these retailers are in stark contrast to the highly conservative pricing strategies observed on Prime Day last year.

    Our recent pricing analysis of the Home & Furniture category revealed more interesting insights and pricing dynamics over the past year.

    Across all the subcategories we analyzed, Bookcases (8.2%), Rugs (7.8%), Mattresses (6.5%), and Luggage (6.2%) were among the ones with high price reductions.

    Meanwhile, Sofas (2.4%), Washer / Dryers (2.4%), and Entertainment Units (2.7%) had lower markdowns. These are large and substantial purchases, making retailers more cautious about deeply discounting them while still ensuring profitability.

    The brands that stepped up and offered the highest markdowns in this category include Zinus (20.2%), Comfee (10.8%), Sauder (9.9%), and Best Choice Products (8.7%).

    In terms of Share of Search, Rockland in Luggage gained the highest (21%), followed by Farberware in Dishwasher, Olee Sleep in Mattresses, and Homeguave in Mattresses gained significant ground in their respective categories as shown in the image below.

    Brands like Best Choice Products in Coffee Tables, Molblly in Mattresses, and Black+Decker in Washer/Dryers and Dishwashers lost a good portion of their Share of Search during the event. Due to high competition for visibility during sale events, brands that fail to keep an eye on their Share of Search stand to take a hit in their sales, especially in categories like Home & Furniture that tend to have low brand loyalty.

    Consumer Electronics

    2023 was the year of consumer electronics on Amazon Prime Day. Amazon’s price reduction during the sale averaged 10.4% across 54.5% of its assortment in the category. Target and Walmart, on the other hand, offered significantly lower additional discounts of 1.9% and 2.7% on 10.4% and 19.1% of their assortment, respectively.

    The consumer electronics category often witnesses aggressive price reductions during Prime Day and other sale events due to its popularity and high demand. In addition, since retailer margins are usually low in this category, shoppers often have to wait for sale events like Prime Day (when brands markdown their wholesale rates) to have several attractive deals to choose from.

    Across all the subcategories we analyzed, Smartwatches (15.4%), Wireless Headphones (15.4%), Earbuds (14.9%), Headphones (12.5%), and Tablets (12.0%), were among the ones with the highest price reductions. All of these subcategories are quite popular that tend to sell in large volumes during sale events.

    Meanwhile, Laptops (2.1%), TVs (3.1%), and Smartphones (7.6%) had lower markdowns. A lower markdown on smartphones may reflect steady demand throughout the year, reducing the urgency to offer significant discounts during the short Prime Day window.

    Amazon (22%), Tozo (12.5%), Lenovo (10.8%), JBL (8.3%), and Apple (5%) offered the highest price reductions in Consumer Electronics as a whole. Clearly, Amazon didn’t hold back on offering attractive deals on its own private label products in this category.

    Consumer Electronics as a category tends to have a brand loyal shopper base. However, Share of Search generic search keywords are still very important for keywords like earbuds, headphones, and tablets that result in relatively lower priced products. HP in Laptops, Samsung in Tablets and TVs, and Oneplus in Smartphones all made strong strides in building their discoverability on Amazon during Prime Day. Beyond just driving more sales, this also has the intended effect of boosting brand awareness among high-intent shoppers.

    Sony in Headphones, Asus in Laptops, and Insignia in TVs lost out to other brands in terms of their discoverability during the sale. Sony and Asus, especially would be hurting as they are prominent brands in their respective categories.

    Health & Beauty

    The Health & Beauty category is a favorite among consumers during Prime Day, as it encompasses a wide range of products like skincare, cosmetics, and grooming items. As shoppers often tend to stock up during the sale, brands and retailers are willing to offer competitive discounts and gain an edge over their competitors.

    Our data reveals that the average additional discount on Amazon was 6.7%, offered on a little over a third of its assortment. Walmart reduced its prices sizably as well, by an average of 3.1% on 13.4% of its assortment.

    Interestingly, Sephora and Ulta Beauty, leading retailers in the Health & Beauty category did not compete on price at all this Prime Day. It is likely they are confident their loyal customer base will not be influenced by Amazon’s Prime Day deals and be driven away merely by lower prices. In addition, keeping their prices steady during Prime Day might have been a strategic choice to protect their brand reputation and premium positioning.

    Relatively premium subcategories like Electric Toothbrushes (10%), Moisturizer (8.3%), Beardcare (7.3%), and Make Up (6.7%) saw the highest price reductions on Amazon.

    In contrast, staple items like Toothpaste (3.7%), Shampoos (5.4%), and Conditioners (5.7%) had lower markdowns.

    Among the leading brands in this category, Oral-B (10.3%), Philips Sonicare (8.7%), Neutrogena (8.4%), and Colgate (5.6%) offered the most attractive deals during the sale event.

    In terms of significant gains in Share of Search for brands, Oral-B in Electric Toothbrushes led the pack again. Neutrogena in Sunscreens and Somall in Toothpastes also gained more than 10% in their Share of Search during the sale event, followed by Tresemme in Shampoos and Airspun in Make-Up products.

    Other popular brands like Crest in Toothpastes, e.l.f in Make-Up, Philips Sonicare in Electric Toothbrushes, and Sheamoisture in Beradcare surprisingly had reduced visibility among the top search results for relevant subcategories.

    Staying Ahead of the Curve During Sale Events

    This Prime Day, Amazon leveraged its scale to offer aggressive discounts across key product categories, while several competing retailers chose to sit back and let the sale play out. Others chose a selective discounting strategy that focused their modest price reductions on a small set of items.

    At DataWeave, we understand the pivotal role competitive pricing insights play in empowering retailers and brands to gain a competitive edge, especially during crucial events like Prime Day. For retailers, the ability to track competitor prices accurately, at scale, in a timely manner is essential to plotting and acting on impactful pricing strategies and staying ahead of the curve.

    To learn more about how this can be done, reach out to us today!

  • Fashion eCommerce 2023: Leveraging Pricing Intelligence to Stay Competitive Despite Reduced Demand

    Fashion eCommerce 2023: Leveraging Pricing Intelligence to Stay Competitive Despite Reduced Demand

    The fashion industry is currently undergoing a period of stabilization after facing significant disruptions in recent years. Fashion retailers find themselves navigating not only changing consumer preferences but also the challenges brought about by inflation and supply chain issues that are remnants of the COVID-19 era.

    The effects of inflation have raised concerns regarding overabundance, rise of sustainable and pre-used fashion and declining sales, creating a mismatch between supply and demand within the market. As consumers scale back on spending due to rising prices, fashion retailers are left grappling with surplus inventory, heightened storage costs, and reduced profit margins.

    Consequently, these market dynamics have significantly impacted the pricing strategies employed by fashion retailers, resulting in dynamic shifts in pricing and competitiveness across different time periods, subcategories, and individual retailers.

    Counteracting this impact requires fashion retailers to adopt a data-driven approach that leverages competitive and market insights. They must adopt agile and versatile pricing strategies that enable advanced pricing and assortment management. By understanding their market position and the competitive landscape, retailers can effectively react to reduced demand and inflationary pressures without compromising heavily on their top line and profitability.

    At DataWeave, we harnessed the power of our proprietary data aggregation and analysis platform to track and analyze the prices of prominent fashion retailers to uncover unique insights into their price competitiveness over the past year, as well as understand how pricing strategies varied across diverse subcategories.

    Our Methodology

    For this analysis, we tracked the average price changes among leading US fashion retailers over 12 months to understand how their pricing across several fashion subcategories altered in response to supply chain inefficiencies, inflationary pressures, seasonal effects, and changing consumer preferences.

    • Sample: 88,000+ SKUs matched across 5 leading retailers
    • Retailers tracked: Amazon, Walmart, Target, Macy’s, Zappos
    • Key subcategories reported on: Boots, Bottoms, Coats, Denims, Flats, Heels, Jackets, Kids
    • Timeline of analysis: April 2022 to April 2023

    Our Analysis

    While prices have generally been rising in several industry segments, such as groceries, due to inflation, the fashion sector has experienced relatively stable prices, with even a few periods of price drops. In fact, average prices in April 2023 are 1.2% lower than those in April 2022. The main reason for this trend is that consumers have become cautious about discretionary spending on fashion in order to prioritize other necessities, resulting in lower demand and overstocking by retailers.

    In the first quarter of 2022, clothing accounted for only 3.9% of total expenditure by US consumers, down from 4.3% in 2019 before the pandemic. Additionally, in March 2023, 60% of fashion retailers in the US still had surplus goods, accounting for almost 20% of their entire stock. As demand decreased, fashion retailers started offering freebies with purchases, bundling products, giving away unwanted items, and notably, slashing prices.

    Subcategory level analysis of Average Price Change Month-on-Month between April 2022 – April 2023

    Our analysis at a subcategory level reveals that in winter 2022, seasonal demand led to the largest price increases of 6-11% in coats, boots, and jackets. However, these prices quickly declined afterward. In 2023, stabilization of raw material costs and a continuing decline in demand for non-essential apparel and fashion accessories are factors contributing to a significant drop in prices.

    Some of these trends vary among retailers as each faces different challenges and responds in distinct ways. Our data indicates that some retailers have chosen to increase their prices from Q3 2022 due to mounting pressure on profit margins, while others have further lowered prices due to increasing inventory levels.

    Average Price Change Month-on-Month Across Amazon, Macy’s, Walmart, Target, and Zappos between April 2022 – April 2023

    _____________

    Capability Spotlight

    Matching products across competitor websites is an essential part of tracking competitive prices and analyzing price leadership. In fashion, matching exact products is no mean feat. Websites often host a slew of variants in terms of size, color, material, etc. without any form of standardization in the way the products are represented. So fashion retailers often struggle with simply unusable pricing insights resulting from inaccurate and incomplete product matching. 

    DataWeave’s industry-leading product matching algorithm recognizes and leverages dozens of product attributes extracted from product titles, descriptions, and images to match products at very high levels of accuracy and coverage. What’s more, our platform can also match similar products based on a large variety of parameters, so our customers can benefit from a comprehensive competitive perspective.

    _____________

    For example, in August, Target reported a 90% plunge in profits during the second quarter of 2022, as shoppers concerned about inflation reduced spending on nonessential items. The company stated that its price cuts did not have the desired impact, resulting in a 1.5% increase in inventory compared to three months prior. As a result, we can see that Target’s average fashion prices spiked in August 2022 and have remained steady since then. Walmart also faced similar challenges and increased its prices in October 2022.

    However, during the same period in August 2022, Macy’s announced increased discounts to clear out excess inventory in preparation for the holiday shopping season. In the same announcement, Macy’s highlighted how the rising cost of groceries, which had experienced a double-digit increase, was impacting consumers’ budgets, changing their behaviors, and increasing the need for discounts. Our data reflects this, showing a significant drop in prices from October 2022 to January 2023.

    However, in January 2023, Macy’s successfully managed its inventory levels, reducing them from $6.4 billion in October 2022 to $4.3 billion in January 2023. As a result, average prices at Macy’s have started to rise.

    _____________

    For today’s fashion retailers, achieving a balance between expansion goals and profitability is crucial. It requires a meticulous examination of competitive and market insights on a regular basis to mitigate competitive pressures and navigate through these challenging times successfully.

    DataWeave’s platform offers retailers the insights they need to gain a competitive advantage. With access to accurate, timely, and actionable pricing and assortment insights, retailers can make informed decisions and stay ahead of the competition. To learn more, reach out to us today!

  • Fashion on Black Friday: Decoding Pricing Strategies of Top U.S. Retailers

    Fashion on Black Friday: Decoding Pricing Strategies of Top U.S. Retailers

    Over the last few Thanksgiving Weekend sales, fashion, what was a category once typically reserved for offline purchases, has evolved into a regularly marked down and popular category as shoppers get more comfortable making these purchases online. This can be credited to the ease of purchase that retailers offer – trials, returns, etc. combined with the desire for shoppers to refresh their wardrobe for the new year ahead.

    At DataWeave, we performed an analysis on a sample of 40,000+ products across six of the top fashion retailers – Amazon, Bloomingdale’s, Macy’s, Nordstrom, Target and Walmart. . Twenty product types were covered across both men’s and women’s fashion and the analysis focused on the top 500 ranked products of each product type.

    Additional Markdowns

    For the sake of this analysis, we compared the prices during the sale with the mode of the prices the week before. This gave us a clear picture of the additional markdowns during the sale period and therefore, the additional value to shoppers.

    Dominating the fashion space, Nordstrom and Macy’s came in hot with the most aggressive discounts on the largest share of their product range, 36% and 27% respectively, on more than a quarter of their range. In the women’s lineup, Target offered a 36% markdown, compared to ~22% for its men’s lineup. Across both categories though, this was only on 1% of Target’s range. In what seems to be an expected trend, Amazon and Walmart remained relatively conservative with their additional markdowns, as they tend to be competitively priced even during non-sale periods.

    Drilling down into the product types, we noticed that very aggressive markdowns were being offered on t-shirts and skirts (over 40%). Swimwear, hosiery, handbags, and sunglasses were other product types that were featured with attractive prices across websites.

    Product Premiumness

    We categorized the products across retailers into buckets of how expensive or cheap the product is, relative to the rest of the products hosted by the retailer. Where the MRP was not displayed, the most expensive price of the product during the holiday period prior to Black Friday was considered. We then bucketed products in categories of High, Medium and Low of product premiumness, with High containing the more expensive products by price.

    Amazon, Bloomingdale’s, Macy’s and Nordstrom chose to markdown the more expensive products in their range higher than the rest of their assortment. This aligns well with what one would expect retailers to do as shoppers tend to expect attractive offers on the more expensive range of products. Also, with the more expensive products, retailers and brands likely have more room to be flexible with margins. Amazon shows a consistent strategy here, having provided higher markdowns on a relatively higher portion of its most premium products and vice versa. This trend can only otherwise partially be seen with Macy’s.

    Walmart though, chose to go the other route and provided higher markdowns on its least premium products. This might have been a targeted effort to maintain their perception among shoppers as a destination for affordable goods. Though it’s important to note here that these markdowns were seen only on a small set of cheap goods – just over 5%.

    Price Change Activity

    Walmart, Nordstrom and to an extent, Bloomingdale’s, had an almost consistent number of price changes throughout the week. Nordstrom recorded the most significant dip in the magnitude of the markdowns over time.

    Amazon and to a smaller degree, Macy’s, had more price changes during the week. However, Amazon’s average price variation remained among the lowest whereas Macy’s clocked in the highest by Black Friday at just under 40%.

    Across the board, the price changes dipped on the 28th and then rose again on the 29th. This can be seen as a conscious effort to have more aggressive activity on Black Friday.

    In summary, fashion-first retailers like Macy’s and Bloomingdale’s went all-in during the sale, while Nordstrom, a multi-category retailer, stood out for its aggressive focus on fashion.

    Amazon and Walmart continued to operate within the competitive space that they’ve carved out for themselves as the leading retailers in the US. We observed a similar trend even in the other product categories we’ve analyzed for the sale. Check out our analysis of the Electronics category during Black Friday here.

  • Prime Day 2019 Fashion: Were the Deals as Attractive as the Merchandise?

    Prime Day 2019 Fashion: Were the Deals as Attractive as the Merchandise?

    Target and Walmart offered more appealing discounts than Amazon during Prime Day 2019.

    Statista estimates that e-commerce fashion accounted for approximately 20.4% of overall fashion retail sales in the United States in 2018, which amounted to about $103 billion in absolute terms. According to Internet Retailer, apparel is the largest and among the most competitive retail categories in e-commerce. Moreover, as a share of total apparel and accessories sales, online apparel sales is growing at a faster rate than US e-commerce as a whole.

    Given the high-growth and competitive nature of the category, we at DataWeave were interested to find out how high the stakes got during the fifth annual Prime Day earlier this month.

    Our Methodology

    Since Prime Day is no longer necessarily an Amazon event (since competing websites often offer attractive discounts as well), we tracked the pricing of several leading retailers selling fashion apparel, footwear, and accessories to assess their pricing and product strategies during the sale event. Our analysis was focused on additional discounts offered during the sale to estimate the true value that the sale represented to its customers. We calculated this by comparing product prices on Prime Day versus the same prices prior to the sale.

    Our sample consisted of 20 product types across women’s as well as men’s fashion categories. While we did monitor exclusive fashion retailers Macy’s, Bloomingdales, Nordstrom, and Neiman Marcus, we did not find them offering any additional discounts – an interesting insight all on its own since they’ve clearly chosen not to compete with Amazon during the two days of the Prime Day sale. We therefore restricted the rest of our study to Amazon, Target, and Walmart – the latter two of which interestingly offered immensely aggressive discounts in their apparel categories.

    The Verdict

    Despite owning the day at least in name, Amazon was found to offer the lowest additional discounts among the retailers studied. Target and Walmart, on the other hand, ensured that they didn’t lose out on market share this Prime Day by offering substantially high discounts of their own. While Target was the most aggressive with a steep average markdown of 26.5%, Amazon closed out the bottom at 8.4%.

    Walmart and Target didn’t seem particularly focused on compensating their sharp discounts with price increases in other products – their focus seems to have been solely only on offering timely discounts during the sale. Amazon, on the other hand, marked up just about as many products as it marked down, with the markup margin being close to double that of the markdown in an effort to protect margins during the sale.

    Top product types by additional discount

    Target and Walmart both offered aggressive discounts across their top product categories. Walmart ended up with a marginally higher overall average additional discounts on product types like Shirts, T-shirts, and Tops.

    Interestingly, though Amazon offered moderate discounts across its top categories (Lingerie, Swimwear, and Underwear), the volume of marked down products was very limited.

    Additional discounts across popularity levels

    We determined popularity using a combination of average review rating and number of reviews, and the resulting scores were categorized as low, moderate, and high.

    When it came to discounting popular products, there were clear differences in strategy among all the three retailers. Amazon, which interestingly had close to 60% of its products in the low popularity bucket, chose to offer the highest discounts in the same category – indicating an effort to clear its stock of unpopular products. Target and Walmart, on the other hand, focused their discounts on moderate rated products.

    Additional discounts across product “premiumness” levels

    Premiumness was calculated as the average selling price before the sale event. This was divided into four percentile blocks, with higher percentile blocks indicating higher selling prices.

    As found in the electronics and furniture categories that were analyzed previously, most of the discounting activity was focused on the lower end of the premium spectrum with a view to protect margin – despite a largely equitable distribution of discounted products across percentile ranges (with the exception of Target, which had a discounted assortment heavily dominated by its least premium products).

    This indicates a clear strategy to protect margins, while still maintaining the perception of promoting attractive offers to draw traffic. Target and Walmart both offered substantial additional discounts of close to 30% on their least premium products, while at 12%, Amazon offered less than half that discount.

    Additional discounts across visibility levels

    Given the fairly large number of SKUs across the fashion category in general, the discounts across visibility levels understandably didn’t vary much when compared to the more pronounced fluctuations observed in the electronics and furniture categories. This is also largely because consumers tend to explore lower ranked products more so in the fashion category than in other categories.

    Across product categories, we’re seeing lower-than-expected additional discounts on Amazon this Prime Day, coupled with more aggressive pricing activity by Amazon’s competitors. While this puts more pressure on Amazon, this also is a strong validation of Prime Day as a key annual sale event on the US shopper’s calendar.

    Curious to know how Amazon and its competitors performed in other product categories this Prime Day? Watch this space for more!

  • A Study of Fashion Retail Pricing Across Thanksgiving, Black Friday and Cyber Monday 2018

    A Study of Fashion Retail Pricing Across Thanksgiving, Black Friday and Cyber Monday 2018

    The biggest holiday sale event of the western retail calendar — the Thanksgiving weekend sale, which includes Thanksgiving Day, Black Friday, and Cyber Monday — came and went a few weeks ago and made a huge splash along the way. While the sale event, especially Black Friday, is traditionally an offline sale event, modern online retailers too step up to offer products at attractive prices through this period.

    Online retail sales numbers grew at an impressive clip based on stats reported by Adobe Analytics. Thanksgiving Day sale itself generated $3.7 billion in sales, up 28 percent from a year ago. Black Friday delivered a record $6.22 billion in online sales — a substantial leap of 23.6 percent year on year. Cyber Monday sales online generated a new record of $7.9 billion, up nearly 18 percent from last year.

    Spending on fashion specifically was up 5.4 percent over the 2018 Black Friday weekend, the best growth seen since 2011, according to consulting firm Customer Growth Partners. Apparel retailers now book nearly a quarter of their annual sales during these holiday sales — a measure of just how important these annual sales have become to the online retailer’s commercial performance.

    As a provider of Competitive Intelligence as a Service to retailers and consumer brands, DataWeave consistently monitors and captures pricing and assortment information from leading retailer websites during sale events to study their product and pricing strategies — and we’ve done the same for this year’s Thanksgiving weekend sale as well.

    Our Methodology

    We tracked the pricing of 6 leading fashion retailers to study their pricing and product strategies during the sale events. Our analysis focused on additional discounts offered during the sale to evaluate the true value of the sale event to customers. To calculate this effect, we compared the pricing of products on Thanksgiving Day, Black Friday and Cyber Monday to the pricing of products prior to the sale commencing. We considered the Top 500 ranked products on 15 product types across Men’s and Women’s Fashion for this analysis.

    Key Findings in Men’s Fashion

    Macy’s and Bloomingdale’s featured prominently among the top discounting retailers. This is unsurprising, given their focus on Fashion. Macy’s, in particular, additionally discounted just over half its fashion assortment over the three days. This was an order of magnitude greater than its nearest competitor Amazon at 29 percent.

    Target and Walmart too discounted aggressively on Thanksgiving and Black Friday. Target exceeded Macy’s by 2 percentage points. However, Target and Walmart rolled back their discounts on Cyber Monday effectively halving them.

    Walmart’s discount strategy displayed significant variation across the 3 days of sale. On Black Friday, Walmart led the retailing pack with its 46 percent discount only to roll back to 15% on Cyber Monday. The fluctuations in these discounts reflect significant variation and churn in Walmart’s Top 500 ranked products across the three days of sales.

    As we have seen in previous sales, Amazon was a model of consistency in its discount strategy across the three days, maintaining a healthy 15% — 16% on roughly a third of its assortment. Strikingly, Newegg elected not to compete too aggressively in Fashion this year, adopting high single digit discounts on a similar percentage of its products.

    Across all six retailers, Shirts, Jeans, and T-shirts proved to be the most popular product types in terms of additional discounts although accessories such as sunglasses (Newegg) and watches (Macy’s) broke up apparel’s dominance.

    Did additional discounts vary by price range?

    We also studied the variation of discounts across ranges of product “premiumness”. We generated a percentile scale based on price ranges of products from before the sale, and studied the additional discounts offered for products in these price range buckets during the sale. A percentile score or 1 is the cheapest product and 100 is the most expensive product. All of these metrics were calculated first at a product type level and then aggregated at an overall level for each retailer.

    Amazon and Target display a clear strategy to additionally discount their more affordable range of products – those in the 1–20 cluster.

    Bloomingdale’s showed a less structured strategic approach. Its additional discounts were largely spread evenly across levels. Its product churn among the Top 500 items during the sale focused on its more expensive products as indicated by its score of 0 for the 81–100 percentile bracket.

    Macy’s opted to discount even more evenly across the board than Bloomingdale’s. It’s likely Macy’s relied on a different lever to drive discounts strategically. Walmart’s pricing approach was markedly uneven and all over the board from a strategic perspective.

    Key Findings in Women’s Fashion

    One of the most interesting patterns to emerge from these sale events was the marked difference in discounting strategy adopted for Women’s Fashion compared to Men’s Fashion. Both Amazon and Macy’s discounted their Women’s Fashion line up far less aggressively than their Men’s Fashion products. Their discounts also applied to a smaller set of products.

    Bloomingdale’s Women’s Fashion discounting was similarly marginally less aggressive than its approach to its Men’s Fashion. Only Target’s pricing remained consistent across its Men’s and Women’s Fashion products. However, Newegg’s strategy of not engaging too aggressively in Men’s Fashion this year carried over to its treatment of Women’s Fashion.

    The top product types additionally discounted were also not unexpectedly different between the Men’s and Women’s Fashion products. Skirts, Shoes, and Tops emerged as the favorite product types to discount, although no two retailers had the same discounting emphasis.

    As with Women’s Fashion, Amazon and Target discounted their less expensive products more consistently. However, in Women’s Fashion, they were joined by Walmart and to a lesser degree, Newegg.

    This showed evidence of a strategy to retail the less expensive products at more attractive price points to generate the price perception of being low-priced. Meanwhile, they continued to harvest comparatively more margin through their more expensive products. This was a more nuanced approach to margin management than what we saw in Men’s Fashion.

    Does product visibility correlate with discounts?

    One working hypothesis is that products discounted heavily tend to have higher visibility to drive the perception of lower price. However, the results of our analysis appear counter-intuitive.

    Amazon’s additional discounts in Men’s Fashion appear relatively uniform across all product cohorts. In fact, Amazon’s peaked additional discounts with the 200–400 cohort.

    Similar trends surfaced with other retailers. Newegg additionally discounted its longer tail products, while Walmart additionally discounted its Top 50 products at only 16% compared to an average of around 23% for other cohorts in its Top 500.

    A closer look at Amazon.com

    (Read Also: Amazon’s US Fashion and Apparel Product Assortment Evolves)

    We extracted data on Amazon’s reviews and ratings to investigate its discounting strategy across ranges of product popularity — a measure that’s defined using a combination of average review rating and number of reviews. We compiled a measure of all products that were rated as High, Medium, and Low cohorts and evaluated Amazon’s discounting strategy in each cohort.

    In Men’s Fashion, Amazon aggressively discounted its Medium and Low rated products on Thanksgiving, only to switch its strategy the next day on Black Friday. This tactical switch was presumably intended to showcase Amazon’s well-reviewed products at attractive prices on Black Friday — a larger sale event.

    By Cyber Monday, Amazon’s Medium reviewed products were back enjoying more aggressive discount levels, albeit the discount variance across all three cohorts was minor.

    Amazon’s discounting strategy for its Men’s Fashion products was in stark contrast to its strategy in Women’s Fashion. Here, Amazon additionally discounted its High and Medium reviewed products on Thanksgiving. While there was no specific discernible pattern on Black Friday, Amazon’s discounting was most consistent across its three popularity cohorts on Cyber Monday.

    We also looked at Amazon’s discounting activity across its private label products relative to other brands. Unsurprisingly, Amazon discounted its private label fashion products at an aggressive 30%, while the other brands benefited from, on average across all days and all categories, an additional 15% discount.

    Online drives shifting tides in holiday sale events

    While traditionally the holiday shopping season sees a peak around Black Friday and Christmas, retailers are increasingly seeing the demand spread across the entirety of the sale season of November and December. As a result, retailers need to stay on their toes to drive increased sales and gain market share over an extended period of time.

    Certainly, in 2018, we witnessed a more focused approach to mine margins in Women’s Fashion while still discounting aggressively. As expected, both Macy’s and Bloomingdale’s featured prominently in the discounting stakes while both Amazon and Target appeared to implement a more nuanced approach to juggling a reputation for low prices and driving increased margin.

    If you’re curious about how DataWeave aggregates data from eCommerce data at massive to deliver actionable insights to retailers and consumer brands, check us out on our website!

  • Decoding Alibaba’s Singles Day Sales

    Decoding Alibaba’s Singles Day Sales

    An average of $11.7 million per second was the rate at which Alibaba clocked $1 billion in sales during the first 85 seconds of Singles’ Day. As Alibaba’s annual sale event continues to grow in scale, referring to it as a global retail phenomenon is an understatement. Alibaba closed the day having shipped 1.04 billion express packages based on sales of merchandize worth 213.5 billion yuan ($30.67 billion).

    This performance shredded any lingering concerns analysts may have harbored about the prospects of this year’s sale, given the international backdrop of the ongoing trade skirmish between the US and China.

    Along with attractive discounts across a range of product categories, Singles’ Day also promised an integrated experience fusing entertainment, digital and shopping, in stark contrast to other large global sale events like Black Friday, which focus predominantly on discounts.

    At DataWeave, we set out to investigate if all the hype resulted in actual price benefits to the shoppers and how the various categories and brands performed in terms of sales during the event. To do this, we leveraged our proprietary data aggregation and analysis platform to capture a range of diverse data points on Tmall Global, covering unit sales (reported by the website) and pricing associated with Tmall Global’s major categories over the Singles’ Day period.

    Our Methodology

    We captured 5 separate snapshots of data from Tmall.com during the period between October 25 and November 14, encompassing over 15,000 unique products each time, across 15 product categories.

    To calculate the average discount rate, we considered the percentage difference between the maximum retail price and the available price of each product. We also looked at the additional discount rate, for which we compared the available price during Singles’ Day to the available price from before the sale. This metric reflects the truest value to the shopper during Singles’ Day in terms of price.

    Our AI-powered technology platform is also capable of capturing prices embedded in an image. For example, the offer price of ¥4198 was extracted accurately from the accompanying image by our algorithms and attributed as the available price while ¥100 from the same image was ignored.

    This technology was employed across hundreds of products using DataWeave’s proprietary Computer Vision technology.

    Domestic Appliances and Digital/Computer Categories Powered Turnover

    The Domestic Appliances and Digital/Computer categories dominated the Singles Day Sale in terms of absolute sales turnover. This isn’t surprising, since the average order value for these categories are typically much higher compared to the other categories analyzed.

    What clearly stands out in the above infographic is that the two largest categories in terms of sales turnover had average additional discounts of only 2 per cent and 0 per cent — a rather surprising insight. In general, with the exceptions of Women’s skincare, Men’s skincare, and Women’s bags (11 per cent, 10 per cent, and 9 per cent respectively), all other categories saw low additional discounts during Singles’ Day.

    However, the absolute discounts across the board were consistently high, with only Luggage (6 per cent), Digital/Computer (9 per cent) and Women’s wear (12 per cent) staying significantly below the 20 per cent mark. In fact, eight categories enjoyed absolute discounts greater than 30 per cent.

    Among common categories between Men and Women, the Men clocked more sales in Men’s wear, shoes, and bags. Only skincare proved to be an exception, where Women’s skincare generated twice the turnover of their Men’s equivalent.

    The Infants category was another intriguing sector to emerge during the sale. Both Diapers (38 per cent) and Infant’s Formula (25 per cent) were substantially discounted, despite only receiving low additional discounts of 2 per cent and 0 per cent respectively – indicating aggressive pricing strategies in this category even during non-sale time periods.

    The biggest takeaway from our analysis is the lack of any correlation between sales turnover and additional discounts, or even the absolute discounts.

    International Brands Make Gains

    International brands continue to penetrate the Chinese market showing up amongst the Top 5 brands of 13 of the 16 categories on sale.

    In the Diaper category, Pampers delivered nearly twice the sales turnover of its next biggest competitor. As expected, Apple and Huawei battled it out for honors in the Digital/Computer category although Xiaomi enjoyed pleasing results, nearly matching Huawei’s sales to go with its sales leadership of the Domestic Appliances category. Local brands, though, swept the Domestic Appliances, Furniture and Women’s Wear categories.

    The challenge posed by Chinese brands was illustrated by Nike’s spot in the second place in the highly competitive Men’s Shoes category after Anta.

    International brands topped only five of the 16 categories and Top 3 positions in ten categories. Still, there’s a growing presence of international brands in China’s eCommerce.

    Gillette won handsomely over its competition in the Personal Care category while Skechers enjoyed a similar result in Women’s Shoes, racking up nearly twice the retail sales of its nearest competitor. Another category dominated by international brands was the Women’s Cosmetics category where international brands accounted for 4 of the Top 5 brands.

    Similarly, Samsonite’s acquisition of American Tourister gave it two top 5 brands in the Luggage category. Other global brands to make the cut during the Singles’ Day sale included L’Oréal, Canada’s Hershel, Playboy, South Korea’s Innisfree and Japan’s Uniqlo.

    It’s Not All About Price On Singles’ Day

    The dramatic rise in shopping during Singles’ Day is not driven solely by price reductions. Alibaba’s commitment to its “New Retail” strategic model has led the Chinese giant to channel its impressive resources to focus on bringing together the online elements of its business with the more traditional offline aspects of its retail distribution. This is combined with entertainment to create a larger story based around the shopper’s overall “experience” rather than just driving “attractive prices” as a short-term retail hook.

    Alibaba is betting big on erasing the line between online and offline and its futuristic vision of structuring retail around the way people actually want to shop. Based on the consistently impressive results of Singles’ Day year after year, “New Retail” has a promising future.

    If you wish to know more about how DataWeave aggregates data from online sources to provide actionable insights to retailers and consumer brands, check out our website!

  • Evolution of Amazon’s US Product Assortment

    Evolution of Amazon’s US Product Assortment

    As with many other product categories, Amazon has made a significant incursion in Apparel — a key battleground category in retail today. Recently, DataWeave once more collaborated with Coresight Research, a retail-focused research firm to publish an in-depth report revealing insights on Amazon’s approach to its US fashion offerings.

    Since our initial collaborative report in February this year, we have witnessed some seismic shifts in the category at both the brand and the product-type level.

    Research Methodology

    We aggregated our analytical data on more than 1 million women’s and men’s clothing products listed on Amazon.com in two stages:

    Firstly, we identified all brands included in the Top 500 featured product listings for each product subcategory in both the Women’s Clothing and Men’s Clothing sections featured on Amazon Fashion (e.g., the top 500 product listings for women’s tops and tees, the top 500 product listings for men’s activewear, etc.). We believe these Top 500 products reflect around 95 percent of all Amazon.com’s clothing sales. This represents 2,782 unique brands.

    We then aggregated the data on all product listings within the Women’s Clothing and Men’s Clothing sections for each of those 2,782 brands. This generated a total of 1.12 million individually listed products. This expansive list forms the basis for our highlights of the report.

    Third-Party Seller Listings Are Rising Sharply

    We identified a total of 1.12 million products across men’s and women’s clothing — a significant increase of 27.3 percent in the seven months between February and September 2018. The drivers of this sharp spike are third-party seller listings. In contrast, the report indicates only a 2.2 percent rise in first-party listings over the same period, compared to a 30.5 percent jump in third-party listings.

    In addition, Amazon has listed just 11.1 percent of all clothing products for sale, with third-party sellers offering the remaining 88.9 percent — an indication of the strength of Amazon’s open marketplace platform.

    A Major Brand Shift On Amazon Fashion Is Underway

    In just over six short months, major brand shifts on Amazon Fashion have taken place. The number of Nike listings has plummeted by 46 percent, driven by a slump in third-party listings following Amazon’s new partnership with Nike — a story recently covered by Quartz. Limited growth in Nike clothing first-party listings failed to compensate for this decline.

    Gildan’s spike in total product listings appears to be fueled by increased first-party listings off a low base. Calvin Klein’s 2017 agreement to supply Amazon with products appears to be driving the Calvin Klein brand’s double-digit uptick in first-party listings on Amazon Fashion.

    Aéropostale’s decline appears to be entirely driven by a drop in its third-party listings. The brand itself is not listed as a seller on Amazon.com.

    Amazon Is Rebalancing Its Apparel Portfolio and Switching Its Focus from Sportswear To Suits

    As its Fashion footprint rapidly matures, Amazon now appears to be rebalancing its portfolio with strong growth being shown in listings for formal categories such as suits and away from sportswear. We recorded a 98.6 percent increase in listings of women’s suits and blazers complemented by a 52.2 percent rise in men’s suit and sports coat listings between February and September 2018.

    Generic “Non-Brands” Are Surging On Top 25 Brands List

    Over the past six months, low-price generic brands have made major inroads into Amazon’s listings. Four unknown “brands” captured the top positions on the list of brands offered on Amazon Fashion. The WSPLYSPJY, Cruiize and Comfy brands appear to be shipped directly to customers from China.

    Source: Coresight/DataWeave (Amazon Fashion: Top 25 Brands’ Number of Listings, February 2018 vs. September 2018)


    Source: Coresight/DataWeave (Amazon Fashion: Top 25 Brands’ Number of Listings, February 2018 vs. September 2018)

    WSPLYSPJY alone accounts for fully 8.6 percent of Amazon men’s and women’s clothing listings. Cruiize accounts for a further 3.2 percent of listings while Comfy chips in another 3.1 percent.

    Amazon Appears To be Executing A Strategic Pivot

    Amazon’s fashion offering is fast maturing. We saw substantial growth in the number of listings for more formal categories. The realignment in third-party listings by Nike together with increased first-party listings for Calvin Klein and Gildan appear to be driven by alliances with Amazon.

    Simultaneously, ultralow-price generic clothing items delivered on order from China have inundated the “Most-Listed Products” rankings. Third parties now represent nearly 90 percent of Amazon Fashion’s offering.

    While Amazon Fashion shoppers enjoy a wider choice than they did even six months ago, we believe a stronger emphasis on first-party listings would grow the products eligible for Prime delivery. This tactic could strengthen Amazon Fashion’s long-term appeal as a shopping destination.

    If you’re interested in DataWeave’s technology, and how we aggregate data from online sources to provide unique and comprehensive insights on eCommerce products and pricing, check us out on our website!

  • Inside India’s eCommerce Battle: Attractive Offers Usher In The Festive Season

    Inside India’s eCommerce Battle: Attractive Offers Usher In The Festive Season

    It’s festival season in India again and shoppers took advantage of aggressive cutthroat competition between Indian online retailers to drive sales to unprecedented highs.

    All the major Indian eCommerce websites including, Amazon, Flipkart, Myntra, and Shopclues opted to go head to head by holding their first sale event this season over 4 to 5 days starting on the 10th of October. Still, as industry reports indicate, one retailer came out on top during this event — an insight supported by our analysis as well.

    A New Battleground

    The highlight this year was seeing how the announcement of global retail colossus Walmart’s acquisition of Flipkart would impact the sale events. The acquisition was the most influential development in India’s eCommerce sector, and it has transported a decades-long U.S. rivalry between Amazon and Walmart to Indian soil. As a result, this year’s sale event held out the promise of more attractive pricing and vast product selection for India’s consumers than ever before.

    Industry analysts estimate that the sale generated a cumulative Rs 15,000 crore in sales over the spread of the five sale days, a whopping outcome. In 2018, this translated into around a 64 per cent year-on-year growth outcome compared to the USD 1.4 billion (around Rs 10,325 crore) generated by the 2017 sales.

    The DataWeave Analysis

    At DataWeave, we analyzed the performance of each of the major eCommerce platforms including Amazon, Flipkart, Myntra, Paytm, and Shopclues. For each eCommerce website, we aggregated data on the Top 500 ranked products for over 40 product types spread across 6 product categories (Electronics, Men’s & Women’s Fashion, Furniture, Haircare, Skincare).

    We focused our analysis on only the additional discounts offered during the sale and compared them to prices prior to the sale, to reflect the true value of the sale to India’s shoppers.


    The battle of the discounts was led primarily by Flipkart and Amazon. Flipkart’s average additional discounts by category actually exceeded Amazon’s in three out of six categories, and it discounted more products that Amazon across all categories.

    Clearly, the focus for all e-tailers was skewed towards the main battlegrounds of Electronics and Fashion, compared to mainstream FMCG categories such as Hair and Skin Care. However, this is not surprising given FMCG functions on rather skinny margins.

    Across retailers, the Men’s and Women’s Fashion categories were the most aggressively discounted, attracting both the highest additional discounts and the highest percentage of products with additional discounts.

    The Furniture category too was an interesting battleground between Amazon and Flipkart, attracting attractive discounts on a wide range of products, particularly in Flipkart’s case.

    Prospective shoppers in search of relatively more expensive clothing products on discount during the sale would have established Myntra as their ideal destination, as it carried more premium products on discount during the sale, relative to all its competitors. For shoppers in search of an electronics bargain though, they would have done well to opt for Flipkart.

    Shoppers may have found some interesting deals on Paytm Mall too, especially in Men’s Fashion, while Shopclues largely held itself back from any dramatic price reductions.

    While Myntra capitalized on its niche though aggressive discounting in the Fashion category, most of the discounting action revolved unsurprisingly around Amazon and Flipkart. To drill down for a more complete understanding of just how the Amazon and Flipkart discounted their products, we conducted a more detailed follow-on analysis.

    We normalized additional discounts and popularity using a scale of 1 to 10 and plotted each product on a chart to analyze its distribution characteristics. Popularity was calculated as a combination of the average review rating and the number of reviews posted. Products with a popularity score of zero, as well as zero additional discounts were excluded from this analysis.


    The most obvious insight yield through this analysis is how Flipkart elected to distribute its additional discounts across a larger range of discount percentages. By contrast, Amazon went all in on the more limited range of products it decided to provide additional discounts on. This is a strategy we have seen Amazon adopt previously.

    One other intriguing insight is Flipkart’s decision to go for a much higher distribution of products falling below a popularity score of 0.5 compared to Amazon. Amazon’s strategy resulted in more of its discounted products having a higher popularity score, relative to Flipkart, albeit only by a comparatively minor amount. However, a shopper’s chances of buying a popular, positively reviewed product at a lower price were higher on Amazon than Flipkart during this sale.

    Achieving a Consistent Competitive Edge

    Flipkart claims to have recorded a 70 per cent plus share of entire Indian e-commerce market in the 4 day-BBD’18 sales. Flipkart further claimed to have cornered an 85 per cent share in the online Fashion category together with a 75 per cent share in the Electrical category’s large appliances during the sale. This includes a contribution by Flipkart’s subsidiary Myntra.

    As these numbers reflect, Amazon still has some way to go to entrench itself in the Fashion category of the Indian market. However, Amazon appears content to continue its surgical discounting philosophy.

    Overall, this year witnessed an impressive participation by Tier II and Tier III Indian city consumers — a sign of things to come in Indian online retail.

    With increasing competitive pressure, retailers simply cannot adopt discounting and product selection strategies in isolation and be successful. Having access to up to date insights on competitors’ products dynamically during the day is emerging as key to ensuring they’re able to sustain their lowest priced strategy for appropriate products. These insights are also proving critical in identifying gaps in their product assortment, which can hamper customer conversion and retention.

    During sale events, modern retailers need to rely on highly granular competitive insights on an hourly basis (or even more frequently) to inform their pricing and product strategies to ensure they consistently maintain a competitive edge for the consumer’s wallet. And while access to reliable competitive intelligence is critical, true value can only be derived when it gets integrated with a retailer’s core business and decision-making processes, such as assortment management, promotions planning, pricing strategies, etc.

    DataWeave’s Competitive Intelligence as a Service helps global retailers do just this by providing timely, accurate, and actionable competitive pricing and product insights, at massive scale. Check out our website to find out more!

  • Prime Day Sale: Unraveling the Highs and Lows of Amazon’s Flagship Event

    Prime Day Sale: Unraveling the Highs and Lows of Amazon’s Flagship Event

    Another year, another round of media frenzy, and another set of records broken.

    In only three years, Amazon’s Prime Day has evolved into one of the landmark sale events of the shopper’s calendar. Reports indicate that this year’s sale made a major splash, raking in over $4.2 billion in sales — a 33% increase compared to last year. Also, the retail behemoth shipped over 100 million products during the 36-hour sale. Amazon stated that they “welcomed more new Prime members on July 16 than on any other previous day in Prime history.”

    The much talked about website outage added some spice and drama to the proceedings during the first hour. However, this was fixed quickly.

    This year is also the first Prime Day with Whole Foods, Amazon’s most expensive acquisition, giving US shoppers unprecedented incentives to shop at the physical stores of the grocery retailer.

    However, Prime Day is not just about the US, but a truly global event. In India, as part of its promotions for Prime Day, Amazon leveraged VR to have people experience the products in their true form factor at select malls.

    At DataWeave, our proprietary data aggregation and analysis platform enabled us to keep an eye on the pricing and discounts of products during the sale. We tracked Amazon.com, Amazon.co.uk, and Amazon.in before (14th July) and during the sale (16th July) and monitored several product types in Electronics, Men’s Fashion, Women’s Fashion and Furniture categories. We captured information on the price, brand, rank on the category page, whether Prime was offered or not, etc. and analyzed the top 200 ranks in each product type listing page. To best indicate the additional value to shoppers during the sale, we focused our analysis only on additional discounts on products between the 14th and 16th of July.

    Scrutinizing the data yielded some rather interesting insights:

    Amazon UK was more aggressive with its discounts than the US and India across most categories, with Furniture being the only exception (highest discounts in the US).

    In the US, Women’s Fashion observed the steepest discounts (12%), though there were discounts available on a larger number of Men’s Fashion products (5% additional discount on 20% of products).

    While disparity between discounts on Prime products vs non-Prime was quite evident, it was surprisingly low for many categories. In fact, the Electronics category in the UK and the Furniture category in India witnessed sharper discounts for non-Prime products than Prime.

    Top categories by additional discount include Women’s Handbags, Sports Shoes, and Pendrives in the US, Sunglasses and Tablets in the UK, and Women’s Tops, Men’s Jeans, Women’s Sunglasses, and Refrigerators in India. Top brands include Nike, Amazon Essentials, Sandisk, and 1home in the US, Oakley, Toshiba, Belledorm, and rfiver in the UK, and Adidas, Sony, UCB, and Red Tape in India.

    As indicated in the following infographic, some of the most discoverable brands during the sale include Canon, Apple, Nike and Casio in the US, Sandisk, Amazon, Levi’s, and Ray Ban in the UK, and Nikon, UCB, Whirlpool, and HP in India. Discoverability here is measured as a combination of the number of the brand’s products in the top 100 ranks and the average rank of all products of the brand. Also in the infographic, is a set of products with high additional discounts during the sale.


    Amazon’s competitors though aren’t ones that simply roll with the punches.

    Flipkart, Amazon’s largest competitor in India (recently acquired by Walmart), announced its own Big Shopping Days sale between July 16 and July 19. On Prime Day, the company joined in with some attractive offers:

    • 8%, 10%, and 7% additional discounts on 11%, 29%, and 16% of Electronics, Men’s Fashion, and Women’s Fashion categories, respectively.
    • 35% off on Perfect Homes 3-seater Sofa
    • 27% additional discount on Acer Predator Helios Gaming Laptop
    • 25% additional discount on Sandisk 16GB Pen Drive

    Propelling the Amazon Flywheel

    While Amazon clearly benefits in the short-term with this sale, the long-term effect of feeding its famous flywheel is evident as well.

    Amazon’s flywheel is a framework through which the company looks to build a self-feeding platform that accelerates growth over time. Attractive discounts and a broad selection of products improves customer experience, which increases traffic to the website, which attracts more merchants on its platform, who in turn broaden the selection of available products.

    Sale events like Prime Day create the sort of hype needed to draw a lot of traffic to Amazon’s website, generating momentum that has a compounding effect on Amazon’s growth. Not surprisingly, more than half of the people surveyed in the US by Cowen last December said they lived in a household with at least one Prime subscription.

    As Amazon’s stock traded at an all time high following Prime Day, it’s only a matter of time before the company becomes the world’s first trillion dollar company.

    Check us out, if you’re interested in learning more about our technology and how we provide Competitive Intelligence as a Service to retailers and consumer brands.

  • Clearance Sale Analysis: Retailing Woes Stagger H&M and Toys “R” Us

    Clearance Sale Analysis: Retailing Woes Stagger H&M and Toys “R” Us

    Confidence amongst retailing analysts was rocked last month by two successive announcements.

    H&M’s most recent quarterly report, which revealed it had accumulated over $4.3 billion in unsold inventory, shocked retail analysts. In an era of on-the-fly inventory replenishment where stocks are closely matched to sales, a spike in unsold inventory is a strong indicator of trouble ahead. The news left analysts questioning H&M’s competitiveness in the fiercely contested global apparel category, where ever-changing consumer preferences demand agility in managing inventory levels.

    In the other major announcement, Toys “R” Us officially closed its doors to shoppers. The retailer’s losses continued to pile up and the chain groaned under a mountain of debt, leaving it little choice but to close down. “The stark reality is that the (chain is) projected to run out of cash in the U.S. in May,” it said in its bankruptcy filing.

    While the emergence of the online shopping phenomenon hasn’t helped Toys “R” Us, its ongoing afflictions largely reflect strategic missteps that predated the online shopping boom. In a category where the shopping experience is all, the retailer failed to adapt to changing consumer expectations. The warehouse context which shaped the retailing did little to promote toys sales or communicate the sheer breadth of inventory carried by Toys “R” Us.

    So, as Toys “R” Us begins to wind down its operations, the company has shuttered its online store and is channeling customers to its remaining physical retail outlets. However, prior to the closure, shoppers enjoyed some amazing bargains during their clearance sale.

    H&M’s problems appear less terminal. Its management claim to have implemented a strategy to slash its accumulated inventory and reign in its aggressive store expansion strategy.

    At DataWeave, we leveraged our proprietary data aggregation and analysis platform to analyze the clearance sales of both H&M and Toys “R” Us. We tracked the pricing, product categories, discounts, review ratings, stock status and more between 29-Mar and 3-Apr.

    The Toys “R” Us Sale


    Although the dolls and stuffed animals category carried the most products, its average discount was along the mid-range point for the sale at 28 percent. Games & Puzzles and Action Figures and NERF were the most heavily discounted categories at 40 percent and 36 percent respectively.

    As anticipated, products with lower review ratings were sold at slightly higher discounts. However, even exclusive products were sold at comparatively high discounts. Not surprising, given this was effectively a clearance sale.

    Hasbro, Mattel, and Spin Master were the highest represented brands during the sale, while for their part, Kid’s Furniture and Outdoor Play had fewer products participating in the sale. Other popular brands such as Fisher-Price and LEGO had a presence during the sale but offered fewer products.

    Zuru was the most aggressive in offering discounts with Spin Master the least aggressive. The remaining brands offered discounts of between 30 and 36 percent.

    Reports suggest that last year, toymakers Mattel and Hasbro each sold around $1 billion worth of their toys at Walmart, more than the volume they achieved selling through Toys “R” Us. Strategically, these leading brands seem to have their bases covered even though Toys “R” Us is closing down.

    Interestingly, some products were seen to go out of stock during the sale week, only to be replenished a day later, as illustrated in the above infographic.

    The H&M Sale

    Overall, H&M’s clearance sale was more aggressive in Women’s Apparel with three times more products on offer than for Men’s Apparel. However, there wasn’t much difference between the two in terms of the discounts on offer which hovered around the 45 percent range. Women’s Tops, Cardigan’s and Sweaters offered discounts on the most products during the sale period.

    Little difference was observed tactically, between how the different product categories, were handled.

    We saw a significant movement of products in Women’s apparel during the week, with over 330 newly added products and close to 200 products that were effectively churned. This pattern indicates H&M achieved a faster shelf velocity for this category than for Men’s, possibly due to a more aggressive approach to the selection of items on sale.

    Customer focus is key

    Reports indicate that despite a series of widespread and aggressive markdowns as shown in the analysis above, H&M is struggling to sell off its mountain of accumulated merchandise. Changing consumer tastes and increasing competition seem to have taken their toll on the once agile Swedish retailer. If it is going to weather this storm, H&M needs to revisit its fast fashion approach to assortment and inventory management. The retailer would also appear to need to improve its demand forecasting expertise.

    The bankruptcy filing by Toys “R” Us presents yet another lesson for eCommerce and bricks-and-mortar retailers alike, to address evolving consumer expectations and focus closely on the customer experience aspect of their business, which are supported by appropriate pricing and product assortment strategies.

    At DataWeave, our technology platform enables retailers to do just that, through comprehensive and timely insights on competitive pricing, promotions, and product assortment. Check out our website to find out more!


  • Amazon’s Fashion & Apparel Product Assortment | DataWeave

    Amazon’s Fashion & Apparel Product Assortment | DataWeave

    Apparel remains one of the key battleground categories in retail today, and like in most other product categories, Amazon has made significant in-roads here. Beyond expanding the range of product offerings and brands in its marketplace, Amazon has also launched several private label brands in this vertical and looked to drive more sales as a first-party seller.

    Recently, DataWeave collaborated with Coresight Research, formerly known as Fung Global Retail & Technology, a retail-focused research arm of Li & Fung Group, to publish an in-depth report revealing Amazon’s strategic approach to product assortment in its fashion and apparel category.

    In this blog post, we’ll summarize some interesting insights into Amazon’s strategy from the report. For an in-depth and detailed view, check out the original article at — “Amazon Apparel: Who Is Selling What? An Exclusive Analysis of Nearly 1 Million Clothing Listings on Amazon Fashion

    Research Methodology

    Our analysis focused on several critical areas, including the presence of Amazon’s private label, the demarcation between Amazon as a seller and its third-party sellers and the top brands and categories in women and men’s apparel.

    We aggregated data from Amazon.com in two stages:

    Firstly, we identified brands with a meaningful presence in Amazon’s clothing offering by identifying all brands included in the top 500 ranks of featured product listings for each product type in the Women’s Clothing and Men’s Clothing sections on Amazon (e.g., the Top 500 product listings for women’s tops and tees, the Top 500 product listings for men’s activewear, and so on.). This generated a total of 2,798 unique brands.

    Secondly, we aggregated our data on all product listings within the Women’s Clothing and Men’s Clothing sections for each of the 2,798 brands identified previously. This returned a total of 881,269 individually listed products. This extensive list forms the basis for the highlights in Coresight’s report.

    Coresight’s Analysis — Some Interesting Insights

    Strategically, Amazon remains heavily reliant on its third-party sellers in the clothing category. In total, just 13.7 percent of women’s and men’s clothing products featured on Amazon Fashion are listed for sale by Amazon itself (first-party sales), while third-party sellers account for 86.3 percent of listings.

    In womenswear, third-party sellers account for 85.7 percent of listings, while in menswear, they account for 87.1 percent of listings. Moreover, Amazon appears to be focusing its first-party clothing inventory on the higher-value categories. Clearly, the retailer’s reliance on third-party sellers underscores its opportunity to grow its sales of apparel volumes by bringing more of its current inventory in-house.

    The analysis found 834 Amazon private-label products on Amazon website, equivalent to 0.1 percent of all clothing available through Amazon Fashion. The company’s private labels appear to be clustered tightly in specific clothing categories.

    Womenswear brand Lark & Ro is by far the biggest of Amazon’s apparel private labels, as measured by the number of items.

    Nike is the most-listed brand on Amazon Fashion, with 16,764 listed products spanning womenswear and menswear. Lower-price brands such as Gildan and Hanes also rank very highly in terms of the number of products listed.

    Value-positioned brands that have traditionally focused on wholesaling to retailers, such as Gildan and Hanes, also rank very highly in terms of the number of products listed.

    What is clear is that currently, Amazon’s clothing listings are highly diluted, with no one major brand dominating the listings.

    Interestingly, casualwear and activewear clearly lead Amazon’s category rankings. Women’s tops and tees are the most heavily listed clothing category on Amazon Fashion, with 138,001 products listed.

    Men’s shirts, which includes a large number of casual shirts together with polo shirts and some T-shirts, comes in second, with 109,043 products listed. Echoing the prominence of the global Nike and Adidas brands on the Amazon website, activewear has achieved a centre of gravity status as a category, accounting for 76,930 men’s activewear products and 51,992 women’s activewear products listed on the site.

    Several Opportunities for Growth

    Amazon Fashion remains heavily dependent on third-party sellers. It’s a fair assumption that more first-party listings would attract greater numbers of shoppers, especially Amazon Prime members. Amazon’s private-label ranges represent another potential lever for growth.

    Also, the 30 most-listed brands on Amazon Fashion comprise 30 percent of all clothing products listed on the website, while just 189 brands have more than 1,000 products each listed on the website.

    This data indicates the presence of major growth opportunities across the board, be it Amazon private label brands, Amazon as a seller, and for several mid-range clothing brands.

    If you’re interested in DataWeave’s technology, and how we aggregate data from the Web to provide unique and comprehensive insights on eCommerce products and pricing, check us out on our website!

  • Boxing Day Sale: How UK’s Top Retailers and Brands Fared

    Boxing Day Sale: How UK’s Top Retailers and Brands Fared

    Following a successful Black Friday in November, the United Kingdom geared up for the 2017 Christmas season in December. Analysts estimate the total splurge in December at about £45 billion, beating last December’s record of £43 billion.

    Online sales hit £1.03billion, passing the £1billion threshold for the first time and up 7.9 percent on 2016’s £954million, according to the Centre for Retail Research. The rise of online shopping together with the timing of Christmas in 2017 meant shopper footfall in physical stores was lower than in previous years as people increasingly moved to shopping online.

    Total shopper numbers were 4.5 percent down on the previous year, according to research group Springboard, which may reflect the growing strength and reliability of online’s product range and delivery responsiveness.

    Major online retailers though continued to pull out the big discount guns across categories in an effort to attract online shoppers on Boxing Day, the biggest sale event in December.

    At DataWeave, we focused our proprietary data aggregation and analysis platform to analyze the top 500 ranked products in over 20 product categories across electronics and fashion retailers in the UK. Our analysis included several top UK retailers, which include Amazon, Argos, Currys, Tesco, Asos, Marks & Spencer, and Topshop.

    The discounts in the infographic below indicate the magnitude of reduction in prices during the sale (26th Dec), compared to before the sale (19th Dec), in order to best represent the additional value derived from the sale for shoppers.


    Boxing Day Sale Highlights

    In electronics, while Amazon offered discounts on the most number of products, Argos was aggressive in the average size of its additional discounts.

    Surprisingly, Amazon appeared to be much more conservative in the Men’s Fashion category with an average additional discount of 13.8 percent, spanning 341 products. Here, Asos deployed the most aggressive combination of high average additional discounts (36.9 percent) on a large number of products (165).

    Marks & Spencer focused their targeted discounts (43.1 percent) on a tight set of Men’s Fashion products (45), while interestingly, the story almost reverses in Women’s Fashion, where both M&S (43.1 percent, 281 products) and Topshop (40.5 percent, 226 products) were aggressive in what turned out to be a critical battleground category.

    Leading brands weren’t left out of the discounting action either, with the largest discount on offer going to Ruche (48.9 percent on 33.3 percent) women’s tops, closely followed by M S Collection (41.9 percent on 32.3 percent) handbags and Asos’ (37.5 percent on 21.2 percent) men’s jeans.

    Most Discoverable Brands

    We also analysed the most discoverable brands in each product type. This was measured as a combination of the number of the brand’s products present in the Top 500 ranks of a product type, as well as the average rank (lower the number, higher is the discoverability).

    It was no surprise that Canon DSLR cameras were highly discoverable on Amazon with 90 products, along with an average ranking of 93.2, while 34 Asus laptops recorded an average ranking of 85.2. At Argos, 57 Acer laptops recorded an average ranking of 73.4 while 50 LG televisions delivered an average ranking of 124.1.

    Other highly discoverable brands included MS Collection in Marks & Spencer, Apple iPhones and Tablets on Curry’s and Tesco.

    The Online Retail March Continues

    If we look at sales results across the world, from the United Kingdom to the United States, to Asia in countries such as India, Singapore and Indonesia through to Australia, online retail is aggressively cannibalizing traditional bricks and mortar in-store retail sales. Online retail’s demonstrated superiority in exploiting competitive intelligence and a sophisticated suite of analytics that accompany digital transactions, is surfacing in its agile discounting strategies, and its ability to continuously refresh product lines during key sales periods.

    This Boxing Day in the UK, fashion proved to reveal divergent discounting strategies between retailers, while only marginal differences in approach were visible in electronics — both high volume categories around Christmas season.

    Overall, December 2017 in UK marked a strong validation of online retail’s influence and we can expect a continuation of it’s ability to harness discounting with extensive product offerings, in order to lure shoppers away from in-store.

    If you’re interested in DataWeave technology, and how we deliver Competitive Intelligence as a Service to retailers and consumer brands, check out our website!


  • Myntra Leads End of Year Promotions in Fashion

    Myntra Leads End of Year Promotions in Fashion

    Following three back-to-back mega-sale events leading up to Diwali, India’s eCommerce companies once again opened the discount floodgates heralding Christmas and New Year. This time around, Fashion was the battleground category of focus for Indian e-retailers.

    Myntra launched its End of Reason Sale held between 22nd and 25th December. eCommerce behemoth Amazon too announced its own grand Amazon Fashion Wardrobe Refresh Sale on the same days, while Flipkart hit the market with its End of Year Bonanza held on the 24th and 25th of December. Paytm and Snapdeal held sale events as well, starting 23rd December. All competing sale events promised consumers up to 80 percent discounts across a range of products, especially in Fashion.

    At DataWeave, we analyzed and reported on the competing pricing strategies of Amazon, Flipkart, Myntra, Paytm, and Snapdeal. In the following infographic, we look specifically only at additional discounts offered on the top 500 ranked products of over 15 product types during the sale, compared to those before the sale events went live.

    Myntra Gets Aggressive

    Myntra elected to discount over 84 percent of its Top 500 ranked Fashion products encompassing each product category, with an average additional discount percentage of over 25 percent offered during the sale.

    A prime example of this discounting approach was the sports shoe segment, which received an aggressive additional discount of 28 percent on over 93 percent of the Top 500 ranked sports shoes. Similarly, Myntra’s additional discounts ranged from between 22 percent and 25 percent across most product types, including T-shirts, Shirts, Handbags, Jeans, Skirts, Sunglasses, and Watches. The fashion e-retailer’s private label brands enjoyed attractive reductions in prices, which include Hrx and Roadster, along with other brands like Red Tape, Nike, and Puma.

    Amazon Discounts To A Different Beat

    Amazon discounted 35 percent of its Top 500 ranked Fashion products in each product type, with an average additional discount percentage of 12.5 percent during the sale. Given Amazon’s track record of dynamic pricing, this was relatively conservative.

    Overall, additional discounts on Amazon ranged between 4 percent and 16 percent across all product types in Fashion. Top brands discounted on Amazon included Adidas, Fastrack, Hush Puppies and Ray-Ban.

    Flipkart Joins The Party

    Flipkart too joined the End of Year discount action with several attractively positioned offers, exceeding those featured on Amazon. Flipkart discounted over 65 percent of its Top 500 ranked Fashion products in each product type, with an average additional discount percentage of over 14 percent during the sale.

    Additional discounts promoted on Flipkart ranged between 8 percent and 22 percent across all Fashion product types, while some of the top discounting brands included Dkny, Metronaut and United Colors of Benetton.

    Conspicuously, other Indian e-retailers like Paytm and Snapdeal chose not to join in the price war. Snapdeal, especially, has consistently offered only moderate additional discounts during recent sale events, choosing to focus more on other areas of improving the user experience for their shoppers.

    Strategic Focus On Profitability

    In contrast to the profit-sapping Diwali sale season, characterized by steep discounts across all product categories, this end of year sale was more concentrated, largely honing in on Fashion. From a strategic and shareholder perspective, limiting the discounting action to Fashion insulated the retailers’ bottom line from another major profit hit.

    Myntra determinedly reaffirmed its leadership status in the Fashion category, with its highly aggressive discounting strategy. This was well received by shoppers, who spent a staggering ₹5 crore in only the first five minutes of the sale.

    Flipkart opted to double down this time around with attractive offers on its own eCommerce platform as well. The e-retailer, currently locked in a battle with Amazon for leadership in India’s eCommerce sector, had acquired Myntra in 2014 in a bid to strengthen its position in the fashion category.

    Amazon, intriguingly, opted for a more conservative approach to its end of year sale than we are used to witnessing from the eCommerce giant. As we enter the new year, and kickstart yet another cycle of aggressive e-retail promotions in India, there will be ample opportunities to see if this is evidence of a rethink in Amazon’s approach to pricing in India.

    If you’d like to know more about DataWeave’s technology, and how we provide Competitive Intelligence as a Service to retailers and consumer brands, check out our website!


  • Tracing Lazada’s Pricing Across the Month-Long Online Revolution Sale

    Tracing Lazada’s Pricing Across the Month-Long Online Revolution Sale

    Commencing on the 11th of November and ending just a few days ago on the 12th of December, Southeast Asia’s biggest sale event, the Lazada Online Revolution sale rewrote the record books.

    This mega-shopping event is held simultaneously across six Southeast Asian countries, spanning Singapore, Malaysia, Thailand, Indonesia, the Philippines and Vietnam and was bookended by its two biggest sale days, on 11.11 and 12.12.

    In an earlier blog post, we published a highly detailed analysis of the sale on 11.11, using DataWeave’s proprietary data aggregation and analysis platform. This post zoomed in on the pricing and product strategies of Lazada and its competitors in Singapore and Indonesia.

    On the 12th December, Southeast Asian shoppers shattered all retailing expectations by reportedly spending a record-breaking $250 million. This was double both this year’s 11.11 sale and last year’s 12.12 sale. According to Forbes, the 12.12 sales became such a hit that Indonesia even designated the day to be its National Online Shopping Day, or Harlbonas.

    At the end of the sale event on 12th December, DataWeave assimilated all the data we collated throughout the Online Revolution sale and examined pricing trends across the entire span of four weeks, exploring each retailer’s strategy by brand, by category, and by product type.

    We aggregated pricing information on the Top 500 ranked products of over 20 product types featured on each website (Lazada, ListQoo10, and Blibli), spread across the critical Electronics and Fashion categories, covering over 120,000 products in total.

    Online Revolution — Singapore

    Interestingly, one of the trends that became immediately apparent, was the relatively stable track of the average absolute discounts in Electronics, Men’s Fashion, and Women’s Fashion. No significant spikes or drops were evident throughout the duration of the entire sale season.

    Similarly, the number of discounted products remained relatively stable. However, in Electronics, there was a conspicuous dip in the number of discounted products, which occurred on the 21st of November. Aside from this anomaly, even the number of products discounted remained relatively stable. The other interesting phenomenon was an uptick in the number of discounted products on the 15th of December, after the Online Revolution sale — something counterintuitive.


    When we explored the behaviour of the average MRP of discounted products, we noticed a sharp dip on the 21st of November. Clearly, prices were increased specifically on higher-priced electronic products.

    Comparing these numbers with those of ListQoo10’s, who were forced to adopt a more aggressive stance on pricing to stay competitive through this period, we once again see a very consistent discount percentage throughout this period. The average discount in men’s fashion, however, showed a slight upward trend during this period.

    ListQoo10’s number of discounted products in Electronics dipped as well on the 21st of November, demonstrating the retailer’s ability to dynamically react to competitor strategies. This can be evidence of a robust market monitoring system.

    Returning to Lazada, DataWeave identified several product types displaying a significant variation in average discounts through this period. These included men’s shorts, women’s shoes, men’s Jeans, Laptops, DSLR Cameras, and women’s T-shirts.


    Once again, our analysis pointed to substantial competitive activity around the 21st of November, together with a second significant dip in discounts on men’s shirts in the period around 5th December. Discounts on women’s shoes, by contrast, proved to be a roller coaster throughout the entire sale period.

    Some of the brands with high variation through this period were Lenovo Laptops, Levi’s T-shirts, Adidas Women’s Shoes, Seiko Watches, and Sony Phones.


    Discounting activity by these brands appeared to be all over the place during this period, without any discernible pattern or structure. While Sony predictably lowered discounts on its phones after 12.12, Levi’s increased its discounts in the same period

    Online Revolution — Indonesia

    Moving on to Indonesia, we once again witnessed a similar approach to average discounting by category as we saw emerge in Singapore. At a category level, the retailer evidently opted for trading within a narrow discount band across the sale period rather than attempting to inject an overly dynamic discounting approach into their sale execution.


    This is not to say there were not some surprises in store with the number of discounted products in Indonesia. In electronics, there was a noticeable dip in the number of discounted products just ahead of the 12.12 sale. The number of discounted products then surprisingly surged after the 12.12 sale, in combination with a slight reduction in average discount percentage during the period.

    In comparing Blilbi, Lazada’s main competitor in Indonesia, we see a fairly consistent discounting level throughout the sale period, although markedly lower than those rolled out by Lazada across its three core categories.

    This approach held true even for the number of discounted products. Blibli seems to have been content to take a backseat to Lazada during the heavily promoted Online Revolution sale period, rather than attempting to compete aggressively in any single category.

    It will be interesting to see if Blilbi is content to repeat this strategy in 2018 as it effectively surrenders the discounting high ground to Lazada during the peak sales period. While this strategy may yet be proven to have paid off in terms of profitability, it may have undesirable consequences for Blilbi’s brand and share performance in the longer term.

    Returning our focus to Lazada in Indonesia, some product types showed major variation through the sale period, specifically DSLR Cameras, which dipped significantly approximately a week out from the 12.12 sale. However, compared to Singapore, Indonesian discounts by product types appeared relatively more stable, except a few dips prior to 12.12.

    Three distinct discounting strategies appears to have been adopted by participating brands. Some, such as Electrolux (Refrigerators), opted for a comparatively stable discounting approach. Others, like Apple, increased prices through the sale period, while Alienware, reduced prices through the sale period.

    In particular, Apple’s pricing approach to its iPhones was surprising, given its strong partnership with Lazada during this Online Revolution sale. Yet another example where the marketing hype failed to translate into an aggressive discounting strategy.

    More Talk Than Walk

    For Lazada, the Online Revolution sale proved to be a triumph, effectively extending its record-breaking streak with USD 250 million in sales on 12.12 alone. However, on parsing through the pricing across the entire month of the sale, there is clearly no dramatic increase in discounts either on 11.11 or on 12.12 — some anomalies notwithstanding.

    This goes to show that much of the sales is driven by hype, more than the additional value of discounts. To be fair, 11.11 and 12.12 hosted discounts on some of the more premium products in the assortment, while discounts on most of the mid-range products remained consistent. While some competitors like ListQoo10 chose to stay competitive, so as not to lose out significantly on their customer base and market share, others like Blilbli chose to sit and watch, and pick up on what’s left after the sale.

    This year’s Online Revolution has set the bar high for South East Asian retail, and going by how the event has grown over the last few years, few would be surprised if we witness another record braking sale in 2018.

    If you’re interested in DataWeave’s technology, and how we provide Competitive Intelligence as a Service to retailers and consumer brands, check us out on our website!


  • Thanksgiving, Black Friday and Cyber Monday Parade Discounts in Fashion

    Thanksgiving, Black Friday and Cyber Monday Parade Discounts in Fashion

    Fashion has always been one of the great engines of retail, and two of its iconic sale events are Thanksgiving and Black Friday. While Black Friday was traditionally an in-store shopping event, a large number of shoppers have migrated online taking much of the sales action with them.

    Despite shoppers typically liking to be able to touch and feel fashion and apparel products prior to purchasing them, the convenience of online shopping combined with time-poor shoppers returning to work after their Thanksgiving break has triggered changes to consumer behavior. Today, the retail narrative has shifted to focus on online, with this year’s Thanksgiving weekend turnover up 6.8 percent from last year.

    At DataWeave, using our proprietary data aggregation and analysis platform, we have been tracking the pricing and product information of the Top 500 ranked Fashion products across 15 product types on Amazon, Walmart, Target, Bloomingdales, JC Penney, Macy’s, Neiman Marcus, and Nordstrom.

    Our primary focus was to compare the three key days of the Thanksgiving weekend: Thanksgiving Day, Black Friday, and Cyber Monday. We performed an in-depth analysis of discounts offered across product types and brands, together with how dynamic retailers were in both their pricing strategy and products displayed.

    (Read also: Thanksgiving vs Black Friday vs Cyber Monday: The Electronics Price War Heats Up)

    In analyzing these monster sale events, we observed a range of products sneaking through to enjoy high absolute discounts, but offer no additional discounts during the sale, i.e. prices remained unchanged between before the sale and during each day of the sale, even though high discounts were advertised. The following infographic highlights some of the products where this phenomenon was observed.


    Having identified the aggressive use of high but unchanged absolute discounts among the retailers during the sale, we focused our analysis on the additional discounts offered on each of the days of the sale, compared to before the sale (we considered 11.21), in order to more accurately reflect the true value these sale events deliver to American shoppers.

    The following infographic provides some interesting insights from our analysis along several perspectives, including additional discounts offered, top brands, quality of product assortment, number of price changes, and more. All indicated prices are in USD.


    Our analysis illustrated how aggressive Target was in its strategy for discounting fashion, compared to most other retailers, especially on Thanksgiving and Black Friday. Interestingly, while Macy’s offered reasonably attractive discounts across all product types, it chose to offer them on a much larger product set than any other retailer.

    Overall, the level of discounts, together with the number of products they were offered on, shows no dramatic change for each retailer over the three-day sale period.

    With Neiman Marcus however, we observed a unique pattern. Sharp discounts were offered on Thanksgiving and Black Friday, which were subsequently rolled back completely on Cyber Monday. This represents a clear holiday pricing and discount strategy, albeit conducted on a comparatively compact and highly targeted set of products.

    Other sales discounting phenomena we observed include major discounts on Sunglasses, Shoes, Skirts, and T-shirts across all retailers, clearly representing battleground categories, while some of the top brands offering attractive discounts include Ray Ban, Oakley, Levi’s and Nike.

    Another relatively constant factor across each of the sale days was the average selling price of respective retailers. This parameter indicates how premium each retailer’s product mix is, providing another perspective on each retailer’s customer segment targeting strategy.

    As expected, Target, Walmart and JC Penney housed the more affordable set of products (average selling prices of $25, $31, and $45 respectively). At the other end of the premium spectrum, Neiman Marcus — home to luxury brands and products — adopted a more premium product assortment (average selling price between $820 and $914).

    In fashion, presenting a fresh assortment consistently is key to customer retention, and Amazon leads the pack in this regard, with a product churn rate of 50% in the top 100 ranks each day. Contrast that with Walmart and Target, who follow a more traditional approach, with a largely static set of options to choose from in its top ranks.

    Most of the retailers we analysed implemented several price changes to large percentages of their product sets. Macy’s and Walmart were at the forefront of this dynamic pricing activity. While Bloomingdales too made over 1,300 price changes, the average magnitude of these changes proved to be very high, at 206 percent.

    Fashion Fast-Forwards Its Online Sales

    While the memories of frantic shoppers tussling over fashion and apparel items on Black Friday still linger, they are fast receding as online fashion sales turnover goes from strength to strength. Shoppers are firmly placing long, winding queues in their rearview mirror and embracing the digital shopping cart more with each passing year, as spotlighted this Thanksgiving sale weekend.

    Sunglasses, Shoes, Skirts, and T-shirts emerged as key battleground categories for retailers over the weekend, while individual retailers displayed diverse approaches to capturing and retaining market share with their target demographic — quite assuredly while using modern retail technologies that help develop and execute on competitive strategies.

    As retailers move into the Christmas sales phase it will be fascinating to discover how they are evolving their ability to dynamically change pricing, refresh product categories and focus their shopper promotions.

    Visit our website, if you’re interested in DataWeave’s technology and how we provide Competitive Intelligence as a Service to retailers and consumer brands.


  • Under the Microscope: Lazada’s 11.11 Online Revolution Sale

    Under the Microscope: Lazada’s 11.11 Online Revolution Sale

    Lazada’s signature event, Online Revolution, is a month-long sale extravaganza that commenced with a Mega Sale on 11 November, and culminates in an End-Of-Year sale on 12 December. The shopping event is held across six southeast Asian countries — Singapore, Malaysia, Thailand, Indonesia, the Philippines and Vietnam — making it the region’s biggest retail event.

    Lazada Group’s chief executive officer Maximilian Bittner observed, “We aim to provide Southeast Asia’s rapidly growing middle-class the access to a wide range of products with deals and discounts that were previously available only abroad or in the capital cities.”

    On 11.11, the first Mega Sale, shoppers took advantage of great deals, ordering 6.5 million items (nearly doubling last year’s tally), resulting in sales of US$123m, annihilating last year’s takings by a whopping 191 percent.

    At DataWeave, our proprietary data aggregation and analysis platform enabled us to seamlessly analyze and compare Lazada’s discounts during 11.11 with those of its competitors. We focussed specifically on two markets — Singapore and Indonesia. While the sale itself is Lazada’s, we looked at its immediate competitors as well, to study how competitively they position themselves during Lazada’s sale.

    For our analysis, we aggregated pricing information on the Top 500 ranked products of over 20 product types on each website, spread across Electronics and Fashion, covering over 120,000 products in total.

    11.11 — Singapore

    In our analysis, we scrutinized the additional discounts offered by Lazada, ListQoo10, and Zalora during the sale period, compared to prices leading up to the sale. As today’s shoppers often encounter deep discounts on several products even on normal days, our analysis of additional discounts offered during the sale more accurately reflects the true value of the sale event to shoppers.

    In the following infographic, all prices are in Singapore Dollars, and additional discounts are the percentage reduction in price on 11.11 compared to 10.11.

    Lazada’s discounting strategy was more focused on Fashion rather than Electronics. However, Lazada didn’t have it all its own way with Zalora providing comparably high discounts, enabling it to compete effectively, especially in Women’s Fashion (16.2 percent on 406 products).

    Zalora actually exceeded Lazada in the number of additionally discounted products on offer (Zalora 406, Lazada 347). ListQoo10 did not match either Lazada or Zalora’s level of discounting.

    While Lazada held a more premium, high-value product mix in Electronics compared to ListQoo10, it chose to target the more affordable segment in Fashion, with both ListQoo10 and Zalora displaying a higher average selling price in each category.

    Interestingly, Lazada refreshed very few of its Top 500 products during the sale, limiting new options to choose from for its shoppers. On the other hand, Zalora refreshed 22.5 and 22.8 percent of its products in men’s and women’s fashion respectively.

    11.11 — Indonesia

    Using a similar methodology to our Singapore analysis, we analyzed Lazada’s promotions against Blibli and Zalora, three of the top eCommerce websites in the region. In the following infographic, all currencies are in Indonesian Rupiah.

    As with its Singapore strategy, Lazada targeted Fashion as the lead category for discounts in Indonesia. It offered steep discounts in both Men’s and Women’s Fashion (around 18 percent in each) across a large number of products (550 and 776 respectively). While Zalora matched and occasionally exceeded the discounts offered by Lazada, it did so across a significantly smaller range of additionally discounted products.

    Surprisingly, Electronics were de-emphasised in Indonesia (4.1 percent compared to 9 percent in Singapore).

    Compared to the market leaders Lazada and Zalora, Blibli struggled to be competitive from both an absolute discount level and a product assortment perspective.

    Like in Singapore, Lazada looked to be targeting the affordable value end of the product mix spectrum across all categories, and introduced very few new products in its Top 500 ranks.

    Zalora had a healthier churn rate of 14.6 percent and 18.1 percent in Men’s and Women’s Fashion, compared to Lazada’s 9.1 percent (Electronics), 10.7 percent (Men’s Fashion) and 10.8 percent (Women’s Fashion).

    It’s Not Just About Discounts

    Lazada’s ‘Fashion First’ targeting strategy creates an effective tie-in to its broader model of surfing the convergence wave between entertainment and eCommerce, something unique to southeast Asia.

    Together with sumptuously attractive discounts, major sale events in South East Asia are fast becoming characterized by entertainment. By launching Southeast Asia’s first star-studded eCommerce TV show, Lazada continues to be the region’s eCommerce innovator, following in the footsteps of its pioneering parent company, Alibaba.

    While time will tell how effective Lazada’s strategy ultimately proves to be, together with Alibaba, it has set up a fascinating and uniquely Asian retail sale model. No doubt another milestone will be set on 12.12 when the Online Revolution Mega Sale returns with even greater deals. At DataWeave, we’ll be sure to analyze that sale as well and bring you all its highlights.

  • Black Friday Sales Season: How US Retailers Are Gearing Up

    Black Friday Sales Season: How US Retailers Are Gearing Up

    In today’s rapidly evolving online and mobile worlds, few things encapsulate the competitive nature of the online retail battlefield like the Black Friday sales season. With this year’s Black Friday and Cyber Monday sale events just around the corner, 2017 promises another titanic tussle between contenders.

    The holiday shopping season commences on Black Friday, November 24, and continues through much of December. Anticipating the sales season, many retailers are already offering discounts on several key categories and anchor products, providing a sneak peek into what we can expect towards the end of the month.

    While traditionally, Black Friday sales were dominated by brick and mortar retail stores, with the odd shopper stampede not unheard of, retail dynamics have changed in the recent past. Online sales now consume a larger proportion of Black Friday spending, and for the first time, consumers are expected to spend more online in the 2017 holiday season than in-store.

    In anticipation of this mammoth sale event, we at DataWeave trained our proprietary data aggregation and analysis platform on several major US retailers to understand the competitive market environment before the sales kick off.

    Between the 15th and 29th of October, we tracked the prices of the top 200 ranked products each day in the Electronics and Fashion categories across several major retailers. For Electronics, we analyzed Amazon, Walmart, Best Buy, and New Egg, while Amazon, Walmart, Bloomingdales, Nordstrom, Neiman Marcus, New Egg, and JC Penney provided our insights into the pivotal Fashion category. Product types analyzed include mobile phones, tablets, televisions, wearables techs, digital cameras, DSLRs, irons, USB drives, and refrigerators in Electronics, and T-shirts, shirts, shoes, jeans, sunglasses, watches, skirts, and handbags in Fashion.

    Automated Competitive Pricing Is the New Norm

    With the accelerated evolution of online commerce, retailers have increasingly harnessed the power of competitive data to drive changes on the go to their pricing, product assortment, and promotional strategy. During sale events, however, these numbers spike significantly. Amazon famously made 80 million price changes each day during 2014’s Christmas Season sale. Similarly, even on normal days some retailers have adopted the tactics of changing their product pricing more frequently than others, in their quest to stay competitive and build their desired price perception amongst shoppers.

    In our analysis of price changes, we considered the set of products that ranked consistently in the Top 200 from the 20th to the 25th of October. We identified the number of price changes together with the number of products affected by price changes that were implemented by the retailers.

    As anticipated, Amazon led the way with 508 price changes on 236 products in the Electronics category during the period compared to Walmart’s 413. By comparison, New Egg’s 95 price changes trailed the field by a significant margin and illustrate the tactical advantage Amazon’s dynamic pricing technology confers. However, the price variation (8.0%) of Amazon’s was also the lowest of the four retailers included in the study, showing that Amazon makes short, sharp tweaks to its pricing at a higher frequency than its competitors.

    By comparison, the Fashion category demonstrated a much lower level of price changes than Electronics, albeit with significantly higher price variations. Walmart leads the pack, adopting an order of magnitude greater number of price changes across a significantly larger number of products compared to the majority of its competitors.

    Product Mix Suited to Target Market Segments

    While competitive pricing is one strategy for attracting new customers and retaining existing ones, the selection of products featured in a retailer’s inventory is just as important. Ensuring a disciplined product assortment, which caters exclusively to a retailer’s target market segments is key. While some retailers such as Walmart choose to house a more affordable range of products, Neiman Marcus and Bloomingdales target the more premium segment of shoppers.

    It is clear from the data that Walmart has aligned its pricing strategy to support its affordability pitch to its shopper base, while Neiman Marcus and Nordstrom use pricing to juggle the demands of a more premium inventory with perceptions of price competitiveness.

    Product Movement In The Top 200

    Much of a retailer’s sales performance comes down to how effectively it maintains the optimal mix of reassuring bestsellers complemented by attractive new arrivals. Sound product assortment clearly provides shoppers with a variety of options each time they visit the retailer’s website. To achieve this balance, retailers typically employ their own, unique algorithm that ranks products in their listings based on several factors, including price range, discount offered, review ratings, popularity and promotions by brands.

    To study this, we evaluated the average percentage of products that were replaced in the Top 200 ranks for each product type of each website.

    Amazon has clearly adopted a strategy of offering new options to its shoppers each day, with an average of 60% new products in the Top 200 ranks of the Fashion category. Contrast that with Walmart which appears to be more conservative in its approach to churning its Top 200 products. In the case of Neiman Marcus however, the reason for the lower volume of product pricing movements in its Top 200 ranks may be due to the relatively high value of its premium product assortment, which imposes the internal constraints of having a smaller pool of new products to choose from.

    Online-First, This Black Friday Sale Season

    Amazon continues to demonstrate its dominance as a pacesetter in US retail, largely due to its progressive online pricing and merchandising strategies. These embrace the power of big data in its approach to online retail.

    Research shows online is consistently outperforming in-store along critical customer satisfaction dimensions spanning: product quality, selection and/or variety, availability of hard-to-find and unique products, ease of searching and delivery options.

    According to global consultancy Deloitte, for the first time ever, American shoppers will purchase more online than they buy offline in the 2017 holiday shopping season — 51 percent, up from 47 percent in 2016. With Black Friday looming in the next few weeks, it will be interesting to see how US retailers push to seize a larger piece of this growing pie.

    Check out our website to learn more about how DataWeave provides Competitive Intelligence as a Service to retailers and consumer brands globally.

  • Our Analysis of Diwali Season Sales

    Our Analysis of Diwali Season Sales

    As the battle of the Indian eCommerce heavyweights continues to accelerate, we have witnessed three separate sale events compressed into the last four weeks of this festive season. Flipkart has come out with all guns blazing following its multi-billion-dollar funding round, leaving Amazon with little choice but to follow suit with its own aggressive promotions. At this stage of a highly competitive eCommerce cycle, market share is a prize worth its weight in gold and neither Flipkart nor Amazon are prepared to blink first.

    At DataWeave, our proprietary data aggregation and analysis platform enables us to seamlessly analyze these sale events, focusing on multiple dimensions, including website, category, sub-category, brand, prices, discounts, and more. Over the past six weeks, we have been consistently monitoring the prices of the top 200 ranked products spread over sub-categories spanning electronics, fashion, and furniture. In total, we amassed data on over 65,000 products during this period.

    The first of these pivotal sale events was held between the 20th and 24th September, which we earlier analyzed in detail. Another major sale soon followed, contested by Amazon, Flipkart and Myntra for varying periods between the 4th and 9th of October. Lastly, was the Diwali season sale held by Amazon, Flipkart, and Myntra between the 14th and 18th of October, joined by Jabong between the 12th and 15th of October.

    In analyzing these significant sale events for all eCommerce websites, we observed an extensive range of products enjoying high absolute discounts, but with no additional discounts during the sale, i.e. prices remained unchanged between the day before the sale and the first day of the sale. The following infographic highlights some of the sub-categories and products where this phenomenon was more pronounced during the recently concluded Diwali season sale. Here, discount percentages are average absolute discounts of products with unchanged discounts during the sale.

    Having identified the aggressive use of high but unchanged absolute discounts amongst eCommerce heavyweights during the sale, we focused our analysis on the additional discounts offered during the sale, to more accurately reflect the value these sale events deliver to Indian consumers.

    Several categories, sub-categories and brands emerged as enjoying substantial additional discounts. The following infographic details our analysis:

    Amazon and Flipkart continue to stand toe to toe on discounts in Electronics, although Amazon offered discounts across a greater number of products. Flipkart adopted a more premium brand assortment in the Electronics category with an average MRP of INR 30,442 for additionally discounted products.

    What stands out in our analysis is Amazon’s consistently aggressive discounting in fashion compared to Flipkart. As anticipated, Jabong and Myntra continued to offer attractive discounts in a large number of fashion products, seeking to maintain their grip in their niche. Furniture, too, is a category where Amazon out-discounted Flipkart, albeit through a less premium assortment mix (average MRP of INR 23,580 compared to Flipkart’s INR 34,304).

    Several big brands elected to dig deep into their pockets during the sales to offer very high discounts. These included attractive discounts from Redmi, Asus, and Acer in Electronics, and W, Wrangler, Levi’s, Puma, Fossil, and Ray Ban in Fashion.

    Which Sale Delivered Greater Value For Consumers?

    Since DataWeave has extensive data on both the pre-Diwali sale (held between 4th and 9th of October), and the Diwali season sale (held between 12th and 18th October), we compared prices to identify which of the sale events offered more attractive discounts across categories, sub-categories and products.

    While the discount levels were generally consistent across most sub-categories, only varying by a few percentage points, we identified several sub-categories and products that displayed a large variation in the absolute level of discount offered.

    As the infographic above shows, Amazon identified women’s formal shoes as a key category in its discounting strategy, which saw its level of discounting triple during the Diwali sale. By comparison, Flipkart doubled its discount in men’s jeans, and Myntra tripled its discounts on Men’s shirts and sunglasses.

    Similarly, during the Diwali sale Amazon, Flipkart and Myntra all offered selected products with an aggressive 40% to 50% discount level.

    Interestingly, Amazon, Flipkart and Myntra all elected to reduce the level of discounts offered on specific products as well. One of the biggest discount moves was Amazon’s reduction on iPhone 6s from 34% to only 4%. Flipkart recorded a similar price move on Adidas originals Stan Smith sneakers (30% to 5%) and Canon EOS 200D DSLR cameras (20% to 8%).

    Market Share Reigns Supreme

    Based on our analysis of the festive season sales, Flipkart’s aggressive approach powered by its multi-billion-dollar funding round enabled it to stave off Amazon’s discounting strategy in the annual eCommerce festive season sales this year, increasing its lead over Amazon India in a market where the total sales is believed to have surged by up to 40 percent over 2016’s sales.

    Based on several reports, Flipkart’s share of total festive season sales appears to have increased from 45 percent in 2016 to 50 percent this year, capturing much of the market up for grabs from a now relegated Snapdeal. Amazon’s market share during a festive sales period that stretched over a month is estimated to have remained steady at 35 percent, though the company reported it saw a 50 percent share in other metrics such as order volume and active customers.

    The key question for both industry analysts and consumers alike is, how much deeper are retailers willing to go in their quest to capture market share at the expense of operating margins?

    If you’re interested in DataWeave’s data aggregation and analysis platform, and how we provide Competitive Intelligence as a Service to retailers and brands, visit our website!

  • Festive Season Sale: Who’s Winning the Great Indian eCommerce Battle?

    Festive Season Sale: Who’s Winning the Great Indian eCommerce Battle?

    In the lead up to October’s Diwali celebrations, almost all major Indian e-retailers had announced mammoth sale events for last week. Resuming the epic battle of India’s online shopping carts during festival seasons, Flipkart, together with Jabong and Myntra, kicked off their five-day-long “Big Billion Days” sales on September 20, while Amazon India‘s “Great Indian Festival” launched the next day.

    The stakes were high as Amazon and Flipkart are more evenly matched this year than ever before, making predicting an eventual winner of these dueling discounters a lot tougher than in previous years.

    At DataWeave, our proprietary data aggregation and analysis platform enabled us to easily assess which e-retailer offered better deals and discounts. Over the last two weeks, we have been consistently monitoring the prices of the top 200 ranked products in Amazon, Flipkart, Myntra, and Jabong, across several sub-categories of Electronics, Men’s Fashion, and Women’s Fashion, encompassing over 35,000 products in total.

    Divergent Discount Strategies

    In our analysis, we bring focus to the additional discounts offered by competing e-retailers during the sale, compared to prices before the sale. This is key, as today’s shoppers often encounter deep discounts on several products even on normal days, which could potentially dampen the value suggested by the large discounts advertised during the sale.

    Based on our analysis, Flipkart clearly adopted a more aggressive pricing strategy this year, establishing a lead over Amazon in average discount percentage for Electronics and Women’s Fashion. Moreover, Flipkart launched additional discounts on a larger number of products across categories. Amazon, though, offered 6.9 percent additional discounts on smartphones compared to Flipkart (6.2 percent), led by 10.7 percent discount on Apple and 7.7 percent discount on Redmi smartphones.

    Flipkart has already reported a doubling of revenue from the sale (which includes sales volumes of Myntra and Jabong) compared to last year, and claimed it accounted for 70 percent of eCommerce sales during these five days — beating Amazon by a considerable margin. Amazon, for its part, reported a “2.5X growth in smartphone sales, 4X increase in large appliances and 7X in fashion sales.”

    The difference in discounting strategies between Amazon and Flipkart is starkly illustrated by their respective highest discounts. Flipkart led the way with a 65.5 percent discount on Vero Moda skirts, a 65 percent discount on Tommy Hilfiger skirts, and 50 percent off Calvin Klein sunglasses.

    By contrast, Amazon’s greatest discounts were an 83.4 percent discount on Redfoot formal shoes, 45.5 percent on Motorola Tablets, a 40 percent on US Polo T-shirts, and a 25.1 percent discount on Puma sports shoes.

    Also, Flipkart hosted a more premium range of products in its assortment compared to Amazon, evidenced by a higher average MRP for its discounted products. Surprisingly, Amazon’s spread of discounted products has the least average MRP in Electronics and Women’s Fashion, compared to all other competitors.

    New Products Break Through the Top 200

    What’s fascinating in this battle of the e-retail giants is the correlation we uncovered between prices and rank. During the sale, as prices dropped on hundreds of products across the board, newer products successfully broke through into the Top 200 ranks for each sub-category. New products in the top 200 ranks had higher discount levels than the ones they replaced.

    This trend was especially pronounced in fashion, where we observed an almost complete overhaul of products filling the Top 200 during the sale period, led by sports shoes in Amazon, Men’s shirts in Flipkart, and Men’s formal shirts in Jabong.

    What About Pre-Sale Prices?

    Another angle we explored was whether (like most of us suspect) e-retailers increase their prices before a sale, only to reduce them during the sale, so they can advertise higher discounts. We observed that all e-retailers did increase their prices for an albeit small set of products before the sale.

    While the number of products where the prices increased for each website prior to the sales is small, it is interesting to observe that certain brands choose to perform the oldest trick in the retail book even today — raising prices to accentuate the degree of discount during the sale period, something shoppers need to keep an eye out for.

    A Sign of Things to Come?

    Based on our analysis, Flipkart has recognized the threat from Amazon and has approached this year’s “Big Billion Days” sale aggressively. It has dug deep into its freshly funded pockets, and offered better discounts for a larger set of products across most categories, in its attempt to lock down a greater market share in the burgeoning Indian eCommerce space.

    Amazon, though, has continued to maintain a firm grip on the Indian consumer, having achieved tremendous growth in specific categories during the sale.

    What’ll be interesting now is to see how these pricing strategies impact company revenues and margins, and how this will shape the soon-to-follow Diwali sales in mid-October.

    If you’re intrigued by DataWeave’s data aggregation and analysis technology, and would like to learn more about how we help retailers and brands build and maintain a competitive edge, please visit our website.


  • The Role of Competitive Intelligence in Modern Retail

    The Role of Competitive Intelligence in Modern Retail

    When retailers today look to compete in the cutthroat world of online commerce, they face several challenges unique to the nature of modern retail. It is now significantly harder for retailers to benchmark their pricing, assortment, and promotions against their competition, as the online world is highly dynamic and significantly more complex than before.

    Trends like the growing adoption of mobile shopping apps, the rising influence of customer reviews in buying behavior, hyperlocal e-commerce websites differentiating themselves by fulfilling deliveries in a matter of hours — the list goes on — have only added to this complexity.

    However, this complexity also presents an opportunity for retailers to incorporate layers of external competitive information into their merchandising strategies to deliver more value to customers and personalize their experience.

    Vipul Mathur, Chief Branding and Merchandising Officer at Aditya Birla Online Fashion, recently published an article highlighting some of the areas in which Competitive Intelligence providers like DataWeave can strategically influence modern merchandising.

    “The consumer is often driven by the aesthetics of a product, more so in the fashion and lifestyle industries than others. Hence, the choices of buyers are hard to interpret. However, innovative modern technologies are helping us understand these decisions,” says Vipul.

    He provides an example of how using AI-based tools (like DataWeave’s) to unearth the sentiments behind thousands of online reviews can help retailers better channel and message their online promotions.

    “Deciphering the consumers’ comments and converting them into tangible insights is incredible proof of the refinement possible with data analysis tools. It’s like knowing that consumers are delighted by the quality of the soles of a pair of Adidas running shoes. Using this, marketing communication can be modified to highlight this specific product feature,” explains Vipul.

    And it’s not just merchandising. This data can percolate across multiple functions in retail, enabling greater efficiency in operations. “If we have data on the best-selling styles across websites, including other attributes like pricing, region/locality (through pin-code mapping), and possibly even rate of sales, it’s up to our supply-chain systems to ensure that the supply is in accordance with demand.”

    DataWeave’s Retail Intelligence offers global retailers and e-commerce websites with these benefits and more. Our AI-powered technology platform aggregates and analyzes vast volumes of online competitive data and presents them in an easily consumable and actionable form, aiding quick, data-driven merchandising decisions.

    “DataWeave, our partner, has helped us refine our merchandising decisions, saving cost and creating value,” sums up Vipul.

    Read the entire article here, and if you’re intrigued by what DataWeave can do for retail businesses and wish to learn more, visit our website!


  • Was Amazon’s Prime Day Sale Really That Big a Deal?

    Was Amazon’s Prime Day Sale Really That Big a Deal?

    Hint: Only in some product categories

    Amazon’s Prime Day sale, the first-of-its-kind in India, made a conspicuous splash across the media a couple of weeks ago, with several stories of the sale’s dramatic success doing the rounds. For 30 hours spread over 10th and 11th of July, the online retail giant rolled out deals as frequently as every five minutes, exclusively for Amazon Prime subscribers. And online shoppers lapped it up.

    According to Amazon India, more customers signed up for Prime on the day of the sale and in the week leading up to it, than on any other month since Prime’s launch in India last year. To boot, Prime subscribers shopped three-times more during the sale compared to other days.

    The discounts offered on several products were quite frequently in the range of 60–70% and beyond, with some products reaching absurd discount levels of up to 85%. However, for a retailer as competitively priced as Amazon, what’s interesting to explore is how much additional discount was offered during the sale. After all, even on normal days, Amazon discounts aggressively on its top 20% selling SKUs, in order to reinforce the commonly held perception that the company is the lowest priced retailer around.

    More Than Meets the Eye

    At DataWeave, our AI-based technology platform aggregates and analyzes publicly accessible data on the Web, at large scale, to deliver insights on competitors to retailers and consumer brands. We collected pricing and discount information for the Electronics and Fashion categories on Amazon during the sale, and compared it to numbers from before the sale. Thus, we evaluated just how much additional value Prime subscribers could’ve potentially drawn from this sale.

    We performed a similar analysis on Flipkart as well, to examine how competing e-commerce websites react to big-ticket sale events.

    The infographic below lists out some of the more interesting bits of our analysis.

    Unsurprisingly, Amazon strengthened its grip in the electronics category by offering, on average, 3.9% higher discount than Flipkart, even with a higher-value assortment mix. Subsequently, Amazon reported a 5X increase in sales of smartphones and an 8X increase in sales of televisions during Prime Day.

    While Apple discounted its phones by 8.5% during the sale, Sanyo was among the top discounting brands (10%) in Televisions, with the company reporting a 4X jump in television sales. TCL offered 20% additional discount, the highest for televisions.

    What stands out from this analysis, though, is that Flipkart beat Amazon on price definitively in the fashion for women category, by extending 6.8% more discount than Amazon on a significantly higher-value assortment mix.

    It’s not uncommon to see e-commerce companies lowering their prices across the board to take advantage of the hype surrounding a competing e-commerce website’s promotional activity. Clearly, it’s a good idea for shoppers to always compare prices across websites before buying any product online.

    The New Age of Retail

    That shoppers today can easily compare products and prices across different e-commerce websites has brought about greater competition among online retailers. With the consequent margin pressure, comes the need for retailers to be able to react to price changes by their competitors in near-real-time.

    And it’s no mean task. Amazon has been found to effect over 80 million price changes a day during holiday season, and retailer-driven sale events like the Prime Day Sale are here to stay. Consequently, retailers look to Competitive Intelligence providers like DataWeave for easily consumable competitive information that enables them to react effectively and compete profitably.

    DataWeave’s AI-powered technology platform aggregates, compiles, and presents millions of data points to provide e-commerce companies with actionable competitive insights. With our solutions, retailers can effect profitable price changes, implement high-value assortment expansion, and proactively monitor and respond to promotional campaigns by competitors.

    Find what we do interesting? Visit our website to find out more about how modern retailers benefit from using DataWeave’s Competitive Intelligence as a Service.