Tag: ecommerce analytics

  • Competitor Price Monitoring in E-commerce: Everything You Need to Know

    Competitor Price Monitoring in E-commerce: Everything You Need to Know

    Picture this: You wake up one morning to discover that your top competitor reduced their prices overnight. And now your shopper traffic has tanked and your sales have taken a hit.

    Unfortunately, this is a common scenario because your customers can compare prices online in seconds—and loyalty lies with the budget.

    So, how can you protect your business? Price monitoring.

    Price monitoring solutions can help you keep abreast of competitor price changes—which, of course, will help you improve your pricing strategies, retain your customers, and maximize your profits.

    How? In this article, we’ll explore:

    • What is price monitoring
    • The key benefits of price monitoring for retailers and brands
    • What a capable price monitoring solution can do

    What Is Price Monitoring?

    Price monitoring is the process of tracking and analyzing your competitor’s prices across various online and offline platforms. By monitoring competitors’ prices, you can understand market price trends and adjust your prices strategically—which, in turn, helps you remain competitive, increase margins, and improve customer retention.

    5 Benefits of Price Monitoring

    Competitor price monitoring can help you:

    1. Gain a competitive edge: Competitor price tracking allows you to adjust your prices to remain attractive to consumers.
    2. Maximize revenue: With timely pricing data, you’re empowered to identify optimum price points that strike a delicate balance between maximizing revenue and maintaining customer loyalty.
    3. Retain customers: Consumers are looking for the most value for their dollar, so maintaining consistently competitive pricing is crucial for retaining loyal customers.
    4. Understand promotional effectiveness: Price monitoring helps businesses evaluate the effectiveness of their promotions and discounts. By comparing the impact of different pricing strategies, businesses can refine their promotional tactics to maximize sales and customer engagement.
    5. Understand market movements: By analyzing historical pricing data, you’re better positioned to anticipate future pricing changes — and adjust your strategies accordingly.

    4 Essential Capabilities of Price Monitoring Software

    Here are four capabilities to look for when choosing a price monitoring system.

    1. AI-Driven Product Matching

    Product matching is the process of identifying identical or similar products across different platforms to ensure accurate price comparisons.

    If your price monitoring solution can’t reliably match your products with competitors’ across various sales channels at scale, you’ll end up with poor data. Inaccurate data will then lead you to make misinformed pricing decisions.

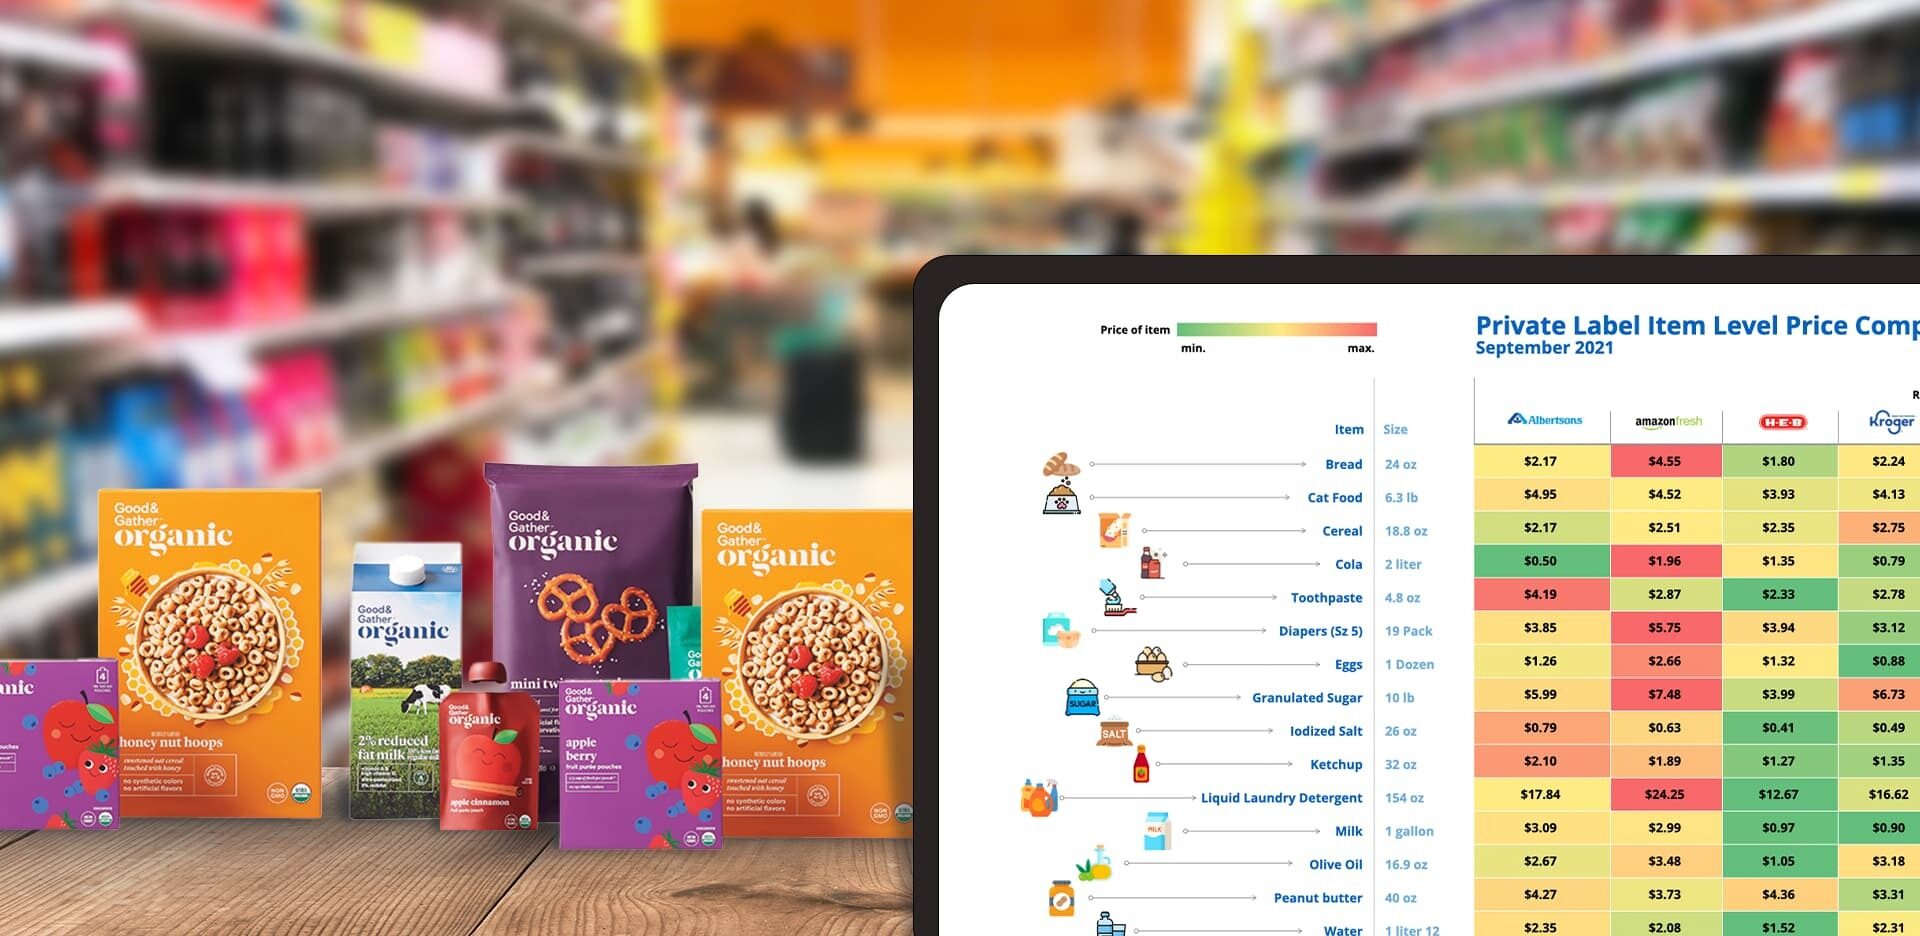
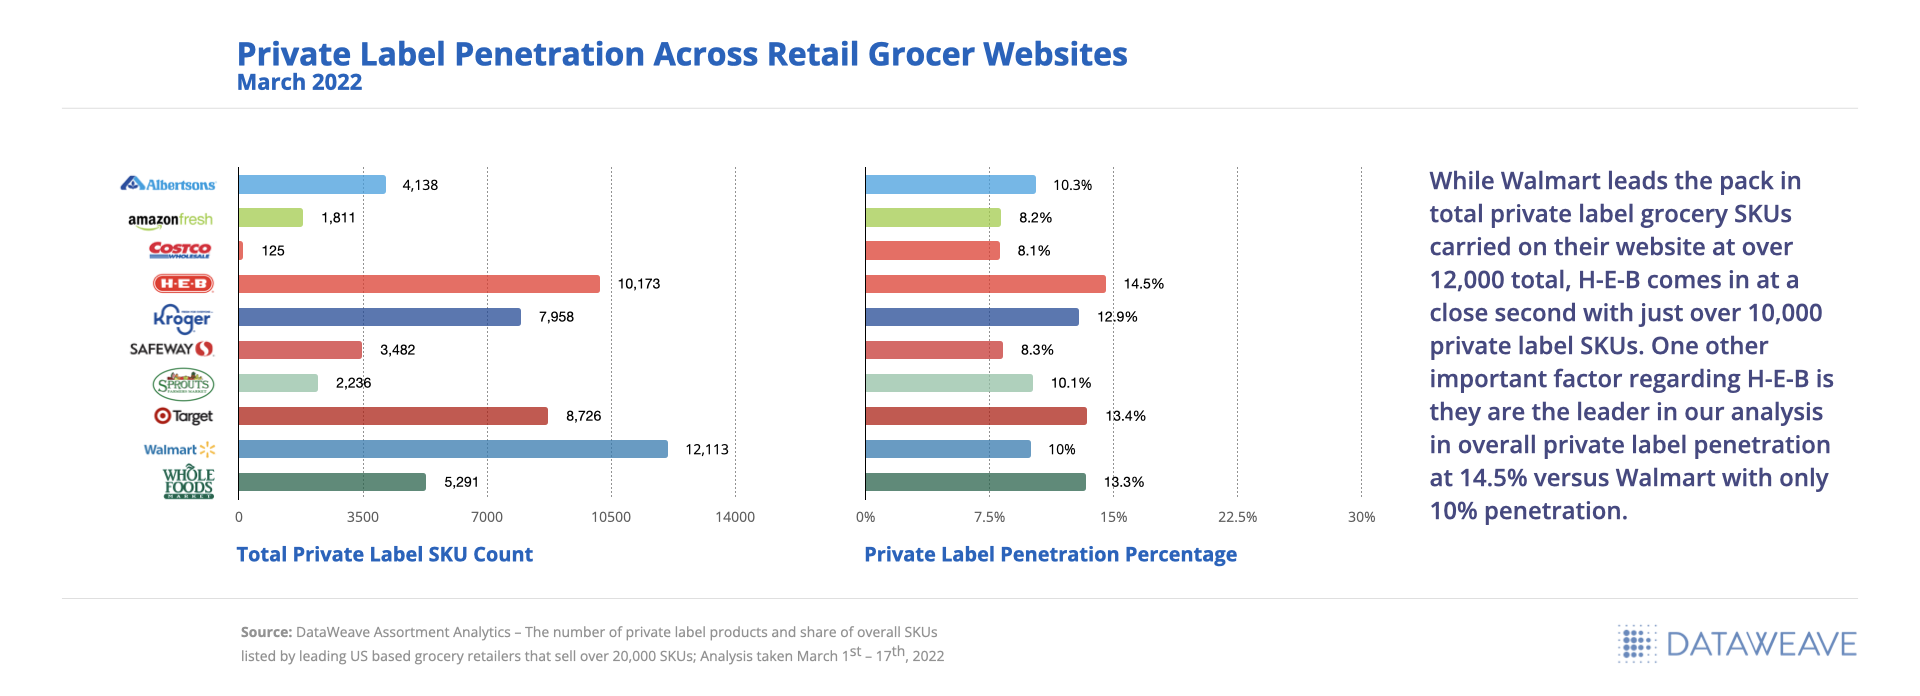
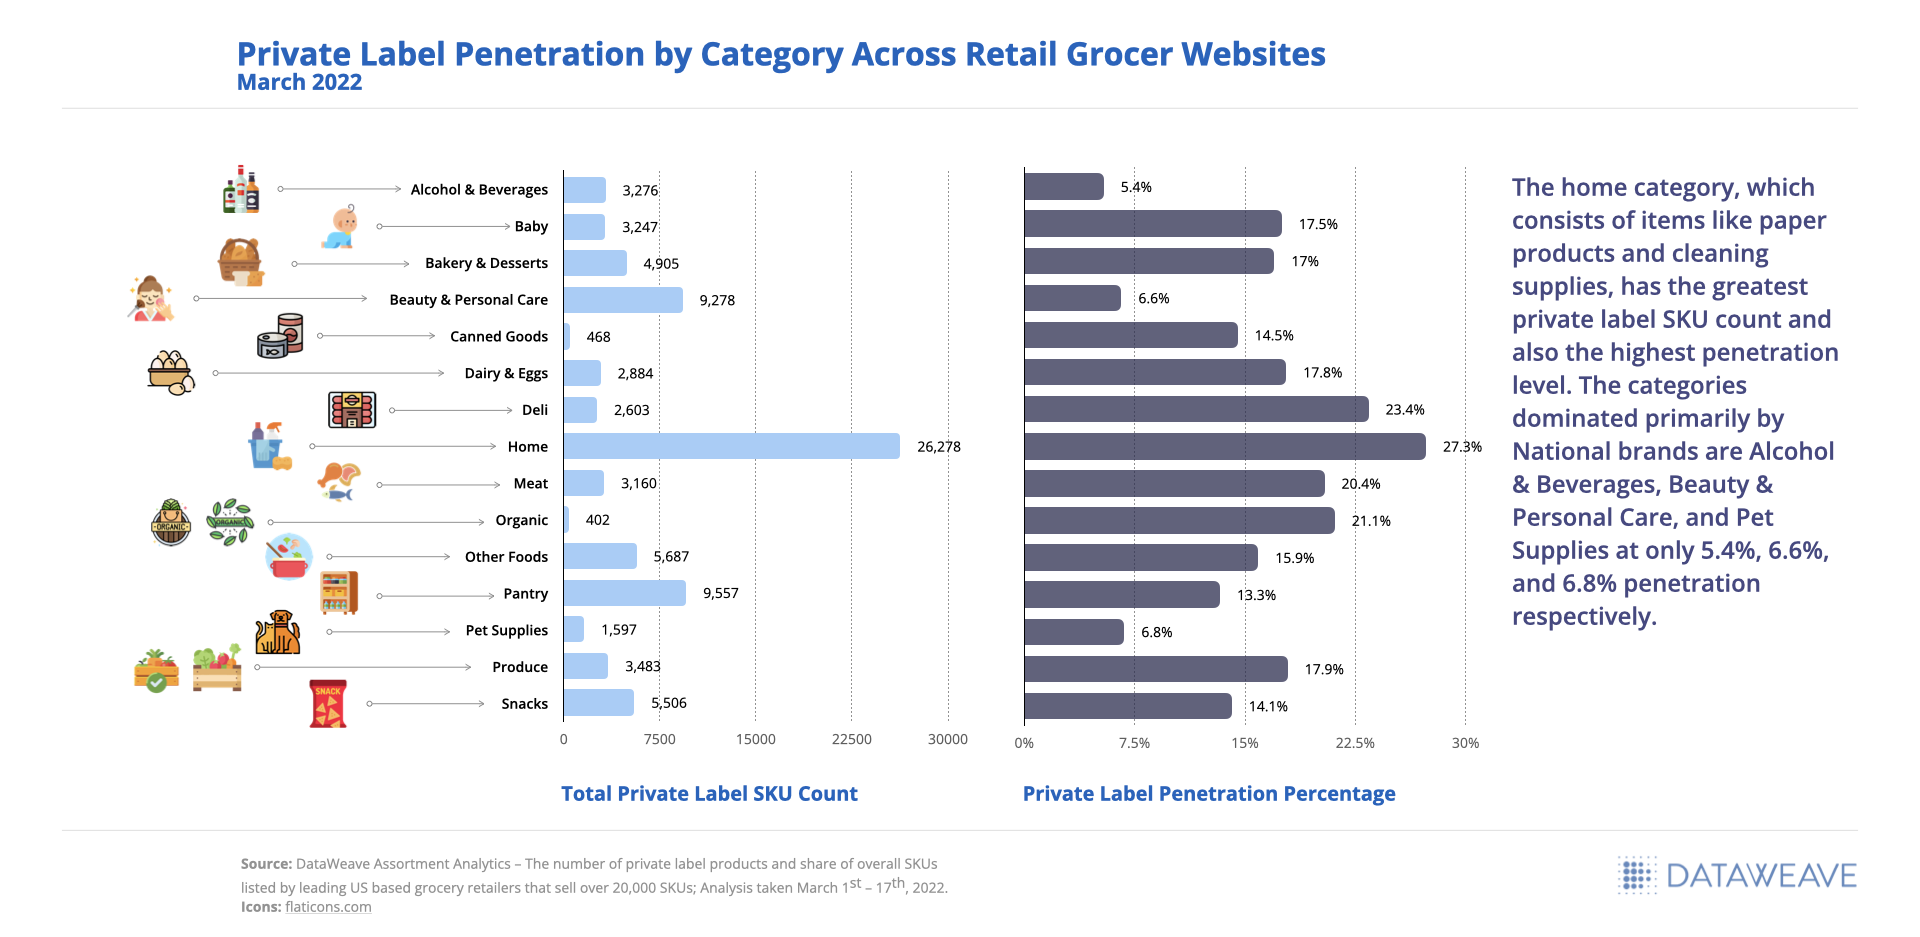
    Product matching needs to be accurate and comprehensive, covering a wide range of products and product variations—even for including private label products.

    For example, AI-driven product matching can recognize a specific brand and model of sneakers across multiple online stores—even if product descriptions and images differ. Here’s how it works in a nutshell:

    • Sophisticated algorithms and deep learning architecture enable AI to identify and match products that aren’t identical but share key characteristics and features.
    • Using unified systems for text and image recognition, the AI matches similar SKUs across hundreds of eCommerce stores and millions of products.
      The AI zeroes in on critical product elements in images, like a t-shirt’s shape, sleeve length, and color.
    • The AI also extracts unique signatures from photos for rapid, efficient identification and grouping across billions of indexed items.

    DataWeave’s AI algorithm can initially match products with 80–90% accuracy. Then, humans can bring contextual judgement and make nuanced decisions that the AI might miss to correct errors quickly and push for accuracy closer to 100%. By integrating AI automation with human validation, you can achieve accurate and reliable product-matching coverage at scale.

    2. Accurate and Comprehensive Data Collection and Aggregation

    The insights you derive are only as good as the data you collect. However, capturing comprehensive pricing data is tough when your competitors operate on multiple platforms.

    For truly effective price monitoring insights, you need consistent, comprehensive, and highly accurate data. This means your chosen price monitoring system should:

    • Scrape data from various sources, such as desktop and mobile sites and mobile applications.
    • Pull data from various online platforms like aggregators, omnichannel retailers, delivery intermediaries, online marketplaces, and more.
    • Handle data from different regions and languages.
    • Collect data at regular intervals to ensure timeliness.

    DataWeave’s online price monitoring software covers all of these bases and more with a fast, automated data source configuration system. It also allows you to painlessly add new data sources to scrape.

    Instead of incomplete or inaccurate data, you’ll have comprehensive and up-to-date data, allowing you to respond quickly to market changes with confidence.

    3. Seamless Normalization of Product Measurement Units

    You can’t compare apples to oranges—or price-per-kilogram to price-per-pound.

    For price monitoring to be accurate, there must be a way to normalize measurement units—so that we’re always comparing price-per-gram to price-per-gram. If we compare prices without taking into account measurement units, our data will be misleading at best.

    Let’s take a closer look. Say that your top competitor sells 12oz cans of beans for $3, and you sell 15oz cans for $3.20. At first glance, your larger cans of beans will appear more expensive—but that’s not true. If we normalize the measurement unit—in this example, an oz—the larger can of beans offers more value to customers.

    Unit of measure normalization facilitates sound price adjustments based on accurate and reliable data. For this reason, every business needs a price tracking tool that can guarantee accurate comparisons by normalizing unit measurements—including weight, volume, and quantity.

    4. Actionable Data and an Intuitive User Experience

    Knowledge is only powerful when applied—and price monitoring insights are only useful when they’re accessible and actionable.

    For this reason, the best price monitoring software doesn’t just provide insights based on accurate and comprehensive data, but it also provides several ways to understand and deploy those insights.

    Ideal price monitoring solutions provide customized pricing alerts, intuitive dashboards, detailed reports, and visuals that are easy to interpret—all tailored to each particular team or a team member’s needs. These features should make it easy for team members to compare prices against those of competitors in specific categories and product groupings.

    Your price tracking tool should also permit flexible API integrations and offer straightforward data export options. This way, you can integrate competitive pricing data with your pricing software, Business Intelligence (BI) tools, or Enterprise Resource Planning (ERP) system.

    4 Ways Retailers Can Leverage Price Monitoring

    Retailers can use price monitoring tools to remain competitive without compromising profitability—here’s how:

    1. Track Competitors’ Prices

    Competitor price monitoring helps you avoid being undercut—and, as a result, maintain market share. By tracking competitor prices in real-time, you can adjust prices to remain competitive, especially in dynamic markets. Ideally, you should monitor both direct competitors selling the same products and indirect competitors selling similar or alternative products. This way, you’ll have a complete picture of market prices and can make more informed pricing adjustments.

    2. Understand Historical and Seasonal Price Trends

    As a retailer, you may want to analyze historical data to identify price patterns and predict future price movements—especially in relation to holidays and seasonal products. Knowing what’s coming, you’re better positioned to plan for pricing changes and promotional campaigns.

    3. Implement Dynamic Pricing

    Dynamic pricing is the process of adjusting prices based on real-time market conditions, product demand, and competitors’ prices—allowing you to respond faster to market changes to maintain optimized prices.

    4. Optimize Promotional Strategies

    Price monitoring tools can track retail promotions across numerous online and offline sales avenues, providing insight into the nature and timing of competitors’ promotions. This data can help you determine which promotions are most effective—and which aren’t—allowing you to improve your own promotions and discounts, and allocate marketing resources where it matters most. This is especially beneficial during peak sales periods.

    3 Ways Brands Can Employ Price Monitoring

    Here are three ways brands can use price monitoring to remain profitable, protect brand equity, and gain a competitive edge.

    1. Maintain Consistent Retail Prices

    Minimum advertised price (MAP) policies are designed to prevent retailers from devaluing a brand while ensuring fair competition among retailers. Price monitoring applications allow your brand to track retailers’ prices to detect MAP policy violations. Data in hand, you can maintain consistent pricing across online sales channels, physical stores, and retail stores’ digital shelves — and, critically, protect your brand equity.

    2. Improve Product and Brand Positioning

    When you understand how your products’ prices compare to those of competitors, you can set prices to improve brand positioning. For example, if you want to position your brand as luxurious and high-quality, you need to set higher product prices than budget-friendly alternative products.

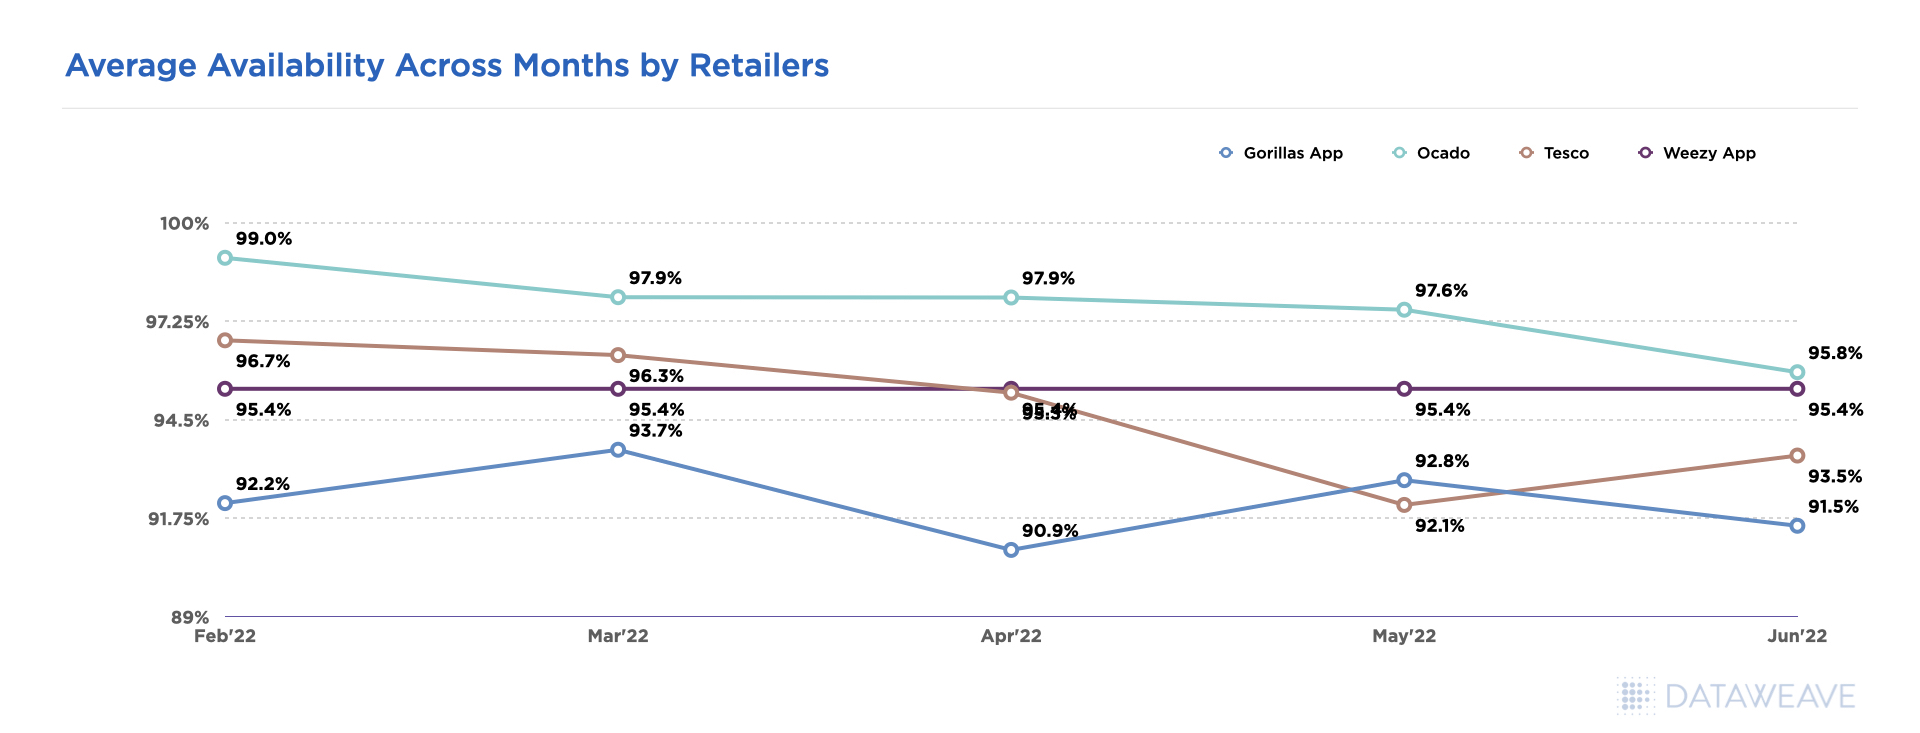
    3. Ensure Product Availability

    You can use a price monitoring solution to track product availability to ensure products are always in stock, even across different physical stores and online marketplaces. If a product is frequently sold out, you can adjust production levels or help retailers to improve their inventory management.

    Key Takeaways: E-commerce Price Monitoring

    Price monitoring software allows you to compare your products’ prices with competitors. This valuable data can help you:

    • Optimize revenue through timely price changes and dynamic pricing
      Avoid being undercut by competitors
    • Improve pricing strategies and promotions to increase sales and retain customers
    • Maintain consistent prices across sales channels

    To learn more, check out our article, What is Competitive Pricing Intelligence: The Ultimate Guide here or reach out and talk to us today!

  • Decoding the 2022 Black Friday Record Sales: The Who, The What, and The How?

    Decoding the 2022 Black Friday Record Sales: The Who, The What, and The How?

    Contrary to popular speculation of lukewarm online sales owing to the weak economy, high inflation, and stretched wallets, Black Friday this year recorded a whopping $9 billion in e-commerce sales. Despite the lull in online shopping across many retailers in the months preceding Thanksgiving and weakened consumer sentiment, US online merchants saw a sizable boost in sales during and after Thanksgiving, albeit at a slower growth of 2.3%, as reported by Adobe Analytics.

    This article looks closely at the Black Friday data to understand which brands, retailers, and product categories were key players. Through DataWeave’s innovative Digital Shelf Analytics product, we deep dive into the availability, discount, and share-of-search data to deduce why some product categories and retailers fared better than others.

    Who: Retailers and Brands that had the Highest Presence

    Black Friday sales this year were driven by consumers grabbing the biggest and best deals to make the most of their already stretched wallets. Many shoppers opted for flexible payment schemes, and Buy Now Pay Later (BPNL) payments rose by 78% compared to the week before Thanksgiving. Surprisingly, Amazon, which was the most searched retailer during Black Friday last year, came only fourth this year, as reported by the Search Intelligence company, Captify.

    According to Captify, Walmart was the most searched retailer for Black Friday deals, followed by Target, Kohls, and Amazon in that order. Amazon, however, has reported its biggest Thanksgiving sale this year, with independent retailers selling through Amazon seeing a total sales of $1 billion. With the economic slowdown and thin wallets looming large, discount rates greatly influenced consumer spending. Mobile shopping accounted for 55% of digital sales, 8.5% more than the previous year. 

    As told by Adobe, Electronics were the significant sales driver, reporting 221% higher sales than in October this year, with smart home items and audio equipment playing an important role with 271% and 230% higher sales. Toys ( popular purchases were Fortnite, Roblox, Bluey, Funko Pop!, and Disney Encanto) and exercise equipment also registered a substantial growth of 285% and 218%, respectively. 

    Other top-selling items included gaming consoles (Xbox Series X and PlayStation 5 devices, games including FIFA 23, NBA 2k23, and Pokemon Scarlet & Violet), drones, Apple MacBooks, and Dyson products (airwrap and vacuum). Amazon’s most popular items were reported to be Apple Airpods, Nintendo Switches, Echo Dot smart speakers, and Fire TV sticks. 

    What: Top Selling Product Categories

    Electronics, closely followed by home appliances (robotic vacuum cleaners), toys, and exercise equipment, were popular product categories in demand during Black Friday this year. Several retailers, including Amazon, Walmart, Target, Kohls, BestBuy, and Home Depot, offered lucrative pre-Black Friday discounts to trigger early sales kick-off. 

    Amazon carried an early discount of 50% on its Echo smart speaker, Target offered 30% off on Dyson vacuum cleaners, Walmart offered 25-35% off on Apple ipads and watches, and Kohls offered 51% off on the iRobot Roomba. 

    Amazon’s top ten best-selling products ranged from Amazon devices like Echo Dot speakers, Fire TV sticks, and Echo Show to Apple AirPods, Nintendo Switches, New Balance sneakers, Champion Apparel, and Burt’s Bees Lotions. The popular product categories were home, fashion, toys, beauty & health, and Amazon devices. Consumers heavily supported small businesses, contributing to $1 billion in sales. Top sellers from small businesses included card and board games.

    Briefly correlating the discounts offered with the best-selling product categories, one can notice that the deals have largely influenced Black Friday sales this year. Popular categories are those that have had deep discounts, reflecting the consumer’s tendency to wait and grab the best deals.  

    How: Role of Digital Shelf Analytics – Key Performance Indicators 

    Digital Shelf Analytics
    DataWeave’s Analysis Methodology

    We have seen a summary of the Black Friday 2022 statistics – sales recorded, top-selling products, product categories, and retailers. Using DataWeave’s e-commerce analytics product, we track and study the variations in digital shelf KPIs across retailers before Thanksgiving and during Thanksgiving to understand how these influence sales. 

    Availability scores, discount rates, and share of search data are analyzed for top retailers in the US for key product categories. Data is tracked and analyzed across two time periods – before Thanksgiving (Nov 10 – Nov 21) and during Thanksgiving (Nov 21 – Nov 25).

    Methodology

    • Retailers tracked: Amazon, Best Buy, Sephora, Target, Ulta, Walmart
    • Product Categories tracked: Electronics, Home Improvement, Beauty, Furniture
    • Digital Shelf KPIs tracked: Availability, Discount rates, Share of Search
    • Location: USA
    Amazon Digital Shelf Analytics

    Amazon maintained good availability across all product categories – Beauty ranks the highest.

    Salient Insights

    • Amazon maintained good overall availability – an improvement of 3% over Prime day
    • Beauty had the highest availability of 95%, with none and Lotion & Brushes reporting 97% and 95% availability, respectively. Shampoo reported the lowest availability at 92%
    • Home Improvement had the least availability at 87%, with dishwashers (68%) and washers and dryers (78%) having the lowest availability. 
    • Unlike Furniture and Home Improvement, most categories maintained similar availability scores before and during Black Friday.
    • Furniture improved its availability during Black Friday by 4%, while Home Improvement reported a decrease in availability during Black Friday by 4%. 
    • Electronics, which was a major sales driver, had an availability of > 90% across all sub-categories except for Television, which had a low availability of 70%
    • Tables and chairs registered 99% availability under Furniture

    The above data indicates that Amazon ensured the high availability of utility products that consumers would buy even during a slow economy. Other retailers showed similar availability trends, with scores being similar prior to and during the event.  

    Black Friday Discounts with ecommerce analytics

    Discounts Drove Sales – Best Buy offered the Highest Discounts

    Highlights

    • Best Buy offered the highest early Black Friday discount of 30%, followed by an additional 9% discount around Black Friday. Walmart followed next with 21% early discounts and an extra 4.5% discount during the event. Amazon came next with 17% early discounts and a 5% discount during Black Friday. Discount rates seem to strongly correlate with online searches, with Walmart beating Amazon this year as the most searched retailer for Black Friday deals. 
    • Electronics was the most discounted category across Amazon, Best Buy, and Target, with an average discount of 21%. Walmart gave lower deals on electronics (12%). Electronics also had heavy early discounts of 12%, with most retailers giving an additional discount of 7-8% closer to Thanksgiving.
    • Best Buy offered early discounts of 10% and further upped their discounts by another 12% closer to Thanksgiving. Being the most discounted category, electronics was also a significant sales driver this Black Friday.
    • Amazon offered the highest discounts for Beauty products (18%), followed by Ulta at 10% and Walmart at 8%. Sephora and Target gave minimal discounts on beauty products (3%)
    • Best Buy gave the maximum discounts on Home Improvement products (16%), followed by Amazon at 14%. Walmart gave much lower discounts of 7% on Home Improvement products. 
    • Furniture is another category with 12-13% discounts at both Amazon and Walmart.
    • Best Buy’s strategy this year has been to offer heavily discounted early deals to boost their sales.
    Black friday 2022 Beauty Analytics
    Icons: Flaticons.com
    Black friday 2022 Electronics analytics
    Icons: Flaticons.com
    Home improvements black friday 2022
    Icons: Flaticons.com
    home furniture black friday 2022
    Icons: Flaticons.com

    Highlights

    • Airpods and headphones were the most discounted item under Electronics, with Amazon and Target offering a whopping 27-29% discount. This clearly resulted in heavy sales of AirPods this Thanksgiving.
    • Best Buy and Target had good discounts on all electronic items, while Amazon gave heavier discounts on AirPods, headphones, and smartwatches.
    • Walmart did not offer hefty discounts on laptops and headphones, instead focused on Smartwatches, smartphones, and television.
    • In Home improvement, Best Buy offered the biggest discounts for refrigerators, washers and dryers, and dishwashers, while Amazon focussed more on Tools.
    • Walmart did not offer many discounts in this category.
    • Amazon topped the discount charts for maximum combined discounts for makeup and hair brushes on the day of the event. 
    • All retailers offered better discounts for utility products like tables, chairs, and cots (~15-17%), while dressers and couches carried lower discounts (~6-10%).
    Discount brackets - Black Friday 2022

    Highlights

    • Different companies had different discount strategies based on price buckets.
    • Amazon gave heavier discounts in the lower price buckets (< 200$) and lower discounts for products priced higher than 200$. 
    • Best Buy offered the heaviest early discounts of >25% on products priced under 20$ but provided a few additional discounts during the event. For products priced higher than 20$, Best Buy uniformly offered substantial early discounts as well as further discounts during the event.
    • On the other hand, Target focussed on mid and high-priced items, offering heavy early discounts of 16-18% on products priced higher than 100$ and early discounts of ~7% for middle and lower-priced items. For middle-priced products (40-100$), it offered heavier discounts of 10-12% during the event. 
    • Walmart focussed on mid-priced products, offering the highest discounts (both early (~12%) and additional discounts (5%)). It offered the least discounts (~8-9%) on products priced higher than 200$.
    Share of Search - Digital Shelf Analytics - Dataweave

    Share of Search – Amazon is the only retailer with sponsored searches; Apple AirPods rule the roost.

    Salient Insights

    • Amazon is the only retailer with sponsored searches, with HP, Lenovo laptops, and Apple AirPods occupying the highest share. This correlates with AirPods being one of the most sold products.
    • HP laptops had the highest share on Amazon pre-Event but gave the spot to Lenovo during Thanksgiving.
    • Tracphone and Motorola smartphones, Insignia Televisions, and JBL headphones had a good SoS on Amazon.
    • On Best Buy, HP and Dell laptops featured most in searches, with HP ruling the roost during the event. Lenovo had a small presence.
    • Samsung smartwatches, televisions, and Apple AirPods have a big chunk of the search at Best Buy.
    • On Target, pop sockets, smartphones, Apple smartwatches, headphones, and AirPods have the most prominent presence. Apple was the most featured brand in this segment.
    share of search beauty - black friday 2022
    Note: The share of search percentage reported here is the average score across all subcategories (makeup, lotion, shampoo, hair dryers and hair brushes) of Beauty.

    Salient Insights

    • Amazon, Target, Sephora, and Ulta sold beauty products, with Amazon being the only retailer with sponsored products.
    • Ogx, bs-mall, conair, hywestger were popular brands on Amazon, with interest-based ads occupying a substantial part of the search results, especially in Lotions (~40-50%)
    • Tresemme, Scotch Brite, Revlon and Cerave were popular brands in Target
    • Dyson products (brushes and hair dryers) are featured at Ulta’s top of the search, followed by Pureology shampoos.
    • Sephora’s own collection of brushes featured prominently on their website both before and during the event, followed by Dyson and T3 brushes and hair dryers.
    share of search -Digital Shelf Analytics- home improvements
    Note: The share of search percentage reported here is the average score across all subcategories (refrigerator, washers/dryers, dishwashers, tools and coolers) of Home Improvements.

    Salient Insights

    • In Amazon, Frigidaire and RCA had the highest SoS amongst Refrigerators, and LG occupied the highest share among washers and dryers, Coleman in Coolers, Dewalt in Tools, and  Comfee in Dishwashers, both before and during Black Friday.
    • In contrast, on Best Buy, Samsung had the highest share of SoS amongst Refrigerators, package deals were most prominent in washers and dryers, LG among dishwashers, ifixit in Tools, and Corsair in Coolers.
    share of search furniture on amazon
    Note: The share of search percentage reported here is the average score across all subcategories (bed, chair, couch, dresser, and table) of Furniture.

    Salient Insights

    • Interest-based ads occupied the highest SoS on Amazon for Beds.
    • Urban shop and Amazon basics were popular in Chairs, Lifestyle in Couches, WLive in Dressers both before and during the event.
    • Vasagle was more popular during the event than Furrion in Tables, though the reverse was true prior to the event.

    Summary & Key Takeaways

    Black Friday this year was a pleasant surprise to Brands and Retailers, reporting much larger sales than predicted. After experiencing a slump in sales in the months leading up to Thanksgiving, e-commerce vendors have a reason to be optimistic about their holiday season sales forecasts.

    • A record-breaking $9.2 Billion in online sales was reported by Adobe Analytics, a growth of 2.3 % compared to the previous year.
    • Mobile shopping accounted for 55% of digital sales, a rise of 8.5% compared to last year.
    • Retailers wooed customers through deep discounts (~30%) prior to Thanksgiving and around Black Friday. Heavily discounted items like Apple AirPods were the most popular.
    • Thanks to inflation and stretched wallets, consumers were willing to spend but waited to grab the best and biggest deals. Utility products had better sales.
    • With tough competition between retailers on who offers the best discounts, Amazon slid down to the fourth position, and Walmart was the most searched retailer.

    DataWeave, through its Digital Shelf Analytics and Commerce Intelligence solutions, gleans useful insights from e-commerce data and breaks down trends during global shopping events like Prime Day, Black Friday, and Cyber Monday. If you are a brand or a retailer who would like to know more about our products and solutions, contact us at contact@dataweave.com.

  • It’s not easy being a Bakery Brand: Insights from Digital Shelf

    It’s not easy being a Bakery Brand: Insights from Digital Shelf

    By 2028, Fortune Business Insights projects that the global bakery products market will reach USD 590 billion. The CAGR (Compounded annual growth rate) for 2021-28 is estimated at 5.12%. Products in this segment include bread, buns, cookies, tortillas, salted snacks, English muffins, bagels, confectionery food, hot dogs, cakes, popcorn, and so on.

    Due to disruptions in the global supply chain caused by lockdowns and border closures, the pandemic has had a negative impact on the demand for bakery products and snacks worldwide. However, the market is not only changing, but consumer demand is increasing. Post-pandemic, health, food, and safety have gained renewed attention.

    People across the world are making healthier choices with a focus on wellness. 

    A growing number of people are interested in plant-based foods and beverages, reducing sugar consumption, and understanding the link between lifestyle and health, including obesity and diabetes. As a result of these trends, food producers are reshaping their product strategies to meet new consumer demands.

    In this article, we take a look at the ways companies can leverage data to inform their e-commerce strategy.

    What’s driving up the demand for bakery products?

    More people are choosing easy-to-use bakery products and snacks over other foods due to urbanization, convenience, western diets, and women’s participation in the workforce. Additionally, innovations in baking systems, food technologies, ingredients, formulations, and product ideas are providing customers with a greater level of choice, flexibility, and freedom.

    How is e-commerce changing the game for bakery product companies?

    To optimize their supply chains, bakery food and snack companies must better understand e-commerce metrics given the wide variety of products available and eventually convert sales. There are several measures that companies need to pay attention to. 

    Stock availability metrics, discounts across locations, and share of search results – are all critical metrics companies need to track. In addition to providing manufacturers and retailers with an insight into the trends, DataWeave’s tools also allow them to make better business decisions and ultimately improve their bottom line. 

    Grocery Retailers and Bakery Brands tracked

    Methodology

    • Data Scrape period: February 2022 to September 2022
    • Country: Canada
    • Grocery Retailers tracked: Atlantic Superstore, Fortinos, InstaCart, Loblaws, Voila, Walmart Grocery, Zehrs.
    • Bakery brands: Betty Crocker, Dempsters, Hostess, No Name, Presidents Choice, Quaker, Vachon, Doritos.
    • Category tracked: Bread and Bakery, Chips, Crackers, Deserts, Snacks.

    Share of Search Analysis

    Which brands feature the most on e-commerce portals?

    When listing items on e-commerce platforms, share of search is crucial. The highest share of the top ten or top twenty items available on these platforms is correlated with how many times the item may be viewed. As a result, it would have a greater chance of being selected by the customer.

    By Retailer for Category “Desserts”

    Share of Search for Brands in each retailer
    • In Walmart Grocery, Vachon has the highest share of search at 41%, whereas Betty Crocker, Presidents Choice and No Name had the lowest share of search at 0%, in the Desserts Category.
    • In Loblaws, Presidents Choice had the highest share of search of 34%, whereas Dempsters had the lowest share of search of 2%  in the Desserts Category. 
    • The brand Presidents Choice consistently ranks high in the share of search results for Desserts across multiple retailers, including Atlantic Superstore, Fortinos, Instacart, Loblaws, and Zehrs – except at two retailers, Voila and Watlmart Grocery, where its share is zero.

    Trend of Share of Search for “Desserts”

    Share of Search analysis by Brands over Time in category “Desserts”
    • Share of search had dropped by around 4% for No Name, whereas for Vachon, it increased by 3% from Jan’-22 to Sep’ 22
    • By brands, Presidents Choice had the highest share of search at 42%, whereas Betty Crocker had the lowest share of search at 12% between Jan’ 22 and Sep’ 22 in the Desserts Category.

    Availability Analysis

    Which products are widely available across e-commerce portals?

    The availability of the product on the e-commerce portal is one of the key indicators of meeting customer demand. Brands can use insights from DataWeave to strategize how to restock their inventory and ease customer demand. Based on data analysis, brands can also determine which products to prioritize on which platforms.

    By Category

    Availability analysis by Category over Time
    • Availability of all five categories was around 52% in Feb’ 22, which steadily increased to 61% until Aug’ 22 and has reduced to reach 55% availability in Sep’ 22
    • Sliced Bread category has seen the most drop in availability by 12% between Jun’ 22 and Sep’ 22
    • The tortilla category has the most rise in availability. It has increased by 16% between Feb-22 and May-22. It also showed an overall rise in availability of 5% from Feb-22 to Sep-22

    By Location

    Availability analysis by Location and Category
    • Across categories, Snacks & Candy had better availability at 73% than Bread & Bakery, with 56% availability.
    • By Location, New Brunswick had more than 65% availability across all three categories; the closest Location is Nova Scotia, with 63% availability.
    • Alberta had the highest availability of 100% in the Snacks & Candy category and the lowest availability of 21% overall in all three categories (weighted aggregate)

    Discounts Analysis

    Several discount-based insights can be studied on e-commerce platforms. From location-based trends, retailer-based trends, and manufacturer-based insights. These insights can help companies make the most of the revenue opportunity while creating an attractive value proposition for the retail consumer.

    By Category

    Discount analysis by Category
    • Discounts of all three categories were around 24% in Feb’ 22, which steadily reduced to reach 15% in Sep’ 22
    • Snacks, cookies & chips category has contributed the most to the drop in discounting, which dropped by 17% between Apr’ 22 and Sep’ 22
    • The Tortilla Category does not have any discount in the month of Jul’ 22

    By Retailer

    • Discount on Bread & Bakery category in Walmart Grocery was around 9% in Feb’ 22. It steadily increased to 13% by Jun’ 22 and thereon reduced to reach 11% availability in Sep’ 22.

    By Location

    • Across Retailers, Nova Scotia had the highest availability of discounts at 22%, whereas New Brunswick had the lowest with discounts at 9% in Bread & Bakery category.
    Discount analysis by Retailers and Locations – Alberta, Ontario, New Brunswick, Nova Scotia
    Note: Analysis does not cover all locations

    Bakery and snack product manufacturers on e-commerce platforms have access to a rich trove of insights they can leverage to benchmark their strategies. They can better understand customer demands, align their supply chain and critically understand the trends impacting their bottom line. Engaging with a third-party platform like DataWeave’s Digital Shelf Analytics  can help brands unlock tremendous value. 

  • Insights from the Digital Shelf of Indian FMCG Brands

    Insights from the Digital Shelf of Indian FMCG Brands

    Analyzing Search, Promotions and Availability for Chocolates, Biscuits, and Malt Drinks across BigBasket, Blinkit, Dmart, Swiggy etc.

    Imagine you log into an e-commerce portal with a list of food items you need for the month. You know what you want, and scroll through the platform to see if there are any discounts. You check competitor products to see if you can get better deals. And within no time, fill your cart with products that you need and proceed to check out. 

    It all happens quickly. It’s an online shopping experience that we are familiar with. But what exactly is happening in the background?

    Brands are tracking and ensuring the highest keyword ranking, optimal availability and competitive discounts to grab your order. And to enable this, Brands rely on Digital Shelf Analytics.

    The FMCG marketplace

    Here, we take a closer look at some of the key factors that Fast Moving Consumer Goods (FMCG) Brands on e-commerce platforms need to pay attention to – to ensure their products appear on the top of search items, to better understand competitor discounts and to monitor the availability of their products across regions.

    FMCG has experienced rapid growth in the last two years, largely attributed to digitalization, changing consumer habits, and increased spending post-pandemic.  Macro factors, including government impetus, inflationary pressures, and consumption recovery, indicate a double digital growth for FMCG brands in the country. According to NielsenIQ’s FMCG Snapshot for Q2 2022, the FMCG industry has grown by 10.9% in the quarter ending June 2022, compared to 6% in the previous quarter.  In the second half of 2022, consumers are expected to spend even more during the festive season. With these shifts underway, the growth opportunities in this sector can only be exploited by companies that can sense trends early – and take appropriate action.

    In addition to providing manufacturers and retailers with actionable insights into e-commerce trends, DataWeave’s tools also allow them to make informed business decisions and ultimately improve their bottom line. Data-driven insights on e-commerce products can help brands optimize their supply chain to maximize sales. A company can determine the key areas that need attention based on an analysis of the availability of products on specific e-commerce channels, associated discounts, as well as zip-code level demand and supply statistics.

    Here are a few sample insights and trend analyses for some popular FMCG brands in the Biscuits, Chocolate and Malt drinks categories spotted by DataWeave.  

    Analytics Methodology: An overview of the data set analyzed

    • Data Scrape period: January 2022 to August 2022
    • Grocery Retailers tracked: Amazon Fresh, BigBasket, Dmart, Jiomart, Swiggy, Milkbasket
    • FMCG brands: Britannia, ITC, Mondelez, Nestle, Parle, Complan, Boost, Amul, Hershey’s
    • Category tracked: Biscuits, Chocolate, Malt drinks


    Availability Analysis

    What is the availability of Biscuits, Chocolate and Malt Drinks on e-commerce portals?

    The availability of a product on an e-commerce marketplace is a key indicator of whether the product meets consumer demands.  DataWeave’s availability analytics can be leveraged by FMCG brands to strategize their inventory and stock planning.  Brands can also make data-driven decisions on product visibility, i.e. identify which products to prioritize on which platforms. 

    • Biscuits had a better availability at 63% when compared to chocolates at 56% across all retailers
    • Dmart and Swiggy had more than 85% availability across all three categories, with Bigbasket coming next at 67% availability 
    • Flipkart Grocery and Blinkit had the lowest availability at 46% and 50%, respectively.
     Figure 1: Availability Scores for Biscuits, Chocolates and Malt Drinks across Retailers

    Which manufacturers have the highest availability of products on e-commerce platforms?

    A study of the availability of products across different manufacturers can reveal brands that have successfully tapped the market opportunity. Here’s a look at brands that have steadily improved their availability on e-commerce platforms.

    Figure 2: Availability Trends for Biscuits across Manufacturers
    • In the biscuits category, all five manufacturers marked approximately 50% availability in Jan 2022. Availability steadily grew to 68% in June 2022, then declined to 63% in Aug 2022.
    • Unibic experienced the largest drop in availability, dropping 15% between May 22 and Aug 22.
    • Mondelez saw the largest rise in availability, an increase of  23% between Mar-22 and Aug-22.
    Figure 3: Availability Trends for Malt Drinks across Manufacturers
    • Except for Boost and Nestle, availability for all seven manufacturers of malt drinks was consistently above 50%. The average availability across all manufacturers rose gradually from 55% in Jan to 63% in Jul-22, followed by a small decline to 57% in August.
    • From 30% availability in January 22 to a mere 7% in August 22, Boost has seen the greatest drop in availability.
    • The availability of Amul has risen the most over the past year, rising from 51% in January 22 to 78% in August 22, hitting 80% in July 22.

    Chocolate: Which manufacturers have the highest availability of products on the e-commerce platforms?

    Figure 4: Availability Trends for Chocolates across Manufacturers
    • Chocolate availability across all manufacturers averaged 47% in Jan-22, reaching a peak of 64% in May-22 and dropping to 51% in Aug-22.
    • From 46% in Jan-22 to 74% in May, Mondelez saw the biggest increase in availability, followed by a decline to 68% in August.
    • Ferrero experienced one of the sharpest drops in availability. Although the brand’s availability steadily grew from 77% in Jan 22 to 94% in Jul 22., it registered a steep drop to 49% in August. 

    The drop in availability hurts the Brand’s eCommerce in two ways. Not only does the Brand lose sales directly. But poor availability also impacts the keyword search ranking, which further hurts the sales.

    Check out DataWeave’s Digital Shelf Analytics Product for insights on how Availability tracking can help reduce stock-outs and boost sales. Click here to know more.

    Discount Analysis

    Location-based, retailer-based, and manufacturer-based discount trends can be analyzed. These studies can help companies plan attractive and appropriate promotional and discount strategies to enhance their revenue opportunities. 

    Which manufacturer has been offering the most discounts?

    A study of discounts offered across manufacturers for chocolates, malt drinks and biscuits indicates that some brands have increased their discounts while others have reduced their discount rates. These decisions could be triggered by demand, availability, and production cycle. Parle, for example, has steadily reduced its discount rates. 

    Figure 5: Discount Rate Trends across Manufacturers

    Average discount rates across manufacturers were around 9% in Jan 2022 and rose steadily to reach 14% in Jul 2022. A small decline is observed post-July, with a 12% discount rate registered in Aug 2022.

    • In the biscuit category, Unibic offered the biggest discount of 28%, followed by ITC at 20%.     
    • In the Chocolate category, Hershey’s offered the largest discount of 14%, followed by ITC at 12%.
    • In the Malt Drink Category, Amul offered the largest discount of 16%, followed by Boost at about 10%. 

    Check out DataWeave’s Digital Shelf Analytics Product for insights to respond to Competitor’s pricing and promotions. Click here to know more.

    Share of Search Analysis

    Which brands feature within the top 5 on the first page of the search?

    A product that appears within the top 5 items on the first page of a search, has a higher probability of being purchased. Below is a study of the share of the search for biscuits across manufacturers and retailers. 

    Figure 6: Share of Search for Biscuits across Manufacturers and Retailers
    • Britannia dominates the top ten share of search across different online retail platforms.
    • Mondelez has the highest share of search at 62% in Amazon Fresh, whereas Parle-G has the lowest share of search at 7%.
    • In Bigbasket, Britannia has the highest search share of 62%, whereas Parle-G has the lowest search share of 7%.

    Check out DataWeave’s Digital Shelf Analytics to track the Share of Keyword and Navigation Search. Click here to know more.

    Conclusion

    FMCG is a rapidly evolving industry sector with a high potential for growth in the coming years. FMCG brands must compete with one another to fully tap this market opportunity on several factors to ensure that their products are visible, available, and attractive to consumers. Digital crawling and big data technologies have enabled manufacturers and retailers to collect publicly available e-commerce data for useful, actionable insights and trend analysis. To stay competitive, it is crucial for manufacturers and retailers to engage with analytics and data experts to seamlessly integrate e-commerce analytics into their short- and long-term business strategies. Whether it’s building keywords to increase the share of search, knowing the right discounts to attract customers in a particular city or increasing the availability of products on specific e-commerce platforms, companies need to invest in the right data intelligence!

    DataWeave for FMCG Brands

    DataWeave has been working with global CPG/FMCG brands, helping them drive their growth on eCommerce platforms by enabling them to monitor their key metrics, diagnose improvement areas, recommend action, and measure interventions’ impact. DataWeave’s KPIs enable Brands to fill in the blind spots in their funnel data and allows them to respond to competitors on a near-real-time basis.

    If you want to know to learn how your brand can leverage DataWeave’s data insights and improve sales, then click here to sign up for a demo

  • The Rapid Rise of Alcohol eCommerce in the UK

    The Rapid Rise of Alcohol eCommerce in the UK

    Alcohol eCommerce has been rapidly growing over the years, and like a lot of other industries, the pandemic accelerated its growth. Convenience, safety & home delivery became important criteria for customers in the post pandemic era and so the sale of alcohol via eCommerce went up. Kantar reported that UK booze sales were up £261m & online and convenience stores were the biggest winners. The latest IWSR Drinks Market Analysis Report 2022 reported on another interesting trend – when ordering alcohol online, consumers prefer using websites v/s apps in most parts of the world except China and Brazil. In the UK the largest chunk of online alcohol purchases happens on a retailer website instead of an app. 

    Platform used for last online alcohol purchase. Source

    To get a better understanding of this, we tracked 2 grocery retailers and 3 grocery Q-Commerce apps in the UK to get insights into Alcohol sales, pricing, trends & more! 

    Methodology

    • Data Scrape time period: Feb 2022 – June 2022
    • Grocery Retailers tracked: Tesco & Ocado
    • Grocery Apps trackedGorillasWeezy & Getir
    • Category tracked: Alcohol

    Which retailer was the Price Leader in the alcohol category? 

    Before the pandemic Tesco was the only Big 4 retailer to increase their alcohol market share & Waitrose was the biggest loser, with its share of booze sales falling from 5.4% to 4.7%. Maintaining Price Leadership is a critical element and plays a big role in increasing sales & market share because consumers will buy the most competitively priced product. We wanted to track and see which retailer was the Price Leader in the alcohol category – i.e., had the most number of lower-priced items in the alcohol category. We also wanted to see if & how Tesco’s position had changed post pandemic. 

    Price Leadership
    • Tesco enjoyed price leadership in the Alcohol category from Feb – June 2022 with 38.9% products priced the lowest. This, followed by Ocado at 33.8%. Gorillas had price leadership for the least amount of products in the alcohol category at 5.6%. Tesco was the clear winner! 
    • Tesco’s Price Leadership kept declining through the months though – at the beginning of the year in Feb, Tesco had 44% products priced the lowest but by June, that number fell to a little over 36%. Ocado showed a reverse trend – in Feb they had price leadership on 32% items and by June that number rose to 35.3%.
    • One player Tesco could’ve potentially lost price leadership to was Getir. In Feb, Getir had price leadership on only 8.2% products but that increased gradually over the months to land on 14.5% in June. 

    Which retailers focused on Discounts to perk up alcohol sales? 

    Discounts are a great way to draw in inflation-hit shoppers. Loyalty card discounts, reward vouchers, and other promotional strategies retailers offer help make their products more competitive & attractive to customers. To stay competitive, retailers need to be aware of the discounts their competition is offering. They also need to understand the risk of deep discounting and the impact on margins. We wanted an insight into alcohol related discounts in the UK so we dug into our data. Here’s what we saw. 

    Average discounts across months by retailers
    • A host of European and UK based startups like Jiffy, Dija, Weezy, Zapp, Getir & Gorillas launched with the promise of delivering groceries the fastest & cheapest
    • Our data showed that Gorillas offered discounts in line with the competition, however, Getir likely went the deep discounting route. 
    • Getir offered the highest discounts across all months. And in the month of April they offered almost 9% more discount than Ocado – the retailer with the 2nd highest discounts. 
      Like we discussed above, Getir gained price Leadership from Feb to June. Deep discounting could have potentially played a role. 
    • Gorillas on the other hand had the lowest, almost non-existent discounts.

    Let’s look at Price Index trends across 5 months 

    We tracked the Price Index (PI) across these 5 retailers to measure how alcohol prices changed over a 5 month period from Feb – June 2022. 

    Note: Retailers selling at the 100% mark were selling at an optimal price & did not undercut the market. The pricing sweet spot is 95% – 105%. Anything lower would compromise margins, and higher would mean the retailer was not competitive. 

    Price Index across months by retailers
    • Weezy had a Price Index that was the most optimal, sitting in the 100% – 102% range.
    • Gorillas had the lowest Price Index, between 89% – 91%.
    • Getir had a low price index in Feb (96.1%) but slowly kept increasing to cross 110% in April, May & June.
    • What was interesting to see was the competition between the 2 retail giants Ocado & Tesco. Ocado had a lower price index at the start of the year at 105.1%, while Tesco was at 109.8%. In the subsequent months, Ocado kept increasing prices to be competitive with Tesco and Tesco decreased prices to likely match Ocado’s pricing. By June BOTH Tesco & Ocado had the exactly the same price index – 108.7%

    Which retailers were the quickest to make price changes?

    Competitive pricing is critical to eCommerce success. Competitive pricing involves tracking your competitor’s pricing & strategically tweaking your own prices without hurting margins. We tracked the month-wise average Price change from Feb – June across all 5 retailers to see which retailer was making price changes and at what frequency. 

    Average price change across months by retailers
    • Most retailers did not make massive prices changes, they were ballpark competitive with each other from a pricing standpoint. 
    • However, Gorillas made significant changes in the month of March when they dropped prices by 3.8% and in May when they increased prices by 5.5%!
    • In May, the same month Gorillas made a big price hike, Weezy dropped their prices significantly by 10% widening the gap between the 2 retailers. 

    Which retailers avoided lost sales by maintaining stock availability?

    Having a near real time view on stock availability is crucial to driving sales. Customers can buy products only when they’re available! So, we went ahead, looked into our data to see how each of these retailers managed stock availability from Feb to June.

    Average availability across months by retailers
    • Our data showed varying availability levels across retailers with Ocado having the highest availability across all 5 months. They had a robust stock at the beginning of the year at 100% but kept dwindling through the months to land at 95.8% by June. 
    • Tesco had a sharp drop in availability in May & June – from 97% at the beginning of the year to the 92-93% range.
    • Gorillas had the lowest availability across months between 90 & 94%.
    • Weezy consistently maintained availability at 95% across all 5 months.

    Conclusion

    For the most part, the UK market has a positive outlook towards buying alcohol online thanks to changes to shopper behavior arising from the pandemic. As per the IWSR Drinks Market Analysis Report 2022 in website-led markets, such as the UK, breadth of product range is important to customers along with price. These 2 play a key factor in purchase decisions. By contrast, consumers in app-driven markets have different preferences. While price matters, it is less important than convenience and speed. 

    As an alcohol retailer, if you need help tracking your competitor prices, discounts and product assortment, reach out to the team at DataWeave to learn how we can help!

  • eCommerce Performance Analytics for CPG Private Label

    eCommerce Performance Analytics for CPG Private Label

    The combination of economic uncertainty, inflation, and perceived affordability has increased consumer’s willingness to buy and try more private label products, challenging National brands to differentiate their eCommerce strategies, especially those related to price positioning, in other ways.

    Our previously released report, Inflation Accelerates Private Label Share and Penetration, confirmed 8 out of 10 brands with the highest SKU count carried across all grocery retailer websites to be private label, signaling the strength of their digital Share of Voice. Given the growing shift in consumer preference toward private label brands, we are providing access to the latest trends seen from September 2021 through March 2022. Below you will find a summary of what the data revealed about the growing presence of private label brands on the Digital Shelf.

    Private Label Account and Category Penetration

    We analyzed private label penetration at an account level to understand which private label brands have the greatest presence on retailer digital shelves, and to see which retailers may be leaving product assortment opportunities on the table.

    Private Label Penetration Across Retail Grocer Websites

    As a retailer, it is important to understand how your private label penetration stacks up against the industry average at a category level, especially given the performance tracked for retailers included within our analysis and the vast number of SKUs they offer online (over 20,000).

    Private Label Penetration by Category Across Retail Grocer Websites

    The Private Label and National Brand Price Gap Widens

    Private label brands tried out of necessity mid-pandemic increased in popularity as grocery prices continued to rise, providing an opportunity for retailers to increase brand affinity and loyalty for their online shoppers. Retailers alike were able to keep affordability at the forefront of their strategies and maintain a price gap of 23% or more, despite inflationary pressures to increase prices.

    Private Label / National Brand Price Gap by Retailer

    Looking at the results at a category level, we can see that Meat is the only category found within our analysis where private label brands are priced higher than National brands at an average of 8% greater. The Alcohol & Beverages category tends to always see the greatest price gap between private label and National brands given the price variances by unit (ranging from under $10 to over $100), in this case averaging a 148% price gap.

    Private Label & National Brand Price Gap by Category

    Private Label Total Basket Value Comparison Across Retailers

    While SKU-level pricing is extremely important to product strategy, for a retailer, it is equally as important to be as mindful of the total basket value even more so now as consumers further their private label loyalty across various categories. A few SKU-level missteps in pricing decisions can exacerbate cart abandonment and negatively impact shopper loyalty in a world where prices can be compared instantly in the palm of your hand.

    Based on our analysis, Walmart and H-E-B private label products offered the lowest priced total basket of goods at $42.90 and $45.06 respectively, whereas AmazonFresh and Safeway offered the highest total at $73.19 and $69.52 respectively.

    Private Label Item Level Price Comparison by Retailer

    Inflation-driven Price Changes are on the Rise with Room to Grow

    Based on the 20,000+ SKUs analyzed, we saw a continual price increase every month since September 2021 when comparing future monthly prices to those we tracked in September. The greatest price increase happened in March 2022 at 12.5% on average, however, there are still 48% of SKUs that have yet to see a price increase even as inflationary pressures rise.

    When viewing the split between National and private label brand price increases in March 2022 versus September 2021, we saw National brands increased prices on average by 13% where private label brand prices only increased an average of 7%.

    Private Label & National Brand Price Change
    Private Label & National Brand Price Change (%)

    Price decreases are still occurring across all categories, despite inflation, but to varying degrees ranging from 5% for Deli items to 17% for Dairy & Eggs. Within the Dairy & Eggs and Pantry categories, private label brands reduced prices for an additional 10% of total SKUs compared to National brands.

    The greatest category of opportunity for price increases within private label were found within Beauty & Personal Care with 67% of private label products yet to see a price change since September 2021.

    Price Change (%) by Category and Brand Type

    Private Label Price Change Correlation to Product Availability

    The category with the greatest magnitude of price increase seen within private label brands occurred within Baby at 16.3% followed by Home at 14.3% on average. Private label products within Home and Baby categories were also showing the lowest availability rates, 75.9% and 79.5% respectively, indicating a high demand for these items even as prices increased.

    The private label categories with the smallest price increase on average were Dairy & Eggs at 2.4% and Other Foods and Pantry at 3.4% and 3.6%, respectively.

    Private Label Price Change Magnitude & Availability
    Private Label Price Change Magnitude & Availability

    While in many accounts both private label and National brands struggled with stock availability in March 2022, National brand availability is much lower (around 10% on average) than private label availability.

    H-E-B had the lowest overall product availability at 76% across both private label and National brands on average. Only Walmart had lower availability for Private Label at 75% compared to 93% for National brands, but they also had the greatest price gap between private label and National brands.

    Private Label & National Brand Product Stock Availability

    The Future of eCommerce Growth for Private Label

    Our greatest learning from this analysis is that it’s time for retailers to start thinking and planning more like the National brands they carry when it comes to positioning their private label brands for success. Successful retailers are taking this time to reset their private-label strategies and transfer short-term switching behavior into long-term customer loyalty.

    Retailers playing catch up have the opportunity to address some of the gaps highlighted throughout this analysis, for example, relative to pricing and assortment changes. Below are some of the highlighted opportunities:

    • Though inflation is driving price hikes, more than 50% of products analyzed have yet to see a price increase indicating an opportunity to protect margin
    • Narrowing the price gap between a store’s brand and National brands should not be the only focus as competitive private label brands are becoming a greater threat at a category and basket level
    • Modifying and expanding assortments as demand increases for private label can improve customer retention and loyalty, especially for cross-shopping consumers

    According to The Food Industry Association (FMI), only 20% of food retailers currently promote private brands on their homepages, and only 48% include detailed product descriptions indicating even more opportunities left on the table for retailers to optimize private label digital performance.

    Many leading retailers are leveraging real-time digital marketplace insights and eCommerce analytics solutions like ours to further their online brand presence and optimize sales performance. This report highlights only a small sample of the types of near real-time insights we provide our clients to effectively build competing strategies, make smarter pricing and merchandising decisions, and accomplish eCommerce growth goals. Be sure to reach out to our Retail Analytics experts for access to more details regarding the above analysis.

    For access to a previously recorded webinar presented in partnership with the Private Label Manufacturers Association and conducted by DataWeave’s President and COO, Krish Thyagarajan, click here.