On Black Friday this year, Health & Beauty brands saw a significant increase with a 13% jump in foot traffic, according to a report by RetailNext. Despite caution from various sources, higher prices for everyday goods, and high interest rates, consumers chose to spend big this cyber week.
So what kind of deals did top retailers and brands offer in the Health & Beauty category this BFCM? At DataWeave, we harnessed the power of our proprietary data aggregation and analysis platform to track and analyze the prices and deals of Health & Beauty products across prominent retailers to uncover unique insights into their price competitiveness this BFCM, as well as understand how pricing strategies varied across diverse subcategories and brands.
For this analysis, we tracked the average discounts among leading US retailers in the Health & Beauty category during the Thanksgiving weekend sale, including Black Friday and Cyber Monday. We noticed prices and discounts didn’t change significantly over the course of the weekend, and hence the average prices of products between the 24th and 27th of November are being reported. Our sample was chosen to encompass the top 500 ranked products in each product subcategory across leading retailers during the sale.
Subcategories reported on: Shampoo, Toothpaste, Conditioner, Sunscreen, Makeup, Electric Toothbrush, Beard Care, Moisturizer
Timeline of analysis: 24 to 27 November 2023
Our Key Findings
Average Discounts Across Retailers
Amazon leads the pack with a huge margin, offering an average discount of 31.9%, covering 62% of its products analyzed. Target follows an 18.8% average discount across only 5% of its analyzed assortment. The other retailers aren’t even close.
Ulta Beauty was the next in line, providing a 9.2% average discount followed by Walmart with a 6.8% average discount. Sephora, known for its premium beauty offerings, adopted a more conservative approach with a 3.5% average discount, targeting only 9% of its top products
Across retailers, it is clear that Amazon led the charge by far this cyber week, with the other retailers choosing to markdown prices conservatively in the Health & Beauty category.
Average Discounts: Subcategories
Amazon offered high discounts on lower priced subcategories like Toothpaste (49.4%), Sunscreen (46.3%), Moisturizers (38.5%), and Conditioners (37.5%), highlighting its focus on products with high demand that consumers would look to stock up on. Ulta Beauty also focused its discounts on Toothpaste (15.6%), Moisturizers (14.9%), and Conditioners (12.6%), targeting skincare and grooming.
Sephora, meanwhile, offered the most attractive deals on the Makeup subcategory at 5.3% across 12.67% of its analyzed assortment, banking on the demand generated due to the brand’s popularity in this subcategory.
Target prioritized discounts on Toothpaste (22.5%), Shampoo (21.6%), and Moisturizers (18.9%). Walmart too offered significant discounts on Shampoo (21.6%) and Toothpaste (22.5%).
Retailers prioritized staple subcategories like Toothpaste and Moisturizer with substantial discounts during this Black Friday Cyber Monday, ensuring a broad consumer appeal. In contrast, discretionary items like Makeup may be less motivated by discounts alone, and hence saw lower discounts during the sale.
Average Discounts: Brands
Brands offered the most attractive deals on Amazon, with OGX leading the pack at 58.4% average discount. Neutrogena and Colgate followed with an average discount of 50.4% and 44%. This mirror’s Amazon’s subcategory focus on shampoos, conditioners, and toothpastes.
Other instances of brands offering attractive deals across retailers include Belif (27.9%) and Anastasia Beverly Hills (17.6%) on Sephora, Johnson’s (20%) and Philips Sonicare (18.8%) on Target, and Olay (12.2%) and Colgate (10.6%) on Walmart.
Ulta Beauty hosted several attractive deals by specific brands, including Moon (30.7%), Joico (24%), and Clinique (22.3%).
Share of Search For Health & Beauty Brands Across Subcategories
Our Share of Search analysis illuminates the strategic moves made by brands to enhance their visibility, playing a crucial role in influencing consumer choices during Black Friday and Cyber Monday.
Among some of the leading brands, Head & Shoulders and Oral-B increased their Share of Search by 2.3% and 1% respectively, reflecting a successful strategy to boost brand visibility during the Black Friday and Cyber Monday shopping events. On the other hand, L’Oreal Paris, Colgate, and Neutrogena faced marginal decreases in Share of Search.
Overall, since the difference in Share of Search values did not change dramatically, the visibility levels of leading brands across key subcategories remained consistent during the Thanksgiving weekend.
—
For deeper insights on pricing and discounting trends across a diverse range of shopping categories during Black Friday and Cyber Monday, check out our blog!
To learn more about our AI-powered Pricing Intelligence and Digital Shelf Analytics platform, contact us today!
As the highly anticipated shopping season approached, industry analysts, including Deloitte, had forewarned consumer spending caution owing to persistent inflationary pressures tightening budgets. Despite these concerns, the holiday spirit was buoyed by sensational deals that delighted bargain-hunting shoppers.
According to the National Retail Federation (NRF), over 200 million consumers participated in both in-store and online shopping activities over the Thanksgiving weekend. This marked an almost 2% uptick from the previous year, surpassing the NRF’s initial estimates of 182 million and showcasing a robust start to the holiday shopping season.
So what was all the hype about this Black Friday and Cyber Monday? How did top retailers react to reports of possibly decreased consumer spending? At DataWeave, we harnessed the power of our proprietary data aggregation and analysis platform to track and analyze the prices and deals of products across prominent retailers and categories to uncover unique insights into their price competitiveness this BFCM, as well as understand how pricing strategies varied across diverse subcategories and brands.
In this article, we focus on the pricing and discounting strategies of Amazon, Walmart, and Target in the Apparel category.
Stay tuned to our blog for insights on other shopping categories like Home & Furniture, and Health & Beauty!
Our Methodology
For this analysis, we tracked the average discounts of apparel products among leading US retailers during the Thanksgiving weekend sale, including Black Friday and Cyber Monday. We noticed prices and discounts didn’t change significantly over the course of the weekend, and hence the average prices of products between the 24th and 27th of November are being reported. Our sample was chosen to encompass the top 500 ranked products in each product subcategory across during the sale.
Amazon offered the most attractive deals, showcasing an average discount of 19.5%, applying to a substantial 61% of their apparel inventory.
Trailing closely behind was Target, offering an average discount of 14.8% across 52% of the products analyzed. Walmart, however, took a more conservative approach, providing an average discount of 8.5%, applicable to 29% of its products.
The contrast in discounting strategies highlights the diverse tactics employed by retailers to entice Black Friday and Cyber Monday shoppers within the Apparel category. Amazon remains the forerunner, balancing competitive discounts with a significant coverage of discounted items.
Target follows suit with a competitive stance, while Walmart opts for a more reserved markdown approach, given that the retailer tends to carry a large number of products in the affordable price ranges.
Average Discounts: Subcategories
Examining the Black Friday and Cyber Monday discount landscape within the Apparel category reveals intriguing patterns among major retailers. Amazon led the charge, boasting an impressive 24.9% average discount on Women’s Tops, covering a substantial 76.5% of its products. In the same subcategory, Target competed fiercely with a 25.1% average discount, covering 87.5% of its products. Walmart, taking a measured approach, presented a 14.6% average discount across 45.1% of its Women’s Tops inventory.
Notably, Men’s Swimwear at Target has no discounts. Meanwhile, Amazon remained aggressive across various subcategories, particularly in Women’s Shoes and Women’s Tops, aiming to capture a significant market share through both competitive pricing and a broad coverage of discounted items.
Average Discounts: Brands
Across brands, Tommy Hilfiger and Jockey took the lead on Amazon with an enticing average discount of 28.3% and 24.6% respectively, appealing to savvy shoppers. Calvin Klein followed closely with a 17.3% discount, offering a balance of style and affordability.
In Walmart, Crocs stood out with a 39.9% average discount, followed by Reebok (15.7%) and Hanes (14.9%) Xhilaration, Target’s in-house brand, stole the spotlight on the retailer platform with an impressive 50% average discount. Reebok (32.3%) and Levi’s (22.9%) maintained competitive discounts, appealing to diverse tastes.
Our analysis sheds light on the dynamic landscape of apparel discounts, showcasing how brands adopt varying pricing strategies to position themselves competitively for Black Friday and Cyber Monday shoppers.
Share of Search For Apparel Brands Across Subcategories
The dynamics of Black Friday and Cyber Monday extend beyond price reductions, with brands strategically vying for increased visibility through Share of Search metrics. This metric signifies a brand’s prominence among the top 20 ranked products in a given subcategory, offering valuable insights into their online marketplace visibility.
Among the standout performers in the Apparel category, Jockey experienced a significant surge in Share of Search, leaping from 1.70% before the event to an impressive 13.30% during the Black Friday and Cyber Monday sales. Speedo, in the Women’s Swimwear subcategory, demonstrated a substantial increase from 4.40% to 13.30%, solidifying its presence and gaining an 8.90% boost in Share of Search.
Tommy Hilfiger and Adidas also exhibited notable gains in Share of Search, increasing by 5.30% and 5.60%, respectively. However, some brands experienced a slight dip, with Speedo in the Men’s Swimwear subcategory seeing a 2.50% dip in their search visibility, and Reebok in Men’s Shoes witnessing a 3.3% decrease.
These fluctuations highlight the dynamic nature of brand strategies during Black Friday and Cyber Monday in the Apparel category, where gaining visibility also proves to be crucial alongside offering competitive discounts.
—
For a deeper dive into the world of competitive pricing intelligence and to explore how our solutions can benefit apparel retailers and brands, reach out to us today!
Stay tuned to our blog for forthcoming analyses on pricing and discounting trends across a spectrum of shopping categories, as we continue to unravel the intricacies of consumer behavior and market dynamics.
As Black Friday and Cyber Monday unfolded across the globe, there was a noticeable subdued atmosphere compared to previous years. TD Cowen brokerage adjusted its forecast for US holiday spending, revising it down from an initial 4-5% growth to a more conservative estimate of 2-3%.
Compounded by persistent inflation and elevated interest rates, many consumers find themselves financially strained, leading to the projection of the slowest growth in US holiday spending in five years.
In this context, it would be relevant to investigate whether this restrained reaction from consumers had an influence on the extent of attractive deals and discounts provided by top retailers and brands during the sale event.
At DataWeave, we harnessed the power of our proprietary data aggregation and analysis platform to track and analyze the prices and deals of consumer electronics products across prominent retailers to uncover unique insights into their price competitiveness this BFCM, as well as understand how pricing strategies varied across diverse subcategories and brands.
Keep an eye on our blog for insights on other shopping categories like Apparel, Home & Furniture, and Health & Beauty!
Our Methodology
For this analysis, we tracked the average discounts among leading US electronics retailers during the Thanksgiving weekend sale, including Black Friday and Cyber Monday. We noticed prices and discounts didn’t change significantly over the course of the weekend, and hence the average prices of products between the 24th and 27th of November are being reported. Our sample was chosen to encompass the top 500 ranked products in each product subcategory across leading retailers during the sale.
Sample size: 23,505 SKUs
Retailers tracked: Amazon, Walmart, Target, Best Buy
The observed Black Friday and Cyber Monday discount strategies reveal a distinct competitive landscape among major retailers. Amazon emerged as the frontrunner, offering the highest average discounts at 23.30%, spanning a significant 74% of their consumer electronics inventory. Best Buy closely followed, with an average discount of 19.40% across 76% of their products.
On the other hand, Target and Walmart adopted a more conservative stance, providing lower average discounts at 14.8% and 12%, respectively, with Target discounting 51% of its products and Walmart discounting 41%. This variation in discounting strategies highlights the diverse approaches retailers take to attract and retain Black Friday and Cyber Monday shoppers, balancing competitiveness with profit margins.
Average Discounts: Subcategories
In the Headphones subcategory, Amazon stands out with a substantial 31.40% average discount, targeting 84.69% of SKUs, showcasing an aggressive discounting strategy. Best Buy follows closely, demonstrating competitive pricing with a 21.80% average discount on 67.03% of products.
Meanwhile, in TVs, Best Buy offered a significant 17.9% average discount across 89% of its products, signaling a targeted effort to capture a broad market share in this subcategory.
In the Laptop subcategory, Target was highly conservative, with only a 4.1% average discount covering 14.3% of its products, while Walmart positioned itself with a moderate 9.5% average discount, targeting 39.8% of its inventory.
Among Smartphones, Amazon (14.7%) was third to Best Buy and Target, which offered average discounts of 20.5% and 18.1%, respectively. Walmart, with an average discount of only 9.9% in the subcategory opted for a relatively muted approach.
Average Discounts: Brands
The discount strategies across top electronics brands during Black Friday unveil distinct approaches. Samsung emerges as a focal point across Amazon, Best Buy, Walmart, and Target. The brand was most attractively priced on Best Buy, with an average discount of 25.3%, followed by Target (18.3%) and Amazon (17.9%).
Apple’s discounts were quite consistent across Amazon (17.6%), Best Buy (16.1%), and Target (17.8%), with the exception of Walmart (8.1%). JBL, interestingly, opted to discount very heavily on Best Buy, at an average of 38.8%, resulting in several attractive deals for shoppers on the website. Sony, too, offered impressive discounts at over 23% on Amazon and Best Buy, followed by 16% on Walmart. On Amazon, Amazon Renewed (13.9%) was among the most aggressively discounted products, highlighting an effort to further appeal to cost-conscious consumers.
Overall, our analysis throws light on the nuanced strategies employed by leading brands on Amazon, Best Buy, Walmart, and Target, reflecting a delicate interplay between brand positioning, pricing competitiveness, and customer appeal.
Share of Search For Consumer Electronics Brands Across Subcategories
The Share of Search data reflects intriguing shifts in brand strategies during the Black Friday and Cyber Monday events. During sale events, brands looking to entice shoppers don’t rely only on price but also on search visibility to help drive awareness and conversion. Share of Search is defined as the share of a brand’s products among the top 20 ranked products in a subcategory, thereby providing insight into a brand’s visibility on online marketplaces.
Some of the brands that improved their Share of Search the most include LG, Skullcandy, Asus, JBL, and Samsung. On the other hand, prominent brands like Sony and Apple actually lost ground on this metric by 0.4% and 2% respectively.
At DataWeave, our commitment to empowering retailers and brands with actionable competitive and digital shelf insights remains unwavering. Our AI-powered platform provides a comprehensive view of market dynamics for our customers, enabling informed decision-making. As a partner in your journey, we offer tailored solutions to enhance your competitive edge, drive sales, and elevate your brand presence. To find out more about our solution, reach out to us today!
To learn more about pricing and discounting trends during Black Friday and Cyber Monday across various other shopping categories, stay tuned to our blog!
Amazon reported a record-breaking Prime Day this July, marking it as the biggest sales event in the company’s history. So when the eCommerce giant announced the Prime Big Deal Days this fall, we were curious to find out how big a deal it really is.
The Prime Big Deal Days, similar in magnitude to the Summer Prime Day, promised to present substantial savings across a diverse range of categories, including electronics, toys, home, fashion, beauty, and Amazon products.
However, for a shopper, an important question is: Does the Prime Big Deal Days in October offer lower prices than Amazon’s mega Prime Day event in July?
To answer this question, we turned our data aggregation and analysis platform to focus on these two sale events and analyzed which event offered better deals across key categories and brands.
TL;DR: Surprisingly, the Prime Big Deal Days in October offered, on average, 2.02% higher discounts than its counterpart event in July.
Read on for details on how we went about our analysis and how discounts vary across categories, sub-categories, and brands.
Our Methodology
We tracked the prices and discounts of a large sample of products during both Prime Day events. The following are some relevant details about our sample:
Number of products analyzed: 1500+
Categories: Apparel, Consumer Electronics, Home & Furniture, Health & Beauty
Prime Day Sale Analysis: 11-12 July 2023
Prime Big Deal Days Analysis: 10-11 Oct 2023
Website: Amazon.com
Our analysis focused on the differences in the prices and discount levels of products between the two sale events.
Our Key Findings
The average discount during the Prime Big Deal Days in October was 29.44%, which was 2.02% higher than the average discount during the Prime Day sale in July (27.42%). Interestingly, the October event offered better deals across each product category analyzed, albeit at slightly varying levels.
By offering deeper discounts in October, Amazon may have aimed to encourage early holiday shopping, thereby capturing a larger share of the consumer wallet before competitors intensify their promotional activities closer to the festive season.
As other retailers and online marketplaces gear up for their own holiday promotional events, Amazon’s decision to provide heightened discounts in October could serve as a preemptive move to secure customer loyalty and drive sales momentum before the onset of the peak shopping period.
Additionally, Amazon’s strategic push to amplify the visibility of its diverse product offerings, including exclusive launches and partnerships during the October event might have contributed to the higher discounts.
Next, let’s take a closer look at each product category.
Apparel
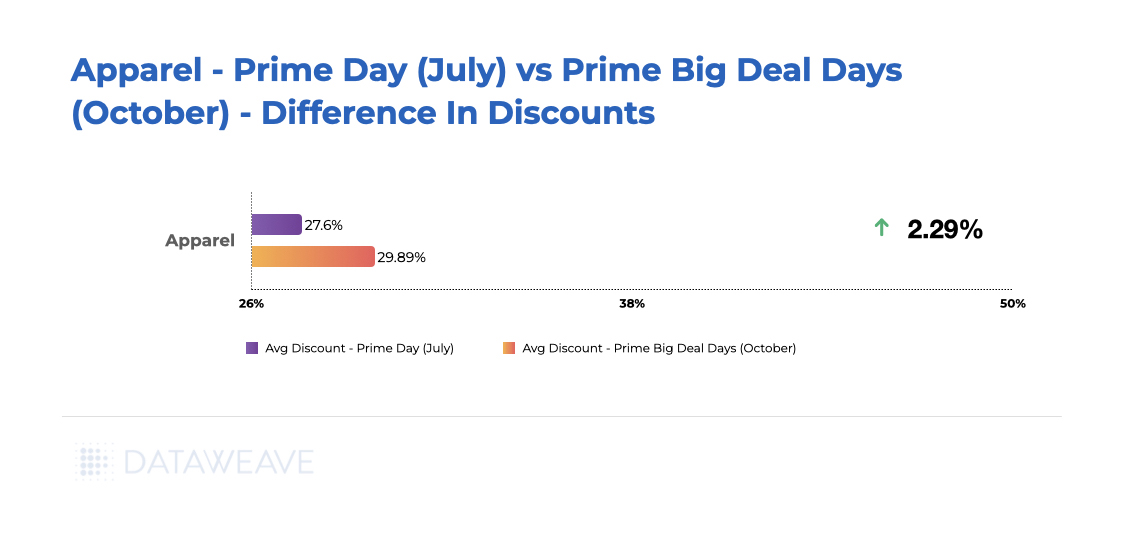
During October’s Prime Big Deal Days, the Apparel category experienced a notable uptick, boasting a 2.29% increase in discounts compared to the earlier Prime Day event in July.
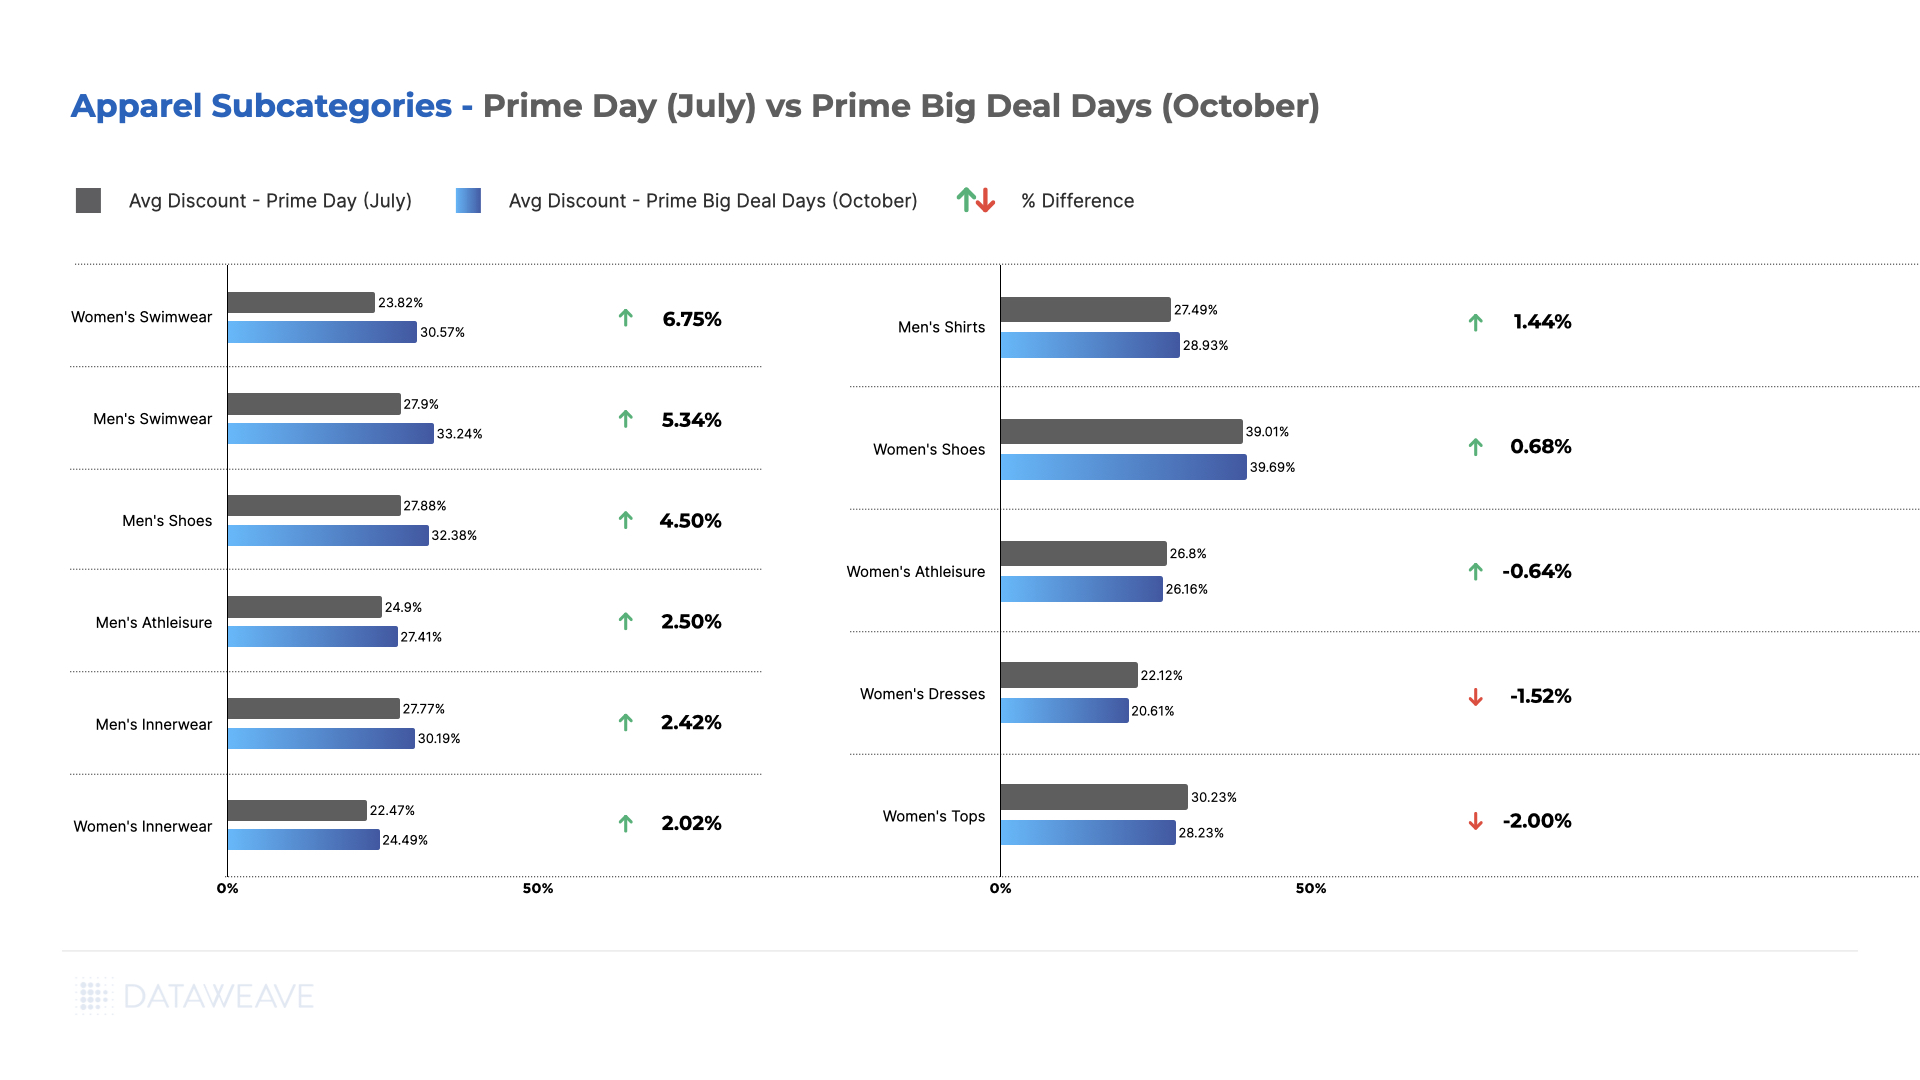
In the detailed assessment of Apparel sub-categories, Men’s and Women’s Swimwear, alongside Men’s Shoes, Innerwear, and Athleisure, emerged as the segments showcasing the most substantial average discounts during October. Fall also brought about more affordable prices for Women’s Innerwear and Men’s Shirts. However, Women’s Athleisure, Dresses, and Tops displayed diminished average discounts during this Prime Big Deal Days event.
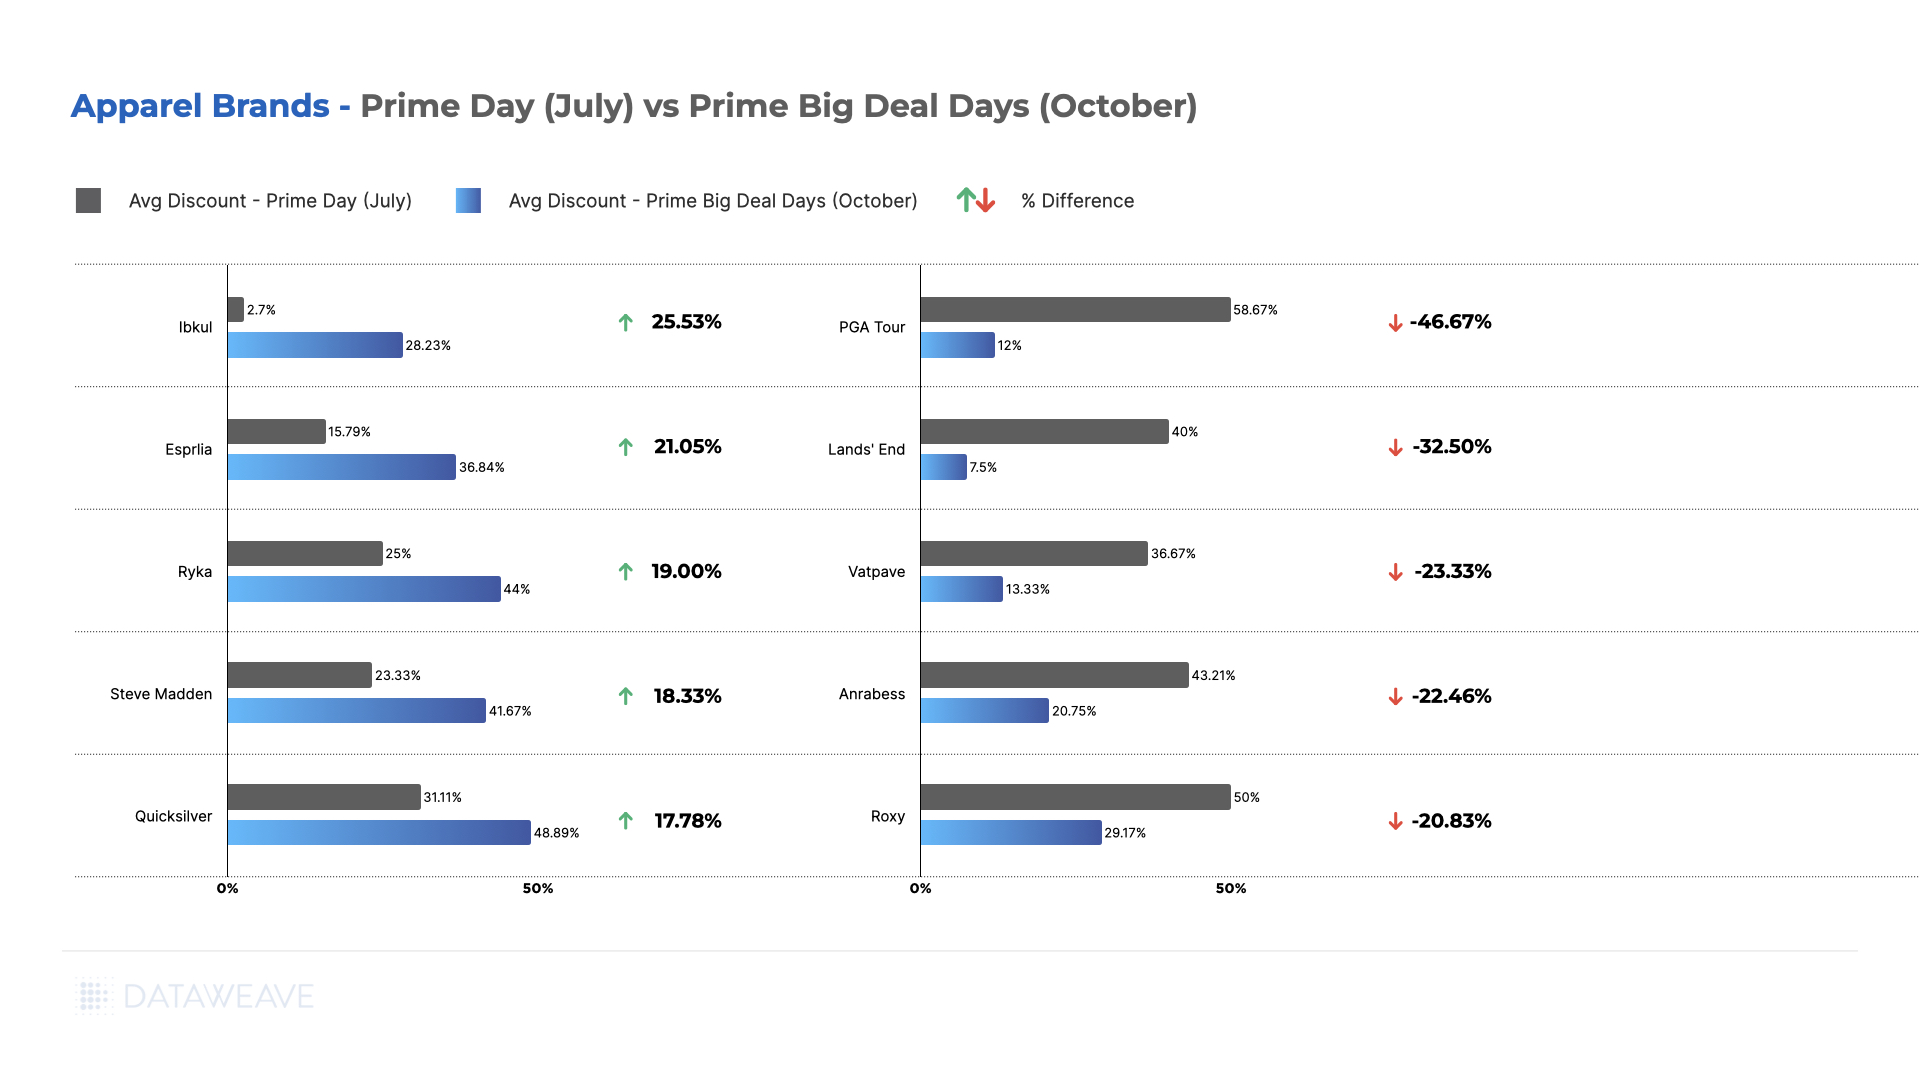
Delving into brand-specific analyses revealed intriguing trends. Athleisure brands such as Ibkul, Esprlia, and Ryka notably escalated their discounts in October after minimal markdowns during the Summer Prime Day sale.
Steve Madden, witnessing heightened discounts in October, hinted at a growing demand for boots and footwear in the Autumn and Winter seasons. For instance, the Steve Madden Men’s Fenta Fashion Sneaker was priced at $46 during the Summer Prime Day, and only at $35 during the Prime Big Deal Days in October.
Conversely, brands like PGA Tour, Land’s End, Roxy, and Anrabess offered more substantial discounts during the Summer compared to the October event.
Consumer Electronics
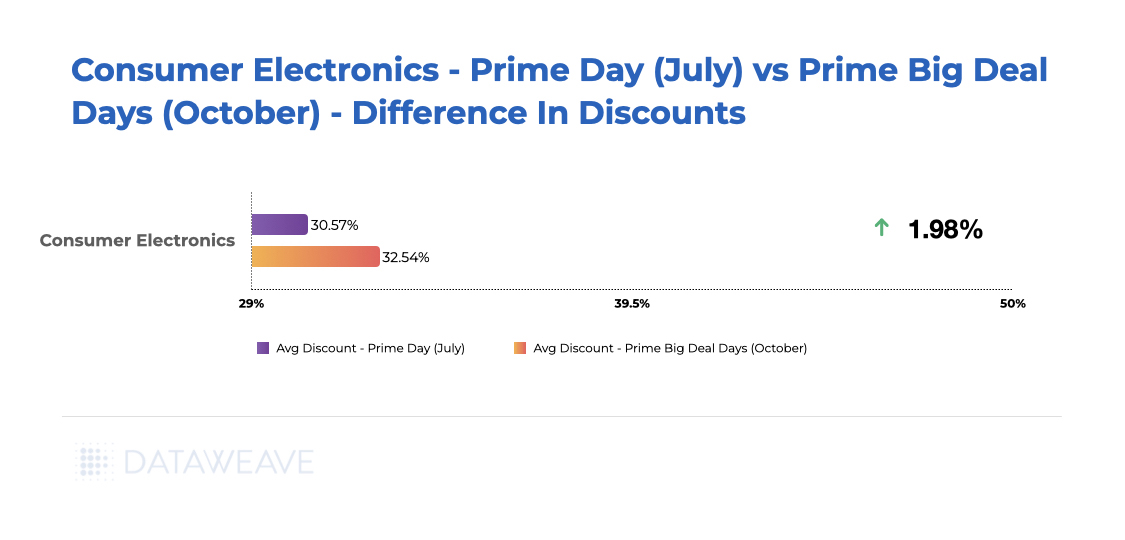
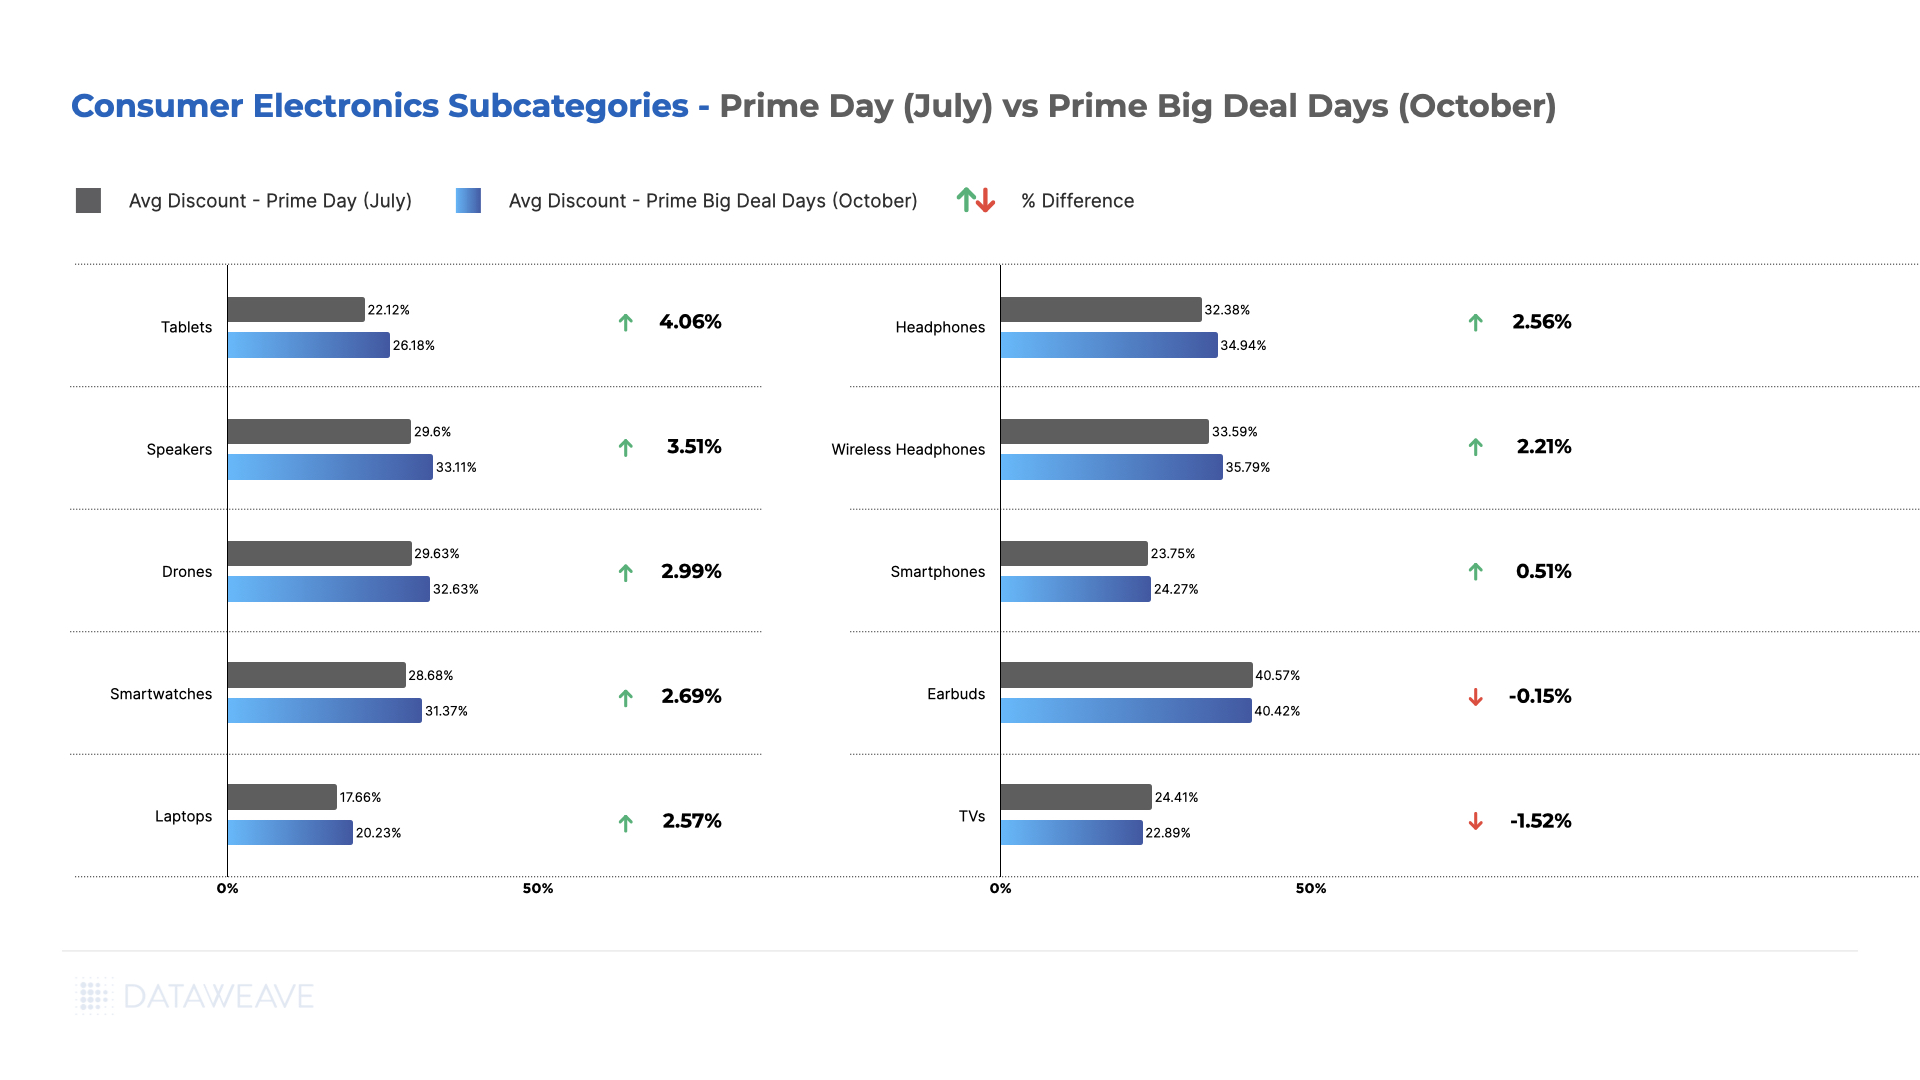
The Consumer Electronics segment during October’s Prime Big Deal Days showcased an average price decrease of 1.98% compared to the Prime Day event in July.
Nearly all scrutinized subcategories experienced heightened discounts during the Fall Prime Big Deal Days in October. Tablets, Speakers, Drones, and Smartwatches notably presented higher discounts of 4.06%, 3.51%, 2.99%, and 2.69%, respectively, in October. However, more enticing deals were found on Earbuds and TVs during July’s event.
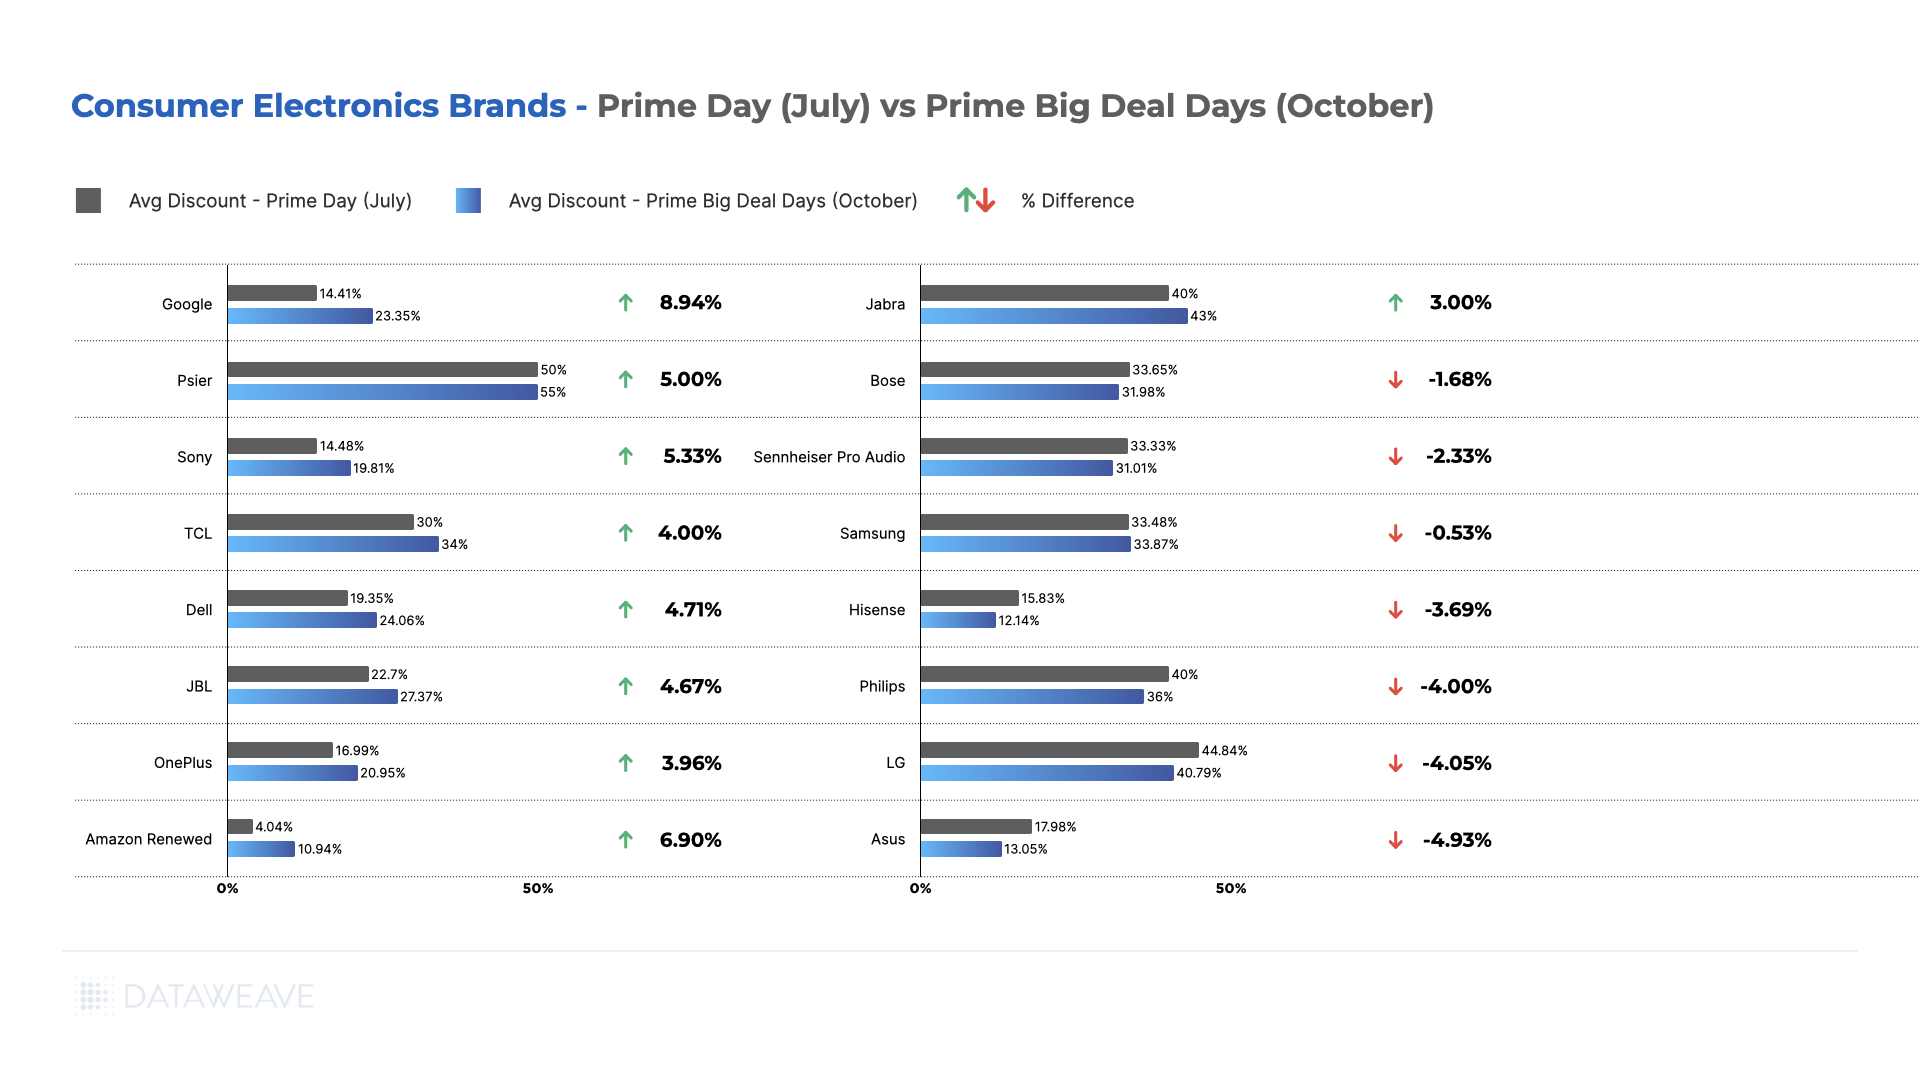
Examining consumer electronics brands, Google stood out by offering the most compelling deals in October, boasting an average discount of 23.35%, marking an 8.94% increase from the Summer Prime Days’ 14.41%. Psier, Sony, and OnePlus also featured significantly reduced prices during the Fall. For example, the OnePlus 10 Pro | 8GB+128GB was $500 during the sale in July and only $440 during the Prime Big Deal Days in October.
Conversely, prominent brands such as Bose, Sennheiser, Samsung, LG, and Asus opted to offer heavier discounts in July. Notably, the Samsung All-in-One Soundbar w/Dolby 5.1 was priced at $218 in October but only $168 in July.
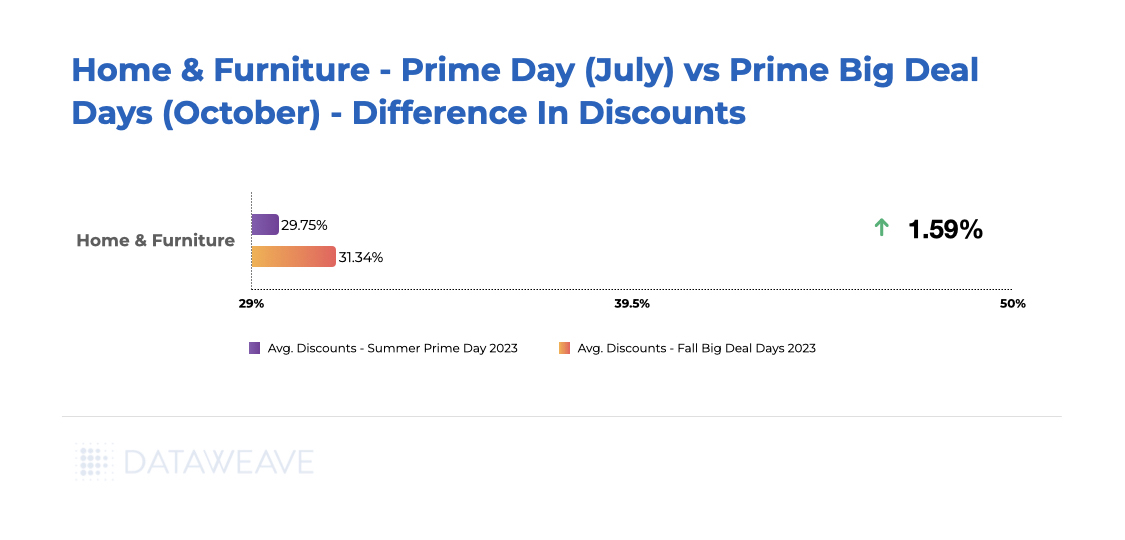
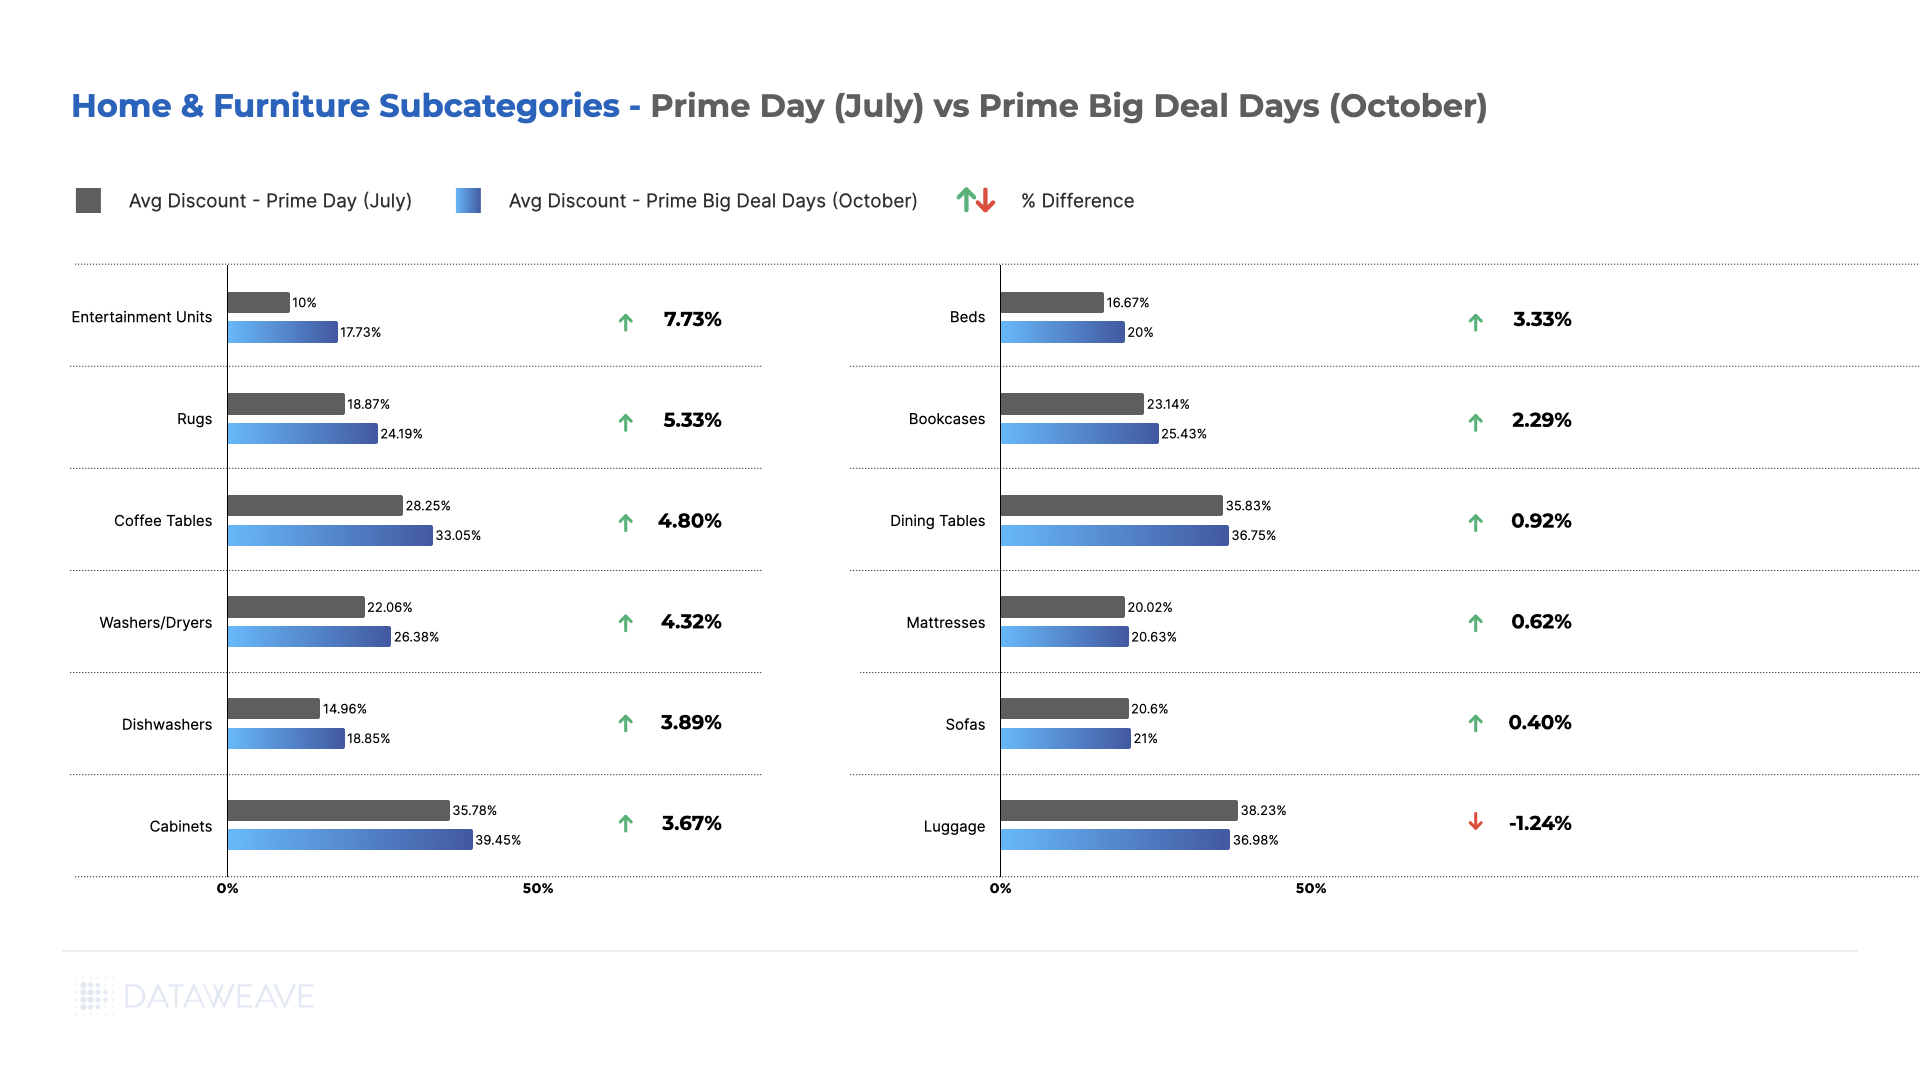
Home & Furniture
During October’s Prime Big Deal Days, the Home & Furniture category experienced a notable 1.59% increase in average discounts compared to the Prime Day event held in July.
Notably, Entertainment Units, Rugs, and Coffee Tables emerged as standout sub-categories that were more attractively priced in October, exhibiting price differences of 7.73%, 5.33%, and 4.80%, respectively.
Interestingly, among the scrutinized sub-categories, only Luggage showed a lower price during the Prime Day sale in July compared to the October event. This shift likely reflects evolving consumer demand as the holiday season approaches, with items like rugs and entertainment units becoming increasingly sought-after categories for purchase.
If you’re keen to explore how these trends vary across brands within this category, reach out to us for more insights.
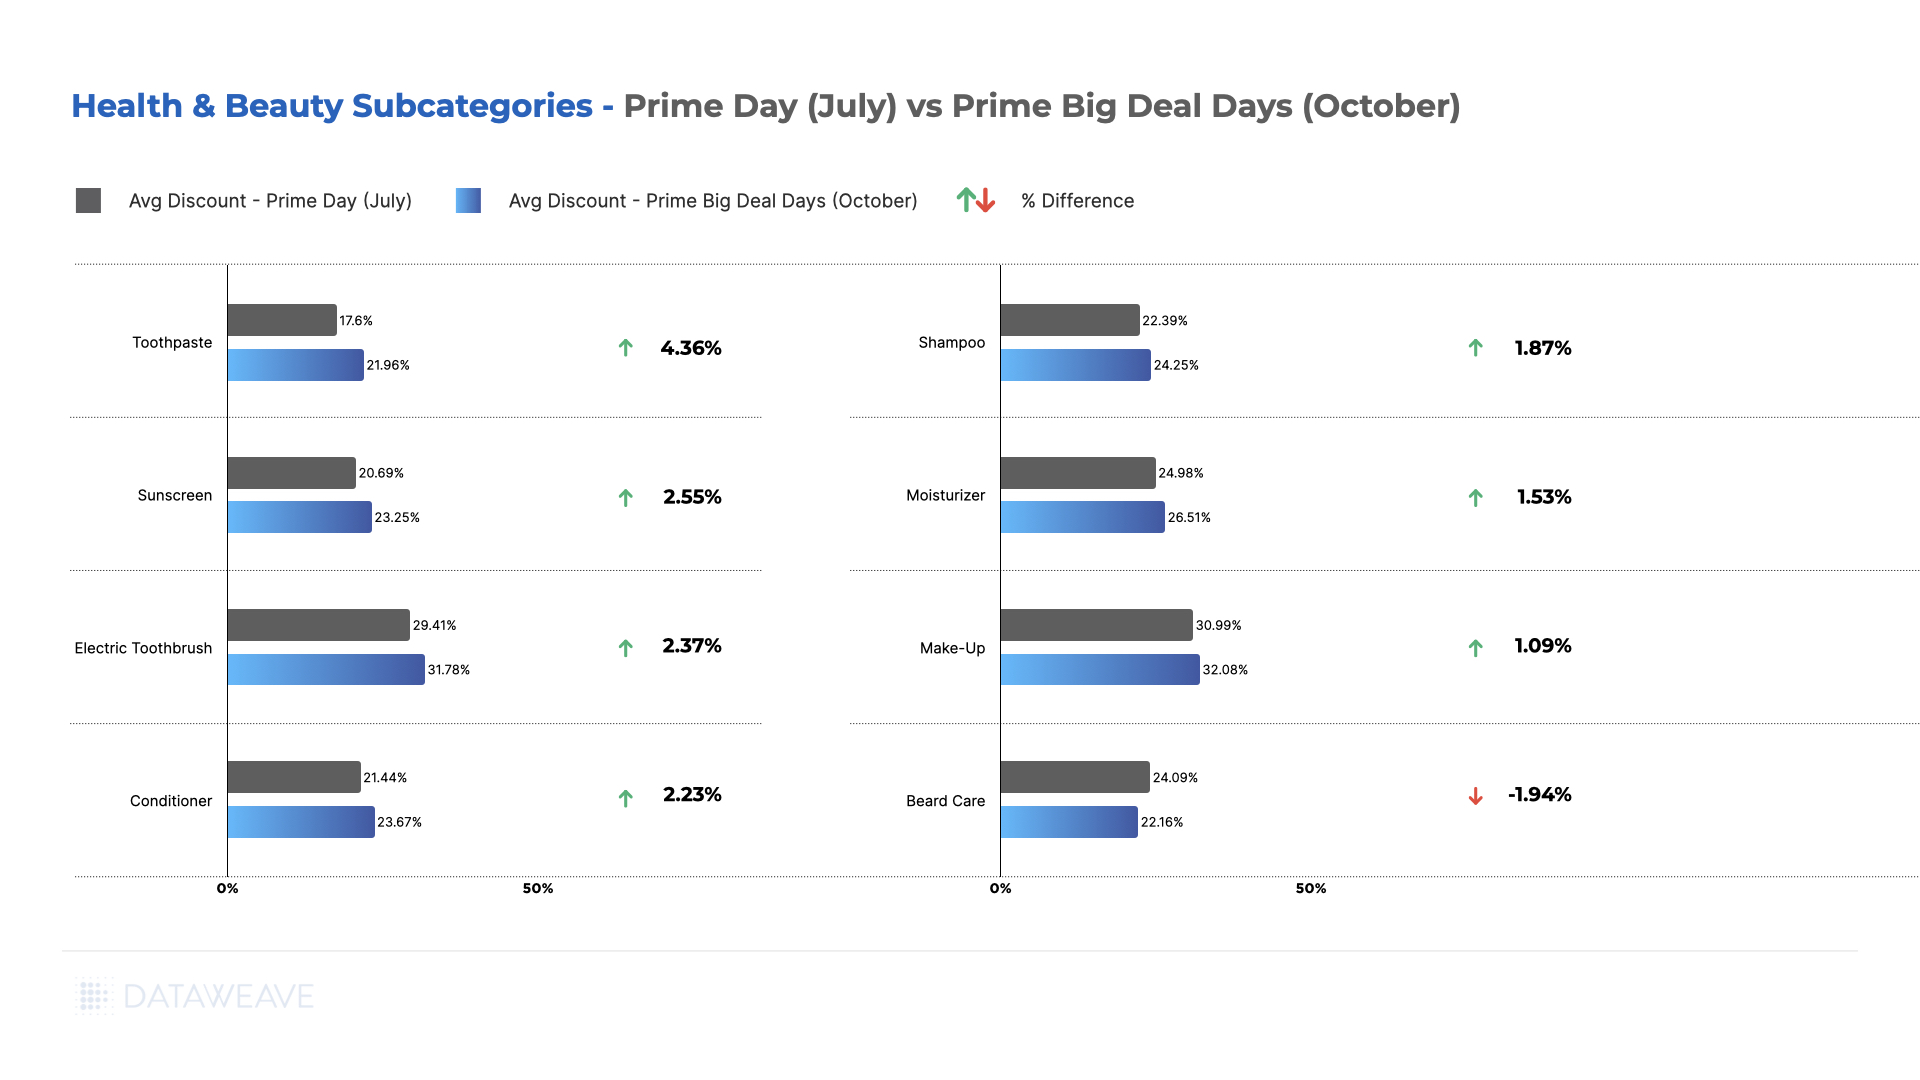
Health & Beauty
During October’s Prime Big Deal Days, the Health & Beauty category showcased products at an average of 1.99% lower prices compared to the Prime Day event held in July.
Our analysis of Health & Beauty reveals that a majority of the subcategories presented higher discounts during the October Big Deal Days event. Essential items such as Toothpaste, Sunscreen, and Electric Toothbrushes notably stood out as significantly more affordable during the Fall event, reflecting not only consistent demand but also a seasonal emphasis on these products. For instance, the Oral B iO Series 3 Limited Edition Electric Toothbrush, priced at $140 during the summer Prime Days, was further discounted to $120 in the fall event.
Interestingly, Beard Care emerged as an exception, displaying higher discounts during the Prime Day sale in Summer compared to Fall’s Prime Big Deal Days.
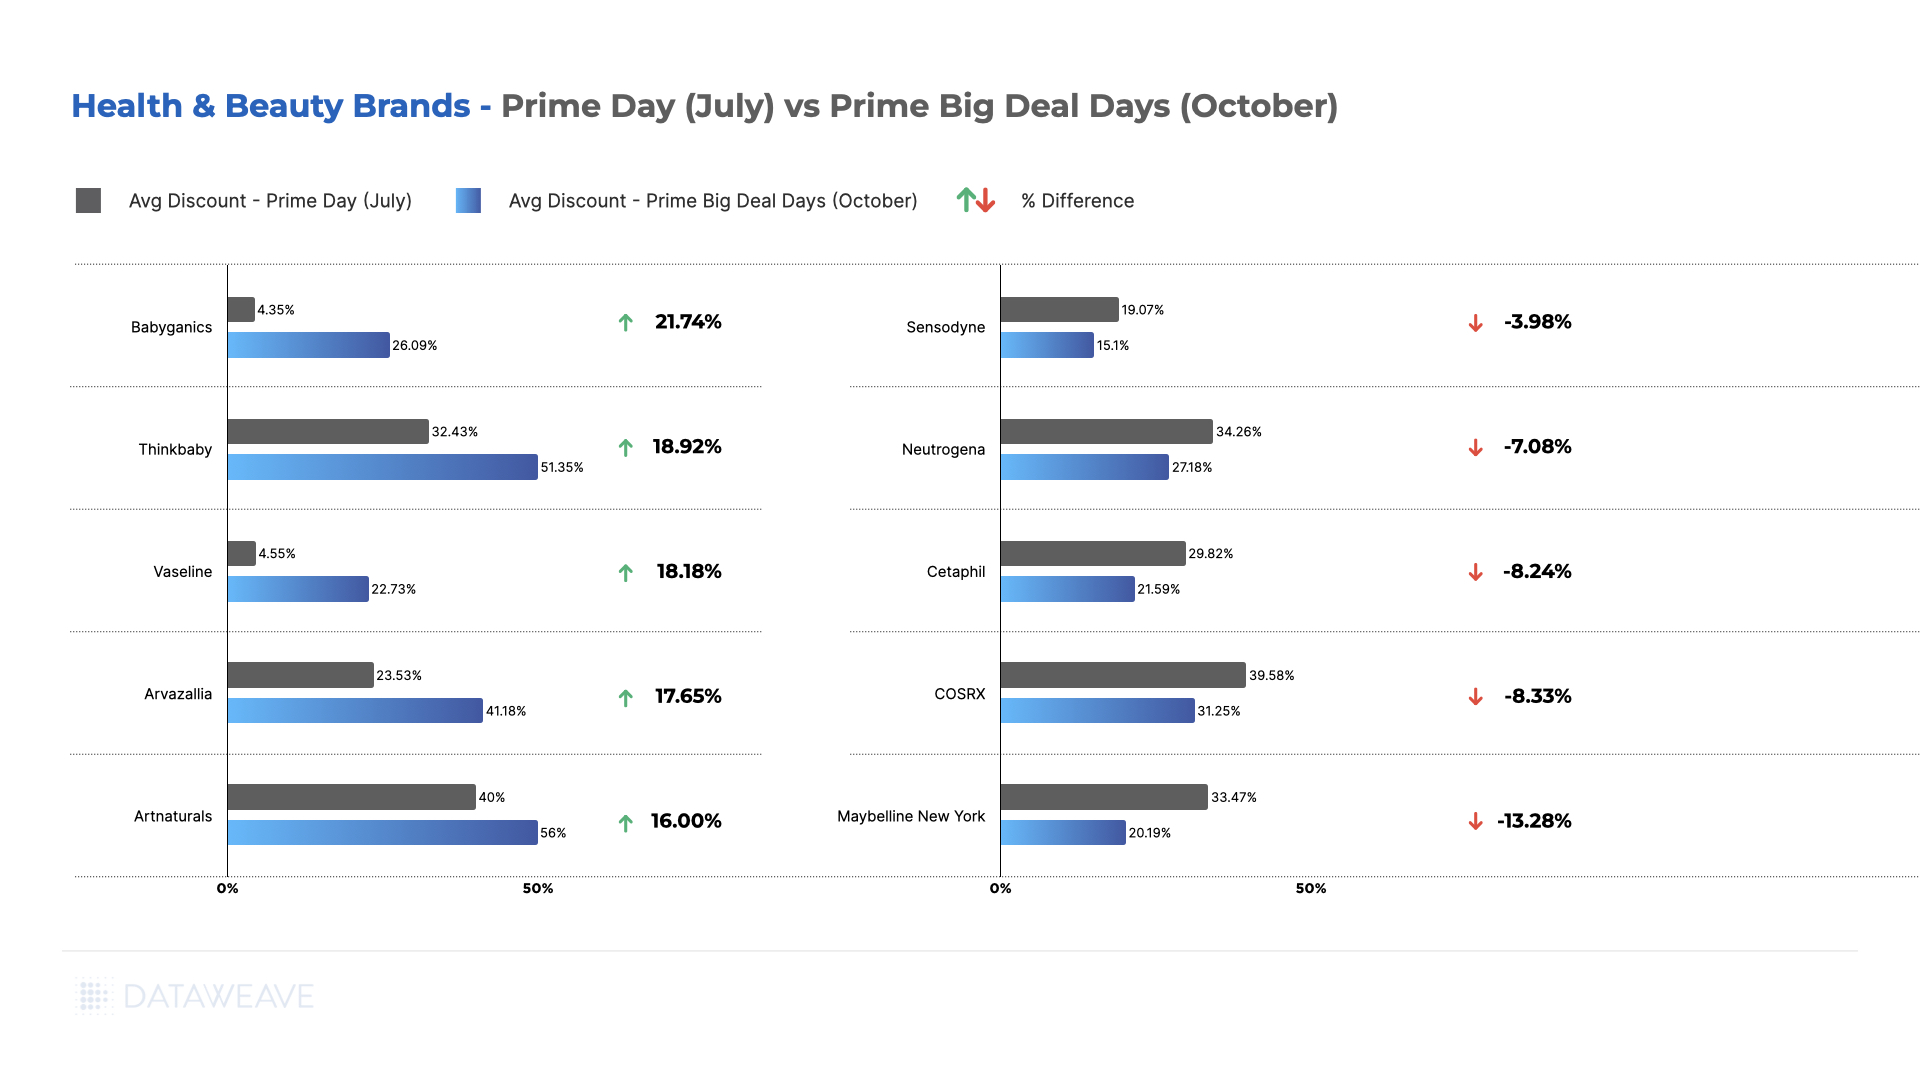
Examining brands within the category, Babyganics, Thinkbaby, and Vaseline showcased substantial increases in average additional discounts during October’s Prime Big Deal Days.
Conversely, prominent brands like Maybelline, Neutrogena, and Cetaphil offered lower discounts during the fall event.
Competitive Insights to Drive Optimized Sale Event Pricing
At DataWeave, we understand the pivotal role of competitive pricing insights in empowering retailers and brands to gain a competitive edge, especially during significant events like Prime Day. Our commitment lies in providing retailers with precise and extensive competitor price tracking on a large scale. This empowers them to devise impactful pricing strategies and consistently uphold a competitive stance in the market. To learn more about how this can be done, talk to us today!
Amazon’s India Prime Day 2023 shattered previous records with a peak of 22,190 orders received in a minute. An important aspect of Amazon’s India Prime Day was the benefits it offers to Prime Members. Thousands of sellers, brands, and bank partners collaborated to help Prime members save a staggering sum of over Rs. 300 Crores. The 2 day (July 15-16) event even witnessed strong growth in Prime membership, with 14% more members shopping than last year’s Prime Day event. 45,000+ new products were launched by over 400+ top Indian and global brands.
However, our analysis reveals that Amazon was able to make a huge splash despite adopting a relatively modest discounting strategy for the event.
Pricing and Discounts on Prime Day 2023
While Prime Day is Amazon’s showstopper, bringing huge benefits to partner brands and sellers, it’s interesting to also see how Flipkart responded to such a massive sale by its biggest competitor. Therefore, we leveraged our proprietary data aggregation and analysis platform to analyze the prices and discounts of Amazon and Flipkart across key product categories – Apparel, Home & Furniture, Consumer Electronics, and Health & Beauty – during Prime Day.
Since products on Amazon and other eCommerce websites are often sold at discounts even on normal days not linked to a sale event, we delved into the real value that Prime Day offers to shoppers by focusing on price reductions or additional discounts during the sale compared to the week before. As a result, our approach highlights the genuine benefits of the event for shoppers who count on lower prices during the sale.
Research Methodology
For our analysis, we tracked the prices of a large number of products across Amazon and Flipkart during Prime Day as well as the week prior to the event. The details of our sample are mentioned below:
Number of SKUs: 85,000+
Retailers: Amazon, Flipkart
Categories: Apparel, Home & Furniture, Consumer Electronics, Health & Beauty
Pre-event Analysis:10-14 July 2023
Prime Day Analysis: 15-16 July 2023
Our Findings
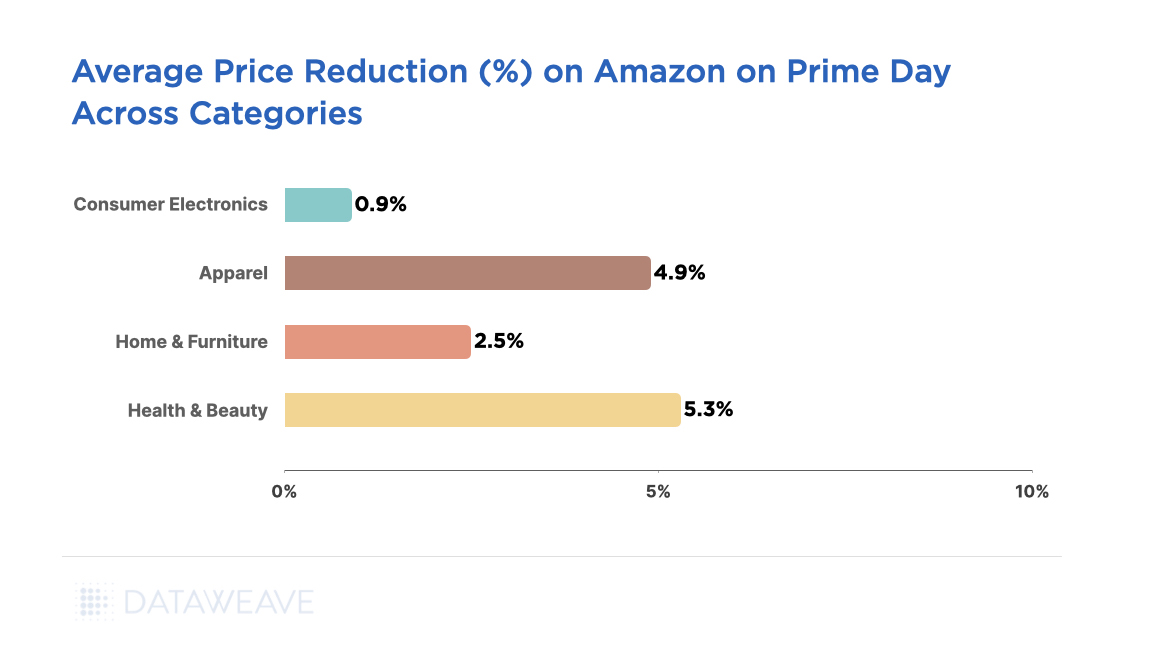
Based on our analysis, Prime Day showcased relatively higher price reductions in the Health and Beauty category, offering an average additional discount of 5.3%. In comparison, the Apparel category had lower discounts at 4.90%, followed by the Home & Furniture category at 2.50% during the sale event.
The Consumer Electronics category, known for attractive prices during sale events, featured only 0.9% price reductions. This is due to the fact that the category was already being sold at a very high average discount of around 44.8% the week prior to Prime Day.
Below, we delve deeper into our analysis of each category to better understand how price reductions were distributed across key subcategories on Amazon. We also report on the degree to which Flipkart responded to Amazon’s pricing actions during the event.
Apparel
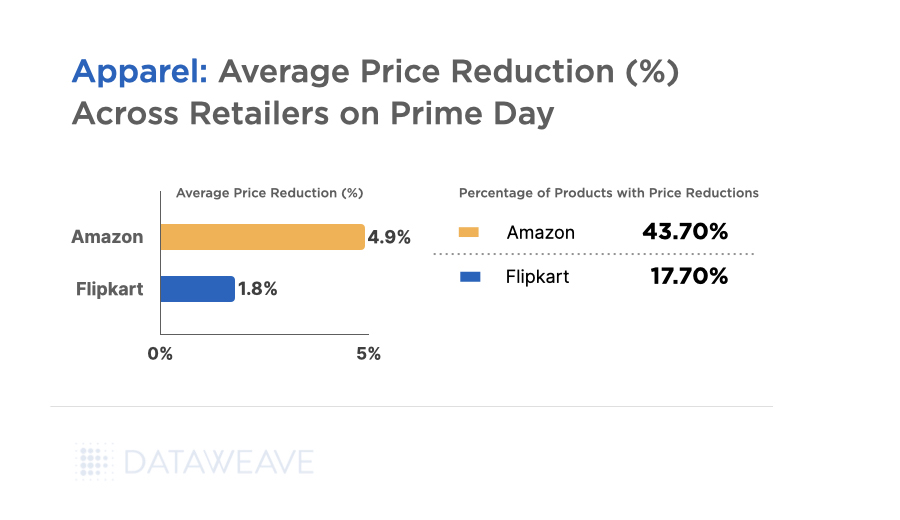
As Amazon grappled with heightened costs and reduced profit margins in apparel (like most other retailers), its average discount before Prime Day was already at 36.5%. Then, on Prime Day, Amazon’s apparel deals were tempered at around 4.9% average price reduction across 43.7% of its assortment.
Flipkart, on the other hand, offered only a modest additional discount of 1.8% across 17.7% of its Apparel assortment. It’s clear that while Flipkart took steps to compete against Amazon in this category, it was done to a lower extent on fewer products than Amazon.
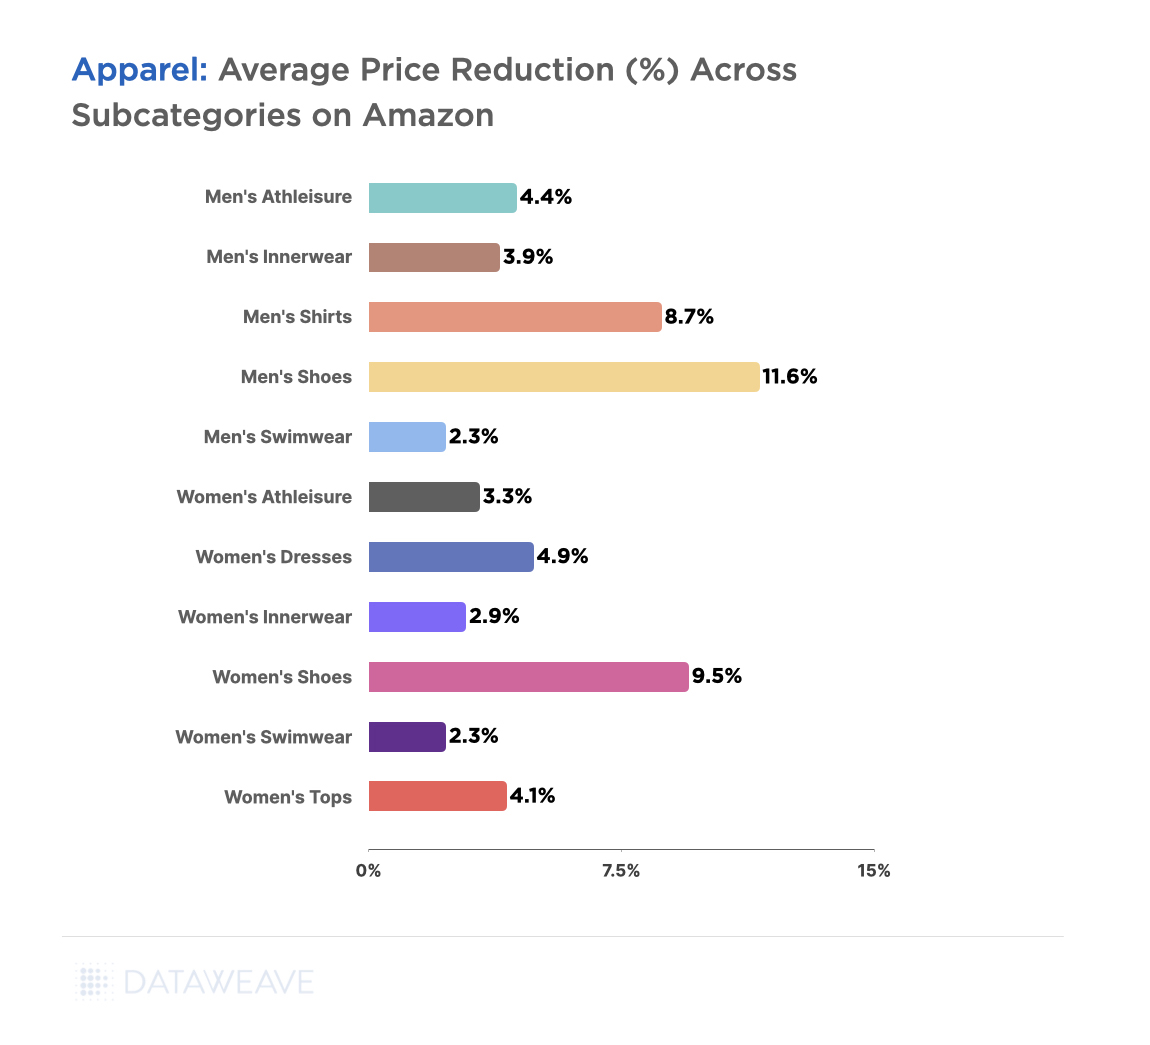
Across all the apparel subcategories we analyzed, Men’s Shoes (11.6%), Women’s Shoes (9.5%), and Men’s Shirts (8.7%) were among the ones with the highest price reductions. On the other hand, Men’s and Women’s Swimwear (2.3%), Women’s Innerwear (2.9%), and Women’s Athleisure (3.3%) had conservative markdowns.
Pricing choices within different subcategories likely stemmed from a range of factors, such as inventory quantities, trends in demand, and the aim to harmonize competitive deals with the maintenance of viable profit margins. These decisions reflect Amazon’s attempt to cater to a consumer base that is particularly conscious of pricing.
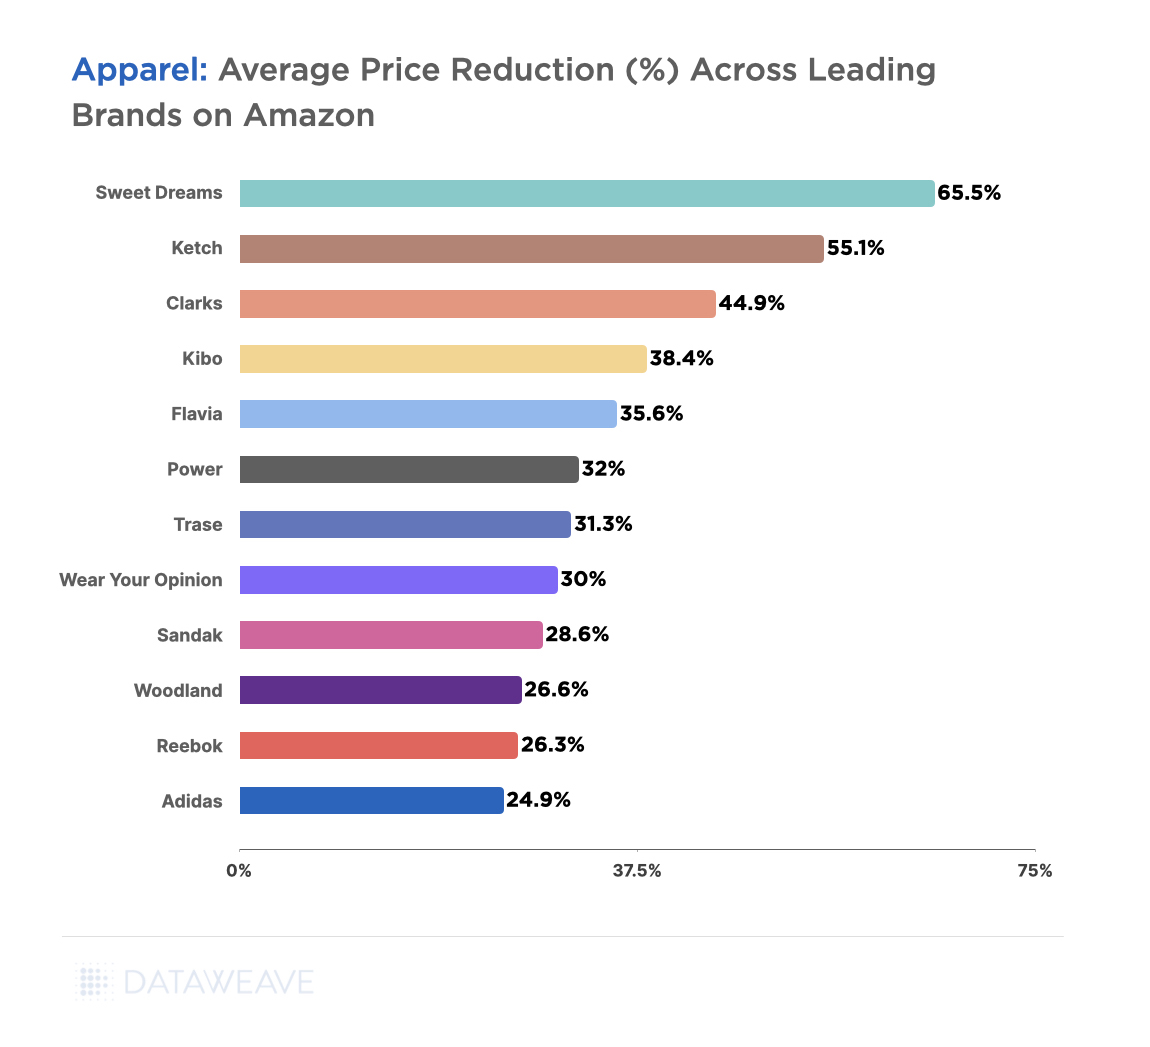
Across all apparel subcategories, leading brands that offered the highest markdowns were Sweet Dreams (65.5%), Ketch (55.1%), Clarks (44.9%), and Kibo (38.4%). Meanwhile, Reebok and Adidas offered significant additional discounts at 26.3% and 24.9%, respectively, as well.
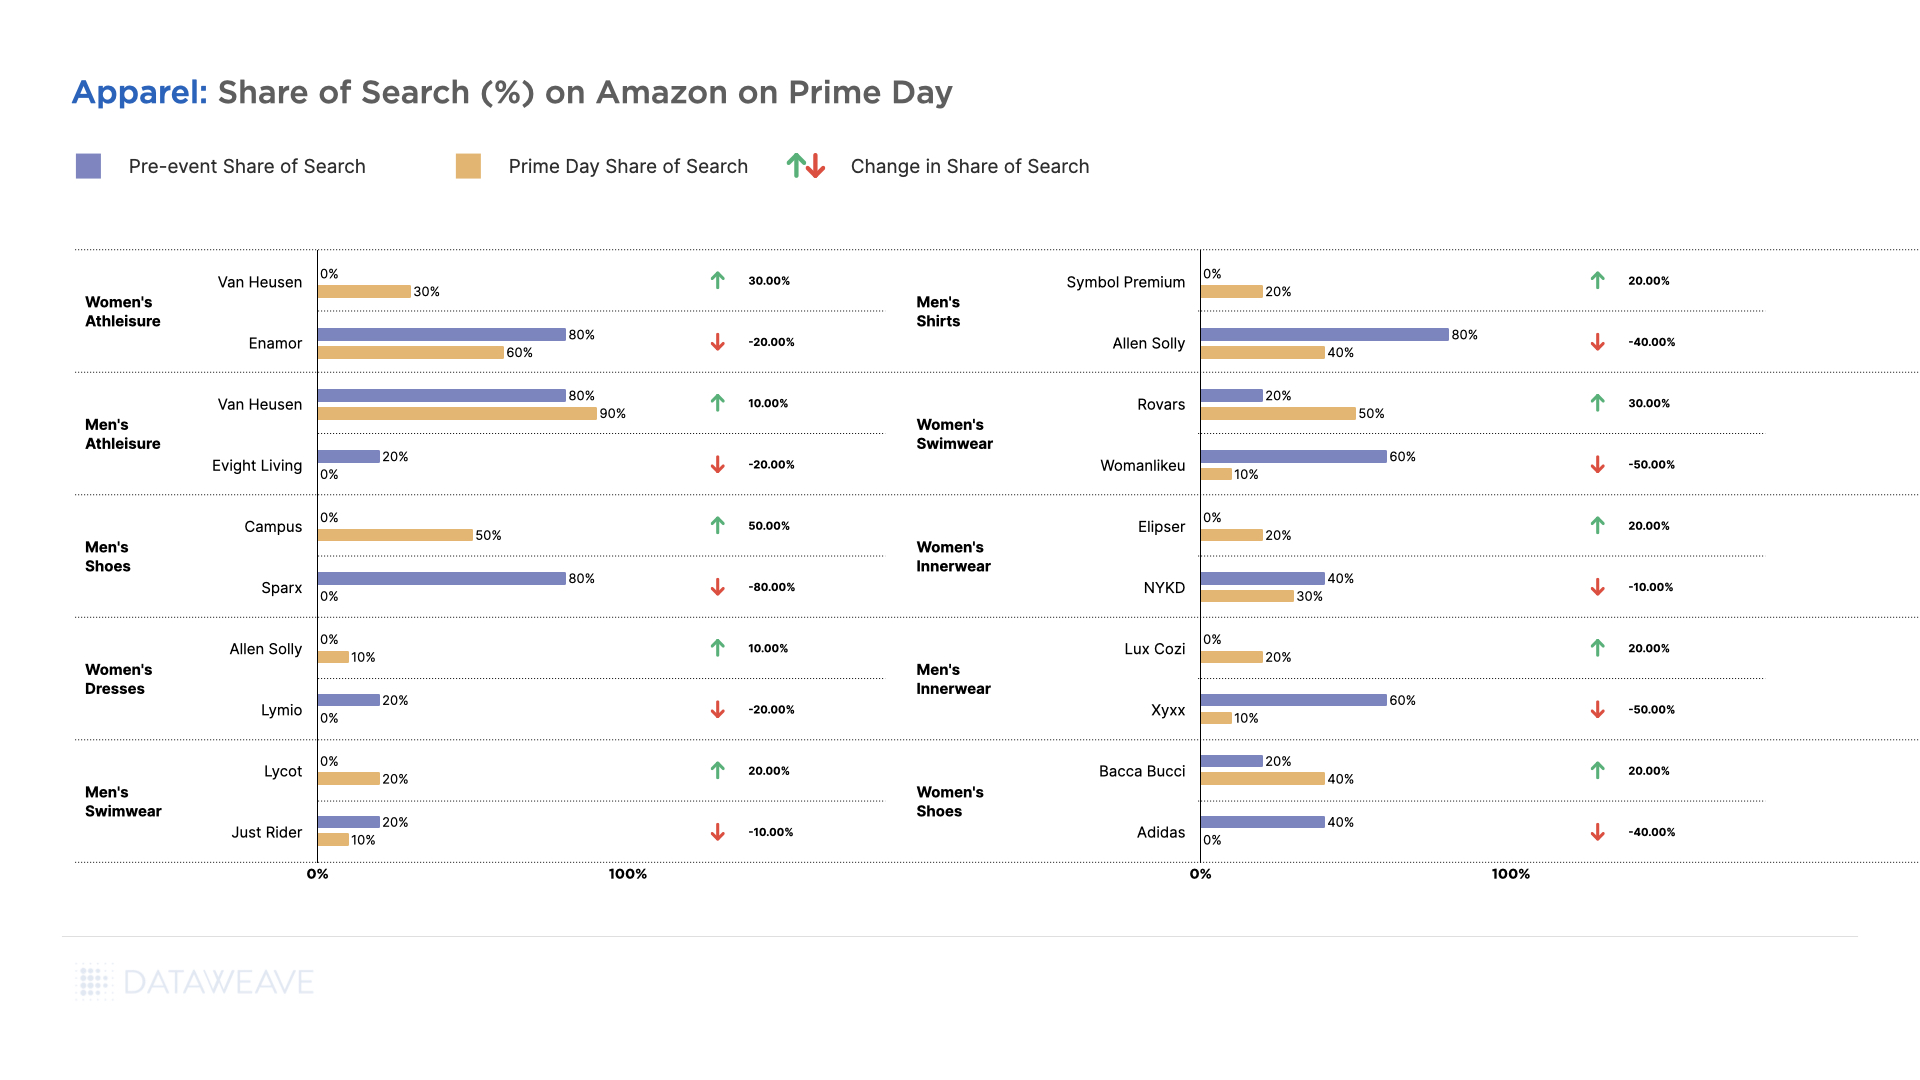
For brands, however, reducing prices is just one approach to entice shoppers. They must also guarantee their prominent presence and easy discoverability within Amazon’s search results. This significantly amplifies their potential to generate higher clicks and conversions. In our analysis, we monitored brands’ Share of Search across various frequently used search terms in addition to the discounts they provided. The Share of Search denotes the portion of a brand’s products within the top 20 search results for a specific search query.
Our data indicates that certain brands gained ground in their discoverability during Prime Day, while others fell behind. Van Heusen in Women’s Athleisure (30%), Campus in Men’s Shoes (50%), and Rovar’s (30%) in Women’s Swimwear among others, improved their Share of Search by significant levels during Prime Day.
On the other hand, brands like Sparkx in Men’s Shoes, Xyxx in Men’s Innerwear, WomanLikeU in Women’s Swimwear, and Adidas in Women’s Shoes lost around 40%-80% in their Share of Search during the event. This is likely to have impacted their sales volumes adversely.
Home & Furniture
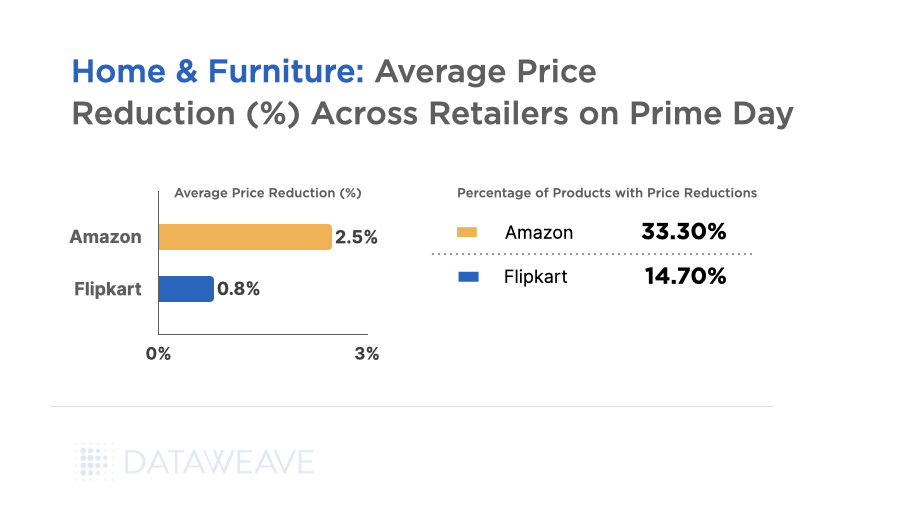
The Home & Furniture industry faced challenges of reduced demand and overstocked inventory over the past year. Therefore, even before Prime Day, discounts offered in this category on Amazon averaged a staggering 45.3%. Consequently, on Amazon Prime Day, additional discounts averaged only 2.5% on Amazon, offered across 33.3% of its assortment. Flipkart opted, in effect, not to compete with Amazon in this category, offering a negligible additional discount of 0.8% across 14.70% of its assortment.
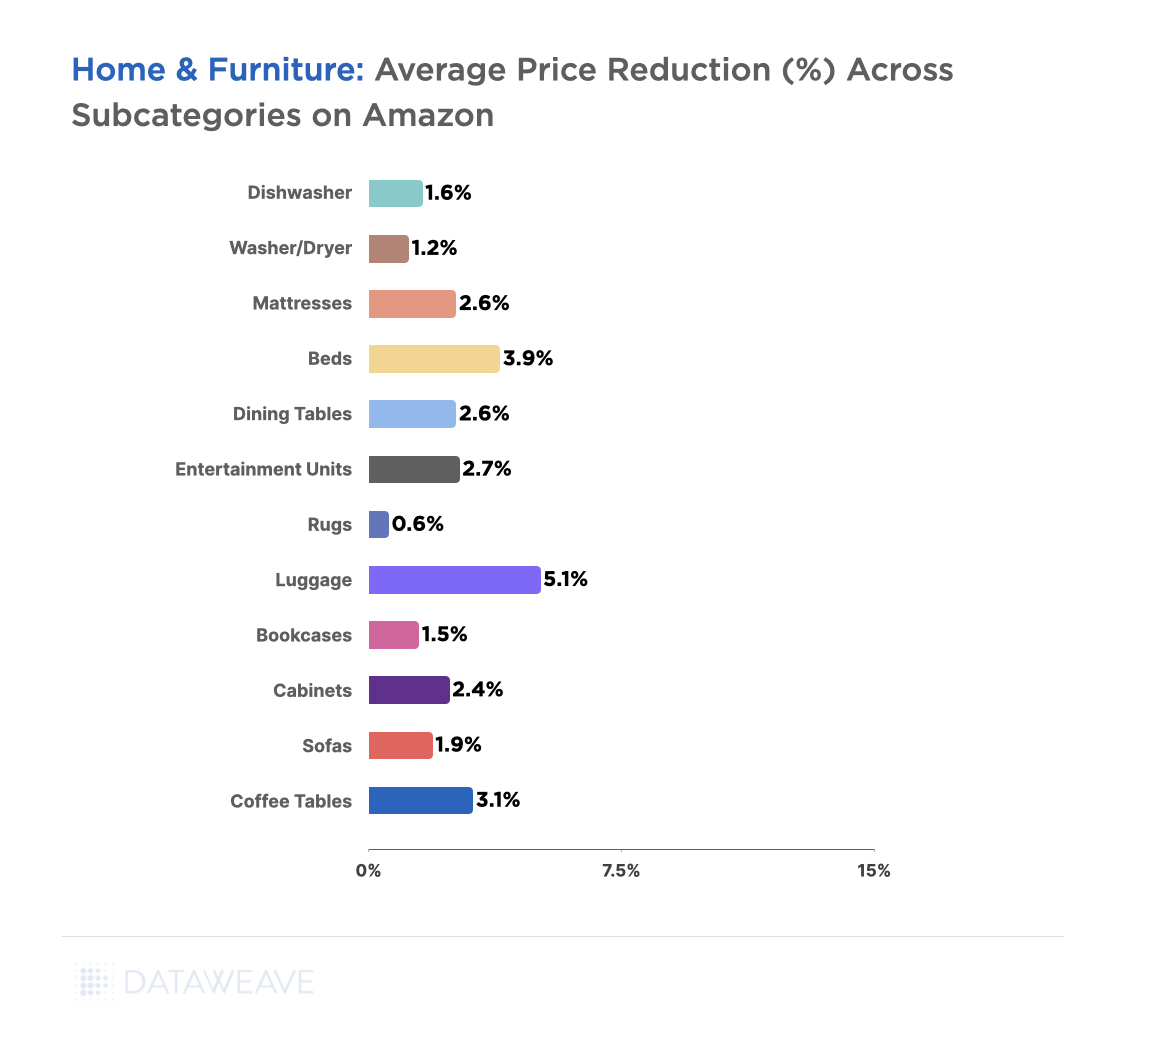
Of all the Home & Furniture subcategories we analyzed, Luggage (5.1%), Beds (3.9%), and Coffee Tables (3.1%) had high price reductions, while Rugs (0.6%), Bookcases (1.5%), and Washer/Dryers (1.2%) had lower markdowns. This highlights the difference in consumer preferences across geographies, with rugs being more discretionary in India but staple in the US.
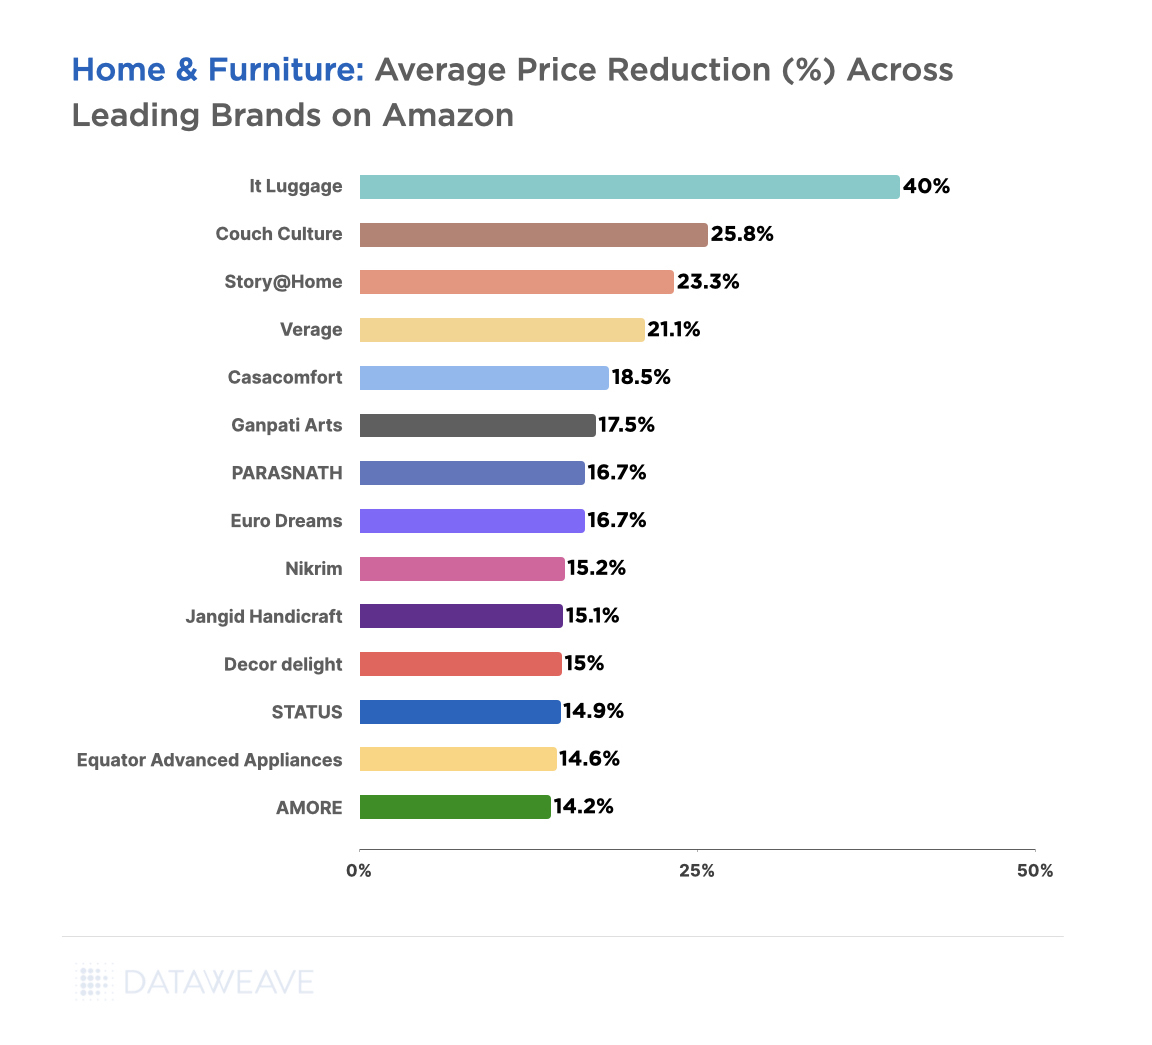
The Home & Furniture category is not known for its brand loyalty among shoppers. Therefore, brands often rely on attractive pricing to gain shopper interest. This Prime Day, brands that offered the highest markdowns in this category include It Luggage (40%), Couch Culture (25.8%), Story@Home (23.3%), and Verage (21.2%).
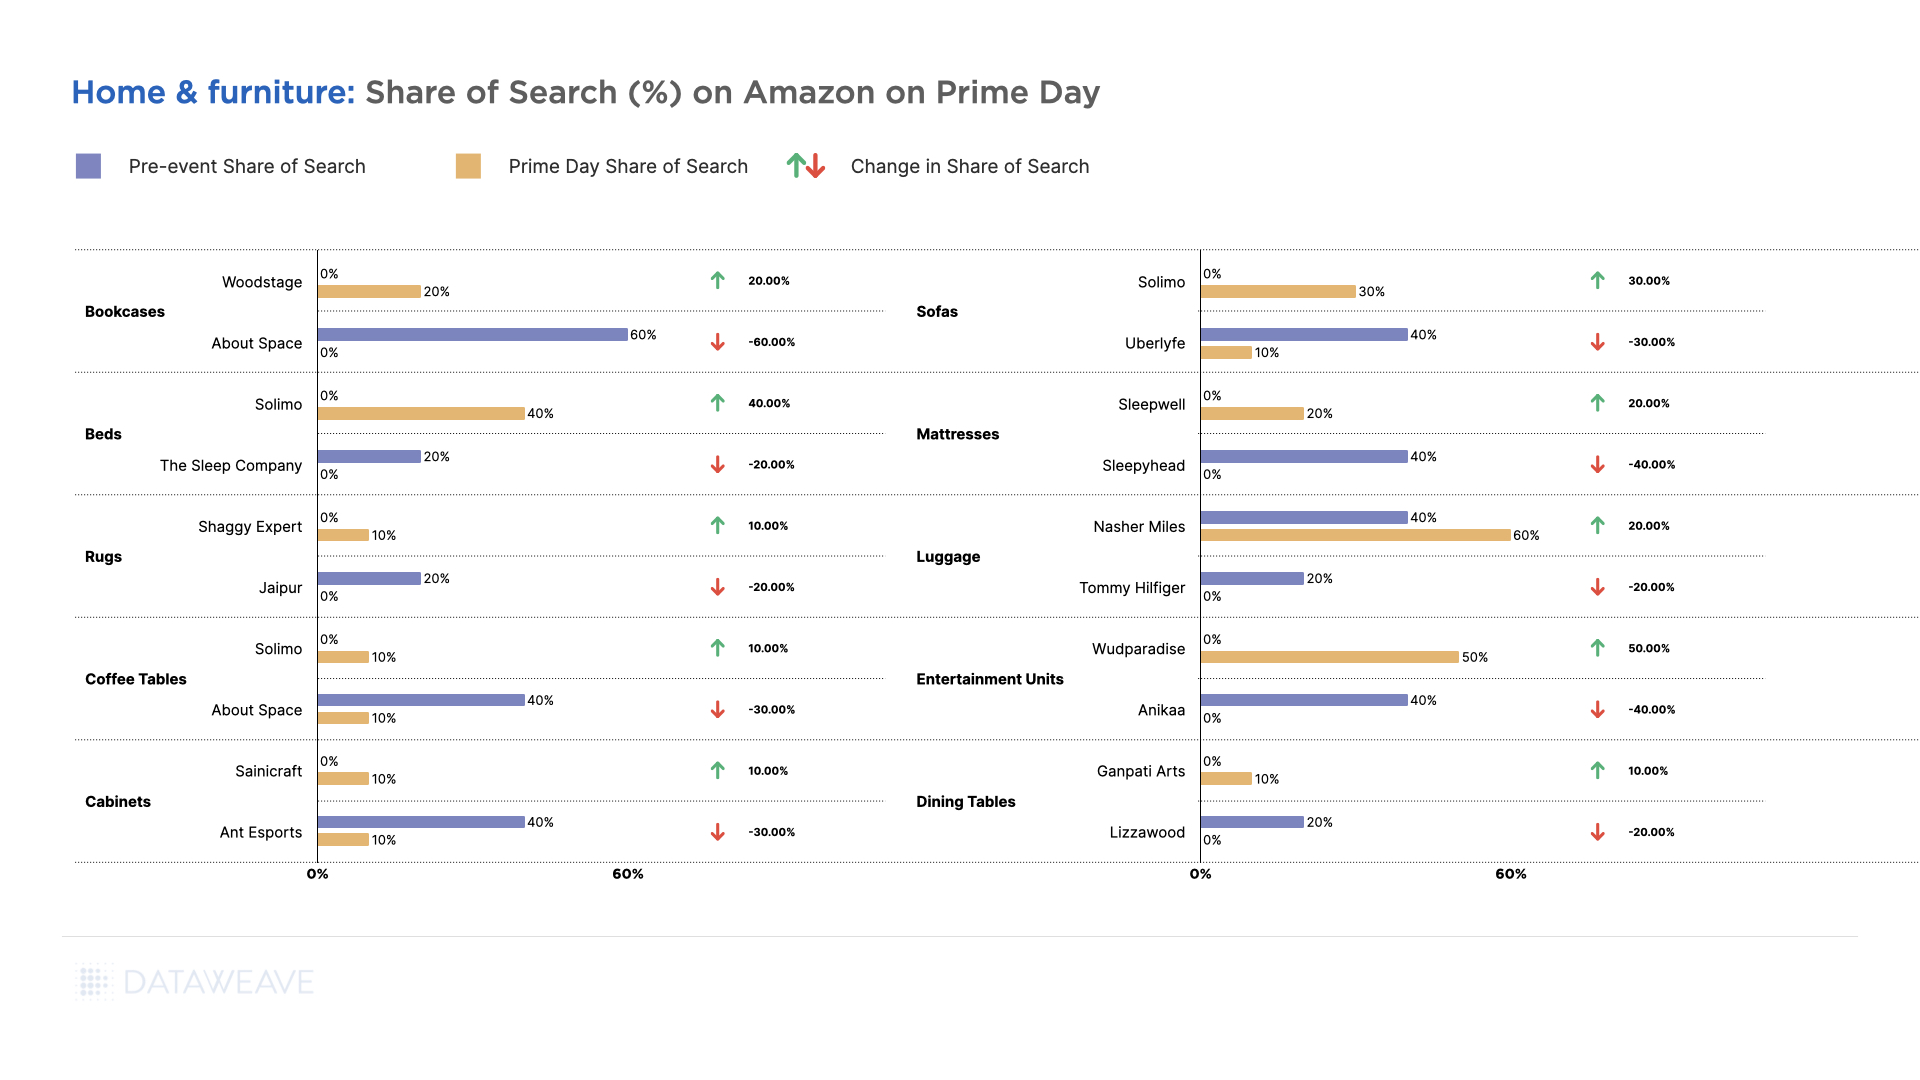
In terms of Share of Search, Wudparadise in Entertainment Units gained the highest (50%). Solimo (an Amazon Brand) in Beds (40%), Sofas (30%), and Coffee Tables (10%) gained significant ground in its respective categories too. In contrast, About Space in Bookcases (-60%), Anika in Entertainment Units (-40%), and Sleepyhead in Mattresses (-40%) lost out on their discoverability in their respective categories during the event.
To gain a competitive edge during sale events like Prime Day, brands need to monitor their Share of Search closely, especially in categories like Home & Furniture with low brand loyalty.
Consumer Electronics
This Prime Day, five smartphones got sold every second with 70% of the demand coming from Tier 2 & 3 cities in India, largely comprising of foldable smartphones and newly launched smartphones (OnePlus Nord 3 5G, Samsung Galaxy M34 5G, Motorola Razr 40 Series, Realme Narzo 60 Series and iQOO Neo 7 Pro 5G). Multiple new products were launched this Prime Day, by brands such as OnePlus, iQOO, Realme Narzo, Samsung, Motorola, boAt, Sony, and more in India.
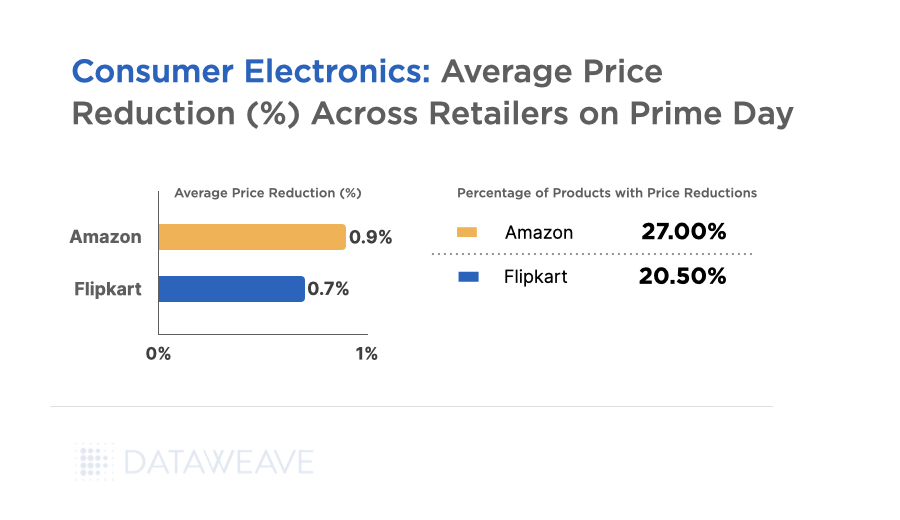
Despite the high demand and new product launches, Amazon’s price reductions in the Consumer Electronics category averaged only 0.9% across 27% of its assortment. Similar to what we observed in the Home & Furniture category, this can be attributed to the prevailing high average discount of 44.8% the week prior to Prime Day. Essentially, in Consumer Electronics, shoppers needn’t always wait till sale events like Prime Day to view the most attractive deals. Several are offered even during the days leading up to the sale.
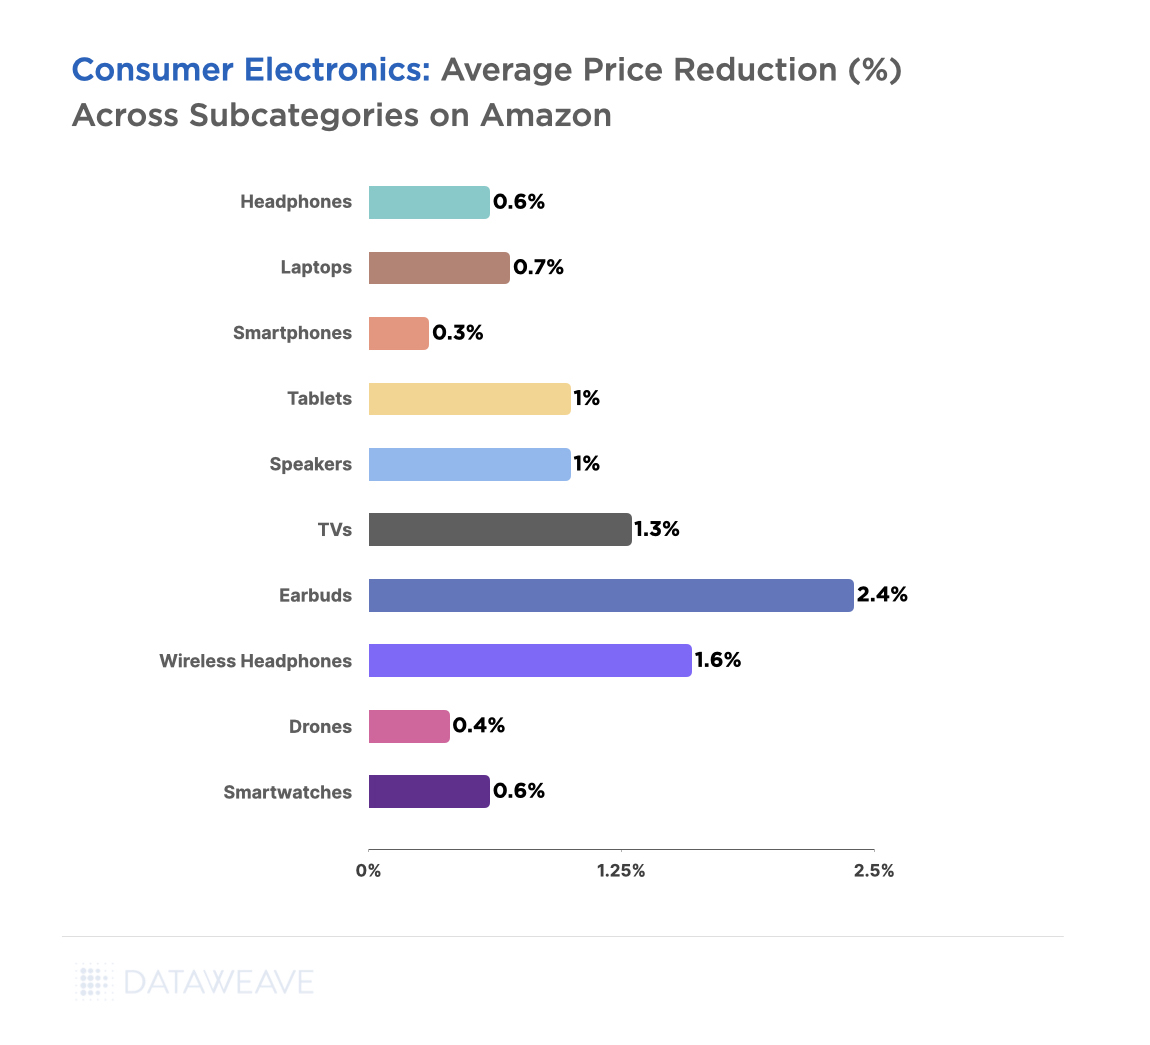
Across subcategories, Earbuds (2.4%), Wireless Headphones (1.6%), and TVs (1.3%) received the highest price reductions due to their popularity and high sales volumes during sales events. On the other hand, Smartwatches (0.6%), Drones (0.4%), and Smartphones (0.3%) had lower markdowns.
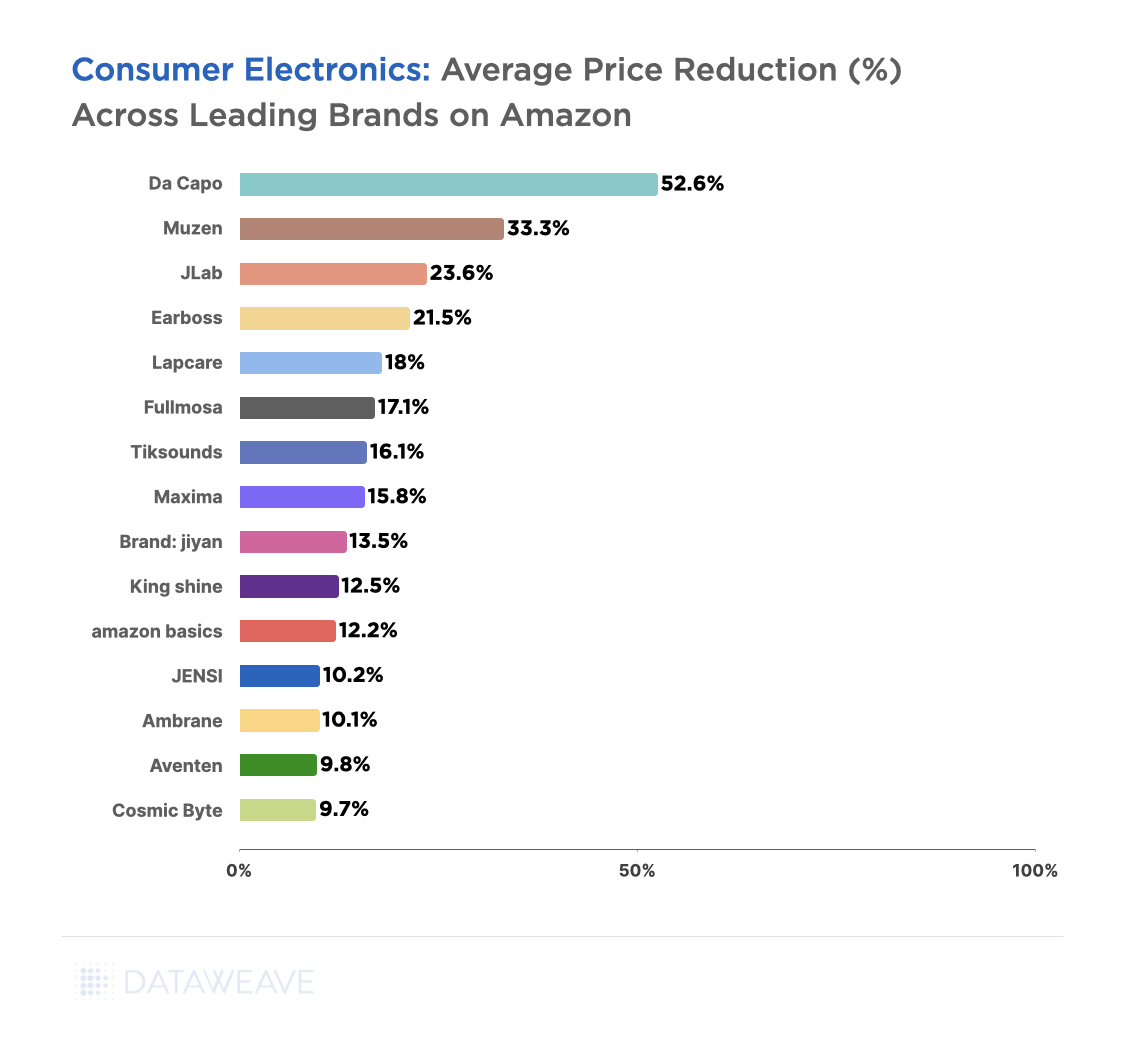
In terms of price reductions across brands, Da Capo (52.6%), Muzen (33.3%), JLab (23.6%), and Earboss (21.5%) offered the most attractive deals in the Consumer Electronics category. Notably, Amazon Basics also offered modestly attractive deals (12.2%), highlighting Amazon’s strategy of promoting in-house brands.
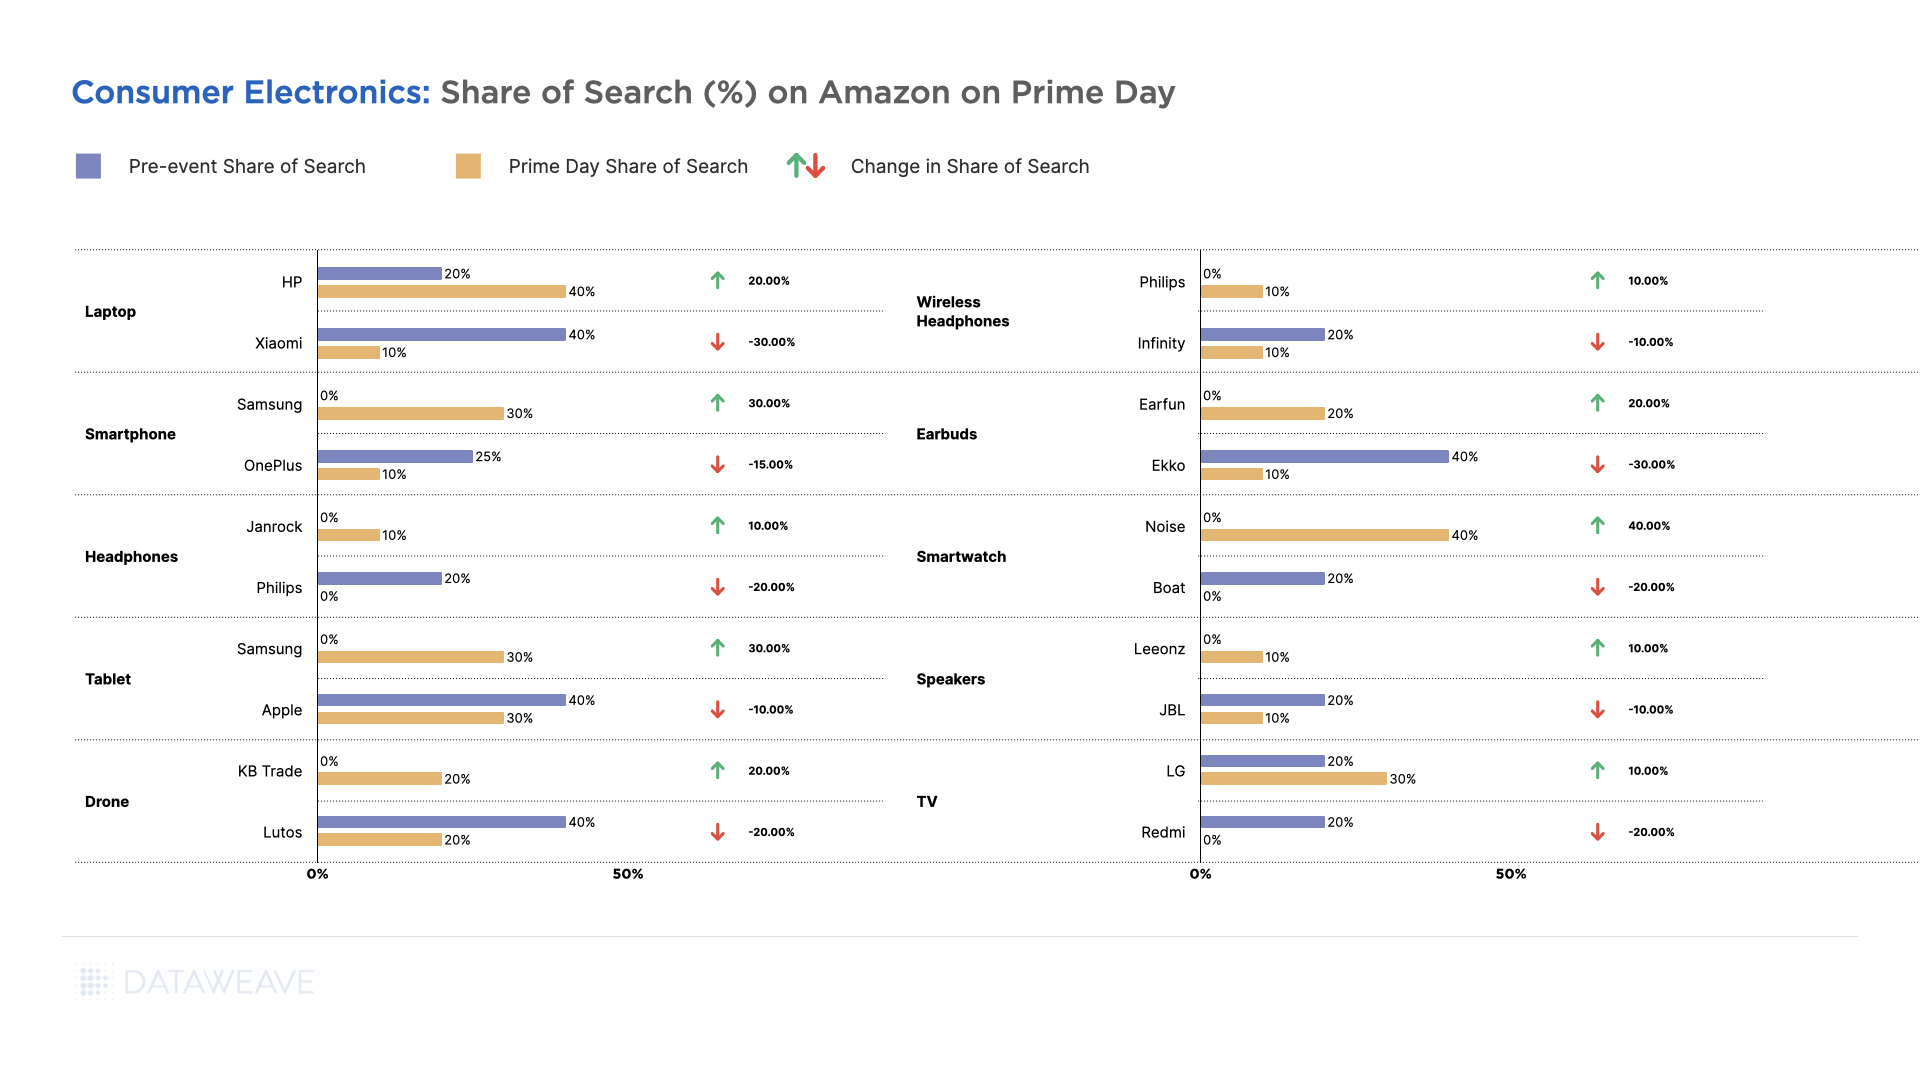
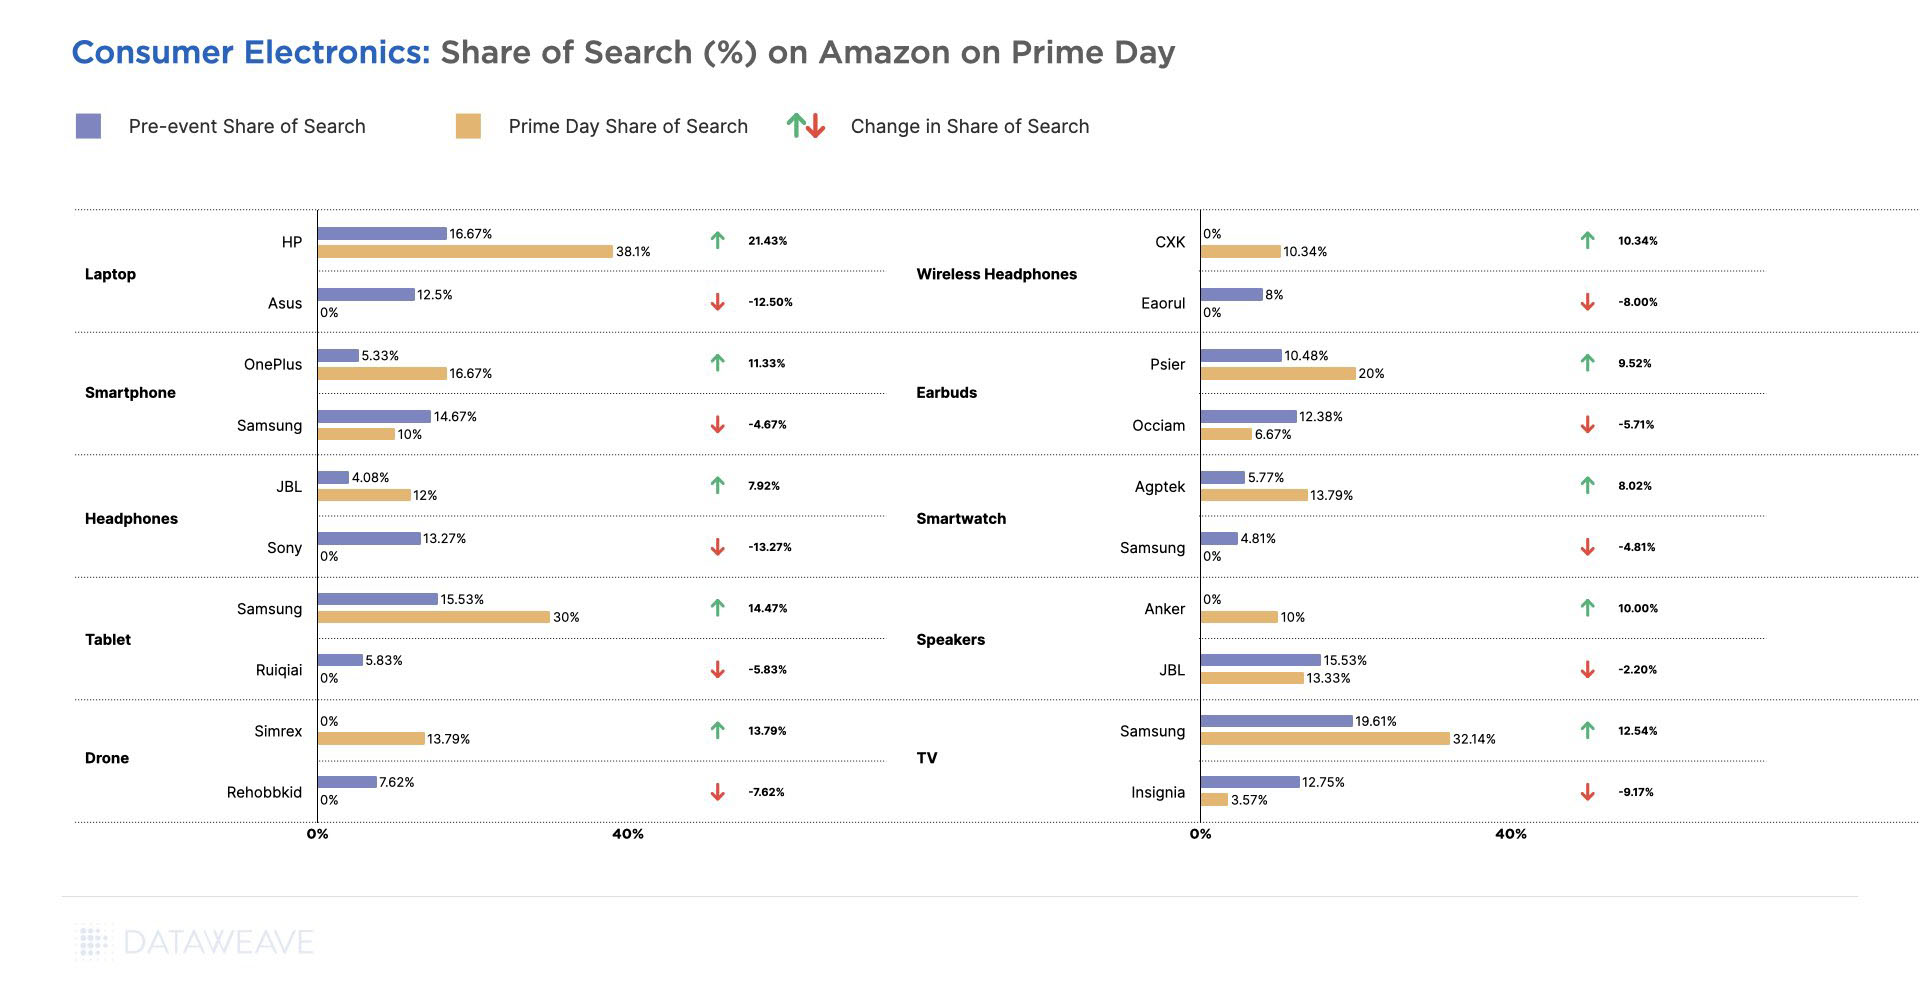
The Consumer Electronics category has a loyal shopper base, but generic search keywords like earbuds, headphones, and tablets remain essential for attracting high-intent shoppers and increasing brand awareness. So when it comes to Share of Search, Noise in Smartwatches, Samsung in Smartphones and Tablets, and HP in Laptops, all made strong strides in building their discoverability on Amazon during Prime Day.
Xiaomi in Laptops, Ekko in Earbuds, OnePlus in Smartphones and Apple in Tablets, lost out to other brands during the sale.
Health & Beauty
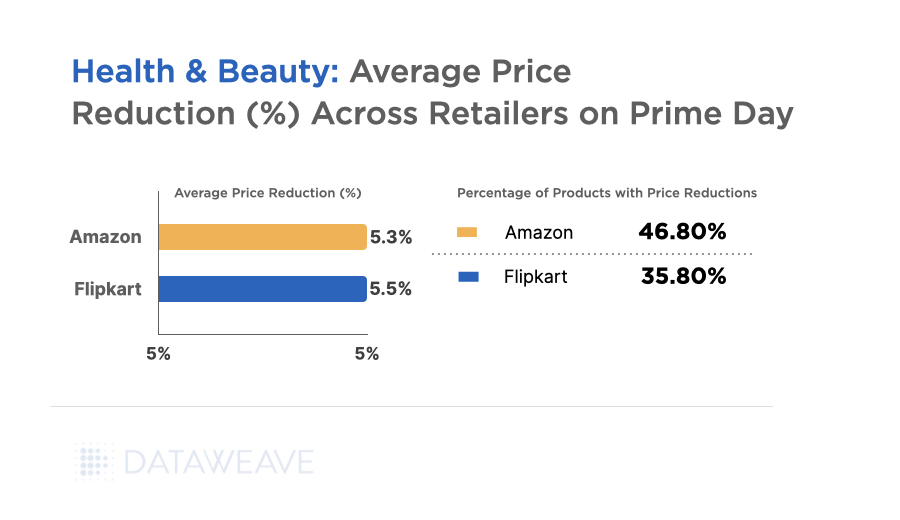
Health & Beauty emerged as the top-performing category in terms of additional discounts during Prime Day in India. Our data shows that Amazon offered an average additional discount of 5.3% on almost half of its products (46.8%) in this category. Competing head to head with Amazon in this category, Flipkart offered 5.5% additional discounts across 35.8% of its assortment.
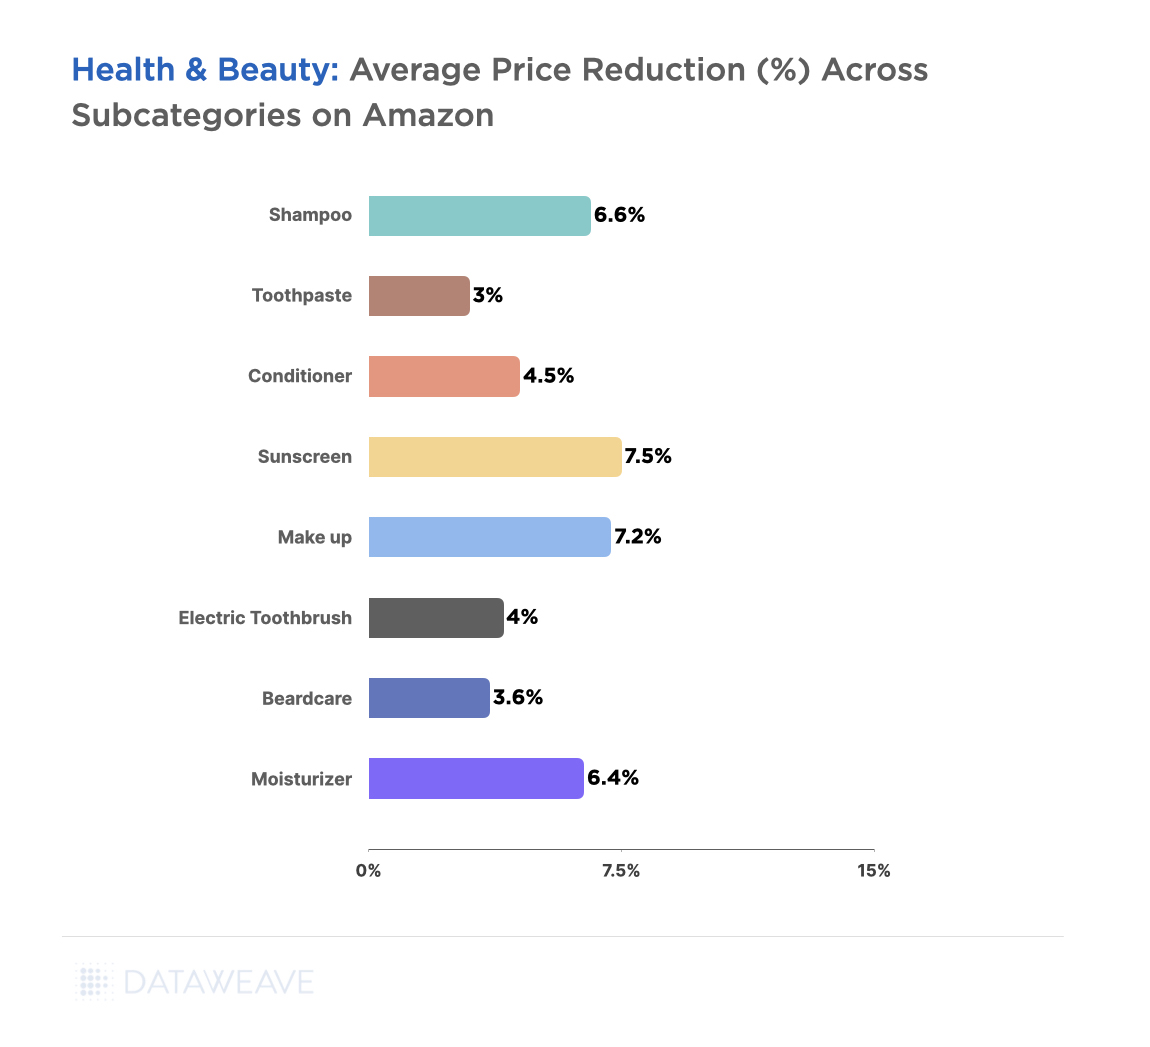
Within all the subcategories we analyzed, Sunscreen (7.5%), Make-Up (7.2%), Shampoo (6.6%), and Moisturiser (6.4%) saw the highest price reductions on Amazon. Conversely, staple items like Toothpaste (3.%) and Beardcare (3.6%) had lower markdowns.
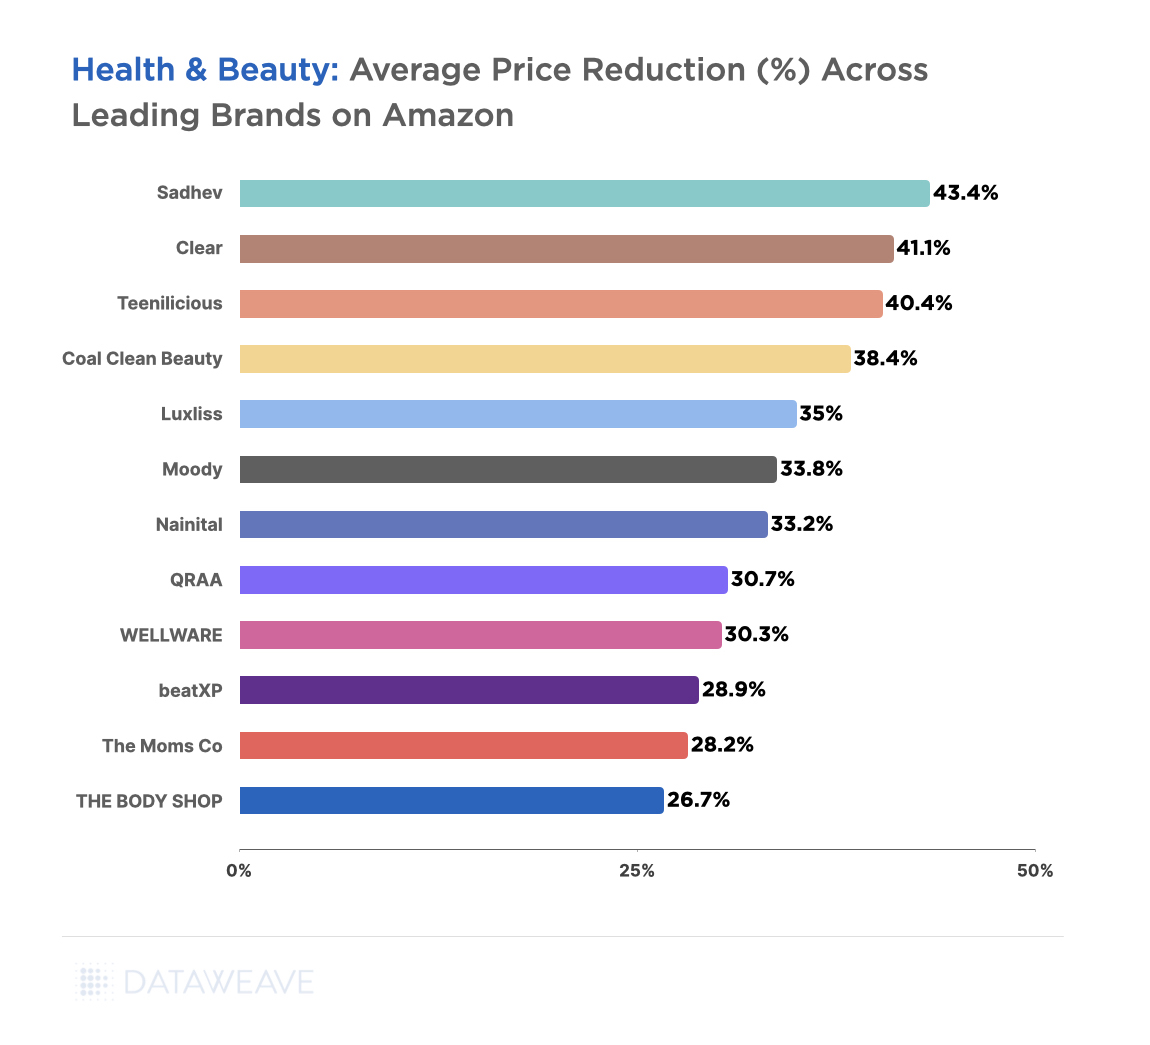
During the sale event, brands like Sadhev (43.4%), Clear (41.1%), Teenilicious (40.4%), and Coal Clean Beauty (38.4%), offered the most attractive deals.
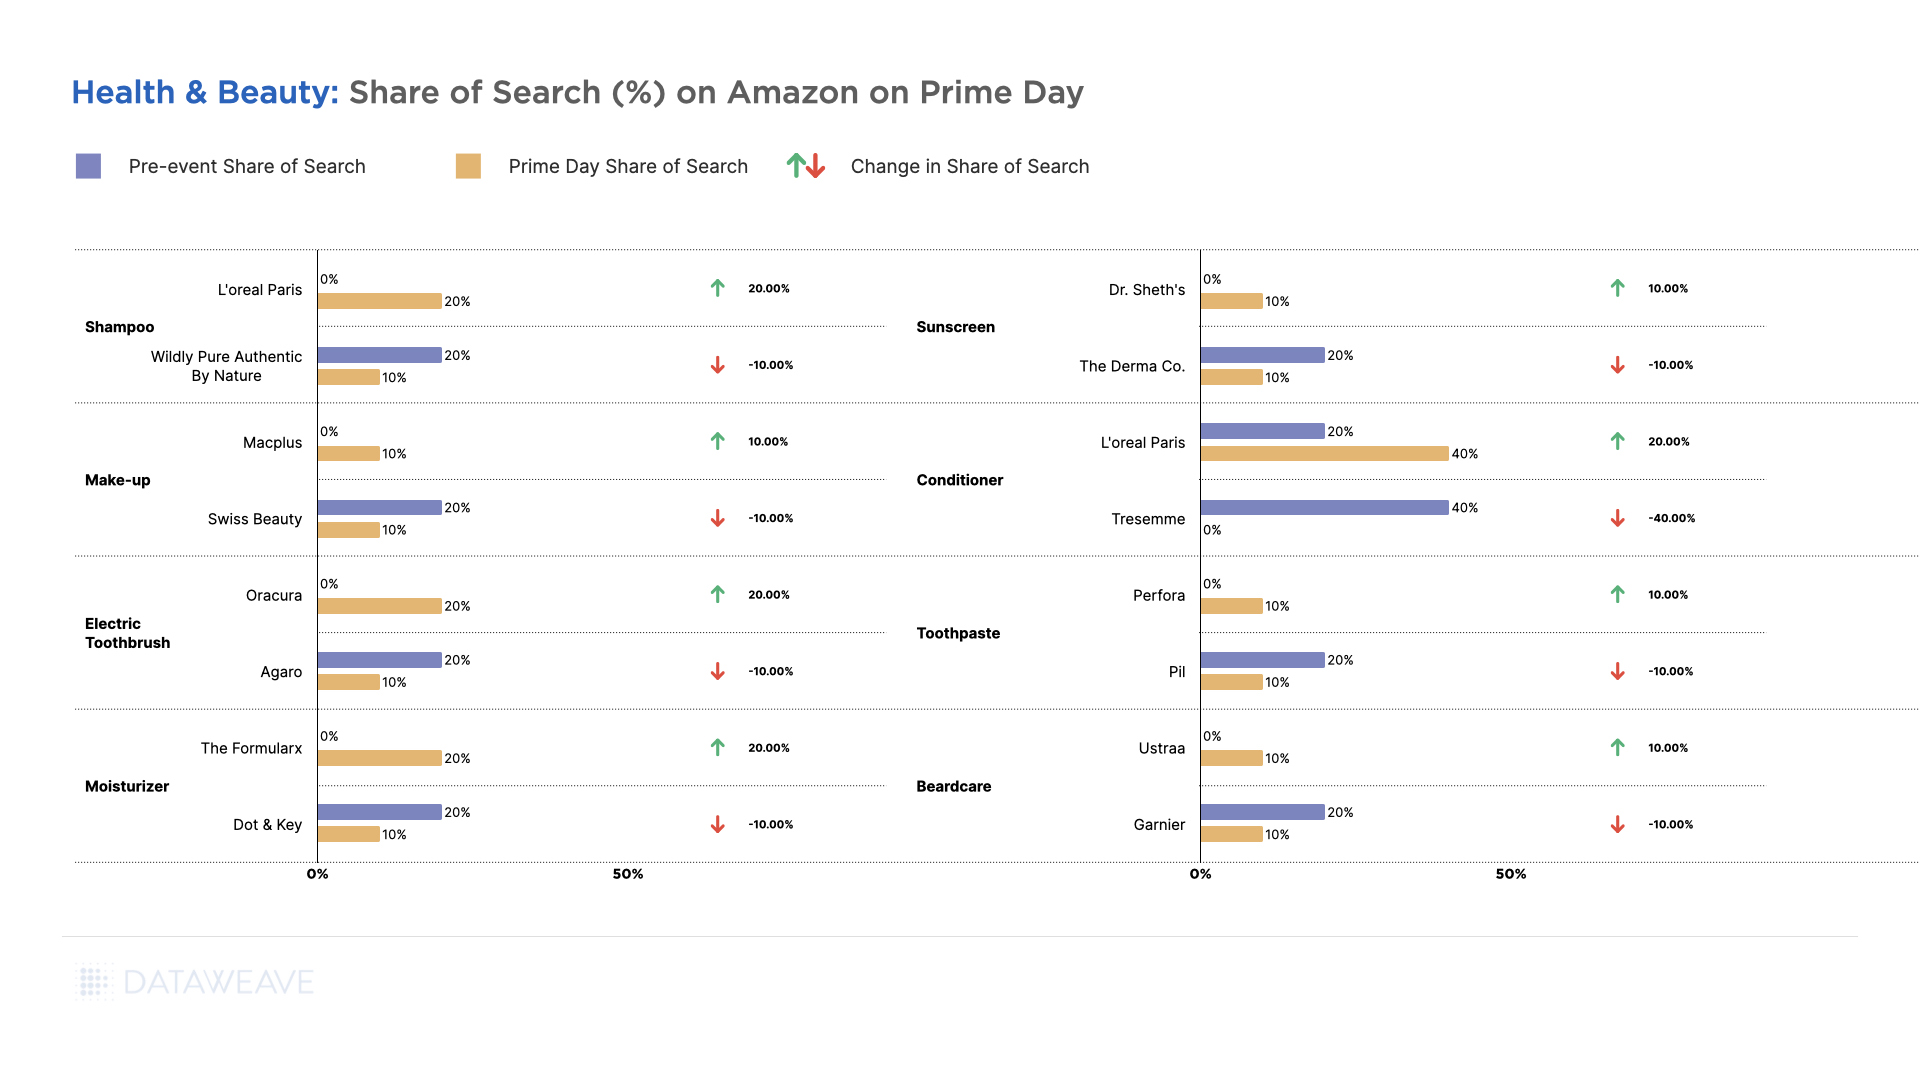
In terms of significant gains in Share of Search for brands, L’Oreal Paris in Shampoo and Conditioner led the pack along with Oracura in Electric toothbrushes and The Formularx in Moisturiser. Perfora in Toothpastes and Ustraa in Beardcare also gained more than 10% in their Share of Search during the sale event.
Other popular brands like Tresemme in Conditioners, and Swiss Beauty in Make-Up surprisingly had reduced visibility among the top search results for relevant subcategories.
Navigating the Competitive Landscape: How To Thrive During Sale Events
Amazon’s strategic pricing during Prime Day reflects a balance of profitability, inventory, and competition. Competitive pricing insights empower retailers to make informed decisions, optimize strategies, and thrive during high-stakes events. Prime Day serves as a crucial opportunity to drive sales, attract new customers, and boost loyalty. Therefore, monitoring competitor prices accurately, at scale, is essential for impactful pricing strategies.
For more insights on staying ahead during sale events, reach out to us today!
If you’d like to learn about Amazon’s pricing and discounts during Prime Day 2023 in the US, check out our analysis here.
Amazon’s Prime Day this year proved to be a record-breaking success, becoming the largest Prime Day event in the company’s history. Over the two-day extravaganza, shoppers in the US spent a staggering $12.7 billion, a 6.1% increase from the previous year. Amid inflationary pressures and supply chain disruptions, Amazon adopted a bold discounting strategy, offering steeper discounts compared to Prime Day 2022.
An interesting aspect of Amazon’s approach is their loyalty based offerings. In the weeks leading to Prime Day on July 11-12, members of the loyalty program were given access to “invite-only deals” where shoppers could request invites to specific products that they were looking to purchase on deals. Overall, Amazon’s pricing and discount strategies during Prime Day were carefully designed to create a buzz among shoppers, generate increased sales, and maintain a competitive advantage in the market.
While Prime Day is Amazon’s showstopper, it’s interesting to also see how other leading retailers respond to such a massive sale by their biggest competitor. Do they also lower their prices during the event, or are they happy to take a backseat? To answer these questions, we leveraged our proprietary data aggregation and analysis platform to analyze the prices and discounts of Amazon and its leading competitors across key product categories – Apparel, Home & Furniture, Consumer Electronics, and Health & Beauty – during Prime Day.
Since products on Amazon and other eCommerce websites are often sold at discounts even on normal days not linked to a sale event, we delved into the real value that Prime Day offers to shoppers by focusing on price reductions or additional discounts during the sale compared to the week before. As a result, our approach highlights the genuine benefits of the event for shoppers who count on lower prices during the sale.
Research & Methodology
For our analysis, we tracked the prices of a large number of products across several leading retailers during Prime Day as well as the week prior to the event. The details of our sample are mentioned below:
Number of SKUs: 110,000+
Websites: Amazon, Walmart, Target, Overstock, The Home Depot, Wayfair, Ulta Beauty, Sephora
Categories: Apparel, Home & Furniture, Electronics, Health & Beauty
Pre-event Analysis: 4-10 July 2023
Prime Day Analysis: 11-12 July 2023
Our Key Findings
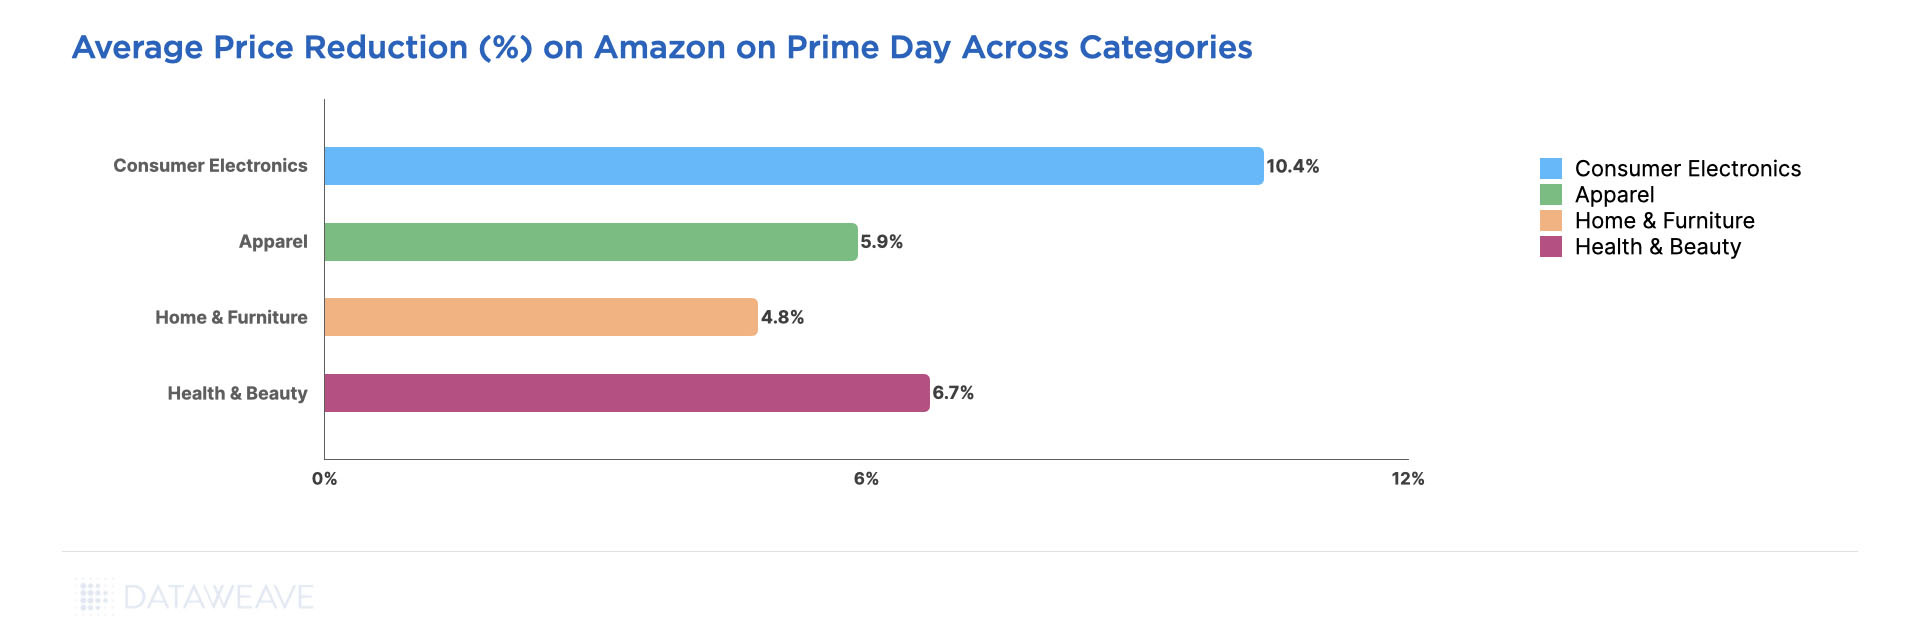
Our data reveals that Amazon’s price reductions were most aggressive in the Consumer Electronics category, with an average price reduction of 10.4% on Prime Day, due to the category’s popularity and high demand.
The Health & Beauty (6.7%), Apparel (5.9%), and Home & Furniture (4.8%) categories offered relatively modest deals during the sale event.
Below, we delve deeper into our analysis of each category to better understand how price reductions were distributed across key subcategories on Amazon as well as the discounting strategies of Amazon’s leading competitors.
Apparel
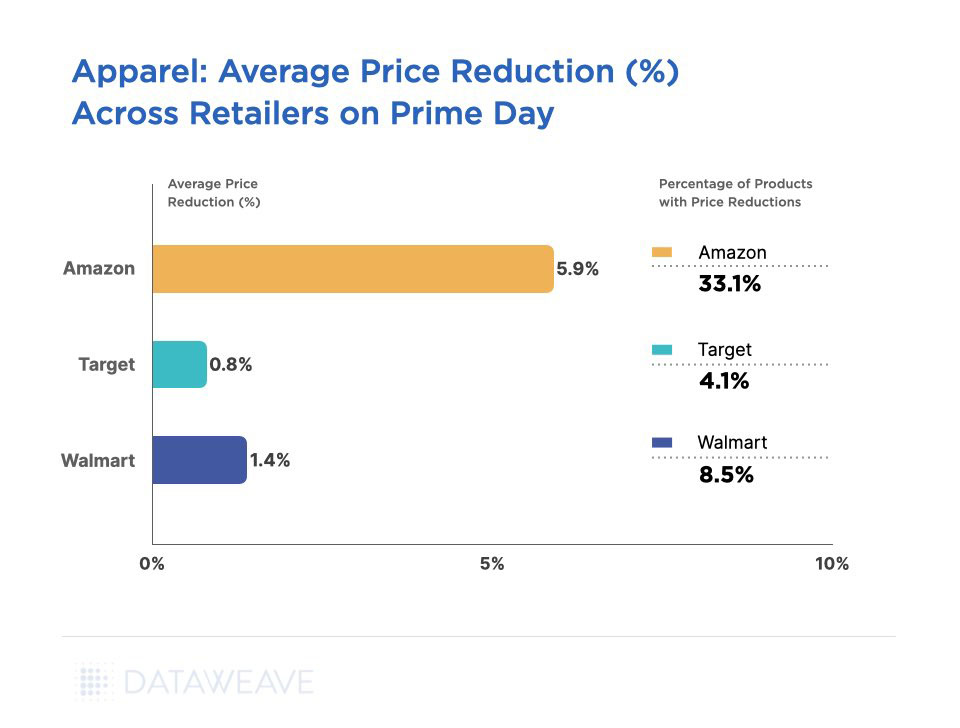
As Amazon grappled with surplus inventory, heightened storage costs, and reduced profit margins in apparel (like most other retailers), its average discount before Prime Day was already as high as 13.3%. Then, on Prime Day, Amazon’s apparel deals were tempered at around 5.9% across an impressive 33.1% of its assortment, while Target and Walmart chose not to compete in a meaningful way.
Unlike Prime Day 2022, when Target competed with Amazon with high discounts, the retailer offered only 0.8% additional discount across 4.4% of its assortment in this category. Walmart, too, reduced its prices by only 1.4% on 8.5% of its assortment during Prime Day.
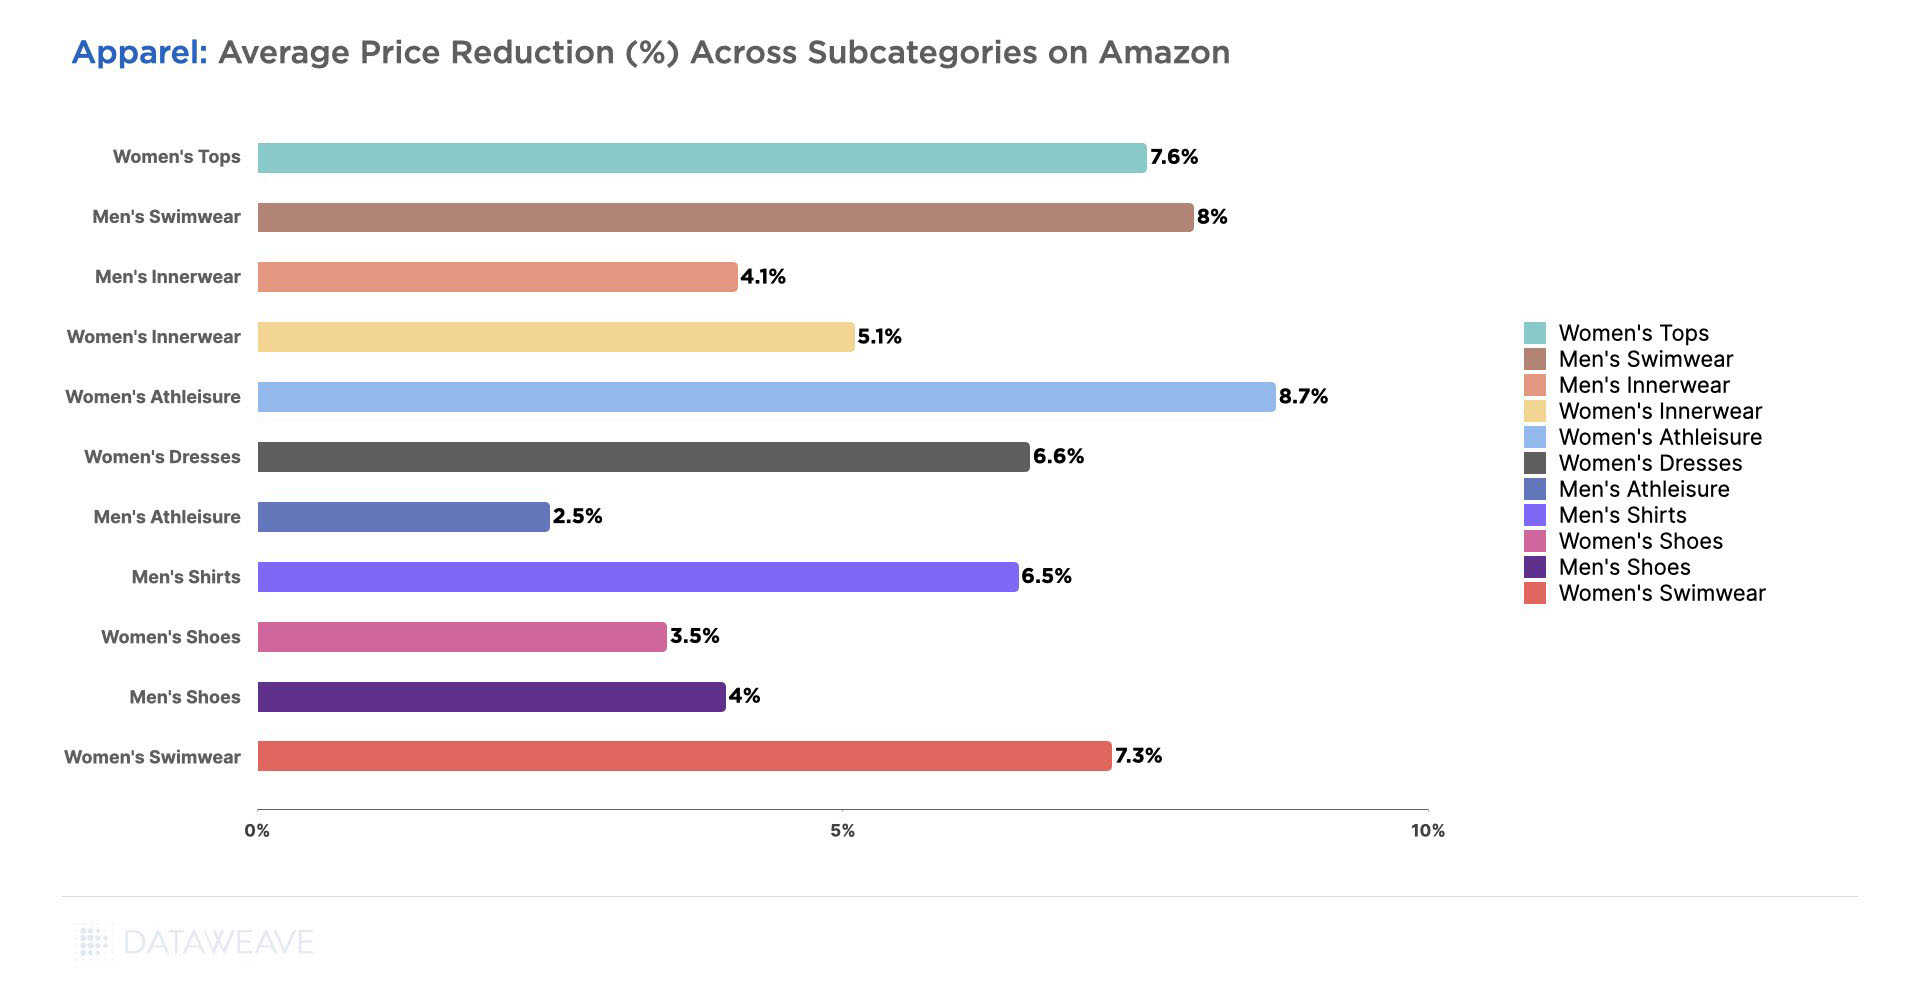
Across all the apparel subcategories we analyzed, Women’s Athleisure (8.7%), Men’s Swimwear (8%), and Women’s Tops (7.6%) were among the ones with the highest price reductions. On the other hand, Men’s Athleisure (2.5%), Women’s Shoes (3.5%), and Men’s Innerwear (4.1%) had conservative markdowns.
Pricing decisions across the various subcategories are likely to have been influenced by several factors like inventory levels, demand patterns, and the need to balance competitive offers with maintaining reasonable profit margins, as Amazon tried to cater to a more price-sensitive consumer.
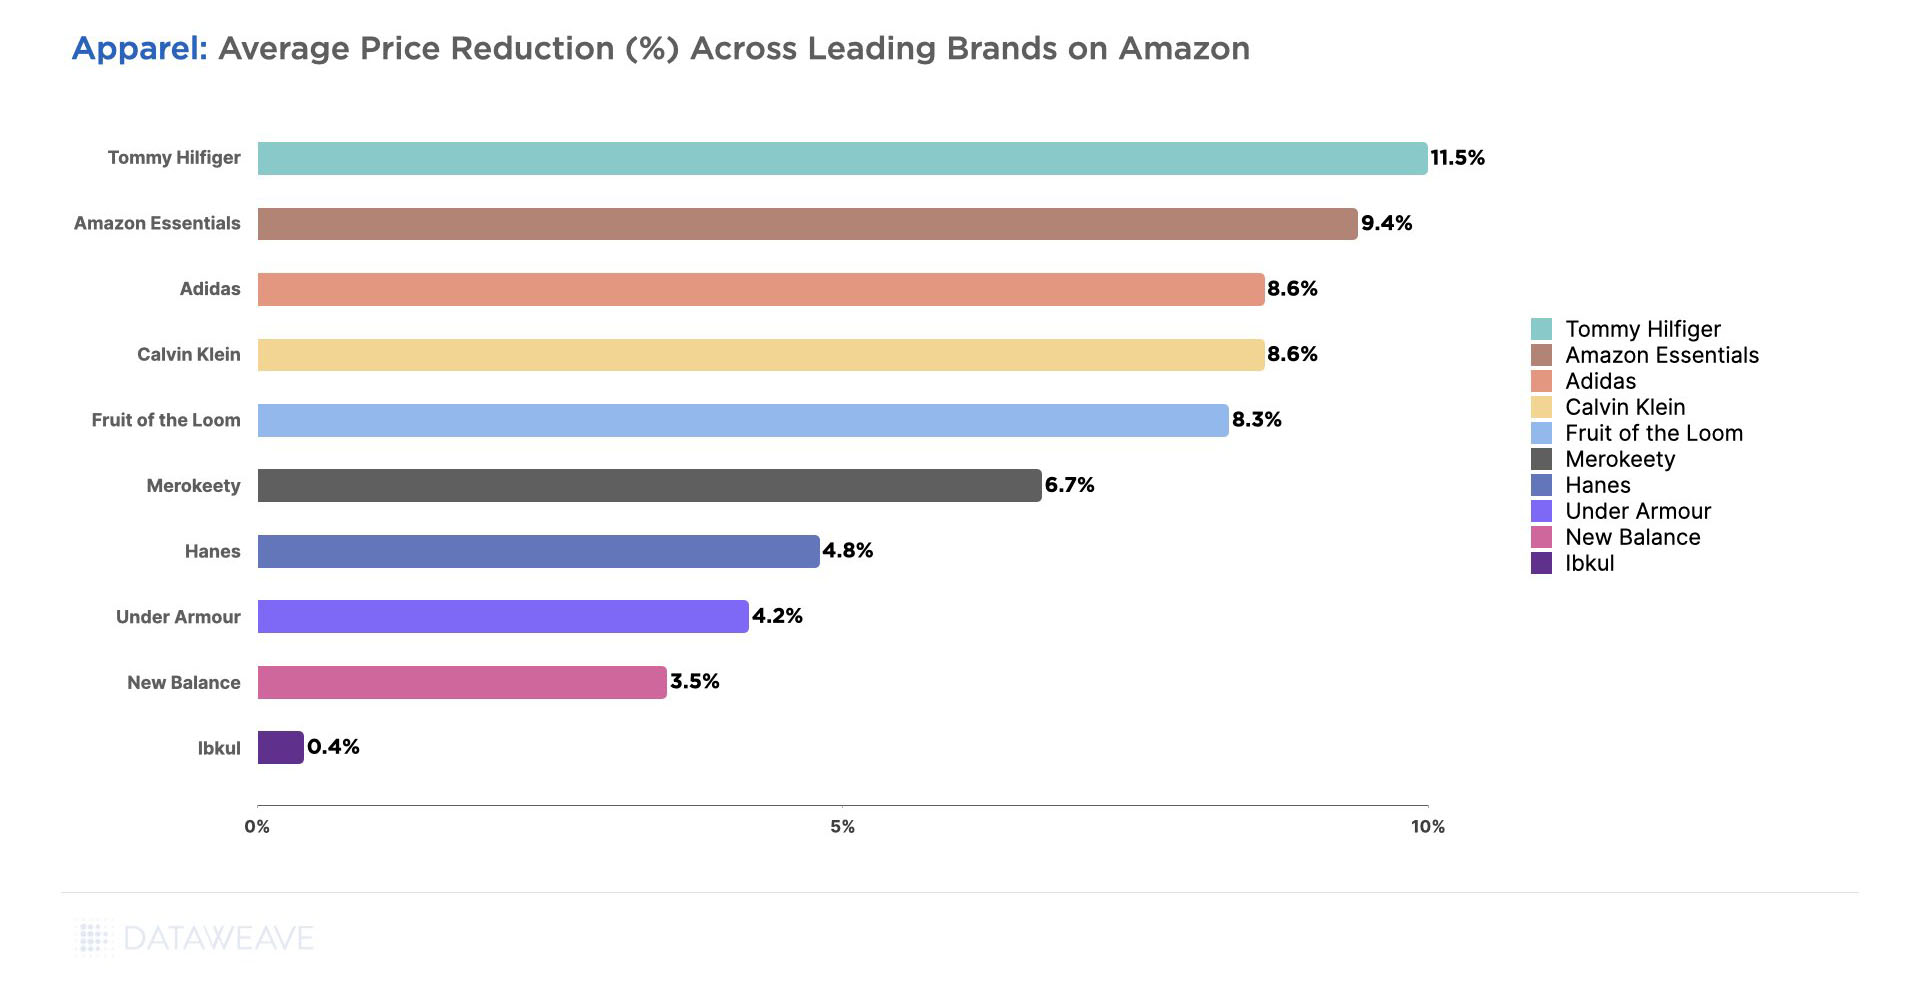
Across all apparel subcategories, leading brands that offered the highest markdowns were Tommy Hilfiger (11.5%), Amazon Essentials (9.4%), Adidas (8.6%), and Calvin Klein (8.6%).
For brands, however, lowering prices is only one lever to attract and convert shoppers. They also need to ensure they’re highly visible and discoverable on Amazon’s search listings. This exponentially improves their chances of driving more clicks and conversions. In our analysis, we tracked the Share of Search of brands across several popular search keywords. Share of Search for a brand is defined as the proportion of the brand’s products in the top 20 search results for a search query.
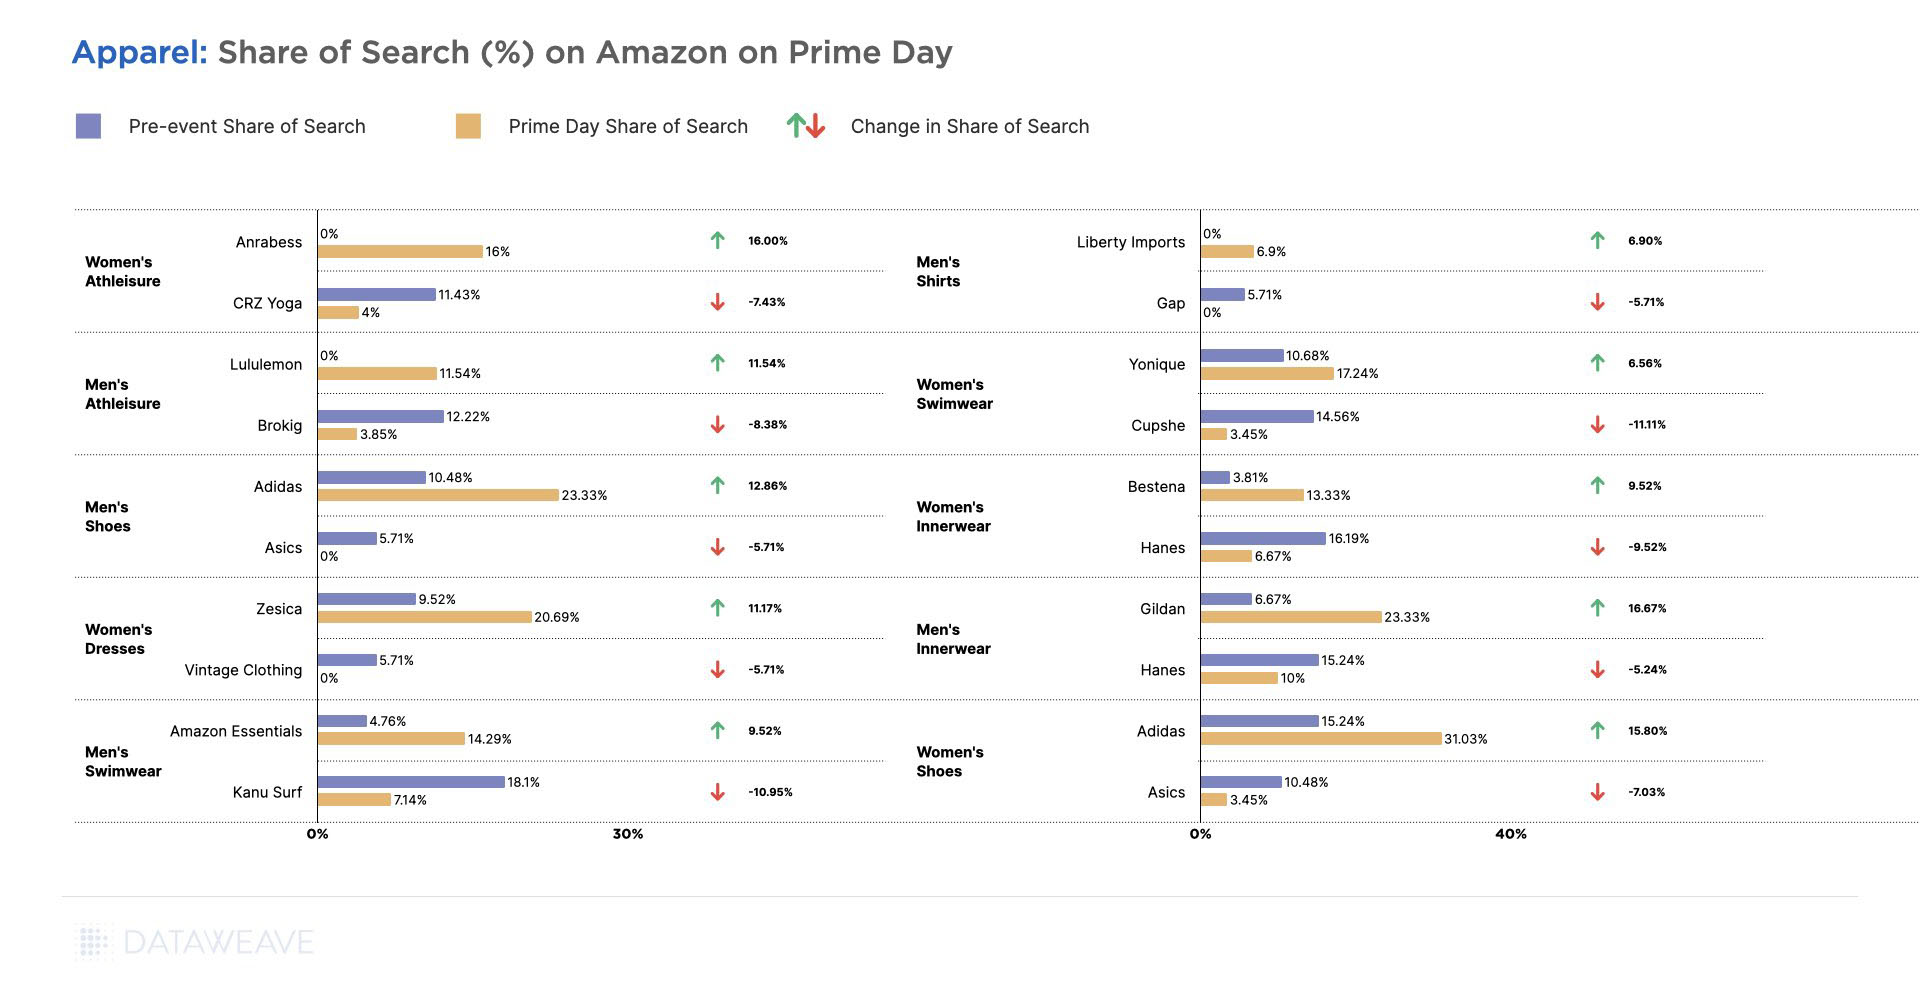
Our data indicates that several brands gained impressive ground in their discoverability during Prime Day, while others fell behind. Gildan in Men’s Innerwear, Adidas in Men’s and Women’s Shoes, Anrabess in Women’s Athleisure, and Lululemon in Men’s Athleisure, among others, improved their Share of Search by significant levels during Prime Day.
On the other hand, brands like Hanes in Men’s and Women’s Innerwear, Kanu Surf in Men’s Swimwear, Cupshe in Women’s Swimwear, and others lost around 10% in their Share of Search during the event. This is likely to have impacted their sales volumes adversely.
Home & Furniture
The Home & Furniture industry has been challenged with reduced demand due to inflationary pressures over the past year or so. Leading retailers in the category overestimated the demand, leading to overstocking of inventory. As a result, Home & Furniture is one of the few categories that saw Amazon’s competitors participate at a significant level on Prime Day in order to ensure they don’t fall behind on liquidating their stock.
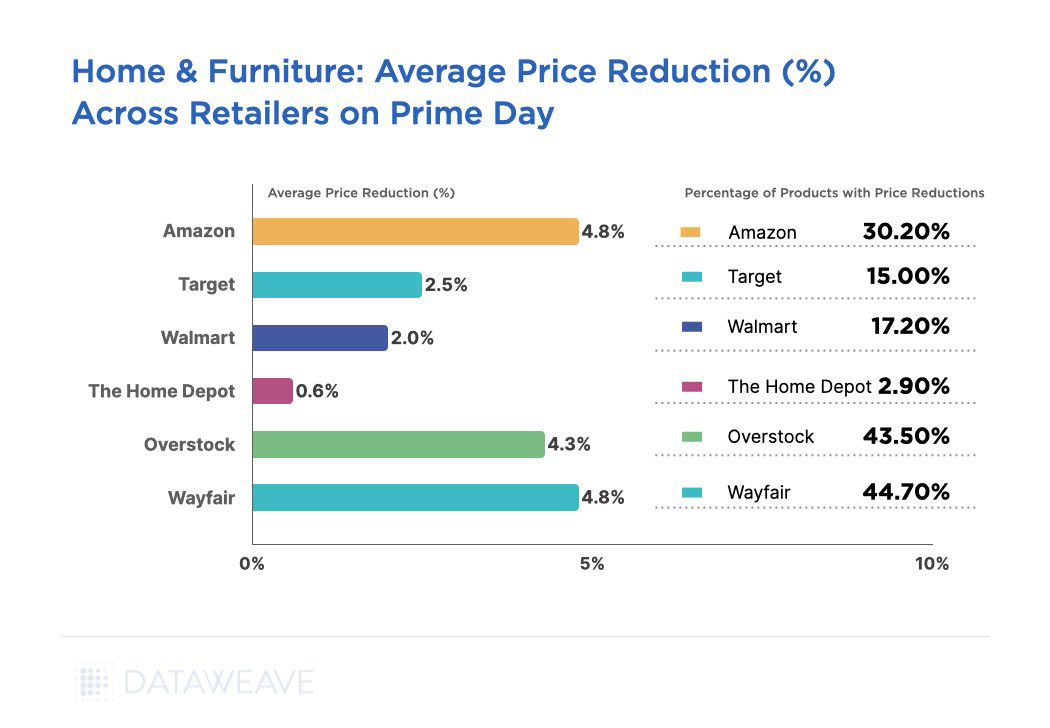
Amazon’s additional discounts averaged 4.8% across 30.2% of its assortment. Wayfair and Overstock too reduced their prices by 4.8% and 4.3% on around 44% of their respective assortments. Wayfair’s move is likely a part of their strategy to attract new customers and expand their market share, in response to a decline in their consumer base. Last year, Wayfair experienced a loss of 5 million out of its 1.3 billion consumers due to weakening demand.
Target and Walmart did offer additional discounts, but they were not at a competitive level. The Home Depot effectively opted not to compete at all during the sale event. Overall, the pricing actions of these retailers are in stark contrast to the highly conservative pricing strategies observed on Prime Day last year.
Our recent pricing analysis of the Home & Furniture category revealed more interesting insights and pricing dynamics over the past year.
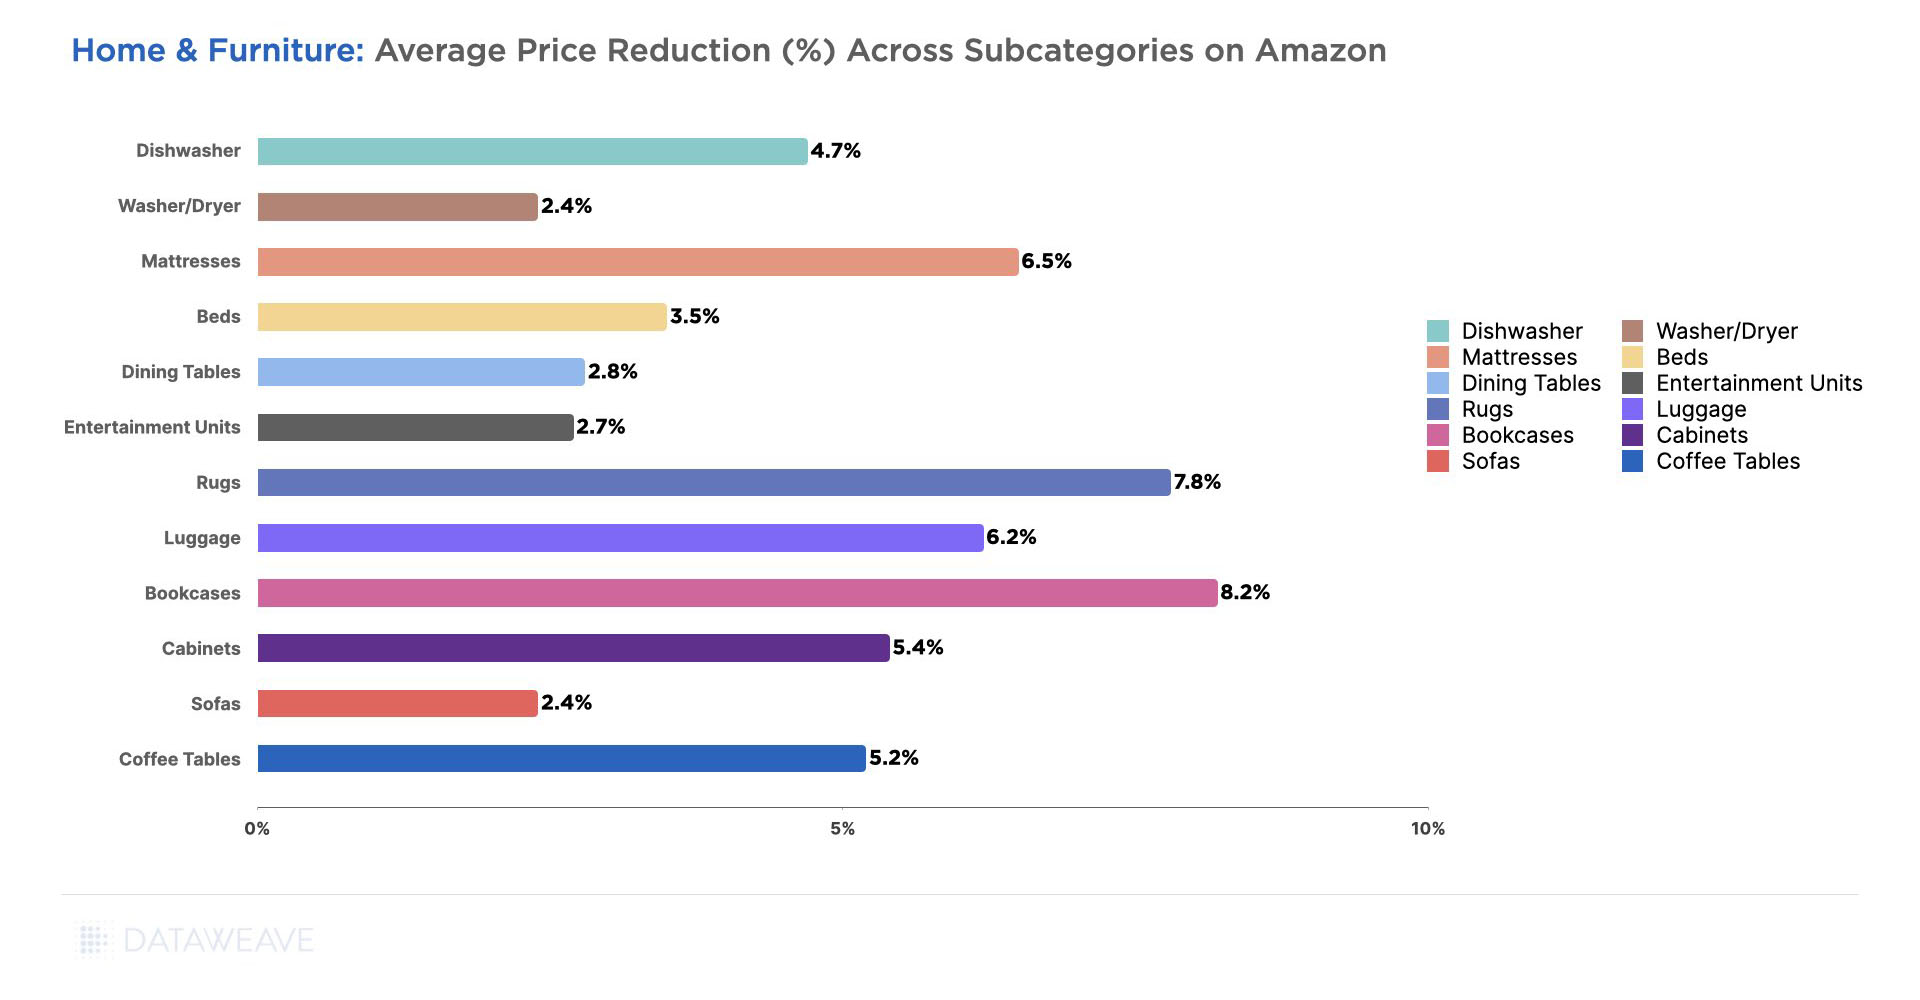
Across all the subcategories we analyzed, Bookcases (8.2%), Rugs (7.8%), Mattresses (6.5%), and Luggage (6.2%) were among the ones with high price reductions.
Meanwhile, Sofas (2.4%), Washer / Dryers (2.4%), and Entertainment Units (2.7%) had lower markdowns. These are large and substantial purchases, making retailers more cautious about deeply discounting them while still ensuring profitability.
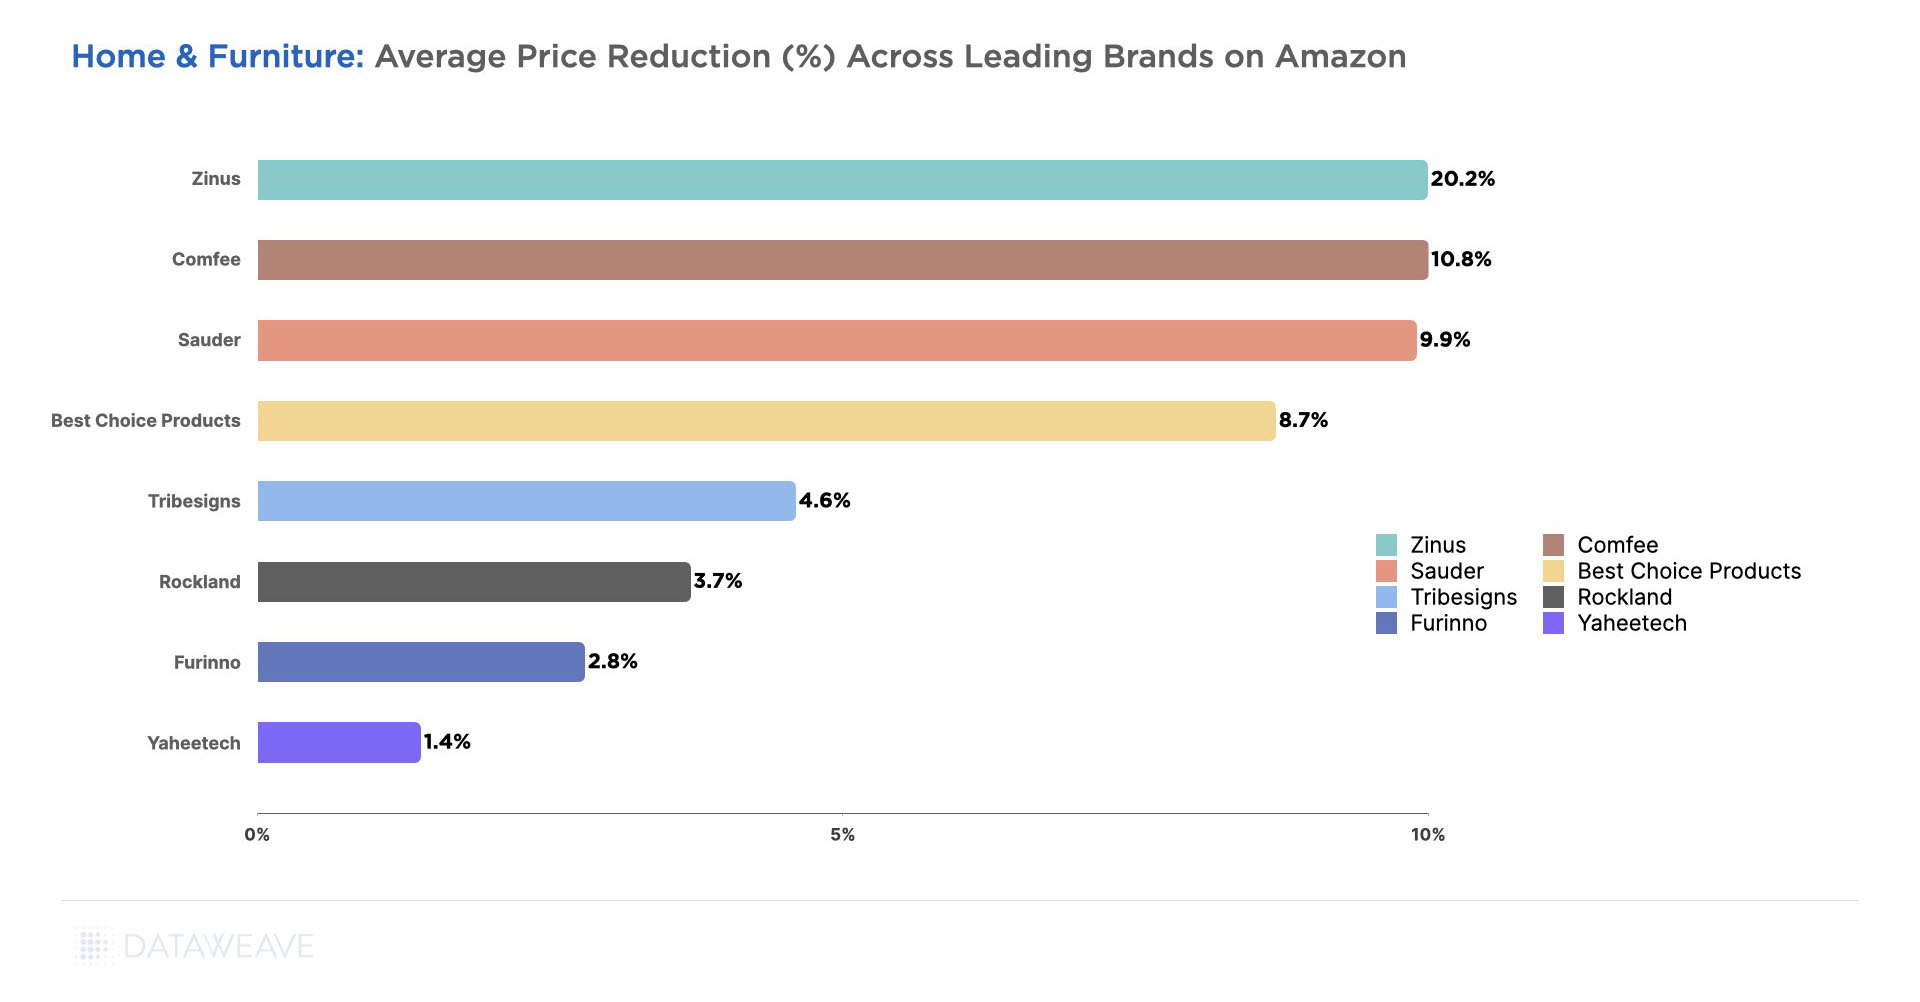
The brands that stepped up and offered the highest markdowns in this category include Zinus (20.2%), Comfee (10.8%), Sauder (9.9%), and Best Choice Products (8.7%).
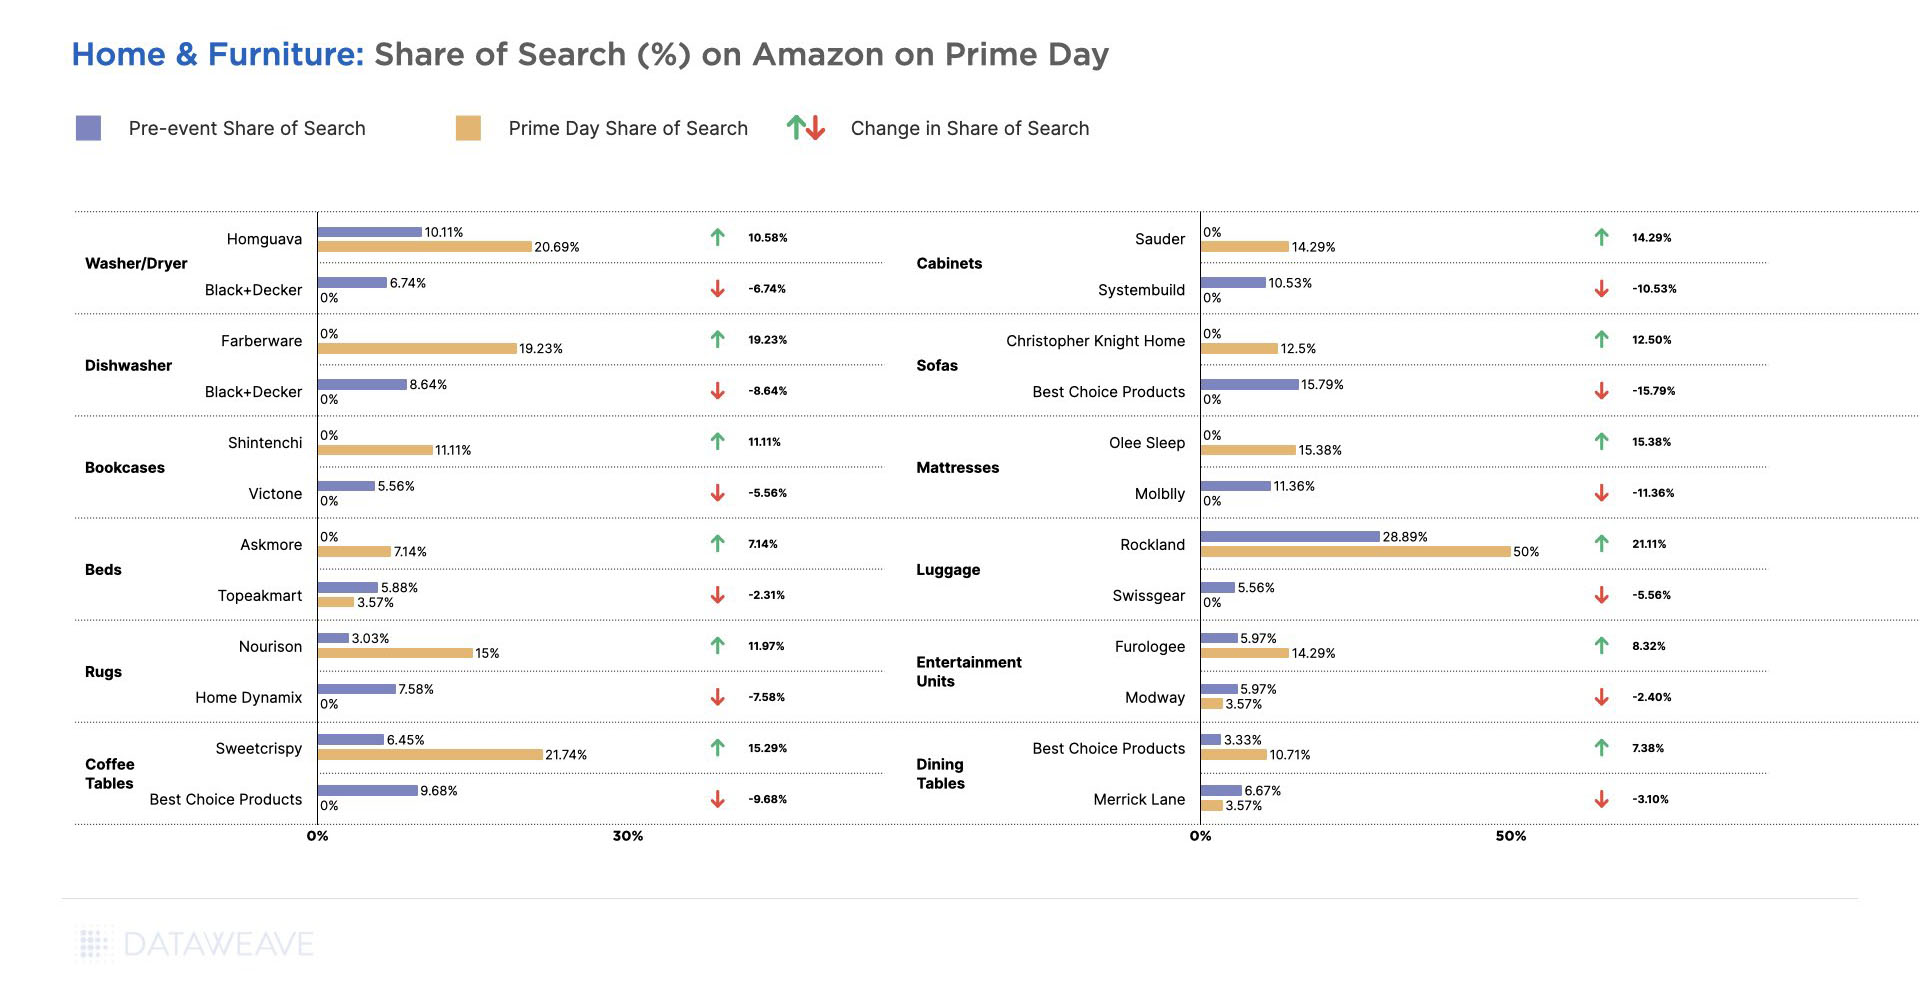
In terms of Share of Search, Rockland in Luggage gained the highest (21%), followed by Farberware in Dishwasher, Olee Sleep in Mattresses, and Homeguave in Mattresses gained significant ground in their respective categories as shown in the image below.
Brands like Best Choice Products in Coffee Tables, Molblly in Mattresses, and Black+Decker in Washer/Dryers and Dishwashers lost a good portion of their Share of Search during the event. Due to high competition for visibility during sale events, brands that fail to keep an eye on their Share of Search stand to take a hit in their sales, especially in categories like Home & Furniture that tend to have low brand loyalty.
Consumer Electronics
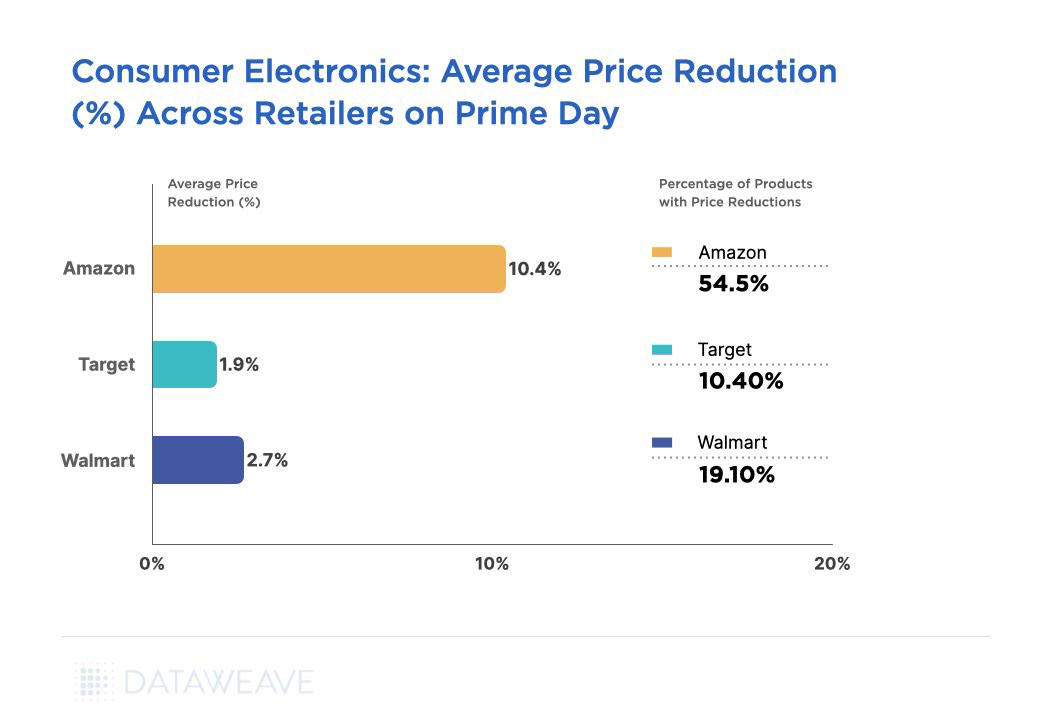
2023 was the year of consumer electronics on Amazon Prime Day. Amazon’s price reduction during the sale averaged 10.4% across 54.5% of its assortment in the category. Target and Walmart, on the other hand, offered significantly lower additional discounts of 1.9% and 2.7% on 10.4% and 19.1% of their assortment, respectively.
The consumer electronics category often witnesses aggressive price reductions during Prime Day and other sale events due to its popularity and high demand. In addition, since retailer margins are usually low in this category, shoppers often have to wait for sale events like Prime Day (when brands markdown their wholesale rates) to have several attractive deals to choose from.
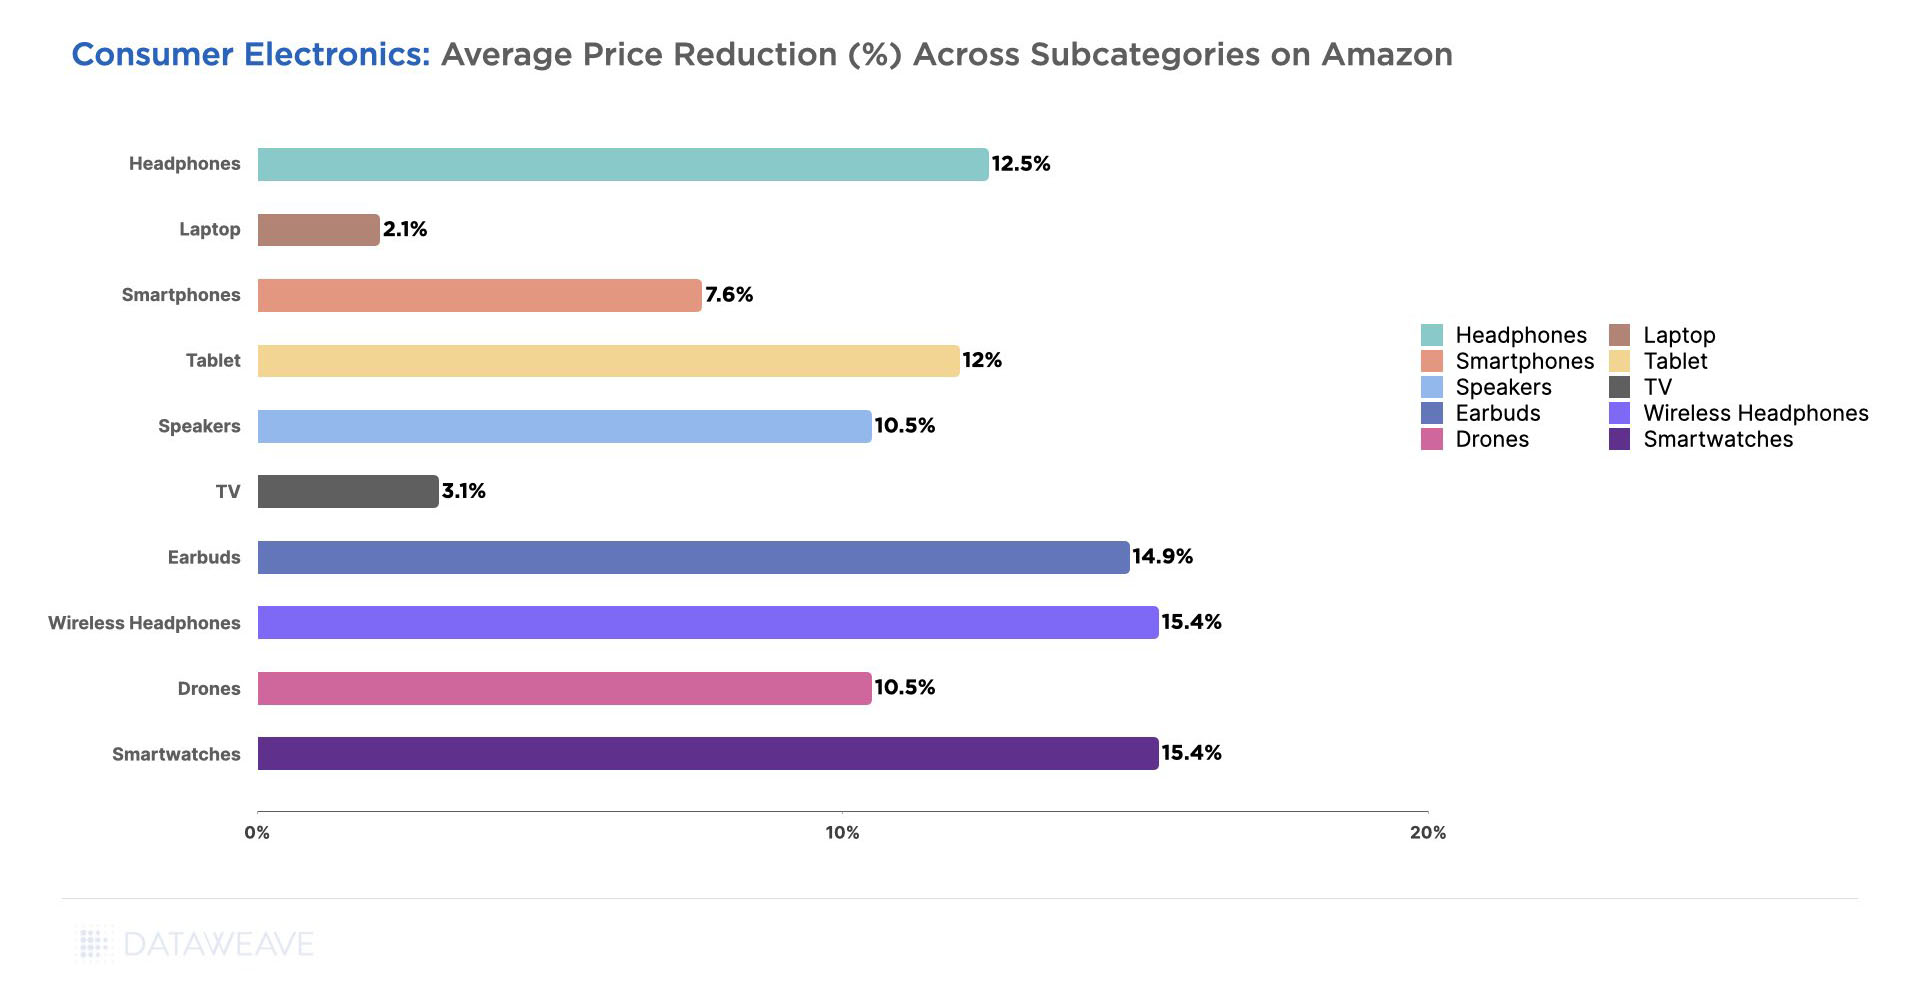
Across all the subcategories we analyzed, Smartwatches (15.4%), Wireless Headphones (15.4%), Earbuds (14.9%), Headphones (12.5%), and Tablets (12.0%), were among the ones with the highest price reductions. All of these subcategories are quite popular that tend to sell in large volumes during sale events.
Meanwhile, Laptops (2.1%), TVs (3.1%), and Smartphones (7.6%) had lower markdowns. A lower markdown on smartphones may reflect steady demand throughout the year, reducing the urgency to offer significant discounts during the short Prime Day window.
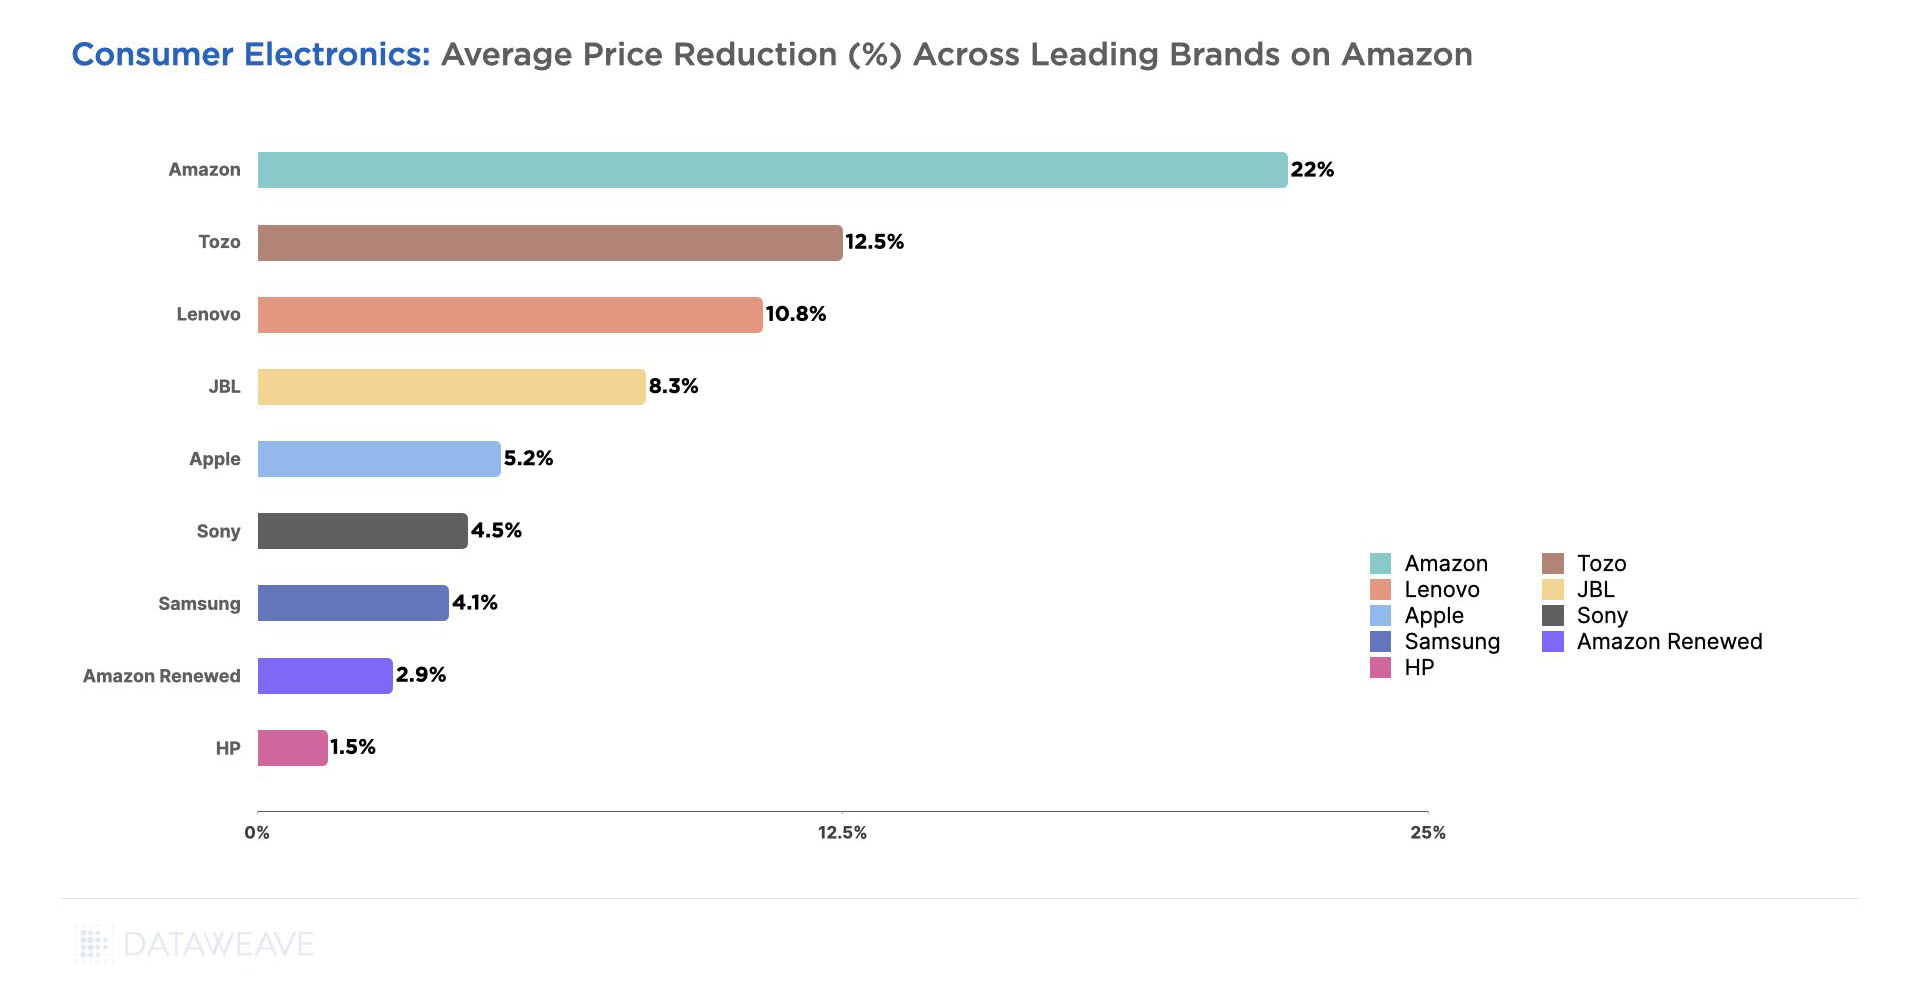
Amazon (22%), Tozo (12.5%), Lenovo (10.8%), JBL (8.3%), and Apple (5%) offered the highest price reductions in Consumer Electronics as a whole. Clearly, Amazon didn’t hold back on offering attractive deals on its own private label products in this category.
Consumer Electronics as a category tends to have a brand loyal shopper base. However, Share of Search generic search keywords are still very important for keywords like earbuds, headphones, and tablets that result in relatively lower priced products. HP in Laptops, Samsung in Tablets and TVs, and Oneplus in Smartphones all made strong strides in building their discoverability on Amazon during Prime Day. Beyond just driving more sales, this also has the intended effect of boosting brand awareness among high-intent shoppers.
Sony in Headphones, Asus in Laptops, and Insignia in TVs lost out to other brands in terms of their discoverability during the sale. Sony and Asus, especially would be hurting as they are prominent brands in their respective categories.
Health & Beauty
The Health & Beauty category is a favorite among consumers during Prime Day, as it encompasses a wide range of products like skincare, cosmetics, and grooming items. As shoppers often tend to stock up during the sale, brands and retailers are willing to offer competitive discounts and gain an edge over their competitors.
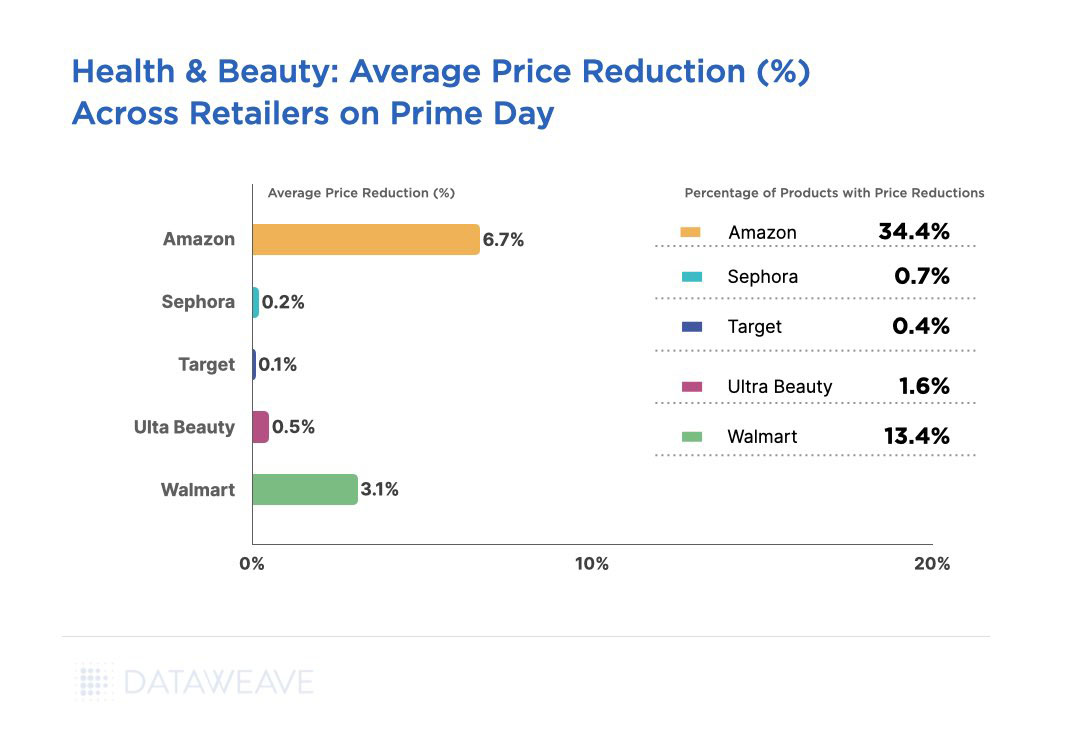
Our data reveals that the average additional discount on Amazon was 6.7%, offered on a little over a third of its assortment. Walmart reduced its prices sizably as well, by an average of 3.1% on 13.4% of its assortment.
Interestingly, Sephora and Ulta Beauty, leading retailers in the Health & Beauty category did not compete on price at all this Prime Day. It is likely they are confident their loyal customer base will not be influenced by Amazon’s Prime Day deals and be driven away merely by lower prices. In addition, keeping their prices steady during Prime Day might have been a strategic choice to protect their brand reputation and premium positioning.
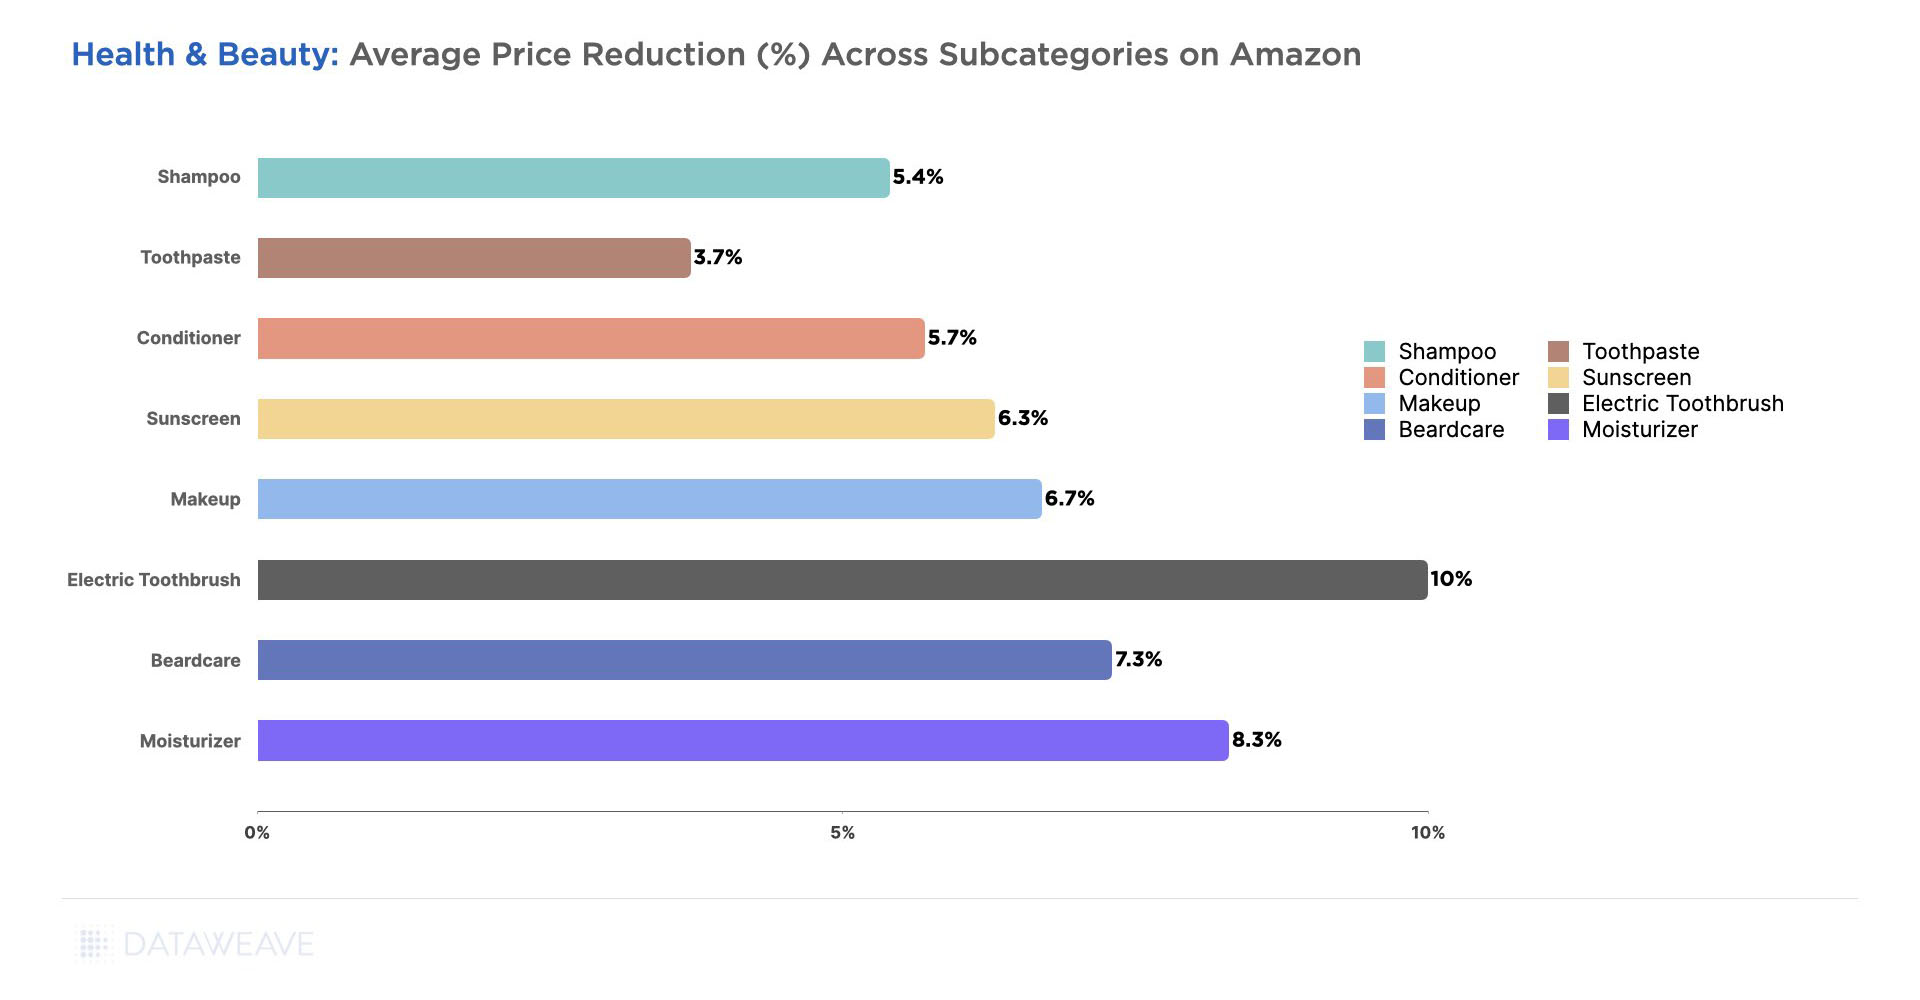
Relatively premium subcategories like Electric Toothbrushes (10%), Moisturizer (8.3%), Beardcare (7.3%), and Make Up (6.7%) saw the highest price reductions on Amazon.
In contrast, staple items like Toothpaste (3.7%), Shampoos (5.4%), and Conditioners (5.7%) had lower markdowns.
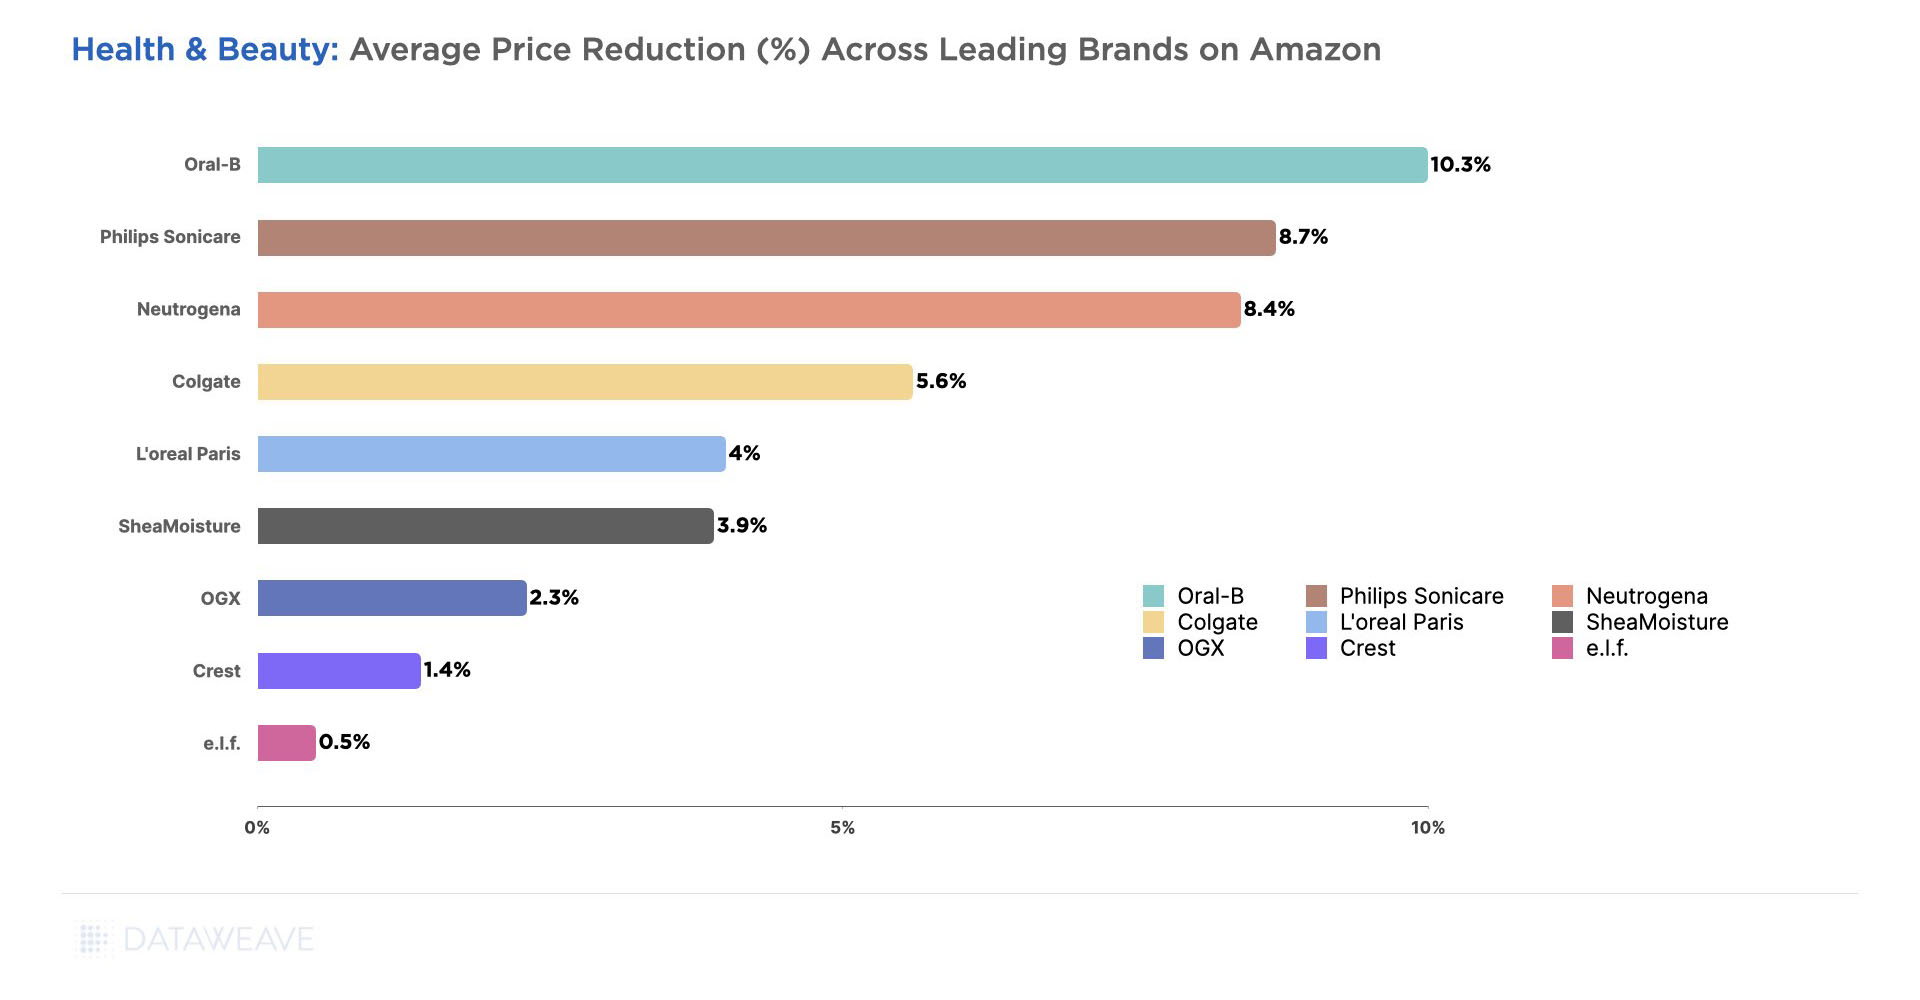
Among the leading brands in this category, Oral-B (10.3%), Philips Sonicare (8.7%), Neutrogena (8.4%), and Colgate (5.6%) offered the most attractive deals during the sale event.
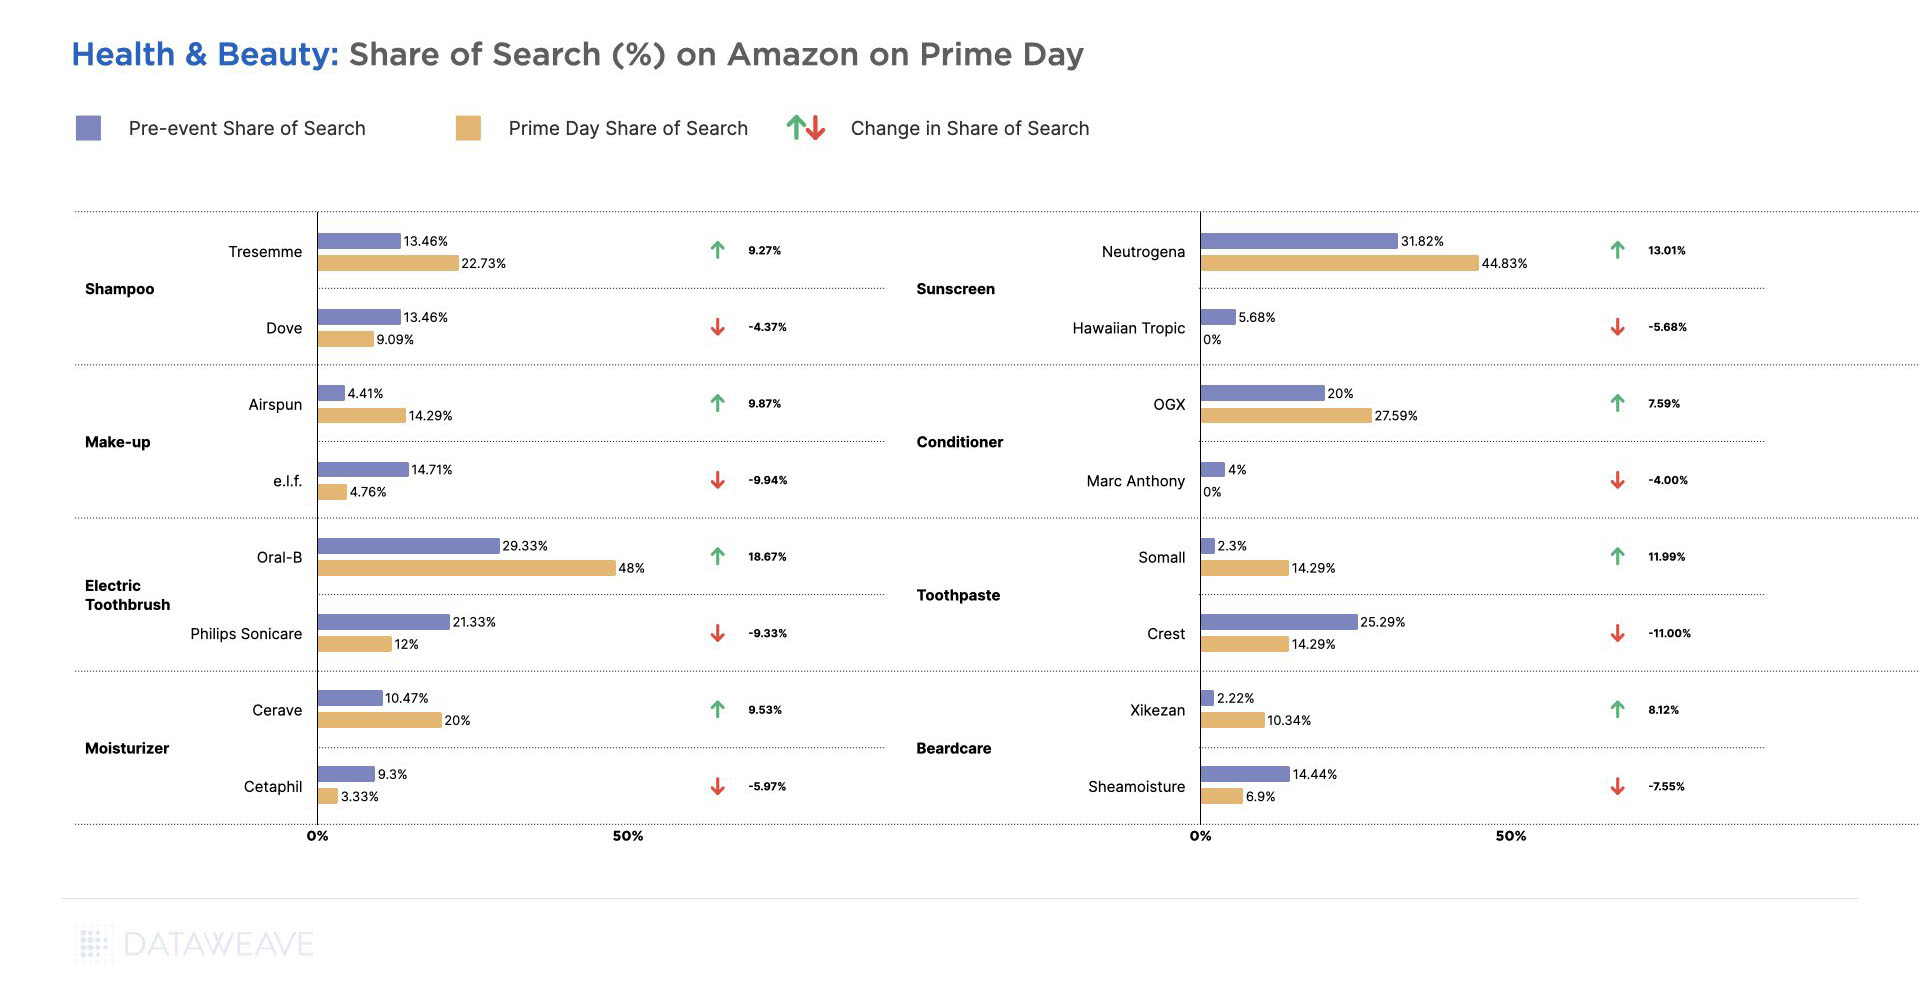
In terms of significant gains in Share of Search for brands, Oral-B in Electric Toothbrushes led the pack again. Neutrogena in Sunscreens and Somall in Toothpastes also gained more than 10% in their Share of Search during the sale event, followed by Tresemme in Shampoos and Airspun in Make-Up products.
Other popular brands like Crest in Toothpastes, e.l.f in Make-Up, Philips Sonicare in Electric Toothbrushes, and Sheamoisture in Beradcare surprisingly had reduced visibility among the top search results for relevant subcategories.
Staying Ahead of the Curve During Sale Events
This Prime Day, Amazon leveraged its scale to offer aggressive discounts across key product categories, while several competing retailers chose to sit back and let the sale play out. Others chose a selective discounting strategy that focused their modest price reductions on a small set of items.
At DataWeave, we understand the pivotal role competitive pricing insights play in empowering retailers and brands to gain a competitive edge, especially during crucial events like Prime Day. For retailers, the ability to track competitor prices accurately, at scale, in a timely manner is essential to plotting and acting on impactful pricing strategies and staying ahead of the curve.