Tag: digital shelf analytics

  • Turning Headwinds Into Wins: How Brands Can Navigate Price, Share, and Visibility Amid Tariff Disruption

    Turning Headwinds Into Wins: How Brands Can Navigate Price, Share, and Visibility Amid Tariff Disruption

    Disruption Is Now the Baseline

    Tariffs can spike landed costs overnight, regulations rewrite labelling rules, and competitors slash prices before your team finishes its daily stand-up. And yet, some consumer brands thrive.

    The winning brands see changes early, decide quickly, and execute flawlessly across the digital shelf. This post blends three decades of pricing and merchandising expertise with timely digital shelf insights from DataWeave, offering a clear path forward for brands navigating today’s volatile retail environment.

    From Cost Shock to Chronic Uncertainty

    Tariffs are no longer just one-off headlines; they’ve become an unpredictable, ongoing variable in the global marketplace. The true challenge isn’t always the duty rate itself, but the constant whiplash of not knowing if, when, or how much that duty will change. This pervasive uncertainty is having a tangible impact:

    • Market Uncertainty: Tariff talk alone disrupts planning and fuels market instability.
    • Operational cost inflation: Shifting trade rules raise expenses across sourcing, freight, and distribution.
    • Compromised SKU-level Margin: The profitability of individual products is under constant threat.
    • Shrinkflation: Brands shrink product quantities to mask rising costs, risking consumer trust.

    Unpredictable Competitive Response: Delaying price moves while watching competitors can erode margins as much as tariffs.

    To stay ahead, pricing decisions must be stress-tested against multiple tariff scenarios and aligned with likely competitor reactions. Timing matters as much as accuracy, move too soon or too late, and margins suffer either way.

    The Tariff Math No One Can Afford to Get Wrong

    When it comes to tariff disruption, the difference between profit and loss often hinges on a precise understanding of a three-step process. Get any part of this chain wrong, and the financial ripple effect can undermine pricing and promotions. The duty you pay, therefore, is the direct result of the following three critical steps:

    Step 1: Harmonized System (HS) Code

    • What it is: A six- to ten-digit classifier that drills down to product sub-types.
    • Why it matters: A single digit change can shift an item into a higher-tariff bracket.

    Step 2: Country of Origin

    • What it is: The nation in which the imported item was made.
    • Why it matters: Mis-tagging the origin can lead to mis-pricing and inaccurate margin calculations.

    Step 3: Trade-Agreement Overlay

    • What it is: Differentiation between the World Trade Organization (WTO) baseline tariffs and special trade agreements (e.g., USMCAUnited States-Mexico-Canada Agreement).
    • Why it matters: The same HS code can result in significantly different duties, up to a 10% swing, depending on the originating country (see the example below).

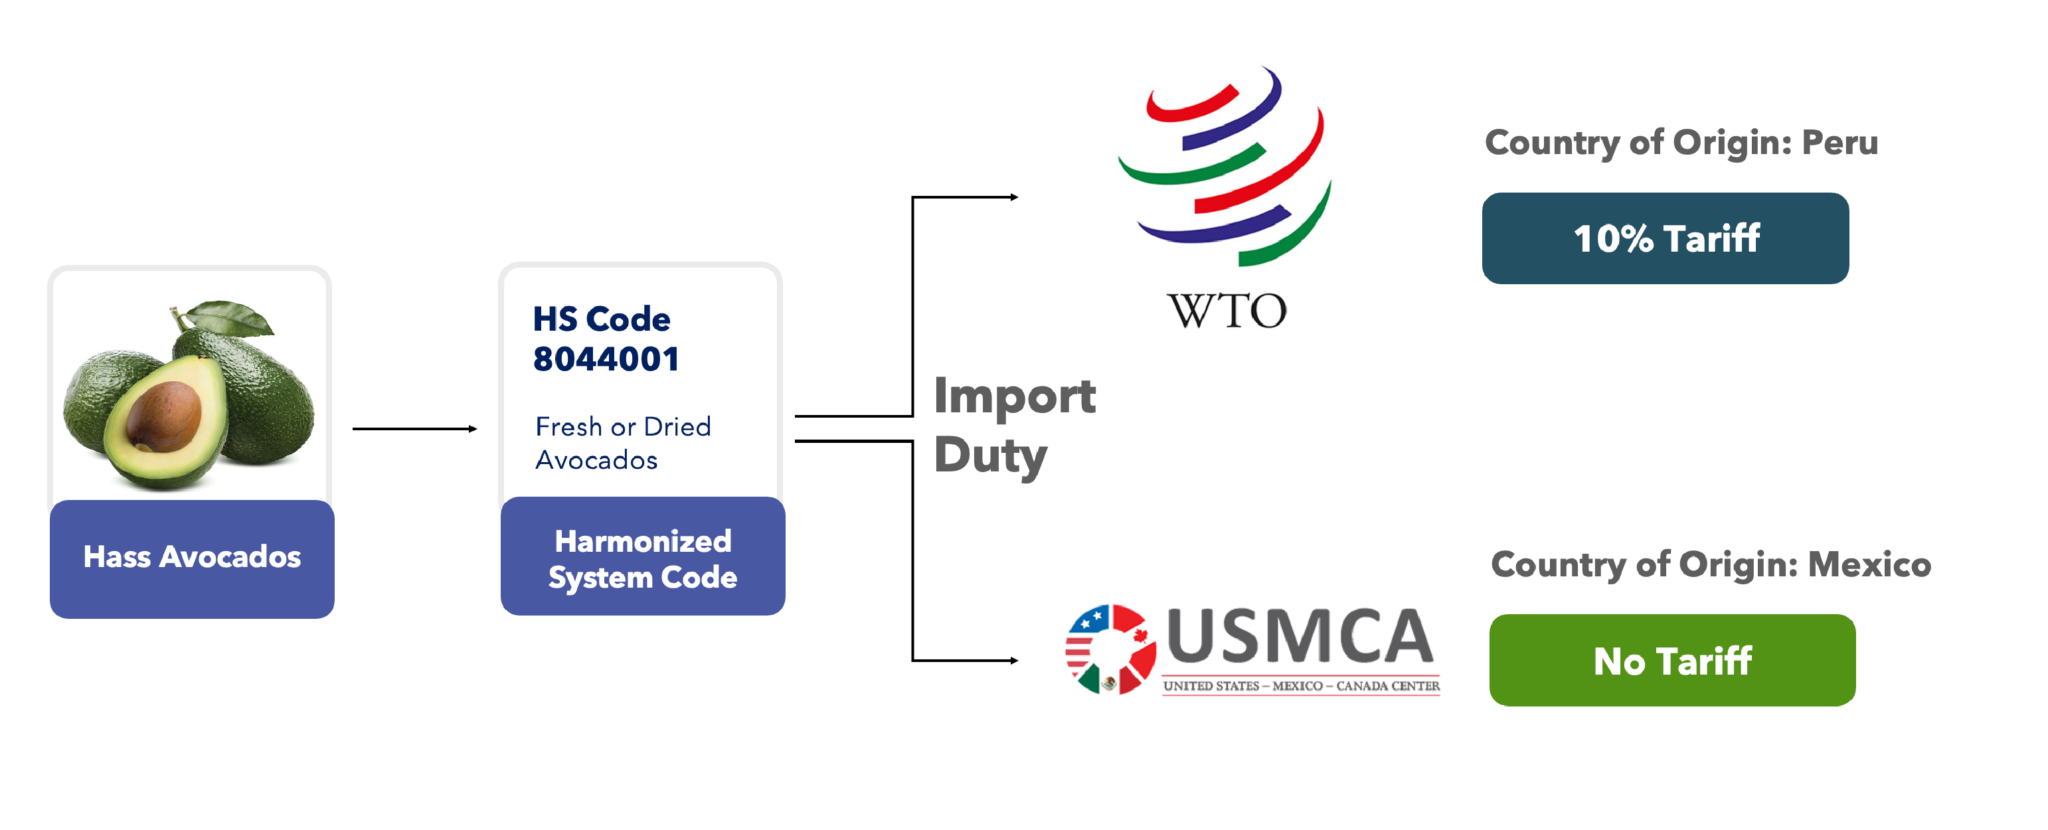
    This isn’t just about paying the correct duty; it’s about safeguarding your bottom line in a global marketplace where every digit and every designation carries substantial weight.

    The wrong origin, the wrong rule, the wrong margin.

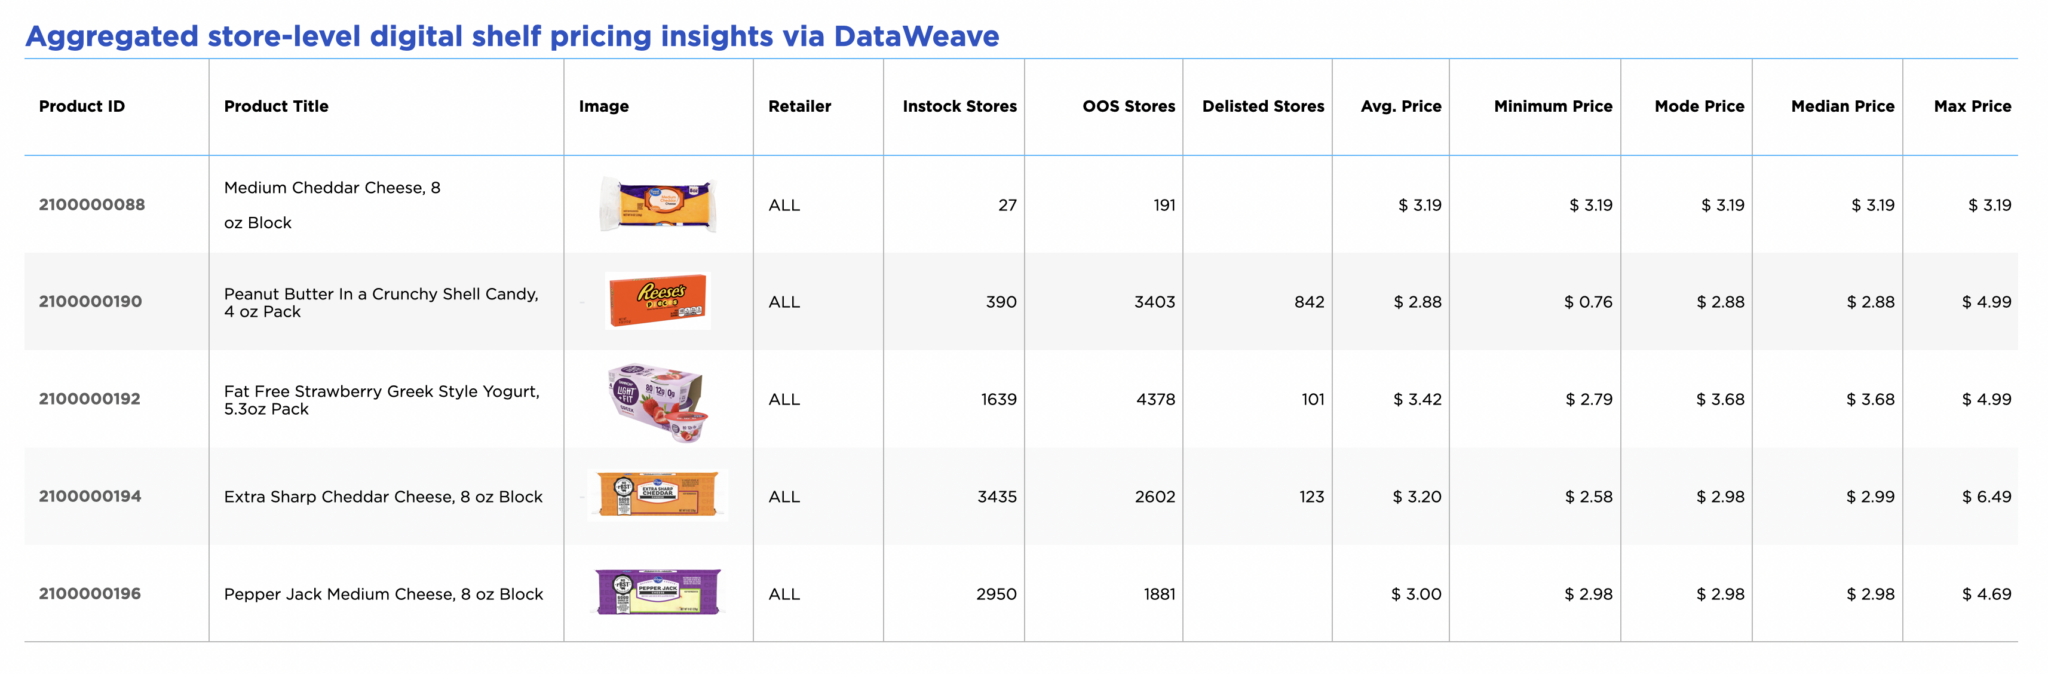
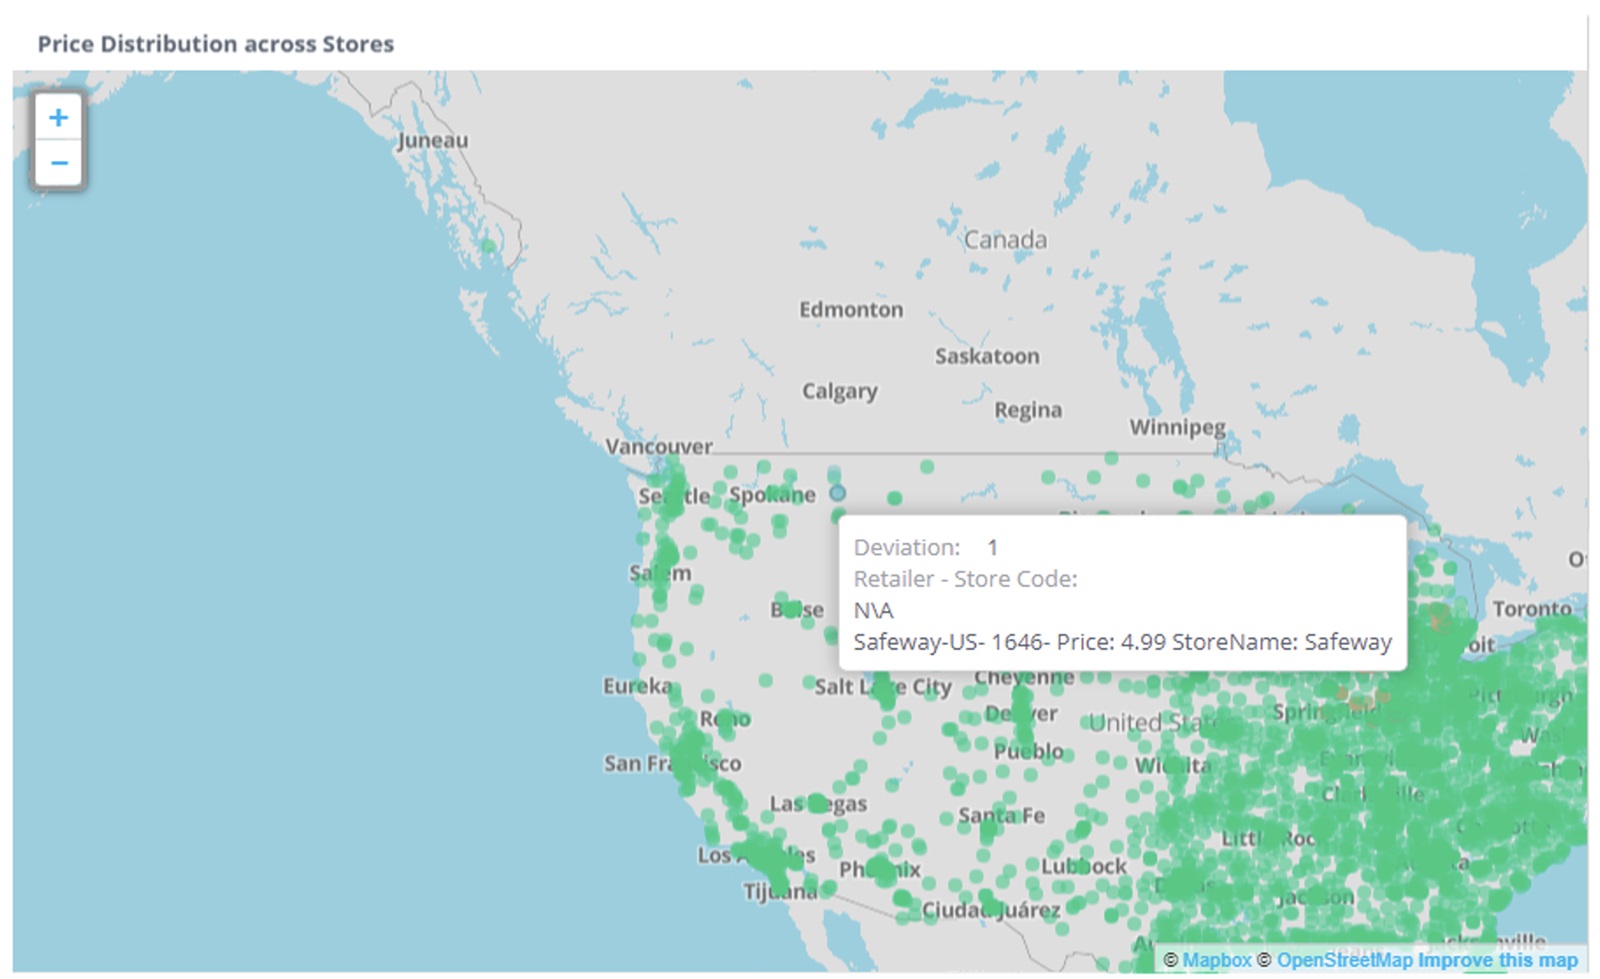
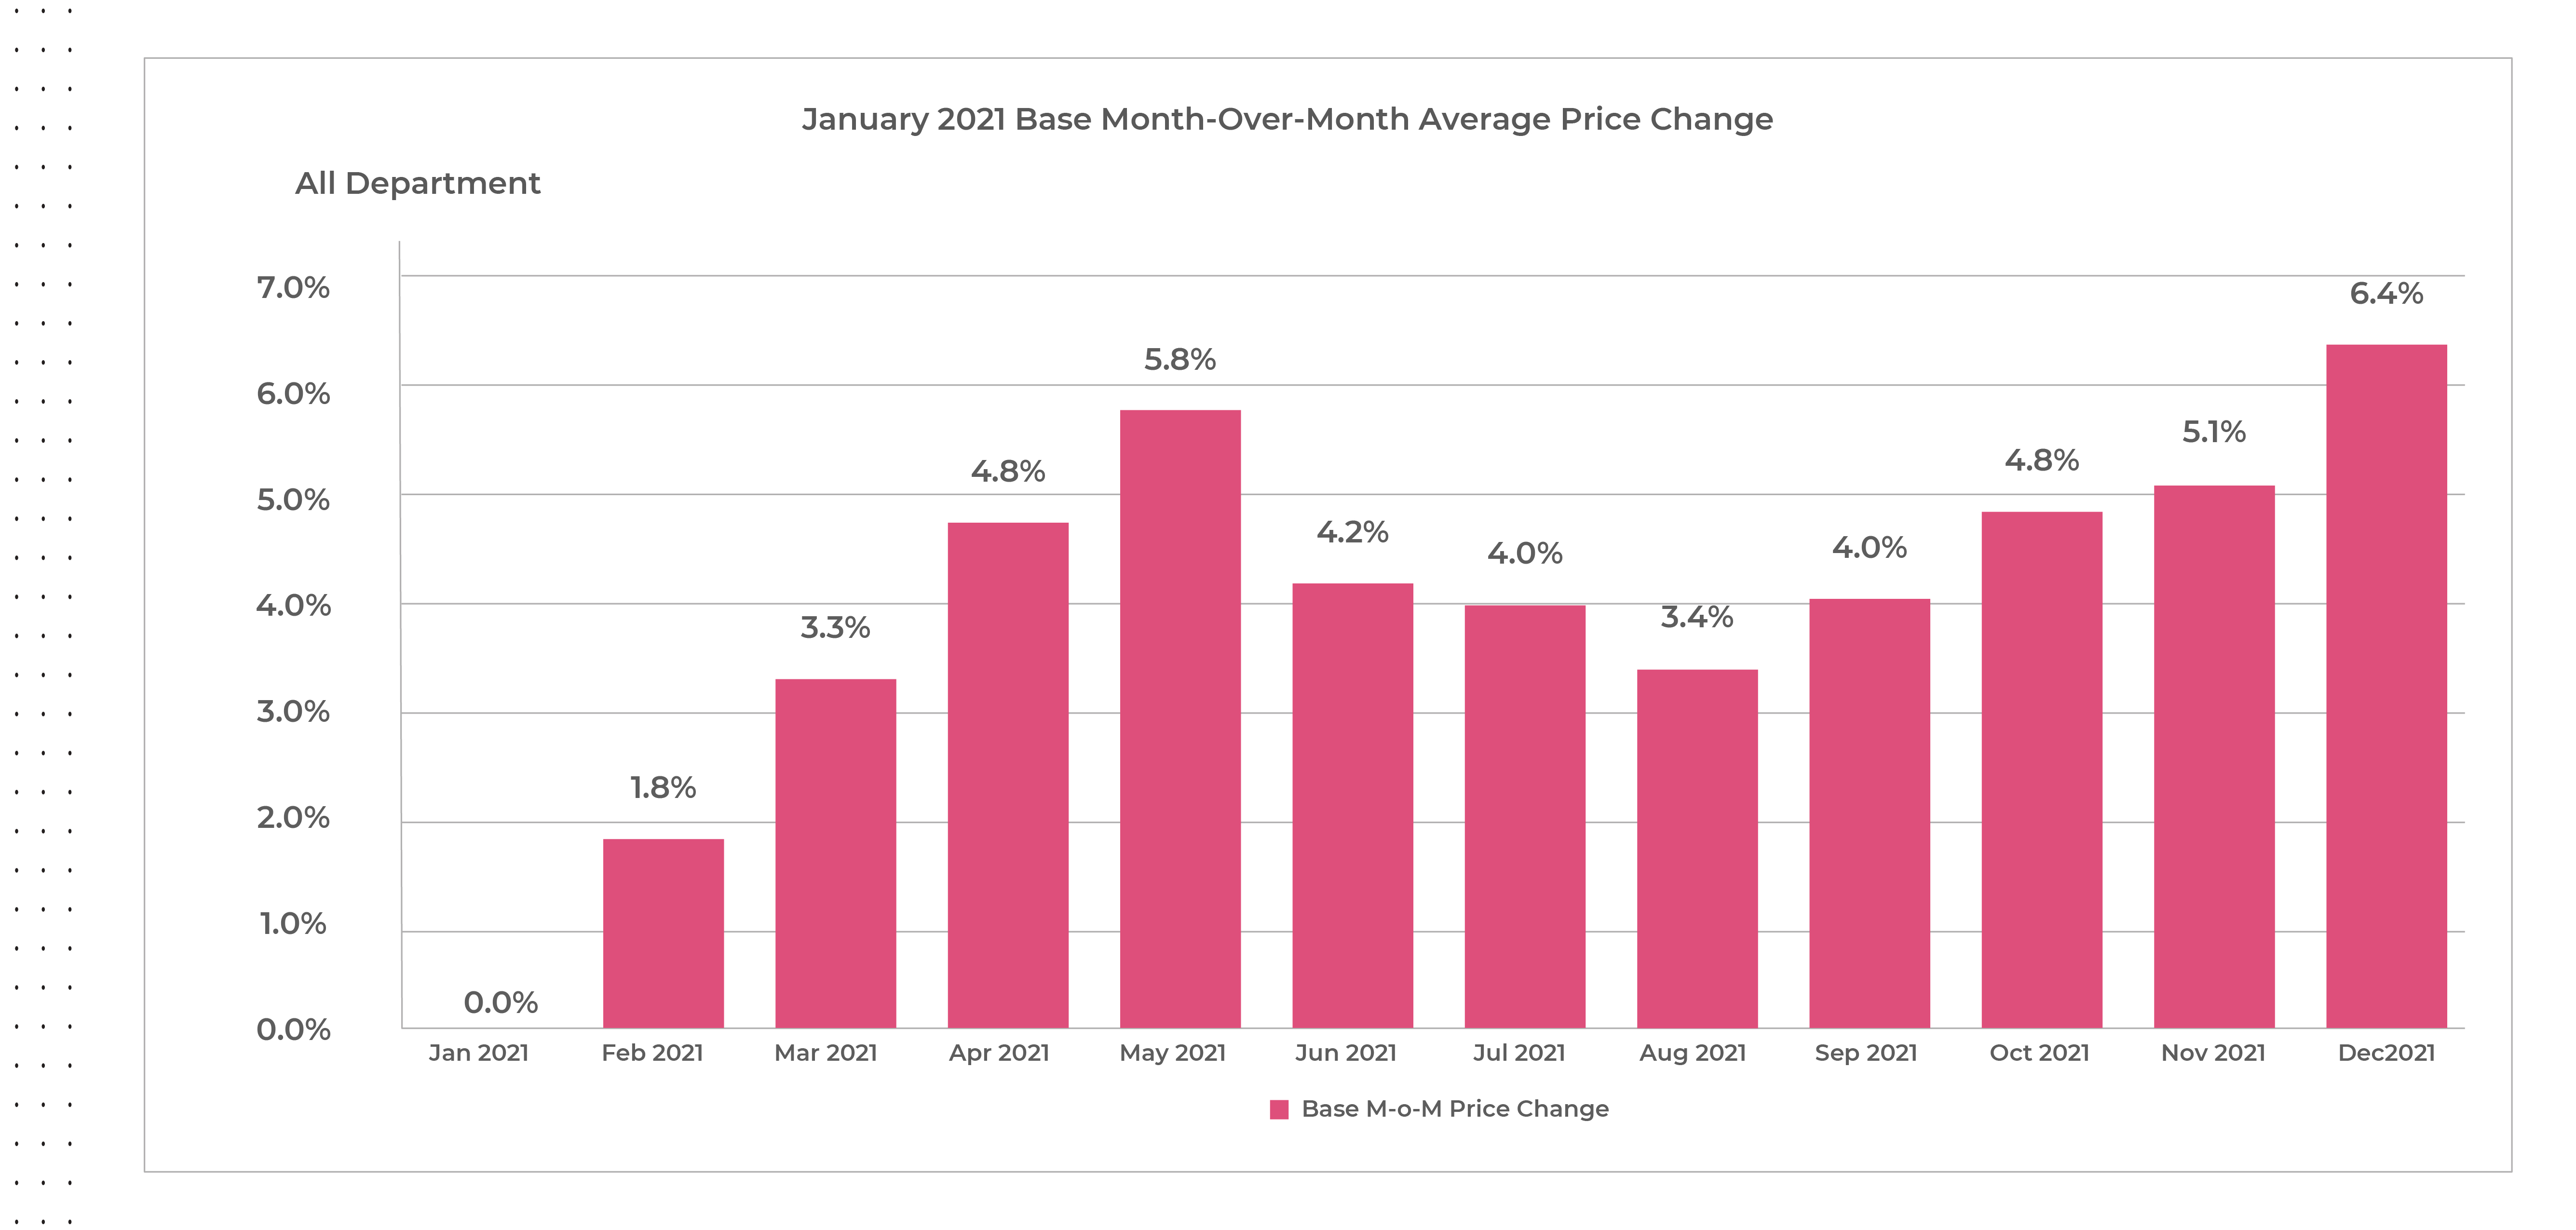
    Hard Numbers: Where Prices Are Already Climbing

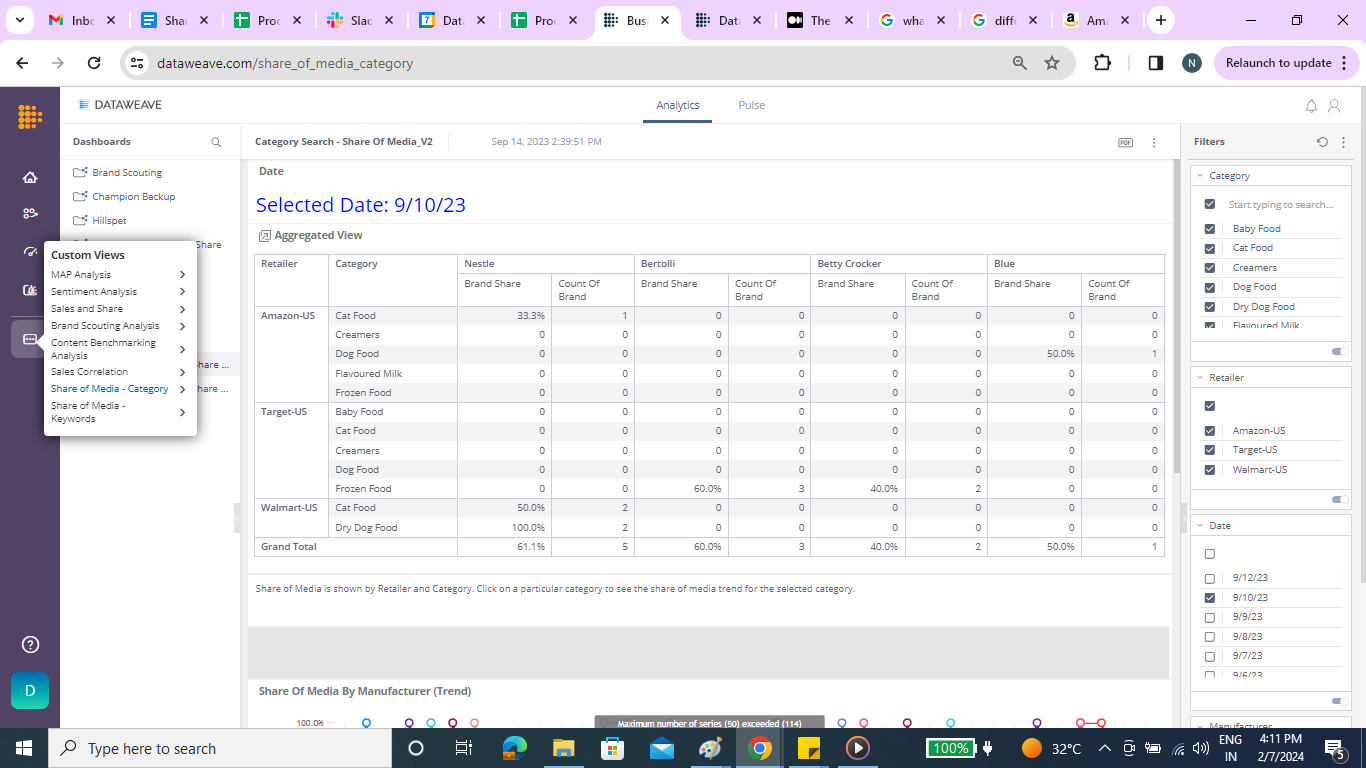
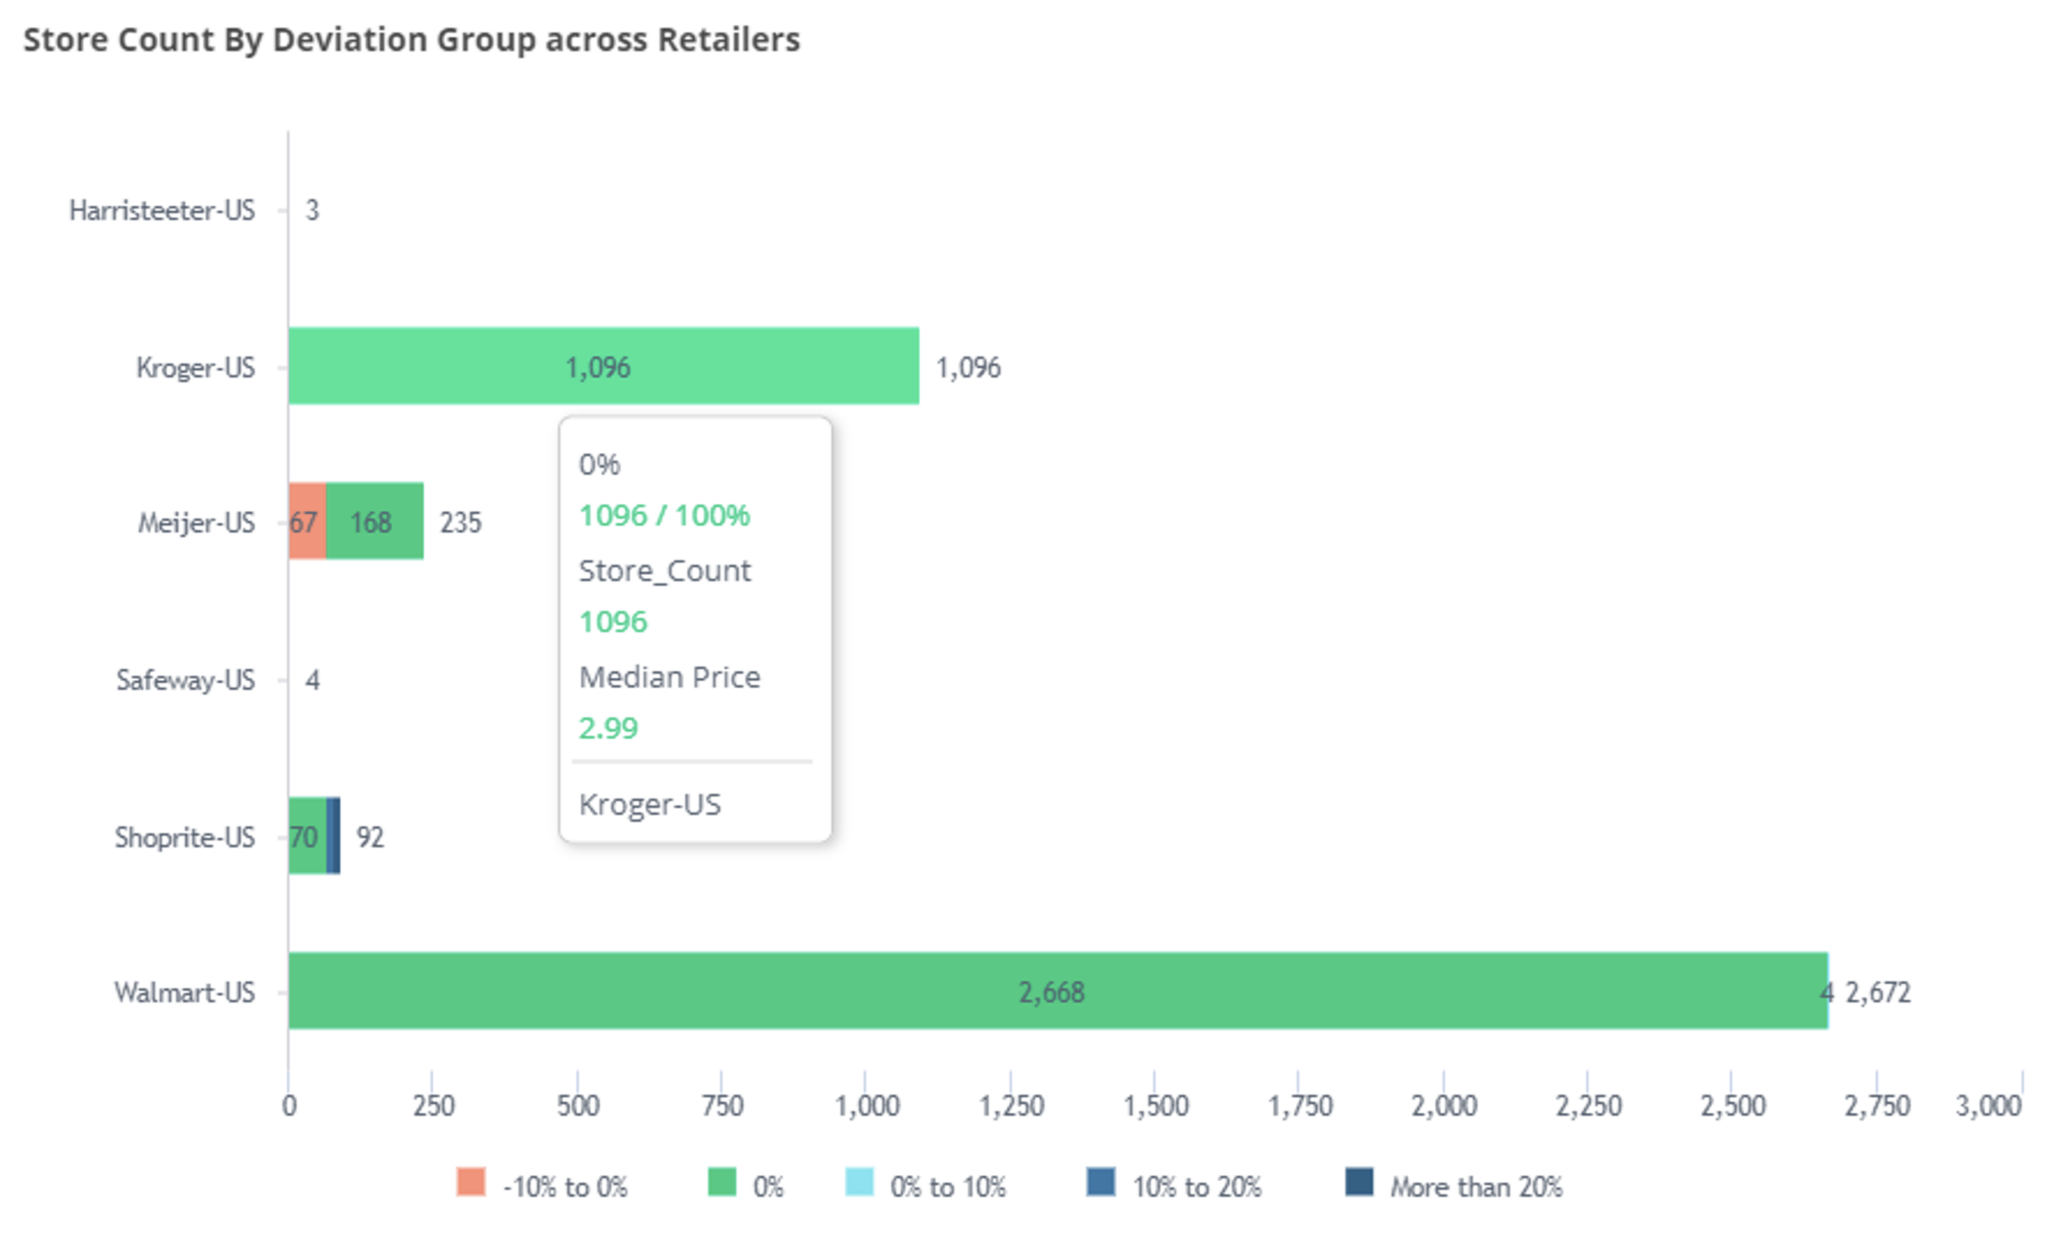
    DataWeave’s latest digital shelf analysis shows import-driven price inflation diverging sharply by source country.

    The intricate dance of HS codes, country of origin, and trade agreements directly translates into the prices consumers see. And the data doesn’t lie. Below, we delve into the hard numbers: where prices are already climbing, as illuminated by DataWeave’s latest digital shelf monitoring, showing significant import-driven price inflation by source country.

    • China: Products sourced from China are up 5%. This is largely attributable to the numerous tariffs currently imposed on Chinese goods.
    • Mexico: Prices for products from Mexico have risen by 3%.
    • United States: Interestingly, even U.S.-sourced products show a 3% increase.
    tariff price increases

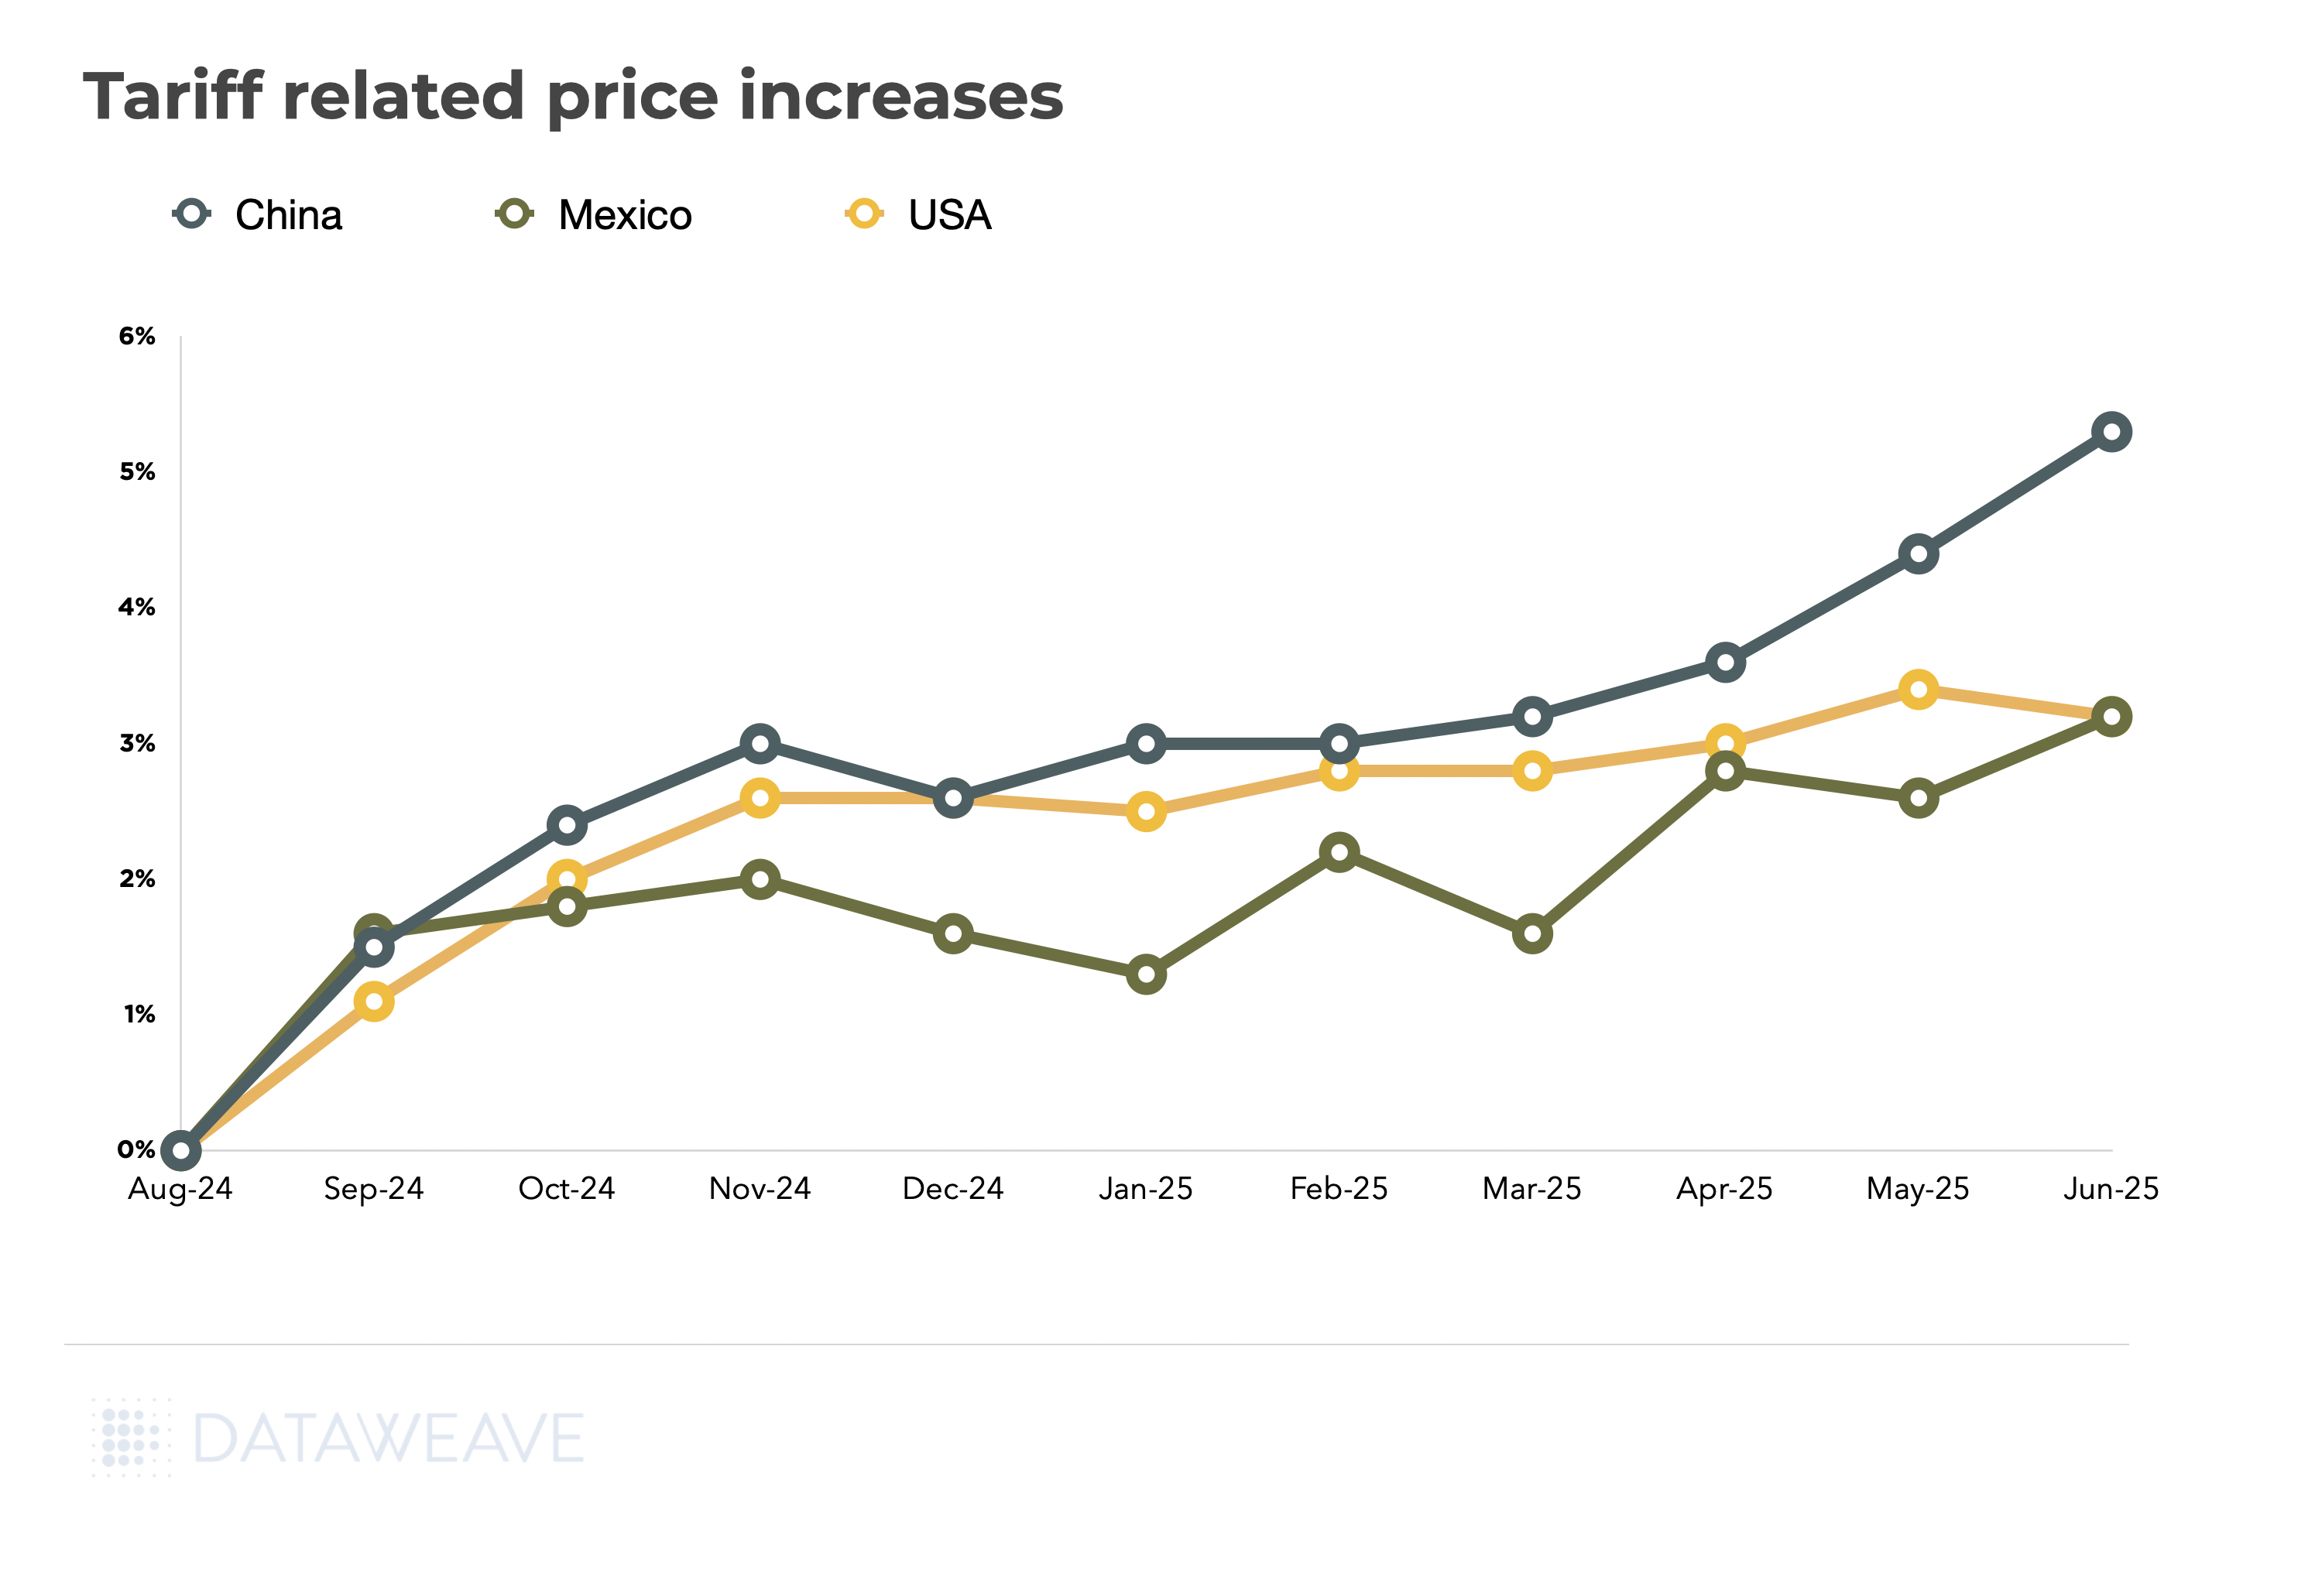
    This rise in U.S. product prices might seem counterintuitive if tariffs are solely focused on imports. However, the reality lies in the global supply chain for many products.

    Consider guacamole as an example: While the final product might be “Made in the USA,” its components often come from various international sources. Avocados might be imported from Mexico, lime juice from Central America, and seasonings from India or China. Even packaging could originate in Asia. Each of these imported components can be subject to tariffs. Therefore, even if an item is assembled in the U.S., the tariffs on its constituent parts contribute to an overall price increase, explaining the rising rates for U.S.-sourced goods.

    Action step: Map tariff exposure at both finished-goods and component-level to avoid “Made in USA” blind spots.

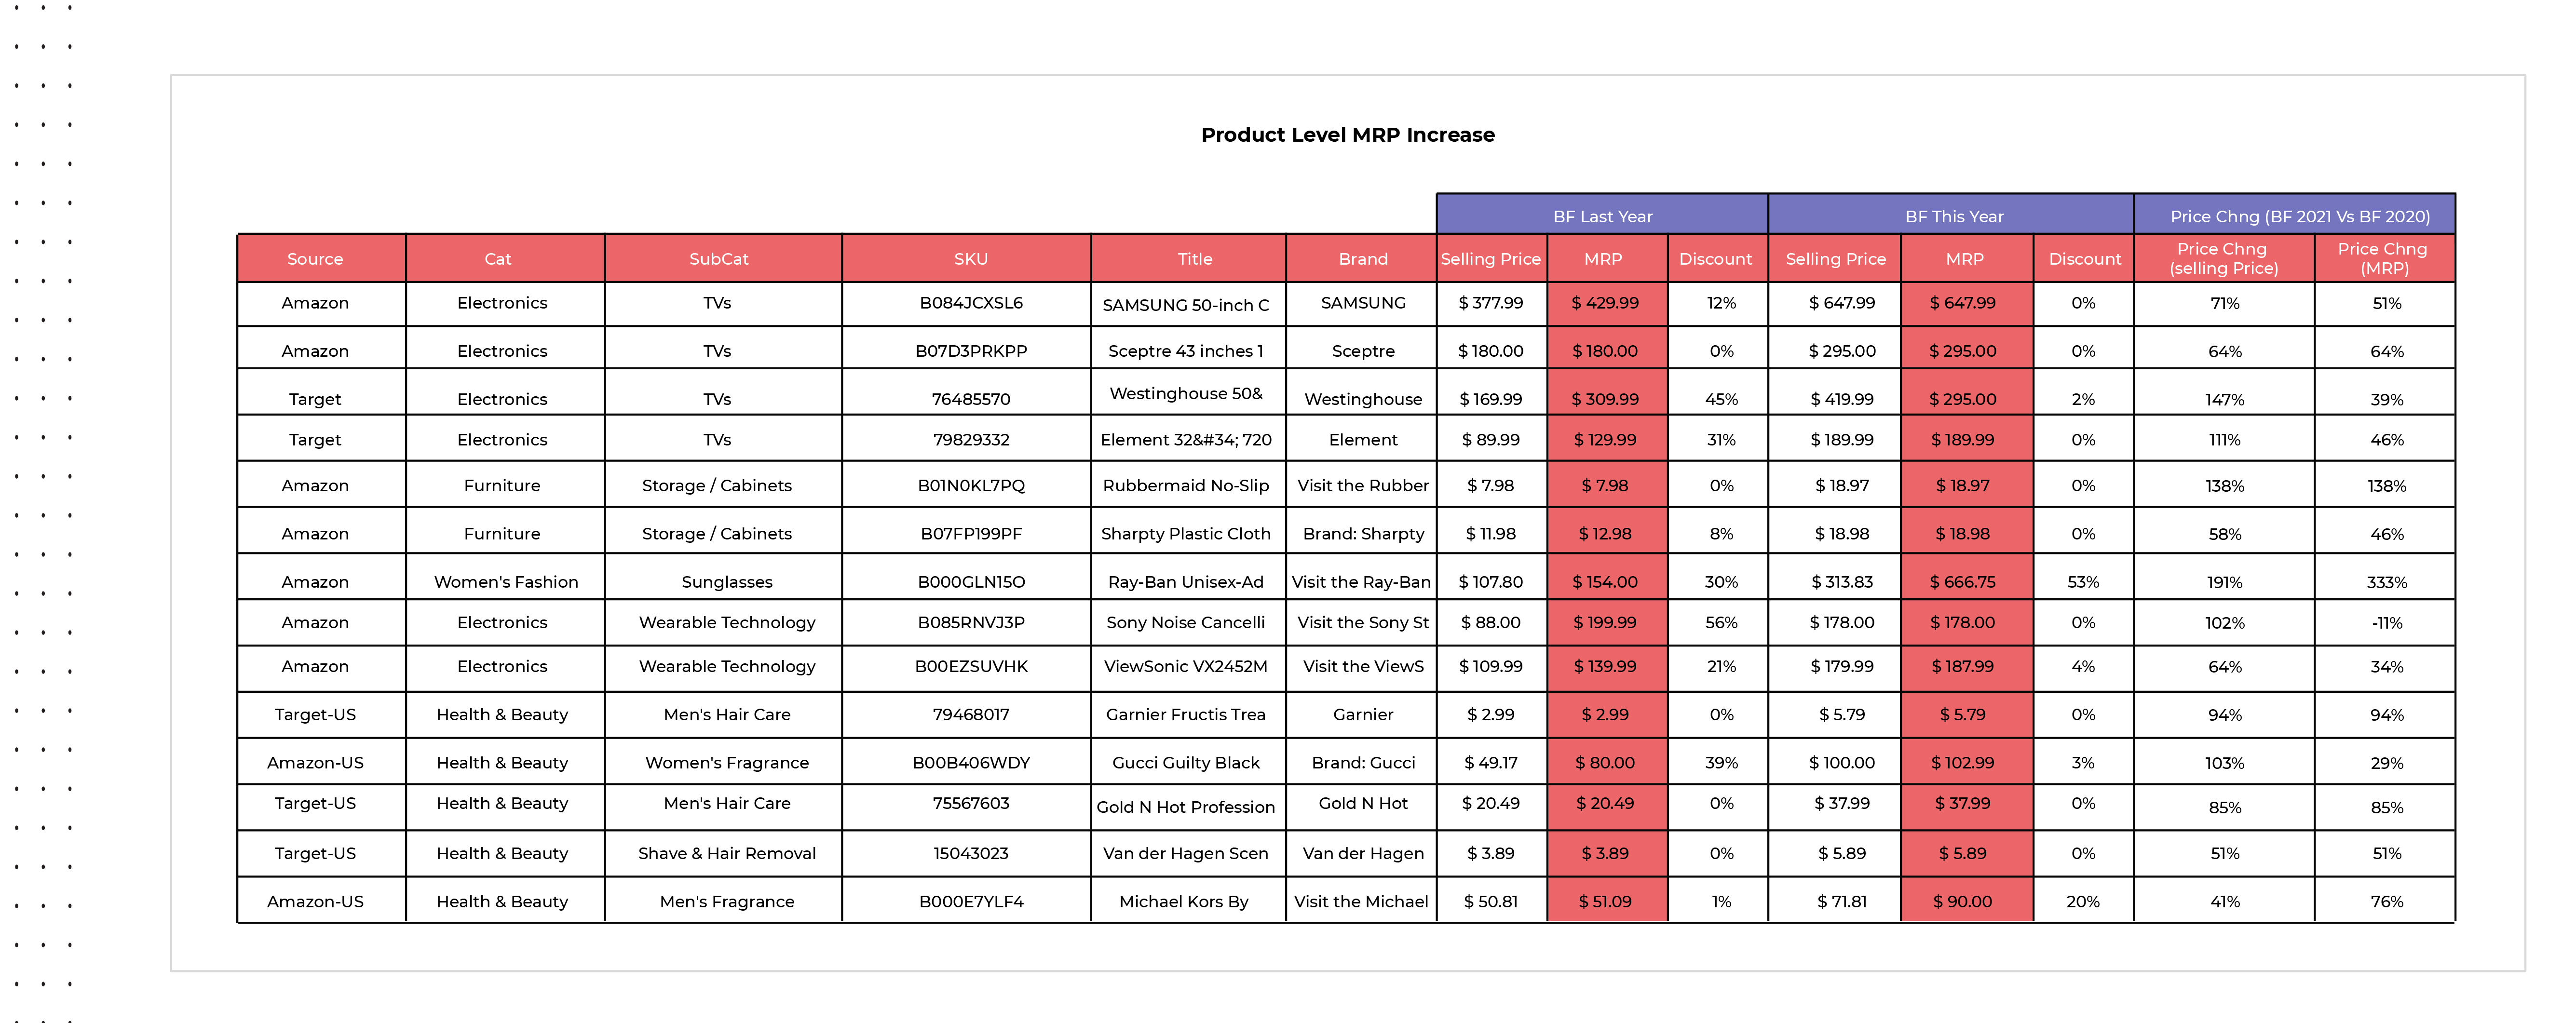
    Timing Is a Competitive Weapon

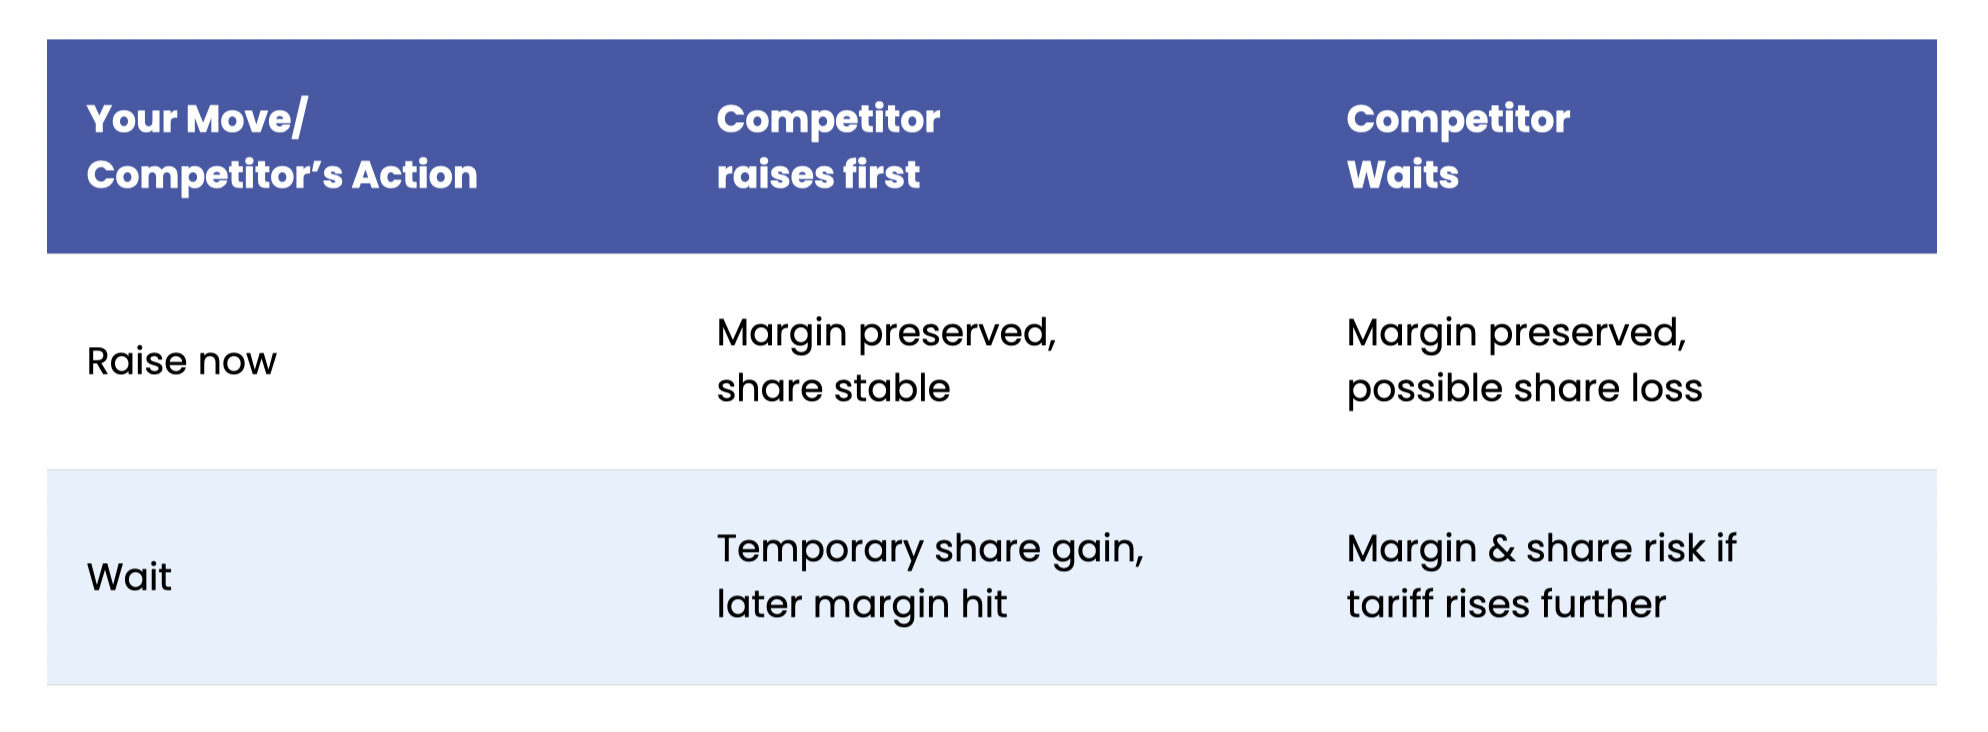
    With duty tables and competitor reactions changing fast, the question is: move first or follow? Early movers recoup cost fastest but risk overshooting if tariffs ease; laggards may enjoy a brief price advantage but suffer sudden margin compression.

    The Strategic Dilemma

    The table below illustrates this strategic choice and its potential outcomes:

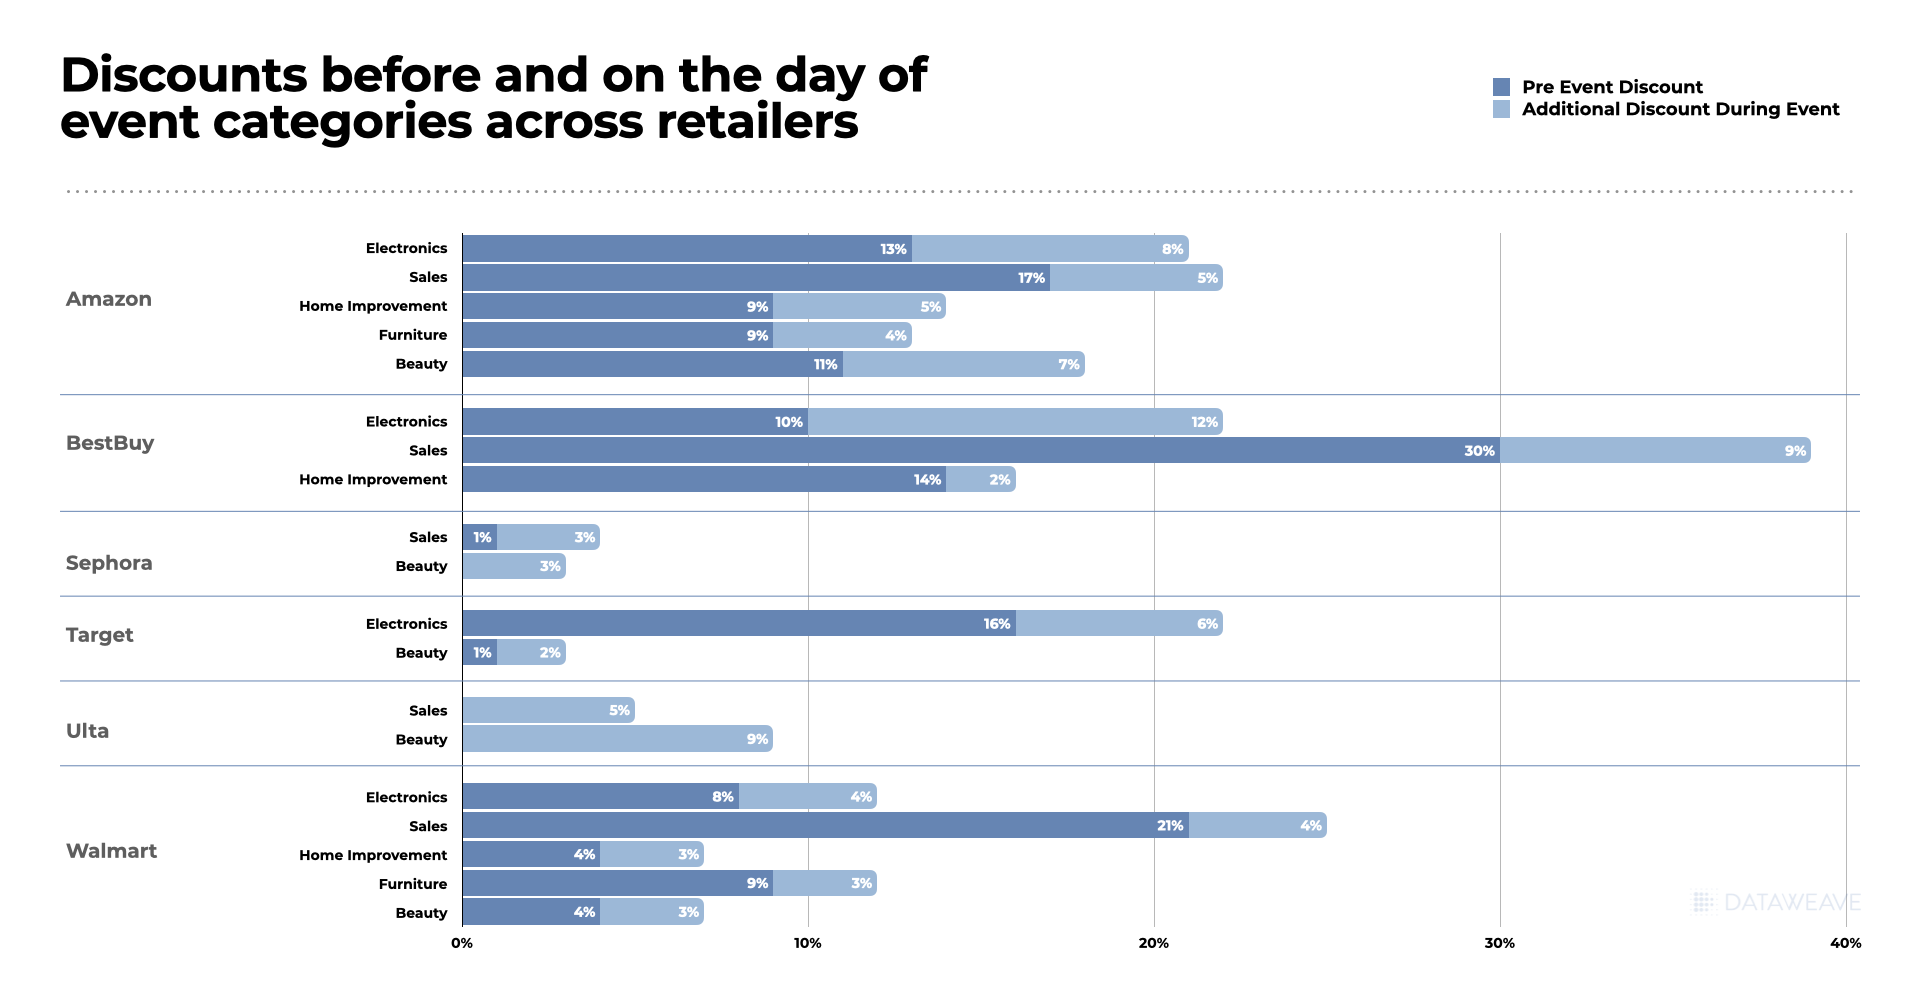
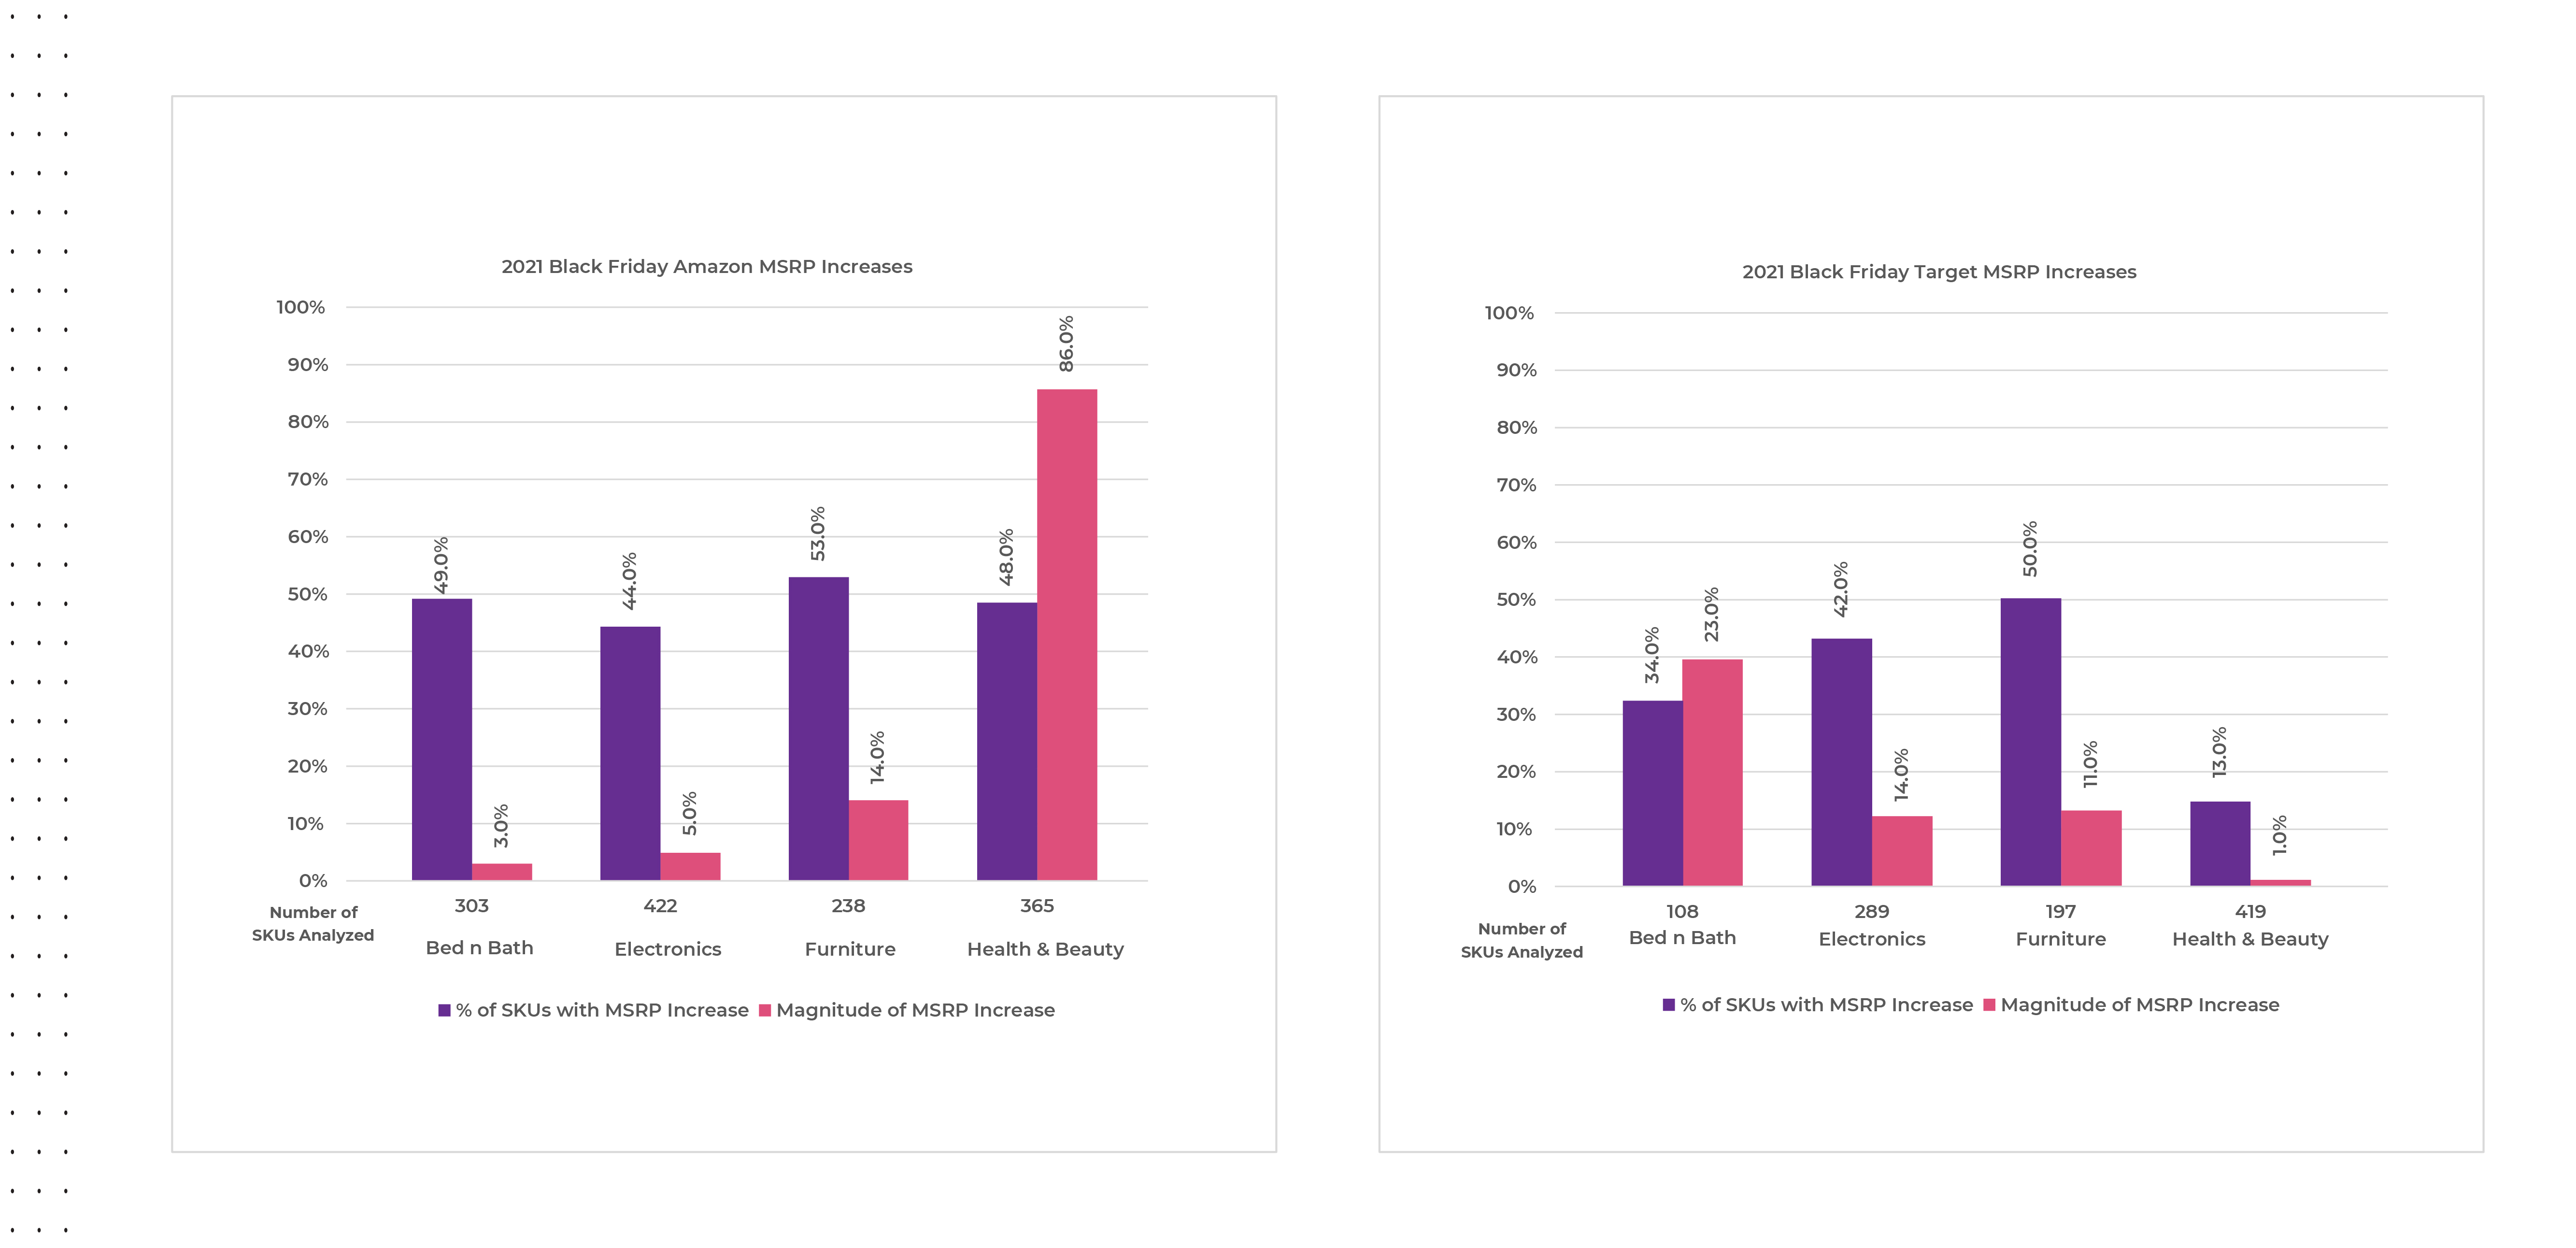
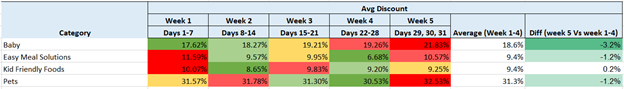
    Shrinkflation: Margin Patch or Trust Erosion?

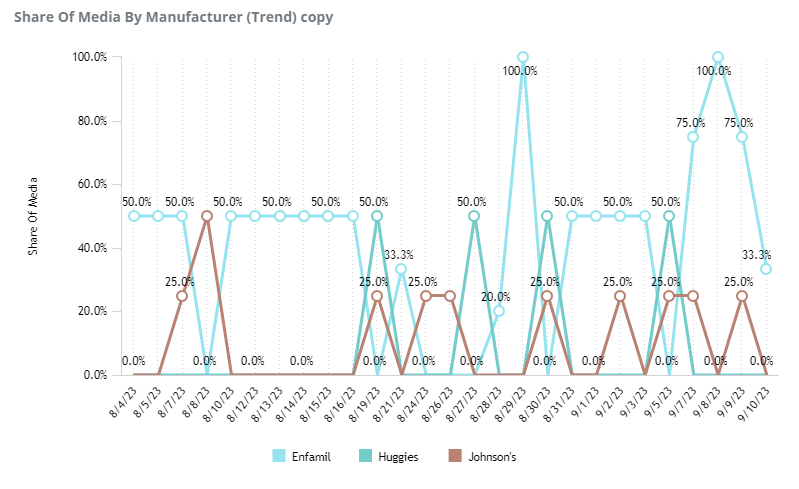
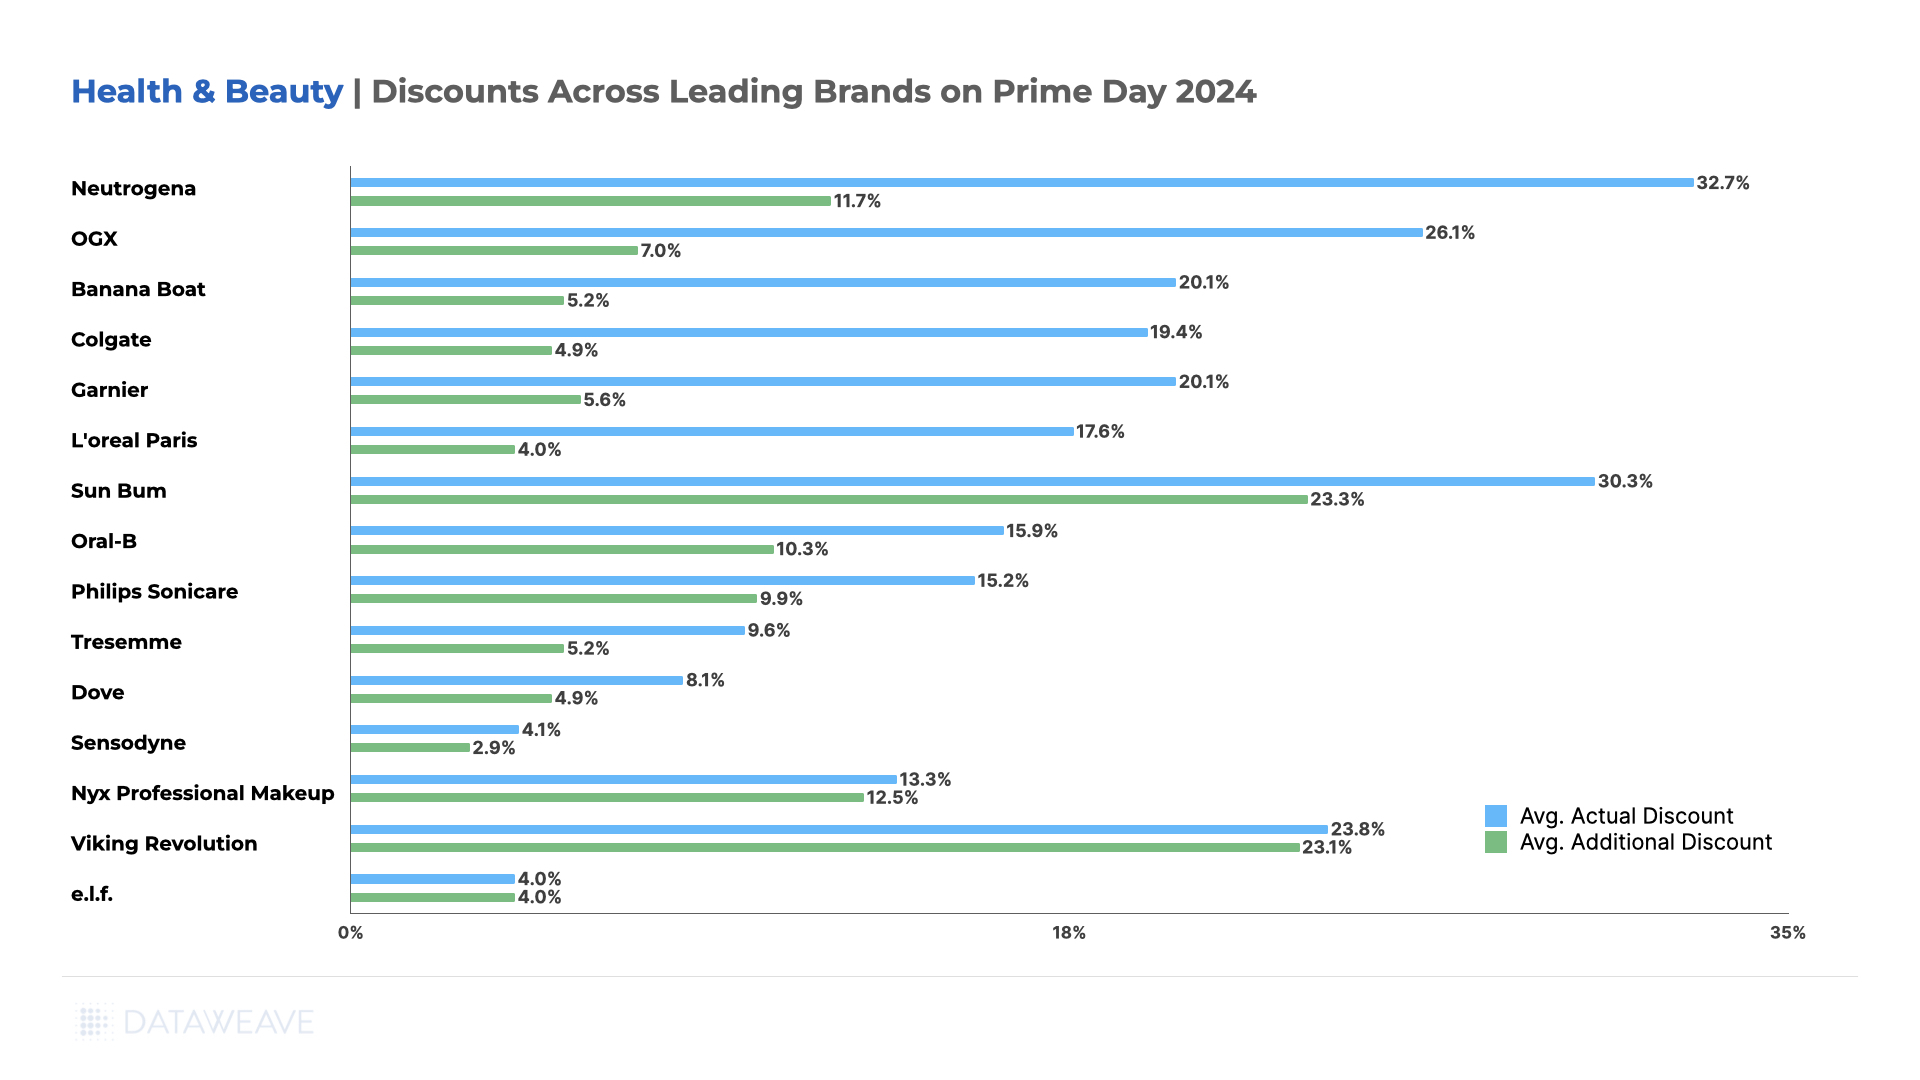
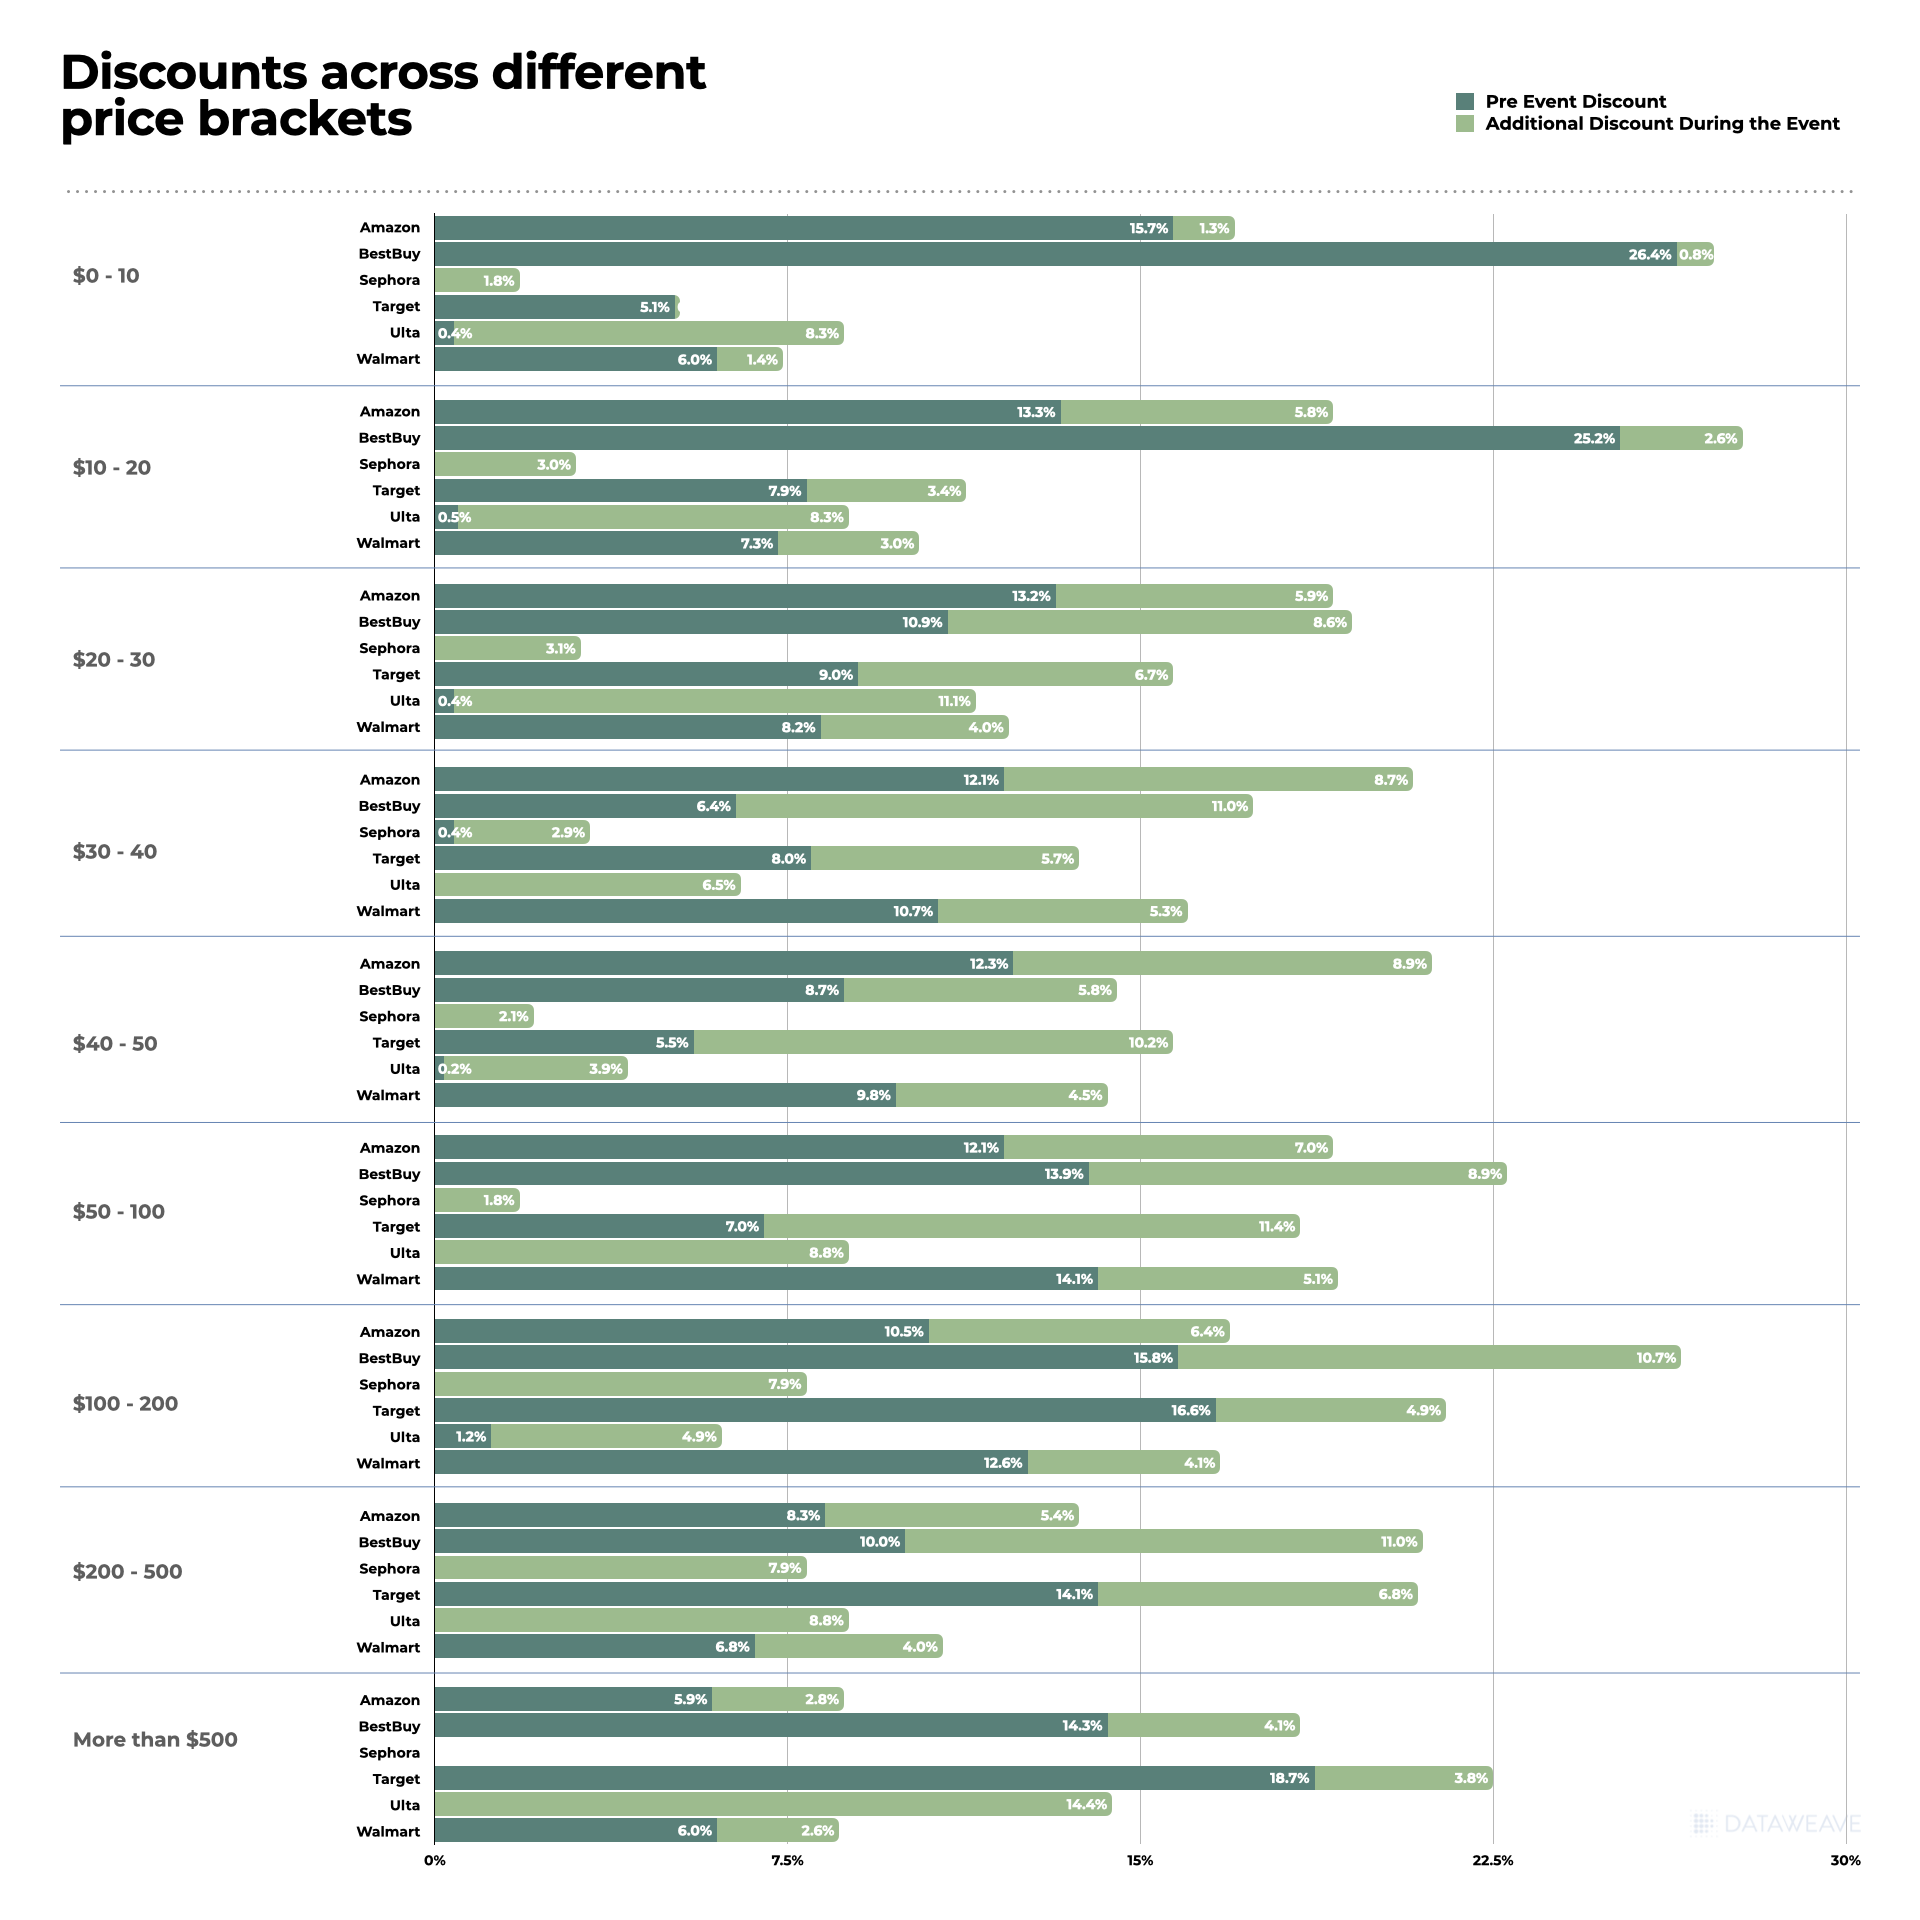
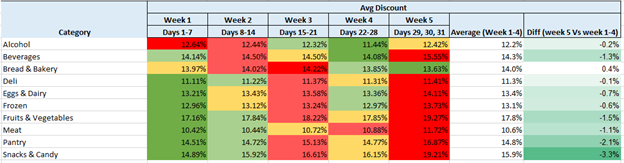
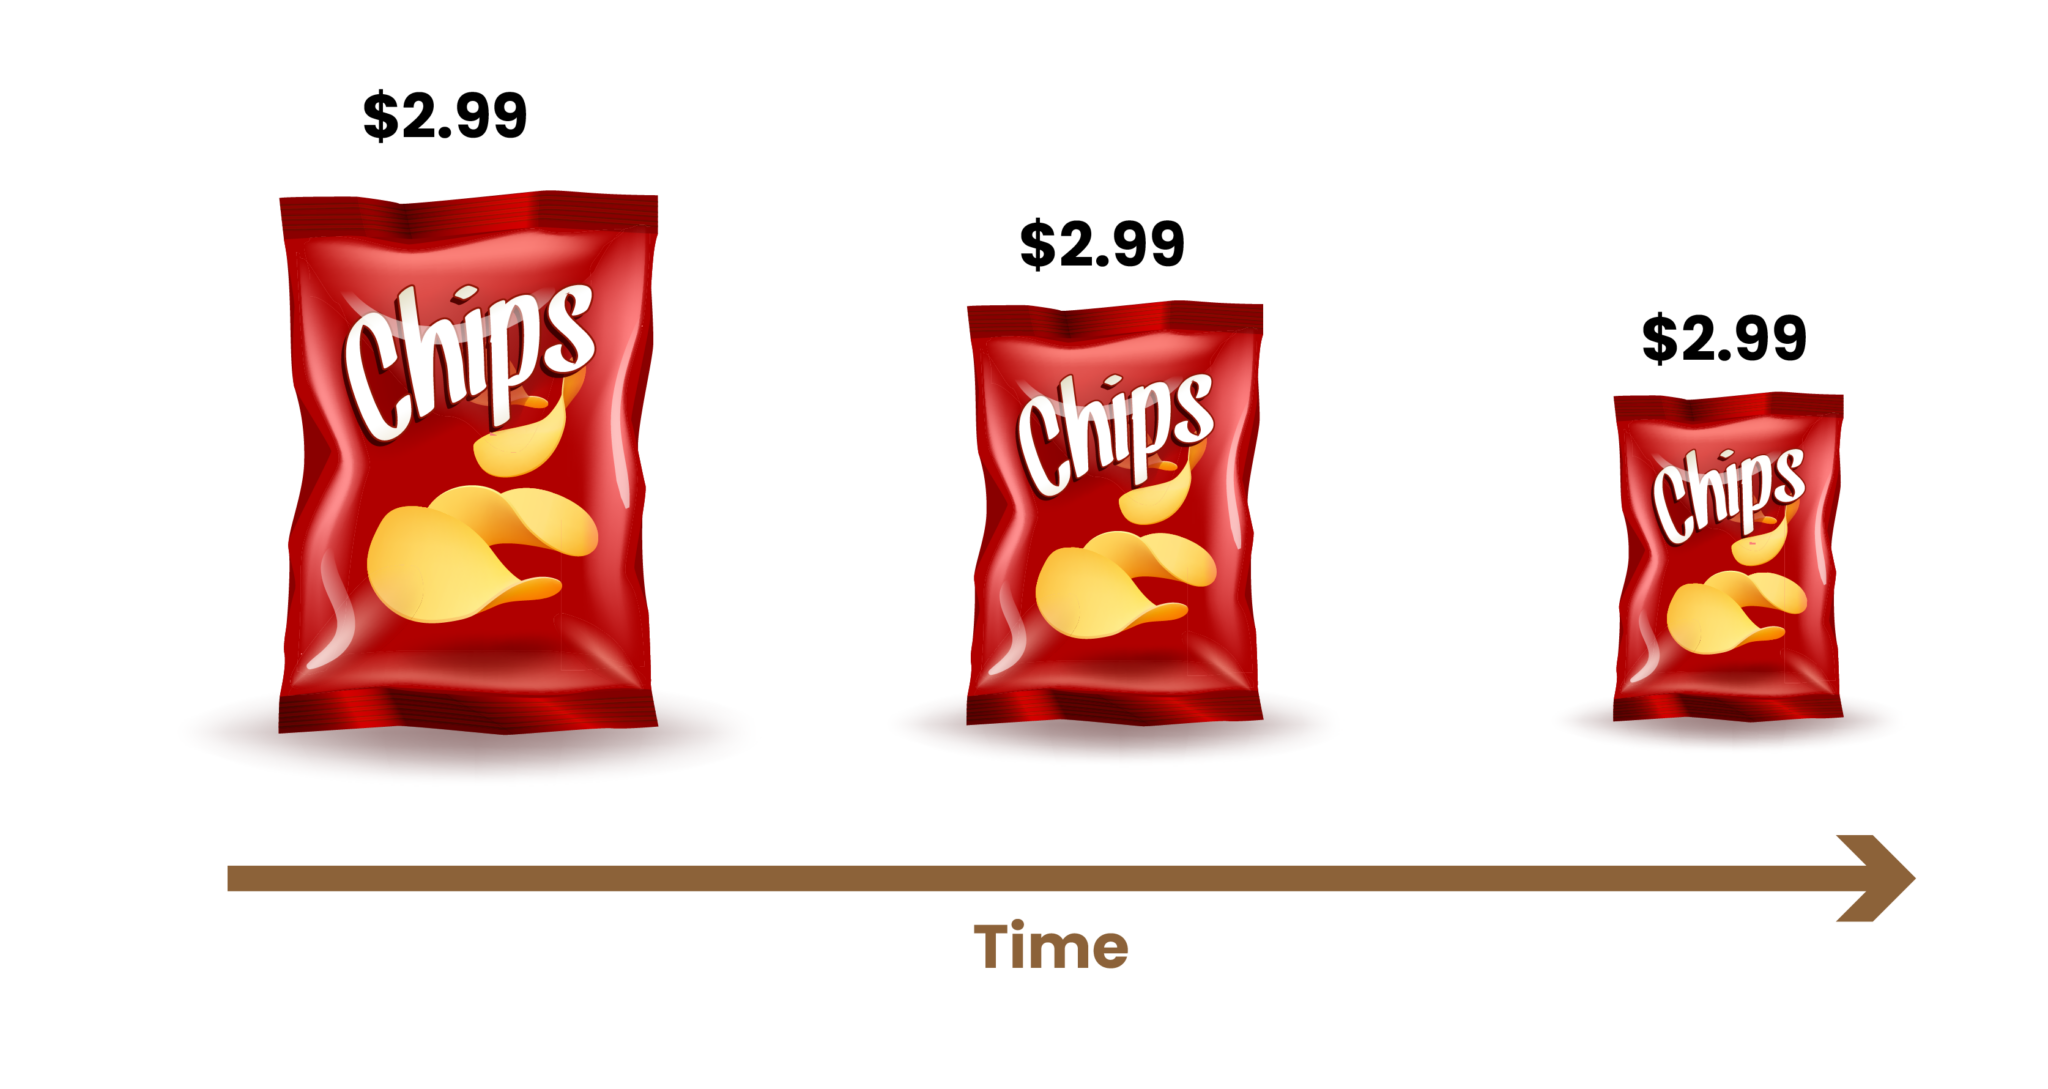
    Beyond direct price adjustments, many brands are turning to shrinkflation to manage tariff-driven cost pressure, shaving net weight instead of hiking prices. DataWeave’s analysis reveals an average package reduction of 5 – 6%, with extreme cases reaching 15 – 25%, sometimes even coupled with a shelf-price increase.

    While this can cushion immediate margin, it comes at a significant cost: brand credibility. Savvy shoppers quickly spot these changes, sharing “before-and-after” photos online and fueling consumer frustration. What begins as a margin patch can rapidly erode trust and damage long-term loyalty.

    Ultimately, navigating this volatile environment requires dynamic intelligence and a holistic pricing strategy that balances profitability with market share and, crucially, consumer trust.

    Price Hikes May be Inevitable, But You Can Still Run Your Digital Shelf

    Tariff‑driven cost pressure can force list‑price increases, but it does not dictate how well your products show up, sell through, or satisfy shoppers online. Those outcomes still hinge on five levers that live entirely inside your control. Master them and you cushion margin hits while protecting (or even expanding) share.

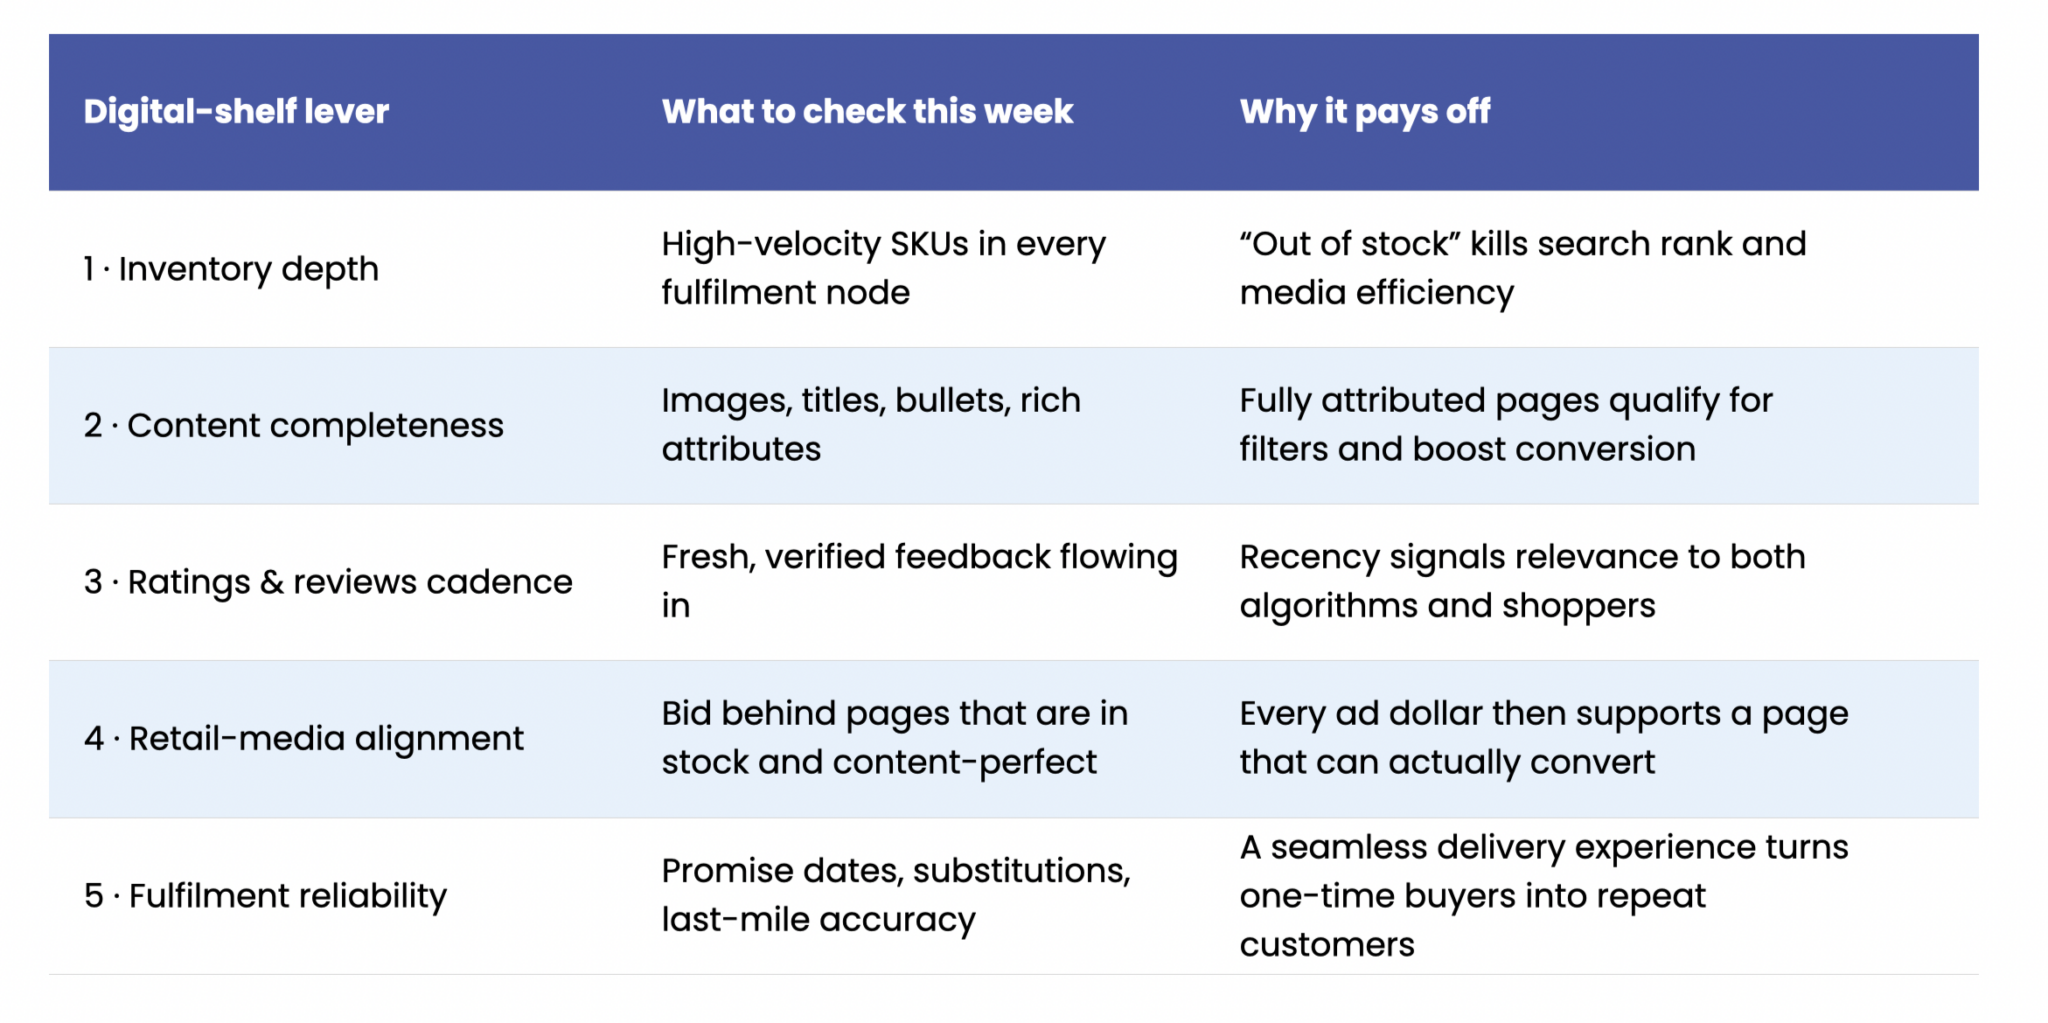
    The Five Levers of Digital‑Shelf Control

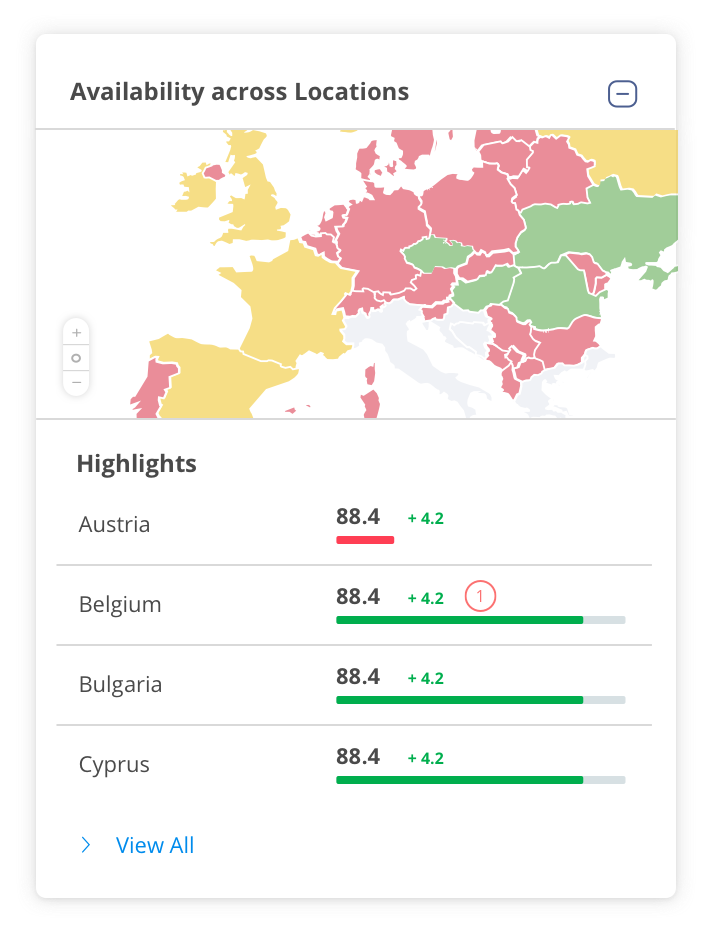
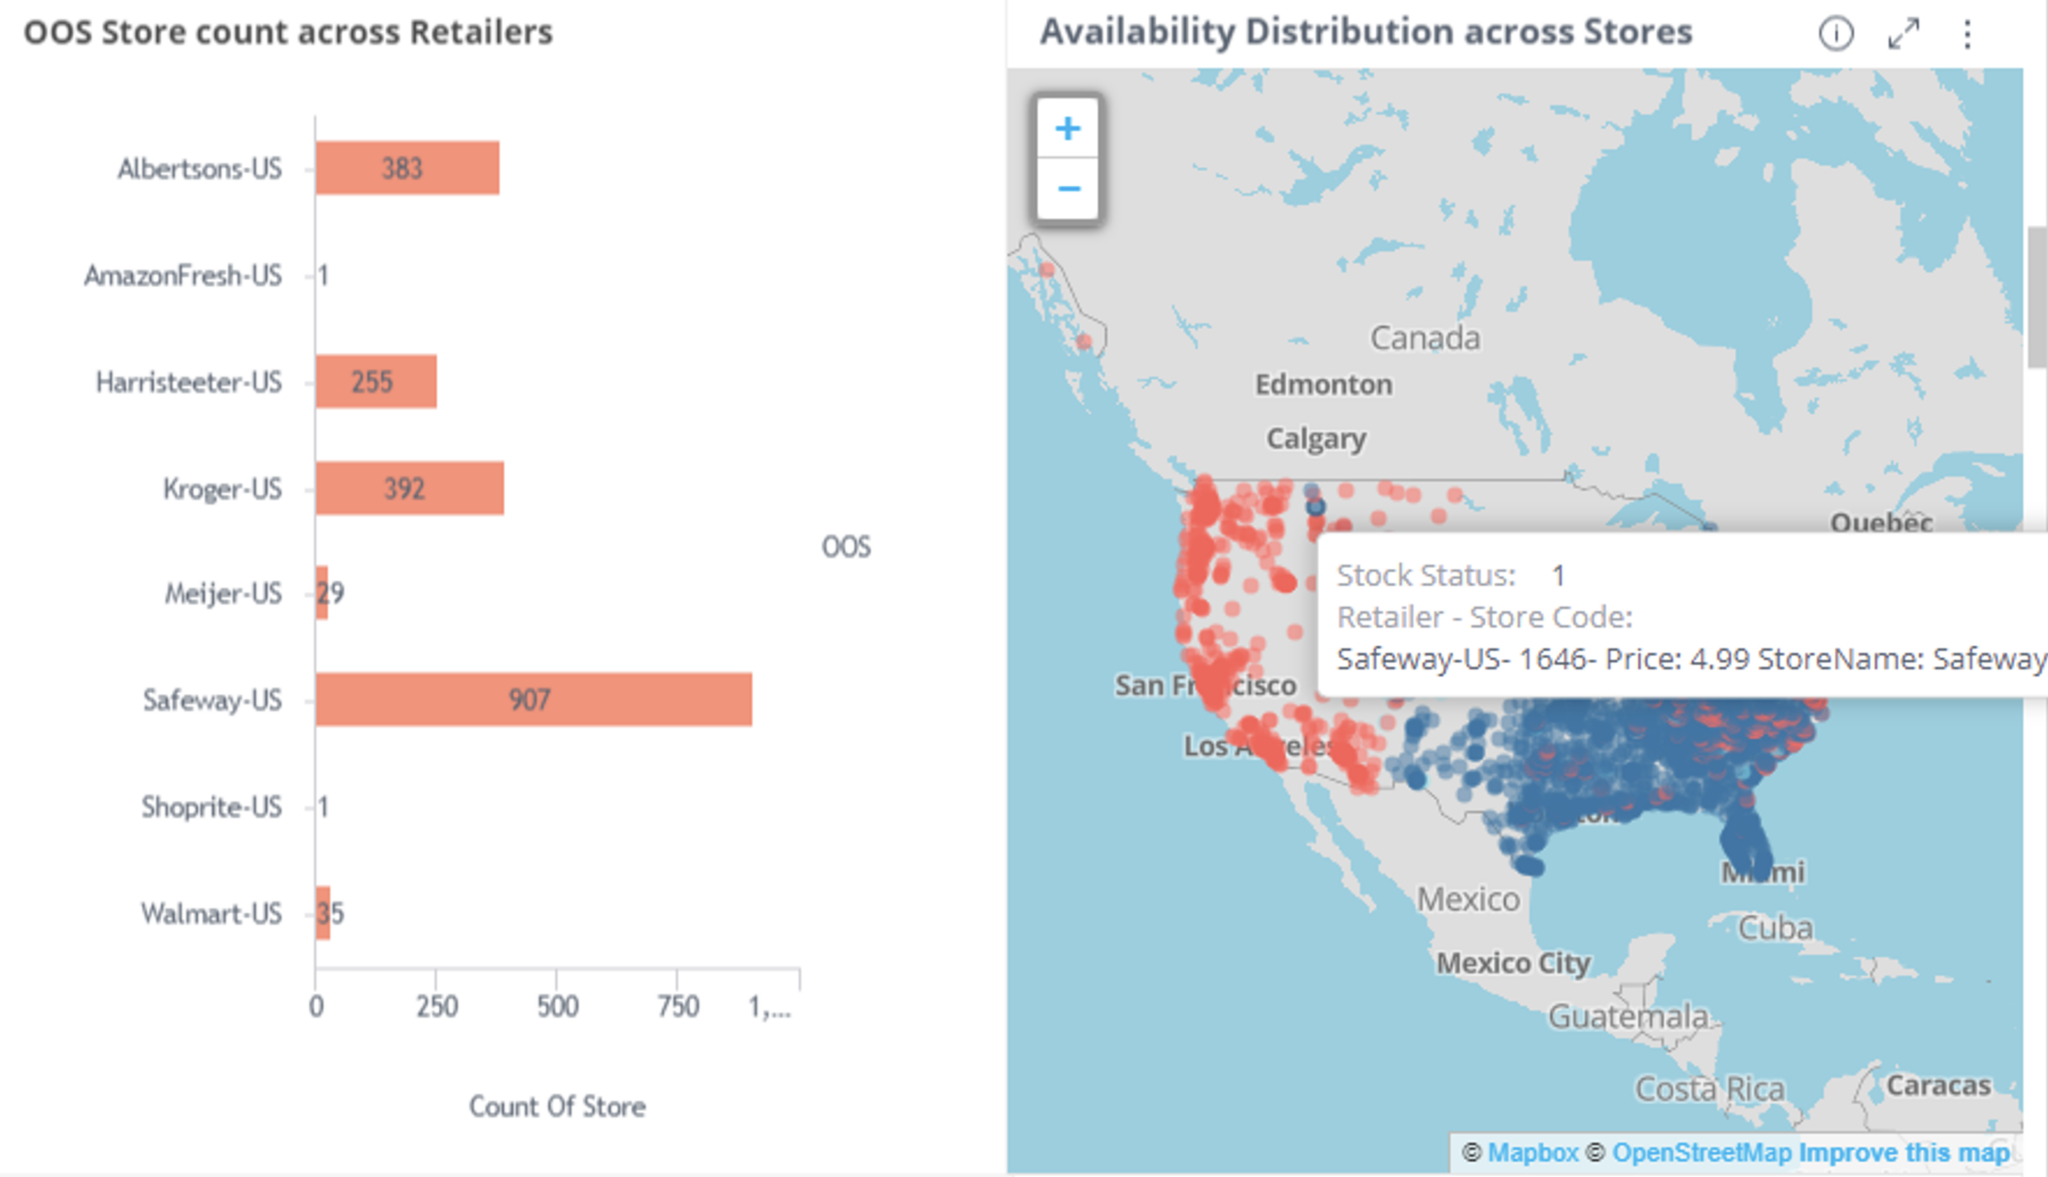
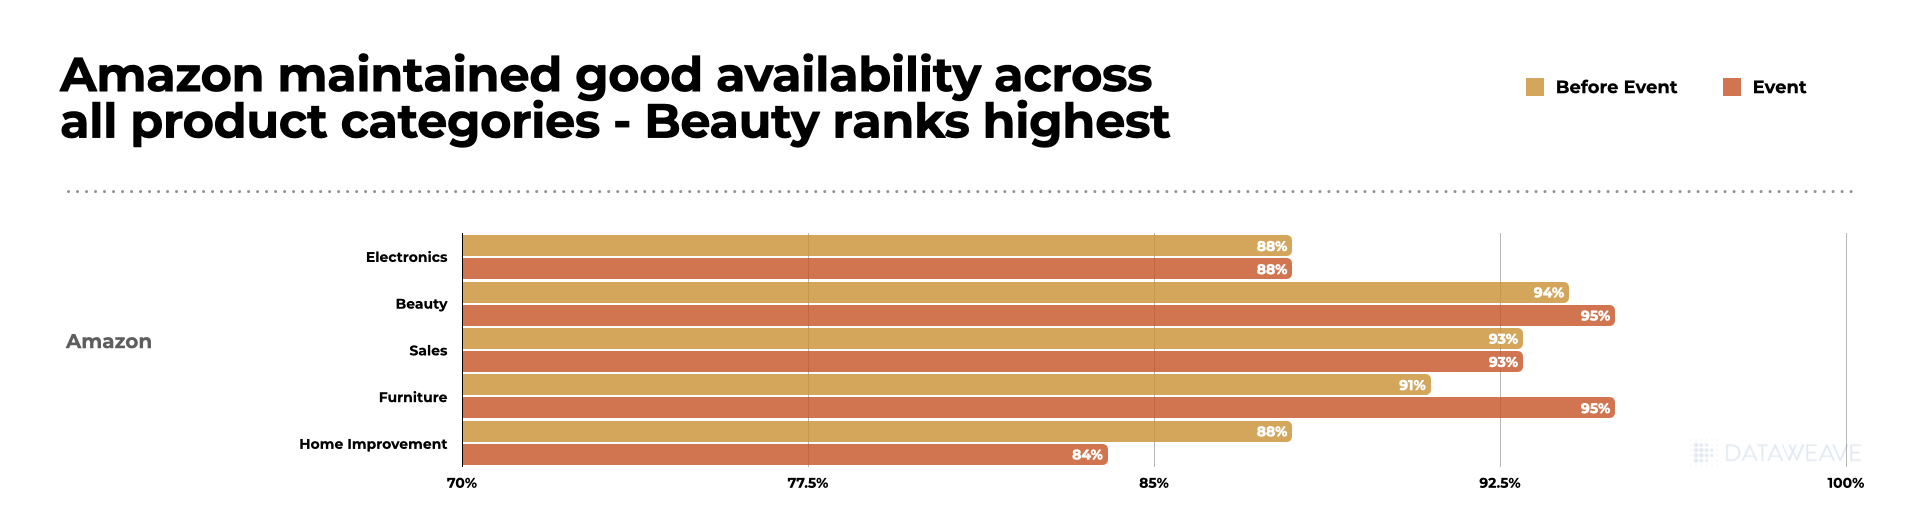
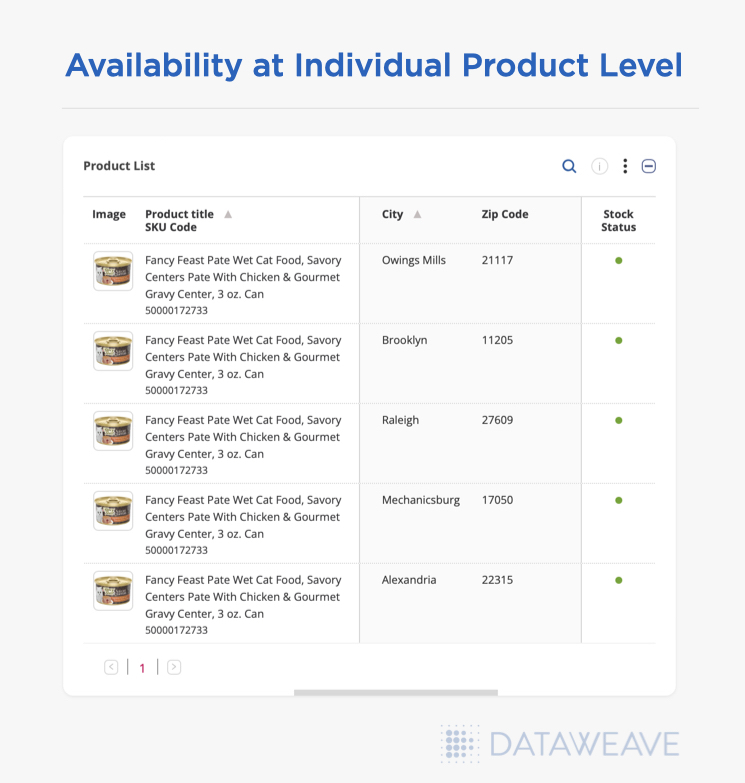
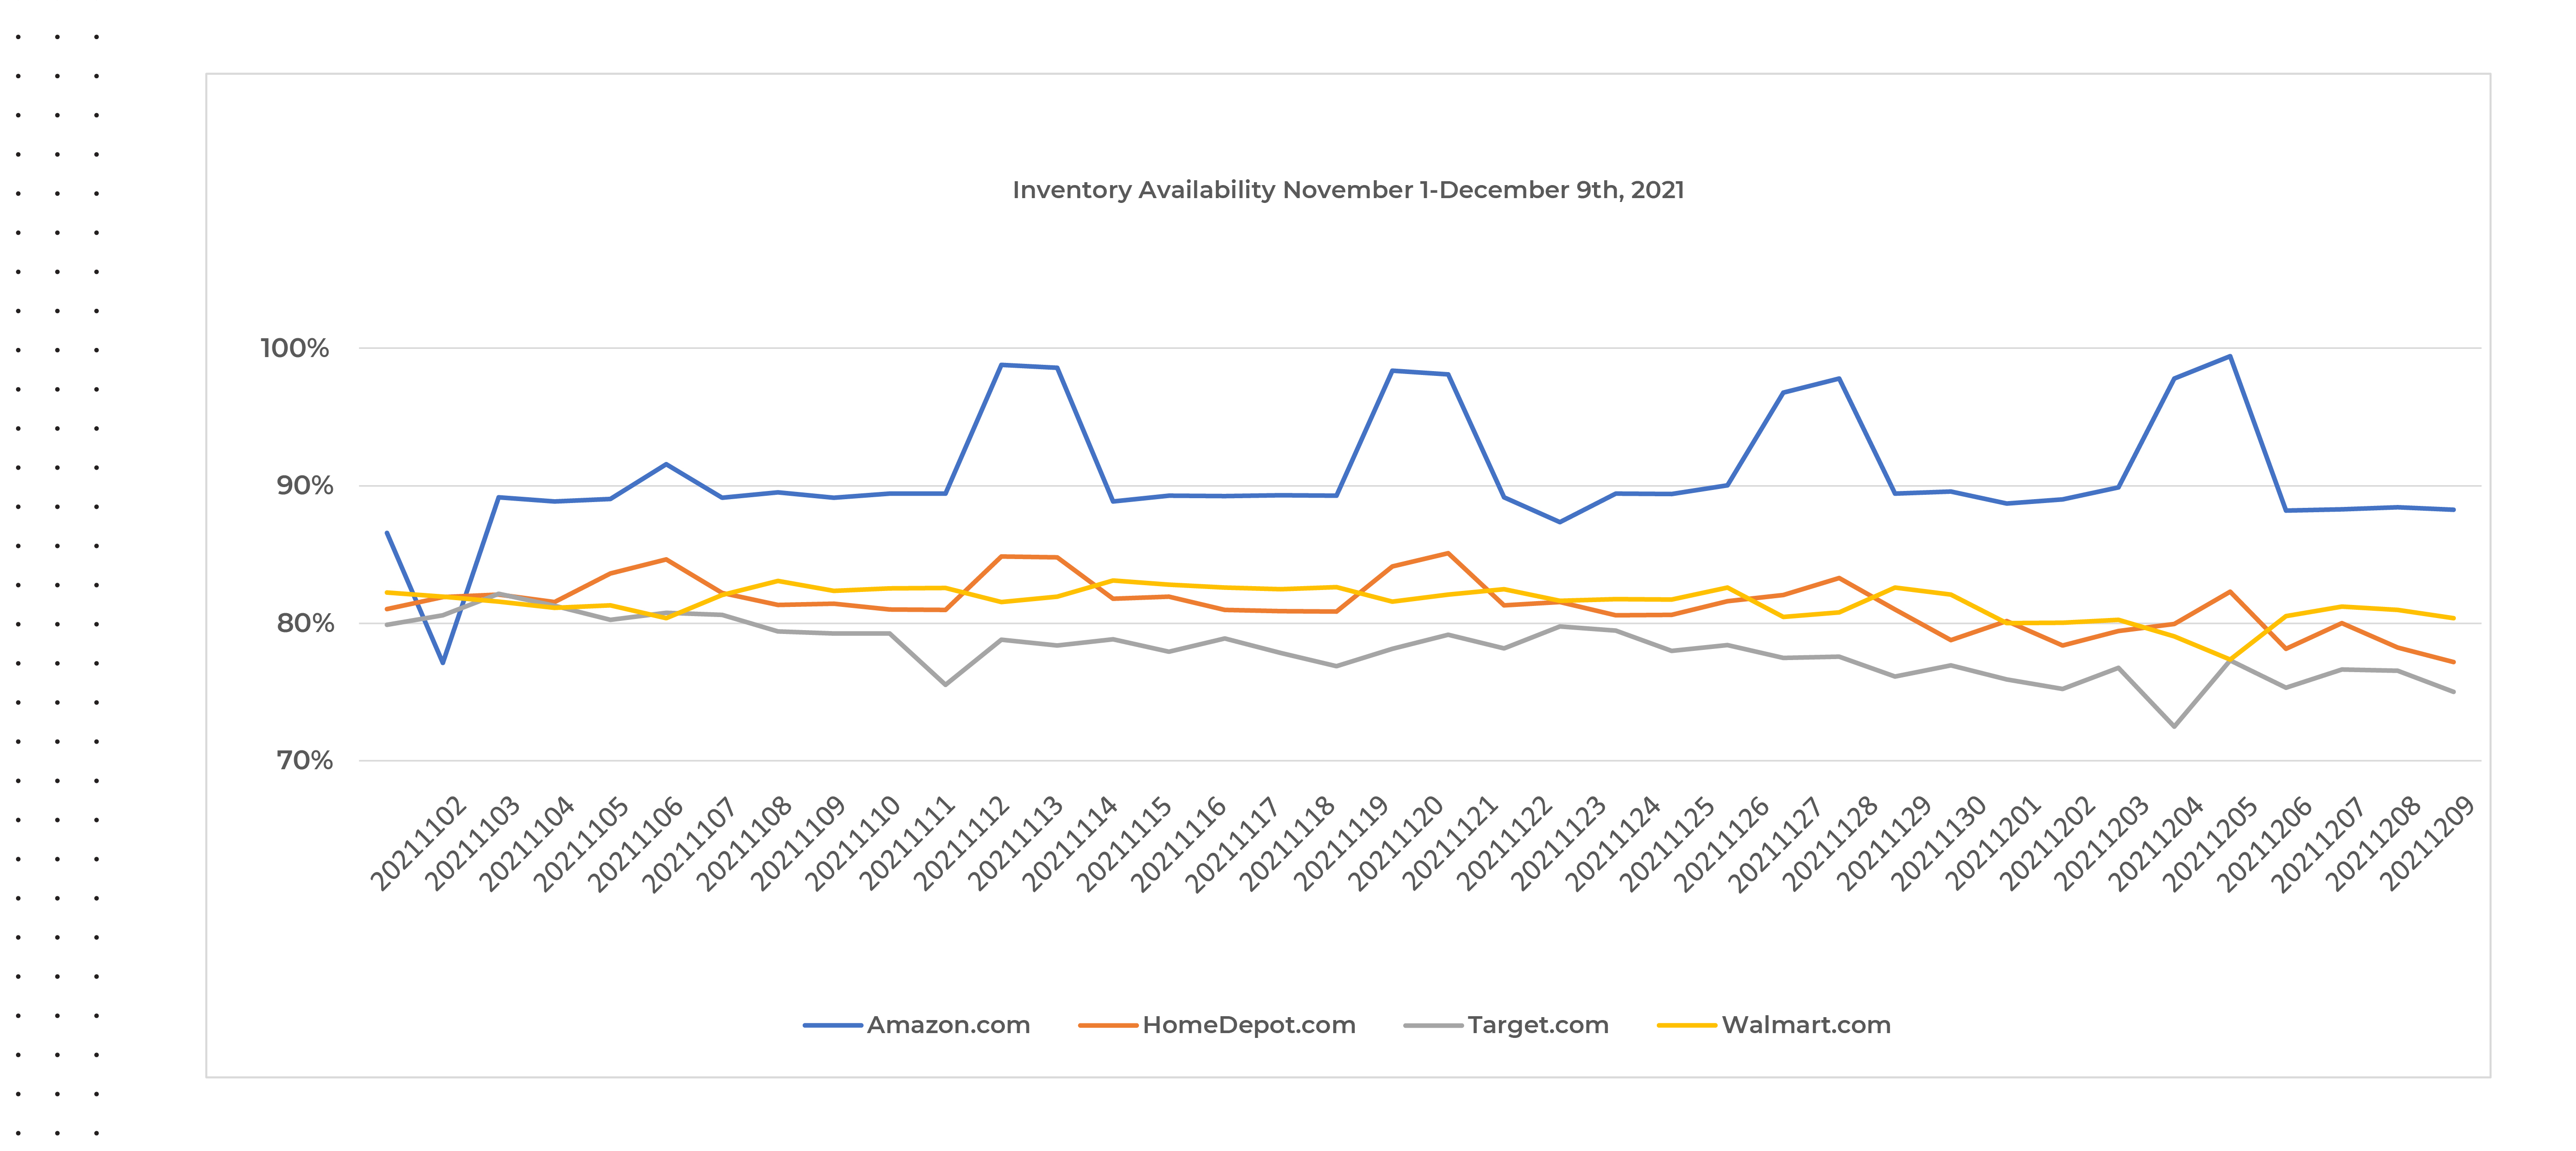
    • Inventory Depth – Maintain online in‑stock rates above 95 percent for high‑velocity SKUs and flag substitute logic when unavoidable out‑of‑stocks occur.
    • Content Quality & Accuracy – Keep titles keyword‑rich, imagery crisp, and attributes complete so search filters never bury you.
    • Ratings & Reviews Cadence – Proactively request fresh reviews to earn retailer search boosts and reassure value‑conscious shoppers.
    • Retail‑Media Precision – Bid where pages are healthy and in‑stock; pause spend on broken listings that leak conversion and ROAS.
    • Fulfillment Excellence – Monitor pick‑pack accuracy, on‑time delivery, and substitution rates; each one influences retailer algorithmic visibility.

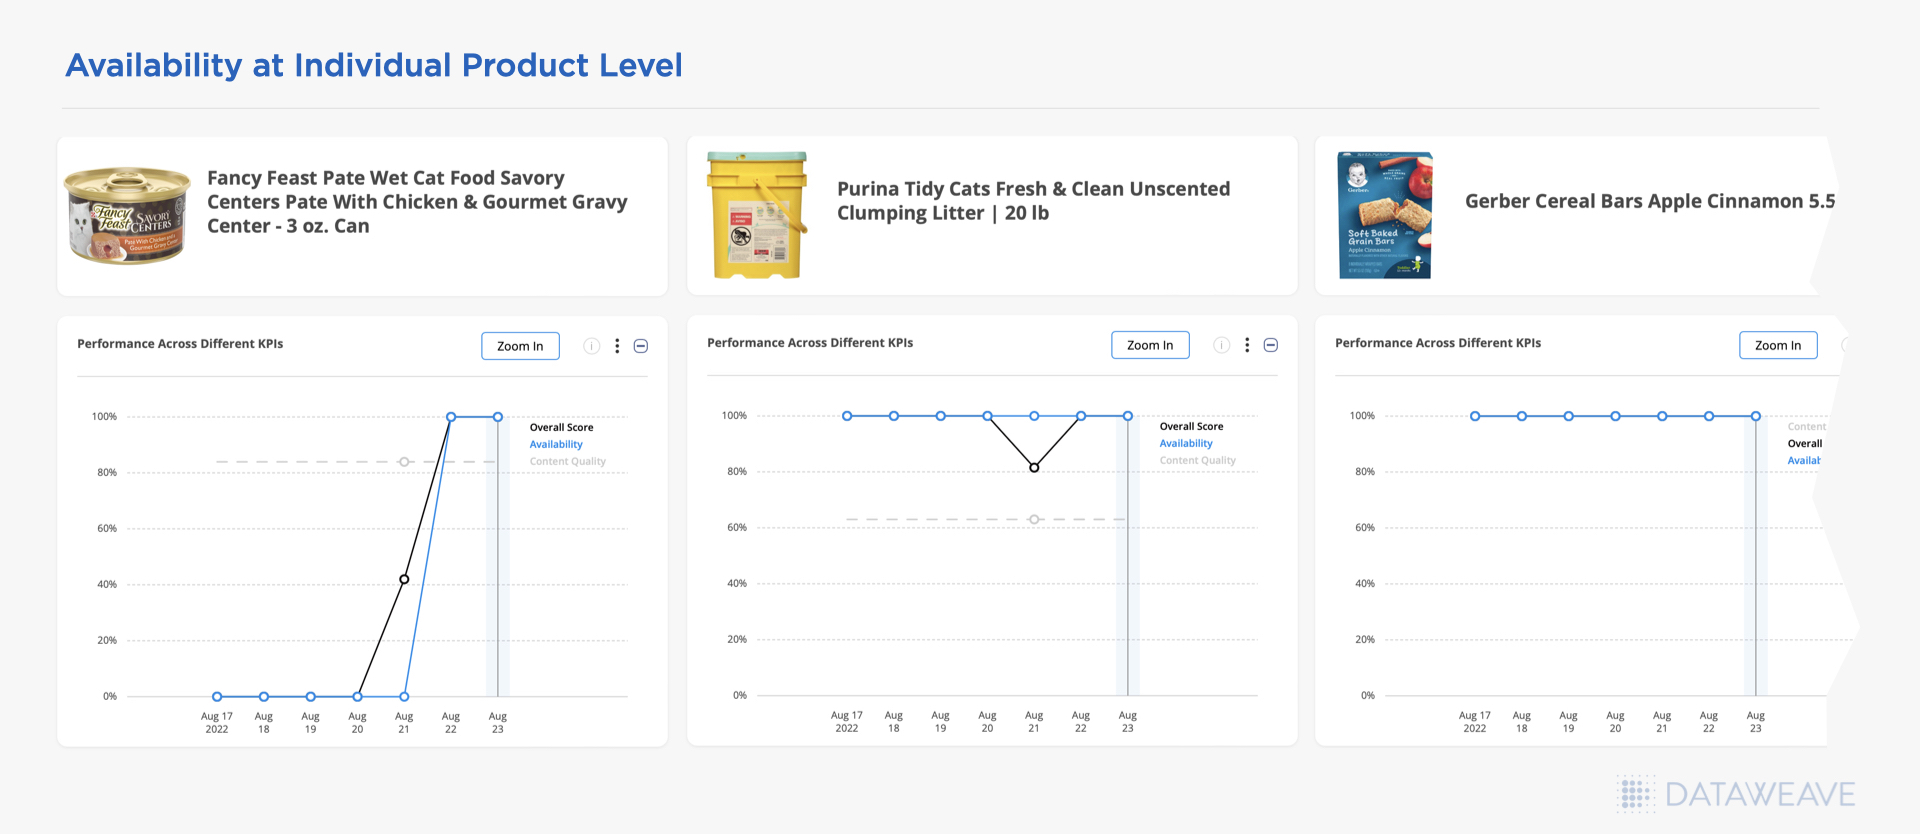
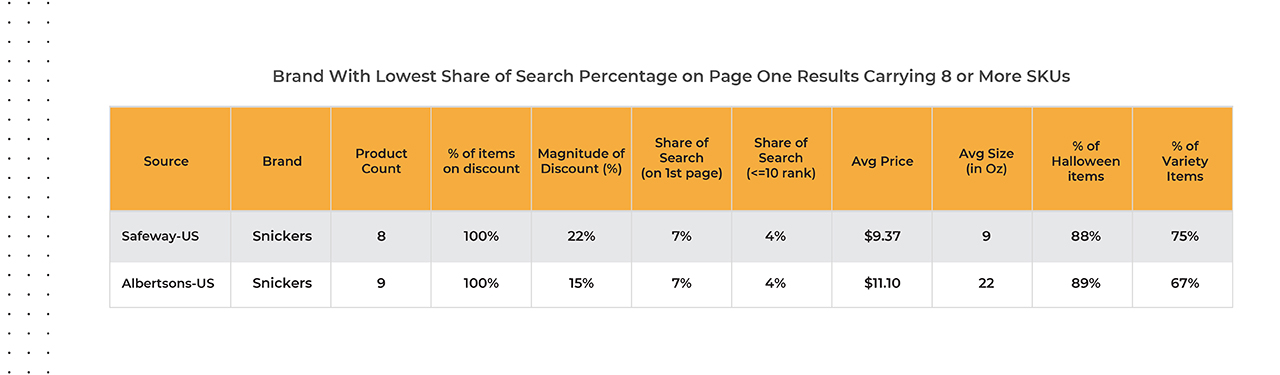
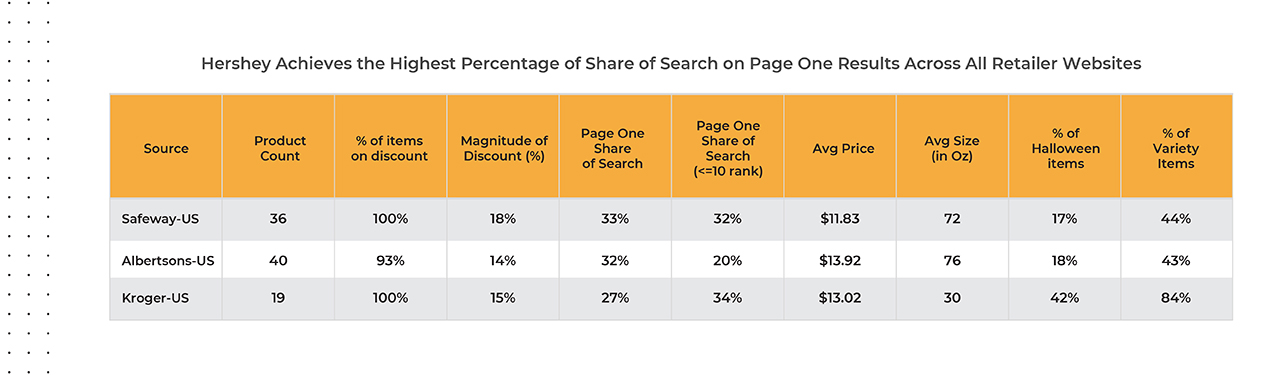
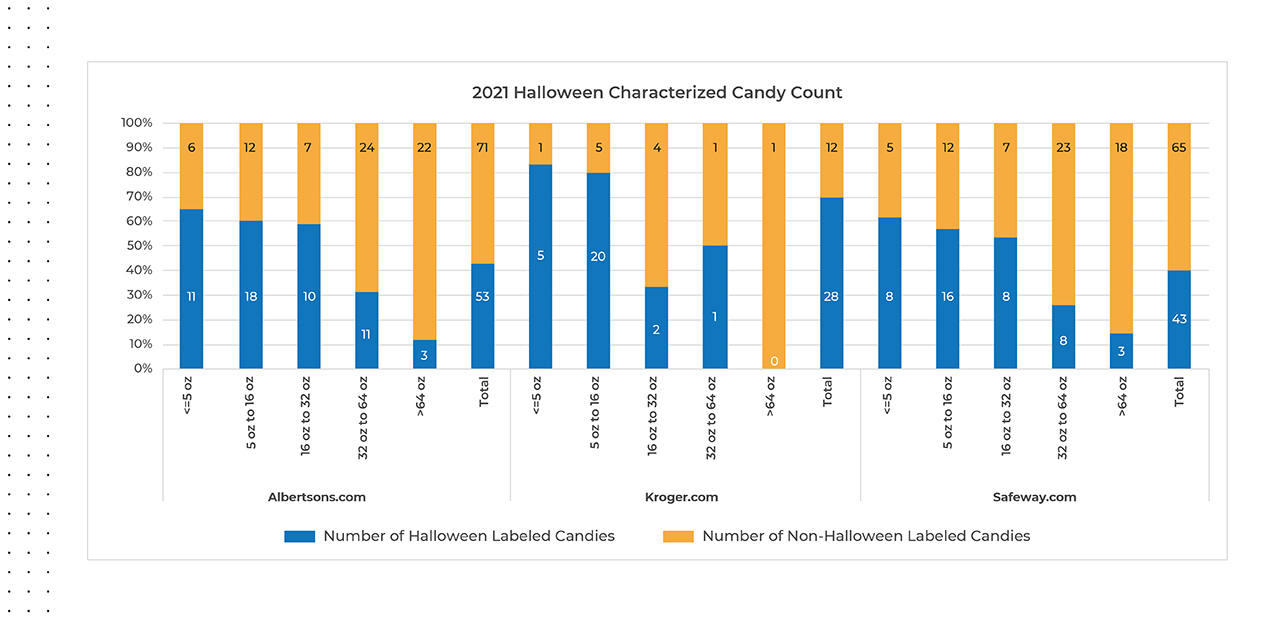
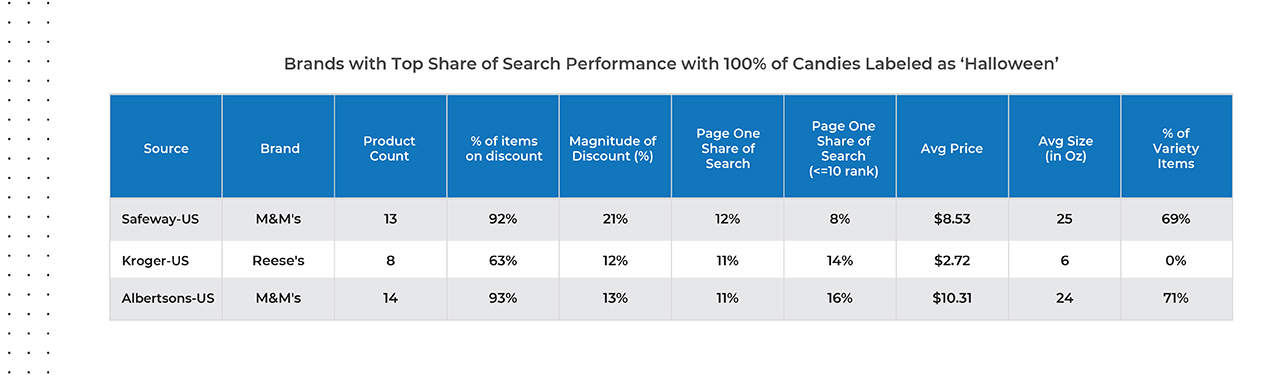
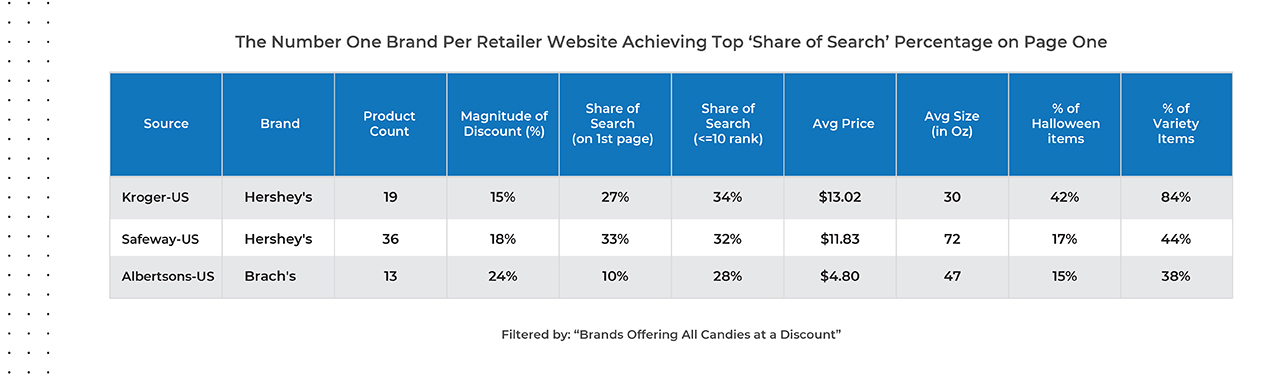
    Content Hygiene Keeps You Visible, Compliant, and Conversion-Ready

    Missing or incorrect product attributes (e.g., “gluten-free,” “caffeine content”) can swiftly jeopardize both regulatory compliance and your product’s fundamental search visibility. Simply put, if it’s not labeled right, it won’t be found.

    This impact plays out in two crucial areas:

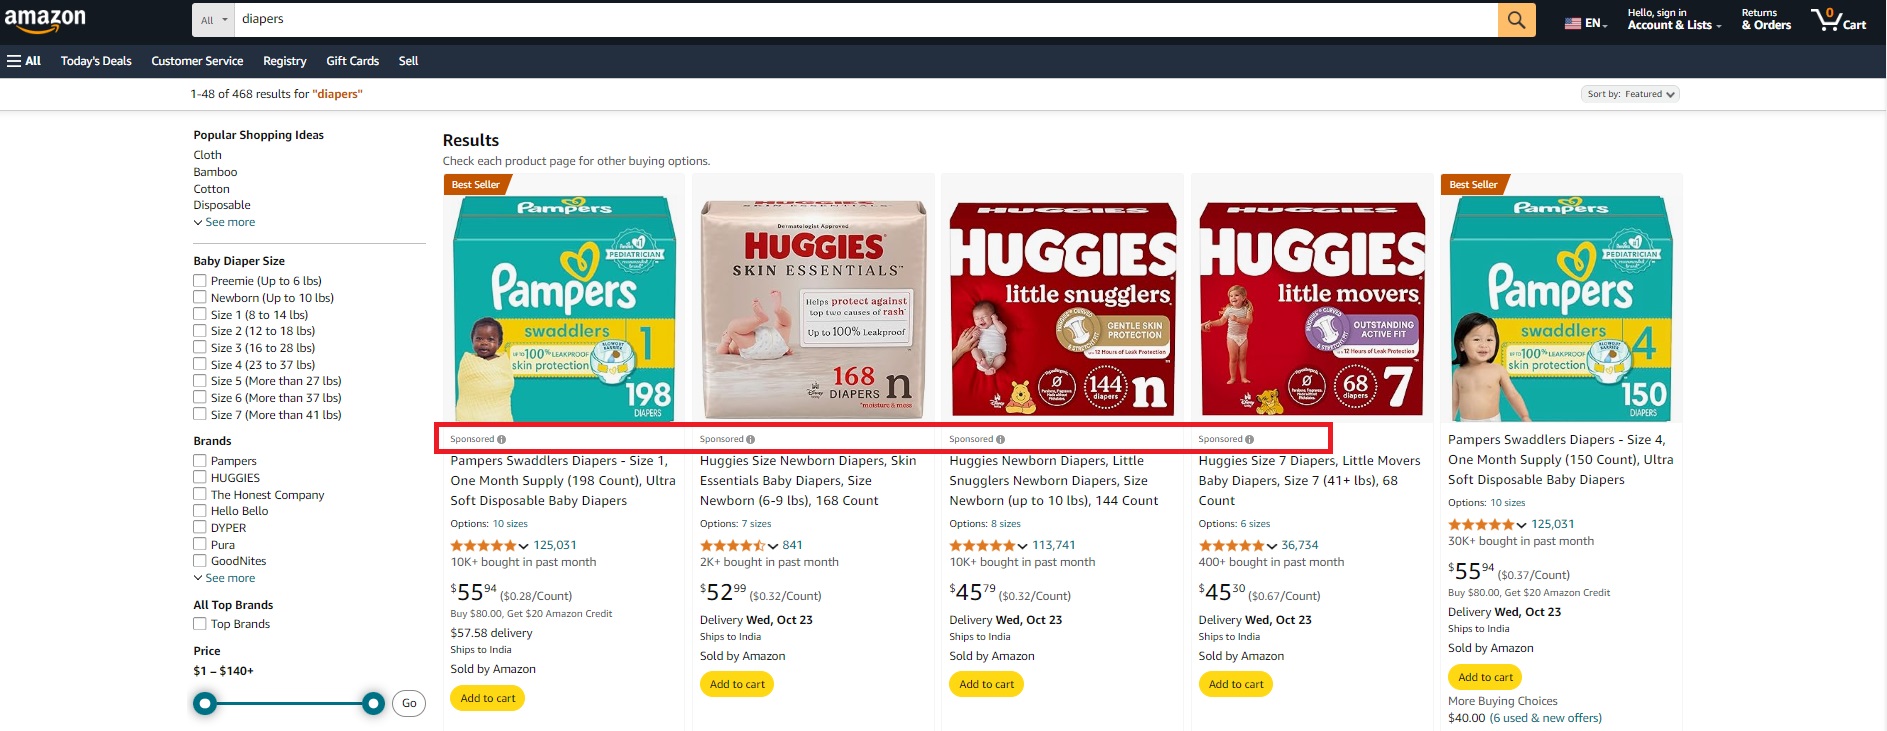
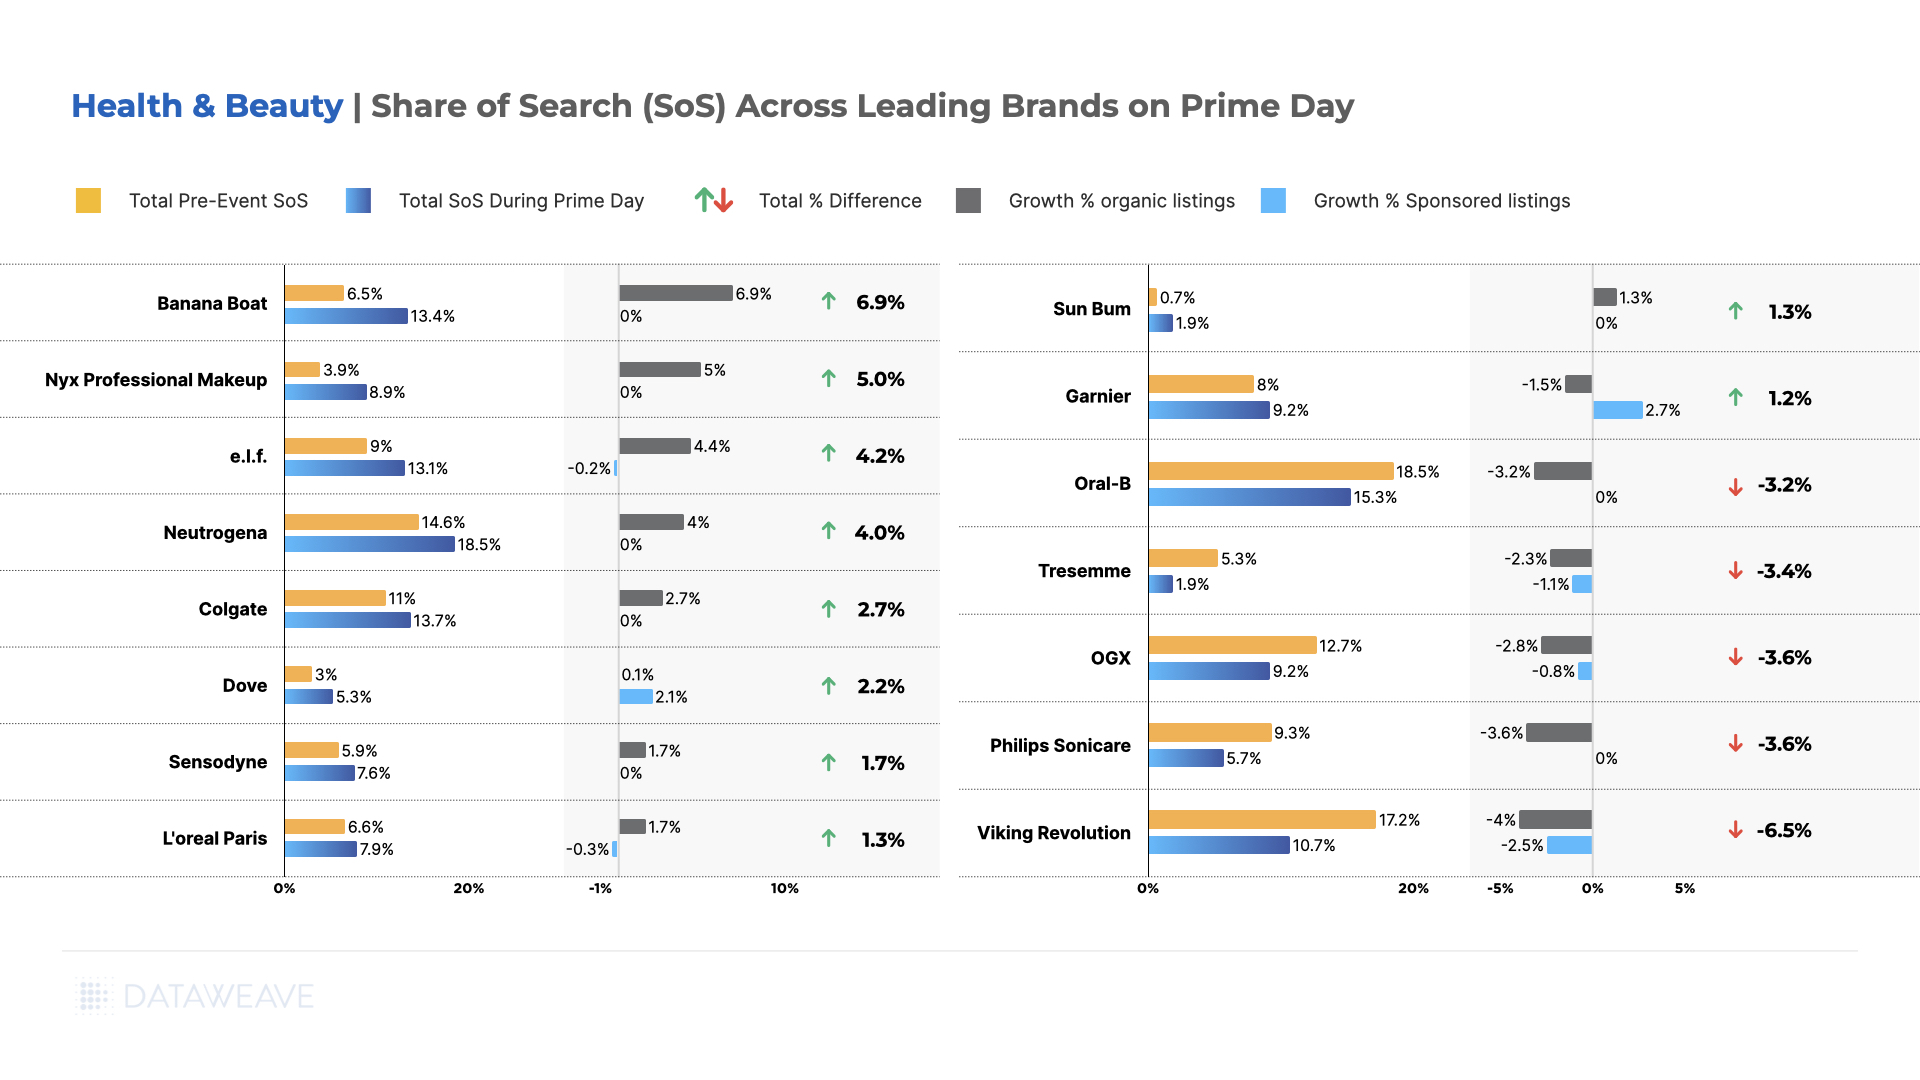
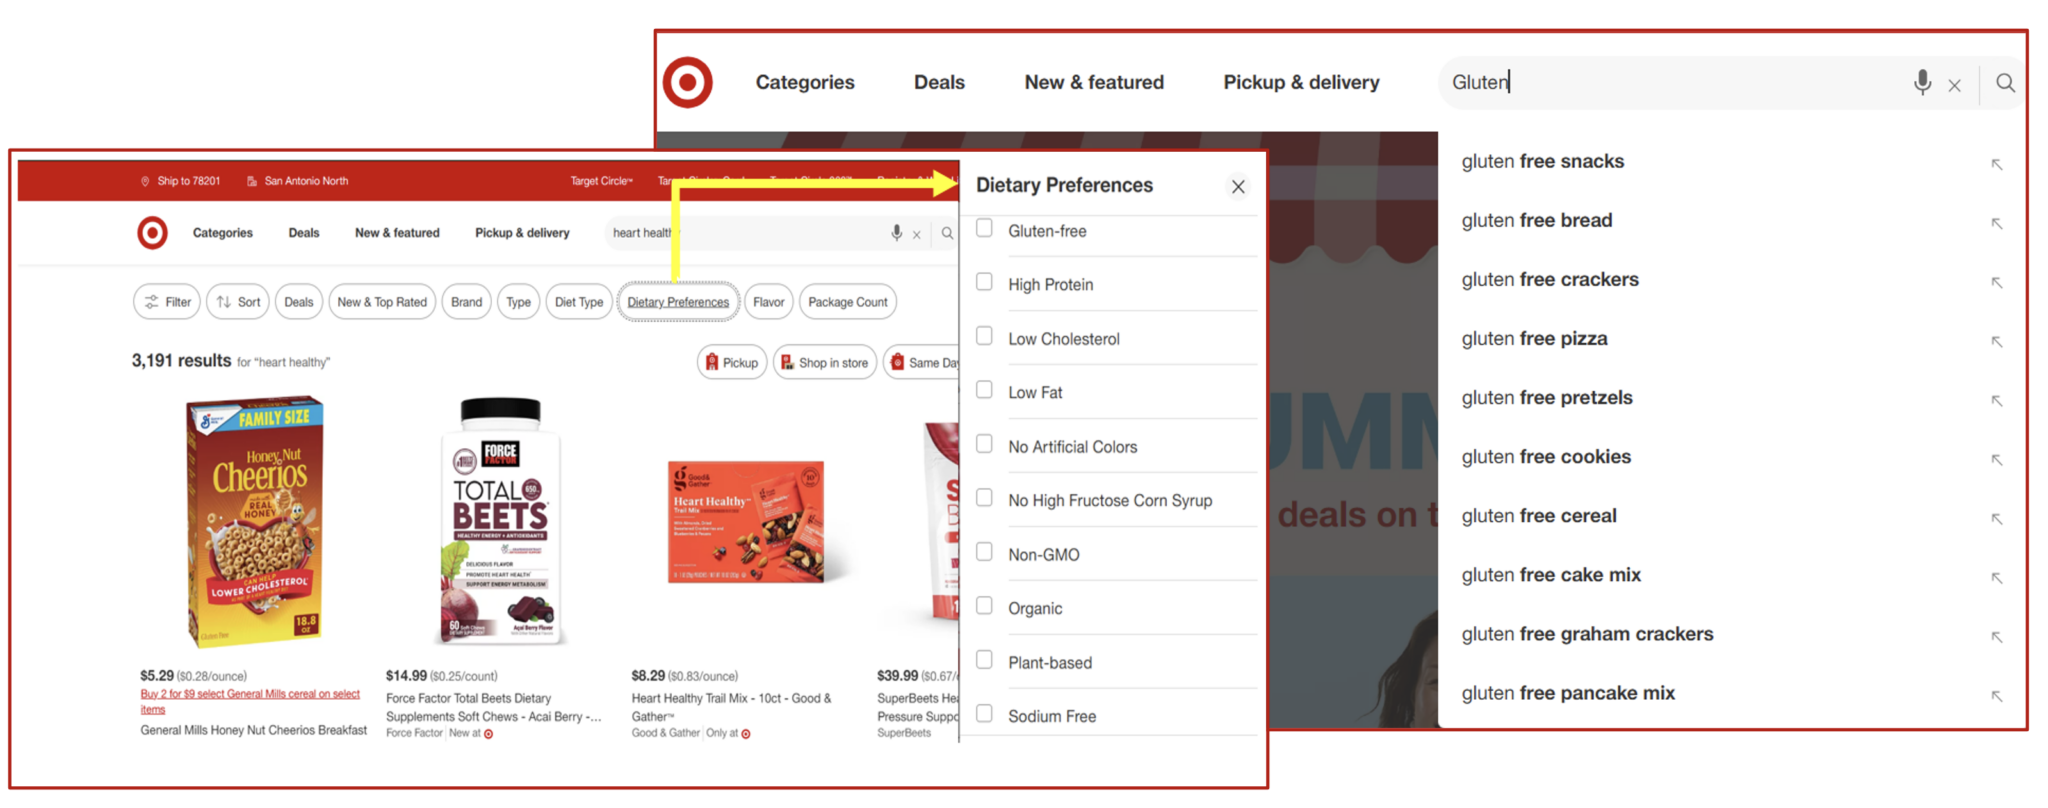
    1. Retailer Search Visibility: Filter logic on major e-commerce platforms like Target.com, Walmart.com, and Instacart is increasingly driven by precise attribute tags (e.g., “gluten-free,” “BPA-free,” “0g added sugar”). Fail to provide or correctly format these claims, and your product will simply never appear when shoppers apply these critical search filters. You become invisible to a motivated audience.
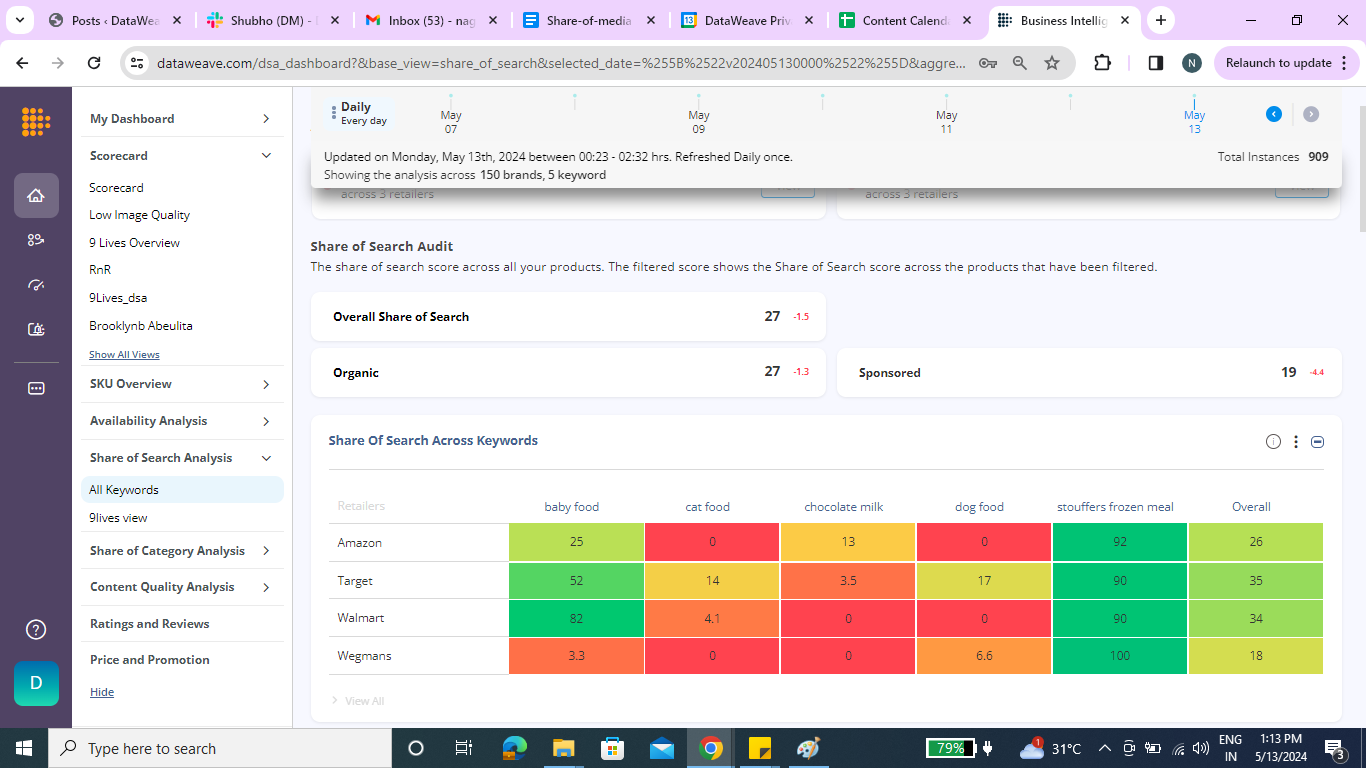
    2. Regulatory Compliance: Global regulatory bodies, including the U.S. FDA and EU authorities, now treat online product detail pages as officially regulated labeling space. This means that a single missing allergen statement or an inaccurate nutritional claim can trigger severe consequences, from product takedowns and hefty fines to a devastating “straight-to-zero” share of search. Non-compliance isn’t just a legal risk; it’s a direct threat to your market presence (see example below).

    The Hygiene Playbook: Audit → Score → Fix → Grow

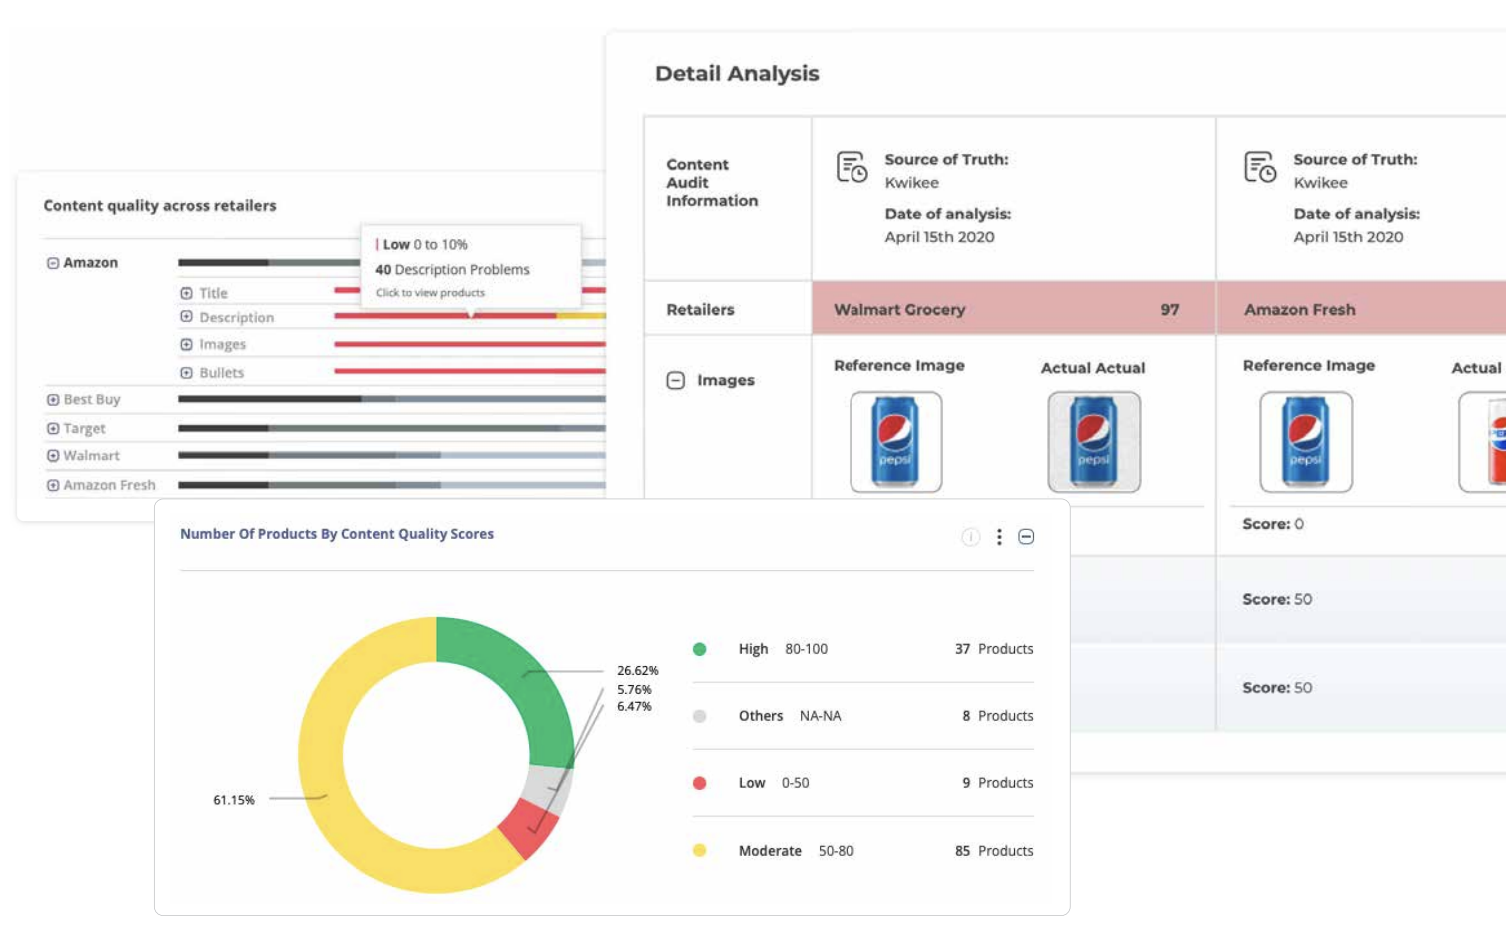
    Your Product Detail Pages (PDPs) are your digital storefronts, and they need to be impeccable. Modern content-intelligence tools are like vigilant auditors, constantly scanning, structuring, and scoring every PDP across your retail network.

    Tools like DataWeave do the heavy lifting by:

    • Surfacing critical gaps: They’ll pinpoint issues like blurry images, inaccurate titles, or missing nutrition information.
    • Optimizing for search: They ensure your product attributes align with live search filters, turning claims into clicks.
    • Flagging compliance risks: You’ll know about potential issues before regulators or retail partners ever do.
    • Quantifying your impact: Get a clear Content Quality Score that your teams can own and improve, week after week.

    When you execute this well, it’s not just about tidying up; it’s a powerful growth engine. This proactive approach fuels every step of the digital customer journey – from getting found, to winning the click, converting the cart, and ultimately, capturing reviews that boost your search rankings.

    A Case Study: Bush’s Beans Converts Visibility into Revenue

    Before Bush’s Beans achieved rapid success with their “audit → scorecard → rapid-fix” approach, they confronted a significant hurdle. Here’s how they overcame it to drive impressive revenue growth.

    The Challenge

    Bush’s Beans saw its e-commerce contribution stall at just 1.5 percent while competition in canned goods intensified. A quick audit revealed three root causes:

    1. Dipping online sales that signalled slipping visibility and conversion.
    2. Fragmented product content across major retailer sites as images, titles, and claims were inconsistent or missing altogether.
    3. Heavier category competition  making it harder to hold first-page search positions.

    The Fix

    The brand adopted DataWeave’s Digital Shelf Analytics to create a single source of truth for every PDP. A lean internal team then:

    • Ran content audits across priority retailers to surface incomplete or non-compliant attributes.
    • Prioritized quick wins focusing on high-velocity SKUs where simple edits (e.g., adding pack-size keywords or allergy statements) would unlock search filters.
    • Tracked progress weekly using an automated scorecard to keep everyone focused on the next set of fixes.

    The Win

    Twelve months later the numbers told the story:

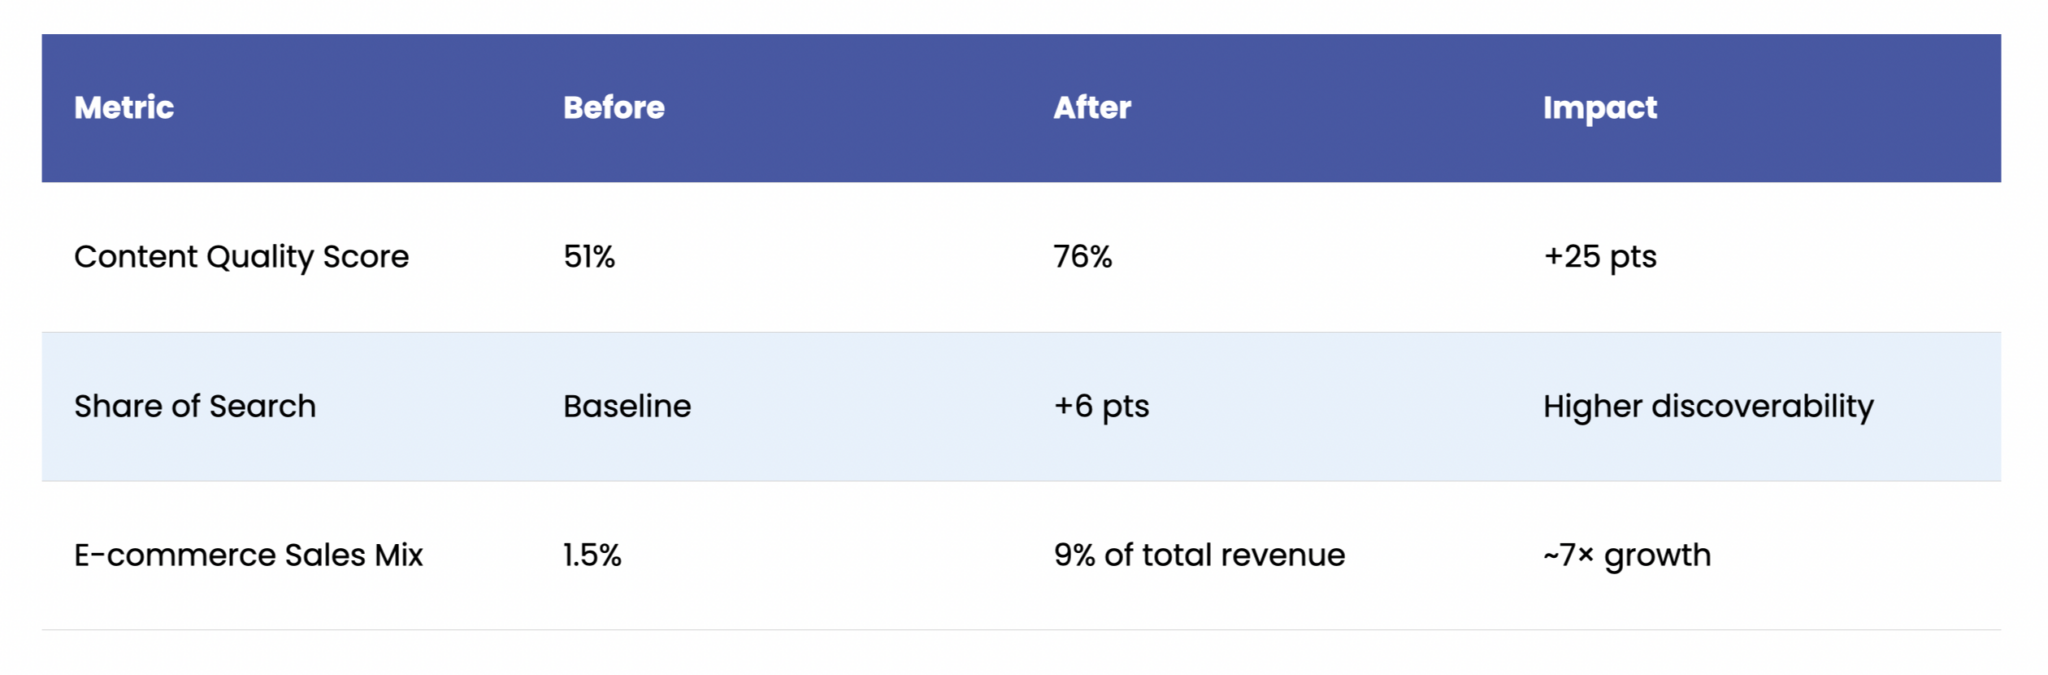
    Bush’s Beans transformed their product data into a strategic asset, significantly improving online visibility, safeguarding brand reputation, and driving sustained revenue growth. Accurate and complete product pages ensured compliance and boosted search rankings, directly increasing sales. While you can’t control external factors like tariffs, you can control the quality and compliance of your product pages and that control directly translates margin pressure into market share gains.

    Unified Insight: Turning Signals into Sustained Advantage

    Imagine one living dashboard where every digital shelf signal like timely price moves, share-of-search shifts, retail media spend, on-shelf availability gaps, compliance flags, MAP breaches, plus content and review health flows together. With that single lens, the “whose numbers are right?” debate disappears and cross-functional teams can act in minutes rather than days.

    A consolidated feed lets you:

    • Build market awareness: Spot competitor price changes as they happen, understand who owns first-page search, and measure the true lift of retail media campaigns.
    • Mitigate emerging risks: Surface impending out-of-stocks before rank erodes, catch claim or label errors ahead of audits, and receive instant alerts when a seller breaks MAP.
    • Activate growth levers: Prioritize content edits that open search filters and use ratings and reviews trends to fine-tune messaging and assortment.

    Brands that weave these signals into one workflow move faster than the disruption. That’s the connective tissue highlighted in our recent post on pairing Digital Shelf Analytics with Marketing-Mix Modelling: when granular shelf data sits beside strategic performance metrics, smarter decisions follow.

    A platform like DataWeave brings the pieces together quietly ingesting millions of price checks, availability reads, and PDP audits each day, then presenting only the next best actions. The payoff is simple: sharper market awareness, lower operational risk, and growth that compounds with every iteration.

    Keep Moving, Keep Winning

    Tariffs, evolving regulations, and agile competitors are no longer storms; they are the climate. Brands that pair a clear, shared insight stream with rapid execution turn volatility into durable advantage. Keep your data united, keep iterating on the five digital-shelf levers, and every new headwind becomes another step ahead.

  • Mastering Retail Media Metrics: A Deep Dive into Share of Media

    Mastering Retail Media Metrics: A Deep Dive into Share of Media

    Brands are investing millions of dollars in digital retail media to make their products stand out amid unrelenting competition.

    The ad spend on digital retail media worldwide was estimated at USD 114.4 billion in 2022, and the current projections indicate that it will grow to USD 176 billion by 2028. This amounts to a 54% increase in just six years.

    The current surge in digital retail media advertising has led brands to find an effective way to monitor the efficacy of their ad spend. While Share of Search has long been used to measure brand visibility effectively, the metrics often missed tracking ads on retail sites.

    DataWeave’s Share of Media solution helps solve this problem.

    What is the Share of Media?

    At DataWeave, Share of Media is a metric used to measure a brand’s presence in sponsored listings and banner ads on eCommerce platforms. It captures how often a brand appears in paid promotions compared to competitors, offering insights into advertising visibility and effectiveness.

    These days most marketplaces seamlessly blend banner ads and sponsored listings into organic search results. Let’s take a closer look.

    Banner Advertising

    Banner advertising strategically places creative banners across websites—often at the top, bottom, or sides. Some eCommerce platforms also integrate these banners into product search listings.

    Banner Advertising on Amazon_Share of Media Analytics to win the digital shelf

    What makes banner ads so special is the unique ability to allow marketers to use various types of media in a single ad, such as images, auto-play videos, and animations. Brands can also present curated collections of products. This flexibility provides marketers with creative opportunities to differentiate from competitors, capture customer interest, and encourage conversions.

    Sponsored Listings

    Sponsored listings are paid placements within search engine results or eCommerce platforms. They are usually marked as ‘sponsored’ or ‘ad,’ and they often appear at the top of search results and alongside organic product listing results.

    Sponsored Product Listings on Amazon_Share of Media Analytics to win the digital shelf

    Unlike organic search results, sponsored listings are prioritized based on the advertiser’s bid amount and relevance to users’ search queries.

    Sponsored listings offer a strategic advantage by enabling businesses to connect directly with consumers who are actively searching for their products. This targeted approach ensures that marketing efforts are focused on individuals with high intent of making a purchase, maximizing the potential return on investment.

    The Power of Banner Ads and Sponsored Listings

    Banner ads and sponsored listings are great choices for boosting customer engagement and product sales. Here are four key advantages they offer:

    • Enhanced Visibility: Digital retail media strategically places your brand where it will stand out—outshining competitors and grabbing the attention of high-purchase-intent consumers.
    • Precision in Reach: These ads target specific keywords or categories, allowing for highly focused advertising based on demographics and search intent.
    • Minimal Conversion Friction: Smooth transitions from ads to a brand’s native store or product listing on the marketplace keep conversion friction to a minimum.
    • Brand Awareness and Recall: Consistent exposure to your brand through banner ads and sponsored product listings can leave lasting impressions and build brand recognition.

    The bottom line is that it’s increasingly important for brands to monitor their Share of Media.

    How to Monitor Your Brand’s Share of Media

    DataWeave’s Digital Shelf Analytics (DSA) platform extends beyond the traditional Share of Search metrics and provides robust support for monitoring the Share of Media.

    DataWeave monitors the Share of Media in two ways: keywords and product categories. Users can view Share of Media insights through aggregated views, trend charts, and detailed tables. The views are designed to show brand visibility and the overall competitive landscape. For example, the screenshot below, taken from DataWeave’s dashboard, showcases the Share of Media across keywords, categories, and retailers.

    Share of Media by Keyword

    The Share of Media metric captures a brand’s advertising presence within search listings for a designated keyword. This provides a comprehensive view of a brand’s visibility and promotional efforts across retail platforms, helping brands validate and gauge the effectiveness of their ad spend.

    For example, the screenshot below shows the trend of manufacturer’s Share of Media by keyword—‘baby food.’

    Share of media by keyword_Share of Media Analytics to win the digital shelf

    Share of Media by Category

    The Share of Media metric measures the presence of brands’ banner ads and sponsored listings across product categories on retail sites. This helps brands see which product categories require more investment, making it easier for them to spend their ad budget wisely.

    The screenshot below illustrates manufacturers’ Share of Media by category across retailers.

    Share of Media: An Essential Ecommerce Metric

    As retail media continues to evolve, our analytics must follow—after all, knowledge is a competitive advantage. In the dynamic world of eCommerce, where competition is fierce and consumer attention is scarce, understanding your share of media is crucial.

    Analyzing the Share of Media can give brands a competitive edge. By regularly monitoring and analyzing this metric, you can make data-driven decisions to improve your brand’s visibility, attract more customers, and ultimately drive sales growth. With a deeper understanding of their target audience and market dynamics, brands can refine promotional efforts to drive more effective results and optimize return on ad spend (ROAS).

    For more information on how Digital Shelf Analytics can enhance your brand’s digital shelf presence, request a demo or contact us at contact@dataweave.com.

  • A Guide to Digital Shelf Metrics for Consumer Brands

    A Guide to Digital Shelf Metrics for Consumer Brands

    Our world is increasingly going online. We work online, socialize online, and shop online every day. As a consumer brand, you need to ensure complete awareness of your brand’s online presence across eCommerce platforms, search engines, and media.

    Only by deeply understanding the customer journey can you ensure that your product is reaching your ideal customers and maximizing your brand’s market share. You need data to intrinsically understand your customer journey and make changes where you’re lacking.

    As the old adage goes: ‘You can’t manage what you don’t measure.’

    You need digital shelf metrics to measure and start benchmarking your buyer’s journey. To find several of these types of key performance indicators (KPIs), you need a digital shelf analytics solution. These platforms allow you to track various metrics along the path to purchase from the awareness stage to the post-purchase phase across the entire internet, helping to inform online and offline sales strategies.

    Digital shelf analytics will help you gain insights into how your brand is doing versus the competition, which areas are lagging behind in historical performance, and what activities are driving sales. There are innumerable ways in which you can leverage these valuable insights. But how do you know which KPIs to start tracking with your digital shelf analytics solution?

    Here, we’ve summarized the top metric types your peers report, track and base their decisions on.

    With these KPIs in hand, consumer brands like yours can ensure that their products are consistently visible and appealing to their target audience across online marketplaces, ultimately enhancing conversion rates, market share, and profitability.

    Read this guide to learn more about the top digital shelf metrics consumer brands are tracking and how to use them in your own strategy.

    1. Share of Search

    Share of Search (SoS) is a KPI in digital shelf analytics that measures how frequently a consumer brand’s products appear in search results on eCommerce platforms relative to the competition for specific keywords. A good digital shelf analytics solution will be able to show this metric across all the top marketplaces and retailers, such as Amazon and Walmart, but also more niche marketplaces for industry-specific selling.

    This metric provides brands with a quantifiable way to measure how frequently their products are being “served up” to customers on online marketplaces. Essentially, it measures visibility and discoverability.

    Share of Search exmple_Digital Shelf Metrics

    With Share of Search on DataWeave, you can slice and dice your data in innumerable ways. These are a few important views you can see:

    • Aggregated SoS
    • Organic and Sponsored SoS scores
    • SoS scores across brands, retailers, keywords, cities
    • Historical SoS score trends

    Once you have benchmarked your SoS and category presence relative to your competition, you need to start interpreting the data. Here are some questions you can ask yourself to help interpret your findings:

    Share of Search exmple_Digital Shelf Metrics
    • Which of my key categories have the lowest SoS score?
    • Which products feature low on search results because they are out of stock?
    • Are my competitors’ products faring better due to sponsored searches?
    • Is my SoS low due to poor content quality?

    With insights in hand, you will know which actions to take to drive the biggest impact. For example, you could increase sponsored search results or improve organic reach by optimizing product pages.

    Understanding your SoS is essential to maximizing the awareness phase of your customer journey. It will help you improve your brand visibility and increase product conversions through better search and category presence.

    2. Share of Media

    Share of Media (SoM) is a KPI that is just as impactful, if not more so, than the SoS metric. However, only a limited number of brands track it or use it to drive strategic action. This makes it a perfect opportunity for brands looking to get an edge on the competition.

    But what is SoM in digital shelf analytics? Essentially, it’s a way of measuring retail media advertising activities like brand-sponsored banners, listings, videos, ads, and promotions that sometimes blend into search results. The main types of retail media advertising exist in two categories: banner advertising and sponsored listings.

    Banner advertising involves strategically placing designed banners within websites and search listings. These banners raise brand awareness and drive traffic to online storefronts.

    Sponsored listings are paid placements within search results on search engines or eCommerce platforms. They are prioritized based on the total bid amount and the product’s relevance. These paid listings are marked with “sponsored” or “ad.”

    Sponsored listings on an Amazon webpage

    It’s important to run these types of advertising campaigns on eCommerce platforms to gain customer visibility. In fact, “some 57% of US consumers started their online shopping searches on Amazon as of Q2 2023.” If you aren’t showing up, paying for placement can help.

    These listings serve to enhance your brand’s overall visibility, help you gain more precise reach, increase conversions, and drive better brand awareness and recall with your customers.

    These efforts aren’t free, however, so measuring their effectiveness is critical not only to gain all the listed benefits but to also not waste your valuable marketing budget. The SoM KPI can help a consumer brand answer questions like:

    • Where are the opportunities to increase paid ads?
    • Which categories could benefit from a promotional boost or a strategic and streamlined allocation of ad spend?
    • Which of my competitors have active banners and what is their share of media by keyword?
    • How has my ad spend trended historically in comparison to my competitor?
    Analytics Dashboard on Dataweave

    DataWeave’s digital shelf analytics (DSA) is among the first providers to offer Share of Media KPI tracking and analysis. This is because it requires advanced, multi-modal AI to gather, view, and aggregate listings that encompass text, images, and video. With Share of Media tracking facilitated by DataWeave, consumer brands can track and analyze the effectiveness of their own promotional investments as well as those of their competitors.

    3. Content Quality

    The content quality metric measures how well your product content adheres to the retailer’s specific guidelines, which are in place to steer traffic and sales on their sites.

    With the help of a DSA platform’s AI and ML capabilities, you can measure different elements of your product detail pages (PDPs), such as titles, descriptions, images, videos, and even customer reviews. You need to know which elements are missing, where they are missing, and which ones are negatively affecting sales so you can take corrective action.

    Did you know that the average cart abandonment rate is 69.99%? The quality of your content can significantly impact this number. Ensuring that your content is high-quality will help influence product discoverability, customer engagement, and conversion rates. It will also help position you ahead of the competition. If your content quality is poor, you may find yourself with lower search rankings, a higher return rate, and more abandoned carts.

    Here are some questions you can answer with the help of the content quality digital shelf metric:

    • Is my product content at a retail site exactly what was syndicated?
    • Are there any retailer initiated changes to my product content?
    • Are my product content updates reflected on the retailer platforms?
    • How well does my product content comply with the retailer guidelines?
    • How do I optimize my product content for enhanced discoverability and conversion?

    DataWeave’s content quality digital shelf analysis helps consumer brands ensure that product content on eCommerce platforms is high-quality and benchmark their product listings against the competition. It does this through a combination of AI-driven quality analysis and by presenting brands with actionable recommendations. These optimized suggestions are based on the top-performing products so you can focus your valuable time on the areas that will drive the biggest impact.

    4. Pricing & Promotions

    Your customers can easily shop around to find the best price for the product you’re selling. If your competitor is selling it cheaper, you’ll lose that sale.

    That’s why it’s essential to understand the pricing and promotional landscape for each of your products and categories. This can be a challenge, especially if it’s a common product or comes in multiple pack sizes or variants.

    It’s equally important to track pricing and promotions even at individual, physical stores. Doing so will allow you to remain competitive and responsive to local market dynamics by tailoring your pricing strategies based on regional competition. You don’t want your products to be overpriced (lost sales) or underpriced (lost profit) in specific markets.

    Harmonizing insights when operating an omnichannel consumer brand is extremely difficult without the aid of a digital shelf analytics solution. Insights need to be aggregated between desktop sites, mobile sites, and mobile applications, as well as from physical storefronts.

    Questions you can answer with the help of the pricing & promotions digital shelf metric include:

    • How do my product prices and promotions compare to my competitors?
    • How consistent is my product pricing across retail websites?
    • How does my product pricing vary across regions, ZIPs, and stores?
    • How do price changes influence my sales numbers?
    • Are there regional differences in pricing and promotion effectiveness?

    DataWeave’s digital shelf analytics platform stands out with its sophisticated location-aware capabilities, which enable the aggregation and analysis of localized pricing and promotions. The platform defines locations based on a range of identifiers, such as latitudes and longitudes, regions, states, ZIP codes, or specific store numbers.

    The platform can also extract promotional information, such as credit card-based or volume-based promotions. You can see variances across retailers, split by price groups, brands, and competitors. DataWeave specializes in enabling brands to conduct in-depth analyses across a wide array of attributes so you can answer just about any pricing or promotional question you have.

    Digital shelf pricing insights via Dataweave

    5. Availability

    The availability KPI in digital shelf analytics measures the in-stock and availability rates for a brand’s products across eCommerce and physical locations. Similar to the pricing and promotions metric, it relies heavily on location awareness, down to individual stores. Measuring both online availability and offline in-stock rates will help you understand the big picture and take more informed replenishment action.

    When you start leveraging the availability KPI with the help of digital shelf analytics, you can improve inventory management, boost product discoverability, increase the frequency with which your online product listings convert, and generally drive more sales. This KPI is essential for ensuring your customers can always find and buy the products they want.

    With the availability KPI, you can start answering questions like:

    • What is my overall in-stock rate?
    • Which of my products frequently go out of stock?
    • How does product availability vary across different regions and stores?
    • What is the impact of availability on my conversion rates?
    • Are there any seasonal trends in product availability that I need to address?
    • How quickly are we resolving stockout issues across different locations?
    • What are my biggest opportunities to reduce stockouts?

    DataWeave enables consumer brands to track their product availability metric through automated data collection from various eCommerce platforms in conjunction with physical in-stock rates. The platform provides granular, store-level insights so you can understand regional stock variations and optimize inventory distribution. By tracking historical availability data, you can identify seasonal patterns and predict future demand to pre-empt stockout issues. All of this can be configured with automatic notifications to alert you when there has been a stockout event or when a low stock threshold has been passed, facilitating timely replenishment.

    Graph showing availability across locations

    6. Ratings & Reviews

    The final KPI in our guide is the ratings & reviews digital shelf metric. Consumers rely heavily on genuine feedback from their peers and refer to star ratings, posted comments, and uploaded pictures to inform their buying decisions. This KPI analyzes the impact of customer feedback and reviews on your products’ performance across eCommerce platforms so you can measure overall brand perception and isolate areas of opportunity.

    This metric does something other digital shelf metrics don’t; it can inform your product strategy. It can help you identify repeat complaints that your product team can address with the manufacturer or use for the design of future products.

    Some questions you can answer with this powerful KPI include:

    • What is the overall customer sentiment towards my products based on ratings and reviews?
    • Which product features are frequently mentioned positively or negatively by customers?
    • How do my product ratings and reviews compare to those of my competitors?
    • Are there common issues or complaints that need to be addressed to improve customer satisfaction?
    • Which products have the highest and lowest ratings, and why?

    With DataWeave’s digital ratings and reviews feature, you can keep a pulse on customer sentiment to take short-term action as well as decide long-term strategy. You can leverage reviews to influence product perception, refine products, and enhance overall customer satisfaction.

    DataWeave’s Digital Shelf Metrics

    Each one of these metrics is interconnected and collectively influences a brand’s success. For instance, improving content quality and earning higher ratings can significantly enhance your product’s visibility in search results, thereby boosting the Share of Search digital shelf metric. By focusing on a comprehensive approach that integrates these metrics, brands can ensure their products are consistently visible, competitively priced, well-reviewed, and readily available.

    DataWeave gives consumer brands the means to execute a holistic digital shelf strategy. From a single portal, track and improve digital shelf metrics like Share of Search, Share of Media, Pricing and promotions, Availability, and Ratings and Reviews.

    Our solutions help audit and optimize the most critical KPIs that drive sales and market share for brands so you can stay competitive in a dynamic digital landscape and foster long-term customer satisfaction.

    Ready to get started? Schedule a call with a specialist to see how it can work for your brand.

  • How Digital Shelf Analytics Can Fix Common Revenue Growth Management Challenges for Consumer Brands

    How Digital Shelf Analytics Can Fix Common Revenue Growth Management Challenges for Consumer Brands

    As consumer goods brands increasingly turn to eCommerce marketplaces as a source of profitable growth, it becomes harder for teams to grapple with the complexity of revenue growth management.

    This complexity emerges from multiple fonts: there are hundreds, and even thousands, of competitors to consider when formulating strategies for managing pricing, promotion, and assortment changes. The world is currently experiencing a period of unprecedented supply chain instability, shifting more consumers away from traditional retail and into eCommerce shopping. And finally, consumer buying patterns, preferences, and trends are constantly shifting.

    Revenue growth management (RGM) and net revenue management (NRM) were once less complex processes; but that is no longer the case. Now, some 80% of consumer brand CEOs report that they “aren’t satisfied with their RGM results.”

    Gathering data, analyzing it, and acting on it quickly stand out as major challenges that businesses must overcome to grow their market share, earn more profits, and capitalize on market shifts in real time. In this article, we’ll dive into RGM and NRM, the obstacles business teams face, and explore how using technology for digital shelf analytics can help bridge the gap.

    What is Net Revenue Management (NRM) or Revenue Growth Management (RGM)?

    Every consumer goods company aims to increase profits and grow market share. This requires a concerted effort in RGM and net revenue management (NRM) strategy. Whether a company has a specific team dedicated to this task or relies on the abilities of business analysts or merchandisers, this function is crucial.

    It’s worth mentioning that though the terms NRM and RGM are often used interchangeably, there are subtle differences. While both net revenue management and revenue growth management focus on maximizing overall revenue for the brand, NRM typically has a narrower focus and is specific to optimizing profitability through product pricing, promotion, product mix, and cost management. RGM strategies are a bit broader and tend to look at the top line to grow market share and expand the customer base.

    The Challenges Revenue Teams Face

    Differentiating between ‘good growth’ and ‘bad growth’ is central to NRM and RGM. Net revenue management and revenue growth management teams need the data and tools in place to determine if growth in one area is coming at the expense of another so as not to cannibalize business. Tracking and analyzing extensive data to successfully take action on opportunities and determine whether strategies are working as intended consumes a tremendous amount of mental bandwidth. The fact that these decisions are incredibly time-sensitive only compounds the issue.

    To cope, many teams in charge of NRM or RGM employ digital shelf analytics strategies to help speed up data aggregation and analysis to make sure they’re capitalizing on potential opportunities.

    eCommerce has added a whole new layer of complexity to consumer goods sales. Instead of a few relatively stable prices at big-box stores, a single item for sale may experience high price volatility, with dozens of minute pricing changes occurring online each day. In some cases, consumers become blind to price volatility, letting brands increase prices, but consumer sentiment, the overall price elasticity of the product, and dozens of other factors go into determining the final price of an online product. Net revenue teams need to modernize and adapt to changing eCommerce environments to competitively price, promote, and grow their revenue.

    Here are the top three challenges standing in the way of net revenue management and revenue growth management teams and solutions to address these issues.

    Challenge 1: Incomplete or Inaccurate Data

    Incomplete and inaccurate data are critical for Net Revenue Management and Revenue Growth Management teams to get under control when attempting to modernize in a digital-centric selling environment. As more competitors enter the market, many brands find it hard to make strategic decisions without the complete picture.

    Data may be incomplete or inaccurate because a brand is analyzing only part of the market, such as Amazon or another enterprise-scale eCommerce marketplace. Additionally, they might not be analyzing all types of online media, such as branded ads, sponsored search listings, or sponsored category listings.

    Most importantly, another pitfall is the lack of hyperlocal data. Generalized data across regions, states, ZIPs, and stores can skew the decision-making process and result in poor outcomes.

    Overcoming Incomplete or Inaccurate Data

    In order to get the full picture, consumer brands need to ensure they have a view of the entire competitive landscape across their channels. This includes gathering data down to the case pack, the unique product identifier, and the geography, including ZIP and store. They also need the respective MSRP by SKU, the unit normalized price, and the selling price at a specific moment in time. This is done by aggregating brick-and-mortar store information available online, such as when stores list curbside pickup SKUs and pricing online.

    Individual teams cannot manually gather all this detailed data. The growth in eCommerce means there is simply too much data to find and aggregate. Instead, they can employ digital shelf technology to get more data from more sites. Teams can leverage AI to better match product listings, ads, and even visuals to avoid missing data on listings that lack common attributes, such as UPCs for normalization.

    To add to this, advanced pricing intelligence systems can cache URLs to help teams audit and verify their data, avoiding delays and confusion when ad hoc requests arise.

    Challenge 2: Difficulty in Making Sense of the Competitive Landscape

    Once net revenue management and revenue growth management teams have gathered all of the available data, it’s time to make sense of it. This is a monumental challenge, and ends up being the stage where most NRM and RGM teams flounder. Disparate marketplaces include different product attributes and images. This makes it extremely complicated to sync competitors’ data to ready it for analysis, especially if this analysis is carried out manually in Excel. These are some of the attributes that teams need to harmonize in order to make sense of the competitive landscape:

    • Product identifiers (UPC, SKU, Internal Code)
    • Size, case, pack, volume, bundled offerings
    • Language
    • Currency
    • Stock Status (Whether the product is available or not)
    • Platform-specific attributes such as ‘Amazon’s Choice,’ ‘Best Seller,’ etc.

    Teams also need to group and classify various categories of promotions. These can include sponsored listings, banner ads, coupons, bank offers, and others. Each of these categories needs to be tracked separately. This vast array of data points across hundreds of sites creates a big data problem for teams.

    Making Sense of the Competitive Landscape

    The best way to overcome this challenge is to task a digital shelf analytics system with gathering and harmonizing data automatically across the consumer goods competitive landscape. Competitive and market intelligence tools can help break down an overwhelming amount of data, matching similar products across competing brands and analyzing their various strengths and weaknesses. Once the technology matches complex product attributes and identifiers, it becomes easier for teams to gain insights and exploit findings. In a sense, the data needs to be cleaned before analysis can occur.

    Technology can gather data in multiple ways, and the best systems employ several methods to get the best matches. Data consumption modes include API integrations, CSV and Excel file uploads, and proprietary scrapers that view websites independently of direct inputs. Having all the data in a single place helps net revenue management and revenue growth management teams gain indicative insights on product popularity, pricing, and sales, on their own and competitor products.

    Challenge 3: Lack of Timely Visibility

    The final challenge that many net revenue management and revenue growth management teams face is something of a ‘silent killer’ — timeliness. Even if they successfully gather data across the entire competitive landscape and harmonize that data into a format for easy analysis, a lack of timeliness can render even the best actions irrelevant.

    Speed is of the utmost importance when there are market changes. If a product goes viral and competitors raise prices in response to increased demand, without timely visibility, the trend may be over before a consumer goods brand can successfully increase its prices for the duration of the trend. This can mean lost margins.

    Another example is analyzing data and incorporating lagging promotional and sales data into analyses. This can skew pricing strategies because timely data is not accessible to inform decision-making. Many teams waste time firefighting due to a lack of timely pricing and promotional intelligence data.

    Get Near Real-Time Insights for Faster Decision Making

    Using technology that allows for net revenue management and revenue growth management teams at consumer goods brands to establish update frequencies can be a game changer. Teams can set update frequencies based on their need. They can set up the system to check a fast-moving product daily, while a slow-moving item might only need to be checked weekly, monthly, or even quarterly. This allows teams to focus on the highest-impact products first and address the largest exceptions before they lose out on an opportunity. Managing exceptions with a digital shelf analytics platform saves teams significant time instead of poring over low-impact changes in the data.

    Digital Shelf Analytics for Net Revenue Management

    Modernizing a consumer goods brand’s net revenue management or revenue growth management processes requires advanced digital shelf analytics. DataWeave provides consumer goods companies with the technology they need for quick and accurate pricing, promotional, and assortment intelligence. By tracking over 200 million products each day, users can be sure they get the widest and most timely view of the competitive landscape. DataWeave’s deep industry knowledge is baked into every aspect of its platform.

    Learn more by requesting a demo today!

  • Why Localized, Store-Specific Pricing and Availability Insights is Critical for Consumer Brands

    Why Localized, Store-Specific Pricing and Availability Insights is Critical for Consumer Brands

    Brands are becoming increasingly proficient in monitoring and refining their presence on online marketplaces, utilizing Digital Shelf Analytics to gather and analyze data on their online performance. These tools offer invaluable insights into enhancing visibility, adjusting pricing strategies, and improving content quality on eCommerce sites.

    Yet, as the retail landscape shifts towards a more integrated omnichannel approach, it’s crucial for brands, particularly those in CPG, to apply similar strategies to their offline channels. For brands that count physical stores among their primary sales channels, gaining localized insights is key to boosting in-store sales performance.

    Collecting shelf data from offline channels presents more challenges than online. Traditional methods, such as physical store visits, often fall short in reliability, timeliness, scale, and level of coverage.

    However, the world of eCommerce provides a solution. As part of the effort to facilitate options like buy-online-pickup-in-store (BOPIS) for shoppers, major retailers make store-specific product details available online. Consumers often go online and select their nearest store to make purchases digitally before choosing a fulfillment option like picking up at the store or direct delivery. Aggregating this store-level information offers brands critical insights into pricing and inventory across a vast network of stores, enabling them to make informed decisions that improve pricing strategies and supply chain efficiency, thus minimizing stockouts in crucial markets.

    Further, as consumers increasingly seek flexibility in how they receive their purchases—be it through in-store pickup, delivery, or shipping—brands need to adeptly monitor pricing and availability for these different fulfilment options. Such granular insight empowers brands to adapt swiftly and maintain a competitive edge in today’s dynamic retail environment.

    Why does monitoring pricing and availability data across stores matter to brands?

    • Hyperlocal Competitive Strategy: This allows brands to adjust their pricing strategies based on regional competition. By understanding the local market, brands can decide whether to position themselves as cost leaders or premium offerings. In particular, this is indispensable for Net Revenue Management (NRM) teams.
    • Targeted Marketing Initiatives: Understanding regional price and availability enables brands to customize their marketing efforts for specific markets. By aligning their strategies with local demand trends and inventory levels, brands can more effectively engage their target audiences.
    • Efficient Inventory Management: By keeping a close eye on store-level data, brands can better manage their stock, ensuring high-demand products are readily available while minimizing the risk of overstocking or running out of stock.
    • Minimum Advertised Price (MAP) Monitoring: While brands cannot directly control retail pricing, staying updated on pricing trends helps them adjust their MAP to reflect the competitive landscape, consumer expectations, cost considerations, and regional differences. A strategic approach to MAP management supports brand competitiveness and profitability in a fluctuating market.

    DataWeave’s Digital Shelf Analytics solutions equip brands with the necessary data and insights to do all of the above.

    DataWeave’s Digital Shelf Analytics is location-aware

    DataWeave’s Digital Shelf Analytics platform stands out with its sophisticated location-aware capabilities, enabling the aggregation and analysis of localized pricing, promotions, and availability data. Our platform defines locations using a range of identifiers, including latitudes and longitudes, ZIP codes, or specific stores, and can aggregate this data for particular states or regions.

    The strength of the platform lies in its robust data collection and processing framework, which operates seamlessly across thousands of stores and regions. This system is designed to operate at configurable intervals—daily, weekly, or monthly—allowing brands to keep a vigilant eye on product availability, pricing strategies, and delivery timelines based on the selected fulfillment option.

    Unlike many other providers, who may provide limited insights from a sample of stores, our solution delivers exhaustive analytics from every storefront. This comprehensive approach grants brands a strategic edge, facilitating efficient inventory tracking, precise pricing adjustments, and rapid responses to fluctuating market dynamics. It cultivates brand consistency and loyalty by enabling brands to adapt proactively to the changing landscape.

    Aggregated store-level digital shelf insights via DataWeave

    In the summarized view shown above, a brand can track how its various products are positioned across stores and retailers like Walmart, Amazon, Meijer, and others in the US.

    Using DataWeave, brands can easily see important metrics like availability levels, prices, and other metrics across these stores gaining immediate visibility without having to physically audit them. the brand can track the same metrics for products across competitor brands and inform its own pricing, stock, and assortment decisions.

    Store-level availability insights

    We provide a comprehensive view of product availability, highlighting the distribution of out-of-stock (OOS) scenarios across various retailers and pinpointing the availability status throughout a brand’s network of stores. This capability enables swift identification of widespread availability issues, offering a bird’s-eye view of where shortages are most pronounced. By simply hovering over a specific location, detailed information about stock status and pricing for individual stores becomes accessible.

    Such insights are crucial for brands to adapt their strategies, mitigate risks, and ensure they meet consumer needs despite the ever-changing retail ecosystem.

    Store-level pricing insights

    Retailers often adopt different pricing strategies to deal with margin pressure, local competition, and surplus stock. Grasping these pricing dynamics at a hyperlocal level enables brands to tailor their strategies effectively to maintain a competitive edge.

    Our platform offers an in-depth look at how prices vary among retailers, across different stores, and throughout various regions. This analysis reveals the nuanced pricing tactics employed by retailers on a regional scale.

    For example, brands might see that some retailers, like Kroger and Walmart in the chart below, maintain consistent pricing across their outlets, demonstrating a uniform pricing strategy. In contrast, others, such as Meijer and Shoprite, might adjust their prices to match local market conditions, indicating a more localized approach to pricing.

    With DataWeave, brands can dive deeper into the pricing landscape of a specific retailer, examining a price map that provides detailed information on pricing at the store level upon hovering over a given location.

    By presenting a historical analysis of average selling prices across different retailers, we equip brands with the insights needed to understand past pricing strategies and anticipate future trends, helping them to strategize more effectively in an ever-evolving market.

    Digital Shelf Analytics that work for both eCommerce and brick-and-mortar store data

    While established brands have made strides in gathering online pricing and availability data through Digital Shelf Analytics solutions, integrating comprehensive insights from both brick-and-mortar and eCommerce channels often remains a challenge.

    DataWeave stands out for its capacity to collect data across diverse digital platforms, including desktop sites, mobile sites, and mobile applications. This capability ensures that omnichannel brands can have a holistic view of their pricing, promotional, and inventory strategies across all locations and digital landscapes.

    Leveraging localized Digital Shelf Analytics to understand the intricacies of pricing and availability at the store level allows brands to fine-tune their approaches, swiftly adapt to local market shifts, and uphold a unified brand presence across the digital and offline spheres. This strategic agility places them in a favorable competitive position, enhancing customer satisfaction and trust, which are crucial for sustained success.

    Know more about DataWeave’s Digital Shelf Analytics here.

    Schedule a call with a specialist to see how it can work for your brand.

  • Capturing and Analyzing Retail Mobile App Data for Digital Shelf Analytics: Are Brands Missing Out?

    Capturing and Analyzing Retail Mobile App Data for Digital Shelf Analytics: Are Brands Missing Out?

    Consumer brands around the world increasingly recognize the vital role of tracking and optimizing their digital shelf KPIs, such as Content Quality, Share of Search, Availability, etc. These metrics play a crucial role in boosting eCommerce sales and securing a larger online market share. With the escalating requirements of brands, the sophistication of top Digital Shelf Analytics providers is also on the rise. Consequently, the adoption of digital shelf solutions has become an essential prerequisite for today’s leading brands.

    As brands and vendors continue to delve further and deeper into the world of Digital Shelf Analytics, a significant and often overlooked aspect is the analysis of digital shelf data on mobile apps. The ability of solution providers to effectively track and analyze this mobile-specific data is crucial.

    Why is this emphasis on mobile apps important?

    Today, the battle for consumer attention unfolds not only on desktop web platforms but also within the palm of our hands – on mobile devices. As highlighted in a recent Insider Intelligence report, customers will buy more on mobile, exceeding 4 in 10 retail eCommerce dollars for the first time.

    Moreover, thanks to the growth of delivery intermediaries like Instacart, DoorDash, Uber Eats, etc., shopping on mobile apps has received a tremendous organic boost. According to an eMarketer report, US grocery delivery intermediary sales are expected to reach $68.2 billion in 2025, from only $8.8 billion in 2019.

    In essence, mobile is increasingly gaining share as the form factor of choice for consumers, especially in CPG. In fact, one of our customers, a leading multinational CPG company, revealed to us that it sees up to 70% of its online sales come through mobile apps. That’s a staggering number!

    The surge in app usage reflects a fundamental change in consumer behavior, emphasizing the need for brands to adapt their digital shelf strategies accordingly.

    Why Brands Need To Look at Apps and Desktop Data Differently

    Conventionally, brands that leverage digital shelf analytics rely on data harnessed from desktop sites of online marketplaces. This is because capturing data reliably and accurately from mobile apps is inherently complex. Data aggregation systems designed to scrape data from web applications cannot easily be repurposed to capture data on mobile apps. It requires dedicated effort and exceptional tech prowess to pull off in a meaningful and consistent way.

    In reality, it is extremely important for brands to track and optimize their mobile digital shelf. Several digital shelf metrics vary significantly between desktop sites and mobile apps. These differences are natural outcomes of differences in user behavior between the two form factors.

    One of these metrics that has a huge impact on a brand’s performance on retail mobile apps is their search discoverability. Ecommerce teams are well aware of the adverse impact of the loss of even a few ranks on search results.

    Anyone can easily test this. Searching something as simple as “running shoes” on the Amazon website and doing the same on its mobile app shows at least a few differences in product listings among the top 20-25 ranks. There are other variances too, such as the number of sponsored listings at the top, as well as the products being sponsored. These variations often result in significant differences in a brand’s Share of Search between desktop and mobile.

    Share of Search is the share of a brand’s products among the top 20 ranked products in a category or subcategory, providing insight into a brand’s visibility on online marketplaces.

    Picture a scenario in which a brand heavily depends on desktop digital shelf data, confidently assuming it holds a robust Share of Search based on reports from its Digital Shelf Analytics partner. However, unbeknownst to the team, the Share of Search on mobile is notably lower, causing a detrimental effect on sales.

    To fully understand the scale of these differences, we decided to run a small experiment using our proprietary data analysis and aggregation platform. We restricted our analysis to just Amazon.com and Amazon’s mobile app. However, we did cover over 13,000 SKUs across several shopping categories to ensure the sample size is strong.

    Below, we provide details of our key findings.

    Share of Search on The Digital Shelf – App Versus Desktop

    Our analysis focused on three popular consumer categories – Electronics, CPG, and Health & Beauty.

    In the electronics category, brands like Apple, Motorola, and Samsung, known for their mobile phones, earbuds, headphones, and more, have a higher Share of Search on the Amazon mobile app compared to the desktop.

    Meanwhile, Laptop brands like Dell, Acer, and Lenovo, as well as other leading brands like Google have a higher Share of Search on the desktop site compared to the app. This is the scenario that brands need to be careful about. When their Share of Search on mobile apps is lower, they might miss the chance to take corrective measures since they lack the necessary data from their provider.

    In the CPG category, Ramen brand Samyang, with a lot of popularity on Tiktok and Instagram, shows a higher Share of Search on Amazon’s mobile app. Speciality brands like 365 By Whole Foods, pasta and Italian food brands La Moderna, Divinia, and Bauducco too have a significantly higher Share of Search on the app.

    Cheese and dessert brands like Happy Belly, Atlanta Cheesecake Company, among others, have a lower Share of Search on the mobile app. Ramen brand Sapporo is also more easily discovered on Amazon’s desktop site. Here, we see a difference of more than 5% in the Share of Search of some brands, which is likely to have a huge impact on the brand’s mobile eCommerce sales levels and overall performance.

    Lastly, in the Health & Beauty category, Shampoos and hair care brands like Olaplex, Dove, and Tresemme exhibited a higher Share of Search on the mobile app compared to the desktop.

    On the other hand, body care brands like Neutrogena and Hawaiian Tropic, as well as Beardcare brand Viking Revolution displayed a higher Share of Search on Amazon’s desktop site.

    Based on our data, it is clear that there are several examples of brands that do better in either one of Amazon’s desktop sites or mobile apps. In many cases, the difference is stark.

    So What Must Brands Do?

    Our findings emphasize the imperative for brands to move beyond a one-size-fits-all approach to digital shelf analytics. The striking variations in Share of Search between mobile apps and desktops conclusively demonstrate that relying solely on desktop data for digital shelf optimization is inadequate.

    If brands see that they’re falling behind on the mobile digital shelf, there are a few things they can do to help boost their performance:

    • If a brand’s Share of Search is lower on the mobile app, they can divert their retail spend to mobile in order to inorganically compensate for this difference. This way, any short-term impact due to lower discoverability is mitigated. This is also likely to result in optimized budget allocation and ROAS.
    • Brands also need to ensure their content is optimized for the mobile form factor, with images that are easy to view on smaller screens, and tailored product titles that are shorter than on desktops, highlighting the most important product attributes from the consumer’s perspective. Not only will this help brands gain more clicks from mobile shoppers, but this will also gradually lead to a boost in their organic Share of Search on mobile.
    • CPG brands, specifically, need to optimize their digital shelf for delivery intermediary apps (along with marketplaces). The grocery delivery ecosystem is booming with companies like DoorDash, Delivery Hero, Uber Eats, Swiggy, etc. leading the way. Using Digital Shelf Analytics to optimize performance on delivery apps is quite an involved process with a lot of bells and whistles to consider. Read our recently published whitepaper that specifically details how brands can successfully boost their visibility and conversions on delivery apps.

    But first, brands need to identify and work with a Digital Shelf Analytics partner that is able to capture and analyze mobile app data, enabling tailored optimization approaches for all eCommerce platforms.

    DataWeave leads the way here, providing the world’s most comprehensive and sophisticated digital shelf analytics solution, rising above all other providers to provide digital shelf insights for both web applications and mobile apps. Our data aggregation platform successfully navigates the intricacies of capturing public data accurately and reliably from mobile apps, thereby delivering a comprehensive cross-device view of digital shelf KPIs to our brand customers.

    So reach out to us today to find out more about our digital shelf solutions for mobile apps!

  • From Data to Dollars: How Digital Shelf Analytics Drives Tangible Business Impact and ROI for Brands

    From Data to Dollars: How Digital Shelf Analytics Drives Tangible Business Impact and ROI for Brands

    For consumer brands, the digital marketplace presents an unparalleled landscape of opportunities for engaging with consumers and expanding their market presence. Within this dynamic environment, Digital Shelf Analytics has emerged as a crucial pillar in a brand’s eCommerce strategy. This technology provides valuable insights into a brand’s organic and paid visibility on marketplaces, content quality, pricing strategies, promotional efforts, and product availability. These insights help brands gain a comprehensive understanding of their competitive positioning and overall market performance.

    Nevertheless, many brands often grapple with the question of whether this understanding translates into tangible actions that drive real business impact and return on investment (ROI). This uncertainty stems from a lack of clarity about the direct correlation between digital shelf insights and key metrics such as enhanced sales conversions.

    Nonetheless, there is compelling evidence that when these insights are effectively harnessed and strategic actions are taken, brands can realize significant, measurable benefits.

    So, the question arises: does Digital Shelf Analytics genuinely deliver on its promises?

    At DataWeave, we’ve partnered with numerous brands to fuel their eCommerce growth through the application of digital shelf analytics. In this article, we will delve into these insights, uncovering the concrete and quantifiable results that brands can achieve through their investments in digital shelf analytics.

    Digital Shelf KPIs and Their Impact

    Digital Shelf Analytics is a robust system that analyzes specific key performance indicators (KPIs) about the digital shelf, furnishing brands with precise recommendations to not only bolster these KPIs but also to monitor the enhancements over time. The following is a brief explanation of digital shelf KPis and their expected impact areas:

    Product Availability: Ensuring Shoppers Never Hear “Out of Stock” Again

    Timely insights on the availability of products ensures brands reduce replenishment times at scale, which can significantly impact sales, creating an unbreakable link between product availability and revenue. With Digital Shelf Analytics, procurement and replenishment teams can set up notifications to promptly identify low or out-of-stock items and take swift action. This can also be done for specific ZIP codes or individual stores. In addition, availability plays a crucial role in a brand’s Share of Search and search rankings, as online marketplaces often ensure only in-stock products are shown among the top ranks.

    Share of Search: Dominating the Digital Aisles

    If a product isn’t visible, does it even exist? In fact, 70% of consumers never go beyond the first page of search results on major online marketplaces. Therefore, as a brand, the visibility of your products for relevant search keywords and their appearance on the first page can heavily determine your awareness metrics. This is where the concept of Share of Search comes into play. Think of it as securing prime shelf space in a physical store. Digital shelf insights and benchmarking with category leaders for Share of Search help ensure your products command relevant attention on the digital shelf.

    Content Quality: Crafting the Perfect Product Story

    Creating engaging product descriptions and visuals is akin to giving your products a megaphone in a crowded marketplace. By enhancing content quality, including product names, titles, descriptions, and images, brands can climb the search result rankings, leading to increased visibility and subsequently, more sales.

    Ratings and Reviews: The Power of Social Proof

    Public opinion holds immense sway. Research indicates that a single positive review can trigger a 10% surge in sales, while a multitude of favorable reviews can propel your product to a 44% higher trajectory. The correlation between ratings and sales is not surprising—each step up the rating ladder can translate to substantial revenue growth.

    While it’s reasonable to anticipate a connection between these KPIs and downstream impact metrics such as impressions, clicks, and conversions, we were driven to explore this correlation through the lens of real-world data. To do so, we meticulously monitored the digital shelf KPIs for one of our clients and analyzed the improvements in these metrics.

    It’s essential to acknowledge that not all observed impact areas can be solely attributed to enhancements in digital shelf KPIs. Still, it’s evident that a robust correlation exists. The following section presents an in-depth case study, shedding light on the results of this analysis.

    A Success Story: Real-World Impact of Digital Shelf Analytics

    Let’s dive into the journey of one of our clients – a prominent CPG brand specializing in the sale of baked goods and desserts. Through their experience, we will illustrate the transformative impact of our DataWeave Digital Shelf Analytics product suite.

    Over a period of one year, from August 2022 to July 2023, the brand leveraged several key modules of Digital Shelf Analytics for Amazon, including Share of Search, Share of Category, Availability, Ratings and Reviews, and Content Audit. Each of these digital shelf KPIs played a vital role in shaping the brand’s performance across various stages of the buyer’s journey.

    The buyer’s journey is typically delineated into three key stages:

    • Awareness: At this stage, shoppers peruse multiple product options presented on search and category listing pages, gaining an initial understanding of the available choices.
    • Consideration: Here, shoppers narrow down their selections and evaluate a handful of products, moving closer to a purchase decision.
    • Conversion: In this final stage, shoppers make their ultimate product choice and proceed to complete the purchase.

    Let’s now examine the data to understand how digital shelf KPIs helped drive tangible ROI on Amazon for the brand across the stages of the buyer journey.

    Stage 1: Raising Awareness

    Enhancing Share of Search and Share of Category can help brands boost product visibility and raise brand awareness. The following chart demonstrates the steady, incremental improvements in our client’s Share of Search and Share of Category (in the top 20 ranks of each listing page) throughout the analyzed period. These enhancements were achieved through various measures, including product sponsorship, content enhancement, price optimization, promotional initiatives, and more.

    This amplified Share of Search and Share of Category directly translates into improved product discoverability, as evident from the surge in impressions depicted in the chart below.

    Stage 2: All Things Considered

    In the consideration stage, shoppers make their product selections by clicking on items that meet their criteria, which may include factors like average rating, number of ratings, price, product title, and images. For brands, this underscores the importance of crafting meticulously detailed product content and accumulating a substantial number of ratings.

    The subsequent chart illustrates the year-long trend in both average ratings and the number of ratings, both of which have displayed steady improvement over time.

    The enhancements in the number of ratings and the average rating have a direct and positive impact on product consideration. This, in turn, has led to a noticeable year-over-year increase in page views, as indicated in the chart below.

    These improvements are likely to have also been influenced by the overall enhancement of content quality, which is detailed separately in the section below.

    Stage 3: Driving Decisions

    As buyers progress to the next stage, they reach the pivotal point of making a purchase decision. This decision is influenced by multiple factors, including product availability, content quality, and the quality of reviews, reflecting customer sentiment.

    Our client effectively harnessed our Availability insights, significantly reducing the likelihood of potential out-of-stock scenarios and enhancing replenishment rates, as highlighted in the chart below. The same chart also indicates improvements in content quality, measured by the degree to which the content on Amazon aligns with the brand’s ideal content standards.

    Below, you’ll find the year-over-year growth in conversion rates for the brand on Amazon. This metric stands as the ultimate measure of business impact, directly translating into increased revenue for brands.

    As the data uncovers, growth in key digital shelf KPIs cumulatively had a strong correlation with impressions, page views, and conversion rates.

    It is also important to note that the effect of each KPI cannot be viewed in isolation, since they are often interdependent. For example, improvement in content and availability could boost Share of Search. Accurate content could also influence more positive customer feedback. Brands need to consider optimizing digital shelf KPIs holistically to create sustained business impact.

    Impact on eCommerce Sales

    After the implementation of digital shelf analytics, the results spoke for themselves. Sales consistently outperformed the previous year’s records month after month. As shown in the chart below, the diligent application of DataWeave’s recommendations paved the way for an impressive 8.5% year-over-year increase in sales, leaving an indelible mark on the brand’s eCommerce success.

    From boosting product visibility to catapulting conversion rates, Digital Shelf Analytics serves as the key to unlocking unparalleled online success.

    While the success story detailed above does not establish a direct causation between Digital Shelf Analytics and sales revenue, there is undoubtedly a strong correlation. It’s evident that digital shelf KPIs play a pivotal role in optimizing a brand’s eCommerce performance across all stages of the buyer journey. Hence, for brands, it is vital that they collaborate with the right partner and harness digital shelf insights to fine-tune their eCommerce strategies and tactics.

    That said, the eCommerce landscape is in a constant state of flux, and there is still much to learn about how each digital shelf KPI influences brand performance in the online realm. With more data and an increasing number of brands embracing Digital Shelf Analytics, it’s only a matter of time before a direct causation is firmly established.

    Reach out to us today to know more about how your brand can leverage Digital Shelf Analytics to drive higher sales and market share in eCommerce.

  • Decoding the 2022 Black Friday Record Sales: The Who, The What, and The How?

    Decoding the 2022 Black Friday Record Sales: The Who, The What, and The How?

    Contrary to popular speculation of lukewarm online sales owing to the weak economy, high inflation, and stretched wallets, Black Friday this year recorded a whopping $9 billion in e-commerce sales. Despite the lull in online shopping across many retailers in the months preceding Thanksgiving and weakened consumer sentiment, US online merchants saw a sizable boost in sales during and after Thanksgiving, albeit at a slower growth of 2.3%, as reported by Adobe Analytics.

    This article looks closely at the Black Friday data to understand which brands, retailers, and product categories were key players. Through DataWeave’s innovative Digital Shelf Analytics product, we deep dive into the availability, discount, and share-of-search data to deduce why some product categories and retailers fared better than others.

    Who: Retailers and Brands that had the Highest Presence

    Black Friday sales this year were driven by consumers grabbing the biggest and best deals to make the most of their already stretched wallets. Many shoppers opted for flexible payment schemes, and Buy Now Pay Later (BPNL) payments rose by 78% compared to the week before Thanksgiving. Surprisingly, Amazon, which was the most searched retailer during Black Friday last year, came only fourth this year, as reported by the Search Intelligence company, Captify.

    According to Captify, Walmart was the most searched retailer for Black Friday deals, followed by Target, Kohls, and Amazon in that order. Amazon, however, has reported its biggest Thanksgiving sale this year, with independent retailers selling through Amazon seeing a total sales of $1 billion. With the economic slowdown and thin wallets looming large, discount rates greatly influenced consumer spending. Mobile shopping accounted for 55% of digital sales, 8.5% more than the previous year. 

    As told by Adobe, Electronics were the significant sales driver, reporting 221% higher sales than in October this year, with smart home items and audio equipment playing an important role with 271% and 230% higher sales. Toys ( popular purchases were Fortnite, Roblox, Bluey, Funko Pop!, and Disney Encanto) and exercise equipment also registered a substantial growth of 285% and 218%, respectively. 

    Other top-selling items included gaming consoles (Xbox Series X and PlayStation 5 devices, games including FIFA 23, NBA 2k23, and Pokemon Scarlet & Violet), drones, Apple MacBooks, and Dyson products (airwrap and vacuum). Amazon’s most popular items were reported to be Apple Airpods, Nintendo Switches, Echo Dot smart speakers, and Fire TV sticks. 

    What: Top Selling Product Categories

    Electronics, closely followed by home appliances (robotic vacuum cleaners), toys, and exercise equipment, were popular product categories in demand during Black Friday this year. Several retailers, including Amazon, Walmart, Target, Kohls, BestBuy, and Home Depot, offered lucrative pre-Black Friday discounts to trigger early sales kick-off. 

    Amazon carried an early discount of 50% on its Echo smart speaker, Target offered 30% off on Dyson vacuum cleaners, Walmart offered 25-35% off on Apple ipads and watches, and Kohls offered 51% off on the iRobot Roomba. 

    Amazon’s top ten best-selling products ranged from Amazon devices like Echo Dot speakers, Fire TV sticks, and Echo Show to Apple AirPods, Nintendo Switches, New Balance sneakers, Champion Apparel, and Burt’s Bees Lotions. The popular product categories were home, fashion, toys, beauty & health, and Amazon devices. Consumers heavily supported small businesses, contributing to $1 billion in sales. Top sellers from small businesses included card and board games.

    Briefly correlating the discounts offered with the best-selling product categories, one can notice that the deals have largely influenced Black Friday sales this year. Popular categories are those that have had deep discounts, reflecting the consumer’s tendency to wait and grab the best deals.  

    How: Role of Digital Shelf Analytics – Key Performance Indicators 

    Digital Shelf Analytics
    DataWeave’s Analysis Methodology

    We have seen a summary of the Black Friday 2022 statistics – sales recorded, top-selling products, product categories, and retailers. Using DataWeave’s e-commerce analytics product, we track and study the variations in digital shelf KPIs across retailers before Thanksgiving and during Thanksgiving to understand how these influence sales. 

    Availability scores, discount rates, and share of search data are analyzed for top retailers in the US for key product categories. Data is tracked and analyzed across two time periods – before Thanksgiving (Nov 10 – Nov 21) and during Thanksgiving (Nov 21 – Nov 25).

    Methodology

    • Retailers tracked: Amazon, Best Buy, Sephora, Target, Ulta, Walmart
    • Product Categories tracked: Electronics, Home Improvement, Beauty, Furniture
    • Digital Shelf KPIs tracked: Availability, Discount rates, Share of Search
    • Location: USA
    Amazon Digital Shelf Analytics

    Amazon maintained good availability across all product categories – Beauty ranks the highest.

    Salient Insights

    • Amazon maintained good overall availability – an improvement of 3% over Prime day
    • Beauty had the highest availability of 95%, with none and Lotion & Brushes reporting 97% and 95% availability, respectively. Shampoo reported the lowest availability at 92%
    • Home Improvement had the least availability at 87%, with dishwashers (68%) and washers and dryers (78%) having the lowest availability. 
    • Unlike Furniture and Home Improvement, most categories maintained similar availability scores before and during Black Friday.
    • Furniture improved its availability during Black Friday by 4%, while Home Improvement reported a decrease in availability during Black Friday by 4%. 
    • Electronics, which was a major sales driver, had an availability of > 90% across all sub-categories except for Television, which had a low availability of 70%
    • Tables and chairs registered 99% availability under Furniture

    The above data indicates that Amazon ensured the high availability of utility products that consumers would buy even during a slow economy. Other retailers showed similar availability trends, with scores being similar prior to and during the event.  

    Black Friday Discounts with ecommerce analytics

    Discounts Drove Sales – Best Buy offered the Highest Discounts

    Highlights

    • Best Buy offered the highest early Black Friday discount of 30%, followed by an additional 9% discount around Black Friday. Walmart followed next with 21% early discounts and an extra 4.5% discount during the event. Amazon came next with 17% early discounts and a 5% discount during Black Friday. Discount rates seem to strongly correlate with online searches, with Walmart beating Amazon this year as the most searched retailer for Black Friday deals. 
    • Electronics was the most discounted category across Amazon, Best Buy, and Target, with an average discount of 21%. Walmart gave lower deals on electronics (12%). Electronics also had heavy early discounts of 12%, with most retailers giving an additional discount of 7-8% closer to Thanksgiving.
    • Best Buy offered early discounts of 10% and further upped their discounts by another 12% closer to Thanksgiving. Being the most discounted category, electronics was also a significant sales driver this Black Friday.
    • Amazon offered the highest discounts for Beauty products (18%), followed by Ulta at 10% and Walmart at 8%. Sephora and Target gave minimal discounts on beauty products (3%)
    • Best Buy gave the maximum discounts on Home Improvement products (16%), followed by Amazon at 14%. Walmart gave much lower discounts of 7% on Home Improvement products. 
    • Furniture is another category with 12-13% discounts at both Amazon and Walmart.
    • Best Buy’s strategy this year has been to offer heavily discounted early deals to boost their sales.
    Black friday 2022 Beauty Analytics
    Icons: Flaticons.com
    Black friday 2022 Electronics analytics
    Icons: Flaticons.com
    Home improvements black friday 2022
    Icons: Flaticons.com
    home furniture black friday 2022
    Icons: Flaticons.com

    Highlights

    • Airpods and headphones were the most discounted item under Electronics, with Amazon and Target offering a whopping 27-29% discount. This clearly resulted in heavy sales of AirPods this Thanksgiving.
    • Best Buy and Target had good discounts on all electronic items, while Amazon gave heavier discounts on AirPods, headphones, and smartwatches.
    • Walmart did not offer hefty discounts on laptops and headphones, instead focused on Smartwatches, smartphones, and television.
    • In Home improvement, Best Buy offered the biggest discounts for refrigerators, washers and dryers, and dishwashers, while Amazon focussed more on Tools.
    • Walmart did not offer many discounts in this category.
    • Amazon topped the discount charts for maximum combined discounts for makeup and hair brushes on the day of the event. 
    • All retailers offered better discounts for utility products like tables, chairs, and cots (~15-17%), while dressers and couches carried lower discounts (~6-10%).
    Discount brackets - Black Friday 2022

    Highlights

    • Different companies had different discount strategies based on price buckets.
    • Amazon gave heavier discounts in the lower price buckets (< 200$) and lower discounts for products priced higher than 200$. 
    • Best Buy offered the heaviest early discounts of >25% on products priced under 20$ but provided a few additional discounts during the event. For products priced higher than 20$, Best Buy uniformly offered substantial early discounts as well as further discounts during the event.
    • On the other hand, Target focussed on mid and high-priced items, offering heavy early discounts of 16-18% on products priced higher than 100$ and early discounts of ~7% for middle and lower-priced items. For middle-priced products (40-100$), it offered heavier discounts of 10-12% during the event. 
    • Walmart focussed on mid-priced products, offering the highest discounts (both early (~12%) and additional discounts (5%)). It offered the least discounts (~8-9%) on products priced higher than 200$.
    Share of Search - Digital Shelf Analytics - Dataweave

    Share of Search – Amazon is the only retailer with sponsored searches; Apple AirPods rule the roost.

    Salient Insights

    • Amazon is the only retailer with sponsored searches, with HP, Lenovo laptops, and Apple AirPods occupying the highest share. This correlates with AirPods being one of the most sold products.
    • HP laptops had the highest share on Amazon pre-Event but gave the spot to Lenovo during Thanksgiving.
    • Tracphone and Motorola smartphones, Insignia Televisions, and JBL headphones had a good SoS on Amazon.
    • On Best Buy, HP and Dell laptops featured most in searches, with HP ruling the roost during the event. Lenovo had a small presence.
    • Samsung smartwatches, televisions, and Apple AirPods have a big chunk of the search at Best Buy.
    • On Target, pop sockets, smartphones, Apple smartwatches, headphones, and AirPods have the most prominent presence. Apple was the most featured brand in this segment.
    share of search beauty - black friday 2022
    Note: The share of search percentage reported here is the average score across all subcategories (makeup, lotion, shampoo, hair dryers and hair brushes) of Beauty.

    Salient Insights

    • Amazon, Target, Sephora, and Ulta sold beauty products, with Amazon being the only retailer with sponsored products.
    • Ogx, bs-mall, conair, hywestger were popular brands on Amazon, with interest-based ads occupying a substantial part of the search results, especially in Lotions (~40-50%)
    • Tresemme, Scotch Brite, Revlon and Cerave were popular brands in Target
    • Dyson products (brushes and hair dryers) are featured at Ulta’s top of the search, followed by Pureology shampoos.
    • Sephora’s own collection of brushes featured prominently on their website both before and during the event, followed by Dyson and T3 brushes and hair dryers.
    share of search -Digital Shelf Analytics- home improvements
    Note: The share of search percentage reported here is the average score across all subcategories (refrigerator, washers/dryers, dishwashers, tools and coolers) of Home Improvements.

    Salient Insights

    • In Amazon, Frigidaire and RCA had the highest SoS amongst Refrigerators, and LG occupied the highest share among washers and dryers, Coleman in Coolers, Dewalt in Tools, and  Comfee in Dishwashers, both before and during Black Friday.
    • In contrast, on Best Buy, Samsung had the highest share of SoS amongst Refrigerators, package deals were most prominent in washers and dryers, LG among dishwashers, ifixit in Tools, and Corsair in Coolers.
    share of search furniture on amazon
    Note: The share of search percentage reported here is the average score across all subcategories (bed, chair, couch, dresser, and table) of Furniture.

    Salient Insights

    • Interest-based ads occupied the highest SoS on Amazon for Beds.
    • Urban shop and Amazon basics were popular in Chairs, Lifestyle in Couches, WLive in Dressers both before and during the event.
    • Vasagle was more popular during the event than Furrion in Tables, though the reverse was true prior to the event.

    Summary & Key Takeaways

    Black Friday this year was a pleasant surprise to Brands and Retailers, reporting much larger sales than predicted. After experiencing a slump in sales in the months leading up to Thanksgiving, e-commerce vendors have a reason to be optimistic about their holiday season sales forecasts.

    • A record-breaking $9.2 Billion in online sales was reported by Adobe Analytics, a growth of 2.3 % compared to the previous year.
    • Mobile shopping accounted for 55% of digital sales, a rise of 8.5% compared to last year.
    • Retailers wooed customers through deep discounts (~30%) prior to Thanksgiving and around Black Friday. Heavily discounted items like Apple AirPods were the most popular.
    • Thanks to inflation and stretched wallets, consumers were willing to spend but waited to grab the best and biggest deals. Utility products had better sales.
    • With tough competition between retailers on who offers the best discounts, Amazon slid down to the fourth position, and Walmart was the most searched retailer.

    DataWeave, through its Digital Shelf Analytics and Commerce Intelligence solutions, gleans useful insights from e-commerce data and breaks down trends during global shopping events like Prime Day, Black Friday, and Cyber Monday. If you are a brand or a retailer who would like to know more about our products and solutions, contact us at contact@dataweave.com.

  • It’s not easy being a Bakery Brand: Insights from Digital Shelf

    It’s not easy being a Bakery Brand: Insights from Digital Shelf

    By 2028, Fortune Business Insights projects that the global bakery products market will reach USD 590 billion. The CAGR (Compounded annual growth rate) for 2021-28 is estimated at 5.12%. Products in this segment include bread, buns, cookies, tortillas, salted snacks, English muffins, bagels, confectionery food, hot dogs, cakes, popcorn, and so on.

    Due to disruptions in the global supply chain caused by lockdowns and border closures, the pandemic has had a negative impact on the demand for bakery products and snacks worldwide. However, the market is not only changing, but consumer demand is increasing. Post-pandemic, health, food, and safety have gained renewed attention.

    People across the world are making healthier choices with a focus on wellness. 

    A growing number of people are interested in plant-based foods and beverages, reducing sugar consumption, and understanding the link between lifestyle and health, including obesity and diabetes. As a result of these trends, food producers are reshaping their product strategies to meet new consumer demands.

    In this article, we take a look at the ways companies can leverage data to inform their e-commerce strategy.

    What’s driving up the demand for bakery products?

    More people are choosing easy-to-use bakery products and snacks over other foods due to urbanization, convenience, western diets, and women’s participation in the workforce. Additionally, innovations in baking systems, food technologies, ingredients, formulations, and product ideas are providing customers with a greater level of choice, flexibility, and freedom.

    How is e-commerce changing the game for bakery product companies?

    To optimize their supply chains, bakery food and snack companies must better understand e-commerce metrics given the wide variety of products available and eventually convert sales. There are several measures that companies need to pay attention to. 

    Stock availability metrics, discounts across locations, and share of search results – are all critical metrics companies need to track. In addition to providing manufacturers and retailers with an insight into the trends, DataWeave’s tools also allow them to make better business decisions and ultimately improve their bottom line. 

    Grocery Retailers and Bakery Brands tracked

    Methodology

    • Data Scrape period: February 2022 to September 2022
    • Country: Canada
    • Grocery Retailers tracked: Atlantic Superstore, Fortinos, InstaCart, Loblaws, Voila, Walmart Grocery, Zehrs.
    • Bakery brands: Betty Crocker, Dempsters, Hostess, No Name, Presidents Choice, Quaker, Vachon, Doritos.
    • Category tracked: Bread and Bakery, Chips, Crackers, Deserts, Snacks.

    Share of Search Analysis

    Which brands feature the most on e-commerce portals?

    When listing items on e-commerce platforms, share of search is crucial. The highest share of the top ten or top twenty items available on these platforms is correlated with how many times the item may be viewed. As a result, it would have a greater chance of being selected by the customer.

    By Retailer for Category “Desserts”

    Share of Search for Brands in each retailer
    • In Walmart Grocery, Vachon has the highest share of search at 41%, whereas Betty Crocker, Presidents Choice and No Name had the lowest share of search at 0%, in the Desserts Category.
    • In Loblaws, Presidents Choice had the highest share of search of 34%, whereas Dempsters had the lowest share of search of 2%  in the Desserts Category. 
    • The brand Presidents Choice consistently ranks high in the share of search results for Desserts across multiple retailers, including Atlantic Superstore, Fortinos, Instacart, Loblaws, and Zehrs – except at two retailers, Voila and Watlmart Grocery, where its share is zero.

    Trend of Share of Search for “Desserts”

    Share of Search analysis by Brands over Time in category “Desserts”
    • Share of search had dropped by around 4% for No Name, whereas for Vachon, it increased by 3% from Jan’-22 to Sep’ 22
    • By brands, Presidents Choice had the highest share of search at 42%, whereas Betty Crocker had the lowest share of search at 12% between Jan’ 22 and Sep’ 22 in the Desserts Category.

    Availability Analysis

    Which products are widely available across e-commerce portals?

    The availability of the product on the e-commerce portal is one of the key indicators of meeting customer demand. Brands can use insights from DataWeave to strategize how to restock their inventory and ease customer demand. Based on data analysis, brands can also determine which products to prioritize on which platforms.

    By Category

    Availability analysis by Category over Time
    • Availability of all five categories was around 52% in Feb’ 22, which steadily increased to 61% until Aug’ 22 and has reduced to reach 55% availability in Sep’ 22
    • Sliced Bread category has seen the most drop in availability by 12% between Jun’ 22 and Sep’ 22
    • The tortilla category has the most rise in availability. It has increased by 16% between Feb-22 and May-22. It also showed an overall rise in availability of 5% from Feb-22 to Sep-22

    By Location

    Availability analysis by Location and Category
    • Across categories, Snacks & Candy had better availability at 73% than Bread & Bakery, with 56% availability.
    • By Location, New Brunswick had more than 65% availability across all three categories; the closest Location is Nova Scotia, with 63% availability.
    • Alberta had the highest availability of 100% in the Snacks & Candy category and the lowest availability of 21% overall in all three categories (weighted aggregate)

    Discounts Analysis

    Several discount-based insights can be studied on e-commerce platforms. From location-based trends, retailer-based trends, and manufacturer-based insights. These insights can help companies make the most of the revenue opportunity while creating an attractive value proposition for the retail consumer.

    By Category

    Discount analysis by Category
    • Discounts of all three categories were around 24% in Feb’ 22, which steadily reduced to reach 15% in Sep’ 22
    • Snacks, cookies & chips category has contributed the most to the drop in discounting, which dropped by 17% between Apr’ 22 and Sep’ 22
    • The Tortilla Category does not have any discount in the month of Jul’ 22

    By Retailer

    • Discount on Bread & Bakery category in Walmart Grocery was around 9% in Feb’ 22. It steadily increased to 13% by Jun’ 22 and thereon reduced to reach 11% availability in Sep’ 22.

    By Location

    • Across Retailers, Nova Scotia had the highest availability of discounts at 22%, whereas New Brunswick had the lowest with discounts at 9% in Bread & Bakery category.
    Discount analysis by Retailers and Locations – Alberta, Ontario, New Brunswick, Nova Scotia
    Note: Analysis does not cover all locations

    Bakery and snack product manufacturers on e-commerce platforms have access to a rich trove of insights they can leverage to benchmark their strategies. They can better understand customer demands, align their supply chain and critically understand the trends impacting their bottom line. Engaging with a third-party platform like DataWeave’s Digital Shelf Analytics  can help brands unlock tremendous value. 

  • Insights from the Digital Shelf of Indian FMCG Brands

    Insights from the Digital Shelf of Indian FMCG Brands

    Analyzing Search, Promotions and Availability for Chocolates, Biscuits, and Malt Drinks across BigBasket, Blinkit, Dmart, Swiggy etc.

    Imagine you log into an e-commerce portal with a list of food items you need for the month. You know what you want, and scroll through the platform to see if there are any discounts. You check competitor products to see if you can get better deals. And within no time, fill your cart with products that you need and proceed to check out. 

    It all happens quickly. It’s an online shopping experience that we are familiar with. But what exactly is happening in the background?

    Brands are tracking and ensuring the highest keyword ranking, optimal availability and competitive discounts to grab your order. And to enable this, Brands rely on Digital Shelf Analytics.

    The FMCG marketplace

    Here, we take a closer look at some of the key factors that Fast Moving Consumer Goods (FMCG) Brands on e-commerce platforms need to pay attention to – to ensure their products appear on the top of search items, to better understand competitor discounts and to monitor the availability of their products across regions.

    FMCG has experienced rapid growth in the last two years, largely attributed to digitalization, changing consumer habits, and increased spending post-pandemic.  Macro factors, including government impetus, inflationary pressures, and consumption recovery, indicate a double digital growth for FMCG brands in the country. According to NielsenIQ’s FMCG Snapshot for Q2 2022, the FMCG industry has grown by 10.9% in the quarter ending June 2022, compared to 6% in the previous quarter.  In the second half of 2022, consumers are expected to spend even more during the festive season. With these shifts underway, the growth opportunities in this sector can only be exploited by companies that can sense trends early – and take appropriate action.

    In addition to providing manufacturers and retailers with actionable insights into e-commerce trends, DataWeave’s tools also allow them to make informed business decisions and ultimately improve their bottom line. Data-driven insights on e-commerce products can help brands optimize their supply chain to maximize sales. A company can determine the key areas that need attention based on an analysis of the availability of products on specific e-commerce channels, associated discounts, as well as zip-code level demand and supply statistics.

    Here are a few sample insights and trend analyses for some popular FMCG brands in the Biscuits, Chocolate and Malt drinks categories spotted by DataWeave.  

    Analytics Methodology: An overview of the data set analyzed

    • Data Scrape period: January 2022 to August 2022
    • Grocery Retailers tracked: Amazon Fresh, BigBasket, Dmart, Jiomart, Swiggy, Milkbasket
    • FMCG brands: Britannia, ITC, Mondelez, Nestle, Parle, Complan, Boost, Amul, Hershey’s
    • Category tracked: Biscuits, Chocolate, Malt drinks


    Availability Analysis

    What is the availability of Biscuits, Chocolate and Malt Drinks on e-commerce portals?

    The availability of a product on an e-commerce marketplace is a key indicator of whether the product meets consumer demands.  DataWeave’s availability analytics can be leveraged by FMCG brands to strategize their inventory and stock planning.  Brands can also make data-driven decisions on product visibility, i.e. identify which products to prioritize on which platforms. 

    • Biscuits had a better availability at 63% when compared to chocolates at 56% across all retailers
    • Dmart and Swiggy had more than 85% availability across all three categories, with Bigbasket coming next at 67% availability 
    • Flipkart Grocery and Blinkit had the lowest availability at 46% and 50%, respectively.
     Figure 1: Availability Scores for Biscuits, Chocolates and Malt Drinks across Retailers

    Which manufacturers have the highest availability of products on e-commerce platforms?

    A study of the availability of products across different manufacturers can reveal brands that have successfully tapped the market opportunity. Here’s a look at brands that have steadily improved their availability on e-commerce platforms.

    Figure 2: Availability Trends for Biscuits across Manufacturers
    • In the biscuits category, all five manufacturers marked approximately 50% availability in Jan 2022. Availability steadily grew to 68% in June 2022, then declined to 63% in Aug 2022.
    • Unibic experienced the largest drop in availability, dropping 15% between May 22 and Aug 22.
    • Mondelez saw the largest rise in availability, an increase of  23% between Mar-22 and Aug-22.
    Figure 3: Availability Trends for Malt Drinks across Manufacturers
    • Except for Boost and Nestle, availability for all seven manufacturers of malt drinks was consistently above 50%. The average availability across all manufacturers rose gradually from 55% in Jan to 63% in Jul-22, followed by a small decline to 57% in August.
    • From 30% availability in January 22 to a mere 7% in August 22, Boost has seen the greatest drop in availability.
    • The availability of Amul has risen the most over the past year, rising from 51% in January 22 to 78% in August 22, hitting 80% in July 22.

    Chocolate: Which manufacturers have the highest availability of products on the e-commerce platforms?

    Figure 4: Availability Trends for Chocolates across Manufacturers
    • Chocolate availability across all manufacturers averaged 47% in Jan-22, reaching a peak of 64% in May-22 and dropping to 51% in Aug-22.
    • From 46% in Jan-22 to 74% in May, Mondelez saw the biggest increase in availability, followed by a decline to 68% in August.
    • Ferrero experienced one of the sharpest drops in availability. Although the brand’s availability steadily grew from 77% in Jan 22 to 94% in Jul 22., it registered a steep drop to 49% in August. 

    The drop in availability hurts the Brand’s eCommerce in two ways. Not only does the Brand lose sales directly. But poor availability also impacts the keyword search ranking, which further hurts the sales.

    Check out DataWeave’s Digital Shelf Analytics Product for insights on how Availability tracking can help reduce stock-outs and boost sales. Click here to know more.

    Discount Analysis

    Location-based, retailer-based, and manufacturer-based discount trends can be analyzed. These studies can help companies plan attractive and appropriate promotional and discount strategies to enhance their revenue opportunities. 

    Which manufacturer has been offering the most discounts?

    A study of discounts offered across manufacturers for chocolates, malt drinks and biscuits indicates that some brands have increased their discounts while others have reduced their discount rates. These decisions could be triggered by demand, availability, and production cycle. Parle, for example, has steadily reduced its discount rates. 

    Figure 5: Discount Rate Trends across Manufacturers

    Average discount rates across manufacturers were around 9% in Jan 2022 and rose steadily to reach 14% in Jul 2022. A small decline is observed post-July, with a 12% discount rate registered in Aug 2022.

    • In the biscuit category, Unibic offered the biggest discount of 28%, followed by ITC at 20%.     
    • In the Chocolate category, Hershey’s offered the largest discount of 14%, followed by ITC at 12%.
    • In the Malt Drink Category, Amul offered the largest discount of 16%, followed by Boost at about 10%. 

    Check out DataWeave’s Digital Shelf Analytics Product for insights to respond to Competitor’s pricing and promotions. Click here to know more.

    Share of Search Analysis

    Which brands feature within the top 5 on the first page of the search?

    A product that appears within the top 5 items on the first page of a search, has a higher probability of being purchased. Below is a study of the share of the search for biscuits across manufacturers and retailers. 

    Figure 6: Share of Search for Biscuits across Manufacturers and Retailers
    • Britannia dominates the top ten share of search across different online retail platforms.
    • Mondelez has the highest share of search at 62% in Amazon Fresh, whereas Parle-G has the lowest share of search at 7%.
    • In Bigbasket, Britannia has the highest search share of 62%, whereas Parle-G has the lowest search share of 7%.

    Check out DataWeave’s Digital Shelf Analytics to track the Share of Keyword and Navigation Search. Click here to know more.

    Conclusion

    FMCG is a rapidly evolving industry sector with a high potential for growth in the coming years. FMCG brands must compete with one another to fully tap this market opportunity on several factors to ensure that their products are visible, available, and attractive to consumers. Digital crawling and big data technologies have enabled manufacturers and retailers to collect publicly available e-commerce data for useful, actionable insights and trend analysis. To stay competitive, it is crucial for manufacturers and retailers to engage with analytics and data experts to seamlessly integrate e-commerce analytics into their short- and long-term business strategies. Whether it’s building keywords to increase the share of search, knowing the right discounts to attract customers in a particular city or increasing the availability of products on specific e-commerce platforms, companies need to invest in the right data intelligence!

    DataWeave for FMCG Brands

    DataWeave has been working with global CPG/FMCG brands, helping them drive their growth on eCommerce platforms by enabling them to monitor their key metrics, diagnose improvement areas, recommend action, and measure interventions’ impact. DataWeave’s KPIs enable Brands to fill in the blind spots in their funnel data and allows them to respond to competitors on a near-real-time basis.

    If you want to know to learn how your brand can leverage DataWeave’s data insights and improve sales, then click here to sign up for a demo

  • 5 Ways to Manage and Improve Stock Availability

    5 Ways to Manage and Improve Stock Availability

    Stock availability is the degree to which a brand or retailer has inventory of all their listed items to meet customer demand. Product availability becomes even more critical when they have to respond to unforeseen changes in demand and supply. To maintain the ideal stock availability levels for all items, they need robust inventory management tools to ensure real-time updates on current stock and accurate insights into upcoming demand.

    However, managing stock availability is not a clear-cut science. Retailers must balance the change in demand and keep stock availability in check

    Why Stock Availability Matters

    One of the challenges of running a retail business is to optimize inventory and associated costs. Maintaining stock availability in stores is critical for offline retail businesses. And when selling online, making sure products are available across different retailers and marketplaces can have a huge impact on sales and conversions. 

    1. Understocking: It’s when a brand’s product fails to meet consumer demand. If this happens often enough, customers may not return to the brand’s website or app because of the initial experience. Understocking is not a brand’s fault entirely since they might not always be able to anticipate a change in demand. However, it’s about a their ability to adapt to a quick change in the market trends through historical analysis and accurate forecasting. 
    2. Overstocking: It’s when a company orders too much inventory. Holding too much stock will lead to higher storage costs, shrinkage, and obsolescence losses. Another loss occurs if the brand can’t quickly sell the items — diminishing the value of the products. 

    We gathered data to see the impact of a short-term stockout on Amazon for one of our customers. Read more about what we uncovered & how deep the damage was, here.

    7 Ways to improve stock availability 

    1. Collect Accurate Data

    Availability across Brands and Categories

    When multiple items are moving through a supply chain, companies can easily run into inventory inaccuracies. Discrepancies between the values of your system and the actual inventory of products can lead to understocking or overstocking. The best way to avoid discrepancies in inventory is to invest in an inventory management tool that gives you real-time updates on your stock. This is applicable for offline retail businesses. 

    2. Managing eCommerce inventory

    Availability at Individual Product Level
    Availability at Individual Product level by regions

    Effective eCommerce inventory management is as important as making sure products are available in stores. Keeping track of your inventory levels and ensuring that you’re always well-stocked can avoid lost sales and keep your company running smoothly. Brands must ensure their stock is available across all the online platforms they sell. Access to real-time inventory data can help to keep a close eye on stock status across all marketplaces & retailers the product is available. Retailers also need to keep track of market trends to ensure they have the right inventory assortment to match customers’ demands. 

    3. Understand Consumer Demand

    The only way to accurately predict future demand is to rely on historical data about your customer purchase trends. What do your customers purchase during holiday seasons? What are the upcoming trends in your category? Having data-backed answers to such questions will help brands and retailers properly stock up their inventory.

    4. Adequate forecasting 

    Anticipating demand will help determine which products should be stocked during which seasons. Tracking past sales and metrics such as economic conditions, seasonality, peak buying months, and promotions will help brands predict demand. Analyzing such statistics will also help you get insights into the target market.

    Availability across regions

    5. Improve supplier relationships

    It’s important to rely on a supply chain that delivers your shipment promptly. In fact, you should foster close relationships with your suppliers to trim costs and improve stock availability. You should be able to share key details such as future demands, so suppliers can ensure timely delivery. 

    Availability Analysis
    Availability Analysis across Retailers and Categories

    Consequences of Inefficient Inventory Management

    What are the effects of overstocking?

    Tied-up cash: Money spent on overstocking is tied-up money that your company could have put to better use. You can use it to pay off debts, wages, and rent. Inventory often has a limited shelf life due to material degradation, changing consumer trends, spoilage, and obsolescence.

    Product expiration: If your brand offers time-sensitive goods or perishable items, overstocking can lead to product obsolescence and expiry. eCommerce platforms that also sell time-sensitive goods or grocery delivery apps are forced to sell products at below-margin prices to free up resources, leading to losses. 

    What are the effects of understocking?

    Poor customer experience: Poor product availability will lead to low customer satisfaction & dropping customer loyalty. 

    Missed sales: Customers could gravitate towards the competition to make their current purchase if a product is unavailable at your online store. The more freequent the stockouts, the more lost sales. 

    Conclusion

    To avoid the knock-on effects of overstocking and understocking, companies need a real-time view of their inventory, both online & offline. At DataWeave, we help companies decrease their latency period between stock replenishment and efficiently plan their supply chain. If you need help tracking your eCommerce product availability, reach out to the experts at DataWeave to know how we can help!

  • 5 Ways DataWeave Helps Brands Drive Growth With Amazon Ads

    5 Ways DataWeave Helps Brands Drive Growth With Amazon Ads

    Consumers are discovering and trialing new eCommerce marketplaces, brands and products at a faster rate than ever before, given the vast amount of choices encountered browsing for products online. A recent analysis shows how events like Amazon Prime Day, Black Friday, and Cyber Monday are especially fruitful for new-to-brand customer advertising, encouraging B2C marketers to increase their digital advertising spend to fuel product discovery, sales and market share for their brands.

    Amazon advertisers grow market share and brand loyalty with ecommerce intelligence
    DataWeave joins Amazon Advertising partner network

    The majority of eCommerce consumers are discovering products via relevant keywords attributable to their needs, with most clicks happening on page one results for the first few products listed. Simplifying the digital shopping experience is critical for brands to be in the consideration set for the majority of consumers who won’t venture past page one results. 

    An internal analysis conducted shows getting a product to page one on retailer websites can improve sales by as much as 50 percent, but figuring out the right levers to pull to get there organically—without paid advertising—is a real challenge, especially given fast-changing algorithms. While more than half of all retail related online browsing sessions are “organic”, sometimes brands need to boost their product visibility by investing in sponsored (paid) opportunities to improve a product’s rank.

    Data analytics can equip brands with intelligence to help them decide when, where, and how to make digital advertising investments profitably, while simultaneously acting on insights that help drive organic growth. Considering a majority of U.S. consumers begin their product discovery on marketplaces like Amazon, it makes sense for brands to prioritize digital advertising opportunities with Amazon.

    Maximize Return on Ad Spend (ROAS) with Amazon Ads

    Brands use Amazon Ads to drive brand awareness, acquire new customers, drive sales and gain market share, with the goal of furthering their marketing return on investment. Top performing advertisers average 40 percent greater year-on-year (YoY) sales growth, 50 percent greater YoY growth in customer product page viewership on Amazon, and 30 percent higher returns on ad spend (ROAS) with Amazon Ads, according to a recent analysis. Sponsored Products, Sponsored Brands, Amazon DSP and Sponsored Display are among the types of Amazon Ads options cited that produce maximum return.

    Ensuring your product listings appear at the top of page one results on Amazon for the most relevant discovery keywords is therefore the most important determinant for maximizing ROAS. DataWeave has become a vetted partner and measurement provider in the Amazon Advertising Partner Network, with the goal of supporting brands to optimize digital advertising campaigns by providing visibility to Digital Shelf Analytics (DSA) key performance indicators (KPIs), like Share of Search, Pricing and Product Availability, Content Audits, Ratings and Reviews, and Sales Performance and Market Share.

    Below is a summary of how our Digital Shelf solutions, in partnership with Amazon Ads, can improve the performance of your Amazon Ads campaigns

    1. Keyword Recommendations Improve Share of Search

    With the DataWeave Share of Search solution, brands can monitor their placement of both organic and paid discovery keywords relative to their competition. Once your keywords are determined, you are also provided a weighted Share of Search score that helps measure how well each keyword performs relative to product discoverability. Below is an example of insights you’d gain.

    Share of Keyword Search

    Brands can provide their own list of keywords to monitor, or through our Amazon Ads collaborative solution, learn which keywords are the “best” for them to measure in the realm of Amazon. Performance results are based on data that shows which keywords consumers are actually using when browsing online alongside other keywords brands request to measure. Users are able to see exactly which keywords are most popular, competitive (and even unexpected), and relevant at an Amazon Standard Identification Number (ASIN) level of granularity. 

    We can also estimate the degree of relevance and estimated traffic for the recommended keywords. Brands can then use these insights to adjust campaign strategies based on these parameters, which can boost product discoverability and rank visibility. A brand could assume people find its products by brand name, yet traffic insights may reveal a majority of people look for a generic product type before they end up buying that particular brand. 

    2. Content Audits Increase Discovery Relevancy Scores

    Strong product content is critical to succeeding on Amazon. Thorough, accurate, and descriptive content leads to better click through rates (CTR), conversion rates, more positive reviews, and fewer returns, which results in increased discoverability. DataWeave’s Content Audit solution reviews existing copy and images on a per-attribute basis to highlight any gaps essential to improving visibility, as seen in the example below.

    Content Analysis

    To further growth, it is equally as important that your product content aligns with your advertising strategy. With Amazon Ads partner add-on, our solution can also audit your content to measure how effectively you are incorporating Amazon Ads keywords into your product content to enhance discovery relevancy.

    3. Discover More Opportunities with Pricing and Product Availability Insights

    Quality content and keyword updates will only get you so far if your products are not consistently available and priced competitively. With DataWeave’s Pricing and Promotions and Product Availability modules, advertisers can monitor their selling prices and availability trends alongside their competitors to uncover more opportunities to incorporate into advertising campaigns, as seen in the Pricing and Promotions dashboard example below.

    Promotion Analysis

    Additionally, product targeting recommendations can be utilized to target a competitor’s ASIN that may be overpriced or that is having issues staying in stock. Alternatively, broaden your strategy to target specific brands, complementary products, or category listing pages.

    You can also create alerts on your own products to monitor when items are low on inventory or out of stock to ensure key products are consistently available when customers are shopping.

    4. Leverage Ratings and Reviews to Increase Conversion

    Product ratings and reviews are also a critical component to running a successful Amazon Ads campaign. A large number of reviews and a positive star rating will provide customers with the confidence to purchase, resulting in higher conversion rates. Conversely, negative feedback can have a detrimental impact, resulting in lost sales and wasted ad spend. DataWeave’s Ratings and Reviews module can help you monitor your reviews and extract attribute-level insights on your products. This information can then be utilized to further optimize your advertising strategy.

    If you see consistent feedback in your reviews on aspects of a product not meeting customer expectations, address them in your product content to prevent potential misplaced expectations. Alternatively, if customer reviews are raving about certain product features, ensure these are promoted and relevant keywords are populated throughout your descriptions and feature bullets. Below is an example of insights seen within the DSA Ratings & Reviews dashboard.

    Ratings and Reviews

    5. Correlate Digital Shelf KPIs to Sales Performance and Market Share

    The newest DSA module, Sales Performance and Market Share, provides SKU, sub-category, and brand-level sales and market share estimates on Amazon for brands and their competitors, via customer defined taxonomies, to easily benchmark performance results.

    This data can also be correlated with other Digital Shelf KPIs, like Content Audit and Product Availability, giving brands an easy way to check the effect of attribute changes and how they impact sales and market share. Similarly, brands can see how search rank, both organic and sponsored, affects sales and market share estimates.

    Understanding the correlation between your advertising campaigns and your Digital Shelf brand visibility will help you identify which areas to prioritize to drive sales and win more market share.

    Digital Shelf Insights Help Brands Win with Amazon Ads

    The need for access to flexible, actionable eCommerce insights is growing exponentially as a way to help brands drive growth, increase their Share of Voice, and to gain a competitive edge. As a result, more global brands are seeking Digital Shelf Analytics for access to near real-time marketplace changes and to develop data-driven growth strategies that leverage pricing, merchandising, and competitive insights at scale.

    By monitoring, measuring and analyzing key performance indicators (KPIs) like Sales Performance and Market Share, Share of Search, Content Audits, Product Availability, Pricing and Promotions and Ratings and Reviews alongside competitors, brands will know what actions to take to boost brand visibility, customer satisfaction, and online sales. 

    DataWeave’s acceptance into the Amazon Advertising Partner Network enables Amazon advertisers to effectively build their Amazon growth strategies and determine systems that enable faster and smarter advertising and marketing decision-making to optimize product discoverability and overall results.

    Connect with us now to learn how we can scale with your brand’s analytical needs, or for access to more details regarding our Amazon Ads Partnership or Digital Shelf solutions.

    UPDATED: Read the full press release here

  • 2021 Cost-Push Inflationary Trends Ran Rampant, Impacting Holiday Discounts

    2021 Cost-Push Inflationary Trends Ran Rampant, Impacting Holiday Discounts

    Business has been anything but usual this holiday season, especially in the digital retail world. The holiday hustle and bustle historically seen in stores was once again occurring online, but not as anticipated given the current strength of consumer demand and the reemergence of COVID-19 limiting in-store traffic. While ‘Cyber Weekend’, Thanksgiving through Cyber Monday, continues to further its importance to retailers and brands, this year’s performance fell short of expectation due to product shortages and earlier promotions that pulled forward holiday demand.

    Holiday promotions were seen beginning as early as October in order to compete with 2020 Prime Day sales, but discounting, pricing and availability took an opposite direction from usual. This shift influenced our team to get a jump start on our 2021 digital holiday analysis to assess how drastic the changes were versus 2020 activity, and to understand how much of this change has been influenced by inflationary pressures and product scarcity.

    Scarcity Becomes a Reality

    Our initial analysis started by reviewing year-over-year product availability and pricing changes from January through September 2021, leading up to the holiday season, as detailed in our 2021 Cyber Weekend Preliminary Insights blog. We reviewed popular holiday categories like apparel, electronics, and toys, to have a broad sense of notable trends seen consistently throughout various, applicable marketplaces. What we found was a consistent decline in product availability over the last six months compared to last year, alongside an increase in prices.

    Although retailers significantly improved stock availability in November and early December 2021, even digital commerce giants like Amazon and Target were challenged to maintain consistent product availability on their website as seen below. While small in magnitude, there is also a declining trend occurring again closer toward the end of our analysis period, post Cyber Weekend, across all websites included in our analysis.

    Inventory Availability 2021 Holidays
    Source: Commerce Intelligence – Product Availability insights for Home & Garden, Jewelry & Watches, Clothing & Shoes, Bed N Bath, Lighting & Ceiling Fans categories

    Greater Discounts, Higher Prices?

    With inflation at a thirty-nine year high, retailers and manufacturers have realized they can command higher prices without impacting demand as consumers have shown their willingness to pay the price, especially when threatened by product scarcity. Our assessment is that while some products and categories have responded drastically, manufacturers’ suggested retail prices (MSRPs) have increased nearly seven percent on average from January to December 2021. MSRP adjustments are not taken lightly either, as this is an indication increased prices will be part of a longer-term shift in product strategy.

    2021 MoM Retail Inflation Tracker
    Source: Commerce Intelligence – Pricing Insights for Bed & Bath, Electronics, Furniture, Healthy & Beauty, and Fashion categories on Amazon.com & Target.com each month in 2021 comparing price increases from January 2021 base

    Our 2021 pre-Cyber Weekend analysis reviewed MSRP changes for select categories (Bed & Bath, Electronics, Furniture, Healthy & Beauty, and Fashion) on Amazon and Target.com, and found around forty-eight percent of products on Amazon and thirty-five percent of products on Target.com have increased their MSRPs year-over-year, but kept pre-holiday discount percentages the same.

    Looking more specifically as to what year-over-year changes occurred on Black Friday in 2021, we observed MSRPs increasing across the board for all categories at various magnitudes. This indicates why 2021 discounts appeared to be greater than or equivalent to 2020 for many categories, when in reality consumers paid a higher price than they would have in 2020 for the same items.

    2021 Black Friday MSRP Increases
    Source: Commerce Intelligence – MSRP Pricing Insights for Bed & Bath, Electronics, Furniture, Healthy & Beauty, and Fashion categories on Black Friday November 27th, 2021, versus average MSRP pricing for the same SKU count from November 20-26th 2021

    On Amazon.com, categories like health & beauty have already increase MSRPs by a much greater percentage and magnitude versus Target.com leading up to and during Black Friday 2021, while other categories like furniture have increased MSRPs evenly on average across both retail websites. The below chart cites a few specific examples of year-over-year SKU-level MSRP, promotional price, and discount changes within found within the electronics, furniture, fashion, and health & beauty categories.

    Black Friday 2021 vs. 2020 SKU-level Price Changes
    Source: Commerce Intelligence – MSRP Pricing Insights for Bed & Bath, Electronics, Furniture, Healthy & Beauty, and Fashion categories on Black Friday November 27th, 2021, versus average MSRP pricing for the same SKUs on Black Friday November 26th, 2020.

    Fewer, but Deeper Discounts

    From October through early November 2021, fewer products were discounted compared to this same period in 2020, and the few that were saw much deeper discounts apart from the home improvement category. The most extreme example we saw in discounts offered was within furniture where only three percent of SKUs were on discount in 2021 compared to twenty-six percent in 2020. Interestingly, the magnitude of discount was also higher pre-Cyber Weekend 2021 versus 2020, but this trend was not exclusive to furniture and was also seen within electronics, health & beauty, and home improvement.

    Pre-Black Friday 2021 and 2020 SKUs on Discount and Magnitude
    Source: Commerce Intelligence – Pricing Insights for Bed & Bath, Electronics, Furniture, Healthy & Beauty, and Fashion categories on Amazon.com & Target.com Pre-Black Friday average selling price during November 20-26th 2021 versus average selling price from November 13-19th 2021 compared to Pre-Black Friday average selling price during November 19-25th 2020 versus average selling price from November 12-18th, 2020.

    Within the furniture category, the subcategories offering the greatest number of SKUs with price decreases on Black Friday 2021 were rugs by a wide margin, followed by cabinets, bed and bath, and entertainment units, but the magnitude of discounts offered were all under twenty percent.

    2021 Black Friday Furniture Category Price Decreases
    Source: Commerce Intelligence – Pricing Insights for Bed & Bath, Electronics, Furniture, Healthy & Beauty, and Fashion categories on Amazon.com and Target.com on Black Friday November 27th, 2021, versus average pricing for the same SKUs from Pre-Black Friday November 20-26th 2021 and Black Friday November 26th, 2020, versus average pricing for the same SKUs from Pre-Black Friday November 19th-25th 2020

    Accounting for this phenomenon could have been retailers’ attempts to clear inventory for SKUs which hadn’t sold even during the period of severe supply chain shortages. With more products selling at higher prices this year, retailers were also able to use fewer SKUs with greater discounts to attract buyer in hopes of filling their digital baskets with more full-priced goods, helping to protect margins heading in to Cyber Weekend. Scarcity threats also encouraged consumers to buy early, even when not on promotion, to ensure they would have gifts in time for the holidays.

    The same trends seen pre-Cyber Weekend 2021 were also seen on Black Friday with a year-over-year decrease in the percentage of SKUs offered on discount versus 2020, and steeper price reductions for the discounted products which can also be attributed to the increase in MSRPs.

    Black Friday 2021 and 2020 SKUs on Discount and Magnitude
    Source: Commerce Intelligence – Pricing Insights for Bed & Bath, Electronics, Furniture, Healthy & Beauty, and Fashion categories on Amazon.com and Target.com on Black Friday November 27th, 2021, versus average pricing for the same SKUs from Pre-Black Friday November 20-26th 2021 and Black Friday November 26th, 2020, versus average pricing for the same SKUs from Pre-Black Friday November 19th-25th 2020

    2021 Black Friday Price Increases?

    We all know Black Friday is all about price reductions, discounts and deals and so it’s rare to see actual price increases, yet for Black Friday 2021, trends ran counter to this. We observed price increases across all categories for around thirteen to nineteen percent of SKUs, with an average price increase of around fifteen percent in 2021 versus an average of only two percent in 2020.

    SKUs with Price Increases Black Friday 2021 and 2020
    Source: Commerce Intelligence – Pricing Insights for Bed & Bath, Electronics, Furniture, Healthy & Beauty, and Fashion categories on Amazon.com and Target.com on Black Friday November 27th, 2021, versus pricing for the same SKUs from Pre-Black Friday November 20-26th 2021 and Black Friday November 26th, 2020, versus average pricing for the same SKUs from Pre-Black Friday November 19th-25th 2020

    At an account level, we noticed a few interesting differences happening on Black Friday 2021 versus 2020 regarding category price changes. On Target.com, almost ninety percent of the bed and bath SKUs analyzed had a price change on Black Friday in 2021 versus 2020 with eighty-two percent presenting a higher price year-over-year versus only around seven percent showing a decrease, where on Amazon nearly forty-four percent of bed and bath SKUs showed an increase in price and around thirty-eight percent showed a decrease. Except for the health and beauty category on Target.com, more than half of the SKUs in each category saw a price increase on Black Friday versus a price decrease.

    2021 YoY Price Changes on Black Friday
    Source: Commerce Intelligence – Pricing Insights for Bed & Bath, Electronics, Furniture, Healthy & Beauty, and Fashion categories on Amazon.com and Target.com on Black Friday November 27th, 2021, versus average pricing for the same SKUs on Black Friday November 26th, 2020.

    The magnitude of year-over-year price changes seen on Black Friday 2021 was significant across all categories, but the magnitude of price increases found on Amazon.com within the health and beauty category outpaced the rest by far. We reviewed three hundred and sixty-five SKUs on Amazon.com within the health & beauty category and saw almost eighty-three percent of them had a price change with around thirty-one percent decreasing prices and around fifty-two percent increasing prices. This means that within the health & beauty category on Amazon.com, more than fifty percent of the SKUs tracked were sold at a one hundred and seventy-six percent higher price on average during Black Friday 2021 versus 2020.

    Magnitude of Black Friday 2021 Price Increases
    Source: Commerce Intelligence – Pricing Insights for Bed & Bath, Electronics, Furniture, Healthy & Beauty, and Fashion categories on Amazon.com and Target.com on Black Friday November 27th, 2021, versus average pricing for the same SKUs on Black Friday November 26th, 2020.

    The subcategories offering the greatest number of SKUs with price increases on Black Friday 2021 were cameras, followed by men’s fragrances, laptops, and desktops & accessories, but the magnitude of discounts offered were all under ten percent.

    2021 Subcategories with Price Increases during Black Friday
    Source: Commerce Intelligence – Pricing Insights for Bed & Bath, Electronics, Furniture, Healthy & Beauty, and Fashion categories on Amazon.com and Target.com on Black Friday November 27th, 2021, versus pricing for the same SKUs from Pre-Black Friday November 20-26th 2021 and Black Friday November 26th, 2020, versus average pricing for the same SKUs from Pre-Black Friday November 19th-25th 2020

    The Aftermath Post-2021 Cyber Weekend

    Extending this analysis beyond the holiday weekend, we analyzed price change activity from December third through the ninth across the top US retailers (chart below) and found that price decreases have been very minimal, comparatively speaking. Though there was a spike in number of price decreases from December 8th to the 9th, the percentage of SKUs with price decreases was still very low (less than three percent). We anticipate this trend will continue into 2022.

    SKUs with Price Decrease Post Cyber Weekend 2021
    Source: Commerce Intelligence – Pricing insights for Home & Garden, Jewelry & Watches, Clothing & Shoes, Bed N Bath, Lighting & Ceiling Fans categories

    A Sign of Things to Come

    A confluence of inflationary trends, product shortages and consumer liquidity have driven many marketplace changes to occur simultaneously. Government programs in the form of stimulus checks, have put extra money in consumers’ hands, and so they’ve been more willing to spend. That, coupled with the shock in the supply chain, has motivated people to buy far ahead of the 2021 holiday season. Hence, retailers have needed to rely much less on across-the-board discounts. Promotions have been more strategic – we’ve seen deeper discounts over fewer products, likely used to draw consumers in to buy certain items, and once they’re there, customers are buying everything else at a non-discount level. When these factors once again normalize, we could see a return to the “race to the bottom” that has occurred since the financial crisis of 2008-2009, but for once, retailers may be able to maintain some pricing power as the 2021 holiday shopping season played out.

    Even though performance was not as anticipated and holiday sales did not grow as rapidly as they did in 2020, Cyber Monday was still the greatest online shopping day in 2021. Through it all, retailers managed to keep their digital shelves stocked and orders filled in time for the holidays for the most part, running the risk of housing aged inventory if goods didn’t arrive in time. Despite predictions for steep promotions in January 2022, with supply chains still challenged and inflationary pressures still full steam ahead, we don’t anticipate much in the way of enhanced discounts to continue beyond the holidays.

    Access to these types of real-time digital marketplace insights can enable retailers and brands to make strategic decisions like how and when to address inflationary pressures, while also supporting many other day-to-day operations and help drive profitable growth in an intensifying competitive environment. Continue to follow us in the coming weeks for a detailed 2021 year-end review across more retailers and categories. Be sure to reach out to our Retail Analytics experts for access to more details regarding the above analysis.         

  • How Brands Boost Sales & Satisfaction on Walmart.com

    How Brands Boost Sales & Satisfaction on Walmart.com

    The explosive growth of online shopping has forced brands to re-examine their e-commerce processes to stay competitive and profitable. In particular, out-of-stocks are a common, costly retail challenge, as product shortages frustrate online shoppers – and even prompt them to leave brands.

    According to McKinsey & Company, forty-eight percent of consumers switched to a different brand in 2020 because those products were in stock. Among these consumers, seventy-three percent plan to keep using the new brands, linking product availability gaps to the erosion of sales and loyalty. Conversely, brands with effective inventory planning and replenishment can keep items in stock, drive sales and improve the customer experience.

    Retailers like Walmart, collaborating with these brands to meet customer demand, are still facing inventory challenges but, as noted in 2021 Q3 earnings, inventory was up almost twelve percent year-over-year as they worked to stay ahead of increased holiday demand. They have also adjusted in-store operations to accommodate ever-growing e-commerce demands, especially within grocery-centric categories, as digital grocery buyers now amount to more than half the U.S. population.

    Maximizing Conversions with Category Insights

    Walmart’s dot-com strategy is paying off in spades, considering they surpassed Amazon as the leading U.S. grocery e-commerce retailer in 2020 and grew another forty-one percent in Q3, 2021. Our team has been actively tracking digital shelf analytic KPIs on Walmart.com to identify inventory and promotional performance improvement opportunities at a category level to support brands in capitalizing on these digital growth opportunities.

    The latest analysis is summarized below, reviewing average category availability and discount trends occurring each week of the month, from May to August 2021, at a category level. A recent report found the 29th of each month to be the busiest day for online sales because consumers often get paid at the end of the month, which made DataWeave analysts wonder:

    • Which categories are maximizing their growth potential on Walmart.com and where are the greatest opportunities for improvement during periods of increased demand?
    • How do increased demand periods (like payday) impact category online availability?
    • Are category promotions offered at the right times throughout the month to best support demand?

    When Seasonal Demand for Groceries and Payday Merge

    Across all Walmart.com food categories tracked, Week 5 – where payday commonly falls for most consumers, had the lowest average product availability, while Week 4 had the highest average product availability for all categories except Deli and Fruits and Vegetables. These findings may inspire Walmart’s brand partners to rethink their inventory and assortment planning, replenishment and even pricing efforts to maintain a healthy stock closer toward the end of the month to match higher demand.

    The categories with the greatest difference in average availability during Week 5 versus the rest of the month were Snacks & Candy, Beverages and Alcohol, indicating consumers consistently made these types of purchases closest to payday, when income was highest throughout the month. Seasonality is a secondary factor that influenced demand for these items given events like Memorial Day, Fourth of July, Summer Break, and Back-to-School shopping all took place during our analysis. Additionally, most holidays overlapped payday, which also furthered Week 5 demand.

    Source: DataWeave Digital Shelf Analytics for Brands – Category average availability percentages from May to August 2021 between Week 1 (the 1st to the 7th day of the month) and Week 5 (the 29th, 30th and 31st day of the month).

    Coupling availability with discounts allows us to consider whether consumers buy more in Week 5 due to high discounts or increased purchasing power, or both. In reviewing the average category discounts offered within the same grocery-centric categories analyzed above, we found almost every grocery category showed a higher discount in Week 5 compared to the rest of the month, except for Bread & Bakery and Alcohol.

    Source: DataWeave Digital Shelf Analytics for Brands – Category average discount percentages from May to August 2021 between Week 1 (the 1st to the 7th day of the month) and Week 5 (the 29th, 30th and 31st day of the month).

    Regarding Alcohol, during Week 4, when average availability was the highest, the average discounts offered were the lowest. This can indicate inventory was primed for payday shoppers (and the holidays of course). Bread & Bakery offers the greatest average discounts when inventory levels are lowest on average, indicating Week 3 is a great time to stock up, while Week 4 might be a great time to buy the freshest inventory.

    The greatest average discounts in Week 5 were in Snacks & Candy, Pantry and Fruits & Vegetables. Deeper discounts for Snacks & Candy in Week 5 may have helped brands compete for consumers’ disposable income despite being a discretionary category. Pantry brands’ discounts may have reflected a need to compete for shoppers’ attention. During this period, consumers were out of the house more and less likely to use these grocery staples compared to earlier lockdown periods and cooler months.

    Making Specialty Categories and Health a Priority for Online Shoppers

    Interestingly, the only two categories where inventory was higher in Week 5 versus all other weeks each month were ‘Special Diets’ foods and ‘Summer Flavors’, although ‘Special Diets’ foods consistently maintained the lowest level of average availability each week across all food categories analyzed. This consistent lack of inventory could indicate a great opportunity for brands to increase inventory for dietary products sold on Walmart.com.

    Source: DataWeave Digital Shelf Analytics for Brands – Category average availability percentages from May to August 2021 between Week 1 (the 1st to the 7th day of the month) and Week 5 (the 29th, 30th and 31st day of the month).

    The average availability for ‘Summer Flavors’ foods verifies brands are maintaining a solid replenishment strategy for these seasonal items, and a high likelihood consumers will happily find what they need to plan their Summer gatherings on Walmart.com. One alarming factor we found was the change in average discounts offered during Week 5 versus Weeks 1 through 4, indicating promotions surrounding payday may be driving sales volume versus organic demand.

    Source: DataWeave Digital Shelf Analytics for Brands – Category average discount percentages from May to August 2021 between Week 1 (the 1st to the 7th day of the month) and Week 5 (the 29th, 30th and 31st day of the month).

    Digital Growth Opportunity in Meal Kits and Kids’ Meals

    Two categories primed for growth, according to Statista, are meal kits and kids’ food and beverages. Their research indicates retail sales for kids’ food has grown steadily year-over-year since 2013, and a recent report also indicates meal kit sales are expected to more than double 2017 sales in 2022, reaching $11.6 billion in the U.S., spurred by pandemic-induced demand. A concerning find in our research indicates both categories, ‘Easy Meal Solutions’ and ‘Kid Friendly Foods’ on Walmart.com, showed great volatility when it comes to in-stock availability. For example, in Week 1, ‘Easy Meal Solutions’ had an average availability nearly half the average of the rest of the month (around nineteen percent versus nearly thirty-eight percent), and in Week 5, payday week, ‘Kid Friendly Foods’ saw the biggest drop in average availability compared to Weeks 1 through 4 (over sixty-seven percent versus seventy-five percent) indicating supply may not be keeping up with the heightened demand.

    Source: DataWeave Digital Shelf Analytics for Brands – Category average availability percentages from May to August 2021 between Week 1 (the 1st to the 7th day of the month) and Week 5 (the 29th, 30th and 31st day of the month).

    The heightened average discounts offered during Week 5 for ‘Baby’ and ‘Pets’ items indicate two categories consumers will most likely stock up on during payday.

    Source: DataWeave Digital Shelf Analytics for Brands – Category average discount percentages from May to August 2021 between Week 1 (the 1st to the 7th day of the month) and Week 5 (the 29th, 30th and 31st day of the month).

    Back to School Stock-Outs

    U.S. retail sales unexpectedly increased in August, likely boosted by back-to-school shopping and child tax credit payments. Meanwhile, product shortages and other supply chain issues slowed 2021’s back-to-school sales, possibly affecting school supplies’ and clothing availability on Walmart.com. According to our analysis, the average product availability in Walmart.com’s school supplies category fell from over sixty-two percent during Weeks 1 through 4 to nearly forty-two percent in Week 5.

    Warmer weather, seasonal events, reduced lockdowns, and vaccination efforts led more Americans to resume in-person socializing, giving reason to update their spring and summer wardrobes. In July, Forbes shared that three-quarters of shoppers are purchasing apparel, accessories and shoes the most. On average, only around sixty-three percent of clothing items were available on Walmart.com during Weeks 1 through 4. However, in Week 5, that figure plummeted to just over thirty-eight percent, the most significant drop among all categories.

    Source: DataWeave Digital Shelf Analytics for Brands – Category average availability percentages from May to August 2021 between Week 1 (the 1st to the 7th day of the month) and Week 5 (the 29th, 30th and 31st day of the month).

    Demand for new fashion remained high throughout this period, seemingly fueled organically, as only moderate additional discounts took place in Week 5, and although the average discount on school supplies was only around twenty-seven percent during Weeks 1 through 4, it surged to just over forty-seven percent in Week 5. Generous additional discounts in Week 5 may have inspired online shoppers to shift spending from clothing to school supplies in late July and August ahead of students’ return to the classroom.

    Source: DataWeave Digital Shelf Analytics for Brands – Category average discount percentages from May to August 2021 between Week 1 (the 1st to the 7th day of the month) and Week 5 (the 29th, 30th and 31st day of the month).

    Prioritizing Product Availability with Digital Advertising Strategies

    Seventy-eight percent of B2C marketers increased their 2021 digital advertising spend to fuel online product discoverability (Share of Search), and sales and market share, but out-of-stock experiences simultaneously surged 172% this year from pre-pandemic levels. Paying for ads that drive traffic to your out-of-stock products can be as detrimental to your brand as a bad user experience. Our review of the ‘Featured Products’ sold on Walmart.com show consistent, low-levels of product availability each week throughout the months reviewed.

    Source: DataWeave Digital Shelf Analytics for Brands – Category average availability percentages from May to August 2021 between Week 1 (the 1st to the 7th day of the month) and Week 5 (the 29th, 30th and 31st day of the month).

    Additionally, the average discount offered on these products tended to be higher than most other categories reviewed, indicating brands participating in the featured product section of the website were not only investing in digital ads, but also doubling down with promotional activity as well.

    Source: DataWeave Digital Shelf Analytics for Brands – Category average discount percentages from May to August 2021 between Week 1 (the 1st to the 7th day of the month) and Week 5 (the 29th, 30th and 31st day of the month).

    How Brands can Replenish Their Digital Shelf

    It is well known just how important it is to have products available during the right time of day, week, month, or season to improve customer satisfaction rates, but with your e-commerce store open 24/7 and omnichannel fulfillment strategies in place, it drastically changes the way in which strategic execution is prioritized for a retailer to reduce basket abandonment and for brands to build loyalty.

    Our greatest takeaway from this analysis is realizing how crucial it is for brands to proactively track product availability and competitive pricing insights to stay ahead of the curve and achieve their digital growth goals. Early visibility to stock replenishment could help brands align with heightened cyclical and seasonal demand to avoid out-of-stocks and grow e-commerce sales.

    This is why more leading brands now rely on our Digital Shelf Analytics solutions, including Pricing and Availability insights, to keep eCommerce planning agile, to maximize online conversions, and ultimately maintain shopper satisfaction and loyalty.

  • How Brands Can Outperform Rivals With Next-Gen Digital Shelf Analytics

    How Brands Can Outperform Rivals With Next-Gen Digital Shelf Analytics

    As eCommerce grows in complexity, brands need new ways to grow sales and market share. Right now, brands face urgent market pressures like out-of-stocks, an influx of new competition and rising inflation, all of which erode profitability. As online marketplaces mature, more brands need to make daily changes to their digital marketing strategies in response to these market pressures, shifts in demand, and competitive trends.

    eMarketer forecasts 2021 U.S. eCommerce will rise nearly 18% year-over-year (vs. 6.3% for brick-and-mortar), led by apparel and accessories, furniture, food and beverage, and health and personal care. The eCommerce industry is also undergoing fundamental changes with newer entities emerging and traditional business models evolving to adapt to the changed environment. For example, sales for delivery intermediaries such as Doordash, Instacart, Shipt, and Uber have gone from $8.8 billion in 2019 to an estimated $35.3 billion by the end of 2021. Similarly, many brands have established or are building out a Direct to Consumer (D2C) model so they can fully own and control their customer’s experiences.

    In response, DataWeave has launched the next generation of our Digital Shelf Analytics suite to help brands across retail categories directly address today’s costly market risks to drive eCommerce growth and gain a competitive advantage.

    Our new enhancements help brands improve online search rank visibility and quantify the impact of digital investments – especially in time for the busy holiday season.”  
    ~ Karthik Bettadapura, CEO and co-founder, DataWeave

    The latest product enhancements provide brands access to tailored dashboard views that track KPI achievements and trigger actionable alerts to improve online search rank visibility, protect product availability and optimize share of search 24/7. Dataweave’s Digital Shelf Analytics platform works seamlessly across all forms of eCommerce platforms and models – marketplaces, D2C websites and delivery intermediaries.

    Dashboard for Multiple Functions

    While all brands share a common objective of increasing sales and market share, their internal teams are often challenged to communicate and collaborate, given differing needs for competitive and performance data across varying job functions. As a result, teams face pressure to quickly grasp market trends and identify what’s holding their brands back.

    In response, DataWeave now offers executive-level and customized scorecard views, tailored to each user’s job function, with the ability to measure and assess marketplace changes across a growing list of online retail channels for metrics that matter most to each user. This enhancement enables data democratization and internal alignment to support goal achievement, such as boosting share of category and content effectiveness. The KPIs show aggregated trends, plus granular reasons that help to explain why and where brands can improve.

    Brands gain versatile insights serving users from executives to analysts and brand and customer managers.

    Prioritized, Actionable Insights

    As brands digitize more of their eCommerce and digital marketing processes, they accumulate an abundance of data to analyze to uncover actionable insights. This deluge of data makes it a challenge for brands to know exactly where to begin, create a strategy and determine the right KPIs to set to measure goal accomplishment.

    DataWeave’s Digital Shelf Analytics tool enables brands to effectively build a competitive online growth strategy. To boost online discoverability (Share of Search), brands can define their own product taxonomies across billions of data points aggregated across thousands of retailer websites. They can also create customized KPIs that track progress toward goal accomplishment, with the added capability of seeing recommended courses of action to take via email alerts when brands need to adjust their eCommerce plans for agility.

    “Brands need an integrated view of how to improve their discoverability
    and share of search by considering all touchpoints in the digital commerce ecosystem.”

    ~ Karthik Bettadapura, CEO and co-founder, DataWeave

    Of vital importance, amid today’s global supply chain challenges, brands gain detailed analysis on product inventory and availability, as well as specific insights and alerts that prompt them to solve out-of-stocks faster, which Deloitte reports is a growing concern of consumers (75% are worried about out-of-stocks) this holiday season.

    User and system generated alerts provide clarity to actionable steps to improving eCommerce effectiveness.
    You also have visibility to store-level product availability, and are alerted to recurring out-of-stock experiences.

    Scalable Insights – From Bird’s Eye to Granular Views

    DataWeave’s Digital Shelf Analytics allows brands to achieve data accuracy at scale, including reliable insights from a top-down and bottom-up perspective. For example, you can see a granular view of one SKUs product content alongside availability, or you can monitor a group of SKUs, say your best selling ones, at a higher level view with the ability to drill down into more detail.

    Brands can access flexible insights, ranging from strategic overviews to finer details explaining performance results.

    Many brands struggle with an inability to scale from a hyper-local eCommerce strategy to a global strategy. Most tools available on the market solve for one or the other, addressing opportunities at either a store-level basis or top-down basis – but not both.

    According to research by Boston Consulting Group and Google, advanced analytics and AI can drive more than 10% of sales growth for consumer packaged goods (CPG) companies, of which 5% comes directly from marketing. With DataWeave’s advanced analytics, AI and scalable insights, brands can set and follow global strategies while executing changes at a hyper-local level, using root-cause analysis to drill deeper into problems to find out why they are occurring.

    As more brands embrace eCommerce and many retailers localize their online assortment strategies, the need for analytical flexibility and granular visibility to insights becomes increasingly important. Google reports that search terms “near me” and “where to buy” have increased by more than 200% among mobile users in the last few years, as consumers seek to buy online locally.

    e-Retailers are now fine-tuning merchandising and promotional strategies at a hyper-local level based on differences seen in consumer’s localized search preferences, and DataWeave’s Digital Shelf Analytics solution provides brands visibility to retailer execution changes in near real-time.

    Competitive Benchmarking

    Brand leaders cannot make sound decisions without considering external factors in the competitive landscape, including rival brands’ pricing, promotion, content, availability, ratings and reviews, and retailer assortment. Dataweave’s Digital Shelf Analytics solution allows you to monitor share of search, search rankings and compare content (assessing attributes like number of images, presence of video, image resolution, etc.) across all competitors, which helps brands make more informed marketing decisions.

    Brands are also provided visibility into competitive insights at a granular level, allowing them to make actionable changes to their strategies to stay ahead of competitors’ moves. A new module called ‘Sales and Share’ now enables brands to benchmark sales performance alongside rivals’ and measure market share changes over time to evaluate and improve competitive positioning.

    Monitor competitive activity, spot emerging threats and immediately see how your performance compares to all rivals’, targeting ways to outmaneuver the competition.

    Sales & Market Share Estimates Correlated with Digital Shelf KPIs

    In a brick-and-mortar world, brands often use point of sale (POS) based measurement solutions from third party providers, such as Nielsen, to estimate market share. In the digital world, it is extremely difficult to get such estimates given the number of ways online orders are fulfilled by retailers and obtained by consumers. Dataweave’s Digital Shelf Analytics solution now provides sales and market share estimates via customer defined taxonomy, for large retailers like Amazon. Competitive sales and market share estimates can also be obtained at a SKU level so brands can easily benchmark their performance results.

    Additionally, sales and market share data can also be correlated with digital shelf KPIs. This gives an easy way for brands to check the effect of changes made to attributes, such as content and/or product availability, and how the changes impact sales and market share. Similarly, brands can see how modified search efforts, both organic and sponsored, correspond to changes in sales and market share estimates.

    Take Your Digital Shelf Growth to the Next Level

    The importance of accessing flexible, actionable insights and responding in real-time is growing exponentially as online is poised to account for an increasing proportion of brands’ total sales. With 24/7 digital shelf accessibility among consumers comes 24/7 visibility and the responsibility for brands to address sales and digital marketing opportunities in real-time to attract and serve online shoppers around the clock.

    Brands are turning to data analytics to address these new business opportunities, enhance customer satisfaction and loyalty, drive growth and gain a competitive advantage. Companies that adopt data-driven marketing strategies are six times more likely to be profitable year-over-year, and DataWeave is here to help your organization adopt these practices. To capitalize on the global online shopping boom, brands must invest in a digital shelf analytics solution now to effectively build their growth strategies and track measurable KPIs.

    DataWeave’s next-gen Digital Shelf Analytics enhancements now further a brand’s ability to monitor, analyze, and determine systems that enable faster and smarter decision-making and sales performance optimization. The results delight consumers by helping them find products they’re searching for, which boosts brand trust.

    Connect with us to learn how we can scale with your brand’s analytical needs. No project or region is too big or small, and we can start where you want and scale up to help you stay agile and competitive.

  • Online Halloween Shopping Is Here to Stay – Winning Share of Search

    Online Halloween Shopping Is Here to Stay – Winning Share of Search

    Lessons from Kroger, Albertson’s, and Safeway’s Optimized Online Positioning   

    As consumers continue their migration to online shopping through and after the pandemic, Halloween shopping is no exception. 

    If that’s the new paradigm, what clues should retailers and brands be looking for to enhance their sales? With Halloween around the corner, the analyst team at DataWeave wanted to see how successfully grocers are partnering with brands to prepare for the influx of online Halloween shoppers. We tracked insights from September 14 to 24, 2021, using data from Kroger, Albertson’s, and Safeway websites to understand the preparedness of each retailer, their partnered brands, and how their online strategies compare with one another.

    There are hundreds of ways for a consumer to search for a brand’s products online and of critical importance, almost 50 percent of traffic across the top 1000 retailers come through search. At the same time, consumers are becoming less brand conscious. This is a significant development, and there are significant ramifications to consumers searching for products using generic category specific keywords without including brand names in the search.  Consequently, we can’t sufficiently stress how understanding online channel experiences is critical to successful outcomes. Retailers and brands alike need an integrated view of how to improve their discoverability and share of search by considering all touchpoints in the digital commerce ecosystem.

    The Importance of Product Descriptions, Assortment, Sizes, Price Points

    With 75 percent of people never scrolling past the first page of a website when searching for the goods they desire, getting products to page one is imperative to a brand’s success. While in-store, festive displays will help drive traffic and availability awareness, the ‘digital shelf’ is a totally different locus of opportunity. Here, brands rely on proper product descriptions, the right assortment, sizes, and competitive price points to stand out among the crowd and modify their positioning, given each retailer’s consumer base and assorted competitive brands.

    Optimizing the Digital Shelf and leading Share of Search for page one across all retail websites isn’t achievable overnight, but it is never too early or too late to start, given the 24/7 visibility your products have online. When it comes to Halloween candies, confectionery brands must consider many factors when differentiating their online positioning, such as finding the ‘sweet spot’ for pricing, size, and variety within each product offered, and knowing the right and wrong times to drive promotions. Additional elements to consider when introducing seasonal candies include cannibalization of non-holiday inventory, which can increase spoilage for aged inventory, or if holiday items are successful, could cause an abundance of markdown items to be sold before replacement inventory can be ordered.

    To better understand what retailers are doing—or should be doing—to optimize their Halloween holiday sales, we turned to our DataWeave Digital Shelf Analytics data to answer these questions:

    • Which brands and products are dominating “Share of Search” page one results across all three retailer websites?
    • How do discounts and promotions vary among candy brands and retailers?
    • How does each retailer use Halloween-specific and ‘variety’ labeling within the product descriptor to differentiate their holiday season assortment?
    • What sizes of candy packages is each retailer offering, and how does this play out in online positioning?

    Winning Candy Brands

    Which Halloween candies are people searching for—and presumably buying? Our data shows that Hershey’s branded candies achieved the greatest page one ‘Share of Search’ results across all three retailers’ websites—Albertson’s, Kroger and Safeway. This was unsurprising, given their total SKU count as well as the brand loyalty Hershey’s steadily maintains throughout the year. There is a high likelihood of consumers buying what they see on page one, so in our analysis, Hershey’s has the best chance of ‘winning’ this holiday season within all three of these retail channels. 

    That said, looking more specifically at how candy items are labeled and bundled adds another layer of insight to how candy brands are performing at each of these retailers.

    Historically speaking, Snickers is almost always within the top five confectionery brands sold during the Halloween season, but with the migration of more consumers shopping online, Mars may be leaving opportunity on the table this year. Our data shows that Snickers had the lowest Share of Search percentage on page one results on Safeway.com and Albertson’s.com for brands carrying 8 or more SKUs each, indicating they will most likely not make the first page results—and therefore may end up as a clearance item after Halloween if relying on online promotional efforts to achieve sales goals.

    Source: DataWeave’s Digital Shelf Analytics Solution: Data aggregated from 9/14/21-9/24/21 for Albertson’s.com and Kroger.com, and 9/17-9/24 for Safeway.com; Analysis was conducted reviewing product information for items falling within the ‘Halloween Candy’ listing category

    What Size Candy Packages Are Retailers Carrying/Betting On?

    For example, Albertsons.com and Safeway.com’s assortment includes 124 SKUs and 108 SKUs respectively with most of those items falling within the 5 to 16-ounce (averaging 25 percent) and 32 to 64-ounce (averaging 29 percent) sizes, Kroger.com is betting on a ‘smaller is better’ strategy, with a majority (63 percent) of their candies sold in the 5 to 16-ounce package size. 

    The average Hershey candies available through all three retailers happen to be much greater in size and price point, on average, than other top ranked items, and while these larger items appear to mostly be variety packs, a majority are not labeled as ‘Halloween’ candy.

    Source: DataWeave’s Digital Shelf Analytics Solution: Data aggregated from 9/14/21-9/24/21 for Albertson’s.com and Kroger.com, and 9/17-9/24 for Safeway.com; Analysis was conducted reviewing product information for items falling within the ‘Halloween Candy’ listing category

    How Important Is Halloween-Specific Branding?

    Our data shows that Kroger.com included the name ‘Halloween’ within the product description for most (around 80 percent) of the candies sized 16 ounces or smaller, and overall have labeled more than two-thirds of their total candy items sold as ‘Halloween.’ This indicates they are staged well for the peak of the seasonal demand and anticipate their shoppers to buy smaller unit sizes, comparatively speaking.

    Source: DataWeave’s Digital Shelf Analytics Solution: Data aggregated from 9/14/21-9/24/21 for Albertson’s.com and Kroger.com, and 9/17-9/24 for Safeway.com; Analysis was conducted reviewing product information for items falling within the ‘Halloween Candy’ listing category

    Taking a closer look at all items positioned as ‘Halloween’ across the three retailer websites, Hershey’s brand Reese’s is set for success at Kroger.com for total Share of Search percentage, considering they carry eight Reese’s, non-variety SKUs. Competing in the audience of others leading with variety packs indicates the weight the Reese’s brand carries and also indicates they will also have a great likelihood of success for increased sales this Halloween season. 

    Mars M&M’s brand came out on top at Safeway.com and Albertsons.com within the ‘Halloween’ labeled SKUs, but a majority (around 70 percent) of these are variety packs that leads with the M&M’s brand versus an M&M’s only bag.

    Source: DataWeave’s Digital Shelf Analytics Solution: Data aggregated from 9/14/21-9/24/21 for Albertson’s.com and Kroger.com, and 9/17-9/24 for Safeway.com; Analysis was conducted reviewing product information for items falling within the ‘Halloween Candy’ listing category

    How Much (Less) Are People Paying for Halloween Candy?

    To determine whether candy promotions are increasing Share of Search, DataWeave measured the average promotional discount these retailers and top candy brands are offering online. When looking only at brands offering discounts on 100% of the SKUs they carry within each retailer, Brach’s brand is performing best on Albertson’s.com, and Hershey products are positioned at the top for Kroger.com and Safeway.com. 

    Source: DataWeave’s Digital Shelf Analytics Solution: Data aggregated from 9/14/21-9/24/21 for Albertson’s.com and Kroger.com, and 9/17-9/24 for Safeway.com; Analysis was conducted reviewing product information for items falling within the ‘Halloween Candy’ listing category

    Do Consumers Search For ‘Variety’ Candy Bags, or One-Product-Only Bags?

    DataWeave tagged the word ‘variety’ and found that across all three retailers’ websites, non-variety candy bags take up a greater overall Share of Search than ‘variety’ bags. Either this isn’t an important search word or retailers could try adding ‘variety’ to product descriptions to increase Share of Search.

    Source: DataWeave’s Digital Shelf Analytics Solution: Data aggregated from 9/14/21-9/24/21 for Albertson’s.com and Kroger.com, and 9/17-9/24 for Safeway.com; Analysis was conducted reviewing product information for items falling within the ‘Halloween Candy’ listing category

    Time to Make a Change

    Getting products to page one on retailers’ websites can improve sales by as much as 50 percent, but determining the right levers to pull to get there is no easy feat. Based on our preliminary analysis of Halloween insights, our advice to confectionery brands this Halloween season is to invest now to increase visibility to the fast-changing market, to get orders right and on time, establish effective pricing and promotional plans, and get the right candies in stock, to the right locations. Retailers able to get an end-to-end view of the online competitive landscape will be able to make calculated marketing decisions that stand to help generate growth and profitability.

    We are now within the prime Halloween shopping season, given that 55 percent of candy sales usually happen in the last two weeks of October (According to Timothy LeBel, President of U.S. Sales for Mars Wrigley). With online sales still growing as consumers have shifted their comfort level in buying more online, retailers should be looking for ways to optimize their product positioning, increase their Share of Search, to improve the likelihood of consumers ordering their brand’s candy to ply those Trick-or-Treaters knocking on their doors.

    About DataWeave

    DataWeave is a leading provider of advanced sales optimization solutions for e-commerce businesses, consumer brands and marketplaces. The AI-driven proprietary technology and language-agnostic platform aggregates consumable and actionable Competitive Intelligence across 500+ billion data points globally, in 25+ languages, with insights to performance for more than 400,000 brands across 1,500+ websites tracked across 20+ verticals, to ensure online performance is always optimized.


  • Prep, Prime and Plenish For Prime Day India 2021

    Prep, Prime and Plenish For Prime Day India 2021

    After demonetization, Covid-19 has probably been one of the worst scenarios for the retail sector in India. The entire nation went into lockdown and the industry noticed some big changes around the entire globe. From remote working to shopping, everything turned to digital and Bharat witnessed new trends across payments, e-commerce, and more.

    Not surprisingly, D2C has been a favorite amongst businesses thanks to its agility. More than 800 brands have joined the direct-to-consumer bandwagon in order to reach their audience quickly and in an efficient way. Where brands such as MamaEarth, Clovia, Bewakoof, Lenskart have been some of the popular brands in the sector, last year even traditional giants such as LG, Ajanta-Orpat, Piaggio, Havells also adopted the D2C model.

    Ramp up in D2c Brand Activity
    Source: Avendus

    Brands are more focused on making the user experience better and it will be safe to say that this year, D2C will be the highlight of the e-tail ecosystem. Naturally, e-commerce giants such as Amazon, Flipkart have played an important role in this revolution. Amazon, which has over 100 Million registered users in India, announced that it will host its flagship event, Prime Day this year on 26-27 July.

    Let’s look at some of the things brands can do to leave their mark this Prime Day in India.

    Digital Shelf Optimisation: Need Of The Hour

    Given that the pandemic has accelerated online shopping nationwide, Digital Shelf Optimisation (DSO) should be the key lever for any brand to accelerate its digital commerce growth. Events such as Prime day are significant for a brand’s reputation, customer experience, overall sales and can help you build a loyal customer base.

    With that in mind, we have prepared a list of things to consider, in order to help brands stand out from the crowd.

    1. Pricing And Discounting

    Pricing and Discounting
    Pricing and Discounting: Offer discounts and deals to attract customers.

    It is obvious that Prime Day will see a tremendous influx of shoppers. Noticeably, impulsive shopping is a trend during these sales, as everybody loves a good product for a discounted price. Make sure to offer discounts and deals to attract customers.

    Another suggestion is to keep a track of competition, their pricing and promotional strategies and keep an eye on price changes happening across relevant categories or SKU’s (Stock Keeping Unit). Competition analysis is a powerful tool and having accurate data on their sales, market share is a critical part of this.

    2. Optimise Product Visibility

    Product Visibility
    Product Visibility: Lakhs of sellers & brands are vying for the same spot

    Marketplaces are crowded, and getting discovered is already hard. Lakhs of sellers & brands are vying for the same spot. And with more people moving online, it’s going to get increasingly harder for brands to stand out. Optimize your search visibility using the right keywords relevant to your brand, strategically spend on Sponsored Ads to secure high visibility placements on Amazon and lastly make sure your online product packaging via product pages contain attractive images to position your product in the best light.

    3. Product Availability

    Product Availability
    Product Availability: Have plenty of stock available

    Make sure to have plenty of stock available as shoppers are likely to turn to other brands/products in case your product is unavailable. Also, keep in mind that people are generally more open to trying new products during a sale as it offers discounts. Track your products’ stock status to make sure they’re available 24 x 7.

    As the foremost goal during sales is to move inventory as much as possible, offering a large assortment is a good idea. Create product bundles that complement each other.

    4. Use A + Content

    A+ Content
    A+ Content is King: The new age packaging for your product

    Content is the new age packaging for your product. Content is crucial to change consumer shortlists & considerations into conversions.

    Your content tells your product story & gives customers the information they need to make a purchase. Use high resolution and accurate images, add features, benefits, USPs of your products clearly. It is advisable to use more than one image to show your product more clearly. Make sure all your brand & product pages on Amazon are optimized.

    5. Ratings And Reviews

    Ratings and Reviews
    Reviews and Ratings: Feedback is a very important e-commerce tool.

    Why would shoppers rely on word-of-mouth when they can take help from millions of people from the community? Not said enough, feedback is a very important e-commerce tool. Amazon’s A9 algorithm presents the choices to the consumers but reviews and star ratings still play an influential role in the journey from consideration to conversion.

    Brands could consider partnering with Dataweave, to keep track of reviews and manage negative ratings on Amazon.

    Summary

    According to a report by EY-IVCA Trend Book 2021, “ The e-commerce industry in India is expected to reach $99 Bn by 2024 and penetration of retail is expected to be 10.7% by 2024, compared to 4.7% in 2019.”

    Internet penetration rate in India 2007-2021 Published by Sandhya Keelery, Apr 27, 2021  Internet penetration rate in India went up to nearly around 45 percent in 2021, from just about four percent in 2007. Although these figures seem relatively low, it meant that nearly half of the population of 1.37 billion people had access to internet that year. This also ranked the country second in the world in terms of active internet users. Internet penetration rate in India from 2007 to 2021
    Source: Statista

    The same report also revealed that India will have 220 Million online shoppers by 2025. With e-commerce growing at an exponential rate, brands are advised to be more statistical & data-driven to win a larger % of online sales. 
    If you think this is the right time to optimize your digital shelf, take a look at our products and services.

    We at DataWeave would be happy to be a part of your e-commerce and digitization journey. You can sign up for a demo with our team to know more

  • This Mother’s Day, Dazzle Moms With These Beauty & Fashion Trends

    This Mother’s Day, Dazzle Moms With These Beauty & Fashion Trends

    Show moms extra love this year. With Mother’s Day coming up fast, savvy beauty and fashion brands will use this special occasion to inspire pampering and gift giving to fuel their e-commerce sales growth.


    This year, beauty and fashion are poised to boom, as 40% of consumers plan to buy beauty products and 37% will buy new outfits for going out. 1 According to eMarketer, apparel and accessories e-commerce sales will grow nearly 19% this year due to pent-up demand for clothing, while health and beauty sales will rise 16%. 2

    “People will be happy to go out again …
    there will be a fiesta in makeup and in fragrances.”

    ~L’Oréal CEO and Chairman Jean-Paul Agon

    After beauty and apparel sales declined last year, brands now seize every opportunity to capitalize on the categories’ resurgence in 2021. To differentiate their goods, brands can use e-commerce marketing best practices to position their fashion and beauty items as spectacular gifts that moms will love.


    Aligning with the latest trends can help brands boost online growth.

    Hot trends dominating beauty and fashion

    This Mother’s Day, shoppers can delight moms with beauty bestsellers like:

    • Mask-friendly makeup: As we continue to wear masks over the short-term, cosmetics like false lashes, smudge-proof mascara and ultra-hypoallergenic eyeshadow will remain popular. 3
    • Fragrances: Online fragrance sales rose 45% year-over-year in 2020. Clean and organic beauty categories grew 56% with fragrance brands growing the most. 4
    • Purpose-led brands: Consumers crave companies that care. More online searches contain keywords like “ethical beauty” and “sustainable makeup” for products that help consumers look good and feel good. 5

    Online fashion is in vogue

    Before the pandemic, consumers bought less than one-third of their apparel or footwear online; last year, the proportion surged to an astounding 51%. In 2021, consumers will invest even more in their wardrobes, including trends like:

    • Comfort: Athleisure will remain in demand as many consumers still prefer comfortable clothing when they work from home. 7
    • Beloved staples: Classic pieces like jeans, dresses and simple yet elegant tops are making a comeback as consumers start to go out more. 8
    • Retro ‘80s: Ladies are ready to party like it’s 1984. Bright and metallic colors and sequins for occasionwear (and even NFL linebacker-inspired shoulderpads) are recreating a fun, indulgent ’80s vibe. 9

    Brands’ secret weapon for a competitive advantage

    For successful Mother’s Day campaigns, more fashion and beauty brands will use digital shelf analytics for marketing decisions that maximize their ROI and e-commerce sales.

    To ensure online shoppers discover Mother’s Day products with ease, brands are using Share of Search insights to measure their share of digital shelf. These DataWeave analytics tell brands which keywords perform best. Brands can also benchmark their search and navigation visibility against rivals’ rankings across e-commerce categories, websites and geographic regions.


    Using Content Audit insights tells brands how their content is performing. They can discover and fill content gaps so their products show up more prominently. Optimizing content (like keywords, product page titles, descriptions, ads and sponsored space) and images to align with the retailers’ search algorithms ensures a consistent brand experience across all online channels. Improving content helps brands connect to consumers with marketing that resonates and inspires them to buy.
    Brands also use

    Pricing and Promotions insights to measure the effectiveness of their online promotions and secure sales. Brands can stay competitive by ensuring their pricing and promotions are in line with rivals’ offers, such as identifying first movers and rivals with the deepest discounts across retailers and SKUs. Brands can even determine how imitating rivals’ pricing and promotional moves could impact revenue and sales volume.

    Help shoppers make Mom’s day

    Since Mother’s Day is almost here, beauty and fashion brands can apply these data insights to connect consumers with a variety of products moms will love. Digital shelf analytics from DataWeave can help brands deliver timely campaigns, improve their return on digital marketing spend and make effective marketing decisions to drive e-commerce sales.


    1 Howland, Daphne. Wells Fargo sees permanent behavior shifts from the pandemic. Retail Dive. March 29, 2021.
    2 Droesch, Blake. US Ecommerce by Category 2021. eMarketer. April 27, 2021.
    3 Wood, Dana. Is Makeup Dead? The Robin Report. April 18, 2021.
    4 Larson, Kristin. Fragrance Sales Pick Up As Consumers Reengage With The Outside World. Forbes. April 27, 2021.
    5 What Can Brands Learn About Sustainability From Green Beauty Consumers? Beauty Business Journal. June 15, 2020.
    6 Howland, Daphne. Wells Fargo sees permanent behavior shifts from the pandemic. Retail Dive. March 29, 2021.
    7 Ibid.
    8 Bhattarai, Abha. Americans are starting to buy real clothes again. The Washington Post. March 18, 2021.
    9 Warren, Liz. Loose Denim and Bold Occasionwear on Full Display for Fall 2021. Sourcing Journal. April 2, 2021.

  • How Brands Make Their Marketing Magnetic

    How Brands Make Their Marketing Magnetic

    E-commerce is getting crowded.

    The proliferation of informed shoppers, e-commerce sites, and competitors of all sizes has increased the complexity of – and lucrative opportunities in – brand management.

    Now more brands rely on data insights to uncover specific ways to make their digital marketing more arresting, effective and profitable. Many brands struggle with e-commerce profitability due, in part, to advertising expenses that often yield lackluster results.1

    Analytics are growing in retail significance, as 88% of retail and consumer goods marketers say data improves their marketing by allowing them to personalize touchpoints. Relevant marketing and great marketers helps brands connect with consumers. Let’s see why leading brands are adding data insights to their 2021 marketing strategies to fuel online sales growth.

    Brands discover how to get discovered

    Consumer goods brands no longer leave it up to chance that consumers will find them online. The digital migration of companies and consumers over the past year means more noise for brands to breakthrough.

    Now search is growing in importance to improve brands’ online product discovery. Here’s why:

    • 87% of shoppers begin their hunt in digital channels3
    • 17% rise in paid search in late 20204
    • 24% rise in paid social advertising during the same period5

    To grab consumers’ attention by being easier to see, more brands are turning to data insights to track their online visibility.

    Brands need to look for ways to mitigate the high costs of acquiring customers online6

    Brands use marketing analytics related to keywords and navigation searches help brands know exactly how much space on the digital shelf they occupy across different online platforms.

    These DataWeave’s Share of Search solutions help brands understand what percentage of the digital shelf they command through either keywords or navigation. These insights can help brands decide whether to boost their brand visibility using sponsored ads to ensure their products show up more prominently in online search results to boost brand reach and awareness on each channel. For instance, brands can tell whether consumers search for products using branded, generic or category-specific keywords to align their marketing accordingly.

    In addition, brands can see how their organic and sponsored results rank compared to their competitors to spot ways to improve their visibility rank and decrease customer acquisition costs.

    Content differentiates a brand’s digital shelf

    For a striking digital presence and enhanced discoverability, leading brands measure how effectively their content inspires online shoppers to choose them.

    Brands can improve their digital marketing results by using Content Audit insights to spot patterns among their top-performing campaigns. They can also benchmark their content with category bestsellers to discover how to optimize their online performance to grow sales volume and market share.


    Strategic advertising requires high-quality photography and data-driven content7

    Using these data insights from DataWeave helps brands determine how well their content (including product description pages and images) align with e-commerce algorithms and lead to online traffic, engagement and sales. Brands also adapt faster by adjusting underperforming campaigns to reduce costs and optimize their digital marketing spends.

    Brands can fill content gaps across online channels with enhanced product information that aligns content and images with brands’ product information management (PIM). Using analytics to deliver a consistent brand experience across all online channels can help brands build relationships with consumers and earn their trust.


    Alluring promotions help brands secure the sale

    As e-commerce evolves, brands have matured beyond Google AdWords and Facebook campaigns to offer targeted promotions across digital touchpoints, which increases marketing reach and complexity.

    To boost clarity, be in demand and drive sales across online platforms, more leading brands use data insights to measure the effectiveness of their digital Promotions. Promotional insights from DataWeave keep brands informed of trending categories and products to keep their online offerings relevant and timely. Brands can pinpoint exactly which products to promote and which e-commerce sites help them drive the most profitable results with compelling digital offers.

    Brands that respond quickly to their customers’ needs have the upper hand8

    Analytics also keep brands competitive and relevant by benchmarking their promotional strategies with their rivals’ and continuously monitoring rivals’ online moves. For instance, brands can track the promotions their competitors offer for similar products across different e-commerce sites. These competitive insights help brands quickly spot opportunities to optimize their online conversions with appealing promotions that reflect market trends.

    Better marketing decisions can help brands grow sales and share

    Data insights make brands more enticing by connecting the dots among their online visibility, content and promotions. Brands uncover ways to make smarter marketing decisions faster to improve their top line and decrease customer acquisition costs. DataWeave analytics also help brands stand out and improve product discovery, engagement and sales. As a result, brands save time and boost their agility with relevant marketing that resonates and inspires shoppers to keep coming back.


    1 Jansen, Caroline, Cara Salpini and Maria Monteros. 8 DTC trends to watch in 2021. Retail Dive. February 3, 2021
    2 Casna, Kathryn. Ecommerce Trends That Are Shaping the Way Businesses Sell Online. Salesforce. 2021.
    3 Casna, Kathryn. Ecommerce Trends That Are Shaping the Way Businesses Sell Online. Salesforce. 2021.
    4 The Future of eCommerce in 2021. Shopify Plus. 2021.
    5 The Future of eCommerce in 2021. Shopify Plus. 2021.
    6 Jansen, Caroline, Cara Salpini and Maria Monteros. 8 DTC trends to watch in 2021. Retail Dive. February 3, 2021.
    7 Glasheen, Jasmine. 2021 Forecast: Next Gens in a Brand-New World. The Robin Report. January 3, 2021.
    8 Monteros, Maria. Forrester: Few brands can anticipate and act on consumer needs. Retail Dive. February 10, 2021.

  • How Brands Boost Their E-Commerce Profitability

    How Brands Boost Their E-Commerce Profitability

    Brands that protect their bottom line will win online.

    As global e-commerce smashes sales records, more brands are now taking control over their online presence (“digital shelf”) to enhance their performance and profit margins.

    In the U.S., the increase in e-commerce penetration during the first half of 2020 was equivalent to that of the last decade.1 Last year also marked the first time in history that all retail sales gains came from e-commerce.2 E-commerce has lasting appeal, as two-thirds of consumers plan to continue to shop online after the pandemic.3

    “Brands need to continue to look for ways to
    mitigate the high costs of acquiring customers online.”
    4

    To keep up as shopping migrates online, brands face bigger expenditures. In the second quarter of 2020, e-commerce costs grew much faster (up 60% year-over-year) than revenues (up 40%).5 Namely, brands face steep costs for customer acquisition and logistics, which erode their online profit margins.

    The bottom line for brands is they must sell online – profitably – to stay competitive. They urgently need new ways to drive online sales and incur fewer costs. Let’s see why brand leaders are using data insights to optimize their e-commerce decisions and profitability.

    Brands find new growth opportunities

    Over the past year, e-commerce has gotten more crowded. Now brands seek proven ways to differentiate their offerings and consistently deliver an alluring online experience. That’s because a recent study found 42% of consumers cite less trust in online shopping due to poor experiences, such as inconsistent pricing and out-of-stock merchandise.6 In response, these e-commerce best practices can help brands improve the customer journey and top line sales.

    To help consumers find their products online with ease, brands can use data insights for superior product discovery. Insights help brands know exactly which keywords shoppers search for to earn high visibility rankings among consumers’ online search results. Data analytics direct brands to the most relevant keywords, which they can use in marketing, including product descriptions, for effective online discovery.7


    Brands also face increased pressure to keep up with rivals’ real-time pricing changes across retailers’ e-commerce sites, online marketplaces and social media. Insights help brands price competitively across channels by monitoring and promptly adapting to competitors’ online pricing moves. Brands can even use data to ensure merchants consistently respect pricing policies.

    Data analytics also help brands measure their marketing effectiveness and popularity across e-commerce

    websites, and how they compare to their rivals. Brands can improve how they promote their products by using targeted digital content that resonates. For instance, they can publish unique content on each channel tailored to the platform’s unique algorithm and use data to discover patterns among their top performing campaigns. Also, brands can determine when to use their own social media channels or pay for sponsored ads to drive more sales.


    As we saw last March, in-stock merchandise is essential to maximize online sales. Data analytics help brands track their stock status to ensure products are available across all their digital channels for reliable service that sparks more sales. 

    Brands find new efficiencies

    Cost effectiveness is also vital and these e-commerce best practices help brands boost their online efficiencies.

    Brands use insights to pinpoint and keep sharing content that effectively resonates with and enages their target audience. They can use data insights to see where to allocate their marketing spend for online promotions and either revitalize or drop underperforming online promotions. Brands can also track whether their online promotions align with rivals’ promotions to stay competitive and agile.

    Likewise, measuring a brand’s popularity through consumer reviews reveals which underperforming products to downplay to conserve marketing resources for the specific products and bundles that perform best in their categories. For instance, PepsiCo’s and Kraft Heinz’s new online shops offer only large items or bundles for basket sizes large enough to offset shipment costs.8


    To reduce the high cost of product returns, brands can use data insights to prioritize bestselling products rather than items consumers are more likely to send back. Using clear, up-to-date content, including product descriptions with accurate dimensions, can also help online consumers know exactly what they’re buying to minimize returns.


    How brands and consumers profit

    When brands use insights to make better e-commerce decisions, they can compensate for ballooning expenses. Analytics help brands connect the dots among their online visibility, promotions, performance and reviews. These best practices can give brands an edge by uncovering how to be more aggressive with revenue-earning and cost-cutting opportunities. Brands find effective ways to acquire more online customers to improve their top line and offset e-commerce expenses with new efficiencies. Data-driven digital marketing decisions help brands improve their e-commerce effectiveness to stay profitable and competitive. 


    Meanwhile, consumers also win by having an inviting, smooth and reliable online shopping experience. They find the products they want with greater ease, and feel confident enough to buy based on information like a brand’s pricing, promotions and product availability.


    1 Arora, Arun, Hamza Khan. Sajal Kohli and Caroline Tufft. DTC e-commerce: How consumer brands can get it right. McKinsey & Company. November 30, 2020.
    2 Ali, Fareeha. US ecommerce grows 44.0% in 2020. Digital Commerce 360. January 29, 2021.
    3 Arora, Arun, Hamza Khan. Sajal Kohli and Caroline Tufft. DTC e-commerce: How consumer brands can get it right. McKinsey & Company. November 30, 2020.
    4 Jansen, Caroline, Cara Salpini and Maria Monteros. 8 DTC trends to watch in 2021. Retail Dive. February 3, 2021.
    5 Haber, John. Logistics Costs Challenge E-Commerce Profit Margins. Parcel Industry. October 9, 2020.
    6 O’Carroll, Derek. 5 Hidden Trends That Will Shape E-Commerce in 2021. Total Retail. February 4, 2020.
    7 Leong, Brandon. COVID-19 strategy: Use the power of your digital sell sheet. Digital Commerce 360. August 23, 2020.
    8 Arora, Arun, Hamza Khan. Sajal Kohli and Caroline Tufft. DTC e-commerce: How consumer brands can get it right. McKinsey & Company. November 30, 2020.

  • How E-commerce Brands Build Customer Trust | DataWeave

    How E-commerce Brands Build Customer Trust | DataWeave

    Brands that build consumer trust will win big as online shopping explodes this year. As the COVID-19 pandemic propels more shoppers online, an astounding $5 trillion (30%) of annual global retail sales is up for grabs as the market shifts to e-commerce, according to Boston Consulting Group.[1]

    Notably, e-commerce has changed brands’ retail processes. Unlike brick-and-mortar stores, the digital shelf is where brands manage their company and products among online shoppers, influencing what they browse and buy.

    Rather than stocking merchandise through retailers’ physical stores, brands can now manage their online products by working with logistics experts like Fulfillment by Amazon. Instead of merchandising in stores with planograms and endcap displays, brands promote their digital assortment with targeted product content that resonates and keeps them coming back.[2] The evolution of retail can help brands save time and effort, and increase their agility and effectiveness.


    Gaining high visibility on the digital shelf can help brands boost their reach, brand awareness and sales. That’s why more brands are now investing in proven e-commerce best practices to increase consumer confidence by offering reliable products, relevant marketing and a smooth online experience. Now that the 2020 holiday sales season is underway, it’s the perfect time to see how leading brands compete in the increasingly crowded online market by demonstrating credibility and consistency.


    Market fragmentation increases brand complexity

    Selling across multiple online touchpoints means brands have more e-commerce websites and digital shelves to monitor to ensure compliance with brand guidelines to ensuring a consistent customer experience. To engage online shoppers, brands’ marketing strategies must now diligently manage their digital shelf across diverse online shopping arenas, including:

    • Direct-to-consumer (DTC) sites: More brand manufacturers are shortening the supply chain by bypassing retailers and selling directly to consumers, including sales through their own e-commerce websites.eMarketer predicts that U.S. DTC e-commerce sales will grow by 24% to reach nearly $18 billion in 2020.[3]

    • Retailers’ e-commerce sites: Brands are also migrating online because the retailers who sell their merchandise moved online this yearto adapt to the pandemic and survive shuttered storefronts. As of April 21, e-commerce grew 129% year-over-yearin U.S. and Canadian orders and U.S. e-commerce sales are on track to hit nearly $710 billion this year.[4] More than ever, sharing timely, accurate product information with retail partners is essential for success.

    • Online marketplaces: A growing number of brands are investing in digital advertising and content to stand out on popular, high-traffic online marketplaces. Global e-commerce leaders Amazon, eBay and China’s Alibaba and JD, are mostly search-based sites, as users know what they want and search for it, which makes product description pages and ads important marketing tools. Conversely, China’s Pinduoduo platform involves group-buying and interactive games to boost brand awareness and sales by entertaining online consumers and inspiring flattering word-of-mouth.[5] Among online marketplaces, digital content fuels brand discovery and sales.

    • Last-mile delivery channels: Brands can also sell in collaboration with their last-mile partners. Last-mile experts like Peapod, Instacart, Uber and Shipt offer online advertising opportunities for brands to reach new audiences. For instance, Instacart launched a self-serve advertising platform that lets brands promote their products in search results. Brands can choose the products to promote, set a budget and pay when users engage with those products.[6]

    • Social media: To reach and influence consumers where they already spend their time, more brands are investing in social media promotions and even embracing social commerce innovation. Social media matters to brands’ marketing effectiveness, as 52% of online brand discovery happens on social feeds.[7] Also, 92% of Instagram users say they’ve followed a brand, visited their website or made a purchase after seeing a product on Instagram.[8]

    Brand promotions have evolved beyond Google AdWords and Facebook campaigns. Now promotions include digital content and ads across all of these digital touchpoints, which increases the scope of brand marketing efforts to reach online consumers.

    How brands transform digital shelf complexity into clarity

    To earn online shoppers’ trust across e-commerce arenas, more leading companies are turning to a common solution: data.


    Too often, online shoppers abandon their cart due to concerns that they will unwittingly buy inauthentic products from fraudulent sellers. To protect their brands, manufacturers use data insights to pinpoint and prevent unauthorized sellers, counterfeit products and minimum advertised price (MAP) violations to demonstrate authenticity, accountability and price parity.

    Digital is the new normal”
    ~ Nike CEO John Donahoe
    [9]

    To invigorate underperforming online promotions, brands rely on analytics to connect the dots among their online promotions, marketing performance and share of voice. Insights on advertising, keywords and consumer reviews help brands make better marketing decisions faster. These insights help brands stand out from competitors and build relationships with shoppers by ensuring their promotions resonate and drive more sales online.

    To overcome low online traffic and sales, more brands apply data insights to improve their digital presence, visibility and sell-through rates. Brand analytics measure their popularity on e-commerce websites and track their stock status to improve accessibility, optimize digital shelf velocity and deliver a reliable customer experience that builds trust.


    Watch over your brand: To stay competitive and earn consumer trust, more brands now rely on data insights to make fast, effective decisions that enhance their reputation and boost online sales.

    As e-commerce explodes, more leading brands are collaborating with DataWeave for actionable brand analytics to protect their digital shelves, decrease complexity and boost consumer trust. These accurate, trusted insights help brands gain clarity to make smarter e-commerce decisions faster. Making data-driven brand management, promotional and digital marketing decisions helps brands prove their authenticity, improve marketing effectiveness and boost online sales. To see how DataWeave helps brands stand out, sell more and stay competitive, visit www.dataweave.com.


    [1] Taylor, Lauren, Chris Biggs, Ben Eppler, Henry Fovargue and Gaby Barrios.  How Retailers Can Capture $5 Trillion of Shifting Demand. Boston Consulting Group. August 31, 2020.

    [2] Gibbons, David. Ecommerce and content: How retailers have shifted strategies during the COVID-19 pandemic. Digital Commerce 360. August 18, 2020.

    [3] US Direct-to-Consumer Ecommerce Sales Will Rise to Nearly $18 Billion in 2020. eMarketer. April 1, 2020.

    [4] Wertz, Jia. 3 Emerging E-Commerce Growth Trends To Leverage In 2020. Forbes. August 1, 2020.

    [5] Lee, Emma. The incredible rise of Pinduoduo, China’s newest force in e-commerce. TechCrunch. July 26, 2018.

    [6] Goyal, Vivek. Browsing e-commerce: An untapped $250B+ opportunity. Medium. September 27, 2020.

    [7] Cooper, Paige. 43 Social Media Advertising Statistics that Matter to Marketers in 2020. Hootsuite. April 23, 2020.

    [8] Cooper, Paige. 43 Social Media Advertising Statistics that Matter to Marketers in 2020. Hootsuite. April 23, 2020.

    [9] Grill-Goodman, Jamie. ‘Digital is the New Normal,’ Nike CEO Says. RIS News. September 23, 2020.