On Black Friday this year, Health & Beauty brands saw a significant increase with a 13% jump in foot traffic, according to a report by RetailNext. Despite caution from various sources, higher prices for everyday goods, and high interest rates, consumers chose to spend big this cyber week.
So what kind of deals did top retailers and brands offer in the Health & Beauty category this BFCM? At DataWeave, we harnessed the power of our proprietary data aggregation and analysis platform to track and analyze the prices and deals of Health & Beauty products across prominent retailers to uncover unique insights into their price competitiveness this BFCM, as well as understand how pricing strategies varied across diverse subcategories and brands.
For this analysis, we tracked the average discounts among leading US retailers in the Health & Beauty category during the Thanksgiving weekend sale, including Black Friday and Cyber Monday. We noticed prices and discounts didn’t change significantly over the course of the weekend, and hence the average prices of products between the 24th and 27th of November are being reported. Our sample was chosen to encompass the top 500 ranked products in each product subcategory across leading retailers during the sale.
Subcategories reported on: Shampoo, Toothpaste, Conditioner, Sunscreen, Makeup, Electric Toothbrush, Beard Care, Moisturizer
Timeline of analysis: 24 to 27 November 2023
Our Key Findings
Average Discounts Across Retailers
Amazon leads the pack with a huge margin, offering an average discount of 31.9%, covering 62% of its products analyzed. Target follows an 18.8% average discount across only 5% of its analyzed assortment. The other retailers aren’t even close.
Ulta Beauty was the next in line, providing a 9.2% average discount followed by Walmart with a 6.8% average discount. Sephora, known for its premium beauty offerings, adopted a more conservative approach with a 3.5% average discount, targeting only 9% of its top products
Across retailers, it is clear that Amazon led the charge by far this cyber week, with the other retailers choosing to markdown prices conservatively in the Health & Beauty category.
Average Discounts: Subcategories
Amazon offered high discounts on lower priced subcategories like Toothpaste (49.4%), Sunscreen (46.3%), Moisturizers (38.5%), and Conditioners (37.5%), highlighting its focus on products with high demand that consumers would look to stock up on. Ulta Beauty also focused its discounts on Toothpaste (15.6%), Moisturizers (14.9%), and Conditioners (12.6%), targeting skincare and grooming.
Sephora, meanwhile, offered the most attractive deals on the Makeup subcategory at 5.3% across 12.67% of its analyzed assortment, banking on the demand generated due to the brand’s popularity in this subcategory.
Target prioritized discounts on Toothpaste (22.5%), Shampoo (21.6%), and Moisturizers (18.9%). Walmart too offered significant discounts on Shampoo (21.6%) and Toothpaste (22.5%).
Retailers prioritized staple subcategories like Toothpaste and Moisturizer with substantial discounts during this Black Friday Cyber Monday, ensuring a broad consumer appeal. In contrast, discretionary items like Makeup may be less motivated by discounts alone, and hence saw lower discounts during the sale.
Average Discounts: Brands
Brands offered the most attractive deals on Amazon, with OGX leading the pack at 58.4% average discount. Neutrogena and Colgate followed with an average discount of 50.4% and 44%. This mirror’s Amazon’s subcategory focus on shampoos, conditioners, and toothpastes.
Other instances of brands offering attractive deals across retailers include Belif (27.9%) and Anastasia Beverly Hills (17.6%) on Sephora, Johnson’s (20%) and Philips Sonicare (18.8%) on Target, and Olay (12.2%) and Colgate (10.6%) on Walmart.
Ulta Beauty hosted several attractive deals by specific brands, including Moon (30.7%), Joico (24%), and Clinique (22.3%).
Share of Search For Health & Beauty Brands Across Subcategories
Our Share of Search analysis illuminates the strategic moves made by brands to enhance their visibility, playing a crucial role in influencing consumer choices during Black Friday and Cyber Monday.
Among some of the leading brands, Head & Shoulders and Oral-B increased their Share of Search by 2.3% and 1% respectively, reflecting a successful strategy to boost brand visibility during the Black Friday and Cyber Monday shopping events. On the other hand, L’Oreal Paris, Colgate, and Neutrogena faced marginal decreases in Share of Search.
Overall, since the difference in Share of Search values did not change dramatically, the visibility levels of leading brands across key subcategories remained consistent during the Thanksgiving weekend.
—
For deeper insights on pricing and discounting trends across a diverse range of shopping categories during Black Friday and Cyber Monday, check out our blog!
To learn more about our AI-powered Pricing Intelligence and Digital Shelf Analytics platform, contact us today!
Insider Intelligence‘s forecast of a 4.5% growth in US Holiday Sales this year has been validated by the sustained robust spending observed during Black Friday and Cyber Monday. Despite multiple challenges impacting consumer spending, such as escalating prices of everyday products and elevated interest rates, shoppers continued to spend significantly, aligning with these earlier predictions.
However, in response to these projections, retailers strategically adjusted their approach. Our analysis indicates substantial discounts prevalent in the Consumer Electronics and Home & Furniture segments during Cyber Week. Prominent retailers specializing in Home & Furniture, such as Wayfair, Overstock, and Home Depot, notably led the charge in offering attractive discounts.
At DataWeave, we harnessed the power of our proprietary data aggregation and analysis platform to track and analyze the prices and deals of home & furniture products across prominent retailers to uncover unique insights into their price competitiveness this BFCM, as well as understand how pricing strategies varied across diverse subcategories and brands.
We’ve also recently published our analysis of the Consumer Electronics and Apparel categories this Black Friday and Cyber Monday.
Our Methodology
For this analysis, we tracked the discounts offered by leading US retailers in the Home & Furniture category during the Thanksgiving weekend sale, including Black Friday and Cyber Monday. We noticed prices and discounts didn’t change significantly over the course of the weekend, and hence the average prices of products between the 24th and 27th of November are being reported. Our sample was chosen to encompass the top 500 ranked products in each product subcategory across leading retailers during the sale.
Sample size: 44,716 SKUs
Retailers tracked: Amazon, Walmart, Target, Best Buy, Overstock, Wayfair, Home Depot
Subcategories reported on: Dishwasher, Washer/Dryer, Mattresses, Beds, Dining Tables, Entertainment Units, Rugs, Luggage, Bookcases, Cabinets, Sofas, Coffee Tables
Timeline of analysis: 24 to 27 November 2023
Our Key Findings
Discounts Across Retailers
Wayfair led the pack with the highest average discount of 27.5%, covering an impressive 88% of its Home & Furniture inventory. This bold strategy positions Wayfair as a go-to destination for consumers seeking substantial savings on high-quality Home & Furniture items during Black Friday and Cyber Monday.
Home Depot offered an average discount of 17.5%, covering a substantial 69% of the products analyzed, choosing to cash in on the Cyber Week madness. Overstock followed next with an average discount of 16.6%.
Interestingly, Home & Furniture happens to be one of the few categories in which Amazon did not offer the highest discount among the analyzed retailers, choosing a moderate average discount of 13.8%.
Best Buy also maintained a competitive stance in the category, providing an average discount of 12.8% across 58% of their assortment. Target adopted a conservative markdown strategy, offering a relatively low average discount of 6.5%.
In summary, the Home & Furniture category exhibited a diverse range of discounting strategies among retailers, reflecting a balance between competitiveness and profit margins. Consumers could have chosen from a spectrum of discounts based on their preferences and budget considerations during Black Friday and Cyber Monday.
Average Discounts: Subcategories
Among subcategories, Amazon offered a moderate 8.3% average discount on 32.9% of its products in this Dishwasher category, while Best Buy took a more aggressive stance with a 14.7% average discount covering 55.9% of its products.
Home Depot emerged as a standout player in the Washer/Dryer category, providing a substantial 21.3% discount on 78.4% of its analyzed inventory. Best Buy closely followed with a 15.1% average discount targeting 67.6% of its products.
Wayfair grabbed attention with a generous 36.9% average discount on Mattresses, covering almost all (99%) of its analyzed products. In addition, Wafair led the discount war in Beds, Dining Tables, Cabinets, Sofas, Coffee Tables, and Entertainment Units. Overstock took an aggressive pricing stance on Rugs, offering a substantial 52.3% average discount, covering 100% of its Rugs inventory.
Average Discounts: Brands
Among brands, Signature Design by Ashley maintained a consistent presence with substantial discounts on both Best Buy (25.24%) and Overstock (16.19%). This could be indicative of the brand’s commitment to appealing to a diverse customer base through varied retail channels. Costway emerges as a standout brand offering exceptionally high discounts at both Target (61.6%) and Walmart (51.7%).
Home Decorators Collection, Home Depot’s in-house brand, offered a significant 30.9% discount at Home Depot. High-margin private label brands like these afford retailers the opportunity to offer markdowns while retaining significant margins.
Strategic positioning on specific platforms, as seen with Alwyn Home on Wayfair and Noble House at Home Depot, suggests brands tailor their approach to the strengths and customer demographics of each retailer. The data suggests a nuanced interplay between brand positioning, discount strategies, and the perceived value offered.
Share of Search For Home & Furniture Brands
The Share of Search data for the Home & Furniture category unveils intriguing insights into brand visibility and performance during the Black Friday and Cyber Monday events. In this competitive landscape, where consumer decisions are influenced not only by discounts but also by brand visibility, the dynamics of Share of Search become pivotal.
Samsung strategically increased its Share of Search during the sale, showcasing a 1.2% improvement. This suggests a deliberate effort to reinforce brand visibility and capture the attention of potential buyers actively searching for Home & Furniture products, in this case, Washer/Dryers and Dishwashers.
Bosch too experienced a notable surge in Share of Search by 1.1%. LG, meanwhile, maintained a consistent Share of Search, with a marginal decrease of 0.1%. American Tourister experienced a modest increase in Share of Search by 0.4%.
Like in the other categories analyzed, the dynamics of Share of Search in the Home & Furniture category reflect brand strategies aimed at not only offering discounts but also ensuring heightened visibility during the critical Black Friday and Cyber Monday shopping events. Positive shifts indicate effective marketing efforts, while stable performers demonstrate a resilient brand presence in a competitive online marketplace.
To explore how our insights can help retailers and brands boost their pricing strategies during sale events, reach out to us today!
For more in-depth analyses and trends across various shopping categories, stay tuned to our blog.
The exponential growth of eCommerce has forever changed holiday shopping as we know it. What was once led by the launch of Cyber Monday in 2005, has since expanded to ‘Cyber Five’ in 2018, now spans beyond an eight-week period, and is collectively the busiest digital shopping period of the year. Most retail websites have launched a ‘Thanksgiving Comes Early’ sales event for a mosaic of products, causing one to wonder how this ‘early start’ to holiday shopping will impact the traditional promotional cadence consumers have grown to expect to see launch closer to the holidays. Given today’s environmental challenges, threats of scarcity are also encouraging consumers to buy early, which could also impact traffic on the shopping days that have traditionally seen the highest sales volume from digital shoppers.
In the current environment, the onus will be on consumers to keep a watch for their categories of interest and buy them as and when they appear on sale in their favorite store, because there is no guarantee of sustained availability. Of course, they might return and buy at a different store if a better deal comes up, but there’s a time cost for the dollars saved. More broadly, there has been enough noise made about deals and discounts to keep consumer interest and curiosity going.
The early promotional start and heightened demand has influenced our team to get a jump start on our 2021 Black Friday analysis to look deeper at trends seen pre-Black Friday 2021 versus 2020. With this assessment, we can track how promotional prices and product availability rates may have changed throughout the event leading in to 2021 Cyber Five, and compare it to last year’s activity to understand how 2021 holiday sales may be impacted.
We reviewed popular holiday categories like apparel, electronics, and toys (for kids and pets), to have a broad sense of notable trends seen consistently throughout various, applicable marketplaces. What we found is a consistent decline in product availability over the last six months and as compared to last year, alongside an increase in prices.
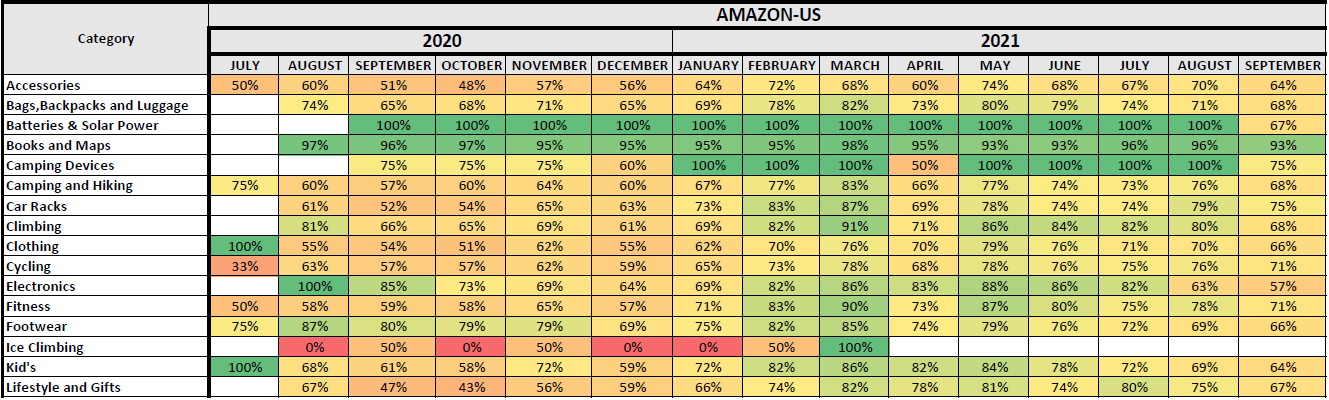
We first analyzed availability changes for popular categories on Amazon, noted in the chart below, to understand how inventory may have changed throughout the year, and also compared to 2020. With the exception of batteries and solar power goods and books and maps, there appears to be consistency in greater product availability in 2021 versus 2020, but a slow decline in availability throughout 2021, leading into the holiday season.
Source: DataWeave Commerce Intelligence – Product Availability in-stock percentage from July 2020 through September 2021 for a sample size of 1000+ products on Amazon.com
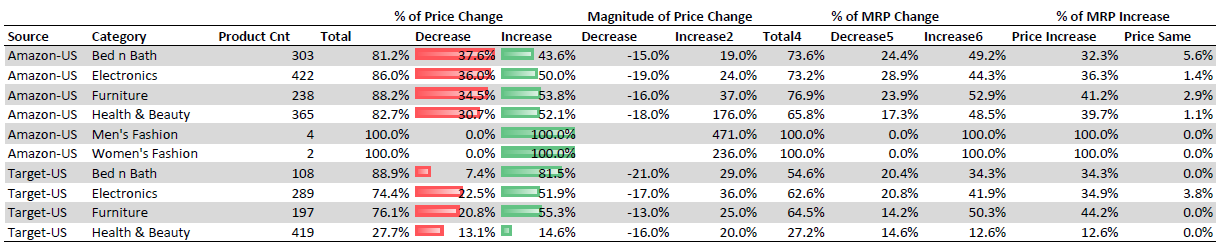
When it came to our pricing analysis, we reviewed select categories on Amazon and Target.com, and found around fifty percent of products on both websites to have seen a price increase year-over-year, while only thirty-seven percent and sixteen percent of products saw a price decrease on Amazon and Target.com, respectively. We also see an increase in the manufacturer’s retail price (MRP) in 2021 versus 2020 for a very high proportion of products (forty-eight percent of products on Amazon and thirty-five percent of products on Target.com), but the discount percentages have remained the same.
Source: DataWeave Commerce Intelligence – Pricing Intelligence: MRP and promotional pricing for 1000+ products on Amazon and Target.com were analyzed from November 13th – 15th, 2021 versus Pre-Black Friday November 24th & 25th 2020
This indicates 2021 discounts may appear to be greater than or equivalent to 2020, but in reality, consumers will end up paying higher prices than they would have for the same items in 2020. The remainder of this article highlights our key findings found within each key category reviewed – Electronics, Apparel and Toys.
Electronics Category Analysis
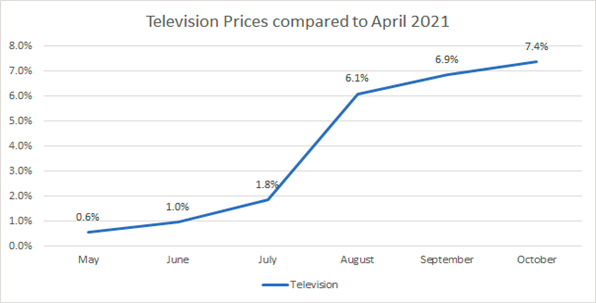
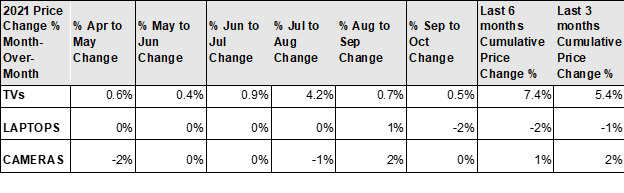
The television category showcases a great example of how pricing fluctuations impact holiday promotional cadences. Based on our analysis, we found the average television price to have increased around seven percent from April to October 2021, as seen below and as noted within our analysis conducted with NerdWallet.
Source: DataWeave Commerce Intelligence – Pricing Intelligence: The change in average price captured for televisions sold on Amazon from May 2021 through October 2021.
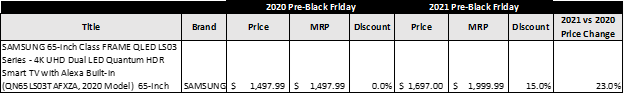
In fact, on Amazon and Target.com, we see around eighty-four percent of the SKUs listed show both an MRP and promotional price increase in 2021 versus 2020 during pre-Black Friday times. One specific example found on Amazon is noted below for Samsung TV model QN65LS03TAFXZA, a 65 inch QLED TV that was priced at $1697 during this analysis at a fifteen percent discount from MRP, but was priced last year at $1497 without a discount from MRP. In essence, even though the TV offers a greater discount this year, it is actually more expensive than it was in 2020 at this same time of year.
Source: DataWeave Commerce Intelligence – Pricing Intelligence: MRP and promotional pricing analysis on Amazon.com comparing prices from November 13th – 15th, 2021 versus Pre-Black Friday November 24th & 25th 2020
Unlike TVs, the price of laptops has experienced a decrease over time based on our analysis conducted during the same timeframe, indicating these are a great buy for consumers this holiday season versus promotional offers seen in 2020.
Source: DataWeave Commerce Intelligence – Pricing Intelligence: The month-over-month change in average price captured for televisions sold on Amazon from April 2021 through September 2021.
Overall, our prediction is that within the electronics category, promotions during Cyber Five may be equivalent to last year’s offers, however, supply will be limited and the total spend versus last year will be greater to the consumer outside of Doorbuster deals offered on select models.
Apparel Category Analysis
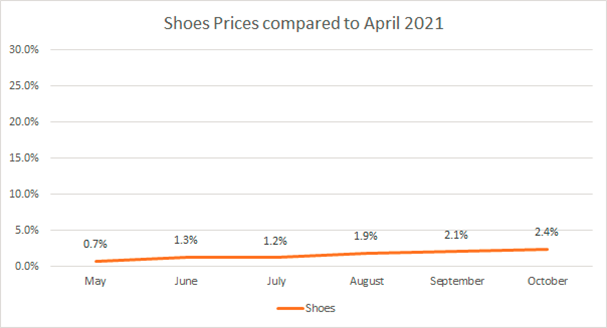
The Luxury market is seeing a Roaring 20s-like feeling this season given the Covid-induced changes in work and lifestyle and higher disposable income. Therefore, our prediction is that prices for these goods are likely to remain flat, or offer very little discounts this season both due to supply constraints as well as higher demand. For example, our analysis on shoe pricing changes shows relative stability from April to October 2021.
Source: DataWeave Commerce Intelligence – Pricing Intelligence: The change in average price captured for shoes sold on Amazon from May 2021 through October 2021.
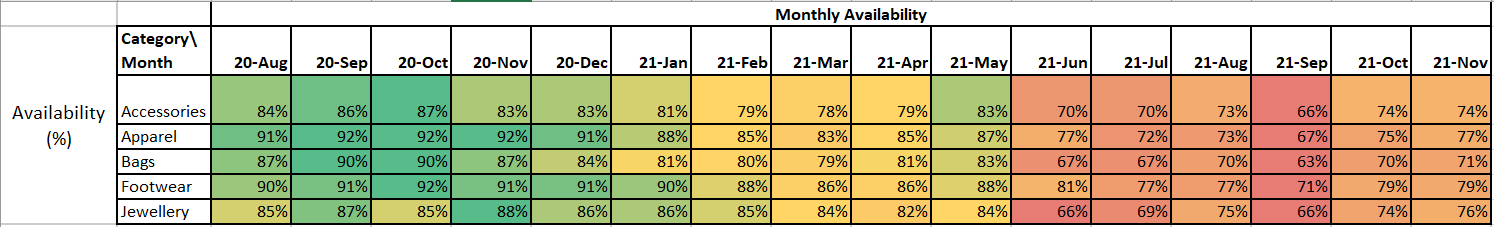
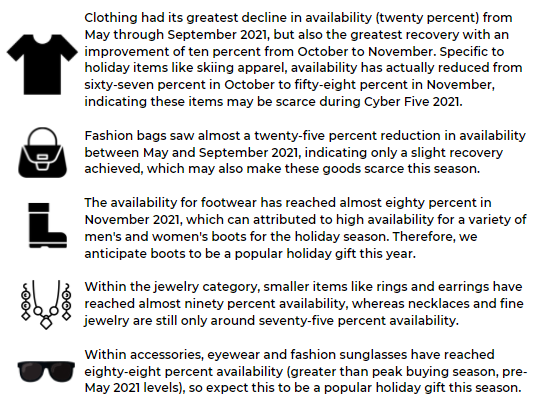
Given heightened demand and the Global shipping crisis, we anticipate luxury apparel categories to face out-of-stock challenges this holiday season, and therefore we also anticipate seeing less promotional activity for these items as well during Cyber Five 2021. To dive deeper into the severity of the impact, we looked at availability for clothing, accessories, and footwear categories from August 2020 until present to verify our thesis.
Focusing only on clothing, accessories, and footwear, these categories followed the same downward trending pattern regarding product availability decreases this year with a decline from June (seventy-six percent versus eighty-six percent in May 2021) to September 2021 (the lowest rate seen at sixty-eight percent availability), followed by a partial recovery in October and November (achieving seventy-seven percent availability).
Source: DataWeave’s Commerce Intelligence – Product Availability: 10k SKUs tracked across 11 retailers US websites (Farfetch, Brownsfashion, NetAPorter, EndClothing, 24s, Selfridges, Ssense, Harrods, Luisaviaroma, MyTheresa, MrPorter) tracked daily stock status in apparel categories; Availability is calculated as percent of instances when product is in stock against all instances tracked.
Not all recoveries were the same however, and given this, we predict accessories to have the lowest availability rate and greatest risk of facing out of stocks heading into Cyber Five. From May through November 2021, accessories availability continued to decline significantly from month to month, beginning at eighty-three percent in May and ending at seventy-four percent in November. Given this continued decline and with Black Friday right around the corner, we don’t anticipate inventory levels to increase enough to meet the increased holiday demand.
Source: DataWeave’s Commerce Intelligence – Product Availability: 10k SKUs tracked across 11 retailers US websites (Farfetch, Brownsfashion, NetAPorter, EndClothing, 24s, Selfridges, Ssense, Harrods, Luisaviaroma, MyTheresa, MrPorter) tracked daily stock status in apparel categories; Availability is calculated as percent of instances when product is in stock against all instances tracked.
Toys & Games Category Analysis
As noted by DigitalCommerce360, we also anticipate toys to be one of the greatest impacted categories this holiday season given the continued decline in overall availability for these items on Amazon.com, as one great example. Within our category analysis, we saw a steady decline in availability from March 2021 through June (eighty percent to sixty-one percent), followed by a period of stability from June through August (approximately sixty percent), followed by another decline from September through October, finally reaching the lowest availability of fifty-six percent (down twenty-four percent from March 2021).
Source: DataWeave’s Commerce Intelligence – Product Availability – hundreds of Toys & Games SKUs tracked on Amazon.com on a weekly basis from March 2021-October 2021
The biggest sub-category within the toys department on Amazon, Sports and Outdoor Play, followed the same trend as Toys and Games overall through June 2021, also reaching its lowest availability of fifty-six percent. Instead of continuing along that pattern, Sports and Outdoor Play started on a recovery path, ending at a relatively high availability level of sixty-seven percent in October, which is only five percent lower than its highest availability (seventy-two percent in March 2021). Games and Accessories, the second largest sub-category in Toys and Games, had a continuous decline starting with eighty-nine percent in March 2021, reaching its lowest availability of fifty-four percent in October.
Source: DataWeave’s Commerce Intelligence – Product Availability – hundreds of Toys & Games SKUs tracked on Amazon.com on a weekly basis from March 2021-October 2021
The sub-category Tricycles, Scooters and Wagons interestingly had its highest availability from July to September 2021 (around eighty percent), unlike other sub-categories which as a whole, had their lowest availability during the same timeframe. From September through October, there was a significant decline (fourteen percent), reaching its lowest availability of sixty-seven percent. The sub-category Babies & Toddlers started on a continuous decline from its highest availability of eighty percent in April to its lowest availability of fifty-six percent in October.
Source: DataWeave’s Commerce Intelligence – Product Availability – hundreds of Toys & Games SKUs tracked on Amazon.com on a weekly basis from March 2021-October 2021
*Please reach out to our Retail Analytics experts for access to sub-category details available within the above analysis on the Toys and Games category on Amazon.com.
Pet Toys Category Analysis
When it comes to in demand holiday toys, you can’t forget about the needs for gifts for our furry friends and family. We also tracked sub-categories such as dog, cat, and bird toys, following the same methodology as tracked within Toys and Games to track pet toy availability changes.
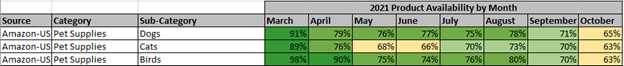
Source: DataWeave’s Commerce Intelligence – Product Availability – hundreds of Pet Toys SKUs tracked on Amazon.com on a weekly basis from March 2021-October 2021
Dog toys, the biggest sub-category out of the three pet toys analyzed, had high availability – ninety percent in March 2021, but started to decline reaching a low of sixty-five percent in October. There was a period of stability from April to August (averaging seventy-seven percent), followed by a significant decline of over thirteen percent in from September to October. Cat toys, the second largest sub-category, also had its highest availability in March (eighty-nine percent) followed by a steady decline to sixty-six percent in June, a recovery from July to August (achieving seventy-three percent), followed by another decline during September and October, reaching its lowest availability of sixty-three percent (down twenty-six percent from eighty-one percent in March). Interestingly, dog toys which has a product count eight times greater than cat toys, had higher availability than cat toys during each of the months considered during the analysis.
Source: DataWeave’s Commerce Intelligence – Product Availability – hundreds of Pet Toys SKUs tracked on Amazon.com on a weekly basis from March 2021-October 2021
In Conclusion
If we consider discounts and availability to be a good indicator of sales for the 2021 holiday season, with the Global shipping crisis looming over this year’s event, we expect retailers to have trouble keeping their inventory well stocked, which might affect growth rates. That being said, while discounts may be muted and popular items may come on very limited sales given constraints, we believe digital sales on Black Friday will see the highest year-over-year growth to date, given a number of supporting factors: scarcity threats increasing demand and the reason to buy, and consumers waiting to see if holiday offers surpass those see in the early start promotions, followed by the sudden rush to buy on Black Friday so as not to risk a given product being out of stock beyond this time period.
We also anticipate seeing a continued decline in product availability day-to-day as we progress throughout Cyber Five 2021. Given the analysis conducted on 2020 trends, (we tracked nearly a one percent decline in availability on Black Friday 2020 vs. Thanksgiving Day, followed by a two percent decline on Cyber Monday), our data indicates products went out-of-stock at a faster rate then also.
Ultimately only the digital-savvy retailers and brands will thrive during these opportune times, while others will continue to be in catch-up mode. Access to real-time marketplace insights can enable a first-to-market strategy, while having access to historical patterns can also help react faster to commonly seen future market factors, such as another pandemic or Global shipping crisis. These types of insights also support day-to-day operations, enabling retailers and brands to accelerate eCommerce growth, determine systems to distinguish their online strategies, discover efficiencies and drive profitable growth in an intensifying competitive environment.
Continue to follow us in the coming weeks to see the insights we track through Cyber Five 2021, and be sure to reach out to our Retail Analytics experts for access to more details regarding the above analysis.