Tag: CPG Stories

  • Mastering Grocery Pricing Intelligence: A Strategic Approach for Modern Retailers

    Mastering Grocery Pricing Intelligence: A Strategic Approach for Modern Retailers

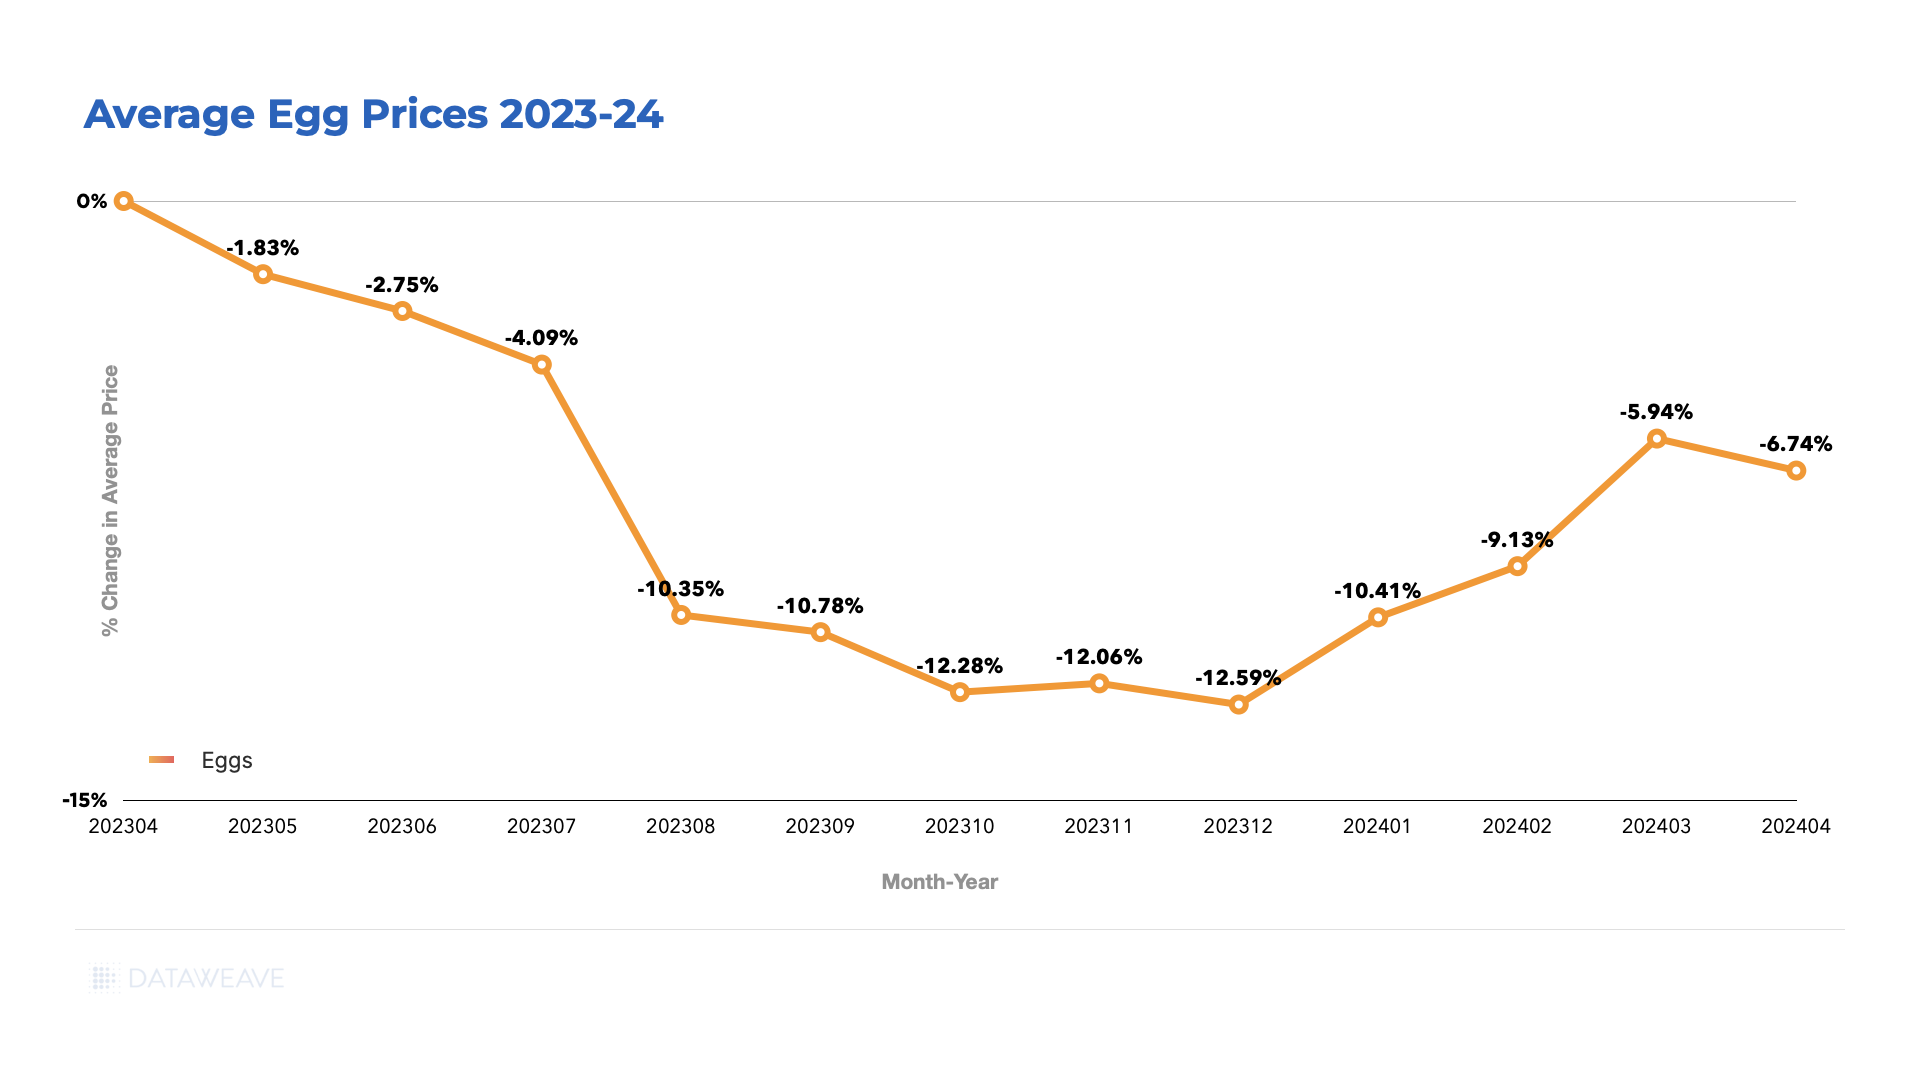
    When egg prices surged 70% during the 2023 avian flu outbreak, grocery retailers faced a critical dilemma: maintain margins and risk losing customers, or absorb costs and watch profits evaporate. Similarly, rising olive oil and chocolate prices also had domino effects, cascading down from retailers to consumers. In each of these scenarios, those with sophisticated pricing intelligence systems adapted swiftly, finding the sweet spot between competitiveness and profitability. Others weren’t so fortunate.

    This scenario continues to play out daily across thousands of products in the grocery sector. From breakfast cereals to fresh produce to bottled water, retailers must orchestrate pricing across a variety of categories – each with its own competitive dynamics, margin requirements, and price sensitivity patterns.

    The Evolution of Grocery Pricing Intelligence

    Imagine these scenarios in the grocery industry:

    • Milk prices spike during a supply shortage.
    • Your competitor drops egg prices by 20%.
    • Fresh produce costs fluctuate with an unseasonable frost.

    For grocery retailers, these aren’t occasional challenges—they’re Tuesday. Reacting to each pricing crisis as it comes isn’t just exhausting—it’s a recipe for shrinking margins and missed opportunities.

    Think of it this way: If you’re constantly playing defense with your pricing strategy, you’re already two steps behind. Commoditized items like milk and eggs face intense price competition, while seasonal products and fresh produce demand constant attention. Simply matching competitor prices or adjusting for cost changes isn’t enough anymore. What’s needed is a proactive approach that anticipates market shifts before they happen and turns pricing challenges into competitive advantages. This is where price management comes in.

    Price management has transformed from simple competitor checks into a strategic power play that can make or break a retailer’s market position. Weekly manual adjustments have given way to a long-term strategic view, driven by data analytics and market intelligence. Here are the basics of how price management in grocery retail works today.

    Three Pillars of Grocery Price Management

    1. Smart Data Collection: Building Your Foundation

    The journey begins with comprehensive data collection and storage across your entire product ecosystem. This means:

    • Complete Coverage Of All SKUs Across All Stores: Tracking prices for all SKUs across all stores, with particular attention to high-velocity items and volatile categories.
    • Dynamic Monitoring: Tracking prices across different time frequencies as grocery prices are highly volatile for different categories. So daily tracking for volatile items like dairy and produce, and weekly for more stable categories may be needed.
    • Competitive Intelligence: Gathering data not just on prices, but on promotions, pack sizes, and private label alternatives.
    • Infrastructure to Support Large Volumes of Data: Partnering with external data and analytics providers to bridge the gap when retailers struggle with the scale of digital infrastructure these data sets require.

    2. Intelligent Data Refinement: Making Sense of the Numbers

    Raw data alone isn’t enough—it needs context and structure to become actionable intelligence. This is called Data Refinement—the process of establishing meaningful relationships within the data to facilitate the extraction of valuable insights. This refinement stage is closely tied to the data collection strategy, as the quality and depth of the insights derived depend on the accuracy and coverage of the collected data.

    Data refinement includes several key processes:

    Advanced Product Matching

    Picture this: You’re tracking a competitor’s pricing on organic apples. Simple, right? Not quite. Yes, Universal Product Codes (UPCs) and Price Lookup Codes (PLUs) are present in Grocery to standardize product identification across different retailers—unlike the fashion industry’s endless style variations. Still, product matching isn’t as straightforward as scanning barcodes.

    Grocery Pricing Intelligence data faces a challenge when product names, weights, and details differ

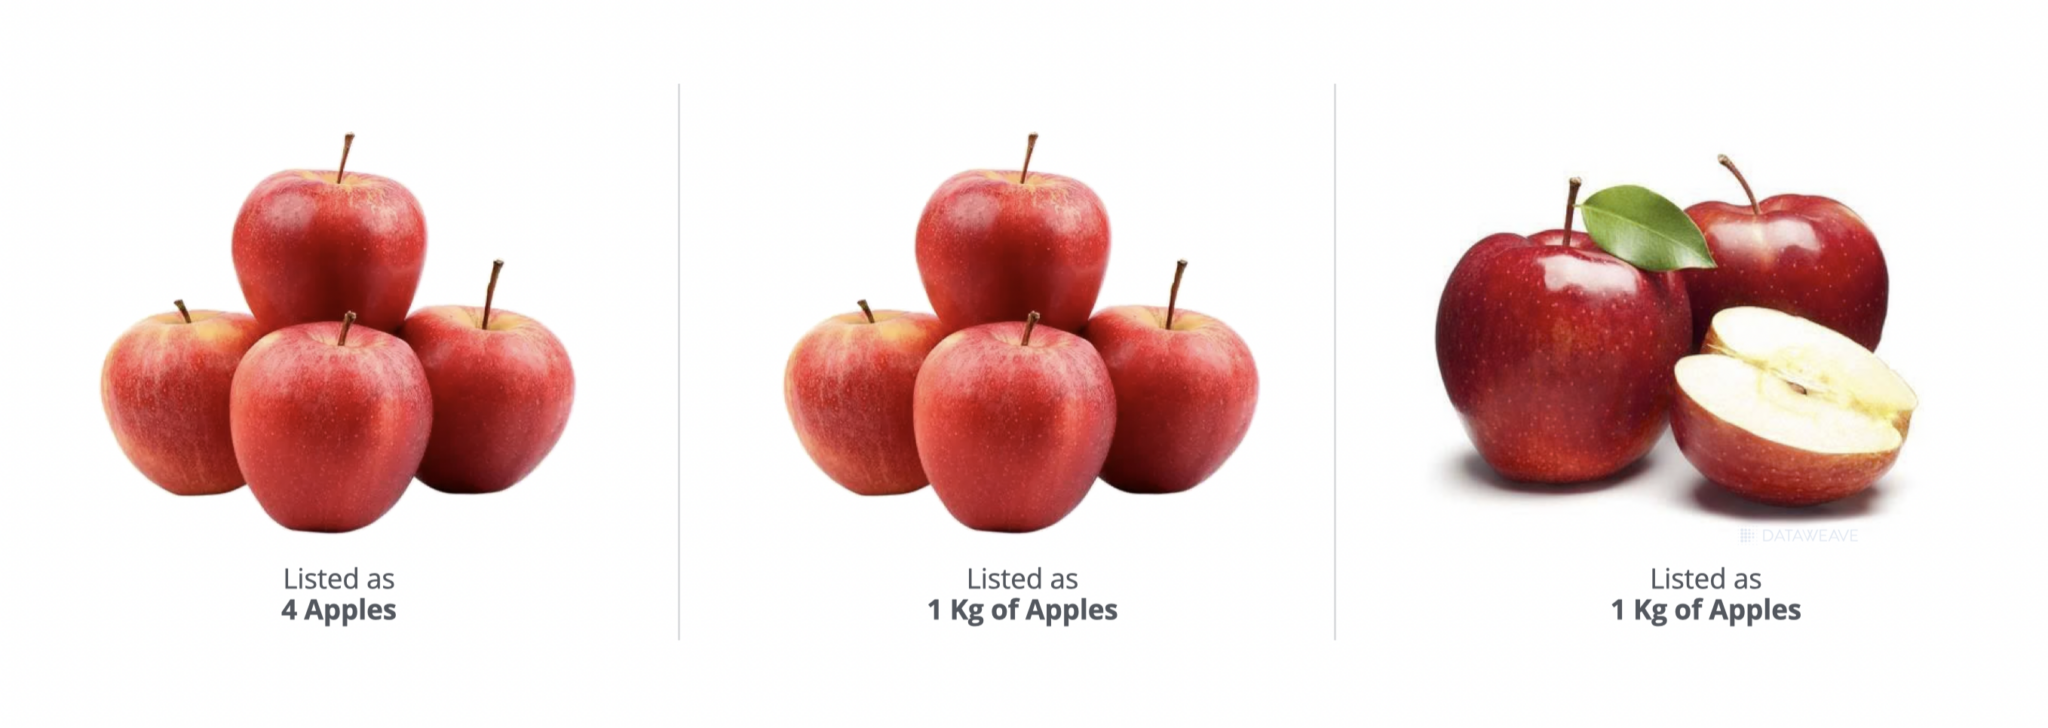
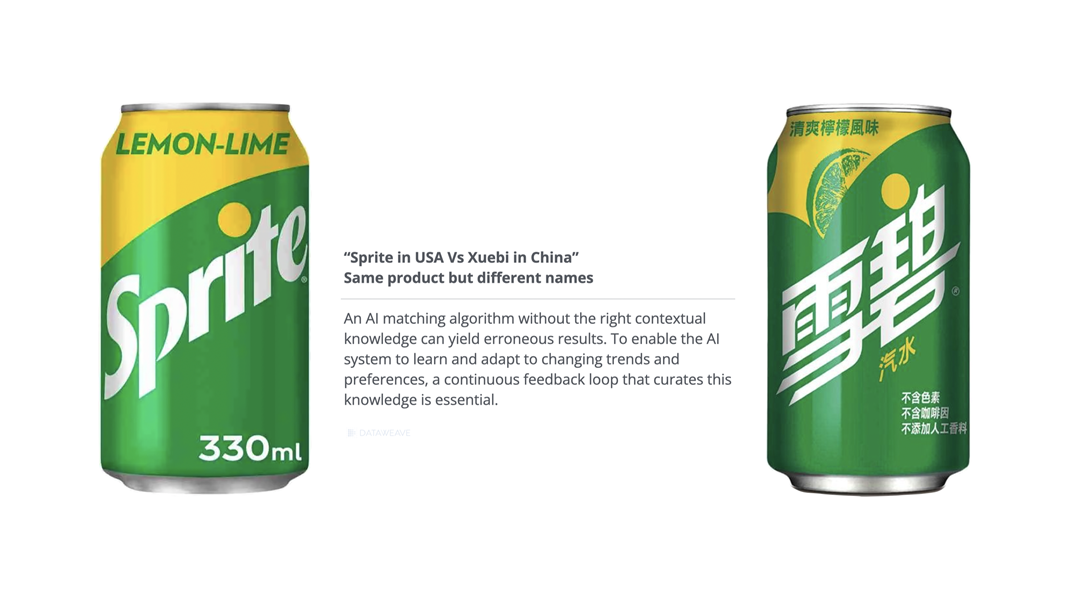
    Here’s the catch: many retailer websites don’t display them. Then there’s the private label puzzle—your “Store’s Best” organic apples need to match against competitors’ house brands, each with their own unique UPC. Throw in different sizes (4 Apples vs. 1Kg of Apples), regional product names (fancy naming for plain old arugula), and international brand variations (like the name for Sprite in the USA and China), and you’ve got yourself a complex matching challenge that would make conventional pricing intelligence providers sweat.

    Grocery Pricing Intelligence data faces a challenge when different naming conventions and languages are used in different geographies

    Custom Product Relationships for Consistent Pricing and Competitive Positioning

    Think like a shopper browsing the dairy aisle. You regularly buy your family’s favorite organic yogurt, the 24oz tub. But today, you notice the larger 32oz size is on sale – except the 24oz isn’t. As you stand there, confused, you wonder: Is the sale only for the bigger size? Did I miss a promotion? Should I buy the 32oz even though it’s more than I need?

    For shoppers, this inconsistent pricing across product variations creates a frustrating experience. Establishing clear relationships between related items in your catalog is essential for maintaining consistent pricing and a coherent competitive strategy.

    Grocery Pricing Intelligence data refinement involves Custom Product Relationships for Consistent Pricing and Competitive Positioning

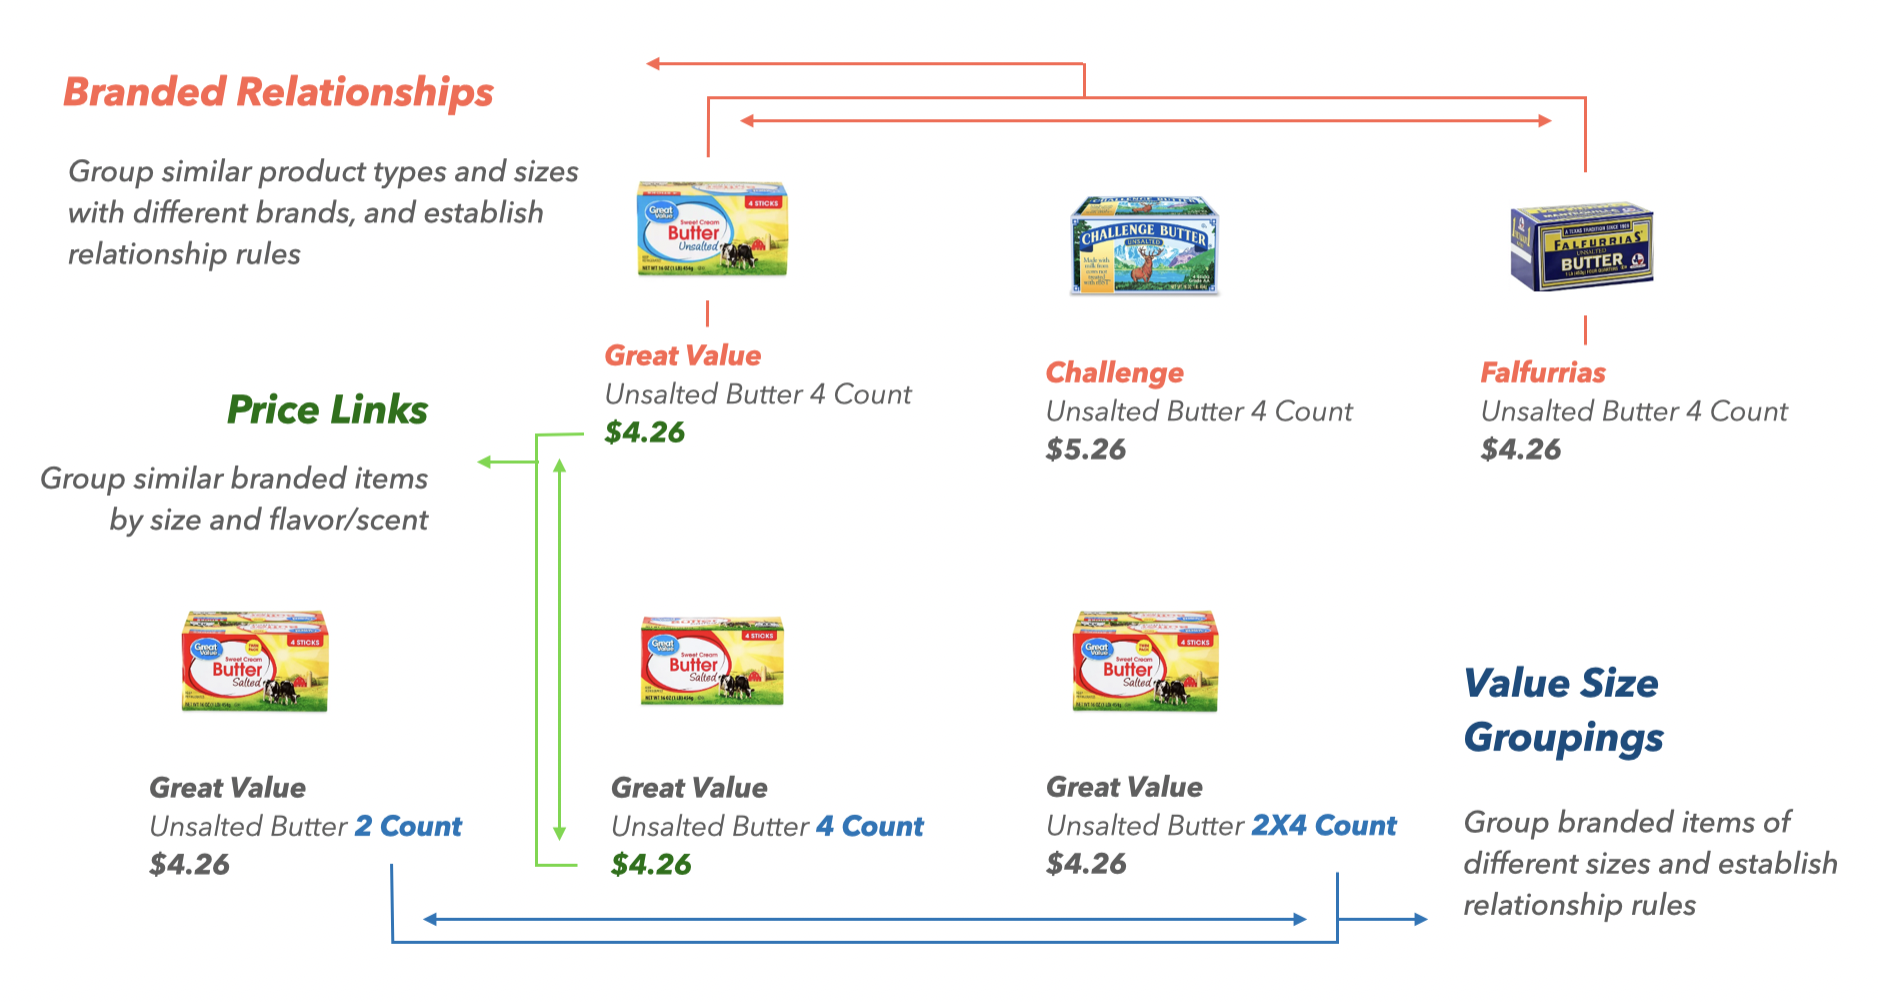
    Start by linking products based on attributes like size, brand, and packaging. That way, when you adjust the price of the 32oz yogurt, the 24oz version automatically updates too – no more scrambling to ensure uniform pricing across your assortment. Similarly, products of the same brand but with flavor variations should be connected to keep pricing consistent.

    Taking this one step further, mapping your competitors’ exact and similar products is crucial for comprehensive competitive intelligence. Distinguishing between premium and private label tiers, national brands, and regional players gives you a holistic view of the landscape. With this understanding, you can hone your pricing strategies to maintain a clear, compelling position across your entire category lineup.

    Consistent pricing, whether across your own product variations or against competitors, provides clarity and accuracy in your overall competitive positioning. By establishing these logical connections, you avoid the customer confusion of seemingly random, inconsistent discounts – and ensure your pricing strategies work in harmony, not disarray.

    The Role of AI and Data Sciences in Data Refinement

    On the surface, linking products based on attributes like size, brand, and packaging seems like a no-brainer. But developing and maintaining the systems to accurately and automatically identify these connections? That’s a whole different animal.

    Think about it – you’re not just dealing with text-based product titles and UPCs. There are images, videos, regional variations, private labels, and a whole host of other data types and industry nuances to account for.

    Luckily, DataWeave is one of the few companies that’s truly cracked the code. Our multimodal AI models are trained to process all those diverse data formats – from granular product specs to zany regional produce names. And it’s not just about technology; we also harness the power of human intelligence.

    See, in the grocery world, category managers are the real decision makers. They know their shelves inside and out and can spot those tricky connections in product matching, especially when they are not UPC-based. That’s why DataWeave built in a Human-in-the-Loop (HITL) process, where their AI systems continuously learn from expert feedback. It’s a feedback loop that allows our customers to pitch in and keep product relationships accurate, reliable, and always adapting to new market realities.

    So while product mapping may seem straightforward on the surface, the reality is it takes some serious horsepower to do it right. Thankfully, DataWeave has both the technical chops and the grocery industry know-how to make it happen. Because when it comes to pricing intelligence, getting those product connections right is half the battle.

    3. Strategic Implementation: Turning Insights into Action

    The true value of pricing intelligence (PI) is realized through its strategic application. Although many view PI as a technical function, its strategic significance is increasing, particularly in the context of recent economic pressures like inflation. Here’s why:

    Tactical vs Strategic Use of Data: From Standard Reporting to Competitive Analysis

    Pricing intelligence has come a long way from the days of simply reacting to daily price changes. These days, it’s not just about firefighting—it’s about driving long-term strategy.

    You can use pricing data to make quick, tactical adjustments, like matching a competitor’s sudden price drop on milk. Or, you can leverage that same data to predict market trends, optimize your product lineup, and shape your overall pricing strategy. Retailers who take that strategic view can get out ahead of the curve, anticipating shifts instead of just chasing them.

    DataWeave supports both of these approaches. Our Standard Reporting tools give pricing managers the nitty-gritty details they need—current practices, historical patterns, and operational KPIs. It’s all the insights you’d expect for making those tactical, day-to-day tweaks.

    In addition, DataWeave offers something more powerful: Competitive analysis. This is where pricing intelligence becomes a true strategic weapon. By providing a high-level view of market positioning, competitor moves, and untapped opportunities, competitive analysis empowers leadership to make proactive, big-picture decisions.

    Armed with this broader perspective, retailers can start taking a more surgical approach. Maybe you need to adjust pricing zones to better meet customer demands. Or rethink your overall strategies to stay ahead of the competition, not just keep pace. It’s the difference between constantly putting out fires and systematically fortifying your entire pricing fortress.

    Beyond Pricing: Comprehensive Data for Broader Insights

    Pricing intelligence is just the tip of the iceberg. When you really start to refine and harness your data, the possibilities for grocery retailers expand far beyond simple price comparisons. Think about it – all that information you’re collecting on products, markets, and consumer behavior? That’s a goldmine waiting to be tapped. Sure, you can use it to keep a pulse on competitor pricing. But why stop there?

    What if you could leverage that data to optimize your product assortment, making sure you’re stocking the right mix to meet customer demands? Or tap into predictive analytics to get a glimpse of future market shifts, so you can get out ahead of the curve? How about using it to streamline your supply chain, identify availability inefficiencies, and get products to shelves faster?

    Sure, pricing intelligence will always be mission-critical. But when you couple it with these other data-driven insights, that’s when grocery retailing gets really interesting. It’s about evolving from a price-matching robot to a true strategic visionary, armed with the intelligence to take your business to new heights.

    Looking Ahead: The Future of Grocery Pricing Intelligence

    The grocery pricing landscape continues to evolve, driven by:

    • Integration of AI and machine learning for predictive pricing
    • Enhanced focus on omnichannel pricing consistency
    • Growing importance of personalization in pricing strategies

    Pricing intelligence isn’t just about having data—it’s about having the right data and knowing how to use it strategically. Success requires a comprehensive approach that combines robust data collection, sophisticated analysis, and strategic implementation.

    By embracing modern pricing intelligence tools and strategies, grocery retailers can navigate market volatility, maintain competitive positioning, and drive sustainable growth. The key lies in building a pricing ecosystem that’s both sophisticated enough to handle complex data and flexible enough to adapt to changing market conditions.

    Ready to transform your pricing strategy? Check out our grocery price tracker to get month-on-month updates on grocery prices in the real world. Contact us to learn how our advanced pricing intelligence solutions can help your business stay ahead in the competitive grocery market.

  • Cracking the Code: How Retailers Can Adapt to Plummeting Egg Prices in 2024

    Cracking the Code: How Retailers Can Adapt to Plummeting Egg Prices in 2024

    Virtually every cuisine in the world uses eggs. They’re in your breakfast, lunch, dinner, and dessert — which is perhaps why the global egg market is expected to generate $130.70 billion in revenue in 2024 and is projected to grow to approximately $193.56 billion by 2029.

    More specifically, the United States is the fourth-largest egg producer worldwide. The country’s egg market is projected to generate $15.75 billion in 2024 and increase to $22.51 billion by 2029.

    This growth is driven by several factors, most notably:

    • Health-consciousness among consumers: Consumers value eggs for their essential nutrients and rich protein content.
    • Demand for convenience foods: Consumers’ preferences are shifting toward quick and easy foods, which drives demand for shell eggs and pre-packaged boiled or scrambled eggs.
    • Population Growth: A growing worldwide population increases the demand for eggs.
    • Affordability and accessibility: Eggs are an affordable and accessible nutrient-dense food source for many.

    Despite these factors contributing to the U.S. egg market’s growth, recent times have seen egg prices fall dramatically.

    Based on a sample of 450 SKUs, DataWeave discovered that egg prices in the U.S. fell by 6.7% between April 2023 and April 2024, dipping to its lowest (-12.6%) in December 2023.

    Egg Price Chart: Egg Prices USA Going Down 98.95% between April 2023 and April 2024

    So, what’s causing the decrease in egg prices?

    The Rise and Fall of Egg Prices: A Recent History

    In 2022, avian influenza severely impacted the United States. The disease affected wild birds in nearly every state and devastated commercial flocks in approximately half of the country.

    The 2022 incident was the first major outbreak since 2015 and led to the culling of more than 52.6 million birds, mainly poultry, to prevent the disease from spreading uncontrollably.

    With almost 12 million fewer egg-laying hens, the United States produced around 109.5 billion eggs in 2022 — a drop of nearly two billion from the previous year.

    Consequently, the cost of eggs soared, peaking at $4.82 a dozen — more than double the price of eggs in the previous year.

    The avian flu continues to affect egg-laying hens and other poultry birds across the United States. As of April 2024, farms have killed a total of 85 million poultry birds in an attempt to contain the disease.

    Despite the disease’s effects, production facilities have made significant efforts to repopulate flocks, leading to a steady increase in supply – and a much anticipated decrease in egg prices.

    According to the U.S. Bureau of Labor Statistics, there was an increase in producer egg prices in 2022, reaching a peak in November 2022, at which point they began to fall.

    Retailer’s egg prices followed suit. The egg price chart below depicts retailers’ declining egg prices over one year, from April 2023 to April 2024, with Giant Eagle showing the most significant price reductions and Walmart the least.

    Egg Price Chart Featuring Leading Retailers 2023-2024

    What Does the Future Hold for Egg Prices?

    The USDA reported recent severe avian flu outbreaks in June 2024. These outbreaks are estimated to have affected 6.23 million birds.

    With a reduction in egg-laying hens, egg prices are likely to increase — time will tell.

    Nonetheless, the annual per capita consumption of eggs in the U.S. is projected to reach 284.4 per person in 2024 from 281.3 per person in 2023. So for now, producers and retailers can rest assured of the growing demand for eggs.

    How Can Retailers Adapt to the Unpredictability of Egg Prices?

    Egg prices were down to $2.69 for a dozen in May 2024. However, they are still significantly higher than consumers were used to just a few years ago—eggs were, on average, $1.46 a dozen in early 2020.

    Additionally, while the avian flu puts pressure on producers, inflation and supply chain disruptions exert pressure on retailers.

    With such challenging egg market conditions, what can retailers do to maintain customer loyalty amid reduced consumer spending while maintaining profitability?

    1. Give the Customer What They Want: Increase Offerings of Organic, Cage-Free, and Free-Range Eggs

    As mentioned, Data Bridge Market Research’s trends and forecast report highlighted a significant increase in consumer health consciousness. Additionally, animal welfare increasingly influences consumers’ purchasing decisions when buying meat and dairy products.

    DataWeave data shows that the prices of organic, cage-free, and free-range eggs—such as those by brands like Happy Eggs and Marketside—have fallen less than those of non-organic, caged egg brands.

    Egg Price Chart Featuring Leading Egg Brand Prices 2023-2024

    2. Increase Private-Label Offerings

    Private labels typically offer retailers higher margins than national brands. These margins can shield consumers from sudden wholesale egg price swings, helping to preserve brand trust and consumer loyalty without sacrificing profitability.

    Moreover, eggs are particularly suited to private labeling, given their uniform appearance and taste and the lack of product innovation opportunities.

    Undoubtedly, this is why sales of private-label eggs dwarf sales of national egg brands in the United States. Statista reports that across three months in 2024, private label egg sales amounted to $1.55 billion U.S. dollars, while the combined sales of the top nine national egg brands totaled just $617.88 million U.S. dollars.

    3. Price Intelligently

    With the current and predicted fluctuations in egg prices over the foreseeable future, price competitiveness is paramount to margin management and customer loyalty.

    This is especially true when lower prices are the primary factor influencing the average consumer’s choice of supermarket for daily essentials purchases.

    AI-driven pricing intelligence tools like DataWeave give retailers valuable highly granular and reliable insights on competitor pricing and market dynamics. In today’s data-motivated environment, these insights are necessary for competitiveness and profitability.

    Final Thoughts

    Egg prices have fluctuated significantly due to the impact of avian flu. Despite recent price drops, future egg price increases are possible due to ongoing outbreaks. Retailers should adapt to unstable egg prices by increasing organic, free-range, cage-free, and private-label egg offerings while leveraging AI-driven pricing tools to maintain margins and customer loyalty.

    Speak to us today to learn more!

  • Capturing and Analyzing Retail Mobile App Data for Digital Shelf Analytics: Are Brands Missing Out?

    Capturing and Analyzing Retail Mobile App Data for Digital Shelf Analytics: Are Brands Missing Out?

    Consumer brands around the world increasingly recognize the vital role of tracking and optimizing their digital shelf KPIs, such as Content Quality, Share of Search, Availability, etc. These metrics play a crucial role in boosting eCommerce sales and securing a larger online market share. With the escalating requirements of brands, the sophistication of top Digital Shelf Analytics providers is also on the rise. Consequently, the adoption of digital shelf solutions has become an essential prerequisite for today’s leading brands.

    As brands and vendors continue to delve further and deeper into the world of Digital Shelf Analytics, a significant and often overlooked aspect is the analysis of digital shelf data on mobile apps. The ability of solution providers to effectively track and analyze this mobile-specific data is crucial.

    Why is this emphasis on mobile apps important?

    Today, the battle for consumer attention unfolds not only on desktop web platforms but also within the palm of our hands – on mobile devices. As highlighted in a recent Insider Intelligence report, customers will buy more on mobile, exceeding 4 in 10 retail eCommerce dollars for the first time.

    Moreover, thanks to the growth of delivery intermediaries like Instacart, DoorDash, Uber Eats, etc., shopping on mobile apps has received a tremendous organic boost. According to an eMarketer report, US grocery delivery intermediary sales are expected to reach $68.2 billion in 2025, from only $8.8 billion in 2019.

    In essence, mobile is increasingly gaining share as the form factor of choice for consumers, especially in CPG. In fact, one of our customers, a leading multinational CPG company, revealed to us that it sees up to 70% of its online sales come through mobile apps. That’s a staggering number!

    The surge in app usage reflects a fundamental change in consumer behavior, emphasizing the need for brands to adapt their digital shelf strategies accordingly.

    Why Brands Need To Look at Apps and Desktop Data Differently

    Conventionally, brands that leverage digital shelf analytics rely on data harnessed from desktop sites of online marketplaces. This is because capturing data reliably and accurately from mobile apps is inherently complex. Data aggregation systems designed to scrape data from web applications cannot easily be repurposed to capture data on mobile apps. It requires dedicated effort and exceptional tech prowess to pull off in a meaningful and consistent way.

    In reality, it is extremely important for brands to track and optimize their mobile digital shelf. Several digital shelf metrics vary significantly between desktop sites and mobile apps. These differences are natural outcomes of differences in user behavior between the two form factors.

    One of these metrics that has a huge impact on a brand’s performance on retail mobile apps is their search discoverability. Ecommerce teams are well aware of the adverse impact of the loss of even a few ranks on search results.

    Anyone can easily test this. Searching something as simple as “running shoes” on the Amazon website and doing the same on its mobile app shows at least a few differences in product listings among the top 20-25 ranks. There are other variances too, such as the number of sponsored listings at the top, as well as the products being sponsored. These variations often result in significant differences in a brand’s Share of Search between desktop and mobile.

    Share of Search is the share of a brand’s products among the top 20 ranked products in a category or subcategory, providing insight into a brand’s visibility on online marketplaces.

    Picture a scenario in which a brand heavily depends on desktop digital shelf data, confidently assuming it holds a robust Share of Search based on reports from its Digital Shelf Analytics partner. However, unbeknownst to the team, the Share of Search on mobile is notably lower, causing a detrimental effect on sales.

    To fully understand the scale of these differences, we decided to run a small experiment using our proprietary data analysis and aggregation platform. We restricted our analysis to just Amazon.com and Amazon’s mobile app. However, we did cover over 13,000 SKUs across several shopping categories to ensure the sample size is strong.

    Below, we provide details of our key findings.

    Share of Search on The Digital Shelf – App Versus Desktop

    Our analysis focused on three popular consumer categories – Electronics, CPG, and Health & Beauty.

    In the electronics category, brands like Apple, Motorola, and Samsung, known for their mobile phones, earbuds, headphones, and more, have a higher Share of Search on the Amazon mobile app compared to the desktop.

    Meanwhile, Laptop brands like Dell, Acer, and Lenovo, as well as other leading brands like Google have a higher Share of Search on the desktop site compared to the app. This is the scenario that brands need to be careful about. When their Share of Search on mobile apps is lower, they might miss the chance to take corrective measures since they lack the necessary data from their provider.

    In the CPG category, Ramen brand Samyang, with a lot of popularity on Tiktok and Instagram, shows a higher Share of Search on Amazon’s mobile app. Speciality brands like 365 By Whole Foods, pasta and Italian food brands La Moderna, Divinia, and Bauducco too have a significantly higher Share of Search on the app.

    Cheese and dessert brands like Happy Belly, Atlanta Cheesecake Company, among others, have a lower Share of Search on the mobile app. Ramen brand Sapporo is also more easily discovered on Amazon’s desktop site. Here, we see a difference of more than 5% in the Share of Search of some brands, which is likely to have a huge impact on the brand’s mobile eCommerce sales levels and overall performance.

    Lastly, in the Health & Beauty category, Shampoos and hair care brands like Olaplex, Dove, and Tresemme exhibited a higher Share of Search on the mobile app compared to the desktop.

    On the other hand, body care brands like Neutrogena and Hawaiian Tropic, as well as Beardcare brand Viking Revolution displayed a higher Share of Search on Amazon’s desktop site.

    Based on our data, it is clear that there are several examples of brands that do better in either one of Amazon’s desktop sites or mobile apps. In many cases, the difference is stark.

    So What Must Brands Do?

    Our findings emphasize the imperative for brands to move beyond a one-size-fits-all approach to digital shelf analytics. The striking variations in Share of Search between mobile apps and desktops conclusively demonstrate that relying solely on desktop data for digital shelf optimization is inadequate.

    If brands see that they’re falling behind on the mobile digital shelf, there are a few things they can do to help boost their performance:

    • If a brand’s Share of Search is lower on the mobile app, they can divert their retail spend to mobile in order to inorganically compensate for this difference. This way, any short-term impact due to lower discoverability is mitigated. This is also likely to result in optimized budget allocation and ROAS.
    • Brands also need to ensure their content is optimized for the mobile form factor, with images that are easy to view on smaller screens, and tailored product titles that are shorter than on desktops, highlighting the most important product attributes from the consumer’s perspective. Not only will this help brands gain more clicks from mobile shoppers, but this will also gradually lead to a boost in their organic Share of Search on mobile.
    • CPG brands, specifically, need to optimize their digital shelf for delivery intermediary apps (along with marketplaces). The grocery delivery ecosystem is booming with companies like DoorDash, Delivery Hero, Uber Eats, Swiggy, etc. leading the way. Using Digital Shelf Analytics to optimize performance on delivery apps is quite an involved process with a lot of bells and whistles to consider. Read our recently published whitepaper that specifically details how brands can successfully boost their visibility and conversions on delivery apps.

    But first, brands need to identify and work with a Digital Shelf Analytics partner that is able to capture and analyze mobile app data, enabling tailored optimization approaches for all eCommerce platforms.

    DataWeave leads the way here, providing the world’s most comprehensive and sophisticated digital shelf analytics solution, rising above all other providers to provide digital shelf insights for both web applications and mobile apps. Our data aggregation platform successfully navigates the intricacies of capturing public data accurately and reliably from mobile apps, thereby delivering a comprehensive cross-device view of digital shelf KPIs to our brand customers.

    So reach out to us today to find out more about our digital shelf solutions for mobile apps!

  • It’s not easy being a Bakery Brand: Insights from Digital Shelf

    It’s not easy being a Bakery Brand: Insights from Digital Shelf

    By 2028, Fortune Business Insights projects that the global bakery products market will reach USD 590 billion. The CAGR (Compounded annual growth rate) for 2021-28 is estimated at 5.12%. Products in this segment include bread, buns, cookies, tortillas, salted snacks, English muffins, bagels, confectionery food, hot dogs, cakes, popcorn, and so on.

    Due to disruptions in the global supply chain caused by lockdowns and border closures, the pandemic has had a negative impact on the demand for bakery products and snacks worldwide. However, the market is not only changing, but consumer demand is increasing. Post-pandemic, health, food, and safety have gained renewed attention.

    People across the world are making healthier choices with a focus on wellness. 

    A growing number of people are interested in plant-based foods and beverages, reducing sugar consumption, and understanding the link between lifestyle and health, including obesity and diabetes. As a result of these trends, food producers are reshaping their product strategies to meet new consumer demands.

    In this article, we take a look at the ways companies can leverage data to inform their e-commerce strategy.

    What’s driving up the demand for bakery products?

    More people are choosing easy-to-use bakery products and snacks over other foods due to urbanization, convenience, western diets, and women’s participation in the workforce. Additionally, innovations in baking systems, food technologies, ingredients, formulations, and product ideas are providing customers with a greater level of choice, flexibility, and freedom.

    How is e-commerce changing the game for bakery product companies?

    To optimize their supply chains, bakery food and snack companies must better understand e-commerce metrics given the wide variety of products available and eventually convert sales. There are several measures that companies need to pay attention to. 

    Stock availability metrics, discounts across locations, and share of search results – are all critical metrics companies need to track. In addition to providing manufacturers and retailers with an insight into the trends, DataWeave’s tools also allow them to make better business decisions and ultimately improve their bottom line. 

    Grocery Retailers and Bakery Brands tracked

    Methodology

    • Data Scrape period: February 2022 to September 2022
    • Country: Canada
    • Grocery Retailers tracked: Atlantic Superstore, Fortinos, InstaCart, Loblaws, Voila, Walmart Grocery, Zehrs.
    • Bakery brands: Betty Crocker, Dempsters, Hostess, No Name, Presidents Choice, Quaker, Vachon, Doritos.
    • Category tracked: Bread and Bakery, Chips, Crackers, Deserts, Snacks.

    Share of Search Analysis

    Which brands feature the most on e-commerce portals?

    When listing items on e-commerce platforms, share of search is crucial. The highest share of the top ten or top twenty items available on these platforms is correlated with how many times the item may be viewed. As a result, it would have a greater chance of being selected by the customer.

    By Retailer for Category “Desserts”

    Share of Search for Brands in each retailer
    • In Walmart Grocery, Vachon has the highest share of search at 41%, whereas Betty Crocker, Presidents Choice and No Name had the lowest share of search at 0%, in the Desserts Category.
    • In Loblaws, Presidents Choice had the highest share of search of 34%, whereas Dempsters had the lowest share of search of 2%  in the Desserts Category. 
    • The brand Presidents Choice consistently ranks high in the share of search results for Desserts across multiple retailers, including Atlantic Superstore, Fortinos, Instacart, Loblaws, and Zehrs – except at two retailers, Voila and Watlmart Grocery, where its share is zero.

    Trend of Share of Search for “Desserts”

    Share of Search analysis by Brands over Time in category “Desserts”
    • Share of search had dropped by around 4% for No Name, whereas for Vachon, it increased by 3% from Jan’-22 to Sep’ 22
    • By brands, Presidents Choice had the highest share of search at 42%, whereas Betty Crocker had the lowest share of search at 12% between Jan’ 22 and Sep’ 22 in the Desserts Category.

    Availability Analysis

    Which products are widely available across e-commerce portals?

    The availability of the product on the e-commerce portal is one of the key indicators of meeting customer demand. Brands can use insights from DataWeave to strategize how to restock their inventory and ease customer demand. Based on data analysis, brands can also determine which products to prioritize on which platforms.

    By Category

    Availability analysis by Category over Time
    • Availability of all five categories was around 52% in Feb’ 22, which steadily increased to 61% until Aug’ 22 and has reduced to reach 55% availability in Sep’ 22
    • Sliced Bread category has seen the most drop in availability by 12% between Jun’ 22 and Sep’ 22
    • The tortilla category has the most rise in availability. It has increased by 16% between Feb-22 and May-22. It also showed an overall rise in availability of 5% from Feb-22 to Sep-22

    By Location

    Availability analysis by Location and Category
    • Across categories, Snacks & Candy had better availability at 73% than Bread & Bakery, with 56% availability.
    • By Location, New Brunswick had more than 65% availability across all three categories; the closest Location is Nova Scotia, with 63% availability.
    • Alberta had the highest availability of 100% in the Snacks & Candy category and the lowest availability of 21% overall in all three categories (weighted aggregate)

    Discounts Analysis

    Several discount-based insights can be studied on e-commerce platforms. From location-based trends, retailer-based trends, and manufacturer-based insights. These insights can help companies make the most of the revenue opportunity while creating an attractive value proposition for the retail consumer.

    By Category

    Discount analysis by Category
    • Discounts of all three categories were around 24% in Feb’ 22, which steadily reduced to reach 15% in Sep’ 22
    • Snacks, cookies & chips category has contributed the most to the drop in discounting, which dropped by 17% between Apr’ 22 and Sep’ 22
    • The Tortilla Category does not have any discount in the month of Jul’ 22

    By Retailer

    • Discount on Bread & Bakery category in Walmart Grocery was around 9% in Feb’ 22. It steadily increased to 13% by Jun’ 22 and thereon reduced to reach 11% availability in Sep’ 22.

    By Location

    • Across Retailers, Nova Scotia had the highest availability of discounts at 22%, whereas New Brunswick had the lowest with discounts at 9% in Bread & Bakery category.
    Discount analysis by Retailers and Locations – Alberta, Ontario, New Brunswick, Nova Scotia
    Note: Analysis does not cover all locations

    Bakery and snack product manufacturers on e-commerce platforms have access to a rich trove of insights they can leverage to benchmark their strategies. They can better understand customer demands, align their supply chain and critically understand the trends impacting their bottom line. Engaging with a third-party platform like DataWeave’s Digital Shelf Analytics  can help brands unlock tremendous value. 

  • Insights from the Digital Shelf of Indian FMCG Brands

    Insights from the Digital Shelf of Indian FMCG Brands

    Analyzing Search, Promotions and Availability for Chocolates, Biscuits, and Malt Drinks across BigBasket, Blinkit, Dmart, Swiggy etc.

    Imagine you log into an e-commerce portal with a list of food items you need for the month. You know what you want, and scroll through the platform to see if there are any discounts. You check competitor products to see if you can get better deals. And within no time, fill your cart with products that you need and proceed to check out. 

    It all happens quickly. It’s an online shopping experience that we are familiar with. But what exactly is happening in the background?

    Brands are tracking and ensuring the highest keyword ranking, optimal availability and competitive discounts to grab your order. And to enable this, Brands rely on Digital Shelf Analytics.

    The FMCG marketplace

    Here, we take a closer look at some of the key factors that Fast Moving Consumer Goods (FMCG) Brands on e-commerce platforms need to pay attention to – to ensure their products appear on the top of search items, to better understand competitor discounts and to monitor the availability of their products across regions.

    FMCG has experienced rapid growth in the last two years, largely attributed to digitalization, changing consumer habits, and increased spending post-pandemic.  Macro factors, including government impetus, inflationary pressures, and consumption recovery, indicate a double digital growth for FMCG brands in the country. According to NielsenIQ’s FMCG Snapshot for Q2 2022, the FMCG industry has grown by 10.9% in the quarter ending June 2022, compared to 6% in the previous quarter.  In the second half of 2022, consumers are expected to spend even more during the festive season. With these shifts underway, the growth opportunities in this sector can only be exploited by companies that can sense trends early – and take appropriate action.

    In addition to providing manufacturers and retailers with actionable insights into e-commerce trends, DataWeave’s tools also allow them to make informed business decisions and ultimately improve their bottom line. Data-driven insights on e-commerce products can help brands optimize their supply chain to maximize sales. A company can determine the key areas that need attention based on an analysis of the availability of products on specific e-commerce channels, associated discounts, as well as zip-code level demand and supply statistics.

    Here are a few sample insights and trend analyses for some popular FMCG brands in the Biscuits, Chocolate and Malt drinks categories spotted by DataWeave.  

    Analytics Methodology: An overview of the data set analyzed

    • Data Scrape period: January 2022 to August 2022
    • Grocery Retailers tracked: Amazon Fresh, BigBasket, Dmart, Jiomart, Swiggy, Milkbasket
    • FMCG brands: Britannia, ITC, Mondelez, Nestle, Parle, Complan, Boost, Amul, Hershey’s
    • Category tracked: Biscuits, Chocolate, Malt drinks


    Availability Analysis

    What is the availability of Biscuits, Chocolate and Malt Drinks on e-commerce portals?

    The availability of a product on an e-commerce marketplace is a key indicator of whether the product meets consumer demands.  DataWeave’s availability analytics can be leveraged by FMCG brands to strategize their inventory and stock planning.  Brands can also make data-driven decisions on product visibility, i.e. identify which products to prioritize on which platforms. 

    • Biscuits had a better availability at 63% when compared to chocolates at 56% across all retailers
    • Dmart and Swiggy had more than 85% availability across all three categories, with Bigbasket coming next at 67% availability 
    • Flipkart Grocery and Blinkit had the lowest availability at 46% and 50%, respectively.
     Figure 1: Availability Scores for Biscuits, Chocolates and Malt Drinks across Retailers

    Which manufacturers have the highest availability of products on e-commerce platforms?

    A study of the availability of products across different manufacturers can reveal brands that have successfully tapped the market opportunity. Here’s a look at brands that have steadily improved their availability on e-commerce platforms.

    Figure 2: Availability Trends for Biscuits across Manufacturers
    • In the biscuits category, all five manufacturers marked approximately 50% availability in Jan 2022. Availability steadily grew to 68% in June 2022, then declined to 63% in Aug 2022.
    • Unibic experienced the largest drop in availability, dropping 15% between May 22 and Aug 22.
    • Mondelez saw the largest rise in availability, an increase of  23% between Mar-22 and Aug-22.
    Figure 3: Availability Trends for Malt Drinks across Manufacturers
    • Except for Boost and Nestle, availability for all seven manufacturers of malt drinks was consistently above 50%. The average availability across all manufacturers rose gradually from 55% in Jan to 63% in Jul-22, followed by a small decline to 57% in August.
    • From 30% availability in January 22 to a mere 7% in August 22, Boost has seen the greatest drop in availability.
    • The availability of Amul has risen the most over the past year, rising from 51% in January 22 to 78% in August 22, hitting 80% in July 22.

    Chocolate: Which manufacturers have the highest availability of products on the e-commerce platforms?

    Figure 4: Availability Trends for Chocolates across Manufacturers
    • Chocolate availability across all manufacturers averaged 47% in Jan-22, reaching a peak of 64% in May-22 and dropping to 51% in Aug-22.
    • From 46% in Jan-22 to 74% in May, Mondelez saw the biggest increase in availability, followed by a decline to 68% in August.
    • Ferrero experienced one of the sharpest drops in availability. Although the brand’s availability steadily grew from 77% in Jan 22 to 94% in Jul 22., it registered a steep drop to 49% in August. 

    The drop in availability hurts the Brand’s eCommerce in two ways. Not only does the Brand lose sales directly. But poor availability also impacts the keyword search ranking, which further hurts the sales.

    Check out DataWeave’s Digital Shelf Analytics Product for insights on how Availability tracking can help reduce stock-outs and boost sales. Click here to know more.

    Discount Analysis

    Location-based, retailer-based, and manufacturer-based discount trends can be analyzed. These studies can help companies plan attractive and appropriate promotional and discount strategies to enhance their revenue opportunities. 

    Which manufacturer has been offering the most discounts?

    A study of discounts offered across manufacturers for chocolates, malt drinks and biscuits indicates that some brands have increased their discounts while others have reduced their discount rates. These decisions could be triggered by demand, availability, and production cycle. Parle, for example, has steadily reduced its discount rates. 

    Figure 5: Discount Rate Trends across Manufacturers

    Average discount rates across manufacturers were around 9% in Jan 2022 and rose steadily to reach 14% in Jul 2022. A small decline is observed post-July, with a 12% discount rate registered in Aug 2022.

    • In the biscuit category, Unibic offered the biggest discount of 28%, followed by ITC at 20%.     
    • In the Chocolate category, Hershey’s offered the largest discount of 14%, followed by ITC at 12%.
    • In the Malt Drink Category, Amul offered the largest discount of 16%, followed by Boost at about 10%. 

    Check out DataWeave’s Digital Shelf Analytics Product for insights to respond to Competitor’s pricing and promotions. Click here to know more.

    Share of Search Analysis

    Which brands feature within the top 5 on the first page of the search?

    A product that appears within the top 5 items on the first page of a search, has a higher probability of being purchased. Below is a study of the share of the search for biscuits across manufacturers and retailers. 

    Figure 6: Share of Search for Biscuits across Manufacturers and Retailers
    • Britannia dominates the top ten share of search across different online retail platforms.
    • Mondelez has the highest share of search at 62% in Amazon Fresh, whereas Parle-G has the lowest share of search at 7%.
    • In Bigbasket, Britannia has the highest search share of 62%, whereas Parle-G has the lowest search share of 7%.

    Check out DataWeave’s Digital Shelf Analytics to track the Share of Keyword and Navigation Search. Click here to know more.

    Conclusion

    FMCG is a rapidly evolving industry sector with a high potential for growth in the coming years. FMCG brands must compete with one another to fully tap this market opportunity on several factors to ensure that their products are visible, available, and attractive to consumers. Digital crawling and big data technologies have enabled manufacturers and retailers to collect publicly available e-commerce data for useful, actionable insights and trend analysis. To stay competitive, it is crucial for manufacturers and retailers to engage with analytics and data experts to seamlessly integrate e-commerce analytics into their short- and long-term business strategies. Whether it’s building keywords to increase the share of search, knowing the right discounts to attract customers in a particular city or increasing the availability of products on specific e-commerce platforms, companies need to invest in the right data intelligence!

    DataWeave for FMCG Brands

    DataWeave has been working with global CPG/FMCG brands, helping them drive their growth on eCommerce platforms by enabling them to monitor their key metrics, diagnose improvement areas, recommend action, and measure interventions’ impact. DataWeave’s KPIs enable Brands to fill in the blind spots in their funnel data and allows them to respond to competitors on a near-real-time basis.

    If you want to know to learn how your brand can leverage DataWeave’s data insights and improve sales, then click here to sign up for a demo

  • The Rapid Rise of Alcohol eCommerce in the UK

    The Rapid Rise of Alcohol eCommerce in the UK

    Alcohol eCommerce has been rapidly growing over the years, and like a lot of other industries, the pandemic accelerated its growth. Convenience, safety & home delivery became important criteria for customers in the post pandemic era and so the sale of alcohol via eCommerce went up. Kantar reported that UK booze sales were up £261m & online and convenience stores were the biggest winners. The latest IWSR Drinks Market Analysis Report 2022 reported on another interesting trend – when ordering alcohol online, consumers prefer using websites v/s apps in most parts of the world except China and Brazil. In the UK the largest chunk of online alcohol purchases happens on a retailer website instead of an app. 

    Platform used for last online alcohol purchase. Source

    To get a better understanding of this, we tracked 2 grocery retailers and 3 grocery Q-Commerce apps in the UK to get insights into Alcohol sales, pricing, trends & more! 

    Methodology

    • Data Scrape time period: Feb 2022 – June 2022
    • Grocery Retailers tracked: Tesco & Ocado
    • Grocery Apps trackedGorillasWeezy & Getir
    • Category tracked: Alcohol

    Which retailer was the Price Leader in the alcohol category? 

    Before the pandemic Tesco was the only Big 4 retailer to increase their alcohol market share & Waitrose was the biggest loser, with its share of booze sales falling from 5.4% to 4.7%. Maintaining Price Leadership is a critical element and plays a big role in increasing sales & market share because consumers will buy the most competitively priced product. We wanted to track and see which retailer was the Price Leader in the alcohol category – i.e., had the most number of lower-priced items in the alcohol category. We also wanted to see if & how Tesco’s position had changed post pandemic. 

    Price Leadership
    • Tesco enjoyed price leadership in the Alcohol category from Feb – June 2022 with 38.9% products priced the lowest. This, followed by Ocado at 33.8%. Gorillas had price leadership for the least amount of products in the alcohol category at 5.6%. Tesco was the clear winner! 
    • Tesco’s Price Leadership kept declining through the months though – at the beginning of the year in Feb, Tesco had 44% products priced the lowest but by June, that number fell to a little over 36%. Ocado showed a reverse trend – in Feb they had price leadership on 32% items and by June that number rose to 35.3%.
    • One player Tesco could’ve potentially lost price leadership to was Getir. In Feb, Getir had price leadership on only 8.2% products but that increased gradually over the months to land on 14.5% in June. 

    Which retailers focused on Discounts to perk up alcohol sales? 

    Discounts are a great way to draw in inflation-hit shoppers. Loyalty card discounts, reward vouchers, and other promotional strategies retailers offer help make their products more competitive & attractive to customers. To stay competitive, retailers need to be aware of the discounts their competition is offering. They also need to understand the risk of deep discounting and the impact on margins. We wanted an insight into alcohol related discounts in the UK so we dug into our data. Here’s what we saw. 

    Average discounts across months by retailers
    • A host of European and UK based startups like Jiffy, Dija, Weezy, Zapp, Getir & Gorillas launched with the promise of delivering groceries the fastest & cheapest
    • Our data showed that Gorillas offered discounts in line with the competition, however, Getir likely went the deep discounting route. 
    • Getir offered the highest discounts across all months. And in the month of April they offered almost 9% more discount than Ocado – the retailer with the 2nd highest discounts. 
      Like we discussed above, Getir gained price Leadership from Feb to June. Deep discounting could have potentially played a role. 
    • Gorillas on the other hand had the lowest, almost non-existent discounts.

    Let’s look at Price Index trends across 5 months 

    We tracked the Price Index (PI) across these 5 retailers to measure how alcohol prices changed over a 5 month period from Feb – June 2022. 

    Note: Retailers selling at the 100% mark were selling at an optimal price & did not undercut the market. The pricing sweet spot is 95% – 105%. Anything lower would compromise margins, and higher would mean the retailer was not competitive. 

    Price Index across months by retailers
    • Weezy had a Price Index that was the most optimal, sitting in the 100% – 102% range.
    • Gorillas had the lowest Price Index, between 89% – 91%.
    • Getir had a low price index in Feb (96.1%) but slowly kept increasing to cross 110% in April, May & June.
    • What was interesting to see was the competition between the 2 retail giants Ocado & Tesco. Ocado had a lower price index at the start of the year at 105.1%, while Tesco was at 109.8%. In the subsequent months, Ocado kept increasing prices to be competitive with Tesco and Tesco decreased prices to likely match Ocado’s pricing. By June BOTH Tesco & Ocado had the exactly the same price index – 108.7%

    Which retailers were the quickest to make price changes?

    Competitive pricing is critical to eCommerce success. Competitive pricing involves tracking your competitor’s pricing & strategically tweaking your own prices without hurting margins. We tracked the month-wise average Price change from Feb – June across all 5 retailers to see which retailer was making price changes and at what frequency. 

    Average price change across months by retailers
    • Most retailers did not make massive prices changes, they were ballpark competitive with each other from a pricing standpoint. 
    • However, Gorillas made significant changes in the month of March when they dropped prices by 3.8% and in May when they increased prices by 5.5%!
    • In May, the same month Gorillas made a big price hike, Weezy dropped their prices significantly by 10% widening the gap between the 2 retailers. 

    Which retailers avoided lost sales by maintaining stock availability?

    Having a near real time view on stock availability is crucial to driving sales. Customers can buy products only when they’re available! So, we went ahead, looked into our data to see how each of these retailers managed stock availability from Feb to June.

    Average availability across months by retailers
    • Our data showed varying availability levels across retailers with Ocado having the highest availability across all 5 months. They had a robust stock at the beginning of the year at 100% but kept dwindling through the months to land at 95.8% by June. 
    • Tesco had a sharp drop in availability in May & June – from 97% at the beginning of the year to the 92-93% range.
    • Gorillas had the lowest availability across months between 90 & 94%.
    • Weezy consistently maintained availability at 95% across all 5 months.

    Conclusion

    For the most part, the UK market has a positive outlook towards buying alcohol online thanks to changes to shopper behavior arising from the pandemic. As per the IWSR Drinks Market Analysis Report 2022 in website-led markets, such as the UK, breadth of product range is important to customers along with price. These 2 play a key factor in purchase decisions. By contrast, consumers in app-driven markets have different preferences. While price matters, it is less important than convenience and speed. 

    As an alcohol retailer, if you need help tracking your competitor prices, discounts and product assortment, reach out to the team at DataWeave to learn how we can help!

  • Decoding Growth for CPG Brands in India with Data Analytics

    Decoding Growth for CPG Brands in India with Data Analytics

    It’s been a pivotal year for the CPG industry in India. Consumers were forced to stay at home due to the pandemic, leading to a surge in online CPG shopping, simultaneously increasing the expectation for safety and convenience.

    Brands and retailers needed to adjust to this new reality to meet customer expectations that were very different from the pre-Covid era. They needed to make adjustments right from the way of marketing to product assortments, communication to customer interaction. Factors such as increased competition from e-commerce platforms, the emergence of homegrown brands, traditional players making the online shift all have transformed the CPG industry. 

    Kantar study
    A survey conducted by Kantar showed the delta growth of top CPG brands in the last five years in India.

    A survey conducted by Kantar showed the delta growth of top CPG brands in the last five years in India. As per the report, among the 428 brands, 55% of brands failed to grow their penetration. 

    Some big brands like Lux and Lifebuoy feature in this list of brands that failed to grow – each of these brands still reached over half of India, but in 2016 they were much bigger. Size alone, therefore, does not guarantee success, but it helps.

    Going forward too, CPG sales will remain high as consumers are spending more time at home and brands must ensure they are doing everything possible to work on their strategies. Hence, CPG companies are turning to technology to increase their productivity and efficiency.

    What Is Data Analytics?

    In brief, data analytics refers to the process of drawing conclusions from any predetermined datasets. With CPG data analytics, it means any product-related or consumer behavior-related data that is relevant to the brand. However, data has long been ignored by CPG companies. Research by McKinsey shows that CPG scored below average when it comes to digitally mature industries globally. Only 40 percent of consumer-goods companies that have made digital and analytics investments are achieving returns above the cost of capital. The rest are stuck in “pilot purgatory,” eking out small wins but failing to make an enterprise-wide impact.”

    Kantar study
    A survey conducted by Kantar showed the delta growth of top CPG brands in the last five years in India.

    It is important for any company that sells products to understand the structure and needs of the consumers. The goal is to know what products they should produce and what makes it profitable for them to produce it. This is where data comes in. The more data, the better it is, and it is important for companies to understand what to study to discover the trends in their consumers’ behavior. If they can identify trends and make predictions based on that data, then they will be better prepared to make changes that will improve the business.

    Another banner trend and rightly so is using modern-day technologies such as AI & Machine Learning (ML) to spot hidden trends and opportunities. ML capabilities can help CPG companies identify anomalies that are not obvious to human intelligence so they can react accordingly.

    Data Analytics Gives You An Edge Over Your Competitors

    Big CPG companies such as PepsiCo, Unilever, and McDonald’s have been focusing on data for a long time. McDonald’s has been investing in data heavily since 2015 and also acquired analytics firm Dynamic Yield, an ML platform for retailers in 2019. Some of the data points that McDonald’s uses are historical sales data, customers’ past purchases, items in trend, and so on. For maximum efficiency, brands must focus on data across the board – from data related to sales and merchandising to price optimization, marketing, supply chain, and more.

    Key Data points for CPG

    Some of the key data points for CPG companies to reconfigure their businesses are:

    a. Sales Data And Trends

    Sales data shows the units of a product (SKUs) that are sold across different locations or channels. This data gives a better idea of what decisions, activities, assortments lead to higher sales. While the companies often have a track of their offline sales, it is important that you combine both offline and online sales data, especially now that digital channels are turning out to be a make or break for a lot of CPG brands.

    Instead of relying on traditional surveys or testimonies, brands must look to invest in tools that can present this highly complex data in a clear and communicative manner.

    Getting sales data from your own website is the easy part, but if you want to know your online sales and market share on marketplaces like Amazon v/s your competitors, get in touch with our team to know more.

    b. Competitive Analytics

    Competitor analysis provides an opportunity to go deeper and evaluate who’s operating in your space, how they operate if there is a specific competitor you don’t know of, or even a potential competitive advantage you are not aware of. 

    This data also helps to focus on the root cause for positive and negative developments, and uncover relative market positions of main competitors. Depending on the product and goals, companies should gather data about their competitors’ pricing & promotional strategies, package design, sizes, product range, etc.

    c. Market Basket Analytics

    Popularly known as assortment optimization analytics, this is one of the most important data points, from a marketing perspective. This is based on the theory that customers who buy one item are more likely to buy another specific item.

    For instance, if a customer is buying hot dogs they are typically more likely to buy buns. Grocery stores also pay attention to product placement and shelving, you will almost always find shampoos and conditioners together. Walmart’s infamous beer-and-diapers anecdote is also a classic example of Market Basket Analytics.

    If you want insights into your product assortment, bestsellers, or insights into your competitor’s assortment and bestsellers, we can help!

    d. Price And Promotional Analytics

    CPG industry is a highly fragmented market and companies focus on pricing and promotions to boost their sales. More than often, promotion spends tend to be even bigger than advertising budgets. However, many companies struggle to get their pricing right and often find that promotions are actually counterproductive. 

    Creating optimized pricing and promotional strategies especially in a digital world can be a struggle. In a world where shoppers compare prices and deals, have thousands (if not lakhs) of options to choose from, pricing agility can be the key to competitive advantage. Top retailers and CPG companies rely on data and analytics to get their strategies right.

    CPG Analytics breakup
    CPG Analytics Breakup

    e. Customer analytics

    Businesses can take full advantage of advanced analytics to map their customers’ shopping experience and make changes to their marketing strategies accordingly. Brands can create a personalized experience for their audience using information such as customer demographics, store and brand loyalty, purchase frequency, completed transactions, abandoned products, and carts, etc. This will help CPG manufacturers deliver superb customer experiences and design lean operations to meet their objectives of better understanding their consumers to enhance their experience, reduce costs, streamline the supply chain and enhance the relationships.

    Conclusion

    If used right these data points can create exponential profits and margins for CPG brands. It’s Important that businesses invest in big data and advanced analytics to focus on delivering impactful services to consumers. Businesses can use these data points to identify strengths, gaps, and opportunities. 

    For short-term goals, CPG data helps by providing an accurate and clear picture of the ongoing operations across the entire business. As a long-term plan, measuring, evaluating, and tracking this data can empower your business to make better decisions and allocate your resources better. CPG data analytics affects the entire supply chain processes and solutions and can boost sales, ROI, and YoY growth if used tactfully.DataWeave’s AI-Powered analytics solutions give CPG brands the data they need to improve customer experience and drive e-commerce sales. Sign up for a demo with our team to know more.

  • Introducing the CPG Brand Monitor by DataWeave

    Introducing the CPG Brand Monitor by DataWeave

    As DataWeave continues to engage with brands and manufacturers of all sizes, a consistent theme keeps emerging, “click and collect tracking”. Right now, brands rely on manual-store checks or waiting upwards of two weeks for a retailer to report sales data, which reveals low sales because a product is out of stock. In addition, there are always questions about the local price of your products compared to top competitors in the category. This is where DataWeave’s CPG Brand Monitor solution can help. 

    Click here for a quick tour of our dashboard.

    What we cover?

    On a daily basis, we track over 13,000 variant level SKUs across 100 stores, via seven of the top grocery retailers. We have selected the largest grocers in each region of the US, to allow for the widest coverage. These grocers include Albertsons/ Safeway in the west, HEB in Texas, Kroger in the upper mid-west, Wegmans in the Mid-Atlantic and Publix in the Southeast. 

    How does it work?

    In the application, you will see the list of all the SKUs we’re covering, with filters on the left side of the page to help with navigation. You can sort by Brand, Category, Store/ City, State, etc. After the filters are applied, the SKU list will be displayed based on these filters.  On the right side of the screen, you will see all the product level details including a 7-day price history, individual store level pricing/ stock availability and exportable charts and graphs. 

    How do I get access?

    Simply access the CPG Brand Monitor page, fill in your credentials via “Start Free Trial” and your login will be sent directly to your inbox. No commitments or phone calls are needed to test out the data. After a few days, our team will be in touch to make sure you understand how to navigate the tool and take you through our subscription options.   

    What else do we offer?

    DataWeave also offers a full Digital Shelf Analytics suite that covers Share of Voice (keyword, navigation and banner audits), Content Audit/ Optimization, Ratings/ Review Sentiment Analysis, Promotional Analysis, and much more. 

  • Coronavirus Outbreak: Impact on E-Commerce Retailers and Consumer Brands

    Coronavirus Outbreak: Impact on E-Commerce Retailers and Consumer Brands

    The Coronavirus, otherwise known as COVID-19, has made landfall on U.S. shores. At the time of writing this article, there are over 230 confirmed cases in the country and 12 deaths. The growing unease about the virus, which has quickly accumulated 95,000+ confirmed cases globally, has, among other things, adversely affected businesses and stock markets the world over.

    In the wake of this outbreak, U.S. based retailers and brands would be prudent to brace themselves and plan ahead to minimize disruptions as much as possible.

    Businesses and consumers in China, the global epicenter of the epidemic, have been dealing with these challenges over the last couple of months. It’s likely that some of the trends observed in China would be mimicked in the U.S. as well, something that domestic retailers and brands would do well to study and prepare for.

    The Inadvertent E-commerce Wave

    When the outbreak happened in China, it caused an uptick in e-commerce adoption as shoppers were reluctant to step out of their homes and instead, opted to shop for their goods online.

    Reports indicate that Chinese online retailer JD.com’s online grocery sales grew 215% YoY over a 10-day period between late January and early February. Similarly, Carrefour’s vegetable deliveries grew by 600% YoY during the Lunar New Year period. Online sales of Dettol, a disinfectant produced by Reckitt Benckiser, rose 643% YoY between 10 February and 13 February on China’s Suning.com.

    In Singapore, another region affected by the virus more recently than in China, Lazada’s grocery arm, RedMart, and Supermarket chain, NTUC FairPrice, both reported an unprecedented surge in demand, which tested their delivery capabilities to the limit.

    This bump in online sales isn’t just restricted to grocery, but other categories as well. Jean-Paul Agon, CEO of L’Oréal, recently said that online sales of the brand’s beauty products increased in China in February.

    Given such a consistent shift in shopping behavior across coronavirus-affected regions, it’s logical to expect that a similar trend would be followed in the U.S. – in fact, it might already be underway.

    A recent survey by Coresight Research indicated that 27.5% of U.S. respondents are avoiding public areas at least to some extent, and 58% plan to if the outbreak worsens. Of those who have altered their routines, more than 40% say they are “avoiding or limiting visits to shopping centers/ malls” and more than 30% are avoiding stores in general. The survey also found consumers will likely begin to avoid restaurants, movie theaters, sporting events and other entertainment venues.

    Therefore, it’s essential for U.S. retailers and brands to swiftly energize their e-commerce readiness and be fully prepared to cater to the circumstances-induced shift in shopping behavior, inclined toward online.

    A Logistical Nightmare

    The most obvious area of impact for retailers and brands is in their supply chain and order fulfilment operations.

    A large portion of consumer product manufacturers rely to some extent on China, and the potential impact of the virus on supply chain processes is inescapable. Chinese factories have been operating at partial capacity, impacting supply chains globally. This has largely affected highly popular e-commerce categories like consumer electronics, fashion and furniture.

    Shares in the U.S. of furniture e-commerce retailer, Wayfair, fell as much as 26% toward the end of February, according to a Bloomberg report. The is particularly revealing, as the online retailer reportedly relies on China for half of its merchandise.

    Retailers struggling to cope with this stress in their supply chain systems would do well to warn their customers beforehand about delays in deliveries, like AliExpress has just done.

    For categories like CPG, as consumers increasingly shop online, retailers that offer Buy Online Pick Up In Store (BOPIS), should expect a surge in its adoption, and reinforce their online infrastructure and in-store operations to cater to the rising demand.

    In addition to disruptions in the supply chain, several other mission-critical areas are likely to get affected too.

    Keeping Up With The Online Surge

    As with any event of this magnitude, the business implications reach far and wide. The following are a few areas that we’ve identified as critical, based on our experience working with retailers and brands. Being aware of and focusing on these issues are likely to alleviate some of the issues faced by consumers today.

    Fair pricing: There have been several reports of price gouging on e-commerce platforms. Examples include 2-ounce Purell bottles being sold for $400 and face masks for up to $20. While these prices have mostly been set by third party merchants, brands are likely to face the flak from consumers. A recent Bloomberg article reported that online retailers still rely partly on employees to manually monitor these items. This approach has obvious limitations, such as products quickly reappearing on the website after being de-listed. Brands and e-commerce platforms will need to explore automated ways of controlling their online pricing practices at large scale.

    3P merchant and counterfeit management: Often, unauthorized third-party merchants selling an original manufacturer’s goods are the ones who unreasonably inflate prices. These merchants tend to test the markets on online marketplaces with their pricing, which adversely affects the brand image of the manufacturer. Further still, they sometimes list counterfeit or fake goods that make incorrect or extravagant claims. Brands will need to swiftly identify and de-list these merchants from online marketplaces.

    Ensuring stock availability: During times like these, it’s a common sight to see empty aisles at supermarkets selling items like canned food, water, paper products and personal care products. Consumers will benefit from brands monitoring their stock availability at stores, which will help them better align their supply chain operations to the rapidly changing demand patterns across the U.S. map. This way, efforts can be more targeted at regions with severe shortages.

    Content compliance: Helium 10, a technology provider for Amazon sellers, reported that since 26 February, 90% of searches on Amazon are coronavirus related, and searches for hand sanitizers spiked to 1.5 million searches in February compared to 90,000 in November. As a result, to arrest exploitative practices, some online marketplaces have announced policy guidelines on product content claiming health benefits. Words like ‘Coronavirus‘, ‘COVID-19‘, ‘Virus‘ and ‘epidemic’ are, in fact, prohibited.  Amazon has already de-listed several merchants claiming fraudulent cures. Ebay has gone as far as to ban all new listings for face masks, hand sanitizers, and disinfecting wipes, due to regulatory restrictions. In this context, retailers and brands will benefit from deploying tracking mechanisms that quickly identify offenders.

    The areas of business presented above are by no means a comprehensive list for retailers and brands to rely on during this time. Still, these are critical impact areas for them to address, even as huge efforts are made toward managing highly stressed supply chains.

    DataWeave Offers Support

    The coronavirus outbreak is likely to get worse before it gets better. As we enter unchartered territories, DataWeave is offering to contribute in small ways, pro bono, by leveraging our expert talent and competitive intelligence technology platform, to address some of the challenges faced by retailers and brands.

    We’re announcing a limited-time, no-cost offer to detect and report on price gouging, the presence of unauthorized third-party merchants, as well as stock availability across U.S. ZIP-codes. This offer will be valid for 4-6 weeks (timeline will be flexible based on how the outbreak develops) and limited to monitoring the top 10 U.S. online marketplaces, as well as critical product categories such as medicinal and hygiene-related products, emergency food items, survival-related products, fuel, etc.

    Reach out to us for further details.

  • Retailers Adopt Aggressive Private Label Pricing Strategies in CPG

    Retailers Adopt Aggressive Private Label Pricing Strategies in CPG

    Nine out of 10 leading retailers price their private label products lower than the average prices of their respective categories, reveals the latest DataWeave study, drafted in collaboration with SunTrust Robinson Humphrey The study reveals that an increasing number of retailers are viewing private label brands as a way to ensure sustained profitability.

    “As the CPG space reels under intense competition, a number of retailers are doubling down on private labels to capture valuable additional margin. For instance, Kroger, Walmart, and Amazon Fresh have a higher degree of private label penetration than the other retailers we analyzed,” said Karthik Bettadapura, Co-founder & CEO at DataWeave. “Our study unveils several such key insights covering product assortment & distribution patterns, price perception, and private label dynamics, revealing a clear snapshot of the disruptive transformations sweeping across the US CPG landscape.”

    Other key findings from the report, which tracked and analyzed 450,000 products across 10 leading retailers and 10 ZIP codes each, include the following:

    • Product assortment is emerging as a driver that’s as critical as pricing when it comes to customer retention. Target, H-E-B, and Kroger have a head start here, offering the largest product assortments among the retailers analyzed.
    • A sharp assortment strategy customized to local tastes and preferences is key to sustaining and enhancing customer satisfaction. Albertsons, Walmart, and Amazon Fresh lead here, revealing a higher focus on localized assortments.
    • “Home” and “Beauty & Personal Care” categories lead the distribution of private label products across retailers. The focus on these categories echoes a similar focus among national brands as well. These categories have the highest overall brand concentration, with around 4,000 brands each.

    To download the entire report, click here.

  • Decoding Alibaba’s Singles Day Sales

    Decoding Alibaba’s Singles Day Sales

    An average of $11.7 million per second was the rate at which Alibaba clocked $1 billion in sales during the first 85 seconds of Singles’ Day. As Alibaba’s annual sale event continues to grow in scale, referring to it as a global retail phenomenon is an understatement. Alibaba closed the day having shipped 1.04 billion express packages based on sales of merchandize worth 213.5 billion yuan ($30.67 billion).

    This performance shredded any lingering concerns analysts may have harbored about the prospects of this year’s sale, given the international backdrop of the ongoing trade skirmish between the US and China.

    Along with attractive discounts across a range of product categories, Singles’ Day also promised an integrated experience fusing entertainment, digital and shopping, in stark contrast to other large global sale events like Black Friday, which focus predominantly on discounts.

    At DataWeave, we set out to investigate if all the hype resulted in actual price benefits to the shoppers and how the various categories and brands performed in terms of sales during the event. To do this, we leveraged our proprietary data aggregation and analysis platform to capture a range of diverse data points on Tmall Global, covering unit sales (reported by the website) and pricing associated with Tmall Global’s major categories over the Singles’ Day period.

    Our Methodology

    We captured 5 separate snapshots of data from Tmall.com during the period between October 25 and November 14, encompassing over 15,000 unique products each time, across 15 product categories.

    To calculate the average discount rate, we considered the percentage difference between the maximum retail price and the available price of each product. We also looked at the additional discount rate, for which we compared the available price during Singles’ Day to the available price from before the sale. This metric reflects the truest value to the shopper during Singles’ Day in terms of price.

    Our AI-powered technology platform is also capable of capturing prices embedded in an image. For example, the offer price of ¥4198 was extracted accurately from the accompanying image by our algorithms and attributed as the available price while ¥100 from the same image was ignored.

    This technology was employed across hundreds of products using DataWeave’s proprietary Computer Vision technology.

    Domestic Appliances and Digital/Computer Categories Powered Turnover

    The Domestic Appliances and Digital/Computer categories dominated the Singles Day Sale in terms of absolute sales turnover. This isn’t surprising, since the average order value for these categories are typically much higher compared to the other categories analyzed.

    What clearly stands out in the above infographic is that the two largest categories in terms of sales turnover had average additional discounts of only 2 per cent and 0 per cent — a rather surprising insight. In general, with the exceptions of Women’s skincare, Men’s skincare, and Women’s bags (11 per cent, 10 per cent, and 9 per cent respectively), all other categories saw low additional discounts during Singles’ Day.

    However, the absolute discounts across the board were consistently high, with only Luggage (6 per cent), Digital/Computer (9 per cent) and Women’s wear (12 per cent) staying significantly below the 20 per cent mark. In fact, eight categories enjoyed absolute discounts greater than 30 per cent.

    Among common categories between Men and Women, the Men clocked more sales in Men’s wear, shoes, and bags. Only skincare proved to be an exception, where Women’s skincare generated twice the turnover of their Men’s equivalent.

    The Infants category was another intriguing sector to emerge during the sale. Both Diapers (38 per cent) and Infant’s Formula (25 per cent) were substantially discounted, despite only receiving low additional discounts of 2 per cent and 0 per cent respectively – indicating aggressive pricing strategies in this category even during non-sale time periods.

    The biggest takeaway from our analysis is the lack of any correlation between sales turnover and additional discounts, or even the absolute discounts.

    International Brands Make Gains

    International brands continue to penetrate the Chinese market showing up amongst the Top 5 brands of 13 of the 16 categories on sale.

    In the Diaper category, Pampers delivered nearly twice the sales turnover of its next biggest competitor. As expected, Apple and Huawei battled it out for honors in the Digital/Computer category although Xiaomi enjoyed pleasing results, nearly matching Huawei’s sales to go with its sales leadership of the Domestic Appliances category. Local brands, though, swept the Domestic Appliances, Furniture and Women’s Wear categories.

    The challenge posed by Chinese brands was illustrated by Nike’s spot in the second place in the highly competitive Men’s Shoes category after Anta.

    International brands topped only five of the 16 categories and Top 3 positions in ten categories. Still, there’s a growing presence of international brands in China’s eCommerce.

    Gillette won handsomely over its competition in the Personal Care category while Skechers enjoyed a similar result in Women’s Shoes, racking up nearly twice the retail sales of its nearest competitor. Another category dominated by international brands was the Women’s Cosmetics category where international brands accounted for 4 of the Top 5 brands.

    Similarly, Samsonite’s acquisition of American Tourister gave it two top 5 brands in the Luggage category. Other global brands to make the cut during the Singles’ Day sale included L’Oréal, Canada’s Hershel, Playboy, South Korea’s Innisfree and Japan’s Uniqlo.

    It’s Not All About Price On Singles’ Day

    The dramatic rise in shopping during Singles’ Day is not driven solely by price reductions. Alibaba’s commitment to its “New Retail” strategic model has led the Chinese giant to channel its impressive resources to focus on bringing together the online elements of its business with the more traditional offline aspects of its retail distribution. This is combined with entertainment to create a larger story based around the shopper’s overall “experience” rather than just driving “attractive prices” as a short-term retail hook.

    Alibaba is betting big on erasing the line between online and offline and its futuristic vision of structuring retail around the way people actually want to shop. Based on the consistently impressive results of Singles’ Day year after year, “New Retail” has a promising future.

    If you wish to know more about how DataWeave aggregates data from online sources to provide actionable insights to retailers and consumer brands, check out our website!

  • Consumer Packaged Goods Join The Black Friday Blitz

    Consumer Packaged Goods Join The Black Friday Blitz

    While the Thanksgiving weekend sale, which includes Black Friday and Cyber Monday, is famous for attractive offers across all consumer categories, it remains better known for its discounts on Electronics and Fashion. Consumer goods, traditionally, have evaded much the hype.

    This year, notwithstanding notoriously slim margins, consumer goods and grocery retailers and brands joined Electronics and Fashion in offering sharp discounts on select products in an attempt to carve out increased market share.

    In the past, discounts on consumer packed products have been to drive increased store traffic during the holiday season. Increasingly, however, Thanksgiving has emerged as a viable opportunity for grocers to recruit online shoppers as well and build out their franchise.

    Online Grocers Make Their Move

    Faced with the holiday rush, large numbers of shoppers are proving to be relaxed about trusting the retailer to bag up and deliver their holiday feasts and treats. Grocers themselves have taken the strategic decision to boost their online shopping presence this year.

    They geared up to support their new holiday presence with aggressive price cuts designed to cut through the holiday sales clutter and make direct appeals to a newly-in-play online shopper pool. So transparent was this commercial decision, that many retailers experienced sharp drops in their share prices as industry analysts anticipated the retailers’ new discount-driven strategy.

    Tracking The Numbers

    At DataWeave, using our proprietary data aggregation and analysis platform, we have been tracking, through November, pricing and product information of the Top 1,000 ranked consumer goods products in over 10 product types featured on Amazon Prime, Walmart, Target, Costco, Kroger, Safeway, and Whole Foods, across up to six zip codes each, distributed across the country.

    DataWeave’s major focus was to compare the three main days of the Thanksgiving weekend; Thanksgiving Day, Black Friday, and Cyber Monday. We performed an in-depth analysis of discounts offered across product types and brands, together with how aggressively dynamic retailers were in both their pricing strategy and in the products they displayed.

    In analyzing this major sale event, we observed an extensive range of products enjoying high absolute discounts, but with no additional discounts during the sale, i.e. prices remained unchanged between the period prior to the sale and during each day of the sale, even though high discounts were advertised. The following infographic highlights some of the products where this phenomenon was observed.

    As a result, we focused our analysis only on the additional discounts offered on each day of the sale, compared to the period prior to the sale (we considered 11.21), in order to accurately illustrate the true value shoppers enjoyed during these sale days.

    The following infographic reveals some interesting highlights from our analysis, including the level of additional discounts offered to shoppers, the top brands featured, and the number of dynamic price changes implemented during the sale. All prices analysed are in USD, and all discount percentages represent average values across all zip codes, analyzed for individual retailers.

    In contrast to Amazon Prime, Costco, and Kroger who opted to run with deep discounts on a limited range of products, retailers such as Target and Walmart chose to offer only marginally higher additional discounts but across a large number of products. Others like Safeway adopted a safer approach, combining low discounts on a modest range of products.

    Overall, our analysis discovered little variation in discounts offered across each of the three sale days, with the only enduring trend being a marginally higher discount percentage implemented on Cyber Monday across all retailers.

    Categories significantly discounted across retailers included Personal Care, Deli, Dairy & Eggs, and Babycare products. Stove Top, Martinelli, Colgate, Dove and Hillshire Farm emerged as the leading brands to adopt a more aggressive discount approach.

    While most of the products offered across each of the three peak holiday sale days were comparatively constant (few new products featured amongst the Top 500 ranks), there were a number of conspicuous exceptions. Amazon Prime (19 percent on Cyber Monday), Whole Foods (15 percent on Thanksgiving), and Kroger (12 percent and 11 percent on the first two days of sale respectively), elected to refresh a significant portion of their Top 500 ranked product assortment.

    Across the entire Thanksgiving week, we saw Target, Amazon Prime, and Kroger all highly active in changing prices to stay competitive. Our analysis of these retailers showed more than 1.6 price changes for each price-changed product. While these were implemented on roughly 20 percent of their assortment, itself a significant proportion, the average price variation for each of these retailers was also on the higher side of expectations. In contrast, the other retailers adopted a far more conservative approach to dynamic pricing.

    Consumer Goods Walk The Discount Talk

    In a year when Amazon acquired Whole Foods to forever merge the dynamics of offline and online grocery retail, aggressive discounting by several retailers in specific product categories, combined with high visibility brands, has carved out a new profile for CPG retail.

    Grocers are eyeing a future where online shopping becomes a prime feature of their retail franchise. Amazon for its part demonstrated its prowess in discounting strategy, and its ability to implement a dynamic pricing strategy in tandem with a refreshed Top 500 product assortment.

    Other retailers are not far behind, as the use of market and competitive intelligence technologies pick up steam across the board. In today’s digital economy, data can be the biggest competitive advantage for a retailer, and retail technology providers like DataWeave have upped their game to deliver highly unique and sophisticated data and insights to meet this demand.

    Visit our website, if you’re interested in DataWeave and how we provide zip-code level Competitive Intelligence as a Service to retailers and consumer brands.

  • Analysis of Target’s Discount Strategy

    Analysis of Target’s Discount Strategy

    Earlier this year, we witnessed Amazon and Walmart going head to head in a CPG goods price war of fluctuating intensity that soon rippled out to embrace the entire grocery industry.

    This further intensified with Amazon’s takeover of Whole Foods and the Whole Foods’ subsequent announcement hinting at significant discounts toward the end of August.

    (Read Also: Amazon’s Whole Foods Pricing Strategy Revealed)

    Soon, Target announced it was lowering prices on literally “thousands of items.” As Mark Tritton, Target executive vice president and the chief merchandising officer put it, “We want our guests to feel a sense of satisfaction every time they shop at Target.”

    To drive home the seriousness of their intent, Target nominated grocery staples such as cereal, paper towels, milk, eggs, baby formula, razors and bath tissue and vowed to, “eliminate more than two-thirds of their price.”

    At DataWeave, we focused our proprietary data aggregation and analysis platform on Target’s reported price reduction. Our team acquired data on the prices of over 160,000 products listed by Target across 12 zip-codes selected at random. The platform then took two snapshots. Firstly, between 23rd August and 30th August which included the Whole Foods’ price reduction (to study any possible reactions on price) and, secondly, between the 6th September and 13th September, which included Target’s discount strategy announcement.

    Of the categories Target identified as priorities for its discount strategy, only baby products, cereals, and Milk & Eggs displayed significant price drops. This price discounting effect varies, however, across brands in each category. In cereals, while KIND (30.4%) and Purely Elizabeth (24%) displayed high discounts, Apple Jacks, Corn Pops, and Krave more surprisingly increased their prices by up to 25% each.

    Similarly, in the Milk & Eggs category, Price’s (13.6%) and Coffee-Mate (10%) exemplified hefty discounts, while Moon Cheese and Challenge Butter increased their prices by 33% and 48% respectively in the same time period. By comparison, Razors and Paper Towels showed no price changes whatsoever across the review period.

    Interestingly, we observed greater price-change activity coinciding with the time of the Whole Foods’ announcement (between 23rd and 30th of August) than the later time period. Once again, however, no definite price discounting pattern emerged from the study, indeed the team found discount rates fluctuated significantly across categories.

    Looking across the spectrum of CPG categories pricing, we saw significant, sustained variation across both categories and zip-codes.

    Beauty products showed a 2 percent discount on average although this varied by zip-code, fluctuating between a 7 percent discount and an actual 10 percent price increase. F&B showed a 2 percent price increase, which jumped to 10 percent in some zip-codes. Personal care displayed a 2.5 percent increase on average, varying anywhere between an 8 percent discount and a 10 percent price increase. Baby products surprisingly recorded a 4 percent price increase on average during the study.

    So, What Does This All Mean?

    Based on our analysis, Target’s pricing strategy appears to be a combination of very closely concentrated discounting, complemented by selective price increases. Is discounting more a perception than a reality at this stage of the CPG cycle?

    Aggressive price discounting has never been a decisive factor in successfully building Target’s consumer franchise. However, given the current trading environment and the continued pressure applied by competitive omni-channel strategies, which has seen a host of new entrants elbowing their way into the market, we anticipate price will continue to play a prominent role in retailing.

    We suspect, based on evidence we gathered, that price discounts are more a highly targeted weapon in the fight for market share than a broadsword slashing of prices across the board. As Target’s CEO Brian Cornell noted during an earnings call, the company experienced “a meaningful increase in the percent of our business done at regular price and a meaningful decline in the percent on promotion.”

    If you’re interested in DataWeave’s data aggregation and analysis technology, and would like to learn more about how we help retailers and brands build and maintain a competitive edge, visit our website.

  • Amazon’s Whole Foods Pricing Strategy Analysis | DataWeave

    Amazon’s Whole Foods Pricing Strategy Analysis | DataWeave

    Amazon.com, America’s retail behemoth, dominated headlines in August when it completed its acquisition of Whole Foods in early August 2017. Having officially taken control of the up-market grocer, which focuses on premium quality produce, market observers and consumers alike are eagerly awaiting Amazon’s pricing strategy analysis.

    At the heart of Amazon.com’s seemingly unstoppable growth trajectory is the company’s ability to understand consumers, complemented by deep insights into buying cycles and purchase decisions and preferences. It also helps that Amazon.com boasts one of the planet’s mightiest marketing and publicity machines.

    Is Amazon.com About To Launch A Grocery Price War?

    Reports of Amazon.com dropping Whole Foods prices by up to 43 percent quickly made splashes across the news media. Given Jeff Bezos has been quoted in the past as saying, “your margin is our opportunity”, an aggressive promotional campaign to achieve dominance for its new Whole Foods acquisition was anticipated by some commentators.

    These sentiments ignited fears of a profit-sapping price war, immediately hit stock prices in the cutthroat grocery industry, which survives on famously thin margins. Memories of Amazon.com’s impact on US department store profitability quickly surfaced with analysts pointing to Walmart’s revenue/market share plunge from 26 percent in 2005 to just 11 percent in 2016 when the sector came under sustained pressure from Amazon.com.

    How Deep Are Amazon.com’s Price Cuts Really?

    At DataWeave, a Competitive Intelligence as a Service provider for retailers and brands, we put Amazon.com’s actual Whole Foods discounts under the microscope. The resulting careful analysis of price discounts revealed quite a different story to the one initially featured in the media. Scrutiny by our proprietary data aggregation and analysis platform showed the drop in retail grocery prices was minimal to almost negligible, depending on the category.

    In delivering near-real-time competitive insights to retailers and brands, we acquire and compile large volumes of data from the Web on an ongoing basis. A key differentiator is our ability to aggregate data down to a zip-code level.

    Our analysis of Amazon.com’s reported drop in prices was based on data acquired for 13 zip-codes distributed across the country and selected at random. Our platform compared market prices by zip code valid between 23rd August and 30th August.

    Each zip code indicated the overall average discount offered varied between 0.20 percent and -0.20 percent. When the discounts at a category-level were separated out, the discounts available to customers per category varied between -6.8 percent (an actual price increase) and 6.1 percent.

    Moving on to the “Fill the Grill” category, discounts again were modest, varying between -5.6 percent (another price increase) and 6.1 percent across the zip codes analyzed.

    This aligns with Amazon.com’s recognized preference for basing its strategy on competing on breadth and depth of product assortment rather than pure pricing discounts at the checkout.

    Some Sunshine For Foodies

    There was some good news for shoppers looking for higher discounts. Amongst those products attracting a higher discount were:

    • Belton Farm Oak Smoked Cheddar Cheese: 50 percent
    • Beemster Premium Dutch Cheese: 50 percent
    • Heritage Store Black Castor Oil: 50 percent
    • Organic French Lentils: 45 percent
    • Vibrant Health Pro Matcha Protein: 40 percent
    • Hass Avocado: 50 percent (confined to one zip-code).

    Final Word

    Amazon.com’s marketing engine is renowned for skillfully nurturing consumer price perceptions of the giant retail website as being the lowest priced retailer. We kept a keen eye on Amazon’s pricing these past weeks, and unearthed a carefully conceived and executed Whole Foods pricing campaign, which is yet another example of their market shaping expertise at work.

    If you’re intrigued by DataWeave’s technology and would like to learn more about how we help retailers and brands build and maintain a competitive edge, please visit our website!