Americans spent a whopping total of $10.8 billion online this Black Friday. As Thanksgiving Week 2024 wraps up, one thing is clear: the consumer electronics category continues to dominate seasonal shopping trends. Fueled by a blend of enticing deals and high consumer demand, the sector delivered competitive discounts across subcategories like wearables, gaming, and mobile devices.
At DataWeave, we analyzed discounting trends in the U.S. consumer electronics market during this year’s sales events. Using our AI-powered pricing intelligence platform, we tracked pricing and promotions for 22383 SKUs across Amazon, Walmart, Target, and Best Buy from November 10 to 29. We focused on the top 500 products ranked for each search keyword on each retail site, using targeted terms aligned with categories like “gaming” and “apple.” Here’s what we uncovered.
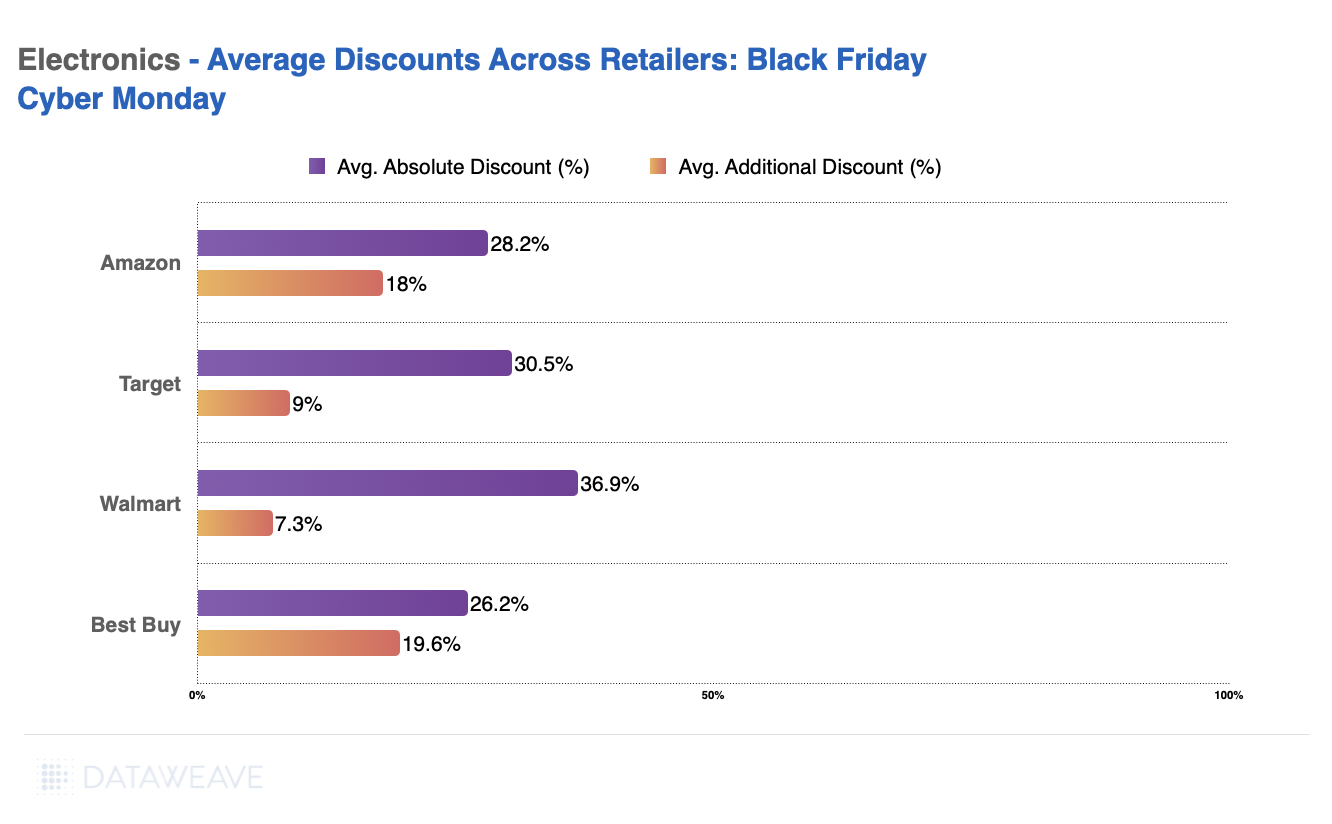
Retailers Battle It Out with Competitive Discounts
Discount trends reveal clear leaders in terms of markdowns:
Walmart offered the deepest average absolute discounts at 36.9%.
Amazon and Target followed closely, highlighting a diverse range of deals designed to appeal to budget-conscious shoppers
Best Buy, the specialist consumer electronics retailer, offers the lowest discounts this Black Friday at 26.2%.
Note: The Absolute Discount represents the reduction of the selling price compared to the Manufacturer’s Suggested Retail Price (MSRP). The Additional Discount reflects how much lower the selling price is during Black Friday compared to its price a week before the sale. This metric reveals the actual or effective value of the sale event, beyond the standard discounts typically offered.
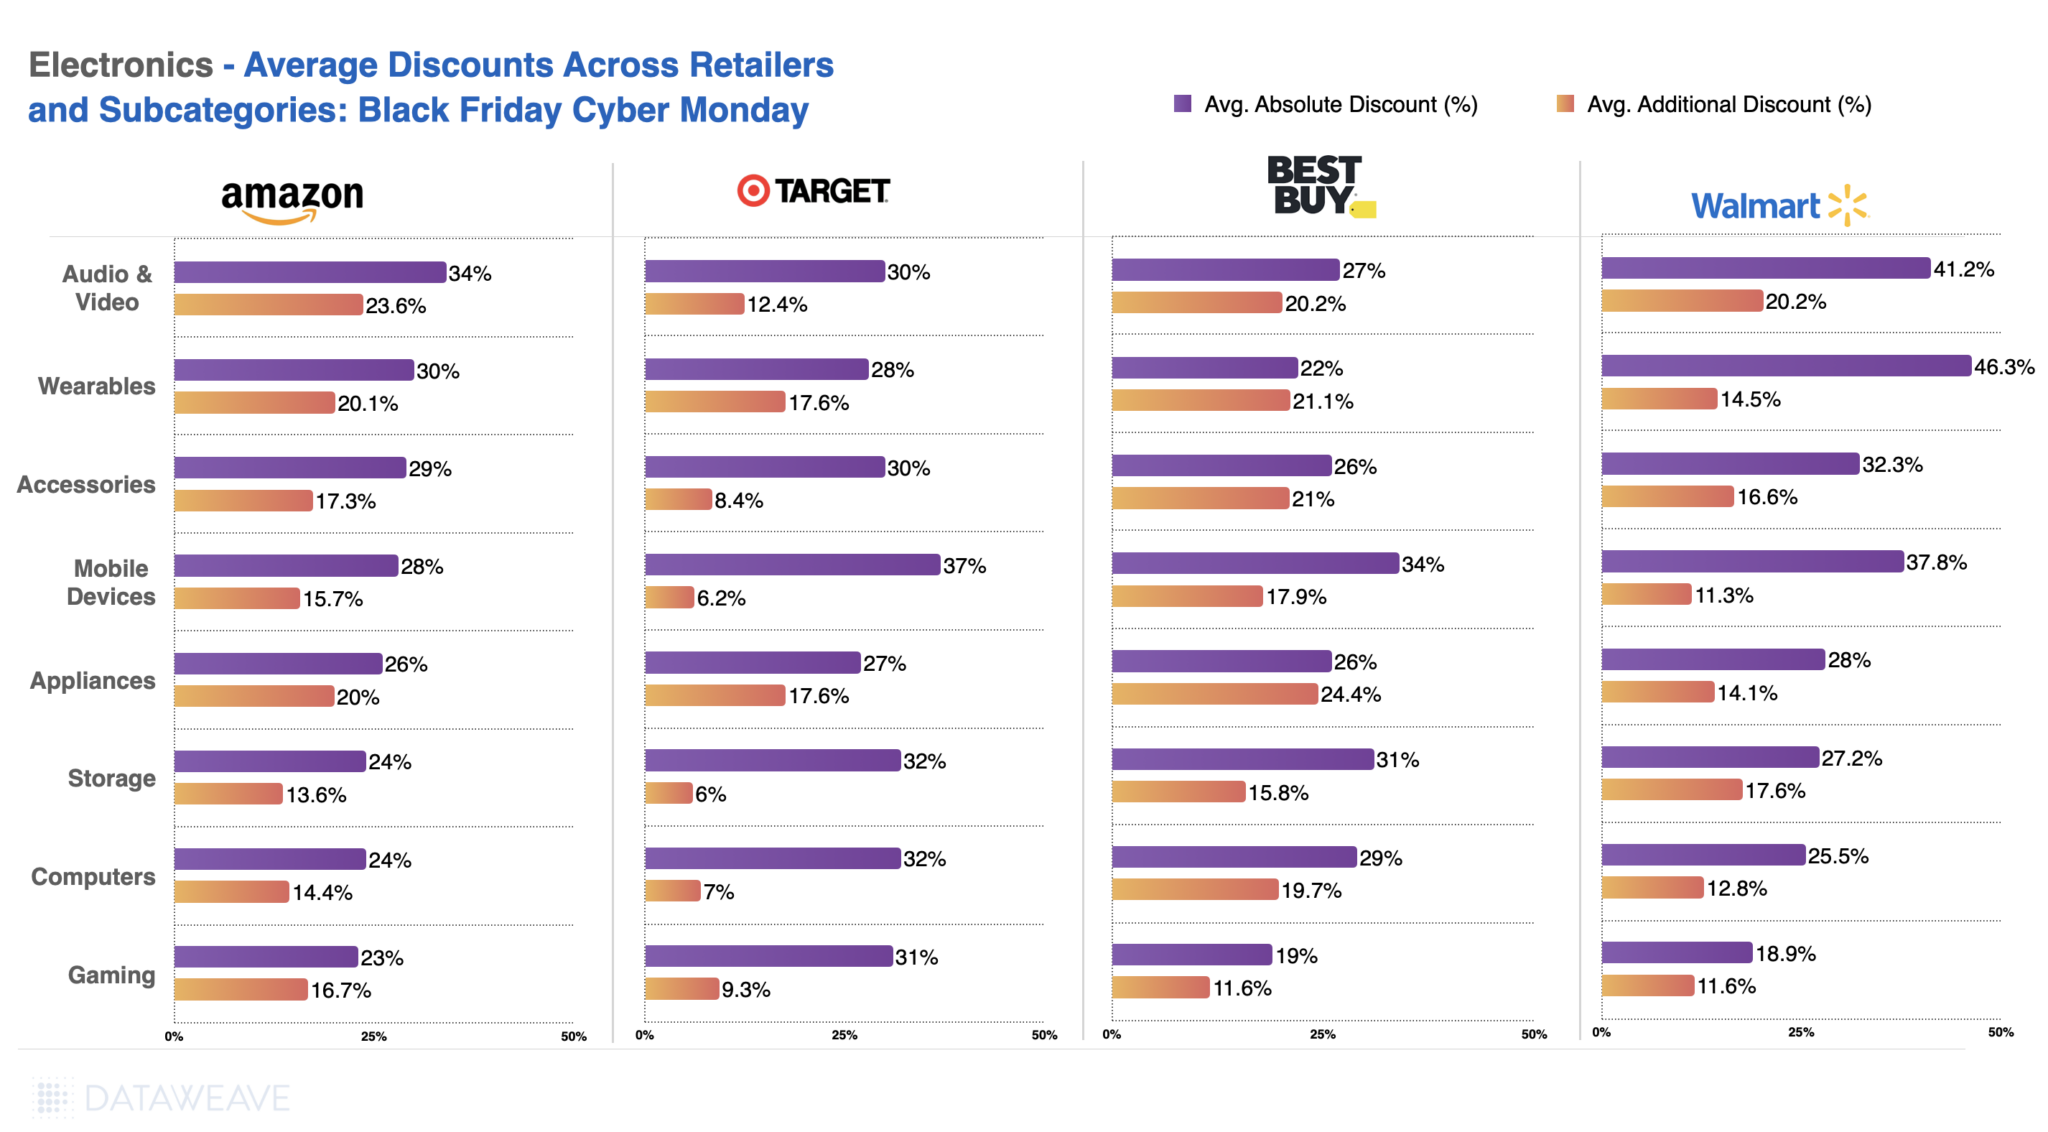
Subcategory Spotlight: Where the Best Deals Happened
From audio & video to wearables, each retailer carved out competitive advantages across subcategories.
Both Amazon and Walmart offered high discounts in audio & video and wearables, but Walmart led, with discounts up to 46.3%.
Best Buy, meanwhile, offered high absolute discounts on Mobile Devices(34%) and Storage (31%), followed by high discounts on wearables and Audio & Video.
Amazon maintained a balanced approach, excelling in audio & video and mobile devices.
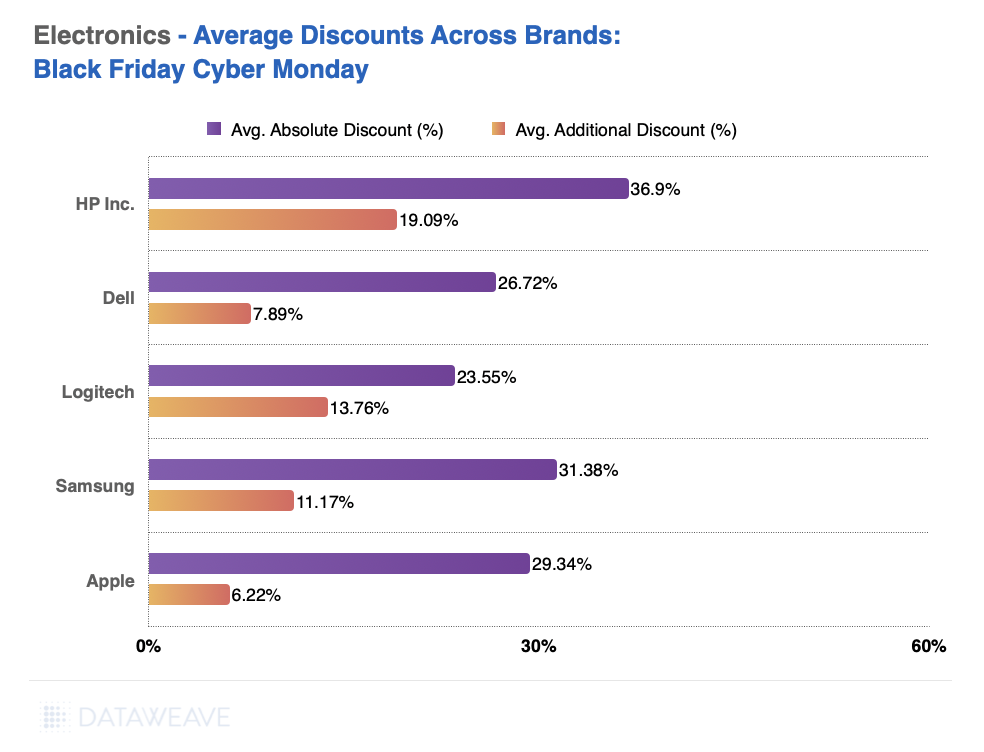
Brand-Level Insights: HP and Samsung Dominate
The biggest winners this year were brands that strategically leveraged Black Friday discounts to boost visibility and sales:
HP took the top spot with average discounts of 36.9%, followed by Samsung at 31.4%.
Despite its premium reputation, Apple offered an average discount of 29.3%, signaling a shift in strategy to attract deal hunters.
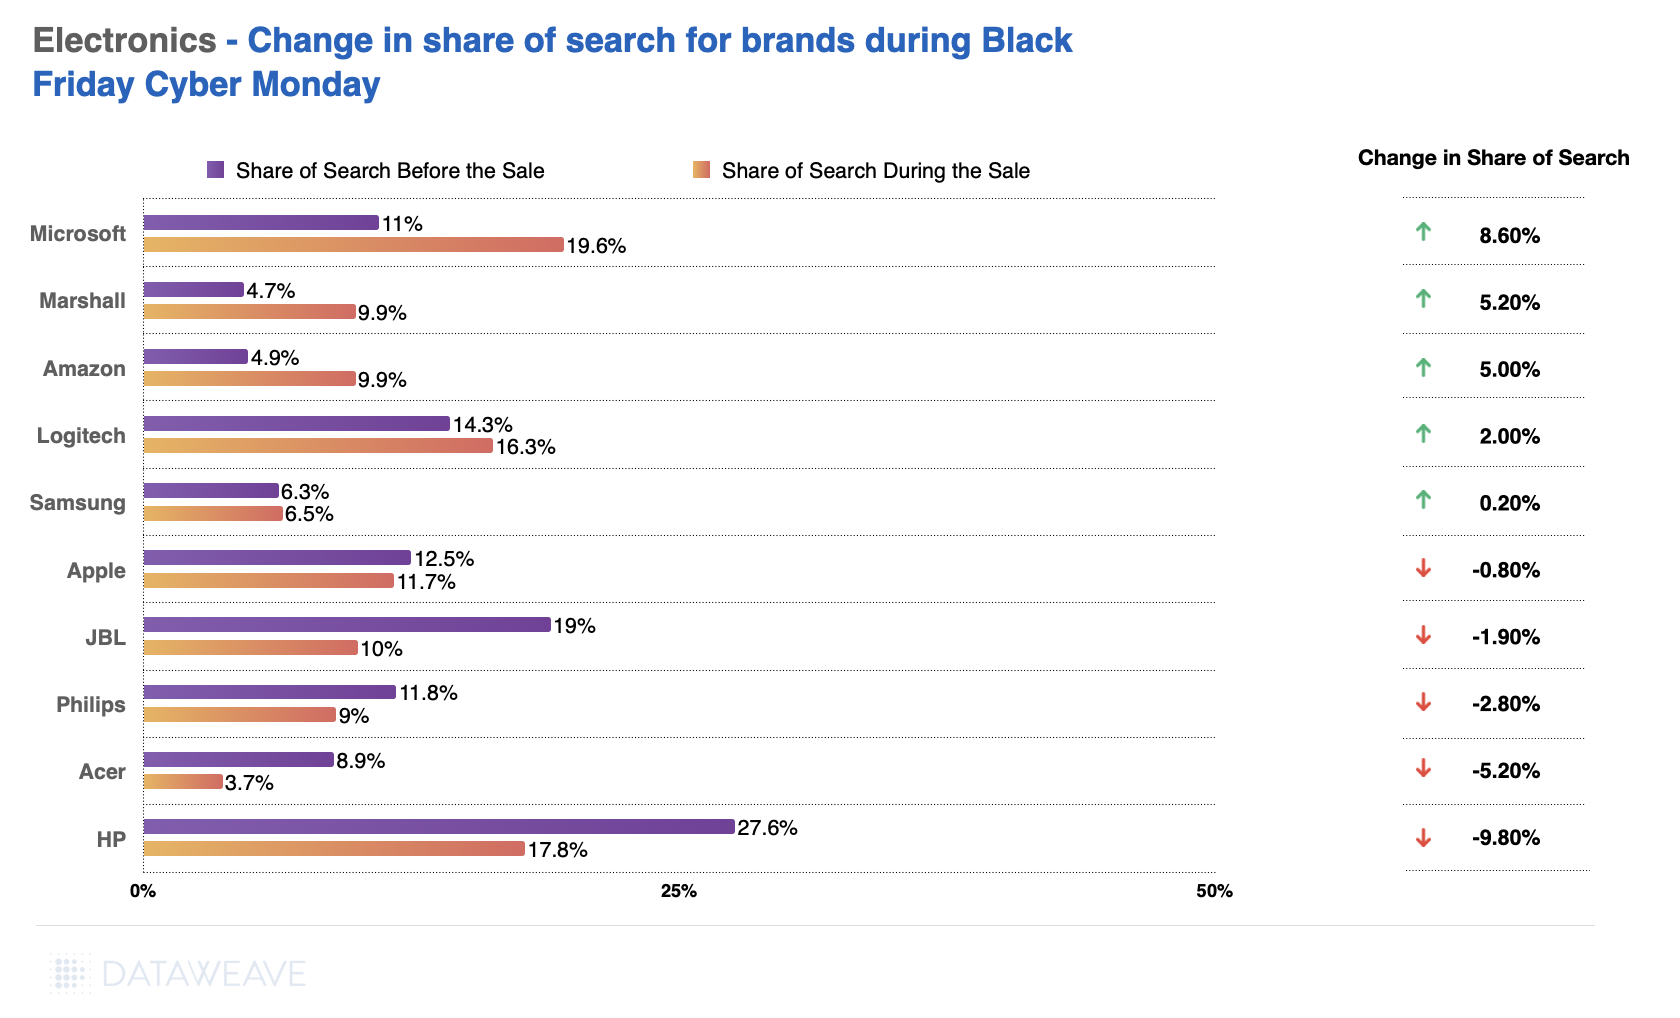
Share of Search: Shifting Consumer Attention
Search trends reveal how discounts shaped brand visibility:
Microsoft saw the largest spike in share of search (+8.6%), thanks to aggressive pricing on gaming consoles and accessories.
Marshall and Amazon also saw significant gains in visibility.
Surprisingly, HP experienced a sharp decline (-9.8%), indicating missed opportunities despite steep discounts.
In the previous analysis, we focused on the top 500 products within each subcategory for each retailer, showcasing the discount strategies for their highlighted or featured items. However, to identify which retailer offered the lowest or highest prices for the same set of products, it’s necessary to match items across retailers. For this, we analyzed a separate dataset of 340 matched products across retailers to compare their pricing during Black Friday. This approach provides a clearer picture of price leadership and competitiveness across categories.
Here are the key takeaways from this analysis.
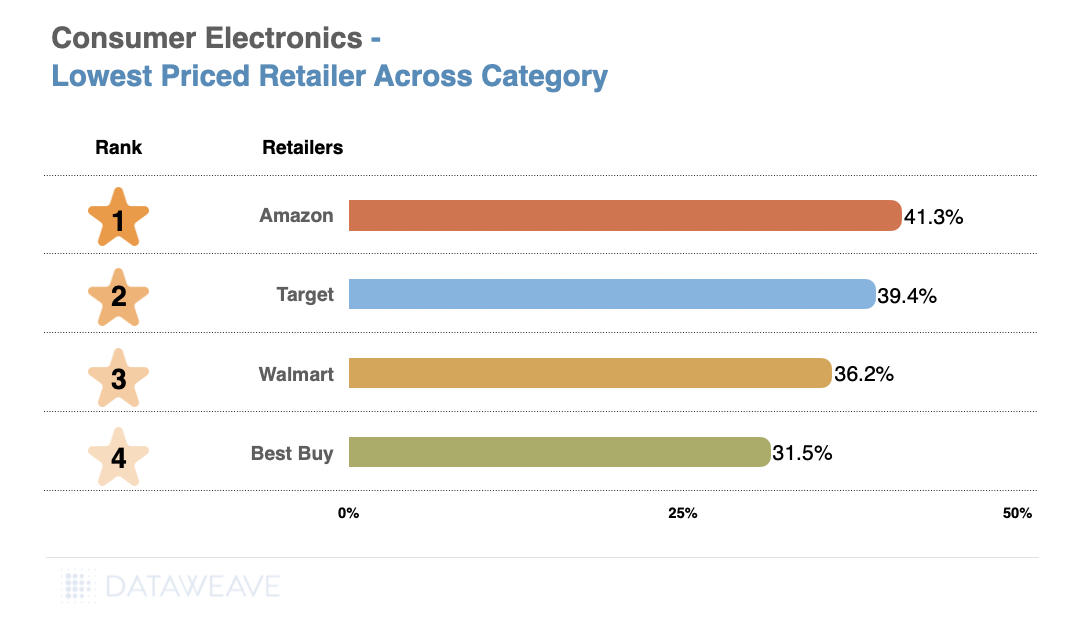
Category-Level Highlights
Amazon leads with the highest average discount (41.35%), offering the most value to consumers. It is followed by Target (39.37%) and Walmart (36.15%).
Best Buy, the specialist consumer electronics retailer, ranks last with an average discount of 31.53%, emphasizing a less aggressive pricing strategy compared to competitors.
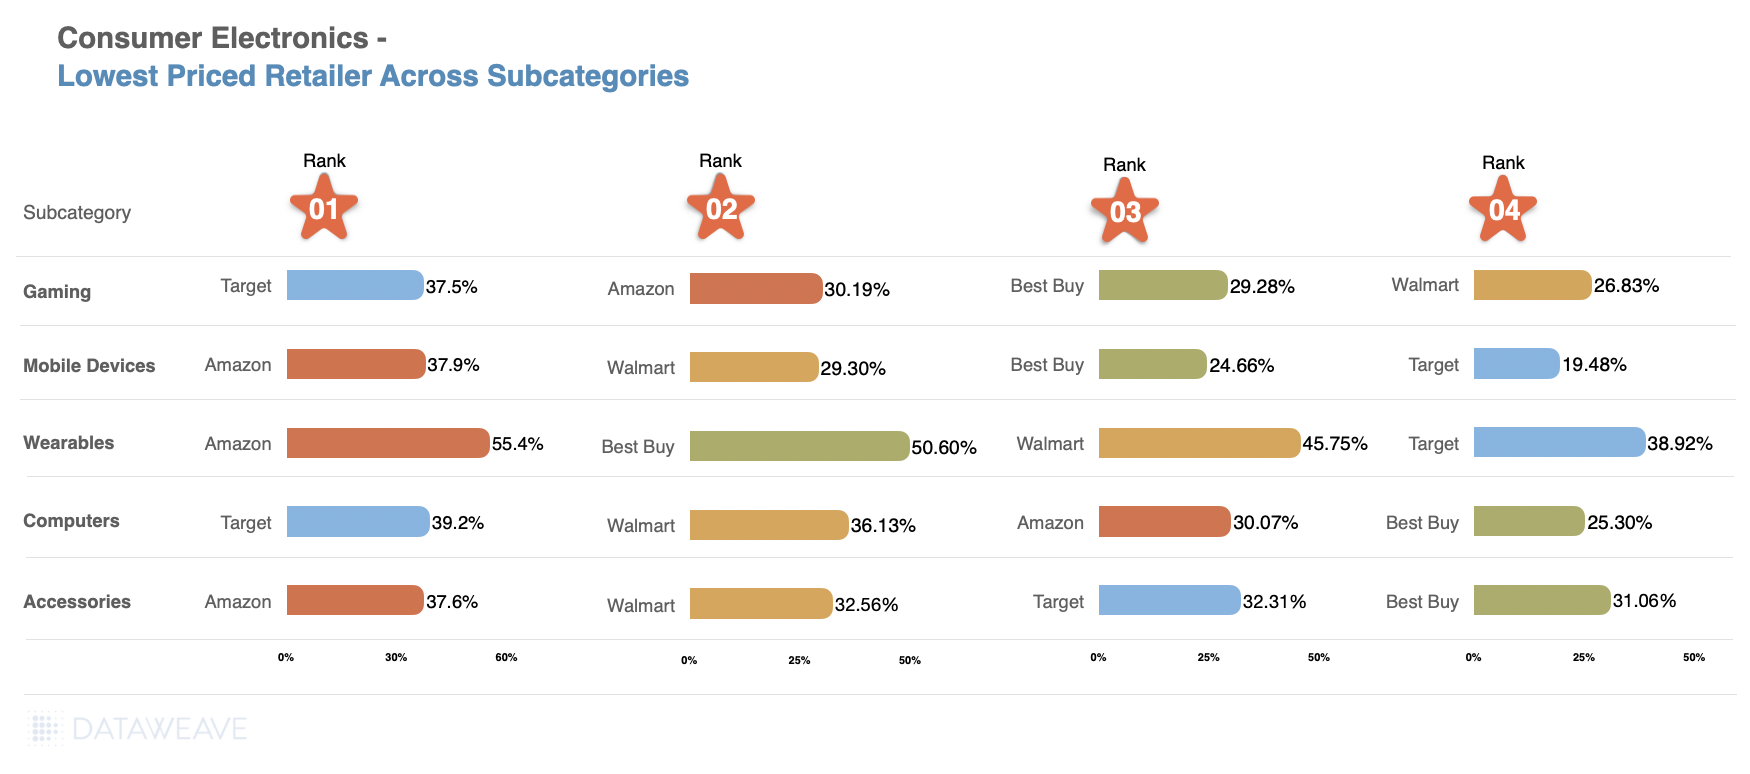
Subcategory Highlights
Wearables: Amazon offers the steepest discounts (55.40%), followed by Best Buy (50.60%) and Walmart (45.75%).
Mobile Devices: Amazon also leads (37.94%), with Walmart (29.30%) in second place and Target trailing at 19.48%.
Gaming: Target takes the lead (37.47%), with Amazon and Best Buy offering similar discounts around 30%.
Computers: Target again emerges as the leader (39.18%), narrowly surpassing Walmart (36.13%).
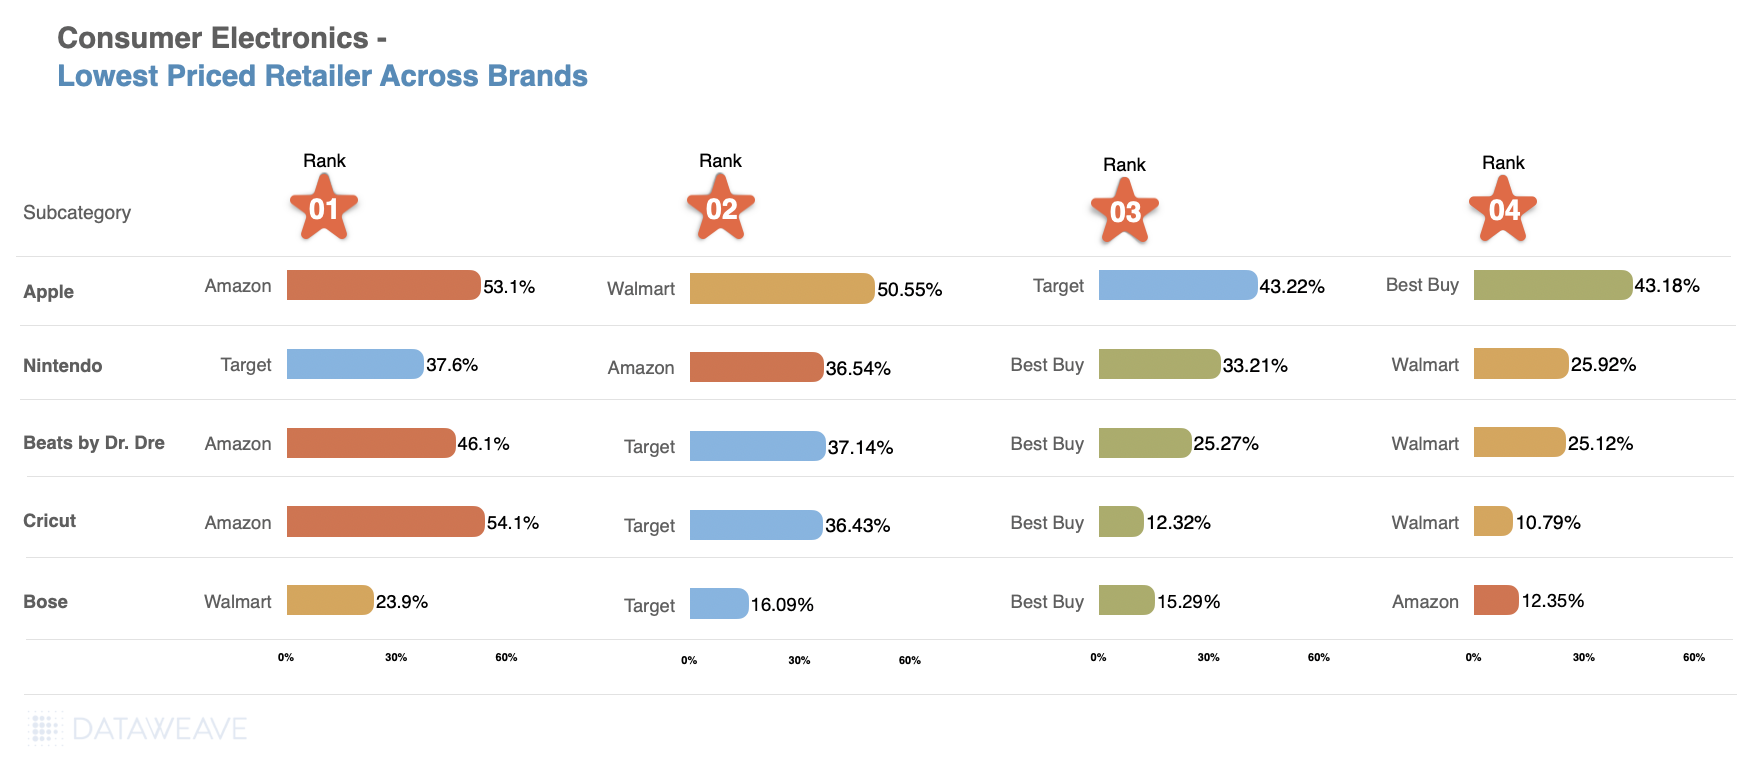
Brand Highlights
Apple: Amazon dominates with 53.06%, closely followed by Walmart (50.55%), while Target and Best Buy hover around 43%.
Nintendo: Target edges out Amazon (37.62% vs. 36.54%), with Best Buy (33.21%) and Walmart (25.92%) trailing.
Beats by Dr. Dre: Amazon leads (46.07%), with Target (37.14%) as the runner-up. Best Buy and Walmart offer comparatively modest discounts around 25%.
Bose: Walmart emerges as the value leader (23.90%), surpassing Target (16.09%) and Best Buy (15.29%).
Cricut: Amazon sets a high benchmark (54.13%), with Target far behind (36.43%) for this viral portable printer brand. Best Buy (12.32%) and Walmart (10.79%) offer significantly lower discounts.
What This Means for Retailers and Brands
Retailers looking to stay competitive should focus on strategic discounting and enhanced brand visibility. Brands must align with consumer expectations by:
Leveraging platforms like DataWeave to analyze discount trends.
Optimizing pricing and assortment strategies for seasonal demand.
For more insights into consumer electronics pricing, contact DataWeave to discover how our AI-powered solutions can drive success in today’s fast-paced market. Stay tuned for more category-specific analyses in the coming weeks!
Our world is increasingly going online. We work online, socialize online, and shop online every day. As a consumer brand, you need to ensure complete awareness of your brand’s online presence across eCommerce platforms, search engines, and media.
Only by deeply understanding the customer journey can you ensure that your product is reaching your ideal customers and maximizing your brand’s market share. You need data to intrinsically understand your customer journey and make changes where you’re lacking.
As the old adage goes: ‘You can’t manage what you don’t measure.’
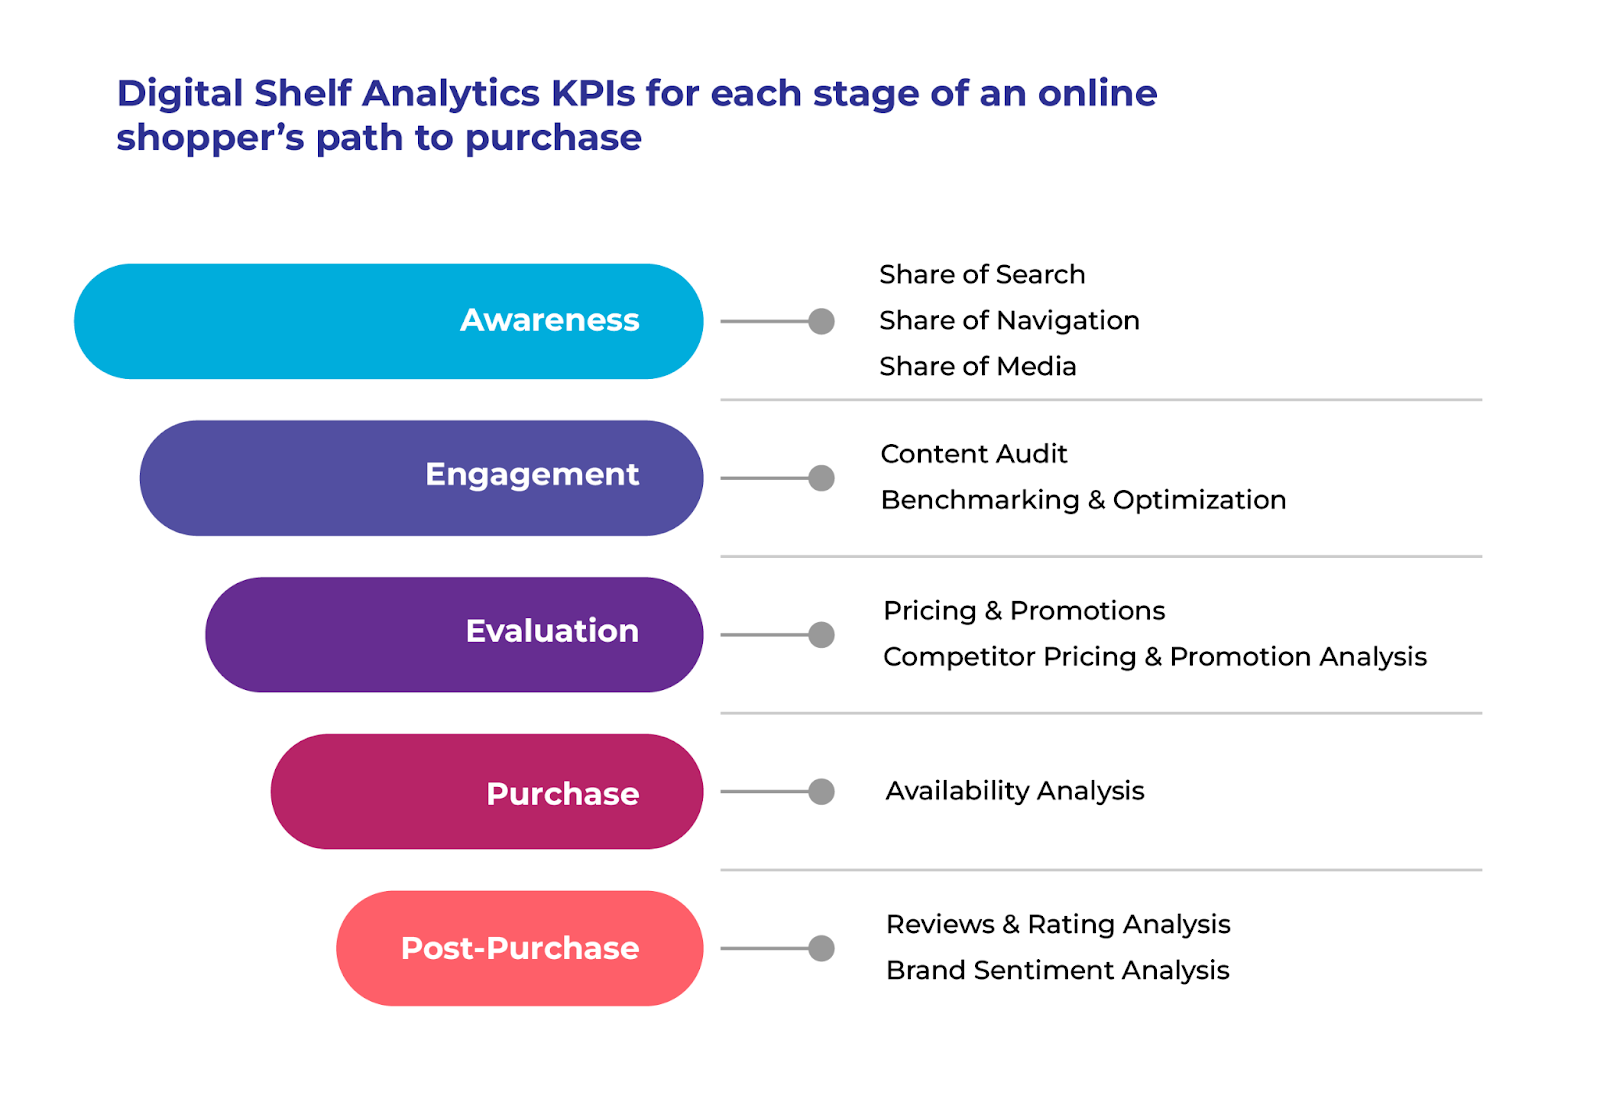
You need digital shelf metrics to measure and start benchmarking your buyer’s journey. To find several of these types of key performance indicators (KPIs), you need a digital shelf analytics solution. These platforms allow you to track various metrics along the path to purchase from the awareness stage to the post-purchase phase across the entire internet, helping to inform online and offline sales strategies.
Digital shelf analytics will help you gain insights into how your brand is doing versus the competition, which areas are lagging behind in historical performance, and what activities are driving sales. There are innumerable ways in which you can leverage these valuable insights. But how do you know which KPIs to start tracking with your digital shelf analytics solution?
Here, we’ve summarized the top metric types your peers report, track and base their decisions on.
With these KPIs in hand, consumer brands like yours can ensure that their products are consistently visible and appealing to their target audience across online marketplaces, ultimately enhancing conversion rates, market share, and profitability.
Read this guide to learn more about the top digital shelf metrics consumer brands are tracking and how to use them in your own strategy.
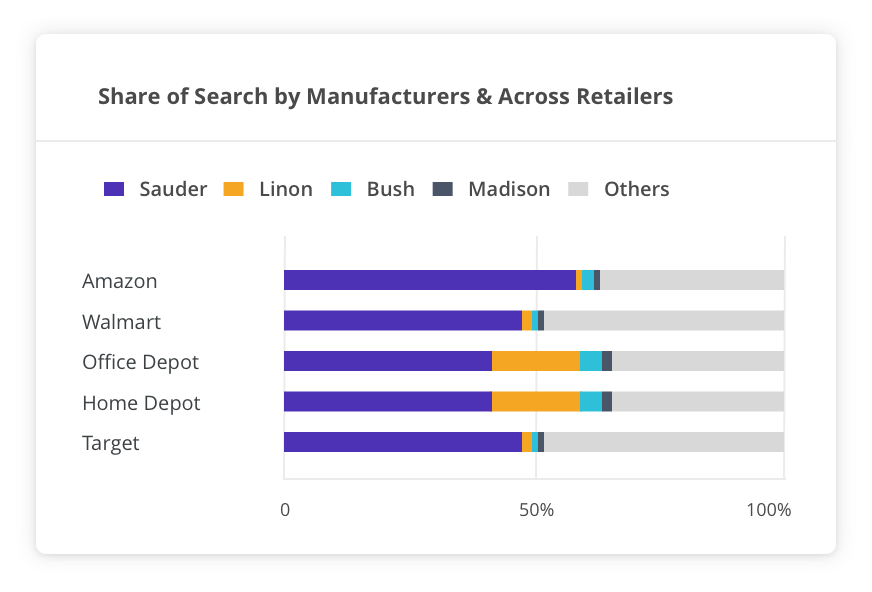
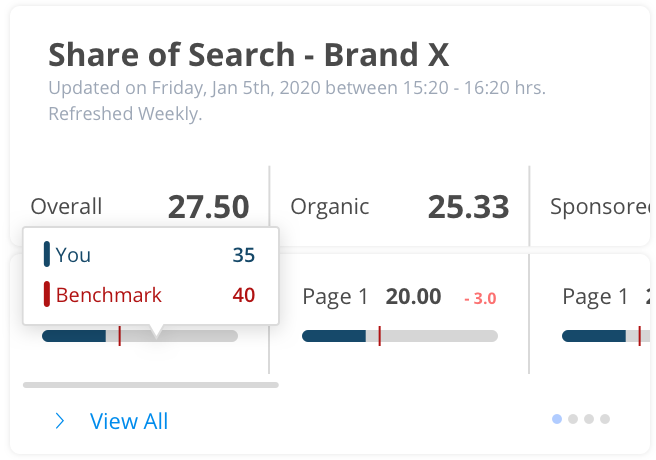
1. Share of Search
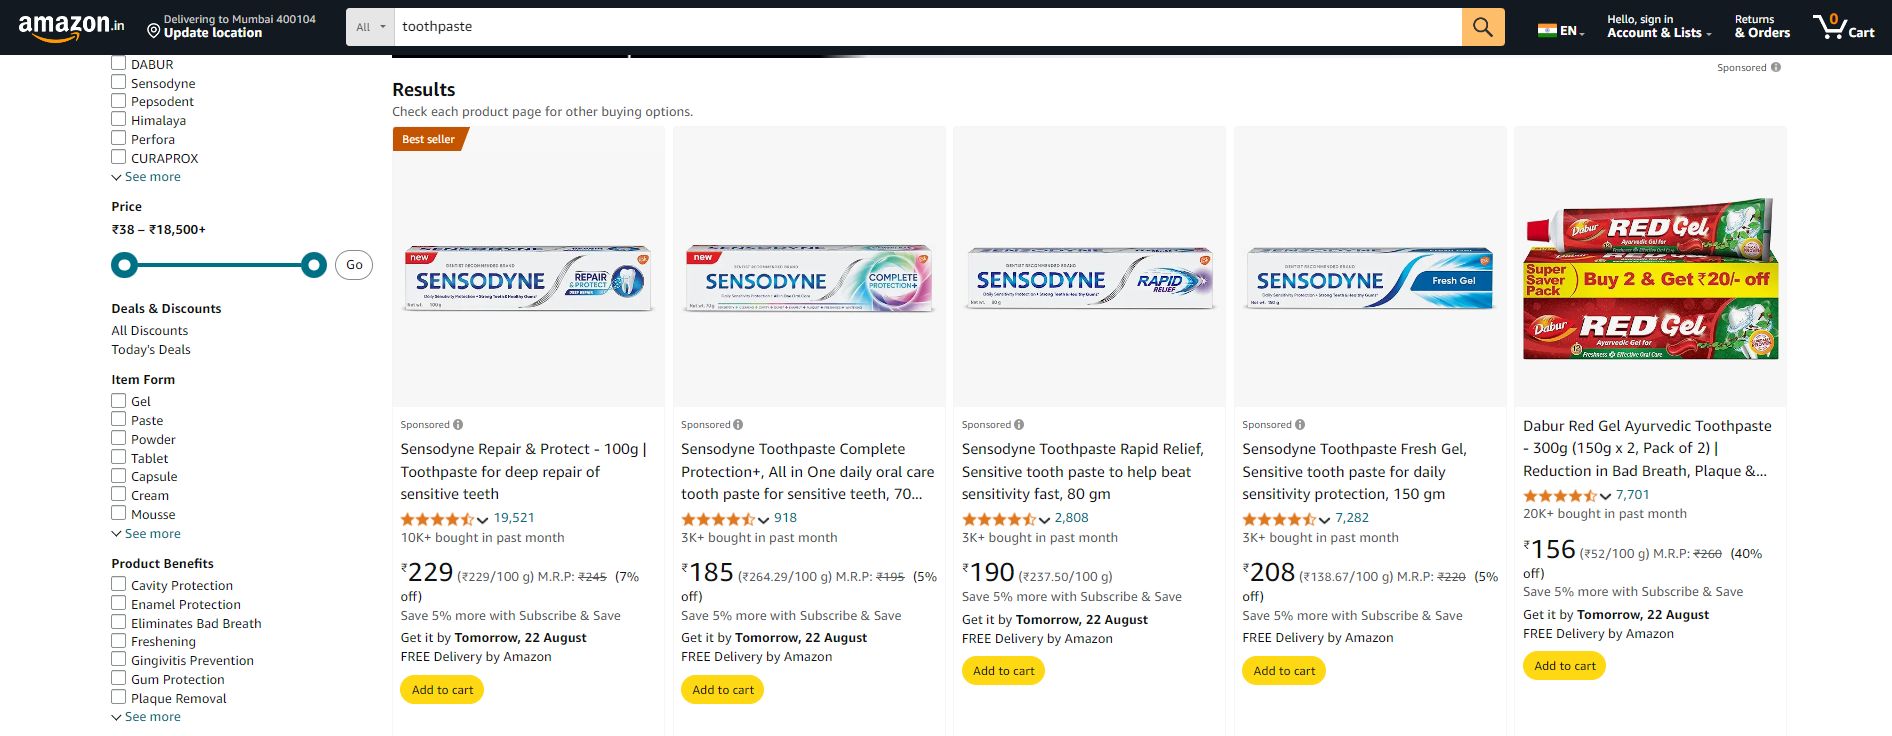
Share of Search (SoS) is a KPI in digital shelf analytics that measures how frequently a consumer brand’s products appear in search results on eCommerce platforms relative to the competition for specific keywords. A good digital shelf analytics solution will be able to show this metric across all the top marketplaces and retailers, such as Amazon and Walmart, but also more niche marketplaces for industry-specific selling.
This metric provides brands with a quantifiable way to measure how frequently their products are being “served up” to customers on online marketplaces. Essentially, it measures visibility and discoverability.
With Share of Search on DataWeave, you can slice and dice your data in innumerable ways. These are a few important views you can see:
Aggregated SoS
Organic and Sponsored SoS scores
SoS scores across brands, retailers, keywords, cities
Historical SoS score trends
Once you have benchmarked your SoS and category presence relative to your competition, you need to start interpreting the data. Here are some questions you can ask yourself to help interpret your findings:
Which of my key categories have the lowest SoS score?
Which products feature low on search results because they are out of stock?
Are my competitors’ products faring better due to sponsored searches?
Is my SoS low due to poor content quality?
With insights in hand, you will know which actions to take to drive the biggest impact. For example, you could increase sponsored search results or improve organic reach by optimizing product pages.
Understanding your SoS is essential to maximizing the awareness phase of your customer journey. It will help you improve your brand visibility and increase product conversions through better search and category presence.
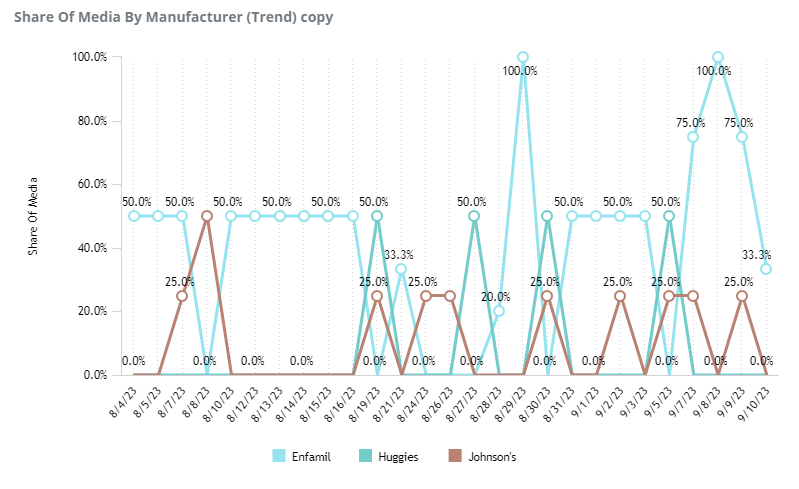
2. Share of Media
Share of Media (SoM) is a KPI that is just as impactful, if not more so, than the SoS metric. However, only a limited number of brands track it or use it to drive strategic action. This makes it a perfect opportunity for brands looking to get an edge on the competition.
But what is SoM in digital shelf analytics? Essentially, it’s a way of measuring retail media advertising activities like brand-sponsored banners, listings, videos, ads, and promotions that sometimes blend into search results. The main types of retail media advertising exist in two categories: banner advertising and sponsored listings.
Banner advertising involves strategically placing designed banners within websites and search listings. These banners raise brand awareness and drive traffic to online storefronts.
Sponsored listings are paid placements within search results on search engines or eCommerce platforms. They are prioritized based on the total bid amount and the product’s relevance. These paid listings are marked with “sponsored” or “ad.”
These listings serve to enhance your brand’s overall visibility, help you gain more precise reach, increase conversions, and drive better brand awareness and recall with your customers.
These efforts aren’t free, however, so measuring their effectiveness is critical not only to gain all the listed benefits but to also not waste your valuable marketing budget. The SoM KPI can help a consumer brand answer questions like:
Where are the opportunities to increase paid ads?
Which categories could benefit from a promotional boost or a strategic and streamlined allocation of ad spend?
Which of my competitors have active banners and what is their share of media by keyword?
How has my ad spend trended historically in comparison to my competitor?
DataWeave’s digital shelf analytics (DSA) is among the first providers to offer Share of Media KPI tracking and analysis. This is because it requires advanced, multi-modal AI to gather, view, and aggregate listings that encompass text, images, and video. With Share of Media tracking facilitated by DataWeave, consumer brands can track and analyze the effectiveness of their own promotional investments as well as those of their competitors.
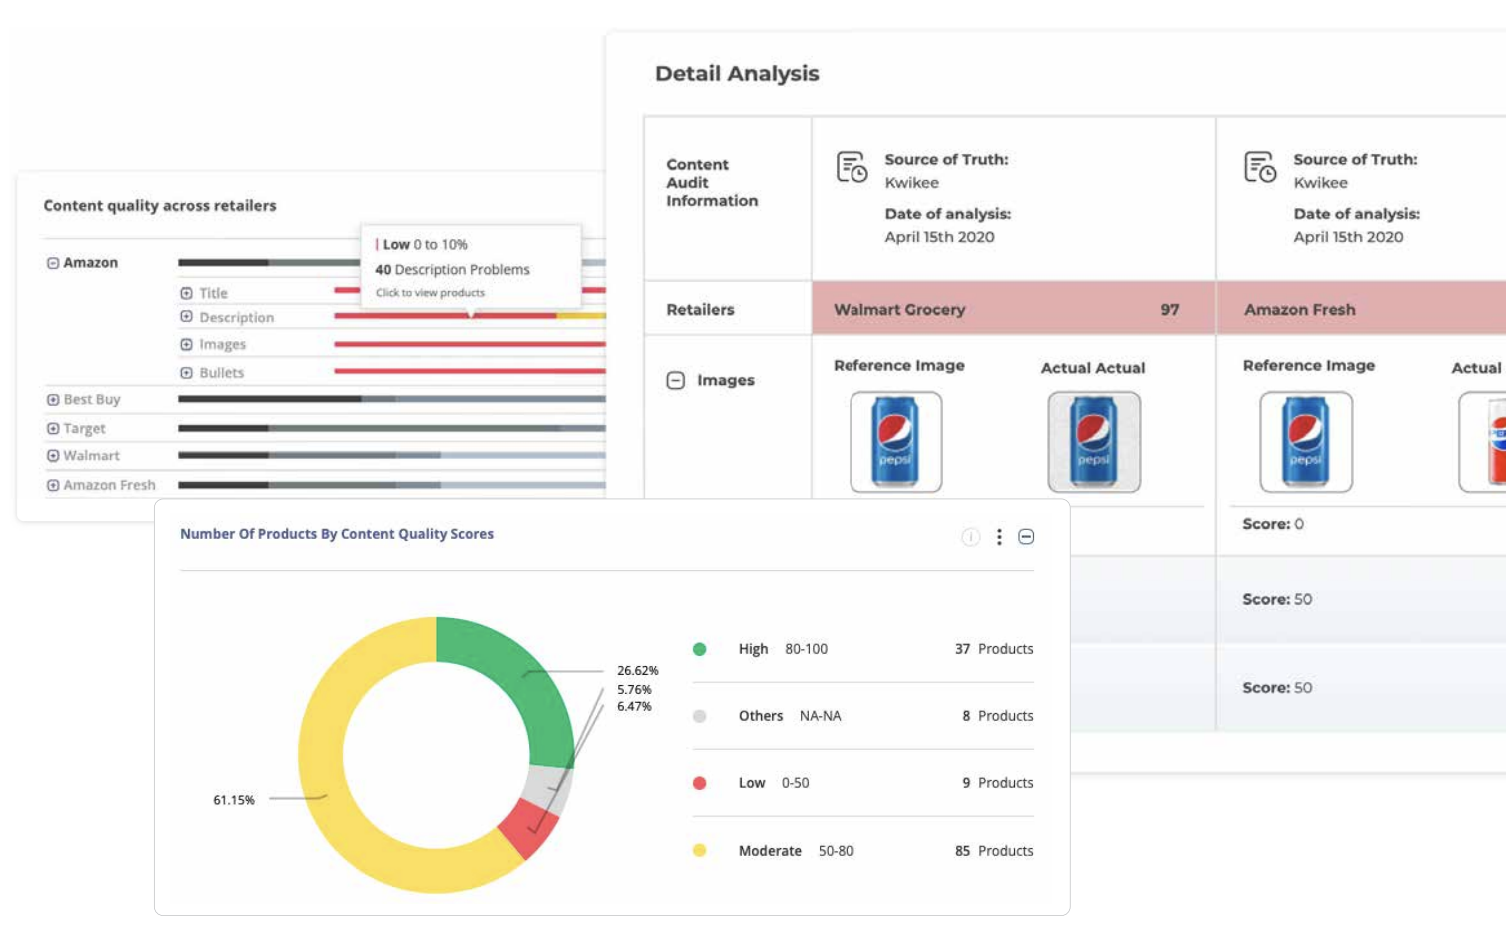
3. Content Quality
The content quality metric measures how well your product content adheres to the retailer’s specific guidelines, which are in place to steer traffic and sales on their sites.
With the help of a DSA platform’s AI and ML capabilities, you can measure different elements of your product detail pages (PDPs), such as titles, descriptions, images, videos, and even customer reviews. You need to know which elements are missing, where they are missing, and which ones are negatively affecting sales so you can take corrective action.
Did you know that the average cart abandonment rate is 69.99%? The quality of your content can significantly impact this number. Ensuring that your content is high-quality will help influence product discoverability, customer engagement, and conversion rates. It will also help position you ahead of the competition. If your content quality is poor, you may find yourself with lower search rankings, a higher return rate, and more abandoned carts.
Here are some questions you can answer with the help of the content quality digital shelf metric:
Is my product content at a retail site exactly what was syndicated?
Are there any retailer initiated changes to my product content?
Are my product content updates reflected on the retailer platforms?
How well does my product content comply with the retailer guidelines?
How do I optimize my product content for enhanced discoverability and conversion?
DataWeave’s content quality digital shelf analysis helps consumer brands ensure that product content on eCommerce platforms is high-quality and benchmark their product listings against the competition. It does this through a combination of AI-driven quality analysis and by presenting brands with actionable recommendations. These optimized suggestions are based on the top-performing products so you can focus your valuable time on the areas that will drive the biggest impact.
4. Pricing & Promotions
Your customers can easily shop around to find the best price for the product you’re selling. If your competitor is selling it cheaper, you’ll lose that sale.
That’s why it’s essential to understand the pricing and promotional landscape for each of your products and categories. This can be a challenge, especially if it’s a common product or comes in multiple pack sizes or variants.
It’s equally important to track pricing and promotions even at individual, physical stores. Doing so will allow you to remain competitive and responsive to local market dynamics by tailoring your pricing strategies based on regional competition. You don’t want your products to be overpriced (lost sales) or underpriced (lost profit) in specific markets.
Harmonizing insights when operating an omnichannel consumer brand is extremely difficult without the aid of a digital shelf analytics solution. Insights need to be aggregated between desktop sites, mobile sites, and mobile applications, as well as from physical storefronts.
Questions you can answer with the help of the pricing & promotions digital shelf metric include:
How do my product prices and promotions compare to my competitors?
How consistent is my product pricing across retail websites?
How does my product pricing vary across regions, ZIPs, and stores?
How do price changes influence my sales numbers?
Are there regional differences in pricing and promotion effectiveness?
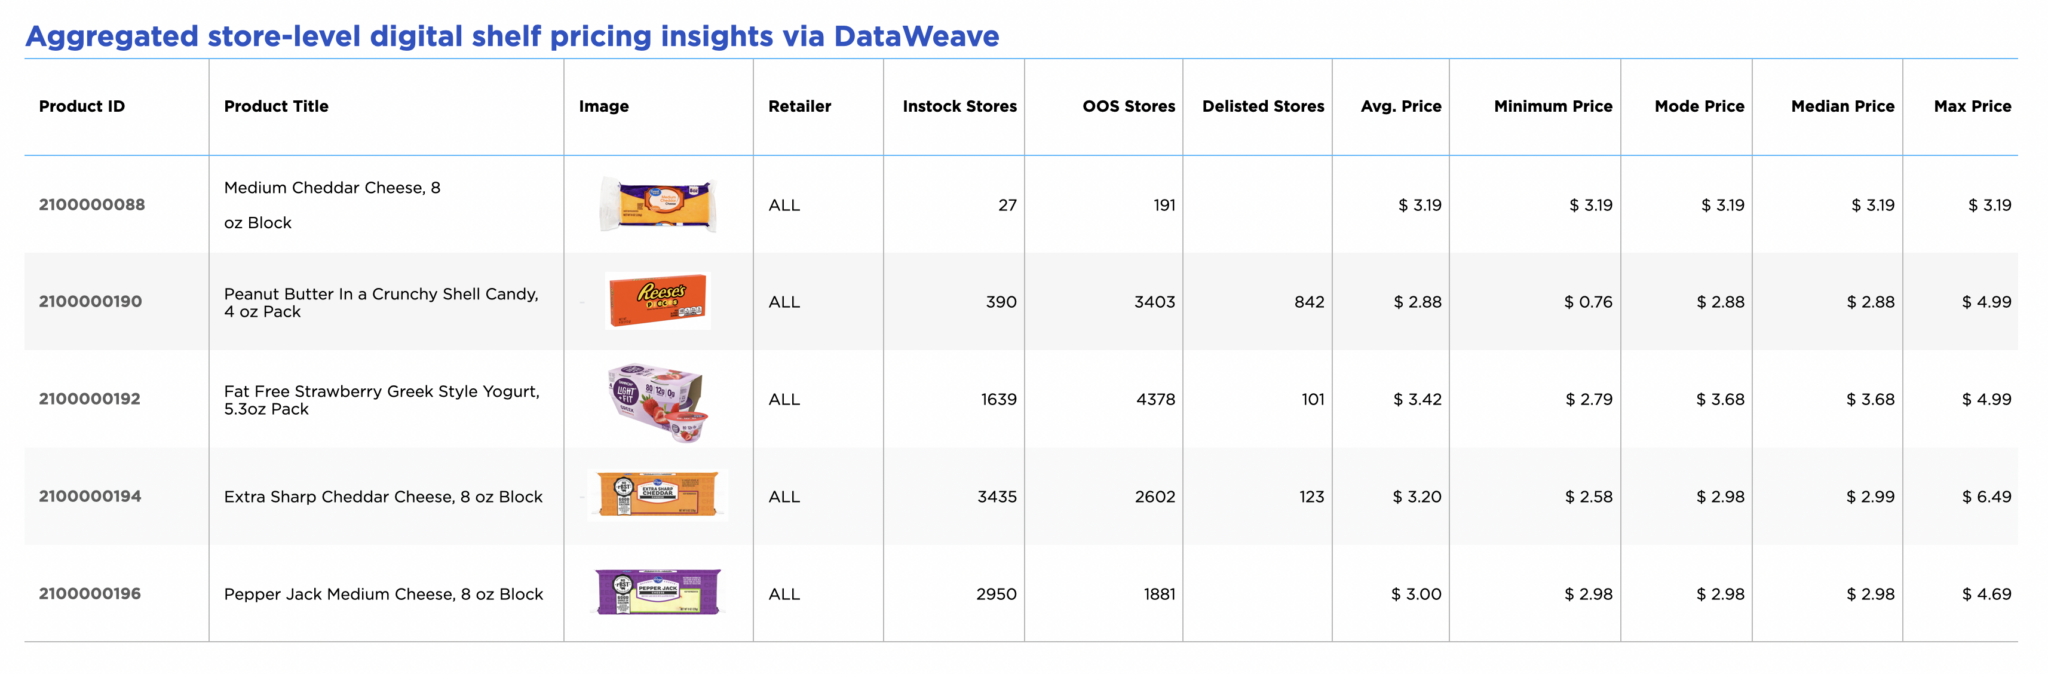
DataWeave’s digital shelf analytics platform stands out with its sophisticated location-aware capabilities, which enable the aggregation and analysis of localized pricing and promotions. The platform defines locations based on a range of identifiers, such as latitudes and longitudes, regions, states, ZIP codes, or specific store numbers.
The platform can also extract promotional information, such as credit card-based or volume-based promotions. You can see variances across retailers, split by price groups, brands, and competitors. DataWeave specializes in enabling brands to conduct in-depth analyses across a wide array of attributes so you can answer just about any pricing or promotional question you have.
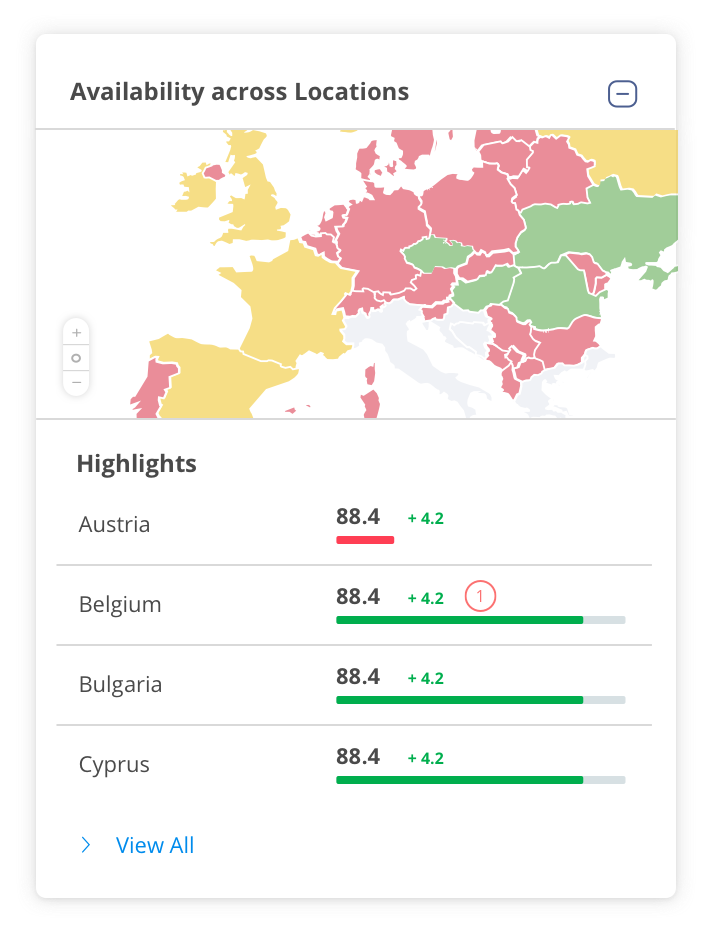
5. Availability
The availability KPI in digital shelf analytics measures the in-stock and availability rates for a brand’s products across eCommerce and physical locations. Similar to the pricing and promotions metric, it relies heavily on location awareness, down to individual stores. Measuring both online availability and offline in-stock rates will help you understand the big picture and take more informed replenishment action.
When you start leveraging the availability KPI with the help of digital shelf analytics, you can improve inventory management, boost product discoverability, increase the frequency with which your online product listings convert, and generally drive more sales. This KPI is essential for ensuring your customers can always find and buy the products they want.
With the availability KPI, you can start answering questions like:
What is my overall in-stock rate?
Which of my products frequently go out of stock?
How does product availability vary across different regions and stores?
What is the impact of availability on my conversion rates?
Are there any seasonal trends in product availability that I need to address?
How quickly are we resolving stockout issues across different locations?
What are my biggest opportunities to reduce stockouts?
DataWeave enables consumer brands to track their product availability metric through automated data collection from various eCommerce platforms in conjunction with physical in-stock rates. The platform provides granular, store-level insights so you can understand regional stock variations and optimize inventory distribution. By tracking historical availability data, you can identify seasonal patterns and predict future demand to pre-empt stockout issues. All of this can be configured with automatic notifications to alert you when there has been a stockout event or when a low stock threshold has been passed, facilitating timely replenishment.
6. Ratings & Reviews
The final KPI in our guide is the ratings & reviews digital shelf metric. Consumers rely heavily on genuine feedback from their peers and refer to star ratings, posted comments, and uploaded pictures to inform their buying decisions. This KPI analyzes the impact of customer feedback and reviews on your products’ performance across eCommerce platforms so you can measure overall brand perception and isolate areas of opportunity.
This metric does something other digital shelf metrics don’t; it can inform your product strategy. It can help you identify repeat complaints that your product team can address with the manufacturer or use for the design of future products.
Some questions you can answer with this powerful KPI include:
What is the overall customer sentiment towards my products based on ratings and reviews?
Which product features are frequently mentioned positively or negatively by customers?
How do my product ratings and reviews compare to those of my competitors?
Are there common issues or complaints that need to be addressed to improve customer satisfaction?
Which products have the highest and lowest ratings, and why?
With DataWeave’s digital ratings and reviews feature, you can keep a pulse on customer sentiment to take short-term action as well as decide long-term strategy. You can leverage reviews to influence product perception, refine products, and enhance overall customer satisfaction.
DataWeave’s Digital Shelf Metrics
Each one of these metrics is interconnected and collectively influences a brand’s success. For instance, improving content quality and earning higher ratings can significantly enhance your product’s visibility in search results, thereby boosting the Share of Search digital shelf metric. By focusing on a comprehensive approach that integrates these metrics, brands can ensure their products are consistently visible, competitively priced, well-reviewed, and readily available.
DataWeave gives consumer brands the means to execute a holistic digital shelf strategy. From a single portal, track and improve digital shelf metrics like Share of Search, Share of Media, Pricing and promotions, Availability, and Ratings and Reviews.
Our solutions help audit and optimize the most critical KPIs that drive sales and market share for brands so you can stay competitive in a dynamic digital landscape and foster long-term customer satisfaction.