Amazon Prime Day 2025 generated a record-breaking $24.1 billion in US online sales during its extended four-day run (July 8–11, 2025). While the expanded format helped broaden participation, it also diluted the urgency and daily peaks that typically define Prime Day.
Beneath this record-setting performance lies a more complex reality. Persistent inflation, shifting consumer behavior, and rising pricing pressures created a retail environment very different from previous years, one where higher baseline prices often replaced the deep discounts shoppers expected.
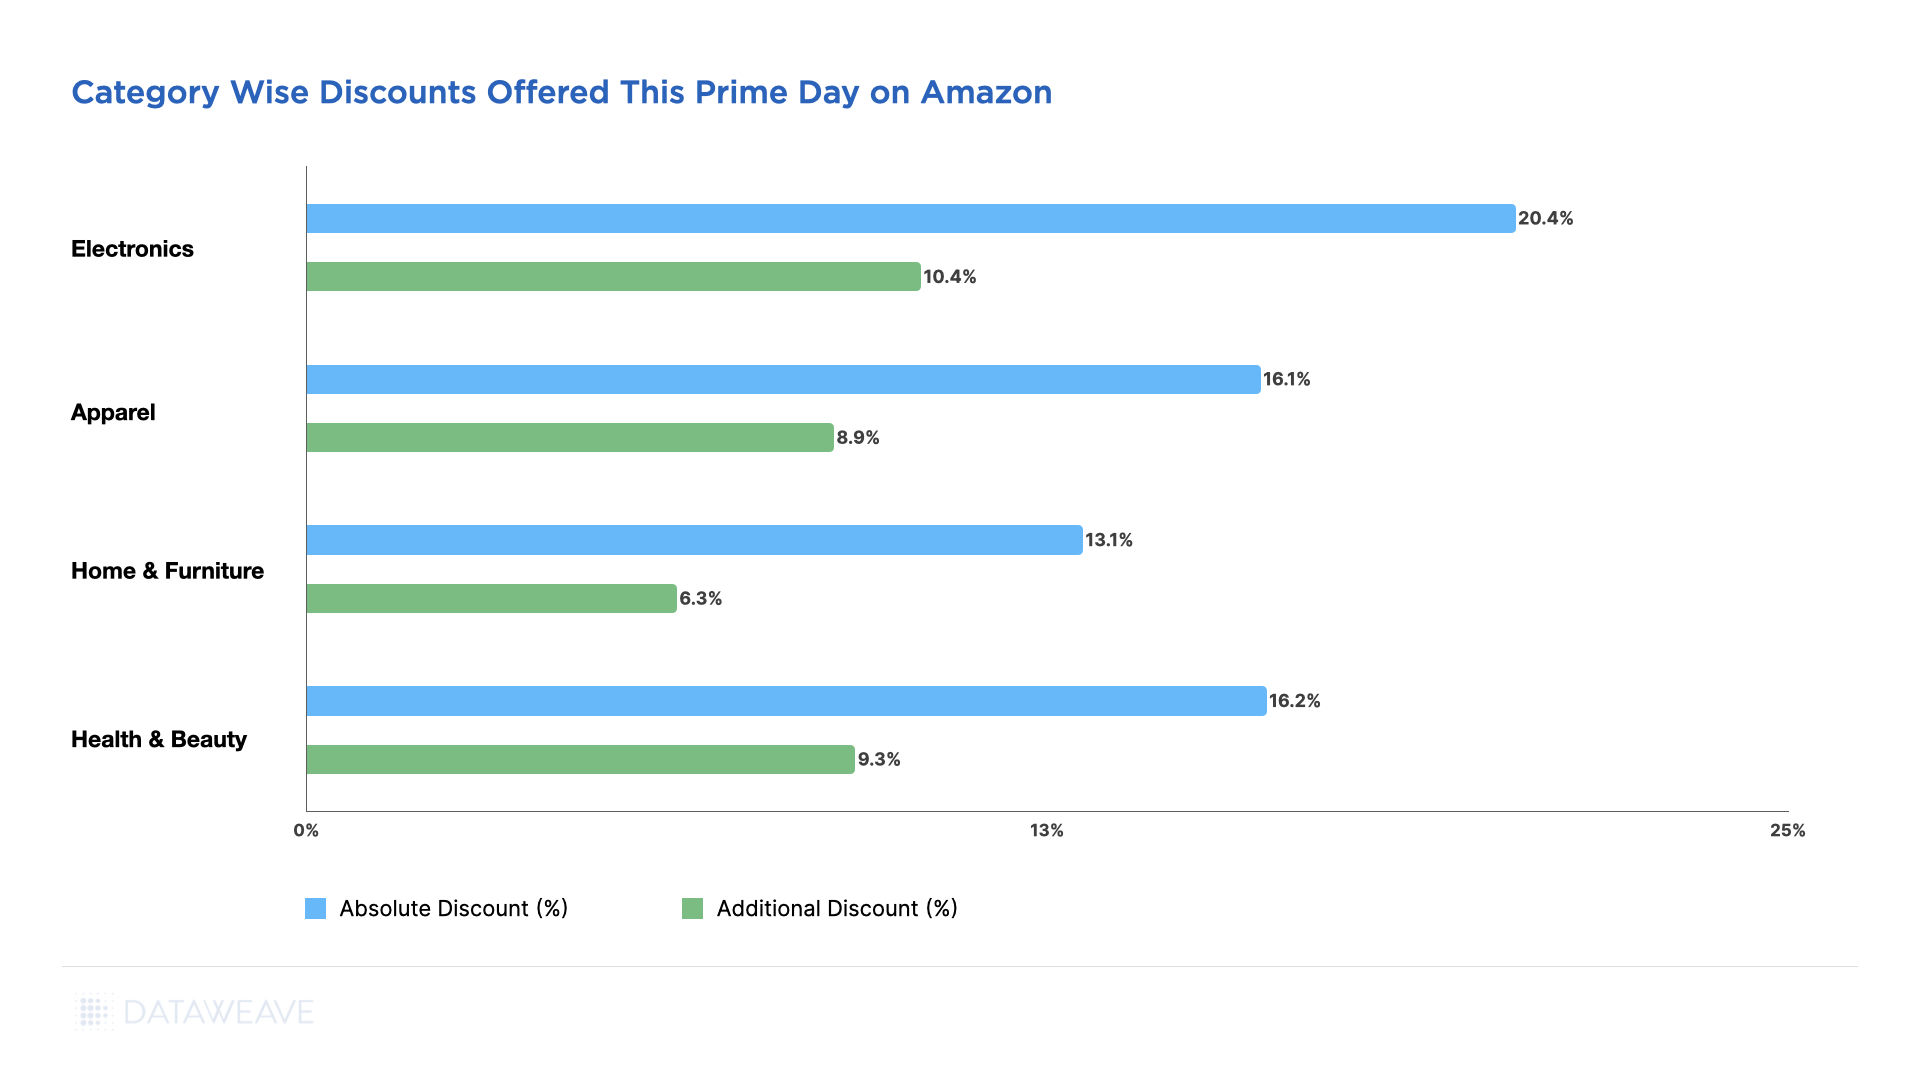
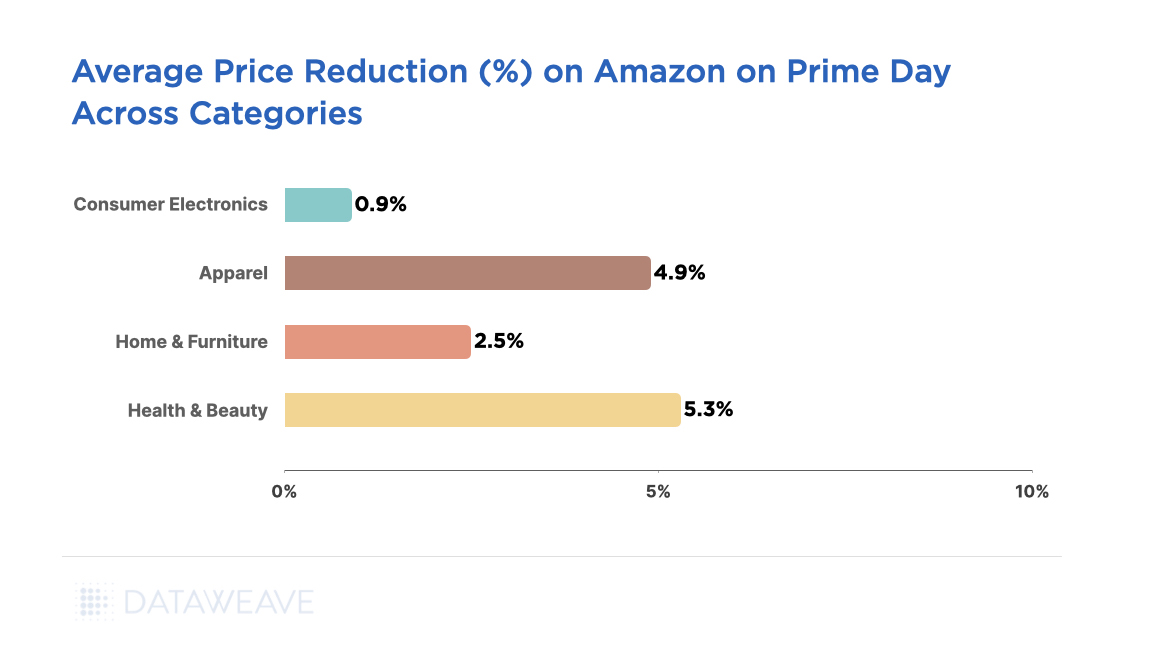
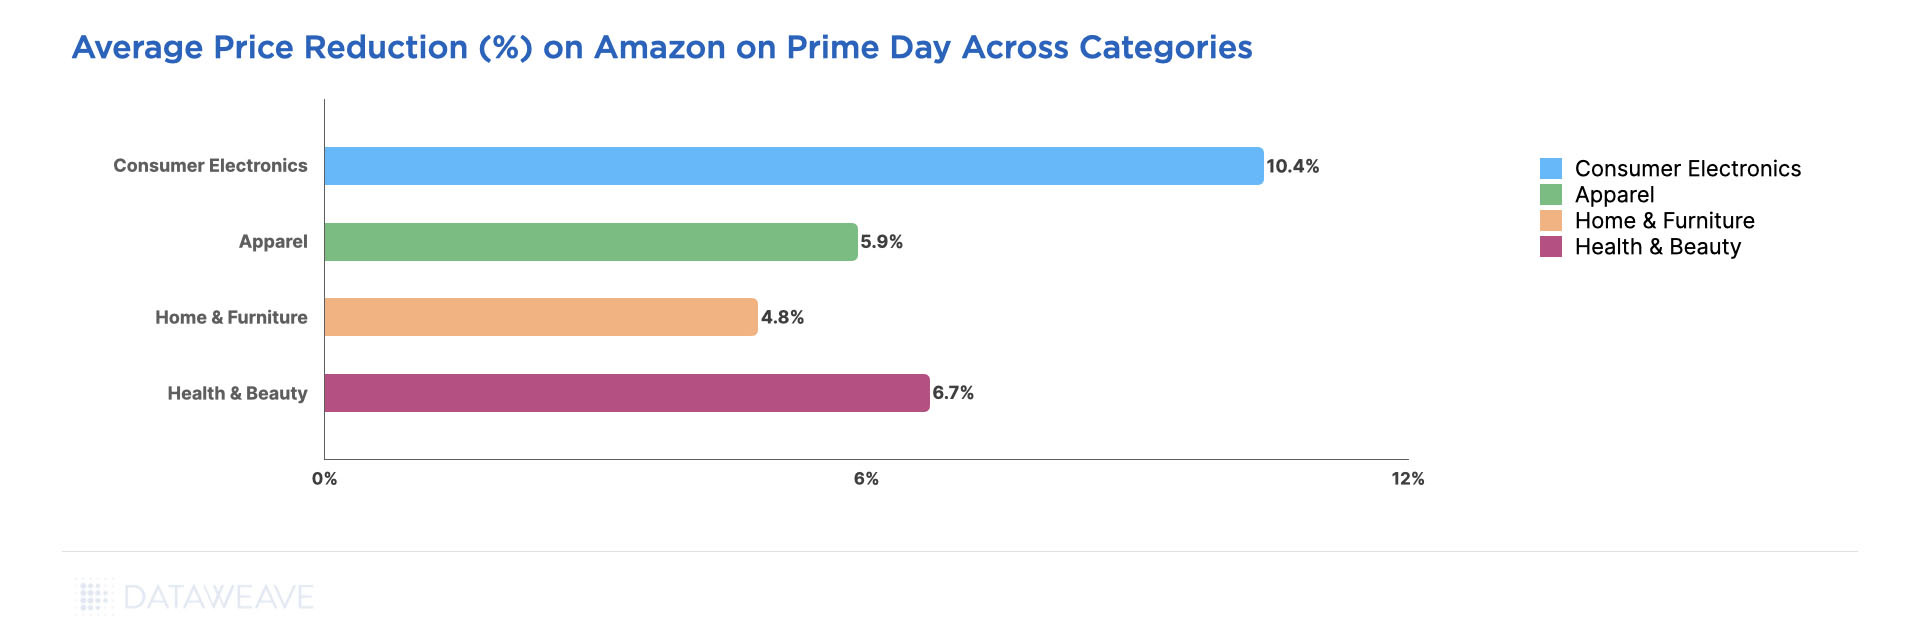
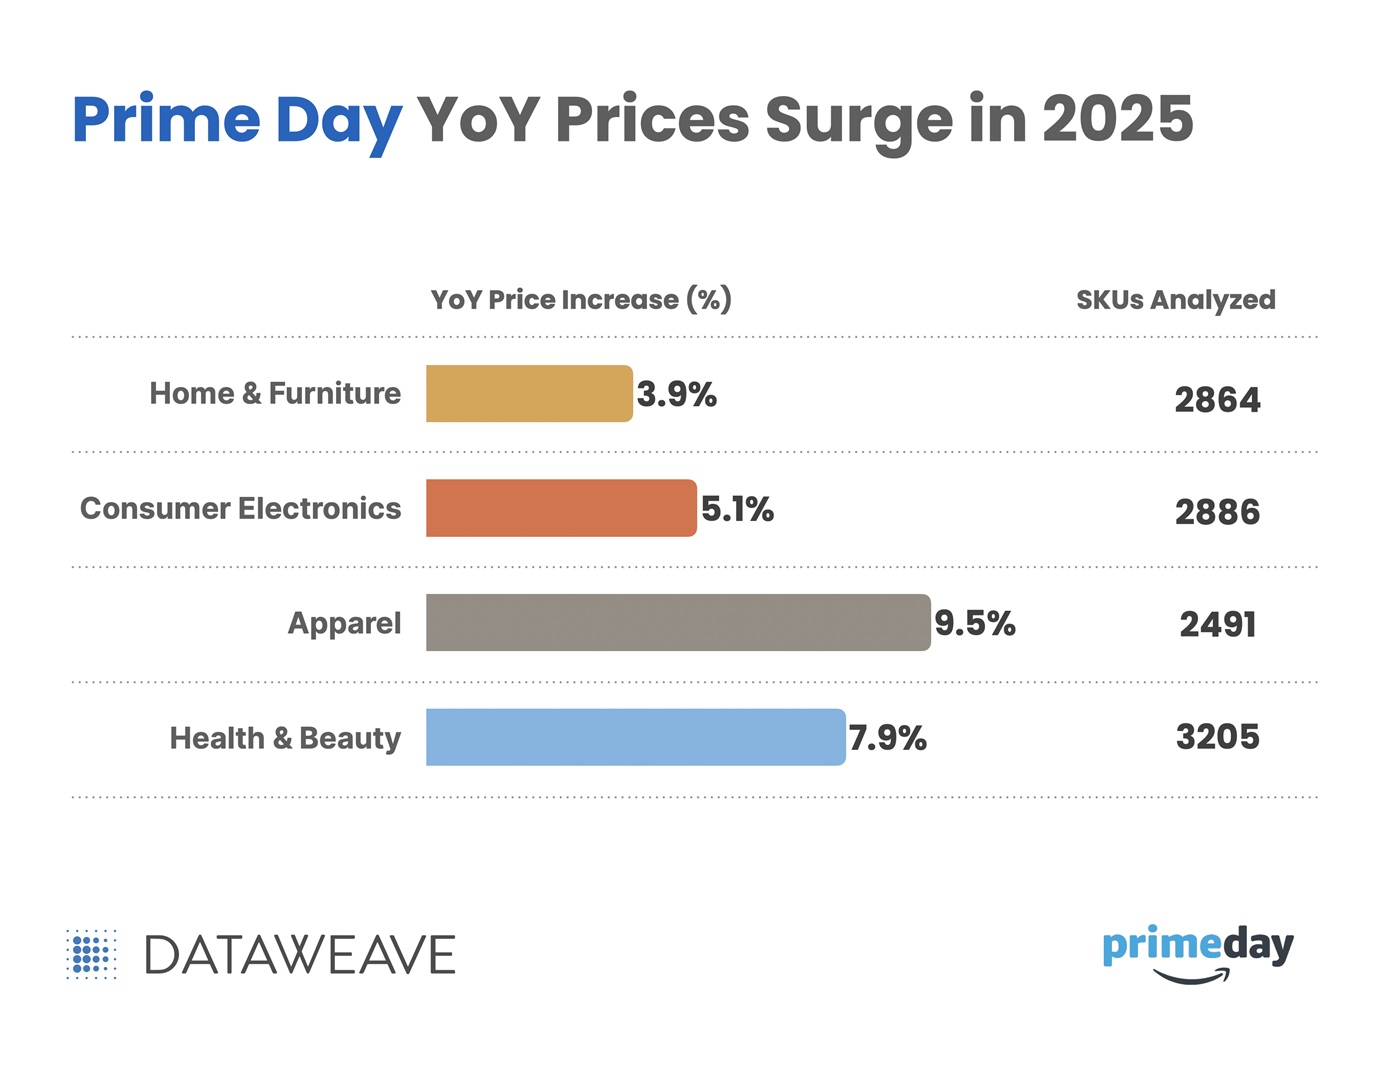
To understand these dynamics, DataWeave analyzed pricing and visibility trends across 11,495 products using our proprietary AI platform. The study focused on four major categories – Consumer Electronics, Apparel, Home & Furniture, and Health & Beauty – comparing identical SKUs from Prime Day 2024 and 2025, and tracking changes in both organic and sponsored share of search for leading brands.
The results reveal clear year-over-year price increases: Apparel led with a 9.5% rise, followed by Health & Beauty (7.9%), Consumer Electronics (5.1%), and Home & Furniture (3.9%). In total, 47% of tracked products saw higher prices, indicating that this year’s record sales were achieved in an environment of elevated base pricing rather than deeper discounts.
Multiple converging forces shaped the retail landscape leading into Prime Day 2025, pushing baseline prices higher even before promotions began.
- Supply Chain Pressures: Ongoing disruptions and elevated shipping and production costs continue to shape the cost structure across categories.
- Trade Policy Factors: Recent tariff measures and trade regulations may be contributing to upward pricing trends in certain categories, particularly those with high import dependence such as electronics and home goods.
- Labor and Operating Costs: Rising wages, transportation expenses, and general operating overhead are placing additional pressure on retailer margins and influencing pricing decisions.
- Currency Fluctuations: Shifts in exchange rates continue to add variability to the cost of imported goods, especially in globally sourced categories like electronics and apparel.
These combined pressures created a pricing environment where brands had less room for deep discounting, shaping not just how products were priced, but also how aggressively they were promoted.
To better understand the impact, we compared Prime Day 2025 prices to those from Prime Day 2024 for the same SKUs across major categories. This year-over-year view highlights how elevated baseline prices, driven by the factors outlined above, shaped the shopping experience and promotional strategies.
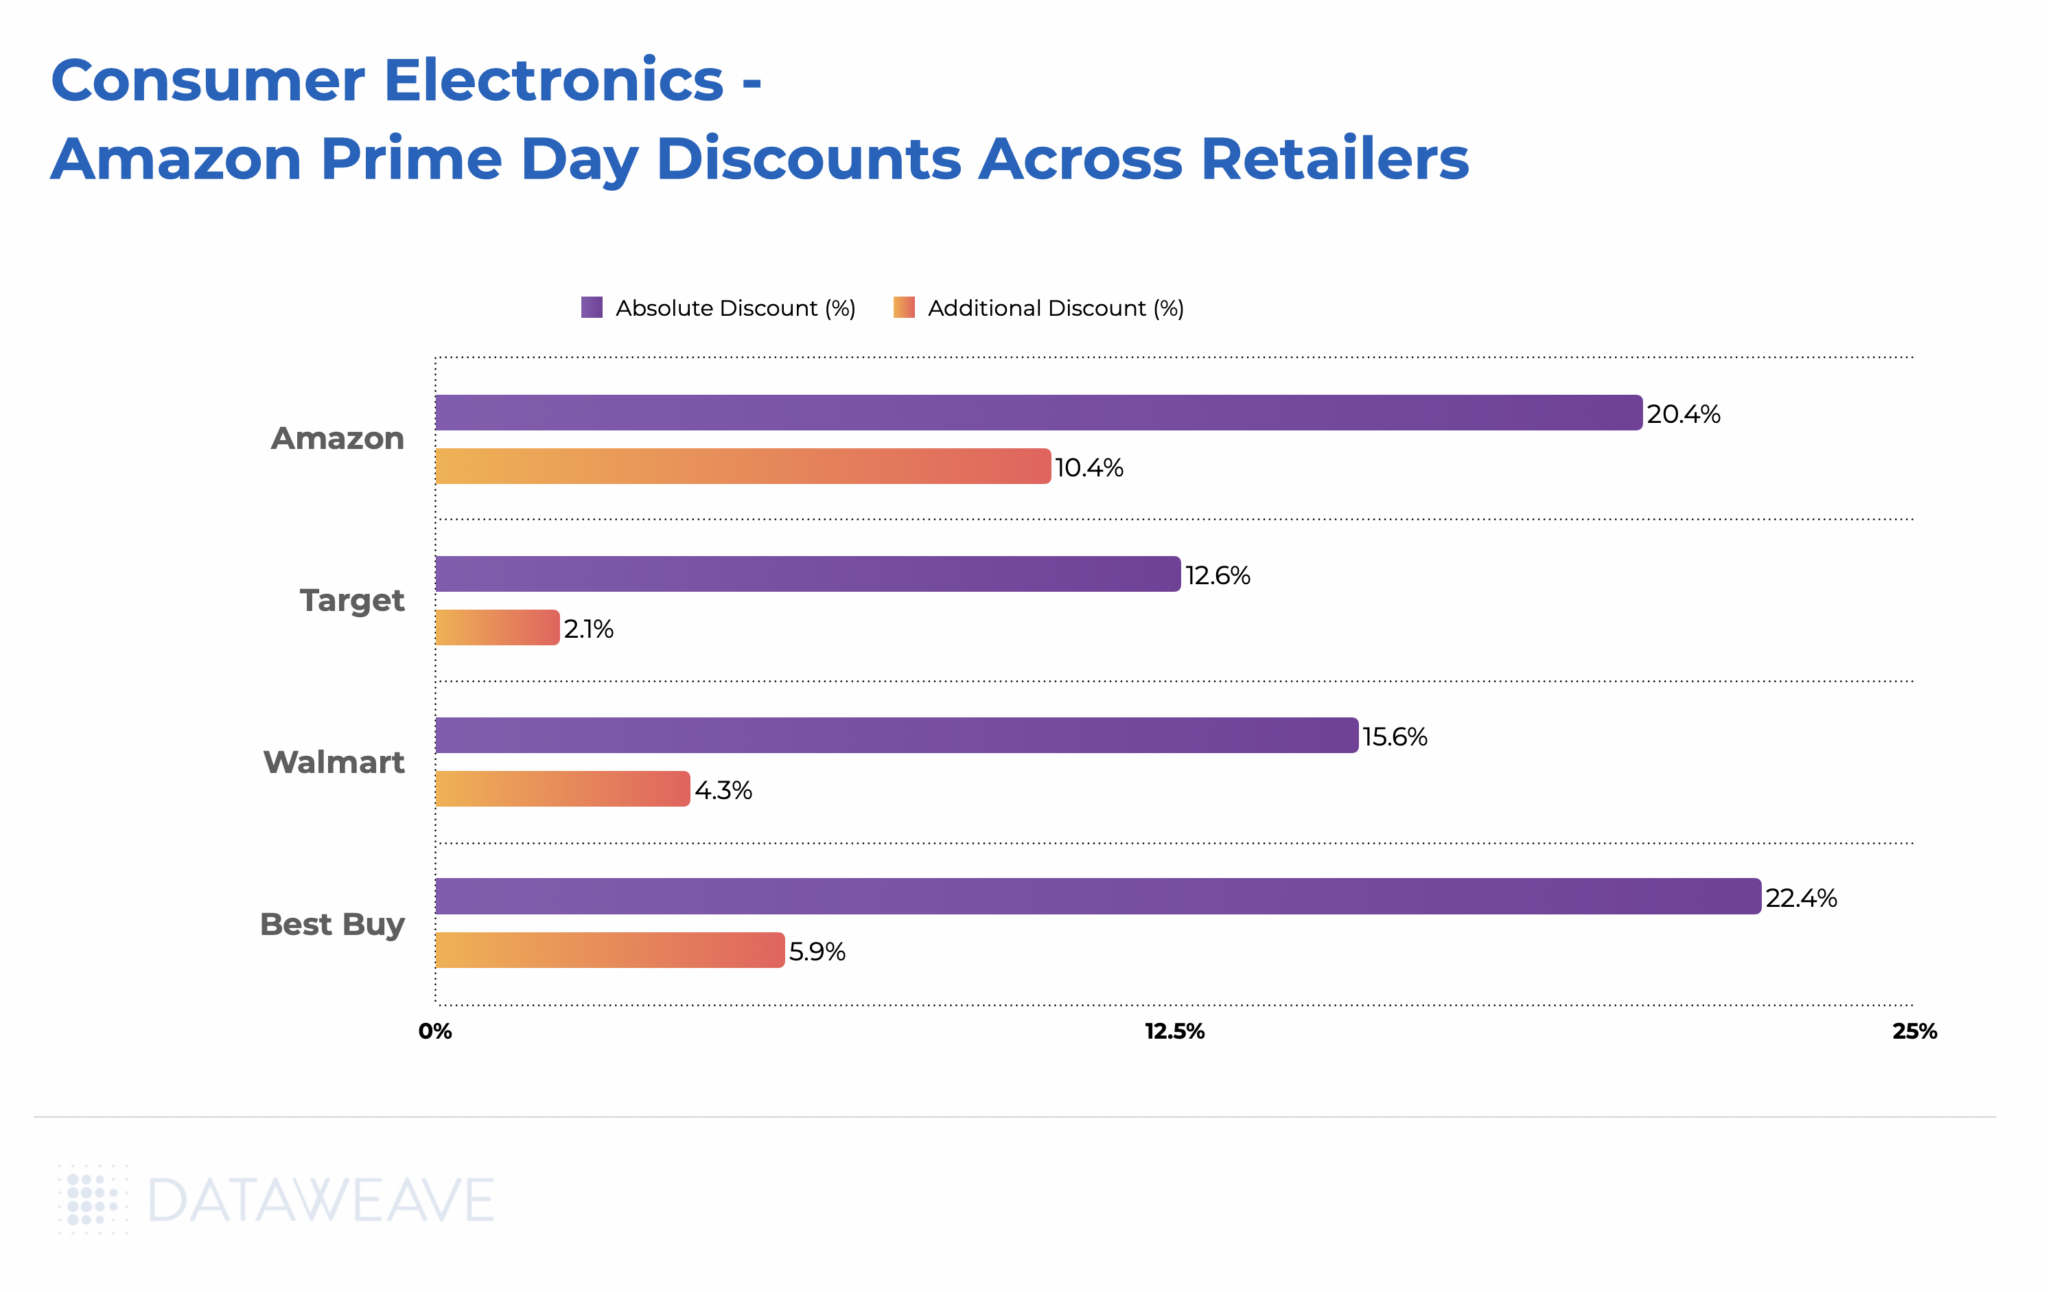
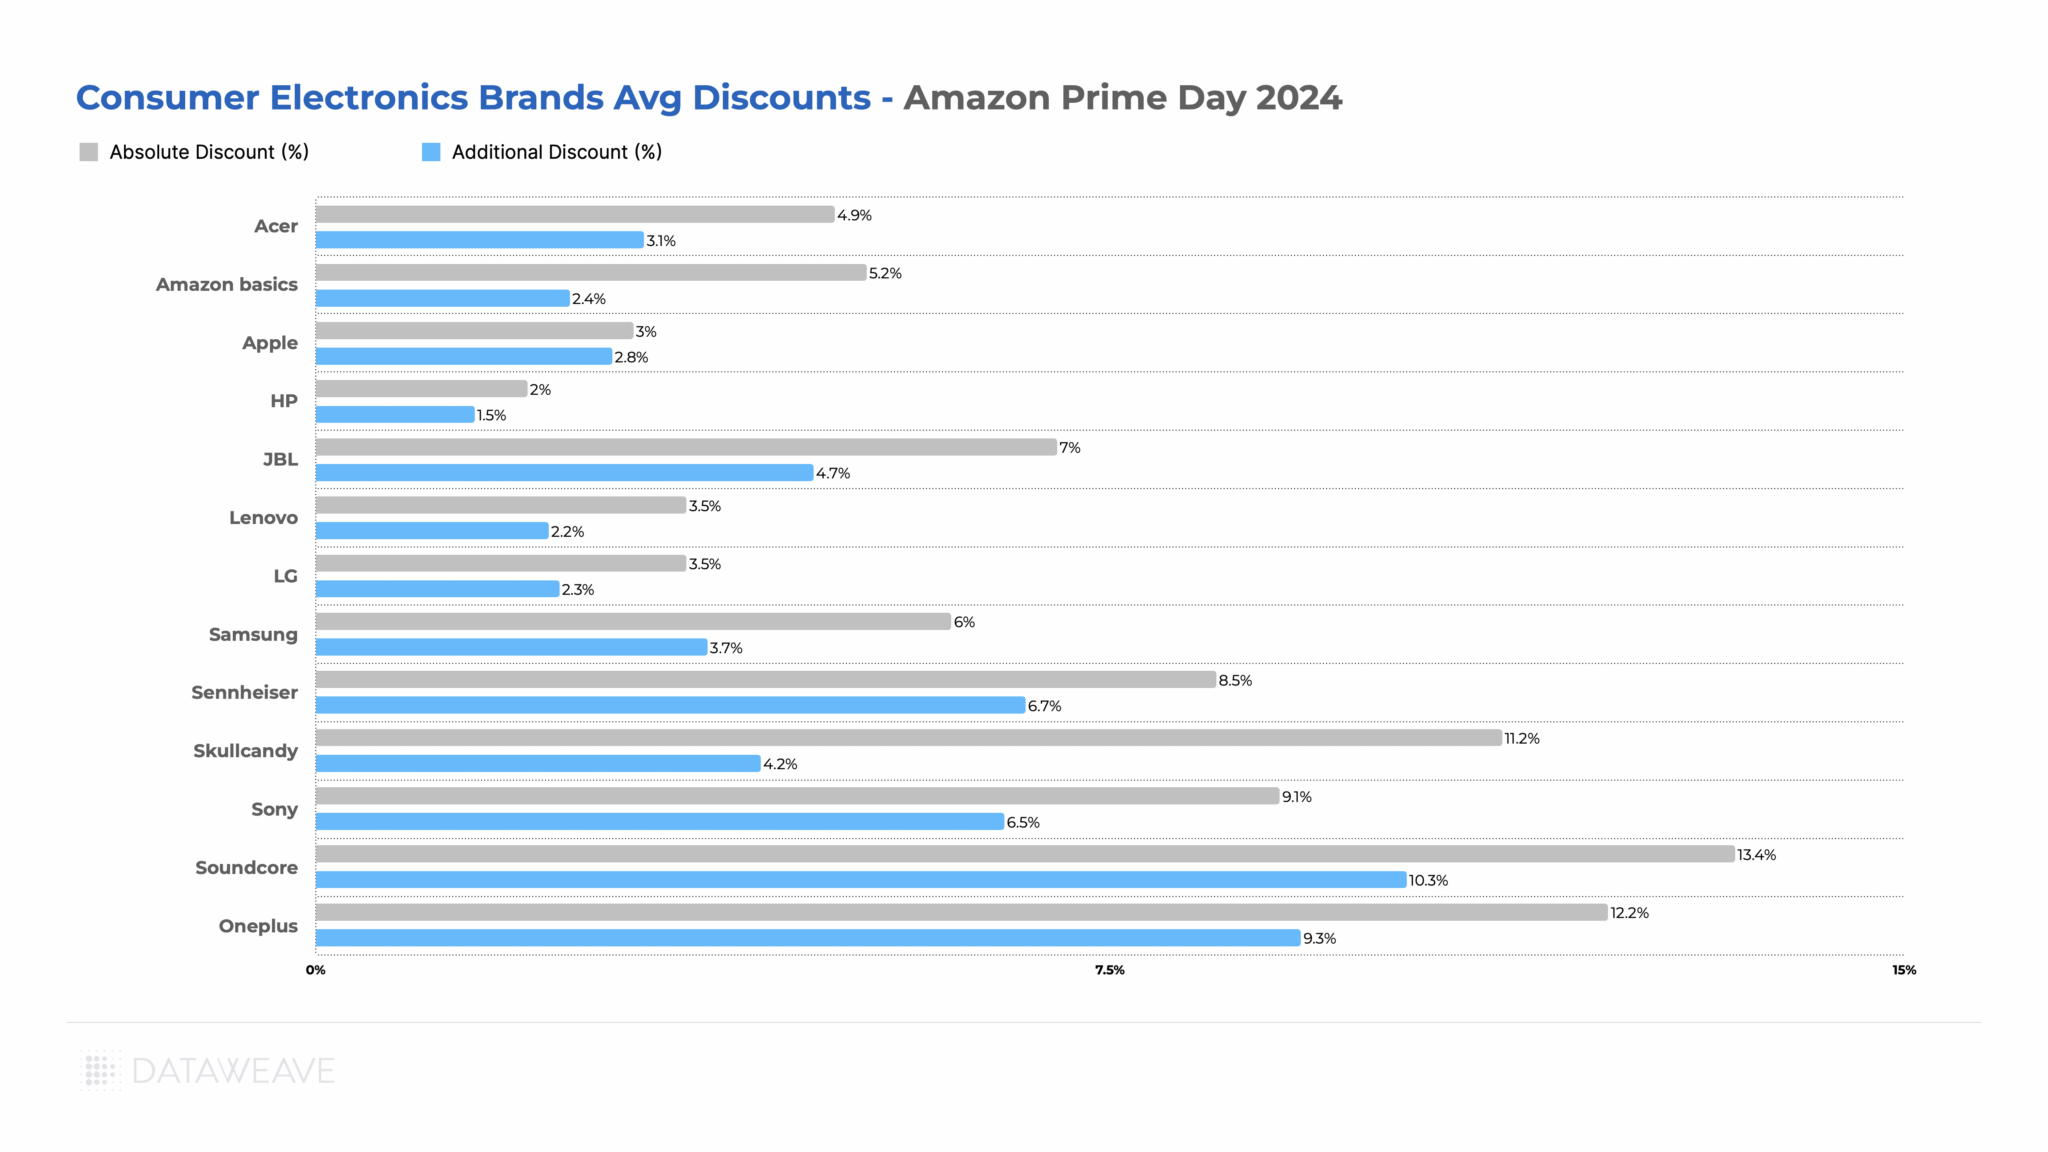
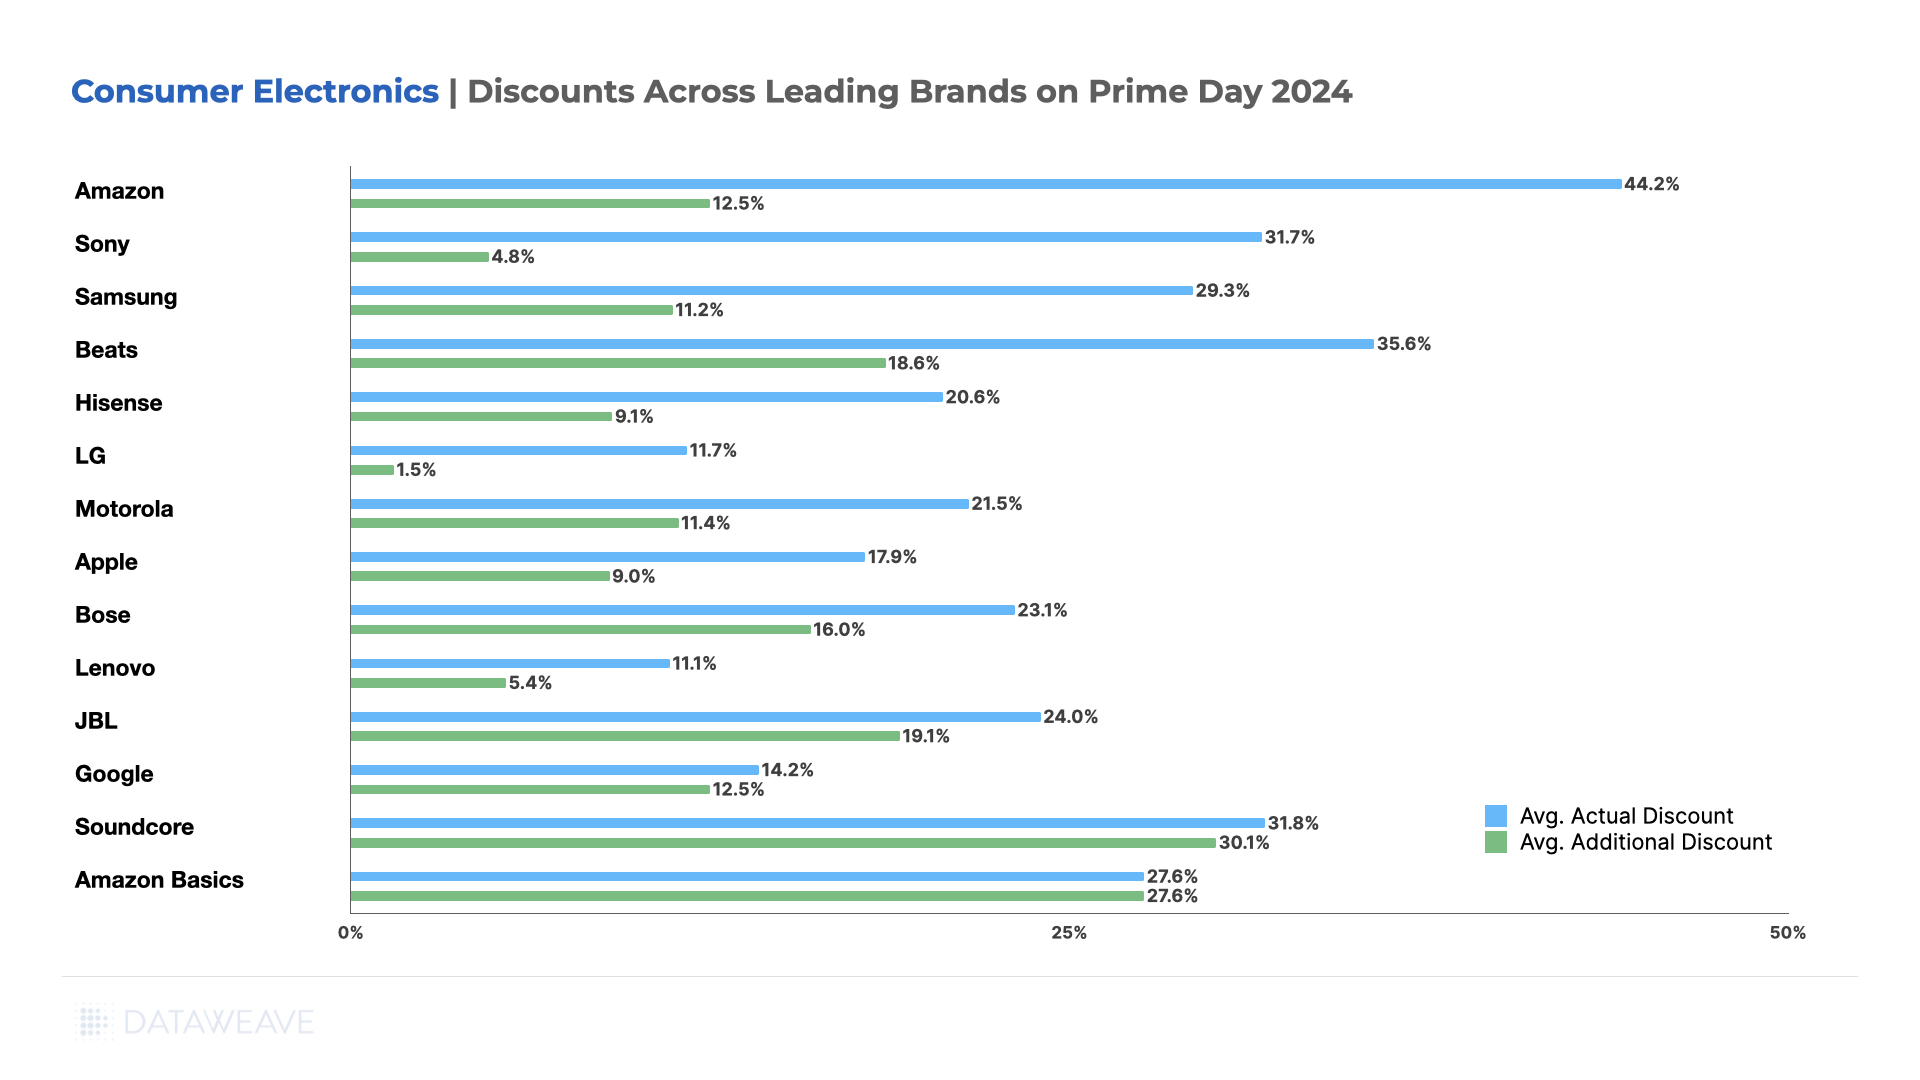
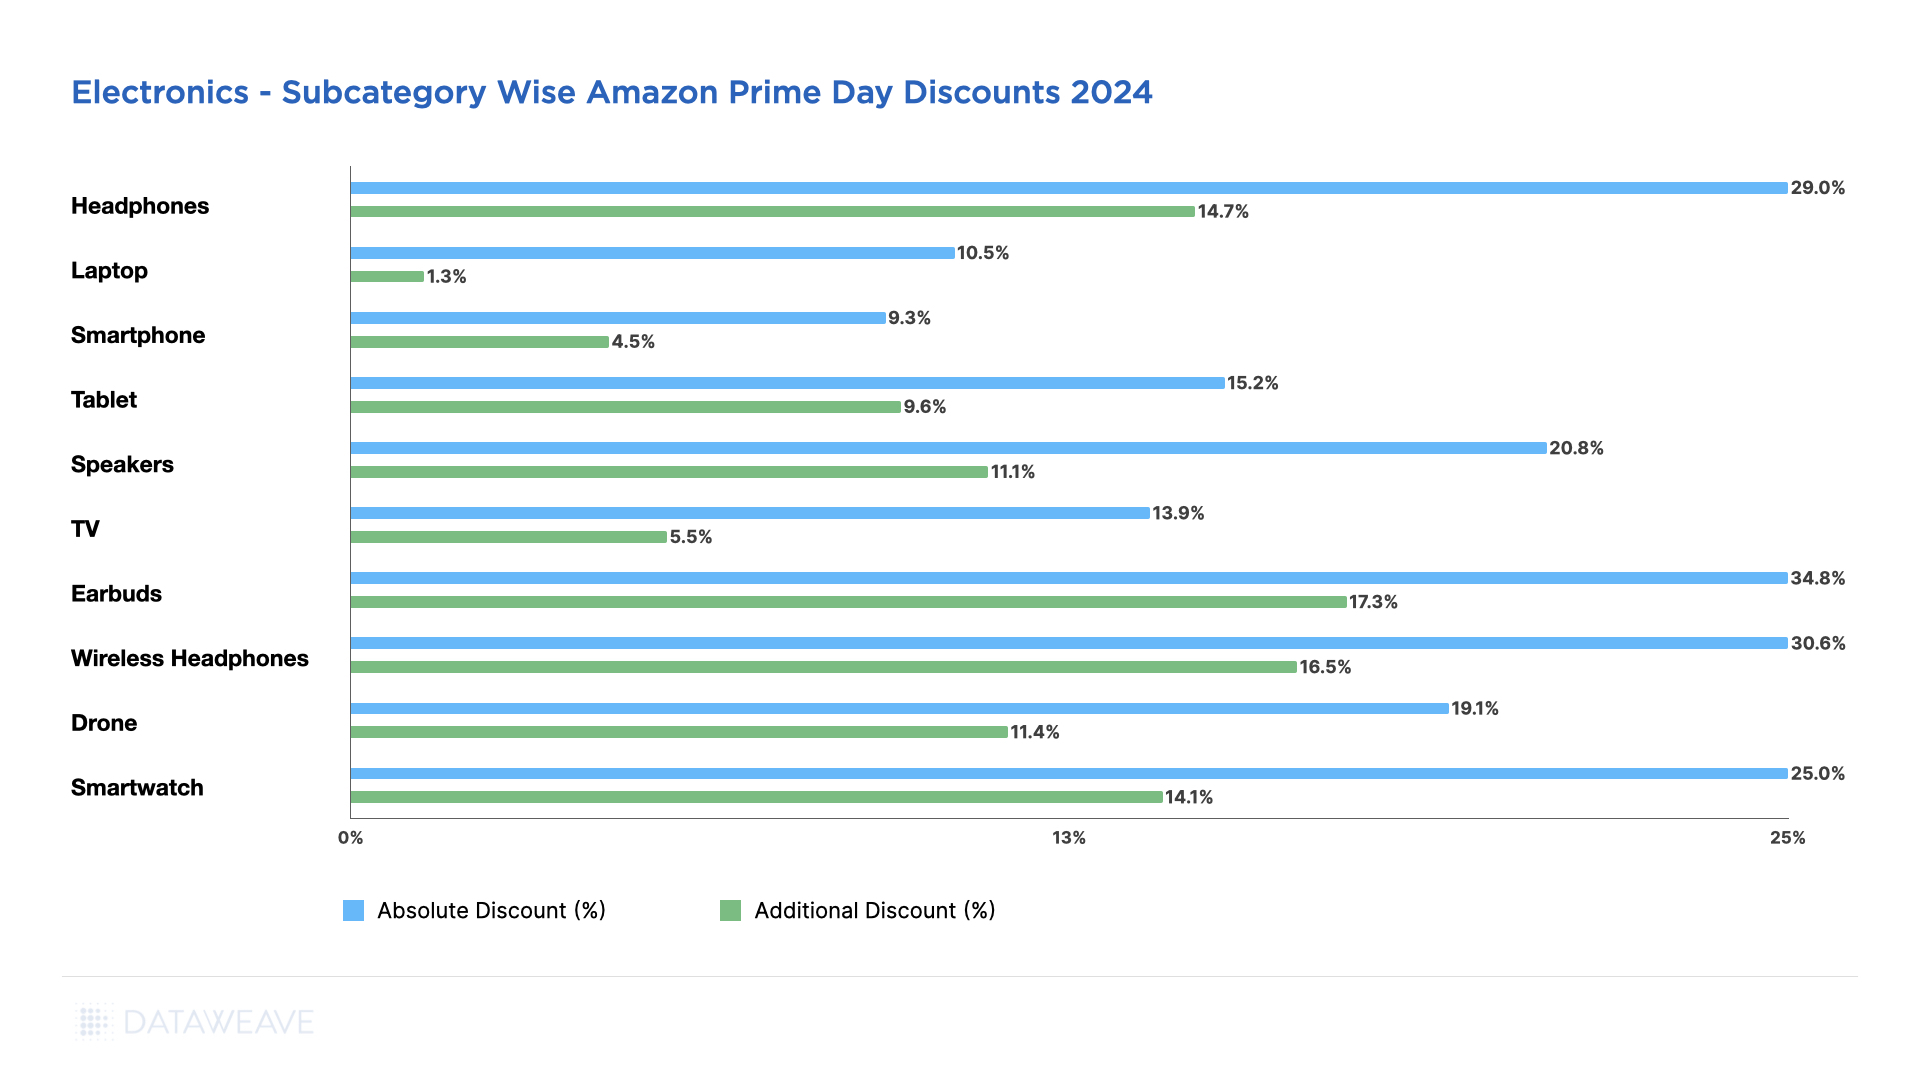
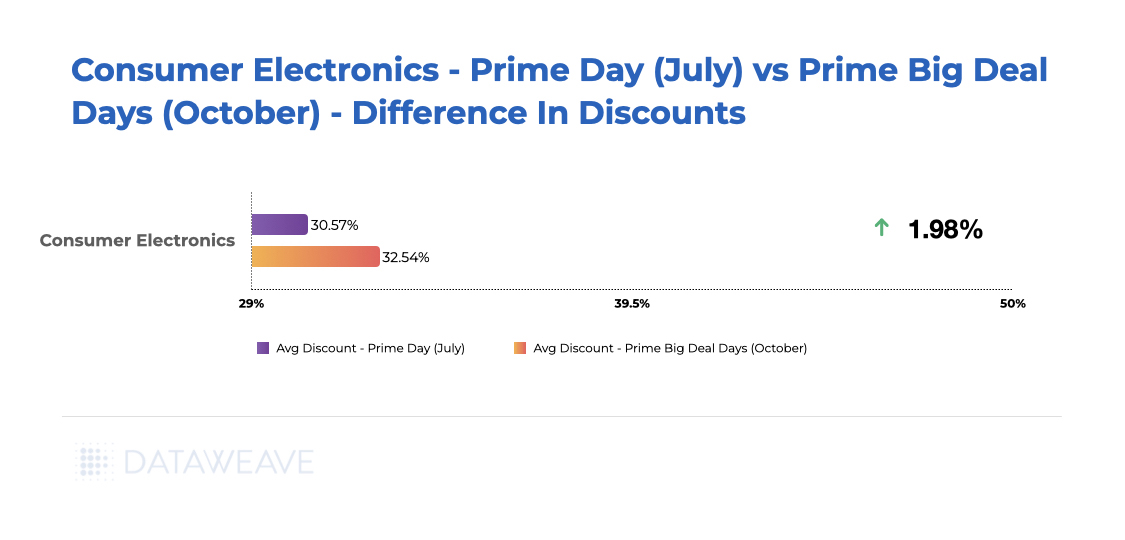
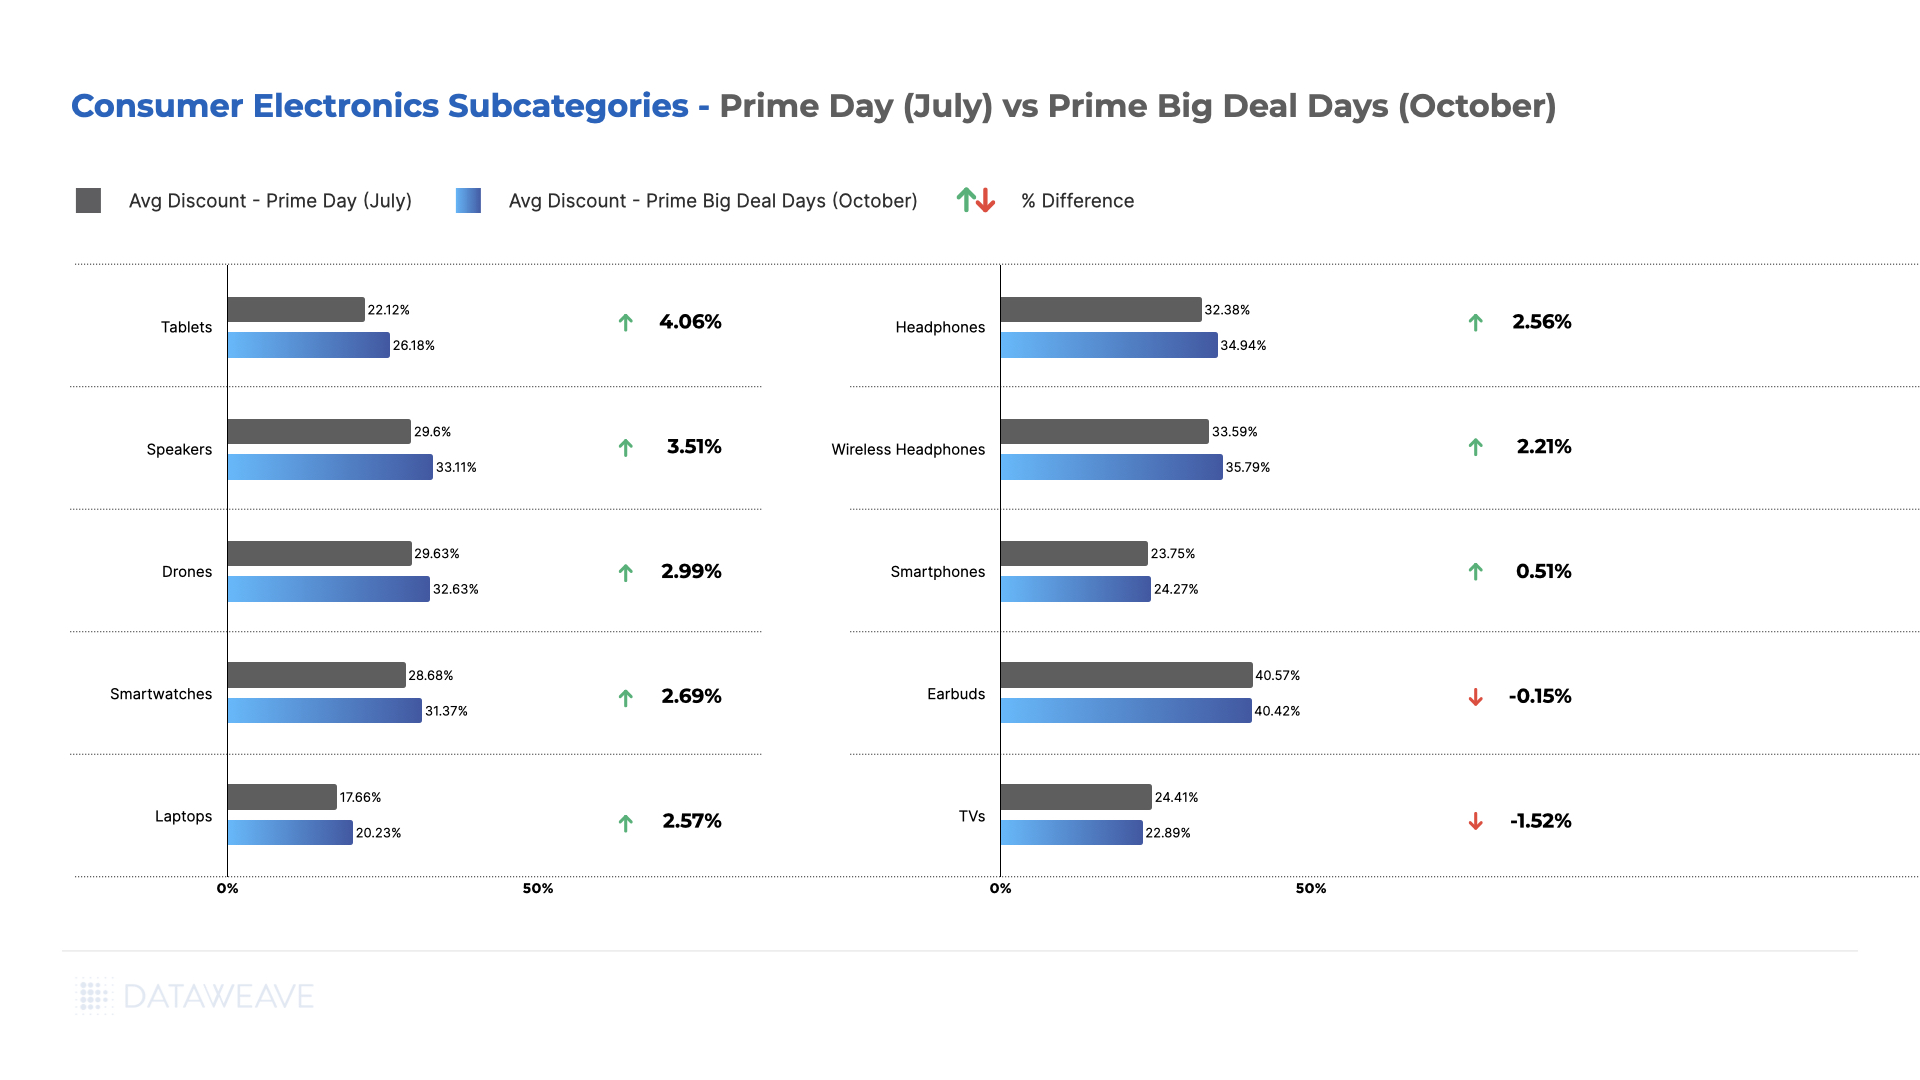
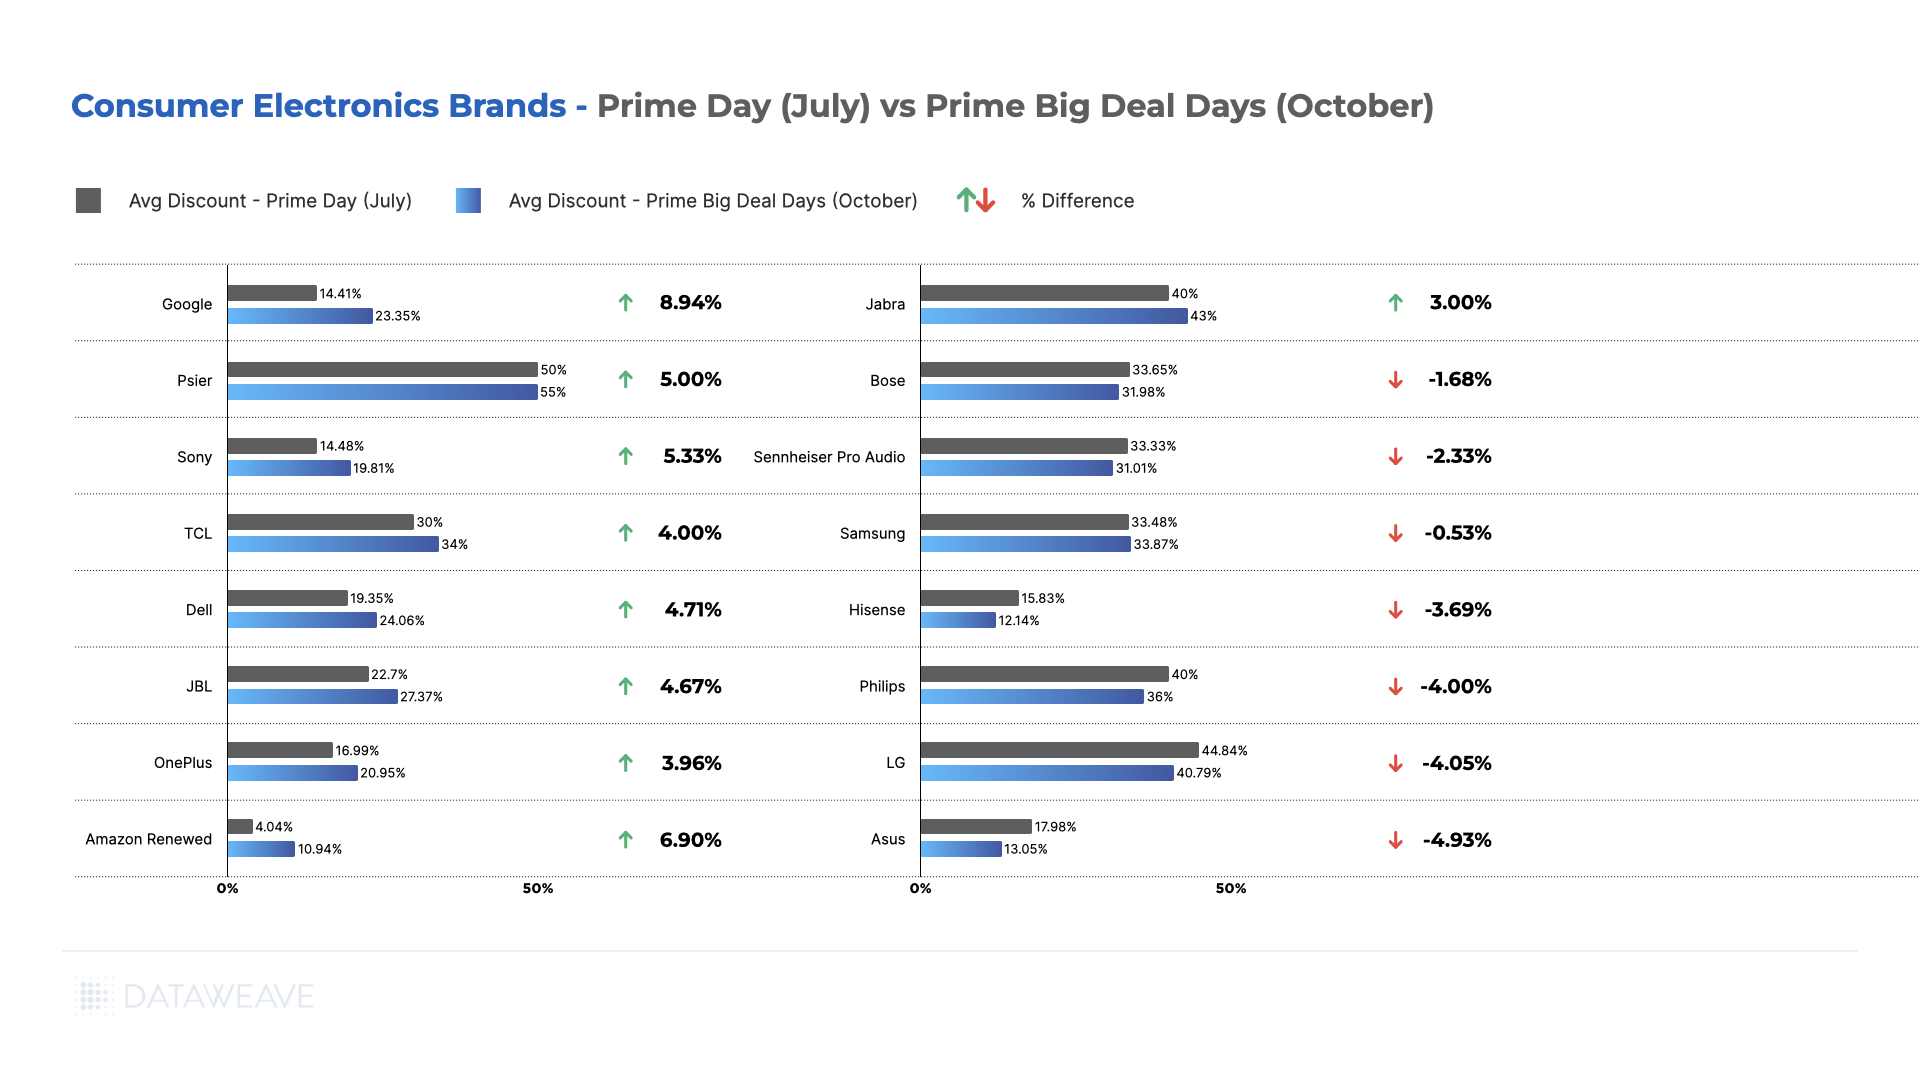
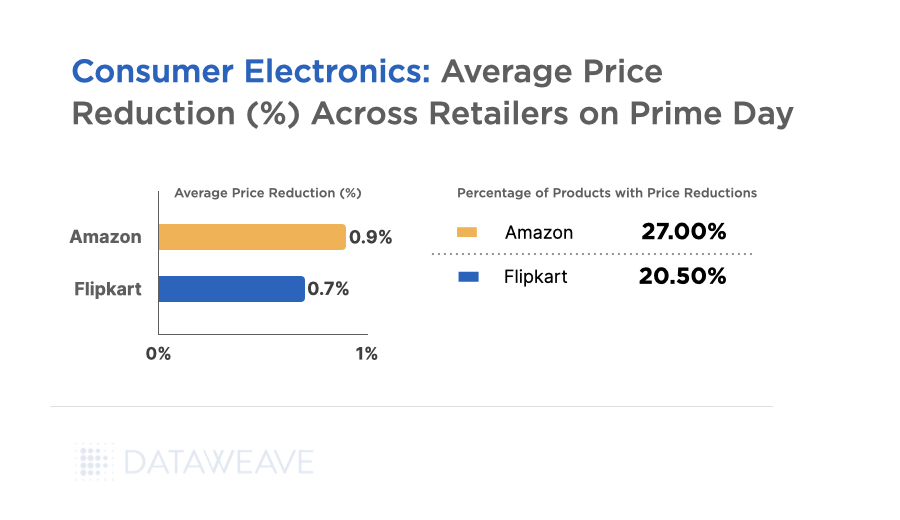
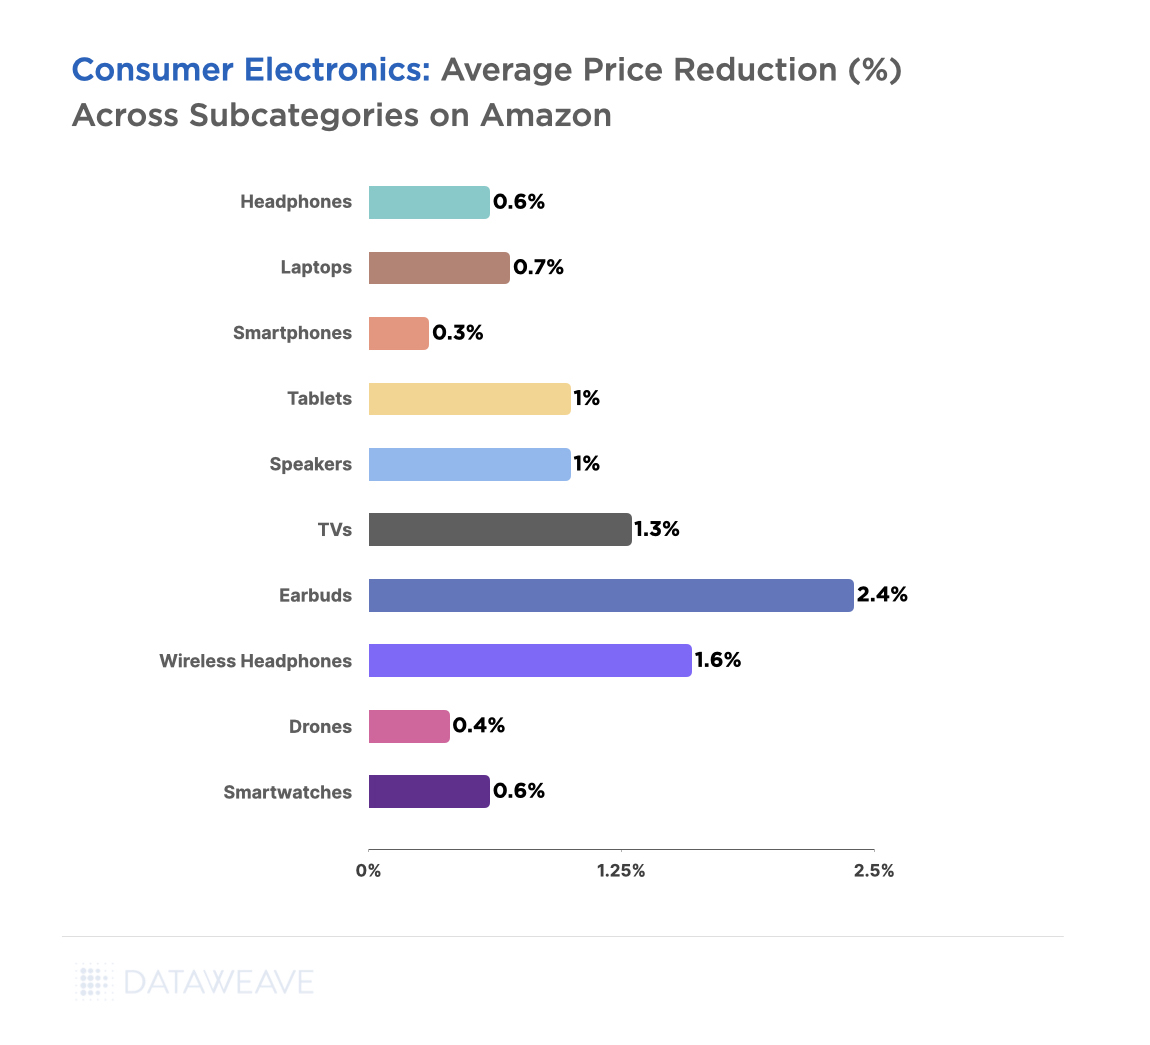
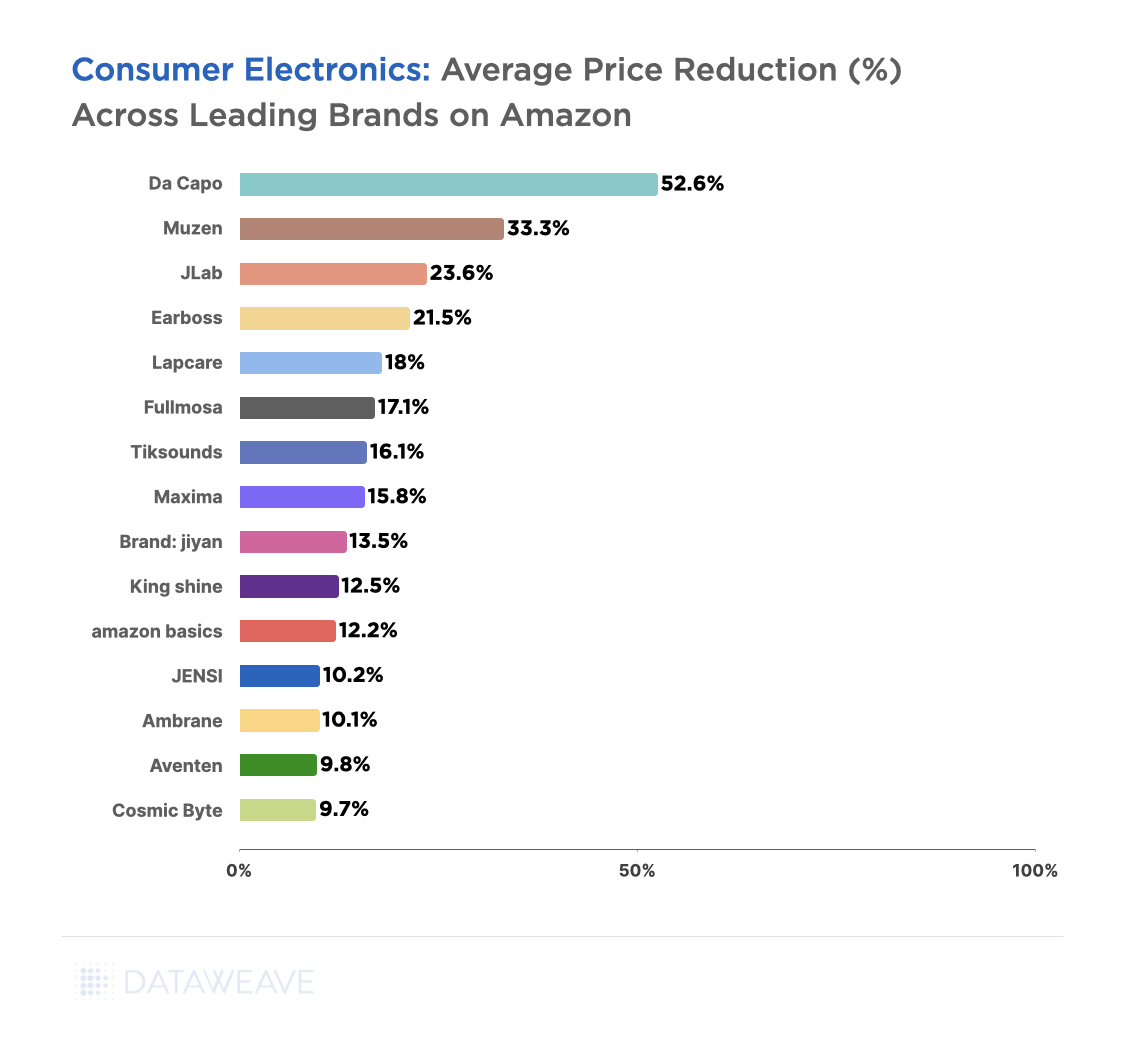
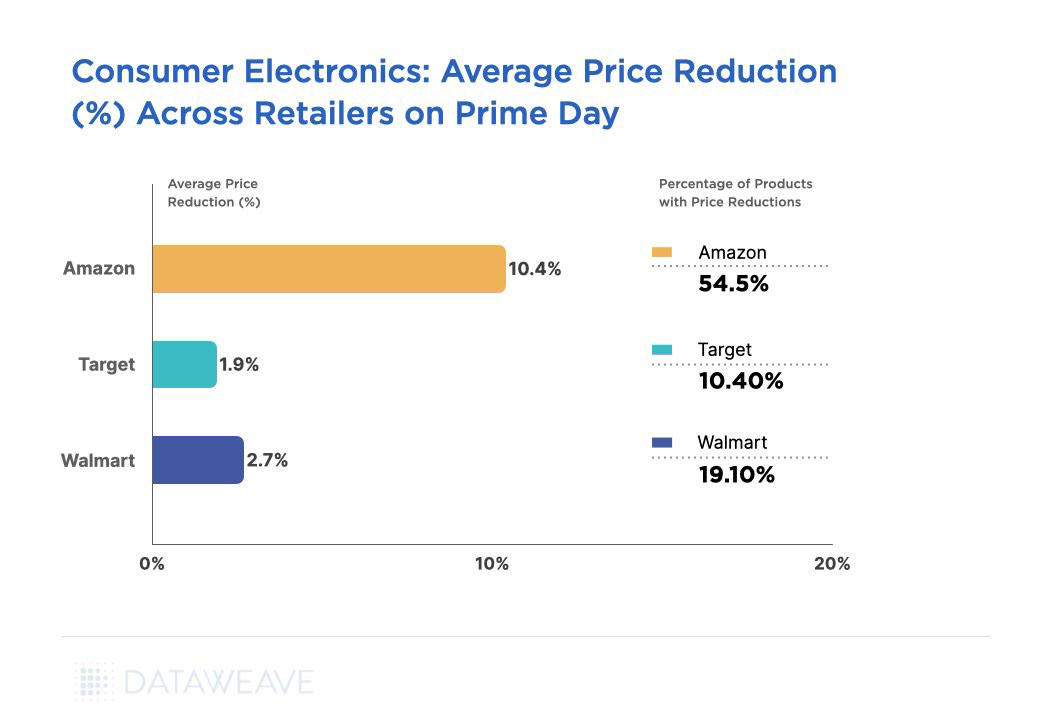
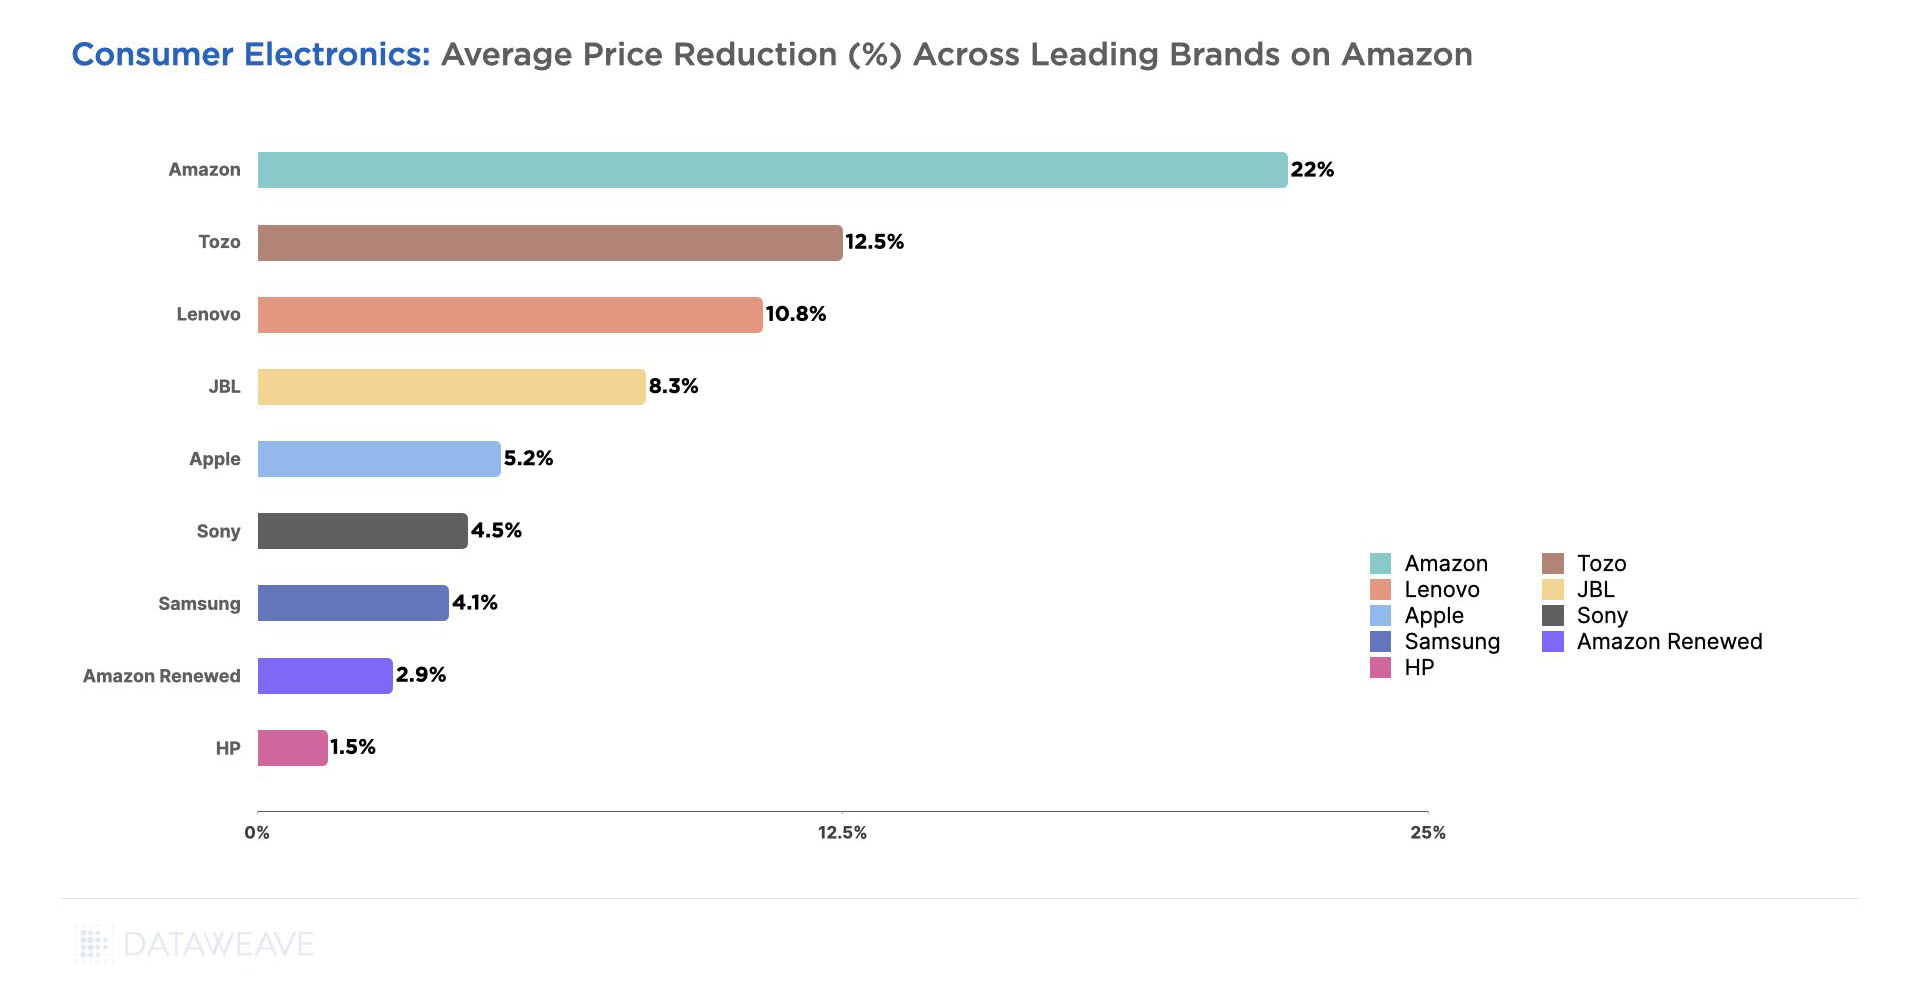
Consumer Electronics
- JBL prices increased 24% year-over-year, the highest among major electronics brands.
- Amazon’s own brand saw prices increase by 22%.
- Beats saw a significant 9% increase, while Sony and Samsung both experienced 8% price increases. Apple prices went up by 6%, and Google saw a 7% increase.
- Meanwhile, other established brands like LG and Motorola maintained minimal increases at 1%, Lenovo at 2%, Soundcore at 3%, and Bose and Hisense both at 5%.
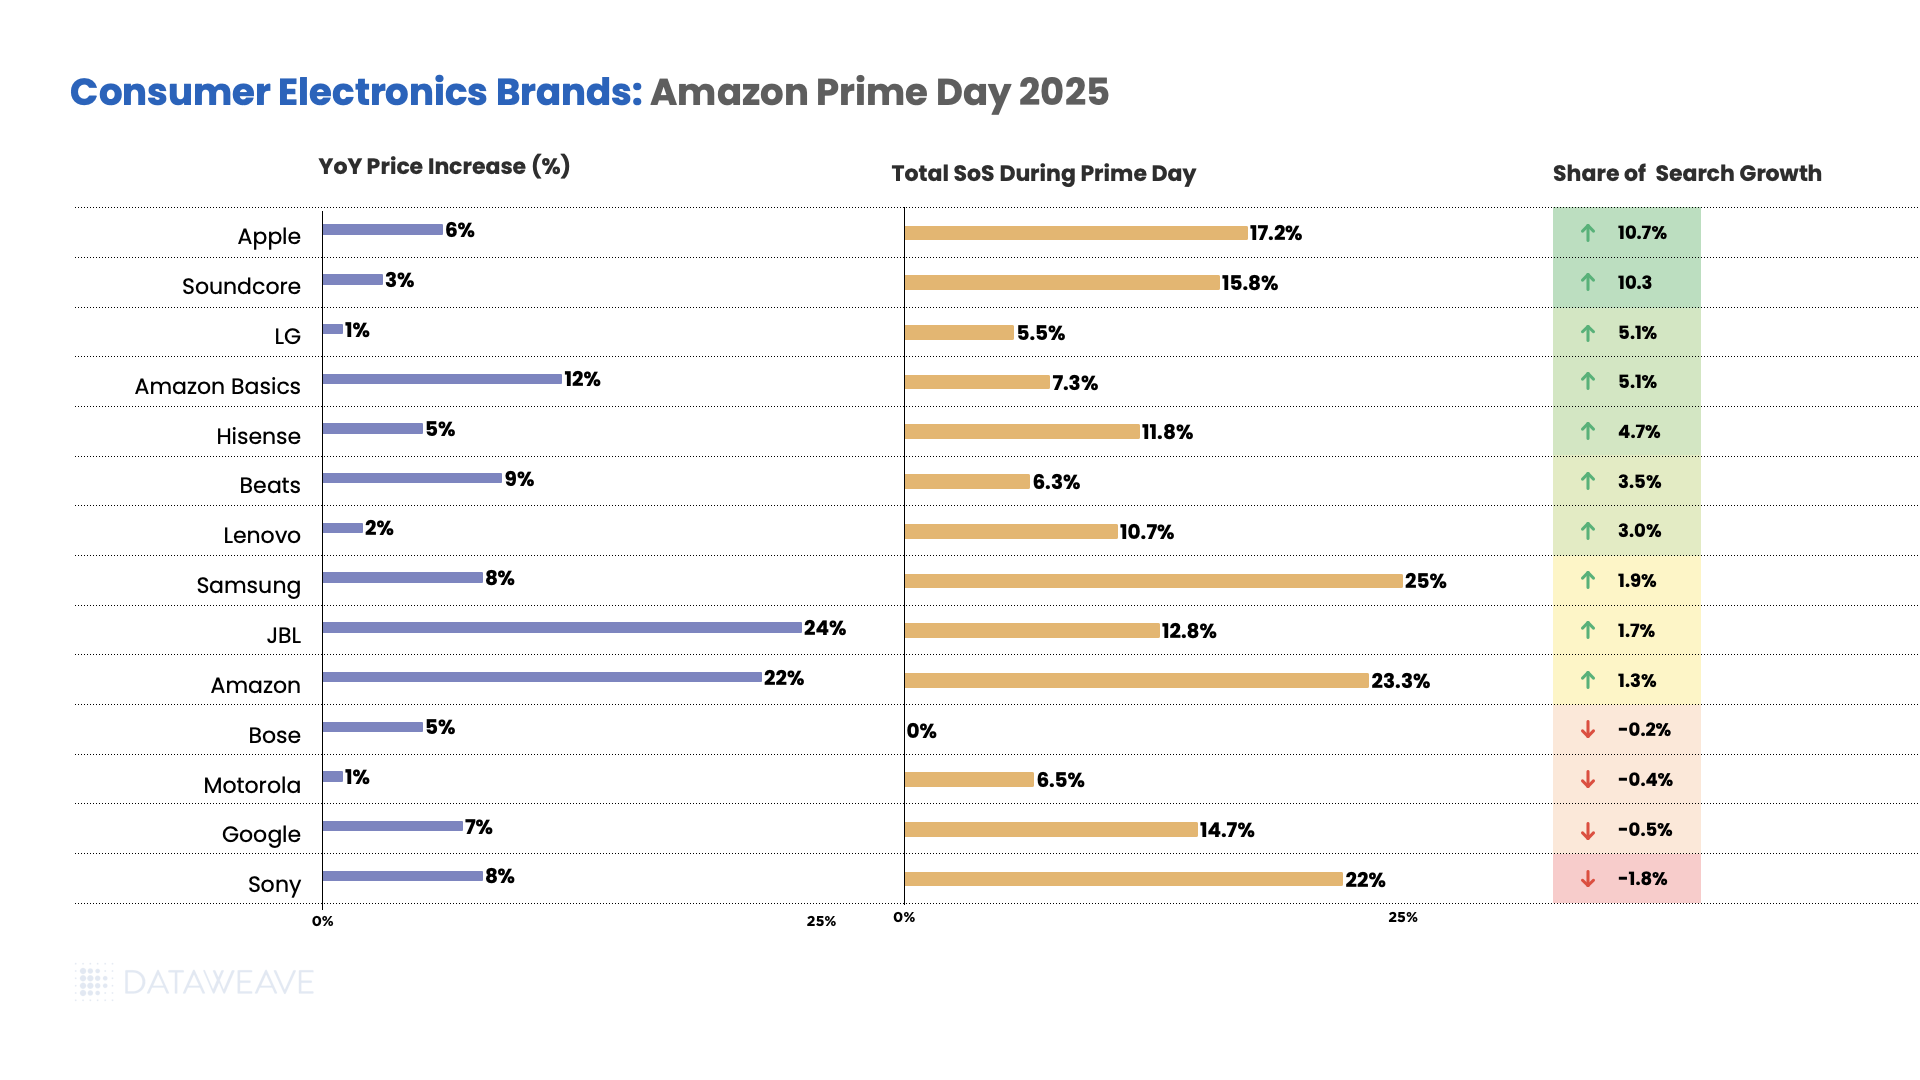
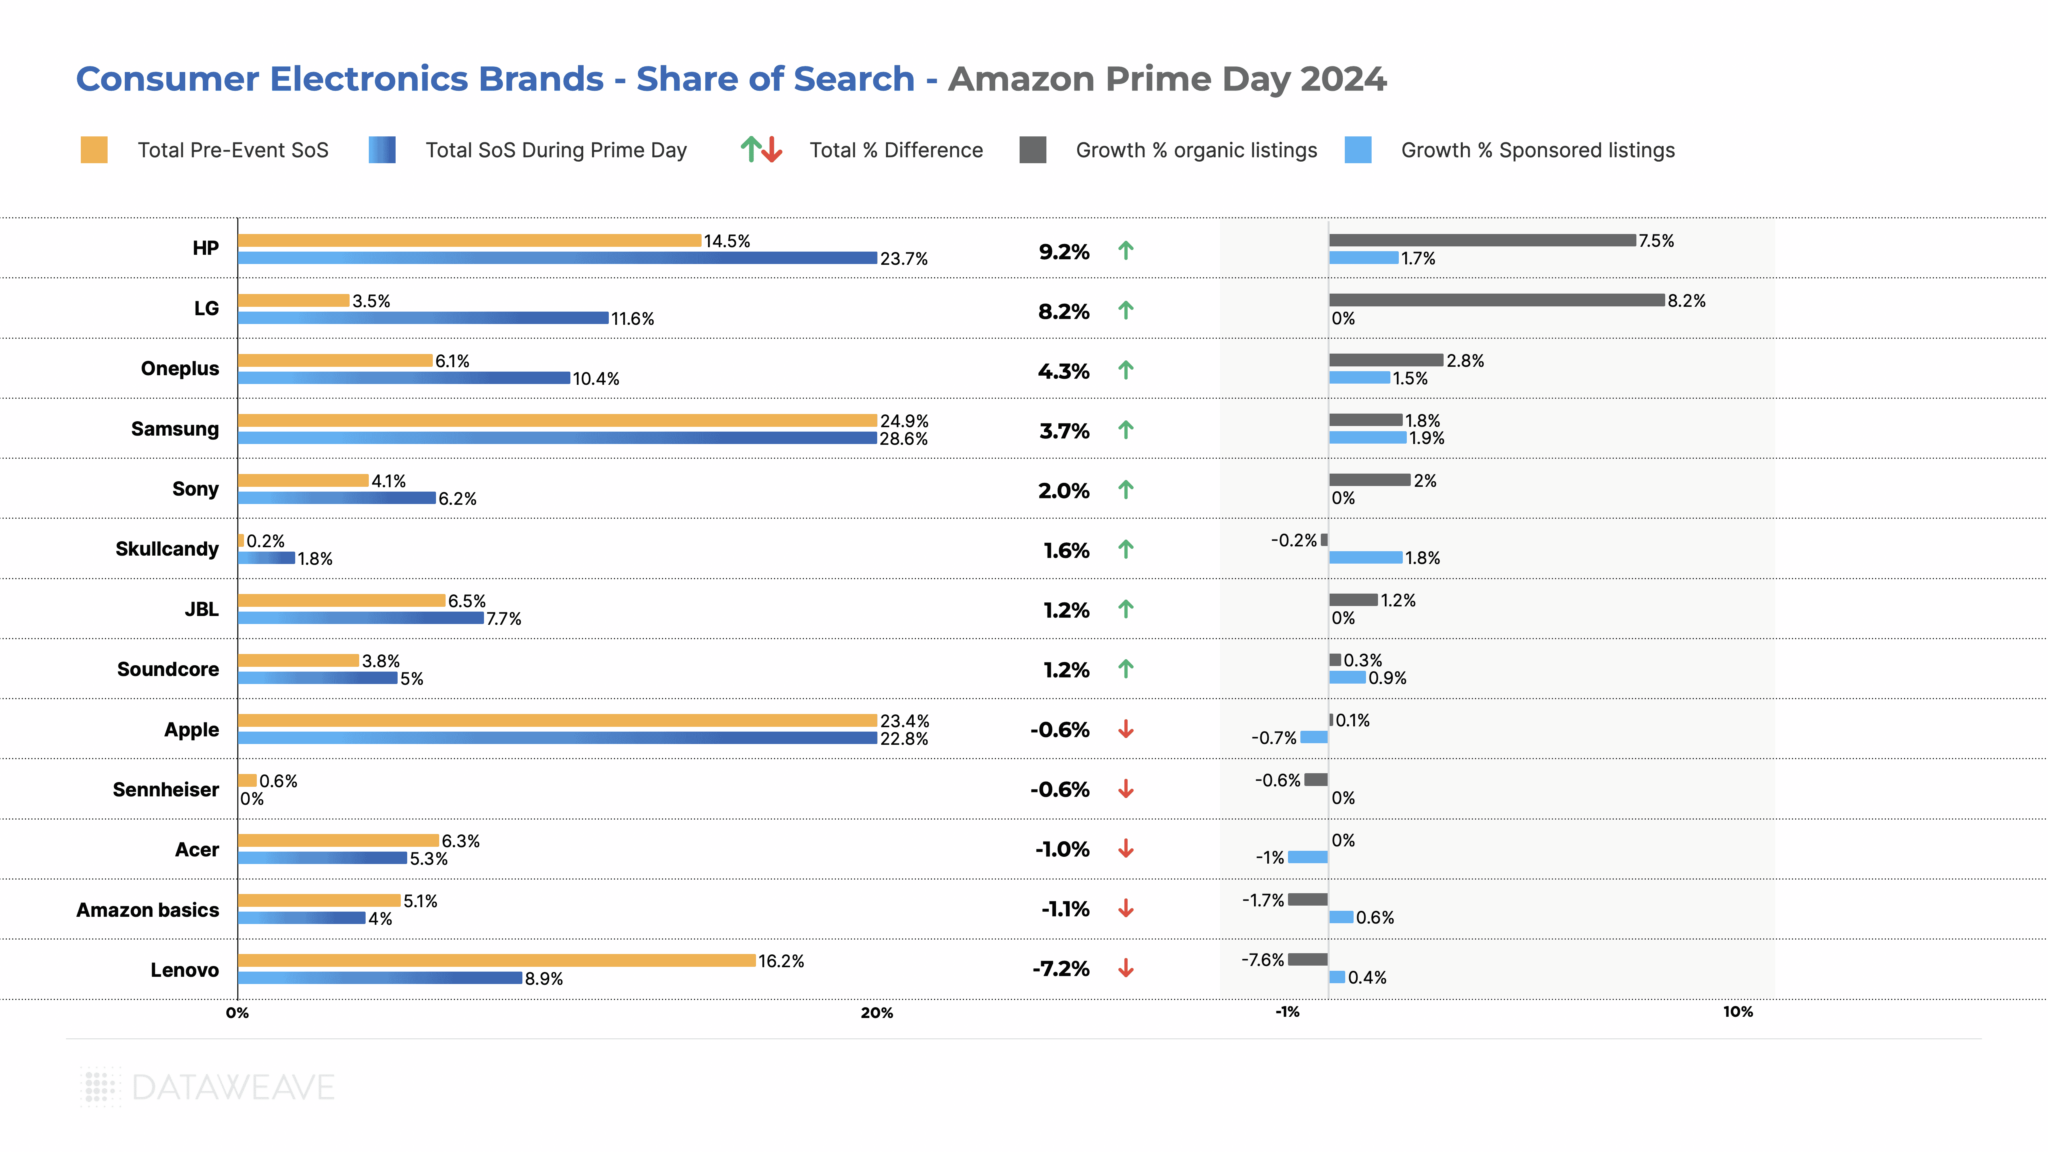
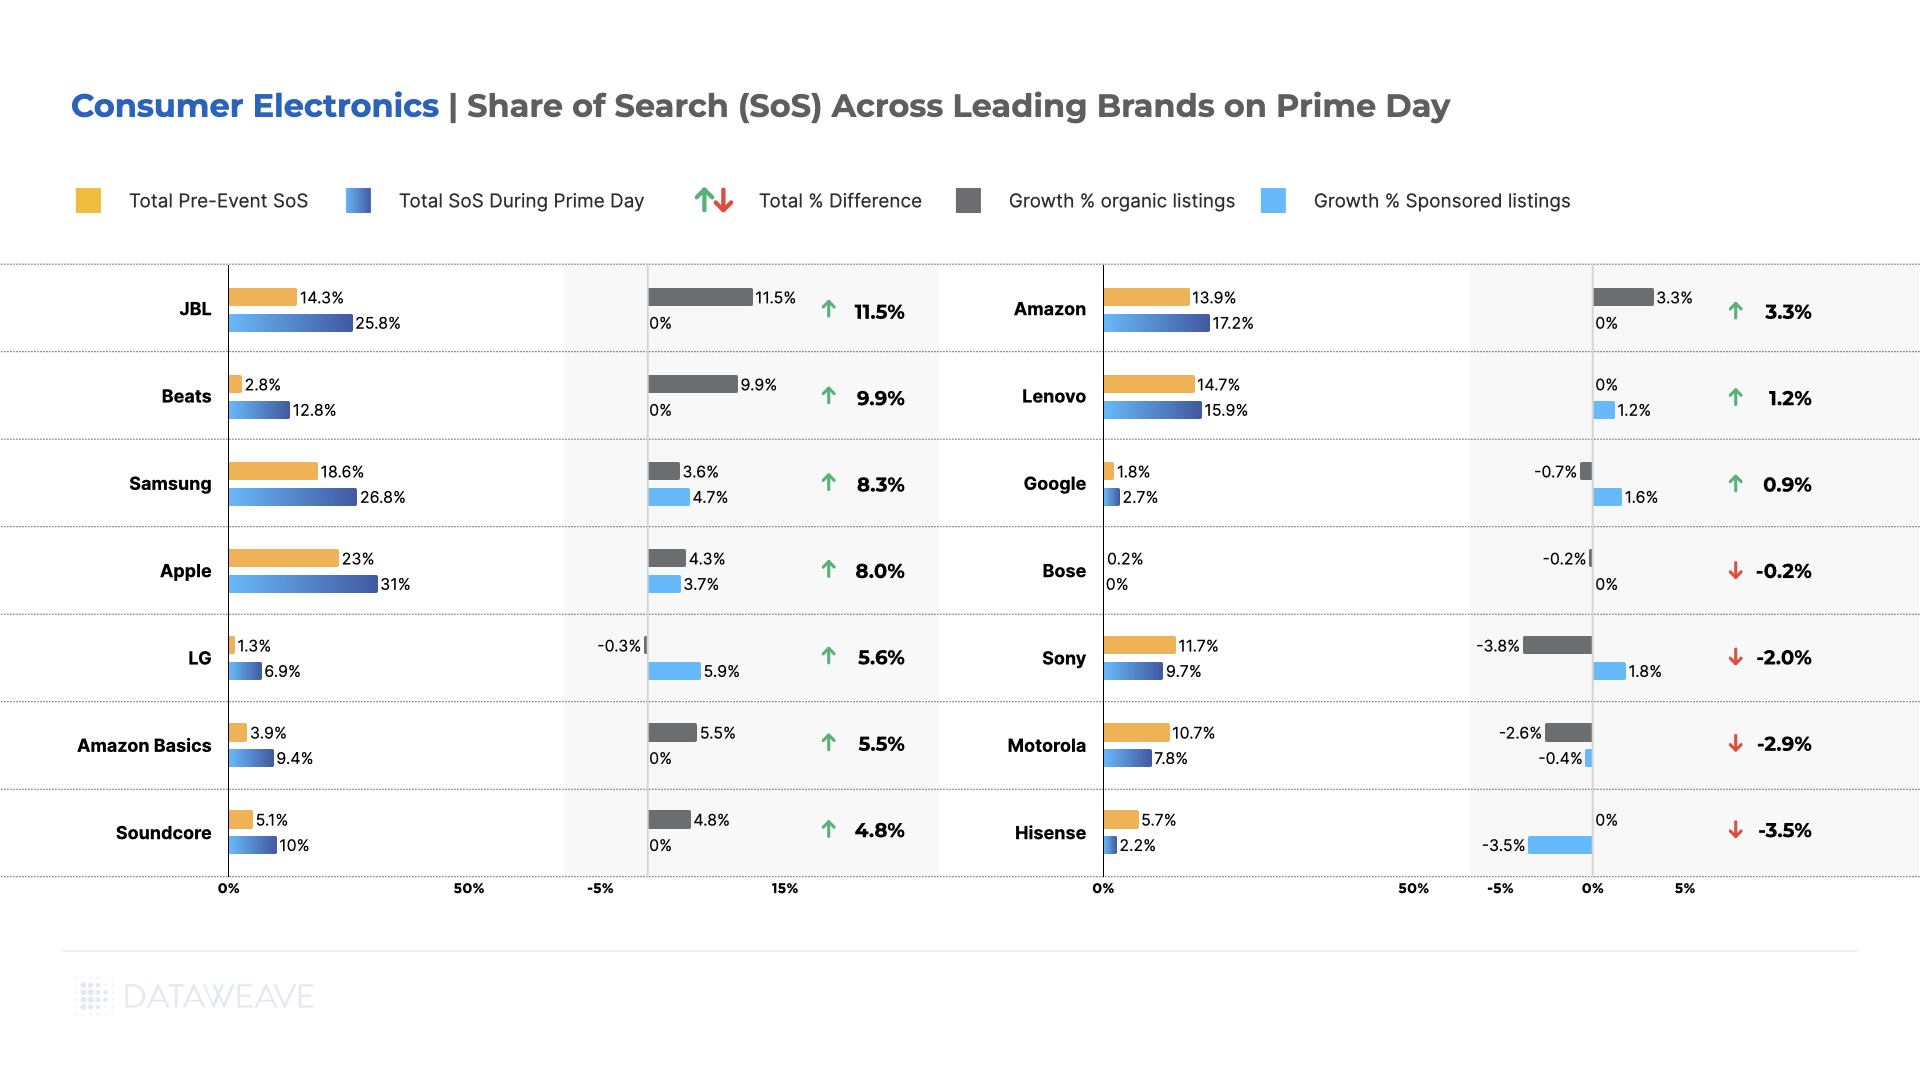
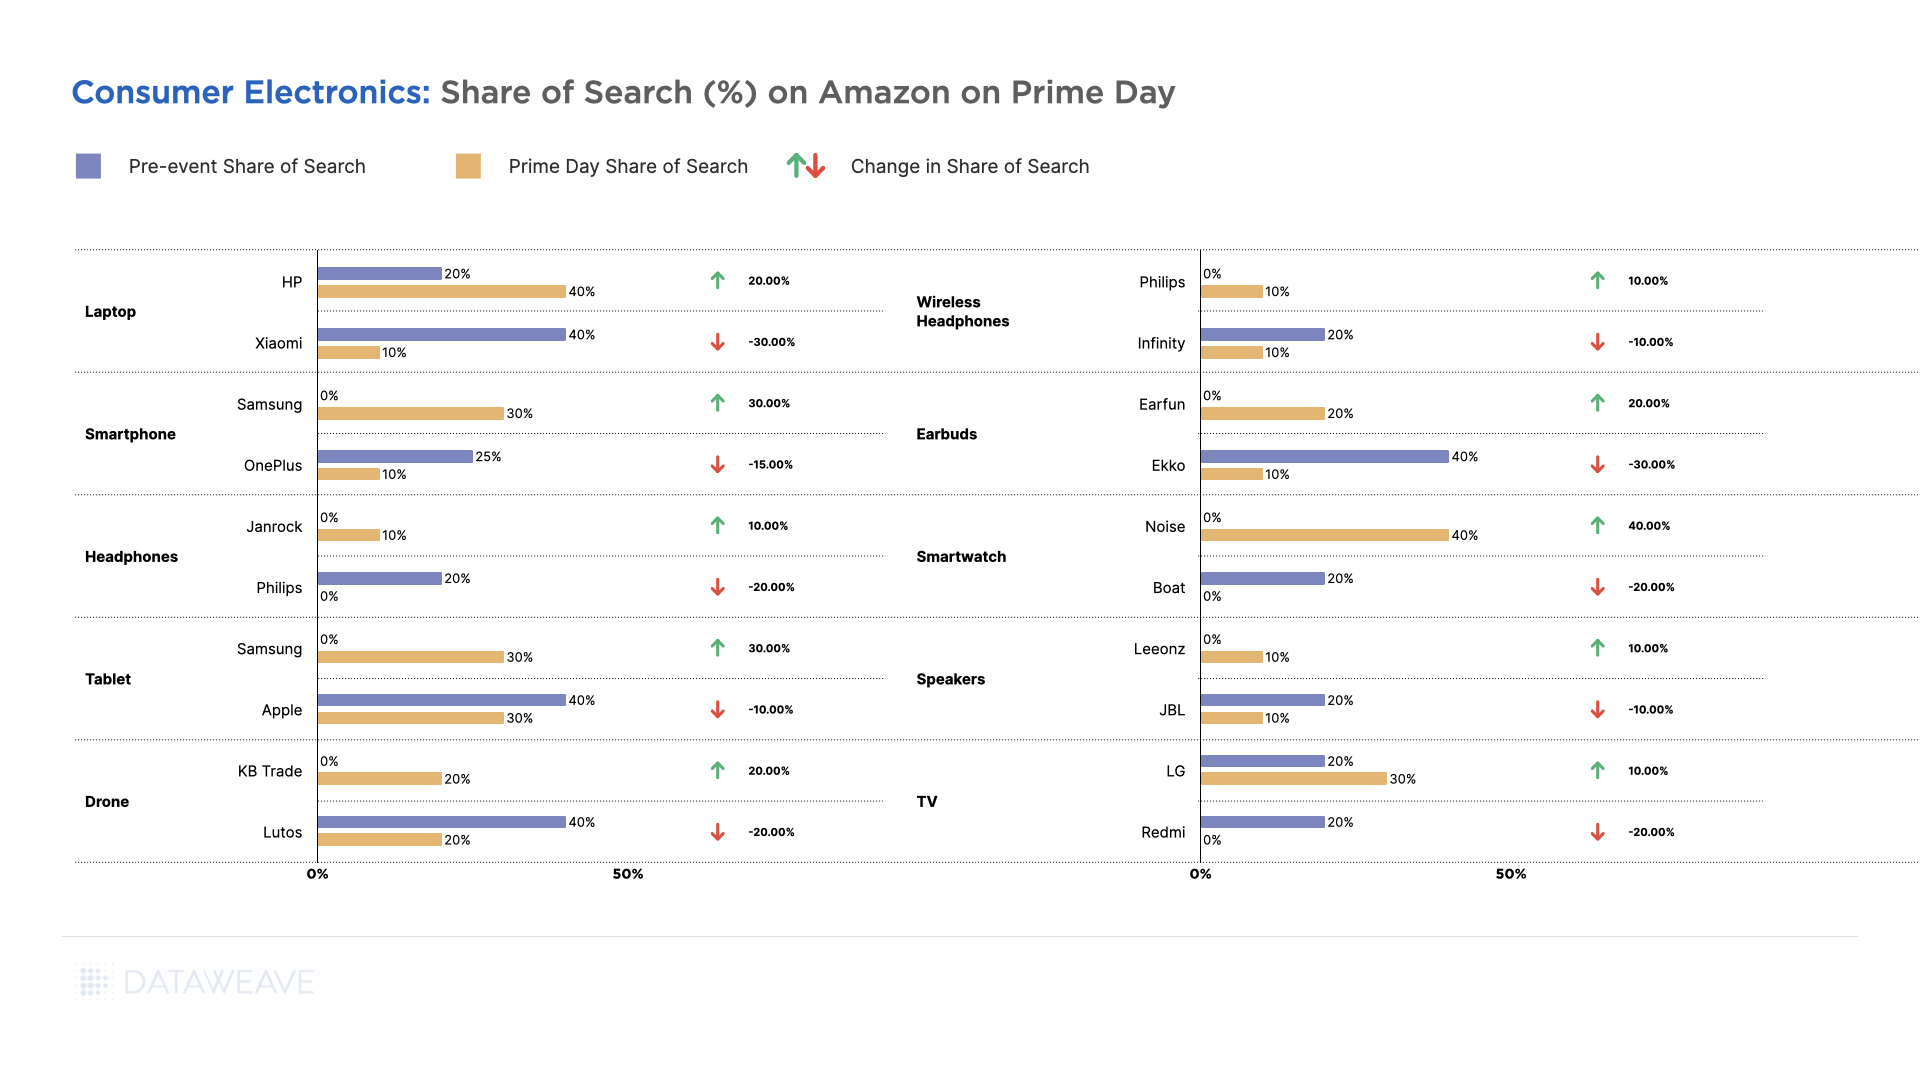
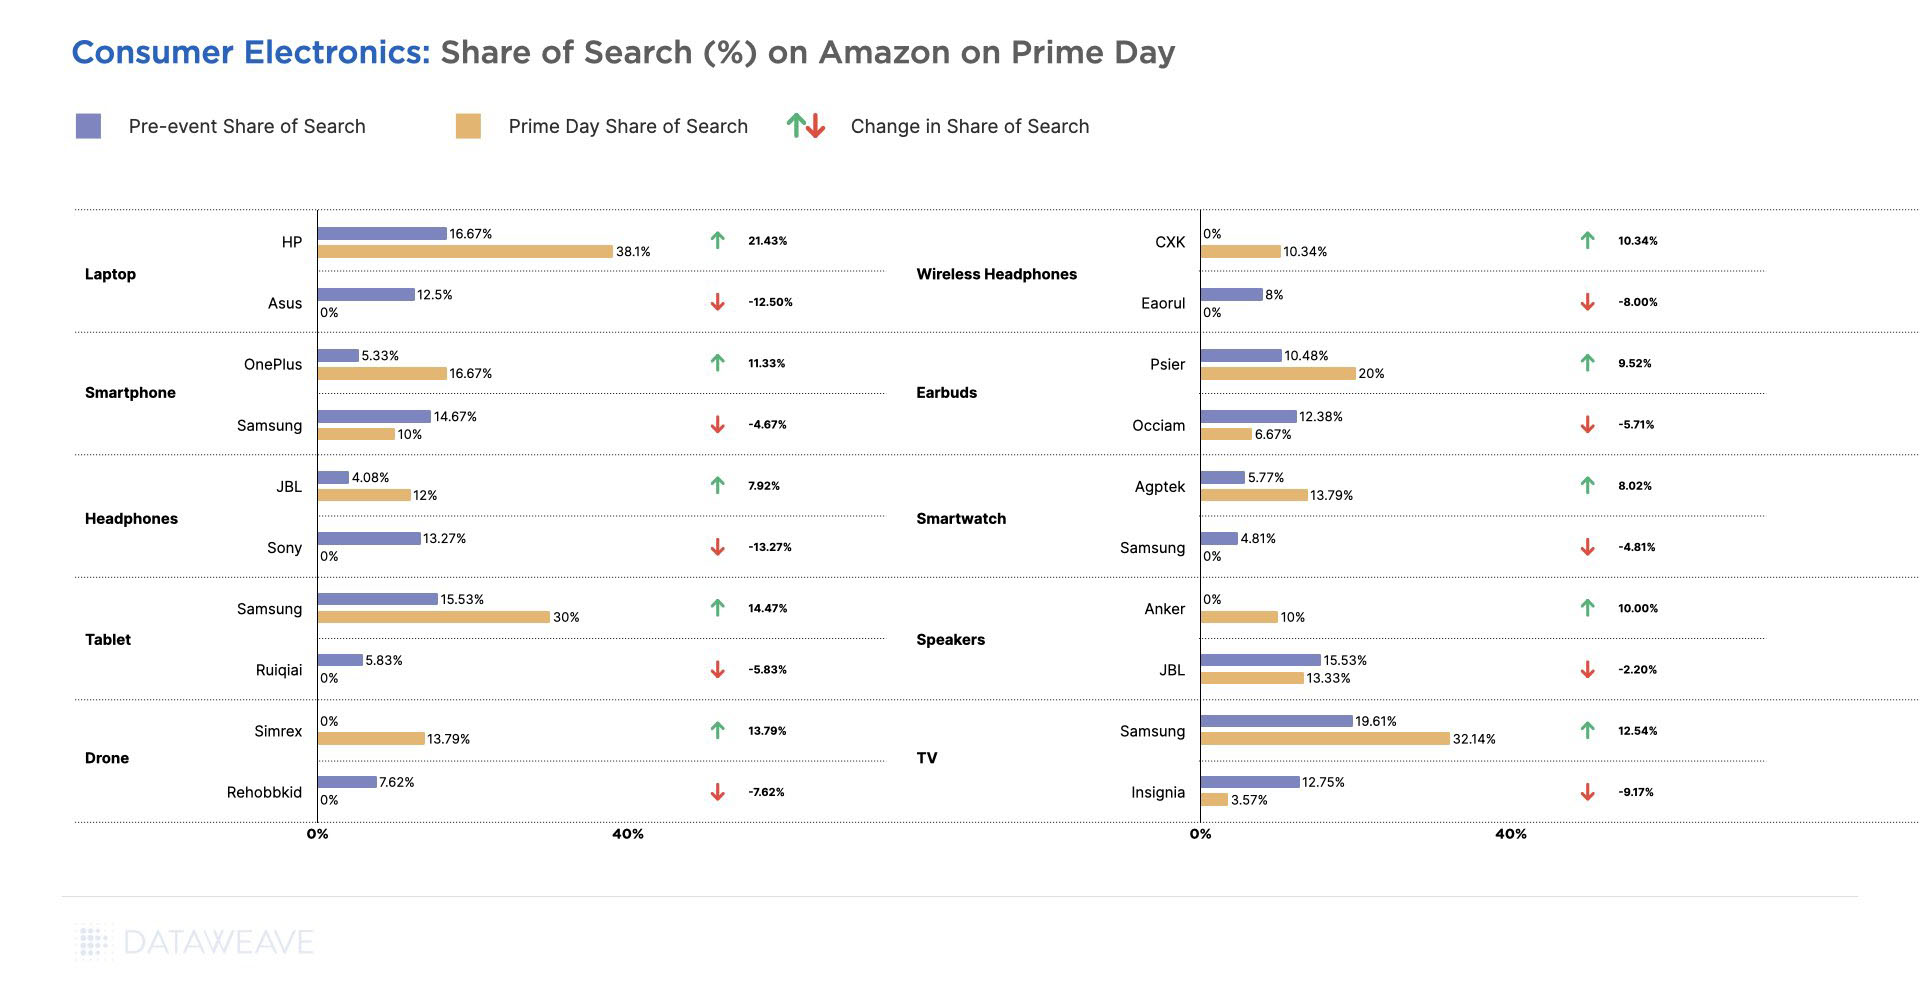
Apple dominated visibility gains, jumping to 17.2% share of search during Prime Day with a 10.7% growth, likely driven by promotional focus on premium devices. Soundcore also saw significant gains of 10.3%, reaching 15.8% share of search.
LG and Amazon Basics both achieved strong 5.1% growth. Hisense gained 4.7% share with 5% price increases. Samsung and Amazon maintained strong positions with modest gains of 1.9% and 1.3% respectively.
However, several brands lost ground, with Sony declining most significantly by 1.8% share despite its strong market position, followed by Google (-0.5%) and Motorola (-0.4%).
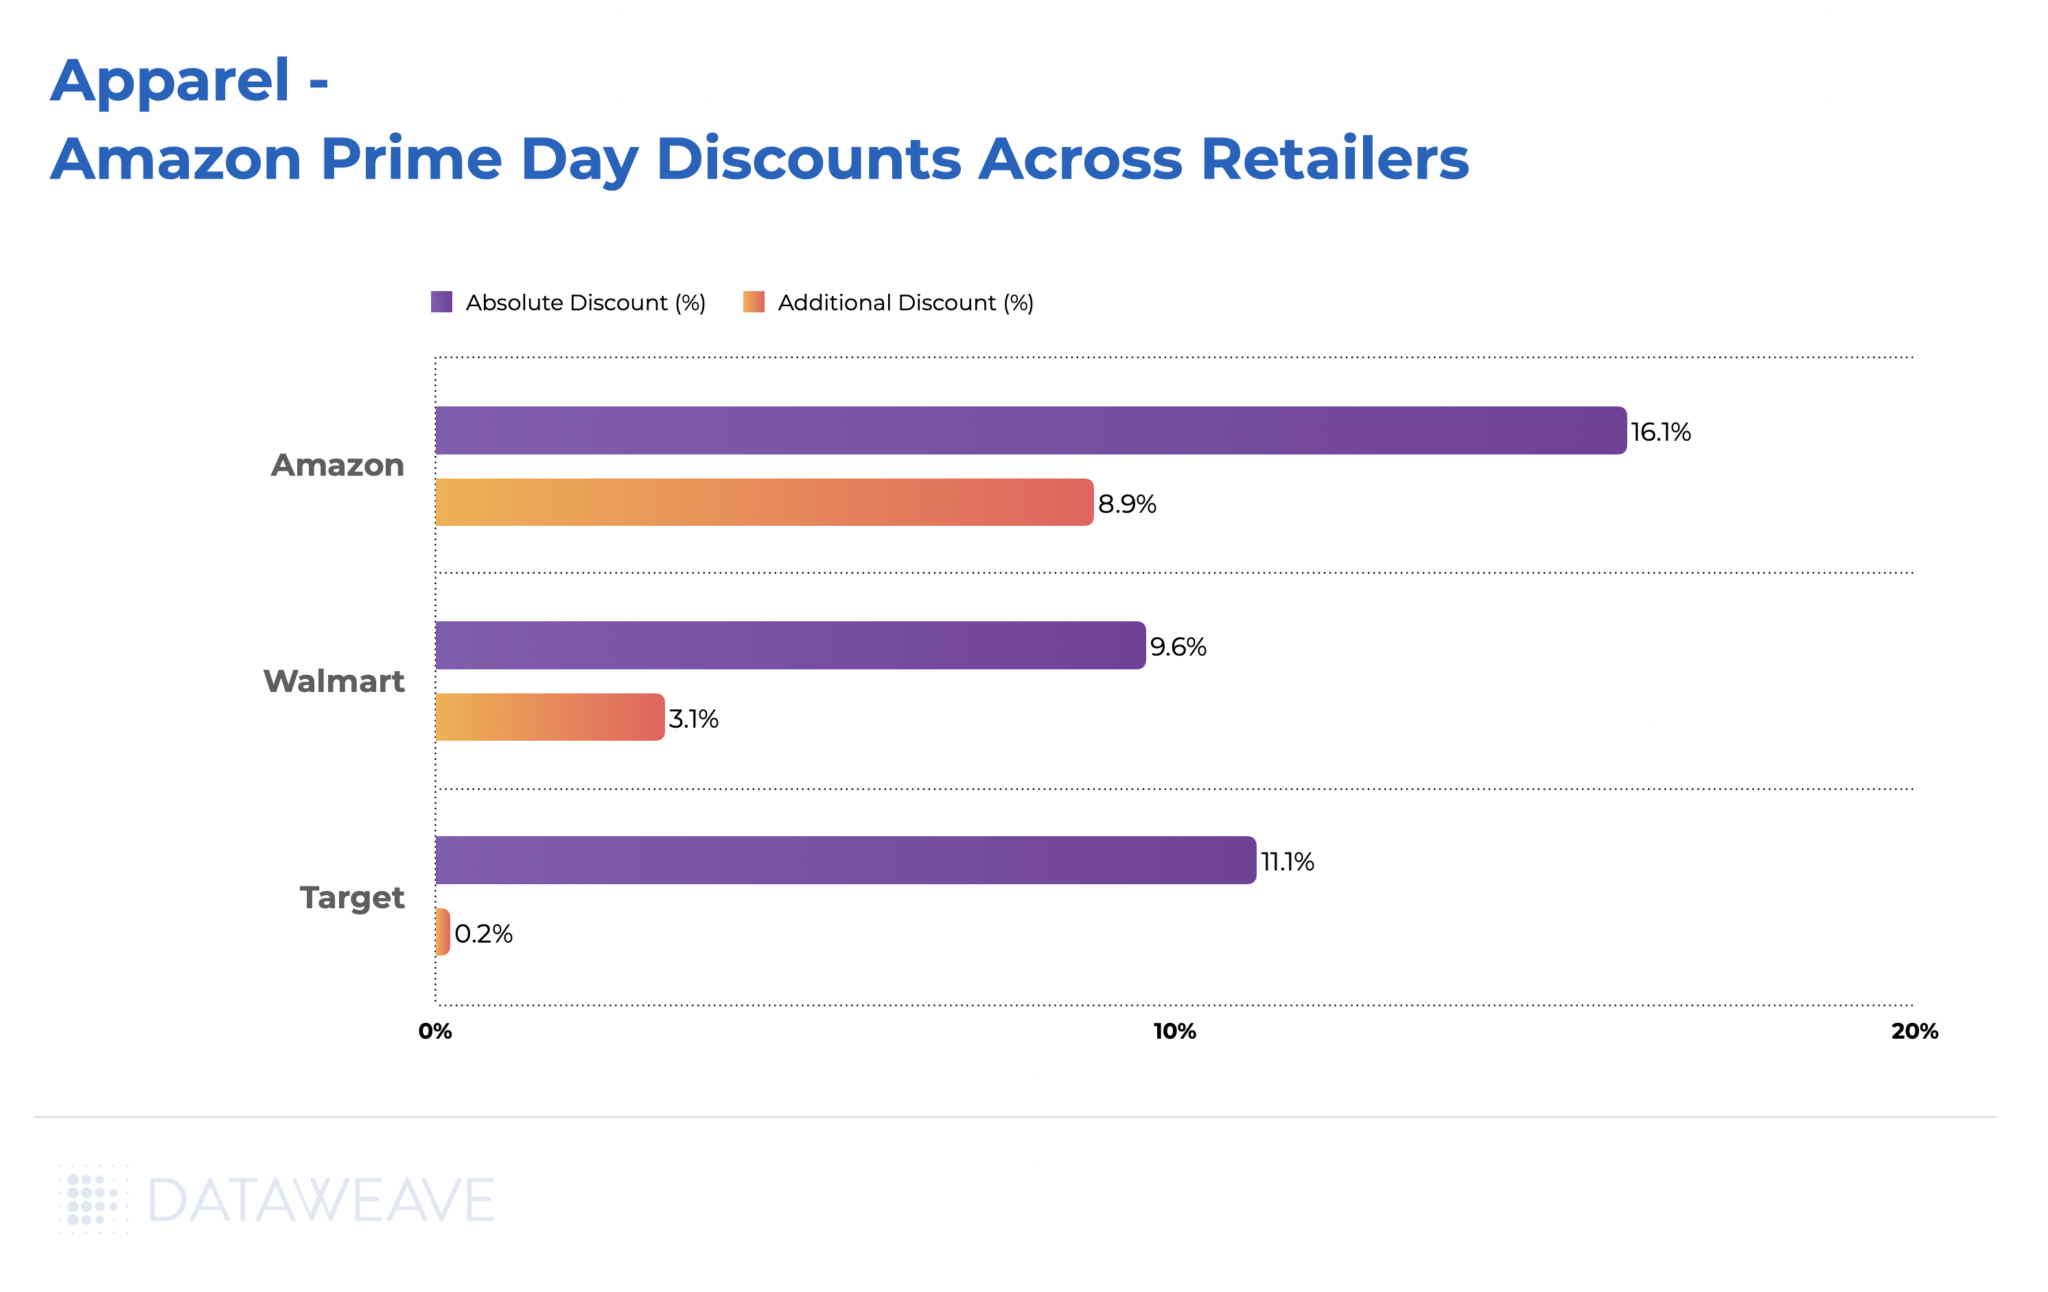
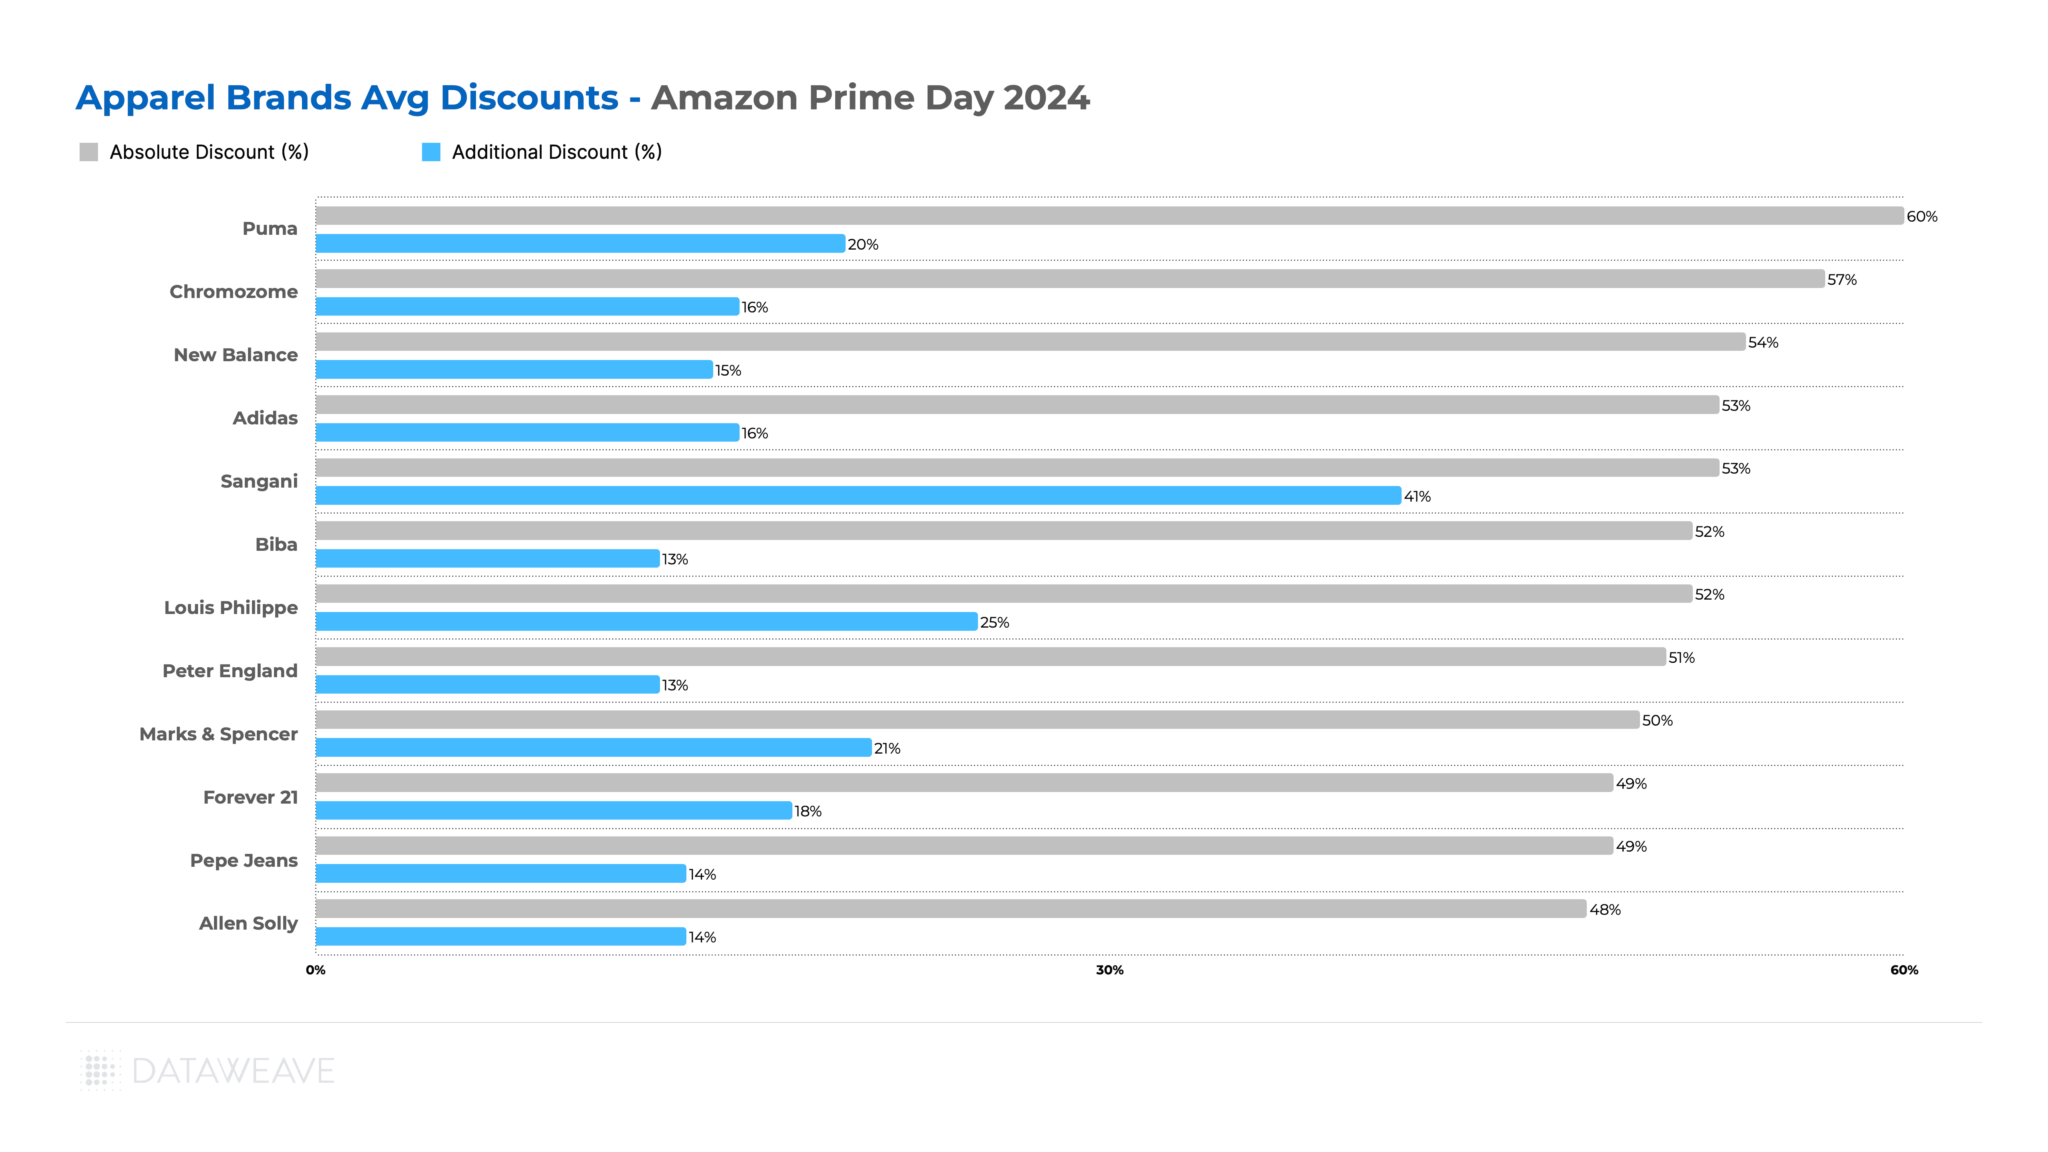
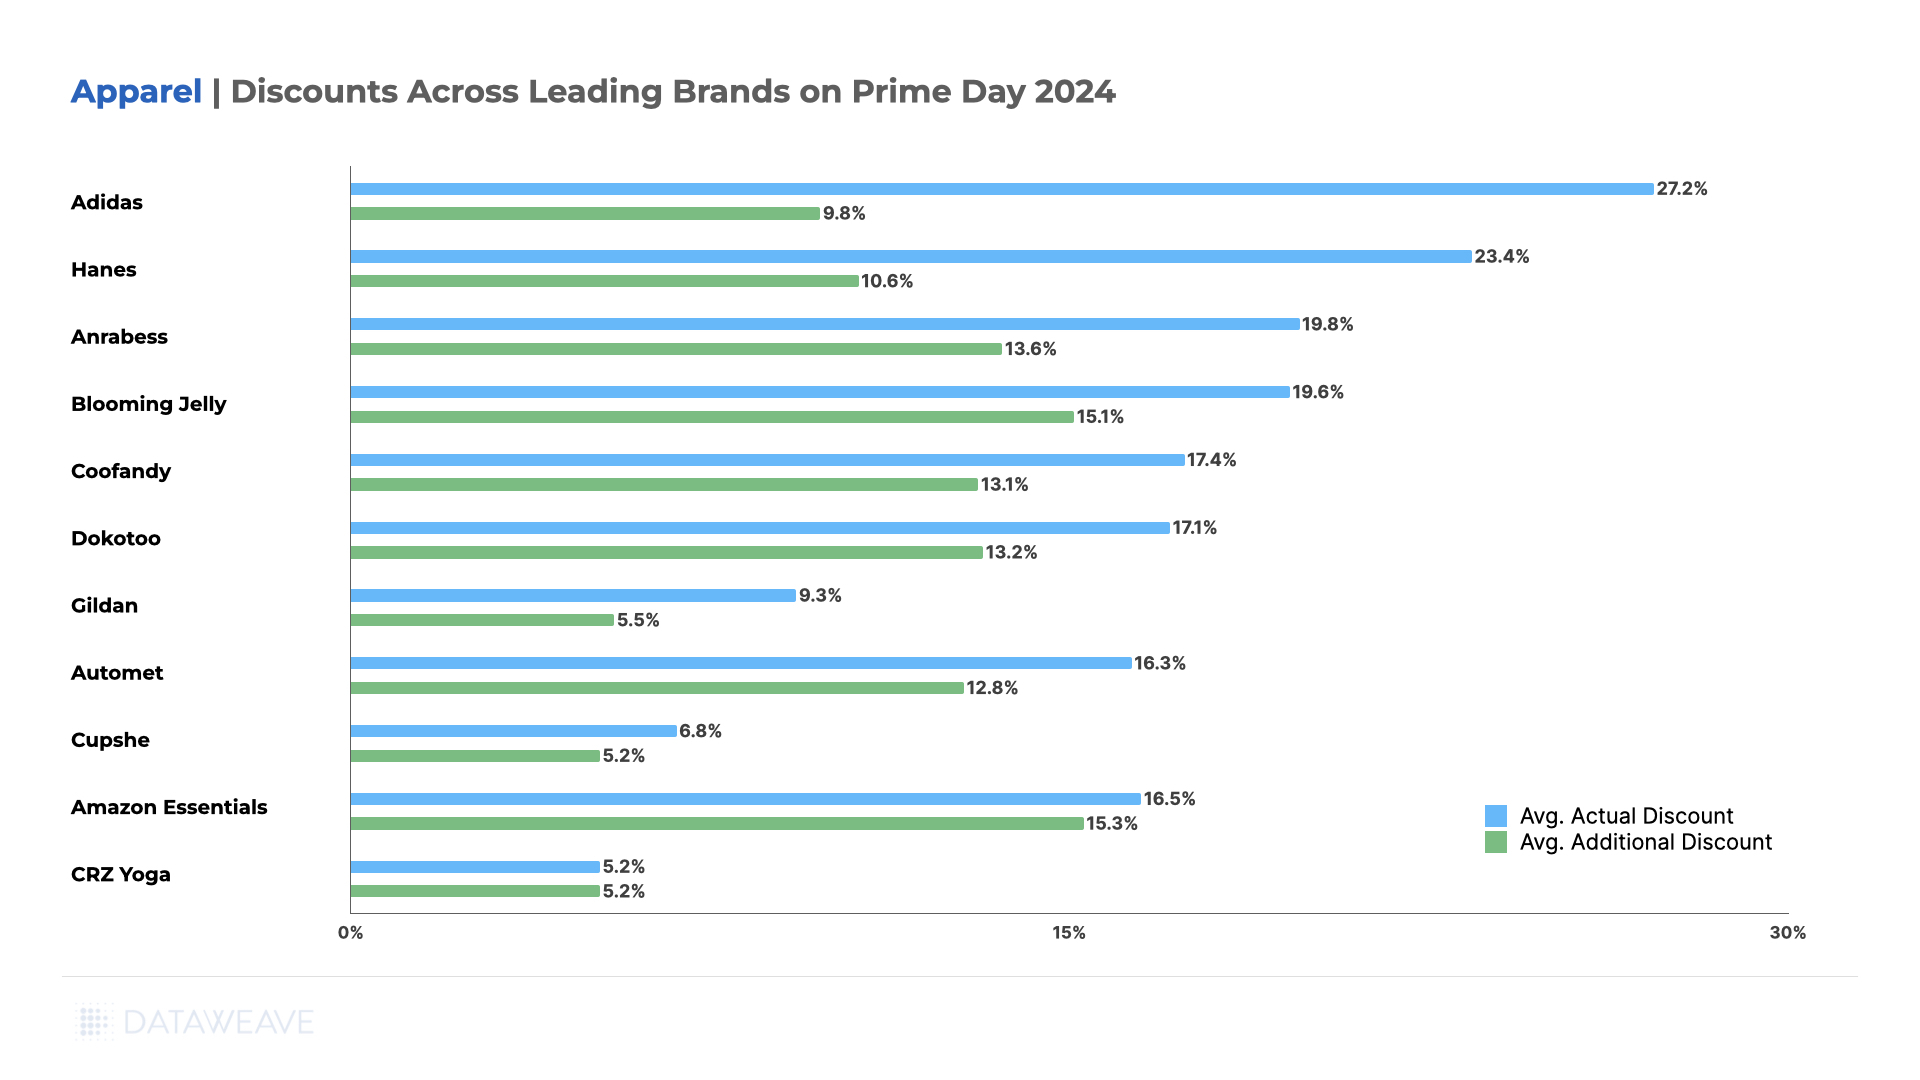
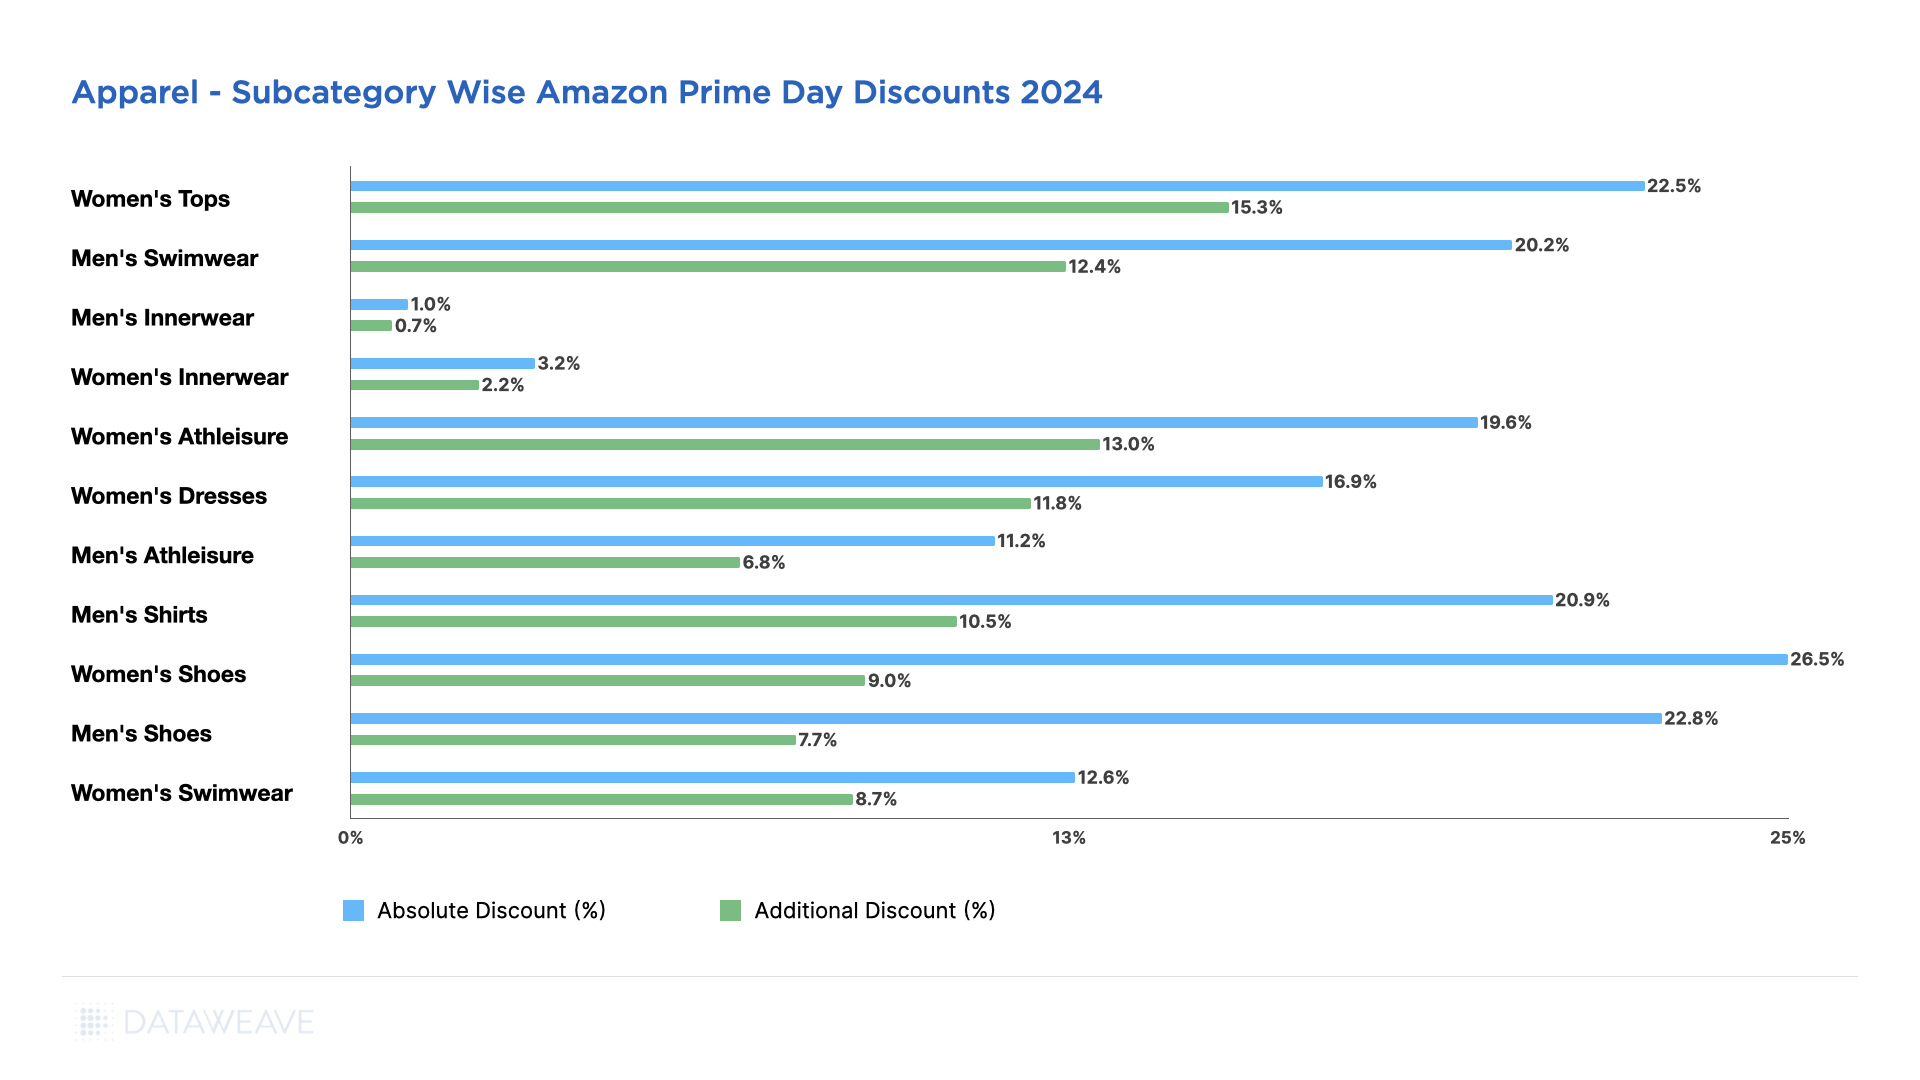
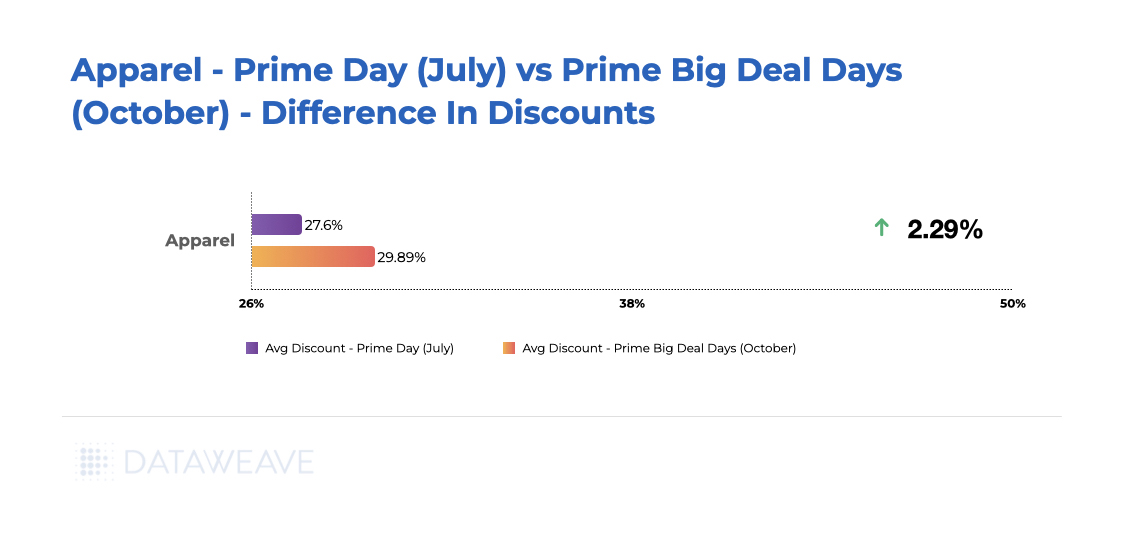
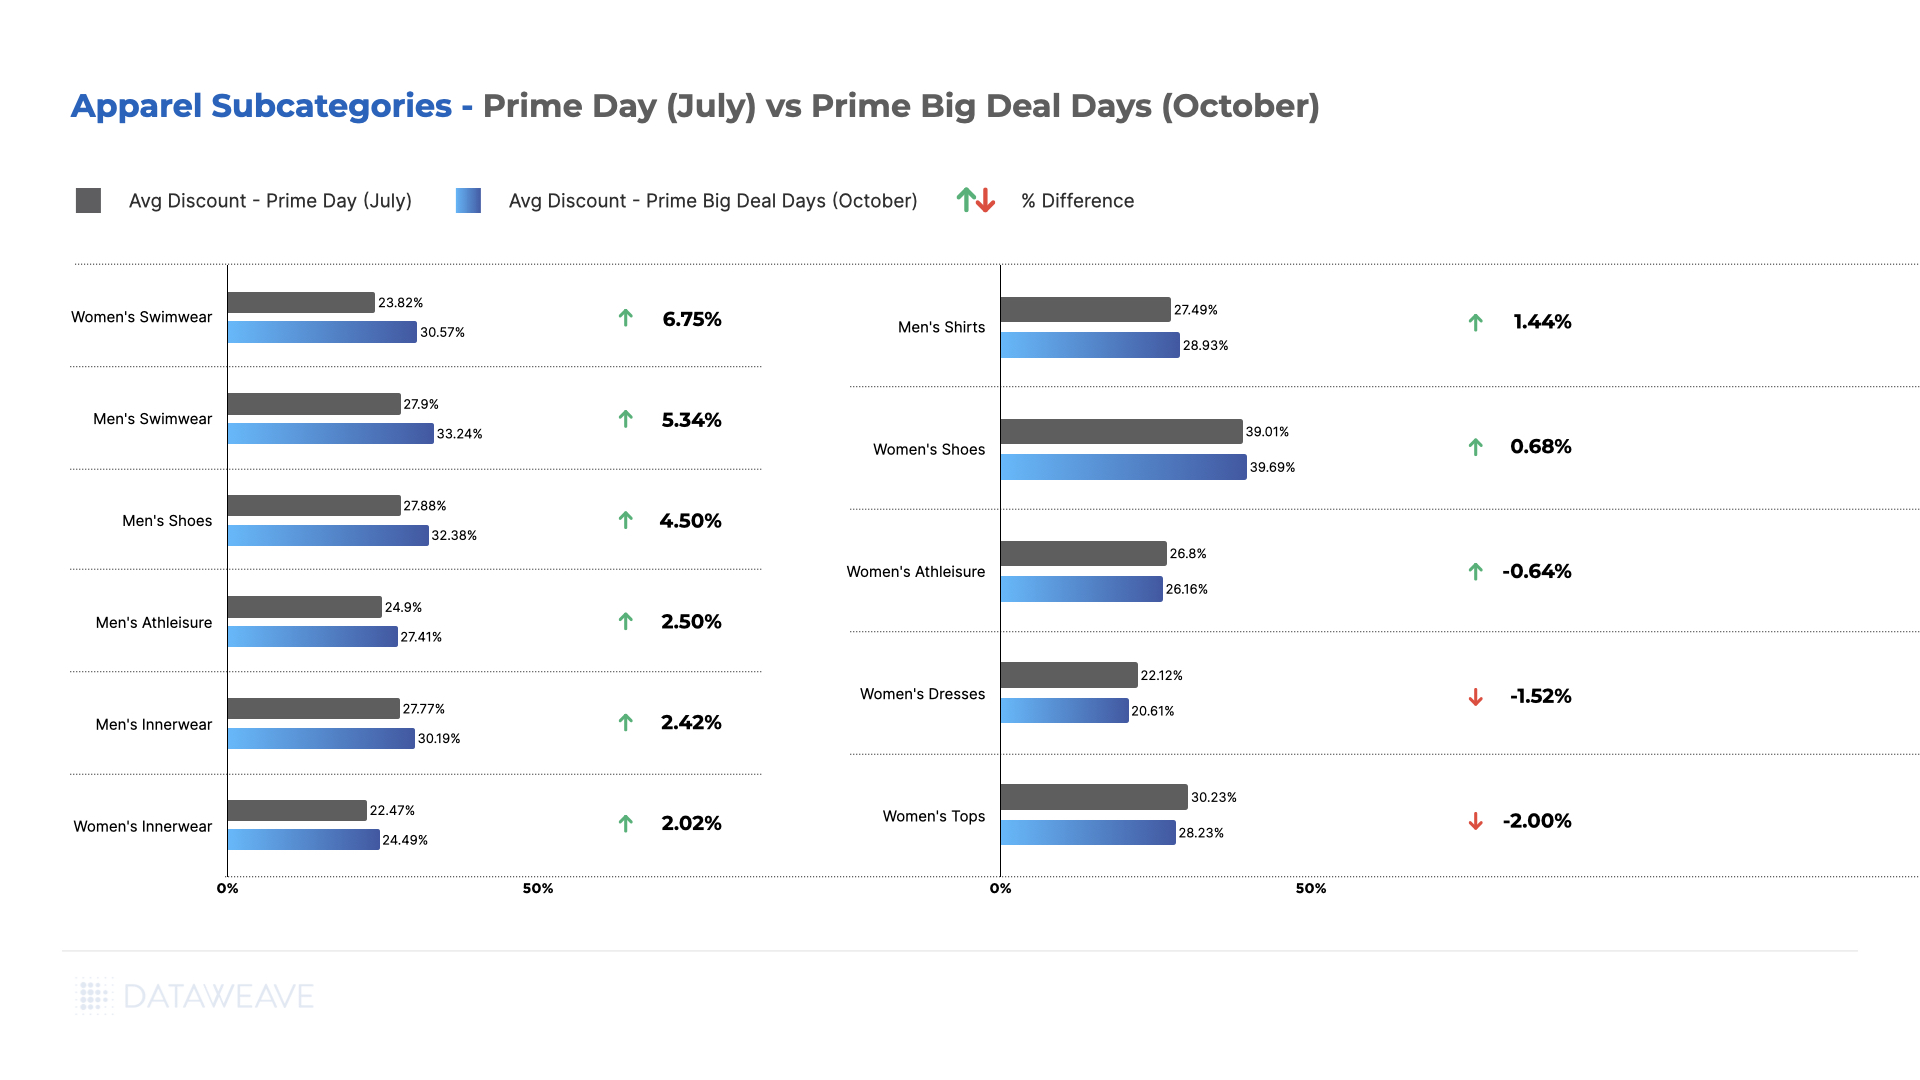
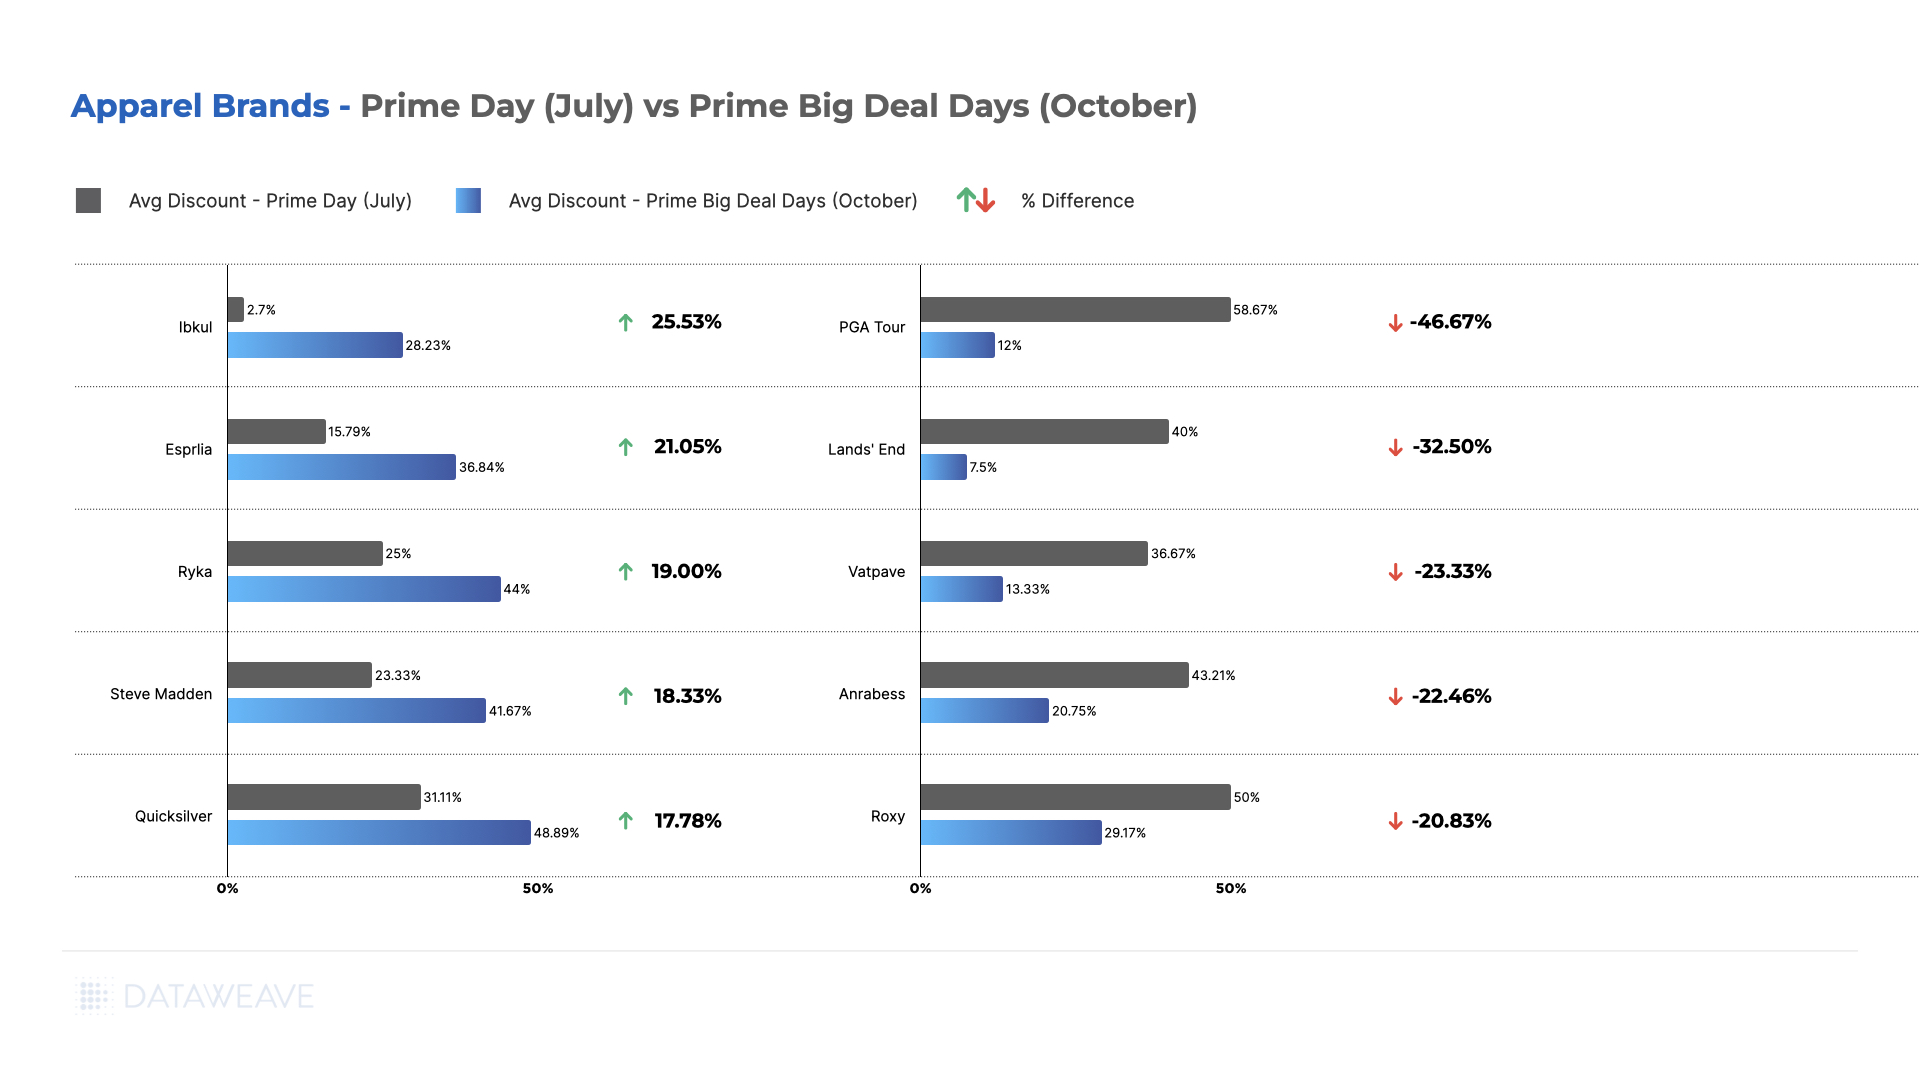
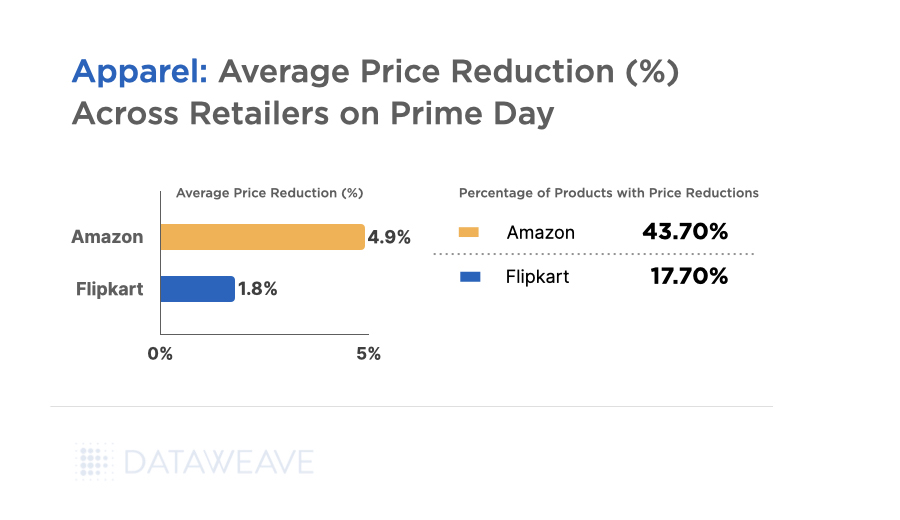
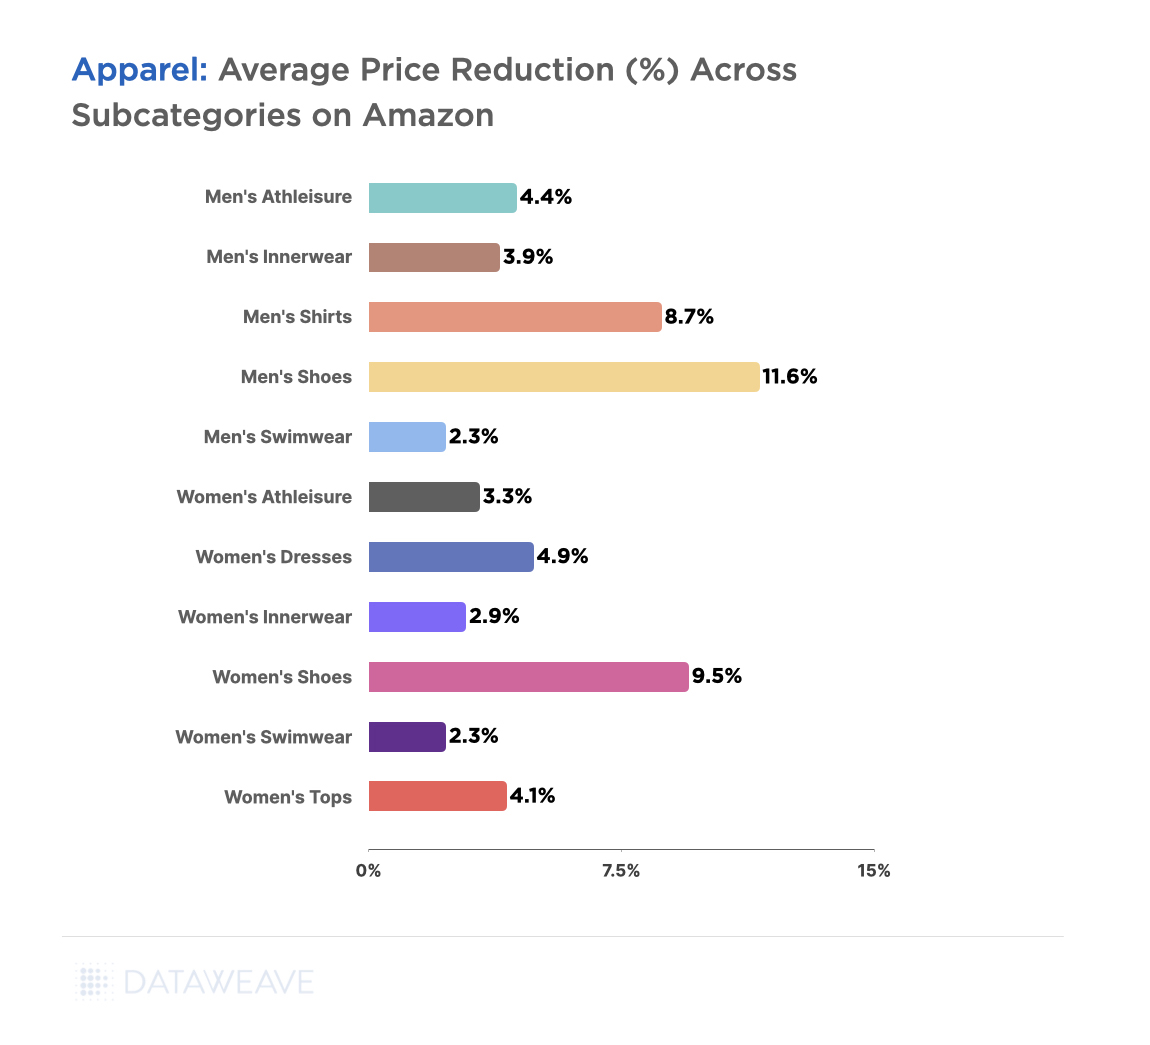
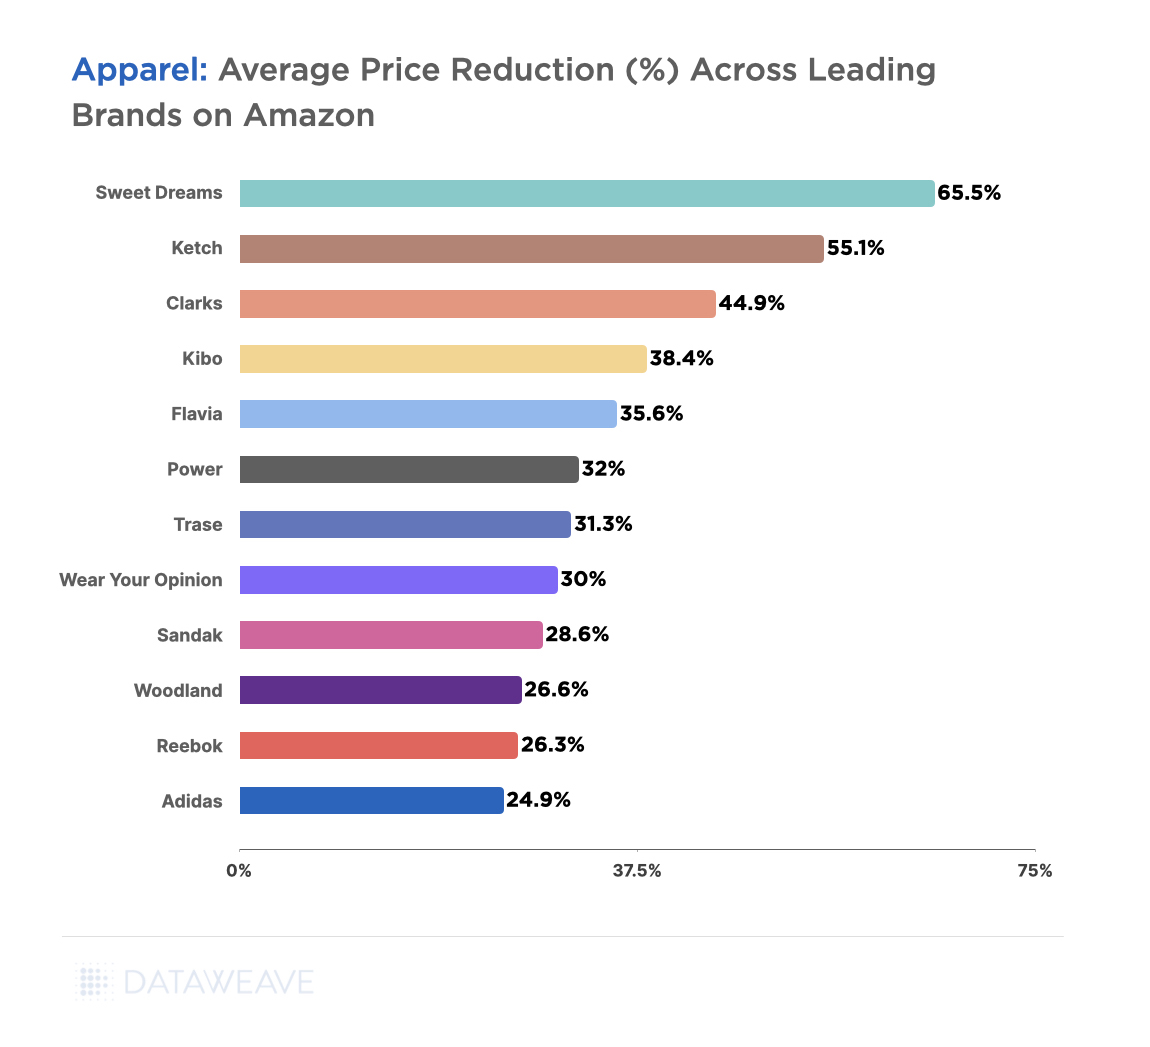
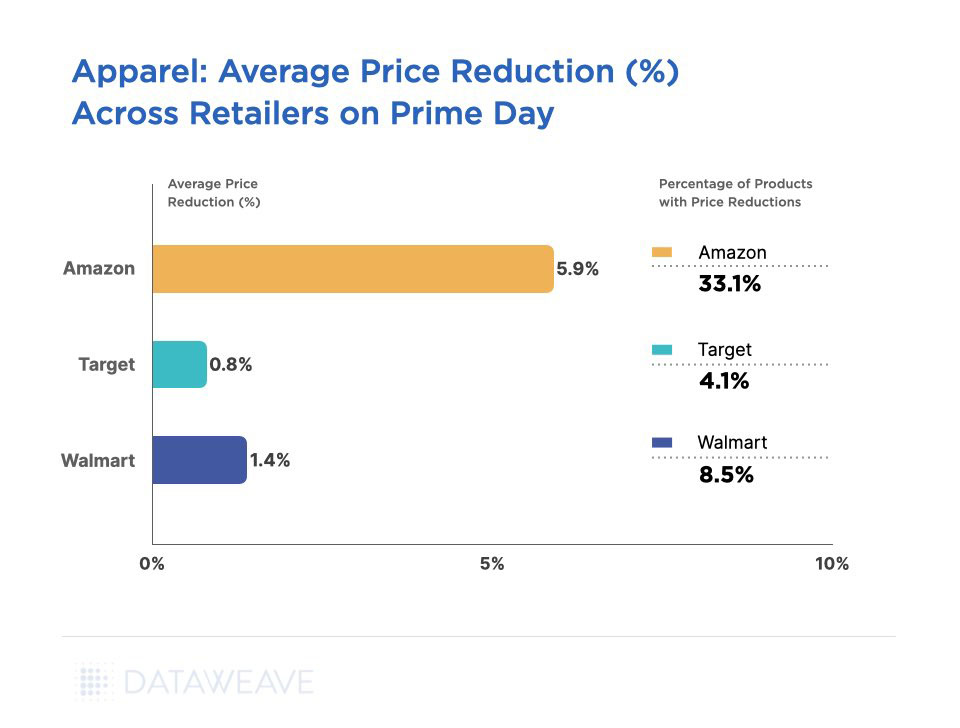
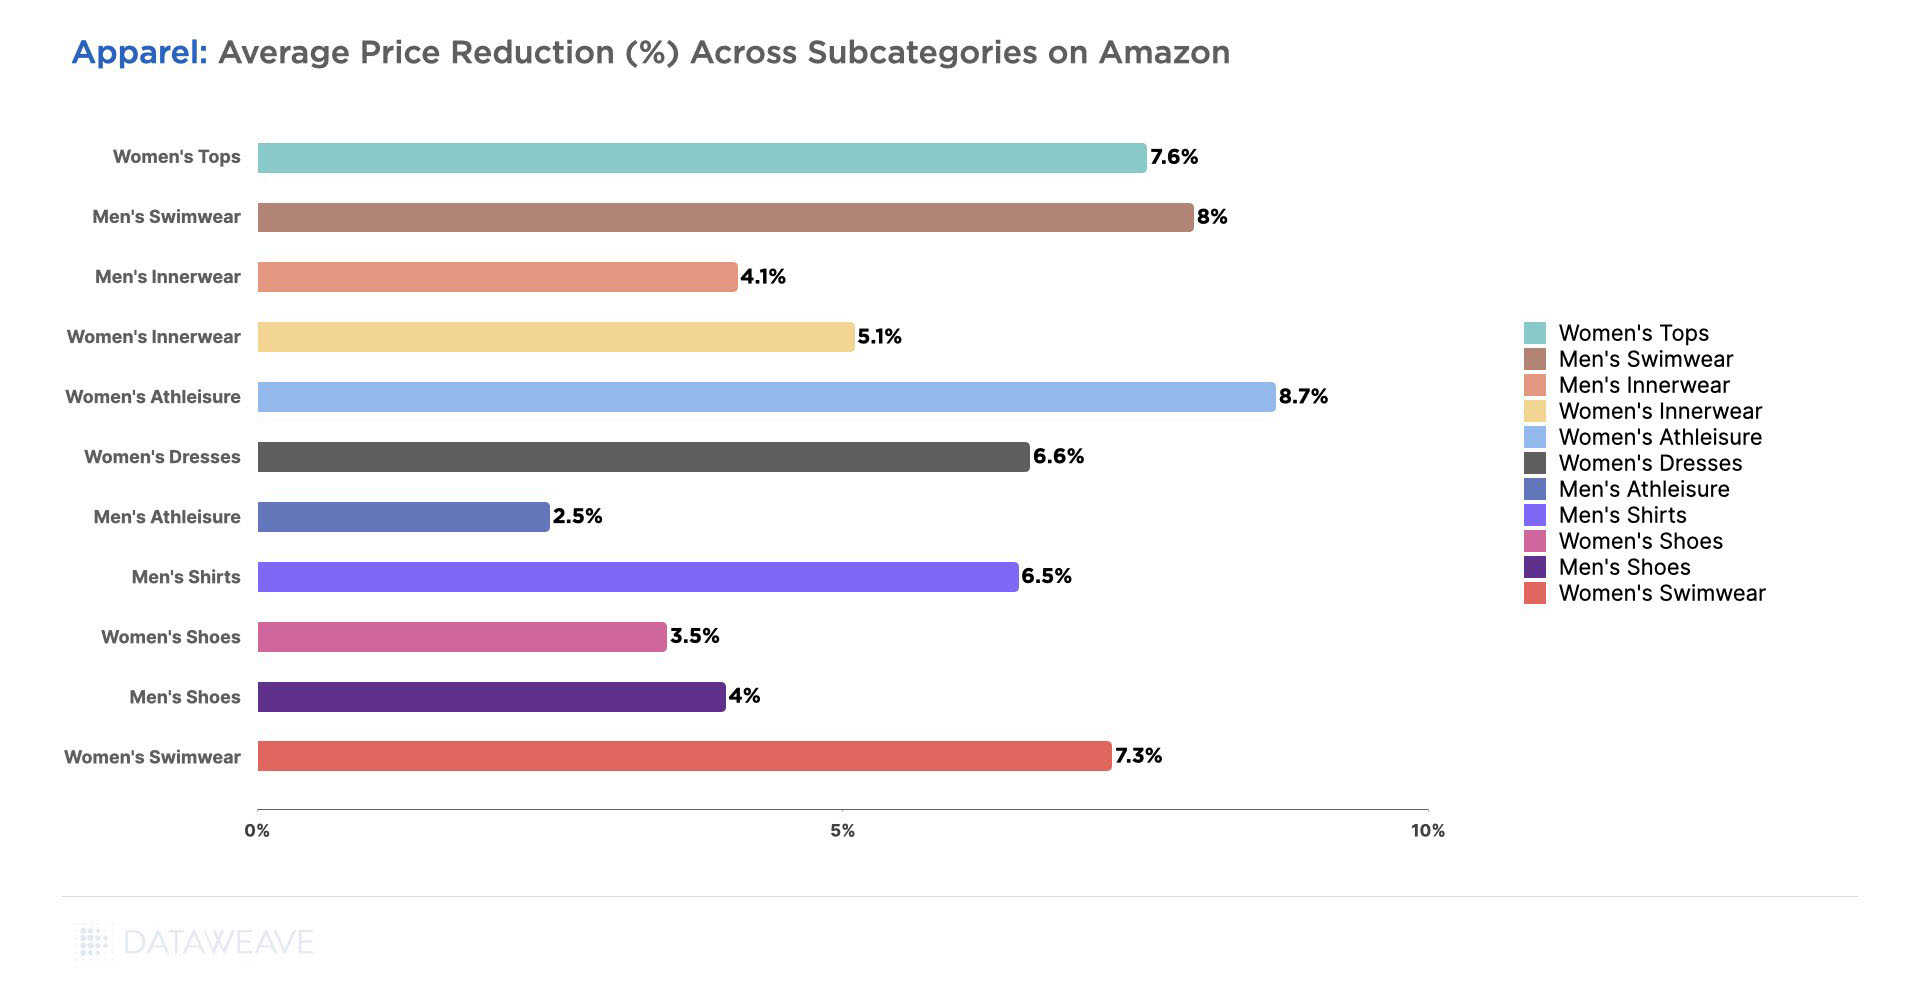
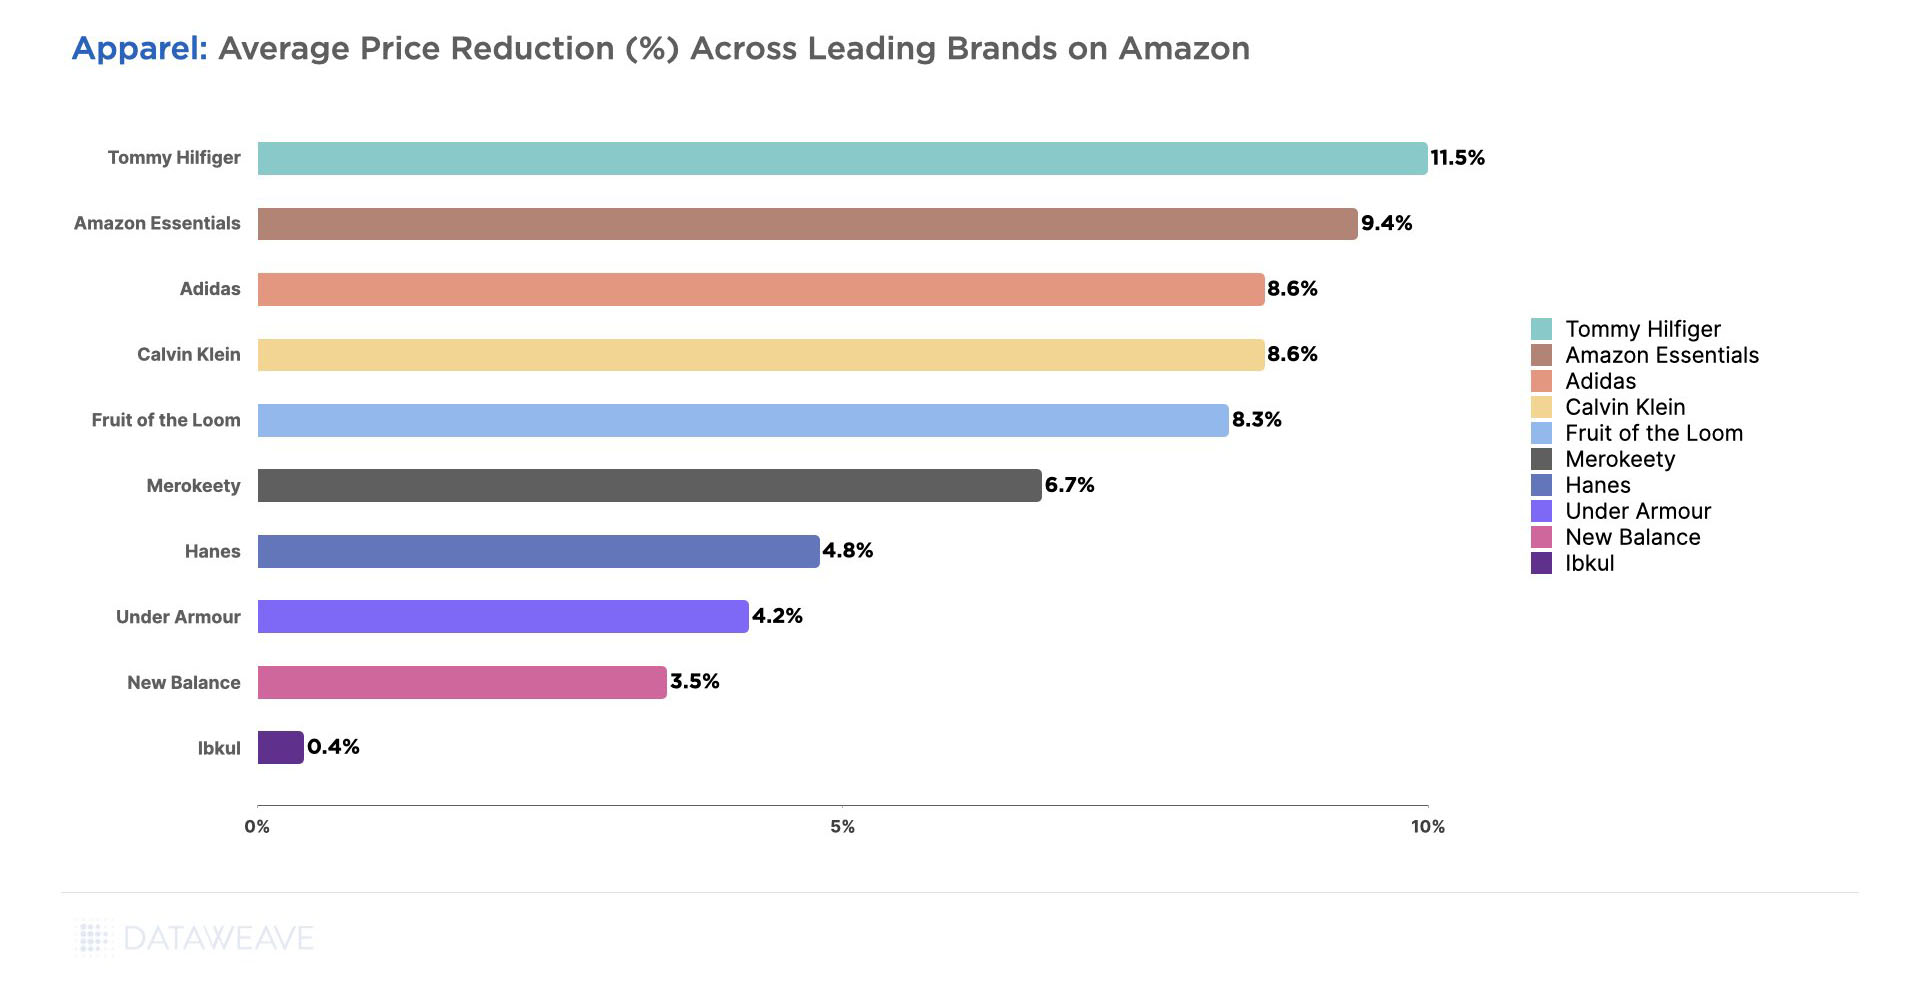
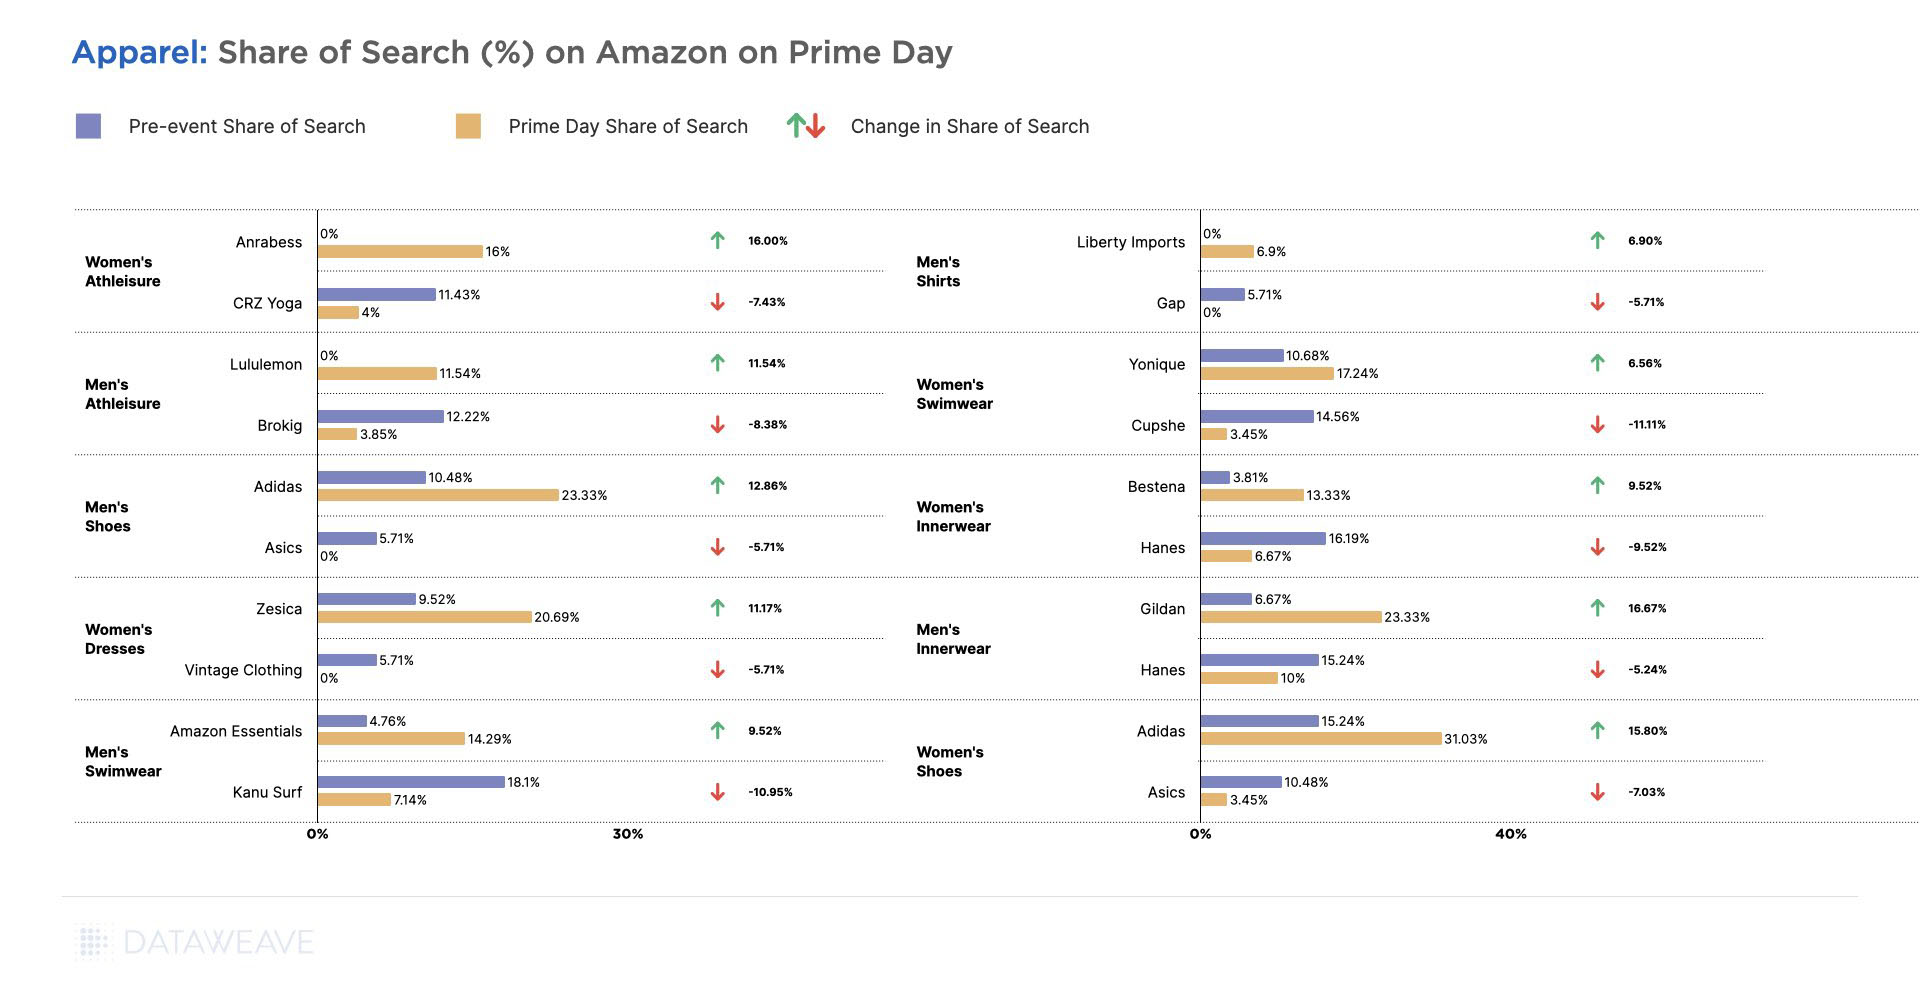
Apparel
- Party Pants showed the highest price increases at 18% year-over-year, followed by casual wear brand Dokotoo at 13%.
- Athleisure brand CRZ Yoga saw prices increasing by 11%, while Under Armour saw prices rise by 10%.
- While Reebok experienced a significant 12% increase, Adidas saw 5% price increase.
- Meanwhile, innerwear brands like Hanes and Cupshe saw minimal price increases at 1%, while Coofandy also saw minimal increases of 1%.
- Amazon’s own Amazon Essentials maintained minimal price increases of 2%, and Jockey saw modest increases of 4%.
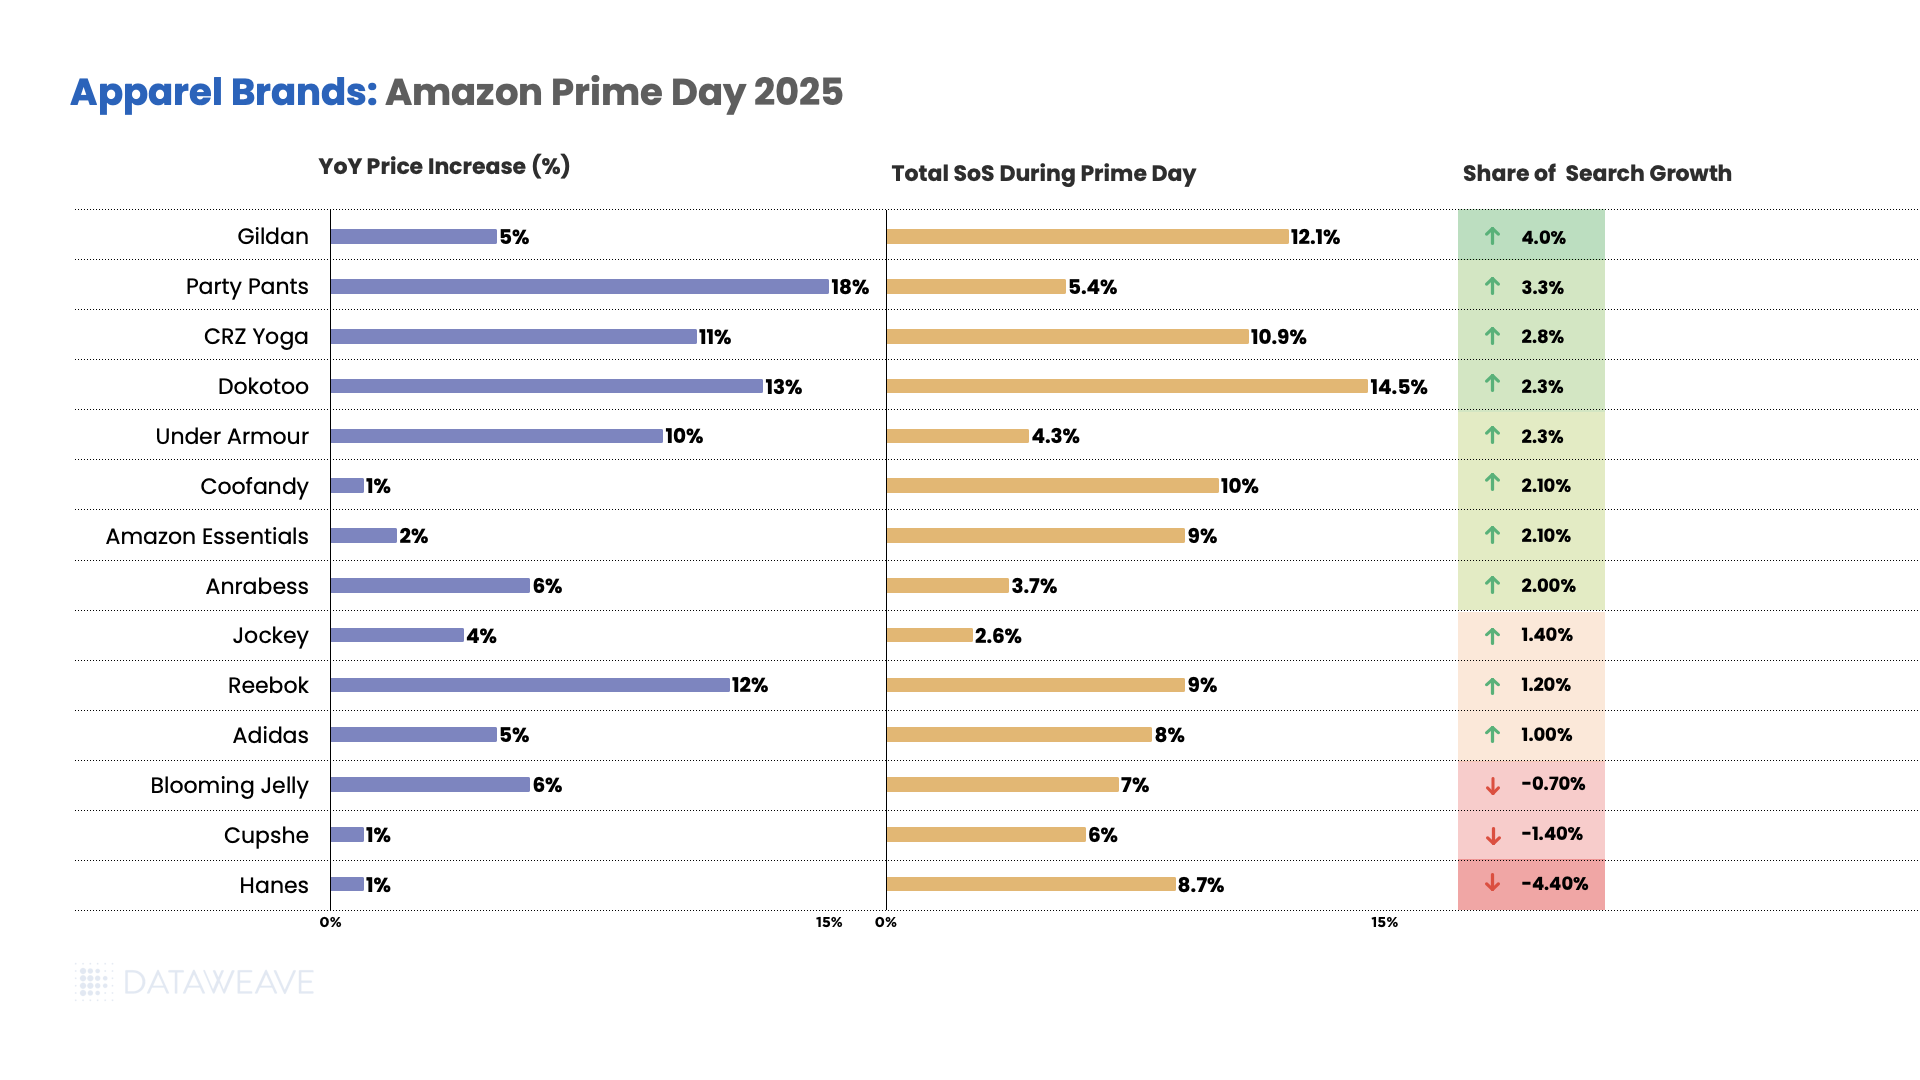
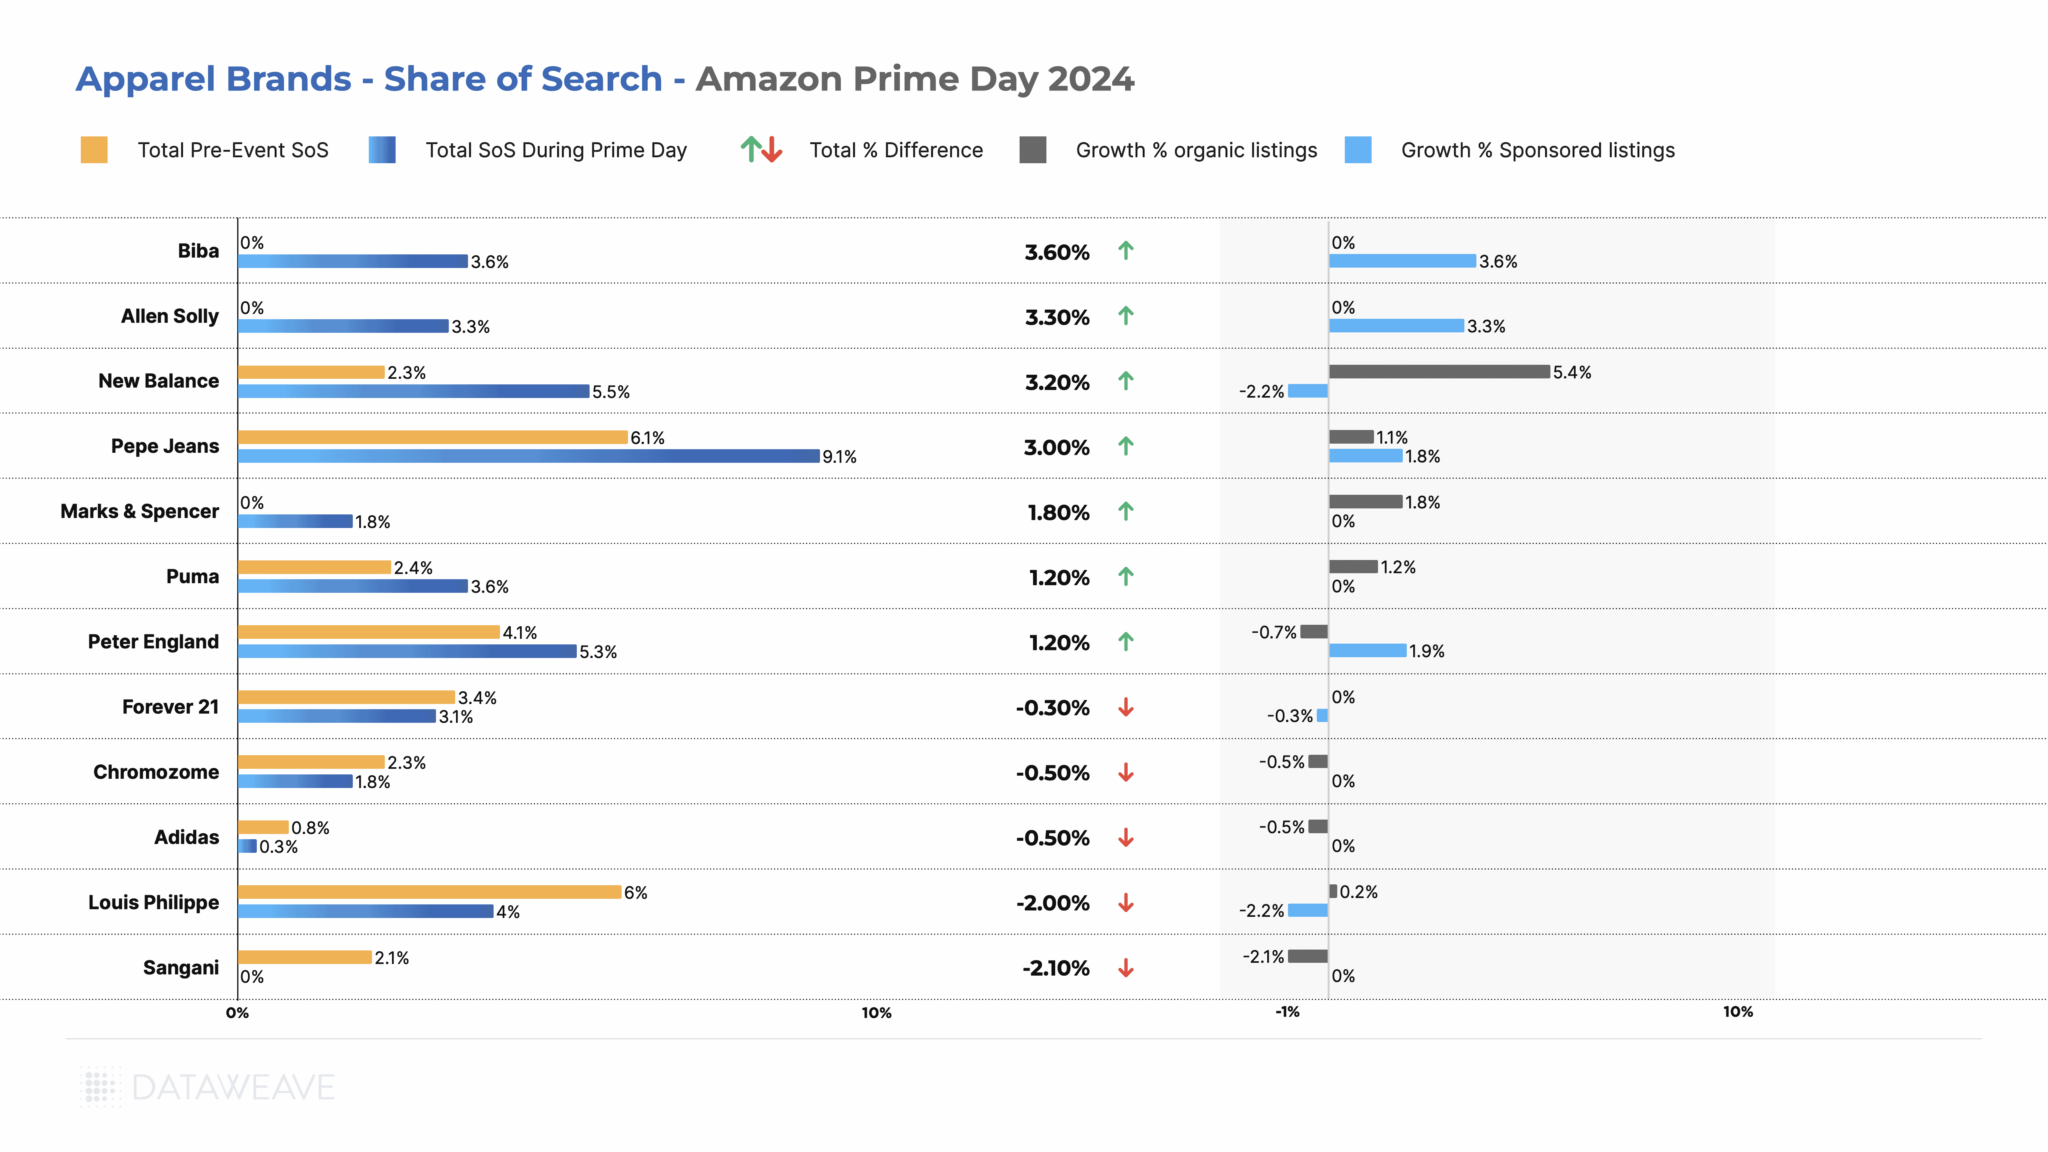
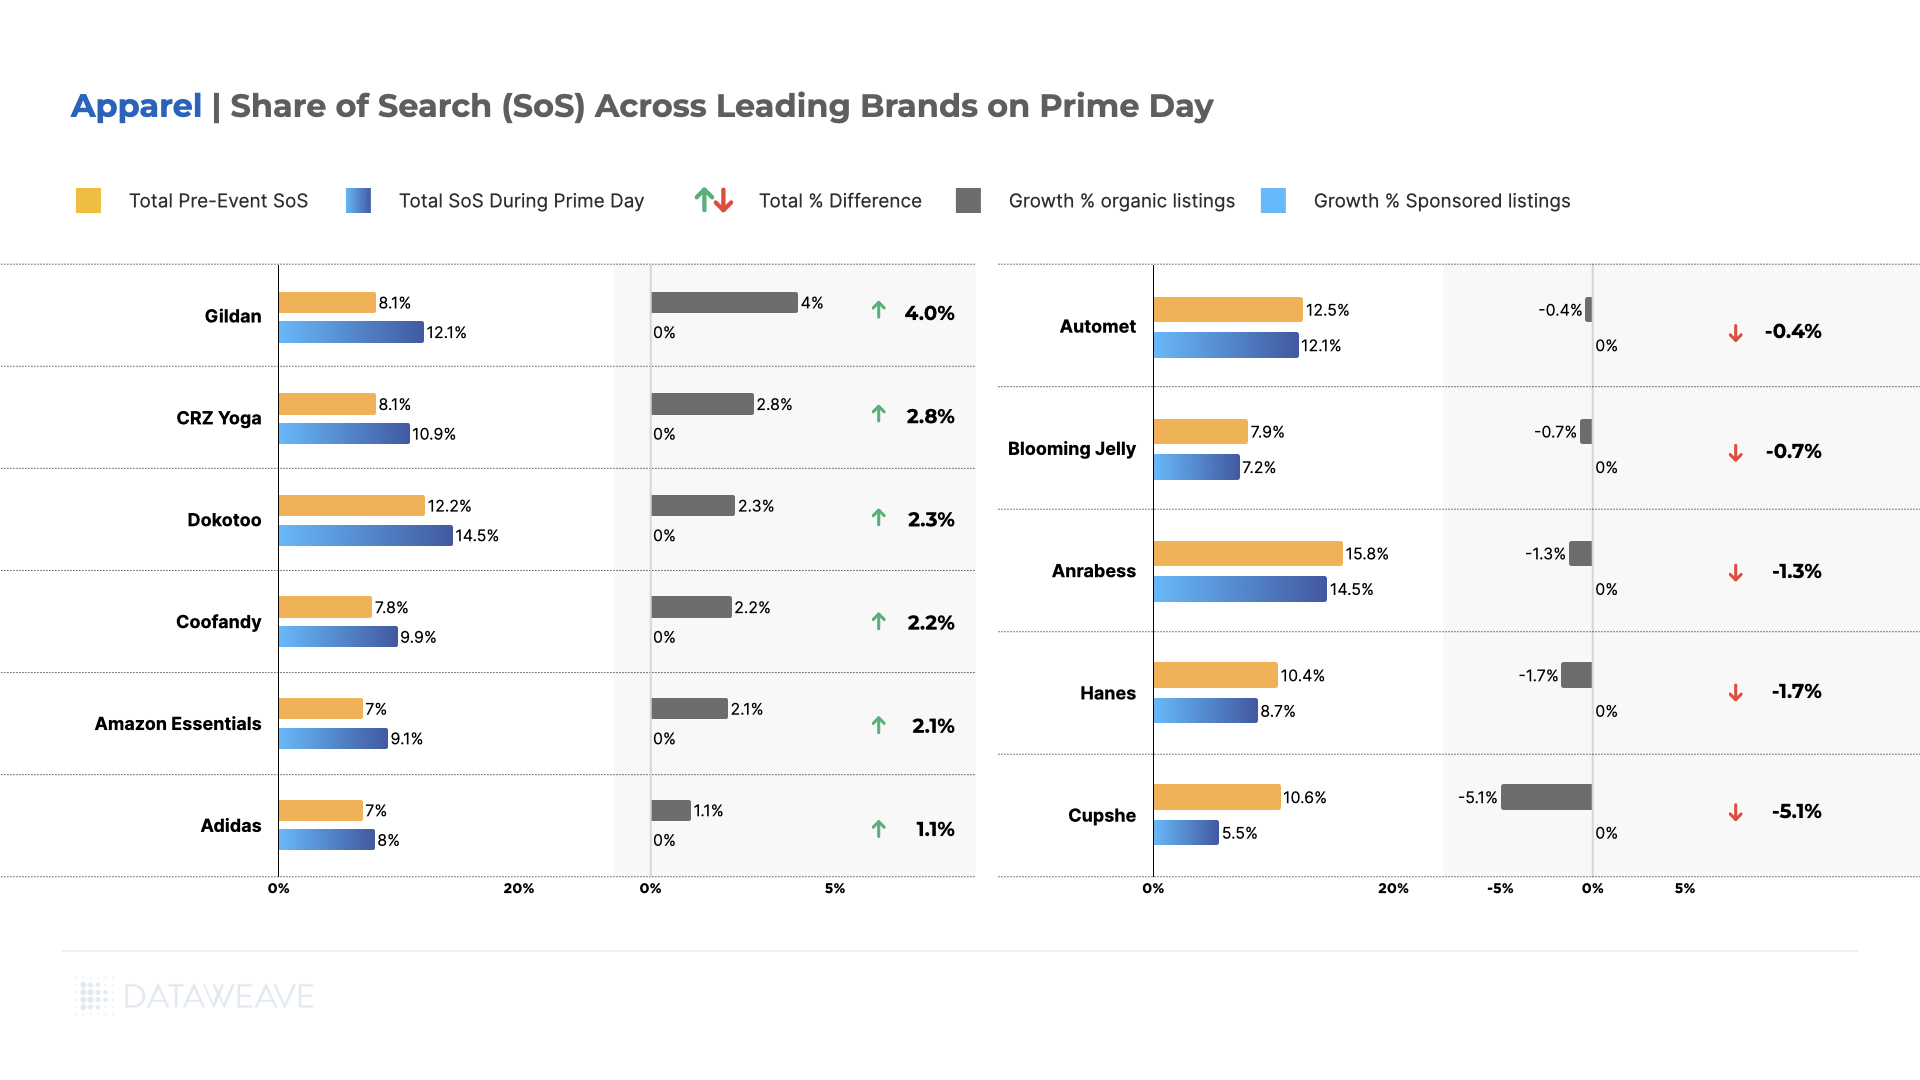
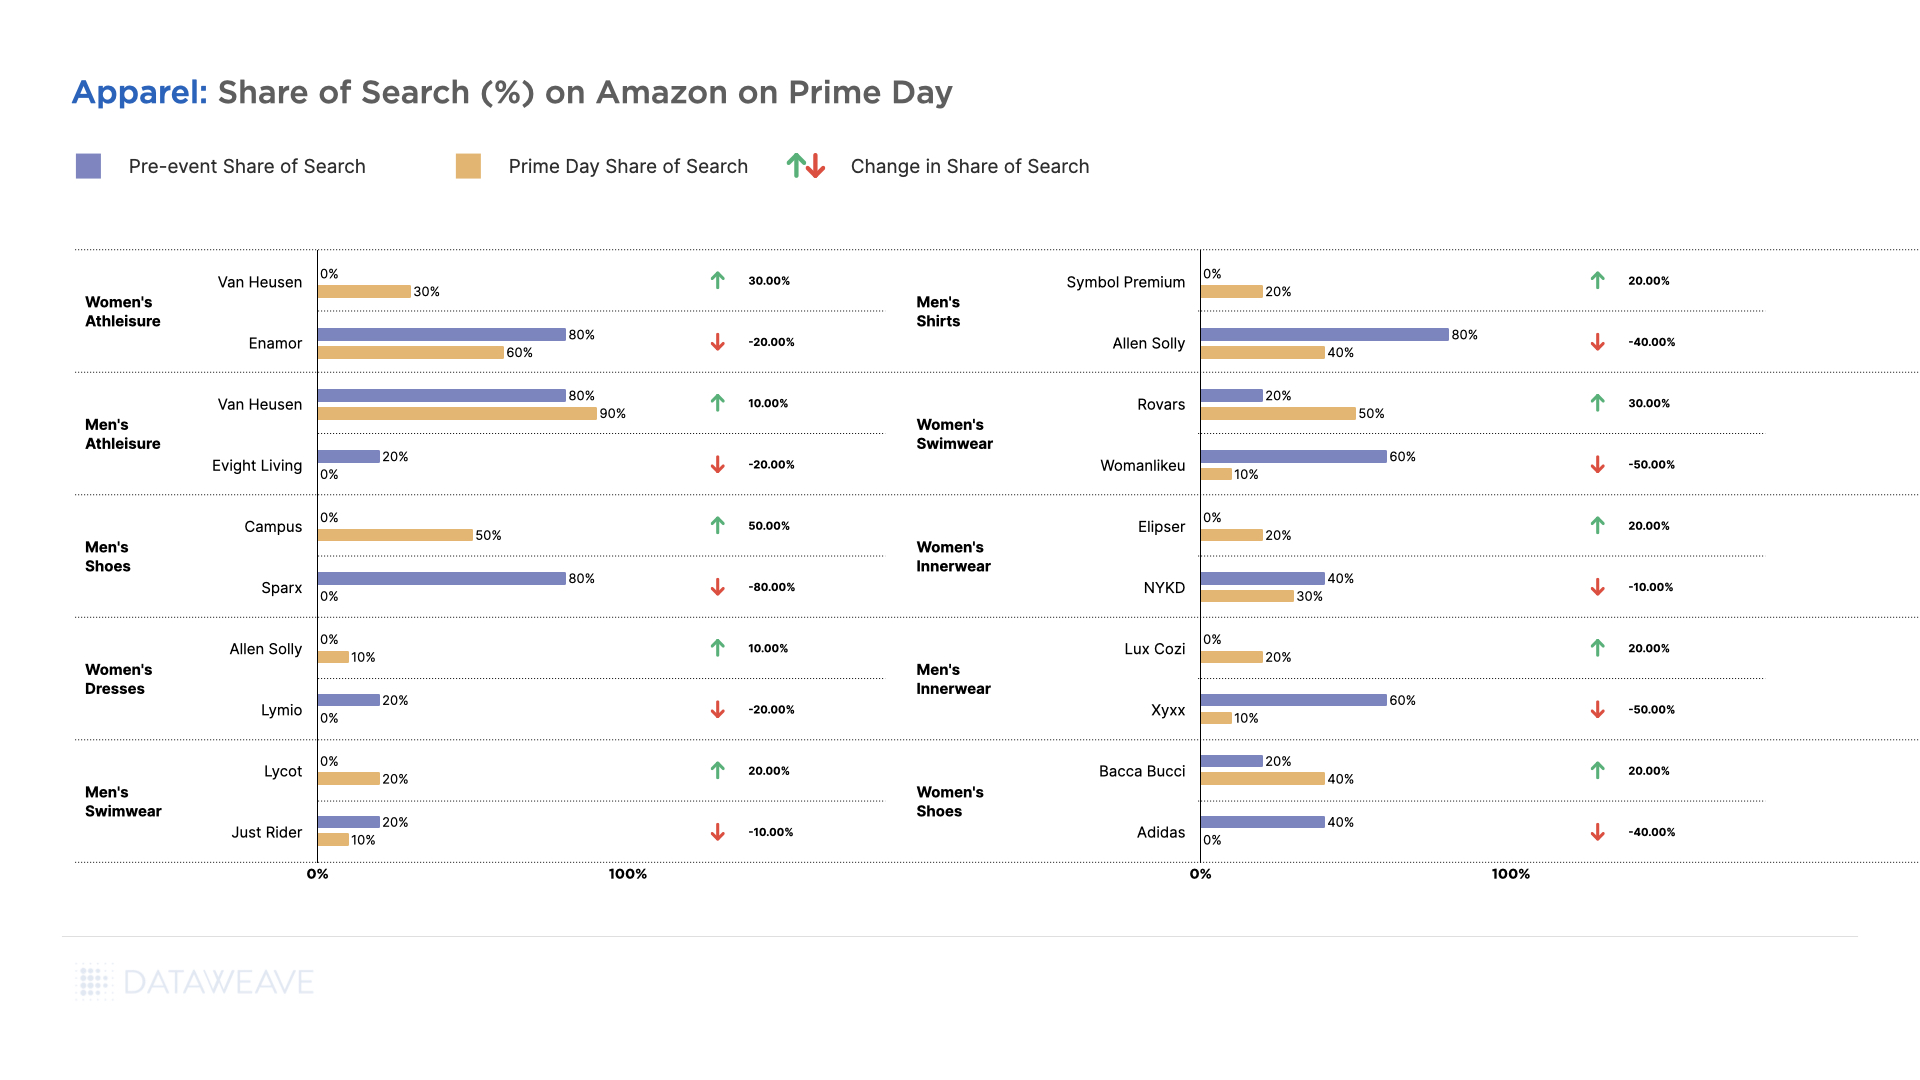
T-shirt brand Gildan led share of search gains with 4.0% growth along with a 5% price increase. Party Pants achieved 3.3% growth with 18% price increases, while CRZ Yoga gained 2.8% share and 11% price increases.
Amazon Essentials and Mens’ apparel brand Coofandy both improved share by 2.1%, with Amazon Essentials keeping price increases to just 2% and Coofandy at 1%. Under Armour gained 2.3% share with 10% price increase.
However, several brands lost ground, with Hanes declining significantly by 4.4% while keeping price increases to just 1%, followed by Cupshe (-1.4%) and Blooming Jelly (-0.7%).
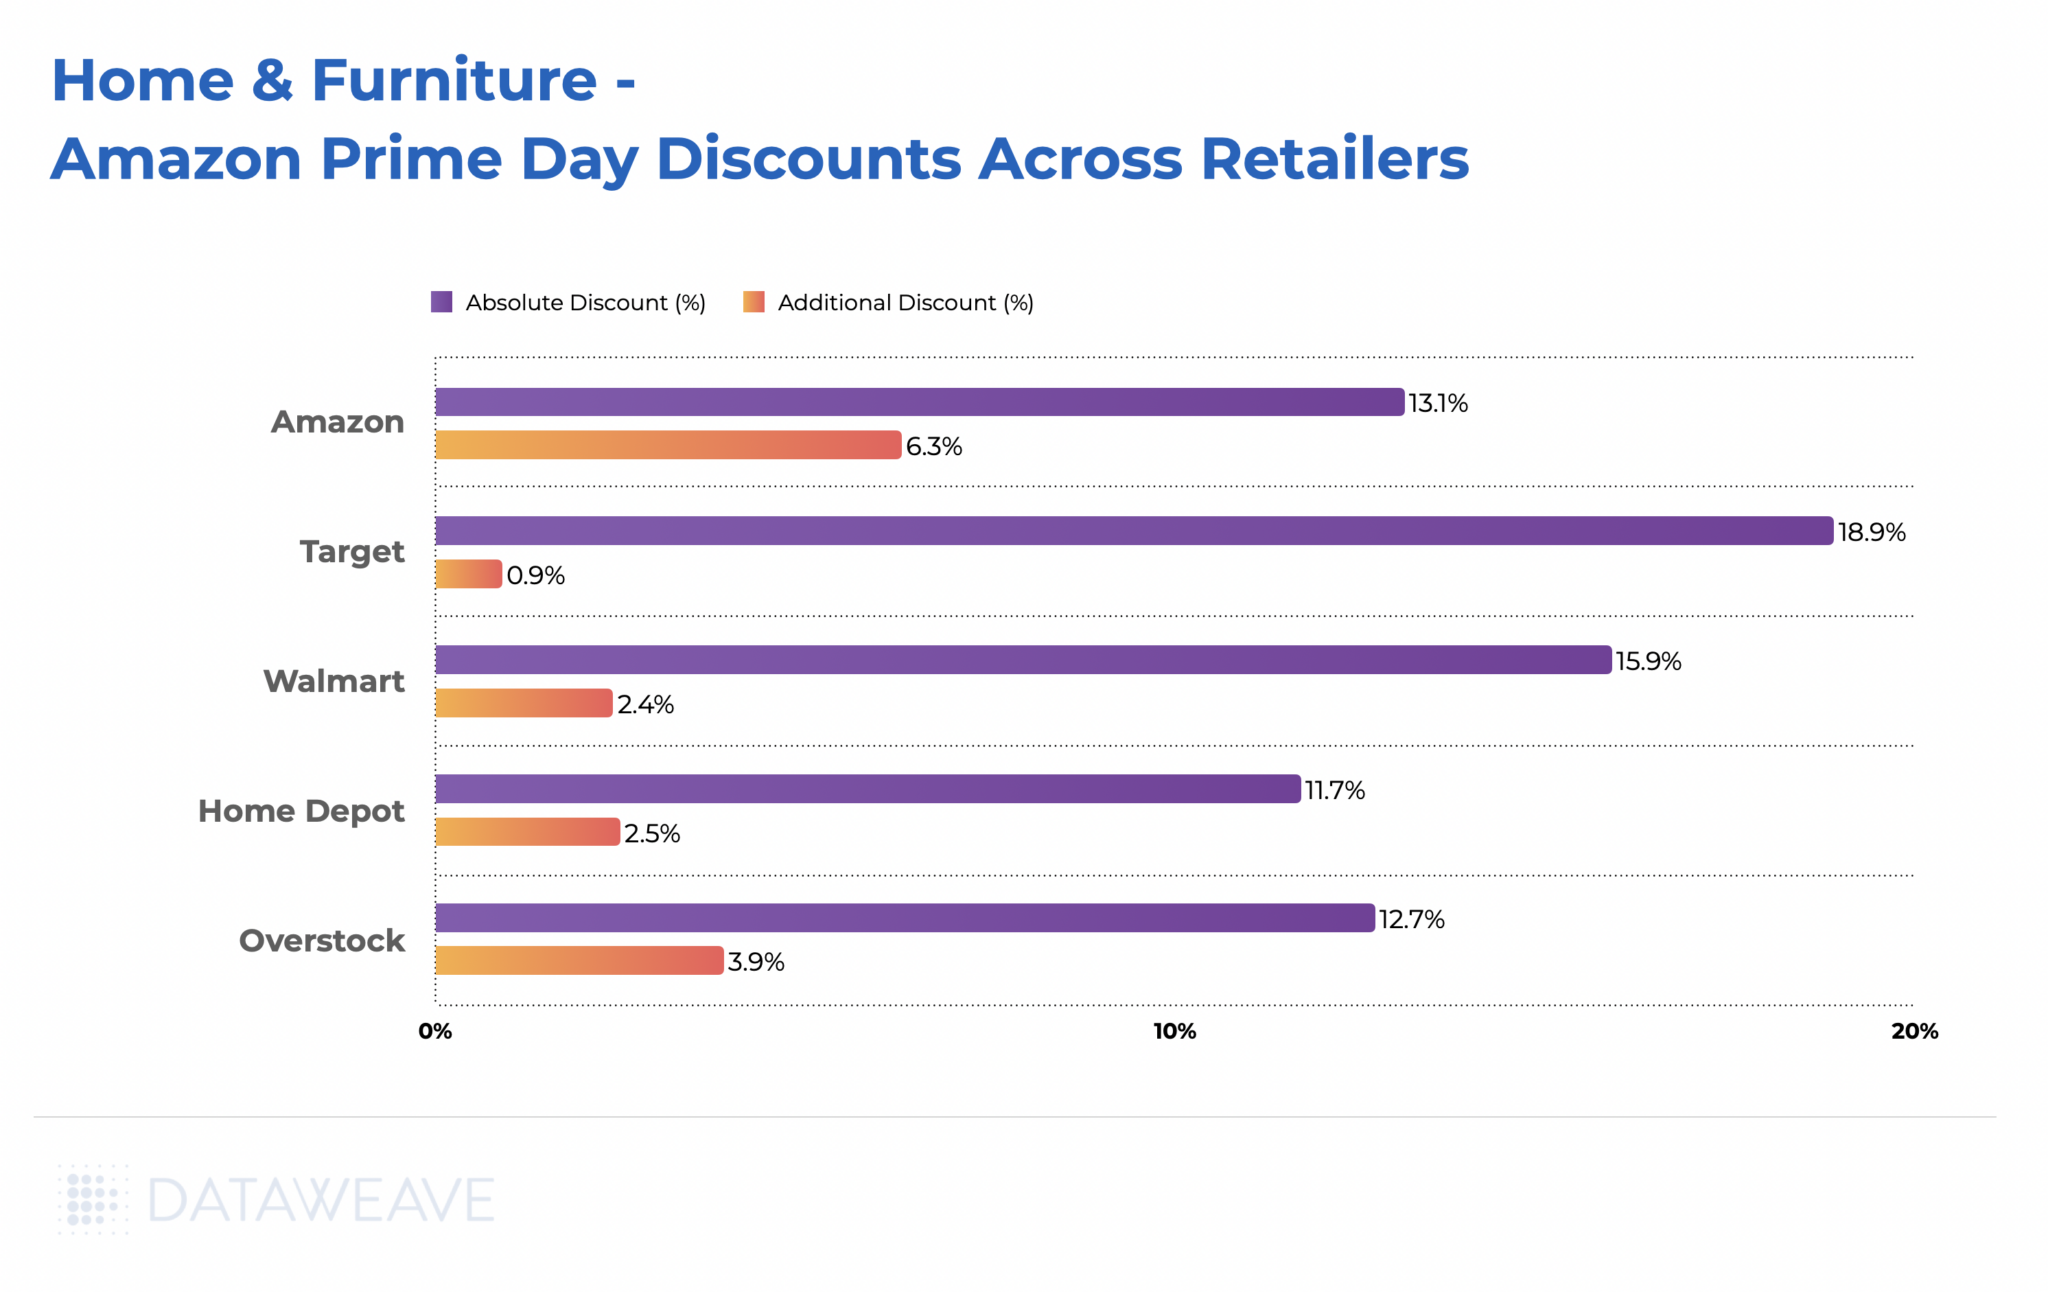
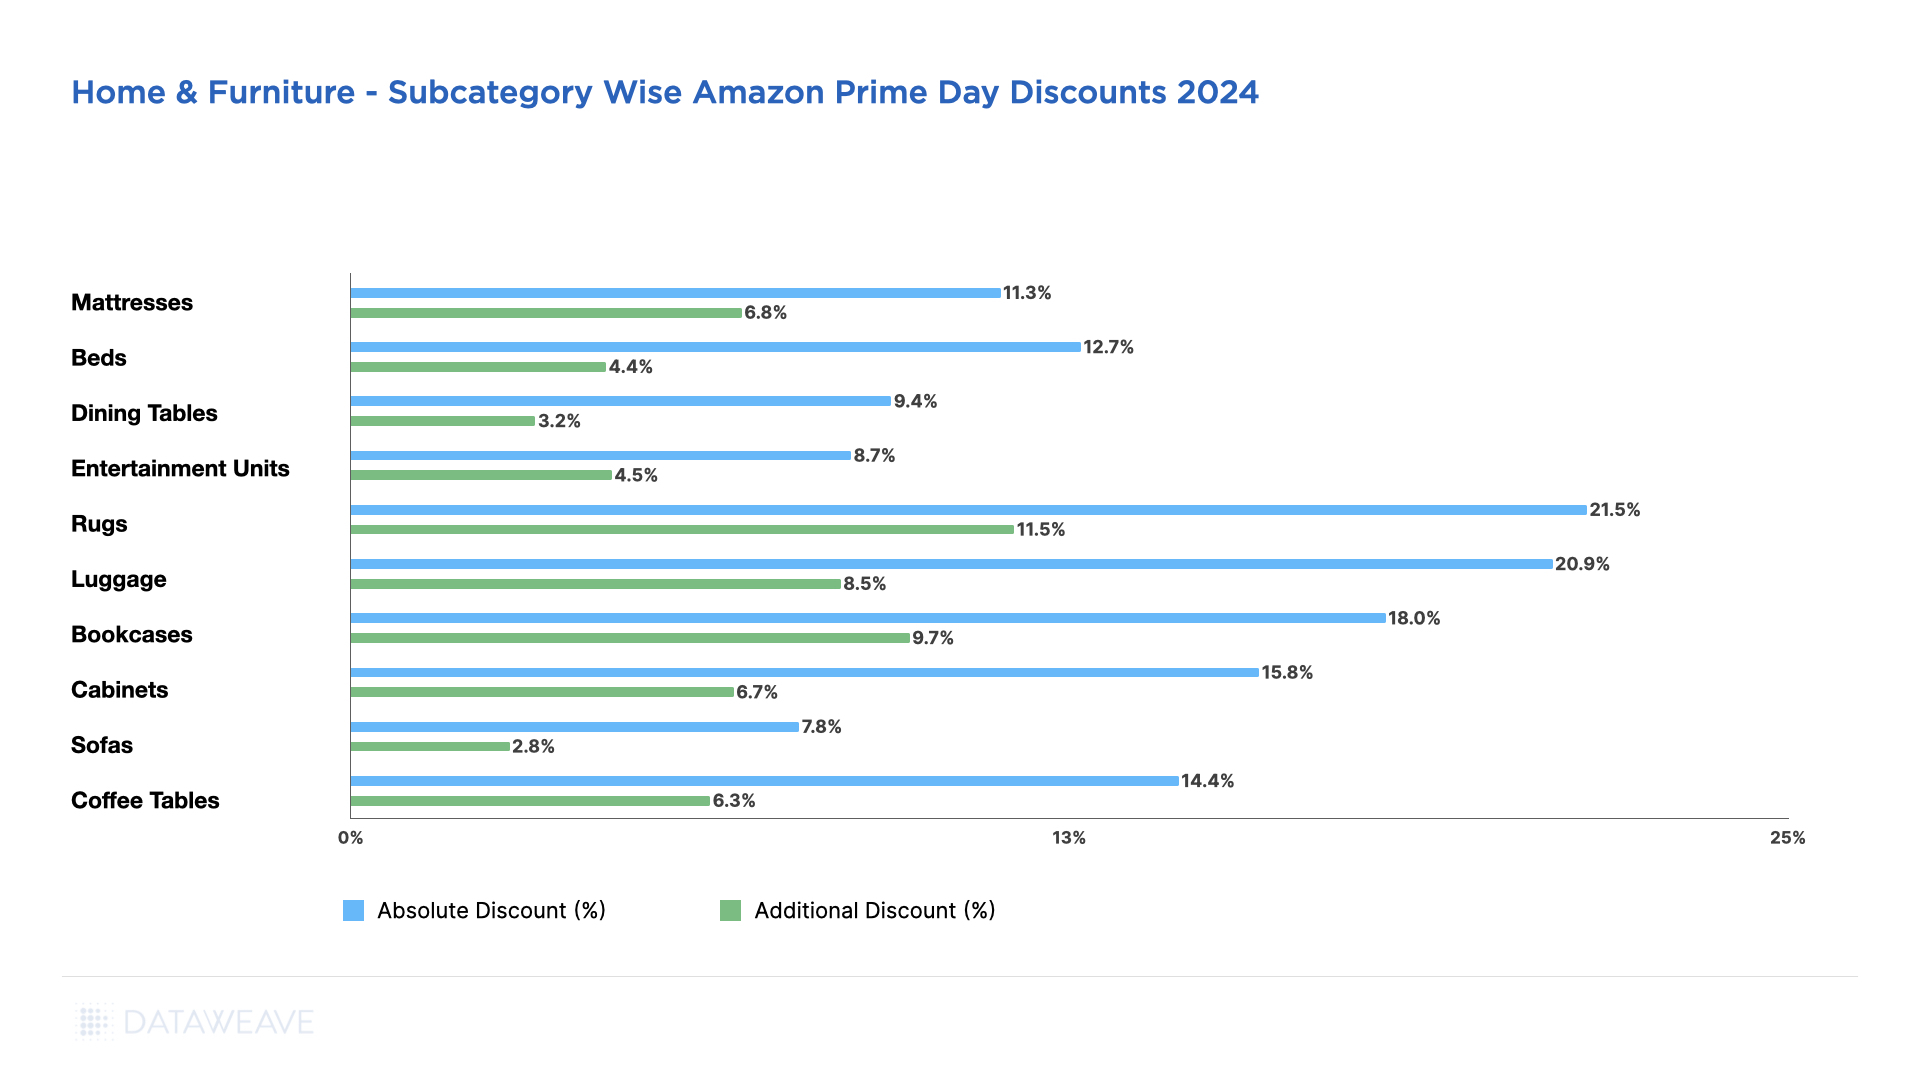
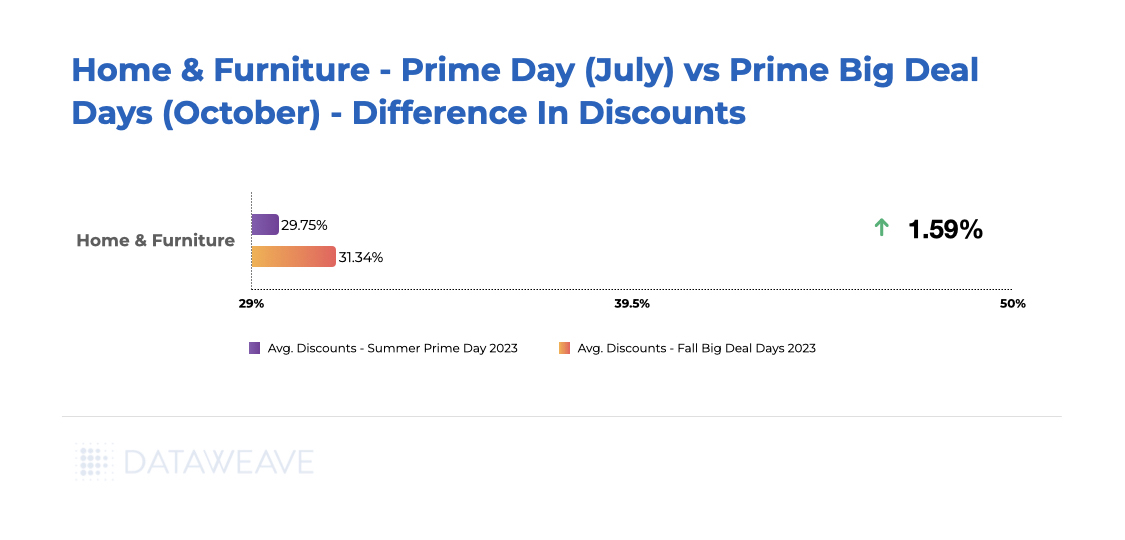
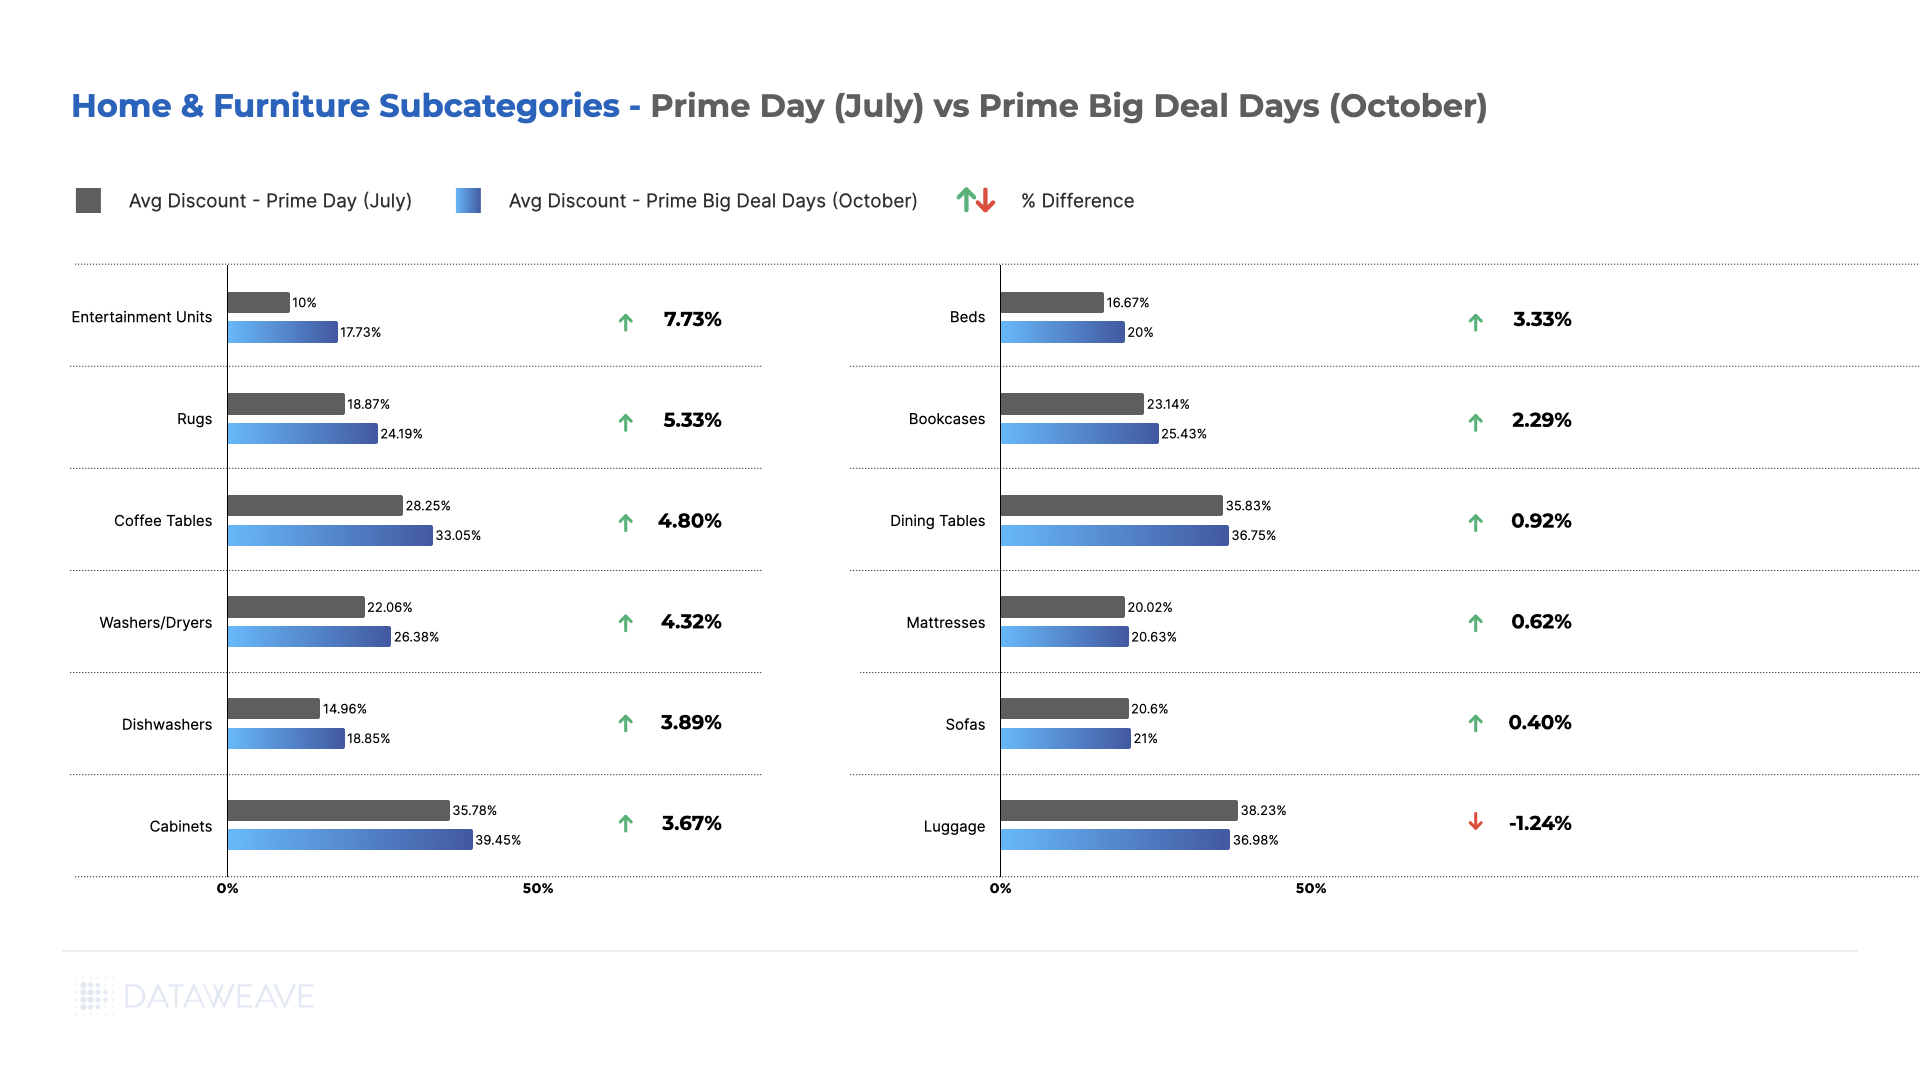
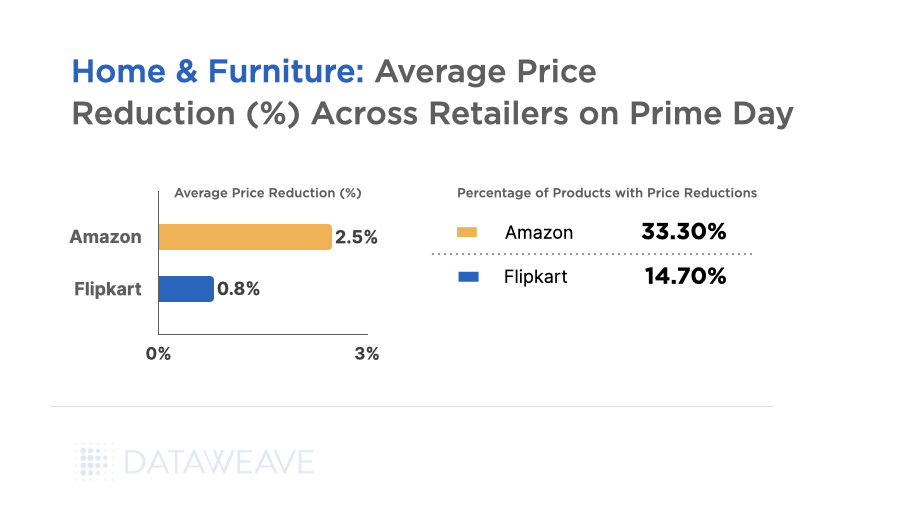
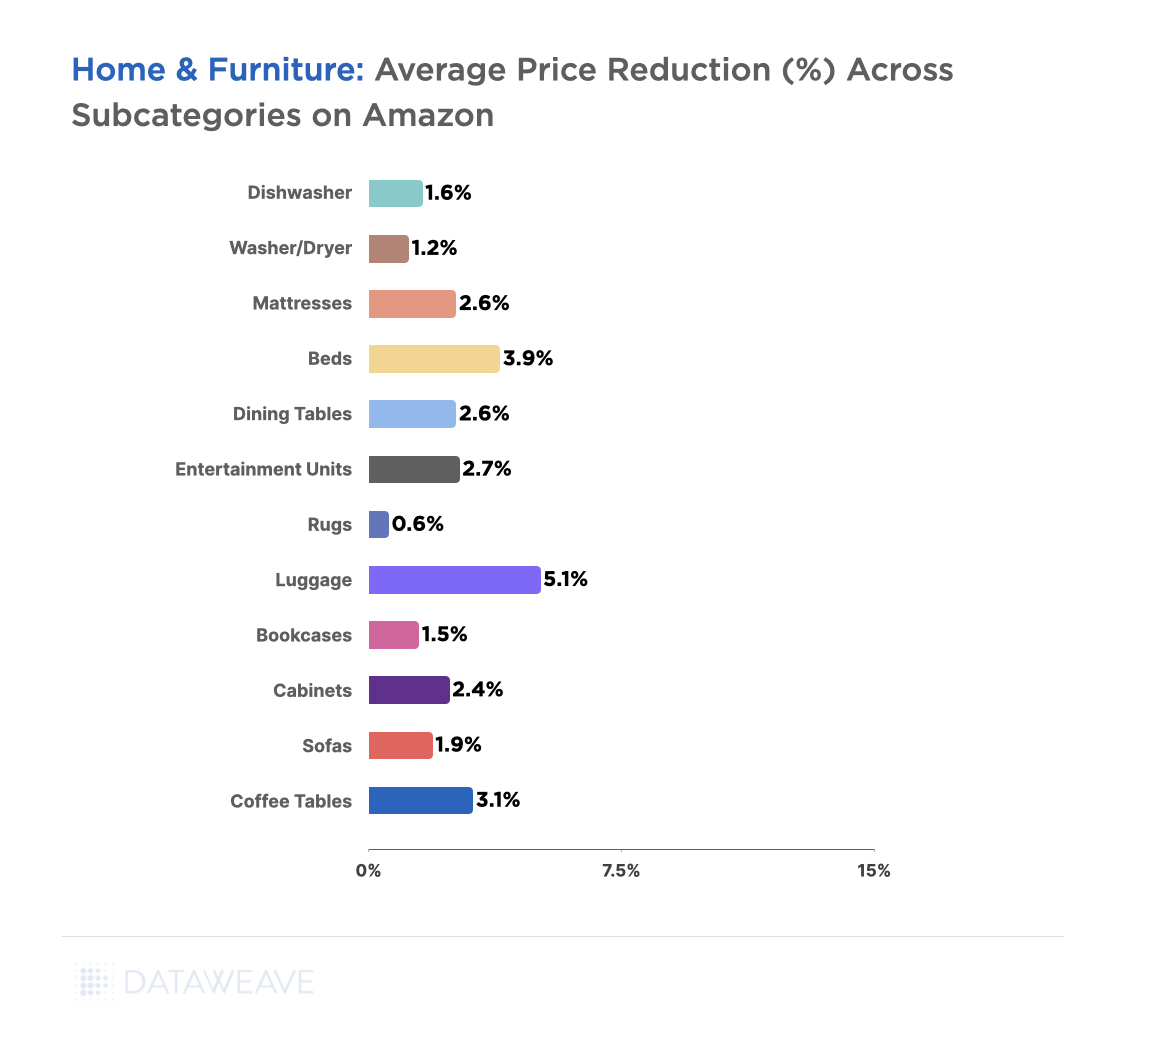
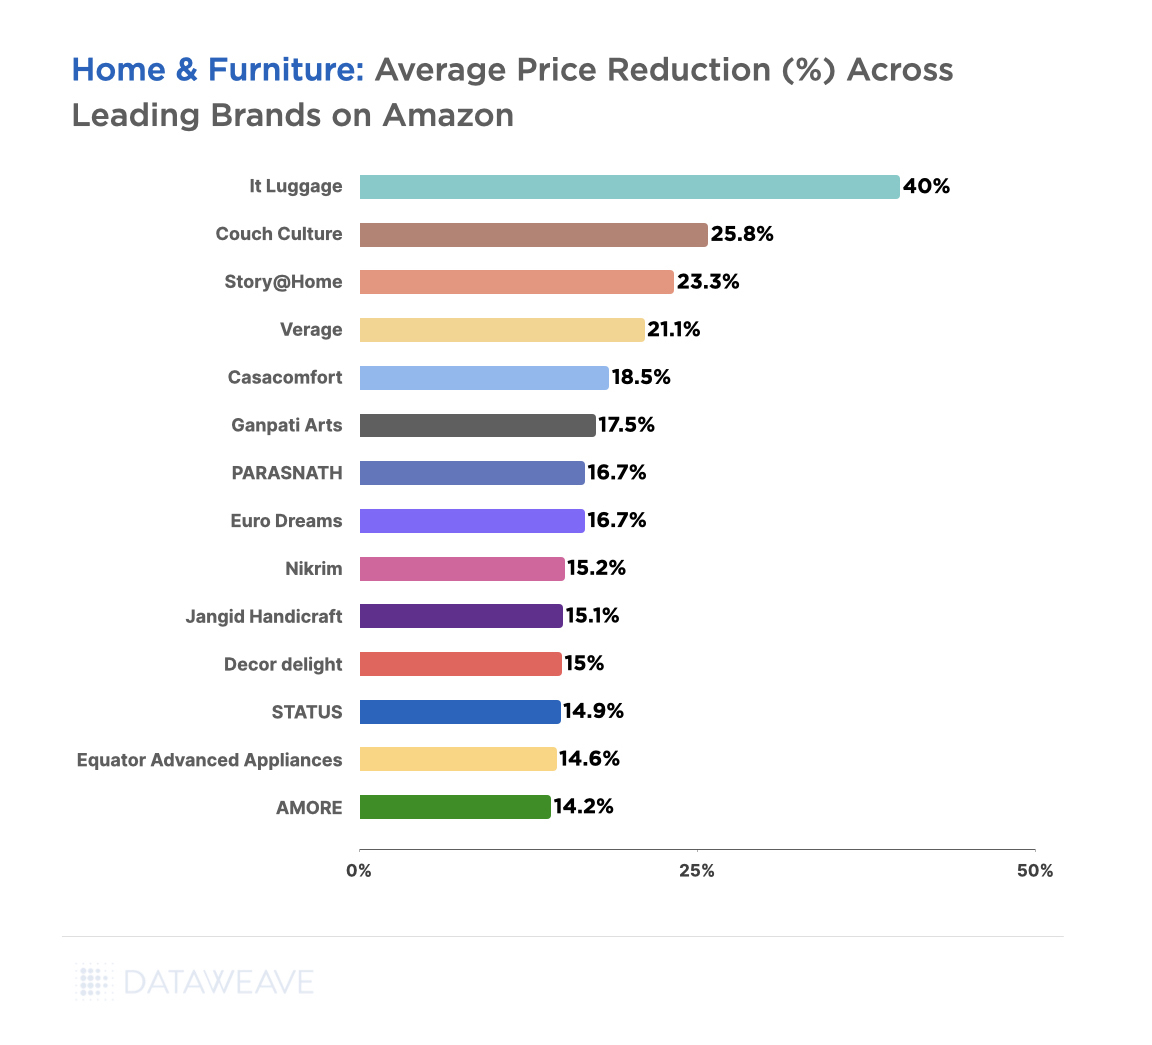
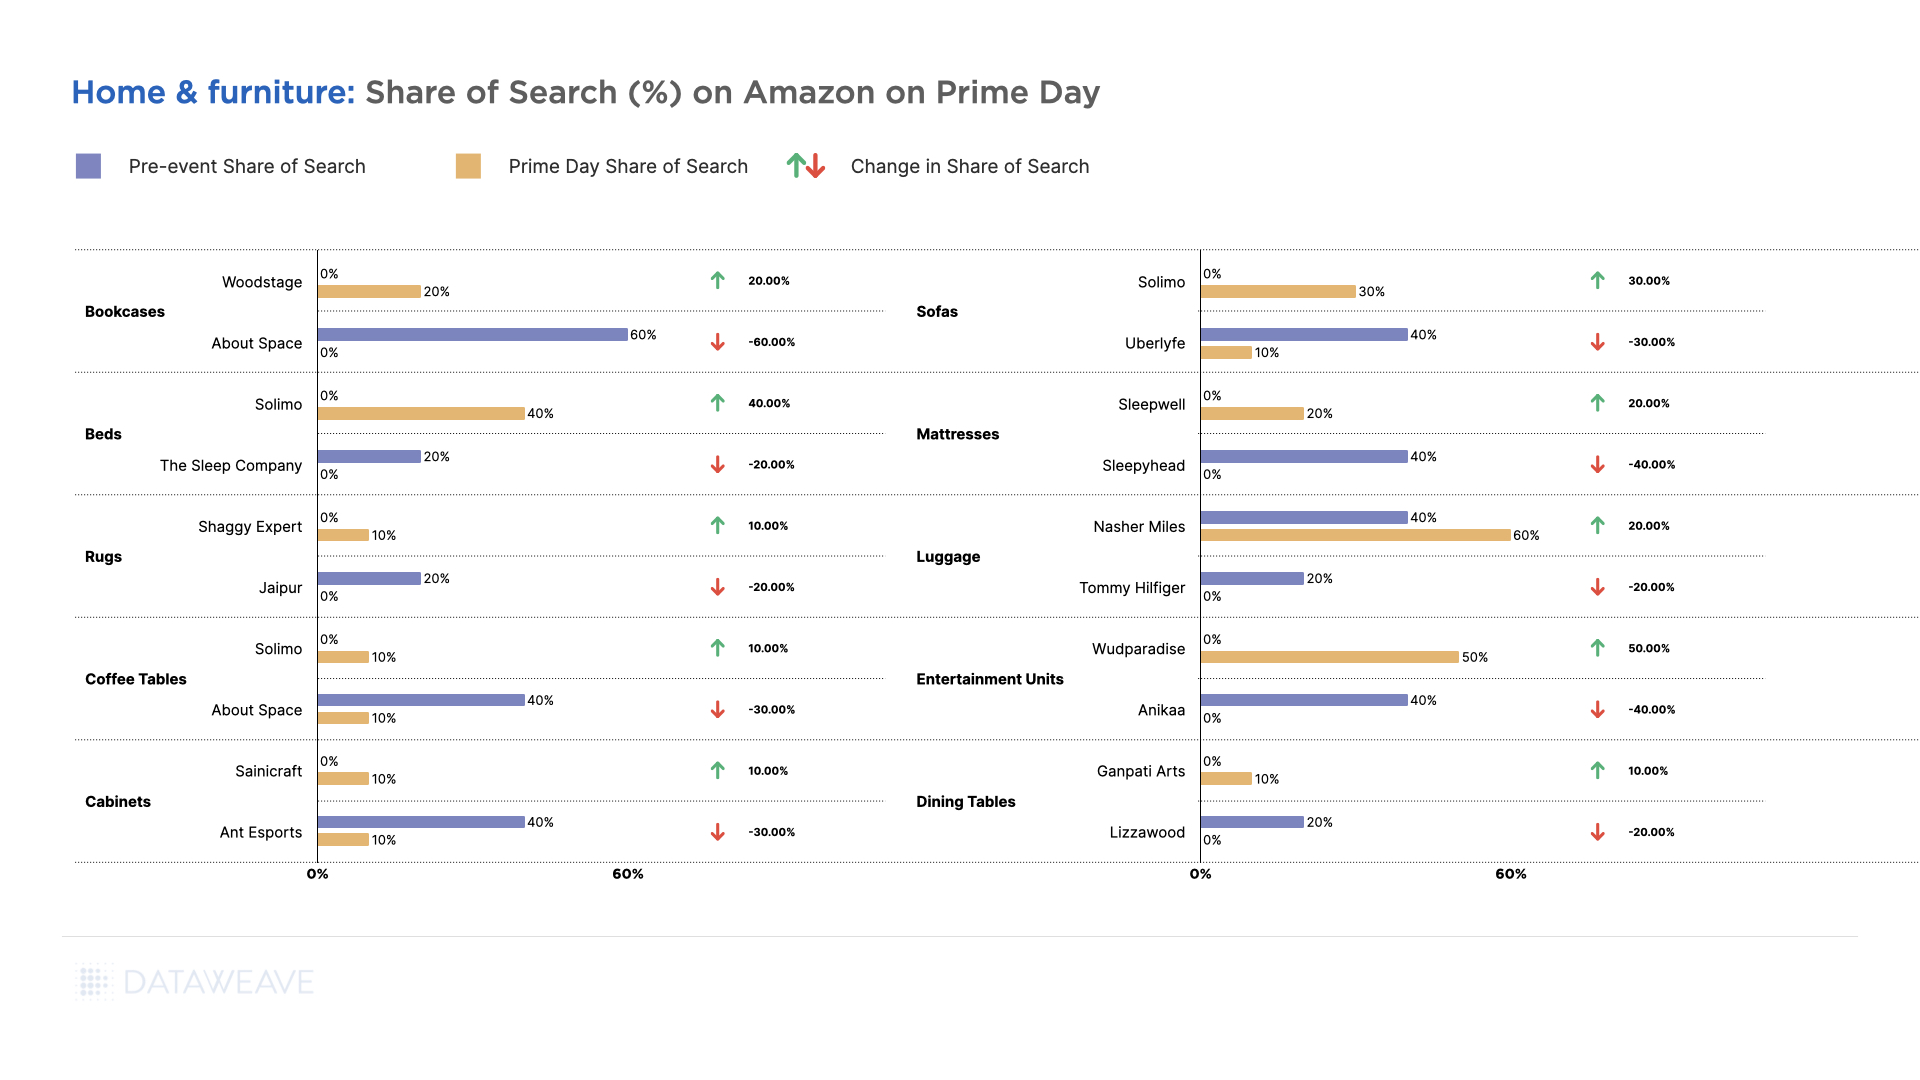
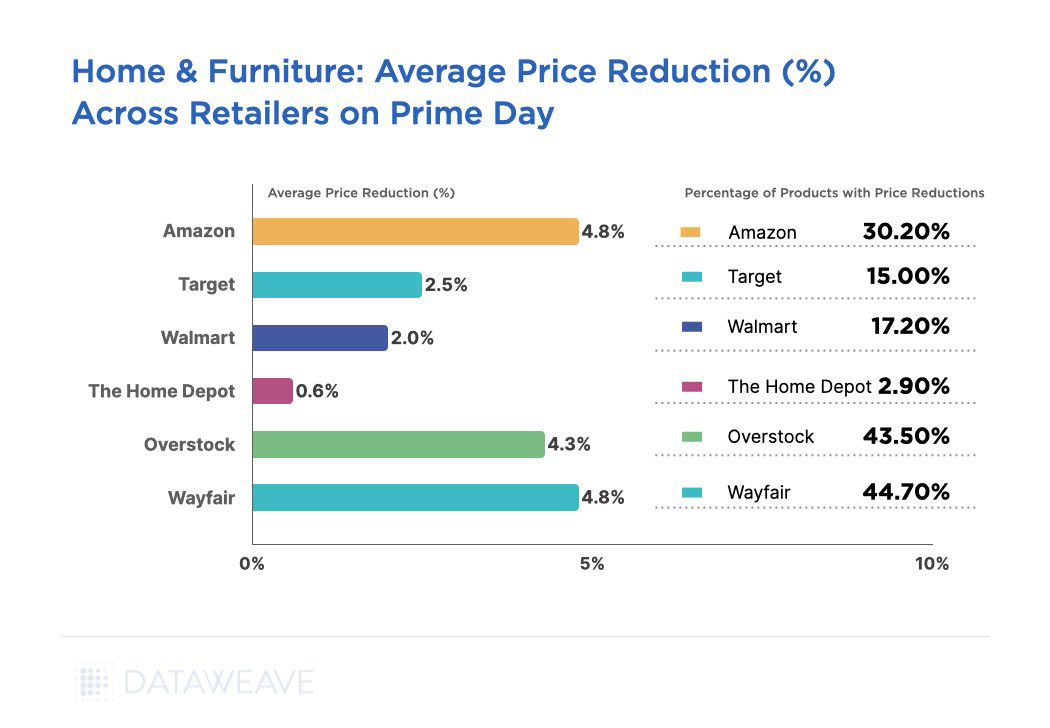
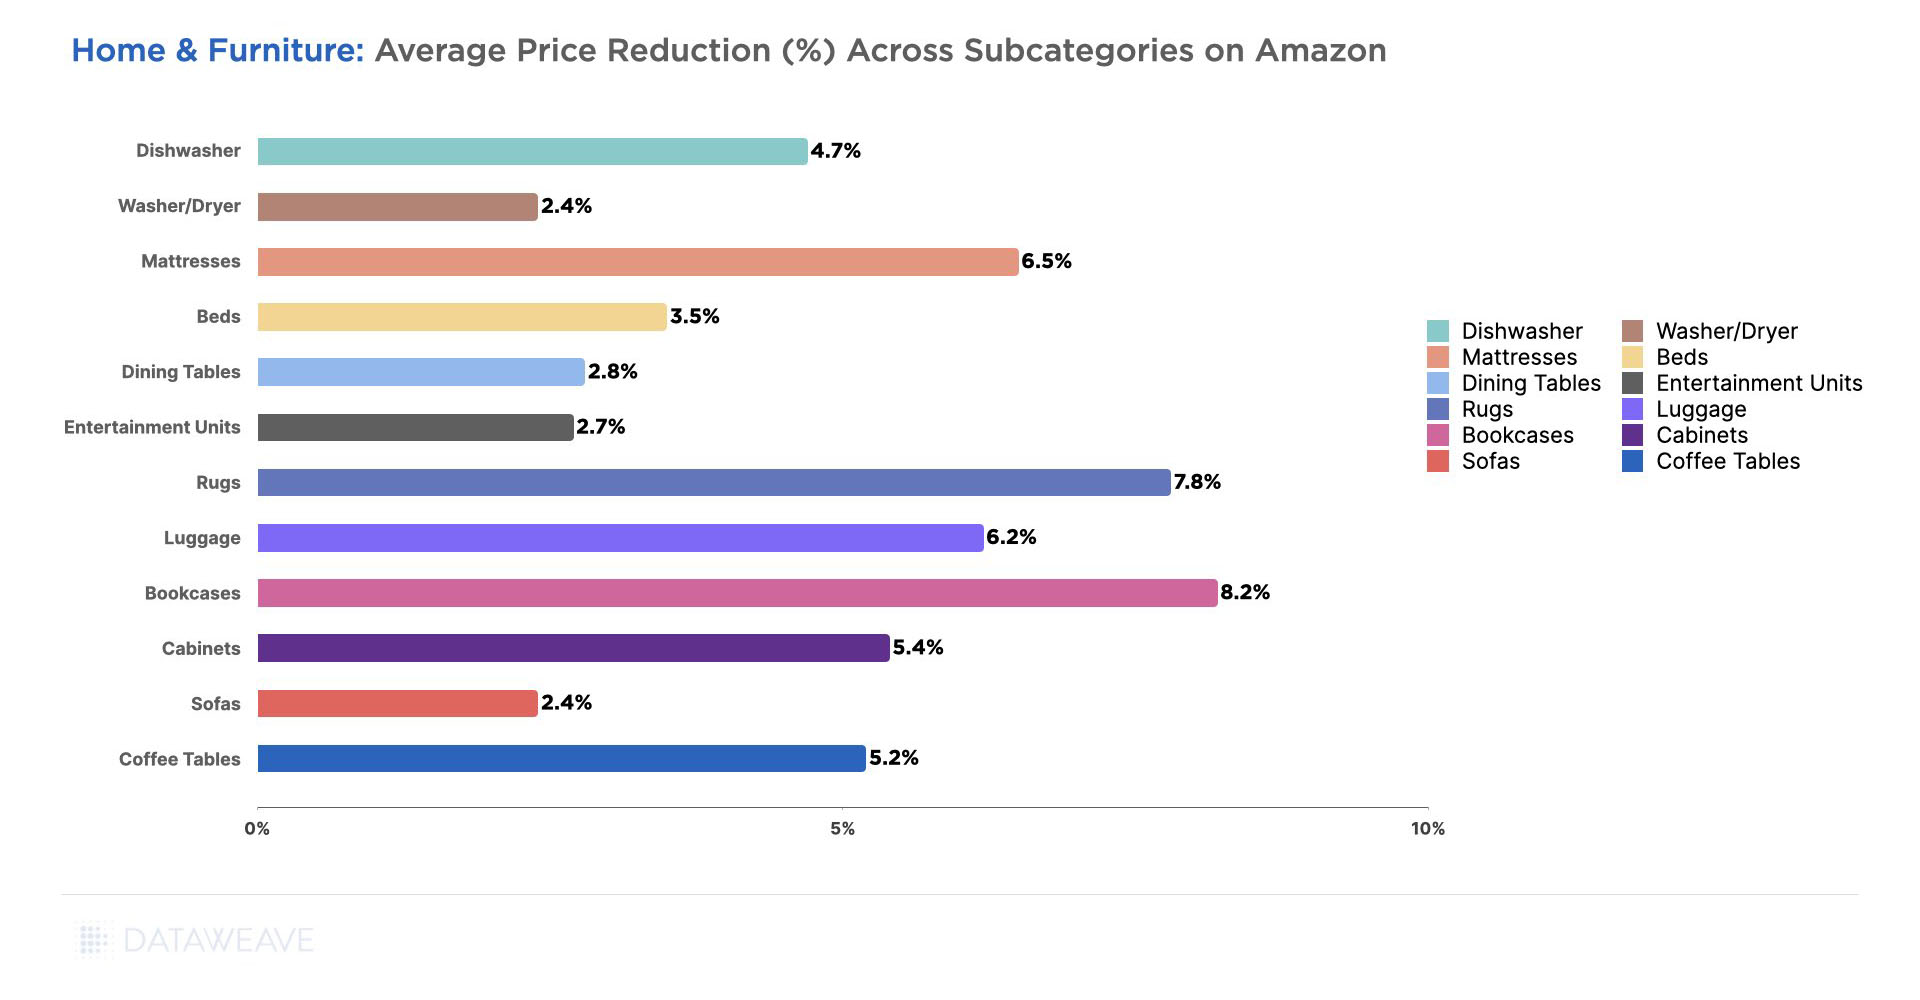
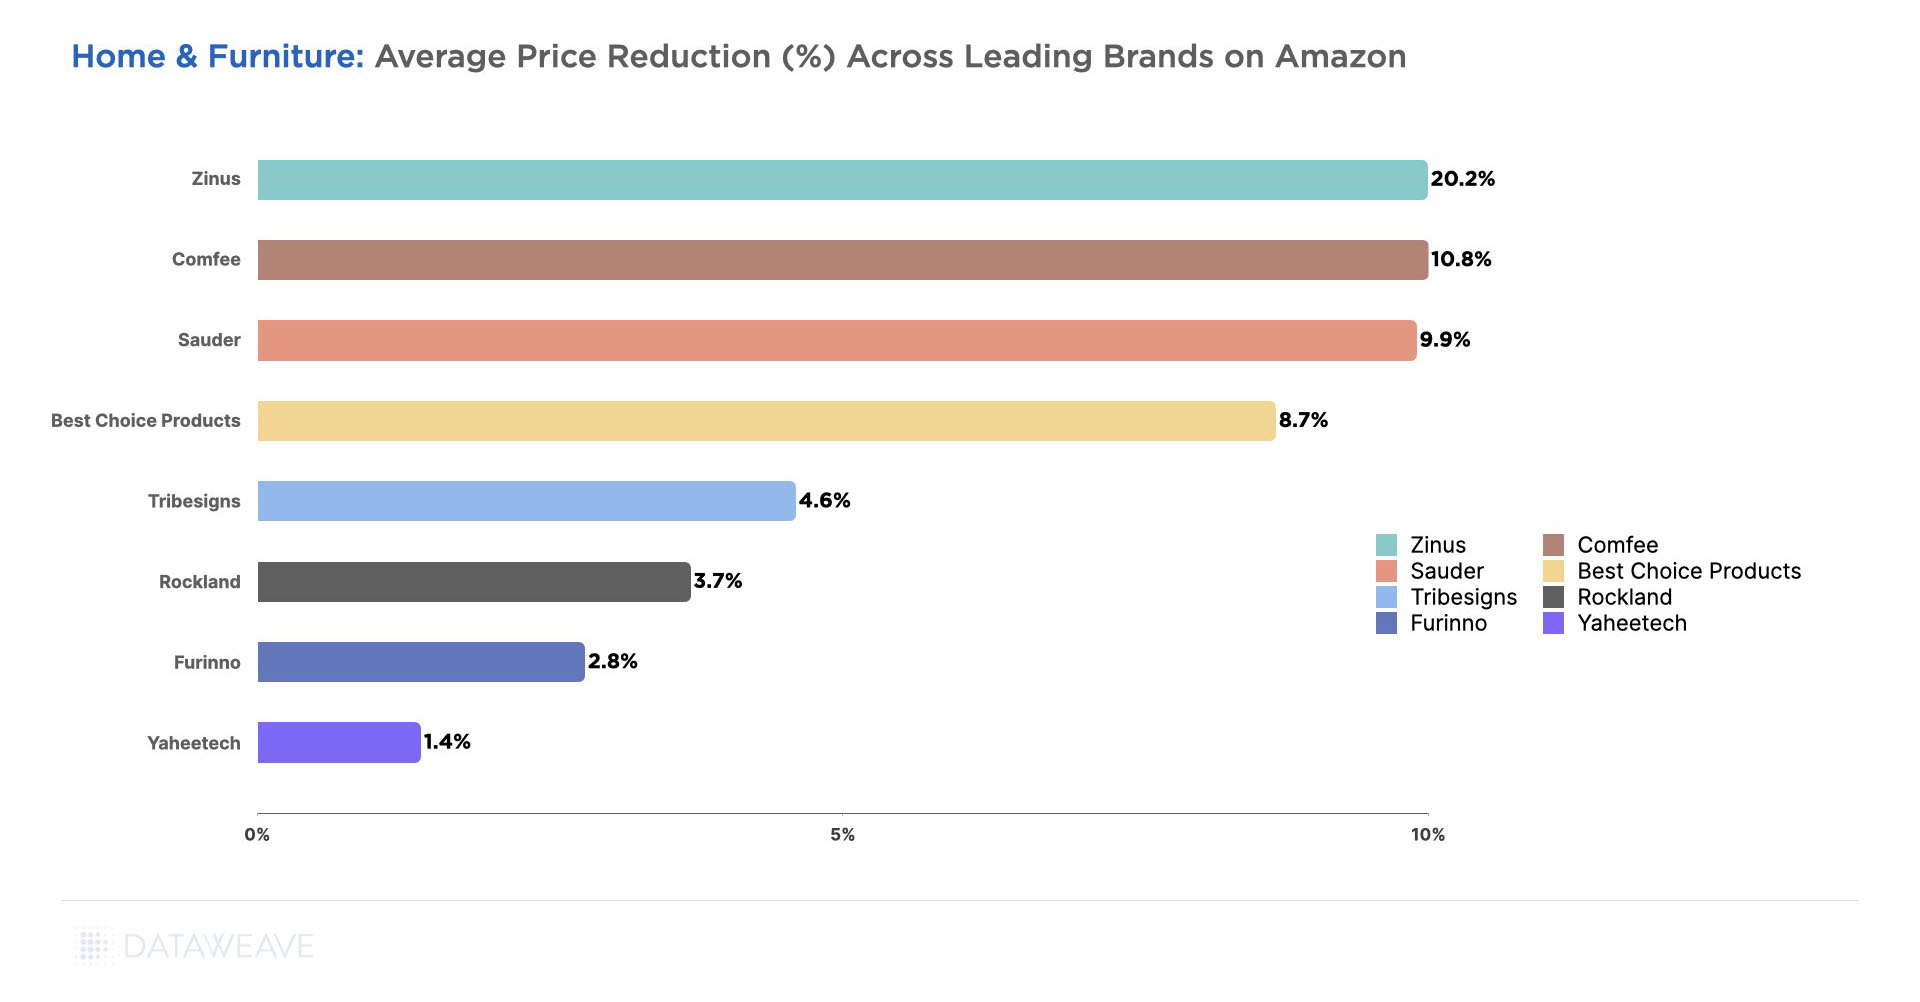
Home & Furniture
- Mattress brand Best Price Mattress increased prices 23% year-over-year, the highest in the category.
- Amazon Basics showed 12% price increases, demonstrating strategic private label pricing.
- Home Improvement and Appliances brand Black+Decker saw a pricing increase of 11%.
- Better Homes saw an 8% increase, while most other brands saw price increases between 4-7%.
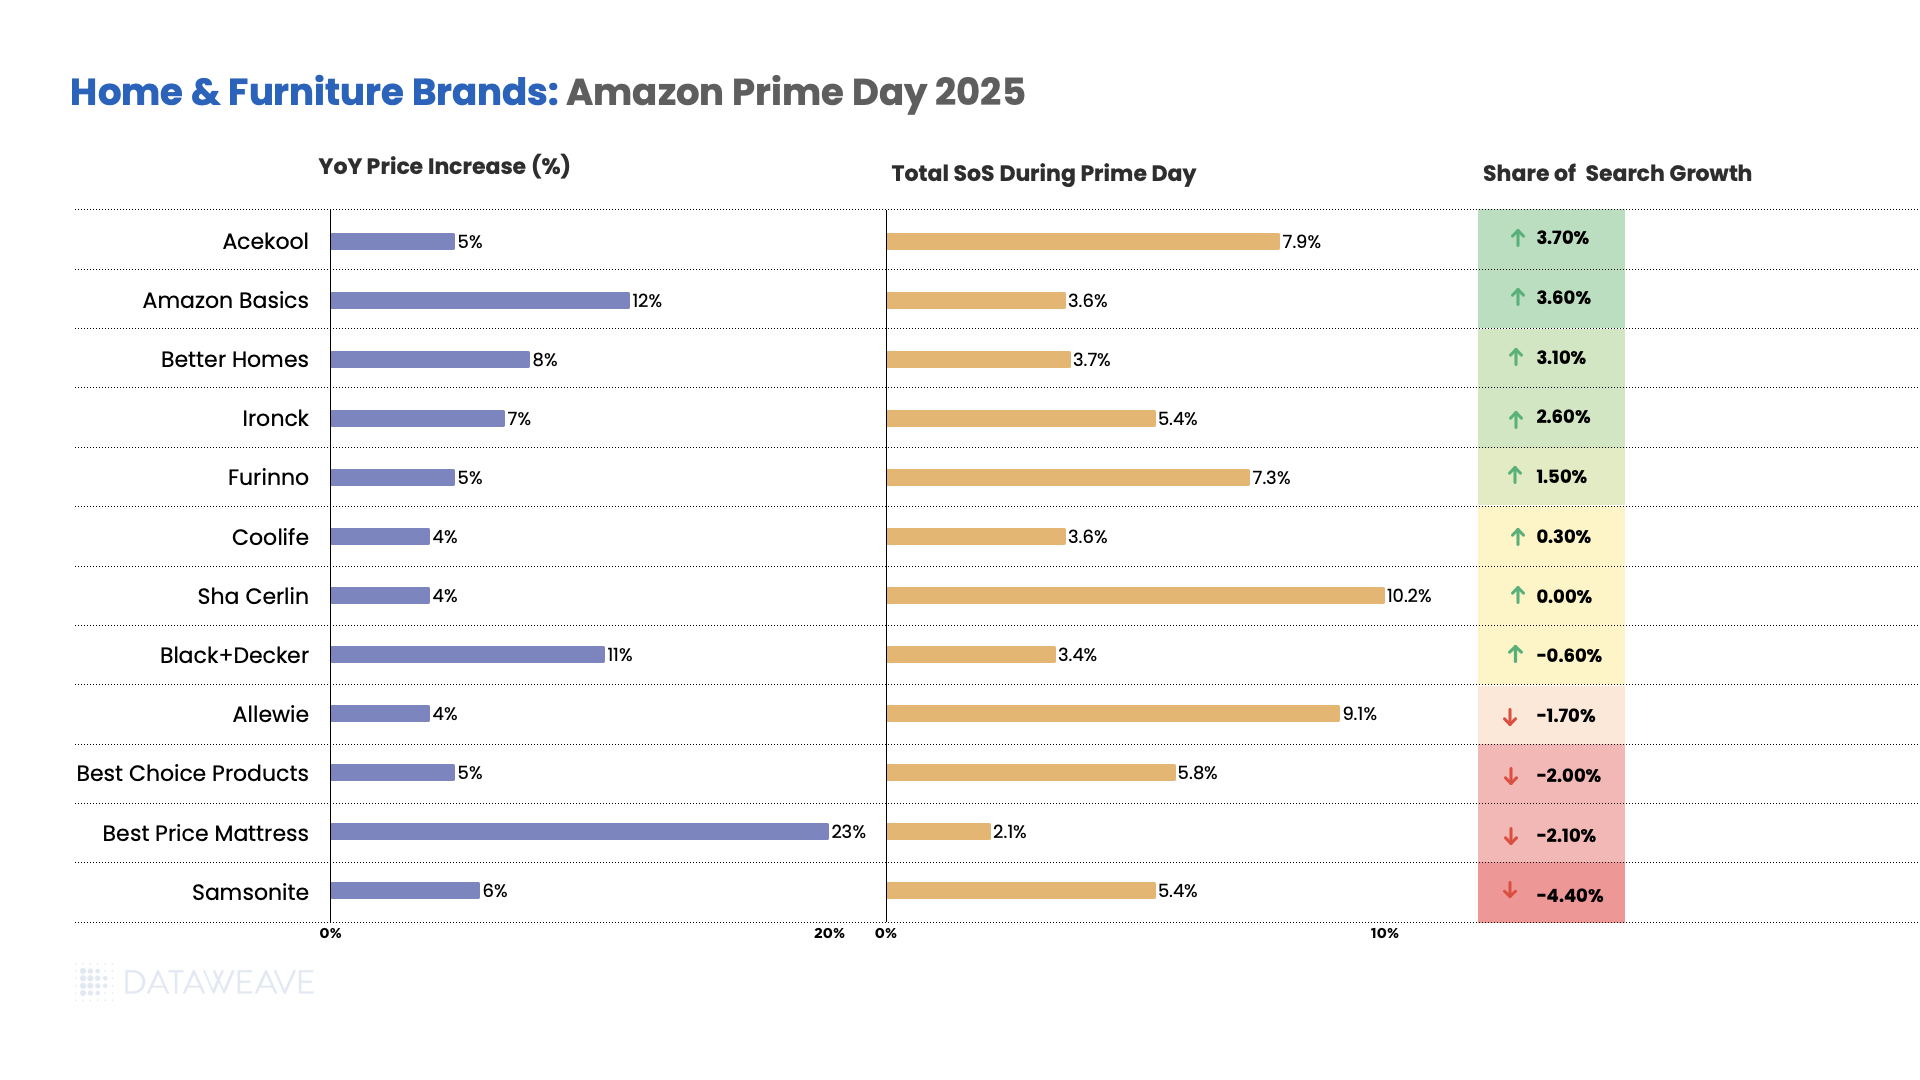
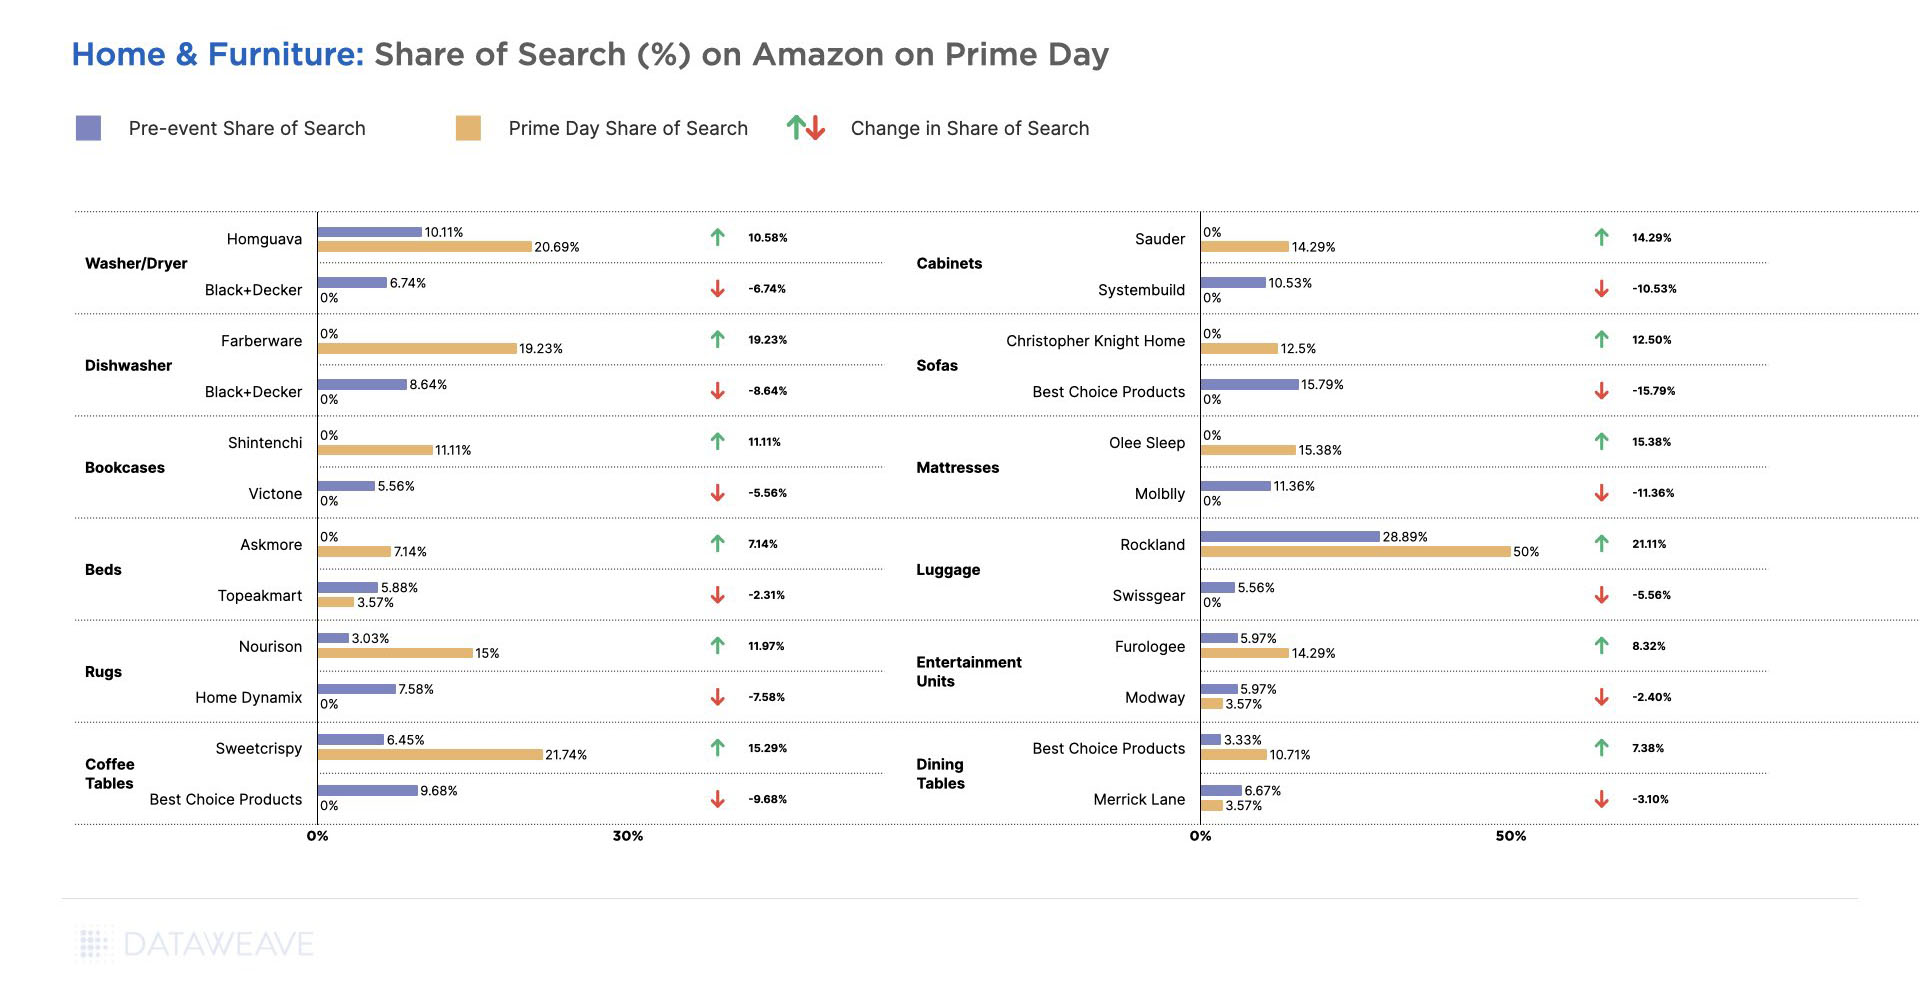
Appliance brand Acekool led visibility gains with 3.7% growth along with a 5% price increase. Amazon Basics improved significantly with a 3.6% share growth alongside its 12% price increases. Better Homes achieved 3.1% gains with 8% price increases.
Ironck gained 2.6% share with 7% price increases, and furniture brand Furinno improved by 1.5% with 5% price increases. However, several brands lost ground, with Samsonite declining most significantly by 4.4%, Best Price Mattress lost 2.1% share with its massive 23% price increase, and Allewie declined by 1.7% with 4% price increases.
Home goods face elevated pressure from expanded steel and aluminium tariffs increased to 50%.
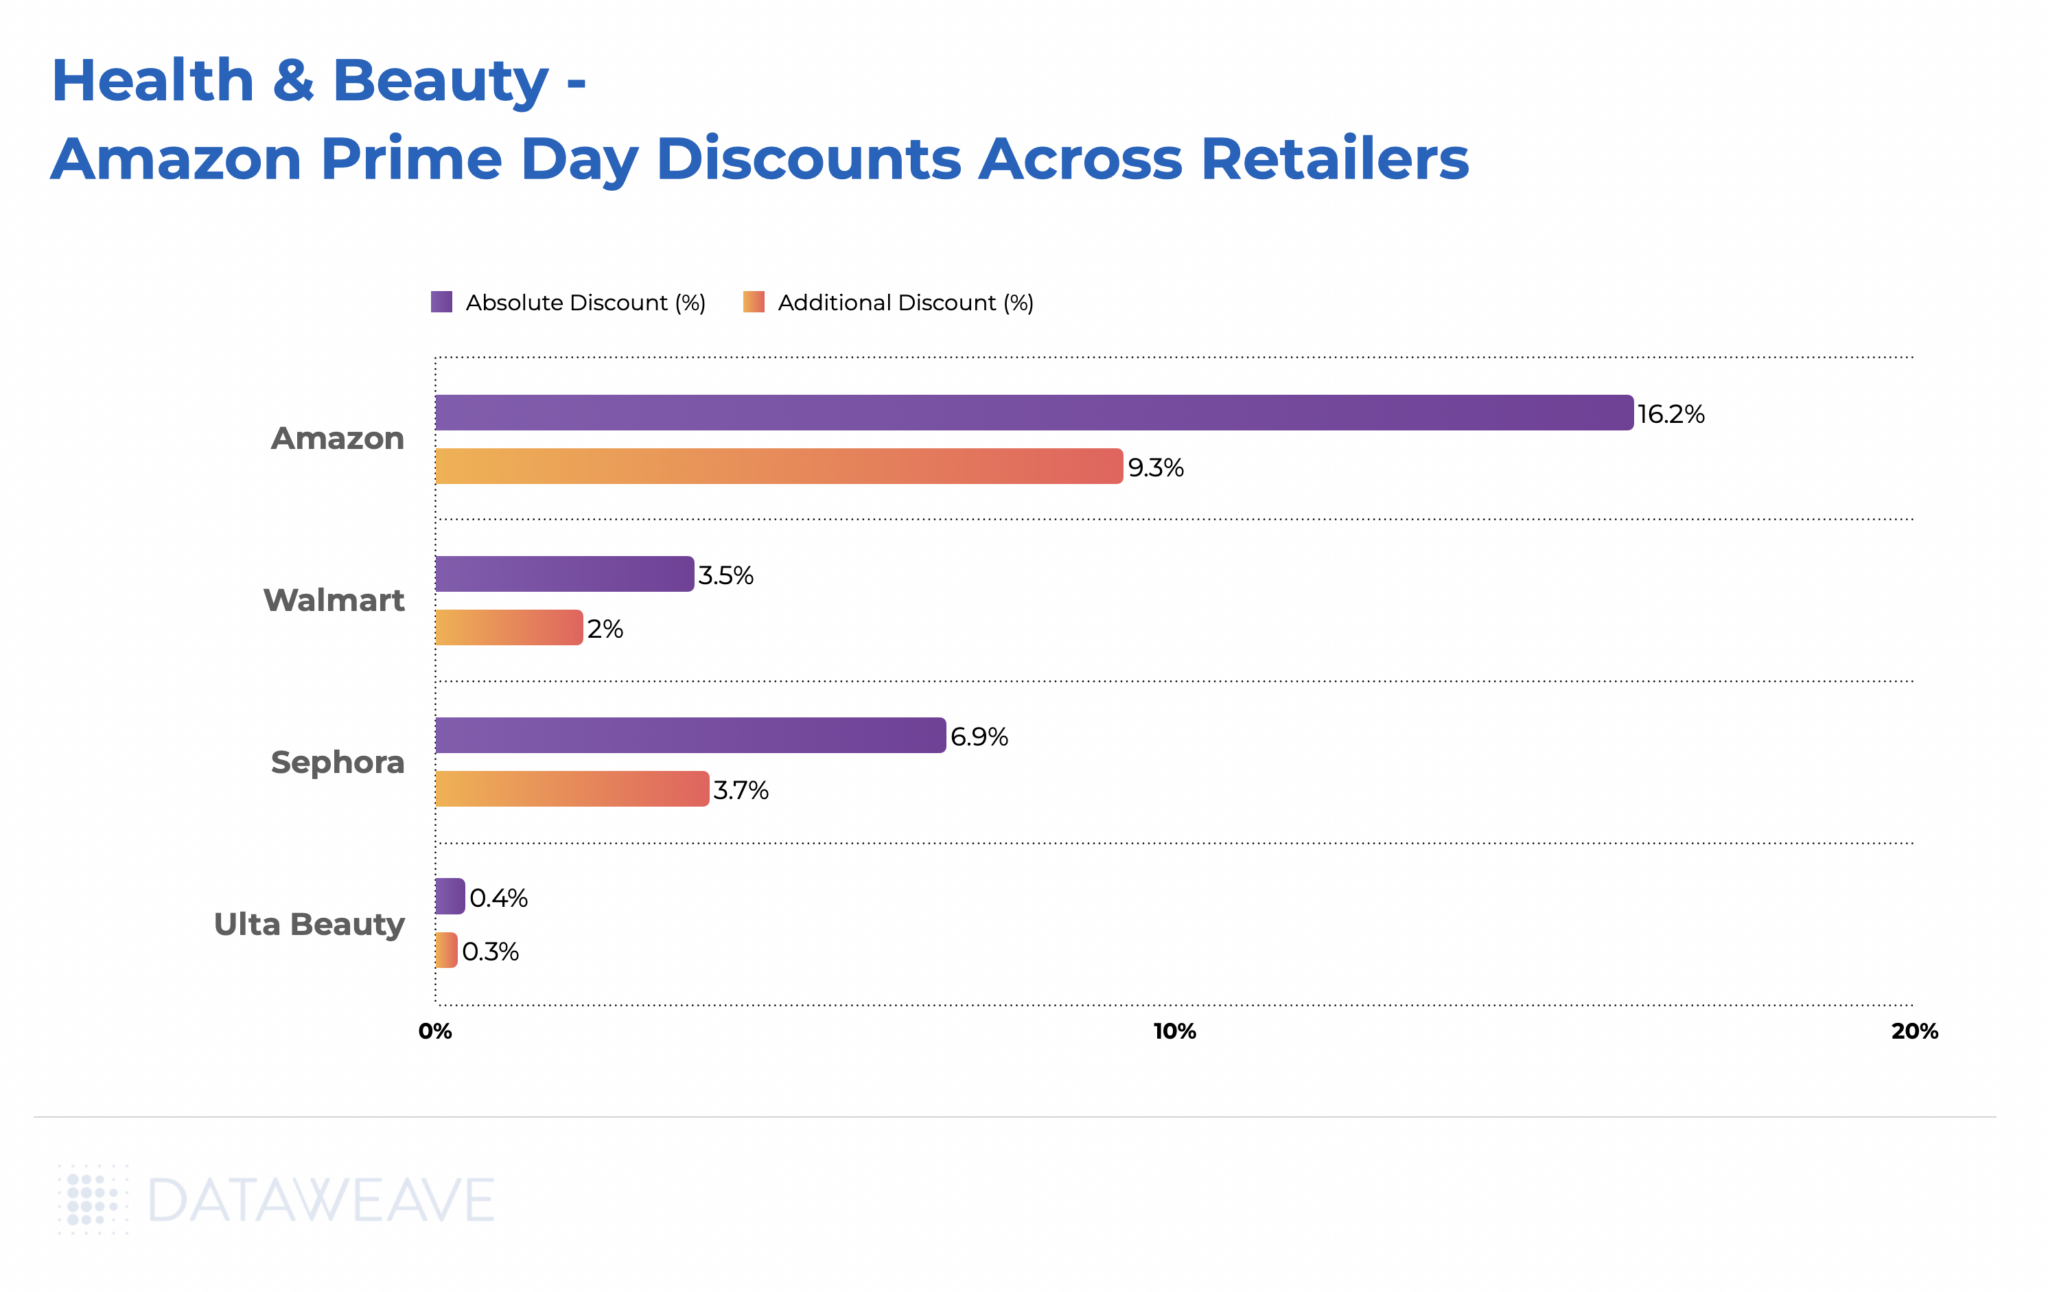
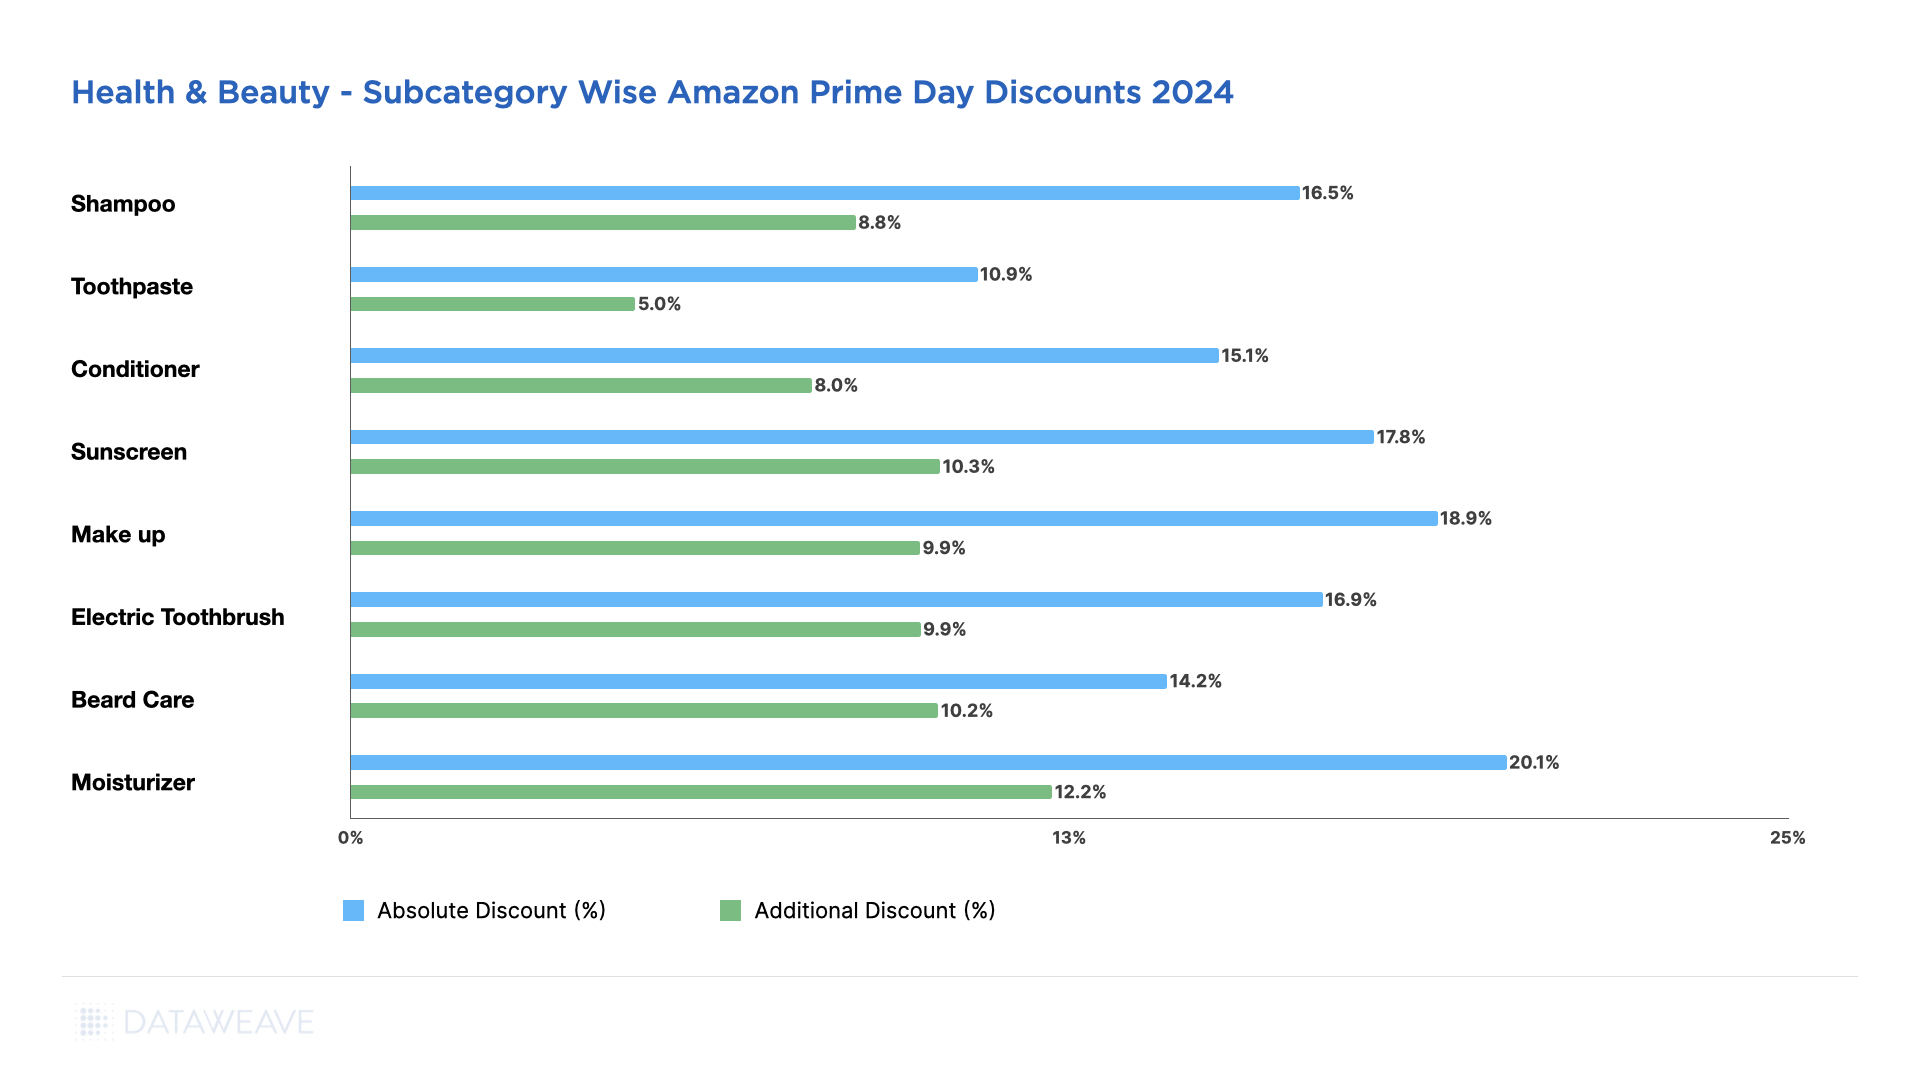
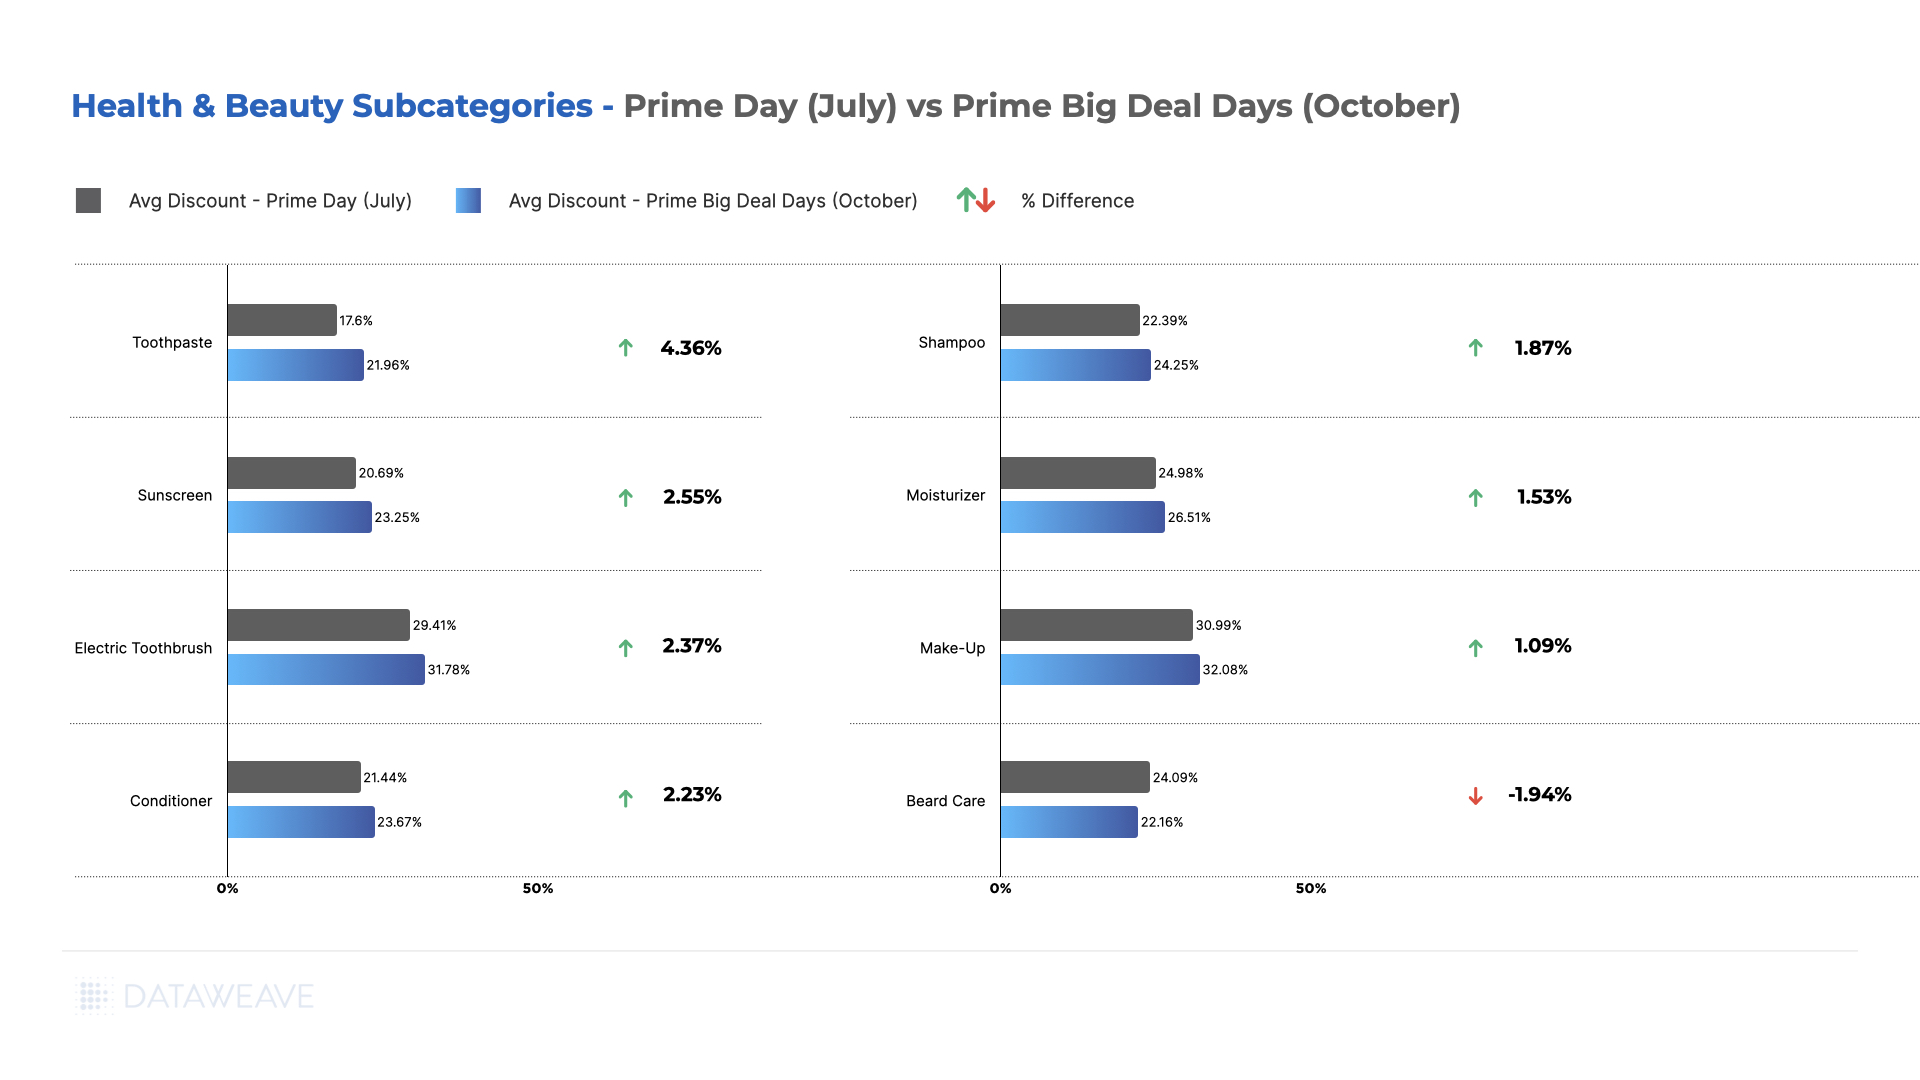
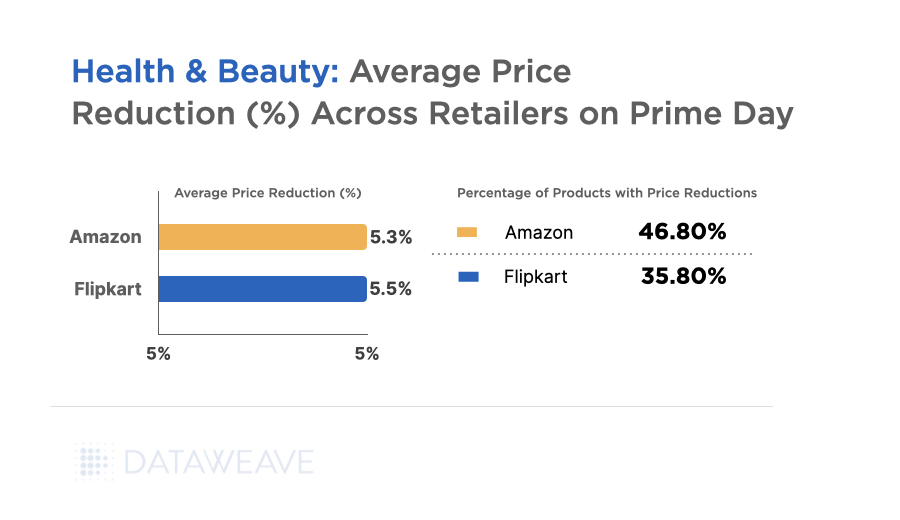
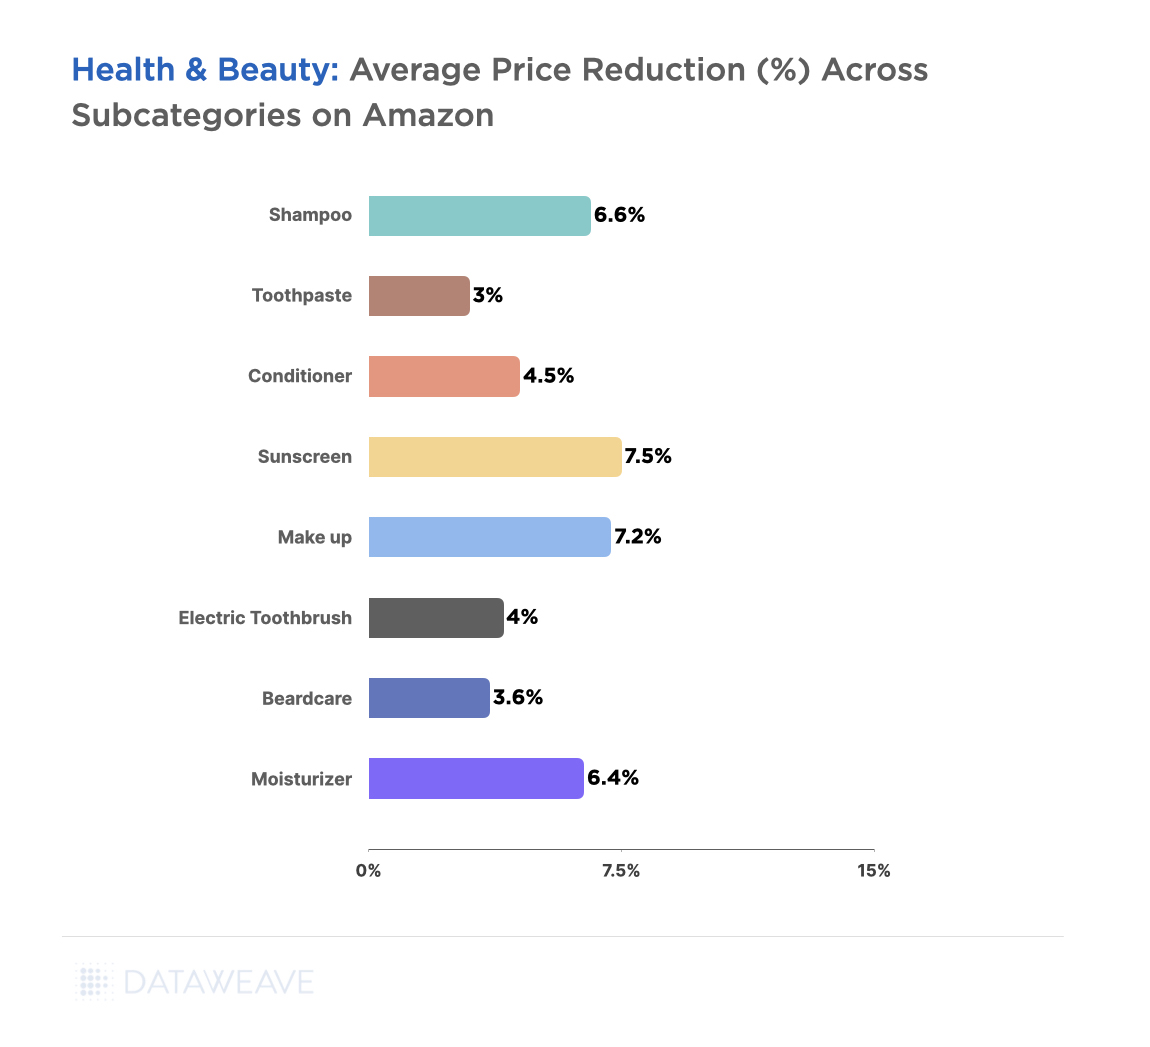
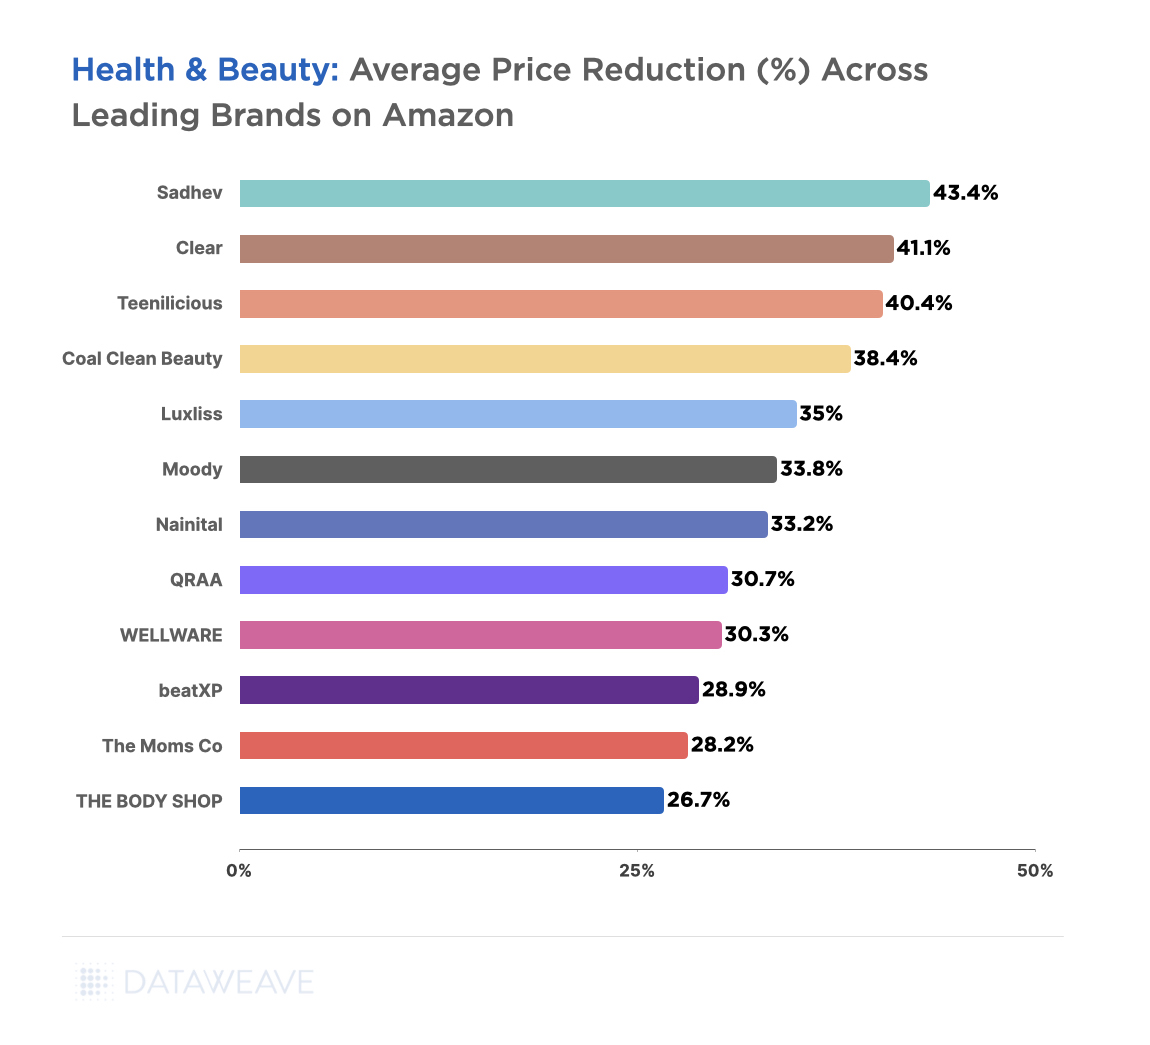
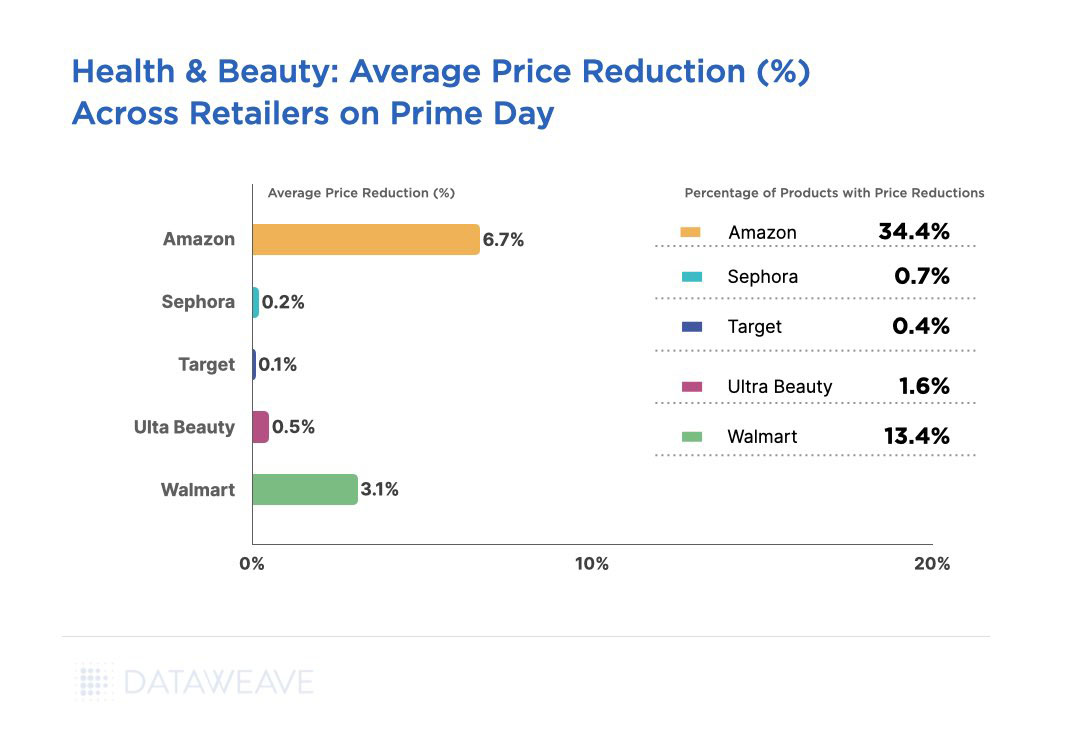
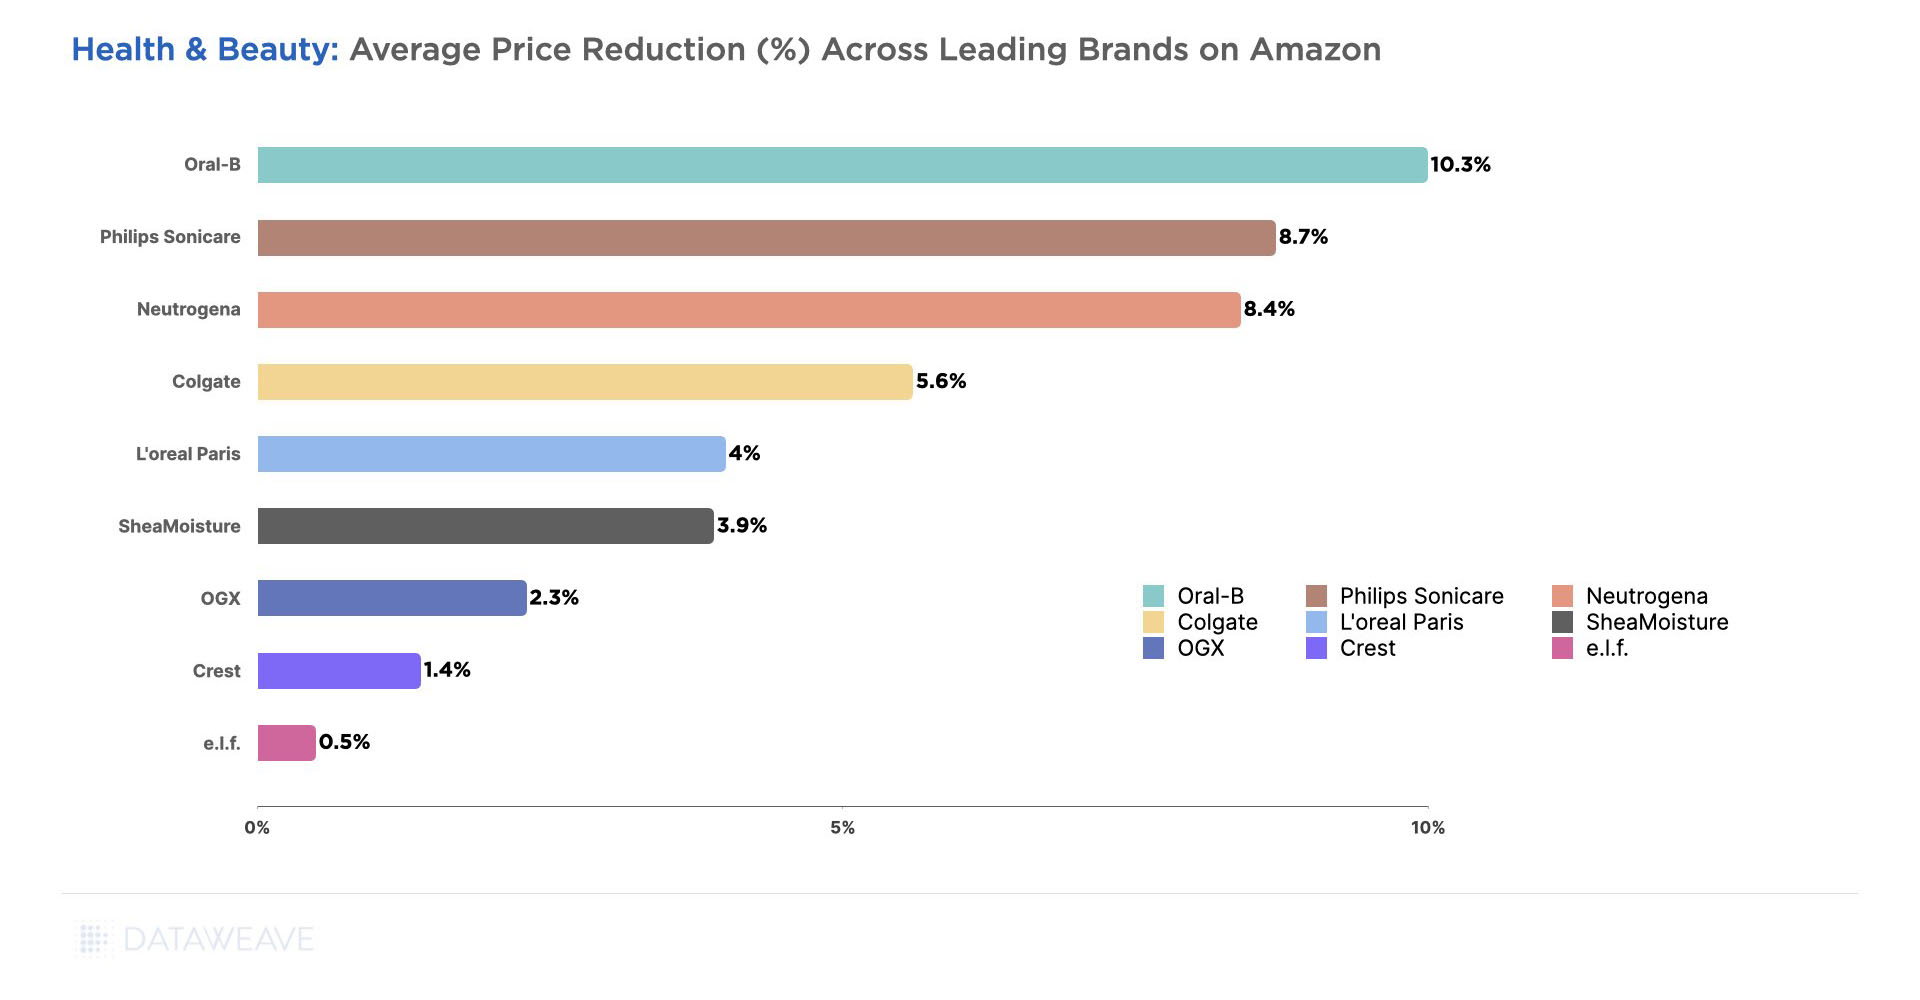
Health & Beauty
- Minimalist saw prices increase 25% year-over-year, the highest in the category, followed by Tresemme at 20% and Oral-B at 17%.
- Neutrogena increased pricing by 14%, while Sun Bum rose 13% and Viking Revolution 12%.
- Nyx Professional Makeup saw price increases of 10%, Dove and L’Oréal Paris both at 8%, and Maybelline at 7%.
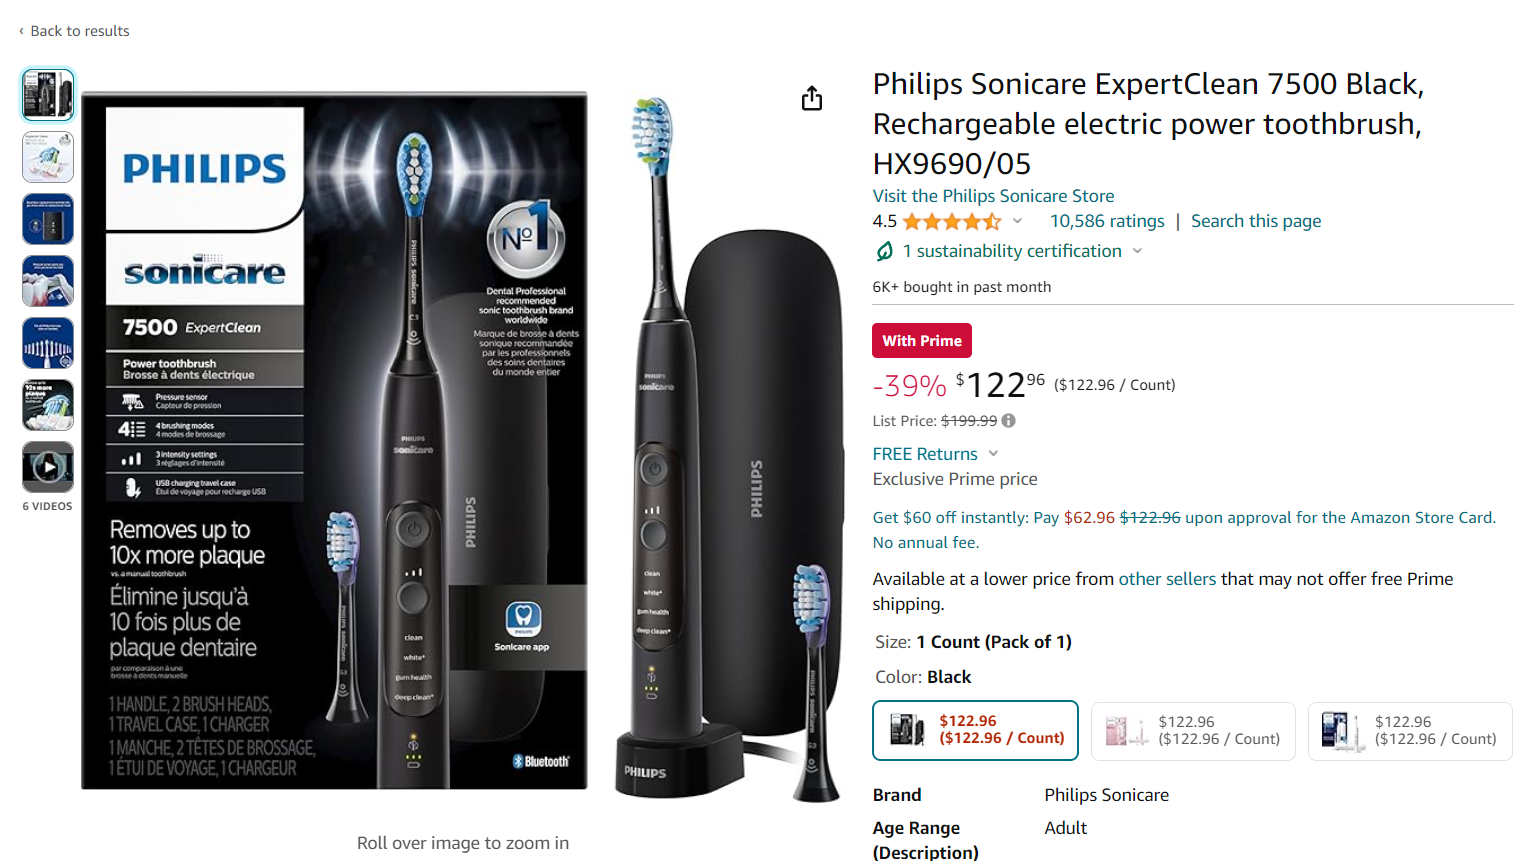
- Value-positioned brands saw modest price increases, with Philips Sonicare (6%), OGX and Banana Boat (both 5%), e.l.f. (4%), and Garnier (3%).
- Notably, Cetaphil, Colgate, and Sensodyne all kept increases to just 1%.
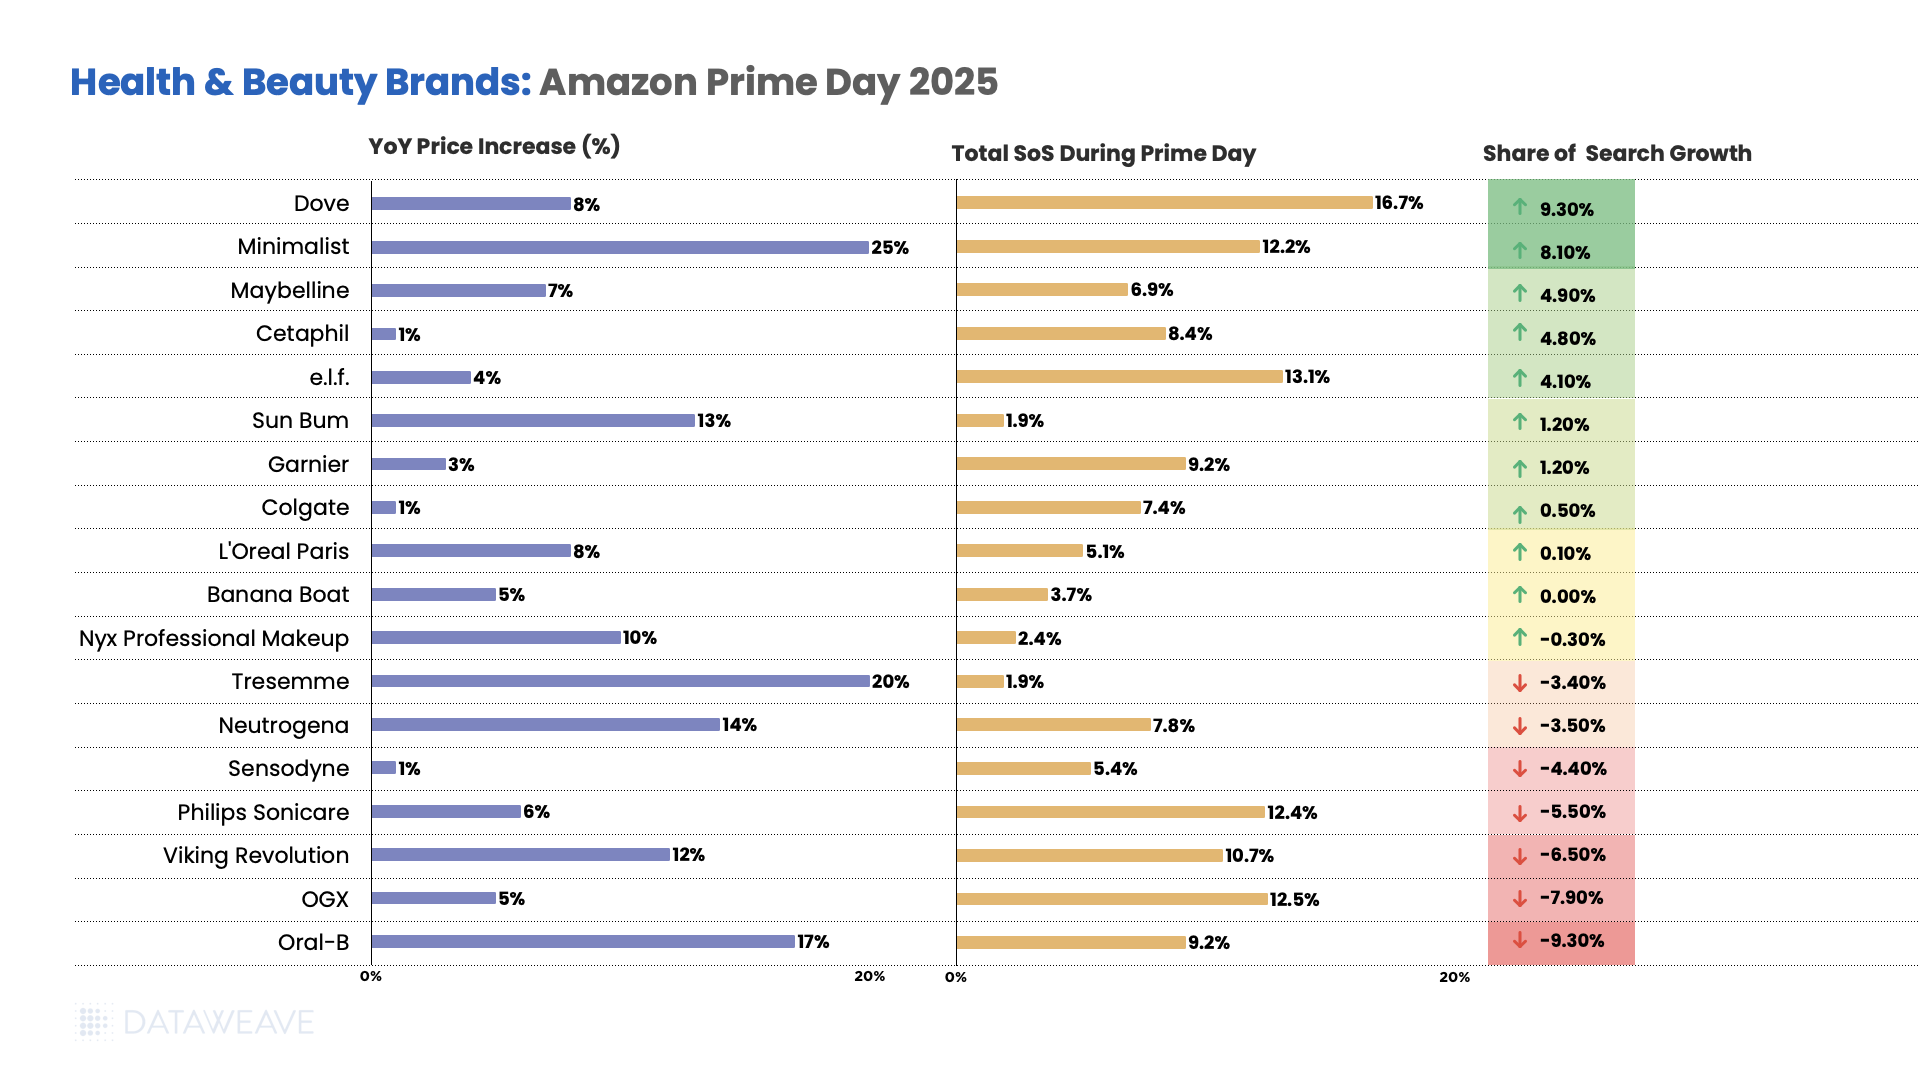
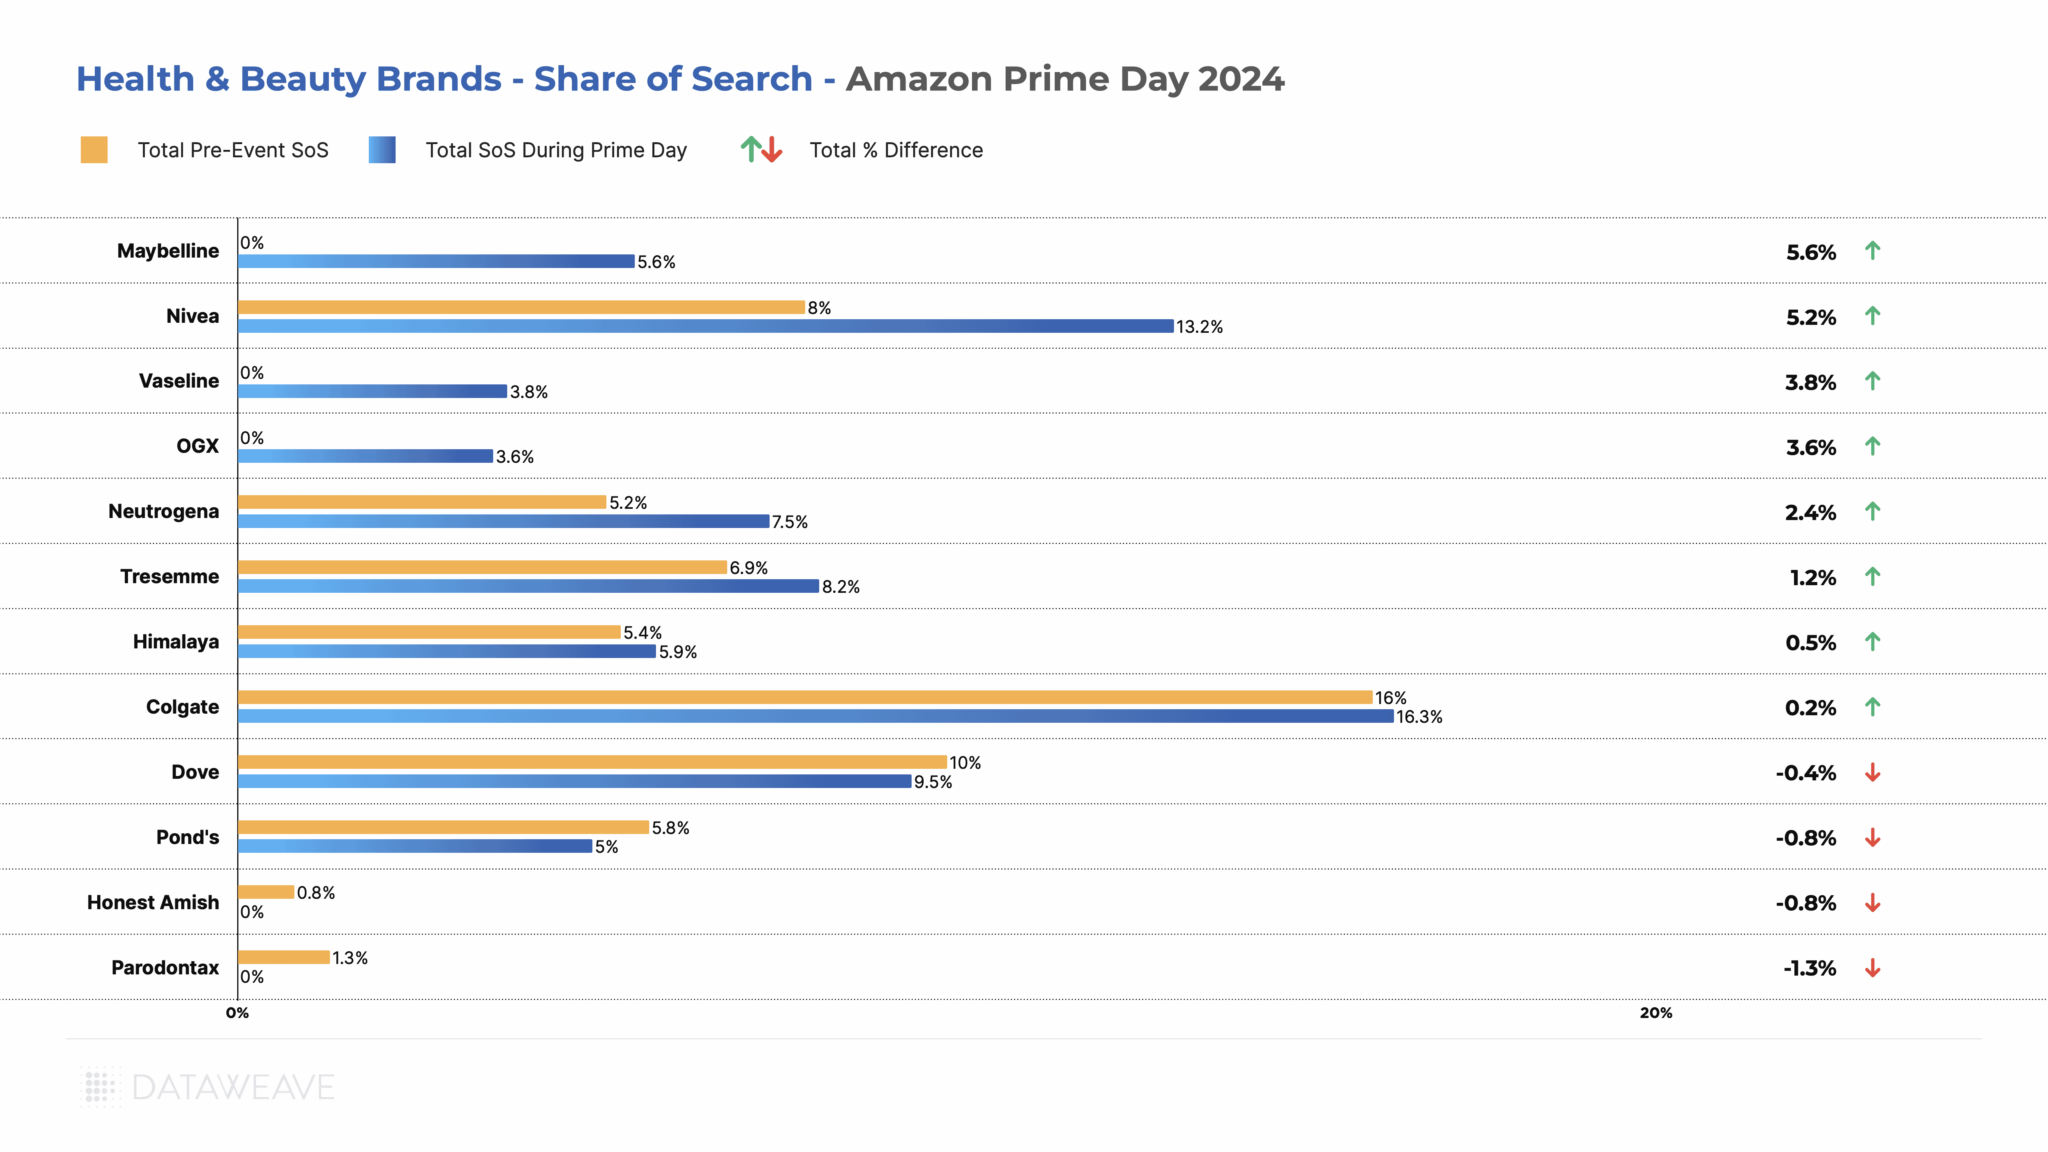
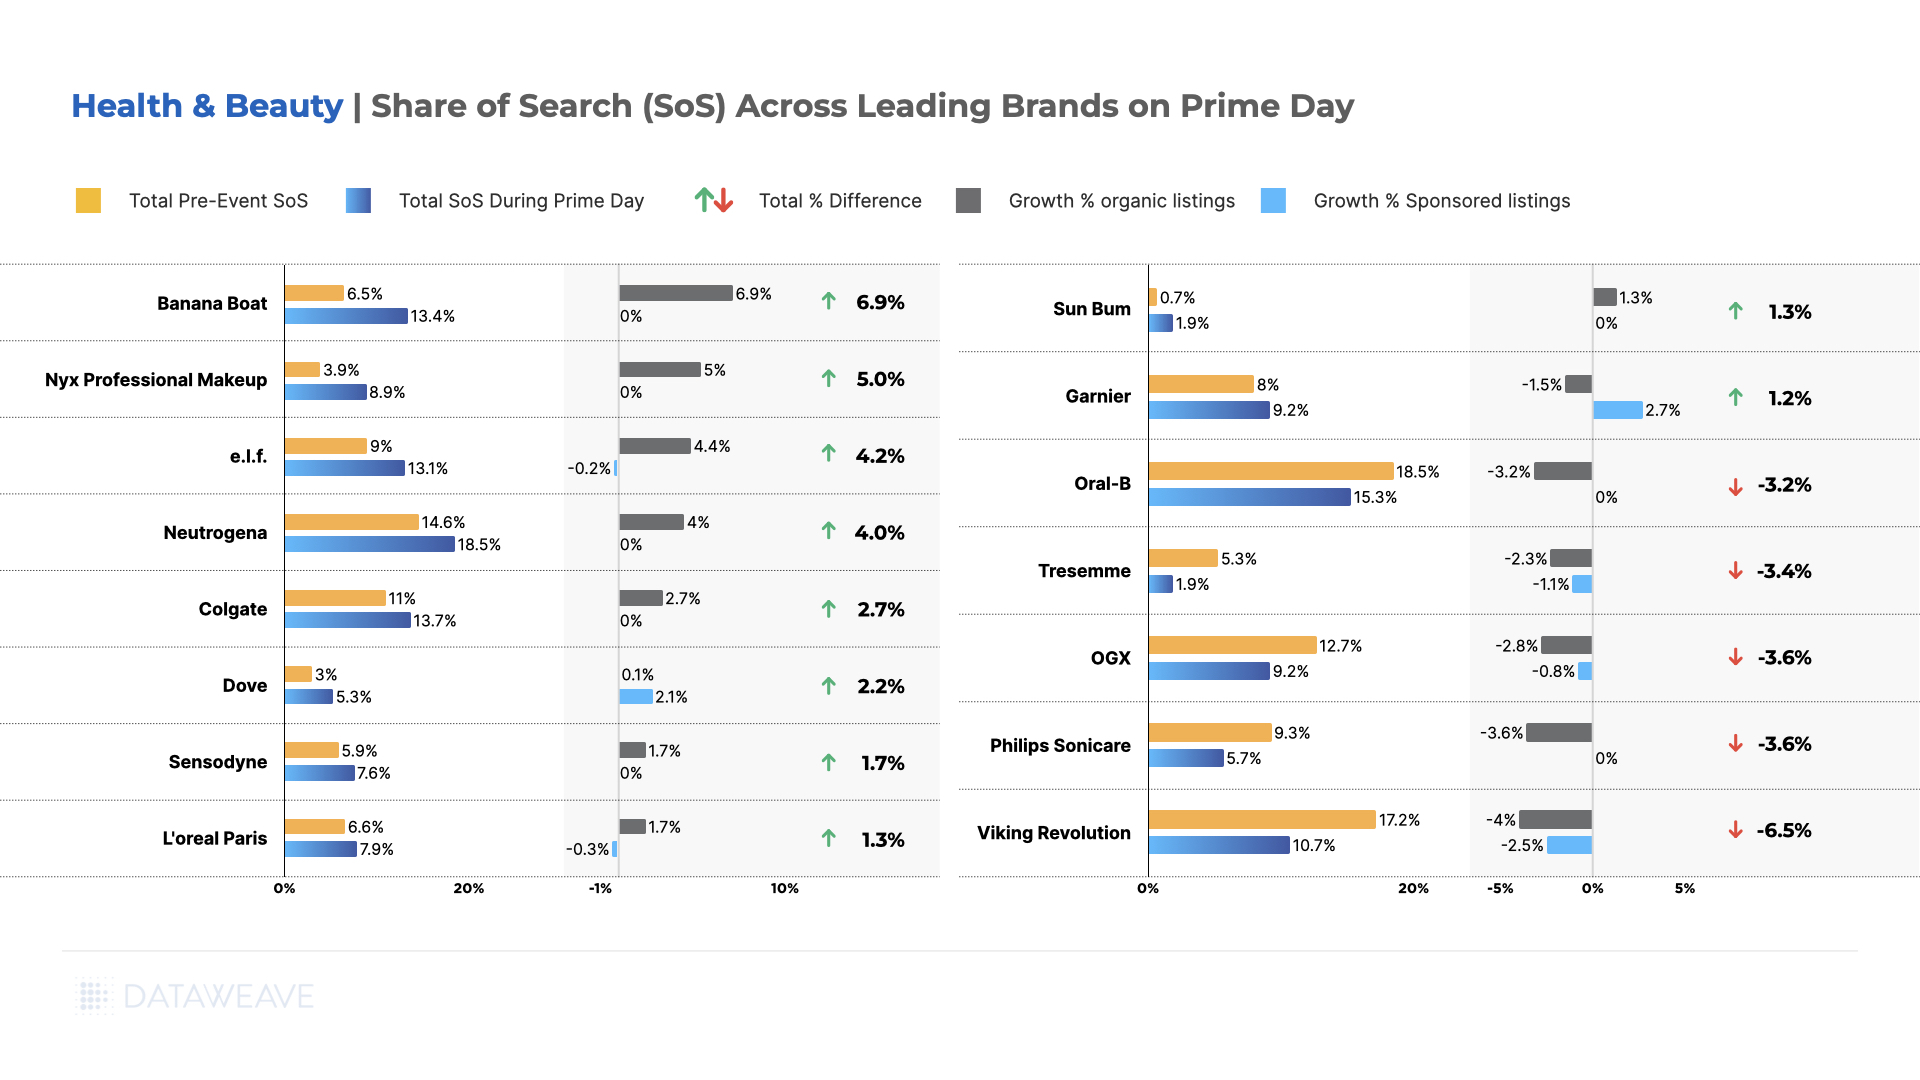
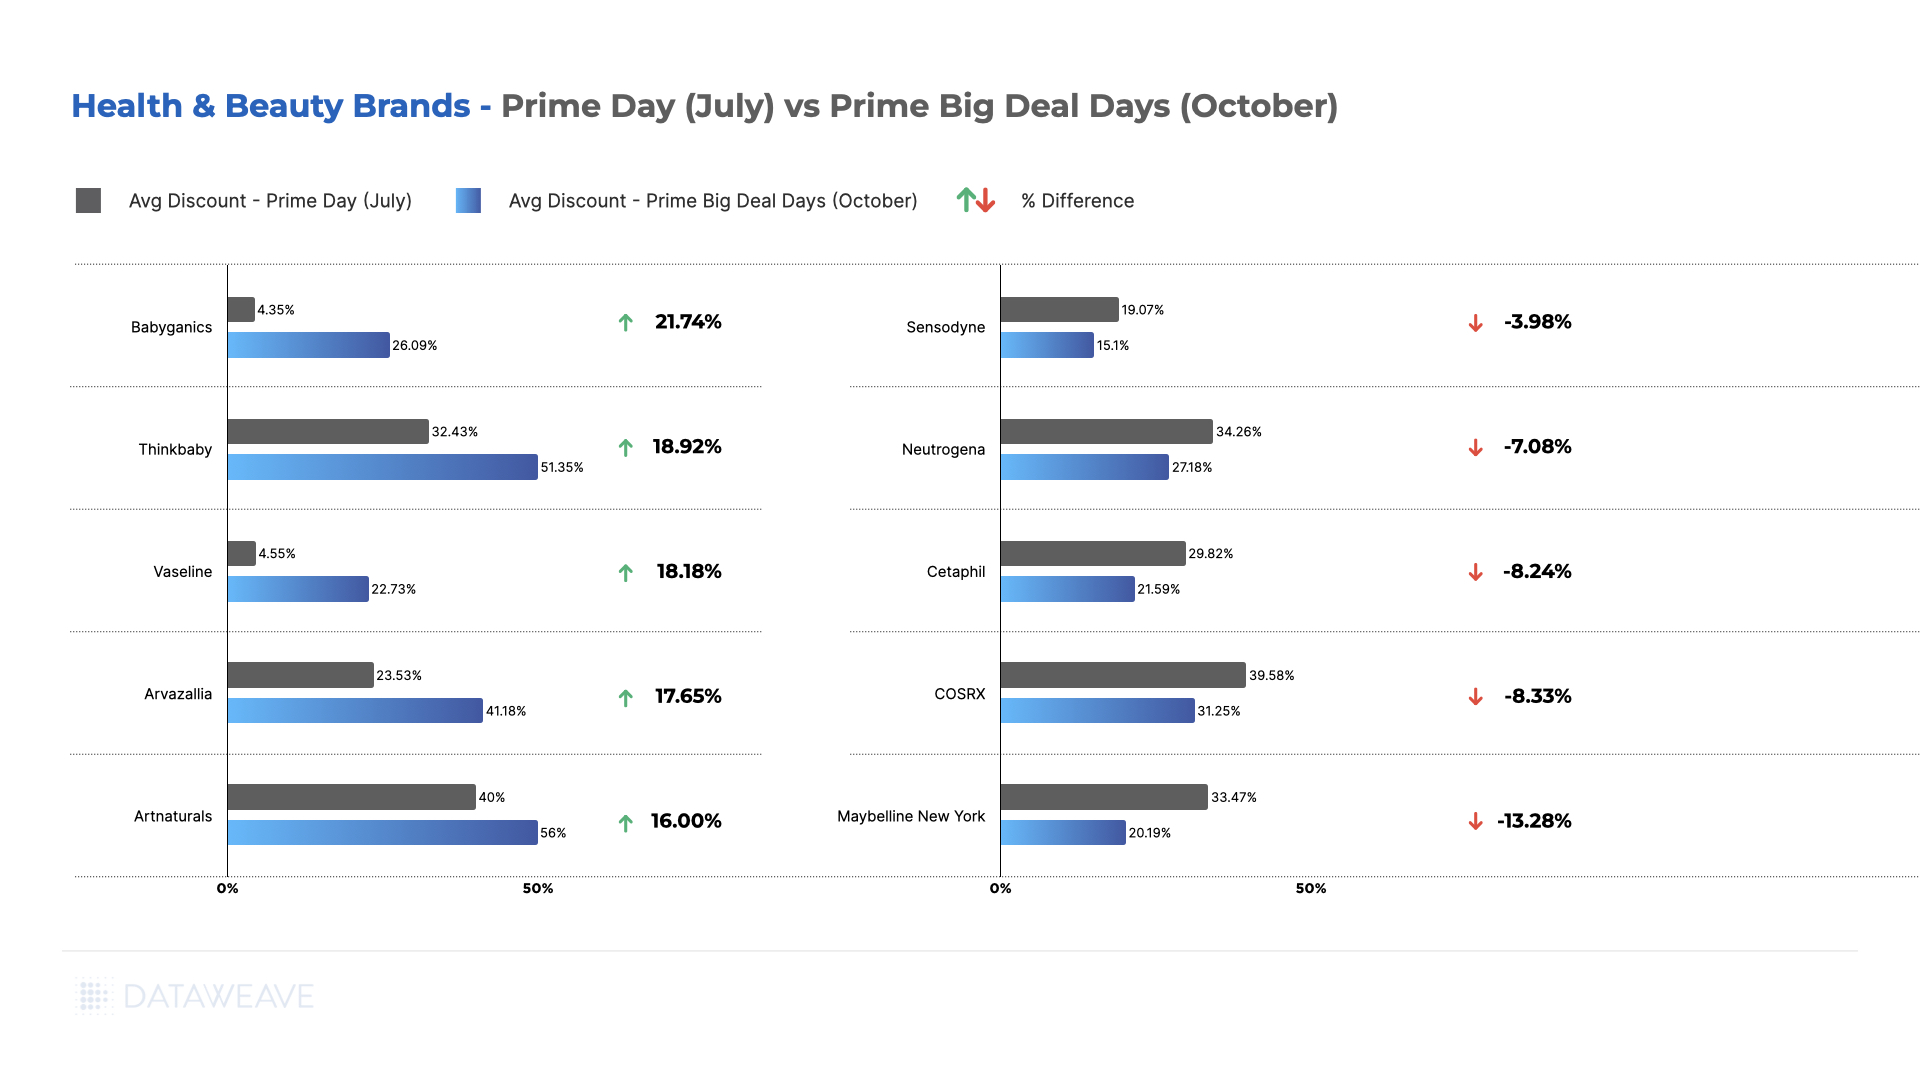
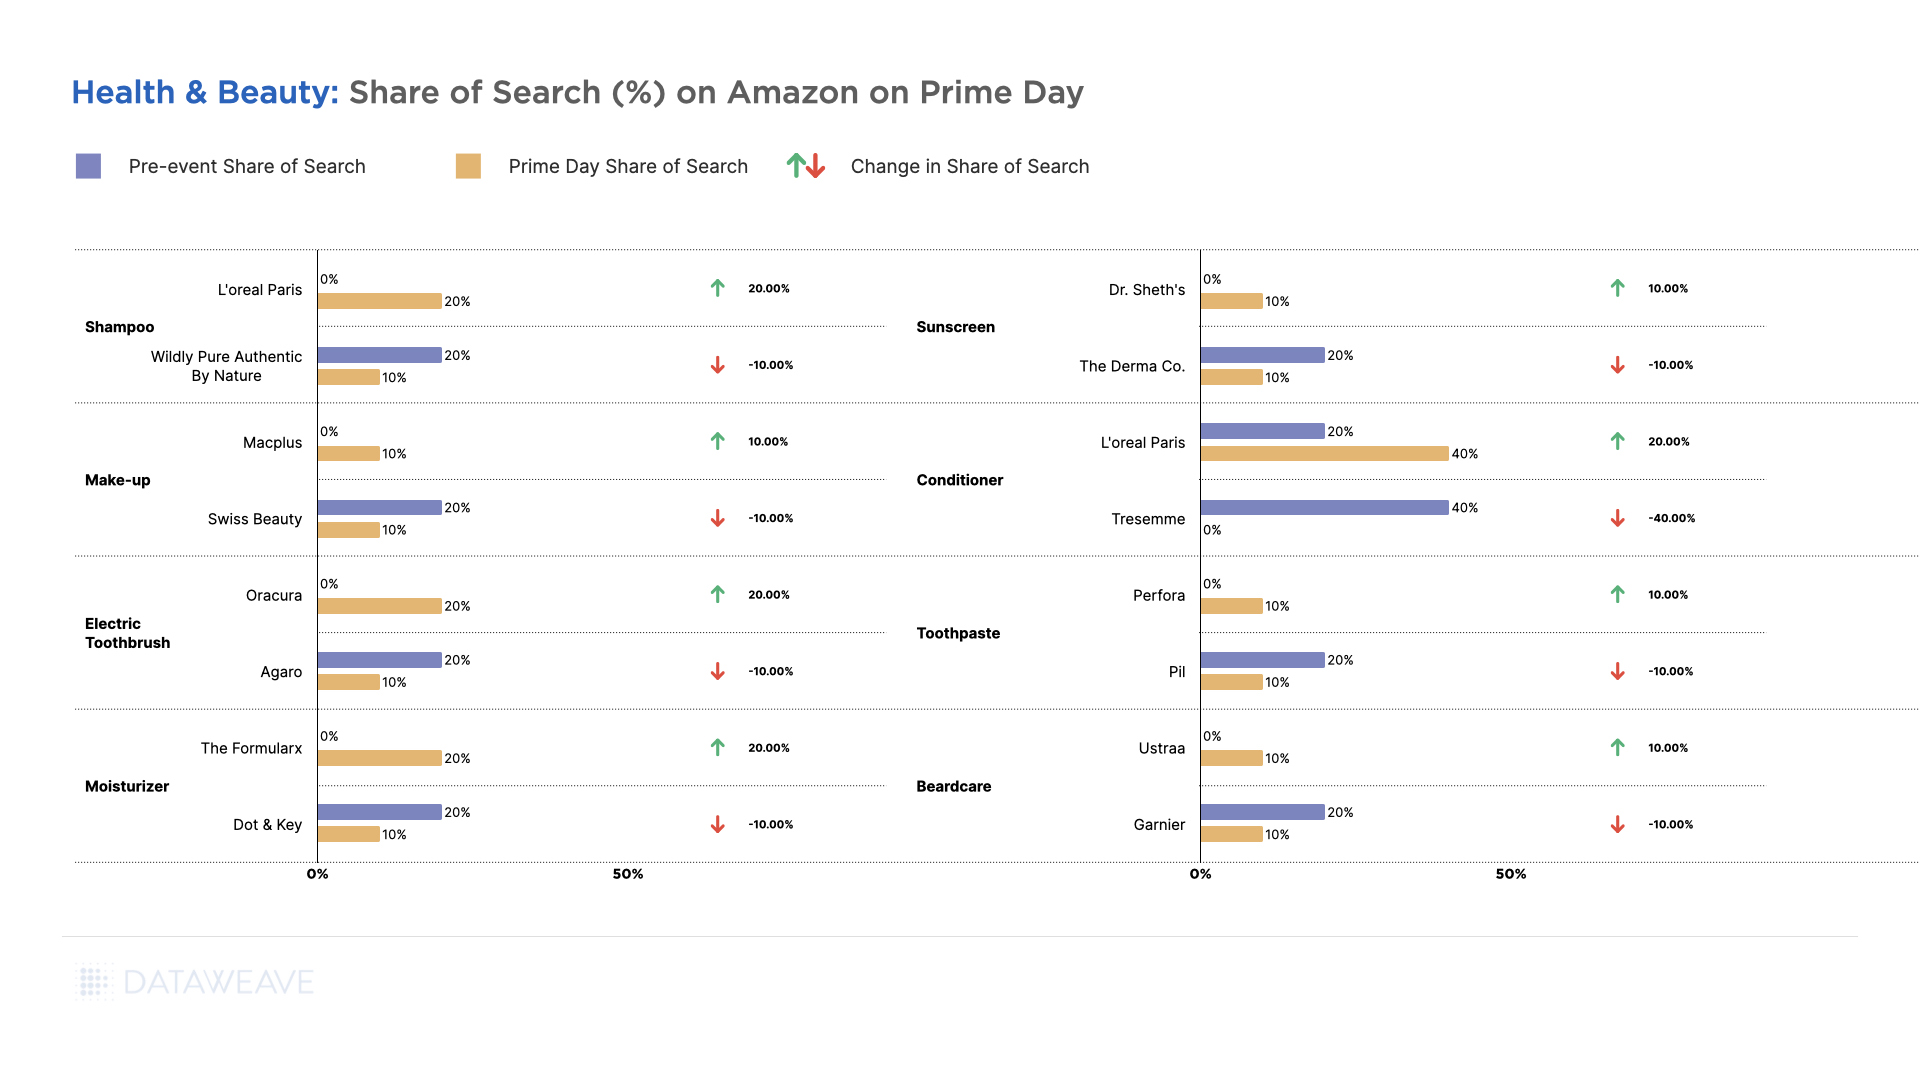
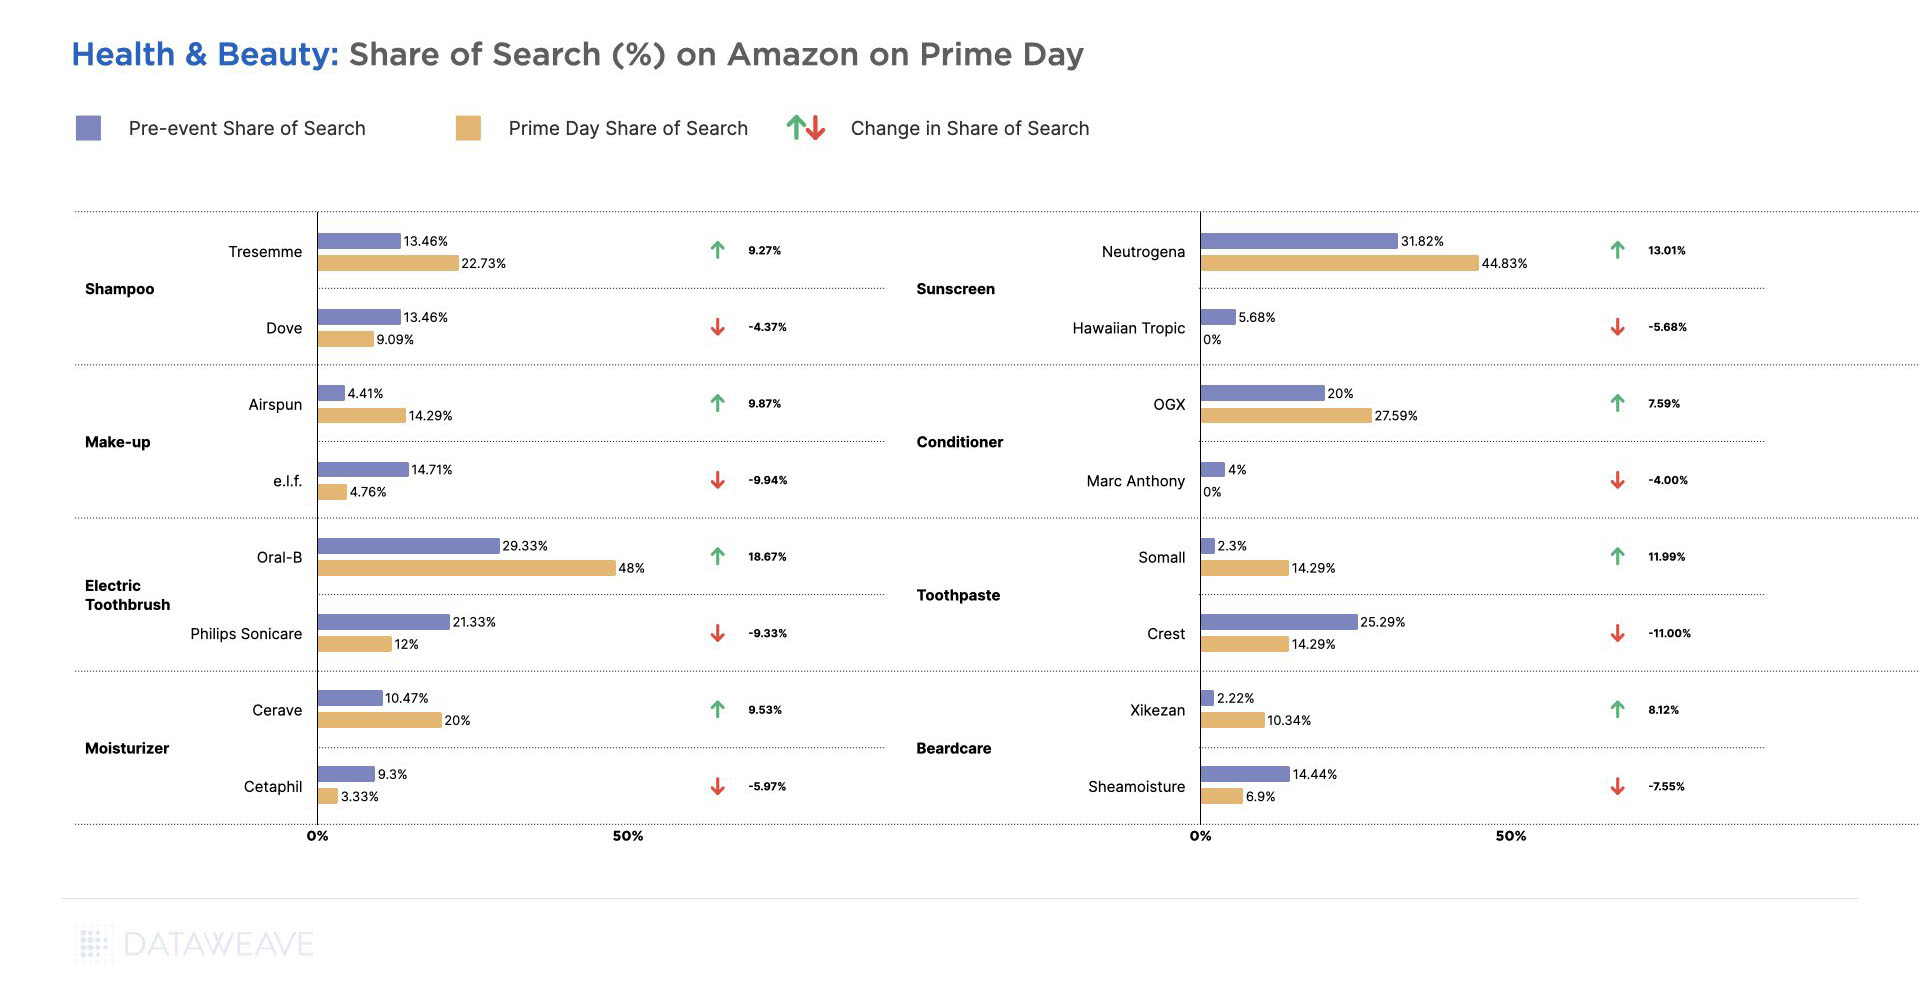
Dove led visibility gains with 9.3% growth along with 8% price increases. Minimalist achieved remarkable 8.1% growth even with the category’s highest 25% price increases, and Maybelline gained 4.9% share with 7% price increases.
Cetaphil improved by 4.8% with minimal 1% price increases, while e.l.f. gained 4.1% share with 4% price increases. However, several established brands lost share, with Oral-B declining most significantly by 9.3% along with 17% price increases, followed by OGX (-7.9%) with 5% price increases, Viking Revolution (-6.5%) with 12% increases, and Philips Sonicare (-5.5%) with 6% price increases.
In Conclusion
Prime Day 2025 underscores the shifting realities of retail, where persistent pricing pressures, evolving consumer behavior, and complex market forces are redefining how promotions are planned and executed. In this environment, success hinges on having the right intelligence at the right time, empowering brands to target promotions strategically, protect margins, and maintain visibility in a crowded marketplace.
As competition intensifies, the ability to anticipate trends and respond with precision will separate market leaders from the rest. At DataWeave, we equip retailers and brands with the insights needed to navigate these changes and make data-backed decisions that drive sustainable growth.
Stay connected to our blog for ongoing analysis of pricing, promotion, and visibility trends or reach out to us today to learn more.