Blog

  • How an American QSR (Quick Service Restaurants) improved its Business ROI Food Apps

    How an American QSR (Quick Service Restaurants) improved its Business ROI Food Apps

    Traditionally, Quick Service Restaurants (QSRs) such as McDonald’s or Burger King, have been strategically operating on a brick and mortar model. However, according to some studies, an average QSR generates as much as 75% of its sales from online orders.

    With the advent of delivery apps such as Uber Eats and Doordash, a significant portion of QSRs’ business has moved to these platforms. The war to top rank on one of these platforms is an even greater feat. With each brand competing for the top listing, it’s much less about the dollars you pay and much more about optimizing your investments.

    The relationship between QSR chains and food delivery apps has its advantages and disadvantages. One of the critical grouses QSRs have against food apps is the incremental marketing spend required to participate on the platform and the inability to measure the impact of their investment. What makes matters worse is the limitation in metrics even available to measure the impact – neither the food apps provide them, nor does anyone else.

    At DataWeave, we have made it our mission to enable QSRs to not only define measurable metrics to achieve a positive ROI for food app marketing investments, but we also equip QSRs with the tools to track their competitive performance at granular, zip code-based level so that localized strategies can be modified as needed. Below is an example of a 1000+ store chain QSR we partnered with to optimize a pre-existing investment made with a large food aggregator app. Within months of engagement with us, they were able to achieve a 3X increase in sales without adding any additional marketing dollars.

    Below are the pain points we identified and solved together:

    1. No Defined Metric

    Problem – No leading metric to track marketing performance

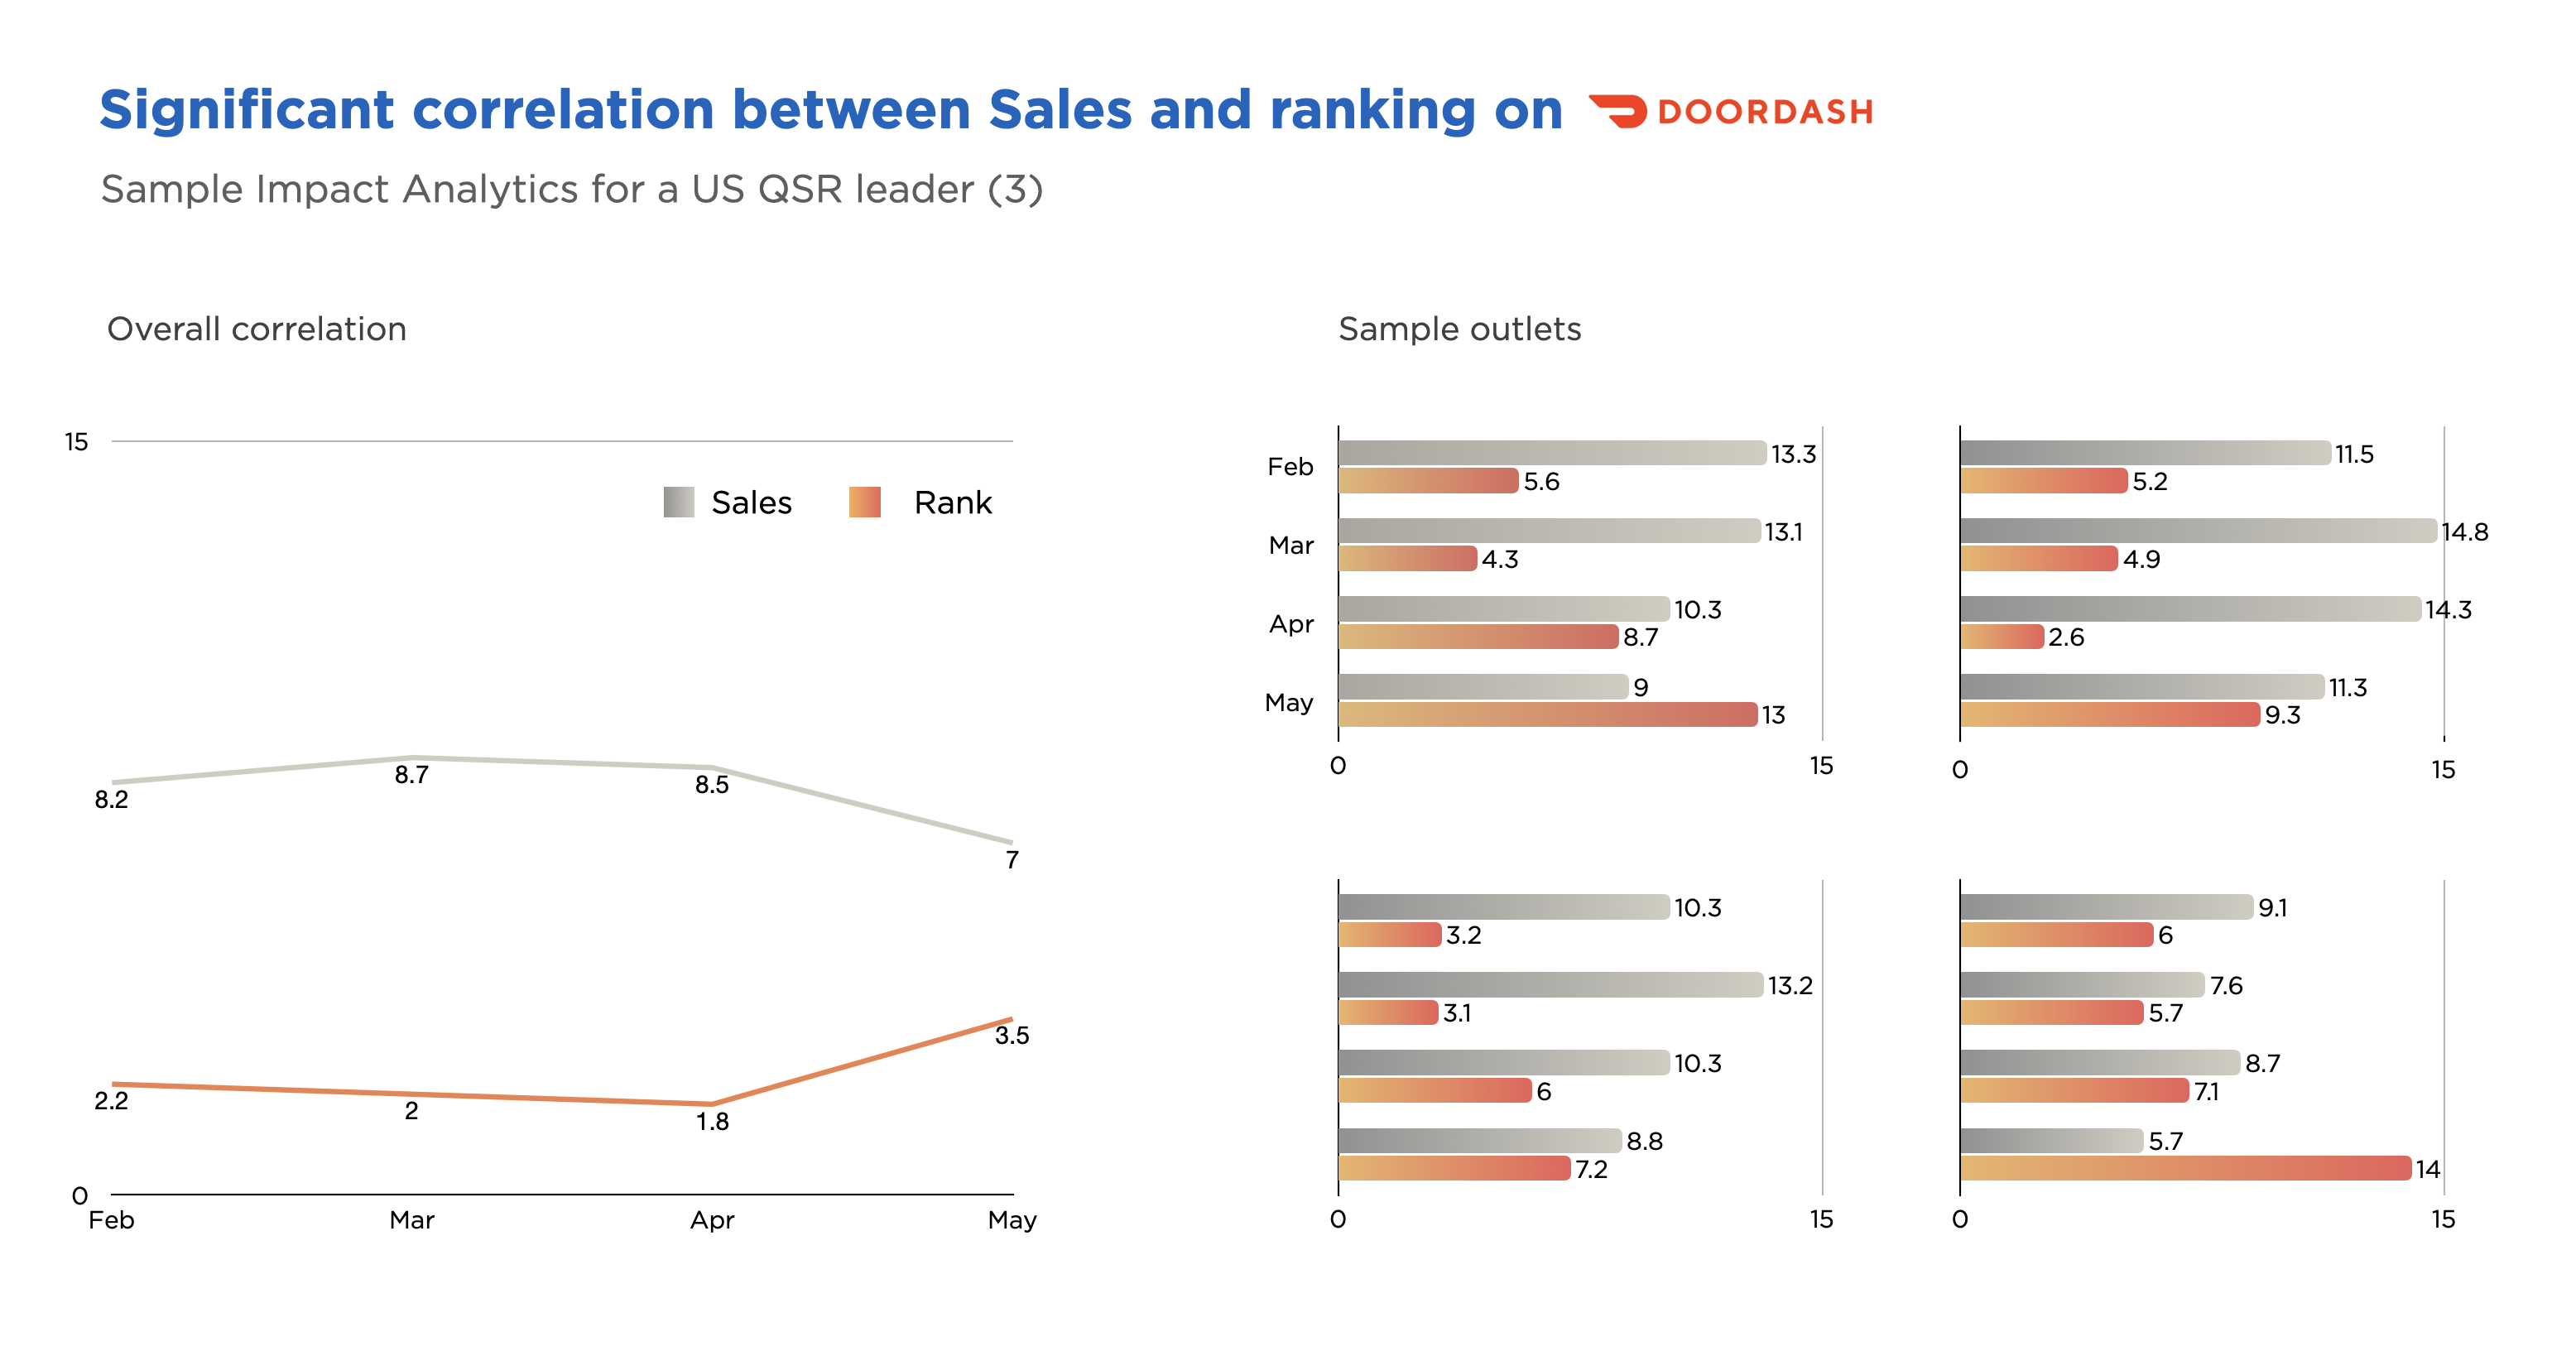
    One of the first issues we realized was that sales was not a good metric for tracking marketing performance as it’s a lagging metric and doesn’t capture the issues that help grow or suppress sales.

    Most of the sales are driven by rank in the cuisine category and searches for branded keywords. But, the QSR chain had no way to track these ranks.

    In fact, 70%+ sales go to the first five restaurants for the category and keyword

    Comparing ranking on food delivery platforms
    Comparing ranking on food delivery platforms across different categories and times

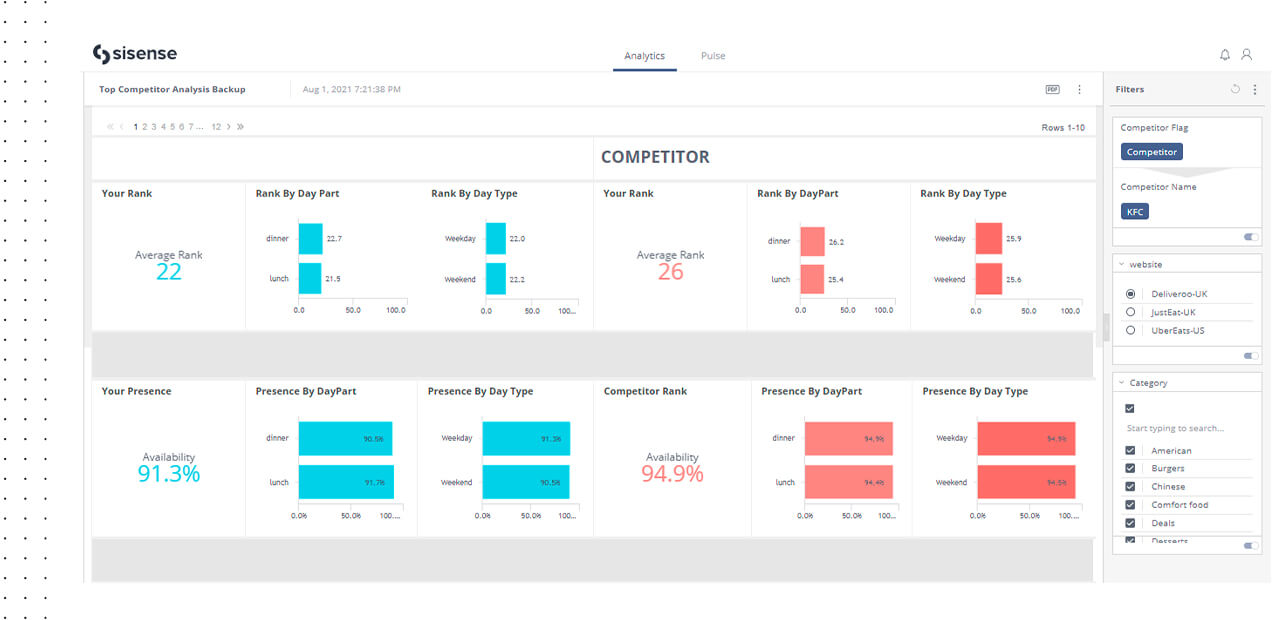
    Solution – Establish ranking as a clear marketing metric

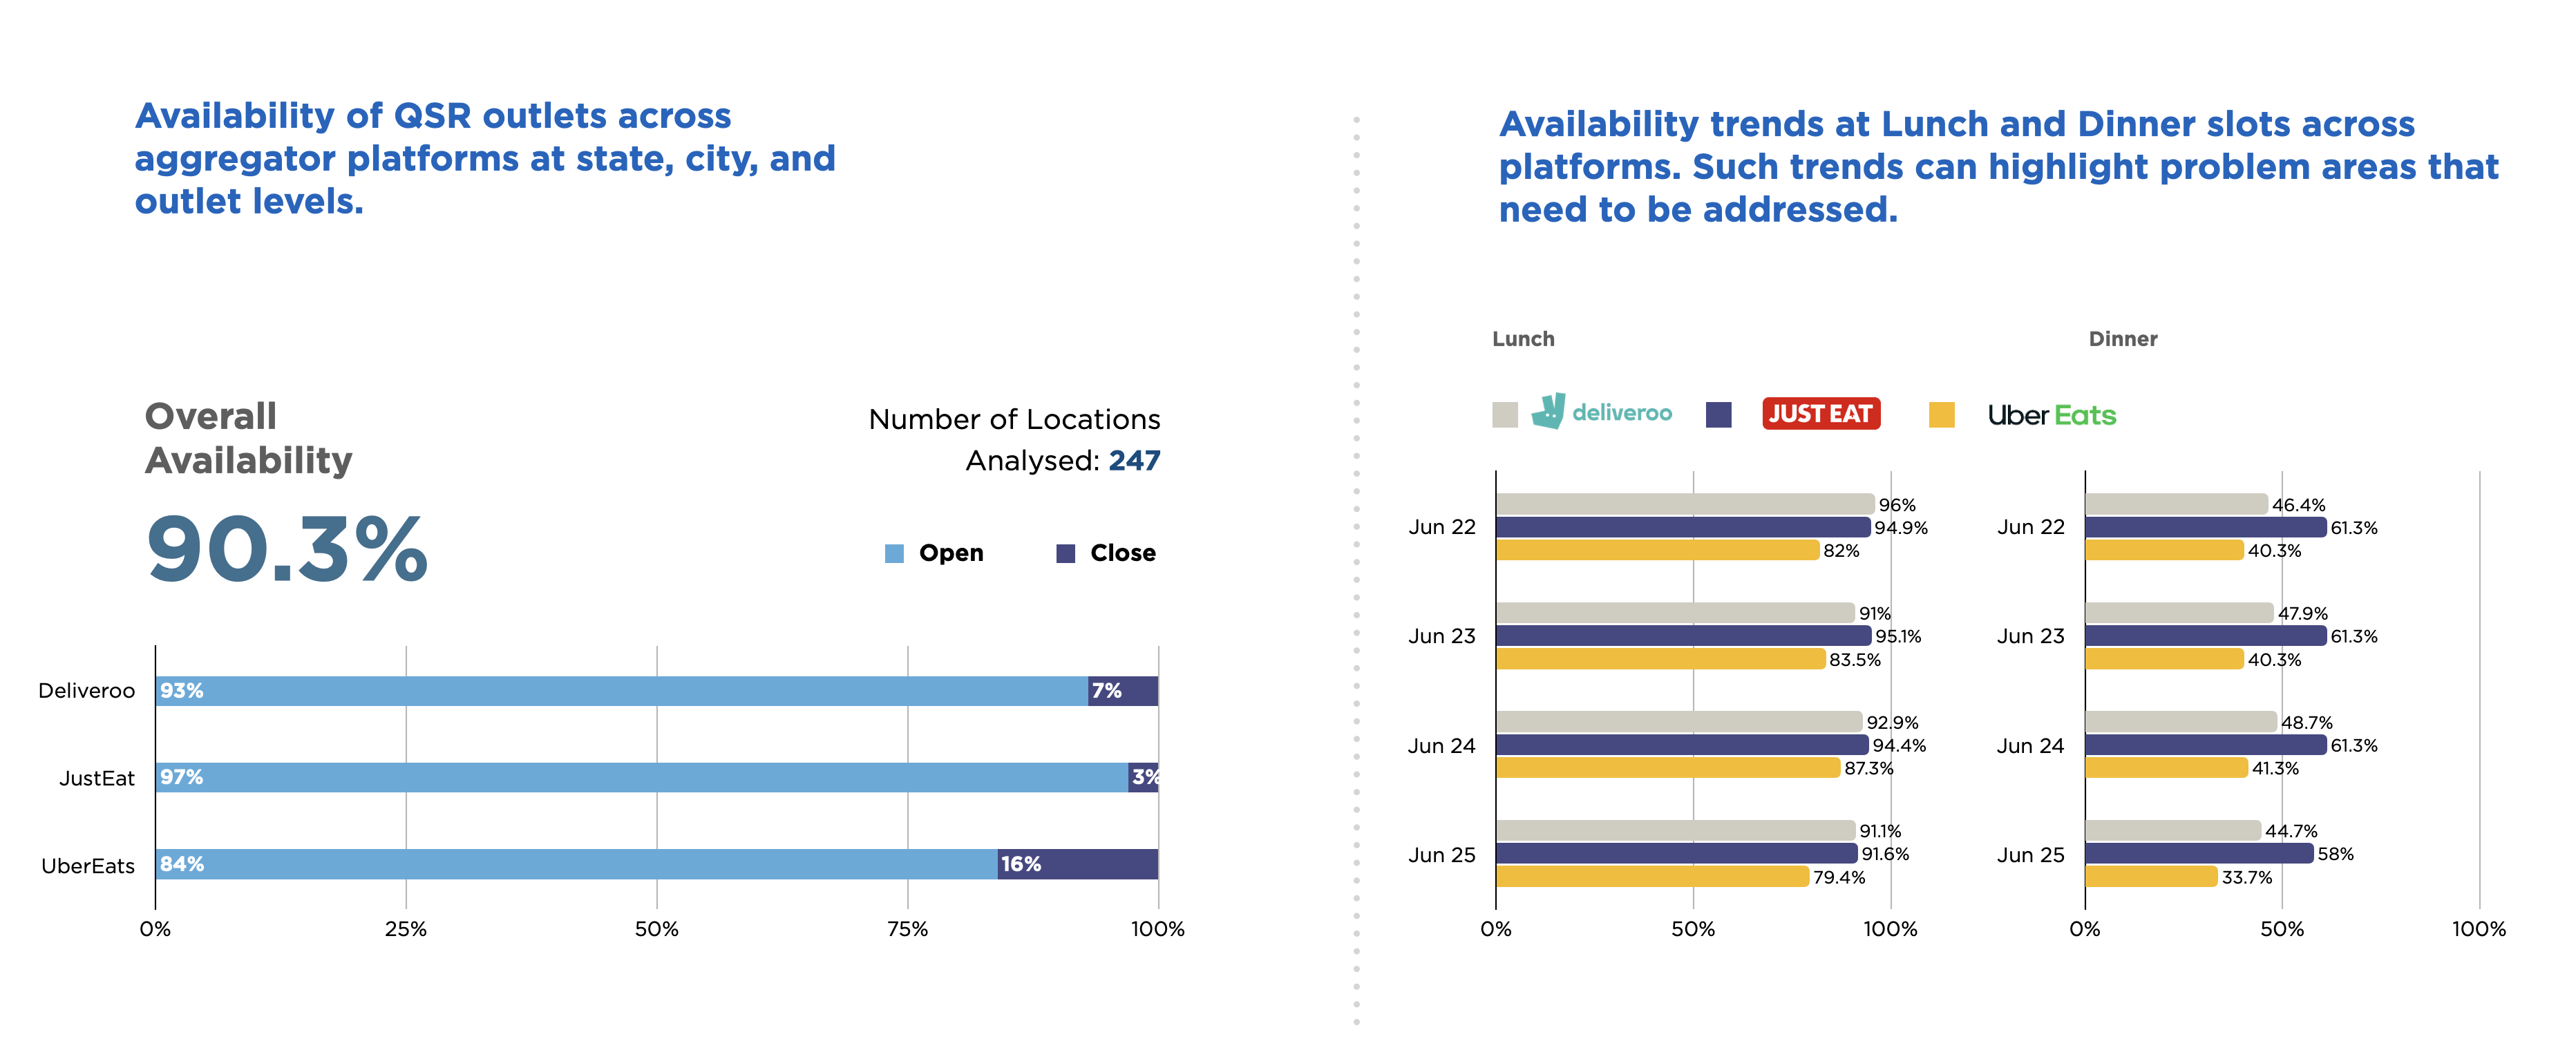
    By aggregating data across different food app platforms comprehensively, i.e. across locations, at different times of the day, we established the ranking of the QSR chain in critical categories and for priority keywords, identifying where they under or over-performed relative to the competition. As we did this daily- this became a straightforward metric that helped establish the performance of their marketing campaign.

    2. Geographical & Categorical Challenges

    Problem: Identifying poor-performing stores and zip codes

    We realized  it was not a simple exercise to identify well performing stores on food apps since sales depend on many factors such as competition, population of the area, local cuisine preference, etc.

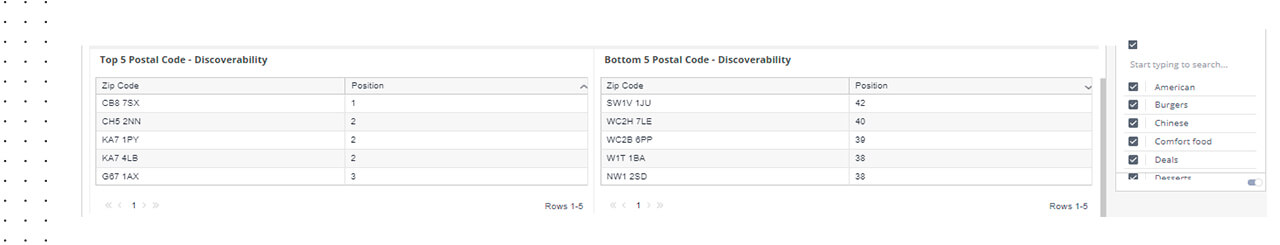
    Solution: Zip Code Ranking and Attributes

    We tracked the ranking of each store within each Zip Code for keywords and created a list of poor-performing stores. We also extracted attributes such as estimated time of arrival (ETAs), Delivery Fee, Ratings, Reviews, etc., for each of these poor performing stores, to identify the reasons for the poor ranking. 

    Analysing key metrics at a store level
    Analysing key metrics at a store level – identifying worst & best performing stores

    E.g., We realized 356 of the stores were not populating on first page results, primarily because of poor ratings and High ETAs. After the focused initiative, 278 of these stores started showing on the first page and increased sales by 23%. 

    3. Sensitivity Analysis Deficiency

    Problem: Not clear about the contribution of Rating, ETAs, Fees, etc. on the Ranking

    The exact ranking algorithms of these food apps are not publicly shared – so the QSR chain wasn’t clear which variable of rating, ETAs, fees, ad spend, or availability contributed more or less to the overall ranking. 

    Solution: Sensitivity analysis for measuring contribution 

    Comprehensive data for multiple zip codes in various timestamps was analyzed to determine which variable contributes most significantly to the rankings and when. We also conducted A/B testing – simultaneously testing two different variables, such as reducing ETAs at one store and improving ad spend at another, calculating which led to greater rank and sales impact.

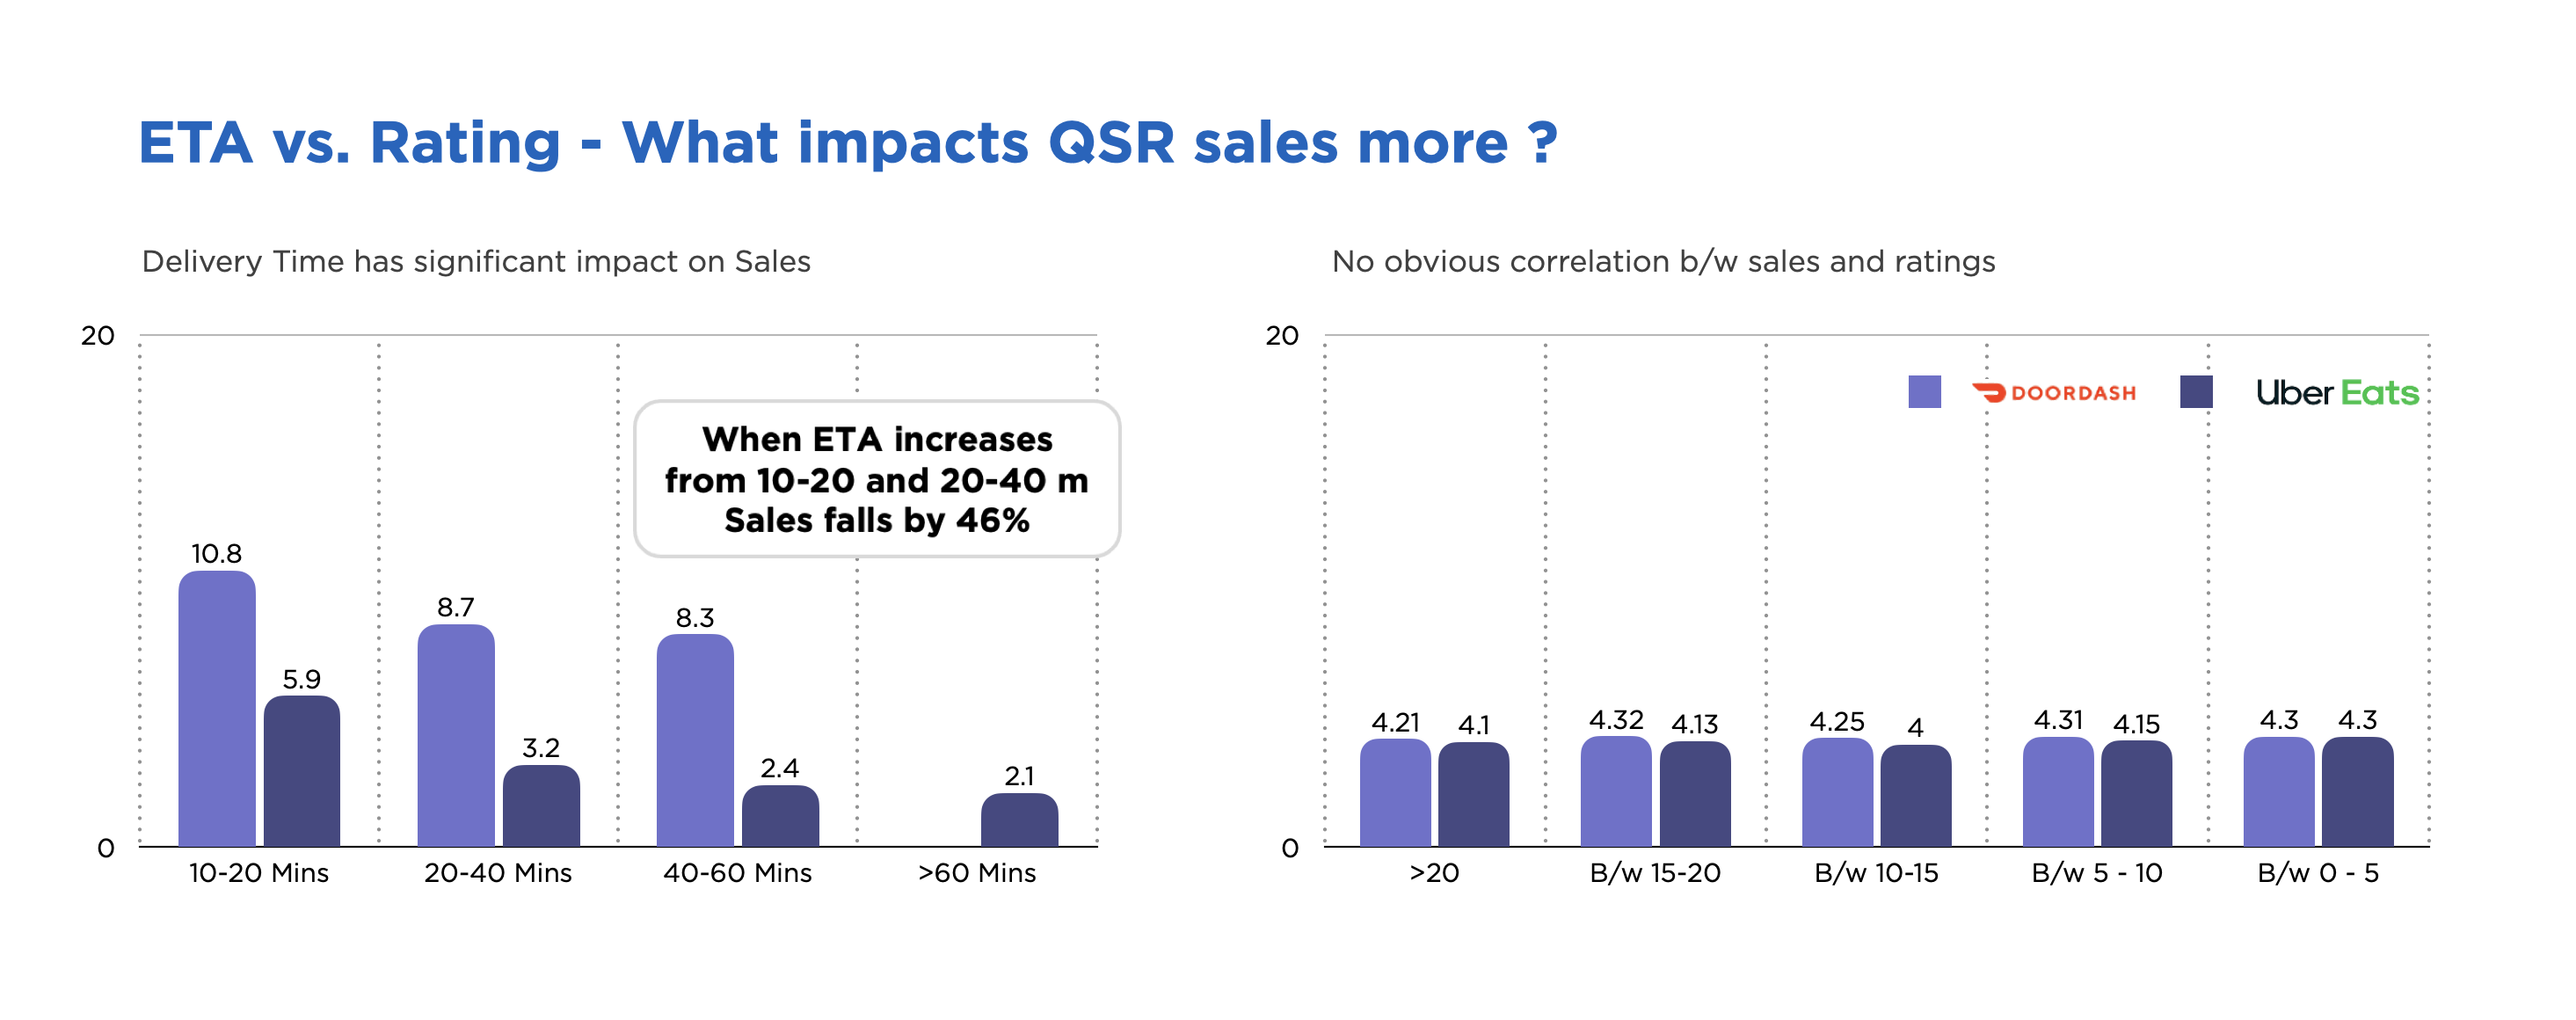
    For example, we realized reducing publicized ETA’s (even by decreasing the delivery radius) contributed much more to improve the rankings than changes to ratings.

    4. An Unknown Competitive Landscape

    Problem: Tracking competitor performance

    For example, we found the QSR chain performed well in key urban centers, but the competition was doing even better, but there wasn’t a good way to track and compare the performance of the competitors.

    Solution:

    We started tracking the QSR chain and the competition for each of the metrics and started comparing performance.

    Analysing competitive performance
    Analysing competitive performance on key metrics such as ETA, Availability etc

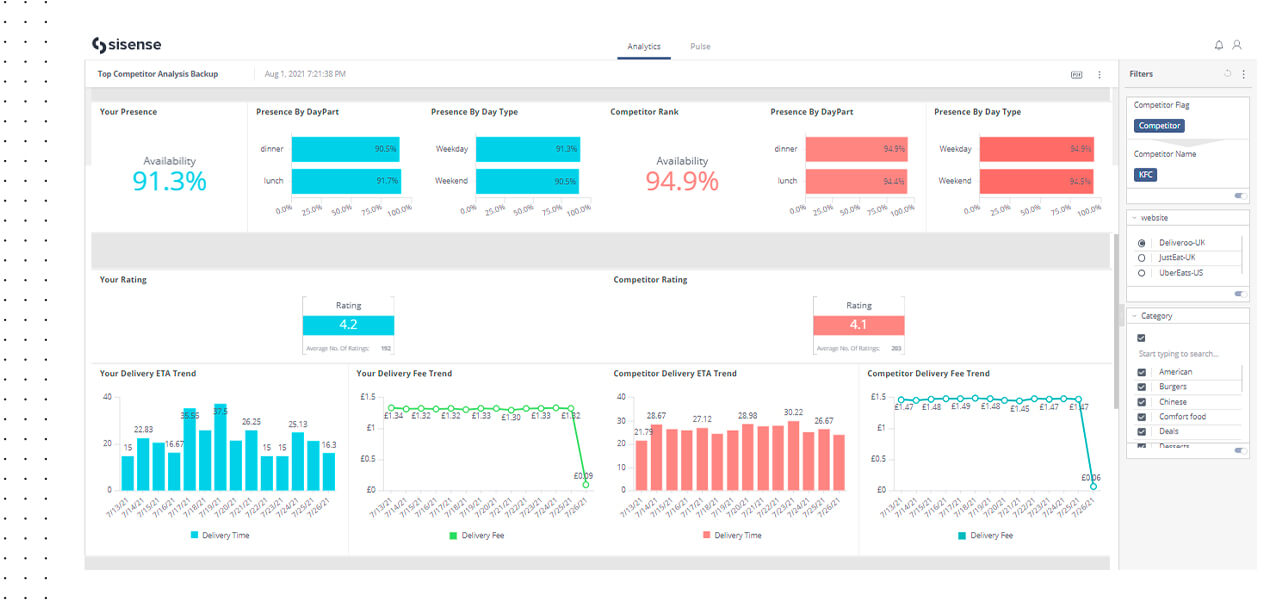
    We quickly realized ranking started quickly improving as we gained a slight edge in each metric against the competitors. For example, 5 minutes less ETA adds to higher ranking.

    In six months of this exercise with the QSR chain, we improved the average ranking from 24 to 11 for the QSR chain, getting them featured on the first page.

    5. Blind Advertising Investment Opportunities

    Problem: 

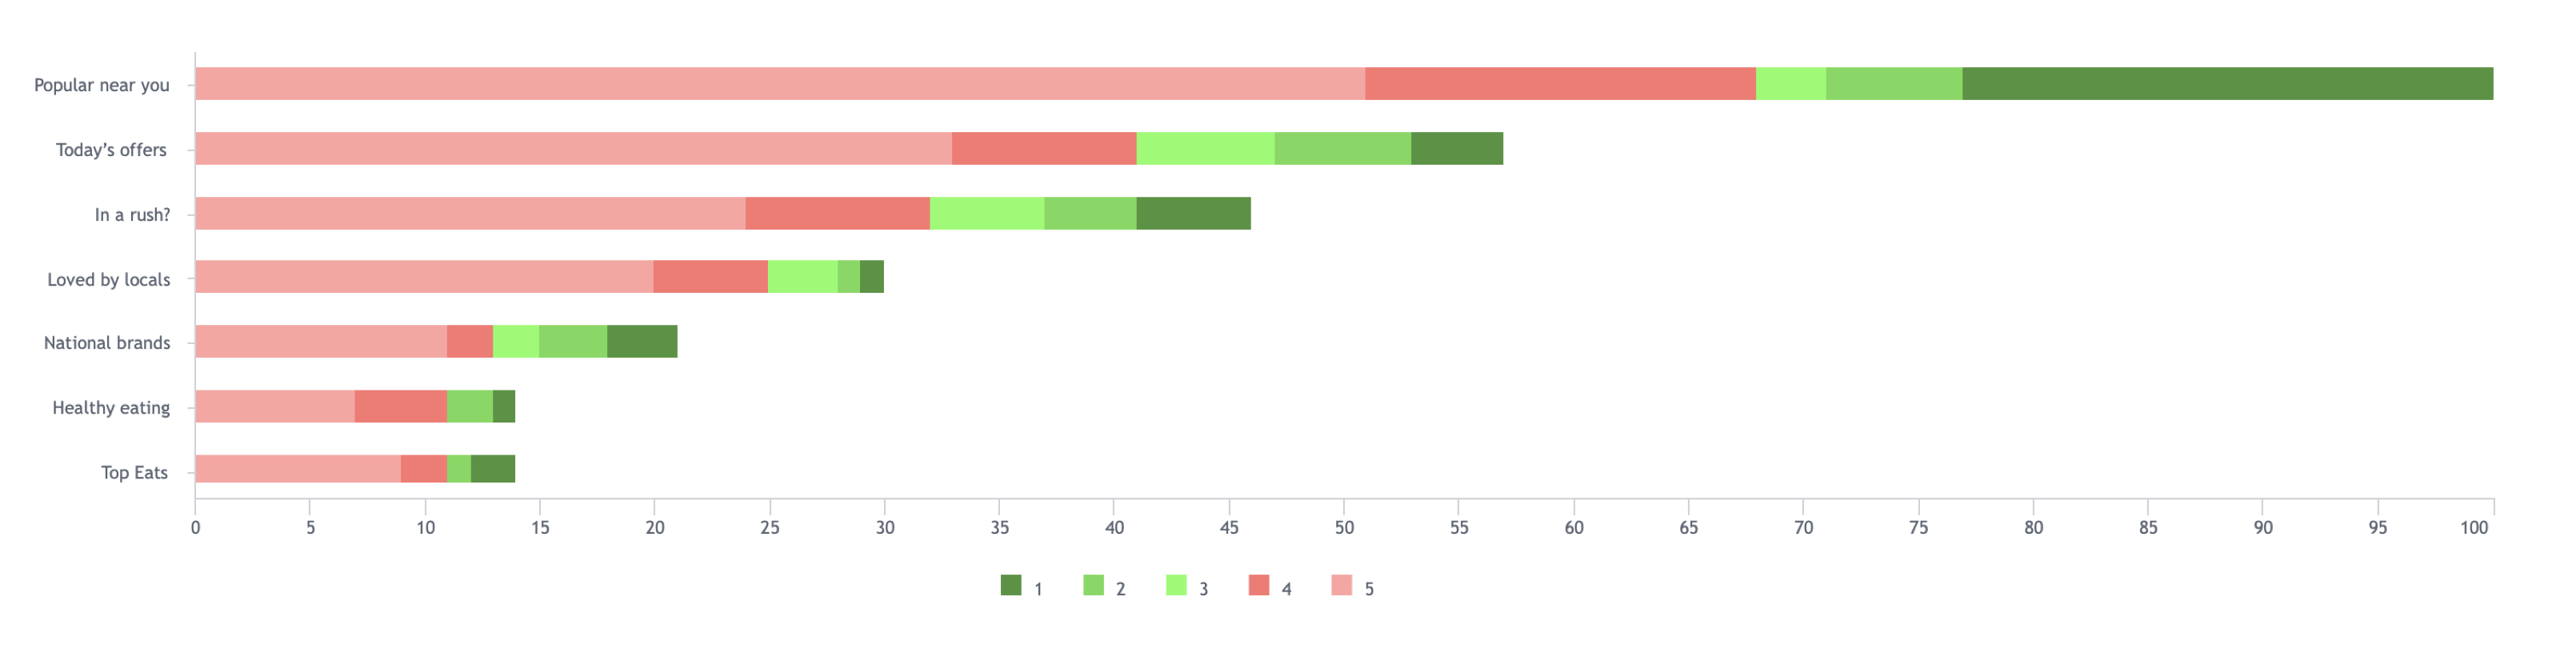
    The QSR chain was not clear on which banners (Popular near you, National Favorites, etc.)  to choose to invest in, and had to depend on the recommendations of the food platforms entirely. 

    They weren’t even provided a clear view of which position made the banner visible and at what rank among those banners was their promo visible. They were at times the 7th promo in the 6th banner, which has almost zero probability of being discovered by the user – this happened despite paying heavily for the banners.

    Solution: 

    We aggregated data for all banners populated within each zip code and found out the ranking and in which position the QSR chain was visible.

    Analysing right banners
    Identifying and analysing right banners for advertising spends

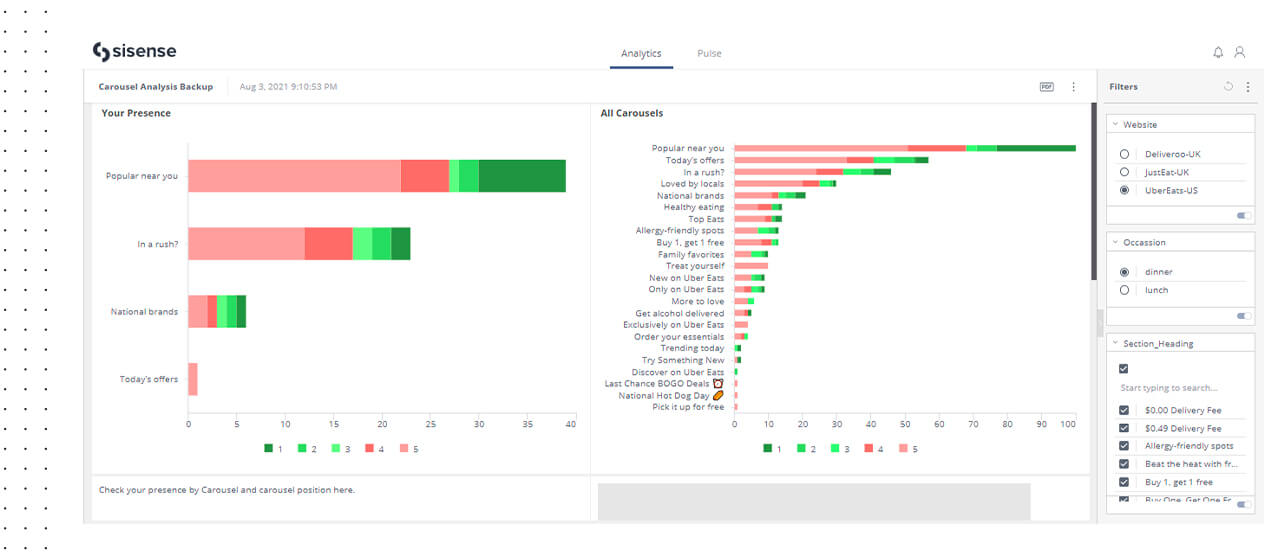
    The QSR chain invested in 630 zip code-based banners with guaranteed visibility, but our assessment indicated the banners were only visible in 301 zip codes. After selecting suitable banners for promotions, we improved visibility to 533 zip codes within enhancing the budget.  

    We are now using the same strategy for refining discounts, offers, promotions, and coupons. 

    6. Lack of Campaign Performance Monitoring

    Problem: Unsure of the long-term impact of marketing spend

    In general, increasing marketing spend does give a temporary boost to sales, but the QSR chain’s question was, how can we measure the long-term impact i.e., ranking keywords and the targeted zip codes.

    Solution: 

    We created a simple widget for every marketing campaign which showed the rank for the keywords for selected zip codes before the campaign, during the campaign, and post the campaign, clearly establishing the midterm impact of the campaign. This constant monitoring allowed the QSR to also quickly pivot on their strategy on account of national holidays etc, and act accordingly.

    7. Non-Existent ROI Measurement

    Problem: Establishing the impact of ranking on sales

    Though the QSR chain could track sales that were coming via the food app channel, they had no way of knowing incremental organic volume driven by marketing efforts. 

    One missing variable here was how much of extra sales could be attributed to improvement of QSR ranking? 

    Solution: 

    By combining the sales data with aggregated insights over time, we established for the QSR chain how much increase in sales they could anticipate from an increase in ranking, also knowing which changed variables led to the percentage of change increase.

    So, in essence, we were able to tell the QSR chain that for each store how much sales would increase by improving ETAs, rating, ad visibility, availability, etc., enabling precise ROI calculations for each intervention they make for their stores.

    Increasing sales by 3x within six months was only the beginning, and the journey of driving marketing efficiency using competitive and channel data has only just begun. 

    DataWeave for QSRs

    DataWeave has been working with global QSR chains, helping them drive their growth on aggregator platforms by enabling them to monitor their key metrics, diagnose improvement areas, recommend action, and measure interventions’ impact. DataWeave’s strategy eliminates the dependence on food apps for accurate data. We aggregate food app data and websites to help you with analysis and the justification of marketing spend and drive 10-15% growth.

    DataWeave’s strategy eliminates the dependence on food apps for accurate data. We aggregate food app data and websites to help you with analysis and the justification of marketing spend and drive 10-15% growth.

    If you want to know learn how your brand can leverage Dataweave’s data insights and improve sales, then click here to sign up for a demo
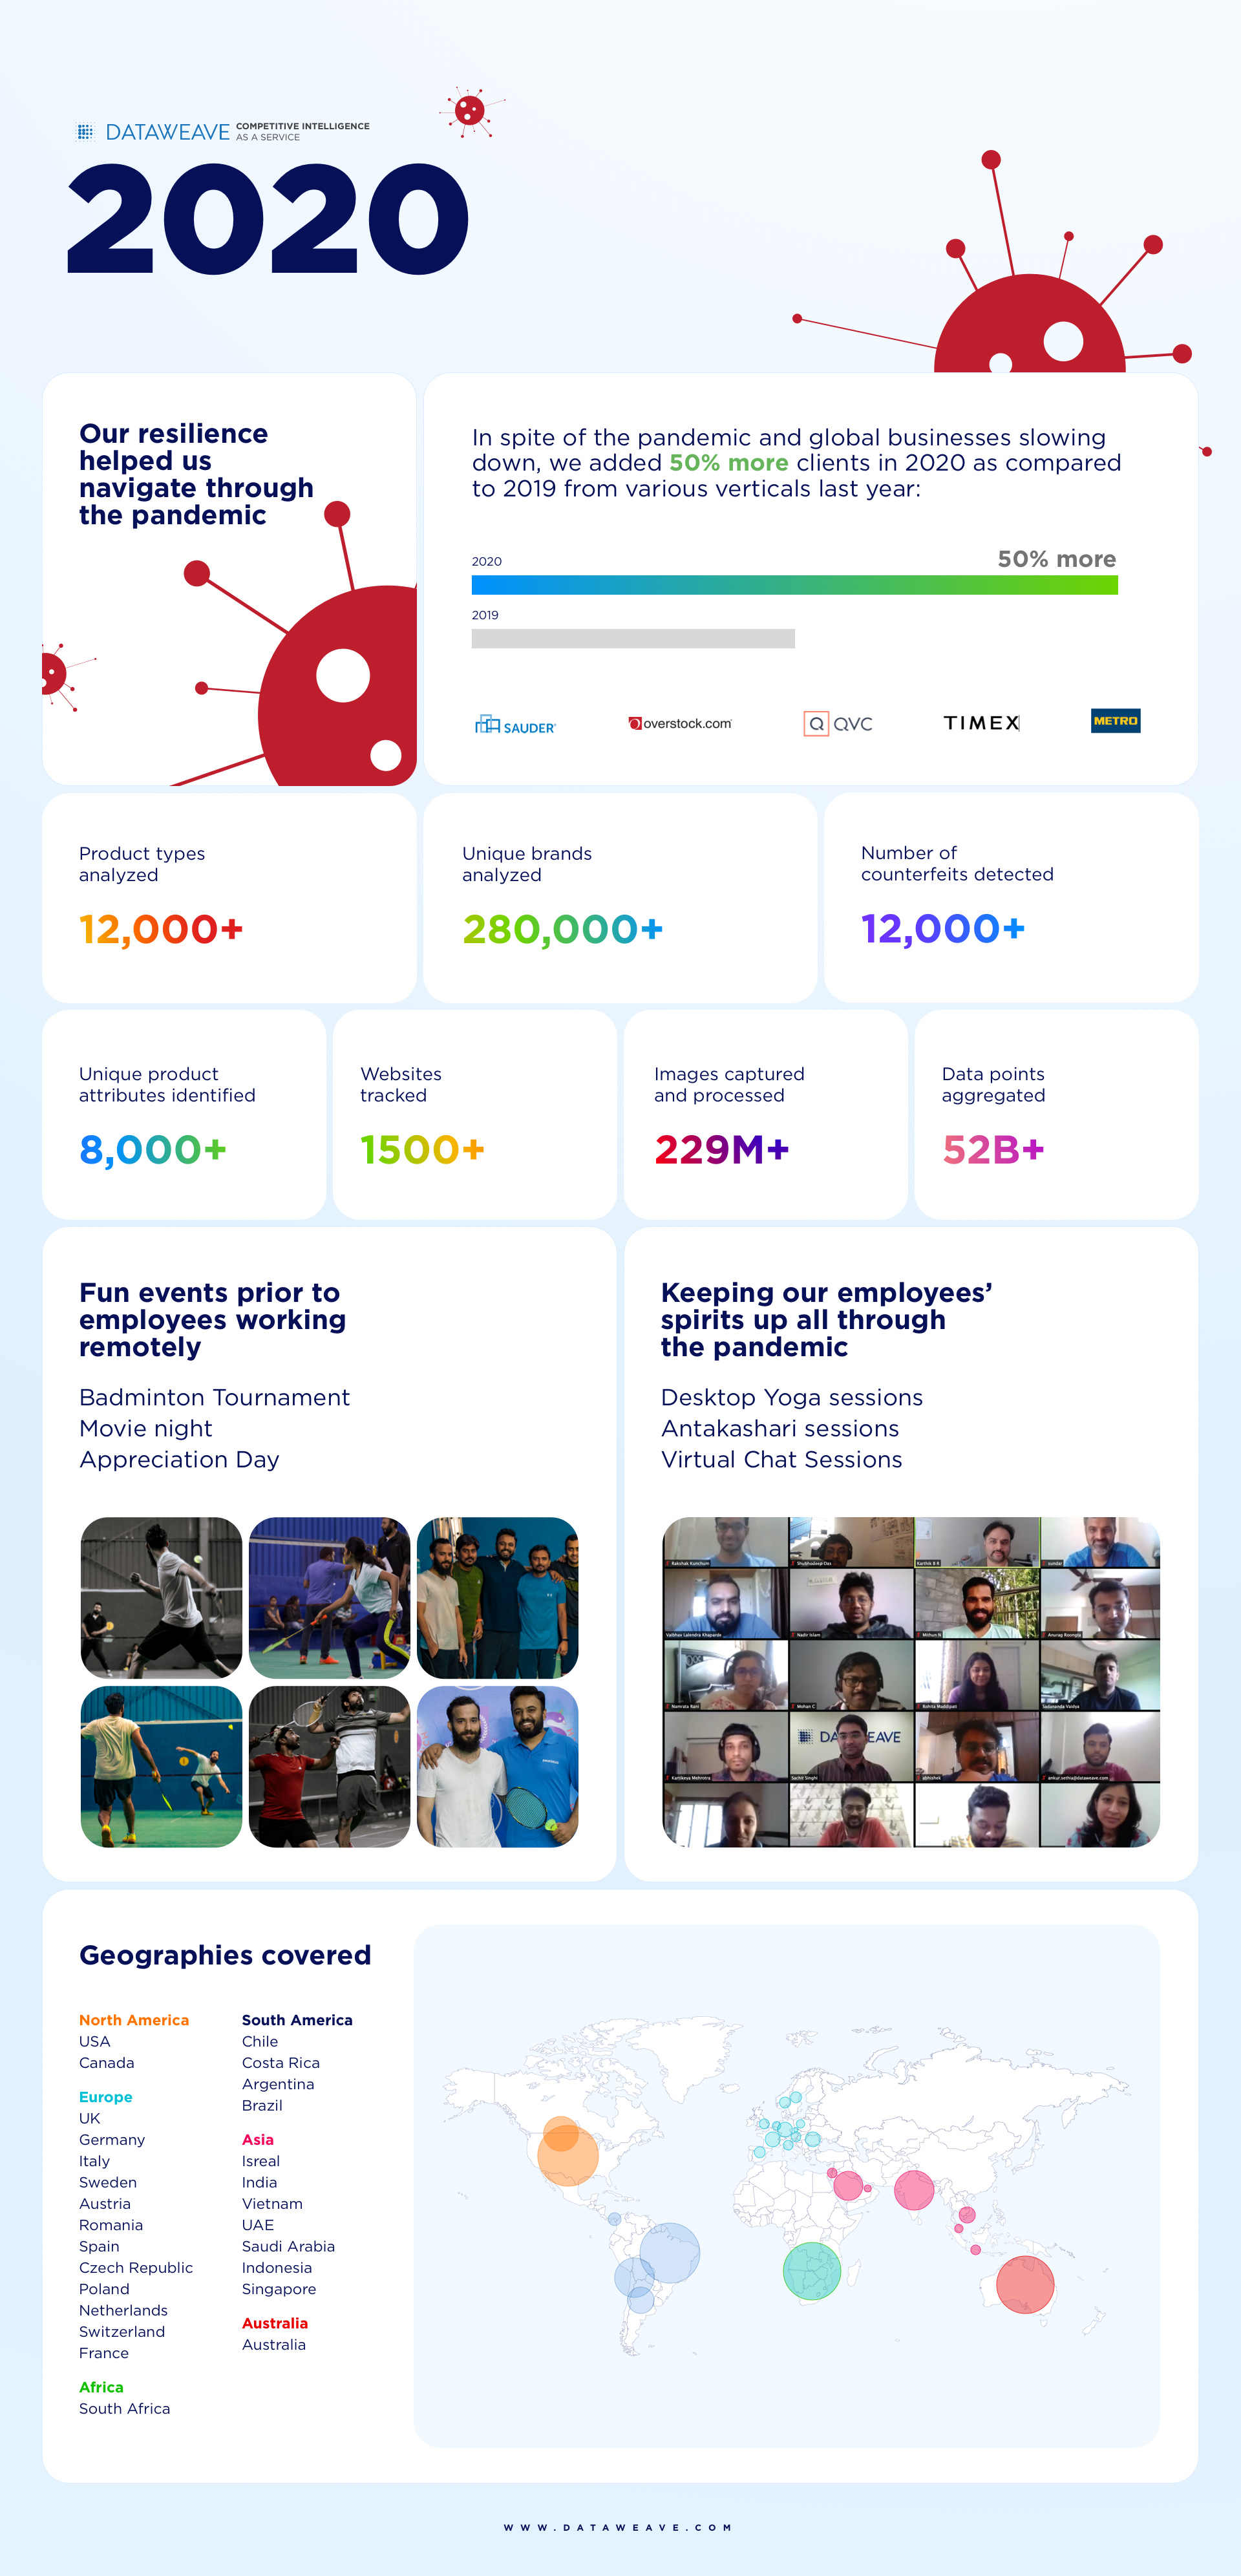
  • Structured and Unstructured data – Benefits of Big Data

    Structured and Unstructured data – Benefits of Big Data

    The big buzzword of the decade has got to be data. When the untapped potentials of great data were first discovered, experts started calling it the new oil, implying that it is now the most precious resource. And then when the usage of data became more mainstream, where corporations started mining and getting access to piles of data, people started calling it the new soil, insinuating that if all this data isn’t regularly nurtured and optimally used, it would be rendered useless. 

    But amidst all this hype, all the clutter, and all the buzz around this four-letter word, data is just a bunch of numbers and statistics collected for reference and analysis. Basically, it is just what you, your company, your government, or your country make of it. So how can retailers make the most of it? 

    Before assessing the use cases, it is paramount to understand the different types of data retailers have access to today. Broadly, it is structured and unstructured. Log files, excel spreadsheets with point-of-sale figures, hierarchies, and inventory data are rich sources of structured data; and information that is derived from in-store sensors, customer reviews, social media posts and hashtags, and even conversations between the store staff and customers serve as unstructured data. While the former sits on well-organized databases for retailers to access, giving them operational robustness, unstructured data gathered from social media and personal interactions helps retailers achieve unprecedented value and gain a competitive advantage. However, the very nature of unstructured data makes the process of obtaining, analyzing and making sense of it rather difficult.

    Structuring vs Unstructured
    Structuring vs Unstructured

    In fact, according to a survey by Deloitte, only 18% of organizations reported being able to take advantage of such data. However, harnessing this data isn’t rocket science (not anymore, at least) as there are a number of tools at a retailer’s disposal today that makes this process convenient and efficient. At DataWeave, we help retailers and brands make sense of unstructured data. Read more about our tech here

    Unstructured data is also qualitative, rather than being quantitative, which in turn makes its use cases more effective, giving businesses a competitive edge. How? Glad you asked!

    Customer Behaviour Analytics

    What motivates a customer to buy more, or spend more time in a store or online? What is the best time to reach them and where (in an omnichannel world) would they like to be reached? Million-dollar questions, right? Big data gives you insights into this and more, which will then help improve customer acquisition and loyalty. 

    UK-based home retailer Argos uses data to find out exactly how consumers felt about them. After having embarked on an ambitious project of opening 53 new digital stores a few years back, Argos invested in tools that helped them analyze data received from various social media sites based on the demographics and location to assess the performance of each store and identify rooms for improvement. This helped them understand which stores were perceived more favorably and in which areas, quickly identify issues in-store, action feedback, and find resolutions to increase customer satisfaction.

    Want to know customer sentiment against your product? Our Sentiment Analysis solution can help! Access in-depth insights sourced from customer opinions with our constantly evolving algorithm.

    DataWeave Sentiment Analysis
    DataWeave Sentiment Analysis

    Personalization and hyper-personalization

    The fact that customers are interacting with retailers on multiple platforms today gives retailers access to a wealth of information about their individual customers that could help them tailor their products, offerings, services and communication to these individuals. According to a study conducted by BCG and commissioned by Google, customers increasingly prefer a shopping experience that’s easy and fast and that helps them make purchase decisions.

    Target’s popular pregnancy prediction score based on purchase and purchase volume of about 25 different products in-store, such as unscented lotion, large amounts of calcium, magnesium, and zinc, serves as a great example of how they use this information to then target advertising (e.g sending a booklet of coupons related for baby products) to this cohort of their customers. This algorithm got the international limelight when Target started sending such coupons to the irate father of a teenager who had no idea that his daughter was pregnant. Basically, the retailer knew about the man’s daughter’s pregnancy even before he did!

    Operations and supply chain

    Amazon Go
    Amazon Go

    A healthy mix of structured and unstructured data is key today in achieving operational excellence. Faster product life cycles and ever-complex operations cause organizations to use big data in retail analytics to understand supply chains and product distribution to reduce costs. Combining that with CRM, ERPs, and other log file data can help in real-time delivery management, improved order picking, and overall supply chain efficiency to reduce costs. 

    Amazon Go, the checkout-free convenience store by Amazon uses AI-powered cameras, computer vision, and sensors to facilitate grab-and-go systems. Now, the store wholly relies on structured and unstructured data in order to function.  The sophisticated automated system makes ordering and restocking highly efficient, given that the cameras can track inventory in real-time. The system knows how many picks-per-hour each stocker is completing and exactly when items go out of stock. 

    The fact that data enables prediction and forecasts can help cater to a prospective rise in demand by managing the supply chain in advance. For example, if a pharmaceutical company analyzed social media content and determined that people in specific geographical areas were discussing cold and flu symptoms, that could give them a heads-up that demand for products to treat those conditions is on the rise.

    Price and cost optimization

    Machine learning algorithms are not only designed to learn, but over time they get better at finding the optimal price points for retailers. Retailers can use machine learning models to set prices against sales targets. According to an IBM study, 73 percent of companies surveyed plan to optimize their pricing and promotions through smart automation before the end of 2021.

    Automation achievers outshine peers in profitability and revenue growth
    Automation achievers outshine peers in profitability and revenue growth

    Walmart has shrewdly utilized powerful proprietary algorithms to make their offers nearly impossible to beat over the last few years. It still reigns in offering the best price match policy for their customers. This strategy has helped it gain a lot of trust, good publicity, and enabled retention of customers. But how do you optimize what you charge without pricing yourself out? That is where data comes into play. You need real-time monitoring across thousands of stock-keeping units (SKUs) to identify key value categories and items. With proper data analytics in your pocket, you can ask and answer the following important questions: Which items’ prices matter most? Which items have the biggest pull on price perception?  What pricing strategies are competitors adopting, and how can you match them? And which items can you afford to reduce in price to win loyalty and boost that very perception?

    Learn more about how DataWeave can help retailers make smarter pricing decisions

    Seamless shopping journey
    Seamless shopping journey

    Every company uses data to achieve its own personal goals and objectives, but what makes one retailer better than the other is how they use both structured and unstructured data to provide a seamless experience and shopping journey to customers in a way that is effortless, non-intrusive, and innovative. So use your structured data and also find a way, use the tools, and leverage the power of technology to structure your unstructured big data. In today’s competitive retail landscape where retailers – both online and offline – are leveraging cutting edge technologies to deliver close-to-perfect products and services, and innovative concepts, it is only the ability to harness all forms of structured and unstructured data that will result in achieving your ever-evolving customer engagement and experience goals. 

    Want to learn how DataWeave can help make sense of your unstructured data? Sign up for a demo with our team to know more. 

  • Decoding Growth for CPG Brands in India with Data Analytics

    Decoding Growth for CPG Brands in India with Data Analytics

    It’s been a pivotal year for the CPG industry in India. Consumers were forced to stay at home due to the pandemic, leading to a surge in online CPG shopping, simultaneously increasing the expectation for safety and convenience.

    Brands and retailers needed to adjust to this new reality to meet customer expectations that were very different from the pre-Covid era. They needed to make adjustments right from the way of marketing to product assortments, communication to customer interaction. Factors such as increased competition from e-commerce platforms, the emergence of homegrown brands, traditional players making the online shift all have transformed the CPG industry. 

    Kantar study
    A survey conducted by Kantar showed the delta growth of top CPG brands in the last five years in India.

    A survey conducted by Kantar showed the delta growth of top CPG brands in the last five years in India. As per the report, among the 428 brands, 55% of brands failed to grow their penetration. 

    Some big brands like Lux and Lifebuoy feature in this list of brands that failed to grow – each of these brands still reached over half of India, but in 2016 they were much bigger. Size alone, therefore, does not guarantee success, but it helps.

    Going forward too, CPG sales will remain high as consumers are spending more time at home and brands must ensure they are doing everything possible to work on their strategies. Hence, CPG companies are turning to technology to increase their productivity and efficiency.

    What Is Data Analytics?

    In brief, data analytics refers to the process of drawing conclusions from any predetermined datasets. With CPG data analytics, it means any product-related or consumer behavior-related data that is relevant to the brand. However, data has long been ignored by CPG companies. Research by McKinsey shows that CPG scored below average when it comes to digitally mature industries globally. Only 40 percent of consumer-goods companies that have made digital and analytics investments are achieving returns above the cost of capital. The rest are stuck in “pilot purgatory,” eking out small wins but failing to make an enterprise-wide impact.”

    Kantar study
    A survey conducted by Kantar showed the delta growth of top CPG brands in the last five years in India.

    It is important for any company that sells products to understand the structure and needs of the consumers. The goal is to know what products they should produce and what makes it profitable for them to produce it. This is where data comes in. The more data, the better it is, and it is important for companies to understand what to study to discover the trends in their consumers’ behavior. If they can identify trends and make predictions based on that data, then they will be better prepared to make changes that will improve the business.

    Another banner trend and rightly so is using modern-day technologies such as AI & Machine Learning (ML) to spot hidden trends and opportunities. ML capabilities can help CPG companies identify anomalies that are not obvious to human intelligence so they can react accordingly.

    Data Analytics Gives You An Edge Over Your Competitors

    Big CPG companies such as PepsiCo, Unilever, and McDonald’s have been focusing on data for a long time. McDonald’s has been investing in data heavily since 2015 and also acquired analytics firm Dynamic Yield, an ML platform for retailers in 2019. Some of the data points that McDonald’s uses are historical sales data, customers’ past purchases, items in trend, and so on. For maximum efficiency, brands must focus on data across the board – from data related to sales and merchandising to price optimization, marketing, supply chain, and more.

    Key Data points for CPG

    Some of the key data points for CPG companies to reconfigure their businesses are:

    a. Sales Data And Trends

    Sales data shows the units of a product (SKUs) that are sold across different locations or channels. This data gives a better idea of what decisions, activities, assortments lead to higher sales. While the companies often have a track of their offline sales, it is important that you combine both offline and online sales data, especially now that digital channels are turning out to be a make or break for a lot of CPG brands.

    Instead of relying on traditional surveys or testimonies, brands must look to invest in tools that can present this highly complex data in a clear and communicative manner.

    Getting sales data from your own website is the easy part, but if you want to know your online sales and market share on marketplaces like Amazon v/s your competitors, get in touch with our team to know more.

    b. Competitive Analytics

    Competitor analysis provides an opportunity to go deeper and evaluate who’s operating in your space, how they operate if there is a specific competitor you don’t know of, or even a potential competitive advantage you are not aware of. 

    This data also helps to focus on the root cause for positive and negative developments, and uncover relative market positions of main competitors. Depending on the product and goals, companies should gather data about their competitors’ pricing & promotional strategies, package design, sizes, product range, etc.

    c. Market Basket Analytics

    Popularly known as assortment optimization analytics, this is one of the most important data points, from a marketing perspective. This is based on the theory that customers who buy one item are more likely to buy another specific item.

    For instance, if a customer is buying hot dogs they are typically more likely to buy buns. Grocery stores also pay attention to product placement and shelving, you will almost always find shampoos and conditioners together. Walmart’s infamous beer-and-diapers anecdote is also a classic example of Market Basket Analytics.

    If you want insights into your product assortment, bestsellers, or insights into your competitor’s assortment and bestsellers, we can help!

    d. Price And Promotional Analytics

    CPG industry is a highly fragmented market and companies focus on pricing and promotions to boost their sales. More than often, promotion spends tend to be even bigger than advertising budgets. However, many companies struggle to get their pricing right and often find that promotions are actually counterproductive. 

    Creating optimized pricing and promotional strategies especially in a digital world can be a struggle. In a world where shoppers compare prices and deals, have thousands (if not lakhs) of options to choose from, pricing agility can be the key to competitive advantage. Top retailers and CPG companies rely on data and analytics to get their strategies right.

    CPG Analytics breakup
    CPG Analytics Breakup

    e. Customer analytics

    Businesses can take full advantage of advanced analytics to map their customers’ shopping experience and make changes to their marketing strategies accordingly. Brands can create a personalized experience for their audience using information such as customer demographics, store and brand loyalty, purchase frequency, completed transactions, abandoned products, and carts, etc. This will help CPG manufacturers deliver superb customer experiences and design lean operations to meet their objectives of better understanding their consumers to enhance their experience, reduce costs, streamline the supply chain and enhance the relationships.

    Conclusion

    If used right these data points can create exponential profits and margins for CPG brands. It’s Important that businesses invest in big data and advanced analytics to focus on delivering impactful services to consumers. Businesses can use these data points to identify strengths, gaps, and opportunities. 

    For short-term goals, CPG data helps by providing an accurate and clear picture of the ongoing operations across the entire business. As a long-term plan, measuring, evaluating, and tracking this data can empower your business to make better decisions and allocate your resources better. CPG data analytics affects the entire supply chain processes and solutions and can boost sales, ROI, and YoY growth if used tactfully.DataWeave’s AI-Powered analytics solutions give CPG brands the data they need to improve customer experience and drive e-commerce sales. Sign up for a demo with our team to know more.

  • “The Rise of Digitally Native Brands (DNVB)”

    “The Rise of Digitally Native Brands (DNVB)”

    Direct-to-Consumer (D2C), Digitally Native Vertical Brands (DNVB), and brand.com serve as
    different variations of a similar concept that has blown up in the past few years fueled by factors ranging from a surge in online shopping, stay-at-home restrictions brought about by the pandemic, and a general shift in consumer behavior.

    US D2C E-commerce sales

    D2C sales were forecasted to account for $17.75 billion of total e-commerce sales in 2020, up 24.3% from the previous year, according to eMarketer. The Middle East might have been late in joining the party but the key players from across the board including brands that sold the traditional way via wholesalers and retailers or those that use online marketplaces such as Amazon and Noon, and the new brands entering this nascent market today are all realizing the potentials of communicating with and selling to customers directly.

    The Middle East has one of the highest youth populations in the world with more than 28% of the residents aged between 14 and 29. This means that a great chunk of the population is inherently digital natives, who grew up with smartphones. These young tech-savvy consumers are more informed, are massively influenced by social media for their purchases, are more value and purpose-driven compared to the older generations, as a result of which are open to experimenting with newer brands that align with their ideas and ideologies.

    This presents an opportunity for both traditional retailers as well as nascent brands to tap into their e-commerce potential and tailor their offerings to this new cohort of customers leveraging data to understand their individual needs by connecting and engaging with their customers. And the best way to “pivot” to the ever-evolving demands would be by adopting the D2C approach.

    Some of the benefits of the D2C milieu in retail would be:

    Access to Customer Data
    Access to Customer Data

    1. Complete access to customer data

    Many retailers agree that data is the real differentiator in D2C retail. Using marketplaces like noon.com and Amazon to retail products is great because of the large customer base they have access to, but the downside is, these behemoth marketplaces own the customers and hence their data. The importance of data can’t be stressed enough, but a key use case of all that complex algorithm is that it empowers retailers to customize and personalize offerings to their customers. According to a study by InstaPage, 74% of customers feel frustrated when website content is not personalised.  Not having control or access means, they are now crippled from the ‘ability to customize’.

    2. Building direct connections with customers

    Building direct connections with customers
    Building direct connections with customers

    Trust is a strong consideration for most consumers today. According to a PWC report, 60% of consumers in the Middle East shop online with companies they feel they can trust Gaining trust has proven to be an arduous task for retailers, who now must assure security and demonstrate high levels of education and awareness of their customers, which can only happen through direct connections, personal interactions, and consistent engagement. D2C brands are much better placed to respond to consumer demand to meet their expectations and more importantly address and resolve any grievances they might have. 

    3. Increasing margins by cutting out middlemen

    Increasing margins by cutting out middlemen
    Increasing margins by cutting out middlemen

    Studies have shown that successful D2C companies have a gross margin of 50 – 85%, thanks to two components – effective customer acquisition and eliminating middlemen. Brands with their own unique value proposition, voice, channels and strategies come across as more authentic, and for the millennials and Gen Z, authenticity is the name of the game. Secondly, and perhaps more evidently, getting rid of distribution partners ends up saving costs for the company tremendously.

    Also, e-commerce eliminates the high fixed distribution costs brands used to pay retailers for shelf space and replaces it with variable costs to list on their website or an e-commerce marketplace. However, one thing to keep in mind when listing on marketplaces is that digital channels provide transparency into pricing. And customers will be comparing the prices of your products against your competitors. That’s why it’s critical for D2C brands to benchmark their pricing strategies against their rivals to drive more revenue and margins by pricing products competitively. Want to know how? Read about how DataWeave’s AI-Powered e-commerce analytics solutions can help

    4. Enables to expand presence 

    Enables to expand presence
    Enables to expand presence

    While the D2C approach is proving to be profitable, it also gives brands the flexibility to expand and enhance their presence. Nike would be a prime example of how it has aggressively expanded its presence offline and online since it announced a decade back about its Customer Direct Acceleration strategy. Over the years, Nike’s D2C sales have grown from 16% of the brand’s total revenue to 35% or $12.4 billion by the end of fiscal 2020. Undoubtedly, Nike’s e-commerce focus has been strong, but what they have also mastered is its digitally integrated concept stores that have taken in-store experience to the next level. Moreover, going the D2C way has given the brand more flexibility to build on its voice and purpose, which is reflected across all of its channels and touchpoints. As a result, Nike has been able to grow its presence in existing markets, and establish the brand in new markets by widening its e-commerce penetration and opening stores that helps build communities and serve as marketing fronts instead of merely being points of sale.

    In the Middle East too, there are some strong players, that realized the benefits of D2C and are reaping the benefits now. The most prominent of them would be Huda Beauty, founded by makeup artist turned billionaire entrepreneur Huda Kattan. Beginning as a blog in 2010, Huda Beauty has fast become the number one beauty Instagram account in the world. Huda launched her brand into Sephora in the Dubai Mall in 2013 and has since expanded the range to include a vast array of beauty products. The brand has since had several record-breaking launches globally, with products now available worldwide on hudabeauty.com as well as retailers including, Sephora, Sephora in JC Penney, Harrods, Selfridges, and Cult Beauty. Equipped with a clear value proposition and an army of loyal customers, the company continues to grow as its founder continues to deliver on the brand promise and remains connected with her customers bypassing middlemen. 

    Also read how DataWeave helped Douglas, a premium beauty retailer in Germany go D2C when the pandemic forced them to focus on their ‘Digital First’ strategy. 

    Another example would be the popular eyewear brand, Warby Parker, a company that capitalized on technology, data, and strived to bring a solution to the market. It stepped into an industry that was criticized for being expensive, entered a market that was skeptical of purchasing online, and turned the whole situation around by going D2C. They designed their own frames and sourced their own raw materials, drastically bringing down the costs that would have been passed on to end consumers. They introduced virtual try-on that delivered accurate results turning customers into loyal consumers. And today, after six separate rounds of fundraising, the company is reportedly set to launch an Initial Public Offering this year.

    The playing field in the Middle East is wide open and the appetite for brands that respect value, put people over profits, care about providing suitable, cruelty-free, and ethical products, and understand their customers is only growing. Brands with a robust infrastructure, the right technical know-how and technologies, expertise to manage data, and clear strategies are already on the right path to establishing a strong D2C platform. 

    Insights from DataWeave can help D2C brands make smart, competitive assortment, promotion, and pricing decisions amongst other things to improve the customer experience and drive e-commerce sales. Sign up for a demo with our team to know more.

  • Seven tricks to win food wars on food aggregators apps

    Seven tricks to win food wars on food aggregators apps

    Food aggregators have emerged as a critical channel for Quick Service Restaurant (QSR) chains to grow their business – especially post-pandemic. Quick Service Restaurants, QSRs, as we call them, are capitalizing on the opportunity too. For many chains, as high as 50% of their revenue now comes via aggregator channels.

    However, most QSR chains are only beginning to leverage data and analytics to drive business on the food aggregator apps.

    Currently, QSRs spend vast amounts on marketing on Food apps but are always unsure of the return on their investment. Aggregators share some data, but they have an inherent motive to entice QSRs to buy more advertisements. They cannot share competitive insights as well. Moreover, as QSRs work with several platforms at once, it gets difficult to collate and analyze data from all these platforms together. These issues make leveraging data for QSR chains difficult. At Dataweave, we have collated some insights from our recent experience of working with global QSR chains helping them improve their sales on different food applications using data:

    1. Availability

    Availability of QSR and Availability Trends
    (L) Availability of QSR outlets across aggregator platforms at state, city, and outlet levels. (R) Availability trends at Lunch and Dinner slots across platforms. Such trends can highlight problem areas that need to be addressed.

    The easiest and most impactful fix is to ensure that all your outlets are available on the app at the peak slots, typically lunch and dinner. Availability increase of ~2% at peak times results in order volume increase by ~5%-7%.

    The reasons for unavailability range from lack of riders, overwhelming orders at the outlet, or just plain technical glitches. Tracking this metric and actively engaging with your stores and aggregator platforms to resolve any issues should be a daily priority.

     2. Monitoring Keyword Ranks

    High correlation between ranking and sales
    Illustrative chart showing a high correlation between ranking and sales

    If you are a Pizza chain but don’t show up among the first five ranks when your target customer is searching for Pizza, the chances of a sale are lower.

    What helps is to track the ranking for your brand, and your competitor brands, in different category listings across different keywords.

    Your ranking may differ a lot by region, markets, and Zip codes depending on consumer tastes, competitors, and your brand presence, and it’s helpful to track it granularly. 

    No surprises here – but rank is strongly correlated with your order volumes!

    3. Tracking competitors

    QSR chain rank
    Illustrative chart showing the rank of key QSR chains on the home page and various categories

    One of the tricks to rapidly gain in ranking is to monitor competitors in your category and ensure that you are doing better on each attribute – ranking, rating, ETAs (estimated time of arrival), fees, discounts, etc.

    A slight edge across your outlets translates to rapid gain in ranking and order volumes.

    4. Choosing suitable banners for promotions

    Position of banners
    Position of various banners at various zip codes. Important to choose banners that rank higher.

    Choosing banners is an essential strategy to gain visibility – but it’s vital to know two factors: 

    • At what rank does the banner you are choosing show up on the App/Website.
    • At what position does your brand show up in the banner?

    If you are on a 5th rank on the 4th banner, your marketing spend is probably going down the drain.


    5. A/B Testing

    Before starting an effective marketing campaign, it helps to do A/B testing by running two different banners in the same city one week apart to see which yields more impact.

    A/B testing can also be a tool to choose banners, discounts, offers, signature images, etc.

    6. Sensitivity analysis

    Delivery time impact
    Illustrative chart showing that ETAs are highly correlated with sales, whereas ratings do not have much impact.
    • What has more impact on sales – Ratings or ETAs? 
    • What will be the likely impact on sales of the marketing campaign in New York vs. Denver? 
    • What is the likely impact of competitors’ ad blitz on your sales?

    Data can answer these and many more questions, and this sensitivity analysis should be part of the QSR chain’s decision-making

    7. Monitoring campaign performance

    QSR chains spend millions of dollars of ad budget running campaigns on aggregator platforms combining banner ads, discounts, offers, etc.

    It’s a great idea to measure QSRs rank on these aggregator’s platforms before, during, and post the campaign in focus Zip Codes for priority keywords to see if the gain in ranking is temporary or lasts for a while.

    The ultimate factors for QSRs to win will remain the quality of food and consistency of the brand’s messaging. Leveraging the power of data can help understand the aggregator platform’s characteristics, competitor’s strengths, weaknesses, & strategy, and consumer behavior trends.

    Also, data can help better direct ad dollars and the eCommerce teams’ focus on the right initiatives to drive maximum sales and growth.

    DataWeave for QSRs

    DataWeave has been working with global QSR chains, helping them drive their growth on aggregator platforms by enabling them to monitor their key metrics, diagnose improvement areas, recommend action, and measure interventions’ impact. 

    DataWeave’s strategy eliminates the dependence on food apps for accurate data. We directly crawl food aggregators apps and websites and help you with data and analysis to solve the aforementioned issues and drive 10-15% growth.

  • G2 recognise DataWeave as Leader and High Performer in 2021.

    G2 recognise DataWeave as Leader and High Performer in 2021.

    We are really excited by the recognition that G2 has given us. G2 has awarded us 3 new badges this year in G2’s Summer 2021 Reports. Before we dive into what these awards are, let me give you a little background

    What are G2 and G2 Grid Report?

    G2 (formerly G2 Crowd) is the world’s leading B2B software and services review platform. The platform helps potential customers choose the right software and services for their business based on authentic, timely reviews from genuine users.

    Every quarter, G2 creates a report that showcases the top-rated solutions in the industry, as chosen by the real heroes, our customers

    The Grid Report represents the democratic voice of real software users, rather than the subjective opinion of one analyst. G2 rates products from the E-Commerce Analytics category and Multi-Channel Retail category algorithmically based on data sourced from:

    • Product reviews shared by G2 users
    • Data aggregated from online sources and social networks

    Who is DataWeave?

    DataWeave provides Competitive Intelligence and Digital Shelf Analytics to eCommerce businesses and consumer brands by aggregating and analyzing Web data at a massive scale.

    The company’s AI-powered technology platform enables eCommerce businesses to make smarter pricing and merchandising decisions and helps brands optimize their online channels to drive more sales.

    With that context here is a deeper look at what we have been recognized for.

    Leader Summer 2021 – E-Commerce Analytics

    Leader Summer G2 2021

    Products in the Leader quadrant in the Grid® Report are rated highly by G2 users and have substantial Satisfaction and Market Presence scores in the category of E-Commerce Analytics.

    Simply put, this means, among all the e-commerce analytics solutions listed on G2, DataWeave scored the highest on customer delight, consideration & market share along with a handful of select companies that were all ‘Leaders’ in this category.

    High Performer Summer 2021: Multi-Channel Retail

    High Performer Summer G2 2021

    Products in the High Performer quadrant in the Grid® Report have high customer satisfaction scores and Market Presence scores compared to the rest of the Multi-Channel Retail category.

    This means that in the Multi-Channel Retail category, while we’re not “Leaders” we come in at a very close second as a “High Performer”. We’re still the preferred choice and have a greater market share & customer consideration over a lot of other solutions in this category on G2.

    We have also won the Users Love Us reward badge, for receiving 20+ reviews with an average rating of 4.4 stars.

    Users Love Us G2

    We would like to thank all the users for sharing their love and giving us such amazing reviews. These awards give us the impetus to continue our journey in making customer delight our top priority and helping our customers win.

    Here is what DataWeave’s team has to say about earning these badges:

    “Winning these badges from G2 is not only a huge confidence booster but also validation from users that DataWeave’s solution and capabilities are making a difference for our customers.”

    Krishnan Thyagarajan, COO and President, DataWeave

    “DataWeave as a Leader and High Performer in these categories brings credibility and showcases the market share that the product holds amongst our valued customers.
    It also showcases that our customers value the proactive engagements driven by our customer success managers. A big kudos to our team at DataWeave and a big thank you to our customers for helping us achieve this recognition.”

    Srikanth Ramanolla, Director of Customer Success, DataWeave

    If you are one of our customers who have loved using our product, then I urge you to give us your review over here to continue providing value to wonderful customers like you.

  • Amazon Prime Day Secrets all Brands need to know.

    Amazon Prime Day Secrets all Brands need to know.

    Prime Day or not, brands need to make sure their Digital Shelf is well stocked, highly discoverable in crowded marketplaces, have the right offers and discounts to stay competitive, all while making sure their products have glowing reviews, ratings and optimized content. While this is a year-round effort, brands go the extra mile on Prime Day to make sure they’re putting their best foot forward.

    Methodology
    To understand how brands adapted their digital shelf for Prime Day, we examined data insights across Amazon in 6 markets and compared the following brand KPIs:

    • Share of voice (SOV): The percentage of a brands products that appear in the search results page for relevant keywords on Amazon.
    • Availability: The percentage of products in stock on Amazon for Prime Day.
    • Additional discounts: The reduction in the listing price of a product during Prime Day compared to before or after the event to see how brands adapted their pricing strategies to stand out from rivals

    Winning brands made sure their products were ‘highly’ discoverable

    With all the global lockdowns, home entertainment hit a new high. So we looked at the word “TV” to see which brand had the highest share against this keyword during the Prime Day event.

    • In the US – Samsung won hands down with close to 15% SOV. LG came in at a not so close 2nd with 9% SOV.
    • In the UK – Samsung won again with a whooping 16.7% SOV with Sharp at # 2 at 12%.

    Now let’s look at some key European markets

    • On Amazon Italy we saw a similar trend – Samsung & LG, neck to neck at 22% & 19% respectively.
    • Amazon Germany was no different – Samsung had the highest SOV at 15% and Philips far behind at 7%.

    Samsung has such a strong association with the keyword TV. This means, when customers are searching for TVs on Amazon in these regions – the brand that has the largest selection up on display for them to choose from is Samsung! That’s definitely going to have a positive impact on sales, don’t you think?

    Do you know which keywords you should be tracking for your brand? And do you know your Brand’s SOV against those keywords?

    … & finally, an outlier!

    • In Amazon France, LG took the lead for a change – with 15% SOV. But we have Samsung not far behind at 13%.

    Kudos to team Samsung!

    Winning Brands kept a close eye on product availability

    Poor product availability leads to lost sales. But not on Amazon Prime Day! Bigger brands that sell over 500 products created artificial scarcity by listing a chunk of products out of stock before the sale. And restocked aggressively during the sale.

    In contrast, the smaller brands that sold fewer than 100 products didn’t dare make such bold moves and stayed stocked up even pre-event to avoid even a single day of lost sales.

    Let’s look at some data from the US

    • The average availability for bigger brands selling 500+ products before the sale was 41% and then went up dramatically to 81.4% the day of the sale when they aggressively restocked.

    Similar trend in the UAE

    • Availability pre-sale was 26.2% and during the sale shot up to 87.6%!

    Various other markets displayed similar patterns. And this was only possible because these brands were able to track their availability with precision and plan their stock levels accordingly.

    How are you tracking your availability across marketplaces? Do you know when your products are out of stock and are in immediate need of replenishment?

    Winning Brands made strategic pricing and discounting decisions

    Discounts matter. Period. And brands that use discounts strategically, win.

    Let’s look at Airpods on Amazon in the US.

    • During the event, Apple had the highest SOV for the keyword Airpod at 7.5% followed by SkullCandy, an American audio accessory manufacturer at 5.6%. 
    • Here’s the interesting part – during the sale Apple offered just 3.4% additional discounts while SkullCandy offered 32.1% additional discount to try and win sales from Apple. And looks like it worked! Apples SOV dropped from 13.5% before the event to 7.5% during the event and SkullCandy’s SOV improved 

    Now let’s look at the same data cut in the UAE – a market where Apple products have a fair penetration, but not as high as in the US. They needed a more aggressive discounting strategy in this market.

    • In the US, during the sale, Apple offered additional discounts on just 30% of products. However, in the UAE that number rose to 90% – a clear strategy to make their product pricing more attractive to customers to win sales

    Discounts and markdowns aren’t always the answer to improving sales, but when used strategically can drive significant impact to your bottom line.

    Are you tracking your competitor pricing? Do you know if they’re keeping tabs on your pricing strategy to get ahead of you?

    Winning Brands made it to the Amazon Best Seller list

    Amazon Best Sellers are products that have the highest sales on Amazon. Products with a higher Amazon Best Seller Rank have higher sales.

    • In the US, Nintendo had the highest share in the Electronics Best Seller category during the sale at 18.6%. Before the sale their share stood at 22.5% – so they lost ground a little ground with a 27.2% drop in their Best Seller share. While they gave additional discounts of 17%, only 27% of their catalogue was discounted.
    • But here’s a brand that knocked it out of the park! The Razer had an SOV of just 1.18% before the sale and during Prime Day it shot up to 6%! A clear indication that sales for the Razer spiked exponentially during Prime Day. Could this be because Razer offered 100% of their catalogue on an additional discount of 31%? It’s a bold move that could have paid off and contributed to super high sales. 

    Now let’s look at France – the Fashion Capital of the World and which brand came out on top in the Fashion Best Seller Category

    • Footwear brand Havaianas had the highest SOV on Prime Day (13.48%) Not too surprising because before the sale they were at 14.09%
    • Now let’s look at the Best Seller Rank – Lacoste secured BSR #1 at the event. Pat on the back for them because before the sale they were at Rank 46! And post-sale they dropped to #6. Definitely a combination of techniques involved here that got them from #46 to #1 at super speed!

    What techniques have you tried to boost sales for your products on Amazon?

    Brands that do not optimize their Digital Shelf risk losing out on their share of basket. If you’ve been thinking about how to optimize your Brands Digital Shelf, then get in touch & learn how DataWeave can help!

  • Amazon Prime Day 2021 Discounts Set Home Leaders Apart

    Amazon Prime Day 2021 Discounts Set Home Leaders Apart

    Home is where the shopping cart is.

    After last year’s blistering pace of e-commerce sales growth in the home category, we at DataWeave wanted to know how Prime Day 2021 discounts on home products would impact retailers and brands around the world.

    We focused our analysis on how international retailers adapted their Prime Day pricing strategies to distinguish their offerings across eight home subcategories, including bed & bath, kitchen and pet supplies.

    Our Methodology
    We tracked the pricing of products among 21 leading retailers in nine countries across five regions, including:

    • The US (Ace Hardware, Amazon US, Best Buy, Home Depot, Lowe’s, Petco, PetSmart, Target and Wayfair US)
    • The UK (Amazon UK, Ebay, Etsy, OnBuy and Wayfair UK)
    • Europe (Amazon France, Amazon Germany and Amazon Italy)
    • The Middle East (Amazon Saudi Arabia and Amazon UAE)
    • Asia (Amazon Japan and Amazon Singapore)

    The results showed some surprising differences among retailers and regions. See how retailers used pricing as a competitive strategy to win Prime Day sales in the home category, as well as international home brands that stood out for the discounts on their products.

    Percentage of items with a price decrease

    The US retailer with the overall highest percentage of home products with a price decrease for Prime Day was Amazon US (26.4%).

    Home subcategories with the highest percentage of items with a price decrease per US retailer were:

    Ace Hardware: Power & hand tools (21.2%)
    Amazon US: Furniture (36.3%), appliances (34.1%) and kitchen (28.3%)
    Best Buy: Appliances (0.9%)
    Home Depot: Power & hand tools (0.2%)
    Lowe’s: Furniture (29.2%), power & hand tools (5.5%) and appliances (4.1%)
    Petco: Pet supplies (11.6%)
    Target: Bed & bath (37.9%), furniture (32.5%) and kitchen (11.5%)
    Wayfair US: Pet supplies (31.9%), home & garden (25.6%) and bed & bath (24.8%)

    The UK retailer with the overall highest percentage of items with a price decrease for Prime Day was Amazon UK (36.4%).

    Home subcategories with the highest percentage of items with a price decrease per UK retailer were:

    Amazon UK: Appliances (41.7%), power & hand tools (39.5%) and furniture (36.4%)
    Ebay: Smart home (10.5%), bed & bath (10.1%) and furniture (8.3%)
    Etsy: Bed & bath (1.7%), kitchen and pet supplies (both 1.5%)
    Wayfair UK: Kitchen (17.7%), bed & bath (10.8%) and home & garden (5.9)

    In Europe, Amazon Germany had the overall highest percentage of items with a price decrease for Prime Day (27.3%).

    Home subcategories with the highest percentage of items with a price decrease per European retailer were:

    Amazon France: Appliances (15.9%), power & hand tools (15.8%) and furniture (14.2%)
    Amazon Germany: Power & hand tools (40.0%), appliances (33.7%) and pet supplies (28.4%)
    Amazon Italy: Furniture (11.8%)

    Across the Middle East & Asia, Amazon UAE had the overall highest percentage of items with a price decrease for Prime Day (41.6%).

    Home subcategories with the highest percentage of items with a price decrease per retailer were:

    Amazon Saudi Arabia: Power & hand tools (53.8%), pet supplies (33.3%) and appliances (30.4%)
    Amazon UAE: Appliances (55.8%), kitchen (49.9%) and pet supplies (49.0%)
    Amazon Japan: Appliances (15.3%), power & hand tools (10.8%) and furniture (9.0%)
    Amazon Singapore: Bed & bath (35.4%), appliances (30.2%) and power & hand tools (27.2%)

    Magnitude of price decrease

    The US retailer with the greatest overall magnitude of price decrease for Prime Day was Target (20.3%).

    The home subcategories with the greatest magnitude of price decrease per US retailer were:

    Ace Hardware: Power & hand tools (14.3%)
    Amazon US: Kitchen (21.0%), appliances and pet supplies (both 18.3%) and furniture (15.1%)
    Best Buy: Appliances (8.7%)
    Home Depot: Power & hand tools (17.7%)
    Lowe’s: Power & hand tools (13.4%), furniture (13.0%) and appliances (10.8%)
    Petco: Pet supplies (17.2%)
    Target: Bed & bath (28.9%), smart home and kitchen (both 19.1%) and furniture (18.5%)
    Wayfair US: Pet supplies (4.6%), kitchen (4.4%) and bed & bath (4.1%)

    Brands with the greatest magnitude of price decreases per US retailer included:

    Ace Hardware: Zircon (48.6%), Smith\u0027s (36.1%) and DMT (30.0%)
    Amazon US: Supply Guru (56.3%), Seresto (55.4%) and Advantage (53.4%)
    Best Buy: Panasonic (29.1%), Farberware (16.6%) and Insignia™ (14.0%)
    Home Depot: Husky (17.7%)
    Lowe’s: Metabo HPT (43.2%), Dewalt (27.8%) and GZMR (26.5%)
    Petco: Seresto (50.0%), Open Road Brands (45.4%) and Starmark (42.1%)
    Target: Little Tikes (50.0%), Bobsweep (43.9%) and Shark (42.2%)
    Wayfair US: Sorbus (57.8%), GE Appliances (45.9%) and Nu Steel (42.1%)

    The UK retailer with the greatest overall magnitude of price decrease for Prime Day was Etsy UK (19.8%).

    The home subcategories with the greatest magnitude of price decrease per UK retailer were:

    Amazon UK: Furniture (21.8%), power & hand tools (21.5%) and appliances (20.8%)
    Ebay: Pet supplies (12.2%), appliances and furniture (both 12.0%) and bed & bath (10.0%)
    Etsy: Pet supplies (44.3%), kitchen (18.1%) and bed & bath (14.2%)
    Wayfair UK: Home & garden (12.2%), bed & bath (9.2%) and furniture (8.9%)

    Brands with the greatest magnitude of price decreases across home sub-categories per UK retailer included:

    Amazon UK: Tefal (54.0%), Caterpack (51.6%) and Nylabone (49.9%)
    Ebay: Bob Martin (59.8%), Fridgemaster (57.5%) and Tetramin (49.3%)
    Etsy: Celebnails and vitrifiedstudio (both 49.5%), Deco-Den UK Supplies (46.5%) and Caxo Beauty (36.9%)
    Wayfair UK: Breakwater Bay (41.1%), Zipcode Design (33.3%) and Heritage Brass (29.7

    Among European retailers, Amazon Italy offered the greatest overall magnitude of price decrease for Prime Day (29.9%) among a total of 49 products.

    The home subcategories with the greatest magnitude of price decrease per European retailer were:

    Amazon France: Bed & bath (11.7%), pet supplies (11.2%) and appliance (9.2%)
    Amazon Germany: Kitchen (23.4%), power & hand tools (22.3%) and furniture (20.2%)
    Amazon Italy: Furniture (29.9%)

    Brands with the greatest magnitude of price decreases per European retailer included:

    Amazon France: Thermobaby (47.6%), Sinogoods (44.6%) and Tractive (40.0%)
    Amazon Germany: Sage Appliances (56.5%), Nasum (51.7%) and Hikenture (49.2%)
    Amazon Italy: Gifort (55.1%) and Wokkol (4.8%)

    Across the Middle East and Asia, Amazon UAE offered the greatest overall magnitude of price decrease for Prime Day (15.3%).

    The home subcategories with the greatest magnitude of price decrease per retailer were:

    Amazon Saudi Arabia: Furniture (18.0%), pet supplies (15.9%) and power & hand tools (15.8%)
    Amazon UAE: Pet supplies (17.8%), appliances (16.4%) and kitchen (16.2%)
    Amazon Japan: Kitchen (25.4%), furniture (14.5%) and bed & bath (13.6%)
    Amazon Singapore: Kitchen (14.0%), furniture (11.1%) and appliances (8.0%)

    Brands with the greatest magnitude of price decreases per retailer in the Middle East and Asia included:

    Amazon Saudi Arabia: American Baby Company (55.5%), Charmcollection (49.0%) and LG (46.9%)
    Amazon UAE: Knorr (54.0%), Ocean Patio (50.0%) and Bikuul (48.2%)
    Amazon Japan: キングジム (King Jim) (59.1%), Skylight (52.0%) and Cozyone, Hbada and Bauhutte (バウヒュッテ) (all 50.0%)
    Amazon Singapore: Trademark Home (59.8%), Gaggia (54.5%) and Ely’s & Co. (46.8%)

    Discounts before, during and after the event

    The US retailer with the biggest overall home discount before Prime Day was Amazon US (27.0%). Amazon’s biggest pre-event discounts were on power & hand tools (28.6%), kitchen (28.3%) and furniture (28.0%).

    Ace Hardware offered the biggest discounts on power & hand tools during and after the event (both 34.1%).

    Amazon UK stood out for discounts this Prime Day. It was the UK retailer with the biggest overall home discount before (26.1%) Prime Day, with the deepest discounts on appliances (29.0%), power & hand tools (27.1%) and pet supplies (25.9%).

    During Prime Day, Etsy and Amazon UK offered the biggest discounts (29.7% and 29.6%, respectively).
    Etsy’s top discounts were on pet supplies (40.0%), kitchen (32.5%) and bed & bath (28.1%), while Amazon UK’s top discounts were on power & hand tools (32.3%), appliances (31.4%) and pet supplies (28.9%).

    After the event, Etsy had the biggest discount (29.8%), led by kitchen (34.3%), pet supplies (32.9%) and bed & bath (28.9%).

    In Europe, Amazon Italy offered the biggest overall home discount before (31.6%) and during (29.4%) Prime Day. Amazon France offered the biggest discount after (21.4%) Prime Day.

    In the pre-sales event, Amazon Italy gave the most generous discounts on pet supplies (31.6%) and appliances (9.3%).

    During Prime Day, Amazon Italy offered the biggest discounts on pet supplies (31.6%), furniture (28.3%) and appliances (9.3%).

    After Prime Day, Amazon France offered the biggest discounts on kitchen (24.6%), appliances (22.9%) and pet supplies (21.4%).

    Popularity

    In the US, among home products with high popularity, Amazon US offered the highest percentage of items with a price decrease (26.8%) and Target offered the greatest magnitude of price decrease (23.6%).

    For home items with moderate popularity, Amazon US offered the highest percentage of items with a price decrease (26.9%) and Target offered the greatest magnitude of price decrease (18.9%).

    Among home merchandise with low popularity, Amazon US offered both the highest percentage of items with a price decrease (23.8%) and the greatest magnitude of price decrease (15.9%).

    Amazon UK stood out in this analysis of product popularity. In the UK, among home products with high popularity, Amazon UK offered the highest percentage of items with a price decrease (37.1%) and Etsy offered the greatest magnitude of price decrease (20.9%).

    For home items with medium popularity, Amazon UK offered the highest percentage of items with a price decrease (35.9%) and Etsy offered the greatest magnitude of price decrease (24.4%).

    Among home merchandise with low popularity, Amazon UK offered both the highest percentage of items with a price decrease (34.9%) and the greatest magnitude of price decrease (21.7%).

    In Europe, Amazon Germany stood out for discounts for home products across all levels of popularity.

    Among home goods with high popularity, Amazon Germany offered both the highest overall percentage of items with a price decrease (29.1%) and the greatest overall magnitude of price decrease (19.1%).

    For home items with medium popularity, Amazon Germany offered both the highest percentage of items with a price decrease (28.4%) and the greatest magnitude of price decrease (19.8%).

    Among home merchandise with low popularity, Amazon Germany offered the highest percentage of items with a price decrease (22.5%) and Amazon Italy offered the greatest magnitude of price decrease (55.1%) related to a product count of 9.

    In Middle East & Asia, among home items with high popularity, Amazon Singapore offered the highest overall percentage of items with a price decrease (35.6%) and Amazon Saudi Arabia had the greatest overall magnitude of price decrease (19.4%).

    For home products with medium popularity, Amazon UAE offered both the highest percentage of items with a price decrease (47.5%) and the greatest magnitude of price decrease (16.0%).

    Among home goods with low popularity, Amazon UAE offered the highest percentage of items with a price decrease (43.3%) and Amazon Japan had the greatest magnitude of price decrease (15.5%).

    Prime Day 2021 hit a global home run

    Overall, Prime Day 2021 offered consumers many generous deals on home products across every region.

    According to our analysis, the retailers whose Prime Day pricing stood the most were Amazon US and Target in the US, Amazon UK and Etsy in the UK, Amazon Germany and Amazon Italy in Europe, Amazon UAE in the Middle East and Amazon Japan in Asia.

    Check out our Prime Day 2021 pricing insights across other categories, including health & beauty, fashion and electronics.

  • Prime Day 2021’s Best Fashion Discounts Around the World

    Prime Day 2021’s Best Fashion Discounts Around the World

    Consumers are moving beyond yoga pants. After a long year of pandemic lockdowns and the casual comfort of a homebody lifestyle, shoppers are giving their wardrobes a makeover. During this year’s Prime Day sales event, retailers around the world were well prepared for fashion shoppers’ enthusiasm for a fresh look.

    That’s why we at DataWeave wanted to know how Prime Day 2021 discounts played a role in fashion marketing. We focused our analysis on how global retailers adapted their Prime Day pricing strategies to distinguish their offerings across seven fashion subcategories, including men’s and women’s shoes, and clothing & accessories.

    Our Methodology
    We tracked the pricing of products among 16 leading retailers in nine countries across five regions, including:

    • The US (Amazon US, Nordstrom, Target, Walmart and Zappos)
    • The UK (Amazon UK, Ebay, Etsy and OnBuy)
    • Europe (Amazon France, Amazon Germany and Amazon Italy)
    • The Middle East (Amazon Saudi Arabia and Amazon UAE)
    • Asia (Amazon Japan and Amazon Singapore)

    This year’s results showed some impressive discounts among retailers and across regions. Let’s see how retailers used pricing as a competitive strategy to win Prime Day sales in the fashion category, as well as international fashion brands that stood out for the generous discounts on their products.

    Percentage of items with a price decrease

    The US retailer with the overall highest percentage of fashion products with a price decrease for Prime Day was Amazon US (34.5%).

    Fashion subcategories with the highest percentage of items with a price decrease per US retailer were:

    Amazon US: Watches (43.1%), men’s clothing & accessories (34.0%) and men’s shoes and women’s shoes (both 32.8%)
    Nordstrom: Men’s clothing & accessories (5.2%), women’s shoes (2.1%) and women’s clothing & accessories (1.5%)
    Target: Women’s shoes (28.3%), men’s shoes (13.0%) and women’s clothing & accessories (7.2%)
    Walmart: Watches (6.8%), women’s clothing & accessories (6.4%) and men’s shoes (4.2%)
    Zappos: Women’s shoes (28.2%), men’s clothing & accessories (13.6%) and men’s shoes (6.5%

    By far, the UK retailer with the overall highest percentage of items with a price decrease for Prime Day was Amazon UK (30.7%).

    Fashion subcategories with the highest percentage of items with a price decrease per UK retailer were:

    Amazon UK: Women’s shoes (38.5%), watches (33.5%) and men’s shoes (25.0%)
    Ebay: Men’s shoes (7.6%), women’s clothing & accessories (6.0%) and women’s shoes (5.5%)
    Etsy: Jewellery & accessories (4.7%), men’s clothing & accessories (4.3%) and women’s clothing & accessories (2.4%)

    In Europe, Amazon Germany had the overall highest percentage of items with a price decrease for Prime Day (35.0%).

    Fashion subcategories with the highest percentage of items with a price decrease per European retailer were:

    Amazon France: Women’s clothing & accessories (27.6%), watches (24.2%) and men’s shoes (19.4%)
    Amazon Germany: Women’s shoes (38.7%), watches (37.6%) and men’s shoes (36.7%)

    Across the Middle East & Asia, Amazon UAE had the overall highest percentage of fashion items with a price decrease for Prime Day (49.1%).

    Fashion subcategories with the highest percentage of items with a price decrease per retailer were:

    Amazon Saudi Arabia: Men’s clothing & accessories (54.0%), watches (52.0%) and men’s shoes (47.0%)
    Amazon UAE: Watches (55.8%), men’s clothing & accessories (54.3%) and men’s shoes (51.0%)
    Amazon Japan: Women’s clothing & accessories (17.5%) and men’s clothing & accessories (2.6%)
    Amazon Singapore: Women’s clothing & accessories (50.0%), men’s shoes (44.8%) and women’s shoes (40.9%)

    Magnitude of price decrease

    The US retailer with the greatest overall magnitude of price decrease for Prime Day was Nordstrom (29.3%).

    The fashion subcategories with the greatest magnitude of price decrease per US retailer were:

    Amazon US: Women’s clothing & accessories (16.3%), watches (14.6%) and men’s clothing & accessories (14.3%)
    Nordstrom: Women’s clothing & accessories (35.0%), women’s shoes (29.3%) and men’s clothing & accessories (28.4%)
    Target: Men’s clothing & accessories (21.9%), women’s clothing & accessories (19.3%) and women’s shoes (18.6%)
    Walmart: Men’s clothing & accessories (23.5%), women’s shoes (16.7%) and women’s clothing & accessories (11.5%)
    Zappos: Women’s clothing & accessories (11.9%), men’s clothing & accessories (10.6%) and women’s shoes (6.6%)

    Brands with the greatest magnitude of price decreases on fashions per US retailer included:

    Amazon US: Free Soldier (57.3%), Rockport (52.0%) and Alvaq (48.9%)
    Nordstrom: Little Words Project (60.0%), Robert Barakett and Nordstrom (50.0%) and Bonobos (49.1%)
    Target: Cowboy Bebop, Avatar: The Last Airbender, YuYu Hakusho, Dragon Ball Z and Naruto (all 40.0%)
    Walmart: Tredsafe (42.2%), C. Wonder and Crocs (both 30.0%) and Deer Stags (26.1%)
    Zappos: Volcom (25.9%), O’Neill (20.8%) and Bandolino (20.5%)

    In the UK, Ebay and Etsy tied for the greatest overall magnitude of price decrease on fashion products for Prime Day (both 14.7%).

    The fashion subcategories with the greatest magnitude of price decrease per UK retailer were:

    Amazon UK: Women’s shoes (27.9%), men’s shoes (27.5%) and men’s clothing & accessories (18.2%)
    Ebay: Men’s clothing & accessories (19.1%), men’s shoes (17.7%) and watches (17.6%)
    Etsy: Women’s shoes (30.2%), men’s shoes (17.1%) and jewellery & accessories (16.3%)

    Brands with the greatest magnitude of price decreases across fashion sub-categories per UK retailer included:

    Amazon UK: Invicta (43.9%), Boss (42.7%) and Accurist (41.2%)
    Ebay: Dickies (55.6%), Havaianas (55.0%) and Branded (46.7%)
    Etsy: Mirugb (50.0%), LilisLeatherShop (41.6%) and OnaieShop (40.0%)

    Among European retailers, Amazon Germany offered the greatest overall magnitude of price decrease on fashion products for Prime Day (16.1%).

    The fashion subcategories with the greatest magnitude of price decrease per European retailer were:

    Amazon France: Women’s shoes (22.4%), men’s clothing & accessories (12.1%) and watches (9.1%)
    Amazon Germany: Women’s clothing & accessories (17.7%), watches (17.3%) and men’s clothing & accessories (15.0%)

    Brands with the greatest magnitude of price decreases per European retailer included:

    Amazon France: Converse (58.3%), Alsino (43.2%) and Scuderia Ferrari (35.6%)
    Amazon Germany: Truth & Fable Damen Kleider (59.6%), Victorinox (59.5%) and Sockenkauf24 (56.7%)

    Across the Middle East and Asia, Amazon Japan offered the greatest overall magnitude of price decrease on fashion products for Prime Day (18.4%).

    The fashion subcategories with the greatest magnitude of price decrease per retailer were:

    Amazon Saudi Arabia: Men’s clothing & accessories (20.3%), men’s shoes (18.4%) and women’s shoes (16.7%)
    Amazon UAE: Men’s shoes (20.5%), men’s clothing & accessories (19.0%) and women’s shoes (18.9%)
    Amazon Japan: Men’s clothing & accessories (23.7%) and women’s clothing & accessories (18.0%)
    Amazon Singapore: Women’s shoes (12.2%), watches (7.6%) and men’s shoes (5.0%)

    Brands with the greatest magnitude of price decreases per retailer in the Middle East and Asia included:

    Amazon Saudi Arabia: Dorina (48.7%), Cole Haan (40.2%) and Boss (39.7%)
    Amazon UAE: Aldo (53.2%), Mvmt (51.4%) and Inkast Denim Co. (39.4%)
    Amazon Japan: Face Trick Glasses (30.2%), モアプレッシャー (More Pressure) (23.7%) and
    アツギ (Atsugi) (21.7%)
    Amazon Singapore: Bloch (49.0%), Adidas (38.5%) and Chums (31.4%)

    Discounts before, during and after the event

    Nordstrom was the US retailer with the biggest overall fashion discount before (39.0%), during (40.5%) and after (41.2%) Prime Day.

    Nordstrom’s biggest pre-event discounts were on women’s shoes (44.2%), women’s clothing & accessories (36.6%) and men’s clothing & accessories (36.1%).

    Women’s shoes (43.1%), men’s shoes (42.6%) and men’s clothing & accessories (39.5%) were the leading subcategories for Nordstrom’s discounts during Prime Day.

    After the event, Nordstrom’s biggest discounts were for women’s shoes (42.5%), men’s shoes (42.2%) and men’s clothing & accessories (41.5%).

    In the UK, Ebay offered the highest discounts before (43.7%), during (42.1%) and after (42.3%) Prime Day.

    Before Prime Day, Ebay biggest discounts were on men’s clothing & accessories (47.9%), men’s shoes (43.9%) and watches (43.3%).

    Ebay’s top discounts during Prime Day were on men’s clothing & accessories (45.3%), men’s shoes (44.6%) and women’s shoes (39.5%).

    After the event, Ebay had the biggest discounts on men’s clothing & accessories (45.6%), women’s shoes (42.9%) and men’s shoes (41.9%).

    In Europe, Amazon Germany dominated with the biggest overall fashion discounts before (27.1%), during (31.8%) and after (26.5%) Prime Day.

    In the pre-sales event, Amazon Germany offered its most generous discounts on watches (27.5%), women’s shoes (12.6%) and men’s shoes (5.7%).

    During Prime Day, Amazon Germany’s biggest discounts were on women’s clothing & accessories (36.8%), men’s clothing & accessories (32.5%) and watches (32.0%).

    After Prime Day, Amazon Germany had the highest discounts on women’s clothing & accessories (34.1%), men’s clothing & accessories (27.6%) and watches (26.6%).

    Popularity

    In the US, among fashion products with high popularity, Amazon US offered the highest percentage of items with a price decrease (36.8%) and Nordstrom offered the greatest magnitude of price decrease (29.8%).

    For fashion items with medium popularity, Amazon US offered the highest percentage of items with a price decrease (35.2%), and Nordstrom offered the greatest magnitude of price decrease (28.1%).

    Among fashion merchandise with low popularity, Amazon US offered the highest percentage of items with a price decrease (27.2%) and Nordstrom offered the greatest magnitude of price decrease (31.6%).

    In the UK, among fashion products with high popularity, Amazon UK offered the highest percentage of items with a price decrease (31.6%) and Ebay offered the greatest magnitude of price decrease (14.3%).

    For fashion items with medium popularity, Amazon UK offered the highest percentage of items with a price decrease (32.5%) and Ebay offered the greatest magnitude of price decrease (17.6%).

    Among fashion merchandise with low popularity, Amazon UK offered the highest percentage of items with a price decrease (24.5%) and Etsy offered the greatest magnitude of price decrease (23.1%).

    In Europe, Amazon Germany dominated discounts for Prime Day 2021 across all levels of popularity.

    Among fashion goods with high popularity, Amazon Germany offered both the highest overall percentage of items with a price decrease (40.5%) and the greatest overall magnitude of price decrease (16.3%).

    For fashion items with medium popularity, Amazon Germany offered both the highest percentage of items with a price decrease (32.5%) and the greatest magnitude of price decrease (16.5%).

    Among fashion merchandise with low popularity, Amazon Germany offered the highest percentage of items with a price decrease (30.8%) and the greatest magnitude of price decrease (15.1%).

    In Middle East & Asia, among fashion items with high popularity, Amazon Saudi Arabia offered the highest overall percentage of items with a price decrease (55.9%) and Amazon UAE had the greatest overall magnitude of price decrease (20.6%).

    For fashion products with medium popularity, Amazon UAE offered both the highest overall percentage of items with a price decrease (49.3%) and the greatest overall magnitude of price decrease (17.8%).

    Among fashion items with low popularity, Amazon UAE offered the highest percentage of items with a price decrease (46.1%) and Amazon Japan had the greatest magnitude of price decrease (21.5%).

    Prime Day fashion deals galore

    Overall, Prime Day 2021 gave global shoppers an abundance of generous discounts on fashion items.

    According to our analysis, the retailers whose Prime Day pricing stood out the most were Amazon US and Nordstrom in the US, Amazon UK and Ebay in the UK, Amazon Germany in Europe, Amazon UAE in the Middle East and Amazon Japan in Asia.

    For more global Prime Day 2021 pricing insights, see our analysis of electronics and health & beauty products.

  • Prep, Prime and Plenish For Prime Day India 2021

    Prep, Prime and Plenish For Prime Day India 2021

    After demonetization, Covid-19 has probably been one of the worst scenarios for the retail sector in India. The entire nation went into lockdown and the industry noticed some big changes around the entire globe. From remote working to shopping, everything turned to digital and Bharat witnessed new trends across payments, e-commerce, and more.

    Not surprisingly, D2C has been a favorite amongst businesses thanks to its agility. More than 800 brands have joined the direct-to-consumer bandwagon in order to reach their audience quickly and in an efficient way. Where brands such as MamaEarth, Clovia, Bewakoof, Lenskart have been some of the popular brands in the sector, last year even traditional giants such as LG, Ajanta-Orpat, Piaggio, Havells also adopted the D2C model.

    Ramp up in D2c Brand Activity
    Source: Avendus

    Brands are more focused on making the user experience better and it will be safe to say that this year, D2C will be the highlight of the e-tail ecosystem. Naturally, e-commerce giants such as Amazon, Flipkart have played an important role in this revolution. Amazon, which has over 100 Million registered users in India, announced that it will host its flagship event, Prime Day this year on 26-27 July.

    Let’s look at some of the things brands can do to leave their mark this Prime Day in India.

    Digital Shelf Optimisation: Need Of The Hour

    Given that the pandemic has accelerated online shopping nationwide, Digital Shelf Optimisation (DSO) should be the key lever for any brand to accelerate its digital commerce growth. Events such as Prime day are significant for a brand’s reputation, customer experience, overall sales and can help you build a loyal customer base.

    With that in mind, we have prepared a list of things to consider, in order to help brands stand out from the crowd.

    1. Pricing And Discounting

    Pricing and Discounting
    Pricing and Discounting: Offer discounts and deals to attract customers.

    It is obvious that Prime Day will see a tremendous influx of shoppers. Noticeably, impulsive shopping is a trend during these sales, as everybody loves a good product for a discounted price. Make sure to offer discounts and deals to attract customers.

    Another suggestion is to keep a track of competition, their pricing and promotional strategies and keep an eye on price changes happening across relevant categories or SKU’s (Stock Keeping Unit). Competition analysis is a powerful tool and having accurate data on their sales, market share is a critical part of this.

    2. Optimise Product Visibility

    Product Visibility
    Product Visibility: Lakhs of sellers & brands are vying for the same spot

    Marketplaces are crowded, and getting discovered is already hard. Lakhs of sellers & brands are vying for the same spot. And with more people moving online, it’s going to get increasingly harder for brands to stand out. Optimize your search visibility using the right keywords relevant to your brand, strategically spend on Sponsored Ads to secure high visibility placements on Amazon and lastly make sure your online product packaging via product pages contain attractive images to position your product in the best light.

    3. Product Availability

    Product Availability
    Product Availability: Have plenty of stock available

    Make sure to have plenty of stock available as shoppers are likely to turn to other brands/products in case your product is unavailable. Also, keep in mind that people are generally more open to trying new products during a sale as it offers discounts. Track your products’ stock status to make sure they’re available 24 x 7.

    As the foremost goal during sales is to move inventory as much as possible, offering a large assortment is a good idea. Create product bundles that complement each other.

    4. Use A + Content

    A+ Content
    A+ Content is King: The new age packaging for your product

    Content is the new age packaging for your product. Content is crucial to change consumer shortlists & considerations into conversions.

    Your content tells your product story & gives customers the information they need to make a purchase. Use high resolution and accurate images, add features, benefits, USPs of your products clearly. It is advisable to use more than one image to show your product more clearly. Make sure all your brand & product pages on Amazon are optimized.

    5. Ratings And Reviews

    Ratings and Reviews
    Reviews and Ratings: Feedback is a very important e-commerce tool.

    Why would shoppers rely on word-of-mouth when they can take help from millions of people from the community? Not said enough, feedback is a very important e-commerce tool. Amazon’s A9 algorithm presents the choices to the consumers but reviews and star ratings still play an influential role in the journey from consideration to conversion.

    Brands could consider partnering with Dataweave, to keep track of reviews and manage negative ratings on Amazon.

    Summary

    According to a report by EY-IVCA Trend Book 2021, “ The e-commerce industry in India is expected to reach $99 Bn by 2024 and penetration of retail is expected to be 10.7% by 2024, compared to 4.7% in 2019.”

    Internet penetration rate in India 2007-2021 Published by Sandhya Keelery, Apr 27, 2021  Internet penetration rate in India went up to nearly around 45 percent in 2021, from just about four percent in 2007. Although these figures seem relatively low, it meant that nearly half of the population of 1.37 billion people had access to internet that year. This also ranked the country second in the world in terms of active internet users. Internet penetration rate in India from 2007 to 2021
    Source: Statista

    The same report also revealed that India will have 220 Million online shoppers by 2025. With e-commerce growing at an exponential rate, brands are advised to be more statistical & data-driven to win a larger % of online sales. 
    If you think this is the right time to optimize your digital shelf, take a look at our products and services.

    We at DataWeave would be happy to be a part of your e-commerce and digitization journey. You can sign up for a demo with our team to know more

  • Prime Day 2021 Reflected the Global Health & Beauty Category

    Prime Day 2021 Reflected the Global Health & Beauty Category

    As consumers socialize more this year, retailers around the world are competing for sales in the torrid health & beauty category.

    That’s why we at DataWeave wanted to know how Prime Day 2021 discounts played a role in the pricing strategies for health & beauty products. We focused our analysis on how global retailers adapted their Prime Day pricing strategies to distinguish their offerings across seven health & beauty subcategories, including makeup, health care and baby care.

    Our Methodology
    We tracked the pricing of products among 16 leading retailers in nine countries across five regions, including:

    ● The US (Amazon US, Sephora, Target, Ulta and Walmart)
    ● The UK (Amazon UK, Ebay, Etsy and OnBuy)
    ● Europe (Amazon France, Amazon Germany and Amazon Italy)
    ● The Middle East (Amazon Saudi Arabia and Amazon UAE)
    ● Asia (Amazon Japan and Amazon Singapore)

    The results showed some surprising differences among retailers and regions. See how retailers used pricing as a competitive strategy to win Prime Day sales in the health & beauty category, as well as international health & beauty brands that stood out for the discounts on their products.

    Percentage of items with a price decrease

    The US retailer with the overall highest percentage of health & beauty products with a price decrease for Prime Day was Amazon US (23.9%).

    Health & beauty subcategories with the highest percentage of items with a price decrease per US retailer were:

    Amazon US: Fragrance (32.4%), oral care (27.1%) and skin care (22.7%)
    Sephora: Makeup (0.2%)
    Target: Oral care (2.7%), baby care (1.6%) and hair care (0.8%)
    Ulta: Makeup (3.7%), skin care (0.8%) and hair care (0.1%)
    Walmart: Fragrance (35.3%), hair care (27.0%) and skin care (23.1%)

    By far, the UK retailer with the overall highest percentage of items with a price decrease for Prime Day was Amazon UK (41.9%).

    Health & beauty subcategories with the highest percentage of items with a price decrease per UK retailer were:

    Amazon UK: Oral care (62.5%), fragrance (46.2%) and hair care and skin care (both 45.4%)
    Ebay: Makeup (8.1%), fragrance (7.1%) and skin care (4.7%)
    Etsy: Oral care (3.4%), skin care (2.3%) and makeup (0.9%)

    In Europe, Amazon Germany had the overall highest percentage of items with a price decrease for Prime Day (33.1%).

    Health & beauty subcategories with the highest percentage of items with a price decrease per European retailer were:

    Amazon France: Skin care (27.2%), fragrance (25.0%) and hair care (24.4%)
    Amazon Germany: Skin care (49.7%), fragrance (41.3%) and hair care (37.2%)
    Amazon Italy: Skin care (5.9%)

    Across the Middle East & Asia, Amazon UAE had the overall highest percentage of health & beauty items with a price decrease for Prime Day (54.1%).

    Health & beauty subcategories with the highest percentage of items with a price decrease per retailer were:

    Amazon Saudi Arabia: Health care (56.4%), hair care (48.8%) and fragrance (46.2%)
    Amazon UAE: Skin care (64.3%), fragrance (64.0%), and hair care (58.4%)
    Amazon Japan: Oral care (5.3%), skin care (4.5%) and makeup (3.3%)
    Amazon Singapore: Baby care and health care (both 35.6%), makeup (32.6%) and fragrance (31.3%)

    Magnitude of price decrease

    The US retailer with the greatest overall magnitude of price decrease for Prime Day was Ulta (33.3%).

    The health & beauty subcategories with the greatest magnitude of price decrease per US retailer were:

    Amazon US: Hair care (18.0%), baby care (15.5%) and health care (15.4%)
    Sephora: Makeup (24.5%)
    Target: Hair care (46.6%), oral care (28.4%) and skin care and baby care (both 15.0%)
    Ulta: Hair care (40.8%), skin care (34.0%) and makeup (32.5%)
    Walmart: Baby care (11.5%), skin care (11.3%) and hair care (11.0%)

    Brands with the greatest magnitude of price decreases per US retailer included:

    Amazon US: Cerave (54.5%), Aquaphor (54.4%) and Yankee Candle (50.7%)
    Sephora: Nars (25.9%) and Marc Jacobs Beauty (23.1%)
    Target: Kristin Ess (50.0%), Hot Tools (48.6%) and Arc Oral Care (both 40.1%)
    Ulta: KKW Beauty, Lime Crime, Ulta and NYX Professional Makeup (all 50.0%), CoverGirl (47.8%) and Biolage (40.8%)
    Walmart: Whitening Toothpaste (57.6%), Absolute New York (56.7%) and Zdmathe (48.5%)

    The UK retailer with the greatest overall magnitude of price decrease on health & beauty products for Prime Day was Amazon UK (18.6%).

    The health & beauty subcategories with the greatest magnitude of price decrease per UK retailer were:

    Amazon UK: Oral care (23.5%), makeup (22.0%) and skin care (20.2%)
    Ebay: Hair care (16.0%), fragrance (14.4%) and makeup (11.5%)
    Etsy: Makeup (20.0%), oral care (16.1%) and skin care (13.3%)

    Brands with the greatest magnitude of price decreases across health & beauty sub-categories per UK retailer included:

    Amazon UK: Philips Sonicair (56.8%), BaByliss For Men (53.0%) and Dr. PawPaw (52.9%)
    Ebay: Oral-B Braun (50.3%), Clean (50.1%) and Versace (46.0%)
    Etsy: Valdenize (both 48.4%), Allure Wedding Jewelry (32.8%) and Moroccan White (30.0%)

    Among European retailers, Amazon Germany offered the greatest overall magnitude of price decrease on health & beauty products for Prime Day (20.2%).

    The health & beauty subcategories with the greatest magnitude of price decrease per European retailer were:

    Amazon France: Skin care (20.4%), baby care (17.8%) and makeup (16.2%)
    Amazon Germany: Skin care (28.2%), makeup (22.6%) and health care (21.3%)
    Amazon Italy: Skin care (9.9%)

    Brands with the greatest magnitude of price decreases per European retailer included:

    Amazon France: Look Concept (59.8%), Douyao (57.5%) and Eco Styler (57.4% for both hair care and health care)
    Amazon Germany: Le Cuisinier (58.4%), Beurer (47.5%) and Solida (45.9%)
    Amazon Italy: Bezox (9.9%)

    Across the Middle East and Asia, Amazon Japan offered the greatest overall magnitude of price decrease on health & beauty products for Prime Day (18.0%).

    The health & beauty subcategories with the greatest magnitude of price decrease per retailer were:

    Amazon Saudi Arabia: Health care (25.1%), skin care (19.3%) and baby care (16.5%)
    Amazon UAE: Makeup (23.1%), hair care (18.3%) and baby care (18.1%)
    Amazon Japan: Skin care (27.6%), hair care (17.2%) and makeup (14.7%)
    Amazon Singapore: Skin care (10.1%), hair care (8.9%) and health care (8.2%)

    Brands with the greatest magnitude of price decreases per retailer in the Middle East and Asia included:

    Amazon Saudi Arabia: Tide (59.8%), bblüv (58.3%) and Mas (55.0%)
    Amazon UAE: Syoss (59.7%), Vertex (59.1%) and Onesea (58.7%)
    Amazon Japan: ドクターブロナー (Dr. Bronner’s) (54.8%), ゼルマ (Zelma) (50.0%) and いち髪 (47.8%)
    Amazon Singapore: Changing Lifestyles (56.6%), Dynarex (53.0%) and Grohe (52.5%)

    Discounts before, during and after the event

    In the US, specialty beauty retailers’ discounts stood out during Prime Day sales. The US retailer with the biggest overall health & beauty discount before (43.4%), during (39.3%) and after (39.4%) Prime Day was Ulta. During and after Prime Day, Sephora was a close second at 38.2% for both periods.

    Ulta’s biggest pre-event discounts were on makeup (44.2%) and skin care (33.0%). Hair care (40.8%). makeup (39.5%) and skin care (36.0%) were the leading subcategories for Ulta’s discounts during Prime Day. After the event, Ulta’s biggest discounts were for hair care (40.8%), makeup (39.6%) and skin care (37.3%)

    In the UK, OnBuy offered the highest discounts before, during and after Prime Day at 70.0% off baby care products. Yet the total product count was only 2.

    Among the remaining rivals, all of whom had a product count above 1000, Ebay had the highest discounts before (30.8%), during (33.8%) and after (35.0%) Prime Day.

    Before Prime Day, Ebay biggest discounts were on hair care (48.9%), fragrance (23.9%) and makeup (23.4%). Ebay’s top discounts during Prime Day were on hair care (50.3%), makeup (24.9%) and fragrance (24.8%). Similarly, after the event, Ebay had the biggest discounts on hair care (49.9%), makeup (26.7%) and fragrance (26.2%).

    Across retailers in the Middle East & Asia, Amazon UAE offered the biggest overall health & beauty discounts before (26.0%), during (30.7%) and after (26.0%) Prime Day.

    In the pre-sales event, Amazon UAE offered the most generous discounts on makeup (30.7%), fragrance (29.9%) and health care (29.2%).

    During Prime Day, Amazon UAE’s biggest discounts were on makeup (37.2%), fragrance (31.6%) and health care (31.3%).

    During Prime Day, Amazon UAE offered the biggest discounts on fragrance (30.5%), makeup (30.0%) and health care and baby care (both 26.8%).

    Popularity

    In the US, among health & beauty products with high popularity, Amazon US offered the highest percentage of items with a price decrease (24.3%) and Target offered the greatest magnitude of price decrease (29.3%).

    For health & beauty items with medium popularity, Amazon US offered the highest percentage of items with a price decrease (26.0%), and strategic partners Target and Ulta both offered the greatest magnitude of price decrease (33.4%).

    Among health & beauty merchandise with low popularity, Walmart offered the highest percentage of items with a price decrease (18.5%) and Ulta offered the greatest magnitude of price decrease (37.4%).

    Amazon UK stood out among all levels of health & beauty product popularity.

    In the UK, among health & beauty products with high popularity, Amazon UK offered both the highest percentage of items with a price decrease (42.8%) and the greatest magnitude of price decrease (18.6%).

    For health & beauty items with medium popularity, Amazon UK offered the highest percentage of items with a price decrease (42.8%) and Etsy offered the greatest magnitude of price decrease (20.1%).

    Among health & beauty merchandise with low popularity, Amazon UK offered both the highest percentage of items with a price decrease (35.4%) and the greatest magnitude of price decrease (17.6%).

    In Europe, Amazon Germany dominated discounts for health & beauty products across all levels of popularity.

    Among health & beauty goods with high popularity, Amazon Germany offered both the highest overall percentage of items with a price decrease (34.6%) and the greatest overall magnitude of price decrease (20.6%).

    For health & beauty items with medium popularity, Amazon Germany offered both the highest percentage of items with a price decrease (32.7%) and the greatest magnitude of price decrease (20.0%).

    Among health & beauty merchandise with low popularity, Amazon Germany offered the highest percentage of items with a price decrease (33.5%) and the greatest magnitude of price decrease (20.6%).

    In Middle East & Asia, among health & beauty items with high popularity, Amazon UAE offered the highest overall percentage of items with a price decrease (53.0%) and Amazon Saudi Arabia had the greatest overall magnitude of price decrease (18.7%).

    For health & beauty products with medium popularity, Amazon UAE offered the highest overall percentage of items with a price decrease (55.3%) and Amazon Saudi Arabia had the greatest overall magnitude of price decrease (19.7%).

    Among health & beauty goods with low popularity, Amazon UAE offered the highest percentage of items with a price decrease (54.5%) and Amazon Japan had the greatest magnitude of price decrease (18.7%).

    Health & beauty’s stunning Prime Day deals

    Overall, Prime Day 2021 gave shoppers around the world the opportunity to score generous discounts on health & beauty products.

    According to our analysis, the retailers whose Prime Day pricing stood out the most were Amazon US and Ulta in the US, Amazon UK and Ebay in the UK, Amazon Germany in Europe, Amazon UAE in the Middle East and Amazon Japan in Asia.

    Stay tuned for Prime Day 2021 international fashion and home goods pricing insights.

  • Who Won Prime Day 2021’s Consumer Electronics Price War?

    Who Won Prime Day 2021’s Consumer Electronics Price War?

    Amazon’s Prime Day 2021 global shopping event took place June 21 and 22, 2021 and smashed previous sales records. At DataWeave, we wanted to know how Prime Day 2021 deals and discounts on electronics compared across retailers and regions. We focused on how retailers adapted their Prime Day pricing strategies to stand out in the competitive consumer electronics category.

    Our Methodology
    We tracked the pricing of several leading retailers in nine countries across five regions, including:

    • The US (Amazon US, Best Buy, Target and Walmart)
    • The UK (Amazon UK, Ebay, Etsy and OnBuy)
    • Europe (Amazon France, Amazon Germany and Amazon Italy)
    • The Middle East (Amazon Saudi Arabia and Amazon UAE)
    • Asia (Amazon Japan and Amazon Singapore)

    Let’s see how retailers used pricing tactics to gain a competitive advantage during Prime Day, as well as which electronics brands had the highest discounts around the world.

    Percentage of items with a price decrease

    The US retailer with the overall highest percentage of items with a price decrease for Prime Day was Amazon US (26.3%).

    Electronics subcategories with the highest percentage of items with a price decrease per US retailer were:

    Amazon US: Headphones (36.3%), video games and electronics (both 35.8%) and cameras (35.7%)
    Best Buy: Wearables (10.1%) and electronics (6.8%)
    Target: Electronics (21.4%), Bluetooth & wireless speakers (19.4%) and tech accessories (14.8%)
    Walmart: Cell phones & accessories (25.8%), TV & video (14.9%) and cameras (9.4%)

    The UK retailer with the overall highest percentage of items with a price decrease for Prime Day was Amazon UK (30.4%), closely followed by OnBuy (30.0%). Of note, Amazon UK offered price increases on 10 times as many products as OnBuy (2379 vs. 237).

    Electronics subcategories with the highest percentage of items with a price decrease per UK retailer were:

    Amazon UK: Electronics (53.2%), cameras (41.8%) and headphones (41.5%)
    Ebay: TV & video (19.2%), computers & office (12.2%) and cell phones & accessories (7.5%)
    Etsy: Electronics (1.4%)
    OnBuy: Cell phones & accessories (35.5%) and wearables (4.8%)

    In Europe, Amazon Germany had the overall highest percentage of items with a price decrease for Prime Day (28.9%).

    Electronics subcategories with the highest percentage of items with a price decrease per European retailer were:

    Amazon France: Cell phones & accessories (35.2%), electronics (21.0%) and cameras (19.6%)
    Amazon Germany: Cell phones & accessories (43.3%), electronics (42.5%) and headphones (39.2%)
    Amazon Italy: Headphones (25.0%), cell phones & accessories (14.3%) and Bluetooth & wireless speakers (8.3%)

    Across the Middle East & Asia, Amazon UAE had the overall highest percentage of items with a price decrease for Prime Day (36.1%).

    Electronics subcategories with the highest percentage of items with a price decrease per retailer were:

    Amazon Saudi Arabia: Video games (47.8%), electronics (46.8%) and cell phones & accessories (41.2%)
    Amazon UAE: Electronics (63.4%), tech accessories (60.3%) and cell phones & accessories (60.1%)
    Amazon Japan: TV & video (14.9%), musical instruments (11.8%) and electronics (10.3%)
    Amazon Singapore: Wearables (32.2%), car electronics (30.4%) and musical instruments (30.2%)

    Magnitude of price decrease

    The US retailer with the greatest overall magnitude of price decrease for Prime Day was Target (18.6%).

    The electronics subcategories with the greatest magnitude of price decrease per US retailer were:

    Amazon US: Cell phones & accessories (20.4%), electronics (20.1%) and headphones (18.7%)
    Best Buy: Wearables (16.9%) and electronics (13.3%)
    Target: Video games (27.9%), tech accessories (25.6%) and headphones (24.4%)
    Walmart: TV & video (10.6%), computers & office (10.3%) and home audio & theater (10.1%)

    Brands with the greatest magnitude of price decreases per US retailer included:

    Amazon US: JBL (57.2%), Hape (55.0%) and Falcon (52.8%)
    Best Buy: Bower (40.0%), Vtech (36.7%) and Wingthings (30.0%)
    Target: 2k Sports and 2K Games (both 56.7%), Little Tikes (50.0%)
    Walmart: Moonlite (54.3%), Sceptre (45.9%) and Polaroid (38.5%)

    The UK retailer with the greatest overall magnitude of price decrease for Prime Day was OnBuy (22.1%).

    The electronics subcategories with the greatest magnitude of price decrease per UK retailer were:

    Amazon UK: Home audio & theater (28.4%), electronics (21.7%) and cell phones & accessories (20.1%)
    Ebay: TV & video (19.5%), wearables (18.7%) and computer & office (16.6%)
    Etsy: Electronics (14.8%)
    OnBuy: Cell phones & accessories (22.3%) and wearables (5.9%)

    Brands with the greatest magnitude of price decreases across electronics categories per UK retailer included:

    Amazon UK: Amazon (58.3% for both cell phones & accessories and headphones), Flexson (55.4%) and Ibra (47.9% for both cameras and TV & video)
    Ebay: Falcon (52.0%), Ticwatch (48.4%) and Grougs by Live Lead (47.9%)
    OnBuy: Sony (33.1%), Apple (23.1%) and Samsung (21.3%)

    Among European retailers, Amazon Italy offered the greatest overall magnitude of price decrease for Prime Day (18.9%) among a total of 66 products.

    The electronics subcategories with the greatest magnitude of price decrease per European retailer were:

    Amazon France: Home audio & theater (13.1%), video games (10.5%) and TV & video (10.3%)
    Amazon Germany: Video games (22.0%), electronics and musical instruments (both 20.3%) and cell phones & accessories (20.2%)
    Amazon Italy: Cell phones & accessories (41.2%) and headphones (28.1%)

    Brands with the greatest magnitude of price decreases per European retailer included:

    Amazon France: DCSk (59.0%), Amazon Basics (58.7%) and Qoosea (46.3%)
    Amazon Germany: Meister (53.5%), Rampow (51.4%) and Gewa (51.1%)
    Amazon Italy: Homscam (41.2%) and Gamurry (15.1)

    Across the Middle East and Asia, Amazon Japan offered the greatest overall magnitude of price decrease for Prime Day (11.9%) among a total of 66 products.

    The electronics subcategories with the greatest magnitude of price decrease per retailer were:

    Amazon Saudi Arabia: Video games (16.8%), electronics (12.8%) and cell phones & accessories (12.4%)
    Amazon UAE: Car electronics, headphones and tech accessories (all 13.1%)
    Amazon Japan: Headphones (25.4%), home audio & theater (23.6%) and cameras (14.9%)
    Amazon Singapore: Car electronics (9.4%), cell phones & accessories (8.6%) and electronics (8.3%)

    Brands with the greatest magnitude of price decreases per retailer in the Middle East and Asia included:

    Amazon Saudi Arabia: Belkin (52.9%), Topoint (49.3%) and Promate (45.7%)
    Amazon UAE: Amazon Basics (56.3%), Bettyliss (52.1%) and Acreate (50.3%)
    Amazon Japan: タニタ(Tanita) (49.7%), Laza-Vally (47.8%) and Nebula (33.3%)
    Amazon Singapore: Pintech Percussion (55.0%), Pac (53.4%) and Goldwood Sound Inc. (52.9%)

    Discounts before, during and after the event

    The US retailer with the biggest overall electronics discount before Prime Day was Amazon US (26.6%). Amazon’s biggest discounts were on home audio & theater (30.5%), TV & video (29.1%) and cell phones & accessories (28.6%).

    Walmart offered the biggest discounts during (32.1%) and after (31.5%) the event. During the event, Walmart’s biggest discounts were on cell phones & accessories (46.3%), home audio & theater (35.5%) and computers & office (31.0%). Similarly, after the event, Walmart’s biggest discounts were on cell phones & accessories (45.8%), home audio & theater (35.3%) and computers & office (30.8%).

    OnBuy was the UK retailer with the biggest overall electronics discount before (65.3%), during (68.6%) and after (69.1%) Prime Day with a product count of 237. OnBuy’s biggest discounts were on cameras (69.5% before, during and after the sales event), cell phones & accessories (rising from 67.6% before the sales event to 71.6% during and 71.8% after the event) and wearables (65.2% before and after the event yet 35.5% during Prime Day).

    In Europe, Amazon Germany offered the biggest overall electronics discount before (21.4%), during (25.6%) and after (20.2%) Prime Day. Amazon France and Amazon Italy also offered comparable overall discounts (21.1%) before Prime Day.

    In the pre-sales event, Amazon Germany gave the most generous discounts on cameras (34.1%), wearables (24.7%) and headphones (24.3%). During Prime Day, Amazon Germany offered the biggest discounts on video games (30.7%), headphones (30.1%) and electronics (28.3%). After Prime Day, Amazon Germany offered the biggest discounts on headphones (24.2%) electronics (22.6%) and cell phones & accessories (22.1%).

    Across retailers in the Middle East & Asia, Amazon UAE offered the biggest overall electronics discount before Prime Day (24.3%), whereas Amazon Japan offered the biggest discount during (32.0%) and after (32.3%) Prime Day.

    In the pre-sales event, Amazon UAE offered the most generous discounts on TV & video (31.3%), musical instruments (31.0%) and headphones (25.4%). During and after Prime Day, Amazon Japan offered the biggest discounts on Bluetooth & wireless speakers and electronics (both 99.0%).

    Popularity

    In the US, among electronics with high popularity, Amazon US offered the highest percentage of items with a price decrease (27.8%) and Target offered the greatest magnitude of price decrease (21.3%).

    For electronics with moderate popularity, Amazon US offered the highest percentage of items with a price decrease (24.7%) and Best Buy offered the greatest magnitude of price decrease (15.4%).

    Among electronics with low popularity, Amazon US offered the highest percentage of items with a price decrease (25.2%) and Best Buy offered the greatest magnitude of price decrease (13.4%), closely followed by Amazon US (13.3%).

    In the UK, among electronics with high popularity, OnBuy offered the highest percentage of items with a price decrease (44.0%) among 84 products and Etsy offered the greatest magnitude of price decrease (28.5%) among 150 products.

    For electronics with moderate popularity, Amazon UK offered the highest percentage of items with a price decrease (29.3%) and OnBuy offered the greatest magnitude of price decrease (26.7%).

    Electronics with low popularity, Amazon UK offered the highest percentage of items with a price decrease (23.9%) and OnBuy offered the greatest magnitude of price decrease (26.3%).

    In Europe, among electronics with high popularity, Amazon Germany offered the highest overall percentage of items with a price decrease (30.1%) and the greatest overall magnitude of price decrease (20.2%).

    For electronics with moderate popularity, Amazon Germany offered the highest percentage of items with a price decrease (29.7%) and Amazon Italy offered the greatest magnitude of price decrease (41.2%) among 12 products.

    Among electronics with low popularity, Amazon Germany offered the highest percentage of items with a price decrease (26.7%) and the greatest magnitude of price decrease (17.2%).

    In Middle East & Asia, among electronics with high popularity, Amazon Singapore offered the highest overall percentage of items with a price decrease (32.2%) and Amazon Saudi Arabia had the greatest overall magnitude of price decrease (10.4%).

    For electronics with moderate popularity, Amazon UAE offered the highest percentage of items with a price decrease (48.8%) and Amazon Japan offered the greatest magnitude of price decrease (11.5%).

    Similarly, among electronics with low popularity, Amazon UAE offered the highest percentage of items with a price decrease (36.9%) and Amazon Japan the greatest magnitude of price decrease (13.3%).

    Consumers won big on Prime Day 2021

    Overall, Prime Day 2021 offered a wide range of deals across the competitive electronics category in each region. Almost all of the retailers we studied (except for Ebay) showed up in the analysis for offering notable discounts and pricing strategies this year. Amazon US, OnBuy, Amazon Germany, Amazon Japan and Amazon UAE appeared in the results most often among their respective regions. Stay tuned for Prime Day 2021 pricing insights across other categories, including home, health & beauty and fashion.

  • Dazzle Dad With Electronics & Home Goods for Father’s Day

    Dazzle Dad With Electronics & Home Goods for Father’s Day

    This year, shoppers will skip neckties and celebrate Dad with gifts for his home office or man cave.

    As our personal and professional lives grow increasingly digital and tied to our homes, retailers face new seasonal sales opportunities. Retailers whose assortments contain in-demand electronics and home products can drive more e-commerce sales revenue and gain a competitive edge in time for Father’s Day 2021.

    According to the NRF, Father’s Day spending is expected to hit $20.1 billion, up 18% from 2020’s total of $17 billion. The vast majority (75%) of Americans plan to celebrate the fathers, husbands and other paternal figures in their life this Father’s Day.

    Popular products dads will love


    Retailers can inspire Father’s Day shoppers by filling their assortments with in-demand electronics and home products, as these two categories continue to boom.

    Consider these recent results related to electronics and home goods:

    • Online sales of consumer electronics grew 18% year-over-year in 2020 as more consumers work, shop and enjoy entertainment in the comfort of their homes. 
    • To win more sales on Black Friday 2020, certain retailers offered attractive deals and deep discounts on electronics like laptops, mobiles, wearables, USB flash drives, tablets and headphones.
    • Home furnishings sales rose 12% year-over-year in 2020 as homebound consumers invested in products for domestic comfort, organization and functional purposes. 
    • On Cyber Monday 2020, home merchandise saw bustling sales, as storage items, cabinets and bookcases were among the most competitively priced products in the category.

    Since home is the new hub, retailers can plan their assortments to align with this enduring consumer trend to outplay rivals. Optimizing their product mix involves making decisions on the right balance among bestsellers, hot trends, unique products and essential items to gain a competitive advantage.

    Grab shoppers’ attention with desirable promotions 

    Although shoppers appreciate variety, the abundance of product choices available online can overwhelm consumers. In response, retailers can craft persuasive and timely digital campaigns to help simplify the customer experience.

    Digital promotions, including banner ads and search campaigns, can help retailers spark a sense of urgency that motivates shoppers to buy. The key is for retailers to connect to consumers with the right messaging, timing and targeting to earn their attention, trust and sales. Retailers need effective promotions to optimize their ad spend.

    Pricing secures the sale


    To maximize top line performance, retailers also need to nail their Father’s Day pricing strategies.

    Notably, consumption habits and loyalty have dramatically shifted during the pandemic, which has affected retailers’ pricing strategies. Value pricing continues to soar due to economic uncertainty, job losses and a growing desire for value for money. Last year, 30% of consumers switched to a new brand due to better prices, while 25% cited better value as the reason they switched, according to McKinsey & Company. 

    On the other side of the socioeconomic spectrum, premium pricing is also on the rise. Upscale shoppers are now more willing to splurge on high quality goods, including home furnishings and electronics. These consumers will pay more for merchandise that adds value or purpose to their lives. In addition, digitally-savvy Gen Z and Millennial consumers are spending 125% as much as they did in 2019. As a result, retailers that capitalize on consumers’ enthusiasm and price elasticity will drive incremental e-commerce revenue gains.

    As e-commerce competition intensifies and informed, empowered shoppers know where to find the best prices, more retailers now seek a new pricing approach to stand out, drive sales growth and protect against price wars.

    Drive revenue with the right products, promotions and prices 


    To win the attention and sales of Father’s Day shoppers, more leading retailers now use data insights to make faster, more effective assortment and pricing decisions that maximize their e-commerce sales.

    Data analytics help retailers know which products consumers will actually buy. Leading global retailers rely on Assortment Analytics from DataWeave to ensure their online assortments keep up with evolving consumer needs. Building a competitive product mix can set retailers apart and boost e-commerce sales by offering in-demand merchandise. Assortment analytics give retailers insights on the most popular brands and products on any e-commerce website, and help them spot and fill any assortment gaps to capture more sales.

    To captivate online shoppers’ attention, retailers use DataWeave’s Promotional Insights to lower acquisition costs with marketing promotions that resonate. As online shoppers increasingly seek timely offers, these insights help retailers quickly evaluate the effectiveness of their promotions and optimize their digital ad spend. Retailers gain near-real-time insights on the brands, categories and products their rivals promote, including campaign frequency, duration and messaging for promotions that convert.

    Major retailers also turn to Pricing Intelligence from DataWeave to promptly adapt to rivals’ online price changes and shifts in consumer demand. Retailers drive more revenue and margin by easily identifying fluctuations in consumer demand and rivals’ pricing, as well as any gaps. Retailers gain an edge by seeing pricing patterns that their rivals miss. They gain accurate exact and similar product matching, and near real-time pricing updates to stay competitive and fuel e-commerce conversions.

    Data insights help retailers delight dads

    This Father’s Day, retailers can apply data insights to offer consumers eye-catching promotions of in-demand electronics and home products at the right price to wow dads. Insights from DataWeave can help retailers make smart, competitive assortment, promotion and pricing decisions that boost agility, improve the customer experience and drive e-commerce sales for this special occasion – and all year long.

  • As Value Shopping Soars, Pricing Matters More

    As Value Shopping Soars, Pricing Matters More

    The pandemic’s profound economic impact sparked a surge in value shopping.

    Between February and December 2020, 10 million Americans lost their jobs.1 Due to the pandemic, 36% of lower-income adults and 28% of middle-income adults lost a job or took a pay cut (vs. 22% of upper-income adults). In addition, less than a quarter of lower-income adults have three months’ worth of emergency funds (vs. 48% of middle-income adults and 75% of upper-income adults).2

    These financial shifts matter to retailers, as lower- and middle-income households account for 81% (29% and 52%, respectively) of the total U.S. population.3 Reduced disposable income among households like these has led more consumers to embrace bargain-hunting as a shopping habit.

    We’ll see why price sensitive consumers are influencing retailers to adjust their e-commerce pricing strategies to stay competitive and responsive.

    Consumers seek value across retail categories


    Recent research shows 50% of U.S. adults are more sensitive to product prices now than before the pandemic. Also, 80% of U.S. shoppers are taking at least one action to seek more value when they shop for groceries, prioritizing value for money over speed.4

    According to McKinsey, 65% of consumers cited value as one of their top three reasons they switched brands during the pandemic. Also, 40% of shoppers cited a desire for better value and 38% cited better prices or promotions as reasons for choosing new products.5

    Value-oriented pricing influences purchases, as 70% of consumers said product discounts are more important today compared to a year ago. In addition, 54% of consumers said better online deals and discounts are a leading factor that persuades them to choose a specific retailer.6

    As e-commerce explodes, consumers have greater access to information. They can find the best price across online sites and receive notifications when a product’s price drops before they buy.

    Retailers face intense pricing pressure

    Similar to the aftermath of the 2008 recession, discounters and dollar chain retailers are now thriving as consumers seek superior value for money. Consumers need new products yet they no longer want to spend as much as before.

    That’s why bargain retail is poised to be among the biggest winners in 2021 as consumers get out and socialize more. 7

    Dollar General continues to aggressively expand its omnichannel reach as value shopping soars.8 To stay competitive, Family Dollar has partnered with Instacart on same-day delivery.9 In the fierce grocery sector, hard discounter Aldi’s omnichannel expansion includes a focus on private labels and efficient operational processes that improve cost effectiveness and competitive pricing.10

    Across retail categories, a remarkable 50 million price changes take place online every day. Given consumers’ shift to value shopping, more retailers are changing their pricing to offer discounts both online and in-store.11 However, to avoid costly price wars, more retailers are now taking a renewed approach to their pricing strategies to protect their margins as they compete.

    Specifically, to optimize their e-commerce business for profitable growth, more retailers are modernizing their pricing strategies with data insights.

    Pricing intelligence is retailers’ secret weapon 

    As e-commerce rivalry heats up, retailers must evaluate pricing across more online websites to keep their own prices competitive. This process is becoming increasingly complex and time consuming. Meanwhile, retailers may consider adopting aggressive pricing tactics to win online sales. Yet this pricing strategy is unsustainable over the longer term, as it erodes profit margins.

    Today’s heated e-commerce rivalry means retailers can no longer afford to guess at price points or use the same pricing tactics that relied on before the pandemic.

    That’s why leading retailers turn to data insights for their pricing strategies to stay agile and flexible while rapidly adapting to fluctuations in consumer demand and competitors’ pricing.

    Now more retailers turn to DataWeave’s Pricing Intelligence to drive more revenue and margin.

    To optimize profit margins, retailers use our actionable insights to make pricing decisions according to data-driven recommendations. They also make decisions to protect their desired price perception.

    Monitoring competitors’ pricing moves helps retailers benchmark their own performance, identify gaps and respond to market trends faster. They can also refer to historic pricing data analytics to accurately anticipate and counter rivals’ next moves to gain an edge.

    Retailers that apply data insights to optimize their pricing can drive more online revenue by finding the ideal price consumers are willing to pay while still maintaining profitability. Pricing intelligence can make customer acquisition more efficient, and help retailers grow online sales and market share. 

    Amid greater price sensitivity, retailers’ pricing strategies are evolving to use data to adapt to consumers’ needs and drive e-commerce sales and profitability. DataWeave’s Pricing Intelligence gives retailers an edge so they stay agile and competitive, and maximize e-commerce sales across consumers of all economic levels.


    1. Howland, Daphne. The middle class is stressed and the pandemic isn’t helping. Retail Dive. January 20, 2021.
    2. Howland, Daphne. The middle class is stressed and the pandemic isn’t helping. Retail Dive. January 20, 2021.
    3. Bennett, Jesse, Richard Fry and Rakesh Kochhar. Are you in the American middle class? Find out with our income calculator. Pew Research Center. July 23, 2020.
    4. Maake, Katishi. DoorDash, Instacart Eye Launching Credit Cards. The Harris Poll. April 9, 2021.
    5. Charm, Tamara, Harrison Gillis, Anne Grimmelt, Grace Hua, Kelsey Robinson and Ramiro Sanchez Caballero.Survey: US consumer sentiment during the coronavirus crisis. McKinsey & Company. May 13, 2021.
    6. Berthiaume, Dan. Survey: Deals drive purchases during pandemic. Chain Store Age. March 18, 2021.
    7. Thomas, Lauren. Beauty and bargain retail could be the biggest winners in 2021, Wells Fargo predicts. CNBC. March 25, 2021.
    8. Unglesbee, Ben. Dollar General ramps up expansion of Popshelf concept. Retail Dive. March 19, 2021.
    9. Ryan, Tom. Will same-day delivery pay off for dollar stores? RetailWire. February 8, 2021.
    10. Anderson, George. Should Aldi’s growing store count and digital progress keep rivals up at night? RetailWire. February 11, 2021.
    11. Berthiaume, Dan. Survey: Deals drive purchases during pandemic. Chain Store Age. March 18, 2021

  • Food Delivery Gives Moms a Delicious Break On Mother’s Day

    Food Delivery Gives Moms a Delicious Break On Mother’s Day

    Moms deserve a scrumptious celebration. In time for Mother’s Day, restaurants and their food delivery partners can unburden mothers from the chore of cooking by delivering the gifts of ease, convenience and nourishment.

    Over the past year, moms have been starved for time amid the disruption of working from home and supporting their children’s virtual schooling. Meanwhile, grandmothers have been starved for social connection, as many of them have only seen their loved ones on Zoom.

    Restaurants can satisfy consumers’ unmet needs. Using timely, empathetic digital marketing can help restaurant operators stand out on food delivery apps (like DoorDash, Uber Eats, Grubhub and Postmates) and sell more online this Mother’s Day – and all year round.

    Delight moms with what they really want

    According to the NRF, 83% of consumers plan to celebrate Mother’s Day in 2021. On average, shoppers plan to spend $220.48 (up $16 since last year), the highest amount in the history of NRF’s Mother’s Day surveys. 1


    Most (62%) moms say they would love to eliminate the chore of cooking on Mother’s Day. Dinner is the most important meal on Mother’s Day, and most moms prefer restaurant meals (53%) to home cooked meals (39%). 2

    Given consumers’ willingness to spend and Mom’s appetite for restaurants, Mother’s Day 2021 is poised to be a powerful sales event for restaurants.

    Restaurants need new ways to navigate market trends

    The restaurant industry faces consolidation, as 17% (110,000) of U.S. restaurants permanently closed in 2020, and 87% of full-service restaurants reported an average 36% drop in revenue. 3 These figures prove restaurant operators need help to boost their top line and cut costs as they adapt to intense rivalry and shifting market conditions.

    During the pandemic, many consumers have embraced home for health or financial reasons or a creative outlet. Although 55% of consumers have been eating at home more often since the pandemic began, 65% say they are tired of cooking at home. 4

    Fortunately, consumers are in a celebratory mood. Last year, Mother’s Day was a top sales day, as consumer spending at restaurants soared 103% on Mother’s Day Sunday and 63% on Saturday. 5 Restaurants can relieve consumers of the chore of cooking and add variety to dining occasions like Mother’s Day.


    Successful restaurants gain a digital data advantage

    To satisfy consumers’ needs and outplay rivals, restaurants now turn to data analytics from DataWeave to protect their profitability with effective pricing, menu and promotion decisions. 

    Pricing analytics

    Restaurant operators can optimize their pricing to stay competitive. For instance, restaurants can compare their offerings and delivery fees with those of rivals to pinpoint and fill any gaps. Monitoring rivals’ pricing moves also helps restaurant operators stay flexible by keeping their prices affordable, so they can attract online sales growth.

    Menu analytics

    To minimize costs, more restaurants are streamlining their menus. Menu analytics can help operators spot the optimal mix of bestselling items and emerging food trends, like plant-based, vegan, gluten-free and local sourcing. To know which items to keep, operators can even use data insights on menu items down to the ZIP code level to localize their offerings and adapt to diverse tastes to drive online sales.

    Promotion analytics

    As consumers embrace home entertaining this Mother’s Day, restaurant operators can use data insights to boost sales. They can monitor rivals’ moves and compare their promotional strategies with those of competitors. Evaluating their digital marketing performance (like their brand’s discoverability and visibility ranking on food apps’ homepages) helps restaurants show up more prominently online and sell more.


    Savvy restaurants welcome celebrations as lucrative sales occasions

    Restaurants can spice up Mom’s life by letting her relax and receive the gifts of tasty meals, time savings and family festivities. Operators can simplify Mother’s Day celebrations by giving consumers a hassle-free dining experience so families can focus on connecting rather than cooking.

    For a business advantage, restaurant operators can apply digital marketing insights to boost their agility in responding to consumers’ needs and rivals’ moves.

    To stay agile and competitive as the food delivery market booms, leading restaurant chains and food delivery providers are collaborating with DataWeave to make data-driven pricing, menu and promotional decisions that fuel online sales.


    1 Retail Holiday and Seasonal Trends: Mother’s Day. NRF. 2021
    2 New Study Shows What Moms Really Want On Mother’s Day. US Foods. May 2020.
    3 Valinsky, Jordan. 10,000 of America’s restaurants have closed in the past three months. CNN. December 9, 2020.
    4 Contreras, Tricia. How the pandemic is shaping home cooking trends. SmartBrief. September 30, 2020.
    5 Lalley, Heather. Despite pandemic, Mother’s Day was huge for restaurants. Restaurant Business. May 18, 2020.

  • This Mother’s Day, Dazzle Moms With These Beauty & Fashion Trends

    This Mother’s Day, Dazzle Moms With These Beauty & Fashion Trends

    Show moms extra love this year. With Mother’s Day coming up fast, savvy beauty and fashion brands will use this special occasion to inspire pampering and gift giving to fuel their e-commerce sales growth.


    This year, beauty and fashion are poised to boom, as 40% of consumers plan to buy beauty products and 37% will buy new outfits for going out. 1 According to eMarketer, apparel and accessories e-commerce sales will grow nearly 19% this year due to pent-up demand for clothing, while health and beauty sales will rise 16%. 2

    “People will be happy to go out again …
    there will be a fiesta in makeup and in fragrances.”

    ~L’Oréal CEO and Chairman Jean-Paul Agon

    After beauty and apparel sales declined last year, brands now seize every opportunity to capitalize on the categories’ resurgence in 2021. To differentiate their goods, brands can use e-commerce marketing best practices to position their fashion and beauty items as spectacular gifts that moms will love.


    Aligning with the latest trends can help brands boost online growth.

    Hot trends dominating beauty and fashion

    This Mother’s Day, shoppers can delight moms with beauty bestsellers like:

    • Mask-friendly makeup: As we continue to wear masks over the short-term, cosmetics like false lashes, smudge-proof mascara and ultra-hypoallergenic eyeshadow will remain popular. 3
    • Fragrances: Online fragrance sales rose 45% year-over-year in 2020. Clean and organic beauty categories grew 56% with fragrance brands growing the most. 4
    • Purpose-led brands: Consumers crave companies that care. More online searches contain keywords like “ethical beauty” and “sustainable makeup” for products that help consumers look good and feel good. 5

    Online fashion is in vogue

    Before the pandemic, consumers bought less than one-third of their apparel or footwear online; last year, the proportion surged to an astounding 51%. In 2021, consumers will invest even more in their wardrobes, including trends like:

    • Comfort: Athleisure will remain in demand as many consumers still prefer comfortable clothing when they work from home. 7
    • Beloved staples: Classic pieces like jeans, dresses and simple yet elegant tops are making a comeback as consumers start to go out more. 8
    • Retro ‘80s: Ladies are ready to party like it’s 1984. Bright and metallic colors and sequins for occasionwear (and even NFL linebacker-inspired shoulderpads) are recreating a fun, indulgent ’80s vibe. 9

    Brands’ secret weapon for a competitive advantage

    For successful Mother’s Day campaigns, more fashion and beauty brands will use digital shelf analytics for marketing decisions that maximize their ROI and e-commerce sales.

    To ensure online shoppers discover Mother’s Day products with ease, brands are using Share of Search insights to measure their share of digital shelf. These DataWeave analytics tell brands which keywords perform best. Brands can also benchmark their search and navigation visibility against rivals’ rankings across e-commerce categories, websites and geographic regions.


    Using Content Audit insights tells brands how their content is performing. They can discover and fill content gaps so their products show up more prominently. Optimizing content (like keywords, product page titles, descriptions, ads and sponsored space) and images to align with the retailers’ search algorithms ensures a consistent brand experience across all online channels. Improving content helps brands connect to consumers with marketing that resonates and inspires them to buy.
    Brands also use

    Pricing and Promotions insights to measure the effectiveness of their online promotions and secure sales. Brands can stay competitive by ensuring their pricing and promotions are in line with rivals’ offers, such as identifying first movers and rivals with the deepest discounts across retailers and SKUs. Brands can even determine how imitating rivals’ pricing and promotional moves could impact revenue and sales volume.

    Help shoppers make Mom’s day

    Since Mother’s Day is almost here, beauty and fashion brands can apply these data insights to connect consumers with a variety of products moms will love. Digital shelf analytics from DataWeave can help brands deliver timely campaigns, improve their return on digital marketing spend and make effective marketing decisions to drive e-commerce sales.


    1 Howland, Daphne. Wells Fargo sees permanent behavior shifts from the pandemic. Retail Dive. March 29, 2021.
    2 Droesch, Blake. US Ecommerce by Category 2021. eMarketer. April 27, 2021.
    3 Wood, Dana. Is Makeup Dead? The Robin Report. April 18, 2021.
    4 Larson, Kristin. Fragrance Sales Pick Up As Consumers Reengage With The Outside World. Forbes. April 27, 2021.
    5 What Can Brands Learn About Sustainability From Green Beauty Consumers? Beauty Business Journal. June 15, 2020.
    6 Howland, Daphne. Wells Fargo sees permanent behavior shifts from the pandemic. Retail Dive. March 29, 2021.
    7 Ibid.
    8 Bhattarai, Abha. Americans are starting to buy real clothes again. The Washington Post. March 18, 2021.
    9 Warren, Liz. Loose Denim and Bold Occasionwear on Full Display for Fall 2021. Sourcing Journal. April 2, 2021.

  • Similarity matching keeps retailers competitive: Know your rivals

    Similarity matching keeps retailers competitive: Know your rivals

    Soaring e-commerce growth has made retail more crowded, complex and competitive. Now retailers face an urgent need to keep an eye on more rivals with potential substitute products to maximize their own e-commerce growth.

    Consider these recent figures, which illustrate online shoppers’ abundance of product choices:
     

    • 24% year-over-year increase in direct-to-consumer (DTC) brands in the U.S. alone was estimated for 2020 as more brands bypass retailers1
    • 55% of shoppers have purchased private label in the past year and many retailers are investing more in their own brands2
    • 110% average increase in small retailers’ 2020 online holiday sales, as more players launched new e-commerce shops during the pandemic3
    • 39% of U.S. consumers have changed brands, with the level of brand switching doubling in 2020 compared to 2019, especially among Gen Z and Millennial consumers, as loyalty declines4

    These statistics prove that in 2021 retailers need to navigate more online players and products. Now retailers need a new approach to stay on top of market trends to keep their e-commerce strategies competitive, profitable and attractive to discerning online shoppers. 


    Retailers reduce the risk of substitutes with similarity matching

    In response to online crowding, more leading retailers are turning to similarity matching. Similarity matching is a type of retail analytics that scour global e-commerce sites to find products that exactly match a specific item as well as products that closely match it. Similarity matching insights have grown in strategic significance because they increase retailers’ visibility into potential substitute products, so they can respond to all rivals’ moves with greater agility and efficiency to stay competitive.


    In terms of e-commerce applications, similarity matching helps retailers gather insights on potential substitute products so they can adjust their pricing and assortment strategies accordingly. Retailers can align their pricing with rivals’ pricing moves for similar items to protect their margins and maximize profitability. They can also make informed assortment decisions, including which product mix of bestsellers, unique items and private labels could optimize their online sales performance.

    Online shoppers search for products differently across different categories

    Consumer behavior plays a role, as online search habits differ across product categories, which influences the type of similarity matching retailers need. For example, categories like fashion, toys, home and kitchen work best with similarity matching based on text and images. In these highly-visual categories, consumers can quickly determine whether a product fits the design and aesthetic they are looking for. As a result, e-commerce product titles, descriptions and product images play a big role in consumers’ purchase decisions.

    By contrast, consumer electronics and furniture are categories in which consumers tend to seek specific product attributes, such as a certain level of resolution for their high-definition TV or a couch with particular dimensions so it fits their living room. For these types of products, consumer purchases are driven by product specifications, so similarity matching takes into account their specific needs as well as a degree of tolerance for exact or near-similar attributes across online competitors.

    Expect intense e-commerce rivalry in 2021

    As more consumers shop online, they are increasingly informed by online product comparison information. A wide variety of product choices means consumers can substitute similar goods with ease, especially if a particular item is out-of-stock. Perceived product differentiation, price sensitivity and private labels can also influence consumers’ purchase decisions.

    Across categories, e-commerce growth is outpacing total retail growth. When competition is this fierce, there is an increased risk that numerous and aggressive players will drive down profit margins. Leading retailers are now seizing opportunities to earn consumer loyalty. Using similarity matching helps retailers by offering in-demand products that consumers will actually buy and deliver exceptional online experiences to prevent shoppers from switching to rivals and their comparable products.

    Similarity matching lets you stay competitive

    As e-commerce traffic and rivalry increase, similarity matching helps retailers stand out and serve online shoppers more effectively.

    Retailers gain visibility into their entire competitive landscape to keep their e-commerce strategy responsive to shifts among consumers and rivals. By knowing the full scope of potential substitute products available online, retailers can keep their pricing and assortment strategies in line with rivals’ to reduce their risk of losing sales to rivals, and boost their top line, profitability and cost savings.

    The data insights give retailers the flexibility they need to align with online shoppers’ different needs across categories. As a result, retailers can use similarity matching to boost agility and gain a competitive advantage by adapting to online shoppers’ needs, winning their sales and fueling e-commerce growth.DataWeave’s similarity matching capability lets clients


    1 US Direct-to-Consumer Ecommerce Sales Will Rise to Nearly $18 Billion in 2020. eMarketer. April 2, 2020.

    2 Ochwat, Dan. Shopper study: Private brands purchased because they’re preferred. Store Brands. February 24, 2021
    3 Miranda, Leticia. Small businesses who pivoted to e-commerce saw record sales during Black Friday weekend. December 1, 2020.
    4 Charm, Tamara, Harrison Gillis, Anne Grimmelt, Grace Hua, Kelsey Robinson and Ramiro Sanchez Caballero. Survey: US consumer sentiment during the coronavirus crisis. McKinsey & Company. March 24, 2021.

  • How Brands Make Their Marketing Magnetic

    How Brands Make Their Marketing Magnetic

    E-commerce is getting crowded.

    The proliferation of informed shoppers, e-commerce sites, and competitors of all sizes has increased the complexity of – and lucrative opportunities in – brand management.

    Now more brands rely on data insights to uncover specific ways to make their digital marketing more arresting, effective and profitable. Many brands struggle with e-commerce profitability due, in part, to advertising expenses that often yield lackluster results.1

    Analytics are growing in retail significance, as 88% of retail and consumer goods marketers say data improves their marketing by allowing them to personalize touchpoints. Relevant marketing and great marketers helps brands connect with consumers. Let’s see why leading brands are adding data insights to their 2021 marketing strategies to fuel online sales growth.

    Brands discover how to get discovered

    Consumer goods brands no longer leave it up to chance that consumers will find them online. The digital migration of companies and consumers over the past year means more noise for brands to breakthrough.

    Now search is growing in importance to improve brands’ online product discovery. Here’s why:

    • 87% of shoppers begin their hunt in digital channels3
    • 17% rise in paid search in late 20204
    • 24% rise in paid social advertising during the same period5

    To grab consumers’ attention by being easier to see, more brands are turning to data insights to track their online visibility.

    Brands need to look for ways to mitigate the high costs of acquiring customers online6

    Brands use marketing analytics related to keywords and navigation searches help brands know exactly how much space on the digital shelf they occupy across different online platforms.

    These DataWeave’s Share of Search solutions help brands understand what percentage of the digital shelf they command through either keywords or navigation. These insights can help brands decide whether to boost their brand visibility using sponsored ads to ensure their products show up more prominently in online search results to boost brand reach and awareness on each channel. For instance, brands can tell whether consumers search for products using branded, generic or category-specific keywords to align their marketing accordingly.

    In addition, brands can see how their organic and sponsored results rank compared to their competitors to spot ways to improve their visibility rank and decrease customer acquisition costs.

    Content differentiates a brand’s digital shelf

    For a striking digital presence and enhanced discoverability, leading brands measure how effectively their content inspires online shoppers to choose them.

    Brands can improve their digital marketing results by using Content Audit insights to spot patterns among their top-performing campaigns. They can also benchmark their content with category bestsellers to discover how to optimize their online performance to grow sales volume and market share.


    Strategic advertising requires high-quality photography and data-driven content7

    Using these data insights from DataWeave helps brands determine how well their content (including product description pages and images) align with e-commerce algorithms and lead to online traffic, engagement and sales. Brands also adapt faster by adjusting underperforming campaigns to reduce costs and optimize their digital marketing spends.

    Brands can fill content gaps across online channels with enhanced product information that aligns content and images with brands’ product information management (PIM). Using analytics to deliver a consistent brand experience across all online channels can help brands build relationships with consumers and earn their trust.


    Alluring promotions help brands secure the sale

    As e-commerce evolves, brands have matured beyond Google AdWords and Facebook campaigns to offer targeted promotions across digital touchpoints, which increases marketing reach and complexity.

    To boost clarity, be in demand and drive sales across online platforms, more leading brands use data insights to measure the effectiveness of their digital Promotions. Promotional insights from DataWeave keep brands informed of trending categories and products to keep their online offerings relevant and timely. Brands can pinpoint exactly which products to promote and which e-commerce sites help them drive the most profitable results with compelling digital offers.

    Brands that respond quickly to their customers’ needs have the upper hand8

    Analytics also keep brands competitive and relevant by benchmarking their promotional strategies with their rivals’ and continuously monitoring rivals’ online moves. For instance, brands can track the promotions their competitors offer for similar products across different e-commerce sites. These competitive insights help brands quickly spot opportunities to optimize their online conversions with appealing promotions that reflect market trends.

    Better marketing decisions can help brands grow sales and share

    Data insights make brands more enticing by connecting the dots among their online visibility, content and promotions. Brands uncover ways to make smarter marketing decisions faster to improve their top line and decrease customer acquisition costs. DataWeave analytics also help brands stand out and improve product discovery, engagement and sales. As a result, brands save time and boost their agility with relevant marketing that resonates and inspires shoppers to keep coming back.


    1 Jansen, Caroline, Cara Salpini and Maria Monteros. 8 DTC trends to watch in 2021. Retail Dive. February 3, 2021
    2 Casna, Kathryn. Ecommerce Trends That Are Shaping the Way Businesses Sell Online. Salesforce. 2021.
    3 Casna, Kathryn. Ecommerce Trends That Are Shaping the Way Businesses Sell Online. Salesforce. 2021.
    4 The Future of eCommerce in 2021. Shopify Plus. 2021.
    5 The Future of eCommerce in 2021. Shopify Plus. 2021.
    6 Jansen, Caroline, Cara Salpini and Maria Monteros. 8 DTC trends to watch in 2021. Retail Dive. February 3, 2021.
    7 Glasheen, Jasmine. 2021 Forecast: Next Gens in a Brand-New World. The Robin Report. January 3, 2021.
    8 Monteros, Maria. Forrester: Few brands can anticipate and act on consumer needs. Retail Dive. February 10, 2021.

  • How Brands Boost Their E-Commerce Profitability

    How Brands Boost Their E-Commerce Profitability

    Brands that protect their bottom line will win online.

    As global e-commerce smashes sales records, more brands are now taking control over their online presence (“digital shelf”) to enhance their performance and profit margins.

    In the U.S., the increase in e-commerce penetration during the first half of 2020 was equivalent to that of the last decade.1 Last year also marked the first time in history that all retail sales gains came from e-commerce.2 E-commerce has lasting appeal, as two-thirds of consumers plan to continue to shop online after the pandemic.3

    “Brands need to continue to look for ways to
    mitigate the high costs of acquiring customers online.”
    4

    To keep up as shopping migrates online, brands face bigger expenditures. In the second quarter of 2020, e-commerce costs grew much faster (up 60% year-over-year) than revenues (up 40%).5 Namely, brands face steep costs for customer acquisition and logistics, which erode their online profit margins.

    The bottom line for brands is they must sell online – profitably – to stay competitive. They urgently need new ways to drive online sales and incur fewer costs. Let’s see why brand leaders are using data insights to optimize their e-commerce decisions and profitability.

    Brands find new growth opportunities

    Over the past year, e-commerce has gotten more crowded. Now brands seek proven ways to differentiate their offerings and consistently deliver an alluring online experience. That’s because a recent study found 42% of consumers cite less trust in online shopping due to poor experiences, such as inconsistent pricing and out-of-stock merchandise.6 In response, these e-commerce best practices can help brands improve the customer journey and top line sales.

    To help consumers find their products online with ease, brands can use data insights for superior product discovery. Insights help brands know exactly which keywords shoppers search for to earn high visibility rankings among consumers’ online search results. Data analytics direct brands to the most relevant keywords, which they can use in marketing, including product descriptions, for effective online discovery.7


    Brands also face increased pressure to keep up with rivals’ real-time pricing changes across retailers’ e-commerce sites, online marketplaces and social media. Insights help brands price competitively across channels by monitoring and promptly adapting to competitors’ online pricing moves. Brands can even use data to ensure merchants consistently respect pricing policies.

    Data analytics also help brands measure their marketing effectiveness and popularity across e-commerce

    websites, and how they compare to their rivals. Brands can improve how they promote their products by using targeted digital content that resonates. For instance, they can publish unique content on each channel tailored to the platform’s unique algorithm and use data to discover patterns among their top performing campaigns. Also, brands can determine when to use their own social media channels or pay for sponsored ads to drive more sales.


    As we saw last March, in-stock merchandise is essential to maximize online sales. Data analytics help brands track their stock status to ensure products are available across all their digital channels for reliable service that sparks more sales. 

    Brands find new efficiencies

    Cost effectiveness is also vital and these e-commerce best practices help brands boost their online efficiencies.

    Brands use insights to pinpoint and keep sharing content that effectively resonates with and enages their target audience. They can use data insights to see where to allocate their marketing spend for online promotions and either revitalize or drop underperforming online promotions. Brands can also track whether their online promotions align with rivals’ promotions to stay competitive and agile.

    Likewise, measuring a brand’s popularity through consumer reviews reveals which underperforming products to downplay to conserve marketing resources for the specific products and bundles that perform best in their categories. For instance, PepsiCo’s and Kraft Heinz’s new online shops offer only large items or bundles for basket sizes large enough to offset shipment costs.8


    To reduce the high cost of product returns, brands can use data insights to prioritize bestselling products rather than items consumers are more likely to send back. Using clear, up-to-date content, including product descriptions with accurate dimensions, can also help online consumers know exactly what they’re buying to minimize returns.


    How brands and consumers profit

    When brands use insights to make better e-commerce decisions, they can compensate for ballooning expenses. Analytics help brands connect the dots among their online visibility, promotions, performance and reviews. These best practices can give brands an edge by uncovering how to be more aggressive with revenue-earning and cost-cutting opportunities. Brands find effective ways to acquire more online customers to improve their top line and offset e-commerce expenses with new efficiencies. Data-driven digital marketing decisions help brands improve their e-commerce effectiveness to stay profitable and competitive. 


    Meanwhile, consumers also win by having an inviting, smooth and reliable online shopping experience. They find the products they want with greater ease, and feel confident enough to buy based on information like a brand’s pricing, promotions and product availability.


    1 Arora, Arun, Hamza Khan. Sajal Kohli and Caroline Tufft. DTC e-commerce: How consumer brands can get it right. McKinsey & Company. November 30, 2020.
    2 Ali, Fareeha. US ecommerce grows 44.0% in 2020. Digital Commerce 360. January 29, 2021.
    3 Arora, Arun, Hamza Khan. Sajal Kohli and Caroline Tufft. DTC e-commerce: How consumer brands can get it right. McKinsey & Company. November 30, 2020.
    4 Jansen, Caroline, Cara Salpini and Maria Monteros. 8 DTC trends to watch in 2021. Retail Dive. February 3, 2021.
    5 Haber, John. Logistics Costs Challenge E-Commerce Profit Margins. Parcel Industry. October 9, 2020.
    6 O’Carroll, Derek. 5 Hidden Trends That Will Shape E-Commerce in 2021. Total Retail. February 4, 2020.
    7 Leong, Brandon. COVID-19 strategy: Use the power of your digital sell sheet. Digital Commerce 360. August 23, 2020.
    8 Arora, Arun, Hamza Khan. Sajal Kohli and Caroline Tufft. DTC e-commerce: How consumer brands can get it right. McKinsey & Company. November 30, 2020.

  • [INFOGRAPHIC] 2020: The Year the World Navigated Uncertainty Together

    [INFOGRAPHIC] 2020: The Year the World Navigated Uncertainty Together

    The start of 2020 brought with it the promise of global economic growth. Markets in the US were on a steady rise we also witnessed demand from brands and retailers in Europe and the Middle East. All seemed to be on track to make it a year of plenty.

    Out of nowhere, the end of the first quarter saw the world coming to a grinding halt. The world was held hostage by a global pandemic and the force with which we were hit, was unprecedented.

    From February to mid-May we saw things come to a sharp halt. We at DataWeave seized this intermittent downtime to bolster our product offerings.

    On the flip side, when the world did start opening May onwards, we saw completely new categories take center stage digitally. With new habits and trends taking shape, the pandemic single-handedly caused exceptional growth in the Food and Grocery Delivery intermediaries. Predictably, the rest of the world followed. Our existing customers saw the competition rise steeply with everyone coming online. We invested substantially in our Digital Shelf Analytics solutions after noticing that e-commerce was seeing a boom. 2020 saw brands making their online presence the new norm. This meant that small, medium and large enterprises had to now divert their spending to analytics and e-commerce. 

    It is interesting to note that the rise in the food and grocery delivery segment gave brands another channel to focus on vis a vis their presence. Brands that were available on these sites focused on how they could optimize their sales on these channels, which proved to be the front runners during the height of the pandemic. While the challenges and opportunities for both these segments overlapped and seemed similar, our solutions helped measure and optimize brand performance across all online channels. Some of the in-demand solutions and analytics we saw our customers use were; share of search, content audit, assortment and availability, pricing and promotions, and ratings and reviews. 

    There were mixed emotions in the market, with regard to the best use of marketing spends. Human resource and client cutbacks happened across the board. At DataWeave however, we had the pleasure of onboarding 25 new clients including retailers and brands ranging from food and grocery delivery, home improvement from across multiple geographies.

    Infographics

    Throughout the year, the work never ceased at DataWeave. The team showed incredible resilience while working remotely, making sure our deliverables were being taken care of, at all times. Due to the e-commerce boom and immense pressure from existing and new entrants in the digital space, our clients saw a need to gather more insights. With the given uptick, we are happy to report that our stellar 95%+ accuracy record for in-depth insights at scale, was maintained through the course of all the work done.

    Looking forward to the year 2021:

    In the US, the adoption of e-commerce accelerated as traditional brick and mortar stores shut down and pivoted. To put things into perspective, e-commerce adoption grew only by 4.3% from 2014 to 2019. In just three months in 2020, e-commerce adoption grew at 4.3%! Add to that, with approved vaccines making their way slowly to the public, we do anticipate the travel sector to open up and we look forward to working with new clients.

    Nike’s Chief Executive, John Donahoe recently said, ” We know that digital is the new normal. The consumer today is digitally grounded and simply will not revert back…the shift to online sales could be a permanent trend.” We could not agree more! With online sales here to stay, brand and retailers’ requirements to keep their competitive edge will only continue to grow. We at DataWeave, look forward to delivering the results they want in this new year, and for the years to come.