Blog

  • 2021 Cost-Push Inflationary Trends Ran Rampant, Impacting Holiday Discounts

    2021 Cost-Push Inflationary Trends Ran Rampant, Impacting Holiday Discounts

    Business has been anything but usual this holiday season, especially in the digital retail world. The holiday hustle and bustle historically seen in stores was once again occurring online, but not as anticipated given the current strength of consumer demand and the reemergence of COVID-19 limiting in-store traffic. While ‘Cyber Weekend’, Thanksgiving through Cyber Monday, continues to further its importance to retailers and brands, this year’s performance fell short of expectation due to product shortages and earlier promotions that pulled forward holiday demand.

    Holiday promotions were seen beginning as early as October in order to compete with 2020 Prime Day sales, but discounting, pricing and availability took an opposite direction from usual. This shift influenced our team to get a jump start on our 2021 digital holiday analysis to assess how drastic the changes were versus 2020 activity, and to understand how much of this change has been influenced by inflationary pressures and product scarcity.

    Scarcity Becomes a Reality

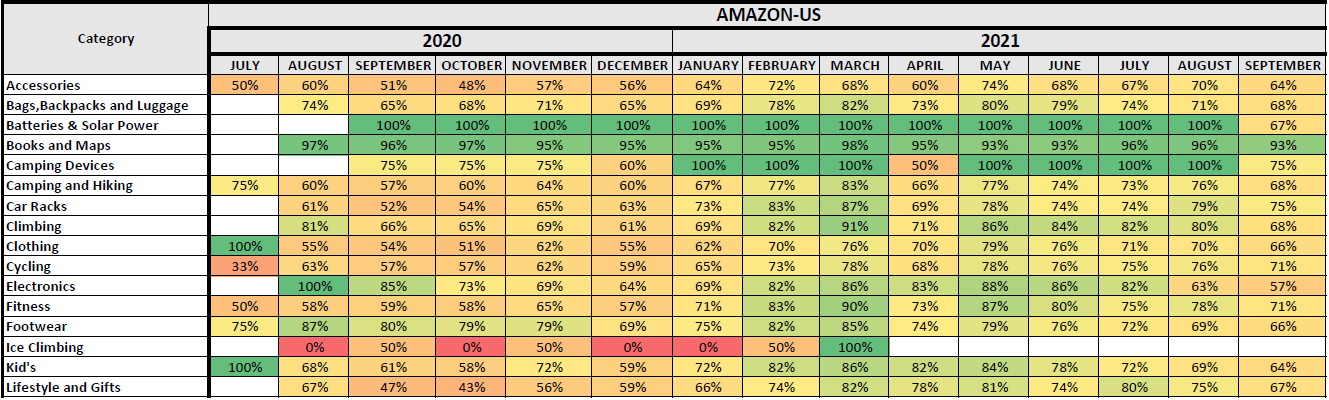
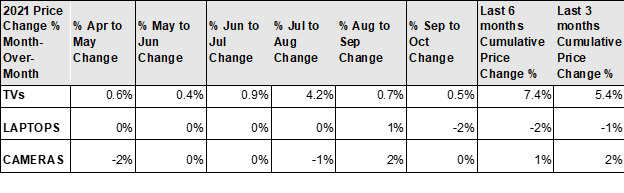
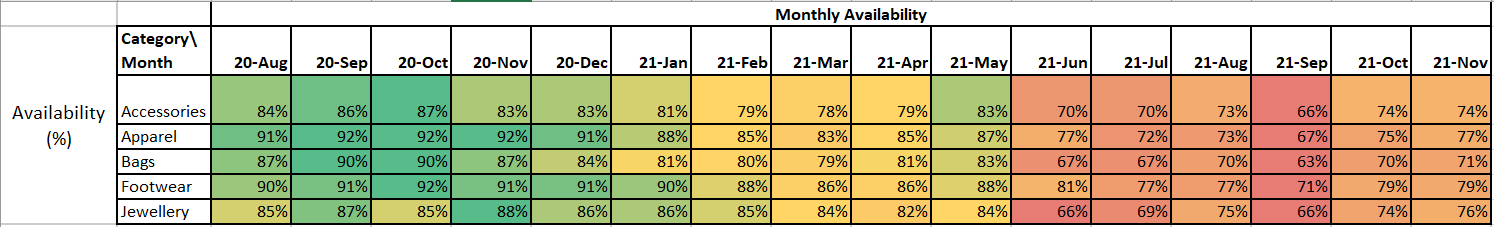
    Our initial analysis started by reviewing year-over-year product availability and pricing changes from January through September 2021, leading up to the holiday season, as detailed in our 2021 Cyber Weekend Preliminary Insights blog. We reviewed popular holiday categories like apparel, electronics, and toys, to have a broad sense of notable trends seen consistently throughout various, applicable marketplaces. What we found was a consistent decline in product availability over the last six months compared to last year, alongside an increase in prices.

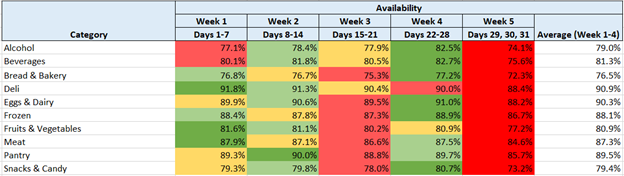
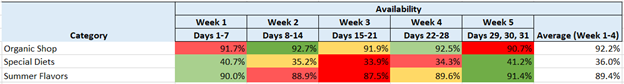
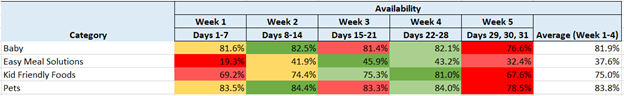
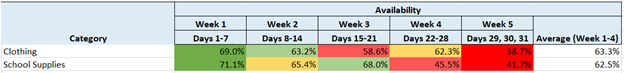
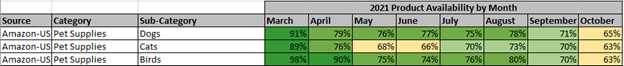
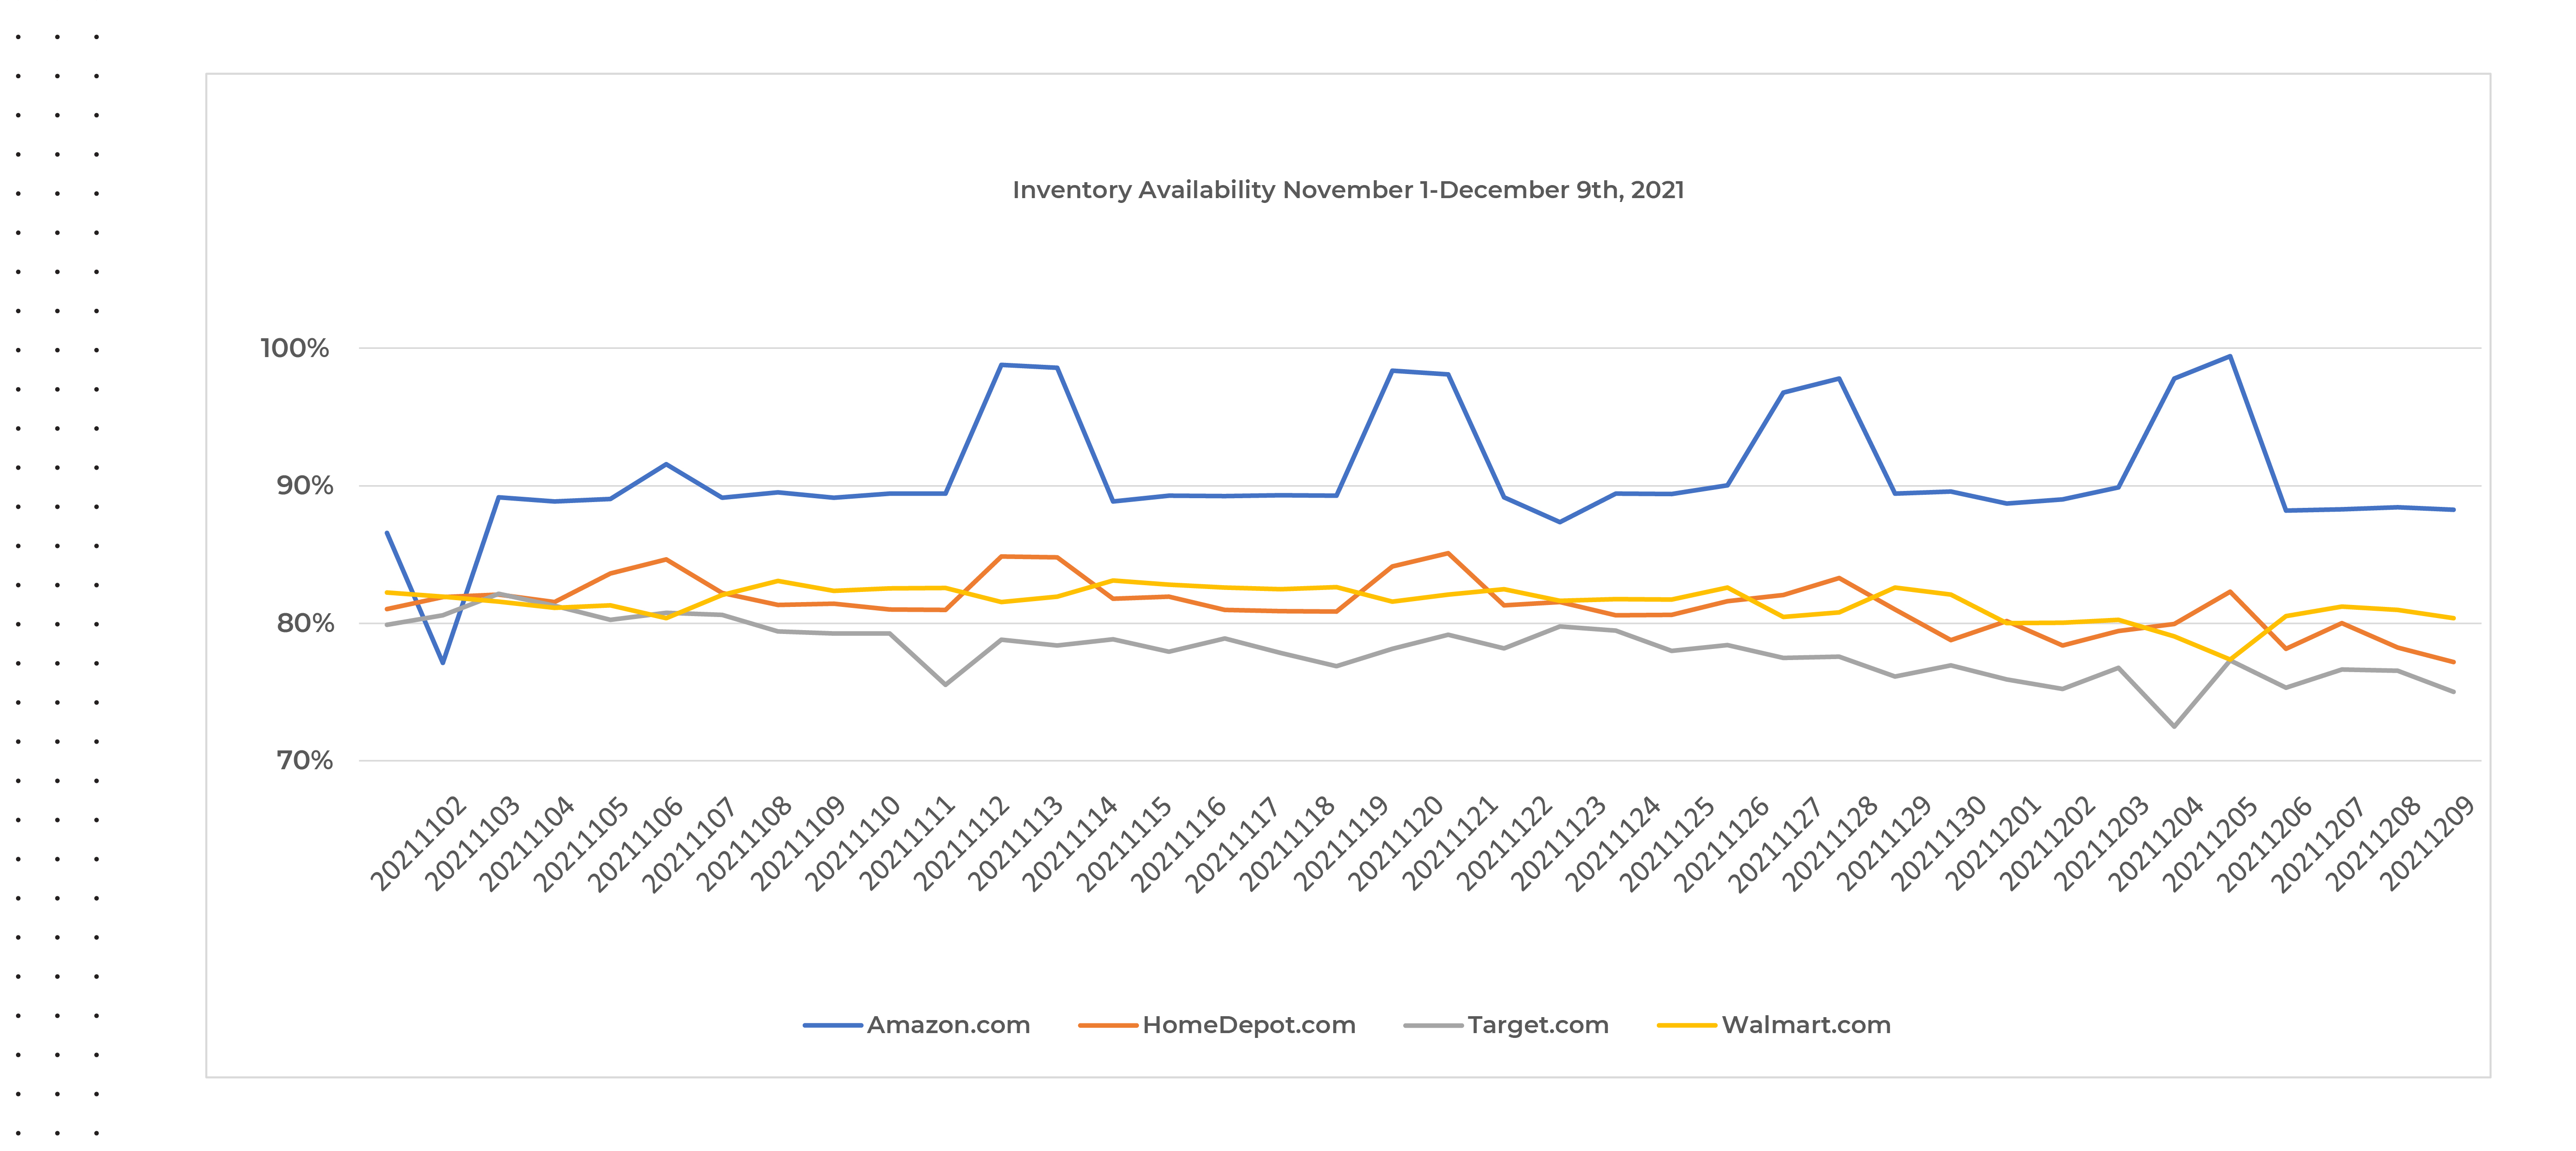
    Although retailers significantly improved stock availability in November and early December 2021, even digital commerce giants like Amazon and Target were challenged to maintain consistent product availability on their website as seen below. While small in magnitude, there is also a declining trend occurring again closer toward the end of our analysis period, post Cyber Weekend, across all websites included in our analysis.

    Inventory Availability 2021 Holidays
    Source: Commerce Intelligence – Product Availability insights for Home & Garden, Jewelry & Watches, Clothing & Shoes, Bed N Bath, Lighting & Ceiling Fans categories

    Greater Discounts, Higher Prices?

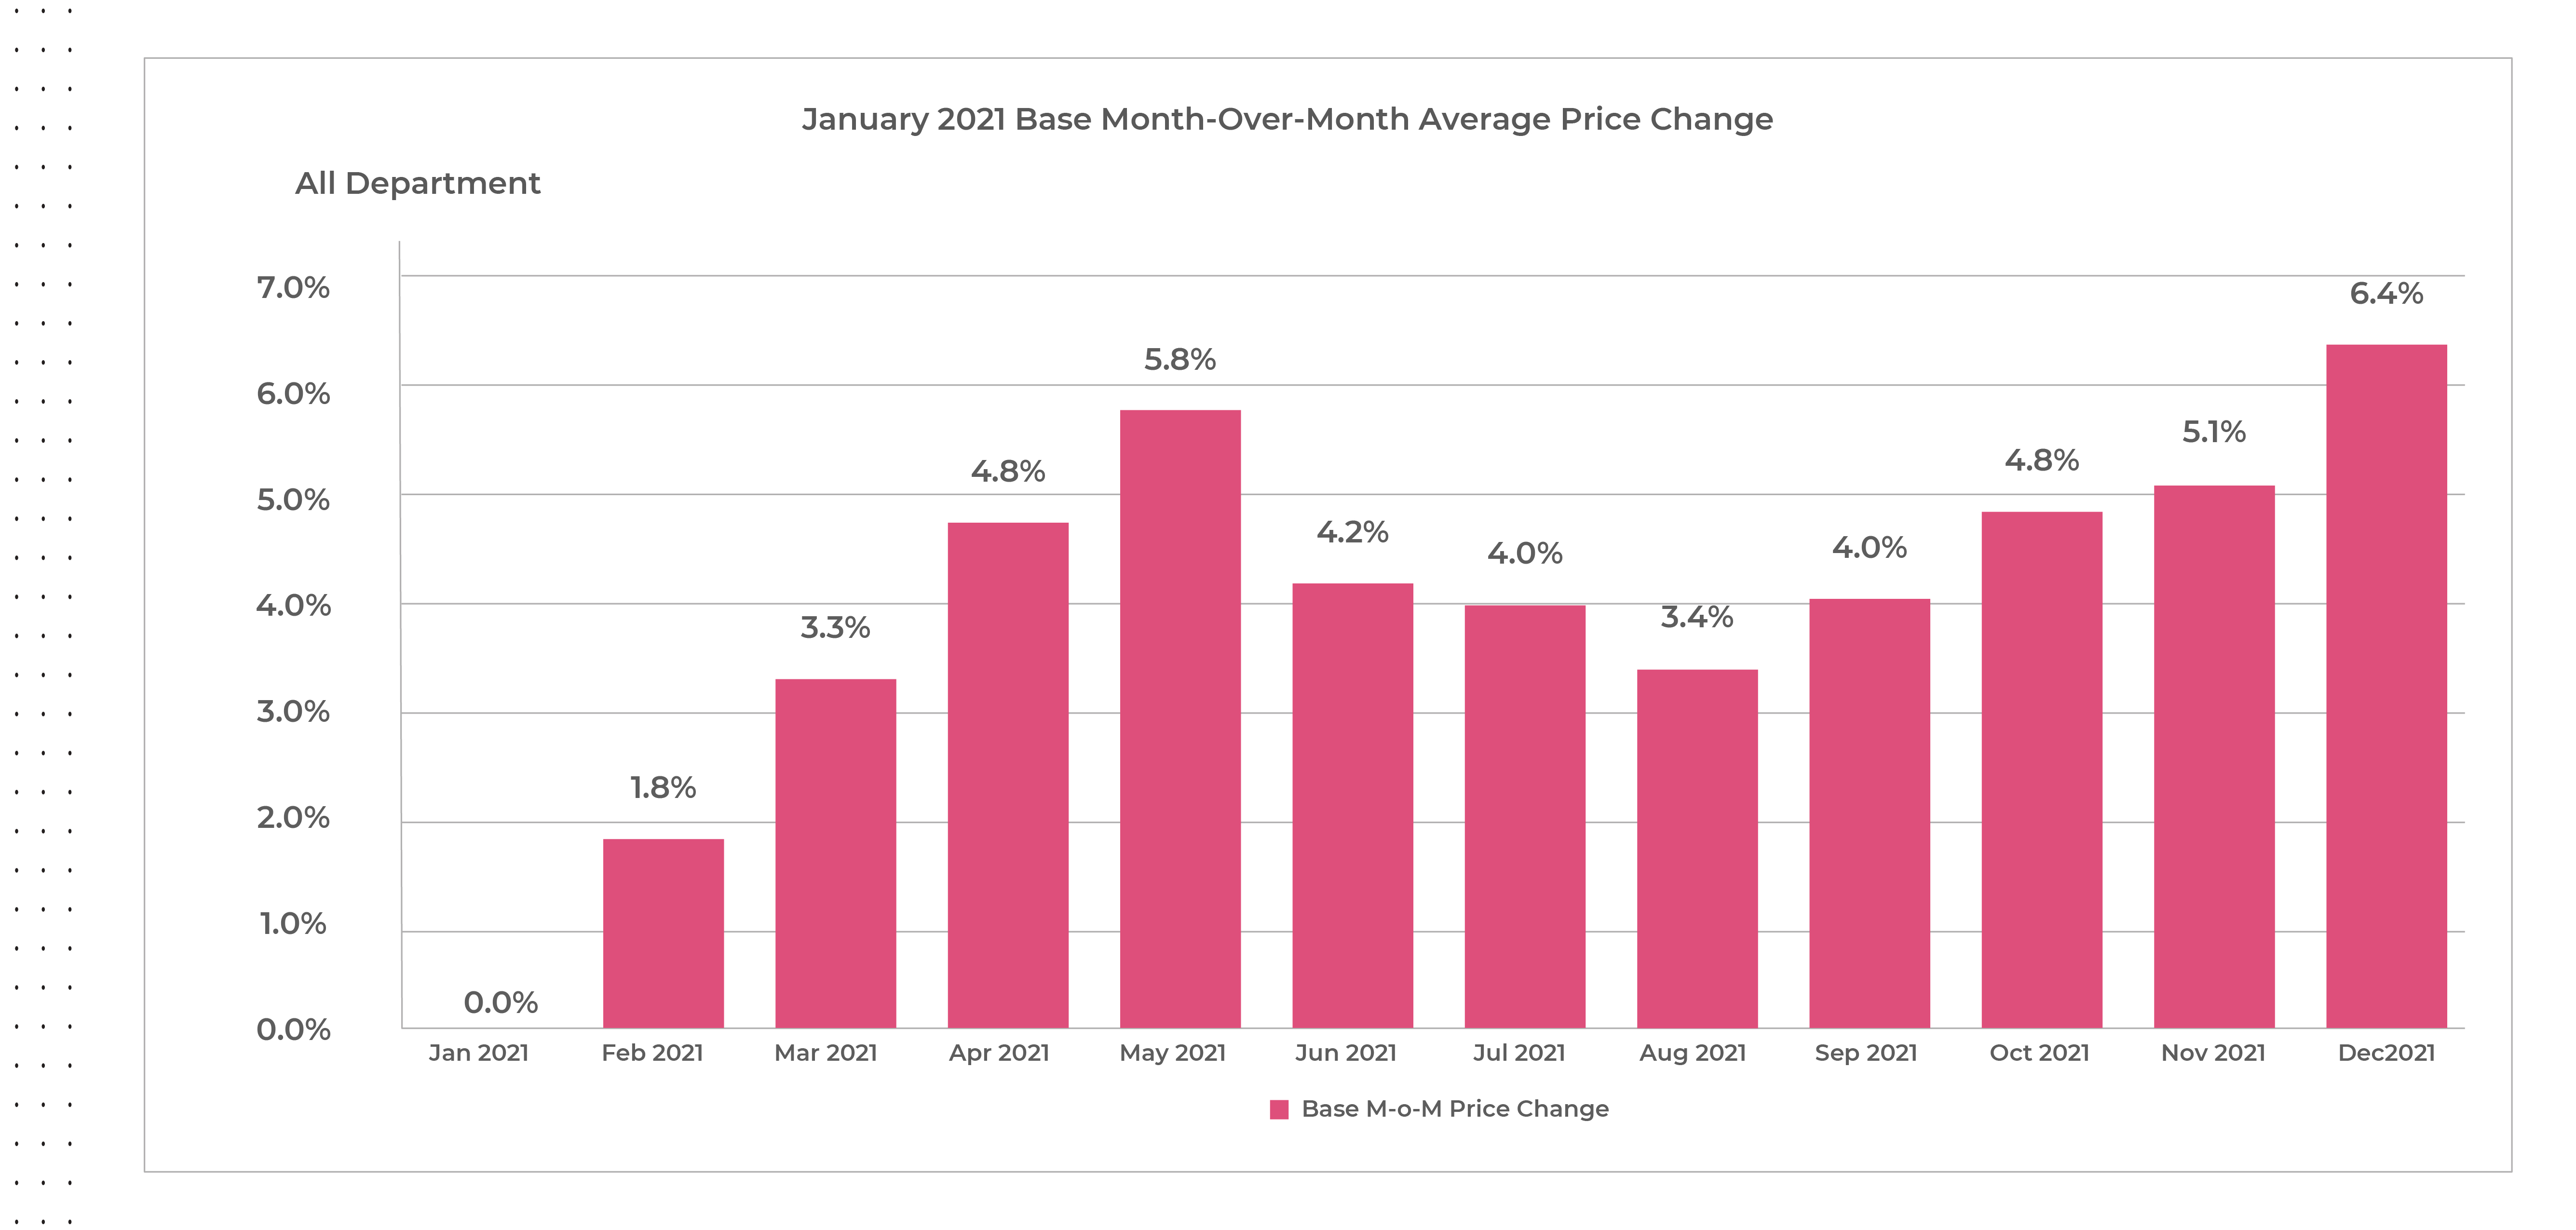
    With inflation at a thirty-nine year high, retailers and manufacturers have realized they can command higher prices without impacting demand as consumers have shown their willingness to pay the price, especially when threatened by product scarcity. Our assessment is that while some products and categories have responded drastically, manufacturers’ suggested retail prices (MSRPs) have increased nearly seven percent on average from January to December 2021. MSRP adjustments are not taken lightly either, as this is an indication increased prices will be part of a longer-term shift in product strategy.

    2021 MoM Retail Inflation Tracker
    Source: Commerce Intelligence – Pricing Insights for Bed & Bath, Electronics, Furniture, Healthy & Beauty, and Fashion categories on Amazon.com & Target.com each month in 2021 comparing price increases from January 2021 base

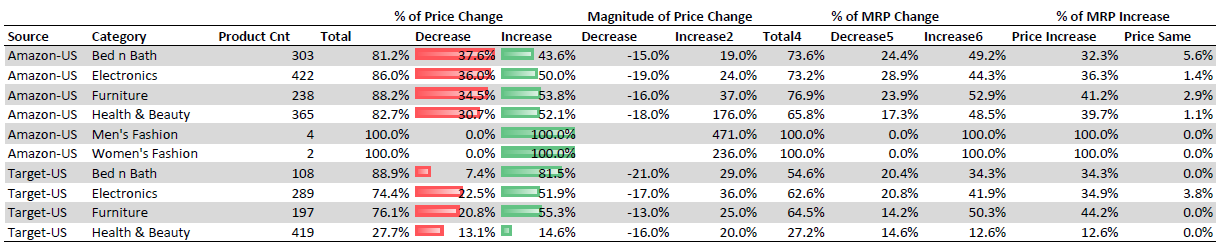
    Our 2021 pre-Cyber Weekend analysis reviewed MSRP changes for select categories (Bed & Bath, Electronics, Furniture, Healthy & Beauty, and Fashion) on Amazon and Target.com, and found around forty-eight percent of products on Amazon and thirty-five percent of products on Target.com have increased their MSRPs year-over-year, but kept pre-holiday discount percentages the same.

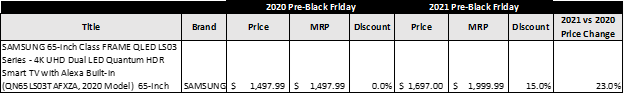
    Looking more specifically as to what year-over-year changes occurred on Black Friday in 2021, we observed MSRPs increasing across the board for all categories at various magnitudes. This indicates why 2021 discounts appeared to be greater than or equivalent to 2020 for many categories, when in reality consumers paid a higher price than they would have in 2020 for the same items.

    2021 Black Friday MSRP Increases
    Source: Commerce Intelligence – MSRP Pricing Insights for Bed & Bath, Electronics, Furniture, Healthy & Beauty, and Fashion categories on Black Friday November 27th, 2021, versus average MSRP pricing for the same SKU count from November 20-26th 2021

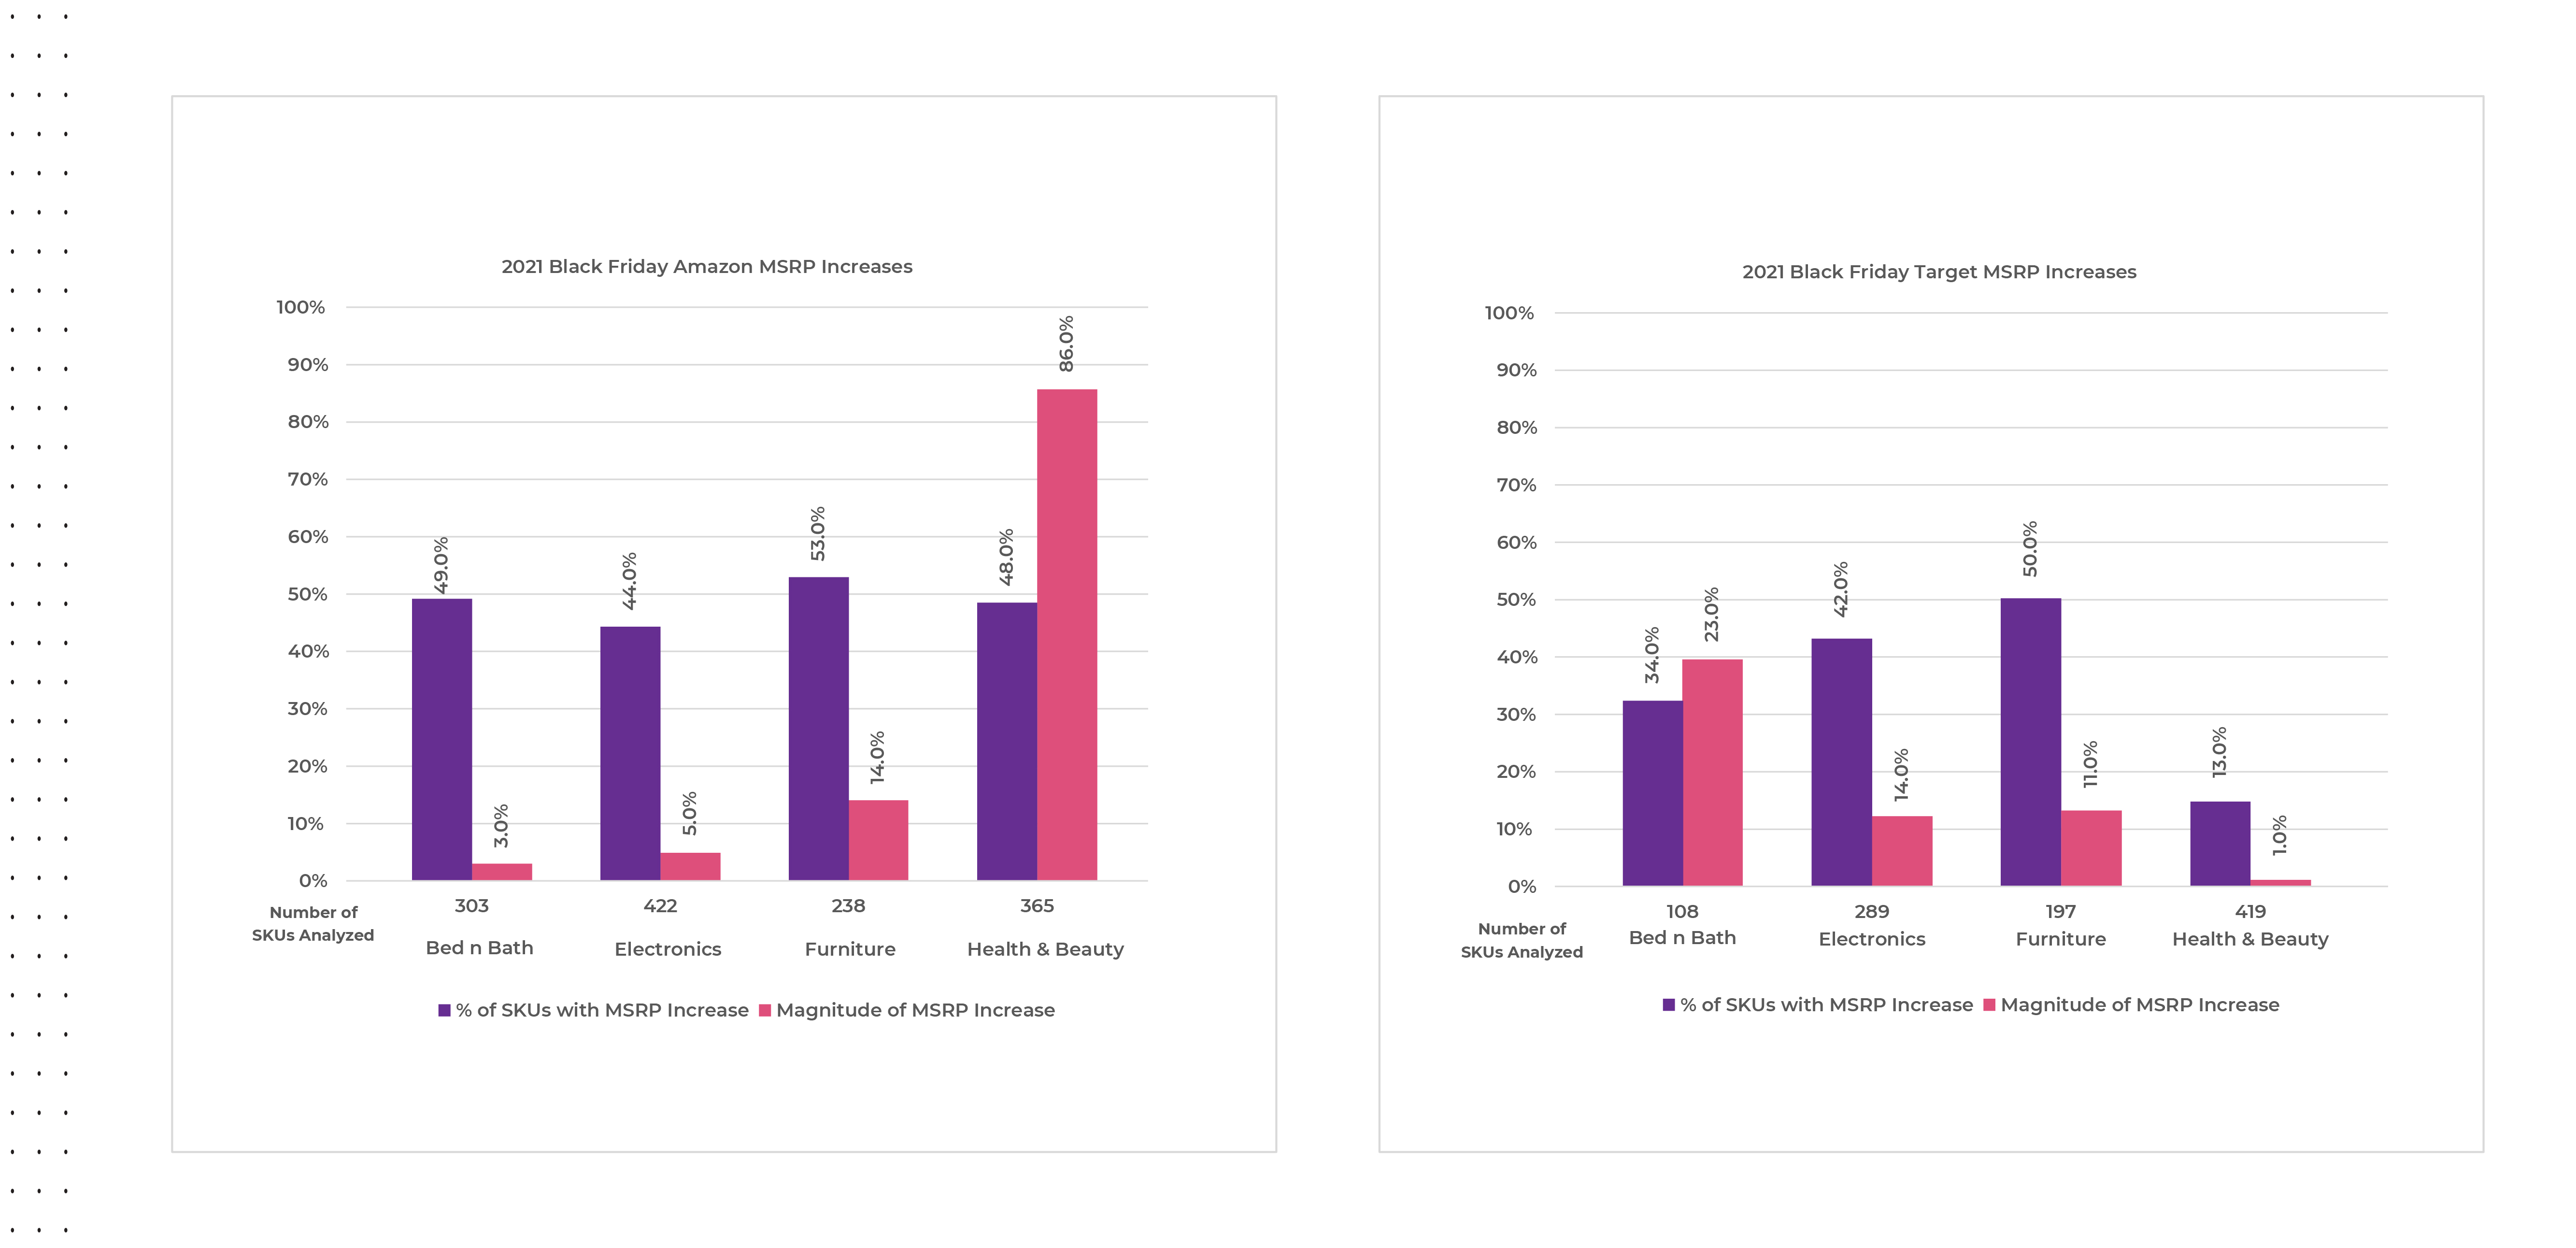
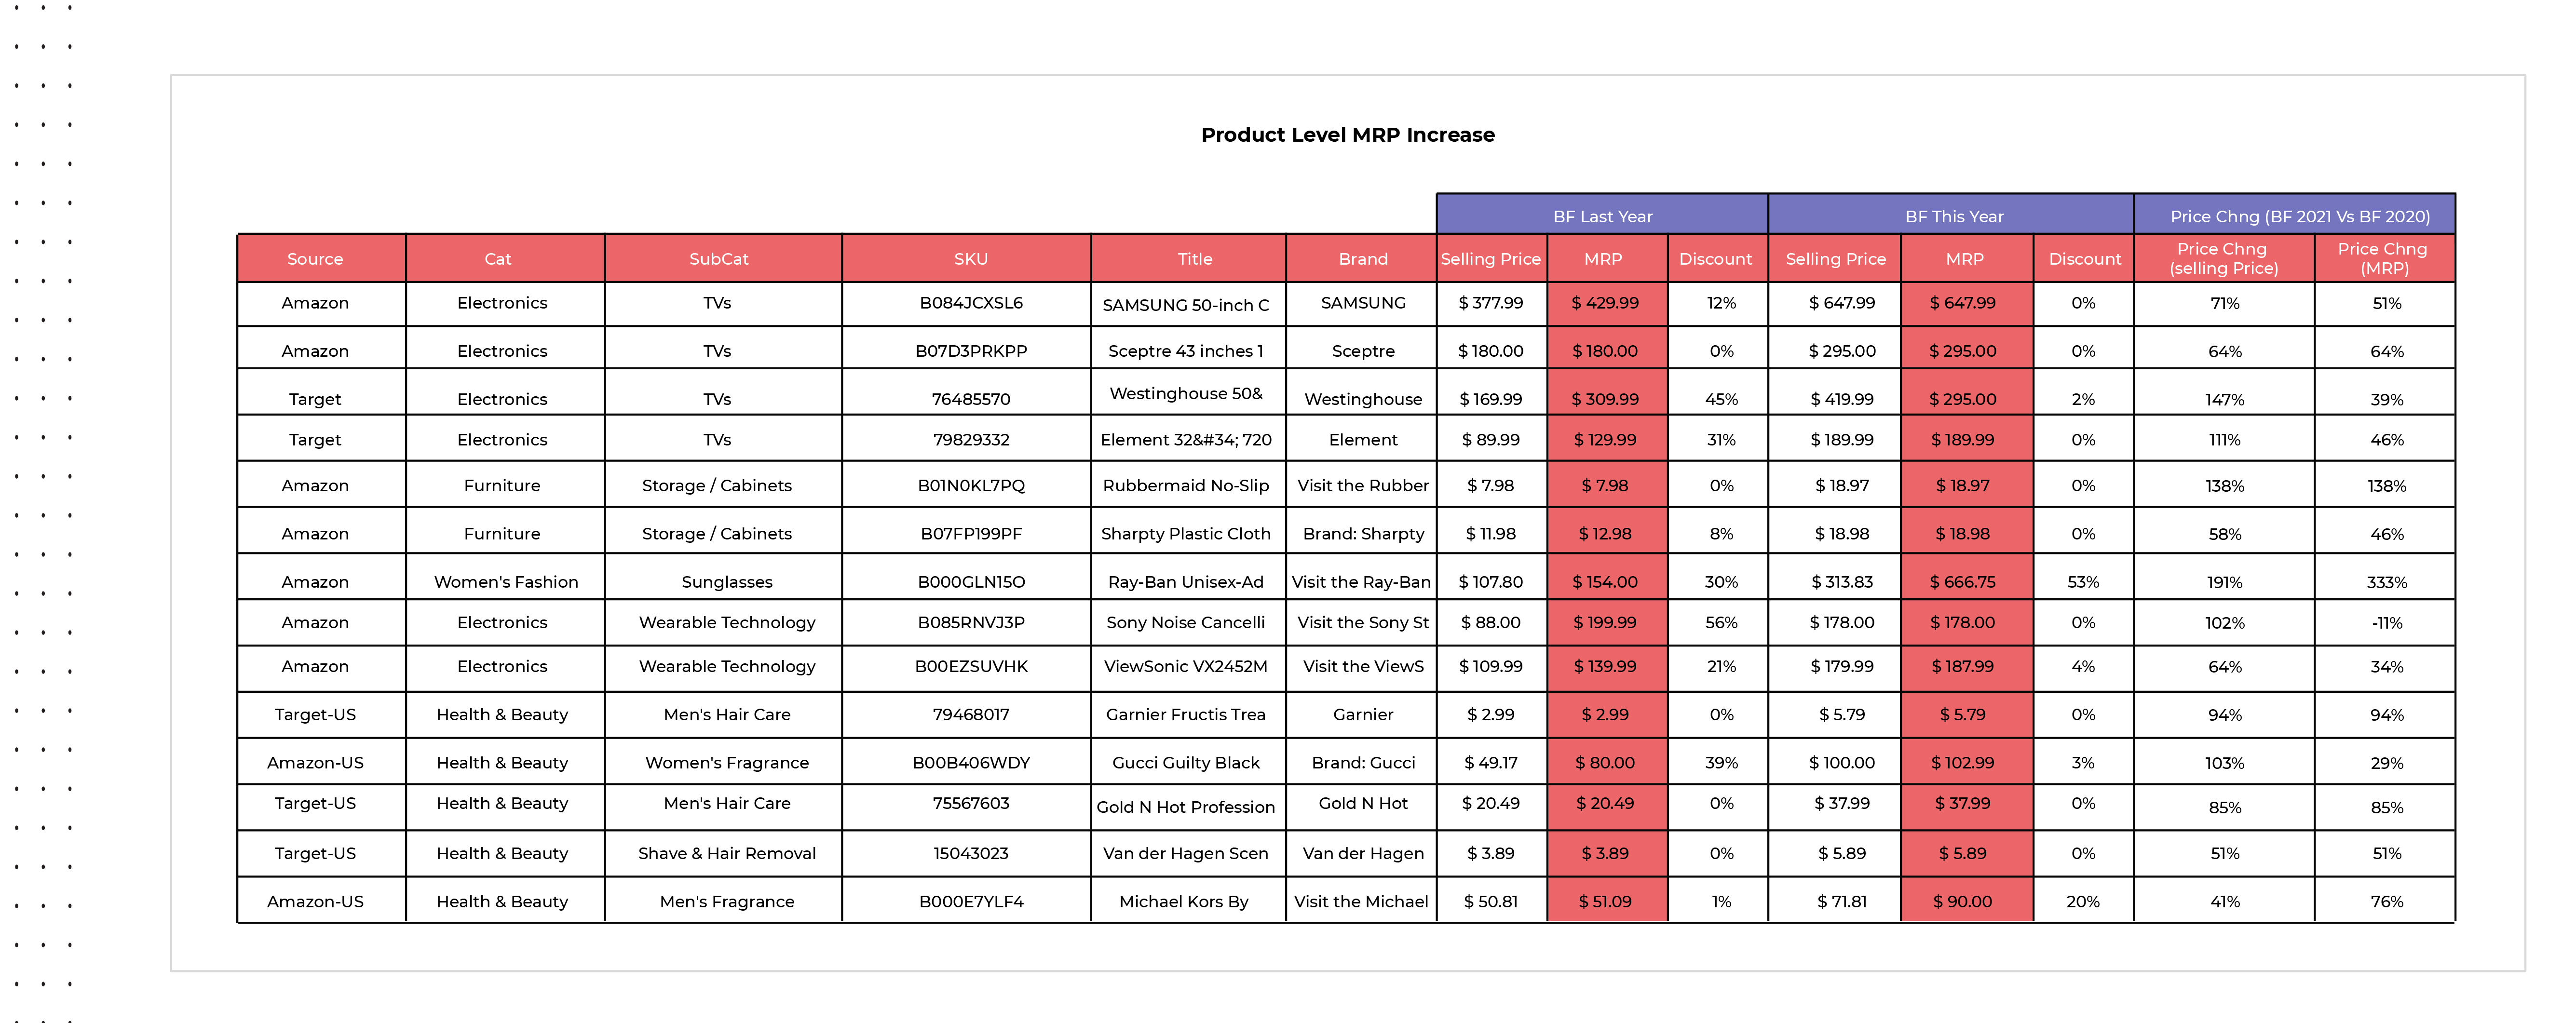
    On Amazon.com, categories like health & beauty have already increase MSRPs by a much greater percentage and magnitude versus Target.com leading up to and during Black Friday 2021, while other categories like furniture have increased MSRPs evenly on average across both retail websites. The below chart cites a few specific examples of year-over-year SKU-level MSRP, promotional price, and discount changes within found within the electronics, furniture, fashion, and health & beauty categories.

    Black Friday 2021 vs. 2020 SKU-level Price Changes
    Source: Commerce Intelligence – MSRP Pricing Insights for Bed & Bath, Electronics, Furniture, Healthy & Beauty, and Fashion categories on Black Friday November 27th, 2021, versus average MSRP pricing for the same SKUs on Black Friday November 26th, 2020.

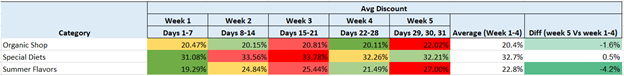
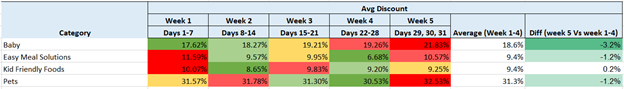
    Fewer, but Deeper Discounts

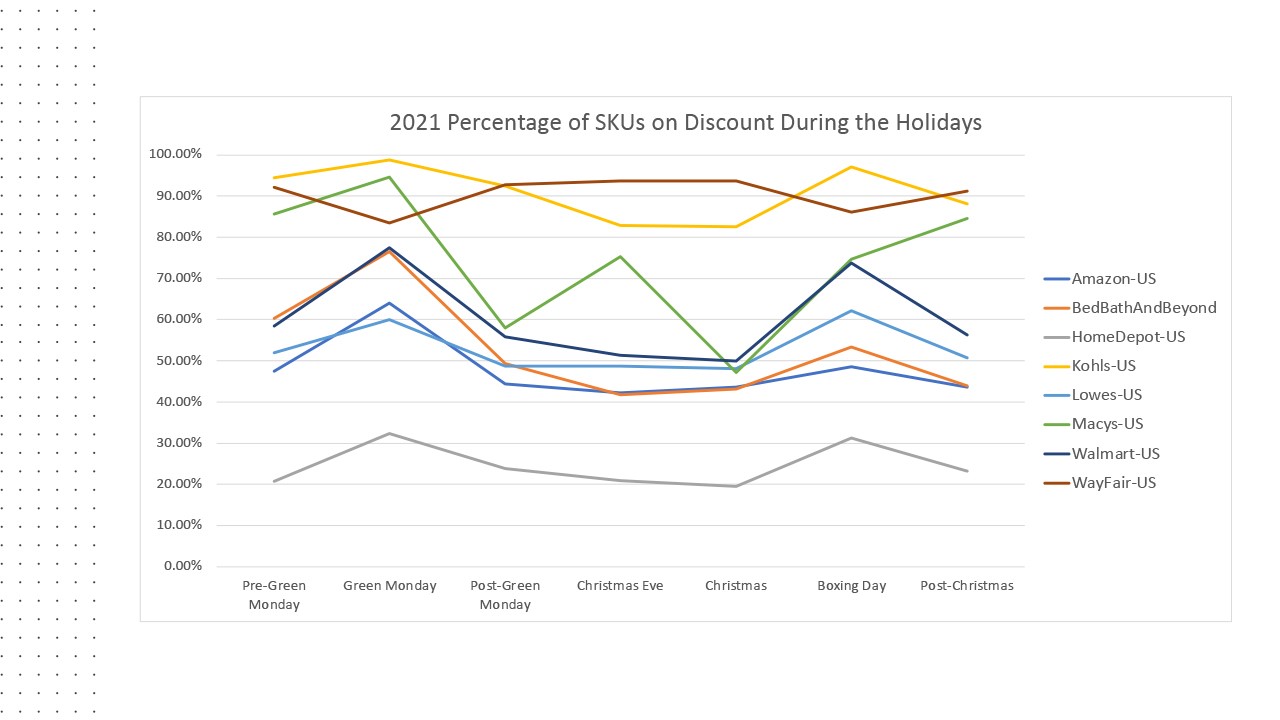
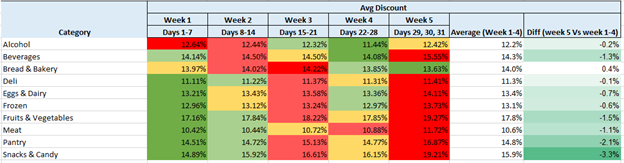
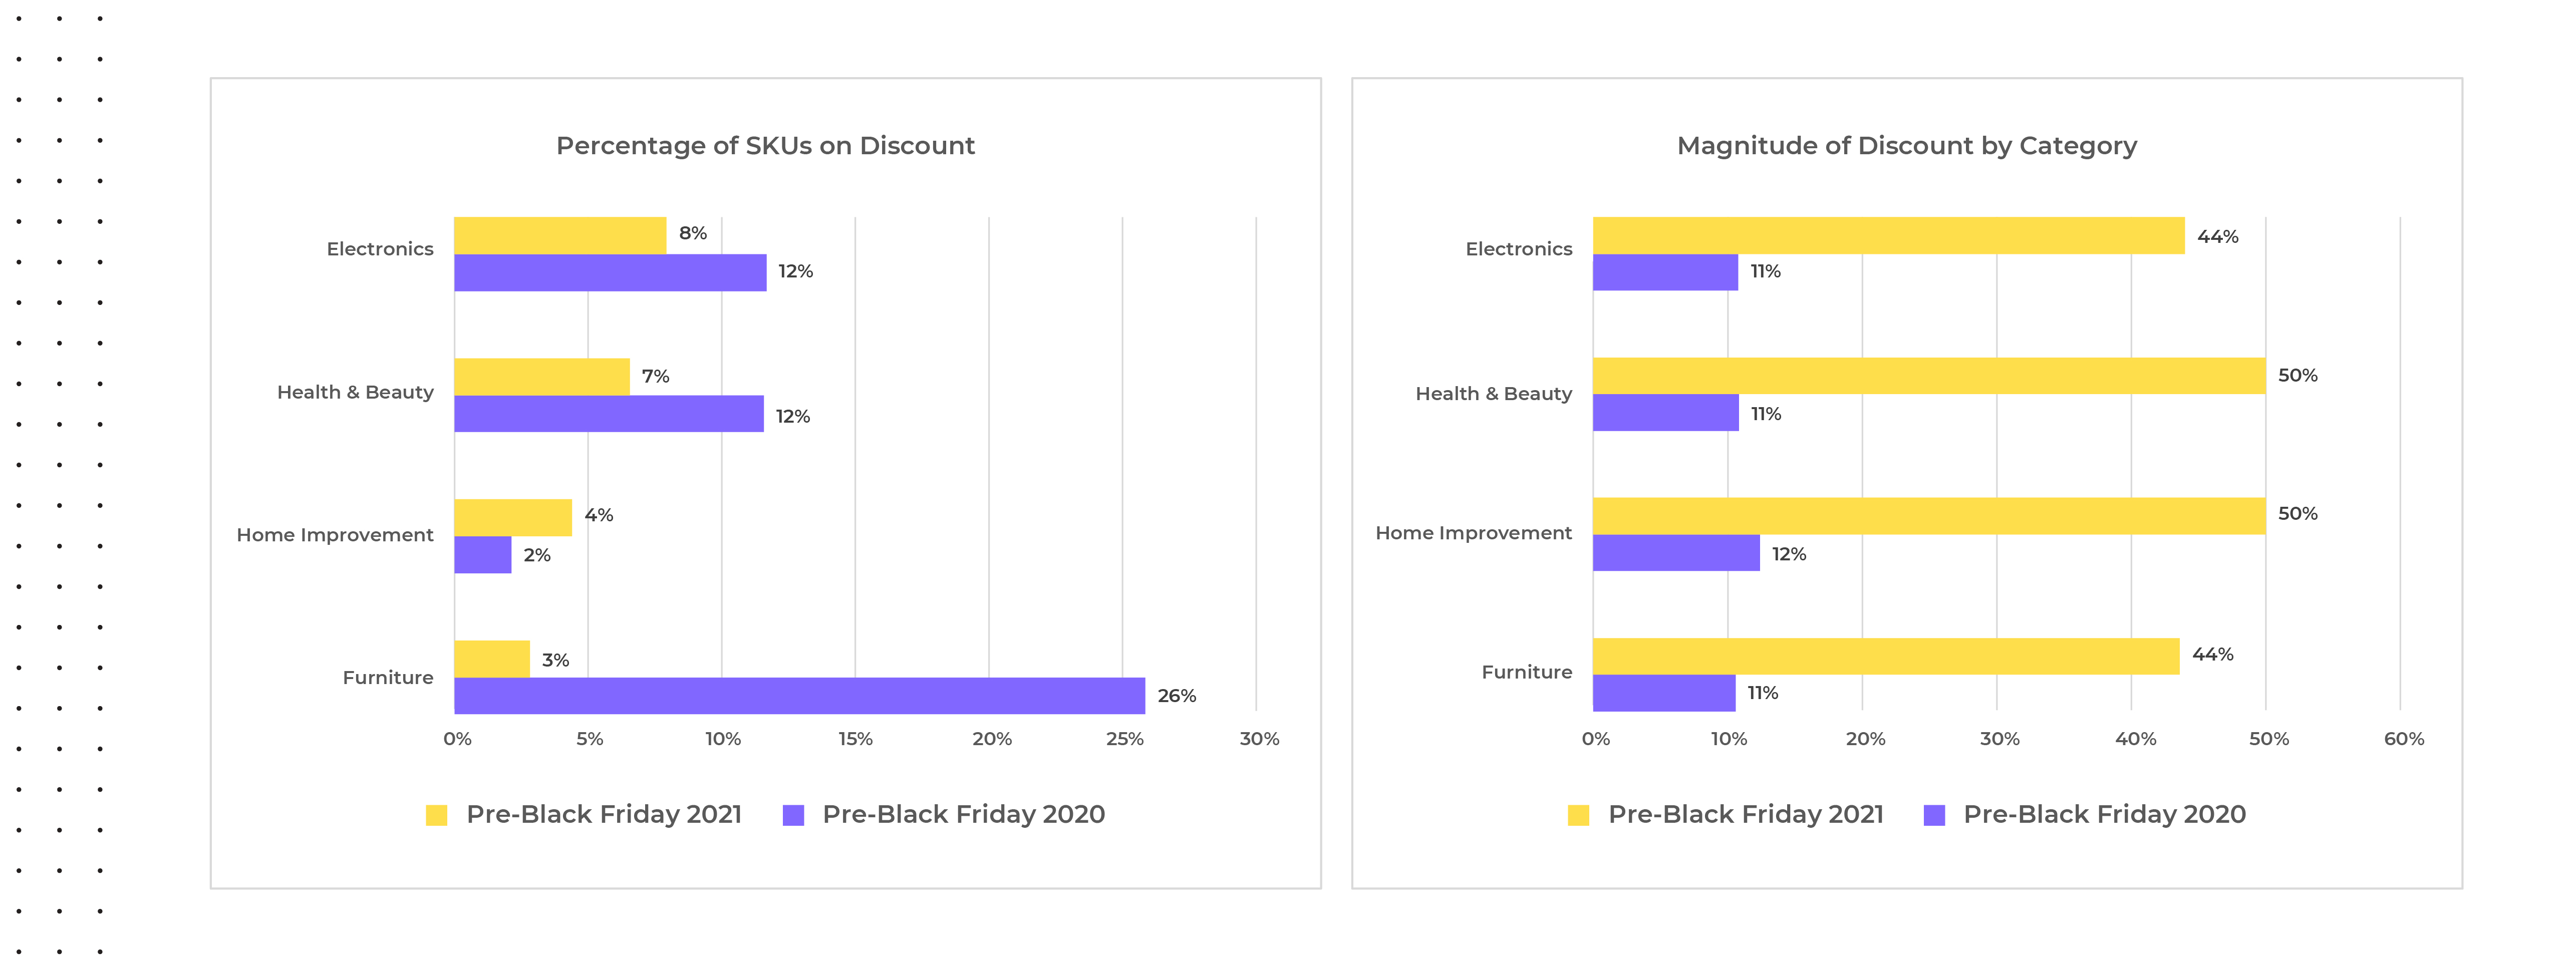
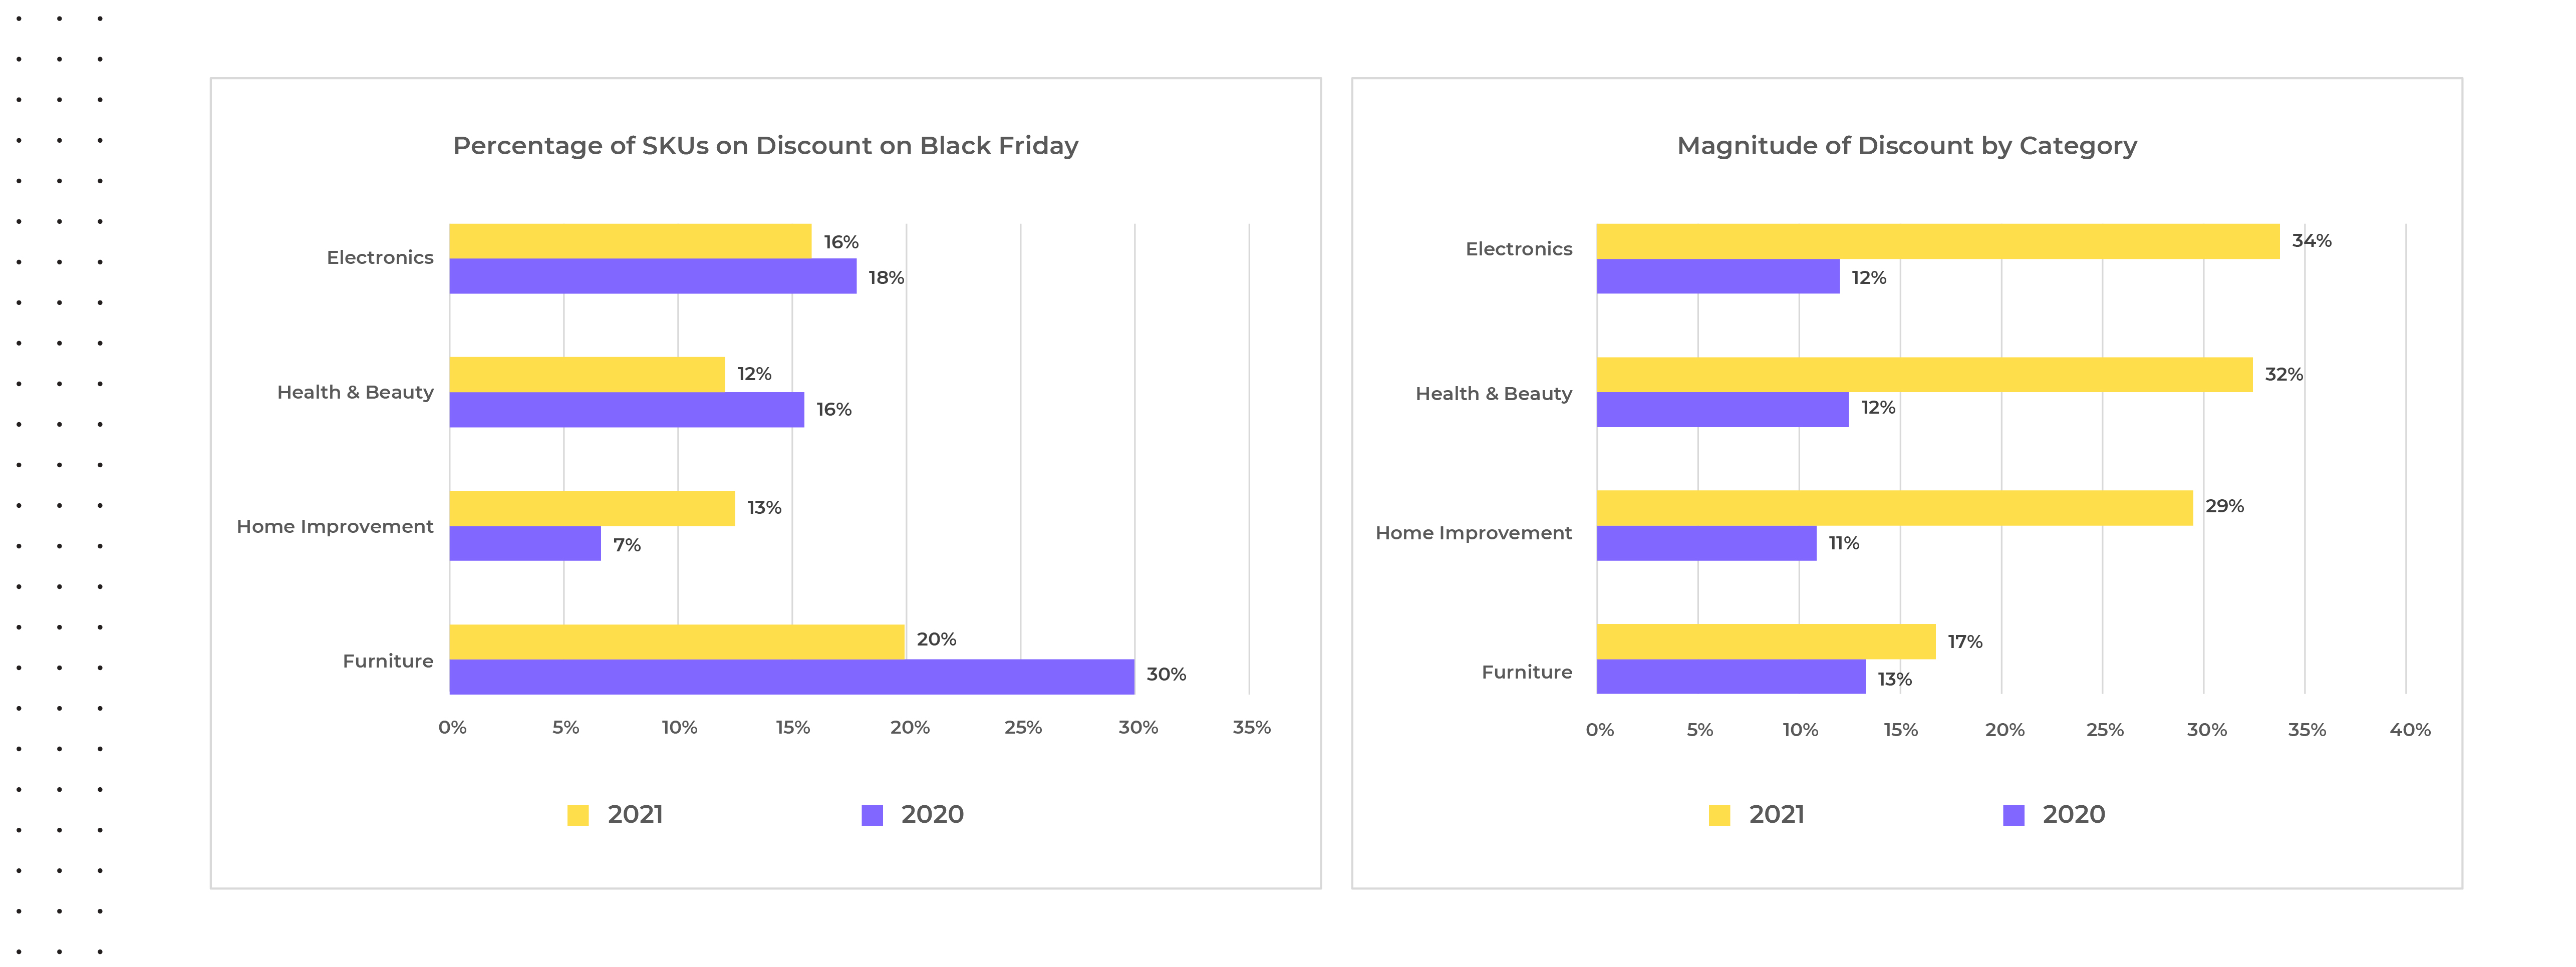
    From October through early November 2021, fewer products were discounted compared to this same period in 2020, and the few that were saw much deeper discounts apart from the home improvement category. The most extreme example we saw in discounts offered was within furniture where only three percent of SKUs were on discount in 2021 compared to twenty-six percent in 2020. Interestingly, the magnitude of discount was also higher pre-Cyber Weekend 2021 versus 2020, but this trend was not exclusive to furniture and was also seen within electronics, health & beauty, and home improvement.

    Pre-Black Friday 2021 and 2020 SKUs on Discount and Magnitude
    Source: Commerce Intelligence – Pricing Insights for Bed & Bath, Electronics, Furniture, Healthy & Beauty, and Fashion categories on Amazon.com & Target.com Pre-Black Friday average selling price during November 20-26th 2021 versus average selling price from November 13-19th 2021 compared to Pre-Black Friday average selling price during November 19-25th 2020 versus average selling price from November 12-18th, 2020.

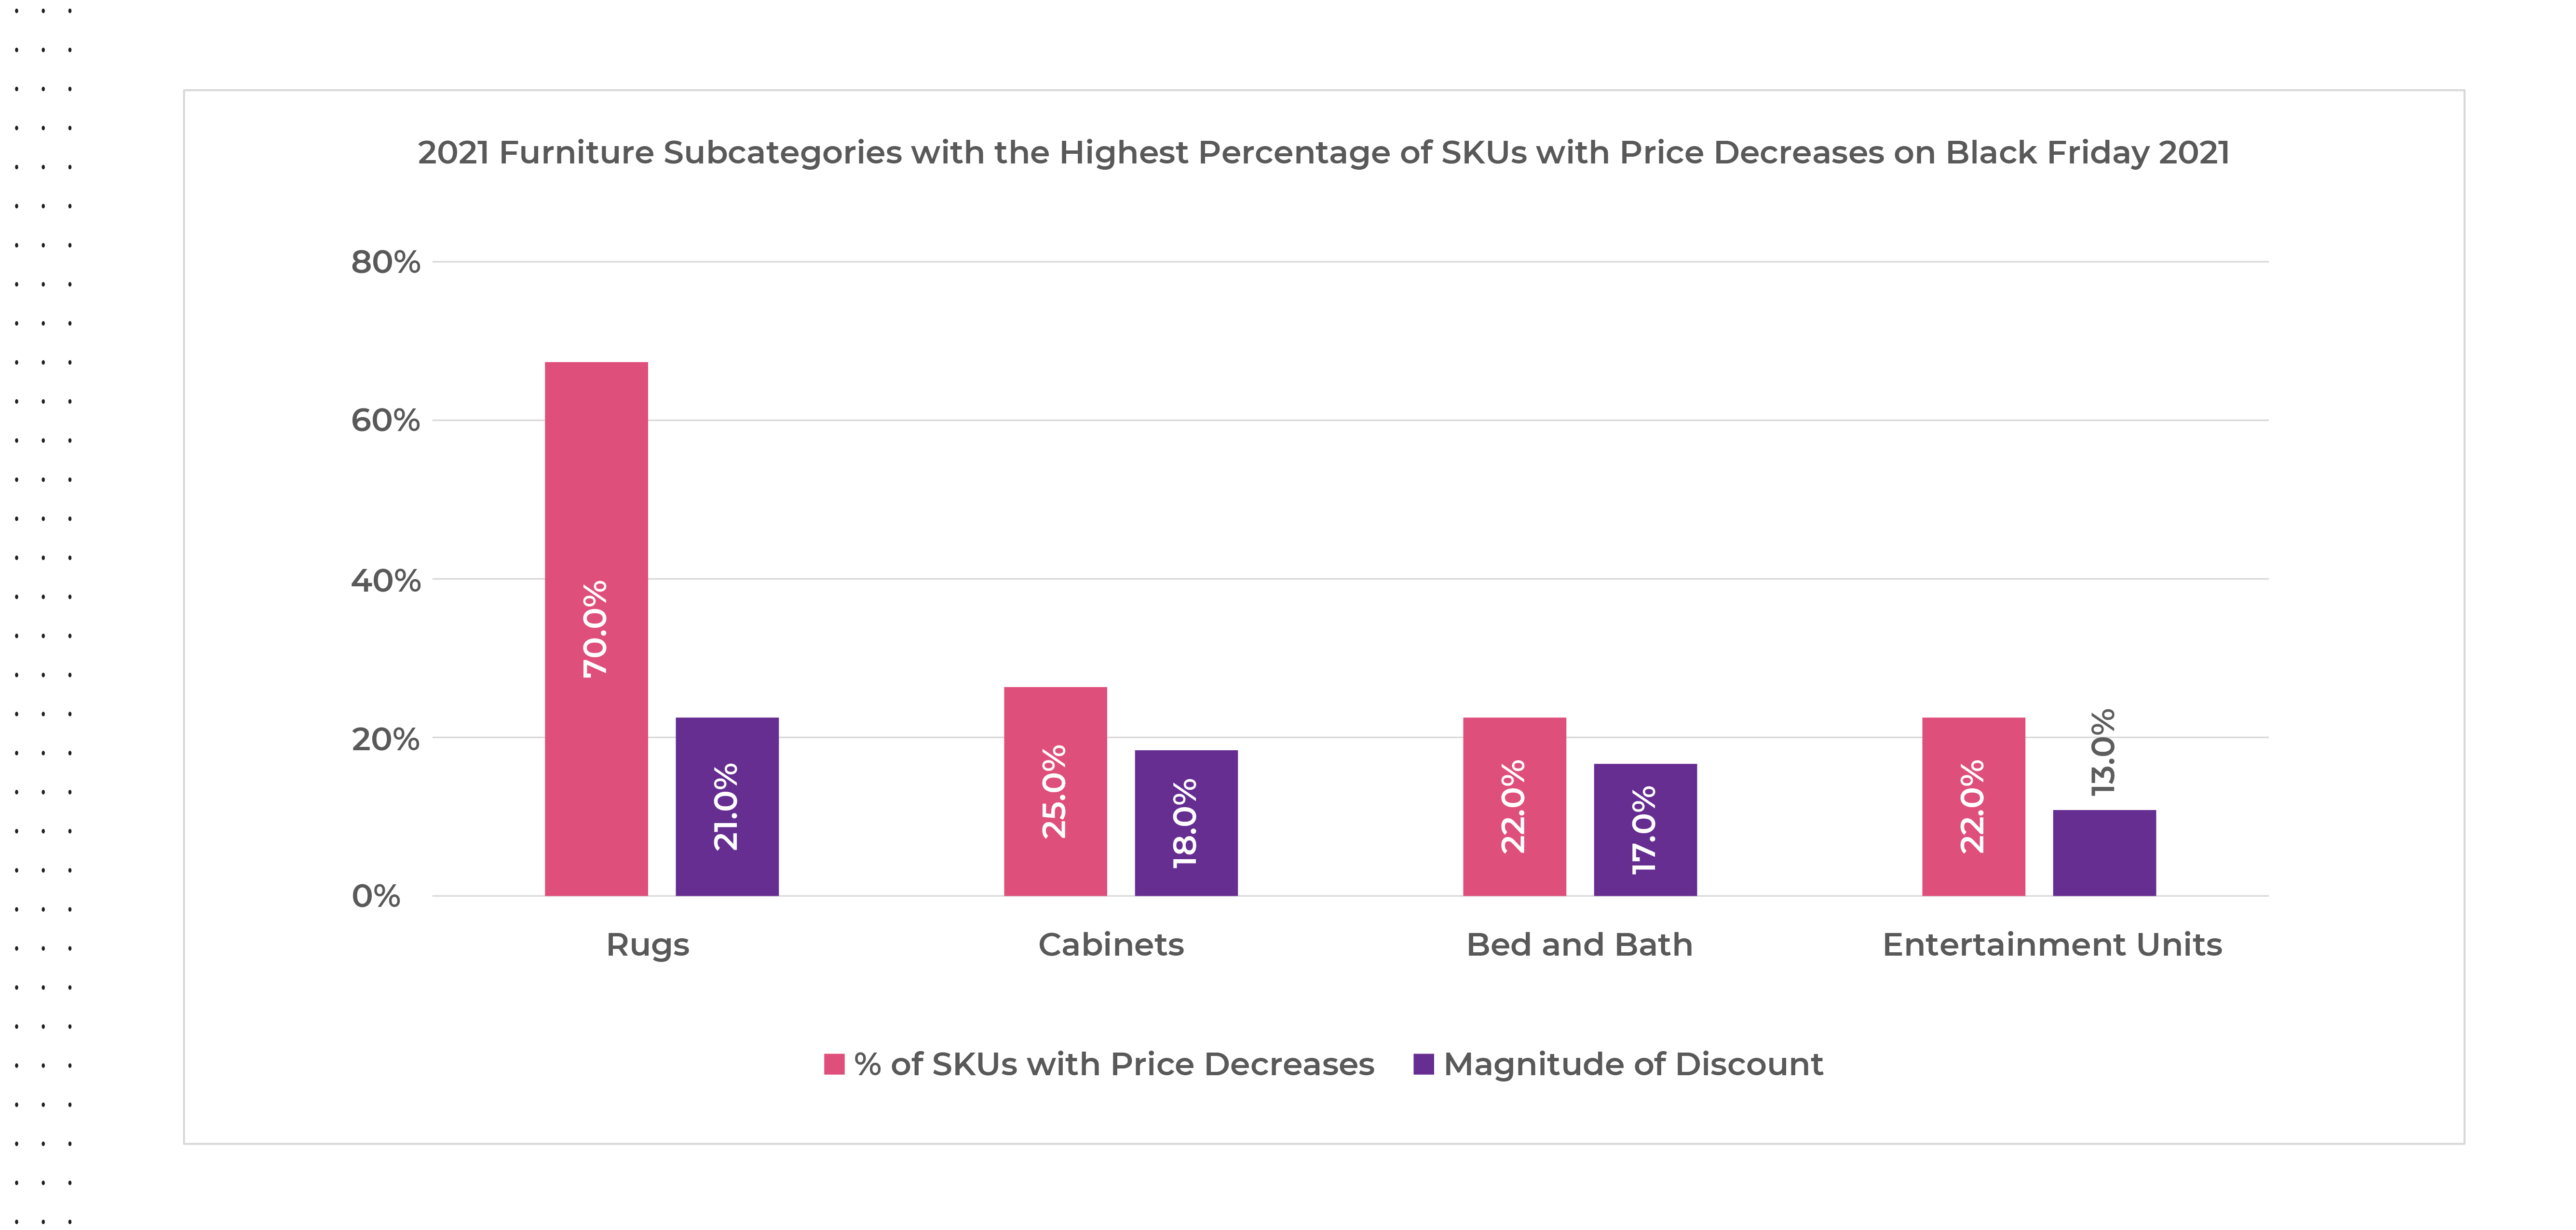
    Within the furniture category, the subcategories offering the greatest number of SKUs with price decreases on Black Friday 2021 were rugs by a wide margin, followed by cabinets, bed and bath, and entertainment units, but the magnitude of discounts offered were all under twenty percent.

    2021 Black Friday Furniture Category Price Decreases
    Source: Commerce Intelligence – Pricing Insights for Bed & Bath, Electronics, Furniture, Healthy & Beauty, and Fashion categories on Amazon.com and Target.com on Black Friday November 27th, 2021, versus average pricing for the same SKUs from Pre-Black Friday November 20-26th 2021 and Black Friday November 26th, 2020, versus average pricing for the same SKUs from Pre-Black Friday November 19th-25th 2020

    Accounting for this phenomenon could have been retailers’ attempts to clear inventory for SKUs which hadn’t sold even during the period of severe supply chain shortages. With more products selling at higher prices this year, retailers were also able to use fewer SKUs with greater discounts to attract buyer in hopes of filling their digital baskets with more full-priced goods, helping to protect margins heading in to Cyber Weekend. Scarcity threats also encouraged consumers to buy early, even when not on promotion, to ensure they would have gifts in time for the holidays.

    The same trends seen pre-Cyber Weekend 2021 were also seen on Black Friday with a year-over-year decrease in the percentage of SKUs offered on discount versus 2020, and steeper price reductions for the discounted products which can also be attributed to the increase in MSRPs.

    Black Friday 2021 and 2020 SKUs on Discount and Magnitude
    Source: Commerce Intelligence – Pricing Insights for Bed & Bath, Electronics, Furniture, Healthy & Beauty, and Fashion categories on Amazon.com and Target.com on Black Friday November 27th, 2021, versus average pricing for the same SKUs from Pre-Black Friday November 20-26th 2021 and Black Friday November 26th, 2020, versus average pricing for the same SKUs from Pre-Black Friday November 19th-25th 2020

    2021 Black Friday Price Increases?

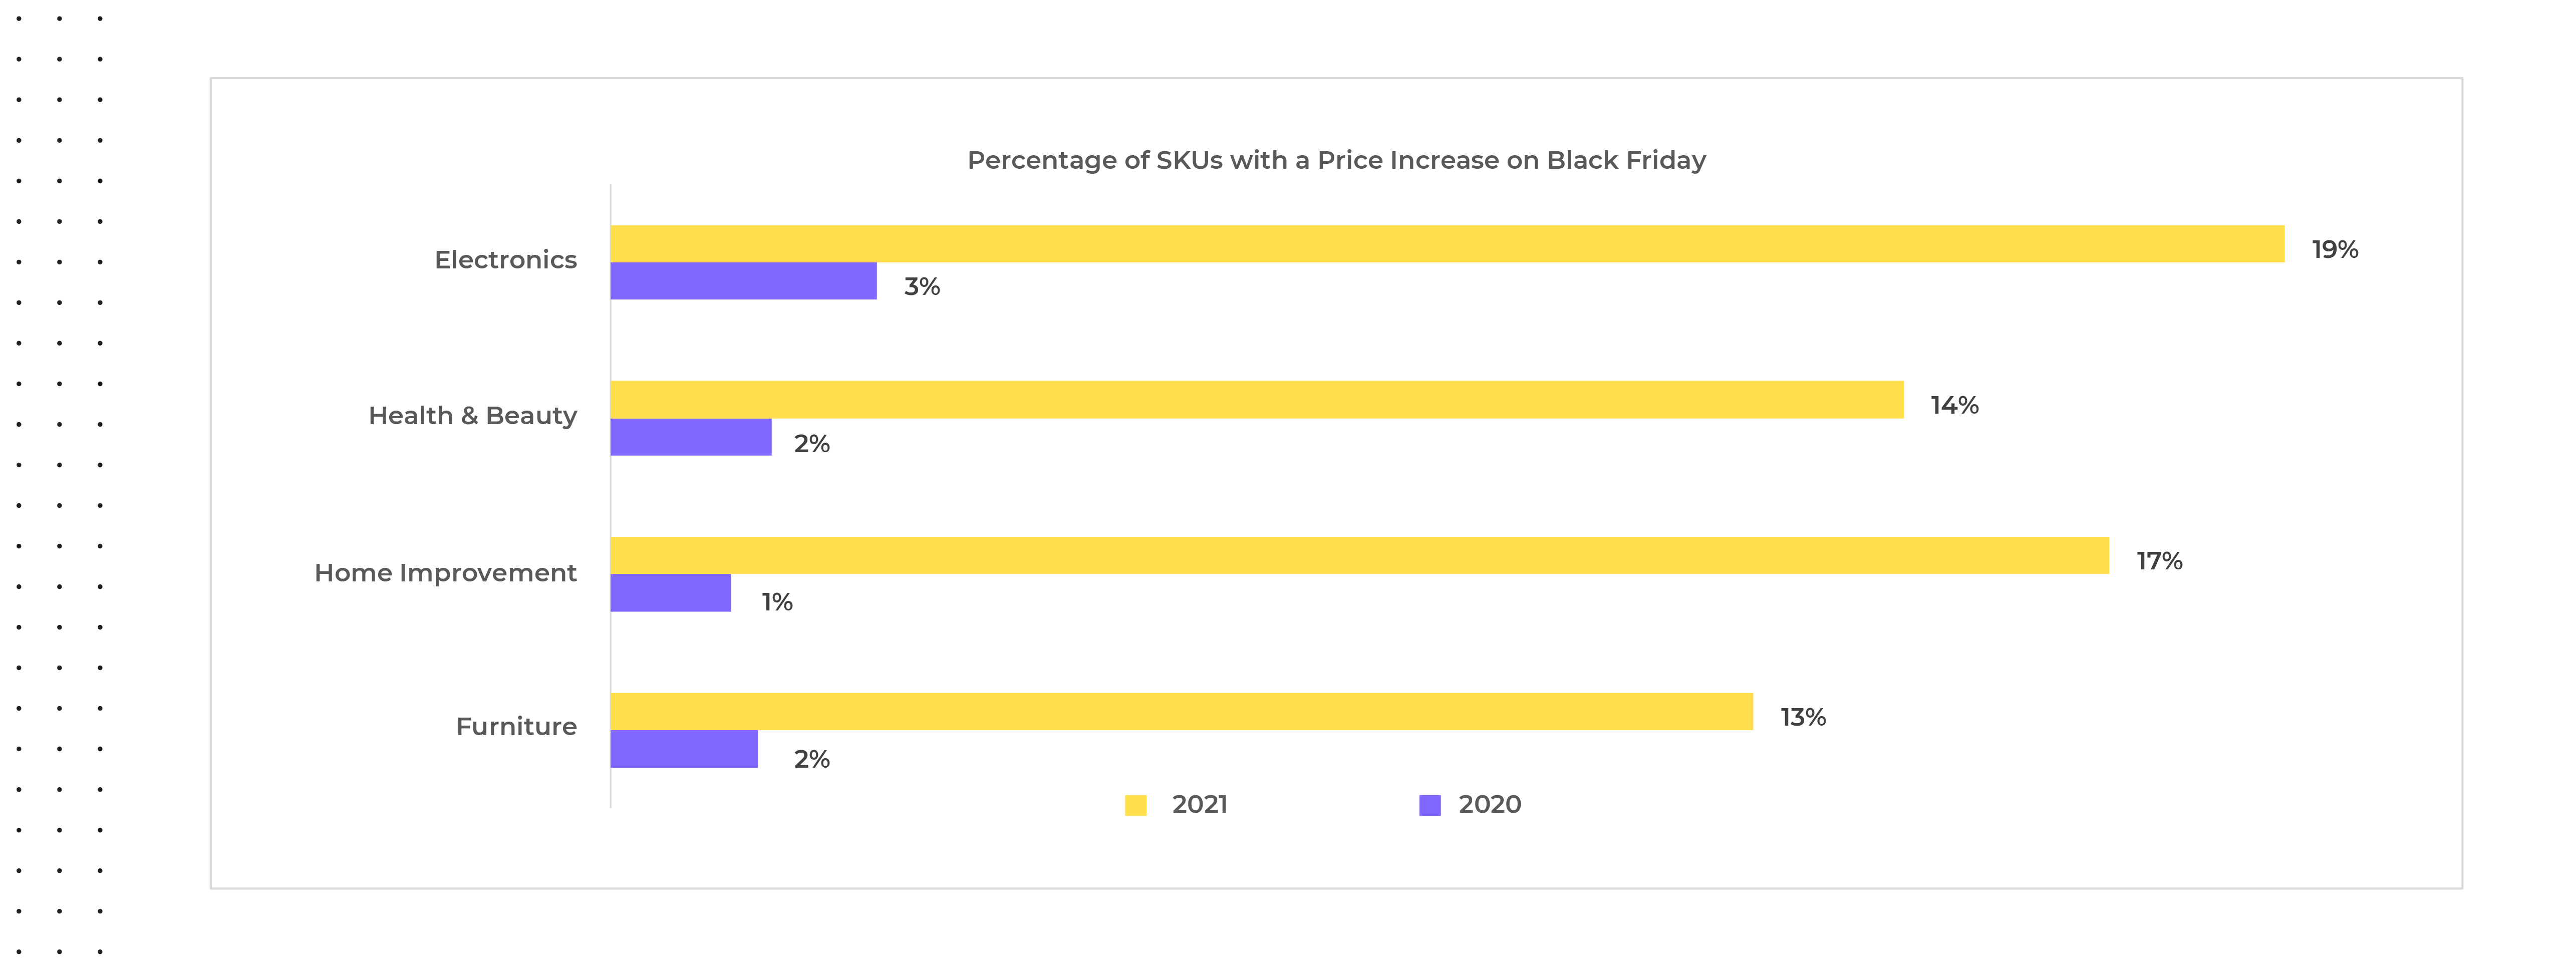
    We all know Black Friday is all about price reductions, discounts and deals and so it’s rare to see actual price increases, yet for Black Friday 2021, trends ran counter to this. We observed price increases across all categories for around thirteen to nineteen percent of SKUs, with an average price increase of around fifteen percent in 2021 versus an average of only two percent in 2020.

    SKUs with Price Increases Black Friday 2021 and 2020
    Source: Commerce Intelligence – Pricing Insights for Bed & Bath, Electronics, Furniture, Healthy & Beauty, and Fashion categories on Amazon.com and Target.com on Black Friday November 27th, 2021, versus pricing for the same SKUs from Pre-Black Friday November 20-26th 2021 and Black Friday November 26th, 2020, versus average pricing for the same SKUs from Pre-Black Friday November 19th-25th 2020

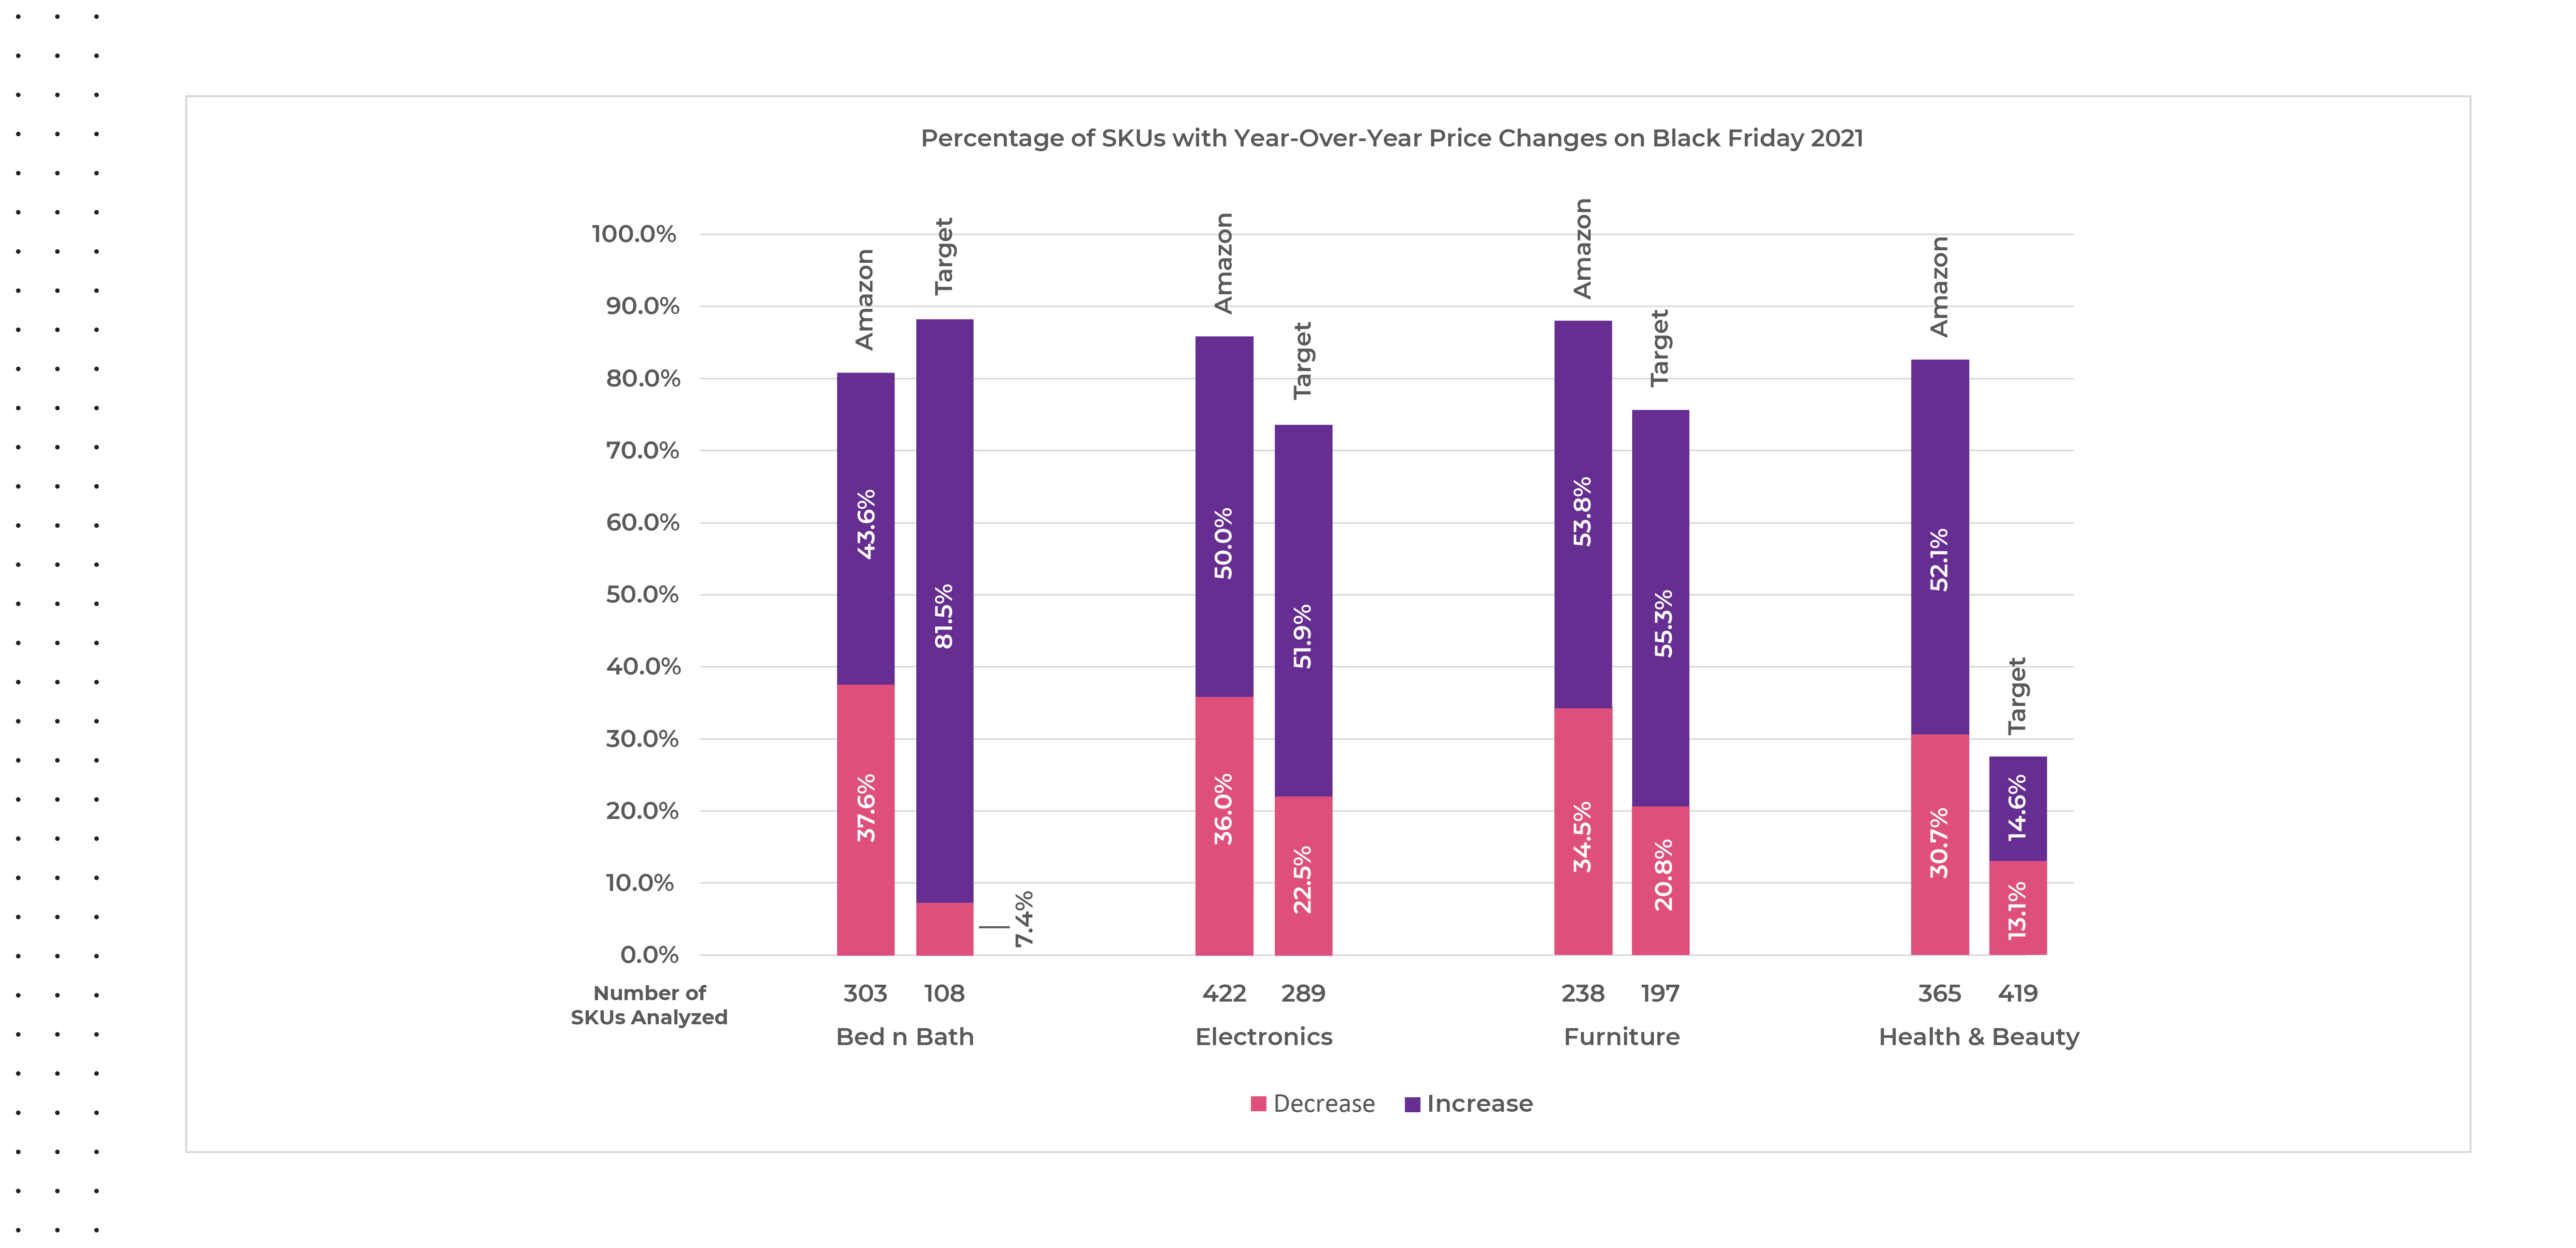
    At an account level, we noticed a few interesting differences happening on Black Friday 2021 versus 2020 regarding category price changes. On Target.com, almost ninety percent of the bed and bath SKUs analyzed had a price change on Black Friday in 2021 versus 2020 with eighty-two percent presenting a higher price year-over-year versus only around seven percent showing a decrease, where on Amazon nearly forty-four percent of bed and bath SKUs showed an increase in price and around thirty-eight percent showed a decrease. Except for the health and beauty category on Target.com, more than half of the SKUs in each category saw a price increase on Black Friday versus a price decrease.

    2021 YoY Price Changes on Black Friday
    Source: Commerce Intelligence – Pricing Insights for Bed & Bath, Electronics, Furniture, Healthy & Beauty, and Fashion categories on Amazon.com and Target.com on Black Friday November 27th, 2021, versus average pricing for the same SKUs on Black Friday November 26th, 2020.

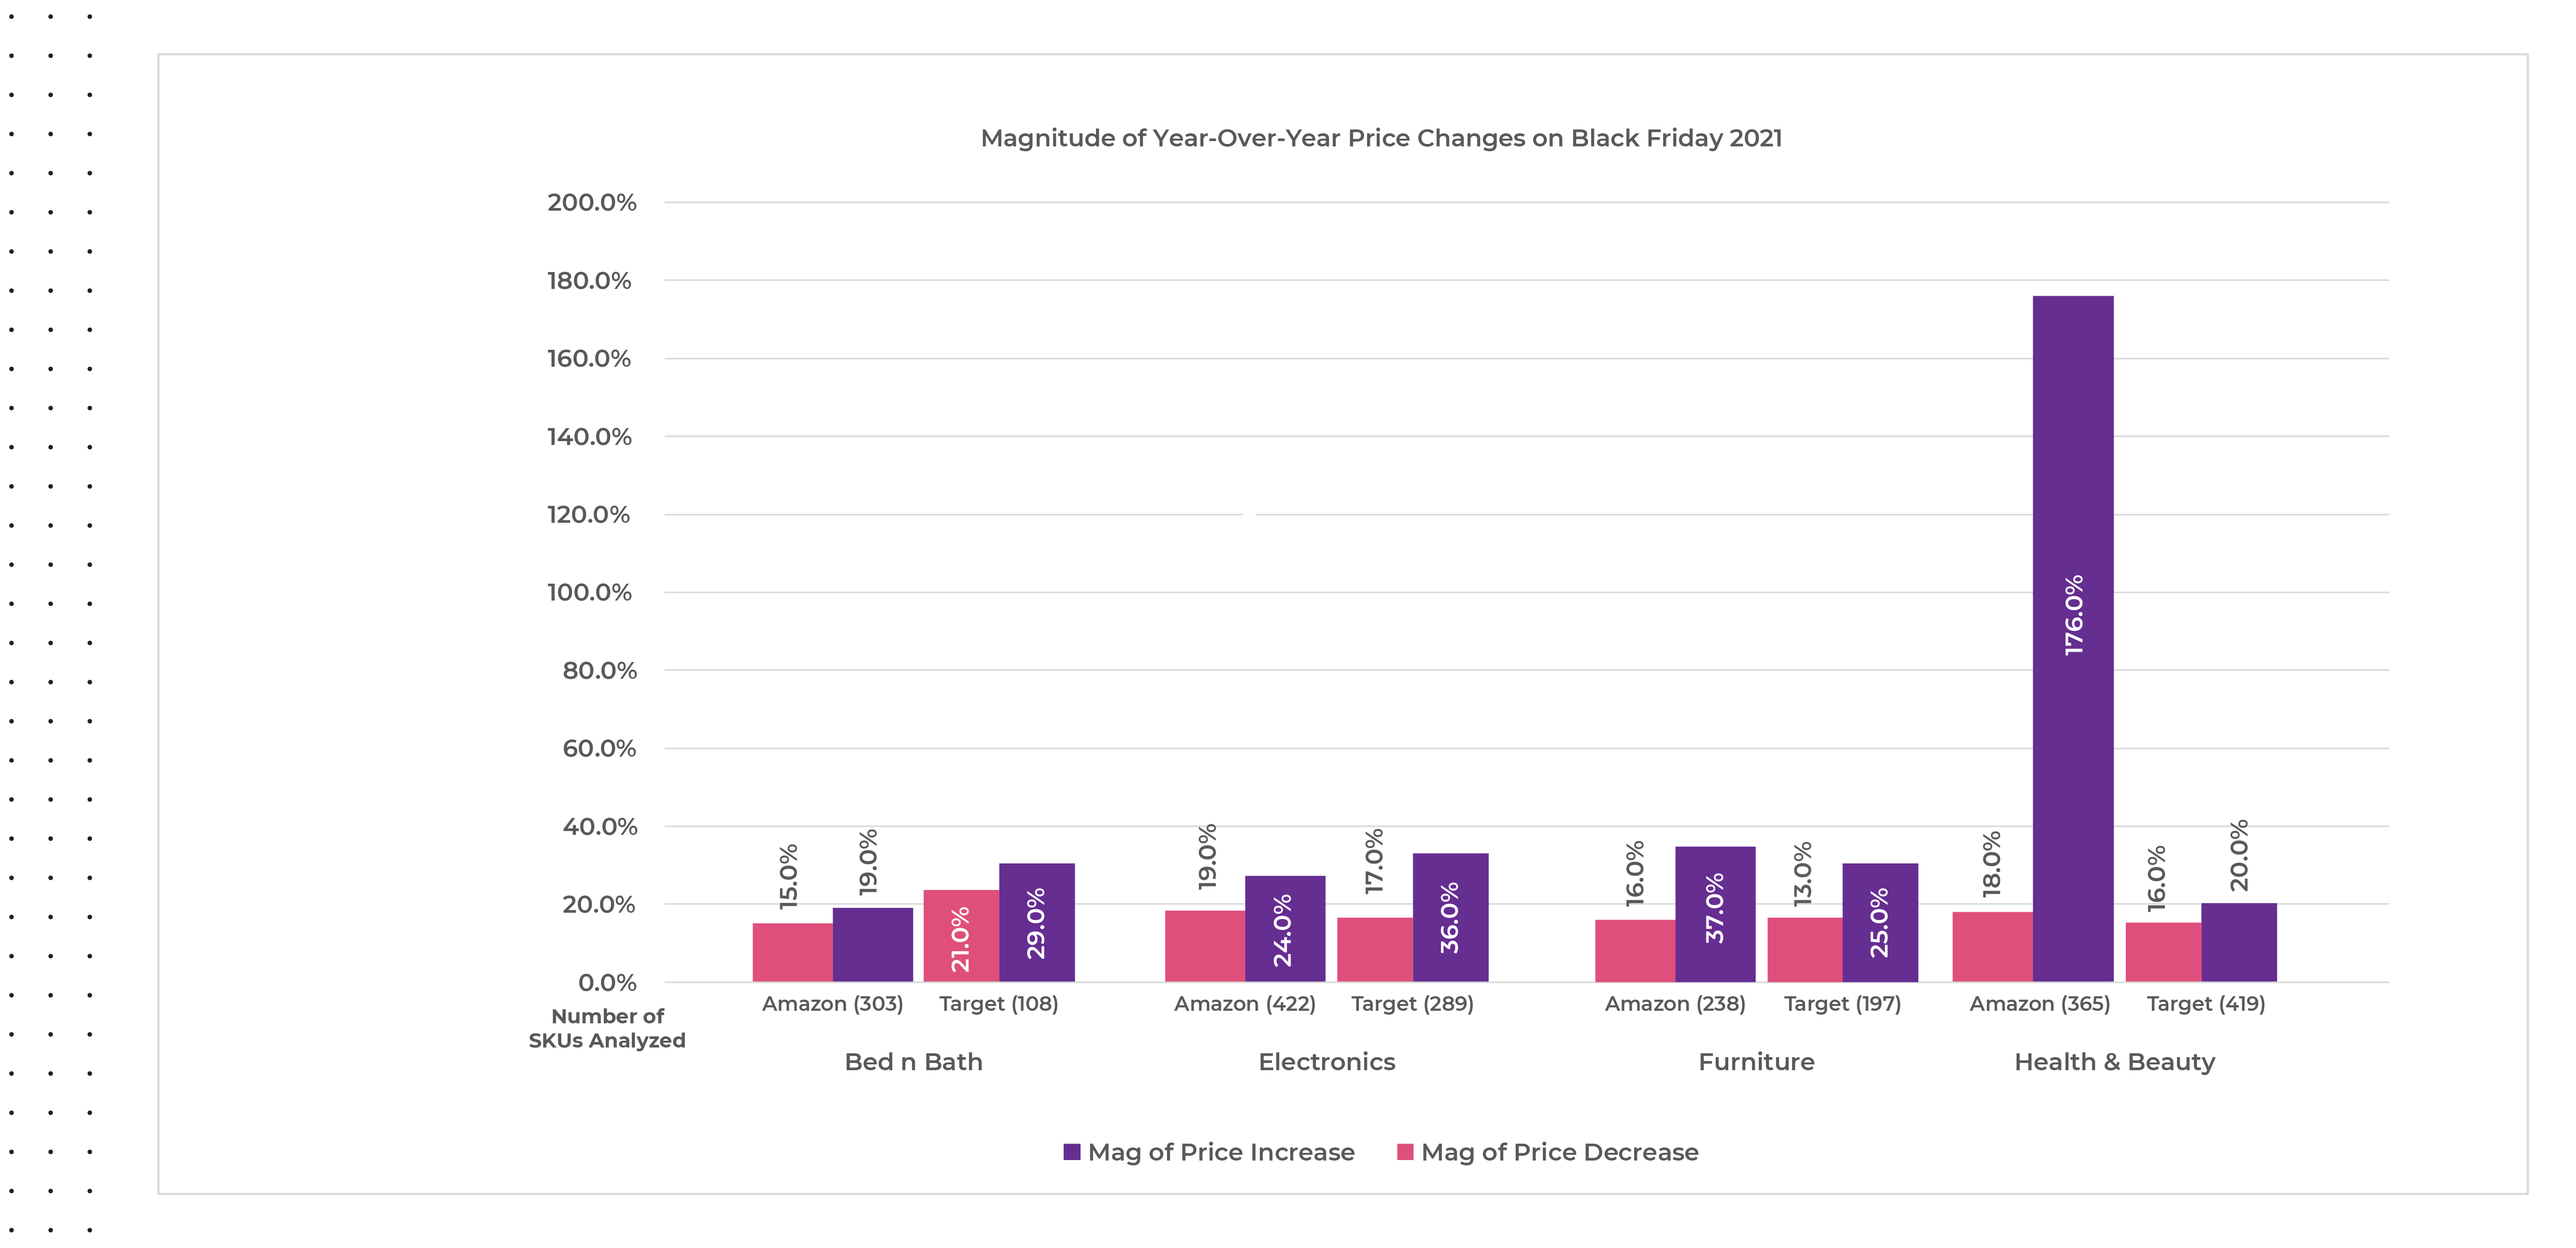
    The magnitude of year-over-year price changes seen on Black Friday 2021 was significant across all categories, but the magnitude of price increases found on Amazon.com within the health and beauty category outpaced the rest by far. We reviewed three hundred and sixty-five SKUs on Amazon.com within the health & beauty category and saw almost eighty-three percent of them had a price change with around thirty-one percent decreasing prices and around fifty-two percent increasing prices. This means that within the health & beauty category on Amazon.com, more than fifty percent of the SKUs tracked were sold at a one hundred and seventy-six percent higher price on average during Black Friday 2021 versus 2020.

    Magnitude of Black Friday 2021 Price Increases
    Source: Commerce Intelligence – Pricing Insights for Bed & Bath, Electronics, Furniture, Healthy & Beauty, and Fashion categories on Amazon.com and Target.com on Black Friday November 27th, 2021, versus average pricing for the same SKUs on Black Friday November 26th, 2020.

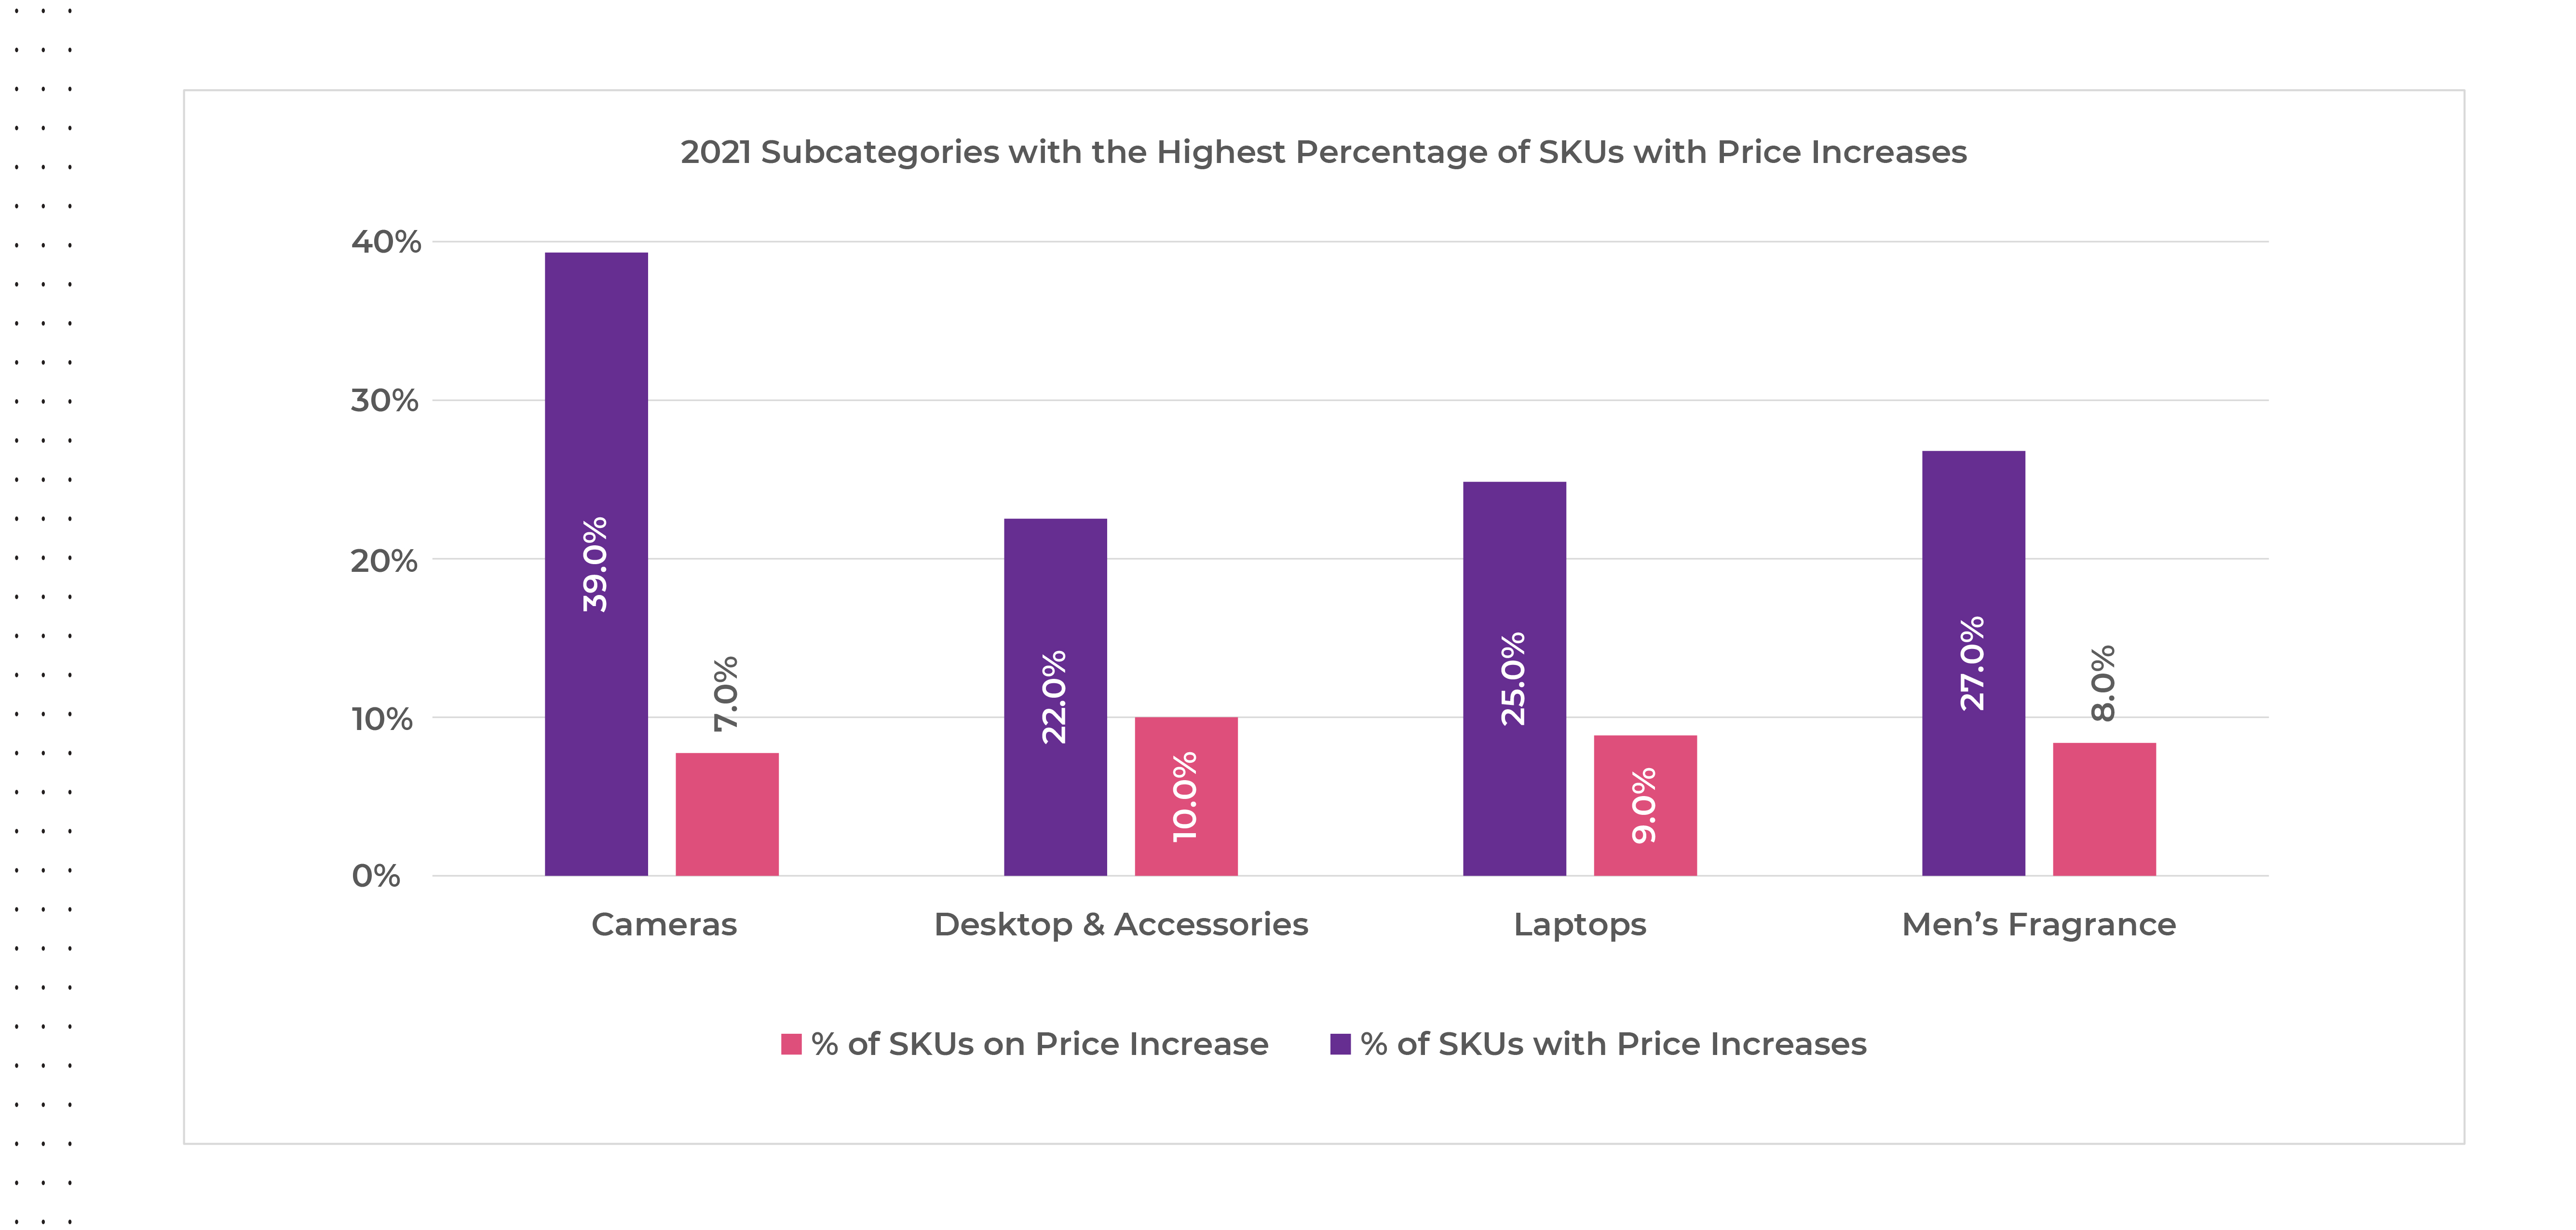
    The subcategories offering the greatest number of SKUs with price increases on Black Friday 2021 were cameras, followed by men’s fragrances, laptops, and desktops & accessories, but the magnitude of discounts offered were all under ten percent.

    2021 Subcategories with Price Increases during Black Friday
    Source: Commerce Intelligence – Pricing Insights for Bed & Bath, Electronics, Furniture, Healthy & Beauty, and Fashion categories on Amazon.com and Target.com on Black Friday November 27th, 2021, versus pricing for the same SKUs from Pre-Black Friday November 20-26th 2021 and Black Friday November 26th, 2020, versus average pricing for the same SKUs from Pre-Black Friday November 19th-25th 2020

    The Aftermath Post-2021 Cyber Weekend

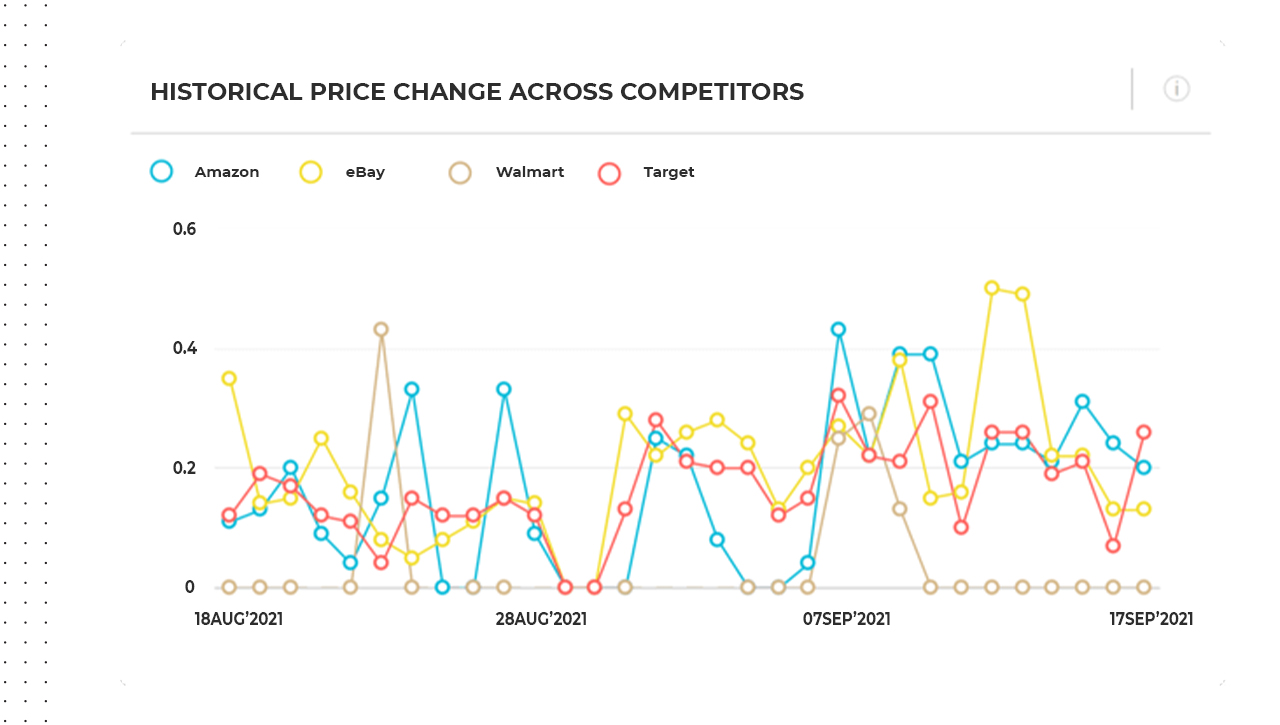
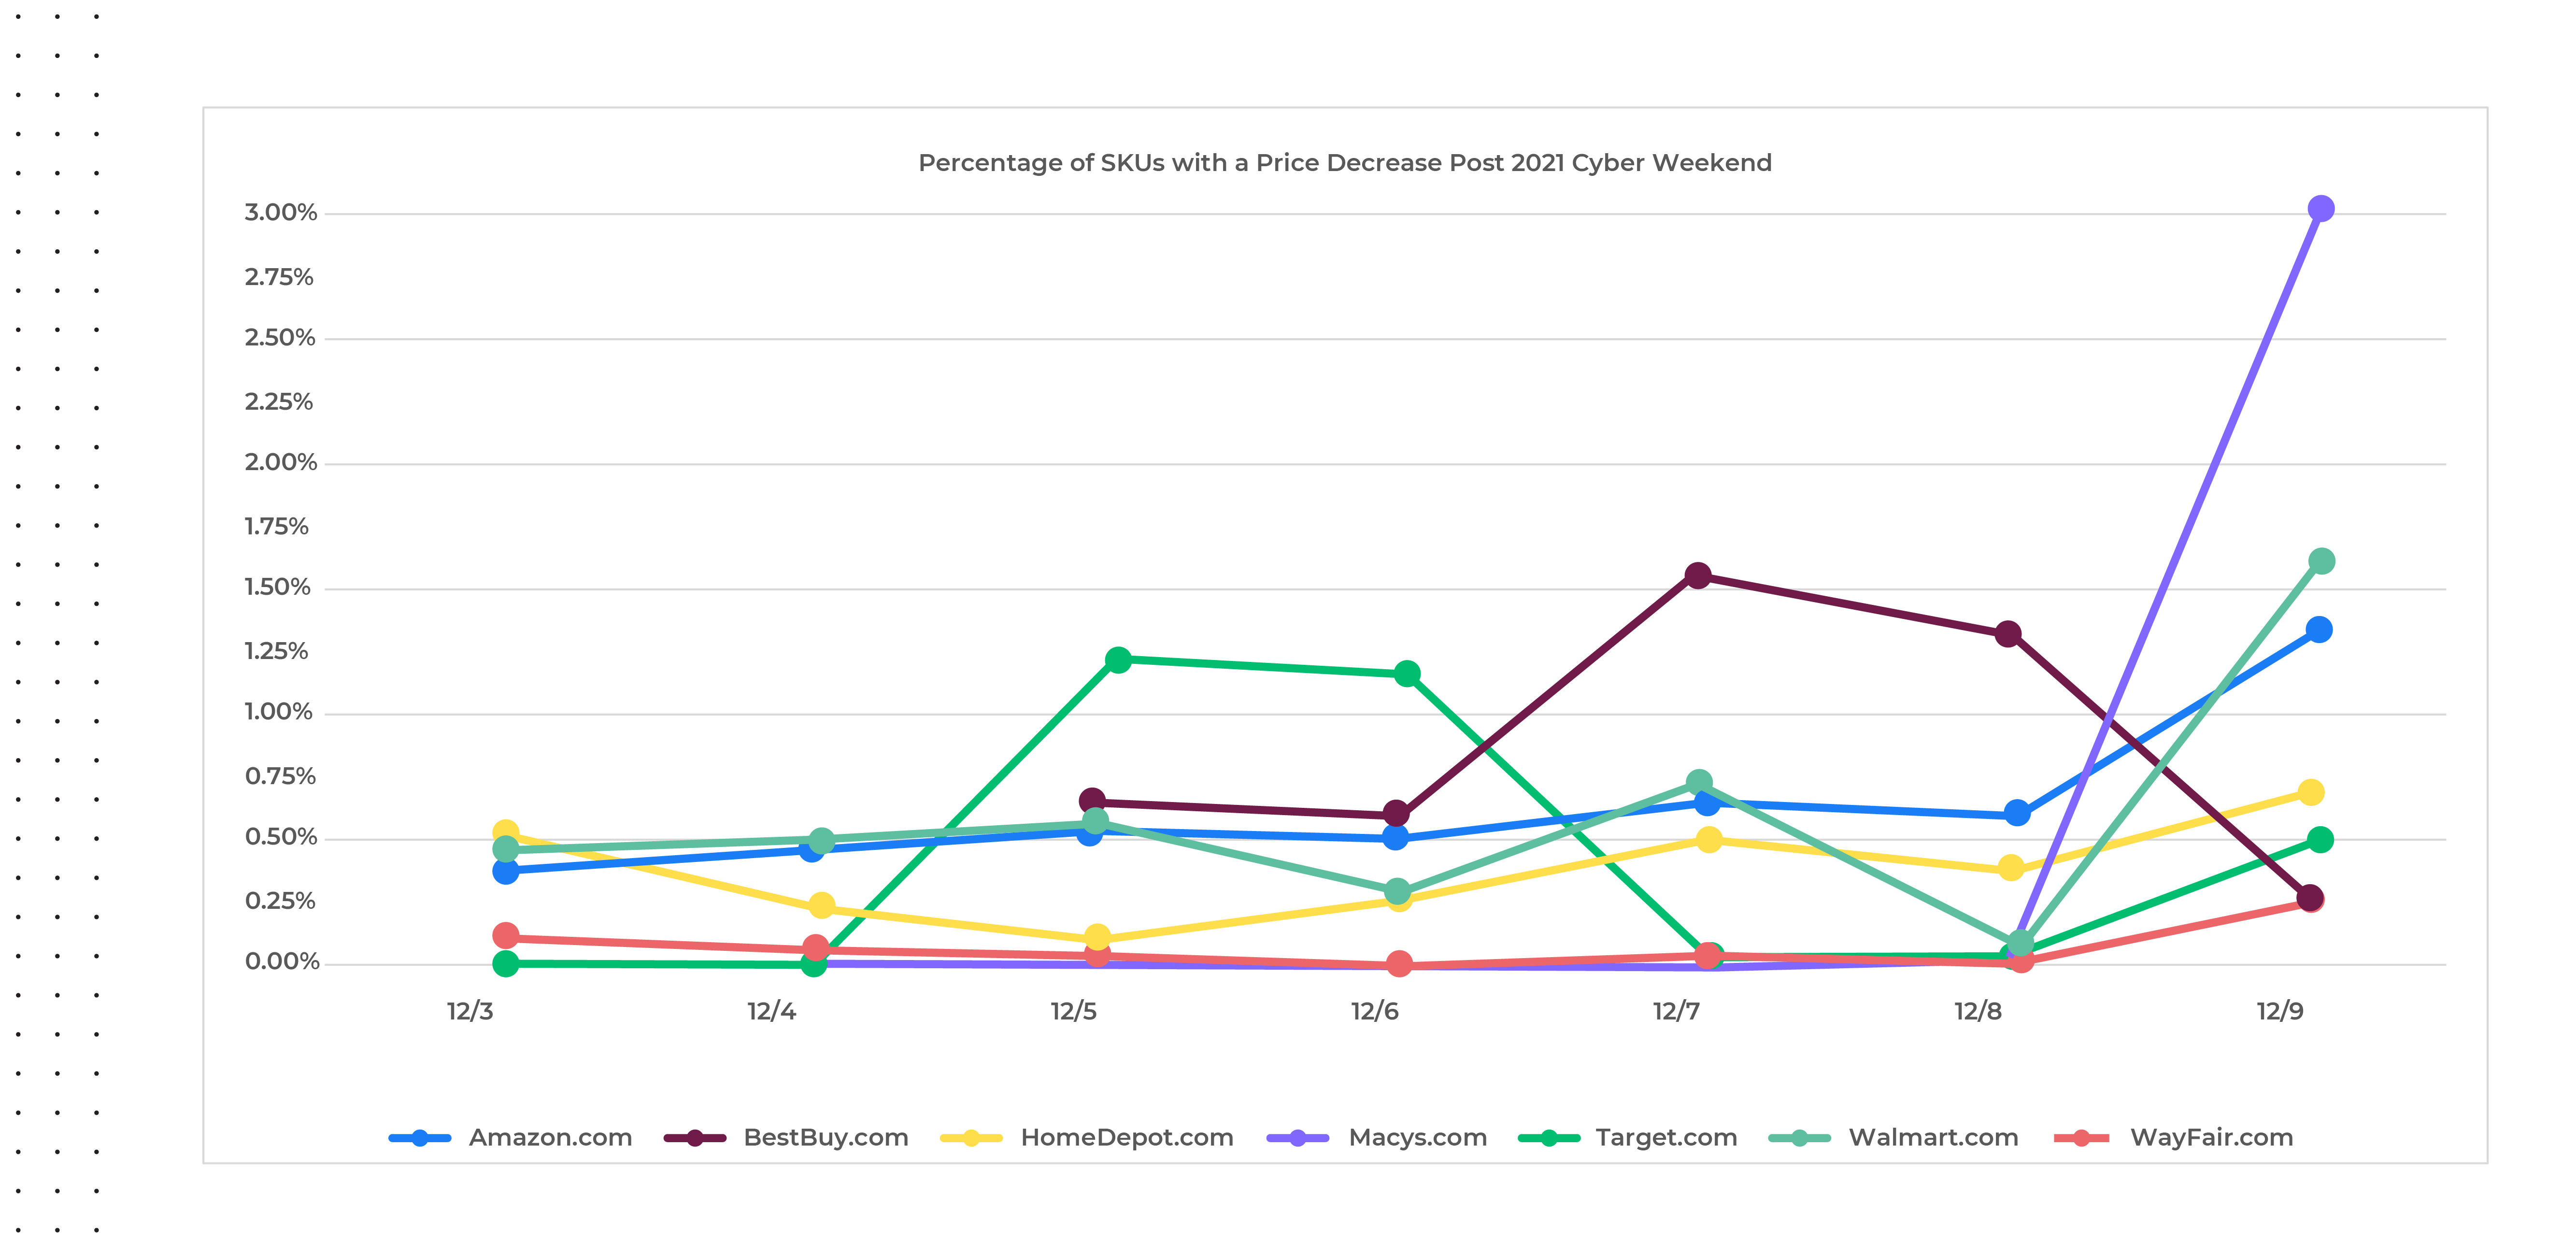
    Extending this analysis beyond the holiday weekend, we analyzed price change activity from December third through the ninth across the top US retailers (chart below) and found that price decreases have been very minimal, comparatively speaking. Though there was a spike in number of price decreases from December 8th to the 9th, the percentage of SKUs with price decreases was still very low (less than three percent). We anticipate this trend will continue into 2022.

    SKUs with Price Decrease Post Cyber Weekend 2021
    Source: Commerce Intelligence – Pricing insights for Home & Garden, Jewelry & Watches, Clothing & Shoes, Bed N Bath, Lighting & Ceiling Fans categories

    A Sign of Things to Come

    A confluence of inflationary trends, product shortages and consumer liquidity have driven many marketplace changes to occur simultaneously. Government programs in the form of stimulus checks, have put extra money in consumers’ hands, and so they’ve been more willing to spend. That, coupled with the shock in the supply chain, has motivated people to buy far ahead of the 2021 holiday season. Hence, retailers have needed to rely much less on across-the-board discounts. Promotions have been more strategic – we’ve seen deeper discounts over fewer products, likely used to draw consumers in to buy certain items, and once they’re there, customers are buying everything else at a non-discount level. When these factors once again normalize, we could see a return to the “race to the bottom” that has occurred since the financial crisis of 2008-2009, but for once, retailers may be able to maintain some pricing power as the 2021 holiday shopping season played out.

    Even though performance was not as anticipated and holiday sales did not grow as rapidly as they did in 2020, Cyber Monday was still the greatest online shopping day in 2021. Through it all, retailers managed to keep their digital shelves stocked and orders filled in time for the holidays for the most part, running the risk of housing aged inventory if goods didn’t arrive in time. Despite predictions for steep promotions in January 2022, with supply chains still challenged and inflationary pressures still full steam ahead, we don’t anticipate much in the way of enhanced discounts to continue beyond the holidays.

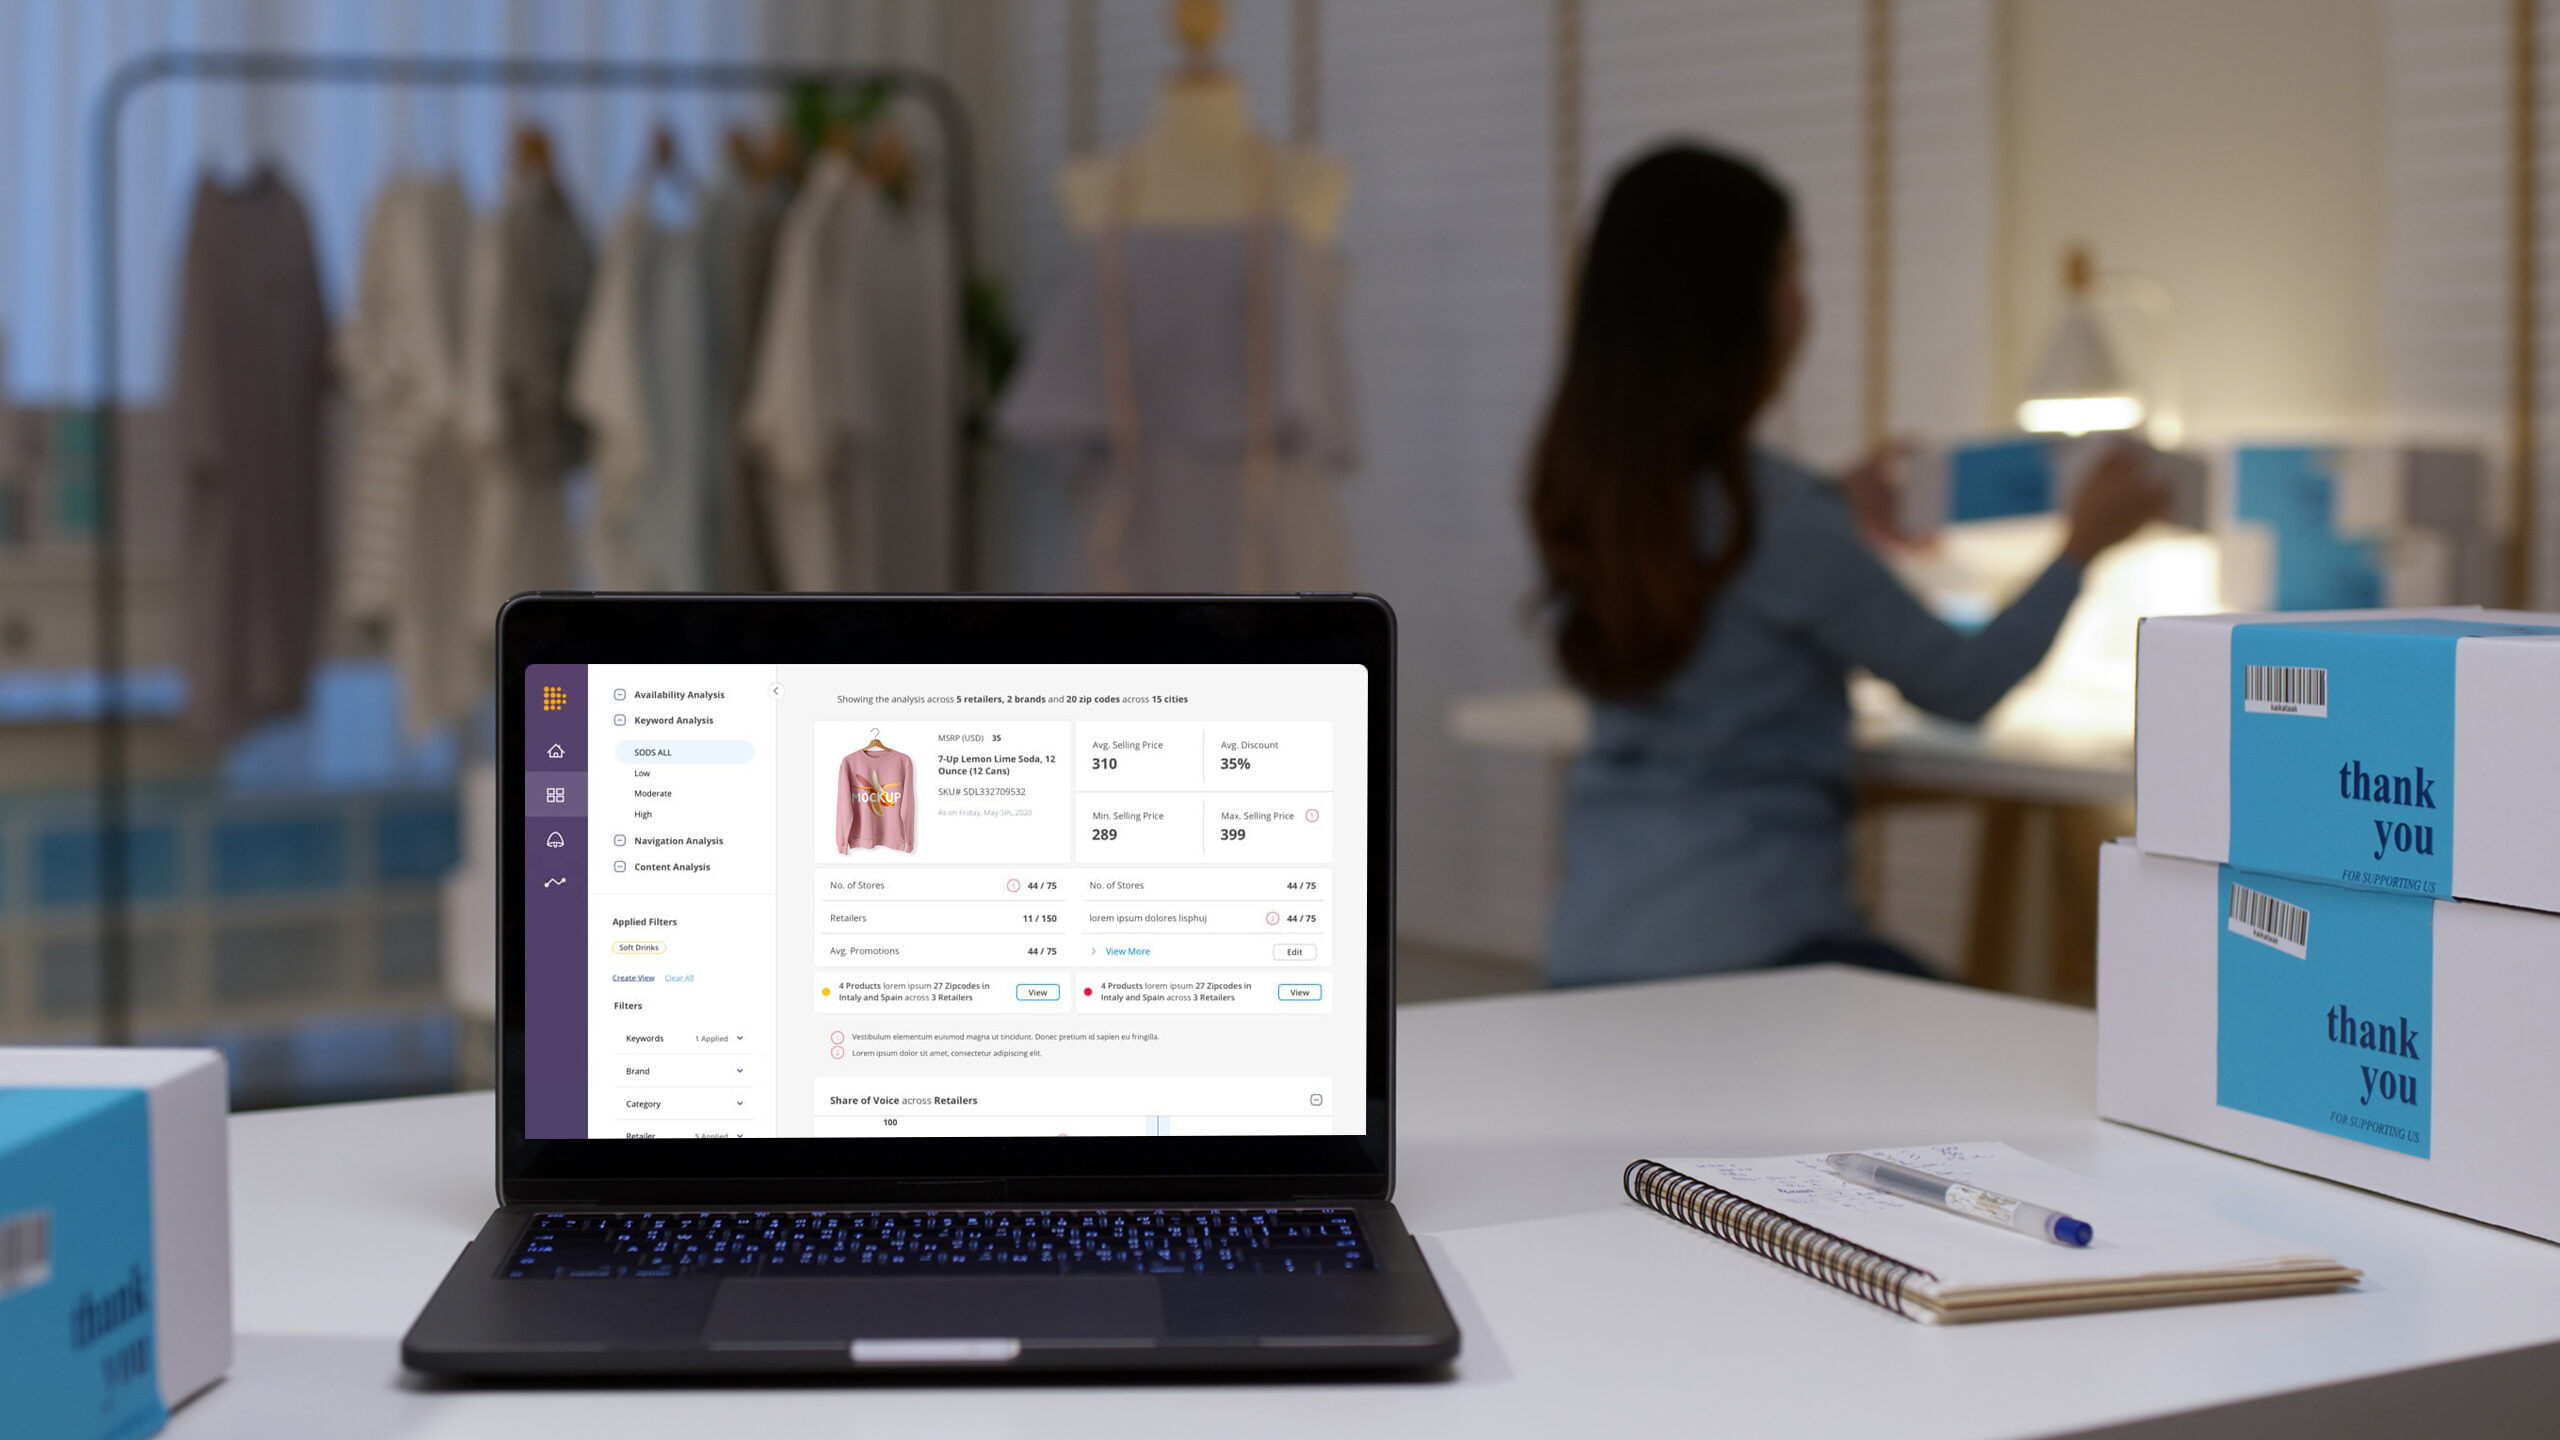
    Access to these types of real-time digital marketplace insights can enable retailers and brands to make strategic decisions like how and when to address inflationary pressures, while also supporting many other day-to-day operations and help drive profitable growth in an intensifying competitive environment. Continue to follow us in the coming weeks for a detailed 2021 year-end review across more retailers and categories. Be sure to reach out to our Retail Analytics experts for access to more details regarding the above analysis.         

  • Importance of Image Recognition in the Retail Industry

    Importance of Image Recognition in the Retail Industry

    When it comes to classifying and analyzing images, humans can easily recognize distinct features of objects and associate them with individual definitions. However, visual recognition is a highly complex task for machines because it involves identifying multiple objects and finding object relationships. Image recognition has been a long-standing research problem in the computer vision field. But, the recent development in AI has improved the process of object detection, image identification, and image classification. The image recognition market is assumed to rise globally to a market size of $42.2 billion by 2022. Various industries are adopting image recognition technology to improve augmented reality applications, optimize medical imagery, boost driverless car technology, predict consumer behavior, and much more. 

    Although image recognition is a relatively new aspect of analysis, it is also making its way into eCommerce. Image recognition is helping retailers to expand consumer reach, offer insights into trends, and improve customers’ online shopping experience for the eCommerce industry. The Global Image Recognition in Retail Market is estimated to be USD 1.8 Bn in 2021 and is expected to reach USD 4.5 Bn by 2026, growing at a CAGR of 20%.

    Image Recognition
    Global Image Recognition in Retail Market

    In this blog, you’ll learn about image recognition technology and its importance in the retail industry. 

    What is Image Recognition?

    Image recognition, a subcategory of computer vision, is a technology that can identify objects, entities, or attributes in digital images or videos. However, computer vision is a broader term, including methods for gathering, processing, and analyzing data from the real world. Image recognition can be performed at varying degrees of accuracy, depending on the type of information required.

    Image recognition can perform the following tasks:

    Object Detection, Semantic Segmentation &  Instance Segmentation
    Object Detection, Semantic Segmentation & Instance Segmentation
    • Classification: It identifies the “class,” i.e., the category to which an image belongs. A picture can have only one class.
    • Tagging: It’s a classification task but involves a higher degree of accuracy. Tagging can recognize several concepts or objects within an image, and there can be more than one tag assigned to a particular image.
    • Detection and localization: This step helps locate object(s) in an image. Once the system locates the object in question, localization helps to place a bounding box around it. 
    • Segmentation: This is also a detection task but involves a higher degree of precision. Segmentation locates element(s) to the nearest pixel in an image. 
    • Instance segmentation: It helps differentiate multiple objects belonging to the same class. 

    Image Recognition in eCommerce and how it works

    Nowadays, increasing competition and customer expectations are forcing online retailers to constantly monitor market dynamics wrt their pricing, promotion & product assortment in order to stay competitive. To get these insights, retailers need to match and compare their products against their competitors to see where the gaps are. That’s where product matching comes in. 

    Product matching refers to finding the same or similar products against a target universe of products from across the web, across multiple competing retailers. Product matching uses AI-based image recognition to determine product attributes, find patterns, and detect text, product price, shipping information, and so on. 

    Here’s how DataWeave’s AI-powered analytics platform uses image recognition & aggregates insights & data for retailers from across the web to provide a comprehensive view of the online competitive environment.

    Image recognition use-cases in the retail industry

    a. Attribute tagging

    Attribute Tagging
    Attribute Tagging

    Getting shoppers to your eCommerce platform is one thing and getting them to complete a purchase is a steeper hill to climb. If your platform can’t provide search results that match with customers’ requirements, they’ll get lost, grow frustrated, and drop off. Attribute tagging with image recognition allows eCommerce stores to automatically generate attributes for all products so customers can quickly find products they are looking for. 

    Tags allow users to filter products based on the categories they want to explore. Product tags include everything the customer might specifically search for — color, type, size, brand, use, design, fabric, discount, etc. For example, a dress could have tags like red, evening, midi, summer, long-sleeve, silk, summer sale, etc. When a user looks for midi dresses or long-sleeve dresses, products with these tags will show up. 

    b. Search by image

    Visual Search
    Visual Search

    Visual Search allows users to look for similar products using a reference image from their camera roll or downloaded from the internet. The visual search feature also enables eCommerce businesses to implement image-based search into their software applications. It maximizes the searchable potential of their visual data. 

    Meanwhile, Gartner predicts a 30% increase in digital commerce revenue by 2021 for companies who start supporting visual and voice search on their websites and apps. The benefits of visual search include more personalized, easy product recommendations and enhanced product discovery.

    c. Fashion trend analysis

    similarity matching
    Similarity Matching

    Tapping into trending product categories is a goldmine for any eCommerce business. Having insights into trending categories and products means less competition on search engines, fewer ads, and intelligent pricing. All of which can boost any retailer’s margins. Image recognition technology provides information about colors, styling techniques, fabric textures, prints, and more to spark consumer demand. It works by scanning social media images to pinpoint trending attributes and predict fashion trends. For instance, while scanning images, technology understands that it’s seeing a photo of a color-blocked sweatshirt because it recognizes the product has a hooded neck, full sleeves, blocks of different colors, and even the type of fabric. This technology can analyze millions of images, helping retailers analyze the volume of color-blocked sweatshirts. 

    We do this seamlessly at DataWeave. Our similarity matching solution helps retailers gather insights into attributes for products similar to the ones they’re carrying on their site. Similarity matching helps retailers gain visibility into their entire competitive landscape to keep their e-commerce strategy responsive to price & product assortment shifts among consumers and rivals

    d. Augmented reality

    According to Statista, the AR market is valued at $9.5 billion, with around 810 million active mobile users. Since shoppers want the full sensory product experience before shopping online, augmented reality (AR) can help them understand what they’re buying and how the product will work for them. There are AR applications for trying makeup, clothing, accessories, and even eyeglasses. IKEA was one of the pioneers in using AR for eCommerce retail. In 2017, IKEA launched the Place app, allowing shoppers to see how thousands of items will look in their homes, with 98% accuracy. 

    Image recognition helps AR applications anchor virtual content with the real world. For instance, Sephora has a Virtual Artist that allows users to try different makeup looks and even take pictures of an outfit they’re planning to wear to match the shade. Users can even check out full-face looks and learn how to do their makeup with virtual tutorials. 

    e. Counterfeit Detection

    Counterfeit Detection
    Counterfeit Detection

    Another application of image recognition that has proven to be very successful is counterfeit product detection. It has become increasingly difficult for brands and retailers to find and eliminate fake items on eCommerce sites. U.S. Customs seized over 13,500 counterfeit goods worth $30 Million in November 2021, indicating how brands and online marketplaces have struggled in the past to find an effective solution. 

    Essentially, image recognition technology allows eCommerce sites to detect products with fake logos and designs attempting to sell as legitimate brands by capturing discrepancies in images and content. The system flags and delists the products and sellers when a fake is detected.

    Here’s how DataWeave helped Classic Accessories, a leading manufacturer of high-quality covers, furnishings, and accessories automate their counterfeit detection process using our super Image Recognition capabilities. 

    f. User-generated content analysis

    Visual content plays a vital role in eCommerce sites, especially when it comes to product photos and videos. Today, branded visual content isn’t as effective as it’s one-dimensional. As a matter of fact, 93% of marketers agree that customers trust user-generated content more than content produced by brands. However, user-generated content that features product images or videos is way more exciting, realistic, and creative. It gives customers an appealing view of products being used in real life. 

    The most common form of UGC, i.e., reviews and ratings, have been the key for eCommerce brands as they are quantitative and qualitative metrics about a product/service quality, worth, value, reliability, etc. With image recognition, retailers can access insights into strengths and gaps in all product offerings by understanding what consumers are saying about them. 

    Here’s how DataWeave can help retailers and brands analyze consumer reviews & help them adapt to customer needs.

    Conclusion

    Because of its massive influence, image recognition technology is becoming widely adopted by eCommerce companies. It benefits both retailers and customers. Image recognition based on deep learning can provide retailers with helpful capacities like customer analytics, counterfeit detection, personalized searches, and more. Retailers can also use the data gathered from image recognition eCommerce technology to design effective marketing campaigns and improve their ROI.

    With super sharp image recognition capabilities, DataWeave offers 90% accuracy in matching eCommerce products, allowing us to provide comprehensive and precise insights into pricing and assortments. Sign up for a demo with our team to know more.

  • 6 Promotional Strategies for the Holiday Season

    6 Promotional Strategies for the Holiday Season

    For eCommerce companies, holidays are the busiest season of the year. Whether creating brand awareness with your marketing campaigns or freshening up your landing pages or finding new ways to segment & understand your customers, the list of tasks seems endless. It’s the time of the year when most people look forward to shopping for friends and family. 

    The holiday shopping season begins with Black Friday and Cyber Monday and leads to the December holidays, including Christmas and New Year. Consequently, proper planning and marketing are essential for a successful holiday season. 

    In fact, holiday sales during November and December are forecasted to be between $843.4B – $859B, up 10.5% over 2020, according to the National Retail Federation (NRF). For online stores specifically, sales are predicted to increase between 11% – 15% to a total of between $218.3B and $226.2B driven by online purchases.

    This guide will share eight promotional strategies retailers can use during the holiday season. We will also discuss how data analytics can help retailers improve their promotional strategies. 

    Using data analytics to guide promotional strategies

    Promotional Strategies
    Promotional Strategies

    Data is the foundation of every successful marketing campaign. Data analysis helps companies understand which graphics worked well and campaigns that generated the most revenue. Gathering data and running analysis helps companies improve their next marketing campaign. Retailers can also get deeper insights into campaigns/channels with the highest conversion rate or average order value (AOV).

    With data analytics, retailers can prioritize campaigns and channels that resonate the most with their customers this holiday season. But, it would be best to try more than one promotional strategy to ensure you double down on what works without placing all of your eggs in one Christmas-themed basket. 

    Here are four ways that data analytics can help guide promotional strategies:

    a. Customized alerts for listing pages

    Data analysis helps retailers determine if certain products are out of stock on their rival’s website and adjust their own pricing accordingly. It allows retailers to grab market share for trending items. For example, if you get an out-of-stock alert for a particular product at competitors’ stores, you can invest more in advertising that product on your online store. In addition, customized alerts keep retailers informed about their inventory status, allowing them to plan promotions and ads. They can see which products are becoming commoditized due to intense competition and which ones offer better revenue opportunities. 

    Learn how DataWeave can help retailers track their competitor’s stock and inventory status.

    b. Maximize conversions by tracking product trends

    Assortment Analytics
    Assortment Analytics

    Customers are always looking for products that are currently trending. With assortment analytics, eCommerce companies can get insights into hot trends, allowing them to stock in-demand categories and products. Integrating assortment analytics with AI-powered image analytics can also provide insights into attributes that are popular among customers. By filling gaps in their current assortments, retailers can improve conversion rates and increase revenue. 

    Here’s a case study on how DataWeave helped Douglas, a luxury beauty retailer in Germany boost sales by building an in-demand product assortment 

    c. Monitor competitor promotions

    Promotional Insights
    Promotional Insights

    With increased competition and consumer demand for deals, it has become important for retailers to monitor their competitor’s promotions. Monitoring promotions helps retailers to optimize their ad spend accordingly. AI-powered image analysis tools can capture important information from competitors’ ad banners and deliver insights into metrics that are working to deliver sales. 

    Here’s how DataWeave can help retailers make their marketing magnetic with competitive promotional insights

    d. Optimize margins with a data-driven pricing strategy 

    Pricing Intelligence
    Pricing Intelligence

    It has become challenging to price products in recent years since digital tools enable price transparency across channels. Although this trend is excellent for consumers, it makes competition fierce for retailers. A data-driven pricing strategy incorporates a variety of factors, including industry needs, competitor analysis, consumer demand, production costs, and profit margins. 

    With data-driven competitive pricing, retailers can keep pace with the changing eCommerce environment with real-time pricing updates. It also helps them optimize margins and quickly respond to changes in prices on rival stores. 

    Promotional Strategies for the Holiday Season

    a. Virtual Webrooms

    When customers want to see a product in-person, they go to a store showroom. It helps them make a purchase decision. However, with the Internet, eCommerce companies can bring this tactic online. The only difference between showrooming and webrooming is that the former takes in-person, whereas the latter happens digitally. Webrooming grew in popularity during the COVID-19 pandemic. Instead of spending weekends browsing stores, consumers took to the Internet for most of their product research.

    A webroom allows customers to explore products from every angle, providing them with the complete in-person showroom experience online. Webrooming is a powerful holiday marketing strategy, especially regarding expensive purchases. Customers prefer to understand how the product will look. However, building a webroom is extensive and requires retailers to hire developers and professional photographers.

    Webrooms allow retailers to share their collections, schedule virtual appointments, share 3D product images, set up virtual fitting rooms for clothing products, and accept purchase orders. For example, in 2015, Tommy Hilfiger launched its first digital showroom in Amsterdam to improve sustainability and minimize its carbon footprint. Through remote wholesale selling and digital product creation, a digital showroom helped Tommy Hilfiger transform the buying journey and retail value chain.

    b. Loyalty-rewarding sales and perks

    Loyalty Rewarding
    Customer Loyalty

    Consider building customer loyalty during your holiday promotions. First, encourage your holiday shoppers to become loyal customers by offering bonus rewards, contests, or giveaways when they sign up for your loyalty program. You can encourage them to purchase right away by providing instant discount coupons or points for a reward to redeem on their next purchase. For maximum impact, you should run this promotion throughout the holiday season. 

    Second, you should attract your current loyalty program members with discount codes. Offer free shipping or provide a one-day-only discount code to ensure your customers choose you during their last-minute purchases. With these rewards, you’ll attract customers who are window shopping and simultaneously bring your loyal customers back throughout the holiday season.

    c. Charitable Tie-Ins

    AmazonSmile
    AmazonSmile

    Research shows that customers are four times more likely to purchase from brands with a strong sense of purpose. With the festive season being the time of giving, working with a charity and giving back to your community is a great way to reach out to customers. 

    After a tough one and half years because of the pandemic, people want to give back and help those in need this holiday season. You can partner with a non-profit and run campaigns that allow customers to give back. It’s also great for sharing your brand mission with your customers. For instance, Amazon allows customers to shop from AmazonSmile, which donates 0.5% of their eligible Charity List purchases to a selected charity, at no extra cost to the customers. 

    Consider partnering with an organization within your industry. For example, you can pair up with a non-profit that collects and gives clothes to the needy if you sell clothes. You can involve customers by asking them to exchange old dresses for coupons or cash discounts. 

    d. Omni-channel customer experience

    Omni-channel marketing provides customers with a seamless, consistent, and cohesive experience over multiple marketing channels. Omnichannel marketing aims to provide a meaningful and cohesive experience that inspires your customers to make a purchase. Unlike multichannel marketing, this strategy puts the customer at the center of marketing campaigns and elevates the cross-channel customer experience. 

    Omnichannel shoppers spend 10% more money and purchase 15% more items than the original shoppers. eCommerce companies can use historical data to analyze successful channels and create a more transparent marketing strategy for the holiday season. Omnichannel analytics will provide a holistic picture of customer data that will help retailers to better meet the customer’s requirements and predict inventory. 

    e. Buy now, pay later (BNPL)

    Buy Now Pay Later
    Buy Now Pay Later (BNPL)

    Technically, buy now, pay later isn’t a promotional idea since your customers will still be paying the full price. However, BNPL allows them to delay their payments and not pay in full right away at checkout. Buy now, pay later needs to be on every eCommerce company’s holiday promotions plans. Various retailers, including Walmart, offer affordable monthly payments at the pace of 3 to 24 months with Affirm. Target also has a similar scheme with Sezzle and Affirm. Whereas Sephora and Macy’s offer 4 interest-free payments with Klarna.

    BNPL is especially popular with millennials and Gen Z shoppers and will factor into their 2021 holiday shopping plans. Research showed 62% growth in the use of buy now, pay later service in consumers aged 18 to 24. Giving customers a means to manage their budgets during holidays while still taking home their purchases will attract more customers. While the customer doesn’t pay the full price right away for their purchase, businesses still get the total worth of the item. In the eCommerce industry—nearly 50% of BNPL users say they use it while shopping online, and among them, 45% use the service frequently.

    f. Buy One, Get One

    The last promotional idea is a classic buy one, get one offer. Everyone likes a good BOGO promotional offer. In fact, 66% of shoppers from a survey preferred BOGO over other promotions. It’s a win-win promotional strategy for retailers and customers. With this offer, people shop and stock up on gifts for their friends and family, while retailers make a more significant profit than 50% off sales. People prefer to get 100% off on a product over 50% on two items. 

    BOGO sales are best to move inventory by giving shoppers a deal they can’t pass up. If you have stocked up extra items during Black Friday, you can move those last-minute gifts as end-of-year BOGO sales, making room for new merchandise in January.

    Conclusion

    In this post, you saw that there’s more to holiday marketing than a few social media posts. eCommerce companies can use these holiday promotional ideas to offer Loyalty-rewarding sales and perks, buy now pay later service, and an omnichannel customer experience. Regardless of which strategies you’re using, remember that historical data analytics and early planning will play a significant role in increasing your sales and revenue. 

    Proper planning backed by insights into key metrics will help your team develop a one-of-a-kind holiday marketing strategy to drive your holiday sales upward. From sharing gratitude to offering personalized experiences, retailers have various options for promoting business this holiday season.

    Learn how DataWeave can help make sense of your and your competitor’s pricing, promotional, and assortment data this holiday season. Sign up for a demo with our team to know more.

  • Are Your Digital Shelves Prepared for Green Monday?

    Are Your Digital Shelves Prepared for Green Monday?

    Traditionally, retailers have staged multiple promotions between Black Friday and before Christmas Day to keep consumers excited about holiday shopping, so it’s easy to see why one more promotional day might fall into relative obscurity. As if ‘Early Start’ offers to Black Friday and extended ‘Cyber Weekend’ promotions weren’t enough to plan for, eBay added another day into the mix called ‘Green Monday’, much to the benefit of consumers, as it furthers the window of opportunity to secure a bargain during the holiday season. 

    Green Monday falls on the second Monday of December and has historically been one of the greatest sales days of the year for eBay, often attracting last-minute shoppers or those searching for last-minute deals. However, because of the 2021 Global Shipping Crisis, there is speculation that Green Monday may be the last chance this year to have items delivered in time for Christmas. For this reason, we believe it could turn into quite a fruitful event for participating retailers if it encourages procrastinating shoppers that traditionally spend closer to December 25th to buy earlier in the season.

    This isn’t the first year retailers outside of eBay have offered Green Monday promotions, however. Our team has been actively monitoring activity on this day from 2017 through present, to not only assess which retailers participate in the event, but also to understand how the discounts may change surrounding the event. The categories monitored include Apparel (Clothing, Shoes & Jewelry), Bed and Bath, and Home and Garden, and we’ve identified products offered on discount by comparing each applicable product’s price on Green Monday versus the most commonly seen price for the product offered throughout the month of December.

    Better Promotions Than Boxing Day

    Taking a closer look at 2020 Green Monday discounts within the categories and retailers analyzed, apart from Wayfair.com, we see all offered more SKUs on discount on Green Monday versus the days leading up to and out of the event. Kohls.com led the pack with around 93% of SKUs offered on discount, followed by Macys.com with 95%, and Wayfair.com with 83%. Overall, the number of SKUs on discount on Green Monday were greater than the SKUs offered on discount on Boxing Day, which is traditionally known as a great day to bargain shop.

    Source: DataWeave Commerce Intelligence – Promotional Insights tracking Apparel, Bed & Bath, and Home & Garden category product’s online price on Green Monday 2020 in the US versus regular prices for the same products in the month of December each year.

    What’s in Store for Green Monday 2021?

    The insights we’ve tracked over the last four years have not indicated any signs to an end for Green Monday any time soon. As we see it, for consumers it is an extremely convenient time to order holiday gifts, and for retailers it is a good time to build brand trust and loyalty by fulfilling last minute orders at a great value, in time for the holidays.

    Our prediction for the categories analyzed is to expect to see more retailers participate in Green Monday 2021 to a greater degree (more SKUs on sale and enhanced promotions). For retailers in this analysis, we would anticipate HomeDepot.com to enhance the number of offers to match 2020 competitive activity, and for Wayfair.com to look at increasing the number of offers on Green Monday versus the period leading into the event.

    If you are interested in learning more about the details behind this analysis or our Promotional Insights solution, be sure to contact us. We can help you evaluate the effectiveness of your holiday promotional spend with access to near real-time marketplace insights on the brands, categories, and products your rivals promote, including discounts, campaign frequency and duration and more.

  • Manage Your Supply Chain Like a Pro

    Manage Your Supply Chain Like a Pro

    To make faster, seamless deliveries possible, brands need to tighten their supply chain. The pandemic has put a lot of stress on the global supply chain. The supply shock that began in China in February and the demand shock that followed as the global economy shut down uncovered weaknesses in production strategies and supply chains. Temporary trade restrictions and shortages of pharmaceuticals, critical medical supplies, and other products, further added to the problem. 

    As a consequence of all this, brands have to reduce or even eliminate their dependence on sources that are perceived as risky and rethink their use of lean manufacturing strategies that involve minimizing the amount of inventory held in their global supply chains. In the post-pandemic world, the supply chain will take center stage, and managing it efficiently with technical support is going to be what gives one brand an upper hand over the others.

    1. Micro fulfillment is emerging as the need of the hour

    Micro fulfillment
    Emerging Micro Fulfillment

    Retailers are now faced with unprecedented omnichannel fulfillment complexities. Not only do customers expect faster order fulfillment and delivery, but they’re also opting to ‘buy online and pick up in-store (BOPIS)’ or ‘click-and-collect’. Amazon has spent billions of dollars on building its shipping infrastructure, including its existing operating 175+ fulfillment centers across the world and investing nearly $1.5 Bn to build an air hub in the US. Walmart, on the other hand, is relying on its existing footprint across 5000+ US stores to help deliver online orders faster.

    All this is hinting towards micro-fulfillment emerging as a strategy retailers are using to make the fulfillment process more efficient and their supply chain more ready — from receiving an online order to packing it and offering last-mile delivery. This approach will certainly work towards imparting speed to localized, in-store pick-up and combine it with the efficiency of large, automated warehouses. Delivery speed and costs are more important than ever to retain customers and foster brand loyalty. In fact, this will become a big differentiator for grocery e-commerce as the number of people making online grocery purchases has increased drastically the world over and a recent report indicated that in the US, 46% of people use online delivery more now than before the COVID crisis, and 40% use online pickup more.

    2. Use big data to tie-in loose nodes

    The landscape of supply

    Supply chain management is held at the heart of every successful e-commerce company. Supply Chain efficiency always ensures that the right product reaches the right place at the right time. It ensures cost reduction and enhancement of cash utilization. That is why it is important to stay alert and tie-in all loose ends in the supply chain architecture. Big data can come in handy here and it is that quantitative method and structure that can be used to improve decision-making for all activities across the supply chain. While the role of big data is extremely exhaustive and full-pronged across the entire supply chain design, it is important to understand it in theory in a simplified way so that brands can incorporate it to make their backend operations seamless.

    Big data is all about real-time analytics and it primarily does two very important things in making supply chain management easy

    • It expands the dataset for analysis beyond the traditional internal data held on Enterprise Resource Planning (ERP) and supply chain management (SCM) systems. 
    • Big data apply powerful statistical methods to both new and existing data sources. This helps give structure to new insights. This in turn allows forecasting and helps improve supply chain decision-making capabilities for your brand, all the way from the improvement of front-line operations, to strategic choices such as the selection of the right supply chain operating models.

    3. Improve ROI by introducing automation to the mix

    Introducing automation
    Introducing Automation to Improve ROI

    Introducing automation will help take care of tasks usually done manually, such as placing orders, processing changes, data entry, and much more. This frees up time and cuts down on human errors leading to error-free, faster processes. Adidas for instance has been able to reduce 60% of its operational supply chain costs just by switching to end-to-end automation. The largest sportswear manufacturer used automation across 400 factories by bringing in standardized, reusable processes to deliver the best results in a cost-effective way across the supply chain, marketing, finance, retail, and eCommerce. On the supply chain part, with automation, the brand was able to globally attend to supply chain service desk management, vendor onboarding, PO change management, Contract form approval, product data verification, and other such tasks in real-time. This highly successful initiative helped the brand save a lot of time, it earlier lost in manually attending to internal processes and reduced the time to market for Adidas by two-thirds. Moreover, automating systems helps cut down slacks and in return allows the supply chain to stay agile and alert for any unforeseen situations. This readiness further boosts the framework towards growth. 

    4. Eye the future and introduce robotics

    Introduce Robotics
    Robotics is the next big thing in Future

    Autonomous technology is not the next big thing of the future but is the most important thing at present defining the face of the supply chain. Autonomous robots are expected to see strong growth over the next five years. In fact, according to the Boston Consulting Group (BCG), the global robotics market is estimated to reach USD 87 Billion by 2025. It is believed that more than half of this will be allocated for the retail market. In fact, it is not uncommon to find giant beetle-like robots moving around busily with vertical shelves stacked on them inside Amazon’s warehouse in southern New Jersey, US. Tesco for instance uses Radio Frequency Identification (RFID) robots who are used to scan inventories for entire stores in just an hour (as against seven hours for a store employee) with far fewer errors. 

    Even though every word of this sounds too futuristic to be believable, this is the reality for now and retailers are beginning to realize that innovation must set in holistically and extend far beyond just the warehouse or supply chain. Autonomous mobile robots (AMRs) are fast becoming commonplace in warehouses, helping warehouse workers to fulfill orders quickly and efficiently. There are a few different types of robots that companies are considering, and each has its own unique set of advantages. AMRs in totality enable workers to be more productive due to constant collaboration and promote agility, cutting down on slacks and errors. 

    A cohesive and well-defined supply chain where you can leave enough room for tweaks in the future owing to evolving trends will surely help you gain an edge over your competitors through the entire lifecycle of your product. Getting a grip over the supply chain is necessary now as, by 2025, many supply chains may shift from global flows of goods and services to national, regional, and local networks of buyers and suppliers. So, integrating the supply chain keeping an eye on the global and local is the real deal!

  • How Brands Boost Sales & Satisfaction on Walmart.com

    How Brands Boost Sales & Satisfaction on Walmart.com

    The explosive growth of online shopping has forced brands to re-examine their e-commerce processes to stay competitive and profitable. In particular, out-of-stocks are a common, costly retail challenge, as product shortages frustrate online shoppers – and even prompt them to leave brands.

    According to McKinsey & Company, forty-eight percent of consumers switched to a different brand in 2020 because those products were in stock. Among these consumers, seventy-three percent plan to keep using the new brands, linking product availability gaps to the erosion of sales and loyalty. Conversely, brands with effective inventory planning and replenishment can keep items in stock, drive sales and improve the customer experience.

    Retailers like Walmart, collaborating with these brands to meet customer demand, are still facing inventory challenges but, as noted in 2021 Q3 earnings, inventory was up almost twelve percent year-over-year as they worked to stay ahead of increased holiday demand. They have also adjusted in-store operations to accommodate ever-growing e-commerce demands, especially within grocery-centric categories, as digital grocery buyers now amount to more than half the U.S. population.

    Maximizing Conversions with Category Insights

    Walmart’s dot-com strategy is paying off in spades, considering they surpassed Amazon as the leading U.S. grocery e-commerce retailer in 2020 and grew another forty-one percent in Q3, 2021. Our team has been actively tracking digital shelf analytic KPIs on Walmart.com to identify inventory and promotional performance improvement opportunities at a category level to support brands in capitalizing on these digital growth opportunities.

    The latest analysis is summarized below, reviewing average category availability and discount trends occurring each week of the month, from May to August 2021, at a category level. A recent report found the 29th of each month to be the busiest day for online sales because consumers often get paid at the end of the month, which made DataWeave analysts wonder:

    • Which categories are maximizing their growth potential on Walmart.com and where are the greatest opportunities for improvement during periods of increased demand?
    • How do increased demand periods (like payday) impact category online availability?
    • Are category promotions offered at the right times throughout the month to best support demand?

    When Seasonal Demand for Groceries and Payday Merge

    Across all Walmart.com food categories tracked, Week 5 – where payday commonly falls for most consumers, had the lowest average product availability, while Week 4 had the highest average product availability for all categories except Deli and Fruits and Vegetables. These findings may inspire Walmart’s brand partners to rethink their inventory and assortment planning, replenishment and even pricing efforts to maintain a healthy stock closer toward the end of the month to match higher demand.

    The categories with the greatest difference in average availability during Week 5 versus the rest of the month were Snacks & Candy, Beverages and Alcohol, indicating consumers consistently made these types of purchases closest to payday, when income was highest throughout the month. Seasonality is a secondary factor that influenced demand for these items given events like Memorial Day, Fourth of July, Summer Break, and Back-to-School shopping all took place during our analysis. Additionally, most holidays overlapped payday, which also furthered Week 5 demand.

    Source: DataWeave Digital Shelf Analytics for Brands – Category average availability percentages from May to August 2021 between Week 1 (the 1st to the 7th day of the month) and Week 5 (the 29th, 30th and 31st day of the month).

    Coupling availability with discounts allows us to consider whether consumers buy more in Week 5 due to high discounts or increased purchasing power, or both. In reviewing the average category discounts offered within the same grocery-centric categories analyzed above, we found almost every grocery category showed a higher discount in Week 5 compared to the rest of the month, except for Bread & Bakery and Alcohol.

    Source: DataWeave Digital Shelf Analytics for Brands – Category average discount percentages from May to August 2021 between Week 1 (the 1st to the 7th day of the month) and Week 5 (the 29th, 30th and 31st day of the month).

    Regarding Alcohol, during Week 4, when average availability was the highest, the average discounts offered were the lowest. This can indicate inventory was primed for payday shoppers (and the holidays of course). Bread & Bakery offers the greatest average discounts when inventory levels are lowest on average, indicating Week 3 is a great time to stock up, while Week 4 might be a great time to buy the freshest inventory.

    The greatest average discounts in Week 5 were in Snacks & Candy, Pantry and Fruits & Vegetables. Deeper discounts for Snacks & Candy in Week 5 may have helped brands compete for consumers’ disposable income despite being a discretionary category. Pantry brands’ discounts may have reflected a need to compete for shoppers’ attention. During this period, consumers were out of the house more and less likely to use these grocery staples compared to earlier lockdown periods and cooler months.

    Making Specialty Categories and Health a Priority for Online Shoppers

    Interestingly, the only two categories where inventory was higher in Week 5 versus all other weeks each month were ‘Special Diets’ foods and ‘Summer Flavors’, although ‘Special Diets’ foods consistently maintained the lowest level of average availability each week across all food categories analyzed. This consistent lack of inventory could indicate a great opportunity for brands to increase inventory for dietary products sold on Walmart.com.

    Source: DataWeave Digital Shelf Analytics for Brands – Category average availability percentages from May to August 2021 between Week 1 (the 1st to the 7th day of the month) and Week 5 (the 29th, 30th and 31st day of the month).

    The average availability for ‘Summer Flavors’ foods verifies brands are maintaining a solid replenishment strategy for these seasonal items, and a high likelihood consumers will happily find what they need to plan their Summer gatherings on Walmart.com. One alarming factor we found was the change in average discounts offered during Week 5 versus Weeks 1 through 4, indicating promotions surrounding payday may be driving sales volume versus organic demand.

    Source: DataWeave Digital Shelf Analytics for Brands – Category average discount percentages from May to August 2021 between Week 1 (the 1st to the 7th day of the month) and Week 5 (the 29th, 30th and 31st day of the month).

    Digital Growth Opportunity in Meal Kits and Kids’ Meals

    Two categories primed for growth, according to Statista, are meal kits and kids’ food and beverages. Their research indicates retail sales for kids’ food has grown steadily year-over-year since 2013, and a recent report also indicates meal kit sales are expected to more than double 2017 sales in 2022, reaching $11.6 billion in the U.S., spurred by pandemic-induced demand. A concerning find in our research indicates both categories, ‘Easy Meal Solutions’ and ‘Kid Friendly Foods’ on Walmart.com, showed great volatility when it comes to in-stock availability. For example, in Week 1, ‘Easy Meal Solutions’ had an average availability nearly half the average of the rest of the month (around nineteen percent versus nearly thirty-eight percent), and in Week 5, payday week, ‘Kid Friendly Foods’ saw the biggest drop in average availability compared to Weeks 1 through 4 (over sixty-seven percent versus seventy-five percent) indicating supply may not be keeping up with the heightened demand.

    Source: DataWeave Digital Shelf Analytics for Brands – Category average availability percentages from May to August 2021 between Week 1 (the 1st to the 7th day of the month) and Week 5 (the 29th, 30th and 31st day of the month).

    The heightened average discounts offered during Week 5 for ‘Baby’ and ‘Pets’ items indicate two categories consumers will most likely stock up on during payday.

    Source: DataWeave Digital Shelf Analytics for Brands – Category average discount percentages from May to August 2021 between Week 1 (the 1st to the 7th day of the month) and Week 5 (the 29th, 30th and 31st day of the month).

    Back to School Stock-Outs

    U.S. retail sales unexpectedly increased in August, likely boosted by back-to-school shopping and child tax credit payments. Meanwhile, product shortages and other supply chain issues slowed 2021’s back-to-school sales, possibly affecting school supplies’ and clothing availability on Walmart.com. According to our analysis, the average product availability in Walmart.com’s school supplies category fell from over sixty-two percent during Weeks 1 through 4 to nearly forty-two percent in Week 5.

    Warmer weather, seasonal events, reduced lockdowns, and vaccination efforts led more Americans to resume in-person socializing, giving reason to update their spring and summer wardrobes. In July, Forbes shared that three-quarters of shoppers are purchasing apparel, accessories and shoes the most. On average, only around sixty-three percent of clothing items were available on Walmart.com during Weeks 1 through 4. However, in Week 5, that figure plummeted to just over thirty-eight percent, the most significant drop among all categories.

    Source: DataWeave Digital Shelf Analytics for Brands – Category average availability percentages from May to August 2021 between Week 1 (the 1st to the 7th day of the month) and Week 5 (the 29th, 30th and 31st day of the month).

    Demand for new fashion remained high throughout this period, seemingly fueled organically, as only moderate additional discounts took place in Week 5, and although the average discount on school supplies was only around twenty-seven percent during Weeks 1 through 4, it surged to just over forty-seven percent in Week 5. Generous additional discounts in Week 5 may have inspired online shoppers to shift spending from clothing to school supplies in late July and August ahead of students’ return to the classroom.

    Source: DataWeave Digital Shelf Analytics for Brands – Category average discount percentages from May to August 2021 between Week 1 (the 1st to the 7th day of the month) and Week 5 (the 29th, 30th and 31st day of the month).

    Prioritizing Product Availability with Digital Advertising Strategies

    Seventy-eight percent of B2C marketers increased their 2021 digital advertising spend to fuel online product discoverability (Share of Search), and sales and market share, but out-of-stock experiences simultaneously surged 172% this year from pre-pandemic levels. Paying for ads that drive traffic to your out-of-stock products can be as detrimental to your brand as a bad user experience. Our review of the ‘Featured Products’ sold on Walmart.com show consistent, low-levels of product availability each week throughout the months reviewed.

    Source: DataWeave Digital Shelf Analytics for Brands – Category average availability percentages from May to August 2021 between Week 1 (the 1st to the 7th day of the month) and Week 5 (the 29th, 30th and 31st day of the month).

    Additionally, the average discount offered on these products tended to be higher than most other categories reviewed, indicating brands participating in the featured product section of the website were not only investing in digital ads, but also doubling down with promotional activity as well.

    Source: DataWeave Digital Shelf Analytics for Brands – Category average discount percentages from May to August 2021 between Week 1 (the 1st to the 7th day of the month) and Week 5 (the 29th, 30th and 31st day of the month).

    How Brands can Replenish Their Digital Shelf

    It is well known just how important it is to have products available during the right time of day, week, month, or season to improve customer satisfaction rates, but with your e-commerce store open 24/7 and omnichannel fulfillment strategies in place, it drastically changes the way in which strategic execution is prioritized for a retailer to reduce basket abandonment and for brands to build loyalty.

    Our greatest takeaway from this analysis is realizing how crucial it is for brands to proactively track product availability and competitive pricing insights to stay ahead of the curve and achieve their digital growth goals. Early visibility to stock replenishment could help brands align with heightened cyclical and seasonal demand to avoid out-of-stocks and grow e-commerce sales.

    This is why more leading brands now rely on our Digital Shelf Analytics solutions, including Pricing and Availability insights, to keep eCommerce planning agile, to maximize online conversions, and ultimately maintain shopper satisfaction and loyalty.

  • Top 7 AI tools for your eCommerce business

    Top 7 AI tools for your eCommerce business

    The 2020 global health crisis sped up the adoption of omnichannel shopping and fulfillment. Consumers spent $791.70 billion online with U.S. merchants in 2020, a 32.4% rise compared to 2019. To keep up with this digital shift, offline businesses have substantially moved investments to online infrastructures for everything from e-commerce platforms, product recommendations, inventory management, and communications. AI tools for eCommerce have played a major role in helping businesses in the digital shift. 

    However, the benefits of setting up e-commerce stores are potentially outweighed by the increased costs. As markets transition to online retailers, they must learn to efficiently collect, secure, and analyze data coming in from multiple sources. Strategically approaching the data problem with artificial intelligence (AI) can help better serve customers, gain a competitive advantage, and drive loyalty.

    In this blog, you will learn about seven data and AI tools for eCommerce businesses:

    Seven data and AI tools for eCommerce businesses
    Seven Data and AI tools for eCommerce businesses

    1. Data Warehouse

    Data is the one advantage that eCommerce merchants and marketers have over brick and mortar retailers. When buyers are from the internet, eCommerce retailers can collect data and measure almost every aspect of their interactions. However, that advantage is worthless unless there is a system to make sense of the data they collect. Companies assume that they have a sound system in place. But, what they have is a network of silos. In such a system, data sticks to different platforms like Google Analytics, Shopify, or Klaviyo and can’t move to deliver valuable insights. Funneling all your data into a single location for your eCommerce stores is the right way to go. Data warehouses centralize and merge a plethora of data from various sources, helping organizations to derive valuable business insights and improve decision-making. 

    Data Warehouses support real-time analytics and ML operations quickly & are designed to enable and support business intelligence (BI) activities like performing queries and analysis on a colossal amount of data. Data could range from customer-related data, product or pricing data, or even competitor data. 

    However, the time needed to gather, clean, and upload the data to the warehouse is a time-consuming process. Here’s where DataWeave’s AI-Powered Data Aggregation & Analysis Platform can help! Get critical insights on your competitor’s pricing, assortment, and historical sale trends with a real-time dashboard. Build a winning eCommerce strategy with market intelligence without the need to store your data. 

    2. Data Lake

    Data Lake

    A data lake is a centralized repository that can store structured and unstructured data at any scale. Companies don’t have to provide a schema to the data before storing it, but they still can run different analytics and ML-related operations. However, it takes more time to refine the raw data and then analyze or create ML models for predictions. 

    An Aberdeen survey saw businesses implementing a Data Lake outperforming similar companies by 9% in organic revenue growth. The organizations that implemented Data Lake could perform various analytics over additional data from social media, click-streams, websites, etc. A Data Lake allows for the democratization of data and the versatility of storing multi-structured data from diverse sources, improving insights and business growth. 

    eCommerce businesses can collect competitors’ data in data lakes like their popular products, categories, landing pages, and ads. Analyzing competitors’ data helps retailers price their products correctly, helps with product matching, historical trend analysis, and much more. However, data lakes can also be used to store consumer data such as who they are, what they purchase, how much they spend on average, and how they interact with a company. Successful retailers leverage both competitor and consumer data to understand their consumers better, what brands to carry, how to price each product, and what categories to expand or contract. Retailers also store identity data such as a person’s name, contact information, gender, email address, and social media profiles. Other types of data stored are website visits, purchase patterns, email opens, usage rates, and behavioral data. 

    The major challenge with a data lake architecture is that it stores raw data with no oversight of the contents. Without elements like a defined mechanism to catalog and secure data, data cannot be found, or trusted resulting in a “data swamp.” Consequently, companies need teams of data engineers to clean data for data scientists or analysts to generate insights. This not only increases the turnaround time of gaining valuable information but also increases operational costs.

    However, you can rely on platforms like DataWeave that stores competitor pricing & assortment information at a centralized location. You can leverage intelligently designed dashboards to get real-time insights into the collected data and make data-driven decisions without the need for storing, cleaning, and transforming the data.

    3. Data Ingestion & ETL

    To churn out better insights, businesses need access to all data sources. An incomplete picture of data can cause spurious analytic conclusions, misleading reports and inhibit decision-making. As a result, to correlate data from multiple sources, data must be in a centralized location—a data warehouse or a data lake. However, extracting and storing information into these systems require data engineers who can implement techniques like data ingestion and ETL.

    While data ingestion focuses on getting data into data lakes, ETL focuses on transforming data into well-defined rigid structures optimized and storing it into a data warehouse for better analytics workflows. Both processes allow for the transportation of data from various sources to a storage medium that an organization can access, use, and analyze. The destination can be a data warehouse in the case of ETL and a data lake in case of data ingestion. Sources can be almost anything from in-house apps, websites, SaaS data, databases, spreadsheets, or anywhere on the internet.

    Data ingestion & ETL are the backbones of any analytics/AI architecture since these processes provide consistent and convenient data, respectively. 

    4. Programming languages

    Programming languages

    Programming languages are tools used by programmers to write instructions for computers to follow since they “think” in binary—strings of 1s and 0s. It serves as a bridge that allows humans to translate instructions into a language that computers can understand. Some common and highly used programming languages for building AI models are Python and R.  

    While Python is the most widely used language for training and testing models, R is mostly embraced for visualizations and statistical analysis. However, to productize the ML models, you would require Java programming language so that models can be integrated with your websites to provide recommendations.

    5. Libraries/AI frameworks

    An AI framework is a structure that acts as a starting point for companies or developers to add higher-level functionality and build advanced AI software. A framework serves as a foundation, ensuring that developers aren’t starting entirely from scratch.

    Using AI frameworks like TensorFlow, Theano, PyTorch, and more saves time and reduces the risk of errors while building complex deep learning models. Libraries and AI frameworks also assist in building a more secure and clean code. They future aid developers in simpler testing and debugging.

    Various open-source frameworks in the market also come with pre-trained models for specific use cases. Organizations can leverage off-the-shelf models and tweak with existing data to enhance the accuracy of the predictions.

    6. IDE & Notebooks tools

    IDE or Integrated Development Environment is a coding tool that allows developers to write and test their code more efficiently. However, notebooks are one of the most popular AI tools for organizations to execute analysis and other machine learning tasks. It offers more flexibility over IDEs in terms of exploratory analysis.

    All the features, including auto-complete, that IDEs or notebooks offer are beneficial for development as they make coding more comfortable. IDEs/Notebooks increase developers’ productivity by combining common software activities into a single application: building executables, editing code, and debugging.

    7. Analytics tools

    Competitive Pricing

    Data Analysis transforms raw data into valuable statistics, insights, and explanations to help companies make data-driven business decisions. Data analytics tools like PowerBI and Tableau have become the cornerstone of modern business for quickly analyzing structured and semi-structured data. 

    However, these platforms aren’t optimized specifically for the eCommerce industry. Consequently, you should embrace analytical tools particularly designed for eCommerce companies to make better decisions about product assortment, pricing, and promotions. With data analytics, companies can gain insights into the most popular and discoverable brands on their own and competitors’ platforms. Paired with attribute matching, competitive intelligence gives a deeper understanding of the latest trends and why certain products are popular with your customers. Some more meaningful metrics that retailers can track are discount gap, price gap, catalog strength, and product type gaps. 

    Competitive pricing is another benefit of data analytics with which retailers can identify gaps and keep up with actionable pricing insights. Retailers get to maximize profits and respond to demand by cashing in on insights into rivals’ pricing. With the right analytics tools, they can also track changes in pricing across crucial metrics such as matched products, recent price changes, highest price positions, stock status, and much more. 

    Analytics tools can also help eCommerce companies to capture information about competitors’ promotional banners through AI-powered image analysis. It can provide insights into how and where to spend promotional expenditure. 

    Conclusion

    This listicle discusses some of the AI and data tools commonly used by the eCommerce industry. Data analytics has become a popular method for retailers to understand their customers and boost productivity. Data analytics help companies improve customer experience, improve customer loyalty, generate insights, and advise on data-driven actions. Business intelligence tools can help companies monitor key performance indicators (KPIs), perform proper data analyses, and generate accurate reports. 

    Want to learn how DataWeave can help make sense of your and your competitor’s pricing, promotional, and assortment data? Sign up for a demo with our team to know more.

  • How Brands Can Outperform Rivals With Next-Gen Digital Shelf Analytics

    How Brands Can Outperform Rivals With Next-Gen Digital Shelf Analytics

    As eCommerce grows in complexity, brands need new ways to grow sales and market share. Right now, brands face urgent market pressures like out-of-stocks, an influx of new competition and rising inflation, all of which erode profitability. As online marketplaces mature, more brands need to make daily changes to their digital marketing strategies in response to these market pressures, shifts in demand, and competitive trends.

    eMarketer forecasts 2021 U.S. eCommerce will rise nearly 18% year-over-year (vs. 6.3% for brick-and-mortar), led by apparel and accessories, furniture, food and beverage, and health and personal care. The eCommerce industry is also undergoing fundamental changes with newer entities emerging and traditional business models evolving to adapt to the changed environment. For example, sales for delivery intermediaries such as Doordash, Instacart, Shipt, and Uber have gone from $8.8 billion in 2019 to an estimated $35.3 billion by the end of 2021. Similarly, many brands have established or are building out a Direct to Consumer (D2C) model so they can fully own and control their customer’s experiences.

    In response, DataWeave has launched the next generation of our Digital Shelf Analytics suite to help brands across retail categories directly address today’s costly market risks to drive eCommerce growth and gain a competitive advantage.

    Our new enhancements help brands improve online search rank visibility and quantify the impact of digital investments – especially in time for the busy holiday season.”  
    ~ Karthik Bettadapura, CEO and co-founder, DataWeave

    The latest product enhancements provide brands access to tailored dashboard views that track KPI achievements and trigger actionable alerts to improve online search rank visibility, protect product availability and optimize share of search 24/7. Dataweave’s Digital Shelf Analytics platform works seamlessly across all forms of eCommerce platforms and models – marketplaces, D2C websites and delivery intermediaries.

    Dashboard for Multiple Functions

    While all brands share a common objective of increasing sales and market share, their internal teams are often challenged to communicate and collaborate, given differing needs for competitive and performance data across varying job functions. As a result, teams face pressure to quickly grasp market trends and identify what’s holding their brands back.

    In response, DataWeave now offers executive-level and customized scorecard views, tailored to each user’s job function, with the ability to measure and assess marketplace changes across a growing list of online retail channels for metrics that matter most to each user. This enhancement enables data democratization and internal alignment to support goal achievement, such as boosting share of category and content effectiveness. The KPIs show aggregated trends, plus granular reasons that help to explain why and where brands can improve.

    Brands gain versatile insights serving users from executives to analysts and brand and customer managers.

    Prioritized, Actionable Insights

    As brands digitize more of their eCommerce and digital marketing processes, they accumulate an abundance of data to analyze to uncover actionable insights. This deluge of data makes it a challenge for brands to know exactly where to begin, create a strategy and determine the right KPIs to set to measure goal accomplishment.

    DataWeave’s Digital Shelf Analytics tool enables brands to effectively build a competitive online growth strategy. To boost online discoverability (Share of Search), brands can define their own product taxonomies across billions of data points aggregated across thousands of retailer websites. They can also create customized KPIs that track progress toward goal accomplishment, with the added capability of seeing recommended courses of action to take via email alerts when brands need to adjust their eCommerce plans for agility.

    “Brands need an integrated view of how to improve their discoverability
    and share of search by considering all touchpoints in the digital commerce ecosystem.”

    ~ Karthik Bettadapura, CEO and co-founder, DataWeave

    Of vital importance, amid today’s global supply chain challenges, brands gain detailed analysis on product inventory and availability, as well as specific insights and alerts that prompt them to solve out-of-stocks faster, which Deloitte reports is a growing concern of consumers (75% are worried about out-of-stocks) this holiday season.

    User and system generated alerts provide clarity to actionable steps to improving eCommerce effectiveness.
    You also have visibility to store-level product availability, and are alerted to recurring out-of-stock experiences.

    Scalable Insights – From Bird’s Eye to Granular Views

    DataWeave’s Digital Shelf Analytics allows brands to achieve data accuracy at scale, including reliable insights from a top-down and bottom-up perspective. For example, you can see a granular view of one SKUs product content alongside availability, or you can monitor a group of SKUs, say your best selling ones, at a higher level view with the ability to drill down into more detail.

    Brands can access flexible insights, ranging from strategic overviews to finer details explaining performance results.

    Many brands struggle with an inability to scale from a hyper-local eCommerce strategy to a global strategy. Most tools available on the market solve for one or the other, addressing opportunities at either a store-level basis or top-down basis – but not both.

    According to research by Boston Consulting Group and Google, advanced analytics and AI can drive more than 10% of sales growth for consumer packaged goods (CPG) companies, of which 5% comes directly from marketing. With DataWeave’s advanced analytics, AI and scalable insights, brands can set and follow global strategies while executing changes at a hyper-local level, using root-cause analysis to drill deeper into problems to find out why they are occurring.

    As more brands embrace eCommerce and many retailers localize their online assortment strategies, the need for analytical flexibility and granular visibility to insights becomes increasingly important. Google reports that search terms “near me” and “where to buy” have increased by more than 200% among mobile users in the last few years, as consumers seek to buy online locally.

    e-Retailers are now fine-tuning merchandising and promotional strategies at a hyper-local level based on differences seen in consumer’s localized search preferences, and DataWeave’s Digital Shelf Analytics solution provides brands visibility to retailer execution changes in near real-time.

    Competitive Benchmarking

    Brand leaders cannot make sound decisions without considering external factors in the competitive landscape, including rival brands’ pricing, promotion, content, availability, ratings and reviews, and retailer assortment. Dataweave’s Digital Shelf Analytics solution allows you to monitor share of search, search rankings and compare content (assessing attributes like number of images, presence of video, image resolution, etc.) across all competitors, which helps brands make more informed marketing decisions.

    Brands are also provided visibility into competitive insights at a granular level, allowing them to make actionable changes to their strategies to stay ahead of competitors’ moves. A new module called ‘Sales and Share’ now enables brands to benchmark sales performance alongside rivals’ and measure market share changes over time to evaluate and improve competitive positioning.

    Monitor competitive activity, spot emerging threats and immediately see how your performance compares to all rivals’, targeting ways to outmaneuver the competition.

    Sales & Market Share Estimates Correlated with Digital Shelf KPIs

    In a brick-and-mortar world, brands often use point of sale (POS) based measurement solutions from third party providers, such as Nielsen, to estimate market share. In the digital world, it is extremely difficult to get such estimates given the number of ways online orders are fulfilled by retailers and obtained by consumers. Dataweave’s Digital Shelf Analytics solution now provides sales and market share estimates via customer defined taxonomy, for large retailers like Amazon. Competitive sales and market share estimates can also be obtained at a SKU level so brands can easily benchmark their performance results.

    Additionally, sales and market share data can also be correlated with digital shelf KPIs. This gives an easy way for brands to check the effect of changes made to attributes, such as content and/or product availability, and how the changes impact sales and market share. Similarly, brands can see how modified search efforts, both organic and sponsored, correspond to changes in sales and market share estimates.

    Take Your Digital Shelf Growth to the Next Level

    The importance of accessing flexible, actionable insights and responding in real-time is growing exponentially as online is poised to account for an increasing proportion of brands’ total sales. With 24/7 digital shelf accessibility among consumers comes 24/7 visibility and the responsibility for brands to address sales and digital marketing opportunities in real-time to attract and serve online shoppers around the clock.

    Brands are turning to data analytics to address these new business opportunities, enhance customer satisfaction and loyalty, drive growth and gain a competitive advantage. Companies that adopt data-driven marketing strategies are six times more likely to be profitable year-over-year, and DataWeave is here to help your organization adopt these practices. To capitalize on the global online shopping boom, brands must invest in a digital shelf analytics solution now to effectively build their growth strategies and track measurable KPIs.

    DataWeave’s next-gen Digital Shelf Analytics enhancements now further a brand’s ability to monitor, analyze, and determine systems that enable faster and smarter decision-making and sales performance optimization. The results delight consumers by helping them find products they’re searching for, which boosts brand trust.

    Connect with us to learn how we can scale with your brand’s analytical needs. No project or region is too big or small, and we can start where you want and scale up to help you stay agile and competitive.

  • Top 4 ways to optimize content to drive e-commerce sales

    Top 4 ways to optimize content to drive e-commerce sales

    Content is the reigning king for e-commerce & plays a big role in driving sales and conversions. And, consumer-centric content that drives traffic is vital for e-commerce sales. Unlike offline retail where the sales staff on the ground is always available to answer customer queries, online that is not the case. When shopping online, customers rely on audio & visual product content to give them the information they need in order to make purchase decisions. Understanding that your product speaks to your customers directly on online channels is critical – so optimizing your product content to represent your brand in the best light is very important.

    Here are the Top 4 ways to optimize content & drive ROI.

    1. Focus on your customer & set a brand tone

    Who is your customer? And what type of product is your brand selling? The golden rule to getting the right content for your brand is to answer these two questions right. For instance, if you’re selling furniture and focusing on a family audience then using flowery language will not help your cause. You need to share factual, product-specific content, calling out furniture specs from color, fabric, size, and so on.

    Flower Glossary Categories

    Take for instance ProFlowers – a US-based flower retailer who created an entire Florapedia® – an in-depth flower guide. This content helped their customers learn more about the various flowers & discover new flowers they never knew of when making purchase decisions. To drive e-commerce sales, ProFlowers set the brand tone using educational content.
    On the other hand, if you are selling clothing or lingerie, you need to be extremely specific about the details of each product. Let’s look at reputed outdoor clothing brand Jack Wolfskin – they use high-quality images for content optimization and showcase real instances and moods in which the clothing can be worn or what they can be paired with. This is a good way to allow customers to picture themselves owning the item, as well as research their unique qualities.

    Clothing brand Jack Wolfskin
    Educational, visual-heavy, or fun & quirky – pick your content style based on your brand tone.

    2. Use videos as a powerful content optimization tool

    Videos empower content and hook your customers in. In a report, Cisco had earlier projected that by the year 2022, videos will be responsible for 82% of all consumer internet traffic. For e-commerce, video content can not only deliver a message but is easily shareable across all platforms. Videos not only possess the power to captivate people for extended amounts of time, but according to research, if a video is embedded on your website, you’re 53 times more likely to rank on the first page of Google. 

    Videos work as a descriptive medium to give more details about your product. Further, explanatory videos relieve consumer fears regarding the quality of the product by allowing viewers to visually experience its usages and benefits. MAC for instance uses a host of make-up tutorials and other video content on their website.

    videos as a powerful content optimization tool

    Videos bring brand storytelling to life and keep visitors informed. In the case of the videos created by MAC, they are not only informative and engaging, but they also help the brand answer common shopper questions with live examples. Customers who land upon the MAC website can watch videos relevant to the products they want to shop for, understand the product details and then decide if the product is for them. Thus, brands using videos can create a better customer experience by giving the visitors an immersive brand exposure online, just like they could have got offline. 

    3. Focus on making your product page consumer-centric

    A product page can be highly discoverable if it aligns with the best practices & standard e-commerce algorithms put in place by popular marketplaces and e-commerce channels. This is because the organic product ranking algorithms vary across channels and are composed of direct and indirect factors used to match a consumer’s popular search queries to products they are most likely to purchase. For better content optimization that ensures visibility, start by mapping platform-specific content standards. Then follow the SEO trends and tweak your product titles and description, to give your brand content a boost.

    LOVE Hair product
    Love Hair Product

    Take for instance the LOVE Hair product pages – the product titles are crafted using product features and benefits like revitalizing, nourishing, volumizing. Consumers searching for shampoos normally type in these attributes to look for shampoos that may suit their requirements – so using attributes as a hook in the product title is a great idea to make the product more discoverable against that keyword or attribute. 

    Next, keeping these standards as a backbone, fine-tune the product details you are putting out on the page. Your product features are the reasons why your consumer will buy your brand as compared to your competitors, so your descriptions should be crisp, easy to read, highlighting all the product features & facts that help them make that purchase decision. Let’s look at the Fitbit product page…

    Fitbit product page
    Fitbit Product Page

    4. Optimize content based on devices

    With mobile commerce reaching the tipping point in the e-commerce sales funnel, you cannot ignore attending to content optimization for hand-held devices. Many times, buyers on the go use mobile devices to conduct their research and your success lies in being able to entice them with a perfectly optimized e-commerce page even on their mobile device. Here are a few tips to keep in mind:

    • Keep their reading experience in mind. Use shorter titles, and bite-sized product information so key points are upfront and visible on a tinier screen 
    • Be concise with your content presentation
    • Video content should not autoplay on mobile. The less invasive your content, the better
    • Keep video & image file sizes small so that page load time is quick
    Optimize content based on devices
    E-Commerce Product Page

    A perfectly balanced e-commerce product page is even more vital in the new normal, given that COVID has accelerated e-commerce, globally. So, whether you are selling furniture, books, clothes, or health juices, with the right focus on product content, you can convert shoppers into customers more easily and increase your sales & revenue. Feel free to take inspiration from some of the examples above to apply some of these strategies to your online store.

    And if you need to get your brand discovered with content optimization, here’s how DataWeave can help! 

    Building the right product page with the right content is not enough. You will also need to keep rehashing your product pages with reviews, offers, and other such relevant nodes to deliver the right punch. After all, delivering the right customer experience starts with a product page done right. 

    Want to see first-hand how DataWeave can help brands with content optimization? Sign up for a demo with our Digital Shelf experts to know more. 

  • Win Search. Win the Digital Shelf this Holiday Season!

    Win Search. Win the Digital Shelf this Holiday Season!

    With the holiday shopping frenzy right around the corner, brands need to do everything they can to win their customer’s share of wallets. ‘Tis the season shoppers have longer shopping lists and will likely buy products they’ve never purchased before for gift giving. This makes it even more critical for brands to make sure they make it easy for shoppers to find their product at the time right time, with the right deals and discounts.
    Watch the webinar with Karthik BettadapuraCEO, Co-Founder at DataWeave & Vladimir Sushko– E-Retail Director at Anheuser-Busch InBev & learn about the key levers brands need to pull to get their Digital Shelf ready for the Holiday Season

    Let’s start with Product Search…

    Search Optimization

    Organic levers you can pull for Search Optimization

    Key Highlights:

    • Product content is not a one-time fix. It’s seasonal. Seasons change and so does your product. Your content needs to reflect these dynamic changes. 
    • Fact – Search rankings drop when product availability starts dipping.
      Lesser known fact – even after stock replenishing, your search ranking does not bounce back immediately. The opportunity cost of dwindling product stock is high. 
    • Being optimized for the right keyword is good. Being optimized for the right keyword, with a higher ranking than your competitor is great
    • Ratings & Reviews have a large correlation with search ranking and impact on sales.

    We then asked the audience what factors they thought had the biggest impact on search rankings… 

    Search Ranking

    Listen to the experts answer questions that have been on everyone’s mind this Holiday Season! 

    Win Search Wn the Digital Shelf
    • Vladimir: How do you approach Search at Ab InBev? 
    • Vladimir: Favourites have an impact, but is this something you can influence? If yes, how?
    • Vladimir: When it comes to growing your online sales via marketplaces what’s the one lever you pull most aggressively?
    • Karthik: Optimizing Share of Search on Marketplaces v/s traditional online retailers 
    • Vladimir: What organic efforts do you use to improve your share of search?
    • Vladimir: When it comes to sponsored search do you use an always-on strategy or are ads spent strategically? 
    • Karthik: Sponsored or Organic? What’s your advice to brands? 
    • Vladimir: Are you tracking your competitor’s Digital Shelf? 
    • Karthik: Which competitor KPIs do you recommend brands should track?
    Bonus Content

    Vladimir: What’s your strategy to make sure you have a high share of search during Christmas – the busiest shopping season. 

    Karthik: What’s your advice for brands for the festive season?

    Click here to register for the On-Demand Webinar

    Do you know if your brand is prepped and ready to make an impact during the biggest holiday season of the year? Or simply just wondering if your Digital Shelf is optimized with the right price, discounts, reviews, and keywords? Our team can DataWeave can help! Reach out to our Digital Shelf experts to learn more.

  • 2021 Cyber Weekend Preliminary Insights

    2021 Cyber Weekend Preliminary Insights

    The exponential growth of eCommerce has forever changed holiday shopping as we know it. What was once led by the launch of Cyber Monday in 2005, has since expanded to ‘Cyber Five’ in 2018, now spans beyond an eight-week period, and is collectively the busiest digital shopping period of the year. Most retail websites have launched a ‘Thanksgiving Comes Early’ sales event for a mosaic of products, causing one to wonder how this ‘early start’ to holiday shopping will impact the traditional promotional cadence consumers have grown to expect to see launch closer to the holidays. Given today’s environmental challenges, threats of scarcity are also encouraging consumers to buy early, which could also impact traffic on the shopping days that have traditionally seen the highest sales volume from digital shoppers.

    In the current environment, the onus will be on consumers to keep a watch for their categories of interest and buy them as and when they appear on sale in their favorite store, because there is no guarantee of sustained availability. Of course, they might return and buy at a different store if a better deal comes up, but there’s a time cost for the dollars saved. More broadly, there has been enough noise made about deals and discounts to keep consumer interest and curiosity going.

    The early promotional start and heightened demand has influenced our team to get a jump start on our 2021 Black Friday analysis to look deeper at trends seen pre-Black Friday 2021 versus 2020. With this assessment, we can track how promotional prices and product availability rates may have changed throughout the event leading in to 2021 Cyber Five, and compare it to last year’s activity to understand how 2021 holiday sales may be impacted.

    We reviewed popular holiday categories like apparel, electronics, and toys (for kids and pets), to have a broad sense of notable trends seen consistently throughout various, applicable marketplaces. What we found is a consistent decline in product availability over the last six months and as compared to last year, alongside an increase in prices.

    We first analyzed availability changes for popular categories on Amazon, noted in the chart below, to understand how inventory may have changed throughout the year, and also compared to 2020. With the exception of batteries and solar power goods and books and maps, there appears to be consistency in greater product availability in 2021 versus 2020, but a slow decline in availability throughout 2021, leading into the holiday season.

    Source: DataWeave Commerce Intelligence – Product Availability in-stock percentage from July 2020 through September 2021 for a sample size of 1000+ products on Amazon.com

    When it came to our pricing analysis, we reviewed select categories on Amazon and Target.com, and found around fifty percent of products on both websites to have seen a price increase year-over-year, while only thirty-seven percent and sixteen percent of products saw a price decrease on Amazon and Target.com, respectively. We also see an increase in the manufacturer’s retail price (MRP) in 2021 versus 2020 for a very high proportion of products (forty-eight percent of products on Amazon and thirty-five percent of products on Target.com), but the discount percentages have remained the same.

    Source: DataWeave Commerce Intelligence – Pricing Intelligence: MRP and promotional pricing for 1000+ products on Amazon and Target.com were analyzed from November 13th – 15th, 2021 versus Pre-Black Friday November 24th & 25th 2020

    *Please reach out to our Retail Analytics experts for access to sub-category details available within the above analysis conducted on Amazon and Target.com.

    This indicates 2021 discounts may appear to be greater than or equivalent to 2020, but in reality, consumers will end up paying higher prices than they would have for the same items in 2020. The remainder of this article highlights our key findings found within each key category reviewed – Electronics, Apparel and Toys.

    Electronics Category Analysis

    The television category showcases a great example of how pricing fluctuations impact holiday promotional cadences. Based on our analysis, we found the average television price to have increased around seven percent from April to October 2021, as seen below and as noted within our analysis conducted with NerdWallet.

    Source: DataWeave Commerce Intelligence – Pricing Intelligence: The change in average price captured for televisions sold on Amazon from May 2021 through October 2021.

    In fact, on Amazon and Target.com, we see around eighty-four percent of the SKUs listed show both an MRP and promotional price increase in 2021 versus 2020 during pre-Black Friday times. One specific example found on Amazon is noted below for Samsung TV model QN65LS03TAFXZA, a 65 inch QLED TV that was priced at $1697 during this analysis at a fifteen percent discount from MRP, but was priced last year at $1497 without a discount from MRP. In essence, even though the TV offers a greater discount this year, it is actually more expensive than it was in 2020 at this same time of year.

    Source: DataWeave Commerce Intelligence – Pricing Intelligence: MRP and promotional pricing analysis on Amazon.com comparing prices from November 13th – 15th, 2021 versus Pre-Black Friday November 24th & 25th 2020

    Unlike TVs, the price of laptops has experienced a decrease over time based on our analysis conducted during the same timeframe, indicating these are a great buy for consumers this holiday season versus promotional offers seen in 2020.

    Source: DataWeave Commerce Intelligence – Pricing Intelligence: The month-over-month change in average price captured for televisions sold on Amazon from April 2021 through September 2021.

    Overall, our prediction is that within the electronics category, promotions during Cyber Five may be equivalent to last year’s offers, however, supply will be limited and the total spend versus last year will be greater to the consumer outside of Doorbuster deals offered on select models.

    Apparel Category Analysis

    The Luxury market is seeing a Roaring 20s-like feeling this season given the Covid-induced changes in work and lifestyle and higher disposable income. Therefore, our prediction is that prices for these goods are likely to remain flat, or offer very little discounts this season both due to supply constraints as well as higher demand. For example, our analysis on shoe pricing changes shows relative stability from April to October 2021.

    Source: DataWeave Commerce Intelligence – Pricing Intelligence: The change in average price captured for shoes sold on Amazon from May 2021 through October 2021.

    Given heightened demand and the Global shipping crisis, we anticipate luxury apparel categories to face out-of-stock challenges this holiday season, and therefore we also anticipate seeing less promotional activity for these items as well during Cyber Five 2021. To dive deeper into the severity of the impact, we looked at availability for clothing, accessories, and footwear categories from August 2020 until present to verify our thesis.

    Focusing only on clothing, accessories, and footwear, these categories followed the same downward trending pattern regarding product availability decreases this year with a decline from June (seventy-six percent versus eighty-six percent in May 2021) to September 2021 (the lowest rate seen at sixty-eight percent availability), followed by a partial recovery in October and November (achieving seventy-seven percent availability).

    Source: DataWeave’s Commerce Intelligence – Product Availability: 10k SKUs tracked across 11 retailers US websites (Farfetch, Brownsfashion, NetAPorter, EndClothing, 24s, Selfridges, Ssense, Harrods, Luisaviaroma, MyTheresa, MrPorter) tracked daily stock status in apparel categories; Availability is calculated as percent of instances when product is in stock against all instances tracked.

    Not all recoveries were the same however, and given this, we predict accessories to have the lowest availability rate and greatest risk of facing out of stocks heading into Cyber Five. From May through November 2021, accessories availability continued to decline significantly from month to month, beginning at eighty-three percent in May and ending at seventy-four percent in November. Given this continued decline and with Black Friday right around the corner, we don’t anticipate inventory levels to increase enough to meet the increased holiday demand.

    Source: DataWeave’s Commerce Intelligence – Product Availability: 10k SKUs tracked across 11 retailers US websites (Farfetch, Brownsfashion, NetAPorter, EndClothing, 24s, Selfridges, Ssense, Harrods, Luisaviaroma, MyTheresa, MrPorter) tracked daily stock status in apparel categories; Availability is calculated as percent of instances when product is in stock against all instances tracked.

    Toys & Games Category Analysis

    As noted by DigitalCommerce360, we also anticipate toys to be one of the greatest impacted categories this holiday season given the continued decline in overall availability for these items on Amazon.com, as one great example. Within our category analysis, we saw a steady decline in availability from March 2021 through June (eighty percent to sixty-one percent), followed by a period of stability from June through August (approximately sixty percent), followed by another decline from September through October, finally reaching the lowest availability of fifty-six percent (down twenty-four percent from March 2021).

    Source: DataWeave’s Commerce Intelligence – Product Availability – hundreds of Toys & Games SKUs tracked on Amazon.com on a weekly basis from March 2021-October 2021

    The biggest sub-category within the toys department on Amazon, Sports and Outdoor Play, followed the same trend as Toys and Games overall through June 2021, also reaching its lowest availability of fifty-six percent. Instead of continuing along that pattern, Sports and Outdoor Play started on a recovery path, ending at a relatively high availability level of sixty-seven percent in October, which is only five percent lower than its highest availability (seventy-two percent in March 2021). Games and Accessories, the second largest sub-category in Toys and Games, had a continuous decline starting with eighty-nine percent in March 2021, reaching its lowest availability of fifty-four percent in October.

    Source: DataWeave’s Commerce Intelligence – Product Availability – hundreds of Toys & Games SKUs tracked on Amazon.com on a weekly basis from March 2021-October 2021

    The sub-category Tricycles, Scooters and Wagons interestingly had its highest availability from July to September 2021 (around eighty percent), unlike other sub-categories which as a whole, had their lowest availability during the same timeframe. From September through October, there was a significant decline (fourteen percent), reaching its lowest availability of sixty-seven percent. The sub-category Babies & Toddlers started on a continuous decline from its highest availability of eighty percent in April to its lowest availability of fifty-six percent in October.

    Source: DataWeave’s Commerce Intelligence – Product Availability – hundreds of Toys & Games SKUs tracked on Amazon.com on a weekly basis from March 2021-October 2021

    *Please reach out to our Retail Analytics experts for access to sub-category details available within the above analysis on the Toys and Games category on Amazon.com.

    Pet Toys Category Analysis

    When it comes to in demand holiday toys, you can’t forget about the needs for gifts for our furry friends and family. We also tracked sub-categories such as dog, cat, and bird toys, following the same methodology as tracked within Toys and Games to track pet toy availability changes.

    Source: DataWeave’s Commerce Intelligence – Product Availability – hundreds of Pet Toys SKUs tracked on Amazon.com on a weekly basis from March 2021-October 2021

    Dog toys, the biggest sub-category out of the three pet toys analyzed, had high availability – ninety percent in March 2021, but started to decline reaching a low of sixty-five percent in October. There was a period of stability from April to August (averaging seventy-seven percent), followed by a significant decline of over thirteen percent in from September to October. Cat toys, the second largest sub-category, also had its highest availability in March (eighty-nine percent) followed by a steady decline to sixty-six percent in June, a recovery from July to August (achieving seventy-three percent), followed by another decline during September and October, reaching its lowest availability of sixty-three percent (down twenty-six percent from eighty-one percent in March). Interestingly, dog toys which has a product count eight times greater than cat toys, had higher availability than cat toys during each of the months considered during the analysis.

    Source: DataWeave’s Commerce Intelligence – Product Availability – hundreds of Pet Toys SKUs tracked on Amazon.com on a weekly basis from March 2021-October 2021

    In Conclusion

    If we consider discounts and availability to be a good indicator of sales for the 2021 holiday season, with the Global shipping crisis looming over this year’s event, we expect retailers to have trouble keeping their inventory well stocked, which might affect growth rates. That being said, while discounts may be muted and popular items may come on very limited sales given constraints, we believe digital sales on Black Friday will see the highest year-over-year growth to date, given a number of supporting factors: scarcity threats increasing demand and the reason to buy, and consumers waiting to see if holiday offers surpass those see in the early start promotions, followed by the sudden rush to buy on Black Friday so as not to risk a given product being out of stock beyond this time period.

    We also anticipate seeing a continued decline in product availability day-to-day as we progress throughout Cyber Five 2021. Given the analysis conducted on 2020 trends, (we tracked nearly a one percent decline in availability on Black Friday 2020 vs. Thanksgiving Day, followed by a two percent decline on Cyber Monday), our data indicates products went out-of-stock at a faster rate then also.

    Ultimately only the digital-savvy retailers and brands will thrive during these opportune times, while others will continue to be in catch-up mode. Access to real-time marketplace insights can enable a first-to-market strategy, while having access to historical patterns can also help react faster to commonly seen future market factors, such as another pandemic or Global shipping crisis. These types of insights also support day-to-day operations, enabling retailers and brands to accelerate eCommerce growth, determine systems to distinguish their online strategies, discover efficiencies and drive profitable growth in an intensifying competitive environment.

    Continue to follow us in the coming weeks to see the insights we track through Cyber Five 2021, and be sure to reach out to our Retail Analytics experts for access to more details regarding the above analysis.

  • Top 10 Retail Analytics that You Must Know

    Top 10 Retail Analytics that You Must Know

    Customers expect personalization. Unless they have a seamless experience on your online channels, they’ll leave for a different retailer. Retail analytics can solve these problems for merchants looking to increase customer satisfaction and sales. It provides insights into inventory, sales, customers, and other essential aspects crucial for decision-making. Retail analytics also encompasses several granular fields to create a broad picture of a retail business’s health and sales, along with improvement areas.

    Big data analytics in the retail market
    Big data analytics in the retail market

    Big data analytics in the retail market is expected to reach USD 13.26 billion by the end of 2026, registering a CAGR of 21.20% during the forecast period (2021-2026). The growth of analytics in retail depicts how it can help companies run businesses more efficiently, make data-backed choices, and deliver improved customer service.

    In this blog, we’ll discuss the top 10 analytics that retailers are using to gain a competitive advantage in accurately evaluating business & market performance.

    Top 10 of Retail Analytics You Must Know
    Top 10 of Retail Analytics You Must Know

    1. Assortment

    Assortment planning allows retailers to choose the right breadth (product categories) and depth (product variation within each category) for their retail or online stores. Assortment management has grown beyond simple performance metrics like total sales or rotation numbers. Instead, retail analytics offers a comprehensive analysis of product merchandise and an estimated number of units at the push of a button. Retailers that effectively apply assortment analytics can enjoy increased gross margins and prevent significant losses from overstocks sold at discounted prices or out-of-stock inventory leading their customers to buy from competitors. 

    It also helps retailers gain insights into the trendy and discoverable brands and products on all e-commerce websites across the globe. They can boost sales by making sure they have an in-demand product assortment. They can also track pricing information and attributes common across popular products to drive their pricing and promotion strategies.

    2. Inventory Management

    An inadequately maintained inventory is every retailer’s worst nightmare. It represents a poor indicator of inadequate demand for a product and leads to a loss in sales. Data can help companies answer issues like what to store and what to discard. It’s beneficial to discard or increase offers on products that are not generating sales and keep replenished stocks of popular items. 

    Worldwide Inventory Distribution

    In 2020, the estimated value for out-of-stock items ($1.14 trillion) was double that of overstock items ($626 billion). A similar trend was especially prominent in grocery stores, where out-of-stock items were worth five times more than overstock items.

    Unavailability of high-selling products can lead to reduced sales, ultimately generating incorrect data for future forecasting and producing skewed demand and supply insights. Retailers can now use analytics to identify which products are in demand, which are moving slowly, and which ones contribute to dead stock. They can know in real-time if a high-demand product is unavailable at a specific location and take action to increase the stock. Retailers can use this historical data to predict what to stock, at what place, time, and cost to maintain and optimize revenue. It helps satisfy consumer needs, prevents loss of sales, reduces inventory cost, and streamlines the complete supply chain.

    3. Competitive Intelligence

    Market intelligence & Competitive Insights
    Market intelligence & Competitive Insights

    The ability to accurately predict trends after the global pandemic and with an unknown economic future is becoming the cornerstone for successful retailers. Smart retailers know how important it is to Pandemic-Proof their retail strategy with Market Intelligence & Competitive Insights 

    With 90% of Fortune 500 companies using competitive intelligence, it’s an essential tool to gain an advantage over industry competitors. Competitive Intelligence allows you to gather and analyze information about your competitors and understand the market–providing valuable insights that you can apply to your own business. A more strategic competitor analysis will explain brand affinities and provide insights on what to keep in stock and when to start promotions. Customer movement data will also give you access to where your customers are shopping.

    4. Fraud Detection

    Fraud Detection
    Fraud Detection

    Retailers have been in a constant struggle with fraud detection and prevention since time immemorial. Fraudulent products lead to substantial financial losses and damage the reputation of both brands and retailers. Every $1 of fraud now costs U.S. retail and eCommerce merchants $3.60, a 15% growth since the pre-Covid study in 2019, which was $3.13. Retail Analytics acts as a guardian against fraudsters by constantly monitoring, identifying, and flagging fraud products and sellers. 

    5. Campaign Management

    Some of the challenges of the retail industry are that it’s seasonal, promotion-based, highly competitive, and fast-moving. In today’s competitive marketplace, consumers compare prices and expect personalized shopping experiences. Campaign management allows marketing teams to plan, track, and analyze marketing strategies for promoting products and attracting audiences. Retail analytics can help businesses predict consumer behavior, improve decision-making across the company, and determine the ROI of their marketing efforts. 

    According to Invesp, 64% of marketing executives “strongly agree” that data-driven marketing is crucial in the economy. Retail analytics can help businesses analyze their data to learn about their customers with target precision. With predictive analysis, retailers can design campaigns that encourage consumers to interact with the brand, move down the sales funnel, and ultimately convert.

    6. Behavioral Analytics

    Retail firms often look to improve customer conversion rates, personalize marketing campaigns to increase revenue, predict and avoid customer churn, and lower customer acquisition costs. Data-driven insights on customer shopping behaviors can help companies tackle these challenges. However, several interaction points like social media, mobile, e-commerce sites, stores, and more, cause a substantial increase in the complexity and diversity of data to accumulate and analyze. 

    Insider Intelligence forecasts that m-eCommerce volume will rise at 25.5% (CAGR) until 2024, hitting $488 billion in sales, or 44% of all e-commerce transactions. 

    Data can provide valuable insights, for example, recognizing your high-value customers, their motives behind the purchase, their buying patterns, behaviors, and which are the best channels to market to them and when. Having these detailed insights increases the probability of customer acquisition and perhaps drives their loyalty towards you. 

    7. Pricing

    competitive pricing in retail
    Competitive pricing in retail

    Market trends fluctuate at an unprecedented pace, and pricing has become as competitive as it’s ever been. The only way to keep up with competitive pricing in retail is to use retail analytics that enables retailers to drive more revenue & margin by pricing products competitively

    A report from Inside Big Data found companies experience anywhere from 0.5% up to 17.1% in margin loss purely because of pricing errors. Pricing analytics provides companies with the tools and methods to perceive better, interpret and predict pricing that matches consumer behavior. Appropriate pricing power comes from understanding what your consumers want, which offers they respond to, how and where they shop, and how much they will pay for your products. 

    In 2021, the price optimization segment is anticipated to own the largest share of the overall retail analytics market. Retailers can identify gaps and set alerts to track changes across crucial SKUs or products with pricing analytics. Knowing your customer’s price perception will increase sales and also allow you to design promotions that’ll attract customers. Pricing analytics also accounts for factors like demographics, weather forecasting, inventory levels, real-time sales data, product movement, purchase history, and much more to arrive at an excellent price.  

    8. Sales and Demand Forecasting

    Sales and demand forecasting allow retailers to plan for levels of granularity—monthly, weekly, daily, or even hourly—and use the insights in their marketing campaigns and business decisions. The benefits of a granular forecast are apparent since retailers don’t have to bank on historical data of previous clients and customers to predict revenues. Retailers can plan their strategies and promotions that suit their customer’s demands. 

    With sales and demand forecasting, retailers can also consider the most recent, historical, and real-time data to predict potential future revenue. Sales and demand analytics can predict buying patterns and market trends based on socioeconomic and demographic conditions. 

    9. Customer Service and Experience

    With the development of eCommerce, more and more customers prefer to browse and interact with the product before purchasing online. They look for better deals and discounts across stores and platforms. 3 out of 5 consumers say retail’s investment in technology is improving their online and in-store shopping experiences. To enhance merchandising and marketing strategies, retailers can gather data on customer buying journeys to understand their in-store and online experiences. 

    Retailers can run test campaigns to know the impact on sales and use historical data to predict consumers’ needs based on their demographics, buying patterns, and interests. Retail analytics help retailers to bring more efficiency in promotions and drive impulsive purchases and cross-selling.

    10. Promotion

    Analyze competitors' promotions
    Analyze Competitors’ Promotions

    Promotions are potent sales drivers and need to be cleverly targeted towards specific customers with precise deals to generate outstanding sales. Retail analytics allows companies to study their customers and competitors to a vastly elevated level. 

    To be an industry leader, retail companies not only have to understand their customers, but they must also analyze competitors’ promotions to improve their marketing strategies. Analyzing your competitor’s promotional banners, ads, and marketing campaigns are no more associated with imitation. 

    With data analytics and AI, retailers can watch their competitors’ commercialization strategies. It can uncover vital information about their target audience, sales volume fluctuations, popular seasonal product types, product attributes of popular items, and significant industry trends.  Knowing exactly which products and brands are popular among your competitor’s campaigns can help retailers improve their promotional strategies. 

    Conclusion

    The benefits of retail analytics are spread across various verticals, from merchandising, assortment, inventory management, and marketing to reducing losses. The need for analytics has become even more apparent considering the growing eCommerce platforms, changing customer buying journeys, and the complexity of the industry. Understanding which products sell best among which customers will help retailers to deliver an optimized shopping experience.

    Want to drive profitable growth by making smarter pricing, promotions, and product merchandising decisions using real-time retail insights? DataWeave’s AI-powered Competitive Intelligence can help! Reach out to our Retail Analytics experts to know more.

  • How Artificial Intelligence is giving the  Indian Beauty Industry a Facelift

    How Artificial Intelligence is giving the Indian Beauty Industry a Facelift

    With the help of artificial intelligence and machine learning, beauty and cosmetics companies are exploring new possibilities. According to a report by Avendus, the global beauty and personal care market are expected to touch US$725 billion by 2025 and the young Indian market is expected to grow to $28 billion by then. This segment is a space of opportunity and today we have more than 80 Indian brands in this domain. 

    D2C beauty brand logos
    D2C beauty brand logos

    While technology in this space plays a very important role, Artificial Intelligence (AI) amongst everything else is giving the beauty industry a makeover. This is because, AI can create an impact on all stages of the beauty value chain — from research & development to supply chain management to product selection, marketing, and more! Resonating this thought, Chaitanya Nallan, CEO & Co-Founder, SkinKraft Laboratories mentions “As a digital-first brand, we sell across multiple e-commerce platforms as well as through our own website. Thus, it is very important that we track and maintain inventory across all channels in real-time to avoid stock-outs and loss of sales. We use AI for this. We have built an in-house data tracking dashboard that pulls in inventory information from all warehouses and maps them against sales to give us an accurate estimate of days of inventory across all SKUs and across all platforms. This information directly feeds into our procurement dashboard and also helps the marketing team to create the right sales strategy.”

    Stock availability is crucial to driving sales. If you need help tracking your online inventory – DataWeave can help give you a near real-time view of your product stock status across marketplaces. 

    With AI being a powerful technology wand, here is how it can drive the future of beauty brands within the D2C segment in India.

    Making Virtual Product trials a reality

    virtual product trial
    Virtual Product Trial

    Augmented Reality (AR) is a prevalent term and many companies are already using it on an everyday basis. More commonly, the Snapchat and Instagram filters we use are all powered by AR. In a similar vein, virtual images can be laid over actual images in real-time using AI. And keeping this concept handy, beauty brands are bringing to the front the AR-powered ‘virtual mirrors’ that let consumers try on cosmetic products in real-time. Modiface by L’Oréal is a perfect example of VR-mirrors, which has pioneered the AR-powered makeup try-ons in the market. These virtual mirrors use AI algorithms to detect the user’s face through a camera by focal points and map the face. Then using AR, images of makeup are adjusted according to the terms obtained and overlaid over the features on the face giving consumers a virtual feel of what they’d look like wearing the product. 

    Virtual try on
    Virtual Try-on

    Much recently, Indian brand Lakme has made ‘virtual try on’ possible by creating a smart mirror on its official website that allows customers to watch their reflection, try on different shades, and customize those shades according to their preferences. Shade matching until a few years back was an entirely on-ground phenomenon and customers visiting a local cosmetics store were able to choose and match the shade of compact, eye shadow, and lipstick against their true skin tone. Today AI can allow you to narrow down on products based on a virtual shade card, put them against your skin in real-time. 

    Make it Truly Personalised

    Every customer is unique, and one size does not fit all. Everyone has a personalized beauty regime they follow & understanding this could be the key to success for beauty brands. For this reason, the future of beauty lies in harnessing AI and AR solutions to tailor the beauty shopping experience to match the needs of the individual consumer. This not only enhances digital engagement but also increases purchasing confidence which in turn helps brands drive conversion and brand loyalty.  

    Pre-pandemic, offline beauty advisors played a consultative role when customers were making purchase decisions. A lot of this has moved online – take for instance Olay. It launched an online “Skin Advisor” app based on a deep-learning algorithm that analyses a consumer’s skin using a simple selfie! Armed with information on their skin type, customers can make an informed, personalized purchase that’s right for their specific skin type. 

    Skin Advisor App
    Skin Advisor App

    Understanding customer preferences and using data from their past purchases also help with personalized marketing in a big way. “Data-driven personalization gives brands insight into what their customers are interested in. We integrate this data into our marketing campaigns and deliver specific, personalized, and relevant content. This way, we make sure to target the right audience with the right messaging. This, in turn, helps us increase engagement and retain customers. Moreover, this combined data, allows us to get repeat sales through upselling and cross-selling. Further, knowing customers beyond just simple demographics helps us improve our targeting and helps us predict future behaviour. We’d like to know, for instance, if a customer clicked on our advertisement, liked, or commented on our social media product displays, signed up to our email list, etc. These analytics reveal a customer’s interest. Combine it with demographics – and you get a sense of what the customer is interested in,” Dhruv Madhok, Co-Founder, ARATA highlights. 

    Boost Product Development

    Social listening
    Social listening

    AI algorithms can be used to study and analyse customer feedback. The algorithm works towards interpreting customer comments, reviews, and feedback on a brand’s website, social media channels, and other online platforms. Artificial Intelligence can also decode and analyse questionnaires and feedback forms that the customers may have responded to online or offline. 

    The beauty and personal care industry is largely driven by usage and customer preferences, so gauging how customers feel about key products can help businesses create & develop products that customers will most likely prefer to buy. For instance, reputed beauty brand Avon recently mentioned that it developed the True 5-in-1 Lash Genius Mascara based on actual consumer feedback! They used machine learning & artificial intelligence to read, filter, process & rank thousands of online consumer comments to determine the top features they crave in a mascara. Using this customer gathered intelligence, they developed a unique product that consumers we’re “asking for”!

    True 5-in-1 Lash Genius Mascara by beauty brand Avon
    True 5-in-1 Lash Genius Mascara by beauty brand Avon

    Need help listening to what your consumers are saying about your brand online? Read more about DataWeave’s AI Powered Sentiment Analysis solution.

    More and more brands are listening to customer responses closely to give way to new products, bring in tweaks to their existing basket, and innovate further. “Our ORM team is leading the knowledge accumulation as far as social listening is concerned. They are not just responsible for responding to customer queries, they are also instrumental in highlighting key insights based on user behaviour being observed,” Chaitanya of SkinKraft Laboratories further asserts. 

    Bombay Shaving Company too with its data-centric culture leverages customer responses for decision making & product development. “In-home personal care and hygiene exploded during the pandemic. We used data analytics to explore different dimensions of in-home experience-driven needs (new usage occasions, need for convenience and DIY, etc.). We listened to our customers & were able to introduce our women’s brand, with innovative hair removal products in a big way during this period. Which today contributes to a significant percentage of our business,” Shantanu Deshpande, Founder & CEO, Bombay Shaving Company mentions.

    Given the scope and scale of the beauty and personal care industry that is major ‘usage’ driven, Artificial Intelligence with its diverse potential can bring a paradigm shift in the industry. AI can help not only with virtual trials, personalization, listening in to customers’ feedback but also with monitoring a brand’s Digital Shelf. Brands can amplify their online sales by tracking Digital Shelf KPIs like share of search & product visibility, pricing & discounting, product content, availability & assortment. Reach out to our Digital Shelf experts to learn more.

  • Gold, Gift Hampers & Gadgets – brands that sparkled this Diwali!

    Gold, Gift Hampers & Gadgets – brands that sparkled this Diwali!

    The festival of lights symbolized the victory of light over darkness, good over evil & knowledge over ignorance. Over the years, Diwali has become all that and more. It has single-handedly become the biggest shopping season in India! Splurging on a new Smart TV or Fridge, or a furniture upgrade at home has become customary during Diwali. Not to forget buying gold and gifts for all your loved ones! 

    As more and more people are doing their Diwali shopping online, we decided to look at the data, see what people were browsing and buying. And more importantly, which brands spruced up their Digital Shelf & put their best foot forward this Diwali Season. 

    Methodology

    • We tracked the first 250 products on Amazon & Flipkart against specific keyword searches & product categories. 
    • Share of Search (SoS): The percentage of products that appeared on the search results page on Amazon or Flipkart belonging to a brand, against a specific keyword or category. 
    • Dates of Crawl during the Flipkart Big Billion Day / Amazon Great Indian Festival.
      – Pre-sale period: 1st October 2021
      – Sale Period: 3rd to 10th October 2021
      – Post Sale Period: 11th – 18th October 2021

    India’s E-Commerce Gold Rush

    YouGov reported that almost three in ten urban Indians (28%) are planning to spend on gold in the next 3 months. Seven in ten (69%) of these prospective gold buyers agreed with the statement, “Diwali is the best time to buy gold”, highlighting their inclination to spend during the festive season. Also, the same survey showed that Tanishq was the most trusted gold brand. With Kalyan Jewellers, Malabar Gold & Diamonds and PC Jewellers also making it to the top 5 list.

    E-Commerce Gold Rush

    While traditionally Gold was mostly sold offline, that trend has fast changed. We tracked brands that had the highest Share of Search against the keyword “Gold Coin” on both Amazon & Flipkart to see if Tanishq, Malabar Gold, PC Jewellers – the big trusted names in jewellery were making their mark online. 

    Search Insights for Gold Coin
    Search Insights for Gold Coin
    • On Amazon, MMTC-PAMP (a joint venture between Switzerland-based PAMP SA & MMTC Ltd, a Government of India undertaking) and Kundan had the highest visibility for the keyword “Gold Coin” at 10%, followed by Malabar Gold at 9%. (Refer to above graph of Search Visibility on Amazon)
    • MMTC-PAMP used the help of Sponsored ads to get this visibility. They sponsored 9 products during the sale, while ACPL, the largest supplier of silver in India sponsored 26 products and New Delhi-based PC Jewellers sponsored 12 products. (Refer to above graph of Sponsored Products on Amazon)

    As recently as 2 weeks ago, MMTC-PAMP launched their e-commerce portal following in the footsteps of other jewellery brands. According to a report by the World Gold Council, the jewellery industry went through a massive slowdown amid the pandemic and prepping their e-commerce & digital strategies are likely going to be the only way forward.

    • On Flipkart, PC Jewellers, Malabar Gold & Kundan occupied the top 3 spots on the search results page. While PC Jewellers sponsored 12 products on Amazon, on Flipkart they sponsored zero. Malabar Gold on the other hand sponsored a whopping 25 products on Flipkart! Interestingly Malabar Gold sponsored no products on Amazon for the keyword Gold Coin. (Refer to above graph of Sponsored Products on Flipkart)

    Unboxing the love – Branded Diwali Gift Hampers

    Branded-Diwali-Gift-Hampers
    Branded-Diwali-Gift-Hampers

    Now let’s talk about Diwali Gifts. How often have you thought of buying someone a Diwali gift but had absolutely no idea what to get them? You’re not alone! A lot of consumers would simply run a search for “Diwali Gift Hampers” or Diwali Gifts” in the hope to stumble across a great gifting idea and make an instant purchase! Smart brands who know this make sure their products have organic or sponsored visibility against these keywords

    On Amazon, Tied Ribbons, a D2C gift and Décor company had the highest number of Sponsored products (15) against the keyword Diwali Gift followed by the iconic Brand Archies with (14) products.
    Flipkart had a whole bunch of smaller brands and sellers optimizing their products for this keyword. Some bigger, more known brands like Chaayos, Cadbury, D2C Tea brand Vahdam did have visibility for the keywords “Diwali Gift Hampers/ Diwali Gifts” but they were way down on the list, at the bottom of the search results page, or on Page 2.

    Was this a missed opportunity for them?

    Give your home a festive upgrade!

    Diwali is a perfect time to upgrade or buy new electrical appliances for your home. Great prices, new product launches, and an unmatched festive feeling make it even more ideal to make new purchases. If you’re eyeing smart innovative electrical appliances for your home this year and decided to go make your purchase during the Flipkart Big Billion Day or Amazon Great Indian Festival, let’s take a look at which brands made sure they showed up right on top in your online search. 

    We tracked search visibility for 5 keywords in the home appliance space – Smart TV, Washing Machine, Microwave, Air Conditioner & Refrigerators to see which brands had the highest share of search

    Brands with the highest Share of Search on Amazon
    Brands with the Highest Share of Search on Amazon
    • On Amazon, both Samsung & LG had high visibility across all products except Air Conditioners!
    • For ACs, Voltas had the highest share of search even though they sponsored 0 products! And that’s definitely noteworthy. So what really gave them the edge and put them in this winning position?

    We took a look at their product reviews to draw an analysis. Voltas ACs had close to 10k reviews! The highest in the AC category. Ratings & Reviews play a key role in helping brands drive their Digital Shelf experience. Customers trust user-generated content more than information brands share with them. Also, Amazon’s A9 algorithm prioritizes products with better reviews & shows them higher up in search – a low-cost & organic way for brands to get to the top without spending money on Sponsored ads!

    Most loved AC brand
    Most loved Air Conditioner brand
    • When it comes to washing machines, Lloyd & White Westinghouse (trademark by Electrolux) sponsored the maximum number of products in the category, this gave them the highest Sponsored SoS (13%) on the first page. 
    • While their sponsored visibility was high, their overall SoS was low which is why they didn’t organically feature in the top 5. Sponsoring products is a great but expensive way to artificially boost product visibility during sale periods. Brands need to go the Voltas route by optimizing their reviews & rating or content, to organically gain and sustain product visibility.

    … & here are the brands that made it to the top on Flipkart.

    Brands with the highest Share of Search-on-FLIPKART
    Brands with the Highest Share of Search-on-FLIPKART

    Gift-worthy gizmos!

    Buy the latest gadgets and pamper yourself this Diwali or gift them to your loved ones! You could be looking to upgrade your laptop, or buying a fancy DSLR or Smartwatch, buying it online may be your best bet. Discounts have dwindled over the years but you may still get the most lucrative discounts online. Let’s look at the discounts offered on Amazon & Flipkart for some gift-worthy gizmos like Laptops, Cameras, Smart Watches & Headphones this festive season. 

    The platform that offered the highest number of products in their catalog at a discount

    Flipkart had the higher number of gizmos on Discount this Diwali

    On Amazon, during the sale, the headphones category offered a 75% of products on discount as compared to the pre-sales period. That number was just around 51% for cameras. Far more number of products were discounted on Flipkart – 87% for headphones & laptops. And cameras 77%. So if you were looking to shop for gadgets around Diwali, Flipkart would’ve been a better bet. 

    Let’s look at which platform offered the highest percentage of discounts on products. 

    Discounts were higher across all 4 product categories!
    Discounts were higher across all 4 product categories!

    Apart from more products being discounted on Flipkart, Flipkart also offered higher discounts across these 4 categories. Discounts were higher across all 4 product categories!  

    Do you know if your brand is prepped and ready to make an impact on a Big Festival Sale Day? Or simply just wondering if your Digital Shelf is optimized with the right price, discounts, reviews and keywords? Our team can DataWeave can help! Reach out to our Digital Shelf experts to learn more.

  • Discounts continue to fizzle out on Amazon-Flipkart as e-commerce gathers steam

    Discounts continue to fizzle out on Amazon-Flipkart as e-commerce gathers steam

    Around 30 percent of electronic products across Amazon and 19 percent across Flipkart continued to be sold without any discount during October which is ironically seen as the festive month where the two companies make tall claims about deals and discounts offered around Indian festivals.

    Out of the 70-80 percent products where discounts were available, Flipkart surprisingly turned out to be more generous than Amazon during the period under review.

    As per the data exclusively shared with Moneycontrol by digital commerce analytics platform DataWeave, Flipkart on an average offered 26.3 percent discounts across the categories mentioned as compared to Amazon which had just 10.6 percent discounts.

    What makes it more interesting is that while Amazon was officially running its flagship sale The Great Indian Festival for the entire month, Flipkart had concluded its The Big Billion Days on October 10th itself.

    However, it looks like the latter was in no mood to let the competition have it all.

    The pattern is slightly different from the week-long data which was reported by Moneycontrol last month. During the first week of the festive sale, both the two companies offered no additional discounts across 30 percent of the products across the electronics category which houses products like refrigerators, air-conditioners, and laptops.

    While Amazon continues to stick to the trend, Flipkart seems to have become a little aggressive there.

    On a product level, across air conditioners, while Flipkart offered discounts across 84 percent of the products, Amazon offered it only across 73.1 percent of products. Laptops saw at least 87 percent of products on Flipkart having discounts while on Amazon it was across 76.3 percent.

    Smart TV interestingly had a different pattern. While Amazon had 72.1 percent of the products at a discounted price, Flipkart had just 63.7 percent of smart TV’s on discount.

    Interestingly, on Amazon and Flipkart at least 2.5 percent and 3.1 percent of electronic products also had a price hike during the period under review respectively.

    This is a far cry from discounts in the 60-70 percent range that the two companies advertise across electronics and appliances categories on their platforms during the sale period to lure customers.

    “Sellers decide the price of their products on Amazon. Our investment in technology and infrastructure has allowed them to save costs and consistently offer great prices to customers. Our partnership with banks, sellers, and ecosystem partners allow us to add further value through exchange offers, no-cost EMI, instant bank discounts among others, ” said an Amazon spokesperson.

    Flipkart did not respond to queries.

    Bengaluru-based Dataweave counts Japanese ad-tech firm FreakOut Group and domestic venture capital firm Blume Ventures among its investors. The data was shared exclusively with Moneycontrol.

    The price comparisons were made with rates displayed on October 1, the last business-as-usual day before the sale started and the month-long sale period beginning October 3.

    For this analysis, DataWeave crawled pages of the electronics category, which houses products, including air-conditioners, cameras, headphones, laptops, microwave ovens, refrigerators, smart televisions, smartwatches and washing machines. The firm scanned 2,285 products on Amazon and 3,131 on Flipkart.

    According to experts,…Continue reading the article here
    This article was originally published on Moneycontrol on November 3, 2021

  • Prioritizing Brand Protection Before the Holiday Rush

    Prioritizing Brand Protection Before the Holiday Rush

    Counterfeits pose a dangerous threat to any retail brand. Since every single sale is a pivotal branding opportunity, especially for young, burgeoning eCommerce brands, an online marketplace flooded with counterfeits can be particularly dangerous. One in five customers will boycott a brand after mistakenly purchasing a counterfeit product, and that’s not the kind of ratio that any retailer –– from the smallest Direct-to-Consumer (DTC) site to the behemoths like Amazon –– can afford to ignore.

    In the age of online reviews, it’s especially dangerous to have counterfeits floating around. Customers that have a bad experience with a counterfeit can take to the internet to disparage your brand without ever actually interacting with your company or trying your product. That’s why consistent and thorough content audits are paramount to ensuring your brand’s authentic products are highly discoverable, and brand protection and governance processes are in place to safeguard brand integrity across all applicable eCommerce websites.

    The Holiday Counterfeit Boom

    The holidays are a time when customers search for gifts for their friends and family, which means exploring brands outside of their usual fare. Many consumers will be exposed to your brand’s Digital Shelf for the first time over the holiday season, creating an opportunity for brand growth. But if you don’t have eCommerce brand protection initiatives in place, the holidays can be detrimental to brand positioning, customer trust, and your bottom line.

    As consumers boost their online spending and web traffic increases over the holidays, so does the likelihood of them purchasing counterfeit goods online. eMarketer predicts that retail eCommerce sales will comprise almost 20 percent of total holiday retail sales this year. As such, there will also be a surge in counterfeit inventory. So, this is an ideal time to invest in a brand protection solution to help you stay ahead of unauthorized sellers entering the marketplace.

    Brand Integrity Helps Suppliers Save

    Implementing a solution to mitigate the risks of counterfeit products should be at the top of every retailer’s “To-Do” list this year. However, for many retailers, this means manually reviewing numerous websites and third-party marketplaces for violations. Not only is manually reviewing content, images, and seller authenticity a time-consuming process, but it also leaves a lot of room for human error – making it possible for counterfeits to slip through the cracks and into the hands of unsuspecting customers. Not to mention your time should be spent fulfilling orders and increasing customer satisfaction during the high-traffic holiday season, not distracted by monitoring counterfeits.

    Fortunately, that’s not the only way to identify counterfeits and protect your brand online. An effective content auditing tool can help you monitor, detect, and determine systems to identify and act on identified violations, saving time and labor hours normally spent on manual auditing processes. Content audit software also often contains helpful features to help you run your business more strategically by monitoring online hygiene factors like product titles and description. It works across all online channels by highlighting content gaps, which can then be remedied to improve product visibility and conversions. Through online content optimization, you can save money (in unnecessary labor costs), improve your Share of Search, and increase sales and share, with a modest up-front investment.

    Brand Value Protection Boosts Consumer Confidence

    Brand image protection doesn’t just protect retailers, it also protects customers from unintentionally buying dangerous counterfeit goods. Counterfeiting has skyrocketed during the pandemic. The International Chamber of Commerce reports that, by 2022, counterfeit goods will be a $4.2 trillion industry, and global damage from counterfeit goods is projected to exceed $323 billion. Studies show one in four customers has unknowingly purchased a counterfeit item online.

    As counterfeits increase in number, so does the risk of counterfeit consumption by unwitting consumers. Counterfeit goods are as dangerous as they are ubiquitous. Customs and Border Patrol has found ingredients such as cadmium, arsenic, lead, and cyanide inside of counterfeit cosmetics. Consumers are aware of these risks. So, as a retailer, you need to be able to reassure customers that they can trust the authenticity of the goods they are purchasing at your online store.

    A counterfeit detection tool can help you identify fakes and image replicas across multiple online marketplaces, so you can get fake products delisted. Automated counterfeit solutions can increase customer satisfaction in their purchasing experience, since they know they’re getting an authentic product right off the bat. This type of online brand protection creates increased brand loyalty over time, as well as more positive first-time product interactions.

    Making a Measurable Impact: A Counterfeit Detection Case Study

    Classic Accessories is a leading manufacturer of high-quality furnishings and accessories. The company’s investment in a counterfeit detection tool paid off in spades for their organization. After noticing a surge in counterfeit versions of their goods being sold via online, global marketplaces, they decided they needed to change their manual counterfeit and image violation detection process to an automated one to proactively respond to concerned activity in a timely manner.

    Their goal was to achieve streamlined, actionable insights across all retail websites to account for varied violation submission processes, and to reduce the timespan in which insights were generated, ultimately eliminating the need to conduct daily, manual audits. They partnered with DataWeave, who built out a fully customized program to automate Classic Accessories’ content inventory management process, and identified SKU-level violations by matching names and images in diverse online marketplaces.

    During the first three months of onboarding, Classic Accessories was able to detect more than 25,000 violations, submitting notices to each marketplace, and even achieved a 100% removal rate across all Amazon sources. Additionally, they also achieved their goal of saving time (22 hours per week) in automation processes, translating to a $68,000 savings opportunity in labor costs.

    Closing Thoughts

    Prioritizing your online brand protection strategy is imperative to growing your online presence and achieving customer satisfaction and brand loyalty. Fortunately, there are options like DataWeave’s brand protection tool available to help curate your online content, provide consistency across online channels, and improve consumer confidence by addressing and removing counterfeit violations. Implementing the right solution can help find counterfeit products in real-time to keep your brand safe –– and your reputation intact –– throughout the 2021 holiday season. The right brand protection software will provide both Brand Protection and Content Audits, so your brand is optimized from every possible angle for truly competitive results.

  • Amazon-Flipkart sops war in festive sales fizzles out, shows data

    Amazon-Flipkart sops war in festive sales fizzles out, shows data

    Discounts may have been scaled down as the e-commerce market matures and the government looks out for alleged malpractices.

    Radhika Subramanium made umpteen trips to the shiny black Bosch mixer-grinder on her phone in the last few weeks. She put it in her shopping cart and waited for the festive season sale to begin, hoping to get a good deal. At the end of the day, who doesn’t want to save a few extra bucks?

    But, on October 3, the big day when e-commerce giants Amazon and Flipkart locked horns and launched The Great Indian Festival and Big Billion Days, Subramaniam was sorely disappointed. Her cart barely showed any discount. She bought the appliance anyway because it was needed, but her excitement was gone.

    It was largely the same story for Vaibhav Jaiswal. His Boat headphones didn’t even fetch a Rs 200 discount.

    Revati Krishna, in fact, checked out with zero discount on the sit-and-bounce ball she had picked up for her nephew.

    Subramanium, Jaiswal and Krishna are among hundreds of Indians who realised that e-commerce sales no longer offer the lucrative discounts they used to, except for select products such as mobile phones.

    On average, 30 percent of the products sold across the electronics category which houses products like refrigerators, air-conditioners and laptops on Amazon and Flipkart had no discount during their week-long festive sale season, according to a study by a data analytics company.

    Higher prices

    Interestingly, 8-11 percent of the products across categories such as washing machines, microwave ovens and laptops even showed higher prices during the sale across the two platforms.

    The price comparisons were made with rates displayed on October 1, the last business-as-usual day before the sale started.

    The data was compiled by Bengaluru-based digital commerce analytics platform DataWeave, which counts Japanese ad-tech firm FreakOut Group and domestic venture capital firm Blume Ventures among its investors. The data was shared exclusively with Moneycontrol.

    The discounts were lean even on lower-priced products. Amazon dangled a 6.4 percent discount on air-conditioners priced at Rs 33,500-34,000 during the sale, while Flipkart offered barely a 5 percent discount, according to the data.

    This is a far cry from discounts in the 60-70 percent range that used to be advertised across electronics and appliances categories on online marketplaces.

    For this analysis, DataWeave trawled the first five pages of the electronics category, which houses products, including air-conditioners, cameras, headphones, laptops, microwave ovens, refrigerators, smart televisions, smartwatches, and washing machines. The firm scanned 1,184 products.

    Gone are the days when discounts were offered for habit-forming. According to experts, with the markets maturing, companies no longer fancy hoarding deal hunters.

    “As people have got used to buying online, the companies have decided to focus on convenience rather than price,” said Harish HV, managing partner at ECube Investment Advisors. “You won’t even find a significant difference between the price of a product across the two marketplaces Amazon and Flipkart, which have a clear duopoly. It will go on like this unless a big new entrant starts disrupting prices again.”

    According to Harish Bijoor, … Continue reading the article here
    This article was originally published on Moneycontrol on October 27, 2021

  • 6 ways Reviews & Ratings can Skyrocket your eCommerce sales

    6 ways Reviews & Ratings can Skyrocket your eCommerce sales

    As per recent research conducted by Deloitte, approximately 81% of consumers use reviews to make purchase decisions. Reviews work like social testimonials. They are credible recommendations, as a vote of confidence from an existing customer. And when satisfied customers express themselves through the right words, automatically your product gets a boost.

    In case you’re thinking, ‘who has time to read through each and every review?’ Put a pause to your thought, because more than 70% of people regularly or occasionally read online reviews, and 19% of US shoppers trust online reviews as much as a personal recommendation. Online reviews matter and for brands that are selling online, this is becoming a big deciding ground, contributing to sales.

    Let’s go a little deeper and take a look at why good Ratings and Reviews are important for your eCommerce sales.

    1. Use your customer’s voice as a marketing tool!

    Reviews have emerged as a new and effective product promotional tool that never fails to attract the right audience. Even standalone, reviews or word-of-mouth from real users have always been the hook for consumers, so using reviews in your marketing amps up the impact. And the best part is, that it is absolutely free and user-generated!

    Here’s how Fabletics in the UK is using reviews for marketing – they’ve brought these customer testimonials right onto their website homepage! These attention-grabbing reviews showcase the voice of their existing customers and serve as the main influence for future customers that visit their website and want to know more about their brand offerings.

    Fabletics
    Fabletics website

    Using reviews in Search ads is another really impactful way to amplify your customer’s voice and confidence in your brand. Here’s a sample of how we at DataWeave could use our fantastic G2 reviews to build out a Search ad.  

    G2 Review
    G2 Review

    2. Use Reviews & Ratings to influence buying decisions

    Suja Website
    Product page from Suja website

    Display your reviews upfront. Help consumers make their purchase decision easier. Take for instance Suja, a cold-pressed juice brand. Suja converts user ratings and reviews into scores for each of their organic drinks and displays it right below the product, so at one glance users know which products have high reviews and which don’t. This further eases purchase decisions and every customer can decide on the variant right at the product page and then add it to the cart if it meets their expectations.  

    3. Positive reviews impact your brand’s conversion rate

    Improved star rating

    Experts say that 50 or more reviews per product can mean a 4.6% increase in conversion rates. McKinsey has attempted to quantify the relationship between reviews and conversion rates by analyzing reviews and ratings across the 70 highest-selling categories on a major online platform. After tracking hundreds of thousands of individual SKUs over a two-year time span, they found out that the correlation between star ratings and product sales was positive in 55 of the 70 categories they examined. In fact, a jump in rating was also seen to add to the conversion rates growing. Loyalty drives ratings and that, in turn, leads to positive conversions.

    Negative or fewer ratings can directly impact sales. We at DataWeave can help Brands adapt to consumer feedback by tracking their reviews and rating.

    4. Use honest & transparent reviews to build trust, including negative reviews.

    Product Review

    Take for instance this detailed review for a Lancôme mascara on Ulta Beauty. It not only gives the user a ready guide to the product they are eyeing but also makes the brand come out very transparent and believable, courtesy of the cons & negative reviews on display. This helps build a relationship of trust with customers across the board. Various studies have been conducted where consumers said when looking at reviews of businesses, they would trust the company less if there were no negative reviews on display. And they said the probability of every single customer having a four or five-star experience just isn’t believable – this would cause suspicion and has a strong potential of turning them away from making a purchase. Consumers clearly want the real story about a brand or business and not just a rosy picture.

    5 Ratings and reviews can boost SEO

     Ratings and reviews to structure
    Use ratings and reviews to structure the entire listing

    Online reviews are estimated to make up 10% of the criteria Google algorithms use when displaying search results. Every brand understands the importance of putting SEO-optimized content online via blogs & an array of other content marketing activities. Reviews can contribute to that cause too! User-generated content like reviews can work as a ready stream of optimized content, which Google can crawl to rank products higher in search. What is interesting is that buyers when posting a review for products are bound to mention the brand name and use certain words to describe their experience, which subconsciously in most cases become the right keywords! This actually then turns into organically generated authentic, keyword-optimized content. In fact, brands can collect and use rich snippets of reviews on their website or use it for marketing purposes to further optimize listings on Google. Take for Instance Face Theory, they use ratings and reviews to structure the entire listing for their own e-commerce website. This helps them rank higher in search on Google and even on Amazon.

    #6 Understand Customer Sentiment via reviews

    Consumers use reviews to make purchase decisions. On the flip side, what’s interesting is that brands can also gauge their consumers through reviews or feedbacks they submit. This feedback helps brands align with the ground reality of how consumers really feel about their products. And by synthesizing & breaking down reviews across channels, brands can work towards bringing more innovation and personalization for their customer, just the way they want.

    Understand Customer Sentiment via reviews
    Understand Customer Sentiment via reviews

    Take, for instance, Starbucks, a leading international coffee chain introduced MyStarbucksIdea in 2008. This was an instant hit and Starbucks customers within just the first five years of operation, shared over 150,000 ideas and recommendations to the brand, and the company put hundreds of them to use. This is a real case of a brand becoming an advocate to customer sentiments to drive its innovations directly from the core of ideas and reviews submitted by discerning customers.

    In today’s scenario, brands do not need elaborate programs like MyStarbucksIdea, they can simply ask customers for their ideas, thoughts, and suggestions via online reviews across numerous platforms! The only task from there is on is collecting and analyzing these reviews to glean insights.

    explosion of product reviews

    The new normal has led to an explosion of product reviews as more and more people shop online. In the US alone reviews were 40 – 80% higher during the core months of the pandemic in 2020 as compared to 2019.

    Reviews matter, and even more so now. Brands need to build it as part of their actionable strategies and incentivize consumers to rate and review products with each purchase.

    Need help tracking your online ratings? Or decoding customer sentiment from reviews they’ve left for your products? Sign up for a demo with our team to know how DataWeave can help!  

  • Online Halloween Shopping Is Here to Stay – Winning Share of Search

    Online Halloween Shopping Is Here to Stay – Winning Share of Search

    Lessons from Kroger, Albertson’s, and Safeway’s Optimized Online Positioning   

    As consumers continue their migration to online shopping through and after the pandemic, Halloween shopping is no exception. 

    If that’s the new paradigm, what clues should retailers and brands be looking for to enhance their sales? With Halloween around the corner, the analyst team at DataWeave wanted to see how successfully grocers are partnering with brands to prepare for the influx of online Halloween shoppers. We tracked insights from September 14 to 24, 2021, using data from Kroger, Albertson’s, and Safeway websites to understand the preparedness of each retailer, their partnered brands, and how their online strategies compare with one another.

    There are hundreds of ways for a consumer to search for a brand’s products online and of critical importance, almost 50 percent of traffic across the top 1000 retailers come through search. At the same time, consumers are becoming less brand conscious. This is a significant development, and there are significant ramifications to consumers searching for products using generic category specific keywords without including brand names in the search.  Consequently, we can’t sufficiently stress how understanding online channel experiences is critical to successful outcomes. Retailers and brands alike need an integrated view of how to improve their discoverability and share of search by considering all touchpoints in the digital commerce ecosystem.

    The Importance of Product Descriptions, Assortment, Sizes, Price Points

    With 75 percent of people never scrolling past the first page of a website when searching for the goods they desire, getting products to page one is imperative to a brand’s success. While in-store, festive displays will help drive traffic and availability awareness, the ‘digital shelf’ is a totally different locus of opportunity. Here, brands rely on proper product descriptions, the right assortment, sizes, and competitive price points to stand out among the crowd and modify their positioning, given each retailer’s consumer base and assorted competitive brands.

    Optimizing the Digital Shelf and leading Share of Search for page one across all retail websites isn’t achievable overnight, but it is never too early or too late to start, given the 24/7 visibility your products have online. When it comes to Halloween candies, confectionery brands must consider many factors when differentiating their online positioning, such as finding the ‘sweet spot’ for pricing, size, and variety within each product offered, and knowing the right and wrong times to drive promotions. Additional elements to consider when introducing seasonal candies include cannibalization of non-holiday inventory, which can increase spoilage for aged inventory, or if holiday items are successful, could cause an abundance of markdown items to be sold before replacement inventory can be ordered.

    To better understand what retailers are doing—or should be doing—to optimize their Halloween holiday sales, we turned to our DataWeave Digital Shelf Analytics data to answer these questions:

    • Which brands and products are dominating “Share of Search” page one results across all three retailer websites?
    • How do discounts and promotions vary among candy brands and retailers?
    • How does each retailer use Halloween-specific and ‘variety’ labeling within the product descriptor to differentiate their holiday season assortment?
    • What sizes of candy packages is each retailer offering, and how does this play out in online positioning?

    Winning Candy Brands

    Which Halloween candies are people searching for—and presumably buying? Our data shows that Hershey’s branded candies achieved the greatest page one ‘Share of Search’ results across all three retailers’ websites—Albertson’s, Kroger and Safeway. This was unsurprising, given their total SKU count as well as the brand loyalty Hershey’s steadily maintains throughout the year. There is a high likelihood of consumers buying what they see on page one, so in our analysis, Hershey’s has the best chance of ‘winning’ this holiday season within all three of these retail channels. 

    That said, looking more specifically at how candy items are labeled and bundled adds another layer of insight to how candy brands are performing at each of these retailers.

    Historically speaking, Snickers is almost always within the top five confectionery brands sold during the Halloween season, but with the migration of more consumers shopping online, Mars may be leaving opportunity on the table this year. Our data shows that Snickers had the lowest Share of Search percentage on page one results on Safeway.com and Albertson’s.com for brands carrying 8 or more SKUs each, indicating they will most likely not make the first page results—and therefore may end up as a clearance item after Halloween if relying on online promotional efforts to achieve sales goals.

    Source: DataWeave’s Digital Shelf Analytics Solution: Data aggregated from 9/14/21-9/24/21 for Albertson’s.com and Kroger.com, and 9/17-9/24 for Safeway.com; Analysis was conducted reviewing product information for items falling within the ‘Halloween Candy’ listing category

    What Size Candy Packages Are Retailers Carrying/Betting On?

    For example, Albertsons.com and Safeway.com’s assortment includes 124 SKUs and 108 SKUs respectively with most of those items falling within the 5 to 16-ounce (averaging 25 percent) and 32 to 64-ounce (averaging 29 percent) sizes, Kroger.com is betting on a ‘smaller is better’ strategy, with a majority (63 percent) of their candies sold in the 5 to 16-ounce package size. 

    The average Hershey candies available through all three retailers happen to be much greater in size and price point, on average, than other top ranked items, and while these larger items appear to mostly be variety packs, a majority are not labeled as ‘Halloween’ candy.

    Source: DataWeave’s Digital Shelf Analytics Solution: Data aggregated from 9/14/21-9/24/21 for Albertson’s.com and Kroger.com, and 9/17-9/24 for Safeway.com; Analysis was conducted reviewing product information for items falling within the ‘Halloween Candy’ listing category

    How Important Is Halloween-Specific Branding?

    Our data shows that Kroger.com included the name ‘Halloween’ within the product description for most (around 80 percent) of the candies sized 16 ounces or smaller, and overall have labeled more than two-thirds of their total candy items sold as ‘Halloween.’ This indicates they are staged well for the peak of the seasonal demand and anticipate their shoppers to buy smaller unit sizes, comparatively speaking.

    Source: DataWeave’s Digital Shelf Analytics Solution: Data aggregated from 9/14/21-9/24/21 for Albertson’s.com and Kroger.com, and 9/17-9/24 for Safeway.com; Analysis was conducted reviewing product information for items falling within the ‘Halloween Candy’ listing category

    Taking a closer look at all items positioned as ‘Halloween’ across the three retailer websites, Hershey’s brand Reese’s is set for success at Kroger.com for total Share of Search percentage, considering they carry eight Reese’s, non-variety SKUs. Competing in the audience of others leading with variety packs indicates the weight the Reese’s brand carries and also indicates they will also have a great likelihood of success for increased sales this Halloween season. 

    Mars M&M’s brand came out on top at Safeway.com and Albertsons.com within the ‘Halloween’ labeled SKUs, but a majority (around 70 percent) of these are variety packs that leads with the M&M’s brand versus an M&M’s only bag.

    Source: DataWeave’s Digital Shelf Analytics Solution: Data aggregated from 9/14/21-9/24/21 for Albertson’s.com and Kroger.com, and 9/17-9/24 for Safeway.com; Analysis was conducted reviewing product information for items falling within the ‘Halloween Candy’ listing category

    How Much (Less) Are People Paying for Halloween Candy?

    To determine whether candy promotions are increasing Share of Search, DataWeave measured the average promotional discount these retailers and top candy brands are offering online. When looking only at brands offering discounts on 100% of the SKUs they carry within each retailer, Brach’s brand is performing best on Albertson’s.com, and Hershey products are positioned at the top for Kroger.com and Safeway.com. 

    Source: DataWeave’s Digital Shelf Analytics Solution: Data aggregated from 9/14/21-9/24/21 for Albertson’s.com and Kroger.com, and 9/17-9/24 for Safeway.com; Analysis was conducted reviewing product information for items falling within the ‘Halloween Candy’ listing category

    Do Consumers Search For ‘Variety’ Candy Bags, or One-Product-Only Bags?

    DataWeave tagged the word ‘variety’ and found that across all three retailers’ websites, non-variety candy bags take up a greater overall Share of Search than ‘variety’ bags. Either this isn’t an important search word or retailers could try adding ‘variety’ to product descriptions to increase Share of Search.

    Source: DataWeave’s Digital Shelf Analytics Solution: Data aggregated from 9/14/21-9/24/21 for Albertson’s.com and Kroger.com, and 9/17-9/24 for Safeway.com; Analysis was conducted reviewing product information for items falling within the ‘Halloween Candy’ listing category

    Time to Make a Change

    Getting products to page one on retailers’ websites can improve sales by as much as 50 percent, but determining the right levers to pull to get there is no easy feat. Based on our preliminary analysis of Halloween insights, our advice to confectionery brands this Halloween season is to invest now to increase visibility to the fast-changing market, to get orders right and on time, establish effective pricing and promotional plans, and get the right candies in stock, to the right locations. Retailers able to get an end-to-end view of the online competitive landscape will be able to make calculated marketing decisions that stand to help generate growth and profitability.

    We are now within the prime Halloween shopping season, given that 55 percent of candy sales usually happen in the last two weeks of October (According to Timothy LeBel, President of U.S. Sales for Mars Wrigley). With online sales still growing as consumers have shifted their comfort level in buying more online, retailers should be looking for ways to optimize their product positioning, increase their Share of Search, to improve the likelihood of consumers ordering their brand’s candy to ply those Trick-or-Treaters knocking on their doors.

    About DataWeave

    DataWeave is a leading provider of advanced sales optimization solutions for e-commerce businesses, consumer brands and marketplaces. The AI-driven proprietary technology and language-agnostic platform aggregates consumable and actionable Competitive Intelligence across 500+ billion data points globally, in 25+ languages, with insights to performance for more than 400,000 brands across 1,500+ websites tracked across 20+ verticals, to ensure online performance is always optimized.


  • 4 Hacks to improve your online Product Visibility

    4 Hacks to improve your online Product Visibility

    With online shopping becoming increasingly important for brands, the concept of ‘product visibility’ within this ecosystem has emerged as the most noteworthy path to generate sales & win the Digital Shelf. Research shows that on Amazon, the first 3 products garner 64% of business generated. And post-pandemic, more and more people are now shopping online, which means your ‘digital product visibility’ becomes as critical as your in-store product visibility. What’s more, this digital shopper loves to start their search for products directly at leading marketplaces like Amazon, eBay, and the likes. As per the Shopper-First Retail report released by Salesforce almost 87% of shoppers begin product searches online. So, this is the window that brands have and this is where they need to hold their customer’s attention. But the primary question here is how to appear high up on your customer’s search?

    Imagine the pages of an e-commerce marketplace as Digital Shelves and correlate that with the offline space. Will the customer sieve through a rack-full of products to reach for your brand, lying at the back of the shelf? No, they won’t. If they have to buy a personal care item, they will choose the brand that is visible to them at the front of the rack. In a similar vein, when they search for a product online on popular marketplaces, they will quickly click “add to cart” for the ones that come up top in the search. 

    Algorithms of popular e-commerce marketplaces are usually well-kept secrets, but here are 4 hacks brands can consider to increase product visibility on their Digital Shelf.

    1. Optimize what you say about your products

    Content Quality
    Work on the product listing content

    To ensure that your products are visible, you will have to work on the product listing content judiciously. And it’s all about using the right keywords. Here, you will have to tighten the strength of your content to ensure that both your listing text and titles are accurate, and include natural language search keywords that consumers normally use when searching for products. Ignore, jargon or business-heavy words, and think what a real consumer may use to search for a smartwatch – for instance. ‘Bluetooth watch’ or ‘Smart Watch’ or ‘Camera Watch’ etc. The product title below has it all covered.  So no matter which of the 3 keywords a customer is searching for, this watch will come up in their search results.

    Title enables Product Visibility
    Listing Text and Title enables Product Visibility

    This aside, the title should highlight as much as possible about the product and the description should be pointed and readily related to the search one can use to look for it. For instance, in the below image Puracy, has not only used the word shampoo in its title, which normally the consumers will use to search, but has given all the major highlights as a part of the title. The consumer at a glance would get the whole picture inclusive of the quality, fragrance, quantity and the dispenser type.

    Product Features mentioned in Title
    Product features mentioned in Title ensures greater Product Visibility

    Search engines take consumer’s natural language preferences into consideration, so a bad or incomplete product description or title will never help customers see your brand easily on the marketplaces listing. Here’s a listing, which does not work at all.

    Bad or incomplete product description
    Bad or incomplete product description is bad for Product Searchability

    Let’s look at the above example closely. If the customer is a diehard fan of Calvin Klein and is searching for a Calvin Klein sweater, then this product will definitely show up in their search results, but what if he was looking to buy full sleeve polos or wanted a full sleeve sweater, or a navy blue sweater – even though this product fits the bill completely for all the searches, but it may not show up in his search results only because the right content/ keywords have not been used to describe the product. And that is why it is important to use common keywords in your product content that consumers normally use when searching for your product.

    In fact, according to a recent Forrester survey 45% of online shoppers do not complete a purchase if they cannot find what they are looking for, and insufficient product information adds to the cause. If you want to audit your current e-commerce content, DataWeave can help!

    2. Improve product ranking through the right reviews

    Reviews and Ratings
    Good Reviews and Ratings boost product page rankings

    Marketplace search engines prioritize products with good reviews and ratings and show them higher up in search. This prompts product visibility and assures your brand of organic discoverability. So, it is important to fetch as many honest reviews and ratings for your products, in order to gain marketplace visibility.

    Research shows that 88% of consumers trust online reviews as much as personal recommendations, and 72% of consumers are inspired to trust a brand based on the positive reviews it receives. Moreover, millennials, trust user-generated content 50% more than other media. Even though bad reviews are part and parcel of any business, a brand’s focus should be on ‘honest’ reviews. Real user-based reviews have the power to generate customer trust. When customers begin to trust your product and in your brand, they are more willing to add that product to their cart and finalize their purchase. Good product reviews will certainly make your Digital Shelf a lot more attractive & boost your product sales. Learn how DataWeave can helps brands monitor & stay on top of their Reviews & Ratings

    3. Give importance to pricing and attain the sweet spot with product ranking

    Pricing leads to Performance
    The right Product Pricing leads to higher rankings in Searches

    Intelligent pricing, which is not too low or too high should be your weapon to make your brand gain ample visibility among its competitors. Moreover, if the cost of your products is ominously dissimilar from other products it is competing with, it is bound to impact your position in search results. To achieve great results, either you can consider your competitors and analyse the pricing to reach a perfect mid-ground or choose a dynamic pricing strategy. This strategy will allow your products to cost less than the competition, marginally. 

    Amazon is pretty sophisticated in this department and reprices top-selling items 3 or 4 times per day and the same can be repriced up to 12 times daily. Following in line, McKinsey reports that multichannel leaders are also changing the prices on 10 to 20 percent for their online assortment daily.At DataWeave, we can help brands track prices on a daily or even every few hours during sale season, when prices are the most sensitive. Learn more here.

    4. Invest in paid advertising to improve your listing

    Paid Ads - Boost Sales
    Paid ads on Online Retail sites can boost product visibility and Sales

    Investing money in paid promotion at e-commerce marketplaces will help you gain visibility and push your products on top of the first page of your category listing. Today, e-commerce platforms allow you to pay for promoted listings that are displayed near organic search results. In fact, a paid Pay Per Click (PPC) campaign will allow you to build up your sales volume and brand awareness, which will in turn assure your brand of long-term organic search placement. 

    The idea of sponsored ads is getting well-received all across and Amazon’s accelerating ad revenue growth is a living proof of this. In the fourth quarter of 2020, Amazon’s ad revenue reached $7.95 billion, up 66% over the previous year. 

    The e-commerce marketplace is expanding and in 2020, retail e-commerce sales worldwide amounted to 4.28 trillion US dollars and e-retail revenues are projected to grow to 5.4 trillion US dollars in 2022. To be able to make the most of this growing market, make sure your brand is winning the Digital Shelf, starting by winning the appropriate ‘Share of Search’. Want to learn how DataWeave can help you win the Digital Shelf? Sign up for a demo with our team to know more.