Blog

  • Competitive Pricing and Availability Trends of South Africa’s Leading Retailers and Brands in 2023

    Competitive Pricing and Availability Trends of South Africa’s Leading Retailers and Brands in 2023

    South Africa’s eCommerce market is primed for robust growth in 2023 and beyond, despite the short-term impact of COVID19 over the last few years. According to Statista, the country’s eCommerce market size is $7.2 billion in 2023, with an expected CAGR of 12.5% till 2027. South Africa’s user penetration is already as high as 49.4% and is only set to grow. In essence, there is a massive opportunity for retailers to capitalize on. 

    For retailers, capturing the lowest priced spot among competitors is often the most certain way to attract and convert online shoppers. Ensuring their products are priced competitively on a consistent basis is key to gaining and maintaining market share in this booming market. This requires South Africa’s online retailers to track and compare the pricing of their products relative to their competitors on an ongoing basis. 

    For brands, ensuring their pricing and discounting strategies are aligned to market trends are key to gaining market share. In addition, on the backdrop of supply chain challenges globally in the recent past, brands need to ensure high stock availability rates to capitalize on rising consumer demand. In addition, as brands conceptualize and implement a cohesive eCommerce strategy, price parity across all online channels becomes increasingly important. 

    In this report, we leveraged DataWeave’s proprietary data aggregation and analysis platform to focus our analysis on leading South African retailers and brands and their eCommerce performance across several key dimensions.  

    Our Research Methodology

    Retailers tracked: Takealot, ShopRite, Pick n Pay, Leroy Merlin  
    Number of SKUs: 40,000+
    Number of categories: 190+
    A few key categories highlighted: Bath, Food, Home, Spirits
    Timeline of analysis: Oct 2022 to March 2023

    Key metrics reported:

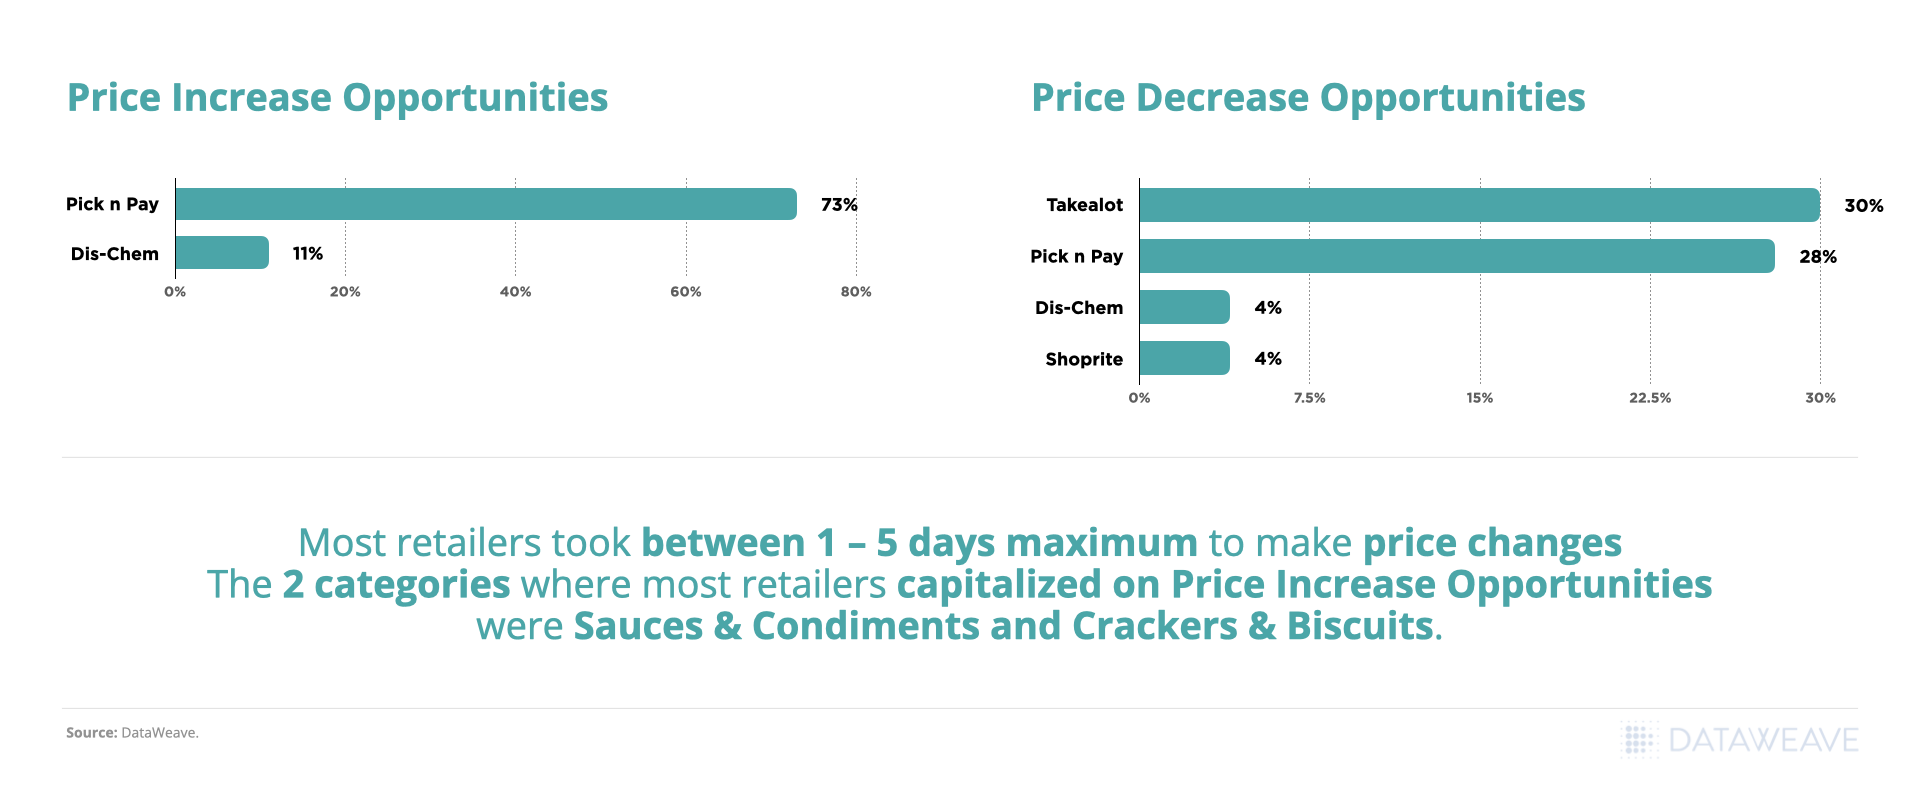
    • Price Increase Opportunity: When a retailer can increase the price of its product by a certain amount while continuing to stay the lowest priced among competitors. This directly helps boost margins.
    • Price Decrease Opportunity: When a retailer must decrease the price of its product by a certain amount to gain the lowest price position. This helps gain more sales. 
    • Action Rate: The share of price improvement opportunities (either price increase or price decrease) actually acted on by the retailer within 15 days of the opportunity presenting itself. For example, an action rate of 25% would mean that for every 100 price improvement opportunities identified, the retailer acted on 25 of them within 15 days. 

    Competitive Pricing Actions of Retailers

    Retailers often have dramatically varying approaches to responding to their competitors’ pricing actions. Also, it is not sufficient merely to react but also to react fast. The following chart displays the average action rates for price increase and decrease opportunities, and also breaks down the reported pricing actions into ones acted on within 5 days, 6-10 days, or 11-15 days of the opportunity presenting itself.  

    Takealot clearly has a strong competitive pricing engine, using which the retailer is able to act on more than half (51%) of price increase opportunities (thereby gaining margin), and over a third (36%) of price decrease opportunities. However,  it can do better in acting on many of them faster. Only 52% of the opportunities are acted on within 5 days, while the rest take up to 15 days.

    Average Action Rate and Velocity of Pricing Actions of Retailers

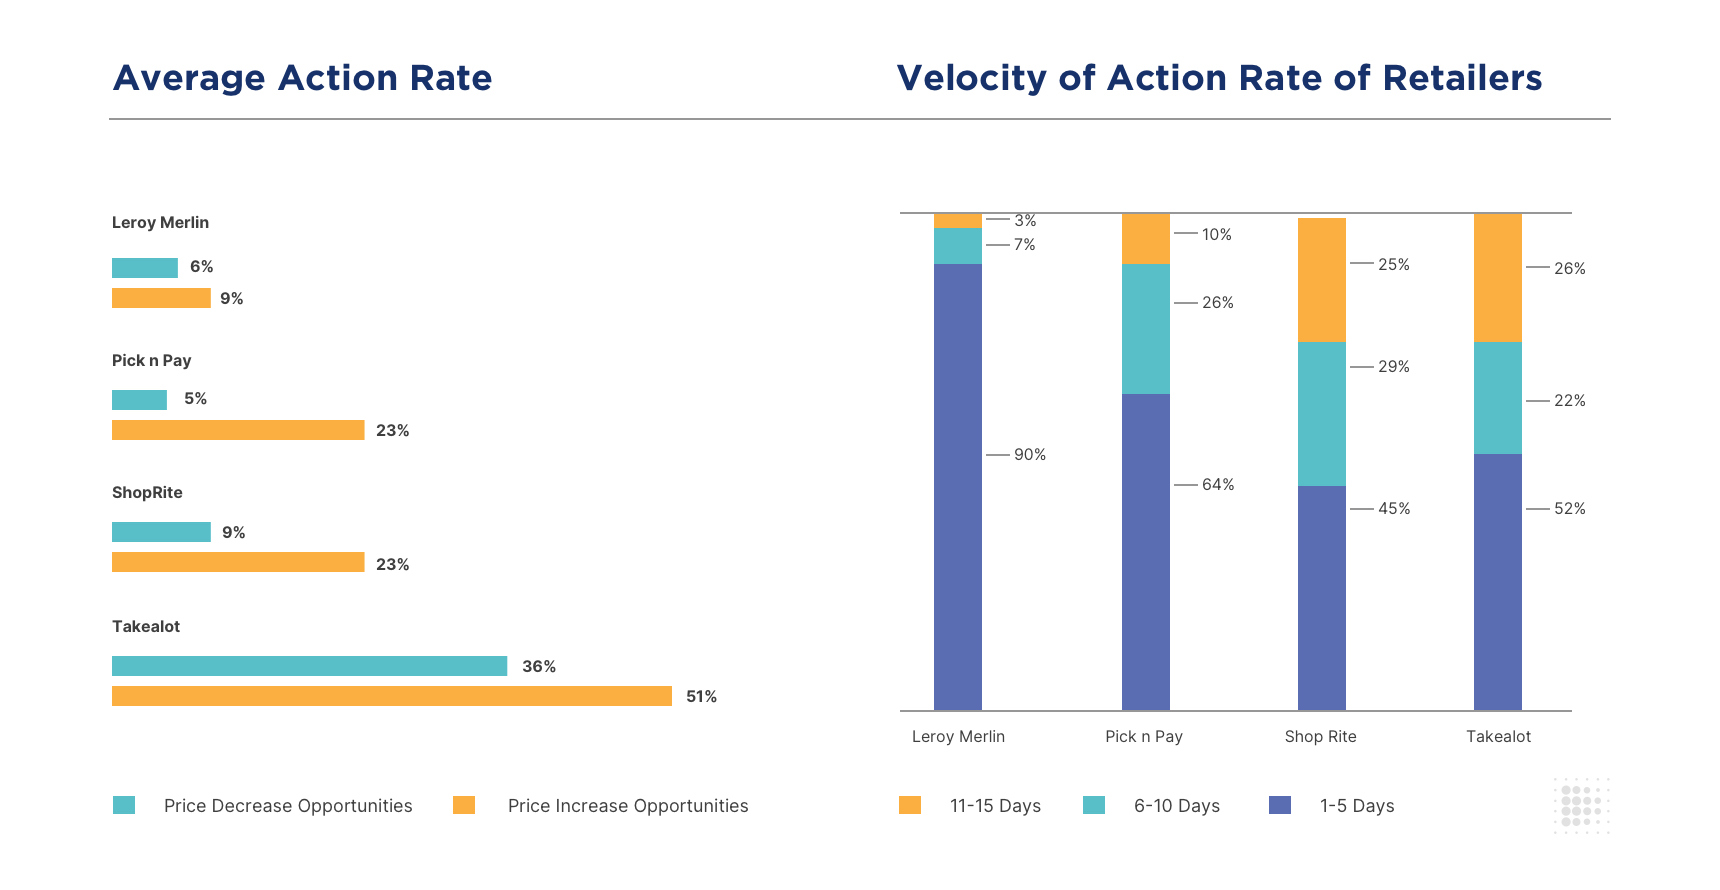
    ShopRite and Pick n Pay each have a healthy action rate of 23% for price increase opportunities, but only 9% and 5% respectively on price decrease opportunities. This displays a relatively inconsistent effort in gaining price leadership. ShopRite follows a similar distribution of pricing action velocity as Takealot, albeit for fewer price improvement actions. In comparison to ShopRite, Pick n Pay (which has a similar level of pricing action levels) acts much faster, with 64% of price improvement opportunities acted on within 5 days. 

    Leroy Merlin acted on only 9% and 6% of its price increase and decrease opportunities, respectively. However, in terms of its velocity of pricing actions, it is far ahead than the rest, with 90% of its pricing actions done within 5 days. This, however, would matter little without strong action rates to begin with. So, Leroy Merlin has a massive opportunity to boost its competitive pricing tracking and operations. 

    Average Action Rate of Retailers, Oct 2022 to Mar 2023 | Price Leadership of Retailers, Nov 2023 to March 2023

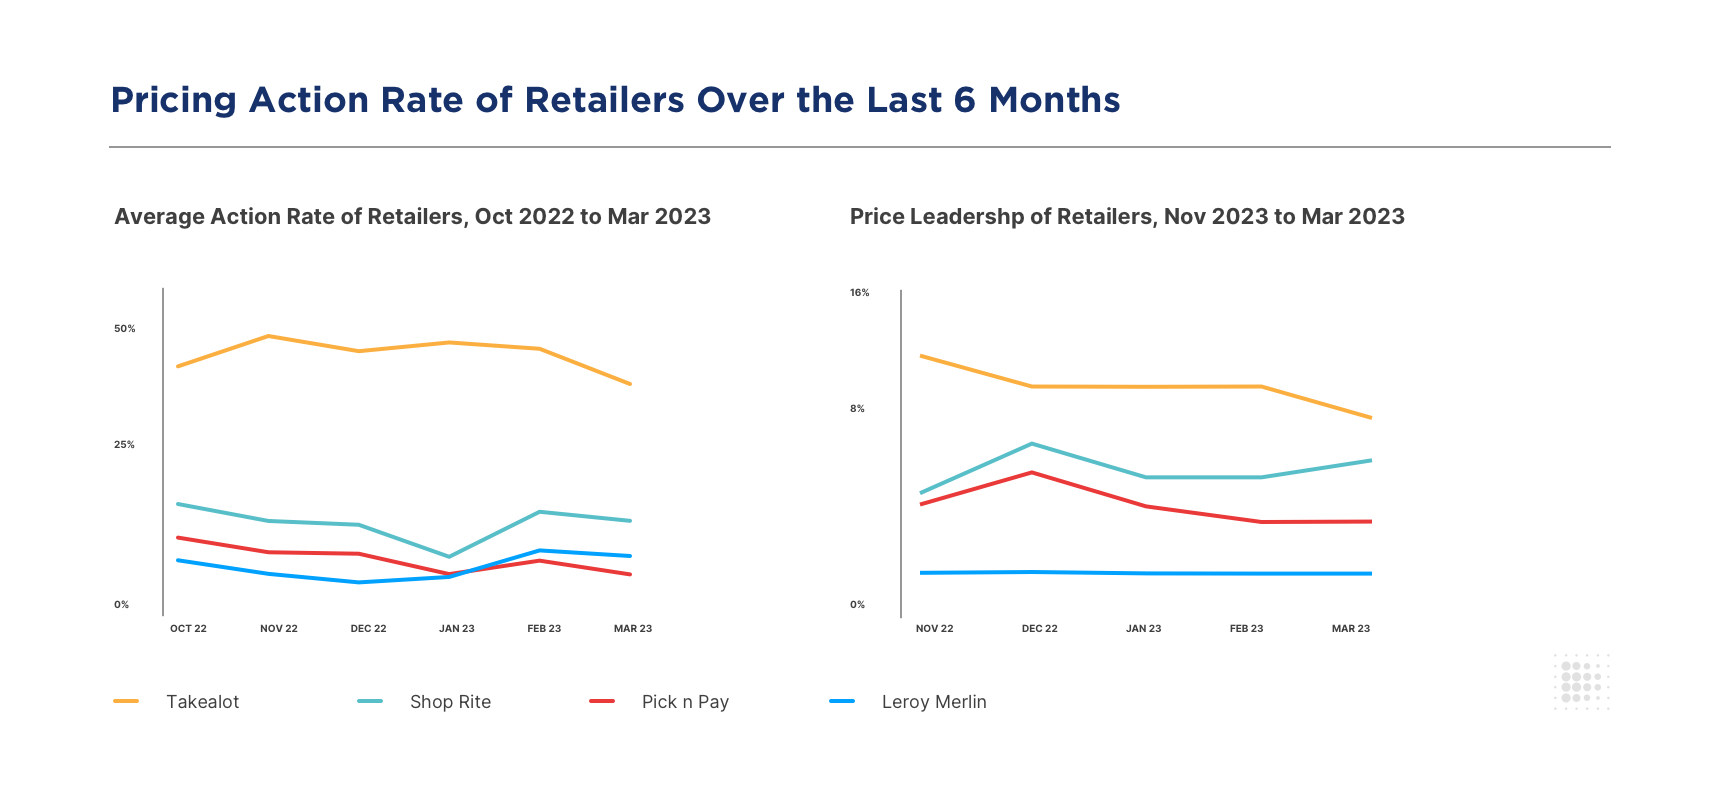
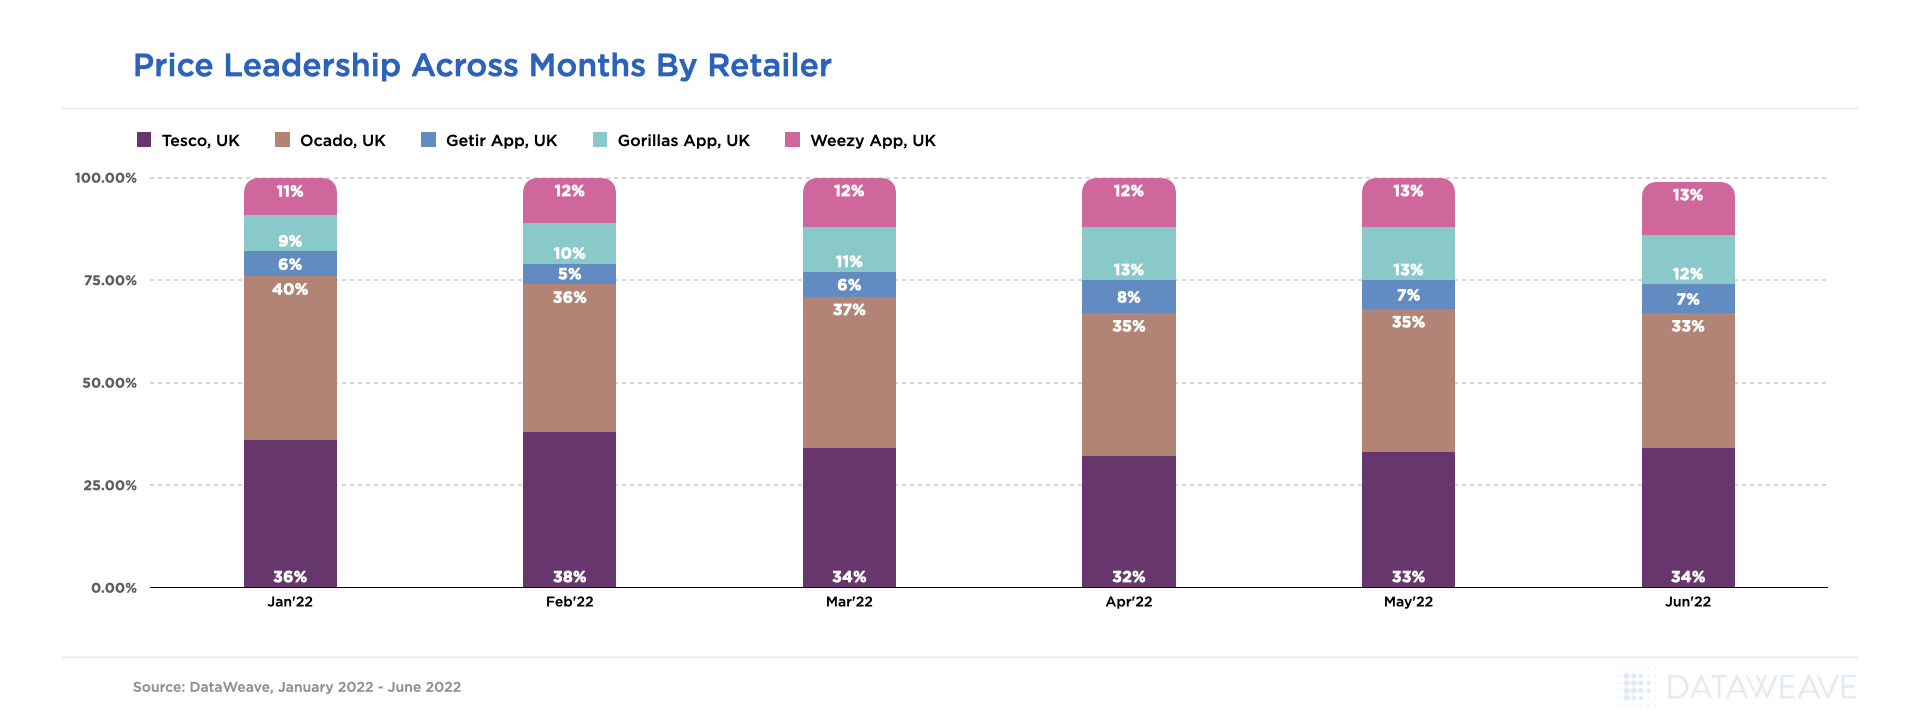
    Based on the chart above, over the last 6 months, it is clear that Takealot has maintained its price leadership throughout the period, driven by consistently aggressive action rates on price improvement opportunities. 

    Certain nuanced trends do emerge when month-on-month variances are observed on both action rates and price leadership rates across the analyzed retailers. For example, Takealot’s actions rates have been marginally declining, which has resulted in price leadership rates also declining from 14% in November 2022 to 10% in March 2023.

    Also, when ShopRite started getting more active in its action rates early in 2023, we observed an uptick in its price leadership positions. Leroy Merlin’s low action rates, coupled with low magnitudes of price changes has resulted in an average of only 2% of its products being the lowest priced relative to its competitors. 

    Pricing and Availability of Leading Brands

    In the following section, we report on the average discounts, price parity levels, and the stock availability of the top 5 brands (in terms of number of SKUs) in each of four key product categories: Bath, Food, Home, and Spirits. 

    Bath

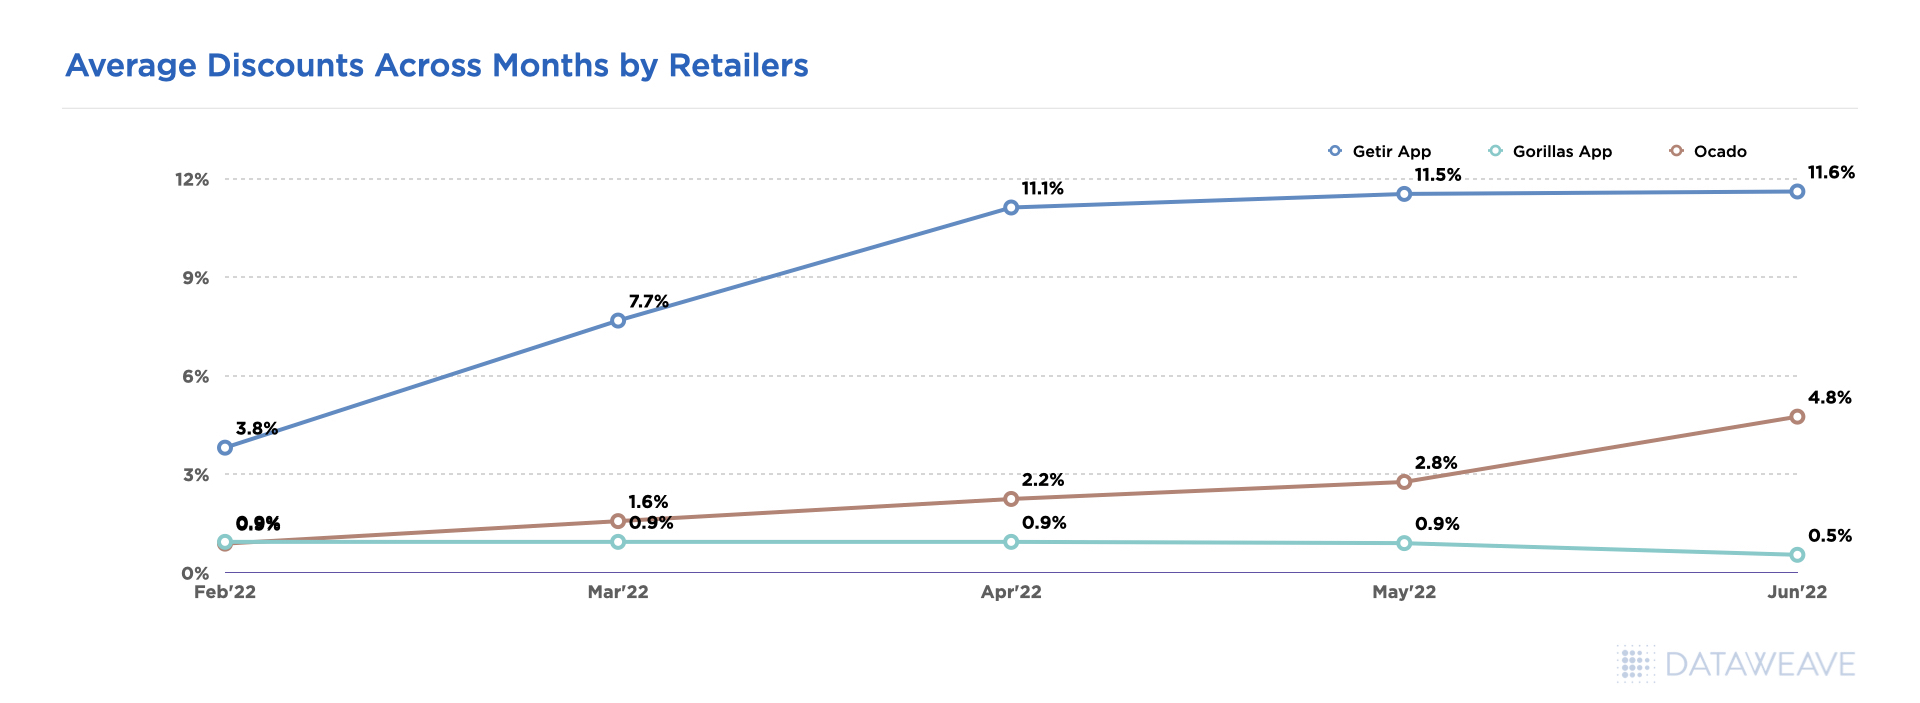
    Nivea and Protex have on average been offering high discounts in the last 6 months, peaking around the holiday season in December 2022 and January 2023. 

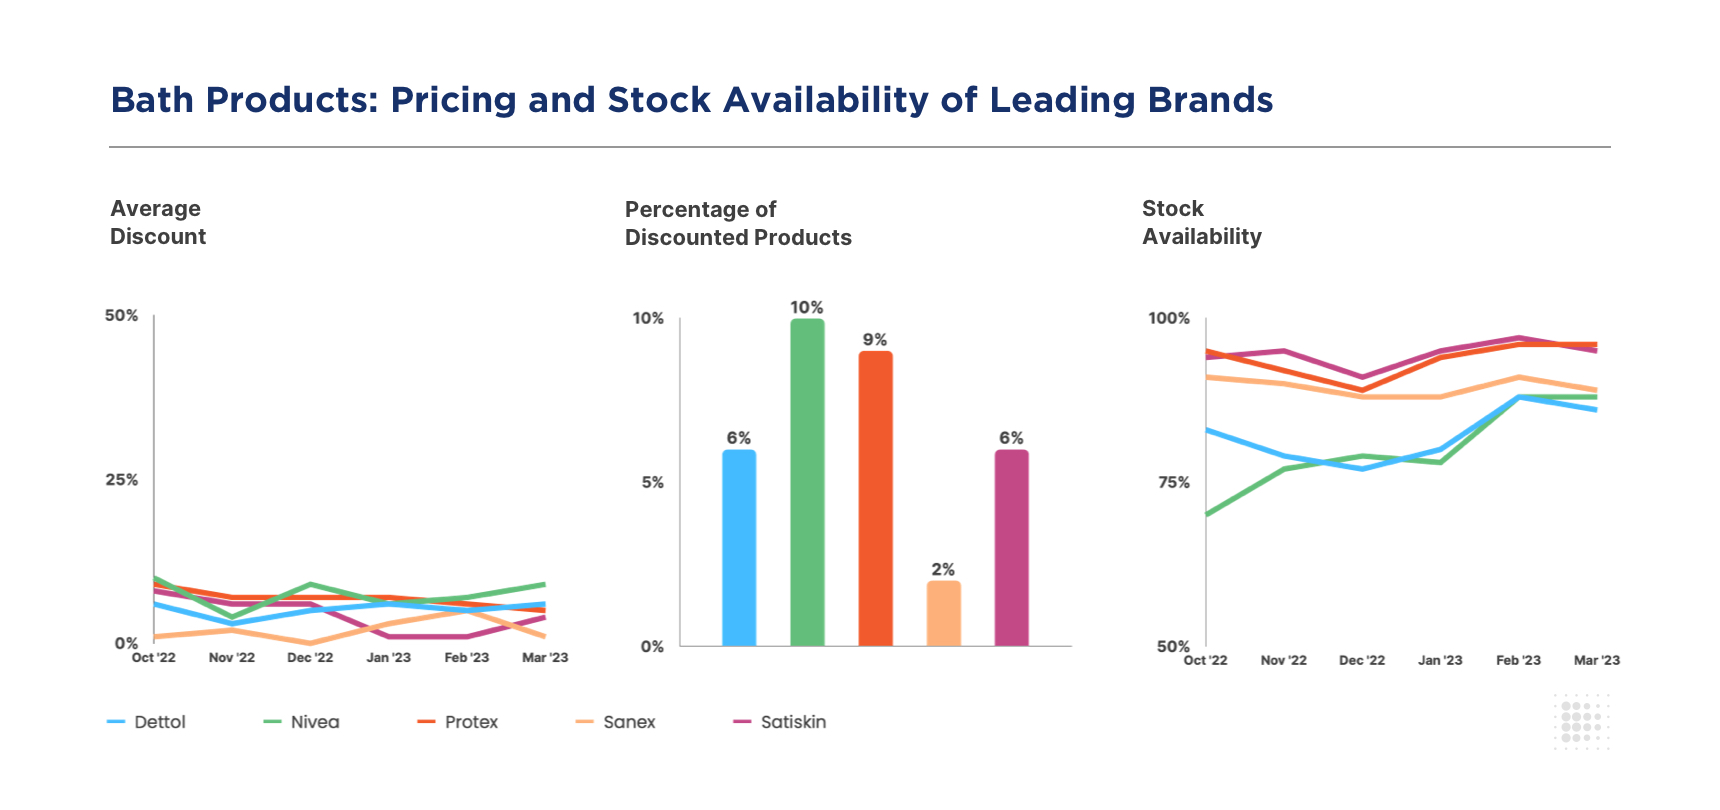
    What’s more, these two brands have the highest share of their own products carrying discounts (10% and 9% respectively). Sanex has been conservative in both the average discounts offered as well as its share of discounted products. 

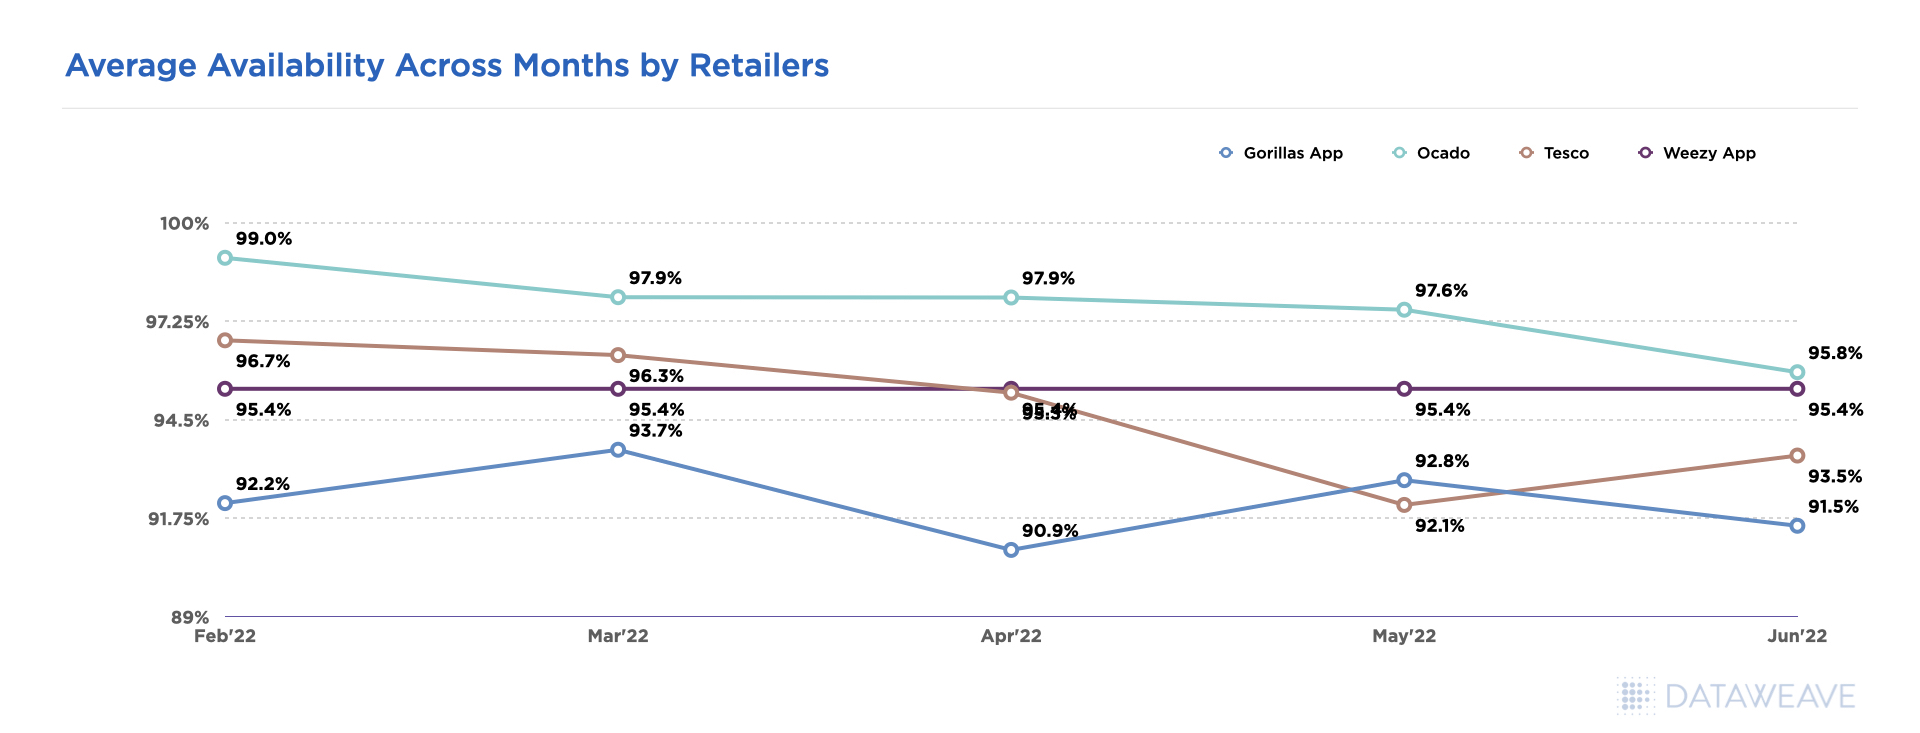
    Though Nivea has been offering attractive discounts, its stock availability has been low on average. However, it has been improving in the past few months, starting as low as 70% in October 2022 to reaching around 90% in March 2023. Dettol, too, has faced issues with its availability while showing some improvement in the recent past. All of the other leading brands in this category display healthy stock availability levels of above 90%.

    Food

    Kellogg’s and Rhodes have been offering the highest discounts in the food category, especially around the holiday season. They also lead in the share of discounted products (14% and 7% respectively).  

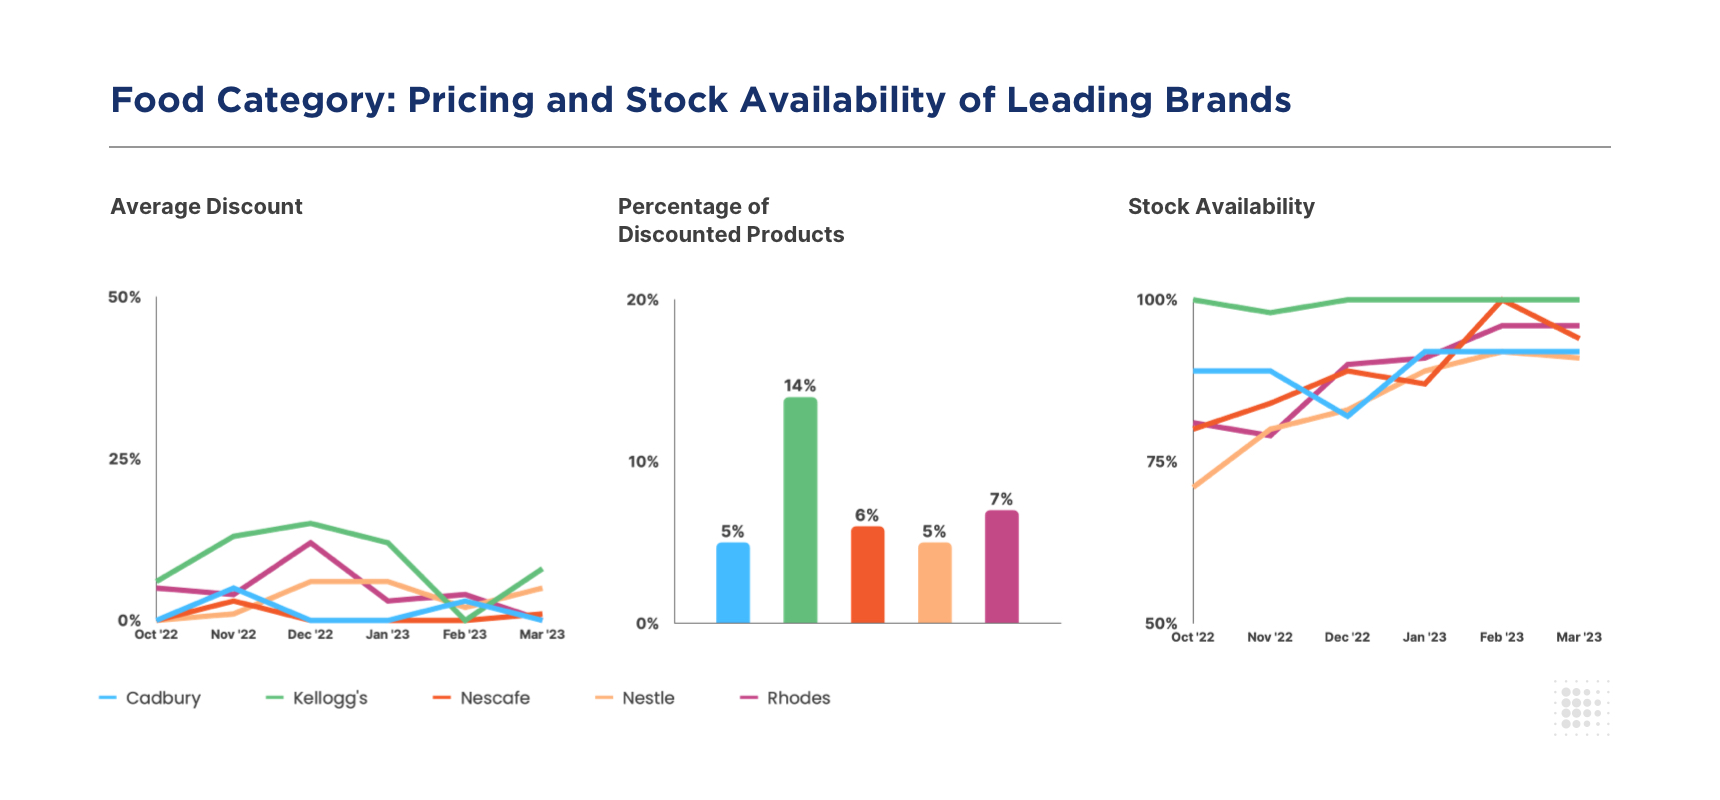
    Typical to the Food category, most other leading brands have offered lesser discounts on a smaller share of their products. 

    In addition to offering attractive pricing, Kellogg’s seems to also have its supply chain operations in control, with almost a consistent stock availability of 100%. Most other brands struggled towards the end of 2022 and have been improving ever since. Nestle, in particular, was challenged with an availability of only 70% in October 2022, but has not improved it to 90% in March 2023. 

    Home

    The Home category displays the highest variance in discount ranges among its leading brands compared to the other categories highlighted in this report. Brands like LocknLock and Legend have been offering discounts in the range of 25% to 35% on a share of more than a third of each of their products.

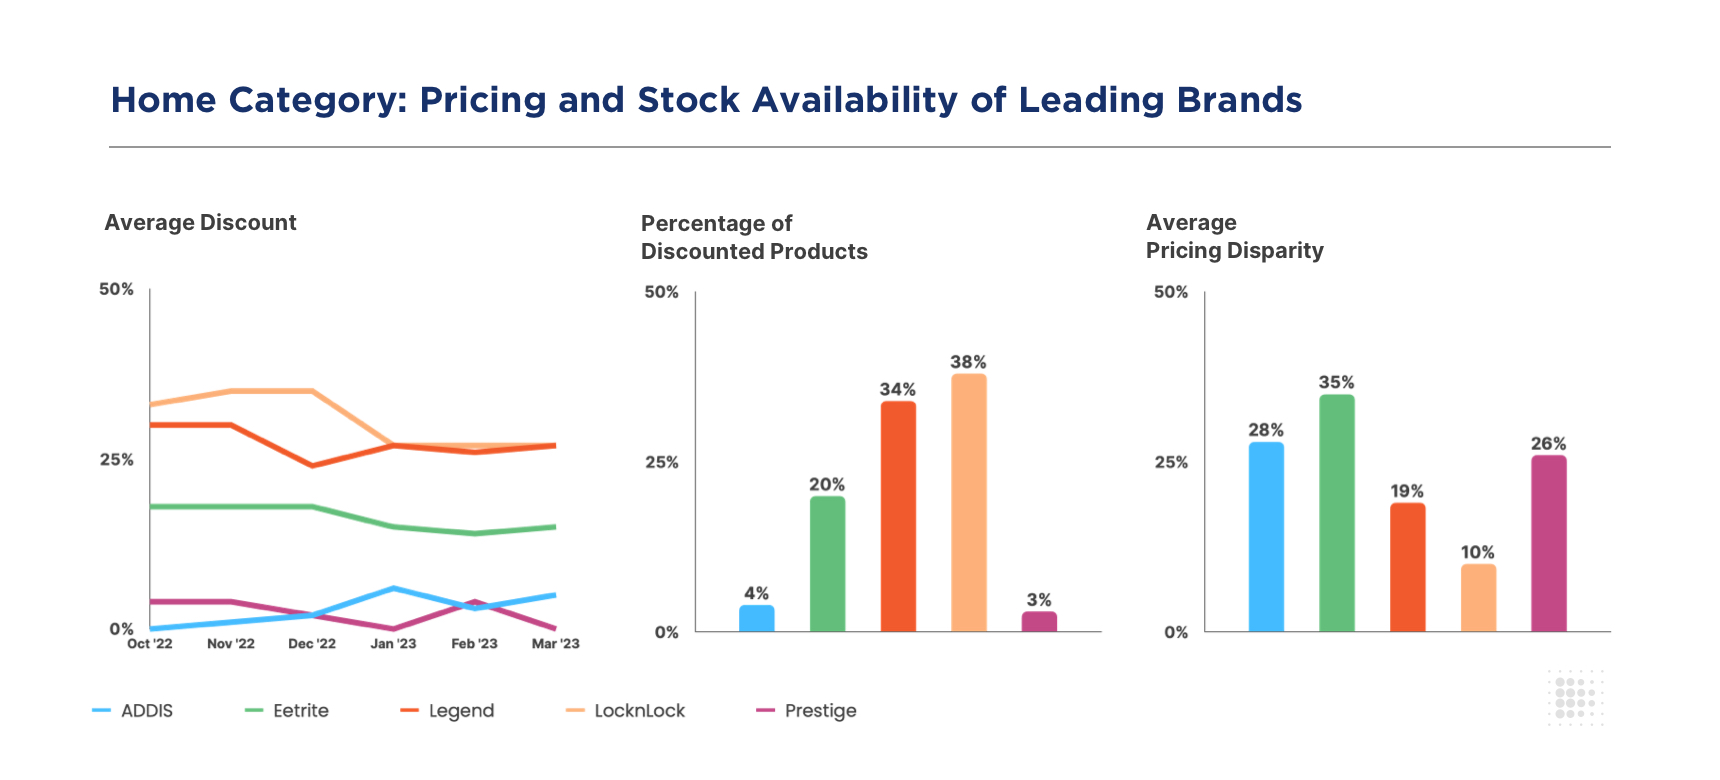
    On the other hand, ADDIS and Prestige have been offering discounts in the range of 0% to 5%, on a very small range of their products (<5%). 

    In categories like Home, maintaining a consistent brand perception among consumers is essential to boost brand value and loyalty. If there is a large disparity in the prices of the products of a brand across multiple eCommerce websites, then it negatively affects how consumers perceive the brand.  

    Here, the average price disparity (or variance) for LocknLock is only 10%, compared to almost 30% or more for other brands like Eetrite, Prestige, and ADDIS. Essentially, the brands discounting the most are also the ones with the lowest pricing disparity, which indicates a well thought-out, data-driven approach to eCommerce pricing and discounting – one that values both sales conversion as well as brand reputation. 

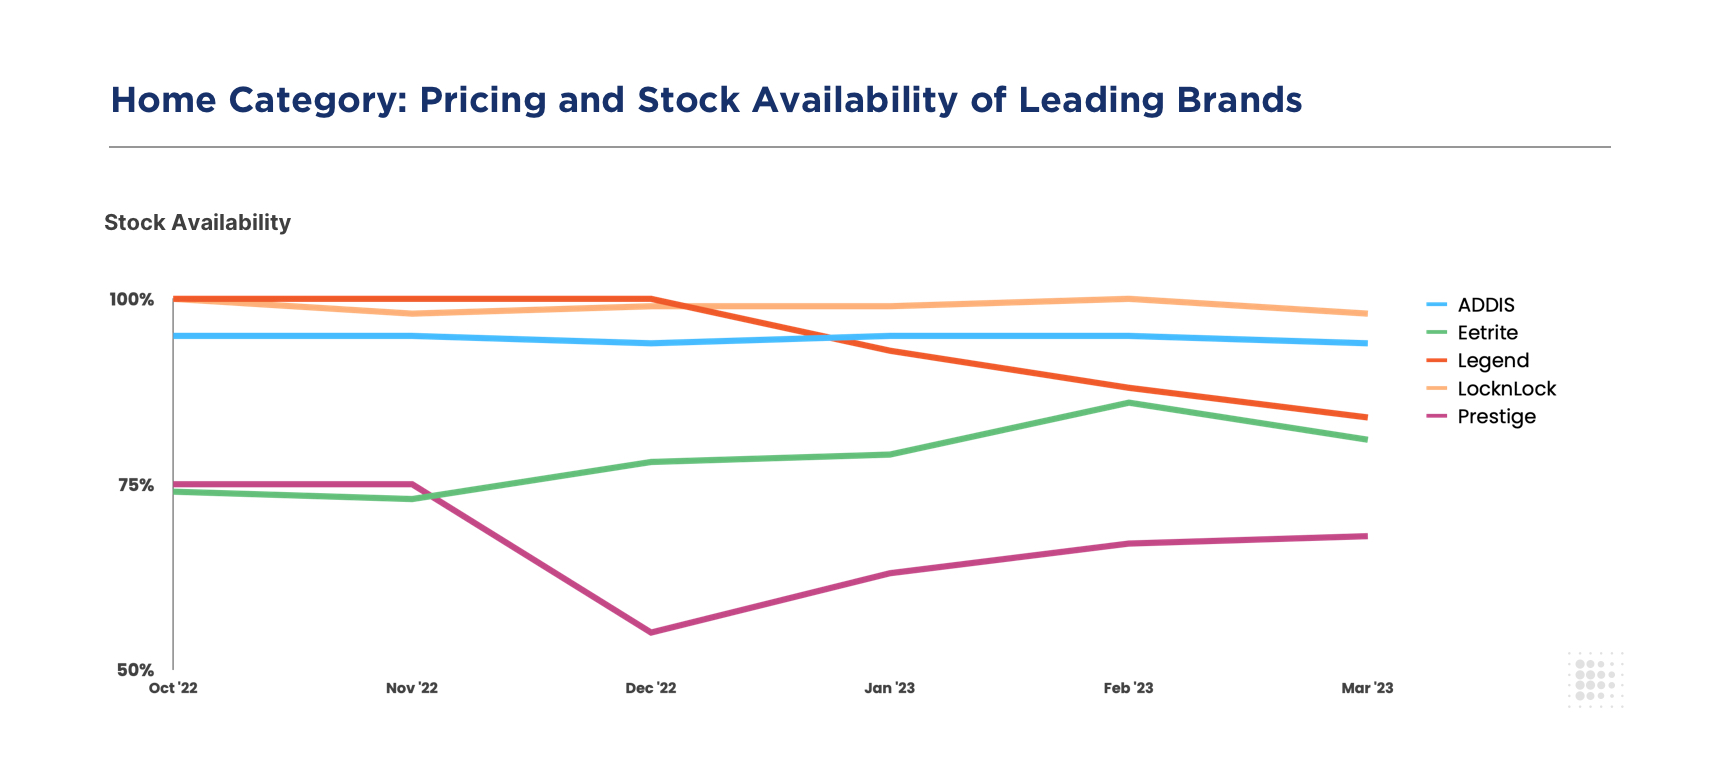
    Prestige and Eetrite have been struggling with their supply chain operations, with the availability of Prestige dipping to as low as 55% in December 2022. Legend’s stock availability was strong towards the end of 2022 but has been steadily declining in 2023 so far. LocknLock and ADDIS display healthy stock availability levels of 95% and above.

    Spirits

    The average discounts of almost all leading Spirits brands peaked during Christmas, with Tanqueray, Jameson, and Glenlivet offering up to 30% discounts in this period. 

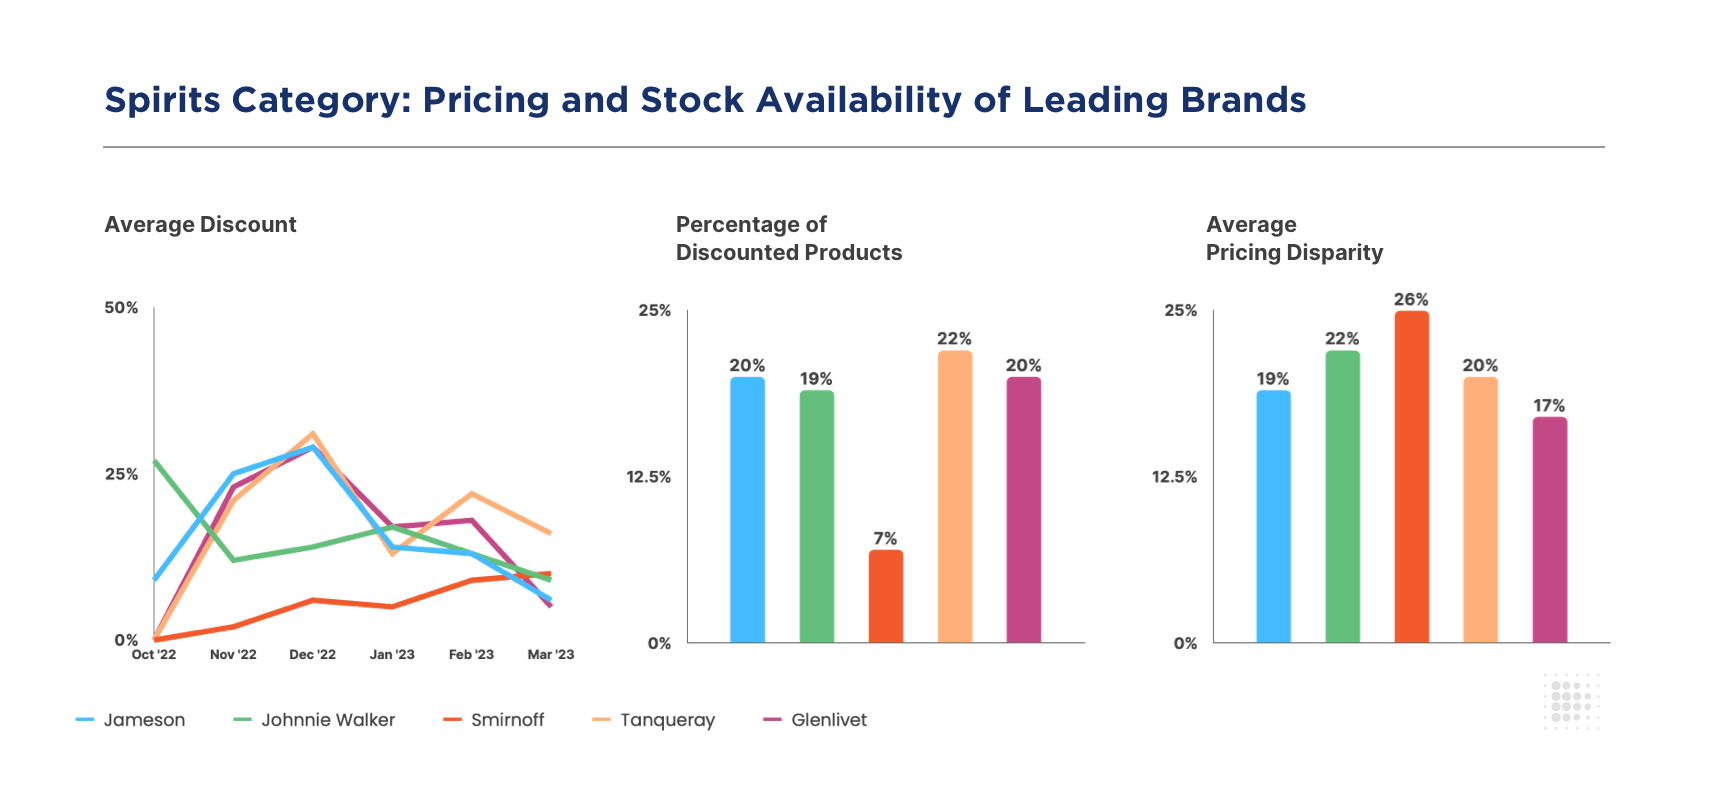
    Since then, the discounts of most brands have been oscillating within the 5% to 20% range. The percentage of discounted products for all leading brands are around 20%, with the exception of Smirnoff. 

    Similar to the Home category, brand perception is vital to the Spirits category as well. However, here we see almost a consistent level of pricing disparity among leading brands, varying between 18% and 25%. Brands looking to build a “premium” perception among consumers, such as Glenlivet and Tanqueray, might do well to ensure better pricing parity across their eCommerce channels. 

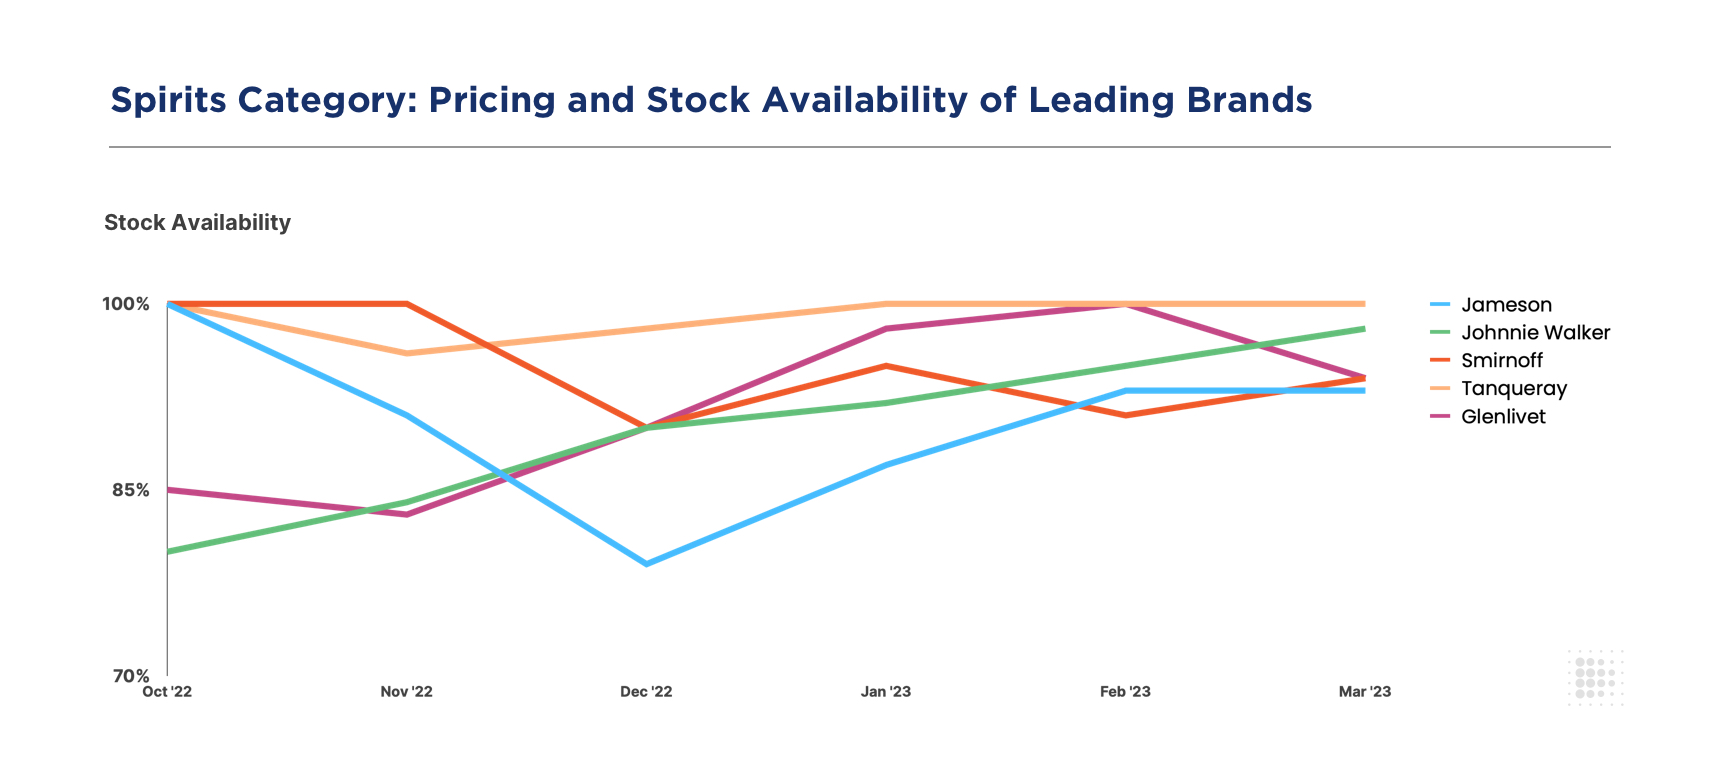
    A few Spirits brands saw a dip in stock availability in December 2022, likely due to increasing demand during the Christmas season. For example, Jameson’s availability dipped to below 80% in this period. It has since improved to reach an availability level of above 90%. Johnnie Walker, too, has shown a significant improvement in its stock availability, moving from 80% in October 2022 to 95%+ in March 2023. 

    For more details on the state of South Africa’s eCommerce landscape as well as similar insights for other retailers and brands in the region, talk to us today

  • Decoding the 2022 Black Friday Record Sales: The Who, The What, and The How?

    Decoding the 2022 Black Friday Record Sales: The Who, The What, and The How?

    Contrary to popular speculation of lukewarm online sales owing to the weak economy, high inflation, and stretched wallets, Black Friday this year recorded a whopping $9 billion in e-commerce sales. Despite the lull in online shopping across many retailers in the months preceding Thanksgiving and weakened consumer sentiment, US online merchants saw a sizable boost in sales during and after Thanksgiving, albeit at a slower growth of 2.3%, as reported by Adobe Analytics.

    This article looks closely at the Black Friday data to understand which brands, retailers, and product categories were key players. Through DataWeave’s innovative Digital Shelf Analytics product, we deep dive into the availability, discount, and share-of-search data to deduce why some product categories and retailers fared better than others.

    Who: Retailers and Brands that had the Highest Presence

    Black Friday sales this year were driven by consumers grabbing the biggest and best deals to make the most of their already stretched wallets. Many shoppers opted for flexible payment schemes, and Buy Now Pay Later (BPNL) payments rose by 78% compared to the week before Thanksgiving. Surprisingly, Amazon, which was the most searched retailer during Black Friday last year, came only fourth this year, as reported by the Search Intelligence company, Captify.

    According to Captify, Walmart was the most searched retailer for Black Friday deals, followed by Target, Kohls, and Amazon in that order. Amazon, however, has reported its biggest Thanksgiving sale this year, with independent retailers selling through Amazon seeing a total sales of $1 billion. With the economic slowdown and thin wallets looming large, discount rates greatly influenced consumer spending. Mobile shopping accounted for 55% of digital sales, 8.5% more than the previous year. 

    As told by Adobe, Electronics were the significant sales driver, reporting 221% higher sales than in October this year, with smart home items and audio equipment playing an important role with 271% and 230% higher sales. Toys ( popular purchases were Fortnite, Roblox, Bluey, Funko Pop!, and Disney Encanto) and exercise equipment also registered a substantial growth of 285% and 218%, respectively. 

    Other top-selling items included gaming consoles (Xbox Series X and PlayStation 5 devices, games including FIFA 23, NBA 2k23, and Pokemon Scarlet & Violet), drones, Apple MacBooks, and Dyson products (airwrap and vacuum). Amazon’s most popular items were reported to be Apple Airpods, Nintendo Switches, Echo Dot smart speakers, and Fire TV sticks. 

    What: Top Selling Product Categories

    Electronics, closely followed by home appliances (robotic vacuum cleaners), toys, and exercise equipment, were popular product categories in demand during Black Friday this year. Several retailers, including Amazon, Walmart, Target, Kohls, BestBuy, and Home Depot, offered lucrative pre-Black Friday discounts to trigger early sales kick-off. 

    Amazon carried an early discount of 50% on its Echo smart speaker, Target offered 30% off on Dyson vacuum cleaners, Walmart offered 25-35% off on Apple ipads and watches, and Kohls offered 51% off on the iRobot Roomba. 

    Amazon’s top ten best-selling products ranged from Amazon devices like Echo Dot speakers, Fire TV sticks, and Echo Show to Apple AirPods, Nintendo Switches, New Balance sneakers, Champion Apparel, and Burt’s Bees Lotions. The popular product categories were home, fashion, toys, beauty & health, and Amazon devices. Consumers heavily supported small businesses, contributing to $1 billion in sales. Top sellers from small businesses included card and board games.

    Briefly correlating the discounts offered with the best-selling product categories, one can notice that the deals have largely influenced Black Friday sales this year. Popular categories are those that have had deep discounts, reflecting the consumer’s tendency to wait and grab the best deals.  

    How: Role of Digital Shelf Analytics – Key Performance Indicators 

    Digital Shelf Analytics
    DataWeave’s Analysis Methodology

    We have seen a summary of the Black Friday 2022 statistics – sales recorded, top-selling products, product categories, and retailers. Using DataWeave’s e-commerce analytics product, we track and study the variations in digital shelf KPIs across retailers before Thanksgiving and during Thanksgiving to understand how these influence sales. 

    Availability scores, discount rates, and share of search data are analyzed for top retailers in the US for key product categories. Data is tracked and analyzed across two time periods – before Thanksgiving (Nov 10 – Nov 21) and during Thanksgiving (Nov 21 – Nov 25).

    Methodology

    • Retailers tracked: Amazon, Best Buy, Sephora, Target, Ulta, Walmart
    • Product Categories tracked: Electronics, Home Improvement, Beauty, Furniture
    • Digital Shelf KPIs tracked: Availability, Discount rates, Share of Search
    • Location: USA
    Amazon Digital Shelf Analytics

    Amazon maintained good availability across all product categories – Beauty ranks the highest.

    Salient Insights

    • Amazon maintained good overall availability – an improvement of 3% over Prime day
    • Beauty had the highest availability of 95%, with none and Lotion & Brushes reporting 97% and 95% availability, respectively. Shampoo reported the lowest availability at 92%
    • Home Improvement had the least availability at 87%, with dishwashers (68%) and washers and dryers (78%) having the lowest availability. 
    • Unlike Furniture and Home Improvement, most categories maintained similar availability scores before and during Black Friday.
    • Furniture improved its availability during Black Friday by 4%, while Home Improvement reported a decrease in availability during Black Friday by 4%. 
    • Electronics, which was a major sales driver, had an availability of > 90% across all sub-categories except for Television, which had a low availability of 70%
    • Tables and chairs registered 99% availability under Furniture

    The above data indicates that Amazon ensured the high availability of utility products that consumers would buy even during a slow economy. Other retailers showed similar availability trends, with scores being similar prior to and during the event.  

    Black Friday Discounts with ecommerce analytics

    Discounts Drove Sales – Best Buy offered the Highest Discounts

    Highlights

    • Best Buy offered the highest early Black Friday discount of 30%, followed by an additional 9% discount around Black Friday. Walmart followed next with 21% early discounts and an extra 4.5% discount during the event. Amazon came next with 17% early discounts and a 5% discount during Black Friday. Discount rates seem to strongly correlate with online searches, with Walmart beating Amazon this year as the most searched retailer for Black Friday deals. 
    • Electronics was the most discounted category across Amazon, Best Buy, and Target, with an average discount of 21%. Walmart gave lower deals on electronics (12%). Electronics also had heavy early discounts of 12%, with most retailers giving an additional discount of 7-8% closer to Thanksgiving.
    • Best Buy offered early discounts of 10% and further upped their discounts by another 12% closer to Thanksgiving. Being the most discounted category, electronics was also a significant sales driver this Black Friday.
    • Amazon offered the highest discounts for Beauty products (18%), followed by Ulta at 10% and Walmart at 8%. Sephora and Target gave minimal discounts on beauty products (3%)
    • Best Buy gave the maximum discounts on Home Improvement products (16%), followed by Amazon at 14%. Walmart gave much lower discounts of 7% on Home Improvement products. 
    • Furniture is another category with 12-13% discounts at both Amazon and Walmart.
    • Best Buy’s strategy this year has been to offer heavily discounted early deals to boost their sales.
    Black friday 2022 Beauty Analytics
    Icons: Flaticons.com
    Black friday 2022 Electronics analytics
    Icons: Flaticons.com
    Home improvements black friday 2022
    Icons: Flaticons.com
    home furniture black friday 2022
    Icons: Flaticons.com

    Highlights

    • Airpods and headphones were the most discounted item under Electronics, with Amazon and Target offering a whopping 27-29% discount. This clearly resulted in heavy sales of AirPods this Thanksgiving.
    • Best Buy and Target had good discounts on all electronic items, while Amazon gave heavier discounts on AirPods, headphones, and smartwatches.
    • Walmart did not offer hefty discounts on laptops and headphones, instead focused on Smartwatches, smartphones, and television.
    • In Home improvement, Best Buy offered the biggest discounts for refrigerators, washers and dryers, and dishwashers, while Amazon focussed more on Tools.
    • Walmart did not offer many discounts in this category.
    • Amazon topped the discount charts for maximum combined discounts for makeup and hair brushes on the day of the event. 
    • All retailers offered better discounts for utility products like tables, chairs, and cots (~15-17%), while dressers and couches carried lower discounts (~6-10%).
    Discount brackets - Black Friday 2022

    Highlights

    • Different companies had different discount strategies based on price buckets.
    • Amazon gave heavier discounts in the lower price buckets (< 200$) and lower discounts for products priced higher than 200$. 
    • Best Buy offered the heaviest early discounts of >25% on products priced under 20$ but provided a few additional discounts during the event. For products priced higher than 20$, Best Buy uniformly offered substantial early discounts as well as further discounts during the event.
    • On the other hand, Target focussed on mid and high-priced items, offering heavy early discounts of 16-18% on products priced higher than 100$ and early discounts of ~7% for middle and lower-priced items. For middle-priced products (40-100$), it offered heavier discounts of 10-12% during the event. 
    • Walmart focussed on mid-priced products, offering the highest discounts (both early (~12%) and additional discounts (5%)). It offered the least discounts (~8-9%) on products priced higher than 200$.
    Share of Search - Digital Shelf Analytics - Dataweave

    Share of Search – Amazon is the only retailer with sponsored searches; Apple AirPods rule the roost.

    Salient Insights

    • Amazon is the only retailer with sponsored searches, with HP, Lenovo laptops, and Apple AirPods occupying the highest share. This correlates with AirPods being one of the most sold products.
    • HP laptops had the highest share on Amazon pre-Event but gave the spot to Lenovo during Thanksgiving.
    • Tracphone and Motorola smartphones, Insignia Televisions, and JBL headphones had a good SoS on Amazon.
    • On Best Buy, HP and Dell laptops featured most in searches, with HP ruling the roost during the event. Lenovo had a small presence.
    • Samsung smartwatches, televisions, and Apple AirPods have a big chunk of the search at Best Buy.
    • On Target, pop sockets, smartphones, Apple smartwatches, headphones, and AirPods have the most prominent presence. Apple was the most featured brand in this segment.
    share of search beauty - black friday 2022
    Note: The share of search percentage reported here is the average score across all subcategories (makeup, lotion, shampoo, hair dryers and hair brushes) of Beauty.

    Salient Insights

    • Amazon, Target, Sephora, and Ulta sold beauty products, with Amazon being the only retailer with sponsored products.
    • Ogx, bs-mall, conair, hywestger were popular brands on Amazon, with interest-based ads occupying a substantial part of the search results, especially in Lotions (~40-50%)
    • Tresemme, Scotch Brite, Revlon and Cerave were popular brands in Target
    • Dyson products (brushes and hair dryers) are featured at Ulta’s top of the search, followed by Pureology shampoos.
    • Sephora’s own collection of brushes featured prominently on their website both before and during the event, followed by Dyson and T3 brushes and hair dryers.
    share of search -Digital Shelf Analytics- home improvements
    Note: The share of search percentage reported here is the average score across all subcategories (refrigerator, washers/dryers, dishwashers, tools and coolers) of Home Improvements.

    Salient Insights

    • In Amazon, Frigidaire and RCA had the highest SoS amongst Refrigerators, and LG occupied the highest share among washers and dryers, Coleman in Coolers, Dewalt in Tools, and  Comfee in Dishwashers, both before and during Black Friday.
    • In contrast, on Best Buy, Samsung had the highest share of SoS amongst Refrigerators, package deals were most prominent in washers and dryers, LG among dishwashers, ifixit in Tools, and Corsair in Coolers.
    share of search furniture on amazon
    Note: The share of search percentage reported here is the average score across all subcategories (bed, chair, couch, dresser, and table) of Furniture.

    Salient Insights

    • Interest-based ads occupied the highest SoS on Amazon for Beds.
    • Urban shop and Amazon basics were popular in Chairs, Lifestyle in Couches, WLive in Dressers both before and during the event.
    • Vasagle was more popular during the event than Furrion in Tables, though the reverse was true prior to the event.

    Summary & Key Takeaways

    Black Friday this year was a pleasant surprise to Brands and Retailers, reporting much larger sales than predicted. After experiencing a slump in sales in the months leading up to Thanksgiving, e-commerce vendors have a reason to be optimistic about their holiday season sales forecasts.

    • A record-breaking $9.2 Billion in online sales was reported by Adobe Analytics, a growth of 2.3 % compared to the previous year.
    • Mobile shopping accounted for 55% of digital sales, a rise of 8.5% compared to last year.
    • Retailers wooed customers through deep discounts (~30%) prior to Thanksgiving and around Black Friday. Heavily discounted items like Apple AirPods were the most popular.
    • Thanks to inflation and stretched wallets, consumers were willing to spend but waited to grab the best and biggest deals. Utility products had better sales.
    • With tough competition between retailers on who offers the best discounts, Amazon slid down to the fourth position, and Walmart was the most searched retailer.

    DataWeave, through its Digital Shelf Analytics and Commerce Intelligence solutions, gleans useful insights from e-commerce data and breaks down trends during global shopping events like Prime Day, Black Friday, and Cyber Monday. If you are a brand or a retailer who would like to know more about our products and solutions, contact us at contact@dataweave.com.

  • It’s not easy being a Bakery Brand: Insights from Digital Shelf

    It’s not easy being a Bakery Brand: Insights from Digital Shelf

    By 2028, Fortune Business Insights projects that the global bakery products market will reach USD 590 billion. The CAGR (Compounded annual growth rate) for 2021-28 is estimated at 5.12%. Products in this segment include bread, buns, cookies, tortillas, salted snacks, English muffins, bagels, confectionery food, hot dogs, cakes, popcorn, and so on.

    Due to disruptions in the global supply chain caused by lockdowns and border closures, the pandemic has had a negative impact on the demand for bakery products and snacks worldwide. However, the market is not only changing, but consumer demand is increasing. Post-pandemic, health, food, and safety have gained renewed attention.

    People across the world are making healthier choices with a focus on wellness. 

    A growing number of people are interested in plant-based foods and beverages, reducing sugar consumption, and understanding the link between lifestyle and health, including obesity and diabetes. As a result of these trends, food producers are reshaping their product strategies to meet new consumer demands.

    In this article, we take a look at the ways companies can leverage data to inform their e-commerce strategy.

    What’s driving up the demand for bakery products?

    More people are choosing easy-to-use bakery products and snacks over other foods due to urbanization, convenience, western diets, and women’s participation in the workforce. Additionally, innovations in baking systems, food technologies, ingredients, formulations, and product ideas are providing customers with a greater level of choice, flexibility, and freedom.

    How is e-commerce changing the game for bakery product companies?

    To optimize their supply chains, bakery food and snack companies must better understand e-commerce metrics given the wide variety of products available and eventually convert sales. There are several measures that companies need to pay attention to. 

    Stock availability metrics, discounts across locations, and share of search results – are all critical metrics companies need to track. In addition to providing manufacturers and retailers with an insight into the trends, DataWeave’s tools also allow them to make better business decisions and ultimately improve their bottom line. 

    Grocery Retailers and Bakery Brands tracked

    Methodology

    • Data Scrape period: February 2022 to September 2022
    • Country: Canada
    • Grocery Retailers tracked: Atlantic Superstore, Fortinos, InstaCart, Loblaws, Voila, Walmart Grocery, Zehrs.
    • Bakery brands: Betty Crocker, Dempsters, Hostess, No Name, Presidents Choice, Quaker, Vachon, Doritos.
    • Category tracked: Bread and Bakery, Chips, Crackers, Deserts, Snacks.

    Share of Search Analysis

    Which brands feature the most on e-commerce portals?

    When listing items on e-commerce platforms, share of search is crucial. The highest share of the top ten or top twenty items available on these platforms is correlated with how many times the item may be viewed. As a result, it would have a greater chance of being selected by the customer.

    By Retailer for Category “Desserts”

    Share of Search for Brands in each retailer
    • In Walmart Grocery, Vachon has the highest share of search at 41%, whereas Betty Crocker, Presidents Choice and No Name had the lowest share of search at 0%, in the Desserts Category.
    • In Loblaws, Presidents Choice had the highest share of search of 34%, whereas Dempsters had the lowest share of search of 2%  in the Desserts Category. 
    • The brand Presidents Choice consistently ranks high in the share of search results for Desserts across multiple retailers, including Atlantic Superstore, Fortinos, Instacart, Loblaws, and Zehrs – except at two retailers, Voila and Watlmart Grocery, where its share is zero.

    Trend of Share of Search for “Desserts”

    Share of Search analysis by Brands over Time in category “Desserts”
    • Share of search had dropped by around 4% for No Name, whereas for Vachon, it increased by 3% from Jan’-22 to Sep’ 22
    • By brands, Presidents Choice had the highest share of search at 42%, whereas Betty Crocker had the lowest share of search at 12% between Jan’ 22 and Sep’ 22 in the Desserts Category.

    Availability Analysis

    Which products are widely available across e-commerce portals?

    The availability of the product on the e-commerce portal is one of the key indicators of meeting customer demand. Brands can use insights from DataWeave to strategize how to restock their inventory and ease customer demand. Based on data analysis, brands can also determine which products to prioritize on which platforms.

    By Category

    Availability analysis by Category over Time
    • Availability of all five categories was around 52% in Feb’ 22, which steadily increased to 61% until Aug’ 22 and has reduced to reach 55% availability in Sep’ 22
    • Sliced Bread category has seen the most drop in availability by 12% between Jun’ 22 and Sep’ 22
    • The tortilla category has the most rise in availability. It has increased by 16% between Feb-22 and May-22. It also showed an overall rise in availability of 5% from Feb-22 to Sep-22

    By Location

    Availability analysis by Location and Category
    • Across categories, Snacks & Candy had better availability at 73% than Bread & Bakery, with 56% availability.
    • By Location, New Brunswick had more than 65% availability across all three categories; the closest Location is Nova Scotia, with 63% availability.
    • Alberta had the highest availability of 100% in the Snacks & Candy category and the lowest availability of 21% overall in all three categories (weighted aggregate)

    Discounts Analysis

    Several discount-based insights can be studied on e-commerce platforms. From location-based trends, retailer-based trends, and manufacturer-based insights. These insights can help companies make the most of the revenue opportunity while creating an attractive value proposition for the retail consumer.

    By Category

    Discount analysis by Category
    • Discounts of all three categories were around 24% in Feb’ 22, which steadily reduced to reach 15% in Sep’ 22
    • Snacks, cookies & chips category has contributed the most to the drop in discounting, which dropped by 17% between Apr’ 22 and Sep’ 22
    • The Tortilla Category does not have any discount in the month of Jul’ 22

    By Retailer

    • Discount on Bread & Bakery category in Walmart Grocery was around 9% in Feb’ 22. It steadily increased to 13% by Jun’ 22 and thereon reduced to reach 11% availability in Sep’ 22.

    By Location

    • Across Retailers, Nova Scotia had the highest availability of discounts at 22%, whereas New Brunswick had the lowest with discounts at 9% in Bread & Bakery category.
    Discount analysis by Retailers and Locations – Alberta, Ontario, New Brunswick, Nova Scotia
    Note: Analysis does not cover all locations

    Bakery and snack product manufacturers on e-commerce platforms have access to a rich trove of insights they can leverage to benchmark their strategies. They can better understand customer demands, align their supply chain and critically understand the trends impacting their bottom line. Engaging with a third-party platform like DataWeave’s Digital Shelf Analytics  can help brands unlock tremendous value. 

  • Insights from the Digital Shelf of Indian FMCG Brands

    Insights from the Digital Shelf of Indian FMCG Brands

    Analyzing Search, Promotions and Availability for Chocolates, Biscuits, and Malt Drinks across BigBasket, Blinkit, Dmart, Swiggy etc.

    Imagine you log into an e-commerce portal with a list of food items you need for the month. You know what you want, and scroll through the platform to see if there are any discounts. You check competitor products to see if you can get better deals. And within no time, fill your cart with products that you need and proceed to check out. 

    It all happens quickly. It’s an online shopping experience that we are familiar with. But what exactly is happening in the background?

    Brands are tracking and ensuring the highest keyword ranking, optimal availability and competitive discounts to grab your order. And to enable this, Brands rely on Digital Shelf Analytics.

    The FMCG marketplace

    Here, we take a closer look at some of the key factors that Fast Moving Consumer Goods (FMCG) Brands on e-commerce platforms need to pay attention to – to ensure their products appear on the top of search items, to better understand competitor discounts and to monitor the availability of their products across regions.

    FMCG has experienced rapid growth in the last two years, largely attributed to digitalization, changing consumer habits, and increased spending post-pandemic.  Macro factors, including government impetus, inflationary pressures, and consumption recovery, indicate a double digital growth for FMCG brands in the country. According to NielsenIQ’s FMCG Snapshot for Q2 2022, the FMCG industry has grown by 10.9% in the quarter ending June 2022, compared to 6% in the previous quarter.  In the second half of 2022, consumers are expected to spend even more during the festive season. With these shifts underway, the growth opportunities in this sector can only be exploited by companies that can sense trends early – and take appropriate action.

    In addition to providing manufacturers and retailers with actionable insights into e-commerce trends, DataWeave’s tools also allow them to make informed business decisions and ultimately improve their bottom line. Data-driven insights on e-commerce products can help brands optimize their supply chain to maximize sales. A company can determine the key areas that need attention based on an analysis of the availability of products on specific e-commerce channels, associated discounts, as well as zip-code level demand and supply statistics.

    Here are a few sample insights and trend analyses for some popular FMCG brands in the Biscuits, Chocolate and Malt drinks categories spotted by DataWeave.  

    Analytics Methodology: An overview of the data set analyzed

    • Data Scrape period: January 2022 to August 2022
    • Grocery Retailers tracked: Amazon Fresh, BigBasket, Dmart, Jiomart, Swiggy, Milkbasket
    • FMCG brands: Britannia, ITC, Mondelez, Nestle, Parle, Complan, Boost, Amul, Hershey’s
    • Category tracked: Biscuits, Chocolate, Malt drinks


    Availability Analysis

    What is the availability of Biscuits, Chocolate and Malt Drinks on e-commerce portals?

    The availability of a product on an e-commerce marketplace is a key indicator of whether the product meets consumer demands.  DataWeave’s availability analytics can be leveraged by FMCG brands to strategize their inventory and stock planning.  Brands can also make data-driven decisions on product visibility, i.e. identify which products to prioritize on which platforms. 

    • Biscuits had a better availability at 63% when compared to chocolates at 56% across all retailers
    • Dmart and Swiggy had more than 85% availability across all three categories, with Bigbasket coming next at 67% availability 
    • Flipkart Grocery and Blinkit had the lowest availability at 46% and 50%, respectively.
     Figure 1: Availability Scores for Biscuits, Chocolates and Malt Drinks across Retailers

    Which manufacturers have the highest availability of products on e-commerce platforms?

    A study of the availability of products across different manufacturers can reveal brands that have successfully tapped the market opportunity. Here’s a look at brands that have steadily improved their availability on e-commerce platforms.

    Figure 2: Availability Trends for Biscuits across Manufacturers
    • In the biscuits category, all five manufacturers marked approximately 50% availability in Jan 2022. Availability steadily grew to 68% in June 2022, then declined to 63% in Aug 2022.
    • Unibic experienced the largest drop in availability, dropping 15% between May 22 and Aug 22.
    • Mondelez saw the largest rise in availability, an increase of  23% between Mar-22 and Aug-22.
    Figure 3: Availability Trends for Malt Drinks across Manufacturers
    • Except for Boost and Nestle, availability for all seven manufacturers of malt drinks was consistently above 50%. The average availability across all manufacturers rose gradually from 55% in Jan to 63% in Jul-22, followed by a small decline to 57% in August.
    • From 30% availability in January 22 to a mere 7% in August 22, Boost has seen the greatest drop in availability.
    • The availability of Amul has risen the most over the past year, rising from 51% in January 22 to 78% in August 22, hitting 80% in July 22.

    Chocolate: Which manufacturers have the highest availability of products on the e-commerce platforms?

    Figure 4: Availability Trends for Chocolates across Manufacturers
    • Chocolate availability across all manufacturers averaged 47% in Jan-22, reaching a peak of 64% in May-22 and dropping to 51% in Aug-22.
    • From 46% in Jan-22 to 74% in May, Mondelez saw the biggest increase in availability, followed by a decline to 68% in August.
    • Ferrero experienced one of the sharpest drops in availability. Although the brand’s availability steadily grew from 77% in Jan 22 to 94% in Jul 22., it registered a steep drop to 49% in August. 

    The drop in availability hurts the Brand’s eCommerce in two ways. Not only does the Brand lose sales directly. But poor availability also impacts the keyword search ranking, which further hurts the sales.

    Check out DataWeave’s Digital Shelf Analytics Product for insights on how Availability tracking can help reduce stock-outs and boost sales. Click here to know more.

    Discount Analysis

    Location-based, retailer-based, and manufacturer-based discount trends can be analyzed. These studies can help companies plan attractive and appropriate promotional and discount strategies to enhance their revenue opportunities. 

    Which manufacturer has been offering the most discounts?

    A study of discounts offered across manufacturers for chocolates, malt drinks and biscuits indicates that some brands have increased their discounts while others have reduced their discount rates. These decisions could be triggered by demand, availability, and production cycle. Parle, for example, has steadily reduced its discount rates. 

    Figure 5: Discount Rate Trends across Manufacturers

    Average discount rates across manufacturers were around 9% in Jan 2022 and rose steadily to reach 14% in Jul 2022. A small decline is observed post-July, with a 12% discount rate registered in Aug 2022.

    • In the biscuit category, Unibic offered the biggest discount of 28%, followed by ITC at 20%.     
    • In the Chocolate category, Hershey’s offered the largest discount of 14%, followed by ITC at 12%.
    • In the Malt Drink Category, Amul offered the largest discount of 16%, followed by Boost at about 10%. 

    Check out DataWeave’s Digital Shelf Analytics Product for insights to respond to Competitor’s pricing and promotions. Click here to know more.

    Share of Search Analysis

    Which brands feature within the top 5 on the first page of the search?

    A product that appears within the top 5 items on the first page of a search, has a higher probability of being purchased. Below is a study of the share of the search for biscuits across manufacturers and retailers. 

    Figure 6: Share of Search for Biscuits across Manufacturers and Retailers
    • Britannia dominates the top ten share of search across different online retail platforms.
    • Mondelez has the highest share of search at 62% in Amazon Fresh, whereas Parle-G has the lowest share of search at 7%.
    • In Bigbasket, Britannia has the highest search share of 62%, whereas Parle-G has the lowest search share of 7%.

    Check out DataWeave’s Digital Shelf Analytics to track the Share of Keyword and Navigation Search. Click here to know more.

    Conclusion

    FMCG is a rapidly evolving industry sector with a high potential for growth in the coming years. FMCG brands must compete with one another to fully tap this market opportunity on several factors to ensure that their products are visible, available, and attractive to consumers. Digital crawling and big data technologies have enabled manufacturers and retailers to collect publicly available e-commerce data for useful, actionable insights and trend analysis. To stay competitive, it is crucial for manufacturers and retailers to engage with analytics and data experts to seamlessly integrate e-commerce analytics into their short- and long-term business strategies. Whether it’s building keywords to increase the share of search, knowing the right discounts to attract customers in a particular city or increasing the availability of products on specific e-commerce platforms, companies need to invest in the right data intelligence!

    DataWeave for FMCG Brands

    DataWeave has been working with global CPG/FMCG brands, helping them drive their growth on eCommerce platforms by enabling them to monitor their key metrics, diagnose improvement areas, recommend action, and measure interventions’ impact. DataWeave’s KPIs enable Brands to fill in the blind spots in their funnel data and allows them to respond to competitors on a near-real-time basis.

    If you want to know to learn how your brand can leverage DataWeave’s data insights and improve sales, then click here to sign up for a demo

  • The Rapid Rise of Alcohol eCommerce in the UK

    The Rapid Rise of Alcohol eCommerce in the UK

    Alcohol eCommerce has been rapidly growing over the years, and like a lot of other industries, the pandemic accelerated its growth. Convenience, safety & home delivery became important criteria for customers in the post pandemic era and so the sale of alcohol via eCommerce went up. Kantar reported that UK booze sales were up £261m & online and convenience stores were the biggest winners. The latest IWSR Drinks Market Analysis Report 2022 reported on another interesting trend – when ordering alcohol online, consumers prefer using websites v/s apps in most parts of the world except China and Brazil. In the UK the largest chunk of online alcohol purchases happens on a retailer website instead of an app. 

    Platform used for last online alcohol purchase. Source

    To get a better understanding of this, we tracked 2 grocery retailers and 3 grocery Q-Commerce apps in the UK to get insights into Alcohol sales, pricing, trends & more! 

    Methodology

    • Data Scrape time period: Feb 2022 – June 2022
    • Grocery Retailers tracked: Tesco & Ocado
    • Grocery Apps trackedGorillasWeezy & Getir
    • Category tracked: Alcohol

    Which retailer was the Price Leader in the alcohol category? 

    Before the pandemic Tesco was the only Big 4 retailer to increase their alcohol market share & Waitrose was the biggest loser, with its share of booze sales falling from 5.4% to 4.7%. Maintaining Price Leadership is a critical element and plays a big role in increasing sales & market share because consumers will buy the most competitively priced product. We wanted to track and see which retailer was the Price Leader in the alcohol category – i.e., had the most number of lower-priced items in the alcohol category. We also wanted to see if & how Tesco’s position had changed post pandemic. 

    Price Leadership
    • Tesco enjoyed price leadership in the Alcohol category from Feb – June 2022 with 38.9% products priced the lowest. This, followed by Ocado at 33.8%. Gorillas had price leadership for the least amount of products in the alcohol category at 5.6%. Tesco was the clear winner! 
    • Tesco’s Price Leadership kept declining through the months though – at the beginning of the year in Feb, Tesco had 44% products priced the lowest but by June, that number fell to a little over 36%. Ocado showed a reverse trend – in Feb they had price leadership on 32% items and by June that number rose to 35.3%.
    • One player Tesco could’ve potentially lost price leadership to was Getir. In Feb, Getir had price leadership on only 8.2% products but that increased gradually over the months to land on 14.5% in June. 

    Which retailers focused on Discounts to perk up alcohol sales? 

    Discounts are a great way to draw in inflation-hit shoppers. Loyalty card discounts, reward vouchers, and other promotional strategies retailers offer help make their products more competitive & attractive to customers. To stay competitive, retailers need to be aware of the discounts their competition is offering. They also need to understand the risk of deep discounting and the impact on margins. We wanted an insight into alcohol related discounts in the UK so we dug into our data. Here’s what we saw. 

    Average discounts across months by retailers
    • A host of European and UK based startups like Jiffy, Dija, Weezy, Zapp, Getir & Gorillas launched with the promise of delivering groceries the fastest & cheapest
    • Our data showed that Gorillas offered discounts in line with the competition, however, Getir likely went the deep discounting route. 
    • Getir offered the highest discounts across all months. And in the month of April they offered almost 9% more discount than Ocado – the retailer with the 2nd highest discounts. 
      Like we discussed above, Getir gained price Leadership from Feb to June. Deep discounting could have potentially played a role. 
    • Gorillas on the other hand had the lowest, almost non-existent discounts.

    Let’s look at Price Index trends across 5 months 

    We tracked the Price Index (PI) across these 5 retailers to measure how alcohol prices changed over a 5 month period from Feb – June 2022. 

    Note: Retailers selling at the 100% mark were selling at an optimal price & did not undercut the market. The pricing sweet spot is 95% – 105%. Anything lower would compromise margins, and higher would mean the retailer was not competitive. 

    Price Index across months by retailers
    • Weezy had a Price Index that was the most optimal, sitting in the 100% – 102% range.
    • Gorillas had the lowest Price Index, between 89% – 91%.
    • Getir had a low price index in Feb (96.1%) but slowly kept increasing to cross 110% in April, May & June.
    • What was interesting to see was the competition between the 2 retail giants Ocado & Tesco. Ocado had a lower price index at the start of the year at 105.1%, while Tesco was at 109.8%. In the subsequent months, Ocado kept increasing prices to be competitive with Tesco and Tesco decreased prices to likely match Ocado’s pricing. By June BOTH Tesco & Ocado had the exactly the same price index – 108.7%

    Which retailers were the quickest to make price changes?

    Competitive pricing is critical to eCommerce success. Competitive pricing involves tracking your competitor’s pricing & strategically tweaking your own prices without hurting margins. We tracked the month-wise average Price change from Feb – June across all 5 retailers to see which retailer was making price changes and at what frequency. 

    Average price change across months by retailers
    • Most retailers did not make massive prices changes, they were ballpark competitive with each other from a pricing standpoint. 
    • However, Gorillas made significant changes in the month of March when they dropped prices by 3.8% and in May when they increased prices by 5.5%!
    • In May, the same month Gorillas made a big price hike, Weezy dropped their prices significantly by 10% widening the gap between the 2 retailers. 

    Which retailers avoided lost sales by maintaining stock availability?

    Having a near real time view on stock availability is crucial to driving sales. Customers can buy products only when they’re available! So, we went ahead, looked into our data to see how each of these retailers managed stock availability from Feb to June.

    Average availability across months by retailers
    • Our data showed varying availability levels across retailers with Ocado having the highest availability across all 5 months. They had a robust stock at the beginning of the year at 100% but kept dwindling through the months to land at 95.8% by June. 
    • Tesco had a sharp drop in availability in May & June – from 97% at the beginning of the year to the 92-93% range.
    • Gorillas had the lowest availability across months between 90 & 94%.
    • Weezy consistently maintained availability at 95% across all 5 months.

    Conclusion

    For the most part, the UK market has a positive outlook towards buying alcohol online thanks to changes to shopper behavior arising from the pandemic. As per the IWSR Drinks Market Analysis Report 2022 in website-led markets, such as the UK, breadth of product range is important to customers along with price. These 2 play a key factor in purchase decisions. By contrast, consumers in app-driven markets have different preferences. While price matters, it is less important than convenience and speed. 

    As an alcohol retailer, if you need help tracking your competitor prices, discounts and product assortment, reach out to the team at DataWeave to learn how we can help!

  • 5 Ways to Manage and Improve Stock Availability

    5 Ways to Manage and Improve Stock Availability

    Stock availability is the degree to which a brand or retailer has inventory of all their listed items to meet customer demand. Product availability becomes even more critical when they have to respond to unforeseen changes in demand and supply. To maintain the ideal stock availability levels for all items, they need robust inventory management tools to ensure real-time updates on current stock and accurate insights into upcoming demand.

    However, managing stock availability is not a clear-cut science. Retailers must balance the change in demand and keep stock availability in check

    Why Stock Availability Matters

    One of the challenges of running a retail business is to optimize inventory and associated costs. Maintaining stock availability in stores is critical for offline retail businesses. And when selling online, making sure products are available across different retailers and marketplaces can have a huge impact on sales and conversions. 

    1. Understocking: It’s when a brand’s product fails to meet consumer demand. If this happens often enough, customers may not return to the brand’s website or app because of the initial experience. Understocking is not a brand’s fault entirely since they might not always be able to anticipate a change in demand. However, it’s about a their ability to adapt to a quick change in the market trends through historical analysis and accurate forecasting. 
    2. Overstocking: It’s when a company orders too much inventory. Holding too much stock will lead to higher storage costs, shrinkage, and obsolescence losses. Another loss occurs if the brand can’t quickly sell the items — diminishing the value of the products. 

    We gathered data to see the impact of a short-term stockout on Amazon for one of our customers. Read more about what we uncovered & how deep the damage was, here.

    7 Ways to improve stock availability 

    1. Collect Accurate Data

    Availability across Brands and Categories

    When multiple items are moving through a supply chain, companies can easily run into inventory inaccuracies. Discrepancies between the values of your system and the actual inventory of products can lead to understocking or overstocking. The best way to avoid discrepancies in inventory is to invest in an inventory management tool that gives you real-time updates on your stock. This is applicable for offline retail businesses. 

    2. Managing eCommerce inventory

    Availability at Individual Product Level
    Availability at Individual Product level by regions

    Effective eCommerce inventory management is as important as making sure products are available in stores. Keeping track of your inventory levels and ensuring that you’re always well-stocked can avoid lost sales and keep your company running smoothly. Brands must ensure their stock is available across all the online platforms they sell. Access to real-time inventory data can help to keep a close eye on stock status across all marketplaces & retailers the product is available. Retailers also need to keep track of market trends to ensure they have the right inventory assortment to match customers’ demands. 

    3. Understand Consumer Demand

    The only way to accurately predict future demand is to rely on historical data about your customer purchase trends. What do your customers purchase during holiday seasons? What are the upcoming trends in your category? Having data-backed answers to such questions will help brands and retailers properly stock up their inventory.

    4. Adequate forecasting 

    Anticipating demand will help determine which products should be stocked during which seasons. Tracking past sales and metrics such as economic conditions, seasonality, peak buying months, and promotions will help brands predict demand. Analyzing such statistics will also help you get insights into the target market.

    Availability across regions

    5. Improve supplier relationships

    It’s important to rely on a supply chain that delivers your shipment promptly. In fact, you should foster close relationships with your suppliers to trim costs and improve stock availability. You should be able to share key details such as future demands, so suppliers can ensure timely delivery. 

    Availability Analysis
    Availability Analysis across Retailers and Categories

    Consequences of Inefficient Inventory Management

    What are the effects of overstocking?

    Tied-up cash: Money spent on overstocking is tied-up money that your company could have put to better use. You can use it to pay off debts, wages, and rent. Inventory often has a limited shelf life due to material degradation, changing consumer trends, spoilage, and obsolescence.

    Product expiration: If your brand offers time-sensitive goods or perishable items, overstocking can lead to product obsolescence and expiry. eCommerce platforms that also sell time-sensitive goods or grocery delivery apps are forced to sell products at below-margin prices to free up resources, leading to losses. 

    What are the effects of understocking?

    Poor customer experience: Poor product availability will lead to low customer satisfaction & dropping customer loyalty. 

    Missed sales: Customers could gravitate towards the competition to make their current purchase if a product is unavailable at your online store. The more freequent the stockouts, the more lost sales. 

    Conclusion

    To avoid the knock-on effects of overstocking and understocking, companies need a real-time view of their inventory, both online & offline. At DataWeave, we help companies decrease their latency period between stock replenishment and efficiently plan their supply chain. If you need help tracking your eCommerce product availability, reach out to the experts at DataWeave to know how we can help!

  • 5 Ways DataWeave Helps Brands Drive Growth With Amazon Ads

    5 Ways DataWeave Helps Brands Drive Growth With Amazon Ads

    Consumers are discovering and trialing new eCommerce marketplaces, brands and products at a faster rate than ever before, given the vast amount of choices encountered browsing for products online. A recent analysis shows how events like Amazon Prime Day, Black Friday, and Cyber Monday are especially fruitful for new-to-brand customer advertising, encouraging B2C marketers to increase their digital advertising spend to fuel product discovery, sales and market share for their brands.

    Amazon advertisers grow market share and brand loyalty with ecommerce intelligence
    DataWeave joins Amazon Advertising partner network

    The majority of eCommerce consumers are discovering products via relevant keywords attributable to their needs, with most clicks happening on page one results for the first few products listed. Simplifying the digital shopping experience is critical for brands to be in the consideration set for the majority of consumers who won’t venture past page one results. 

    An internal analysis conducted shows getting a product to page one on retailer websites can improve sales by as much as 50 percent, but figuring out the right levers to pull to get there organically—without paid advertising—is a real challenge, especially given fast-changing algorithms. While more than half of all retail related online browsing sessions are “organic”, sometimes brands need to boost their product visibility by investing in sponsored (paid) opportunities to improve a product’s rank.

    Data analytics can equip brands with intelligence to help them decide when, where, and how to make digital advertising investments profitably, while simultaneously acting on insights that help drive organic growth. Considering a majority of U.S. consumers begin their product discovery on marketplaces like Amazon, it makes sense for brands to prioritize digital advertising opportunities with Amazon.

    Maximize Return on Ad Spend (ROAS) with Amazon Ads

    Brands use Amazon Ads to drive brand awareness, acquire new customers, drive sales and gain market share, with the goal of furthering their marketing return on investment. Top performing advertisers average 40 percent greater year-on-year (YoY) sales growth, 50 percent greater YoY growth in customer product page viewership on Amazon, and 30 percent higher returns on ad spend (ROAS) with Amazon Ads, according to a recent analysis. Sponsored Products, Sponsored Brands, Amazon DSP and Sponsored Display are among the types of Amazon Ads options cited that produce maximum return.

    Ensuring your product listings appear at the top of page one results on Amazon for the most relevant discovery keywords is therefore the most important determinant for maximizing ROAS. DataWeave has become a vetted partner and measurement provider in the Amazon Advertising Partner Network, with the goal of supporting brands to optimize digital advertising campaigns by providing visibility to Digital Shelf Analytics (DSA) key performance indicators (KPIs), like Share of Search, Pricing and Product Availability, Content Audits, Ratings and Reviews, and Sales Performance and Market Share.

    Below is a summary of how our Digital Shelf solutions, in partnership with Amazon Ads, can improve the performance of your Amazon Ads campaigns

    1. Keyword Recommendations Improve Share of Search

    With the DataWeave Share of Search solution, brands can monitor their placement of both organic and paid discovery keywords relative to their competition. Once your keywords are determined, you are also provided a weighted Share of Search score that helps measure how well each keyword performs relative to product discoverability. Below is an example of insights you’d gain.

    Share of Keyword Search

    Brands can provide their own list of keywords to monitor, or through our Amazon Ads collaborative solution, learn which keywords are the “best” for them to measure in the realm of Amazon. Performance results are based on data that shows which keywords consumers are actually using when browsing online alongside other keywords brands request to measure. Users are able to see exactly which keywords are most popular, competitive (and even unexpected), and relevant at an Amazon Standard Identification Number (ASIN) level of granularity. 

    We can also estimate the degree of relevance and estimated traffic for the recommended keywords. Brands can then use these insights to adjust campaign strategies based on these parameters, which can boost product discoverability and rank visibility. A brand could assume people find its products by brand name, yet traffic insights may reveal a majority of people look for a generic product type before they end up buying that particular brand. 

    2. Content Audits Increase Discovery Relevancy Scores

    Strong product content is critical to succeeding on Amazon. Thorough, accurate, and descriptive content leads to better click through rates (CTR), conversion rates, more positive reviews, and fewer returns, which results in increased discoverability. DataWeave’s Content Audit solution reviews existing copy and images on a per-attribute basis to highlight any gaps essential to improving visibility, as seen in the example below.

    Content Analysis

    To further growth, it is equally as important that your product content aligns with your advertising strategy. With Amazon Ads partner add-on, our solution can also audit your content to measure how effectively you are incorporating Amazon Ads keywords into your product content to enhance discovery relevancy.

    3. Discover More Opportunities with Pricing and Product Availability Insights

    Quality content and keyword updates will only get you so far if your products are not consistently available and priced competitively. With DataWeave’s Pricing and Promotions and Product Availability modules, advertisers can monitor their selling prices and availability trends alongside their competitors to uncover more opportunities to incorporate into advertising campaigns, as seen in the Pricing and Promotions dashboard example below.

    Promotion Analysis

    Additionally, product targeting recommendations can be utilized to target a competitor’s ASIN that may be overpriced or that is having issues staying in stock. Alternatively, broaden your strategy to target specific brands, complementary products, or category listing pages.

    You can also create alerts on your own products to monitor when items are low on inventory or out of stock to ensure key products are consistently available when customers are shopping.

    4. Leverage Ratings and Reviews to Increase Conversion

    Product ratings and reviews are also a critical component to running a successful Amazon Ads campaign. A large number of reviews and a positive star rating will provide customers with the confidence to purchase, resulting in higher conversion rates. Conversely, negative feedback can have a detrimental impact, resulting in lost sales and wasted ad spend. DataWeave’s Ratings and Reviews module can help you monitor your reviews and extract attribute-level insights on your products. This information can then be utilized to further optimize your advertising strategy.

    If you see consistent feedback in your reviews on aspects of a product not meeting customer expectations, address them in your product content to prevent potential misplaced expectations. Alternatively, if customer reviews are raving about certain product features, ensure these are promoted and relevant keywords are populated throughout your descriptions and feature bullets. Below is an example of insights seen within the DSA Ratings & Reviews dashboard.

    Ratings and Reviews

    5. Correlate Digital Shelf KPIs to Sales Performance and Market Share

    The newest DSA module, Sales Performance and Market Share, provides SKU, sub-category, and brand-level sales and market share estimates on Amazon for brands and their competitors, via customer defined taxonomies, to easily benchmark performance results.

    This data can also be correlated with other Digital Shelf KPIs, like Content Audit and Product Availability, giving brands an easy way to check the effect of attribute changes and how they impact sales and market share. Similarly, brands can see how search rank, both organic and sponsored, affects sales and market share estimates.

    Understanding the correlation between your advertising campaigns and your Digital Shelf brand visibility will help you identify which areas to prioritize to drive sales and win more market share.

    Digital Shelf Insights Help Brands Win with Amazon Ads

    The need for access to flexible, actionable eCommerce insights is growing exponentially as a way to help brands drive growth, increase their Share of Voice, and to gain a competitive edge. As a result, more global brands are seeking Digital Shelf Analytics for access to near real-time marketplace changes and to develop data-driven growth strategies that leverage pricing, merchandising, and competitive insights at scale.

    By monitoring, measuring and analyzing key performance indicators (KPIs) like Sales Performance and Market Share, Share of Search, Content Audits, Product Availability, Pricing and Promotions and Ratings and Reviews alongside competitors, brands will know what actions to take to boost brand visibility, customer satisfaction, and online sales. 

    DataWeave’s acceptance into the Amazon Advertising Partner Network enables Amazon advertisers to effectively build their Amazon growth strategies and determine systems that enable faster and smarter advertising and marketing decision-making to optimize product discoverability and overall results.

    Connect with us now to learn how we can scale with your brand’s analytical needs, or for access to more details regarding our Amazon Ads Partnership or Digital Shelf solutions.

    UPDATED: Read the full press release here

  • Prime Day India 2022 – highlights from the 2 day annual shopping festival!

    Prime Day India 2022 – highlights from the 2 day annual shopping festival!

    Amazon India’s much-awaited annual two-day shopping event, Prime Day, kicked off with a bang on July 23rd & 24th this year & was one of the most successful Prime Day events yet! Amazon reported that more than 32,000 sellers saw their highest ever sales day during the event. Interestingly 70% of these sellers who received orders during Prime Day were based in Tier 2 cities in India, further validating how the post-pandemic eCommerce boom has spread across the country. Also, Indian exporters saw 50% business growth on Amazon on Prime Day as customers across markets like North America, Europe, Australia, and Japan continued to purchase Made In India products.
    It was a great 2 days for Indian sellers, but what about customers who were waiting in anticipation for the great deals typically offered on Prime Day? We dug into our data to take a look at the deals, discounts, and brands that shone bright on Prime Day in India.

    Methodology

    • In addition to Amazon IN, we also tracked Flipkart on 23 & 24th July 2022, on Prime Day.
    • Categories tracked – Electronics, Grocery, Fashion & Beauty.
    • We looked at Additional Discounts offered on Prime Day: Additional Discount is the extra discount on an item during Prime Day when compared to the Pre-Prime Day price. 
    • We also looked at Post Prime Day Discounts, which were the discounts offered after the 2-day event ended.

    Amazon v/s Flipkart – who offered better discounts?

    Prime Day discounts are legendary. And across the globe, during Prime Day retailers try and compete to see if they can offer better deals than Amazon. Forbes even published an article on the 36 Prime Day competitor sales that were way more enticing than what Amazon had to offer. In India, we wanted to see if Amazon’s homegrown rival Flipkart might give it a tough fight, so we tracked the volume of discounts across categories on both retailers. 

    Discounts on Amazon & Flipkart across categories
    Discounts on Amazon & Flipkart across categories
    • Out of the 4 categories we tracked, in spite of Prime Day, Amazon offered discounts higher than Flipkart in only 2 categories – Electronics & Beauty. 
    • … while Flipkart offered higher discounts than Amazon in the Grocery & Fashion category. For groceries, Flipkart offered a 3.2% additional discount v/s 2.2% on Amazon. However, in the Fashion category, the difference was marginal – 8.1% on Amazon v/s 8.6% on Flipkart
    • Post-event, both Amazon & Flipkart went back to the original pre-event prices. This made it clear that Flipkart was tracking and making price changes based on their closest competitor. It’s what smart eCommerce businesses do to stay ahead in the race. 
    • Interestingly, post-event, in the fashion category, not only did Amazon revert to the original pre-event price, they even increased prices by close to 2%.

    Let’s take a look at discounts across 4 categories & the Brands that WON in each category.

    From Electronics to Fashion, Beauty & Groceries, let’s deep dive into the data to see which products were highly discounted within each category and brands that sprinted ahead to win the race on Amazon on Prime Day 2022.

    ELECTRONICS

    Tech publication Gadgets360 reported on the biggest Smartphone deals right from Brands like Samsung, Redmi, Oppo, and more. There were some fab deals on earphones too with Boat taking the lead. We wanted to take a look at electronics on Amazon and see which products had the heaviest discounts & if discounts were more lucrative than Prime Day 2021

    Discounts on Electronics on Prime Day
    Discounts on Electronics on Prime Day
    • Amazon India released highlights from Prime Day and reported that Smartphones & Electronics were among the categories that saw the most success in terms of units sold.
    • From the 6 product categories we tracked within electronics, we saw the highest additional discounts on Smartwatches (13.4%), followed by Bluetooth headphones (10.5%)
    • TV, Smartphones, cameras, and laptops had an additional discount of between 3 – 5.5%

    ELECTRONICS Brands that had the highest Share of Search on Amazon during Prime Day

    Research shows that on Amazon, the first 3 products garner 64% of business generated. This is why it is critical for brands to appear in the top few listings when consumers are searching for products. Being on top helps shoppers find your brand with ease & increases the chances of a sale. 

    On Prime Day 2022, Amazon India reported that the top-selling consumer electronics brands were HP, Lenovo, Asus, and Boat to name a few. Our assumption is, these brands must’ve had a high Share of Search (SoS), which played a massive role in increasing sales, so we looked into our data to see which brands had the highest SoS against specific keywords related to electronics. 

    Brand Visibility against the Keywords
    Brand Visibility against the Keywords
    • Our data aligned with what Amazon reported. HP had high sales, perhaps because they occupied the premium #1 spot in the laptop category with a 44% SoS! Simply put, this means of the 100 laptops that appeared on a page, against a search for the keyword laptop, 44 products were listed by HP! Consumers always gravitate towards buying products they can find with ease
    • Lenovo had a 32% SoS for Laptops. Asus at 14% 
    • The top selling smartphone brands reported by Amazon included OnePlus, Redmi, Samsung, Realme & iQOO – our data showed that 3 out of these 5 brands were in the top 5 listings on Prime Day! Redmi had a whopping 30% SoS against the keyword smartphone, Samsung at 15%, and iQOO at 5% – clear validation that a high SoS can positively impact sales.

    BEAUTY & GROOMING

    Now let’s look at discounts in the beauty & grooming category. 

    Discounts on Beauty Products on Prime Day
    Discounts on Beauty Products on Prime Day
    • The highest additional discounts were given on shampoos (9.3%), followed by Lipsticks (6.6%)
    • Shaving kits for men were at an additional discount of 3.4%. Hair gel at 4.9% & Face Masks at 4.3%

    BEAUTY Brands that had the highest Share of Search on Amazon during Prime Day

    Brand Visibility against the Keywords
    Brand Visibility against the Keywords

    In the beauty category, Amazon India reported that top-selling brands included Head & Shoulders, Dove, Biotique, L’Oreal, Sugar Cosmetics, and Mamaearth to name a few. Once again, we looked into our data to see the sort of brand visibility & SoS each of these brands had.

    • All the top-selling brand’s Amazon reported on we noticed appeared in the top 5 search results. 
    • Head & Shoulders & Dove were the top 2 listings against the keyword Shampoo at 26% & 16% SoS respectively. Biotique came in at #5 with a 7% SoS
    • Bombay Shaving Company, Gillette, and Axe were the top grooming brands for men in the Shaving Kit category. 
    • Lakme made a clean sweep with a 19% SoS against the keyword lipstick, which speaks volumes, considering the aggressive competition from D2C beauty brands in India today.

    GROCERY

    According to the New eCommerce in India report by consulting firm Redseer, grocery has been a major contributor to the growth of ecommerce in India & Amazon Fresh used Prime Day to grab a larger piece of that pie! As part of the Prime Day sale, Amazon Fresh also pushed discounts on groceries, as well as fruits and vegetables. We tracked products that fell into the “snack” category, and here’s what we saw.

    Discounts on Snacks on Prime Day
    Discounts on Snacks on Prime Day
    • Given changing lifestyles & healthy food fads, it was no surprise that we saw the highest additional discounts were given on Healthy Snacks (3.2%) & Diet Food (2.7%)
    • Chocolates and chips saw much lower additional discounts at 1.2% each.
    • Drinks were additionally discounted by 2.5% during Prime Day.

    SNACK Brands that had the highest Share of Search on Amazon during Prime Day

    Brand Visibility against the Keywords
    Brand Visibility against the Keywords
    • Cadbury had a 69% share of search against the keyword Chocolate, leaving some of its key competitors way behind. Amul had a 20% SoS, while Hershey’s was at just 4%. 
    • According to an article in the Economic times, YogaBar tripled sales in FY22, which is why we were not surprised to see the brand at #1 when users were searching for “Healthy Snacks” during Prime Day. YogaBar products typically enjoy high visibility year-round, which clearly helped with brand awareness on Amazon & sales.

    FASHION

    Amazon reported that Men’s t-shirts and polos, denims, Kurtis, tops, and dresses for women, designer wear, and clothing for kids were some of the most-loved fashion categories on Prime Day. We looked into our data to see the trends that emerged.

    Discounts on Fashion on Prime Day
    Discounts on Fashion on Prime Day
    • From the categories we tracked, women’s handbags had the highest additional discount (11.8%), followed by watches (9.1%)
    • Sneakers & jeans had additional discounts in the ballpark of 7% and sunglasses at 4.4%

    FASHION Brands that had the highest Share of Search on Amazon during Prime Day

    Brand Visibility against the Keywords
    Brand Visibility against the Keywords
    • Some of the usual suspects made it to the top 5, but what really stood out for us were brands that popped up against the keyword Jeans. While Levi’s came in at #2 with an 11% SoS, 2 Private Label Amazon brands featured in the top 5! Symbol at 27% SoS and Inkast Denim at 9%
    • Against the keyword Handbag, Lavie had a massive lead at 38% v/s the #2 brand – Caprese, at 13%
    • Boat found a #2 spot against the keyword watches, racing way ahead of the age-old popular brand Fastrack at #5 with a 4% SoS.

    Conclusion

    Amazon Prime Day 2022 in India came to a successful close as shoppers across India discovered the joy of the 2 day celebration with the best deals, savings, new launches, and more. Prime members from 95% of pin codes in India made purchases, there were 1000’s of deals and 500+ new product launches from brand partners & sellers. Nearly 18% more sellers grossed sales over INR 1 crore, and close to 38% more sellers grossed sales of over 1 lakh vs Prime Day 2021. Local neighborhood shops that sell on Amazon witnessed 4x sales growth. And start-ups and brands under the Amazon Launchpad program witnessed a growth of 3x. All in all, a successful event for everyone involved! 

  • Prime Day Germany 2022 – highlights from the 2 day annual shopping festival!

    Prime Day Germany 2022 – highlights from the 2 day annual shopping festival!

    In 2022, Amazon sold 300 million products during Prime Day – selling roughly 100,000 items per minute. Since Amazon started Prime Day in 2015 to celebrate its 20th birthday, the shopping festival has grown into a holiday and rivals Black Friday and Cyber Monday in the U.S. and Singles’ Day in China. 

    According to RetailDetail, the leading B2B retail community in Benelux, Amazon is planning a 2nd Prime Day shopping festival in the autumn, just a few months after its annual Prime Day event. The retailer has asked its sales partners to prepare for a promotional event in the autumn where they have until the beginning of September to propose attractive discounts, with at least 20% discounts. This year’s second Prime Day may occur in October, with or without the same name. 

    But before that, let’s examine what happened in Germany this year on Prime Day 2022.

    Methodology

    • We tracked Amazon.de both before & on 12 & 13th July 2022, on Prime Day.
    • Categories Tracked – Electronics, Wine & Spirits, Grocery, Furniture, Fashion, and Beauty. 
    • We looked at Additional Discounts offered on Prime Day: Additional Discount is the extra discount on an item during Prime Day when compared to the Pre-Prime day price.
    • We also looked at Post Prime Day Discounts, which were the discounts offered after the 2-day event ended.

    What kind of Discounts did Amazon.de offer?

    Amazon Prime Day will be significant, especially for customers hoping to get discounts amid soaring inflation. Both Amazon as well as other sources reported that electrical and electronic items were the most popular purchases, followed by general retail products. Electrical and electronics saw the value of transactions soar 90% on the first day. Mobile phones and accessories were the most popular, with transaction values almost doubling to 96% on day one.

    Discounts across Categories on Amazon.de
    Discounts across Categories on Amazon.de
    • Based on trends from past events, Amazon likely knew electronic items were going to be best sellers. Keeping this in mind, they made sure to offer high discounts in the electronics category. They offered a 6.5% additional discount on electronics on Prime Day. And once the sale ended, they continued to discount electronics by 1.3%.
    • The Fashion category also had a fair bit of discounts and came in at a close second at 5.9%
    • Looks like Amazon discounted everyday use items minimally. Groceries had an additional discount of just 1.8% on Prime Day, and wine and spirits had 2% extra discount.  
    Discounts on Electronics Category on Amazon.de
    Discounts on Electronics Category on Amazon.de
    • Within Electronics, in the four categories we tracked, we saw the highest additional discounts were offered on Bluetooth earphones (10.6%) and Smartwatches (9%)
    Discounts on Fashion Category on Amazon.de
    Discounts on Fashion Category on Amazon.de
    • Jeans and Sunglasses had the highest discounts at 8.6% & 7.6% respectively.
    • Sneakers & Watches too had additional discounts of 6.6% on Prime Day.
    • Post the Prime Day event, Amazon retained an average of 1.5% discount across all products in the fashion category instead of pricing them at the original price. 
    • However, in the case of women’s T-Shirts, they increased the price by 1.7% from the pre-event price.

    Discounts across Price Tiers

    Retailers must consider several factors when making strategic discounting decisions, including customer buying behavior, the type of discount offered & the volume of discount offered. The best discounting approach will vary depending on the product and other factors like the original selling price of the product.

    Now let’s compare the discounting strategy Amazon used in the Electronics v/s Fashion category on Prime Day.

    Discounts across Price Ranges
    Discounts across Price Ranges
    • Interestingly, in both the Electronics and Fashion categories, Amazon increased prices for the lowest-end products between the €0-10 range by 3.6% and 13.2%, respectively, during the sale instead of discounting them! Maybe this was a strategy to drive consumers to higher-value products with greater discounts? 
    • Another similarity in strategy was that most of the mid-priced items had maximum discounts. In electronics & fashion both, the maximum discounts were given to products between the € 30-100 range. 
    • Here’s a difference that stood out – for Electronics in the higher price range between €100 – 500, the volume of discounts dropped a bit which meant Amazon gave moderate discounts on high-end electronics. But the trend flipped for Fashion as luxury fashion items were made to look more attractive with higher discounts.

    Monitoring stock availability during key sales days is critical

    Brands need to have the right stock availability, especially during sale events, because more customers shop online during sales. What’s worse, non-availability of products may drive customers to competitors that are stocking the same product.  Out-of-stock situations lead to missed opportunities & lost sales! Let’s take a look at our data and see how Amazon planned product availability across categories on Prime Day. 

    Availability Analysis across Categories on Prime Day
    Availability Analysis across Categories on Prime Day
    • Amazon was betting big on 2 categories – Electronics & Home. This meant they needed to keep a keen eye on availability in these categories, especially since they forecasted the highest sales to be generated here.
      … it was no surprise that the Furniture category had almost 100% availability during Prime Day! Electronics too had a high availability at 94% during the event.
    • Generally, our data showed that availability across multiple categories we tracked seemed robust and above 80% in more cases. Only Beauty & Grocery had 79% availability.

    Conclusion

    Prime Day sales reached an estimated 12 billion U.S. dollars worldwide, 9.8% higher than last year, making it the most successful shopping event in Amazon’s history. If you’re a brand selling on Amazon or a retailer trying to compete with Amazon, reach out to us at DataWeave to know how we can help!

  • Prime Day UK 2022 – highlights from the 2 day annual shopping festival!

    Prime Day UK 2022 – highlights from the 2 day annual shopping festival!

    Prime Day launched in 2015 as a celebration of the 20th anniversary of Amazon’s founding & has quickly become the biggest shopping event of the year for Amazon. Prime Day is a great opportunity for customers to snag fantastic deals on products they might not otherwise consider buying. Last year, Amazon Prime Day was a tremendous success, with Prime members spending billions of dollars on discounted items. In 2022 alone, global sales during the event reached a new record high of $12 Bn.

    18 countries participated in Prime Day this year, including the US. We did a deep dive into what happened in the UK – the discounts Amazon offered and categories with the highest discounts as well as checked to see if other retailers tweaked their pricing strategy to compete with Amazon on Prime Day.

    Methodology

    • In addition to Amazon UK, we tracked some key retailers on 12 & 13th July 2022, on Prime Day.
      Retailers tracked – eBay UK, OnBuy, Selfridges, ASOS.com, Net-A-Porter 
    • Categories tracked – Electronics, Wine & Spirits, Grocery, Furniture, Fashion, Beauty. 
    • We looked at Additional Discounts offered on Prime Day: Additional Discount is the extra discount on an item during Prime Day when compared to the Pre-Prime day price. 
    • We also looked at Post Prime Day Discounts, which were the discounts offered after the 2-day event ended.

    Did other retailers compete with Amazon on Prime Day?

    Traditionally, as Amazon’s Prime Day sale approaches, other retailers adjust their prices by offering summer deals or getting creative with offers. However, we did not see aggressive strategies from other retailers this year. In the US, Walmart always has a sale during Amazon’s Prime Day. The Wall Street Journal reported that Walmart announced there wouldn’t be an annual promotional event on Prime Day 2022 this year.

    Another report published by Forrester stated that major retailers scaled back their promotions, and overall offers from other retailers were less than impressive. We took a look at the data we gathered in the UK to see if this trend aligned. 

    Discounts offered on Prime Day on Amazon v/s other retailers
    Discounts offered on Prime Day on Amazon v/s other retailers
    • Our data showed that most retailers we tracked offered negligible discounts (in the range of 0.1 – 1.5%) and did not really try and compete or match the discounts Amazon was offering. 
    • However, ASOS was the one retailer that competed heavily with Amazon in the Fashion & Beauty category. While Amazon offered an average additional discount of 7.7% in the Fashion category, ASOS offered 13.2%. And in the beauty category, Amazon offered 6.7%, while ASOS offered 15.2%.
    • When we looked at post-prime day discounts, we saw that as soon as Prime Day ended, ASOS went back to the original price and stopped offering a discount which clearly shows they were keeping an active eye on out their competitors pricing. In fact, ASOS was offering up to 80% off almost everything on the site until Prime Day.

    Which were the popular categories that offered the most discounts?

    During Prime Day, shoppers saw tons of deals on essential gadgets. Tech deals were a massive hit and saw big discounts on everything from TVs, laptops, smartwatches, phones, and tablets. We look at the data we collected to see if we saw a similar trend. 

    Discounts on Amazon UK across categories
    Discounts on Amazon UK across categories
    • Amazon offered discounts across categories and reported that some of the best-selling categories were Consumer Electronics & Home. 
    • Our data too showed that the highest additional discounts were offered in electronics – Bluetooth Earphones at 18.4%, followed by Smartwatches at 14.9% and Laptops as well as Cameras, both at 12%.
    • Low discounts were offered on Alcohol, with Beer at 0.9% and Wine at 1.3%, respectively.
    • Relatively attractive discounts were seen in the Fashion & Beauty category – Sunglasses (9.1%), Shampoo (9.7%), & Watches (9.4%)
    Discounts on Amazon UK in the Electronics category
    Discounts on Amazon UK in the Electronics category

    Electronics being the hot favorite – we wanted to deep dive into the data and get more insights on Amazon’s pricing & discounting strategy here. Discounts can entice customers to buy more, encourage customer loyalty, or clear out old inventory. However, businesses must be careful since too much discounting can eat into profits. They also have to be mindful of which products should be discounted and by how much. 

    • Our data showed that the highest discounts (between 13 – 18%) were given on electronics priced between the £ 20-100 price range.
    • Electronics priced higher, between the £ 100 – 500 pound price range, were discounted less than 10%
    • However, high-value premium electronics over £ 500 were discounted slightly above 10%

    How did Amazon manage stock availability during Prime Day?

    Keeping track of inventory is especially important during big sales like Prime Day when thousands of customers are actively looking for deals.  There’s nothing worse than them finding the item they wanted is out of stock (OOS). OOS leads to lost sales, a situation that must be avoided at all costs. Read about how a small short term stock out on Amazon led to long term negative impacts for one of our customers. And let’s also look at the data and see what product availability looked like on Prime Day.

    • Overall, Amazon maintained robust availability across categories, and re-stocking was constant both before, during & after the event. 
    • Furniture, Fashion & Electronics had the highest availability. No surprise there since Amazon estimated that Home/ Furniture would be one of the best-selling categories.
    • Grocery saw average availability – perhaps cause some of these products are perishables, so it’s best to be mindful about overstocking.

    Which Brands Won on Prime Day?

    If there is one thing to remember about improving your product visibility on Amazon, it’s that it all boils down to the usage of the right keywords. Using relevant keywords makes your product appear higher up in search when customers are running searches on Amazon for those products. And the higher up a product appears in search, the higher the chances of a sale! 

    Let’s take a look at some popular categories and which brands had the highest Share of Search (SoS) during Prime Day.

    • Corona, San Miguel, and Becks were the top 3 brands optimized for the keyword Beer. However, what’s really important to note is both Corona & Becks had 20% SoS that was completely organic. San Miguel had a 20% SoS too, but it was sponsored ads that gave them this artificial boost. 
    • While a whole bunch of other brands had a 10% SoS most of them achieved this via Sponsored Ads. Youngever was the only brand that achieved this completely organically. They must have made sure they optimized key KPIs like content, ratings & reviews & product availability to achieve this result.
    • There were deep discounts on a wide range of Lenovo laptops. For example, the Lenovo IdeaPad duet Chromebook and Lenovo IdeaPad Flex 3 Chromebook were available at £100 off. Our data, too saw Lenovo & Asus fight for the top spot.
    • Asus sponsored 28% of products before Prime Day, hoping to capitalize on the pre-sale frenzy. During the event, they sponsored only 13% of products, bringing down their total SoS from 31% before the event to 13% during the event. 
    • Lenovo followed the opposite strategy; they sponsored just 6% of products before the event and during the event sponsored a whopping 25% which made them “almost” dominate the Laptop category during Prime Day.
    • Then there was Microsoft, with the highest SoS at 38%, of which all of it was organic!
    • The Smartphone SoS battle was clearly between Samsung & Xiaomi. Samsung was a consistent #1 at all 3 time periods (Before, During & After Prime Day) with the highest total SoS. Xiaomi came in at a close second. 
    • Samsung had an exciting strategy – they went heavy on sponsorships before and after the event. Their sponsored SoS was 31% & 39% respectively. And SoS of 13% during the event. 
    • Xiaomi’s strategy was just the opposite. Their sponsored SoS was 16% before the event. And 17% after the event, which was moderate compared to their Sponsored SoS during the event at 25%, which was much higher than Samsung’s 13%
    • Critical to note, Xiaomi’s organic search visibility before, during, and after the event was 0%. It definitely should be a concern area for any brand.
    Share of search
    Share of search
    • Both before & after the event, Cadbury had the highest visibility for the keyword Chocolate. During the event, they were not in the top 5 brands.
    • During Prime Day, Nestle won the top spot and had a 29% SoS. However, before the event, they were at #3 and after at #2. Artificially boosting visibility might’ve had something to do with this.

    Conclusion

    Prime Day sales reached an estimated 12 billion U.S. dollars worldwide, 9.8% higher than last year, making it the most successful shopping event in Amazon’s history. If you’re a brand selling on Amazon or a retailer trying to compete with Amazon, reach out to us at DataWeave to know how we can help!

  • UK Grocery Pricing Wars in 2022! A quick look at Pricing Data we gathered from 5 Grocery retailers in the UK

    UK Grocery Pricing Wars in 2022! A quick look at Pricing Data we gathered from 5 Grocery retailers in the UK

    Grocery sales in the UK are dominated by the “big four” – Tesco, Asda, Sainsbury’s, and Morrisons. A Statista report on these Grocery Giants as of May 2022 indicates that Tesco, Sainsbury’s, and Asda own approximately 27%, 15%, and 13% market share of grocery stores in the UK. Whereas Ocado and Symbols & Independent have the lowest market share, 1.8% each.

    However, the grocery delivery market is seeing a major shift because of new-age Quick Commerce companies that have swooped into the already crowded grocery space offering super-speedy home delivery! These new entrants added to the already competitive Grocery market & price wars intensified. Customers today rely on ultra-fast delivery services for their grocery requirements. For example, Berlin-based Gorillas charges £1.80 to deliver anything from a £7 pizza to a 30p apple — with no minimum order value. 

    Investors funded over £5B in grocery delivery apps such as Getir, Gorillas, Zapp, Fancy, Dija, Weezy, Jiffy, and Beelivery, in the UK. These rapid grocery delivery apps offer shorter delivery times, as low as 10 minutes, along with deep discounts to attract customers. For example, Gorillas, Weezy, and Getir all claim a 10-minute delivery time and offer promotional codes for the first couple of orders. Customers also get discounts for inviting friends and family.  

    To get more insight into the Grocery space in the UK, we tracked 5 Grocery retailers & Q-Commerce companies to try and understand trends wrt pricing in this competitive environment. Let’s take a look at what our data found & which retailer won the competitive pricing tug of war. 

    Methodology

    • Data Scrape time period: January 2022 – June 2022
    • Grocery Retailers tracked: Tesco & Ocado
    • Grocery Apps tracked: Gorillas, Weezy & Getir
    • Categories tracked: Alcohol, Drinks & Beverages, Fresh & Frozen, Grocery, Health & Wellness, Home Care, Packed Food & Snacks, and Smoke shop.

    Grocery Giants v/s Grocery Delivery apps – who was the Price Leader?

    Price leadership by category
    Price leadership by category
    Price leadership across months by Retailer
    Price leadership across months by Retailer

    We wanted to track and see which retailer was the Price Leader – i.e., had the most number of lower-priced items in a particular category. Our data clearly showed that the Grocery Giants Ocado & Tesco won hands down! Interestingly, Ocado launched a new Ad Campaign earlier in Jan this year about bringing value to the table for customers with quality products at affordable prices – seems like they’re taking this new promise very seriously! 

    • Tesco and Ocado were price leaders in maximum categories when compared to Gorillas, Weezy, and Getir. 
    • Between Tesco & Ocado, Ocado enjoyed price leadership across all these categories for 4 out of the 6 months we tracked pricing for. Tesco occupied the top slot for just the balance 2 months. 
    • Tesco was the price leader in the Alcohol category, with close to 40% of products priced the lowest compared to other retailers. They were also price leaders in the Smoke Shop category.
    • Ocado won price leadership for the remaining 6 categories, with a marginal gap between both retailers. 

    Watching Price Index Trends as inflation soars!

    Price index across monthsby Retailer
    Price index across months by Retailer

    The Guardian reports that Grocery inflation has hit a 13-year high in the UK, and food price rises could hit 15% by this summer – the highest level in more than 20 years. Meats, cereals, dairy, fruit & vegetables are likely to be the worst affected. Keeping this in mind, we tracked the Price Index (PI) across these 5 retailers to measure how prices changed over a 6 month period from Jan – June 2022. 

    Note: Retailers selling at the 100% mark were selling at an optimal price & did not undercut the market. The pricing sweet spot is 95% – 105%. Anything lower would compromise margins, and higher would mean the retailer was not competitive. 

    • Getir & Ocado had a Price Index that was the most optimal, sitting in the 95% – 105% range.
    • Gorillas had the lowest Price Index, between 88% – 90%.
    • Weezy has the highest Price Index – they were selling at a minimum 30% – 40% premium over other retailers! Perhaps it’s their quick delivery service that justified these super high prices? Unlike other apps with a lower delivery fee but longer delivery times, Weezy offers a 15-minute delivery service & customers seem to be willing to pay for convenience! Wheezy also has a delivery fee of £2.95, which is at least £1 more than other platforms.
      Supermarkets like Ocado are now playing catch up to compete with Q-Commerce and quick delivery services. Ocado has launched a new “Zoom” service promising delivery in 60 minutes, and Amazon is now delivering “same day” groceries (but both have a minimum spend of £15)

    Which Retailers were the quickest to make price changes?

    Average price change across months by Retailer
    Average price change across months by Retailer

    Competitive pricing is critical to winning the eCommerce race. Competitive pricing involves tracking your competitor’s pricing & strategically tweaking your own prices without hurting margins. We tracked the month-wise average Price change from Jan – June across all 5 retailers to see which retailer was making price changes and at what frequency. 

    • The main observation was – across all 6 months, all retailers were likely tracking each other’s prices and making minor price changes accordingly – the need of the hour in this hyper-competitive environment. 
    • Gorillas made significant changes to prices between Jan & Feb. And Getir in the May/ June time period. 

    Discounts & Promos in a turbulent UK Grocery Market

    Average discount across months by Retailer

    Although customer acquisition starts with building awareness, discounts are a proven way to attract customers quickly. When approached with the right strategy, promotional discounts can promote long-term customer loyalty, drive customer acquisition, and improve customer lifetime value. However, deep discounting can risk margins and create more problems than benefits. We wanted an insight into discounting trends in the Grocery space, so we looked at our data. Here’s what we saw:

    • Getir offered by far the highest discounts compared to Ocado & Gorillas. In fact, in most cases, they offered discounts close to 2-3% higher than the retailer with the 2nd highest discounts! 
    • Our data showed that Gorillas offered the lowest discounts. As reported in The Sun & other sources, newer Q-Commerce players like Gorillas have been showering users with discount codes, and that is why this data surprised us! 

    We went & looked back at the Price Index earlier in this blog, we noticed that Gorillas had a low price index overall, with most products priced at a 90%, way below other retailers. Perhaps this already lower price is why they’re offered very few discounts?

    Conclusion

    The UK grocery delivery market saw a huge rise in new retailers who are currently fighting for better discounts, competitive prices, and quick delivery. Although Tesco and Ocado were the price leaders in our findings, new players like Gorillas, Weezy, and Getir are attracting customers with quicker delivery times and low delivery costs. 

  • The Role of eCommerce in Sustainable Fashion

    The Role of eCommerce in Sustainable Fashion

    Today, environmental damage is rapidly occurring on a global scale. And there are many reasons and causes for this. Global warming is one, deforestation, over population are some others. The list is long. In a small way, the retail & clothing industry contributes to environmental damage too. The good news is that sustainable fashion addresses this issue. Sustainable clothing is designed using sustainable fabrics like organic cotton, hemp, and Pima cotton that have less of a negative impact on the planet. 

    sustainable clothing and its benefits
    Sustainable clothing and its benefits

    In this blog, we will discuss the rise of sustainable clothing and its benefits. We will also discuss marketplaces for sustainable fashion.

    Benefits of Sustainable Fashion

    a. Reduces carbon footprint

    The fashion industry emits numerous greenhouse gases annually. Most clothes are made from fossil fuels and require significantly more energy in production. Sustainable brands often use natural or recycled fabrics that require less chemical treatment, water, and energy. Organic fabrics such as linen, hemp, and organic cotton are biodegradable and environmentally sound.

    b. Saves animal lives

    Leather isn’t a by-product of the meat industry, and it’s estimated that it alone is slaughtering and killing over 430 million animals annually. Sustainable fashion brands are increasingly embracing the use of cruelty-free alternatives. Various alternatives include polyester made with ocean trash, plant-based compostable sneakers, bags from recycled seatbelts, silk created from yeast, and bio-fabricated vegan wool. Another interesting leather alternative comes from pineapples, where the fabric is produced using the leaves of pineapples.

    c. Requires less water

    Water is used in the dyeing and finishing process for nearly all items in the fashion industry. It takes 2,700 liters of water to produce a single T-shirt. Cotton is highly dependent on water but is usually grown in hot and dry areas. Linen, hemp, Refibra, and recycled fibers are some other sustainable fabrics that require little to no water during production.

    d. Supports safer working conditions

    Endless working hours, unacceptable health & safety conditions, and minimum wages, are the reality for most garment workers in the fast fashion sector. A few informative documentaries like “The True Cost” or “Fashion Factories Undercover” document the social injustices of the fast fashion industry. Eco-ethical brands advocate for sustainable fashion, health care, humane working conditions, and fair wages for their workers. 

    e. Healthy for people and the environment

    Fast fashion products often undergo an intense chemical process where 8,000 types of chemicals are used to bleach, dye, and wet process garments. Those chemicals often lead to diseases or fatal accidents for workers and inflict serious congenital disabilities on their children. These chemicals harm our health, as our skin absorbs anything we put on it.

    5 Sustainable & Ethical Online Marketplaces

    Here is a list of five earth-minded and socially responsible marketplaces that have sustainable and fair trade brands for the discerning and mindful shopper:

    1. thegreenlabels

    Netherlands-based webshop thegreenlabels is a sustainable fashion retailer that sells sneakers, womenswear, and accessories from various “green labels” brands. Founded in 2018, this is a marketplace where people can buy products from brands that care about a positive impact on the environment. All brands featured here guarantee fair working conditions and represent at least one of these 4 values – “CLEAN PROCESS” environmentally friendly production, clothes that support “LOCAL” communities, “VEGAN” brands to assure no animals were harmed and “WASTE REDUCTION”

    2. LVRSustainable

    LVRSustainable
    LVRSustainable

    Luisa Via Roma started as a family-owned boutique in the early 1900s. They have grown into a luxury e-retailer and created an LVRSustainable section for people trying to insert sustainability into their wardrobes. They have brands rated ‘Good’ or ‘Great.’ The site offers a wide range of products like bags, accessories, sports, shoes, lingerie, and much more for men, women, and kids. You can find organic, vegan, eco-friendly, ethical, and recycled & upcycled items here.

    3. Brothers We Stand

    Brothers We Stand
    Brothers We Stand

    Brothers We Stand is a retailer set up in solidarity with the people who make our clothes. This retailer conducts rigorous research to ensure that every product in their collection meets the following three standards: designed to please, ethical production, and created to last. It’s a great platform to shop for ethical and sustainable menswear. They also have their private clothing line along with other brands.

    4. Labell-D 

    Labell-D was launched with a clear mission to reduce the negative impact of fast fashion on the planet. This retailer wants to make Responsible Fashion the new norm. They intend to make sustainable clothing and fashion easy for both brands and consumers. Labell-D has a transparent accreditation process where they evaluate the brand’s carbon footprint and environmental impact. Their verification assessment includes animal welfare, emissions, materials, production processes, chemical usage, waste management, and traceability.

    5. Cerqular

    Cerqular wants to make sustainable shopping affordable and accessible for all. The retailer promises that every product and seller is verified as organic, recycled, sustainable, carbon-neutral, eco-friendly, vegan, or circular. They have a wide range of sellers and do not limit products only from luxury brands, so sustainable shopping is no longer expensive or inconvenient.

    Conclusion

    The fashion industry is a contributor to worldwide carbon emissions. Sustainable fashion is the new big thing giving rise to more and more sustainable brands and marketplaces. 

    To stand out and shine in the crowded eCommerce space is not easy. Having a robust Digital Shelf becomes critical for brands. A brand’s Digital Shelf is all of the ways their customers digitally interact with the brand, not only on marketplaces but on the brand’s DTC website & shoppable social media. This is why brands need to closely track & optimize their Digital Shelf KPIs like assortment, availability, pricing, ratings & reviews, product discoverability & product content to increase their online sales.

    Want to learn how DataWeave can help you win the Digital Shelf? Sign up for a demo with our team to know more.

  • U.S. Prime Day Deals 2022: Promotion Intelligence First Look

    U.S. Prime Day Deals 2022: Promotion Intelligence First Look

    As inflation hits another 40-year high at 9.1 percent, U.S. consumers geared up for their first sign of hope and relief in the form of anticipated discount buys – 2022 Amazon Prime Days, or so we thought. While Prime Days have grown to become a promotional period almost as important as Black Friday to digital shoppers, the combination of economic uncertainty, inflationary pressures, and supply chain challenges seemed to alter the discount strategy expected given activity seen during 2021 Prime Days.

    Our analyst team has been hard at work aiming to provide a ‘first look’ at 2022 Prime Day Promotional Insights, tracking discounts offered across 46,000+ SKUs within key categories like Electronics, Clothing, Health & Beauty and Home, on seven major retailer websites – Amazon, Target, Best Buy, Sephora, Ulta, Lowe’s and Home Depot. Our analysis compares prices seen during Amazon Prime Day 2022 on July 12th, to pre-Prime Day maximum value prices seen in the ten days leading up to Prime Days, to determine the average change in discounts offered during the promotional period. Below is a summary of our findings.

    Competitive Promotions Give Amazon a Run for their Money

    Amazon offered the greatest average discount enhancements for Electronics at 5.6 percent followed by Health & Beauty items at 5.1 percent, and Home products at 4.2 percent versus pre-Prime Day discounts seen across the categories considered within our analysis. The only category reviewed where average discounts were greater on a competitor’s website was on Target.com within the Clothing category. As seen below, Clothing on Target.com average discounts were 6.8 percent greater than pre-Prime Day offers, which was 2.6 percent higher than the average discounts offered for Clothing on Amazon.

    Target Capitalizes on Growth Opportunity in Clothing Category

    Diving deeper into the details of where Target won within the Clothing category, you can see a majority of their promotional activity took place within Women’s Accessories where discounts offered were 18.5 percent greater than those seen pre-Prime Day 2022, which was almost 15 percent greater than the discount enhancements seen on Amazon for Women’s Accessories. In fact, Women’s Shoes and Sneakers were the only two categories where the average discounts offered were greater on Amazon than on Target.com.

    Overall, the discounts offered on Target.com within the Clothing category were primarily concentrated within items priced $40 and lower, but what was most interesting is that within the $10 and under price bucket, Target offered average discounts of over 11 percent whereas Amazon increased prices for these items on average by over 9 percent.

    While most of the Clothing available on both Amazon and Target.com during Prime Days 2022 were offered without a price change, the greatest discount percentages tracked were within the range of 10-25 percent off on Amazon whereas Target chose to offer the bulk of their promotions at 25 percent off an up.

    Strategic Promotional Strategies Defined at the Electronics Subcategory Level

    When it comes to the Electronics category on Prime Day, the big question is always who will win the battle of the brands. Below shows the difference in average pricing and promotions discounts offered between products manufactured by Samsung versus Apple across each retailer platform, noting discounts were almost 3 percent greater on average for Apple versus Samsung products on Amazon, and Apple discounts were almost 5 percent greater on Amazon versus than those seen on Target.com.

    Amazon wasn’t going all in on Apple however, as we saw ‘Alexa’ devices (Amazon products) available on Best Buy and Target websites also, but the discounts were almost 4 percent greater on Amazon versus Target and over 7 percent greater than the discounts seen on BestBuy.com.

    While the average discounts offered within the Electronics category were greatest on Amazon (5.6 percent) versus Best Buy (3.9 percent) and Target (3.4 percent) as noted within the first chart of this blog and across brands and technologies considered above, the discounts offered on Amazon were strategically focused between 10-25 percent as seen below.

    Amazon’s Electronics promotions were also targeted at smaller price points, items priced between $20-500, whereas Best Buy and Target offered greater promotions for electronics priced $500 and up than Amazon.

    Below is a snapshot of price buckets tracked for Electronics available on BestBuy.com, highlighting where most of the promotional activity was targeted at products priced $50 and up during Prime Days 2022, with discounts ranging from 10 percent up to greater than 25 percent greater than pre-Prime day prices.

    The standout categories were TVs on Target.com with discounts averaging nearly 12 percent greater than those seen pre-Prime day, and smartphones on BestBuy.com with discounts averaging just over 11 percent greater than those seen pre-Prime Day. The category with the greatest average discount enhancements seen on Amazon during Prime Days 2022 was for Wireless Headphones with an average discount of 8.7 percent.

    Home is Where Amazon’s Heart Was on Prime Day

    Amazon dominated offers within the Home categories, especially for products within mid ($40-100) and higher price ranges (items priced $200-500), with the bulk of the discounts offered between 10-25 percent. There was little to no promotional activity seen across all price points on Lowe’s or Home Depot’s websites within the categories we tracked, and most other competitive offers on Home products were seen on BestBuy.com for products priced from $50-500. Even a subcategory like Tools offered deeper average discounts on Amazon (4.7 percent) than discounts seen on HomeDepot.com (1.1 percent) or Lowes.com (0 percent).

    For Large Appliances, Amazon was the only retailer to off any significant discount across each major subcategory with the greatest average discount being on Ovens at 6 percent, followed by Refrigerators at 4 percent. One caveat with this category, when we reviewed Large Appliance prices two weeks prior to Prime Days, we saw average price increases around 16.7 percent occurring on Amazon.

    During Prime Days 2022 however, Amazon also offered top average discounts for small appliances, except for on Instant Pots which appeared to have greater average discounts on Target.com (5.9 percent versus 4.2 percent on Amazon), and Vacuum Cleaners which appeared to have the best promotion of appliances small and large at 13.8 percent average discount on BestBuy.com. Another subcategory deeply discounted on BestBuy.com was weighted blankets, which averaged discounts around 18.5 percent versus Amazon’s average discount at only 6.2 percent.

    Health & Beauty Retailer Pricing Strategies Revealed

    Given the importance Health & Beauty Brands placed on Prime Day sales last year, we had anticipated to see more offers, especially within pure-play beauty retail channels, than we did for this booming category.

    Amazon drove most of the Health & Beauty offers seen averaging 5.1% discounts versus other retailers only offering less than 1% on average, but discounts were aimed at a targeted group of SKUs on Amazon, bringing the average discount lower overall. Most of the promotions offered on Amazon fell within mid-range price points ($20-50) and were discounted between 10-25 percent versus pre-Prime Day prices.

    Target.com offered the most comparable discounts to Amazon for Health & Beauty products on average, but their strategy primarily focused on items within the $20 and lower price range with discounts ranging primarily between 10-25 percent.

    More 2022 Prime Day Insights Coming Soon

    We know the significance visibility to critical pricing and promotional insights play in enabling retailers and brands to offer the right discounts to stay competitive, especially during promotional periods like Prime Days. While this blog is intended to provide a ‘sneak peek’ into 2022 Prime Day insights for the U.S. market, we will be providing more extensive, global coverage and will proactively share new insights with the marketplace as they become available throughout the month of July.

    Be sure to also check out our Press page for access to the latest media coverage on Prime Day insights and more. Don’t hesitate to reach out to our team if there is any particular category you are interested in seeing in more detail, or for access to more information on our Commerce Intelligence and Digital Shelf solutions.

  • The challenges in scaling a ‘House of Brands’

    The challenges in scaling a ‘House of Brands’

    Let’s start with the basics – what is a ‘House of Brands.’

    House of Brands is a portfolio management strategy that defines how a family of brands owned by one parent company, each independent of one another and each with its own audience, marketing, look & feel operate in harmony with each other. 

    Advantages of a House of Brands Strategy

    • The Profit Playbook: The playbook generated by the success of one brand can be leveraged to scale other brands.
    • Economies of Scale: Cost across Marketing, Supply chain, Advertising, and Operations gets shared across multiple brands helping optimize costs.
    • Market Coverage: Multiple products enable brands to cover multiple market niches and audiences while maintaining unique messaging for each niche. 
    • Future-Proofing: By hedging bets across multiple brands, it cushions the parent company against changes in customer preferences and trends. 

    … for these reasons and more, it’s no surprise that every digital-first consumer brand today aspires to leverage a portfolio strategy to become a House of Brands.

    More and more companies are slowly adopting this strategy

    • In the US the brands like P&G, Newell, and Unilever which found early success in the online space are quickly acquiring more brands and betting on the “House of Brands” strategy to scale.
    • In India, Unicorn D2C start-ups like MamaEarth, Good Glamm Group, Sugar Cosmetics, Rebel, Boat, and Lenskart to name a few, are already knee-deep into this strategy as their brand portfolio keeps growing.
    • And then there are brand roll-ups like Thrasio, Perch, HeyDay in the USA, Branded, Hero in the UK and Mensa, and GlobalBees in India which started as a House of Brands from the get-go.

    More Brands. More Data. More need for Monitoring!

    You cannot improve what you cannot measure! In order to scale these brands, the first thing needed is DATA. Data across all digital platforms – data on social media performance, customer engagement, eCommerce sales, product stock availability, pricing, reviews, and customer sentiment to name a few. This data will unlock huge value for brands and it gives them a sense of what’s working and what needs to be improved in order to increase sales & scale. 

    All brands need to track this information – but here’s a challenge unique to a House of Brands – it is the sheer volume & scale of data needed across multiple brands across multiple digital platforms! For example, a House of Brands with let’s say 10+ brands, each brand with 50 SKUs, selling on 10 eCommerce platforms is the equivalent of managing 10 retail shops with 500 SKUs! 

    Let’s look at some of the questions the analytics, marketing, and brand management teams at House Of Brands would ask. And the data they would need almost on a daily basis for every single brand. 

    • What is the search ranking for all of our SKUs across each and every single eCommerce store it is available on? How does this benchmark to the closest competitor? And are competitors using aggressive advertising strategies to outperform & overshadow our SKUs?
    • Are competitors offering discounts? Are those discounts higher than what we’re offering leading customers to purchase their products instead of ours?
    • Are my products & SKUs available and not out of stock across every single marketplace and online store?
    • Are positive ratings & reviews driving my customers to purchase my product? Or do our competitors have a better customer perception than my brand does?
    • Are Amazon and other marketplaces displaying my product content correctly so customers have enough information to make an informed purchase decision?

    … if the sheer scale across multiple brands was not a big enough challenge when this data needs to be tracked hyper-locally for each brand, it becomes anyone’s worst data nightmare!

    Need Data? Lots of it? No problem!

    To get ample data, across key KPIs brands need to invest in a Digital Shelf Solution. However, traditional Digital Shelf Solutions were built for brands that got a majority of their revenue from in-store sales and only a part of their revenue was being generated online. 

    That’s where DataWeave is different. DataWeave’s AI-Powered Digital Shelf Solutions was built with Digital Native brands in mind. 

    What KPIs do we help House of Brands track?

    • Keyword Search Ranking: Track & improve your search rankings for priority keywords. Boost product visibility and sales
    Keyword Analysis
    Keyword Analysis
    • Content: Optimize your brand’s product content to drive up conversions
    Content Quality Analysis
    Content Quality Analysis
    Availability Analysis
    Availability Analysis

    The following metrics are available to view in one single dashboard, across multiple online stores and multiple geographies making it so easy to get a consolidated view of the health of the entire portfolio of products! What’s more, we’ve created a dashboard with multiple views – brand-wise, function-wise & even hierarchy-wise. This means a brand manager can see all KPIs specific for only the brand they manage, while the marketing team can look at keyword search rankings across all brands and the leadership team can see a brand-level daily scorecard for a quick health check. And that’s not all! Our dashboard highlights insights that can be “actioned asap” to make it easier to understand what critical tweaks and changes can help improve sales. Lastly, as a House of Brands adds more Brands & SKUs to its portfolio, our solution has the full flexibility to add and delete SKUs on the go!

    If you are a House of Brand and wish to explore how some of the problems you face daily can be solved – please email: contact@dataweave.com.

    Brand Roll-Ups and House of Brands are always scouting for new brands to acquire. DataWeave has a unique product to help you track a category daily, highlighting brands that show exceptional KPIs across – Ranking, Reviews, Ratings, Bestseller ranks, Sales Estimates, etc. Read more about how VC’s & Brand Rolls up are using Data for faster Acquisitions

  • How short term Stockouts on Amazon can have a long-term impact on your eCommerce business

    How short term Stockouts on Amazon can have a long-term impact on your eCommerce business

    It’s common knowledge that upward of 70% of Amazon customers never scroll past the first page of search results. And that the first 3 products garner 64% of business generated. This is why it is critical for brands and businesses to make sure they rank well on Amazon. A good search ranking helps customers find your product with ease. And findability is fundamental! Having a better ranking is also a driver of the “flywheel effect” at online retailers. According to this effect, products that sell more tend to rank better in search results, and products that rank well in search results tend to sell more.

    Negative impact on Sales Ranking due to Stockouts

    If you want to stay on top of search rankings on Amazon, one of the things you need to keep an eye out for is your product stock availability. It’s not the ideal customer experience to have to click on a product listing only to find out it’s currently out of stock. This is why Amazon will not rank products at the top if they’re not available & customers cannot buy them immediately. Not only does this lead to a lost sale for a brand, to make things worse, but customers also end up buying a competitor’s product instead. 

    We were tracking product availability on Amazon for one of our customers in the CPG space. We tracked availability for products across varying ranks & looked at how going out of stock impacted their search rankings.

    Product Availability
    Product Availability

    Impact on products with a Search Rank between 1 to 10:

    • Our data showed that when products that ranked between 1-10 went out of stock for just 1 day, their rank fell by over 28%. After 3+ days of being out of stock, their rank fell by 83% and after being out of stock for over 10 days their rank fell by close to 150%! 
    • This clearly illustrates that when the longer top-ranking products are out of stock, the greater the impact on search rank and product discoverability.

    Impact on products with a Search Rank between 10 to 20:

    • The impact of being out of stock on products that ranked lower, i.e. between 10 to 20 was much lower. After being stocked out for 1 day, the ranking fell 17% compared to the 28% dip for products in the top 10 ranks. 
    • Incremental change was minimal, too. After 3+ days of being OOS, search rank dropped by 22% and by 53% after 10+ days v/s close to 150% for higher-ranked products.

    Impact on products with a Search Rank between 20 to 30:

    • These products had the least impact but there was an impact nonetheless. 
    • After being OOS for 5+ days, search ranking fell by close to 8% and to close to 30% after 10 days of product unavailability.

    Avoiding Stockouts with better Inventory Management

    Customers can buy your product only when it is available. Failing to provide products at the right time will lead to losing sales to your competitors. If your products become unavailable, you’ll notice a drop in customers’ overall satisfaction and shopping experience too in addition to a lost sales rank on Amazon. In fact, your reputation and sales will take a beating long term in case of consistent product unavailability. Moreover, once the product is back in stock, the climb back to the top ranking is a slow and not-so-easy process. This is why brands need to maximize conversions by tracking product availability on a constant basis.

    Conclusion

    Stockout is a critical issue that has a significant impact on sales, brand image, and customer loyalty. Items ranking higher on eCommerce platforms take the biggest hit when they get out of stock. Brands can recapture their search share after restocking their inventory. 

    Want to maximize sales by reducing latency periods between stock replenishment? Reach out to our Digital Shelf Experts to know how! 

  • Feminine Hygiene Products Face Supply Chain Shortage and Price Increases

    Feminine Hygiene Products Face Supply Chain Shortage and Price Increases

    Last week the DataWeave analytics team identified the states most impacted by the baby formula shortage, only to see feminine hygiene products following similar trends with price increases occurring alongside a supply chain shortage. In this analysis, the team has identified over four hundred feminine hygiene products made available across eighteen retailer and delivery intermediary websites from August 2021 through June 2022, to see how product availability and price changes correlated.

    Within the feminine care products analyzed, both tampons and sanitary pads show to have under 58% availability as of June 2022. For sanitary pads, June 2022 shows the lowest level of product availability at around 58%, which has steadily declined each month from August 2021 where product availability started around 69%. Tampons however, reached their lowest level of availability in April 2022 at 45%, and appear to be slowly recovering each month, now reaching around 53% availability in June 2022.

    Product Availability for Feminine Care Products - June 2022
    Product Availability for Feminine Care Products – June 2022

    The Evolution of the Tampon Shortage by Retailer

    Looking at tampons in more detail and at a retail level, we can see how much and how often product availability fluctuated from August 2021 through June 2022 across Kroger, Meijer, Baker’s Plus, Target and Walmart websites. Baker’s Plus, for example, shows the lowest product availability, maintaining an average of around 39% from October 2021 through June 2022. Kroger appears to be a notable exception only facing stock availability issues in March and April 2022, achieving nearly 78% availability in June 2022, which is 16% greater than the other retailers analyzed.

    Product Availability for Tampons by Retailer - June 2022
    Product Availability for Tampons by Retailer – June 2022

    Feminine Care Product Price Changes Over Time

    When looking at Pricing Intelligence insights and average price changes occurring alongside declining product availability for tampons and sanitary pads combined, we see a very different story. Tampons have seen steep price hikes from December 2021 onward, increasing the most in June 2022, up 6% compared to prices seen in November 2021. This steep price increase could be attributed to consistently low availability for tampons that has been seen in recent months.

    To the contrary, sanitary pads have seen a price reduction of around 1.25% as of June 2022 compared to average prices seen in November 2021. While prices are lower in June 2022 for sanitary pads, the percentage by which they are lower is shrinking in recent months, potentially for the same reasons related to decreasing product availability.

    Price Change for Feminine Care Products - June 2022
    Price Change for Feminine Care Products – June 2022

    When looking at month-over-month average price changes for tampons only, we can clearly identify which months had the biggest price changes, noting price hikes that lead to the currently high prices seen in June 2022. In March and May 2022, over 10% of tampons offered had seen a price increase, and around 8% had seen significant price increases of more than 10%.

    Month-Over-Month Price Changes for Tampons - June 2022
    Month-Over-Month Price Changes for Tampons – June 2022

    eCommerce Intelligence Provides Early Visibility to Evolving Trends

    Price increases don’t seem to be stopping anytime soon given there was a 3.6% price hike seen on average in May 2022 versus April, with June seeing yet another .6% increase from May’s prices. That being said, as the market evolves and feminine hygiene products stabilize, our team will continue to provide visibility to critical pricing and product availability changes to enable our clients to stay ahead of the curve.

    From a baby formula shortage to a tampon shortage, what category will be next to follow the supply chain shortage trend? Follow our blog for access to the latest insights and be sure to reach out to our team if there is any particular category you are interested in tracking next, or for access to more information on our Commerce Intelligence and Digital Shelf solutions.

  • 7 Key Metrics that QSRs want (but may not get) from Food Delivery Apps

    7 Key Metrics that QSRs want (but may not get) from Food Delivery Apps

    The Quick Service Restaurant market is projected to be valued at $691 billion by 2022. As the QSR industry grows and the market becomes even more competitive, restaurant chains continuously seek ways to increase sales via food aggregators to market their business. To improve ROI and sales, having data and insights into key metrics could help QSRs to boost their success rate.

    QSRs would like to know how they stack up against their competition regarding discoverability on cluttered food aggregator apps. Restaurants want to know the gaps in their product assortment to understand what drives customers to their competitors. Getting insights into delivery time and competitors’ delivery fees will help QSR improve delivery ETAs and optimize fees. They can also set competitive pricing with insights into their competitors’ pricing. In addition, they can use data to optimize their ad spending on food apps and improve marketing ROI.

    In this blog, we will discuss the relationship between QSRs and food aggregators and how getting data about key metrics from these food delivery platforms can help QSRs scale their revenue. 

    Data: The Key Ingredient to increasing sales

    According to Statista, online food ordering revenue is expected to grow at a robust CAGR of 10.39% between 2021 and 2025. Food Aggregators apps like Uber Eats, DoorDash, and GrubHub offer convenient meal delivery options from various QSRs within a single app. Food aggregators provide a multitude of benefits for QSRs. They give access to a huge customer base, quick delivery, and an easy entry into quick commerce, helping QSRs increase visibility. Although QSRs rely on food aggregator platforms for hassle-free ordering, tracking, and delivery, they can’t always rely on them to share critical data that could help them optimize their operations & increase sales. 

    Online food ordering revenue
    Online food ordering revenue

    1. Data on Product Assortment

    QSRs need assortment insights to understand their competitor’s menu assortment. Assortment analytics plays a crucial role in ensuring that QSRs aren’t losing sales because their competitors are offering cuisines and dishes that they aren’t. Understanding gaps in menus helps QSRs to better plan their menu. However, food aggregator apps can’t share competitors’ assortment data with QSRs for a multitude of reasons, guidelines, and privacy laws. Thankfully, at DataWeave, our QSR intelligence solution can! We help restaurants improve their assortment by sharing insights into the dishes and cuisines their competitors’ have on display.

    Menu Assortment
    Menu Assortment

    2. Data on QSR Discoverability

    QSRs would love to know how to increase discoverability on food aggregators, as it will help them to appear ahead in search results and beat the competition. Improving visibility on these apps directly impacts sales and drives more orders for restaurants. Some aggregators offer discoverability information but give it on demand, usually after 20-30 days, making it irrelevant due to the enormous time gap. They also don’t provide information about the change in the discoverability of your competition. All these data points are so critical, and understandably so, Food Apps can’t share this level of information with restaurants. However, DataWeave’s QSR Intelligence solution can! It provides real-time discoverability insights into your restaurant and competitor’s visibility so that the data is actionable, and QSRs can use insights to improve visibility

    Read how DataWeave’s QSR Intelligence helped an American QSR Chain and how their ranking on search results page on Ube rEats, DoorDash & Grubhub impacted outlet discoverability & sales!

    3. Data on Pricing & Promotions

    Pricing a QSR’s menu is tricky. If you price too high, you’ll turn off new customers. If you price too low, you’ll cut margins & may even come off as low-qualify. Customer Price Perception is greatly influenced by the Price-Quality relationship. To add to this, restaurants are often up against stiff competition from restaurants with similar cuisine offerings so it’s critical that prices are competitive. Understanding competitor pricing doesn’t imply that you have to beat their prices. You can compensate for any price differences by offering higher quality cuisines, better customer service, and quicker delivery. Once again, food apps can’t share competitors’ pricing data with QSRs. But DataWeave’s QSR & Pricing Intelligence solution can! QSRs can use these insights to drive more revenue & margins by pricing their menu right.

    4. Data on Delivery Time

    QSRs must be able to deliver hot meals, in a timely manner to customers because customers want to quickly dig into the delicious food they ordered. Quicker deliveries within the ETA will also help earn the trust and loyalty of customers. However, food aggregators don’t share information on the delivery times with restaurants – not their own delivery time or their competitors. DataWeave can help QSRs to understand their peak hours and optimize their service to ensure quick ETAs. They can also get detailed insights into competitors’ delivery times to make sure they’re competitive. This is important because customers will often pick restaurants with quicker ETAs.


    Read how DataWeave’s QSR Intelligence helped an American QSR Chain understand the correlation between delivery time & sales volumes

    Delivery time trend by urbanity
    Delivery time trend by urbanity

    5. Data on Delivery Fee

    As a thumb rule, customers will always compare delivery fees across apps. They’re conscious of delivery dollars included in their bill and often choose a restaurant with lesser delivery fees. This makes it even more critical for restaurants to understand how they stack up against their competitors. Understanding competitors’ delivery fees could potentially help QSRs to optimize their rates. And once again, food aggregators can’t share information on competitors’ delivery fees with restaurants. However, DataWeave’s QSR Intelligence can provide all delivery-related insights – be it Delivery etas or fees. 

    Delivery fee trend by urbanity
    Delivery fee trend by urbanity

    6. Data on Ad Performance & ROI

    Getting ad analytics will help QSRs better manage their budgets & increase the ROI on their Ad spends. For example, wouldn’t it be great if QSRs were able to understand which ad formats or promotions led to the most sales? Or which carousal ads had the most visibility in key zip codes where your QSR is expected to do maximum business? Or even insights into a competitor’s ads and promotions on food apps. Knowing this information will help restaurants spend sensibly when buying media on Food Apps & get the most bang for their advertising buck. Food apps do provide standard ad analytics – a number of clicks, CTR, and so on, but for more complex, insightful & actionable insights, there’s DataWeave’s QSR Intelligence

    Read how DataWeave’s QSR Intelligence helped an American QSR Chain understand the ROI delivered on ad spends across Food Delivery apps.

    Insightful & actionable insights for QSR Chains
    Insightful & actionable insights for QSR Chains
    Insightful & actionable insights for QSR Chains
    Insightful & actionable insights for QSR Chains

    7. Data on Outlet Availability / Availability Audit

    To avoid lost sales, being available & “open for business” on Food Apps during peak lunch & dinner hours is critical. Also on weekends, when order volumes are usually high. Sometimes because of technical glitches, QSR outlets appear unavailable on Food Apps. A glitch like that can lead to lost business, and the longer the glitch stays undiscovered, the greater the impact on revenue. While Food Aggregators do their best to make sure all QSRs are up and running on their app, using DataWeave’s QSR Intelligence, restaurants can now do an outlet audit to make sure that’s the case. With just a mere 2.8% unavailability, we saw a 28% drop in the sales for one of our QSR customers! That’s how critical Availability insights are. 

    Conclusion

    Analyzing and optimizing sales, delivery, discoverability, availability & customer data is one of the fastest ways to help grow your QSRs revenue. However, the biggest challenge QSRs face is that it isn’t always easy to get this information. With DataWeave’s QSR Intelligence now some of that data is a little more accessible as we discussed in this blog. And additionally, here are the 7 Tricks we recommend QSRs to use to win on Food Apps

  • Baby Formula Shortage Continues Alongside National Price Increases – June 2022

    Baby Formula Shortage Continues Alongside National Price Increases – June 2022

    As the baby formula shortage continues, retailers and brands are working quickly to meet evolving consumer demand, considering supply chain driven headwinds, a baby formula recall, and inflationary-driven impacts. The DataWeave analytics team has actively tracked marketplace changes, alongside reports from the FDA, for the baby formula category at a state-level, and has shared the latest snapshot of product availability through June 7th, 2022, below.

    Average Baby Formula Product Availability by State - June 2022
    Average Baby Formula Product Availability by State – June 2022

    While the U.S. has reached an average of 84% baby formula availability the first week of June 2022, given recent news headlines related to the baby formula shortage, and tracking out of stock encounters by state, we see a continued decline in availability throughout the Midwest versus product availability levels seen in May 2022.

    Wisconsin, Michigan, Illinois, Indiana, Ohio, and Kentucky all show average availability for baby formula to be less than 50%, with Wisconsin being impacted the most at less than 18% average availability. While Texas shows an average availability improvement of 3.5% from the first two weeks of May 2022 to the first week of June 2022 as noted in the below chart, availability is also very low overall at less than 60%.

    Average Change in Baby Formula Product Availability by State: May-June 2022
    Average Change in Baby Formula Product Availability by State – May 2022 to June 2022

    Outside of the Midwest and Texas, the other states for consumers to be cautious in are California, Virginia, and South Carolina as their month-over-month average change in availability also declined 4%, 12.6% and 8.2% respectively. Below is a snapshot of where the baby formula availability average started as of May 1st through the 15th, 2022.

    Average Baby Formula Product Availability by State - May 2022
    Average Baby Formula Product Availability by State – May 2022

    Baby Formula Product Availability Changes – March 2021 through May 2022

    At an aggregated level overall, the availability for baby formula was relatively stable across all retailers considered within our analysis from March 2021 through September 2021, but has been on a steady decline ever since, starting at 81.7% availability in September and ending at 53.8% availability in May 2022 as noted in the below chart.

    Monthly Average Availability for Baby Formula Across Major Retailer Websites
    Monthly Average Availability for Baby Formula Across Major Retailer Websites

    Looking at baby formula availability at a retail level, we saw yet again not all availability challenges were alike, by month or retailer. Costco.com lead the other retailers within our analysis for greatest average availability from March 2021 through May 2022, but had one of the lowest availability percentages at 62.7% in May 2021, and dropped to the lowest availability of the group in May 2022 at 37.5%.

    Average Availability for Baby Formula Across Major Retailer Websites
    Average Availability for Baby Formula Across Major Retailer Websites

    Baby Formula Prices Increase as Availability Changes

    While unnecessary price gouging is prohibited, price increases are still happening at a slow and steady rate across all the accounts included within our Pricing Intelligence analysis given external market factors outside of baby formula recall related stockout scenarios.

    Kroger.com experienced the greatest average price increases overall, with the peak being in May 2022 at a 19% increase, 8% higher than other retailers on average, versus prices seen in March 2021 for the same baby formula products. The most significant price hike occurred on Kroger.com from December 2021 to January 2022. Other retailers like H-E-B, Target and Wegman’s have had minimal price changes from March 2021 through May 2022. 

    Average Price Inflation for Baby Formula, Indexed to March 2021
    Average Price Inflation for Baby Formula, Indexed to March 2021

    Address the Baby Formula Shortage With eCommerce Intelligence

    As the market continues to evolve and baby formula supply works its way to catching back up to demand, our team will continue providing critical pricing, merchandising, and competitive insights at scale, to enable retailers and brands to develop data-driven growth strategies that directly influence their eCommerce performance, accelerate revenue growth and drive profitability.

    Be sure to reach out to our Retail Analytics experts for access to more details regarding the above analysis, or for more information on our Commerce Intelligence and Digital Shelf solutions, and let us know what other category insights you’d be interested in seeing this year.

  • eCommerce in South Africa: Data-Driven approach to getting ahead

    eCommerce in South Africa: Data-Driven approach to getting ahead

    What an exciting month we’ve had at DataWeave! Our team flew down to gorgeous Cape Town, South Africa to attend the 8th edition of #EcomAfrica! After months of Zoom calls and virtual events, it was a refreshing change to see our customers in person and meet some of the movers and shakers in eCommerce and some of the top South African brands. 

    Top eCommerce Companies in South Africa
    Top eCommerce Companies in South Africa

    My last visit to South Africa was before the pandemic. Things have changed since then, & the difference was stark! The eCommerce landscape had a paradigm shift during Covid-19 and grew exponentially. My customers spoke to me about the new opportunities, growth potential as well as challenges that came in because of this boom. For one, eCommerce in South Africa has become more competitive than ever – from online retail to grocery and food delivery to even alcohol delivery! All retail businesses seem to have jumped onto the eCommerce bandwagon.

    A recent Deloitte report found that over 70% of South Africans shop online at least once a month & 2 out of 3 respondents said they plan to increase their frequency of online shopping. 65% said they know what they want, search online & check all stores that stock the product to compare prices. Price is one of the key factors that influence consumer purchase decisions. Other critical factors include delivery fee, delivery time, promotions & discounts & product assortment to name a few. In order to stay ahead in this highly competitive arena, both retailers and brands need to make data-driven decisions about critical KPIs like pricing to stay ahead of the competition.

    Increased Online Shopping & Online Shopping Frequency
    Increased Online Shopping & Online Shopping Frequency

    We’ve been working with customers in South Africa for over 4 years now, even before the pandemic. So on Day 2 of the event – S.Krishnan Thyagarajan “Krish”, President & COO, Dataweave had a chance to share our learnings and experience from all these years and how user data is critical to getting ahead & winning the eCommerce race in South Africa.

    For the purpose of Krish’s keynote address, we tracked pricing insights for a finite set of categories across key South African retailers like Checkers, Pick n Pay, EveryShop, Incredible, Makro, Waltons, Shoprite & Dis-Chem to name a few over a period of 16 months from Dec 2020 to April 2022. We highlighted price increase and decrease opportunities and how each retailer reacted in order to stay competitive, increase sales and protect margins. 

    BATTLE of the eCommerce GIANTS!

    Key Highlights from the Keynote

    • Increasing prices where an opportunity exists helps retailers increase their margins exponentially. Pick n Pay had the highest action rate (73%) when it came to capitalizing on price increase opportunities v/s Dis-Chem at 11%. 
    • When it came to price decrease opportunities (in order to stay competitive with rival brands) Takealot was the most responsive retailer – they capitalized on 30% of the opportunities, followed by Pick n Pay at a close second (28%) and Shoprite & Dis-Chem at just 4%.
    • Most retailers took between 1 – 5 days maximum to make price changes which means responsiveness to the market among all retailers is high making it more important for online retailers to always be on their toes.  
    • The 2 categories where most retailers capitalized on Price Increase Opportunities were Sauces & Condiments and Crackers & Biscuits.

    Want to watch the Keynote video on Demand? Click here to register & watch.

    Price Increase & Decrease Opportunities
    Price Increase & Decrease Opportunities

    Bonus video content! 

    • Watch the Impact of price increase & decrease opportunities on Private Label brands! 
    • See how product stock availability impacts price changes over a 16-month period. 
    • Find out which brands are in the lead in the Skin Care, Pet, Baby, Laundry & Cleaning Aid categories 

    If you’re an online retailer in South Africa & need insights on staying competitive with the right pricing, product assortment, delivery time, delivery rates, and the other key influencers that affect customers’ choice of online retailers, sign up for a demo with our team at DataWeave to know how we can help!  

  • The Rise of South African eCommerce : The Growth, & the Future

    The Rise of South African eCommerce : The Growth, & the Future

    2020 onwards, the South African economy was crippled due to the pandemic and lockdowns. However, according to StatsSA, South Africa’s online retail market share grew to 2.8% in 2020, double that in 2018. After the pandemic, South Africa’s eCommerce industry grew by 66% in 2020 compared to the year before. This increase was primarily because of restrictions on traditional stores that led to a 30% reduction in in-store purchases. 
    According to a Deloitte study, over 70% of South Africans shop online at least once a month because of convenience. Household appliances, footwear, clothing, electronics, and health products are the most popular categories among South African online customers.

    Top Categories
    South African Ecommerce
    South African Ecommerce


    These eCommerce stores account for 15% of online revenue in South Africa

    1. Takealot.com: Revenue US$602 million 
    2. Superbalist.com: Revenue US$85 million 
    3. Woolworths.co.za: Revenye US$57 million

    In this blog, we will discuss emerging eCommerce trends in South Africa and their impact on the various retail segments. 

    Trends to watch in 2022

    Trends to watch
    Trends to watch

    1. Quick commerce

    Quick delivery, especially when it comes to groceries, medicines, and food has become a customer expectation now. Q-commerce, a trend that capitalizes on optimizing delivery time, has become common in food tech companies and is now gaining traction in grocery delivery too, especially after the pandemic. UberEats, Checkers, Pick ‘n Pay, and Jumia is some of the country’s biggest Q-commerce players.

    2. Omnichannel eCommerce

    Omnichannel experience has taken center stage for retailers in South Africa after the pandemic. According to Nielseniq’s study, 30% of South African consumers indicated they had shifted their shopping habits to online shopping from in-person grocery store visits between March 2021 and 2022. 

    3. Digital Payment Trends

    The digital payment ecosystem in South Africa has seen a massive growth trajectory after the pandemic. Customers seamlessly use digital payments across shopping, entertainment, groceries, food, health, and wellness – a trend we suspect is here to stay.

    4. Buy Now Pay Later

    Buy now pay later is an interest-free mode of payment that is popular worldwide for helping customers who cannot make high-value purchases. Consumers don’t have to pay any price upfront and pay off the amount in interest-free installments over a predefined period. The BNPL is forecasted to account for 13.6% of global eCommerce payments by 2024.

    5. Chatbots

    Quick response to customer queries and problems is instrumental in increasing conversion rate and sales. However, it can be difficult to respond to emails and instant chat 24/7 for small businesses. This is where automated chatbots are helping South African retailers answer customer questions promptly and correctly.

    The 4 Fastest-Growing Retail Segments

    4 Fastest-Growing Retail Segments
    4 Fastest-Growing Retail Segments

    1. Online Retail

    eCommerce & online retail grew 20% YOY after the pandemic. Retailers saw a huge increase in the adoption of online shopping by consumers. Traditional brick-and-mortar stores looked for omnichannel opportunities to keep up with online retailers. Mr. Price, a clothing retailer in South Africa, saw a surge in online sales by a massive 90% between April and June 2020. There is a similar success story where OneDayOnly, another South African online retailer, saw 40% growth during the same period.

    … but this growth surge brought in some challenges for retailers too. With more and more customers shopping online, competition increased. Price-sensitive customers would constantly compare prices across online retailers before making a purchase. It became critical for retailers to price their products right to beat the competition & win the sale, without hurting their margins! 

    2. On-Demand Grocery Delivery

    Groceries saw an increase of 54% from 2019 driven by the pandemic & lockdown restrictions.

    South African eCommerce companies offer a wide range of on-demand services, from taxi rides and grocery orders to liquor delivery. Retailers fulfill orders from stores to offer affordable rates and quick delivery across South Africa. It replicates the instant gratification of purchasing products from brick and mortar stores and the added benefits of the hyper convenience of shopping from a mobile or a computer. 

    Read quotes from our customers at Talabat, Glovo & Grab Food – we worked closely with them & helped them in their efforts to scale through this global Q-Commerce boom.

    3. Online Food Delivery

    According to Statista, revenue in the online food delivery segment in South Africa is projected to reach US$0.87bn in 2022. As competition heats up and more and more players enter the market, staying competitive is becoming increasingly challenging for food delivery businesses.

    Bolt Foods SA said they grew 50% month on month in mid-2021 and said they had to bet on making sure they were offering competitive prices in order to get ahead. Additionally, in their quest to have a stronger competitive advantage, Bolt Food says it is also offering customers a very low delivery fee, lower than Uber Eats & Mr. D since delivery costs are a major consideration for customers when using food delivery apps.

    The right price, product assortment, delivery fee, and delivery eta are critical to scaling a Food Delivery business. If you’re in the food-tech business, reach out and we can tell you how DataWeave’s Food Delivery Intelligence can help you scale quickly and profitably! 

    4. Social Commerce

    With approximately 41.19 million South African customers engaging in online activity, there is a huge shift in user behavior as customers get comfortable purchasing directly via social platforms instead of online retailers or physical stores. Social commerce uses networking websites such as Facebook, Instagram, and Twitter as vehicles to promote and sell products and services.

    What matters to South African online shoppers?

    Between June and November 2020, South African consumers mostly used online retailers monthly (42%), food delivery services weekly (36%), and online classifieds less than once a month (34%). 

    Here is a summary of things that matter to South African shoppers when they shop online:

    1. Easy product discovery and competitive pricing

    Most customers start their online shopping with a product in mind and look for discounts and sales across retailers. More than 67% of respondents of a survey have said that they go to a specific online store and search for the product they want. Almost the same share of consumers said they compare online stores to find offers for products they want. Price plays an important part in product selection. 

    In order to offer the most competitive pricing, retailers in South Africa need to keep a keen eye on competitor pricing. They need to identify gaps and opportunities to make price changes to not only offer the most attractive price to customers but also drive more revenue and margins by pricing products right.

    2. Reliable Delivery time

    81% of South African consumers say that unreliable delivery time is one of the reasons that affect their choice of an online store. Quick delivery time has become a differentiator in the eCommerce space, where ‘next day delivery or even ‘same-day delivery’ have become the norm. South African online shoppers want reliable delivery times that suit their busy schedules. 

    Read more here, about how DataWeave helped an America QSR understand the correlation between their delivery time & sales volumes! 

    3. Low delivery fee

    86% of South African customers believe that high delivery fees impact their online stores’ choices. The high delivery cost is a problem for low-income customers and customers who shop daily.
    If you want to track how your delivery fee compares to your competition and how it’s impacting your sales, our Food Delivery Intelligence solutions are for you!

    4. Customer Service

    Your company’s customer service should be responsive, smooth, omnichannel, and hassle-free. 78% of South African customers are frustrated with delays in customer support from online retailers. Slow response times and lack of communication in case of delays, delivery, and refunds hamper the customer experience drastically.

    Customer Service
    Customer Service

    Conclusion

    eCommerce in South Africa is growing at unprecedented rates. There has been a surge in the appetite of South Africans for online shopping and online retailers across the board are gearing up to meet this demand. 

    If you’re an online retailer in South Africa & need insights on staying competitive with the right pricing, product assortment, delivery time, delivery rates, and the other key influencers that affect customers’ choice of online retailers, sign up for a demo with our team at DataWeave to know how can help!