Blog

  • A Guide to Digital Shelf Metrics for Consumer Brands

    A Guide to Digital Shelf Metrics for Consumer Brands

    Our world is increasingly going online. We work online, socialize online, and shop online every day. As a consumer brand, you need to ensure complete awareness of your brand’s online presence across eCommerce platforms, search engines, and media.

    Only by deeply understanding the customer journey can you ensure that your product is reaching your ideal customers and maximizing your brand’s market share. You need data to intrinsically understand your customer journey and make changes where you’re lacking.

    As the old adage goes: ‘You can’t manage what you don’t measure.’

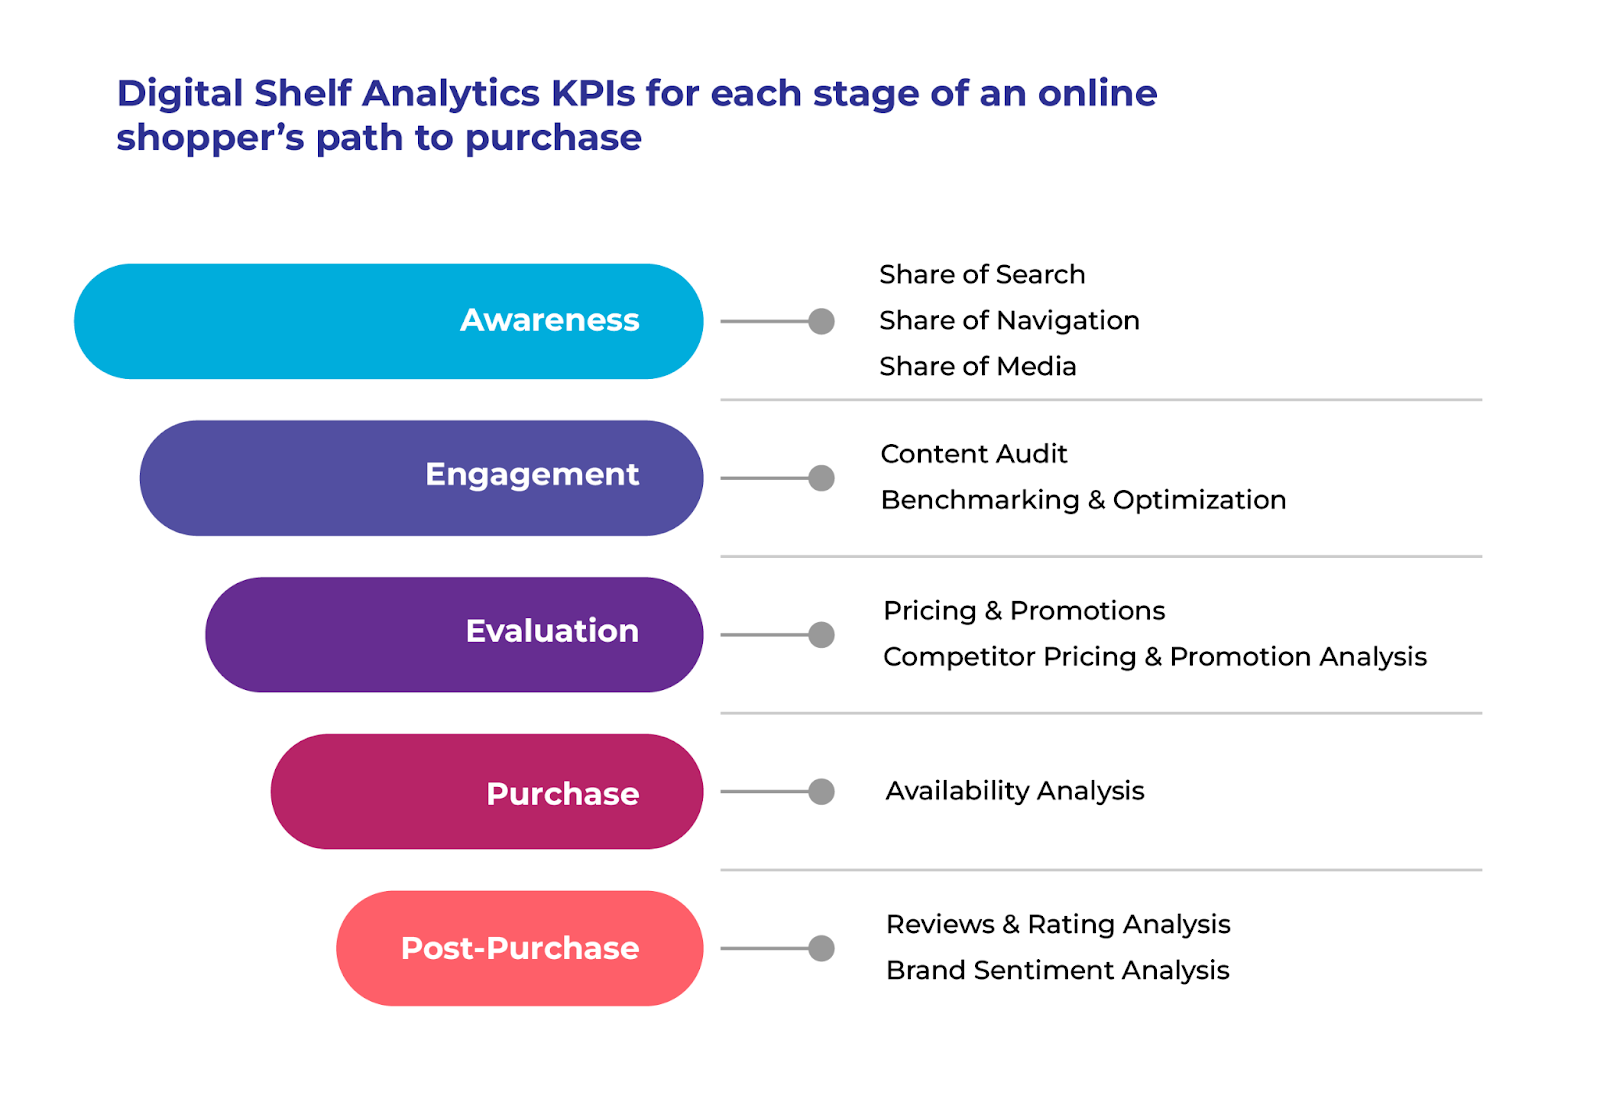
    You need digital shelf metrics to measure and start benchmarking your buyer’s journey. To find several of these types of key performance indicators (KPIs), you need a digital shelf analytics solution. These platforms allow you to track various metrics along the path to purchase from the awareness stage to the post-purchase phase across the entire internet, helping to inform online and offline sales strategies.

    Digital shelf analytics will help you gain insights into how your brand is doing versus the competition, which areas are lagging behind in historical performance, and what activities are driving sales. There are innumerable ways in which you can leverage these valuable insights. But how do you know which KPIs to start tracking with your digital shelf analytics solution?

    Here, we’ve summarized the top metric types your peers report, track and base their decisions on.

    With these KPIs in hand, consumer brands like yours can ensure that their products are consistently visible and appealing to their target audience across online marketplaces, ultimately enhancing conversion rates, market share, and profitability.

    Read this guide to learn more about the top digital shelf metrics consumer brands are tracking and how to use them in your own strategy.
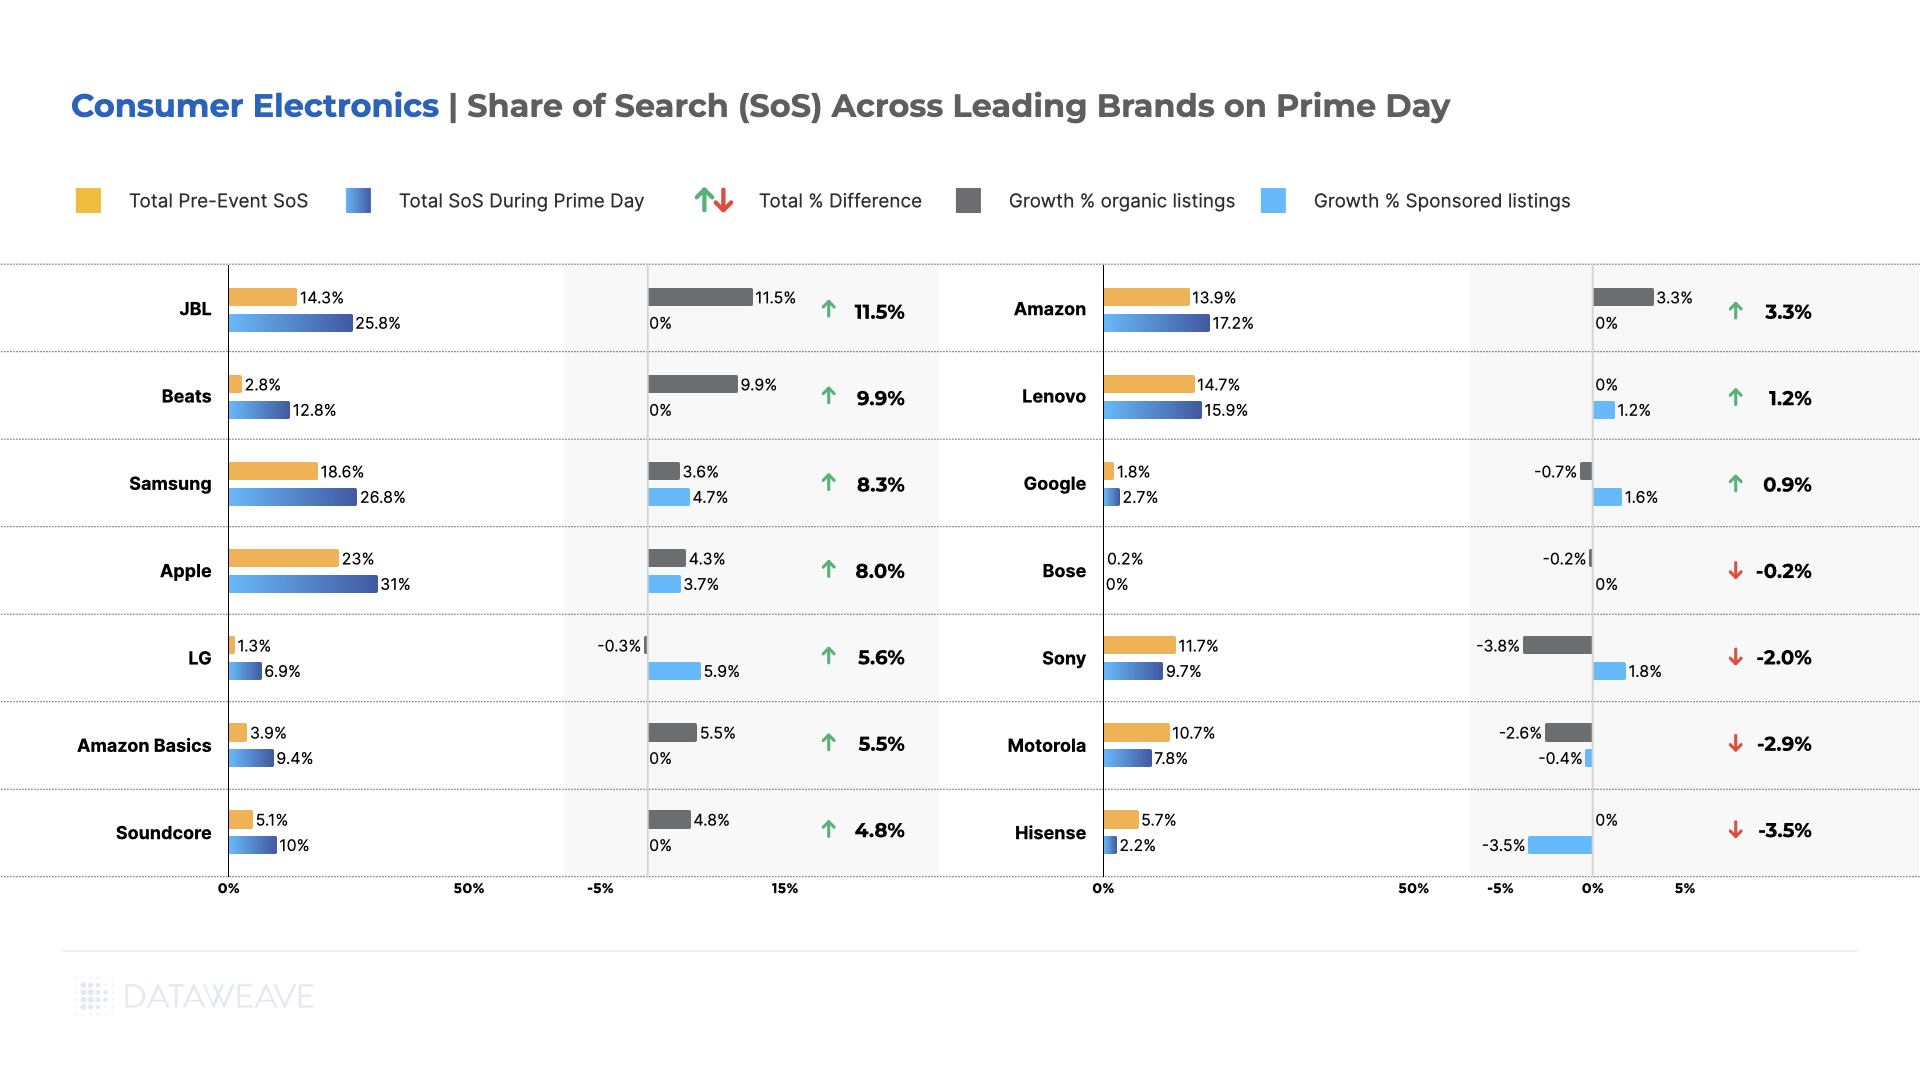
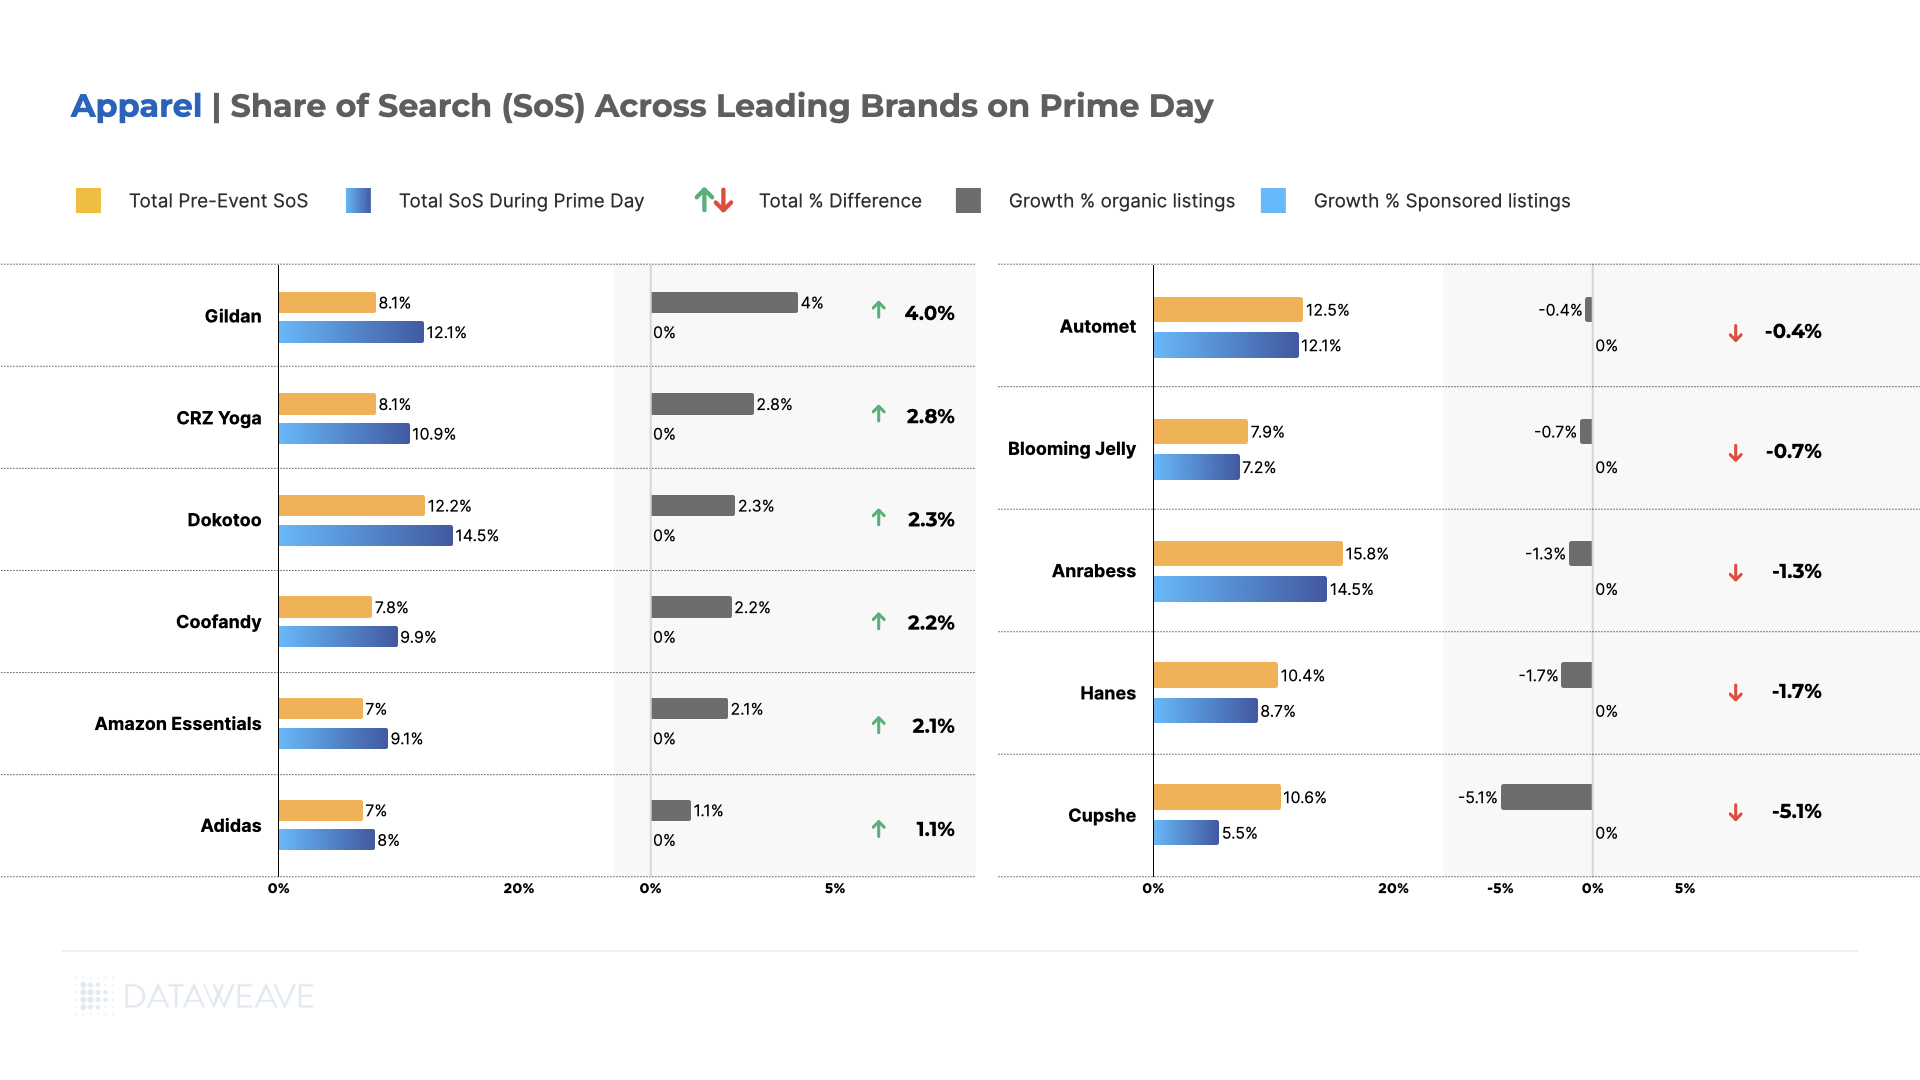
    1. Share of Search

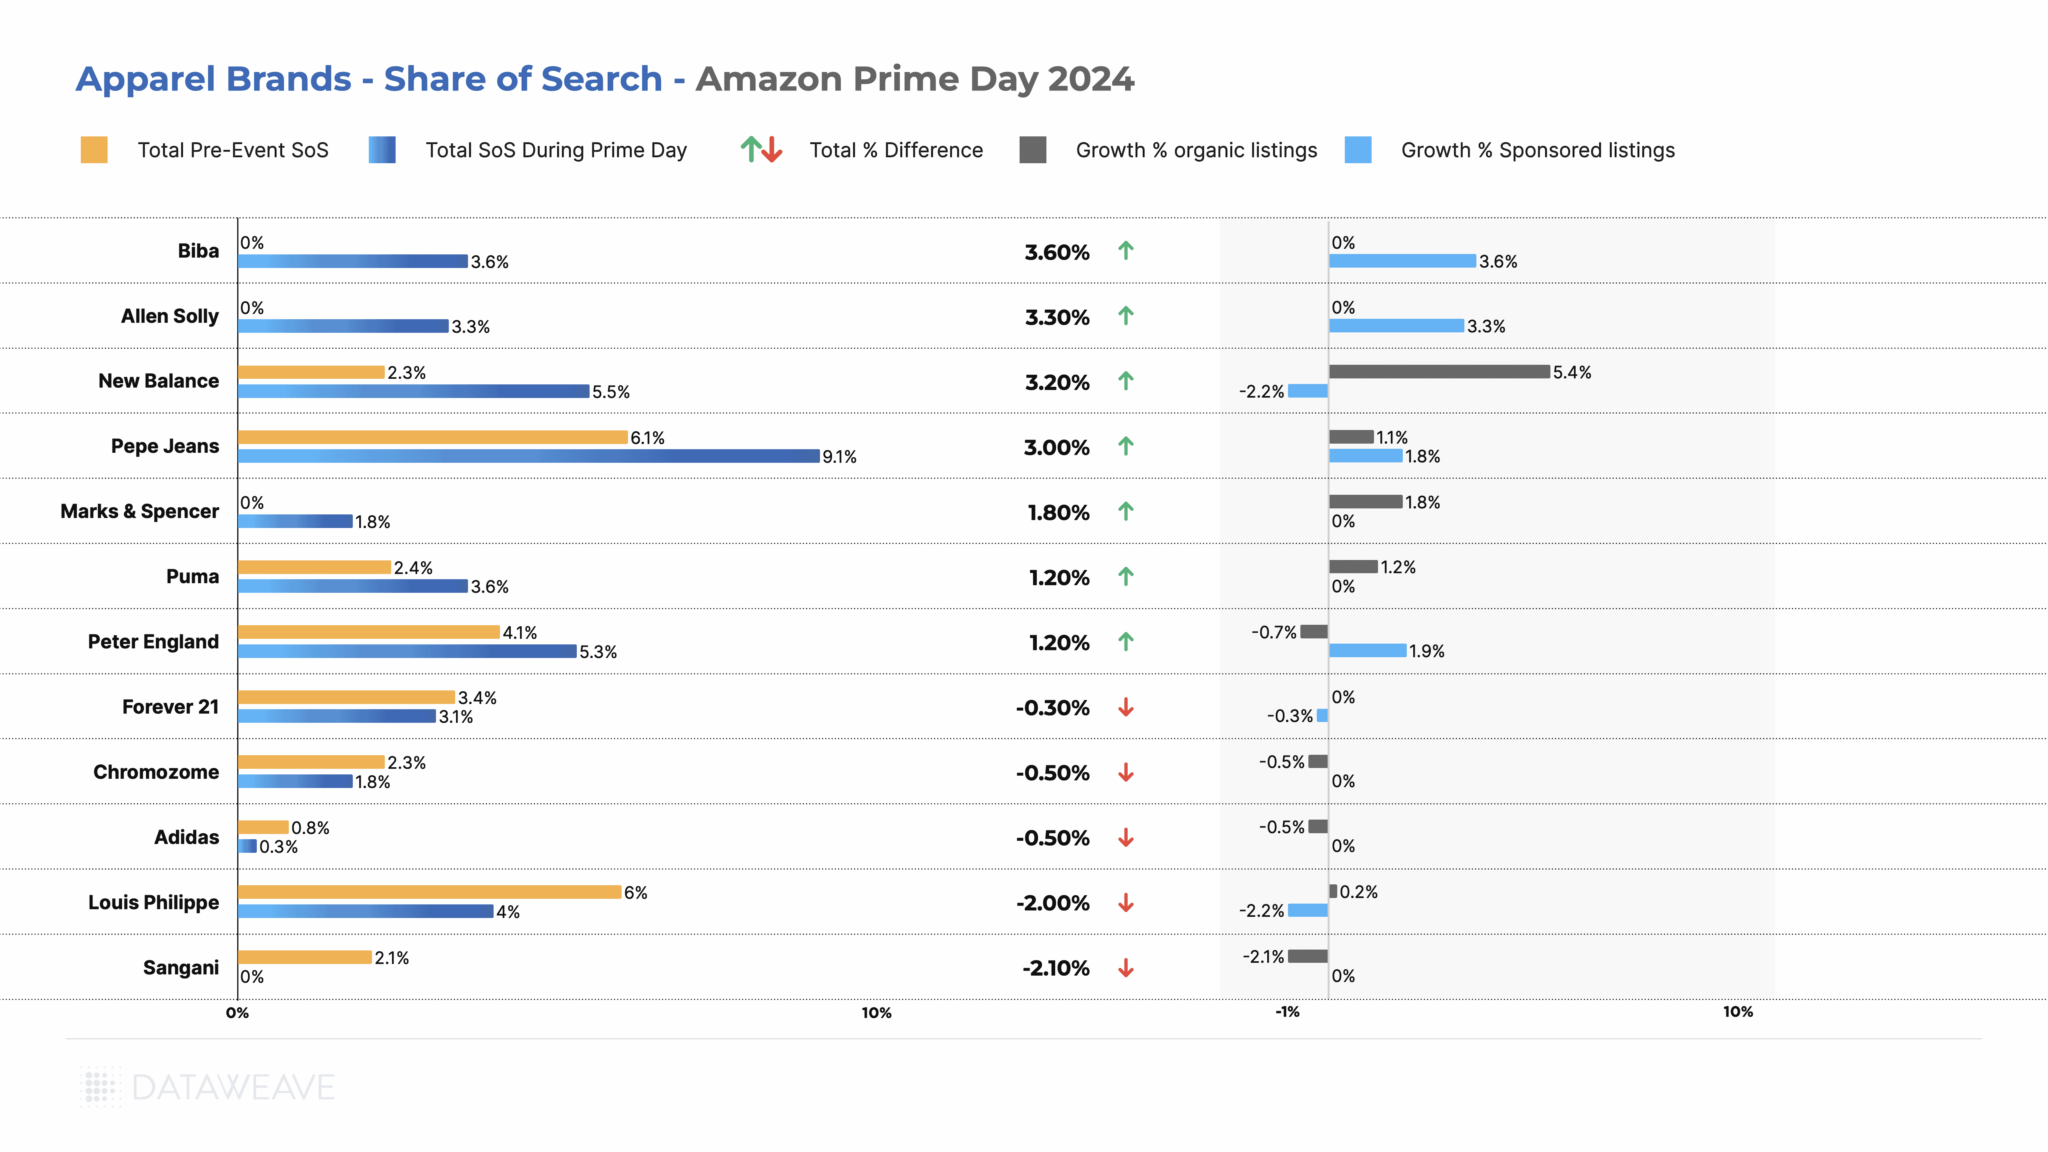
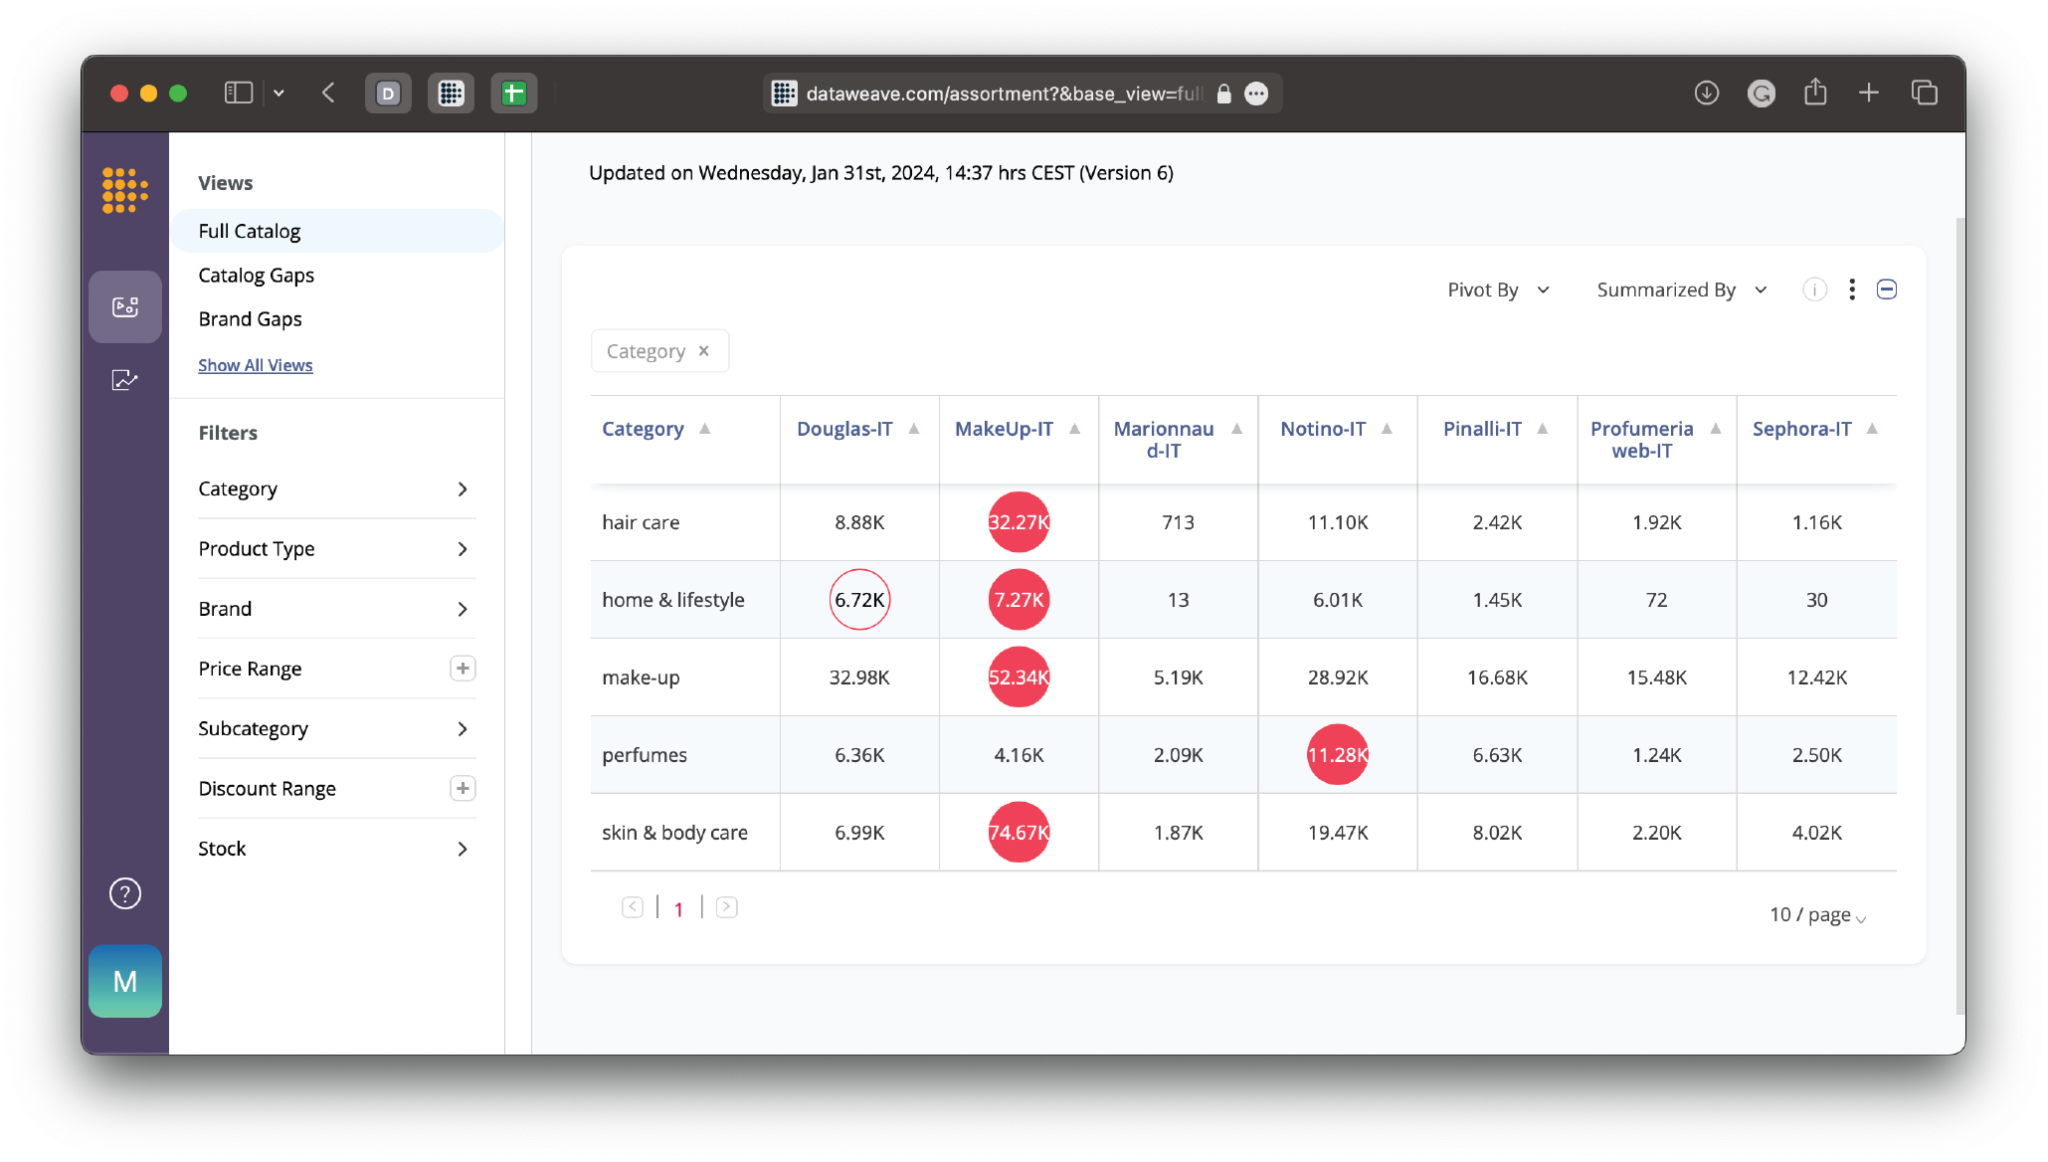
    Share of Search (SoS) is a KPI in digital shelf analytics that measures how frequently a consumer brand’s products appear in search results on eCommerce platforms relative to the competition for specific keywords. A good digital shelf analytics solution will be able to show this metric across all the top marketplaces and retailers, such as Amazon and Walmart, but also more niche marketplaces for industry-specific selling.

    This metric provides brands with a quantifiable way to measure how frequently their products are being “served up” to customers on online marketplaces. Essentially, it measures visibility and discoverability.

    Share of Search exmple_Digital Shelf Metrics

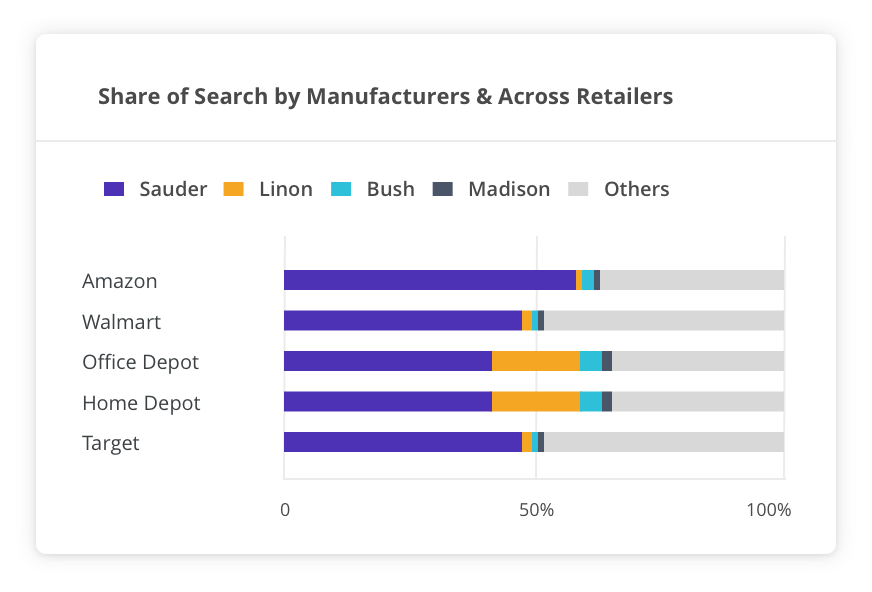
    With Share of Search on DataWeave, you can slice and dice your data in innumerable ways. These are a few important views you can see:

    • Aggregated SoS
    • Organic and Sponsored SoS scores
    • SoS scores across brands, retailers, keywords, cities
    • Historical SoS score trends

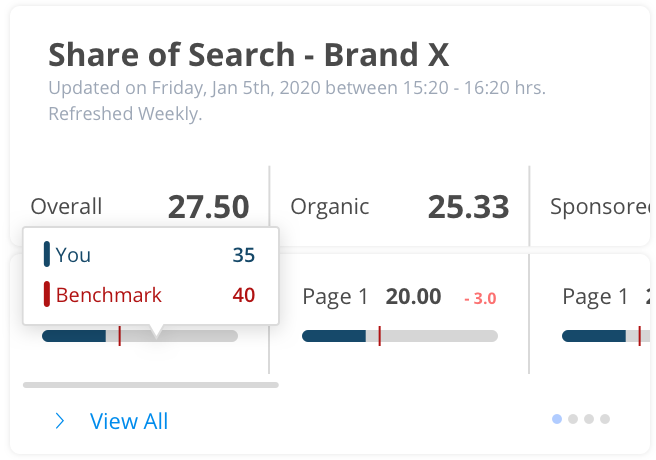
    Once you have benchmarked your SoS and category presence relative to your competition, you need to start interpreting the data. Here are some questions you can ask yourself to help interpret your findings:

    Share of Search exmple_Digital Shelf Metrics
    • Which of my key categories have the lowest SoS score?
    • Which products feature low on search results because they are out of stock?
    • Are my competitors’ products faring better due to sponsored searches?
    • Is my SoS low due to poor content quality?

    With insights in hand, you will know which actions to take to drive the biggest impact. For example, you could increase sponsored search results or improve organic reach by optimizing product pages.

    Understanding your SoS is essential to maximizing the awareness phase of your customer journey. It will help you improve your brand visibility and increase product conversions through better search and category presence.

    2. Share of Media

    Share of Media (SoM) is a KPI that is just as impactful, if not more so, than the SoS metric. However, only a limited number of brands track it or use it to drive strategic action. This makes it a perfect opportunity for brands looking to get an edge on the competition.

    But what is SoM in digital shelf analytics? Essentially, it’s a way of measuring retail media advertising activities like brand-sponsored banners, listings, videos, ads, and promotions that sometimes blend into search results. The main types of retail media advertising exist in two categories: banner advertising and sponsored listings.

    Banner advertising involves strategically placing designed banners within websites and search listings. These banners raise brand awareness and drive traffic to online storefronts.

    Sponsored listings are paid placements within search results on search engines or eCommerce platforms. They are prioritized based on the total bid amount and the product’s relevance. These paid listings are marked with “sponsored” or “ad.”

    Sponsored listings on an Amazon webpage

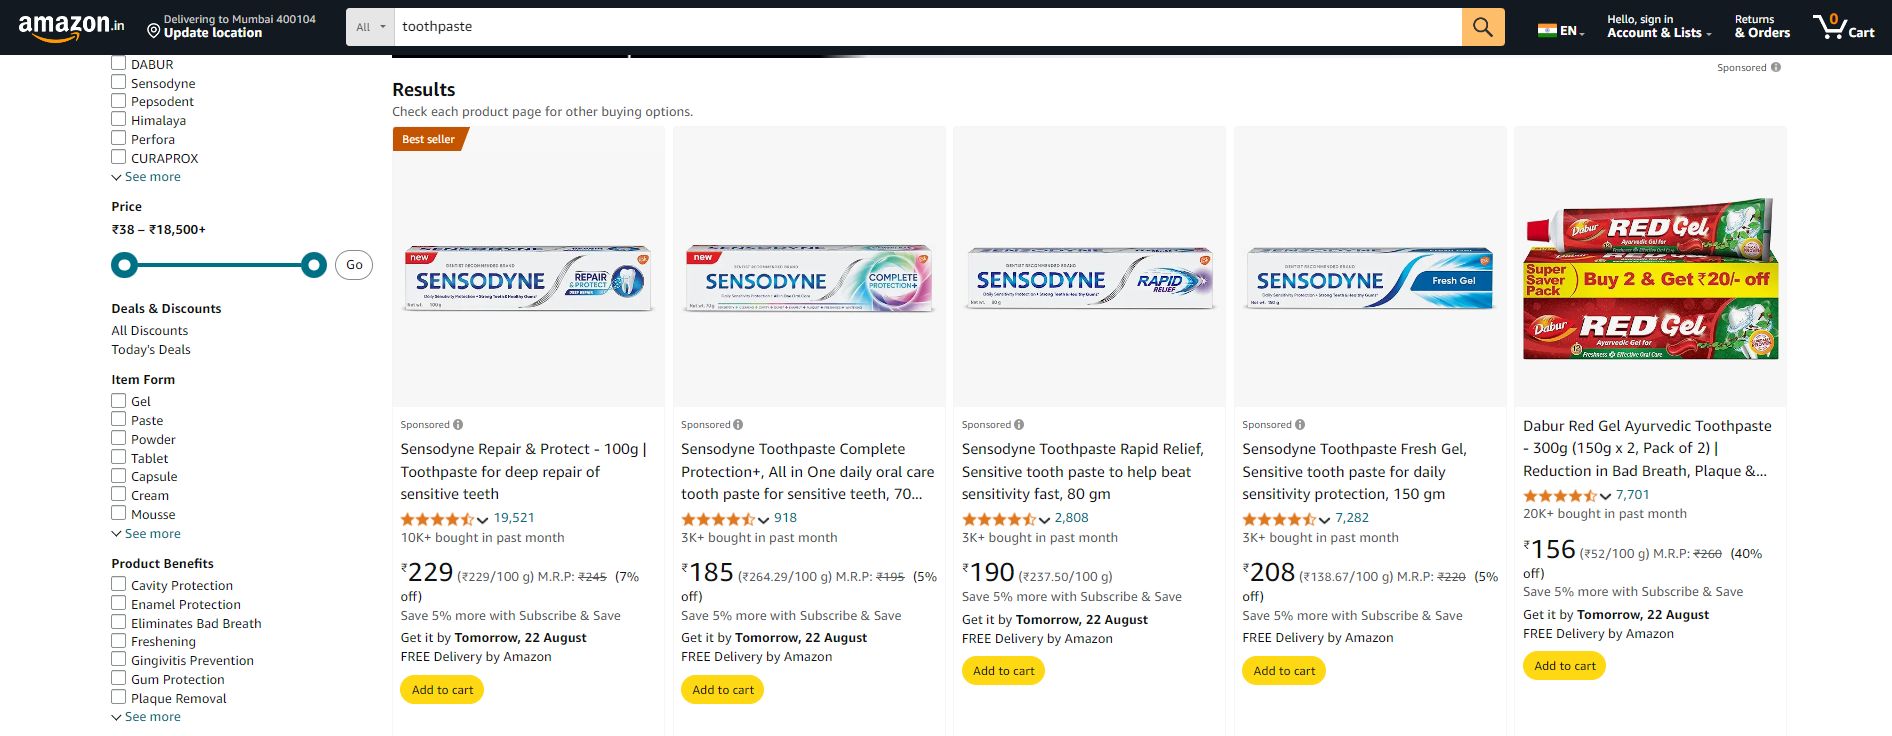
    It’s important to run these types of advertising campaigns on eCommerce platforms to gain customer visibility. In fact, “some 57% of US consumers started their online shopping searches on Amazon as of Q2 2023.” If you aren’t showing up, paying for placement can help.

    These listings serve to enhance your brand’s overall visibility, help you gain more precise reach, increase conversions, and drive better brand awareness and recall with your customers.

    These efforts aren’t free, however, so measuring their effectiveness is critical not only to gain all the listed benefits but to also not waste your valuable marketing budget. The SoM KPI can help a consumer brand answer questions like:

    • Where are the opportunities to increase paid ads?
    • Which categories could benefit from a promotional boost or a strategic and streamlined allocation of ad spend?
    • Which of my competitors have active banners and what is their share of media by keyword?
    • How has my ad spend trended historically in comparison to my competitor?
    Analytics Dashboard on Dataweave

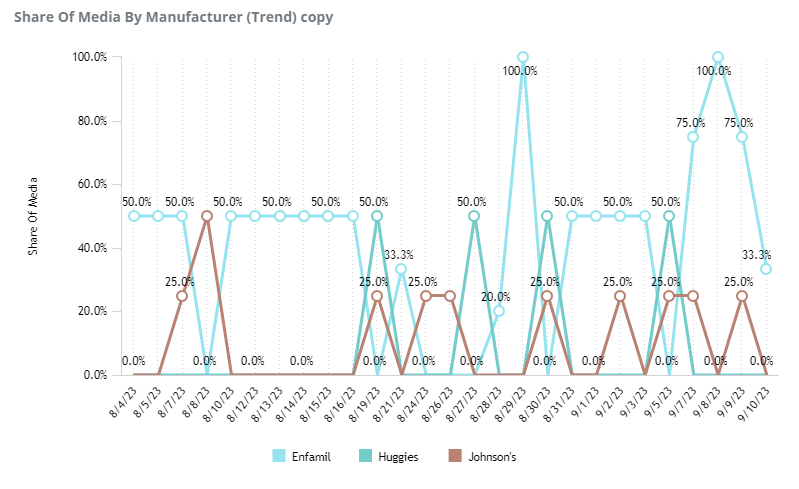
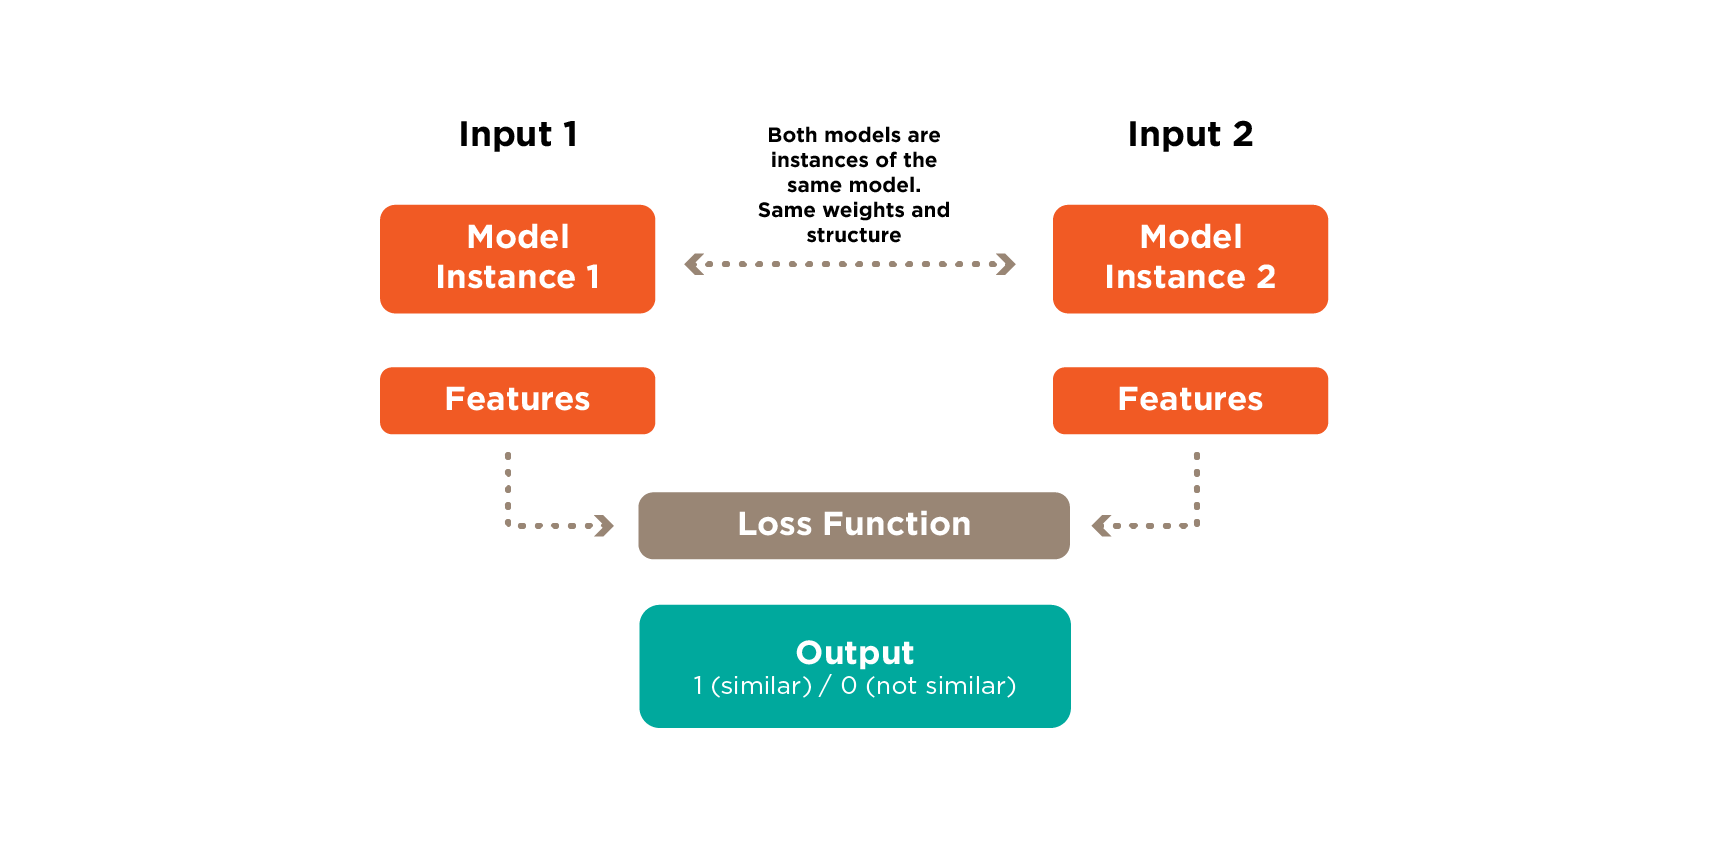
    DataWeave’s digital shelf analytics (DSA) is among the first providers to offer Share of Media KPI tracking and analysis. This is because it requires advanced, multi-modal AI to gather, view, and aggregate listings that encompass text, images, and video. With Share of Media tracking facilitated by DataWeave, consumer brands can track and analyze the effectiveness of their own promotional investments as well as those of their competitors.
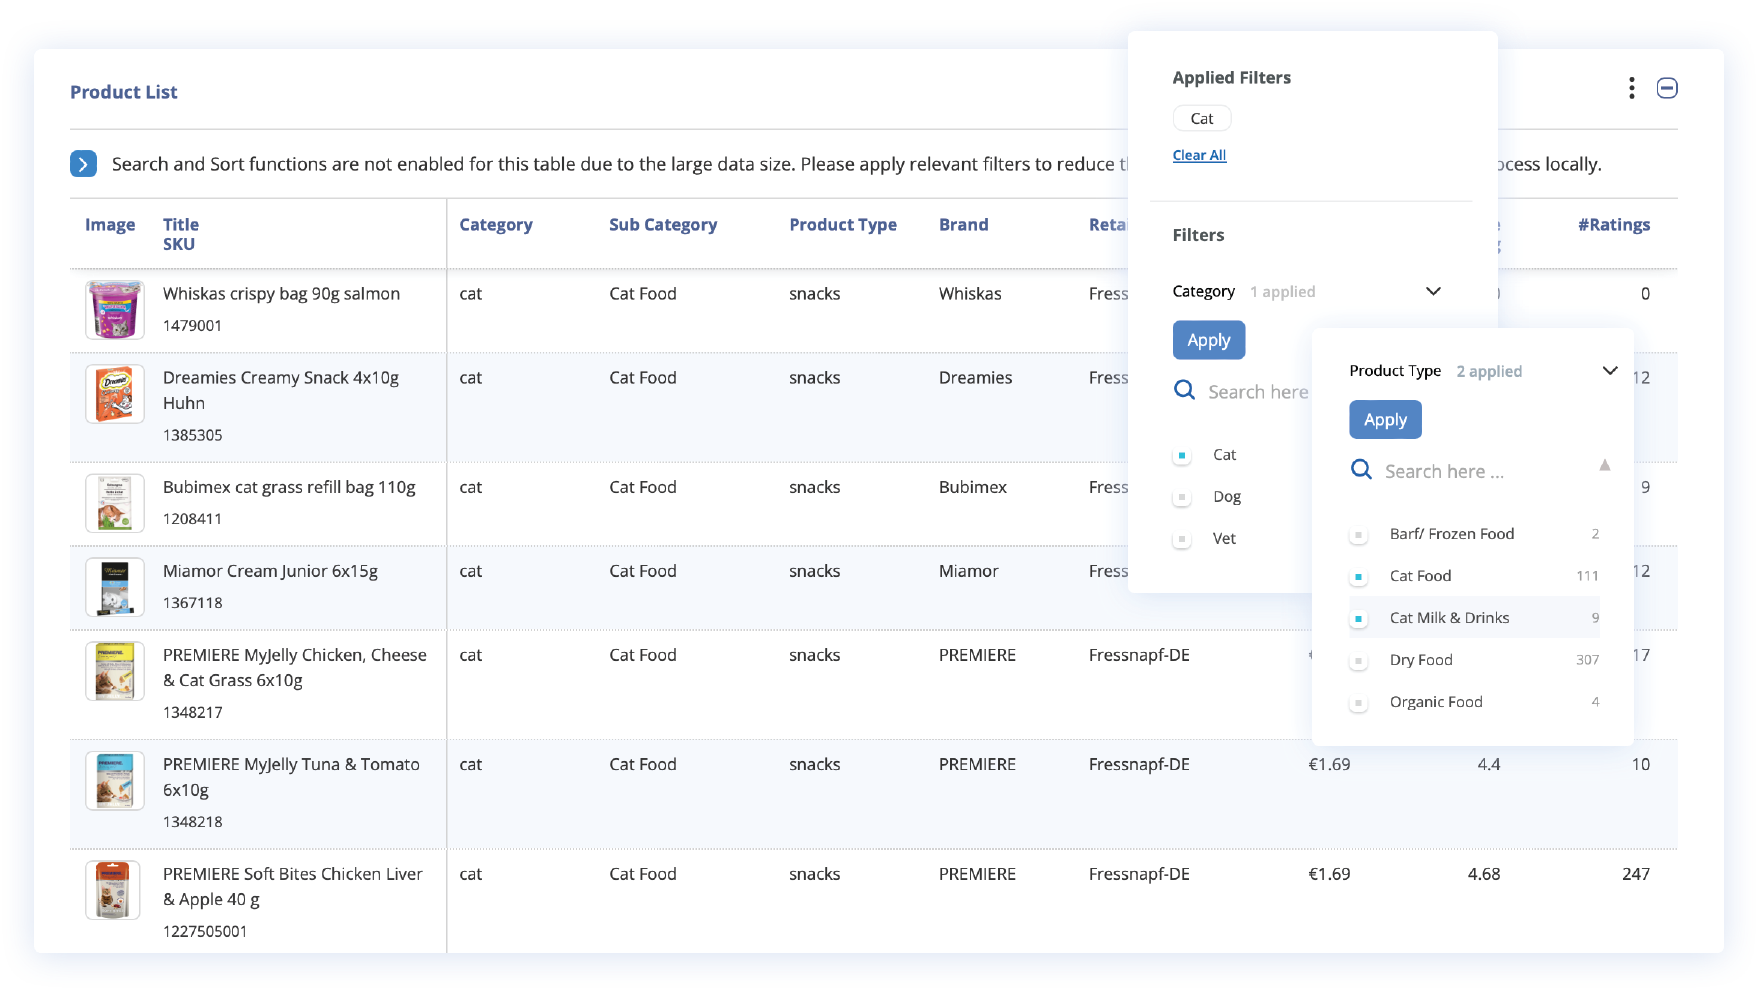
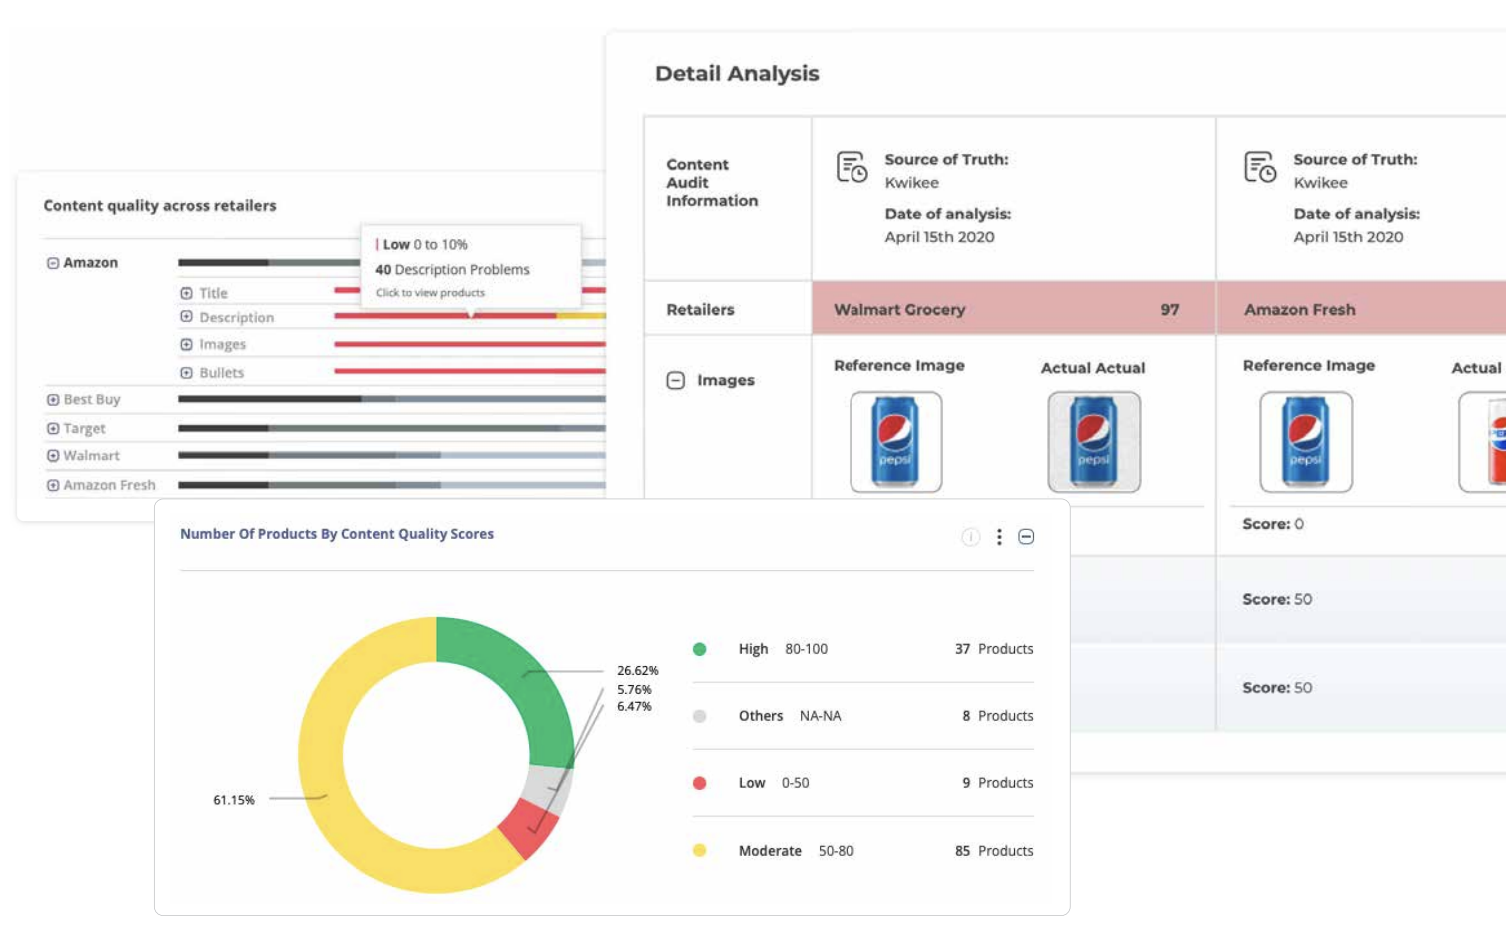
    3. Content Quality

    The content quality metric measures how well your product content adheres to the retailer’s specific guidelines, which are in place to steer traffic and sales on their sites.

    With the help of a DSA platform’s AI and ML capabilities, you can measure different elements of your product detail pages (PDPs), such as titles, descriptions, images, videos, and even customer reviews. You need to know which elements are missing, where they are missing, and which ones are negatively affecting sales so you can take corrective action.

    Did you know that the average cart abandonment rate is 69.99%? The quality of your content can significantly impact this number. Ensuring that your content is high-quality will help influence product discoverability, customer engagement, and conversion rates. It will also help position you ahead of the competition. If your content quality is poor, you may find yourself with lower search rankings, a higher return rate, and more abandoned carts.

    Here are some questions you can answer with the help of the content quality digital shelf metric:

    • Is my product content at a retail site exactly what was syndicated?
    • Are there any retailer initiated changes to my product content?
    • Are my product content updates reflected on the retailer platforms?
    • How well does my product content comply with the retailer guidelines?
    • How do I optimize my product content for enhanced discoverability and conversion?

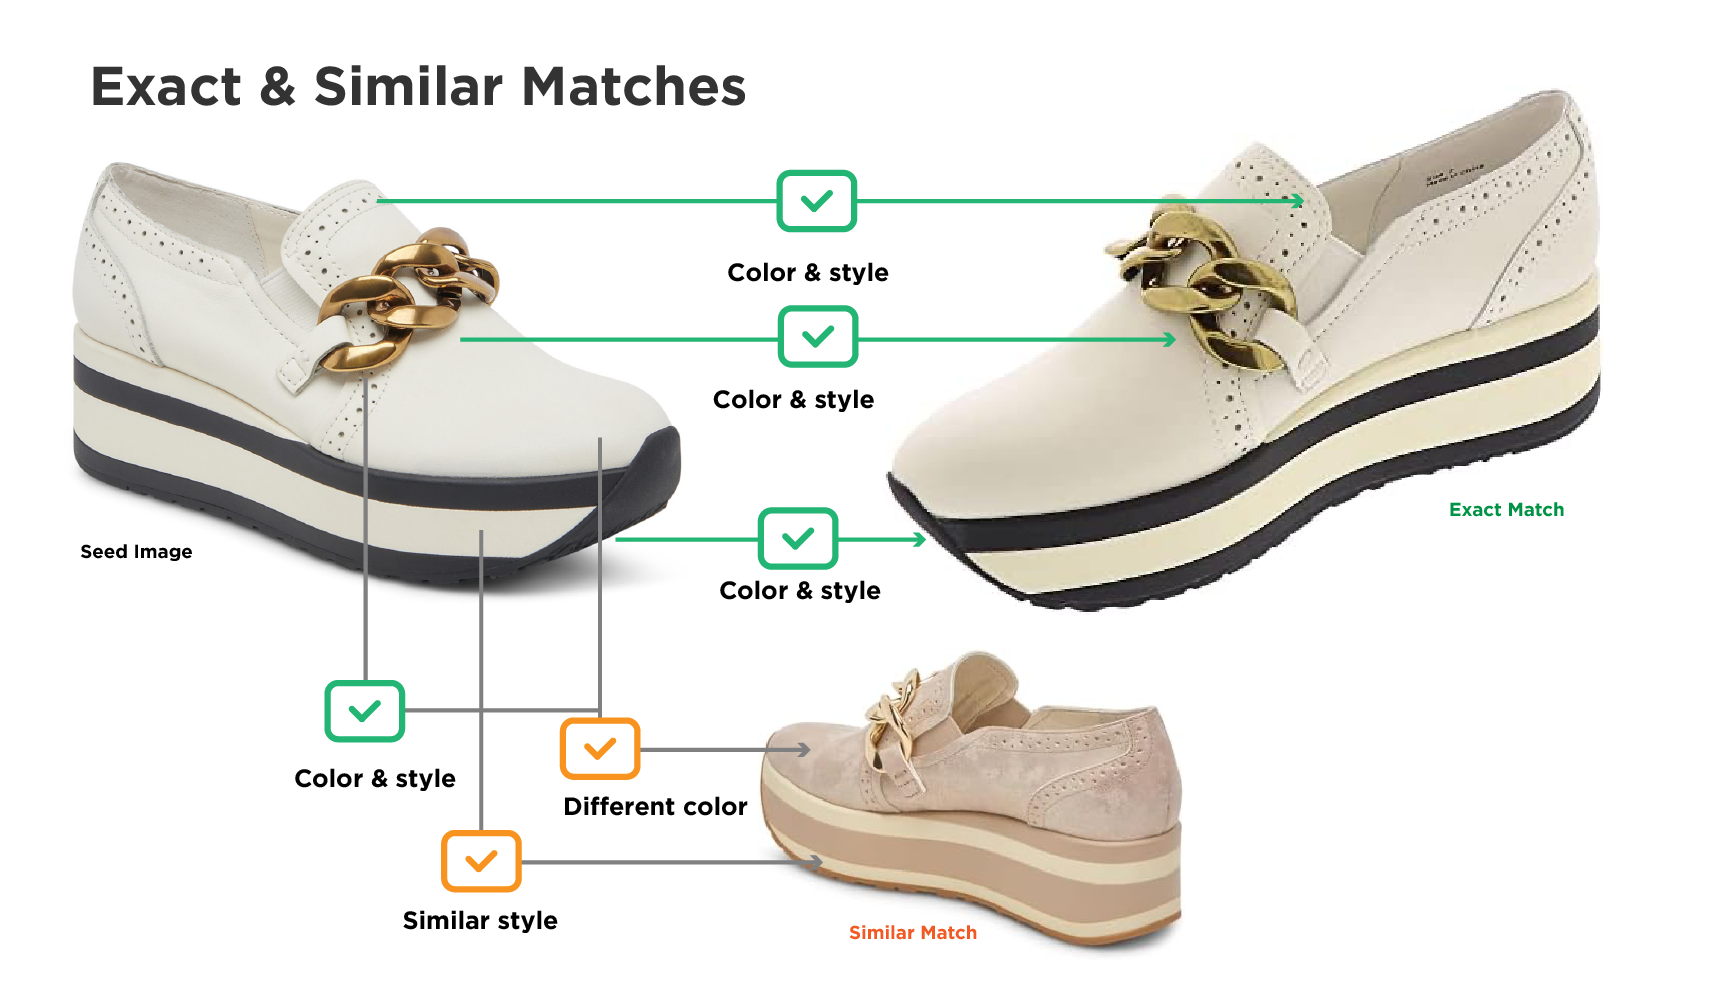
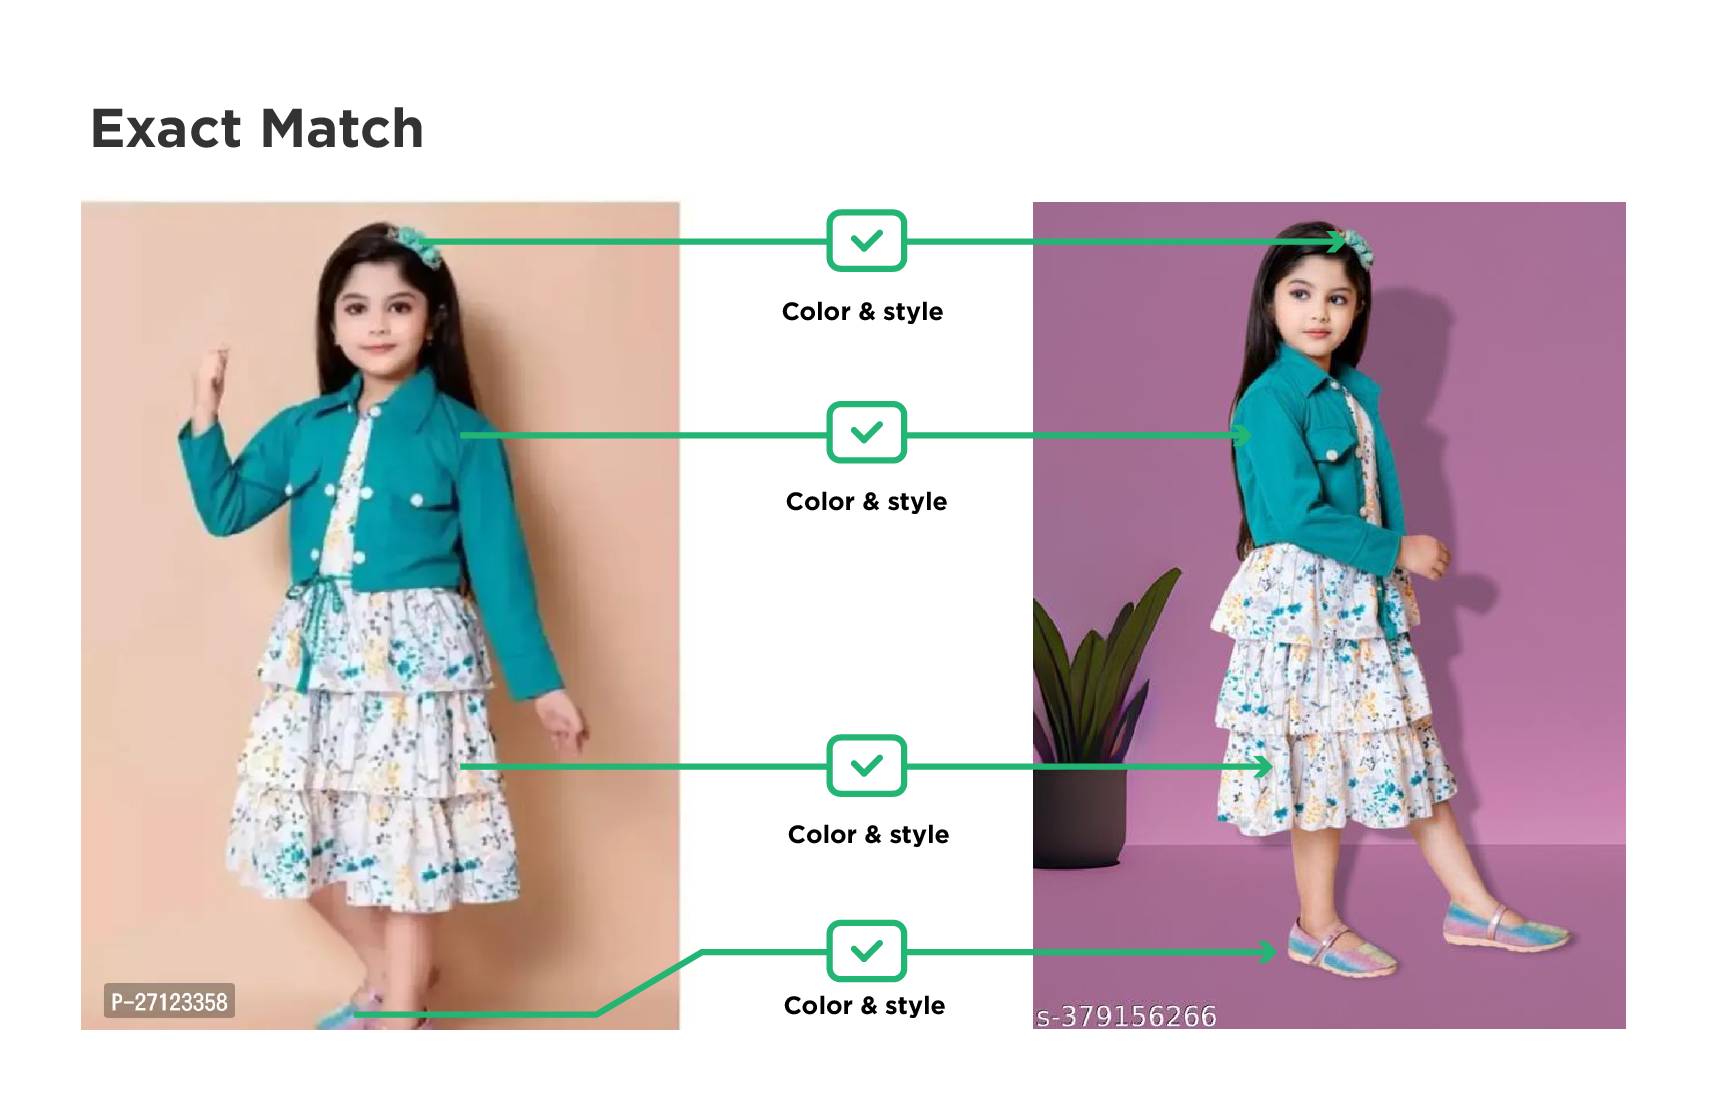
    DataWeave’s content quality digital shelf analysis helps consumer brands ensure that product content on eCommerce platforms is high-quality and benchmark their product listings against the competition. It does this through a combination of AI-driven quality analysis and by presenting brands with actionable recommendations. These optimized suggestions are based on the top-performing products so you can focus your valuable time on the areas that will drive the biggest impact.

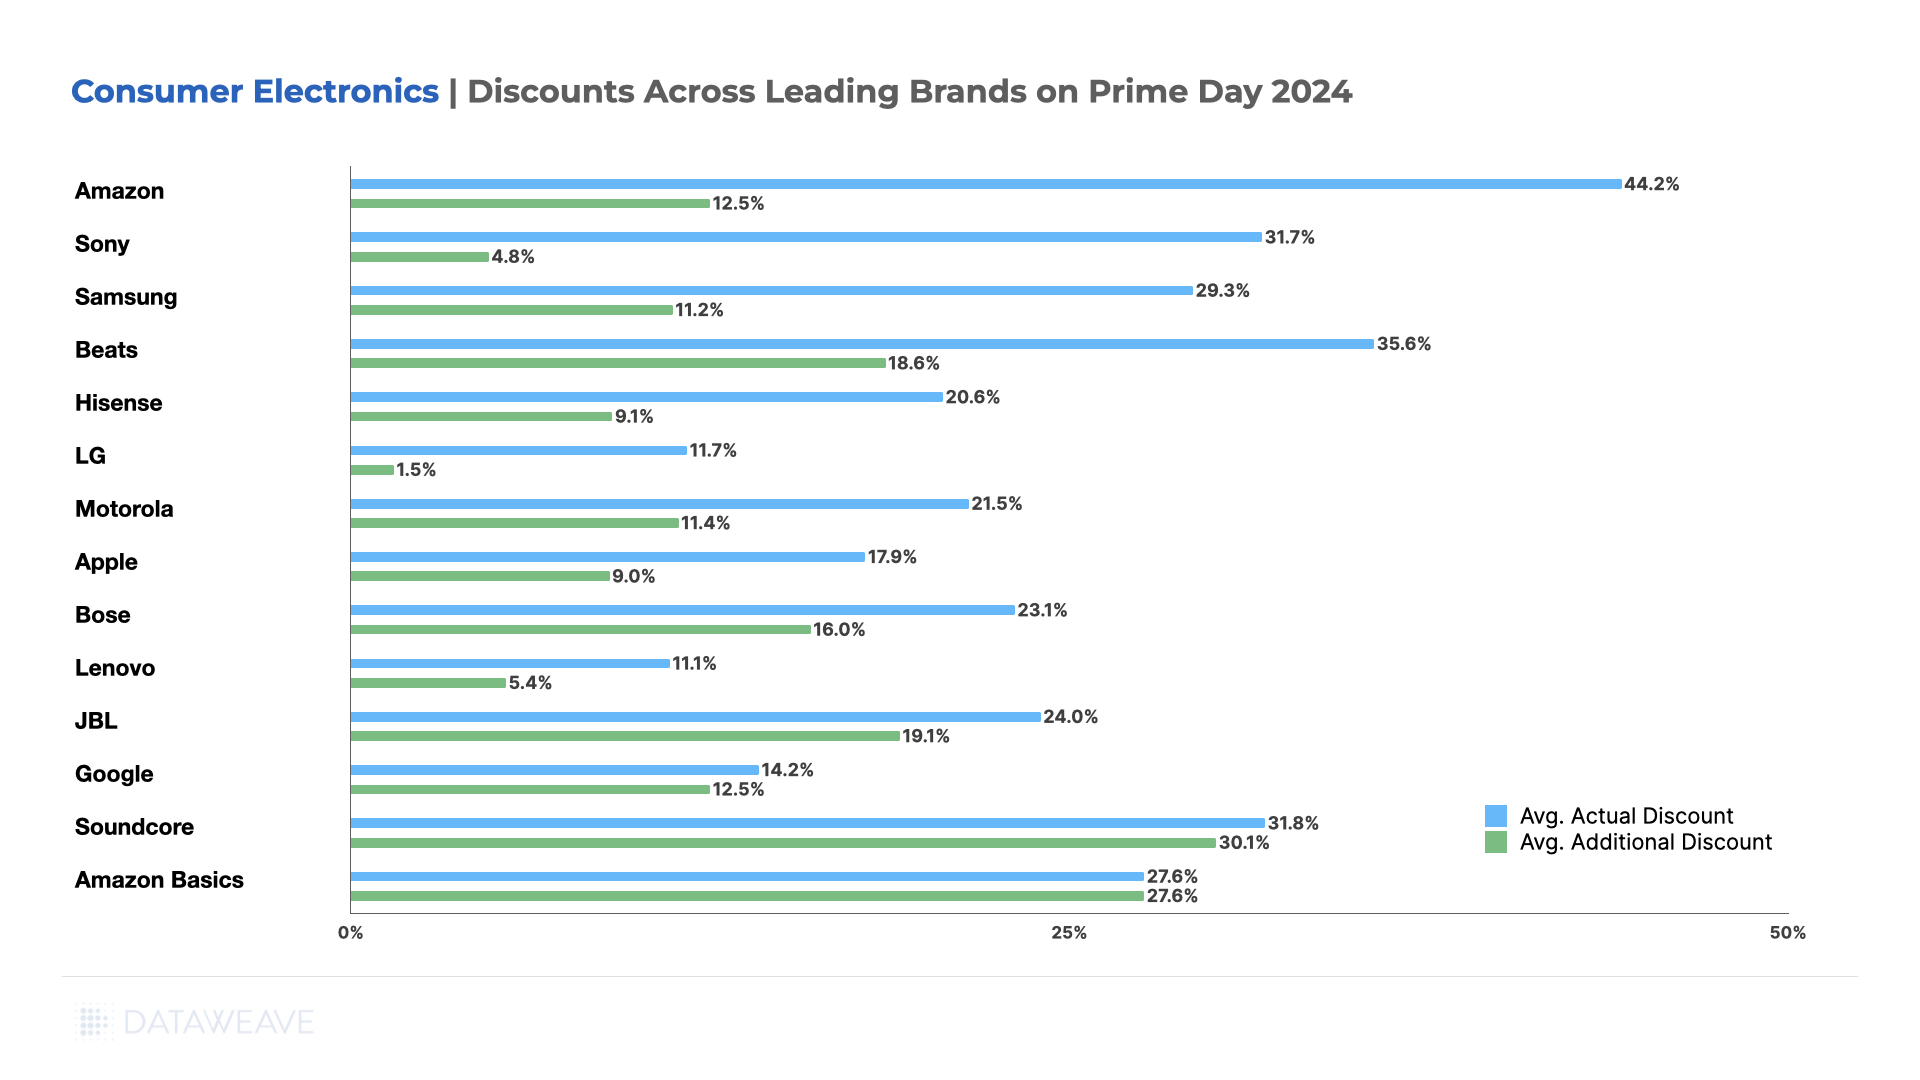
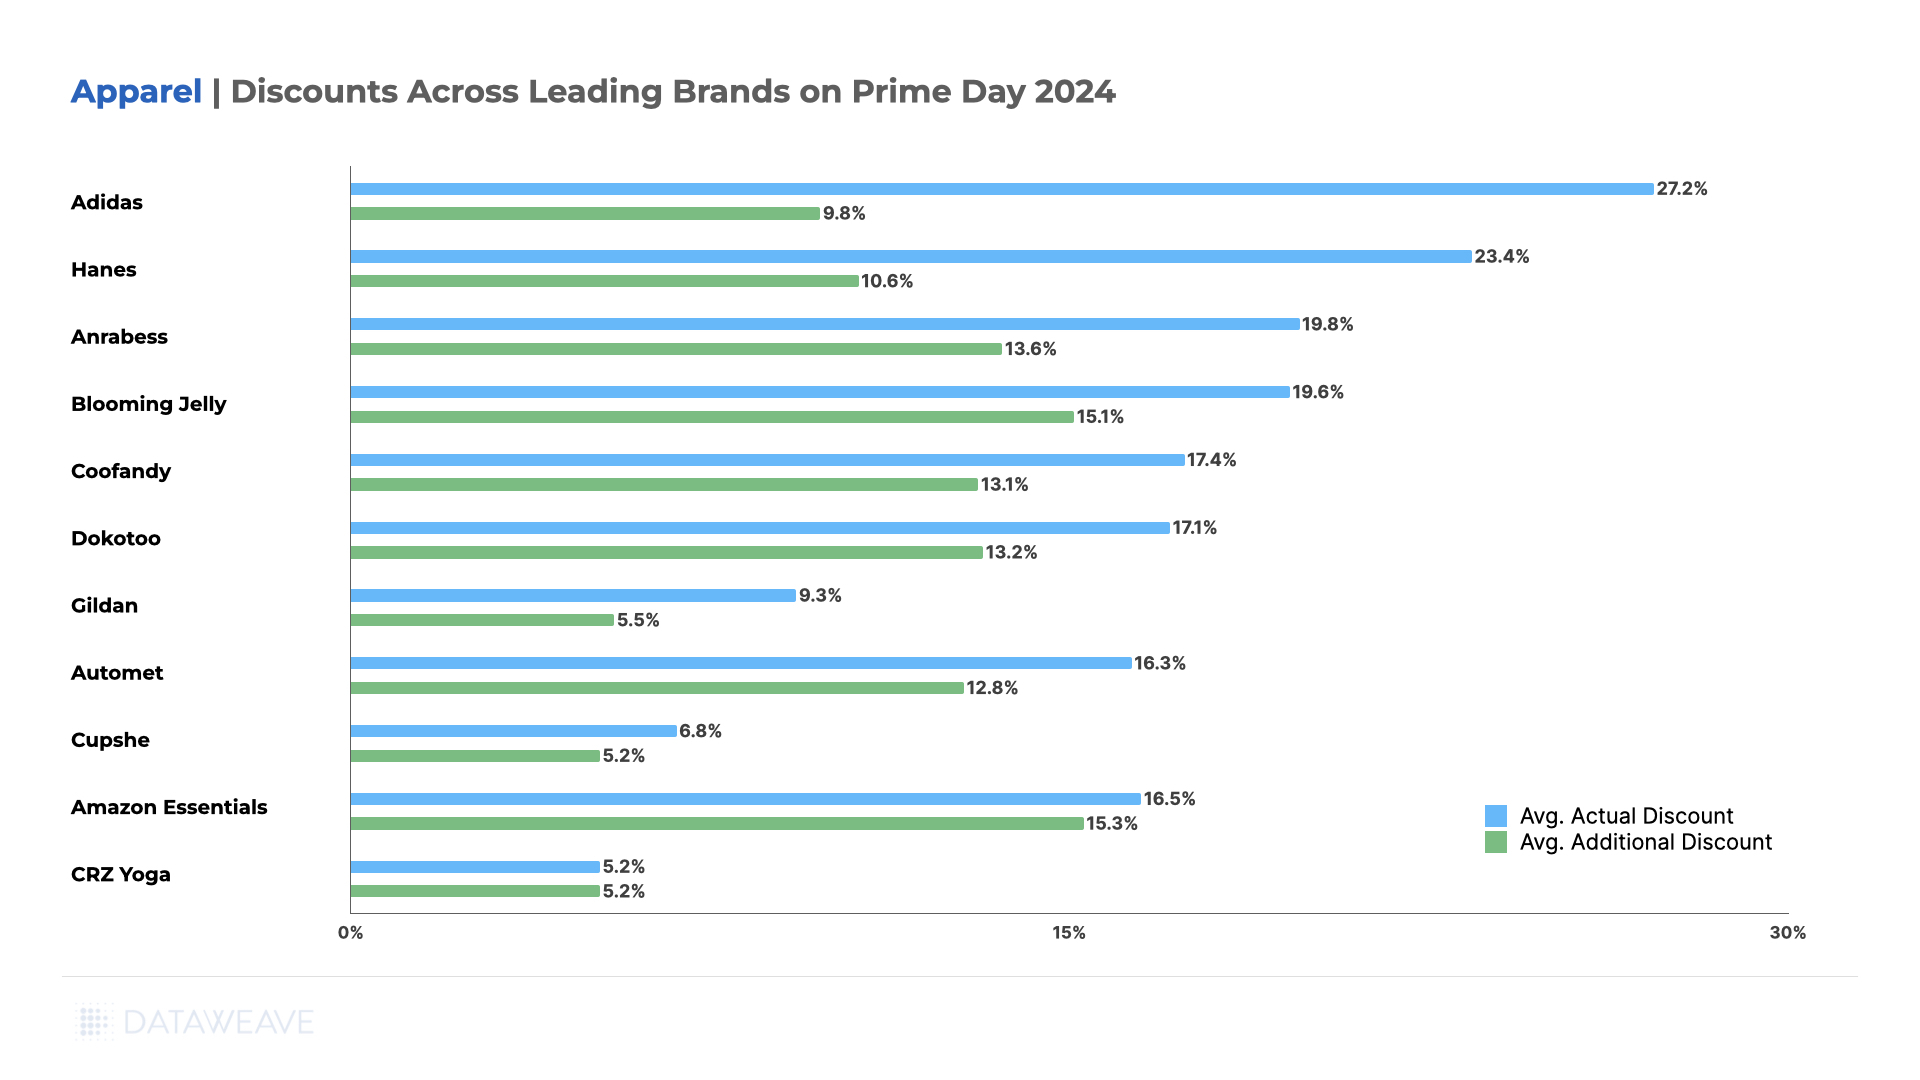
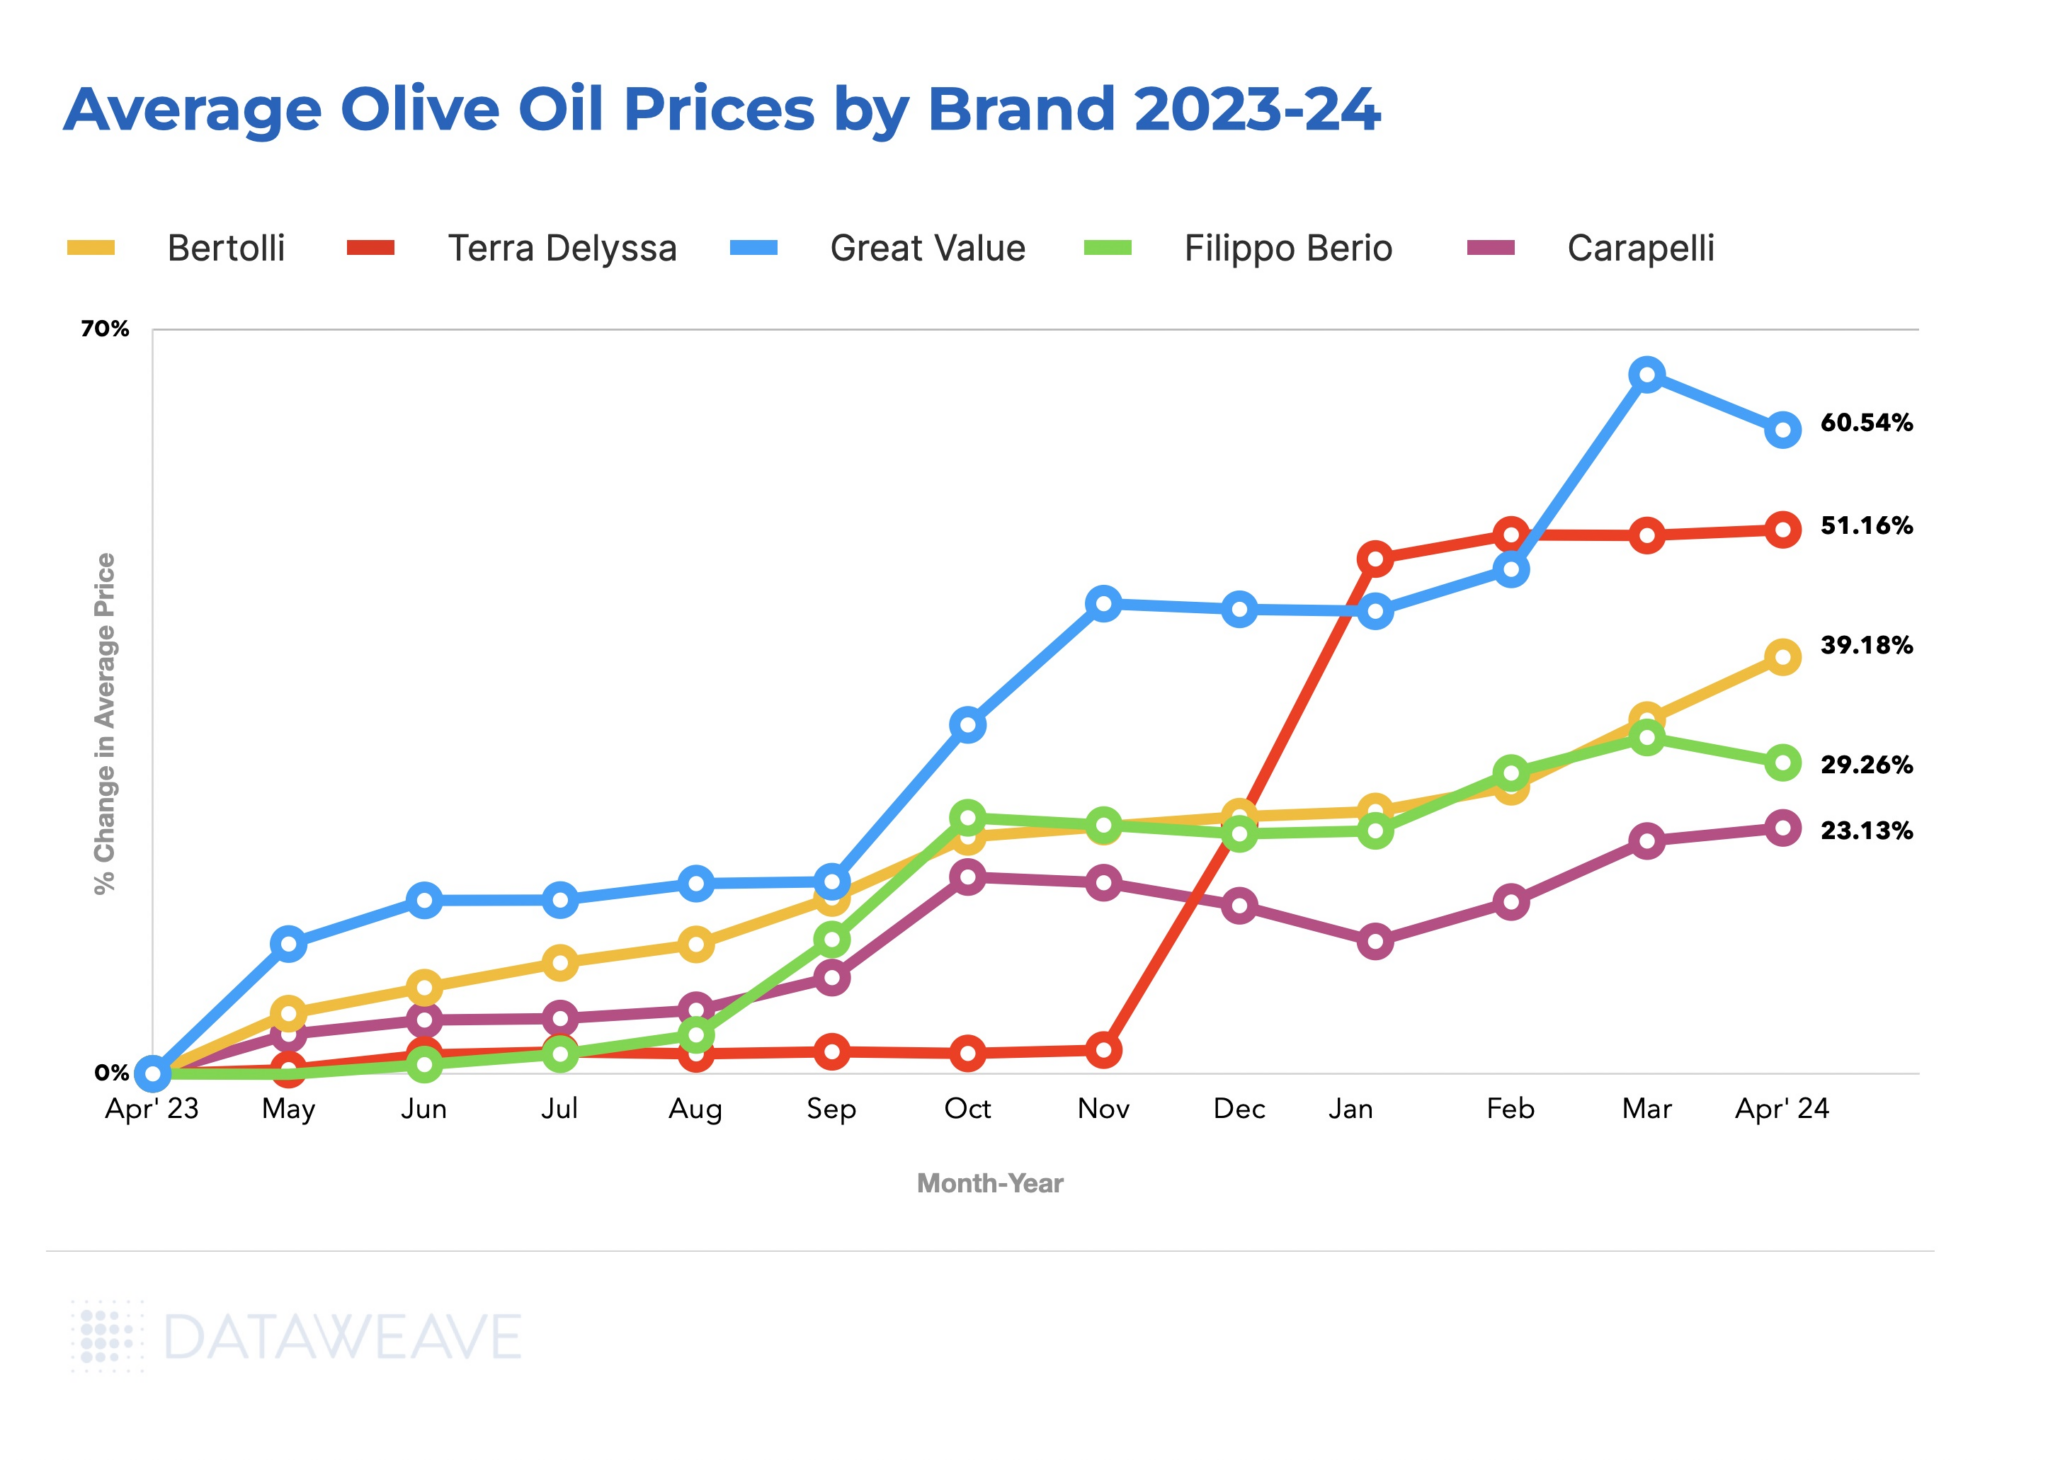
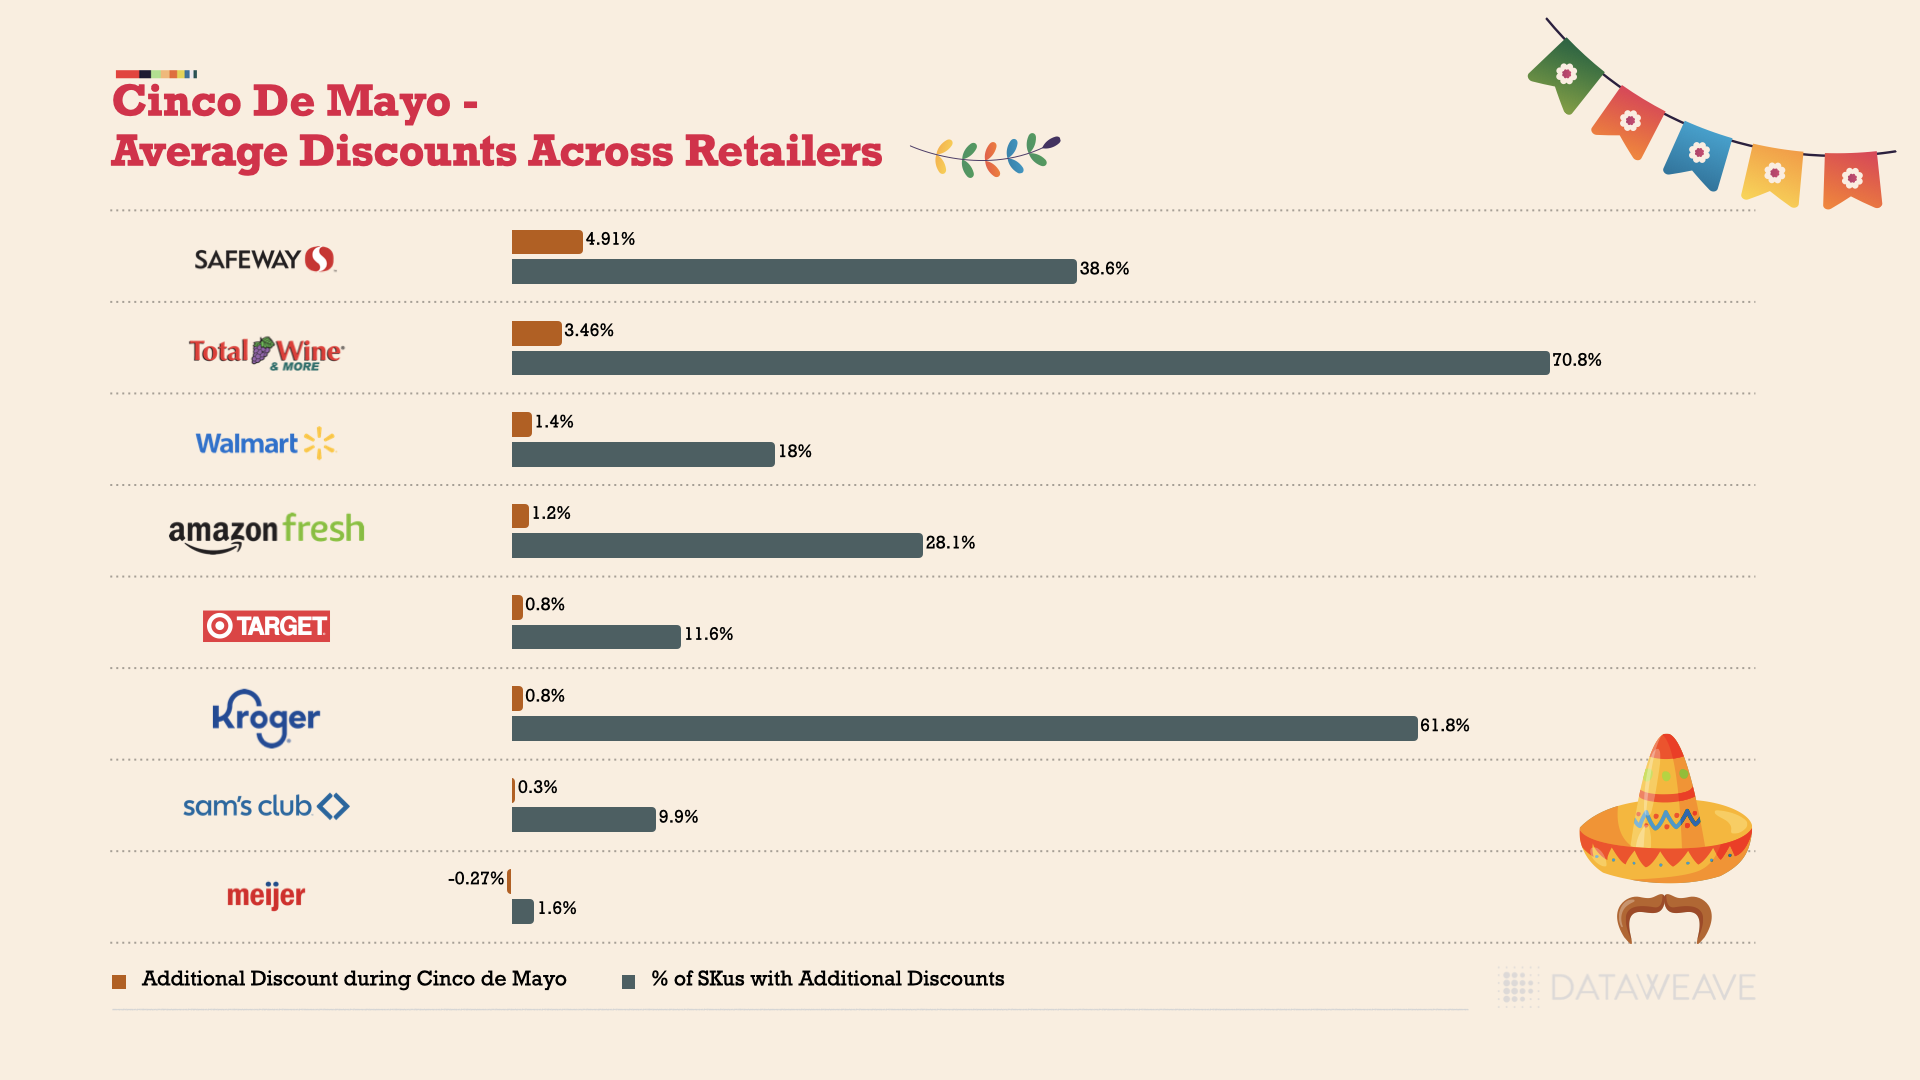
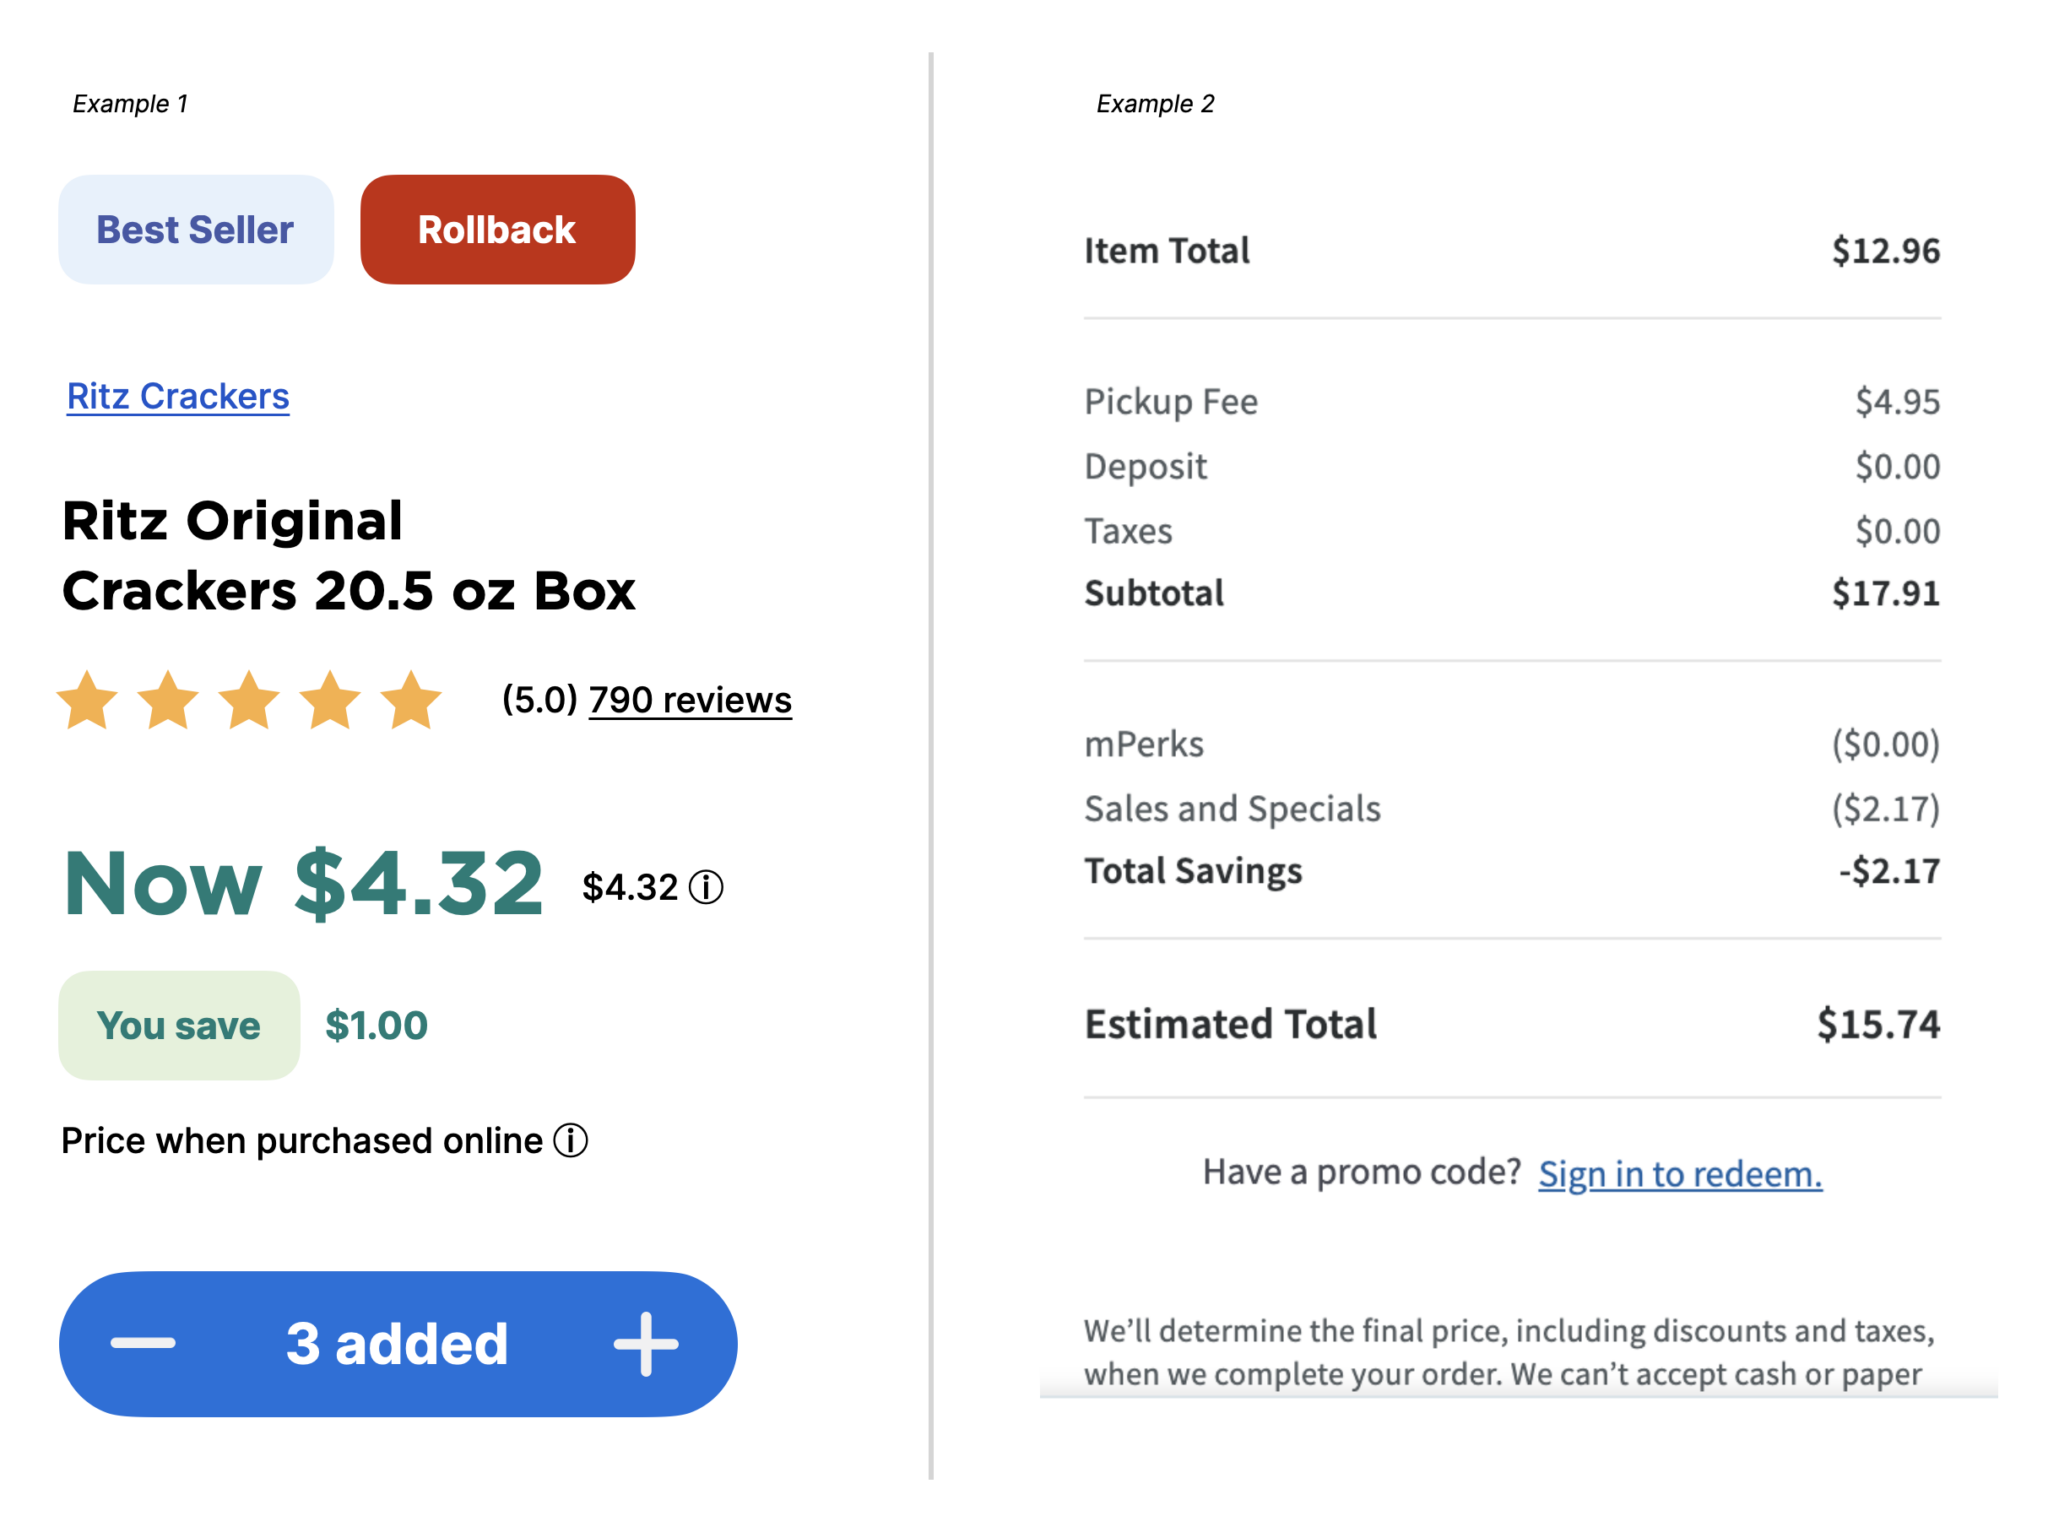
    4. Pricing & Promotions

    Your customers can easily shop around to find the best price for the product you’re selling. If your competitor is selling it cheaper, you’ll lose that sale.

    That’s why it’s essential to understand the pricing and promotional landscape for each of your products and categories. This can be a challenge, especially if it’s a common product or comes in multiple pack sizes or variants.

    It’s equally important to track pricing and promotions even at individual, physical stores. Doing so will allow you to remain competitive and responsive to local market dynamics by tailoring your pricing strategies based on regional competition. You don’t want your products to be overpriced (lost sales) or underpriced (lost profit) in specific markets.

    Harmonizing insights when operating an omnichannel consumer brand is extremely difficult without the aid of a digital shelf analytics solution. Insights need to be aggregated between desktop sites, mobile sites, and mobile applications, as well as from physical storefronts.

    Questions you can answer with the help of the pricing & promotions digital shelf metric include:

    • How do my product prices and promotions compare to my competitors?
    • How consistent is my product pricing across retail websites?
    • How does my product pricing vary across regions, ZIPs, and stores?
    • How do price changes influence my sales numbers?
    • Are there regional differences in pricing and promotion effectiveness?

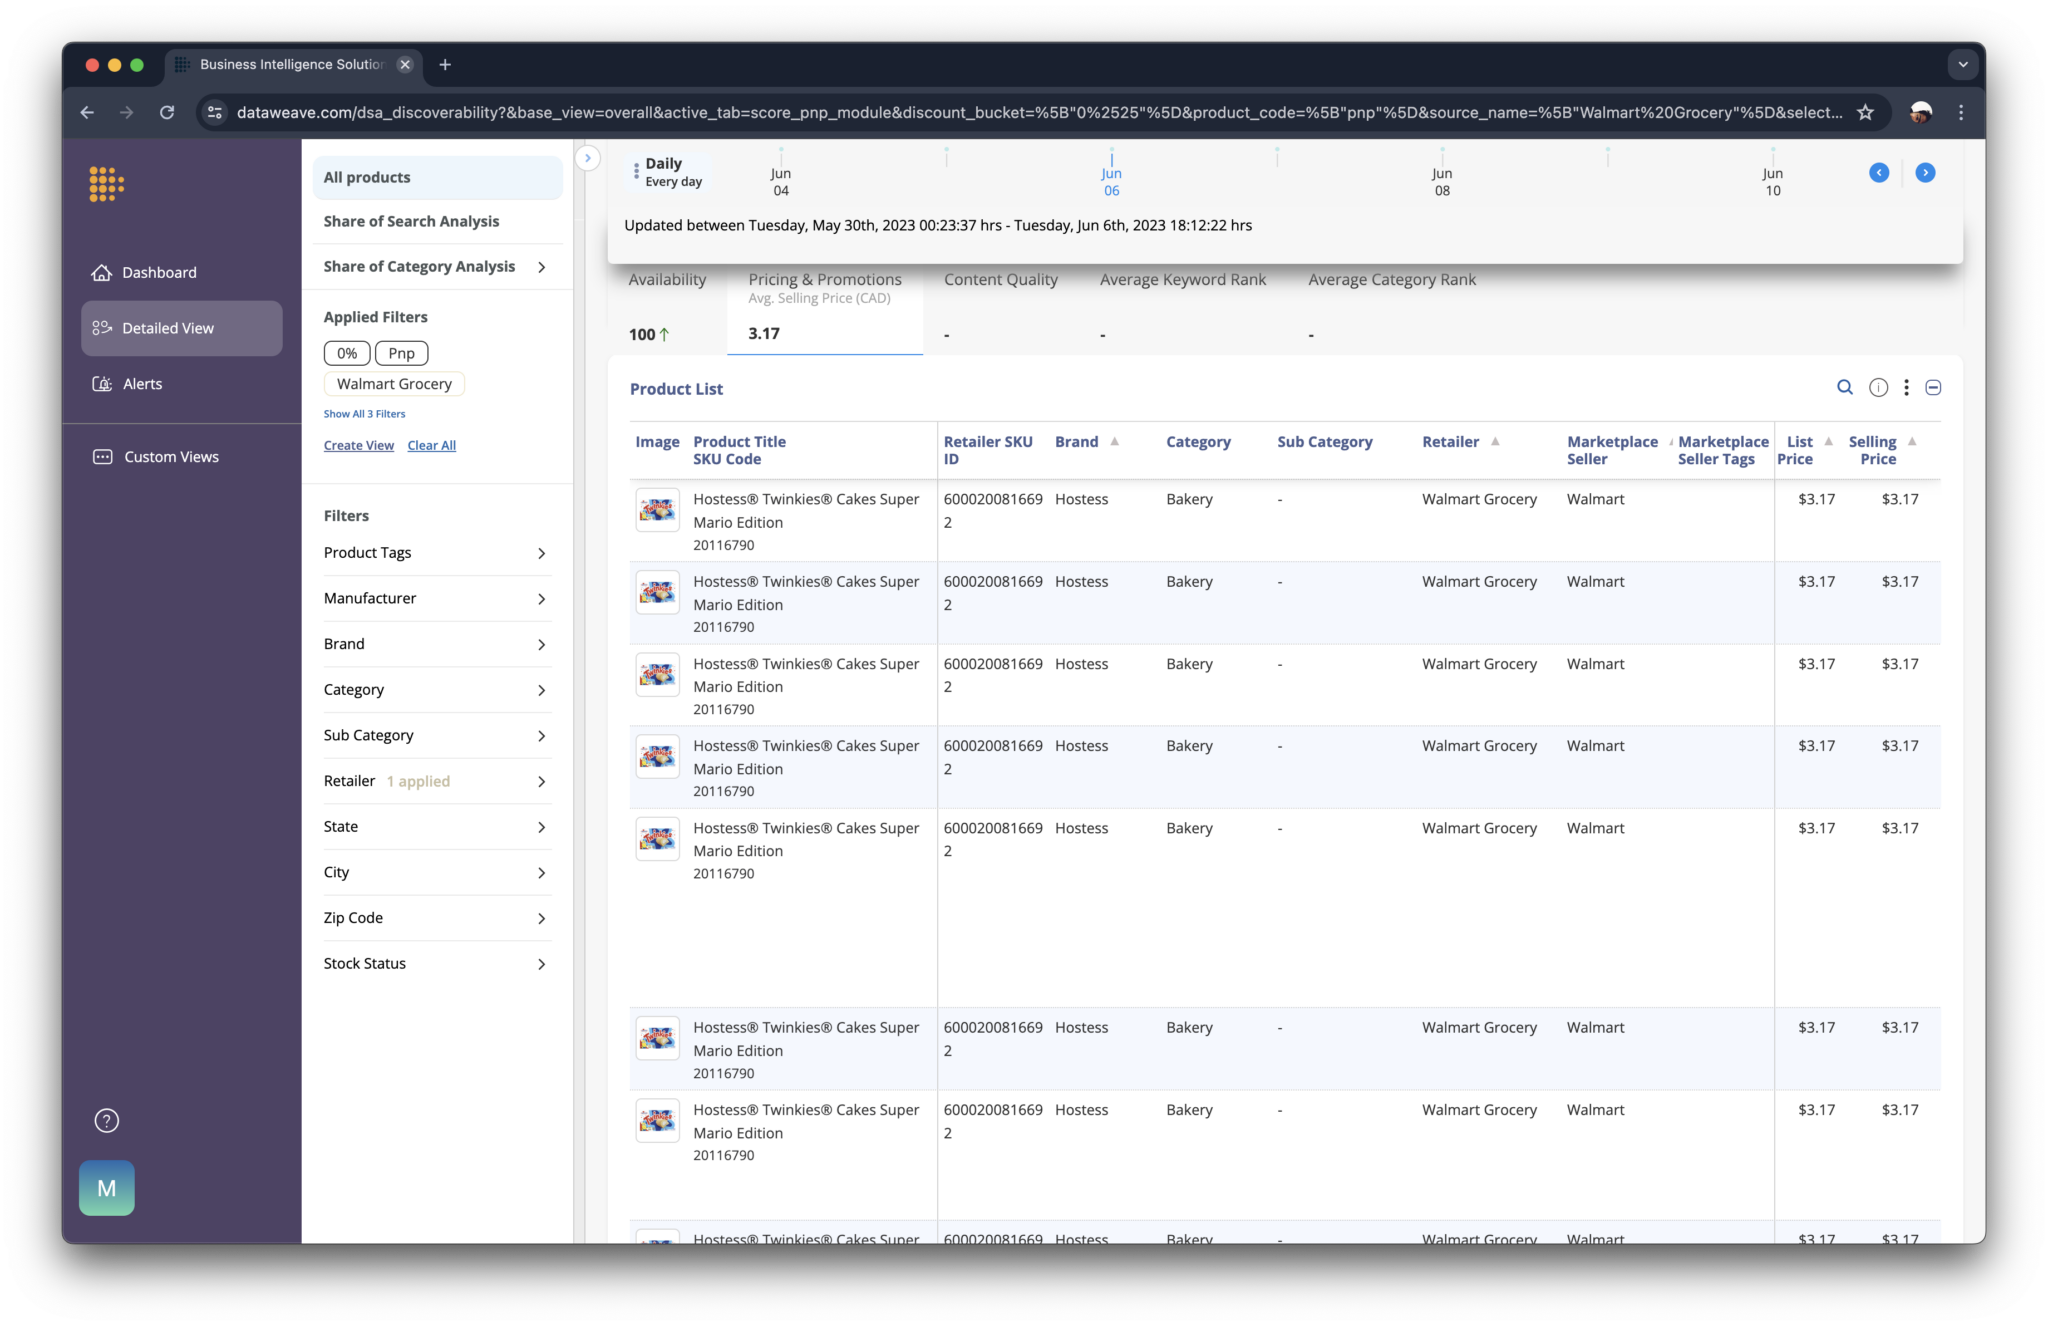
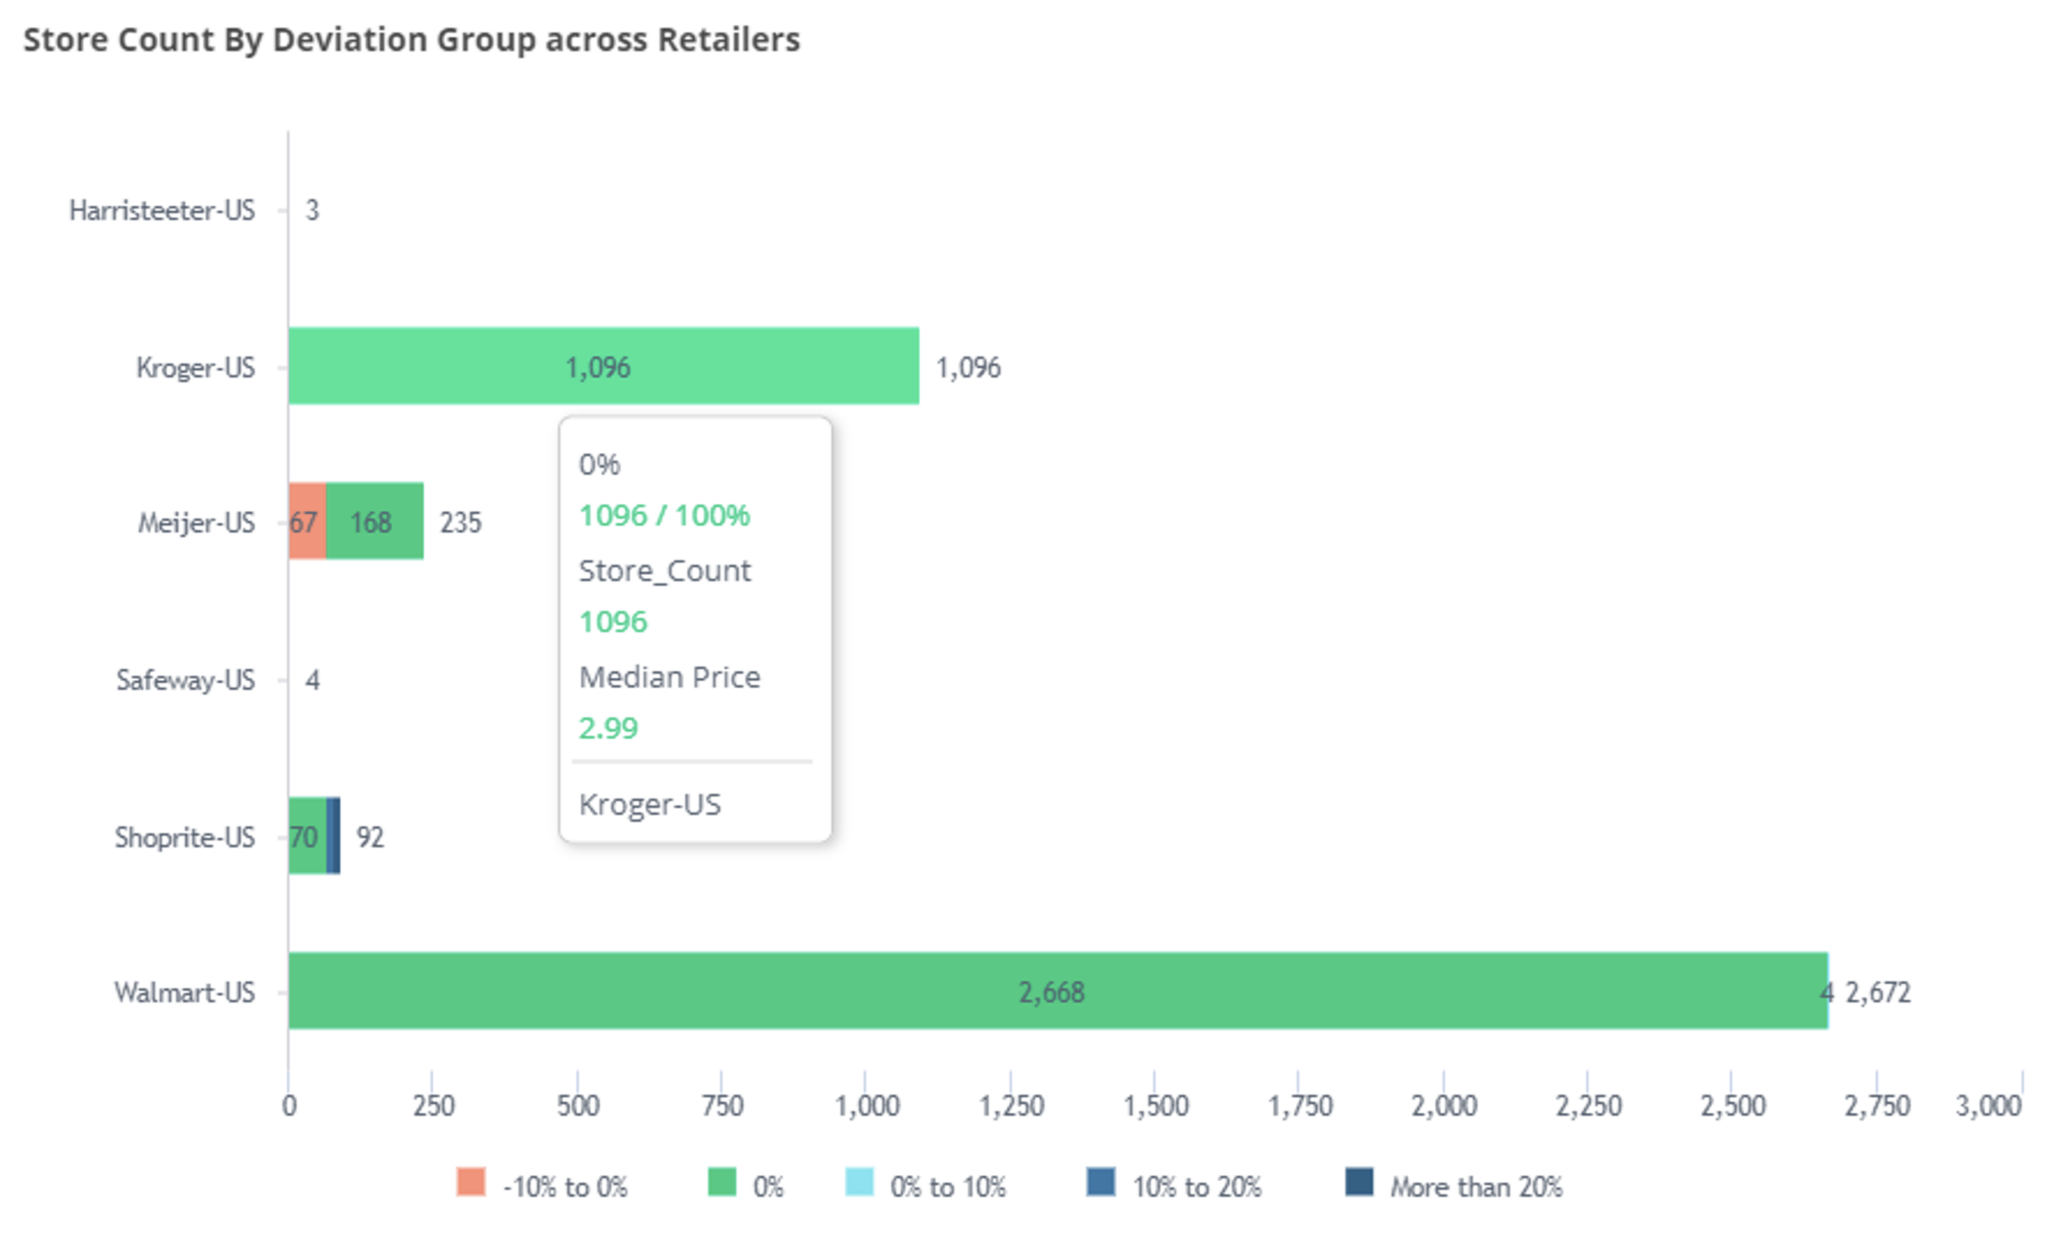
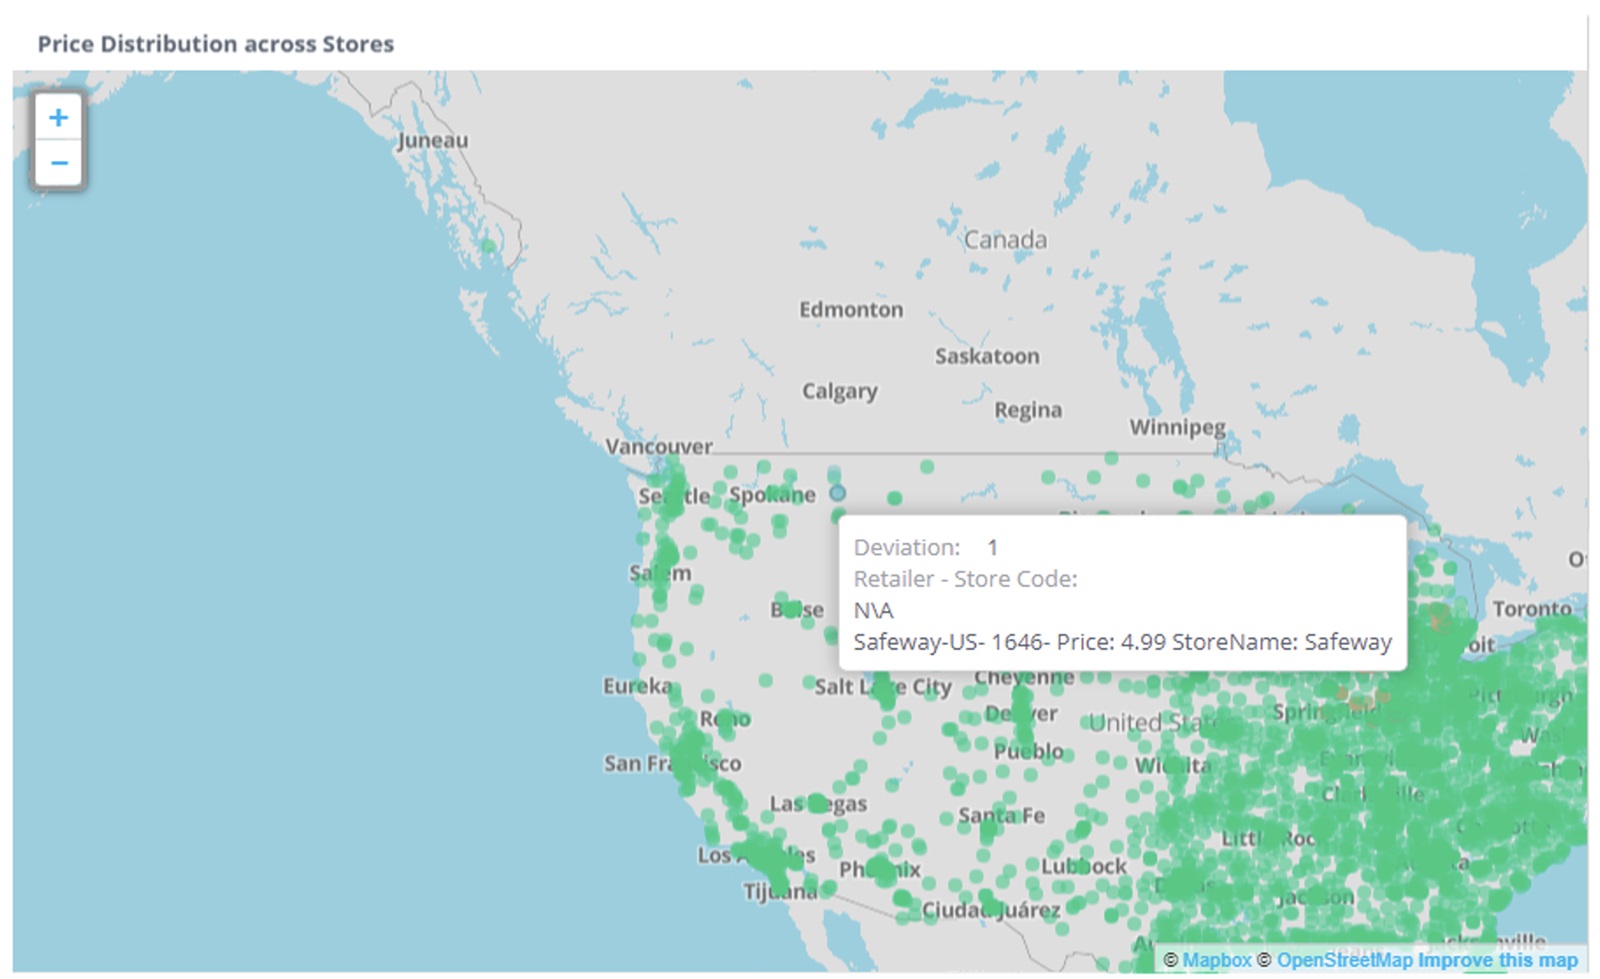
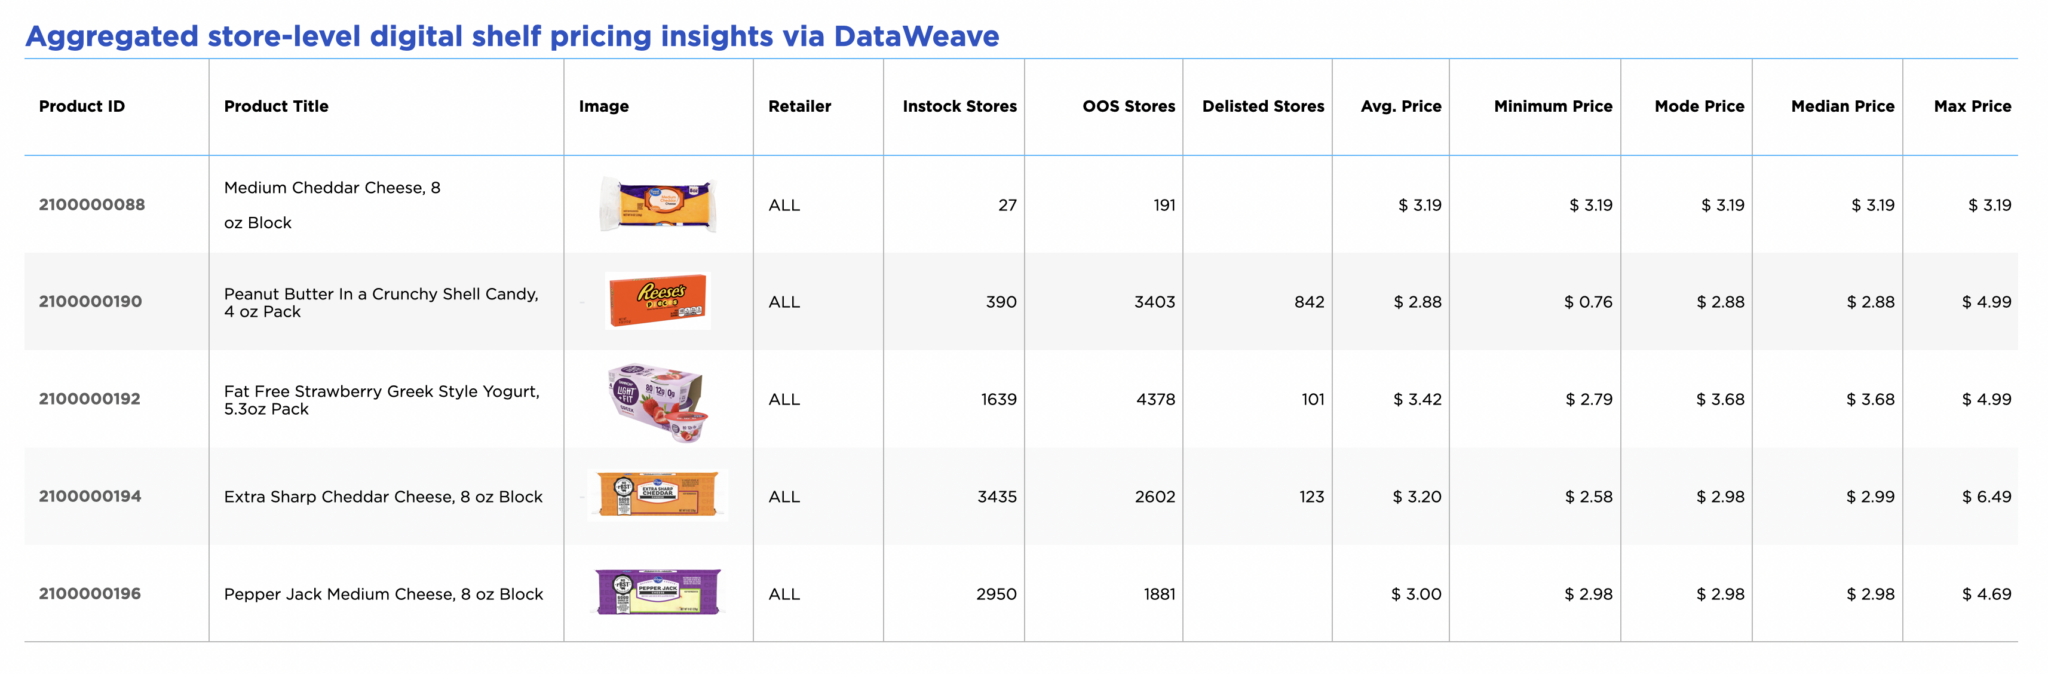
    DataWeave’s digital shelf analytics platform stands out with its sophisticated location-aware capabilities, which enable the aggregation and analysis of localized pricing and promotions. The platform defines locations based on a range of identifiers, such as latitudes and longitudes, regions, states, ZIP codes, or specific store numbers.

    The platform can also extract promotional information, such as credit card-based or volume-based promotions. You can see variances across retailers, split by price groups, brands, and competitors. DataWeave specializes in enabling brands to conduct in-depth analyses across a wide array of attributes so you can answer just about any pricing or promotional question you have.
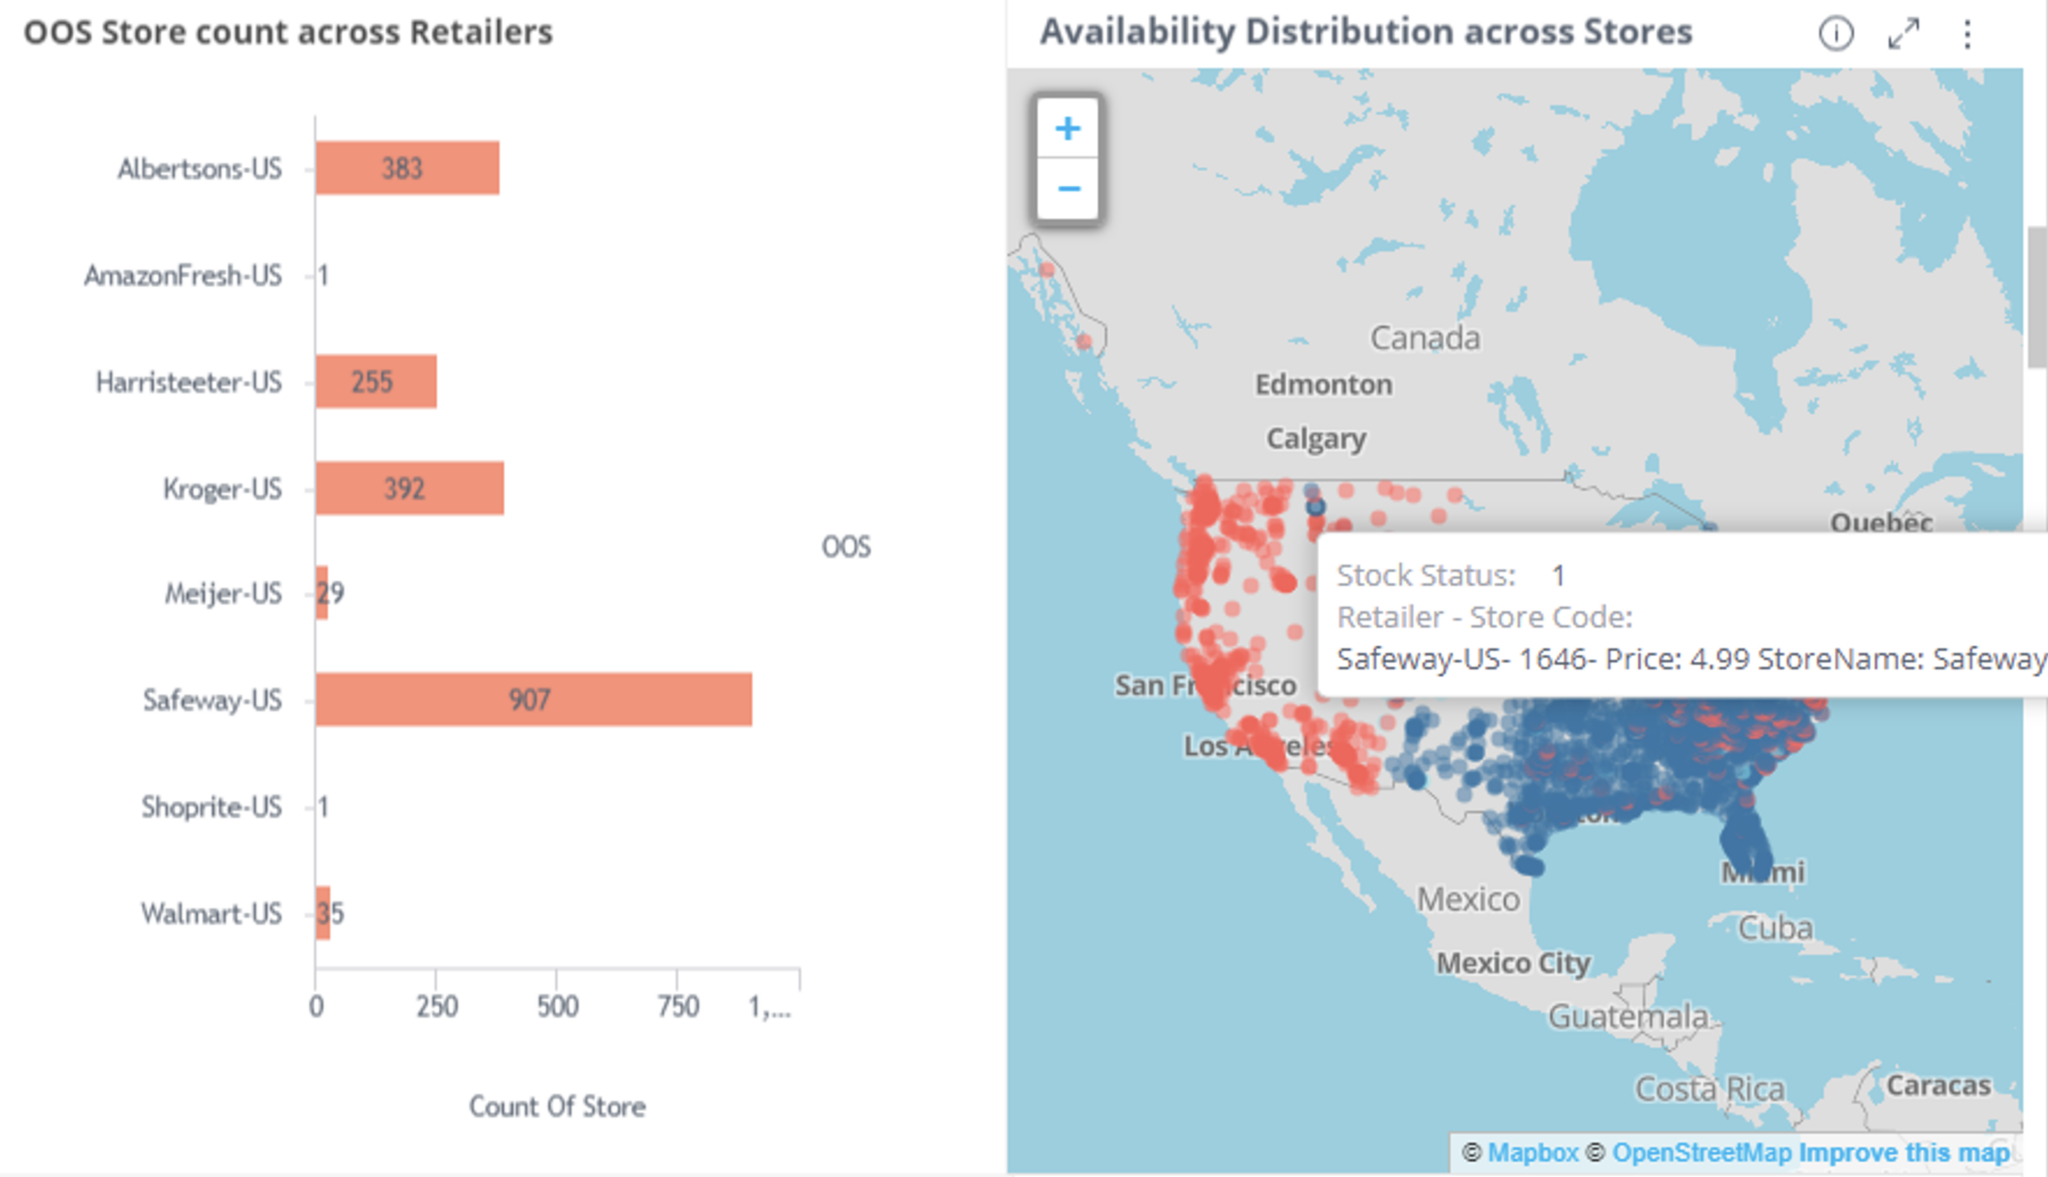
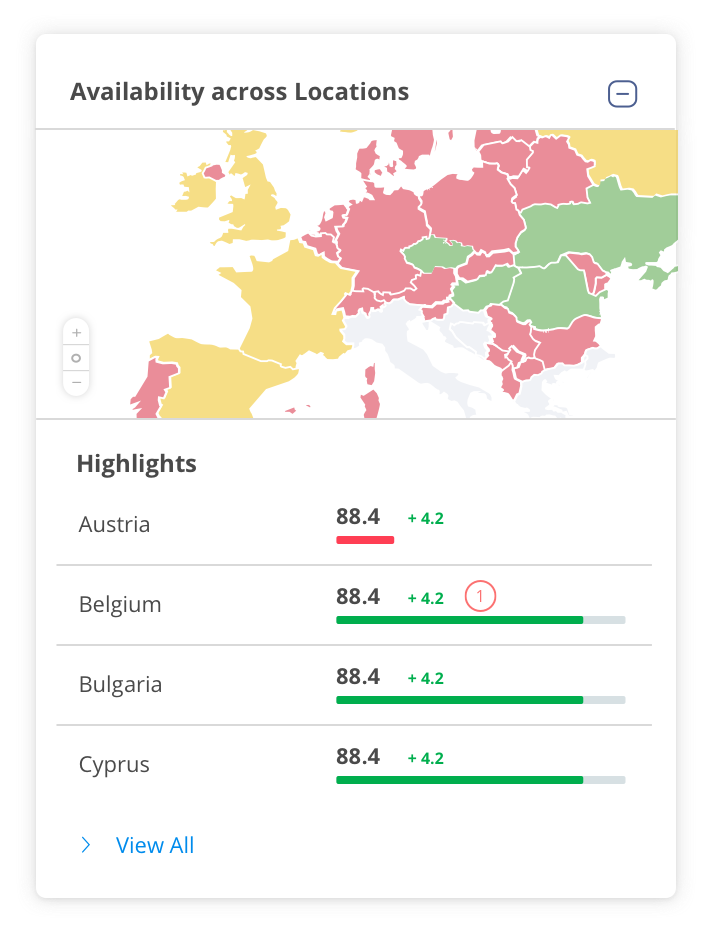
    Digital shelf pricing insights via Dataweave

    5. Availability

    The availability KPI in digital shelf analytics measures the in-stock and availability rates for a brand’s products across eCommerce and physical locations. Similar to the pricing and promotions metric, it relies heavily on location awareness, down to individual stores. Measuring both online availability and offline in-stock rates will help you understand the big picture and take more informed replenishment action.

    When you start leveraging the availability KPI with the help of digital shelf analytics, you can improve inventory management, boost product discoverability, increase the frequency with which your online product listings convert, and generally drive more sales. This KPI is essential for ensuring your customers can always find and buy the products they want.

    With the availability KPI, you can start answering questions like:

    • What is my overall in-stock rate?
    • Which of my products frequently go out of stock?
    • How does product availability vary across different regions and stores?
    • What is the impact of availability on my conversion rates?
    • Are there any seasonal trends in product availability that I need to address?
    • How quickly are we resolving stockout issues across different locations?
    • What are my biggest opportunities to reduce stockouts?

    DataWeave enables consumer brands to track their product availability metric through automated data collection from various eCommerce platforms in conjunction with physical in-stock rates. The platform provides granular, store-level insights so you can understand regional stock variations and optimize inventory distribution. By tracking historical availability data, you can identify seasonal patterns and predict future demand to pre-empt stockout issues. All of this can be configured with automatic notifications to alert you when there has been a stockout event or when a low stock threshold has been passed, facilitating timely replenishment.

    Graph showing availability across locations

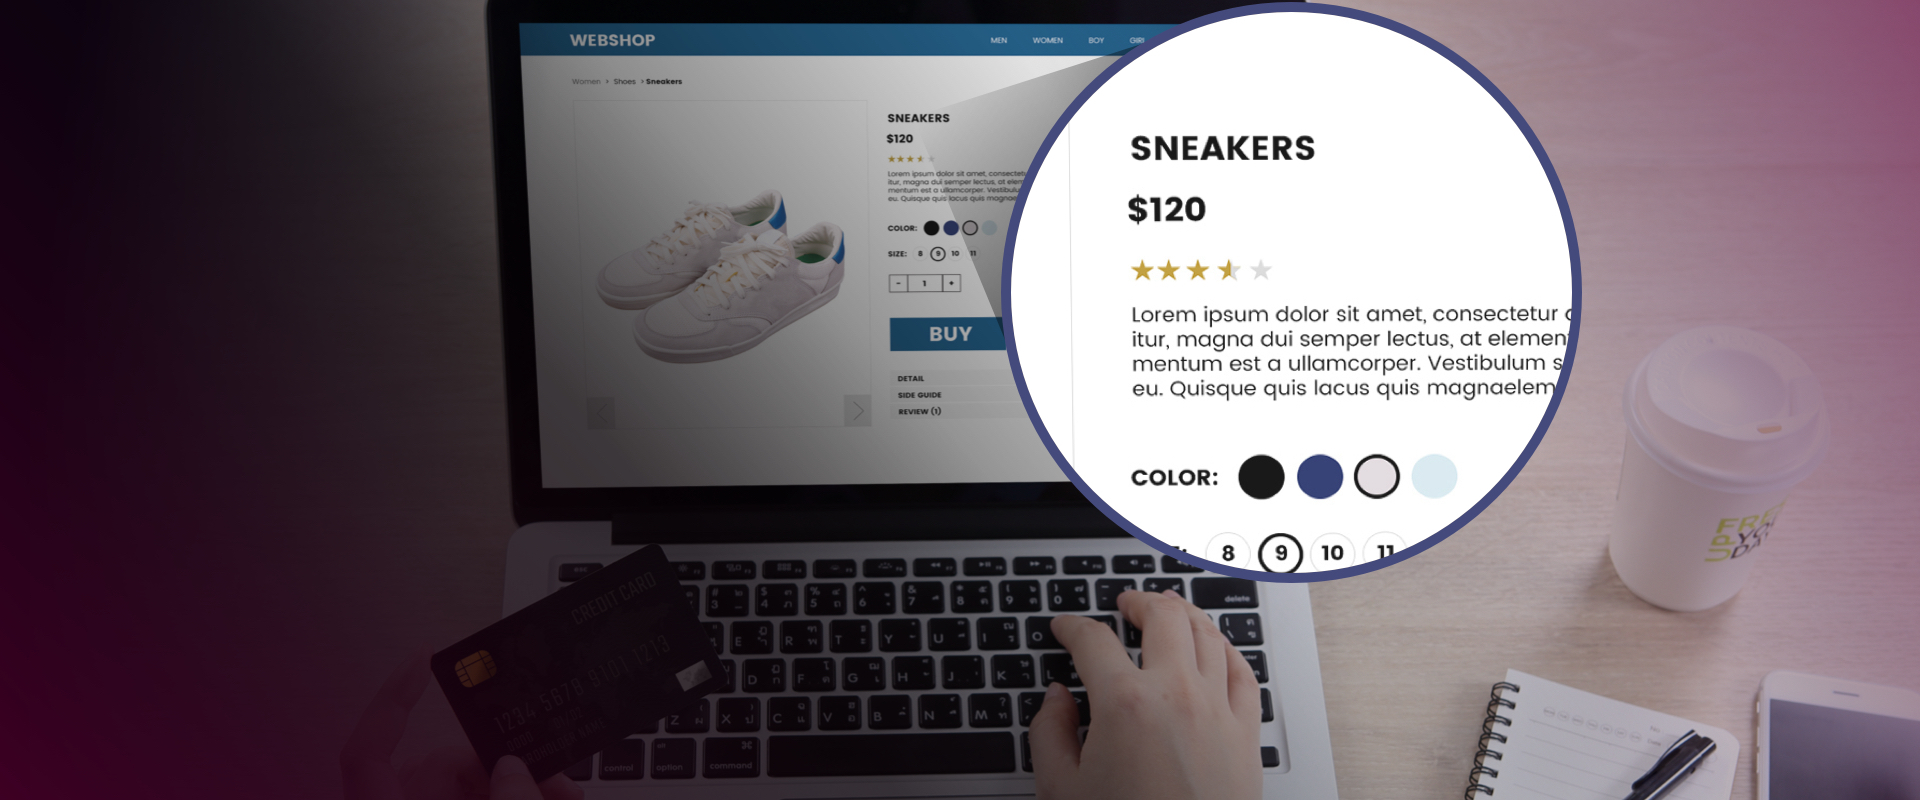
    6. Ratings & Reviews

    The final KPI in our guide is the ratings & reviews digital shelf metric. Consumers rely heavily on genuine feedback from their peers and refer to star ratings, posted comments, and uploaded pictures to inform their buying decisions. This KPI analyzes the impact of customer feedback and reviews on your products’ performance across eCommerce platforms so you can measure overall brand perception and isolate areas of opportunity.

    This metric does something other digital shelf metrics don’t; it can inform your product strategy. It can help you identify repeat complaints that your product team can address with the manufacturer or use for the design of future products.

    Some questions you can answer with this powerful KPI include:

    • What is the overall customer sentiment towards my products based on ratings and reviews?
    • Which product features are frequently mentioned positively or negatively by customers?
    • How do my product ratings and reviews compare to those of my competitors?
    • Are there common issues or complaints that need to be addressed to improve customer satisfaction?
    • Which products have the highest and lowest ratings, and why?

    With DataWeave’s digital ratings and reviews feature, you can keep a pulse on customer sentiment to take short-term action as well as decide long-term strategy. You can leverage reviews to influence product perception, refine products, and enhance overall customer satisfaction.

    DataWeave’s Digital Shelf Metrics

    Each one of these metrics is interconnected and collectively influences a brand’s success. For instance, improving content quality and earning higher ratings can significantly enhance your product’s visibility in search results, thereby boosting the Share of Search digital shelf metric. By focusing on a comprehensive approach that integrates these metrics, brands can ensure their products are consistently visible, competitively priced, well-reviewed, and readily available.

    DataWeave gives consumer brands the means to execute a holistic digital shelf strategy. From a single portal, track and improve digital shelf metrics like Share of Search, Share of Media, Pricing and promotions, Availability, and Ratings and Reviews.

    Our solutions help audit and optimize the most critical KPIs that drive sales and market share for brands so you can stay competitive in a dynamic digital landscape and foster long-term customer satisfaction.

    Ready to get started? Schedule a call with a specialist to see how it can work for your brand.

  • How Digital Shelf Analytics Can Fix Common Revenue Growth Management Challenges for Consumer Brands

    How Digital Shelf Analytics Can Fix Common Revenue Growth Management Challenges for Consumer Brands

    As consumer goods brands increasingly turn to eCommerce marketplaces as a source of profitable growth, it becomes harder for teams to grapple with the complexity of revenue growth management.

    This complexity emerges from multiple fonts: there are hundreds, and even thousands, of competitors to consider when formulating strategies for managing pricing, promotion, and assortment changes. The world is currently experiencing a period of unprecedented supply chain instability, shifting more consumers away from traditional retail and into eCommerce shopping. And finally, consumer buying patterns, preferences, and trends are constantly shifting.

    Revenue growth management (RGM) and net revenue management (NRM) were once less complex processes; but that is no longer the case. Now, some 80% of consumer brand CEOs report that they “aren’t satisfied with their RGM results.”

    Gathering data, analyzing it, and acting on it quickly stand out as major challenges that businesses must overcome to grow their market share, earn more profits, and capitalize on market shifts in real time. In this article, we’ll dive into RGM and NRM, the obstacles business teams face, and explore how using technology for digital shelf analytics can help bridge the gap.

    What is Net Revenue Management (NRM) or Revenue Growth Management (RGM)?

    Every consumer goods company aims to increase profits and grow market share. This requires a concerted effort in RGM and net revenue management (NRM) strategy. Whether a company has a specific team dedicated to this task or relies on the abilities of business analysts or merchandisers, this function is crucial.

    It’s worth mentioning that though the terms NRM and RGM are often used interchangeably, there are subtle differences. While both net revenue management and revenue growth management focus on maximizing overall revenue for the brand, NRM typically has a narrower focus and is specific to optimizing profitability through product pricing, promotion, product mix, and cost management. RGM strategies are a bit broader and tend to look at the top line to grow market share and expand the customer base.

    The Challenges Revenue Teams Face

    Differentiating between ‘good growth’ and ‘bad growth’ is central to NRM and RGM. Net revenue management and revenue growth management teams need the data and tools in place to determine if growth in one area is coming at the expense of another so as not to cannibalize business. Tracking and analyzing extensive data to successfully take action on opportunities and determine whether strategies are working as intended consumes a tremendous amount of mental bandwidth. The fact that these decisions are incredibly time-sensitive only compounds the issue.

    To cope, many teams in charge of NRM or RGM employ digital shelf analytics strategies to help speed up data aggregation and analysis to make sure they’re capitalizing on potential opportunities.

    eCommerce has added a whole new layer of complexity to consumer goods sales. Instead of a few relatively stable prices at big-box stores, a single item for sale may experience high price volatility, with dozens of minute pricing changes occurring online each day. In some cases, consumers become blind to price volatility, letting brands increase prices, but consumer sentiment, the overall price elasticity of the product, and dozens of other factors go into determining the final price of an online product. Net revenue teams need to modernize and adapt to changing eCommerce environments to competitively price, promote, and grow their revenue.

    Here are the top three challenges standing in the way of net revenue management and revenue growth management teams and solutions to address these issues.

    Challenge 1: Incomplete or Inaccurate Data

    Incomplete and inaccurate data are critical for Net Revenue Management and Revenue Growth Management teams to get under control when attempting to modernize in a digital-centric selling environment. As more competitors enter the market, many brands find it hard to make strategic decisions without the complete picture.

    Data may be incomplete or inaccurate because a brand is analyzing only part of the market, such as Amazon or another enterprise-scale eCommerce marketplace. Additionally, they might not be analyzing all types of online media, such as branded ads, sponsored search listings, or sponsored category listings.

    Most importantly, another pitfall is the lack of hyperlocal data. Generalized data across regions, states, ZIPs, and stores can skew the decision-making process and result in poor outcomes.

    Overcoming Incomplete or Inaccurate Data

    In order to get the full picture, consumer brands need to ensure they have a view of the entire competitive landscape across their channels. This includes gathering data down to the case pack, the unique product identifier, and the geography, including ZIP and store. They also need the respective MSRP by SKU, the unit normalized price, and the selling price at a specific moment in time. This is done by aggregating brick-and-mortar store information available online, such as when stores list curbside pickup SKUs and pricing online.

    Individual teams cannot manually gather all this detailed data. The growth in eCommerce means there is simply too much data to find and aggregate. Instead, they can employ digital shelf technology to get more data from more sites. Teams can leverage AI to better match product listings, ads, and even visuals to avoid missing data on listings that lack common attributes, such as UPCs for normalization.

    To add to this, advanced pricing intelligence systems can cache URLs to help teams audit and verify their data, avoiding delays and confusion when ad hoc requests arise.

    Challenge 2: Difficulty in Making Sense of the Competitive Landscape

    Once net revenue management and revenue growth management teams have gathered all of the available data, it’s time to make sense of it. This is a monumental challenge, and ends up being the stage where most NRM and RGM teams flounder. Disparate marketplaces include different product attributes and images. This makes it extremely complicated to sync competitors’ data to ready it for analysis, especially if this analysis is carried out manually in Excel. These are some of the attributes that teams need to harmonize in order to make sense of the competitive landscape:

    • Product identifiers (UPC, SKU, Internal Code)
    • Size, case, pack, volume, bundled offerings
    • Language
    • Currency
    • Stock Status (Whether the product is available or not)
    • Platform-specific attributes such as ‘Amazon’s Choice,’ ‘Best Seller,’ etc.

    Teams also need to group and classify various categories of promotions. These can include sponsored listings, banner ads, coupons, bank offers, and others. Each of these categories needs to be tracked separately. This vast array of data points across hundreds of sites creates a big data problem for teams.

    Making Sense of the Competitive Landscape

    The best way to overcome this challenge is to task a digital shelf analytics system with gathering and harmonizing data automatically across the consumer goods competitive landscape. Competitive and market intelligence tools can help break down an overwhelming amount of data, matching similar products across competing brands and analyzing their various strengths and weaknesses. Once the technology matches complex product attributes and identifiers, it becomes easier for teams to gain insights and exploit findings. In a sense, the data needs to be cleaned before analysis can occur.

    Technology can gather data in multiple ways, and the best systems employ several methods to get the best matches. Data consumption modes include API integrations, CSV and Excel file uploads, and proprietary scrapers that view websites independently of direct inputs. Having all the data in a single place helps net revenue management and revenue growth management teams gain indicative insights on product popularity, pricing, and sales, on their own and competitor products.

    Challenge 3: Lack of Timely Visibility

    The final challenge that many net revenue management and revenue growth management teams face is something of a ‘silent killer’ — timeliness. Even if they successfully gather data across the entire competitive landscape and harmonize that data into a format for easy analysis, a lack of timeliness can render even the best actions irrelevant.

    Speed is of the utmost importance when there are market changes. If a product goes viral and competitors raise prices in response to increased demand, without timely visibility, the trend may be over before a consumer goods brand can successfully increase its prices for the duration of the trend. This can mean lost margins.

    Another example is analyzing data and incorporating lagging promotional and sales data into analyses. This can skew pricing strategies because timely data is not accessible to inform decision-making. Many teams waste time firefighting due to a lack of timely pricing and promotional intelligence data.

    Get Near Real-Time Insights for Faster Decision Making

    Using technology that allows for net revenue management and revenue growth management teams at consumer goods brands to establish update frequencies can be a game changer. Teams can set update frequencies based on their need. They can set up the system to check a fast-moving product daily, while a slow-moving item might only need to be checked weekly, monthly, or even quarterly. This allows teams to focus on the highest-impact products first and address the largest exceptions before they lose out on an opportunity. Managing exceptions with a digital shelf analytics platform saves teams significant time instead of poring over low-impact changes in the data.

    Digital Shelf Analytics for Net Revenue Management

    Modernizing a consumer goods brand’s net revenue management or revenue growth management processes requires advanced digital shelf analytics. DataWeave provides consumer goods companies with the technology they need for quick and accurate pricing, promotional, and assortment intelligence. By tracking over 200 million products each day, users can be sure they get the widest and most timely view of the competitive landscape. DataWeave’s deep industry knowledge is baked into every aspect of its platform.

    Learn more by requesting a demo today!

  • Competitor Price Monitoring in E-commerce: Everything You Need to Know

    Competitor Price Monitoring in E-commerce: Everything You Need to Know

    Picture this: You wake up one morning to discover that your top competitor reduced their prices overnight. And now your shopper traffic has tanked and your sales have taken a hit.

    Unfortunately, this is a common scenario because your customers can compare prices online in seconds—and loyalty lies with the budget.

    So, how can you protect your business? Price monitoring.

    Price monitoring solutions can help you keep abreast of competitor price changes—which, of course, will help you improve your pricing strategies, retain your customers, and maximize your profits.

    How? In this article, we’ll explore:

    • What is price monitoring
    • The key benefits of price monitoring for retailers and brands
    • What a capable price monitoring solution can do

    What Is Price Monitoring?

    Price monitoring is the process of tracking and analyzing your competitor’s prices across various online and offline platforms. By monitoring competitors’ prices, you can understand market price trends and adjust your prices strategically—which, in turn, helps you remain competitive, increase margins, and improve customer retention.

    5 Benefits of Price Monitoring

    Competitor price monitoring can help you:

    1. Gain a competitive edge: Competitor price tracking allows you to adjust your prices to remain attractive to consumers.
    2. Maximize revenue: With timely pricing data, you’re empowered to identify optimum price points that strike a delicate balance between maximizing revenue and maintaining customer loyalty.
    3. Retain customers: Consumers are looking for the most value for their dollar, so maintaining consistently competitive pricing is crucial for retaining loyal customers.
    4. Understand promotional effectiveness: Price monitoring helps businesses evaluate the effectiveness of their promotions and discounts. By comparing the impact of different pricing strategies, businesses can refine their promotional tactics to maximize sales and customer engagement.
    5. Understand market movements: By analyzing historical pricing data, you’re better positioned to anticipate future pricing changes — and adjust your strategies accordingly.

    4 Essential Capabilities of Price Monitoring Software

    Here are four capabilities to look for when choosing a price monitoring system.

    1. AI-Driven Product Matching

    Product matching is the process of identifying identical or similar products across different platforms to ensure accurate price comparisons.

    If your price monitoring solution can’t reliably match your products with competitors’ across various sales channels at scale, you’ll end up with poor data. Inaccurate data will then lead you to make misinformed pricing decisions.

    Product matching needs to be accurate and comprehensive, covering a wide range of products and product variations—even for including private label products.

    For example, AI-driven product matching can recognize a specific brand and model of sneakers across multiple online stores—even if product descriptions and images differ. Here’s how it works in a nutshell:

    • Sophisticated algorithms and deep learning architecture enable AI to identify and match products that aren’t identical but share key characteristics and features.
    • Using unified systems for text and image recognition, the AI matches similar SKUs across hundreds of eCommerce stores and millions of products.
      The AI zeroes in on critical product elements in images, like a t-shirt’s shape, sleeve length, and color.
    • The AI also extracts unique signatures from photos for rapid, efficient identification and grouping across billions of indexed items.

    DataWeave’s AI algorithm can initially match products with 80–90% accuracy. Then, humans can bring contextual judgement and make nuanced decisions that the AI might miss to correct errors quickly and push for accuracy closer to 100%. By integrating AI automation with human validation, you can achieve accurate and reliable product-matching coverage at scale.

    2. Accurate and Comprehensive Data Collection and Aggregation

    The insights you derive are only as good as the data you collect. However, capturing comprehensive pricing data is tough when your competitors operate on multiple platforms.

    For truly effective price monitoring insights, you need consistent, comprehensive, and highly accurate data. This means your chosen price monitoring system should:

    • Scrape data from various sources, such as desktop and mobile sites and mobile applications.
    • Pull data from various online platforms like aggregators, omnichannel retailers, delivery intermediaries, online marketplaces, and more.
    • Handle data from different regions and languages.
    • Collect data at regular intervals to ensure timeliness.

    DataWeave’s online price monitoring software covers all of these bases and more with a fast, automated data source configuration system. It also allows you to painlessly add new data sources to scrape.

    Instead of incomplete or inaccurate data, you’ll have comprehensive and up-to-date data, allowing you to respond quickly to market changes with confidence.

    3. Seamless Normalization of Product Measurement Units

    You can’t compare apples to oranges—or price-per-kilogram to price-per-pound.

    For price monitoring to be accurate, there must be a way to normalize measurement units—so that we’re always comparing price-per-gram to price-per-gram. If we compare prices without taking into account measurement units, our data will be misleading at best.

    Let’s take a closer look. Say that your top competitor sells 12oz cans of beans for $3, and you sell 15oz cans for $3.20. At first glance, your larger cans of beans will appear more expensive—but that’s not true. If we normalize the measurement unit—in this example, an oz—the larger can of beans offers more value to customers.

    Unit of measure normalization facilitates sound price adjustments based on accurate and reliable data. For this reason, every business needs a price tracking tool that can guarantee accurate comparisons by normalizing unit measurements—including weight, volume, and quantity.

    4. Actionable Data and an Intuitive User Experience

    Knowledge is only powerful when applied—and price monitoring insights are only useful when they’re accessible and actionable.

    For this reason, the best price monitoring software doesn’t just provide insights based on accurate and comprehensive data, but it also provides several ways to understand and deploy those insights.

    Ideal price monitoring solutions provide customized pricing alerts, intuitive dashboards, detailed reports, and visuals that are easy to interpret—all tailored to each particular team or a team member’s needs. These features should make it easy for team members to compare prices against those of competitors in specific categories and product groupings.

    Your price tracking tool should also permit flexible API integrations and offer straightforward data export options. This way, you can integrate competitive pricing data with your pricing software, Business Intelligence (BI) tools, or Enterprise Resource Planning (ERP) system.

    4 Ways Retailers Can Leverage Price Monitoring

    Retailers can use price monitoring tools to remain competitive without compromising profitability—here’s how:

    1. Track Competitors’ Prices

    Competitor price monitoring helps you avoid being undercut—and, as a result, maintain market share. By tracking competitor prices in real-time, you can adjust prices to remain competitive, especially in dynamic markets. Ideally, you should monitor both direct competitors selling the same products and indirect competitors selling similar or alternative products. This way, you’ll have a complete picture of market prices and can make more informed pricing adjustments.

    2. Understand Historical and Seasonal Price Trends

    As a retailer, you may want to analyze historical data to identify price patterns and predict future price movements—especially in relation to holidays and seasonal products. Knowing what’s coming, you’re better positioned to plan for pricing changes and promotional campaigns.

    3. Implement Dynamic Pricing

    Dynamic pricing is the process of adjusting prices based on real-time market conditions, product demand, and competitors’ prices—allowing you to respond faster to market changes to maintain optimized prices.

    4. Optimize Promotional Strategies

    Price monitoring tools can track retail promotions across numerous online and offline sales avenues, providing insight into the nature and timing of competitors’ promotions. This data can help you determine which promotions are most effective—and which aren’t—allowing you to improve your own promotions and discounts, and allocate marketing resources where it matters most. This is especially beneficial during peak sales periods.

    3 Ways Brands Can Employ Price Monitoring

    Here are three ways brands can use price monitoring to remain profitable, protect brand equity, and gain a competitive edge.

    1. Maintain Consistent Retail Prices

    Minimum advertised price (MAP) policies are designed to prevent retailers from devaluing a brand while ensuring fair competition among retailers. Price monitoring applications allow your brand to track retailers’ prices to detect MAP policy violations. Data in hand, you can maintain consistent pricing across online sales channels, physical stores, and retail stores’ digital shelves — and, critically, protect your brand equity.

    2. Improve Product and Brand Positioning

    When you understand how your products’ prices compare to those of competitors, you can set prices to improve brand positioning. For example, if you want to position your brand as luxurious and high-quality, you need to set higher product prices than budget-friendly alternative products.

    3. Ensure Product Availability

    You can use a price monitoring solution to track product availability to ensure products are always in stock, even across different physical stores and online marketplaces. If a product is frequently sold out, you can adjust production levels or help retailers to improve their inventory management.

    Key Takeaways: E-commerce Price Monitoring

    Price monitoring software allows you to compare your products’ prices with competitors. This valuable data can help you:

    • Optimize revenue through timely price changes and dynamic pricing
      Avoid being undercut by competitors
    • Improve pricing strategies and promotions to increase sales and retain customers
    • Maintain consistent prices across sales channels

    To learn more, check out our article, What is Competitive Pricing Intelligence: The Ultimate Guide here or reach out and talk to us today!

  • Amazon Prime Day Pricing Trends 2024: Deals and Discounts Galore Across Categories

    Amazon Prime Day Pricing Trends 2024: Deals and Discounts Galore Across Categories

    Amazon Prime Day 2024 has once again shattered records, with more items sold during the two-day event than any previous Prime Day. Prime members worldwide saved billions across all categories, while independent sellers moved an impressive 200 million items.

    At DataWeave, we conducted an extensive analysis of the discounts offered by Amazon across major categories. By examining over 47,000 SKUs, we’ve uncovered compelling insights into pricing strategies, competitive positioning, and emerging trends in the eCommerce space.

    Since products on Amazon and other eCommerce websites are often sold at discounts even on normal days not linked to a sale event, we delved into the real value that Prime Day offers to shoppers by focusing on price reductions or the Additional Discount during the sale compared to the week before. As a result, our approach highlights the genuine benefits of the event for shoppers who count on lower prices during the sale. At the same time, our report also includes the Absolute Discounts offered during Prime Day, which represents the total markdown relative to the MSRP.

    Amazon’s Cross-Category Discount Strategy

    Our analysis reveals that the Electronics category saw the highest discounts with an average absolute discount of 20.4% and additional discounts on Prime Day amounting to 10.4%. Meanwhile the Home & Furniture had the lowest discount at 13.1%.

    Discounts offered Across Key Categories on Amazon Prime Day USA 2024

    The Health & Beauty category saw significant additional discounts during Prime Day, at 9.26%. The Apparel category offered attractive absolute (16.10%) and additional (8.90%) discounts.

    Category Deep Dive

    Consumer Electronics

    Still the star of the show, the electronics category saw the highest markdowns this Prime Day with absolute discounts at 20.40% and across 14.61% of their inventory.

    Discounts offered on Consumer Electronics Subcategories During Amazon Prime Day USA 2024.

    Across Electronics subcategories, Earbuds had the highest markdowns at 34.80%, followed closely by Wireless Headphones at 30.60% and Headphones at 29.00%, with steep additional discounts during Prime Day as well. Apple AirPods Pro, for example, retailed at $168 (down from $249) at a 32% discount.

    Discounts offered on Consumer Electronics Subcategories During Amazon Prime Day USA 2024 Featuring Apple Air Pods

    Meanwhile, smartphones had the lowest markdowns at 9.30%, followed by Laptops at 10.50%. Laptops also had the lowest additional discount during Prime Day at just 1.28%, significantly lower than other subcategories. Speakers (20.80%), Drones (19.10%), and Smartwatches (25.00%) offered moderate to high markdowns.

    Notably, all Amazon products including Kindle, Echo, Echo Earbuds, Alexa, Fire TV, Fire TV Stick, and Fire Tablets, were aggressively discounted upwards of 30% this Prime Day. These products also came with the label “Climate Pledge Friendly.”

    Sustainability Features For Amazon Products During Prime Day USA 2024

    These aspects indicate Amazon’s push to promote its own ecosystem of products to the top, as well as cater to changing consumer preferences.

    Apparel

    Discounts offered this Prime Day increased from 13.2% in 2023 to 16.1% in 2024.

    Discounts offered on Apparel Subcategories During Amazon Prime Day USA 2024

    Amid apparel subcategories, Amazon appears to be pushing Women’s apparel categories more aggressively, particularly in Tops, Shoes, and Athleisure.

    Women’s Shoes lead with the highest discounts at 26.50%, followed by Women’s Tops at 22.50% and Men’s Shoes at 22.80%. Women’s Tops also maintained the highest additional discount at 15.27%, followed by Women’s Athleisure at 13.03% and Men’s Swimwear at 12.44%.

    Similar to 2023, Men’s Innerwear offered significantly lower discounts, with only 1% absolute discount and 0.72% additional discount. Women’s Innerwear also shows low discounts at 3.20% absolute and 2.23% additional.

    Health & Beauty

    Amid health & beauty subcategories, Moisturizes witnessed the highest markdowns at 20.10%, followed by Make Up at 18.90%. The Moisturizer subcategory also offers highest additional discounts at 12.20%, followed closely by Sunscreen at 10.25% and Beard Care at 10.22%.

    Discounts offered on Health & Beauty Subcategories During Amazon Prime Day USA 2024

    The Toothpaste subcategory has the lowest discounts, at 10.90%. The lower discounts on everyday essentials like this might indicate a steady demand or an attempt to maintain margins on frequently purchased items.

    Most Health & Beauty subcategories fall in the 15-18% range for actual discounts and 8-10% range for additional discounts. Electric Toothbrush (16.90% actual, 9.91% additional) and Shampoo (16.50% actual, 8.78% additional) represent the middle of the pack. There were a few highly attractive deals though, such as the Philips Sonicare toothbrush retailing at $122.96 (down from $199.99), with a 39% discount.

    Discounts offered on Health & Beauty Subcategories During Amazon Prime Day USA 2024 Featuring A Philips Electric Toothbrush

    Amazon also offered significant discounts on Open Box products (products that are returned, but unused, out of mint condition boxes) to Prime members.

    Home & Furniture

    This category saw the lowest discounts for this Prime Day event at 13.1%. Across subcategories, Rugs lead with the highest average discount at 21.50%, closely followed by Luggage at 20.90%. Amazon seems to be pushing decorative and organizational items (Rugs, Bookcases) more aggressively, possibly due to higher margins. Rugs also stood out as the subcategory with the highest additional discount of 11.54%.

    Discounts offered on Home & Furniture Subcategories During Amazon Prime Day USA 2024

    Sofas have the lowest additional discount at 2.76%, followed by Dining Tables at 3.21%. Items like Cabinets (15.80% absolute, 6.66% additional) and Coffee Tables (14.40% absolute, 6.25% additional) represent the middle range of discounts.

    Watch Out For More

    As the holiday season approaches, it’s clear that the retail landscape continues to evolve. While Amazon remains a formidable force, there are opportunities for savvy competitors to carve out their niches and attract deal-hungry shoppers. By analyzing these trends and adjusting strategies accordingly, retailers can position themselves for success in the high-stakes world of summer sales events.

    Stay tuned to our blog for more insights on how Amazon’s competitors reacted to Prime Day, and how leading brands across categories fared in terms of their pricing and their visibility during the sale event. Reach out to us today to learn more.

  • Cracking the Code: How Retailers Can Adapt to Plummeting Egg Prices in 2024

    Cracking the Code: How Retailers Can Adapt to Plummeting Egg Prices in 2024

    Virtually every cuisine in the world uses eggs. They’re in your breakfast, lunch, dinner, and dessert — which is perhaps why the global egg market is expected to generate $130.70 billion in revenue in 2024 and is projected to grow to approximately $193.56 billion by 2029.

    More specifically, the United States is the fourth-largest egg producer worldwide. The country’s egg market is projected to generate $15.75 billion in 2024 and increase to $22.51 billion by 2029.

    This growth is driven by several factors, most notably:

    • Health-consciousness among consumers: Consumers value eggs for their essential nutrients and rich protein content.
    • Demand for convenience foods: Consumers’ preferences are shifting toward quick and easy foods, which drives demand for shell eggs and pre-packaged boiled or scrambled eggs.
    • Population Growth: A growing worldwide population increases the demand for eggs.
    • Affordability and accessibility: Eggs are an affordable and accessible nutrient-dense food source for many.

    Despite these factors contributing to the U.S. egg market’s growth, recent times have seen egg prices fall dramatically.

    Based on a sample of 450 SKUs, DataWeave discovered that egg prices in the U.S. fell by 6.7% between April 2023 and April 2024, dipping to its lowest (-12.6%) in December 2023.

    Egg Price Chart: Egg Prices USA Going Down 98.95% between April 2023 and April 2024

    So, what’s causing the decrease in egg prices?

    The Rise and Fall of Egg Prices: A Recent History

    In 2022, avian influenza severely impacted the United States. The disease affected wild birds in nearly every state and devastated commercial flocks in approximately half of the country.

    The 2022 incident was the first major outbreak since 2015 and led to the culling of more than 52.6 million birds, mainly poultry, to prevent the disease from spreading uncontrollably.

    With almost 12 million fewer egg-laying hens, the United States produced around 109.5 billion eggs in 2022 — a drop of nearly two billion from the previous year.

    Consequently, the cost of eggs soared, peaking at $4.82 a dozen — more than double the price of eggs in the previous year.

    The avian flu continues to affect egg-laying hens and other poultry birds across the United States. As of April 2024, farms have killed a total of 85 million poultry birds in an attempt to contain the disease.

    Despite the disease’s effects, production facilities have made significant efforts to repopulate flocks, leading to a steady increase in supply – and a much anticipated decrease in egg prices.

    According to the U.S. Bureau of Labor Statistics, there was an increase in producer egg prices in 2022, reaching a peak in November 2022, at which point they began to fall.

    Retailer’s egg prices followed suit. The egg price chart below depicts retailers’ declining egg prices over one year, from April 2023 to April 2024, with Giant Eagle showing the most significant price reductions and Walmart the least.

    Egg Price Chart Featuring Leading Retailers 2023-2024

    What Does the Future Hold for Egg Prices?

    The USDA reported recent severe avian flu outbreaks in June 2024. These outbreaks are estimated to have affected 6.23 million birds.

    With a reduction in egg-laying hens, egg prices are likely to increase — time will tell.

    Nonetheless, the annual per capita consumption of eggs in the U.S. is projected to reach 284.4 per person in 2024 from 281.3 per person in 2023. So for now, producers and retailers can rest assured of the growing demand for eggs.

    How Can Retailers Adapt to the Unpredictability of Egg Prices?

    Egg prices were down to $2.69 for a dozen in May 2024. However, they are still significantly higher than consumers were used to just a few years ago—eggs were, on average, $1.46 a dozen in early 2020.

    Additionally, while the avian flu puts pressure on producers, inflation and supply chain disruptions exert pressure on retailers.

    With such challenging egg market conditions, what can retailers do to maintain customer loyalty amid reduced consumer spending while maintaining profitability?

    1. Give the Customer What They Want: Increase Offerings of Organic, Cage-Free, and Free-Range Eggs

    As mentioned, Data Bridge Market Research’s trends and forecast report highlighted a significant increase in consumer health consciousness. Additionally, animal welfare increasingly influences consumers’ purchasing decisions when buying meat and dairy products.

    DataWeave data shows that the prices of organic, cage-free, and free-range eggs—such as those by brands like Happy Eggs and Marketside—have fallen less than those of non-organic, caged egg brands.

    Egg Price Chart Featuring Leading Egg Brand Prices 2023-2024

    2. Increase Private-Label Offerings

    Private labels typically offer retailers higher margins than national brands. These margins can shield consumers from sudden wholesale egg price swings, helping to preserve brand trust and consumer loyalty without sacrificing profitability.

    Moreover, eggs are particularly suited to private labeling, given their uniform appearance and taste and the lack of product innovation opportunities.

    Undoubtedly, this is why sales of private-label eggs dwarf sales of national egg brands in the United States. Statista reports that across three months in 2024, private label egg sales amounted to $1.55 billion U.S. dollars, while the combined sales of the top nine national egg brands totaled just $617.88 million U.S. dollars.

    3. Price Intelligently

    With the current and predicted fluctuations in egg prices over the foreseeable future, price competitiveness is paramount to margin management and customer loyalty.

    This is especially true when lower prices are the primary factor influencing the average consumer’s choice of supermarket for daily essentials purchases.

    AI-driven pricing intelligence tools like DataWeave give retailers valuable highly granular and reliable insights on competitor pricing and market dynamics. In today’s data-motivated environment, these insights are necessary for competitiveness and profitability.

    Final Thoughts

    Egg prices have fluctuated significantly due to the impact of avian flu. Despite recent price drops, future egg price increases are possible due to ongoing outbreaks. Retailers should adapt to unstable egg prices by increasing organic, free-range, cage-free, and private-label egg offerings while leveraging AI-driven pricing tools to maintain margins and customer loyalty.

    Speak to us today to learn more!

  • How Healthy is Your Assortment?

    How Healthy is Your Assortment?

    In 2025, both consumers and retailers continue to prioritize better health – albeit with evolving definitions and expectations.

    The pandemic fundamentally transformed how consumers approach wellness, with this shift becoming entrenched in shopping behaviors years later. As shopping habits have permanently altered, retailers now face increased pressure to rapidly adapt their assortments with in-demand health and wellness products that enhance customer experience across various channels – online and offline.

    Let’s explore how leading retailers are keeping consumers – and their own bottom lines – healthy by responding effectively to market trends to drive online sales and market share.

    Health & Wellness Influence The Product Mix Across Categories

    Consumption habits have changed dramatically since the onset of the pandemic. A McKinsey study shows that 82% and 73% of US, and UK consumers respectively now consider health & wellness a top priority. Typically shoppers adjust grocery shopping and meal planning at the start of the year, with many focusing on fresh, organic, and nutrient-rich foods.

    The influential health and wellness mega-trend spans diverse retail channels, including grocery, pharmacy and mass. It extends across numerous categories like:

    • Food and beverage (natural, organic, vegan, plant-based food)
    • Health and personal care
    • Beauty
    • Cleaning products
    • Fitness equipment 
    • Athleisure (apparel)
    • Consumer electronics like health wearables.

    Today’s health movement is so powerful and compelling that retailers have revised their business strategies to better serve health-conscious consumers. For instance, drugstores are reinventing themselves as healthcare destinations, with CVS and Kroger expanding into personalized care delivery and value-based clinics to enhance their health offerings.

    Major retailers like Amazon, Walmart, and Target report robust sales in health and wellness categories. For example, Walmart saw a 4.6% increase in comparable sales in early 2024, driven significantly by grocery, consumables, and health-related products.

    New product categories are gaining traction:

    • Functional foods and beverages are seeing unprecedented growth, with Target launching over 2,000 wellness items in the category, including exclusive products priced under $10.
    • Personalized nutrition and mental health products are surging, including tailored dietary solutions and stress-reducing items.
    • Health wearables and wellness tech continue to rise in popularity, with over 150 new wellness tech items launched at Target this year, including innovative red-light therapy devices.
    • Transparency and sustainability certifications like organic, non-GMO, and vegan labels are increasingly driving purchasing decisions.
    • Clinically proven benefits offered by health & wellness products are gaining traction among Gen Z.

    Retail’s Survival Of The Fittest Moves Online

    As the omnichannel retail sector continues to grow, more shoppers now make purchase decisions within minutes using just a few clicks rather than physically visiting brick-and-mortar stores. In some cases, AI agents like Operator from Chat-GPT or Gemini (Google’s Chatbot) even make personalized, curated lists and reduce the time taken to make purchase decisions. Traditional retail paradigms are rapidly becoming obsolete as consumers grow savvier, more empowered, and better informed than ever before.

    To stay competitive, more retailers are embracing AI-driven data insights to adjust their assortments to reflect consumer demand for health and wellness products.

    According to industry experts, data insights have emerged as a critical retail strategy that continues to gain momentum. This is because retailers can no longer afford to guess how to approach their omnichannel strategy. They need the accuracy, clarity, and efficiency of data insights to guide their assortment and pricing decisions to outmaneuver competitors, maximize sales, and win market share as shopping evolves online.

    Among its retail best practices, Bain & Company recommends retailers “lead with superior assortments that use a customer-centric lens to reduce complexity and increase space for the products customers love.” Insights can help retailers discover the optimal mix of national brands, private labels, limited-time offers, and value-added bundles.

    Lead with superior assortments …
    increase space for the products consumers love

    ~ Bain & Company

    Determining the optimal mix of products also includes bestsellers and unique items that help retailers distinguish their offerings. Assortment insights help retail executives track competitors’ assortment changes and spot gaps in their own product assortment to adapt to emerging consumer trends and in-demand products.

    Why Effective Assortment Planning Matters

    Assortment planning sits at the heart of retail success, directly influencing profitability, customer satisfaction, and competitive differentiation. In today’s health-conscious market, getting your assortment right means:

    • Meeting Customer Expectations: Today’s health-conscious consumers expect relevant, high-quality products that match their wellness goals. A well-planned assortment signals that a retailer understands its customers’ evolving needs.
    • Optimizing Inventory Investment: Strategic assortment planning ensures capital is allocated to products with the highest return potential while minimizing investments in slow-moving items.
    • Creating Competitive Advantage: A distinctive assortment that includes popular health and wellness products alongside unique offerings helps retailers stand out in a crowded marketplace.
    • Reducing Lost Sales: Effective assortment planning minimizes the risk of stockouts on high-demand health and wellness items, preventing customers from shopping elsewhere.
    • Supporting Omnichannel Strategies: Well-executed assortment planning ensures consistency across physical and digital touchpoints, creating a seamless customer experience.
    • Improving Operational Efficiency: A thoughtfully curated assortment reduces complexity throughout the supply chain, from procurement to warehouse management to in-store operations.

    As health and wellness continues to drive consumer spending, retailers who excel at assortment planning can capitalize on these trends more effectively than their competitors, turning market insights into tangible business results.

    AI-Powered Assortment Analytics Driving Retail Success

    The synergy of AI and data analytics into retail assortment planning is changing how businesses approach inventory management. Retailers using AI-driven predictive analytics have achieved a 36% SKU reduction while increasing sales by 1-2%, showcasing the efficiency of data-driven approaches according to a McKinsey report.

    Retailers face several challenges that can hinder strategic assortment planning:

    • Limited Understanding of Competition: Retailers struggle to gain comprehensive insights into their product assortments relative to competitors, often lacking visibility into their strengths and weaknesses across categories.
    • Data Overload: Assortment planning involves handling vast amounts of data, making it challenging for category managers to extract actionable insights without user-friendly tools and visualization.
    • Cross-Channel Consistency: With omnichannel retailing, ensuring consistency across physical stores, e-commerce, and other channels is complex. Misalignment can lead to customer dissatisfaction and loss of loyalty.
    • Adapting to Changing Market Trends: Identifying top-selling products and tracking consumer preferences is challenging. Balancing the right mix of products is crucial; without analytics, retailers risk lost sales or excess slow-moving inventory.
    • Scalability and Efficiency: As retailers expand into new markets or categories, scaling their assortment planning processes efficiently becomes a challenge. Legacy systems and manual methods often fail to support the agility needed for quick decision-making at scale.

    DataWeave’s Assortment Analytics helps retailers address these challenges by providing a robust, easy-to-use platform that delivers actionable insights into product assortments and competitive positioning. With AI-driven, contextual insights and alerts, retailers can effortlessly identify high-demand, unique products, capitalize on catalog strengths, optimize pricing and promotions, improve stock availability, and refine assortments to maintain a competitive edge.

    Beyond Data: Actionable Insights That Drive Results

    DataWeave’s platform provides a comprehensive, insight-led view into assortments through several key dimensions:

    • Stock Insights: Monitor stock changes across retailers to stay updated on availability.
    • Category and Sub-Category Insights: Analyze assortment changes, identify newly introduced or discontinued categories, and track leading retailers in specific segments.
    • Brand Insights: Identify newly introduced, missing, or discontinued brands, as well as leading brands within chosen categories.
    • Product Insights: Identify bestsellers and evaluate their impact on your portfolio, analyzing pricing and promotions.
    • Personalized Recommendations: Receive suggestions tailored to your behavior and user profile to refine decision-making.
    • User-Configured Alerts: Stay informed with alerts designed to highlight significant changes or opportunities.

    The platform addresses data overload by providing an intuitive, insight-driven view of your assortment. Category managers gain a comprehensive, bird’s-eye perspective of key changes within specified timeframes, allowing them to focus on what matters most.

    Preparing for the Future of Retail Health

    To avoid supply chain bottlenecks, inventory shortages, and out-of-stock scenarios, retailers are strategically using data insights to anticipate fluctuations in demand and proactively plan how to manage disruptions that could affect their assortments.

    For variety that satisfies consumers’ diverse product needs, retailers are using data insights to determine whether to collaborate with nimble suppliers to promptly fill any gaps.

    To further strengthen their assortments’ attractiveness, retailers are using AI-powered pricing analytics to offer the right product at the right price. These analytics help retailers know exactly how they compare to rivals’ pricing moves with relevant data so they can keep up with market fluctuations and stay competitive by earning consumer engagement, sales, and trust.

    To Conclude

    Like nourishing habits that improve consumers’ health, data insights improve retailers’ e-commerce health. Advanced assortment and pricing analytics, powered by artificial intelligence, help retailers make better decisions faster to boost their agility, outmaneuver rivals, and fuel online growth.

    In a retail landscape where consumer preferences for health and wellness continue to evolve rapidly, the retailers who thrive will be those who leverage data and AI to understand, anticipate, and meet these changing demands with the right products at the right time. Reach out to us to know more.

  • How Retailers and Brands Can Navigate Skyrocketing Olive Oil Prices in 2024

    How Retailers and Brands Can Navigate Skyrocketing Olive Oil Prices in 2024

    Olive oil, renowned for its complex flavor and myriad health benefits, holds a significant place in the global market, valued at $14.64 billion in 2023. It is anticipated to reach $19.77 billion by 2032, with a steady compound annual growth rate (CAGR) of 3.42%.

    This growth is fueled by:

    • Increased consumer demand for healthier oils.
    • Olive oil’s rising popularity in skincare products.
    • Greater retail availability.

    Interestingly, this market expansion occurs alongside rising olive oil prices, mainly due to a notable decrease in production. Eight European Union countries, which are the main producers, saw a dramatic drop in output from an average of 2.17 million tons to just 1.50 million tons in 2022—a 30.88% decline. Unfortunately, this drop in production comes as no surprise.

    Erratic weather patterns, rising temperatures, and exacerbating drought conditions in the Mediterranean basin have taken their toll. These climate changes disrupt the growing cycles of olive trees, leading to poorer crop yields and lower-quality olives.

    In the US, where olive oil constitutes 19% of all cooking oils sold and 40% of sales value due to its premium pricing, the market is expected to grow at an impressive CAGR of 11.31% between 2024 and 2032. This forecast is significant despite a recent dip in domestic consumption, which may further decline due to economic pressures. As a result, consumers must make difficult choices as they battle inflation, shrinkflation, and thin budgets.

    DataWeave’s Analysis of Rising Olive Oil Prices

    At DataWeave, we utilized our advanced AI-powered data aggregation and analysis platform to scrutinize the pricing trends of olive oils across key US retailers over the past year. Our analysis covered 130+ SKUs from major chains including Walmart, Kroger, Giant Eagle, and Target.

    The data revealed a notable escalation in olive oil prices, with consumers facing a sharp 25.8% increase from April 2023 to April 2024.

    This trend of rising costs was consistent across all analyzed retailers. Specifically, Walmart and Giant Eagle each reported a substantial 30% increase in their olive oil prices over the past year. In contrast, Target and Kroger experienced somewhat more modest hikes, at 20% and 15% respectively.

    Further investigation into individual brands within our sample highlighted that no brand is immune to the impacts of the ongoing supply shortages. Walmart’s own Great Value brand saw an exceptional 60% surge in prices. Other prominent olive oil brands such as Carapelli, Terra Delysia, and Bertolli also faced significant price increases, ranging from 20% to 50%.

    This across-the-board rise in prices underscores the widespread effect of supply constraints on the olive oil market, affecting both premium and private label brands alike.

    What Strategies Can Retailers and Brands Employ?

    In a market where consumer preferences and price sensitivities are rapidly evolving, retailers and brands must adopt versatile strategies without compromising on profit margins.

    Diversifying Brand Selection

    Retailers can enhance their appeal by offering a diverse range of olive oil brands, thereby stimulating competition among brands based on price, quality, innovation, and customer satisfaction. A well-curated selection that includes well-known brands like Filippo Berio and Bertolli, alongside emerging labels such as Terra Delyss, and premium options like Carapelli, allows retailers to meet a wide array of consumer preferences and budgets.

    For premium outlets, it might be beneficial to introduce more economical options than typically offered to attract budget-conscious consumers. Employing advanced assortment intelligence tools can provide retailers with crucial data, helping them make informed decisions about which brands to stock and promote, ensuring they meet consumer demand effectively while managing inventory costs.

    Data-driven Pricing

    With rising olive oil prices, competitive pricing is more crucial than ever. Retailers must strive to balance competitiveness with margin preservation. It’s essential for retailers to not just passively respond to market price increases but to actively ensure that their offerings are competitively priced relative to the market.

    This involves using sophisticated pricing intelligence tools, such as those provided by DataWeave, which track market trends and competitor pricing actions. These tools enable retailers to implement dynamic pricing strategies that respond promptly to market conditions and consumer demand shifts, helping to optimize sales and profitability.

    Diversifying Sourcing

    The traditional powerhouses of olive oil production, Spain and Italy, are now facing stiff competition from countries like Turkey and Tunisia. This shift is influenced by various factors, including currency fluctuations and changing trade policies, such as the imposition of tariffs on European olive oils by significant importers like the US. Retailers can take advantage of these changes by diversifying their sourcing strategies to include olive oil from non-traditional regions.

    The 2022/2023 season saw remarkable production levels from countries outside the Mediterranean basin, with Iran and China setting new production records. By broadening their supply chains to incorporate these emerging markets, retailers can benefit from lower production costs and introduce unique products to their consumers, enhancing both competitiveness and profit margins.

    Double Down on Private Labels

    Large retailers have successfully used their scale to develop strong private-label brands that can buffer consumers from price hikes in the olive oil market. By focusing on expanding and promoting their private-label offerings, retailers can provide cost-effective alternatives to national brands.

    Private labels generally have lower price points, making them particularly attractive during times of economic pressure and market volatility. Additionally, the development of private labels allows retailers to control more of their supply chain, from pricing to packaging, enabling them to offer high-quality products at competitive prices, thereby retaining customer loyalty and enhancing market share.

    Navigating Market Pressures

    High olive oil prices impact the entire supply chain, presenting varied challenges and opportunities:

    • Producers benefit from higher revenues but face increased pressure to maintain quality and yields in challenging climates. Adapting to these conditions with sustainable practices is crucial.
    • Exporters and Importers navigate tighter margins and greater risks due to tariffs and volume restrictions, requiring agility and strategic planning to adapt to market changes.
    • Retailers must carefully balance competitive pricing with rising procurement costs, affecting consumer affordability and potentially leading to shifts in buying patterns.
    • Consumers may seek cheaper alternatives or reduce their olive oil consumption, which influences overall market demand and pricing stability.

    These dynamics underscore the necessity for retailers and brands to adopt innovative and proactive strategies to navigate the volatile olive oil market effectively. By focusing on adaptive pricing, diversified sourcing, and customer engagement, businesses can enhance their resilience and secure long-term success in this competitive landscape.

    To learn more, talk to us today!

  • Using Siamese Networks to Power Accurate Product Matching in eCommerce

    Using Siamese Networks to Power Accurate Product Matching in eCommerce

    Retailers often compete on price to gain market share in high performance product categories. Brands too must ensure that their in-demand assortment is competitively priced across retailers. Commerce and digital shelf analytics solutions offer competitive pricing insights at both granular and SKU levels. Central to this intelligence gathering is a vital process: product matching.

    Product matching or product mapping involves associating identical or similar products across diverse online platforms or marketplaces. The matching process leverages the capabilities of Artificial Intelligence (AI) to automatically create connections between various representations of identical or similar products. AI models create groups or clusters of products that are exactly the same or “similar” (based on some objectively defined similarity criteria) to solve different use cases for retailers and consumer brands.

    Accurate product matching offers several key benefits for brands and retailers:

    • Competitive Pricing: By identifying identical products across platforms, businesses can compare prices and adjust their strategies to remain competitive.
    • Market Intelligence: Product matching enables brands to track their products’ performance across various retailers, providing valuable insights into market trends and consumer preferences.
    • Assortment Planning: Retailers can analyze their product range against competitors, identifying gaps or opportunities in their offerings.

    Why Product Matching is Incredibly Hard

    But product matching stands out as one of the most demanding technical processes for commerce intelligence tools. Here’s why:

    Data Complexity

    Product information comes in various (multimodal) formats – text, images, and sometimes video. Each format presents its own set of challenges, from inconsistent naming conventions to varying image quality.

    Data Variance

    The considerable fluctuations in both data quality and quantity across diverse product categories, geographical regions, and websites introduce an additional layer of complexity to the product matching process.

    Industry Specific Nuances

    Industry specific nuances introduce unique challenges to product matching. Exact matching may make sense in certain verticals, such as matching part numbers in industrial equipment or identifying substitute products in pharmaceuticals. But for other industries, exactly matched products may not offer accurate comparisons.

    • In the Fashion and Apparel industry, style-to-style matching, accommodating variants and distinguishing between core sizes and non-core sizes and age groups become essential for accurate results.
    • In Home Improvement, the presence of unbranded products, private labels, and the preference for matching sets rather than individual items complicates the process.
    • On the other hand, for grocery, product matching becomes intricate due to the distinction between item pricing and unit pricing. Managing the diverse landscape of different pack sizes, quantities, and packaging adds further layers of complexity.

    Diverse Downstream Use Cases

    The diverse downstream business applications give rise to various flavors of product matching tailored to meet specific needs and objectives.

    In essence, while product matching is a critical component in eCommerce, its intricacies demand sophisticated solutions that address the above challenges.

    To solve these challenges, at DataWeave, we’ve developed an advanced product matching system using Siamese Networks, a type of machine learning model particularly suited for comparison tasks.

    Siamese Networks for Product Matching

    Our methodology involves the use of ensemble deep learning architectures. In such cases, multiple AI models are trained and used simultaneously to ensure highly accurate matches. These models tackle NLP (natural language processing) and Computer Vision challenges specific to eCommerce. This technology helps us efficiently narrow down millions of product candidates to just 5-15 highly relevant matches.

    The Tech Powering Siamese Networks

    The key to our approach is creating what we call “embeddings” – think of these as unique digital fingerprints for each product. These embeddings are designed to capture the essence of a product in a way that makes similar products easy to identify, even when they look slightly different or have different names.

    Our system learns to create these embeddings by looking at millions of product pairs. It learns to make the embeddings for similar products very close to each other while keeping the embeddings for different products far apart. This process, known as metric learning, allows our system to recognize product similarities without needing to put every product into a rigid category.

    This approach is particularly powerful for eCommerce, where we often need to match products across different websites that might use different names or images for the same item. By focusing on the key features that make each product unique, our system can accurately match products even in challenging situations.

    How Siamese Networks Work?

    Imagine having a pair of identical twins who are experts at spotting similarities and differences. That’s essentially what a Siamese network is – a pair of identical AI systems working together to compare things.

    How it works:

    • Twin AI systems: Two identical AI systems look at two different products.
    • Creating ‘fingerprints’ or ‘embedding’: Each system creates a unique ‘fingerprint’ of the product it’s looking at.
    • Comparison: These ‘fingerprints’ are then compared to see how similar the products are.

    Architecture

    The architecture of a Siamese network typically consists of three main components: the shared network, the similarity metric, and the contrastive loss function.

    • Shared Network: This is the ‘brain’ that creates the product ‘fingerprints’ or ‘embeddings.’ It is responsible for extracting meaningful feature representations from the input samples. This network is composed of layers of neural units that work together. Weight sharing between the twin networks ensures that the model learns to extract comparable features for similar inputs, providing a basis for comparison.
    • Similarity Metric: After the shared network processes the inputs, a similarity metric is employed. This decides how alike two ‘fingerprints’ or ‘embeddings’ are. The selection of a similarity metric depends on the specific task and characteristics of the input data. Frequently used similarity metrics include the Euclidean distance, cosine similarity, or correlation coefficient, each chosen based on its suitability for the given context and desired outcomes.
    • Loss Function: For training the Siamese network, a specialized loss function is used. This helps the system improve its comparison skills over time. It guides and trains the network to generate akin embeddings for similar inputs and disparate embeddings for dissimilar inputs.

      This is achieved by imposing penalties on the model when the distance or dissimilarity between similar pairs surpasses a designated threshold, or when the distance between dissimilar pairs falls below another predefined threshold. This training strategy ensures that the network becomes adept at discerning and encoding the desired level of similarity or dissimilarity in its learned embeddings.

    How DataWeave Uses Siamese Networks for Product Matching

    At DataWeave, we use Siamese Networks to match products across different retailer websites. Here’s how it works:

    Pre-processing (Image Preparation)

    • We collect product images from various websites.
    • We clean these images up to make them easier for our AI to understand.
    • We use techniques like cropping, flipping, and adjusting colors to help our AI recognize products even if the images are slightly different.

    Training The AI

    • We show our AI system millions of product images, teaching it to recognize similarities and differences.
    • We use a special learning method called “Triplet Loss” to help our AI understand which products are the same and which are different.
    • We’ve tested different AI structures to find the one that works best for product matching, including ResNet, EfficientNet, NFNet, and ViT. 

    Image Retrieval 

    • Once trained, our AI creates a unique “fingerprint” for each product image.
    • We store these fingerprints in a smart database.
    • When we need to find a match for a product, we:
      • Create a fingerprint for the new product.
      • Quickly search our database for the most similar fingerprints.
      • Return the top matching products.

    Matches are then assigned a high or a low similarity score and segregated into “Exact Matches” or “Similar Matches.” For example, check out the image of this white shoe on the left. It has a low similarity score with the pink shoe (below) and so these SKUs are categorized as a “Similar Match.” Meanwhile, the shoe on the right is categorized as an “Exact Match.”

    Similarly, in the following image of the dress for a young girl, the matched SKU has a high similarity score and so this pair is categorized as an “Exact Match.”

    Siamese Networks play a pivotal role in DataWeave’s Product Matching Engine. Amid the millions of images and product descriptions online, our Siamese Networks act as an equalizing force, efficiently narrowing down millions of candidates to a curated selection of 10-15 potential matches. 

    In addition, these networks also find application in several other contexts at DataWeave. They are used to train our system to understand text-only data from product titles and joint multimodal content from product descriptions.

    Leverage Our AI-Driven Product Matching To Get Insightful Data

    In summary, accurate and efficient product matching is no longer a luxury – it’s a necessity. DataWeave’s advanced product matching solution provides brands and retailers with the tools they need to navigate this complex landscape, turning the challenge of product matching into a competitive advantage.

    By leveraging cutting-edge technology and simplifying it for practical use, we empower businesses to make informed decisions, optimize their operations, and stay ahead in the ever-evolving eCommerce market. To learn more, reach out to us today!

  • Why Strategic Competitive Insights Are Key to Optimizing Your Product Assortment

    Why Strategic Competitive Insights Are Key to Optimizing Your Product Assortment

    For retailers, the breadth and relevance of their product assortment are critical for success. Amid a crowded market filled with countless products clamoring for consumer attention, retailers must find innovative ways to distinguish themselves. While pricing undeniably impacts purchasing decisions, the diversity and distinctiveness of a retailer’s product range can provide a crucial competitive advantage.

    Creating an attractive and profitable assortment that resonates with your target audience requires more than intuition; it demands deep insights into both your own and your competitors’ offerings. A well-curated assortment aligned with current trends can drive higher conversions and foster customer loyalty. However, achieving this perfect balance is a formidable challenge without the right insights.

    This is where a data-driven strategy becomes essential, enabling you to curate a product mix that captivates and converts.

    However, retailers often encounter significant challenges when attempting to strategically plan their assortments:

    • Limited Competitive Insights: Gaining a clear understanding of your competitors’ assortment strengths and weaknesses across various categories is challenging. Without this visibility, it’s difficult to know where you have an edge or where you might be falling behind.
    • Tracking Demand Patterns: Identifying top-sellers and monitoring shifts in consumer demand can be a struggle. Without the ability to easily detect trends or changes in demand, you risk missing opportunities to stock trending items.

    Attempting to navigate these challenges manually is not only arduous but also susceptible to substantial errors.

    How Assortment Analytics Solutions Help

    The ideal Assortment Analytics solution must offer a fact-based approach to:

    • Identify Strengths and Weaknesses: Understand how your assortment measures up against the competition.
    • Stay Trend-Responsive: Keep your product mix fresh and aligned with the latest consumer trends.
    • Boost Conversions: Create a relatively unique, customer-focused assortment that enhances conversions.

    Many retailers attempt to analyze competitor assortments using manual, in-house methods, which inevitably leads to significant blind spots:

    • Variations in product classifications and taxonomies across competitors make meaningful comparisons challenging.
    • Gathering complete and accurate data across a vast competitive landscape is difficult.
    • Inconsistent titles and descriptions hinder reliable product matching without AI assistance.
    • Capturing and comparing detailed product attributes efficiently is nearly impossible without advanced tools.

    To overcome these challenges, retailers need a scalable, accurate Assortment Analysis solution designed specifically for the complexities of modern retail needs.

    DataWeave’s Assortment Analytics Solution

    DataWeave addresses these challenges by providing retailers with a robust platform to gain actionable insights into their product assortments and the competitive landscape. Leveraging advanced analytics and AI-driven algorithms, Assortment Analytics empowers retailers to make informed assortment management decisions, optimize their product offerings, and stay competitive.

    Armed with our insights, retailers can lead with their strengths and stock unique and in-demand products in their assortment. Further, by recognizing the strengths in their product catalog, they can craft effective pricing strategies and optimize their logistics, creating a more competitive and appealing shopping experience for their customers. Here are a few capabilities of DataWeave’s solution:

    In-Depth Competitive Analysis Across Retailers

    The solution offers detailed competitive analysis, revealing insights into competitors’ assortments. It maps competitor products to a common taxonomy, making comparisons accurate and meaningful. Retailers can visualize assortments at granular levels like category, sub-category, and product type.

    The data for these insights is collected at configurable intervals, typically monthly or quarterly, and is consumed not only via dashboard summaries but also raw data files to enable in-depth analysis. Retailers have the flexibility to choose specific competitors, brands, products, and categories for tracking, allowing for a tailored and strategic approach to assortment optimization.

    Brand and Category Views to Assess Your Portfolio

    The solution provides a comprehensive evaluation of your product assortment through brand and category views. In brand views, your portfolio is assessed against competitors at the brand level, highlighting:

    • Newly Introduced Brands: Insights into recently introduced brands, revealing shifts in the brand landscape.
    • Absence or Limited Presence: Identification of brands lacking representation or with minimal presence compared to competitors, indicating areas for improvement.
    • Strong Presence and Exclusivity: Recognition of brands where you excel, including exclusive offerings, showcasing your competitive edge.

    Identifying Top-Selling Competitive Products To Boost Assortment Strategy

    Beyond just comparing assortment numbers, the DataWeave solution surfaces insights into which competitor products are actually performing well. It equips category and assortment managers with indicators that assess competitor products in terms of their popularity and shelf velocity.

    It analyzes metrics like pricing fluctuations, ratings, customer reviews, search rankings, and replenishment rates to pinpoint hot sellers you may want to stock. With these insights, merchandizing managers can pinpoint top-selling products among competitors, enabling informed decisions to enhance their assortment in comparison.

    Sophisticated Attribute Tagging and Analysis

    Using AI-powered attribute tagging, the solution simplifies granular product analysis within specific categories. An Apparel retailer, for instance, can filter the data to compare assortments based on attributes like material, pattern, color, etc.

    Retailers can select attributes relevant to their products and gain detailed insights. These custom filter attributes dynamically populate the panel, facilitating targeted data exploration. Category and merchandizing managers can delve into critical details swiftly, enabling strategic decision-making and comprehensive competitive analysis within their categories.

    You can capitalize on opportunities by stocking in-demand, on-trend items and address assortment gaps quickly. At the same time, you can double down on your strengths by enhancing your exclusive or top-performing product sets.

    In summary, DataWeave’s Assortment Analytics solution provides an invaluable competitive edge. The insights enable evidence-based decisions to attract more customers, encourage bigger baskets, and maximize the value of every assortment choice.

    To learn more, read our detailed product guide here or get on a exploratory call with one of our experts today!

  • 5 Must-Have Capabilities of Your Ideal Competitive Pricing Intelligence Solution

    5 Must-Have Capabilities of Your Ideal Competitive Pricing Intelligence Solution

    In the cutthroat world of retail, where razor-thin margins and fierce competition reign supreme, pricing becomes your secret weapon to driving sales. The magic bullet unlocks sales, attracts customers, and ultimately fuels your bottom line. But with ever-changing market trends and competitor tactics shifting constantly, effective pricing strategies become even more crucial.

    A recent Bain & Company study highlights this very point. 78% of respondents acknowledged that their pricing decisions could be improved, leaving significant revenue untapped. John Furner, President and CEO of Kroger, echoes this sentiment. In a press release announcing a new pricing strategy, he emphasized their commitment to “providing our customers with predictable, affordable prices on the products they need most.” This focus on transparent and consistent pricing reflects the growing importance of building trust with customers, where value goes beyond just the lowest price tag.

    The right pricing strategy can unlock a treasure trove of benefits for retailers, including attracting new customers, boosting sales, and ultimately increasing their bottom line.

    But here’s the challenge: keeping pace with market trends and competitor strategies requires constant vigilance. This is where an advanced, user-centric pricing intelligence tool comes into play. Retailers need a platform specifically designed to address their unique challenges. It should empower them to protect margins, create a seamless pricing process, and attract and retain price-sensitive customers. To help you navigate this landscape, we’ve identified the must-have capabilities of a pricing intelligence solution that will transform your pricing strategy and propel your business toward long-term success.

    1. Reliable and Accurate Data Collection

    Retailers need a competitive intelligence solution that goes beyond merely capturing information en masse from competitor sites. An ideal solution ensures that data is consistent, extensive, and highly accurate, with an added level of granularity. This is achieved through statistical process control methods for data quality assurance, enabling highly accurate data capture and processing.

    Such a platform should be capable of scraping data from various sources, including desktop sites, mobile sites, and mobile applications, as well as a variety of online platforms: aggregators, omnichannel retailers, delivery intermediaries, quick commerce platforms, D2C sites, and more. This versatility ensures that data is captured across any global region and in dozens of languages, making the system geography and language agnostic.

    DataWeave’s solution includes a fast and automated data source configuration system, enabling a swift setup of new web sources for data capture. This capability ensures that retailers can stay ahead of the curve as the market landscape and competitor strategies evolve.

    An effective competitive pricing intelligence solution allows retailers to move away from working with incomplete or inaccurate data and instead leverage a comprehensive information stream to create strategic pricing decisions and optimize their overall business strategy. At the end of the day, the insights you base your decisions on are only as good as the data you aggregate. Even with the world’s best analytics engine, it’s always a case of “garbage in, garbage out.”

    2. Hyperlocal Insights From Store-Level Data

    Monitoring pricing and availability across specific stores is crucial for retailers to gain critical insights into a vast network of locations, enabling them to make strategic decisions that enhance pricing strategies and supply chain effectiveness, thereby minimizing stockouts or pricing inefficiencies in key markets. A platform like DataWeave provides retailers with a comprehensive view of store-level data across ZIP codes, maintaining a hyperlocal competitive strategy. It offers detailed visibility into product availability, highlighting out-of-stock scenarios across different competitors. This capability is invaluable, allowing quick identification of price improvement opportunities and providing retailers with a bird’s eye view of where products can be priced higher than usual to gain margins.

    The system operates at configurable intervals—daily, weekly, or monthly—enabling retailers to keep a vigilant eye on pricing, product availability, and delivery timelines based on the selected fulfillment option. Unlike many other providers who offer limited insights from a sample of stores, this solution delivers exhaustive analytics from every storefront. This comprehensive approach grants retailers (and brands) a strategic edge, facilitating efficient inventory tracking, precise pricing adjustments, and rapid responses to fluctuating market dynamics.

    3. Sophisticated, AI-Powered Product Matching

    A solution that matches products accurately at scale is essential for a robust and reliable competitive pricing strategy. Advanced platforms use unified systems for both text and image recognition to accurately match similar SKUs across thousands of eCommerce stores and millions of products. Deep learning architecture is employed to develop unique AI that matches text and images, grouping similar products based on their features, ensuring accurate matches even for private label products.

    This AI identifies critical elements of products in images, such as focusing on the top half of a model wearing a shirt, the sleeve length, the color of the product, etc.. Deep learning models, trained on extensive datasets of images, enhance these images by removing irrelevant background details and improving the quality of the core product image. Innovative AI then extracts unique signatures from the photos, allowing for quick and efficient identification and grouping of products across billions of indexed items.

    No matter how powerful the AI, combining it with human expertise is key to achieving true data veracity—ensuring accuracy, freshness, and comprehensive coverage required for reliable product matching. A human-in-the-loop approach elevates the AI-powered product matching process by addressing key challenges. AI algorithms may initially identify product matches with 80-90% accuracy, but human validation corrects errors, pushing accuracy closer to 100%. Humans apply contextual judgment for subjective criteria like aesthetics and design, making nuanced decisions that quantitative rules might miss. Continuous learning through an iterative feedback loop allows AI models to quickly adapt to changing trends and preferences as human experts provide context and re-label incorrect predictions. By integrating AI’s automation and scale with human validation, judgment, and knowledge curation, pricing intelligence solutions can achieve the accuracy and coverage necessary for actionable competitive pricing insights.

    This approach results in retailers being able to match products and compare prices between identical products, similar products, and private label brands.

    4. Unit of Measure Normalization

    Effective product matching and grouping are crucial for maintaining competitive pricing, but this requires a tech stack that can normalize units of measure across various sites. For example, a 10.75oz can of chicken noodle soup priced at $3 may seem cheaper than a 12.90oz can priced at $3.20, but this isn’t always the case. Initially, the larger package might appear more expensive, but when prices are compared based on the same unit amount, it often offers better value. Therefore, it is essential for retailers to standardize units to accurately compare prices. Advanced technology goes beyond simply matching products; it ensures accurate comparisons by normalizing unit measurements, including weight, quantity, and volume—crucial factors for establishing a clear pricing picture across competitors.

    Imagine comparing soup prices regardless of whether they are advertised in ounces, milliliters, or liters. By normalizing unit measurements, retailers can develop tailored pricing strategies on a level playing field, eliminating the risk of being misled by seemingly lower prices that conceal smaller quantities. Unit normalization allows retailers to uncover hidden value propositions by accurately determining the cost per unit, enabling them to set competitive prices, highlight the true value of their products, and make data-driven decisions.

    5. Ease of Actionability

    The most valuable insights are ineffective if they cannot be easily accessed and acted upon. Imagine a solution that not only provides industry insights but also customizes alerts and dashboards to show exactly how your prices compare to competitors in your specific categories and product groupings. An ideal solution would offer all this in one centralized platform, giving retailers easy access to data through intuitive dashboards, seamless data export options, and flexible API integrations. This enables a smooth, effortless process for adopting and utilizing the platform.

    Ease of use and actionable insights should be at the core of such a solution. A SaaS-based web portal can provide businesses with access to insights through user-friendly dashboards, detailed reports, and impactful visualizations. Customized insights tailored for each persona within the organization facilitate swift actions on relevant competitive intelligence. Whether it’s day-to-day tactical recommendations or inputs for long-term strategies, the platform should ensure that all insights are easily consumable and actionable.

    Moreover, the data should be accessible using plug-and-play APIs, enabling businesses to integrate external data with their internal pricing or ERP systems and BI tools. This integration generates predictive intelligence, enhances decision-making, and drives more robust business outcomes.

    Choosing the Right Pricing Intelligence Solution Will Determine Your Success

    Retailers need to leave behind generic pricing intelligence tools. For true success, retailers need a solution built to tackle their specific challenges. With capabilities like comprehensive data collection capturing granular details across regions and languages, local insights into store-level data for informed decision-making, accurate price comparisons with unit normalization, and access to actionable insights, retailers gain a complete and holistic picture of the pricing landscape, setting them up for success. Additionally, AI-powered and human-aided product matching ensures accurate competitor analysis

    These are just some of the essential capabilities DataWeave offers to retailers. By prioritizing these, retailers can transform their pricing strategy into a profit-generating machine, keeping them ahead of the curve and exceeding customer expectations in a competitive market to help them stay at the forefront of their categories.

    To learn more, talk to us today!

  • 6 Common Pricing Intelligence Challenges Retailers Face (And How to Overcome Them)

    6 Common Pricing Intelligence Challenges Retailers Face (And How to Overcome Them)

    When your product pricing is sub-optimal, you leave money on the table. This is especially significant for eCommerce retailers who must contend with their consumers ‘shopping around’ for the best price before making a purchase. All eCommerce retailers experience some amount of cart abandonment. In fact, the average cart abandonment rate is estimated at 70.19%, and the reason is often that customers find a better price elsewhere, whether at other online stores or in traditional brick-and-mortar ones.

    If you want to win the business of price-sensitive shoppers, you need a robust pricing strategy to keep up with changing competitor pricing. That’s one reason (among others) that retailers rely heavily on pricing intelligence solutions. With the right pricing intelligence solution, retailers can stay on top of market shifts, manage profit margins, maintain price perception, and of course, price their products competitively.

    Unfortunately, adding a new pricing intelligence solution to a retailer’s tech stack is not without its challenges. But the good news is there are ways to overcome them.

    In this post, we’ve rounded up six challenges most commonly cited by retailers and proposed strategies to overcome them. So if you’re considering a pricing intelligence solution that can get you closer to your business goals, read on to learn more.

    1. Scalability Constraints

    As access to the internet has expanded globally, the ratio of brick-and-mortar sales compared with eCommerce continues to narrow. A natural consequence of this is that more shoppers than ever before now browse and buy across diverse web environments, including mobile apps.

    This means that retailers need to track pricing across not just websites and physical stores, but also across mobile apps — a sales channel that was largely sidelined before.

    Modern pricing intelligence solutions need to consolidate data from:

    • Online storefronts
    • Mobile apps


    … and also from delivery channels, which often have different assortments and pricing:

    • Standard home delivery
    • Expedited, same-day home delivery
    • Buy online, pickup in-store (BOPIS)
    • Subscription
    • Curbside pickup


    In this context, imagine having to track the pricing of millions of SKUs compared against dozens of competitors each day. When new channels and devices are added, many pricing intelligence solutions in the market are unable to handle such data complexity and scale. They’re not built to continually grow and expand to meet changing needs. Even worse, some retailers opt for homegrown DIY systems, which struggle to keep the datasets updated, accurate, and current—activities that require significant cost and human effort.

    How DataWeave Bridges This Gap:

    What you need is a platform that can track millions of SKUs across dozens of competitors and geographies. No matter where the data is coming from or how vast the demand for the product is, an ideal solution should be able to synthesize huge amounts of complex data and generate meaningful insights.

    Your competitors are continually changing their eCommerce setup, whether through subtle changes to their product attribute listings or broader changes to domains or apps. With DataWeave’s pricing intelligence solution designed to scale up as required, you never need to worry about the backend flexing to accommodate changes.

    2. Inability to Match Products Without Clear UPC/EAN Identifiers

    Another problem with many pricing intelligence solutions is their inability to match products if a UPC/EAN identifier is missing. Often, a competitor will list an identical product on their storefront and omit any clear identifiers. On Amazon, an ASIN might be listed or you might be able to bring in a DPCI from Target.com. However, without clear identifiers across eCommerce platforms, retailers struggle to aggregate every instance of the products, and as a result, are unable to achieve accurate pricing comparisons. They often face this challenge when they work with commoditized web scraping service providers who have very limited expertise or experience in refining the data into meaningful insights.

    How DataWeave Bridges This Gap:

    If you can’t match UPC/EAN codes, you need a solution that leverages artificial intelligence to match products based on other variables, such as product titles, descriptions, and images. AI, in combination with human expertise, can take on the task at a speed and accuracy that would be unfeasible for humans alone.

    Artificial Intelligence is constantly learning and improving. At DataWeave, we accelerate this process by introducing new scenarios and datasets for the product to continually learn from. At the outset, our AI product matching is roughly 80-90% accurate every time. To improve this number to over 95%, we introduce human validation and nuanced judgments. Over the years, this feedback loop has continued to refine its algorithms, resulting in near-perfect data accuracy for retailers.

    Our solution uses AI built on more than ten years of data to perform robust product matching for retailers at a massive scale. Using a unified platform with text and image recognition, DataWeave matches products from among hundreds of eCommerce websites and across millions of products.

    3. Poor and Inconsistent Data

    Retailers often complain that the data within their pricing intelligence solution isn’t accurate, is inconsistent, and may even be comprised of statistical smoothing and gap-plugging smokescreens. The root of this problem often lies in the inability of these tools to consistently track prices across diverse web environments. Poorly designed web scraping infrastructure fail when eCommerce websites change their underlying configuration and structure (which happens periodically). As a result, they don’t have enough data to see the market as a whole, and end up viewing synthetic or small sample-set data.

    How DataWeave Bridges This Gap:

    At DataWeave, transparency drives our approach to delivering insights. We only present real-world data in our data feeds and dashboards to customers. This is possible only due to the supreme confidence we have in our ability to consistently capture and present accurate data. We achieve this by using a combination of AI and sophisticated web scraping infrastructure developed and enhanced over a decade.

    In fact, we are the first in the industry to launch a Data Statistics Dashboard that helps our customers scrutinize match rates, track data freshness, highlight any gaps in the data, and manage product matches independently.

    4. Limited Integration Options with Internal Systems

    Too often, a retailer will select a pricing intelligence solution that promises exceptional insights but then fails to offer a manageable workflow for day-to-day use. This usually happens because it doesn’t integrate with the retailer’s existing tech stack.

    Without a convenient process that connects internal systems, your pricing intelligence solution is just another piece of technology that your team does not use to its full potential. You may require your competitor pricing data to flow into price optimization tools, price management tools, BI tools, ERP systems, or revenue management systems. Without this capability, you’ll see limited ROI and underwhelming results because all the insights in the world are of little use if you can’t consume them easily and put them into action.

    How DataWeave Bridges This Gap:

    At DataWeave, we understand the importance of being able to integrate external data with your internal tech stack. Our data can be accessed and extracted using plug-and-play APIs, enabling businesses to combine their external and internal data to generate predictive intelligence.

    We also have other data feeds ready to be integrated, including FTP and Amazon S3. Our integration experts can work with you to create custom integrations to existing internal pricing platforms. Our ultimate goal here is to seamlessly elevate your pricing intelligence strategy with minimal change management.

    5. Limited Custom Analysis Capabilities

    Every retailer is unique. There are various geographies, languages, markets, product categories, and pricing strategies that differentiate one retailer from the next. Many retailers find it challenging to derive actionable insights from their pricing intelligence solution because the analysis and customization capabilities are too limited.

    For example, some retailers might want to evaluate their competitiveness after applying coupons and promos to selling prices. Others may want to perform a one-time pricing analysis of just list prices across competitors. Some may want to view insights that help them take tactical decisions day-to-day, while others would like a historical view across multiple dimensions to help make strategic long-term pricing decisions.

    Without the ability to customize their views or the underlying data, retailers could feel restricted in their ability to drive meaningful impact with their pricing intelligence.

    How DataWeave Bridges This Gap:

    What you need are foundational dashboards, reports, and visualizations in a web portal that can be tailored to your business needs. Then, you need the expertise and guidance of a team of business analysts who can help you configure custom reports and dashboards.

    At DataWeave, we offer bespoke insights for each persona, enabling swift actions on relevant competitive intelligence. These include day-to-day tactical recommendations or inputs for long-term strategies. And because all DataWeave customers get access to our team of expert analysts, it’s simple and straightforward to configure unique reports and dashboards to suit your business.

    6. Sloppy Support

    No solution, at least not one that undertakes complex work, works optimally with a ‘set it and forget it’ approach. From time-to-time, you need human intervention to ensure your pricing intelligence is working in the way that it needs to for you. Unfortunately, one of the most common challenges retailers face with their pricing intelligence tool is a lack of support.

    Unavailable or patchy customer support is a significant challenge that can result in low confidence, delayed resolutions, and even abandoned pricing actions.

    How DataWeave Bridges This Gap:

    Dataweave’s global team of pricing experts are available around the clock for support and guidance. Not only do we have tech experts and business analysts that you can consult at any point, we also have an exceptional team of customer success professionals to help you overcome any technical and strategic issue you might face.

    As one customer puts it, with DataWeave you gain access to: “Excellent customer service, super collaborative staff, user-friendly interface.”

    Another verified user from the consumer goods industry had this to say:

    “Great platform and customer service! Our client service team is very helpful and always responds to ad-hoc requests in a very timely matter!”

    Read more reviews from real DataWeave users on G2: https://www.g2.com/products/dataweave/reviews

    Finding The Right Pricing Intelligence Solution

    As the competition heats up, retailers need to unlock every available opportunity to gain an edge and capture market share. At DataWeave, our AI-powered pricing intelligence software helps you uncover gaps quickly and build a pricing strategy that is as attractive as it is effective. Our ability to scale, match your products across the entire ecosystem with consistent accuracy, and slide right into your current operations to provide advanced analytics, makes us the preferred choice for many of the world’s leading retailers.

    Want to start benefiting from actionable product matching and pricing intelligence? Request a demo today.

  • Cinco de Mayo 2024 Pricing Insights: An Analysis of Discounts Amid Inflation

    Cinco de Mayo 2024 Pricing Insights: An Analysis of Discounts Amid Inflation

    Cinco de Mayo is a vibrant celebration of Mexican-American and Hispanic heritage, marked by lively parades, festive tacos, and refreshing tequila across North America. For the service industry, brands, and retailers, this day offers a golden opportunity to roll out enticing promotions on beloved Mexican foods and beverages, drawing in large crowds and boosting sales.

    Americans love to indulge in Mexican cuisine during Cinco de Mayo. Take avocados, for example: despite inflation, avocado sales soared to 52.3 million units this year, marking a 25% increase from last year, according to the Hass Avocado Board’s 2023 Holiday Report. Such festive events see a significant sales spike, largely driven by appealing discounts and special offers.

    So, what discounts did retailers roll out this Cinco de Mayo?

    At DataWeave, our cutting-edge data aggregation and analysis platform tracked and analyzed the prices and deals on Mexican food and alcohol products offered by leading retailers. Our in-depth analysis sheds light on their pricing competitiveness during Cinco de Mayo, revealing how pricing strategies differed across various subcategories and brands.

    We conducted a similar analysis in 2022, allowing us to compare the prices of identical products this year versus last year. This comparison helps us understand the impact of inflation over the past two years on the prices offered today.

    Our Methodology

    For our analysis, we monitored the average discounts offered by major US retailers on over 2,000 food and beverage products during Cinco de Mayo, as well as in the days leading up to the event. Many retailers kick off their Cinco de Mayo promotions a week before, so we included the entire week leading up to May 5th in our analysis.

    Key Details:

    • Number of SKUs: 2000+
    • Retailers Analyzed: Target, Amazon Fresh, Safeway, Walmart, Total Wines & More, Sam’s Club, Meijer, Kroger
    • Categories: Food, Alcohol
    • Analysis Period: April 28 – May 5

    To truly demonstrate the value of Cinco de Mayo for shoppers, we concentrated on price reductions and additional discounts during the event. By comparing these with regular day discounts, we were able to highlight the genuine savings and benefits that Cinco de Mayo promotions offer to budget-conscious consumers.

    Our Findings

    Safeway led the pack with the highest average additional discount of 4.91%, covering 38.6% of their food inventory for Cinco de Mayo. Total Wine & More followed closely, offering an average discount of 3.46% across 70.8% of its tequila, whiskey, mezcal, and other spirit products during the Cinco de Mayo week.

    In contrast, Target provided minimal additional discounts, averaging just 0.8% over a small fraction (11.6%) of its SKUs. Similarly, Kroger’s additional discounts were also 0.8%, but they were spread across over 60% of its tracked products. Walmart (1.4%) and Amazon Fresh (1.2%) offered relatively conservative discounts during the sale period.

    During Cinco de Mayo, various brands rolled out attractive discounts to entice shoppers. Among beverage brands, The American Plains vodka led the way with the highest average discount of 20.80%. Coffee brands also joined the festivities with significant discounts: Death Wish Coffee at 14.30%, Dunkin’ at 11.10%, and Starbucks at 5.70%. Notably, Dunkin’ and Death Wish Coffee introduced complimentary beverages such as whiskey barrel-aged coffee and spiked coffee products to celebrate the event.

    In the wine category, Erath stood out with a 10% additional discount. However, brands like Jose Cuervo and Franzia offered more modest discounts of 0.70% and 1.80%, respectively.

    Food brands associated with traditional Mexican ingredients or products, such as tortillas, salsas, and spices, provided higher discounts compared to mainstream snack brands. For instance, McCormick (25%), El Monterey (13.3%), and La Tortilla Factory (16.7%)—known for ready-to-eat frozen foods, seasonings, and condiments—delivered the highest discounts. Other notable discounts included Jose Ole (12.5%), a frozen food brand, and Yucatan (8.3%), known for its guacamole.

    Safeway’s private label brand, Signature Select, offered a 5.20% discount. Additionally, Safeway provided deep discounts on brands like Pace, Herdez, and Taco Bell, indicating an aggressive discounting strategy. In contrast, brands closely associated with Mexican or Tex-Mex cuisine, such as Old El Paso, Mission, Rosarita, and La Banderita, offered relatively modest discounts ranging from 0.5% to 3.3%.

    The discount patterns varied between alcohol and food categories, with food brands generally offering higher discounts. This trend may be attributed to pricing being regulated in the alcohol industry. These differing discount levels highlight how brands navigated the balance between driving sales and maintaining profit margins during Cinco de Mayo, particularly in the context of inflation affecting costs.

    Impact of Inflation on Cinco de Mayo Prices (2024 vs 2022)

    To gauge the impact of inflation on popular Cinco de Mayo products, we analyzed the average prices at Walmart and Target between 2022 and 2024. These two retailers were chosen due to their prominence in the retail sector and the robustness of our sample data.

    At Walmart, the Tex Mex category saw the highest average price increase, rising by 22.51%. Other notable subcategories with significant price hikes include Condiments (23.21%), Vegetables/Packaged Vegetables (21.22%), and Lasagne (14.10%). Categories like Dips & Spreads (13.77%), Pantry Staples (14.92%), and Salsa & Dips (8.23%) experienced relatively lower increases.

    At Target, the Snacks subcategory had the steepest average price rise at 27.94%, followed by Meal Essentials (16.07%) and Deli Pre-Pack (8.82%). Categories such as Dairy (0.51%), Frozen Meals/Sides (7.11%), and Adult Beverages (7.41%) saw smaller price increases.

    Brands associated with traditional Mexican or Tex-Mex cuisine faced higher price hikes. Examples include Old El Paso (24.59% at Walmart, 8.70% at Target), Tostitos (35.44% at Walmart, 11.41% at Target), Ortega (30.59% at Walmart, 19.69% at Target), and Rosarita (14.39% at Walmart).

    In contrast, private label or store brands generally experienced lower price increases compared to national brands. For instance, Good & Gather (Target’s private label) saw a 9.55% increase, while Market Pantry (Walmart’s private label) had a 17.27% rise. This trend is understandable as retailers have more control over their costs with private label brands.

    The data clearly indicates that both Walmart and Target have significantly raised prices across various categories and brands, reflecting the broader inflationary environment where the cost of goods and services has been steadily climbing.

    Interestingly, we observed higher price increases at Walmart compared to Target. Although Walmart is renowned for its consumer-friendly pricing strategies, it too had to elevate grocery prices post-2022 to combat inflationary pressures. As consumers become more cost-conscious and reduce spending on discretionary items, Walmart and other retailers are now cutting prices across categories to align with shifting consumer behaviors.

    Mastering Pricing Strategies During Sale Events

    Our pricing analysis for Cinco de Mayo reveals compelling insights into the dynamics of retailer landscapes in the US. It highlights the enduring relevance of private label brands, even amidst fluctuating demand, showing the emergence of local, national, and small players vying for market share.

    As retailers navigate inflationary pressures and evolving consumer behaviors, understanding these pricing dynamics becomes crucial for optimizing strategies and bolstering market competitiveness. This analysis offers actionable intelligence for retailers seeking to navigate the intricate terrain of sale event promotions while addressing shifting consumer preferences and economic challenges.

    Access to reliable and timely pricing data equips retailers and brands with the tools needed to make informed decisions and drive profitable growth in an increasingly competitive environment. To learn more and gain guidance, reach out to us to speak to a DataWeave expert today!

  • How Monitoring and Analyzing  End-User Prices can Help Retailers and Brands Gain a Competitive Edge

    How Monitoring and Analyzing  End-User Prices can Help Retailers and Brands Gain a Competitive Edge

    Retailers and brands are constantly engaged in a fierce battle over prices and discounts. Whether it’s major events like Amazon Prime Day, brand-led sales, or everyday price wars, they depend on pricing intelligence and digital shelf analytics to fine-tune their strategies. With a variety of offers such as sales, promotions, and bundles, determining the actual cost to the customer becomes a complex task. The price set by the brand, the retailer’s offer, and the final amount paid by the customer often vary significantly.

    In their analysis, retailers and brands frequently focus on the listed price or the final sale price, overlooking a critical factor: the “end-user price.” This includes all discounts, taxes, and shipping costs, providing a more accurate picture of what customers are truly willing to pay at checkout.

    Grasping this end-user price is vital for both retailers and brands. For retailers, it helps them stay competitive and refine their promotional strategies. For brands, it offers insights into competitive positioning, net revenue management, and shaping customer price perception.

    However, emphasizing the end-user price is challenging, as it involves comprehending all the intricate elements of pricing.

    How end-user pricing is calculated

    The list price, also known as the manufacturer’s recommended retail price (MSRP), is the initial price set by the brand. This may not always be displayed on marketplaces, especially in categories like grocery. The selling price, on the other hand, is the amount at which a retailer offers the product, often reduced from the list price. The end-user price is the actual amount the customer pays at checkout, which includes taxes, promotions, and other factors that affect the final cost.

    The process involves 3 key stages:

    Step 1: Identifying and categorizing promotional offers

    The first critical step in calculating end-user pricing is to identify and categorize the various promotional offers available for a given product that can reduce the final amount paid by the consumer. These promotions span a wide range of types:

    • Bank Offers: Involving discounts or cash back incentives when paying with specific bank credit or debit cards. For instance, a customer may receive 10% cashback on their purchase by using a specific bank’s card.
    • Bundled Deals: Combining multiple products or services at a discounted bundle price. A common example is a smartphone bundle including the phone itself, a protective case, and earphones at a reduced total cost.
    • Promo Codes/Coupons: Customers can enter promo codes or coupons during checkout to unlock special discounted prices or percentage-off offers, like 20% off a hotel booking, or even a special brand discount personalized for their needs (think loyalty offers and in-app promotions).
    • Shipping Offers: These include free shipping or reduced shipping fees for certain products or orders, such as free delivery on orders above a set amount.
    • TPRs (Temporary Price Reductions): TPRs play a significant role in the strategies of most retailers. Brands and retailers use them to encourage shoppers to purchase more of a product or to try a new product they wouldn’t usually buy. A TPR involves reducing the price of a product by more than 5% from its regular shelf price.

    By accurately identifying and classifying each type of promotion available, brands can then calculate the potential end-user pricing points.

    Step 2: Accounting for location and fulfilment nuances (delivery, in-store pickup) that impact final pricing

    Product pricing and promotional offers can vary based on the consumer’s location or ZIP code. Additionally, customers may opt for different fulfilment modes like delivery, shipping, or in-store pickup, which can further impact the final cost. Accurately calculating the end-user price necessitates considering these location-based pricing nuances as well as the chosen fulfilment method.

    In the example below, the selling price is $4.32 for one retailer (on the left in the image) after a discount for online purchase. In another case with Meijer, the item total shows $17.91, but the consumer ends up paying $15.74 after taxes and fees are applied (on the right in the image).

    Step 3: Applying each eligible promotion or offer to the selling price to determine potential end-user price points

    With the various promotional offers and discounts categorized in the previous steps, retailers and brands can now apply each eligible promotion to the product’s selling price. This involves deducting percentages for bank cashback, implementing bundled pricing, applying coupon code discounts, and incorporating shipping promotions.

    For retailers, this step allows them to calculate their true effective selling price to customers after all discounts and promotions. They can then compare this end-user price against competitors to ensure they remain competitively priced.

    For brands, by systematically layering every applicable offer onto the baseline selling price, they can accurately calculate the multiple potential end-user price points a customer may pay at checkout for their products across different retailers and regions.

    Why the end-user price matters

    Optimizing pricing strategies using the end-user price can benefit retailers and brands in several ways:

    • Price Competitiveness: By monitoring end-user pricing, retailers can adjust for discounts and promotional offers to attract customers, while brands can refine their pricing models to stay ahead in the market.
    • Customer Acquisition and Loyalty: Offers, promotions, and discounts directly impact the final price paid by customers, playing a crucial role in attracting new customers and retaining existing ones. For example, Walmart’s competitive pricing in groceries boosts customer loyalty and repeat purchases.
    • Consumer Perception: End-user pricing significantly shapes how consumers perceive both retailers and brands. Competitive pricing and promotional transparency enhance reputation and conversion rates. Amazon, for instance, is known for its competitive pricing and fast deliveries, which strengthen its consumer perception and satisfaction.
    • Sales Volumes: The final checkout price influences affordability and perceived value, directly affecting sales volumes. Both retailers and brands benefit from understanding this, as it guides consumer purchasing decisions and drives revenue streams.
    • Brand Perception: Consistent and transparent pricing enhances the perception of both the retailer and the brand. This not only strengthens the value proposition but also builds consumer trust and fosters long-term loyalty.

    While the listed and selling prices are readily available, calculating the true end-user price is quite complex. It involves meticulous tracking and application of various types of promotions, offers, location-based pricing nuances, and fulfillment costs – an uphill task without robust technological solutions.

    Track and Analyze end-user prices with DataWeave

    DataWeave’s end-user price tracking capability empowers retailers and brands with the insights and tools necessary to comprehend the complexities of pricing dynamics. For retailers, it offers the ability to monitor end-user pricing across various products and categories compared to competitors, ensuring competitiveness after all discounts and enabling optimization of promotional strategies. Brands benefit from informed pricing decisions, optimized strategies across retail channels, and a strengthened position within their industries.

    Our intuitive dashboard presents classified promotions and corresponding end-user prices across retailers, providing both retailers and brands with a transparent, comprehensive view of the end-user pricing landscape.

    Within the detailed product view of DataWeave’s dashboard, the Price and Promotions panel showcases diverse promotions available across different retailers for each product, along with the potential end-user price post-promotions.

    Harness the power of DataWeave’s sophisticated Pricing Intelligence and Digital Shelf Analytics to gain an accurate, real-time understanding of your end-user pricing dynamics. Make data-driven pricing decisions that resonate with customers and propel your brand toward sustained success.

    Find out how DataWeave can empower your eCommerce pricing strategy – get in touch with us today or write to us at contact@dataweave.com!

  • Augmenting AI-powered Product Matching with Human Expertise to Achieve Unparalleled Accuracy

    Augmenting AI-powered Product Matching with Human Expertise to Achieve Unparalleled Accuracy

    In today’s expansive omnichannel commerce landscape, pricing intelligence has become indispensable for retailers seeking to stay competitive and refine their pricing strategies. The sheer magnitude of eCommerce, spanning thousands of websites, billions of SKUs, and various form factors, adds layers of complexity. Consequently, ensuring the accuracy and reliability of competitive insights presents a formidable challenge for retailers aiming to leverage pricing data effectively.

    At the core of any robust pricing intelligence system lies product matching. This process enables retailers to recognize identical or similar products across competitors. Once these matches are identified, tracking prices is a relatively more straightforward task, facilitating ongoing analysis and informed decision-making.

    Accurate matching is crucial for meaningful price comparisons and tailoring product assortments. The challenge is matching products is often complicated, especially for non-local brands, niche categories, or items lacking consistent global identifiers. It becomes even trickier when trying to match very similar but not identical products. A comprehensive approach that compares and analyzes multiple attributes like product titles, descriptions, images and more is essential.

    Artificial intelligence algorithms are commonly used to automate product matching, leveraging machine learning techniques to analyze patterns in images and text data. While AI can adapt and improve over time, the question remains: Can it fully address the complexities of product matching on its own?

    The reality is that many retailers still struggle with incomplete, inaccurate, or outdated product data, despite these AI-powered product matching solutions. This can lead to suboptimal pricing decisions, missed opportunities, and reduced competitiveness.

    Challenges in an ‘AI-only’ Approach to Product Matching

    While AI plays a vital role in automated product matching solutions, there are complexities that AI alone cannot fully address:

    Subjectivity in Matching Criteria

    Some product categories have subjective or hard-to-quantify criteria for determining similarity. AI learns from historical data, so it may struggle with nuanced aspects like:

    Aesthetics, style, and design: In the Fashion and Jewellery vertical, for example, products are matched according to attributes like style, aesthetics, design – all of which have some subjectivity involved.

    Quantity/packaging variations: In the grocery sector, variations in product packaging and quantities can introduce complexities that require subjective decision-making. For example, apples may be sold in different packaging like a 0.5 kg bag or a pack of 4 individual apples. Determining if these different packaging options should be considered equivalent often involves making a qualitative judgment call, rather than a clear-cut objective decision.

    Matching product sets: For categories like home furnishings, the focus is often on matching coordinated sets rather than individual items. For example, in the bedroom category, matching may involve grouping together an entire set of complementary furniture like a bed frame, dresser, and wardrobe based on their cohesive design and style. This goes beyond simply making one-to-one product associations, requiring more nuanced judgments about aesthetic coordination.

    Contextual Factor

    Products can have regional preferences, cultural differences, or evolving trends that impact how they are matched. AI may miss important context like Local/regional product names or distinct brand names across countries.

    For instance, in the image we see Sprite (in the US) is branded Xubei in China. Continuous human curation is needed to help AI adapt to this context.

    High Accuracy & Coverage Expectations

    Retailers rely on AI powered and automated pricing adjustments based on product matching for insight. To ensure that pricing recommendations and updates are accurate, accurate product matching is crucial. For this, simply identifying similar top results is not enough – the process must comprehensively capture all relevant matches. While AI excels at finding the top groupings with around 80% accuracy, even small matching errors can have significant consequences.

    As AI matching improves, customer expectations may rise even higher. If AI achieves 90% accuracy, for instance, SLAs may demand over 95%. Reaching such a high level of accuracy is very challenging for AI alone, especially when faced with incomplete data, contextual nuances, evolving trends, and subjective matching criteria across products and categories.

    The solution is to combine the power of AI with human expertise. This is the key to achieving true data veracity – the accuracy, freshness, and comprehensive coverage required for precise and reliable product matching.

    Human-in-the-Loop Approach for Elevated Product Matching

    Human intelligence and quality testing can elevate the AI powered product matching process by addressing key challenges:

    • Matching Validation: AI algorithms may identify product matches with 80-90% accuracy initially. Having humans validate these AI-suggested matches allows for correcting errors and pushing the accuracy close to 100%. As humans flag issues, provide context, and re-label incorrect predictions, it allows the AI model to learn and enhance its reliability for complex, high-stakes decisions.
    • Applying Contextual Judgment: For subjective matching criteria like aesthetics, design, and categorizing product sets, human discernment is needed. Humans can make nuanced judgments beyond just quantitative rules, ensuring meaningful apples-to-apples product comparisons. Their contextual understanding augments AI’s capabilities.
    • Continuous Learning Via Feedback Loop: Product experts possess rich category knowledge across markets. Integrating this human insight through an iterative feedback loop helps AI models quickly learn and adapt to changing trends, preferences, and context. As humans explain their match assessments, the AI continuously enhances its precision over time.

    By combining AI’s automation and scale with human validation, judgment, and knowledge curation, pricing intelligence solutions can achieve the accuracy and coverage demanded for actionable competitive pricing insights.

    DataWeave’s Data Veracity Framework: A Scalable Workflow Combining AI and Human Expertise

    Given the vast number of products, retailers, and brands that exist today, any product matching solution must be highly scalable. At DataWeave, we bring you such a scalable workflow to address these complexities by integrating human expertise with AI-driven automation. The image below outlines our approach for combining AI with human intelligence in a seamless, scalable workflow for accurate product matching:

    Retailers and brands can benefit in several ways with this workflow, as listed below.

    Several Rounds of Data Verification Due to Hierarchical Validation Teams

    The workflow employs a hierarchical validation team of Leads and Executives to efficiently integrate human expertise without creating bottlenecks. Verification Leads play a pivotal role in managing the distribution of product matches identified by DataWeave’s AI model to the Verification Executives.

    The Executives then meticulously validate these AI-suggested matches, adding any missing product associations and removing inaccurate matches. After validation, the matched product groups are sent back to the Leads, who perform random sampling checks to ensure quality.

    Throughout this entire workflow, feedback and suggestions are continuously gathered from both the Executives and Leads. This curated input is then incorporated back into DataWeave’s AI model, allowing it to learn and improve its matching accuracy on an ongoing basis.

    This hierarchical structure ensures that human validation seamlessly scales alongside the AI’s matching capabilities. Leveraging the respective strengths of AI automation and human expertise in an iterative feedback loop prevents operational bottlenecks while steadily elevating overall accuracy.

    Confidence-based Distribution of Matched Articles for Validation

    The AI model assigns confidence scores, differentiating high-confidence (>95%) and low-confidence matches. For high-confidence groups, executives simply remove incorrect matches – a quicker process. Low-confidence matches require more human effort in adding/removing matches.

    As the AI model improves over time with feedback, the share of high-confidence matches increases, making validation more efficient and swift.

    Automated, Standardized Process with Iterative Feedback Loop

    The entire workflow is standardized and automated, with verification metrics seamlessly tracked. At each step, feedback captured from both leads and executives flows back into the AI, enhancing its matching accuracy and coverage iteratively.

    DataWeave’s closed-loop system of AI automation with hierarchical human validation allows product matching to achieve comprehensive accuracy at a vast scale.

    Unleash the Power Accurate and Comprehensive Product Matching

    In summary, combining AI and human expertise in product matching is crucial for retailers navigating the complexities of omnichannel retail. While AI algorithms excel in automation, they often struggle with subjective criteria and contextual nuances. DataWeave’s approach integrates AI-driven automation with human validation, delivering the industry’s most accurate product matching capabilities, enabling actionable competitive pricing insights.

    To learn more, reach out to us today!

  • How Gas Stations and Convenience Stores in the U.S. Can Adapt To Evolving Fuel Pricing Trends in 2024

    How Gas Stations and Convenience Stores in the U.S. Can Adapt To Evolving Fuel Pricing Trends in 2024

    As we move into the second quarter of 2024, the US energy landscape is poised for notable shifts that will impact gasoline and diesel prices. The shift towards renewable energy sources, evolving consumer preferences, and volatile global market forces are all converging to reshape the fuel retail industry.

    For fuel retailers, understanding these projections is crucial – changes in consumer demand and cost pressures can significantly affect their bottom line. In this article, we provide insights on the factors shaping the fuel pricing environment for the remainder of the year, covering a variety of fuel types.

    Gasoline Prices: A Downward Trend Ahead

    According to the January Short-Term Energy Outlook by the EIA, US retail gasoline prices are projected to decline in 2024. Similarly, the forecast also predicts reduced gasoline consumption in 2025. This is attributed to a significant increase in inventories, thanks to expanded refinery capacity. US operable refinery capacity has grown from 18.06 million barrels per day in January 2023 to 18.31 million barrels per day by December 2023.

    Meanwhile, the World Bank reports that global trade growth in 2024-25 is expected to be only half the average in the decade before the pandemic, leading to reduced consumption and demand.

    The increase in supply, coupled with this dip in demand and consumption expected in 2025, sets the stage for further price reductions. Such expansion not only enhances supply but also alleviates price pressures for consumers.

    Diesel Dynamics: Supply Up, Prices Down

    Similar supply-side dynamics are at play in the diesel market, with retail prices expected to fall in both 2024 and 2025. Despite a forecasted uptick in US diesel consumption in these two years, an increase in production capacity and easing inventory strains are likely to keep prices in check. This is particularly noteworthy, as diesel fuel plays a critical role in transportation and logistics, underpinning the movement of goods and services nationwide.

    Crude Oil and Crack Spreads: The Refining Equation

    Crude oil prices, a pivotal factor in the fuel price equation, are expected to mirror 2023 levels through 2024.

    The anticipated decrease in gasoline and diesel prices is largely attributed to narrowing crack spreads—the differential between wholesale fuel prices and crude oil. A lower crack spread signifies reduced refining costs, a welcome development for both refiners and consumers. This expectation is grounded in the increasing availability of refinery capacity and, consequently, fuel supply, even as demand shows signs of tapering off.

    Global Influences and Economic Implications

    The outlook is further buoyed by new refinery capacities coming online internationally, particularly in the Middle East. This global increase in refined product supplies is poised to ease price pressures for consumers not just domestically but across international markets. Interestingly, this forecast comes at a time when gasoline consumption is expected to remain flat or slightly decrease, a rare occurrence in the context of positive economic growth. This decoupling of fuel consumption from economic expansion highlights evolving consumer behaviors and efficiency gains across the automotive sector.

    Looking Ahead: Uncertainties and Transformations

    While the projections offer a glimpse into a future of potentially lower fuel prices, they are not without uncertainties. Factors such as crude oil price fluctuations, refinery shutdowns, and logistical challenges could sway outcomes.

    The projected decrease in US gasoline and diesel prices presents both opportunities and challenges.

    • For American consumers, lower fuel costs offer relief for household budgets and transportation expenses, potentially freeing up disposable income and stimulating broader economic activity.
    • However, these pricing trends pose a need for strategic planning and adaptation within the US energy sector. Companies must navigate shifting supply dynamics and the ongoing transition towards renewable energy sources – a pivotal chapter in the quest for sustainable and affordable solutions.
    • Energy firms will need to carefully analyze the implications, aligning their business models through refining capacity expansions, logistical optimizations, and a focus on renewable fuels.

    Staying Ahead of Competition with Fuel Price Tracking

    In this evolving landscape, closely tracking fuel prices and having access to up-to-date data is crucial for informed decision-making and staying competitive in the market for fuel retailers. While prices may go down in the long- to medium-term, ensuring short-term price competitiveness at a hyperlocal level is essential for gas stations and convenience stores navigating the changing tides.

    DataWeave’s real-time fuel pricing data, covering a wide range of fuel types from gasoline to diesel and updated as frequently as every 30 minutes, empowers retailers to quickly adapt to market changes and remain strategically aligned with evolving consumer preferences.

    By closely monitoring hyperlocal fuel price fluctuations across their coverage areas, retailers can quickly adapt their pricing strategies to remain competitive and align with shifting consumer behaviors.

    Further, DataWeave’s real-time fuel pricing intelligence can help retailers understand the relationship between crude oil prices, crack spreads (the differential between wholesale fuel prices and crude oil), and their own pricing strategies. Our solution offers real-time insights and analytics to help retailers navigate the evolving fuel pricing landscape.

    Visit our recently launched U.S. Fuel Price Interactive Dashboard which displays weekly fuel prices across 400+ unique ZIP codes, delivering insights into price changes by region, store, fuel type, and other dimensions.

    To learn more about DataWeave’s solutions or to discuss how we can support your fuel retail business, reach out to our team today!

  • Why Localized, Store-Specific Pricing and Availability Insights is Critical for Consumer Brands

    Why Localized, Store-Specific Pricing and Availability Insights is Critical for Consumer Brands

    Brands are becoming increasingly proficient in monitoring and refining their presence on online marketplaces, utilizing Digital Shelf Analytics to gather and analyze data on their online performance. These tools offer invaluable insights into enhancing visibility, adjusting pricing strategies, and improving content quality on eCommerce sites.

    Yet, as the retail landscape shifts towards a more integrated omnichannel approach, it’s crucial for brands, particularly those in CPG, to apply similar strategies to their offline channels. For brands that count physical stores among their primary sales channels, gaining localized insights is key to boosting in-store sales performance.

    Collecting shelf data from offline channels presents more challenges than online. Traditional methods, such as physical store visits, often fall short in reliability, timeliness, scale, and level of coverage.

    However, the world of eCommerce provides a solution. As part of the effort to facilitate options like buy-online-pickup-in-store (BOPIS) for shoppers, major retailers make store-specific product details available online. Consumers often go online and select their nearest store to make purchases digitally before choosing a fulfillment option like picking up at the store or direct delivery. Aggregating this store-level information offers brands critical insights into pricing and inventory across a vast network of stores, enabling them to make informed decisions that improve pricing strategies and supply chain efficiency, thus minimizing stockouts in crucial markets.

    Further, as consumers increasingly seek flexibility in how they receive their purchases—be it through in-store pickup, delivery, or shipping—brands need to adeptly monitor pricing and availability for these different fulfilment options. Such granular insight empowers brands to adapt swiftly and maintain a competitive edge in today’s dynamic retail environment.

    Why does monitoring pricing and availability data across stores matter to brands?

    • Hyperlocal Competitive Strategy: This allows brands to adjust their pricing strategies based on regional competition. By understanding the local market, brands can decide whether to position themselves as cost leaders or premium offerings. In particular, this is indispensable for Net Revenue Management (NRM) teams.
    • Targeted Marketing Initiatives: Understanding regional price and availability enables brands to customize their marketing efforts for specific markets. By aligning their strategies with local demand trends and inventory levels, brands can more effectively engage their target audiences.
    • Efficient Inventory Management: By keeping a close eye on store-level data, brands can better manage their stock, ensuring high-demand products are readily available while minimizing the risk of overstocking or running out of stock.
    • Minimum Advertised Price (MAP) Monitoring: While brands cannot directly control retail pricing, staying updated on pricing trends helps them adjust their MAP to reflect the competitive landscape, consumer expectations, cost considerations, and regional differences. A strategic approach to MAP management supports brand competitiveness and profitability in a fluctuating market.

    DataWeave’s Digital Shelf Analytics solutions equip brands with the necessary data and insights to do all of the above.

    DataWeave’s Digital Shelf Analytics is location-aware

    DataWeave’s Digital Shelf Analytics platform stands out with its sophisticated location-aware capabilities, enabling the aggregation and analysis of localized pricing, promotions, and availability data. Our platform defines locations using a range of identifiers, including latitudes and longitudes, ZIP codes, or specific stores, and can aggregate this data for particular states or regions.

    The strength of the platform lies in its robust data collection and processing framework, which operates seamlessly across thousands of stores and regions. This system is designed to operate at configurable intervals—daily, weekly, or monthly—allowing brands to keep a vigilant eye on product availability, pricing strategies, and delivery timelines based on the selected fulfillment option.

    Unlike many other providers, who may provide limited insights from a sample of stores, our solution delivers exhaustive analytics from every storefront. This comprehensive approach grants brands a strategic edge, facilitating efficient inventory tracking, precise pricing adjustments, and rapid responses to fluctuating market dynamics. It cultivates brand consistency and loyalty by enabling brands to adapt proactively to the changing landscape.

    Aggregated store-level digital shelf insights via DataWeave

    In the summarized view shown above, a brand can track how its various products are positioned across stores and retailers like Walmart, Amazon, Meijer, and others in the US.

    Using DataWeave, brands can easily see important metrics like availability levels, prices, and other metrics across these stores gaining immediate visibility without having to physically audit them. the brand can track the same metrics for products across competitor brands and inform its own pricing, stock, and assortment decisions.

    Store-level availability insights

    We provide a comprehensive view of product availability, highlighting the distribution of out-of-stock (OOS) scenarios across various retailers and pinpointing the availability status throughout a brand’s network of stores. This capability enables swift identification of widespread availability issues, offering a bird’s-eye view of where shortages are most pronounced. By simply hovering over a specific location, detailed information about stock status and pricing for individual stores becomes accessible.

    Such insights are crucial for brands to adapt their strategies, mitigate risks, and ensure they meet consumer needs despite the ever-changing retail ecosystem.

    Store-level pricing insights

    Retailers often adopt different pricing strategies to deal with margin pressure, local competition, and surplus stock. Grasping these pricing dynamics at a hyperlocal level enables brands to tailor their strategies effectively to maintain a competitive edge.

    Our platform offers an in-depth look at how prices vary among retailers, across different stores, and throughout various regions. This analysis reveals the nuanced pricing tactics employed by retailers on a regional scale.

    For example, brands might see that some retailers, like Kroger and Walmart in the chart below, maintain consistent pricing across their outlets, demonstrating a uniform pricing strategy. In contrast, others, such as Meijer and Shoprite, might adjust their prices to match local market conditions, indicating a more localized approach to pricing.

    With DataWeave, brands can dive deeper into the pricing landscape of a specific retailer, examining a price map that provides detailed information on pricing at the store level upon hovering over a given location.

    By presenting a historical analysis of average selling prices across different retailers, we equip brands with the insights needed to understand past pricing strategies and anticipate future trends, helping them to strategize more effectively in an ever-evolving market.

    Digital Shelf Analytics that work for both eCommerce and brick-and-mortar store data

    While established brands have made strides in gathering online pricing and availability data through Digital Shelf Analytics solutions, integrating comprehensive insights from both brick-and-mortar and eCommerce channels often remains a challenge.

    DataWeave stands out for its capacity to collect data across diverse digital platforms, including desktop sites, mobile sites, and mobile applications. This capability ensures that omnichannel brands can have a holistic view of their pricing, promotional, and inventory strategies across all locations and digital landscapes.

    Leveraging localized Digital Shelf Analytics to understand the intricacies of pricing and availability at the store level allows brands to fine-tune their approaches, swiftly adapt to local market shifts, and uphold a unified brand presence across the digital and offline spheres. This strategic agility places them in a favorable competitive position, enhancing customer satisfaction and trust, which are crucial for sustained success.

    Know more about DataWeave’s Digital Shelf Analytics here.

    Schedule a call with a specialist to see how it can work for your brand.

  • Easter Candy Pricing Trends 2024: Winning Strategies for Retailers and Brands Amid Cocoa Price Surge

    Easter Candy Pricing Trends 2024: Winning Strategies for Retailers and Brands Amid Cocoa Price Surge

    Easter egg hunts just got more challenging for families this year as the price of chocolate and other candies has soared. The root of this price surge lies in a cocoa deficit, attributed to diseases affecting crops and the adverse effects of climate change on West African farms, which supplies over 70% of the world’s cocoa. This has resulted in a tripling of cocoa prices over the last year, causing a “cocoa crunch,” and severely impacted confectioners and chocolate makers.

    Reuters recently reported that Iconic brands such as Hershey’s and Cadbury find themselves grappling with the need to adjust to escalating costs for raw materials. Given that Easter is one of the top three candy-purchasing occasions, these manufacturers are contemplating raising their prices to sustain their profit margins.

    Despite the challenges posed by the cocoa shortfall and persistent inflation, the National Confectioners Association anticipates that Easter candy sales in the U.S. will match or even exceed last year’s figures, which amounted to approximately $5.4 billion. This expectation is predicated more on price increases than on a rise in sales volume.

    At DataWeave, our ongoing analysis of pricing trends across various consumer categories among retailers has provided insight into the evolving landscape of chocolate and candy prices in 2023 and 2024.

    Our Analysis of Inflation in Candy and Chocolate Prices

    Our study encompassed a broad array of 3,300 products from leading U.S. retailers, Amazon, Target, Kroger, and Giant Eagle. As illustrated in the following chart, the trajectory of prices over the past 15 months was compared against the average prices in January 2023. Our tracking focused on two key price points: the selling price, which represents the final cost to consumers after applying any discounts or promotions, and the Manufacturer’s Suggested Retail Price (MSRP), as determined by the brands themselves.

    The findings from our analysis indicate that the average selling price, primarily influenced by retailer decisions, has experienced a steady increase throughout 2023, reaching a peak at 16.2% above January 2023’s figures by December. As of March 2024, coinciding with the Easter season, the selling prices are approximately 10% higher than they were at the beginning of the previous year.

    Simultaneously, the MSRP has seen a consistent uptick, driven by the climbing costs of cocoa. Brands have adjusted their suggested prices accordingly, with the current MSRP standing about 7% above its January 2023 level, after having peaked at a 7.6% increase by December 2023. This reflects the direct impact of rising cocoa costs on product pricing strategies.

    Chocolate Candies Are Hit The Hardest

    Across all candies, chocolate-based products have witnessed significantly sharper price increases than their non-chocolate counterparts. In the past 14 months, the selling prices of chocolate items have surged by 14.9%, a stark contrast to the modest 4% rise observed in non-chocolate candies.

    This price escalation was particularly pronounced during the Christmas shopping period, a response to heightened demand, before experiencing a temporary decline in February.

    The diminishing availability of cocoa, coupled with rising costs for packaging and transportation, has compelled brands and retailers alike to transfer these added expenses onto the consumer. This dynamic underpins the distinct pricing trends observed across the candy spectrum, with chocolate items bearing the brunt of these cost pressures.

    Discounts Offered By Retailers and Brands to Entice Easter Shoppers

    In our analysis, we delved deeper to identify the retailers and brands offering the most compelling prices for Easter-centric confections, including Chocolate Eggs, Chocolate Bunnies, and Easter-themed gift packs.

    Kroger emerged as the frontrunner among the retailers we monitored, offering an impressive 19% discount on Easter candies. Giant Eagle followed with a solid 14% average markdown. Meanwhile, Amazon and Target provided more modest promotional discounts at 12% and 10%, respectively.

    Kroger is making significant efforts to ensure consumers have access to attractively priced Easter treats. The retailer planned to keep its doors open throughout the Easter weekend, featuring baskets brimming with discounted items such as Russell Stover chocolate bunnies, Brach’s jelly beans, Reese’s eggs, and assorted bags of popular candies from Snickers, Twix, and Starburst, among others. Additionally, Kroger is enhancing its value proposition through gift card offers and exclusive Easter deals for its loyalty program members.

    On the brand front, Starburst by Mars Wrigley leads with the steepest discount of 25%. Cadbury, under Mondelez, is not far behind, offering 21% off its mini eggs and other Easter treats, marking an increase from last year’s 17% discount. Ferrero Rocher is making a strong pricing move with an average 20% markdown on its Easter selections, including the chocolate bunny and squirrel figures.

    The beloved Peeps marshmallow candies by Just Born are being offered at an 18% discount this year, slightly less than the 23% discount seen in 2023, likely reflecting the impact of rising sugar costs, given their sugar and corn composition.

    Other notable brands, including M&M’s and the premium Swiss chocolatier Lindt, have elevated their average Easter discounts to 17% this year, up from the previous year’s discounts of 12%, and 10% respectively, showcasing a competitive pricing strategy to delight consumers this Easter season.

    Coping With Inflation This Easter Season

    Retailers and brands aiming to remain profitable and competitive in the current challenging environment can adopt a few strategic approaches:

    • Creative Product Bundling: Design innovative combo packs that mix chocolate and non-chocolate items. Such bundles can cater to diverse consumer preferences and budget ranges while preserving profit margins.
    • Encouragement of Bulk Purchases: Offer enticing discounts on larger quantities to promote bulk buying. This strategy can help amplify sales volumes, compensating for increased costs per item and fostering economies of scale.
    • Strategic Competitive Pricing: Keeping a vigilant eye on competitors’ pricing strategies is vital. Aim to capture market share through well-thought-out discount strategies that balance competitiveness with margin preservation. Leveraging advanced pricing intelligence, such as that offered by DataWeave, can provide invaluable insights for making informed pricing decisions.
    • Product Size Adjustments: Consider revising the size or weight of products as a cost management measure, a strategy known as “shrinkflation.” It’s crucial to approach this transparently, ensuring clear communication on packaging to uphold consumer trust.

    Adopting these strategies—focusing on bundle offerings, incentivizing bulk purchases, optimizing pricing strategies based on competitive intelligence, and thoughtfully adjusting product sizes—will be pivotal for confectioners to navigate the challenges posed by the cocoa price surge.

    For more information, reach out to us to speak to a DataWeave expert today!


  • How AI-Powered Visual Highlighting Helps Brands Achieve Product Consistency Across eCommerce

    How AI-Powered Visual Highlighting Helps Brands Achieve Product Consistency Across eCommerce

    As eCommerce increasingly becomes a prolific channel of sales for consumer brands, they find that maintaining a consistent and trustworthy brand image is a constant struggle. In an ecosystem filled with dozens of marketplaces and hundreds of third-party merchants, ensuring that customers see what aligns with a brand’s intended image is quite tricky. With many fakes and counterfeit products doing the rounds, brands may further struggle to get the right representation.

    One way brands can track and identify inconsistencies in their brand representation across marketplaces is to use Digital Shelf Analytics solutions like DataWeave’s – specifically the Content Audit module.

    This solution uses advanced AI models to identify image similarities and dissimilarities compared with the original brand image. Brands could then use their PIM platform or work with the retailer to replace inaccurate images.

    But here’s the catch – AI can’t always accurately predict all the differences. Relying solely on scores given by these models poses a challenge in tracking the subtle differences between images. Often, image pairs with seemingly high match scores fail to catch important distinctions. Fake or counterfeit products and variations that slip past the AI’s scrutiny can lead to significant inaccuracies. Ultimately, it puts the reliability of the insights that brands depend on for crucial decisions at risk, impacting both top and bottom lines.

    Dealing with this challenge means finding a balance between the number-based assessments of AI models and the human touch needed for accurate decision-making. However, giving auditors the ability to pinpoint variations precisely goes beyond simply sharing numerical values of the match scores with them. Visualizing model-generated scores is important as it provides human auditors with a tangible and intuitive understanding of the differences between two images. While numerical scores are comparable in the relative sense, they lack specificity. Visual interpretation empowers auditors to identify precisely where variations occur, aiding in efficient decision-making.

    How AI-Powered Image Scoring Works

    At DataWeave, our approach involves employing sophisticated computer vision models to conduct extensive image comparisons. Convolutional Neural Network (CNN) models such as Resnet-50 or YOLO, in conjunction with feature extraction models, analyze images quantitatively. This AI-powered image scoring process yields scores that indicate the level of similarity between images.

    However, interpreting these scores and understanding the specific areas of difference can be challenging for human auditors. While computer vision models excel at processing vast amounts of data quickly, translating their output into actionable insights can be a stumbling block. A numerical score may not immediately convey the nature or extent of the differences between images

    In the assessment of these images, all fall within the 70 to 80 range of scores (out of a maximum of 100). However, discerning the nature of differences—whether they are apparent or subtle—poses a challenge for the AI models and human auditors. For example, there are differences in the placement or type of images in the packaging, as well as packing text that are often in an extremely small font size. It is, of course, possible for human auditors to identify the differences in these images, but it’s a slow, error-prone, and tiring process, especially when auditors often have to check hundreds of image pairs each day.

    So how do we ensure that we identify differences in images accurately? The answer lies in the process of visual highlighting.

    How Visual Highlighting Works

    Visual highlighting is a method that enhances our ability to comprehend differences in images by combining sophisticated algorithms with human understanding. Instead of relying solely on numerical scores, this approach introduces a visual layer, resembling a heatmap, guiding human auditors to specific areas where discrepancies are present.

    Consider the scenario depicted in the images above: a computer vision model assigns a score of 70-85 for these images. While this score suggests relatively high similarity, it fails to uncover major differences between the images. Visual highlighting comes into play to overcome this limitation, precisely indicating regions where even subtle differences are seen.

    Visual highlighting entails overlaying compared images and emphasizing areas of difference, achieved through techniques like color coding, outlining, or shading specific regions. The significance of the difference in a particular area determines the intensity of the visual highlight.

    For instance, if there’s a change in the product’s color or a discrepancy in the packaging, these variations will be visually emphasized. This not only streamlines the auditing process but also enables human evaluators to make well-informed decisions quickly.

    Benefits of Visual Highlighting

    • Intuitive Understanding: Visual highlighting offers an intuitive method for interpreting and acting upon the outcomes of computer vision models. Instead of delving into numerical scores, auditors can concentrate on the highlighted areas, enhancing the efficiency and accuracy of the decision-making process.
    • Accelerated Auditing: By bringing attention to specific regions of concern, visual highlighting speeds up the auditing process. Human evaluators can swiftly identify and address discrepancies without the need for exhaustive image analysis.
    • Seamless Communication: Visual highlighting promotes clearer communication between automated systems and human auditors. Serving as a visual guide, it enhances collaboration, ensuring that the subtleties captured by computer vision models are effectively conveyed.

    The Way Forward

    As technology continues to evolve, the integration of visual highlighting methodologies is likely to become more sophisticated. Artificial intelligence and machine learning algorithms may play an even more prominent role in not only detecting differences but also in refining the visual highlighting process.

    The collaboration between human auditors and AI ensures a comprehensive approach to maintaining brand integrity in the ever-expanding digital marketplace. By visually highlighting differences in images, brands can safeguard their visual identity, foster consumer trust, and deliver a consistent and reliable online shopping experience. In the intricate dance between technology and human intuition, visual highlighting emerges as a powerful tool, paving the way for brands to uphold their image with precision and efficiency.

    To learn more, reach out to us today!


    (This article was co-authored by Apurva Naik)