Blog

  • CEO Speak: Serving the US Market, Hiring the Right Talent, And More

    CEO Speak: Serving the US Market, Hiring the Right Talent, And More

    Recently, Karthik Bettadapura, Co-founder & CEO at DataWeave, was interviewed by Vishal Krishna, Business Editor at YourStory, in the Bay Area, California. They discussed DataWeave’s focus on the US market, challenges that retailers face today, DataWeave’s technology platform and hiring practices, and more.

    The following is a transcript of the interview.

    (The transcript has been edited for clarity and brevity)

    Vishal Krishna (VK)You left India to come and conquer America, why is that?

    Karthik Bettadapura (KB) : Just a bit of history — we started in 2011 and product development and research was based in Bangalore, and still is. At the end of the first 5 years, we realized that we built great technology, but we were not able to scale beyond a certain point [in India]. If we had to build a growing business, we had to look at other markets as well.

    VK: Quickly, can you tell me what DataWeave does?

    KB: We provide Competitive Intelligence to retailers and customer brands. We work with some of the largest brands and retailers out there and we provide them with analyses to compete profitably.

    VK: You said you had marque clients in India, yet you didn’t want to stay there because you wouldn’t have scaled beyond a particular point. Why is that?

    KB :The ticket size in India is still on the lower side. If you must build a sustainable business, you need access to a much larger customer base and we found that in the US.

    VK: Let’s start from the basics. What are a few things that a startup should decide to do when coming to America?

    KB: A few things:

    • A good understanding of the market
    • Learn fast about the market
    • Build a team here, or a have a team here already doing some work initially
    • Consider how your team back in India will go about doing things in your absence
    • The last one is about your own personal journey. I was so used to walking into an office and interacting with people. You come here, and you are all alone!

    VK: It’s a lonely journey. Doors don’t open all that easily and you’ve got to hustle. Why?

    KB: For people here, you are an unknown entity. Why should they be trusting someone who does not have enough customers here or has not raised money here? We had two US-based customers when we came in. It’s an uphill task to ensure that customers trust you.

    VK: Who was the first customer you personally met here and why was that meeting so important?

    KB: The first customer I met here was a large, big box retailer, and the meeting was primarily focused around why they should trust us — how can they know that we would survive and serve them, as well as how we are better than some of the other guys out there.

    VKCan you tell us what DataWeave does for US retailers?

    KB: For retailers, we provide competitive intelligence, primarily around pricing optimization and assortment analytics. In the US, a lot of retailers are shutting shop and filing for bankruptcy.

    VK: Yeah, we saw Sears go through something like that.

    KB: The reasons fall broadly into 3 categories:

    • They failed to compete profitably with a lot of these new age businesses.
    • The new age retailers offer superior customer experience. They have figured out a better assortment/product strategy.
    • The third one is ‘Price’ — price is such an important feature.
      What we do is help these retailers optimize their strategies around pricing, assortment and promotions, eventually enabling them to compete profitably.

    VK: Typically, customers pay you on the outcome, pricing, license or subscription?

    KB: It’s a subscription-based model. There is a one-time setup fee and an ongoing subscription fee.

    VK: So you plug into their data management system?

    KB: Yes, but we can also have our product sit independently. Sitting out of their internal systems is a benefit for us as we don’t have to get into the entire loop of integrations into their internal systems right from Day 1. We prove our product works and then we integrate with their systems.

    VK: How do you integrate? Is the CIO your target?

    KB: No, we don’t sell to the CIO world. We sell to analytics, pricing, and merchandising teams.

    VK: Can pricing alone give retailers a competitive edge?

    KB: Yes, pricing is a big lever that retailers use. For example, last holiday season’s sale, Amazon and Walmart made 120 million price changes in just 2–3 days.

    VKSo they change the prices so dynamically to compete with each other. Is this price war coming to India?

    KB: It is happening in India already.

    VK: How much data can DataWeave’s infrastructure ingest?

    KB: We are a global platform — we have customers across the globe, not just the US or India. So, on a daily basis, we process data on around 120 million products.

    VKTalk a little bit on R&D quickly. Do you have your marketing team in the US?

    KB: We have marketing teams in the US and India.

    VK: And the engineering team?

    KB: The engineering team is in Bangalore.

    VK: For people who want to work in your company, what kind of talent are you looking for?

    KB: We look at 4 broad talent areas:

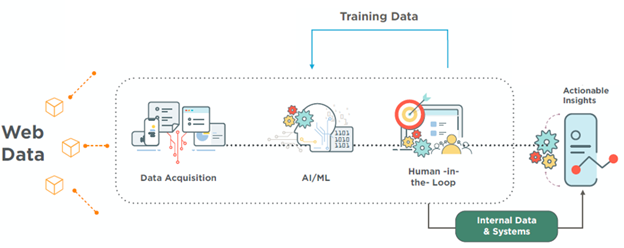
    • One is in the world of data acquisition, which addresses issues like how data can be aggregated from thousands of websites and millions of pages on an ongoing basis, and how this data can be stored.
    • The second area is on what kind of insights can be generated using this data. This could be done using text analytics, image analytics, and other technologies. This includes process optimization, in terms of building efficient and scalable systems.
    • The third area is on how well the data can be represented if we have a customer who wants 60–70 million data points to be consumed on a weekly basis.
    • And the last area is on data modeling — what kind of insights can we eventually give to the customer? And, when I say insights, I mean specific actions.

    VK: You want people who can handle massive scale and for that they should be good at linear regression.

    KB: We value people who write good code. We primarily work in Python, and we use a lot of optimization techniques in the middle of the stack to help us scale.

    VK: Would you do something for supermarkets?

    KB: Absolutely. The largest offline supermarket in India is our customer.

    VKSo what can you do for supermarkets?

    KB: Offline retailers across the world are facing something that’s called showrooming. This is when a shopper walks up to a store, looks at and feels a product, then searches online to see it’s available at a better price. So we have retailers who are wary of this phenomenon. We also have retailers who are wary of diminishing customer loyalty. So they have to constantly ensure that they are priced better in the market and are not losing customers because of [online] pricing.

    VK: How powerful are your algorithms?

    KB: There is a dedicated team that works on our algorithms. These fall into several buckets. One is pure data scale algorithms — how do you build systems which ensure that you are able to efficiently query them in real time and get the desired output. The second one is — how do you keep improving your machine learning algorithms. For example, computer vision algorithms, text analytics algorithm, etc. The third — how do you keep experimenting effectively.

    VK: What role can an MBA degree holder play in DataWeave?

    KB: We have people who hold MBA degrees and are working in customer success, delivery management, marketing, and sales.

    VK: Do you spend time in training?

    KB: You do have some lead time if you are a fresher, but if you are a lateral hire, its expected that you keep the ball rolling. They should be able to learn and learn fast — learning is more important than knowing. So, we give a lot of importance to people who can learn and pick up things quickly – about our product, handling customer objections, etc.

    *

    Watch the whole video here or check out DataWeave’s website to know more about how we use data engineering and artificial intelligence to enable retailers and brands to compete profitably in the age of eCommerce.
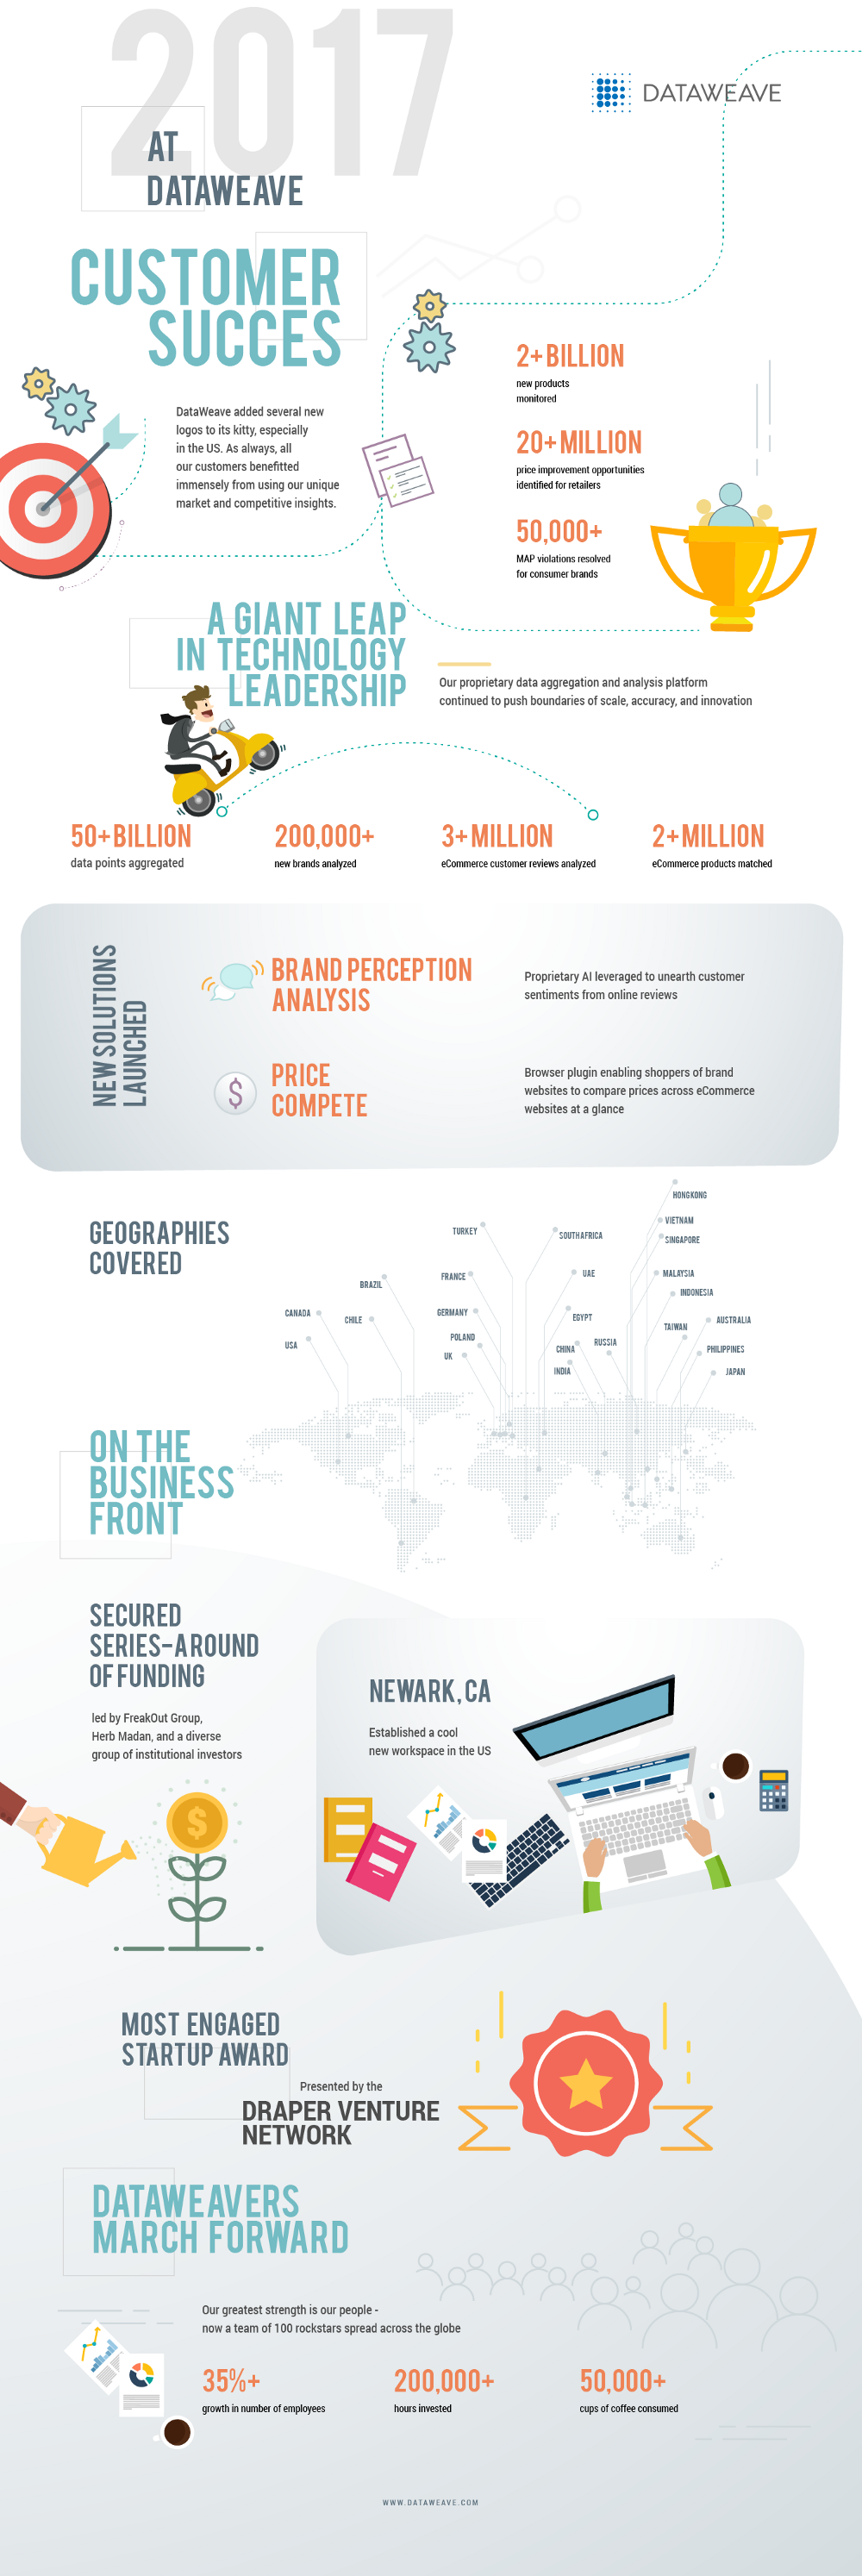
  • Evolution of Amazon’s US Product Assortment

    Evolution of Amazon’s US Product Assortment

    As with many other product categories, Amazon has made a significant incursion in Apparel — a key battleground category in retail today. Recently, DataWeave once more collaborated with Coresight Research, a retail-focused research firm to publish an in-depth report revealing insights on Amazon’s approach to its US fashion offerings.

    Since our initial collaborative report in February this year, we have witnessed some seismic shifts in the category at both the brand and the product-type level.

    Research Methodology

    We aggregated our analytical data on more than 1 million women’s and men’s clothing products listed on Amazon.com in two stages:

    Firstly, we identified all brands included in the Top 500 featured product listings for each product subcategory in both the Women’s Clothing and Men’s Clothing sections featured on Amazon Fashion (e.g., the top 500 product listings for women’s tops and tees, the top 500 product listings for men’s activewear, etc.). We believe these Top 500 products reflect around 95 percent of all Amazon.com’s clothing sales. This represents 2,782 unique brands.

    We then aggregated the data on all product listings within the Women’s Clothing and Men’s Clothing sections for each of those 2,782 brands. This generated a total of 1.12 million individually listed products. This expansive list forms the basis for our highlights of the report.

    Third-Party Seller Listings Are Rising Sharply

    We identified a total of 1.12 million products across men’s and women’s clothing — a significant increase of 27.3 percent in the seven months between February and September 2018. The drivers of this sharp spike are third-party seller listings. In contrast, the report indicates only a 2.2 percent rise in first-party listings over the same period, compared to a 30.5 percent jump in third-party listings.

    In addition, Amazon has listed just 11.1 percent of all clothing products for sale, with third-party sellers offering the remaining 88.9 percent — an indication of the strength of Amazon’s open marketplace platform.

    A Major Brand Shift On Amazon Fashion Is Underway

    In just over six short months, major brand shifts on Amazon Fashion have taken place. The number of Nike listings has plummeted by 46 percent, driven by a slump in third-party listings following Amazon’s new partnership with Nike — a story recently covered by Quartz. Limited growth in Nike clothing first-party listings failed to compensate for this decline.

    Gildan’s spike in total product listings appears to be fueled by increased first-party listings off a low base. Calvin Klein’s 2017 agreement to supply Amazon with products appears to be driving the Calvin Klein brand’s double-digit uptick in first-party listings on Amazon Fashion.

    Aéropostale’s decline appears to be entirely driven by a drop in its third-party listings. The brand itself is not listed as a seller on Amazon.com.

    Amazon Is Rebalancing Its Apparel Portfolio and Switching Its Focus from Sportswear To Suits

    As its Fashion footprint rapidly matures, Amazon now appears to be rebalancing its portfolio with strong growth being shown in listings for formal categories such as suits and away from sportswear. We recorded a 98.6 percent increase in listings of women’s suits and blazers complemented by a 52.2 percent rise in men’s suit and sports coat listings between February and September 2018.

    Generic “Non-Brands” Are Surging On Top 25 Brands List

    Over the past six months, low-price generic brands have made major inroads into Amazon’s listings. Four unknown “brands” captured the top positions on the list of brands offered on Amazon Fashion. The WSPLYSPJY, Cruiize and Comfy brands appear to be shipped directly to customers from China.

    Source: Coresight/DataWeave (Amazon Fashion: Top 25 Brands’ Number of Listings, February 2018 vs. September 2018)


    Source: Coresight/DataWeave (Amazon Fashion: Top 25 Brands’ Number of Listings, February 2018 vs. September 2018)

    WSPLYSPJY alone accounts for fully 8.6 percent of Amazon men’s and women’s clothing listings. Cruiize accounts for a further 3.2 percent of listings while Comfy chips in another 3.1 percent.

    Amazon Appears To be Executing A Strategic Pivot

    Amazon’s fashion offering is fast maturing. We saw substantial growth in the number of listings for more formal categories. The realignment in third-party listings by Nike together with increased first-party listings for Calvin Klein and Gildan appear to be driven by alliances with Amazon.

    Simultaneously, ultralow-price generic clothing items delivered on order from China have inundated the “Most-Listed Products” rankings. Third parties now represent nearly 90 percent of Amazon Fashion’s offering.

    While Amazon Fashion shoppers enjoy a wider choice than they did even six months ago, we believe a stronger emphasis on first-party listings would grow the products eligible for Prime delivery. This tactic could strengthen Amazon Fashion’s long-term appeal as a shopping destination.

    If you’re interested in DataWeave’s technology, and how we aggregate data from online sources to provide unique and comprehensive insights on eCommerce products and pricing, check us out on our website!

  • Inside India’s eCommerce Battle: Attractive Offers Usher In The Festive Season

    Inside India’s eCommerce Battle: Attractive Offers Usher In The Festive Season

    It’s festival season in India again and shoppers took advantage of aggressive cutthroat competition between Indian online retailers to drive sales to unprecedented highs.

    All the major Indian eCommerce websites including, Amazon, Flipkart, Myntra, and Shopclues opted to go head to head by holding their first sale event this season over 4 to 5 days starting on the 10th of October. Still, as industry reports indicate, one retailer came out on top during this event — an insight supported by our analysis as well.

    A New Battleground

    The highlight this year was seeing how the announcement of global retail colossus Walmart’s acquisition of Flipkart would impact the sale events. The acquisition was the most influential development in India’s eCommerce sector, and it has transported a decades-long U.S. rivalry between Amazon and Walmart to Indian soil. As a result, this year’s sale event held out the promise of more attractive pricing and vast product selection for India’s consumers than ever before.

    Industry analysts estimate that the sale generated a cumulative Rs 15,000 crore in sales over the spread of the five sale days, a whopping outcome. In 2018, this translated into around a 64 per cent year-on-year growth outcome compared to the USD 1.4 billion (around Rs 10,325 crore) generated by the 2017 sales.

    The DataWeave Analysis

    At DataWeave, we analyzed the performance of each of the major eCommerce platforms including Amazon, Flipkart, Myntra, Paytm, and Shopclues. For each eCommerce website, we aggregated data on the Top 500 ranked products for over 40 product types spread across 6 product categories (Electronics, Men’s & Women’s Fashion, Furniture, Haircare, Skincare).

    We focused our analysis on only the additional discounts offered during the sale and compared them to prices prior to the sale, to reflect the true value of the sale to India’s shoppers.


    The battle of the discounts was led primarily by Flipkart and Amazon. Flipkart’s average additional discounts by category actually exceeded Amazon’s in three out of six categories, and it discounted more products that Amazon across all categories.

    Clearly, the focus for all e-tailers was skewed towards the main battlegrounds of Electronics and Fashion, compared to mainstream FMCG categories such as Hair and Skin Care. However, this is not surprising given FMCG functions on rather skinny margins.

    Across retailers, the Men’s and Women’s Fashion categories were the most aggressively discounted, attracting both the highest additional discounts and the highest percentage of products with additional discounts.

    The Furniture category too was an interesting battleground between Amazon and Flipkart, attracting attractive discounts on a wide range of products, particularly in Flipkart’s case.

    Prospective shoppers in search of relatively more expensive clothing products on discount during the sale would have established Myntra as their ideal destination, as it carried more premium products on discount during the sale, relative to all its competitors. For shoppers in search of an electronics bargain though, they would have done well to opt for Flipkart.

    Shoppers may have found some interesting deals on Paytm Mall too, especially in Men’s Fashion, while Shopclues largely held itself back from any dramatic price reductions.

    While Myntra capitalized on its niche though aggressive discounting in the Fashion category, most of the discounting action revolved unsurprisingly around Amazon and Flipkart. To drill down for a more complete understanding of just how the Amazon and Flipkart discounted their products, we conducted a more detailed follow-on analysis.

    We normalized additional discounts and popularity using a scale of 1 to 10 and plotted each product on a chart to analyze its distribution characteristics. Popularity was calculated as a combination of the average review rating and the number of reviews posted. Products with a popularity score of zero, as well as zero additional discounts were excluded from this analysis.


    The most obvious insight yield through this analysis is how Flipkart elected to distribute its additional discounts across a larger range of discount percentages. By contrast, Amazon went all in on the more limited range of products it decided to provide additional discounts on. This is a strategy we have seen Amazon adopt previously.

    One other intriguing insight is Flipkart’s decision to go for a much higher distribution of products falling below a popularity score of 0.5 compared to Amazon. Amazon’s strategy resulted in more of its discounted products having a higher popularity score, relative to Flipkart, albeit only by a comparatively minor amount. However, a shopper’s chances of buying a popular, positively reviewed product at a lower price were higher on Amazon than Flipkart during this sale.

    Achieving a Consistent Competitive Edge

    Flipkart claims to have recorded a 70 per cent plus share of entire Indian e-commerce market in the 4 day-BBD’18 sales. Flipkart further claimed to have cornered an 85 per cent share in the online Fashion category together with a 75 per cent share in the Electrical category’s large appliances during the sale. This includes a contribution by Flipkart’s subsidiary Myntra.

    As these numbers reflect, Amazon still has some way to go to entrench itself in the Fashion category of the Indian market. However, Amazon appears content to continue its surgical discounting philosophy.

    Overall, this year witnessed an impressive participation by Tier II and Tier III Indian city consumers — a sign of things to come in Indian online retail.

    With increasing competitive pressure, retailers simply cannot adopt discounting and product selection strategies in isolation and be successful. Having access to up to date insights on competitors’ products dynamically during the day is emerging as key to ensuring they’re able to sustain their lowest priced strategy for appropriate products. These insights are also proving critical in identifying gaps in their product assortment, which can hamper customer conversion and retention.

    During sale events, modern retailers need to rely on highly granular competitive insights on an hourly basis (or even more frequently) to inform their pricing and product strategies to ensure they consistently maintain a competitive edge for the consumer’s wallet. And while access to reliable competitive intelligence is critical, true value can only be derived when it gets integrated with a retailer’s core business and decision-making processes, such as assortment management, promotions planning, pricing strategies, etc.

    DataWeave’s Competitive Intelligence as a Service helps global retailers do just this by providing timely, accurate, and actionable competitive pricing and product insights, at massive scale. Check out our website to find out more!

  • Evaluating the Influence of Learning Models

    Evaluating the Influence of Learning Models

    Natt Fry, a renowned thought leader in the world of retail and analytics, published recently an article expounding the value and potential of learning models influencing business decision-making across industries over the next few years.

    He quotes a Wall Street Journal article (paywall) published by Steven A. Cohen and Matthew W. Granade who claim that, “while software ate the world the past 7 years, learning models will ‘eat the world’ in the next 7 years.”

    The article defines a learning model as a “decision framework in which the logic is derived by algorithm from data. Once created, a model can learn from its successes and failures with speed and sophistication that humans usually cannot match.”

    Narrowing this down to the world of retail, Natt states, “if we believe that learning models are the future, then retailers will need to rapidly transform from human-learning models to automated-learning models.”

    This, of course, comes with several challenges, one of which is the scarcity of easily consumable data for supervised learning algorithms to get trained on. This scarcity often results in a garbage-in-garbage-out situation and limits the ability of AI systems to improve in accuracy over time, or to generate meaningful output on a consistent basis.

    Enabling Retailers Become More Model-Driven
    As a provider of Competitive Intelligence as a Service to retailers and consumer brands, DataWeave uses highly trained AI models to harness and analyze massive volumes of Web data consistently.

    Far too often, we’ve seen traditional retailers rely disproportionately on internal data (such as POS data, inventory data, traffic data, etc.) to inform their decision-making process. This isn’t a surprise, as internal data is readily accessible and likely to be well structured.

    However, if retailers can harness external data at scale (from the Web — the largest and richest source of information, ever), and use it to generate model-driven insights, they can achieve a uniquely holistic perspective to business decision-making. Also, due simply to the sheer vastness of Web data, it serves as a never-ending source of training data for existing models.

    DataWeave’s AI-based model to leverage Web data


    Web data is typically massive, noisy, unstructured, and constantly changing. Therefore, at DataWeave, we’ve designed a proprietary data aggregation platform that is capable of capturing millions of data points from complex Web and mobile app environments each day.

    We then apply AI/ML techniques to process the data into a form that can be easily interpreted and acted on. The human-in-the-loop is an additional layer to this stack which ensures a minimum threshold of output accuracy. Simultaneously, this approach feeds information on human-driven decisions back to the algorithm, thereby rendering it more and more accurate with time.

    Businesses derive the greatest value when external model-based competitive and market insights are blended with internal data and systems to generate optimized recommendations. For example, our retail customers combine competitor pricing insights provided by our platform with their internal sales and inventory data to develop algorithmic price optimization systems that maximize revenue and margin for millions of products.

    This way, DataWeave enables retailers and consumer brands to utilize a unique model-based decision framework, something that will soon be fundamental (if not already) to business decision-making across industry verticals and global regions.

    As AI-based technologies become more pervasive in retail, it’s only a matter of time before they’re considered merely table stakes. As summarized by Natt, “going forward, retailers will be valued on the completeness of the data they create and have access to.”

    If you would like to learn more about how we use AI to empower retailers and consumer brands to compete profitably, check out our website!

    Read Natt’s article in full below:

    Steven A. Cohen and Matthew W. Granade published a very interesting article in the Wall Street Journal on August 19, 2018 — https://www.wsj.com/articles/models-will-run-the-world-1534716720

    Their premise is that while software ate the world (Mark Andreessen essay in 2011, “Why Software is Eating the World”) the past 7 years, learning models will “eat the world” in the next 7 years.

    A learning model is a decision framework in which the logic is derived by algorithm from data. Once created, a model can learn from its successes and failures with speed and sophistication that humans usually cannot match.

    The authors believe a new, more powerful, business opportunity has evolved from software. It is where companies structure their business processes to put continuously learning models at their center.

    Amazon, Alibaba, and Tencent are great examples of companies that widely use learning models to outperform their competitors.

    The implications of a model-driven world are significant for retailers.

    Incumbents can have an advantage in a model-driven world as they already have troves of data.

    Going forward retailers will be valued on the completeness of the data they create and have access to.

    Retailers currently rely on the experience and expertise of their people to make good decisions (what to buy, how much to buy, where to put it, etc.).

    If we believe that learning models are the future then retailers will need to rapidly transform from human-learning models to automated-learning models, creating two significant challenges.

    First, retailers have difficulty in finding and retaining top learning-model talent (data scientists).

    Second, migrating from human-based learning models to machine-based learning models will create significant cultural and change management issues.

    Overcoming these issues is possible, just as many retailers have overcome the issues presented by the digital age. The difference is, that while the digital age has developed over a 20 year period, the learning-model age will develop over the next 7 years. The effort and pace of change will need to be much greater.

  • Prime Day Sale: Unraveling the Highs and Lows of Amazon’s Flagship Event

    Prime Day Sale: Unraveling the Highs and Lows of Amazon’s Flagship Event

    Another year, another round of media frenzy, and another set of records broken.

    In only three years, Amazon’s Prime Day has evolved into one of the landmark sale events of the shopper’s calendar. Reports indicate that this year’s sale made a major splash, raking in over $4.2 billion in sales — a 33% increase compared to last year. Also, the retail behemoth shipped over 100 million products during the 36-hour sale. Amazon stated that they “welcomed more new Prime members on July 16 than on any other previous day in Prime history.”

    The much talked about website outage added some spice and drama to the proceedings during the first hour. However, this was fixed quickly.

    This year is also the first Prime Day with Whole Foods, Amazon’s most expensive acquisition, giving US shoppers unprecedented incentives to shop at the physical stores of the grocery retailer.

    However, Prime Day is not just about the US, but a truly global event. In India, as part of its promotions for Prime Day, Amazon leveraged VR to have people experience the products in their true form factor at select malls.

    At DataWeave, our proprietary data aggregation and analysis platform enabled us to keep an eye on the pricing and discounts of products during the sale. We tracked Amazon.com, Amazon.co.uk, and Amazon.in before (14th July) and during the sale (16th July) and monitored several product types in Electronics, Men’s Fashion, Women’s Fashion and Furniture categories. We captured information on the price, brand, rank on the category page, whether Prime was offered or not, etc. and analyzed the top 200 ranks in each product type listing page. To best indicate the additional value to shoppers during the sale, we focused our analysis only on additional discounts on products between the 14th and 16th of July.

    Scrutinizing the data yielded some rather interesting insights:

    Amazon UK was more aggressive with its discounts than the US and India across most categories, with Furniture being the only exception (highest discounts in the US).

    In the US, Women’s Fashion observed the steepest discounts (12%), though there were discounts available on a larger number of Men’s Fashion products (5% additional discount on 20% of products).

    While disparity between discounts on Prime products vs non-Prime was quite evident, it was surprisingly low for many categories. In fact, the Electronics category in the UK and the Furniture category in India witnessed sharper discounts for non-Prime products than Prime.

    Top categories by additional discount include Women’s Handbags, Sports Shoes, and Pendrives in the US, Sunglasses and Tablets in the UK, and Women’s Tops, Men’s Jeans, Women’s Sunglasses, and Refrigerators in India. Top brands include Nike, Amazon Essentials, Sandisk, and 1home in the US, Oakley, Toshiba, Belledorm, and rfiver in the UK, and Adidas, Sony, UCB, and Red Tape in India.

    As indicated in the following infographic, some of the most discoverable brands during the sale include Canon, Apple, Nike and Casio in the US, Sandisk, Amazon, Levi’s, and Ray Ban in the UK, and Nikon, UCB, Whirlpool, and HP in India. Discoverability here is measured as a combination of the number of the brand’s products in the top 100 ranks and the average rank of all products of the brand. Also in the infographic, is a set of products with high additional discounts during the sale.


    Amazon’s competitors though aren’t ones that simply roll with the punches.

    Flipkart, Amazon’s largest competitor in India (recently acquired by Walmart), announced its own Big Shopping Days sale between July 16 and July 19. On Prime Day, the company joined in with some attractive offers:

    • 8%, 10%, and 7% additional discounts on 11%, 29%, and 16% of Electronics, Men’s Fashion, and Women’s Fashion categories, respectively.
    • 35% off on Perfect Homes 3-seater Sofa
    • 27% additional discount on Acer Predator Helios Gaming Laptop
    • 25% additional discount on Sandisk 16GB Pen Drive

    Propelling the Amazon Flywheel

    While Amazon clearly benefits in the short-term with this sale, the long-term effect of feeding its famous flywheel is evident as well.

    Amazon’s flywheel is a framework through which the company looks to build a self-feeding platform that accelerates growth over time. Attractive discounts and a broad selection of products improves customer experience, which increases traffic to the website, which attracts more merchants on its platform, who in turn broaden the selection of available products.

    Sale events like Prime Day create the sort of hype needed to draw a lot of traffic to Amazon’s website, generating momentum that has a compounding effect on Amazon’s growth. Not surprisingly, more than half of the people surveyed in the US by Cowen last December said they lived in a household with at least one Prime subscription.

    As Amazon’s stock traded at an all time high following Prime Day, it’s only a matter of time before the company becomes the world’s first trillion dollar company.

    Check us out, if you’re interested in learning more about our technology and how we provide Competitive Intelligence as a Service to retailers and consumer brands.

  • How to Win the Coveted Amazon Buy Box | DataWeave

    How to Win the Coveted Amazon Buy Box | DataWeave

    Did you know that over 80% of purchases on Amazon.com is via the buy box?

    While Amazon is all the rage today, raking in 43% of all eCommerce dollars, thousands of merchants on the online marketplace look to seize every opportunity to attract shoppers and drive sales each day. And for these merchants, getting on the buy box is more than half the battle won.

    Recently, Forbes.com published our study of how online merchants can plot their strategy to win the buy box. In this article, we’ll explore some of the key takeaways from this study.

    What is the Amazon buy box?

    The buy box is the section on the right side of Amazon’s product page, where shoppers can add items for purchase to their cart. Since multiple merchants often offer the same product, they compete to win the buy box spot on the product page, which is where customers typically begin the purchasing process — a huge competitive advantage.

    How can merchants win the buy box spot?

    At DataWeave, we aggregate and analyze billions of data points from the Web to deliver Competitive Intelligence as a Service to retailers and consumer brands. Using our proprietary technology platform, we aggregated data for a large sample of products in the mobile phones, clothing, shoes and jewelry categories on Amazon and collected information on all merchants (over 700 in number) selling these product over a period of 10 days.

    We looked closely at several factors that could possibly impact the choice for the buy box:

    • Was Amazon a merchant or not?
    • The effective price (list price + shipping charges — offer/cashback amount) — after all, a common assumption is that the lowest priced merchant has the best chance of winning.
    • Were Prime benefits offered?
    • The quality of review ratings
    • The stock status
    • The number of products offered by a merchant

    We parsed through the data to unearth some interesting insights and found that some factors influenced the move to the buy box spot more than others.

    We see that when Amazon is a merchant, it’s twice as likely to win the buy box compared to other merchants. Further analysis revealed that for around 95% of instances where Amazon was a merchant but was NOT the in the buy box, Amazon was selling at a price 20% greater than the minimum price.

    When the effective price is the lowest, relative to other merchants, the chances of the merchant winning the buy box increased 2.5-fold. Essentially, for the set of merchants who were the lowest priced for each product, only 26% of them won the buy box.

    Merchants who provided Prime benefits to shoppers were 3.5 times more likely to win compared to other merchants. And lastly, if the percentage of positive reviews for a merchant are decreasing over time, the merchant is 5X less likely to win. All other factors analyzed failed to yield statistically significant results.

    Interestingly, no single factor played an overwhelming role in influencing the buy box criteria. So, with the help of statistical modelling, which considers and weighs all factors, we better understood the relationship between all factors, and traced a path for merchants to win the buy box.

    The Cheat Sheet

    While it isn’t quite possible to develop a fool proof framework, the following flowchart can act as a fairly useful guide.


    Clearly, the path to the buy box is not a straightforward one.

    If Amazon itself is a merchant for a product, chances of other merchants winning the buy box are low (35%). However, if a merchant is looking to compete with Amazon for the buy box spot, offering Prime benefits is key (82% probability). Without offering Prime, chances of winning the buy box are almost negligible, even if the merchant is the lowest priced. It’s interesting to note that when Amazon does occupy the buy box spot, it’s the lowest priced in 79% of the cases.

    When Amazon is not a merchant for a product, and competition is only between third-party merchants, offering Prime benefits is still the most influential factor (78%). When Prime isn’t offered, the price is the primary determinant of the buy box merchant (86%).

    Evidently, reducing the price is not always the best course of action. It appears that offering Prime benefits has the biggest impact on a merchant’s chances of winning the buy box, across various scenarios.

    However, it’s important to keep in mind that moving up the “merchant ladder” is a gradual process, based on how merchants perform consistently over time.

    If you’re interested to learn more about DataWeave’s technology, and how we help retailers and consumer brands optimize their online strategies, visit our website!

  • Clearance Sale Analysis: Retailing Woes Stagger H&M and Toys “R” Us

    Clearance Sale Analysis: Retailing Woes Stagger H&M and Toys “R” Us

    Confidence amongst retailing analysts was rocked last month by two successive announcements.

    H&M’s most recent quarterly report, which revealed it had accumulated over $4.3 billion in unsold inventory, shocked retail analysts. In an era of on-the-fly inventory replenishment where stocks are closely matched to sales, a spike in unsold inventory is a strong indicator of trouble ahead. The news left analysts questioning H&M’s competitiveness in the fiercely contested global apparel category, where ever-changing consumer preferences demand agility in managing inventory levels.

    In the other major announcement, Toys “R” Us officially closed its doors to shoppers. The retailer’s losses continued to pile up and the chain groaned under a mountain of debt, leaving it little choice but to close down. “The stark reality is that the (chain is) projected to run out of cash in the U.S. in May,” it said in its bankruptcy filing.

    While the emergence of the online shopping phenomenon hasn’t helped Toys “R” Us, its ongoing afflictions largely reflect strategic missteps that predated the online shopping boom. In a category where the shopping experience is all, the retailer failed to adapt to changing consumer expectations. The warehouse context which shaped the retailing did little to promote toys sales or communicate the sheer breadth of inventory carried by Toys “R” Us.

    So, as Toys “R” Us begins to wind down its operations, the company has shuttered its online store and is channeling customers to its remaining physical retail outlets. However, prior to the closure, shoppers enjoyed some amazing bargains during their clearance sale.

    H&M’s problems appear less terminal. Its management claim to have implemented a strategy to slash its accumulated inventory and reign in its aggressive store expansion strategy.

    At DataWeave, we leveraged our proprietary data aggregation and analysis platform to analyze the clearance sales of both H&M and Toys “R” Us. We tracked the pricing, product categories, discounts, review ratings, stock status and more between 29-Mar and 3-Apr.

    The Toys “R” Us Sale


    Although the dolls and stuffed animals category carried the most products, its average discount was along the mid-range point for the sale at 28 percent. Games & Puzzles and Action Figures and NERF were the most heavily discounted categories at 40 percent and 36 percent respectively.

    As anticipated, products with lower review ratings were sold at slightly higher discounts. However, even exclusive products were sold at comparatively high discounts. Not surprising, given this was effectively a clearance sale.

    Hasbro, Mattel, and Spin Master were the highest represented brands during the sale, while for their part, Kid’s Furniture and Outdoor Play had fewer products participating in the sale. Other popular brands such as Fisher-Price and LEGO had a presence during the sale but offered fewer products.

    Zuru was the most aggressive in offering discounts with Spin Master the least aggressive. The remaining brands offered discounts of between 30 and 36 percent.

    Reports suggest that last year, toymakers Mattel and Hasbro each sold around $1 billion worth of their toys at Walmart, more than the volume they achieved selling through Toys “R” Us. Strategically, these leading brands seem to have their bases covered even though Toys “R” Us is closing down.

    Interestingly, some products were seen to go out of stock during the sale week, only to be replenished a day later, as illustrated in the above infographic.

    The H&M Sale

    Overall, H&M’s clearance sale was more aggressive in Women’s Apparel with three times more products on offer than for Men’s Apparel. However, there wasn’t much difference between the two in terms of the discounts on offer which hovered around the 45 percent range. Women’s Tops, Cardigan’s and Sweaters offered discounts on the most products during the sale period.

    Little difference was observed tactically, between how the different product categories, were handled.

    We saw a significant movement of products in Women’s apparel during the week, with over 330 newly added products and close to 200 products that were effectively churned. This pattern indicates H&M achieved a faster shelf velocity for this category than for Men’s, possibly due to a more aggressive approach to the selection of items on sale.

    Customer focus is key

    Reports indicate that despite a series of widespread and aggressive markdowns as shown in the analysis above, H&M is struggling to sell off its mountain of accumulated merchandise. Changing consumer tastes and increasing competition seem to have taken their toll on the once agile Swedish retailer. If it is going to weather this storm, H&M needs to revisit its fast fashion approach to assortment and inventory management. The retailer would also appear to need to improve its demand forecasting expertise.

    The bankruptcy filing by Toys “R” Us presents yet another lesson for eCommerce and bricks-and-mortar retailers alike, to address evolving consumer expectations and focus closely on the customer experience aspect of their business, which are supported by appropriate pricing and product assortment strategies.

    At DataWeave, our technology platform enables retailers to do just that, through comprehensive and timely insights on competitive pricing, promotions, and product assortment. Check out our website to find out more!


  • Recognize Product Attributes with AI-Powered Image Analytics

    Recognize Product Attributes with AI-Powered Image Analytics

    Anna is a fashionista and a merchandise manager at a large fast-fashion retailer. As part of her job, she regularly browses through the Web for the most popular designs and trends in contemporary fashion, so she can augment her product assortment with fresh and fast-moving products.

    She spots a picture on social media of a fashion blogger sporting a mustard colored, full-sleeved, woolen coat, a yellow sweatshirt, purple polyester leggings, and a pair of pink sneakers with laces. She finds that the picture has garnered several thousand “likes” and several hundred “shares”. She also sees that a few other online fashion influencers have blogged about similar styles in coats and shoes being in vogue.

    Anna thinks it’s a good idea to house a selection of similar clothing and accessories for the next few weeks, before the trend dies down.

    But, she is in a bit of a pickle.

    Different brands represent their catalog differently. Some have only minimalistic text-based product categorization, while others are more detailed. The ones that are detailed don’t categorize products in a way that helps her narrow down her consideration set. Product images, too, lack standardization as each brand has its own visual merchandising norms and practices.

    Poring through thousands of products across hundreds of brands, looking for similar products is time-consuming and debilitating for Anna, restricting her ability to spend time on higher-value activities. Luckily, at DataWeave, we’ve come across several merchandise managers facing challenges like hers, and we can help.

    AI-powered product attribute tagging in fashion

    DataWeave’s AI-powered, purpose-built Fashion Tagger automatically assigns labels to attributes of fashion products at great granularity. For example, on processing the image of the blogger described earlier, our algorithm generated the following output.

    Original Image Source: Rockpaperdresses.dk

    Vision beyond the obvious

    Training machines is hard. While modern computers can “see” as well as any human, the difference lies in their lack of ability to perceive or interpret what they see.

    This can be compared to a philistine at a modern art gallery. While he or she could quite easily identify the colors and shapes in the paintings, additional instructions would be needed on how the painting can be interpreted, evaluated, and appreciated.

    While machines haven’t gotten that far yet, our image analytics platform is highly advanced, capable of identifying and interpreting complex patterns and attributes in images of clothing and fashion accessories. Our machines recognize various fashion attributes by processing both image- and associated text-based information available for a product.

    Here’s how it’s done:

    • With a single glance of its surroundings, the human eye can identify and localize each object within its field of view. We train our machines to mimic this capability using neural-network-based object detection and segmentation. As a result, our system is sensitive to varied backgrounds, human poses, skin exposure levels, and more, which are quite common for images in fashion retail.
    • The image is then converted to 0s and 1s, and fed into our home-brewed convolutional neural network trained on millions of images with several variations. These images were acquired from diverse sources on the Web, such as user-generated content (UGC), social media, fashion shows, and hundreds of eCommerce websites around the world.
    • If present, text-based information associated with images, like product title, metadata, and product descriptions are used to enhance the accuracy of the output and leverage non-visual cues for the product, like the type of fabric. Natural-language processing, normalization and several other text processing techniques are applied here. In these scenarios, the text and image pipelines are merged based on assigned weightages and priorities to generate the final list of product attributes.

    The Technology Pipeline

    Our Fashion Tagger can process most clothing types in fashion retail, including casual wear, sportswear, footwear, bags, sunglasses and other accessories. The complete catalog of clothing types we support is indicated in the image below.

    Product Types Processed and Classified by DataWeave

    One product, several solutions

    Across the globe, our customers in fast-fashion wield our technology every day to compare their product assortment against their competitors. Our SaaS-based portal provides highly granular product-attribute-wise comparisons and tracking of competitors’ products, enabling our customers to spot assortment gaps of in-demand and trending products, as well as to better capitalize on the strengths in their assortment.


    Some other popular use cases include:

    • Similar product recommendations: This intelligent product recommendation engine can help retailers identify and recommend to their shoppers, products with similar attributes to the one they’re looking at, which can potentially help drive higher sales. For example, they can recommend alternatives to out-of-stock products, so customers don’t bounce off their website easily.
    • Ensemble recommendations: Our proprietary machine-learning based algorithms analyze images on credible fashion blogs and websites to learn the trendiest combinations of products worn by online influencers, helping retailers recommend complementary products and drive more value. Combining this with insights on customer behavior can generate personalized ensemble recommendations. It’s almost like providing a personal stylist for shoppers!
    • Diverse styling options: The same outfit can often be worn in several different ways, and shoppers typically like to experiment with unconventional modes of styling. Our technology helps retailers create “lookbooks” that provide real world examples of multiple ways a particular piece of clothing can be worn, adding another layer to the customer’s shopping experience.
    • Search by image: Shoppers can search for products similar to ones worn by celebrities and other influencers through an option to “Search by Image”, which is possible due to our technology’s ability to automatically identify product attributes and find similar matches.
    • Fast-fashion trend analysis: Retailers can study emerging trends in fashion and host them in their product assortment before anyone else.

    The devil is in the details

    DataWeave’s Fashion Tagger guarantees very high levels of accuracy. Our unique human-in-the-loop approach combines the power of machine-learning-based algorithms with human intelligence to accurately differentiate between similar product attributes, such as between boat, scoop and round necks in T-shirts.

    This system is a closed feedback loop, in which a large amount of ground-truth (manually verified) data is generated by in-house teams, which power the algorithms. In this way, the machine-generated output gets more and more accurate with time, which goes a long way in our ability to swiftly deliver insights at massive scale.

    In summary, DataWeave’s Image Analytics platform is driven by: enormous amount of training data + algorithms + infrastructure + humans-in-loop.

    If you’re intrigued by DataWeave’s technology and wish to know more about how we help fashion retailers compete more effectively, check us out on our website!


  • Study of Brand Inconsistency in Furniture eCommerce

    Study of Brand Inconsistency in Furniture eCommerce

    From initially lagging well behind early high-penetration categories such as consumer electronics, books, and apparel, furniture is now emerging as a key growth category.

    Online furniture purchases are growing at a rapid clip, estimated to currently be around 14 percent rate annually and is anticipated to reach 7.6 percent of total category sales in 2018.

    Savvy furniture brands are becoming increasingly aware of this shift in consumer shopping patterns and are taking steps to embrace the importance of creating a seamless online customer experience consistent across all eCommerce websites.

    Selling furniture online remains logistically complex. It requires the disciplined coordination across an ecosystem teeming with bricks and mortar stores, salespeople, warehouses merchants, and a network of delivery systems.

    All this complexity poses challenges for brands looking to deliver a consistent brand experience for consumers across multiple eCommerce websites.

    One frequent outcome of this complex ecosystem is the emergence of white labeling.

    The Invasion of White Labeling in the Furniture Category

    A white label product is one that is manufactured by one company only to be bundled and sold by other online merchants using different brand names. The end product is positioned as having been manufactured by the brand marketer.

    These white label products are frequently sold at a significant discount, compared to more mainstream name brands in the category.

    Electronics brands have often been victims of this phenomenon. Typical electronic white label products now commonplace range from radios and DVD players to computer mice and keyboards, through to TV remote controls.

    Increasingly, the furniture vertical is no longer a stranger to white label packaging and marketing as well.

    At DataWeave, using our proprietary data aggregation and analysis platform, we analyzed a range of factors of the furniture vertical, specifically the emerging phenomenon of white labeling.

    Our analysis spanned a sample set of over 20,000 products that we tracked across the websites of two of our eCommerce customers (whom we don’t wish to name) that have a large assortment of furniture products. Let’s call these eCommerce companies Retailer A and Retailer B.

    We identified white labeled products as being those that featured the exact same image between the two retailers but were sold under different brand names. Here, our AI-powered advanced image analytics platform matched the images of various products at an accuracy of more than 95%.

    The following infographic summarizes our analysis.

    Clearly, not only is white labeling quite prevalent here, but in almost every instance, we identified price variation. Some of the white labeled products were sold by lesser-known brands with significantly lower price points. This pricing strategy could potentially damage the customer experience for well-established consumer brand franchises in several ways.

    The shopper sees through the branding exercise where the same product is repackaged and presented as having been “produced” by a different brand, potentially eroding brand loyalty.

    As some 71 percent of the products studied were identified as white labeled products, this exposes the category as a whole to this risk.

    The shopper may be confused by the price difference as well, undermining the brand’s carefully constructed pricing perception. The average spread of 21 percent between competing white labeled products is potentially a major source of consumer dissonance and confusion.

    A Closer Look at Pricing

    While the inconsistent experience potentially created by widespread white labeling is almost characteristic of the furniture vertical, other eCommerce areas such as pricing and promotion have also been demonstrated as being key influencers of the shopping experience.

    Today, brands have little control over how their products are priced on eCommerce websites and are susceptible to pricing decisions taken by either the merchant selling the product or retailers themselves. Here, price change decisions have little to do with providing a consistent brand experience, as it’s not really a priority for merchants and retailers.

    In a hyper-competitive retail environment, retailers often discount heavily or change prices frequently to drive sales and margins. The following infographic summarizes the differences in pricing approaches between the two retailers we analyzed.

    Both retailers demonstrated quite divergent approaches in their pricing strategies. The key point of difference appeared to be Retailer B’s discount execution, which proved more aggressive than Retailer A’s, routinely exceeding the latter by five percent or more.

    This discounting strategy is focused on the 40+ percentile (by price, with 100 percentile being the most expensive product), and above price bands, while both retailers displaying similar strategies to their Top 20 and Top 20 to 40 percentile ranges.

    We also observe how Retailer B is more inclined to offer higher discounts on products with higher review ratings, compared to Retailer B’s strategy — a play on developing a “low price” perception among shopper.

    The Consumer Experience Matters

    Today, consumers expect a truly seamless shopping experience right across a brand’s entire integrated retail community, regardless of whether it is physical or digital. Consumers have evolved beyond being merely time poor and have emerged as a group of impatient shoppers, unforgiving of inconsistencies in their experience.

    With retail evolving to embrace multiple consumer touch points with a brand, the practice of white labelling represents a dangerous source of potential confusion and disillusionment. This raises the degree of difficulty involved in converting website visitors into buyers. Further, inconsistent pricing between eCommerce websites, due to dissimilar pricing strategies adopted by each website, only compounds the problem for furniture brands.

    Technologies like DataWeave’s Competitive Intelligence as a Service, that can provide furniture brands with timely insights on white labelled products, unauthorized merchants, and price disparity between ecommerce websites, can assist furniture brands in their efforts to better manage their online channel.

    Visit our website to find out more on how we help consumer brands protect their brand equity and optimize the experience delivered to their customers on eCommerce websites!


  • Amazon’s Fashion & Apparel Product Assortment | DataWeave

    Amazon’s Fashion & Apparel Product Assortment | DataWeave

    Apparel remains one of the key battleground categories in retail today, and like in most other product categories, Amazon has made significant in-roads here. Beyond expanding the range of product offerings and brands in its marketplace, Amazon has also launched several private label brands in this vertical and looked to drive more sales as a first-party seller.

    Recently, DataWeave collaborated with Coresight Research, formerly known as Fung Global Retail & Technology, a retail-focused research arm of Li & Fung Group, to publish an in-depth report revealing Amazon’s strategic approach to product assortment in its fashion and apparel category.

    In this blog post, we’ll summarize some interesting insights into Amazon’s strategy from the report. For an in-depth and detailed view, check out the original article at — “Amazon Apparel: Who Is Selling What? An Exclusive Analysis of Nearly 1 Million Clothing Listings on Amazon Fashion

    Research Methodology

    Our analysis focused on several critical areas, including the presence of Amazon’s private label, the demarcation between Amazon as a seller and its third-party sellers and the top brands and categories in women and men’s apparel.

    We aggregated data from Amazon.com in two stages:

    Firstly, we identified brands with a meaningful presence in Amazon’s clothing offering by identifying all brands included in the top 500 ranks of featured product listings for each product type in the Women’s Clothing and Men’s Clothing sections on Amazon (e.g., the Top 500 product listings for women’s tops and tees, the Top 500 product listings for men’s activewear, and so on.). This generated a total of 2,798 unique brands.

    Secondly, we aggregated our data on all product listings within the Women’s Clothing and Men’s Clothing sections for each of the 2,798 brands identified previously. This returned a total of 881,269 individually listed products. This extensive list forms the basis for the highlights in Coresight’s report.

    Coresight’s Analysis — Some Interesting Insights

    Strategically, Amazon remains heavily reliant on its third-party sellers in the clothing category. In total, just 13.7 percent of women’s and men’s clothing products featured on Amazon Fashion are listed for sale by Amazon itself (first-party sales), while third-party sellers account for 86.3 percent of listings.

    In womenswear, third-party sellers account for 85.7 percent of listings, while in menswear, they account for 87.1 percent of listings. Moreover, Amazon appears to be focusing its first-party clothing inventory on the higher-value categories. Clearly, the retailer’s reliance on third-party sellers underscores its opportunity to grow its sales of apparel volumes by bringing more of its current inventory in-house.

    The analysis found 834 Amazon private-label products on Amazon website, equivalent to 0.1 percent of all clothing available through Amazon Fashion. The company’s private labels appear to be clustered tightly in specific clothing categories.

    Womenswear brand Lark & Ro is by far the biggest of Amazon’s apparel private labels, as measured by the number of items.

    Nike is the most-listed brand on Amazon Fashion, with 16,764 listed products spanning womenswear and menswear. Lower-price brands such as Gildan and Hanes also rank very highly in terms of the number of products listed.

    Value-positioned brands that have traditionally focused on wholesaling to retailers, such as Gildan and Hanes, also rank very highly in terms of the number of products listed.

    What is clear is that currently, Amazon’s clothing listings are highly diluted, with no one major brand dominating the listings.

    Interestingly, casualwear and activewear clearly lead Amazon’s category rankings. Women’s tops and tees are the most heavily listed clothing category on Amazon Fashion, with 138,001 products listed.

    Men’s shirts, which includes a large number of casual shirts together with polo shirts and some T-shirts, comes in second, with 109,043 products listed. Echoing the prominence of the global Nike and Adidas brands on the Amazon website, activewear has achieved a centre of gravity status as a category, accounting for 76,930 men’s activewear products and 51,992 women’s activewear products listed on the site.

    Several Opportunities for Growth

    Amazon Fashion remains heavily dependent on third-party sellers. It’s a fair assumption that more first-party listings would attract greater numbers of shoppers, especially Amazon Prime members. Amazon’s private-label ranges represent another potential lever for growth.

    Also, the 30 most-listed brands on Amazon Fashion comprise 30 percent of all clothing products listed on the website, while just 189 brands have more than 1,000 products each listed on the website.

    This data indicates the presence of major growth opportunities across the board, be it Amazon private label brands, Amazon as a seller, and for several mid-range clothing brands.

    If you’re interested in DataWeave’s technology, and how we aggregate data from the Web to provide unique and comprehensive insights on eCommerce products and pricing, check us out on our website!

  • What Retailers Can Learn from the Lowe’s Board Announcement

    What Retailers Can Learn from the Lowe’s Board Announcement

    Last Friday, Reuters published, “Home Improvement chain Lowe’s said it has nominated two independent board members and plans to add a third following “constructive” talks with hedge fund D.E. Shaw Group, which has taken an activist stake.”

    It was reported that D.E. Shaw Group had utilized available external data to identify quantifiable opportunities to grow sales by several billion dollars and to reduce costs significantly.

    A question that comes immediately to mind is, “Why didn’t Lowe’s utilize this same available external data themselves?”

    Is it because Lowe’s and many other retailers spend their time focusing on internally generated data, rather than looking at available external data, or better yet, combining available external data with their internal data?

    There are huge opportunities to drive incremental sales, margins and profits through leveraging external data, like competitive intelligence data produced by firms like DataWeave.

    There are huge opportunities to drive incremental store sales, margins, and profits through leveraging digital data to drive better store specific assortments, prices and promotions by providing relevant local digital data to store executives using solutions by firms like Radius8.

    I expect to see more Lowe’s-like announcements in the near future as investment firms realize there are very substantial, untapped financial opportunities within retail.

  • Dataweave – CherryPy vs Sanic: Which Python API Framework is Faster?

    Dataweave – CherryPy vs Sanic: Which Python API Framework is Faster?

    Rest APIs play a crucial role in the exchange of data between internal systems of an enterprise, or when connecting with external services.

    When an organization relies on APIs to deliver a service to its clients, the APIs’ performance is crucial, and can make or break the success of the service. It is, therefore, essential to consider and choose an appropriate API framework during the design phase of development. Benefits of choosing the right API framework include the ability to deploy applications at scale, ensuring agility of performance, and future-proofing front-end technologies.

    At DataWeave, we provide Competitive Intelligence as a Service to retailers and consumer brands by aggregating Web data at scale and distilling them to produce actionable competitive insights. To this end, our proprietary data aggregation and analysis platform captures and compiles over a hundred million data points from the Web each day. Sure enough, our platform relies on APIs to deliver data and insights to our customers, as well as for communication between internal subsystems.

    Some Python REST API frameworks we use are:

    • Tornado — which supports asynchronous requests
    • CherryPy — which is multi-threaded
    • Flask-Gunicorn — which enables easy worker management

    It is essential to evaluate API frameworks depending on the demands of your tech platforms and your objectives. At DataWeave, we assess them based on their speed and their ability to support high concurrency. So far, we’ve been using CherryPy, a widely used framework, which has served us well.

    CherryPy

    An easy to use API framework, Cherrypy does not require complex customizations, runs out of the box, and supports concurrency. At DataWeave, we rely on CherryPy to access configurations, serve data to and from different datastores, and deliver customized insights to our customers. So far, this framework has displayed very impressive performance.

    However, a couple of months ago, we were in the process of migrating to python 3 (from python 2), opening doors to a new API framework written exclusively for python 3 — Sanic.

    Sanic

    Sanic uses the same framework that libuv uses, and hence is a good contender for being fast.

    (Libuv is an asynchronous event handler, and one of the reasons for its agility is its ability to handle asynchronous events through callbacks. More info on libuv can be found here)

    In fact, Sanic is reported to be one of the fastest API frameworks in the world today, and uses the same event handler framework as nodejs, which is known to serve fast APIs. More information on Sanic can be found here.

    So we asked ourselves, should we move from CherryPy to Sanic?

    Before jumping on the hype bandwagon, we looked to first benchmark Sanic with CherryPy.

    CherryPy vs Sanic

    Objective

    Benchmark CherryPy and Sanic to process 500 concurrent requests, at a rate of 3500 requests per second.

    Test Setup

    Machine configuration: 4 VCPUs/ 8GB RAM.
    Network Cloud: GCE
    Number of Cherrypy/Sanic APIs: 3 (inserting data into 3 topics of a Kafka cluster)
    Testing tool : apache benchmarking (ab)
    Payload size: All requests are POST requests with 2.1KB of payload.

    API Details

    Sanic: In Async mode
    Cherrypy: 10 concurrent threads in each API — a total of 30 concurrent threads
    Concurrency: Tested APIs at various concurrency levels. The concurrency varied between 10 and 500
    Number of requests: 1,00,000

    Results

    Requests Completion: A lower mean and a lower spread indicate better performance


    Observation

    When the concurrency is as low as 10, there is not much difference between the performance of the two API frameworks. However, as the concurrency increases, Sanic’s performance becomes more predictable, and the API framework functions with lower response times.

    Requests / Second: Higher values indicate faster performance

    Sanic clearly achieves higher requests/second because:

    • Sanic is running in Async mode
    • The mean response time for Sanic is much lower, compared to CherryPy

    Failures: Lower values indicate better reliability

    Number of non-2xx responses increased for CherryPy with increase in concurrency. In contrast, number of failed requests in Sanic were below 10, even at high concurrency values.

    Conclusion

    Sanic clearly outperformed CherryPy, and was much faster, while supporting higher concurrency and requests per second, and displaying significantly lower failure rates.

    Following these results, we transitioned to Sanic for ingesting high volume data into our datastores, and started seeing much faster and reliable performance. We now aggregate much larger volumes of data from the Web, at faster rates.

    Of course, as mentioned earlier in the article, it is important to evaluate your API framework based on the nuances of your setup and its relevant objectives. In our setup, Sanic definitely seems to perform better than CherryPy.

    What do you think? Let me know your thoughts in the comments section below.

    If you’re curious to know more about DataWeave’s technology platform, check out our website, and if you wish to join our team, check out our jobs page!


  • Boxing Day Sale: How UK’s Top Retailers and Brands Fared

    Boxing Day Sale: How UK’s Top Retailers and Brands Fared

    Following a successful Black Friday in November, the United Kingdom geared up for the 2017 Christmas season in December. Analysts estimate the total splurge in December at about £45 billion, beating last December’s record of £43 billion.

    Online sales hit £1.03billion, passing the £1billion threshold for the first time and up 7.9 percent on 2016’s £954million, according to the Centre for Retail Research. The rise of online shopping together with the timing of Christmas in 2017 meant shopper footfall in physical stores was lower than in previous years as people increasingly moved to shopping online.

    Total shopper numbers were 4.5 percent down on the previous year, according to research group Springboard, which may reflect the growing strength and reliability of online’s product range and delivery responsiveness.

    Major online retailers though continued to pull out the big discount guns across categories in an effort to attract online shoppers on Boxing Day, the biggest sale event in December.

    At DataWeave, we focused our proprietary data aggregation and analysis platform to analyze the top 500 ranked products in over 20 product categories across electronics and fashion retailers in the UK. Our analysis included several top UK retailers, which include Amazon, Argos, Currys, Tesco, Asos, Marks & Spencer, and Topshop.

    The discounts in the infographic below indicate the magnitude of reduction in prices during the sale (26th Dec), compared to before the sale (19th Dec), in order to best represent the additional value derived from the sale for shoppers.


    Boxing Day Sale Highlights

    In electronics, while Amazon offered discounts on the most number of products, Argos was aggressive in the average size of its additional discounts.

    Surprisingly, Amazon appeared to be much more conservative in the Men’s Fashion category with an average additional discount of 13.8 percent, spanning 341 products. Here, Asos deployed the most aggressive combination of high average additional discounts (36.9 percent) on a large number of products (165).

    Marks & Spencer focused their targeted discounts (43.1 percent) on a tight set of Men’s Fashion products (45), while interestingly, the story almost reverses in Women’s Fashion, where both M&S (43.1 percent, 281 products) and Topshop (40.5 percent, 226 products) were aggressive in what turned out to be a critical battleground category.

    Leading brands weren’t left out of the discounting action either, with the largest discount on offer going to Ruche (48.9 percent on 33.3 percent) women’s tops, closely followed by M S Collection (41.9 percent on 32.3 percent) handbags and Asos’ (37.5 percent on 21.2 percent) men’s jeans.

    Most Discoverable Brands

    We also analysed the most discoverable brands in each product type. This was measured as a combination of the number of the brand’s products present in the Top 500 ranks of a product type, as well as the average rank (lower the number, higher is the discoverability).

    It was no surprise that Canon DSLR cameras were highly discoverable on Amazon with 90 products, along with an average ranking of 93.2, while 34 Asus laptops recorded an average ranking of 85.2. At Argos, 57 Acer laptops recorded an average ranking of 73.4 while 50 LG televisions delivered an average ranking of 124.1.

    Other highly discoverable brands included MS Collection in Marks & Spencer, Apple iPhones and Tablets on Curry’s and Tesco.

    The Online Retail March Continues

    If we look at sales results across the world, from the United Kingdom to the United States, to Asia in countries such as India, Singapore and Indonesia through to Australia, online retail is aggressively cannibalizing traditional bricks and mortar in-store retail sales. Online retail’s demonstrated superiority in exploiting competitive intelligence and a sophisticated suite of analytics that accompany digital transactions, is surfacing in its agile discounting strategies, and its ability to continuously refresh product lines during key sales periods.

    This Boxing Day in the UK, fashion proved to reveal divergent discounting strategies between retailers, while only marginal differences in approach were visible in electronics — both high volume categories around Christmas season.

    Overall, December 2017 in UK marked a strong validation of online retail’s influence and we can expect a continuation of it’s ability to harness discounting with extensive product offerings, in order to lure shoppers away from in-store.

    If you’re interested in DataWeave technology, and how we deliver Competitive Intelligence as a Service to retailers and consumer brands, check out our website!


  • [INFOGRAPHIC] 2017 at DataWeave: A Year in Retrospect

    [INFOGRAPHIC] 2017 at DataWeave: A Year in Retrospect

    And that’s a wrap! Another exciting year done and dusted, in which DataWeave continued to execute strongly through accelerated revenue growth, new customer wins, and expansion to heretofore unchartered regions.

    Through the year, we engaged with retailers and consumer brands of all types and sizes, and our belief that actionable competitive insights will increasingly play a defining role in driving profitable growth in retail was reinforced. Competition was stiff, and more times than not, we came out on top due to our ability to process huge data-sets, and the unmatched accuracy of our insights.

    Encouragingly, the emerging vertical of Alternative Data gained greater maturity, as adoption of non-traditional data sources from the Web by Asset Managers picked up steam.

    Our extensive focus on the North American market yielded impressive results, and we’ve only just scratched the surface.

    Other regions and verticals continued to contribute significantly, helping us close out the year with record sale volumes.

    As we wind ourselves up again for another marathon year in 2018, we look back at some of our achievements across the board, including customer impact, technology leadership, and team contribution and growth:

    Moving into 2018, we have a lot to look forward to.

    We’ll roll out a new and improved version of our SaaS-based data visualization platform, built with greater focus on actionability and customizability for our customers. Feedback from early beta tests have already been promising.

    As our team size swells, we’ll be on the lookout for passionate problem solvers, who thrive in a hyper-competitive environment, to join us and contribute to the next stage of our growth journey.

    Across verticals, we are well on our way to digging our heels into the North American market. 2018 will also see us gain a more solid footing in the Alternative Data space.

    With eCommerce adoption showing no sign of slowing down, demand in retail for competitive intelligence solutions is set to soar, and our proprietary data aggregation and analysis platform is up to the challenge of catering to this growing need.

    Stay tuned for more from DataWeave in 2018!

  • Myntra Leads End of Year Promotions in Fashion

    Myntra Leads End of Year Promotions in Fashion

    Following three back-to-back mega-sale events leading up to Diwali, India’s eCommerce companies once again opened the discount floodgates heralding Christmas and New Year. This time around, Fashion was the battleground category of focus for Indian e-retailers.

    Myntra launched its End of Reason Sale held between 22nd and 25th December. eCommerce behemoth Amazon too announced its own grand Amazon Fashion Wardrobe Refresh Sale on the same days, while Flipkart hit the market with its End of Year Bonanza held on the 24th and 25th of December. Paytm and Snapdeal held sale events as well, starting 23rd December. All competing sale events promised consumers up to 80 percent discounts across a range of products, especially in Fashion.

    At DataWeave, we analyzed and reported on the competing pricing strategies of Amazon, Flipkart, Myntra, Paytm, and Snapdeal. In the following infographic, we look specifically only at additional discounts offered on the top 500 ranked products of over 15 product types during the sale, compared to those before the sale events went live.

    Myntra Gets Aggressive

    Myntra elected to discount over 84 percent of its Top 500 ranked Fashion products encompassing each product category, with an average additional discount percentage of over 25 percent offered during the sale.

    A prime example of this discounting approach was the sports shoe segment, which received an aggressive additional discount of 28 percent on over 93 percent of the Top 500 ranked sports shoes. Similarly, Myntra’s additional discounts ranged from between 22 percent and 25 percent across most product types, including T-shirts, Shirts, Handbags, Jeans, Skirts, Sunglasses, and Watches. The fashion e-retailer’s private label brands enjoyed attractive reductions in prices, which include Hrx and Roadster, along with other brands like Red Tape, Nike, and Puma.

    Amazon Discounts To A Different Beat

    Amazon discounted 35 percent of its Top 500 ranked Fashion products in each product type, with an average additional discount percentage of 12.5 percent during the sale. Given Amazon’s track record of dynamic pricing, this was relatively conservative.

    Overall, additional discounts on Amazon ranged between 4 percent and 16 percent across all product types in Fashion. Top brands discounted on Amazon included Adidas, Fastrack, Hush Puppies and Ray-Ban.

    Flipkart Joins The Party

    Flipkart too joined the End of Year discount action with several attractively positioned offers, exceeding those featured on Amazon. Flipkart discounted over 65 percent of its Top 500 ranked Fashion products in each product type, with an average additional discount percentage of over 14 percent during the sale.

    Additional discounts promoted on Flipkart ranged between 8 percent and 22 percent across all Fashion product types, while some of the top discounting brands included Dkny, Metronaut and United Colors of Benetton.

    Conspicuously, other Indian e-retailers like Paytm and Snapdeal chose not to join in the price war. Snapdeal, especially, has consistently offered only moderate additional discounts during recent sale events, choosing to focus more on other areas of improving the user experience for their shoppers.

    Strategic Focus On Profitability

    In contrast to the profit-sapping Diwali sale season, characterized by steep discounts across all product categories, this end of year sale was more concentrated, largely honing in on Fashion. From a strategic and shareholder perspective, limiting the discounting action to Fashion insulated the retailers’ bottom line from another major profit hit.

    Myntra determinedly reaffirmed its leadership status in the Fashion category, with its highly aggressive discounting strategy. This was well received by shoppers, who spent a staggering ₹5 crore in only the first five minutes of the sale.

    Flipkart opted to double down this time around with attractive offers on its own eCommerce platform as well. The e-retailer, currently locked in a battle with Amazon for leadership in India’s eCommerce sector, had acquired Myntra in 2014 in a bid to strengthen its position in the fashion category.

    Amazon, intriguingly, opted for a more conservative approach to its end of year sale than we are used to witnessing from the eCommerce giant. As we enter the new year, and kickstart yet another cycle of aggressive e-retail promotions in India, there will be ample opportunities to see if this is evidence of a rethink in Amazon’s approach to pricing in India.

    If you’d like to know more about DataWeave’s technology, and how we provide Competitive Intelligence as a Service to retailers and consumer brands, check out our website!


  • Tracing Lazada’s Pricing Across the Month-Long Online Revolution Sale

    Tracing Lazada’s Pricing Across the Month-Long Online Revolution Sale

    Commencing on the 11th of November and ending just a few days ago on the 12th of December, Southeast Asia’s biggest sale event, the Lazada Online Revolution sale rewrote the record books.

    This mega-shopping event is held simultaneously across six Southeast Asian countries, spanning Singapore, Malaysia, Thailand, Indonesia, the Philippines and Vietnam and was bookended by its two biggest sale days, on 11.11 and 12.12.

    In an earlier blog post, we published a highly detailed analysis of the sale on 11.11, using DataWeave’s proprietary data aggregation and analysis platform. This post zoomed in on the pricing and product strategies of Lazada and its competitors in Singapore and Indonesia.

    On the 12th December, Southeast Asian shoppers shattered all retailing expectations by reportedly spending a record-breaking $250 million. This was double both this year’s 11.11 sale and last year’s 12.12 sale. According to Forbes, the 12.12 sales became such a hit that Indonesia even designated the day to be its National Online Shopping Day, or Harlbonas.

    At the end of the sale event on 12th December, DataWeave assimilated all the data we collated throughout the Online Revolution sale and examined pricing trends across the entire span of four weeks, exploring each retailer’s strategy by brand, by category, and by product type.

    We aggregated pricing information on the Top 500 ranked products of over 20 product types featured on each website (Lazada, ListQoo10, and Blibli), spread across the critical Electronics and Fashion categories, covering over 120,000 products in total.

    Online Revolution — Singapore

    Interestingly, one of the trends that became immediately apparent, was the relatively stable track of the average absolute discounts in Electronics, Men’s Fashion, and Women’s Fashion. No significant spikes or drops were evident throughout the duration of the entire sale season.

    Similarly, the number of discounted products remained relatively stable. However, in Electronics, there was a conspicuous dip in the number of discounted products, which occurred on the 21st of November. Aside from this anomaly, even the number of products discounted remained relatively stable. The other interesting phenomenon was an uptick in the number of discounted products on the 15th of December, after the Online Revolution sale — something counterintuitive.


    When we explored the behaviour of the average MRP of discounted products, we noticed a sharp dip on the 21st of November. Clearly, prices were increased specifically on higher-priced electronic products.

    Comparing these numbers with those of ListQoo10’s, who were forced to adopt a more aggressive stance on pricing to stay competitive through this period, we once again see a very consistent discount percentage throughout this period. The average discount in men’s fashion, however, showed a slight upward trend during this period.

    ListQoo10’s number of discounted products in Electronics dipped as well on the 21st of November, demonstrating the retailer’s ability to dynamically react to competitor strategies. This can be evidence of a robust market monitoring system.

    Returning to Lazada, DataWeave identified several product types displaying a significant variation in average discounts through this period. These included men’s shorts, women’s shoes, men’s Jeans, Laptops, DSLR Cameras, and women’s T-shirts.


    Once again, our analysis pointed to substantial competitive activity around the 21st of November, together with a second significant dip in discounts on men’s shirts in the period around 5th December. Discounts on women’s shoes, by contrast, proved to be a roller coaster throughout the entire sale period.

    Some of the brands with high variation through this period were Lenovo Laptops, Levi’s T-shirts, Adidas Women’s Shoes, Seiko Watches, and Sony Phones.


    Discounting activity by these brands appeared to be all over the place during this period, without any discernible pattern or structure. While Sony predictably lowered discounts on its phones after 12.12, Levi’s increased its discounts in the same period

    Online Revolution — Indonesia

    Moving on to Indonesia, we once again witnessed a similar approach to average discounting by category as we saw emerge in Singapore. At a category level, the retailer evidently opted for trading within a narrow discount band across the sale period rather than attempting to inject an overly dynamic discounting approach into their sale execution.


    This is not to say there were not some surprises in store with the number of discounted products in Indonesia. In electronics, there was a noticeable dip in the number of discounted products just ahead of the 12.12 sale. The number of discounted products then surprisingly surged after the 12.12 sale, in combination with a slight reduction in average discount percentage during the period.

    In comparing Blilbi, Lazada’s main competitor in Indonesia, we see a fairly consistent discounting level throughout the sale period, although markedly lower than those rolled out by Lazada across its three core categories.

    This approach held true even for the number of discounted products. Blibli seems to have been content to take a backseat to Lazada during the heavily promoted Online Revolution sale period, rather than attempting to compete aggressively in any single category.

    It will be interesting to see if Blilbi is content to repeat this strategy in 2018 as it effectively surrenders the discounting high ground to Lazada during the peak sales period. While this strategy may yet be proven to have paid off in terms of profitability, it may have undesirable consequences for Blilbi’s brand and share performance in the longer term.

    Returning our focus to Lazada in Indonesia, some product types showed major variation through the sale period, specifically DSLR Cameras, which dipped significantly approximately a week out from the 12.12 sale. However, compared to Singapore, Indonesian discounts by product types appeared relatively more stable, except a few dips prior to 12.12.

    Three distinct discounting strategies appears to have been adopted by participating brands. Some, such as Electrolux (Refrigerators), opted for a comparatively stable discounting approach. Others, like Apple, increased prices through the sale period, while Alienware, reduced prices through the sale period.

    In particular, Apple’s pricing approach to its iPhones was surprising, given its strong partnership with Lazada during this Online Revolution sale. Yet another example where the marketing hype failed to translate into an aggressive discounting strategy.

    More Talk Than Walk

    For Lazada, the Online Revolution sale proved to be a triumph, effectively extending its record-breaking streak with USD 250 million in sales on 12.12 alone. However, on parsing through the pricing across the entire month of the sale, there is clearly no dramatic increase in discounts either on 11.11 or on 12.12 — some anomalies notwithstanding.

    This goes to show that much of the sales is driven by hype, more than the additional value of discounts. To be fair, 11.11 and 12.12 hosted discounts on some of the more premium products in the assortment, while discounts on most of the mid-range products remained consistent. While some competitors like ListQoo10 chose to stay competitive, so as not to lose out significantly on their customer base and market share, others like Blilbli chose to sit and watch, and pick up on what’s left after the sale.

    This year’s Online Revolution has set the bar high for South East Asian retail, and going by how the event has grown over the last few years, few would be surprised if we witness another record braking sale in 2018.

    If you’re interested in DataWeave’s technology, and how we provide Competitive Intelligence as a Service to retailers and consumer brands, check us out on our website!


  • Consumer Packaged Goods Join The Black Friday Blitz

    Consumer Packaged Goods Join The Black Friday Blitz

    While the Thanksgiving weekend sale, which includes Black Friday and Cyber Monday, is famous for attractive offers across all consumer categories, it remains better known for its discounts on Electronics and Fashion. Consumer goods, traditionally, have evaded much the hype.

    This year, notwithstanding notoriously slim margins, consumer goods and grocery retailers and brands joined Electronics and Fashion in offering sharp discounts on select products in an attempt to carve out increased market share.

    In the past, discounts on consumer packed products have been to drive increased store traffic during the holiday season. Increasingly, however, Thanksgiving has emerged as a viable opportunity for grocers to recruit online shoppers as well and build out their franchise.

    Online Grocers Make Their Move

    Faced with the holiday rush, large numbers of shoppers are proving to be relaxed about trusting the retailer to bag up and deliver their holiday feasts and treats. Grocers themselves have taken the strategic decision to boost their online shopping presence this year.

    They geared up to support their new holiday presence with aggressive price cuts designed to cut through the holiday sales clutter and make direct appeals to a newly-in-play online shopper pool. So transparent was this commercial decision, that many retailers experienced sharp drops in their share prices as industry analysts anticipated the retailers’ new discount-driven strategy.

    Tracking The Numbers

    At DataWeave, using our proprietary data aggregation and analysis platform, we have been tracking, through November, pricing and product information of the Top 1,000 ranked consumer goods products in over 10 product types featured on Amazon Prime, Walmart, Target, Costco, Kroger, Safeway, and Whole Foods, across up to six zip codes each, distributed across the country.

    DataWeave’s major focus was to compare the three main days of the Thanksgiving weekend; Thanksgiving Day, Black Friday, and Cyber Monday. We performed an in-depth analysis of discounts offered across product types and brands, together with how aggressively dynamic retailers were in both their pricing strategy and in the products they displayed.

    In analyzing this major sale event, we observed an extensive range of products enjoying high absolute discounts, but with no additional discounts during the sale, i.e. prices remained unchanged between the period prior to the sale and during each day of the sale, even though high discounts were advertised. The following infographic highlights some of the products where this phenomenon was observed.

    As a result, we focused our analysis only on the additional discounts offered on each day of the sale, compared to the period prior to the sale (we considered 11.21), in order to accurately illustrate the true value shoppers enjoyed during these sale days.

    The following infographic reveals some interesting highlights from our analysis, including the level of additional discounts offered to shoppers, the top brands featured, and the number of dynamic price changes implemented during the sale. All prices analysed are in USD, and all discount percentages represent average values across all zip codes, analyzed for individual retailers.

    In contrast to Amazon Prime, Costco, and Kroger who opted to run with deep discounts on a limited range of products, retailers such as Target and Walmart chose to offer only marginally higher additional discounts but across a large number of products. Others like Safeway adopted a safer approach, combining low discounts on a modest range of products.

    Overall, our analysis discovered little variation in discounts offered across each of the three sale days, with the only enduring trend being a marginally higher discount percentage implemented on Cyber Monday across all retailers.

    Categories significantly discounted across retailers included Personal Care, Deli, Dairy & Eggs, and Babycare products. Stove Top, Martinelli, Colgate, Dove and Hillshire Farm emerged as the leading brands to adopt a more aggressive discount approach.

    While most of the products offered across each of the three peak holiday sale days were comparatively constant (few new products featured amongst the Top 500 ranks), there were a number of conspicuous exceptions. Amazon Prime (19 percent on Cyber Monday), Whole Foods (15 percent on Thanksgiving), and Kroger (12 percent and 11 percent on the first two days of sale respectively), elected to refresh a significant portion of their Top 500 ranked product assortment.

    Across the entire Thanksgiving week, we saw Target, Amazon Prime, and Kroger all highly active in changing prices to stay competitive. Our analysis of these retailers showed more than 1.6 price changes for each price-changed product. While these were implemented on roughly 20 percent of their assortment, itself a significant proportion, the average price variation for each of these retailers was also on the higher side of expectations. In contrast, the other retailers adopted a far more conservative approach to dynamic pricing.

    Consumer Goods Walk The Discount Talk

    In a year when Amazon acquired Whole Foods to forever merge the dynamics of offline and online grocery retail, aggressive discounting by several retailers in specific product categories, combined with high visibility brands, has carved out a new profile for CPG retail.

    Grocers are eyeing a future where online shopping becomes a prime feature of their retail franchise. Amazon for its part demonstrated its prowess in discounting strategy, and its ability to implement a dynamic pricing strategy in tandem with a refreshed Top 500 product assortment.

    Other retailers are not far behind, as the use of market and competitive intelligence technologies pick up steam across the board. In today’s digital economy, data can be the biggest competitive advantage for a retailer, and retail technology providers like DataWeave have upped their game to deliver highly unique and sophisticated data and insights to meet this demand.

    Visit our website, if you’re interested in DataWeave and how we provide zip-code level Competitive Intelligence as a Service to retailers and consumer brands.

  • Thanksgiving, Black Friday and Cyber Monday Parade Discounts in Fashion

    Thanksgiving, Black Friday and Cyber Monday Parade Discounts in Fashion

    Fashion has always been one of the great engines of retail, and two of its iconic sale events are Thanksgiving and Black Friday. While Black Friday was traditionally an in-store shopping event, a large number of shoppers have migrated online taking much of the sales action with them.

    Despite shoppers typically liking to be able to touch and feel fashion and apparel products prior to purchasing them, the convenience of online shopping combined with time-poor shoppers returning to work after their Thanksgiving break has triggered changes to consumer behavior. Today, the retail narrative has shifted to focus on online, with this year’s Thanksgiving weekend turnover up 6.8 percent from last year.

    At DataWeave, using our proprietary data aggregation and analysis platform, we have been tracking the pricing and product information of the Top 500 ranked Fashion products across 15 product types on Amazon, Walmart, Target, Bloomingdales, JC Penney, Macy’s, Neiman Marcus, and Nordstrom.

    Our primary focus was to compare the three key days of the Thanksgiving weekend: Thanksgiving Day, Black Friday, and Cyber Monday. We performed an in-depth analysis of discounts offered across product types and brands, together with how dynamic retailers were in both their pricing strategy and products displayed.

    (Read also: Thanksgiving vs Black Friday vs Cyber Monday: The Electronics Price War Heats Up)

    In analyzing these monster sale events, we observed a range of products sneaking through to enjoy high absolute discounts, but offer no additional discounts during the sale, i.e. prices remained unchanged between before the sale and during each day of the sale, even though high discounts were advertised. The following infographic highlights some of the products where this phenomenon was observed.


    Having identified the aggressive use of high but unchanged absolute discounts among the retailers during the sale, we focused our analysis on the additional discounts offered on each of the days of the sale, compared to before the sale (we considered 11.21), in order to more accurately reflect the true value these sale events deliver to American shoppers.

    The following infographic provides some interesting insights from our analysis along several perspectives, including additional discounts offered, top brands, quality of product assortment, number of price changes, and more. All indicated prices are in USD.


    Our analysis illustrated how aggressive Target was in its strategy for discounting fashion, compared to most other retailers, especially on Thanksgiving and Black Friday. Interestingly, while Macy’s offered reasonably attractive discounts across all product types, it chose to offer them on a much larger product set than any other retailer.

    Overall, the level of discounts, together with the number of products they were offered on, shows no dramatic change for each retailer over the three-day sale period.

    With Neiman Marcus however, we observed a unique pattern. Sharp discounts were offered on Thanksgiving and Black Friday, which were subsequently rolled back completely on Cyber Monday. This represents a clear holiday pricing and discount strategy, albeit conducted on a comparatively compact and highly targeted set of products.

    Other sales discounting phenomena we observed include major discounts on Sunglasses, Shoes, Skirts, and T-shirts across all retailers, clearly representing battleground categories, while some of the top brands offering attractive discounts include Ray Ban, Oakley, Levi’s and Nike.

    Another relatively constant factor across each of the sale days was the average selling price of respective retailers. This parameter indicates how premium each retailer’s product mix is, providing another perspective on each retailer’s customer segment targeting strategy.

    As expected, Target, Walmart and JC Penney housed the more affordable set of products (average selling prices of $25, $31, and $45 respectively). At the other end of the premium spectrum, Neiman Marcus — home to luxury brands and products — adopted a more premium product assortment (average selling price between $820 and $914).

    In fashion, presenting a fresh assortment consistently is key to customer retention, and Amazon leads the pack in this regard, with a product churn rate of 50% in the top 100 ranks each day. Contrast that with Walmart and Target, who follow a more traditional approach, with a largely static set of options to choose from in its top ranks.

    Most of the retailers we analysed implemented several price changes to large percentages of their product sets. Macy’s and Walmart were at the forefront of this dynamic pricing activity. While Bloomingdales too made over 1,300 price changes, the average magnitude of these changes proved to be very high, at 206 percent.

    Fashion Fast-Forwards Its Online Sales

    While the memories of frantic shoppers tussling over fashion and apparel items on Black Friday still linger, they are fast receding as online fashion sales turnover goes from strength to strength. Shoppers are firmly placing long, winding queues in their rearview mirror and embracing the digital shopping cart more with each passing year, as spotlighted this Thanksgiving sale weekend.

    Sunglasses, Shoes, Skirts, and T-shirts emerged as key battleground categories for retailers over the weekend, while individual retailers displayed diverse approaches to capturing and retaining market share with their target demographic — quite assuredly while using modern retail technologies that help develop and execute on competitive strategies.

    As retailers move into the Christmas sales phase it will be fascinating to discover how they are evolving their ability to dynamically change pricing, refresh product categories and focus their shopper promotions.

    Visit our website, if you’re interested in DataWeave’s technology and how we provide Competitive Intelligence as a Service to retailers and consumer brands.


  • [INFOGRAPHIC] Thanksgiving vs Black Friday vs Cyber Monday: The Electronics Price War Heats Up

    [INFOGRAPHIC] Thanksgiving vs Black Friday vs Cyber Monday: The Electronics Price War Heats Up

    Alibaba may have raked in some $25 billion on Singles’ Day in the largest one-day sales turnover ever. In the Western world, however, Black Friday remains an economic force.

    This Black Friday, American shoppers spent a record $5 billion online in just 24 hours, representing a 16.9 percent increase in dollars spent online compared with last year.

    The sale period, though, comprises of Thanksgiving Day and Cyber Monday as well — each generating over a billion and half dollars in online sales this year.

    Cyber Monday has especially been a popular day for buying online, as people head back to work after the long weekend, making a physical visit to the stores to pick up deals less manageable during the day.

    However, the idea of the Thanksgiving weekend as a single shopping event was laid to rest this year.

    It’s Now Black November

    Online sales from November 1st through the 22nd totalled almost $30.4 billion this year, driven by deals available throughout the month on eCommerce platforms. In fact, every single day in November so far saw over $1 billion in online sales, creating a new paradigm for both shoppers and retailers, in stark contrast to the brick-and-mortal retail driven Black Friday sale events of the past.

    Several online retailers began offering attractive discounts from the beginning of November, specifically on “Black Friday Deals” pages of their websites.

    At DataWeave, using our proprietary data aggregation and analysis platform, we have been tracking, through November, pricing and product information of the Top 500 ranked Electronics products across 10 products types on Amazon, Walmart, Target, Best Buy, and New Egg.

    (Read also: Black Friday Sales Season: How US Retailers Are Gearing Up)

    We also took a few snapshots of the products and discounts offered on the “Black Friday Deals” pages of Amazon and Walmart. We saw both websites offering deep absolute discounts in Electronics (40.1 percent on Amazon, 30.4 percent on Walmart) on over 400 products each day.


    Moreover, these discounts weren’t restricted to static product sets. 73.2 percent (Amazon) and 30.6 percent (Walmart) churn of products was observed on these pages each day, providing shoppers with a steady stream of attractive discounts on new products every day.

    Our major focus, though, was to compare the three main sale days of the Thanksgiving weekend. We performed an in-depth analysis of discounts offered across product types and brands, as well as how dynamic retailers were in both the pricing and products displayed — all of these, across Thanksgiving (11.23), Black Friday (11.24) and Cyber Monday (11.27).

    We looked specifically only at additional discounts offered on each of the days of the sale, compared to before the sale (represented by products and its prices on 11.21).

    Overall, we discovered that the level of discounts, together with the number of products they were offered on, does not change dramatically across all 3 days. Some exceptions include –

    • Higher number of additionally discounted products on Amazon and Walmart on Cyber Monday
    • Lower additional discounts offered by Best Buy on Cyber Monday
    • Lower number of products additionally discounted on New Egg on Thanksgiving and Black Friday.

    Discounting strategies across most retailers converged on significant discounts on Pendrives, Smartwatches, DSLR Cameras, and Mobile Phones, while some of the top brands that offered attractive discounts include Apple, Fossil, Canon, Nikon, Sandisk, and HP — across a range of product types.

    While the average selling price (indicative of how premium the product mix is) for each retailer did not change significantly across each of the featured sale days, there was some variation at a product type level, with Laptops and Digital Cameras displaying some variation in average assortment value across Target, Walmart, and New Egg.

    Perhaps the most interesting insight provided by the analysis is just how different each retailer is in its approach to changing its prices. Over the entire week (11.21 to 11.27), Amazon made over 3,600 price changes on over 50 percent of its consistently-top-ranked products. Compare that to Target’s 289 price changes on 30 percent of its products.

    While the average magnitude of price change on Amazon is 27 percent, Best Buy has been far more aggressive with the magnitude of its price adjustments (47 percent), even if it has implemented fewer price changes. Amazon clearly leads the industry here, with its continual focus on employing advanced retail technologies that enable automated, optimized price changes designed to ensure its products are competitively priced.

    How Strategic Is Retail Pricing?

    Another aspect DataWeave explored was whether e-retailers sometimes increase their prices in the lead-up to a sale, only to reduce them during the sale, enabling them to advertise larger discounts. We did observe that all e-retailers effectively increased their prices on a discrete and small set of products prior to their sale. For the purposes of our analysis, price increases before the sale was calculated as an increase in price between 11.14 and 11.21.


    Highlights of our analysis include the discovery that Best Buy increased its prices in Electronics significantly on a small selection (3.5 percent) of its product range prior to the sale, only to reduce those prices immediately during the Thanksgiving weekend sale.

    While Amazon proved not to be as aggressive in the magnitude of this activity as Best Buy, this phenomenon was observed across a larger portion of Amazon’s assortment (6.7 percent)

    Online is Now More Important Than Ever

    While the legend and aura of past Black Friday sale events, complete with long overnight queues and highly publicized stampedes, is ebbing away, in lock-step with the dwindling numbers of store footfall this year (down 2 percent), the Thanksgiving sale season is set for a new transformation, following the growing number of shoppers preferring to shop online.

    A survey by the National Retail Federation found that 59 percent of shoppers plan to shop online this year, marking the first time that online has emerged as the most popular choice for America’s shoppers.

    With an extended sales season to offer discounts, and moving into Christmas, it has become increasingly important for retailers to monitor and react dynamically to their competitors’ pricing, product and promotional activities. Without the ability to track, react, and tweak in real time, retailers risk having their competitive position eroded, dramatically impacting both sales and retail margins.

    Leading eCommerce retailers such as Amazon, and evolving retailers like Walmart have embedded these systems into their overarching strategy and operations, while others are condemned to play catch up.

    As this fascinating cycle of the sale season ends, and retailers crunch their numbers to assess their comparative performance, sights are now set on Christmas to extend this sale extravaganza.

    Visit our website, if you’re interested in DataWeave’s technology and how we provide Competitive Intelligence as a Service to retailers and consumer brands.


  • Walmart’s Online Pricing Analysis | DataWeave

    Walmart’s Online Pricing Analysis | DataWeave

    In an increasingly competitive retail landscape and facing intense margin pressures, improving the profitability of online commerce is a growing area of focus for all retailers.

    When Amazon acquired Whole Foods in August, several media outlets and analysts speculated whether there would be a slashing of prices across the board. Instead, Amazon lowered prices only on those items that it knew would drive increased traffic to the stores, resulting in a 25% increase in footfall the first 30 days after the acquisition closed.

    (Read also: Amazon’s Whole Foods Pricing Strategy Revealed)

    Disrupting the Status Quo

    Walmart has now announced a shift in its online pricing to draw more shoppers to purchase from its brick-and-mortar stores and save on shipping costs.

    Sarah Nassauer wrote an interesting article for the Wall Street Journal recently, outlining Walmart’s online pricing strategy and its approach to pricing its products differently between its online and offline stores.

    Sarah reports, “Walmart wants to charge customers more to buy some products online than in stores, part of the company’s efforts to boost profits and drive store traffic as it competes with Amazon.”

    What’s interesting is Walmart’s move to display the lower offline store prices on its website for some grocery products, nudging shoppers to drive down to the nearest Walmart store.

    Again, Walmart did not raise prices for all items but only a few, select food and household items, “including boxes of Kraft Macaroni & Cheese, Colgate toothbrushes and bags of Purina dog food, according to people familiar with the matter and comparisons between online and in-store prices.”

    The article goes on to state that, “[T]he move is unusual for Walmart, which has long honed an ‘everyday low price’ message and has worked to keep online prices at least as low as shoppers find in its 4,700 U.S. stores. Walmart e-commerce workers responsible for product sales have been instructed to boost profits along with sales, according to the people familiar with the situation, and are ‘no longer obligated to follow store pricing.’”

    This move indicates a greater focus on online-to-offline (O2O) strategies by the world’s largest retailer in an effort to cut down on the crippling costs of transport operations and logistics. According to a cost analysis by consultants Spend Management Experts, “A $1.28 box of Kraft Macaroni & Cheese could cost a big retailer around $10 to ship from Chicago to Atlanta, depending on how remote the buyer’s address is . . . A smaller retailer would likely pay about double.”

    With this news, the days of providing the same price online and in stores are over, setting a precedent and reflecting important differences in costs and competitor capabilities.

    But how did Walmart know which items to focus on for lowering (or raising) prices?

    Cutting-Edge Competitive Intelligence Solutions

    Did Walmart pick items at random or guess? Not likely. With recent enhancements in competitive intelligence and data analysis solutions, the era of guesswork, gut-fuelled decisions, and manual number crunching is over.

    In today’s digital economy, actionable competitive intelligence has become a critical component in the transformation of retail. Retailers like Amazon and Walmart use competitive insights to identify categories and items that show the greatest potential for increased shopper interest, sales, and profits, to adjust their prices.

    Competitive intelligence providers like DataWeave provide unique, AI-driven, competitive insights and business recommendations by harnessing and analyzing competitive data from the Web.

    When retailers link these competitive insights and data to their internal pricing and inventory systems, they create a powerful engine that marries internal and external forces to produce highly accurate assortment, pricing, and promotion recommendations, all in near real-time.

    As retailers like Walmart experiment with their pricing and merchandizing across channels, they have come to rely on modern retail technology solutions that continue to evolve to help them reduce operational complexities and yield higher ROI.