Online retailers in the US have enjoyed an impressive turnover during 2018’s Thanksgiving weekend sale. Over the last few weeks, DataWeave has published deep-dive reports on the performance of top US retailers in fashion and consumer electronics during this period, detailing their discounting and product strategies across several product types.
In continuation of our series of articles on the Thanksgiving weekend sale, this article focuses specifically on the top brands across all retailers analyzed.
Read Also:
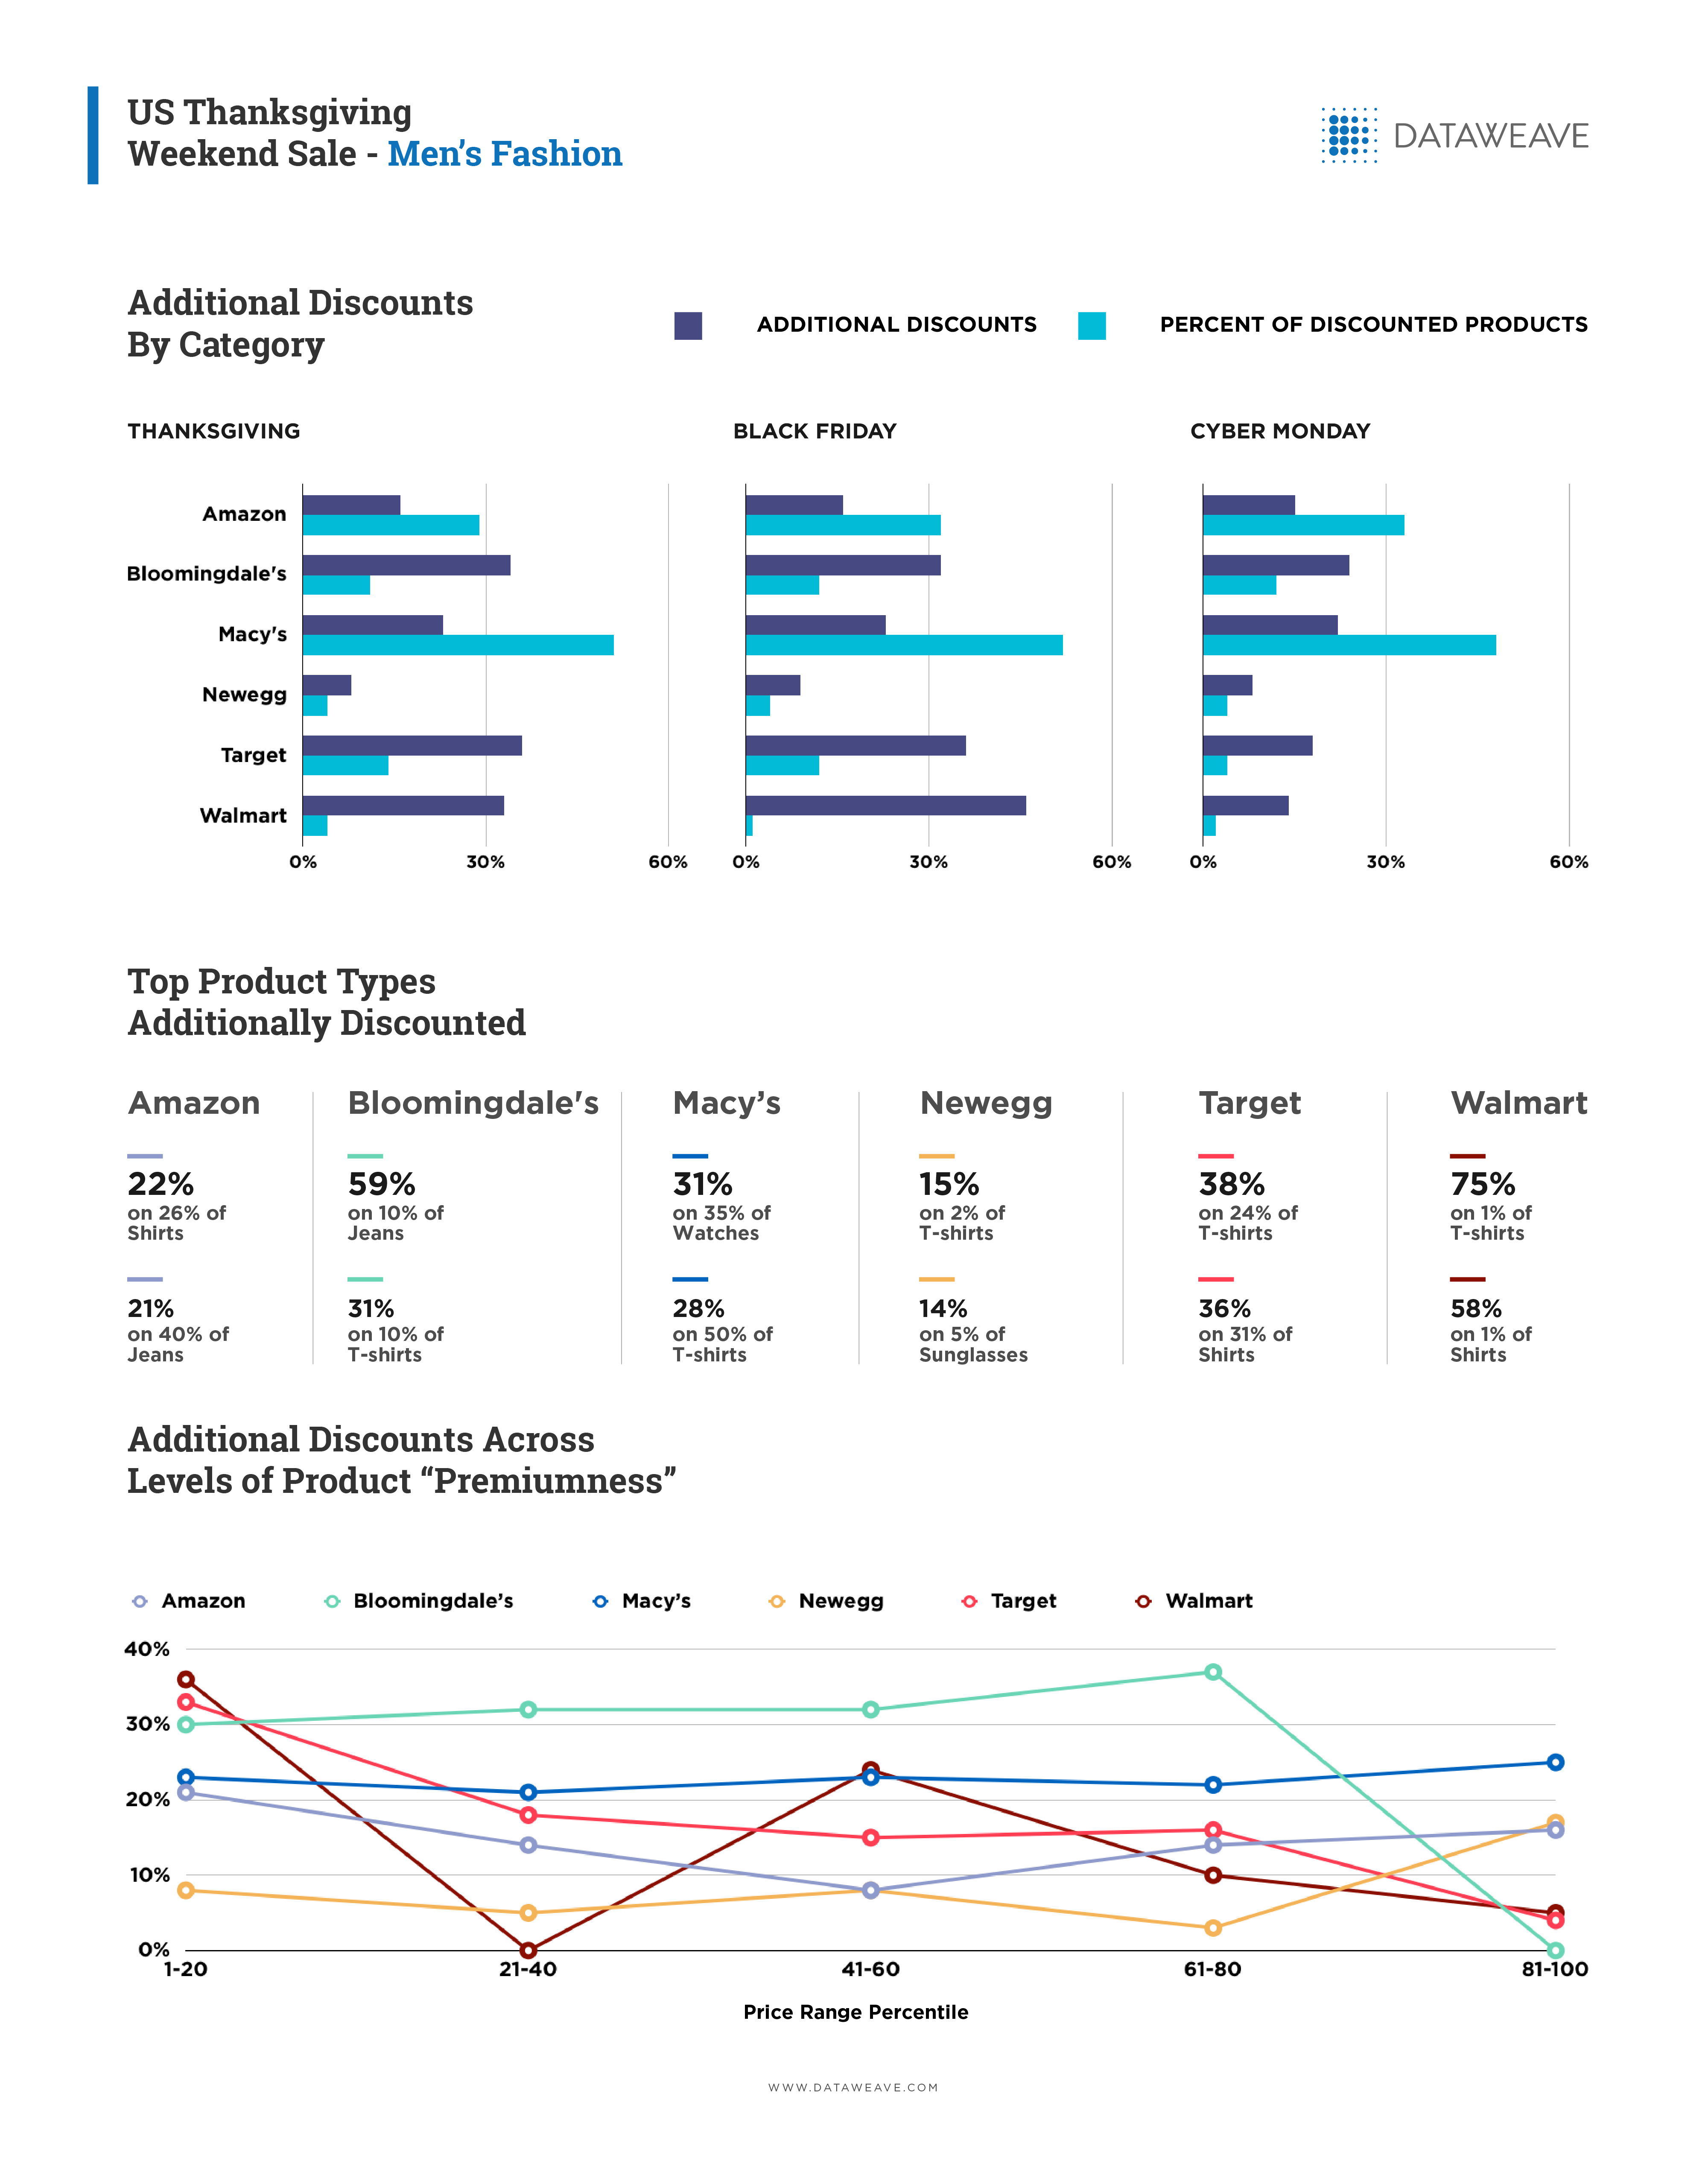
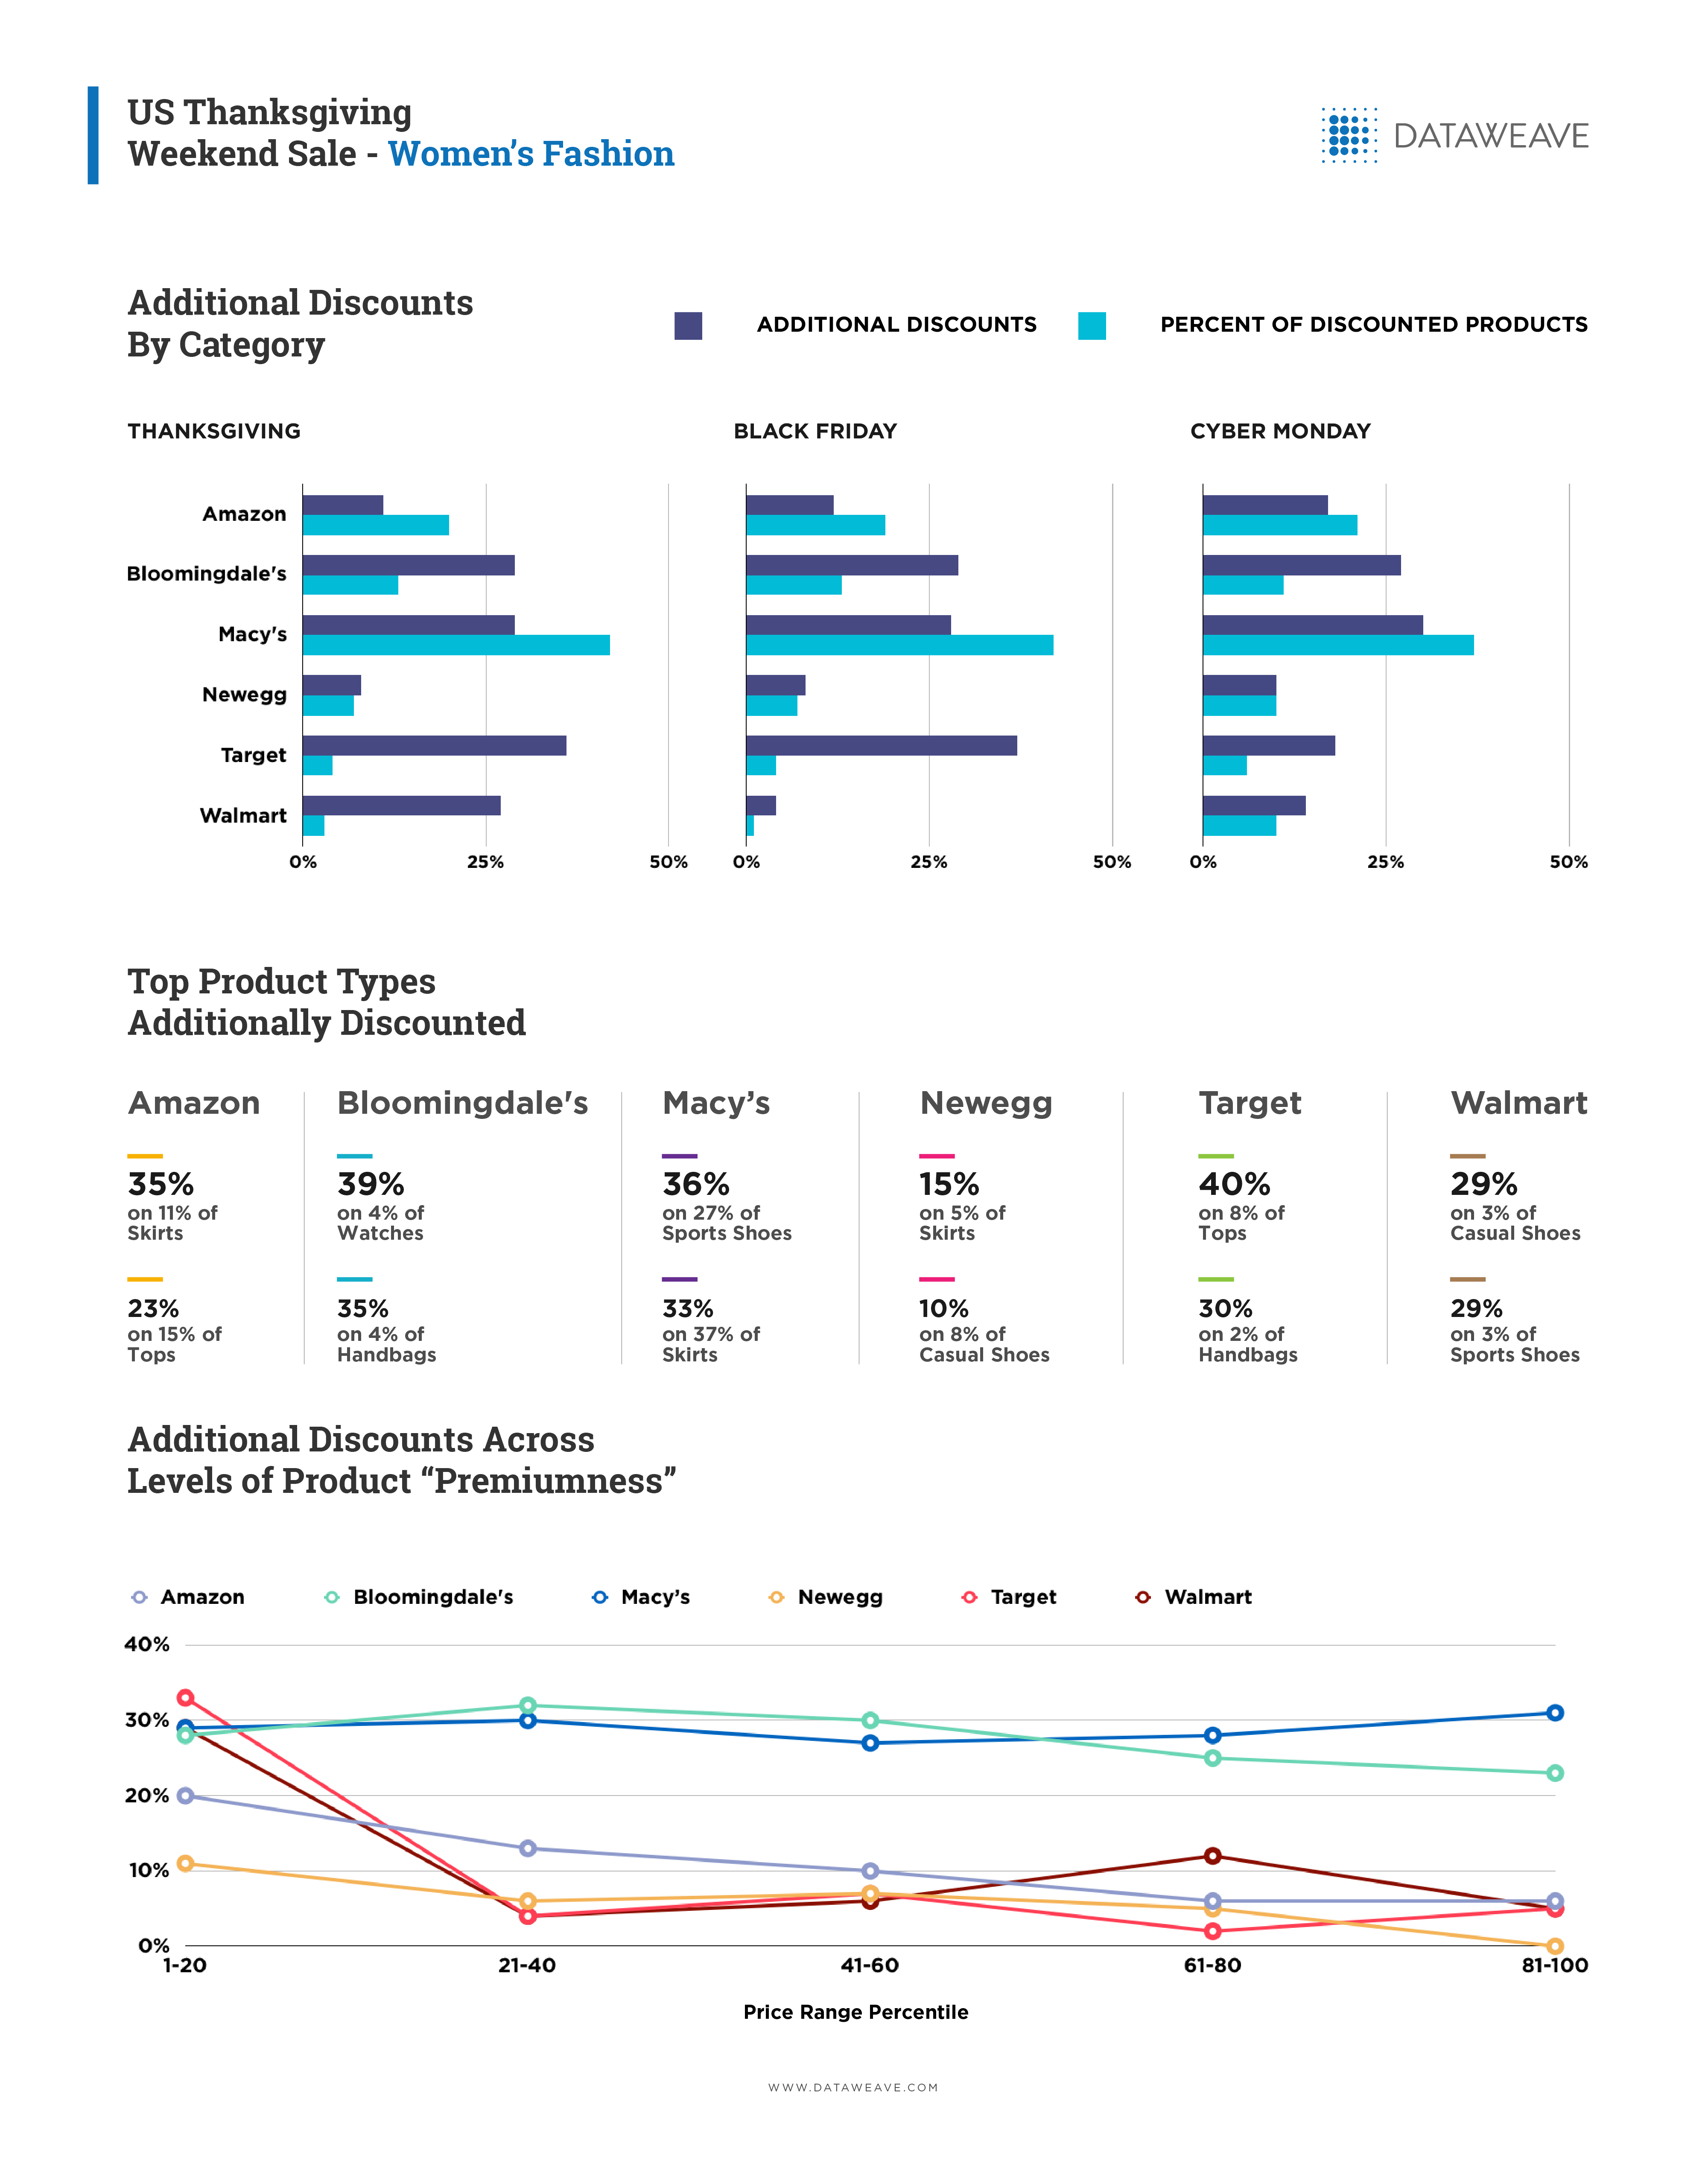
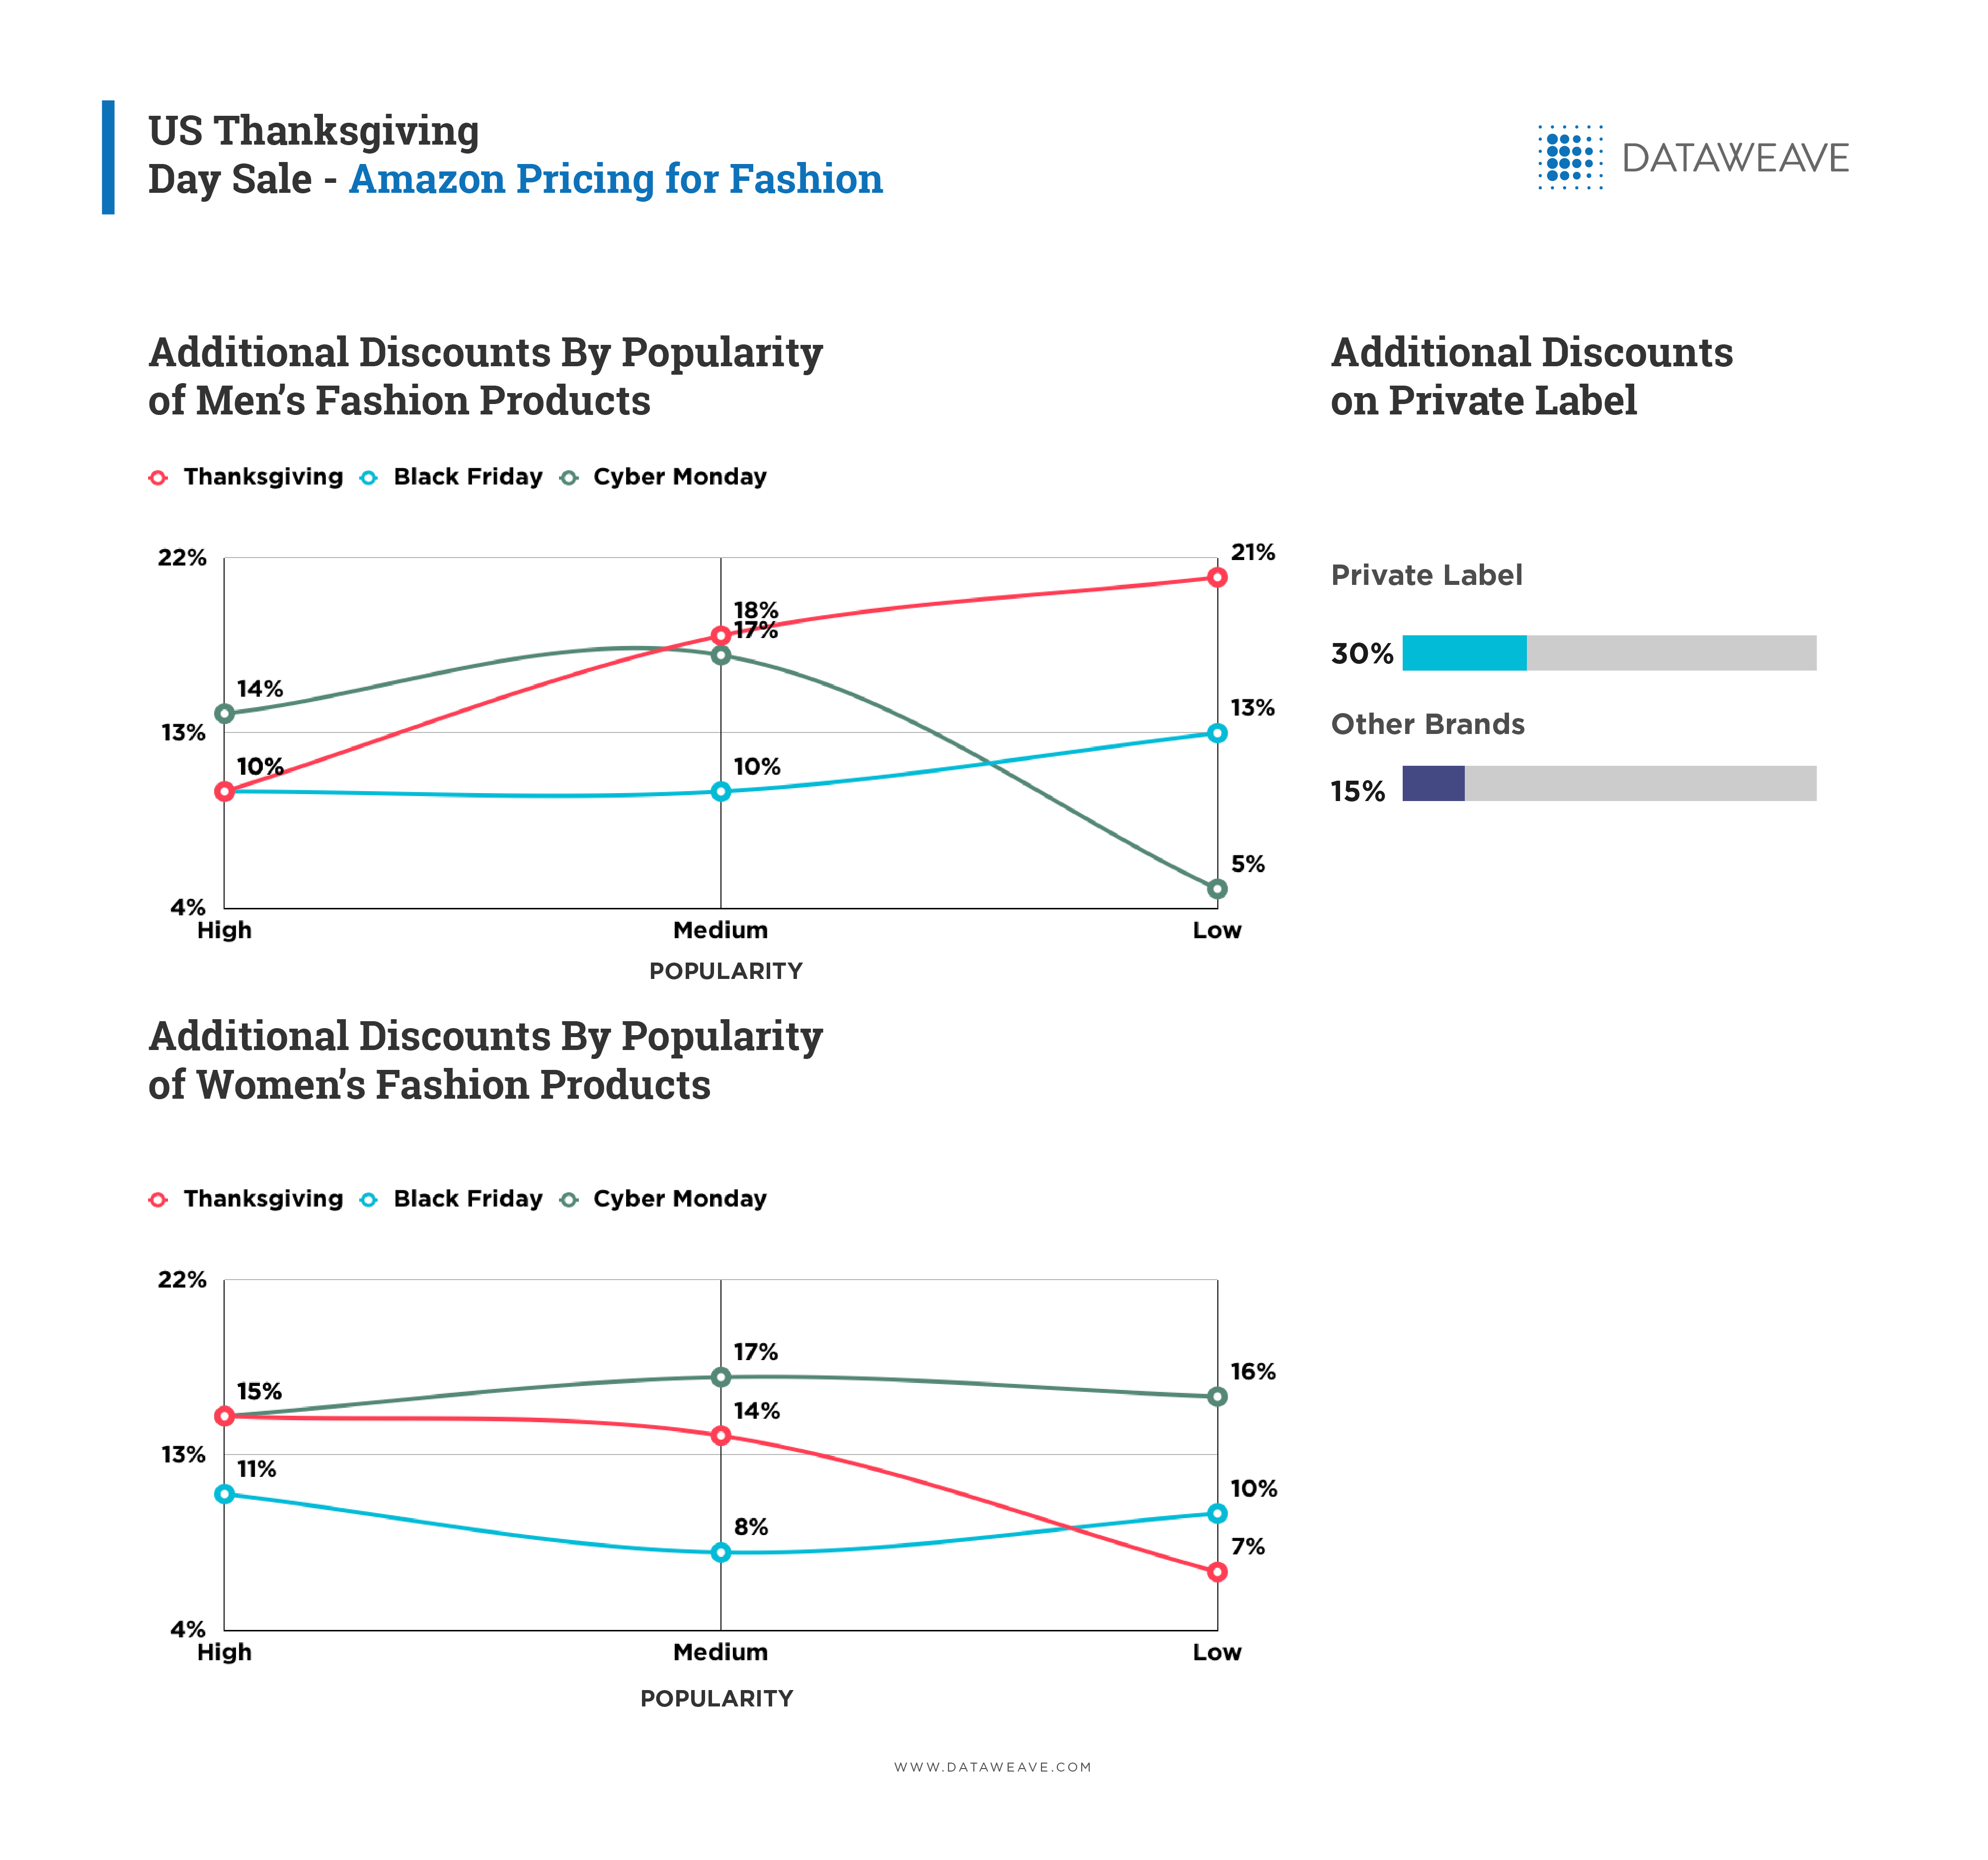
A Study of Fashion Retail Pricing Across Thanksgiving, Black Friday and Cyber Monday 2018
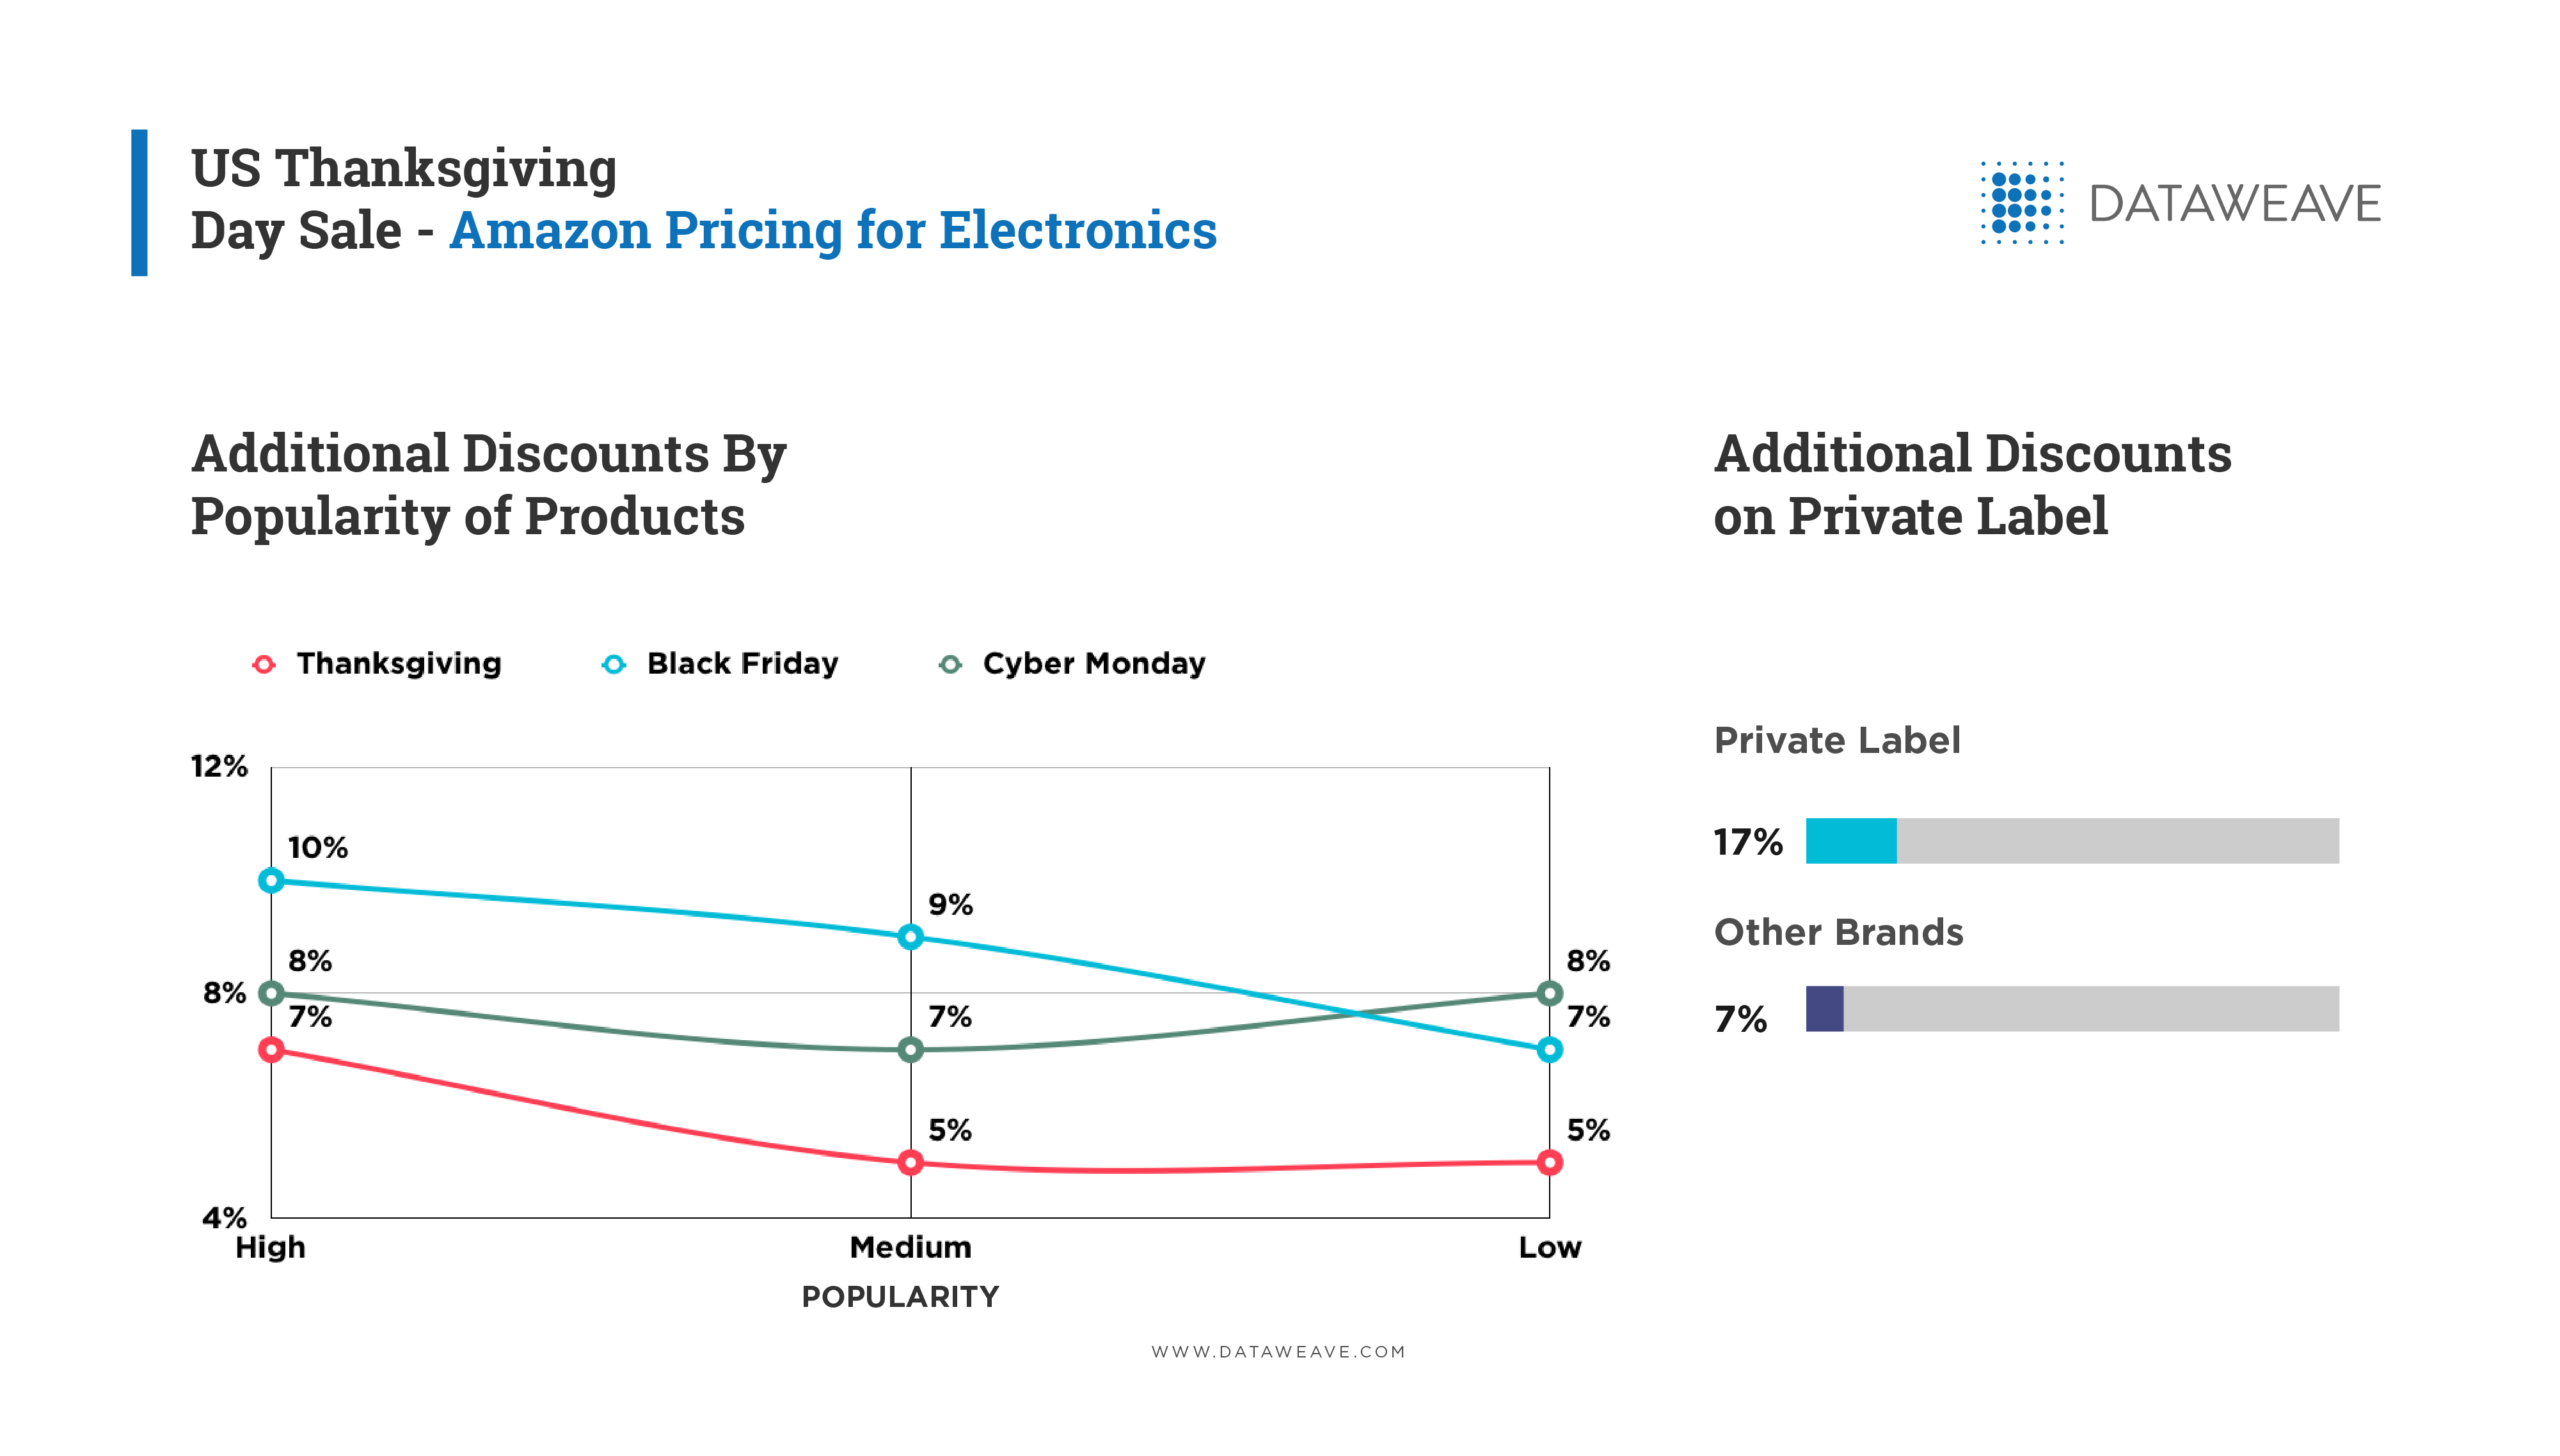
How Consumer Electronics Was Priced Across Thanksgiving, Black Friday and Cyber Monday 2018
While a lot of attention from the media and analysts during these sale events is often focused on the strategies and performance of retailers, the festive sale period is equally vital for consumer brands. Both established brands and new entrants across all categories compete aggressively to gain market share during a period that accounts for a substantial portion of annual sales turnover.
For brands, the two primary drivers of conversion specific to sale events are competitive pricing and prominent brand visibility. At DataWeave, we went about analyzing which brands came out on top across retailers and categories during the Thanksgiving weekend sale, based on these two factors.
Our Methodology
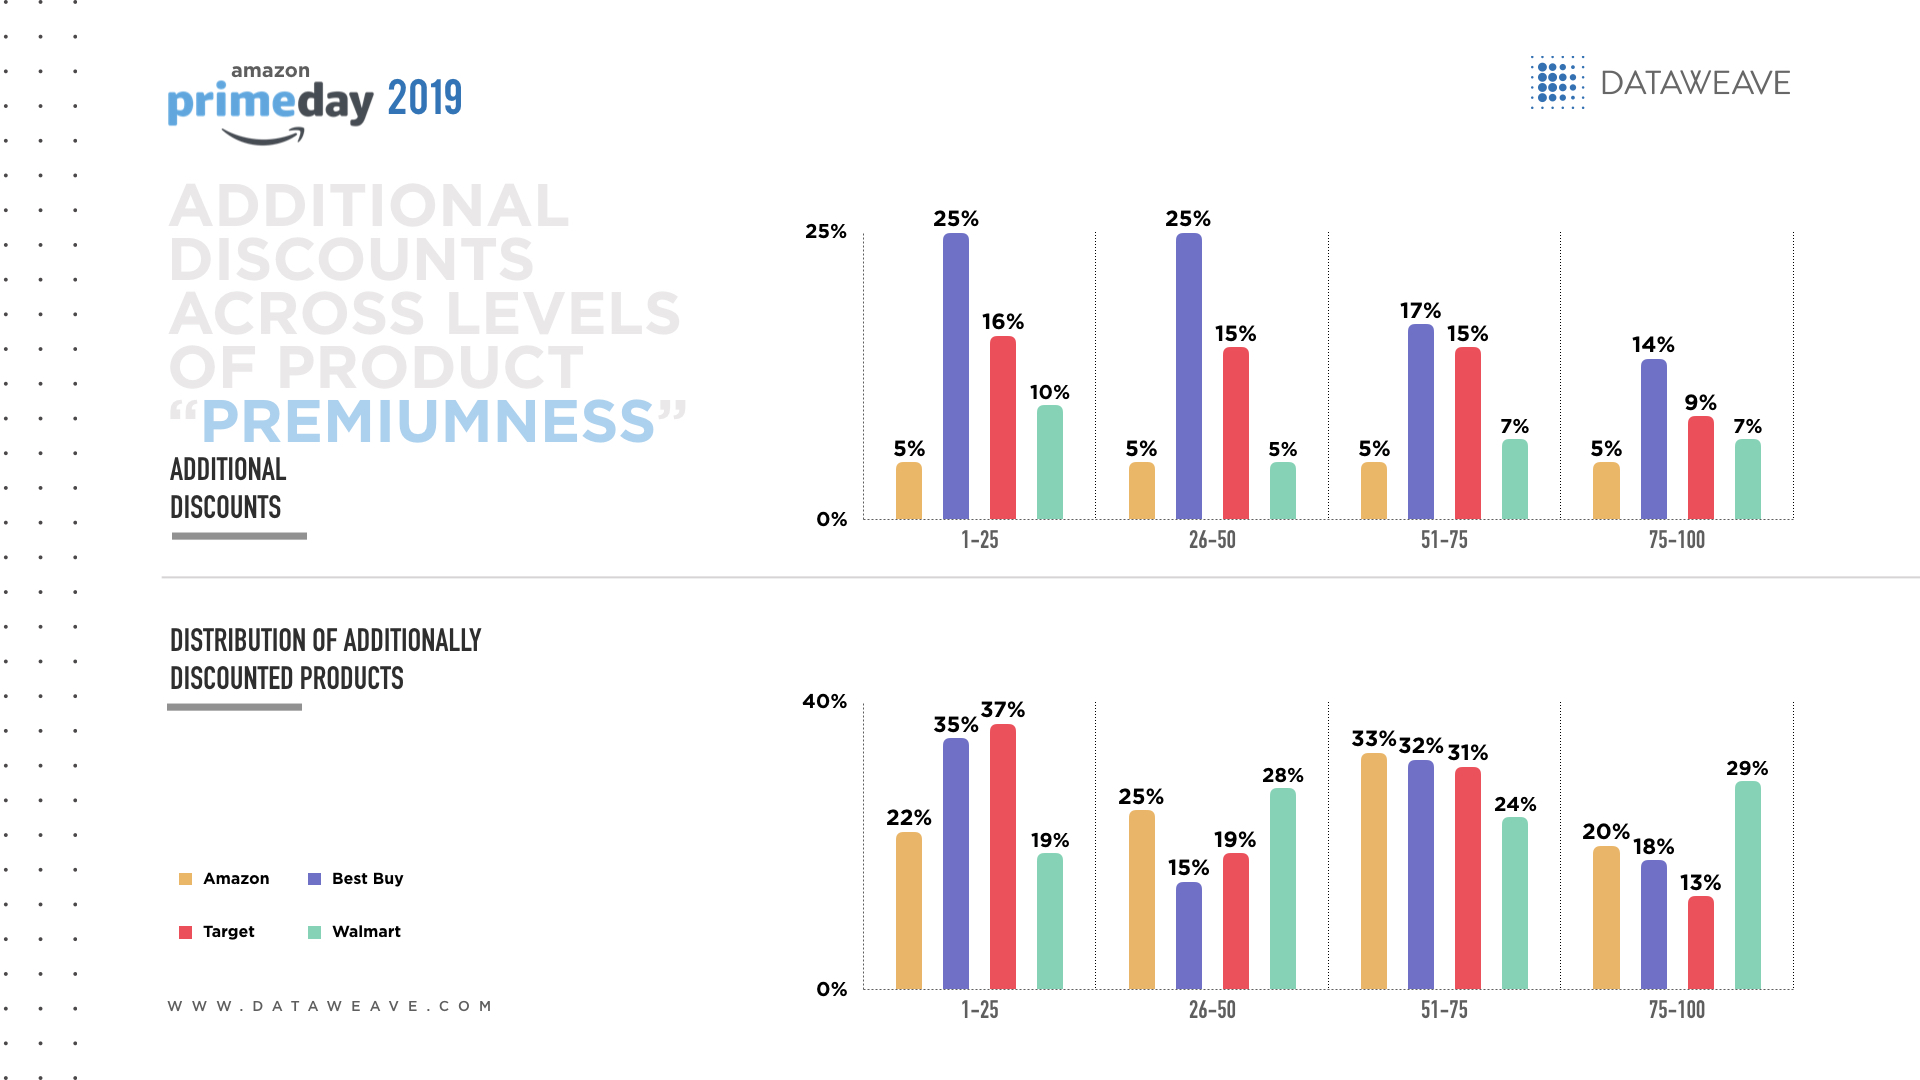
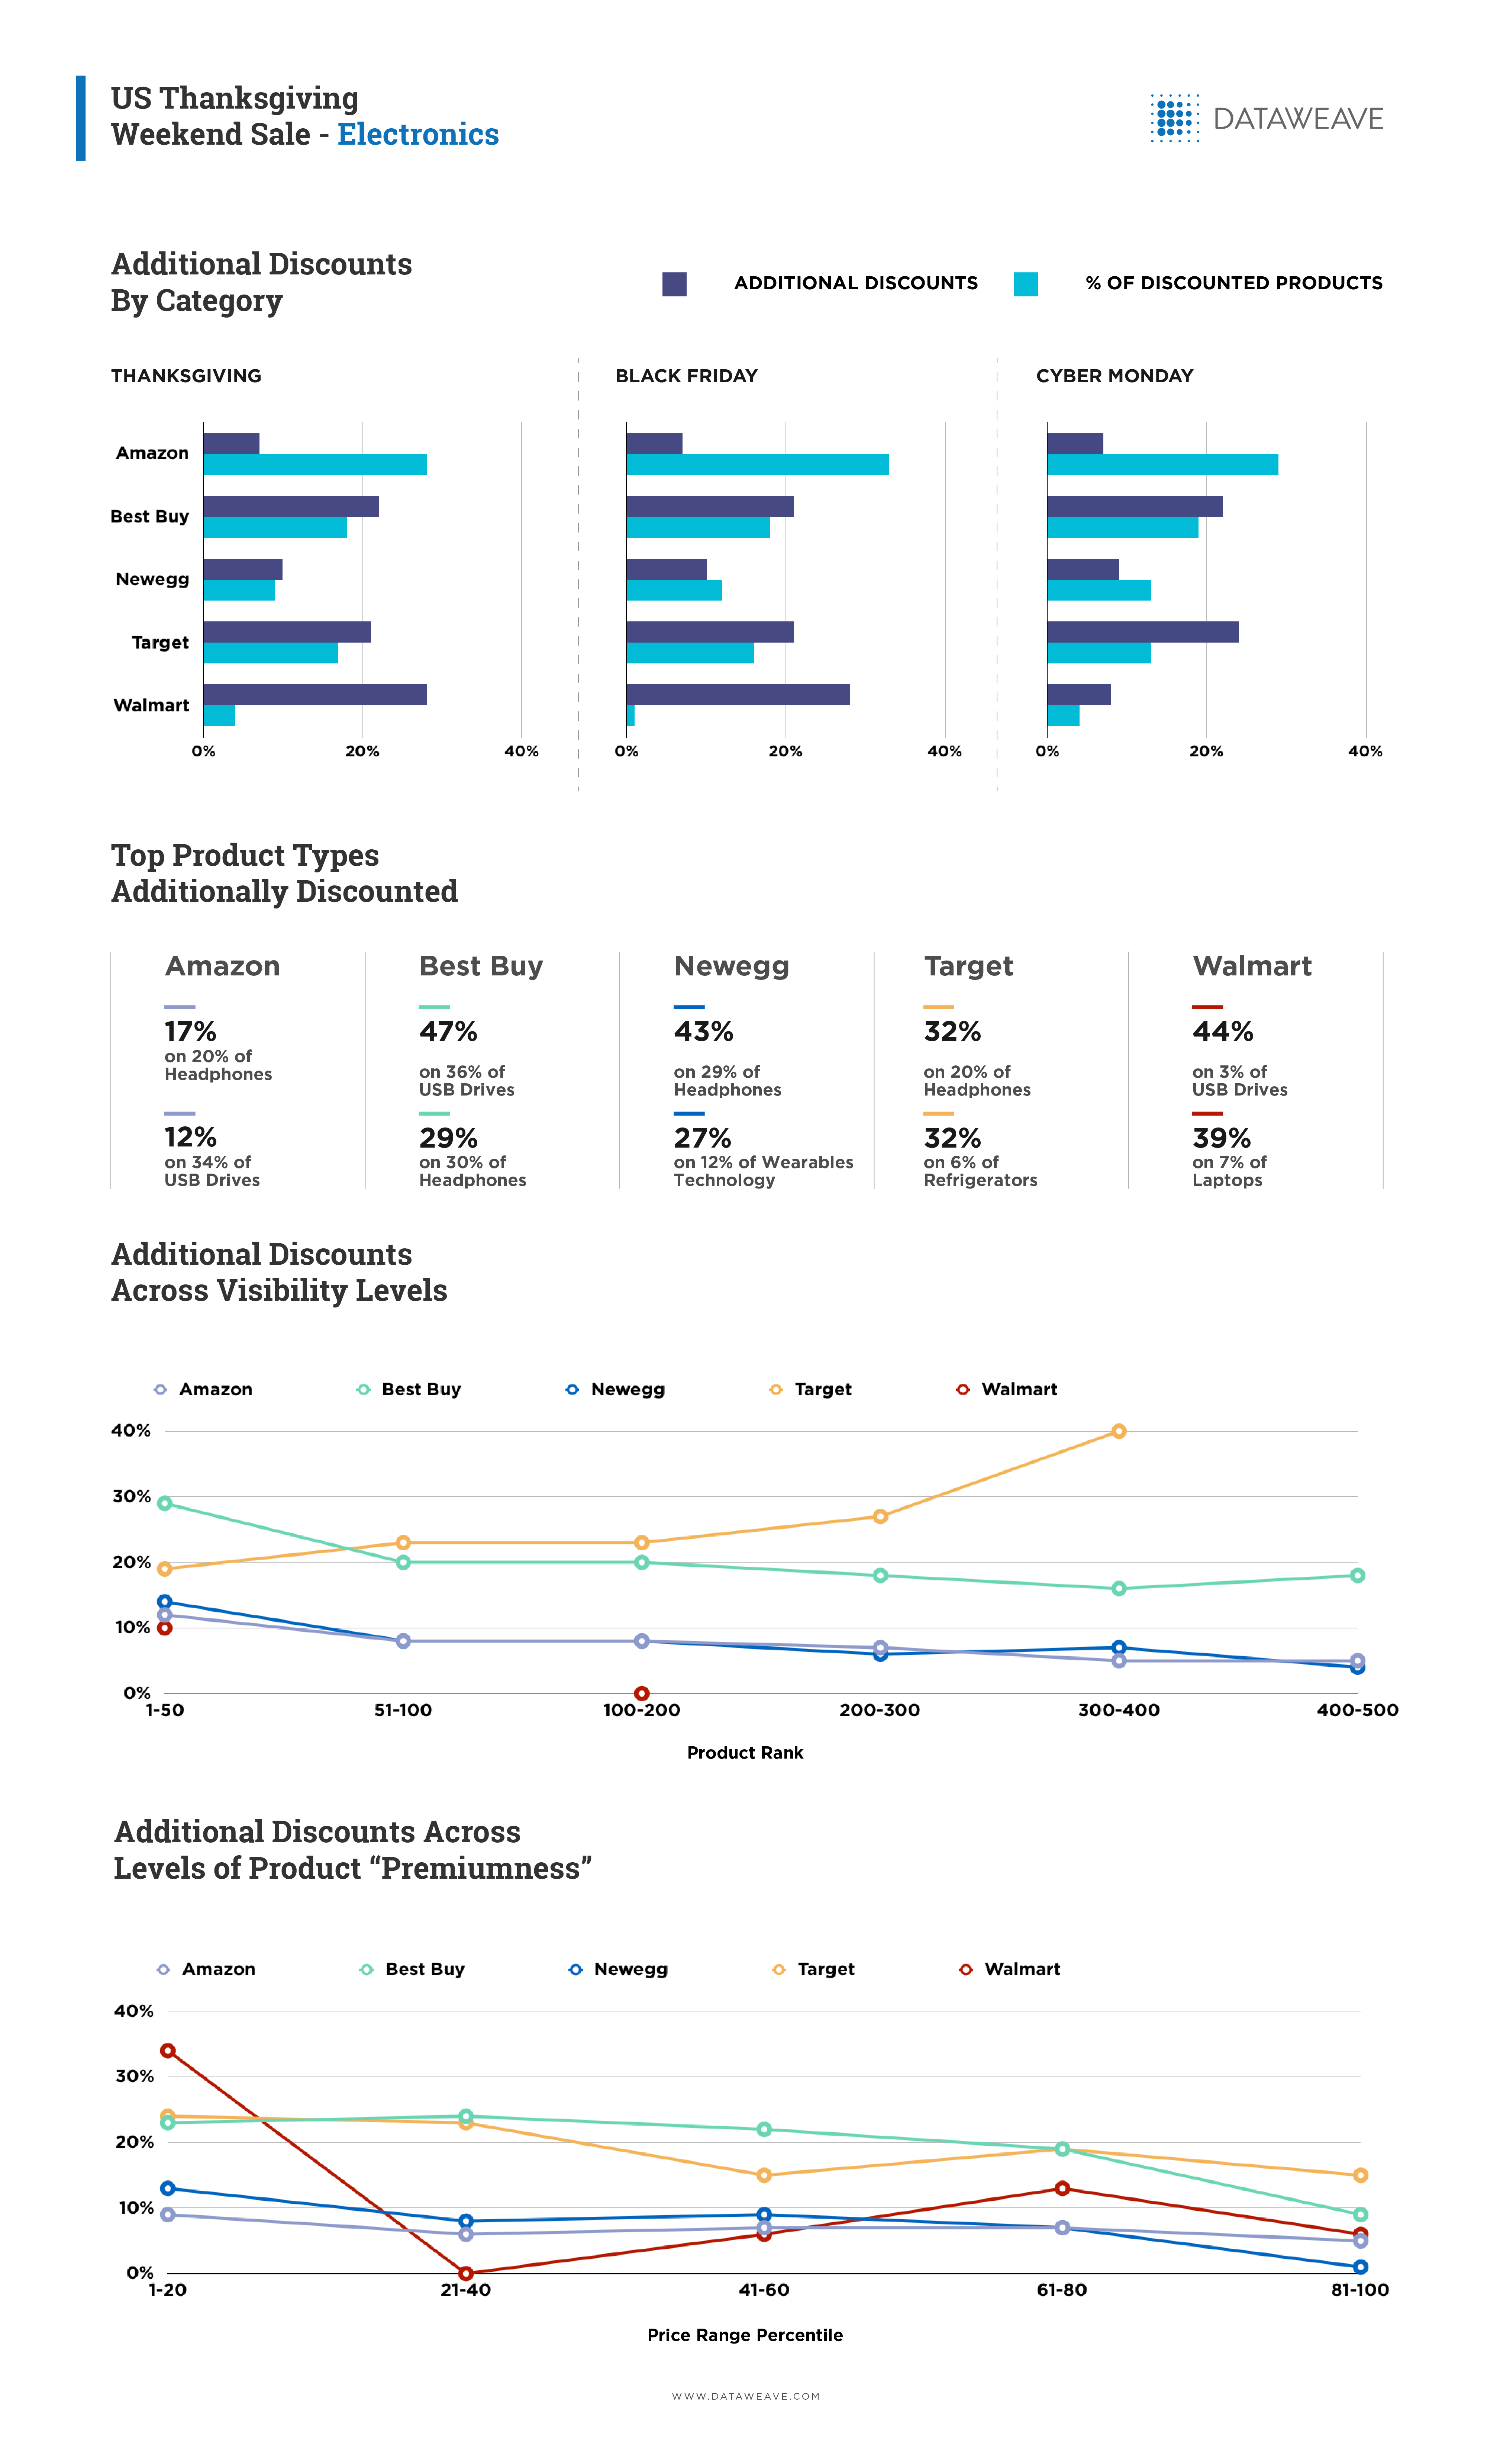
We tracked the pricing of 6 leading fashion retailers and 5 major consumer electronics retailers to study the pricing strategies of brands during the sale events. Our analysis focused on additional discounts offered during the sale period to evaluate the true value of the sale event to customers. To calculate this effect, we compared the pricing of products on Thanksgiving Day, Black Friday and Cyber Monday to the pricing of products prior to the sale commencing. We considered the Top 500 ranked products on 11 product types across Men’s and Women’s Fashion and 11 popular consumer electronics products for this analysis.
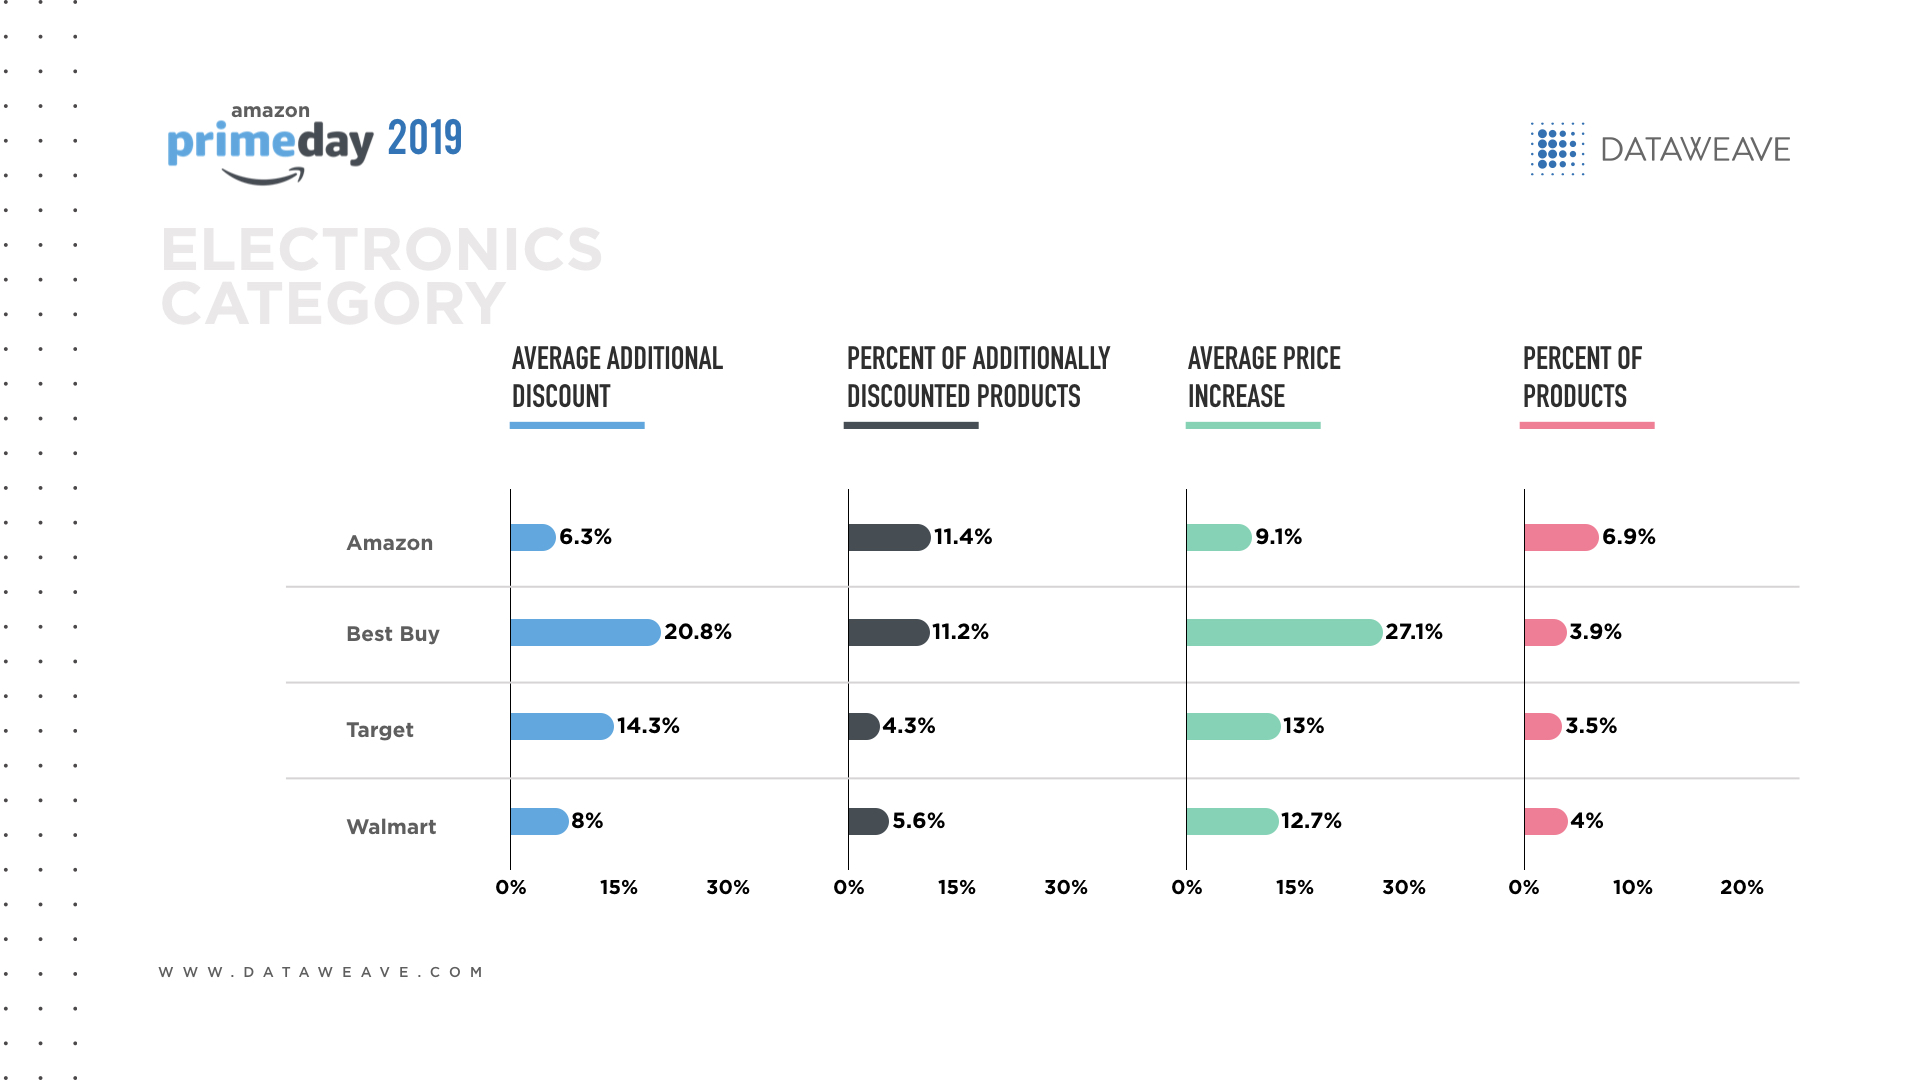
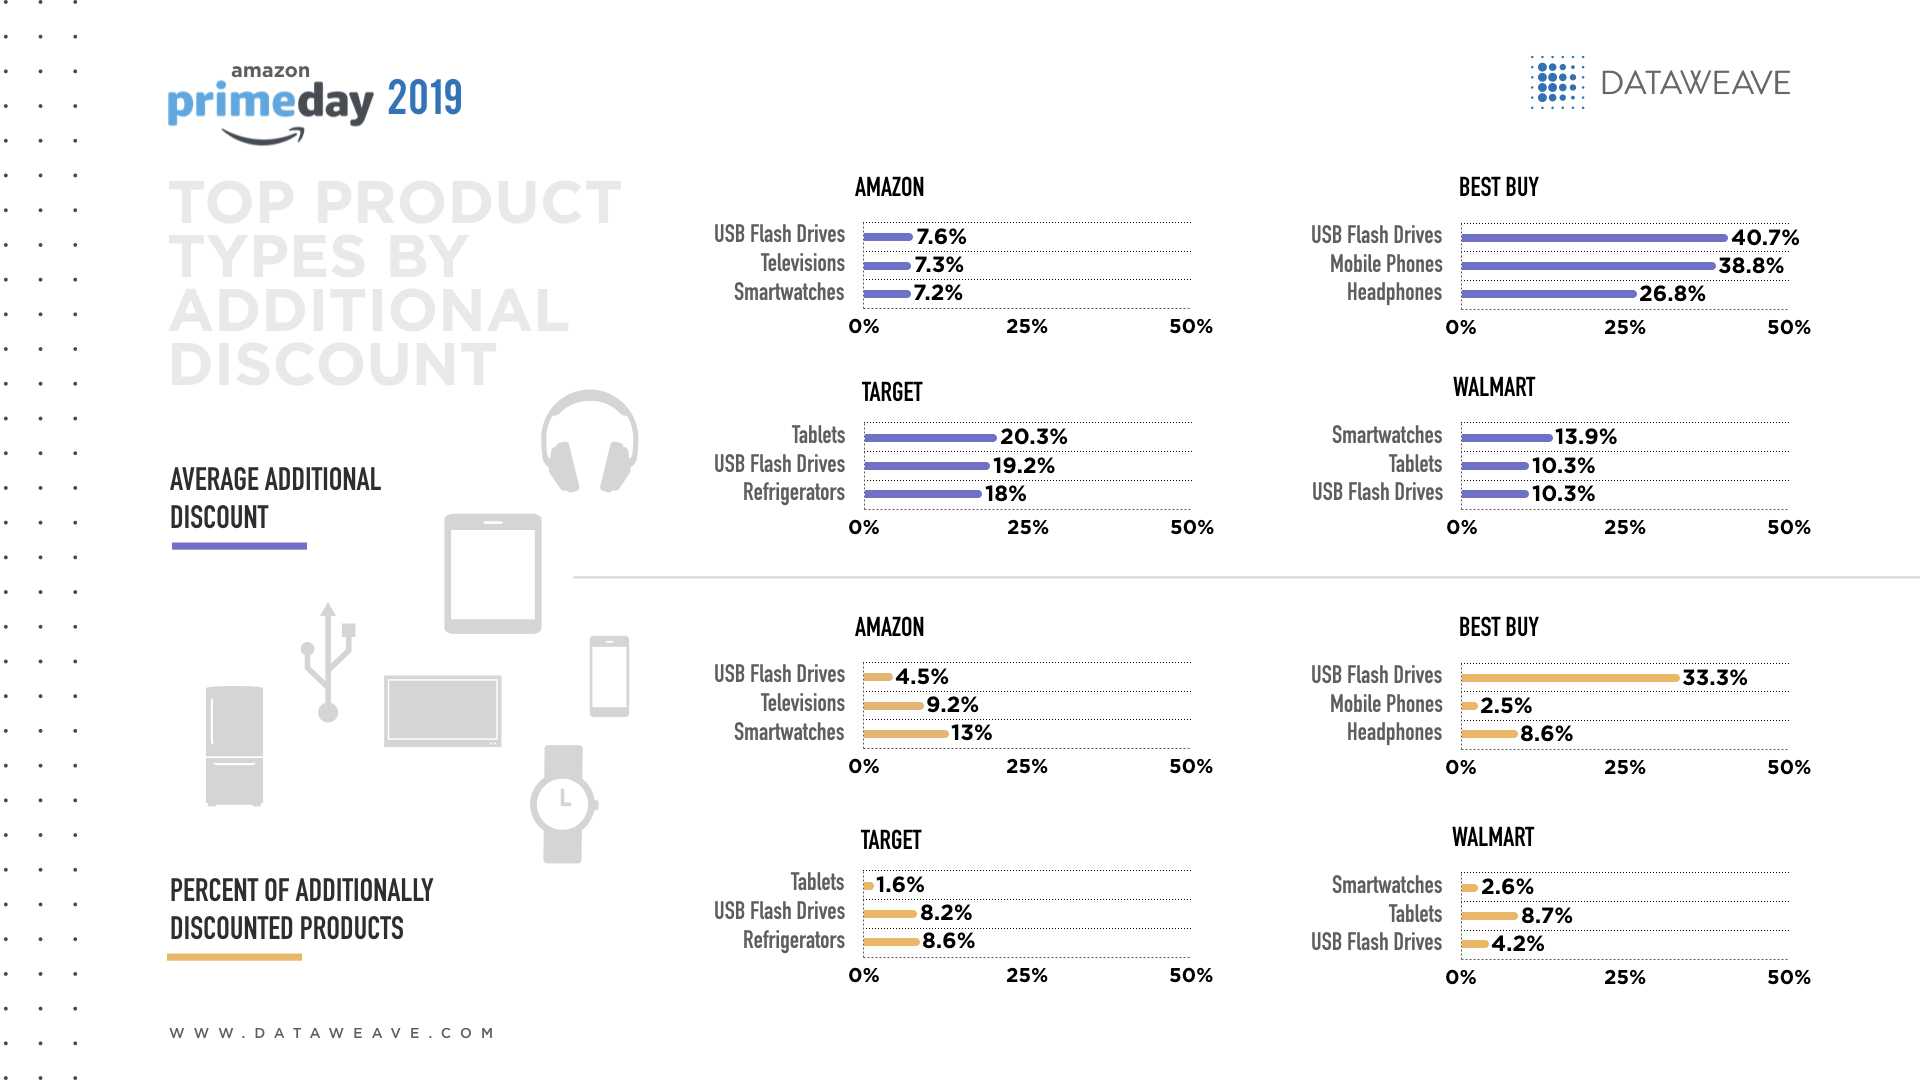
Consumer Electronics Brands
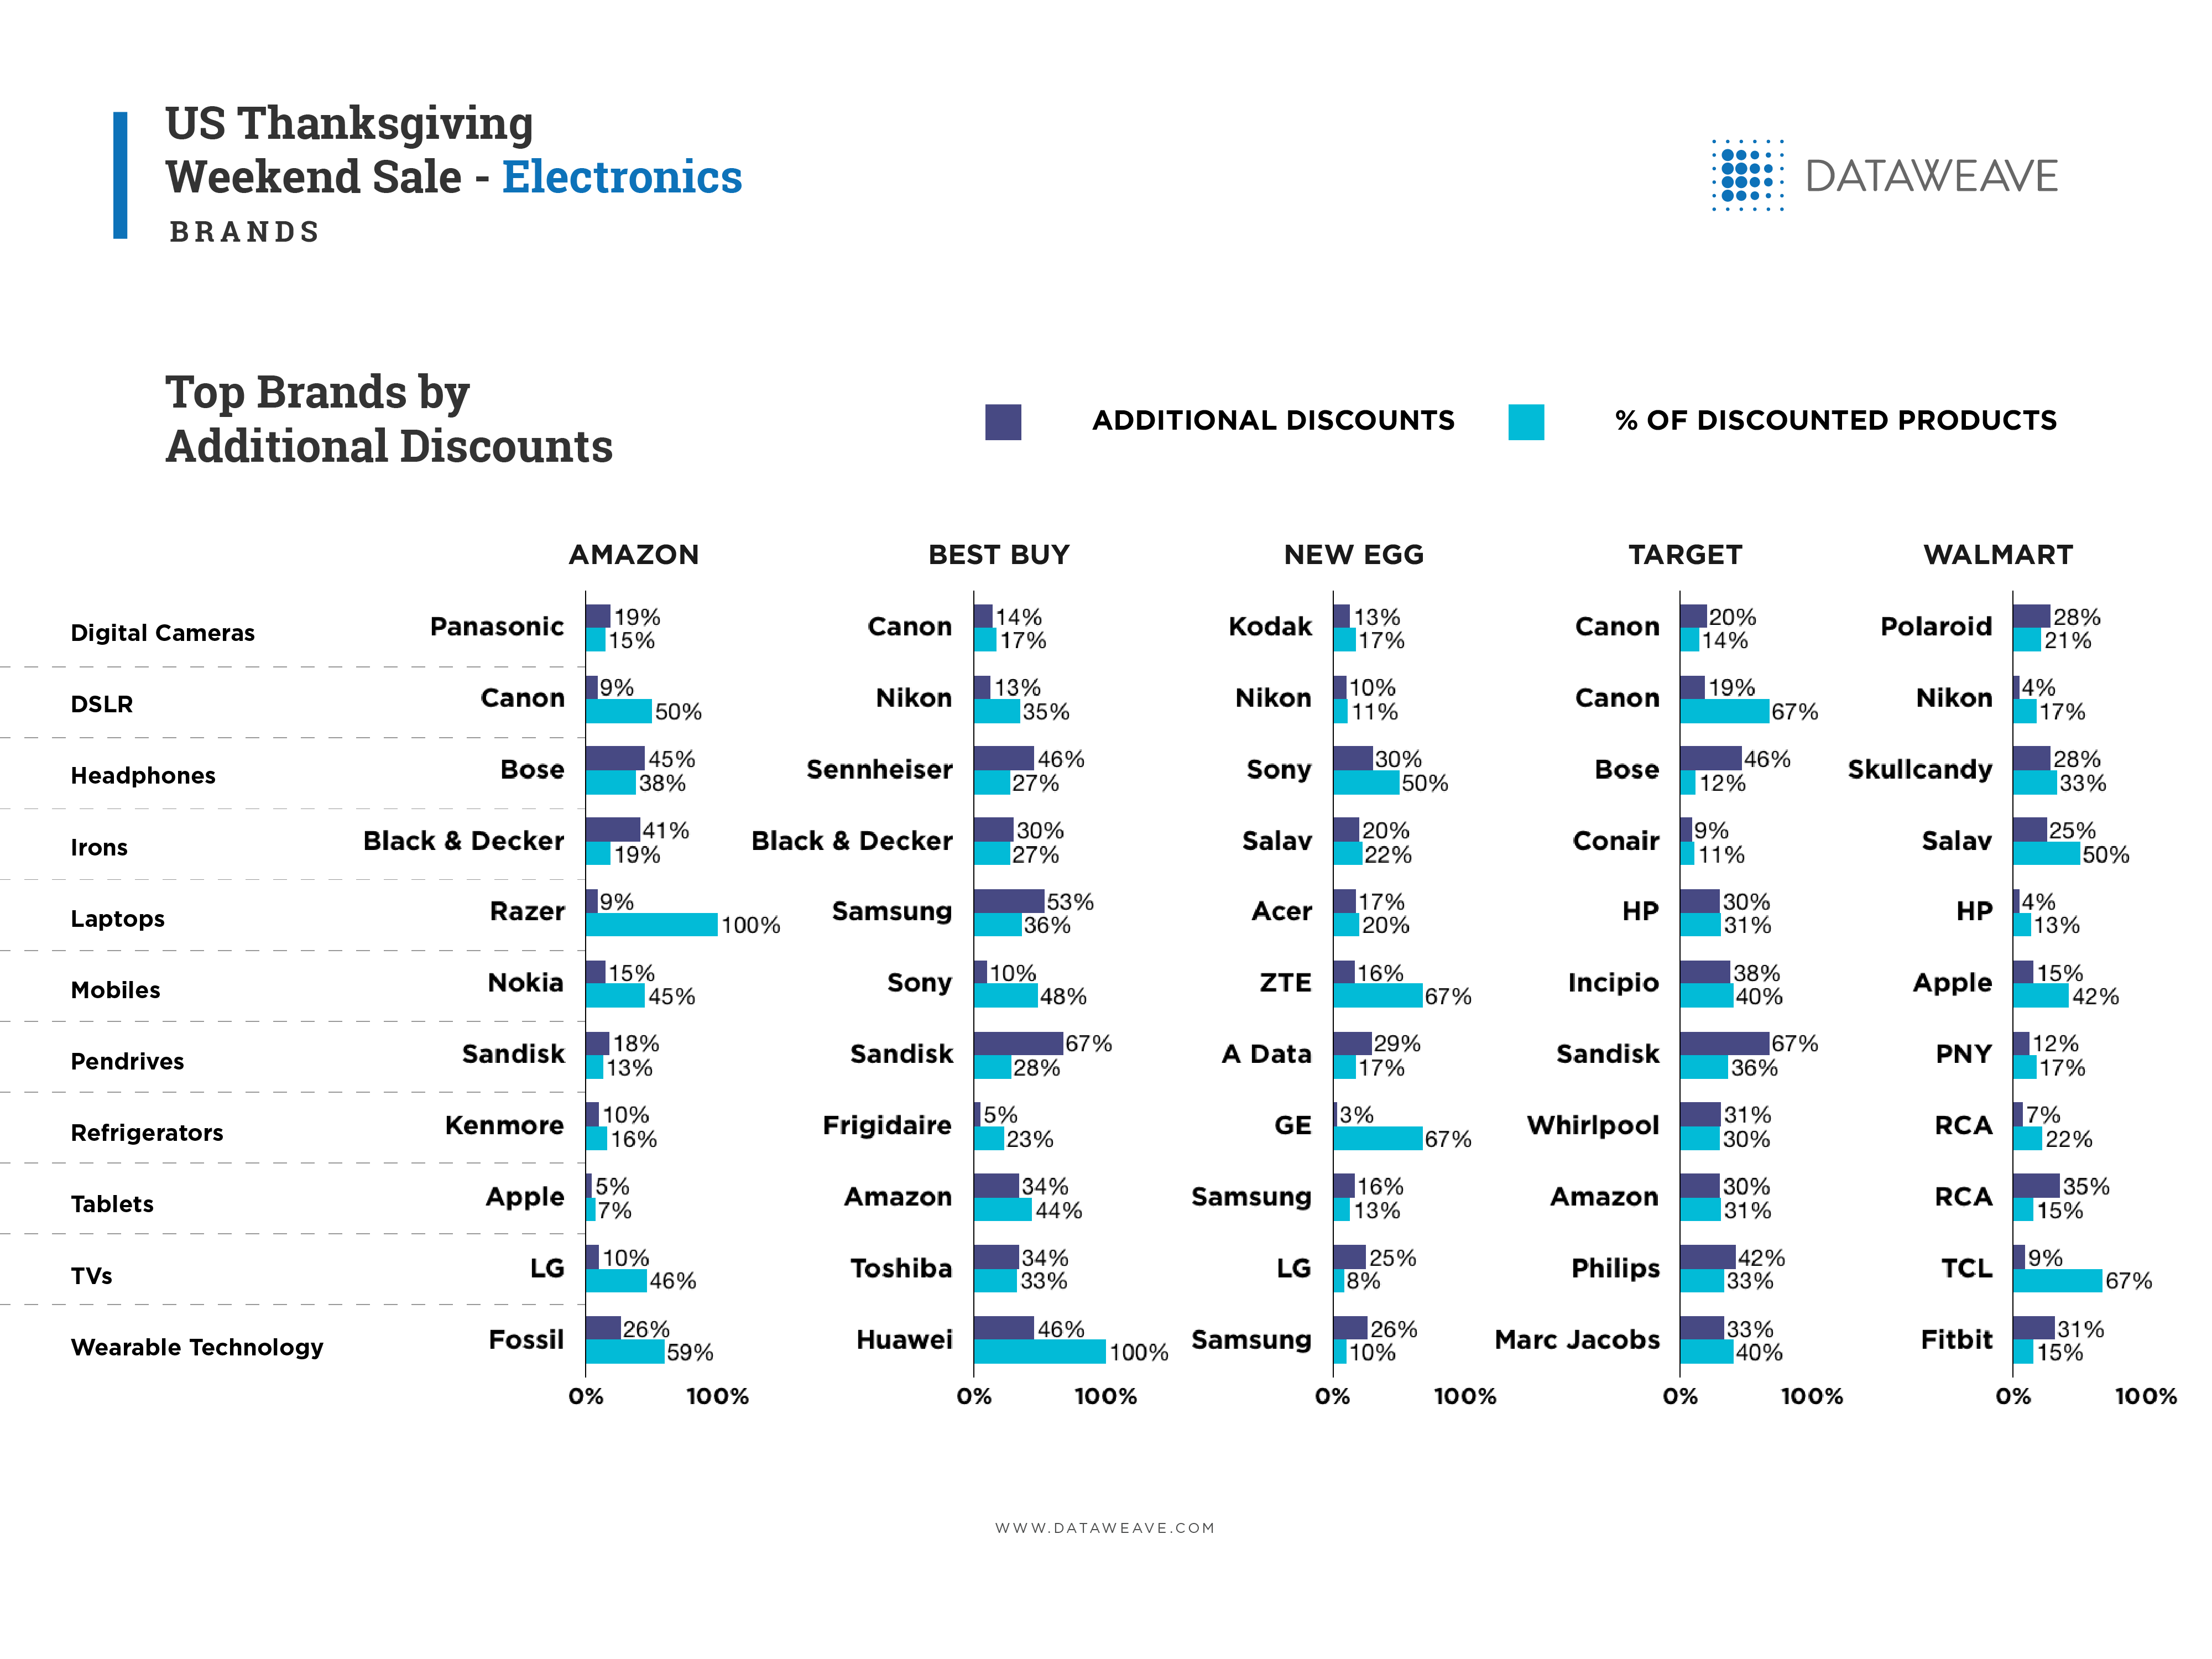
In digital cameras, Canon’s traditional role as a discount leader was on show, featuring on both Best Buy (14%) and Target (20%), the two most aggressive price discounters in consumer electronics. Nikon took Canon’s place in DSLR cameras, for Best Buy (13%), New Egg (10%) and Walmart (4%), albeit at a comparatively low additional discount point.
Razor benefited from Amazon’s strategy of promoting its lower-priced products, promoting a modest 9% additional discount but across its entire range of laptop products. The competitiveness of this category between brands is shown by Samsung’s decision to give an additional 53% discount across 36% of its product line at Best Buy.
The strategic approach brands take with different retailers was illustrated by HP’s 30% additional discount on 31% of its products at Target while over at Walmart, HP had a dire a 4% additional discount on a mere 13% of its products. A similar strategy was employed by LG with its televisions. On Amazon, its TVs had a 10% additional discount applied to 46% of its products, while at New Egg that translated to 25% and 8% respectively.
Among the fast emerging wearables category, under-pressure Chinese firm Huawei dropped an aggressive 46% additional discount on 100% of its product range at Best Buy. By comparison, the next highest in this category was Marc Jacobs at Target with 33% and 40% respectively.
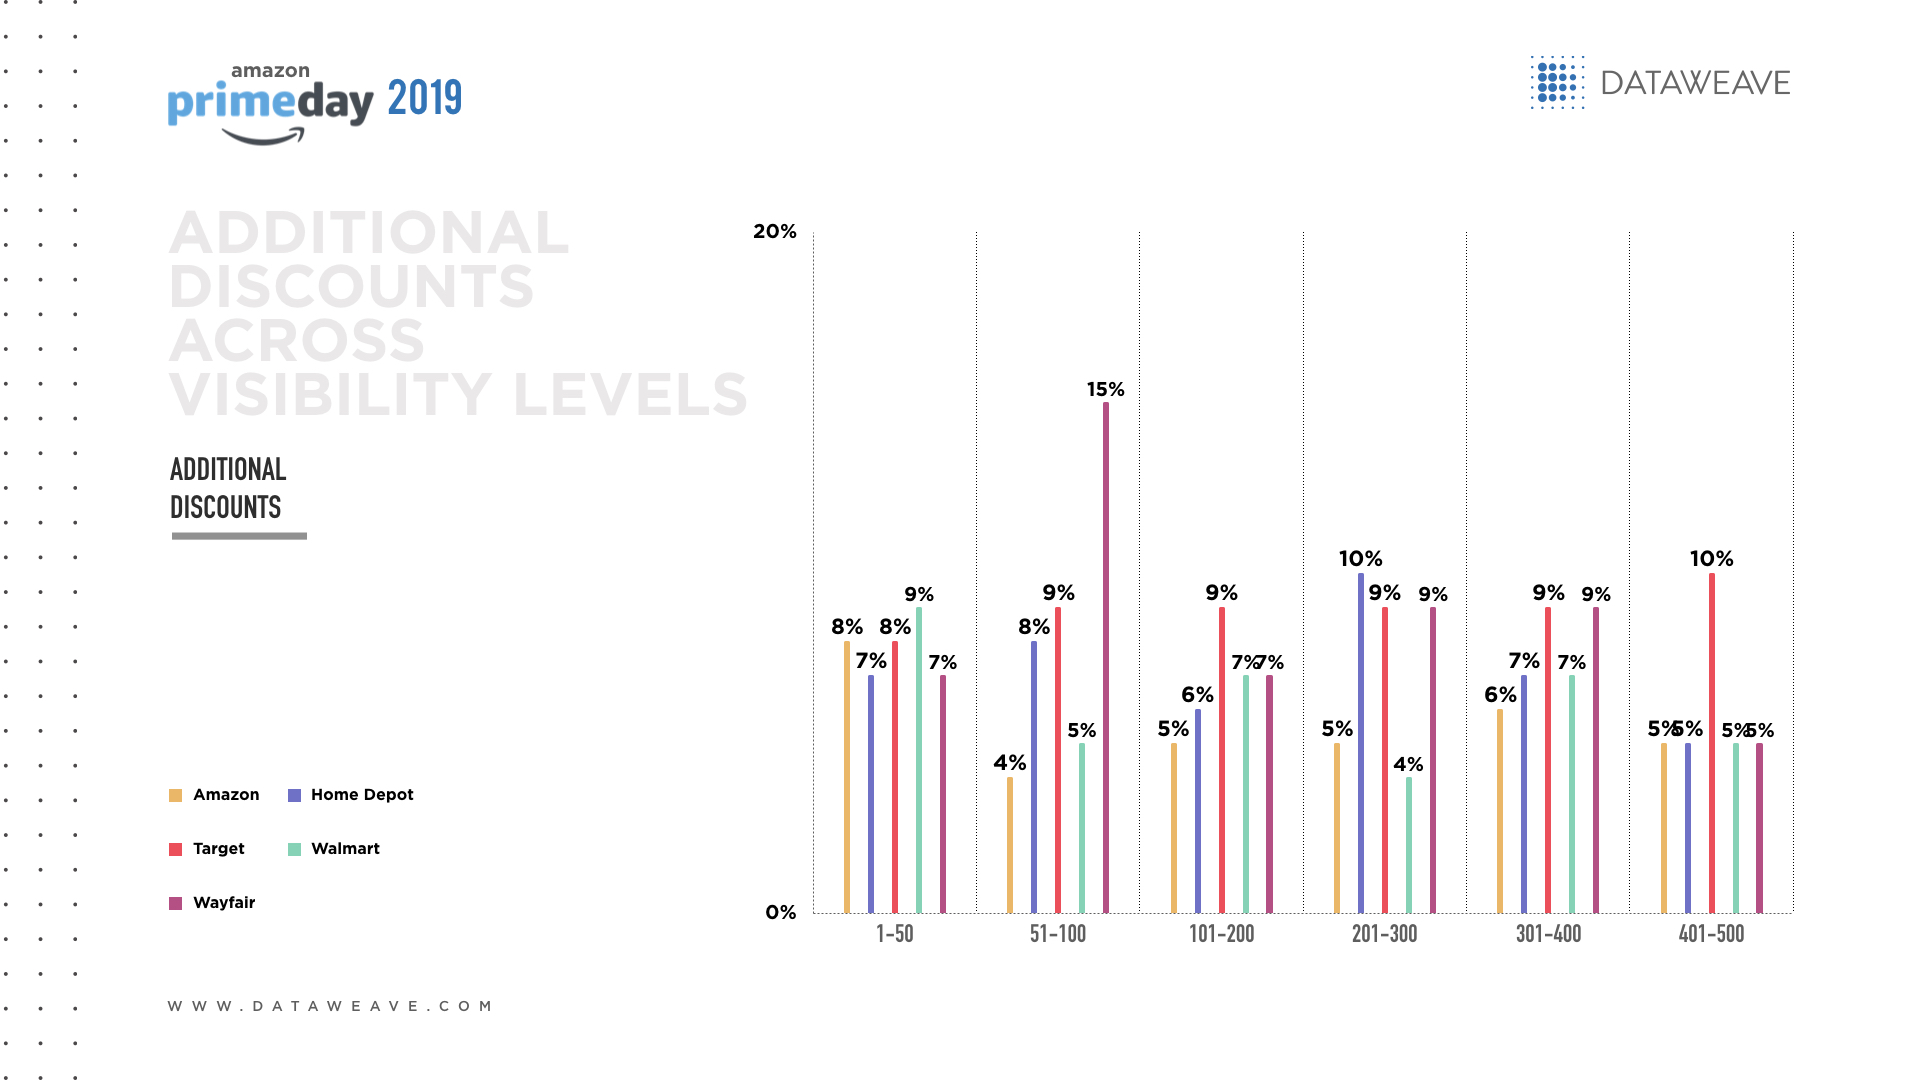
Most Visible Brands Across Product Types
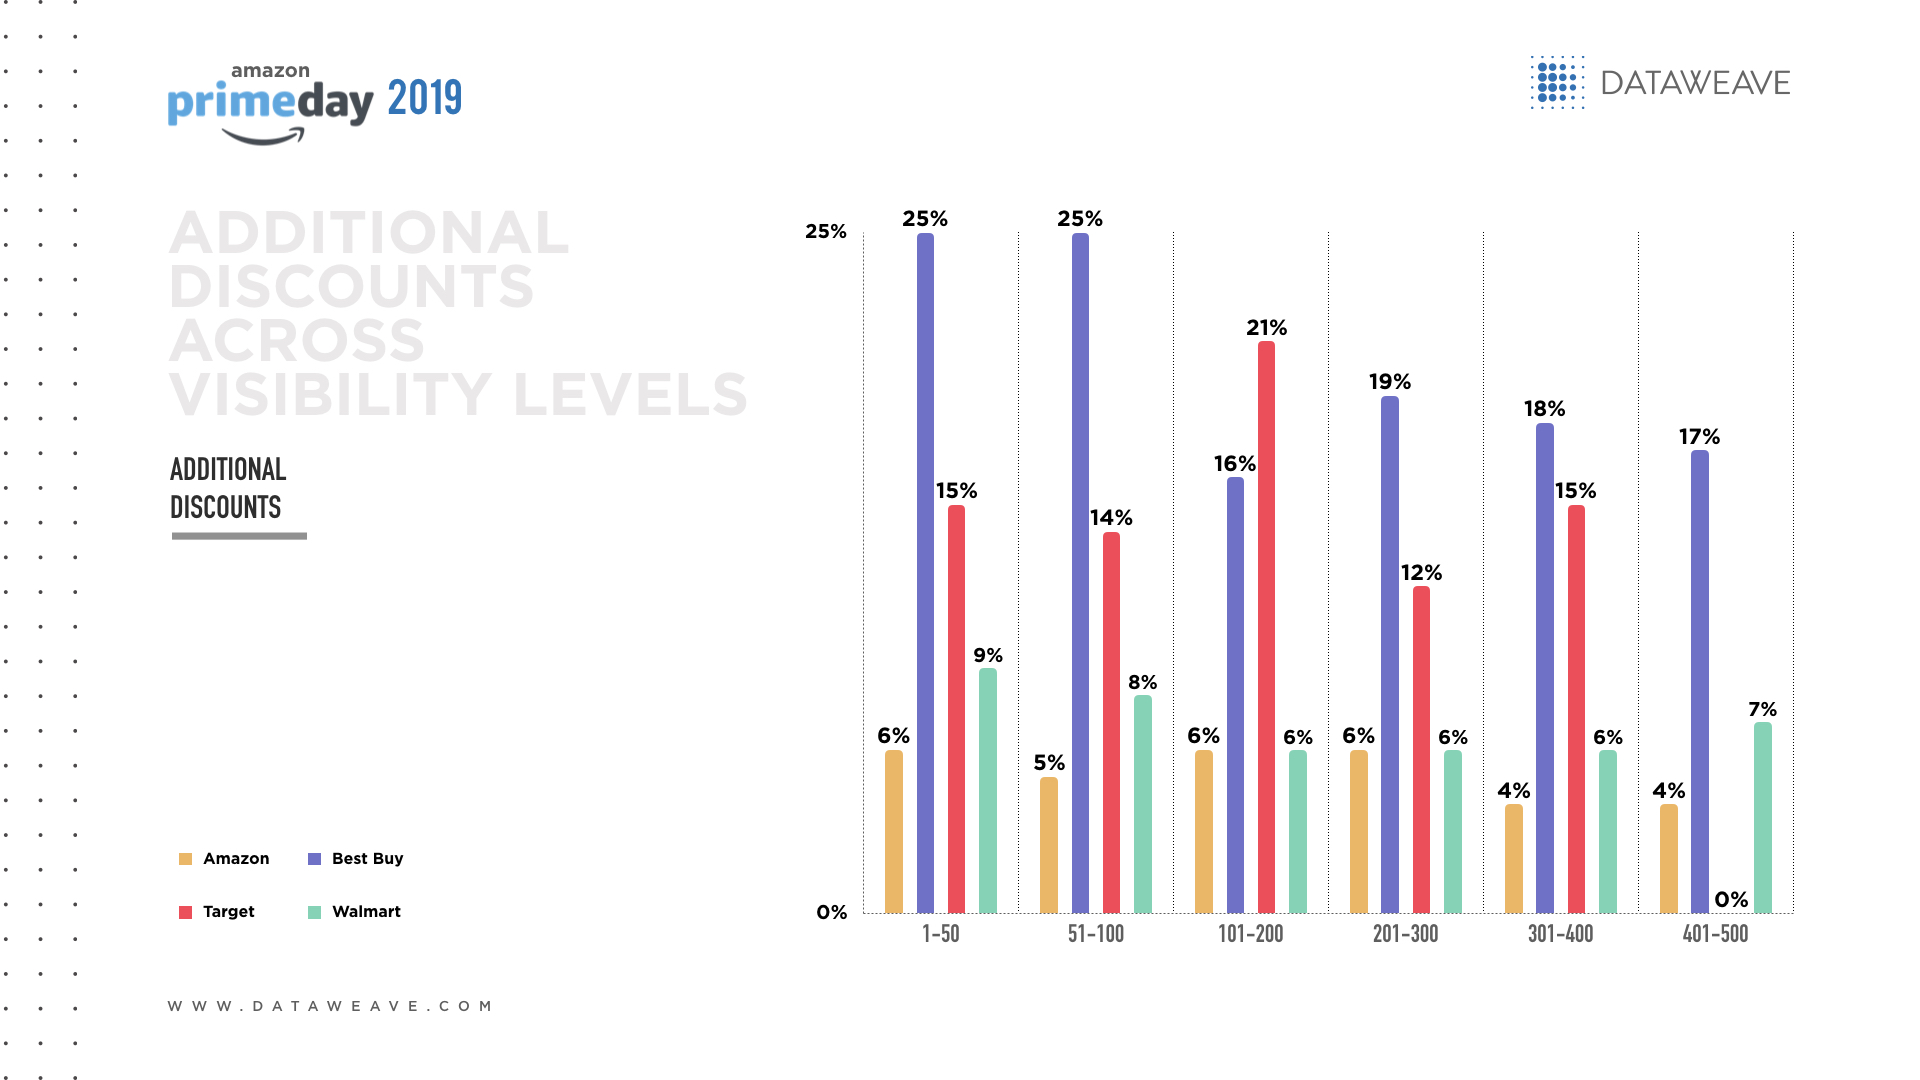
In our analysis, brand visibility is represented in terms of both the number of products for each brand, as well as the average rank of all its products (“lower” the rank value, higher is the visibility).
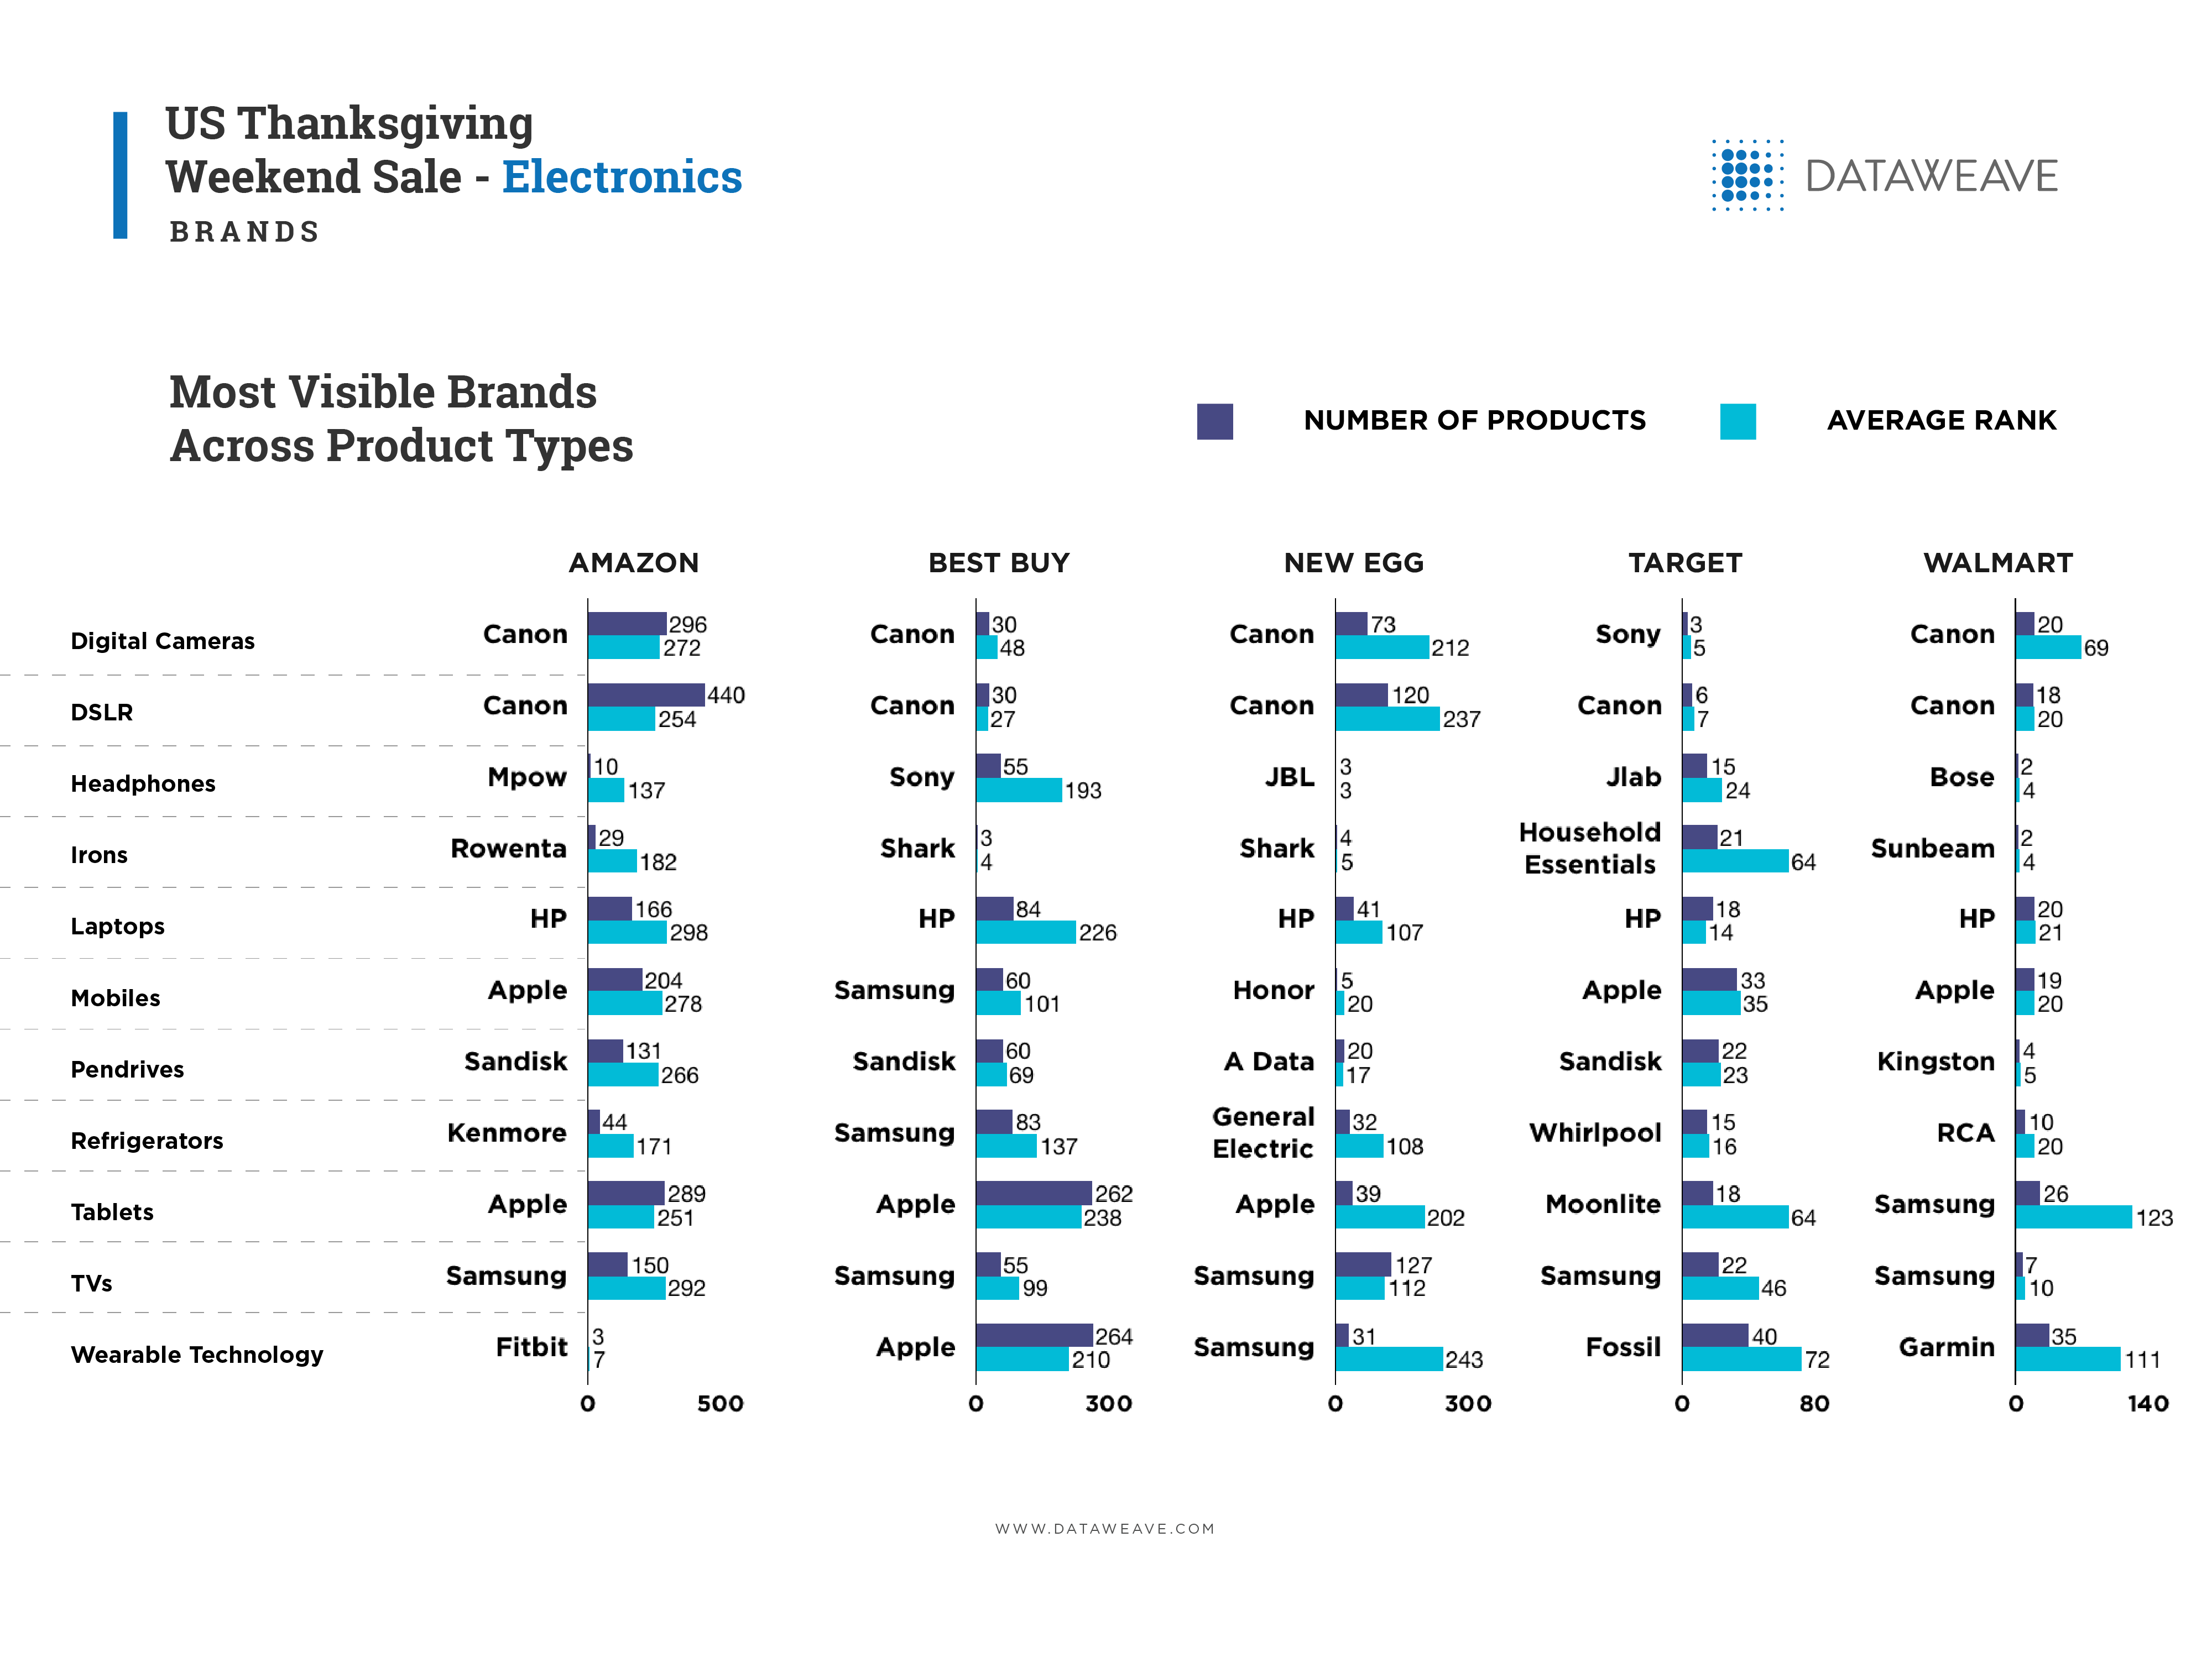
The influence an online retailer exerted on a brand’s average ranking is illustrated by Canon’s digital cameras. On Amazon, its 296 products had an average ranking of 272, while on Best Buy it was 30 and 48, 73 and 212 on New Egg and 20 and 69 on Walmart. For all these retailers, Canon was the most visible brand in digital cameras, despite such variation.
It was a similar story on laptops, with HP’s Amazon ranking of 298 based on 166 products, contrasting with a Target ranking of 14 on 18 products and Walmart ranking of 21 on 20 products.
These patterns appear to play out in TVs too, with Samsung’s Amazon average ranking of 292 based on 150 products contrasting with Walmart average ranking of 10 across 7 products.
Unsurprisingly, across our analysis of additional discounts and brand visibility, the top brands are well known and recognizable brands in each product type, with very few new entrants breaking out from the pack. This story, though, takes a turn in the following analysis on visibility growth.
Brands With Highest Growth in Visibility
To perform this analysis, we developed an index for the visibility of a brand based on the number of products available per brand as well as the average rank of those products. We then compared this score for each brand between before and during the sale period, and subsequently calculated the percentage growth.
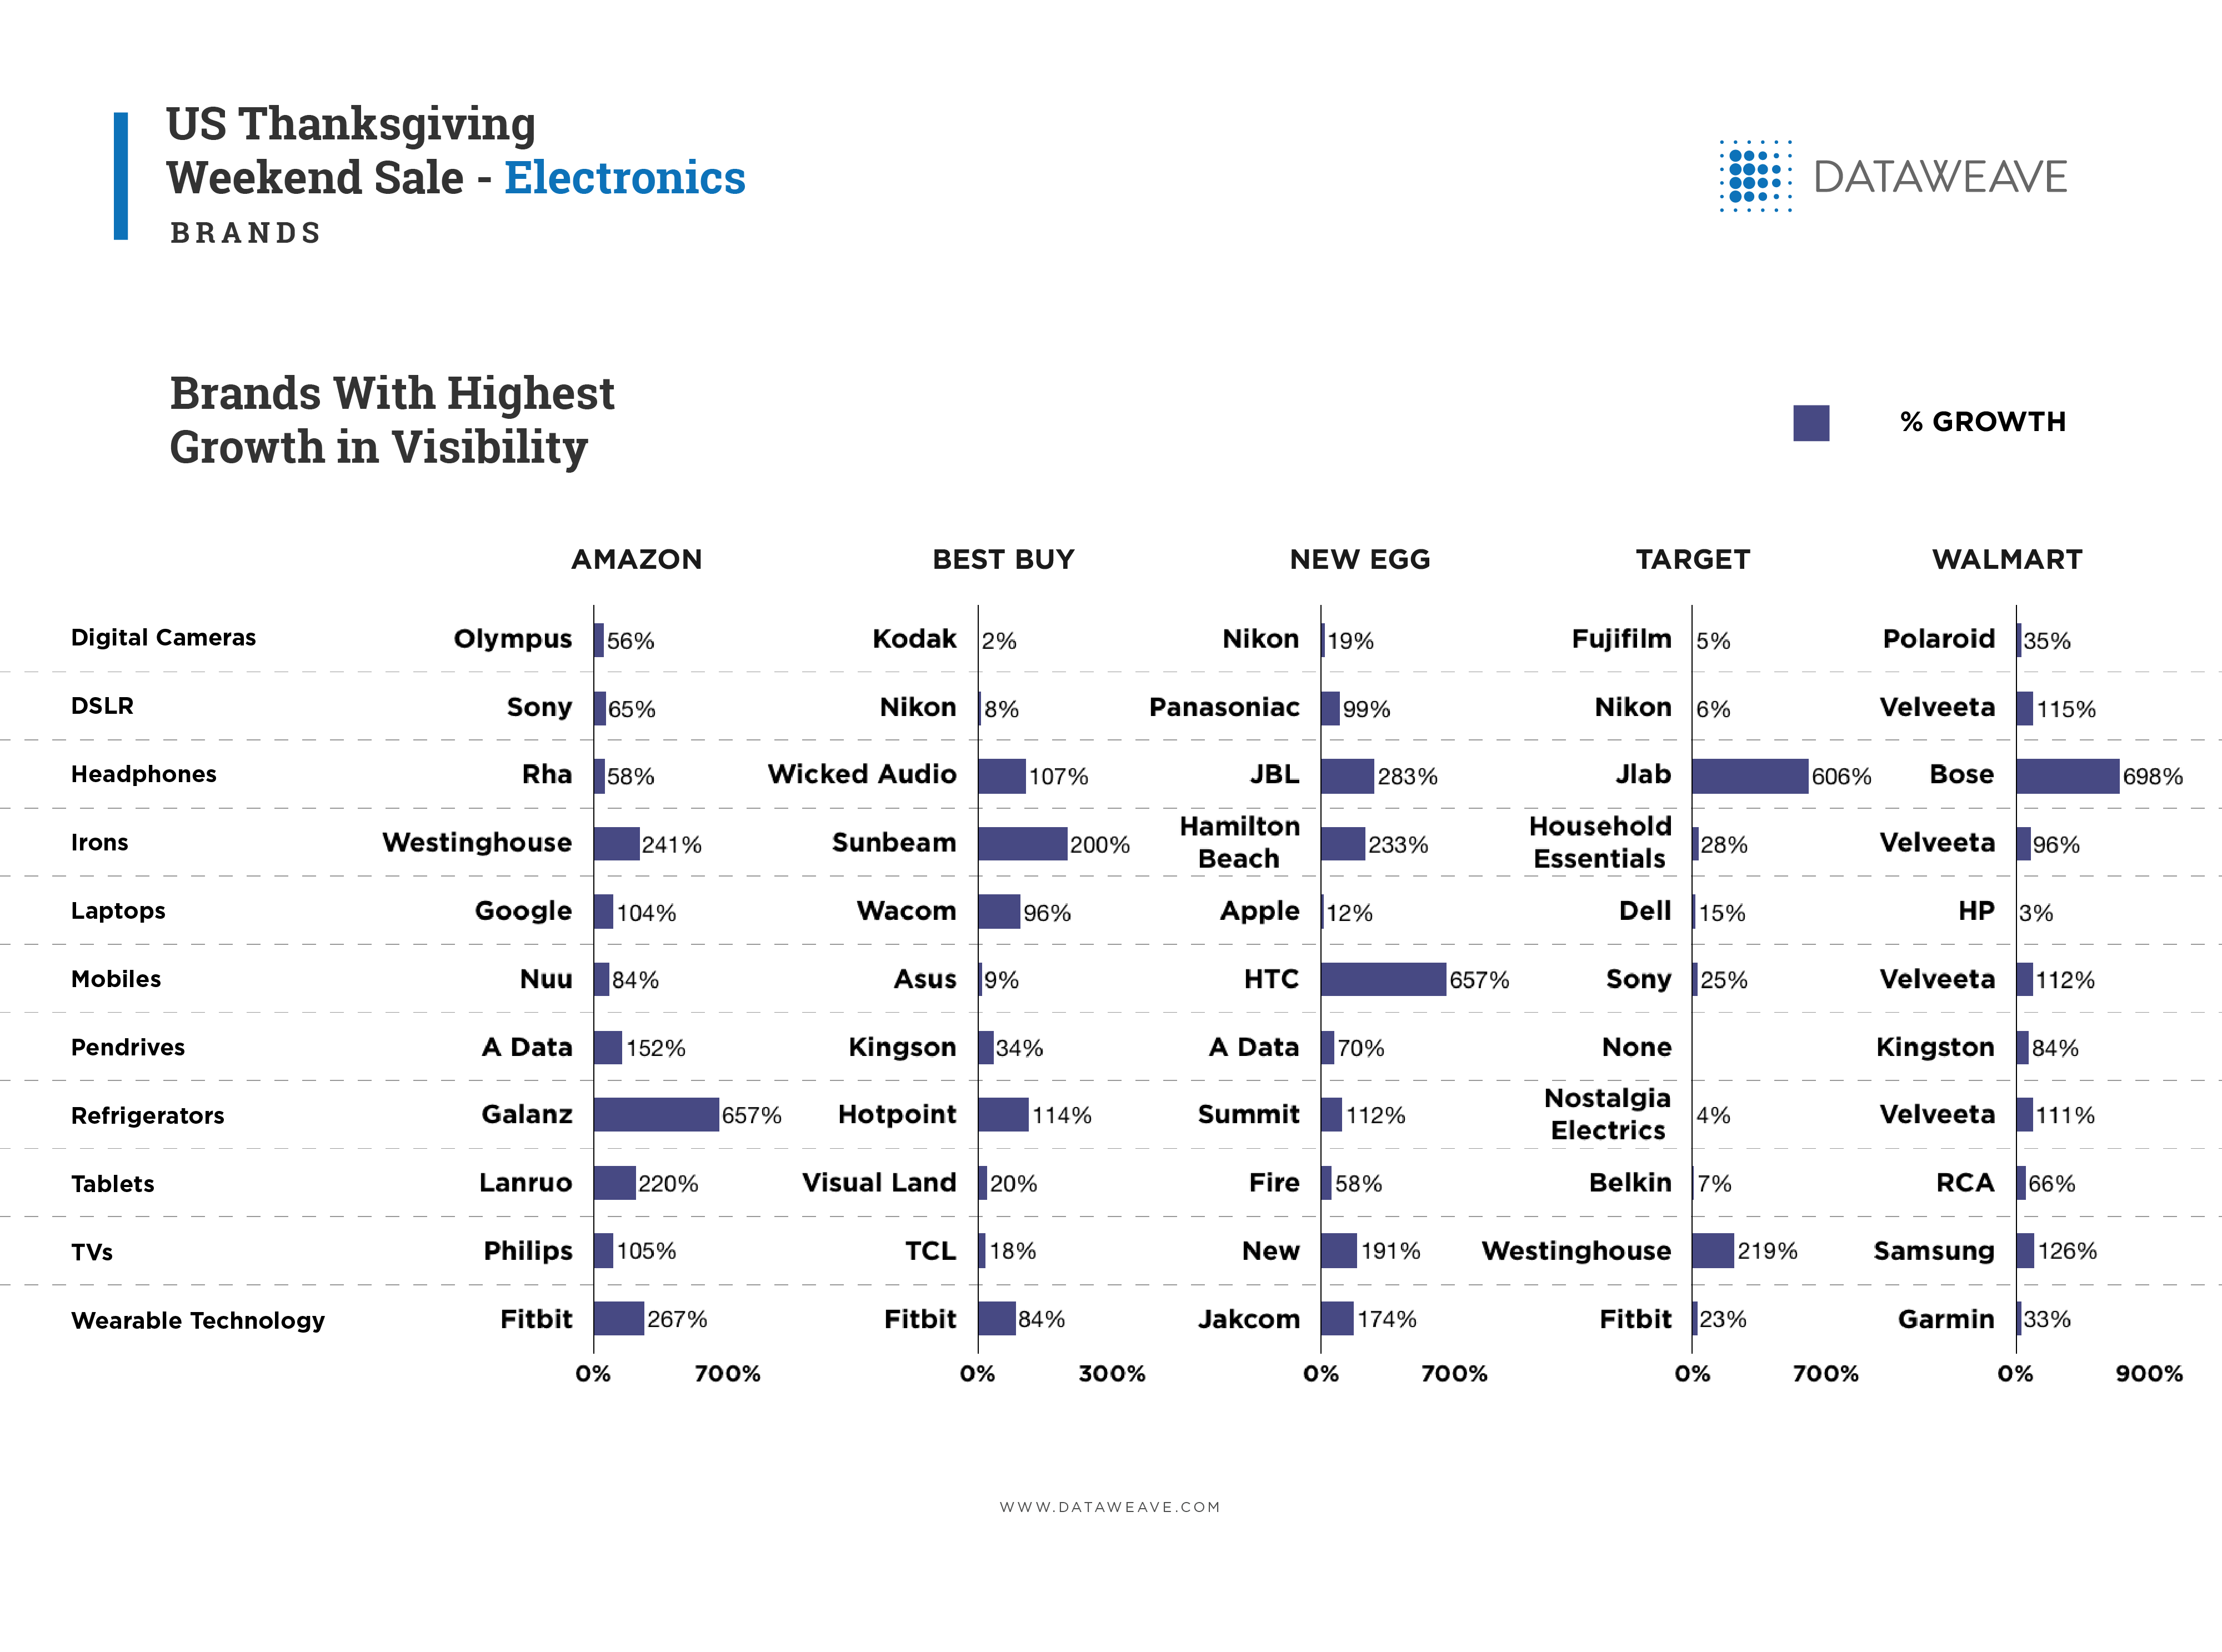
The list of brands that showed the highest growth in visibility for each product type is an interesting mix of well established and newer brands. The usual suspects included the likes of Philips, Fitbit, Sony, Kodak, Nikon, etc. The presence of brands like Apple, Google, and Bose is surprising as they would be expected to command strong visibility even before the sale. Some of the newer brands include Rha, Westinghouse, Garmin, Lanruo, and more.
Some brands showed a dramatic increase in visibility. Examples include Bose on Walmart (698%), HTC on New Egg (657%), Galanz on Amazon (657%), and Jlab on Target (608%).
Kodak’s digital cameras (2% growth) on Best Buy took the honors for the lowest increase in visibility, just ahead of HP laptops (3%) on Walmart, Nostalgia Electrics refrigerators (4%) and Belkin Tablets (7%) both on sale at Target. These numbers indicate a relatively static assortment for the respective retailers and product types.
Fashion Brands
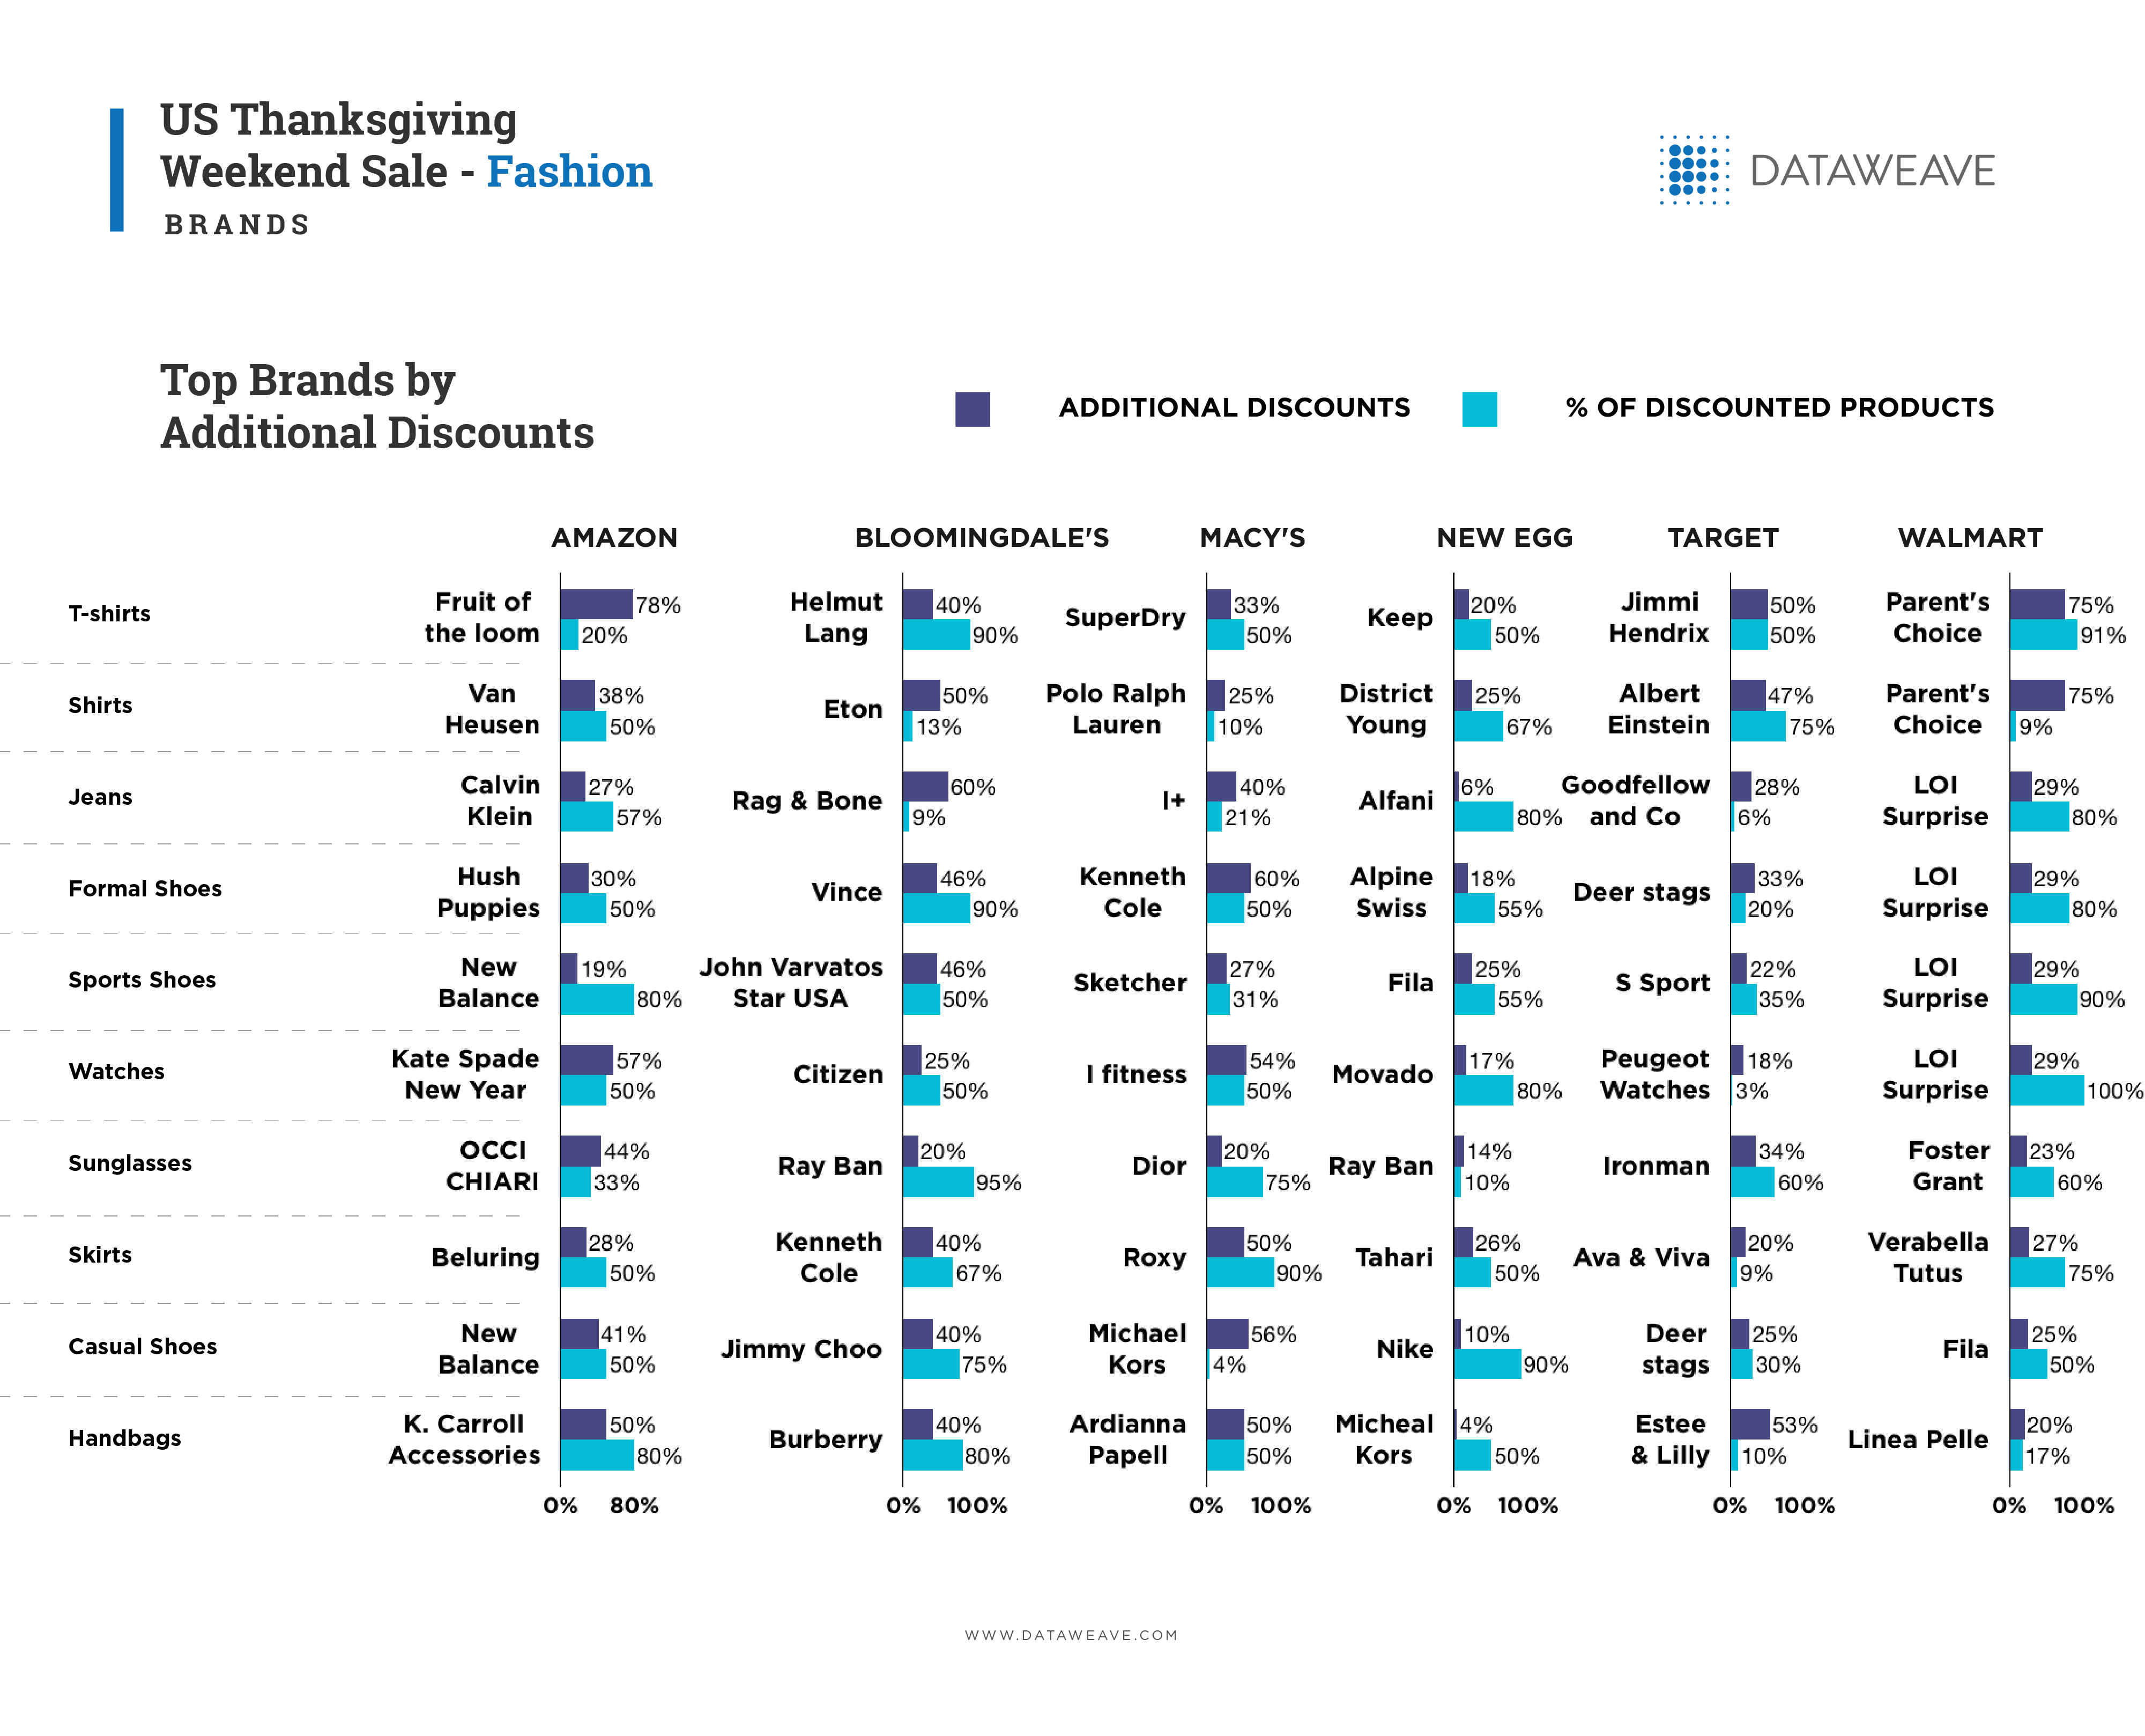
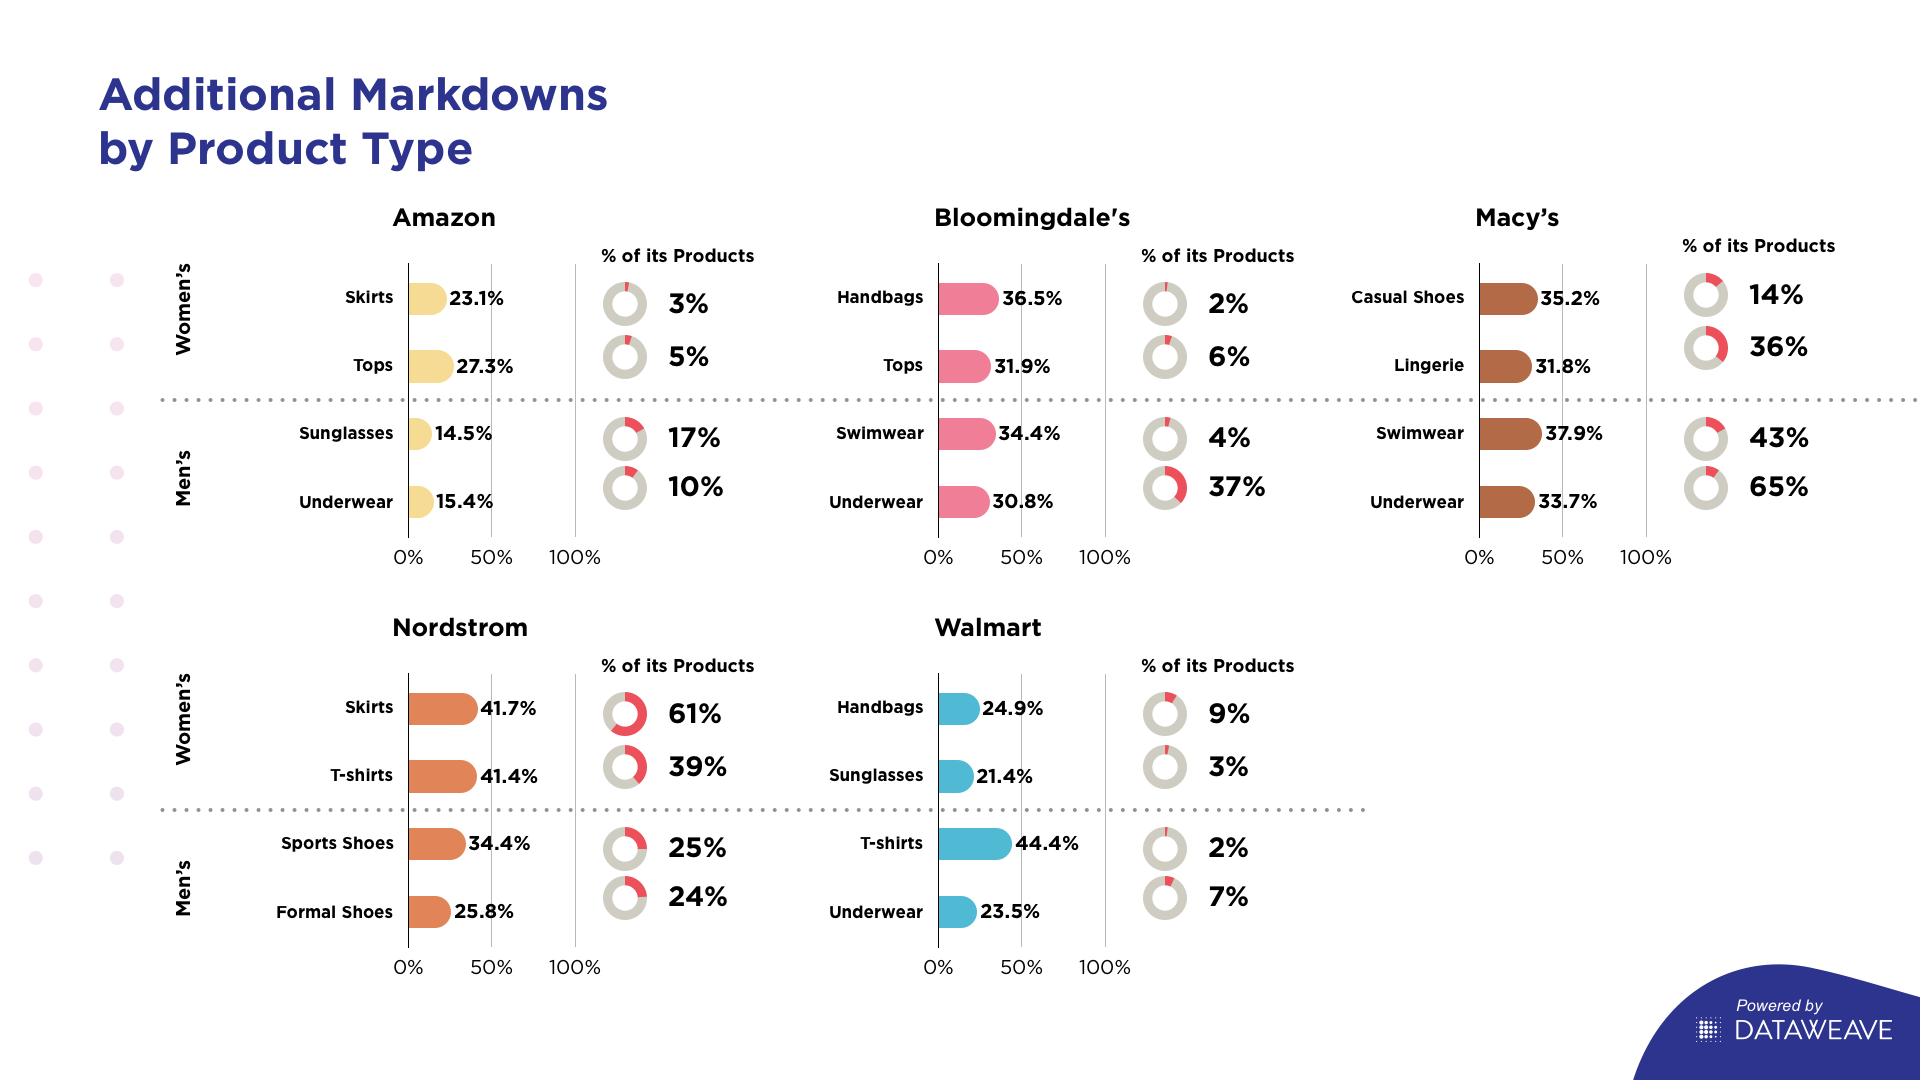
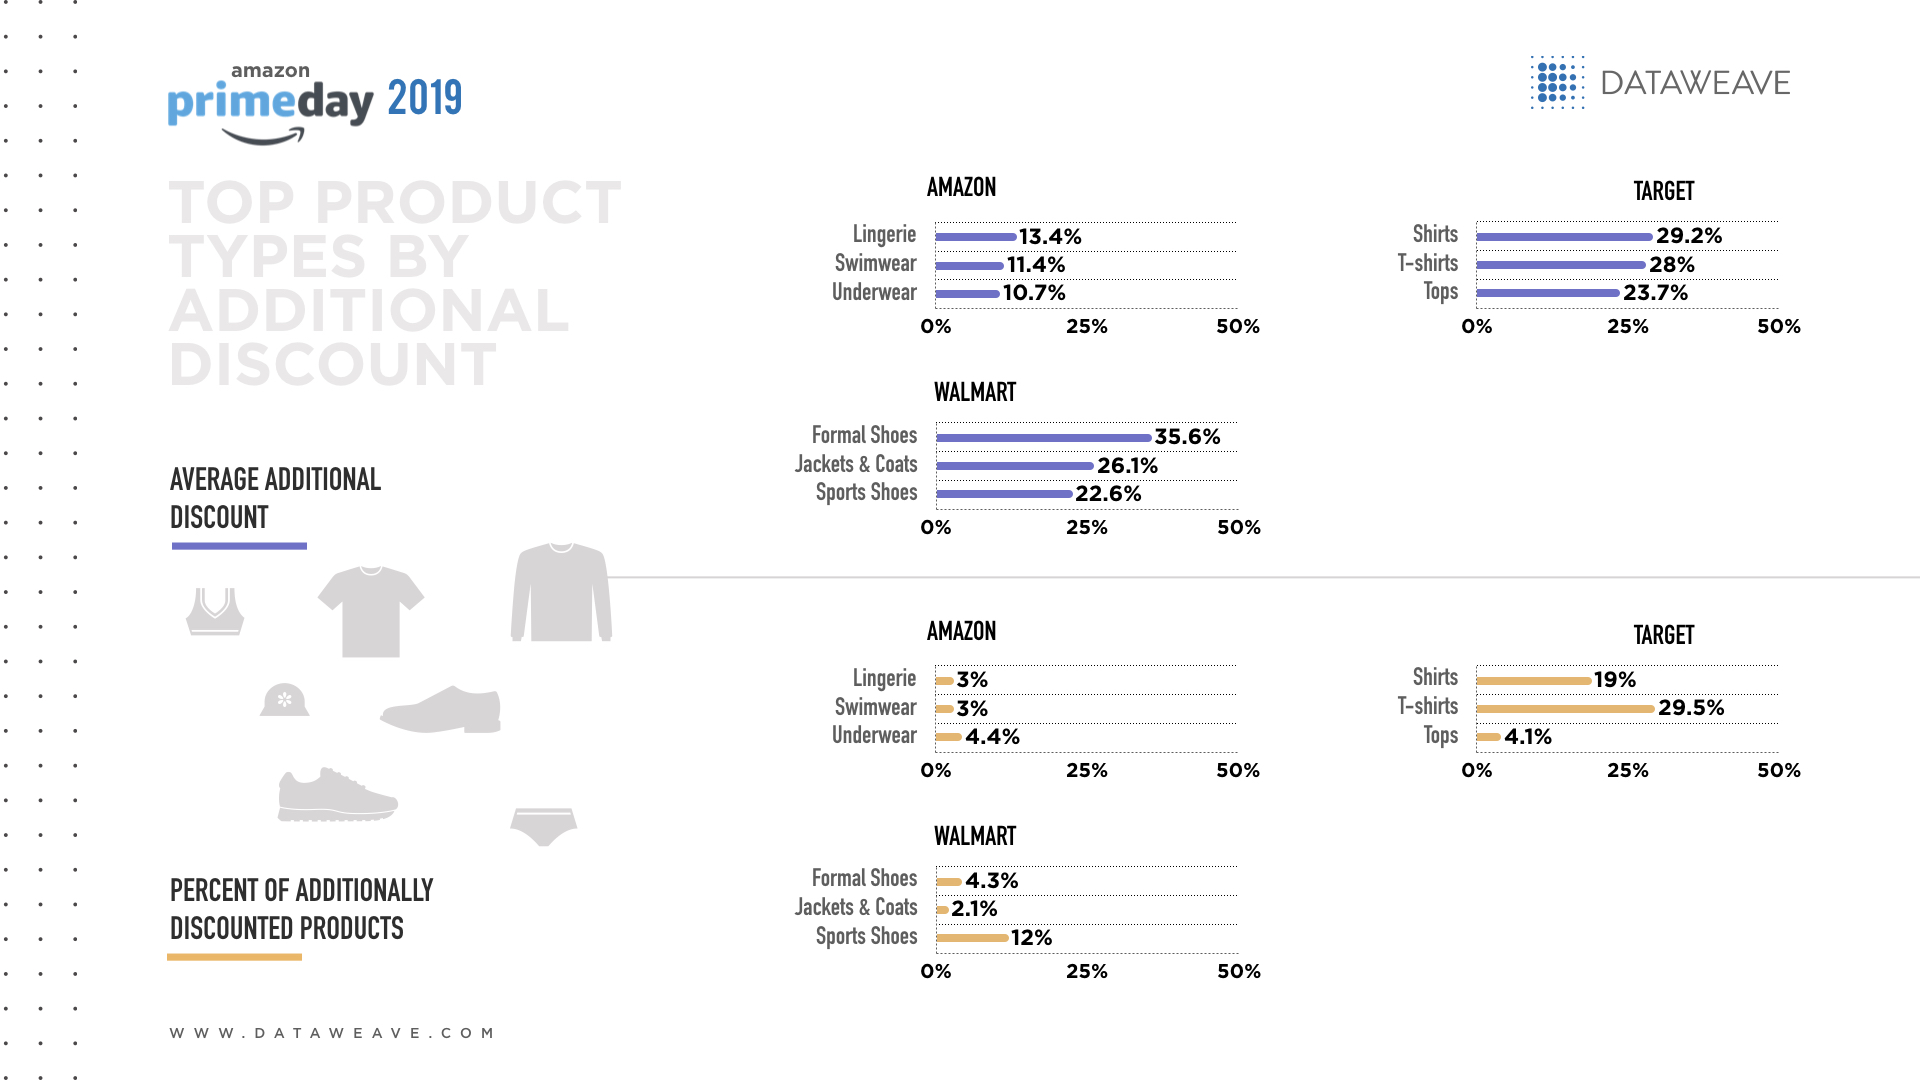
Moving over to the Fashion category, we observed significantly more aggressive discounting activity, as expected. Parent’s Choice T-shirts recorded the highest additional discount (80%) applied to the widest product range (Walmart 91%). Similarly, Fruit of the Loom saw Amazon promote a 78% additional discount applied across 20% of its products.
In shoes, Macy’s promoted a 60% additional discount on 50% of Kenneth Cole’s product range. In watches, Amazon featured a 57% additional discount on 50% of Kate Spade New Year branded products. Meanwhile, in sunglasses, Ray Ban in Bloomingdale’s enjoyed a 20% additional discount spread across a whopping 95% of its products, compared to just a 14% additional discount applied to a mere 10% of Ray Ban products in New Egg.
In stark contrast to what was observed in Electronics, the Fashion category saw fewer large brands dominate the discounting landscape across categories. This isn’t surprising given how the Fashion category tends to be cluttered with a plethora of brands, while the Electronics category usually consists of a leaner set of popular brands in each product type.
Most Visible Brands Across Product Types
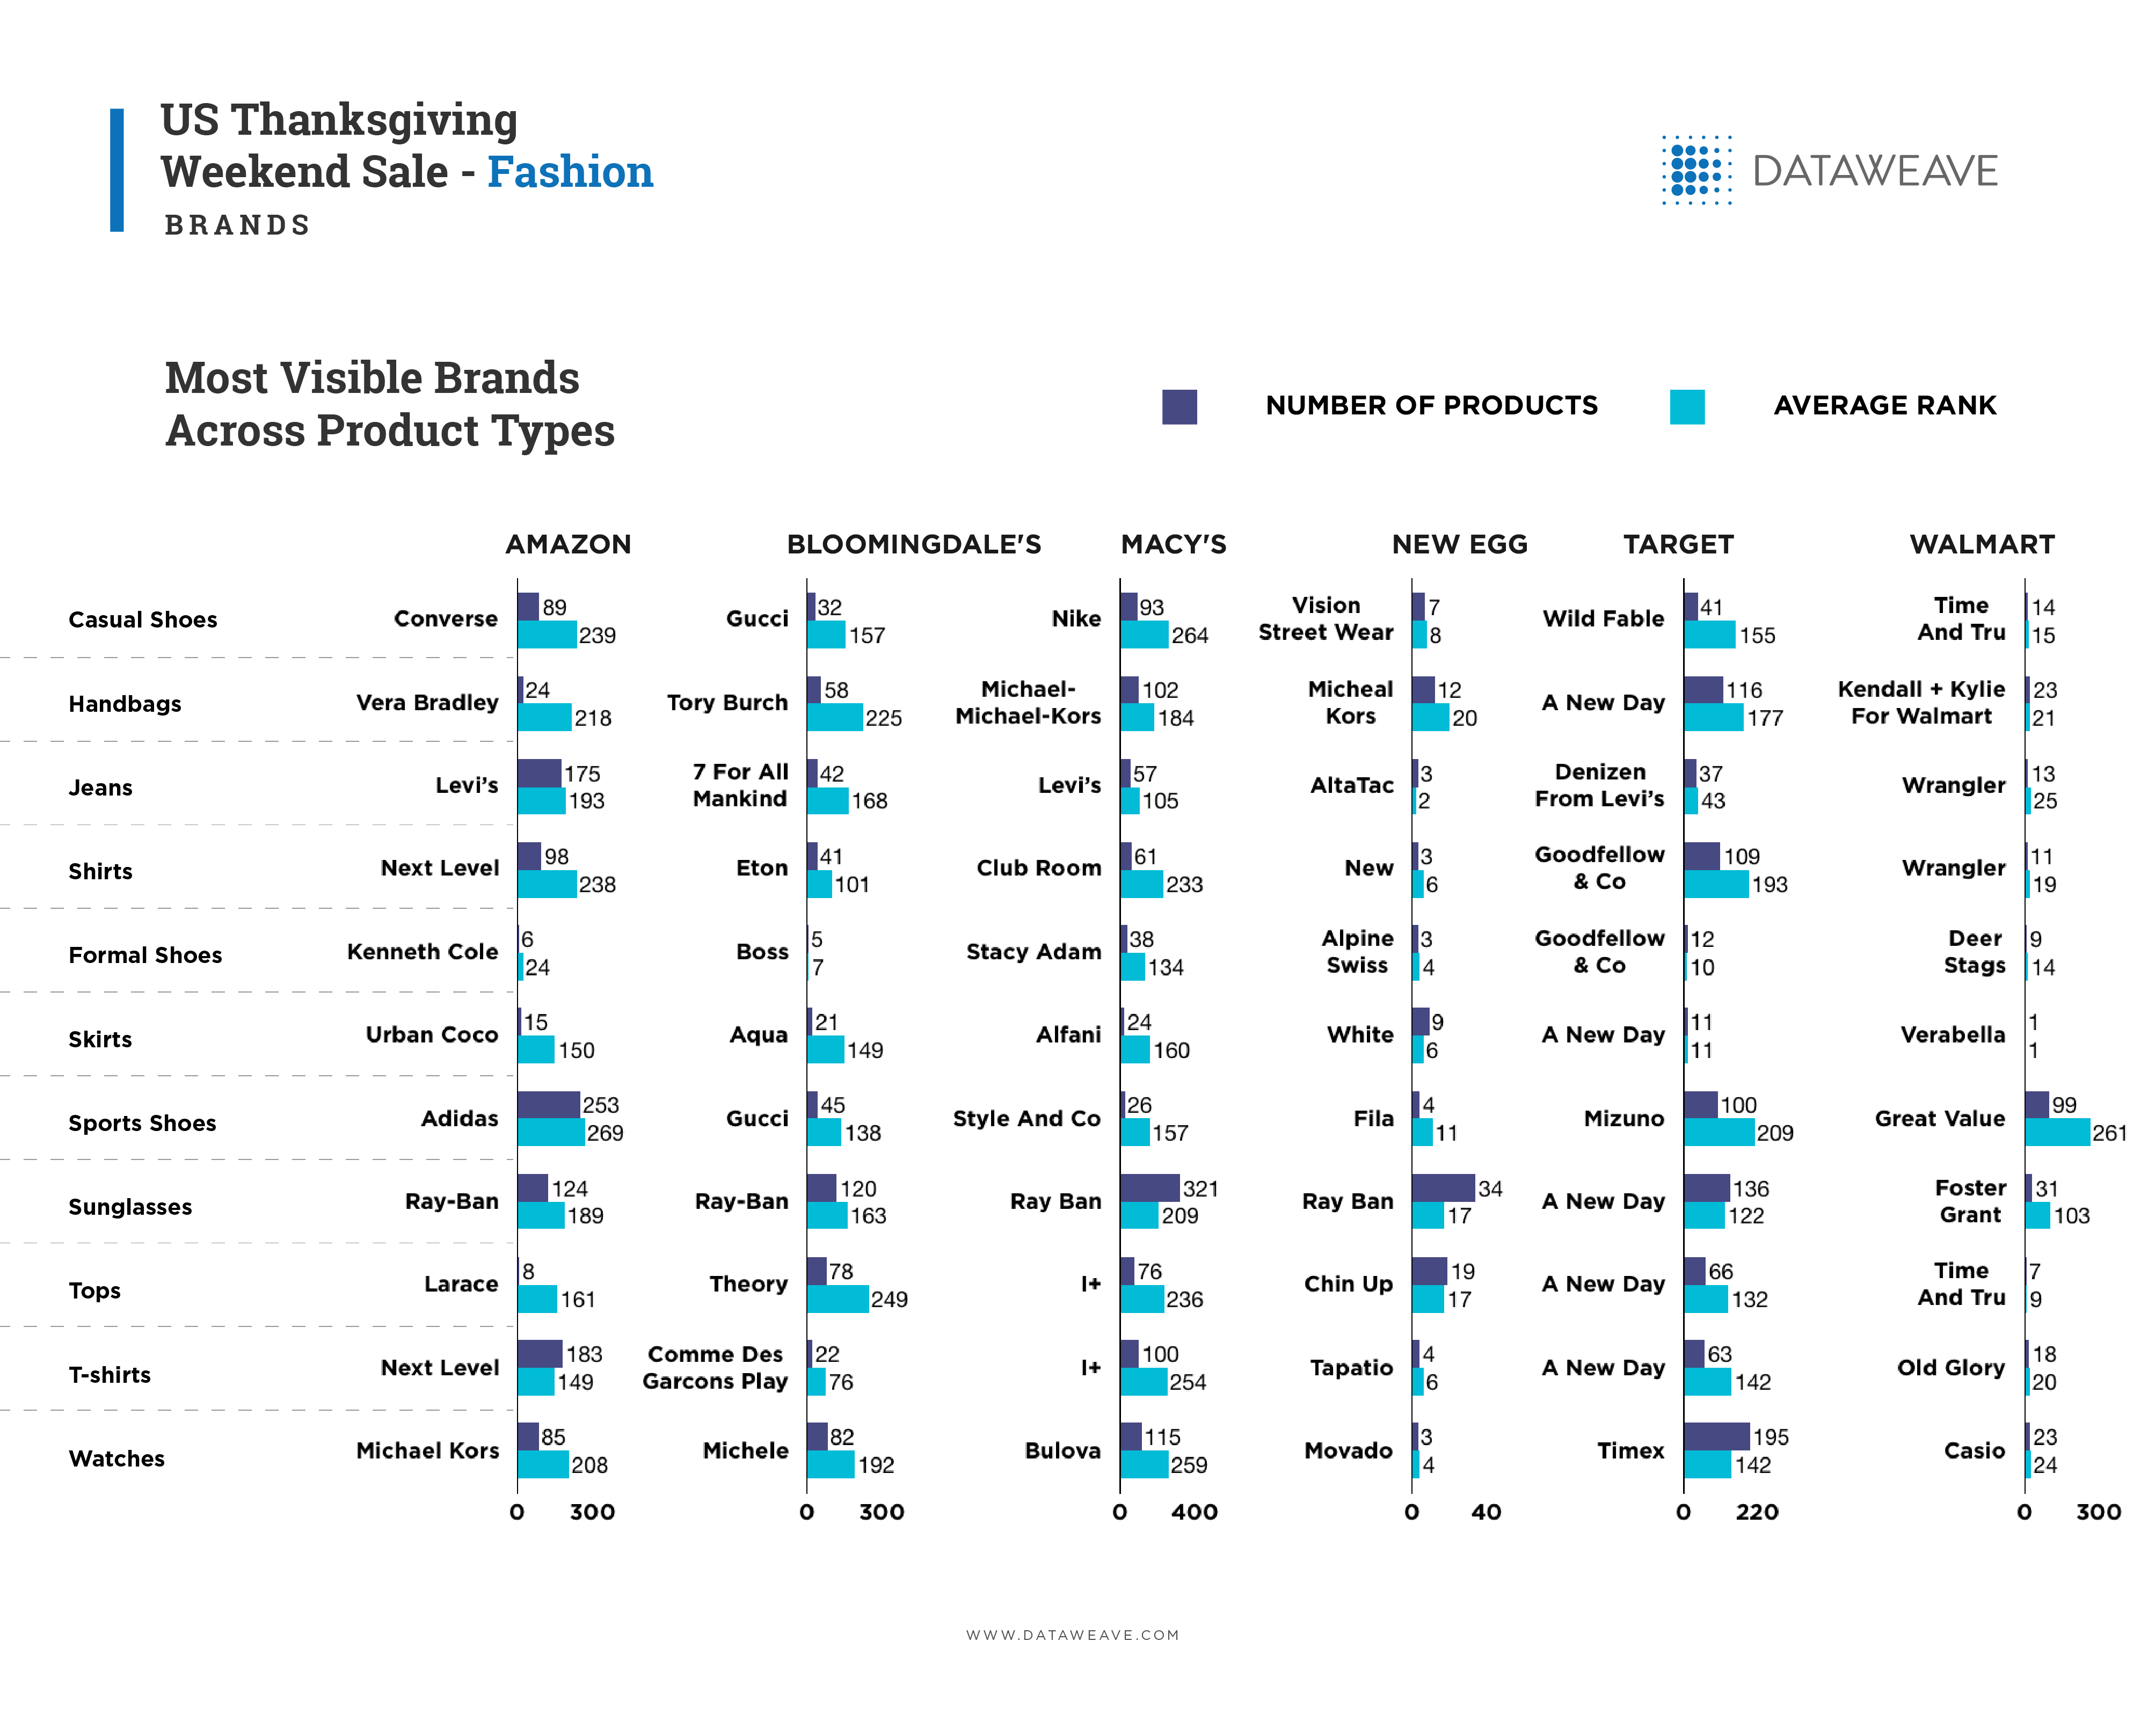
In casual shoes, Nike’s ranking of 264 on 93 and Converse’s ranking of 239 on 89 products contrasted with Vision Street Wear’s ranking of 8 on 9 products and Time And Tru’s 15 ranking on 14 products.
Another point of contrast was Micheal Kors (Handbags) cross-retailer platform performance - its average ranking of 184 on 102 products on Macy’s while its average ranking on New Egg was 20 across 12 products. Still, it appears the brand discounted heavily in New Egg to compensate for its relatively low visibility on the website.
Ray Ban recorded a category high ranking of 209 based on 321 products on Macy’s. By comparison, Ray Ban had a ranking of 17 on 34 products at New Egg. Over at Amazon, Ray Ban managed a creditable 189 ranking on 124 products and a 163 ranking on 120 products at Bloomingdale’s.
Brands With Highest Growth in Visibility
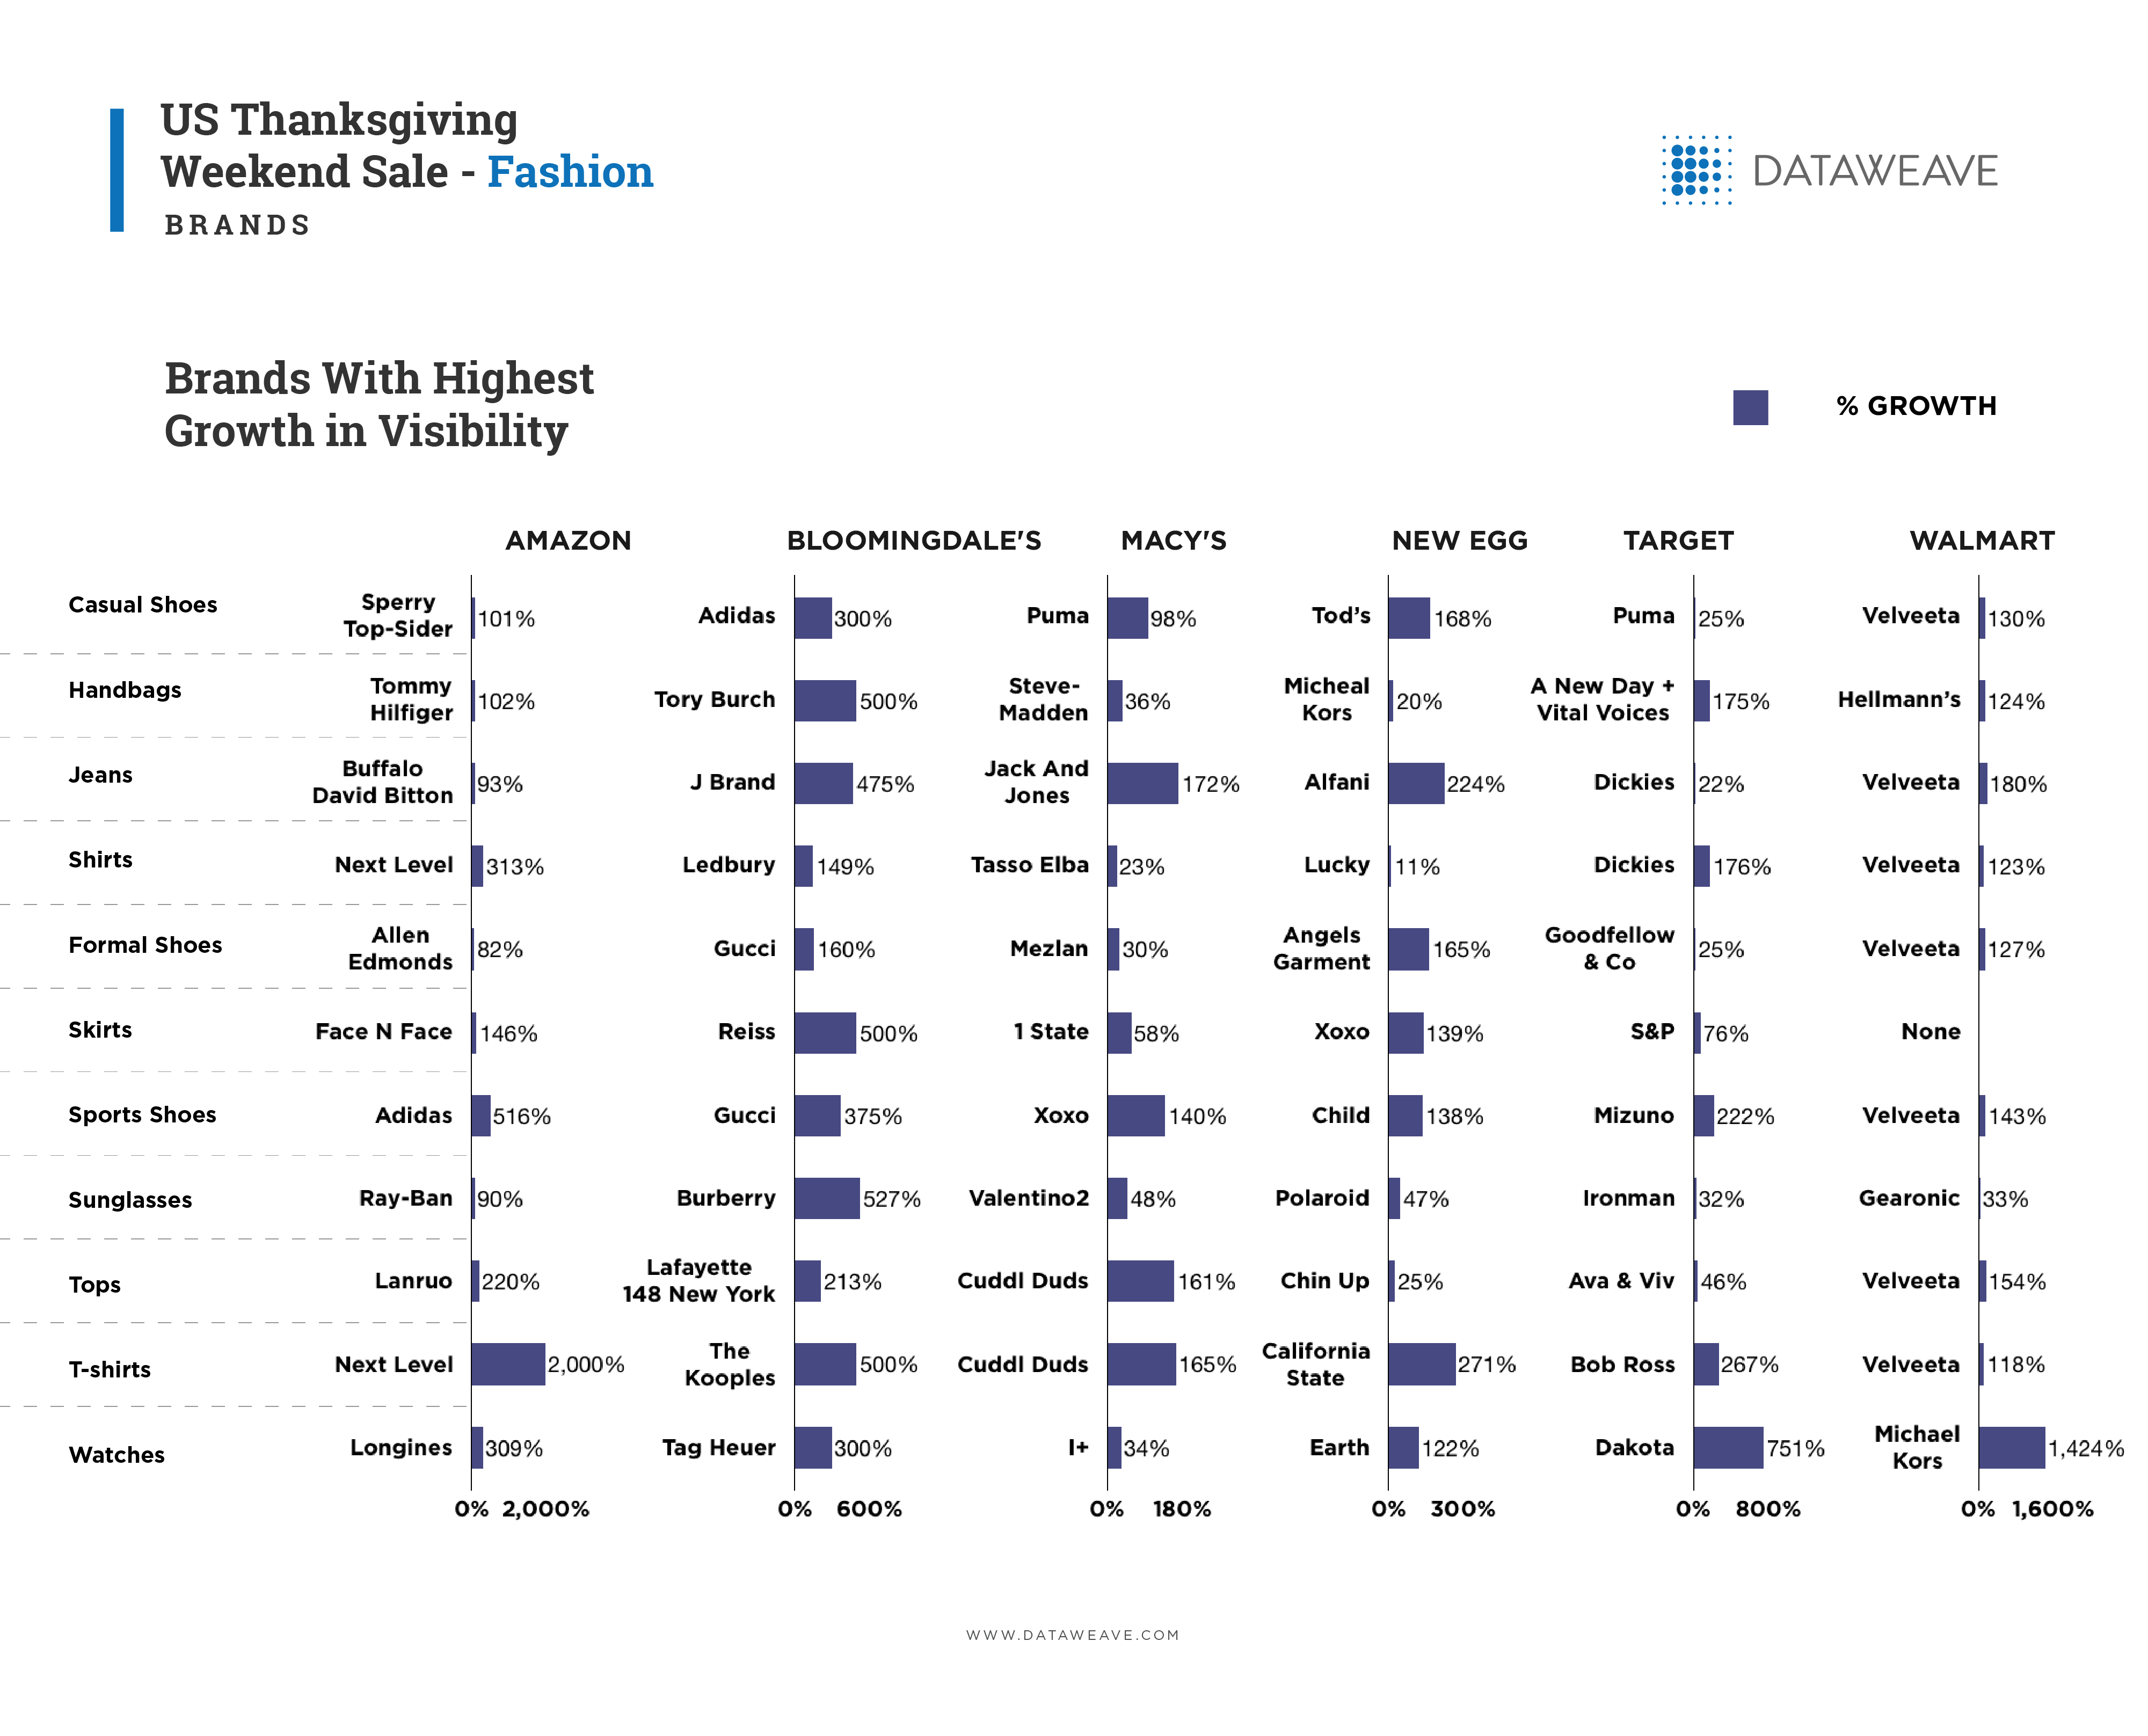
Compared to the Electronics category, Fashion consists of certain brands that skyrocketed in their visibility. Examples include Next Level T-shirts (Amazon 2,000%), Michael Kors Watches (Walmart 1,424%), Dakota Watches (Target 751%) and Adidas sports shoes (Amazon 516%).
Bloomingdale’s delivered amazing visibility growth for key brands, with Burberry (527%), Reiss (500%), The Kooples (%00%), Tory Burch (500%), J Brand (475%), and Adidas (300%) all enjoying strong visibility growth.
At the other end of the visibility growth spectrum, the growth rates of Lucky shirts (New Egg, 11%), Micheal Kors (New Egg, 20%) Dickies jeans (Target, 22%), Tasso Elba shirts (Macy’s, 23%), and Puma Casual Shoes (Target, 25%) indicate a relatively more static assortment in their respective product types.
Depth Of Product Range And Discounting Strategy Matters
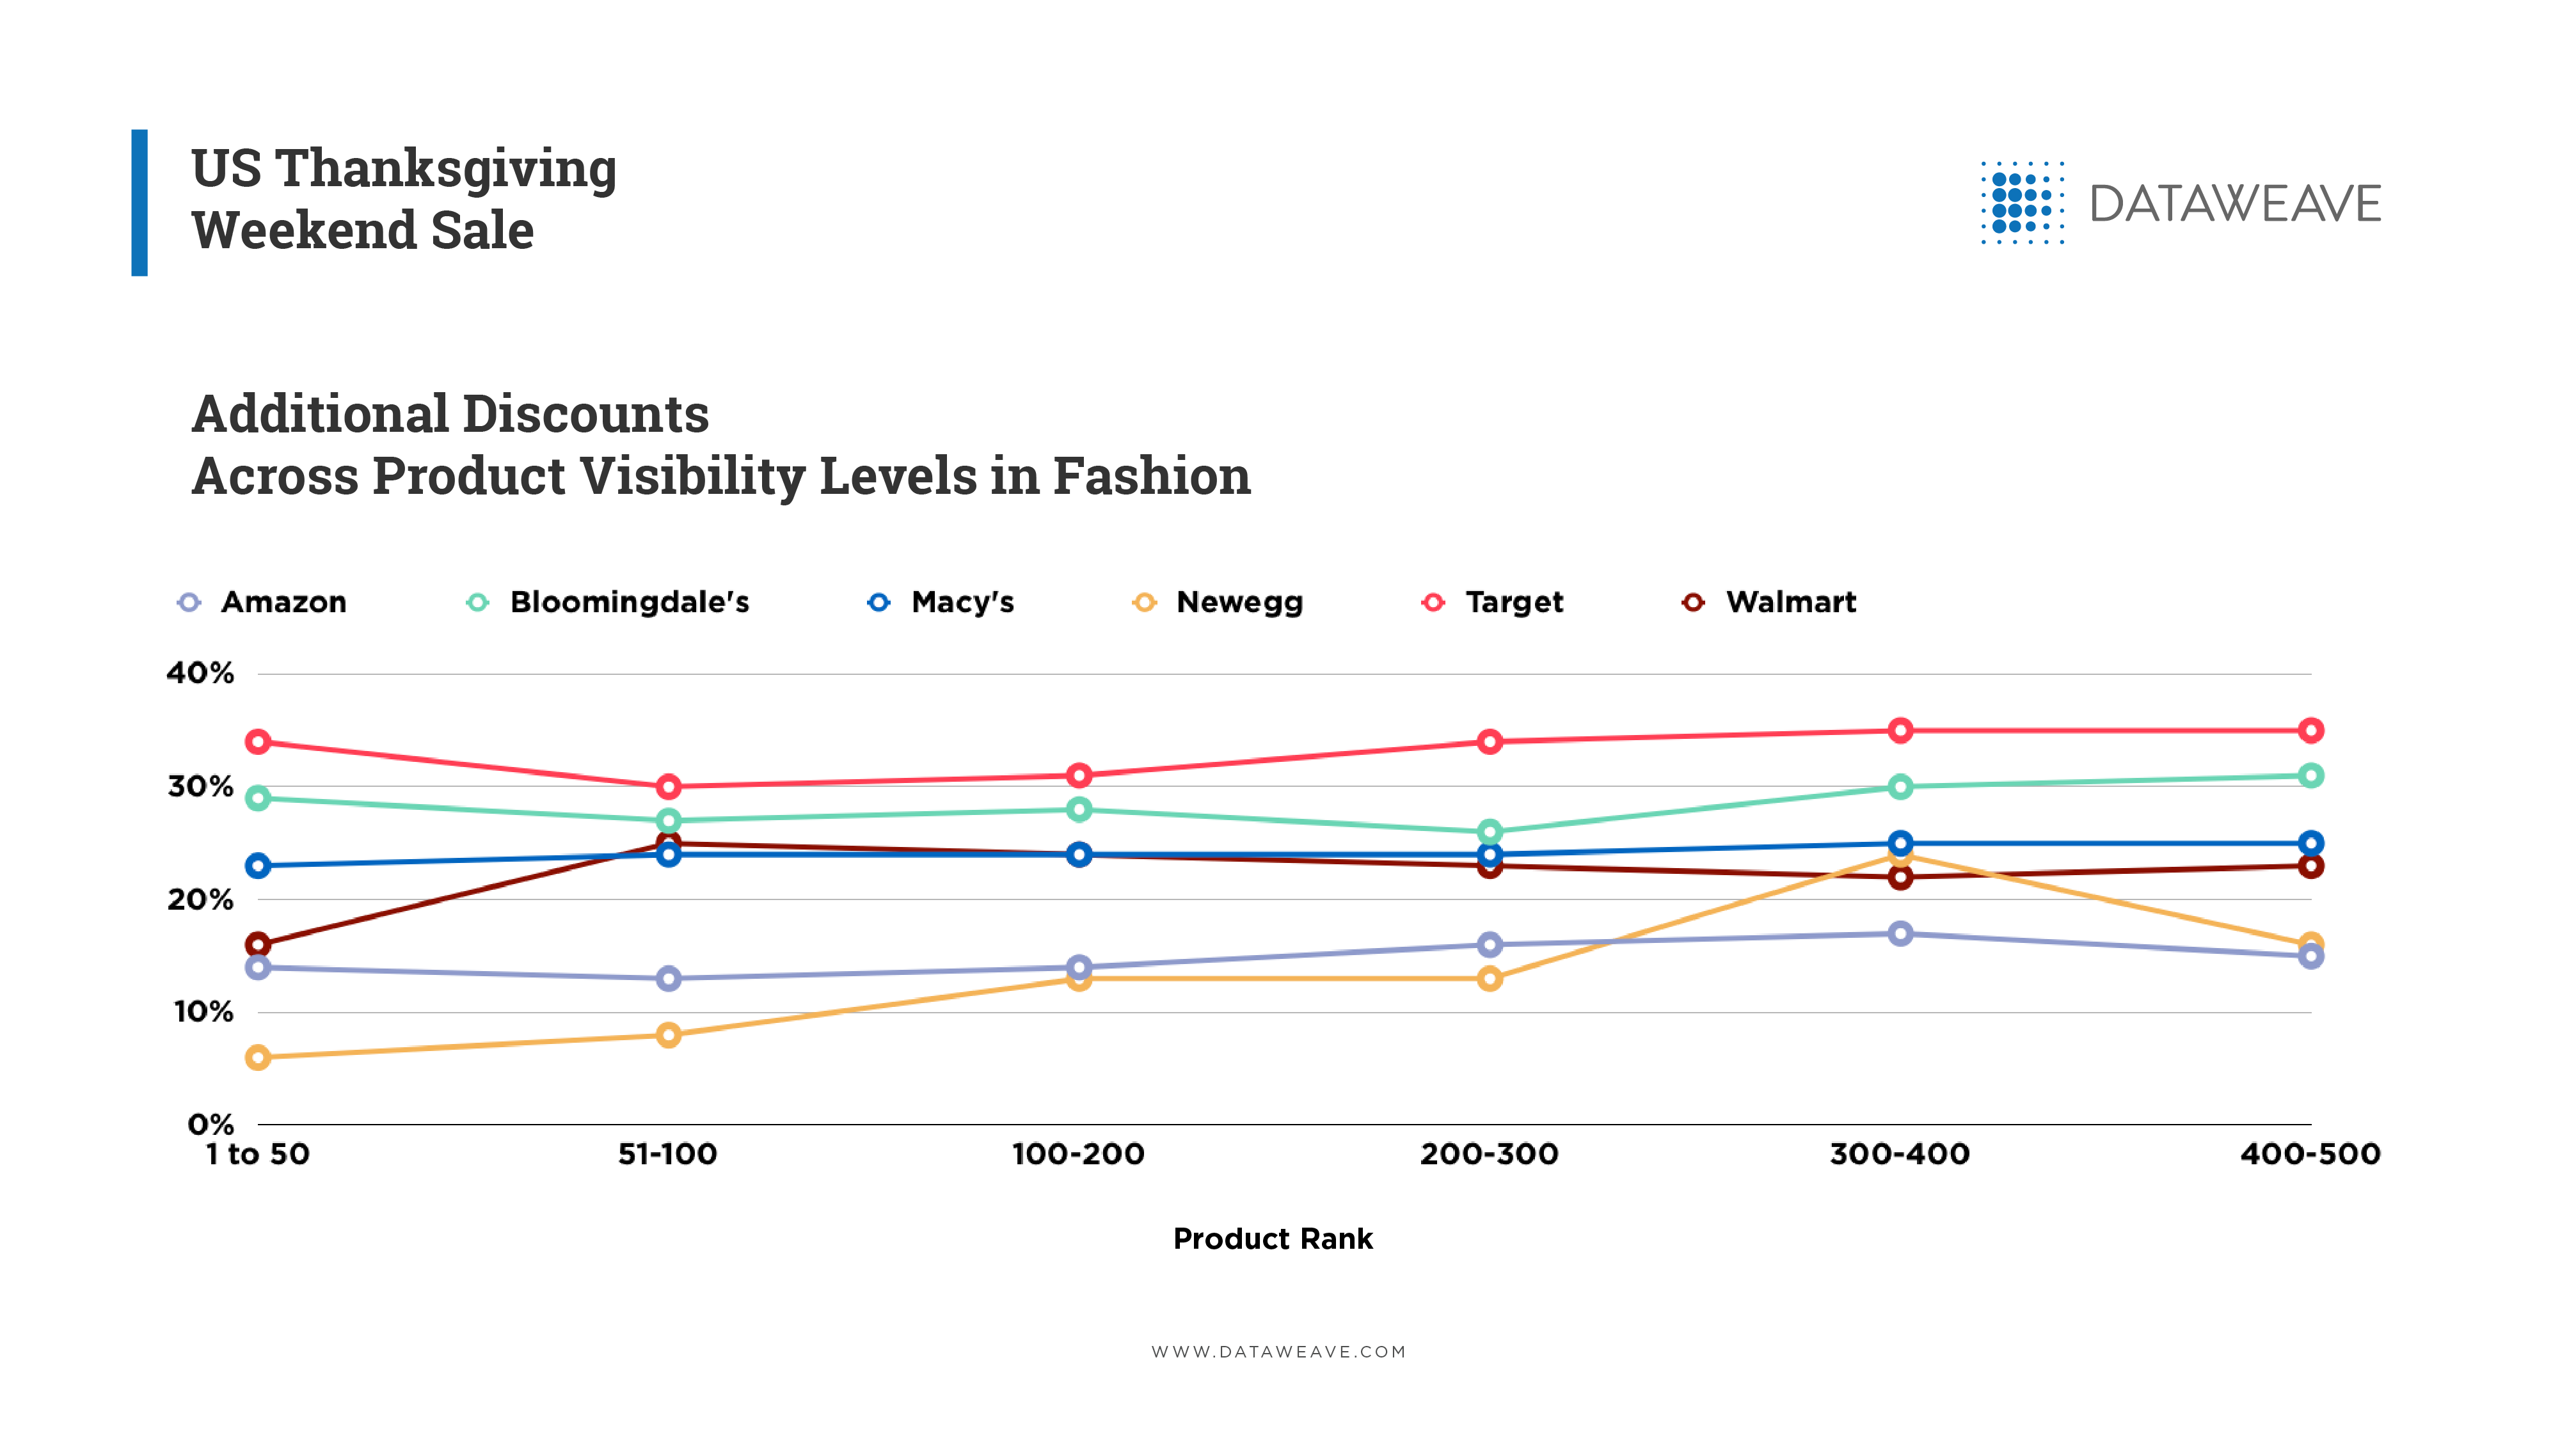
Across the three sales, DataWeave identified several different additional discounting and product assortment strategies by both the retailers and the brands.
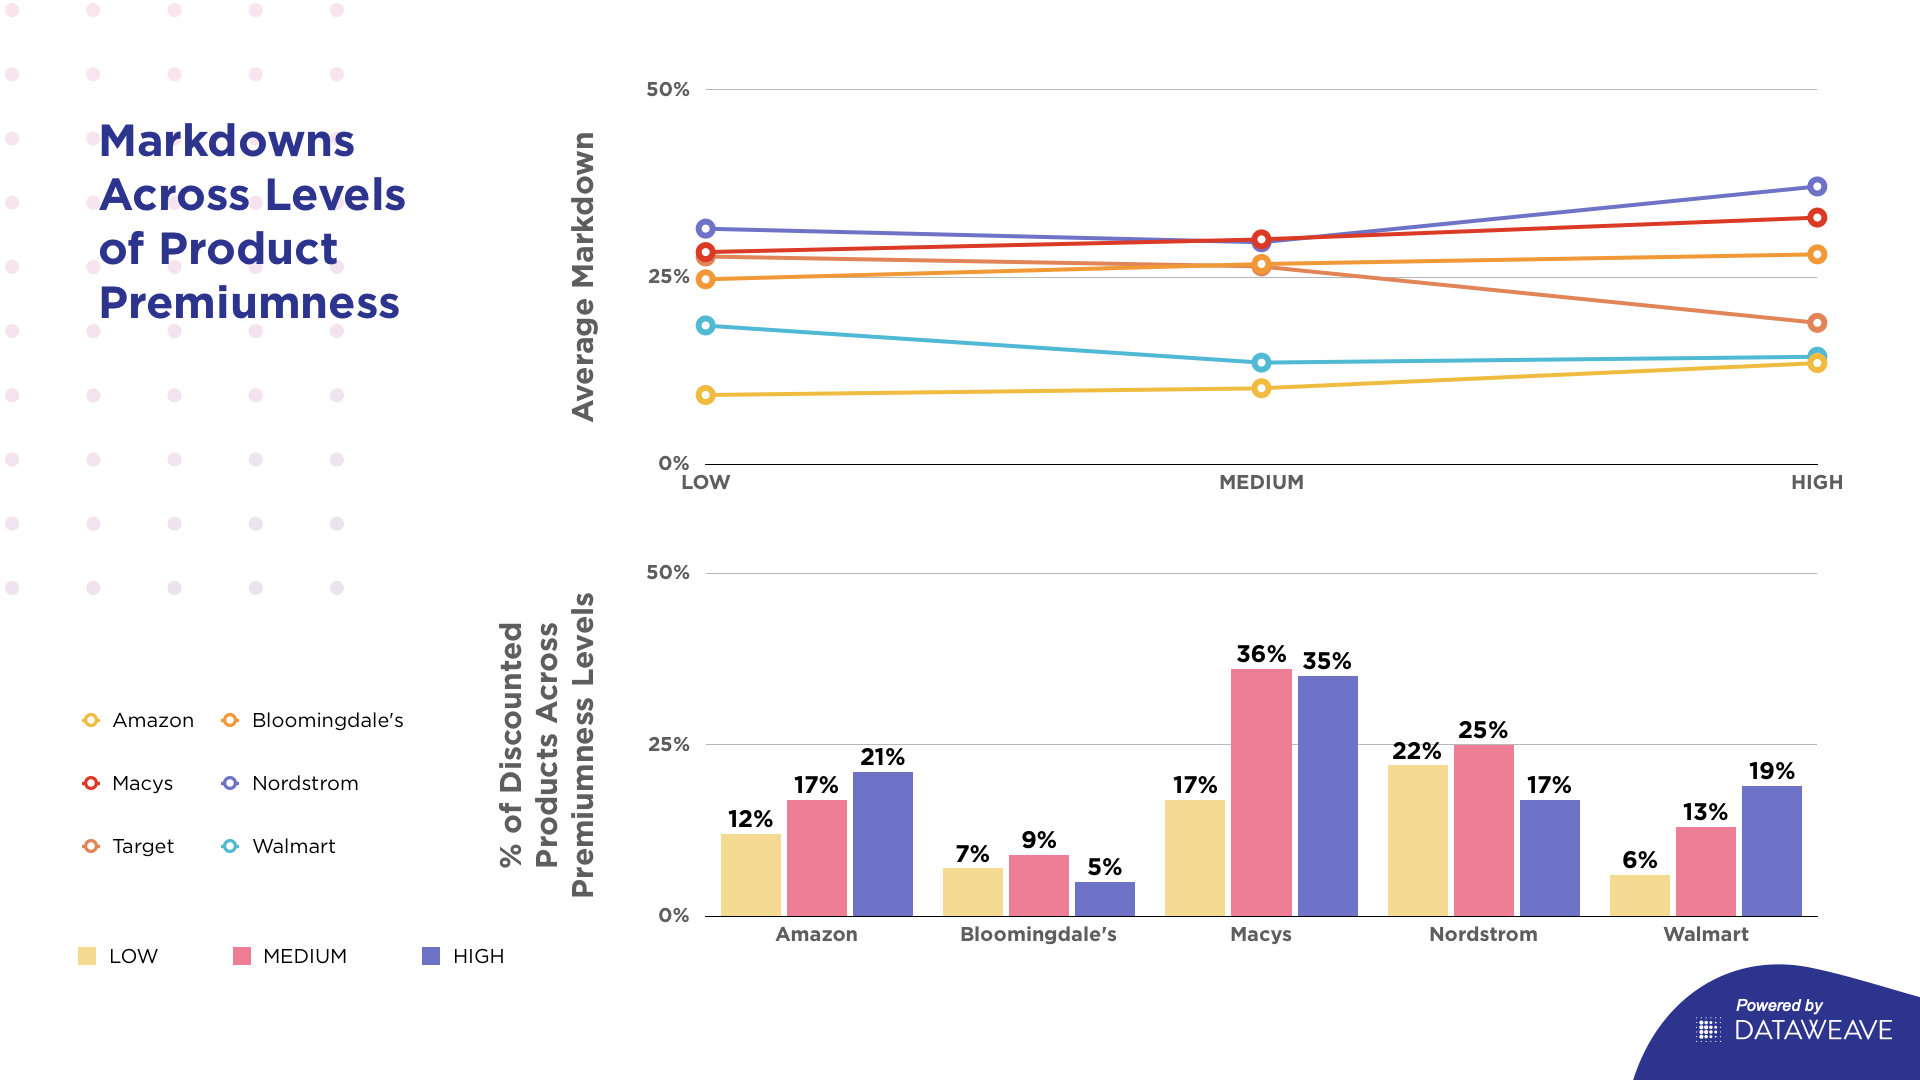
While retailers are increasingly discounting the lower priced products to shape price perceptions among shoppers (take a bow Amazon), what are the implications for brands? Firstly, a thin product range is going to make achieving visibility more challenging. Secondly, brand strategies across online retailing platforms will need to be more clearly defined and executed. Thirdly, those brands that treated Thanksgiving, Black Friday and Cyber Monday as discrete events are going to have to rethink their approach as these lines increasingly blur with time.
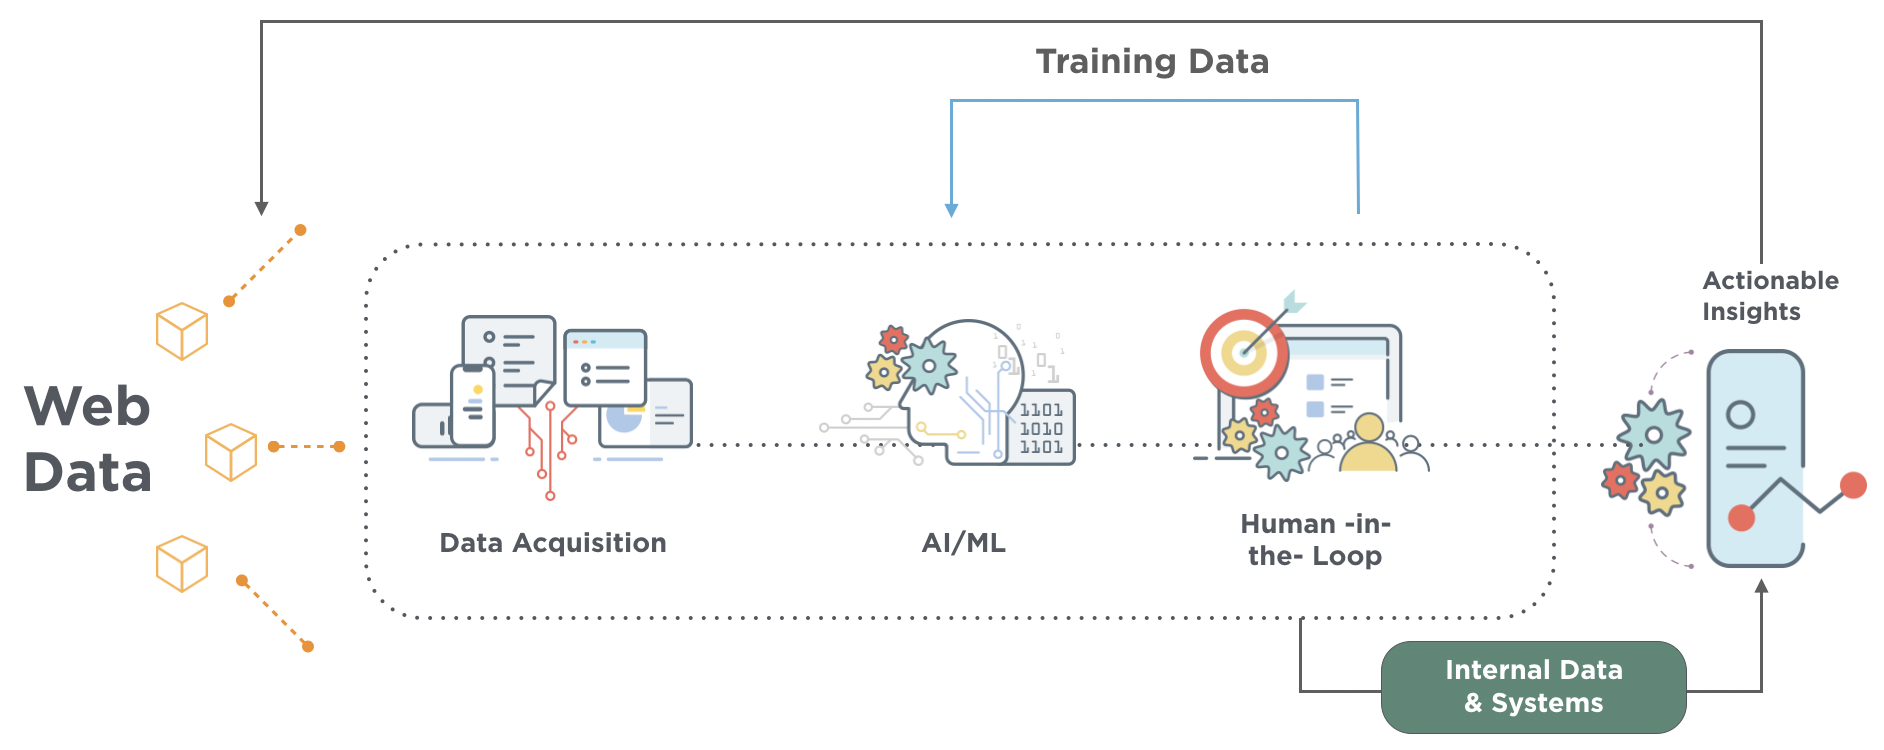
If you’re interested to learn more about how DataWeave aggregates and analyzes data from online sources as massive scale, as well as how we provide competitive intelligence to retailers and consumer brands, visit our website!
![[INFOGRAPHIC] 2019 at DataWeave: Blazing New Trails](https://stage-cdnblog.dataweave.com/wp-content/uploads/2020/01/2020-.jpg)