Traditionally, retailers have staged multiple promotions between Black Friday and before Christmas Day to keep consumers excited about holiday shopping, so it’s easy to see why one more promotional day might fall into relative obscurity. As if ‘Early Start’ offers to Black Friday and extended ‘Cyber Weekend’ promotions weren’t enough to plan for, eBay added another day into the mix called ‘Green Monday’, much to the benefit of consumers, as it furthers the window of opportunity to secure a bargain during the holiday season.
Green Monday falls on the second Monday of December and has historically been one of the greatest sales days of the year for eBay, often attracting last-minute shoppers or those searching for last-minute deals. However, because of the 2021 Global Shipping Crisis, there is speculation that Green Monday may be the last chance this year to have items delivered in time for Christmas. For this reason, we believe it could turn into quite a fruitful event for participating retailers if it encourages procrastinating shoppers that traditionally spend closer to December 25th to buy earlier in the season.
This isn’t the first year retailers outside of eBay have offered Green Monday promotions, however. Our team has been actively monitoring activity on this day from 2017 through present, to not only assess which retailers participate in the event, but also to understand how the discounts may change surrounding the event. The categories monitored include Apparel (Clothing, Shoes & Jewelry), Bed and Bath, and Home and Garden, and we’ve identified products offered on discount by comparing each applicable product’s price on Green Monday versus the most commonly seen price for the product offered throughout the month of December.
Better Promotions Than Boxing Day
Taking a closer look at 2020 Green Monday discounts within the categories and retailers analyzed, apart from Wayfair.com, we see all offered more SKUs on discount on Green Monday versus the days leading up to and out of the event. Kohls.com led the pack with around 93% of SKUs offered on discount, followed by Macys.com with 95%, and Wayfair.com with 83%. Overall, the number of SKUs on discount on Green Monday were greater than the SKUs offered on discount on Boxing Day, which is traditionally known as a great day to bargain shop.
Source: DataWeave Commerce Intelligence – Promotional Insights tracking Apparel, Bed & Bath, and Home & Garden category product’s online price on Green Monday 2020 in the US versus regular prices for the same products in the month of December each year.
What’s in Store for Green Monday 2021?
The insights we’ve tracked over the last four years have not indicated any signs to an end for Green Monday any time soon. As we see it, for consumers it is an extremely convenient time to order holiday gifts, and for retailers it is a good time to build brand trust and loyalty by fulfilling last minute orders at a great value, in time for the holidays.
Our prediction for the categories analyzed is to expect to see more retailers participate in Green Monday 2021 to a greater degree (more SKUs on sale and enhanced promotions). For retailers in this analysis, we would anticipate HomeDepot.com to enhance the number of offers to match 2020 competitive activity, and for Wayfair.com to look at increasing the number of offers on Green Monday versus the period leading into the event.
If you are interested in learning more about the details behind this analysis or our Promotional Insights solution, be sure to contact us. We can help you evaluate the effectiveness of your holiday promotional spend with access to near real-time marketplace insights on the brands, categories, and products your rivals promote, including discounts, campaign frequency and duration and more.
The explosive growth of online shopping has forced brands to re-examine their e-commerce processes to stay competitive and profitable. In particular, out-of-stocks are a common, costly retail challenge, as product shortages frustrate online shoppers – and even prompt them to leave brands.
According to McKinsey & Company, forty-eight percent of consumers switched to a different brand in 2020 because those products were in stock. Among these consumers, seventy-three percent plan to keep using the new brands, linking product availability gaps to the erosion of sales and loyalty. Conversely, brands with effective inventory planning and replenishment can keep items in stock, drive sales and improve the customer experience.
Retailers like Walmart, collaborating with these brands to meet customer demand, are still facing inventory challenges but, as noted in 2021 Q3 earnings, inventory was up almost twelve percent year-over-year as they worked to stay ahead of increased holiday demand. They have also adjusted in-store operations to accommodate ever-growing e-commerce demands, especially within grocery-centric categories, as digital grocery buyers now amount to more than half the U.S. population.
Maximizing Conversions with Category Insights
Walmart’s dot-com strategy is paying off in spades, considering they surpassed Amazon as the leading U.S. grocery e-commerce retailer in 2020 and grew another forty-one percent in Q3, 2021. Our team has been actively tracking digital shelf analytic KPIs on Walmart.com to identify inventory and promotional performance improvement opportunities at a category level to support brands in capitalizing on these digital growth opportunities.
The latest analysis is summarized below, reviewing average category availability and discount trends occurring each week of the month, from May to August 2021, at a category level. A recent report found the 29th of each month to be the busiest day for online sales because consumers often get paid at the end of the month, which made DataWeave analysts wonder:
Which categories are maximizing their growth potential on Walmart.com and where are the greatest opportunities for improvement during periods of increased demand?
How do increased demand periods (like payday) impact category online availability?
Are category promotions offered at the right times throughout the month to best support demand?
When Seasonal Demand for Groceries and Payday Merge
Across all Walmart.com food categories tracked, Week 5 – where payday commonly falls for most consumers, had the lowest average product availability, while Week 4 had the highest average product availability for all categories except Deli and Fruits and Vegetables. These findings may inspire Walmart’s brand partners to rethink their inventory and assortment planning, replenishment and even pricing efforts to maintain a healthy stock closer toward the end of the month to match higher demand.
The categories with the greatest difference in average availability during Week 5 versus the rest of the month were Snacks & Candy, Beverages and Alcohol, indicating consumers consistently made these types of purchases closest to payday, when income was highest throughout the month. Seasonality is a secondary factor that influenced demand for these items given events like Memorial Day, Fourth of July, Summer Break, and Back-to-School shopping all took place during our analysis. Additionally, most holidays overlapped payday, which also furthered Week 5 demand.
Source: DataWeave Digital Shelf Analytics for Brands – Category average availability percentages from May to August 2021 between Week 1 (the 1st to the 7th day of the month) and Week 5 (the 29th, 30th and 31st day of the month).
Coupling availability with discounts allows us to consider whether consumers buy more in Week 5 due to high discounts or increased purchasing power, or both. In reviewing the average category discounts offered within the same grocery-centric categories analyzed above, we found almost every grocery category showed a higher discount in Week 5 compared to the rest of the month, except for Bread & Bakery and Alcohol.
Source: DataWeave Digital Shelf Analytics for Brands – Category average discount percentages from May to August 2021 between Week 1 (the 1st to the 7th day of the month) and Week 5 (the 29th, 30th and 31st day of the month).
Regarding Alcohol, during Week 4, when average availability was the highest, the average discounts offered were the lowest. This can indicate inventory was primed for payday shoppers (and the holidays of course). Bread & Bakery offers the greatest average discounts when inventory levels are lowest on average, indicating Week 3 is a great time to stock up, while Week 4 might be a great time to buy the freshest inventory.
The greatest average discounts in Week 5 were in Snacks & Candy, Pantry and Fruits & Vegetables. Deeper discounts for Snacks & Candy in Week 5 may have helped brands compete for consumers’ disposable income despite being a discretionary category. Pantry brands’ discounts may have reflected a need to compete for shoppers’ attention. During this period, consumers were out of the house more and less likely to use these grocery staples compared to earlier lockdown periods and cooler months.
Making Specialty Categories and Health a Priority for Online Shoppers
Interestingly, the only two categories where inventory was higher in Week 5 versus all other weeks each month were ‘Special Diets’ foods and ‘Summer Flavors’, although ‘Special Diets’ foods consistently maintained the lowest level of average availability each week across all food categories analyzed. This consistent lack of inventory could indicate a great opportunity for brands to increase inventory for dietary products sold on Walmart.com.
Source: DataWeave Digital Shelf Analytics for Brands – Category average availability percentages from May to August 2021 between Week 1 (the 1st to the 7th day of the month) and Week 5 (the 29th, 30th and 31st day of the month).
The average availability for ‘Summer Flavors’ foods verifies brands are maintaining a solid replenishment strategy for these seasonal items, and a high likelihood consumers will happily find what they need to plan their Summer gatherings on Walmart.com. One alarming factor we found was the change in average discounts offered during Week 5 versus Weeks 1 through 4, indicating promotions surrounding payday may be driving sales volume versus organic demand.
Source: DataWeave Digital Shelf Analytics for Brands – Category average discount percentages from May to August 2021 between Week 1 (the 1st to the 7th day of the month) and Week 5 (the 29th, 30th and 31st day of the month).
Digital Growth Opportunity in Meal Kits and Kids’ Meals
Two categories primed for growth, according to Statista, are meal kits and kids’ food and beverages. Their research indicates retail sales for kids’ food has grown steadily year-over-year since 2013, and a recent report also indicates meal kit sales are expected to more than double 2017 sales in 2022, reaching $11.6 billion in the U.S., spurred by pandemic-induced demand. A concerning find in our research indicates both categories, ‘Easy Meal Solutions’ and ‘Kid Friendly Foods’ on Walmart.com, showed great volatility when it comes to in-stock availability. For example, in Week 1, ‘Easy Meal Solutions’ had an average availability nearly half the average of the rest of the month (around nineteen percent versus nearly thirty-eight percent), and in Week 5, payday week, ‘Kid Friendly Foods’ saw the biggest drop in average availability compared to Weeks 1 through 4 (over sixty-seven percent versus seventy-five percent) indicating supply may not be keeping up with the heightened demand.
Source: DataWeave Digital Shelf Analytics for Brands – Category average availability percentages from May to August 2021 between Week 1 (the 1st to the 7th day of the month) and Week 5 (the 29th, 30th and 31st day of the month).
The heightened average discounts offered during Week 5 for ‘Baby’ and ‘Pets’ items indicate two categories consumers will most likely stock up on during payday.
Source: DataWeave Digital Shelf Analytics for Brands – Category average discount percentages from May to August 2021 between Week 1 (the 1st to the 7th day of the month) and Week 5 (the 29th, 30th and 31st day of the month).
Back to School Stock-Outs
U.S. retail sales unexpectedly increased in August, likely boosted by back-to-school shopping and child tax credit payments. Meanwhile, product shortages and other supply chain issues slowed 2021’s back-to-school sales, possibly affecting school supplies’ and clothing availability on Walmart.com. According to our analysis, the average product availability in Walmart.com’s school supplies category fell from over sixty-two percent during Weeks 1 through 4 to nearly forty-two percent in Week 5.
Warmer weather, seasonal events, reduced lockdowns, and vaccination efforts led more Americans to resume in-person socializing, giving reason to update their spring and summer wardrobes. In July, Forbes shared that three-quarters of shoppers are purchasing apparel, accessories and shoes the most. On average, only around sixty-three percent of clothing items were available on Walmart.com during Weeks 1 through 4. However, in Week 5, that figure plummeted to just over thirty-eight percent, the most significant drop among all categories.
Source: DataWeave Digital Shelf Analytics for Brands – Category average availability percentages from May to August 2021 between Week 1 (the 1st to the 7th day of the month) and Week 5 (the 29th, 30th and 31st day of the month).
Demand for new fashion remained high throughout this period, seemingly fueled organically, as only moderate additional discounts took place in Week 5, and although the average discount on school supplies was only around twenty-seven percent during Weeks 1 through 4, it surged to just over forty-seven percent in Week 5. Generous additional discounts in Week 5 may have inspired online shoppers to shift spending from clothing to school supplies in late July and August ahead of students’ return to the classroom.
Source: DataWeave Digital Shelf Analytics for Brands – Category average discount percentages from May to August 2021 between Week 1 (the 1st to the 7th day of the month) and Week 5 (the 29th, 30th and 31st day of the month).
Prioritizing Product Availability with Digital Advertising Strategies
Seventy-eight percent of B2C marketers increased their 2021 digital advertising spend to fuel online product discoverability (Share of Search), and sales and market share, but out-of-stock experiences simultaneously surged 172% this year from pre-pandemic levels. Paying for ads that drive traffic to your out-of-stock products can be as detrimental to your brand as a bad user experience. Our review of the ‘Featured Products’ sold on Walmart.com show consistent, low-levels of product availability each week throughout the months reviewed.
Source: DataWeave Digital Shelf Analytics for Brands – Category average availability percentages from May to August 2021 between Week 1 (the 1st to the 7th day of the month) and Week 5 (the 29th, 30th and 31st day of the month).
Additionally, the average discount offered on these products tended to be higher than most other categories reviewed, indicating brands participating in the featured product section of the website were not only investing in digital ads, but also doubling down with promotional activity as well.
Source: DataWeave Digital Shelf Analytics for Brands – Category average discount percentages from May to August 2021 between Week 1 (the 1st to the 7th day of the month) and Week 5 (the 29th, 30th and 31st day of the month).
How Brands can Replenish Their Digital Shelf
It is well known just how important it is to have products available during the right time of day, week, month, or season to improve customer satisfaction rates, but with your e-commerce store open 24/7 and omnichannel fulfillment strategies in place, it drastically changes the way in which strategic execution is prioritized for a retailer to reduce basket abandonment and for brands to build loyalty.
Our greatest takeaway from this analysis is realizing how crucial it is for brands to proactively track product availability and competitive pricing insights to stay ahead of the curve and achieve their digital growth goals. Early visibility to stock replenishment could help brands align with heightened cyclical and seasonal demand to avoid out-of-stocks and grow e-commerce sales.
This is why more leading brands now rely on our Digital Shelf Analytics solutions, including Pricing and Availability insights, to keep eCommerce planning agile, to maximize online conversions, and ultimately maintain shopper satisfaction and loyalty.
As eCommerce grows in complexity, brands need new ways to grow sales and market share. Right now, brands face urgent market pressures like out-of-stocks, an influx of new competition and rising inflation, all of which erode profitability. As online marketplaces mature, more brands need to make daily changes to their digital marketing strategies in response to these market pressures, shifts in demand, and competitive trends.
eMarketer forecasts 2021 U.S. eCommerce will rise nearly 18% year-over-year (vs. 6.3% for brick-and-mortar), led by apparel and accessories, furniture, food and beverage, and health and personal care. The eCommerce industry is also undergoing fundamental changes with newer entities emerging and traditional business models evolving to adapt to the changed environment. For example, sales for delivery intermediaries such as Doordash, Instacart, Shipt, and Uber have gone from $8.8 billion in 2019 to an estimated $35.3 billion by the end of 2021. Similarly, many brands have established or are building out a Direct to Consumer (D2C) model so they can fully own and control their customer’s experiences.
In response, DataWeave has launched the next generation of our Digital Shelf Analytics suite to help brands across retail categories directly address today’s costly market risks to drive eCommerce growth and gain a competitive advantage.
“Our new enhancements help brands improve online search rank visibility and quantify the impact of digital investments – especially in time for the busy holiday season.” ~ Karthik Bettadapura, CEO and co-founder, DataWeave
The latest product enhancements provide brands access to tailored dashboard views that track KPI achievements and trigger actionable alerts to improve online search rank visibility, protect product availability and optimize share of search 24/7. Dataweave’s Digital Shelf Analytics platform works seamlessly across all forms of eCommerce platforms and models – marketplaces, D2C websites and delivery intermediaries.
Dashboard for Multiple Functions
While all brands share a common objective of increasing sales and market share, their internal teams are often challenged to communicate and collaborate, given differing needs for competitive and performance data across varying job functions. As a result, teams face pressure to quickly grasp market trends and identify what’s holding their brands back.
In response, DataWeave now offers executive-level and customized scorecard views, tailored to each user’s job function, with the ability to measure and assess marketplace changes across a growing list of online retail channels for metrics that matter most to each user. This enhancement enables data democratization and internal alignment to support goal achievement, such as boosting share of category and content effectiveness. The KPIs show aggregated trends, plus granular reasons that help to explain why and where brands can improve.
Brands gain versatile insights serving users from executives to analysts and brand and customer managers.
Prioritized, Actionable Insights
As brands digitize more of their eCommerce and digital marketing processes, they accumulate an abundance of data to analyze to uncover actionable insights. This deluge of data makes it a challenge for brands to know exactly where to begin, create a strategy and determine the right KPIs to set to measure goal accomplishment.
DataWeave’s Digital Shelf Analytics tool enables brands to effectively build a competitive online growth strategy. To boost online discoverability (Share of Search), brands can define their own product taxonomies across billions of data points aggregated across thousands of retailer websites. They can also create customized KPIs that track progress toward goal accomplishment, with the added capability of seeing recommended courses of action to take via email alerts when brands need to adjust their eCommerce plans for agility.
“Brands need an integrated view of how to improve their discoverability and share of search by considering all touchpoints in the digital commerce ecosystem.” ~ Karthik Bettadapura, CEO and co-founder, DataWeave
Of vital importance, amid today’s global supply chain challenges, brands gain detailed analysis on product inventory and availability, as well as specific insights and alerts that prompt them to solve out-of-stocks faster, which Deloitte reports is a growing concern of consumers (75% are worried about out-of-stocks) this holiday season.
User and system generated alerts provide clarity to actionable steps to improving eCommerce effectiveness.You also have visibility to store-level product availability, and are alerted to recurring out-of-stock experiences.
Scalable Insights – From Bird’s Eye to Granular Views
DataWeave’s Digital Shelf Analytics allows brands to achieve data accuracy at scale, including reliable insights from a top-down and bottom-up perspective. For example, you can see a granular view of one SKUs product content alongside availability, or you can monitor a group of SKUs, say your best selling ones, at a higher level view with the ability to drill down into more detail.
Brands can access flexible insights, ranging from strategic overviews to finer details explaining performance results.
Many brands struggle with an inability to scale from a hyper-local eCommerce strategy to a global strategy. Most tools available on the market solve for one or the other, addressing opportunities at either a store-level basis or top-down basis – but not both.
According to research by Boston Consulting Group and Google, advanced analytics and AI can drive more than 10% of sales growth for consumer packaged goods (CPG) companies, of which 5% comes directly from marketing. With DataWeave’s advanced analytics, AI and scalable insights, brands can set and follow global strategies while executing changes at a hyper-local level, using root-cause analysis to drill deeper into problems to find out why they are occurring.
As more brands embrace eCommerce and many retailers localize their online assortment strategies, the need for analytical flexibility and granular visibility to insights becomes increasingly important. Google reports that search terms “near me” and “where to buy” have increased by more than 200% among mobile users in the last few years, as consumers seek to buy online locally.
e-Retailers are now fine-tuning merchandising and promotional strategies at a hyper-local level based on differences seen in consumer’s localized search preferences, and DataWeave’s Digital Shelf Analytics solution provides brands visibility to retailer execution changes in near real-time.
Competitive Benchmarking
Brand leaders cannot make sound decisions without considering external factors in the competitive landscape, including rival brands’ pricing, promotion, content, availability, ratings and reviews, and retailer assortment. Dataweave’s Digital Shelf Analytics solution allows you to monitor share of search, search rankings and compare content (assessing attributes like number of images, presence of video, image resolution, etc.) across all competitors, which helps brands make more informed marketing decisions.
Brands are also provided visibility into competitive insights at a granular level, allowing them to make actionable changes to their strategies to stay ahead of competitors’ moves. A new module called ‘Sales and Share’ now enables brands to benchmark sales performance alongside rivals’ and measure market share changes over time to evaluate and improve competitive positioning.
Monitor competitive activity, spot emerging threats and immediately see how your performance compares to all rivals’, targeting ways to outmaneuver the competition.
Sales & Market Share Estimates Correlated with Digital Shelf KPIs
In a brick-and-mortar world, brands often use point of sale (POS) based measurement solutions from third party providers, such as Nielsen, to estimate market share. In the digital world, it is extremely difficult to get such estimates given the number of ways online orders are fulfilled by retailers and obtained by consumers. Dataweave’s Digital Shelf Analytics solution now provides sales and market share estimates via customer defined taxonomy, for large retailers like Amazon. Competitive sales and market share estimates can also be obtained at a SKU level so brands can easily benchmark their performance results.
Additionally, sales and market share data can also be correlated with digital shelf KPIs. This gives an easy way for brands to check the effect of changes made to attributes, such as content and/or product availability, and how the changes impact sales and market share. Similarly, brands can see how modified search efforts, both organic and sponsored, correspond to changes in sales and market share estimates.
Take Your Digital Shelf Growth to the Next Level
The importance of accessing flexible, actionable insights and responding in real-time is growing exponentially as online is poised to account for an increasing proportion of brands’ total sales. With 24/7 digital shelf accessibility among consumers comes 24/7 visibility and the responsibility for brands to address sales and digital marketing opportunities in real-time to attract and serve online shoppers around the clock.
Brands are turning to data analytics to address these new business opportunities, enhance customer satisfaction and loyalty, drive growth and gain a competitive advantage. Companies that adopt data-driven marketing strategies are six times more likely to be profitable year-over-year, and DataWeave is here to help your organization adopt these practices. To capitalize on the global online shopping boom, brands must invest in a digital shelf analytics solution now to effectively build their growth strategies and track measurable KPIs.
DataWeave’s next-gen Digital Shelf Analytics enhancements now further a brand’s ability to monitor, analyze, and determine systems that enable faster and smarter decision-making and sales performance optimization. The results delight consumers by helping them find products they’re searching for, which boosts brand trust.
Connect with us to learn how we can scale with your brand’s analytical needs. No project or region is too big or small, and we can start where you want and scale up to help you stay agile and competitive.
Traditionally, Quick Service Restaurants (QSRs) such as McDonald’s or Burger King, have been strategically operating on a brick and mortar model. However, according to some studies, an average QSR generates as much as 75% of its sales from online orders.
With the advent of delivery apps such as Uber Eats and Doordash, a significant portion of QSRs’ business has moved to these platforms. The war to top rank on one of these platforms is an even greater feat. With each brand competing for the top listing, it’s much less about the dollars you pay and much more about optimizing your investments.
The relationship between QSR chains and food delivery apps has its advantages and disadvantages. One of the critical grouses QSRs have against food apps is the incremental marketing spend required to participate on the platform and the inability to measure the impact of their investment. What makes matters worse is the limitation in metrics even available to measure the impact – neither the food apps provide them, nor does anyone else.
At DataWeave, we have made it our mission to enable QSRs to not only define measurable metrics to achieve a positive ROI for food app marketing investments, but we also equip QSRs with the tools to track their competitive performance at granular, zip code-based level so that localized strategies can be modified as needed. Below is an example of a 1000+ store chain QSR we partnered with to optimize a pre-existing investment made with a large food aggregator app. Within months of engagement with us, they were able to achieve a 3X increase in sales without adding any additional marketing dollars.
Below are the pain points we identified and solved together:
1. No Defined Metric
Problem – No leading metric to track marketing performance
One of the first issues we realized was that sales was not a good metric for tracking marketing performance as it’s a lagging metric and doesn’t capture the issues that help grow or suppress sales.
Most of the sales are driven by rank in the cuisine category and searches for branded keywords. But, the QSR chain had no way to track these ranks.
In fact, 70%+ sales go to the first five restaurants for the category and keyword
Comparing ranking on food delivery platforms across different categories and times
Solution – Establish ranking as a clear marketing metric
By aggregating data across different food app platforms comprehensively, i.e. across locations, at different times of the day, we established the ranking of the QSR chain in critical categories and for priority keywords, identifying where they under or over-performed relative to the competition. As we did this daily- this became a straightforward metric that helped establish the performance of their marketing campaign.
2. Geographical & Categorical Challenges
Problem: Identifying poor-performing stores and zip codes
We realized it was not a simple exercise to identify well performing stores on food apps since sales depend on many factors such as competition, population of the area, local cuisine preference, etc.
Solution: Zip Code Ranking and Attributes
We tracked the ranking of each store within each Zip Code for keywords and created a list of poor-performing stores. We also extracted attributes such as estimated time of arrival (ETAs), Delivery Fee, Ratings, Reviews, etc., for each of these poor performing stores, to identify the reasons for the poor ranking.
Analysing key metrics at a store level – identifying worst & best performing stores
E.g., We realized 356 of the stores were not populating on first page results, primarily because of poor ratings and High ETAs. After the focused initiative, 278 of these stores started showing on the first page and increased sales by 23%.
3. Sensitivity Analysis Deficiency
Problem: Not clear about the contribution of Rating, ETAs, Fees, etc. on the Ranking
The exact ranking algorithms of these food apps are not publicly shared – so the QSR chain wasn’t clear which variable of rating, ETAs, fees, ad spend, or availability contributed more or less to the overall ranking.
Solution: Sensitivity analysis for measuring contribution
Comprehensive data for multiple zip codes in various timestamps was analyzed to determine which variable contributes most significantly to the rankings and when. We also conducted A/B testing – simultaneously testing two different variables, such as reducing ETAs at one store and improving ad spend at another, calculating which led to greater rank and sales impact.
For example, we realized reducing publicized ETA’s (even by decreasing the delivery radius) contributed much more to improve the rankings than changes to ratings.
4. An Unknown Competitive Landscape
Problem: Tracking competitor performance
For example, we found the QSR chain performed well in key urban centers, but the competition was doing even better, but there wasn’t a good way to track and compare the performance of the competitors.
Solution:
We started tracking the QSR chain and the competition for each of the metrics and started comparing performance.
Analysing competitive performance on key metrics such as ETA, Availability etc
We quickly realized ranking started quickly improving as we gained a slight edge in each metric against the competitors. For example, 5 minutes less ETA adds to higher ranking.
In six months of this exercise with the QSR chain, we improved the average ranking from 24 to 11 for the QSR chain, getting them featured on the first page.
5. Blind Advertising Investment Opportunities
Problem:
The QSR chain was not clear on which banners (Popular near you, National Favorites, etc.) to choose to invest in, and had to depend on the recommendations of the food platforms entirely.
They weren’t even provided a clear view of which position made the banner visible and at what rank among those banners was their promo visible. They were at times the 7th promo in the 6th banner, which has almost zero probability of being discovered by the user – this happened despite paying heavily for the banners.
Solution:
We aggregated data for all banners populated within each zip code and found out the ranking and in which position the QSR chain was visible.
Identifying and analysing right banners for advertising spends
The QSR chain invested in 630 zip code-based banners with guaranteed visibility, but our assessment indicated the banners were only visible in 301 zip codes. After selecting suitable banners for promotions, we improved visibility to 533 zip codes within enhancing the budget.
We are now using the same strategy for refining discounts, offers, promotions, and coupons.
6. Lack of Campaign Performance Monitoring
Problem: Unsure of the long-term impact of marketing spend
In general, increasing marketing spend does give a temporary boost to sales, but the QSR chain’s question was, how can we measure the long-term impact i.e., ranking keywords and the targeted zip codes.
Solution:
We created a simple widget for every marketing campaign which showed the rank for the keywords for selected zip codes before the campaign, during the campaign, and post the campaign, clearly establishing the midterm impact of the campaign. This constant monitoring allowed the QSR to also quickly pivot on their strategy on account of national holidays etc, and act accordingly.
7. Non-Existent ROI Measurement
Problem: Establishing the impact of ranking on sales
Though the QSR chain could track sales that were coming via the food app channel, they had no way of knowing incremental organic volume driven by marketing efforts.
One missing variable here was how much of extra sales could be attributed to improvement of QSR ranking?
Solution:
By combining the sales data with aggregated insights over time, we established for the QSR chain how much increase in sales they could anticipate from an increase in ranking, also knowing which changed variables led to the percentage of change increase.
So, in essence, we were able to tell the QSR chain that for each store how much sales would increase by improving ETAs, rating, ad visibility, availability, etc., enabling precise ROI calculations for each intervention they make for their stores.
Increasing sales by 3x within six months was only the beginning, and the journey of driving marketing efficiency using competitive and channel data has only just begun.
DataWeave for QSRs
DataWeave has been working with global QSR chains, helping them drive their growth on aggregator platforms by enabling them to monitor their key metrics, diagnose improvement areas, recommend action, and measure interventions’ impact. DataWeave’s strategy eliminates the dependence on food apps for accurate data. We aggregate food app data and websites to help you with analysis and the justification of marketing spend and drive 10-15% growth.
DataWeave’s strategy eliminates the dependence on food apps for accurate data. We aggregate food app data and websites to help you with analysis and the justification of marketing spend and drive 10-15% growth.
If you want to know learn how your brand can leverage Dataweave’s data insights and improve sales, then click here to sign up for a demo
Prime Day or not, brands need to make sure their Digital Shelf is well stocked, highly discoverable in crowded marketplaces, have the right offers and discounts to stay competitive, all while making sure their products have glowing reviews, ratings and optimized content. While this is a year-round effort, brands go the extra mile on Prime Day to make sure they’re putting their best foot forward.
Methodology To understand how brands adapted their digital shelf for Prime Day, we examined data insights across Amazon in 6 markets and compared the following brand KPIs:
Share of voice (SOV): The percentage of a brands products that appear in the search results page for relevant keywords on Amazon.
Availability: The percentage of products in stock on Amazon for Prime Day.
Additional discounts: The reduction in the listing price of a product during Prime Day compared to before or after the event to see how brands adapted their pricing strategies to stand out from rivals
Winning brands made sure their products were ‘highly’ discoverable
With all the global lockdowns, home entertainment hit a new high. So we looked at the word “TV” to see which brand had the highest share against this keyword during the Prime Day event.
In the US – Samsung won hands down with close to 15% SOV. LG came in at a not so close 2nd with 9% SOV.
In the UK – Samsung won again with a whooping 16.7% SOV with Sharp at # 2 at 12%.
Now let’s look at some key European markets
On Amazon Italy we saw a similar trend – Samsung & LG, neck to neck at 22% & 19% respectively.
Amazon Germany was no different – Samsung had the highest SOV at 15% and Philips far behind at 7%.
Samsung has such a strong association with the keyword TV. This means, when customers are searching for TVs on Amazon in these regions – the brand that has the largest selection up on display for them to choose from is Samsung! That’s definitely going to have a positive impact on sales, don’t you think?
Do you know which keywords you should be tracking for your brand? And do you know your Brand’s SOV against those keywords?
… & finally, an outlier!
In Amazon France, LG took the lead for a change – with 15% SOV. But we have Samsung not far behind at 13%.
Kudos to team Samsung!
Winning Brands kept a close eye on product availability
Poor product availability leads to lost sales. But not on Amazon Prime Day! Bigger brands that sell over 500 products created artificial scarcity by listing a chunk of products out of stock before the sale. And restocked aggressively during the sale.
In contrast, the smaller brands that sold fewer than 100 products didn’t dare make such bold moves and stayed stocked up even pre-event to avoid even a single day of lost sales.
Let’s look at some data from the US
The average availability for bigger brands selling 500+ products before the sale was 41% and then went up dramatically to 81.4% the day of the sale when they aggressively restocked.
Similar trend in the UAE
Availability pre-sale was 26.2% and during the sale shot up to 87.6%!
Various other markets displayed similar patterns. And this was only possible because these brands were able to track their availability with precision and plan their stock levels accordingly.
How are you tracking your availability across marketplaces? Do you know when your products are out of stock and are in immediate need of replenishment?
Winning Brands made strategic pricing and discounting decisions
Discounts matter. Period. And brands that use discounts strategically, win.
Let’s look at Airpods on Amazon in the US.
During the event, Apple had the highest SOV for the keyword Airpod at 7.5% followed by SkullCandy, an American audio accessory manufacturer at 5.6%.
Here’s the interesting part – during the sale Apple offered just 3.4% additional discounts while SkullCandy offered 32.1% additional discount to try and win sales from Apple. And looks like it worked! Apples SOV dropped from 13.5% before the event to 7.5% during the event and SkullCandy’s SOV improved
Now let’s look at the same data cut in the UAE – a market where Apple products have a fair penetration, but not as high as in the US. They needed a more aggressive discounting strategy in this market.
In the US, during the sale, Apple offered additional discounts on just 30% of products. However, in the UAE that number rose to 90% – a clear strategy to make their product pricing more attractive to customers to win sales
Discounts and markdowns aren’t always the answer to improving sales, but when used strategically can drive significant impact to your bottom line.
Are you tracking your competitor pricing? Do you know if they’re keeping tabs on your pricing strategy to get ahead of you?
Winning Brands made it to the Amazon Best Seller list
Amazon Best Sellers are products that have the highest sales on Amazon. Products with a higher Amazon Best Seller Rank have higher sales.
In the US, Nintendo had the highest share in the Electronics Best Seller category during the sale at 18.6%. Before the sale their share stood at 22.5% – so they lost ground a little ground with a 27.2% drop in their Best Seller share. While they gave additional discounts of 17%, only 27% of their catalogue was discounted.
But here’s a brand that knocked it out of the park! The Razer had an SOV of just 1.18% before the sale and during Prime Day it shot up to 6%! A clear indication that sales for the Razer spiked exponentially during Prime Day. Could this be because Razer offered 100% of their catalogue on an additional discount of 31%? It’s a bold move that could have paid off and contributed to super high sales.
Now let’s look at France – the Fashion Capital of the World and which brand came out on top in the Fashion Best Seller Category
Footwear brand Havaianas had the highest SOV on Prime Day (13.48%) Not too surprising because before the sale they were at 14.09%
Now let’s look at the Best Seller Rank – Lacoste secured BSR #1 at the event. Pat on the back for them because before the sale they were at Rank 46! And post-sale they dropped to #6. Definitely a combination of techniques involved here that got them from #46 to #1 at super speed!
What techniques have you tried to boost sales for your products on Amazon?
Brands that do not optimize their Digital Shelf risk losing out on their share of basket. If you’ve been thinking about how to optimize your Brands Digital Shelf, then get in touch & learn how DataWeave can help!
Show moms extra love this year. With Mother’s Day coming up fast, savvy beauty and fashion brands will use this special occasion to inspire pampering and gift giving to fuel their e-commerce sales growth.
This year, beauty and fashion are poised to boom, as 40% of consumers plan to buy beauty products and 37% will buy new outfits for going out. 1 According to eMarketer,apparel and accessories e-commerce sales will grow nearly 19% this year due to pent-up demand for clothing, while health and beauty sales will rise 16%. 2
“People will be happy to go out again … there will be a fiesta in makeup and in fragrances.”
~L’Oréal CEO and Chairman Jean-Paul Agon
After beauty and apparel sales declined last year, brands now seize every opportunity to capitalize on the categories’ resurgence in 2021. To differentiate their goods, brands can use e-commerce marketing best practices to position their fashion and beauty items as spectacular gifts that moms will love.
Aligning with the latest trends can help brands boost online growth.
Hot trends dominating beauty and fashion
This Mother’s Day, shoppers can delight moms with beauty bestsellers like:
Mask-friendly makeup: As we continue to wear masks over the short-term, cosmetics like false lashes, smudge-proof mascara and ultra-hypoallergenic eyeshadow will remain popular. 3
Fragrances: Online fragrance sales rose 45% year-over-year in 2020. Clean and organic beauty categories grew 56% with fragrance brands growing the most. 4
Purpose-led brands: Consumers crave companies that care. More online searches contain keywords like “ethical beauty” and “sustainable makeup” for products that help consumers look good and feel good. 5
Online fashion is in vogue
Before the pandemic, consumers bought less than one-third of their apparel or footwear online; last year, the proportion surged to an astounding 51%. In 2021, consumers will invest even more in their wardrobes, including trends like:
Comfort: Athleisure will remain in demand as many consumers still prefer comfortable clothing when they work from home. 7
Beloved staples: Classic pieces like jeans, dresses and simple yet elegant tops are making a comeback as consumers start to go out more. 8
Retro ‘80s: Ladies are ready to party like it’s 1984. Bright and metallic colors and sequins for occasionwear (and even NFL linebacker-inspired shoulderpads) are recreating a fun, indulgent ’80s vibe. 9
Brands’ secret weapon for a competitive advantage
For successful Mother’s Day campaigns, more fashion and beauty brands will use digital shelf analytics for marketing decisions that maximize their ROI and e-commerce sales.
To ensure online shoppers discover Mother’s Day products with ease, brands are usingShare of Searchinsights to measure their share of digital shelf. These DataWeave analytics tell brands which keywords perform best. Brands can also benchmark their search and navigation visibility against rivals’ rankings across e-commerce categories, websites and geographic regions.
Using Content Auditinsights tells brands how their content is performing. They can discover and fill content gaps so their products show up more prominently. Optimizing content (like keywords, product page titles, descriptions, ads and sponsored space) and images to align with the retailers’ search algorithms ensures a consistent brand experience across all online channels. Improving content helps brands connect to consumers with marketing that resonates and inspires them to buy. Brands also use
Pricing and Promotionsinsights to measure the effectiveness of their online promotions and secure sales. Brands can stay competitive by ensuring their pricing and promotions are in line with rivals’ offers, such as identifying first movers and rivals with the deepest discounts across retailers and SKUs. Brands can even determine how imitating rivals’ pricing and promotional moves could impact revenue and sales volume.
Help shoppers make Mom’s day
Since Mother’s Day is almost here, beauty and fashion brands can apply these data insights to connect consumers with a variety of products moms will love. Digital shelf analytics from DataWeave can help brands deliver timely campaigns, improve their return on digital marketing spend and make effective marketing decisions to drive e-commerce sales.
1 Howland, Daphne. Wells Fargo sees permanent behavior shifts from the pandemic. Retail Dive. March 29, 2021. 2 Droesch, Blake. US Ecommerce by Category 2021. eMarketer. April 27, 2021. 3 Wood, Dana. Is Makeup Dead? The Robin Report. April 18, 2021. 4 Larson, Kristin. Fragrance Sales Pick Up As Consumers Reengage With The Outside World. Forbes. April 27, 2021. 5 What Can Brands Learn About Sustainability From Green Beauty Consumers? Beauty Business Journal. June 15, 2020. 6 Howland, Daphne. Wells Fargo sees permanent behavior shifts from the pandemic. Retail Dive. March 29, 2021. 7 Ibid. 8 Bhattarai, Abha. Americans are starting to buy real clothes again. The Washington Post. March 18, 2021. 9 Warren, Liz. Loose Denim and Bold Occasionwear on Full Display for Fall 2021. Sourcing Journal. April 2, 2021.
The proliferation of informed shoppers, e-commerce sites, and competitors of all sizes has increased the complexity of – and lucrative opportunities in – brand management.
Now more brands rely on data insights to uncover specific ways to make their digital marketing more arresting, effective and profitable. Many brands struggle with e-commerce profitability due, in part, to advertising expenses that often yield lackluster results.1
Analytics are growing in retail significance, as 88% of retail and consumer goods marketers say data improves their marketing by allowing them to personalize touchpoints. Relevant marketing and great marketers helps brands connect with consumers. Let’s see why leading brands are adding data insights to their 2021 marketing strategies to fuel online sales growth.
Brands discover how to get discovered
Consumer goods brands no longer leave it up to chance that consumers will find them online. The digital migration of companies and consumers over the past year means more noise for brands to breakthrough.
Now search is growing in importance to improve brands’ online product discovery. Here’s why:
87% of shoppers begin their hunt in digital channels3
17% rise in paid search in late 20204
24% rise in paid social advertising during the same period5
To grab consumers’ attention by being easier to see, more brands are turning to data insights to track their online visibility.
Brands need to look for ways to mitigate the high costs of acquiring customers online6
Brands use marketing analytics related to keywords and navigation searches help brands know exactly how much space on the digital shelf they occupy across different online platforms.
These DataWeave’s Share of Search solutions help brands understand what percentage of the digital shelf they command through either keywords or navigation. These insights can help brands decide whether to boost their brand visibility using sponsored ads to ensure their products show up more prominently in online search results to boost brand reach and awareness on each channel. For instance, brands can tell whether consumers search for products using branded, generic or category-specific keywords to align their marketing accordingly.
In addition, brands can see how their organic and sponsored results rank compared to their competitors to spot ways to improve their visibility rank and decrease customer acquisition costs.
Content differentiates a brand’s digital shelf
For a striking digital presence and enhanced discoverability, leading brands measure how effectively their content inspires online shoppers to choose them.
Brands can improve their digital marketing results by using Content Audit insights to spot patterns among their top-performing campaigns. They can also benchmark their content with category bestsellers to discover how to optimize their online performance to grow sales volume and market share.
Strategic advertising requires high-quality photography and data-driven content7
Using these data insights from DataWeave helps brands determine how well their content (including product description pages and images) align with e-commerce algorithms and lead to online traffic, engagement and sales. Brands also adapt faster by adjusting underperforming campaigns to reduce costs and optimize their digital marketing spends.
Brands can fill content gaps across online channels with enhanced product information that aligns content and images with brands’ product information management (PIM). Using analytics to deliver a consistent brand experience across all online channels can help brands build relationships with consumers and earn their trust.
Alluring promotions help brands secure the sale
As e-commerce evolves, brands have matured beyond Google AdWords and Facebook campaigns to offer targeted promotions across digital touchpoints, which increases marketing reach and complexity.
To boost clarity, be in demand and drive sales across online platforms, more leading brands use data insights to measure the effectiveness of their digital Promotions. Promotional insights from DataWeave keep brands informed of trending categories and products to keep their online offerings relevant and timely. Brands can pinpoint exactly which products to promote and which e-commerce sites help them drive the most profitable results with compelling digital offers.
Brands that respond quickly to their customers’ needs have the upper hand8
Analytics also keep brands competitive and relevant by benchmarking their promotional strategies with their rivals’ and continuously monitoring rivals’ online moves. For instance, brands can track the promotions their competitors offer for similar products across different e-commerce sites. These competitive insights help brands quickly spot opportunities to optimize their online conversions with appealing promotions that reflect market trends.
Better marketing decisions can help brands grow sales and share
Data insights make brands more enticing by connecting the dots among their online visibility, content and promotions. Brands uncover ways to make smarter marketing decisions faster to improve their top line and decrease customer acquisition costs. DataWeave analytics also help brands stand out and improve product discovery, engagement and sales. As a result, brands save time and boost their agility with relevant marketing that resonates and inspires shoppers to keep coming back.
1 Jansen, Caroline, Cara Salpini and Maria Monteros. 8 DTC trends to watch in 2021. Retail Dive. February 3, 2021 2 Casna, Kathryn. Ecommerce Trends That Are Shaping the Way Businesses Sell Online. Salesforce. 2021. 3 Casna, Kathryn. Ecommerce Trends That Are Shaping the Way Businesses Sell Online. Salesforce. 2021. 4 The Future of eCommerce in 2021. Shopify Plus. 2021. 5 The Future of eCommerce in 2021. Shopify Plus. 2021. 6 Jansen, Caroline, Cara Salpini and Maria Monteros. 8 DTC trends to watch in 2021. Retail Dive. February 3, 2021. 7 Glasheen, Jasmine. 2021 Forecast: Next Gens in a Brand-New World. The Robin Report. January 3, 2021. 8 Monteros, Maria. Forrester: Few brands can anticipate and act on consumer needs. Retail Dive. February 10, 2021.
The start of 2020 brought with it the promise of global economic growth. Markets in the US were on a steady rise we also witnessed demand from brands and retailers in Europe and the Middle East. All seemed to be on track to make it a year of plenty.
Out of nowhere, the end of the first quarter saw the world coming to a grinding halt. The world was held hostage by a global pandemic and the force with which we were hit, was unprecedented.
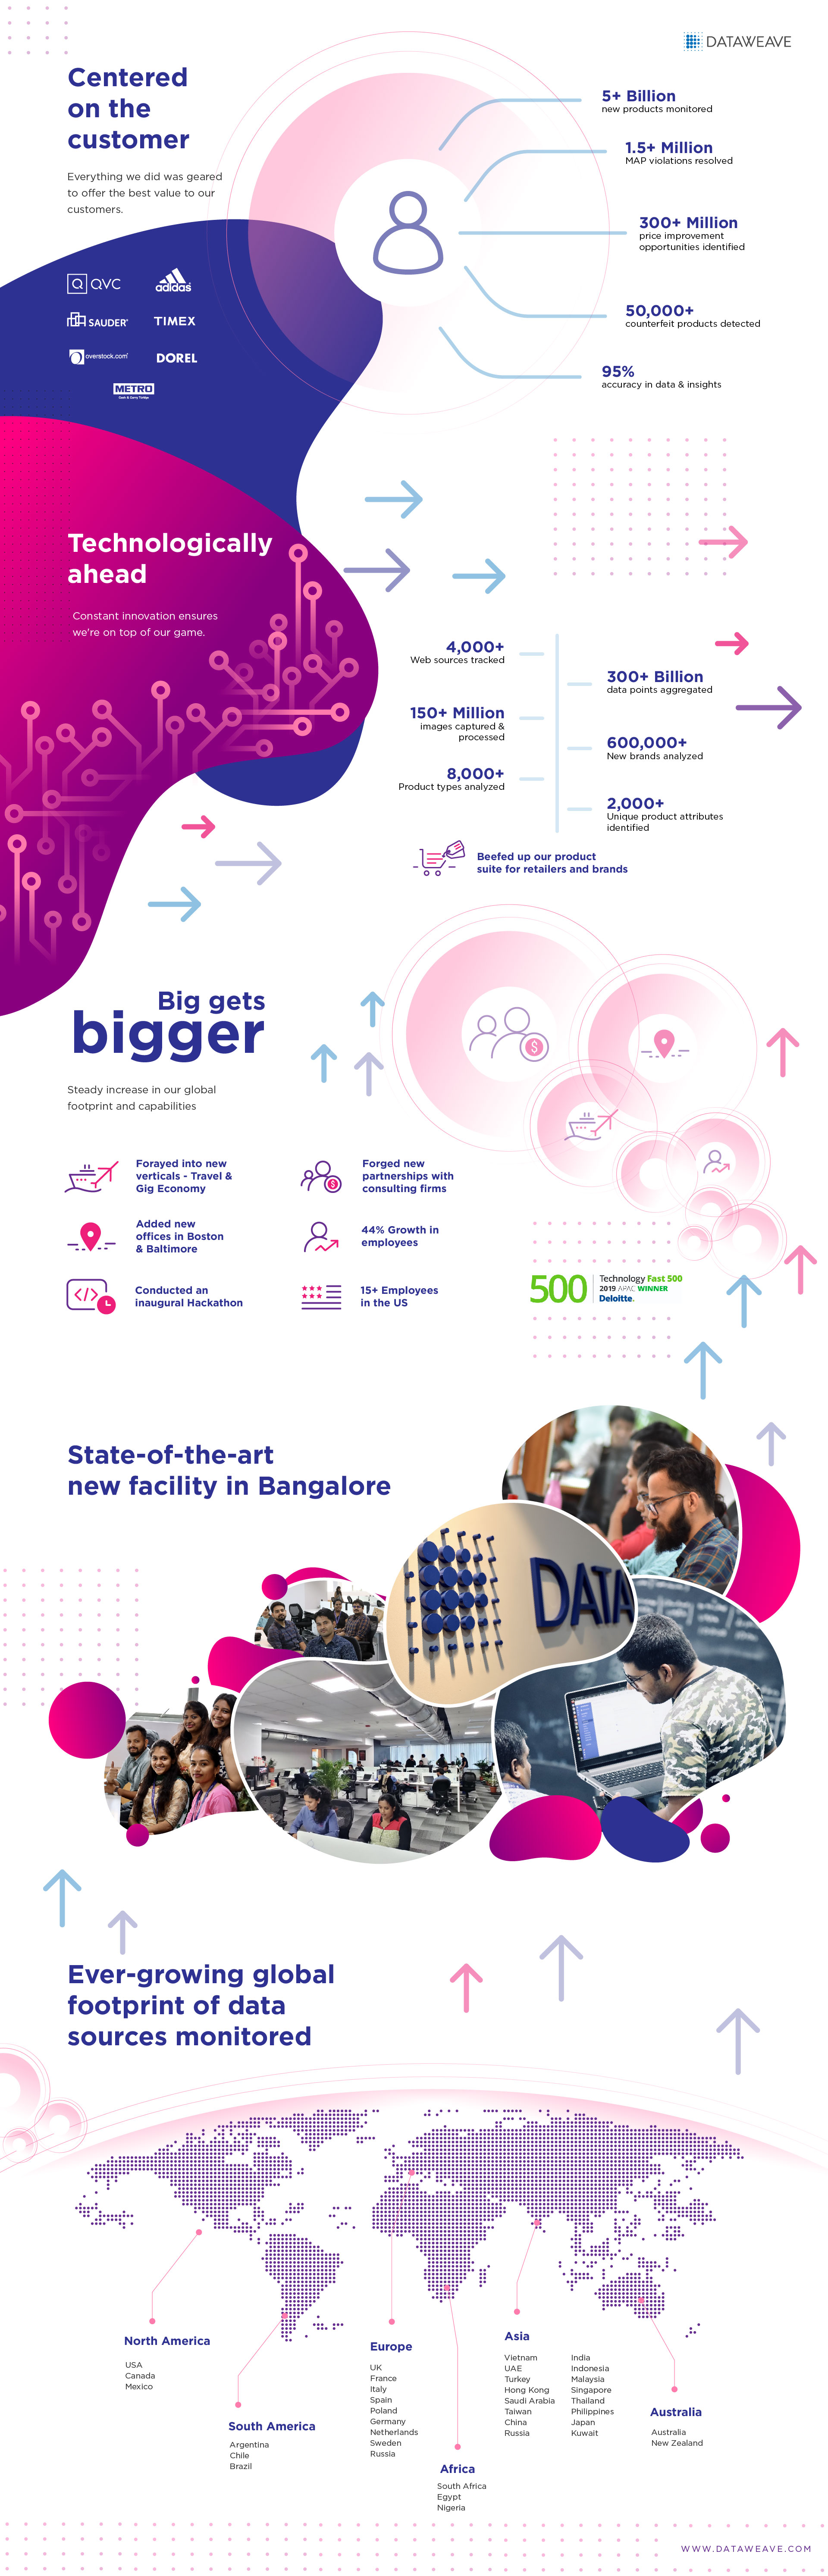
From February to mid-May we saw things come to a sharp halt. We at DataWeave seized this intermittent downtime to bolster our product offerings.
On the flip side, when the world did start opening May onwards, we saw completely new categories take center stage digitally. With new habits and trends taking shape, the pandemic single-handedly caused exceptional growth in the Food and Grocery Delivery intermediaries. Predictably, the rest of the world followed. Our existing customers saw the competition rise steeply with everyone coming online. We invested substantially in our Digital Shelf Analytics solutions after noticing that e-commerce was seeing a boom. 2020 saw brands making their online presence the new norm. This meant that small, medium and large enterprises had to now divert their spending to analytics and e-commerce.
It is interesting to note that the rise in the food and grocery delivery segment gave brands another channel to focus on vis a vis their presence. Brands that were available on these sites focused on how they could optimize their sales on these channels, which proved to be the front runners during the height of the pandemic. While the challenges and opportunities for both these segments overlapped and seemed similar, our solutions helped measure and optimize brand performance across all online channels. Some of the in-demand solutions and analytics we saw our customers use were; share of search, content audit, assortment and availability, pricing and promotions, and ratings and reviews.
There were mixed emotions in the market, with regard to the best use of marketing spends. Human resource and client cutbacks happened across the board. At DataWeave however, we had the pleasure of onboarding 25 new clients including retailers and brands ranging from food and grocery delivery, home improvement from across multiple geographies.
Infographics
Throughout the year, the work never ceased at DataWeave. The team showed incredible resilience while working remotely, making sure our deliverables were being taken care of, at all times. Due to the e-commerce boom and immense pressure from existing and new entrants in the digital space, our clients saw a need to gather more insights. With the given uptick, we are happy to report that our stellar 95%+ accuracy record for in-depth insights at scale, was maintained through the course of all the work done.
Looking forward to the year 2021:
In the US, the adoption of e-commerce accelerated as traditional brick and mortar stores shut down and pivoted. To put things into perspective, e-commerce adoption grew only by 4.3% from 2014 to 2019. In just three months in 2020, e-commerce adoption grew at 4.3%! Add to that, with approved vaccines making their way slowly to the public, we do anticipate the travel sector to open up and we look forward to working with new clients.
Nike’s Chief Executive, John Donahoe recently said, ” We know that digital is the new normal. The consumer today is digitally grounded and simply will not revert back…the shift to online sales could be a permanent trend.” We could not agree more! With online sales here to stay, brand and retailers’ requirements to keep their competitive edge will only continue to grow. We at DataWeave, look forward to delivering the results they want in this new year, and for the years to come.
According to our preliminary analysis of Prime Day 2020, Amazon’s rivals offered more generous discounts within Home categories to stay competitive as more consumers invest in their homes this year.
This year the COVID-19 pandemic has transformed consumers into homebodies who increasingly work, learn and shop from home. This year also marks the first time Prime Day took place in the Fall, jumpstarting the holiday sales season.
At DataWeave, we wanted to know whether Prime Day 2020 lived up to the hype and how Amazon’s deals compared to other retailers’ discounts. Our analysis examines products across four popular Home categories: Bed & Bath, Furniture, Kitchen and Pet Care.
Our Methodology
We tracked the pricing of several leading retailers (Home Depot, Target, Walmart and Amazon) selling the Home categories of Bed & Bath, Furniture, Kitchen and Pet Care to assess their pricing and assortment strategies during this annual sales event. Our analysis focused on additional discounts offered during the sale to estimate the true value that the sale represented to consumers. Our calculations compared product prices on Prime Day versus the prices prior to the sale. The sample consisted of up to the top 750 ranked products across 16 popular product types for the home.
The Verdict
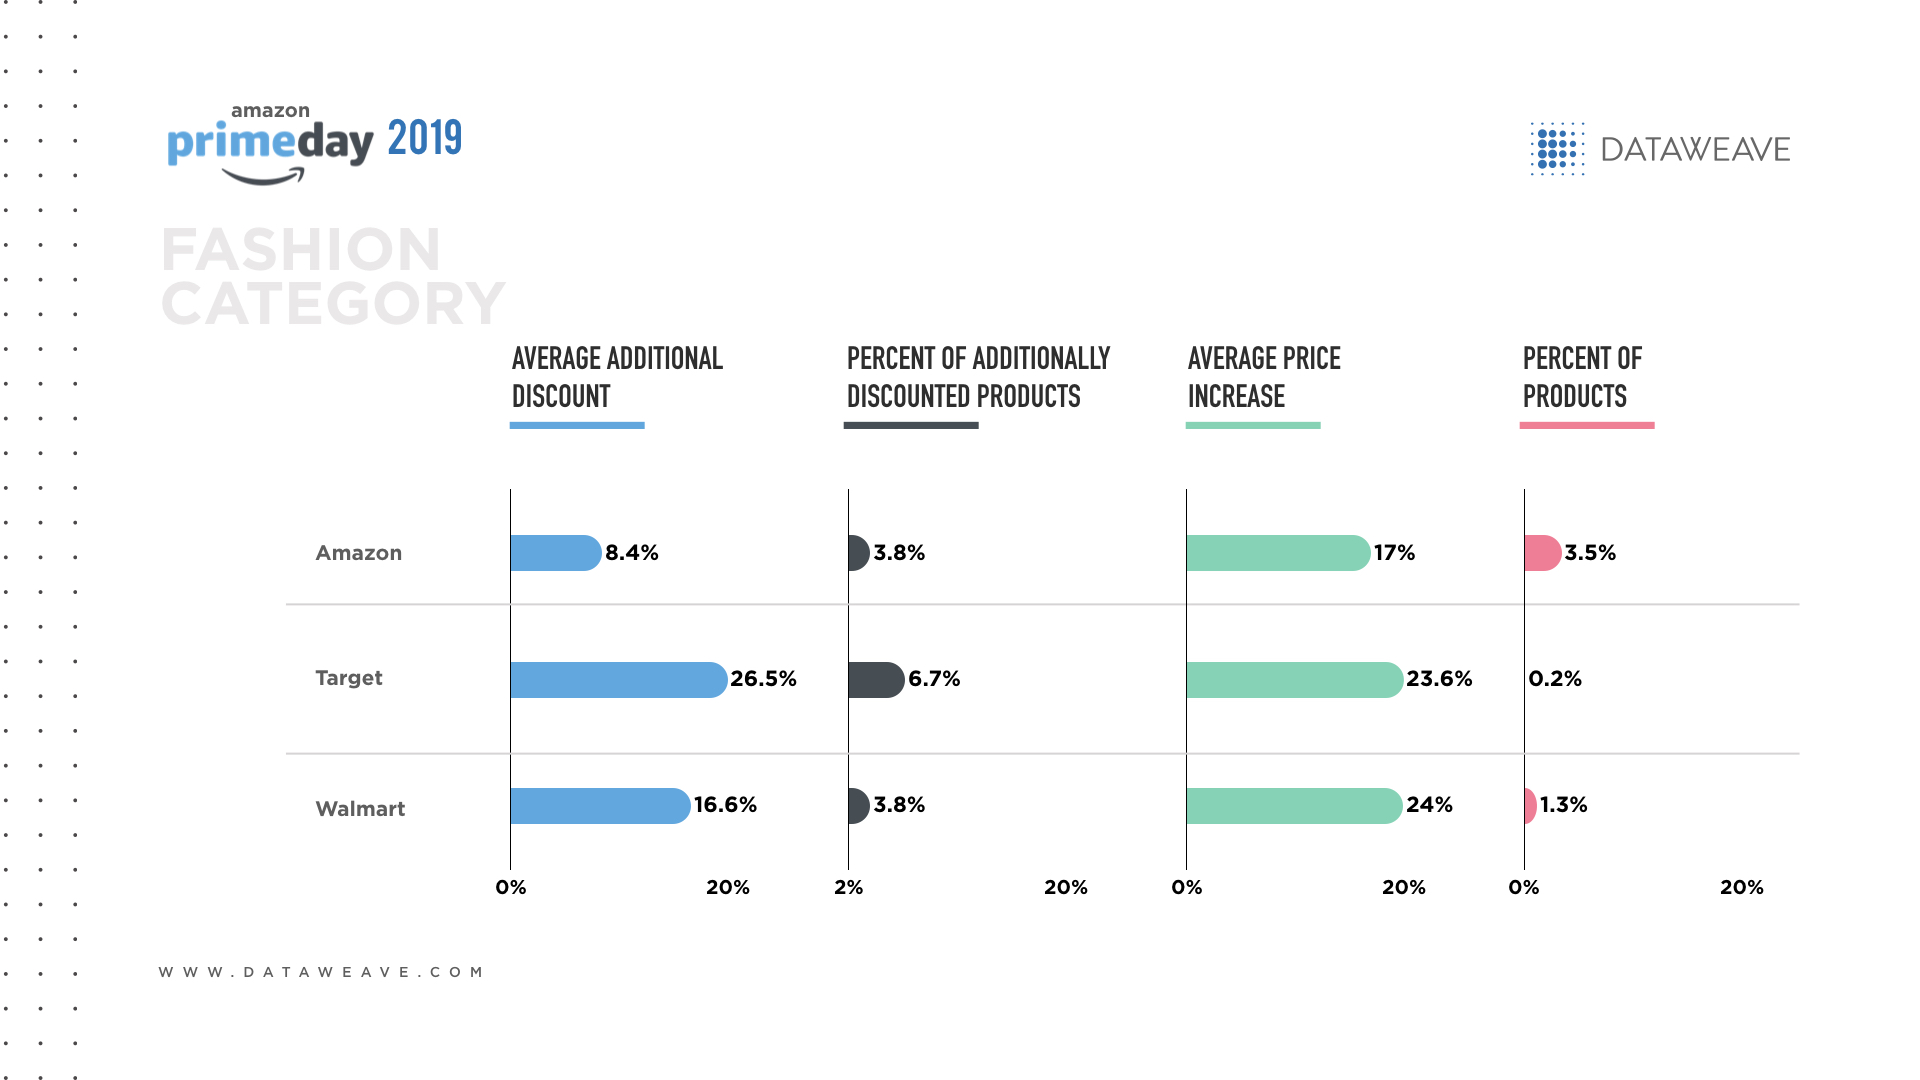
Overall, Amazon reported the lowest price reduction in all Home categories (12.4%), compared to Target (22.1%), Home Depot (16.5%), and Walmart (15.1%). Yet Amazon reported the second-highest percentage of additionally discounted products (9.6% vs. 11.0% for Target).
After Prime Day ended, certain retailers’ Home assortments saw more significant price increases than others. For instance, 88% of Target’s 760 products in Bed & Bath, Furniture, Kitchen and Pet Care received a price increase during the post-sale period, compared to 47% of Walmart’s 1005 products. Walmart’s everyday low price strategy helps to explain the difference between the two big box retailers.
These results suggest that Prime Day 2020 may boost Amazon’s marketing and PR engagement yet its rivals offered the most generous deals in Home categories. As home-related categories’ sales soared during the pandemic, Amazon’s competitors offered deep discounts to stand out online and grow their market share. As such, consumers may want to embrace the habit of comparing multiple retailers’ websites to discover the best Prime Day deals in Home categories.
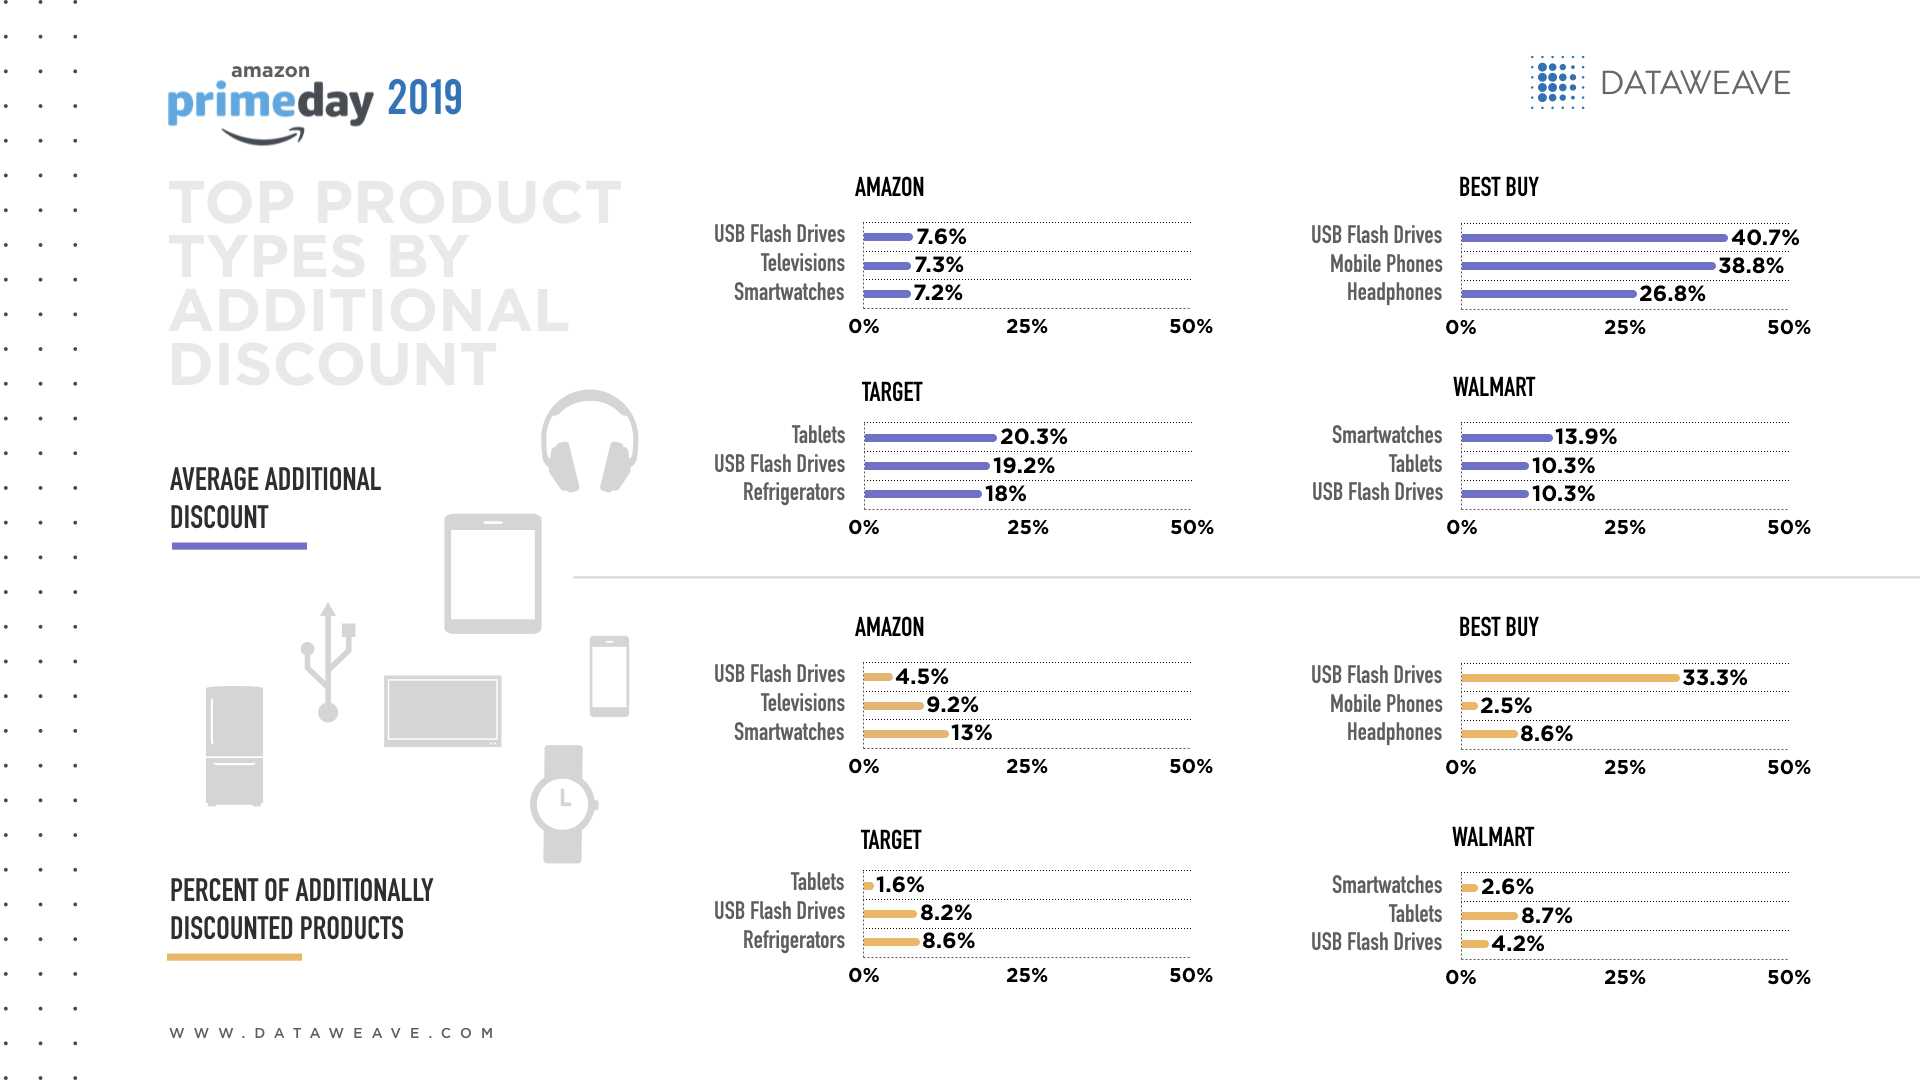
Top product types by additional discount
In Bed & Bath, Target offered the biggest average additional discount (27.4%) and Amazon offered the lowest (13.3%). Bed sheets and pillowcases were a popular product category for additional discounts across all four retailers, with Target offering the best average additional discount at 31.3%. Other popular product types among rival retailers included blankets, comforters and bathroom furniture.
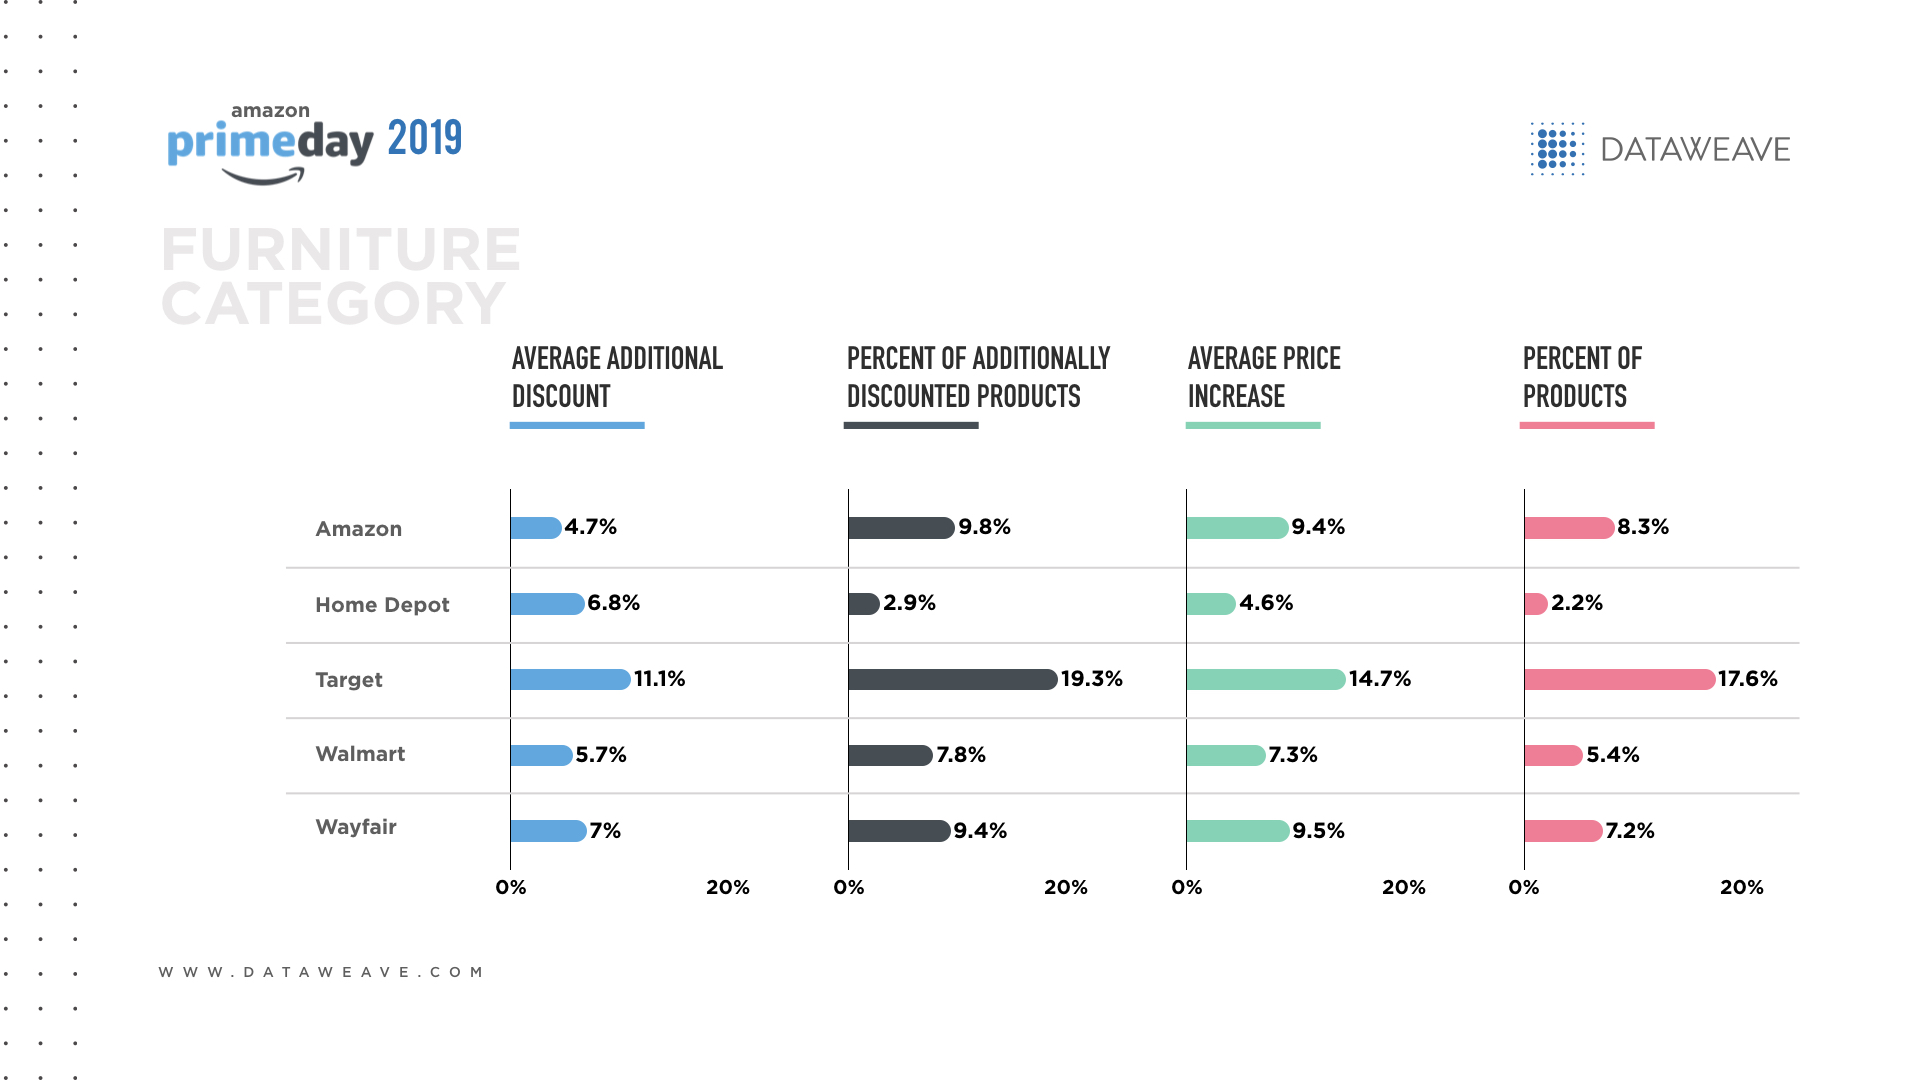
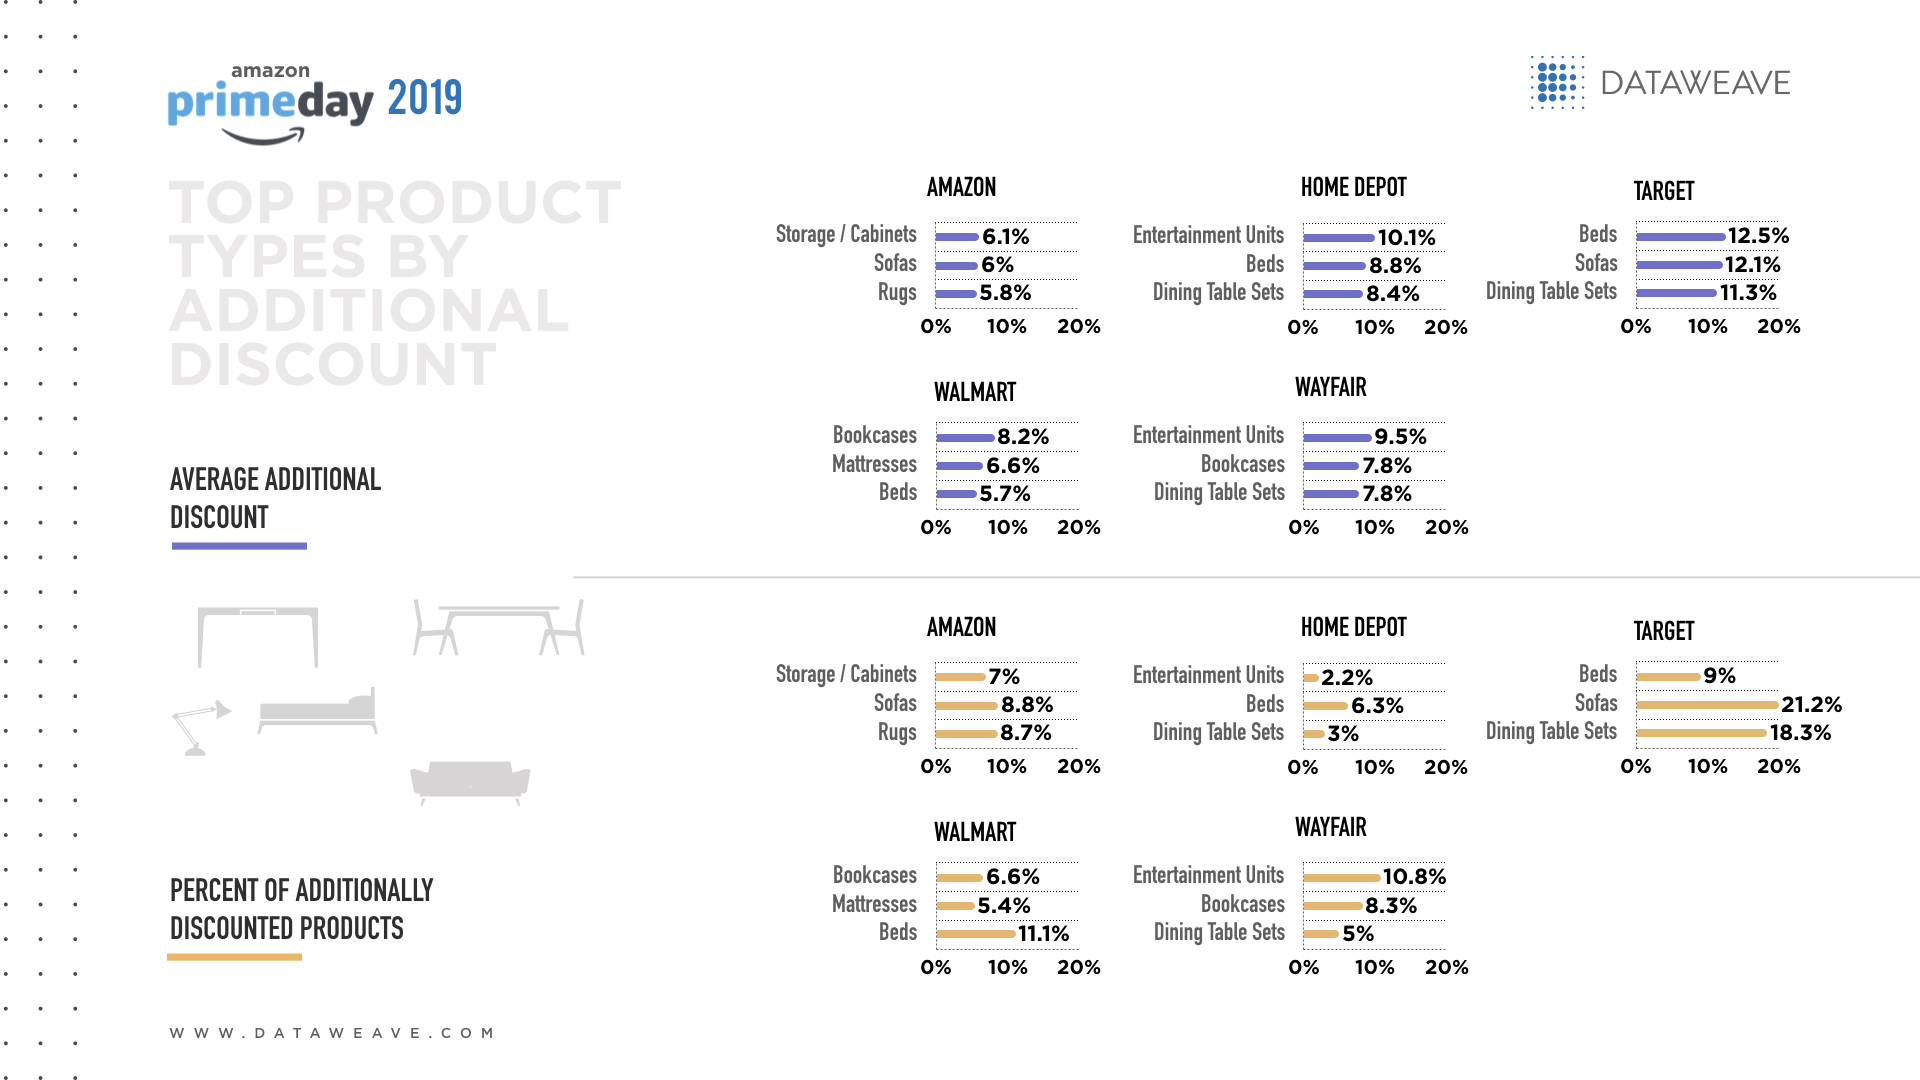
In Furniture, Home Depot (20.5%) offered the biggest overall additional discount, closely followed by and Target (19.2%). Living room furniture was a popular subcategory for all four retailers, with Home Depot offering the highest additional discount (29.1%). Other popular product types included furniture for the bedroom, home office, kitchen and dining room.
In the Kitchen category, Target offered the biggest average additional discount for small appliances (21.8%), a subcategory in which all four retailers offered discounts. Within the large appliance subcategory, Walmart’s additional discounts were nearly triple Amazon’s (15.7% vs. 5.6%).
Within the Pet Care category, Target offered the biggest average additional discount (18.5%). Cat food was a popular product category, with Target offering the best average additional discount (50.0%). Other popular product types across all four retailers included dog collars, leashes and dry dog food.
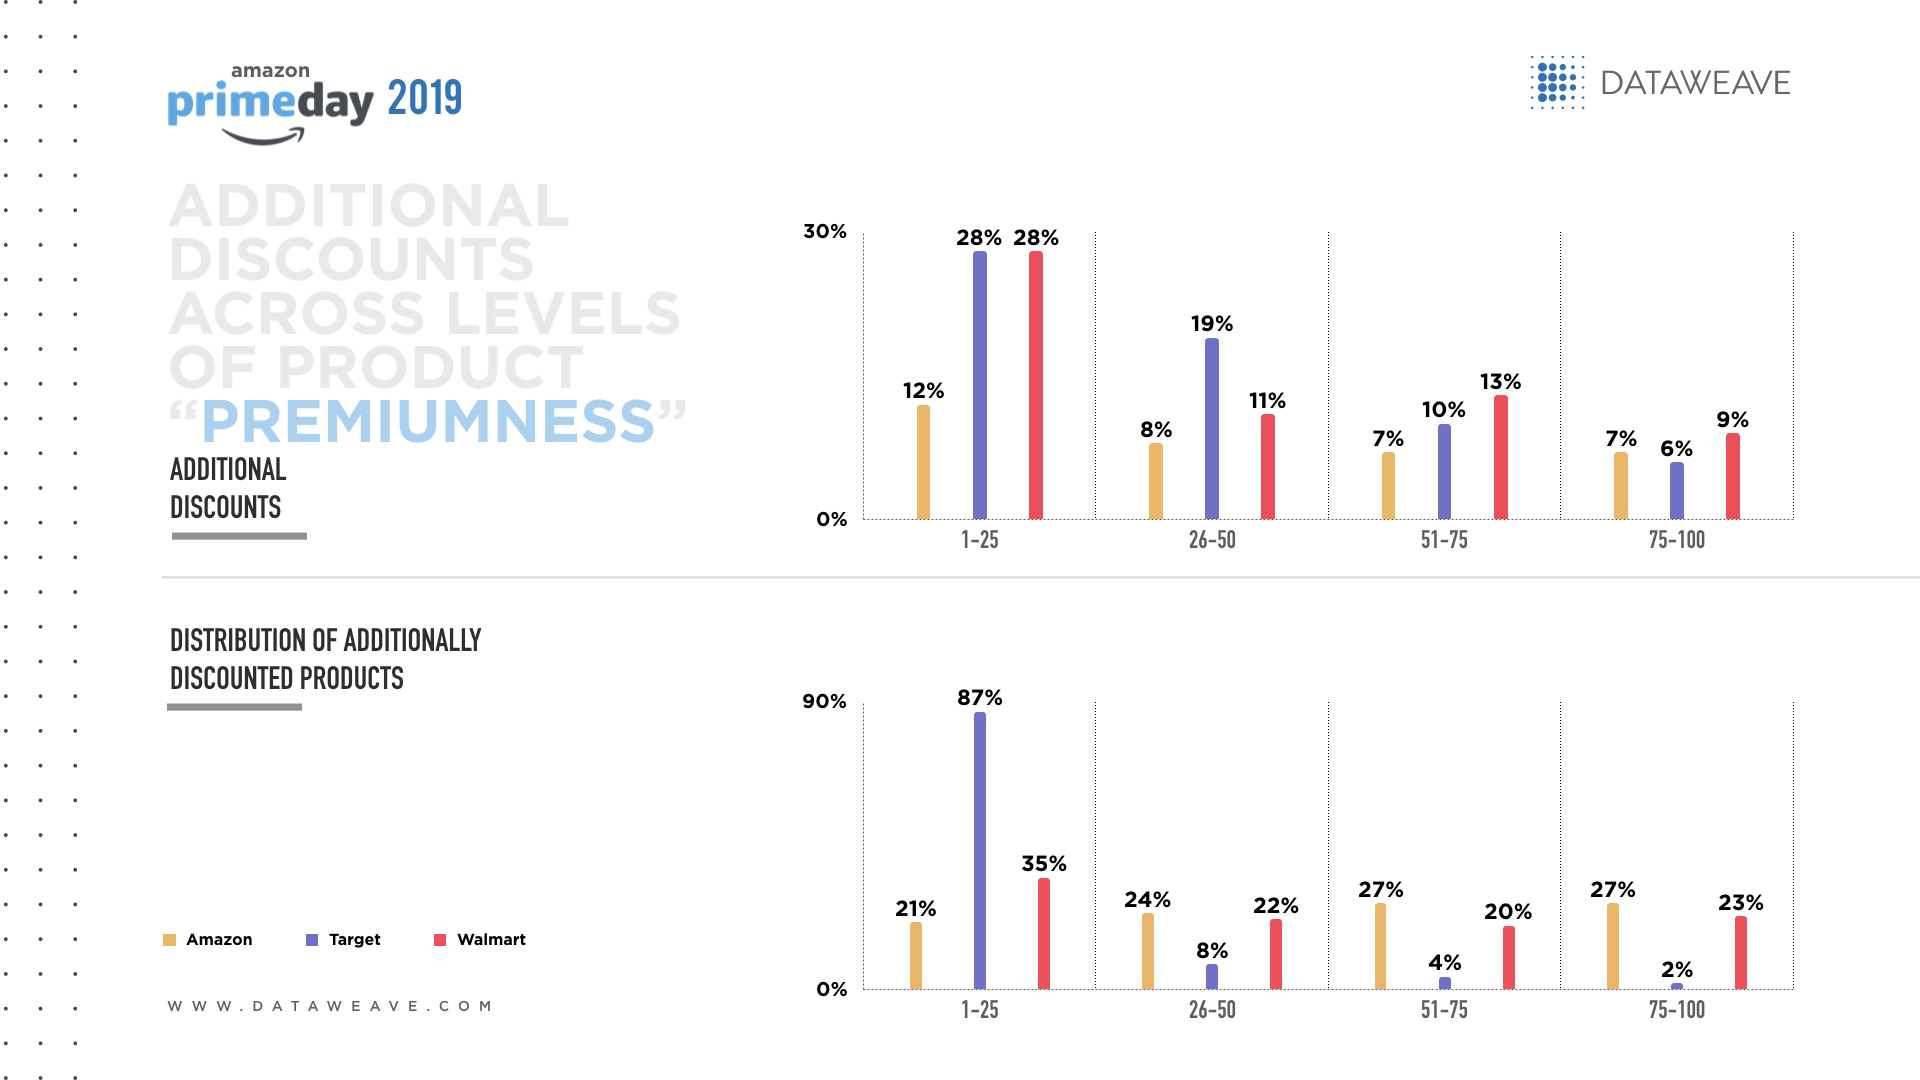
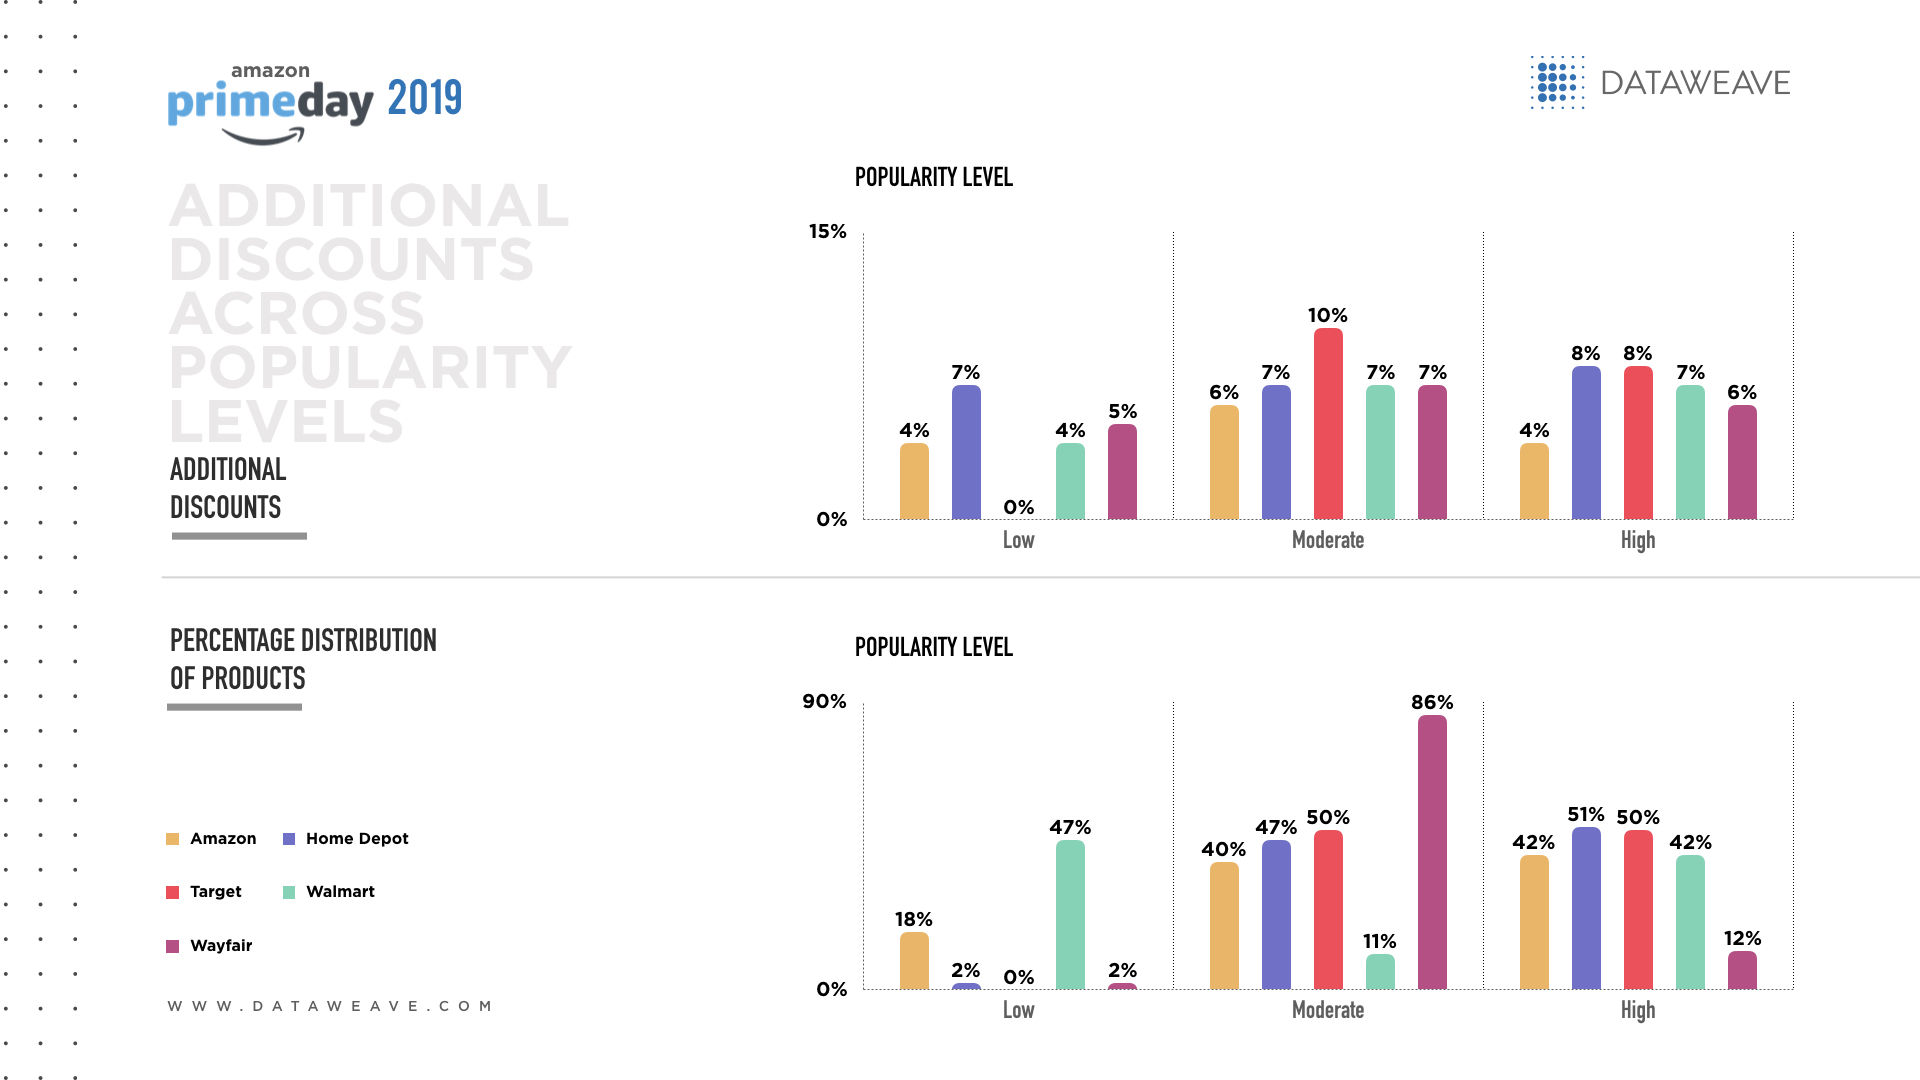
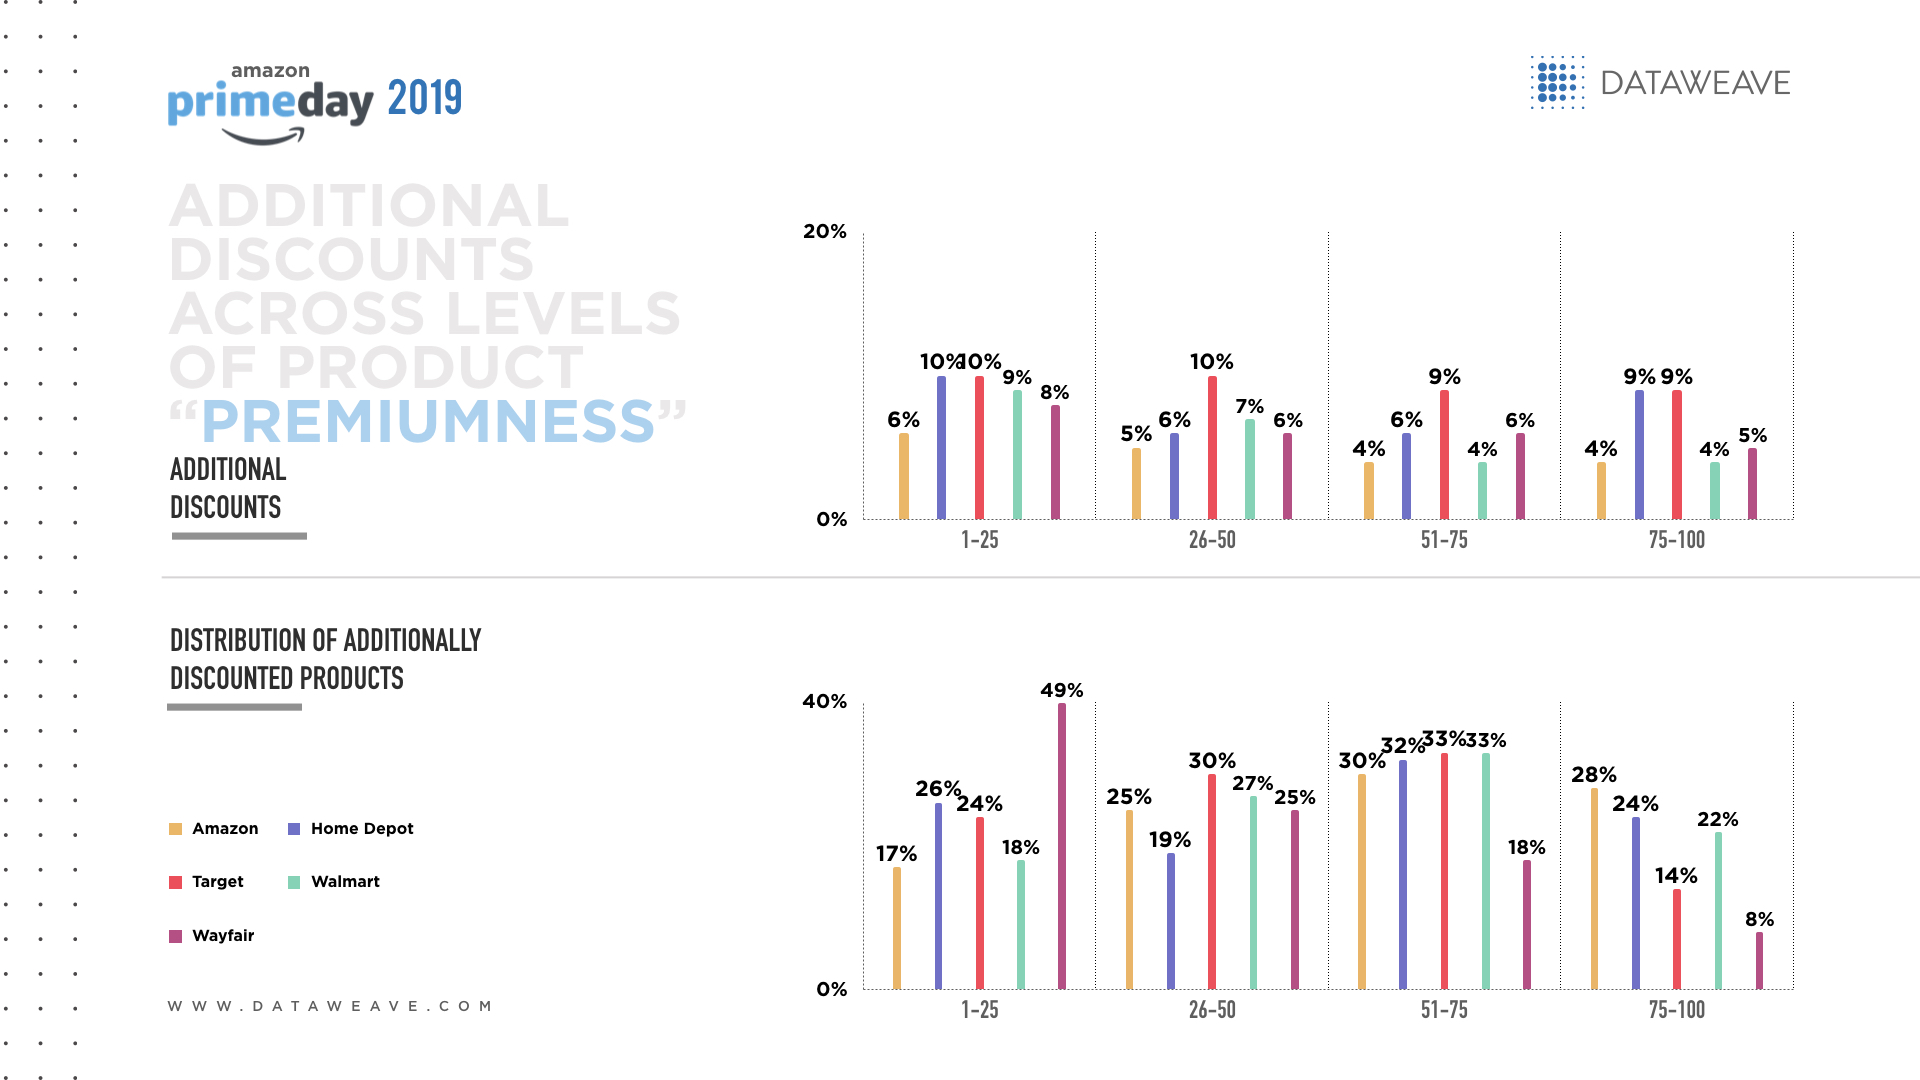
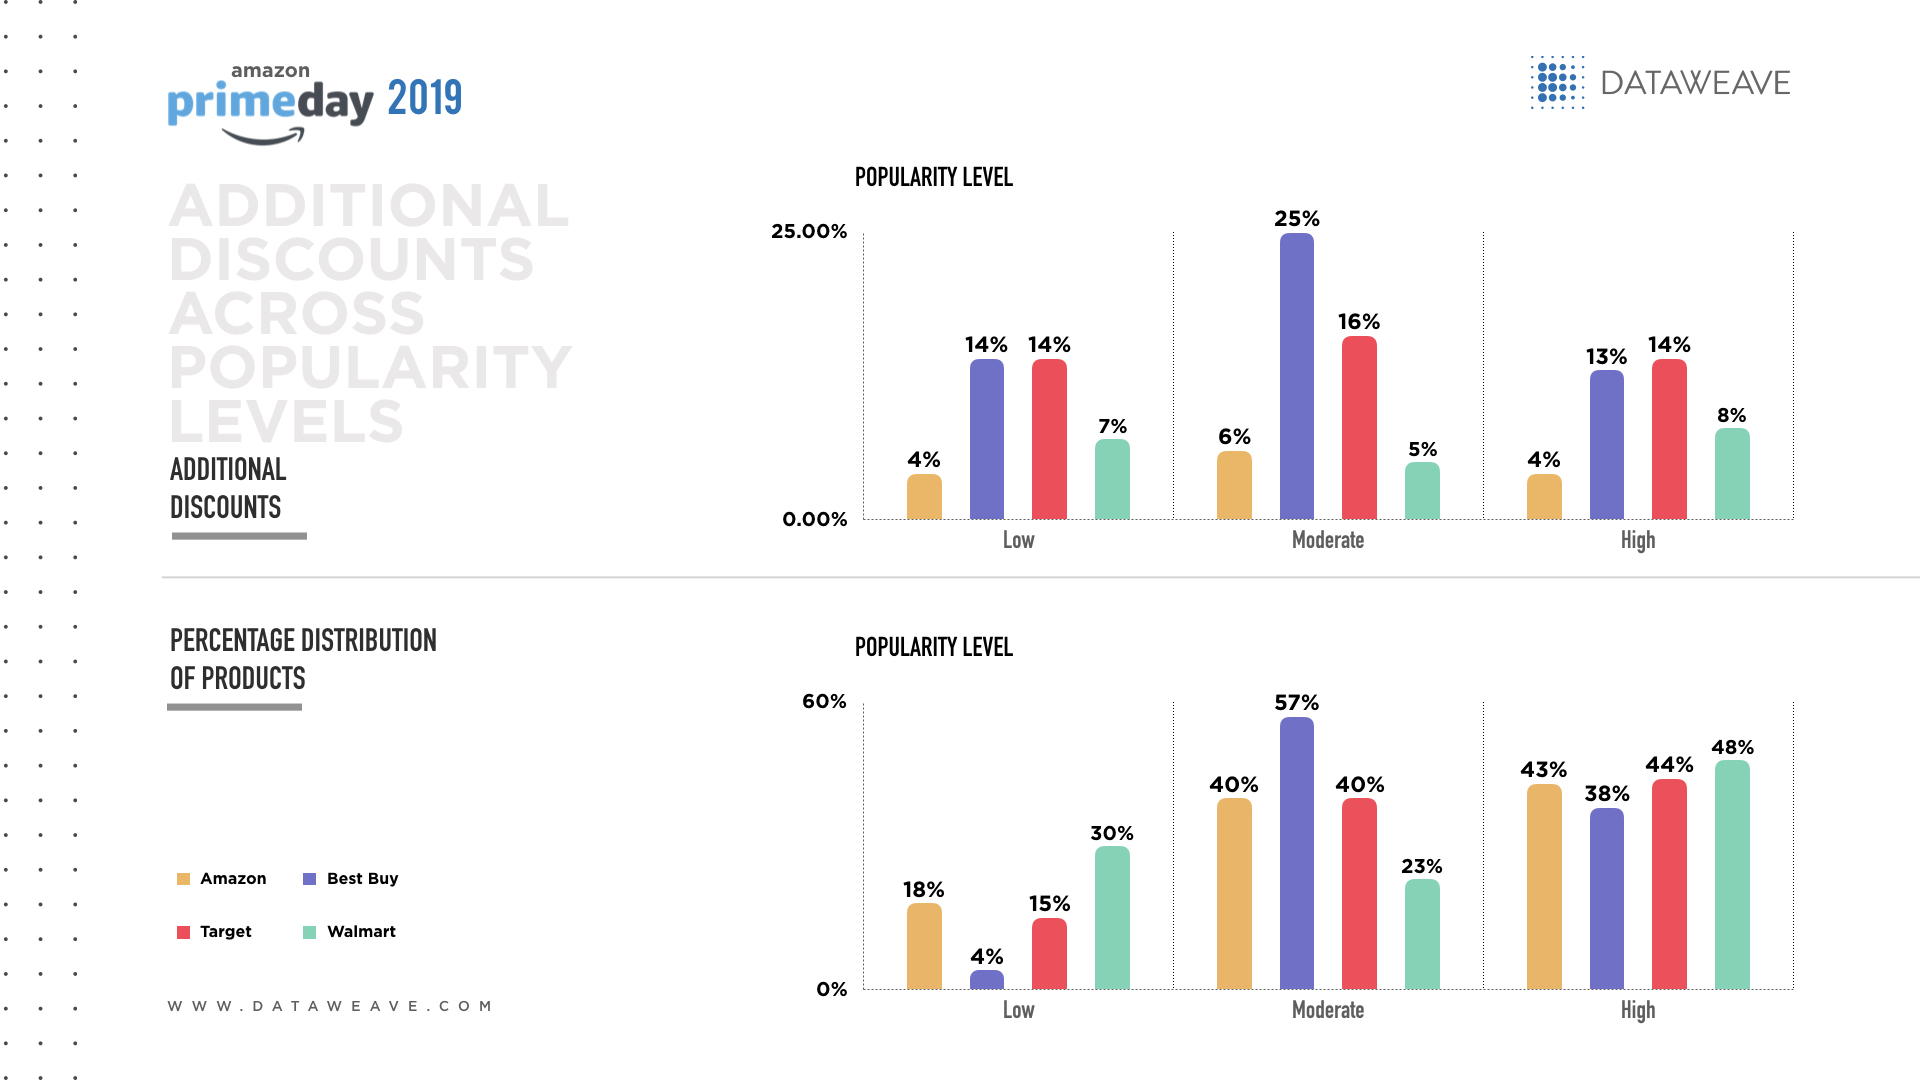
Additional discounts across product “premiumness” levels
Premiumness was calculated as the average selling price before the sale event. This was divided into low, medium and high premiumness levels, with high indicating higher selling prices.
In Bed & Bath, most retailers showed an inverse relationship between their additional discounts and the products’ level of premiumness. Target offered the biggest additional discounts across all levels of premiumness, more than double Amazon’s discounts (27.2% vs. 12.3%). Target’s bold discounting strategy shows a commitment to protecting its competitive position across the entire Bed & Bath category.
By far, Amazon offered the greatest percentage of additional discounts in Bed & Bath compared to its rivals across all levels of premiumness. Comparatively pervasive discounts help the e-commerce giant offer a greater variety of appealing deals within this category.
In Furniture, most retailers showed a direct relationship between their additional discounts and the level of premiumness. Notably, Home Depot offered massive additional discounts at the high premium level, nearly triple Amazon and Walmart (34.5% vs. 12.7%). This move suggests Home Depot is serious about winning the business of upscale consumers in the Furniture category.
Target differentiated its assortment by discounting by far the greatest portion of its Furniture at all premiumness levels (22.4%) and Home Depot discounted the least (4.4%). Amazon and Walmart distributed the greatest portion of their additional discounts to the moderate level of premiumness. Target’s strategy tries to attract all Furniture shoppers while Amazon and Walmart try to make their mid-market offerings affordable to more consumers.
Across all levels of premiumness for Kitchen products, Target offered the biggest additional discounts, including almost double Amazon’s discounts at the medium level (22.5% vs. 13.4%). Target’s aggressive discounting shows a desire to be more competitive by attracting consumers at all levels of the Kitchen category.
In the Kitchen category, most retailers offered a direct relationship between the proportion of additional discounts and the level of premiumness, yet Home Depot showed an inverse relationship. Amazon’s proportion of additional discounts across all levels of premiumness nearly tripled Home Depot’s (10.1% vs. 3.7%). This discount strategy shows Amazon’s willingness to offer shoppers deals across a broader variety of Kitchen items.
In Pet Care, Walmart offered the highest overall additional discounts (16.2%), which could fortify its low-cost leadership position for pet lovers at all price points.
While Target offered the greatest overall percentage of additional discounts in Pet Care, Amazon applied more discounts to the higher end of the premium spectrum and Target focused on the lower end.
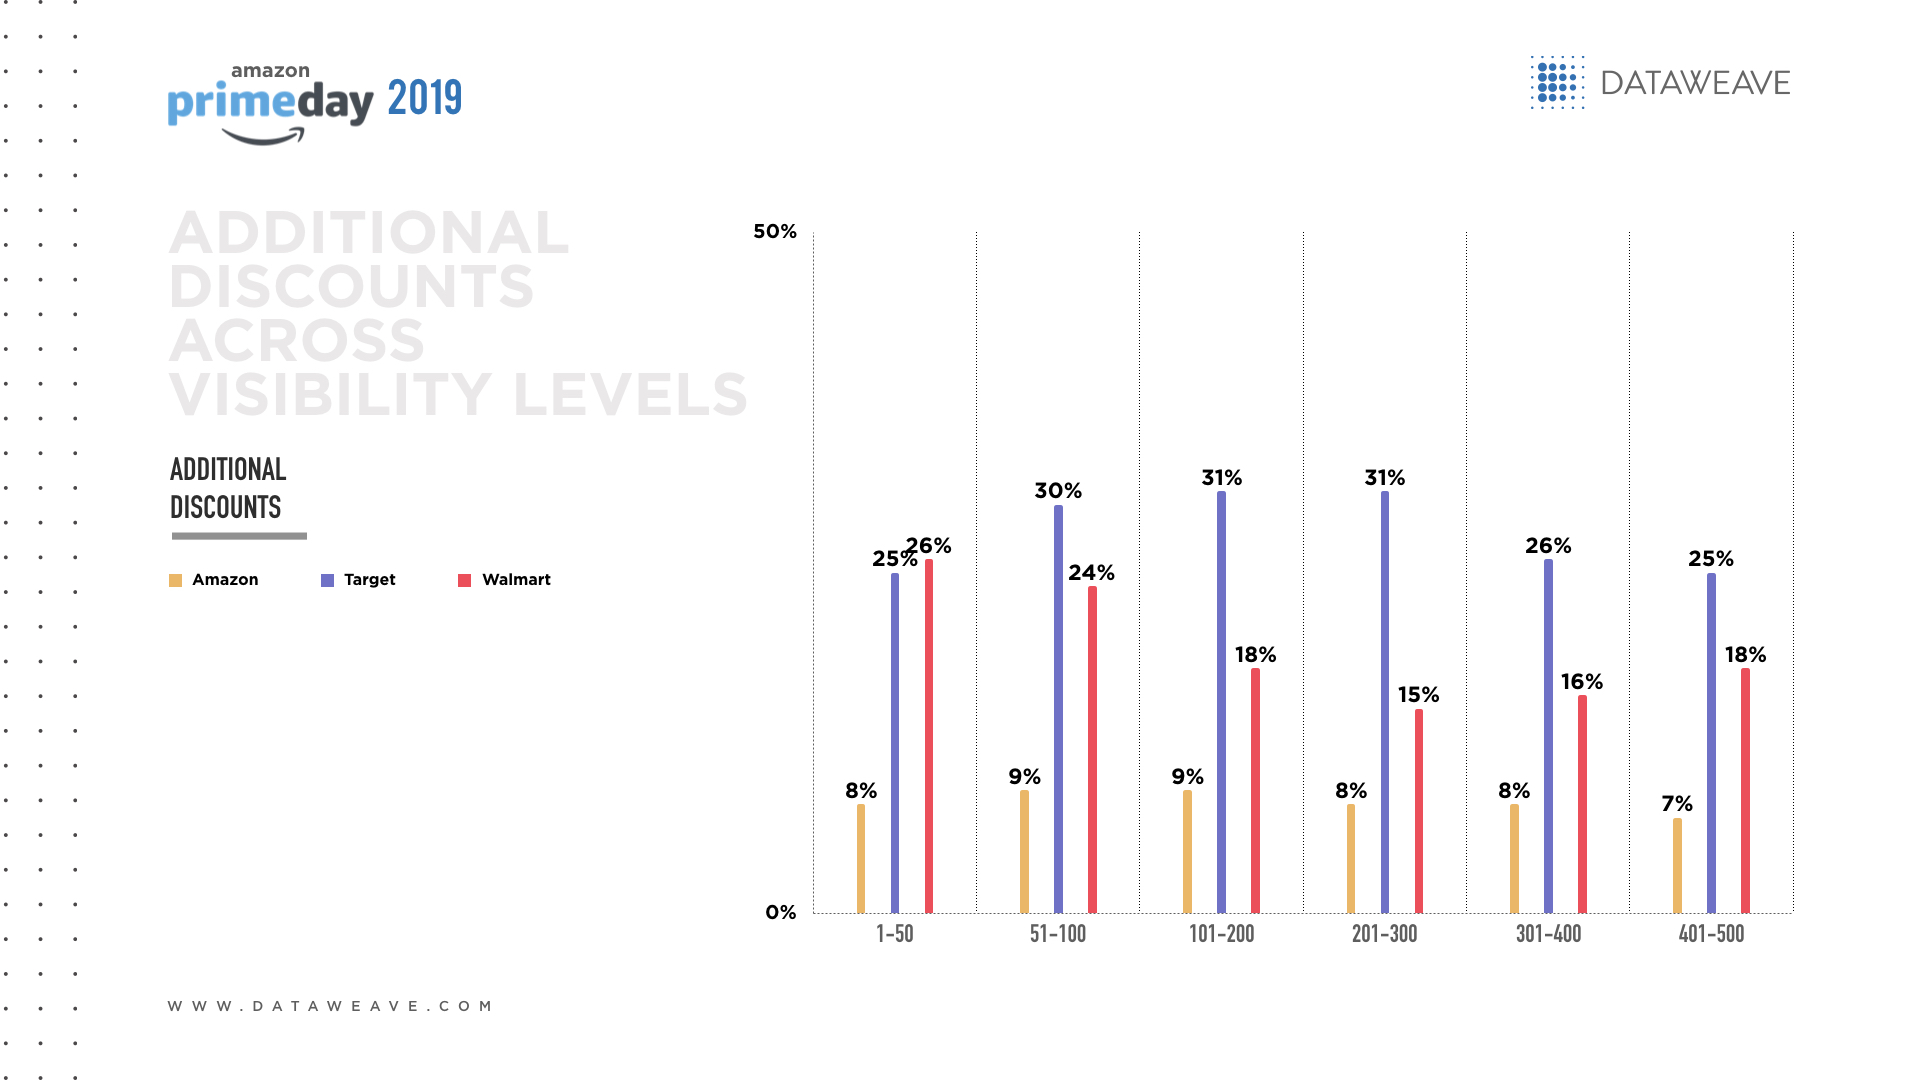
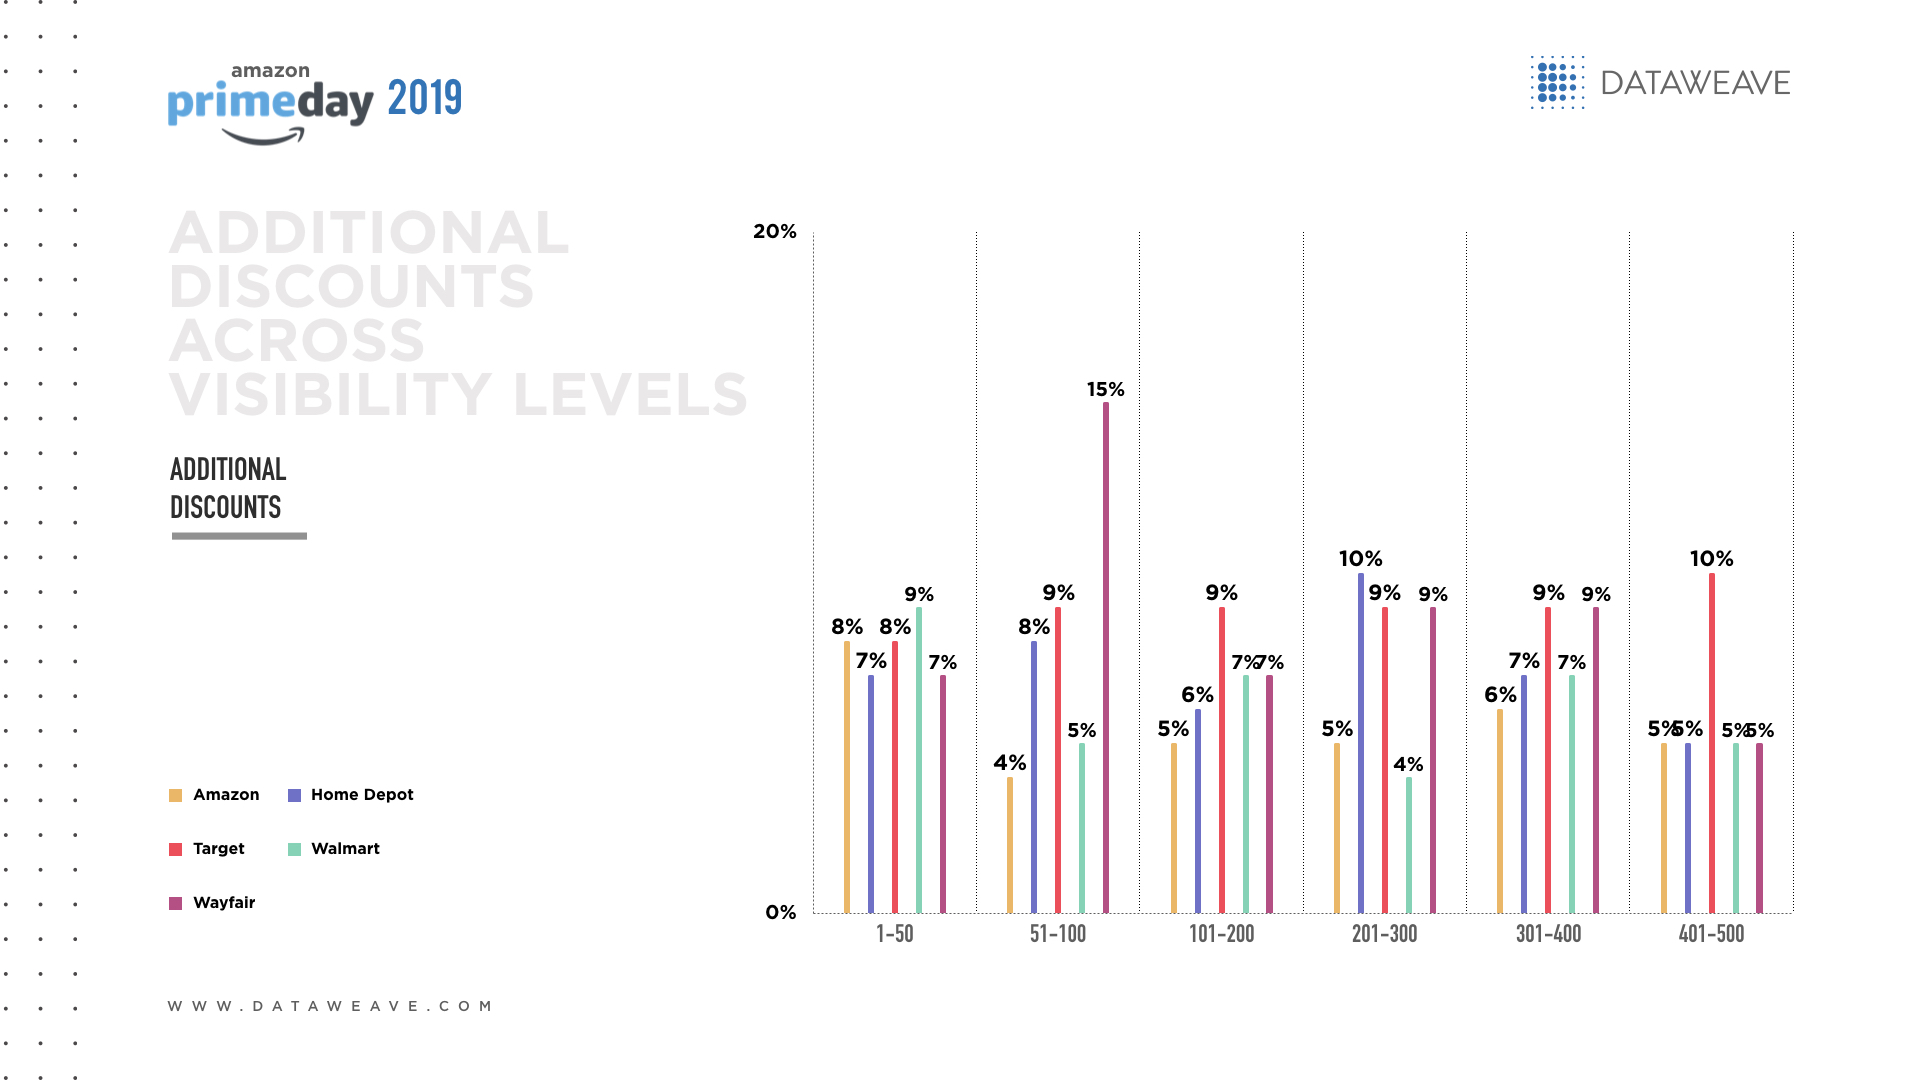
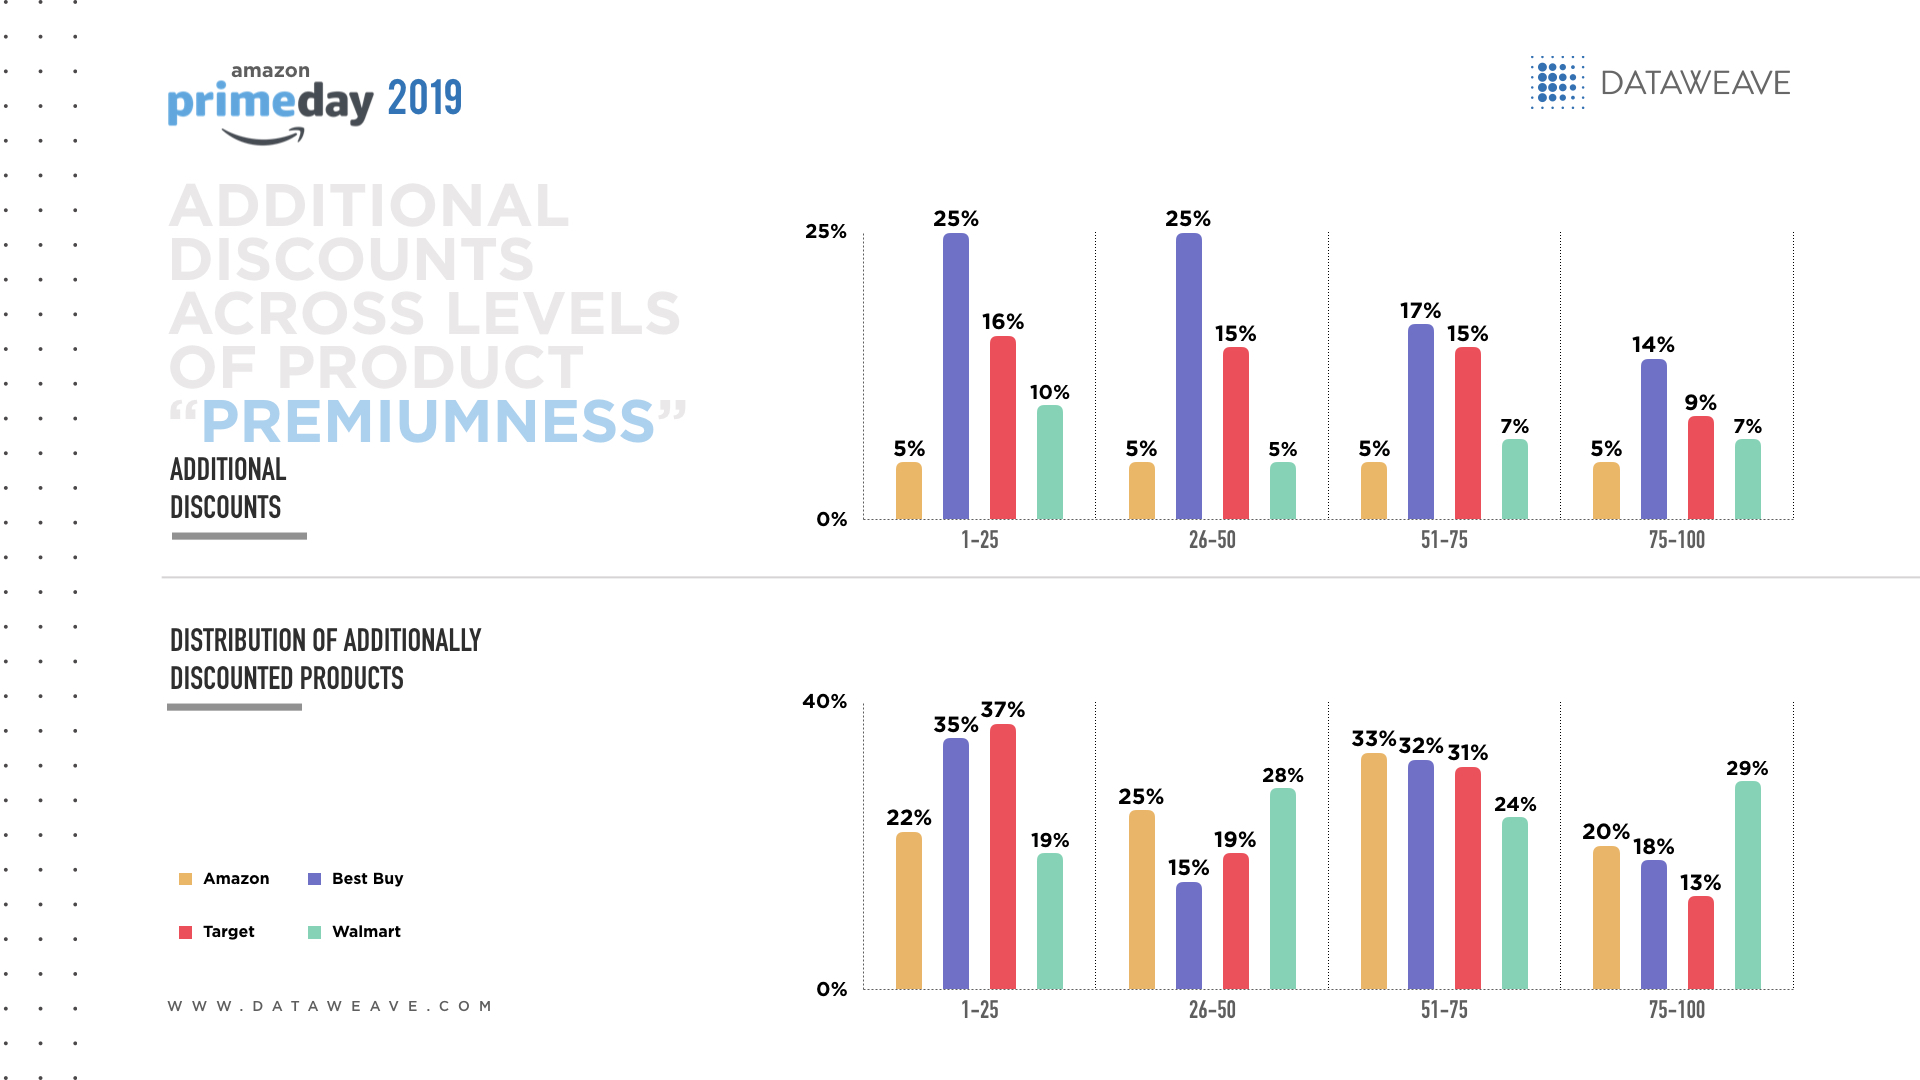
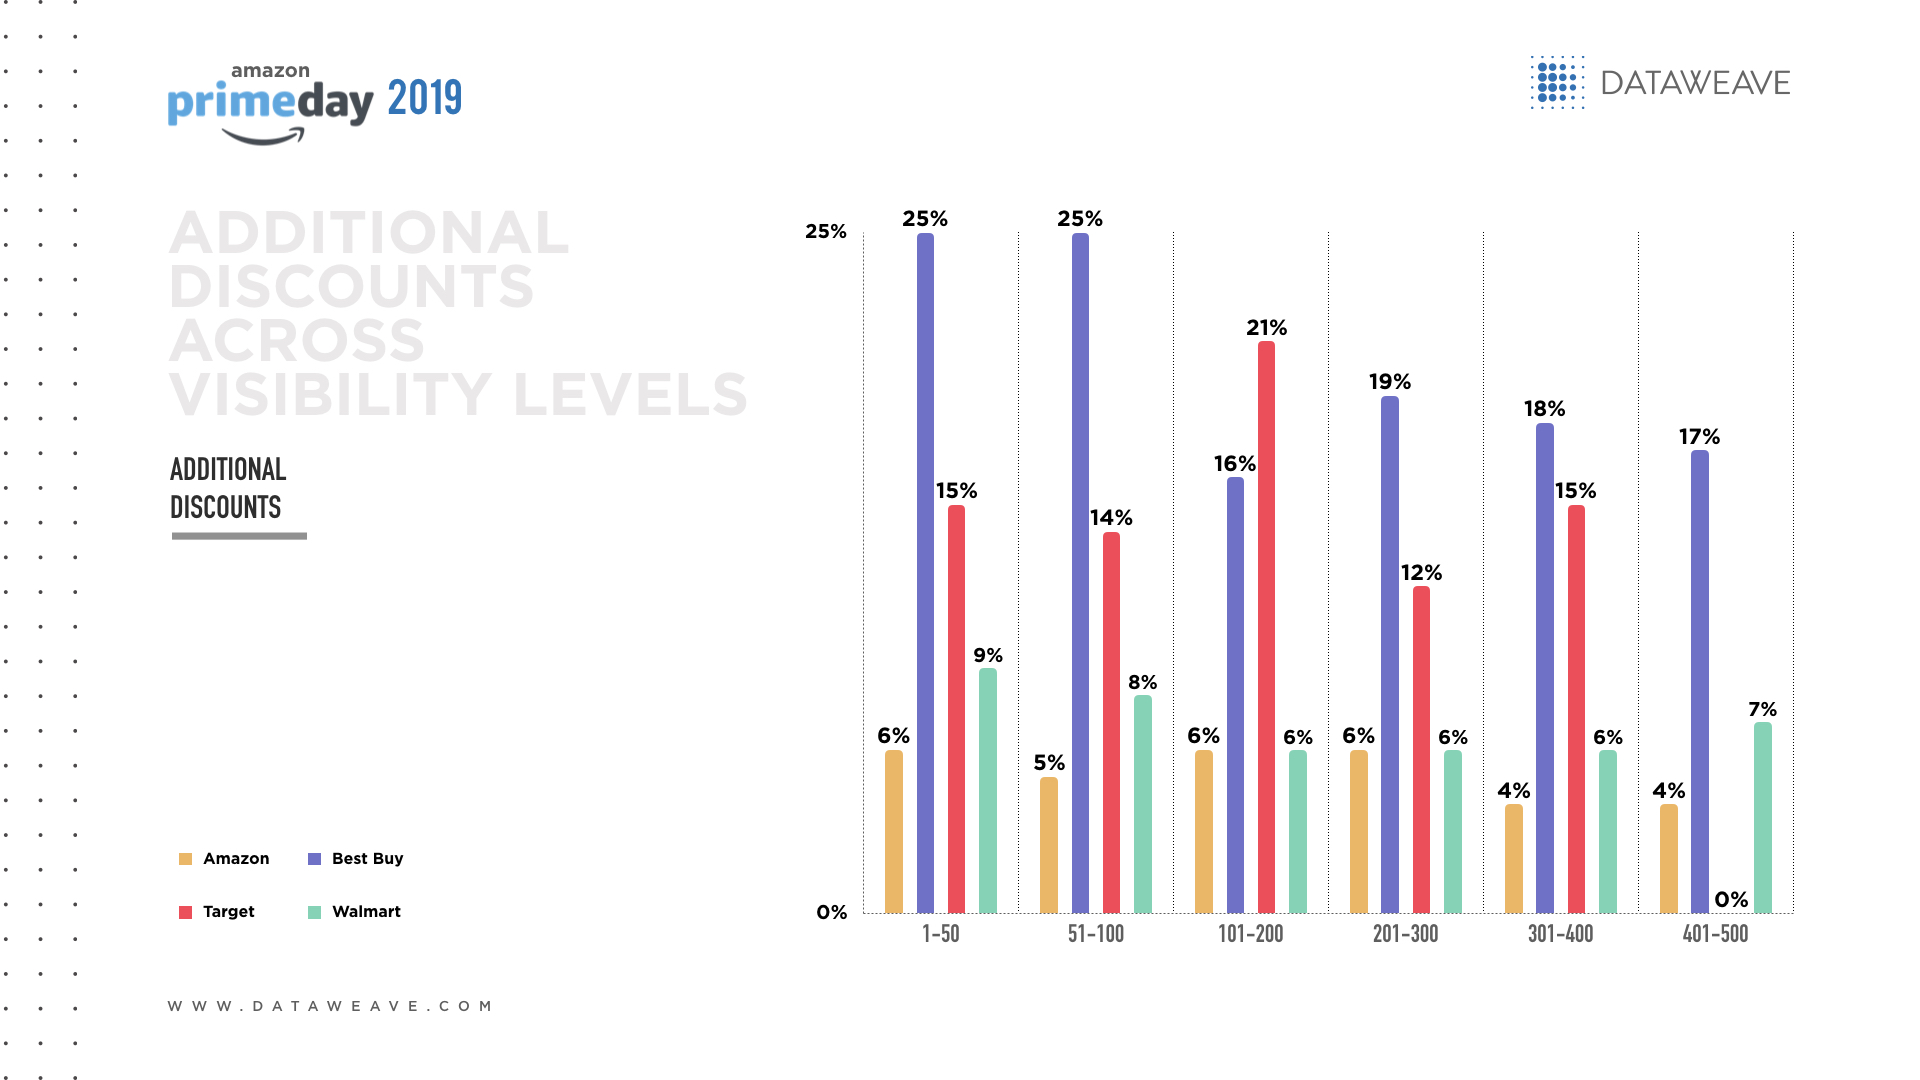
Additional discounts across visibility levels
In Bed & Bath, Target offered the highest overall additional discounts across all levels of visibility (27.3%) and Amazon offered the lowest (12.4%). Amazon focused its additional discounts on the most visible Bed & Bath products to help online shoppers discover those items with ease and make them appealing enough to add to their cart.
Amazon offered the lowest additional discounts in the Furniture category across all levels of product visibility. Yet, among the Furniture category’s most visible items, Amazon offered its highest additional discounts. Home Depot’s additional discounts approach was the most aggressive except among the lowest product visibility levels. Home Depot’s discount strategy shows a desire to compete for Furniture’s most visible items.
In the Kitchen category, Home Depot consistently offered the lowest additional discounts among products at the higher visibility levels. Conversely, Target was the most aggressive in this category, offering additional discounts of up to 43.2% at moderate levels of visibility and double Home Depot’s discounts (26.3% vs. 13.4%) among the most visible items. Amazon may feel confident that men already choose Amazon for their apparel needs.
In Pet Care, the retailers generally offered the most additional discounts for items in the middle of the visibility spectrum. Walmart offered the most aggressive additional discounts among the most visible Pet Care items, more than double Target’s discounts (13.5% vs. 6.5%).
Overall, Prime Day 2020 offered an ideal time for Amazon to attract homebound consumers to invest in domestic products, yet its rivals offer much higher additional discounts in Bed & Bath, Furniture, Kitchen and Pet Care. How about other categories? Watch this space for more insights!
Our preliminary analysis reveals that Prime Day 2020 motivated Amazon’s rivals to offer deeper discounts in key categories to try to make their merchandise more magnetic and lure consumers away from the e-commerce giant.
This year’s Prime Day is momentous, as the COVID-19 pandemic has encouraged more consumers to make online shopping a more regular habit. It also marks the first time Prime Day took place in the strategically significant final quarter of the year, kicking off the holiday sales season.
At DataWeave, we wanted to know whether Prime Day 2020 lived up to the hype and how Amazon’s deals compared to other retailers’ discounts. Our analysis examines products across three popular categories: electronics, beauty and fashion.
Our Methodology
We tracked the pricing of several leading retailers (Best Buy, Target, Walmart and Amazon) selling consumer electronics, beauty and fashion to assess their pricing and assortment strategies during this annual sales event.
Our analysis focused on additional discounts offered during the sale to estimate the true value that the sale represented to consumers. Our calculations compared product prices on Prime Day versus the prices prior to the sale. The sample consisted of up to the top 750 ranked products across 21 popular product types in consumer electronics, beauty and fashion.
The Verdict
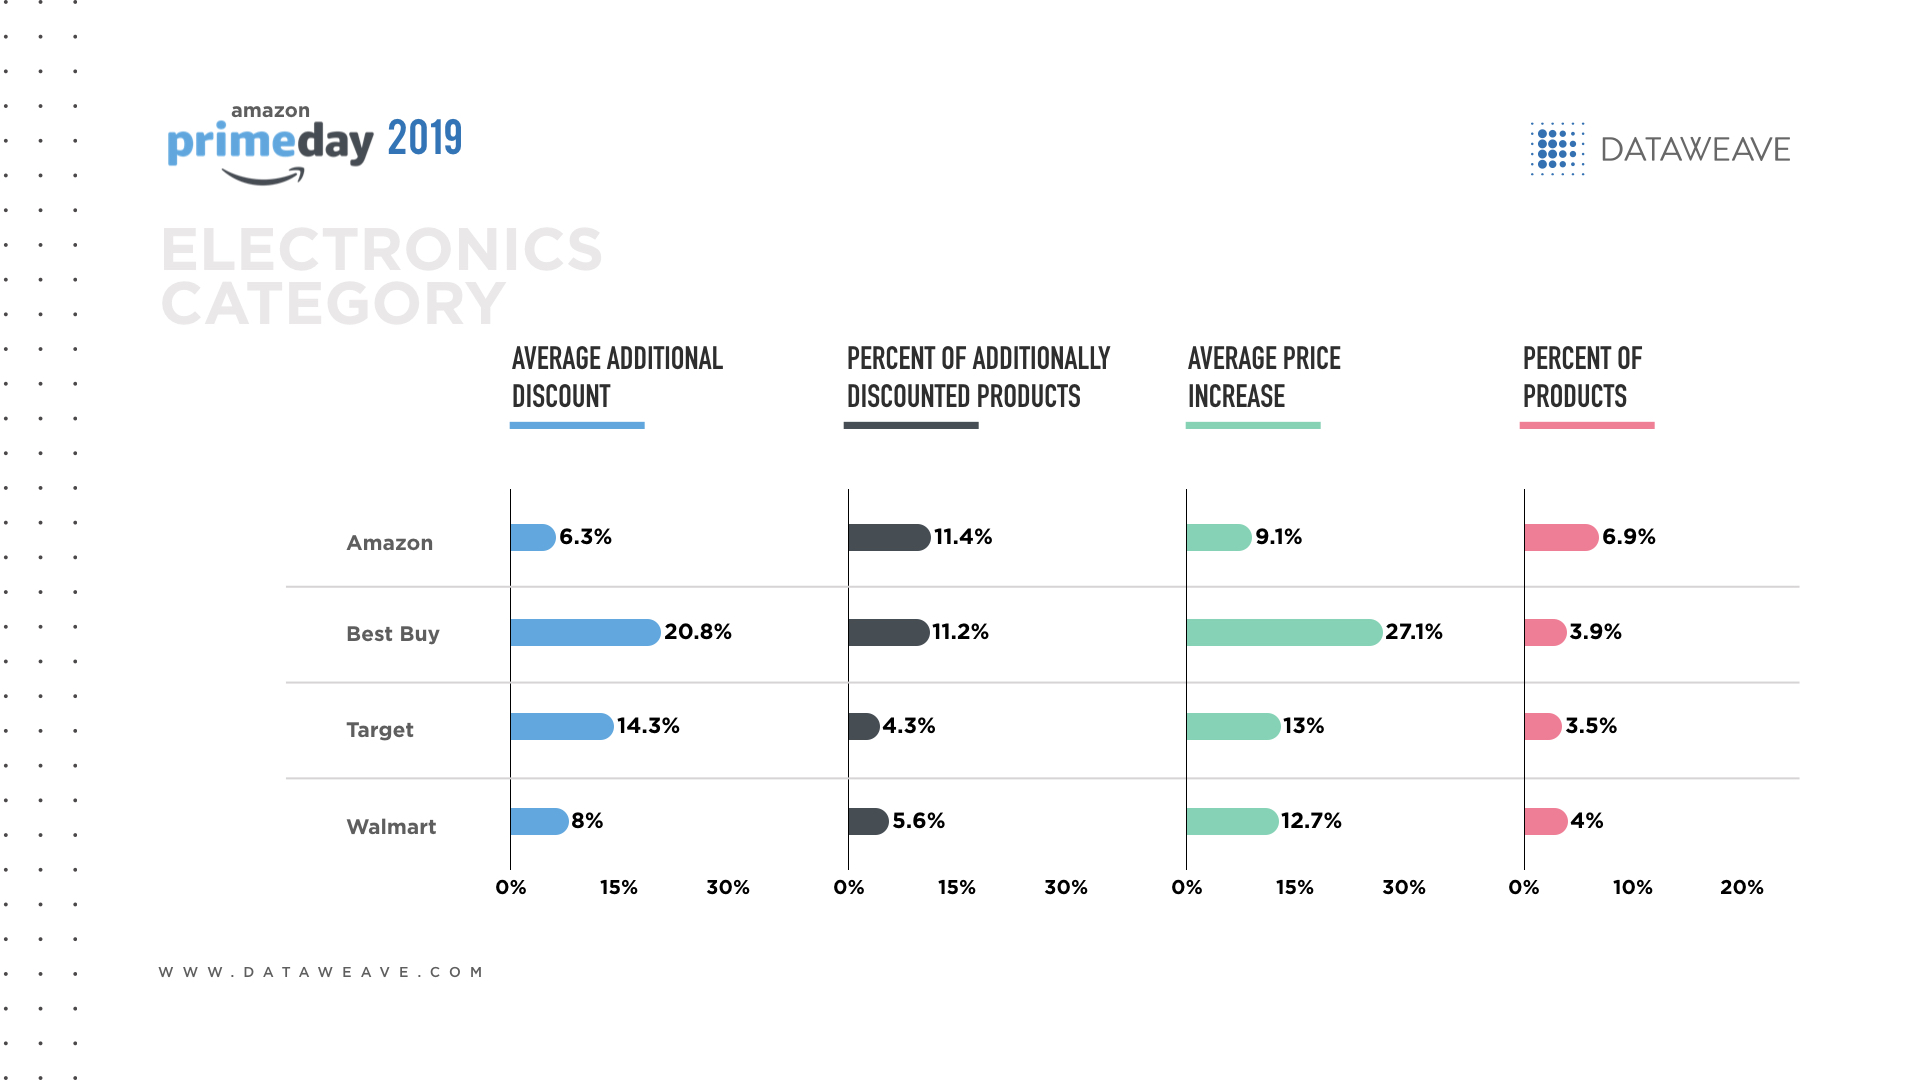
Overall, Amazon reported the lowest price reduction in the Electronics, Beauty and Fashion categories (13.4%), compared to Best Buy (22.5%), Target (21.7%) and Walmart (16.3%). Yet Amazon reported the second-highest percentage of additionally discounted products (12.0% vs. 15.7% for Target).
After Prime Day ended, certain assortments reflected more significant price increases than others. For instance, 97% of Target’s 158 products in Electronics, Beauty and Fashion had a price increase during the post-sale period, compared to 49% of Walmart’s 986 products. This discrepancy makes sense given Walmart’s everyday low price strategy.
These results suggest that although Prime Day generates tremendous media buzz for Amazon, the most generous deals come from its rivals. To stand out and lure shoppers away from Amazon, competitors offered comparatively deeper discounts, especially in categories in which they want to grow their market share. This means online shoppers would be wise to compare prices across retailers’ websites to find the best cross-category deals on Prime Day.
Top product types by additional discount
In Electronics, Best Buy offered the biggest average additional discount (22.4%) and Amazon offered the lowest (9.4%). Tablets were a popular product category among Amazon, Best Buy and Walmart, with Best Buy offering the best average additional discount at 19.1%. Other popular product types among rival retailers included TVs, desktops and laptops.
In Beauty, Target (13.2%) and Walmart (13.1%) almost tied for the biggest overall additional discount. Makeup was a popular beauty subcategory, with Walmart offering the highest additional discount at 19.7%. Other popular product types included hair care, skin care and fragrance.
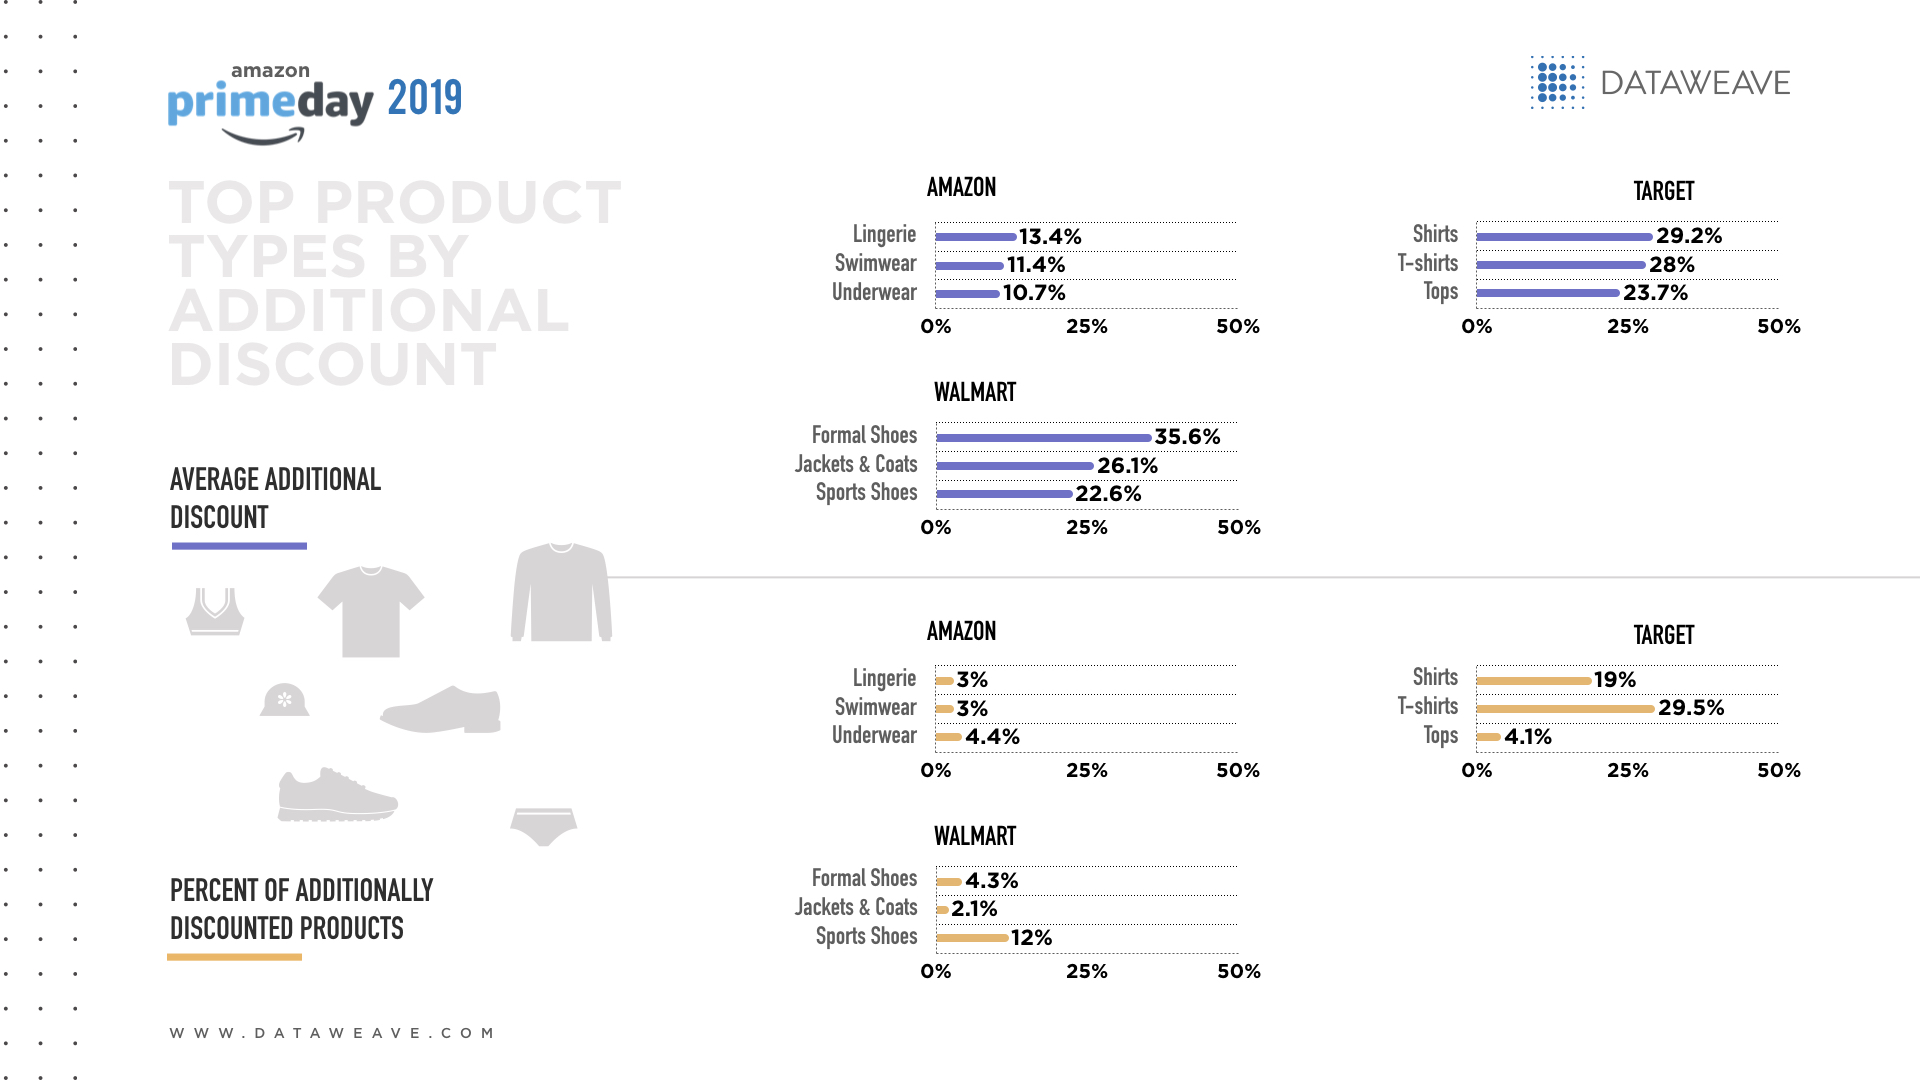
In Men’s Fashion, Target offered the biggest average additional discount of 28.1%. Suits and blazers were a popular fashion subcategory, in which Target offered the highest average additional discount at 50.0%. Other popular product types included T-shirts and tank tops, shirts and jeans.
Within the Women’s Fashion category, Walmart offered the biggest average additional discount of 20.5%. Tops and tees were a popular product category across all three fashion rivals, with Walmart offering the best average additional discount at 23.6%. Other popular product types included dresses, jumpsuits and jeans.
Additional discounts across product “premiumness” levels
Premiumness was calculated as the average selling price before the sale event. This was divided into low, medium and high premiumness levels, with high indicating higher selling prices.
In Electronics, Amazon showed a direct relationship between its additional discounts and the level of premiumness; Best Buy and Walmart showed an inverse relationship. Best Buy offered the biggest additional discounts across all levels of premiumness, nearly triple Amazon’s discounts (20.7% vs. 7.0% ) at the low end of the premium spectrum, and more than double Amazon’s discounts (18.5% vs. 7.3%) at the moderate level. Best Buy’s discounting strategy show it’s serious about protecting its competitive position in electronics.
Best Buy and Walmart offered the most additional discounts at the high end of the premiumness spectrum, making both retailers more competitive in the high-ticket electronics category. By contrast, Amazon offered nearly double the additional discounts of its rivals within the low segment, which helps to protect its margins while making products even more affordable and appealing.
In Beauty, Amazon and Walmart offered their biggest additional discounts at the low premium level, possibly to position those products as loss leaders. Meanwhile Target nearly doubled and tripled its rivals’ additional discounts at the high premium level (30.0% vs. 16.0% for Walmart and 11.0% for Amazon) to stand out in this intensely competitive category.
Amazon stood out by discounting the greatest portion of its Beauty offerings at all premiumness levels and Target discounted the least. Amazon and Walmart showed a direct relationship between their distribution of additional discounts and the beauty products’ premiumness level.
Across all levels of premiumness for Men’s Fashion, Target offered the biggest additional discounts, including more than triple Amazon’s discounts at the high end (38.4% vs. 12.4%). Target’s aggressive discounting shows a desire to be more competitive within the most premium segment of Men’s Fashion.
Amazon’s additional discounts accounted for the greatest percentage of its Men’s Fashions across all levels of premiumness, nearly triple Target’s overall average (15.4% vs. 5.3%). This approach shows Amazon’s willingness to give shoppers deals across a broader variety of Men’s Fashion items.
In Women’s Fashion, Target’s and Walmart’s overall additional discounts were comparable, and Amazon’s discounts were consistently the lowest among all levels of premiumness. Walmart offered its most generous discounts at the low and medium level of premiumness, which could reinforce its low-cost leadership image.
While Amazon and Target offered a comparable overall percentage of additional discounts in Women’s Fashions, Amazon applied more discounts to the higher end of the premium spectrum and Target focused on the lower end.
Additional discounts across visibility levels
In Electronics, Amazon offered the lowest average additional discounts across all levels of visibility. Among the most visible electronics, Amazon and Best Buy gave the most visible electronics higher additional discounts to make those items more alluring to help consumers find the items fast and add them to their online baskets.
Among the Beauty category’s most visible items, Amazon and Target offered their highest additional discounts. Yet Target was most aggressive in beauty, offering a 30% additional discount at the most visible end of the spectrum as well as at the least visible. This discount strategy shows Target wants to compete in Beauty, spreading its generosity beyond an exclusive focus on highly visible items.
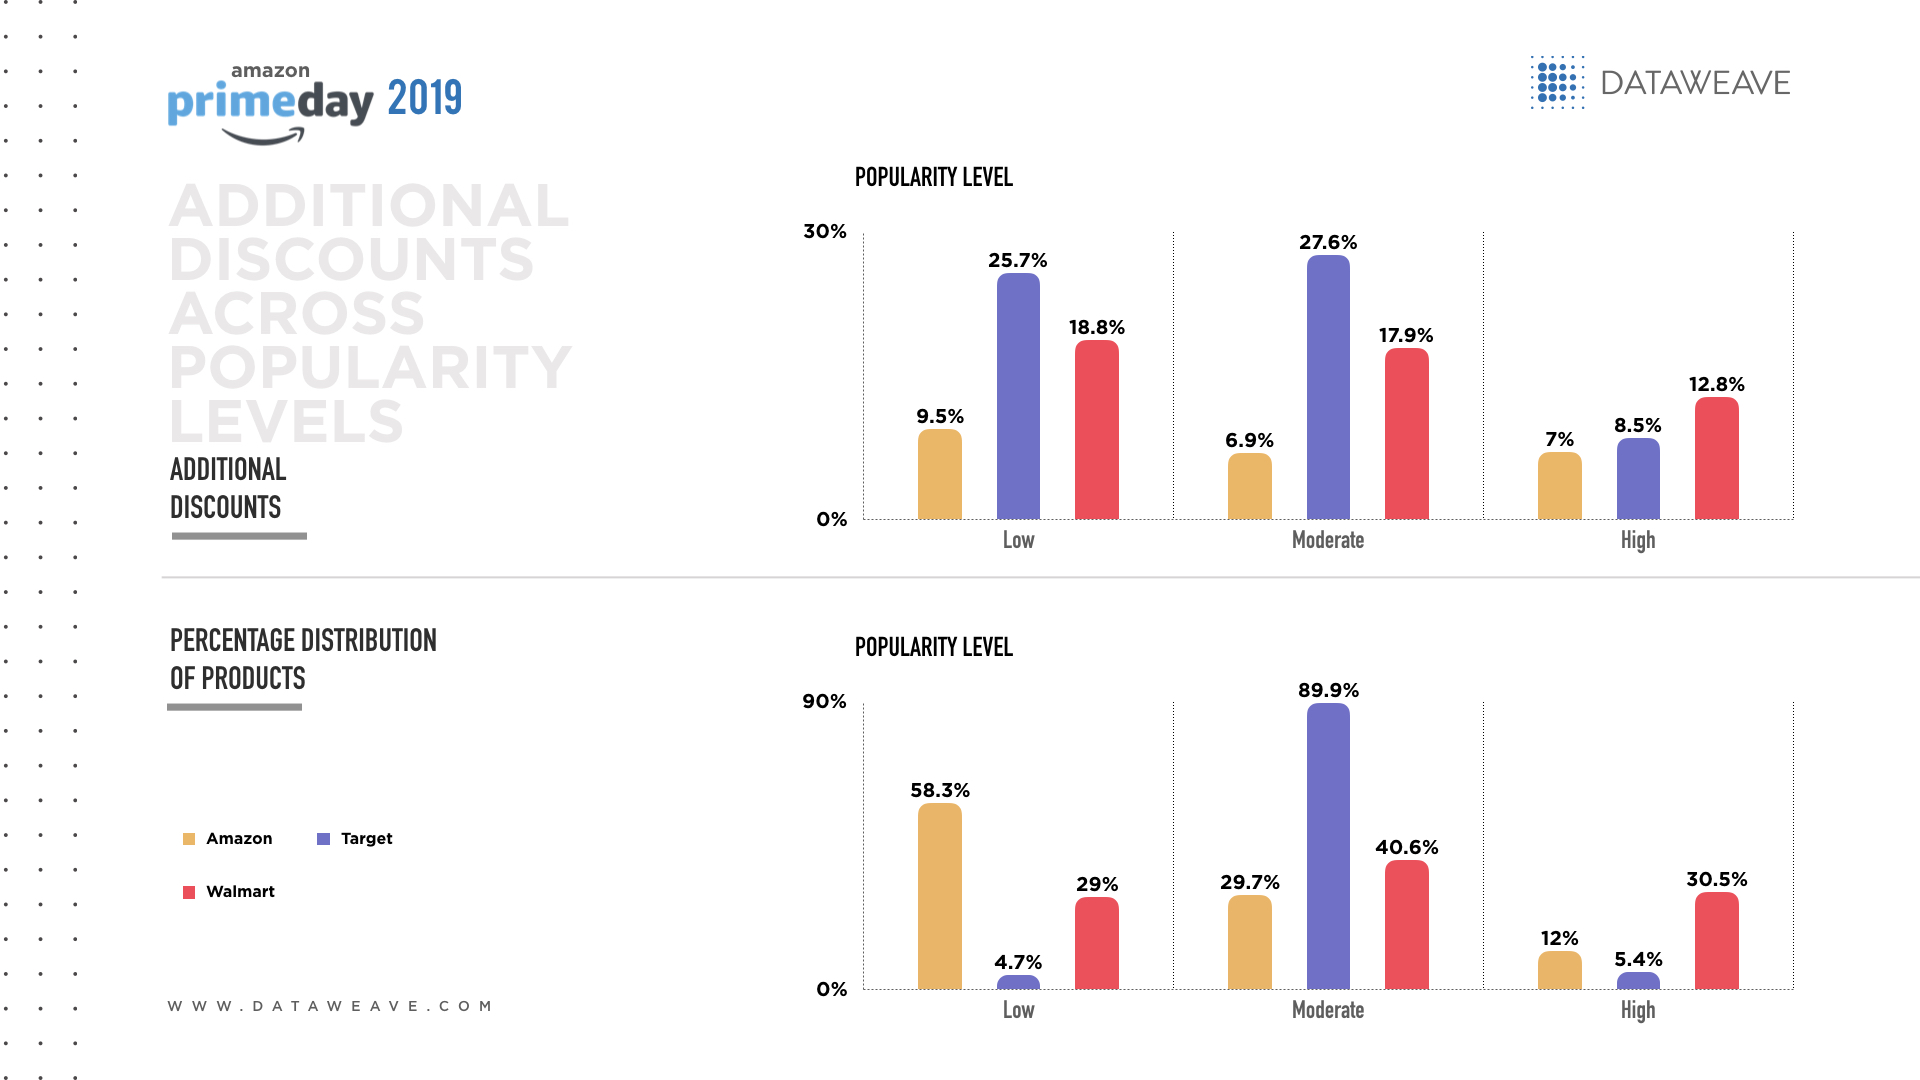
In Men’s Fashion, Amazon consistently offered the lowest additional discounts at all visibility levels. Target was the most aggressive in this category, offering additional discounts of 50% at moderate levels of visibility and 34.5% among the most visible items. Amazon may feel confident that men already choose Amazon for their apparel needs.
In Women’s Fashion, the retailers generally offered the most additional discounts for items at the higher end of the visibility spectrum. Walmart offered the most aggressive additional discounts among the most visible items in Women’s Fashion to try to boost its market share in this category.
Overall, while Prime Day is an effective way for Amazon to boost brand engagement, its rivals overwhelmingly offer higher additional discounts in Electronics, Beauty and Fashion. How about other categories like the booming Home space? Watch this space for more insights!
This year, homebound consumers crave the convenience of food delivery. Growing 20% since 2015, restaurant delivery has sparked intense rivalry to reach consumers’ homes. Although the pandemic led to $165 billion in lost sales industry-wide between March and July, experts predict online food delivery sales will reach $220 billion by 2023, accounting for 40% of total restaurant sales.[1,2]
This massive market opportunity makes food delivery an urgent priority for restaurants to stay competitive and solvent during the pandemic. This year nearly one in six U.S. restaurants have closed either permanently or long-term.[3]
Also, 40% of U.S. operators say they will likely be out of business within six months if economic conditions persist and 60% of Canadian restaurants could close permanently by November.[4,5]
COVID-19 compounds market complexity
Powerful market trends are rattling restaurants. During the pandemic, nearly 70% of operators have added third-party delivery to lift sales.[6]
This year, third-party delivery from food delivery apps like Uber Eats, Grubhub and DoorDash will grow 21% over 2018.[7] The global market for cloud kitchens (also called ghost kitchens or virtual kitchens), commercial kitchens intended for delivery-only orders, will grow from $650 million in 2018 to $2.6 billion by 2026.[8]
To avoid the need to rely on delivery partners, many chains invest in their own last-mile delivery capability to serve their fleet of restaurants. E-grocery sales are poised to surge 40% in 2020 and meal kits have boomeranged back into popularity, nearly doubling 2019 sales.[9, 10]
Consumers demand speed to keep their food fast, fresh and hot. Prompt service matters, as one survey found when consumers face a food delivery issue, 93% want it resolved within 10 minutes.[11]
The recession and job losses mean more consumers now need affordable food options. Meanwhile, restaurants are investing more in technology to modernize operations for efficient omnichannel service.
How restaurants are adapting to 2020’s disruption
Restaurant prices have risen during the pandemic to cover operating costs. Third-party delivery fees have led 41% of consumers to prefer to order food by contacting the restaurant directly (vs. 16% for third-party delivery).[12] To optimize pricing competitiveness, more restaurants now compare their delivery fees and offerings with rivals’ to spot and correct gaps, and keep their prices affordable.
To streamline operational processes and costs during the pandemic, 28% of restaurants shrank their menus.[13]
For clarity on which items to keep, operators now use data insights on restaurant listings and menu items down to the ZIP code level. This information also helps them decide whether to adapt to consumers’ diverse tastes, including vegan, gluten-free and organic, for competitive local assortments.
Outperform rivals: Restaurant operators seek proof of their brand visibility on food delivery apps’ homepages.
Restaurants have discovered consumers welcome reasons to celebrate at home this year. One chain’s weekly virtual happy hours on Facebook Live drew 80,000 participants and a $40,000 sales increase from delivery and takeout orders.[14]
More restaurants now compare their promotional strategies with rivals’ to evaluate marketing performance, including homepage discoverability and visibility ranking, to ensure consumers find their brand online with ease.
Delivery speed and precision also matter. A survey found 70% of consumers had food delivery order complaints, including late delivery (50%), incorrect order (37%) and cold or stale food (36%).[15] Using accurate geographic data can help restaurants improve speed and the customer experience.
To gain a competitive advantage in today’s booming food delivery market, a growing number of leading chains and food delivery providers are collaborating with DataWeave to access actionable insights to make better strategic and operational decisions faster. Using trusted insights to make data-driven pricing, menu and promotional decisions help restaurants save time, reduce risk and gain clarity in today’s evolving market.
Applying DataWeave’s accurate, up-to-date information also helps restaurants deliver affordability, convenience and variety to remain responsive to consumers and agile among competitors. To see how DataWeave helps restaurants stay relevant and competitive, contact us today.
[1] Rogers, Kate. Winter is coming, bringing a new challenge to already-struggling restaurants. CNBC. September 14, 2020. [2] Zahava Dalin-Kaptzan. Food Delivery: Industry Trends for 2020 and beyond. Bringg. April 30, 2020. [3] Klein, Danny. 100,000 Restaurant Closures Expected in 2020. QSR. September 14, 2020. [4] Rogers, Kate. Winter is coming, bringing a new challenge to already-struggling restaurants. CNBC. September 14, 2020. [5] Charlebois, Sylvain. Don’t Want to Save the Restaurant Industry? Fine, but Use it to Save the Canadian Economy. Retail Insider. September 11, 2020.
[6] Rogers, Kate. Winter is coming, bringing a new challenge to already-struggling restaurants. CNBC. September 14, 2020.
[7] US Food Delivery App Usage Will Approach 40 Million Users in 2019. eMarketer. July 2, 2020.
[8] Levy, Ari. Virtual Kitchen, founded by ex-Uber execs to help restaurants with delivery, raises $20 million. CNBC. Sept. 8 2020
[9] Redman, Russell. Online grocery sales to grow 40% in 2020. Supermarket News. May 11, 2020.
[10] De Leon, Riley. How the coronavirus pandemic delivery surge created a lifeline for Blue Apron meal kits. CNBC. May 22, 2020.
[11] Guszkowski, Joe. Delivery services have room to improve, consumers say. Restaurant Business Online. Sept. 1, 2020.
[12] Guszkowski, Joe. Consumers’ desire to order directly from restaurants is a big opportunity. Restaurant Business Online. Aug. 27, 2020.
[13] Romeo, Peter. Best practices for weathering a second COVID wave. Restaurant Business Online. Aug. 28, 2020.
[14] Ibid.
[15] Guszkowski, Joe. Delivery services have room to improve, consumers say. Restaurant Business Online. Sept. 1, 2020.
JioMart, the online channel for Reliance Retail Limited, launched in December 2019 as a contender in the e-grocery segment. Currently in India, this segment is being dominated by bigbasket, Amazon, Flipkart Supermart, Grofers, etc. After less than a year and from their initial launch in Mumbai, they now have their presence in 205 cities across India.
According to their recent press release, they claim to be clocking over 250,000 daily orders, compared to bigbasket’s 220,000 and Amazon’s 150,000. To get an understanding of this rapid penetration, we had a look at the PIN codes that JioMart serves, spanning the country.
The map below represents the percentage of PIN codes that are being served by JioMart’s online grocery in each state:
**Disclaimer -Map for representation purposes only
While states like Chandigarh, Delhi and Punjab in the North are covered extensively, JioMart has a stronger distribution in the Southern states.
The image below shows the top ten states in India where JioMart’s online grocery has the highest presence:
They’re yet to launch in 14 more states but it’s interesting to note that in this limited time, they’ve managed to cover 14% of the PIN codes in the country and all this, in the midst of lockdowns.
Assortment
To get an idea of the assortment in their range, we analyzed select PIN codes across three tiers of cities in India. The parameters we looked at were categories, brands and discounts to get an understanding of how JioMart is stacking up against its competitors. The cities we examined were:
Tier 1 – Bangalore, Delhi, Kolkata, Mumbai
Tier 2 – Ahmedabad, Jaipur, Kochi, Visakhapatnam
Tier 3 – Mohali, Mysore, Nagpur, Siliguri
In its range, they offer eight broad categories, of which, we focussed on the four that offer the highest selection of products: home care, personal care, snacks & branded food and staples.
The table below represents the average selection of products offered across each tier.
Overview of discounts offered and the private label split
Out of the assortment we looked at in the three tiers, we noticed that an average of 18% of the products are JioMart’s private labels. What stood out further is that private labels accounted for 48% in the Staples category and 24% in Personal Care. We noticed this trend (increase in the private label) when we did an analysis of Amazon.
When it comes to discounts, we noticed that a near-total 91% of the products listed are being sold at a discount. Out of this, the highest discounts were witnessed in the Home Care and Staples categories.
The brands with the highest number of products listed were Good Life, Reliance, Amul, Gillette and items sold loosely. All these accounted for 14% of the assortment. Out of these, Good Life, Reliance and the loose items are JioMart’s private labels.
Competitor analysis
To get an idea of where JioMart stands with relation to its competitors, we focussed on food and essentials in the Tier 1 cities. The table below highlights the number of product offerings in each category:
It’s clear that in these categories (food and essentials), JioMart has the least number of products on discount. There’s no doubt that bigbasket is miles ahead in its product range/ assortment.
To get a better idea of the discounting patterns, we analyzed the same categories to get a count of the number of products being discounted, as well as the average discount being offered.
We noticed that JioMart bookended our analysis – the least average discount, across the most number of products. Grofers offered the highest average discount of 23% with Flipkart Supermart and bigbasket closely behind. Lastly, bigbasket had the least number of products on discount with a little over 53%.
Conclusion
JioMart launched during a tumultuous and unprecedented time; the COVID-19 pandemic and the subsequent nation-wide lockdowns. Given this trial by fire, they managed to make an impact in this highly competitive space. Their expansion plans of tying up with mom and pop stores to fortify their penetration, had to take a back seat due to the ongoing situation but is sure to resume once conditions improve. This set-back did not however deter JioMart from attracting strategic investments from Facebook, Google and 12 other investors in a span of 3 months.
In a study by Goldman Sachs, it found that India’s e-commerce business is expected to grow at a compound annual growth rate of 27% by 2024, resulting in a $99 billion market share. What’s even more shocking is that 50% of this market will be captured by Reliance Industries. It, therefore, stands to reason that all we’ve seen and heard of so far, is merely the tip of the iceberg and there’s surely more to come in the near future.
We’re thrilled to announce that we have teamed up with Kenshoo to offer an integrated marketing solution that combines DataWeave’s digital shelf analytics and commerce intelligence platform with Kenshoo’s ad automation platform. This in turn, provides better recommendations on promotions to retailers and consumer brands.
As e-commerce surges, consumer brands can now promote their products through retail-intelligent advertising. Product discoverability, content audit, and availability across large marketplaces can be critical to a brand’s success. Using DataWeave’s digital shelf solutions, Kenshoo now can offer marketers greater visibility into a brand’s performance.
Even large retailers and agencies can use our commerce intelligence platform to improve their price positioning, address category assortment gaps, and more.
Through this partnership, Kenshoo – a global leader in marketing technology, can help its significant base of consumer brands and retailers invest their marketing dollars intelligently and in a timely manner.
At DataWeave, we have constantly strived to bring in a holistic approach to help our customers optimize their online sales channels. This partnership furthers our resolve in this direction. As we collectively strive to adjust to a post-COVID-19 world, we are observing an acceleration towards digital commerce. This acceleration and change in consumer behavior is going to be a lasting change, creating significant growth opportunities for both DataWeave and Kenshoo.
With this partnership, we look forward to helping our customers make timely, intelligent, and data-driven decisions to grow their business.
Among Amazon’s most prominent and decisive steps in achieving retail dominance over the last few years has been its focus on expanding its private label portfolio.
The most recent collaborative report between DataWeave and Coresight Research determines that Amazon’s private label assortment in early 2020 has grown three-fold over the previous two years, most of which is in categories outside of apparel and accessories.
In addition, the report covers various facets of Amazon’s private label penetration and strategy. These include the size of Amazon’s private label portfolio, the distribution of private label products by category, the product ratings and number of reviews, the average price points across products and brands, and more.
Our detailed and proprietary Amazon private label dataset includes information on over 20,000 products and 111 brands.
Around half of the private-label products are in clothing, footwear and accessories, which is lower than the three-quarters found in our similar research from June 2018, indicating Amazon’s push into a broader range of categories.
The average Amazon private-label product generates a customer rating of 4.3 out of 5, representing positive customer feedback overall.
The number of private-label products—22,617—is more than triple the total of 6,825 from June 2018 (see our previous report). The number of private-label brands also increased substantially (up 50% versus June 2018), indicating that the e-commerce giant has stepped up its private-label strategy.
Around Half of Private-Label Products Are in Clothing, Footwear and Accessories
Just over half of Amazon’s private-label products are in “clothing, footwear and accessories,” versus almost three-quarters when we undertook similar research in June 2018, indicating Amazon’s push into a broader range of categories. Other categories that feature more than 1,000 private-label products include “home and kitchen,” “grocery and gourmet food” and “tools and home improvement.”
Source: DataWeave/Coresight
The Average Amazon Private-Label Product Generates a Customer Rating of 4.3 out of 5
We examined feedback provided by Amazon’s private-label customers: Customer satisfaction can be measured by the average star rating that customers have left in reviews. We chart both average star rating and average number of customer reviews per product in the graph below.
The average Amazon private-label product generates a customer rating of 4.3 stars out of 5, suggesting overall solid customer satisfaction levels.
Source: DataWeave/Coresight
The full report is available for Coresight’s premium subscribers. It includes further details of categories and subcategories that suggest longer-term implications—including how Amazon targets a niche customer base through specific category labels but appeals to broader consumer needs by offering multicategory labels.
To access DataWeave’s proprietary database on Amazon’s private label brands and products, reach out to us today!
The Coronavirus, otherwise known as COVID-19, has made landfall on U.S. shores. At the time of writing this article, there are over 230 confirmed cases in the country and 12 deaths. The growing unease about the virus, which has quickly accumulated 95,000+ confirmed cases globally, has, among other things, adversely affected businesses and stock markets the world over.
In the wake of this outbreak, U.S. based retailers and brands would be prudent to brace themselves and plan ahead to minimize disruptions as much as possible.
Businesses and consumers in China, the global epicenter of the epidemic, have been dealing with these challenges over the last couple of months. It’s likely that some of the trends observed in China would be mimicked in the U.S. as well, something that domestic retailers and brands would do well to study and prepare for.
The Inadvertent E-commerce Wave
When the outbreak happened in China, it caused an uptick in e-commerce adoption as shoppers were reluctant to step out of their homes and instead, opted to shop for their goods online.
Reports indicate that Chinese online retailer JD.com’s online grocery sales grew 215% YoY over a 10-day period between late January and early February. Similarly, Carrefour’s vegetable deliveries grew by 600% YoY during the Lunar New Year period. Online sales of Dettol, a disinfectant produced by Reckitt Benckiser, rose 643% YoY between 10 February and 13 February on China’s Suning.com.
In Singapore, another region affected by the virus more recently than in China, Lazada’s grocery arm, RedMart, and Supermarket chain, NTUC FairPrice, both reported an unprecedented surge in demand, which tested their delivery capabilities to the limit.
This bump in online sales isn’t just restricted to grocery, but other categories as well. Jean-Paul Agon, CEO of L’Oréal, recently said that online sales of the brand’s beauty products increased in China in February.
Given such a consistent shift in shopping behavior across coronavirus-affected regions, it’s logical to expect that a similar trend would be followed in the U.S. – in fact, it might already be underway.
A recent survey by Coresight Research indicated that 27.5% of U.S. respondents are avoiding public areas at least to some extent, and 58% plan to if the outbreak worsens. Of those who have altered their routines, more than 40% say they are “avoiding or limiting visits to shopping centers/ malls” and more than 30% are avoiding stores in general. The survey also found consumers will likely begin to avoid restaurants, movie theaters, sporting events and other entertainment venues.
Therefore, it’s essential for U.S. retailers and brands to swiftly energize their e-commerce readiness and be fully prepared to cater to the circumstances-induced shift in shopping behavior, inclined toward online.
A Logistical Nightmare
The most obvious area of impact for retailers and brands is in their supply chain and order fulfilment operations.
A large portion of consumer product manufacturers rely to some extent on China, and the potential impact of the virus on supply chain processes is inescapable. Chinese factories have been operating at partial capacity, impacting supply chains globally. This has largely affected highly popular e-commerce categories like consumer electronics, fashion and furniture.
Shares in the U.S. of furniture e-commerce retailer, Wayfair, fell as much as 26% toward the end of February, according to a Bloomberg report. The is particularly revealing, as the online retailer reportedly relies on China for half of its merchandise.
Retailers struggling to cope with this stress in their supply chain systems would do well to warn their customers beforehand about delays in deliveries, like AliExpress has just done.
For categories like CPG, as consumers increasingly shop online, retailers that offer Buy Online Pick Up In Store (BOPIS), should expect a surge in its adoption, and reinforce their online infrastructure and in-store operations to cater to the rising demand.
In addition to disruptions in the supply chain, several other mission-critical areas are likely to get affected too.
Keeping Up With The Online Surge
As with any event of this magnitude, the business implications reach far and wide. The following are a few areas that we’ve identified as critical, based on our experience working with retailers and brands. Being aware of and focusing on these issues are likely to alleviate some of the issues faced by consumers today.
Fair pricing: There have been several reports of price gouging on e-commerce platforms. Examples include 2-ounce Purell bottles being sold for $400 and face masks for up to $20. While these prices have mostly been set by third party merchants, brands are likely to face the flak from consumers. A recent Bloomberg article reported that online retailers still rely partly on employees to manually monitor these items. This approach has obvious limitations, such as products quickly reappearing on the website after being de-listed. Brands and e-commerce platforms will need to explore automated ways of controlling their online pricing practices at large scale.
3P merchant and counterfeit management: Often, unauthorized third-party merchants selling an original manufacturer’s goods are the ones who unreasonably inflate prices. These merchants tend to test the markets on online marketplaces with their pricing, which adversely affects the brand image of the manufacturer. Further still, they sometimes list counterfeit or fake goods that make incorrect or extravagant claims. Brands will need to swiftly identify and de-list these merchants from online marketplaces.
Ensuring stock availability: During times like these, it’s a common sight to see empty aisles at supermarkets selling items like canned food, water, paper products and personal care products. Consumers will benefit from brands monitoring their stock availability at stores, which will help them better align their supply chain operations to the rapidly changing demand patterns across the U.S. map. This way, efforts can be more targeted at regions with severe shortages.
Content compliance: Helium 10, a technology provider for Amazon sellers, reported that since 26 February, 90% of searches on Amazon are coronavirus related, and searches for hand sanitizers spiked to 1.5 million searches in February compared to 90,000 in November. As a result, to arrest exploitative practices, some online marketplaces have announced policy guidelines on product content claiming health benefits. Words like ‘Coronavirus‘, ‘COVID-19‘, ‘Virus‘ and ‘epidemic’ are, in fact, prohibited. Amazon has already de-listed several merchants claiming fraudulent cures. Ebay has gone as far as to ban all new listings for face masks, hand sanitizers, and disinfecting wipes, due to regulatory restrictions. In this context, retailers and brands will benefit from deploying tracking mechanisms that quickly identify offenders.
The areas of business presented above are by no means a comprehensive list for retailers and brands to rely on during this time. Still, these are critical impact areas for them to address, even as huge efforts are made toward managing highly stressed supply chains.
DataWeave Offers Support
The coronavirus outbreak is likely to get worse before it gets better. As we enter unchartered territories, DataWeave is offering to contribute in small ways, pro bono, by leveraging our expert talent and competitive intelligence technology platform, to address some of the challenges faced by retailers and brands.
We’re announcing a limited-time, no-cost offer to detect and report on price gouging, the presence of unauthorized third-party merchants, as well as stock availability across U.S. ZIP-codes. This offer will be valid for 4-6 weeks (timeline will be flexible based on how the outbreak develops) and limited to monitoring the top 10 U.S. online marketplaces, as well as critical product categories such as medicinal and hygiene-related products, emergency food items, survival-related products, fuel, etc.
As another year comes to a close, we look back at 2019 with fond memories and look forward to the exciting new prospects of 2020. Take a trip with us as we highlight some of DataWeave’s milestones of the last twelve months.
Over the course of the year, DataWeave’s success has gone hand in hand with the evolution of retail and e-commerce, reinforcing the relevance of our technology platform.
Our rapid growth in the North American market is a reflection of how intense competition in the region is triggering the need for accurate, timely, and actionable competitive and market insights, as well as other avenues for retailers and brands to gain a competitive edge.
Last year, we saw a resurgence of big-box (omnichannel) retailers as they adopted innovative approaches to play to their strengths (their offline stores). Offering buy online, pick up in store (BOPIS) or click-and-collect options, rolling out price match guarantee programs, and expanding their partnerships with delivery services like Instacart, enabled these retailers to leverage the best of both the online and offline worlds to compete with e-commerce firms.
Amazon continues to dominate e-commerce with a daunting 38% share in the US. Still, the partnerships between brands and Amazon are increasingly being tested. Nike and Ikea recently joined the likes of Swatch and Birkenstock to sever ties with the retail behemoth. This seemingly growing trend is largely due to counterfeits continuing to leak through the system.
Brands that used to de-prioritize their focus on their eCommerce channel (as it often was only a small portion of their revenues) have come to realize that consumers use large marketplaces like Amazon not just to shop for products but also to perform product research. As a result, how these brands are represented and sold online impact their offline sales. And with the onset of BOPIS and click-and-collect initiatives, brands can now analyze this correlation even at a hyperlocal (ZIP-code) level.
Large marketplaces, for their part, have started taking advantage of the increasingly brand-agnostic shopping behavior of consumers by launching ad-platforms for brands and manufacturers, enabling them to boost their visibility online.
Due to such sweeping transformations to the market landscape, brands and retailers are increasingly looking more toward intelligent tech-based solutions to help them gain a competitive edge.
In order to effectively serve the growing need for competitive and market insights, we’ve pushed our platform to its limits and beyond. It’s our constant endeavor to innovate and improve. This is evident with the launch of a host of new features on our product suite, especially Brand Analytics – designed to enable consumer brands to protect their brand equity and optimize e-commerce performance.
One of the key factors that enabled us to achieve all the milestones we did is the aggressive hiring of some of the most skilled talent in the tech industry. Our team grew by 44% in 2019, giving us additional confidence to raise the bar on our capabilities and offer 95% accuracy in our data and insights to our customers consistently.
We’re encouraged by the fact that we’ve more than doubled as a business, year-over-year, for the past several years, without depending solely on growing the team, but also by consolidating our technology stack, optimizing our processes, and scaling our products.
Here’s a sneak peek into our performance in 2019:
2020 Vision
The upcoming year promises to be an exciting one for the retail industry and the consumer brand space at large. We plan to be at the helm and increase our footprint all around. There’s a strong focus to expand our US team and consequently, the business. While we continue to strengthen our roots in India, we will look toward other mature markets like the UK, Germany and the Middle East as well.
On other fronts, we’re gathering steam on new partnership engagements – consulting firms, ad tech firms, marketing agencies and complementary technologies. We will also expand our foray into the travel and delivery services verticals.
With our diversifying portfolio, we haven’t lost sight of one of the most important aspects of any successful company – its employees. We will continue to keep our employees engaged, motivated, and satisfied by providing vertical and horizontal career growth opportunities, conducting personalized training programs, organizing hackathons, fostering cross-team collaboration and learning, and encouraging everyone to periodically blow off some steam at company retreats and the ferociously fought in-house sports tournaments.
Here’s to a stellar 2020 of empowered retailers and brands. We wish them well as they navigate the dense competitive landscape, knowing that they have an ally in their corner with DataWeave.
Over the last three years, I have helped deploy eCommerce analytics solutions for several brands and manufacturers globally. During this time, I have conversed with day-to-day users up through C-Suite executives of some of the world’s most successful brands, while also working with the founders of startup brands who were simply trying to find their place in the world of commerce.
As I look back on my time to date, I have noticed a few themes emerge from my diverse client conversations with brands, which are indicative of an ecosystem that’s only now coming to terms with retailers and consumers moving online. Here are three fundamental problems I’ve seen brands often run into as they adapt to the world of eCommerce:
1. “We have no idea what we are doing”
My favorite part about being an analytics solution provider is the introduction session with a new client. I always entered these conversations with a few key questions:
– What are your top three eCommerce initiatives for the next 12 months?
– How does your team and other internal resources align with these initiatives
– How do you envision using this type of tool to help you succeed with your goals? What made you choose ours?
Early in my career, what always amazed me was that these enormous brands – wildly successful brands – entered into a partnership without a clear plan to execute. Many would fumble through what I thought were very basic questions. After a few of these conversations, I came to the realization that most brands have a limited understanding of what they are doing in eCommerce.
How could this be possible?
I remember a conversation with a large CPG brand executive. He said, “Keep in mind, most of the people doing these jobs are from a bricks-and-mortar world. They don’t have eCommerce experience because no one does. It is too new. We don’t have the resources to hire more people because eCommerce makes up less than 1% of our total revenue.”
As an industry, brands are collectively making it up as they go. Few admit it, but the industry is growing and evolving so fast, the best that some do is hold on for the ride (while taking a few calculated chances along the way).
2. “We measure success poorly”
I have noticed that, with time, many brands are starting to get a better grasp on how to operate online, though there is still a long way to go for many. The best evidence for this improvement is the growth in the number of job posts for eCommerce-focused roles, new vendors popping up in this space, and industry centers of excellence being developed. As more people choose eCommerce roles, the biggest challenge that I see is the lack of effective measurement and training processes.
Often, the issue is that many brands take a long-standing, loyal executive and assign them as the eCommerce leader. When this person is not forward thinking, analytical or open to trying things a new way, brands fail. The reason startup brands are winning online is because they are entering the eCommerce game with an open and fresh perspective. Forcing old ways into eCommerce will surely lead to failure.
I have worked with many brands that have developed eCommerce centers of excellence and have shared best practices on how to measure teams and success. The most painful to deal with were the organizations that brought their bricks-and-mortar measurements into the eCommerce world. The data used to measure success was the wrong data. The KPIs were set in a way that people would surely fail.
In my opinion, the best measurements for success are sales growth (not share growth), digital shelf KPIs (search and content first), and a subjective measure on maturity in the industry. The best first step is to have someone lead the team who understands how to measure success and execute in a cutting-edge and evolving environment.
3. “We sign up with either too many or the wrong service providers”
The final observation is one that is costing many teams a lot of money. Many brands start to move into eCommerce based on their old team structures. Each team has a separate eCommerce objective, budget, and set of tools to execute with.
Then, when the centralized eCommerce team (Center of Excellence) gets established, they will likely find many teams working with many tools. Sometimes, they see many teams signed up, via separate contracts, with the same tool. Worse still – it’s often the wrong type of tool.
As brands evaluate tools, they need to ask questions such as:
Does this vendor provide global coverage, so that we can establish a global way of thinking and executing (with the ability to customize for local consumption when required)?
Does this vendor have the backbone (people and technology) to scale with my business?
(The best question, in my opinion) Does this vendor have people who are willing to listen and understand my business, or are they simply people who want to sell me a cookie-cutter solution?
In my experience, I have seen brands spending way too much time, effort, and money on vendors who do not check the boxes listed above.
Summing up…
As I look back over my time serving brands in the eCommerce analytics space, I have seen an industry morph and transform time and time again. I have seen companies shift, re-shift, panic and pivot.
If you’re a brand, my encouragement to your team is to hit the pause button. Ask the right questions. Evaluate your goals, your team structure, and your vendor partners. If the strategy, execution, people, and measurement, are not aligned, come up with a plan to get them back on track. Be willing to learn a new way to do business.
Target and Walmart offered more appealing discounts than Amazon during Prime Day 2019.
Statista estimates that e-commerce fashion accounted for approximately 20.4% of overall fashion retail sales in the United States in 2018, which amounted to about $103 billion in absolute terms. According to Internet Retailer, apparel is the largest and among the most competitive retail categories in e-commerce. Moreover, as a share of total apparel and accessories sales, online apparel sales is growing at a faster rate than US e-commerce as a whole.
Given the high-growth and competitive nature of the category, we at DataWeave were interested to find out how high the stakes got during the fifth annual Prime Day earlier this month.
Our Methodology
Since Prime Day is no longer necessarily an Amazon event (since competing websites often offer attractive discounts as well), we tracked the pricing of several leading retailers selling fashion apparel, footwear, and accessories to assess their pricing and product strategies during the sale event. Our analysis was focused on additional discounts offered during the sale to estimate the true value that the sale represented to its customers. We calculated this by comparing product prices on Prime Day versus the same prices prior to the sale.
Our sample consisted of 20 product types across women’s as well as men’s fashion categories. While we did monitor exclusive fashion retailers Macy’s, Bloomingdales, Nordstrom, and Neiman Marcus, we did not find them offering any additional discounts – an interesting insight all on its own since they’ve clearly chosen not to compete with Amazon during the two days of the Prime Day sale. We therefore restricted the rest of our study to Amazon, Target, and Walmart – the latter two of which interestingly offered immensely aggressive discounts in their apparel categories.
The Verdict
Despite owning the day at least in name, Amazon was found to offer the lowest additional discounts among the retailers studied. Target and Walmart, on the other hand, ensured that they didn’t lose out on market share this Prime Day by offering substantially high discounts of their own. While Target was the most aggressive with a steep average markdown of 26.5%, Amazon closed out the bottom at 8.4%.
Walmart and Target didn’t seem particularly focused on compensating their sharp discounts with price increases in other products – their focus seems to have been solely only on offering timely discounts during the sale. Amazon, on the other hand, marked up just about as many products as it marked down, with the markup margin being close to double that of the markdown in an effort to protect margins during the sale.
Top product types by additional discount
Target and Walmart both offered aggressive discounts across their top product categories. Walmart ended up with a marginally higher overall average additional discounts on product types like Shirts, T-shirts, and Tops.
Interestingly, though Amazon offered moderate discounts across its top categories (Lingerie, Swimwear, and Underwear), the volume of marked down products was very limited.
Additional discounts across popularity levels
We determined popularity using a combination of average review rating and number of reviews, and the resulting scores were categorized as low, moderate, and high.
When it came to discounting popular products, there were clear differences in strategy among all the three retailers. Amazon, which interestingly had close to 60% of its products in the low popularity bucket, chose to offer the highest discounts in the same category – indicating an effort to clear its stock of unpopular products. Target and Walmart, on the other hand, focused their discounts on moderate rated products.
Additional discounts across product “premiumness” levels
Premiumness was calculated as the average selling price before the sale event. This was divided into four percentile blocks, with higher percentile blocks indicating higher selling prices.
As found in the electronics and furniture categories that were analyzed previously, most of the discounting activity was focused on the lower end of the premium spectrum with a view to protect margin – despite a largely equitable distribution of discounted products across percentile ranges (with the exception of Target, which had a discounted assortment heavily dominated by its least premium products).
This indicates a clear strategy to protect margins, while still maintaining the perception of promoting attractive offers to draw traffic. Target and Walmart both offered substantial additional discounts of close to 30% on their least premium products, while at 12%, Amazon offered less than half that discount.
Additional discounts across visibility levels
Given the fairly large number of SKUs across the fashion category in general, the discounts across visibility levels understandably didn’t vary much when compared to the more pronounced fluctuations observed in the electronics and furniture categories. This is also largely because consumers tend to explore lower ranked products more so in the fashion category than in other categories.
Across product categories, we’re seeing lower-than-expected additional discounts on Amazon this Prime Day, coupled with more aggressive pricing activity by Amazon’s competitors. While this puts more pressure on Amazon, this also is a strong validation of Prime Day as a key annual sale event on the US shopper’s calendar.
Curious to know how Amazon and its competitors performed in other product categories this Prime Day? Watch this space for more!
Just as with electronics, other retailers actually offered far better discounts than Amazon during Prime Day 2019.
Online furniture sales have risen significantly since the 2000s, driven largely by a growing array of products, and even more so by the convenience of avoiding travel and crowded stores. According to Statista, online furniture and homeware sales were estimated to reach approximately $190 billion in 2018, with China and the United States accounting for over $60 billion in revenue each.
Thus, furniture has quickly become a key product category during sale events globally – and Prime Day was no different. At DataWeave, we got down to figuring out exactly how plum those deals were this year.
Our Methodology
We tracked the pricing of several leading retailers selling home and furniture products to assess their pricing and product strategies during the sale events. Our analysis was focused on additional discounts offered during the sale to estimate the true value that the sale represented to its customers. We calculated this by comparing product prices on Prime Day versus the same prices prior to the sale. Our sample consisted of the top 1,000 ranked products across 10 popular product types, including beds, dining table sets, sofas, entertainment units, and coffee tables – analyzed for five retailers (Amazon, Home Depot, Target, Walmart, and Wayfair).
The Verdict
As we found in the electronics category, there were surprising price spikes in this category too – with Target reporting an average increase as high as 14.7%, and Amazon clocking a still moderately high 9.4%. Target also reported the highest distribution of products with price markups. Home Depot indicated the lowest price increase at 4.6%.
When it came to additional discounts, Amazon fell short of expectations – at 4.7%, it offered the lowest average among its competitors. Target, on the other hand, was extremely aggressive both in terms of additional discounts and volume of discounted products.
To conclude, all the retailers observed seemed to be keeping a close watch on their margins by countering price reductions with nearly equivalent surges elsewhere in their assortment.
While there was no single product type that was found to be popular across all five retailers, it was clear that Target was again the most aggressive at offering discounts. It also had among the largest product ranges on discount.
Amazon chose to follow a very moderate route both in terms of average discount and discounted product volume.
Additional discounts across popularity levels
We determined popularity using a combination of average review rating and number of reviews, and the resulting scores were categorized as low, moderate, and high.
There doesn’t seem to have been much of a focus on low-popularity products in terms of additional discounts. Most of the attention was focused on products with moderate popularity, since there isn’t much of a need to be aggressive on price for highly popular products, and products with lower popularity aren’t really worth promoting.
The only retailer that offered a higher discount on its most popular products was Home Depot. Walmart, too, seemed reluctant to let go of the opportunity to capitalize on popularity – it chose to offer the same discount on moderately as well as highly popular products.
Interestingly, Walmart seems to have a disproportionately large share of products in its low popularity category – something it should possibly evaluate in the future in terms of brand quality, products, and service.
The percentage distribution of products mostly indicated a linear relationship, with the highest distribution usually being offered for highly popular products. The exception was Wayfair, which offered a much larger array in its moderately popular category.
Additional discounts across product “premiumness” levels
Premiumness was calculated as the average selling price before the sale event. This was divided into four percentile blocks, with higher percentile blocks indicating higher selling prices.
Most of the discounting activity seems to have occurred in the lower end of the premium spectrum, with a view to protect margin – despite a largely healthy distribution of products across percentile ranges. This indicates a clear strategy to protect margins, while also promoting attractive offers to draw traffic.
However, there are a couple of exceptions – Target was consistent throughout the “premiumness” spectrum, resulting in the highest overall discounting activity. Home Depot too was aggressive, but selectively so – it chose attractive pricing for the lower and higher ends of its assortment.
As expected, many retailers showed higher discounting activity in the higher ranks of their listing pages. As usual, though, there are a few exceptions here too. Home Depot and Wayfair indicated unusual patterns – perhaps relying on search results as opposed to organic listing page results. On the other hand, Target again indicated a consistent pattern, with mostly similar discounts across visibility levels.
Overall, across all parameters analyzed, both the Electronics and Furniture categories have been treated quite similarly in terms of pricing activity by most retailers. Is Prime Day really all about its marketing hype, or will it live up to its promise in at least one segment? Stay with us to find out as we follow through with our series of articles analyzing various product categories on this year’s Prime Day.
Our preliminary analysis reveals that Prime Day 2019 had other retailers offering better deals than Amazon in many cases.
As Prime Day extended into an additional day this year, Amazon seems to be hitting the right note with its customers, going by the revenue it’s raking in. This year, the longest Prime Day event ever witnessed a sales increase of 72% – overtaking Black Friday and Cyber Monday combined.
At DataWeave, we were curious to find out how prime these deals were, and if in fact other retailers were offering better discounts. We started with the electronics category, which remains among the most popular categories year on year.
Our Methodology
We tracked the pricing of several leading retailers selling consumer electronics to assess their pricing and product strategies during the sale event. Our analysis was focused on additional discounts offered during the sale to estimate the true value that the sale represented to its customers. We calculated this by comparing product prices on Prime Day versus the prices prior to the sale. Our sample consisted of up to the top 1,000 ranked products across 10 popular product types in consumer electronics on Amazon, Best Buy, Target, and Walmart.
The Verdict
What we found most surprising was that across retailers, some portions of the assortment underwent price increases as well. While Amazon indicated the lowest increase at 9.1%, Best Buy indicated an increase as high as 27.1%. However, Amazon reported the highest percentage of products (6.9%) that showed a price increase.
Equally surprising was that Amazon reported the lowest price reduction at 6.3% – Walmart, Target, and Best Buy in fact reduced their prices by much larger margins than Amazon did. A point to note here, however, is that Amazon did report the highest percentage of additionally discounted products – with Best Buy coming in at a close second.
This goes to show that Prime Day, for all its hype, does not in truth offer the best deals to Amazon shoppers. This, of course, is expected based on the competitors’ perspective of wanting to avoid losing market share. As a result, shoppers would be well advised to compare prices across websites to find the best deal.
Top product types by additional discount
USB flash drives were a popular product category across all four retailers analyzed, with Best Buy offering the best average additional discount at 40.7%. Other popular product types ranged from the usual personal devices such as mobile phones, tablets, and smartwatches to home appliances such as refrigerators and TVs.
Additional discounts across popularity levels
We determined popularity using a combination of average review rating and number of reviews, and the resulting scores were categorized as low, moderate, and high.
Interestingly, discounts were not found to be directly proportional to popularity. Except Walmart, all the retailers tended to offer the best discounts on products that enjoyed moderate popularity. This makes sense, since there isn’t a strong need to be aggressive on price for highly popular products in any case. On the other hand, products with lower popularity aren’t really worth promoting. Walmart, which was the exception, reported a higher discount on low- and high-popularity products than it did on moderately popular products.
The percentage distribution of products did mostly show a directly proportional relationship, with the highest distribution usually being offered for highly popular products. The exception in this case was Best Buy, which evidenced a much higher distribution in its moderately popular goods.
Additional discounts across product “premiumness” levels
Premiumness was calculated as the average selling price before the sale event. This was divided into four percentile blocks, with higher percentile blocks indicating higher selling prices.
In general, all retailers were found to have slightly higher additional discounts in the lower end of the “premiumness” spectrum. This is still a smart move, as it enables sellers to save on margin while still promoting attractive discount percentages. Interestingly, Amazon offered the lowest additional discount – a flat 5% – across all categories, despite offering more or less competitive product distributions compared to other retailers.
Additional discounts across visibility levels
Here, too, the lower end of the spectrum mostly witnessed higher additional discounts. This tactic actually offers double benefits – one, the most attractive discounts are offered in the higher realms of visibility, thus effectively enticing consumers to buy these products, and two, it helps build a low price perception (despite this not holding good as one delves deeper into the higher ranks). Again, it’s interesting to note that Amazon didn’t offer the highest discounts here either – in fact, it mostly offered the lowest additional discounts.
All in all, it seems that Prime Day isn’t all it’s hyped up to be, at least not in the Electronics segment. How about other categories? Watch this space for more insights!

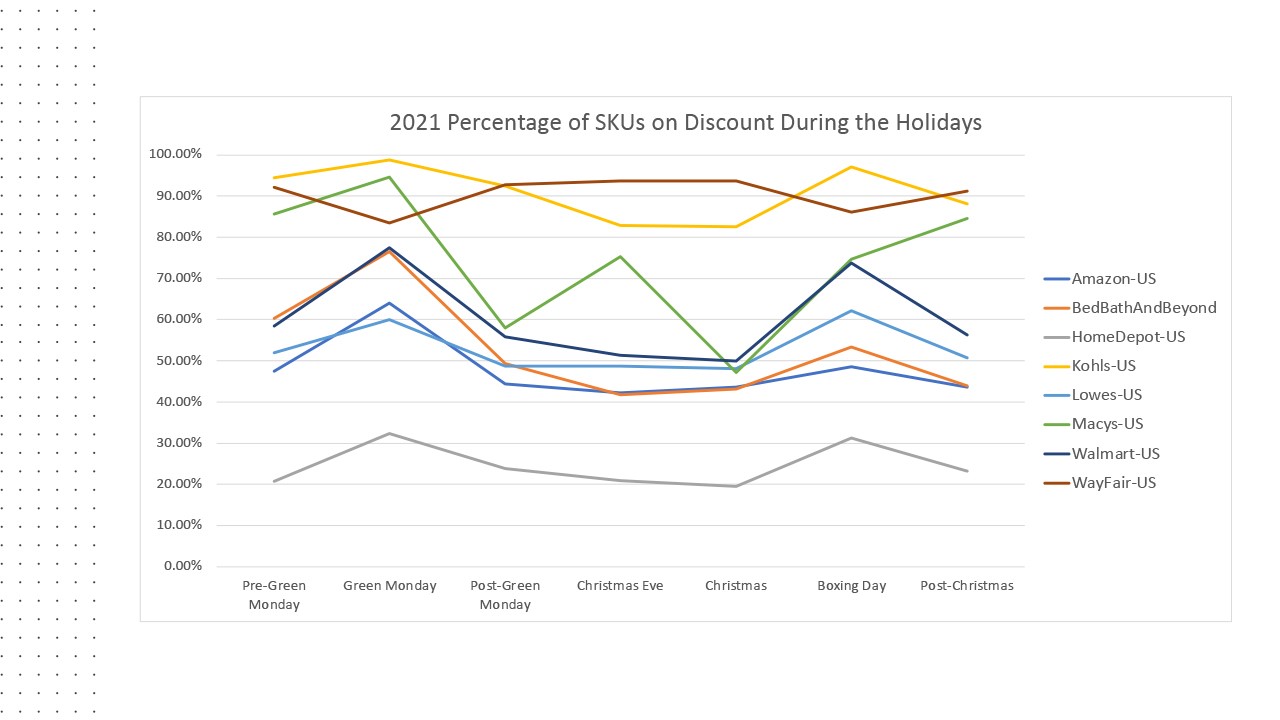
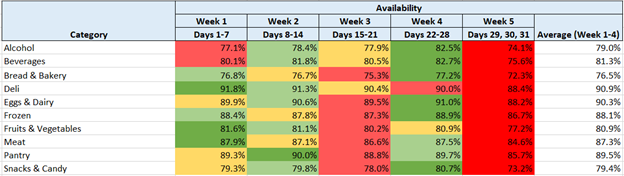
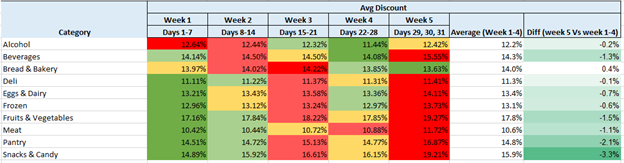
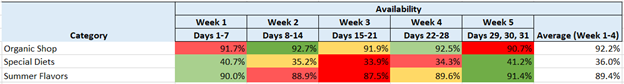
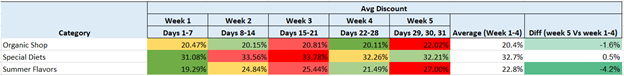
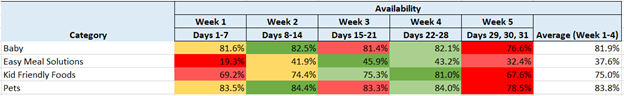
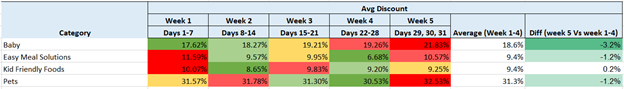
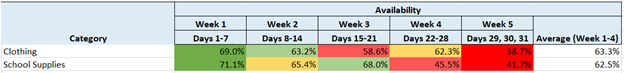
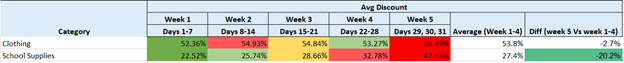


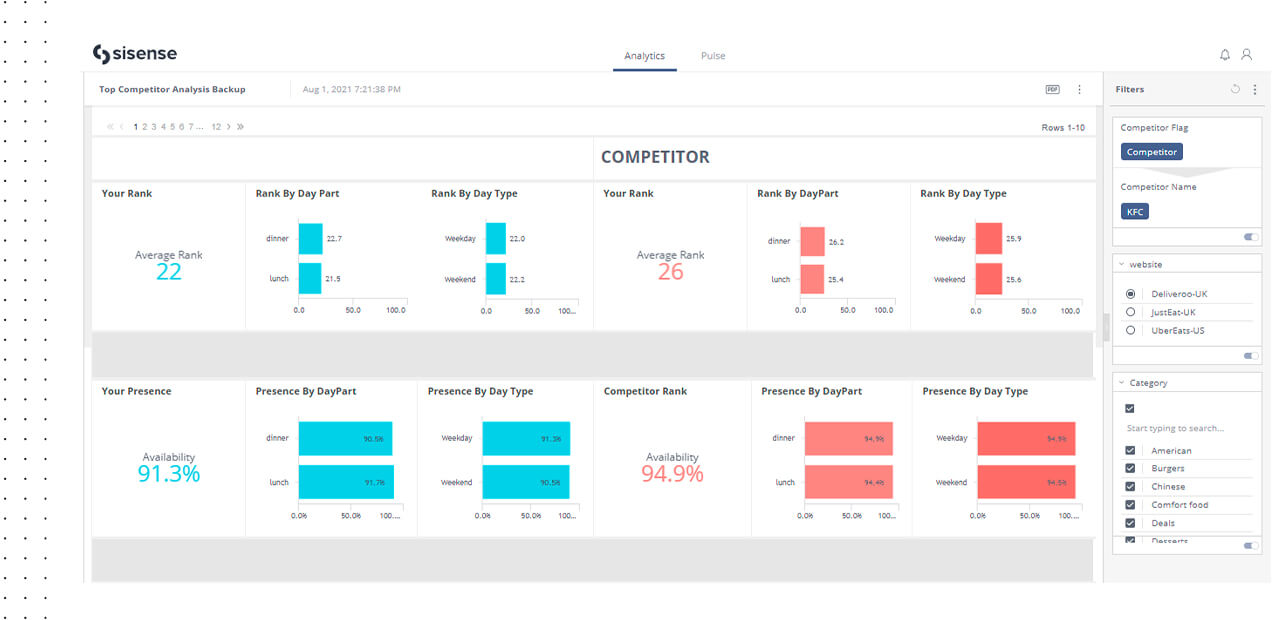
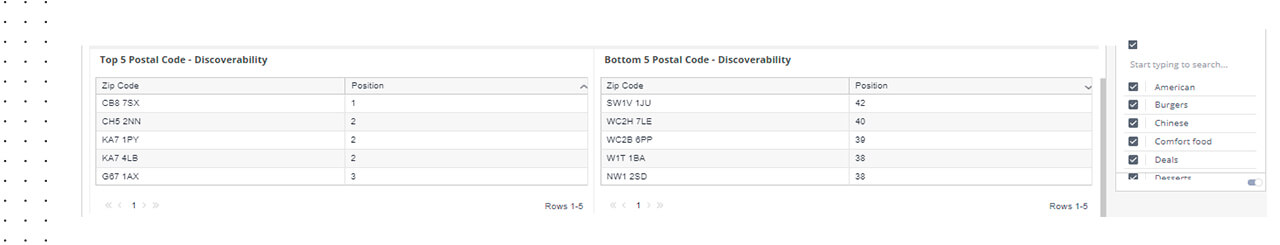
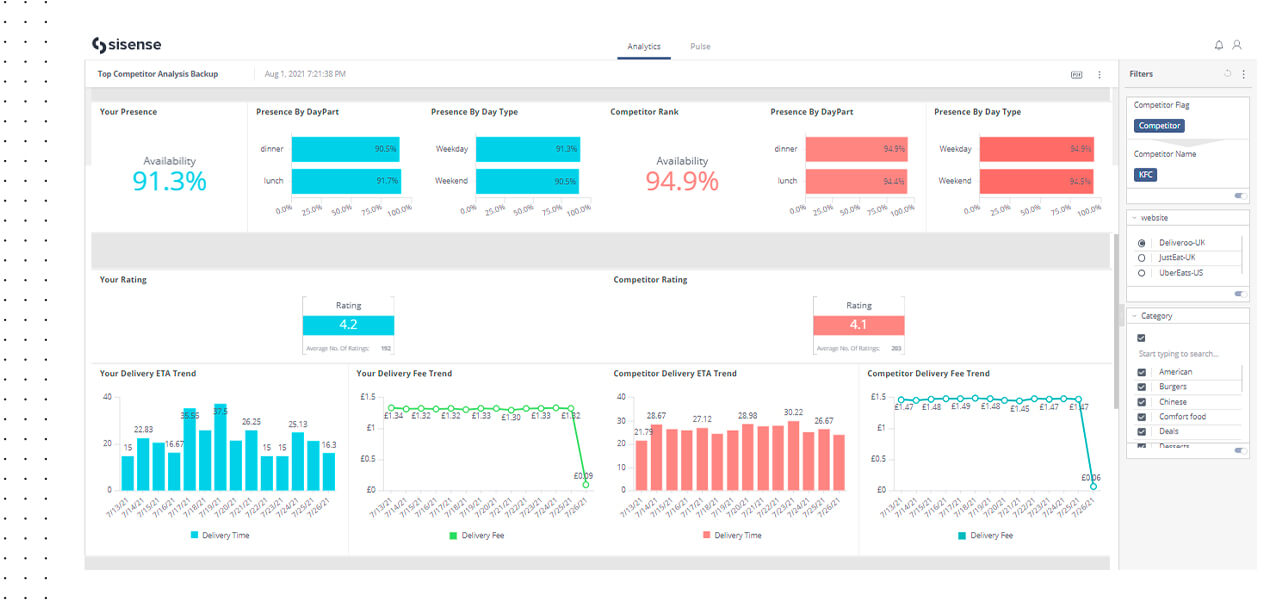
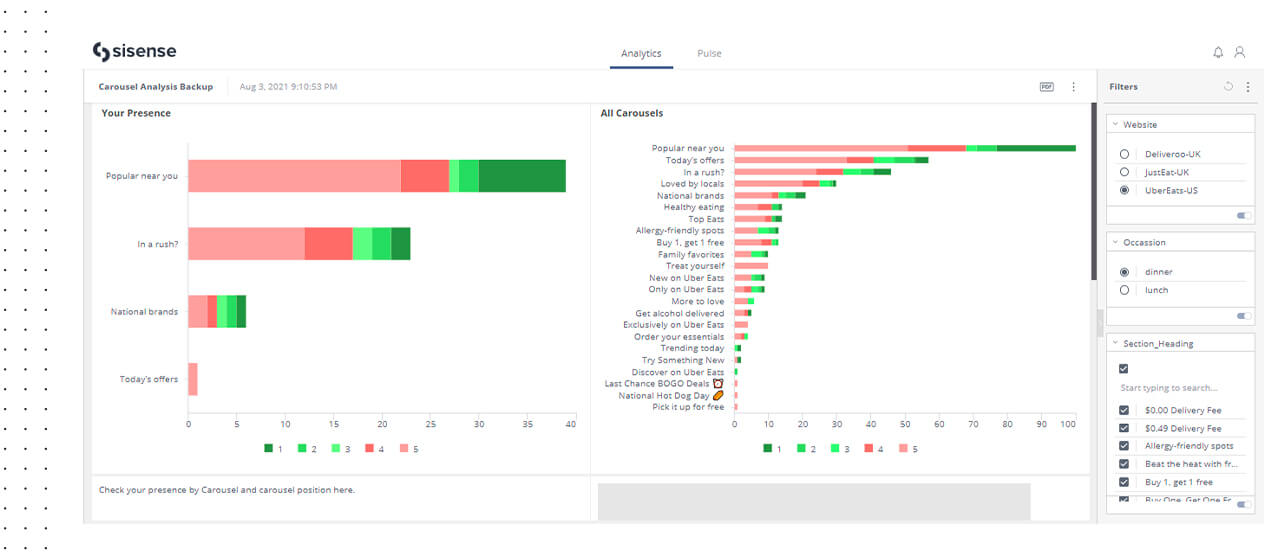

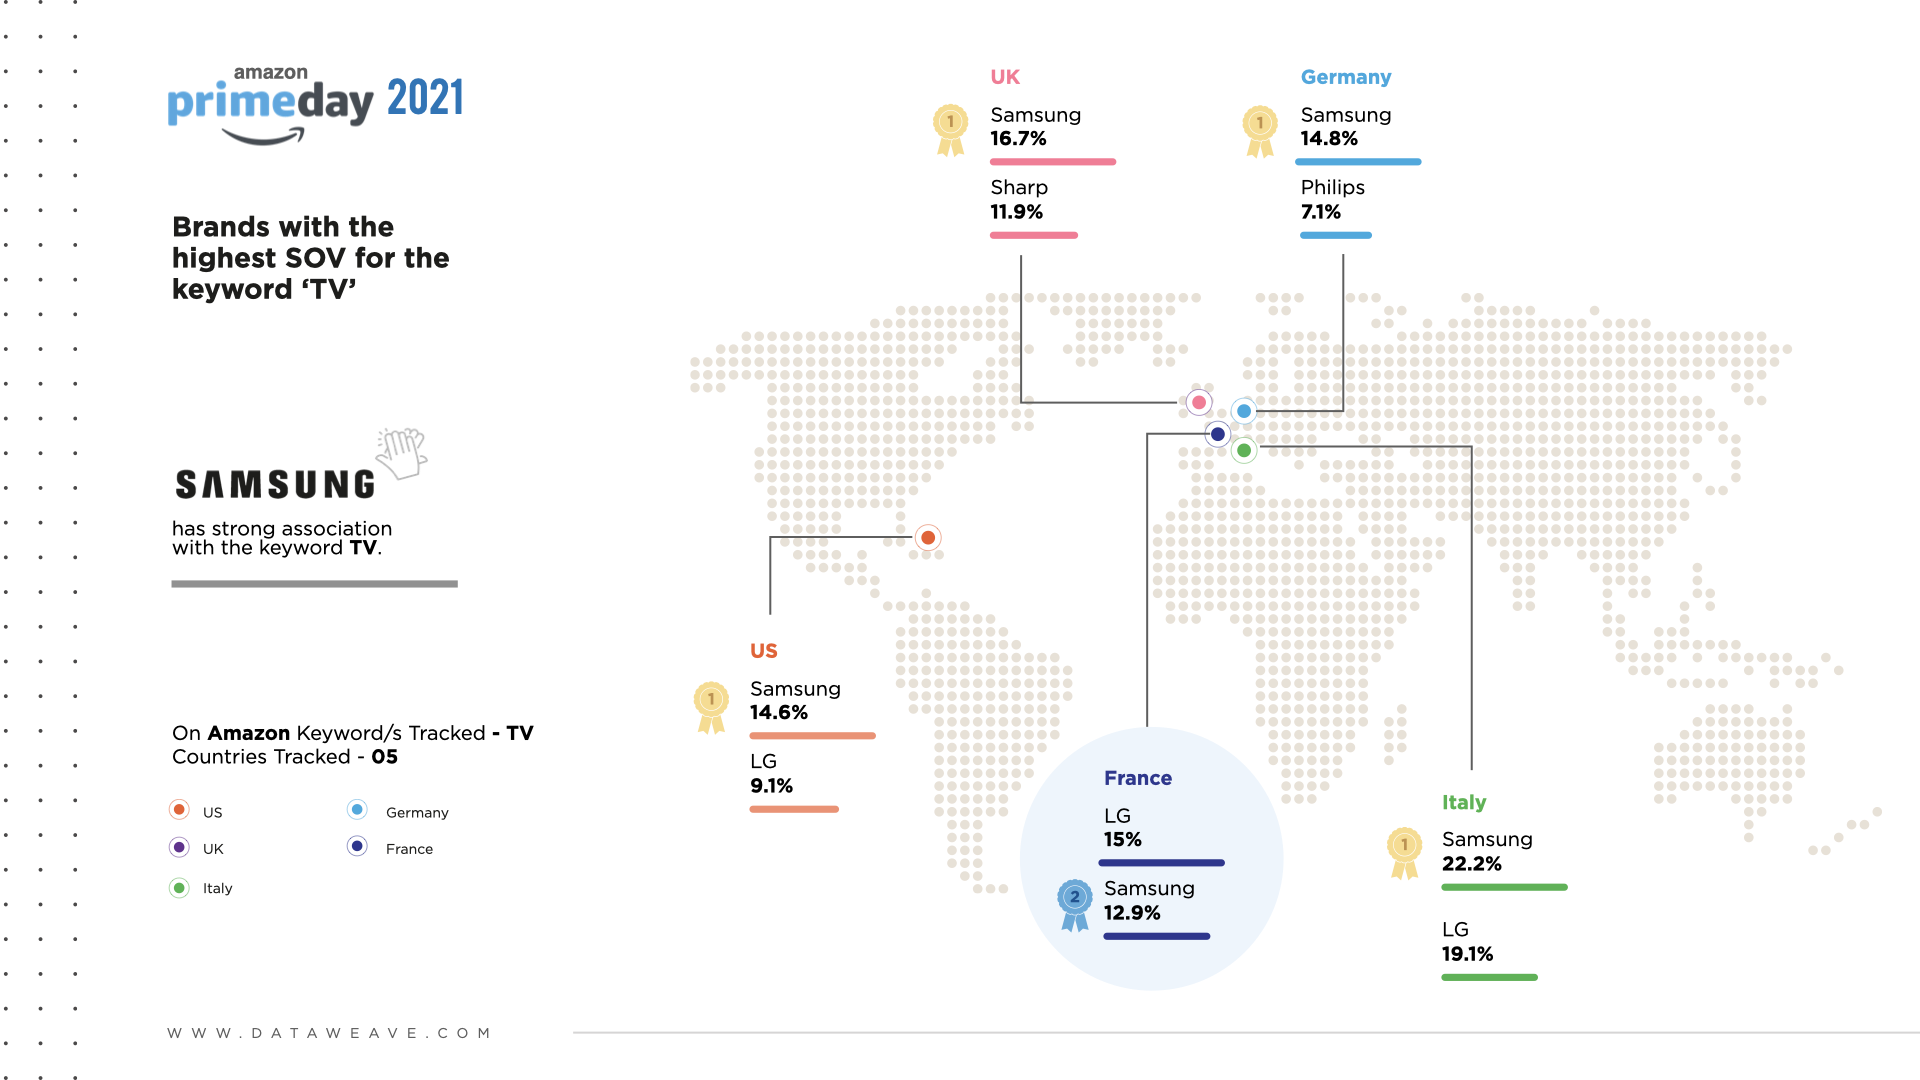
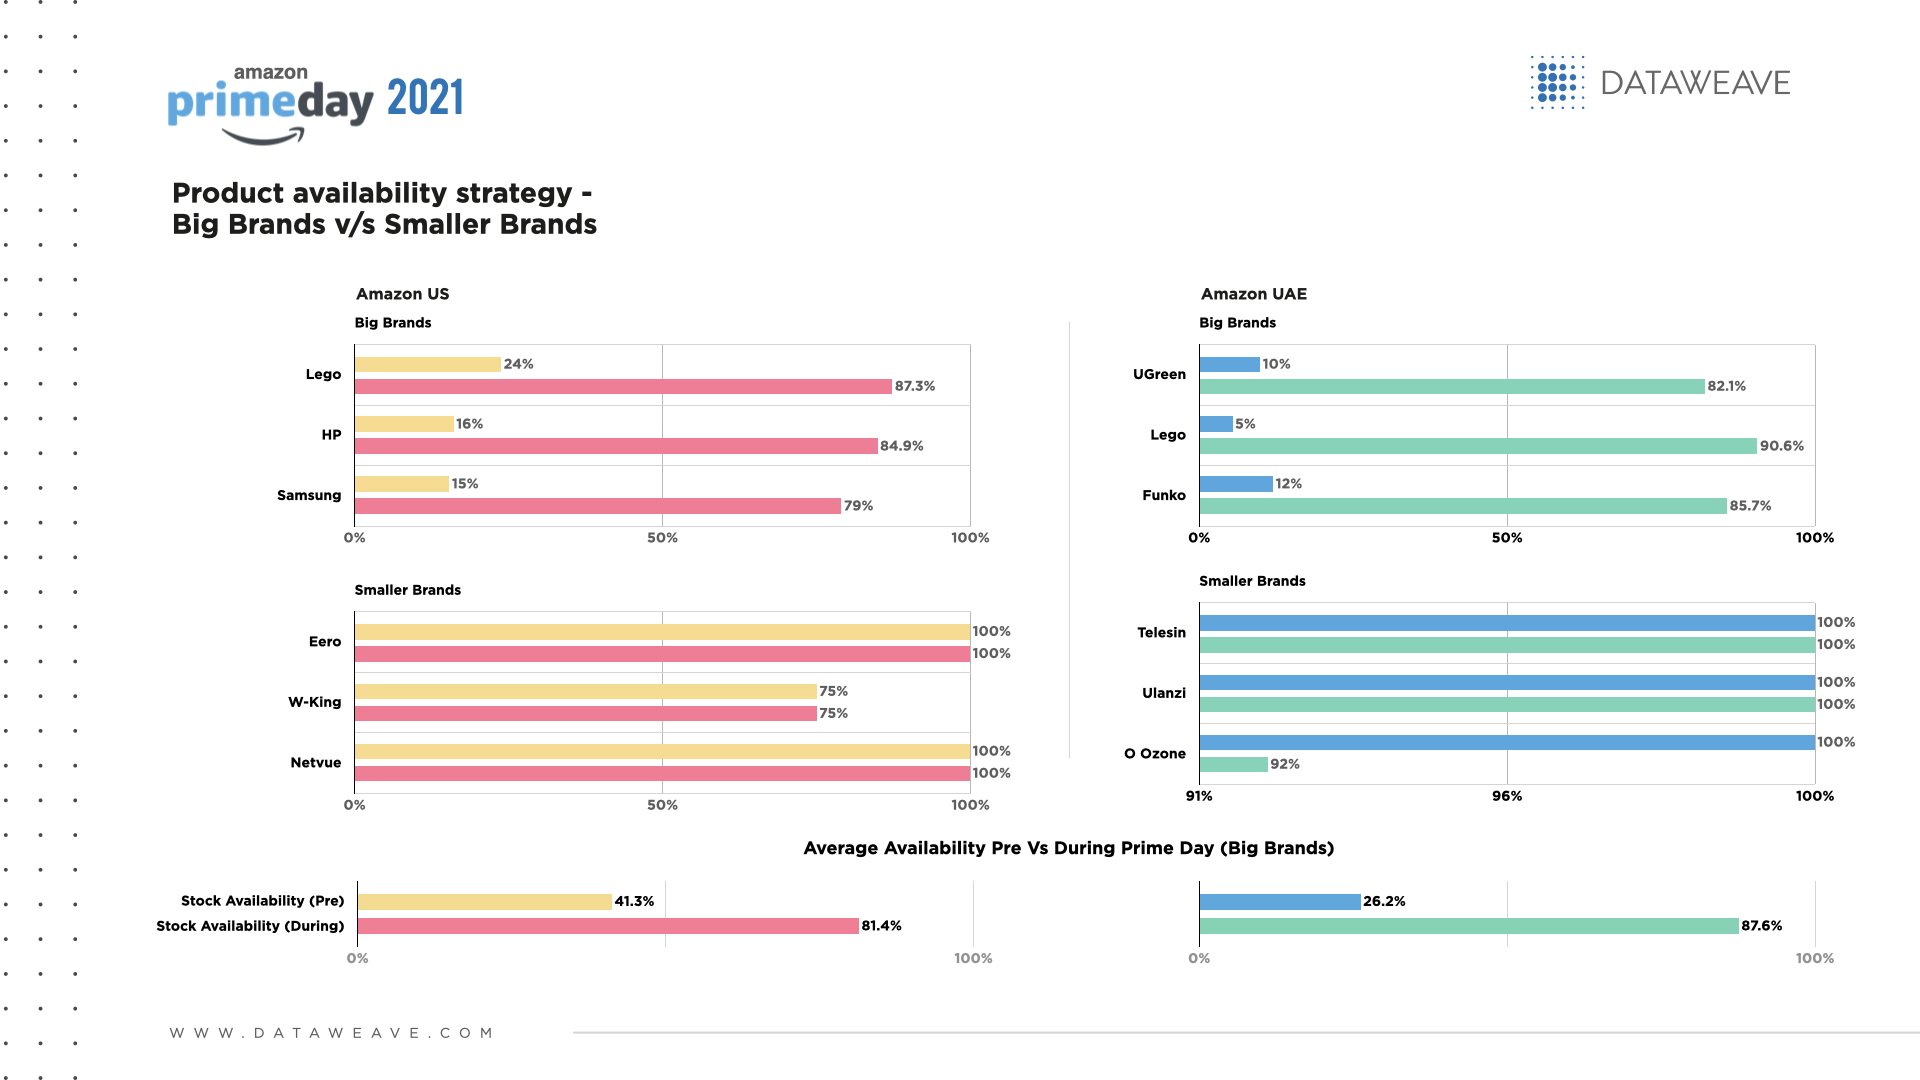
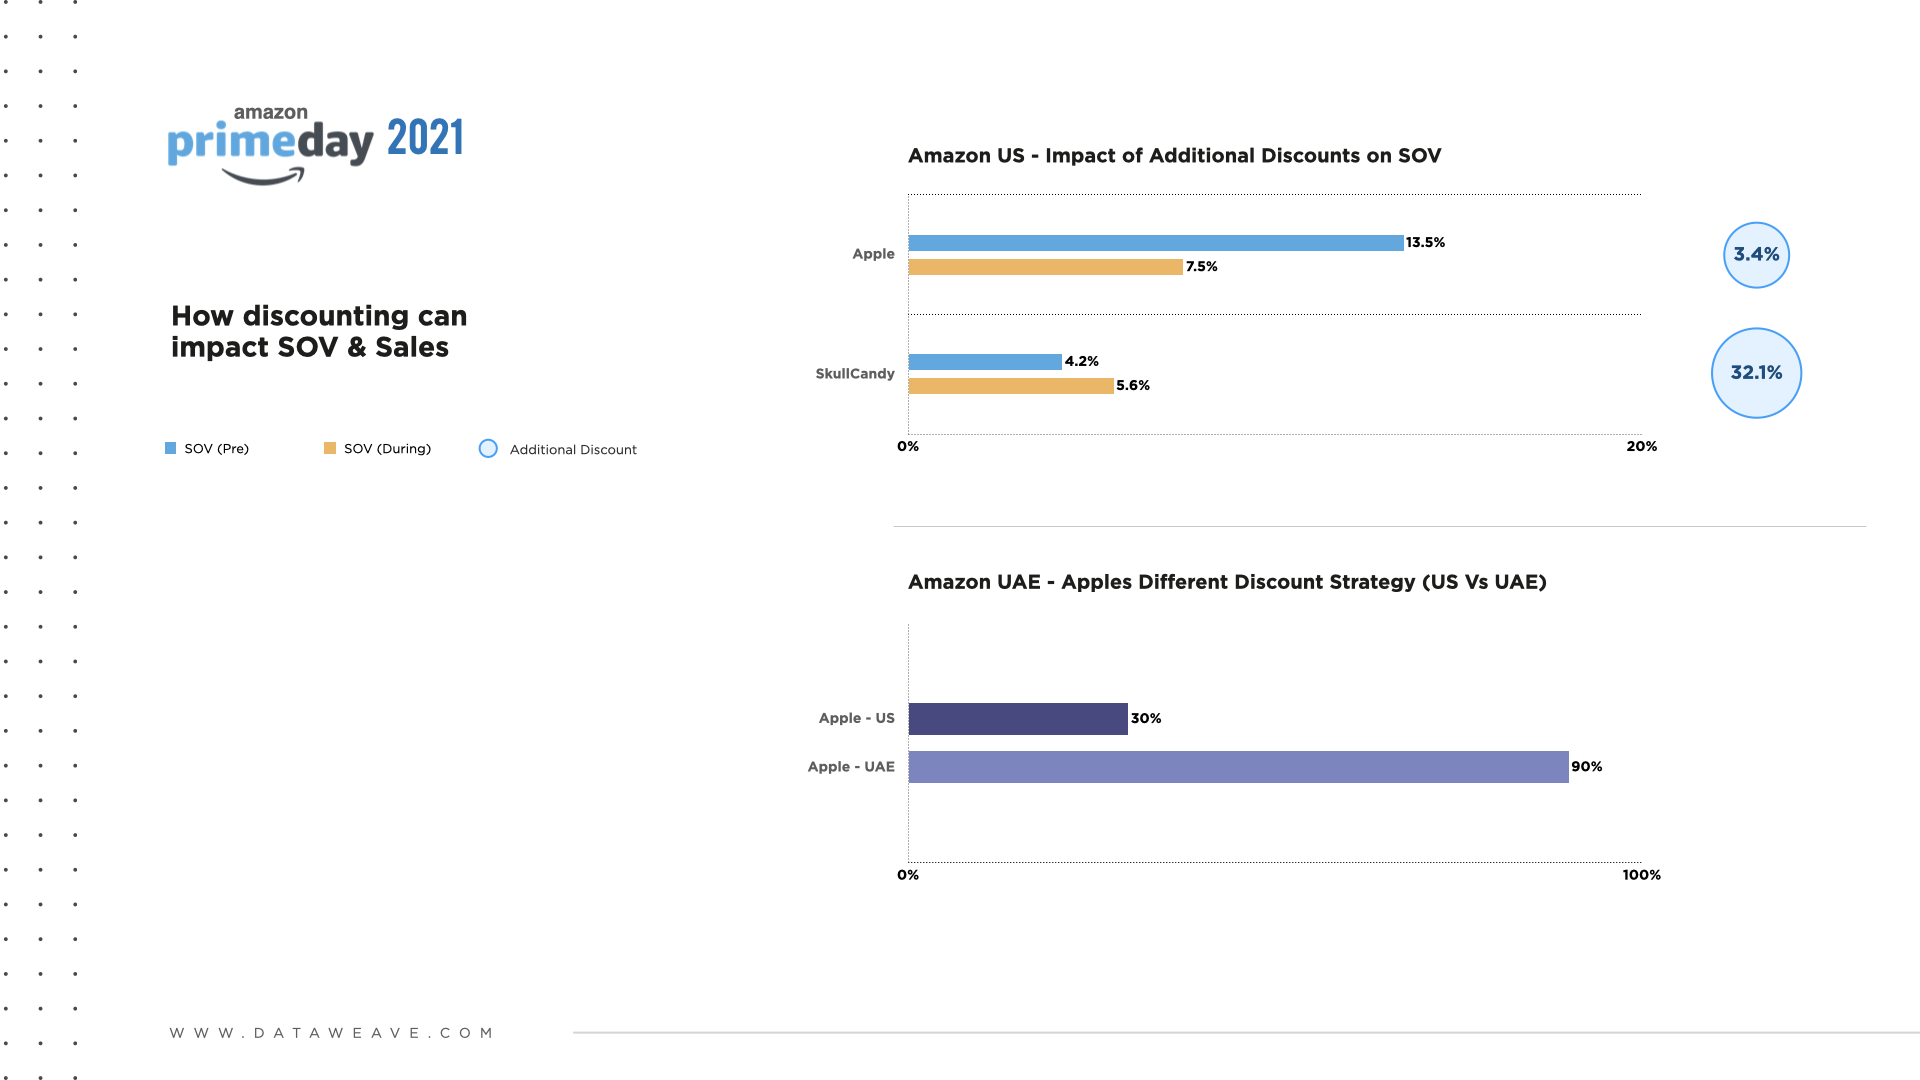
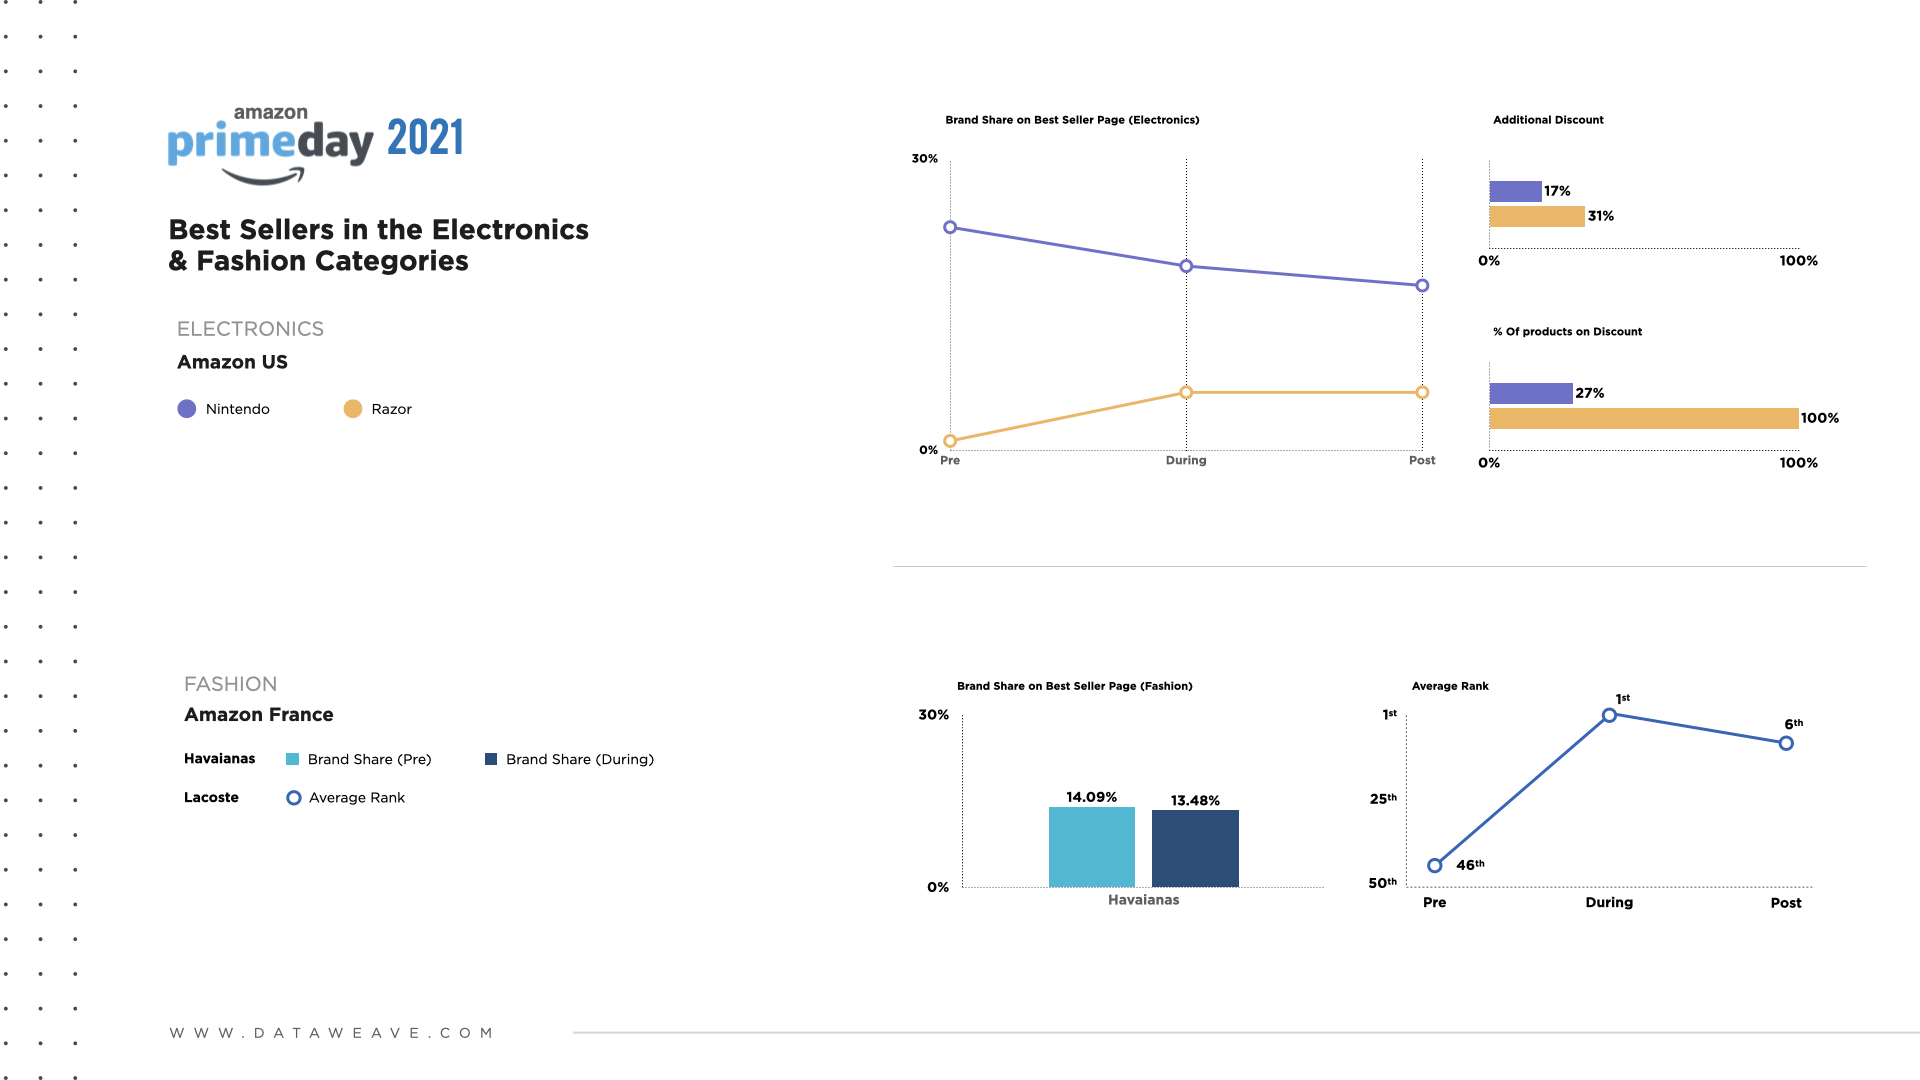
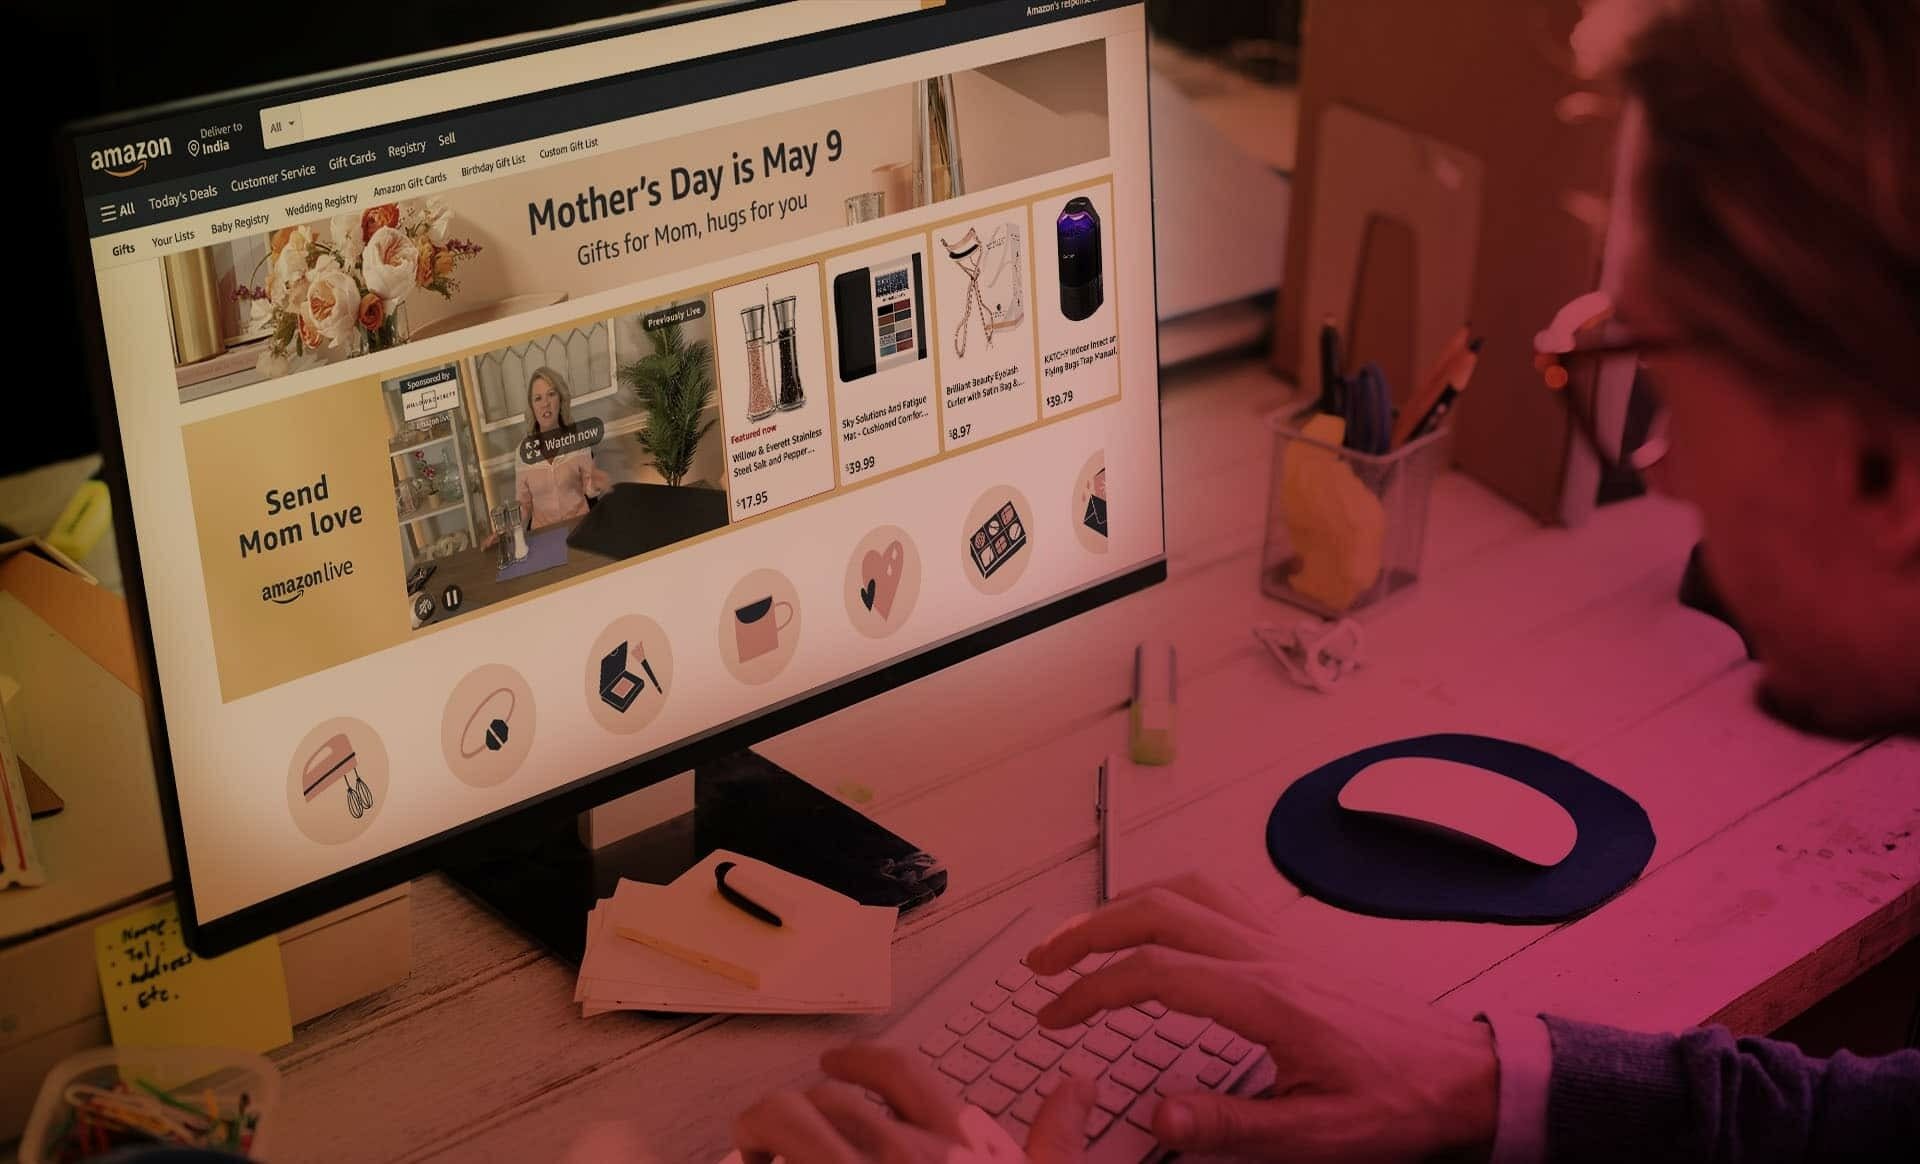
![[INFOGRAPHIC] 2020: The Year the World Navigated Uncertainty Together](https://stage-cdnblog.dataweave.com/wp-content/uploads/2021/01/Year2020_At_DataWeave-e1688039574468.jpg)
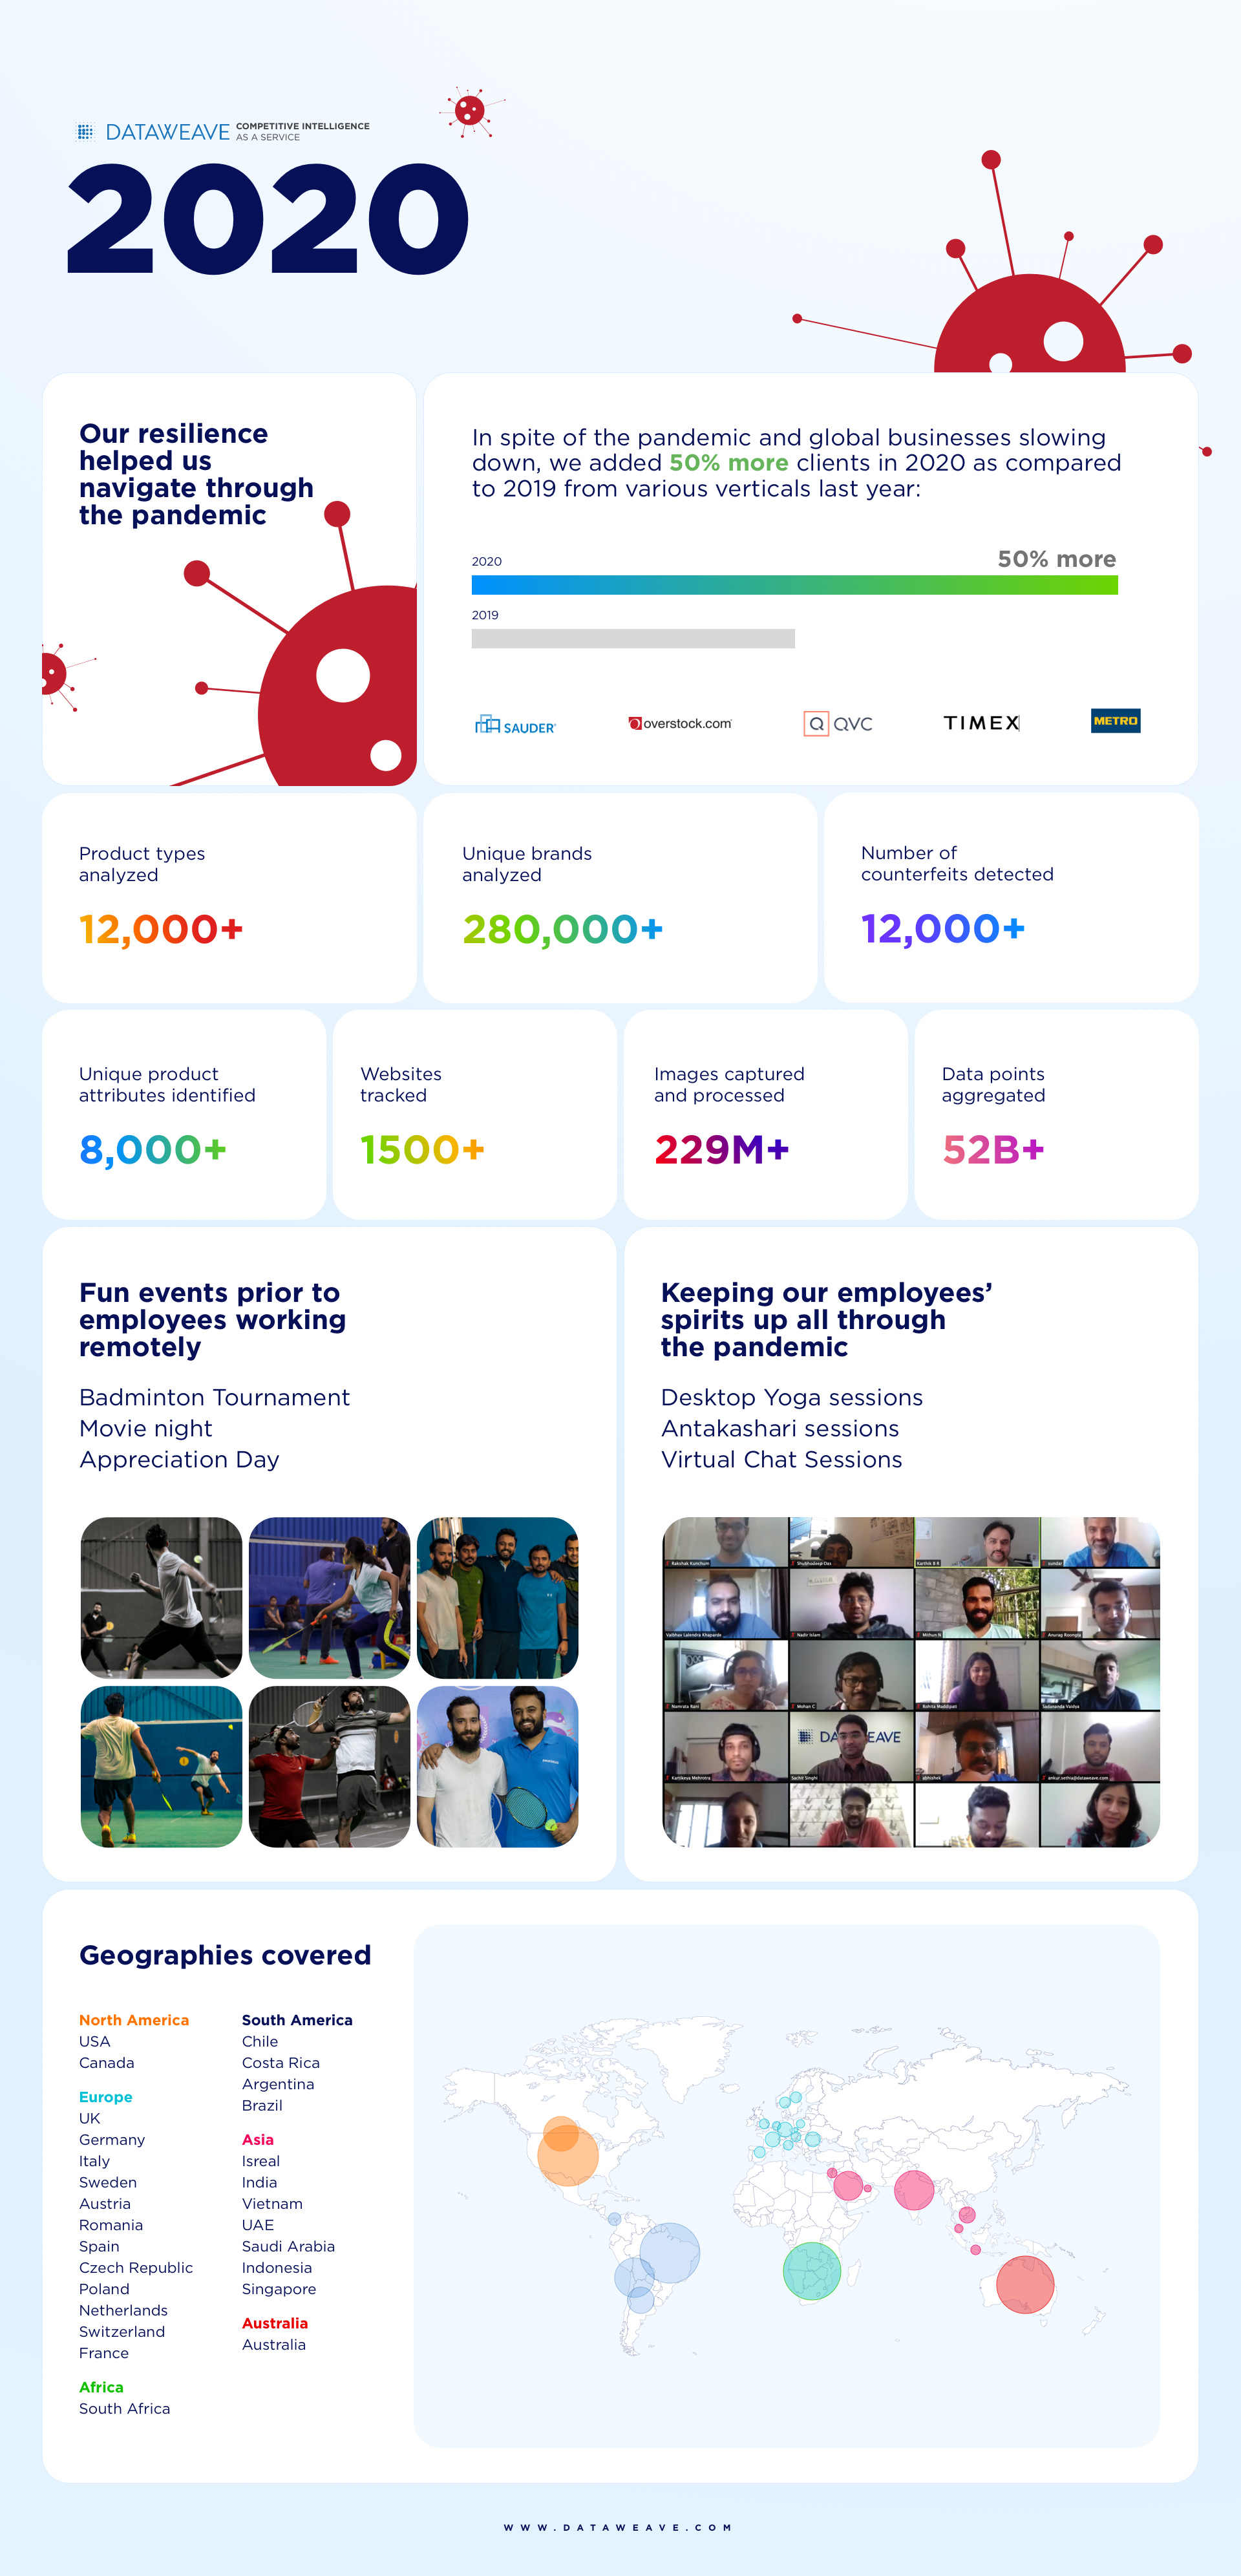
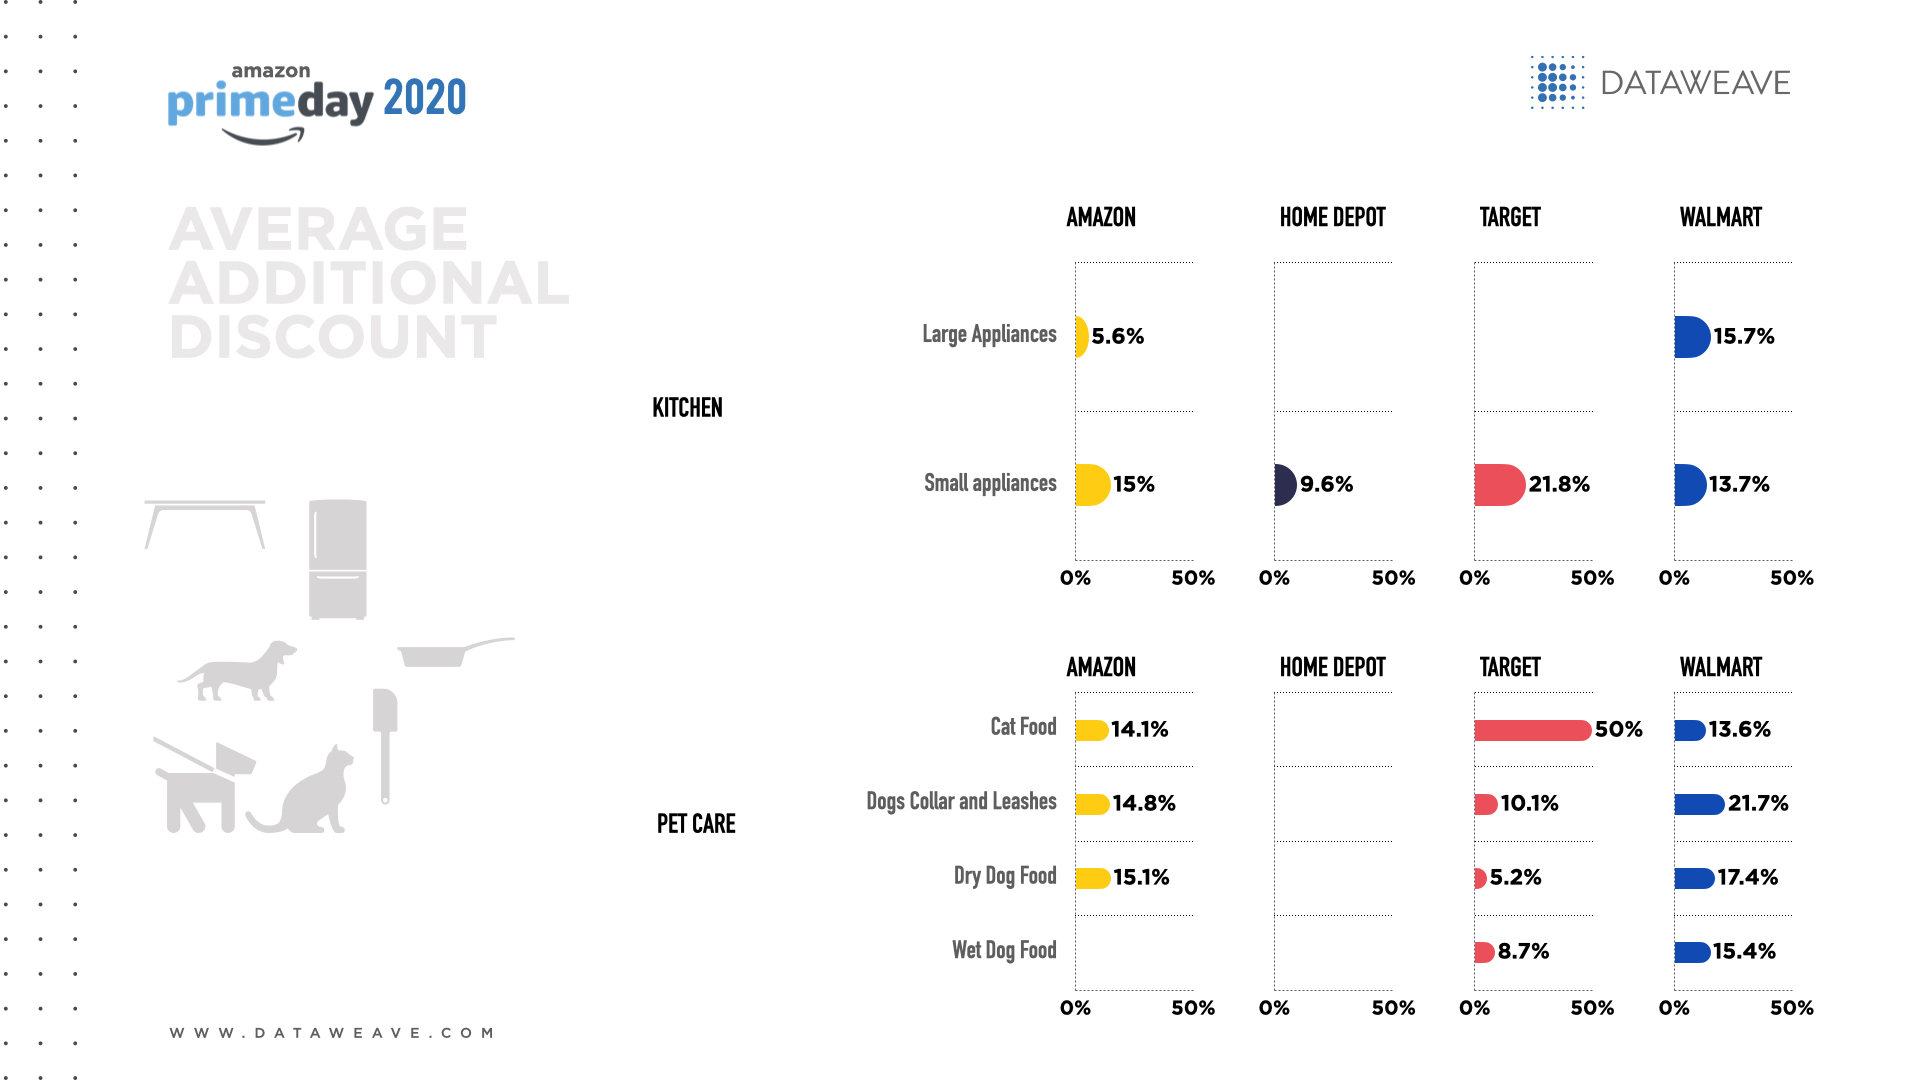
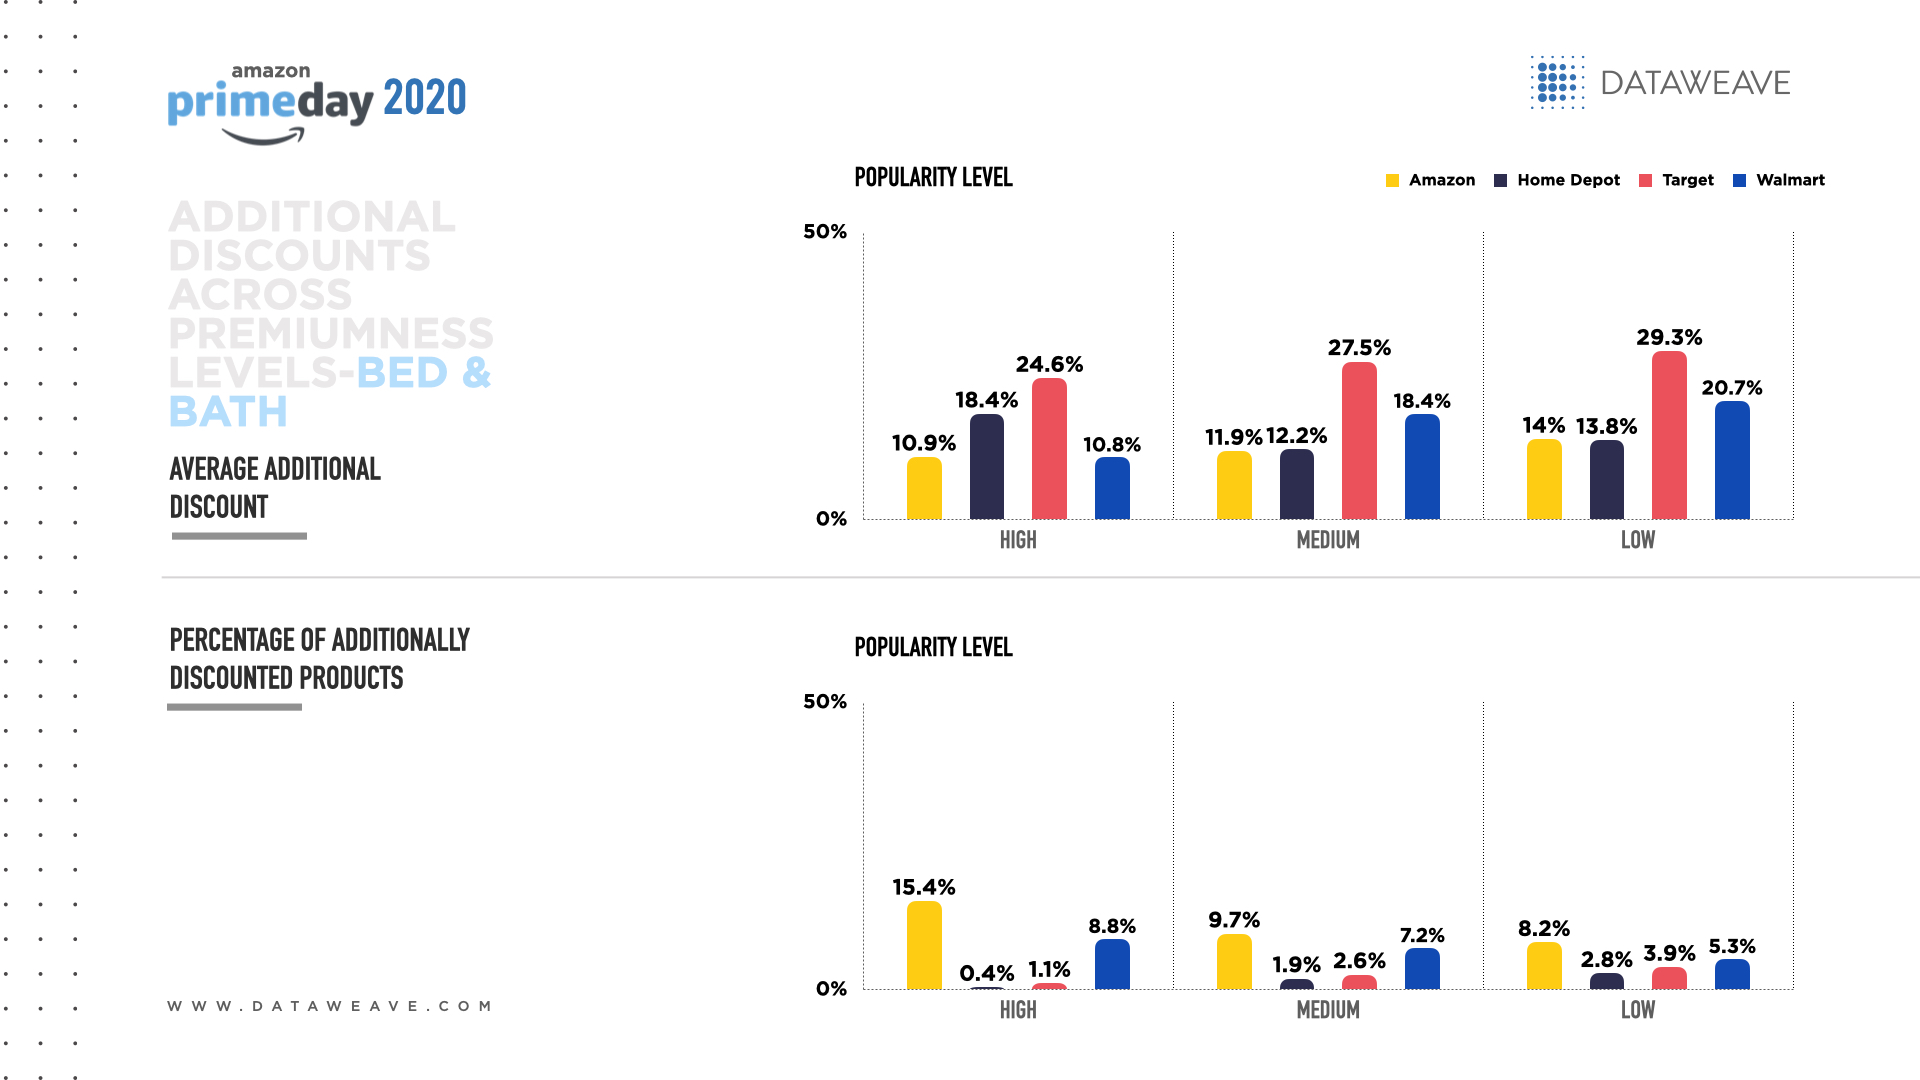
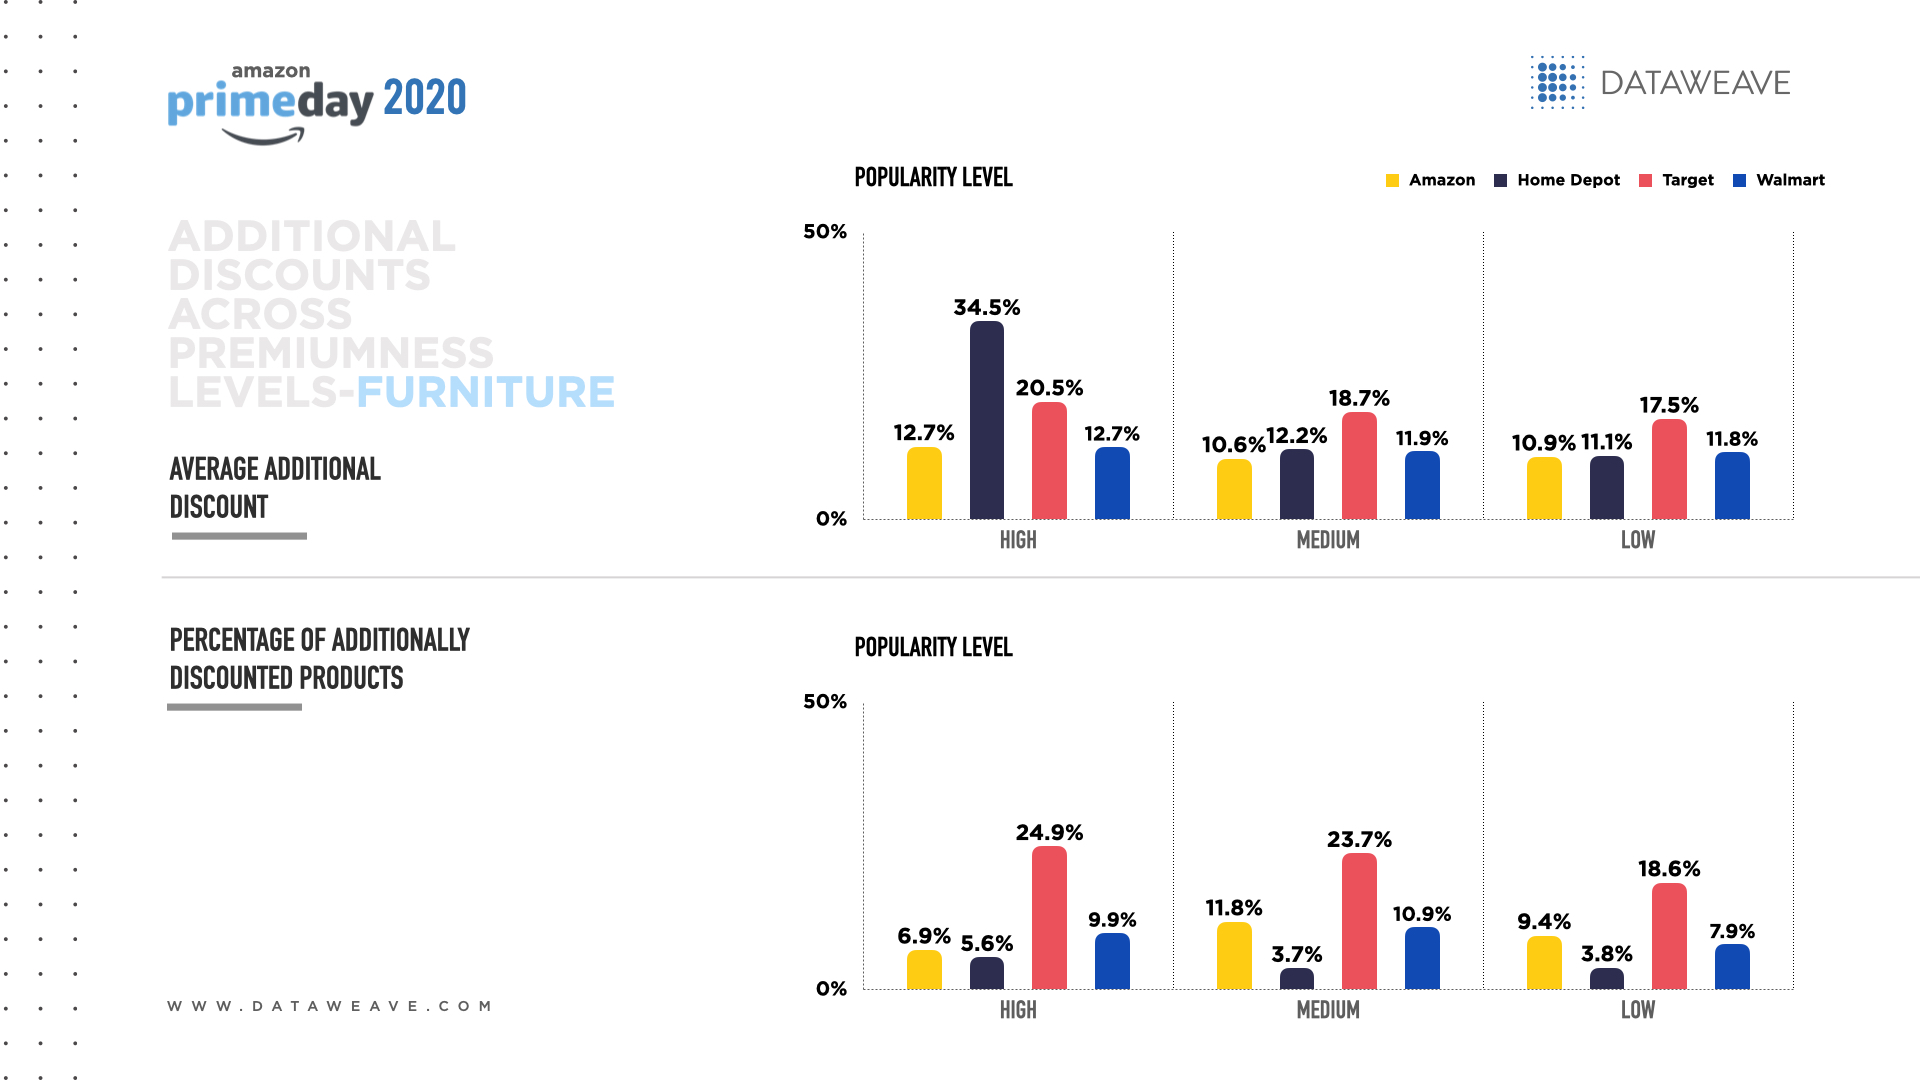
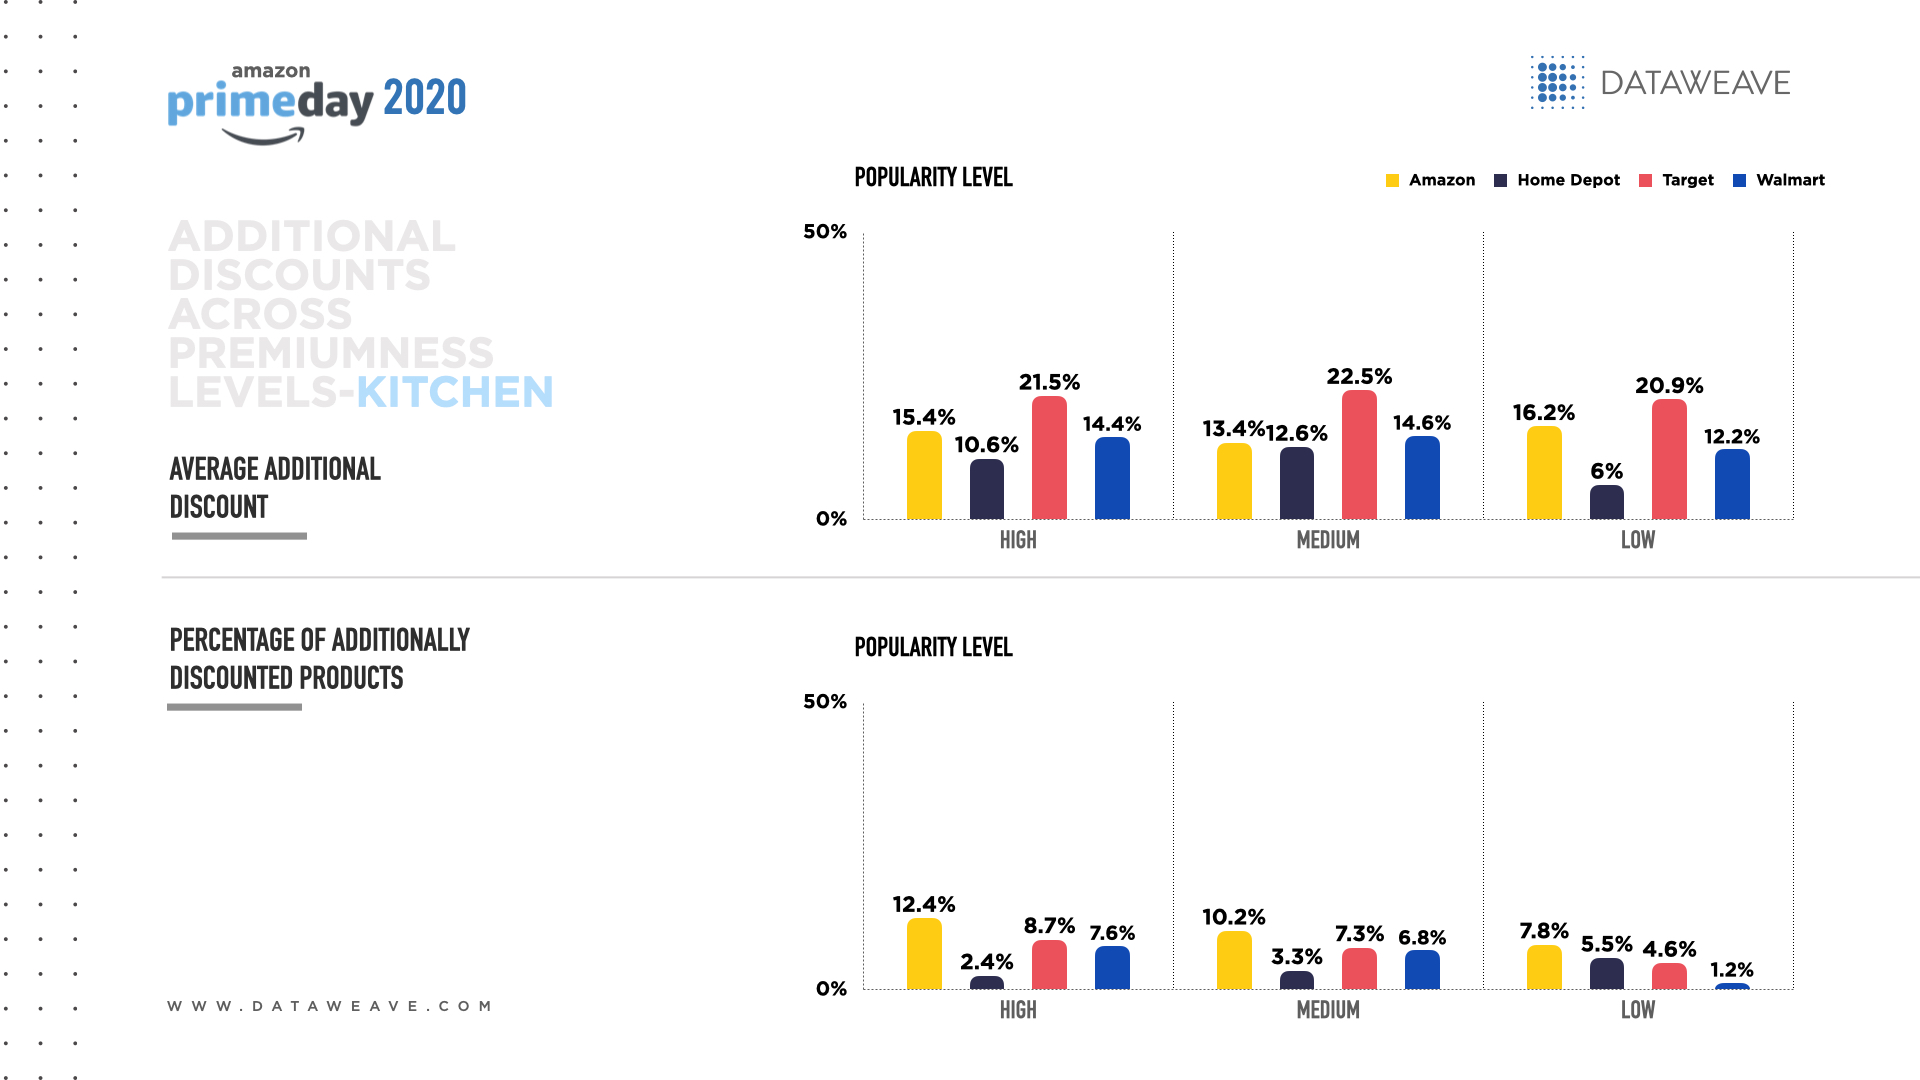
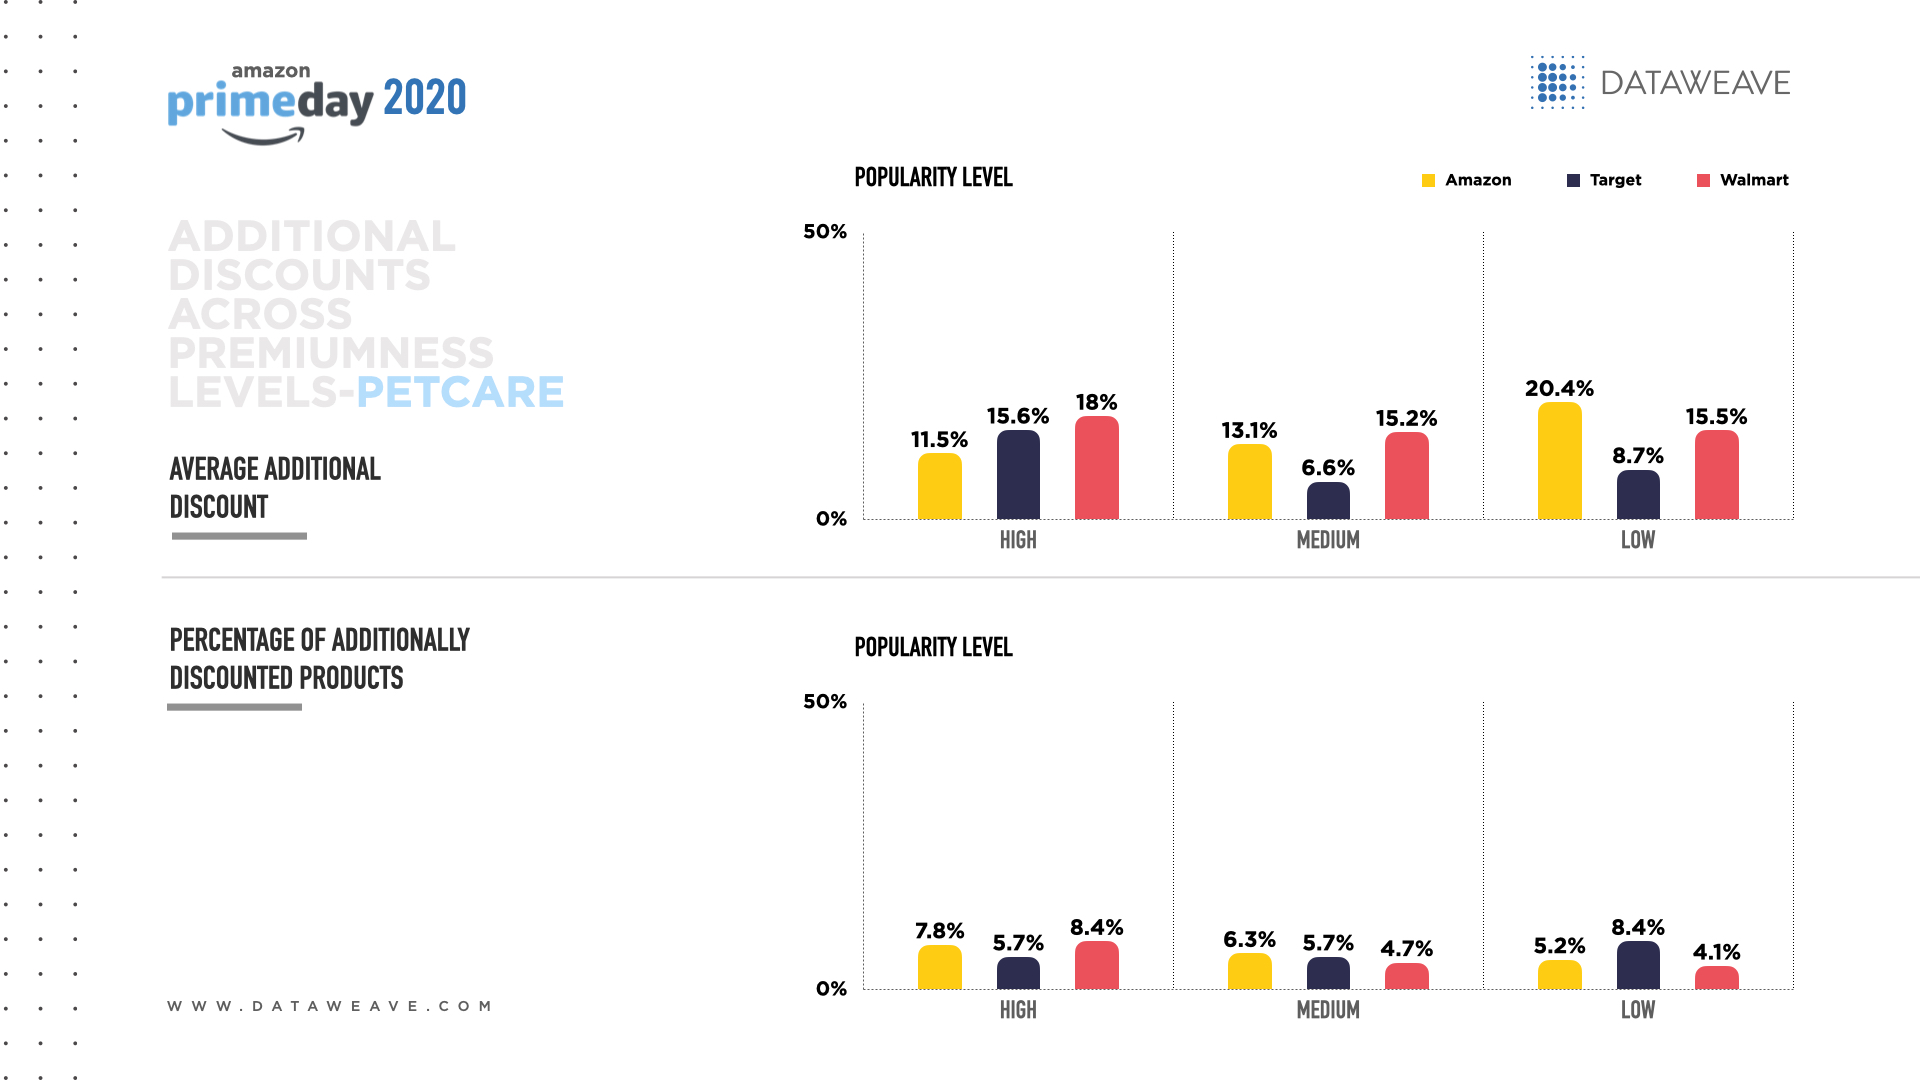
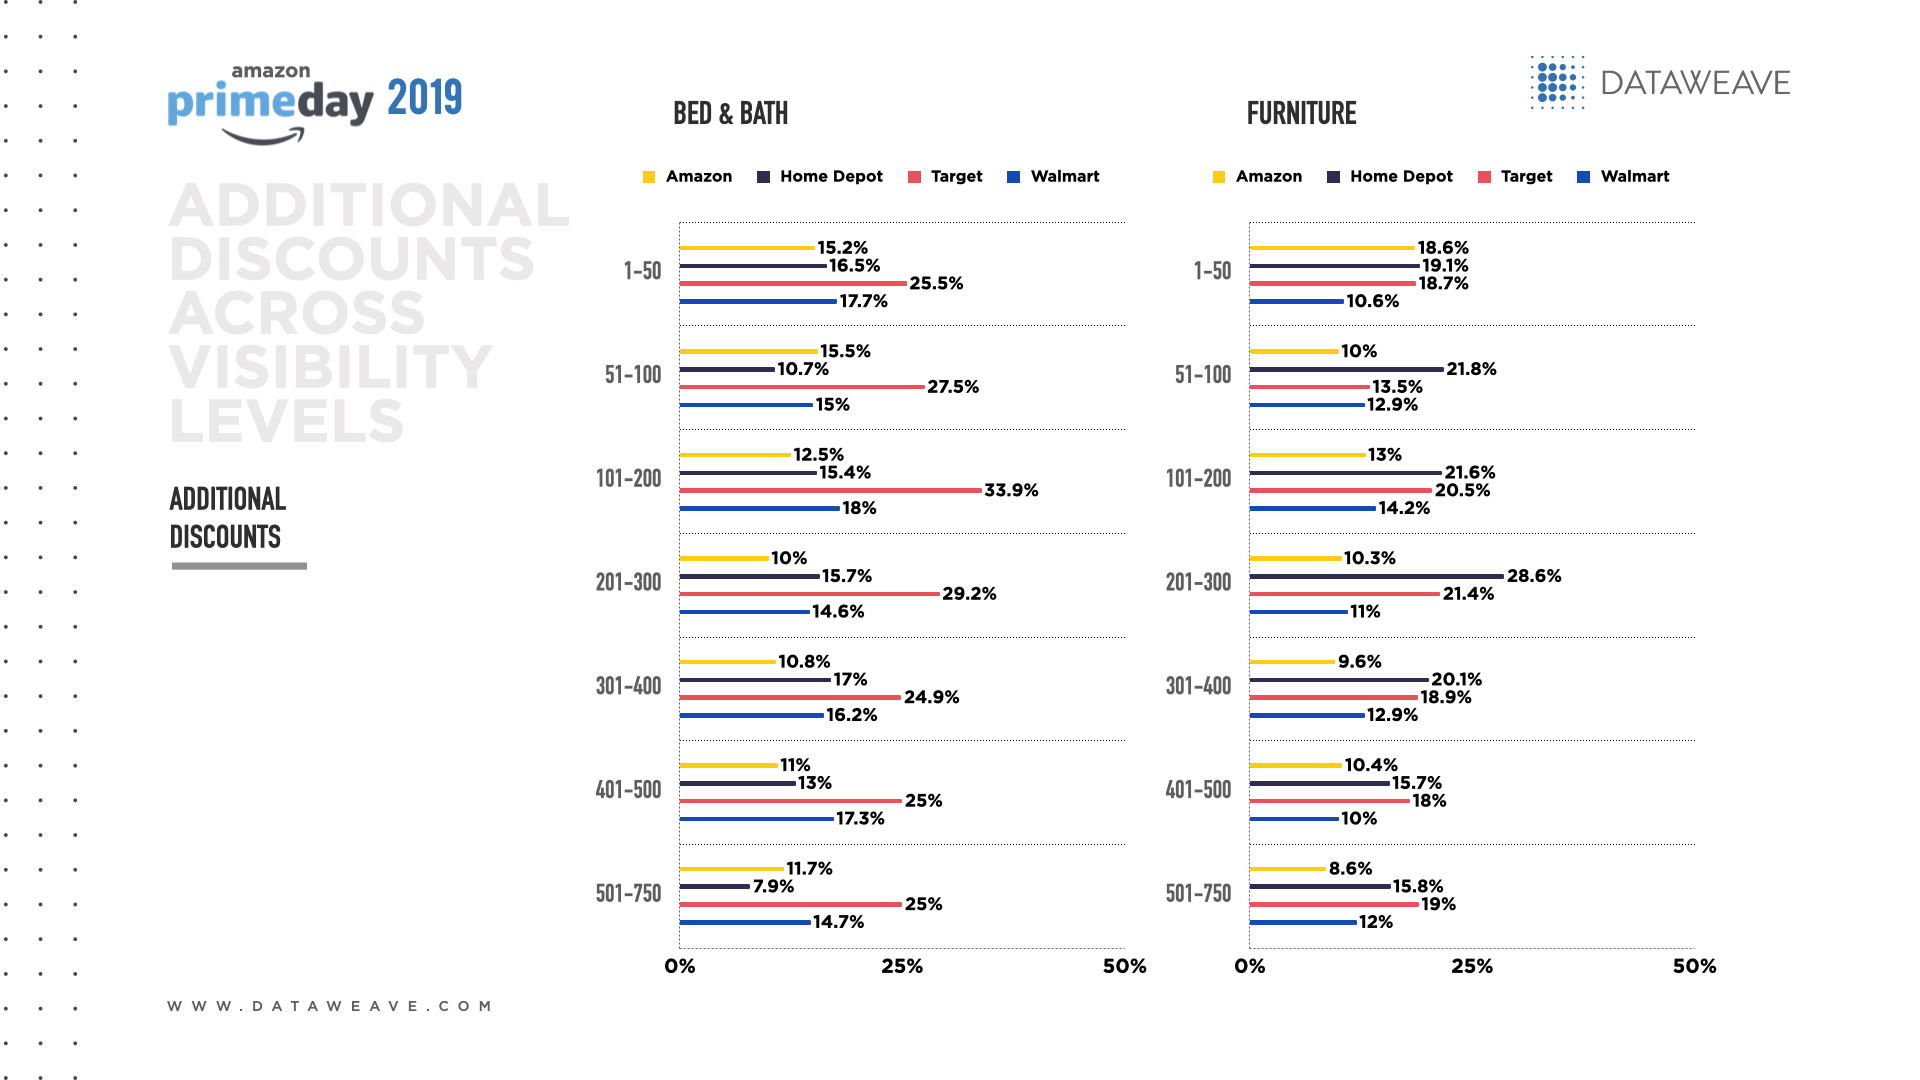
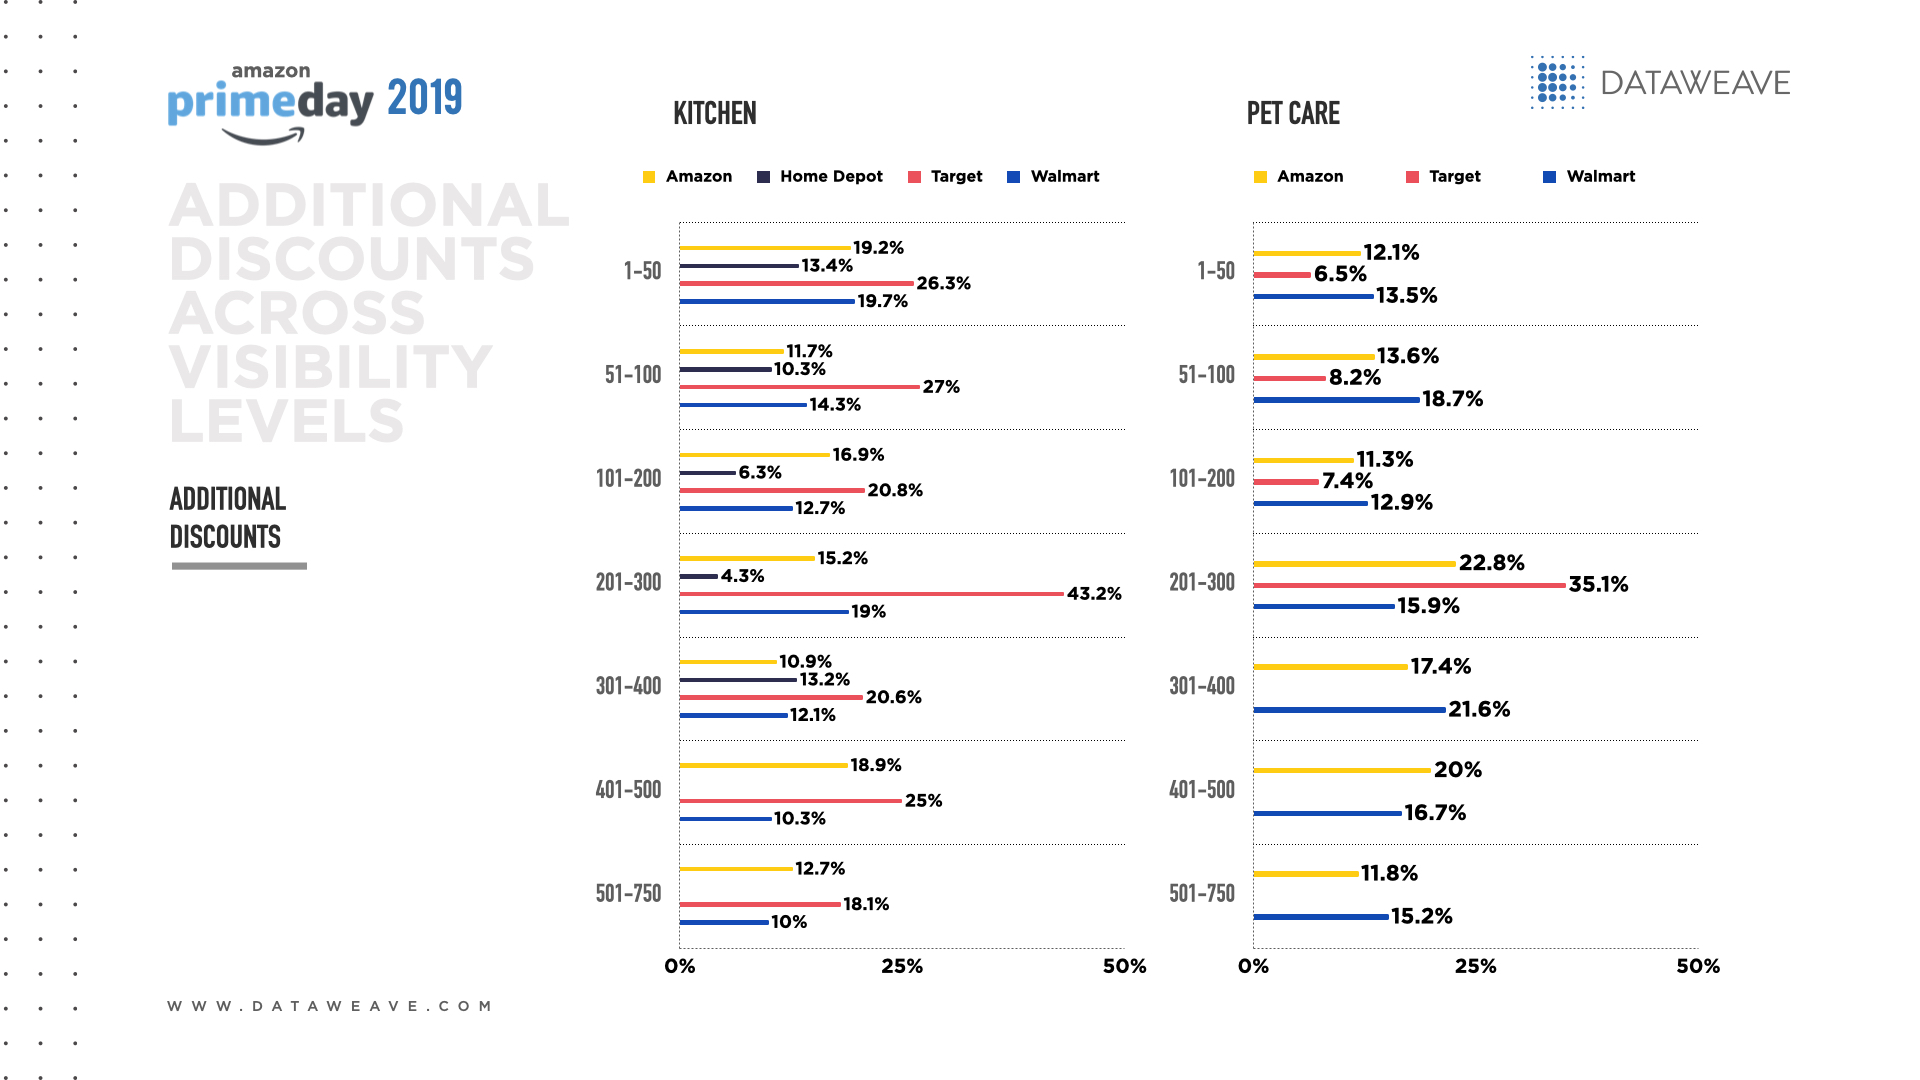
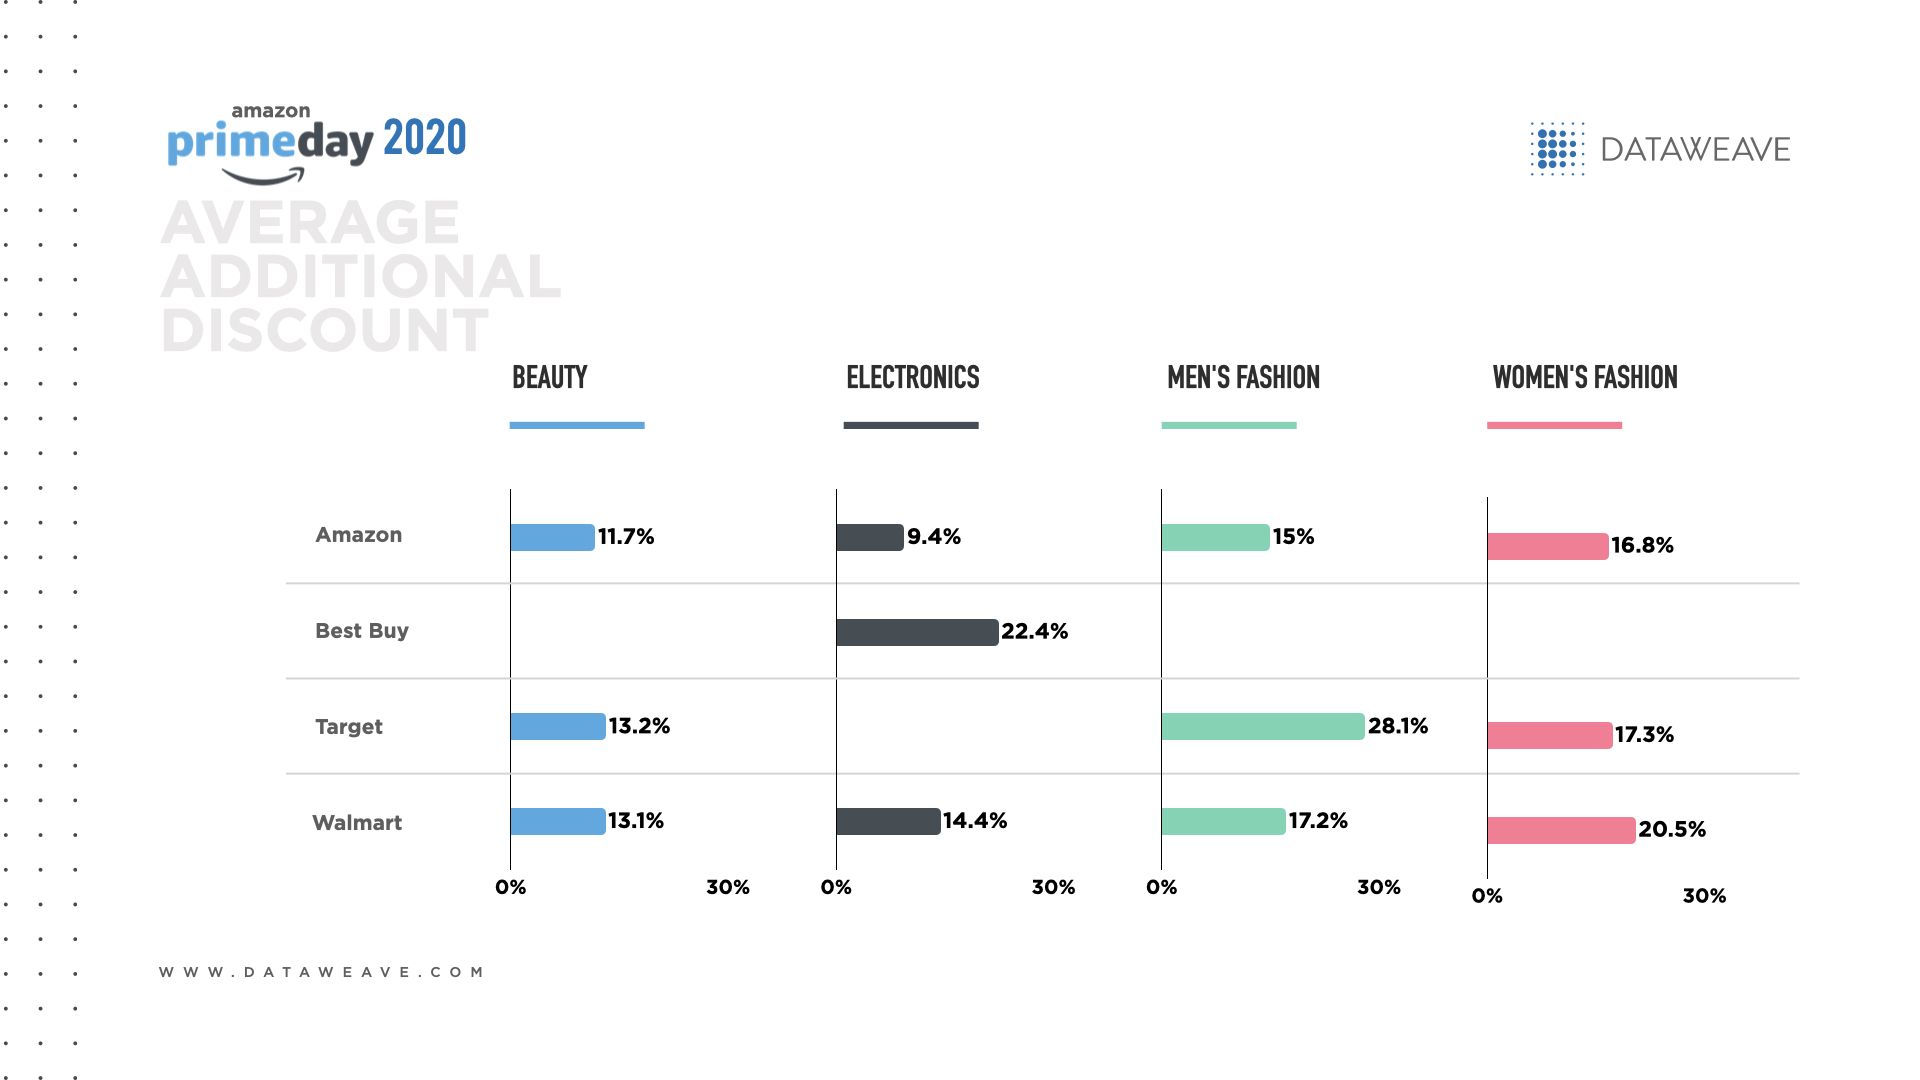
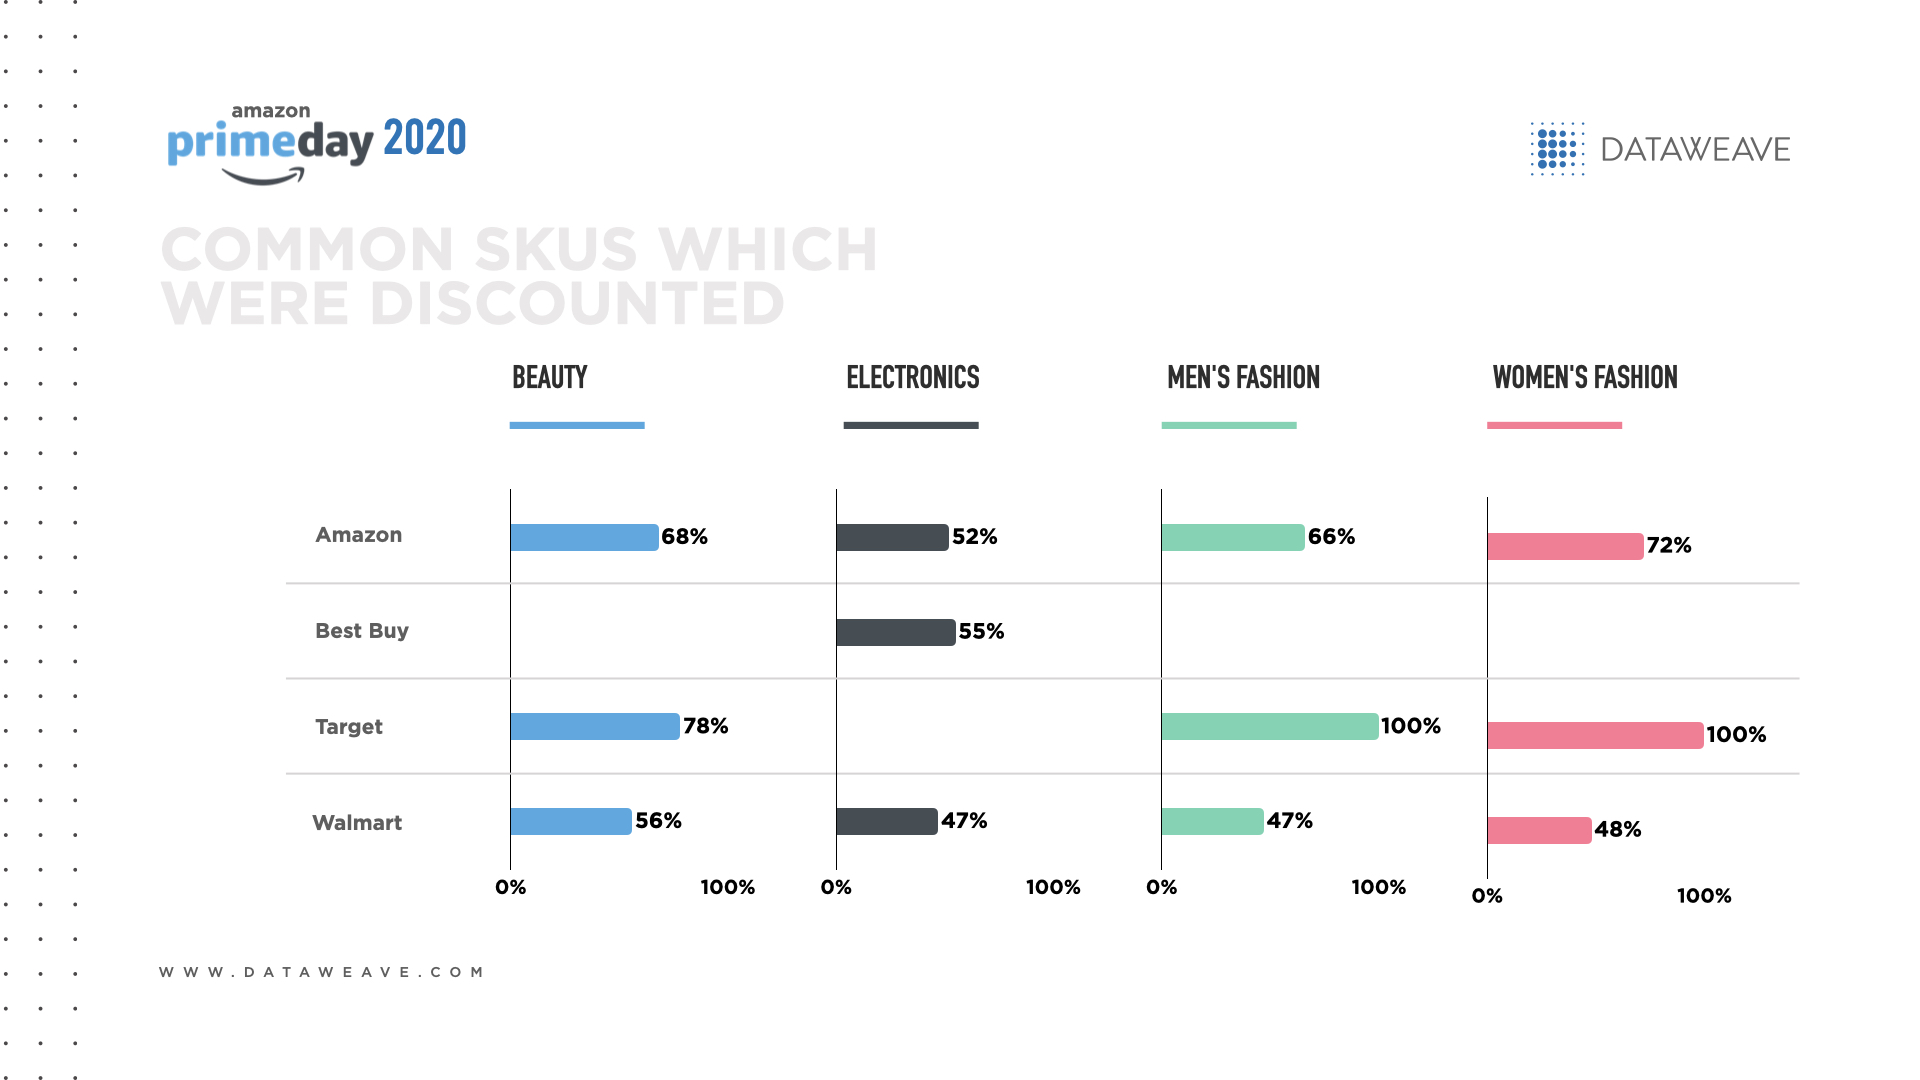
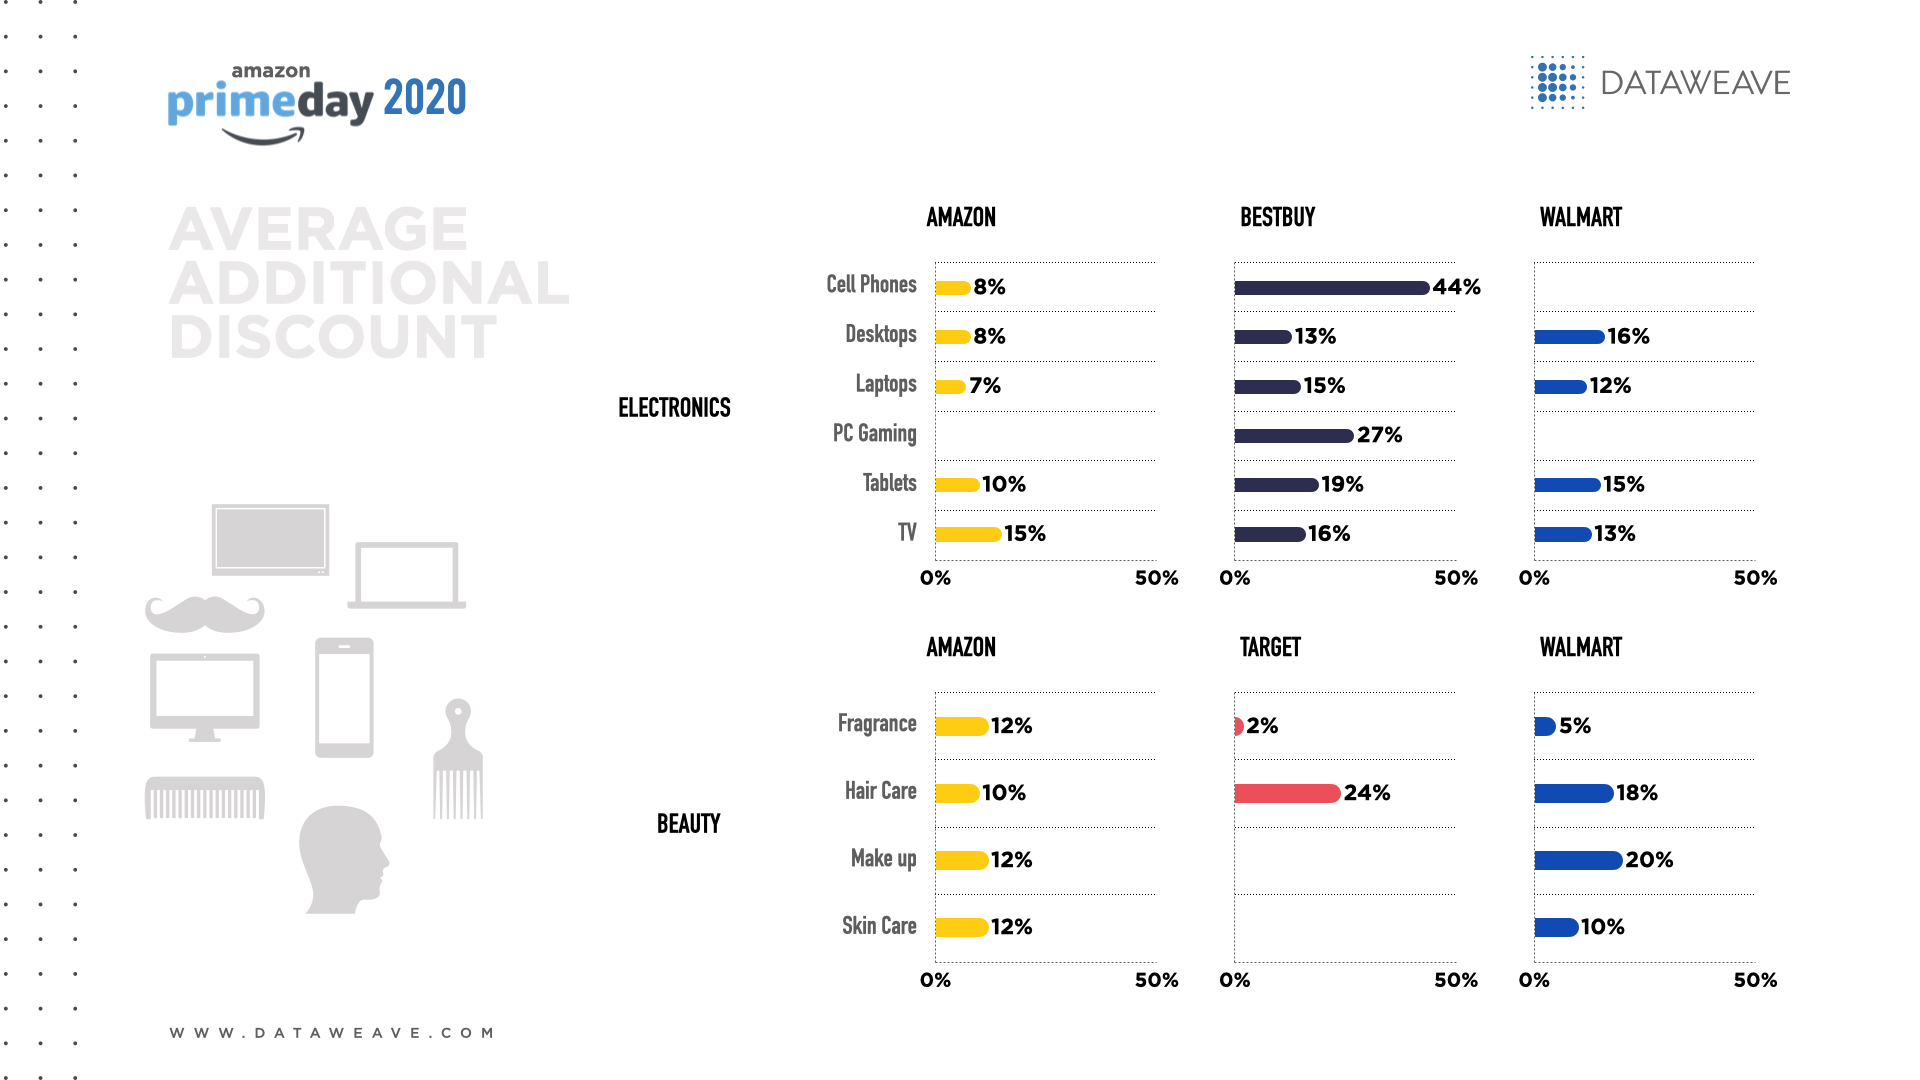
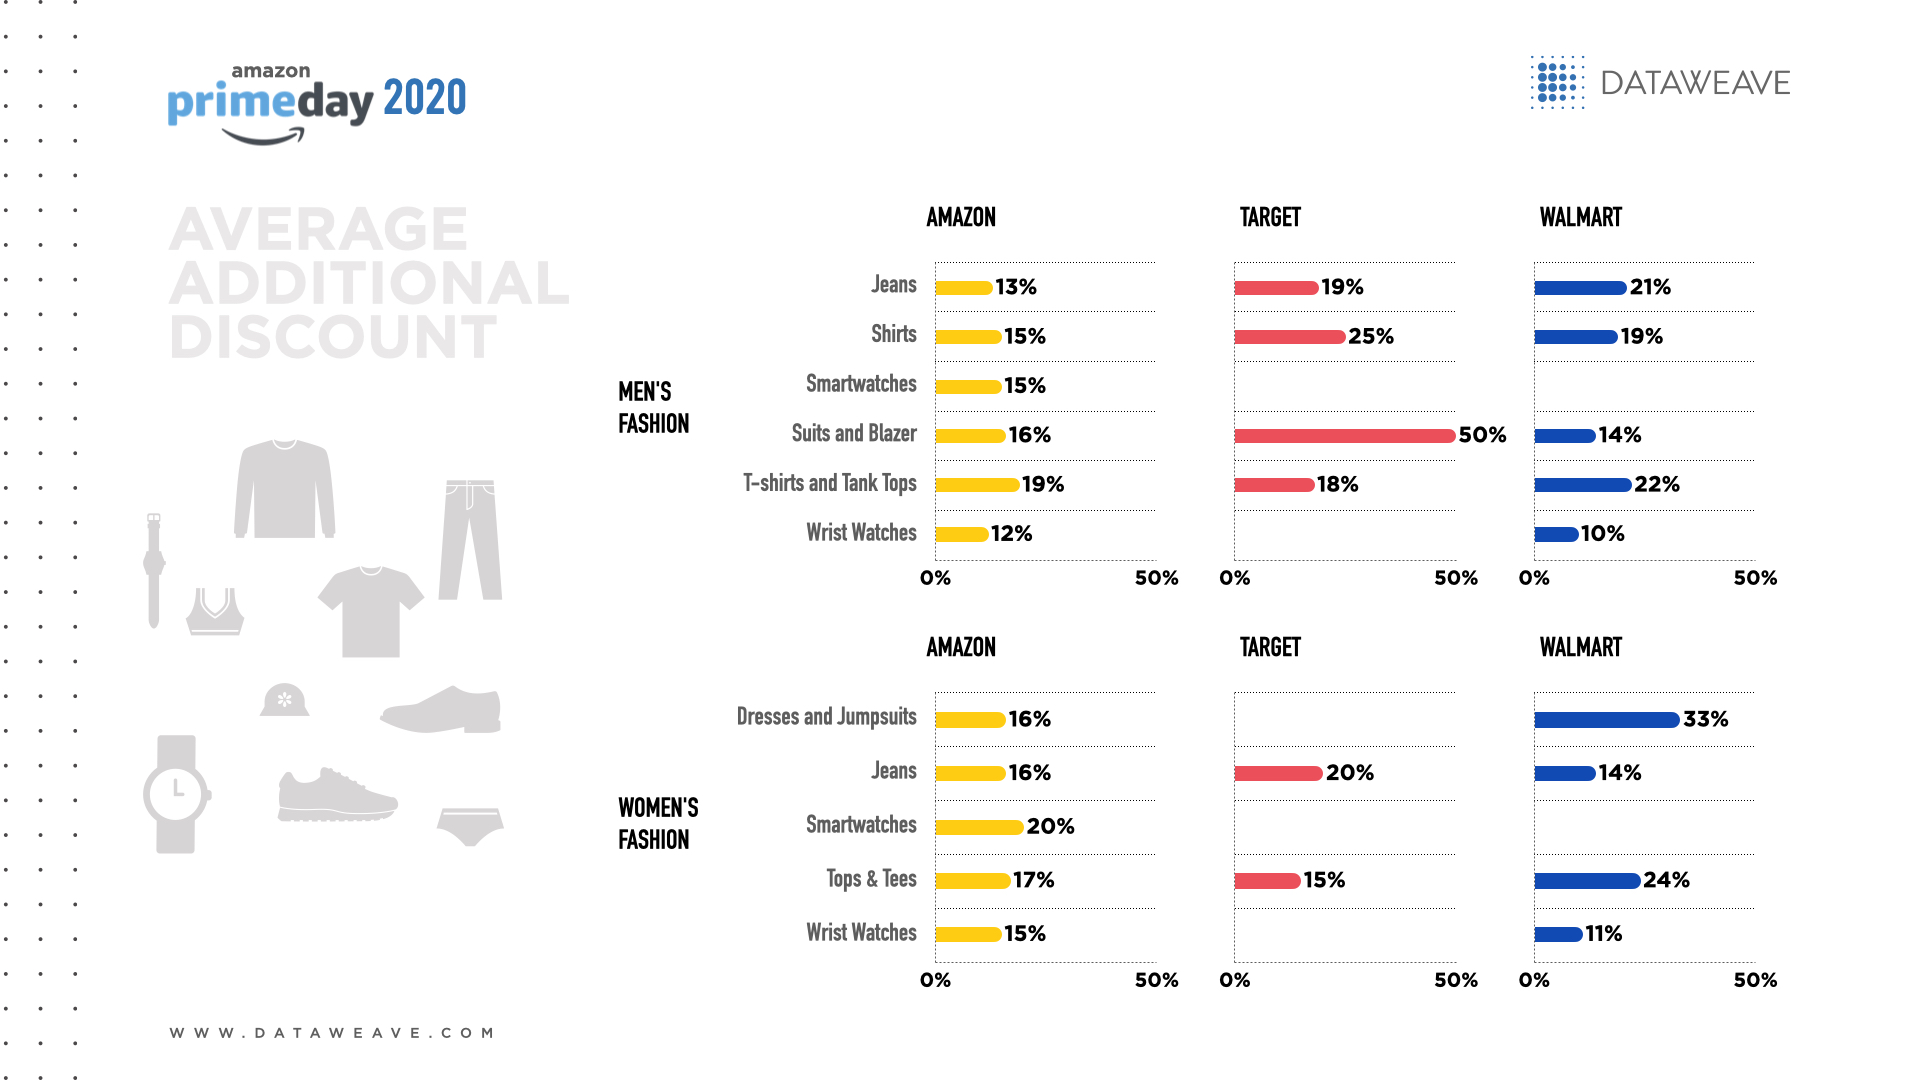
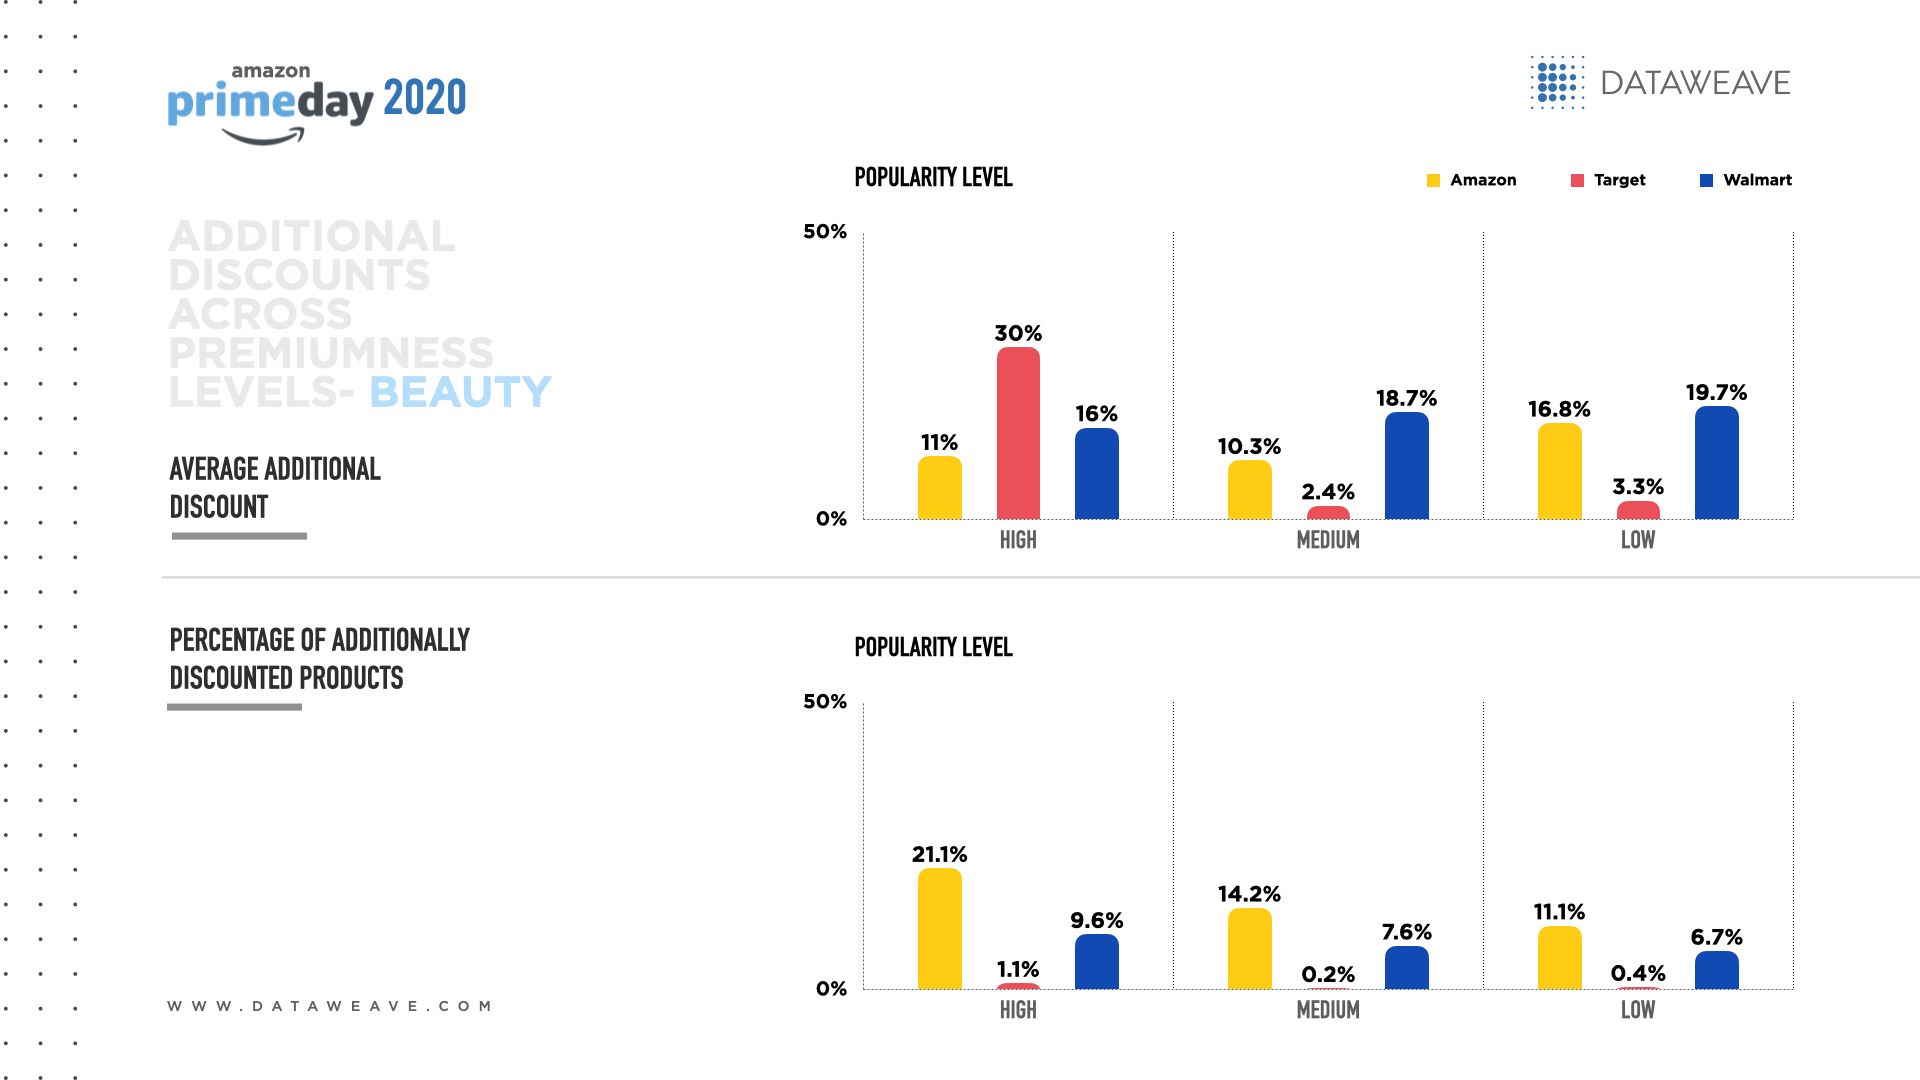
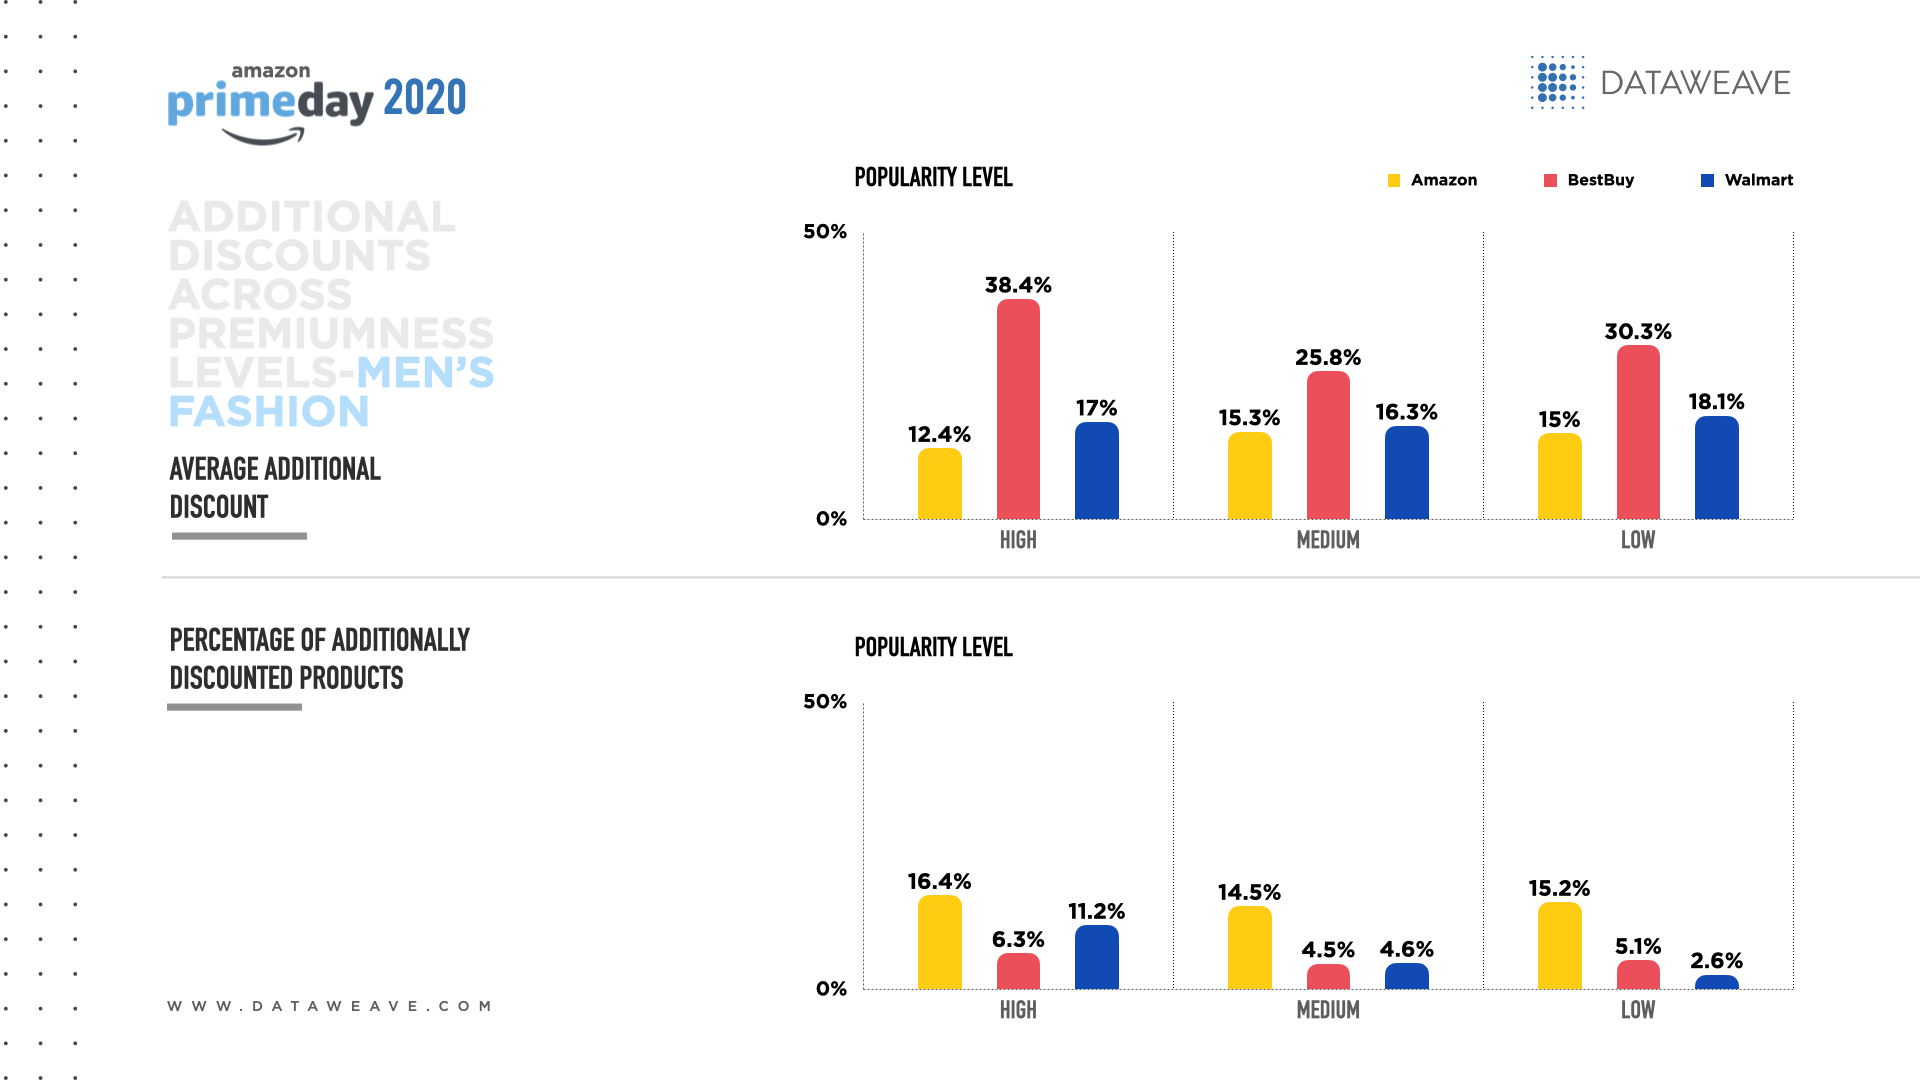

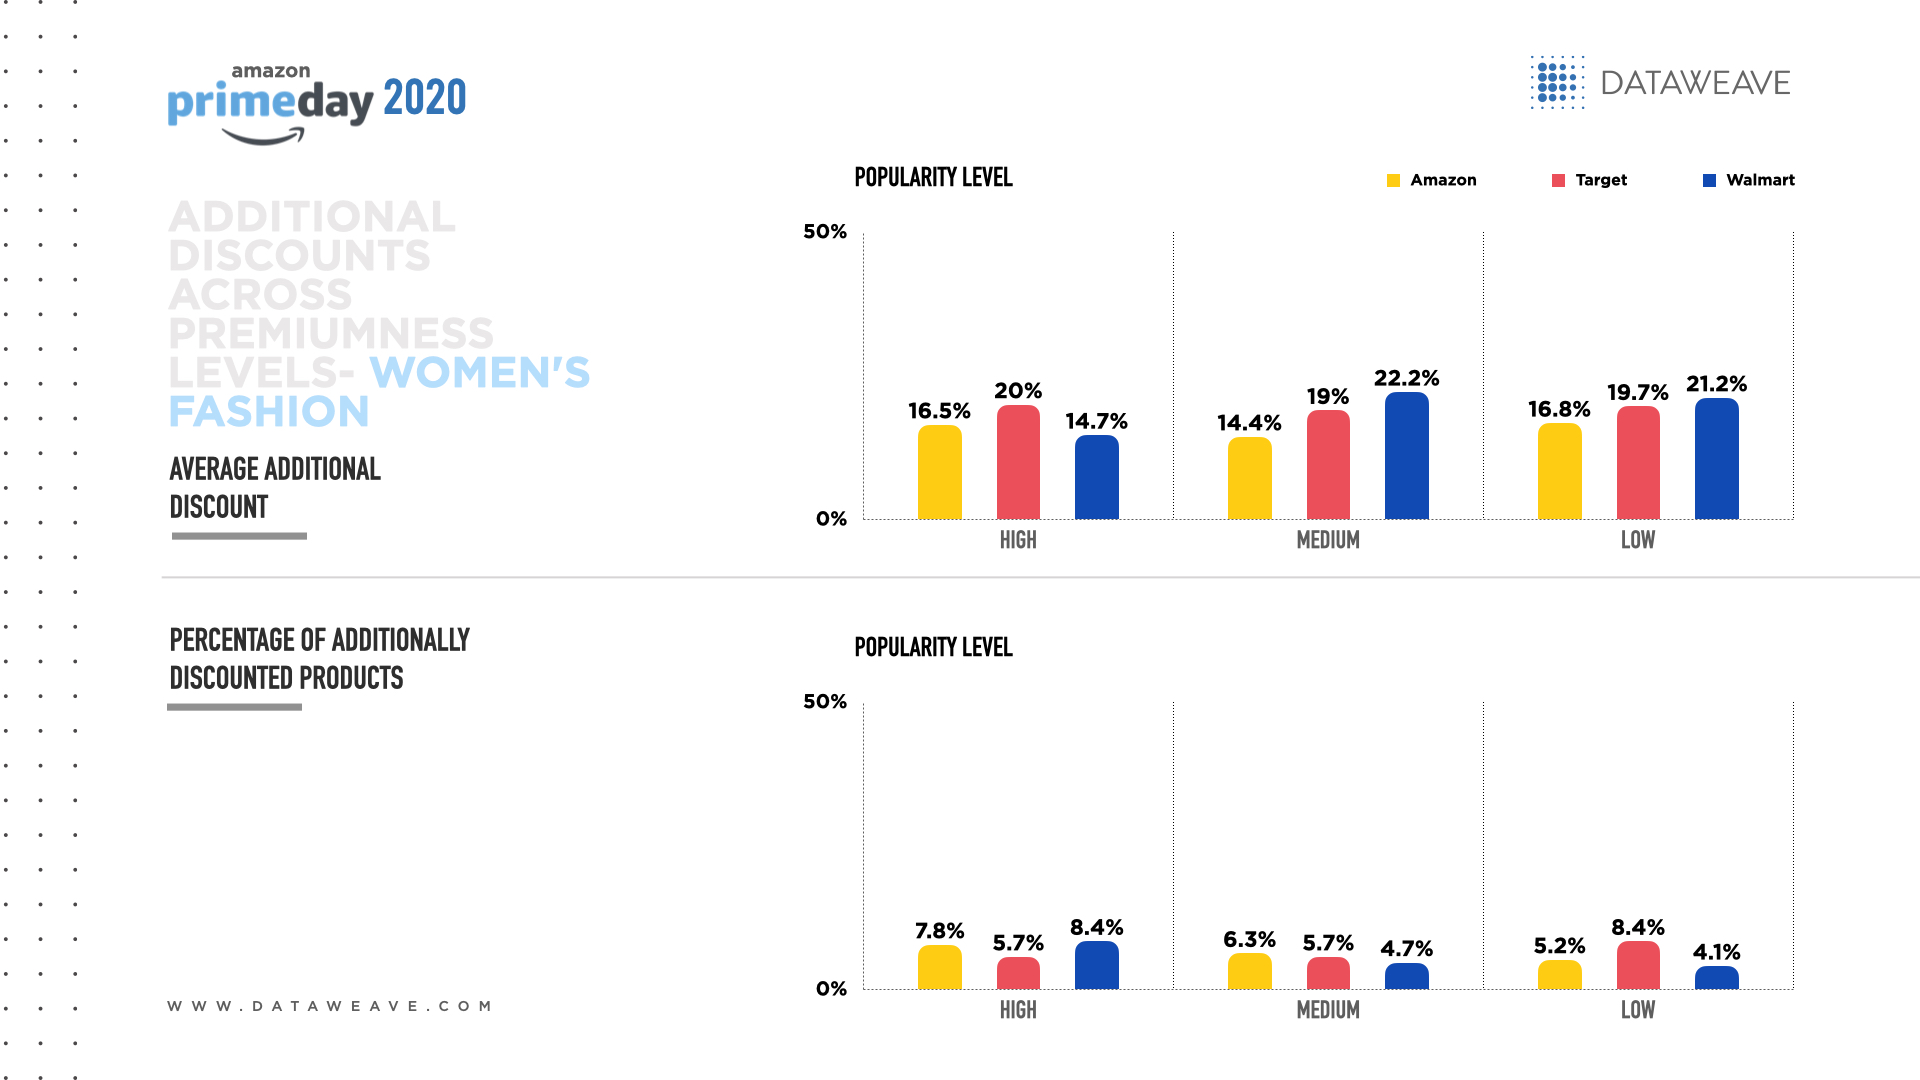
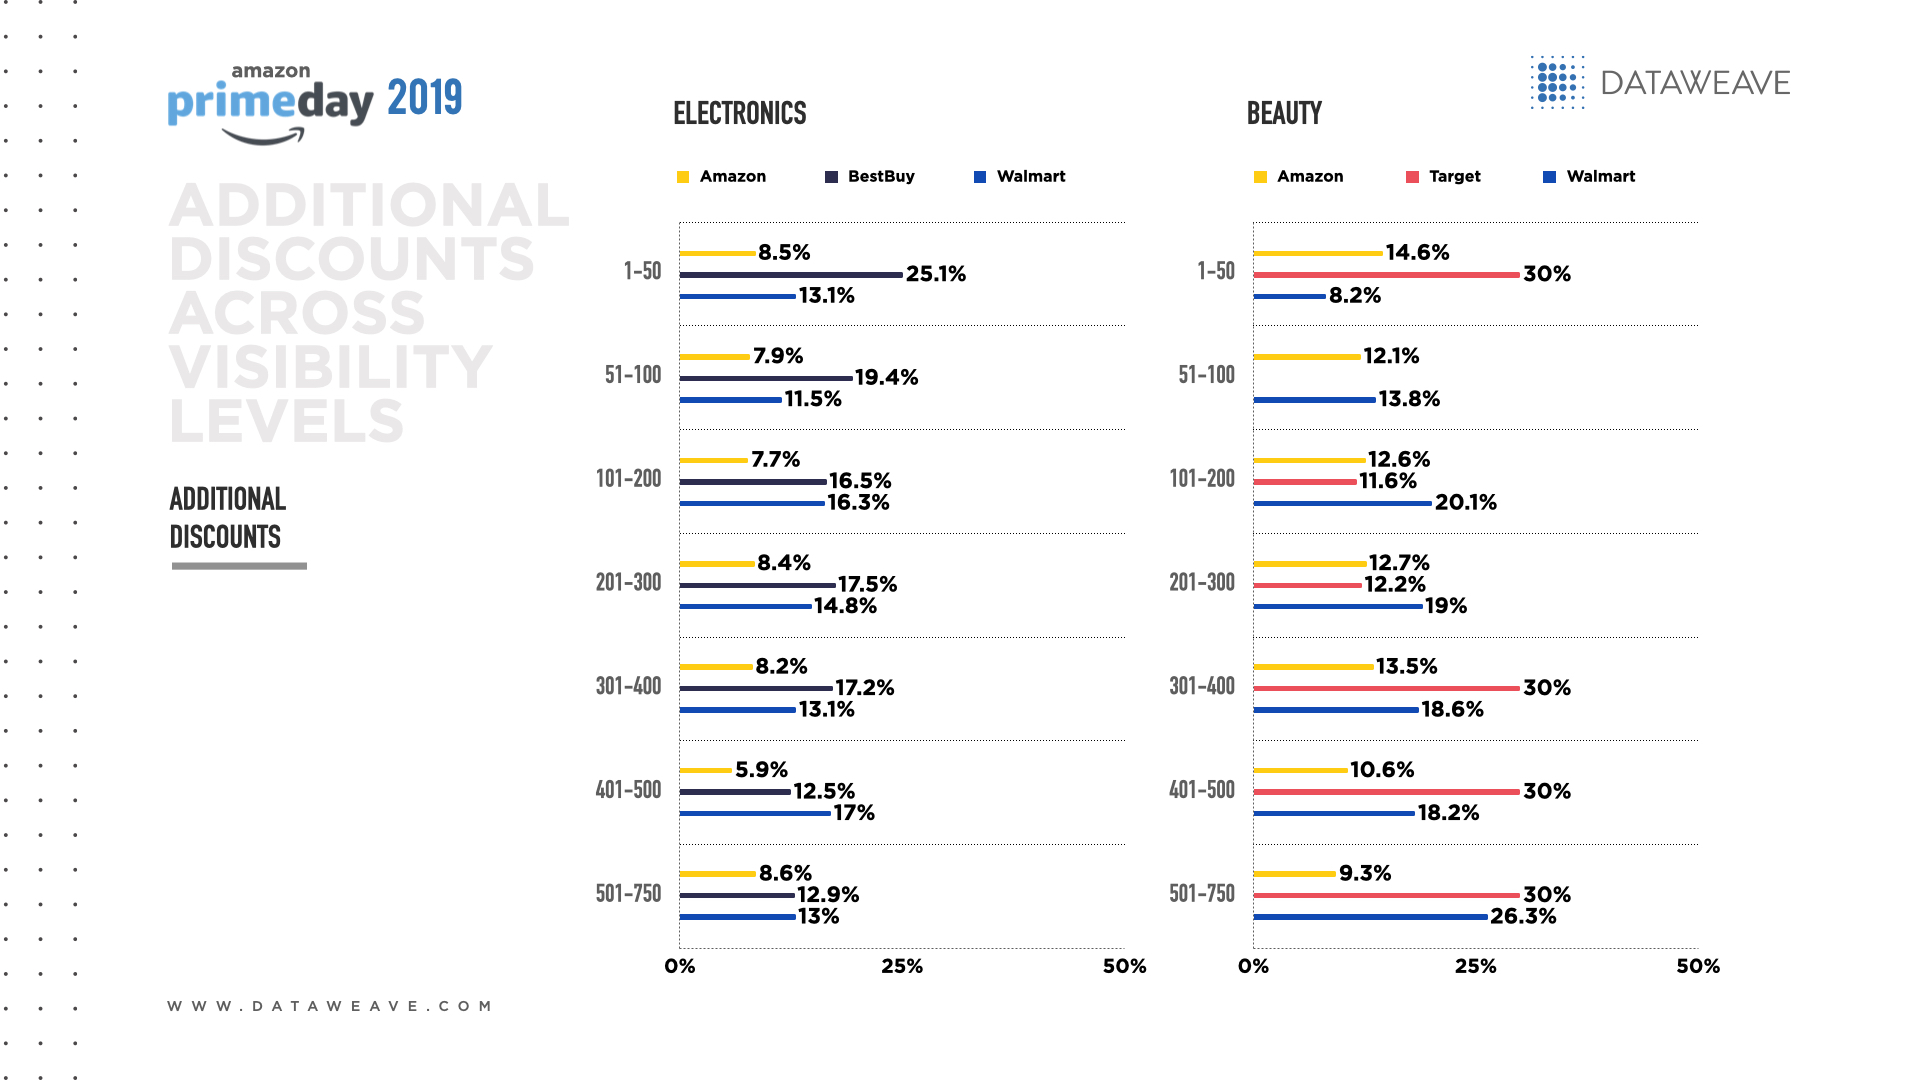
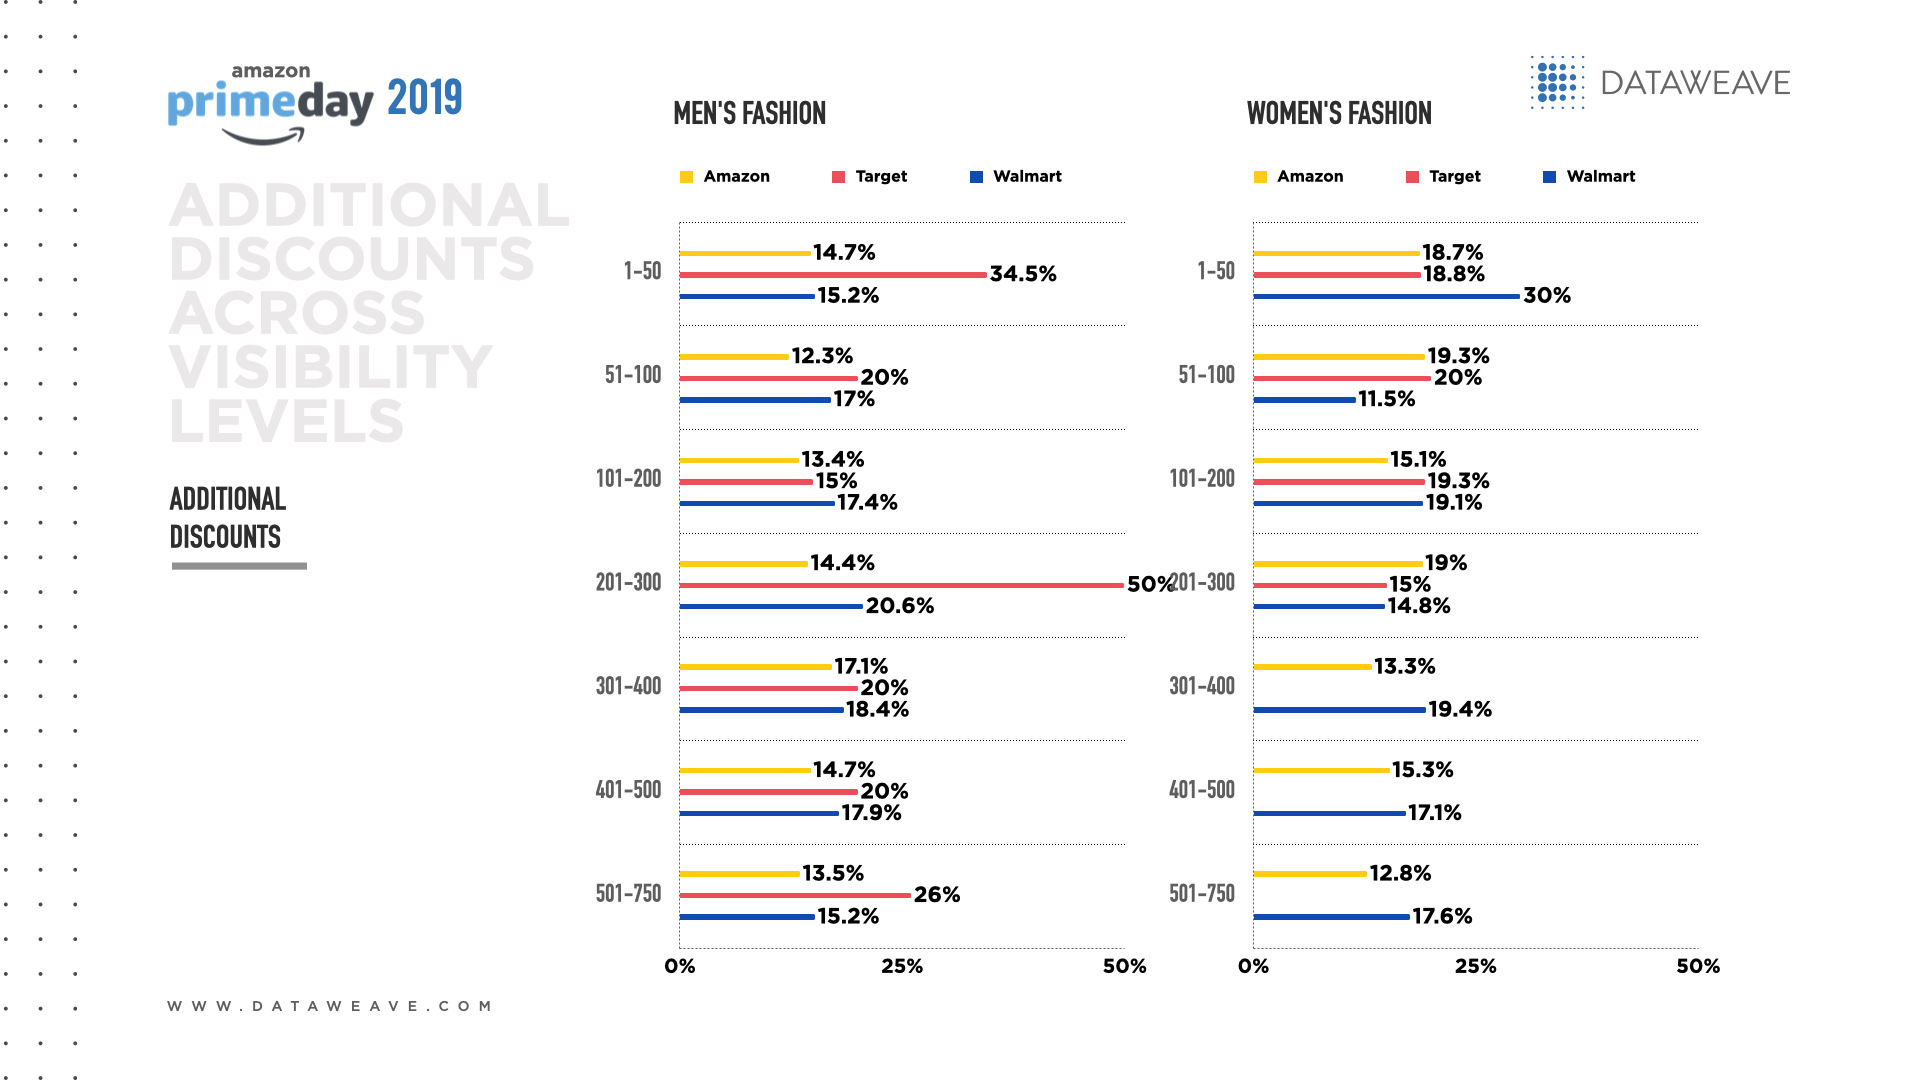
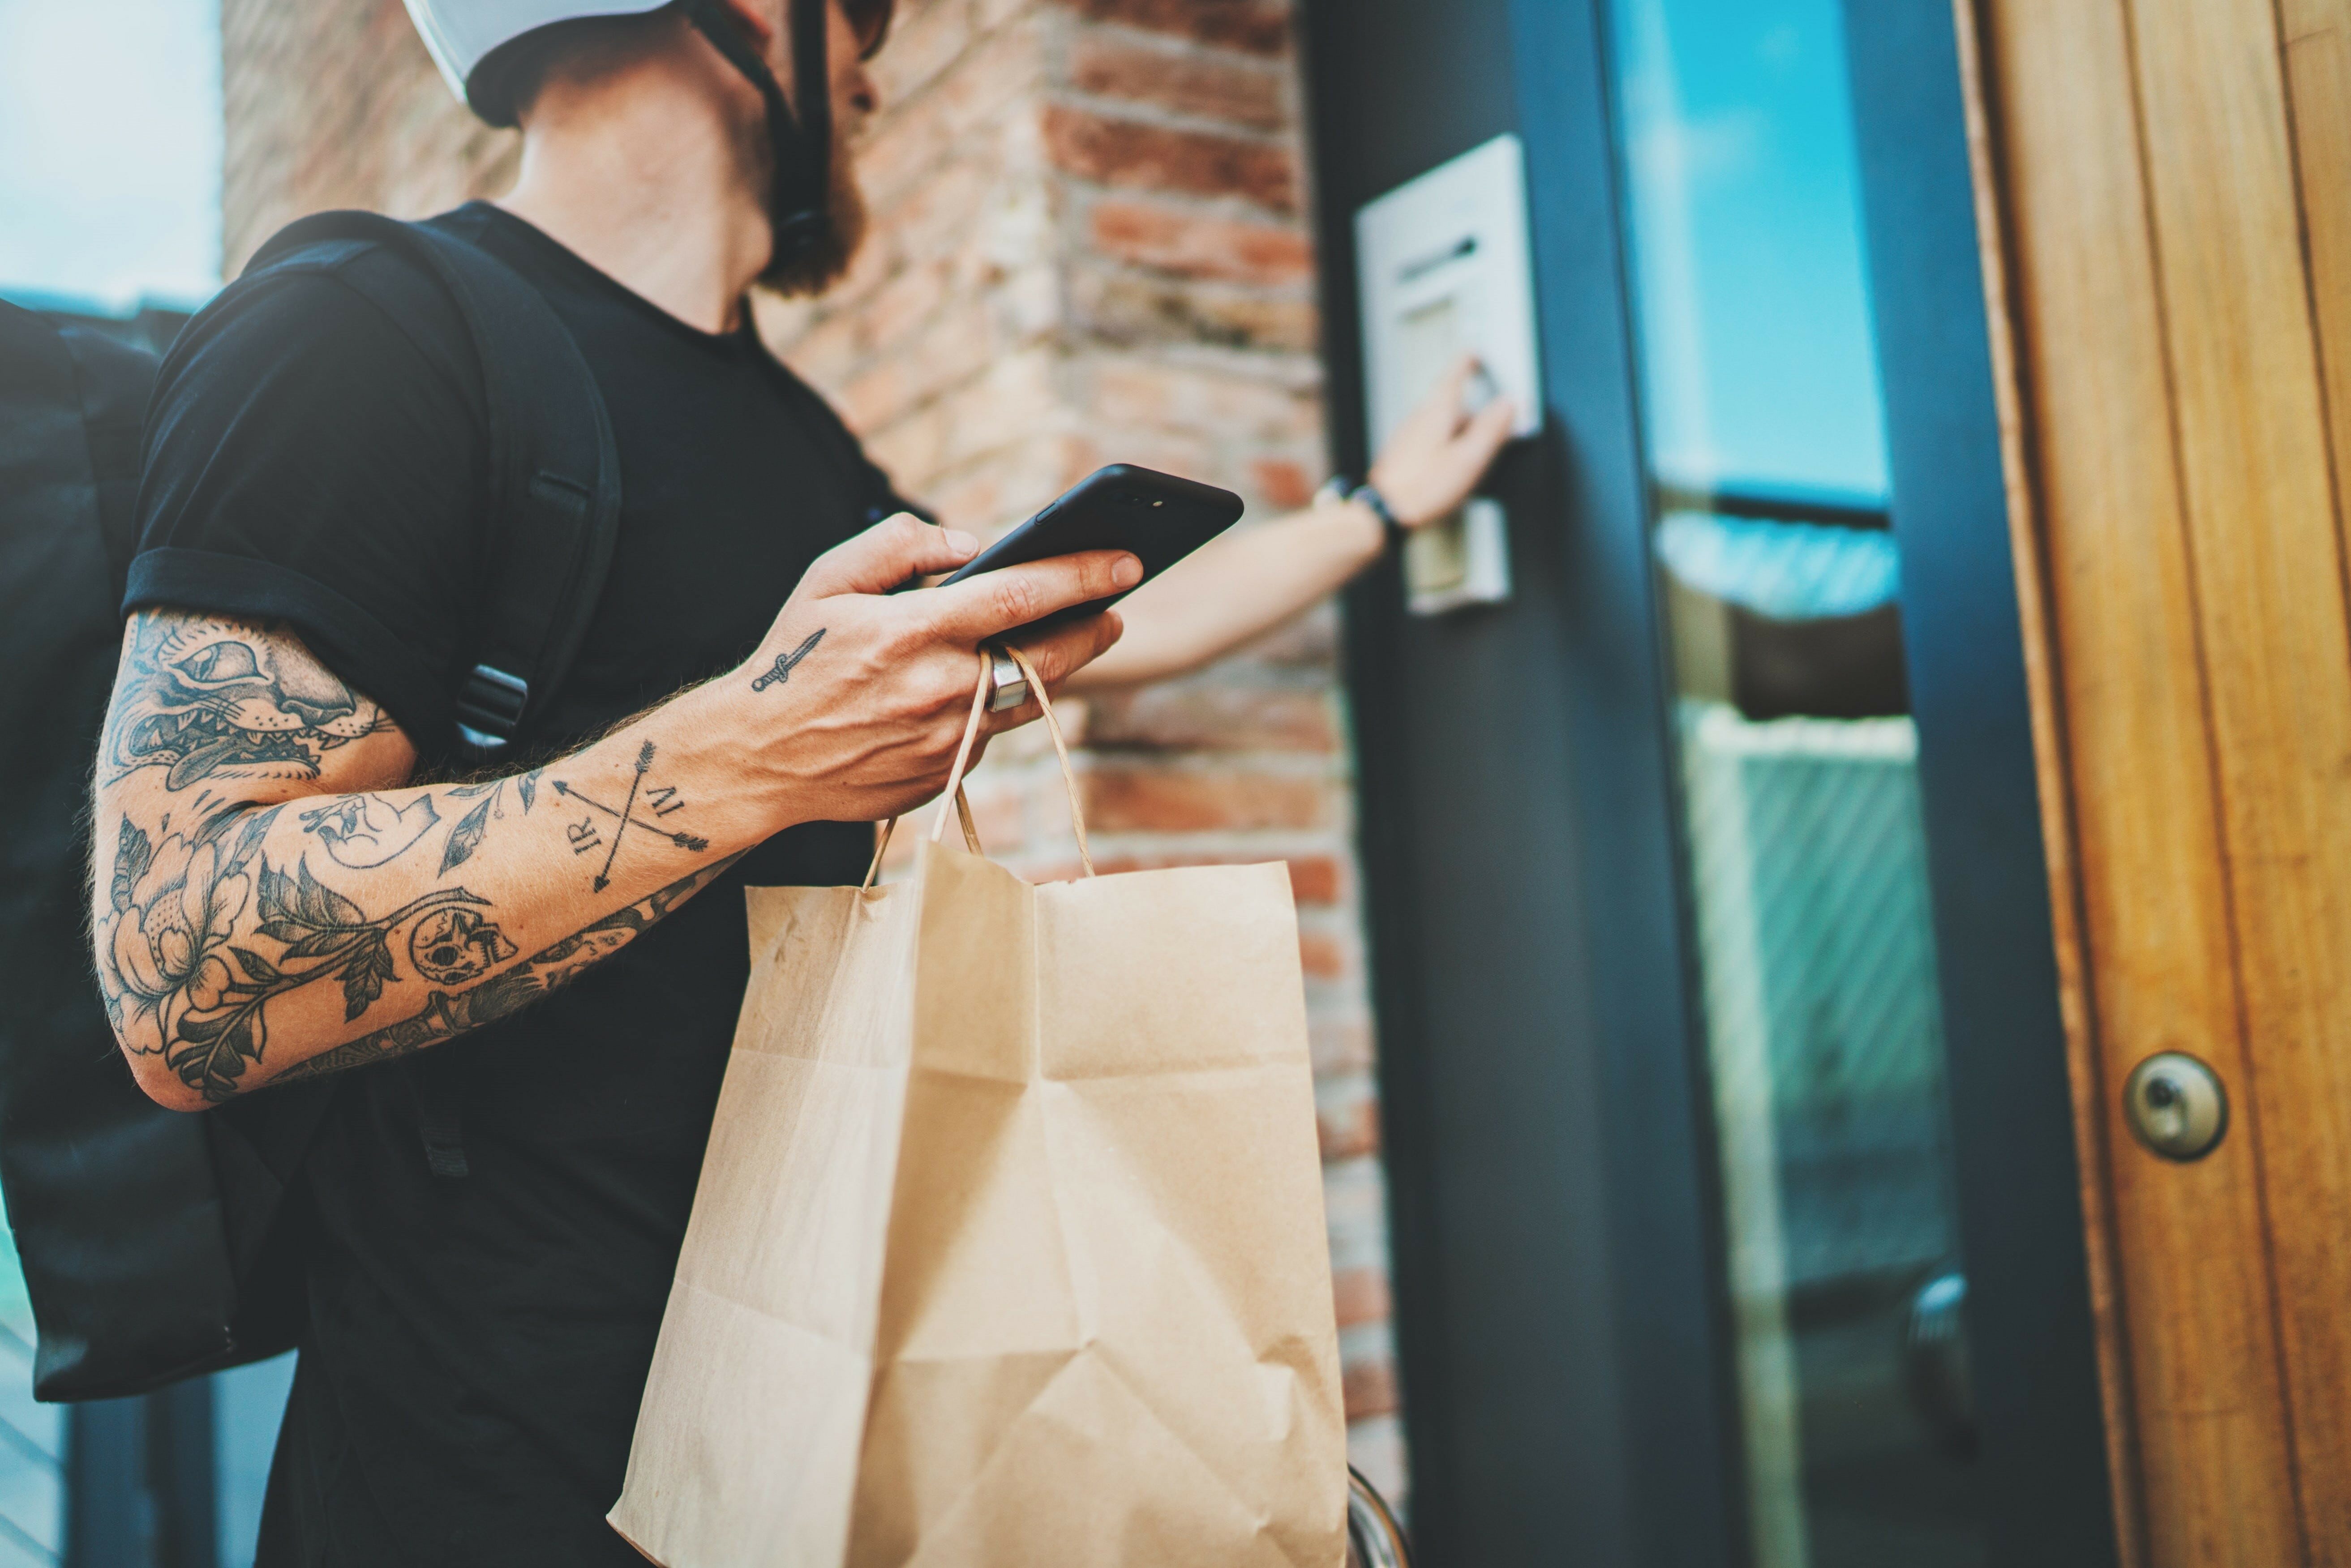
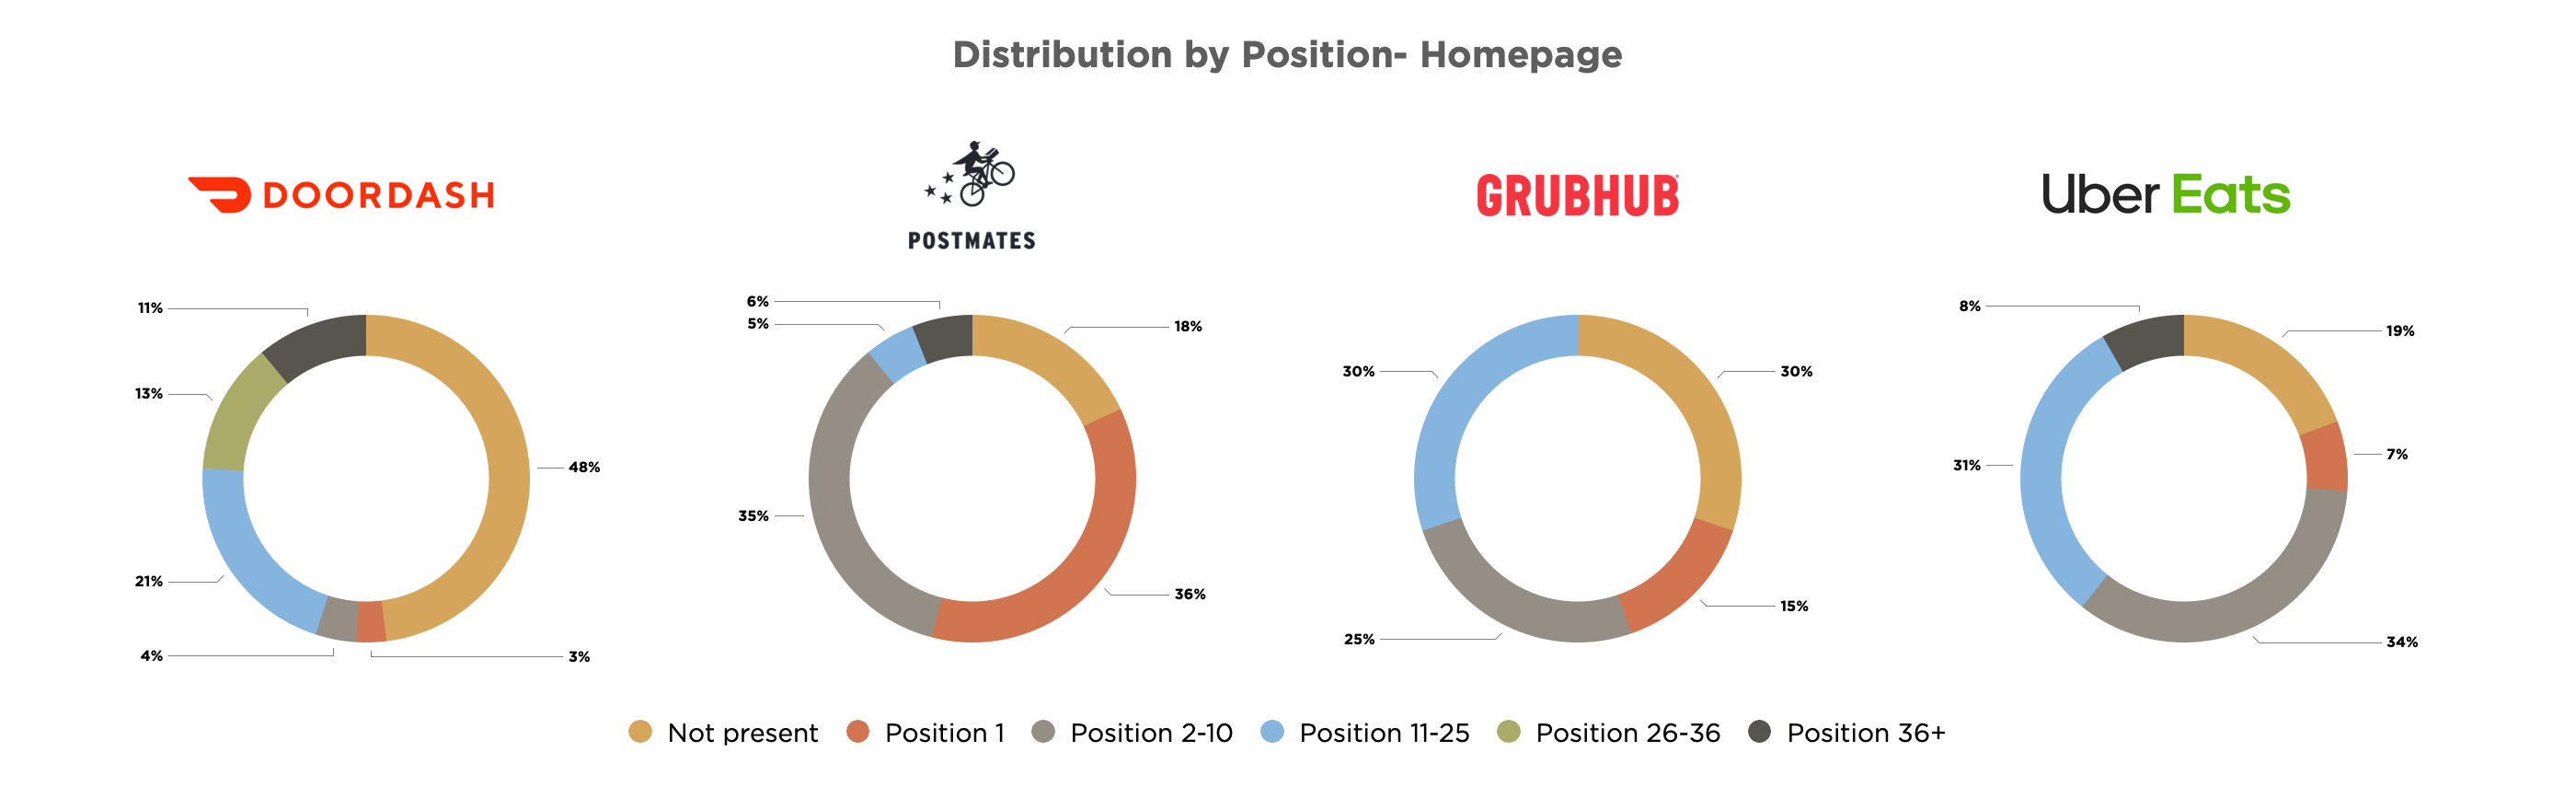

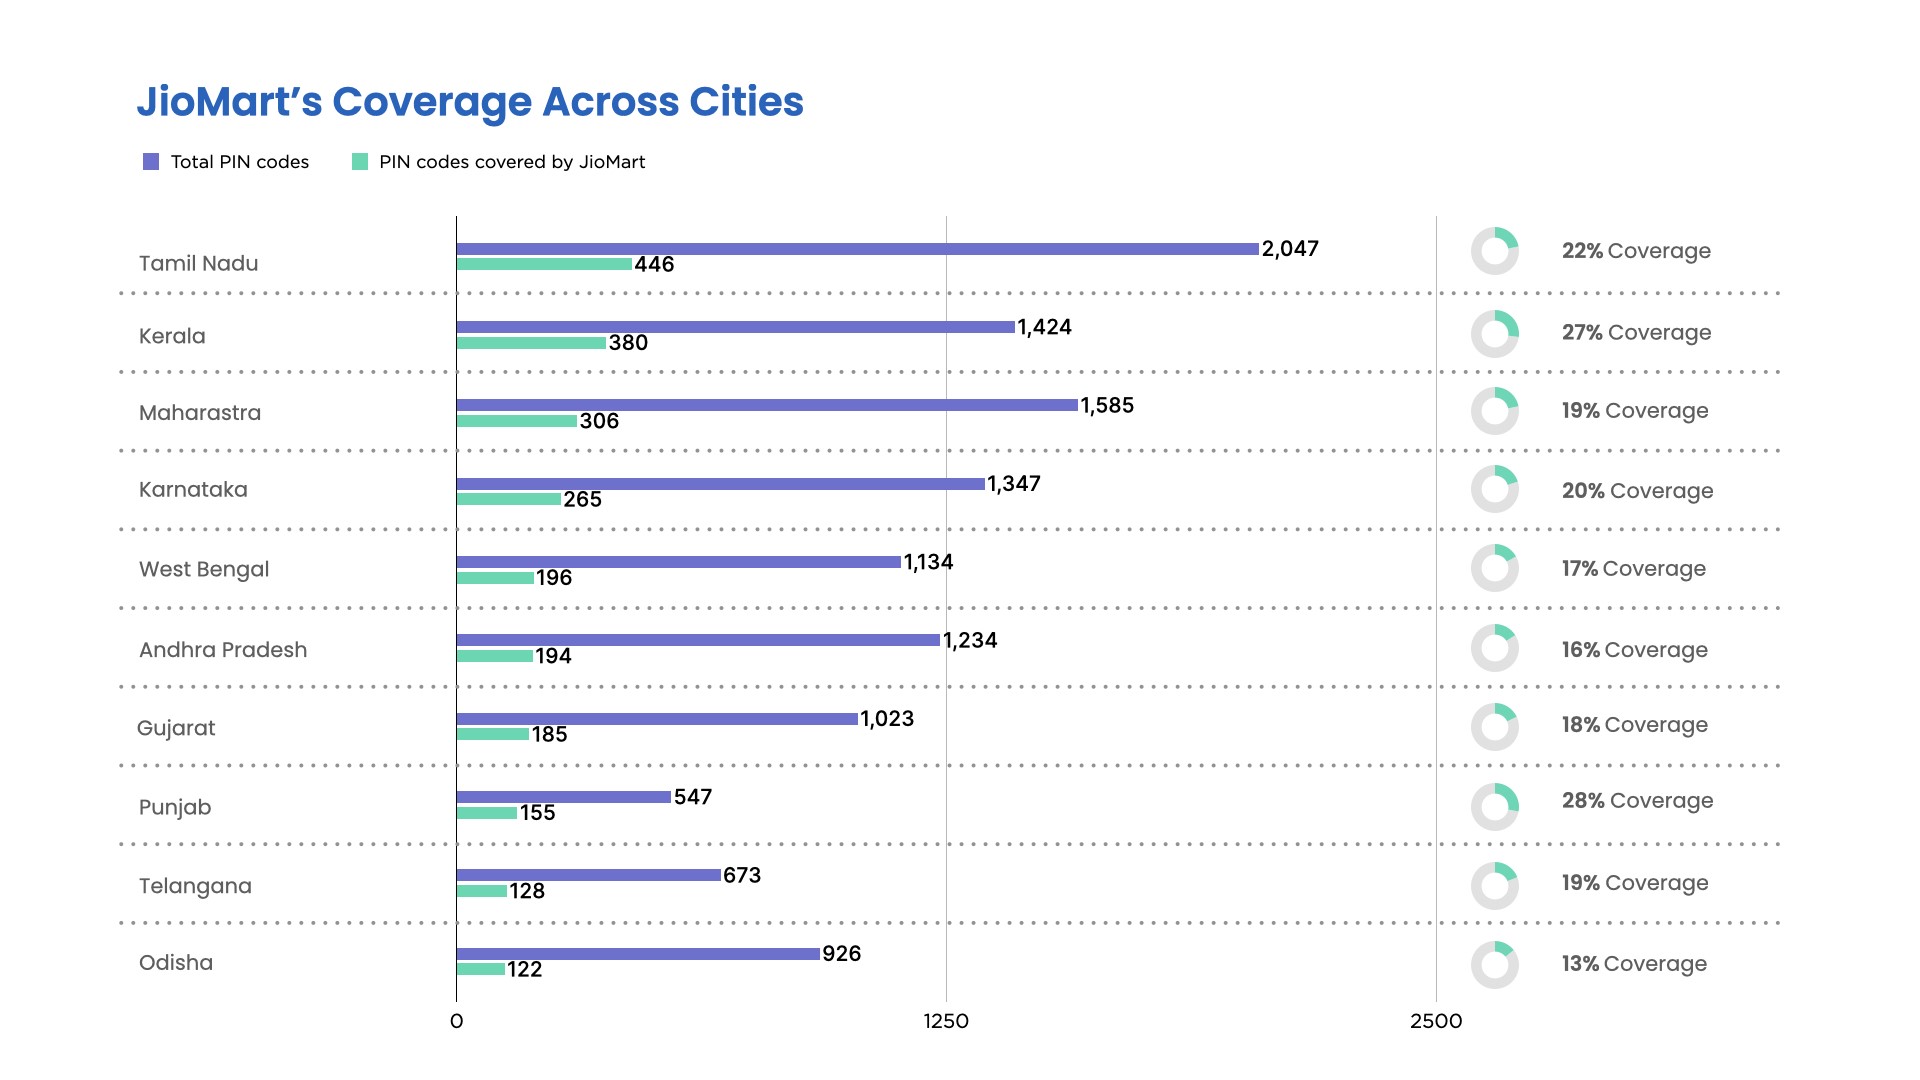
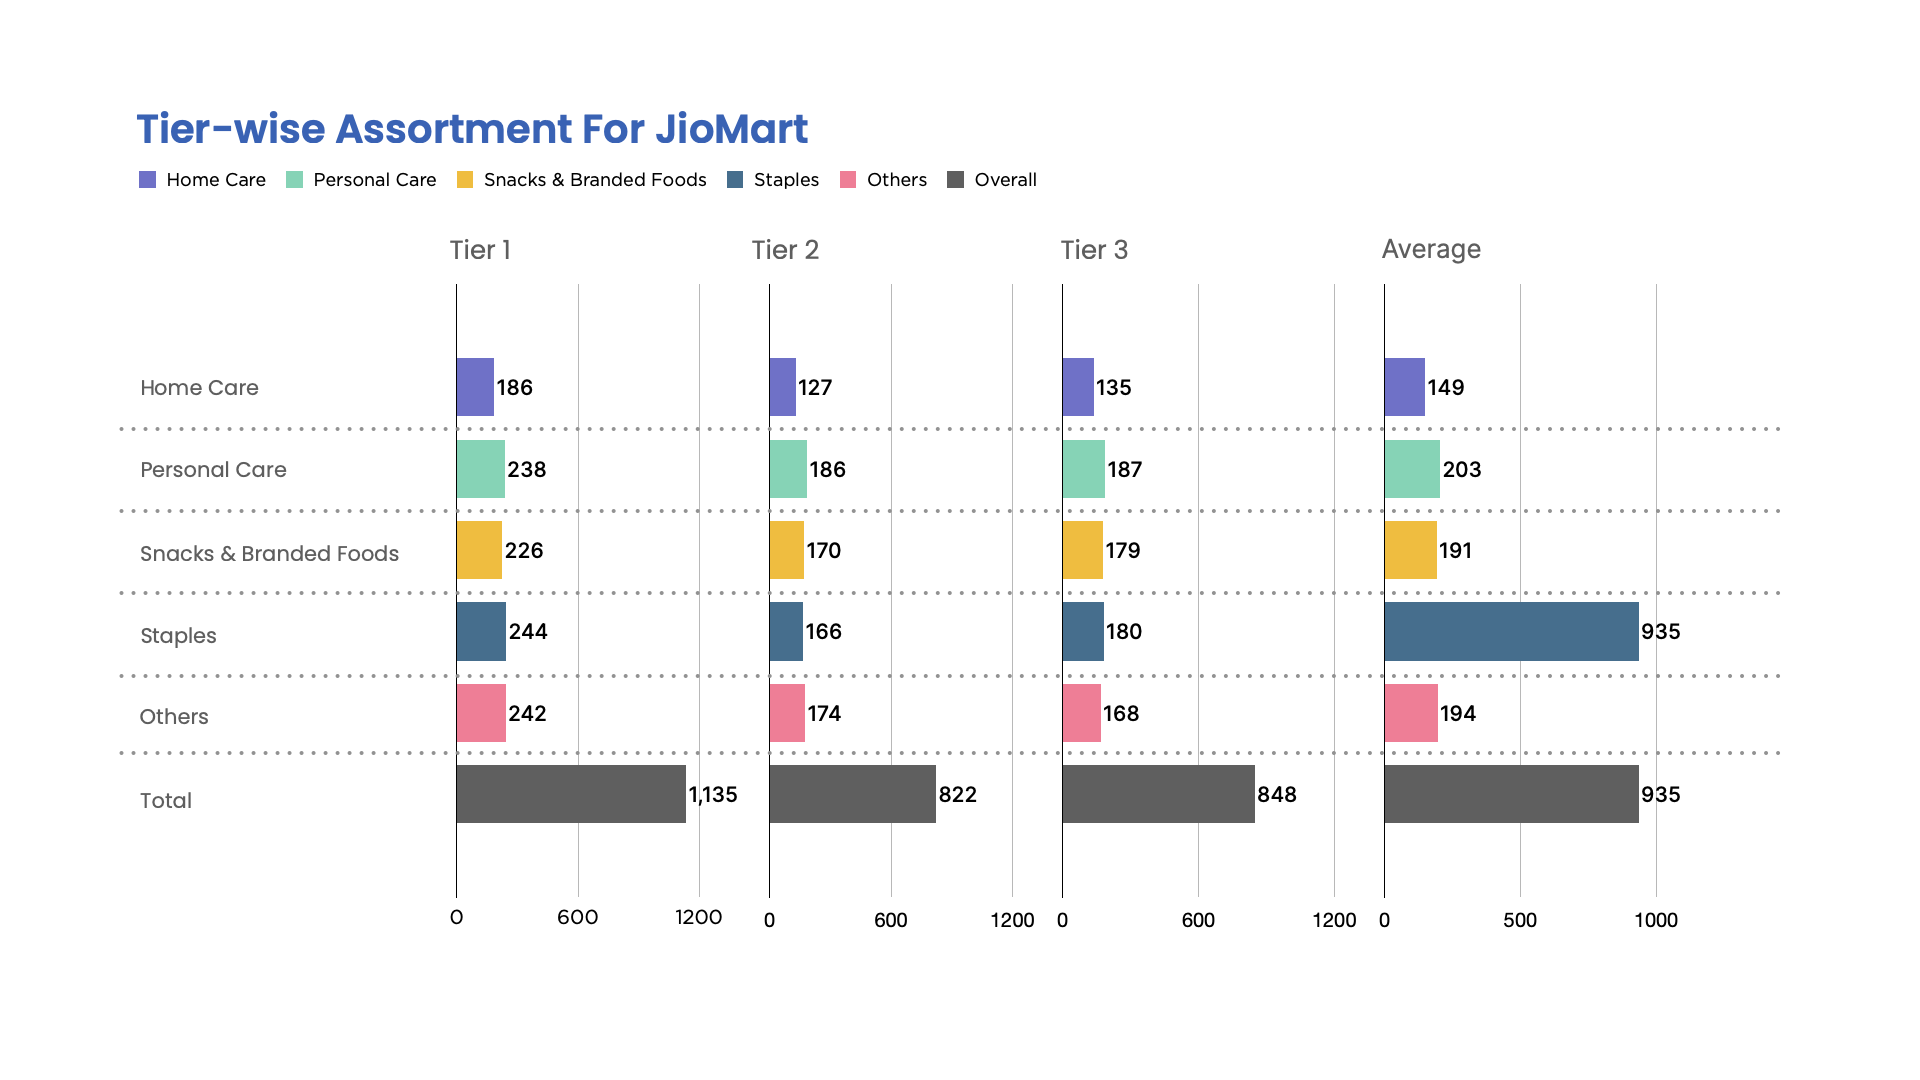
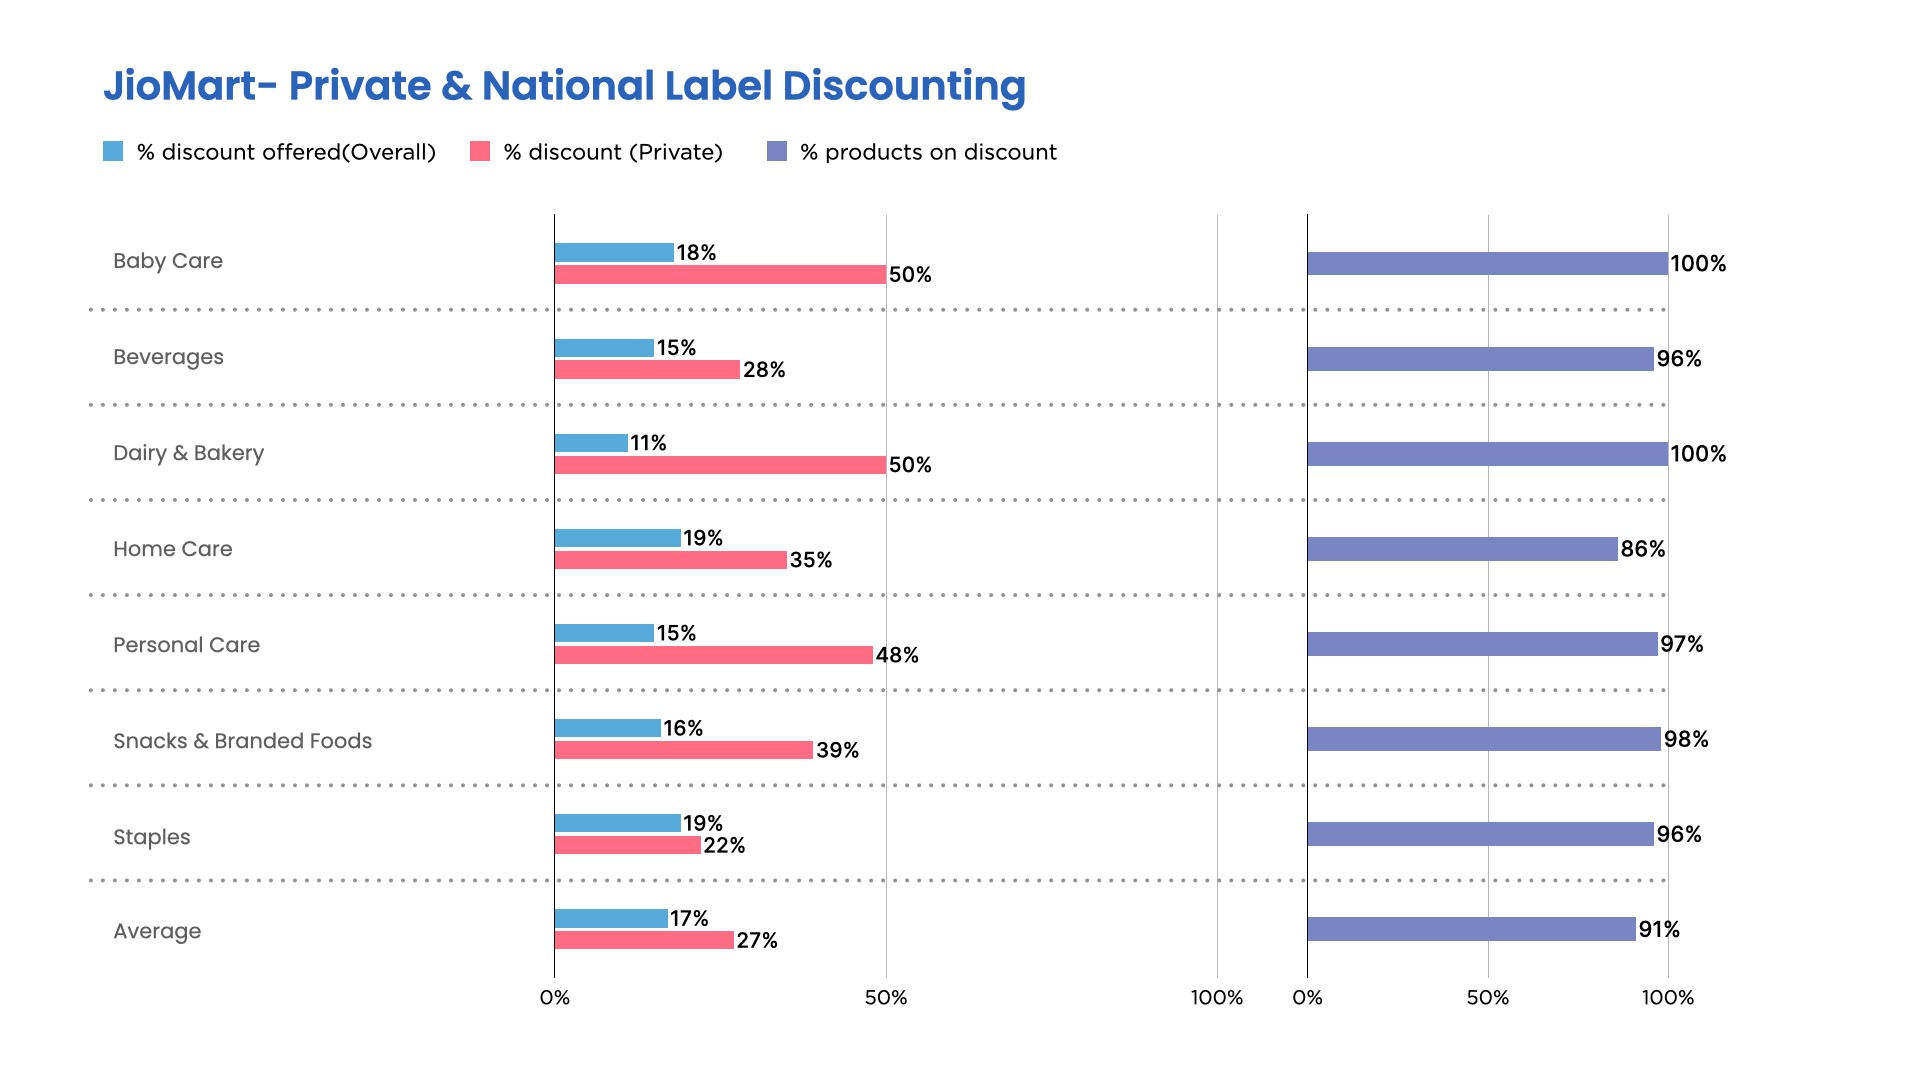
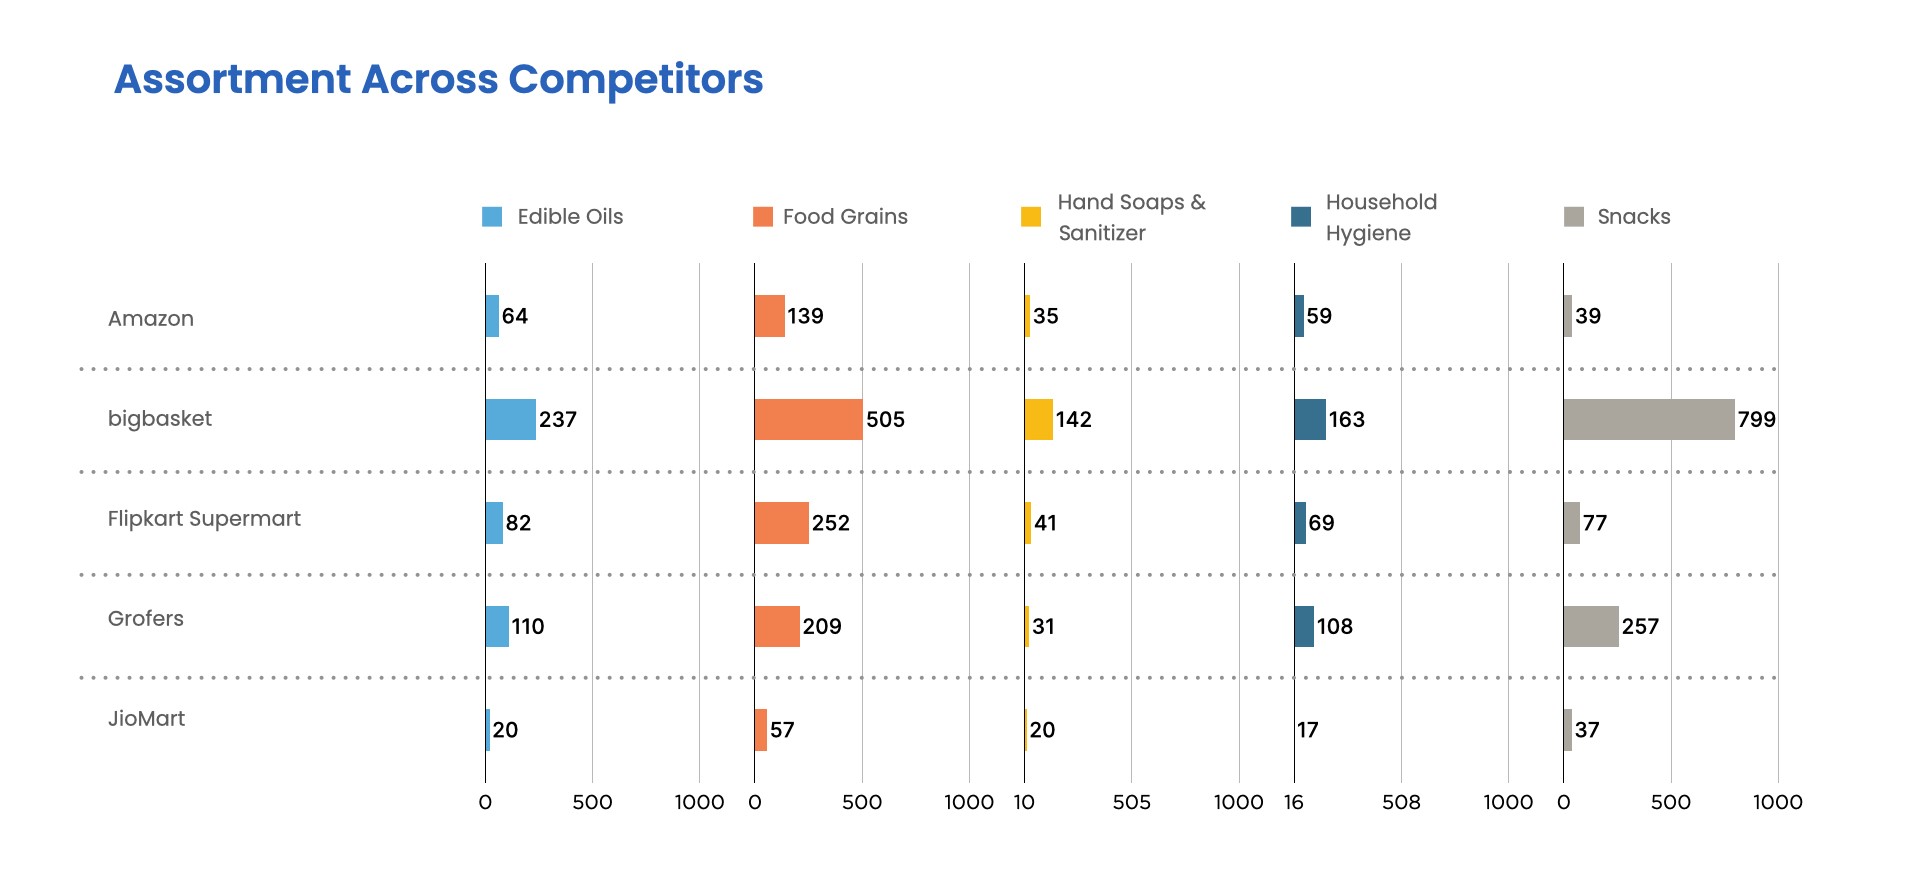
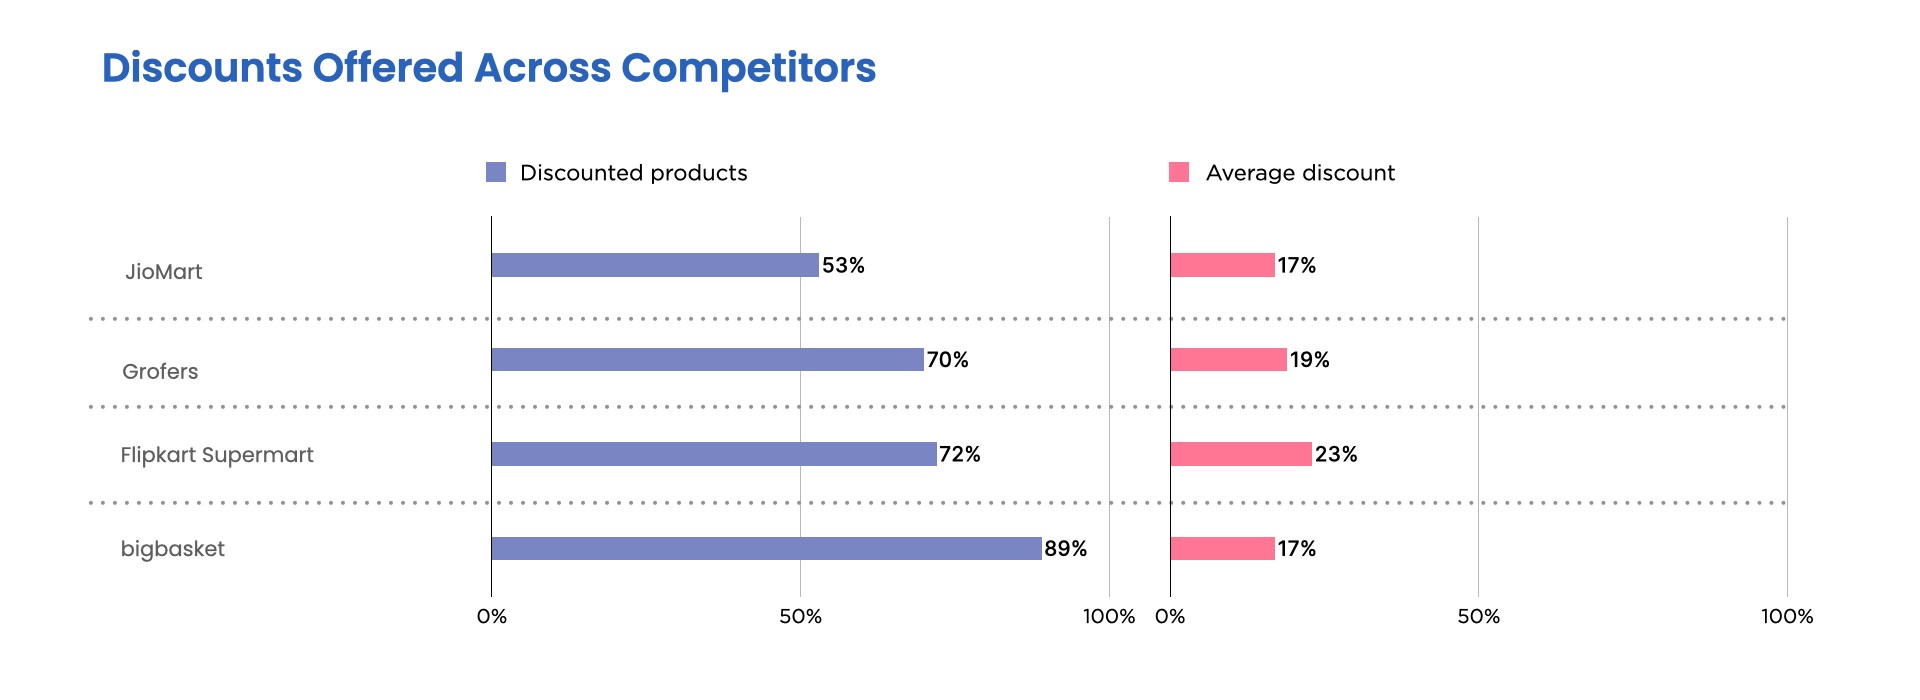


![[INFOGRAPHIC] 2019 at DataWeave: Blazing New Trails](https://stage-cdnblog.dataweave.com/wp-content/uploads/2020/01/2020-.jpg)