Black Friday has evolved from a purely Western retail phenomenon into a global shopping event. India is no exception. While the country celebrates its own mega sale events like the Great Indian Festival and Big Billion Days, Black Friday has carved out its own space in the Indian retail calendar. E-commerce in India is expected to reach $325 billion by 2030, with festive shopping seasons driving significant portions of that growth.
So how did Indian retailers and brands navigate Black Friday 2025? At DataWeave, we analyzed pricing trends across four major categories: Consumer Electronics, Home & Furniture, Health & Beauty, and Apparel. Our AI-powered retail intelligence platform tracked nearly 128,000 SKUs across leading platforms including Amazon India, Flipkart, Myntra, and others, revealing how the Indian market approached discounting and brand visibility during this high-stakes shopping period.
Our Methodology
DataWeave monitored average discount percentages across major Indian e-commerce platforms during two distinct periods:
Pre-Black Friday: Up to November 23, 2025 – capturing early promotional activity and baseline pricing
Black Friday Week: November 24 – December 1,2025 – spanning Thanksgiving week through Black Friday (November 28) and Cyber Monday (December 1)
We analyzed top-ranked products across subcategories on major retail sites, alongside Share of Search data, a metric that measures brand visibility by tracking which brand names appear in the top 20 search results for high-intent keywords.
Here’s a quick look at the overall discounts this Black Friday in India:
Consumer Electronics
Consumer electronics remain a cornerstone of Black Friday shopping in India, with smartphones and laptops driving significant online sales. Our analysis of 20,439 SKUs reveals distinctive discount patterns across subcategories.
Subcategory Discount Analysis
The category averaged 23.2% pre-Black Friday discounts with an additional 0.5% during Black Friday Week. Drones and TVs led pre-sale discounting at 47.1% and 45.2% respectively, suggesting retailers wanted to clear high-ticket inventory ahead of the main event. Tablets (25.2%) also saw aggressive pre-sale pricing. During Black Friday Week, Earbuds saw the most substantial additional discounts at 1.1%, while categories like Laptops and Smartphones, already heavily discounted, had minimal incremental price cuts at 0.2%.
Share of Search: Brand Visibility Trends
The most notable is Cofendy, electronics accessories and speaker brand, that saw the share of search rise from 1.4% pre Black Friday to 8.2% during the event. Realme followed with a solid 2.3% gain, reinforcing its position as a rising smartphone brand. Smart gadget brand Hammer also saw visibility increase by 1.4% at par with OnePlus, Fastrack, HP and Asus.
Samsung saw the highest brand visibility with share of search at 9.6% pre-event and 9.5% during Black Friday week, despite seeing a small drop in visibility. Audio brand Boat saw a visibility drop by 0.8%, while Xiaomi saw the share of search drop by 0.1%. This shift suggests that Indian consumers were drawn to newer brands and compelling deals across computing and mobile devices during the sale period.
Health & Beauty
The Indian beauty and personal care market is experiencing rapid growth, expected to reach $30 billion by 2027. Black Friday has become an important sales window for beauty brands and retailers. Our analysis of 19,854 SKUs reveals distinct patterns.
Subcategory Discount Analysis
The category averaged 17% pre-Black Friday discounts with an additional 0.4% during Black Friday Week. Beard Care led early discounting at 21.3%, reflecting strong pre-sale positioning in men’s grooming. Conditioner (17.2%), Makeup (16.9%), and Moisturizer (16.9%) also saw solid baseline promotions. During Black Friday Week, Makeup and Sunscreen saw the highest additional discounts at 0.5% each, while Electric Toothbrush and Toothpaste maintained modest incremental discounts at 0.2%.
Share of Search: Brand Visibility Trends
Affordable and emerging beauty brands dominated during Black Friday in India. Kellsie (beauty tools brand) surged from 1.6% to 6.5%. Classic mass-market brands like Pond’s (+3.4%) and Parachute Advanced (+2.8%) also performed strongly, alongside men’s grooming favorite Beardo (+1.6%). Other popular brands like Maybelline, Tresemme, Vaseline, all saw share of search and visibility increase during Black Friday.
Skincare brand Minimalist made a notable entry, jumping from 0% to 2.0% visibility. The flip side? Premium international brand L’Oréal Paris dropped from 8.3% to 6.5%, losing visibility during Black Friday.
Apparel
Our analysis of 57,537 SKUs reveals interesting discount dynamics.
Subcategory Discount Analysis
The category averaged 14.3% pre-Black Friday discounts with an additional 0.1% during Black Friday Week. Men’s Swimwear and Men’s Athleisure led pre-sale promotions at 22.2% and 18.5% respectively, while Women’s Swimwear and Women’s Shoes also saw strong pre event discounts at 19.3% and 17.6%.
Black Friday Week saw minimal incremental discounting across all subcategories, with most adding just 0.1-0.3%. The relatively subdued incremental discounting indicates that early birds captured the best deals, or that margins were already stretched from pre-sale promotions.
Share of Search: Brand Visibility Trends
Pepe Jeans dominated visibility, surging from 7.4% to 24.6%, a staggering gain that represents the largest visibility increase across all categories. Jockey also performed strongly with a 6% gain, solidifying its position in innerwear.
On the flip side, athletic and footwear stalwarts faced headwinds: Speedo dropped 1.4% and Bata fell 1.1%. This data suggests that during Black Friday 2025 in India, denim and lifestyle fashion brands invested heavily in promotional visibility, capturing massive mindshare at the expense of traditional athletic and footwear brands.
For brands and retailers navigating India’s increasingly competitive e-commerce landscape, the 2025 Black Friday data reveals a critical insight: pre-sale positioning matters more than Black Friday Week discounting. Early promotional investment and visibility campaigns delivered far greater returns than late-stage price drops, fundamentally reshaping how brands should approach this shopping event.
Want to understand how DataWeave’s retail intelligence platform can help your business make data-driven decisions during peak sales events? Contact us to learn more about competitive insights, price intelligence, assortment analytics, content analytics, and digital shelf analytics.
Check out our analysis on Black Friday 2025 Pricing and Discount trends in the USA, Canada, UK, and Germany. Follow our blog for more insights on retail pricing trends, brand visibility analysis, and data-driven commerce intelligence.
Black Friday 2025 marked another significant shopping event for Canadian consumers, with retailers deploying sophisticated pricing strategies to capture holiday spending. Online and in-store spending on Black Friday reached an estimated $865 million in Canada, which marked a 6% increase compared to last year.
At DataWeave, we analyzed Black Friday 2025 pricing dynamics across two major categories in the Canadian market: Consumer Electronics and Home & Furniture. Our AI-powered pricing intelligence platform tracked approximately 16,000 SKUs across leading Canadian retailers like Target, Walmart, Wayfair, Home Depot, Amazon, Best Buy, Loblaws, Metro and more, uncovering distinct patterns in how brands and retailers structured their promotional calendars this year.
Our Methodology
DataWeave monitored pricing and discount trends across Canadian retailers during two key timeframes:
Pre-Black Friday Period: Up to November 23, 2025 – establishing baseline promotional activity and early holiday deals
Black Friday Week: November 24 – December 1, 2025 – spanning Thanksgiving through Black Friday (November 28) and Cyber Monday (December 1)
Our dataset included top-performing products across multiple subcategories on major Canadian retail platforms. We also tracked Share of Search metrics, measuring brand prominence by analyzing which brand names appeared in the top 20 search results for high-value keywords during each period.
Black Friday 2025 Canada: Overview
Here’s how average discounts compared between the Pre-Black Friday period and Black Friday Week:
Key Finding: Canadian retailers front-loaded their promotional strategy significantly, with Pre-Black Friday discounts averaging 16.3% across categories. The additional lift during Black Friday Week was modest at 1.4%.
Consumer Electronics
Consumer electronics consistently drives Black Friday traffic, and Canadian retailers delivered compelling early-season value. Our analysis of 11,772 SKUs reveals nuanced subcategory performance.
Subcategory Discount Breakdown
Consumer Electronics averaged 13.6% discounts in the Pre-Black Friday period, with Black Friday Week adding 1.7%. Audio & Video dominated early promotional activity at 23.8%, signalling retailers’ intent to clear inventory ahead of the main event. Wearables followed at 16.9%, likely timed to capture gift-buying momentum.
During Black Friday Week, Audio & Video maintained leadership with an additional 2.5% discount, the highest incremental lift in the category. Meanwhile, Computers and Gaming, already positioned at modest pre-sale discounts of 6.2% and 6.4%, saw minimal additional movement, suggesting constrained inventory or deliberate pricing discipline in these segments.
Share of Search: Brand Visibility Trends
Our Share of Search data reveals which brands gained or lost prominence during Black Friday Week:
Audio brands dominated visibility gains during Black Friday Week. Beats by Dr. Dre nearly tripled its Share of Search from 3.1% to 9.2%, showing the strongest gains. Visibility for Dutchman climbed 3.6%. Motorola and Samsung also captured increased search prominence with gains of 2.5% and 2.2% respectively.
Conversely, some established tech brands experienced visibility declines. Gaming brand Viprtech by 2.9%. Asus declined by 1.6%, and SanDisk dropped by 1.3%.
Home & Furniture
Home & Furniture showed the most aggressive early discounting of any category in our Canadian analysis. Tracking 4,362 SKUs, we found retailers heavily promoted home goods well before Black Friday weekend.
Subcategory Discount Breakdown
Home & Furniture led all categories with Pre-Black Friday discounts averaging 23.5%, but Black Friday Week added only 0.7%, the smallest incremental discount in our entire study. Kitchenware saw extraordinary pre-sale discounts of 43.2%, the highest in any subcategory we tracked. Bedding followed at 33.6%, while Furniture reached 24.3%. These deep early discounts likely aimed to drive early conversions and manage bulky inventory ahead of peak logistics constraints.
During Black Friday Week, additional discounting remained minimal across the board. Bedding posted the highest lift at 1.1%, while Kitchenware saw just 0.4%. The data suggests Canadian home goods retailers viewed the pre-sale period as their primary promotional window, with Black Friday serving more to sustain momentum than deliver new value.
Share of Search: Brand Visibility Trends
Mattress brand Zinus led gains with a 3.9% increase, positioning itself as a value-focused furniture leader during the sale period. Cuisinart climbed by 1.5%, suggesting strategic amplification of this established kitchenware brand.
Most home brands maintained relatively stable visibility throughout the sale period. Safavieh and Dorel showed essentially no change, while Better Homes & Gardens and Viscologic experienced only minor declines of 0.1% and 0.2% respectively.
Want to understand how DataWeave’s pricing intelligence platform can help your business make data-driven decisions during peak sales events? Contact us to learn more about competitive insights, price intelligence, assortment analytics, content analytics, and digital shelf analytics.
Check out our coverage on Black Friday 2025 across US, UK, and Germany. Follow our blog for more insights on retail pricing trends, brand visibility analysis, and data-driven commerce intelligence.
Black Friday 2025 solidified its position as a major retail event in the German market. German consumers demonstrated an average Black Friday budget of €317, the highest among select European countries.
The German market, however, exhibited unique consumer behavior patterns during Black Friday 2025. Rather than meticulous planning, 59% of German shoppers allowed deals to inspire their purchases, compared to just 32% who shopped with predetermined lists and budgets. This spontaneous yet budget-conscious approach distinguishes German consumers from other markets, where FOMO-driven purchasing tends to dominate.
Against this backdrop of rational deal-seeking and regional diversity, how did retailers and brands perform across key categories this Black Friday?
At DataWeave, we conducted a comprehensive analysis of Black Friday 2025 discounting trends across five major categories in the German market: Consumer Electronics, Home & Furniture, Health & Beauty, Grocery, and Apparel. Our AI-powered pricing intelligence platform monitored over 16,000+ SKUs across leading German retailers like Amazon, Aldi, Douglas, Nutritienda, Carethy, Bofrost, and more, revealing fascinating patterns in how retailers and brands approached this year’s sale season.
Our Methodology
For this analysis, DataWeave monitored average discounts across leading German retailers during two distinct periods:
Pre-Black Friday: November 6 – November 23, 2025 – capturing early holiday deals and baseline pricing
Additional Discounts During Black Friday Week: November 24 – December 1, 2025 – covering Thanksgiving week through Black Friday (November 28) and Cyber Monday (December 1)
Our sample encompassed the top-ranked products across subcategories on major retail sites. We also analyzed Share of Search data, which measures brand visibility by monitoring which brand names appear in the top 20 search results for critical keywords.
Black Friday 2025 Germany: The Big Picture
Our analysis covered 16,653 SKUs across five major categories. Here’s the snapshot of average discounts during the Pre-Black Friday period compared to Black Friday Week:
Key Insight: The German market presented a notably different discounting pattern compared to other markets. Pre-Black Friday discounts averaged 7% across all categories, with Black Friday Week adding 5.1% on average. Unlike the UK and US markets where retailers front-loaded promotions heavily, German retailers took a more balanced approach, with several categories actually seeing higher discounts during the main Black Friday Week.
Beauty led pre-sale discounts at 10%, followed by Electronics at 9.3%. Consumer electronics stood out with the highest Black Friday Week discounts at 9.4%, slightly exceeding even the pre-sale period at 9.3%.
Shopping Behavior Patterns: The relatively modest discount levels reflect the rational, value-oriented approach of German consumers. With the majority of shoppers setting budgets between €100-€299 and prioritizing wish fulfillment over impulse purchases, German retailers focused on strategic discounting rather than aggressive margin erosion.
Consumer Electronics
Consumer electronics dominated German Black Friday interest, with 77% of German shoppers most interested in electronics deals, making it the most anticipated category during the sales period. Our analysis of 2,077 SKUs reveals how discounts varied across subcategories and which brands dominated search visibility in this highly competitive category.
Subcategory Discount Analysis
This was one of the few categories where Black Friday Week discounts matched or exceeded pre-sale levels. Wearables led pre-sale discounting at 16.3%, followed closely by Audio & Video at 15.8%. During Black Friday Week, these categories saw additional discounts of 12.2% and 12.4% respectively.
The standout performer was Home Automation, which nearly doubled its additional discount from 7.2% to 13.9% during Black Friday Week. Mobile Devices saw additional discounts dropping from 13.4% pre-sale to 7.1% during Black Friday Week. Meanwhile Gaming doubled additional discounting from 2.1% to 4.3%.
Share of Search: Brand Visibility Trends
Our Share of Search analysis reveals significant shifts in brand visibility during Black Friday Week:
HP saw the highest share of search across Black Friday at 10.5% pre event and 11.6% during the event. Apple led with a 4.7% increase in visibility, jumping from 1.6% to 6.3%. Asus followed at 4.6%. Motorola surged 3.6 %, while wearables brand Fitbit gained 1.7%.
In stark contrast, Logitech dropped by 7.8 %, Beats fell 6.2 %, and SanDisk declined 5.5 %. Computer manufacturers Dell and Acer also struggled, falling 2.5 and 2.3 % respectively.
Home & Furniture
The Home & Furniture category in Germany showed unique discounting behavior compared to other markets, with additional Black Friday Week discounts (6.7%) actually exceeding Pre-Black Friday levels (6.1%). Our analysis of 1,403 SKUs shows how discounts were distributed across subcategories.
Subcategory Discount Analysis
Kitchenware led pre-sale discounts at 8.7%. Decor surged from 5% to 7.5%, lighting jumped from 5% to 6.9%, and bedding more than doubled from 3.2% to 6.6%. These substantial increases suggest strategic timing to capture consumer attention during peak shopping days.
Share of Search: Brand Visibility Trends
Mattress brand Slumber Solutions saw the highest share of search at 21.8% pre event and 26.1% during Black Friday week. Meanwhile, another mattress brand Swedrea led all brands with a remarkable 10.8% surge in visibility, jumping from 8.8% to 19.6%. Budget-friendly furniture brand Clickbin gained 9.2%, while window treatment brand Sun Zero increased 9% and home textiles brand Safavieh surged 8.6%.
Premium and established brands also performed well: Caraway Home (cookware) rose 6.6%, mattress brand Serta gained 5.3%, and Slumber Solutions added 4.4%. Royal Gourmet, specializing in outdoor cooking equipment, gained 2.0%.
However, several mid-tier brands faced steep declines. Addison Rugs dropped 6.9% from 8.5% to just 1.6%, while Sunlifer fell 6.8 % and Maxax declined 6.4 %.
Health & Beauty
Our analysis of 6,474 SKUs reveals subcategory-level insights and dramatic brand visibility shifts that highlight the evolving German beauty landscape.
Subcategory Discount Analysis
Pre-Black Friday discounts averaged 10%, with Black Friday Week adding 4.5% on average. Fragrance led pre-sale discounting at 11.6%, positioning perfumes and colognes as attractive early holiday purchases. However, Fragrance saw the smallest Black Friday Week addition at just 2.8%.
Hair Care and Skincare both showed strong performance across both periods, with Hair Care at 11.1% pre-sale and 4.9% during Black Friday Week, while Skincare registered 10.9% and 5.1% respectively. Skincare’s 5.1% Black Friday Week discount was the highest in the category.
Men’s Grooming stood apart with notably lower discounts at 3.3% pre-sale and 2.6% during Black Friday Week, suggesting either tighter margins in this subcategory or strategic positioning at different price points.
Share of Search: Brand Visibility Trends
L’Oréal Deutschland GmbH emerged as the most visible brand, surging from 37.7% to 51.9%, (+14.2). German pharmaceutical cosmetics company Medicos Kosmetik GmbH & Co. KG gained 4.4 %. Clinique gained 3.3 %, and French luxury brand Sisley added 3.1 %, German natural cosmetics brand Weleda rose 2.7 %, and Japanese prestige brand Shiseido gained 2.5 %.
The flip side? K-beauty brands and some international names faced significant challenges. Viral make-up brand Tirtir experienced the steepest decline visibility, dropping by 9.2 %. Aveda fell 6.2 %, Elizabeth Arden dropped 5.8 %, and Beauty of Joseon declined 3.8 %. German pharmacy brand Mi.to. Pharm GmbH lost 4.3 %, while Israeli makeup brand GA-DE fell 3.3 %.
The data reveals a clear German preference for European beauty heritage, pharmaceutical-grade cosmetics, and established prestige brands during Black Friday, rather than trendy K-beauty products or mid-tier international brands.
Grocery
While Grocery typically sees more modest discounts compared to discretionary categories, the German market showed interesting patterns with Black Friday Week discounts (3.5%) actually exceeding Pre-Black Friday levels (2.6%). Our analysis of 4,378 SKUs shows how German retailers approached promotions across essential and indulgent subcategories.
Subcategory Discount Analysis
Pre-Black Friday discounts averaged just 2.6% in grocery. But Black Friday Week saw this surging to 3.5%, an increase that represents the highest proportional jump among all categories.
Pet Products and Household Essentials led discounting, with Pet Products at 4.6% pre-sale and an additional 5.5% during Black Friday Week. Meanwhile Household Essentials registered 4.9% and 5.4% respectively.
Beverages showed particularly strong Black Friday Week performance, jumping from 3.3% to 5.3%, while snacks doubled from 1.7% to 3.4%. Fresh categories maintained minimal promotional activity consistent with perishable inventory constraints: Meat & Seafood saw negligible discounts (0.6% pre-sale, 0.4% Black Friday Week), while Fresh Produce actually decreased from 2.4% to 2% during the main event.
Share of Search: Brand Visibility Trends
365 by Whole Foods saw the highest share of search at 9% pre event and 12% during Black Friday week. But Sprite led all brands with a 5.1% surge in share of search. Meanwhile, sister brand Coca-Cola experienced one of the steepest declines in our analysis, with visibility plummeting from 6.0% to just 0.1%. Fanta maintained modest search growth at 0.5 %. This stark divergence between two brands from the same parent company suggests vastly different promotional strategies during Black Friday Week.
Specialty and organic food brands performed well: Amy’s (organic/natural foods) gained 3.6 %, while spice brand McCormick surged 3.1 %. Pet food brand Nutro gained 1.7 %, while value-oriented Great Value added 0.8 %.
Snack brand Planters gained 0.4 %. On the decline side, Organic Valley dropped 2.8 %, Kraft Mac & Cheese fell 2.4 %, and Swanson’s declined 1.1 %.
Apparel
Apparel in the German market showed modest promotional activity compared to other markets, with Pre-Black Friday discounts averaging 5.9% and Black Friday Week at 5.2%. Our analysis of 2,321 SKUs reveals interesting patterns across fashion segments in the German market.
Subcategory Discount Analysis
Footwear dominated discounting in both periods, with an impressive 23.3% pre-sale discount, and 15% additional discount during Black Friday Week. Men’s Clothing followed at 12.5% pre-sale, with additional 7.5% during Black Friday Week.
Activewear presented a unique pattern, with discounts increasing from 7.2% pre-event to additional 9.1% during Black Friday Week: one of the few subcategories to show higher discounts during the main event. Plus Size Clothing saw minimal promotional activity at 0.5% pre-sale and 0.7% during Black Friday Week, the lowest discounts in the entire category.
Share of Search: Brand Visibility Trends
Danish fashion brand Jack & Jones experienced an unprecedented surge with a staggering 19.4% gain in visibility. Sister brand Vero Moda (also owned by Jack & Jones’ parent company Bestseller) maintained flat visibility at 7.1%. Footwear brand Chaoren gained 7%. Meanwhile activewear giant Under Armour rose by 5%.
However, established sportswear giants suffered dramatic visibility losses. Adidas experienced an 11.6% decline in share of search. Dream Pairs saw visibility drop by 10.2%, Puma fell 8.4%, and plus-size brand Just My Size declined by 3.8 %.
Want to understand how DataWeave’s pricing intelligence platform can help your business make data-driven decisions during peak sales events? Contact us to learn more about competitive insights, price intelligence, assortment analytics, content analytics, and digital shelf analytics.
Check out our analysis on Black Friday Pricing and Discount trends in the USA and UK. Follow our blog for more insights on retail pricing trends, brand visibility analysis, and data-driven commerce intelligence.
Black Friday 2025 saw British shoppers spend an average of £430 each this year representing a £91 increase from last year and totaling over £10.2 billion across the sales period.
The 2025 sales event arrived at a pivotal moment for UK retail. Retail sales fell 1.1% in October 2025 as consumers held back spending in anticipation of Black Friday promotions, according to the Office for National Statistics. Over 2 in 5 UK adults participated in Black Friday shopping, with 45% planning to pick up Christmas gifts at a discount, according to a Barclays study.
Against this backdrop of cautious optimism and strategic consumer behavior, how did retailers and brands perform across key categories this Black Friday? At DataWeave, we conducted a comprehensive analysis of Black Friday 2025 discounting trends across five major categories in the UK market: Consumer Electronics, Home & Furniture, Health & Beauty, Grocery, and Apparel. Our AI-powered pricing intelligence platform monitored over 71K SKUs across leading UK retailers like Costco, Selfridges, Boots, Debenham’s, Carethy, Argos, John Lewis, Amazon, and more, revealing fascinating patterns in how retailers and brands approached this year’s sale season.
Our Methodology
For this analysis, DataWeave monitored average discounts across leading UK retailers during two distinct periods:
Pre-Black Friday: November 6 – November 23, 2025 – capturing early holiday deals and baseline pricing
Additional Discounts During Black Friday Week: November 24 – December 1, 2025 – covering Thanksgiving week through Black Friday (November 28) and Cyber Monday (December 1)
Our sample encompassed the top-ranked products across subcategories on major retail sites. We also analyzed Share of Search data, which measures brand visibility by monitoring which brand names appear in the top 20 search results for critical keywords.
Black Friday 2025 UK: The Big Picture
Our analysis covered 71,642 SKUs across five major categories. Here’s the snapshot of average discounts during the Pre-Black Friday period compared to Black Friday Week:
Key Insight: Pre-Black Friday discounts were substantial across all categories. This suggests UK retailers front-loaded their promotions to capture early holiday shoppers, with additional discounts during Black Friday Week adding to the baseline discounts already in place. The extended promotional period transformed Black Friday from a single-day event into a month-long campaign, with 60% of UK shoppers beginning their deal searches as early as October.
Consumer Electronics
Consumer electronics remains a cornerstone of Black Friday shopping in the UK, with technology accounting for 48% of planned consumer spending during the sales period, according to PwC.
AI is transforming how consumers shop for electronics, with AI-driven traffic to retail sites expected to rise 410% year-on-year during the 2025 holiday season. Younger shoppers particularly embraced AI tools, with 17% of Gen Z consumers using AI platforms like Chat GPT and Gemini to source and compare deals. Our analysis of 10,297 SKUs reveals how discounts varied across subcategories and which brands dominated search visibility.
Subcategory Discount Analysis
Pre-Black Friday discounts averaged 11.1% across subcategories, while Black Friday Week saw an additional 2.3% discount on average. Audio & Video products led the pre-sale discounting at 16.3%, indicating retailers were eager to move inventory early in the season.
During Black Friday Week, Home Automation saw the highest additional discount at 2.8%. Wearables and Computers both saw solid 2.5% additional discounts, making them attractive categories during the peak shopping period.
Share of Search: Brand Visibility Trends
Our Share of Search analysis reveals significant shifts in brand visibility during Black Friday Week:
Bose dominated with its Share of Search more than doubling from 11.3% to 23.8%, a remarkable +12.5% gain. Lighting brand Philips Hue followed, gaining by +5.4% in share of search during Black Friday week. Notably, Meta, with it’s range of wearables, stands out for a +3.1% increase in visibility.
Apple’s Share of Search jumped from 10.1% to 16.4%, a gain of 6.4%. At the same time, Fitbit’s share dropped nearly 11%, the steepest decline in the entire electronics category. Meanwhile, Samsung and HP also lost on visibility this Black Friday in the UK.
Home & Furniture
The Home & Furniture category continues to attract UK consumers during Black Friday, though with a more measured discounting approach compared to other categories. Our analysis of 16,487 SKUs shows how discounts were distributed across subcategories.
Subcategory Discount Analysis
Home & Furniture saw Pre-Black Friday discounts averaging 9.1%, with Black Friday Week adding just 1% on average, the lowest additional discount among all categories. Furniture led pre-sale discounts at 13.7%, followed by Bedding at 11.9%. This suggests retailers aggressively promoted larger home goods early in the season to capture deal-seekers.
During Black Friday Week, Kitchenware saw the highest additional discount at 1.9%, making it attractive for holiday cooking and gifting needs. Conversely, Lighting saw minimal additional promotion at just 0.5%.
Share of Search: Brand Visibility Trends
Made.com, the contemporary furniture brand, saw visibility surge during Black Friday with an impressive 8.9% increase. Similarly, emerging mattress brand Vesgantti gained 5.4%. Rug specialist Gooch Oriental also made significant gains with a 4.9% increase.
On the flip side, British heritage brands faced challenges. Both Laura Ashley and Julian Bowen saw share of search drop 2.2%. Premium mattress maker Vispring also declined 2.1%, while French cookware brand Le Creuset fell 1.9%.
Health & Beauty
Health & Beauty has emerged as a growth engine during Black Friday in the UK. The beauty industry is projected to grow 5% annually through 2030 according to a McKinsey survey. The category continues to demonstrate resilience even as consumers show caution in other discretionary categories. Our analysis of 15,816 SKUs reveals fascinating subcategory-level insights and dramatic brand visibility shifts that highlight evolving consumer preferences in the beauty space.
Subcategory Discount Analysis
Health & Beauty presented a unique discounting pattern compared to other categories. Pre-Black Friday discounts averaged 14.4%, the second-highest among all categories. But Black Friday Week discounts were also robust at 6.1%, the highest additional discount increase.
Hair Care led both periods with 16.4% pre-sale discounts and an additional 6.4% during Black Friday Week. Skincare saw the highest Black Friday Week discount at 6.9%, suggesting retailers strategically saved their best skincare promotions for the main event when consumers are actively seeking holiday gift sets. Men’s Grooming stood apart with strong pre-sale discounts of 12.5% but more modest Black Friday Week additions of just 2.3%.
Share of Search: Brand Visibility Trends
The UK Beauty category saw some of the most dramatic Share of Search swings in our analysis.
Himalaya, the Ayurvedic skincare brand, dominated the category with a stunning 16.8% gain. British cult favorite Dr. Pawpaw exploded from 3.7% to 11.8%, a gain that reflects the brand’s growing mainstream appeal. Face the Future, the skincare specialist, also gained significant ground with a 4.9% increase.
Budget-friendly British brand Q+A continued its momentum, rising 4%, while prestige names like Guerlain and Tous each gained 3.8%.
Italian natural beauty brand L’Erbolario saw the steepest decline, with visibility dropping by 9%. Haircare brand Noughty fell 6.1%, and eco-beauty brand So Eco declined by 5.1%.
Grocery
While Grocery typically sees more modest discounts compared to discretionary categories, the sector remains a critical part of Black Friday shopping in the UK, particularly as consumers prepare for holiday entertaining and gifting. Our analysis of 11,979 SKUs shows how UK retailers approached promotions across essential and indulgent subcategories.
Subcategory Discount Analysis
Grocery had the lowest discounts across all categories, reflecting the already-thin margins in food retail. Pre-Black Friday discounts averaged just 5.7%, with Black Friday Week adding only 1.2%. Pet Products led pre-sale discounts at an impressive 13%, significantly outpacing other grocery subcategories.
Beverages and Household Essentials followed with 9.4% and 7.7% pre-sale discounts respectively, and maintained their lead during Black Friday Week with 1.7% and 1.5% additional discounts each. Fresh categories like Meat & Seafood (1.4% pre-sale, 0.6% Black Friday Week) and Frozen Foods (1.7% pre sale, 0.6% additional discounts during Black Friday week) saw minimal promotional activity, consistent with perishable inventory constraints and tight margins.
Share of Search: Brand Visibility Trends
Doritos led with a 7.3% surge in visibility. Pepsi delivered an equally impressive performance, rising from 3.6% pre Black Friday to 10.7% during Black Friday week. Fanta too saw 5.2% gain in share of search.
Conversely, Coca-Cola gained more modestly at 1.6%, while its Sprite brand actually declined 0.9%.
Apparel
Apparel remains a Black Friday staple in the UK and is projected to deliver the strongest year-on-year growth of any UK retail segment this festive season. With clothing accounting for 39% of planned Black Friday purchases, the category represents one of the most hotly contested battlegrounds during the sales period.
Our analysis of 17,063 SKUs, the largest category in our study, reveals interesting patterns across fashion segments that demonstrate both the opportunities and competitive intensity in UK apparel retail.
Subcategory Discount Analysis
Apparel showed the strongest discounting activity throughout the BFCM period among all categories. Pre-Black Friday discounts averaged 17.2%, with Black Friday Week adding 3.5%, making it one of the most heavily promoted categories.
Activewear led pre-sale discounts at an impressive 26.7%, with an additional 4.5% discount during Black Friday week. Plus Size Clothing and Men’s Clothing tied for second place in pre-sale discounts at 21.9% each. Notably, Plus Size Clothing saw the highest Black Friday Week discount at 5.4%.
Women’s Clothing saw robust discounts throughout, with 20.8% pre-sale and an additional 6% during Black Friday Week (the highest additional discount in the category).
Share of Search: Brand Visibility Trends
White Stuff, the British lifestyle brand, saw a 7.2% surge in visibility during Black Friday. Y2K fashion made a statement as Juicy Couture jumped 5.8 %. Fast fashion player Pretty Little Thing gained in visibility by 5.2%. Comfort brands performed strongly, with Skechers gaining 4.5% and activewear specialist Sweaty Betty rising 3.4%. Even premium denim brand Levi’s gained ground, increasing share of search by 2.2%.
However, retail giants faced significant visibility challenges. John Lewis saw the steepest decline in the Apparel category, with share of search dropping by 10.6% during Black Friday week. Fast fashion giant Boohoo declined 2.5%. Premium accessory brand Coach’s share fell 4.9%.
The data suggests UK consumers gravitated toward distinctive brands with clear identities during Black Friday, whether heritage British labels, Y2K nostalgia, or comfort-focused specialists, rather than generalist retailers or fast fashion platforms.
Want to understand how DataWeave’s pricing intelligence platform can help your business make data-driven decisions during peak sales events? Contact us to learn more about competitive insights, price intelligence, assortment analytics, content analytics, and digital shelf analytics.
Black Friday 2025 shattered records once again. U.S. consumers spent a record $11.8 billion online on Black Friday, a 9.1% increase from 2024 and the first time online sales exceeded $11 billion. The National Retail Federation (NRF) projects holiday retail sales (November-December) to grow 3.7% to 4.2% over 2024, with total holiday spending expected to surpass $1 trillion for the first time ever. Against this backdrop of robust consumer spending, how did leading retailers and brands perform across key categories this Black Friday?
At DataWeave, we conducted a detailed analysis of Black Friday 2025 pricing trends across five major categories: Consumer Electronics, Home & Furniture, Health & Beauty, Grocery, and Apparel. Our AI-powered pricing intelligence platform monitored nearly 80,000 SKUs across leading U.S. retailers like Amazon, Walmart, Target, Macy’s, Home Depot, Sephora, and more, revealing interesting patterns in how retailers and brands approached this year’s sale season.
Our Methodology
For this analysis, DataWeave monitored average discounts across leading U.S. retailers during two distinct periods:
Pre-Black Friday: Up to November 23, 2025 – capturing early holiday deals and baseline pricing
Additional Discounts During Black Friday Week: November 24 – December 1, 2025 – covering Thanksgiving week through Black Friday (November 28) and Cyber Monday (December 1)
Our sample encompassed the top-ranked products across subcategories on major retail sites. We also analyzed Share of Search data, which measures brand visibility by monitoring which brand names appear in the top 20 search results for critical keywords.
Black Friday 2025: The Big Picture
Here’s the snapshot of average discounts during the Pre-Black Friday period compared to Black Friday Week:
Key Insight: Pre-Black Friday discounts were significant across all categories. This suggests retailers front-loaded their promotions to capture early holiday shoppers, with additional discounts during Black Friday Week adding to the baseline discounts already in place.
Consumer Electronics
Consumer electronics remain one of the most anticipated categories during Black Friday and Cyber Monday. Notably, AI traffic to retail websites grew 805% year-over-year, with consumers using AI tools most frequently for video games, appliances, and electronics categories. Our analysis of 10,356 SKUs reveals how discounts varied across subcategories.
Subcategory Discount Analysis
In Consumer Electronics, Pre-Black Friday discounts averaged 14.6% across subcategories, while Black Friday Week saw an additional 2.6% discount on average. Audio & Video products led the pre-sale discounting at 17.5%, indicating retailers were eager to move inventory early. During Black Friday Week, Audio & Video, Accessories, and Wearables saw the highest additional discounts (2.9-3 %), while Computers and Storage had already been heavily discounted pre-sale, leaving minimal room for further reductions during the main event.
Share of Search: Brand Visibility Trends
Our Share of Search analysis reveals significant shifts in brand visibility during Black Friday Week:
The Takeaway: Our analysis reveals significant shifts in brand visibility during Black Friday Week compared to the pre-sale period. Computing and mobile-focused brands like Apple and Asus gained substantial ground, while audio brands like Logitech, JBL, and Beats saw their visibility plummet. Apple’s Share of Search jumped from 1.58% to 6.2%, a gain of 4.6%, suggesting strong promotional activity or heightened consumer interest. Meanwhile, Logitech dropped nearly 8%, from 9.9% to just 1.2%.
Home & Furniture
The Home & Furniture category continues to be a consumer favorite during Black Friday. Our analysis of 12,610 SKUs shows how discounts were distributed across subcategories.
Subcategory Discount Analysis
Home & Furniture saw Pre-Black Friday discounts averaging 13.9%, with Black Friday Week adding just 1.7% on average, the second-lowest additional discount among all categories. Bedding led pre-sale discounts at an impressive 18.6%, followed by Furniture at 16.4% and Outdoor at 15.1%. This suggests retailers aggressively promoted home goods early in the season to capture deal-seekers.
During Black Friday Week, Bedding maintained leadership with 2.4% additional discounts, while Kitchenware saw the smallest bump at just 0.9%, indicating early promotions had already captured most of the discount opportunity.
Share of Search: Brand Visibility Trends
The Takeaway: The Home & Furniture category saw some of the most dramatic Share of Search swings in our entire analysis. Emerging and value-oriented brands dominated the gains, with Swedrea surging from 8.7% to 19.6%, a remarkable 10.8% increase. Similarly, Clickbin and Costway each gained over 9%. On the flip side, established premium brands like Beautyrest and Livabliss saw sharp visibility declines, dropping over 7-8%.
Health & Beauty
Health & Beauty has emerged as a growth engine during Black Friday. The beauty industry is projected to grow 5% annually through 2030 according to a McKinsey survey. Our analysis of 16,141 SKUs reveals subcategory-level insights.
Subcategory Discount Analysis
Notable finding: Health & Beauty presented a unique discounting pattern compared to other categories. Pre-Black Friday discounts averaged just 7.1%, the second-lowest among all categories. But Black Friday Week discounts were relatively strong at 4.8%. This indicates the Beauty category held back more discounts for the main event.
Notably, Hair Care was the only subcategory across our entire analysis where Black Friday Week discounts (6%) exceeded Pre-Black Friday discounts (4.6%), suggesting retailers strategically saved their best hair care promotions for the big weekend. Fragrance led pre-sale discounts at 13%, making it an attractive early shopping category.
Share of Search: Brand Visibility Trends
Health & Beauty saw some of the most dramatic Share of Search swings in our analysis, driven largely by celebrity-backed brands. Rare Beauty by Selena Gomez exploded from just 1.9% to 13.7%, a whopping 11.8% gain that made it the biggest winner across all categories. Haus Labs by Lady Gaga also surged (+4.1%), while prestige brands like Dior (+2.6%) and Clinique (+2.4%) gained ground.
The flip side? Retailer private labels took a hit: Beauty Finds by ULTA Beauty collapsed from 24% to 13.7% (-10.3%), and Sephora Collection dropped from 19.8% to 16.0% (-3.8%).
Key Takeaway: The Beauty category tells a compelling story about the power of celebrity brands during Black Friday. The Share of Search shifts appear to reflect how retailers and brands recalibrated their promotional focus for Black Friday. Celebrity-driven lines rose sharply in visibility, suggesting stronger placement, promotion, or search prioritization during the sale period. At the same time, private-label ranges from ULTA and Sephora lost ground, indicating a pivot away from house-brand visibility in favor of more spotlighted national and prestige brands throughout the event.
Grocery
While Grocery typically sees more modest discounts compared to discretionary categories, the sector remains a critical part of Thanksgiving weekend shopping. According to the National Retail Federation, grocery stores and supermarkets ranked as the third most popular shopping destination during Thanksgiving weekend, with 40% of consumers making purchases there. Our analysis of 18,823 SKUs shows how retailers approached promotions across essential and indulgent subcategories.
Subcategory Discount Analysis
Grocery had the lowest discounts across all categories, reflecting the already-thin margins in food retail. Pre-Black Friday discounts averaged just 5.2%, with Black Friday Week adding only 1.5%. Household Essentials and Beverages led pre-sale discounts at 6.9% and 6.7% respectively, and maintained their lead during Black Friday Week with 2.2% additional discounts each. Fresh categories like Meat & Seafood (1.4% pre-sale, 1% Black Friday Week) and Frozen Foods (3.3%, 1%) saw minimal promotional activity, consistent with perishable inventory constraints and tight margins.
Key Takeaway: Grocery discounting remains conservative, with shelf-stable and household items seeing the most promotional activity. The Beverages and Household Essentials subcategories, which have longer shelf life and higher margins, were the primary battleground for grocery promotions during BFCM 2025.
Share of Search: Brand Visibility Trends
The Grocery category saw some surprising Share of Search swings during Black Friday Week. Most notably, there was a dramatic divergence between beverage giants: Sprite surged from 1.7% to 6.8% (+5.1%), while Coca-Cola collapsed from 6% to just 0.1% (-5.9%). This stark contrast suggests vastly different promotional strategies or algorithmic visibility changes between the two brands. Private label 365 by Whole Foods Market continued its steady rise, gaining 3%, reflecting ongoing consumer interest in store brands as shoppers seek value.
The Sprite vs. Coca-Cola divergence is one of the most striking findings in our analysis. Additionally, brands like Amy’s (organic/natural foods) and McCormick (spices/seasonings) gained significant visibility.
Apparel
Apparel remains a Black Friday staple and performed strongly this year. Our analysis of 21,749 SKUs (the largest category in our study) reveals interesting patterns.
Subcategory Discount Analysis
Apparel showed strong discounting activity throughout the BFCM period. Pre-Black Friday discounts averaged 13.8%, with Black Friday Week adding 3.8%, the highest additional discount among all five categories. Men’s Clothing and Women’s Clothing led pre-sale discounts at 17.7% and 17.5% respectively, reflecting aggressive early promotions on core apparel. Interestingly, Plus Size Clothing saw the highest Black Friday Week discount at 5.4%, suggesting retailers pushed harder during the main event to drive conversions in this segment. Kids’ Clothing also saw strong Black Friday Week discounts at 4.4%.
Share of Search: Brand Visibility Trends
Apparel saw dramatic Share of Search movements during Black Friday Week. Fashion-forward brands dominated the gains: Madewell surged from 6.9% to 16.1% (+9.2%), while Alice + Olivia jumped from 14.7% to 23.6% (+8.9%). Nike also performed strongly with a 7.1% gain. Conversely, outdoor and athletic brands faced steep declines: The North Face dropped from 18.4% to 5.9%, a massive 12.5% decline, the largest in our entire analysis. Adidas fell 7.7%, Beyond Yoga declined 5.3%, and luxury brand Coach by 5%.
Key Takeaway: The data suggests fashion-forward and lifestyle brands (Madewell, Alice + Olivia, Saint Laurent) gained visibility at the expense of outdoor/athletic brands (The North Face, Adidas, Beyond Yoga). This could indicate that fashion brands invested more heavily in promotional visibility during the sale period.
Want to understand how DataWeave’s pricing intelligence platform can help your business make data-driven decisions during peak sales events? Contact us to learn more about competitive insights, price intelligence, assortment analytics, content analytics, and digital shelf analytics.
Follow our blog for more insights on retail pricing trends, brand visibility analysis, and data-driven commerce intelligence.
AI-powered product matching is the backbone of competitive pricing intelligence. Accurate matches help you compare prices correctly, identify meaningful assortment gaps, and optimize product content. Inaccurate matches distort every one of these insights. In some categories, a single mismatch can cause millions of dollars of lost revenue.
Retailers and brands know this problem well. Product catalogs are vast. Competitor assortments shift daily. Titles are inconsistent. Product codes are missing. Images vary by region or packaging. Basically, context matters, and AI alone often misses that context.
This is why a human-in-the-loop approach is essential. It allows product matches to be verified consistently, at scale, and with the context that only people can provide. Many retailers have also told us they want to take this a step further. They want the ability to control and define their own product matches.
Sometimes that is because they need to fix inevitable errors quickly. Other times, it is because their teams have deeper category knowledge and can make the right judgment calls when AI falls short.
To make that possible,DataWeave introduced User-Led Match Management. It combines the scale of AI with the judgment of experts within retail organizations. The platform does not just suggest matches. It gives your teams the tools to approve, reject, or refine them. This ensures your competitive intelligence reflects both machine precision and your unique business logic.
Why AI Matching Alone Falls Short
AI has changed the speed and scale of product matching. Algorithms can process millions of SKUs quickly. They can detect similarities in text, images, and metadata. But in retail, the stakes are too high to rely on AI alone.
Here is where AI sometimes falls short:
Category complexity: Matching rules that work in electronics may fail in fashion or grocery. An electronics SKU may depend on a model number. A fashion SKU may depend on seasonality. A grocery SKU may depend on pack size or whether it is a private label.
Data inconsistency: Titles vary. Images differ across regions. These gaps, when large, trip up algorithms.
Business context: Should a premium product ever be compared against a budget line? Should seasonal products match year-round items? AI may not know these boundaries.
Scale vs. accuracy: Automated systems optimize for coverage. That speed often limits accuracy for a small set of SKUs. Even a 1% error rate across millions of SKUs creates thousands of bad comparisons.
AI is critical for scale. But accuracy requires human input. DataWeave’s human-in-the-loop framework addresses this by allowing expert reviewers to validate and improve AI outputs. Our user-led match management takes this further by putting control directly into the hands of your business teams.
What DataWeave’s User-Led Match Management Delivers
With User-Led Match Management, your team is not a passive reviewer. They become active participants in shaping the accuracy of your competitive intelligence.
Your teams can:
Approve, reject, or flag AI-suggested matches. Every suggestion comes with full visibility into why it was made. Your team can validate matches quickly, fix errors, and improve the dataset in real time.
Define what “similar” means for your business. A retailer may want to compare multipacks against single packs. A brand may only care about comparing premium products to other premium products. With User-Led Match Management, your team sets tolerance levels that match your strategy.
Manually add or refine matches. When AI misses edge cases, your team can add them. This ensures coverage is complete and reflects the true competitive landscape.
This approach creates a loop where AI, complemented by DataWeave’s human-in-the-loop framework does the heavy lifting, and your teams can fine-tune the results. The outcome is both scale and accuracy.
Key Features
DataWeave designed User-Led Match Management to be simple, intuitive, and scalable:
Expert-Led Decision Making forms the heart of the system. Rather than trusting AI suggestions blindly, teams gain full visibility into matching logic and can leverage their contextual knowledge of products, categories, and retailers. When the system suggests matching a premium product against a basic alternative, human experts can reject the match and flag it for different criteria. This expertise is particularly valuable for new product launches, seasonal items, or products with complex positioning strategies.
Business Logic Integration: Teams can define matching parameters that reflect their specific strategic needs. A premium brand might establish rules that prevent matches against budget alternatives, while a value retailer might specifically seek those comparisons. Category managers can create different matching criteria for different product lines, ensuring that seasonal items, limited editions, and promotional products are handled appropriately.
Transparent Decision Making: Every match decision creates an audit trail capturing who made the decision, when it occurred, and the reasoning behind it. This transparency is crucial for enterprise environments where pricing decisions need to be defensible and strategies need to be consistent across teams and time periods.
Scalable Validation: User-Led systems provide bulk operations for efficiency while maintaining oversight. Teams can upload thousands of matches for validation, use filtered views to focus on high-priority items, and leverage automated alerts for matches that fall outside established tolerance levels.
Each of these features reduces the friction between AI outputs and business-ready insights.
Technical Foundation
The AI foundation behind User-Led Match Management is built for precision and scale.
It uses multimodal AI that combines text, image, and metadata analysis to identify matches even when products are described or displayed differently across retailers.
Domain heuristics apply retail-specific logic, recognizing that “Large” means something different in apparel than in beverages, and that seasonal items require unique treatment.
Knowledge graphs link products across brands, categories, and regions to reveal true relationships even when surface attributes vary.
Through continuous learning, every human correction improves future AI suggestions, making the system smarter and more accurate over time.
With DataWeave, accurate and reliable product matching is the standard. Advanced algorithms and built-in quality checks deliver consistently high accuracy, reducing the risk of mismatched products and unreliable insights.
In the few cases where a match needs review, User-Led Match Management gives your team the ability to validate it quickly and easily. You get full visibility and control, while DataWeave ensures the integrity of the overall matching framework.
The outcome is true apples-to-apples price comparisons that protect margins, strengthen pricing strategies, and build trust in every decision.
Assortment Analytics
Gaps and overlaps only matter when matches are accurate. To understand your true competitive landscape, you need to eliminate false gaps and phantom overlaps that distort assortment insights.
DataWeave’s advanced Match Management ensures precise product alignment across retailers, categories, and regions, giving you a clear view of your position in the market. At the same time, user-led oversight adds transparent validation, allowing your teams to confirm or refine matches based on their category knowledge.
The result is a complete and trustworthy view of category coverage that reflects reality, not noise. It helps you identify real opportunities to expand assortments, close gaps, and respond quickly to market changes.
Content Optimization
Digital shelf audits only deliver value when the comparisons are accurate. DataWeave ensures that every product is benchmarked against its true competitors so that your insights reflect the real dynamics of your category. For example, a luxury serum is never compared to a basic moisturizer, and a premium electronic device is never matched with an entry-level model.
With user-led control, your teams have transparent oversight of every match. They can review, validate, or adjust comparisons to make sure each audit aligns with your business standards. The result is a more reliable and actionable view of your digital shelf performance, helping you fine-tune content, optimize visibility, and strengthen conversion across channels.
Trust and Accountability
Leadership teams need complete confidence in the data they use to make decisions. User-Led Match Management delivers that confidence by combining the scale of AI with the assurance of human validation. Every match decision is transparent and traceable, giving teams clear visibility into how and why a product was matched.
This approach builds trust across departments, from analysts to executives. It ensures that every pricing, assortment, and content decision is backed by data that is both accurate and accountable.
Your Market, Your Rules, Your Insights
Retailers and brands today need more than fast data. They need data they can trust, shape, and act on with confidence. User-Led Match Management gives them that control. It turns product matching from a static, automated process into a dynamic, collaborative workflow that adapts to how real teams operate.
Category managers can fine-tune match rules instead of waiting on system updates. Pricing teams can validate critical SKUs in minutes, not days. Digital shelf teams can ensure their audits reflect real competitors, not algorithmic guesses. Executives gain visibility into decisions they can stand behind, supported by transparent data trails and measurable accuracy.
In short, User-Led Match Management puts control back where it belongs – in your hands. It helps every team move faster, compete smarter, and make decisions powered by data they can truly believe in.
Every major shift in commerce has been driven by data. A century ago, shopkeepers relied on ledgers to track sales. In the supermarket era, loyalty cards and barcodes turned transactions into insights. With the rise of eCommerce, clickstream data and online analytics reshaped how products were merchandised and sold.
Now, we are entering the next chapter: agentic commerce.
In this new paradigm, autonomous AI agents will handle the tasks that once required teams of analysts, merchandisers, and pricing specialists. Imagine an agent that monitors competitor prices across dozens of retailers, recommends adjustments, and pushes updates to a dynamic pricing engine, all in real time. Picture a shopper’s digital assistant scanning marketplaces for the right mix of price, delivery time, and customer reviews before making a purchase on their behalf.
These aren’t distant scenarios. They’re unfolding now. Industry analysts estimate the enterprise AI market at $24 billion in 2024, projected to grow to $155 billion by 2030 at nearly 38% CAGR . Meanwhile, 65% of organizations already use web data for AI and machine learning projects, and 93% plan to increase their budgets for it in 2024. The trajectory is undeniable: the next era of commerce will be built on AI-driven decision-making.
And what fuels those AI-driven decisions? Data. Reliable, structured, timely, and compliant data.
The Data Problem No One Can Ignore
Here’s the paradox: just as data has become most critical, it has also become harder to acquire.
For data and engineering leaders, the challenges are painfully familiar:
Old school scrapers that collapse whenever a site changes its HTML or introduces new interactivity.
Constant maintenance cycles, with engineering teams spending 20-40 hours a week debugging, rerunning, and patching scripts.
Low success rates, with in-house approaches succeeding just 60-70% of the time.
Complex infrastructure, from managing proxies to retry logic, pulls attention away from higher-value work.
But the costs go far beyond engineering frustration.
For retailers, broken pipelines mean competitive blind spots. A pricing team without reliable visibility into competitor moves can’t respond fast enough, risking lost margin or missed sales. Merchandising teams trying to optimize assortments are left with incomplete data, making poor stocking decisions inevitable.
For brands, unreliable data disrupts visibility into the digital shelf. Products might be misplaced in search rankings, content could be outdated or incomplete, and reviews could signal issues, but without continuous monitoring, those signals are missed until it’s too late.
For AI and ML teams, poor-quality training data means underperforming models. Without clean, consistent, and large-scale inputs, even the most sophisticated algorithms produce flawed predictions.
Finally for consulting firms and research providers, fragile collection systems can compromise credibility. Clients expect robust, evidence-backed recommendations. Data gaps erode trust.
The reality is stark: fragile pipelines don’t just waste engineering hours. They undermine competitive agility, customer experience, and business growth.
Enter the Data Collection API
DataWeave’s Data Collection API is a self-serve, enterprise-scale platform designed to deliver the data foundation today’s enterprises need, and tomorrow’s agentic AI systems will demand.
At its core, the API replaces brittle scrapers and ad hoc tools with a resilient, adaptive, and compliant data acquisition layer. It combines enterprise reliability with retail-specific intelligence to ensure that structured data is always available, accurate, and ready to power critical workflows.
Here’s what makes it different:
Enterprise-scale throughput: The API can process thousands of URLs in a single batch or handle continuous, high-frequency scrape. Whether you need daily pulses or near real-time monitoring, it scales with you.
Flexible access modes: Technical teams can integrate directly into internal workflows via API, while business users can configure jobs through a no-code interface. Everyone gets what they need without bottlenecks.
Adaptive resilience: As websites evolve, the API adapts automatically. No frantic patching, no firefighting.
Structured outputs, your way: Clean JSON, CSV, or WARC formats are delivered directly into your environment – AWS S3, Snowflake, GCP, or wherever your data stack lives.
Built-in monitoring and self-healing: Automated retries, real-time logs, and usage dashboards keep teams in control without manual oversight.
Compliance by design: WARC-based archiving and SOC2 alignment ensure data pipelines are auditable, trustworthy, and enterprise-ready.
This isn’t about scraping pages. It’s about creating a reliable data utility, a system that transforms raw web inputs into structured, actionable data streams that enterprises can trust and scale on.
Who It’s Built For (And How They Use It)
The Data Collection API isn’t limited to one role or industry. It’s been designed with multiple stakeholders in mind, each of whom can apply it to solve pressing challenges:
Retailers and Consumer Brands
Retailers live and die by competitive awareness. With the API, pricing teams can monitor SKU-level prices and promotions across channels, ensuring they don’t leave margin on the table. Merchandising leaders can track assortment coverage, identifying gaps relative to competitors. Digital shelf teams can measure search rankings, share of voice, and content completeness. The result is faster responses, stronger category performance, and fewer blind spots in shopper experience.
AI & Machine Learning Teams
AI teams depend on data at scale. Whether training a natural language model to understand product descriptions or a computer vision system to analyze images, the Data Collection API delivers the structured, high-quality inputs they need. Reviews, ratings, attributes, and product images can all be captured and delivered at scale. For teams building predictive models, from demand forecasting to personalization, the difference between mediocre and world-class often comes down to input quality. This API ensures AI systems are always learning from the best data available.
Retail Intelligence & Pricing Platforms
Technology providers serving retailers and brands face unforgiving client expectations. Missed SLAs on data delivery can mean churn. By using the Data Collection API as their acquisition layer, platform providers gain enterprise reliability without rebuilding infrastructure from scratch. They can scale seamlessly with client needs while maintaining the integrity of the insights their customers rely on.
Marketing & Advertising Teams
For marketing leaders, competition is visible every time a shopper searches. The API enables teams to track keyword rankings, ad placements, and competitor promotions with consistency. Instead of anecdotal data or partial coverage, marketers get a full picture of their brand’s digital presence and the strategies competitors are using to capture share of voice.
Consulting Firms & Research Providers
Consultancies and market research agencies deliver strategy. But a strategy without evidence is just opinion. The API allows these firms to back every recommendation with structured, large-scale data. Whether advising on pricing, benchmarking performance, or publishing analyst research, firms can deliver trustworthy insights without taking on the cost or distraction of building fragile data pipelines.
The diversity of these use cases demonstrates why the API is a platform for collaboration across industries, ensuring every stakeholder, from engineers to strategists, has the reliable data foundation they need.
Why DataWeave, Why It Matters
Many vendors claim to deliver web data. Few can deliver it at enterprise scale, with commerce-specific expertise, and with proven ROI.
What sets DataWeave apart isn’t just that we provide data; it’s the way we do it, and the outcomes we enable.
Commerce expertise baked in: With 14+ years of experience powering the world’s leading retailers and brands, DataWeave brings domain-specific intelligence that generic scraping vendors simply can’t. Our schemas are designed for commerce. Our defaults are smarter because they’re informed by retail realities.
Adaptability without firefighting: Most tools break when websites evolve. Our API adapts automatically, minimizing the need for engineering intervention. Teams stay focused on innovation, not maintenance.
Accessible to everyone: Whether you’re a senior data engineer automating workflows or a business analyst configuring a quick scrape, the API meets you where you are with both API and no-code interfaces.
Enterprise-grade trust: Reliability and compliance are built in, not bolted on. With SLA-backed delivery, SOC2 alignment, and audit-ready archiving, the API is trusted by enterprises that can’t afford uncertainty.
This combination makes the Data Collection API not just a technical solution but a strategic partner for enterprises preparing for the age of agentic commerce.
A Foundation for the Future
The Data Collection API is more than an answer to today’s frustrating data problems. It represents a strategic foundation for tomorrow’s growth, designed to scale alongside the increasingly complex demands of commerce in the AI era.
At the heart of DataWeave’s vision is the Unified Commerce Intelligence Cloud, a layered ecosystem that transforms raw digital signals into strategic insights. The Data Collection API is the entry point, the essential first layer that ensures enterprises have a reliable supply of the most important raw material of the digital economy: data.
Collection: Enterprise-grade acquisition of web data at scale. From product pages and search results to reviews and promotions, enterprises can finally count on continuous, structured inputs without worrying about fragility or failure.
Processing: Once collected, data is normalized, enriched, and matched across sources. What was once noisy and inconsistent becomes clean, comparable, and immediately actionable.
Intelligence: On top of this foundation sits advanced analytics, solutions for pricing optimization, assortment planning, promotion tracking, and digital shelf visibility, enabling sharper decisions at the speed of the market.
This progression means enterprises don’t have to transform overnight. Many start small, solving urgent challenges like competitive price tracking or digital shelf monitoring. From there, they can expand naturally into richer intelligence capabilities, knowing that their data foundation is already strong enough to support more ambitious use cases.
And as agentic AI systems begin to take on a larger share of decision-making, the importance of that foundation grows exponentially. These autonomous systems cannot operate effectively without clean, continuous, and contextual data. Without it, even the most sophisticated AI will falter, making poor predictions or incomplete recommendations. With it, they can operate at full capacity, powering dynamic pricing, real-time demand forecasting, and personalized shopping experiences at scale.
The Data Collection API isn’t just about reducing engineering pain today. It’s about preparing enterprises to compete and win in an AI-driven marketplace that never sleeps.
Getting Started
For teams tired of fragile scrapers, this is a chance to reset. For enterprises preparing for the next era of commerce, it’s a chance to build a foundation that can scale with them.
If your teams are still struggling with generic and inflexible data scrapers, request a demo now to see the DataWeave’s Data Collection API in action.
Back in the day, pricing strategies were a lot easier. These days, not only do teams need to have robust standard price reporting workflows, but they also need to have the know-how and tools to gain and act on competitive intelligence. Retail leaders should prioritize automation and strategic thinking and ensure their teams have the tools, processes, and methodologies required to monitor the competition at scale and over the long term.
Retail leaders who recognize the distinction between standard reporting and competitive intelligence are more likely to gain team buy-in, especially when developing pricing strategies that drive results. You can’t be everywhere at once, but you can optimize pricing strategies to stay ahead of the competition.
This article has everything you need to know about the differences between standard reporting and competitive intelligence and how to use both to make your teams more effective than ever!
Understanding the Distinction
Standard price reporting is much like checking the weather to see if it’s stormy before grabbing a raincoat or sunhat. You need to do it to make essential, everyday choices, but it will not help you predict when the next storm is coming. Standard price reporting deals more with the short-term and immediate actions needed as opposed to long-term strategy.
Don’t get us wrong, standard price reporting is still an essential responsibility of a pricing team’s function—but there’s more to it. It is also lower-tech than a competitive intelligence strategy and can rely on route heuristics.
Think of it as data-in, data-out. It deals with pricing operations like:
Weekly price movements: Seeing which competitors, product categories, and individual items had pricing shifts in the short-term
Basic price indices: Outlining benchmarks to watch how your own, and your competitors’, products are trending in the market
Price competitiveness metrics: Setting thresholds that show whether your products are priced below, above, or equal to your competition for general trend reporting
Standard price reporting is fundamental for operational teams that manage price adjustments in the short term. It can also help teams remain agile and reactive to market condition changes.
It’s likely that your team already has standard reporting strategies or tools to help them with tactical execution. But are they harnessing competitive intelligence correctly with your help?
Characteristics of Competitive Intelligence
While standard price reporting is like checking the weather, competitive intelligence is like being a meteorologist who measures atmospheric changes, predicts storms, and scientifically analyzes weather patterns to keep everyone informed and in the know.
Competitive intelligence goes well beyond simply tracking price movements and benchmarking them against a single set of standards. Competitive intelligence helps steer teams in a strategic direction based on insights from the market. It can drive long-term business success and is one of your best tools to ‘steer the ship’ as a retail leader.
Here are some of the essential elements of competitive intelligence:
Strategic insights: Including but not limited to understanding your competitors’ pricing strategy, promotions, and product positioning
Market-wide patterns: Identifying trends based on geography, product category, or individual SKU across retailers to inform broader strategies
Long-term trends: Taking historical market and competitor data and combining it with real-time retail data to predict future price movements as shifts in consumer behavior to inform pricing strategies
The pricing team serves as a critical strategic partner to senior leadership, delivering the cross-functional insights and market analysis needed to inform C-suite decision-making. By equipping executives with a holistic view of the competitive landscape, pricing gaps, and emerging trends, the team empowers leadership to align pricing strategies with broader business objectives.
This partnership enables senior leaders to guide day-to-day pricing operations with confidence—ensuring tactical execution aligns with corporate goals, monitoring strategy effectiveness, and maintaining competitive agility. Through ongoing market intelligence and scenario modeling, the pricing function helps leadership proactively position the brand, capitalize on untapped opportunities, and future-proof revenue streams.
Different Audiences, Different Needs
As mentioned, there is a place for both standard price reporting and competitive intelligence. They have different roles to play, and different teams find them valuable. Since standard reporting mainly focuses on day-to-day shifts and being able to react to real-time changes, operational teams find it most useful.
On the other hand, competitive intelligence is a tool that leadership can use to shape overarching pricing strategies. The insights from competitive intelligence drive operational activities over months and quarters, whereas standard reporting drives actions daily.
To succeed in pricing, you need to rely on a combination of tactical standard reporting and competitive intelligence for long-term planning. With both, you can successfully navigate the ever-fluctuating retail market.
Price Reporting for Operational Teams
Your operational team is responsible for making pricing adjustments that directly impact sales volume. Automated data aggregation and AI-powered analytics can make this process faster and more accurate by eliminating the need for manual intervention.
Instead of spending hours identifying changes, standard reporting tools surface the most critical areas that need attention and recommend adjustments. This helps operational teams react fast to shifting market conditions.
Key functions of standard price reporting include:
Daily/weekly pricing decisions: Frequent price adjustments based on market trends will help your company remain competitive across entire product categories. With automated, real-time dashboards, your pricing team can monitor broad category-level pricing shifts and make necessary adjustments accordingly.
Individual SKU management: Not all pricing changes happen at the category level. Standard reporting also allows teams to view price and promotion changes on individual SKUs down to the zip code. It’s important to have targeted, granular insights when a change occurs even on a single SKU, especially because these individual changes are easy to miss. Advanced product matching algorithms can tie together exact products across retailers to monitor items conjointly. By incorporating similar product matching technologies beyond standard reporting, your teams can monitor individual price changes on comparable products.
Immediate action items: The best standard reporting tools alert pricing teams when there has been a change in competitor pricing and give them recommendations for what to change. If a competitor launches a flash sale or an aggressive discount program, your team should know as fast as possible which product to adjust. Without this functionality, teams can miss important changes or experience a delay in action that results in lost sales or customer perception.
Competitive Intelligence for Leadership
For Senior Retail Executives, Category Directors, and Pricing Strategy Leaders, pricing cannot only be about reacting to individual competitor price changes. Instead, you must proactively think about your market positioning and brand perception. Doing this without a complete competitive intelligence strategy can feel like throwing darts while blindfolded. Sometimes, you’ll hit the target, but mostly, you’ll miss or only come close. Competitive intelligence tools can help you hit that target every time. They leverage big data, artificial intelligence (AI), and predictive modeling to help you derive holistic insights to understand your current positioning relative to the current and future pricing landscape.
Core strategic functions of competitive intelligence include:
Strategic planning: Competitive intelligence tools can help you forecast competitor behavior, economic shifts, and category-specific patterns you’d otherwise overlook (ex, price drops before new releases, subscription or bundling trends, or seasonable price cycles). Instead of reacting to a change, your team can already have made changes or at least know what playbook to implement.
Market positioning: Geographic pricing intelligence built into competitive intelligence tools can help you understand variations across locations and optimize multiple channels simultaneously. This can be the foundation of regional pricing strategies that factor in local economies and consumer perception.
Long-term decision-making: You can use competitive intelligence technology to align your pricing strategy with upcoming seasonal trends isolated using historical data, predicted economic shifts, and changes in customer purchasing behavior. This aggregate view of the pricing landscape will help you step out of the weeds and make better company decisions.
From Data to Strategy – Transforming Basic Price Data
Shifting your focus from isolated, reactive data to broader market trends is the key to going from basic price reporting to real competitive intelligence. Never forget the importance of real-time data, but know it’s your responsibility as a leader to bring a broader viewpoint to operations.
Transforming from basic price data to competitive intelligence involves:
Harnessing the data
Pattern recognition: Your solution should help you identify repeat pricing behaviors and competitor strategies
Figuring out what to do with the data
Strategic implications: It should help you understand how your pricing changes will affect customer perception of your brand
Doing something with the insights from your data
Action planning: The solution should help you create proactive strategies that position you as a market leader, leaving your competition to try to keep up with you instead of vice versa
Leveraging Technology for Competitive Intelligence
Technology is at the heart of leveling up your standard price reporting game. If you want industry-leading competitive intelligence, you can leverage DataWeave’s comprehensive pricing intelligence solution with built-in competitive intelligence capabilities and features for your operational teams.
You can also uncover gaps and stay competitive in the dynamic world of eCommerce. It provides brands with the competitive intelligence they need to promptly adapt to market demand and competitors’ pricing. Stay ahead of market shifts by configuring your own alerts for price fluctuations on important SKUs, categories, or brands, all time-stamped and down to the zip.
And since our platform relies on human-backed AI technology, you can have complete confidence in your data’s accuracy at any scale. If you want to bring a new strategic mindset to your pricing team, consider adding competitive intelligence to your tech stack. If you want to learn more, connect with our team at DataWeave today.
The power to impose tariffs on foreign countries is one of the most impactful measures a government has at their disposal. The government can use this power for various reasons: to punish rivals, equalize trade, give domestic products a comparative advantage, or collect more funds for the federal government.
Whatever the reason, tariffs have real-world impacts on brands and retailers selling in a global economy. They effectively make products more expensive for some and comparatively cheaper for others. Since tariffs can be added or removed at the drop of a hat, retail executives, category managers, and pricing teams trying to keep up have their work cut out for them.
You’ve come to the right place if you’re wondering how to prepare for and respond to potential tariffs. The answer lies in technology that will make you flexible when you need to react to policy changes. Establishing workflows and processes embedded with pricing intelligence can help you stay competitive even when global politics intercepts your business.
Understanding Tariff Impact
Before diving into tariffs’ implications on pricing strategies, we need to understand how tariffs work and the current economic environment. Tariffs are a government’s tax on products a foreign country sells to domestic buyers. You might remember President Trump’s expanded tariff policy in September 2018. It placed a 10% tax on $200 billion worth of Chinese imports for three months before raising to a rate of 25% in January 2019. At that time, an American buyer would pay the original price of the goods plus the tax to the American government. Many additional tariffs and counter-tariffs by other countries were enacted during Trump’s first term in office, including the European Union, Canada, Mexico, Brazil, and Argentina, resulting in a trade war.
Announcements of when, where, and on what new tariffs will be imposed are unpredictable. The only predictable thing is that this type of market volatility is here to stay. Pricing teams should adjust their mindsets to assume that volatility may always be on the horizon. This is because tariffs have many cost implications. Besides the flat rate imposed by the government on a certain product, tariffs have historically raised the price of all goods.
In economic terms, tariffs create a multiplier effect. Consider a tariff placed on gasoline imported from Canada. This measure may encourage American drilling but will have immediate ripple effects throughout the economy. Everything that relies on ground transportation will increase in price, at least in the short term.
This means that a fashion brand that sources and manufactures its entire line domestically will incur more costs since transportation will be more expensive. If fashion companies act like most companies, they will pass that added tax burden on to the consumer through higher prices. The company will make this decision based on how sensitive its consumers are to price increases, i.e., the elasticity of demand. These interwoven relationships extend across industries and products, affecting most retailers somehow.
Of course, category exposure varies by industry and sector. Tariffs are known to impact specific industries more than others. For example, steel, electronics, and agriculture products are at risk of price fluctuations based on their reliance on imported components. These have high category exposure. Some industries reliant on domestic production with stable input costs are less prone to category exposure. These include domestic power grids, natural gas, real estate, and handmade goods. No matter which industry you’re in, however, expect some spill over.
Preparation Strategies
Forward-thinking leaders can help position their teams for success in the face of pricing volatility brought on by tariffs. The key is to enable teams to sense disruptions quickly and provide a way to take corrective action that doesn’t diminish sales. Here are three strategies you can implement ahead of time that will help keep you competitive during tariff disruption.
Cost Monitoring
Start by getting a firm handle on internal and external costs. Understand and analyze fluctuations in the cost of raw materials, production, and supply chain for your business to operate. Make sure that your products are priced with pre-defined logic so changes in price on one SKU don’t create confusion with another. For example, faux leather costs rise while genuine leather stays the same. In that case, a leather version of a product should be raised to reflect the price increase in the pleather variation, not to devalue the perception of luxury.
Next, you will want to understand historical pricing trends as well as pricing indexes across your categories. These insights can help your teams anticipate cost fluctuations before they even arise and mitigate the risk that economic shifts create, even unexpected tariffs.
Competition Tracking
Tracking your competition is likely already a strategy you have in mind. But how well are your teams executing this important task? If they’re trying to watch for market shifts and adjust pricing in real time without the help of technology, things are likely slipping through the cracks.
Competitive intelligence solutions help retailers discover all competitive SKUs across the e-commerce market, monitor for real-time pricing shifts, and take action to mitigate risk. You need an “always-on” competitive pricing strategy now so that the second a tariff is announced, you can see how it’s affecting your market. This way, you can maintain price competitiveness and avoid margin erosion when competitors’ pricing changes in response to a tariff or other market shift.
Consumer Impact Assessment
The multiplier effect is felt throughout the supply chain when tariffs are implemented. The effect can affect consumers in a number of ways and cause them to become spending averse in certain areas. Often, during times of economic hardship, grocery items remain relatively inelastic. This is because consumers continue to purchase essentials regardless of price changes. Conversely, the price of eating out or home delivery becomes more elastic since consumers cut back on dining expenses when costs rise across their shopping basket.
You need to establish clear visibility into the results of your pricing changes. The goal should be to monitor progress and measure the ROI on specific and broad pricing changes across your assortment. Conducting market share impact analysis will also help you determine if you are losing out on potential customers or whether a decline in sales is being felt across your competition. Impact analysis tools can help your company check actual deployed price changes in real time.
Response Framework
Once you’ve prepared your team with strategies and technologies to set them up for success, it’s time to think about what to do once a tariff is announced or implemented. Here are three real-time decision-making strategies you should consider before your feet are to the fire. Having these in your back pocket will help you avoid financial disruption.
Price Adjustment Strategies
Think about how you strategically adjust prices. These could include percentage increases, flat rate increases, or absorbed via other strategies like bundling. You should also determine a cost increase threshold that you’re willing to absorb before raising prices. Think about the importance of remaining price attractive to consumers and weigh the risk of increasing prices past consumers’ ability or willingness to pay.
Promotion Planning
Folding increased costs into value-added offerings for consumers can be a good way to retain customer sentiment and sales volume without negatively affecting profit margins. You can leverage discounts, promotions, or bundling options to sell more of an item to a customer at a lower per-unit cost.
What you don’t want to do is panic-adjust prices in response to tariffs of competitor moves. Instead, you can use a tool competitor intelligence solutions to watch if your competition is holding prices steady or adjusting. With full information about pricing at your disposal, you can make better decisions on your promotional strategy and not undercut yourself or lose customer loyalty.
Alternative Sourcing
Let’s face it: putting all your eggs in one basket is bad for business. Instead of relying solely on a single supplier for production, you should have a diverse set of suppliers ready and able to shift production when tariffs are announced. If a tariff impacts Chinese exports, having a backup supplier in Vietnam can prevent added costs entirely. You can also consider strategies like bulk pricing, set pricing, or shifting entirely to domestic suppliers.
Forward Buying
Proactively stockpile inventory by purchasing large quantities of at-risk products before tariffs take effect. This strategy locks in lower costs and ensures supply continuity during disruptions. However, balance this with careful demand forecasting to avoid overstocking, which ties up cash flow and incurs storage costs. Use historical sales data and tariff implementation timelines to optimize order volumes—this is especially effective for products with stable demand or long shelf lives.
Market Intelligence Requirements
Preparing your pricing teams and giving them a framework upon which to act when tariffs are announced doesn’t have to be complicated. You can get access to the right data on costs, competitors, and consumer behavior with DataWeave’s pricing intelligence capability.
We provide retailers with insights on pricing trends, category exposure, and competitor adjustments. Our AI-powered competitor intelligence solutions allow you to get timely alerts whenever a significant change happens. This can include changes to competitor pricing and category-level shifts that you’d otherwise react to when it’s too late.
These automated insights can also help you track historical pricing trends, elasticity, and margin impact to construct a clear response framework in an emergency. Additionally, our analytics capabilities can help you identify patterns to power pre-emptive pricing and promotional strategies.
Getting the right pricing intelligence strategy in place now can prevent disaster later. Think through your preparedness strategy and how you want your teams to respond in the event of a new tariff, and consider how much easier reacting accurately would be with all the data needed at your fingertips. Reach out to us to know more.
Many retailers view minimum advertised pricing (MAP) policies as a necessary evil since they present several challenges for competitive positioning. In an idealistic free market, there wouldn’t be a need for MAP policies, and healthy competition would do the work of setting the final advertised price.
However, MAP policies aren’t beneficial only for brands; they also greatly benefit retailers. This article will examine why MAP pricing can be a strategic advantage for both brands and retailers. We’ll also look at ways brand managers and retail pricing teams can navigate MAP requirements to maintain profitability and safeguard customer trust.
Understanding MAP Fundamentals
Minimum Advertised Price (MAP) is a policy set by brands that requires their sales channels to price the brand’s products at a minimum dollar value. Retailers are free to price the items higher, but the advertised price is never to exceed the minimum threshold.
This agreement is established at the outset of a relationship or new product launch and can change at the brand’s discretion. Consumers typically see only the minimum advertised price when they search for a product across competing retailers. This means retailers need to find other ways to differentiate themselves beyond offering the lowest price.
But a retailer can still effectively price the product at a lower cost to win sales away from the competition. This comes in the form of discounts applied at checkout, bundled deals, or other promotions that affect the final cart but not the advertised price. Only the advertised price must remain within MAP guidelines. This gives retailers a way to set themselves apart from the competition while still protecting the brand.
A minimum advertised price has three central values: one for the brand, one for the retailer, and one for both.
Brand or manufacturer: A MAP policy protects the brand’s value and prevents price erosion. If a retailer consistently undercuts a product’s price to make it more competitive, customers may begin to perceive the brand as lower in value over time. It can cause the brand to appear less premium than if prices hold steady. If a customer pays full price one day and then sees the same item advertised at a lower base price the next, it can weaken brand loyalty and cause dissatisfaction.
Retailer: Minimum advertised pricing policies prevent retailers from engaging in a pricing war with one another, driving the price of an item down and hurting margins. This race to the bottom is bad for business. Apart from reducing profits, it discourages sellers from investing in marketing and other activities that drive sales. It also means that smaller retailers can compete with larger retailers, effectively leveling the playing field across the market.
All parties: The issue of counterfeit and unauthorized sellers on the grey market plagues retailers and brands. One of the most straightforward ways to identify these sellers that undercut prices and damage brand perception is to track who is pricing products outside of agreements. Unauthorized or counterfeit sellers can be identified by establishing a MAP policy and monitoring who sells at the wrong price. Then, official legal action can be taken to prevent those merchants from selling the product.
Brand Perspective
Developing a clear and precise MAP policy is an important option for brands looking to stay competitive. Make sure you outline the minimum advertised price for each product for each sales channel and do so by geography. Write clear instructions on how discounts, promotions, and sales can be applied to the advertised price to avoid misunderstandings later. Ensure you work with your legal team to fill in any gaps before presenting them to retailers.
If you find sellers acting outside the MAP policy, you must act swiftly to enforce your MAP policy. Cease and desist orders are the most common enforcement strategy a brand can use on unauthorized sellers and counterfeiters. But there are legal considerations for authorized sellers, too. You may need to fine the retailer for damages, restrict inventory replenishment until prices have been adjusted, remove seller authorization by terminating the relationship entirely, or escalate to your legal team.
Open communication between the brand and retailer is in everyone’s best interest to ensure minimum pricing is being used. Have explanatory documents available for your retailers’ non-legal teams to reference while they set prices. These can take the form of checklists, video explainers, or even well-informed brand representatives working closely with retail pricing teams. It’s likely that some MAP violations will occur from time to time. The importance your retail partners place on fixing those errors will help you determine how much goodwill you will give them in the future.
Brands can consider rewarding retailers that consistently adhere to minimum advertised price policies. Rewards often take the form of more lenient promotion policies, especially during major holidays like Christmas, Prime Day, or Black Friday. However, it’s never advisable to relax the actual MAP policy to allow one retailer to advertise a lower price year-round.
Retailer Strategies
A retailer can take several approaches to complying with a brand’s MAP policy while still maximizing sales. First, you need a dedicated compliance process spearheaded by compliance specialists or, better yet, enabled by technology. Embedding a process that checks for MAP violations into daily or weekly operations will prevent problems before brands become aware.
Automated price tracking tools can help discover discrepancies so that you don’t accidentally violate a MAP agreement. Make sure MAP training extends beyond your pricing team and includes marketing. Anyone who participates in promotions or events should be made aware of the agreements made with specific brands. Determine if there are alternative promotion methods available to attract customers. You could offer free shipping on certain items, bundle giveaways, or apply cart-wide discounts at checkout.
Monitoring your competition in real time will also help you stay ahead. If you discover a competitor undercutting your prices, bring this to the attention of your brand representative. This can build loyalty with the brand and help prevent lost sales due to market share loss.
Digital Implementation for MAP Compliance
Pricing teams at brands and retailers manually attempting to manage MAP pricing will lag behind the competition without help. They must discover, monitor, and enforce MAP compliance simply and effectively.
Over the past several years, there has been a seemingly exponential proliferation of online sellers, complicating the industry and making it nearly impossible to find and discover all instances of every product you sell. It’s further complicated by marketplaces like Amazon, Walmart, and eBay, which are full of individual unauthorized sellers and resellers.
Implementing a digital tool is the first step to effectively discovering and monitoring MAP compliance, even across these marketplaces. This tool should monitor all competition for you and discover imbalances in pricing parity.
DataWeave’s MAP Violations Merchant Analytics solution has AI-backed software that scours the web for your products. It uses identifiers like UPCs and product titles and compares imagery to find where the product is sold. Our AI-powered image recognition capabilities are especially helpful in identifying inauthentic listings that may be counterfeit products or unauthorized sellers. It also has built-in geographic and channel-specific MAP monitoring capabilities to help with localized enforcement.
The tool can aggregate all this data and present dashboard views of your own and competitors’ pricing that are easy to digest and act on. After all, retailers need to monitor their own MAP compliance as well as the competition’s. Brands can also track competitor sellers’ networks to explore potential new retail partnerships and grow their network reach.
The MAP Violations Merchant Analytics solution has automated violation alerts and advanced reporting built into it. This means you can get real-time alerts instead of pouring through dashboards searching for exceptions each week. For deeper insights, the dashboards provide time-stamped proof of which sellers are undercutting MAP minimums, so you have all the information you need to make a case against them. Discovering repeat offenders is easy with historical trends dashboards that show which sellers have a history of violations.
With all this information on who is violating what—and when—enforcement becomes much more manageable. Send cease and desist orders to unauthorized sellers and start having conversations with authorized sellers acting outside of your agreement. Acting quickly will help prevent hits to your brand’s reputation, price erosion, and lost sales.
DataWeave’s MAP solution gives you the competitive edge to effectively discover MAP violations, monitor market activity, and act quickly when an issue is discovered.
Make MAP Compliance a Strategic Advantage
Basic MAP compliance and enforcement isn’t simply about setting pricing policies anymore. These policies are foundational to brand strategies, maintaining good relationships with retailers, and establishing long-term profitability for your business.
When you let MAP violations go unchecked, it can erode your margins, damage how your customers perceive your brand, and create confusion across channels. Discovering, monitoring, and acting on MAP violations is much easier with the help of tools like DataWeave’s AI-enabled MAP Violations Merchant Analytics.
Do you remember when the movie Super Size Me came out? If you missed it, it was about the harmful effects of eating fast food too often. One aspect of the film that stands out is McDonald’s clever use of pricing to encourage consumers to buy bigger—and therefore more expensive—meals.
Hungry patrons could upgrade their meal to a Super Size version for only a few cents more. In doing so, McDonald’s was able to capitalize on perceived value, i.e., getting more product for an apparent lower total price for the volume. It encouraged restaurant-goers to spend a little more while feeling like they got a great deal. It was a smart use of strategic pricing.
There are hundreds of pricing relationship types like this one that pricing leaders need to be aware of and can use to their advantage when creating their team’s pricing strategy and workflows. You need to maintain profitable and logical price relationships across your entire product portfolio while keeping up with the competition. After all, the gimmick to Super Size would never have worked if the upgrade had been of less value than just buying another burger, for example.
In this article, we’ll examine more real-world examples of pricing challenges so you can consider the best ways to manage complex price relationships. We’ll examine things like package sizes, brands, and product lines and how they’re intertwined in systematic price relationship management. Read on to learn how to prevent margin erosion, improve customer perception of your brand, and keep your pricing consistent and competitive.
The Price Relationship Challenge
Pricing is one of the most challenging aspects of managing a retail brand. This is especially true if you are dealing with a large assortment of products, including private label items, the same products of differing sizes, and hundreds, or even thousands, of competing products to link. Inconsistencies in your price relationship management can confuse customers, erode trust, and harm your bottom line.
Let’s take a look at a few common pitfalls in portfolio pricing that you might run into in real life to better understand the impact on customer perception, trust, and sales.
Private Label vs. Premium Product Pricing
Let’s consider a nuanced scenario where price relationships between a retailer’s private label and premium branded products create an unexpected customer perception. Imagine you’re in a supermarket, comparing prices on peanut butter. You’ve always opted for the store’s private-label brand, “Best Choice,” because it’s typically the more affordable option. Here’s what you find:
Best Choice (Private Label) 16 oz – $3.50
Jif (National Brand) 16 oz – $3.25
At first glance, this pricing feels off—shouldn’t the private label be the cheaper option? If a customer has been conditioned to expect savings with private-label products, seeing a national brand undercut that price could make them pause. This kind of pricing misalignment can erode trust in private-label value and even push customers toward the national brand. When price relationships don’t follow consumer expectations, they create friction in the shopping experience and may lead to lost sales for the retailer’s own brand.
Value Size Relationships
A strong value-size relationship ensures that customers receive logical pricing as they move between different sizes of the same product. When this relationship is misaligned, customers may feel confused or misled, which can lead to lost sales and eroded trust.
Let’s look at a real-world example using a well-known branded product—salad dressing. Imagine you’re shopping for Hidden Valley Ranch (HVR) dressing and see the following pricing on the shelf:
HVR 16 oz – $3.99
HVR 24 oz – $6.49
HVR 36 oz – $8.99
At first glance, you might assume that buying a larger size offers better value. However, a quick calculation shows that the price per ounce actually increases with size:
16 oz = $0.25 per ounce
24 oz = $0.27 per ounce
36 oz = $0.25 per ounce
Customers expecting a discount for buying in bulk may feel misled or frustrated when they realize the mid-size option (24 oz) is actually the most expensive per ounce. This mispricing could drive shoppers to purchase the smallest size instead of the intended larger, more profitable unit—or worse, lead them to a competitor with clearer pricing structures.
Retailers must maintain logical price progression by ensuring that price per unit decreases as the product size increases. This not only improves customer trust but also encourages higher-volume purchases, driving profitability while maintaining a fair value perception.
Price Link Relationships
A well-structured price link relationship ensures customers can easily compare similar offerings of the same product and size. When the pricing across different versions or variations of the same item isn’t clear or consistent, it can confuse customers and damage trust, ultimately leading to missed sales and a negative brand perception.
Let’s break this down with an example of a popular product—coffee. Imagine you’re shopping for a bag of Starbucks coffee and you see the following pricing on the shelf:
Starbucks Classic Coffee, 12 oz – $7.99
Starbucks Coffee, Mocha, 12 oz – $9.99
Starbucks Ground Coffee, Pumpkin Spice, 12 oz – $12.99
At first glance, the product is the same size (12 oz) across all options, but the prices vary significantly. One might assume that the price difference is due to differences in quality or features, but what if there’s no clear indication of why the different flavors are priced higher than the standard?
After investigating, you may realize that the only differences are related to different variants—like “Mocha” or “Pumpkin Spice” rather than any significant changes in the product’s core attributes. When customers realize they’re paying a premium for just different flavors, without any tangible difference in product quality, it can lead to feelings of confusion and frustration.
Retailers must ensure that price links between similar offerings are justifiable by clearly communicating what differentiates each product. This avoids the perception that customers are being charged extra for little added value, building trust and encouraging repeat purchases. By maintaining transparent price link relationships, businesses can foster customer loyalty, increase sales, and drive better overall satisfaction.
What is the Foundational Process to Tackle the Price Relationship Challenge?
Now that we’ve reviewed several challenges brands face when pricing their products, what can be done about them?
If you’re a pricing leader, you must create a robust pricing strategy that considers customer expectations, competitive data, sizing, and the overall value progressions of your product assortment. These are the three foundational steps to solve your price relationship challenges.
First, you need to group products together accurately.
Second, you need to establish price management rules around the group of related items.
Third, you should set in place a process to review your assortment each week to see if anything is out of tolerance.
This process is difficult, if not impossible, to manage manually. To effectively set up and execute these steps, you’ll need the help of an advanced pricing intelligence system.
Implementation Strategy
Want to know how to roll out a price relationship management strategy? Follow this implementation strategy for a practical way to get started.
Set up price relationship rules: Determine which of your products go together, such as same products with different sizes or color options. Assign different product assortment groups and determine tolerances for scaling prices based on volume or unit counts.
Monitoring and maintenance: Establish rules to alert the appropriate party when something is out of tolerance or a price change has been discovered with a competitive product.
Exception management: Only spend time actioning the exceptions instead of pouring through clean data each week, looking for discrepancies. This will save your team time and help address the most significant opportunities first.
Change management considerations: Think about the current processes you have in place. How will this affect the individuals on your team who have managed pricing operations? Establish a methodology for rolling this new strategy and technology out over select product assortments or brands one at a time to build trust with internal players.
DataWeave offers features specifically built to help pricing teams manage pricing strategies. These applications can help you optimize profit margins and improve your overall market positioning for long-term success. A concerted effort to create brand hierarchies within your own product assortment from the get-go, followed by routine monitoring and real-time updates, can make all the difference in your pricing efforts.
Within DataWeave, you can create price links between your products (value sizing) and those of the competition. These will alert you to exceptions when discrepancies are discovered outside your established tolerance levels. If a linked set of your products in different sizes shows inconsistent pricing based on scaled volumes, your team can quickly know how to make changes. If a competitor’s price drops significantly, you can react to that change before you lose sales.
DataWeave even offers AI-driven similar product matching capabilities, which can help you manage pricing for private label products by finding and analyzing similar products across the market.
Merchants make countless pricing decisions every day. Whether you’re a brand selling online, a traditional brick-and-mortar retailer, or another seller attempting to navigate the vast world of commerce, figuring out the most effective price intelligence strategy is essential. Having your plan in place will help you price your products in the sweet spot that enhances your price image and maximizes profits.
For the best chance of success, your overall pricing strategy must include competitive intelligence.
Many retailers focus their efforts on just collecting the data. But that’s only a portion of the puzzle. The real value lies in match accuracy and knowing exactly which competitor products to compare against. In this article, we will dive deeper into cutting-edge approaches that combine the traditional matching techniques you already leverage with AI to improve your match rates dramatically.
If you’re a pricing director, category manager, commercial leader, or anyone else who deals with pricing intelligence, this article will help you understand why competitive match rates matter and how you can improve yours.
Change your mindset from tactical to strategic and see the benefits in your bottom line.
The Match Rate Challenge
To the layman, tracking and comparing prices against the competition seems easy. Just match up two products and see which ones are the same! In reality, it’s much more challenging. There are thousands of products to discover, analyze, compare, and derive subjective comparisons from. Not only that, product catalogs across the market are constantly evolving and growing, so keeping up becomes a race of attrition with your competitors.
Let’s put it into focus. Imagine you’re trying to price a 12-pack of Coca-Cola. This is a well-known product that, hypothetically, should be easy to identify across the web. However, every retailer uses their own description in their listing. Some examples include:
Retailer A lists it as “Coca-Cola 12 Fl. Oz 12 Pack”
Retailer B shows “Coca Cola Classic Soda Pop Fridge Pack, 12 Fl. Oz Cans, 12-Pack”
Retailer C has “Coca-Cola Soda – 12pk/12 fl oz Cans”
While a human can easily deduce that these are the same product, the automated system you probably have in place right now is most likely struggling. It cannot tell the difference between the retailers’ unique naming conventions, including brand name, description, bundle, unit count, special characters, or sizing.
This has real-world business impacts if your tools cannot accurately compare the price of a Coca-Cola 12-pack across the market.
Why Match Rates Matter
If your competitive match rates are poor, you aren’t seeing the whole picture and are either overcharging, undercharging, or reacting to market shifts too slowly.
Overcharging can result in lost sales, while undercharging may result in out-of-stock due to spikes in demand you haven’t accounted for. Both are recipes to lose out on potential revenue, disappoint customers, and drive business to your competitors.
What you need is a sophisticated matching capability that can handle the tracking of millions of competitive prices each week. It needs to be able to compare using hundreds of possible permutations, something that is impossible for pricing teams to do manually, especially at scale. With technology to make this connection, you aren’t missing out on essential competitive intelligence.
The Business Impact
Besides the bottom-line savings, accurately matching competitor products for pricing intelligence has other business impacts that can help your business. Adding technology to your workflow to improve match rates can help identify blind spots, improve decision quality, and improve operational efficiency.
Pricing Blind Spots
Missing competitor prices on key products
Inability to detect competitive threats
Delayed response to market changes
Decision Quality
Incomplete competitive coverage leads to suboptimal pricing
Risk of pricing decisions based on wrong product comparisons
Operational Efficiency
Manual verification costs
Time spent reconciling mismatched products
Resources needed to maintain price position
Current Industry Challenges
As mentioned, the #1 reason businesses like yours probably aren’t already finding the most accurate matches is that not all sites carry comparable product codes. If every listing had a consistent product code, it would be very easy to match that code to your code base. In fact, most retailers currently only achieve 60-70% match rates using their traditional methods.
Different product naming conventions, constantly changing product catalogs, and regional product variations contribute to the industry challenges, not to mention the difficulty of finding brand equivalencies and private label comparisons across the competition. So, if you’re struggling, just know everyone else is as well. However, there is a significant opportunity to get ahead of your competition if you can improve your match rates with technology.
The Matching Hierarchy
Direct Code Matching: There are a number of ways to start finding matches across the market. The base tier of the hierarchy of most accurate approaches is Direct Code matching. Most likely, your team already has a process in place that can compare UPC to UPC, for example. When no standard codes are listed, your team is left with a blind spot. This poses limitations in modern retail but is an essential first step to identifying the “low-hanging fruit” to start getting matches.
Non-Code-Based Matching: The next level of the hierarchy is implementing non-code-based matching strategies. This is when there are no UPCs, DPCIs, ASINs, or other known codes that make it easy to do one-to-one comparisons. These tools can analyze complex metrics like direct size comparisons, unique product descriptions, and features to find more accurate matches. They can look deep into the listing to extract data points beyond a code, even going as far as analyzing images and video content to help find matches. Advanced technologies for competitive matching can help pricing teams by adding different comparison metrics to their arsenal beyond code-based.
Private Label Conversions: Up until this level of the hierarchy, comparisons relied on direct comparisons. Finding identical codes and features and naming similarities is excellent for figuring out one-to-one comparisons, but when there is no similar product to compare with for pricing intelligence, things get more complicated. This is the third tier of the matching hierarchy. It’s the ability to find similar product matches for ‘like’ products. This can be used for private label conversions and to create meaningful comparisons without direct matches.
Similar Size Mappings: This final rung on the matching hierarchy adds another layer of advanced calculations to the comparison capability. Often, retailers and merchants list a product with different sizing values. One may choose to bundle products, break apart packs to sell as single items or offer a special-sized product manufactured just for them.
While at the end of the day, the actual product is the same, when there are unusual size permutations, it can be hard to identify the similarities. Technology can help with value size relationships, package variation handling, size equalization, and unit normalization.
The AI Advantage
AI is the natural solution for efficiently executing competitive product matching at scale. DataWeave offers solutions for pricing teams to help them reach over 95% product match accuracy. The tools leverage the most modern Natural Language Processing models for ingesting and analyzing product descriptions. Image recognition capabilities apply methods such as object detection, background removal, and image quality enhancement to focus on an individual product’s key features to improve match accuracy.
Deep learning models have been trained on years of data to perform pattern recognition in product attributes and to learn from historical matches. All of these capabilities, and others, automate the attribute matching process, from code to image to feature description, to help pricing teams build the most accurate profile of products across the market for highly accurate pricing intelligence.
Implementation Strategy
We understand that moving away from manual product comparison methods can be challenging. Every organization is different, but some fundamental steps can be followed for success when leveling up your pricing teams’ workflow.
First, conduct a baseline assessment. Figure out where you are on the Matching hierarchy. Are you still only doing direct code-based comparisons? Has your team branched out to compare other non-code-based identifiers?
Next, establish clear match rate targets for yourself. If your current match rate is aligned with industry norms, strive to significantly improve it, aiming for a high alignment that supports maximizing the match rate. Break this down into achievable milestones across different stages of the implementation process.
Work with your vendor on quality control processes. It may be worth running your current process in tandem to be able to calculate the improvements in real time. With a veteran technology provider like DataWeave, you can rely on the most cutting-edge technology combined with human-in-the-loop checks and balances and a team of knowledgeable support personnel. Additionally, for teams wanting direct control, DataWeave’s Approve/Disapprove Module lets your team review and validate match recommendations before they go live, maintaining full oversight of the matching process.
The more data about your products it has, the better your match rates. DataWeave’s competitive intelligence tools also come with a built-in continuous improvement framework. Part of this is the human element that continually ensures high-quality matches, but another is the AI’s ‘learning’ capabilities. Every time the AI is exposed to a new scenario, it learns for the next time.
The final step, ensure cross-functional alignment is achieved. Every one from the C-Suite down should be able to access the synthesized information useful for their role without complex data to sift through. Customized dashboards and reports can help with this process.
Future-Proofing Match Rates
The world of retail is constantly evolving. If you don’t keep up, you’re going to be left behind. There are emerging retail channels, like the TikTok shop, and new product identification methods to leverage, like image comparisons. As more products enter the market along with new retailers, figuring out how to scale needs to be taken into consideration. It’s impossible to keep up with manual processes. Instead, think about maximizing your match rates every week and not letting them degrade over time. A combination of scale, timely action, and highly accurate match rates will help you price your products the most competitively.
Key Takeaways
Match rates are the foundation of pricing intelligence. You can evaluate how advanced your match rate strategy is based on the matching hierarchy. If you’re still early in your journey, you’re likely still relying on code-to-code matches. However, using a mix of AI and traditional methods, you can achieve a 95% accuracy rate on product matching, leading to overall higher competitive match rates. As a result, with continuous improvement, you will stay ahead of the competition even as the goalposts change and new variables are introduced to the competitive landscape.
Starting this process to add AI to your pricing strategy can be overwhelming. At DataWeave, we work with you to make the change easy. Talk to us today to know more.
Poor retail data is the bane of Chief Commercial Officers and VPs of Pricing. If you don’t have the correct inputs or enough of them in real time, you can’t make data-driven business decisions regarding pricing.
Retail data isn’t limited to your product assortment. Price data from your competition is as important as understanding your brand hierarchies and value size progressions. However, the vast and expanding nature of e-commerce means new competitors are around every corner, creating more raw data for your teams.
Think of competitive price data like crude oil. Crude or unrefined oil is an extremely valuable and sought-after commodity. But in its raw form, crude oil is relatively useless. Simply having it doesn’t benefit the owner. It must be transformed into refined oil before it can be used as fuel. This is the same for competitive data that hasn’t been transformed. Your competitive data needs to be refined into an accurate, consistent, and actionable form to power strategic insights.
So, how can retailers transform vast amounts of competitive pricing data into actionable business intelligence? Read this article to find out.
Poor Data Refinement vs. Good Refinement
Let’s consider a new product launch as an example of poor price data refinement vs. good data refinement, which affects most sellers across industries.
Retailer A
Imagine you’re launching a limited-edition sneaker. Sneakerheads online have highly anticipated the launch, and you know your competitors are watching you closely as go-live looms.
Now, imagine that your pricing data is outdated and unrefined when you go to price your new sneakers. You base your pricing assumptions on last year’s historical data and don’t have a way to account for real-time competitor movements. You price your new product the same as last year’s limited-edition sneaker.
Your competitor, having learned from last year, anticipates your new product’s price and has a sale lined up to go live mid-launch that undercuts you. Your team discovers this a week later and reacts with a markdown on the new product, fearing demand will lessen without action.
Customers who have already bought the much-anticipated sneakers feel like they’ve been overcharged now, and backlash on social media is swift. New buyers see the price reduction as proof that your sneakers aren’t popular, and demand decreases. This hurts your brand’s reputation, and the product launch is not deemed a success.
Retailer B
Imagine your company had refined competitive data to work with before launch. Your team can see trends in competitors’ promotional activity and can see that a line of sneakers at a major competitor is overdue for sale based on trends. Your team can anticipate that the competitor is planning to lower prices during your launch week in the hope of undercutting you.
Instead of needing to react retroactively with a markdown, your team comes up with clever ways to bundle accessories with a ‘deal’ during launch week to create value beyond just the price. During launch week, your competitor’s sneakers look like the lesser option while your new sneakers look like the premium choice while still being a good value. Customer loyalty improves, and buzz on social media is positive.
Here, we can see that refined data drives better decision-making and competitive advantage. It is the missing link in retail price intelligence and can set you ahead of the competition. However, turning raw competitive data into strategic insights is easier said than done. To achieve intelligence from truly refined competitive pricing data, pricing teams need to rely on technology.
The Hidden Cost of Unrefined Data
Technology is advancing rapidly, and more sellers are leveraging competitive pricing intelligence tools to make strategic pricing decisions. Retailers that continue to rely on old, manual pricing methods will soon be left behind.
You might consider your competitive data process to be quite extensive. Perhaps you are successfully gathering vast data about your competitors. But simply having the raw data is just as ineffective as having access to crude oil and making no plan to refine it. Collection alone isn’t enough—you need to transform it into a usable state.
Attempting to harmonize data using spreadsheets will waste time and give you only limited insights, which are often out of date by the time they’re discovered. Trying to crunch inflexible data will set your team up for failure and impact business decision quality.
The Two Pillars of Data Refinement
There are two foundational pillars in data refinement. Neither can truly be achieved manually, even with great effort.
Competitive Matches
There are always new sellers and new products being launched in the market. Competitive matching is the process of finding all these equivalent products across the web and tying them together with your products. It goes beyond matching UPCs to link identical products together. Instead, it involves matching products with similar features and characteristics, just as a shopper might decide to compare two similar products on the shelf. For instance private label brands are compared to legacy brands when consumers shop to discern value.
A retailer using refined competitive matches can quickly and confidently adjust its prices during a promotional event, know where to increase prices in response to demand and availability and stay attractive to sensitive shoppers without undercutting margins.
Internal Portfolio Matches
Product matching is a combination of algorithmic and manual techniques that work to recognize and link identical products. This can even be done internally across your product portfolio. Retailers selling thousands or even hundreds of thousands of products know the challenge of consistently pricing items with varying levels of similarity or uniformity. If you must sell a 12oz bottle of shampoo for $3.00 based on its costs, then a 16oz bottle of the same product should not sell for $2.75, even if that aligns with the competition.
Establishing a process for internal portfolio matching helps to eliminate inefficiencies caused by duplicated or misaligned product data. Instead of discovering discrepancies and having to fire-fight them one by one, an internal portfolio matching feature can help teams preempt this issue.
Leveraging AI for Enhanced Match Rates
As product SKUs proliferate and new sellers seem to enter the market at lightning speed, scaling is essential without hiring dozens more pricing experts. That’s where AI comes in. Not only can AI do the job of dozens of experts, but it also does it in a fraction of the time and at an improved match accuracy rate.
DataWeave’s AI-powered pricing intelligence and price monitoring offerings help retailers uncover gaps and opportunities to stay competitive in the dynamic world of e-commerce. It can gather competitive data from across the market and accurately match competitor products with internal catalogs. It can also internally match your product portfolio, identifying product family trees and setting tolerances to avoid pricing mismatches. The AI synthesizes all this data and links products into a usable format. Teams can easily access reports and dashboards to get their questions answered without manually attempting to refine the data first.
From Refinement to Business Value
Refined competitive price data is your team’s foundation to execute these essential pricing functions: price management, price reporting, and competitive intelligence.
Price Management
Refined data is the core of accurate price management and product portfolio optimization. Imagine you’re an electronics seller offering a range of laptops and personal computing devices marketed toward college students. Without refined competitive data, you might fail to account for pricing differences based on regionality for similar products. Demand might be greater in one city than in another. By monitoring your competition, you can match your forecasted demand assumptions with competitor pricing trends to better manage your prices and even offer a greater assortment where there is more demand.
Price Reporting
Leadership is always looking for new and better market positioning opportunities. This often revolves around how products are priced, whether you’re making a profit, and where. To effectively communicate across departments and with leadership, pricing teams need a convenient way to report on pricing and make changes or updates as new ad hoc requests come through. Spending hours constructing a report on static data will feel like a waste when the C-Suite asks for it again next week but with current metrics. Refined, constantly updated price data nips this problem in the bud.
Competitive Intelligence
Unrefined data can’t be used to discover competitive intelligence accurately. You might miss a new player, fail to account for a new competitive product line, or be unable to extract insights quickly enough to be helpful. This can lead to missed opportunities and misinformed strategies. As a seller, your competitive intelligence should be able to fuel predictive scenario modeling. For example, you should be able to anticipate competitor price changes based on seasonal trends. Your outputs will be wrong without the correct inputs.
Implementation Framework
As a pricing leader, you can take these steps to begin evaluating your current process and improve your strategy.
Assess your current data quality: Determine whether your team is aggregating data across the entire competitive landscape. Ask yourself if all attributes, features, regionality, and other metrics are captured in a single usable format for your analysts to leverage.
Setting refinement objectives: If your competitive data isn’t refined, what are your objectives? Do you want to be able to match similar products or product families within your product portfolio?
Measuring success through KPIs: Establish a set of KPIs to keep you on track. Measure things like match rate accuracy, how quickly you can react to price changes, assortment overlaps, and price parity.
Building cross-functional alignment: Create dashboards and establish methods to build ad hoc reports for external departments. Start the conversation with data to build trust across teams and improve the business.
What’s Next?
The time is now to start evaluating your current data refinement process to improve your ability to capture and leverage competitive intelligence. Work with a specialized partner like DataWeave to refine your competitive pricing data using AI and dedicated human-in-the-loop support.
Want help getting started refining your data fast? Talk to us to get a demo today!
Managing the endlessly growing competitive data from across your eCommerce landscape can feel like pushing a boulder uphill. The sheer volume can be overwhelming, and ensuring that data meets standards of high accuracy and quality, and the insights are actionable is a constant challenge.
This article explores the challenges eCommerce companies face in having sustained access to high-quality competitive data and how AI-driven solutions like DataWeave empower brands and retailers with reliable, comprehensive, and timely market intelligence.
The Data Quality Challenge for Retailers and Brands
Brands and retailers make innumerable daily business decisions relying on accurate competitive and market data. Pricing changes, catalog expansion, development of new products, and where to go to market are just a few. However, these decisions are only as good as the insights derived from the data. If the data is made up of inaccurate or low-quality inputs, the outputs will also be low-quality.
Managing eCommerce data at scale gets more complex every year. There are more market entrants, retailers, and copy-cats trying to sell similar or knock-off products. There are millions of SKUs from thousands of retailers in multiple markets. Not only that, the data is constantly changing. Amazon may add a new subcategory definition in an existing space, or Staples might decide to branch out into a new industry like “snack foods for the office”, an established brand might introduce new sizing options in their apparel, or shrinkflation might decrease the size of a product.
Given this, it is imperative that conventional data collection and validation methods need to be revised. Teams that rely on spreadsheets and manual auditing processes can’t keep up with the scale and speed of change. An algorithm that once could match products easily needs to be updated when trends, categories, or terminology change.
With SKU proliferation, visually matching product images against the competition becomes impossible. Knowing where to look for comprehensive data becomes impossible with so many new sellers in the market. Luckily, technology has advanced to a place where manual intervention isn’t the main course of action.
Advanced AI capabilities, like DataWeave’s, tackle these challenges to help gather, categorize, and extract insights that drive impactful business decisions. It performs the millions of actions that your team can’t accomplish with greater accuracy and in near real-time.
Improving the Accuracy of Product Matching
DataWeave’s product matching capabilities rely on an ensemble of text and image-based models with built-in loss functions to determine confidence levels in all insights. These loss functions measure precision and recall. They help in determining how accurate – both in terms of correctness and completeness – the results are so the system can learn and improve over time. The solution’s built-in scoring function provides a confidence metric that brands and retailers can rely on.
The product matching engine is configurable based on the type of products that we are matching. It uses a “pipelined mode” that first focuses on recall or coverage by maximizing the search space for viable candidates, followed by mechanisms to improve the precision.
How ‘Embeddings’ Enhance Scoring
Embeddings are like digital fingerprints. They are dense vector representations that capture the essence of a product in a way that makes it easy to identify similar products. With embeddings, we can codify a more nuanced understanding of the varied relationships between different products. Techniques used to create good embeddings are generic and flexible and work well across product categories. This makes it easier to find similarities across products even with complex terminology, attributes, and semantics.
These along with advanced scoring mechanisms used across DataWeave’s eCommerce offerings provide the foundation for:
Semantic Analysis: Embeddings identify subtle patterns and meanings in text and image data to better align with business contexts.
Multimodal Integration: A comprehensive representation of each SKU is created by incorporating embeddings from both text (product descriptions) and images or videos (product visuals)
Anomaly Detection: AI models leverage embeddings to identify outliers and inconsistencies to improve the overall score accuracy.
Vector Databases for Enhanced Accuracy
Vector databases play a central role in DataWeave’s AI ecosystem. These databases help with better storage, retrieval, and scoring of embeddings and serve to power real-time applications such as Verification. This process helps pinpoint the closest matches for products, attributes, or categories with the help of similarity algorithms. It can even operate when there is incomplete or noisy data. After identification, the system prioritizes data that exhibits high semantic alignment so that all recommendations are high-quality and relevant.
Evolution of Embeddings and Scoring: A Multimodal Perspective
Product listings undergo daily visual and text changes. DataWeave takes a multimodal approach in its AI to ensure that any content shown on a listing is accounted for, including visuals, videos, contextual signals, and text. DataWeave is continually evolving its embedding and scoring models to align with industry advancements and always works within an up-to-date context.
DataWeave’s AI framework can:
Handle Diverse Data Types: The framework captures a holistic view of the digital shelf by integrating insights from multiple sources.
Improve Matching Precision: Sophisticated scoring methods refine the accuracy of matches so that brands and retailers can trust the competitive intelligence.
Scale Across Markets: Additional, expansive datasets are easy for DataWeave’s capabilities, meaning brands and retailers can scale across markets without pausing.
Quantified Improvements: Model Accuracy and Stats
Since we deployed LLMs and CLIP Embeddings, Product Matching accuracy improved by > 15% from the previous baseline numbers in categories such as Home Improvement, Fashion, and CPG.
High precision in certain categories such as Electronics and Fashion. Upwards of 85%.
Close to 90% of matches are auto-processed (auto-verified or auto-rejected).
Attribute tagging accuracy > 75% and significant improvement for the top 5 categories.
Business Use Case: Multimodal Matching for Price Leadership
For example, if you’re a retailer selling consumer electronics, you probably want to maintain your price leadership across your key markets during peak times like Black Friday Cyber Monday. Doing so is a challenge, as all your competitors are changing prices several times a day to steal your sales. To get ahead of them, this retailer could use DataWeave’s multimodal embedding-based scoring framework to:
Detect Discrepancies: Isolate SKUs with price mismatches with your competition and take action before revenue is lost.
Optimize Coverage: Establish a process to capture complete data across the competition so you can avoid knowledge gaps.
Enable Timely Decisions: Address the ‘low-hanging fruit’ by prioritizing products that need pricing adjustments based on confidence scores on high-impact products. Leverage confidence metrics to prioritize pricing adjustments for high-impact products.
This approach helps retailers stay competitive even as eCommerce evolves around us. By acting fast on complete and reliable data, they can earn and sustain their competitive advantage.
DataWeave’s AI-Driven Data Quality Framework
Let’s look at how our AI can gather the most comprehensive data and output the highest-quality insights. Our framework evaluates three critical dimensions:
Accuracy: “Is my data correct?” – Ensuring reliable product matches and attribute tracking
Coverage: “Do I have the complete picture?” – Maintaining comprehensive market visibility
Freshness: “Is my data recent?” – Guaranteeing timely and current market insights
Scoring Data Quality
To maintain the highest levels of data quality, we rely on a robust scoring mechanism across our solutions. Every dataset that is evaluated is done so based on several key parameters. These can include things like accuracy, consistency, timeliness, and completeness of data. Scores are dynamically updated as new data flows in so that insights can be acted upon.
Accuracy: Compare gathered data with multiple trusted sources to reduce discrepancies.
Consistency: Detect and rectify variations or contradictions across the data with regular audits.
Timeliness: Scoring emphasizes data recency, especially for fast-changing markets like eCommerce.
Completeness: Ensure all essential data points are included and gaps in coverage are highlighted by analysis.
Apart from this, we also leverage an evolved quality check framework:
Statistical Process Control
DataWeave implements a sophisticated system of statistical process control that includes:
Anomaly Detection: Using advanced statistical techniques to identify and flag outlier data, particularly for price and stock variations
Intelligent Alerting: Automated system for notifying stakeholders of significant deviations
Continuous Monitoring: Real-time tracking of data patterns and trends
Error Correction: Systematic approach to addressing and rectifying data discrepancies
Transparent Quality Assurance
The platform provides complete visibility into data quality through:
Comprehensive Data Transparency & Statistics Dashboard: Offering detailed insights into match performance and data freshness
Match Distribution Analysis: Tracking both exact and similar matches across retailers and locations as required
Product Tracking Metrics: Visibility into the number of products being monitored
Autonomous Audit Mechanisms: Giving customers access to cached product pages for transparent, on-demand verification
Human-in-the-Loop Validation (Véracité)
DataWeave’s Véracité system combines AI capabilities with human expertise to ensure unmatched accuracy:
Expert Validation: Product category specialists who understand industry-specific similarity criteria
Continuous Learning: AI models that evolve through ongoing expert feedback
Adaptive Matching: Recognition that similarity criteria can vary by category and change over time
Detailed Documentation: Comprehensive reasoning for product match decisions
Together, these elements create a robust framework that delivers accurate, complete, and relevant product data for competitive intelligence. The system’s combination of automated monitoring, statistical validation, and human expertise ensures businesses can make decisions based on reliable, high-quality data.
In Conclusion
DataWeave’s AI-driven approach to data quality and coverage empowers retailers and brands to navigate the complexities of eCommerce with confidence. By leveraging advanced techniques such as multimodal embeddings, vector databases, and advanced scoring functions, businesses can ensure accurate, comprehensive, and timely competitive intelligence. These capabilities enable them to optimize pricing, improve product visibility, and stay ahead in an ever-evolving market. As AI continues to refine product matching and data validation processes, brands can rely on DataWeave’s technology to eliminate inefficiencies and drive smarter, more profitable decisions.
The evolution of AI in competitive intelligence is not just about automation—it’s about precision, scalability, and adaptability. DataWeave’s commitment to high data quality standards, supported by statistical process controls, transparent validation mechanisms, and human-in-the-loop expertise, ensures that insights remain actionable and trustworthy. In a digital landscape where data accuracy directly impacts profitability, investing in AI-powered solutions like DataWeave’s is not just an advantage—it’s a necessity for sustained eCommerce success.
When it comes to shopping events, Black Friday stands out as one of the most anticipated dates for scoring deals. Typically occurring the day after Thanksgiving, the weekend kicks off the holiday shopping season with a frenzy of discounts. But Boxing Day, celebrated on December 26, is also well-known for its post-Christmas clearance sales.
This Black Friday, US eCommerce sales increased by a hefty 14.6% in 2024, according to Mastercard SpendingPulse. While Black Friday leads in overall revenue generation for retailers, Boxing Day presents unique opportunities for clearing post-holiday inventory.
For a consumer, which sale event is likely to offer the most attractive deals?
At DataWeave, we analyzed discounts across retailers and categories to uncover the answer.
Our Methodology
For this analysis, we tracked pricing data across major retailers for Black Friday and Boxing Day. To provide a comprehensive analysis of Black Friday pricing strategies, we explored a matched products dataset, comparing identical 14,000+ SKUs across retailers within key categories.
Categories included: Consumer Electronics, Home & Furniture, Apparel, Health & Beauty, Grocery
Retailers included: Amazon, Target, Walmart, Sephora, Ulta Beauty, Overstock, Home Depot, Best Buy, Saks Fifth Ave, Nordstrom, Macy’s, Bloomingdale’s, Neiman Marcus
Timeline: November 26 (Black Friday), December 26 (Boxing Day)
Average Discounts: Black Friday vs Boxing Day
Our analysis reveals that Black Friday generally offered steeper discounts across most categories, although Boxing Day wasn’t far behind. Here’s a breakdown:
While Black Friday led in most categories, Apparel saw a slight edge on Boxing Day, with discounts averaging 40.22% compared to 37.67% on Black Friday. Electronics, Beauty, and Home, however, remained more lucrative during Black Friday.
Top 5 Products Higher Discounts on Black Friday
Diving deeper into specific products, here are our top 5 picks offering better discounts during Black Friday.
Appliances like an Immersion blender set offering a discount of 88.29%, significantly higher than its Boxing Day offer of 86.62%.
High-end electronics like the Microsoft Surface Pro 4 also saw substantial markdowns at 84.60%.
In beauty and fashion, both La Roche Posay’s retinol serum and Vera Bradley’s satchel offered discounts above 80%.
Even everyday essentials like paper towels enjoyed generous discounts, with markdowns reaching 82.35% during Black Friday compared to 76.47% on Boxing Day.
Top 5 Products With Higher Discounts on Boxing Day
Boxing Day revealed some remarkable deals across diverse categories, with certain products offering significantly better value than their Black Friday counterparts.
The JBL Go 2 portable speaker emerged as the standout, with an extraordinary 82% Boxing Day discount compared to just 20% on Black Friday—a dramatic 62% difference.
Home furnishings showed strong Boxing Day performance, with the Costway accent armchair set reaching 80.30% off.
In Conclusion
Black Friday reigns supreme in driving early holiday sales, offering deeper discounts and drawing larger crowds. However, Boxing Day remains critical for retailers to offload surplus inventory and attract post-holiday shoppers.
By combining insights from both events, retailers can refine their strategies to maximize revenue and enhance customer satisfaction. For shoppers, the decision comes down to timing—shop early for better deals or wait to capitalize on clearance markdowns. The products and categories with more attractive offers tend to vary between these two sale events. Hence, as a shopper, it’s a good idea to keep track of prices all through the holiday season to take advantage of the best deals.
For a deeper dive into the world of competitive pricing intelligence and to explore how our solutions can benefit apparel retailers and brands, reach out to us today!
Black Friday and Cyber Monday are major retail events in Canada, with 43% and 29% of the population making purchases during these sales respectively, according to a YouGov report. Consumer electronics continue to lead the Canadian retail market during these events, with 55% of surveyed shoppers choosing to buy tech products on Black Friday. Household appliances come in second, with 25% of shoppers opting for these items, while 18% prefer to shop for furniture deals.
These statistics highlight the importance of delivering value during the Thanksgiving sales week. Retailers must cater to shoppers’ expectations with competitive pricing, attractive deals, and a seamless shopping experience. So, what unique offerings did Canadian retailers present to shoppers this season?
To understand the pricing and discount dynamics during BFCM 2024 in Canada, DataWeave analyzed discounts across leading consumer electronics and home & furniture retailers. Using our AI-powered pricing intelligence platform, we analyzed 37,108 SKUs across these categories for major retailers including Amazon, Walmart, Best Buy, Home Depot, and Canadian Tire from the 10th to 29th November. We focused on the top 500 products ranked for each search keyword on each retail site, using targeted terms aligned with categories like “sofa” and “wearables”.
In the following insights, the Absolute Discount represents the reduction of the selling price compared to the Manufacturer’s Suggested Retail Price (MSRP). The Additional Discount reflects how much lower the selling price is during Black Friday compared to its price a week before the sale. This metric reveals the actual or effective value of the sale event, beyond the standard discounts typically offered.
Consumer electronics saw robust participation from major retailers, with Amazon, Best Buy, and Walmart leading the charge. Here’s how they stacked up in terms of discounts:
Best Buy emerged as the frontrunner in absolute discounts at 31.2%, while Amazon impressed with a notable 19.7% additional discount, indicating a strong Black Friday-specific markdown strategy.
Walmart offered steady competition, particularly in audio and video products, which reached an average absolute discount of 37.2%. However, it’s average additional discount was only 3.1%, indicating muted BFCM-specific price reductions in this category.
Subcategory Insights
Diving deeper into consumer electronics subcategories, we observed varied discounting strategies.
Audio & Video stood out as the most discounted subcategory, with Walmart leading at 37.2%.
In Wearables, Walmart again took the top spot with 36.4%, while Amazon offered higher additional discounts (22.4%).
Discounting for computers and gaming was less aggressive, highlighting strategic pricing to maintain profitability in these high-demand segments.
Brand Performance
Brand-level data highlighted how key players used Black Friday to drive visibility and sales.
Dell led in average absolute discounts (36.7%) followed by Samsung at 36.68%
Audio brand JBL offered significant absolute discounts at 35.9%.
Apple and Lenovo offered comparatively fewer discounts but maintained strong visibility, as seen in their increase in the Share of Search during the sale period.
MSI (laptop brand) and Bose (audio and earphone brand) experienced significant increases in visibility, with Share of Search increases of 5% and 3.6%, respectively.
Notably, HP faced a decline (-3.2%) in the Share of Search, suggesting missed opportunities to align promotions with consumer interest.
Home & Furniture
Retailers in Focus
The home and furniture category saw competitive discounting, with Walmart, Canadian Tire, and Home Depot vying for consumer attention.
Walmart took the lead with the highest absolute discounts at 36.8%. The retailer’s additional discounts were more conservative at 3.6%. This is similar to their discount levels in Consumer Electronics.
Canadian Tire offered stiff competition, providing 31.6% absolute discounts and 25% additional discounts.
Home Depot matched its absolute and additional discounts, maintaining consistency at 24.1%.
Subcategory Insights
Home and furniture subcategories revealed targeted discount strategies.
Bedding emerged as the most discounted subcategory at Walmart (50.6%) and Canadian Tire (35.3%).
Kitchenware saw competitive pricing, with Walmart leading at 42.9%, followed by Canadian Tire at 33.9%.
Canadian Tire focused on lighting, offering the highest absolute discounts in this subcategory (38.2%)
Brand Performance
Brand-level analysis revealed stark contrasts in discounting approaches.
Furniture brands Homcom led in absolute discounts (36.4%), while South Shore stood out with the highest additional discounts (30.2%).
Value-oriented brands like furnishings brand Mainstays and mattress and bedding brand Zinus offered more modest discounts, focusing on consistent affordability.
Zinus (mattresses and sofa brand) experienced a significant 7.9% increase in the Share of Search, driven by aggressive promotions.
Home furnishings brands like Costway and Safavieh faced declines, reflecting the importance of aligning promotional strategies with consumer expectations.
Insights for Retailers and Brands
This Black Friday, Canadian retailers effectively balanced deep discounts with category-specific strategies to maximize sales. However, the fluctuating Share of Search highlights the critical need for brands to align promotions with consumer interest.
For brands and retailers looking to stay ahead of the competition, DataWeave’s pricing intelligence platform offers unparalleled insights to refine discounting strategies and boost visibility. Contact us to learn how we can help you stay competitive in this dynamic retail landscape.
Americans spent a whopping total of $10.8 billion online this Black Friday. As Thanksgiving Week 2024 wraps up, one thing is clear: the consumer electronics category continues to dominate seasonal shopping trends. Fueled by a blend of enticing deals and high consumer demand, the sector delivered competitive discounts across subcategories like wearables, gaming, and mobile devices.
At DataWeave, we analyzed discounting trends in the U.S. consumer electronics market during this year’s sales events. Using our AI-powered pricing intelligence platform, we tracked pricing and promotions for 22383 SKUs across Amazon, Walmart, Target, and Best Buy from November 10 to 29. We focused on the top 500 products ranked for each search keyword on each retail site, using targeted terms aligned with categories like “gaming” and “apple.” Here’s what we uncovered.
Retailers Battle It Out with Competitive Discounts
Discount trends reveal clear leaders in terms of markdowns:
Walmart offered the deepest average absolute discounts at 36.9%.
Amazon and Target followed closely, highlighting a diverse range of deals designed to appeal to budget-conscious shoppers
Best Buy, the specialist consumer electronics retailer, offers the lowest discounts this Black Friday at 26.2%.
Note: The Absolute Discount represents the reduction of the selling price compared to the Manufacturer’s Suggested Retail Price (MSRP). The Additional Discount reflects how much lower the selling price is during Black Friday compared to its price a week before the sale. This metric reveals the actual or effective value of the sale event, beyond the standard discounts typically offered.
Subcategory Spotlight: Where the Best Deals Happened
From audio & video to wearables, each retailer carved out competitive advantages across subcategories.
Both Amazon and Walmart offered high discounts in audio & video and wearables, but Walmart led, with discounts up to 46.3%.
Best Buy, meanwhile, offered high absolute discounts on Mobile Devices(34%) and Storage (31%), followed by high discounts on wearables and Audio & Video.
Amazon maintained a balanced approach, excelling in audio & video and mobile devices.
Brand-Level Insights: HP and Samsung Dominate
The biggest winners this year were brands that strategically leveraged Black Friday discounts to boost visibility and sales:
HP took the top spot with average discounts of 36.9%, followed by Samsung at 31.4%.
Despite its premium reputation, Apple offered an average discount of 29.3%, signaling a shift in strategy to attract deal hunters.
Share of Search: Shifting Consumer Attention
Search trends reveal how discounts shaped brand visibility:
Microsoft saw the largest spike in share of search (+8.6%), thanks to aggressive pricing on gaming consoles and accessories.
Marshall and Amazon also saw significant gains in visibility.
Surprisingly, HP experienced a sharp decline (-9.8%), indicating missed opportunities despite steep discounts.
In the previous analysis, we focused on the top 500 products within each subcategory for each retailer, showcasing the discount strategies for their highlighted or featured items. However, to identify which retailer offered the lowest or highest prices for the same set of products, it’s necessary to match items across retailers. For this, we analyzed a separate dataset of 340 matched products across retailers to compare their pricing during Black Friday. This approach provides a clearer picture of price leadership and competitiveness across categories.
Here are the key takeaways from this analysis.
Category-Level Highlights
Amazon leads with the highest average discount (41.35%), offering the most value to consumers. It is followed by Target (39.37%) and Walmart (36.15%).
Best Buy, the specialist consumer electronics retailer, ranks last with an average discount of 31.53%, emphasizing a less aggressive pricing strategy compared to competitors.
Subcategory Highlights
Wearables: Amazon offers the steepest discounts (55.40%), followed by Best Buy (50.60%) and Walmart (45.75%).
Mobile Devices: Amazon also leads (37.94%), with Walmart (29.30%) in second place and Target trailing at 19.48%.
Gaming: Target takes the lead (37.47%), with Amazon and Best Buy offering similar discounts around 30%.
Computers: Target again emerges as the leader (39.18%), narrowly surpassing Walmart (36.13%).
Brand Highlights
Apple: Amazon dominates with 53.06%, closely followed by Walmart (50.55%), while Target and Best Buy hover around 43%.
Nintendo: Target edges out Amazon (37.62% vs. 36.54%), with Best Buy (33.21%) and Walmart (25.92%) trailing.
Beats by Dr. Dre: Amazon leads (46.07%), with Target (37.14%) as the runner-up. Best Buy and Walmart offer comparatively modest discounts around 25%.
Bose: Walmart emerges as the value leader (23.90%), surpassing Target (16.09%) and Best Buy (15.29%).
Cricut: Amazon sets a high benchmark (54.13%), with Target far behind (36.43%) for this viral portable printer brand. Best Buy (12.32%) and Walmart (10.79%) offer significantly lower discounts.
What This Means for Retailers and Brands
Retailers looking to stay competitive should focus on strategic discounting and enhanced brand visibility. Brands must align with consumer expectations by:
Leveraging platforms like DataWeave to analyze discount trends.
Optimizing pricing and assortment strategies for seasonal demand.
For more insights into consumer electronics pricing, contact DataWeave to discover how our AI-powered solutions can drive success in today’s fast-paced market. Stay tuned for more category-specific analyses in the coming weeks!
As the holiday shopping season kicked off, savvy shoppers embraced the spirit of the season, drawn by enticing deals. The apparel category is forecasted as the second highest earning category (Source: Statista), expected to generate revenues up to $43.9 billion, closely following consumer electronics. To understand the pricing strategies of top retailers amidst the sale season, DataWeave analyzed the pricing trends for the Apparel category this Black Friday.
We leveraged our AI-powered data platform to analyze the discounting across key retailers. Our analysis focused on the Apparel category, examining how Amazon, Walmart, Target, Saks Fifth Avenue, Nordstrom, Bloomingdales, Neiman Marcus and Macy’s differentiated themselves through their discounts.
For this analysis, we tracked the average discounts of apparel products among leading US retailers during the Thanksgiving weekend sale, including Black Friday. Our sample was chosen to encompass the top 500 ranked products in each product subcategory across during the sale.
Subcategories reported on: Footwear, Kid’s Clothing, Men’s Clothing, Women’s Clothing, Activewear, Plus Size Clothing, Accessories
Timeline of analysis: 10 to 29 November 2024
We focused on the top 500 products ranked for each search keyword on each retail site, using targeted terms aligned with categories like “athleisure” and “plus size clothing”. Our methodology distinguished between standard discounts and Black Friday-specific ‘additional discounts’ or price reductions during the sale compared to the week before, to reveal true consumer value.
Key Findings
This year’s fashion discounts were unprecedented. Let’s take a look.
Retailer Level Insights
Nordstrom leads with the highest average absolute discount at 59%, followed by Saks Fifth Avenue at 35.5% and Bloomingdale’s at 41.5%. Macy’s shows the lowest average discount at 24.1%, while Amazon has an average discount of 30.4%.
Amazon ranks lower in both average absolute and additional discounts compared to competitors, indicating a more conservative discounting strategy.
Subcategory Analysis
Kids’ Clothing saw the deep discounts (up to 55% at Nordstrom), reflecting growing pressure on family budgets and heightened competition to attract budget-conscious parents.
Plus-Size Clothing emerged as a major focus, with Nordstrom leading at 53.22% average absolute discounts, signaling that retailers are increasingly prioritizing size inclusivity and appealing to a broader consumer base.
Footwear experienced robust discounting, particularly at Bloomingdale’s with 37% average absolute discounts, showing a competitive approach to attract customers looking for seasonal footwear deals.
Activewear displayed substantial discounts, with Walmart offering up to 41% on average, aligning with the trend of consumers looking for practical and comfortable attire during the winter season.
Brand Level Insights
Apparel brands, meanwhile, also offer telling insights.
Top Discounting Brands: Aqua leads with an average absolute discount of 44.58%, followed by Boss at 42.33% and Burberry at 37.84%.
Lowest Discounts: Athletic Works shows the lowest average absolute discount at 31.23%, with a minimal additional discount of 3.73%.
Competitive Advantage: Brands like Ralph Lauren and Boss show strong discounts, indicating aggressive marketing during the sale.
Share of Search Insights
Top Gainers: Adidas and Nike each saw an increase of 1.20% in their share of search during Black Friday/Cyber Monday, highlighting their strong brand presence and consumer interest.
Top Losers: Reebok experienced a sharp decline, losing 2.60% in its share of search, while Levi’s also dropped by 0.60%.
Search Trends: The data suggests a strong consumer preference for activewear brands like Nike and Adidas and a decline in interest for traditional apparel brands like Levi’s.
Who Offered Most Value This Black Friday
In the previous analysis, we focused on the top 500 products within each subcategory for each retailer, showcasing the discount strategies for their highlighted or featured items. However, to identify which retailer offered the lowest or highest prices for the same set of products, it’s necessary to match items across retailers. For this, we analyzed a separate dataset of 418 matched products across Apparel specific retailers to compare their pricing during Black Friday. This approach provides a clearer picture of price leadership and competitiveness across categories.
Here are the key takeaways from this analysis.
Category-Level Analysis
At the overall category level, Macy’s emerged as the lowest-priced retailer, offering the highest average discount of 28.72%, followed closely by Nordstrom (26.06%). The steep decline in average discounts from Saks Fifth Avenue (14.42%) and Neiman Marcus (7.93%) highlights a clear gap in discounting strategies.
Macy’s and Nordstrom are aggressively competitive on pricing in the overall apparel category, likely capturing consumer attention with substantial discounts.
Saks Fifth Avenue and Neiman Marcus may rely more on brand perception and luxury positioning rather than heavy discounting.
Subcategory-Level Analysis
Neiman Marcus tops the ranking with an impressive 60.85% average discount, outperforming Macy’s (52.86%) and Nordstrom (43.04%) for Men’s Clothing. We see a similar trend with Neiman Marcus offering more value across Women’s Clothing as well, compared to other retailers.
The competition in footwear was intense, with Neiman Marcus narrowly securing the top spot at 31.03%, slightly ahead of Saks Fifth Avenue (30.28%) and Macy’s (30.07%).
Saks Fifth Avenue led by a significant margin in the Activewear category, offering 39.89% average discounts, indicating a strong push in this growing segment.
Macy’s followed at 32.16% in Activewear, while Neiman Marcus and Nordstrom had comparatively lower discounts of 26.40% and 19.52%, respectively.
Brand-Level Analysis
Kate Spade New York: Neiman Marcus leads with the highest discount of 55.23%, reflecting strong price leadership in premium fashion, closely followed by Saks Fifth Avenue at 51.66%.
Coach: Neiman Marcus dominates with a significant 75.85% discount, showcasing an aggressive promotional strategy for this luxury brand.
Spanx: While Neiman Marcus leads with 28.22%, discounts across other retailers like Saks Fifth Avenue, Macy’s, and Nordstrom are clustered within a competitive range of 17–19%.
Montblanc: Macy’s takes the lead with 20.32%, signaling its competitiveness even in high-end accessories, with Saks Fifth Avenue and Nordstrom closely behind.
Ugg: Saks Fifth Avenue leads with 31.42%, focusing on maintaining price leadership for this popular brand, while other retailers remain competitive with discounts around 25–30%.
What’s Next
To win over price-conscious shoppers, retailers need to stay competitive and consistently offer the lowest prices.
For a deeper dive into the world of competitive pricing intelligence and to explore how our solutions can benefit apparel retailers and brands, reach out to us today!
Stay tuned to our blog for more insights on different categories this Black Friday and Cyber Monday.
As shoppers flocked online and to stores during Black Friday and Cyber Monday, the grocery category stood out as a key battleground for retailers. With inflation affecting consumer spending, discounted groceries have become a critical driver for both shopper savings and retailer competitiveness.
In fact, according to the NRF, one of the top shopping destinations during Thanksgiving weekend were department stores (42%), online (42%),and grocery stores and supermarkets (40%). Clearly, consumers are looking to stock up in bulk on their groceries to maximize their savings.
To understand the pricing dynamics in the grocery category, DataWeave analyzed grocery discounts across leading grocers, uncovering significant trends that shaped consumer choices during this holiday shopping period.
Our research encompassed retailers like Amazon, Target, and Walmart, examining their discounting strategies across subcategories, alongside trends in share of search for leading CPG companies.
Key Grocery Market Stats for Black Friday-Cyber Monday 2024
Retailer Discounts: Walmart offered the highest average absolute discount at 27.6%, followed by Amazon at 20.4% and Target at 14.0%
Subcategory Insights: Beverages Category at Walmart saw the deepest discounts, with an average of 33.4%
Top Gaining Brands: Cesar experienced the largest increase in share of search during the sales period (+3.89%)
This blog will dive deeper into grocery discount trends and brand-level strategies, offering insights for retailers looking to stay competitive in the grocery sector.
Our Methodology
For this analysis, we tracked the average discounts offered by major U.S. grocery retailers during the Thanksgiving weekend, including Black Friday and Cyber Monday. We focused on key subcategories within the grocery segment, capturing trends in discounting strategies.
In the following insights, the Absolute Discount represents the reduction of the selling price compared to the Manufacturer’s Suggested Retail Price (MSRP). The Additional Discount reflects how much lower the selling price is during Black Friday compared to its price a week before the sale. This metric reveals the actual or effective value of the sale event, beyond the standard discounts typically offered.
Key Findings
Retailer-Level Insights
Walmart emerged as the leader in grocery discounting, offering the highest average absolute (27.6%) and additional (18%) discounts.
Amazon adopted a mid-tier discounting strategy, with average absolute discounts of 20.4%.
Target, while more conservative, maintained competitiveness in select subcategories like baby products.
Subcategory Insights
Pantry Essentials saw Walmart leading with an average discount of 31.2%, appealing to budget-conscious consumers stocking up for the holidays.
Fresh Produce showed consistent discounting across retailers, with Amazon slightly ahead at 27%.
Beverages stood out for significant discounting at Walmart, with an impressive 33.4% average discount.
Brand-Level Insights
Lay’s led in absolute discounts (37.52%) and additional discounts (26.23%) showcasing aggressive pricing in the snacks subcategory.
Good & Gather maintained its competitive edge with strong discounts, appealing to price-conscious consumers seeking value.
Brands like Blue Buffalo (pet food brand) offered significant absolute discounts, but with a low additional discount of just 2%, the overall impact of the sale event on effective value was limited.
Share of Search Insights
Cesar (dog food brand), Tide (laundry staple) and Doritos saw significant gains in share of search, reflecting successful promotional strategies.
Brands like Pampers (baby diapers brand), Healthy Choice, (frozen foods brand) and Pedigree (pet food brand) experienced a decline, indicating less effective engagement during the sale period.
Who offered the lowest prices?
In the previous analysis, we focused on the top 500 products within each subcategory for each retailer, showcasing the discount strategies for their highlighted or featured items. However, to identify which retailer offered the lowest or highest prices for the same set of products, it’s necessary to match items across retailers. For this, we analyzed a separate dataset of 1433 matched products across retailers to compare their pricing during Black Friday. This approach provides a clearer picture of price leadership and competitiveness across categories.
Here are the key takeaways from this analysis.
Category-Level Analysis
Walmart is the lowest priced retailer overall for the grocery category, with an impressive average discount of 44.60%. This significant discount advantage makes Walmart a leading option for value-seeking consumers.
Target follows with strong discounts of 36.73%, indicating solid pricing in comparison but less aggressive than Walmart.
Interestingly, Amazon was the most expensive in Grocery, with an average discount of only 6.3%.
Subcategory-Level Analysis
Walmart leads in various subcategories such as Pet Products (21.12%), Dairy & Eggs (13.79%), Household Essentials (13.05%), Frozen Foods (15.07%), and Meat & Seafood (17.60%), showcasing its extensive value across the board.
Target excels in Beverages (14.58%) and Baby Products (15.00%) with competitive discounts, standing out in these specific subcategories.
Kroger provides notable value in Pantry Essentials (20.04%) and Fresh Produce (15.85%), although its overall average discount is lower than Walmart’s.
Amazon consistently ranks lower in terms of average discounts across most subcategories, highlighting it as less competitive for consumers seeking the lowest prices.
Brand-Level Analysis
Walmart also holds the top position for several key brands like Cheetos (14.92%) and Dannon (8.81%), making it the best option for consumers looking for budget-friendly choices across popular brands.
Target takes the lead for brands like Betty Crocker (25.20%) and Chobani (11.37%), showing that it can offer value for specific products.
Kroger maintains strong discounts for brands such as Delmonte (9.19%), but it does not outpace Walmart in the overall grocery brand comparison.
Amazon generally lags behind in average discounts for most brands, with Dannon (1.12%) and Chobani (2.43%) showing significantly lower discounts.
Walmart is the lowest priced retailer in the grocery category and provides substantial value across a wide range of subcategories and popular brands. This ties in with Walmart’s ELDP pricing strategy. The retailer leads in overall average discounts and maintains its position as the go-to for price-conscious consumers. Target offers strong value in certain subcategories and brands but falls short of Walmart’s broad value based pricing advantages.
What’s Next
For grocery retailers, competitive pricing and targeted promotions are critical to driving sales during key shopping events. As consumers continue to prioritize value, staying ahead in the discounting game can significantly impact market share.
For detailed insights into grocery discounting strategies and to explore how DataWeave’s solutions can help retailers optimize their pricing, contact us today!
Stay tuned to our blog for further analyses of other categories during Black Friday and Cyber Monday.
The Home & Furniture category continues to thrive, propelled by consumer interest in creating personalized and functional living spaces. In 2023, the U.S. furniture and home furnishings market was valued at approximately $641.7 billion in 2023 and is estimated to grow at a CAGR of 5.1% from 2024 to 2032. Black Friday and Cyber Monday play a crucial role in fueling this growth, offering consumers a mix of premium and affordable options across subcategories.
To better understand market trends and discount strategies this Black Friday, at DataWeave we tracked over 18,149 SKUs across major home & furniture retailers, including Amazon, Walmart, Target, Best Buy, Home Depot, and Overstock, from November 10 to 29, 2024. Using our AI-powered pricing intelligence platform, we focused on the top 500 products in subcategories like kitchenware, furniture, decor, lighting, outdoor items, and bedding.
In our analysis, the Absolute Discount represents the reduction of the selling price compared to the Manufacturer’s Suggested Retail Price (MSRP). The Additional Discount reflects how much lower the selling price is during Black Friday compared to its price a week before the Black Friday sale. This metric reveals the actual or effective value of the sale event, beyond the standard discounts typically offered.
Also check out our insights on discounts and pricing for the health & beauty category this Black Friday.
Retailer Performance: Who Led the Discount Race?
Retailers showed varying discount strategies for Home & Furniture products. Walmart emerged as the leader in absolute discounts (37.5%) while Amazon offered the highest additional discount of 14%. Best Buy maintained competitive pricing across all subcategories, while Overstock and Home Depot offered relatively modest discounts.
Subcategories in Focus
Breaking down the discounts by subcategory provides deeper insights into consumer priorities and retailer strategies:
Kitchenware saw strong competition, with Walmart (30.40% absolute discounts) and Amazon (29% absolute discounts) dominating.
Lighting became a discount hotspot, with Walmart offering up to 45.8% in absolute discounts and 25.3% additional markdowns.
Furniture remained a core focus for Target, delivering an impressive 34% average absolute discount.
Bedding stood out at Walmart, where discounts peaked at 49.6%.
Brand Spotlight: Who Stood Out?
Among top-performing brands, furniture brand Costway offered the highest discounts, with an average of 48.4%. Meanwhile, Adesso (lighting solutions), Mainstays and Safavieh (both home furnishings brands) balanced discounts and premium appeal.
Search Visibility: The Winners and Losers
Share of search dynamics revealed significant shifts in brand visibility during Black Friday:
Furniture brand Costway (+1.2%) and home improvement player Black+Decker (+1.5%) gained visibility.
On the flip side, premium brands like Safavieh known for rugs and home furnishings (-16.8%) and furniture brand Burrow ( -1.7%) saw declines.
Who Offers the Lowest Prices?
In the previous analysis, we focused on the top 500 products within each subcategory for each retailer, showcasing the discount strategies for their highlighted or featured items. However, to identify which retailer offered the lowest or highest prices for the same set of products, it’s necessary to match items across retailers. For this, we analyzed a separate dataset of 735 matched products across Home & Furniture specific retailers to compare their pricing during Black Friday. This approach provides a clearer picture of price leadership and competitiveness across categories.
Here are the key takeaways from this analysis.
Category-Level Highlights
Amazon emerges as the lowest-priced retailer across Home & Furniture categories, with the highest average discount of 27.50%, closely followed by Walmart (26.09%).
Overstock and Wayfair trail with average discounts of 22.93% and 20.71%, respectively, while Home Depot offers the least aggressive pricing at 18.14%. This is notable, as all 3 players are known specialists in the category.
Subcategory Highlights
Amazon stands out as the leader in multiple subcategories, including Appliances, Furniture, Decor, and Outdoor, offering competitive average discounts of around 26-29%.
Overstock leads in Bedding and Kitchenware, with strong average discounts of 24.26% and 20.72%, respectively.
Wayfair is notable for Lighting, with an average discount of 19.95%, and is also competitive in Outdoor and Furniture categories.
Walmart consistently ranks high in several subcategories like Appliances and Bedding, providing solid discounts of around 22-23%.
What’s Next
For home & furniture retailers, driving maximum value during mega sale events like Black Friday involves offering bundles and sets to meet customer demands and trend expectations. Gaining insights into competitor discounts and pricing can help furniture retailers get an edge amid this environment.
Want to know how DataWeave’s intelligence platform can empower your business during peak sales events? Contact us to discover more about competitive insights, price intelligence, and data-driven decision-making. Stay tuned to our blog to see more coverage on Black Friday 2024.
The U.S. health and beauty retail sector shows remarkable resilience amid economic uncertainties, with the skincare market projected to hit $21.83 billion in 2024. Black Friday data reinforces this trend, with health and beauty products seeing a 14.6% surge in web traffic compared to last year.
At DataWeave, we conducted an in-depth analysis of Black Friday discounting trends in the U.S. health and beauty sector. DataWeave’s AI-powered pricing intelligence platform was used to monitor pricing and discounts across Sephora, Ulta Beauty, Walmart, Target, and Amazon during Black Friday 2024. The study covered 19985 SKUs from November 10-29. We focused on the top 500 products ranked for each search keyword on each retail site, using targeted terms aligned with categories like “skincare” and “fragrance”.
The results? Beauty leads across categories in discount depth this year, with some retailers offering significant markdowns.
The Beauty Boom: More Than Just Looking Good
If there’s one thing the pandemic taught us, it’s that self-care isn’t just a luxury – it’s a necessity. This Black Friday proved that beauty has become an indispensable part of consumers’ lives, with retailers offering unprecedented discounts and crafting strategic promotions to capture the growing demand.
The Absolute Discount represents the reduction of the selling price compared to the Manufacturer’s Suggested Retail Price (MSRP). The Additional Discount reflects how much lower the selling price is during Black Friday compared to its price a week before the sale. This metric reveals the actual or effective value of the sale event, beyond the standard discounts typically offered.
Ulta Beauty led with 45% average discounts, followed by Sephora at 38.1% and Walmart at 35.2%. In terms of additional Black Friday discounts, Ulta maintained dominance at 35%, with Sephora following at 28%.
Hair care emerged as the standout category, with Ulta Beauty offering up to 56% discounts, reflecting sustained demand for at-home beauty routines. Skincare saw fierce competition, with Sephora emphasizing premium discounts (37%) while Walmart focused on value pricing (32.5%).
Fragrance and Makeup attracted consumers with targeted promotions from Walmart and Ulta Beauty, signaling strong demand for gifting items.
Major beauty brands echoed the sentiment. Premium skincare brand Clinique leads with 50.6% average discounts. Meanwhile, drugstore staples like Revlon (29.1%) and Maybelline (24.4%) balanced accessibility and affordability, driving mass-market appeal. Popular beauty and makeup brand L’Oreal Paris also offered a modest 22.8% average discount, reinforcing its position as a value-oriented brand.
The more interesting story? The massive shift in brand visibility, as our share of search rankings denote:
Shampoo and hair care brand Tresemmé saw an unexpected 5.5% jump in the share of search results
Beauty brand Herbal Essences gained 5.1% in share of search well
Declines in share of search were noted for brands like L’Oreal Paris (-1.8%) and Pantene (-0.6%), indicating missed opportunities in promotional visibility.
Insight: What’s driving this beauty boom? TikTok and social media continue to fuel beauty purchases, with viral products driving significant search and sales spikes. Plus, the “skinification” of hair care has turned basic shampoo shopping into a full-blown beauty ritual.
Who Offered the Lowest Prices?
In the previous analysis, we focused on the top 500 products within each subcategory for each retailer, showcasing the discount strategies for their highlighted or featured items. However, to identify which retailer offered the lowest or highest prices for the same set of products, it’s necessary to match items across retailers. For this, we analyzed a separate dataset of 1133 matched products across Health & Beauty specific retailers to compare their pricing during Black Friday. This approach provides a clearer picture of price leadership and competitiveness across categories.
Here are the key takeaways from this analysis.
Bloomingdale’s emerges as the overall leader, offering the highest average discount of 14.87%, closely followed by Bluemercury (12.41%).
Ulta Beauty ranks third (10.94%), demonstrating competitiveness across key subcategories, while Sephora trails with the lowest average discount (7.33%), reflecting a more premium positioning.
Ulta Beauty leads in Hair Care with the highest discount (22.62%), while Bluemercury dominates in Skin Care (13.81%), Makeup (22.98%), and Fragrance (10.6%).
Sephora consistently offers the lowest discounts across all subcategories, reflecting their premium positioning.
Bluemercury offers the lowest prices for luxury brands like Kiehl (27.02%) and Laura Mercier (34.87%), with Bloomingdale’s closely trailing.
Bloomingdale’s leads for Bumble and Bumble (13.59%) and Hourglass (23.41%), showcasing strong promotional efforts.
Sephora maintains a more restrained discount strategy, with notable leadership only for Estée Lauder (7.18%).
Ulta Beauty shines in offering the steepest discount for Briogeo (33.26%), emphasizing competitiveness in key brands.
What’s Next for Holiday Discounting?
For retailers, the message is clear: traditional holiday playbooks need a serious update. For shoppers, it means unprecedented opportunities to score deals in categories that traditionally held firm on pricing.
Want to stay ahead of retail trends and optimize your holiday shopping strategy? DataWeave’s commerce intelligence platform helps brands and retailers strategically navigate these shifts. Contact us to learn more about how we can help you make data-driven decisions in this rapidly evolving retail landscape.
Stay tuned to our blog for forthcoming analyses on pricing and discounting trends across a spectrum of shopping categories, as we continue to unravel the intricacies of consumer behavior and market dynamics.
Black Friday, once confined to a single weekend, has evolved into a shopping season that now stretches well before Thanksgiving. With inflation hovering around 3% and consumer confidence showing signs of recovery, retailers are adapting their promotional calendars to capture early-bird shoppers and maintain a competitive edge.
Major retailers, including Amazon, Walmart, Target, and Best Buy, have capitalized on this trend by launching promotions weeks in advance, signaling the traditional holiday rush is now a month-long event. At DataWeave, we put these deals under a microscope.
Our Methodology
Using DataWeave’s advanced, AI-powered pricing intelligence platform, we tracked early Black Friday deals across Consumer Electronics, Home & Furniture, Health & Beauty, and Apparel categories. We monitored dedicated Black Friday deal pages on Amazon, Walmart, Target, Best Buy, Nordstrom, Neiman Marcus, and Sephora to gather and analyze discount data a week prior to Black Friday weekend.
Who’s Offering the Best Deals Across Categories?
Our pre- Black Friday analysis reveals a clear pattern of premium brands offering deeper discounts across categories ahead of the holiday. Here are some key findings around retail players:
Walmart emerges as the most aggressive discounter across categories, leading in Health & Beauty (57.07%), Apparel (48.97%), and Consumer Electronics (43.35%).
Amazon maintains consistent but lower discounts (28-29%) across categories, suggesting potential deeper cuts ahead.
Best Buy and Sephora, both category specialists, play it conservative compared to mass retail players.
Let’s look at each category more closely to get a detailed snapshot of the deals this Thanksgiving week:
Health & Beauty
Our analysis reveals that it’s not electronics, but the health & beauty category that leads with the widest discount range pre Black Friday, making it the category to watch out for.
Walmart takes the lead with an aggressive 57.1% average discount in this category, capitalizing on its value-oriented reputation.
Beauty specialist Sephora holds modest beauty discounts (32.81%) compared to other retailers.
Amazon offers the broadest range of SKUs (571) in the category.
Among the health & beauty brands we analyzed, cosmetics brand Tarte and viral K-Beauty skincare brand COSRX stand out with discounts above 40%, appealing to cost-conscious beauty enthusiasts.
Consumer Electronics
Our pre- Black Friday analysis reveals interesting insights about consumer electronics deals this season.
Walmart, once again, emerges as the frontrunner in the category with 43.4% average discounts.
Best Buy plays it conservative in electronics (30.75%), despite being a category specialist, but offers the most extensive SKU coverage (3030).
Amazon’s consistent 29.7% discount across 1,749 SKUs suggests they’re probably holding back their best deals for Prime members during Black Friday.
Brand-specific data for the category reveals significant deals on Speck (48.07%) and smart TV brand Insignia (39.22%), making accessories and mid-tier electronics attractive for early shoppers. Core computing (HP at 32.14%) and electronics brands maintain more conservative discounts. It remains to be seen if this changes on Black Friday or Cyber Monday.
Apparel
Our analysis of the apparel category reveals several highlights:
In the apparel category too, Walmart dominates with an impressive 49% average discount, effectively targeting price-sensitive shoppers in the fashion segment.
Nordstrom and Neiman Marcus, both known for apparel, offer significant discounts at 43.2% and 37.8% respectively.
Amazon’s expansive SKU coverage (1344) is countered by a modest 29.5% discount, showing its focus on variety over depth of discounts.
Premium fashion brands dominate the highest discounts this Black Friday in the apparel category. Vince Camuto leads with over 45.1% average discount. Notably, Levi and Nike’s aggressive 44.43% and 43.50% discounts suggests significant inventory positions or intent to capture market share.
Home & Furniture
Our analysis reveals an interesting trend across the category.
In the home & furniture category too, Walmart leads at 41.8% average discounts. Target follows closely, but with significantly lesser SKUs on offer.
Amazon’s 28.1% discount, though the lowest among major players, spans a substantial 1,982 SKUs, reinforcing its position as a marketplace for diverse needs.
Top 3 Products With the Highest Discounts Across Retailers
To provide a clearer picture of the early Black Friday landscape, we analyzed the top 3 products with the most substantial discounts in consumer electronics and health & beauty categories. These insights highlight how retailers are leveraging strategic discounts on high-value items to attract early shoppers.
Top Discounted Products in Consumer Electronics
Premium TVs dominate the discount scene, with LG’s 83″ OLED offering up to 44.5% off on Amazon, closely followed by a 44.4% discount on Best Buy, showcasing aggressive competition. The same product has much lower discounting on Walmart, but notably, the product is retailed at $3999.9, at least $1000 less than other retailers, highlighting Walmart’s commitment to offering lowest prices.
Gaming consoles, like the PlayStation 5 Slim Bundle, show moderate discounts (ranging from 15% on Walmart and Target to 25% at Best Buy), appealing to tech-savvy shoppers.
Notable competition is evident in price matching across major retailers, particularly in TVs and high-value electronics like the Nikon Z 8 camera, where Walmart offers the deepest discount at 13.75%, edging past Amazon and Best Buy.
Top Discounted Products in Health & Beauty
Viral skincare staples like Tatcha’s Water Cream show tight discounting consistency, with Walmart offering 19.47% off compared to Amazon’s 20% and Sephora’s 20.83%.
Trending haircare brand Olaplex displays greater disparity, with Walmart leading with a 33.33% discount, surpassing Amazon and Sephora. Luxury brand, Yves Saint Laurent’s Satin Lipstick is one of the highest discounted items across retailers.
Looking Ahead
Our analysis suggests that while some early deals offer genuine value, particularly in premium beauty and high-end electronics, many retailers might be holding their best discounts for Black Friday.
For shoppers, the key is being selective: jump on premium brand discounts now (since they’re likely to remain the same though the weekend), but wait on mid-range electronics and home goods where better deals are likely to emerge on Black Friday or Cyber Monday.
For retailers, the imperative is clear: dynamic pricing intelligence is crucial for maintaining a competitive edge while protecting margins. Competitive insights will be critical as the holiday season progresses to balance market share against profitability.
Stay tuned for our Black Friday Cyber Monday analysis next week, where we’ll track how these early discounts compare to the main event’s deals!
In online retail, success hinges on more than just offering quality products at competitive prices. As eCommerce catalogs expand and consumer expectations soar, businesses face an increasingly complex challenge: How do you effectively organize, categorize, and present your vast product assortments in a way that enhances discoverability and drives sales?
Having complete and correct product catalog data is key. Effective product attribute tagging—a crucial yet frequently undervalued capability—helps in achieving this accuracy and completeness in product catalog data. While traditional methods of tagging product attributes have long struggled with issues of scalability, consistency, accuracy, and speed, a new thinking and fundamentally new ways of addressing these challenges are getting established. These follow from the revolution brought in Large Language Models but they fashion themselves as Small Language Models (SLM) or more precisely as Domain Specific Language Models. These can be potentially considered foundational models as they solve a wide variety of downstream tasks albeit within specific domains. They are a lot more efficient and do a much better job in those tasks compared to an LLM. .
Retail Domain Language Models (RLMs) have the potential to transform the eCommerce customer journey. As always, it’s never a binary choice. In fact, LLMs can be a great starting point since they provide an enhanced semantic understanding of the world at large: they can be used to mine structured information (e.g., product attributes and values) out of unstructured data (e.g., product descriptions), create baseline domain knowledge (e.g, manufacturer-brand mappings), augment information (e.g., image to prompt), and create first cut training datasets.
Powered by cutting-edge Generative AI and RLMs, next-generation attribute tagging solutions are transforming how online retailers manage their product catalog data, optimize their assortment, and deliver superior shopping experiences. As a new paradigm in search emerges – based more on intent and outcome, powered by natural language queries and GenAI based Search Agents – the capability to create complete catalog information and rich semantics becomes increasingly critical.
In this post, we’ll explore the crucial role of attribute tagging in eCommerce, delve into the limitations of conventional tagging methods, and unveil how DataWeave’s innovative AI-driven approach is helping businesses stay ahead in the competitive digital marketplace.
Why Product Attribute Tagging is Important in eCommerce
As the eCommerce landscape continues to evolve, the importance of attribute tagging will only grow, making it a pertinent focus for forward-thinking online retailers. By investing in robust attribute tagging systems, businesses can gain a competitive edge through improved product comparisons, more accurate matching, understanding intent, and enhanced customer search experiences.
Taxonomy Comparison and Assortment Gap Analysis
Products are categorized and organized differently on different retail websites. Comparing taxonomies helps in understanding focus categories and potential gaps in assortment breadth in relation to one’s competitors: missing product categories, sizes, variants or brands. It also gives insights into the navigation patterns and information architecture of one’s competitors. This can help in making search and navigation experience more efficient by fine tuning product descriptions to include more attributes and/or adding additional relevant filters to category listing pages.
For instance, check out the different Backpack categories on Amazon and Staples in the images below.
Or look at the nomenclature of categories for “Pens” on Amazon (left side of the image) and Staples (right side of the image) in the image below.
Assortment Depth Analysis
Another big challenge in eCommerce is the lack of standardization in retailer taxonomy. This inconsistency makes it difficult to compare the depth of product assortments across different platforms effectively. For instance, to categorize smartphones,
Retailer A might organize it under “Electronics > Mobile Phones > Smartphones”
Retailer B could use “Technology > Phones & Accessories > Cell Phones”
Retailer C might opt for “Consumer Electronics > Smartphones & Tablets”
Inconsistent nomenclature and grouping create a significant hurdle for businesses trying to gain a competitive edge through assortment analysis. The challenge is exacerbated if you want to do an in-depth assortment depth analysis for one or more product attributes. For instance, look at the image below to get an idea of the several attribute variations for “Desks” on Amazon and Staples.
Custom categorization through attribute tagging is essential for conducting granular assortment comparisons, allowing companies to accurately assess their product offerings against those of competitors.
Enhancing Product Matching Capabilities
Accurate product matching across different websites is fundamental for competitive pricing intelligence, especially when matching similar and substitute products. Attribute tagging and extraction play a crucial role in this process by narrowing down potential matches more effectively, enabling matching for both exact and similar products, and tagging attributes such as brand, model, color, size, and technical specifications.
For instance, when choosing to match similar products in the Sofa category for 2-3 seater sofas from Wayfair and Overstock, tagging attributes like brand, color, size, and more is a must for accurate comparisons.
Taking a granular approach not only improves pricing strategies but also helps identify gaps in product offerings and opportunities for expansion.
Fix Content Gaps and improve Product Detail Page (PDP) Content
Attribute tagging plays a vital role in enhancing PDP content by ensuring adherence to brand integrity standards and content compliance guidelines across retail platforms. Tagging attributes allows for benchmarking against competitor content, identifying catalog gaps, and enriching listings with precise details.
This strategic tagging process can highlight missing or incomplete information, enabling targeted optimizations or even complete rewrites of PDP content to improve discoverability and drive conversions. With accurate attribute tagging, businesses can ensure each product page is fully optimized to capture consumer attention and meet retail standards.
Elevating the Search Experience
In today’s online retail marketplace, a superior search experience can be the difference between a sale and a lost customer. Through in-depth attribute tagging, vendors can enable more accurate filtering to improve search result relevance and facilitate easier product discovery for consumers.
By integrating rich product attributes extracted by AI into an in-house search platform, retailers can empower customers with refined and user-friendly search functionality. Enhanced search capabilities not only boost customer satisfaction but also increase the likelihood of conversions by helping shoppers find exactly what they’re looking for more quickly and with minimal effort.
Pitfalls of Conventional Product Tagging Methods
Traditional methods of attribute tagging, such as manual and rule-based systems, have been significantly enhanced by the advent of machine learning. While these approaches may have sufficed in the past, they are increasingly proving inadequate in the face of today’s dynamic and expansive online marketplaces.
Scalability
As eCommerce catalogs expand to include thousands or even millions of products, the limitations of machine learning and rule-based tagging become glaringly apparent. As new product categories emerge, these systems struggle to keep pace, often requiring extensive revisions to existing tagging structures.
Inconsistencies and Errors
Not only is reliance on an entirely human-driven tagging process expensive, but it also introduces a significant margin for error. While machine learning can automate the tagging process, it’s not without its limitations. Errors can occur, particularly when dealing with large and diverse product catalogs.
As inventories grow more complex to handle diverse product ranges, the likelihood of conflicting or erroneous rules increases. These inconsistencies can result in poor search functionality, inaccurate product matching, and ultimately, a frustrating experience for customers, drawing away the benefits of tagging in the first place.
Speed
When product information changes or new attributes need to be added, manually updating tags across a large catalog is a time-consuming process. Slow tagging processes make it difficult for businesses to quickly adapt to emerging market trends causing significant delays in listing new products, potentially missing crucial market opportunities.
How DataWeave’s Advanced AI Capabilities Revolutionize Product Tagging
Advanced solutions leveraging RLMs and Generative AI offer promising alternatives capable of overcoming these challenges and unlocking new levels of efficiency and accuracy in product tagging.
DataWeave automates product tagging to address many of the pitfalls of other conventional methods. We offer a powerful suite of capabilities that empower businesses to take their product tagging to new heights of accuracy and scalability with our unparalleled expertise.
Our sophisticated AI system brings an advanced level of intelligence to the tagging process.
RLMs for Enhanced Semantic Understanding
Semantic Understanding of Product Descriptions
RLMs analyze the meaning and context of product descriptions rather than relying on keyword matching. Example: “Smartphone with a 6.5-inch display” and “Phone with a 6.5-inch screen” are semantically similar, though phrased differently.
Attribute Extraction
RLMs can identify important product attributes (e.g., brand, size, color, model) even from noisy or unstructured data. Example: Extracting “Apple” as a brand, “128GB” as storage, and “Pink” as the color from a mixed description.
Identifying Implicit Relationships
RLMs find implicit relationships between products that traditional rule-based systems miss. Example: Recognizing that “iPhone 12 Pro” and “Apple iPhone 12” are part of the same product family.
Synonym Recognition in Product Descriptions
Synonym Matching with Context
RLMs identify when different words or phrases describe the same product. Examples: “Sneakers” = “Running Shoes”, “Memory” = “RAM” (in electronics) Even subtle differences in wording, like “rose gold” vs “pink” are interpreted correctly.
Overcoming Brand-Specific Terminology
Some brands use their own terminologies (e.g., “Retina Display” for Apple). RLMs can map proprietary terms to more generic ones (e.g., Retina Display = High-Resolution Display).
Dealing with Ambiguities
RLMs analyze surrounding text to resolve ambiguities in product descriptions. Example: Resolving “charger” to mean a “phone charger” when matched with mobile phones.
Contextual Understanding for Improved Accuracy and Precision
By leveraging advanced natural language processing (NLP), DataWeave’s AI can process and understand the context of lengthy product descriptions and customer reviews, minimizing errors that often arise at human touch points. The solution processes and interprets information to extract key information to dramatically improve the overall accuracy of product tags.
It excels at grasping the subtle differences between similar products, sizes, colors and identifying and tagging minute differences between items, ensuring that each product is uniquely and accurately represented in a retailer’s catalog.
This has a major impact on product and similarity-based matching that can even help optimize similar and substitute product matching to enhance consumer search. At the same time, our AI can understand that the same term might have different meanings in various product categories, adapting its tagging approach based on the specific context of each item.
This deep comprehension ensures that even nuanced product attributes are accurately captured and tagged for easy discoverability by consumers.
Case Study: Niche Jewelry Attributes
DataWeave’s advanced AI can assist in labeling the subtle attributes of jewelry by analyzing product images and generating prompts to describe the image. In this example, our AI identifies the unique shapes and materials of each item in the prompts.
The RLM can then extract key attributes from the prompt to generate tags. This assists in accurate product matching for searches as well as enhanced product recommendations based on similarities.
This multi-model approach provides the flexibility to adapt as product catalogs expand while remaining consistent with tagging to yield more robust results for consumers.
Unparalleled Scalability
DataWeave can rapidly scale tagging for new categories. The solution is built to handle the demands of even the largest eCommerce catalogs enabling:
Effortless management of extensive product catalogs: We can process and tag millions of products without compromising on speed or accuracy, allowing businesses to scale without limitations.
Automated bulk tagging: New product lines or entire categories can be tagged automatically, significantly reducing the time and resources required for catalog expansion.
Normalizing Size and Color in Fashion
Style, color, and size are the core attributes in the fashion and apparel categories. Style attributes, which include design, appearance, and overall aesthetics, can be highly specific to individual product categories.
Our product matching engine can easily handle color and sizing complexity via our AI-driven approach combined with human verification. By leveraging advanced technology to identify and normalize identical and similar products from competitors, you can optimize your pricing strategy and product assortment to remain competitive. Using Generative AI in normalizing color and size in fashion is key to powering competitive pricing intelligence at DataWeave.
Continuous Adaptation and Learning
Our solution evolves with your business, improving continuously through feedback and customization for retailers’ specific product categories. The system can be fine-tuned to understand and apply specialized tagging for niche or industry-specific product categories. This ensures that tags remain relevant and accurate across diverse catalogs and as trends emerge.
The AI in our platform also continuously learns from user interactions and feedback, refining its tagging algorithms to improve accuracy over time.
Stay Ahead of the Competition With Accurate Attribute Tagging
In the current landscape, the ability to accurately and consistently tag product attributes is no longer a luxury—it’s essential for staying competitive. With advancements in Generative AI, companies like DataWeave are revolutionizing the way product tagging is handled, ensuring that every item in a retailer’s catalog is presented with precision and depth. As shoppers demand a more intuitive, seamless experience, next-generation tagging solutions are empowering businesses to meet these expectations head-on.
DataWeave’s innovative approach to attribute tagging is more than just a technical improvement; it’s a strategic advantage in an increasingly competitive market. By leveraging AI to scale and automate tagging processes, online retailers can keep pace with expansive product assortments, manage content more effectively, and adapt swiftly to changes in consumer behavior. In doing so, they can maintain a competitive edge.
When egg prices surged 70% during the 2023 avian flu outbreak, grocery retailers faced a critical dilemma: maintain margins and risk losing customers, or absorb costs and watch profits evaporate. Similarly, rising olive oil and chocolate prices also had domino effects, cascading down from retailers to consumers. In each of these scenarios, those with sophisticated pricing intelligence systems adapted swiftly, finding the sweet spot between competitiveness and profitability. Others weren’t so fortunate.
This scenario continues to play out daily across thousands of products in the grocery sector. From breakfast cereals to fresh produce to bottled water, retailers must orchestrate pricing across a variety of categories – each with its own competitive dynamics, margin requirements, and price sensitivity patterns.
The Evolution of Grocery Pricing Intelligence
Imagine these scenarios in the grocery industry:
Milk prices spike during a supply shortage.
Your competitor drops egg prices by 20%.
Fresh produce costs fluctuate with an unseasonable frost.
For grocery retailers, these aren’t occasional challenges—they’re Tuesday. Reacting to each pricing crisis as it comes isn’t just exhausting—it’s a recipe for shrinking margins and missed opportunities.
Think of it this way: If you’re constantly playing defense with your pricing strategy, you’re already two steps behind. Commoditized items like milk and eggs face intense price competition, while seasonal products and fresh produce demand constant attention. Simply matching competitor prices or adjusting for cost changes isn’t enough anymore. What’s needed is a proactive approach that anticipates market shifts before they happen and turns pricing challenges into competitive advantages. This is where price management comes in.
Price management has transformed from simple competitor checks into a strategic power play that can make or break a retailer’s market position. Weekly manual adjustments have given way to a long-term strategic view, driven by data analytics and market intelligence. Here are the basics of how price management in grocery retail works today.
Three Pillars of Grocery Price Management
1. Smart Data Collection: Building Your Foundation
The journey begins with comprehensive data collection and storage across your entire product ecosystem. This means:
Complete Coverage Of All SKUs Across All Stores: Tracking prices for all SKUs across all stores, with particular attention to high-velocity items and volatile categories.
Dynamic Monitoring: Tracking prices across different time frequencies as grocery prices are highly volatile for different categories. So daily tracking for volatile items like dairy and produce, and weekly for more stable categories may be needed.
Competitive Intelligence: Gathering data not just on prices, but on promotions, pack sizes, and private label alternatives.
Infrastructure to Support Large Volumes of Data: Partnering with external data and analytics providers to bridge the gap when retailers struggle with the scale of digital infrastructure these data sets require.
2. Intelligent Data Refinement: Making Sense of the Numbers
Raw data alone isn’t enough—it needs context and structure to become actionable intelligence. This is called Data Refinement—the process of establishing meaningful relationships within the data to facilitate the extraction of valuable insights. This refinement stage is closely tied to the data collection strategy, as the quality and depth of the insights derived depend on the accuracy and coverage of the collected data.
Data refinement includes several key processes:
Advanced Product Matching
Picture this: You’re tracking a competitor’s pricing on organic apples. Simple, right? Not quite. Yes, Universal Product Codes (UPCs) and Price Lookup Codes (PLUs) are present in Grocery to standardize product identification across different retailers—unlike the fashion industry’s endless style variations. Still, product matching isn’t as straightforward as scanning barcodes.
Here’s the catch: many retailer websites don’t display them. Then there’s the private label puzzle—your “Store’s Best” organic apples need to match against competitors’ house brands, each with their own unique UPC. Throw in different sizes (4 Apples vs. 1Kg of Apples), regional product names (fancy naming for plain old arugula), and international brand variations (like the name for Sprite in the USA and China), and you’ve got yourself a complex matching challenge that would make conventional pricing intelligence providers sweat.
Custom Product Relationships for Consistent Pricing and Competitive Positioning
Think like a shopper browsing the dairy aisle. You regularly buy your family’s favorite organic yogurt, the 24oz tub. But today, you notice the larger 32oz size is on sale – except the 24oz isn’t. As you stand there, confused, you wonder: Is the sale only for the bigger size? Did I miss a promotion? Should I buy the 32oz even though it’s more than I need?
For shoppers, this inconsistent pricing across product variations creates a frustrating experience. Establishing clear relationships between related items in your catalog is essential for maintaining consistent pricing and a coherent competitive strategy.
Start by linking products based on attributes like size, brand, and packaging. That way, when you adjust the price of the 32oz yogurt, the 24oz version automatically updates too – no more scrambling to ensure uniform pricing across your assortment. Similarly, products of the same brand but with flavor variations should be connected to keep pricing consistent.
Taking this one step further, mapping your competitors’ exact and similar products is crucial for comprehensive competitive intelligence. Distinguishing between premium and private label tiers, national brands, and regional players gives you a holistic view of the landscape. With this understanding, you can hone your pricing strategies to maintain a clear, compelling position across your entire category lineup.
Consistent pricing, whether across your own product variations or against competitors, provides clarity and accuracy in your overall competitive positioning. By establishing these logical connections, you avoid the customer confusion of seemingly random, inconsistent discounts – and ensure your pricing strategies work in harmony, not disarray.
The Role of AI and Data Sciences in Data Refinement
On the surface, linking products based on attributes like size, brand, and packaging seems like a no-brainer. But developing and maintaining the systems to accurately and automatically identify these connections? That’s a whole different animal.
Think about it – you’re not just dealing with text-based product titles and UPCs. There are images, videos, regional variations, private labels, and a whole host of other data types and industry nuances to account for.
Luckily, DataWeave is one of the few companies that’s truly cracked the code. Our multimodal AI models are trained to process all those diverse data formats – from granular product specs to zany regional produce names. And it’s not just about technology; we also harness the power of human intelligence.
See, in the grocery world, category managers are the real decision makers. They know their shelves inside and out and can spot those tricky connections in product matching, especially when they are not UPC-based. That’s why DataWeave built in a Human-in-the-Loop (HITL) process, where their AI systems continuously learn from expert feedback. It’s a feedback loop that allows our customers to pitch in and keep product relationships accurate, reliable, and always adapting to new market realities.
So while product mapping may seem straightforward on the surface, the reality is it takes some serious horsepower to do it right. Thankfully, DataWeave has both the technical chops and the grocery industry know-how to make it happen. Because when it comes to pricing intelligence, getting those product connections right is half the battle.
3. Strategic Implementation: Turning Insights into Action
The true value of pricing intelligence (PI) is realized through its strategic application. Although many view PI as a technical function, its strategic significance is increasing, particularly in the context of recent economic pressures like inflation. Here’s why:
Tactical vs Strategic Use of Data: From Standard Reporting to Competitive Analysis
Pricing intelligence has come a long way from the days of simply reacting to daily price changes. These days, it’s not just about firefighting—it’s about driving long-term strategy.
You can use pricing data to make quick, tactical adjustments, like matching a competitor’s sudden price drop on milk. Or, you can leverage that same data to predict market trends, optimize your product lineup, and shape your overall pricing strategy. Retailers who take that strategic view can get out ahead of the curve, anticipating shifts instead of just chasing them.
DataWeave supports both of these approaches. Our Standard Reporting tools give pricing managers the nitty-gritty details they need—current practices, historical patterns, and operational KPIs. It’s all the insights you’d expect for making those tactical, day-to-day tweaks.
In addition, DataWeave offers something more powerful: Competitive analysis. This is where pricing intelligence becomes a true strategic weapon. By providing a high-level view of market positioning, competitor moves, and untapped opportunities, competitive analysis empowers leadership to make proactive, big-picture decisions.
Armed with this broader perspective, retailers can start taking a more surgical approach. Maybe you need to adjust pricing zones to better meet customer demands. Or rethink your overall strategies to stay ahead of the competition, not just keep pace. It’s the difference between constantly putting out fires and systematically fortifying your entire pricing fortress.
Beyond Pricing: Comprehensive Data for Broader Insights
Pricing intelligence is just the tip of the iceberg. When you really start to refine and harness your data, the possibilities for grocery retailers expand far beyond simple price comparisons. Think about it – all that information you’re collecting on products, markets, and consumer behavior? That’s a goldmine waiting to be tapped. Sure, you can use it to keep a pulse on competitor pricing. But why stop there?
What if you could leverage that data to optimize your product assortment, making sure you’re stocking the right mix to meet customer demands? Or tap into predictive analytics to get a glimpse of future market shifts, so you can get out ahead of the curve? How about using it to streamline your supply chain, identify availability inefficiencies, and get products to shelves faster?
Sure, pricing intelligence will always be mission-critical. But when you couple it with these other data-driven insights, that’s when grocery retailing gets really interesting. It’s about evolving from a price-matching robot to a true strategic visionary, armed with the intelligence to take your business to new heights.
Looking Ahead: The Future of Grocery Pricing Intelligence
The grocery pricing landscape continues to evolve, driven by:
Integration of AI and machine learning for predictive pricing
Enhanced focus on omnichannel pricing consistency
Growing importance of personalization in pricing strategies
Pricing intelligence isn’t just about having data—it’s about having the right data and knowing how to use it strategically. Success requires a comprehensive approach that combines robust data collection, sophisticated analysis, and strategic implementation.
By embracing modern pricing intelligence tools and strategies, grocery retailers can navigate market volatility, maintain competitive positioning, and drive sustainable growth. The key lies in building a pricing ecosystem that’s both sophisticated enough to handle complex data and flexible enough to adapt to changing market conditions.
Ready to transform your pricing strategy? Check out our grocery price tracker to get month-on-month updates on grocery prices in the real world. Contact us to learn how our advanced pricing intelligence solutions can help your business stay ahead in the competitive grocery market.
Today, the first name that comes to anybody’s mind when they hear about online shopping is Amazon. In the US alone, Amazon accounted for over 37.6 percent of total online retail sales in 2023 with the second place Walmart not even managing to win double-digit numbers on the same scale.
With such a phenomenal market share, it is not surprising that any retail brand would want to have their products listed on Amazon for sale. However, as enticing as the potential exposure could be, the overwhelming presence of brands selling similar products on Amazon is so huge that getting fair visibility for your products may require some heavy-lifting support.
Will the Same SEO You Use for Google Work with Amazon?
Unfortunately, no, as Google and Amazon have different objectives when it comes to search rankings on their respective customer platforms. Google makes the lion’s share of its revenue from search advertising, whereas Amazon makes money when customers buy products listed on its platform by sellers.
Relying on traditional search engine optimization (SEO) techniques may not get the desired results as they are more optimized for search engines like Google. Amazon embraces its unique DNA when it comes to product display rankings on its search option.
How Does SEO Work in Amazon?
Over the years, Amazon amassed data about shopping experiences that billions of customers globally had on its platform. With this data, they developed their custom search algorithm named A9. Contrary to the gazillion objectives that Google has for its intelligent search algorithms, Amazon has tasked A9 with just a simple straightforward target—when a customer keys in a search query, provide the best choice of products that they will most probably purchase, as search results.
A9 works to fulfill the mission of guiding shoppers to the right product without worrying about semantics, context, intent, mind mapping, etc. of the search query in contrast to what Google does. As with Google search, Amazon does have paid advertising and sponsored results options such as Amazon PPC, Headline ads, etc. but their SEO algorithms are aware of how to support and boost search rankings of genuine products and brands that have taken an effort to follow best practices in Amazon SEO as well as have a great offering with attractive prices.
As additional knowledge, Amazon also has clear guidelines on what it prioritizes for search rankings. Known in the SEO world as Amazon ranking signals, these are core factors that influence how a product is ranked for search queries. Some of the top Amazon ranking signals that carry heavy influence on search rankings include on-page signals, off-page signals, sales rank, best sellers rank, etc.
What Brands Need to Strategize to Master the Amazon SEO Algorithms
From a broad perspective, we can classify the actions brands need to take in this regard in 3 core stages:
Pre-Optimization
This deals with getting first-hand knowledge about both customers who are likely to purchase your product and the competitors who are vying for sales from these very same customers. Filtering your target customer or audience is essential to ensure that you get the most ROI from marketing initiatives and that sales cycles are accelerated. For example, if your product is a premium scented candle, there is no point in wasting advertising dollars trying to win attention from customers who are not likely to ever spend on luxury home décor items.
Knowing how your competitors are performing on Amazon search, the keywords, and SEO strategies they have adapted is critical to ensure that you stay one step ahead.
Product Listing Page Optimization
This includes strategies that a brand can adopt so that its product description page gets the much-needed content optimizations to sync with Amazon’s A9 algorithm. It has a mix of keyword-integrated content, relevant images, descriptions in easy-to-understand language, localized content flavors to resonate with target buyers, etc. For example, a kitchen tool like a grater might be used for different kinds of food preparation techniques in different regions of the same country.
The brand must ensure that the description adequately localizes the linguistic or usage preference representation of the target audience. If the grater is used for grating coconut shells to extract the fibrous pulp in the Midlands and for grating ginger skin in the Far East, both use cases should be part of the product description if the target customers are from both regions.
Sales Optimization
This deals with options that have more sales strategies integrated into their core. For example, blogs on popular websites with the Amazon purchase link embedded in the content, collaboration with social media influencers, paid advertising on Amazon itself as well as on search engines, video ads, banner and display ads, etc.
The key intent here is to drive organic and inorganic traffic to the Amazon product listing page and ultimately win sales.
How Can Your Products Rank High in Amazon Search Results? Top 10 Tactics
Now that you have a clear understanding of the strategies that help in mastering Amazon’s ranking algorithms, here are some great tips to help achieve higher search rankings for your products on Amazon search:
1. Target Relevant Keywords
You need to figure out the best keywords that match what customers put as queries into the Amazon search bar. Your brand needs to clearly understand customer behavior when they arrive on Amazon to search for a product or category of products. The best place to begin looking for the same would be on competitor pages on Amazon. The keywords that helped them rank well on Amazon can help you as well. Manually investigating such a large pool of competitors is nearly impossible but with the right tools, you can easily embrace capabilities to know which keywords can help you in mimicking the success of your competitors.
2. Focus on Product Titles
Every single part of the content in your brand’s Amazon storefront or product page needs dedicated focus. Beginning with the product titles, effort needs to be made to ensure that they include the brand name, key product category or features, and other relevant keyword information.
In other words, product titles must be optimized for searchability. This searchability for product titles needs to be optimized for both mobile and desktop screens.
3. Create Product Descriptions that Resonate with the Audience
For product descriptions on your Amazon webpage, you need to figure out the optimal quality levels needed for the intended audience. Effective content can help achieve better search ranking visibility and convince the incoming traffic of shoppers to make a purchase. It is important to periodically review and modify your page content to suit the interests of visitors from both web and mobile devices.
Leveraging solutions like DataWeave can help with regular content audits to ensure you are putting out the best product content that will delight shoppers and deliver on sales conversion targets.
4. Use High-Quality Media Assets like Images and Videos
Promoting your product doesn’t have to be restricted to just textual content in Amazon product description sections. You can use other multimedia assets of high quality. These include images, videos, brochure images, etc. Every content asset must aim to educate shoppers on why your product should be their number one choice. For example, look at this detailed product description for the viral K-Beauty product COSRX Mucin Essence.
Moreover, images can help attract more attention span from visitors, thereby increasing the probability of purchases.
5. Strengthen the Backend Keywords As Well
Amazon also supports hidden backend keywords that sellers add to their product listings. They help add more relevance to products similar to meta descriptions and titles in traditional SEO for search engines like Google. A typical backend keyword may comprise synonyms, misspelled keywords, textual variations, etc. However, knowing how to pick the right ones is crucial. By analyzing your keyword rankings against competitors and higher-ranking product results in search, the platform can help you consistently optimize your content backend to help grow visibility.
6. Focus on Reviews and Ratings
Reviews and ratings on product pages are key insights that help customers with their purchasing decisions. So, it is natural for brands to keep a close eye on how their products are faring in this regard. Reviews and ratings are a direct indication of the trustworthiness of your product. When previous buyers rate you high and leave favorable reviews on your product, it will directly promote trust and help you secure a better rapport with new customers.
This upfront advantage can help boost sales conversions better. Leveraging solutions like DataWeave can help you understand the sentiments that customers have for your products by intelligently analyzing reviews and ratings.
7. Implement Competitive Pricing Strategies
The goal of most customers when shopping online is to get their desired product at the most affordable prices. The eCommerce price wars every year are growing in scale today and getting your product pricing right is crucial for sales. However, there is a need to gain comprehensive insights into how your competitors are pricing their offerings and how the market responds to specific price ranges. Solutions like DataWeave help your brand access specific insights into pricing. By analyzing competitor pricing, you can create a winning price model that is sustainable for your brand and favorable for target customers.
8. Track Share of Search
Content and other SEO activities will help improve your search rankings on Amazon. However, it is equally important to know how well your products are performing periodically against your competitors for the same set of specific keyword searches. You need to understand the share of search that your products are achieving to formulate improvement strategies. DataWeave’s Digital Shelf Analytics solution provides share of search insights helping you uncover deep knowledge on your discoverability on Amazon (and other marketplaces) for your vital search keywords.
9. Ensure Stock Availability
To achieve better ranking results, brands need to ensure that the relevant products matching the search keywords are available for quick delivery at the desired ZIP codes where users are more likely to search and order them. Out-of-stock items seldom show up high on search results. Certain products, especially if they’re popular, can get stocked out frequently in certain locations. Keeping a close eye on your stock availability across the map can help minimize these scenarios.
10. Optimize Your Brand Presence
While optimizing content and other key areas within the Amazon webpage for your product is critical, there are other avenues to help boost search rankings. One such option includes registering in the Amazon Brand Registry, which provides more beneficial features like protection against counterfeits and ensuring that your brand page is optimized according to Amazon storefront standards.
The Bottom Line
Winning the top spot in Amazon search ranking is crucial for brands that aim to capitalize on online sales revenue to grow their business. Knowing your workaround for Amazon’s proprietary SEO frameworks and algorithms is the first step to succeeding. The key element of success is your ability to gain granular insights into the areas we covered in this blog post such as competitor prices, sentiments of customers, market preferences, and content optimization requirements.
This is where DataWeave’s Digital Shelf Analytics solution becomes the biggest asset for your eCommerce business. Contact us to explore how we can empower your business to build the most visible and discoverable Amazon storefront that guarantees higher search rankings and ultimately increased sales. Talk to us for a demo today.
Fashion is as dynamic a market as any—and more competitive than most others. Consumer trends and customer needs are always evolving, making it challenging for fashion and apparel brands to keep up.
Despite the inherent difficulties fashion and apparel sellers face, this industry is one of the largest grossing markets in the world, estimated at $1.79 trillion in 2024. Global revenue for apparel is expected to grow at an annual rate of about 3.3% over the next four years. That means companies in this space stand to make significant revenue if they can competitively price their products, keep up with the competition, and win customer loyalty with consistent product availability.
There are three main categories in fashion and apparel. These include:
Apparel and clothing (i.e., shirts, pants, dresses, and other apparel)
Footwear (i.e., sneakers, sandals, heels, and other products)
Accessories (i.e., bags, belts, watches, and so on)
If you look at all of these product types across all sorts of retailers, there is a massive amount of overlapping data based on product attributes like style and size that are difficult to normalize.
Fashion Attributes
Style, color, and size are the main attribute categories in fashion and apparel. Style attributes include things like design, look, and overall aesthetics of the product. They’re very dependent on the actual product category of fashion as well. A shirt might have a slim fit attribute associated with it, whereas a belt might have a length. All these different attributes are usually labeled within a product listing and affect the consumer’s decision-making process:
Color (red, blue, sea green, etc.)
Pattern (solid, striped, checked, floral, etc.)
Material (cotton, polyester, leather, denim, silk, etc.)
Fit (regular, slim, relaxed, oversized, tailored, etc.)
Type (casual, formal, sporty, vintage, streetwear)
Color Complexity in Fashion
Color is perhaps the most visually distinctive attribute in fashion, yet it presents unique challenges for retailers. This is because color naming can vary across retailers and marketplaces. There are several major differences in color convention:
A single color can be labeled differently across brands (e.g., “navy,” “midnight blue,” “deep blue”)
Seasonal color names (e.g., “summer sage” vs. “forest green”)
Marketing-driven names (e.g., “sunset coral” vs. “pale orange”)
Size: The Other Critical Dimension
Size in fashion refers to the dimensions or measurements that determine how fashion products fit. Depending on whether the product is a clothing item, shoes, or a hat, there will be different sizing options. Types of sizes include:
Standard sizes (XS, S, M, L, XL, XXL, XXL)
Custom sizes (based on brand, retailer, country, etc.)
A single type of product may have different sizing labels. For instance, one pants listing may use traditional S, M, L, XL sizing, while another pants listing may use 24, 25, or 26, to refer to the waist measurement.
Size is a dynamic attribute that changes based on current trends. For example, there has recently been a significant shift towards inclusive sizing. Size inclusivity refers to the practice of selling apparel in a wide range of sizes to accommodate people of all body types. Consumers are more aware of this trend and are demanding a broader range of sizing offerings from the brands they shop from.
In the US market, in particular, some 67% of American women wear a size 14 or above and may be interested in purchasing plus-size clothing. There is a growing demand in the plus-size market for more options and a wider selection. Many brands are considering expanding their sizes to accommodate more shoppers and tap into this growing revenue channel.
Pricing Based on Size and Color
Many fashion products are priced differently based on size and color. Let’s take a look at an example of what this can look like.
A popular beauty brand (see image) is known for its viral lip tint. While most of the color variants are priced at $9.90 on Amazon, a specific colorway option, featuring less pigmented options, is priced at $9.57. This price differential is driven by both material costs and market demand.
Different colorways (any of a range of combinations of colors in which a style or design is available) of the same product often command different prices also. This is based on:
Dye costs (some colors require more expensive processes)
Seasonal demand (traditional colors vs. trend colors)
Exclusivity (limited edition colors)
An example of price variations by size is a women’s shirt that is being sold on Amazon as shown below. For this product, there are no style attributes to choose from. The only parameter the shopper has to select is the size they’d like to purchase. They can choose from S to XL. On the top, we can see that the product in size S is ₹389. Below, the size XL version of this same shirt is ₹399. This price increase is correlated to the change in size.
So why are these same products priced differently? In an analysis of One Six, a plus-size clothing brand, several reasons for this difference in plus-size clothing were determined.
Extra material is needed, hence an increase in production costs
Extra stitching costs, hence an increase in production costs
Production of plus-size clothing often means acquiring specialized machinery
Smaller scale production runs for plus-size clothing means these initiatives often don’t benefit from cost savings
Some sizes are sold more than others, meaning that in-demand sizes for certain apparel can affect pricing as well. Brands want to be able to charge as much as possible for their listing without risking losing a sale to a competitor.
The Competitive Pricing Challenge: Normalizing Product Attributes Across Competitors in Apparel and Fashion
There are hundreds of possible attribute permutations for every single apparel product. Some retailers may only sell core sizes and basic colors; some may sell a mix of sizes for multiple style types. Most retailers also sell multiple color variants for all styles they have on catalog. Other retailers may only sell a single, in-demand size of the product. Also, when other retailers are selling the product, it’s unlikely that their naming conventions, color options, style options, and sizing match yours one-for-one.
In one analysis, it was found that there were 800+ unique values for heel sizes and 1000+ unique values for shirts and tops at a single retailer! If you’re looking to compare prices, the effort involved in setting up and managing lookup tables to identify discrepancies when one retailer uses European sizes and another uses USA sizes, for example, is simply too onerous to contemplate doing. Colors only add to the complexity – as similar colors may have new names in different regions and locations as well!
Even if you managed to find all the discrepancies between product attributes, you would still need to update them any time a competitor changed a convention.
Still, monitoring your competitors and strategically pricing your listings is essential to maintain and grow market share. So what do you do? You can’t simply eyeball your competitor’s website to check their pricing and naming conventions. Instead, you need advanced algorithms to scan the entire marketplace, identify individual products being sold, and normalize their data and attributes for analysis.
Getting Color and Size Level Pricing Intelligence
With DataWeave, size and color are just two of several dimensions of a product instead of an impossible big data problem for teams. Our product matching engine can easily handle color and sizing complexity via our AI-driven approach combined with human verification.
This works by using AI built on more than 10 years of product catalog data across thousands of retail websites. It matches common identifiers, like UPC, SKU code, and other attributes for harmonization before employing a large language model (LLM) prompts to normalize color variations and sizing to a single standard.
For example, if a competitor has the smallest size listed as Sm but has your smallest listing identified as S, DataWeave can match those two attributes using AI. Similar classification can be performed on color as well.
Complex LLM prompts are pre-established so that this process is fast and efficient, taking minutes rather than weeks of manual effort.
Harmonizing products along with their color and sizing data across different retailers for further analysis has several benefits. Most importantly, product matching helps teams conduct better competitive analysis, allowing them to stay informed about market trends, competitors’ offerings, and how those competitors are pricing various permutations of the same product. It helps ensure that you’re offering the most competitive assortment of sizing in several colors to win more market share as well. Overall, it’s easier for teams to gain insights and exploit their findings when all the data is clean and available at their fingertips.
Product Matching Size and Color in Apparel and Fashion
Color and size are crucial attributes for retailers and brands in the apparel and fashion industry. It adds a level of complexity that can’t be overstated. While it’s a necessity to win consumers (more colors and sizes will mean a wider potential reach), the more permutations you add to your listing, the more complicated it will be to track it against your competition. However, This challenge is worth undertaking as long as you have the right solutions at your disposal.
With a strategy backed by advanced technology to discover identical and similar products across the competitive landscape and normalize their color and sizing attributes, you can ensure that you are competitively pricing your products and offering the best assortment possible. Employing DataWeave’s AI technology to find competitor listings, match products across variants, and track pricing regularly is the way to go.
Interested in learning more about DataWeave? Click here to get in touch!
Fuel retailers today operate in a highly competitive and volatile market. Consumer behavior is increasingly driven by price sensitivity, particularly in industries like fuel where small changes in price can significantly influence where consumers choose to fill up. The stakes are even higher when you consider the razor-thin margins many fuel retailers work with, making every cent count.
For years, retailers have relied on third-party apps and services to provide them with location-based competitive fuel price data. These services collect pricing data based on customer transactions. While these platforms offer a convenient way for consumers to find cheaper fuel prices, their value to retailers is limited. The data they provide is often riddled with inaccuracies, lags, and incomplete coverage, leaving retailers vulnerable to missed pricing opportunities.
In this rapidly shifting landscape, retailers need data that is not only accurate but also real-time. Solving this involves directly tapping into retailers’ own data sources (first-party or 1P data) —such as websites and apps. This is believed to be the most comprehensive and reliable source of fuel price data in the market.
To validate this hypothesis, we conducted a comprehensive analysis comparing first-party and third-party (3P) fuel price data. Our analysis compared pricing (at the same time of the day) across more than 40 gas stations—including major players like Circle K, Costco, Speedway, and Wawa. The data was captured several times a day for over a week.
Accurate Pricing Matters More Than Ever
Our analysis revealed that nearly a quarter (24.4%) of the fuel pricing data provided by third-party sources was inaccurate when compared to first-party data. On average, these inaccuracies amounted to a price difference of 10.9%.
Such discrepancies, though seemingly minor, can significantly affect consumer behavior. Inaccurate prices could drive customers to competitors who are listed with lower prices—even if the real difference is negligible. For fuel retailers, this leads to lost revenue, missed opportunities, and reduced market share.
The implications are clear: relying on third-party competitive data alone puts retailers at risk. With inaccurate data, retailers may fail to adjust their prices in time to respond to market changes, losing customers to competitors.
The Core Challenges of Third-Party Data
Third-party data comes with inherent limitations. The way this data is collected presents significant challenges for fuel retailers looking to optimize pricing strategies. Here are the main issues:
Inconsistent Data Frequency: Third-party pricing data is often gathered through customer card transactions. As a result, pricing data updates only when and where transactions occur. This can lead to irregular data availability, particularly in stations with lower transaction volumes. For instance, in rural areas or during off-peak hours, fewer transactions lead to fewer updates. Retailers are left with outdated data, making it difficult to keep pace with real-time price fluctuations.
Limited Geographic Coverage: Regions with lower transaction volumes are particularly affected by data gaps. While urban centers may enjoy more frequent updates, rural and less-frequented stations often suffer from a lack of data. This limited geographic coverage creates blind spots, making it impossible for retailers in these regions to stay competitive.
Potential Data Inaccuracies Across Fuel Types: Our analysis showed that inaccuracies in third-party pricing data were most pronounced for Unleaded fuel, with errors occurring nearly 80% of the time. While Diesel prices fared slightly better, inaccuracies were still frequent. This inconsistency across fuel types further complicates the challenge for retailers relying on third-party data.
Leveraging First-Party Data
At DataWeave, our Fuel Pricing Intelligence solution leverages real-time 1P data directly from fuel retailers’ websites and mobile apps, ensuring that retailers always have access to the most up-to-the-minute and accurate pricing information.
Here’s why first-party data stands out:
Real-Time Updates: Our solution provides near-instantaneous updates across more than 30,000 ZIP codes, ensuring that retailers always have the most up-to-date pricing information. This real-time accuracy is essential for making dynamic pricing adjustments in a highly competitive market.
Wide Geographic Coverage: DataWeave’s first-party solution captures data across a broad geographic range, ensuring no blind spots in coverage. Retailers in rural or less-frequented areas benefit from the same level of insight as their urban counterparts, giving them the ability to optimize pricing in real-time.
Complementary to Existing Solutions: For retailers already using third-party data, DataWeave’s first-party solution can complement and enhance their current systems. By filling in data gaps and providing more frequent updates, our solution ensures that retailers are never left in the dark when it comes to competitive pricing.
Retailer-Wise Variances
Among the retailers analyzed, we found that some were more affected by third-party data inaccuracies than others. Speedway and Wawa, for instance, experienced inaccuracies in up to 28% of third-party price data. In contrast, Circle K exhibited fewer discrepancies, but even they were not immune to the challenges posed by third-party data.
For their competition, relying on third-party data alone presents a significant risk. By switching to first-party data sources, or complementing their existing third-party data with DataWeave’s first-party solution, retailers can ensure they stay competitive in the eyes of price-sensitive consumers.
In an industry as price-sensitive as fuel retail, accurate data is a strategic asset. Leveraging first-party data allows fuel retailers to:
Maximize Revenue: By using real-time, accurate data, retailers can avoid under- or over-pricing their fuel, ensuring they capitalize on high-demand periods while minimizing losses during low-demand times.
Enhance Margins: First-party data provides the precision needed to fine-tune margins, ensuring profitability even in fiercely competitive markets.
Boost Customer Retention: Competitive pricing fosters customer loyalty. With better data, retailers can maintain customer trust and retention, even during volatile market shifts.
Shift into High Gear with DataWeave
As the fuel retail industry becomes increasingly competitive, the need for accurate, real-time pricing data has never been more important. DataWeave’s Fuel Pricing Intelligence solution empowers retailers with the insights they need to stay ahead of the competition, optimize pricing strategies, and boost profitability.
With first-party data, fuel retailers can eliminate the blind spots and inaccuracies associated with third-party sources. This shift toward data-driven pricing strategies ensures that every price adjustment is backed by real-time insights, giving retailers the edge they need to succeed.
Brands are investing millions of dollars in digital retail media to make their products stand out amid unrelenting competition.
The ad spend on digital retail media worldwide was estimated at USD 114.4 billion in 2022, and the current projections indicate that it will grow to USD 176 billion by 2028. This amounts to a 54% increase in just six years.
The current surge in digital retail media advertising has led brands to find an effective way to monitor the efficacy of their ad spend. While Share of Search has long been used to measure brand visibility effectively, the metrics often missed tracking ads on retail sites.
DataWeave’s Share of Media solution helps solve this problem.
What is the Share of Media?
At DataWeave, Share of Media is a metric used to measure a brand’s presence in sponsored listings and banner ads on eCommerce platforms. It captures how often a brand appears in paid promotions compared to competitors, offering insights into advertising visibility and effectiveness.
These days most marketplaces seamlessly blend banner ads and sponsored listings into organic search results. Let’s take a closer look.
Banner Advertising
Banner advertising strategically places creative banners across websites—often at the top, bottom, or sides. Some eCommerce platforms also integrate these banners into product search listings.
What makes banner ads so special is the unique ability to allow marketers to use various types of media in a single ad, such as images, auto-play videos, and animations. Brands can also present curated collections of products. This flexibility provides marketers with creative opportunities to differentiate from competitors, capture customer interest, and encourage conversions.
Sponsored Listings
Sponsored listings are paid placements within search engine results or eCommerce platforms. They are usually marked as ‘sponsored’ or ‘ad,’ and they often appear at the top of search results and alongside organic product listing results.
Unlike organic search results, sponsored listings are prioritized based on the advertiser’s bid amount and relevance to users’ search queries.
Sponsored listings offer a strategic advantage by enabling businesses to connect directly with consumers who are actively searching for their products. This targeted approach ensures that marketing efforts are focused on individuals with high intent of making a purchase, maximizing the potential return on investment.
The Power of Banner Ads and Sponsored Listings
Banner ads and sponsored listings are great choices for boosting customer engagement and product sales. Here are four key advantages they offer:
Enhanced Visibility: Digital retail media strategically places your brand where it will stand out—outshining competitors and grabbing the attention of high-purchase-intent consumers.
Precision in Reach: These ads target specific keywords or categories, allowing for highly focused advertising based on demographics and search intent.
Minimal Conversion Friction: Smooth transitions from ads to a brand’s native store or product listing on the marketplace keep conversion friction to a minimum.
Brand Awareness and Recall: Consistent exposure to your brand through banner ads and sponsored product listings can leave lasting impressions and build brand recognition.
The bottom line is that it’s increasingly important for brands to monitor their Share of Media.
How to Monitor Your Brand’s Share of Media
DataWeave’s Digital Shelf Analytics (DSA) platform extends beyond the traditional Share of Search metrics and provides robust support for monitoring the Share of Media.
DataWeave monitors the Share of Media in two ways: keywords and product categories. Users can view Share of Media insights through aggregated views, trend charts, and detailed tables. The views are designed to show brand visibility and the overall competitive landscape. For example, the screenshot below, taken from DataWeave’s dashboard, showcases the Share of Media across keywords, categories, and retailers.
Share of Media by Keyword
The Share of Media metric captures a brand’s advertising presence within search listings for a designated keyword. This provides a comprehensive view of a brand’s visibility and promotional efforts across retail platforms, helping brands validate and gauge the effectiveness of their ad spend.
For example, the screenshot below shows the trend of manufacturer’s Share of Media by keyword—‘baby food.’
Share of Media by Category
The Share of Media metric measures the presence of brands’ banner ads and sponsored listings across product categories on retail sites. This helps brands see which product categories require more investment, making it easier for them to spend their ad budget wisely.
The screenshot below illustrates manufacturers’ Share of Media by category across retailers.
Share of Media: An Essential Ecommerce Metric
As retail media continues to evolve, our analytics must follow—after all, knowledge is a competitive advantage. In the dynamic world of eCommerce, where competition is fierce and consumer attention is scarce, understanding your share of media is crucial.
Analyzing the Share of Media can give brands a competitive edge. By regularly monitoring and analyzing this metric, you can make data-driven decisions to improve your brand’s visibility, attract more customers, and ultimately drive sales growth. With a deeper understanding of their target audience and market dynamics, brands can refine promotional efforts to drive more effective results and optimize return on ad spend (ROAS).
For more information on how Digital Shelf Analytics can enhance your brand’s digital shelf presence, request a demo or contact us at contact@dataweave.com.
Your budget-conscious customers are hunting for value and won’t hesitate to switch brands or shop at other retailers.
In saturated and fiercely competitive markets, how can you retain customers? And better yet, how can you attract more customers and grow your market share? One thing you can do as a brand or retailer is to set the right prices for your products.
Competitive or competition-based pricing can help you get there.
So what exactly is competitive pricing? Let’s dive into this strategy, its advantages and disadvantages, and how it can be used to stay ahead of the competition.
What is Competitive Pricing?
Competitive or competition-based pricing is a strategy where brands and retailers set product prices based on what their competitors charge. This method focuses entirely on the market landscape and sets aside the cost of production or consumer demand.
It is a good pricing model for businesses operating in saturated markets, such as consumer packaged goods (CPGs) or retail.
Competitive Pricing Models
Competitive pricing isn’t a one-size-fits-all strategy. The approach includes various pricing models that can be customized to fit your business goals and market positioning.
Here’s a closer look at five of the most common competition-based pricing models:
Price Skimming
If you have a new product entering the market, you can initially set a high price. Price skimming allows you to maximize margins when competition is minimal.
This strategy taps into early adopters’ willingness to pay a premium for new project categories. As competitors enter the market, you can gradually reduce the price to maintain competitiveness.
Premium Pricing
Premium pricing lets you position your product as high-quality or luxurious goods.
When you charge more than your competitors, you’re not just selling a product—you’re selling status and an experience. This strategy is effective when your offering is of superior quality or has unique features that justify a higher price point.
Price Matching
Price matching—also known as parity pricing—is a defensive pricing tactic.
By consistently matching your competitors’ prices, you can retain customers who might otherwise, be tempted to switch to an alternative.
This approach signals your customers that they don’t need to look elsewhere for what they need and can feel comfortable remaining loyal to your brand.
Penetration Pricing
Penetration pricing is when you set a low price for a new product to gain market share quickly. The opposite of price skimming, this strategy can be particularly effective in price-sensitive or highly competitive industries.
By attracting customers early, you can also deter some competitors from entering the market. This bold move can establish your product as a market leader from the get-go.
Loss Leader Pricing
Loss leader pricing is a strategic sacrifice that can lead to greater gains in the long run.
By offering a product at a low price—sometimes even below cost—you can attract new customers to your brand and strengthen your current customers’ loyalty.
Eventually, you can cross-sell other higher-margin products to your loyal customer base to cover the loss from your loss leader pricing and increase sales of other more profitable products.
Key Advantages of Competitive Pricing
Although it’s not the only pricing strategy available, competitive pricing has some significant advantages.
It is Responsive
Agility is synonymous with profit in industries where consumer preferences and market conditions shift rapidly.
Competitive pricing allows you to adapt quickly—if a competitor lowers their prices, you can respond promptly to maintain your positioning.
It is Simple to Execute and Manage
Competitive pricing is straightforward, unlike cost-based pricing, which requires complex calculations and spans various factors and facets.
By closely monitoring competitors’ prices and adjusting your prices accordingly, you can implement this pricing strategy with relative ease and speed.
It Can Be Combined with Other Pricing Strategies
Competitive pricing is not a standalone strategy—it’s a versatile approach that can easily be combined with other pricing strategies. For example, say you want to use competitive pricing without losing money on a product. In this case, you could use cost-plus pricing to determine a base price that you won’t go below, then use competitive pricing as long as the price stays above your base price.
Key Disadvantages of Competitive Pricing
While competition-based pricing has its advantages, it’s not without its pitfalls. Here are some potential disadvantages of competitive pricing.
It De-emphasizes Consumer Demand
If you focus solely on what competitors are charging, you could overlook consumer demand.
For example, you could underprice items that consumers could be willing to purchase for more. Or, you might overprice items that consumers perceive as low-value, which can reduce sales.
You Risk Price Wars
If you and your competition undercut each other for customer acquisition and loyalty, you will eventually erode profit margins and harm the industry’s overall profitability. It’s a slippery slope where everyone loses in the end.
There’s Potential for Complacency
When you base your prices on beating those of competitors, you might neglect to differentiate your offerings through innovation and product improvements. Over time, this can weaken your brand’s position and lead to a loss of market share. Staying competitive means more than just matching prices—it means continuously evolving and adding value for the consumer.
4 Tips for a Successful Competitive Pricing Strategy in Retail
Here are four competition-based pricing tips for retailers:
Retailer Tip #1. Know Where to Position Your Products in the Market
For competitive pricing to work, you must understand your optimal product positioning in the overall market. To gain this understanding, you must regularly compare your offerings and prices with those of your key competitors, especially for high-demand products.
Then, you can decide which competition-based pricing model is suitable for you.
Retailer Tip #2. Price Dynamically
Dynamic pricing is a tactic with which you automatically adjust prices on your chosen variables, such as market conditions, competitor actions, or consumer demand.
When it comes to competitive pricing, a dynamic pricing system can track your competitors’ price changes and update yours in lockstep.
Price-monitoring tools like DataWeave allow you to stay ahead of the game with seasonal and historical pricing trend data.
Retailer Tip #3. Combine Competitive Pricing with Other Pricing Strategies
Competitive pricing can be powerful, but it doesn’t have to stand alone. You can enhance its benefits with complementary marketing tactics.
To illustrate, you can bundle products to offer greater value than what your competitors are offering. You can also leverage loyalty programs to offer exclusive discounts or rewards so customers keep returning, even when your competitors offer them lower prices.
Retailer Tip #4. Stay in Tune with Consumer Demand
Competition-based pricing aligns you with your competitor, but don’t lose sight of what your customers want. Routinely test your pricing strategy against consumer behavior to ensure that your prices reflect the actual value of your offerings.
5 Tips for a Successful Competitive Pricing Strategy for Consumer Brands
If you’re thinking about how to create a competitive pricing strategy for your brand, consider these five tips:
Brand Tip #1. Identify Competing Products for Accurate Comparisons
The first step in competitive pricing is to know the value of what you’re selling and how it compares to that of your competitors’ products. This extends to private-label products, similar but not identical products, and use-case products.
Product matching ensures your pricing decisions are based on accurate like-for-like comparisons, allowing you to compete effectively.
Brand Tip #2. Understand Your Product’s Relative Value
Knowing how your product competes on value is key to setting the right price. If your product offers higher value, price it higher; if it offers less, price it accordingly. This ensures your pricing strategy reflects your product’s market placement.
Brand Tip #3. Consider Brand Perception
Even if your product is virtually the same as a competitor’s, your brand’s perceived value may be different, which plays a crucial role in pricing.
If your brand is perceived as premium, you can justify higher prices. Conversely, if customers perceive you as a value brand, your pricing should reflect affordability.
Brand Tip #4. Leverage Value-Based Differentiation
When your prices are similar to competitors’, you must differentiate your products by expressing your product value through branding, packaging, quality, or something else entirely.
This differentiation will compel consumers to choose your product over other similarly priced options.
Brand Tip #5. Stay Vigilant with Price Monitoring
Your competitors will update their pricing repeatedly, and you will, too.
It can be difficult and time-consuming to monitor your competitive pricing, so you’ll need a system like DataWeave to monitor competitors’ pricing and manage dynamic pricing changes.
This vigilance ensures your brand remains competitive and relevant in real time.
4 Essential Capabilities You Need to Implement Successful Competition-Based Pricing
You’ll need four key capabilities to implement a competitive pricing strategy effectively.
AI-Driven Product Matching
Product matching means you’ll compare many products (sometimes tens or hundreds) with varying details across multiple platforms. Accurate product matching at that scale requires AI.
For instance, AI can identify similar smartphones to yours by analyzing features like screen size and processor type. DataWeave’s AI product matches start with 80–90% matching accuracy, and then human oversight can fine-tune the data for near-perfect matches.
You can make informed pricing decisions once you know which competing products to base your prices on.
Accurate and Comprehensive Data
A successful competition-based pricing strategy depends on high-quality, comprehensive product and pricing data from many retailers and eCommerce marketplaces.
By tracking prices on large online platforms and niche eCommerce sites across certain regions, you’ll gain a more comprehensive market view, which enables you to make quick and confident price changes.
Normalized Measurement Units
Accurate price comparisons are dependent on normalized unit measurements.
For example, comparing laundry detergent sold in liters to laundry detergent sold in ounces requires converting either or both products to a common base like price-per-liter or price-per-ounce.
This normalization ensures accurate pricing analysis.
Timely Actionable Insights
Timely and actionable pricing insights empower you to make informed pricing decisions.
With top-tier competitive pricing intelligence systems, you get customized alerts, intuitive dashboards, and detailed reports to help your team quickly act on insights.
In Conclusion
Competitive pricing or competition-based pricing is a powerful strategy for businesses navigating crowded markets, but you must balance competitive pricing with your brand’s unique value proposition.
Competitive pricing should complement innovation and customer-centric strategies, not replace them. To learn more, talk to us today!
In retail, competition is fierce, and in its ever-evolving landscape, consumer expectations are higher than ever.
For years, our AI-driven solutions have been the foundation that empowers businesses to sharpen their competitive pricing and optimize digital shelf performance. But in today’s world, evolution is constant—so is innovation. We now find ourselves at the frontier of a new era in AI. With the dawn of Generative AI and the rise of Large Language Models (LLMs), the possibilities for eCommerce companies are expanding at an unprecedented pace.
These technologies aren’t just a step forward; they’re a leap—propelling our capabilities to new heights. The insights are deeper, the recommendations more precise, and the competitive and market intelligence we provide is sharper than ever. This synergy between our legacy of AI expertise and the advancements of today positions DataWeave to deliver even greater value, thus helping businesses thrive in a fast-paced, data-driven world.
This article marks the beginning of a series where we will take you through these transformative AI capabilities, each designed to give retailers and brands a competitive edge.
In this first piece, we’ll offer a snapshot of how DataWeave aggregates and analyzes billions of publicly available data points to help businesses stay agile, informed, and ahead of the curve. These fall into four broad categories:
Product Matching
Attribute Tagging
Content Analysis
Promo Banner Analysis
Other Specialized Use Cases
Product Matching
Dynamic pricing is an indispensable tool for eCommerce stores to remain competitive. A blessing—and a curse—of online shopping is that users can compare prices of similar products in a few clicks, with most shoppers gravitating toward the lowest price. Consequently, retailers can lose sales over minor discrepancies of $1–2 or even less.
All major eCommerce platforms compare product prices—especially their top selling products—across competing players and adjust prices to match or undercut competitors. A typical product undergoes 20.4 price changes annually, or roughly once every 18 days. Amazon takes it to the extreme, changing prices approximately every 10 minutes. It helps them maintain a healthy price perception among their consumers.
However, accurate product matching at scale is a prerequisite for the above, and that poses significant challenges. There is no standardized approach to product cataloging, so even identical products bear different product titles, descriptions, and attributes. Information is often incomplete, noisy, or ambiguous. Image data contains even more variability—the same product can be styled using different backgrounds, lighting, orientations, and quality; images can have multiple overlapping objects of interest or extraneous objects, and at times the images and the text on a single page might belong to completely different products!
DataWeave leverages advanced technologies, including computer vision, natural language processing (NLP), and deep learning, to achieve highly accurate product matching. Our pricing intelligence solution accurately matches products across hundreds of websites and automatically tracks competitor pricing data.
Here’s how it works:
Text Preprocessing
It identifies relevant text features essential for accurate comparison.
Metadata Parsing: Extracts product titles, descriptions, attributes (e.g., color, size), and other structured data elements from Product Description Pages (PDP) that can help in accurately identifying and classifying products.
Attribute-Value Normalization: Normalize attributes names (e.g. RAM vs Memory) and their values (e.g., 16 giga bytes vs 16 gigs vs 16 GB); brand names (e.g., Benetton vs UCB vs United Colors of Benetton); mapping category hierarchies a standard taxonomy.
Noise Removal: Removes stop words and other elements with no descriptive value; this focuses keyword extraction on meaningful terms that contribute to product identification.
Image Preprocessing
Image processing algorithms use feature extraction to define visual attributes. For example, when comparing images of a red T-shirt, the algorithm might extract features such as “crew neck,” “red,” or “striped.”
Image hashing techniques create a unique representation (or “hash”) of an image, allowing for efficient comparison and matching of product images. This process transforms an image into a concise string or sequence of numbers that captures its essential features even if the image has been resized, rotated, or edited.
Before we perform these activities there is a need to preprocess images to prepare them for downstream operations. These include object detection to identify objects of interest, background removal, face/skin detection and removal, pose estimation and correction, and so forth.
Embeddings
We have built a hybrid or a multimodal product-matching engine that uses image features, text features, and domain heuristics. For every product we process we create and store multiple text and image embeddings in a vector database. These include a combination of basic feature vectors (e.g. tf-idf based, colour histograms, share vectors) to more advanced deep learning algorithms-based embeddings (e.g., BERT, CLIP) to the latest LLM-based embeddings.
Classification
Classification algorithms enhance product attribute tagging by designating match types. For example, the product might be identified as an “exact match”, “variant”, “similar”, or “substitute.” The algorithm can also identify identical product combinations or “baskets” of items typically purchased together.
What is the Business Impact of Product Matching?
Pricing Intelligence: Businesses can strategically adjust pricing to remain competitive while maintaining profitability. High-accuracy price comparisons help businesses analyze their competitive price position, identify opportunities to improve pricing, and reclaim market share from competitors.
Similarity-Based Matching: Products are matched based on a range of similarity features, such as product type, color, price range, specific features, etc., leading to more accurate matches.
Counterfeit Detection: Businesses can identify counterfeit or unauthorized versions of branded products by comparing them against authentic product listings. This helps safeguard brand identity and enables brands to take legal action against counterfeiters.
Attribute Tagging
Attribute tagging involves assigning standardized tags for product attributes, such as brand, model, size, color, or material. These naming conventions form the basis for accurate product matching. Tagging detailed attributes, such as specifications, features, and dimensions, helps match products that meet similar criteria. For example, tags like “collar” or “pockets” for apparel ensure high-fidelity product matches for hard-to-distinguish items with minor stylistic variations.
Including tags for synonyms, variants, and long-tail keywords (e.g., “denim” and “jeans”) improves the matching process by recognizing different terms used for similar products. Metadata tags categorize similar items according to SKU numbers, manufacturer details, and other identifiers.
Altogether, these capabilities provide high-quality product matches and valuable metadata for retailers to classify their products and compare their product assortment to competitors.
User-Generated Content (UGC) Analysis
Customer reviews and ratings are rich sources of information, enabling brands to gauge consumer sentiment and identify shortcomings regarding product quality or service delivery. However, while informative, reviews constitute unstructured “noisy” data that is actionable only if parsed correctly.
Here’s where DataWeave’s UGC analysis capability steps in.
Feature Extractor: Automatically pulls specific product attributes mentioned in the review (e.g., “battery life,” “design” and “comfort”)
Feature Opinion Pair: Pairs each product attribute with a corresponding sentiment from the review (e.g., “battery life” is “excellent,” “design” is “modern,” and “comfort” is “poor”)
Calculate Sentiment: Calculates an overall sentiment score for each product attribute
The final output combines the information extracted from each of these features, which looks something like this:
Battery life is excellent
Design is modern
Not satisfied with the comfort
The algorithm also recognizes spammy reviews and distinguishes subjective reviews (i.e., those fueled by emotion) from objective ones.
Promo Banner Analysis
Our image processing tool can interpret promotional banners and extract information regarding product highlights, discounts, and special offers. This provides insights into pricing strategies and promotional tactics used by other online stores.
For example, if a competitor offers a 20% discount on a popular product, you can match or exceed this discount to attract more customers.
The banner reader identifies successful promotional trends and patterns from competitors, such as the timing of discounts, frequently promoted product categories or brands, and the duration of sales events. Ecommerce stores can use this information to optimize their promotion strategies, ensuring they launch compelling and timely offers.
Other Specialized Use Cases
While these generalized AI tools are highly useful in various industries, we’ve created other category—and attribute-specific capabilities for specialty goods (e.g., those requiring certifications or approval by federal agencies) and food items. These use cases help our customers adhere to compliance requirements.
Certification Mark Detector
This detector lets retailers match items based on official certification marks. These marks represent compliance with industry standards, safety regulations, and quality benchmarks.
Example:
USDA Organic: Certification for organic food production and handling
ISO 9001: Quality Management System Certification
By detecting these certification marks, the system can accurately match products with their certified counterparts. By identifying which competitor products are certified, retailers can identify products that may benefit from certification.
Nutrition Fact Table Reader
Product attributes alone are insufficient for comparing food items. Differences in nutrition content can influence product category (e.g., “health food” versus regular food items), price point, and consumer choice. DataWeave’s nutrition fact table reader scans nutrition information on packaging, capturing details such as calorie count, macronutrient distribution (proteins, fats, carbohydrates), vitamins, and minerals.
The solution ensures items with similar nutritional profiles are correctly identified and grouped based on specific dietary requirements or preferences. This helps with price comparisons and enables eCommerce stores to maintain a reliable database of product information and build trust among health-conscious consumers.
Building Next-Generation Competitive and Market Intelligence
Moving forward, breakthroughs in generative AI and LLMs have fueled substantial innovation, which has enabled us to introduce powerful new capabilities for our customers.
These include:
Building Enhanced Products, Solutions, and Capabilities: Generative AI and LLMs can significantly elevate the performance of existing solutions by improving the accuracy, relevance, and depth of insights. By leveraging these advanced AI technologies, DataWeave can enhance its product offerings, such as pricing intelligence, product matching, and sentiment analysis. These tools will become more intuitive, allowing for real-time updates and deeper contextual understanding. Additionally, AI can help create entirely new solutions tailored to specific use cases, such as automating competitive analysis or identifying emerging market trends. This positions DataWeave to remain at the forefront of innovation, offering cutting-edge solutions that meet the evolving needs of retailers and brands.
Reducing Turnaround Time (TAT) to Go-to-Market Faster: Generative AI and LLMs streamline data processing and analysis workflows, enabling faster decision-making. By automating tasks like data aggregation, sentiment analysis, and report generation, AI dramatically reduces the time required to derive actionable insights. This efficiency means that businesses can respond to market changes more swiftly, adjusting pricing or promotional strategies in near real-time. Faster insights translate into reduced turnaround times for product development, testing, and launch cycles, allowing DataWeave to bring new solutions to market quickly and give clients a competitive advantage.
Improving Data Quality to Achieve Higher Performance Metrics: AI-driven technologies are exceptionally skilled at cleaning, organizing, and structuring large datasets. Generative AI and LLMs can refine the data input process, reducing errors and ensuring more accurate, high-quality data across all touchpoints. Improved data quality enhances the precision of insights drawn from it, leading to higher performance metrics like better product matching, more accurate price comparisons, and more effective consumer sentiment analysis. With higher-quality data, businesses can make smarter, more informed decisions, resulting in improved revenue, market share, and customer satisfaction.
Augmenting Human Bandwidth with AI to Enhance Productivity: Generative AI and LLMs serve as powerful tools that augment human capabilities by automating routine, time-consuming tasks such as data entry, classification, and preliminary analysis. This allows human teams to focus on more strategic, high-value activities like interpreting insights, building relationships with clients, and developing new business strategies. By offloading these repetitive tasks to AI, human productivity is significantly enhanced. Employees can achieve more in less time, increasing overall efficiency and enabling teams to scale their operations without needing a proportional increase in human resources.
In our ongoing series, we will dive deep into each of these capabilities, exploring how DataWeave leverages cutting-edge AI technologies like Generative AI and LLMs to solve complex challenges for retailers and brands.
As summer winds down, families across the US have been gearing up for the annual back-to-school shopping season. The back-to-school season has always been a significant event in the retail calendar, but its importance has grown in recent years. With inflation still impacting many households, parents and guardians are more discerning than ever about their purchases, seeking the best value for their money.
The National Retail Federation has forecasted that this season could see one of the highest levels of spending in recent years, reaching up to $86.6 billion. As shoppers eagerly stock up on back-to-school and back-to-college essentials, it’s crucial for retailers and brands to refine their pricing strategies in order to capture a larger share of the market.
To understand how retailers are responding to the back-to-school rush this season, our proprietary analysis delves into pricing trends, discount strategies, and brand visibility across major US retailers, including Amazon, Walmart, Kroger, and Target. By examining 1000 exactly matching products in popular back-to-school categories, our analysis provides valuable insights into the pricing strategies adopted by leading retailers and brands this year.
Price Changes: A Tale of Moderation
The most notable trend in our analysis is the much smaller annual price increases this year, in contrast to last year’s sharp price hikes. This shift is a reaction to growing consumer frustration about rising prices. After enduring persistent inflation and steep price growth, which peaked last year, consumers have become increasingly frustrated. As a result, retailers have had to scale back and implement more moderate price increases this year.
Kroger led the pack with the highest price increases, showing a 5.3% increase this year, which follows a staggering 19.9% rise last year. Walmart’s dramatic price increase of 14.9% is now followed by a muted 3.1% hike. Amazon and Target demonstrated a similar pattern of slowing price hikes, with increases of 2.3% and 2.7% respectively in the latest period. This trend indicates that retailers are still adjusting to increased costs but are also mindful of maintaining customer loyalty in a competitive market.
When examining specific product categories, we observe diverse pricing trends. Electronics and apparel saw the largest price increases between 2022 and 2023, likely due to supply chain disruptions and volatile demand. However, the pace of these increases slowed in 2024, indicating a gradual return to more stable market conditions. Notably, backpacks remain an outlier, with prices continuing to rise sharply by 22%.
Interestingly, some categories, such as office organization and planners, experienced a price decline in 2024. This could signal an oversupply or shifting consumer preferences, presenting potential opportunities for both retailers and shoppers.
Brand Visibility: The Search for Prominence
In the digital age, a brand’s visibility in online searches can significantly impact its success during the back-to-school season. Our analysis of the share of search across major retailers provides valuable insights into brand prominence and marketing effectiveness.
Sharpie and Crayola emerged as the strongest performers overall, with particularly high visibility on Target. This suggests strong consumer recognition and demand for these traditional school supply brands. BIC showed strength on Amazon and Target but lagged on Kroger, while Pilot maintained a more balanced presence across most retailers.
The variation in brand visibility across retailers also hints at potential partnerships or targeted marketing strategies. For instance, Sharpie’s notably high visibility on Target (5.16% share of search) could indicate a specific partnership.
Talk to us to get more insights on the most prominent brands broken down by specific product categories.
Navigating the 2024 Back-to-School Landscape
As we look ahead to the 2024 back-to-school shopping season, several key takeaways emerge for retailers and brands:
Price sensitivity remains high, but the rate of increase is moderating. Retailers should carefully balance the need to cover costs with maintaining competitive pricing.
Strategic discounting can be a powerful tool, especially for lesser-known brands looking to gain market share. However, established brands would need to rely more on quality, visibility, and brand loyalty.
Online visibility is crucial. Brands should invest in strong SEO and retail media strategies, tailored to different retail platforms.
Category-specific strategies are essential. What works for backpacks may not work for writing instruments, so a nuanced approach is key.
Retailers and brands should be prepared for potential shifts in consumer behavior, such as increased demand for value-priced items or changes in category preferences.
By staying attuned to these trends and remaining flexible in their strategies, businesses can position themselves for success in the competitive back-to-school retail landscape of 2024. As always, the key lies in understanding and responding to consumer needs while maintaining a keen eye on market dynamics.
Stay tuned to our blog to know more about how retailers can stay aware of changing pricing trends. Reach out to us today to learn more.
As a leader with over 20 years of experience leading pricing strategy at a major US grocery chain, I deeply understand the complexities pricing teams face when trying to derive, quantify, and execute corporate pricing initiatives.
Providing insights into the competitive marketplace in order to ensure the overall success of directed pricing strategies is more than simple reporting.
That’s what many teams get wrong.
Reporting is a post-mortem, which is a valuable exercise, but not one that will help you achieve your pricing goals all by itself. After all, your pricing goals can change due to a number of reasons: macroeconomic challenges, regional competition, corporate objectives, along with several other factors.
Pricing teams need a well-defined process to devise and implement their pricing strategies. This process needs to holistically examine your product base to provide robust price management. It also needs to be backed up by technology powered by the latest advancements because you can be sure your competition is already thinking that way.
Let’s break down an effective and modern price management process for retailers.
Data Collection
The first aspect of any effective price management framework for retailers is a clearly defined product data collection. You need to understand your collection in terms of who to collect pricing data from, what data to collect, where to collect it from, and how often.
The who: Consists of both primary competition and others you’d like to keep tabs on
The what: Can range from targeted single items like Key Value Items (KVIs) or total portfolio
Where: Can range from targeted locations within your market or the total competitive network
How often: To be able to support your price management process and for reporting purposes, determining a cadence is essential.
Data is power and the more data you can acquire, the more insights you’ll gain. Make sure that your collection data is well thought out ahead of time. Leaning on a price management framework built for retailers that can aggregate all your data into representative prices can help.
For example, if you have multiple competitive stores in a single market, flattening pricing data into a defined representative price will help speed up your analysis. Don’t get confined to a single store when a comprehensive assortment view across your target markets will provide a more accurate understanding.
Data Refinement
Competitive Matched Items
Next, you need to examine your competitive-matched items. These are the products that you want to be priced in direct response to your competitors’ pricing. The goal is to remain closely aligned with their prices so as not to lose market share while simultaneously achieving your corporate strategies.
Your price management system needs to help you manage your overlapping items. Trying to do so manually will be inefficient and is almost impossible to execute across 100% of your product catalog.
The mapping needs to go beyond exact UPC / PLU matches to encompass other match criteria. It needs to be able to incorporate any number of derivatives, including competitor-specific item codes like Amazon’s ASINs or Target’s DPCIs. This will help you overcome the challenge of mapping exact items to a competitor when the competitor’s site doesn’t showcase a UPC. It will also help you map your own private-label items to your competitor’s private-label counterparts.
A good price management framework will also help you match the same items but with dissimilar sizes (e.g., Cheerios 18 OZ vs. Cheerios 20 OZ), either by letting you match directly within acceptable tolerances or by enabling you to compare prices on a per-unit basis.
We need to leverage GenAI to help facilitate matches beyond UPC / PLU exact matches, such as Exact Item with no Competitor Code, Exact Item with Competitive Specific Codes, Similarity Matching on Private Label, Similarity Matching on Size all need to leverage it.
If you’re playing in a vertical that doesn’t always have a unifying code (restaurants, apparel, etc.) you’ll need to leverage the latest GenAI tools to map items together for price management. The variables are simply too numerous and complex to do manually.
Unmatched Items and Internal Portfolio
Not every product will be included in your competitive-matched items collection. Competitive matches in your internal portfolio offer a proxy for building clear and concise price management strategies that are in line with your corporate initiatives.
However, your unmatched items still need to be factored into your price strategy. If you only manage your competitively priced items, you won’t have a holistic viewpoint of your total product catalog and pricing. It’s critical to ensure that internal portfolio items are effectively mapped and grouped in order to extend overall price management.
Here are three things you need to consider when managing the pricing of your internal product portfolio. A smart price management framework is your best bet for achieving these results:
Value Size Groupings Value size groupings allow for the same branded items of different sizes to be priced accordingly to ensure price parity. You don’t want to sell a private label gallon of milk for $4.00 while the half gallon is at $1.75, for example. You need certain mechanisms in place to alert you when price parity is off. This is especially true when some of your items are competitively matched, and others are not.
Relationships between Brands Relationships between brands are also critical to ensure price parity. There should be well-defined relationships between like-sized products that are from different brands. This will ensure that your private label program is priced ‘at a value’ compared with their national branded counterparts. You need to maintain the balance between different private label tiers along with different national brand tiers.
Price Links Price Links are also critical to keeping up to date from a consumer perspective. Your customers expect that certain items should be priced together and will be put off if they are not. For example, if you sell an item in different sizes or flavors and scents, their prices should be logically linked.
For your internal portfolio, there may be items that don’t have a competitive match or simply don’t fall into one of your internal portfolio groupings. These are unique items to your banner and should be considered margin drivers for your brand.
Leveraging Data for Action
Now that you have a complete line of sight into both competitively matched items and internal mappings, you can move to fully leveraging your data. Figuring out how to utilize these competitive insights to understand where your price positioning is compared with your competition can be a challenge without a playbook. An effective price management framework will help guide you to the best insights and help you understand how it relates to your corporate strategy.
If you don’t have a well-defined corporate pricing strategy (competitive or margin) or you need to update it to be more modern, the data sets provided by a price management framework can help you ascertain where you are in your pricing journey. They can also help you identify options for where you want to go.
Here are some other ways a price management framework can help you improve your pricing strategy:
Utilize Competitive Data Get competitive insights, identify competitive price zones, and understand your competitors’ pricing philosophy. Figure out if they’re using strategies like:
High-Low
Everyday Low Price (EDLP)
Cost Plus
Unravel Competitor Strategy See if you can unlock what your competition has planned for pricing strategy and promotions. Try relating what you see in corporate filings and tie back to what you see in your competitive data sets.
Assortment Analysis Try looking at the data not only from a pricing perspective but also from a competitive assortment, promotion, and supply chain perspective.
Proactive Alerts Establish alerts for your internal portfolio to ensure that you don’t exceed your tolerance based on price moves.
Leveraging a Price Management Framework Designed for Retailers
A price management system designed specifically for you as a retailer is a game changer. An effective one can be configured specifically for the price owners, whether you have a dedicated team for this function or the price is owned by the category management team.
For category managers, standard reporting offers a clear view of pricing performance and trends. Beyond that, competitive intelligence becomes crucial—using data from various sources like collected pricing data, market filings, social media insights, etc. to provide the senior leadership team with a deeper understanding of competitor strategies and actions. This empowers informed decision-making at the highest levels.
With these price management insights, retailers can gain a holistic view of the competitive marketplace, uncover gaps and opportunities, and scale their business more effectively. As someone with experience on the retailer’s side of the market, I know first-hand how valuable these insights can be.
We’d love to talk with you if you’re interested in learning more about DataWeave’s AI-powered price intelligence solution for retailers. Click here to schedule an introductory conversation.
As the retail landscape continues to evolve, events like Amazon Prime Day have become more than just shopping extravaganzas—they’ve transformed into strategic battlegrounds where retailers assert their market positions and brand identities. Prime Day 2024 was no exception, serving as a crucial moment for retailers to showcase their pricing prowess, customer loyalty programs, and category expertise.
In an era where consumer expectations for deals are at an all-time high, the impact of Prime Day extends far beyond Amazon’s ecosystem. Retailers like Walmart, known for its “everyday low prices,” Target with its emphasis on style and value, and Best Buy, the electronics specialist, have all adapted their strategies to compete. These companies didn’t just react to Prime Day; they proactively launched their own pre-emptive sales events, with Target Circle Week, Walmart July Deals and more, effectively extending the shopping bonanza and challenging Amazon’s dominance.
For Prime Day, we analyzed over 47,000 SKUs across major retailers and product categories to publish insights on Amazon’s pricing strategies as well as the performance of leading consumer brands. Here, we go further to delve into the discounts offered (or not offered) by Amazon’s competitors during Prime Day. Our analysis reveals that some retailers chose to compete on price during the sale for certain categories, while others did not.
Below, we highlight our findings for each product category. The Absolute Discount is the total discount offered by each retailer during Prime Day compared to the MSRP. These are the discounts consumers are familiar with, displayed on retail websites prominently during sale events. The Additional Discount, on the other hand, is the reduction in price during Prime Day compared to the week prior to the sale, revealing the level of price markdowns by the retailer specific to a sale event.
Consumer Electronics
In the Consumer Electronics category, Best Buy stood out as a strong competitor, offering an Additional Discount of 5.9%—the highest among all competitors analyzed. This is unsurprising, as Best Buy is well-known for its focus on consumer electronics and is likely aiming to reinforce its reputation for offering attractive deals in order to maintain its strong consumer perception in the category.
Walmart was a close second with a 4.3% Additional Discount while Target reduced its prices by only 2% during the sale.
Apparel
In the Apparel category, Walmart’s Additional Discount was 3.1%, demonstrating its willingness to be priced competitively on a small portion of its assortment during the sale, without compromising much on margins.
Target, on the other hand, opted out of competing with Amazon on price during the sale, choosing instead to maintain its Absolute Discount level of around 11%.
Home & Furniture
The Home & Furniture category showcased diverse strategies from retailers. Specialty furniture retailers such as Overstock and Home Depot provided Additional Discounts of 3.9% and 2.5%, respectively, compared to Amazon’s 6.9%. This indicates a clear intent to maintain market share and remain top-of-mind for consumers despite Amazon’s competitive pricing.
Although Target didn’t significantly lower its prices during the sale, its Absolute Discount remains substantial at 18.9%. This suggests that Target’s markdowns were already steep before the event, which could explain the lack of further reductions during the sale.
Health & Beauty
The Health & Beauty category saw minimal participation from Amazon’s competitors, with the exception of Sephora, which reduced prices by 3.7% during Prime Day.
Ulta Beauty chose not to adjust its prices, likely reflecting its strategy to uphold a premium brand image. Walmart, on the other hand, offered a modest Additional Discount of 2% on select items. Given Walmart’s generally affordable product range, its total discount remained relatively low, around 3.5%.
In Conclusion
During Prime Day, Walmart was the only major retailer that made an effort to compete, albeit modestly. Target, on the other hand, largely chose not to offer any additional markdowns. However, several category-specific retailers, such as Best Buy in Consumer Electronics, Overstock and Home Depot in Furniture, and Sephora in Health & Beauty, aimed to retain market share by providing notable discounts.
What this means for consumers is that even on Amazon’s Prime Day, it’s not a bad idea to compshop to identify the best deal.
For retailers, the key takeaway is the importance of quickly analyzing competitor pricing and making agile, data-driven decisions to improve both revenues and margins. By utilizing advanced pricing intelligence solutions like DataWeave, retailers can optimize their discount strategies, better navigate pricing complexities, and drive revenue growth — all while staying prepared for major shopping events and beyond.
Picture this: You wake up one morning to discover that your top competitor reduced their prices overnight. And now your shopper traffic has tanked and your sales have taken a hit.
Unfortunately, this is a common scenario because your customers can compare prices online in seconds—and loyalty lies with the budget.
So, how can you protect your business? Price monitoring.
Price monitoring solutions can help you keep abreast of competitor price changes—which, of course, will help you improve your pricing strategies, retain your customers, and maximize your profits.
How? In this article, we’ll explore:
What is price monitoring
The key benefits of price monitoring for retailers and brands
What a capable price monitoring solution can do
What Is Price Monitoring?
Price monitoring is the process of tracking and analyzing your competitor’s prices across various online and offline platforms. By monitoring competitors’ prices, you can understand market price trends and adjust your prices strategically—which, in turn, helps you remain competitive, increase margins, and improve customer retention.
5 Benefits of Price Monitoring
Competitor price monitoring can help you:
Gain a competitive edge: Competitor price tracking allows you to adjust your prices to remain attractive to consumers.
Maximize revenue: With timely pricing data, you’re empowered to identify optimum price points that strike a delicate balance between maximizing revenue and maintaining customer loyalty.
Retain customers: Consumers are looking for the most value for their dollar, so maintaining consistently competitive pricing is crucial for retaining loyal customers.
Understand promotional effectiveness: Price monitoring helps businesses evaluate the effectiveness of their promotions and discounts. By comparing the impact of different pricing strategies, businesses can refine their promotional tactics to maximize sales and customer engagement.
Understand market movements: By analyzing historical pricing data, you’re better positioned to anticipate future pricing changes — and adjust your strategies accordingly.
4 Essential Capabilities of Price Monitoring Software
Here are four capabilities to look for when choosing a price monitoring system.
1. AI-Driven Product Matching
Product matching is the process of identifying identical or similar products across different platforms to ensure accurate price comparisons.
If your price monitoring solution can’t reliably match your products with competitors’ across various sales channels at scale, you’ll end up with poor data. Inaccurate data will then lead you to make misinformed pricing decisions.
Product matching needs to be accurate and comprehensive, covering a wide range of products and product variations—even for including private label products.
For example, AI-driven product matching can recognize a specific brand and model of sneakers across multiple online stores—even if product descriptions and images differ. Here’s how it works in a nutshell:
Sophisticated algorithms and deep learning architecture enable AI to identify and match products that aren’t identical but share key characteristics and features.
Using unified systems for text and image recognition, the AI matches similar SKUs across hundreds of eCommerce stores and millions of products. The AI zeroes in on critical product elements in images, like a t-shirt’s shape, sleeve length, and color.
The AI also extracts unique signatures from photos for rapid, efficient identification and grouping across billions of indexed items.
DataWeave’s AI algorithm can initially match products with 80–90% accuracy. Then, humans can bring contextual judgement and make nuanced decisions that the AI might miss to correct errors quickly and push for accuracy closer to 100%. By integrating AI automation with human validation, you can achieve accurate and reliable product-matching coverage at scale.
2. Accurate and Comprehensive Data Collection and Aggregation
The insights you derive are only as good as the data you collect. However, capturing comprehensive pricing data is tough when your competitors operate on multiple platforms.
For truly effective price monitoring insights, you need consistent, comprehensive, and highly accurate data. This means your chosen price monitoring system should:
Scrape data from various sources, such as desktop and mobile sites and mobile applications.
Pull data from various online platforms like aggregators, omnichannel retailers, delivery intermediaries, online marketplaces, and more.
Handle data from different regions and languages.
Collect data at regular intervals to ensure timeliness.
DataWeave’s online price monitoring software covers all of these bases and more with a fast, automated data source configuration system. It also allows you to painlessly add new data sources to scrape.
Instead of incomplete or inaccurate data, you’ll have comprehensive and up-to-date data, allowing you to respond quickly to market changes with confidence.
3. Seamless Normalization of Product Measurement Units
You can’t compare apples to oranges—or price-per-kilogram to price-per-pound.
For price monitoring to be accurate, there must be a way to normalize measurement units—so that we’re always comparing price-per-gram to price-per-gram. If we compare prices without taking into account measurement units, our data will be misleading at best.
Let’s take a closer look. Say that your top competitor sells 12oz cans of beans for $3, and you sell 15oz cans for $3.20. At first glance, your larger cans of beans will appear more expensive—but that’s not true. If we normalize the measurement unit—in this example, an oz—the larger can of beans offers more value to customers.
Unit of measure normalization facilitates sound price adjustments based on accurate and reliable data. For this reason, every business needs a price tracking tool that can guarantee accurate comparisons by normalizing unit measurements—including weight, volume, and quantity.
4. Actionable Data and an Intuitive User Experience
Knowledge is only powerful when applied—and price monitoring insights are only useful when they’re accessible and actionable.
For this reason, the best price monitoring software doesn’t just provide insights based on accurate and comprehensive data, but it also provides several ways to understand and deploy those insights.
Ideal price monitoring solutions provide customized pricing alerts, intuitive dashboards, detailed reports, and visuals that are easy to interpret—all tailored to each particular team or a team member’s needs. These features should make it easy for team members to compare prices against those of competitors in specific categories and product groupings.
Your price tracking tool should also permit flexible API integrations and offer straightforward data export options. This way, you can integrate competitive pricing data with your pricing software, Business Intelligence (BI) tools, or Enterprise Resource Planning (ERP) system.
4 Ways Retailers Can Leverage Price Monitoring
Retailers can use price monitoring tools to remain competitive without compromising profitability—here’s how:
1. Track Competitors’ Prices
Competitor price monitoring helps you avoid being undercut—and, as a result, maintain market share. By tracking competitor prices in real-time, you can adjust prices to remain competitive, especially in dynamic markets. Ideally, you should monitor both direct competitors selling the same products and indirect competitors selling similar or alternative products. This way, you’ll have a complete picture of market prices and can make more informed pricing adjustments.
2. Understand Historical and Seasonal Price Trends
As a retailer, you may want to analyze historical data to identify price patterns and predict future price movements—especially in relation to holidays and seasonal products. Knowing what’s coming, you’re better positioned to plan for pricing changes and promotional campaigns.
3. Implement Dynamic Pricing
Dynamic pricing is the process of adjusting prices based on real-time market conditions, product demand, and competitors’ prices—allowing you to respond faster to market changes to maintain optimized prices.
4. Optimize Promotional Strategies
Price monitoring tools can track retail promotions across numerous online and offline sales avenues, providing insight into the nature and timing of competitors’ promotions. This data can help you determine which promotions are most effective—and which aren’t—allowing you to improve your own promotions and discounts, and allocate marketing resources where it matters most. This is especially beneficial during peak sales periods.
3 Ways Brands Can Employ Price Monitoring
Here are three ways brands can use price monitoring to remain profitable, protect brand equity, and gain a competitive edge.
1. Maintain Consistent Retail Prices
Minimum advertised price (MAP) policies are designed to prevent retailers from devaluing a brand while ensuring fair competition among retailers. Price monitoring applications allow your brand to track retailers’ prices to detect MAP policy violations. Data in hand, you can maintain consistent pricing across online sales channels, physical stores, and retail stores’ digital shelves — and, critically, protect your brand equity.
2. Improve Product and Brand Positioning
When you understand how your products’ prices compare to those of competitors, you can set prices to improve brand positioning. For example, if you want to position your brand as luxurious and high-quality, you need to set higher product prices than budget-friendly alternative products.
3. Ensure Product Availability
You can use a price monitoring solution to track product availability to ensure products are always in stock, even across different physical stores and online marketplaces. If a product is frequently sold out, you can adjust production levels or help retailers to improve their inventory management.
Key Takeaways: E-commerce Price Monitoring
Price monitoring software allows you to compare your products’ prices with competitors. This valuable data can help you:
Optimize revenue through timely price changes and dynamic pricing Avoid being undercut by competitors
Improve pricing strategies and promotions to increase sales and retain customers
As the dust settles on Amazon’s 8th Prime Day extravaganza in India, held on July 20-21, 2024, the eCommerce giant has once again shattered records. This year’s event saw unprecedented engagement, with 24% more Prime members participating compared to 2023, marking the highest-ever Prime member involvement in the sale’s history.
At DataWeave, we’ve conducted an extensive analysis of this landmark event, examining over 47,000 SKUs across major categories for Flipkart and Amazon to uncover compelling insights into pricing strategies, competitive positioning, and emerging trends in the Indian eCommerce space. This follows our comprehensive analysis of Prime Day in the USA across categories and brands, which readers can explore for a global perspective on Amazon’s strategies.
Key Highlights:
Tier-2 Cities Drive Growth: This year’s exponential growth was notably fueled by orders from tier-2 cities, highlighting the expanding reach of eCommerce in India.
Swift Deliveries: Most Prime members’ orders from metros were delivered the same day or the next, while tier-2 cities saw deliveries in less than 2 days, highlighting the importance of delivery time when it comes to purchase decisions.
Brand Participation: Over 450 top Indian and global brands participated, including Intel, Samsung, OnePlus, and Puma, alongside 3,200 new product launches from small and medium Indian businesses. This highlights Amazon’s policy to promote small, local businesses globally in 2024.
Premium Products in Demand: Despite modest discounts across electronics and similar offerings, consumers chose to purchase premium products during Prime Day. With financial flexibility and no-cost EMI options, Indian consumers, especially Gen Z and millennials, are now ready to invest in premium products and experiences.
Our analysis focused on both the Additional Discounts offered during Prime Day (calculated relative to prices the week prior to the event), highlighting the event’s genuine benefits, and the Absolute Discounts offered during Prime Day, representing the total markdown relative to the MRP.
Cross-Category Discount Strategy
Our analysis this year reveals that the Consumer Electronics category saw the highest Absolute Discounts with an average of 48.9%, closely followed by Apparel at 46.9%. The Health & Beauty category had the lowest Absolute Discount at 32.1%.
However, Amazon offered the highest Additional Discount in Health & Beauty at 9.3%. Electronics and Apparel had additional discounts of 8.6% and 7.7% respectively.
Overall, Flipkart chose to not compete aggressively with Amazon during Prime Day this year. Only in Electronics did Flipkart offer an additional discount of 3.2% during the sale. Price changes in Apparel and Health & Beauty were negligible.
Category Deep Dive
Consumer Electronics
In Electronics, Earbuds (14.7%) and Wireless Headphones (12.5%) saw the highest Additional Discounts on Amazon, likely due to high demand for personal audio devices. Smartwatches followed closely at 12.5%, indicating a strong push in the wearable technology sector.
Larger electronic appliances like TVs saw more modest Additional Discounts (5.2%), despite a significant Absolute Discount (42.3%).
Smartphones, interestingly, had the lowest Additional Discount (2.8%) among the subcategories, potentially due to their already competitive pricing or brand-specific strategies.
Brand-level Insights in Consumer Electronics
During the sale event, Soundcore (headphone and earphone brand from Anker) led with the highest Additional Discount of 10.3%, followed closely by OnePlus at 9.3%. These brands clearly leveraged Prime Day to drive sales and potentially gain market share.
Sennheiser and Sony also offered significant additional discounts, indicating aggressive promotional strategies during the event.
Notably, some well-known brands like Apple and HP offered more conservative discounts, possibly due to their established market positions or differing promotional strategies.
Despite modest discounts though, Amazon revealed that the iPhone 13 and OnePlus 12R were among the top premium smartphones customers bought this Prime Day. Prime members shopped from top brands such as LG, IFB, Bosch, and Haier and upgraded to premium appliances through affordability options of no cost EMI, Bank discounts and exchange offers, claims Amazon.
These learnings offer valuable insight into the mindset of the modern Indian consumer, who is ready to purchase premium products. Brands can leverage more detailed market intelligence to drive their positioning in India.
Share of Search Analysis
The Share of Search (SoS) for a brand represents the number of its products in the top 20 search results for relevant search keywords on Amazon, relative to that of its competitors. It provides insights into a brand’s visibility during the sale event.
HP saw the most significant improvement in its Share of Search during Prime Day, gaining 9.2%, with strong growth in both organic (7.5%) and sponsored (1.7%) listings. LG also made substantial gains of 8.2% and 5.3% respectively. Both brands offered significant markdowns on laptops and accessories.
Surprisingly, some popular brands like Apple (-0.6%) and Acer (-1.0%) experienced slight decreases in their SoS. Lenovo notably lost 7.2% of its visibility share, with a significant decline in organic listings (-7.6%). Samsung maintained its strong position with an increase in SoS (3.7%).
Key Takeaways:
While some brands like Soundcore and OnePlus used aggressive discounting to drive sales, others like HP and LG focused on improving their search visibility. The data suggests that a combination of attractive discounts and improved search visibility was key to success during the event. Brands that managed to balance these factors effectively, like HP and Samsung, seemed to perform particularly well. Interestingly, some brands with lower discounts (like HP) still managed to significantly increase their SoS, indicating that factors beyond pricing played a role in visibility during the event.
Apparel
Within the subcategories analyzed, Women’s Shoes (13.4%) and Men’s Shoes (11.6%) saw the highest Additional Discounts on Amazon, indicating a strong focus on footwear during the event. Men’s Shirts followed closely at 11.1%
Women’s Tops had a more modest Additional Discount of 7.9% despite a high Absolute Discount before the event. Similarly, Women’s Dresses showed substantial Additional Discounts (10.4%).
Swimwear for both men and women saw low Additional Discounts (3.7% and 3.0% respectively). Innerwear categories for both men and women had more conservative discounts, with Men’s Innerwear showing the lowest Absolute Discount (19.9%) among all subcategories.
Brand-level Insights in Apparel
During the sale event, Sangani (innerwear brand) led with the highest Additional Discount of 41%, followed by Louis Philippe at 25%. These brands clearly leveraged Prime Day to drive sales and gain market share.
Puma offered the highest Absolute Discount at 60% with a significant Additional Discount of 20%, indicating a consistently aggressive promotional strategy. Chromozome (men’s innerwear brand) and Bacca Bucci (homegrown shoe brand of Shark Tank India fame) also offered substantial Absolute Discounts (57% and 56% respectively), but their Additional Discounts varied significantly (16% and 6% respectively).
Again, some well-known brands like Adidas, and Pepe Jeans offered more moderate Additional Discounts, possibly due to their established market positions.
Share of Search Analysis
Biba (women’s ethnic wear brand) saw the most significant improvement in its SoS, gaining 3.60%, entirely through investments in sponsored listings. Allen Solly and New Balance (shoe brand) also made substantial gains of 3.3% and 3.2% respectively.
Surprisingly, some popular brands like Louis Philippe (-2.00%) and Sangani (-2.10%) experienced decreases in their SoS. Louis Philippe lost its share due to a roll back of its sponsored listings, while Sangini lost ground organically.
Key Takeaways:
While some brands like Sangani and Louis Philippe used aggressive discounting to drive sales, others like Biba and Allen Solly focused on improving their search visibility through sponsored listings.
Some brands with high discounts (like Sangani) saw a decrease in SoS, while others with more modest discounts (like Biba) significantly increased their visibility. This indicates that factors beyond pricing played a crucial role in brand performance during the event.
The significant use of sponsored listings by some brands highlights the importance of paid advertising in gaining visibility during competitive events like Prime Day.
Health & Beauty
Health & Beauty emerged as a standout category during Amazon Prime Day India 2024, with significant discounts and competitive strategies at play.
Within the subcategories we analyzed, Moisturizer (11.9%) and Sunscreen (11.8%) saw the highest additional price reductions on Amazon, likely due to seasonal demand during Prime Days. Make-up followed closely at 10.6%.
Electric Toothbrushes had the highest Absolute Discount at 47.1%, but a lower Additional Discount of 6.0%, highlighting that these products were already significantly discounted before the event. Similarly, Beard Care products showed high Absolute Discounts (43.7%) but lower Additional Discounts (5.7%) during Prime Day.
Everyday essentials like Toothpaste saw more modest discounts (19.9% Absolute, 8.4% Additional), reflecting steady demand for these products.
Brand-level Insights in Health & Beauty
Vaseline led with the highest Additional Discount of 13.1%, followed by Maybelline at 9.5%. These brands clearly leveraged Prime Day to drive sales and potentially gain market share.
Honest Amish (beard care brand) and Nivea also offered substantial Absolute Discounts (15.6% and 8.2% respectively), but their Additional Discounts were lower, indicating pre-existing promotional strategies.
Once again, some well-known brands like Colgate, Dove, and Neutrogena offered more conservative discounts, possibly due to their established market positions or differing promotional strategies.
Share of Search Analysis
Maybelline saw the most significant improvement, gaining 5.6% in SoS, all through organic listings. The brand has been aggressively increasing market share with several new product launches and influencer campaigns. Nivea and Vaseline also made substantial gains of 5.2% and 3.8% respectively.
In this category as well, some popular brands like Dove (-0.4%), Pond’s (-0.8%), and Honest Amish (-0.8%) experienced slight decreases in their SoS. Parodontax (toothpaste brand) notably lost 1.3% SoS, with most of the decline in sponsored listings. Colgate maintained its strong position with a slight increase in SoS (0.2%), reflecting its dominant market presence.
Key Takeaways:
While some brands like Vaseline and Maybelline used aggressive discounting and improved visibility to drive sales, others like Colgate and Dove relied more on their established market positions.
None of the brands made any significant strides in sponsored listings, revealing that brands in this category are not yet fully leveraging retail media to help manage and boost their visibility on online marketplaces.
Final Thoughts
Amazon Prime Day 2024 has redefined the eCommerce landscape in India, yet again, showcasing diverse strategies employed by brands to maximize their impact. By understanding and leveraging these insights, brands and retailers can better navigate future sales events, optimizing their eCommerce strategies to achieve sustained growth and success.
Stay tuned to our blog for more in-depth analyses of brand and retailer performance across various retail events.
Reach out to us today to learn how you can leverage data-driven insights to optimize your eCommerce strategy.
Amazon Prime Day 2024 has once again shattered records, with more items sold during the two-day event than any previous Prime Day. Prime members worldwide saved billions across all categories, while independent sellers moved an impressive 200 million items.
At DataWeave, we conducted an extensive analysis of the discounts offered by Amazon across major categories. By examining over 47,000 SKUs, we’ve uncovered compelling insights into pricing strategies, competitive positioning, and emerging trends in the eCommerce space.
Since products on Amazon and other eCommerce websites are often sold at discounts even on normal days not linked to a sale event, we delved into the real value that Prime Day offers to shoppers by focusing on price reductions or the Additional Discount during the sale compared to the week before. As a result, our approach highlights the genuine benefits of the event for shoppers who count on lower prices during the sale. At the same time, our report also includes the Absolute Discounts offered during Prime Day, which represents the total markdown relative to the MSRP.
Amazon’s Cross-Category Discount Strategy
Our analysis reveals that the Electronics category saw the highest discounts with an average absolute discount of 20.4% and additional discounts on Prime Day amounting to 10.4%. Meanwhile the Home & Furniture had the lowest discount at 13.1%.
The Health & Beauty category saw significant additional discounts during Prime Day, at 9.26%. The Apparel category offered attractive absolute (16.10%) and additional (8.90%) discounts.
Category Deep Dive
Consumer Electronics
Still the star of the show, the electronics category saw the highest markdowns this Prime Day with absolute discounts at 20.40% and across 14.61% of their inventory.
Across Electronics subcategories, Earbuds had the highest markdowns at 34.80%, followed closely by Wireless Headphones at 30.60% and Headphones at 29.00%, with steep additional discounts during Prime Day as well. Apple AirPods Pro, for example, retailed at $168 (down from $249) at a 32% discount.
Meanwhile, smartphones had the lowest markdowns at 9.30%, followed by Laptops at 10.50%. Laptops also had the lowest additional discount during Prime Day at just 1.28%, significantly lower than other subcategories. Speakers (20.80%), Drones (19.10%), and Smartwatches (25.00%) offered moderate to high markdowns.
Notably, all Amazon products including Kindle, Echo, Echo Earbuds, Alexa, Fire TV, Fire TV Stick, and Fire Tablets, were aggressively discounted upwards of 30% this Prime Day. These products also came with the label “Climate Pledge Friendly.”
These aspects indicate Amazon’s push to promote its own ecosystem of products to the top, as well as cater to changing consumer preferences.
Apparel
Discounts offered this Prime Day increased from 13.2% in 2023 to 16.1% in 2024.
Amid apparel subcategories, Amazon appears to be pushing Women’s apparel categories more aggressively, particularly in Tops, Shoes, and Athleisure.
Women’s Shoes lead with the highest discounts at 26.50%, followed by Women’s Tops at 22.50% and Men’s Shoes at 22.80%. Women’s Tops also maintained the highest additional discount at 15.27%, followed by Women’s Athleisure at 13.03% and Men’s Swimwear at 12.44%.
Similar to 2023, Men’s Innerwear offered significantly lower discounts, with only 1% absolute discount and 0.72% additional discount. Women’s Innerwear also shows low discounts at 3.20% absolute and 2.23% additional.
Health & Beauty
Amid health & beauty subcategories, Moisturizes witnessed the highest markdowns at 20.10%, followed by Make Up at 18.90%. The Moisturizer subcategory also offers highest additional discounts at 12.20%, followed closely by Sunscreen at 10.25% and Beard Care at 10.22%.
The Toothpaste subcategory has the lowest discounts, at 10.90%. The lower discounts on everyday essentials like this might indicate a steady demand or an attempt to maintain margins on frequently purchased items.
Most Health & Beauty subcategories fall in the 15-18% range for actual discounts and 8-10% range for additional discounts. Electric Toothbrush (16.90% actual, 9.91% additional) and Shampoo (16.50% actual, 8.78% additional) represent the middle of the pack. There were a few highly attractive deals though, such as the Philips Sonicare toothbrush retailing at $122.96 (down from $199.99), with a 39% discount.
Amazon also offered significant discounts on Open Box products (products that are returned, but unused, out of mint condition boxes) to Prime members.
Home & Furniture
This category saw the lowest discounts for this Prime Day event at 13.1%. Across subcategories, Rugs lead with the highest average discount at 21.50%, closely followed by Luggage at 20.90%. Amazon seems to be pushing decorative and organizational items (Rugs, Bookcases) more aggressively, possibly due to higher margins. Rugs also stood out as the subcategory with the highest additional discount of 11.54%.
Sofas have the lowest additional discount at 2.76%, followed by Dining Tables at 3.21%. Items like Cabinets (15.80% absolute, 6.66% additional) and Coffee Tables (14.40% absolute, 6.25% additional) represent the middle range of discounts.
Watch Out For More
As the holiday season approaches, it’s clear that the retail landscape continues to evolve. While Amazon remains a formidable force, there are opportunities for savvy competitors to carve out their niches and attract deal-hungry shoppers. By analyzing these trends and adjusting strategies accordingly, retailers can position themselves for success in the high-stakes world of summer sales events.
Stay tuned to our blog for more insights on how Amazon’s competitors reacted to Prime Day, and how leading brands across categories fared in terms of their pricing and their visibility during the sale event. Reach out to us today to learn more.
Virtually every cuisine in the world uses eggs. They’re in your breakfast, lunch, dinner, and dessert — which is perhaps why the global egg market is expected to generate $130.70 billion in revenue in 2024 and is projected to grow to approximately $193.56 billion by 2029.
More specifically, the United States is the fourth-largest egg producer worldwide. The country’s egg market is projected to generate $15.75 billion in 2024 and increase to $22.51 billion by 2029.
Health-consciousness among consumers: Consumers value eggs for their essential nutrients and rich protein content.
Demand for convenience foods: Consumers’ preferences are shifting toward quick and easy foods, which drives demand for shell eggs and pre-packaged boiled or scrambled eggs.
Population Growth: A growing worldwide population increases the demand for eggs.
Affordability and accessibility: Eggs are an affordable and accessible nutrient-dense food source for many.
Despite these factors contributing to the U.S. egg market’s growth, recent times have seen egg prices fall dramatically.
Based on a sample of 450 SKUs, DataWeave discovered that egg prices in the U.S. fell by 6.7% between April 2023 and April 2024, dipping to its lowest (-12.6%) in December 2023.
So, what’s causing the decrease in egg prices?
The Rise and Fall of Egg Prices: A Recent History
In 2022, avian influenza severely impacted the United States. The disease affected wild birds in nearly every state and devastated commercial flocks in approximately half of the country.
The 2022 incident was the first major outbreak since 2015 and led to the culling of more than 52.6 million birds, mainly poultry, to prevent the disease from spreading uncontrollably.
With almost 12 million fewer egg-laying hens, the United States produced around 109.5 billion eggs in 2022 — a drop of nearly two billion from the previous year.
Consequently, the cost of eggs soared, peaking at $4.82 a dozen — more than double the price of eggs in the previous year.
The avian flu continues to affect egg-laying hens and other poultry birds across the United States. As of April 2024, farms have killed a total of 85 million poultry birds in an attempt to contain the disease.
Despite the disease’s effects, production facilities have made significant efforts to repopulate flocks, leading to a steady increase in supply – and a much anticipated decrease in egg prices.
According to the U.S. Bureau of Labor Statistics, there was an increase in producer egg prices in 2022, reaching a peak in November 2022, at which point they began to fall.
Retailer’s egg prices followed suit. The egg price chart below depicts retailers’ declining egg prices over one year, from April 2023 to April 2024, with Giant Eagle showing the most significant price reductions and Walmart the least.
What Does the Future Hold for Egg Prices?
The USDA reported recent severe avian flu outbreaks in June 2024. These outbreaks are estimated to have affected 6.23 million birds.
With a reduction in egg-laying hens, egg prices are likely to increase — time will tell.
Nonetheless, the annual per capita consumption of eggs in the U.S. is projected to reach 284.4 per person in 2024 from 281.3 per person in 2023. So for now, producers and retailers can rest assured of the growing demand for eggs.
How Can Retailers Adapt to the Unpredictability of Egg Prices?
Egg prices were down to $2.69 for a dozen in May 2024. However, they are still significantly higher than consumers were used to just a few years ago—eggs were, on average, $1.46 a dozen in early 2020.
Additionally, while the avian flu puts pressure on producers, inflation and supply chain disruptions exert pressure on retailers.
With such challenging egg market conditions, what can retailers do to maintain customer loyalty amid reduced consumer spending while maintaining profitability?
1. Give the Customer What They Want: Increase Offerings of Organic, Cage-Free, and Free-Range Eggs
As mentioned, Data Bridge Market Research’s trends and forecast report highlighted a significant increase in consumer health consciousness. Additionally, animal welfare increasingly influences consumers’ purchasing decisions when buying meat and dairy products.
DataWeave data shows that the prices of organic, cage-free, and free-range eggs—such as those by brands like Happy Eggs and Marketside—have fallen less than those of non-organic, caged egg brands.
2. Increase Private-Label Offerings
Private labels typically offer retailers higher margins than national brands. These margins can shield consumers from sudden wholesale egg price swings, helping to preserve brand trust and consumer loyalty without sacrificing profitability.
Moreover, eggs are particularly suited to private labeling, given their uniform appearance and taste and the lack of product innovation opportunities.
Undoubtedly, this is why sales of private-label eggs dwarf sales of national egg brands in the United States. Statista reports that across three months in 2024, private label egg sales amounted to $1.55 billion U.S. dollars, while the combined sales of the top nine national egg brands totaled just $617.88 million U.S. dollars.
3. Price Intelligently
With the current and predicted fluctuations in egg prices over the foreseeable future, price competitiveness is paramount to margin management and customer loyalty.
This is especially true when lower prices are the primary factor influencing the average consumer’s choice of supermarket for daily essentials purchases.
AI-driven pricing intelligence tools like DataWeave give retailers valuable highly granular and reliable insights on competitor pricing and market dynamics. In today’s data-motivated environment, these insights are necessary for competitiveness and profitability.
Final Thoughts
Egg prices have fluctuated significantly due to the impact of avian flu. Despite recent price drops, future egg price increases are possible due to ongoing outbreaks. Retailers should adapt to unstable egg prices by increasing organic, free-range, cage-free, and private-label egg offerings while leveraging AI-driven pricing tools to maintain margins and customer loyalty.
In 2025, both consumers and retailers continue to prioritize better health – albeit with evolving definitions and expectations.
The pandemic fundamentally transformed how consumers approach wellness, with this shift becoming entrenched in shopping behaviors years later. As shopping habits have permanently altered, retailers now face increased pressure to rapidly adapt their assortments with in-demand health and wellness products that enhance customer experience across various channels – online and offline.
Let’s explore how leading retailers are keeping consumers – and their own bottom lines – healthy by responding effectively to market trends to drive online sales and market share.
Health & Wellness Influence The Product Mix Across Categories
Consumption habits have changed dramatically since the onset of the pandemic. A McKinsey study shows that 82% and 73% of US, and UK consumers respectively now consider health & wellness a top priority. Typically shoppers adjust grocery shopping and meal planning at the start of the year, with many focusing on fresh, organic, and nutrient-rich foods.
The influential health and wellness mega-trend spans diverse retail channels, including grocery, pharmacy and mass. It extends across numerous categories like:
Food and beverage (natural, organic, vegan, plant-based food)
Health and personal care
Beauty
Cleaning products
Fitness equipment
Athleisure (apparel)
Consumer electronics like health wearables.
Today’s health movement is so powerful and compelling that retailers have revised their business strategies to better serve health-conscious consumers. For instance, drugstores are reinventing themselves as healthcare destinations, with CVS and Kroger expanding into personalized care delivery and value-based clinics to enhance their health offerings.
Major retailers like Amazon, Walmart, and Target report robust sales in health and wellness categories. For example, Walmart saw a 4.6% increase in comparable sales in early 2024, driven significantly by grocery, consumables, and health-related products.
New product categories are gaining traction:
Functional foods and beverages are seeing unprecedented growth, with Target launching over 2,000 wellness items in the category, including exclusive products priced under $10.
Personalized nutrition and mental health products are surging, including tailored dietary solutions and stress-reducing items.
Health wearables and wellness tech continue to rise in popularity, with over 150 new wellness tech items launched at Target this year, including innovative red-light therapy devices.
Transparency and sustainability certifications like organic, non-GMO, and vegan labels are increasingly driving purchasing decisions.
Clinically proven benefits offered by health & wellness products are gaining traction among Gen Z.
Retail’s Survival Of The Fittest Moves Online
As the omnichannel retail sector continues to grow, more shoppers now make purchase decisions within minutes using just a few clicks rather than physically visiting brick-and-mortar stores. In some cases, AI agents like Operator from Chat-GPT or Gemini (Google’s Chatbot) even make personalized, curated lists and reduce the time taken to make purchase decisions. Traditional retail paradigms are rapidly becoming obsolete as consumers grow savvier, more empowered, and better informed than ever before.
To stay competitive, more retailers are embracing AI-driven data insights to adjust their assortments to reflect consumer demand for health and wellness products.
According to industry experts, data insights have emerged as a critical retail strategy that continues to gain momentum. This is because retailers can no longer afford to guess how to approach their omnichannel strategy. They need the accuracy, clarity, and efficiency of data insights to guide their assortment and pricing decisions to outmaneuver competitors, maximize sales, and win market share as shopping evolves online.
Among its retail best practices, Bain & Company recommends retailers “lead with superior assortments that use a customer-centric lens to reduce complexity and increase space for the products customers love.” Insights can help retailers discover the optimal mix of national brands, private labels, limited-time offers, and value-added bundles.
“Lead with superior assortments … increase space for the products consumers love“ ~ Bain & Company
Determining the optimal mix of products also includes bestsellers and unique items that help retailers distinguish their offerings. Assortment insights help retail executives track competitors’ assortment changes and spot gaps in their own product assortment to adapt to emerging consumer trends and in-demand products.
Why Effective Assortment Planning Matters
Assortment planning sits at the heart of retail success, directly influencing profitability, customer satisfaction, and competitive differentiation. In today’s health-conscious market, getting your assortment right means:
Meeting Customer Expectations: Today’s health-conscious consumers expect relevant, high-quality products that match their wellness goals. A well-planned assortment signals that a retailer understands its customers’ evolving needs.
Optimizing Inventory Investment: Strategic assortment planning ensures capital is allocated to products with the highest return potential while minimizing investments in slow-moving items.
Creating Competitive Advantage: A distinctive assortment that includes popular health and wellness products alongside unique offerings helps retailers stand out in a crowded marketplace.
Reducing Lost Sales: Effective assortment planning minimizes the risk of stockouts on high-demand health and wellness items, preventing customers from shopping elsewhere.
Supporting Omnichannel Strategies: Well-executed assortment planning ensures consistency across physical and digital touchpoints, creating a seamless customer experience.
Improving Operational Efficiency: A thoughtfully curated assortment reduces complexity throughout the supply chain, from procurement to warehouse management to in-store operations.
As health and wellness continues to drive consumer spending, retailers who excel at assortment planning can capitalize on these trends more effectively than their competitors, turning market insights into tangible business results.
The synergy of AI and data analytics into retail assortment planning is changing how businesses approach inventory management. Retailers using AI-driven predictive analytics have achieved a 36% SKU reduction while increasing sales by 1-2%, showcasing the efficiency of data-driven approaches according to a McKinsey report.
Retailers face several challenges that can hinder strategic assortment planning:
Limited Understanding of Competition: Retailers struggle to gain comprehensive insights into their product assortments relative to competitors, often lacking visibility into their strengths and weaknesses across categories.
Data Overload: Assortment planning involves handling vast amounts of data, making it challenging for category managers to extract actionable insights without user-friendly tools and visualization.
Cross-Channel Consistency: With omnichannel retailing, ensuring consistency across physical stores, e-commerce, and other channels is complex. Misalignment can lead to customer dissatisfaction and loss of loyalty.
Adapting to Changing Market Trends: Identifying top-selling products and tracking consumer preferences is challenging. Balancing the right mix of products is crucial; without analytics, retailers risk lost sales or excess slow-moving inventory.
Scalability and Efficiency: As retailers expand into new markets or categories, scaling their assortment planning processes efficiently becomes a challenge. Legacy systems and manual methods often fail to support the agility needed for quick decision-making at scale.
DataWeave’s Assortment Analytics helps retailers address these challenges by providing a robust, easy-to-use platform that delivers actionable insights into product assortments and competitive positioning. With AI-driven, contextual insights and alerts, retailers can effortlessly identify high-demand, unique products, capitalize on catalog strengths, optimize pricing and promotions, improve stock availability, and refine assortments to maintain a competitive edge.
Beyond Data: Actionable Insights That Drive Results
DataWeave’s platform provides a comprehensive, insight-led view into assortments through several key dimensions:
Stock Insights: Monitor stock changes across retailers to stay updated on availability.
Category and Sub-Category Insights: Analyze assortment changes, identify newly introduced or discontinued categories, and track leading retailers in specific segments.
Brand Insights: Identify newly introduced, missing, or discontinued brands, as well as leading brands within chosen categories.
Product Insights: Identify bestsellers and evaluate their impact on your portfolio, analyzing pricing and promotions.
Personalized Recommendations: Receive suggestions tailored to your behavior and user profile to refine decision-making.
User-Configured Alerts: Stay informed with alerts designed to highlight significant changes or opportunities.
The platform addresses data overload by providing an intuitive, insight-driven view of your assortment. Category managers gain a comprehensive, bird’s-eye perspective of key changes within specified timeframes, allowing them to focus on what matters most.
Preparing for the Future of Retail Health
To avoid supply chain bottlenecks, inventory shortages, and out-of-stock scenarios, retailers are strategically using data insights to anticipate fluctuations in demand and proactively plan how to manage disruptions that could affect their assortments.
For variety that satisfies consumers’ diverse product needs, retailers are using data insights to determine whether to collaborate with nimble suppliers to promptly fill any gaps.
To further strengthen their assortments’ attractiveness, retailers are using AI-powered pricing analytics to offer the right product at the right price. These analytics help retailers know exactly how they compare to rivals’ pricing moves with relevant data so they can keep up with market fluctuations and stay competitive by earning consumer engagement, sales, and trust.
To Conclude…
Like nourishing habits that improve consumers’ health, data insights improve retailers’ e-commerce health. Advanced assortment and pricing analytics, powered by artificial intelligence, help retailers make better decisions faster to boost their agility, outmaneuver rivals, and fuel online growth.
In a retail landscape where consumer preferences for health and wellness continue to evolve rapidly, the retailers who thrive will be those who leverage data and AI to understand, anticipate, and meet these changing demands with the right products at the right time. Reach out to us to know more.
Retailers often compete on price to gain market share in high performance product categories. Brands too must ensure that their in-demand assortment is competitively priced across retailers. Commerce and digital shelf analytics solutions offer competitive pricing insights at both granular and SKU levels. Central to this intelligence gathering is a vital process: product matching.
Product matching or product mapping involves associating identical or similar products across diverse online platforms or marketplaces. The matching process leverages the capabilities of Artificial Intelligence (AI) to automatically create connections between various representations of identical or similar products. AI models create groups or clusters of products that are exactly the same or “similar” (based on some objectively defined similarity criteria) to solve different use cases for retailers and consumer brands.
Accurate product matching offers several key benefits for brands and retailers:
Competitive Pricing: By identifying identical products across platforms, businesses can compare prices and adjust their strategies to remain competitive.
Market Intelligence: Product matching enables brands to track their products’ performance across various retailers, providing valuable insights into market trends and consumer preferences.
Assortment Planning: Retailers can analyze their product range against competitors, identifying gaps or opportunities in their offerings.
Why Product Matching is Incredibly Hard
But product matching stands out as one of the most demanding technical processes for commerce intelligence tools. Here’s why:
Data Complexity
Product information comes in various (multimodal) formats – text, images, and sometimes video. Each format presents its own set of challenges, from inconsistent naming conventions to varying image quality.
Data Variance
The considerable fluctuations in both data quality and quantity across diverse product categories, geographical regions, and websites introduce an additional layer of complexity to the product matching process.
Industry Specific Nuances
Industry specific nuances introduce unique challenges to product matching. Exact matching may make sense in certain verticals, such as matching part numbers in industrial equipment or identifying substitute products in pharmaceuticals. But for other industries, exactly matched products may not offer accurate comparisons.
In the Fashion and Apparel industry, style-to-style matching, accommodating variants and distinguishing between core sizes and non-core sizes and age groups become essential for accurate results.
In Home Improvement, the presence of unbranded products, private labels, and the preference for matching sets rather than individual items complicates the process.
On the other hand, for grocery, product matching becomes intricate due to the distinction between item pricing and unit pricing. Managing the diverse landscape of different pack sizes, quantities, and packaging adds further layers of complexity.
Diverse Downstream Use Cases
The diverse downstream business applications give rise to various flavors of product matching tailored to meet specific needs and objectives.
In essence, while product matching is a critical component in eCommerce, its intricacies demand sophisticated solutions that address the above challenges.
To solve these challenges, at DataWeave, we’ve developed an advanced product matching system using Siamese Networks, a type of machine learning model particularly suited for comparison tasks.
Siamese Networks for Product Matching
Our methodology involves the use of ensemble deep learning architectures. In such cases, multiple AI models are trained and used simultaneously to ensure highly accurate matches. These models tackle NLP (natural language processing) and Computer Vision challenges specific to eCommerce. This technology helps us efficiently narrow down millions of product candidates to just 5-15 highly relevant matches.
The Tech Powering Siamese Networks
The key to our approach is creating what we call “embeddings” – think of these as unique digital fingerprints for each product. These embeddings are designed to capture the essence of a product in a way that makes similar products easy to identify, even when they look slightly different or have different names.
Our system learns to create these embeddings by looking at millions of product pairs. It learns to make the embeddings for similar products very close to each other while keeping the embeddings for different products far apart. This process, known as metric learning, allows our system to recognize product similarities without needing to put every product into a rigid category.
This approach is particularly powerful for eCommerce, where we often need to match products across different websites that might use different names or images for the same item. By focusing on the key features that make each product unique, our system can accurately match products even in challenging situations.
How Siamese Networks Work?
Imagine having a pair of identical twins who are experts at spotting similarities and differences. That’s essentially what a Siamese network is – a pair of identical AI systems working together to compare things.
How it works:
Twin AI systems: Two identical AI systems look at two different products.
Creating ‘fingerprints’ or ‘embedding’: Each system creates a unique ‘fingerprint’ of the product it’s looking at.
Comparison: These ‘fingerprints’ are then compared to see how similar the products are.
Architecture
The architecture of a Siamese network typically consists of three main components: the shared network, the similarity metric, and the contrastive loss function.
Shared Network: This is the ‘brain’ that creates the product ‘fingerprints’ or ‘embeddings.’ It is responsible for extracting meaningful feature representations from the input samples. This network is composed of layers of neural units that work together. Weight sharing between the twin networks ensures that the model learns to extract comparable features for similar inputs, providing a basis for comparison.
Similarity Metric: After the shared network processes the inputs, a similarity metric is employed. This decides how alike two ‘fingerprints’ or ‘embeddings’ are. The selection of a similarity metric depends on the specific task and characteristics of the input data. Frequently used similarity metrics include the Euclidean distance, cosine similarity, or correlation coefficient, each chosen based on its suitability for the given context and desired outcomes.
Loss Function: For training the Siamese network, a specialized loss function is used. This helps the system improve its comparison skills over time. It guides and trains the network to generate akin embeddings for similar inputs and disparate embeddings for dissimilar inputs.
This is achieved by imposing penalties on the model when the distance or dissimilarity between similar pairs surpasses a designated threshold, or when the distance between dissimilar pairs falls below another predefined threshold. This training strategy ensures that the network becomes adept at discerning and encoding the desired level of similarity or dissimilarity in its learned embeddings.
How DataWeave Uses Siamese Networks for Product Matching
At DataWeave, we use Siamese Networks to match products across different retailer websites. Here’s how it works:
Pre-processing (Image Preparation)
We collect product images from various websites.
We clean these images up to make them easier for our AI to understand.
We use techniques like cropping, flipping, and adjusting colors to help our AI recognize products even if the images are slightly different.
Training The AI
We show our AI system millions of product images, teaching it to recognize similarities and differences.
We use a special learning method called “Triplet Loss” to help our AI understand which products are the same and which are different.
We’ve tested different AI structures to find the one that works best for product matching, including ResNet, EfficientNet, NFNet, and ViT.
Image Retrieval
Once trained, our AI creates a unique “fingerprint” for each product image.
We store these fingerprints in a smart database.
When we need to find a match for a product, we:
Create a fingerprint for the new product.
Quickly search our database for the most similar fingerprints.
Return the top matching products.
Matches are then assigned a high or a low similarity score and segregated into “Exact Matches” or “Similar Matches.” For example, check out the image of this white shoe on the left. It has a low similarity score with the pink shoe (below) and so these SKUs are categorized as a “Similar Match.” Meanwhile, the shoe on the right is categorized as an “Exact Match.”
Similarly, in the following image of the dress for a young girl, the matched SKU has a high similarity score and so this pair is categorized as an “Exact Match.”
Siamese Networks play a pivotal role in DataWeave’s Product Matching Engine. Amid the millions of images and product descriptions online, our Siamese Networks act as an equalizing force, efficiently narrowing down millions of candidates to a curated selection of 10-15 potential matches.
In addition, these networks also find application in several other contexts at DataWeave. They are used to train our system to understand text-only data from product titles and joint multimodal content from product descriptions.
Leverage Our AI-Driven Product Matching To Get Insightful Data
In summary, accurate and efficient product matching is no longer a luxury – it’s a necessity. DataWeave’s advanced product matching solution provides brands and retailers with the tools they need to navigate this complex landscape, turning the challenge of product matching into a competitive advantage.
By leveraging cutting-edge technology and simplifying it for practical use, we empower businesses to make informed decisions, optimize their operations, and stay ahead in the ever-evolving eCommerce market. To learn more, reach out to us today!
For retailers, the breadth and relevance of their product assortment are critical for success. Amid a crowded market filled with countless products clamoring for consumer attention, retailers must find innovative ways to distinguish themselves. While pricing undeniably impacts purchasing decisions, the diversity and distinctiveness of a retailer’s product range can provide a crucial competitive advantage.
Creating an attractive and profitable assortment that resonates with your target audience requires more than intuition; it demands deep insights into both your own and your competitors’ offerings. A well-curated assortment aligned with current trends can drive higher conversions and foster customer loyalty. However, achieving this perfect balance is a formidable challenge without the right insights.
This is where a data-driven strategy becomes essential, enabling you to curate a product mix that captivates and converts.
However, retailers often encounter significant challenges when attempting to strategically plan their assortments:
Limited Competitive Insights: Gaining a clear understanding of your competitors’ assortment strengths and weaknesses across various categories is challenging. Without this visibility, it’s difficult to know where you have an edge or where you might be falling behind.
Tracking Demand Patterns: Identifying top-sellers and monitoring shifts in consumer demand can be a struggle. Without the ability to easily detect trends or changes in demand, you risk missing opportunities to stock trending items.
Attempting to navigate these challenges manually is not only arduous but also susceptible to substantial errors.
How Assortment Analytics Solutions Help
The ideal Assortment Analytics solution must offer a fact-based approach to:
Identify Strengths and Weaknesses: Understand how your assortment measures up against the competition.
Stay Trend-Responsive: Keep your product mix fresh and aligned with the latest consumer trends.
Boost Conversions: Create a relatively unique, customer-focused assortment that enhances conversions.
Many retailers attempt to analyze competitor assortments using manual, in-house methods, which inevitably leads to significant blind spots:
Variations in product classifications and taxonomies across competitors make meaningful comparisons challenging.
Gathering complete and accurate data across a vast competitive landscape is difficult.
Inconsistent titles and descriptions hinder reliable product matching without AI assistance.
Capturing and comparing detailed product attributes efficiently is nearly impossible without advanced tools.
To overcome these challenges, retailers need a scalable, accurate Assortment Analysis solution designed specifically for the complexities of modern retail needs.
DataWeave’s Assortment Analytics Solution
DataWeave addresses these challenges by providing retailers with a robust platform to gain actionable insights into their product assortments and the competitive landscape. Leveraging advanced analytics and AI-driven algorithms, Assortment Analytics empowers retailers to make informed assortment management decisions, optimize their product offerings, and stay competitive.
Armed with our insights, retailers can lead with their strengths and stock unique and in-demand products in their assortment. Further, by recognizing the strengths in their product catalog, they can craft effective pricing strategies and optimize their logistics, creating a more competitive and appealing shopping experience for their customers. Here are a few capabilities of DataWeave’s solution:
In-Depth Competitive Analysis Across Retailers
The solution offers detailed competitive analysis, revealing insights into competitors’ assortments. It maps competitor products to a common taxonomy, making comparisons accurate and meaningful. Retailers can visualize assortments at granular levels like category, sub-category, and product type.
The data for these insights is collected at configurable intervals, typically monthly or quarterly, and is consumed not only via dashboard summaries but also raw data files to enable in-depth analysis. Retailers have the flexibility to choose specific competitors, brands, products, and categories for tracking, allowing for a tailored and strategic approach to assortment optimization.
Brand and Category Views to Assess Your Portfolio
The solution provides a comprehensive evaluation of your product assortment through brand and category views. In brand views, your portfolio is assessed against competitors at the brand level, highlighting:
Newly Introduced Brands: Insights into recently introduced brands, revealing shifts in the brand landscape.
Absence or Limited Presence: Identification of brands lacking representation or with minimal presence compared to competitors, indicating areas for improvement.
Strong Presence and Exclusivity: Recognition of brands where you excel, including exclusive offerings, showcasing your competitive edge.
Identifying Top-Selling Competitive Products To Boost Assortment Strategy
Beyond just comparing assortment numbers, the DataWeave solution surfaces insights into which competitor products are actually performing well. It equips category and assortment managers with indicators that assess competitor products in terms of their popularity and shelf velocity.
It analyzes metrics like pricing fluctuations, ratings, customer reviews, search rankings, and replenishment rates to pinpoint hot sellers you may want to stock. With these insights, merchandizing managers can pinpoint top-selling products among competitors, enabling informed decisions to enhance their assortment in comparison.
Sophisticated Attribute Tagging and Analysis
Using AI-powered attribute tagging, the solution simplifies granular product analysis within specific categories. An Apparel retailer, for instance, can filter the data to compare assortments based on attributes like material, pattern, color, etc.
Retailers can select attributes relevant to their products and gain detailed insights. These custom filter attributes dynamically populate the panel, facilitating targeted data exploration. Category and merchandizing managers can delve into critical details swiftly, enabling strategic decision-making and comprehensive competitive analysis within their categories.
You can capitalize on opportunities by stocking in-demand, on-trend items and address assortment gaps quickly. At the same time, you can double down on your strengths by enhancing your exclusive or top-performing product sets.
In summary, DataWeave’s Assortment Analytics solution provides an invaluable competitive edge. The insights enable evidence-based decisions to attract more customers, encourage bigger baskets, and maximize the value of every assortment choice.
Cinco de Mayo is a vibrant celebration of Mexican-American and Hispanic heritage, marked by lively parades, festive tacos, and refreshing tequila across North America. For the service industry, brands, and retailers, this day offers a golden opportunity to roll out enticing promotions on beloved Mexican foods and beverages, drawing in large crowds and boosting sales.
Americans love to indulge in Mexican cuisine during Cinco de Mayo. Take avocados, for example: despite inflation, avocado sales soared to 52.3 million units this year, marking a 25% increase from last year, according to the Hass Avocado Board’s 2023 Holiday Report. Such festive events see a significant sales spike, largely driven by appealing discounts and special offers.
So, what discounts did retailers roll out this Cinco de Mayo?
At DataWeave, our cutting-edge data aggregation and analysis platform tracked and analyzed the prices and deals on Mexican food and alcohol products offered by leading retailers. Our in-depth analysis sheds light on their pricing competitiveness during Cinco de Mayo, revealing how pricing strategies differed across various subcategories and brands.
We conducted a similar analysis in 2022, allowing us to compare the prices of identical products this year versus last year. This comparison helps us understand the impact of inflation over the past two years on the prices offered today.
Our Methodology
For our analysis, we monitored the average discounts offered by major US retailers on over 2,000 food and beverage products during Cinco de Mayo, as well as in the days leading up to the event. Many retailers kick off their Cinco de Mayo promotions a week before, so we included the entire week leading up to May 5th in our analysis.
To truly demonstrate the value of Cinco de Mayo for shoppers, we concentrated on price reductions and additional discounts during the event. By comparing these with regular day discounts, we were able to highlight the genuine savings and benefits that Cinco de Mayo promotions offer to budget-conscious consumers.
Our Findings
Safeway led the pack with the highest average additional discount of 4.91%, covering 38.6% of their food inventory for Cinco de Mayo. Total Wine & More followed closely, offering an average discount of 3.46% across 70.8% of its tequila, whiskey, mezcal, and other spirit products during the Cinco de Mayo week.
In contrast, Target provided minimal additional discounts, averaging just 0.8% over a small fraction (11.6%) of its SKUs. Similarly, Kroger’s additional discounts were also 0.8%, but they were spread across over 60% of its tracked products. Walmart (1.4%) and Amazon Fresh (1.2%) offered relatively conservative discounts during the sale period.
During Cinco de Mayo, various brands rolled out attractive discounts to entice shoppers. Among beverage brands, The American Plains vodka led the way with the highest average discount of 20.80%. Coffee brands also joined the festivities with significant discounts: Death Wish Coffee at 14.30%, Dunkin’ at 11.10%, and Starbucks at 5.70%. Notably, Dunkin’ and Death Wish Coffee introduced complimentary beverages such as whiskey barrel-aged coffee and spiked coffee products to celebrate the event.
In the wine category, Erath stood out with a 10% additional discount. However, brands like Jose Cuervo and Franzia offered more modest discounts of 0.70% and 1.80%, respectively.
Food brands associated with traditional Mexican ingredients or products, such as tortillas, salsas, and spices, provided higher discounts compared to mainstream snack brands. For instance, McCormick (25%), El Monterey (13.3%), and La Tortilla Factory (16.7%)—known for ready-to-eat frozen foods, seasonings, and condiments—delivered the highest discounts. Other notable discounts included Jose Ole (12.5%), a frozen food brand, and Yucatan (8.3%), known for its guacamole.
Safeway’s private label brand, Signature Select, offered a 5.20% discount. Additionally, Safeway provided deep discounts on brands like Pace, Herdez, and Taco Bell, indicating an aggressive discounting strategy. In contrast, brands closely associated with Mexican or Tex-Mex cuisine, such as Old El Paso, Mission, Rosarita, and La Banderita, offered relatively modest discounts ranging from 0.5% to 3.3%.
The discount patterns varied between alcohol and food categories, with food brands generally offering higher discounts. This trend may be attributed to pricing being regulated in the alcohol industry. These differing discount levels highlight how brands navigated the balance between driving sales and maintaining profit margins during Cinco de Mayo, particularly in the context of inflation affecting costs.
Impact of Inflation on Cinco de Mayo Prices (2024 vs 2022)
To gauge the impact of inflation on popular Cinco de Mayo products, we analyzed the average prices at Walmart and Target between 2022 and 2024. These two retailers were chosen due to their prominence in the retail sector and the robustness of our sample data.
At Walmart, the Tex Mex category saw the highest average price increase, rising by 22.51%. Other notable subcategories with significant price hikes include Condiments (23.21%), Vegetables/Packaged Vegetables (21.22%), and Lasagne (14.10%). Categories like Dips & Spreads (13.77%), Pantry Staples (14.92%), and Salsa & Dips (8.23%) experienced relatively lower increases.
At Target, the Snacks subcategory had the steepest average price rise at 27.94%, followed by Meal Essentials (16.07%) and Deli Pre-Pack (8.82%). Categories such as Dairy (0.51%), Frozen Meals/Sides (7.11%), and Adult Beverages (7.41%) saw smaller price increases.
Brands associated with traditional Mexican or Tex-Mex cuisine faced higher price hikes. Examples include Old El Paso (24.59% at Walmart, 8.70% at Target), Tostitos (35.44% at Walmart, 11.41% at Target), Ortega (30.59% at Walmart, 19.69% at Target), and Rosarita (14.39% at Walmart).
In contrast, private label or store brands generally experienced lower price increases compared to national brands. For instance, Good & Gather (Target’s private label) saw a 9.55% increase, while Market Pantry (Walmart’s private label) had a 17.27% rise. This trend is understandable as retailers have more control over their costs with private label brands.
The data clearly indicates that both Walmart and Target have significantly raised prices across various categories and brands, reflecting the broader inflationary environment where the cost of goods and services has been steadily climbing.
Interestingly, we observed higher price increases at Walmart compared to Target. Although Walmart is renowned for its consumer-friendly pricing strategies, it too had to elevate grocery prices post-2022 to combat inflationary pressures. As consumers become more cost-conscious and reduce spending on discretionary items, Walmart and other retailers are now cutting prices across categories to align with shifting consumer behaviors.
Mastering Pricing Strategies During Sale Events
Our pricing analysis for Cinco de Mayo reveals compelling insights into the dynamics of retailer landscapes in the US. It highlights the enduring relevance of private label brands, even amidst fluctuating demand, showing the emergence of local, national, and small players vying for market share.
As retailers navigate inflationary pressures and evolving consumer behaviors, understanding these pricing dynamics becomes crucial for optimizing strategies and bolstering market competitiveness. This analysis offers actionable intelligence for retailers seeking to navigate the intricate terrain of sale event promotions while addressing shifting consumer preferences and economic challenges.
Access to reliable and timely pricing data equips retailers and brands with the tools needed to make informed decisions and drive profitable growth in an increasingly competitive environment. To learn more and gain guidance, reach out to us to speak to a DataWeave expert today!
Retailers and brands are constantly engaged in a fierce battle over prices and discounts. Whether it’s major events like Amazon Prime Day, brand-led sales, or everyday price wars, they depend on pricing intelligence and digital shelf analytics to fine-tune their strategies. With a variety of offers such as sales, promotions, and bundles, determining the actual cost to the customer becomes a complex task. The price set by the brand, the retailer’s offer, and the final amount paid by the customer often vary significantly.
In their analysis, retailers and brands frequently focus on the listed price or the final sale price, overlooking a critical factor: the “end-user price.” This includes all discounts, taxes, and shipping costs, providing a more accurate picture of what customers are truly willing to pay at checkout.
Grasping this end-user price is vital for both retailers and brands. For retailers, it helps them stay competitive and refine their promotional strategies. For brands, it offers insights into competitive positioning, net revenue management, and shaping customer price perception.
However, emphasizing the end-user price is challenging, as it involves comprehending all the intricate elements of pricing.
How end-user pricing is calculated
The list price, also known as the manufacturer’s recommended retail price (MSRP), is the initial price set by the brand. This may not always be displayed on marketplaces, especially in categories like grocery. The selling price, on the other hand, is the amount at which a retailer offers the product, often reduced from the list price. The end-user price is the actual amount the customer pays at checkout, which includes taxes, promotions, and other factors that affect the final cost.
The process involves 3 key stages:
Step 1: Identifying and categorizing promotional offers
The first critical step in calculating end-user pricing is to identify and categorize the various promotional offers available for a given product that can reduce the final amount paid by the consumer. These promotions span a wide range of types:
Bank Offers: Involving discounts or cash back incentives when paying with specific bank credit or debit cards. For instance, a customer may receive 10% cashback on their purchase by using a specific bank’s card.
Bundled Deals: Combining multiple products or services at a discounted bundle price. A common example is a smartphone bundle including the phone itself, a protective case, and earphones at a reduced total cost.
Promo Codes/Coupons: Customers can enter promo codes or coupons during checkout to unlock special discounted prices or percentage-off offers, like 20% off a hotel booking, or even a special brand discount personalized for their needs (think loyalty offers and in-app promotions).
Shipping Offers: These include free shipping or reduced shipping fees for certain products or orders, such as free delivery on orders above a set amount.
TPRs (Temporary Price Reductions): TPRs play a significant role in the strategies of most retailers. Brands and retailers use them to encourage shoppers to purchase more of a product or to try a new product they wouldn’t usually buy. A TPR involves reducing the price of a product by more than 5% from its regular shelf price.
By accurately identifying and classifying each type of promotion available, brands can then calculate the potential end-user pricing points.
Step 2: Accounting for location and fulfilment nuances (delivery, in-store pickup) that impact final pricing
Product pricing and promotional offers can vary based on the consumer’s location or ZIP code. Additionally, customers may opt for different fulfilment modes like delivery, shipping, or in-store pickup, which can further impact the final cost. Accurately calculating the end-user price necessitates considering these location-based pricing nuances as well as the chosen fulfilment method.
In the example below, the selling price is $4.32 for one retailer (on the left in the image) after a discount for online purchase. In another case with Meijer, the item total shows $17.91, but the consumer ends up paying $15.74 after taxes and fees are applied (on the right in the image).
Step 3: Applying each eligible promotion or offer to the selling price to determine potential end-user price points
With the various promotional offers and discounts categorized in the previous steps, retailers and brands can now apply each eligible promotion to the product’s selling price. This involves deducting percentages for bank cashback, implementing bundled pricing, applying coupon code discounts, and incorporating shipping promotions.
For retailers, this step allows them to calculate their true effective selling price to customers after all discounts and promotions. They can then compare this end-user price against competitors to ensure they remain competitively priced.
For brands, by systematically layering every applicable offer onto the baseline selling price, they can accurately calculate the multiple potential end-user price points a customer may pay at checkout for their products across different retailers and regions.
Why the end-user price matters
Optimizing pricing strategies using the end-user price can benefit retailers and brands in several ways:
Price Competitiveness: By monitoring end-user pricing, retailers can adjust for discounts and promotional offers to attract customers, while brands can refine their pricing models to stay ahead in the market.
Customer Acquisition and Loyalty: Offers, promotions, and discounts directly impact the final price paid by customers, playing a crucial role in attracting new customers and retaining existing ones. For example, Walmart’s competitive pricing in groceries boosts customer loyalty and repeat purchases.
Consumer Perception: End-user pricing significantly shapes how consumers perceive both retailers and brands. Competitive pricing and promotional transparency enhance reputation and conversion rates. Amazon, for instance, is known for its competitive pricing and fast deliveries, which strengthen its consumer perception and satisfaction.
Sales Volumes: The final checkout price influences affordability and perceived value, directly affecting sales volumes. Both retailers and brands benefit from understanding this, as it guides consumer purchasing decisions and drives revenue streams.
Brand Perception: Consistent and transparent pricing enhances the perception of both the retailer and the brand. This not only strengthens the value proposition but also builds consumer trust and fosters long-term loyalty.
While the listed and selling prices are readily available, calculating the true end-user price is quite complex. It involves meticulous tracking and application of various types of promotions, offers, location-based pricing nuances, and fulfillment costs – an uphill task without robust technological solutions.
Track and Analyze end-user prices with DataWeave
DataWeave’s end-user price tracking capability empowers retailers and brands with the insights and tools necessary to comprehend the complexities of pricing dynamics. For retailers, it offers the ability to monitor end-user pricing across various products and categories compared to competitors, ensuring competitiveness after all discounts and enabling optimization of promotional strategies. Brands benefit from informed pricing decisions, optimized strategies across retail channels, and a strengthened position within their industries.
Our intuitive dashboard presents classified promotions and corresponding end-user prices across retailers, providing both retailers and brands with a transparent, comprehensive view of the end-user pricing landscape.
Within the detailed product view of DataWeave’s dashboard, the Price and Promotions panel showcases diverse promotions available across different retailers for each product, along with the potential end-user price post-promotions.
Harness the power of DataWeave’s sophisticated Pricing Intelligence and Digital Shelf Analytics to gain an accurate, real-time understanding of your end-user pricing dynamics. Make data-driven pricing decisions that resonate with customers and propel your brand toward sustained success.
Find out how DataWeave can empower your eCommerce pricing strategy – get in touch with us today or write to us at contact@dataweave.com!
In today’s expansive omnichannel commerce landscape, pricing intelligence has become indispensable for retailers seeking to stay competitive and refine their pricing strategies. The sheer magnitude of eCommerce, spanning thousands of websites, billions of SKUs, and various form factors, adds layers of complexity. Consequently, ensuring the accuracy and reliability of competitive insights presents a formidable challenge for retailers aiming to leverage pricing data effectively.
At the core of any robust pricing intelligence system lies product matching. This process enables retailers to recognize identical or similar products across competitors. Once these matches are identified, tracking prices is a relatively more straightforward task, facilitating ongoing analysis and informed decision-making.
Accurate matching is crucial for meaningful price comparisons and tailoring product assortments. The challenge is matching products is often complicated, especially for non-local brands, niche categories, or items lacking consistent global identifiers. It becomes even trickier when trying to match very similar but not identical products. A comprehensive approach that compares and analyzes multiple attributes like product titles, descriptions, images and more is essential.
Artificial intelligence algorithms are commonly used to automate product matching, leveraging machine learning techniques to analyze patterns in images and text data. While AI can adapt and improve over time, the question remains: Can it fully address the complexities of product matching on its own?
The reality is that many retailers still struggle with incomplete, inaccurate, or outdated product data, despite these AI-powered product matching solutions. This can lead to suboptimal pricing decisions, missed opportunities, and reduced competitiveness.
Challenges in an ‘AI-only’ Approach to Product Matching
While AI plays a vital role in automated product matching solutions, there are complexities that AI alone cannot fully address:
Subjectivity in Matching Criteria
Some product categories have subjective or hard-to-quantify criteria for determining similarity. AI learns from historical data, so it may struggle with nuanced aspects like:
Aesthetics, style, and design: In the Fashion and Jewellery vertical, for example, products are matched according to attributes like style, aesthetics, design – all of which have some subjectivity involved.
Quantity/packaging variations: In the grocery sector, variations in product packaging and quantities can introduce complexities that require subjective decision-making. For example, apples may be sold in different packaging like a 0.5 kg bag or a pack of 4 individual apples. Determining if these different packaging options should be considered equivalent often involves making a qualitative judgment call, rather than a clear-cut objective decision.
Matching product sets: For categories like home furnishings, the focus is often on matching coordinated sets rather than individual items. For example, in the bedroom category, matching may involve grouping together an entire set of complementary furniture like a bed frame, dresser, and wardrobe based on their cohesive design and style. This goes beyond simply making one-to-one product associations, requiring more nuanced judgments about aesthetic coordination.
Contextual Factor
Products can have regional preferences, cultural differences, or evolving trends that impact how they are matched. AI may miss important context like Local/regional product names or distinct brand names across countries.
For instance, in the image we see Sprite (in the US) is branded Xubei in China. Continuous human curation is needed to help AI adapt to this context.
High Accuracy & Coverage Expectations
Retailers rely on AI powered and automated pricing adjustments based on product matching for insight. To ensure that pricing recommendations and updates are accurate, accurate product matching is crucial. For this, simply identifying similar top results is not enough – the process must comprehensively capture all relevant matches. While AI excels at finding the top groupings with around 80% accuracy, even small matching errors can have significant consequences.
As AI matching improves, customer expectations may rise even higher. If AI achieves 90% accuracy, for instance, SLAs may demand over 95%. Reaching such a high level of accuracy is very challenging for AI alone, especially when faced with incomplete data, contextual nuances, evolving trends, and subjective matching criteria across products and categories.
The solution is to combine the power of AI with human expertise. This is the key to achieving true data veracity – the accuracy, freshness, and comprehensive coverage required for precise and reliable product matching.
Human-in-the-Loop Approach for Elevated Product Matching
Human intelligence and quality testing can elevate the AI powered product matching process by addressing key challenges:
Matching Validation: AI algorithms may identify product matches with 80-90% accuracy initially. Having humans validate these AI-suggested matches allows for correcting errors and pushing the accuracy close to 100%. As humans flag issues, provide context, and re-label incorrect predictions, it allows the AI model to learn and enhance its reliability for complex, high-stakes decisions.
Applying Contextual Judgment: For subjective matching criteria like aesthetics, design, and categorizing product sets, human discernment is needed. Humans can make nuanced judgments beyond just quantitative rules, ensuring meaningful apples-to-apples product comparisons. Their contextual understanding augments AI’s capabilities.
Continuous Learning Via Feedback Loop: Product experts possess rich category knowledge across markets. Integrating this human insight through an iterative feedback loop helps AI models quickly learn and adapt to changing trends, preferences, and context. As humans explain their match assessments, the AI continuously enhances its precision over time.
By combining AI’s automation and scale with human validation, judgment, and knowledge curation, pricing intelligence solutions can achieve the accuracy and coverage demanded for actionable competitive pricing insights.
DataWeave’s Data Veracity Framework: A Scalable Workflow Combining AI and Human Expertise
Given the vast number of products, retailers, and brands that exist today, any product matching solution must be highly scalable. At DataWeave, we bring you such a scalable workflow to address these complexities by integrating human expertise with AI-driven automation. The image below outlines our approach for combining AI with human intelligence in a seamless, scalable workflow for accurate product matching:
Retailers and brands can benefit in several ways with this workflow, as listed below.
Several Rounds of Data Verification Due to Hierarchical Validation Teams
The workflow employs a hierarchical validation team of Leads and Executives to efficiently integrate human expertise without creating bottlenecks. Verification Leads play a pivotal role in managing the distribution of product matches identified by DataWeave’s AI model to the Verification Executives.
The Executives then meticulously validate these AI-suggested matches, adding any missing product associations and removing inaccurate matches. After validation, the matched product groups are sent back to the Leads, who perform random sampling checks to ensure quality.
Throughout this entire workflow, feedback and suggestions are continuously gathered from both the Executives and Leads. This curated input is then incorporated back into DataWeave’s AI model, allowing it to learn and improve its matching accuracy on an ongoing basis.
This hierarchical structure ensures that human validation seamlessly scales alongside the AI’s matching capabilities. Leveraging the respective strengths of AI automation and human expertise in an iterative feedback loop prevents operational bottlenecks while steadily elevating overall accuracy.
Confidence-based Distribution of Matched Articles for Validation
The AI model assigns confidence scores, differentiating high-confidence (>95%) and low-confidence matches. For high-confidence groups, executives simply remove incorrect matches – a quicker process. Low-confidence matches require more human effort in adding/removing matches.
As the AI model improves over time with feedback, the share of high-confidence matches increases, making validation more efficient and swift.
Automated, Standardized Process with Iterative Feedback Loop
The entire workflow is standardized and automated, with verification metrics seamlessly tracked. At each step, feedback captured from both leads and executives flows back into the AI, enhancing its matching accuracy and coverage iteratively.
DataWeave’s closed-loop system of AI automation with hierarchical human validation allows product matching to achieve comprehensive accuracy at a vast scale.
Unleash the Power Accurate and Comprehensive Product Matching
In summary, combining AI and human expertise in product matching is crucial for retailers navigating the complexities of omnichannel retail. While AI algorithms excel in automation, they often struggle with subjective criteria and contextual nuances. DataWeave’s approach integrates AI-driven automation with human validation, delivering the industry’s most accurate product matching capabilities, enabling actionable competitive pricing insights.
Easter egg hunts just got more challenging for families this year as the price of chocolate and other candies has soared. The root of this price surge lies in a cocoa deficit, attributed to diseases affecting crops and the adverse effects of climate change on West African farms, which supplies over 70% of the world’s cocoa. This has resulted in a tripling of cocoa prices over the last year, causing a “cocoa crunch,” and severely impacted confectioners and chocolate makers.
Reuters recently reported that Iconic brands such as Hershey’s and Cadbury find themselves grappling with the need to adjust to escalating costs for raw materials. Given that Easter is one of the top three candy-purchasing occasions, these manufacturers are contemplating raising their prices to sustain their profit margins.
Despite the challenges posed by the cocoa shortfall and persistent inflation, the National Confectioners Association anticipates that Easter candy sales in the U.S. will match or even exceed last year’s figures, which amounted to approximately $5.4 billion. This expectation is predicated more on price increases than on a rise in sales volume.
At DataWeave, our ongoing analysis of pricing trends across various consumer categories among retailers has provided insight into the evolving landscape of chocolate and candy prices in 2023 and 2024.
Our Analysis of Inflation in Candy and Chocolate Prices
Our study encompassed a broad array of 3,300 products from leading U.S. retailers, Amazon, Target, Kroger, and Giant Eagle. As illustrated in the following chart, the trajectory of prices over the past 15 months was compared against the average prices in January 2023. Our tracking focused on two key price points: the selling price, which represents the final cost to consumers after applying any discounts or promotions, and the Manufacturer’s Suggested Retail Price (MSRP), as determined by the brands themselves.
The findings from our analysis indicate that the average selling price, primarily influenced by retailer decisions, has experienced a steady increase throughout 2023, reaching a peak at 16.2% above January 2023’s figures by December. As of March 2024, coinciding with the Easter season, the selling prices are approximately 10% higher than they were at the beginning of the previous year.
Simultaneously, the MSRP has seen a consistent uptick, driven by the climbing costs of cocoa. Brands have adjusted their suggested prices accordingly, with the current MSRP standing about 7% above its January 2023 level, after having peaked at a 7.6% increase by December 2023. This reflects the direct impact of rising cocoa costs on product pricing strategies.
Chocolate Candies Are Hit The Hardest
Across all candies, chocolate-based products have witnessed significantly sharper price increases than their non-chocolate counterparts. In the past 14 months, the selling prices of chocolate items have surged by 14.9%, a stark contrast to the modest 4% rise observed in non-chocolate candies.
This price escalation was particularly pronounced during the Christmas shopping period, a response to heightened demand, before experiencing a temporary decline in February.
The diminishing availability of cocoa, coupled with rising costs for packaging and transportation, has compelled brands and retailers alike to transfer these added expenses onto the consumer. This dynamic underpins the distinct pricing trends observed across the candy spectrum, with chocolate items bearing the brunt of these cost pressures.
Discounts Offered By Retailers and Brands to Entice Easter Shoppers
In our analysis, we delved deeper to identify the retailers and brands offering the most compelling prices for Easter-centric confections, including Chocolate Eggs, Chocolate Bunnies, and Easter-themed gift packs.
Kroger emerged as the frontrunner among the retailers we monitored, offering an impressive 19% discount on Easter candies. Giant Eagle followed with a solid 14% average markdown. Meanwhile, Amazon and Target provided more modest promotional discounts at 12% and 10%, respectively.
Kroger is making significant efforts to ensure consumers have access to attractively priced Easter treats. The retailer planned to keep its doors open throughout the Easter weekend, featuring baskets brimming with discounted items such as Russell Stover chocolate bunnies, Brach’s jelly beans, Reese’s eggs, and assorted bags of popular candies from Snickers, Twix, and Starburst, among others. Additionally, Kroger is enhancing its value proposition through gift card offers and exclusive Easter deals for its loyalty program members.
On the brand front, Starburst by Mars Wrigley leads with the steepest discount of 25%. Cadbury, under Mondelez, is not far behind, offering 21% off its mini eggs and other Easter treats, marking an increase from last year’s 17% discount. Ferrero Rocher is making a strong pricing move with an average 20% markdown on its Easter selections, including the chocolate bunny and squirrel figures.
The beloved Peeps marshmallow candies by Just Born are being offered at an 18% discount this year, slightly less than the 23% discount seen in 2023, likely reflecting the impact of rising sugar costs, given their sugar and corn composition.
Other notable brands, including M&M’s and the premium Swiss chocolatier Lindt, have elevated their average Easter discounts to 17% this year, up from the previous year’s discounts of 12%, and 10% respectively, showcasing a competitive pricing strategy to delight consumers this Easter season.
Coping With Inflation This Easter Season
Retailers and brands aiming to remain profitable and competitive in the current challenging environment can adopt a few strategic approaches:
Creative Product Bundling: Design innovative combo packs that mix chocolate and non-chocolate items. Such bundles can cater to diverse consumer preferences and budget ranges while preserving profit margins.
Encouragement of Bulk Purchases: Offer enticing discounts on larger quantities to promote bulk buying. This strategy can help amplify sales volumes, compensating for increased costs per item and fostering economies of scale.
Strategic Competitive Pricing: Keeping a vigilant eye on competitors’ pricing strategies is vital. Aim to capture market share through well-thought-out discount strategies that balance competitiveness with margin preservation. Leveraging advanced pricing intelligence, such as that offered by DataWeave, can provide invaluable insights for making informed pricing decisions.
Product Size Adjustments: Consider revising the size or weight of products as a cost management measure, a strategy known as “shrinkflation.” It’s crucial to approach this transparently, ensuring clear communication on packaging to uphold consumer trust.
Adopting these strategies—focusing on bundle offerings, incentivizing bulk purchases, optimizing pricing strategies based on competitive intelligence, and thoughtfully adjusting product sizes—will be pivotal for confectioners to navigate the challenges posed by the cocoa price surge.
For more information, reach out to us to speak to a DataWeave expert today!
Retailers heavily depend on pricing intelligence solutions to consistently achieve and uphold their desired competitive pricing positions in the market. The effectiveness of these solutions, however, hinges on the quality of the underlying data, along with the coverage of product matches across websites.
As a retailer, gaining complete confidence in your pricing intelligence system requires a focus on the trinity of data quality:
Accuracy: Accurate product matching ensures that the right set of competitor product(s) are correctly grouped together along with yours. It ensures that decisions taken by pricing managers to drive competitive pricing and the desired price image are based on reliable apples-to-apples product comparisons.
Freshness: Timely data is paramount in navigating the dynamic market landscape. Up-to-date SKU data from competitors enables retailers to promptly adjust pricing strategies in response to market shifts, competitor promotions, or changes in customer demand.
Product matching coverage: Comprehensive product matching coverage ensures that products are thoroughly matched with similar or identical competitor products. This involves accurately matching variations in size, weight, color, and other attributes. A higher coverage ensures that retailers seize all available opportunities for price improvement at any given time, directly impacting revenues and margins.
However, the reality is that untimely data and incomplete product matches have been persistent challenges for pricing teams, compromising their pricing actions. Inaccurate or incomplete data can lead to suboptimal decisions, missed opportunities, and reduced competitiveness in the market.
What’s worse than poor-quality data? Poor-quality data masquerading as accurate data.
In many instances, retailers face a significant challenge in obtaining comprehensive visibility into crucial data quality parameters. If they suspect the data quality of their provider is not up to the mark, they are often compelled to manually request reports from their provider to investigate further. This lack of transparency not only hampers their pricing operations but also impedes the troubleshooting process and decision-making, slowing down crucial aspects of their business.
We’ve heard about this problem from dozens of our retail customers for a while. Now, we’ve solved it.
DataWeave’s Data Statistics and SKU Management Capability Enhances Data Transparency
DataWeave’s Data Statistics Dashboard, offered as part of our Pricing Intelligence solution, enables pricing teams to gain unparalleled visibility into their product matches, SKU data freshness, and accuracy.
It enables retailers to autonomously assess and manage SKU data quality and product matches independently—a crucial aspect of ensuring the best outcomes in the dynamic landscape of eCommerce.
Beyond providing transparency and visibility into data quality and product matches, the dashboard facilitates proactive data quality management. Users can flag incorrect matches and address various data quality issues, ensuring a proactive approach to maintaining the highest standards.
Retailers can benefit in several ways with this dashboard, as listed below.
View Product Match Rates Across Websites
The dashboard helps retailers track match rates to gauge their health. High product match rates signify that pricing teams can move forward in their pricing actions with confidence. Low match rates would be a cause for further investigation, to better understand the underlying challenges, perhaps within a specific category or competitor website.
Our dashboard presents both summary statistics on matches and data crawls as well as detailed snapshots and trend charts, providing users with a holistic and detailed perspective of their product matches.
Additionally, the dashboard provides category-wise snapshots of reference products and their matching counterparts across various retailers, allowing users to focus on areas with lower match rates, investigate underlying reasons, and develop strategies for speedy resolution.
Track Data Freshness Easily
The dashboard enables pricing teams to monitor the timeliness of pricing data and assess its recency. In the dynamic realm of eCommerce, having up-to-date data is essential for making impactful pricing decisions. The dashboard’s presentation of freshness rates ensures that pricing teams are armed with the latest product details and pricing information across competitors.
Within the dashboard, users can readily observe the count of products updated with the most recent pricing data. This feature provides insights into any temporary data capture failures that may have led to a decrease in data freshness. Armed with this information, users can adapt their pricing decisions accordingly, taking into consideration these temporary gaps in fresh data. This proactive approach ensures that pricing strategies remain agile and responsive to fluctuations in data quality.
Proactively Manage Product Matches
The dashboard provides users with proactive control over managing product matches within their current bundles via the ‘Data Management’ panel. This functionality empowers users to verify, add, flag, or delete product matches, offering a hands-on approach to refining the matching process. Despite the deployment of robust matching algorithms that achieve industry-leading match rates, occasional instances may arise where specific matches are overlooked or misclassified. In such cases, users play a pivotal role in fine-tuning the matching process to ensure accuracy.
The interface’s flexibility extends to accommodating product variants and enables users to manage product matches based on store location. Additionally, the platform facilitates bulk match uploads, streamlining the process for users to efficiently handle large volumes of matching data. This versatility ensures that users have the tools they need to navigate and customize the matching process according to the nuances of their specific product landscape.
Gain Unparalleled Visibility into your Data Quality
With DataWeave’s Pricing Intelligence, users gain the capability to delve deep into their product data, scrutinize match rates, assess data freshness, and independently manage their product matches. This approach is instrumental in fostering informed and effective decisions, optimizing inventory management, and securing a competitive edge in the dynamic world of online retail.
Consumer brands around the world increasingly recognize the vital role of tracking and optimizing their digital shelf KPIs, such as Content Quality, Share of Search, Availability, etc. These metrics play a crucial role in boosting eCommerce sales and securing a larger online market share. With the escalating requirements of brands, the sophistication of top Digital Shelf Analytics providers is also on the rise. Consequently, the adoption of digital shelf solutions has become an essential prerequisite for today’s leading brands.
As brands and vendors continue to delve further and deeper into the world of Digital Shelf Analytics, a significant and often overlooked aspect is the analysis of digital shelf data on mobile apps. The ability of solution providers to effectively track and analyze this mobile-specific data is crucial.
Why is this emphasis on mobile apps important?
Today, the battle for consumer attention unfolds not only on desktop web platforms but also within the palm of our hands – on mobile devices. As highlighted in a recent Insider Intelligence report, customers will buy more on mobile, exceeding 4 in 10 retail eCommerce dollars for the first time.
Moreover, thanks to the growth of delivery intermediaries like Instacart, DoorDash, Uber Eats, etc., shopping on mobile apps has received a tremendous organic boost. According to an eMarketer report, US grocery delivery intermediary sales are expected to reach $68.2 billion in 2025, from only $8.8 billion in 2019.
In essence, mobile is increasingly gaining share as the form factor of choice for consumers, especially in CPG. In fact, one of our customers, a leading multinational CPG company, revealed to us that it sees up to 70% of its online sales come through mobile apps. That’s a staggering number!
The surge in app usage reflects a fundamental change in consumer behavior, emphasizing the need for brands to adapt their digital shelf strategies accordingly.
Why Brands Need To Look at Apps and Desktop Data Differently
Conventionally, brands that leverage digital shelf analytics rely on data harnessed from desktop sites of online marketplaces. This is because capturing data reliably and accurately from mobile apps is inherently complex. Data aggregation systems designed to scrape data from web applications cannot easily be repurposed to capture data on mobile apps. It requires dedicated effort and exceptional tech prowess to pull off in a meaningful and consistent way.
In reality, it is extremely important for brands to track and optimize their mobile digital shelf. Several digital shelf metrics vary significantly between desktop sites and mobile apps. These differences are natural outcomes of differences in user behavior between the two form factors.
One of these metrics that has a huge impact on a brand’s performance on retail mobile apps is their search discoverability. Ecommerce teams are well aware of the adverse impact of the loss of even a few ranks on search results.
Anyone can easily test this. Searching something as simple as “running shoes” on the Amazon website and doing the same on its mobile app shows at least a few differences in product listings among the top 20-25 ranks. There are other variances too, such as the number of sponsored listings at the top, as well as the products being sponsored. These variations often result in significant differences in a brand’s Share of Search between desktop and mobile.
Share of Search is the share of a brand’s products among the top 20 ranked products in a category or subcategory, providing insight into a brand’s visibility on online marketplaces.
Picture a scenario in which a brand heavily depends on desktop digital shelf data, confidently assuming it holds a robust Share of Search based on reports from its Digital Shelf Analytics partner. However, unbeknownst to the team, the Share of Search on mobile is notably lower, causing a detrimental effect on sales.
To fully understand the scale of these differences, we decided to run a small experiment using our proprietary data analysis and aggregation platform. We restricted our analysis to just Amazon.com and Amazon’s mobile app. However, we did cover over 13,000 SKUs across several shopping categories to ensure the sample size is strong.
Below, we provide details of our key findings.
Share of Search on The Digital Shelf – App Versus Desktop
Our analysis focused on three popular consumer categories – Electronics, CPG, and Health & Beauty.
In the electronics category, brands like Apple, Motorola, and Samsung, known for their mobile phones, earbuds, headphones, and more, have a higher Share of Search on the Amazon mobile app compared to the desktop.
Meanwhile, Laptop brands like Dell, Acer, and Lenovo, as well as other leading brands like Google have a higher Share of Search on the desktop site compared to the app. This is the scenario that brands need to be careful about. When their Share of Search on mobile apps is lower, they might miss the chance to take corrective measures since they lack the necessary data from their provider.
In the CPG category, Ramen brand Samyang, with a lot of popularity on Tiktok and Instagram, shows a higher Share of Search on Amazon’s mobile app. Speciality brands like 365 By Whole Foods, pasta and Italian food brands La Moderna, Divinia, and Bauducco too have a significantly higher Share of Search on the app.
Cheese and dessert brands like Happy Belly, Atlanta Cheesecake Company, among others, have a lower Share of Search on the mobile app. Ramen brand Sapporo is also more easily discovered on Amazon’s desktop site. Here, we see a difference of more than 5% in the Share of Search of some brands, which is likely to have a huge impact on the brand’s mobile eCommerce sales levels and overall performance.
Lastly, in the Health & Beauty category, Shampoos and hair care brands like Olaplex, Dove, and Tresemme exhibited a higher Share of Search on the mobile app compared to the desktop.
On the other hand, body care brands like Neutrogena and Hawaiian Tropic, as well as Beardcare brand Viking Revolution displayed a higher Share of Search on Amazon’s desktop site.
Based on our data, it is clear that there are several examples of brands that do better in either one of Amazon’s desktop sites or mobile apps. In many cases, the difference is stark.
So What Must Brands Do?
Our findings emphasize the imperative for brands to move beyond a one-size-fits-all approach to digital shelf analytics. The striking variations in Share of Search between mobile apps and desktops conclusively demonstrate that relying solely on desktop data for digital shelf optimization is inadequate.
If brands see that they’re falling behind on the mobile digital shelf, there are a few things they can do to help boost their performance:
If a brand’s Share of Search is lower on the mobile app, they can divert their retail spend to mobile in order to inorganically compensate for this difference. This way, any short-term impact due to lower discoverability is mitigated. This is also likely to result in optimized budget allocation and ROAS.
Brands also need to ensure their content is optimized for the mobile form factor, with images that are easy to view on smaller screens, and tailored product titles that are shorter than on desktops, highlighting the most important product attributes from the consumer’s perspective. Not only will this help brands gain more clicks from mobile shoppers, but this will also gradually lead to a boost in their organic Share of Search on mobile.
CPG brands, specifically, need to optimize their digital shelf for delivery intermediary apps (along with marketplaces). The grocery delivery ecosystem is booming with companies like DoorDash, Delivery Hero, Uber Eats, Swiggy, etc. leading the way. Using Digital Shelf Analytics to optimize performance on delivery apps is quite an involved process with a lot of bells and whistles to consider. Read our recently published whitepaper that specifically details how brands can successfully boost their visibility and conversions on delivery apps.
But first, brands need to identify and work with a Digital Shelf Analytics partner that is able to capture and analyze mobile app data, enabling tailored optimization approaches for all eCommerce platforms.
DataWeave leads the way here, providing the world’s most comprehensive and sophisticated digital shelf analytics solution, rising above all other providers to provide digital shelf insights for both web applications and mobile apps. Our data aggregation platform successfully navigates the intricacies of capturing public data accurately and reliably from mobile apps, thereby delivering a comprehensive cross-device view of digital shelf KPIs to our brand customers.
So reach out to us today to find out more about our digital shelf solutions for mobile apps!
India’s homegrown eCommerce giant Flipkart, now backed by Walmart, reported a record 1.4 Billion customer visits during the early access phase and throughout the seven days of its premier shopping event, the Big Billion Days, launched on 8th October 2023. Competing with Flipkart, Amazon’s Great Indian Festival sale event started on October 8th as well and saw a whopping 95 Million customer visits to the website within the first 48 hours of the event.
For consumers, the most pressing question was, “Who offered more attractive deals and lower prices during these sale events?”
To answer this question, we leveraged our proprietary data aggregation and analysis platform and analyzed the prices and discounts on Amazon and Flipkart across key product categories..
The details of our sample are mentioned below:
Number of SKUs Analyzed: 30,000+
Websites: Amazon.com and Flipkart.com
Categories: Apparel, Home & Furniture, Electronics, Health & Beauty
Dates: 7th Oct 2023 to 22nd Oct 2023
Key Findings
Based on our analysis, the Big Billion Days by Flipkart showcased relatively higher price reductions across categories compared to the Great Indian Festival sale by Amazon. The Apparel category on Flipkart saw the highest average discount at 50.6%. The Health & Beauty category had the lowest discount across Flipkart at 39.4% and Amazon at 33%.
Overall, Flipkart offered higher discounts in each product category. It is clear that the retailer invested heavily in leveraging its supplier partnerships with key brands or sellers to enable them to offer higher discounts, thereby attracting more customers.
Next, let’s take a closer look at each product category.
Apparel
While a majority of retailers expected demand for apparel and clothing to dip this festive season in India, eCommerce giants like Amazon and Flipkart are likely to recognize the strong consumer inclination towards apparel during this period.
In the detailed assessment of Apparel sub-categories, Women’s Dresses, Women’s Tops, Men’s Shirts, Men’s Shoes, and Women’s Innerwear emerged as the segments showcasing the most substantial discounts during the sale events. While Flipkart offered higher average discounts across all sub-categories, Amazon offered competitive discounts as well.
We observed significant differences in the average discounts across brands between Flipkart’s Big Billion Days and Amazon’s Great Indian Festival. Reinforcing the significant discounts on the Shoes subcategory, brands like Red Tape, Arrow, Adidas, Reebok, Nike, and more offered extensive discounts on both Flipkart and Amazon. Notably, Adidas and Reebok offered better deals on Amazon’s Great Indian Festival as compared to Flipkart.
One8 by Virat Kohli had a significantly lower discount on Amazon compared to Flipkart, indicating an exclusive partnership.
For brands, however, reducing prices is just one approach to entice shoppers. They must also guarantee their prominent presence and easy discoverability within Amazon and Flipkart search results. To gain insight into this, we monitored brands’ Share of Search across various frequently used search terms in addition to the discounts they provided. The Share of Search denotes the portion of a brand’s products within the top 20 search results for a specific search query.
Our data indicates that Jockey and Speedo gained in Share of Search on Flipkart, but reduced discoverability on Amazon. Van Heusen fell behind in search results on Flipkart but showed a higher Share of Search on Amazon.
Discounts on both Amazon and Flipkart hovered around 50%. Across a few subcategories, Flipkart offered slightly lower discounts compared to Amazon. Only Luggage, Rugs, Sofas, and Entertainment Units saw lower markdowns on Flipkart during the Big Billion Days.
Dishwashers and Washer/ Dryers saw higher discounts on Amazon compared to Flipkart. The significant discounts on these products on Amazon possibly point to changing consumer preferences, as demand for these products is traditionally low in India, but seems to be growing.
When it comes to Home & Furniture brands, Nasher Miles, Safari, Aristocrat, VIP, and American Tourister, luggage brands mostly, offered higher discounts on Flipkart, followed closely by Amazon.
In terms of Share of Search, Skybags had high discoverability on both Flipkart and Amazon. The brand leveraged a strategy of offering big discounts this festive season as well as ensuring prominent placement in search results. Wildcraft lost out on its discoverability on Flipkart in contrast to its prominence on Amazon. Duroflex saw lower searchability on Amazon compared to Flipkart’s Big Billion Days.
Consumer Electronics
The Consumer Electronics and Appliances Manufacturers Association (CEAMA) expected an uptick in sales of consumer electronics products this festive season in India. With more consumers buying premium products using credit cards and EMIs, demand for expensive, high-end electronics was expected to increase.
Again, average discounts in this category hovered around 50% on Flipkart and Amazon.
Across electronics subcategories, Smartwatches, Earbuds, and Drones had the highest markdowns with Flipkart leading the pack during the Big Billion Days. Amazon offered relatively higher discounts at 44.9% on the TV subcategory, compared to Flipkart’s 40.6%.
Speakers, Laptops, Smartphones, and Tablets also saw lower markdowns on Amazon compared to Flipkart. Amazon was the official partner for the launch of many high-level smartphones and products in September-October, contributing to the higher markdowns in the subcategory.
Across brands, Lenovo’s discounts were the most differentiated between the two sites, with the brand offering higher discounts on Amazon (45.4%) compared to Flipkart (24.7%). Noise offered the highest discounts at 72.5% on Amazon and 52.8% on Flipkart. Brands like Boat and Zebronics, also saw lower discounts on Flipkart.
Mi and JBL offered deeper discounts on Flipkart’s Big Billion Days. Apple meanwhile stands out with only 11.83% discounts on Amazon, but the brand offered impressive 31.4% discounts on Flipkart.
Samsung dominated the Share of Search on Amazon at 15.7%, compared to only 2.6% on Flipkart. Apple and Lenovo also saw higher discoverability on Amazon. On Flipkart, JBL and Skullcandy stand out as brands with high search visibility.
Health & Beauty
The Health & Beauty category saw the lowest markdowns with only 39.4% discounts on Flipkart and 33% on Amazon.
In the subcategories analyzed, Electric Toothbrushes had relatively high markdowns across both sites. Staple and lower priced subcategories like Toothpaste had the lowest markdowns across both sale events, with Amazon offering only 17.4% average discounts.
Across brands, Beardo, a leading beard care brand, offered significantly higher discounts on Amazon compared to Flipkart. Most other well-known brands, including Nivea and Vaseline, saw higher discounts on Amazon compared to Flipkart. Only Tresmme and Dove were exceptions with higher discounts on Flipkart.
In terms of Share of Search, once again, Beardo was the most discoverable brand in this category. Brands like Dove, Pond’s, Swiss Beauty, and Tresemme saw a lower Share of Search on Flipkart compared to Amazon.
Navigating the Competitive Landscape: How To Thrive During Sale Events
Amazon and Flipkart’s strategic pricing during the Big Billion Days and the Great Indian Festival Sale reflects a balance of profitability, inventory, and competition. Competitive pricing insights empower retailers to make informed decisions, optimize strategies, and thrive during high-stakes sale events with timely and relevant insights at a massive scale.
To learn more about how you can leverage competitive pricing insights to stay ahead of the game during sale events, reach out to us today!
On Black Friday this year, Health & Beauty brands saw a significant increase with a 13% jump in foot traffic, according to a report by RetailNext. Despite caution from various sources, higher prices for everyday goods, and high interest rates, consumers chose to spend big this cyber week.
So what kind of deals did top retailers and brands offer in the Health & Beauty category this BFCM? At DataWeave, we harnessed the power of our proprietary data aggregation and analysis platform to track and analyze the prices and deals of Health & Beauty products across prominent retailers to uncover unique insights into their price competitiveness this BFCM, as well as understand how pricing strategies varied across diverse subcategories and brands.
For this analysis, we tracked the average discounts among leading US retailers in the Health & Beauty category during the Thanksgiving weekend sale, including Black Friday and Cyber Monday. We noticed prices and discounts didn’t change significantly over the course of the weekend, and hence the average prices of products between the 24th and 27th of November are being reported. Our sample was chosen to encompass the top 500 ranked products in each product subcategory across leading retailers during the sale.
Subcategories reported on: Shampoo, Toothpaste, Conditioner, Sunscreen, Makeup, Electric Toothbrush, Beard Care, Moisturizer
Timeline of analysis: 24 to 27 November 2023
Our Key Findings
Average Discounts Across Retailers
Amazon leads the pack with a huge margin, offering an average discount of 31.9%, covering 62% of its products analyzed. Target follows an 18.8% average discount across only 5% of its analyzed assortment. The other retailers aren’t even close.
Ulta Beauty was the next in line, providing a 9.2% average discount followed by Walmart with a 6.8% average discount. Sephora, known for its premium beauty offerings, adopted a more conservative approach with a 3.5% average discount, targeting only 9% of its top products
Across retailers, it is clear that Amazon led the charge by far this cyber week, with the other retailers choosing to markdown prices conservatively in the Health & Beauty category.
Average Discounts: Subcategories
Amazon offered high discounts on lower priced subcategories like Toothpaste (49.4%), Sunscreen (46.3%), Moisturizers (38.5%), and Conditioners (37.5%), highlighting its focus on products with high demand that consumers would look to stock up on. Ulta Beauty also focused its discounts on Toothpaste (15.6%), Moisturizers (14.9%), and Conditioners (12.6%), targeting skincare and grooming.
Sephora, meanwhile, offered the most attractive deals on the Makeup subcategory at 5.3% across 12.67% of its analyzed assortment, banking on the demand generated due to the brand’s popularity in this subcategory.
Target prioritized discounts on Toothpaste (22.5%), Shampoo (21.6%), and Moisturizers (18.9%). Walmart too offered significant discounts on Shampoo (21.6%) and Toothpaste (22.5%).
Retailers prioritized staple subcategories like Toothpaste and Moisturizer with substantial discounts during this Black Friday Cyber Monday, ensuring a broad consumer appeal. In contrast, discretionary items like Makeup may be less motivated by discounts alone, and hence saw lower discounts during the sale.
Average Discounts: Brands
Brands offered the most attractive deals on Amazon, with OGX leading the pack at 58.4% average discount. Neutrogena and Colgate followed with an average discount of 50.4% and 44%. This mirror’s Amazon’s subcategory focus on shampoos, conditioners, and toothpastes.
Other instances of brands offering attractive deals across retailers include Belif (27.9%) and Anastasia Beverly Hills (17.6%) on Sephora, Johnson’s (20%) and Philips Sonicare (18.8%) on Target, and Olay (12.2%) and Colgate (10.6%) on Walmart.
Ulta Beauty hosted several attractive deals by specific brands, including Moon (30.7%), Joico (24%), and Clinique (22.3%).
Share of Search For Health & Beauty Brands Across Subcategories
Our Share of Search analysis illuminates the strategic moves made by brands to enhance their visibility, playing a crucial role in influencing consumer choices during Black Friday and Cyber Monday.
Among some of the leading brands, Head & Shoulders and Oral-B increased their Share of Search by 2.3% and 1% respectively, reflecting a successful strategy to boost brand visibility during the Black Friday and Cyber Monday shopping events. On the other hand, L’Oreal Paris, Colgate, and Neutrogena faced marginal decreases in Share of Search.
Overall, since the difference in Share of Search values did not change dramatically, the visibility levels of leading brands across key subcategories remained consistent during the Thanksgiving weekend.
—
For deeper insights on pricing and discounting trends across a diverse range of shopping categories during Black Friday and Cyber Monday, check out our blog!
To learn more about our AI-powered Pricing Intelligence and Digital Shelf Analytics platform, contact us today!
Insider Intelligence‘s forecast of a 4.5% growth in US Holiday Sales this year has been validated by the sustained robust spending observed during Black Friday and Cyber Monday. Despite multiple challenges impacting consumer spending, such as escalating prices of everyday products and elevated interest rates, shoppers continued to spend significantly, aligning with these earlier predictions.
However, in response to these projections, retailers strategically adjusted their approach. Our analysis indicates substantial discounts prevalent in the Consumer Electronics and Home & Furniture segments during Cyber Week. Prominent retailers specializing in Home & Furniture, such as Wayfair, Overstock, and Home Depot, notably led the charge in offering attractive discounts.
At DataWeave, we harnessed the power of our proprietary data aggregation and analysis platform to track and analyze the prices and deals of home & furniture products across prominent retailers to uncover unique insights into their price competitiveness this BFCM, as well as understand how pricing strategies varied across diverse subcategories and brands.
We’ve also recently published our analysis of the Consumer Electronics and Apparel categories this Black Friday and Cyber Monday.
Our Methodology
For this analysis, we tracked the discounts offered by leading US retailers in the Home & Furniture category during the Thanksgiving weekend sale, including Black Friday and Cyber Monday. We noticed prices and discounts didn’t change significantly over the course of the weekend, and hence the average prices of products between the 24th and 27th of November are being reported. Our sample was chosen to encompass the top 500 ranked products in each product subcategory across leading retailers during the sale.
Sample size: 44,716 SKUs
Retailers tracked: Amazon, Walmart, Target, Best Buy, Overstock, Wayfair, Home Depot
Subcategories reported on: Dishwasher, Washer/Dryer, Mattresses, Beds, Dining Tables, Entertainment Units, Rugs, Luggage, Bookcases, Cabinets, Sofas, Coffee Tables
Timeline of analysis: 24 to 27 November 2023
Our Key Findings
Discounts Across Retailers
Wayfair led the pack with the highest average discount of 27.5%, covering an impressive 88% of its Home & Furniture inventory. This bold strategy positions Wayfair as a go-to destination for consumers seeking substantial savings on high-quality Home & Furniture items during Black Friday and Cyber Monday.
Home Depot offered an average discount of 17.5%, covering a substantial 69% of the products analyzed, choosing to cash in on the Cyber Week madness. Overstock followed next with an average discount of 16.6%.
Interestingly, Home & Furniture happens to be one of the few categories in which Amazon did not offer the highest discount among the analyzed retailers, choosing a moderate average discount of 13.8%.
Best Buy also maintained a competitive stance in the category, providing an average discount of 12.8% across 58% of their assortment. Target adopted a conservative markdown strategy, offering a relatively low average discount of 6.5%.
In summary, the Home & Furniture category exhibited a diverse range of discounting strategies among retailers, reflecting a balance between competitiveness and profit margins. Consumers could have chosen from a spectrum of discounts based on their preferences and budget considerations during Black Friday and Cyber Monday.
Average Discounts: Subcategories
Among subcategories, Amazon offered a moderate 8.3% average discount on 32.9% of its products in this Dishwasher category, while Best Buy took a more aggressive stance with a 14.7% average discount covering 55.9% of its products.
Home Depot emerged as a standout player in the Washer/Dryer category, providing a substantial 21.3% discount on 78.4% of its analyzed inventory. Best Buy closely followed with a 15.1% average discount targeting 67.6% of its products.
Wayfair grabbed attention with a generous 36.9% average discount on Mattresses, covering almost all (99%) of its analyzed products. In addition, Wafair led the discount war in Beds, Dining Tables, Cabinets, Sofas, Coffee Tables, and Entertainment Units. Overstock took an aggressive pricing stance on Rugs, offering a substantial 52.3% average discount, covering 100% of its Rugs inventory.
Average Discounts: Brands
Among brands, Signature Design by Ashley maintained a consistent presence with substantial discounts on both Best Buy (25.24%) and Overstock (16.19%). This could be indicative of the brand’s commitment to appealing to a diverse customer base through varied retail channels. Costway emerges as a standout brand offering exceptionally high discounts at both Target (61.6%) and Walmart (51.7%).
Home Decorators Collection, Home Depot’s in-house brand, offered a significant 30.9% discount at Home Depot. High-margin private label brands like these afford retailers the opportunity to offer markdowns while retaining significant margins.
Strategic positioning on specific platforms, as seen with Alwyn Home on Wayfair and Noble House at Home Depot, suggests brands tailor their approach to the strengths and customer demographics of each retailer. The data suggests a nuanced interplay between brand positioning, discount strategies, and the perceived value offered.
Share of Search For Home & Furniture Brands
The Share of Search data for the Home & Furniture category unveils intriguing insights into brand visibility and performance during the Black Friday and Cyber Monday events. In this competitive landscape, where consumer decisions are influenced not only by discounts but also by brand visibility, the dynamics of Share of Search become pivotal.
Samsung strategically increased its Share of Search during the sale, showcasing a 1.2% improvement. This suggests a deliberate effort to reinforce brand visibility and capture the attention of potential buyers actively searching for Home & Furniture products, in this case, Washer/Dryers and Dishwashers.
Bosch too experienced a notable surge in Share of Search by 1.1%. LG, meanwhile, maintained a consistent Share of Search, with a marginal decrease of 0.1%. American Tourister experienced a modest increase in Share of Search by 0.4%.
Like in the other categories analyzed, the dynamics of Share of Search in the Home & Furniture category reflect brand strategies aimed at not only offering discounts but also ensuring heightened visibility during the critical Black Friday and Cyber Monday shopping events. Positive shifts indicate effective marketing efforts, while stable performers demonstrate a resilient brand presence in a competitive online marketplace.
To explore how our insights can help retailers and brands boost their pricing strategies during sale events, reach out to us today!
For more in-depth analyses and trends across various shopping categories, stay tuned to our blog.
As the highly anticipated shopping season approached, industry analysts, including Deloitte, had forewarned consumer spending caution owing to persistent inflationary pressures tightening budgets. Despite these concerns, the holiday spirit was buoyed by sensational deals that delighted bargain-hunting shoppers.
According to the National Retail Federation (NRF), over 200 million consumers participated in both in-store and online shopping activities over the Thanksgiving weekend. This marked an almost 2% uptick from the previous year, surpassing the NRF’s initial estimates of 182 million and showcasing a robust start to the holiday shopping season.
So what was all the hype about this Black Friday and Cyber Monday? How did top retailers react to reports of possibly decreased consumer spending? At DataWeave, we harnessed the power of our proprietary data aggregation and analysis platform to track and analyze the prices and deals of products across prominent retailers and categories to uncover unique insights into their price competitiveness this BFCM, as well as understand how pricing strategies varied across diverse subcategories and brands.
In this article, we focus on the pricing and discounting strategies of Amazon, Walmart, and Target in the Apparel category.
Stay tuned to our blog for insights on other shopping categories like Home & Furniture, and Health & Beauty!
Our Methodology
For this analysis, we tracked the average discounts of apparel products among leading US retailers during the Thanksgiving weekend sale, including Black Friday and Cyber Monday. We noticed prices and discounts didn’t change significantly over the course of the weekend, and hence the average prices of products between the 24th and 27th of November are being reported. Our sample was chosen to encompass the top 500 ranked products in each product subcategory across during the sale.
Amazon offered the most attractive deals, showcasing an average discount of 19.5%, applying to a substantial 61% of their apparel inventory.
Trailing closely behind was Target, offering an average discount of 14.8% across 52% of the products analyzed. Walmart, however, took a more conservative approach, providing an average discount of 8.5%, applicable to 29% of its products.
The contrast in discounting strategies highlights the diverse tactics employed by retailers to entice Black Friday and Cyber Monday shoppers within the Apparel category. Amazon remains the forerunner, balancing competitive discounts with a significant coverage of discounted items.
Target follows suit with a competitive stance, while Walmart opts for a more reserved markdown approach, given that the retailer tends to carry a large number of products in the affordable price ranges.
Average Discounts: Subcategories
Examining the Black Friday and Cyber Monday discount landscape within the Apparel category reveals intriguing patterns among major retailers. Amazon led the charge, boasting an impressive 24.9% average discount on Women’s Tops, covering a substantial 76.5% of its products. In the same subcategory, Target competed fiercely with a 25.1% average discount, covering 87.5% of its products. Walmart, taking a measured approach, presented a 14.6% average discount across 45.1% of its Women’s Tops inventory.
Notably, Men’s Swimwear at Target has no discounts. Meanwhile, Amazon remained aggressive across various subcategories, particularly in Women’s Shoes and Women’s Tops, aiming to capture a significant market share through both competitive pricing and a broad coverage of discounted items.
Average Discounts: Brands
Across brands, Tommy Hilfiger and Jockey took the lead on Amazon with an enticing average discount of 28.3% and 24.6% respectively, appealing to savvy shoppers. Calvin Klein followed closely with a 17.3% discount, offering a balance of style and affordability.
In Walmart, Crocs stood out with a 39.9% average discount, followed by Reebok (15.7%) and Hanes (14.9%) Xhilaration, Target’s in-house brand, stole the spotlight on the retailer platform with an impressive 50% average discount. Reebok (32.3%) and Levi’s (22.9%) maintained competitive discounts, appealing to diverse tastes.
Our analysis sheds light on the dynamic landscape of apparel discounts, showcasing how brands adopt varying pricing strategies to position themselves competitively for Black Friday and Cyber Monday shoppers.
Share of Search For Apparel Brands Across Subcategories
The dynamics of Black Friday and Cyber Monday extend beyond price reductions, with brands strategically vying for increased visibility through Share of Search metrics. This metric signifies a brand’s prominence among the top 20 ranked products in a given subcategory, offering valuable insights into their online marketplace visibility.
Among the standout performers in the Apparel category, Jockey experienced a significant surge in Share of Search, leaping from 1.70% before the event to an impressive 13.30% during the Black Friday and Cyber Monday sales. Speedo, in the Women’s Swimwear subcategory, demonstrated a substantial increase from 4.40% to 13.30%, solidifying its presence and gaining an 8.90% boost in Share of Search.
Tommy Hilfiger and Adidas also exhibited notable gains in Share of Search, increasing by 5.30% and 5.60%, respectively. However, some brands experienced a slight dip, with Speedo in the Men’s Swimwear subcategory seeing a 2.50% dip in their search visibility, and Reebok in Men’s Shoes witnessing a 3.3% decrease.
These fluctuations highlight the dynamic nature of brand strategies during Black Friday and Cyber Monday in the Apparel category, where gaining visibility also proves to be crucial alongside offering competitive discounts.
—
For a deeper dive into the world of competitive pricing intelligence and to explore how our solutions can benefit apparel retailers and brands, reach out to us today!
Stay tuned to our blog for forthcoming analyses on pricing and discounting trends across a spectrum of shopping categories, as we continue to unravel the intricacies of consumer behavior and market dynamics.
As Black Friday and Cyber Monday unfolded across the globe, there was a noticeable subdued atmosphere compared to previous years. TD Cowen brokerage adjusted its forecast for US holiday spending, revising it down from an initial 4-5% growth to a more conservative estimate of 2-3%.
Compounded by persistent inflation and elevated interest rates, many consumers find themselves financially strained, leading to the projection of the slowest growth in US holiday spending in five years.
In this context, it would be relevant to investigate whether this restrained reaction from consumers had an influence on the extent of attractive deals and discounts provided by top retailers and brands during the sale event.
At DataWeave, we harnessed the power of our proprietary data aggregation and analysis platform to track and analyze the prices and deals of consumer electronics products across prominent retailers to uncover unique insights into their price competitiveness this BFCM, as well as understand how pricing strategies varied across diverse subcategories and brands.
Keep an eye on our blog for insights on other shopping categories like Apparel, Home & Furniture, and Health & Beauty!
Our Methodology
For this analysis, we tracked the average discounts among leading US electronics retailers during the Thanksgiving weekend sale, including Black Friday and Cyber Monday. We noticed prices and discounts didn’t change significantly over the course of the weekend, and hence the average prices of products between the 24th and 27th of November are being reported. Our sample was chosen to encompass the top 500 ranked products in each product subcategory across leading retailers during the sale.
Sample size: 23,505 SKUs
Retailers tracked: Amazon, Walmart, Target, Best Buy
The observed Black Friday and Cyber Monday discount strategies reveal a distinct competitive landscape among major retailers. Amazon emerged as the frontrunner, offering the highest average discounts at 23.30%, spanning a significant 74% of their consumer electronics inventory. Best Buy closely followed, with an average discount of 19.40% across 76% of their products.
On the other hand, Target and Walmart adopted a more conservative stance, providing lower average discounts at 14.8% and 12%, respectively, with Target discounting 51% of its products and Walmart discounting 41%. This variation in discounting strategies highlights the diverse approaches retailers take to attract and retain Black Friday and Cyber Monday shoppers, balancing competitiveness with profit margins.
Average Discounts: Subcategories
In the Headphones subcategory, Amazon stands out with a substantial 31.40% average discount, targeting 84.69% of SKUs, showcasing an aggressive discounting strategy. Best Buy follows closely, demonstrating competitive pricing with a 21.80% average discount on 67.03% of products.
Meanwhile, in TVs, Best Buy offered a significant 17.9% average discount across 89% of its products, signaling a targeted effort to capture a broad market share in this subcategory.
In the Laptop subcategory, Target was highly conservative, with only a 4.1% average discount covering 14.3% of its products, while Walmart positioned itself with a moderate 9.5% average discount, targeting 39.8% of its inventory.
Among Smartphones, Amazon (14.7%) was third to Best Buy and Target, which offered average discounts of 20.5% and 18.1%, respectively. Walmart, with an average discount of only 9.9% in the subcategory opted for a relatively muted approach.
Average Discounts: Brands
The discount strategies across top electronics brands during Black Friday unveil distinct approaches. Samsung emerges as a focal point across Amazon, Best Buy, Walmart, and Target. The brand was most attractively priced on Best Buy, with an average discount of 25.3%, followed by Target (18.3%) and Amazon (17.9%).
Apple’s discounts were quite consistent across Amazon (17.6%), Best Buy (16.1%), and Target (17.8%), with the exception of Walmart (8.1%). JBL, interestingly, opted to discount very heavily on Best Buy, at an average of 38.8%, resulting in several attractive deals for shoppers on the website. Sony, too, offered impressive discounts at over 23% on Amazon and Best Buy, followed by 16% on Walmart. On Amazon, Amazon Renewed (13.9%) was among the most aggressively discounted products, highlighting an effort to further appeal to cost-conscious consumers.
Overall, our analysis throws light on the nuanced strategies employed by leading brands on Amazon, Best Buy, Walmart, and Target, reflecting a delicate interplay between brand positioning, pricing competitiveness, and customer appeal.
Share of Search For Consumer Electronics Brands Across Subcategories
The Share of Search data reflects intriguing shifts in brand strategies during the Black Friday and Cyber Monday events. During sale events, brands looking to entice shoppers don’t rely only on price but also on search visibility to help drive awareness and conversion. Share of Search is defined as the share of a brand’s products among the top 20 ranked products in a subcategory, thereby providing insight into a brand’s visibility on online marketplaces.
Some of the brands that improved their Share of Search the most include LG, Skullcandy, Asus, JBL, and Samsung. On the other hand, prominent brands like Sony and Apple actually lost ground on this metric by 0.4% and 2% respectively.
At DataWeave, our commitment to empowering retailers and brands with actionable competitive and digital shelf insights remains unwavering. Our AI-powered platform provides a comprehensive view of market dynamics for our customers, enabling informed decision-making. As a partner in your journey, we offer tailored solutions to enhance your competitive edge, drive sales, and elevate your brand presence. To find out more about our solution, reach out to us today!
To learn more about pricing and discounting trends during Black Friday and Cyber Monday across various other shopping categories, stay tuned to our blog!
Competitive pricing intelligence is pivotal for retailers seeking to analyze their product pricing in relation to competitors. This practice is essential for ensuring that their product range maintains a competitive edge, meeting both customer expectations and market demands consistently.
Product matching serves as a foundational element within any competitive pricing intelligence solution. Products are frequently presented in varying formats across different websites, featuring distinct titles, images, and descriptions. Undertaking this process at a significant scale is highly intricate due to numerous factors. One such complication arises from the fact that products are often displayed with differing units of measurement on various websites.
The Challenge of Varying Units
In certain product categories, retailers often offer the same item in varying volumes, quantities, or weights. For instance, a clothing item might be available as a single piece or in packs of 2 or 3, while grocery brands commonly sell eggs in counts of 6, 12, or 24.
Consider this example: a quick glance might suggest that an 850g pack of Kellogg’s Corn Flakes priced at $5 is a better deal than a 980g pack of Nestle Cornflakes priced at $5.2. However, this assumption can be deceptive. In reality, the latter offers better value for your money, a fact that only becomes evident through price comparisons after standardizing the units.
This issue is particularly relevant due to the prevalence of “shrinkflation,” where brands adjust packaging sizes or quantities to offset inflation while keeping prices seemingly low. When quantities, pack sizes, weight, etc. reduce instead of prices increasing, it’s important that this change is considered while analyzing competitive pricing.
Normalizing Units of Measure
In order to effectively compare prices among different competitors, retailers must standardize the diverse units of measurement they encounter. This standardization (or normalization) is crucial because price comparisons should extend beyond individual product SKUs to accommodate variations in package sizes and quantities. It’s essential to normalize units, ranging from “each” (ea) for individual items to “dozen” (dz) for sets, and from “pounds” (lb), “kilograms” (kg), “liters” (ltr), to “gallons” (gal) for various product types.
For example, a predetermined base unit of measure, such as 100 grams for a specific product like cornflakes, serves as the reference point. The unit-normalized price for any cornflake product would then be the price per 100 grams. In the example provided, this reveals that Kellogg’s is priced at $0.59 per 100 grams, while Nestle is priced at $0.53 per 100 grams.
Various Categories of Unit Normalization
1. Weight Normalization
Retailers frequently feature products with weight measurements expressed in grams (g), kilograms (kg), pounds (lbs), or ounces (oz).
2. Quantity or Pack Size Normalization
Products are also often featured with varying pick sizes or quantities in each SKU.
3. Volume or Capacity Normalization
Products can also vary in volumes or capacities with units like liters (L) or fluid ounces (fl oz).
DataWeave’s Unit Normalized Pricing Intelligence Solution
DataWeave’s highly sophisticated product matching engine can match the same or similar products and normalize their units of measurement, leading to highly accurate and actionable competitive pricing insights. It standardizes different units of measurement, like weight, quantity, and volume, ensuring fair comparisons across similar and exact matched products.
Retailers have the flexibility to view pricing insights either with retailer units or normalized units. This capability empowers retailers and analysts to perform accurate, in-depth analyses of pricing information at a product level.
In some scenarios, analyzing unit normalized pricing reflects pricing trends and competitiveness more accurately than retail price alone. This is particularly true for categories like CPG, where products are sold in diverse units of measure. For instance, in the example shown here, we can view a comparison of price position trends for the category of Fruits and Vegetables based on both retail price and unit price.
The difference is striking: the original retail price based analysis shows a stagnation in price position, whereas unit normalized pricing analysis reflects a more dynamic pricing scenario.
With DataWeave, retailers can specify which units to compare, ensuring that comparisons are made accurately. For example, a retailer can specify that unit price comparisons apply only to 8, 12, or 16-ounce packs, as well as 1 or 3-pound packs, but not to 10 and 25-pound bags. This precision ensures that products are matched correctly, and prices are represented for appropriately normalized units, leading to more accurate pricing insights.
For consumer brands, the digital marketplace presents an unparalleled landscape of opportunities for engaging with consumers and expanding their market presence. Within this dynamic environment, Digital Shelf Analytics has emerged as a crucial pillar in a brand’s eCommerce strategy. This technology provides valuable insights into a brand’s organic and paid visibility on marketplaces, content quality, pricing strategies, promotional efforts, and product availability. These insights help brands gain a comprehensive understanding of their competitive positioning and overall market performance.
Nevertheless, many brands often grapple with the question of whether this understanding translates into tangible actions that drive real business impact and return on investment (ROI). This uncertainty stems from a lack of clarity about the direct correlation between digital shelf insights and key metrics such as enhanced sales conversions.
Nonetheless, there is compelling evidence that when these insights are effectively harnessed and strategic actions are taken, brands can realize significant, measurable benefits.
So, the question arises: does Digital Shelf Analytics genuinely deliver on its promises?
At DataWeave, we’ve partnered with numerous brands to fuel their eCommerce growth through the application of digital shelf analytics. In this article, we will delve into these insights, uncovering the concrete and quantifiable results that brands can achieve through their investments in digital shelf analytics.
Digital Shelf KPIs and Their Impact
Digital Shelf Analytics is a robust system that analyzes specific key performance indicators (KPIs) about the digital shelf, furnishing brands with precise recommendations to not only bolster these KPIs but also to monitor the enhancements over time. The following is a brief explanation of digital shelf KPis and their expected impact areas:
Product Availability: Ensuring Shoppers Never Hear “Out of Stock” Again
Timely insights on the availability of products ensures brands reduce replenishment times at scale, which can significantly impact sales, creating an unbreakable link between product availability and revenue. With Digital Shelf Analytics, procurement and replenishment teams can set up notifications to promptly identify low or out-of-stock items and take swift action. This can also be done for specific ZIP codes or individual stores. In addition, availability plays a crucial role in a brand’s Share of Search and search rankings, as online marketplaces often ensure only in-stock products are shown among the top ranks.
If a product isn’t visible, does it even exist? In fact, 70% of consumers never go beyond the first page of search results on major online marketplaces. Therefore, as a brand, the visibility of your products for relevant search keywords and their appearance on the first page can heavily determine your awareness metrics. This is where the concept of Share of Search comes into play. Think of it as securing prime shelf space in a physical store. Digital shelf insights and benchmarking with category leaders for Share of Search help ensure your products command relevant attention on the digital shelf.
Content Quality: Crafting the Perfect Product Story
Creating engaging product descriptions and visuals is akin to giving your products a megaphone in a crowded marketplace. By enhancing content quality, including product names, titles, descriptions, and images, brands can climb the search result rankings, leading to increased visibility and subsequently, more sales.
Ratings and Reviews: The Power of Social Proof
Public opinion holds immense sway. Research indicates that a single positive review can trigger a 10% surge in sales, while a multitude of favorable reviews can propel your product to a 44% higher trajectory. The correlation between ratings and sales is not surprising—each step up the rating ladder can translate to substantial revenue growth.
While it’s reasonable to anticipate a connection between these KPIs and downstream impact metrics such as impressions, clicks, and conversions, we were driven to explore this correlation through the lens of real-world data. To do so, we meticulously monitored the digital shelf KPIs for one of our clients and analyzed the improvements in these metrics.
It’s essential to acknowledge that not all observed impact areas can be solely attributed to enhancements in digital shelf KPIs. Still, it’s evident that a robust correlation exists. The following section presents an in-depth case study, shedding light on the results of this analysis.
A Success Story: Real-World Impact of Digital Shelf Analytics
Let’s dive into the journey of one of our clients – a prominent CPG brand specializing in the sale of baked goods and desserts. Through their experience, we will illustrate the transformative impact of our DataWeave Digital Shelf Analytics product suite.
Over a period of one year, from August 2022 to July 2023, the brand leveraged several key modules of Digital Shelf Analytics for Amazon, including Share of Search, Share of Category, Availability, Ratings and Reviews, and Content Audit. Each of these digital shelf KPIs played a vital role in shaping the brand’s performance across various stages of the buyer’s journey.
The buyer’s journey is typically delineated into three key stages:
Awareness: At this stage, shoppers peruse multiple product options presented on search and category listing pages, gaining an initial understanding of the available choices.
Consideration: Here, shoppers narrow down their selections and evaluate a handful of products, moving closer to a purchase decision.
Conversion: In this final stage, shoppers make their ultimate product choice and proceed to complete the purchase.
Let’s now examine the data to understand how digital shelf KPIs helped drive tangible ROI on Amazon for the brand across the stages of the buyer journey.
Stage 1: Raising Awareness
Enhancing Share of Search and Share of Category can help brands boost product visibility and raise brand awareness. The following chart demonstrates the steady, incremental improvements in our client’s Share of Search and Share of Category (in the top 20 ranks of each listing page) throughout the analyzed period. These enhancements were achieved through various measures, including product sponsorship, content enhancement, price optimization, promotional initiatives, and more.
This amplified Share of Search and Share of Category directly translates into improved product discoverability, as evident from the surge in impressions depicted in the chart below.
Stage 2: All Things Considered
In the consideration stage, shoppers make their product selections by clicking on items that meet their criteria, which may include factors like average rating, number of ratings, price, product title, and images. For brands, this underscores the importance of crafting meticulously detailed product content and accumulating a substantial number of ratings.
The subsequent chart illustrates the year-long trend in both average ratings and the number of ratings, both of which have displayed steady improvement over time.
The enhancements in the number of ratings and the average rating have a direct and positive impact on product consideration. This, in turn, has led to a noticeable year-over-year increase in page views, as indicated in the chart below.
These improvements are likely to have also been influenced by the overall enhancement of content quality, which is detailed separately in the section below.
Stage 3: Driving Decisions
As buyers progress to the next stage, they reach the pivotal point of making a purchase decision. This decision is influenced by multiple factors, including product availability, content quality, and the quality of reviews, reflecting customer sentiment.
Our client effectively harnessed our Availability insights, significantly reducing the likelihood of potential out-of-stock scenarios and enhancing replenishment rates, as highlighted in the chart below. The same chart also indicates improvements in content quality, measured by the degree to which the content on Amazon aligns with the brand’s ideal content standards.
Below, you’ll find the year-over-year growth in conversion rates for the brand on Amazon. This metric stands as the ultimate measure of business impact, directly translating into increased revenue for brands.
As the data uncovers, growth in key digital shelf KPIs cumulatively had a strong correlation with impressions, page views, and conversion rates.
It is also important to note that the effect of each KPI cannot be viewed in isolation, since they are often interdependent. For example, improvement in content and availability could boost Share of Search. Accurate content could also influence more positive customer feedback. Brands need to consider optimizing digital shelf KPIs holistically to create sustained business impact.
Impact on eCommerce Sales
After the implementation of digital shelf analytics, the results spoke for themselves. Sales consistently outperformed the previous year’s records month after month. As shown in the chart below, the diligent application of DataWeave’s recommendations paved the way for an impressive 8.5% year-over-year increase in sales, leaving an indelible mark on the brand’s eCommerce success.
From boosting product visibility to catapulting conversion rates, Digital Shelf Analytics serves as the key to unlocking unparalleled online success.
While the success story detailed above does not establish a direct causation between Digital Shelf Analytics and sales revenue, there is undoubtedly a strong correlation. It’s evident that digital shelf KPIs play a pivotal role in optimizing a brand’s eCommerce performance across all stages of the buyer journey. Hence, for brands, it is vital that they collaborate with the right partner and harness digital shelf insights to fine-tune their eCommerce strategies and tactics.
That said, the eCommerce landscape is in a constant state of flux, and there is still much to learn about how each digital shelf KPI influences brand performance in the online realm. With more data and an increasing number of brands embracing Digital Shelf Analytics, it’s only a matter of time before a direct causation is firmly established.
Reach out to us today to know more about how your brand can leverage Digital Shelf Analytics to drive higher sales and market share in eCommerce.
Consider this scenario: A retailer establishes its fuel prices using pricing data that’s a few days old, only to subsequently discover that a nearby competitor is offering substantially lower prices. The result? Lost customers, decreased foot traffic, and diminished sales. This serves as a stark reality that retailers must confront and address today.
In the fiercely competitive realm of retail, where every decision holds weight, maintaining a competitive edge is paramount. The fuel category, frequently underestimated, has the potential to significantly impact a retailer’s revenue stream. This challenge is not unique; retailers worldwide, particularly in North America, grapple with a common hurdle: mastering the intricate art of real-time fuel pricing.
The Quest For Reliable, Real-Time Fuel Pricing Data
For retailers, traditional methods for procuring and analyzing fuel price data have proven to be both expensive and error-prone, often relying on manual data collection or third-party data providers. These outdated approaches yield frustrating delays, inaccuracies, and missed opportunities. When it comes to obtaining timely fuel pricing intelligence, the majority of fuel retailers grapple with three central challenges:
Low Accuracy: Ensuring that fuel pricing information remains up-to-date, dependable, and actionable, even when sourced from complex web-based platforms.
Less Coverage: Acquiring comprehensive data that encompasses all of North America, spanning across retailers, convenience stores, fuel stations, and beyond.
High Cost: Effectively managing the substantial costs associated with acquiring and processing this vital information.
DataWeave’s Fuel Pricing Intelligence Solution
Comprehensive, accurate, and real-time fuel pricing intelligence can play a huge role in the profitability of retailers throughout North America. DataWeave takes the forefront in delivering this transformative Data-as-a-Service (DaaS) solution to some of the most prominent retailers in the region, including the top 20 fuel retail behemoths.
With a rich and extensive history spanning over a decade in the realm of competitive intelligence, DataWeave boasts an impressive track record of empowering well-informed decision-making in retail. We leverage state-of-the-art technology to bring an unparalleled level of accuracy, timeliness, and coverage to fuel pricing intelligence.
The following are some compelling advantages offered by our solution:
Accurate and Real-Time First Party Data
We deliver retailers an unparalleled advantage through real-time, first-party fuel price data. Our data originates directly from the retailer’s own channels, encompassing websites and mobile apps, rendering it the industry’s foremost and most reliable source.
Imagine having access to fuel pricing information that updates as frequently as every 30 minutes. This rapid update cadence guarantees that you, as a retailer, constantly possess the latest pricing insights at your fingertips, empowering you to respond swiftly to market fluctuations and competitor manoeuvres. Our comprehensive data spans a wide spectrum of fuel types, including:
Gasoline: Be it regular, mid-grade, super, premium, ethanol-free, ethanol blends, methanol blends, or reformulated gasoline, we have got you covered.
Diesel: Our data encompasses biodiesel, biodiesel off-road, biodiesel blends, biodiesel ultra-low sulfur (ULS), diesel ultra-low sulfur (ULS), diesel off-road, standard diesel, and premium diesel.
Armed with our real-time, first-party data, you can make pricing decisions with unwavering confidence, secure in the knowledge that you possess access to the most current, authoritative, and extensive fuel pricing intelligence in North America.
The data points we capture directly from relevant web sources include: gas station postal code, store name and code, location, city, state, ZIP code, fuel type, competitor name, regular price, member price (if available), time and date of data capture, and more.
Click here if you wish to access a sample report of our fuel pricing data.
Unrivaled Geographical Coverage
Our extensive coverage of fuel data spans over 30,000 ZIP codes and encompasses the top 100 retailers across the western, mid-western, and eastern regions of the United States.
Retailers benefit from the flexibility to configure and tailor the solution to their precise needs, whether it involves adding more locations or selectively acquiring specific segments of the data. This far-reaching coverage guarantees that retailers, whether situated in bustling urban centers or remote areas, can readily access the essential data required to maintain their competitive edge.
Moreover, if you currently source your fuel pricing data from alternative providers, our solution seamlessly integrates, amplifies, and complements your existing array of data sources, ensuring a harmonious and unified approach to data acquisition.
Optimization of Dynamic Pricing Strategies
In the world of retail, the importance of timing cannot be overstated. Even a mere difference of a few cents can translate into millions of dollars in revenue impact. With DataWeave, retailers gain the capability to make data-driven decisions that provide them with a competitive edge around the clock, every single day.
Our platform empowers you to unearth margin gaps by pinpointing opportunities to raise prices while maintaining your competitive pricing position. It also identifies instances where you may be substantially overpriced, prompting necessary price adjustments to ensure competitiveness within the market. All these valuable insights are available at a hyperlocal level, facilitating pricing efficiency and optimization across your various regions of coverage. Equipped with this real-time data, you can swiftly adapt to ever-changing market conditions.
Furthermore, our comprehensive competitive data seamlessly integrates into your existing pricing systems through APIs, facilitating quick and informed pricing actions based on robust data.
Reliable and Customer-First Tech Platform
Our platform boasts a remarkable level of sophistication when it comes to data aggregation, normalization, visualization, and integration capabilities. It stands as a massively scalable system with the capacity to aggregate billions of data points daily, spanning thousands of web sources. This includes the intricate handling of sources like mobile apps and websites known for frequently altering their site structures, among others.
What truly sets us apart is our proficiency in addressing these challenges through a blend of human expertise and large-scale machine learning. Additionally, our commitment to delivering unmatched service extends to round-the-clock, 24/7 support. This comprehensive approach makes our fuel pricing intelligence solution not only effective but also cost-efficient in meeting your fuel data requirements.
We also provide a variety of options for you to consume our data, which includes receiving our reports via email, SFTP, S3 buckets, data lakes like Snowflake, and APIs.
Enhance your Fuel Pricing Strategies with DataWeave
In the ever-competitive world of retail, staying ahead is not just a goal; it’s a necessity. The fuel pricing landscape, often overlooked, holds immense power to impact a retailer’s profitability. DataWeave’s real-time, comprehensive, and accurate fuel pricing intelligence solution is the key to securing this advantage. Retailers and convenience stores now have a powerful platform at their disposal, offering unparalleled precision, comprehensive coverage, and the agility needed to navigate this landscape.
Join the ranks of industry leaders who have already harnessed the potential of DataWeave. Reach out to us today to redefine your approach to fuel pricing and propel your business to new heights!
This year’s back-to-school shopping season has presented a considerable challenge for inflation-weary parents in the US. Despite chatter about alleviating inflation rates, the reality of rising prices tells a different story.
As families hunt for school supplies, apparel, and other essential items for the academic year, the financial strain remains palpable. Experts note that elevated prices coupled with extensive shopping lists have compelled many parents to be more discerning about their purchases, expenditure thresholds, and preferred shopping venues. Essentially, shoppers are looking for more value for their money with every purchase. According to the National Retail Federation’s 2023 projection, this back-to-school season is poised to be the most financially demanding one to date. The forecast anticipates total spending exceeding $135 billion, marking an increase of over $24 billion compared to the previous year.
At DataWeave, we continually monitor and analyze pricing activity among retailers across popular shopping categories. Our recent study delved into the pricing trends in the back-to-school category, which includes backpacks, fundamental school supplies, binders, planners, writing instruments, and more. The aim was to understand how the costs of back-to-school essentials have shifted in 2023 in comparison to 2022.
Pricing of Back-to-School Products in 2023
Our analysis, spanning 1200 products across major retailers such as Amazon, Walmart, Kroger, and Target reveals an average price surge of 9.8% in 2023 compared to the previous year.
This upward pricing trend can be attributed to retailers’ strategic efforts to guarantee product availability and uphold quality during a period of heightened demand. As the back-to-school season sparks a surge in shopping activity, retailers like Kroger, Amazon, and Walmart are likely adjusting prices strategically to align with the expenses incurred in securing adequate supplies, managing logistics, and meeting operational demands.
Kroger led the way with a 12.1% price hike, the most significant among the scrutinized retailers. It was followed by Amazon with an average increase of 10.5% and Target with 7.8%. Walmart remains the outlier, with the smallest price increases for back-to-school products in 2023.
Pricing across Categories and Subcategories
Among the various categories examined, backpacks have experienced the most pronounced escalation, with prices soaring by a substantial 25%. Within the top 10 highest priced backpacks we looked at, the most substantial price hikes were observed for brands like The North Face (44%) and Fjallraven (33%).
The Office Organization category also witnessed a significant price surge of 16.8%, attributed to subcategories like File Folders and Desk Accessories, which saw respective price hikes of 31.3% and 25.2%.
Categories like Memo Boards & Supplies (14.3%), Binders (12.5%), and Themebooks & Portfolios (12.4%) have likewise encountered notable price hikes. On the other end of the spectrum, Planners and Journals saw a modest rise of 4.4%, while Mailing and Shipping Supplies and Office Machine Accessories experienced comparatively lower price increases at 7% each.
Interestingly, while items like Journals and Writing Instruments maintain popularity year-round, Backpacks and Memo Boards are particularly sought after during the back-to-school season, contributing to more substantial price hikes in these categories.
On the other hand, consumers are consistently on the lookout for cost savings and deals from retailers, especially as they deal with inflationary pressures. In response, Kroger, Target, and Walmart have introduced back-to-school savings initiatives. For instance, Kroger is offering more than 250 items for less than $3 and some items for just $1, encompassing essentials such as paper, pencils, and glue sticks. Lower price increases across categories like journals and writing essentials could be attributed to these initiatives.
Brands with the Highest Price Increases across Categories
Across various back-to-school categories, some brands stand out with significant price increases. For instance, in the Office Organization category, Ubrands leads the pack with a substantial 38.30% surge, followed by Pendaflex at 30.80%. Meanwhile the Backpacks category sees Champion and Adidas recording significant price jumps of 29.6% and 23.6%, respectively.
Ubrands and Pentel from Basic School and Office Supplies Category also record high price increases at 22.70%, followed by Carolinapd from the Themebooks & Portfolios Category at 21.08%. 3M in Mailing in Shipping Supplies shows the lowest price increase at 6.80%.
Interestingly, the ever popular Writing Instruments category showcases BIC at the forefront, exhibiting the most notable price escalation of 13.2%. Expo trails closely at 11.6%, while Uniball demonstrates an 11.4% increase. Even Sharpie, a beloved writing brand, displays a modest price uptick of 9.3%.
The average price increments seen across brands mirror the overarching trend of increased costs throughout back-to-school categories.
Navigating the Competitive Pricing Landscape During the Back-To -School Season
Given the challenging pricing landscape during the back-to-school season, retailers would be wise to provide lower-cost alternatives alongside popular brand names. This allows parents to easily make substitutions while adhering to a school supplies list.
With our competitive pricing intelligence solution, retailers can confidently analyze and monitor their prices relative to competition, ensuring they maintain a leadership position in pricing within their desired set of products, while posturing for margins with other products.
Stock availability is the degree to which a brand or retailer has inventory of all their listed items to meet customer demand. Product availability becomes even more critical when they have to respond to unforeseen changes in demand and supply. To maintain the ideal stock availability levels for all items, they need robust inventory management tools to ensure real-time updates on current stock and accurate insights into upcoming demand.
However, managing stock availability is not a clear-cut science. Retailers must balance the change in demand and keep stock availability in check.
Why Stock Availability Matters
One of the challenges of running a retail business is to optimize inventory and associated costs. Maintaining stock availability in stores is critical for offline retail businesses. And when selling online, making sure products are available across different retailers and marketplaces can have a huge impact on sales and conversions.
Understocking: It’s when a brand’s product fails to meet consumer demand. If this happens often enough, customers may not return to the brand’s website or app because of the initial experience. Understocking is not a brand’s fault entirely since they might not always be able to anticipate a change in demand. However, it’s about a their ability to adapt to a quick change in the market trends through historical analysis and accurate forecasting.
Overstocking: It’s when a company orders too much inventory. Holding too much stock will lead to higher storage costs, shrinkage, and obsolescence losses. Another loss occurs if the brand can’t quickly sell the items — diminishing the value of the products.
When multiple items are moving through a supply chain, companies can easily run into inventory inaccuracies. Discrepancies between the values of your system and the actual inventory of products can lead to understocking or overstocking. The best way to avoid discrepancies in inventory is to invest in an inventory management tool that gives you real-time updates on your stock. This is applicable for offline retail businesses.
2. Managing eCommerce inventory
Availability at Individual Product Level
Availability at Individual Product level by regions
Effective eCommerce inventory management is as important as making sure products are available in stores. Keeping track of your inventory levels and ensuring that you’re always well-stocked can avoid lost sales and keep your company running smoothly. Brands must ensure their stock is available across all the online platforms they sell. Access to real-time inventory data can help to keep a close eye on stock status across all marketplaces & retailers the product is available. Retailers also need to keep track of market trends to ensure they have the right inventory assortment to match customers’ demands.
3. Understand Consumer Demand
The only way to accurately predict future demand is to rely on historical data about your customer purchase trends. What do your customers purchase during holiday seasons? What are the upcoming trends in your category? Having data-backed answers to such questions will help brands and retailers properly stock up their inventory.
4. Adequate forecasting
Anticipating demand will help determine which products should be stocked during which seasons. Tracking past sales and metrics such as economic conditions, seasonality, peak buying months, and promotions will help brands predict demand. Analyzing such statistics will also help you get insights into the target market.
Availability across regions
5. Improve supplier relationships
It’s important to rely on a supply chain that delivers your shipment promptly. In fact, you should foster close relationships with your suppliers to trim costs and improve stock availability. You should be able to share key details such as future demands, so suppliers can ensure timely delivery.
Availability Analysis across Retailers and Categories
Consequences of Inefficient Inventory Management
What are the effects of overstocking?
Tied-up cash: Money spent on overstocking is tied-up money that your company could have put to better use. You can use it to pay off debts, wages, and rent. Inventory often has a limited shelf life due to material degradation, changing consumer trends, spoilage, and obsolescence.
Poor customer experience: Poor product availability will lead to low customer satisfaction & dropping customer loyalty.
Missed sales: Customers could gravitate towards the competition to make their current purchase if a product is unavailable at your online store. The more freequent the stockouts, the more lost sales.
Conclusion
To avoid the knock-on effects of overstocking and understocking, companies need a real-time view of their inventory, both online & offline. At DataWeave, we help companies decrease their latency period between stock replenishment and efficiently plan their supply chain. If you need help tracking your eCommerce product availability, reach out to the experts at DataWeave to know how we can help!
Consumers are discovering and trialing new eCommerce marketplaces, brands and products at a faster rate than ever before, given the vast amount of choices encountered browsing for products online. A recent analysis shows how events like Amazon Prime Day, Black Friday, and Cyber Monday are especially fruitful for new-to-brand customer advertising, encouraging B2C marketers to increase their digital advertising spend to fuel product discovery, sales and market share for their brands.
The majority of eCommerce consumers are discovering products via relevant keywords attributable to their needs, with most clicks happening on page one results for the first few products listed. Simplifying the digital shopping experience is critical for brands to be in the consideration set for the majority of consumers who won’t venture past page one results.
An internal analysis conducted shows getting a product to page one on retailer websites can improve sales by as much as 50 percent, but figuring out the right levers to pull to get there organically—without paid advertising—is a real challenge, especially given fast-changing algorithms. While more than half of all retail related online browsing sessions are “organic”, sometimes brands need to boost their product visibility by investing in sponsored (paid) opportunities to improve a product’s rank.
Data analytics can equip brands with intelligence to help them decide when, where, and how to make digital advertising investments profitably, while simultaneously acting on insights that help drive organic growth. Considering a majority of U.S. consumers begin their product discovery on marketplaces like Amazon, it makes sense for brands to prioritize digital advertising opportunities with Amazon.
Maximize Return on Ad Spend (ROAS) with Amazon Ads
Brands use Amazon Ads to drive brand awareness, acquire new customers, drive sales and gain market share, with the goal of furthering their marketing return on investment. Top performing advertisers average 40 percent greater year-on-year (YoY) sales growth, 50 percent greater YoY growth in customer product page viewership on Amazon, and 30 percent higher returns on ad spend (ROAS) with Amazon Ads, according to a recent analysis. Sponsored Products, Sponsored Brands, Amazon DSP and Sponsored Display are among the types of Amazon Ads options cited that produce maximum return.
Ensuring your product listings appear at the top of page one results on Amazon for the most relevant discovery keywords is therefore the most important determinant for maximizing ROAS. DataWeave has become a vetted partner and measurement provider in the Amazon Advertising Partner Network, with the goal of supporting brands to optimize digital advertising campaigns by providing visibility to Digital Shelf Analytics (DSA) key performance indicators (KPIs), like Share of Search, Pricing and Product Availability, Content Audits, Ratings and Reviews, and Sales Performance and Market Share.
Below is a summary of how our Digital Shelf solutions, in partnership with Amazon Ads, can improve the performance of your Amazon Ads campaigns
1. Keyword Recommendations Improve Share of Search
With the DataWeave Share of Search solution, brands can monitor their placement of both organic and paid discovery keywords relative to their competition. Once your keywords are determined, you are also provided a weighted Share of Search score that helps measure how well each keyword performs relative to product discoverability. Below is an example of insights you’d gain.
Share of Keyword Search
Brands can provide their own list of keywords to monitor, or through our Amazon Ads collaborative solution, learn which keywords are the “best” for them to measure in the realm of Amazon. Performance results are based on data that shows which keywords consumers are actually using when browsing online alongside other keywords brands request to measure. Users are able to see exactly which keywords are most popular, competitive (and even unexpected), and relevant at an Amazon Standard Identification Number (ASIN) level of granularity.
We can also estimate the degree of relevance and estimated traffic for the recommended keywords. Brands can then use these insights to adjust campaign strategies based on these parameters, which can boost product discoverability and rank visibility. A brand could assume people find its products by brand name, yet traffic insights may reveal a majority of people look for a generic product type before they end up buying that particular brand.
Strong product content is critical to succeeding on Amazon. Thorough, accurate, and descriptive content leads to better click through rates (CTR), conversion rates, more positive reviews, and fewer returns, which results in increased discoverability. DataWeave’s Content Audit solution reviews existing copy and images on a per-attribute basis to highlight any gaps essential to improving visibility, as seen in the example below.
Content Analysis
To further growth, it is equally as important that your product content aligns with your advertising strategy. With Amazon Ads partner add-on, our solution can also audit your content to measure how effectively you are incorporating Amazon Ads keywords into your product content to enhance discovery relevancy.
3. Discover More Opportunities with Pricing and Product Availability Insights
Quality content and keyword updates will only get you so far if your products are not consistently available and priced competitively. With DataWeave’s Pricing and Promotions and Product Availability modules, advertisers can monitor their selling prices and availability trends alongside their competitors to uncover more opportunities to incorporate into advertising campaigns, as seen in the Pricing and Promotions dashboard example below.
Promotion Analysis
Additionally, product targeting recommendations can be utilized to target a competitor’s ASIN that may be overpriced or that is having issues staying in stock. Alternatively, broaden your strategy to target specific brands, complementary products, or category listing pages.
You can also create alerts on your own products to monitor when items are low on inventory or out of stock to ensure key products are consistently available when customers are shopping.
4. Leverage Ratings and Reviews to Increase Conversion
Product ratings and reviews are also a critical component to running a successful Amazon Ads campaign. A large number of reviews and a positive star rating will provide customers with the confidence to purchase, resulting in higher conversion rates. Conversely, negative feedback can have a detrimental impact, resulting in lost sales and wasted ad spend. DataWeave’s Ratings and Reviews module can help you monitor your reviews and extract attribute-level insights on your products. This information can then be utilized to further optimize your advertising strategy.
If you see consistent feedback in your reviews on aspects of a product not meeting customer expectations, address them in your product content to prevent potential misplaced expectations. Alternatively, if customer reviews are raving about certain product features, ensure these are promoted and relevant keywords are populated throughout your descriptions and feature bullets. Below is an example of insights seen within the DSA Ratings & Reviews dashboard.
Ratings and Reviews
5. Correlate Digital Shelf KPIs to Sales Performance and Market Share
The newest DSA module, Sales Performance and Market Share, provides SKU, sub-category, and brand-level sales and market share estimates on Amazon for brands and their competitors, via customer defined taxonomies, to easily benchmark performance results.
This data can also be correlated with other Digital Shelf KPIs, like Content Audit and Product Availability, giving brands an easy way to check the effect of attribute changes and how they impact sales and market share. Similarly, brands can see how search rank, both organic and sponsored, affects sales and market share estimates.
Understanding the correlation between your advertising campaigns and your Digital Shelf brand visibility will help you identify which areas to prioritize to drive sales and win more market share.
Digital Shelf Insights Help Brands Win with Amazon Ads
The need for access to flexible, actionable eCommerce insights is growing exponentially as a way to help brands drive growth, increase their Share of Voice, and to gain a competitive edge. As a result, more global brands are seeking Digital Shelf Analytics for access to near real-time marketplace changes and to develop data-driven growth strategies that leverage pricing, merchandising, and competitive insights at scale.
By monitoring, measuring and analyzing key performance indicators (KPIs) like Sales Performance and Market Share, Share of Search, Content Audits, Product Availability, Pricing and Promotions and Ratings and Reviews alongside competitors, brands will know what actions to take to boost brand visibility, customer satisfaction, and online sales.
DataWeave’s acceptance into the Amazon Advertising Partner Network enables Amazon advertisers to effectively build their Amazon growth strategies and determine systems that enable faster and smarter advertising and marketing decision-making to optimize product discoverability and overall results.
Connect with us now to learn how we can scale with your brand’s analytical needs, or for access to more details regarding our Amazon Ads Partnership or Digital Shelf solutions.
In 2022, Amazon sold 300 million products during Prime Day – selling roughly 100,000 items per minute. Since Amazon started Prime Day in 2015 to celebrate its 20th birthday, the shopping festival has grown into a holiday and rivals Black Friday and Cyber Monday in the U.S. and Singles’ Day in China.
According to RetailDetail, the leading B2B retail community in Benelux, Amazon is planning a 2nd Prime Day shopping festival in the autumn, just a few months after its annual Prime Day event. The retailer has asked its sales partners to prepare for a promotional event in the autumn where they have until the beginning of September to propose attractive discounts, with at least 20% discounts. This year’s second Prime Day may occur in October, with or without the same name.
But before that, let’s examine what happened in Germany this year on Prime Day 2022.
Methodology
We tracked Amazon.deboth before &on 12 & 13th July 2022, on Prime Day.
We looked at Additional Discounts offered on Prime Day: Additional Discount is the extra discount on an item during Prime Day when compared to the Pre-Prime day price.
We also looked at Post Prime Day Discounts, which were the discounts offered after the 2-day event ended.
What kind of Discounts did Amazon.de offer?
Amazon Prime Day will be significant, especially for customers hoping to get discounts amid soaring inflation. Both Amazon as well as other sources reported that electrical and electronic items were the most popular purchases, followed by general retail products. Electrical and electronics saw the value of transactions soar 90% on the first day. Mobile phones and accessories were the most popular, with transaction values almost doubling to 96% on day one.
Discounts across Categories on Amazon.de
Based on trends from past events, Amazon likely knew electronic items were going to be best sellers. Keeping this in mind, they made sure to offer high discounts in the electronics category. They offered a 6.5% additional discount on electronics on Prime Day. And once the sale ended, they continued to discount electronics by 1.3%.
The Fashion category also had a fair bit of discounts and came in at a close second at 5.9%
Looks like Amazon discounted everyday use items minimally. Groceries had an additional discount of just 1.8% on Prime Day, and wine and spirits had 2% extra discount.
Discounts on Electronics Category on Amazon.de
Within Electronics, in the four categories we tracked, we saw the highest additional discounts were offered on Bluetooth earphones (10.6%) and Smartwatches (9%)
Discounts on Fashion Category on Amazon.de
Jeans and Sunglasses had the highest discounts at 8.6% & 7.6% respectively.
Sneakers & Watches too had additional discounts of 6.6% on Prime Day.
Post the Prime Day event, Amazon retained an average of 1.5% discount across all products in the fashion category instead of pricing them at the original price.
However, in the case of women’s T-Shirts, they increased the price by 1.7% from the pre-event price.
Discounts across Price Tiers
Retailers must consider several factors when making strategic discounting decisions, including customer buying behavior, the type of discount offered & the volume of discount offered. The best discounting approach will vary depending on the product and other factors like the original selling price of the product.
Now let’s compare the discounting strategy Amazon used in the Electronics v/s Fashion category on Prime Day.
Discounts across Price Ranges
Interestingly, in both the Electronics and Fashion categories, Amazon increased prices for the lowest-end products between the €0-10 range by 3.6% and 13.2%, respectively, during the sale instead of discounting them! Maybe this was a strategy to drive consumers to higher-value products with greater discounts?
Another similarity in strategy was that most of the mid-priced items had maximum discounts. In electronics & fashion both, the maximum discounts were given to products between the € 30-100 range.
Here’s a difference that stood out – for Electronics in the higher price range between €100 – 500, the volume of discounts dropped a bit which meant Amazon gave moderate discounts on high-end electronics. But the trend flipped for Fashion as luxury fashion items were made to look more attractive with higher discounts.
Monitoring stock availability during key sales days is critical
Brands need to have the right stock availability, especially during sale events, because more customers shop online during sales. What’s worse, non-availability of products may drive customers to competitors that are stocking the same product. Out-of-stock situations lead to missed opportunities & lost sales! Let’s take a look at our data and see how Amazon planned product availability across categories on Prime Day.
Availability Analysis across Categories on Prime Day
Amazon was betting big on 2 categories – Electronics & Home. This meant they needed to keep a keen eye on availability in these categories, especially since they forecasted the highest sales to be generated here. … it was no surprise that the Furniture category had almost 100% availability during Prime Day! Electronics too had a high availability at 94% during the event.
Generally, our data showed that availability across multiple categories we tracked seemed robust and above 80% in more cases. Only Beauty & Grocery had 79% availability.
Conclusion
Prime Day sales reached an estimated 12 billion U.S. dollars worldwide, 9.8% higher than last year, making it the most successful shopping event in Amazon’s history. If you’re a brand selling on Amazon or a retailer trying to compete with Amazon, reach out to us at DataWeave to know how we can help!
Grocery sales in the UK are dominated by the “big four” – Tesco, Asda, Sainsbury’s, and Morrisons. A Statista report on these Grocery Giants as of May 2022 indicates that Tesco, Sainsbury’s, and Asda own approximately 27%, 15%, and 13% market share of grocery stores in the UK. Whereas Ocado and Symbols & Independent have the lowest market share, 1.8% each.
However, the grocery delivery market is seeing a major shift because of new-age Quick Commerce companies that have swooped into the already crowded grocery space offering super-speedy home delivery! These new entrants added to the already competitive Grocery market & price wars intensified. Customers today rely on ultra-fast delivery services for their grocery requirements. For example, Berlin-based Gorillas charges £1.80 to deliver anything from a £7 pizza to a 30p apple — with no minimum order value.
Investors funded over £5B in grocery delivery apps such as Getir, Gorillas, Zapp, Fancy, Dija, Weezy, Jiffy, and Beelivery, in the UK. These rapid grocery delivery apps offer shorter delivery times, as low as 10 minutes, along with deep discounts to attract customers. For example, Gorillas, Weezy, and Getir all claim a 10-minute delivery time and offer promotional codes for the first couple of orders. Customers also get discounts for inviting friends and family.
To get more insight into the Grocery space in the UK, we tracked 5 Grocery retailers & Q-Commerce companies to try and understand trends wrt pricing in this competitive environment. Let’s take a look at what our data found & which retailer won the competitive pricing tug of war.
Categories tracked: Alcohol, Drinks & Beverages, Fresh & Frozen, Grocery, Health & Wellness, Home Care, Packed Food & Snacks, and Smoke shop.
Grocery Giants v/s Grocery Delivery apps – who was the Price Leader?
Price leadership by categoryPrice leadership across months by Retailer
We wanted to track and see which retailer was the Price Leader – i.e., had the most number of lower-priced items in a particular category. Our data clearly showed that the Grocery Giants Ocado & Tesco won hands down! Interestingly, Ocado launched a new Ad Campaign earlier in Jan this year about bringing value to the table for customers with quality products at affordable prices – seems like they’re taking this new promise very seriously!
Tesco and Ocado were price leaders in maximum categories when compared to Gorillas, Weezy, and Getir.
Between Tesco & Ocado, Ocado enjoyed price leadership across all these categories for 4 out of the 6 months we tracked pricing for. Tesco occupied the top slot for just the balance 2 months.
Tesco was the price leader in the Alcohol category, with close to 40% of products priced the lowest compared to other retailers. They were also price leaders in the Smoke Shop category.
Ocado won price leadership for the remaining 6 categories, with a marginal gap between both retailers.
Watching Price Index Trends as inflation soars!
Price index across months by Retailer
The Guardian reports that Grocery inflation has hit a 13-year high in the UK, and food price rises could hit 15% by this summer – the highest level in more than 20 years. Meats, cereals, dairy, fruit & vegetables are likely to be the worst affected. Keeping this in mind, we tracked the Price Index (PI) across these 5 retailers to measure how prices changed over a 6 month period from Jan – June 2022.
Note: Retailers selling at the 100% mark were selling at an optimal price & did not undercut the market. The pricing sweet spot is 95% – 105%. Anything lower would compromise margins, and higher would mean the retailer was not competitive.
Getir & Ocado had a Price Index that was the most optimal, sitting in the 95% – 105% range.
Gorillas had the lowest Price Index, between 88% – 90%.
Weezy has the highest Price Index – they were selling at a minimum 30% – 40% premium over other retailers! Perhaps it’s their quick delivery service that justified these super high prices? Unlike other apps with a lower delivery fee but longer delivery times, Weezy offers a 15-minute delivery service & customers seem to be willing to pay for convenience! Wheezy also has a delivery fee of £2.95, which is at least £1 more than other platforms. Supermarkets like Ocado are now playing catch up to compete with Q-Commerce and quick delivery services. Ocado has launched a new “Zoom” service promising delivery in 60 minutes, and Amazon is now delivering “same day” groceries (but both have a minimum spend of £15)
Which Retailers were the quickest to make price changes?
Average price change across months by Retailer
Competitive pricing is critical to winning the eCommerce race. Competitive pricing involves tracking your competitor’s pricing & strategically tweaking your own prices without hurting margins. We tracked the month-wise average Price change from Jan – June across all 5 retailers to see which retailer was making price changes and at what frequency.
The main observation was – across all 6 months, all retailers were likely tracking each other’s prices and making minor price changes accordingly – the need of the hour in this hyper-competitive environment.
Gorillas made significant changes to prices between Jan & Feb. And Getir in the May/ June time period.
Discounts & Promos in a turbulent UK Grocery Market
Average discount across months by Retailer
Although customer acquisition starts with building awareness, discounts are a proven way to attract customers quickly. When approached with the right strategy, promotional discounts can promote long-term customer loyalty, drive customer acquisition, and improve customer lifetime value. However, deep discounting can risk margins and create more problems than benefits. We wanted an insight into discounting trends in the Grocery space, so we looked at our data. Here’s what we saw:
Getir offered by far the highest discounts compared to Ocado & Gorillas. In fact, in most cases, they offered discounts close to 2-3% higher than the retailer with the 2nd highest discounts!
Our data showed that Gorillas offered the lowest discounts. As reported in The Sun & other sources, newer Q-Commerce players like Gorillas have been showering users with discount codes, and that is why this data surprised us!
We went & looked back at the Price Index earlier in this blog, we noticed that Gorillas had a low price index overall, with most products priced at a 90%, way below other retailers. Perhaps this already lower price is why they’re offered very few discounts?
Conclusion
The UK grocery delivery market saw a huge rise in new retailers who are currently fighting for better discounts, competitive prices, and quick delivery. Although Tesco and Ocado were the price leaders in our findings, new players like Gorillas, Weezy, and Getir are attracting customers with quicker delivery times and low delivery costs.
As inflation hits another 40-year high at 9.1 percent, U.S. consumers geared up for their first sign of hope and relief in the form of anticipated discount buys – 2022 Amazon Prime Days, or so we thought. While Prime Days have grown to become a promotional period almost as important as Black Friday to digital shoppers, the combination of economic uncertainty, inflationary pressures, and supply chain challenges seemed to alter the discount strategy expected given activity seen during 2021 Prime Days.
Our analyst team has been hard at work aiming to provide a ‘first look’ at 2022 Prime Day Promotional Insights, tracking discounts offered across 46,000+ SKUs within key categories like Electronics, Clothing, Health & Beauty and Home, on seven major retailer websites – Amazon, Target, Best Buy, Sephora, Ulta, Lowe’s and Home Depot. Our analysis compares prices seen during Amazon Prime Day 2022 on July 12th, to pre-Prime Day maximum value prices seen in the ten days leading up to Prime Days, to determine the average change in discounts offered during the promotional period. Below is a summary of our findings.
Competitive Promotions Give Amazon a Run for their Money
Amazon offered the greatest average discount enhancements for Electronics at 5.6 percent followed by Health & Beauty items at 5.1 percent, and Home products at 4.2 percent versus pre-Prime Day discounts seen across the categories considered within our analysis. The only category reviewed where average discounts were greater on a competitor’s website was on Target.com within the Clothing category. As seen below, Clothing on Target.com average discounts were 6.8 percent greater than pre-Prime Day offers, which was 2.6 percent higher than the average discounts offered for Clothing on Amazon.
Target Capitalizes on Growth Opportunity in Clothing Category
Diving deeper into the details of where Target won within the Clothing category, you can see a majority of their promotional activity took place within Women’s Accessories where discounts offered were 18.5 percent greater than those seen pre-Prime Day 2022, which was almost 15 percent greater than the discount enhancements seen on Amazon for Women’s Accessories. In fact, Women’s Shoes and Sneakers were the only two categories where the average discounts offered were greater on Amazon than on Target.com.
Overall, the discounts offered on Target.com within the Clothing category were primarily concentrated within items priced $40 and lower, but what was most interesting is that within the $10 and under price bucket, Target offered average discounts of over 11 percent whereas Amazon increased prices for these items on average by over 9 percent.
While most of the Clothing available on both Amazon and Target.com during Prime Days 2022 were offered without a price change, the greatest discount percentages tracked were within the range of 10-25 percent off on Amazon whereas Target chose to offer the bulk of their promotions at 25 percent off an up.
Strategic Promotional Strategies Defined at the Electronics Subcategory Level
When it comes to the Electronics category on Prime Day, the big question is always who will win the battle of the brands. Below shows the difference in average pricing and promotions discounts offered between products manufactured by Samsung versus Apple across each retailer platform, noting discounts were almost 3 percent greater on average for Apple versus Samsung products on Amazon, and Apple discounts were almost 5 percent greater on Amazon versus than those seen on Target.com.
Amazon wasn’t going all in on Apple however, as we saw ‘Alexa’ devices (Amazon products) available on Best Buy and Target websites also, but the discounts were almost 4 percent greater on Amazon versus Target and over 7 percent greater than the discounts seen on BestBuy.com.
While the average discounts offered within the Electronics category were greatest on Amazon (5.6 percent) versus Best Buy (3.9 percent) and Target (3.4 percent) as noted within the first chart of this blog and across brands and technologies considered above, the discounts offered on Amazon were strategically focused between 10-25 percent as seen below.
Amazon’s Electronics promotions were also targeted at smaller price points, items priced between $20-500, whereas Best Buy and Target offered greater promotions for electronics priced $500 and up than Amazon.
Below is a snapshot of price buckets tracked for Electronics available on BestBuy.com, highlighting where most of the promotional activity was targeted at products priced $50 and up during Prime Days 2022, with discounts ranging from 10 percent up to greater than 25 percent greater than pre-Prime day prices.
The standout categories were TVs on Target.com with discounts averaging nearly 12 percent greater than those seen pre-Prime day, and smartphones on BestBuy.com with discounts averaging just over 11 percent greater than those seen pre-Prime Day. The category with the greatest average discount enhancements seen on Amazon during Prime Days 2022 was for Wireless Headphones with an average discount of 8.7 percent.
Home is Where Amazon’s Heart Was on Prime Day
Amazon dominated offers within the Home categories, especially for products within mid ($40-100) and higher price ranges (items priced $200-500), with the bulk of the discounts offered between 10-25 percent. There was little to no promotional activity seen across all price points on Lowe’s or Home Depot’s websites within the categories we tracked, and most other competitive offers on Home products were seen on BestBuy.com for products priced from $50-500. Even a subcategory like Tools offered deeper average discounts on Amazon (4.7 percent) than discounts seen on HomeDepot.com (1.1 percent) or Lowes.com (0 percent).
For Large Appliances, Amazon was the only retailer to off any significant discount across each major subcategory with the greatest average discount being on Ovens at 6 percent, followed by Refrigerators at 4 percent. One caveat with this category, when we reviewed Large Appliance prices two weeks prior to Prime Days, we saw average price increases around 16.7 percent occurring on Amazon.
During Prime Days 2022 however, Amazon also offered top average discounts for small appliances, except for on Instant Pots which appeared to have greater average discounts on Target.com (5.9 percent versus 4.2 percent on Amazon), and Vacuum Cleaners which appeared to have the best promotion of appliances small and large at 13.8 percent average discount on BestBuy.com. Another subcategory deeply discounted on BestBuy.com was weighted blankets, which averaged discounts around 18.5 percent versus Amazon’s average discount at only 6.2 percent.
Health & Beauty Retailer Pricing Strategies Revealed
Given the importance Health & Beauty Brands placed on Prime Day sales last year, we had anticipated to see more offers, especially within pure-play beauty retail channels, than we did for this booming category.
Amazon drove most of the Health & Beauty offers seen averaging 5.1% discounts versus other retailers only offering less than 1% on average, but discounts were aimed at a targeted group of SKUs on Amazon, bringing the average discount lower overall. Most of the promotions offered on Amazon fell within mid-range price points ($20-50) and were discounted between 10-25 percent versus pre-Prime Day prices.
Target.com offered the most comparable discounts to Amazon for Health & Beauty products on average, but their strategy primarily focused on items within the $20 and lower price range with discounts ranging primarily between 10-25 percent.
More 2022 Prime Day Insights Coming Soon
We know the significance visibility to critical pricing and promotional insights play in enabling retailers and brands to offer the right discounts to stay competitive, especially during promotional periods like Prime Days. While this blog is intended to provide a ‘sneak peek’ into 2022 Prime Day insights for the U.S. market, we will be providing more extensive, global coverage and will proactively share new insights with the marketplace as they become available throughout the month of July.
Be sure to also check out our Press page for access to the latest media coverage on Prime Day insights and more. Don’t hesitate to reach out to our team if there is any particular category you are interested in seeing in more detail, or for access to more information on our Commerce Intelligence and Digital Shelf solutions.
Last week the DataWeave analytics team identified the states most impacted by the baby formula shortage, only to see feminine hygiene products following similar trends with price increases occurring alongside a supply chain shortage. In this analysis, the team has identified over four hundred feminine hygiene products made available across eighteen retailer and delivery intermediary websites from August 2021 through June 2022, to see how product availability and price changes correlated.
Within the feminine care products analyzed, both tampons and sanitary pads show to have under 58% availability as of June 2022. For sanitary pads, June 2022 shows the lowest level of product availability at around 58%, which has steadily declined each month from August 2021 where product availability started around 69%. Tampons however, reached their lowest level of availability in April 2022 at 45%, and appear to be slowly recovering each month, now reaching around 53% availability in June 2022.
Product Availability for Feminine Care Products – June 2022
The Evolution of the Tampon Shortage by Retailer
Looking at tampons in more detail and at a retail level, we can see how much and how often product availability fluctuated from August 2021 through June 2022 across Kroger, Meijer, Baker’s Plus, Target and Walmart websites. Baker’s Plus, for example, shows the lowest product availability, maintaining an average of around 39% from October 2021 through June 2022. Kroger appears to be a notable exception only facing stock availability issues in March and April 2022, achieving nearly 78% availability in June 2022, which is 16% greater than the other retailers analyzed.
Product Availability for Tampons by Retailer – June 2022
Feminine Care Product Price Changes Over Time
When looking at Pricing Intelligence insights and average price changes occurring alongside declining product availability for tampons and sanitary pads combined, we see a very different story. Tampons have seen steep price hikes from December 2021 onward, increasing the most in June 2022, up 6% compared to prices seen in November 2021. This steep price increase could be attributed to consistently low availability for tampons that has been seen in recent months.
To the contrary, sanitary pads have seen a price reduction of around 1.25% as of June 2022 compared to average prices seen in November 2021. While prices are lower in June 2022 for sanitary pads, the percentage by which they are lower is shrinking in recent months, potentially for the same reasons related to decreasing product availability.
Price Change for Feminine Care Products – June 2022
When looking at month-over-month average price changes for tampons only, we can clearly identify which months had the biggest price changes, noting price hikes that lead to the currently high prices seen in June 2022. In March and May 2022, over 10% of tampons offered had seen a price increase, and around 8% had seen significant price increases of more than 10%.
Month-Over-Month Price Changes for Tampons – June 2022
eCommerce Intelligence Provides Early Visibility to Evolving Trends
Price increases don’t seem to be stopping anytime soon given there was a 3.6% price hike seen on average in May 2022 versus April, with June seeing yet another .6% increase from May’s prices. That being said, as the market evolves and feminine hygiene products stabilize, our team will continue to provide visibility to critical pricing and product availability changes to enable our clients to stay ahead of the curve.
From a baby formula shortage to a tampon shortage, what category will be next to follow the supply chain shortage trend? Follow our blog for access to the latest insights and be sure to reach out to our team if there is any particular category you are interested in tracking next, or for access to more information on our Commerce Intelligence and Digital Shelf solutions.
As the baby formula shortage continues, retailers and brands are working quickly to meet evolving consumer demand, considering supply chain driven headwinds, a baby formula recall, and inflationary-driven impacts. The DataWeave analytics team has actively tracked marketplace changes, alongside reports from the FDA, for the baby formula category at a state-level, and has shared the latest snapshot of product availability through June 7th, 2022, below.
Average Baby Formula Product Availability by State – June 2022
While the U.S. has reached an average of 84% baby formula availability the first week of June 2022, given recent news headlines related to the baby formula shortage, and tracking out of stock encounters by state, we see a continued decline in availability throughout the Midwest versus product availability levels seen in May 2022.
Wisconsin, Michigan, Illinois, Indiana, Ohio, and Kentucky all show average availability for baby formula to be less than 50%, with Wisconsin being impacted the most at less than 18% average availability. While Texas shows an average availability improvement of 3.5% from the first two weeks of May 2022 to the first week of June 2022 as noted in the below chart, availability is also very low overall at less than 60%.
Average Change in Baby Formula Product Availability by State – May 2022 to June 2022
Outside of the Midwest and Texas, the other states for consumers to be cautious in are California, Virginia, and South Carolina as their month-over-month average change in availability also declined 4%, 12.6% and 8.2% respectively. Below is a snapshot of where the baby formula availability average started as of May 1st through the 15th, 2022.
Average Baby Formula Product Availability by State – May 2022
Baby Formula Product Availability Changes – March 2021 through May 2022
At an aggregated level overall, the availability for baby formula was relatively stable across all retailers considered within our analysis from March 2021 through September 2021, but has been on a steady decline ever since, starting at 81.7% availability in September and ending at 53.8% availability in May 2022 as noted in the below chart.
Monthly Average Availability for Baby Formula Across Major Retailer Websites
Looking at baby formula availability at a retail level, we saw yet again not all availability challenges were alike, by month or retailer. Costco.com lead the other retailers within our analysis for greatest average availability from March 2021 through May 2022, but had one of the lowest availability percentages at 62.7% in May 2021, and dropped to the lowest availability of the group in May 2022 at 37.5%.
Average Availability for Baby Formula Across Major Retailer Websites
Baby Formula Prices Increase as Availability Changes
While unnecessary price gouging is prohibited, price increases are still happening at a slow and steady rate across all the accounts included within our Pricing Intelligence analysis given external market factors outside of baby formula recall related stockout scenarios.
Kroger.com experienced the greatest average price increases overall, with the peak being in May 2022 at a 19% increase, 8% higher than other retailers on average, versus prices seen in March 2021 for the same baby formula products. The most significant price hike occurred on Kroger.com from December 2021 to January 2022. Other retailers like H-E-B, Target and Wegman’s have had minimal price changes from March 2021 through May 2022.
Average Price Inflation for Baby Formula, Indexed to March 2021
Address the Baby Formula Shortage With eCommerce Intelligence
As the market continues to evolve and baby formula supply works its way to catching back up to demand, our team will continue providing critical pricing, merchandising, and competitive insights at scale, to enable retailers and brands to develop data-driven growth strategies that directly influence their eCommerce performance, accelerate revenue growth and drive profitability.
Be sure to reach out to our Retail Analytics experts for access to more details regarding the above analysis, or for more information on our Commerce Intelligence and Digital Shelf solutions, and let us know what other category insights you’d be interested in seeing this year.
What an exciting month we’ve had at DataWeave! Our team flew down to gorgeous Cape Town, South Africa to attend the 8th edition of #EcomAfrica! After months of Zoom calls and virtual events, it was a refreshing change to see our customers in person and meet some of the movers and shakers in eCommerce and some of the top South African brands.
Top eCommerce Companies in South Africa
My last visit to South Africa was before the pandemic. Things have changed since then, & the difference was stark! The eCommerce landscape had a paradigm shift during Covid-19 and grew exponentially. My customers spoke to me about the new opportunities, growth potential as well as challenges that came in because of this boom. For one, eCommerce in South Africa has become more competitive than ever – from online retail to grocery and food delivery to even alcohol delivery! All retail businesses seem to have jumped onto the eCommerce bandwagon.
A recent Deloitte report found that over 70% of South Africans shop online at least once a month & 2 out of 3 respondents said they plan to increase their frequency of online shopping. 65% said they know what they want, search online & check all stores that stock the product to compare prices. Price is one of the key factors that influence consumer purchase decisions. Other critical factors include delivery fee, delivery time, promotions & discounts & product assortmentto name a few. In order to stay ahead in this highly competitive arena, both retailers and brands need to make data-driven decisions about critical KPIs like pricing to stay ahead of the competition.
Increased Online Shopping & Online Shopping Frequency
We’ve been working with customers in South Africa for over 4 years now, even before the pandemic. So on Day 2 of the event – S.Krishnan Thyagarajan “Krish”, President & COO, Dataweave had a chance to share our learnings and experience from all these years and how user data is critical to getting ahead & winning the eCommerce race in South Africa.
For the purpose of Krish’s keynote address, we tracked pricing insights for a finite set of categories across key South African retailers like Checkers, Pick n Pay, EveryShop, Incredible, Makro, Waltons, Shoprite & Dis-Chem to name a few over a period of 16 months from Dec 2020 to April 2022. We highlighted price increase and decrease opportunities and how each retailer reacted in order to stay competitive, increase sales and protect margins.
BATTLE of the eCommerce GIANTS!
Key Highlights from the Keynote
Increasing prices where an opportunity exists helps retailers increase their margins exponentially. Pick n Pay had the highest action rate (73%) when it came to capitalizing on price increase opportunities v/s Dis-Chem at 11%.
When it came to price decrease opportunities (in order to stay competitive with rival brands) Takealot was the most responsive retailer – they capitalized on 30% of the opportunities, followed by Pick n Pay at a close second (28%) and Shoprite & Dis-Chem at just 4%.
Most retailers took between 1 – 5 days maximum to make price changes which means responsiveness to the market among all retailers is high making it more important for online retailers to always be on their toes.
The 2 categories where most retailers capitalized on Price Increase Opportunities were Sauces & Condiments and Crackers & Biscuits.
Watch the Impact of price increase & decrease opportunities on Private Label brands!
See how product stock availability impacts price changes over a 16-month period.
Find out which brands are in the lead in the Skin Care, Pet, Baby, Laundry & Cleaning Aid categories
If you’re an online retailer in South Africa & need insights on staying competitive with the right pricing, product assortment, delivery time, delivery rates, and the other key influencers that affect customers’ choice of online retailers, sign up for a demo with our team at DataWeave to know how we can help!
2020 onwards, the South African economy was crippled due to the pandemic and lockdowns. However, according to StatsSA, South Africa’s online retail market share grew to 2.8% in 2020, double that in 2018. After the pandemic, South Africa’s eCommerce industry grew by 66% in 2020 compared to the year before. This increase was primarily because of restrictions on traditional stores that led to a 30% reduction in in-store purchases. According to a Deloitte study, over 70% of South Africans shop online at least once a month because of convenience. Household appliances, footwear, clothing, electronics, and health products are the most popular categories among South African online customers.
Top Categories
South African Ecommerce
These eCommerce stores account for 15% of online revenue in South Africa
Takealot.com: Revenue US$602 million
Superbalist.com: Revenue US$85 million
Woolworths.co.za: Revenye US$57 million
In this blog, we will discuss emerging eCommerce trends in South Africa and their impact on the various retail segments.
Trends to watch in 2022
Trends to watch
1. Quick commerce
Quick delivery, especially when it comes to groceries, medicines, and food has become a customer expectation now. Q-commerce, a trend that capitalizes on optimizing delivery time, has become common in food tech companies and is now gaining traction in grocery delivery too, especially after the pandemic. UberEats, Checkers, Pick ‘n Pay, and Jumia is some of the country’s biggest Q-commerce players.
2. Omnichannel eCommerce
Omnichannel experience has taken center stage for retailers in South Africa after the pandemic. According to Nielseniq’s study, 30% of South African consumers indicated they had shifted their shopping habits to online shopping from in-person grocery store visits between March 2021 and 2022.
3. Digital Payment Trends
The digital payment ecosystem in South Africa has seen a massive growth trajectory after the pandemic. Customers seamlessly use digital payments across shopping, entertainment, groceries, food, health, and wellness – a trend we suspect is here to stay.
4. Buy Now Pay Later
Buy now pay later is an interest-free mode of payment that is popular worldwide for helping customers who cannot make high-value purchases. Consumers don’t have to pay any price upfront and pay off the amount in interest-free installments over a predefined period. The BNPL is forecasted to account for 13.6% of global eCommerce payments by 2024.
5. Chatbots
Quick response to customer queries and problems is instrumental in increasing conversion rate and sales. However, it can be difficult to respond to emails and instant chat 24/7 for small businesses. This is where automated chatbots are helping South African retailers answer customer questions promptly and correctly.
The 4 Fastest-Growing Retail Segments
4 Fastest-Growing Retail Segments
1. Online Retail
eCommerce & online retail grew 20% YOY after the pandemic. Retailers saw a huge increase in the adoption of online shopping by consumers. Traditional brick-and-mortar stores looked for omnichannel opportunities to keep up with online retailers. Mr. Price, a clothing retailer in South Africa, saw a surge in online sales by a massive 90% between April and June 2020. There is a similar success story where OneDayOnly, another South African online retailer, saw 40% growth during the same period.
… but this growth surge brought in some challenges for retailers too. With more and more customers shopping online, competition increased. Price-sensitive customers would constantly compare prices across online retailers before making a purchase. It became critical for retailers to price their products right to beat the competition & win the sale, without hurting their margins!
South African eCommerce companies offer a wide range of on-demand services, from taxi rides and grocery orders to liquor delivery. Retailers fulfill orders from stores to offer affordable rates and quick delivery across South Africa. It replicates the instant gratification of purchasing products from brick and mortar stores and the added benefits of the hyper convenience of shopping from a mobile or a computer.
According to Statista, revenue in the online food delivery segment in South Africa is projected to reach US$0.87bn in 2022. As competition heats up and more and more players enter the market, staying competitive is becoming increasingly challenging for food delivery businesses.
Bolt Foods SA said they grew 50% month on month in mid-2021 and said they had to bet on making sure they were offering competitive prices in order to get ahead. Additionally, in their quest to have a stronger competitive advantage, Bolt Food says it is also offering customers a very low delivery fee, lower than Uber Eats & Mr. D since delivery costs are a major consideration for customers when using food delivery apps.
With approximately 41.19 million South African customers engaging in online activity, there is a huge shift in user behavior as customers get comfortable purchasing directly via social platforms instead of online retailers or physical stores. Social commerce uses networking websites such as Facebook, Instagram, and Twitter as vehicles to promote and sell products and services.
What matters to South African online shoppers?
Between June and November 2020, South African consumers mostly used online retailers monthly (42%), food delivery services weekly (36%), and online classifieds less than once a month (34%).
Here is a summary of things that matter to South African shoppers when they shop online:
1. Easy product discovery and competitive pricing
Most customers start their online shopping with a product in mind and look for discounts and sales across retailers. More than 67% of respondents of a survey have said that they go to a specific online store and search for the product they want. Almost the same share of consumers said they compare online stores to find offers for products they want. Price plays an important part in product selection.
In order to offer the most competitive pricing, retailers in South Africa need to keep a keen eye on competitor pricing. They need to identify gaps and opportunities to make price changes to not only offer the most attractive price to customers but also drive more revenue and margins by pricing products right.
2. Reliable Delivery time
81% of South African consumers say that unreliable delivery time is one of the reasons that affect their choice of an online store. Quick delivery time has become a differentiator in the eCommerce space, where ‘next day delivery or even ‘same-day delivery’ have become the norm. South African online shoppers want reliable delivery times that suit their busy schedules.
Your company’s customer service should be responsive, smooth, omnichannel, and hassle-free. 78% of South African customers are frustrated with delays in customer support from online retailers. Slow response times and lack of communication in case of delays, delivery, and refunds hamper the customer experience drastically.
Customer Service
Conclusion
eCommerce in South Africa is growing at unprecedented rates. There has been a surge in the appetite of South Africans for online shopping and online retailers across the board are gearing up to meet this demand.
If you’re an online retailer in South Africa & need insights on staying competitive with the right pricing, product assortment, delivery time, delivery rates, and the other key influencers that affect customers’ choice of online retailers, sign up for a demo with our team at DataWeave to know how can help!
Social commerce is the selling of goods and services within a social media platform. Brands use social platforms such as Instagram, Facebook, Snapchat, and Twitter to promote and sell products. These platforms have become an integral part of consumers’ everyday life because they continue to engage users with relatable content, making them scroll their feeds for hours.
The Social Commerce model capitalizes on this high user engagement & moves social media beyond its traditional role in the top-of-the-funnel marketing process by encouraging users to shop without leaving their preferred apps. According to the Social Media Investment Report, 91% of executives agree that social commerce is driving an increasing portion of their marketing revenue, and 85% report that social data will be a primary source of business intelligence.
Let’s talk a little bit about why brands should consider selling via social media platforms:
Social Commerce vs. eCommerce vs. QCommerce
While they may fall under the same umbrella of online selling, social commerce, quick commerce, and eCommerce are three very different concepts
eCommerce refers to online shopping via a (retailer or brand) website or app. Customers can access these platforms via desktop or mobile devices. However, the sales funnel generally looks the same. These brands and retailers use top-of-the-funnel tactics like social media content, digital ads, and other marketing strategies to encourage customers to visit the online store. There are three main types of eCommerce businesses: Business-to-Business (Alibaba, Amazon Business, eWorldTrade), Business-to-Consumer (websites such as Amazon, Rakuten, and Zalando), and Consumer-to-Consumer (platforms such as eBay & Etsy).
Quick Commerce (or QCommerce) refers to eCommerce businesses that deliver goods within a couple of hours or even minutes. Although it’s sometimes used interchangeably with on-demand delivery or instant commerce, the idea of quick commerce has been around in the food industry for ages now. It has been recently ushered into the mainstream by evolving consumer preferences for quicker delivery of groceries and FMCG goods.
Social commerce brings the store to the customer rather than redirecting customers to an online store. It removes unnecessary steps and simplifies the buying process by letting the customer checkout directly through social media platforms, creating a frictionless buying journey for the customer. Additionally, social media platforms are mobile-friendly, a huge benefit for brands because increasingly more and more customers are accessing the internet through mobile devices.
Social Commerce
Rise of Social Commerce
First used in 2005 by Yahoo!, ‘social commerce’ refers to collaborative shopping tools such as user ratings, shared pick lists, and user-generated content. Social media networks snowballed throughout the 2000s and 2010s, alongside a general increase in eCommerce, leading customers and merchants to quickly recognize the benefits of buying and selling through social media networks. Social media platforms have since evolved from merely a showcase tool for brands. They now serve as virtual storefronts and extensions of a company’s website or brick and mortar stores, capable of handling the buying experience.
Top Social Commerce Platforms
Social media platforms aim to keep visitors engaged on their platforms for as long as possible. Increased time in-app or on-site maximizes their opportunity to serve ads, a primary source of revenue generation. Social media platforms have millions of active users and they have a great power to help companies and individuals build their brands, interact with consumers, and support after-sales. Here are the top social commerce platforms:
Facebook
Facebook introduced Facebook Shops to capitalize on the commercial opportunity by allowing vendors to advertise and sell directly through the platform. Facebook integrates social commerce with shopping, allowing users to purchase products smoothly. Facebook shops offer a smooth user experience where users can review products and get recommendations from trusted acquaintances. Customers can directly interact with the merchant’s customer service department post-purchase.
Instagram
60% of people discover new products on Instagram. Owned by Facebook, Instagram facilitates in-app shopping and handles the entire transactions within the app itself. Users scrolling on Instagram often wants to follow trends and replicate the looks of their role models or favorite influencers. By offering purchasing options in the app, Instagram benefits from the platform’s rich visual imagery and videos, allowing businesses to sell an idea rather than the traditional process of selling a product.
TikTok
Shopify partnered with TikTok to introduce shopping and drive sales through the younger and seemingly ever-expanding TikTok audience. With TikTok for Business Ads Manager, brands and merchants can create in-feed video-based content depending on their product offering. This partnership allows Shopify merchants to expand to the TikTok audience.
Snapchat
Snapchat has recently launched Brand profiles, a feature that allows users to scroll through a merchant’s products and buy them in-app. This new experience is powered by Shopify too. Merchants can create Brand Profiles or Native Stores that allow users to purchase products from the app.
Pinterest users are there for Shopping Inspiration
Pinterest
Pinterest is also an image-based platform where users create boards of their favorite wedding accessories, home decor, fashion trends, etc. Pinterest doesn’t specifically offer social commerce for the global audience. Rather, it allows business accounts to create ‘Product Pins’ that are displayed in the brand’s Pinterest shop. Only U.S. customers can purchase within the app. Users from other countries are redirected to the eCommerce site to complete the sale. We have added Pinterest to this list because 89% of Pinterest users are there for shopping inspiration.
Pinterest is an image-based platform where users create boards
Why Should Brands Care About Social Commerce
To enhance social media presence and brand awareness
If your target demographic is in the 18-to-34 age range, they’re already on social media and waiting to shop while they scroll. According to Sprout Social, over 68% of consumers have already purchased directly from social media and nearly all (98%) consumers plan to make at least one purchase through social or influencer commerce this year. You can enhance brand awareness by selling on social media platforms. Influencer marketing is an amazing way to build brand awareness since customers are now seeking authenticity from micro-influencers rather than big-name celebrities.
To generate social proof
90% of online shoppers say that they read online reviews before making an online purchase. Whether it’s an automated follow-up email or a message through the social media platform, ask for a review after your product has been delivered to the customer. You can also offer incentives like a contest to encourage previous customers to weigh in and share their experiences. These steps will allow you to collect social proof since it’s vital to build a positive reputation online. You can also ask customers to create small product review videos that you can share on your social feeds in creative ways. You can also post user-generated content, create a carousel of positive comments, or host a live video with happy customers.
Social Proof
To simplify the buying process for consumers
Traditional eCommerce involves several steps. It starts with displaying ads on social media platforms and customers being redirected to the business website for completing the transaction. To complete the transaction, customers also have to create an account or manually fill in the credit card details and delivery address. On the other hand, social is only a three-step process — find, click and buy.
Counterfeit Products
Conclusion
While social commerce is proliferating, it also has a few setbacks like the rise of counterfeit products. Counterfeiting has expanded into social media and has become an under-reported but vital hub for counterfeiters. A counterfeit detection solution can help brands and merchants identify & remove fake and unauthorized products. Technologies like image recognition can help in counterfeit detection by capturing fake logos and discrepancies. Removing counterfeit products will help brands safeguard customer loyalty and prevent fake products from harming your bottom line.
Here’s how DataWeave helped Classic Accessories, a leading manufacturer of high-quality furnishings & accessories identify counterfeit products across multiple retail marketplace websites eliminating 22 hours of time spent per week conducting manual audits – read the case study here.
Are you a brand or a retailer worried about counterfeits? Sign up for a demo with our team to know how we can help you track, identify and eliminate fakes!
Inflation has resurfaced after a decade of tranquil price increases. The persistent COVID-related supply chain disruptions have been a driving factor in increasing consumer costs since some commodities are harder to come by. While inflation is a normal economic phenomenon, the current 3.81% inflation rate has increased the cost of living for families across the globe.
Global Inflation Rate. Source: Statista
Worldwide inflation is expected to remain near 5.0% in early 2022 before gradually easing in response to industrial and agricultural commodity price declines. Additionally, the global consumer price inflation peaked from 2.2% in 2020 to 3.8% in 2021 and will average 4.1% in 2022 before subsiding to 2.8% in 2023.
In this blog, you’ll learn about the impact of inflation on the Retail Industry.
What is Inflation?
Inflation is an economic term that describes an overall increase in the price of goods and services in an economy, and a by-product of inflation is the devaluation of the currency used within that economy. For example, a clothing retailer that used to pay $8 for a t-shirt two years ago will now have to pay $10 for that exact product. The t-shirt hasn’t changed at all. However, it has become 25% more expensive. Inflation and the devaluation of currency are part of the reasons why they’d now pay $2 more for that same T-shirt.
The Fast-moving consumer goods (FMCG) sector will continue to grow because there is growth in household goods spending despite the Russia-Ukrainian crisis, global interest rate, and rising fuel prices. In fact, the demand for consumer packaged goods rose sharply in countries heavily affected by the pandemic. However, the FMCG sector will see a rise in prices of commodities because crucial resources such as cooking oil, tea, cocoa, etc., become scarce. The persistent shock to the supply chain has forced various FMCG companies to increase their prices. For instance, Mondelez, a Fortune 500–listed snack and beverage company, announced a 6-7% price increase.
Inflation for Fashion & Pharma Industry
Fashion
The global fashion industry posted a 20% decline in revenues in 2019–20. Inflation in fashion is caused by transportation bottlenecks, material shortages, rising shipping costs, and straining supply and demand. The global fashion industry will see complete recovery in 2022. COVID-caused supply and demand constraints have eased, but shoppers will have to reconcile to price jumps in everything from bags to shoes.
Pharma
Pharmaceuticals are recognized as an essential commodity and therefore have a massive impact on the household budget. Vizient has projected a 3.09% increase in the inflation rate in drug prices from July 1, 2022 – June 30, 2023. It shows how inflation has a direct impact on prescription drug costs. Notably, retail prices for some of the most widely used prescription drugs are expected to increase 2x as much as inflation. The demand for pharmaceutical drugs has been higher post-pandemic, ensuring that consumers’ total demand and spending in this vertical will remain unchanged.
Comparison of New, Used & Electric cars
Highest & Lowest Inflation in Beauty category. Source: nielseniq.com
Automotive
The rise of both new and used cars has been steeply increasing partly because of the shortage of semiconductors and the backlog from the closure of factories during COVID-19. According to the Bureau of Labor Statistics, there has been a 24.4% inflation in the used car purchase prices and an 8.8% increase in the new car purchase price. Rising oil prices across the globe and the historical oil crisis fuelled by the Ukraine-Russia war have strained many people’s budgets. However, the automobile market is seeing an uptake in demand for electrical vehicles (EVs). EVs represented 14% of car sales between January and June 2021.
Beauty
COVID-19 brought new challenges to the cosmetics industry, chief among this being face-covering required by law. In light of social distancing and lockdowns across the globe, consumers were buying less makeup. The rising cost of labor, energy, and raw materials used in beauty products have resulted in a “once-in-two-decade” backdrop for price hikes. The cost of palm oil, a common material in beauty products, has soared 82% in two years due to Indonesian labor shortages. Nevertheless, consumers will spend more time outside the house. Beauty price per unit changes shot up 17% in-store and online in 2021.
5 Things that will help retailers during inflationary times
1. Observe Competition
Retailers should follow their competitors closely—when they start to raise/lower prices, consider following suit. Using competitive data to gauge price changes will help in managing price parity. However, excessive discounts and lower prices to gain an advantage over your competitor could backfire in various ways. For example, low pricing may convey that your products aren’t as good as your competitors’, impacting your long-term brand image. Moreover, lowering prices to sell more doesn’t necessarily mean higher profits, especially during high inflation. To leverage this strategy effectively, retailers must first identify SKUs that have the highest impact on their pricing.
2. Build a structured and targeted pricing strategy
An effective pricing strategy that leverages differences in product, channels, and customers will help retailers to maintain long-term value for their business and customers. However, customers might react differently to a steep price increase. Broad price increases will demonstrate insensitivity and erode customer trust. Instead, retailers can thoughtfully tailor their inflationary price increases for each customer and product segment with a competitive pricing strategy. With a competitive and historical pricing strategy, brands can examine their customers’ end-to-end profitability and willingness to pay relative to a comparable peer set.
Price Competitiveness for the right items
3. Rethink commercial positioning
The pandemic and rise of inflation during 2020–2021 have profoundly impacted how consumers live and what they value. Understanding how your consumer’s needs have shifted and used a promotion strategy to manage today’s inflationary pressures is crucial. As new behaviors emerge post-pandemic, retailers must prepare for the potential top-line impact of demand shifts. Rethink commercial positioning and review marketing and packaging strategies, including the potential use of nonuniform and, in some cases, nonprice mechanisms.
4. Ensure price competitiveness on the right items
The Key-Value Item (KVIs) list should be reviewed again, considering changing shopper needs and habits during the pandemic, plus the supply and demand shock that the industry is currently experiencing. Price-sensitive and vulnerable shoppers are finding this inflationary period particularly tough, so brands might require an even deeper investment in KVI pricing. Reinvest base prices on essential products to drive volume for your best price-sensitive (PS) customers. Compete only where you need to be without overspending. Online channels should continue to reflect in-store prices and diverge during this time. Pricing Optimisation software enables best practices to simultaneously manage a high number of price increase requests.
Increasing the number of promoted products is a reflexive response to inflation, but it’s not the right response for building sustainable sales or longer-term loyalty. Inflationary times offer an excellent opportunity to reset promotional strategies to save money and margin. Retailers can increase sales and seize opportunities with a promotional pricing strategy. Increased promotional activity has a knock-on effect vs pricing position in high-low strategies and erodes overall value perception, creating a vicious circle of more promotions equals poorer value.
Conclusion
Today’s economic climate and associated pricing pressures are challenging for retailers and customers. Some companies have responded by announcing an increase in prices across product categories. Companies can manage pricing margins responsibly and profitably during inflation. Determining how and where new opportunities exist can help companies control inflation, drive growth, and remain profitable.
Need help to arrive at the right pricing & discounting strategies to counter inflation? Sign up for a demo with our team to know how we can help!
As inflation continues to hike costs for consumers and supply chains challenge them to maintain loyalty, there is still an active audience willing to pay the ultimate price for the convenience of food and alcohol delivery. That being said, we analyzed 8 popular Retail and Delivery Intermediary websites and 11 popular ‘Cinco de Mayo’ keywords to see which Brands are predicted to win the battle of Digital Shelf Share of Search this holiday.
2022 Cinco de Mayo Share of Search Insights – Top Brands for ‘Cinco de Mayo’
Opportunities for Food & Bev on Cinco de Mayo
While most of our analysis focused on popular Cinco de Mayo food and beverage products, none of these brands populated on either Target (pictured on left below) or Walmart (pictured on right below) page 1 search results for the term ‘Cinco de Mayo’. Keyword search results for this term are dominated primarily by décor brands as indicated below.
Brands Achieving Top Share of Search for Food and Beverage Categories on Cinco de Mayo 2022
Share of Keyword Search Results – Alcohol Category
Three of the most popular alcohol types sought out during Cinco de Mayo are ‘Mexican Beer’, ‘Mezcal’, and ‘Tequila’. Below are the brands dominating Share of Keyword Search results on each of the major retail websites we researched.
AmazonFresh, Meijer, Kroger, and Sam’s Club Share of Search – Beer, Mezcal, and Tequila Keywords on Cinco de Mayo 2022
We also reviewed the same keyword performance across popular delivery intermediaries to see how Share of Keyword Search altered for ‘Mexican Beer’, ‘Mezcal’, and ‘Tequila’. The results are below for TotalWine, Instacart, Drizly and GoPuff:
TotalWine, Instacart, Drizly, and GoPuff of Search – Beer, Mezcal, and Tequila Keywords on Cinco de Mayo 2022
The keyword ‘Agave’ is also a popular search term within the alcohol category during the time leading up to Cinco de Mayo. We reviewed keyword search performance at various zip codes to see how price points that populated on page 1 search results varied given the change in median income. Below are the results:
Share of Search for Alcohol by Price Point and Zip Code on AmazonFresh
Share of Keyword Search Results – Grocery Categories
We also reviewed some of the most popular grocery items purchased during Cinco de Mayo by Keyword Share of Search results to see which brands are primed to win the Digital Shelf this year. Below are the results for Target.com and Walmart.com.
Walmart and Target Share of Search – Food and Beverage Keywords on Cinco de Mayo 2022
Below are the results for the same popular grocery items and alcohol keywords related to Cinco de Mayo and the page 1 results seen for Brand Share of Search on Safeway.com.
Safeway Share of Search – Food and Beverage Keywords on Cinco de Mayo 2022
Access to these types of real-time digital marketplace insights can enable retailers and brands to make strategic decisions and help drive profitable growth in an intensifying competitive environment. Be sure to reach out to our Retail Analytics experts for access to more details regarding the above analysis, and let us know what other holiday insights you’d be interested in seeing this year. Happy Cinco de Mayo!
The combination of economic uncertainty, inflation, and perceived affordability has increased consumer’s willingness to buy and try more private label products, challenging National brands to differentiate their eCommerce strategies, especially those related to price positioning, in other ways.
Our previously released report, Inflation Accelerates Private Label Share and Penetration, confirmed 8 out of 10 brands with the highest SKU count carried across all grocery retailer websites to be private label, signaling the strength of their digital Share of Voice. Given the growing shift in consumer preference toward private label brands, we are providing access to the latest trends seen from September 2021 through March 2022. Below you will find a summary of what the data revealed about the growing presence of private label brands on the Digital Shelf.
Private Label Account and Category Penetration
We analyzed private label penetration at an account level to understand which private label brands have the greatest presence on retailer digital shelves, and to see which retailers may be leaving product assortment opportunities on the table.
Private Label Penetration Across Retail Grocer Websites
As a retailer, it is important to understand how your private label penetration stacks up against the industry average at a category level, especially given the performance tracked for retailers included within our analysis and the vast number of SKUs they offer online (over 20,000).
Private Label Penetration by Category Across Retail Grocer Websites
The Private Label and National Brand Price Gap Widens
Private label brands tried out of necessity mid-pandemic increased in popularity as grocery prices continued to rise, providing an opportunity for retailers to increase brand affinity and loyalty for their online shoppers. Retailers alike were able to keep affordability at the forefront of their strategies and maintain a price gap of 23% or more, despite inflationary pressures to increase prices.
Private Label / National Brand Price Gap by Retailer
Looking at the results at a category level, we can see that Meat is the only category found within our analysis where private label brands are priced higher than National brands at an average of 8% greater. The Alcohol & Beverages category tends to always see the greatest price gap between private label and National brands given the price variances by unit (ranging from under $10 to over $100), in this case averaging a 148% price gap.
Private Label & National Brand Price Gap by Category
Private Label Total Basket Value Comparison Across Retailers
While SKU-level pricing is extremely important to product strategy, for a retailer, it is equally as important to be as mindful of the total basket value even more so now as consumers further their private label loyalty across various categories. A few SKU-level missteps in pricing decisions can exacerbate cart abandonment and negatively impact shopper loyalty in a world where prices can be compared instantly in the palm of your hand.
Based on our analysis, Walmart and H-E-B private label products offered the lowest priced total basket of goods at $42.90 and $45.06 respectively, whereas AmazonFresh and Safeway offered the highest total at $73.19 and $69.52 respectively.
Private Label Item Level Price Comparison by Retailer
Inflation-driven Price Changes are on the Rise with Room to Grow
Based on the 20,000+ SKUs analyzed, we saw a continual price increase every month since September 2021 when comparing future monthly prices to those we tracked in September. The greatest price increase happened in March 2022 at 12.5% on average, however, there are still 48% of SKUs that have yet to see a price increase even as inflationary pressures rise.
When viewing the split between National and private label brand price increases in March 2022 versus September 2021, we saw National brands increased prices on average by 13% where private label brand prices only increased an average of 7%.
Private Label & National Brand Price Change (%)
Price decreases are still occurring across all categories, despite inflation, but to varying degrees ranging from 5% for Deli items to 17% for Dairy & Eggs. Within the Dairy & Eggs and Pantry categories, private label brands reduced prices for an additional 10% of total SKUs compared to National brands.
The greatest category of opportunity for price increases within private label were found within Beauty & Personal Care with 67% of private label products yet to see a price change since September 2021.
Price Change (%) by Category and Brand Type
Private Label Price Change Correlation to Product Availability
The category with the greatest magnitude of price increase seen within private label brands occurred within Baby at 16.3% followed by Home at 14.3% on average. Private label products within Home and Baby categories were also showing the lowest availability rates, 75.9% and 79.5% respectively, indicating a high demand for these items even as prices increased.
The private label categories with the smallest price increase on average were Dairy & Eggs at 2.4% and Other Foods and Pantry at 3.4% and 3.6%, respectively.
While in many accounts both private label and National brands struggled with stock availability in March 2022, National brand availability is much lower (around 10% on average) than private label availability.
H-E-B had the lowest overall product availability at 76% across both private label and National brands on average. Only Walmart had lower availability for Private Label at 75% compared to 93% for National brands, but they also had the greatest price gap between private label and National brands.
Private Label & National Brand Product Stock Availability
The Future of eCommerce Growth for Private Label
Our greatest learning from this analysis is that it’s time for retailers to start thinking and planning more like the National brands they carry when it comes to positioning their private label brands for success. Successful retailers are taking this time to reset their private-label strategies and transfer short-term switching behavior into long-term customer loyalty.
Retailers playing catch up have the opportunity to address some of the gaps highlighted throughout this analysis, for example, relative to pricing and assortment changes. Below are some of the highlighted opportunities:
Though inflation is driving price hikes, more than 50% of products analyzed have yet to see a price increase indicating an opportunity to protect margin
Narrowing the price gap between a store’s brand and National brands should not be the only focus as competitive private label brands are becoming a greater threat at a category and basket level
Modifying and expanding assortments as demand increases for private label can improve customer retention and loyalty, especially for cross-shopping consumers
According to The Food Industry Association (FMI), only 20% of food retailers currently promote private brands on their homepages, and only 48% include detailed product descriptions indicating even more opportunities left on the table for retailers to optimize private label digital performance.
Many leading retailers are leveraging real-time digital marketplace insights and eCommerce analytics solutions like ours to further their online brand presence and optimize sales performance. This report highlights only a small sample of the types of near real-time insights we provide our clients to effectively build competing strategies, make smarter pricing and merchandising decisions, and accomplish eCommerce growth goals. Be sure to reach out to our Retail Analytics experts for access to more details regarding the above analysis.
For access to a previously recorded webinar presented in partnership with the Private Label Manufacturers Association and conducted by DataWeave’s President and COO, Krish Thyagarajan, click here.
Online reviews have revolutionized how customers purchase products and services. In fact, eCommerce success for certain products hinges on the ratings and reviews. With this, have come the pitfalls of corruption in eCommerce.
New brands trying to establish a presence and capture critical mass have been known to resort to soliciting fake and paid reviews to uplift their brand in search rankings. Similarly, these brands can also encourage fake negative reviews on competitor’s listings to bring down their value. Bots and paid manual reviews are usually employed to rake up the review count. Review sites like TrustPilot, Google Reviews, and marketplaces like Amazon are littered with fraudulent reviews. In fact, Guardian calculated that 3.6% of all reviews on TripAdvisor were fraudulent. According to a 2021 report by Statista, 46% of the 2.7 million online fake reviews that were removed were five-star reviews!
Fake online reviews are misleading since customers shopping both online and offline rely on reviews to make purchase decisions. Fake reviews also pose further problems because they deceive consumers into spending money on a product or with a company they may not have otherwise chosen.
Federal Trade Commission (FTC) made a recent announcement to send penalties to over 700 brands and retailers for fake endorsements and reviews. While this notice references influencer content and testimonials, it also applies to customer reviews.
In this blog, we will discuss the importance of reviews for brands and retailers, spotting fake reviews on Amazon, and steps that eCommerce companies can take to tackle fake reviews.
Customers are more likely to purchase if other customers, even strangers, agree that it was a great purchase. Reviews also make brands more visible.
Why are fake online reviews so resilient?
A significant reason is that the ROI of getting fake reviews increases profitability & sales multifold. For example, an extra star on Yelp can increase a restaurant’s revenue by 5% to 9%. FTC has said that the expenditure on fake reviews can provide a 20x return. However, fake and incentivized reviews are a huge problem. Amazon, one of the largest eCommerce marketplaces, banned incentivized reviews in 2016. It took down suspicious reviews and has taken legal action against sellers who violate its policies.
Online Reviews
How to Spot a Fake Review on Amazon
Marketplaces, Google, and review sites like Yelp can get hundreds of thousands of reviews daily. In a survey by PCMag that interviewed 1,000 US shoppers who looked forward to shopping on Prime Day 2020, only 16% were very confident about detecting fake Amazon product reviews, and 24% were confident they could do it. The rest of the survey respondents were somewhat or not confident they could pick out the fakes on Amazon. Here are our best tips for spotting fake reviews on marketplaces like Amazon:
Duplicate Content: If you notice dozens of reviews with the same description and title as if they were copied and pasted multiple times, they’re most likely fake reviews.
Multiple Reviews on the Same Day: Another identification of fake reviews is when there are dozens or multiple reviews on a single day. There can be a bunch of both positive and negative reviews for products.
Unverified or Anonymous Reviewers: You can see if the review is from a verified buyer on Amazon. Brands can also check if they have any record of the reviewer’s purchase to weed out fake reviews.
Incorrect Language: Fake reviews can come from people outside your country. If you notice multiple reviews with similar incorrect words and common errors, there is a good chance those reviews are fake, and someone paid the reviewer to write them.
What can eCommerce brands do to protect themselves against fake reviews?
Follow a zero-tolerance policy for fake reviews.
The major step is to ensure that fake reviews are never posted on your site. Allowing fake reviews negatively affects your business and your bottom line. You can hire a third-party UGC moderator that uses data-driven, anti-fraud methods to evaluate reviews. It will be a much more successful and quicker step in protecting your brand’s reputation.
Don’t screen out negative reviews.
While receiving a negative review might be the worst nightmare, they’re necessary for a successful UGC program. Customers are more likely to purchase from a business that responds to all reviews, including negative reviews. Customers said that negative reviews have more detailed product information, while 32% of those customers think they’re less likely to be fake. Besides, brands that respond to negative reviews gain customers’ trust and loyalty. Here are some Tips on how to Respond to Negative reviews online.
Be transparent about how you collect UGC.
Brands can ensure that their customers trust user-generated content by being honest about how they collected it. Companies should never ask for paid or incentivized positive reviews. Instead, brands should empower their customers to leave honest feedback. If you’re offering free products, a chance to win something, or discount coupons in exchange for an unbiased review, then the review should specify how it was collected. For example, you can add indicators like “this reviewer received a coupon or a free product in exchange for honest feedback.
Maintain trust
Having fake reviews causes a loss of trust, with many consumers believing that they have seen fake reviews for online and offline businesses. Removing fake reviews doesn’t only help with revenue and brand trust, but it also helps brands to maintain trust among their existing and future customers.
Conclusion
Fake reviews are one of the biggest reputation killers and a huge problem for eCommerce platforms, brands, and customers. Brands must take the necessary steps to minimize the risk of fake reviews and expand businesses among authentic users. Although modern text generation tools are becoming more competent in writing realistic reviews, there are AI- and ML-backed tools that can accurately detect reviews written by other machines.
Need help tracking your online ratings & reviews? Or decoding customer sentiment from reviews they’ve left for your products? DataWeave offers a customizable and scaleable data solution to analyse ratings and reviews for online retailers and brands vis v vis their competitors. Sign up for a demo with our team to know how DataWeave can help.
Customers love discounts, and promotions are the most effective tool to attract shoppers and increase sales during the holiday season and clearance sales. According to a survey, 76% of UK customers look for discounts before purchasing a product. Promotional discounts encourage customers to try new brands. And this is why brands often have a special coupon for first-time users.
According to Software Advice, discounting tops the pricing strategy for retailers across all industries. It is preferred by 97% of survey respondents over other promotional strategies.
Share of Respondents
Retail Trends in the UK for 2022
The arrival of the Omicron variant in December 2021 slashed the shopping mood of UK customers and led to a 3.7% monthly drop in retail sales, but sales were still higher than February 2020 levels when Covid-19 first hit worldwide. Sales during the holiday season in 2021 took a hit due to a consistent decline in product availability and an increase in prices. Inflation too started to rise in 2021 and is expected to increase by 7% by spring 2022. However, despite inflation, retail sales jumped back in January 2022. In fact, it is predicted that inflation will be a key driver of sales growth, with underlying demand across categories being uneven. Keeping that in mind, let’s look at sales growth across categories in 2021 and projected growth in 2022.
Category Breakdown: Sales growth 2021/22
Discounting Trends we saw in the UK in 2021
Methodology
We tracked prices on the three biggest Sales Days in the UK – Amazon Prime Day, June 21st & 22nd 2021 – Black Friday, Nov 26th, 2021 – Cyber Monday, Nov 29th, 2021
Categories tracked: Beauty, Fashion, Electronics, Home Improvement, Furniture
Websites tracked: Amazon UK, OnBuy, eBay UK, Etsy, Wayfair, Selfridges, John Lewis
Prime Day, Black Friday, and Cyber Monday are three of the biggest sales days with comparable discounts. However, according to new research, in 54% of cases, it depends on the category of product you’re after that determines the volume of discount you get. For example, tech items such as smartphones, laptops, games consoles, smartwatches, and wireless speakers were cheaper on Black Friday but may not necessarily have been cheaper on the other sale days.
We wanted to see which sale period had the most number of products on discount during the three big sale events. We also wanted to see which of those three sales would’ve been the best for consumers to get a higher section of products at a discount.
How Big were the Discounts?
Discount across 3 key Sale Days
32% of products went on discount during Black Friday, 35% on Cyber Monday, and only 6.6% on Prime Day. One factor contributing to the low Prime Day percentage is the fact that not all retailers participate in discounting wars during Prime Day since it’s an exclusive Amazon-only sale. Customers looking for the best deals would’ve gotten them during the holiday season with a combination of the Black Friday & Cyber Monday sales.
Another interesting thing to note is the percentage discount – on Prime Day, only 0.2% of products had a discount of over 50% of all the discounted products. While on Black Friday & Cyber Monday that number was 1.7% & 1.3% respectively.
In conclusion, more products were offered at a discount on Black Friday & Cyber Monday; and the total percentage discount on those products was also higher.
Which Categories had the Maximum Discount?
Discounts by category
On Black Friday, an estimated 47% of consumers in the UK planned to shop for electronics, whereas 40% of customers planned to shop for clothing and footwear during Black Friday to Cyber Monday. The top-selling categories across the 48 hours of Amazon UK’s Black Friday 2021 sale included Home, Toys, Beauty, Books, and Health & Personal Care.
Our data shows that Categories with the highest discounts were Beauty and Electronics with the highest discount on all 3 sale events. These 2 categories had discounts on over 40% products on Black Friday & Cyber Monday while categories like Home Improvement were in the 30 – 35% range, Furniture in the 27 – 32% range and Fashion has the least products on discounts at a little over 15%
In the fashion category in the UK, Amazon UK offered the highest percentage of items with a price decrease (31.6%), whereas eBay offered the most significant magnitude of price decrease (14.3%).
Which UK Retailers gave the most discounts?
OnBuy is an emerging marketplace in the UK that offers impressive discounted prices and is taking on top UK marketplaces like Amazon. It’s ranked Britain’s fastest-growing eCommerce platform in 2020 and also the fastest grower by traffic. The low listing fees starting at 5% allow sellers to competitively price their products, making them more accessible to a greater number of buyers with huge discounts. The most prominent deals and discounts are highlighted on the landing page and featured across OnBuy’s social pages to grab the audience’s attention.
Discounts by Retailer
This was clearly reflective in the data we gathered from the 3 big sales in 2021. Most retailers in the UK, including Amazon offered at best 20% of their products, in the categories we tracked, at discount. The only outlier was OnBuy – OnBuy offered close to 90% of their products at discount!
OnBuy was able to offer a comparatively high number of discounted products than their competition because the magnitude of the discount was much much lower. The platform offered minimal discounts; out of the 90% of discounted products, 80% of those products had discounts that were less than 10%. As opposed to other retailers who had under 7% of their products on discounts of less than 10%.
OnBuy’s discounting strategy built a perception that they were the biggest discounters, even when the discounts were not as deep.
Black Friday v/s Cyber Monday – which one was better for holiday shoppers?
Discount by category- Black Friday VS Cyber Monday
Black Friday kicks off the holiday shopping season and is synonymous with some of the most significant sales after Thanksgiving. But until recently, Cyber Monday has become a great way for eCommerce retailers to capitalize on holiday discounts and expand their most beneficial sales events of the year.
In 2021, retailers pulled in $8.9 billion in Black Friday online sales and a total sales of $10.7 billion on Cyber Monday. In the YOY review, Black Friday saw a decline of 1.3% from 2020’s record of $9.03 billion, and Cyber Monday saw a drop of 1.4%, only $100 million shy of $10.8 billion in 2020.
Across Beauty, Home Improvement, Electronics & Furniture categories, we saw that more products were on discount on Cyber Monday v/s Black Friday. However, the opposite was true for the Fashion Category. In the Fashion Category, we saw a marginally higher number of products on Discount during Black Friday than Cyber Monday.
Discount percentages across categories
Across both sales, the Electronics category offered the highest discounts at over 40% of products discounted compared to other categories on both Black Friday & Cyber Monday. However, a very small fraction of the products had a discount of over 50%, indicating the lack of ‘BIG blockbuster deals’ in this category. At the same time, the Fashion category offered the least number of deals with less than 20% products on discount, but the highest magnitude of discount across the board! On Black Friday, 3.8% of products had discounts higher than 50%, and 2.6% of products on Cyber Monday. In most other categories, between 1 – 1.5% of products had over 50% discount. However, Fashion brands offered more than 50% discount on 2x the average number of products on both sale days.
Why did the Fashion Category offer such high discounts? Brands are now capitalizing on customers’ need for instant gratification in the age of see-now, buy-now fashion trends by offering their products at high discounts. It also allows them to quickly eliminate overstock. However, this has given rise to fast fashion, a trend that focuses on rapidly producing low-quality clothes in huge volume. Fast fashion focuses on replicating trendy pieces like streetwear and fashion week designs, not four times a year but every week, if not daily. Fast fashion promotes brands to manufacture and sell low-quality merchandise that goes out of trend as soon as buyers wear it once. There is little to no time for quality control, and pieces are thrown away after a few wears. In the UK alone, 300,000 tonnes of used clothes are buried or burned in landfills each year. However, every element of fast fashion from rapid production, competitive pricing, to trend replication has a detrimental impact on the planet.
Conclusion
The effects of COVID-19 can be seen far and wide in the UK retail industry, especially with a steep rise in inflation. Fortunately, even though retail sales in the UK declined during the 2021 holiday season due to the Omicron variant, they increased during Black Friday and Cyber Monday. Sales also jumped back in January 2022 and are further projected to grow by 5% in 2022. Additionally, brands can sustain the impact of disruptive factors throughout 2022 by ensuring their Digital Shelf is updated and flexible enough to react swiftly to both threats and opportunities in order to maximize the chances of success.
Busy lifestyles, urbanization, aging populations, and smaller households led to the preference for convenience and efficiency in eCommerce deliveries. However, the Covid-19 pandemic caused a massive shift in customer demand and buying decisions. The modern consumer journey moved from takeaway food to online shopping to quick or same-day deliveries. With evolving digital touchpoints, customers now favor fast deliveries and convenience.
According to a 2020 survey by KPMG in the UK, 43% of consumers chose next-day delivery, a 4% increase from last year. Interestingly, 17% of consumers abandoned a brand if they faced a longer delivery. Standard delivery time has shortened from 3 to 4 days and two-day shipping to next-day or same-day delivery. This increasing trend of quick delivery has led to the boom of quick commerce or Q-Commerce. Quick commerce or on-demand delivery refers to retailers that deliver goods in under an hour or as quickly as 10 minutes. The rise of Q-commerce is caused by changing consumer behavior and rising expectations since the pandemic.
In this blog, you’ll learn about quick commerce or Q-Commerce and its benefits. You’ll also read about factors to consider for quick commerce and tips to implement this business model.
1. What is Quick Commerce?
On-Demand Delivery
Quick commerce or on-demand delivery is a set of sales and logistics processes that empowers eCommerce businesses, restaurants, grocery chains, and manufacturers to deliver products in less than 24-hours. A study shows that 41% of consumers are willing to pay for same-day delivery while 24% of customers will pay more to deliver their items within a one- or two-hour window.
Changing lifestyles and customer behavior directly impacted the rise of Q-Commerce. The takeaway food industry had used quick commerce for many years. But with Q-Commerce businesses consistently cutting delivery time, quick commerce for instant grocery delivery has become a new trend. For instance, India-based online grocery delivery firm Grofers rebranded to BlinkIt amid rising competition, promising 10-minute instant delivery.
2. How quick is Quick Commerce?
The post-pandemic lifestyle & the rise in the number of small and single-person households has led to an increase in demand for products in small quantities that need to be delivered sooner than later. Sometimes in as little as 10 minutes! This trend is oriented towards specific products such as packed or fresh foods, Groceries, Food delivery, Gifts, Flowers, Medicines to name a few.
Quick Commerce Categories
Local shops that can reach more customers with less friction have swapped traditional brick-and-mortar warehouses to cater to an urban population. These online Q-Commerce stores can deliver goods from favorite stores and offer a vast choice of products that are available 24/7. However, it requires real-time inventory management, data-driven pricing management, innovative logistics technology, a fantastic rider community, and a proper assortment.
3. Factors to consider for Quick Commerce
Competitive Assortment & Pricing
a. Assortment
With growing competition, getting product assortment right isn’t easy for quick commerce businesses, yet it’s critical to their success. To optimize assortment for quick commerce stores, they need to understand how demand differs between demographics and various stores. Since quick delivery involves packed and fresh products, it is even more essential to carry a unique assortment for each store.
Data analytics will help Q-Commerce businesses understand which products are repeatedly purchased in every store. It also helps identify high-demand gaps in your competitors’ platforms. Assortment analytics can help distinguish shifts in customer behavior across short- and long-term demands. The key to increasing sales is shaping inventory to match the overlap between market opportunity and consumer interest. With assortment analytics, they can determine the optimal mix of products for their daily inventory.
b. Pricing
Pricing information is readily available on quick commerce businesses, allowing customers to compare prices before making purchase decisions. Before deciding on a product, shoppers actively track the best deals on platforms across various Q-Commerce delivery platforms. According to a survey, 31% of consumers rated price comparisons as the essential aspect of their shopping experience. Understanding price perception can help quick commerce companies to optimize their pricing strategy while remaining competitive.
A competitive pricing strategy does not imply that Q-Commerce businesses have to cut prices. Instead, it’s about adjusting prices relative to your competitors but not significantly impacting the bottom line. Competitive pricing provides real-time pricing updates, allowing quick commerce platforms to drive sales by nailing their pricing strategy.
c. Delivery Time
Grocery Delivery Race In India
Delivery time has become the game-changer in quick commerce, with platforms fighting over shorter delivery times. Unpredictable factors such as specific delivery windows, last-minute customer requests, and traffic congestion can wreak havoc in your planning. Optimizing your delivery time can improve operational efficiency through faster delivery, quick route planning, and driver monitoring.
Big eCommerce platforms like Amazon offer same-day or next-day delivery to prime members with no extra fee on minimum order criteria. The only demand of customers who do not worry about discounts or lower wholesale prices is quick delivery. The demand for quick delivery services has led to many global retailers offering same-day delivery to meet those expectations.
d. Demand Forecasting
Since quick commerce is a viable solution for certain products, businesses must determine what customers want and when they want it. Q-Commerce businesses can use historical data to predict future sales patterns with demand forecasting. It ensures that Q-Commerce businesses can limit wastages and their inventory can cater to a targeted market. Demand forecasting also helps to replenish stock based on real-time data. Furthermore, companies can identify bottlenecks and points of wastage in the supply chain with a demand-driven system in place.
4. Benefits of Quick Commerce
Q-Commerce Benefits
a. Competitive USP
Q-Commerce businesses get new value propositions because customers that need immediate delivery are willing to try new brands and order from new stores. It also allows online Q-Commerce businesses to compete with global marketplaces and brick-and-mortar stores.
We at DataWeave have helped quick-service restaurants (QSRs) that are going the Q-Commerce route & selling via food aggregator apps to increase their revenue significantly. Our AI-Powered Food Analytic solutions have helped QSRs diagnose improvement areas, monitor key metrics, and drive 10-15% growth. Our data has helped them understand availability during peak times, monitor product visibility by region, track competitors, and choose suitable banners for promotion. Read more about that here.
b. Increase margins
A study from Deloitte suggests that 50% of online shoppers spend extra money to get convenient delivery of the products they need during the pandemic. These customers also paid extra for on-demand fulfillment and bought online pick-up in-store options.
Since the assortment of products in quick commerce is relatively small, Q-Commerce businesses can drive sales for their most profitable product lines. There is a potential for greater margins because wealthier demographics often require convenience. For instance, time-stranded professionals value convenience over discounts.
c. Customer experience is paramount
With quick commerce, retailers can meet customer expectations and exceed them, fostering brand loyalty. Quick commerce addresses customer pain points such as running out of food before a small party or getting a birthday present for your friends. It can simply help people who cannot make it to the shop or stock up essentials.
5. How to implement Quick Commerce
Implementation of Quick Commerce
a. The need for local hubs
To pack and deliver products in under an hour, businesses must be located close to the customers. Therefore, quick commerce relies on local warehouses that can serve customers in immediate proximity. Since the duration of two-wheelers is less likely to be impacted by heavy traffic or parking spaces, delivery services employ riders to deliver products.
b. Ensure you have the right analytics in place
Another essential part of running a quick commerce business is to have a web or phone application that can facilitate online ordering and offer accurate stock information to customers. Q-Commerce businesses also need a real-time inventory management tool that will provide insights into stock levels and allow for quick reordering and redistribution of products. This will also prevent deadstock and stockouts.
DataWeave’s Food Delivery Analytics product suite helps companies to increase order volumes, understand inventory, and optimize prices. It also provides access to discounts, offers, delivery charges, inventory, and final cart value across all your competitors.
c. It’s all about stock availability & assortment
Q-Commerce in the Grocery Delivery space is excellent for specific product niches like packed or fresh foods and vegetables, drinks, gifts, cosmetics, and other CPG products that customers use every day.
The stock assortment is as important in the Food Delivery space with restaurant chains like McDonald’s or Burger King that generate as much as 75% of their sales from online orders. These businesses have to make sure they’re carrying the most in-demand product assortment there is.
Conclusion
Same Day Delivery
The rise of quick commerce represents the next big change in eCommerce, accompanied by a shift in consumer behavior towards online grocery shopping and food ordering. When positioned with proper assortment and pricing, instant delivery services can allow Q-Commerce businesses to capture the influx of consumers looking for speedy delivery. By tapping into big data from quick commerce markets, Q-Commerce businesses can gain insights into consumer demands.
If you’re a Q-Commerce business in the Food Delivery or Grocery Delivery space, reach out to our experts at DataWeave to learn how our solutions can help you understand the best Pricing Strategy, Delivery Time SLAs, Assortment Mix you need in order to successfully sell on Q-Commerce platforms.
Business has been anything but usual this holiday season, especially in the digital retail world. The holiday hustle and bustle historically seen in stores was once again occurring online, but not as anticipated given the current strength of consumer demand and the reemergence of COVID-19 limiting in-store traffic. While ‘Cyber Weekend’, Thanksgiving through Cyber Monday, continues to further its importance to retailers and brands, this year’s performance fell short of expectation due to product shortages and earlier promotions that pulled forward holiday demand.
Holiday promotions were seen beginning as early as October in order to compete with 2020 Prime Day sales, but discounting, pricing and availability took an opposite direction from usual. This shift influenced our team to get a jump start on our 2021 digital holiday analysis to assess how drastic the changes were versus 2020 activity, and to understand how much of this change has been influenced by inflationary pressures and product scarcity.
Scarcity Becomes a Reality
Our initial analysis started by reviewing year-over-year product availability and pricing changes from January through September 2021, leading up to the holiday season, as detailed in our 2021 Cyber Weekend Preliminary Insights blog. We reviewed popular holiday categories like apparel, electronics, and toys, to have a broad sense of notable trends seen consistently throughout various, applicable marketplaces. What we found was a consistent decline in product availability over the last six months compared to last year, alongside an increase in prices.
Although retailers significantly improved stock availability in November and early December 2021, even digital commerce giants like Amazon and Target were challenged to maintain consistent product availability on their website as seen below. While small in magnitude, there is also a declining trend occurring again closer toward the end of our analysis period, post Cyber Weekend, across all websites included in our analysis.
Source: Commerce Intelligence – Product Availability insights for Home & Garden, Jewelry & Watches, Clothing & Shoes, Bed N Bath, Lighting & Ceiling Fans categories
Greater Discounts, Higher Prices?
With inflation at a thirty-nine year high, retailers and manufacturers have realized they can command higher prices without impacting demand as consumers have shown their willingness to pay the price, especially when threatened by product scarcity. Our assessment is that while some products and categories have responded drastically, manufacturers’ suggested retail prices (MSRPs) have increased nearly seven percent on average from January to December 2021. MSRP adjustments are not taken lightly either, as this is an indication increased prices will be part of a longer-term shift in product strategy.
Source: Commerce Intelligence – Pricing Insights for Bed & Bath, Electronics, Furniture, Healthy & Beauty, and Fashion categories on Amazon.com & Target.com each month in 2021 comparing price increases from January 2021 base
Our 2021 pre-Cyber Weekend analysis reviewed MSRP changes for select categories (Bed & Bath, Electronics, Furniture, Healthy & Beauty, and Fashion) on Amazon and Target.com, and found around forty-eight percent of products on Amazon and thirty-five percent of products on Target.com have increased their MSRPs year-over-year, but kept pre-holiday discount percentages the same.
Looking more specifically as to what year-over-year changes occurred on Black Friday in 2021, we observed MSRPs increasing across the board for all categories at various magnitudes. This indicates why 2021 discounts appeared to be greater than or equivalent to 2020 for many categories, when in reality consumers paid a higher price than they would have in 2020 for the same items.
Source: Commerce Intelligence – MSRP Pricing Insights for Bed & Bath, Electronics, Furniture, Healthy & Beauty, and Fashion categories on Black Friday November 27th, 2021, versus average MSRP pricing for the same SKU count from November 20-26th 2021
On Amazon.com, categories like health & beauty have already increase MSRPs by a much greater percentage and magnitude versus Target.com leading up to and during Black Friday 2021, while other categories like furniture have increased MSRPs evenly on average across both retail websites. The below chart cites a few specific examples of year-over-year SKU-level MSRP, promotional price, and discount changes within found within the electronics, furniture, fashion, and health & beauty categories.
Source: Commerce Intelligence – MSRP Pricing Insights for Bed & Bath, Electronics, Furniture, Healthy & Beauty, and Fashion categories on Black Friday November 27th, 2021, versus average MSRP pricing for the same SKUs on Black Friday November 26th, 2020.
Fewer, but Deeper Discounts
From October through early November 2021, fewer products were discounted compared to this same period in 2020, and the few that were saw much deeper discounts apart from the home improvement category. The most extreme example we saw in discounts offered was within furniture where only three percent of SKUs were on discount in 2021 compared to twenty-six percent in 2020. Interestingly, the magnitude of discount was also higher pre-Cyber Weekend 2021 versus 2020, but this trend was not exclusive to furniture and was also seen within electronics, health & beauty, and home improvement.
Source: Commerce Intelligence – Pricing Insights for Bed & Bath, Electronics, Furniture, Healthy & Beauty, and Fashion categories on Amazon.com & Target.com Pre-Black Friday average selling price during November 20-26th 2021 versus average selling price from November 13-19th 2021 compared to Pre-Black Friday average selling price during November 19-25th 2020 versus average selling price from November 12-18th, 2020.
Within the furniture category, the subcategories offering the greatest number of SKUs with price decreases on Black Friday 2021 were rugs by a wide margin, followed by cabinets, bed and bath, and entertainment units, but the magnitude of discounts offered were all under twenty percent.
Source: Commerce Intelligence – Pricing Insights for Bed & Bath, Electronics, Furniture, Healthy & Beauty, and Fashion categories on Amazon.com and Target.com on Black Friday November 27th, 2021, versus average pricing for the same SKUs from Pre-Black Friday November 20-26th 2021 and Black Friday November 26th, 2020, versus average pricing for the same SKUs from Pre-Black Friday November 19th-25th 2020
Accounting for this phenomenon could have been retailers’ attempts to clear inventory for SKUs which hadn’t sold even during the period of severe supply chain shortages. With more products selling at higher prices this year, retailers were also able to use fewer SKUs with greater discounts to attract buyer in hopes of filling their digital baskets with more full-priced goods, helping to protect margins heading in to Cyber Weekend. Scarcity threats also encouraged consumers to buy early, even when not on promotion, to ensure they would have gifts in time for the holidays.
The same trends seen pre-Cyber Weekend 2021 were also seen on Black Friday with a year-over-year decrease in the percentage of SKUs offered on discount versus 2020, and steeper price reductions for the discounted products which can also be attributed to the increase in MSRPs.
Source: Commerce Intelligence – Pricing Insights for Bed & Bath, Electronics, Furniture, Healthy & Beauty, and Fashion categories on Amazon.com and Target.com on Black Friday November 27th, 2021, versus average pricing for the same SKUs from Pre-Black Friday November 20-26th 2021 and Black Friday November 26th, 2020, versus average pricing for the same SKUs from Pre-Black Friday November 19th-25th 2020
2021 Black Friday Price Increases?
We all know Black Friday is all about price reductions, discounts and deals and so it’s rare to see actual price increases, yet for Black Friday 2021, trends ran counter to this. We observed price increases across all categories for around thirteen to nineteen percent of SKUs, with an average price increase of around fifteen percent in 2021 versus an average of only two percent in 2020.
Source: Commerce Intelligence – Pricing Insights for Bed & Bath, Electronics, Furniture, Healthy & Beauty, and Fashion categories on Amazon.com and Target.com on Black Friday November 27th, 2021, versus pricing for the same SKUs from Pre-Black Friday November 20-26th 2021 and Black Friday November 26th, 2020, versus average pricing for the same SKUs from Pre-Black Friday November 19th-25th 2020
At an account level, we noticed a few interesting differences happening on Black Friday 2021 versus 2020 regarding category price changes. On Target.com, almost ninety percent of the bed and bath SKUs analyzed had a price change on Black Friday in 2021 versus 2020 with eighty-two percent presenting a higher price year-over-year versus only around seven percent showing a decrease, where on Amazon nearly forty-four percent of bed and bath SKUs showed an increase in price and around thirty-eight percent showed a decrease. Except for the health and beauty category on Target.com, more than half of the SKUs in each category saw a price increase on Black Friday versus a price decrease.
Source: Commerce Intelligence – Pricing Insights for Bed & Bath, Electronics, Furniture, Healthy & Beauty, and Fashion categories on Amazon.com and Target.com on Black Friday November 27th, 2021, versus average pricing for the same SKUs on Black Friday November 26th, 2020.
The magnitude of year-over-year price changes seen on Black Friday 2021 was significant across all categories, but the magnitude of price increases found on Amazon.com within the health and beauty category outpaced the rest by far. We reviewed three hundred and sixty-five SKUs on Amazon.com within the health & beauty category and saw almost eighty-three percent of them had a price change with around thirty-one percent decreasing prices and around fifty-two percent increasing prices. This means that within the health & beauty category on Amazon.com, more than fifty percent of the SKUs tracked were sold at a one hundred and seventy-six percent higher price on average during Black Friday 2021 versus 2020.
Source: Commerce Intelligence – Pricing Insights for Bed & Bath, Electronics, Furniture, Healthy & Beauty, and Fashion categories on Amazon.com and Target.com on Black Friday November 27th, 2021, versus average pricing for the same SKUs on Black Friday November 26th, 2020.
The subcategories offering the greatest number of SKUs with price increases on Black Friday 2021 were cameras, followed by men’s fragrances, laptops, and desktops & accessories, but the magnitude of discounts offered were all under ten percent.
Source: Commerce Intelligence – Pricing Insights for Bed & Bath, Electronics, Furniture, Healthy & Beauty, and Fashion categories on Amazon.com and Target.com on Black Friday November 27th, 2021, versus pricing for the same SKUs from Pre-Black Friday November 20-26th 2021 and Black Friday November 26th, 2020, versus average pricing for the same SKUs from Pre-Black Friday November 19th-25th 2020
The Aftermath Post-2021 Cyber Weekend
Extending this analysis beyond the holiday weekend, we analyzed price change activity from December third through the ninth across the top US retailers (chart below) and found that price decreases have been very minimal, comparatively speaking. Though there was a spike in number of price decreases from December 8th to the 9th, the percentage of SKUs with price decreases was still very low (less than three percent). We anticipate this trend will continue into 2022.
Source: Commerce Intelligence – Pricing insights for Home & Garden, Jewelry & Watches, Clothing & Shoes, Bed N Bath, Lighting & Ceiling Fans categories
A Sign of Things to Come
A confluence of inflationary trends, product shortages and consumer liquidity have driven many marketplace changes to occur simultaneously. Government programs in the form of stimulus checks, have put extra money in consumers’ hands, and so they’ve been more willing to spend. That, coupled with the shock in the supply chain, has motivated people to buy far ahead of the 2021 holiday season. Hence, retailers have needed to rely much less on across-the-board discounts. Promotions have been more strategic – we’ve seen deeper discounts over fewer products, likely used to draw consumers in to buy certain items, and once they’re there, customers are buying everything else at a non-discount level. When these factors once again normalize, we could see a return to the “race to the bottom” that has occurred since the financial crisis of 2008-2009, but for once, retailers may be able to maintain some pricing power as the 2021 holiday shopping season played out.
Even though performance was not as anticipated and holiday sales did not grow as rapidly as they did in 2020, Cyber Monday was still the greatest online shopping day in 2021. Through it all, retailers managed to keep their digital shelves stocked and orders filled in time for the holidays for the most part, running the risk of housing aged inventory if goods didn’t arrive in time. Despite predictions for steep promotions in January 2022, with supply chains still challenged and inflationary pressures still full steam ahead, we don’t anticipate much in the way of enhanced discounts to continue beyond the holidays.
Access to these types of real-time digital marketplace insights can enable retailers and brands to make strategic decisions like how and when to address inflationary pressures, while also supporting many other day-to-day operations and help drive profitable growth in an intensifying competitive environment. Continue to follow us in the coming weeks for a detailed 2021 year-end review across more retailers and categories. Be sure to reach out to our Retail Analytics experts for access to more details regarding the above analysis.
When it comes to classifying and analyzing images, humans can easily recognize distinct features of objects and associate them with individual definitions. However, visual recognition is a highly complex task for machines because it involves identifying multiple objects and finding object relationships. Image recognition has been a long-standing research problem in the computer vision field. But, the recent development in AI has improved the process of object detection, image identification, and image classification. The image recognition market is assumed to rise globally to a market size of $42.2 billion by 2022. Various industries are adopting image recognition technology to improve augmented reality applications, optimize medical imagery, boost driverless car technology, predict consumer behavior, and much more.
Although image recognition is a relatively new aspect of analysis, it is also making its way into eCommerce. Image recognition is helping retailers to expand consumer reach, offer insights into trends, and improve customers’ online shopping experience for the eCommerce industry. The Global Image Recognition in Retail Market is estimated to be USD 1.8 Bn in 2021 and is expected to reach USD 4.5 Bn by 2026, growing at a CAGR of 20%.
Global Image Recognition in Retail Market
In this blog, you’ll learn about image recognition technology and its importance in the retail industry.
What is Image Recognition?
Image recognition, a subcategory of computer vision, is a technology that can identify objects, entities, or attributes in digital images or videos. However, computer vision is a broader term, including methods for gathering, processing, and analyzing data from the real world. Image recognition can be performed at varying degrees of accuracy, depending on the type of information required.
Image recognition can perform the following tasks:
Classification: It identifies the “class,” i.e., the category to which an image belongs. A picture can have only one class.
Tagging: It’s a classification task but involves a higher degree of accuracy. Tagging can recognize several concepts or objects within an image, and there can be more than one tag assigned to a particular image.
Detection and localization: This step helps locate object(s) in an image. Once the system locates the object in question, localization helps to place a bounding box around it.
Segmentation: This is also a detection task but involves a higher degree of precision. Segmentation locates element(s) to the nearest pixel in an image.
Instance segmentation: It helps differentiate multiple objects belonging to the same class.
Image Recognition in eCommerce and how it works
Nowadays, increasing competition and customer expectations are forcing online retailers to constantly monitor market dynamics wrt their pricing, promotion & product assortment in order to stay competitive. To get these insights, retailers need to match and compare their products against their competitors to see where the gaps are. That’s where product matching comes in.
Product matching refers to finding the same or similar products against a target universe of products from across the web, across multiple competing retailers. Product matching uses AI-based image recognition to determine product attributes, find patterns, and detect text, product price, shipping information, and so on.
Image recognition use-cases in the retail industry
a. Attribute tagging
Attribute Tagging
Getting shoppers to your eCommerce platform is one thing and getting them to complete a purchase is a steeper hill to climb. If your platform can’t provide search results that match with customers’ requirements, they’ll get lost, grow frustrated, and drop off. Attribute tagging with image recognition allows eCommerce stores to automatically generate attributes for all products so customers can quickly find products they are looking for.
Tags allow users to filter products based on the categories they want to explore. Product tags include everything the customer might specifically search for — color, type, size, brand, use, design, fabric, discount, etc. For example, a dress could have tags like red, evening, midi, summer, long-sleeve, silk, summer sale, etc. When a user looks for midi dresses or long-sleeve dresses, products with these tags will show up.
b. Search by image
Visual Search
Visual Search allows users to look for similar products using a reference image from their camera roll or downloaded from the internet. The visual search feature also enables eCommerce businesses to implement image-based search into their software applications. It maximizes the searchable potential of their visual data.
Meanwhile, Gartner predicts a 30% increase in digital commerce revenue by 2021 for companies who start supporting visual and voice search on their websites and apps. The benefits of visual search include more personalized, easy product recommendations and enhanced product discovery.
c. Fashion trend analysis
Similarity Matching
Tapping into trending product categories is a goldmine for any eCommerce business. Having insights into trending categories and products means less competition on search engines, fewer ads, and intelligent pricing. All of which can boost any retailer’s margins. Image recognition technology provides information about colors, styling techniques, fabric textures, prints, and more to spark consumer demand. It works by scanning social media images to pinpoint trending attributes and predict fashion trends. For instance, while scanning images, technology understands that it’s seeing a photo of a color-blocked sweatshirt because it recognizes the product has a hooded neck, full sleeves, blocks of different colors, and even the type of fabric. This technology can analyze millions of images, helping retailers analyze the volume of color-blocked sweatshirts.
We do this seamlessly at DataWeave. Our similarity matching solution helps retailers gather insights into attributes for products similar to the ones they’re carrying on their site. Similarity matching helps retailers gain visibility into their entire competitive landscape to keep their e-commerce strategy responsive to price & product assortment shifts among consumers and rivals
d. Augmented reality
According to Statista, the AR market is valued at $9.5 billion, with around 810 million active mobile users. Since shoppers want the full sensory product experience before shopping online, augmented reality (AR) can help them understand what they’re buying and how the product will work for them. There are AR applications for trying makeup, clothing, accessories, and even eyeglasses. IKEA was one of the pioneers in using AR for eCommerce retail. In 2017, IKEA launched the Place app, allowing shoppers to see how thousands of items will look in their homes, with 98% accuracy.
Image recognition helps AR applications anchor virtual content with the real world. For instance, Sephora has a Virtual Artist that allows users to try different makeup looks and even take pictures of an outfit they’re planning to wear to match the shade. Users can even check out full-face looks and learn how to do their makeup with virtual tutorials.
e. Counterfeit Detection
Counterfeit Detection
Another application of image recognition that has proven to be very successful is counterfeit product detection. It has become increasingly difficult for brands and retailers to find and eliminate fake items on eCommerce sites. U.S. Customs seized over 13,500 counterfeit goods worth $30 Million in November 2021, indicating how brands and online marketplaces have struggled in the past to find an effective solution.
Essentially, image recognition technology allows eCommerce sites to detect products with fake logos and designs attempting to sell as legitimate brands by capturing discrepancies in images and content. The system flags and delists the products and sellers when a fake is detected.
Visual content plays a vital role in eCommerce sites, especially when it comes to product photos and videos. Today, branded visual content isn’t as effective as it’s one-dimensional. As a matter of fact, 93% of marketers agree that customers trust user-generated content more than content produced by brands. However, user-generated content that features product images or videos is way more exciting, realistic, and creative. It gives customers an appealing view of products being used in real life.
The most common form of UGC, i.e., reviews and ratings, have been the key for eCommerce brands as they are quantitative and qualitative metrics about a product/service quality, worth, value, reliability, etc. With image recognition, retailers can access insights into strengths and gaps in all product offerings by understanding what consumers are saying about them.
Because of its massive influence, image recognition technology is becoming widely adopted by eCommerce companies. It benefits both retailers and customers. Image recognition based on deep learning can provide retailers with helpful capacities like customer analytics, counterfeit detection, personalized searches, and more. Retailers can also use the data gathered from image recognition eCommerce technology to design effective marketing campaigns and improve their ROI.
With super sharp image recognition capabilities, DataWeave offers 90% accuracy in matching eCommerce products, allowing us to provide comprehensive and precise insights into pricing and assortments. Sign up for a demo with our team to know more.
Traditionally, retailers have staged multiple promotions between Black Friday and before Christmas Day to keep consumers excited about holiday shopping, so it’s easy to see why one more promotional day might fall into relative obscurity. As if ‘Early Start’ offers to Black Friday and extended ‘Cyber Weekend’ promotions weren’t enough to plan for, eBay added another day into the mix called ‘Green Monday’, much to the benefit of consumers, as it furthers the window of opportunity to secure a bargain during the holiday season.
Green Monday falls on the second Monday of December and has historically been one of the greatest sales days of the year for eBay, often attracting last-minute shoppers or those searching for last-minute deals. However, because of the 2021 Global Shipping Crisis, there is speculation that Green Monday may be the last chance this year to have items delivered in time for Christmas. For this reason, we believe it could turn into quite a fruitful event for participating retailers if it encourages procrastinating shoppers that traditionally spend closer to December 25th to buy earlier in the season.
This isn’t the first year retailers outside of eBay have offered Green Monday promotions, however. Our team has been actively monitoring activity on this day from 2017 through present, to not only assess which retailers participate in the event, but also to understand how the discounts may change surrounding the event. The categories monitored include Apparel (Clothing, Shoes & Jewelry), Bed and Bath, and Home and Garden, and we’ve identified products offered on discount by comparing each applicable product’s price on Green Monday versus the most commonly seen price for the product offered throughout the month of December.
Better Promotions Than Boxing Day
Taking a closer look at 2020 Green Monday discounts within the categories and retailers analyzed, apart from Wayfair.com, we see all offered more SKUs on discount on Green Monday versus the days leading up to and out of the event. Kohls.com led the pack with around 93% of SKUs offered on discount, followed by Macys.com with 95%, and Wayfair.com with 83%. Overall, the number of SKUs on discount on Green Monday were greater than the SKUs offered on discount on Boxing Day, which is traditionally known as a great day to bargain shop.
Source: DataWeave Commerce Intelligence – Promotional Insights tracking Apparel, Bed & Bath, and Home & Garden category product’s online price on Green Monday 2020 in the US versus regular prices for the same products in the month of December each year.
What’s in Store for Green Monday 2021?
The insights we’ve tracked over the last four years have not indicated any signs to an end for Green Monday any time soon. As we see it, for consumers it is an extremely convenient time to order holiday gifts, and for retailers it is a good time to build brand trust and loyalty by fulfilling last minute orders at a great value, in time for the holidays.
Our prediction for the categories analyzed is to expect to see more retailers participate in Green Monday 2021 to a greater degree (more SKUs on sale and enhanced promotions). For retailers in this analysis, we would anticipate HomeDepot.com to enhance the number of offers to match 2020 competitive activity, and for Wayfair.com to look at increasing the number of offers on Green Monday versus the period leading into the event.
If you are interested in learning more about the details behind this analysis or our Promotional Insights solution, be sure to contact us. We can help you evaluate the effectiveness of your holiday promotional spend with access to near real-time marketplace insights on the brands, categories, and products your rivals promote, including discounts, campaign frequency and duration and more.
To make faster, seamless deliveries possible, brands need to tighten their supply chain. The pandemic has put a lot of stress on the global supply chain. The supply shock that began in China in February and the demand shock that followed as the global economy shut down uncovered weaknesses in production strategies and supply chains. Temporary trade restrictions and shortages of pharmaceuticals, critical medical supplies, and other products, further added to the problem.
As a consequence of all this, brands have to reduce or even eliminate their dependence on sources that are perceived as risky and rethink their use of lean manufacturing strategies that involve minimizing the amount of inventory held in their global supply chains. In the post-pandemic world, the supply chain will take center stage, and managing it efficiently with technical support is going to be what gives one brand an upper hand over the others.
1. Micro fulfillment is emerging as the need of the hour
Emerging Micro Fulfillment
Retailers are now faced with unprecedented omnichannel fulfillment complexities. Not only do customers expect faster order fulfillment and delivery, but they’re also opting to ‘buy online and pick up in-store (BOPIS)’ or ‘click-and-collect’. Amazon has spent billions of dollars on building its shipping infrastructure, including its existing operating 175+ fulfillment centers across the world and investing nearly $1.5 Bn to build an air hub in the US. Walmart, on the other hand, is relying on its existing footprint across 5000+ US stores to help deliver online orders faster.
All this is hinting towards micro-fulfillment emerging as a strategy retailers are using to make the fulfillment process more efficient and their supply chain more ready — from receiving an online order to packing it and offering last-mile delivery. This approach will certainly work towards imparting speed to localized, in-store pick-up and combine it with the efficiency of large, automated warehouses. Delivery speed and costs are more important than ever to retain customers and foster brand loyalty. In fact, this will become a big differentiator for grocery e-commerce as the number of people making online grocery purchases has increased drastically the world over and a recent report indicated that in the US, 46% of people use online delivery more now than before the COVID crisis, and 40% use online pickup more.
2. Use big data to tie-in loose nodes
Supply chain management is held at the heart of every successful e-commerce company. Supply Chain efficiency always ensures that the right product reaches the right place at the right time. It ensures cost reduction and enhancement of cash utilization. That is why it is important to stay alert and tie-in all loose ends in the supply chain architecture. Big data can come in handy here and it is that quantitative method and structure that can be used to improve decision-making for all activities across the supply chain. While the role of big data is extremely exhaustive and full-pronged across the entire supply chain design, it is important to understand it in theory in a simplified way so that brands can incorporate it to make their backend operations seamless.
Big data is all about real-time analytics and it primarily does two very important things in making supply chain management easy
It expands the dataset for analysis beyond the traditional internal data held on Enterprise Resource Planning (ERP) and supply chain management (SCM) systems.
Big data apply powerful statistical methods to both new and existing data sources. This helps give structure to new insights. This in turn allows forecasting and helps improve supply chain decision-making capabilities for your brand, all the way from the improvement of front-line operations, to strategic choices such as the selection of the right supply chain operating models.
3. Improve ROI by introducing automation to the mix
Introducing Automation to Improve ROI
Introducing automation will help take care of tasks usually done manually, such as placing orders, processing changes, data entry, and much more. This frees up time and cuts down on human errors leading to error-free, faster processes. Adidas for instance has been able to reduce 60% of its operational supply chain costs just by switching to end-to-end automation. The largest sportswear manufacturer used automation across 400 factories by bringing in standardized, reusable processes to deliver the best results in a cost-effective way across the supply chain, marketing, finance, retail, and eCommerce. On the supply chain part, with automation, the brand was able to globally attend to supply chain service desk management, vendor onboarding, PO change management, Contract form approval, product data verification, and other such tasks in real-time. This highly successful initiative helped the brand save a lot of time, it earlier lost in manually attending to internal processes and reduced the time to market for Adidas by two-thirds. Moreover, automating systems helps cut down slacks and in return allows the supply chain to stay agile and alert for any unforeseen situations. This readiness further boosts the framework towards growth.
4. Eye the future and introduce robotics
Robotics is the next big thing in Future
Autonomous technology is not the next big thing of the future but is the most important thing at present defining the face of the supply chain. Autonomous robots are expected to see strong growth over the next five years. In fact, according to the Boston Consulting Group (BCG),the global robotics market is estimated to reach USD 87 Billion by 2025. It is believed that more than half of this will be allocated for the retail market. In fact, it is not uncommon to find giant beetle-like robots moving around busily with vertical shelves stacked on them inside Amazon’s warehouse in southern New Jersey, US. Tesco for instance uses Radio Frequency Identification (RFID) robots who are used to scan inventories for entire stores in just an hour (as against seven hours for a store employee) with far fewer errors.
Even though every word of this sounds too futuristic to be believable, this is the reality for now and retailers are beginning to realize that innovation must set in holistically and extend far beyond just the warehouse or supply chain.Autonomous mobile robots (AMRs) are fast becoming commonplace in warehouses, helping warehouse workers to fulfill orders quickly and efficiently. There are a few different types of robots that companies are considering, and each has its own unique set of advantages. AMRs in totality enable workers to be more productive due to constant collaboration and promote agility, cutting down on slacks and errors.
A cohesive and well-defined supply chain where you can leave enough room for tweaks in the future owing to evolving trends will surely help you gain an edge over your competitors through the entire lifecycle of your product. Getting a grip over the supply chain is necessary now as, by 2025, many supply chains may shift from global flows of goods and services to national, regional, and local networks of buyers and suppliers. So, integrating the supply chain keeping an eye on the global and local is the real deal!
The explosive growth of online shopping has forced brands to re-examine their e-commerce processes to stay competitive and profitable. In particular, out-of-stocks are a common, costly retail challenge, as product shortages frustrate online shoppers – and even prompt them to leave brands.
According to McKinsey & Company, forty-eight percent of consumers switched to a different brand in 2020 because those products were in stock. Among these consumers, seventy-three percent plan to keep using the new brands, linking product availability gaps to the erosion of sales and loyalty. Conversely, brands with effective inventory planning and replenishment can keep items in stock, drive sales and improve the customer experience.
Retailers like Walmart, collaborating with these brands to meet customer demand, are still facing inventory challenges but, as noted in 2021 Q3 earnings, inventory was up almost twelve percent year-over-year as they worked to stay ahead of increased holiday demand. They have also adjusted in-store operations to accommodate ever-growing e-commerce demands, especially within grocery-centric categories, as digital grocery buyers now amount to more than half the U.S. population.
Maximizing Conversions with Category Insights
Walmart’s dot-com strategy is paying off in spades, considering they surpassed Amazon as the leading U.S. grocery e-commerce retailer in 2020 and grew another forty-one percent in Q3, 2021. Our team has been actively tracking digital shelf analytic KPIs on Walmart.com to identify inventory and promotional performance improvement opportunities at a category level to support brands in capitalizing on these digital growth opportunities.
The latest analysis is summarized below, reviewing average category availability and discount trends occurring each week of the month, from May to August 2021, at a category level. A recent report found the 29th of each month to be the busiest day for online sales because consumers often get paid at the end of the month, which made DataWeave analysts wonder:
Which categories are maximizing their growth potential on Walmart.com and where are the greatest opportunities for improvement during periods of increased demand?
How do increased demand periods (like payday) impact category online availability?
Are category promotions offered at the right times throughout the month to best support demand?
When Seasonal Demand for Groceries and Payday Merge
Across all Walmart.com food categories tracked, Week 5 – where payday commonly falls for most consumers, had the lowest average product availability, while Week 4 had the highest average product availability for all categories except Deli and Fruits and Vegetables. These findings may inspire Walmart’s brand partners to rethink their inventory and assortment planning, replenishment and even pricing efforts to maintain a healthy stock closer toward the end of the month to match higher demand.
The categories with the greatest difference in average availability during Week 5 versus the rest of the month were Snacks & Candy, Beverages and Alcohol, indicating consumers consistently made these types of purchases closest to payday, when income was highest throughout the month. Seasonality is a secondary factor that influenced demand for these items given events like Memorial Day, Fourth of July, Summer Break, and Back-to-School shopping all took place during our analysis. Additionally, most holidays overlapped payday, which also furthered Week 5 demand.
Source: DataWeave Digital Shelf Analytics for Brands – Category average availability percentages from May to August 2021 between Week 1 (the 1st to the 7th day of the month) and Week 5 (the 29th, 30th and 31st day of the month).
Coupling availability with discounts allows us to consider whether consumers buy more in Week 5 due to high discounts or increased purchasing power, or both. In reviewing the average category discounts offered within the same grocery-centric categories analyzed above, we found almost every grocery category showed a higher discount in Week 5 compared to the rest of the month, except for Bread & Bakery and Alcohol.
Source: DataWeave Digital Shelf Analytics for Brands – Category average discount percentages from May to August 2021 between Week 1 (the 1st to the 7th day of the month) and Week 5 (the 29th, 30th and 31st day of the month).
Regarding Alcohol, during Week 4, when average availability was the highest, the average discounts offered were the lowest. This can indicate inventory was primed for payday shoppers (and the holidays of course). Bread & Bakery offers the greatest average discounts when inventory levels are lowest on average, indicating Week 3 is a great time to stock up, while Week 4 might be a great time to buy the freshest inventory.
The greatest average discounts in Week 5 were in Snacks & Candy, Pantry and Fruits & Vegetables. Deeper discounts for Snacks & Candy in Week 5 may have helped brands compete for consumers’ disposable income despite being a discretionary category. Pantry brands’ discounts may have reflected a need to compete for shoppers’ attention. During this period, consumers were out of the house more and less likely to use these grocery staples compared to earlier lockdown periods and cooler months.
Making Specialty Categories and Health a Priority for Online Shoppers
Interestingly, the only two categories where inventory was higher in Week 5 versus all other weeks each month were ‘Special Diets’ foods and ‘Summer Flavors’, although ‘Special Diets’ foods consistently maintained the lowest level of average availability each week across all food categories analyzed. This consistent lack of inventory could indicate a great opportunity for brands to increase inventory for dietary products sold on Walmart.com.
Source: DataWeave Digital Shelf Analytics for Brands – Category average availability percentages from May to August 2021 between Week 1 (the 1st to the 7th day of the month) and Week 5 (the 29th, 30th and 31st day of the month).
The average availability for ‘Summer Flavors’ foods verifies brands are maintaining a solid replenishment strategy for these seasonal items, and a high likelihood consumers will happily find what they need to plan their Summer gatherings on Walmart.com. One alarming factor we found was the change in average discounts offered during Week 5 versus Weeks 1 through 4, indicating promotions surrounding payday may be driving sales volume versus organic demand.
Source: DataWeave Digital Shelf Analytics for Brands – Category average discount percentages from May to August 2021 between Week 1 (the 1st to the 7th day of the month) and Week 5 (the 29th, 30th and 31st day of the month).
Digital Growth Opportunity in Meal Kits and Kids’ Meals
Two categories primed for growth, according to Statista, are meal kits and kids’ food and beverages. Their research indicates retail sales for kids’ food has grown steadily year-over-year since 2013, and a recent report also indicates meal kit sales are expected to more than double 2017 sales in 2022, reaching $11.6 billion in the U.S., spurred by pandemic-induced demand. A concerning find in our research indicates both categories, ‘Easy Meal Solutions’ and ‘Kid Friendly Foods’ on Walmart.com, showed great volatility when it comes to in-stock availability. For example, in Week 1, ‘Easy Meal Solutions’ had an average availability nearly half the average of the rest of the month (around nineteen percent versus nearly thirty-eight percent), and in Week 5, payday week, ‘Kid Friendly Foods’ saw the biggest drop in average availability compared to Weeks 1 through 4 (over sixty-seven percent versus seventy-five percent) indicating supply may not be keeping up with the heightened demand.
Source: DataWeave Digital Shelf Analytics for Brands – Category average availability percentages from May to August 2021 between Week 1 (the 1st to the 7th day of the month) and Week 5 (the 29th, 30th and 31st day of the month).
The heightened average discounts offered during Week 5 for ‘Baby’ and ‘Pets’ items indicate two categories consumers will most likely stock up on during payday.
Source: DataWeave Digital Shelf Analytics for Brands – Category average discount percentages from May to August 2021 between Week 1 (the 1st to the 7th day of the month) and Week 5 (the 29th, 30th and 31st day of the month).
Back to School Stock-Outs
U.S. retail sales unexpectedly increased in August, likely boosted by back-to-school shopping and child tax credit payments. Meanwhile, product shortages and other supply chain issues slowed 2021’s back-to-school sales, possibly affecting school supplies’ and clothing availability on Walmart.com. According to our analysis, the average product availability in Walmart.com’s school supplies category fell from over sixty-two percent during Weeks 1 through 4 to nearly forty-two percent in Week 5.
Warmer weather, seasonal events, reduced lockdowns, and vaccination efforts led more Americans to resume in-person socializing, giving reason to update their spring and summer wardrobes. In July, Forbes shared that three-quarters of shoppers are purchasing apparel, accessories and shoes the most. On average, only around sixty-three percent of clothing items were available on Walmart.com during Weeks 1 through 4. However, in Week 5, that figure plummeted to just over thirty-eight percent, the most significant drop among all categories.
Source: DataWeave Digital Shelf Analytics for Brands – Category average availability percentages from May to August 2021 between Week 1 (the 1st to the 7th day of the month) and Week 5 (the 29th, 30th and 31st day of the month).
Demand for new fashion remained high throughout this period, seemingly fueled organically, as only moderate additional discounts took place in Week 5, and although the average discount on school supplies was only around twenty-seven percent during Weeks 1 through 4, it surged to just over forty-seven percent in Week 5. Generous additional discounts in Week 5 may have inspired online shoppers to shift spending from clothing to school supplies in late July and August ahead of students’ return to the classroom.
Source: DataWeave Digital Shelf Analytics for Brands – Category average discount percentages from May to August 2021 between Week 1 (the 1st to the 7th day of the month) and Week 5 (the 29th, 30th and 31st day of the month).
Prioritizing Product Availability with Digital Advertising Strategies
Seventy-eight percent of B2C marketers increased their 2021 digital advertising spend to fuel online product discoverability (Share of Search), and sales and market share, but out-of-stock experiences simultaneously surged 172% this year from pre-pandemic levels. Paying for ads that drive traffic to your out-of-stock products can be as detrimental to your brand as a bad user experience. Our review of the ‘Featured Products’ sold on Walmart.com show consistent, low-levels of product availability each week throughout the months reviewed.
Source: DataWeave Digital Shelf Analytics for Brands – Category average availability percentages from May to August 2021 between Week 1 (the 1st to the 7th day of the month) and Week 5 (the 29th, 30th and 31st day of the month).
Additionally, the average discount offered on these products tended to be higher than most other categories reviewed, indicating brands participating in the featured product section of the website were not only investing in digital ads, but also doubling down with promotional activity as well.
Source: DataWeave Digital Shelf Analytics for Brands – Category average discount percentages from May to August 2021 between Week 1 (the 1st to the 7th day of the month) and Week 5 (the 29th, 30th and 31st day of the month).
How Brands can Replenish Their Digital Shelf
It is well known just how important it is to have products available during the right time of day, week, month, or season to improve customer satisfaction rates, but with your e-commerce store open 24/7 and omnichannel fulfillment strategies in place, it drastically changes the way in which strategic execution is prioritized for a retailer to reduce basket abandonment and for brands to build loyalty.
Our greatest takeaway from this analysis is realizing how crucial it is for brands to proactively track product availability and competitive pricing insights to stay ahead of the curve and achieve their digital growth goals. Early visibility to stock replenishment could help brands align with heightened cyclical and seasonal demand to avoid out-of-stocks and grow e-commerce sales.
This is why more leading brands now rely on our Digital Shelf Analytics solutions, including Pricing and Availability insights, to keep eCommerce planning agile, to maximize online conversions, and ultimately maintain shopper satisfaction and loyalty.
The 2020 global health crisis sped up the adoption of omnichannel shopping and fulfillment. Consumers spent $791.70 billion online with U.S. merchants in 2020, a 32.4% rise compared to 2019. To keep up with this digital shift, offline businesses have substantially moved investments to online infrastructures for everything from e-commerce platforms, product recommendations, inventory management, and communications. AI tools for eCommerce have played a major role in helping businesses in the digital shift.
However, the benefits of setting up e-commerce stores are potentially outweighed by the increased costs. As markets transition to online retailers, they must learn to efficiently collect, secure, and analyze data coming in from multiple sources. Strategically approaching the data problem with artificial intelligence (AI) can help better serve customers, gain a competitive advantage, and drive loyalty.
In this blog, you will learn about seven data and AI tools for eCommerce businesses:
Seven Data and AI tools for eCommerce businesses
1. Data Warehouse
Data is the one advantage that eCommerce merchants and marketers have over brick and mortar retailers. When buyers are from the internet, eCommerce retailers can collect data and measure almost every aspect of their interactions. However, that advantage is worthless unless there is a system to make sense of the data they collect. Companies assume that they have a sound system in place. But, what they have is a network of silos. In such a system, data sticks to different platforms like Google Analytics, Shopify, or Klaviyo and can’t move to deliver valuable insights. Funneling all your data into a single location for your eCommerce stores is the right way to go. Data warehouses centralize and merge a plethora of data from various sources, helping organizations to derive valuable business insights and improve decision-making.
Data Warehouses support real-time analytics and ML operations quickly & are designed to enable and support business intelligence (BI) activities like performing queries and analysis on a colossal amount of data. Data could range from customer-related data, product or pricing data, or even competitor data.
A data lake is a centralized repository that can store structured and unstructured data at any scale. Companies don’t have to provide a schema to the data before storing it, but they still can run different analytics and ML-related operations. However, it takes more time to refine the raw data and then analyze or create ML models for predictions.
An Aberdeen survey saw businesses implementing a Data Lake outperforming similar companies by 9% in organic revenue growth. The organizations that implemented Data Lake could perform various analytics over additional data from social media, click-streams, websites, etc. A Data Lake allows for the democratization of data and the versatility of storing multi-structured data from diverse sources, improving insights and business growth.
eCommerce businesses can collect competitors’ data in data lakes like their popular products, categories, landing pages, and ads. Analyzing competitors’ data helps retailers price their products correctly, helps with product matching, historical trend analysis, and much more. However, data lakes can also be used to store consumer data such as who they are, what they purchase, how much they spend on average, and how they interact with a company. Successful retailers leverage both competitor and consumer data to understand their consumers better, what brands to carry, how to price each product, and what categories to expand or contract. Retailers also store identity data such as a person’s name, contact information, gender, email address, and social media profiles. Other types of data stored are website visits, purchase patterns, email opens, usage rates, and behavioral data.
The major challenge with a data lake architecture is that it stores raw data with no oversight of the contents. Without elements like a defined mechanism to catalog and secure data, data cannot be found, or trusted resulting in a “data swamp.” Consequently, companies need teams of data engineers to clean data for data scientists or analysts to generate insights. This not only increases the turnaround time of gaining valuable information but also increases operational costs.
However, you can rely on platforms like DataWeave that stores competitor pricing & assortment information at a centralized location. You can leverage intelligently designed dashboards to get real-time insights into the collected data and make data-driven decisions without the need for storing, cleaning, and transforming the data.
3. Data Ingestion & ETL
To churn out better insights, businesses need access to all data sources. An incomplete picture of data can cause spurious analytic conclusions, misleading reports and inhibit decision-making. As a result, to correlate data from multiple sources, data must be in a centralized location—a data warehouse or a data lake. However, extracting and storing information into these systems require data engineers who can implement techniques like data ingestion and ETL.
While data ingestion focuses on getting data into data lakes, ETL focuses on transforming data into well-defined rigid structures optimized and storing it into a data warehouse for better analytics workflows. Both processes allow for the transportation of data from various sources to a storage medium that an organization can access, use, and analyze. The destination can be a data warehouse in the case of ETL and a data lake in case of data ingestion. Sources can be almost anything from in-house apps, websites, SaaS data, databases, spreadsheets, or anywhere on the internet.
Data ingestion & ETL are the backbones of any analytics/AI architecture since these processes provide consistent and convenient data, respectively.
4. Programming languages
Programming languages are tools used by programmers to write instructions for computers to follow since they “think” in binary—strings of 1s and 0s. It serves as a bridge that allows humans to translate instructions into a language that computers can understand. Some common and highly used programming languages for building AI models are Python and R.
While Python is the most widely used language for training and testing models, R is mostly embraced for visualizations and statistical analysis. However, to productize the ML models, you would require Java programming language so that models can be integrated with your websites to provide recommendations.
5. Libraries/AI frameworks
An AI framework is a structure that acts as a starting point for companies or developers to add higher-level functionality and build advanced AI software. A framework serves as a foundation, ensuring that developers aren’t starting entirely from scratch.
Using AI frameworks like TensorFlow, Theano, PyTorch, and more saves time and reduces the risk of errors while building complex deep learning models. Libraries and AI frameworks also assist in building a more secure and clean code. They future aid developers in simpler testing and debugging.
Various open-source frameworks in the market also come with pre-trained models for specific use cases. Organizations can leverage off-the-shelf models and tweak with existing data to enhance the accuracy of the predictions.
6. IDE & Notebooks tools
IDE or Integrated Development Environment is a coding tool that allows developers to write and test their code more efficiently. However, notebooks are one of the most popular AI tools for organizations to execute analysis and other machine learning tasks. It offers more flexibility over IDEs in terms of exploratory analysis.
All the features, including auto-complete, that IDEs or notebooks offer are beneficial for development as they make coding more comfortable. IDEs/Notebooks increase developers’ productivity by combining common software activities into a single application: building executables, editing code, and debugging.
7. Analytics tools
Data Analysis transforms raw data into valuable statistics, insights, and explanations to help companies make data-driven business decisions. Data analytics tools like PowerBI and Tableau have become the cornerstone of modern business for quickly analyzing structured and semi-structured data.
However, these platforms aren’t optimized specifically for the eCommerce industry. Consequently, you should embrace analytical tools particularly designed for eCommerce companies to make better decisions about product assortment, pricing, and promotions. With data analytics, companies can gain insights into the most popular and discoverable brands on their own and competitors’ platforms. Paired with attribute matching, competitive intelligence gives a deeper understanding of the latest trends and why certain products are popular with your customers. Some more meaningful metrics that retailers can track are discount gap, price gap, catalog strength, and product type gaps.
Competitive pricing is another benefit of data analytics with which retailers can identify gaps and keep up with actionable pricing insights. Retailers get to maximize profits and respond to demand by cashing in on insights into rivals’ pricing. With the right analytics tools, they can also track changes in pricing across crucial metrics such as matched products, recent price changes, highest price positions, stock status, and much more.
This listicle discusses some of the AI and data tools commonly used by the eCommerce industry. Data analytics has become a popular method for retailers to understand their customers and boost productivity. Data analytics help companies improve customer experience, improve customer loyalty, generate insights, and advise on data-driven actions. Business intelligence tools can help companies monitor key performance indicators (KPIs), perform proper data analyses, and generate accurate reports.
Want to learn how DataWeave can help make sense of your and your competitor’s pricing, promotional, and assortment data? Sign up for a demo with our team to know more.
As eCommerce grows in complexity, brands need new ways to grow sales and market share. Right now, brands face urgent market pressures like out-of-stocks, an influx of new competition and rising inflation, all of which erode profitability. As online marketplaces mature, more brands need to make daily changes to their digital marketing strategies in response to these market pressures, shifts in demand, and competitive trends.
eMarketer forecasts 2021 U.S. eCommerce will rise nearly 18% year-over-year (vs. 6.3% for brick-and-mortar), led by apparel and accessories, furniture, food and beverage, and health and personal care. The eCommerce industry is also undergoing fundamental changes with newer entities emerging and traditional business models evolving to adapt to the changed environment. For example, sales for delivery intermediaries such as Doordash, Instacart, Shipt, and Uber have gone from $8.8 billion in 2019 to an estimated $35.3 billion by the end of 2021. Similarly, many brands have established or are building out a Direct to Consumer (D2C) model so they can fully own and control their customer’s experiences.
In response, DataWeave has launched the next generation of our Digital Shelf Analytics suite to help brands across retail categories directly address today’s costly market risks to drive eCommerce growth and gain a competitive advantage.
“Our new enhancements help brands improve online search rank visibility and quantify the impact of digital investments – especially in time for the busy holiday season.” ~ Karthik Bettadapura, CEO and co-founder, DataWeave
The latest product enhancements provide brands access to tailored dashboard views that track KPI achievements and trigger actionable alerts to improve online search rank visibility, protect product availability and optimize share of search 24/7. Dataweave’s Digital Shelf Analytics platform works seamlessly across all forms of eCommerce platforms and models – marketplaces, D2C websites and delivery intermediaries.
Dashboard for Multiple Functions
While all brands share a common objective of increasing sales and market share, their internal teams are often challenged to communicate and collaborate, given differing needs for competitive and performance data across varying job functions. As a result, teams face pressure to quickly grasp market trends and identify what’s holding their brands back.
In response, DataWeave now offers executive-level and customized scorecard views, tailored to each user’s job function, with the ability to measure and assess marketplace changes across a growing list of online retail channels for metrics that matter most to each user. This enhancement enables data democratization and internal alignment to support goal achievement, such as boosting share of category and content effectiveness. The KPIs show aggregated trends, plus granular reasons that help to explain why and where brands can improve.
Brands gain versatile insights serving users from executives to analysts and brand and customer managers.
Prioritized, Actionable Insights
As brands digitize more of their eCommerce and digital marketing processes, they accumulate an abundance of data to analyze to uncover actionable insights. This deluge of data makes it a challenge for brands to know exactly where to begin, create a strategy and determine the right KPIs to set to measure goal accomplishment.
DataWeave’s Digital Shelf Analytics tool enables brands to effectively build a competitive online growth strategy. To boost online discoverability (Share of Search), brands can define their own product taxonomies across billions of data points aggregated across thousands of retailer websites. They can also create customized KPIs that track progress toward goal accomplishment, with the added capability of seeing recommended courses of action to take via email alerts when brands need to adjust their eCommerce plans for agility.
“Brands need an integrated view of how to improve their discoverability and share of search by considering all touchpoints in the digital commerce ecosystem.” ~ Karthik Bettadapura, CEO and co-founder, DataWeave
Of vital importance, amid today’s global supply chain challenges, brands gain detailed analysis on product inventory and availability, as well as specific insights and alerts that prompt them to solve out-of-stocks faster, which Deloitte reports is a growing concern of consumers (75% are worried about out-of-stocks) this holiday season.
User and system generated alerts provide clarity to actionable steps to improving eCommerce effectiveness.You also have visibility to store-level product availability, and are alerted to recurring out-of-stock experiences.
Scalable Insights – From Bird’s Eye to Granular Views
DataWeave’s Digital Shelf Analytics allows brands to achieve data accuracy at scale, including reliable insights from a top-down and bottom-up perspective. For example, you can see a granular view of one SKUs product content alongside availability, or you can monitor a group of SKUs, say your best selling ones, at a higher level view with the ability to drill down into more detail.
Brands can access flexible insights, ranging from strategic overviews to finer details explaining performance results.
Many brands struggle with an inability to scale from a hyper-local eCommerce strategy to a global strategy. Most tools available on the market solve for one or the other, addressing opportunities at either a store-level basis or top-down basis – but not both.
According to research by Boston Consulting Group and Google, advanced analytics and AI can drive more than 10% of sales growth for consumer packaged goods (CPG) companies, of which 5% comes directly from marketing. With DataWeave’s advanced analytics, AI and scalable insights, brands can set and follow global strategies while executing changes at a hyper-local level, using root-cause analysis to drill deeper into problems to find out why they are occurring.
As more brands embrace eCommerce and many retailers localize their online assortment strategies, the need for analytical flexibility and granular visibility to insights becomes increasingly important. Google reports that search terms “near me” and “where to buy” have increased by more than 200% among mobile users in the last few years, as consumers seek to buy online locally.
e-Retailers are now fine-tuning merchandising and promotional strategies at a hyper-local level based on differences seen in consumer’s localized search preferences, and DataWeave’s Digital Shelf Analytics solution provides brands visibility to retailer execution changes in near real-time.
Competitive Benchmarking
Brand leaders cannot make sound decisions without considering external factors in the competitive landscape, including rival brands’ pricing, promotion, content, availability, ratings and reviews, and retailer assortment. Dataweave’s Digital Shelf Analytics solution allows you to monitor share of search, search rankings and compare content (assessing attributes like number of images, presence of video, image resolution, etc.) across all competitors, which helps brands make more informed marketing decisions.
Brands are also provided visibility into competitive insights at a granular level, allowing them to make actionable changes to their strategies to stay ahead of competitors’ moves. A new module called ‘Sales and Share’ now enables brands to benchmark sales performance alongside rivals’ and measure market share changes over time to evaluate and improve competitive positioning.
Monitor competitive activity, spot emerging threats and immediately see how your performance compares to all rivals’, targeting ways to outmaneuver the competition.
Sales & Market Share Estimates Correlated with Digital Shelf KPIs
In a brick-and-mortar world, brands often use point of sale (POS) based measurement solutions from third party providers, such as Nielsen, to estimate market share. In the digital world, it is extremely difficult to get such estimates given the number of ways online orders are fulfilled by retailers and obtained by consumers. Dataweave’s Digital Shelf Analytics solution now provides sales and market share estimates via customer defined taxonomy, for large retailers like Amazon. Competitive sales and market share estimates can also be obtained at a SKU level so brands can easily benchmark their performance results.
Additionally, sales and market share data can also be correlated with digital shelf KPIs. This gives an easy way for brands to check the effect of changes made to attributes, such as content and/or product availability, and how the changes impact sales and market share. Similarly, brands can see how modified search efforts, both organic and sponsored, correspond to changes in sales and market share estimates.
Take Your Digital Shelf Growth to the Next Level
The importance of accessing flexible, actionable insights and responding in real-time is growing exponentially as online is poised to account for an increasing proportion of brands’ total sales. With 24/7 digital shelf accessibility among consumers comes 24/7 visibility and the responsibility for brands to address sales and digital marketing opportunities in real-time to attract and serve online shoppers around the clock.
Brands are turning to data analytics to address these new business opportunities, enhance customer satisfaction and loyalty, drive growth and gain a competitive advantage. Companies that adopt data-driven marketing strategies are six times more likely to be profitable year-over-year, and DataWeave is here to help your organization adopt these practices. To capitalize on the global online shopping boom, brands must invest in a digital shelf analytics solution now to effectively build their growth strategies and track measurable KPIs.
DataWeave’s next-gen Digital Shelf Analytics enhancements now further a brand’s ability to monitor, analyze, and determine systems that enable faster and smarter decision-making and sales performance optimization. The results delight consumers by helping them find products they’re searching for, which boosts brand trust.
Connect with us to learn how we can scale with your brand’s analytical needs. No project or region is too big or small, and we can start where you want and scale up to help you stay agile and competitive.
The exponential growth of eCommerce has forever changed holiday shopping as we know it. What was once led by the launch of Cyber Monday in 2005, has since expanded to ‘Cyber Five’ in 2018, now spans beyond an eight-week period, and is collectively the busiest digital shopping period of the year. Most retail websites have launched a ‘Thanksgiving Comes Early’ sales event for a mosaic of products, causing one to wonder how this ‘early start’ to holiday shopping will impact the traditional promotional cadence consumers have grown to expect to see launch closer to the holidays. Given today’s environmental challenges, threats of scarcity are also encouraging consumers to buy early, which could also impact traffic on the shopping days that have traditionally seen the highest sales volume from digital shoppers.
In the current environment, the onus will be on consumers to keep a watch for their categories of interest and buy them as and when they appear on sale in their favorite store, because there is no guarantee of sustained availability. Of course, they might return and buy at a different store if a better deal comes up, but there’s a time cost for the dollars saved. More broadly, there has been enough noise made about deals and discounts to keep consumer interest and curiosity going.
The early promotional start and heightened demand has influenced our team to get a jump start on our 2021 Black Friday analysis to look deeper at trends seen pre-Black Friday 2021 versus 2020. With this assessment, we can track how promotional prices and product availability rates may have changed throughout the event leading in to 2021 Cyber Five, and compare it to last year’s activity to understand how 2021 holiday sales may be impacted.
We reviewed popular holiday categories like apparel, electronics, and toys (for kids and pets), to have a broad sense of notable trends seen consistently throughout various, applicable marketplaces. What we found is a consistent decline in product availability over the last six months and as compared to last year, alongside an increase in prices.
We first analyzed availability changes for popular categories on Amazon, noted in the chart below, to understand how inventory may have changed throughout the year, and also compared to 2020. With the exception of batteries and solar power goods and books and maps, there appears to be consistency in greater product availability in 2021 versus 2020, but a slow decline in availability throughout 2021, leading into the holiday season.
Source: DataWeave Commerce Intelligence – Product Availability in-stock percentage from July 2020 through September 2021 for a sample size of 1000+ products on Amazon.com
When it came to our pricing analysis, we reviewed select categories on Amazon and Target.com, and found around fifty percent of products on both websites to have seen a price increase year-over-year, while only thirty-seven percent and sixteen percent of products saw a price decrease on Amazon and Target.com, respectively. We also see an increase in the manufacturer’s retail price (MRP) in 2021 versus 2020 for a very high proportion of products (forty-eight percent of products on Amazon and thirty-five percent of products on Target.com), but the discount percentages have remained the same.
Source: DataWeave Commerce Intelligence – Pricing Intelligence: MRP and promotional pricing for 1000+ products on Amazon and Target.com were analyzed from November 13th – 15th, 2021 versus Pre-Black Friday November 24th & 25th 2020
This indicates 2021 discounts may appear to be greater than or equivalent to 2020, but in reality, consumers will end up paying higher prices than they would have for the same items in 2020. The remainder of this article highlights our key findings found within each key category reviewed – Electronics, Apparel and Toys.
Electronics Category Analysis
The television category showcases a great example of how pricing fluctuations impact holiday promotional cadences. Based on our analysis, we found the average television price to have increased around seven percent from April to October 2021, as seen below and as noted within our analysis conducted with NerdWallet.
Source: DataWeave Commerce Intelligence – Pricing Intelligence: The change in average price captured for televisions sold on Amazon from May 2021 through October 2021.
In fact, on Amazon and Target.com, we see around eighty-four percent of the SKUs listed show both an MRP and promotional price increase in 2021 versus 2020 during pre-Black Friday times. One specific example found on Amazon is noted below for Samsung TV model QN65LS03TAFXZA, a 65 inch QLED TV that was priced at $1697 during this analysis at a fifteen percent discount from MRP, but was priced last year at $1497 without a discount from MRP. In essence, even though the TV offers a greater discount this year, it is actually more expensive than it was in 2020 at this same time of year.
Source: DataWeave Commerce Intelligence – Pricing Intelligence: MRP and promotional pricing analysis on Amazon.com comparing prices from November 13th – 15th, 2021 versus Pre-Black Friday November 24th & 25th 2020
Unlike TVs, the price of laptops has experienced a decrease over time based on our analysis conducted during the same timeframe, indicating these are a great buy for consumers this holiday season versus promotional offers seen in 2020.
Source: DataWeave Commerce Intelligence – Pricing Intelligence: The month-over-month change in average price captured for televisions sold on Amazon from April 2021 through September 2021.
Overall, our prediction is that within the electronics category, promotions during Cyber Five may be equivalent to last year’s offers, however, supply will be limited and the total spend versus last year will be greater to the consumer outside of Doorbuster deals offered on select models.
Apparel Category Analysis
The Luxury market is seeing a Roaring 20s-like feeling this season given the Covid-induced changes in work and lifestyle and higher disposable income. Therefore, our prediction is that prices for these goods are likely to remain flat, or offer very little discounts this season both due to supply constraints as well as higher demand. For example, our analysis on shoe pricing changes shows relative stability from April to October 2021.
Source: DataWeave Commerce Intelligence – Pricing Intelligence: The change in average price captured for shoes sold on Amazon from May 2021 through October 2021.
Given heightened demand and the Global shipping crisis, we anticipate luxury apparel categories to face out-of-stock challenges this holiday season, and therefore we also anticipate seeing less promotional activity for these items as well during Cyber Five 2021. To dive deeper into the severity of the impact, we looked at availability for clothing, accessories, and footwear categories from August 2020 until present to verify our thesis.
Focusing only on clothing, accessories, and footwear, these categories followed the same downward trending pattern regarding product availability decreases this year with a decline from June (seventy-six percent versus eighty-six percent in May 2021) to September 2021 (the lowest rate seen at sixty-eight percent availability), followed by a partial recovery in October and November (achieving seventy-seven percent availability).
Source: DataWeave’s Commerce Intelligence – Product Availability: 10k SKUs tracked across 11 retailers US websites (Farfetch, Brownsfashion, NetAPorter, EndClothing, 24s, Selfridges, Ssense, Harrods, Luisaviaroma, MyTheresa, MrPorter) tracked daily stock status in apparel categories; Availability is calculated as percent of instances when product is in stock against all instances tracked.
Not all recoveries were the same however, and given this, we predict accessories to have the lowest availability rate and greatest risk of facing out of stocks heading into Cyber Five. From May through November 2021, accessories availability continued to decline significantly from month to month, beginning at eighty-three percent in May and ending at seventy-four percent in November. Given this continued decline and with Black Friday right around the corner, we don’t anticipate inventory levels to increase enough to meet the increased holiday demand.
Source: DataWeave’s Commerce Intelligence – Product Availability: 10k SKUs tracked across 11 retailers US websites (Farfetch, Brownsfashion, NetAPorter, EndClothing, 24s, Selfridges, Ssense, Harrods, Luisaviaroma, MyTheresa, MrPorter) tracked daily stock status in apparel categories; Availability is calculated as percent of instances when product is in stock against all instances tracked.
Toys & Games Category Analysis
As noted by DigitalCommerce360, we also anticipate toys to be one of the greatest impacted categories this holiday season given the continued decline in overall availability for these items on Amazon.com, as one great example. Within our category analysis, we saw a steady decline in availability from March 2021 through June (eighty percent to sixty-one percent), followed by a period of stability from June through August (approximately sixty percent), followed by another decline from September through October, finally reaching the lowest availability of fifty-six percent (down twenty-four percent from March 2021).
Source: DataWeave’s Commerce Intelligence – Product Availability – hundreds of Toys & Games SKUs tracked on Amazon.com on a weekly basis from March 2021-October 2021
The biggest sub-category within the toys department on Amazon, Sports and Outdoor Play, followed the same trend as Toys and Games overall through June 2021, also reaching its lowest availability of fifty-six percent. Instead of continuing along that pattern, Sports and Outdoor Play started on a recovery path, ending at a relatively high availability level of sixty-seven percent in October, which is only five percent lower than its highest availability (seventy-two percent in March 2021). Games and Accessories, the second largest sub-category in Toys and Games, had a continuous decline starting with eighty-nine percent in March 2021, reaching its lowest availability of fifty-four percent in October.
Source: DataWeave’s Commerce Intelligence – Product Availability – hundreds of Toys & Games SKUs tracked on Amazon.com on a weekly basis from March 2021-October 2021
The sub-category Tricycles, Scooters and Wagons interestingly had its highest availability from July to September 2021 (around eighty percent), unlike other sub-categories which as a whole, had their lowest availability during the same timeframe. From September through October, there was a significant decline (fourteen percent), reaching its lowest availability of sixty-seven percent. The sub-category Babies & Toddlers started on a continuous decline from its highest availability of eighty percent in April to its lowest availability of fifty-six percent in October.
Source: DataWeave’s Commerce Intelligence – Product Availability – hundreds of Toys & Games SKUs tracked on Amazon.com on a weekly basis from March 2021-October 2021
*Please reach out to our Retail Analytics experts for access to sub-category details available within the above analysis on the Toys and Games category on Amazon.com.
Pet Toys Category Analysis
When it comes to in demand holiday toys, you can’t forget about the needs for gifts for our furry friends and family. We also tracked sub-categories such as dog, cat, and bird toys, following the same methodology as tracked within Toys and Games to track pet toy availability changes.
Source: DataWeave’s Commerce Intelligence – Product Availability – hundreds of Pet Toys SKUs tracked on Amazon.com on a weekly basis from March 2021-October 2021
Dog toys, the biggest sub-category out of the three pet toys analyzed, had high availability – ninety percent in March 2021, but started to decline reaching a low of sixty-five percent in October. There was a period of stability from April to August (averaging seventy-seven percent), followed by a significant decline of over thirteen percent in from September to October. Cat toys, the second largest sub-category, also had its highest availability in March (eighty-nine percent) followed by a steady decline to sixty-six percent in June, a recovery from July to August (achieving seventy-three percent), followed by another decline during September and October, reaching its lowest availability of sixty-three percent (down twenty-six percent from eighty-one percent in March). Interestingly, dog toys which has a product count eight times greater than cat toys, had higher availability than cat toys during each of the months considered during the analysis.
Source: DataWeave’s Commerce Intelligence – Product Availability – hundreds of Pet Toys SKUs tracked on Amazon.com on a weekly basis from March 2021-October 2021
In Conclusion
If we consider discounts and availability to be a good indicator of sales for the 2021 holiday season, with the Global shipping crisis looming over this year’s event, we expect retailers to have trouble keeping their inventory well stocked, which might affect growth rates. That being said, while discounts may be muted and popular items may come on very limited sales given constraints, we believe digital sales on Black Friday will see the highest year-over-year growth to date, given a number of supporting factors: scarcity threats increasing demand and the reason to buy, and consumers waiting to see if holiday offers surpass those see in the early start promotions, followed by the sudden rush to buy on Black Friday so as not to risk a given product being out of stock beyond this time period.
We also anticipate seeing a continued decline in product availability day-to-day as we progress throughout Cyber Five 2021. Given the analysis conducted on 2020 trends, (we tracked nearly a one percent decline in availability on Black Friday 2020 vs. Thanksgiving Day, followed by a two percent decline on Cyber Monday), our data indicates products went out-of-stock at a faster rate then also.
Ultimately only the digital-savvy retailers and brands will thrive during these opportune times, while others will continue to be in catch-up mode. Access to real-time marketplace insights can enable a first-to-market strategy, while having access to historical patterns can also help react faster to commonly seen future market factors, such as another pandemic or Global shipping crisis. These types of insights also support day-to-day operations, enabling retailers and brands to accelerate eCommerce growth, determine systems to distinguish their online strategies, discover efficiencies and drive profitable growth in an intensifying competitive environment.
Continue to follow us in the coming weeks to see the insights we track through Cyber Five 2021, and be sure to reach out to our Retail Analytics experts for access to more details regarding the above analysis.
Customers expect personalization. Unless they have a seamless experience on your online channels, they’ll leave for a different retailer. Retail analytics can solve these problems for merchants looking to increase customer satisfaction and sales. It provides insights into inventory, sales, customers, and other essential aspects crucial for decision-making. Retail analytics also encompasses several granular fields to create a broad picture of a retail business’s health and sales, along with improvement areas.
Big data analytics in the retail market
Big data analytics in the retail market is expected to reach USD 13.26 billion by the end of 2026, registering a CAGR of 21.20% during the forecast period (2021-2026). The growth of analytics in retail depicts how it can help companies run businesses more efficiently, make data-backed choices, and deliver improved customer service.
In this blog, we’ll discuss the top 10 analytics that retailers are using to gain a competitive advantage in accurately evaluating business & market performance.
Top 10 of Retail Analytics You Must Know
1. Assortment
Assortment planning allows retailers to choose the right breadth (product categories) and depth (product variation within each category) for their retail or online stores. Assortment management has grown beyond simple performance metrics like total sales or rotation numbers. Instead, retail analytics offers a comprehensive analysis of product merchandise and an estimated number of units at the push of a button. Retailers that effectively apply assortment analytics can enjoy increased gross margins and prevent significant losses from overstocks sold at discounted prices or out-of-stock inventory leading their customers to buy from competitors.
It also helps retailers gain insights into the trendy and discoverable brands and products on all e-commerce websites across the globe. They can boost sales by making sure they have an in-demand product assortment. They can also track pricing information and attributes common across popular products to drive their pricing and promotion strategies.
2. Inventory Management
An inadequately maintained inventory is every retailer’s worst nightmare. It represents a poor indicator of inadequate demand for a product and leads to a loss in sales. Data can help companies answer issues like what to store and what to discard. It’s beneficial to discard or increase offers on products that are not generating sales and keep replenished stocks of popular items.
In 2020, the estimated value for out-of-stock items ($1.14 trillion) was double that of overstock items ($626 billion). A similar trend was especially prominent in grocery stores, where out-of-stock items were worth five times more than overstock items.
Unavailability of high-selling products can lead to reduced sales, ultimately generating incorrect data for future forecasting and producing skewed demand and supply insights. Retailers can now use analytics to identify which products are in demand, which are moving slowly, and which ones contribute to dead stock. They can know in real-time if a high-demand product is unavailable at a specific location and take action to increase the stock. Retailers can use this historical data to predict what to stock, at what place, time, and cost to maintain and optimize revenue. It helps satisfy consumer needs, prevents loss of sales, reduces inventory cost, and streamlines the complete supply chain.
3. Competitive Intelligence
Market intelligence & Competitive Insights
The ability to accurately predict trends after the global pandemic and with an unknown economic future is becoming the cornerstone for successful retailers. Smart retailers know how important it is to Pandemic-Proof their retail strategy with Market Intelligence & Competitive Insights
With 90% of Fortune 500 companies using competitive intelligence, it’s an essential tool to gain an advantage over industry competitors. Competitive Intelligence allows you to gather and analyze information about your competitors and understand the market–providing valuable insights that you can apply to your own business. A more strategic competitor analysis will explain brand affinities and provide insights on what to keep in stock and when to start promotions. Customer movement data will also give you access to where your customers are shopping.
4. Fraud Detection
Fraud Detection
Retailers have been in a constant struggle with fraud detection and prevention since time immemorial. Fraudulent products lead to substantial financial losses and damage the reputation of both brands and retailers. Every $1 of fraud now costs U.S. retail and eCommerce merchants $3.60, a 15% growth since the pre-Covid study in 2019, which was $3.13. Retail Analytics acts as a guardian against fraudsters by constantly monitoring, identifying, and flagging fraud products and sellers.
5. Campaign Management
Some of the challenges of the retail industry are that it’s seasonal, promotion-based, highly competitive, and fast-moving. In today’s competitive marketplace, consumers compare prices and expect personalized shopping experiences. Campaign management allows marketing teams to plan, track, and analyze marketing strategies for promoting products and attracting audiences. Retail analytics can help businesses predict consumer behavior, improve decision-making across the company, and determine the ROI of their marketing efforts.
According to Invesp, 64% of marketing executives “strongly agree” that data-driven marketing is crucial in the economy. Retail analytics can help businesses analyze their data to learn about their customers with target precision. With predictive analysis, retailers can design campaigns that encourage consumers to interact with the brand, move down the sales funnel, and ultimately convert.
6. Behavioral Analytics
Retail firms often look to improve customer conversion rates, personalize marketing campaigns to increase revenue, predict and avoid customer churn, and lower customer acquisition costs. Data-driven insights on customer shopping behaviors can help companies tackle these challenges. However, several interaction points like social media, mobile, e-commerce sites, stores, and more, cause a substantial increase in the complexity and diversity of data to accumulate and analyze.
Insider Intelligence forecasts that m-eCommerce volume will rise at 25.5% (CAGR) until 2024, hitting $488 billion in sales, or 44% of all e-commerce transactions.
Data can provide valuable insights, for example, recognizing your high-value customers, their motives behind the purchase, their buying patterns, behaviors, and which are the best channels to market to them and when. Having these detailed insights increases the probability of customer acquisition and perhaps drives their loyalty towards you.
7. Pricing
Competitive pricing in retail
Market trends fluctuate at an unprecedented pace, and pricing has become as competitive as it’s ever been. The only way to keep up with competitive pricing in retail is to use retail analytics that enables retailers to drive more revenue & margin by pricing products competitively.
A report from Inside Big Data found companies experience anywhere from 0.5% up to 17.1% in margin loss purely because of pricing errors. Pricing analytics provides companies with the tools and methods to perceive better, interpret and predict pricing that matches consumer behavior. Appropriate pricing power comes from understanding what your consumers want, which offers they respond to, how and where they shop, and how much they will pay for your products.
In 2021, the price optimization segment is anticipated to own the largest share of the overall retail analytics market. Retailers can identify gaps and set alerts to track changes across crucial SKUs or products with pricing analytics. Knowing your customer’s price perception will increase sales and also allow you to design promotions that’ll attract customers. Pricing analytics also accounts for factors like demographics, weather forecasting, inventory levels, real-time sales data, product movement, purchase history, and much more to arrive at an excellent price.
8. Sales and Demand Forecasting
Sales and demand forecasting allow retailers to plan for levels of granularity—monthly, weekly, daily, or even hourly—and use the insights in their marketing campaigns and business decisions. The benefits of a granular forecast are apparent since retailers don’t have to bank on historical data of previous clients and customers to predict revenues. Retailers can plan their strategies and promotions that suit their customer’s demands.
With sales and demand forecasting, retailers can also consider the most recent, historical, and real-time data to predict potential future revenue. Sales and demand analytics can predict buying patterns and market trends based on socioeconomic and demographic conditions.
9. Customer Service and Experience
With the development of eCommerce, more and more customers prefer to browse and interact with the product before purchasing online. They look for better deals and discounts across stores and platforms. 3 out of 5 consumers say retail’s investment in technology is improving their online and in-store shopping experiences. To enhance merchandising and marketing strategies, retailers can gather data on customer buying journeys to understand their in-store and online experiences.
Retailers can run test campaigns to know the impact on sales and use historical data to predict consumers’ needs based on their demographics, buying patterns, and interests. Retail analytics help retailers to bring more efficiency in promotions and drive impulsive purchases and cross-selling.
10. Promotion
Analyze Competitors’ Promotions
Promotions are potent sales drivers and need to be cleverly targeted towards specific customers with precise deals to generate outstanding sales. Retail analytics allows companies to study their customers and competitors to a vastly elevated level.
To be an industry leader, retail companies not only have to understand their customers, but they must also analyze competitors’ promotions to improve their marketing strategies. Analyzing your competitor’s promotional banners, ads, and marketing campaigns are no more associated with imitation.
With data analytics and AI, retailers can watch their competitors’ commercialization strategies. It can uncover vital information about their target audience, sales volume fluctuations, popular seasonal product types, product attributes of popular items, and significant industry trends. Knowing exactly which products and brands are popular among your competitor’s campaigns can help retailers improve their promotional strategies.
Conclusion
The benefits of retail analytics are spread across various verticals, from merchandising, assortment, inventory management, and marketing to reducing losses. The need for analytics has become even more apparent considering the growing eCommerce platforms, changing customer buying journeys, and the complexity of the industry. Understanding which products sell best among which customers will help retailers to deliver an optimized shopping experience.
Want to drive profitable growth by making smarter pricing, promotions, and product merchandising decisions using real-time retail insights? DataWeave’s AI-powered Competitive Intelligence can help! Reach out to our Retail Analytics experts to know more.
The festival of lights symbolized the victory of light over darkness, good over evil & knowledge over ignorance. Over the years, Diwali has become all that and more. It has single-handedly become the biggest shopping season in India! Splurging on a new Smart TV or Fridge, or a furniture upgrade at home has become customary during Diwali. Not to forget buying gold and gifts for all your loved ones!
As more and more people are doing their Diwali shopping online, we decided to look at the data, see what people were browsing and buying. And more importantly, which brands spruced up their Digital Shelf & put their best foot forward this Diwali Season.
Methodology
We tracked the first 250 products on Amazon & Flipkart against specific keyword searches & product categories.
Share of Search (SoS): The percentage of products that appeared on the search results page on Amazon or Flipkart belonging to a brand, against a specific keyword or category.
Dates of Crawl during the Flipkart Big Billion Day / Amazon Great Indian Festival. – Pre-sale period: 1st October 2021 – Sale Period: 3rd to 10th October 2021 – Post Sale Period: 11th – 18th October 2021
India’s E-Commerce Gold Rush
YouGov reported that almost three in ten urban Indians (28%) are planning to spend on gold in the next 3 months. Seven in ten (69%) of these prospective gold buyers agreed with the statement, “Diwali is the best time to buy gold”, highlighting their inclination to spend during the festive season. Also, the same survey showed that Tanishq was the most trusted gold brand. With Kalyan Jewellers, Malabar Gold & Diamonds and PC Jewellers also making it to the top 5 list.
While traditionally Gold was mostly sold offline, that trend has fast changed. We tracked brands that had the highest Share of Search against the keyword “Gold Coin” on both Amazon & Flipkart to see if Tanishq, Malabar Gold, PC Jewellers – the big trusted names in jewellery were making their mark online.
Search Insights for Gold Coin
On Amazon, MMTC-PAMP (a joint venture between Switzerland-based PAMP SA & MMTC Ltd, a Government of India undertaking) and Kundan had the highest visibility for the keyword “Gold Coin” at 10%, followed by Malabar Gold at 9%. (Refer to above graph of Search Visibility on Amazon)
MMTC-PAMP used the help of Sponsored ads to get this visibility. They sponsored 9 products during the sale, while ACPL, the largest supplier of silver in India sponsored 26 products and New Delhi-based PC Jewellers sponsored 12 products. (Refer to above graph of Sponsored Products on Amazon)
As recently as 2 weeks ago, MMTC-PAMP launched their e-commerce portal following in the footsteps of other jewellery brands. According to a report by the World Gold Council, the jewellery industry went through a massive slowdown amid the pandemic and prepping their e-commerce & digital strategies are likely going to be the only way forward.
On Flipkart, PC Jewellers, Malabar Gold & Kundan occupied the top 3 spots on the search results page. While PC Jewellers sponsored 12 products on Amazon, on Flipkart they sponsored zero. Malabar Gold on the other hand sponsored a whopping 25 products on Flipkart! Interestingly Malabar Gold sponsored no products on Amazon for the keyword Gold Coin. (Refer to above graph of Sponsored Products on Flipkart)
Unboxing the love – Branded Diwali Gift Hampers
Branded-Diwali-Gift-Hampers
Now let’s talk about Diwali Gifts. How often have you thought of buying someone a Diwali gift but had absolutely no idea what to get them? You’re not alone! A lot of consumers would simply run a search for “Diwali Gift Hampers” or Diwali Gifts” in the hope to stumble across a great gifting idea and make an instant purchase! Smart brands who know this make sure their products have organic or sponsored visibility against these keywords
OnAmazon, Tied Ribbons, a D2C gift and Décor company had the highest number of Sponsored products (15) against the keyword Diwali Gift followed by the iconic Brand Archies with (14) products. Flipkarthad a whole bunch of smaller brands and sellers optimizing their products for this keyword. Some bigger, more known brands like Chaayos, Cadbury, D2C Tea brand Vahdam did have visibility for the keywords “Diwali Gift Hampers/ Diwali Gifts” but they were way down on the list, at the bottom of the search results page, or on Page 2.
Was this a missed opportunity for them?
Give your home a festive upgrade!
Diwali is a perfect time to upgrade or buy new electrical appliances for your home. Great prices, new product launches, and an unmatched festive feeling make it even more ideal to make new purchases. If you’re eyeing smart innovative electrical appliances for your home this year and decided to go make your purchase during the Flipkart Big Billion Day or Amazon Great Indian Festival, let’s take a look at which brands made sure they showed up right on top in your online search.
We tracked search visibility for 5 keywords in the home appliance space – Smart TV, Washing Machine, Microwave, Air Conditioner & Refrigerators to see which brands had the highest share of search
Brands with the Highest Share of Search on Amazon
On Amazon, both Samsung & LG had high visibility across all products except Air Conditioners!
For ACs, Voltas had the highest share of search even though they sponsored 0 products! And that’s definitely noteworthy. So what really gave them the edge and put them in this winning position?
We took a look at their product reviews to draw an analysis. Voltas ACs had close to 10k reviews! The highest in the AC category. Ratings & Reviews play a key role in helping brands drive their Digital Shelf experience. Customers trust user-generated content more than information brands share with them. Also, Amazon’s A9 algorithm prioritizes products with better reviews & shows them higher up in search – a low-cost & organic way for brands to get to the top without spending money on Sponsored ads!
Most loved Air Conditioner brand
When it comes to washing machines, Lloyd & White Westinghouse (trademark by Electrolux) sponsored the maximum number of products in the category, this gave them the highest Sponsored SoS (13%) on the first page.
While their sponsored visibility was high, their overall SoS was low which is why they didn’t organically feature in the top 5. Sponsoring products is a great but expensive way to artificially boost product visibility during sale periods. Brands need to go the Voltas route by optimizing their reviews & rating or content, to organically gain and sustain product visibility.
… & here are the brands that made it to the top on Flipkart.
Brands with the Highest Share of Search-on-FLIPKART
Gift-worthy gizmos!
Buy the latest gadgets and pamper yourself this Diwali or gift them to your loved ones! You could be looking to upgrade your laptop, or buying a fancy DSLR or Smartwatch, buying it online may be your best bet. Discounts have dwindled over the years but you may still get the most lucrative discounts online. Let’s look at the discounts offered on Amazon & Flipkart for some gift-worthy gizmos like Laptops, Cameras, Smart Watches & Headphones this festive season.
The platform that offered the highest number of products in their catalog at a discount
On Amazon, during the sale, the headphones category offered a 75% of products on discount as compared to the pre-sales period. That number was just around 51% for cameras. Far more number of products were discounted on Flipkart – 87% for headphones & laptops. And cameras 77%. So if you were looking to shop for gadgets around Diwali, Flipkart would’ve been a better bet.
Let’s look at which platform offered the highest percentage of discounts on products.
Discounts were higher across all 4 product categories!
Apart from more products being discounted on Flipkart, Flipkart also offered higher discounts across these 4 categories. Discounts were higher across all 4 product categories!
Do you know if your brand is prepped and ready to make an impact on a Big Festival Sale Day? Or simply just wondering if your Digital Shelf is optimized with the right price, discounts, reviews and keywords? Our team can DataWeave can help! Reach out to our Digital Shelf experts to learn more.
We are really excited by the recognition that G2 has given us. G2 has awarded us 3 new badges this year in G2’s Summer 2021 Reports. Before we dive into what these awards are, let me give you a little background
What are G2 and G2 Grid Report?
G2 (formerly G2 Crowd) is the world’s leading B2B software and services review platform. The platform helps potential customers choose the right software and services for their business based on authentic, timely reviews from genuine users.
Every quarter, G2 creates a report that showcases the top-rated solutions in the industry, as chosen by the real heroes, our customers
The Grid Report represents the democratic voice of real software users, rather than the subjective opinion of one analyst. G2 rates products from the E-Commerce Analytics category and Multi-Channel Retail category algorithmically based on data sourced from:
Product reviews shared by G2 users
Data aggregated from online sources and social networks
The company’s AI-powered technology platform enables eCommerce businesses to make smarter pricing and merchandising decisions and helps brands optimize their online channels to drive more sales.
With that context here is a deeper look at what we have been recognized for.
Products in the Leader quadrant in the Grid® Report are rated highly by G2 users and have substantial Satisfaction and Market Presence scores in the category of E-Commerce Analytics.
Simply put, this means, among all the e-commerce analytics solutions listed on G2, DataWeave scored the highest on customer delight, consideration & market share along with a handful of select companies that were all ‘Leaders’ in this category.
Products in the High Performer quadrant in the Grid® Report have high customer satisfaction scores and Market Presence scores compared to the rest of the Multi-Channel Retail category.
This means that in the Multi-Channel Retail category, while we’re not “Leaders” we come in at a very close second as a “High Performer”. We’re still the preferred choice and have a greater market share & customer consideration over a lot of other solutions in this category on G2.
We have also won the Users Love Us reward badge, for receiving 20+ reviews with an average rating of 4.4 stars.
Users Love Us G2
We would like to thank all the users for sharing their love and giving us such amazing reviews. These awards give us the impetus to continue our journey in making customer delight our top priority and helping our customers win.
Here is what DataWeave’s team has to say about earning these badges:
“Winning these badges from G2 is not only a huge confidence booster but also validation from users that DataWeave’s solution and capabilities are making a difference for our customers.”
Krishnan Thyagarajan, COO and President, DataWeave
“DataWeave as a Leader and High Performer in these categories brings credibility and showcases the market share that the product holds amongst our valued customers. It also showcases that our customers value the proactive engagements driven by our customer success managers. A big kudos to our team at DataWeave and a big thank you to our customers for helping us achieve this recognition.”
Srikanth Ramanolla, Director of Customer Success, DataWeave
If you are one of our customers who have loved using our product, then I urge you to give us your review over here to continue providing value to wonderful customers like you.
After demonetization, Covid-19 has probably been one of the worst scenarios for the retail sector in India. The entire nation went into lockdown and the industry noticed some big changes around the entire globe. From remote working to shopping, everything turned to digital and Bharat witnessed new trends across payments, e-commerce, and more.
Not surprisingly, D2C has been a favorite amongst businesses thanks to its agility. More than 800 brands have joined the direct-to-consumer bandwagon in order to reach their audience quickly and in an efficient way. Where brands such as MamaEarth, Clovia, Bewakoof, Lenskart have been some of the popular brands in the sector, last year even traditional giants such as LG, Ajanta-Orpat, Piaggio, Havells also adopted the D2C model.
Brands are more focused on making the user experience better and it will be safe to say that this year, D2C will be the highlight of the e-tail ecosystem. Naturally, e-commerce giants such as Amazon, Flipkart have played an important role in this revolution. Amazon, which has over 100 Million registered users in India, announced that it will host its flagship event, Prime Day this year on 26-27 July.
Let’s look at some of the things brands can do to leave their mark this Prime Day in India.
Given that the pandemic has accelerated online shopping nationwide, Digital Shelf Optimisation (DSO) should be the key lever for any brand to accelerate its digital commerce growth. Events such as Prime day are significant for a brand’s reputation, customer experience, overall sales and can help you build a loyal customer base.
With that in mind, we have prepared a list of things to consider, in order to help brands stand out from the crowd.
Pricing and Discounting: Offer discounts and deals to attract customers.
It is obvious that Prime Day will see a tremendous influx of shoppers. Noticeably, impulsive shopping is a trend during these sales, as everybody loves a good product for a discounted price. Make sure to offer discounts and deals to attract customers.
Another suggestion is to keep a track of competition, their pricing and promotional strategies and keep an eye on price changes happening across relevant categories or SKU’s (Stock Keeping Unit). Competition analysis is a powerful tool and having accurate data on their sales, market share is a critical part of this.
Product Visibility: Lakhs of sellers & brands are vying for the same spot
Marketplaces are crowded, and getting discovered is already hard. Lakhs of sellers & brands are vying for the same spot. And with more people moving online, it’s going to get increasingly harder for brands to stand out. Optimize your search visibility using the right keywords relevant to your brand, strategically spend on Sponsored Ads to secure high visibility placements on Amazon and lastly make sure your online product packaging via product pages contain attractive images to position your product in the best light.
Product Availability: Have plenty of stock available
Make sure to have plenty of stock available as shoppers are likely to turn to other brands/products in case your product is unavailable. Also, keep in mind that people are generally more open to trying new products during a sale as it offers discounts. Track your products’ stock status to make sure they’re available 24 x 7.
As the foremost goal during sales is to move inventory as much as possible, offering a large assortment is a good idea. Create product bundles that complement each other.
A+ Content is King: The new age packaging for your product
Content is the new age packaging for your product. Content is crucial to change consumer shortlists & considerations into conversions.
Your content tells your product story & gives customers the information they need to make a purchase. Use high resolution and accurate images, add features, benefits, USPs of your products clearly. It is advisable to use more than one image to show your product more clearly. Make sure all your brand & product pages on Amazon are optimized.
Reviews and Ratings: Feedback is a very important e-commerce tool.
Why would shoppers rely on word-of-mouth when they can take help from millions of people from the community? Not said enough, feedback is a very important e-commerce tool. Amazon’s A9 algorithm presents the choices to the consumers but reviews and star ratings still play an influential role in the journey from consideration to conversion.
Brands could consider partnering with Dataweave, to keep track of reviews and manage negative ratings on Amazon.
Summary
According to a report by EY-IVCA Trend Book 2021, “ The e-commerce industry in India is expected to reach $99 Bn by 2024 and penetration of retail is expected to be 10.7% by 2024, compared to 4.7% in 2019.”
Source: Statista
The same report also revealed that India will have 220 Million online shoppers by 2025. With e-commerce growing at an exponential rate, brands are advised to be more statistical & data-driven to win a larger % of online sales. If you think this is the right time to optimize your digital shelf, take a look at our products and services.
We at DataWeave would be happy to be a part of your e-commerce and digitization journey. You can sign up for a demo with our team to know more
This year, shoppers will skip neckties and celebrate Dad with gifts for his home office or man cave. As our personal and professional lives grow increasingly digital and tied to our homes, retailers face new seasonal sales opportunities.Retailers whose assortments contain in-demand electronics and home products can drive more e-commerce sales revenue and gain a competitive edge in time for Father’s Day 2021.
According to the NRF, Father’s Day spending is expected to hit $20.1 billion, up 18% from 2020’s total of $17 billion. The vast majority (75%) of Americans plan to celebrate the fathers, husbands and other paternal figures in their life this Father’s Day. Popular products dads will love
Retailers can inspire Father’s Day shoppers by filling their assortments with in-demand electronics and home products, as these two categories continue to boom.
Consider these recent results related to electronics and home goods:
Online sales of consumer electronics grew 18% year-over-year in 2020 as more consumers work, shop and enjoy entertainment in the comfort of their homes.
To win more sales on Black Friday 2020, certain retailers offered attractive deals and deep discounts on electronics like laptops, mobiles, wearables, USB flash drives, tablets and headphones.
Home furnishings sales rose 12% year-over-year in 2020 as homebound consumers invested in products for domestic comfort, organization and functional purposes.
On Cyber Monday 2020, home merchandise saw bustling sales, as storage items, cabinets and bookcases were among the most competitively priced products in the category.
Since home is the new hub, retailers can plan their assortments to align with this enduring consumer trend to outplay rivals. Optimizing their product mix involves making decisions on the right balance among bestsellers, hot trends, unique products and essential items to gain a competitive advantage.
Grab shoppers’ attention with desirable promotions
Although shoppers appreciate variety, the abundance of product choices available online can overwhelm consumers. In response, retailers can craft persuasive and timely digital campaigns to help simplify the customer experience.
Digital promotions, including banner ads and search campaigns, can help retailers spark a sense of urgency that motivates shoppers to buy. The key is for retailers to connect to consumers with the right messaging, timing and targeting to earn their attention, trust and sales. Retailers need effective promotions to optimize their ad spend. Pricing secures the sale
To maximize top line performance, retailers also need to nail their Father’s Day pricing strategies.
Notably, consumption habits and loyalty have dramatically shifted during the pandemic, which has affected retailers’ pricing strategies. Value pricing continues to soar due to economic uncertainty, job losses and a growing desire for value for money. Last year, 30% of consumers switched to a new brand due to better prices, while 25% cited better value as the reason they switched, according to McKinsey & Company.
On the other side of the socioeconomic spectrum, premium pricing is also on the rise. Upscale shoppers are now more willing to splurge on high quality goods, including home furnishings and electronics. These consumers will pay more for merchandise that adds value or purpose to their lives. In addition, digitally-savvy Gen Z and Millennial consumers are spending 125% as much as they did in 2019. As a result, retailers that capitalize on consumers’ enthusiasm and price elasticity will drive incremental e-commerce revenue gains.
As e-commerce competition intensifies and informed, empowered shoppers know where to find the best prices, more retailers now seek a new pricing approach to stand out, drive sales growth and protect against price wars. Drive revenue with the right products, promotions and prices
To win the attention and sales of Father’s Day shoppers, more leading retailers now use data insights to make faster, more effective assortment and pricing decisions that maximize their e-commerce sales.
Data analytics help retailers know which products consumers will actually buy. Leading global retailers rely on Assortment Analytics from DataWeave to ensure their online assortments keep up with evolving consumer needs. Building acompetitive product mix can set retailers apart and boost e-commerce sales by offering in-demand merchandise. Assortment analytics give retailers insights on the most popular brands and products on any e-commerce website, and help them spot and fill any assortment gaps to capture more sales.
To captivate online shoppers’ attention, retailers use DataWeave’s Promotional Insights to lower acquisition costs with marketing promotions that resonate. As online shoppers increasingly seek timely offers, these insights help retailers quickly evaluate the effectiveness of their promotions and optimize their digital ad spend. Retailers gain near-real-time insights on the brands, categories and products their rivals promote, including campaign frequency, duration and messaging for promotions that convert.
Major retailers also turn to Pricing Intelligence from DataWeave to promptly adapt to rivals’ online price changes and shifts in consumer demand. Retailers drive more revenue and margin by easily identifying fluctuations in consumer demand and rivals’ pricing, as well as any gaps. Retailers gain an edge by seeing pricing patterns that their rivals miss. They gain accurate exact and similar product matching, and near real-time pricing updates to stay competitive and fuel e-commerce conversions. Data insights help retailers delight dads
This Father’s Day, retailers can apply data insights to offer consumers eye-catching promotions of in-demand electronics and home products at the right price to wow dads. Insights from DataWeave can help retailers make smart, competitive assortment, promotion and pricing decisions that boost agility, improve the customer experience and drive e-commerce sales for this special occasion – and all year long.
The pandemic’s profound economic impact sparked a surge in value shopping.
Between February and December 2020, 10 million Americans lost their jobs.1 Due to the pandemic, 36% of lower-income adults and 28% of middle-income adults lost a job or took a pay cut (vs. 22% of upper-income adults). In addition, less than a quarter of lower-income adults have three months’ worth of emergency funds (vs. 48% of middle-income adults and 75% of upper-income adults).2
These financial shifts matter to retailers, as lower- and middle-income households account for 81% (29% and 52%, respectively) of the total U.S. population.3 Reduced disposable income among households like these has led more consumers to embrace bargain-hunting as a shopping habit.
We’ll see why price sensitive consumers are influencing retailers to adjust their e-commerce pricing strategies to stay competitive and responsive.
Consumers seek value across retail categories
Recent research shows 50% of U.S. adults are more sensitive to product prices now than before the pandemic. Also, 80% of U.S. shoppers are taking at least one action to seek more value when they shop for groceries, prioritizing value for money over speed.4
According to McKinsey, 65% of consumers cited value as one of their top three reasons they switched brands during the pandemic. Also, 40% of shoppers cited a desire for better value and 38% cited better prices or promotions as reasons for choosing new products.5
Value-oriented pricing influences purchases, as 70% of consumers said product discounts are more important today compared to a year ago. In addition, 54% ofconsumers said better online deals and discounts are a leading factor that persuades them to choose a specific retailer.6
As e-commerce explodes, consumers have greater access to information. They can find the best price across online sites and receive notifications when a product’s price drops before they buy. Retailers face intense pricing pressure
Similar to the aftermath of the 2008 recession, discounters and dollar chain retailers are now thriving as consumers seek superior value for money. Consumers need new products yet they no longer want to spend as much as before.
That’s why bargain retail is poised to be among the biggest winners in 2021 as consumers get out and socialize more. 7
Dollar General continues to aggressively expand its omnichannel reach as value shopping soars.8 To stay competitive, Family Dollar has partnered with Instacart on same-day delivery.9 In the fierce grocery sector, hard discounter Aldi’s omnichannel expansion includes a focus on private labels and efficient operational processes that improve cost effectiveness and competitive pricing.10
Across retail categories,a remarkable 50 million price changes take place online every day.Given consumers’ shift to value shopping, more retailers are changing their pricing to offer discounts both online and in-store.11 However, to avoid costly price wars, more retailers are now taking a renewed approach to their pricing strategies to protect their margins as they compete.
Specifically, to optimize their e-commerce business for profitable growth, more retailers are modernizing their pricing strategies with data insights.
Pricing intelligence is retailers’ secret weapon
As e-commerce rivalry heats up, retailers must evaluate pricing across more online websites to keep their own prices competitive. This process is becoming increasingly complex and time consuming. Meanwhile, retailers may consider adopting aggressive pricing tactics to win online sales. Yet this pricing strategy is unsustainable over the longer term, as it erodes profit margins.
Today’s heated e-commerce rivalry means retailers can no longer afford to guess at price points or use the same pricing tactics that relied on before the pandemic.
That’s why leading retailers turn to data insights for their pricing strategies to stay agile and flexible while rapidly adapting to fluctuations in consumer demand and competitors’ pricing.
Now more retailers turn to DataWeave’s Pricing Intelligence to drive more revenue and margin.
To optimize profit margins, retailers use our actionable insights to make pricing decisions according to data-driven recommendations. They also make decisions to protect their desired price perception.
Monitoring competitors’ pricing moves helps retailers benchmark their own performance, identify gaps and respond to market trends faster. They can also refer to historic pricing data analytics to accurately anticipate and counter rivals’ next moves to gain an edge.
Retailers that apply data insights to optimize their pricing can drive more online revenue by finding the ideal price consumers are willing to pay while still maintaining profitability. Pricing intelligence can make customer acquisition more efficient, and help retailers grow online sales and market share.
Amid greater price sensitivity, retailers’ pricing strategies are evolving to use data to adapt to consumers’ needs and drive e-commerce sales and profitability. DataWeave’s Pricing Intelligence gives retailers an edge so they stay agile and competitive, and maximize e-commerce sales across consumers of all economic levels.
1. Howland, Daphne. The middle class is stressed and the pandemic isn’t helping. Retail Dive. January 20, 2021. 2. Howland, Daphne. The middle class is stressed and the pandemic isn’t helping. Retail Dive. January 20, 2021. 3. Bennett, Jesse, Richard Fry and Rakesh Kochhar. Are you in the American middle class? Find out with our income calculator. Pew Research Center. July 23, 2020. 4. Maake, Katishi. DoorDash, Instacart Eye Launching Credit Cards. The Harris Poll. April 9, 2021. 5. Charm, Tamara, Harrison Gillis, Anne Grimmelt, Grace Hua, Kelsey Robinson and Ramiro Sanchez Caballero.Survey: US consumer sentiment during the coronavirus crisis. McKinsey & Company. May 13, 2021. 6. Berthiaume, Dan. Survey: Deals drive purchases during pandemic. Chain Store Age. March 18, 2021. 7. Thomas, Lauren. Beauty and bargain retail could be the biggest winners in 2021, Wells Fargo predicts. CNBC. March 25, 2021. 8. Unglesbee, Ben. Dollar General ramps up expansion of Popshelf concept. Retail Dive. March 19, 2021. 9. Ryan, Tom. Will same-day delivery pay off for dollar stores? RetailWire. February 8, 2021. 10. Anderson, George. Should Aldi’s growing store count and digital progress keep rivals up at night? RetailWire. February 11, 2021. 11. Berthiaume, Dan. Survey: Deals drive purchases during pandemic. Chain Store Age. March 18, 2021
Soaring e-commerce growth has made retail more crowded, complex and competitive. Now retailers face an urgent need to keep an eye on more rivals with potential substitute products to maximize their own e-commerce growth.
Consider these recent figures, which illustrate online shoppers’ abundance of product choices:
24% year-over-year increase in direct-to-consumer (DTC) brands in the U.S. alone was estimated for 2020 as more brands bypass retailers1
55% of shoppers have purchased private label in the past year and many retailers are investing more in their own brands2
110% average increase in small retailers’ 2020 online holiday sales, as more players launched new e-commerce shops during the pandemic3
39% of U.S. consumers have changed brands, with the level of brand switching doubling in 2020 compared to 2019, especially among Gen Z and Millennial consumers, as loyalty declines4
These statistics prove that in 2021 retailers need to navigate more online players and products. Now retailers need a new approach to stay on top of market trends to keep their e-commerce strategies competitive, profitable and attractive to discerning online shoppers.
Retailers reduce the risk of substitutes with similarity matching
In response to online crowding, more leading retailers are turning to similarity matching. Similarity matching is a type of retail analytics that scour global e-commerce sites to find products that exactly match a specific item as well as products that closely match it. Similarity matching insights have grown in strategic significance because they increase retailers’ visibility into potential substitute products, so they can respond to all rivals’ moves with greater agility and efficiency to stay competitive.
In terms of e-commerce applications, similarity matching helps retailers gather insights on potential substitute products so they can adjust their pricing and assortment strategies accordingly. Retailers can align their pricing with rivals’ pricing moves for similar items to protect their margins and maximize profitability. They can also make informed assortment decisions, including which product mix of bestsellers, unique items and private labels could optimize their online sales performance.
Online shoppers search for productsdifferently across different categories
Consumer behavior plays a role, as online search habits differ across product categories, which influences the type of similarity matching retailers need. For example, categories like fashion, toys, home and kitchen work best with similarity matching based on text and images. In these highly-visual categories, consumers can quickly determine whether a product fits the design and aesthetic they are looking for. As a result, e-commerce product titles, descriptions and product images play a big role in consumers’ purchase decisions.
By contrast, consumer electronics and furniture are categories in which consumers tend to seek specific product attributes, such as a certain level of resolution for their high-definition TV or a couch with particular dimensions so it fits their living room. For these types of products, consumer purchases are driven by product specifications, so similarity matching takes into account their specific needs as well as a degree of tolerance for exact or near-similar attributes across online competitors.
Expect intense e-commerce rivalry in 2021
As more consumers shop online, they are increasingly informed by online product comparison information. A wide variety of product choices means consumers can substitute similar goods with ease, especially if a particular item is out-of-stock. Perceived product differentiation, price sensitivity and private labels can also influence consumers’ purchase decisions.
Across categories, e-commerce growth is outpacing total retail growth. When competition is this fierce, there is an increased risk that numerous and aggressive players will drive down profit margins. Leading retailers are now seizing opportunities to earn consumer loyalty. Using similarity matching helps retailers by offering in-demand products that consumers will actually buy and deliver exceptional online experiences to prevent shoppers from switching to rivals and their comparable products.
Similarity matching lets you stay competitive
As e-commerce traffic and rivalry increase, similarity matching helps retailers stand out and serve online shoppers more effectively.
Retailers gain visibility into their entire competitive landscape to keep their e-commerce strategy responsive to shifts among consumers and rivals. By knowing the full scope of potential substitute products available online, retailers can keep their pricing and assortment strategies in line with rivals’ to reduce their risk of losing sales to rivals, and boost their top line, profitability and cost savings.
The data insights give retailers the flexibility they need to align with online shoppers’ different needs across categories. As a result, retailers can use similarity matching to boost agility and gain a competitive advantage by adapting to online shoppers’ needs, winning their sales and fueling e-commerce growth.DataWeave’s similarity matching capability lets clients
1 US Direct-to-Consumer Ecommerce Sales Will Rise to Nearly $18 Billion in 2020. eMarketer. April 2, 2020.
2 Ochwat, Dan. Shopper study: Private brands purchased because they’re preferred. Store Brands. February 24, 2021 3 Miranda, Leticia. Small businesses who pivoted to e-commerce saw record sales during Black Friday weekend. December 1, 2020. 4 Charm, Tamara, Harrison Gillis, Anne Grimmelt, Grace Hua, Kelsey Robinson and Ramiro Sanchez Caballero. Survey: US consumer sentiment during the coronavirus crisis. McKinsey & Company. March 24, 2021.
This year’s COVID-19 pandemic created a seismic shift towards tech, directly affecting retailers’ Black Friday and Cyber Monday pricing strategies for electronics. Prime Day 2020’s new fall date also inevitably influenced pricing and purchasing patterns. If consumers pampered themselves with a 75-inch TV in October, what are the odds they’re in the market for another big-screen TV in late November?
Consumer electronics are perennial holiday bestsellers because they make gift-giving easy, whether we buy them for others or for personal indulgence. Continuous innovation also means a comparatively shorter product lifecycle, making electronics an exciting, progressive retail category.
To determine which retailers’ pricing strategies offered the most generous discounts on electronic products, we examined electronics pricing at Amazon, Best Buy, Overstock, Target and Walmart. We compared during the pre-sale period (November 24-26) to the holiday sales period (Black Friday on November 27 through Cyber Monday on November 30) for a glimpse of retailers’ pricing strategies to stay competitive in 2020.
For competitive pricing insights, we tracked three scenarios before and during 2020’s traditional holiday sales season: whether prices decreased, increased or remained the same. Most strikingly, the overwhelming majority of electronics products (89.8%) maintained the same prices during the pre-sale and sales periods. For instance, Target kept a whopping 98.0% of its electronics prices the same during the period.
Amazon had the greatest proportion of electronics products that offered a price decrease (11.7%), particularly on laptops, mobiles and wearable technology. These results also suggest Amazon wants to reach more consumers by making more electronics affordable with discounts. Target offered the lowest proportion of electronics with price decreases (2.5%).
Overstock had the greatest proportion of electronics products that offered a price increase (10.7%) with 30.3% of TVs increasing in price. Best Buy offered the lowest proportion of electronics with price increases (1.2%).
Among electronics products with price decreases on Black Friday, Best Buy offered the highest average discount (16.6%) and Amazon offered the lowest (10.2%). Among all the retailers, the types of electronics with the highest average discount included tablets, headphones, laptops and TVs.
Among electronics products with price increases on Black Friday, Best Buy had the highest average price hike (30.2%) and Amazon offered the lowest (9.8%). That said, Best Buy increased the price of one laptop by 73.1% whereas Amazon increased the price of 44 laptops by an average of 4.2%.
These findings show that Best Buy aggressively protected its market share in this competitive category by offering the most generous discounts.
Black Friday vs. Cyber Monday
Without exception, the retailers offered more additional discounts across the electronics category on Cyber Monday than on Black Friday. Retailers may have wanted to clear out their inventory to make room for new, innovative products in their assortments.
Amazon had the greatest proportion of electronics with additional discounts on Cyber Monday (15.7%, which is more than double the 7.3% each for Overstock and Target). Amazon’s additional discounts focused on mobiles, laptops and wearable technology.
Overall, the greatest proportion of additional discounts on electronics on Cyber Monday focused on laptops, desktops and USB flash drives.
While most retailers offered deeper discounts on electronics on Cyber Monday than Black Friday, Overstock was the sole exception.
On Cyber Monday, Target offered the most generous average additional discounts (19.6% vs. 10.2% for Amazon); however, Target’s discounts applied to 260 electronics products compared to 924 for Amazon.
Overall, the types of electronics with the deepest discounts on Cyber Monday on electronics were USB flash drives, tablets and headphones.
Additional discounts across products by “premiumness” level
When we examine electronics’ additional discounts according to the products’ premium level, several patterns stand out.
Most apparent is that every retailer offered a higher proportion of additional discounts on Cyber Monday compared to Black Friday, ranging from 15.9% for Amazon to 6.4% for Best Buy.
With only one exception, Amazon offered the greatest proportion of additional discounts across all premium levels. Only Target offered a slightly higher proportion among low premium electronics (11.9% vs. 11.3% for Amazon). This approach could help Amazon make more electronics products more affordable to more consumers and boost its reach in this competitive category.
Among electronic items at the high premium level, Amazon was most aggressive in allocating additional discounts (21.0% vs. 5.4% for Target), which could help the e-commerce giant earn top-of-mind status among affluent shoppers in the market for big-ticket electronics.
Most retailers (Amazon, Best Buy and Walmart) offered deeper discounts on Cyber Monday than Black Friday. By contrast, Overstock and Target were more generous on Black Friday.
Interestingly, Target’s average additional discount on Cyber Monday (18.8%) was still more generous than those of the other retailers.
Among moderately premium items, Target’s average additional discount was 22.3%, more than double Amazon’s 10.3%. Target may have tried to make mid-market electronics more affordable to its core audience of value-seeking shoppers.
Additional discounts across products by “popularity” level
A review of retailers’ additional discounts by electronics’ popularity level reveals that most retailers allocated a bigger proportion of discounts on Cyber Monday than on Black Friday. Overstock was the exception. Again, clearing out 2020 inventory before year-end likely influenced retailers’ pricing strategies.
Overall, on Cyber Monday retailers showed a direct relationship between additional discounts and electronics’ popularity levels. For instance, Amazon offered additional discounts on 21.7% of highly popular electronics and 15.3% on moderately popular electronics. Since Amazon strives to be “The Everything Store,” it makes sense to make more products more appealing and affordable to more consumers. Meanwhile, Target offered nearly double the proportion of additional discounts of less popular electronics than discount rival Walmart (12.5% vs. 6.7%) to tempt value-seekers with deals.
Most retailers (Amazon, Best Buy, Target and Walmart) offered deeper discounts on Cyber Monday than Black Friday. Overstock was more generous on Black Friday.
On Cyber Monday, Target’s average additional discount (21.8%) was the most generous of all the retailers, nearly double that of Amazon (11.1%). However, Target’s discounts applied to 259 electronics products. vs. 903 for Amazon.
Both Amazon and Overstock gave their most generous discounts to less-popular electronics, possibly to clear out their inventory to make room for more popular or higher-margin items.
Black Friday & Cyber Monday 2020 Electronics Pricing Strategies
This year, the pandemic jolted consumers to focus on digital technology to stay connected to work, school and retail, which heightened demand for electronics.
In response, retailers’ 2020 pricing strategies for Black Friday and Cyber Monday suggest a desire to extend their reach beyond their core audience to maximize their brand appeal and steal rivals’ market share.
The Cyber Monday findings, in particular, suggest retailers decluttered their assortments to make space for the latest and highest-margin tech gadgets in time for Christmas.
Click here for more Black Friday and Cyber Monday 2020 analysis for greater clarity on the evolving pricing positions of retail rivals across top e-commerce categories.
Retailers really wanted to dress us up this holiday season.
This year’s Black Friday and Cyber Monday fashion pricing trends reflect how retailers have responded to the pandemic’s influence on apparel shopping to boost their resilience and competitiveness.
For instance, since most consumers now cocoon at home, few of us are likely to splurge on fancy gowns or suits as holiday gifts for ourselves or others. That’s why we wanted to know which retailers doubled down on Black Friday fashion discounts and which ones used Cyber Monday discounts to make room for in-demand merchandise.
To calculate which retailers’ prices offered the greatest proportion of discounts and the deepest discounts, we analyzed men’s and women’s fashions at Amazon, Bloomingdale’s, JC Penney, Macy’s, Neiman Marcus, Overstock, Nordstrom, Target and Walmart. We compared the pre-sale period (November 24-26) to the holiday sales period (Black Friday on November 27 through Cyber Monday on November 30) to gain insights into retailers’ pricing strategies in fashion.
Top product types by additional discounts- Men’s fashion
To review retailers’ holiday pricing strategies, we tracked three scenarios: whether prices decreased, increased or remained the same during the last week of November 2020.
The overall proportion of men’s fashion items that maintained the same prices during the pre-sale and sales periods was 88.6%, ranging from 99.5% for JC Penney to 75.0% for Neiman Marcus.
Neiman Marcus had the highest proportion of men’s fashions with a price decrease (25.0% vs. 1.4% for JC Penney). Top types of men’s fashions that had discounts were formal shoes, jackets and coats, and sports shoes. These findings seem to reflect how we rarely go out during the pandemic yet we’re exercising more.
In addition, Amazon and Walmart were most active in offering discounts across all men’s fashion subcategories with Amazon offering more than double Walmart’s percentage of products discounted (15.9% vs. 7.1%).
On Black Friday, JC Penney offered the most generous average discounts (35.6% vs. 9.4% for Overstock). While that contrast seems dramatic, it’s important to note JC Penney’s discounts applied to only 8 products compared to 929 for Overstock.
Men’s fashions with the highest average discount on Black Friday included formal shoes, jackets and coats and jeans.
Top product types by additional discounts- Women’s fashion
For women’s fashions we also tracked whether prices decreased, increased or remained the same during the last week of November 2020. The vast majority of women’s fashions (89.3%) maintained the same prices during the pre-sale and sales periods. A whopping 99.3% of Target’s women’s fashion prices stayed the same.
Neiman Marcus had the highest proportion of women’s fashions with a price decrease (33.4%), particularly on casual shoes, t-shirts and lingerie. JC Penney and Target offered the lowest proportion of price decreases on women’s fashions (1.9%).
Similar to men’s fashions, Amazon and Walmart offered price discounts across all the women’s fashion subcategories with Amazon offering a higher proportion of products with discounts. (10.7% vs. 7.7% for Walmart)
On Black Friday, JC Penney offered the most generous average discounts (45.0% vs. 12.2% for Overstock) yet JC Penney’s discounts applied to only 28 products compared to 1952 for Overstock.
The types of women’s fashions with the highest average discount on Black Friday included tops, casual shoes and handbags. Perhaps women pampered themselves with a new purse and new tops to look chic on Zoom calls.
Black Friday Vs Cyber Monday
During this year’s holiday sales events, almost all retailers offered more additional discounts on men’s and women’s fashion on Cyber Monday than on Black Friday, possibly to sell off seasonal inventory before year-end. Nordstrom was the only exception, offering more discounts on Black Friday.
On Cyber Monday, Target offered additional discounts on the greatest proportion of men’s fashions (63.3% vs. 10.6% for Walmart). Top types of men’s fashions with discounts included underwear, jeans, jackets and coats.
Similarly, Target offered additional discounts on the greatest proportion of women’s fashions on Cyber Monday (79.4% vs. 3.2% for JC Penney). The most common types of discounted women’s fashions were dresses and jumpsuits, t-shirts and casual shoes.
These findings suggest Target is aggressively pursuing value shoppers and positioning the chain as a convenient source for all the whole family’s apparel needs.
Most retailers (Amazon, Nordstrom, Overstock, Target and Walmart) offered deeper additional discounts on men’s fashions on Cyber Monday than Black Friday, possibly to maximize year-end sales and clear out seasonal inventory. Cyber Monday discounts for men’s fashions ranged from 29.8% for Nordstrom to 11.0% for Overstock. Top types of men’s fashions that received Cyber Monday discounts included jackets and coats, formal shoes, sunglasses and t-shirts, which reflect how men are going out less.
Conversely, most retailers (JC Penney, Macy’s, Neiman Marcus, Nordstrom and Walmart) offered deeper additional discounts on women’s fashions on Black Friday than Cyber Monday, possibly to entice women to get a jumpstart on the holiday sales weekend to maximize top line performance in this competitive category. Black Friday discounts for women’s fashions ranged from 45.0% for JC Penney to 12.2% for Overstock. Top types of women’s fashions with Black Friday discounts included swimwear, lingerie and t-shirts, which reflect seasonal merchandise.
Additional discounts across products by “premiumness” level
For almost every retailer, the percentage of fashions with additional discounts was higher on Cyber Monday than on Black Friday. Target had the highest proportion (62.7% vs. 5.7% for JC Penney). It appears Target really wants to win value-seeking apparel shoppers, by offering additional discounts on 93.3% of fashions at the low premium level (vs. 4.6% for Walmart).
By contrast, Nordstrom had a higher percentage of fashions with additional discounts on Black Friday.
Most retailers (Amazon, Bloomingdale’s, Neiman Marcus, Overstock, Target and Walmart) offered deeper discounts on Cyber Monday than Black Friday, likely make room for new seasonal merchandise.
Neiman Marcus offered the most generous fashion discounts on Cyber Monday with an average additional discount of 30.1%, which ranged from 31.7% at the high premium level to 28.9% at the low premium level. This aggressive discounting could help Neiman Marcus stand out among department stores, and extend its reach and appeal by making fashions more affordable across price points.
Conversely, JC Penney, Macy’s and Nordstrom offered deeper discounts on Black Friday. All three department stores were most generous at the low premium level for fashions, with JC Penney offering the deepest discounts (47.8%) to turn low premium fashions into irresistible Black Friday bargains.
Additional discounts across products by “popularity” level
Almost all retailers offered a greater proportion of additional fashion discounts on Cyber Monday than on Black Friday, ranging from 69.2% for Target to 5.2% for JC Penney, with a direct relationship between product popularity and additional discount percentage. Across all levels of popularity for fashions, Target was by far the most aggressive with discounts to appeal to the broadest variety of fashion shoppers.
Only Nordstrom offered a higher proportion of additional discounts on fashions on Black Friday, focusing on both high and low levels of popularity.
Most retailers (Amazon, Neiman Marcus, Overstock, Target and Walmart) offered deeper fashion discounts on Cyber Monday than on Black Friday, with both Neiman Marcus and Target being the most generous (28.8%). Amazon and Neiman Marcus were most generous with discounts among less popular items, while Overstock, Target and Walmart were most generous among moderately popular fashions.
Conversely, JC Penney, Macy’s and Nordstrom offered more generous fashion discounts on Black Friday, with JC Penney being the most generous (39.2%). All three retailers offered the deepest discounts at the low level of popularity, possibly to make room for in-demand fashion items.
2020’s Fashionable Holiday Prices
As this year’s Black Friday and Cyber Monday fashion pricing results show, we prioritized comfort and basics over debonair formalwear. Since staying at home is in style, many retailers discounted dressier attire.
In terms of competitive pricing strategies, Target’s aggressive discounts could boost the chain’s appeal among diverse fashion shoppers. Also, Neiman Marcus stood out among department stores by extending its reach and affordability across pricing tiers.
Click here for more Black Friday and Cyber Monday analysis to learn about retailers’ holiday pricing strategies during 2020’s e-commerce boom.
The rapid evolution in essential goods is rattling retail. That’s because the COVID-19 pandemic has dramatically changed shopping habits and retail necessities, leading to unpredictable shifts in demand.
Most notably, U.S. e-commerce has surged by an astonishing 45% year-over-year, as the pandemic accelerated online shopping by five years.[1] Since more consumers now work and learn from home, many pandemic-inspired habits will likely shape retail for years to come.[2]
Now that the risk of the second wave lies ahead, it’s the ideal time for retailers to review pandemic bestsellers and patterns to adapt to shifts in shopping behavior.
Pandemic’s bestsellers shape retail strategies
2020’s unexpected consumption patterns give retailers a glimpse of how they can adapt and thrive. The best-selling essential goods during the pandemic have included:
Toilet paper: +734% year-over-year (YoY) growth in March[3]
Disposable gloves: +670% in March[4]
Fitness equipment: + 535% YoY in online sales for February to March[5]
Hand sanitizer: +470% YoY for the week ending March 7[6]
Yeast: +410% YoY for the four weeks ending April 11[7]
Puzzles: +370% YoY in the last two weeks of March
Pyjamas: + 143% in online sales between March and April[8]
As such, retailers can ensure their assortments contain these types of popular cross-category items, which reflect overall themes of consumers’ needs for self-sufficiency, wellness and comfort.
E-grocery is also soaring, as experts predict a 40% rise in U.S. online grocery sales in 2020 due to the pandemic.[9] Top categories bought by online grocery shoppers include:
Packaged non-fresh food (69%)
Toiletries, personal care and diapers (63%)
Household cleaning and paper products (61%)[10]
In response to these trends, retailers can prioritize shelf-stable center store products and non-food consumer goods throughout the pandemic.
How retailers boost agility, clarity and sales amid COVID-19 chaos
Consumer panic led to pricing volatility for hard-to-find items like hand sanitizer, disinfectant wipes and masks.[11] To keep up with competitors’ online price fluctuations, more retailers use competitive analytics to adapt their own prices accordingly. Notably, McKinsey & Company cites data insights and price sensitivity as the top two disruptive trends the pandemic has turbocharged.[12]
In March, shortages of toilet paper and flour led consumers to react with panic and hoarding that created urgent supply chain issues. To avoid out-of-stock items, more retailers now turn to data insights to identify potential disruptions. Up-to-date insights help retailers spot emerging market trends and adapt their assortment to stock in-demand items.
Now that more consumers shop online, retailers are investing in digital promotions to boost sales. Data analytics help retailers quickly evaluate the effectiveness of their promotions, which can inspire consumers to fill their baskets. Nimbly adapting to competitors’ promotions is essential, as McKinsey cites rising competition for deals among the pandemic’s most disruptive retail trends.[13]
Avoid empty shelves: The pandemic has motivated more retailers to rely on data insights to make fast, effective pricing and assortment decisions.
As consumption habits evolve, high-level dashboards help retailers quickly spot inventory shortages to prevent out-of-stocks.
To make their retail strategies pandemic-proof, leading retailers are collaborating with DataWeave to access accurate, actionable insights that boost online agility and sales. Applying DataWeave’s trusted data gives retailers clarity amid today’s chaotic market and shifting demand for essential goods, so they can make effective decisions fast. Insights also help retailers enhance the customer experience by supporting in-stock product assortments, competitive pricing and effective promotions that boost sales, trust and loyalty. To see how DataWeave helps retailers stay agile and competitive, visit dataweave.com.
[1] Perez, Sarah. COVID-19 pandemic accelerated shift to e-commerce by 5 years, new report says. TechCrunch. August 24, 2020.
[2] Gottlieb, David. 5 Strategic Imperatives for Retail’s New Normal. Total Retail. August 18, 2020.
[3] Weiczner, Jen. The case of the missing toilet paper: How the coronavirus exposed U.S. supply chain flaws. Fortune. May 18, 2020.
[4] Clement, J. COVID-19 impact on fastest growing e-commerce categories in the U.S. 2020. Statista. June 19, 2020.
[5] Gibson, Kate. Coronavirus inspires fitness buying binge that tops New Year’s. CBS News. April 1, 2020.
[6] Chasark, Krisann. Coronavirus impact: Hair dye becoming next high-demand item amid COVID-19 pandemic. ABC News. April 11, 2020.
[7] Guynn, Jessica and Kelly Tyko. Dry yeast flew off shelves during coronavirus pantry stocking. Here’s when you can buy it again. USA Today. April 23, 2020
[8] Thomas, Lauren. Comfort is en vogue during coronavirus: PJ sales surge 143%, pants sales fall 13%. CNBC. May 12, 2020.
[9] Redman, Russell. Online grocery sales to grow 40% in 2020. Supermarket News. May 11, 2020.
[10] Redman, Russell. Online grocery sales to grow 40% in 2020. Supermarket News. May 11, 2020.
[11] Levenson, Michael. Price Gouging Complaints Surge Amid Coronavirus Pandemic. The New York Times. March 27, 2020.
[12] Kopka, Udo, Eldon Little, Jessica Moulton, René Schmutzler, and Patrick Simon. What got us here won’t get us there: A new model for the consumer goods industry. McKinsey & Company. July 30, 2020.
[13] Kopka, Udo, Eldon Little, Jessica Moulton, René Schmutzler, and Patrick Simon. What got us here won’t get us there: A new model for the consumer goods industry. McKinsey & Company. July 30, 2020.
Our preliminary analysis reveals that Prime Day 2020 motivated Amazon’s rivals to offer deeper discounts in key categories to try to make their merchandise more magnetic and lure consumers away from the e-commerce giant.
This year’s Prime Day is momentous, as the COVID-19 pandemic has encouraged more consumers to make online shopping a more regular habit. It also marks the first time Prime Day took place in the strategically significant final quarter of the year, kicking off the holiday sales season.
At DataWeave, we wanted to know whether Prime Day 2020 lived up to the hype and how Amazon’s deals compared to other retailers’ discounts. Our analysis examines products across three popular categories: electronics, beauty and fashion.
Our Methodology
We tracked the pricing of several leading retailers (Best Buy, Target, Walmart and Amazon) selling consumer electronics, beauty and fashion to assess their pricing and assortment strategies during this annual sales event.
Our analysis focused on additional discounts offered during the sale to estimate the true value that the sale represented to consumers. Our calculations compared product prices on Prime Day versus the prices prior to the sale. The sample consisted of up to the top 750 ranked products across 21 popular product types in consumer electronics, beauty and fashion.
The Verdict
Overall, Amazon reported the lowest price reduction in the Electronics, Beauty and Fashion categories (13.4%), compared to Best Buy (22.5%), Target (21.7%) and Walmart (16.3%). Yet Amazon reported the second-highest percentage of additionally discounted products (12.0% vs. 15.7% for Target).
After Prime Day ended, certain assortments reflected more significant price increases than others. For instance, 97% of Target’s 158 products in Electronics, Beauty and Fashion had a price increase during the post-sale period, compared to 49% of Walmart’s 986 products. This discrepancy makes sense given Walmart’s everyday low price strategy.
These results suggest that although Prime Day generates tremendous media buzz for Amazon, the most generous deals come from its rivals. To stand out and lure shoppers away from Amazon, competitors offered comparatively deeper discounts, especially in categories in which they want to grow their market share. This means online shoppers would be wise to compare prices across retailers’ websites to find the best cross-category deals on Prime Day.
Top product types by additional discount
In Electronics, Best Buy offered the biggest average additional discount (22.4%) and Amazon offered the lowest (9.4%). Tablets were a popular product category among Amazon, Best Buy and Walmart, with Best Buy offering the best average additional discount at 19.1%. Other popular product types among rival retailers included TVs, desktops and laptops.
In Beauty, Target (13.2%) and Walmart (13.1%) almost tied for the biggest overall additional discount. Makeup was a popular beauty subcategory, with Walmart offering the highest additional discount at 19.7%. Other popular product types included hair care, skin care and fragrance.
In Men’s Fashion, Target offered the biggest average additional discount of 28.1%. Suits and blazers were a popular fashion subcategory, in which Target offered the highest average additional discount at 50.0%. Other popular product types included T-shirts and tank tops, shirts and jeans.
Within the Women’s Fashion category, Walmart offered the biggest average additional discount of 20.5%. Tops and tees were a popular product category across all three fashion rivals, with Walmart offering the best average additional discount at 23.6%. Other popular product types included dresses, jumpsuits and jeans.
Additional discounts across product “premiumness” levels
Premiumness was calculated as the average selling price before the sale event. This was divided into low, medium and high premiumness levels, with high indicating higher selling prices.
In Electronics, Amazon showed a direct relationship between its additional discounts and the level of premiumness; Best Buy and Walmart showed an inverse relationship. Best Buy offered the biggest additional discounts across all levels of premiumness, nearly triple Amazon’s discounts (20.7% vs. 7.0% ) at the low end of the premium spectrum, and more than double Amazon’s discounts (18.5% vs. 7.3%) at the moderate level. Best Buy’s discounting strategy show it’s serious about protecting its competitive position in electronics.
Best Buy and Walmart offered the most additional discounts at the high end of the premiumness spectrum, making both retailers more competitive in the high-ticket electronics category. By contrast, Amazon offered nearly double the additional discounts of its rivals within the low segment, which helps to protect its margins while making products even more affordable and appealing.
In Beauty, Amazon and Walmart offered their biggest additional discounts at the low premium level, possibly to position those products as loss leaders. Meanwhile Target nearly doubled and tripled its rivals’ additional discounts at the high premium level (30.0% vs. 16.0% for Walmart and 11.0% for Amazon) to stand out in this intensely competitive category.
Amazon stood out by discounting the greatest portion of its Beauty offerings at all premiumness levels and Target discounted the least. Amazon and Walmart showed a direct relationship between their distribution of additional discounts and the beauty products’ premiumness level.
Across all levels of premiumness for Men’s Fashion, Target offered the biggest additional discounts, including more than triple Amazon’s discounts at the high end (38.4% vs. 12.4%). Target’s aggressive discounting shows a desire to be more competitive within the most premium segment of Men’s Fashion.
Amazon’s additional discounts accounted for the greatest percentage of its Men’s Fashions across all levels of premiumness, nearly triple Target’s overall average (15.4% vs. 5.3%). This approach shows Amazon’s willingness to give shoppers deals across a broader variety of Men’s Fashion items.
In Women’s Fashion, Target’s and Walmart’s overall additional discounts were comparable, and Amazon’s discounts were consistently the lowest among all levels of premiumness. Walmart offered its most generous discounts at the low and medium level of premiumness, which could reinforce its low-cost leadership image.
While Amazon and Target offered a comparable overall percentage of additional discounts in Women’s Fashions, Amazon applied more discounts to the higher end of the premium spectrum and Target focused on the lower end.
Additional discounts across visibility levels
In Electronics, Amazon offered the lowest average additional discounts across all levels of visibility. Among the most visible electronics, Amazon and Best Buy gave the most visible electronics higher additional discounts to make those items more alluring to help consumers find the items fast and add them to their online baskets.
Among the Beauty category’s most visible items, Amazon and Target offered their highest additional discounts. Yet Target was most aggressive in beauty, offering a 30% additional discount at the most visible end of the spectrum as well as at the least visible. This discount strategy shows Target wants to compete in Beauty, spreading its generosity beyond an exclusive focus on highly visible items.
In Men’s Fashion, Amazon consistently offered the lowest additional discounts at all visibility levels. Target was the most aggressive in this category, offering additional discounts of 50% at moderate levels of visibility and 34.5% among the most visible items. Amazon may feel confident that men already choose Amazon for their apparel needs.
In Women’s Fashion, the retailers generally offered the most additional discounts for items at the higher end of the visibility spectrum. Walmart offered the most aggressive additional discounts among the most visible items in Women’s Fashion to try to boost its market share in this category.
Overall, while Prime Day is an effective way for Amazon to boost brand engagement, its rivals overwhelmingly offer higher additional discounts in Electronics, Beauty and Fashion. How about other categories like the booming Home space? Watch this space for more insights!
As DataWeave continues to engage with brands and manufacturers of all sizes, a consistent theme keeps emerging, “click and collect tracking”. Right now, brands rely on manual-store checks or waiting upwards of two weeks for a retailer to report sales data, which reveals low sales because a product is out of stock. In addition, there are always questions about the local price of your products compared to top competitors in the category. This is where DataWeave’s CPG Brand Monitor solution can help.
On a daily basis, we track over 13,000 variant level SKUs across 100 stores, via seven of the top grocery retailers. We have selected the largest grocers in each region of the US, to allow for the widest coverage. These grocers include Albertsons/ Safeway in the west, HEB in Texas, Kroger in the upper mid-west, Wegmans in the Mid-Atlantic and Publix in the Southeast.
How does it work?
In the application, you will see the list of all the SKUs we’re covering, with filters on the left side of the page to help with navigation. You can sort by Brand, Category, Store/ City, State, etc. After the filters are applied, the SKU list will be displayed based on these filters. On the right side of the screen, you will see all the product level details including a 7-day price history, individual store level pricing/ stock availability and exportable charts and graphs.
How do I get access?
Simply access the CPG Brand Monitor page, fill in your credentials via “Start Free Trial” and your login will be sent directly to your inbox. No commitments or phone calls are needed to test out the data. After a few days, our team will be in touch to make sure you understand how to navigate the tool and take you through our subscription options.
What else do we offer?
DataWeave also offers a full Digital Shelf Analytics suite that covers Share of Voice (keyword, navigation and banner audits), Content Audit/ Optimization, Ratings/ Review Sentiment Analysis, Promotional Analysis, and much more.
JioMart, the online channel for Reliance Retail Limited, launched in December 2019 as a contender in the e-grocery segment. Currently in India, this segment is being dominated by bigbasket, Amazon, Flipkart Supermart, Grofers, etc. After less than a year and from their initial launch in Mumbai, they now have their presence in 205 cities across India.
According to their recent press release, they claim to be clocking over 250,000 daily orders, compared to bigbasket’s 220,000 and Amazon’s 150,000. To get an understanding of this rapid penetration, we had a look at the PIN codes that JioMart serves, spanning the country.
The map below represents the percentage of PIN codes that are being served by JioMart’s online grocery in each state:
**Disclaimer -Map for representation purposes only
While states like Chandigarh, Delhi and Punjab in the North are covered extensively, JioMart has a stronger distribution in the Southern states.
The image below shows the top ten states in India where JioMart’s online grocery has the highest presence:
They’re yet to launch in 14 more states but it’s interesting to note that in this limited time, they’ve managed to cover 14% of the PIN codes in the country and all this, in the midst of lockdowns.
Assortment
To get an idea of the assortment in their range, we analyzed select PIN codes across three tiers of cities in India. The parameters we looked at were categories, brands and discounts to get an understanding of how JioMart is stacking up against its competitors. The cities we examined were:
Tier 1 – Bangalore, Delhi, Kolkata, Mumbai
Tier 2 – Ahmedabad, Jaipur, Kochi, Visakhapatnam
Tier 3 – Mohali, Mysore, Nagpur, Siliguri
In its range, they offer eight broad categories, of which, we focussed on the four that offer the highest selection of products: home care, personal care, snacks & branded food and staples.
The table below represents the average selection of products offered across each tier.
Overview of discounts offered and the private label split
Out of the assortment we looked at in the three tiers, we noticed that an average of 18% of the products are JioMart’s private labels. What stood out further is that private labels accounted for 48% in the Staples category and 24% in Personal Care. We noticed this trend (increase in the private label) when we did an analysis of Amazon.
When it comes to discounts, we noticed that a near-total 91% of the products listed are being sold at a discount. Out of this, the highest discounts were witnessed in the Home Care and Staples categories.
The brands with the highest number of products listed were Good Life, Reliance, Amul, Gillette and items sold loosely. All these accounted for 14% of the assortment. Out of these, Good Life, Reliance and the loose items are JioMart’s private labels.
Competitor analysis
To get an idea of where JioMart stands with relation to its competitors, we focussed on food and essentials in the Tier 1 cities. The table below highlights the number of product offerings in each category:
It’s clear that in these categories (food and essentials), JioMart has the least number of products on discount. There’s no doubt that bigbasket is miles ahead in its product range/ assortment.
To get a better idea of the discounting patterns, we analyzed the same categories to get a count of the number of products being discounted, as well as the average discount being offered.
We noticed that JioMart bookended our analysis – the least average discount, across the most number of products. Grofers offered the highest average discount of 23% with Flipkart Supermart and bigbasket closely behind. Lastly, bigbasket had the least number of products on discount with a little over 53%.
Conclusion
JioMart launched during a tumultuous and unprecedented time; the COVID-19 pandemic and the subsequent nation-wide lockdowns. Given this trial by fire, they managed to make an impact in this highly competitive space. Their expansion plans of tying up with mom and pop stores to fortify their penetration, had to take a back seat due to the ongoing situation but is sure to resume once conditions improve. This set-back did not however deter JioMart from attracting strategic investments from Facebook, Google and 12 other investors in a span of 3 months.
In a study by Goldman Sachs, it found that India’s e-commerce business is expected to grow at a compound annual growth rate of 27% by 2024, resulting in a $99 billion market share. What’s even more shocking is that 50% of this market will be captured by Reliance Industries. It, therefore, stands to reason that all we’ve seen and heard of so far, is merely the tip of the iceberg and there’s surely more to come in the near future.
The Coronavirus, otherwise known as COVID-19, has made landfall on U.S. shores. At the time of writing this article, there are over 230 confirmed cases in the country and 12 deaths. The growing unease about the virus, which has quickly accumulated 95,000+ confirmed cases globally, has, among other things, adversely affected businesses and stock markets the world over.
In the wake of this outbreak, U.S. based retailers and brands would be prudent to brace themselves and plan ahead to minimize disruptions as much as possible.
Businesses and consumers in China, the global epicenter of the epidemic, have been dealing with these challenges over the last couple of months. It’s likely that some of the trends observed in China would be mimicked in the U.S. as well, something that domestic retailers and brands would do well to study and prepare for.
The Inadvertent E-commerce Wave
When the outbreak happened in China, it caused an uptick in e-commerce adoption as shoppers were reluctant to step out of their homes and instead, opted to shop for their goods online.
Reports indicate that Chinese online retailer JD.com’s online grocery sales grew 215% YoY over a 10-day period between late January and early February. Similarly, Carrefour’s vegetable deliveries grew by 600% YoY during the Lunar New Year period. Online sales of Dettol, a disinfectant produced by Reckitt Benckiser, rose 643% YoY between 10 February and 13 February on China’s Suning.com.
In Singapore, another region affected by the virus more recently than in China, Lazada’s grocery arm, RedMart, and Supermarket chain, NTUC FairPrice, both reported an unprecedented surge in demand, which tested their delivery capabilities to the limit.
This bump in online sales isn’t just restricted to grocery, but other categories as well. Jean-Paul Agon, CEO of L’Oréal, recently said that online sales of the brand’s beauty products increased in China in February.
Given such a consistent shift in shopping behavior across coronavirus-affected regions, it’s logical to expect that a similar trend would be followed in the U.S. – in fact, it might already be underway.
A recent survey by Coresight Research indicated that 27.5% of U.S. respondents are avoiding public areas at least to some extent, and 58% plan to if the outbreak worsens. Of those who have altered their routines, more than 40% say they are “avoiding or limiting visits to shopping centers/ malls” and more than 30% are avoiding stores in general. The survey also found consumers will likely begin to avoid restaurants, movie theaters, sporting events and other entertainment venues.
Therefore, it’s essential for U.S. retailers and brands to swiftly energize their e-commerce readiness and be fully prepared to cater to the circumstances-induced shift in shopping behavior, inclined toward online.
A Logistical Nightmare
The most obvious area of impact for retailers and brands is in their supply chain and order fulfilment operations.
A large portion of consumer product manufacturers rely to some extent on China, and the potential impact of the virus on supply chain processes is inescapable. Chinese factories have been operating at partial capacity, impacting supply chains globally. This has largely affected highly popular e-commerce categories like consumer electronics, fashion and furniture.
Shares in the U.S. of furniture e-commerce retailer, Wayfair, fell as much as 26% toward the end of February, according to a Bloomberg report. The is particularly revealing, as the online retailer reportedly relies on China for half of its merchandise.
Retailers struggling to cope with this stress in their supply chain systems would do well to warn their customers beforehand about delays in deliveries, like AliExpress has just done.
For categories like CPG, as consumers increasingly shop online, retailers that offer Buy Online Pick Up In Store (BOPIS), should expect a surge in its adoption, and reinforce their online infrastructure and in-store operations to cater to the rising demand.
In addition to disruptions in the supply chain, several other mission-critical areas are likely to get affected too.
Keeping Up With The Online Surge
As with any event of this magnitude, the business implications reach far and wide. The following are a few areas that we’ve identified as critical, based on our experience working with retailers and brands. Being aware of and focusing on these issues are likely to alleviate some of the issues faced by consumers today.
Fair pricing: There have been several reports of price gouging on e-commerce platforms. Examples include 2-ounce Purell bottles being sold for $400 and face masks for up to $20. While these prices have mostly been set by third party merchants, brands are likely to face the flak from consumers. A recent Bloomberg article reported that online retailers still rely partly on employees to manually monitor these items. This approach has obvious limitations, such as products quickly reappearing on the website after being de-listed. Brands and e-commerce platforms will need to explore automated ways of controlling their online pricing practices at large scale.
3P merchant and counterfeit management: Often, unauthorized third-party merchants selling an original manufacturer’s goods are the ones who unreasonably inflate prices. These merchants tend to test the markets on online marketplaces with their pricing, which adversely affects the brand image of the manufacturer. Further still, they sometimes list counterfeit or fake goods that make incorrect or extravagant claims. Brands will need to swiftly identify and de-list these merchants from online marketplaces.
Ensuring stock availability: During times like these, it’s a common sight to see empty aisles at supermarkets selling items like canned food, water, paper products and personal care products. Consumers will benefit from brands monitoring their stock availability at stores, which will help them better align their supply chain operations to the rapidly changing demand patterns across the U.S. map. This way, efforts can be more targeted at regions with severe shortages.
Content compliance: Helium 10, a technology provider for Amazon sellers, reported that since 26 February, 90% of searches on Amazon are coronavirus related, and searches for hand sanitizers spiked to 1.5 million searches in February compared to 90,000 in November. As a result, to arrest exploitative practices, some online marketplaces have announced policy guidelines on product content claiming health benefits. Words like ‘Coronavirus‘, ‘COVID-19‘, ‘Virus‘ and ‘epidemic’ are, in fact, prohibited. Amazon has already de-listed several merchants claiming fraudulent cures. Ebay has gone as far as to ban all new listings for face masks, hand sanitizers, and disinfecting wipes, due to regulatory restrictions. In this context, retailers and brands will benefit from deploying tracking mechanisms that quickly identify offenders.
The areas of business presented above are by no means a comprehensive list for retailers and brands to rely on during this time. Still, these are critical impact areas for them to address, even as huge efforts are made toward managing highly stressed supply chains.
DataWeave Offers Support
The coronavirus outbreak is likely to get worse before it gets better. As we enter unchartered territories, DataWeave is offering to contribute in small ways, pro bono, by leveraging our expert talent and competitive intelligence technology platform, to address some of the challenges faced by retailers and brands.
We’re announcing a limited-time, no-cost offer to detect and report on price gouging, the presence of unauthorized third-party merchants, as well as stock availability across U.S. ZIP-codes. This offer will be valid for 4-6 weeks (timeline will be flexible based on how the outbreak develops) and limited to monitoring the top 10 U.S. online marketplaces, as well as critical product categories such as medicinal and hygiene-related products, emergency food items, survival-related products, fuel, etc.
For today’s shoppers, instant gratification is the need of the hour. It’s, therefore, no surprise that furniture e-retail has been picking up steam over the last decade. What was once a norm to physically touch and feel before making a purchase, is now just a few clicks away. Retailers have bridged the gap by making the purchase process as seamless as possible – easy finance options, hassle-free returns and variety.
While several factors play a role in driving consumers to shop furniture goods online, price is the primary motivator, as is the case with most popular product categories sold online.
During Black Friday 2019, DataWeave performed an analysis on a sample of 23,000+ products across six of the top furniture retailers – Amazon, Home Depot, JCPenney, Target, Walmart and Wayfair. Ten product types were covered in the furniture category (such as Beds, Bookcases, Mattresses, Sofas, etc.) and the analysis focused on the top 500 ranked products of each product type.
To get an accurate depiction of the additional markdowns during the sale, we took the mode of the prices for the preceding week and compared them with that during the sale.
Additional markdowns
Target (25%) and Home Depot (21%) marked down their prices most aggressively during the sale. JCPenney and Wayfair stood out for offering additional markdowns on the highest portions of their ranges (67% and 46% respectively), even though the average markdown percentage was fairly conservative. Amazon and Walmart were steady as usual, with additional markdowns of 8% and 10% on 15% and 17% of their assortment, respectively.
Premiumness
To further understand the furniture pricing strategies of these retailers, we categorized their products into buckets of how expensive or cheap the product is (High, Medium, and Low in terms of price), relative to the rest of the products hosted by the retailer, and studied how the additional markdowns varied across these buckets. Where the MRP was not displayed, the most expensive price of the product during the holiday period prior to Black Friday was considered to define the “premiumness” of the product.
Two patterns clearly stand out from this analysis. Most of the retailers remained relatively equitable between their premium categories with nothing significant to report in terms of varying markdowns. Home Depot and and JCPenney are the only exceptions here, but not by much. The other interesting insight is that the percentage of marked-down products had a near unanimous pattern of the high level being the most covered, followed by the medium and then low.
Therefore, while there wasn’t a significant variation in the average markdown across premiumness levels, a larger portion of the high-premium goods were consistently offered at a discount across all retailers.
Popularity
Much like our premiumness categorization, we investigated products based on their popularity levels as well. We’ve defined popularity using a combination of the average review rating and the number of reviews for each product, condensed to a scale of low, medium and high.
We observe slightly different furniture pricing strategies adopted by retailers across popularity levels. While Home Depot, Amazon, and Wayfair chose to provide higher markdowns on their more popular products, Target, JCPenney, Walmart chose to provide higher markdowns on their least popular products. In addition, a larger portion of the least popular products were consistently offered on discount by almost all retailers.
In combination with our findings across premiumness levels, we can surmise that part of the strategy of most retailers was to liquidate their stock of expensive and unpopular products during the sale.
Price Change Activity
As part of our analysis, we also tracked the level of pricing activity across retailers over the last week of November, in terms of the number of price changes made as well as the average price variation for each retailer.
In general, we can see that Amazon and Walmart consistently made several price changes through the week, though the average magnitudes of these price changes were relatively low. This echoes the pattern we’ve observed through our analysis of other product categories during the sale event, as well.
Also, we see an almost coordinated increase in the number of price changes and the average magnitude across the 27th and 28th of November. This is likely an attempt by the retailers to get a head start on Black Friday deals.
An unusual and interesting pattern was observed with Wayfair, which started out the week with the most changes at 2500. It then tanked the next day and hovered around 500 till the 28th, only to spike to 2500 again. All these changes though, had their variation in and around 5%.
In summary, its interesting to observe how different retailers approached the much-anticipated holiday season sale events differently. As one might expect, there are significant variations among retailers in the aggressiveness of discounting activity as they approached Black Friday, and on Black Friday itself. Contrasting pricing strategies for popular and premium goods were also observed.
If you would like to learn more about the pricing of top U.S. retailers across other product categories like consumer electronics, fashion, and beauty & health, check out our series of articles on Black Friday 2019.
Target and Walmart offered more appealing discounts than Amazon during Prime Day 2019.
Statista estimates that e-commerce fashion accounted for approximately 20.4% of overall fashion retail sales in the United States in 2018, which amounted to about $103 billion in absolute terms. According to Internet Retailer, apparel is the largest and among the most competitive retail categories in e-commerce. Moreover, as a share of total apparel and accessories sales, online apparel sales is growing at a faster rate than US e-commerce as a whole.
Given the high-growth and competitive nature of the category, we at DataWeave were interested to find out how high the stakes got during the fifth annual Prime Day earlier this month.
Our Methodology
Since Prime Day is no longer necessarily an Amazon event (since competing websites often offer attractive discounts as well), we tracked the pricing of several leading retailers selling fashion apparel, footwear, and accessories to assess their pricing and product strategies during the sale event. Our analysis was focused on additional discounts offered during the sale to estimate the true value that the sale represented to its customers. We calculated this by comparing product prices on Prime Day versus the same prices prior to the sale.
Our sample consisted of 20 product types across women’s as well as men’s fashion categories. While we did monitor exclusive fashion retailers Macy’s, Bloomingdales, Nordstrom, and Neiman Marcus, we did not find them offering any additional discounts – an interesting insight all on its own since they’ve clearly chosen not to compete with Amazon during the two days of the Prime Day sale. We therefore restricted the rest of our study to Amazon, Target, and Walmart – the latter two of which interestingly offered immensely aggressive discounts in their apparel categories.
The Verdict
Despite owning the day at least in name, Amazon was found to offer the lowest additional discounts among the retailers studied. Target and Walmart, on the other hand, ensured that they didn’t lose out on market share this Prime Day by offering substantially high discounts of their own. While Target was the most aggressive with a steep average markdown of 26.5%, Amazon closed out the bottom at 8.4%.
Walmart and Target didn’t seem particularly focused on compensating their sharp discounts with price increases in other products – their focus seems to have been solely only on offering timely discounts during the sale. Amazon, on the other hand, marked up just about as many products as it marked down, with the markup margin being close to double that of the markdown in an effort to protect margins during the sale.
Top product types by additional discount
Target and Walmart both offered aggressive discounts across their top product categories. Walmart ended up with a marginally higher overall average additional discounts on product types like Shirts, T-shirts, and Tops.
Interestingly, though Amazon offered moderate discounts across its top categories (Lingerie, Swimwear, and Underwear), the volume of marked down products was very limited.
Additional discounts across popularity levels
We determined popularity using a combination of average review rating and number of reviews, and the resulting scores were categorized as low, moderate, and high.
When it came to discounting popular products, there were clear differences in strategy among all the three retailers. Amazon, which interestingly had close to 60% of its products in the low popularity bucket, chose to offer the highest discounts in the same category – indicating an effort to clear its stock of unpopular products. Target and Walmart, on the other hand, focused their discounts on moderate rated products.
Additional discounts across product “premiumness” levels
Premiumness was calculated as the average selling price before the sale event. This was divided into four percentile blocks, with higher percentile blocks indicating higher selling prices.
As found in the electronics and furniture categories that were analyzed previously, most of the discounting activity was focused on the lower end of the premium spectrum with a view to protect margin – despite a largely equitable distribution of discounted products across percentile ranges (with the exception of Target, which had a discounted assortment heavily dominated by its least premium products).
This indicates a clear strategy to protect margins, while still maintaining the perception of promoting attractive offers to draw traffic. Target and Walmart both offered substantial additional discounts of close to 30% on their least premium products, while at 12%, Amazon offered less than half that discount.
Additional discounts across visibility levels
Given the fairly large number of SKUs across the fashion category in general, the discounts across visibility levels understandably didn’t vary much when compared to the more pronounced fluctuations observed in the electronics and furniture categories. This is also largely because consumers tend to explore lower ranked products more so in the fashion category than in other categories.
Across product categories, we’re seeing lower-than-expected additional discounts on Amazon this Prime Day, coupled with more aggressive pricing activity by Amazon’s competitors. While this puts more pressure on Amazon, this also is a strong validation of Prime Day as a key annual sale event on the US shopper’s calendar.
Curious to know how Amazon and its competitors performed in other product categories this Prime Day? Watch this space for more!
AI is everywhere. Any retailer worth his salt knows that in today’s hyper-competitive environment, you can’t win just by fighting hard – you have to do it by fighting smart. The solution? Retailers are turning to AI in droves.
The problem is that many organizations regard AI as a black box of sorts – where you can throw all your data (the digital era’s blessing that feels like a curse) in at one end and have miraculously meaningful output appearing out the other. The reality of how AI works, however, is a lot more complex. It takes a lot of work to make AI work for you – and then to derive value out of it.
Image Source: https://xkcd.com/1838
Following the advent of the digital era, businesses across industries, particularly retail, were left grappling with massive amounts of internal data. To make things worse, this data was unstructured and siloed, making it difficult to process effectively. Yet, businesses learned to leverage simple analytics to extract relevant data and insights to affect smarter decisions.
But just as that happened, the e-commerce revolution stirred things up again. As businesses of all shapes, sizes, and types moved online, they suddenly became a whole lot more vulnerable to other players’ movements than they were just about a decade ago, when buyers rarely visited more than one store before they made a purchase. In other words, retailers are now operating in entire ecosystems – with consumers evaluating a number of retailers before making a purchase, and a disproportionate number of players vying for the same consumer mindshare and share of wallet.
Thus, external data from the web – the largest source of data known to man at present – is becoming critical to business’ ability to compete profitably in the market.
Competing profitably in the digital era: Can AI help?
As organizations across industries and geographies increasingly realized that their business decisions were affected by what’s happening around them (such as competitors’ pricing and merchandize decisions), they started shifting away from their excessive obsession with internal data, and began to look for ways to gather external data, integrate it with their internal data, and process it all in entirety to derive wholesome, meaningful insights.
Simply put, harnessing external data consistently and on a large scale is the only way for businesses to gain a sustainable competitive advantage in the retail market. And the only way to practically accomplish that is with the help of AI. Many global giants are already doing this – they’re analyzing loads of external data every minute to take smarter decisions.
That said, though, what you need to know is that all this data, while publicly available and therefore accessible, is massive, unstructured, noisy, scattered, dynamic, and incomplete. There’s no algorithm in the world that can start working on it overnight to churn out valuable insights. AI can only be effective if enormous amounts of training data is constantly fed back into it, coaxing it to get better and more astute each time. However, given the scarcity of readily available training datasets, limited and unreliable access to domain-specific data, and the inconsistent nature of the data itself, a majority of AI initiatives have ended up in a “garbage in, garbage out” loop that they can’t break out of.
What you need is the perfect storm
At DataWeave, we understand the challenge of blindly dealing with data at such a daunting scale. We get that what you need is a practical way to apply AI to the abundant web data out there and generate specific, relevant, and actionable insights that enable you to make the right decisions at the right time. That’s why we’ve developed a system that runs on a human-aided-machine-intelligence driven virtuous loop, ensuring better, sharper outcomes each time.
Our technology platform includes four modules:
1. Data aggregation: Here, we capture public web data at scale – whatever format, size, or shape it’s in – by deploying a variety of techniques.
2. AI-driven analytics: Since the gathered data is extremely raw, it’s cleaned, curated, and normalized to remove the noise and prepare it for the AI layer, which then analyzes the data and generates insights.
3. Human-supervised feedback: Though AI is getting smarter with time, we see that it’s still far from human cognitive capabilities – so we’ve introduced a human in the loop to validate the AI-generated insights, and use this as training data that gets fed back to the AI layer. Essentially, we use human intelligence to make AI smarter.
4. Data-driven decision-making: Once the data has been analyzed and the insights generated, they can either be used as it to drive decision-making, or then integrated with internal data for decision-making at a higher level.
With intelligent, data-backed decision-making capabilities, you can outperform your competitors
Understandably, pricing is one of the most popular applications of data analytics in retail. For instance, a leading, US-based online furniture retailer approached us with the mission-critical challenge of pricing products just right to maximize sell-through rates as well as gross margin in a cost-effective and sustainable manner. We matched about 2.5 million SKUs across 75 competitor websites using AI and captured pricing, discounts, and stock status data every day. As a result, we were able to affect an up to 30% average increase in the sales of the products tracked, and up to a 3x increase in their gross margin.
DataWeave’s powerful AI-driven platform is essentially an engine that can help you aggregate and process external data at scale and in near-real time to manage unavoidably high competition and margin pressures by enabling much sharper business decisions than before. The potential applications for the resulting insights are diverse – ranging from pricing, merchandize optimization, determination of customer perception, brand governance, and business performance analysis.
If you’d like to learn more about our unique approach to AI-driven competitive intelligence in retail, reach out to us for a demo today!
Over the last decade, the proliferation of e-commerce and the consequent surge in competitiveness among retailers has brought focus to one of the most critical drivers of success in online retail: pricing. According to McKinsey, an average 1% increase in price can translate into an 8.7% increase in operating profits (with the assumption that there’s no loss of volume). Yet, the company estimates that up to 30% of pricing decisions fail to provide the best price – every year. That’s a potential impact of millions in lost revenue for most modern-day retailers, a fact only made worse by the irony that in today’s times of automation and big data, there’s no shortage of intelligence to facilitate the best decision-making.
What you need is the ability to gather and rationalize all the data out there – of competitor prices, price perceptions, market dynamics, buyer behavior, etc. – in good time to price your products just right for maximum margin and revenue. The best part? Effective product pricing contributes significantly toward fostering a great customer experience, too.
Once you have your intel in place, there are plenty of eCommerce pricing strategies to choose from – it’s only a matter of identifying the metrics that matter the most to your business goals. That said, there are several models that have gained widespread popularity and acceptance over the years, like the following six:
1) Introductory pricing
This is a common marketing strategy used in the e-commerce space, where you draw consumer focus to a newly launched product or service, or the fact that you’re a new entrant in a market. There are two ways to do this – one is to start with steep discounts (particularly during sale events, and often in partnership with the consumer brand) with the aim of winning over more market share. At the other end is the strategy of setting relatively high initial prices. This works best for “exclusive offer” or “limited edition” opportunities; for instance, the opportunity to be the first to own the latest iPhone model.
2) Cost-linked pricing
In this method, you calculate how much it costs to sell a product and add a pre-determined margin to the final cost. In the world of online retail, product cost amounts to a lot more than the mere sum of manufacturing costs. For instance, it includes the procurement, labor, software, sales and marketing, shipping, and overhead costs that contribute to the total cost of housing it as long as it’s unsold. Therefore, all these costs need to be factored when determining the final product price. While the advantages of this model are its simplicity and the promise of guaranteed returns for each product sold, the flip side is that it doesn’t factor in the competitive landscape. The trick, therefore, lies in finding the balance between higher margin and sell-through rates, particularly given the aggressively competitive nature of online retail.
3) Competitive pricing
Today’s digitally savvy customers are forever comparing prices across several websites in the quest for the lowest prices. In fact, price is among the most critical factors that influences purchase decisions across products as well as categories. The competitive eCommerce pricing strategy, therefore, determines product price based on how the same products are priced by various competitors. While this model allows you to modify prices as frequently as necessary to drive efficient pricing and maximize revenue and margin, the complexity lies in ensuring consistent access to competitor prices, particularly in today’s highly dynamic e-commerce environment. DataWeave’s Pricing Intelligence platform helps eCommerce businesses overcome this challenge by helping them identify price improvement opportunities based on timely competitive intelligence at a massive scale.
4) Dynamic pricing
This model takes into account competitor prices, demand, and inventory levels, which are set up as triggers for automated pricing rules. While this results in sustained competitiveness, it requires a price optimization model that determines the optimal price in real-time response to fluctuations in demand and competitive prices – all the time ensuring alignment with your business goals. In other words, this model allows you to ensure consistently competitive yet optimized prices, thus acquiring and retaining a competitive edge in the market.
5) Price perception management
The company most famous for following this strategy is Amazon. The retail giant frequently identifies its most popular products and offers its largest discounts on them, often undercutting competitors. In other words, in this model, you “invest” in customer acquisition through excessively aggressive discounts on a select group of products – following which, you can cross-sell or up-sell other higher-priced products. Thus, you boost your perceived value to customers. Another way to drive a positive perception is to display discounted products at higher ranks on featured listings. For instance, in a recent study that we conducted, we found that 9 out of 10 leading US retailers’ top 50 ranked products (in each category) were significantly cheaper than the rest of their products.
6) Bundle pricing
The principle for this model is simple. You sell a number of the same products (or a range of complementary ones) for a combined, economical price. This is different from customers adding products individually to their cart as it works on the consumer psyche, which is more likely to favor a purchase that offers considerable perceived value. Thus, not only are you offering enhanced value to your customers (and in turn improving overall customer experience), you’re also actually increasing sales. Bundle pricing works best for products that are likely to involve repeat purchases (such as batteries, cereal boxes, or socks), and also for those that may need accessories (for instance, a food processor with various attachments). However, for bundle pricing to be effective, it’s also important to understand how your competitors are bundling their products.
Granted, it isn’t easy to identify the perfect pricing strategy for you. As customers increasingly engage with you at every stage of their decision-making process and market dynamics become exceedingly complex, pricing as a function has to keep pace. As a retailer, your objective is to unearth the actionable insights hidden in your big data and leverage the resulting opportunities to drive the maximum possible revenue and margin – without getting lost in the flood.
Nine out of 10 leading retailers price their private label products lower than the average prices of their respective categories, reveals the latest DataWeave study, drafted in collaboration with SunTrust Robinson Humphrey The study reveals that an increasing number of retailers are viewing private label brands as a way to ensure sustained profitability.
“As the CPG space reels under intense competition, a number of retailers are doubling down on private labels to capture valuable additional margin. For instance, Kroger, Walmart, and Amazon Fresh have a higher degree of private label penetration than the other retailers we analyzed,” said Karthik Bettadapura, Co-founder & CEO at DataWeave. “Our study unveils several such key insights covering product assortment & distribution patterns, price perception, and private label dynamics, revealing a clear snapshot of the disruptive transformations sweeping across the US CPG landscape.”
Other key findings from the report, which tracked and analyzed 450,000 products across 10 leading retailers and 10 ZIP codes each, include the following:
Product assortment is emerging as a driver that’s as critical as pricing when it comes to customer retention. Target, H-E-B, and Kroger have a head start here, offering the largest product assortments among the retailers analyzed.
A sharp assortment strategy customized to local tastes and preferences is key to sustaining and enhancing customer satisfaction. Albertsons, Walmart, and Amazon Fresh lead here, revealing a higher focus on localized assortments.
“Home” and “Beauty & Personal Care” categories lead the distribution of private label products across retailers. The focus on these categories echoes a similar focus among national brands as well. These categories have the highest overall brand concentration, with around 4,000 brands each.
It’s festival season in India again and shoppers took advantage of aggressive cutthroat competition between Indian online retailers to drive sales to unprecedented highs.
All the major Indian eCommerce websites including, Amazon, Flipkart, Myntra, and Shopclues opted to go head to head by holding their first sale event this season over 4 to 5 days starting on the 10th of October. Still, as industry reports indicate, one retailer came out on top during this event — an insight supported by our analysis as well.
A New Battleground
The highlight this year was seeing how the announcement of global retail colossus Walmart’s acquisition of Flipkart would impact the sale events. The acquisition was the most influential development in India’s eCommerce sector, and it has transported a decades-long U.S. rivalry between Amazon and Walmart to Indian soil. As a result, this year’s sale event held out the promise of more attractive pricing and vast product selection for India’s consumers than ever before.
Industry analysts estimate that the sale generated a cumulative Rs 15,000 crore in sales over the spread of the five sale days, a whopping outcome. In 2018, this translated into around a 64 per cent year-on-year growth outcome compared to the USD 1.4 billion (around Rs 10,325 crore) generated by the 2017 sales.
The DataWeave Analysis
At DataWeave, we analyzed the performance of each of the major eCommerce platforms including Amazon, Flipkart, Myntra, Paytm, and Shopclues. For each eCommerce website, we aggregated data on the Top 500 ranked products for over 40 product types spread across 6 product categories (Electronics, Men’s & Women’s Fashion, Furniture, Haircare, Skincare).
We focused our analysis on only the additional discounts offered during the sale and compared them to prices prior to the sale, to reflect the true value of the sale to India’s shoppers.
The battle of the discounts was led primarily by Flipkart and Amazon. Flipkart’s average additional discounts by category actually exceeded Amazon’s in three out of six categories, and it discounted more products that Amazon across all categories.
Clearly, the focus for all e-tailers was skewed towards the main battlegrounds of Electronics and Fashion, compared to mainstream FMCG categories such as Hair and Skin Care. However, this is not surprising given FMCG functions on rather skinny margins.
Across retailers, the Men’s and Women’s Fashion categories were the most aggressively discounted, attracting both the highest additional discounts and the highest percentage of products with additional discounts.
The Furniture category too was an interesting battleground between Amazon and Flipkart, attracting attractive discounts on a wide range of products, particularly in Flipkart’s case.
Prospective shoppers in search of relatively more expensive clothing products on discount during the sale would have established Myntra as their ideal destination, as it carried more premium products on discount during the sale, relative to all its competitors. For shoppers in search of an electronics bargain though, they would have done well to opt for Flipkart.
Shoppers may have found some interesting deals on Paytm Mall too, especially in Men’s Fashion, while Shopclues largely held itself back from any dramatic price reductions.
While Myntra capitalized on its niche though aggressive discounting in the Fashion category, most of the discounting action revolved unsurprisingly around Amazon and Flipkart. To drill down for a more complete understanding of just how the Amazon and Flipkart discounted their products, we conducted a more detailed follow-on analysis.
We normalized additional discounts and popularity using a scale of 1 to 10 and plotted each product on a chart to analyze its distribution characteristics. Popularity was calculated as a combination of the average review rating and the number of reviews posted. Products with a popularity score of zero, as well as zero additional discounts were excluded from this analysis.
The most obvious insight yield through this analysis is how Flipkart elected to distribute its additional discounts across a larger range of discount percentages. By contrast, Amazon went all in on the more limited range of products it decided to provide additional discounts on. This is a strategy we have seen Amazon adopt previously.
One other intriguing insight is Flipkart’s decision to go for a much higher distribution of products falling below a popularity score of 0.5 compared to Amazon. Amazon’s strategy resulted in more of its discounted products having a higher popularity score, relative to Flipkart, albeit only by a comparatively minor amount. However, a shopper’s chances of buying a popular, positively reviewed product at a lower price were higher on Amazon than Flipkart during this sale.
Achieving a Consistent Competitive Edge
Flipkart claims to have recorded a 70 per cent plus share of entire Indian e-commerce market in the 4 day-BBD’18 sales. Flipkart further claimed to have cornered an 85 per cent share in the online Fashion category together with a 75 per cent share in the Electrical category’s large appliances during the sale. This includes a contribution by Flipkart’s subsidiary Myntra.
As these numbers reflect, Amazon still has some way to go to entrench itself in the Fashion category of the Indian market. However, Amazon appears content to continue its surgical discounting philosophy.
Overall, this year witnessed an impressive participation by Tier II and Tier III Indian city consumers — a sign of things to come in Indian online retail.
With increasing competitive pressure, retailers simply cannot adopt discounting and product selection strategies in isolation and be successful. Having access to up to date insights on competitors’ products dynamically during the day is emerging as key to ensuring they’re able to sustain their lowest priced strategy for appropriate products. These insights are also proving critical in identifying gaps in their product assortment, which can hamper customer conversion and retention.
During sale events, modern retailers need to rely on highly granular competitive insights on an hourly basis (or even more frequently) to inform their pricing and product strategies to ensure they consistently maintain a competitive edge for the consumer’s wallet. And while access to reliable competitive intelligence is critical, true value can only be derived when it gets integrated with a retailer’s core business and decision-making processes, such as assortment management, promotions planning, pricing strategies, etc.
DataWeave’s Competitive Intelligence as a Service helps global retailers do just this by providing timely, accurate, and actionable competitive pricing and product insights, at massive scale. Check out our website to find out more!
Natt Fry, a renowned thought leader in the world of retail and analytics, published recently an article expounding the value and potential of learning models influencing business decision-making across industries over the next few years.
He quotes a Wall Street Journal article (paywall) published by Steven A. Cohen and Matthew W. Granade who claim that, “while software ate the world the past 7 years, learning models will ‘eat the world’ in the next 7 years.”
The article defines a learning model as a “decision framework in which the logic is derived by algorithm from data. Once created, a model can learn from its successes and failures with speed and sophistication that humans usually cannot match.”
Narrowing this down to the world of retail, Natt states, “if we believe that learning models are the future, then retailers will need to rapidly transform from human-learning models to automated-learning models.”
This, of course, comes with several challenges, one of which is the scarcity of easily consumable data for supervised learning algorithms to get trained on. This scarcity often results in a garbage-in-garbage-out situation and limits the ability of AI systems to improve in accuracy over time, or to generate meaningful output on a consistent basis.
Enabling Retailers Become More Model-Driven
As a provider of Competitive Intelligence as a Service to retailers and consumer brands, DataWeave uses highly trained AI models to harness and analyze massive volumes of Web data consistently.
Far too often, we’ve seen traditional retailers rely disproportionately on internal data (such as POS data, inventory data, traffic data, etc.) to inform their decision-making process. This isn’t a surprise, as internal data is readily accessible and likely to be well structured.
However, if retailers can harness external data at scale (from the Web — the largest and richest source of information, ever), and use it to generate model-driven insights, they can achieve a uniquely holistic perspective to business decision-making. Also, due simply to the sheer vastness of Web data, it serves as a never-ending source of training data for existing models.
DataWeave’s AI-based model to leverage Web data
Web data is typically massive, noisy, unstructured, and constantly changing. Therefore, at DataWeave, we’ve designed a proprietary data aggregation platform that is capable of capturing millions of data points from complex Web and mobile app environments each day.
We then apply AI/ML techniques to process the data into a form that can be easily interpreted and acted on. The human-in-the-loop is an additional layer to this stack which ensures a minimum threshold of output accuracy. Simultaneously, this approach feeds information on human-driven decisions back to the algorithm, thereby rendering it more and more accurate with time.
Businesses derive the greatest value when external model-based competitive and market insights are blended with internal data and systems to generate optimized recommendations. For example, our retail customers combine competitor pricing insights provided by our platform with their internal sales and inventory data to develop algorithmic price optimization systems that maximize revenue and margin for millions of products.
This way, DataWeave enables retailers and consumer brands to utilize a unique model-based decision framework, something that will soon be fundamental (if not already) to business decision-making across industry verticals and global regions.
As AI-based technologies become more pervasive in retail, it’s only a matter of time before they’re considered merely table stakes. As summarized by Natt, “going forward, retailers will be valued on the completeness of the data they create and have access to.”
If you would like to learn more about how we use AI to empower retailers and consumer brands to compete profitably, check out our website!
Read Natt’s article in full below:
Steven A. Cohen and Matthew W. Granade published a very interesting article in the Wall Street Journal on August 19, 2018 — https://www.wsj.com/articles/models-will-run-the-world-1534716720
Their premise is that while software ate the world (Mark Andreessen essay in 2011, “Why Software is Eating the World”) the past 7 years, learning models will “eat the world” in the next 7 years.
A learning model is a decision framework in which the logic is derived by algorithm from data. Once created, a model can learn from its successes and failures with speed and sophistication that humans usually cannot match.
The authors believe a new, more powerful, business opportunity has evolved from software. It is where companies structure their business processes to put continuously learning models at their center.
Amazon, Alibaba, and Tencent are great examples of companies that widely use learning models to outperform their competitors.
The implications of a model-driven world are significant for retailers.
Incumbents can have an advantage in a model-driven world as they already have troves of data.
Going forward retailers will be valued on the completeness of the data they create and have access to.
Retailers currently rely on the experience and expertise of their people to make good decisions (what to buy, how much to buy, where to put it, etc.).
If we believe that learning models are the future then retailers will need to rapidly transform from human-learning models to automated-learning models, creating two significant challenges.
First, retailers have difficulty in finding and retaining top learning-model talent (data scientists).
Second, migrating from human-based learning models to machine-based learning models will create significant cultural and change management issues.
Overcoming these issues is possible, just as many retailers have overcome the issues presented by the digital age. The difference is, that while the digital age has developed over a 20 year period, the learning-model age will develop over the next 7 years. The effort and pace of change will need to be much greater.
Confidence amongst retailing analysts was rocked last month by two successive announcements.
H&M’s most recent quarterly report, which revealed it had accumulated over $4.3 billion in unsold inventory, shocked retail analysts. In an era of on-the-fly inventory replenishment where stocks are closely matched to sales, a spike in unsold inventory is a strong indicator of trouble ahead. The news left analysts questioning H&M’s competitiveness in the fiercely contested global apparel category, where ever-changing consumer preferences demand agility in managing inventory levels.
In the other major announcement, Toys “R” Us officially closed its doors to shoppers. The retailer’s losses continued to pile up and the chain groaned under a mountain of debt, leaving it little choice but to close down. “The stark reality is that the (chain is) projected to run out of cash in the U.S. in May,” it said in its bankruptcy filing.
While the emergence of the online shopping phenomenon hasn’t helped Toys “R” Us, its ongoing afflictions largely reflect strategic missteps that predated the online shopping boom. In a category where the shopping experience is all, the retailer failed to adapt to changing consumer expectations. The warehouse context which shaped the retailing did little to promote toys sales or communicate the sheer breadth of inventory carried by Toys “R” Us.
So, as Toys “R” Us begins to wind down its operations, the company has shuttered its online store and is channeling customers to its remaining physical retail outlets. However, prior to the closure, shoppers enjoyed some amazing bargains during their clearance sale.
H&M’s problems appear less terminal. Its management claim to have implemented a strategy to slash its accumulated inventory and reign in its aggressive store expansion strategy.
At DataWeave, we leveraged our proprietary data aggregation and analysis platform to analyze the clearance sales of both H&M and Toys “R” Us. We tracked the pricing, product categories, discounts, review ratings, stock status and more between 29-Mar and 3-Apr.
The Toys “R” Us Sale
Although the dolls and stuffed animals category carried the most products, its average discount was along the mid-range point for the sale at 28 percent. Games & Puzzles and Action Figures and NERF were the most heavily discounted categories at 40 percent and 36 percent respectively.
As anticipated, products with lower review ratings were sold at slightly higher discounts. However, even exclusive products were sold at comparatively high discounts. Not surprising, given this was effectively a clearance sale.
Hasbro, Mattel, and Spin Master were the highest represented brands during the sale, while for their part, Kid’s Furniture and Outdoor Play had fewer products participating in the sale. Other popular brands such as Fisher-Price and LEGO had a presence during the sale but offered fewer products.
Zuru was the most aggressive in offering discounts with Spin Master the least aggressive. The remaining brands offered discounts of between 30 and 36 percent.
Reports suggest that last year, toymakers Mattel and Hasbro each sold around $1 billion worth of their toys at Walmart, more than the volume they achieved selling through Toys “R” Us. Strategically, these leading brands seem to have their bases covered even though Toys “R” Us is closing down.
Interestingly, some products were seen to go out of stock during the sale week, only to be replenished a day later, as illustrated in the above infographic.
The H&M Sale
Overall, H&M’s clearance sale was more aggressive in Women’s Apparel with three times more products on offer than for Men’s Apparel. However, there wasn’t much difference between the two in terms of the discounts on offer which hovered around the 45 percent range. Women’s Tops, Cardigan’s and Sweaters offered discounts on the most products during the sale period.
Little difference was observed tactically, between how the different product categories, were handled.
We saw a significant movement of products in Women’s apparel during the week, with over 330 newly added products and close to 200 products that were effectively churned. This pattern indicates H&M achieved a faster shelf velocity for this category than for Men’s, possibly due to a more aggressive approach to the selection of items on sale.
Customer focus is key
Reports indicate that despite a series of widespread and aggressive markdowns as shown in the analysis above, H&M is struggling to sell off its mountain of accumulated merchandise. Changing consumer tastes and increasing competition seem to have taken their toll on the once agile Swedish retailer. If it is going to weather this storm, H&M needs to revisit its fast fashion approach to assortment and inventory management. The retailer would also appear to need to improve its demand forecasting expertise.
The bankruptcy filing by Toys “R” Us presents yet another lesson for eCommerce and bricks-and-mortar retailers alike, to address evolving consumer expectations and focus closely on the customer experience aspect of their business, which are supported by appropriate pricing and product assortment strategies.
At DataWeave, our technology platform enables retailers to do just that, through comprehensive and timely insights on competitive pricing, promotions, and product assortment. Check out our website to find out more!
From initially lagging well behind early high-penetration categories such as consumer electronics, books, and apparel, furniture is now emerging as a key growth category.
Online furniture purchases are growing at a rapid clip, estimated to currently be around 14 percent rate annually and is anticipated to reach 7.6 percent of total category sales in 2018.
Savvy furniture brands are becoming increasingly aware of this shift in consumer shopping patterns and are taking steps to embrace the importance of creating a seamless online customer experience consistent across all eCommerce websites.
Selling furniture online remains logistically complex. It requires the disciplined coordination across an ecosystem teeming with bricks and mortar stores, salespeople, warehouses merchants, and a network of delivery systems.
All this complexity poses challenges for brands looking to deliver a consistent brand experience for consumers across multiple eCommerce websites.
One frequent outcome of this complex ecosystem is the emergence of white labeling.
The Invasion of White Labeling in the Furniture Category
A white label product is one that is manufactured by one company only to be bundled and sold by other online merchants using different brand names. The end product is positioned as having been manufactured by the brand marketer.
These white label products are frequently sold at a significant discount, compared to more mainstream name brands in the category.
Electronics brands have often been victims of this phenomenon. Typical electronic white label products now commonplace range from radios and DVD players to computer mice and keyboards, through to TV remote controls.
Increasingly, the furniture vertical is no longer a stranger to white label packaging and marketing as well.
At DataWeave, using our proprietary data aggregation and analysis platform, we analyzed a range of factors of the furniture vertical, specifically the emerging phenomenon of white labeling.
Our analysis spanned a sample set of over 20,000 products that we tracked across the websites of two of our eCommerce customers (whom we don’t wish to name) that have a large assortment of furniture products. Let’s call these eCommerce companies Retailer A and Retailer B.
We identified white labeled products as being those that featured the exact same image between the two retailers but were sold under different brand names. Here, our AI-powered advanced image analytics platform matched the images of various products at an accuracy of more than 95%.
The following infographic summarizes our analysis.
Clearly, not only is white labeling quite prevalent here, but in almost every instance, we identified price variation. Some of the white labeled products were sold by lesser-known brands with significantly lower price points. This pricing strategy could potentially damage the customer experience for well-established consumer brand franchises in several ways.
The shopper sees through the branding exercise where the same product is repackaged and presented as having been “produced” by a different brand, potentially eroding brand loyalty.
As some 71 percent of the products studied were identified as white labeled products, this exposes the category as a whole to this risk.
The shopper may be confused by the price difference as well, undermining the brand’s carefully constructed pricing perception. The average spread of 21 percent between competing white labeled products is potentially a major source of consumer dissonance and confusion.
A Closer Look at Pricing
While the inconsistent experience potentially created by widespread white labeling is almost characteristic of the furniture vertical, other eCommerce areas such as pricing and promotion have also been demonstrated as being key influencers of the shopping experience.
Today, brands have little control over how their products are priced on eCommerce websites and are susceptible to pricing decisions taken by either the merchant selling the product or retailers themselves. Here, price change decisions have little to do with providing a consistent brand experience, as it’s not really a priority for merchants and retailers.
In a hyper-competitive retail environment, retailers often discount heavily or change prices frequently to drive sales and margins. The following infographic summarizes the differences in pricing approaches between the two retailers we analyzed.
Both retailers demonstrated quite divergent approaches in their pricing strategies. The key point of difference appeared to be Retailer B’s discount execution, which proved more aggressive than Retailer A’s, routinely exceeding the latter by five percent or more.
This discounting strategy is focused on the 40+ percentile (by price, with 100 percentile being the most expensive product), and above price bands, while both retailers displaying similar strategies to their Top 20 and Top 20 to 40 percentile ranges.
We also observe how Retailer B is more inclined to offer higher discounts on products with higher review ratings, compared to Retailer B’s strategy — a play on developing a “low price” perception among shopper.
The Consumer Experience Matters
Today, consumers expect a truly seamless shopping experience right across a brand’s entire integrated retail community, regardless of whether it is physical or digital. Consumers have evolved beyond being merely time poor and have emerged as a group of impatient shoppers, unforgiving of inconsistencies in their experience.
With retail evolving to embrace multiple consumer touch points with a brand, the practice of white labelling represents a dangerous source of potential confusion and disillusionment. This raises the degree of difficulty involved in converting website visitors into buyers. Further, inconsistent pricing between eCommerce websites, due to dissimilar pricing strategies adopted by each website, only compounds the problem for furniture brands.
Technologies like DataWeave’s Competitive Intelligence as a Service, that can provide furniture brands with timely insights on white labelled products, unauthorized merchants, and price disparity between ecommerce websites, can assist furniture brands in their efforts to better manage their online channel.
Visit our website to find out more on how we help consumer brands protect their brand equity and optimize the experience delivered to their customers on eCommerce websites!
Last Friday, Reuters published, “Home Improvement chain Lowe’s said it has nominated two independent board members and plans to add a third following “constructive” talks with hedge fund D.E. Shaw Group, which has taken an activist stake.”
It was reported that D.E. Shaw Group had utilized available external data to identify quantifiable opportunities to grow sales by several billion dollars and to reduce costs significantly.
A question that comes immediately to mind is, “Why didn’t Lowe’s utilize this same available external data themselves?”
Is it because Lowe’s and many other retailers spend their time focusing on internally generated data, rather than looking at available external data, or better yet, combining available external data with their internal data?
There are huge opportunities to drive incremental sales, margins and profits through leveraging external data, like competitive intelligence data produced by firms like DataWeave.
There are huge opportunities to drive incremental store sales, margins, and profits through leveraging digital data to drive better store specific assortments, prices and promotions by providing relevant local digital data to store executives using solutions by firms like Radius8.
I expect to see more Lowe’s-like announcements in the near future as investment firms realize there are very substantial, untapped financial opportunities within retail.
Following a successful Black Friday in November, the United Kingdom geared up for the 2017 Christmas season in December. Analysts estimate the total splurge in December at about £45 billion, beating last December’s record of £43 billion.
Online sales hit £1.03billion, passing the £1billion threshold for the first time and up 7.9 percent on 2016’s £954million, according to the Centre for Retail Research. The rise of online shopping together with the timing of Christmas in 2017 meant shopper footfall in physical stores was lower than in previous years as people increasingly moved to shopping online.
Total shopper numbers were 4.5 percent down on the previous year, according to research group Springboard, which may reflect the growing strength and reliability of online’s product range and delivery responsiveness.
Major online retailers though continued to pull out the big discount guns across categories in an effort to attract online shoppers on Boxing Day, the biggest sale event in December.
At DataWeave, we focused our proprietary data aggregation and analysis platform to analyze the top 500 ranked products in over 20 product categories across electronics and fashion retailers in the UK. Our analysis included several top UK retailers, which include Amazon, Argos, Currys, Tesco, Asos, Marks & Spencer, and Topshop.
The discounts in the infographic below indicate the magnitude of reduction in prices during the sale (26th Dec), compared to before the sale (19th Dec), in order to best represent the additional value derived from the sale for shoppers.
Boxing Day Sale Highlights
In electronics, while Amazon offered discounts on the most number of products, Argos was aggressive in the average size of its additional discounts.
Surprisingly, Amazon appeared to be much more conservative in the Men’s Fashion category with an average additional discount of 13.8 percent, spanning 341 products. Here, Asos deployed the most aggressive combination of high average additional discounts (36.9 percent) on a large number of products (165).
Marks & Spencer focused their targeted discounts (43.1 percent) on a tight set of Men’s Fashion products (45), while interestingly, the story almost reverses in Women’s Fashion, where both M&S (43.1 percent, 281 products) and Topshop (40.5 percent, 226 products) were aggressive in what turned out to be a critical battleground category.
Leading brands weren’t left out of the discounting action either, with the largest discount on offer going to Ruche (48.9 percent on 33.3 percent) women’s tops, closely followed by M S Collection (41.9 percent on 32.3 percent) handbags and Asos’ (37.5 percent on 21.2 percent) men’s jeans.
Most Discoverable Brands
We also analysed the most discoverable brands in each product type. This was measured as a combination of the number of the brand’s products present in the Top 500 ranks of a product type, as well as the average rank (lower the number, higher is the discoverability).
It was no surprise that Canon DSLR cameras were highly discoverable on Amazon with 90 products, along with an average ranking of 93.2, while 34 Asus laptops recorded an average ranking of 85.2. At Argos, 57 Acer laptops recorded an average ranking of 73.4 while 50 LG televisions delivered an average ranking of 124.1.
Other highly discoverable brands included MS Collection in Marks & Spencer, Apple iPhones and Tablets on Curry’s and Tesco.
The Online Retail March Continues
If we look at sales results across the world, from the United Kingdom to the United States, to Asia in countries such as India, Singapore and Indonesia through to Australia, online retail is aggressively cannibalizing traditional bricks and mortar in-store retail sales. Online retail’s demonstrated superiority in exploiting competitive intelligence and a sophisticated suite of analytics that accompany digital transactions, is surfacing in its agile discounting strategies, and its ability to continuously refresh product lines during key sales periods.
This Boxing Day in the UK, fashion proved to reveal divergent discounting strategies between retailers, while only marginal differences in approach were visible in electronics — both high volume categories around Christmas season.
Overall, December 2017 in UK marked a strong validation of online retail’s influence and we can expect a continuation of it’s ability to harness discounting with extensive product offerings, in order to lure shoppers away from in-store.
If you’re interested in DataWeave technology, and how we deliver Competitive Intelligence as a Service to retailers and consumer brands, check out our website!
Commencing on the 11th of November and ending just a few days ago on the 12th of December, Southeast Asia’s biggest sale event, the Lazada Online Revolution sale rewrote the record books.
This mega-shopping event is held simultaneously across six Southeast Asian countries, spanning Singapore, Malaysia, Thailand, Indonesia, the Philippines and Vietnam and was bookended by its two biggest sale days, on 11.11 and 12.12.
In an earlier blog post, we published a highly detailed analysis of the sale on 11.11, using DataWeave’s proprietary data aggregation and analysis platform. This post zoomed in on the pricing and product strategies of Lazada and its competitors in Singapore and Indonesia.
On the 12th December, Southeast Asian shoppers shattered all retailing expectations by reportedly spending a record-breaking $250 million. This was double both this year’s 11.11 sale and last year’s 12.12 sale. According to Forbes, the 12.12 sales became such a hit that Indonesia even designated the day to be its National Online Shopping Day, or Harlbonas.
At the end of the sale event on 12th December, DataWeave assimilated all the data we collated throughout the Online Revolution sale and examined pricing trends across the entire span of four weeks, exploring each retailer’s strategy by brand, by category, and by product type.
We aggregated pricing information on the Top 500 ranked products of over 20 product types featured on each website (Lazada, ListQoo10, and Blibli), spread across the critical Electronics and Fashion categories, covering over 120,000 products in total.
Online Revolution — Singapore
Interestingly, one of the trends that became immediately apparent, was the relatively stable track of the average absolute discounts in Electronics, Men’s Fashion, and Women’s Fashion. No significant spikes or drops were evident throughout the duration of the entire sale season.
Similarly, the number of discounted products remained relatively stable. However, in Electronics, there was a conspicuous dip in the number of discounted products, which occurred on the 21st of November. Aside from this anomaly, even the number of products discounted remained relatively stable. The other interesting phenomenon was an uptick in the number of discounted products on the 15th of December, after the Online Revolution sale — something counterintuitive.
When we explored the behaviour of the average MRP of discounted products, we noticed a sharp dip on the 21st of November. Clearly, prices were increased specifically on higher-priced electronic products.
Comparing these numbers with those of ListQoo10’s, who were forced to adopt a more aggressive stance on pricing to stay competitive through this period, we once again see a very consistent discount percentage throughout this period. The average discount in men’s fashion, however, showed a slight upward trend during this period.
ListQoo10’s number of discounted products in Electronics dipped as well on the 21st of November, demonstrating the retailer’s ability to dynamically react to competitor strategies. This can be evidence of a robust market monitoring system.
Returning to Lazada, DataWeave identified several product types displaying a significant variation in average discounts through this period. These included men’s shorts, women’s shoes, men’s Jeans, Laptops, DSLR Cameras, and women’s T-shirts.
Once again, our analysis pointed to substantial competitive activity around the 21st of November, together with a second significant dip in discounts on men’s shirts in the period around 5th December. Discounts on women’s shoes, by contrast, proved to be a roller coaster throughout the entire sale period.
Some of the brands with high variation through this period were Lenovo Laptops, Levi’s T-shirts, Adidas Women’s Shoes, Seiko Watches, and Sony Phones.
Discounting activity by these brands appeared to be all over the place during this period, without any discernible pattern or structure. While Sony predictably lowered discounts on its phones after 12.12, Levi’s increased its discounts in the same period
Online Revolution — Indonesia
Moving on to Indonesia, we once again witnessed a similar approach to average discounting by category as we saw emerge in Singapore. At a category level, the retailer evidently opted for trading within a narrow discount band across the sale period rather than attempting to inject an overly dynamic discounting approach into their sale execution.
This is not to say there were not some surprises in store with the number of discounted products in Indonesia. In electronics, there was a noticeable dip in the number of discounted products just ahead of the 12.12 sale. The number of discounted products then surprisingly surged after the 12.12 sale, in combination with a slight reduction in average discount percentage during the period.
In comparing Blilbi, Lazada’s main competitor in Indonesia, we see a fairly consistent discounting level throughout the sale period, although markedly lower than those rolled out by Lazada across its three core categories.
This approach held true even for the number of discounted products. Blibli seems to have been content to take a backseat to Lazada during the heavily promoted Online Revolution sale period, rather than attempting to compete aggressively in any single category.
It will be interesting to see if Blilbi is content to repeat this strategy in 2018 as it effectively surrenders the discounting high ground to Lazada during the peak sales period. While this strategy may yet be proven to have paid off in terms of profitability, it may have undesirable consequences for Blilbi’s brand and share performance in the longer term.
Returning our focus to Lazada in Indonesia, some product types showed major variation through the sale period, specifically DSLR Cameras, which dipped significantly approximately a week out from the 12.12 sale. However, compared to Singapore, Indonesian discounts by product types appeared relatively more stable, except a few dips prior to 12.12.
Three distinct discounting strategies appears to have been adopted by participating brands. Some, such as Electrolux (Refrigerators), opted for a comparatively stable discounting approach. Others, like Apple, increased prices through the sale period, while Alienware, reduced prices through the sale period.
In particular, Apple’s pricing approach to its iPhones was surprising, given its strong partnership with Lazada during this Online Revolution sale. Yet another example where the marketing hype failed to translate into an aggressive discounting strategy.
More Talk Than Walk
For Lazada, the Online Revolution sale proved to be a triumph, effectively extending its record-breaking streak with USD 250 million in sales on 12.12 alone. However, on parsing through the pricing across the entire month of the sale, there is clearly no dramatic increase in discounts either on 11.11 or on 12.12 — some anomalies notwithstanding.
This goes to show that much of the sales is driven by hype, more than the additional value of discounts. To be fair, 11.11 and 12.12 hosted discounts on some of the more premium products in the assortment, while discounts on most of the mid-range products remained consistent. While some competitors like ListQoo10 chose to stay competitive, so as not to lose out significantly on their customer base and market share, others like Blilbli chose to sit and watch, and pick up on what’s left after the sale.
This year’s Online Revolution has set the bar high for South East Asian retail, and going by how the event has grown over the last few years, few would be surprised if we witness another record braking sale in 2018.
If you’re interested in DataWeave’s technology, and how we provide Competitive Intelligence as a Service to retailers and consumer brands, check us out on our website!
While the Thanksgiving weekend sale, which includes Black Friday and Cyber Monday, is famous for attractive offers across all consumer categories, it remains better known for its discounts on Electronics and Fashion. Consumer goods, traditionally, have evaded much the hype.
This year, notwithstanding notoriously slim margins, consumer goods and grocery retailers and brands joined Electronics and Fashion in offering sharp discounts on select products in an attempt to carve out increased market share.
In the past, discounts on consumer packed products have been to drive increased store traffic during the holiday season. Increasingly, however, Thanksgiving has emerged as a viable opportunity for grocers to recruit online shoppers as well and build out their franchise.
Online Grocers Make Their Move
Faced with the holiday rush, large numbers of shoppers are proving to be relaxed about trusting the retailer to bag up and deliver their holiday feasts and treats. Grocers themselves have taken the strategic decision to boost their online shopping presence this year.
They geared up to support their new holiday presence with aggressive price cuts designed to cut through the holiday sales clutter and make direct appeals to a newly-in-play online shopper pool. So transparent was this commercial decision, that many retailers experienced sharp drops in their share prices as industry analysts anticipated the retailers’ new discount-driven strategy.
Tracking The Numbers
At DataWeave, using our proprietary data aggregation and analysis platform, we have been tracking, through November, pricing and product information of the Top 1,000 ranked consumer goods products in over 10 product types featured on Amazon Prime, Walmart, Target, Costco, Kroger, Safeway, and Whole Foods, across up to six zip codes each, distributed across the country.
DataWeave’s major focus was to compare the three main days of the Thanksgiving weekend; Thanksgiving Day, Black Friday, and Cyber Monday. We performed an in-depth analysis of discounts offered across product types and brands, together with how aggressively dynamic retailers were in both their pricing strategy and in the products they displayed.
In analyzing this major sale event, we observed an extensive range of products enjoying high absolute discounts, but with no additional discounts during the sale, i.e. prices remained unchanged between the period prior to the sale and during each day of the sale, even though high discounts were advertised. The following infographic highlights some of the products where this phenomenon was observed.
As a result, we focused our analysis only on the additional discounts offered on each day of the sale, compared to the period prior to the sale (we considered 11.21), in order to accurately illustrate the true value shoppers enjoyed during these sale days.
The following infographic reveals some interesting highlights from our analysis, including the level of additional discounts offered to shoppers, the top brands featured, and the number of dynamic price changes implemented during the sale. All prices analysed are in USD, and all discount percentages represent average values across all zip codes, analyzed for individual retailers.
In contrast to Amazon Prime, Costco, and Kroger who opted to run with deep discounts on a limited range of products, retailers such as Target and Walmart chose to offer only marginally higher additional discounts but across a large number of products. Others like Safeway adopted a safer approach, combining low discounts on a modest range of products.
Overall, our analysis discovered little variation in discounts offered across each of the three sale days, with the only enduring trend being a marginally higher discount percentage implemented on Cyber Monday across all retailers.
Categories significantly discounted across retailers included Personal Care, Deli, Dairy & Eggs, and Babycare products. Stove Top, Martinelli, Colgate, Dove and Hillshire Farm emerged as the leading brands to adopt a more aggressive discount approach.
While most of the products offered across each of the three peak holiday sale days were comparatively constant (few new products featured amongst the Top 500 ranks), there were a number of conspicuous exceptions. Amazon Prime (19 percent on Cyber Monday), Whole Foods (15 percent on Thanksgiving), and Kroger (12 percent and 11 percent on the first two days of sale respectively), elected to refresh a significant portion of their Top 500 ranked product assortment.
Across the entire Thanksgiving week, we saw Target, Amazon Prime, and Kroger all highly active in changing prices to stay competitive. Our analysis of these retailers showed more than 1.6 price changes for each price-changed product. While these were implemented on roughly 20 percent of their assortment, itself a significant proportion, the average price variation for each of these retailers was also on the higher side of expectations. In contrast, the other retailers adopted a far more conservative approach to dynamic pricing.
Consumer Goods Walk The Discount Talk
In a year when Amazon acquired Whole Foods to forever merge the dynamics of offline and online grocery retail, aggressive discounting by several retailers in specific product categories, combined with high visibility brands, has carved out a new profile for CPG retail.
Grocers are eyeing a future where online shopping becomes a prime feature of their retail franchise. Amazon for its part demonstrated its prowess in discounting strategy, and its ability to implement a dynamic pricing strategy in tandem with a refreshed Top 500 product assortment.
Other retailers are not far behind, as the use of market and competitive intelligence technologies pick up steam across the board. In today’s digital economy, data can be the biggest competitive advantage for a retailer, and retail technology providers like DataWeave have upped their game to deliver highly unique and sophisticated data and insights to meet this demand.
Visit our website, if you’re interested in DataWeave and how we provide zip-code level Competitive Intelligence as a Service to retailers and consumer brands.
Fashion has always been one of the great engines of retail, and two of its iconic sale events are Thanksgiving and Black Friday. While Black Friday was traditionally an in-store shopping event, a large number of shoppers have migrated online taking much of the sales action with them.
Despite shoppers typically liking to be able to touch and feel fashion and apparel products prior to purchasing them, the convenience of online shopping combined with time-poor shoppers returning to work after their Thanksgiving break has triggered changes to consumer behavior. Today, the retail narrative has shifted to focus on online, with this year’s Thanksgiving weekend turnover up 6.8 percent from last year.
At DataWeave, using our proprietary data aggregation and analysis platform, we have been tracking the pricing and product information of the Top 500 ranked Fashion products across 15 product types on Amazon, Walmart, Target, Bloomingdales, JC Penney, Macy’s, Neiman Marcus, and Nordstrom.
Our primary focus was to compare the three key days of the Thanksgiving weekend: Thanksgiving Day, Black Friday, and Cyber Monday. We performed an in-depth analysis of discounts offered across product types and brands, together with how dynamic retailers were in both their pricing strategy and products displayed.
In analyzing these monster sale events, we observed a range of products sneaking through to enjoy high absolute discounts, but offer no additional discounts during the sale, i.e. prices remained unchanged between before the sale and during each day of the sale, even though high discounts were advertised. The following infographic highlights some of the products where this phenomenon was observed.
Having identified the aggressive use of high but unchanged absolute discounts among the retailers during the sale, we focused our analysis on the additional discounts offered on each of the days of the sale, compared to before the sale (we considered 11.21), in order to more accurately reflect the true value these sale events deliver to American shoppers.
The following infographic provides some interesting insights from our analysis along several perspectives, including additional discounts offered, top brands, quality of product assortment, number of price changes, and more. All indicated prices are in USD.
Our analysis illustrated how aggressive Target was in its strategy for discounting fashion, compared to most other retailers, especially on Thanksgiving and Black Friday. Interestingly, while Macy’s offered reasonably attractive discounts across all product types, it chose to offer them on a much larger product set than any other retailer.
Overall, the level of discounts, together with the number of products they were offered on, shows no dramatic change for each retailer over the three-day sale period.
With Neiman Marcus however, we observed a unique pattern. Sharp discounts were offered on Thanksgiving and Black Friday, which were subsequently rolled back completely on Cyber Monday. This represents a clear holiday pricing and discount strategy, albeit conducted on a comparatively compact and highly targeted set of products.
Other sales discounting phenomena we observed include major discounts on Sunglasses, Shoes, Skirts, and T-shirts across all retailers, clearly representing battleground categories, while some of the top brands offering attractive discounts include Ray Ban, Oakley, Levi’s and Nike.
Another relatively constant factor across each of the sale days was the average selling price of respective retailers. This parameter indicates how premium each retailer’s product mix is, providing another perspective on each retailer’s customer segment targeting strategy.
As expected, Target, Walmart and JC Penney housed the more affordable set of products (average selling prices of $25, $31, and $45 respectively). At the other end of the premium spectrum, Neiman Marcus — home to luxury brands and products — adopted a more premium product assortment (average selling price between $820 and $914).
In fashion, presenting a fresh assortment consistently is key to customer retention, and Amazon leads the pack in this regard, with a product churn rate of 50% in the top 100 ranks each day. Contrast that with Walmart and Target, who follow a more traditional approach, with a largely static set of options to choose from in its top ranks.
Most of the retailers we analysed implemented several price changes to large percentages of their product sets. Macy’s and Walmart were at the forefront of this dynamic pricing activity. While Bloomingdales too made over 1,300 price changes, the average magnitude of these changes proved to be very high, at 206 percent.
Fashion Fast-Forwards Its Online Sales
While the memories of frantic shoppers tussling over fashion and apparel items on Black Friday still linger, they are fast receding as online fashion sales turnover goes from strength to strength. Shoppers are firmly placing long, winding queues in their rearview mirror and embracing the digital shopping cart more with each passing year, as spotlighted this Thanksgiving sale weekend.
Sunglasses, Shoes, Skirts, and T-shirts emerged as key battleground categories for retailers over the weekend, while individual retailers displayed diverse approaches to capturing and retaining market share with their target demographic — quite assuredly while using modern retail technologies that help develop and execute on competitive strategies.
As retailers move into the Christmas sales phase it will be fascinating to discover how they are evolving their ability to dynamically change pricing, refresh product categories and focus their shopper promotions.
Visit our website, if you’re interested in DataWeave’s technology and how we provide Competitive Intelligence as a Service to retailers and consumer brands.
Alibaba may have raked in some $25 billion on Singles’ Day in the largest one-day sales turnover ever. In the Western world, however, Black Friday remains an economic force.
This Black Friday, American shoppers spent a record $5 billion online in just 24 hours, representing a 16.9 percent increase in dollars spent online compared with last year.
The sale period, though, comprises of Thanksgiving Day and Cyber Monday as well — each generating over a billion and half dollars in online sales this year.
Cyber Monday has especially been a popular day for buying online, as people head back to work after the long weekend, making a physical visit to the stores to pick up deals less manageable during the day.
However, the idea of the Thanksgiving weekend as a single shopping event was laid to rest this year.
It’s Now Black November
Online sales from November 1st through the 22nd totalled almost $30.4 billion this year, driven by deals available throughout the month on eCommerce platforms. In fact, every single day in November so far saw over $1 billion in online sales, creating a new paradigm for both shoppers and retailers, in stark contrast to the brick-and-mortal retail driven Black Friday sale events of the past.
Several online retailers began offering attractive discounts from the beginning of November, specifically on “Black Friday Deals” pages of their websites.
At DataWeave, using our proprietary data aggregation and analysis platform, we have been tracking, through November, pricing and product information of the Top 500 ranked Electronics products across 10 products types on Amazon, Walmart, Target, Best Buy, and New Egg.
We also took a few snapshots of the products and discounts offered on the “Black Friday Deals” pages of Amazon and Walmart. We saw both websites offering deep absolute discounts in Electronics (40.1 percent on Amazon, 30.4 percent on Walmart) on over 400 products each day.
Moreover, these discounts weren’t restricted to static product sets. 73.2 percent (Amazon) and 30.6 percent (Walmart) churn of products was observed on these pages each day, providing shoppers with a steady stream of attractive discounts on new products every day.
Our major focus, though, was to compare the three main sale days of the Thanksgiving weekend. We performed an in-depth analysis of discounts offered across product types and brands, as well as how dynamic retailers were in both the pricing and products displayed — all of these, across Thanksgiving (11.23), Black Friday (11.24) and Cyber Monday (11.27).
We looked specifically only at additional discounts offered on each of the days of the sale, compared to before the sale (represented by products and its prices on 11.21).
Overall, we discovered that the level of discounts, together with the number of products they were offered on, does not change dramatically across all 3 days. Some exceptions include –
Higher number of additionally discounted products on Amazon and Walmart on Cyber Monday
Lower additional discounts offered by Best Buy on Cyber Monday
Lower number of products additionally discounted on New Egg on Thanksgiving and Black Friday.
Discounting strategies across most retailers converged on significant discounts on Pendrives, Smartwatches, DSLR Cameras, and Mobile Phones, while some of the top brands that offered attractive discounts include Apple, Fossil, Canon, Nikon, Sandisk, and HP — across a range of product types.
While the average selling price (indicative of how premium the product mix is) for each retailer did not change significantly across each of the featured sale days, there was some variation at a product type level, with Laptops and Digital Cameras displaying some variation in average assortment value across Target, Walmart, and New Egg.
Perhaps the most interesting insight provided by the analysis is just how different each retailer is in its approach to changing its prices. Over the entire week (11.21 to 11.27), Amazon made over 3,600 price changes on over 50 percent of its consistently-top-ranked products. Compare that to Target’s 289 price changes on 30 percent of its products.
While the average magnitude of price change on Amazon is 27 percent, Best Buy has been far more aggressive with the magnitude of its price adjustments (47 percent), even if it has implemented fewer price changes. Amazon clearly leads the industry here, with its continual focus on employing advanced retail technologies that enable automated, optimized price changes designed to ensure its products are competitively priced.
How Strategic Is Retail Pricing?
Another aspect DataWeave explored was whether e-retailers sometimes increase their prices in the lead-up to a sale, only to reduce them during the sale, enabling them to advertise larger discounts. We did observe that all e-retailers effectively increased their prices on a discrete and small set of products prior to their sale. For the purposes of our analysis, price increases before the sale was calculated as an increase in price between 11.14 and 11.21.
Highlights of our analysis include the discovery that Best Buy increased its prices in Electronics significantly on a small selection (3.5 percent) of its product range prior to the sale, only to reduce those prices immediately during the Thanksgiving weekend sale.
While Amazon proved not to be as aggressive in the magnitude of this activity as Best Buy, this phenomenon was observed across a larger portion of Amazon’s assortment (6.7 percent)
Online is Now More Important Than Ever
While the legend and aura of past Black Friday sale events, complete with long overnight queues and highly publicized stampedes, is ebbing away, in lock-step with the dwindling numbers of store footfall this year (down 2 percent), the Thanksgiving sale season is set for a new transformation, following the growing number of shoppers preferring to shop online.
A survey by the National Retail Federation found that 59 percent of shoppers plan to shop online this year, marking the first time that online has emerged as the most popular choice for America’s shoppers.
With an extended sales season to offer discounts, and moving into Christmas, it has become increasingly important for retailers to monitor and react dynamically to their competitors’ pricing, product and promotional activities. Without the ability to track, react, and tweak in real time, retailers risk having their competitive position eroded, dramatically impacting both sales and retail margins.
Leading eCommerce retailers such as Amazon, and evolving retailers like Walmart have embedded these systems into their overarching strategy and operations, while others are condemned to play catch up.
As this fascinating cycle of the sale season ends, and retailers crunch their numbers to assess their comparative performance, sights are now set on Christmas to extend this sale extravaganza.
Visit our website, if you’re interested in DataWeave’s technology and how we provide Competitive Intelligence as a Service to retailers and consumer brands.
That’s the volume of sales Alibaba generated on 11.11, or Singles Day. This mammoth event, decisively the world’s biggest shopping day, dwarfed last years’ Black Friday and Cyber Monday combined.
This year, the anticipation around Singles Day was all-pervasive, and the sale was widely expected to break all records, as more than 60,000 global brands queued up to participate. By the end of the day, sales topped $25.3 billion, while shattering last year’s record by lunchtime.
It’s an astonishing feat of retailing, eight years in the making. When Alibaba first started 11.11 in 2009, they set out strategically to try and convert shopping into a sport, infusing it with a strong element of entertainment. “Retail as entertainment” is a unique central theme for 11.11 and this year Alibaba leveraged its media and eCommerce platforms in concert to create an entirely immersive experience for viewers and consumers alike.
From a technology perspective, the “See Now, Buy Now” fashion show and the pre-sale gala seamlessly merged offline and online shopping so viewers tuning in to both shows can watch them while simultaneously shopping via their phones or saving the items for a later date.
The eCommerce giant also collaborated with roughly 50 shopping malls in China to set up pop-up shops, eventually extending its shopper reach to span 12 cities.
Of course, attractive discounts on its eCommerce platforms were on offer as well.
Deciphering Taobao.com
At DataWeave, we have been analyzing the major sale events of several eCommerce companies from around the world. During Singles Day, when we trained our data aggregation and analysis platform on Taobao.com (Alibaba’s B2C eCommerce arm), and its competitors JD.com and Amazon.ch, our technology platform and analysts had to overcome two primary challenges:
1. All text on these websites were in Chinese
All information — names of products, brands, and categories — were displayed in Chinese. However, our technology platform is truly language agnostic, capable of processing data drawn from websites featuring all international languages. Several of our customers have benefited strategically from this unique capability.
2. Discounted prices were embedded in images on Taobao.com
While it’s normal for sale prices to be represented in text on a website (relatively easy to capture by our advanced data aggregation system), Taobao chose to display these prices as part of its product images — like the one shown in the adjacent image.
However, our technology stack comprises of an AI-powered, state-of-the-art image processing and analytics platform, which quickly extracted the selling prices embedded in the images at very high accuracy.
We analyzed the Top 150 ranked products of over 20 product types , spread across Electronics, Men’s Fashion, and Women’s Fashion, representing over 25,000 products in total, each day, between 8.11 and 12.11.
In the following infographic, we analyze the absolute discounts offered by Taobao on 11.11, compared to 8.11 (based on pricing information extracted from the product images using our image analytics platform), together with an insight into the level of premium products included in their mix for each product type, between the two days of comparison.
Unexpectedly, we noticed that each day, ALL the products in the Top 150 ranks differed from the previous day — a highly unique insight into Taobao’s unique assortment strategy.
Counter-intuitively, absolute discounts across all categories were considerably higher on 8.11 than on 11.11, even if it were for a marginally fewer number of products. The number of discounted Electronics products on sale rose on 11.11 compared to 8.11 (124 versus 102 respectively), while there was little movement in the number of discounted Men’s Fashion(55 versus 57) and Women’s Fashion (35 verses 27) products.
Taobao targeted the mobile phone and tablets segment with aggressive discounts (21.0 percent and 18.2 percent respectively), compared to the average Electronics discount level of 7.7 percent.
Interestingly, the average selling price drifted up for Electronics on 11.11 compared to 8.11 (¥4040 versus ¥3330). Men’s Fashion dropped to ¥584 from ¥604 while prices for Women’s Fashion was stable.
It’s clear that even with all the fanfare, Singles Day didn’t produce the level of discounts that one might have expected, indicating that purchases were driven as much by the hype surrounding the event as anything else.
How did Alibaba’s Competitors Fare?
While Taobao was widely expected to offer discounts during Alibaba’s major sale event, we looked at how its competitors JD.com and Amazon.ch reacted to Taobao’s strategy.
As over 80 percent of top-ranked products were consistently present in the Top 150 ranks of each product type on these websites, we analyzed the additional discounts offered during 11.11, compared to prices on 8.11.
Broadly speaking, both Amazon.ch and JD.com appear to have elected not to go head to head with Taobao on specific segments. JD.com’s discount strategy was spearheaded by Sports Shoes (22.1 percent) and Refrigerators (14.8 percent) while Amazon.ch featured TVs (15.3 percent) and Mobile Phones (10.2 percent).
The average additional discounts offered by Amazon.ch and JD.com in Electronics (8.4 percent) was slightly above Taobao’s overall absolute discount (7.7 percent). TCL was aggressive with its pricing on both websites, offering over 20% discount on almost its entire assortment.
Surprisingly, JD.com swamped Amazon.ch’s number of additionally discounted products, across all three featured categories although this may be partially explained by Amazon.ch electing to adopt a significantly more premium price position in both Men’s and Women’s Fashions compared to JD.com, while remaining roughly line ball on Electronics.
Jack Ma’s “New Retail”
Interestingly, JD.com wasn’t far behind Taobao in terms of sales, clocking up $20 billion in revenue, and sparking an interesting public debate between the two eCommerce giants extolling their respective performances.
Singles Day is one of the pillars of Jack Ma’s vision of a “New Retail” represented by the merging of entertainment and consumption. Ma’s vision sees the boundary between offline and online commerce disappearing as the focus shifts dramatically to fulfilling the personalized needs of individual customers.
Hence, Alibaba’s Global Shopping Festival should be understood as not just a one-day event that produces massive revenue, but as a demonstrable tour de force of Alibaba’s vision for the future of retail. One thing is certain — as competition heats up between Chinese retailers, we can be prepared for another Singles Day shoot-out sale next year that one-ups the staggering sales volumes this year.
If you’re intrigued by DataWeave’s technology, check out our website to learn more about how we provide Competitive Intelligence as a Service to retailers and consumer brands globally.
Lazada’s signature event, Online Revolution, is a month-long sale extravaganza that commenced with a Mega Sale on 11 November, and culminates in an End-Of-Year sale on 12 December. The shopping event is held across six southeast Asian countries — Singapore, Malaysia, Thailand, Indonesia, the Philippines and Vietnam — making it the region’s biggest retail event.
Lazada Group’s chief executive officer Maximilian Bittner observed, “We aim to provide Southeast Asia’s rapidly growing middle-class the access to a wide range of products with deals and discounts that were previously available only abroad or in the capital cities.”
On 11.11, the first Mega Sale, shoppers took advantage of great deals, ordering 6.5 million items (nearly doubling last year’s tally), resulting in sales of US$123m, annihilating last year’s takings by a whopping 191 percent.
At DataWeave, our proprietary data aggregation and analysis platform enabled us to seamlessly analyze and compare Lazada’s discounts during 11.11 with those of its competitors. We focussed specifically on two markets — Singapore and Indonesia. While the sale itself is Lazada’s, we looked at its immediate competitors as well, to study how competitively they position themselves during Lazada’s sale.
For our analysis, we aggregated pricing information on the Top 500 ranked products of over 20 product types on each website, spread across Electronics and Fashion, covering over 120,000 products in total.
11.11 — Singapore
In our analysis, we scrutinized the additional discounts offered by Lazada, ListQoo10, and Zalora during the sale period, compared to prices leading up to the sale. As today’s shoppers often encounter deep discounts on several products even on normal days, our analysis of additional discounts offered during the sale more accurately reflects the true value of the sale event to shoppers.
In the following infographic, all prices are in Singapore Dollars, and additional discounts are the percentage reduction in price on 11.11 compared to 10.11.
Lazada’s discounting strategy was more focused on Fashion rather than Electronics. However, Lazada didn’t have it all its own way with Zalora providing comparably high discounts, enabling it to compete effectively, especially in Women’s Fashion (16.2 percent on 406 products).
Zalora actually exceeded Lazada in the number of additionally discounted products on offer (Zalora 406, Lazada 347). ListQoo10 did not match either Lazada or Zalora’s level of discounting.
While Lazada held a more premium, high-value product mix in Electronics compared to ListQoo10, it chose to target the more affordable segment in Fashion, with both ListQoo10 and Zalora displaying a higher average selling price in each category.
Interestingly, Lazada refreshed very few of its Top 500 products during the sale, limiting new options to choose from for its shoppers. On the other hand, Zalora refreshed 22.5 and 22.8 percent of its products in men’s and women’s fashion respectively.
11.11 — Indonesia
Using a similar methodology to our Singapore analysis, we analyzed Lazada’s promotions against Blibli and Zalora, three of the top eCommerce websites in the region. In the following infographic, all currencies are in Indonesian Rupiah.
As with its Singapore strategy, Lazada targeted Fashion as the lead category for discounts in Indonesia. It offered steep discounts in both Men’s and Women’s Fashion (around 18 percent in each) across a large number of products (550 and 776 respectively). While Zalora matched and occasionally exceeded the discounts offered by Lazada, it did so across a significantly smaller range of additionally discounted products.
Surprisingly, Electronics were de-emphasised in Indonesia (4.1 percent compared to 9 percent in Singapore).
Compared to the market leaders Lazada and Zalora, Blibli struggled to be competitive from both an absolute discount level and a product assortment perspective.
Like in Singapore, Lazada looked to be targeting the affordable value end of the product mix spectrum across all categories, and introduced very few new products in its Top 500 ranks.
Zalora had a healthier churn rate of 14.6 percent and 18.1 percent in Men’s and Women’s Fashion, compared to Lazada’s 9.1 percent (Electronics), 10.7 percent (Men’s Fashion) and 10.8 percent (Women’s Fashion).
It’s Not Just About Discounts
Lazada’s ‘Fashion First’ targeting strategy creates an effective tie-in to its broader model of surfing the convergence wave between entertainment and eCommerce, something unique to southeast Asia.
Together with sumptuously attractive discounts, major sale events in South East Asia are fast becoming characterized by entertainment. By launching Southeast Asia’s first star-studded eCommerce TV show, Lazada continues to be the region’s eCommerce innovator, following in the footsteps of its pioneering parent company, Alibaba.
While time will tell how effective Lazada’s strategy ultimately proves to be, together with Alibaba, it has set up a fascinating and uniquely Asian retail sale model. No doubt another milestone will be set on 12.12 when the Online Revolution Mega Sale returns with even greater deals. At DataWeave, we’ll be sure to analyze that sale as well and bring you all its highlights.
In today’s rapidly evolving online and mobile worlds, few things encapsulate the competitive nature of the online retail battlefield like the Black Friday sales season. With this year’s Black Friday and Cyber Monday sale events just around the corner, 2017 promises another titanic tussle between contenders.
The holiday shopping season commences on Black Friday, November 24, and continues through much of December. Anticipating the sales season, many retailers are already offering discounts on several key categories and anchor products, providing a sneak peek into what we can expect towards the end of the month.
While traditionally, Black Friday sales were dominated by brick and mortar retail stores, with the odd shopper stampede not unheard of, retail dynamics have changed in the recent past. Online sales now consume a larger proportion of Black Friday spending, and for the first time, consumers are expected to spend more online in the 2017 holiday season than in-store.
In anticipation of this mammoth sale event, we at DataWeave trained our proprietary data aggregation and analysis platform on several major US retailers to understand the competitive market environment before the sales kick off.
Between the 15th and 29th of October, we tracked the prices of the top 200 ranked products each day in the Electronics and Fashion categories across several major retailers. For Electronics, we analyzed Amazon, Walmart, Best Buy, and New Egg, while Amazon, Walmart, Bloomingdales, Nordstrom, Neiman Marcus, New Egg, and JC Penney provided our insights into the pivotal Fashion category. Product types analyzed include mobile phones, tablets, televisions, wearables techs, digital cameras, DSLRs, irons, USB drives, and refrigerators in Electronics, and T-shirts, shirts, shoes, jeans, sunglasses, watches, skirts, and handbags in Fashion.
Automated Competitive Pricing Is the New Norm
With the accelerated evolution of online commerce, retailers have increasingly harnessed the power of competitive data to drive changes on the go to their pricing, product assortment, and promotional strategy. During sale events, however, these numbers spike significantly. Amazon famously made 80 million price changes each day during 2014’s Christmas Season sale. Similarly, even on normal days some retailers have adopted the tactics of changing their product pricing more frequently than others, in their quest to stay competitive and build their desired price perception amongst shoppers.
In our analysis of price changes, we considered the set of products that ranked consistently in the Top 200 from the 20th to the 25th of October. We identified the number of price changes together with the number of products affected by price changes that were implemented by the retailers.
As anticipated, Amazon led the way with 508 price changes on 236 products in the Electronics category during the period compared to Walmart’s 413. By comparison, New Egg’s 95 price changes trailed the field by a significant margin and illustrate the tactical advantage Amazon’s dynamic pricing technology confers. However, the price variation (8.0%) of Amazon’s was also the lowest of the four retailers included in the study, showing that Amazon makes short, sharp tweaks to its pricing at a higher frequency than its competitors.
By comparison, the Fashion category demonstrated a much lower level of price changes than Electronics, albeit with significantly higher price variations. Walmart leads the pack, adopting an order of magnitude greater number of price changes across a significantly larger number of products compared to the majority of its competitors.
Product Mix Suited to Target Market Segments
While competitive pricing is one strategy for attracting new customers and retaining existing ones, the selection of products featured in a retailer’s inventory is just as important. Ensuring a disciplined product assortment, which caters exclusively to a retailer’s target market segments is key. While some retailers such as Walmart choose to house a more affordable range of products, Neiman Marcus and Bloomingdales target the more premium segment of shoppers.
It is clear from the data that Walmart has aligned its pricing strategy to support its affordability pitch to its shopper base, while Neiman Marcus and Nordstrom use pricing to juggle the demands of a more premium inventory with perceptions of price competitiveness.
Product Movement In The Top 200
Much of a retailer’s sales performance comes down to how effectively it maintains the optimal mix of reassuring bestsellers complemented by attractive new arrivals. Sound product assortment clearly provides shoppers with a variety of options each time they visit the retailer’s website. To achieve this balance, retailers typically employ their own, unique algorithm that ranks products in their listings based on several factors, including price range, discount offered, review ratings, popularity and promotions by brands.
To study this, we evaluated the average percentage of products that were replaced in the Top 200 ranks for each product type of each website.
Amazon has clearly adopted a strategy of offering new options to its shoppers each day, with an average of 60% new products in the Top 200 ranks of the Fashion category. Contrast that with Walmart which appears to be more conservative in its approach to churning its Top 200 products. In the case of Neiman Marcus however, the reason for the lower volume of product pricing movements in its Top 200 ranks may be due to the relatively high value of its premium product assortment, which imposes the internal constraints of having a smaller pool of new products to choose from.
Online-First, This Black Friday Sale Season
Amazon continues to demonstrate its dominance as a pacesetter in US retail, largely due to its progressive online pricing and merchandising strategies. These embrace the power of big data in its approach to online retail.
Research shows online is consistently outperforming in-store along critical customer satisfaction dimensions spanning: product quality, selection and/or variety, availability of hard-to-find and unique products, ease of searching and delivery options.
According to global consultancy Deloitte, for the first time ever, American shoppers will purchase more online than they buy offline in the 2017 holiday shopping season — 51 percent, up from 47 percent in 2016. With Black Friday looming in the next few weeks, it will be interesting to see how US retailers push to seize a larger piece of this growing pie.
Check out our website to learn more about how DataWeave provides Competitive Intelligence as a Service to retailers and consumer brands globally.
As the battle of the Indian eCommerce heavyweights continues to accelerate, we have witnessed three separate sale events compressed into the last four weeks of this festive season. Flipkart has come out with all guns blazing following its multi-billion-dollar funding round, leaving Amazon with little choice but to follow suit with its own aggressive promotions. At this stage of a highly competitive eCommerce cycle, market share is a prize worth its weight in gold and neither Flipkart nor Amazon are prepared to blink first.
At DataWeave, our proprietary data aggregation and analysis platform enables us to seamlessly analyze these sale events, focusing on multiple dimensions, including website, category, sub-category, brand, prices, discounts, and more. Over the past six weeks, we have been consistently monitoring the prices of the top 200 ranked products spread over sub-categories spanning electronics, fashion, and furniture. In total, we amassed data on over 65,000 products during this period.
The first of these pivotal sale events was held between the 20th and 24th September, which we earlier analyzed in detail. Another major sale soon followed, contested by Amazon, Flipkart and Myntra for varying periods between the 4th and 9th of October. Lastly, was the Diwali season sale held by Amazon, Flipkart, and Myntra between the 14th and 18th of October, joined by Jabong between the 12th and 15th of October.
In analyzing these significant sale events for all eCommerce websites, we observed an extensive range of products enjoying high absolute discounts, but with no additional discounts during the sale, i.e. prices remained unchanged between the day before the sale and the first day of the sale. The following infographic highlights some of the sub-categories and products where this phenomenon was more pronounced during the recently concluded Diwali season sale. Here, discount percentages are average absolute discounts of products with unchanged discounts during the sale.
Having identified the aggressive use of high but unchanged absolute discounts amongst eCommerce heavyweights during the sale, we focused our analysis on the additional discounts offered during the sale, to more accurately reflect the value these sale events deliver to Indian consumers.
Several categories, sub-categories and brands emerged as enjoying substantial additional discounts. The following infographic details our analysis:
Amazon and Flipkart continue to stand toe to toe on discounts in Electronics, although Amazon offered discounts across a greater number of products. Flipkart adopted a more premium brand assortment in the Electronics category with an average MRP of INR 30,442 for additionally discounted products.
What stands out in our analysis is Amazon’s consistently aggressive discounting in fashion compared to Flipkart. As anticipated, Jabong and Myntra continued to offer attractive discounts in a large number of fashion products, seeking to maintain their grip in their niche. Furniture, too, is a category where Amazon out-discounted Flipkart, albeit through a less premium assortment mix (average MRP of INR 23,580 compared to Flipkart’s INR 34,304).
Several big brands elected to dig deep into their pockets during the sales to offer very high discounts. These included attractive discounts from Redmi, Asus, and Acer in Electronics, and W, Wrangler, Levi’s, Puma, Fossil, and Ray Ban in Fashion.
Which Sale Delivered Greater Value For Consumers?
Since DataWeave has extensive data on both the pre-Diwali sale (held between 4th and 9th of October), and the Diwali season sale (held between 12th and 18th October), we compared prices to identify which of the sale events offered more attractive discounts across categories, sub-categories and products.
While the discount levels were generally consistent across most sub-categories, only varying by a few percentage points, we identified several sub-categories and products that displayed a large variation in the absolute level of discount offered.
As the infographic above shows, Amazon identified women’s formal shoes as a key category in its discounting strategy, which saw its level of discounting triple during the Diwali sale. By comparison, Flipkart doubled its discount in men’s jeans, and Myntra tripled its discounts on Men’s shirts and sunglasses.
Similarly, during the Diwali sale Amazon, Flipkart and Myntra all offered selected products with an aggressive 40% to 50% discount level.
Interestingly, Amazon, Flipkart and Myntra all elected to reduce the level of discounts offered on specific products as well. One of the biggest discount moves was Amazon’s reduction on iPhone 6s from 34% to only 4%. Flipkart recorded a similar price move on Adidas originals Stan Smith sneakers (30% to 5%) and Canon EOS 200D DSLR cameras (20% to 8%).
Market Share Reigns Supreme
Based on our analysis of the festive season sales, Flipkart’s aggressive approach powered by its multi-billion-dollar funding round enabled it to stave off Amazon’s discounting strategy in the annual eCommerce festive season sales this year, increasing its lead over Amazon India in a market where the total sales is believed to have surged by up to 40 percent over 2016’s sales.
Based on several reports, Flipkart’s share of total festive season sales appears to have increased from 45 percent in 2016 to 50 percent this year, capturing much of the market up for grabs from a now relegated Snapdeal. Amazon’s market share during a festive sales period that stretched over a month is estimated to have remained steady at 35 percent, though the company reported it saw a 50 percent share in other metrics such as order volume and active customers.
The key question for both industry analysts and consumers alike is, how much deeper are retailers willing to go in their quest to capture market share at the expense of operating margins?
If you’re interested in DataWeave’s data aggregation and analysis platform, and how we provide Competitive Intelligence as a Service to retailers and brands, visit our website!
Retail has undergone a dramatic transformation over the last decade. Once dominant retailers are today being given a run for their money amid a gradual decline in mall traffic and sharply growing consumer preference for shopping online.
Surfing this online retail wave is Internet behemoth Amazon, which is raking in 43% of all new eCommerce dollars, leaving other retailers floundering in its wake.
As it unfolded, this transformation has unleashed changes across many areas of retail, a phenomenon that’s been well documented by industry commentators in the media. Some of these shifts include:
Customer preferences: Customers today are spoilt for choice, both in terms of being able to quickly and easily compare product prices across websites, as well as consistently driving the demand for new and unique products from retailers.
Hyper-personalization: With shoppers increasingly relying on mobile apps, highly personalized shopping experiences are becoming the new normal.
Delivery: e-Retailers are competing on faster home deliveries, stretching themselves to guarantee same day delivery, or even (as in the case of hyper-local grocery retailers) within a few hours. Drones, anyone?
Payment Modes: Even the more tactical aspects of retail, like payment modes, have been forced to evolve. Starting with cash-on-delivery, this trend quickly spread to embrace card payments and digital wallets. These initiatives have posed significant technological and security challenges for retailers.
As with a forced move in chess, traditional retailers have had to evolve and embrace changes like the ones listed above, in order to survive the incredibly cutthroat world of modern retail. Similar challenges exist for up-and-coming eCommerce companies as well.
However, many pundits and retailers alike often forget that doing even simple, time-tested things correctly can go a long way in forging an effective competitive position, helping win both market share and customer affections. While digital transformation has altered how these strategies were routinely executed, the fundamentals remain as relevant today as they ever were.
1. Smarter Pricing
With 80 percent of first-time shoppers comparing products prior to buying, the need for an eCommerce website to offer competitive pricing has become a mandatory cost-of-entry capability. While dynamic pricing poses a challenge for e-retailers to stay competitive, it also presents them with an opportunity to track their competitors’ pricing and exploit that information to optimize their own pricing.
However, e-retailers today are frequently forced to perform millions of price-changes every day in the eternal quest to either offer the lowest price or entrench a calculated premium price perception among shoppers.
For instance, as far back as Christmas season 2014, Amazon is estimated to have made a total of 80 million price changes per day. Similarly, today’s hyper-local grocery retailers offer differentiated and targeted prices for shoppers living in specific zip codes.
To achieve price controls on this level of scale demands sophisticated automated tracking of competitor pricing to facilitate timely, data-driven dynamic pricing decisions. This has, today, become a table stakes requirement.
2. Variety and Depth of Product Range
If customers cannot find what they are looking for on a website, all other aspects of how an eCommerce operator optimizes their retail strategy falls by the wayside.
A website’s success remains dependent largely on it being able to cater effectively to the needs, wants and desires of its target audience. Simply put, a website offering a mammoth product range may still end up failing compared to a small niche website with a limited but highly targeted assortment that understands closely its customer’s sweet spot.
However, with millions of products on offer online all day every day, gathering and harvesting deep insights into a competitor’s assortment mix can appear daunting. Include dynamically changing product assortments and different product taxonomies into the standard research mix, and many who lack access to automated competitive intelligence systems find themselves struggling to find the expertise required to gather and summarize this information in an actionable form.
3. Customer Centricity
Today, customers demand to be heard. As competitive pricing becomes an expected cost of doing business, retailers will need to place greater support resources and more effective processes to resolve customer problems and complaints in a timely fashion at the heart of their customer service model.
Following the online social revolution, 9 out of 10 retail customers now expect a consistent response across all social media channels.
Successful companies like Zappos, Best Buy and Amazon have been quick to understand this significant shift in customer preferences. These retailers have demonstrated their willingness to go the extra mile by establishing a robust, scalable omni-channel support structure.
The level of this commitment can be seen in Amazon’s recent vision statement announcement, “Amazon today boasts of one of the most responsive omni-channel customer support and Zappos takes pride in sending a personalized response to customer queries. We seek to become Earth’s most customer centric company.” This aggressive customer centric sentiment drives a stake in the ground for all competing eCommerce companies’ to match via their customer service strategy.
4. Superior Customer Experience
While bricks and mortar retail stores continue to attract customers by enabling shoppers to touch, feel and test items before they purchase, online and omni-channel retailers have channelized their efforts into increasingly refining their web user experience.
Several studies reveal it takes only a couple of seconds for a website visitor to decide whether to stay on or leave a website. Aspects such as visual design, ease of use, content attractiveness, website loading time and pervasive calls to action (CTA) are a few of the key user experience parameters that influence visitors to stay on a website.
eCommerce sites such as Zara, Graze, Asos, and Amazon offer attractively organized and clutter-free designs, which are visually engaging and easy to navigate. While these design elements help them keep their customers engaged, it’s their disciplined focus on content that stimulates visitor conversions.
Detailed product descriptions and high-quality images are helping these eCommerce sites educate their customers about their products while simultaneously boosting their website’s SEO ranking, helping it attract and engage still more online visitors.
Complementing the online retailing revolution are substantial efforts by omni-channel retailers to optimize O2O (online to offline) strategies designed to bring together the best of both worlds — the discoverability of online, with the touch-and-feel of an offline environment.
5. Optimized Promotional Strategies
With so many options for a shopper to choose from in an increasingly cluttered and competitive online retailing environment, attracting new customers and entrenching customer loyalty is an ongoing challenge. Strategic online promotions are emerging as an effective technique in solving the customer recruitment and retention dilemma. Online promotions if executed effectively are doing wonders for generating inbound website traffic.
However, for online promotions to be effective, it is critical for e-retailers to understand their competitor’s strategy if they are going to be able to sustain their competitiveness. Key questions to answer in this context are, what brands are they promoting more than others? For how long? At what frequency?
Keeping a keen eye on and reacting to competitors’ promotions is a key aspect to designing effective online promotions. Being able to exploit this competitive intelligence not only boosts their own sales volumes but erodes that of their competitors as well.
Competitive Intelligence As A Service
Having understood the far-reaching impact of these evergreen drivers of eCommerce success, we at DataWeave work with omni-channel and online retailers to provide Competitive Intelligence as a Service and help them evaluate and optimize their strategic approach across the eCommerce landscape.
If you’re interested in DataWeave’s solutions and would like to learn more about how we help retailers and brands optimize their retail strategies, visit our website!
In the lead up to October’s Diwali celebrations, almost all major Indian e-retailers had announced mammoth sale events for last week. Resuming the epic battle of India’s online shopping carts during festival seasons, Flipkart, together with Jabong and Myntra, kicked off their five-day-long “Big Billion Days” sales on September 20, while Amazon India‘s “Great Indian Festival” launched the next day.
The stakes were high as Amazon and Flipkart are more evenly matched this year than ever before, making predicting an eventual winner of these dueling discounters a lot tougher than in previous years.
At DataWeave, our proprietary data aggregation and analysis platform enabled us to easily assess which e-retailer offered better deals and discounts. Over the last two weeks, we have been consistently monitoring the prices of the top 200 ranked products in Amazon, Flipkart, Myntra, and Jabong, across several sub-categories of Electronics, Men’s Fashion, and Women’s Fashion, encompassing over 35,000 products in total.
Divergent Discount Strategies
In our analysis, we bring focus to the additional discounts offered by competing e-retailers during the sale, compared to prices before the sale. This is key, as today’s shoppers often encounter deep discounts on several products even on normal days, which could potentially dampen the value suggested by the large discounts advertised during the sale.
Based on our analysis, Flipkart clearly adopted a more aggressive pricing strategy this year, establishing a lead over Amazon in average discount percentage for Electronics and Women’s Fashion. Moreover, Flipkart launched additional discounts on a larger number of products across categories. Amazon, though, offered 6.9 percent additional discounts on smartphones compared to Flipkart (6.2 percent), led by 10.7 percent discount on Apple and 7.7 percent discount on Redmi smartphones.
Flipkart has already reported a doubling of revenue from the sale (which includes sales volumes of Myntra and Jabong) compared to last year, and claimed it accounted for 70 percent of eCommerce sales during these five days — beating Amazon by a considerable margin. Amazon, for its part, reported a “2.5X growth in smartphone sales, 4X increase in large appliances and 7X in fashion sales.”
The difference in discounting strategies between Amazon and Flipkart is starkly illustrated by their respective highest discounts. Flipkart led the way with a 65.5 percent discount on Vero Moda skirts, a 65 percent discount on Tommy Hilfiger skirts, and 50 percent off Calvin Klein sunglasses.
By contrast, Amazon’s greatest discounts were an 83.4 percent discount on Redfoot formal shoes, 45.5 percent on Motorola Tablets, a 40 percent on US Polo T-shirts, and a 25.1 percent discount on Puma sports shoes.
Also, Flipkart hosted a more premium range of products in its assortment compared to Amazon, evidenced by a higher average MRP for its discounted products. Surprisingly, Amazon’s spread of discounted products has the least average MRP in Electronics and Women’s Fashion, compared to all other competitors.
New Products Break Through the Top 200
What’s fascinating in this battle of the e-retail giants is the correlation we uncovered between prices and rank. During the sale, as prices dropped on hundreds of products across the board, newer products successfully broke through into the Top 200 ranks for each sub-category. New products in the top 200 ranks had higher discount levels than the ones they replaced.
This trend was especially pronounced in fashion, where we observed an almost complete overhaul of products filling the Top 200 during the sale period, led by sports shoes in Amazon, Men’s shirts in Flipkart, and Men’s formal shirts in Jabong.
What About Pre-Sale Prices?
Another angle we explored was whether (like most of us suspect) e-retailers increase their prices before a sale, only to reduce them during the sale, so they can advertise higher discounts. We observed that all e-retailers did increase their prices for an albeit small set of products before the sale.
While the number of products where the prices increased for each website prior to the sales is small, it is interesting to observe that certain brands choose to perform the oldest trick in the retail book even today — raising prices to accentuate the degree of discount during the sale period, something shoppers need to keep an eye out for.
A Sign of Things to Come?
Based on our analysis, Flipkart has recognized the threat from Amazon and has approached this year’s “Big Billion Days” sale aggressively. It has dug deep into its freshly funded pockets, and offered better discounts for a larger set of products across most categories, in its attempt to lock down a greater market share in the burgeoning Indian eCommerce space.
Amazon, though, has continued to maintain a firm grip on the Indian consumer, having achieved tremendous growth in specific categories during the sale.
What’ll be interesting now is to see how these pricing strategies impact company revenues and margins, and how this will shape the soon-to-follow Diwali sales in mid-October.
If you’re intrigued by DataWeave’s data aggregation and analysis technology, and would like to learn more about how we help retailers and brands build and maintain a competitive edge, please visit our website.
Earlier this year, we witnessed Amazon and Walmart going head to head in a CPG goods price war of fluctuating intensity that soon rippled out to embrace the entire grocery industry.
This further intensified with Amazon’s takeover of Whole Foods and the Whole Foods’ subsequent announcement hinting at significant discounts toward the end of August.
Soon, Target announced it was lowering prices on literally “thousands of items.” As Mark Tritton, Target executive vice president and the chief merchandising officer put it, “We want our guests to feel a sense of satisfaction every time they shop at Target.”
To drive home the seriousness of their intent, Target nominated grocery staples such as cereal, paper towels, milk, eggs, baby formula, razors and bath tissue and vowed to, “eliminate more than two-thirds of their price.”
At DataWeave, we focused our proprietary data aggregation and analysis platform on Target’s reported price reduction. Our team acquired data on the prices of over 160,000 products listed by Target across 12 zip-codes selected at random. The platform then took two snapshots. Firstly, between 23rd August and 30th August which included the Whole Foods’ price reduction (to study any possible reactions on price) and, secondly, between the 6th September and 13th September, which included Target’s discount strategy announcement.
Of the categories Target identified as priorities for its discount strategy, only baby products, cereals, and Milk & Eggs displayed significant price drops. This price discounting effect varies, however, across brands in each category. In cereals, while KIND (30.4%) and Purely Elizabeth (24%) displayed high discounts, Apple Jacks, Corn Pops, and Krave more surprisingly increased their prices by up to 25% each.
Similarly, in the Milk & Eggs category, Price’s (13.6%) and Coffee-Mate (10%) exemplified hefty discounts, while Moon Cheese and Challenge Butter increased their prices by 33% and 48% respectively in the same time period. By comparison, Razors and Paper Towels showed no price changes whatsoever across the review period.
Interestingly, we observed greater price-change activity coinciding with the time of the Whole Foods’ announcement (between 23rd and 30th of August) than the later time period. Once again, however, no definite price discounting pattern emerged from the study, indeed the team found discount rates fluctuated significantly across categories.
Looking across the spectrum of CPG categories pricing, we saw significant, sustained variation across both categories and zip-codes.
Beauty products showed a 2 percent discount on average although this varied by zip-code, fluctuating between a 7 percent discount and an actual 10 percent price increase. F&B showed a 2 percent price increase, which jumped to 10 percent in some zip-codes. Personal care displayed a 2.5 percent increase on average, varying anywhere between an 8 percent discount and a 10 percent price increase. Baby products surprisingly recorded a 4 percent price increase on average during the study.
So, What Does This All Mean?
Based on our analysis, Target’s pricing strategy appears to be a combination of very closely concentrated discounting, complemented by selective price increases. Is discounting more a perception than a reality at this stage of the CPG cycle?
Aggressive price discounting has never been a decisive factor in successfully building Target’s consumer franchise. However, given the current trading environment and the continued pressure applied by competitive omni-channel strategies, which has seen a host of new entrants elbowing their way into the market, we anticipate price will continue to play a prominent role in retailing.
We suspect, based on evidence we gathered, that price discounts are more a highly targeted weapon in the fight for market share than a broadsword slashing of prices across the board. As Target’s CEO Brian Cornell noted during an earnings call, the company experienced “a meaningful increase in the percent of our business done at regular price and a meaningful decline in the percent on promotion.”
If you’re interested in DataWeave’s data aggregation and analysis technology, and would like to learn more about how we help retailers and brands build and maintain a competitive edge, visit our website.
Amazon.com, America’s retail behemoth, dominated headlines in August when it completed its acquisition of Whole Foods in early August 2017. Having officially taken control of the up-market grocer, which focuses on premium quality produce, market observers and consumers alike are eagerly awaiting Amazon’s pricing strategy analysis.
At the heart of Amazon.com’s seemingly unstoppable growth trajectory is the company’s ability to understand consumers, complemented by deep insights into buying cycles and purchase decisions and preferences. It also helps that Amazon.com boasts one of the planet’s mightiest marketing and publicity machines.
Is Amazon.com About To Launch A Grocery Price War?
Reports of Amazon.com dropping Whole Foods prices by up to 43 percent quickly made splashes across the news media. Given Jeff Bezos has been quoted in the past as saying, “your margin is our opportunity”, an aggressive promotional campaign to achieve dominance for its new Whole Foods acquisition was anticipated by some commentators.
These sentiments ignited fears of a profit-sapping price war, immediately hit stock prices in the cutthroat grocery industry, which survives on famously thin margins. Memories of Amazon.com’s impact on US department store profitability quickly surfaced with analysts pointing to Walmart’s revenue/market share plunge from 26 percent in 2005 to just 11 percent in 2016 when the sector came under sustained pressure from Amazon.com.
How Deep Are Amazon.com’s Price Cuts Really?
At DataWeave, a Competitive Intelligence as a Service provider for retailers and brands, we put Amazon.com’s actual Whole Foods discounts under the microscope. The resulting careful analysis of price discounts revealed quite a different story to the one initially featured in the media. Scrutiny by our proprietary data aggregation and analysis platform showed the drop in retail grocery prices was minimal to almost negligible, depending on the category.
In delivering near-real-time competitive insights to retailers and brands, we acquire and compile large volumes of data from the Web on an ongoing basis. A key differentiator is our ability to aggregate data down to a zip-code level.
Our analysis of Amazon.com’s reported drop in prices was based on data acquired for 13 zip-codes distributed across the country and selected at random. Our platform compared market prices by zip code valid between 23rd August and 30th August.
Each zip code indicated the overall average discount offered varied between 0.20 percent and -0.20 percent. When the discounts at a category-level were separated out, the discounts available to customers per category varied between -6.8 percent (an actual price increase) and 6.1 percent.
Moving on to the “Fill the Grill” category, discounts again were modest, varying between -5.6 percent (another price increase) and 6.1 percent across the zip codes analyzed.
This aligns with Amazon.com’s recognized preference for basing its strategy on competing on breadth and depth of product assortment rather than pure pricing discounts at the checkout.
Some Sunshine For Foodies
There was some good news for shoppers looking for higher discounts. Amongst those products attracting a higher discount were:
Belton Farm Oak Smoked Cheddar Cheese: 50 percent
Beemster Premium Dutch Cheese: 50 percent
Heritage Store Black Castor Oil: 50 percent
Organic French Lentils: 45 percent
Vibrant Health Pro Matcha Protein: 40 percent
Hass Avocado: 50 percent (confined to one zip-code).
Final Word
Amazon.com’s marketing engine is renowned for skillfully nurturing consumer price perceptions of the giant retail website as being the lowest priced retailer. We kept a keen eye on Amazon’s pricing these past weeks, and unearthed a carefully conceived and executed Whole Foods pricing campaign, which is yet another example of their market shaping expertise at work.
If you’re intrigued by DataWeave’s technology and would like to learn more about how we help retailers and brands build and maintain a competitive edge, please visit our website!
When retailers today look to compete in the cutthroat world of online commerce, they face several challenges unique to the nature of modern retail. It is now significantly harder for retailers to benchmark their pricing, assortment, and promotions against their competition, as the online world is highly dynamic and significantly more complex than before.
Trends like the growing adoption of mobile shopping apps, the rising influence of customer reviews in buying behavior, hyperlocal e-commerce websites differentiating themselves by fulfilling deliveries in a matter of hours — the list goes on — have only added to this complexity.
However, this complexity also presents an opportunity for retailers to incorporate layers of external competitive information into their merchandising strategies to deliver more value to customers and personalize their experience.
Vipul Mathur, Chief Branding and Merchandising Officer at Aditya Birla Online Fashion, recently published an article highlighting some of the areas in which Competitive Intelligence providers like DataWeave can strategically influence modern merchandising.
“The consumer is often driven by the aesthetics of a product, more so in the fashion and lifestyle industries than others. Hence, the choices of buyers are hard to interpret. However, innovative modern technologies are helping us understand these decisions,” says Vipul.
He provides an example of how using AI-based tools (like DataWeave’s) to unearth the sentiments behind thousands of online reviews can help retailers better channel and message their online promotions.
“Deciphering the consumers’ comments and converting them into tangible insights is incredible proof of the refinement possible with data analysis tools. It’s like knowing that consumers are delighted by the quality of the soles of a pair of Adidas running shoes. Using this, marketing communication can be modified to highlight this specific product feature,” explains Vipul.
And it’s not just merchandising. This data can percolate across multiple functions in retail, enabling greater efficiency in operations. “If we have data on the best-selling styles across websites, including other attributes like pricing, region/locality (through pin-code mapping), and possibly even rate of sales, it’s up to our supply-chain systems to ensure that the supply is in accordance with demand.”
DataWeave’s Retail Intelligence offers global retailers and e-commerce websites with these benefits and more. Our AI-powered technology platform aggregates and analyzes vast volumes of online competitive data and presents them in an easily consumable and actionable form, aiding quick, data-driven merchandising decisions.
“DataWeave, our partner, has helped us refine our merchandising decisions, saving cost and creating value,” sums up Vipul.
Read the entire article here, and if you’re intrigued by what DataWeave can do for retail businesses and wish to learn more, visit our website!
For years, the consumer electronics chain Radioshack has endeavored to stay alive in our ever-changing world. Despite their efforts, they have filed for bankruptcy for the second time, in as many years. As of now, the company is closing 200 of their 1,500 stores, slightly more than 13% of their locations
This one-time retail “giant” isn’t alone on the path of reduction in force. Macy’s has announced that they will close 63 stores, and Sears will lock their doors for the final time on 150 of their stores this fiscal year.
Brands too are feeling the heat. Ralph Lauren recently announced the closure of an unspecified number of stores (including its Polo store on Fifth Avenue, New York City), and a reduction in its workforce.
The internet is impacting brick and mortar sales the way that Sears Roebuck and Montgomery Ward catalog mail order sales impacted the general store at the turn of the last century.
Online Retail Plays the Spoiler
The disruption of the retail industry following the onset of e-commerce is largely due to the change in shopping behavior. Shoppers today can sit at home and compare multiple retailers before making a purchase. This has a significant impact on consumer expectations and how retailers do business today.
Smartphone apps make comparing prices, and downloading coupons simple. So, we now see e-retailers compete tooth-and-nail on price, and even willing to take the “loss leader” route to drive adoption. Consequently, consumers expect rock bottom prices. Many brick-and-mortar retailers like Walmart have responded by simply matching online prices.
While there are tens of thousands of e-commerce companies in the world today, this disruption is led primarily by the behemoth of global retail — Amazon.
The Torchbearer of Modern Retail
Amazon’s retail business strategy rests on three pillars: price perception, broad assortments, and customer experience.
Price has long been the primary driving factor in retail. Therefore, there is need to optimize price efficiently to drive revenue and margins. What Amazon has smartly done is to drive the perception among shoppers that the company is always the lowest priced, even though it’s untrue. They do this by ensuring they are the lowest priced in the top 20% selling SKUs by volume. The resulting perception among consumers is a key differentiator.
Also, to deliver superior customer experience compared to competing retailers, Amazon ensures high quality of online catalogs, provides a wide selection of products, and offers fast shipping to a broad coverage area, at no additional cost.
When you factor in the Amazon Prime service, consumers have become spoiled with receiving their purchases within 48 hours. Sunday deliveries, and scheduling within the hour means buyers are in the driving seat.
Some of Amazon’s competitors are following suit. Mega box stores like Costco, in an endeavor to meet their customers’ desire for options, are partnering with Google Express to provide fast delivery of household items, apparel, electronics, pantry staples such as bread and cereal, and more.
The message is clear — today’s brick-and-mortar retailers need to have an omni-channel approach to retail, and an online presence if they are to stay competitive and relevant. However, this move has its fair share of obstacles –
The Challenge of Moving Online
Brick-and-mortar retailers moving online are confronted with several questions that carry more weight today than they used to in the past:
How do I deliver a high-quality shopping experience?
How can I drive price perception among shoppers?
What products do I promote and when?
What product assortment do I build to drive sales and retention?
How do I manage my logistics to reduce shipping cost and time?
Traditional retailers looked largely at only internal data — like POS data, product sell-through rates, inventory, etc. to answer these questions. Today, it is mission-critical for retailers to absorb and utilize external competitive data as well — and here lies the problem. When you are benchmarking yourself against the competition online, it is that much harder, as it’s more dynamic and significantly more complex than before.
For example, Forbes estimated that through Christmas season in 2014, Amazon made a total of 80 million price changes per day to stay competitive. These are extraordinary numbers, and reflect how dynamic online retail is, and its contrast to traditional retail.
Retailers today have no choice but to automate as much as possible, so they can make quick, timely merchandising decisions and keep pace with modern e-retail. Retail technology providers like DataWeave have stepped in to meet this demand.
DataWeave’s Retail Intelligence
At DataWeave, we enable retailers gain a competitive advantage in the online world by providing Competitive Intelligence as a Service. We do this by harnessing public information on the competition, structuring it, and presenting it in a form that is easily consumable and actionable, enabling easy, automated decision-making.
Our AI-based technology platform facilitates smarter pricing decisions by providing retailers with price change (increase and decrease) opportunities as they occur. Retailers can also plug gaps in their product portfolio by identifying opportunities to expand their assortments. In addition, they can benchmark their shipping speed and cost against competition, to enhance customer experience. And there’s more where these come from!
Click here to find out more about how we can help modern retailers stay competitive in the online world.
We all know, online shopping offers a lot of benefits to shoppers. Apart from the convenience it offers access to a wide-assortment base and, of course, discounts are an added benefit. Often we see, retailers claiming large discounts on products.
Many-a-time, the percentage discount that is mentioned drives price perception. Customers when comparing prices across stores view larger percentage discounts as a better deal. However, this is not necessarily the case. To present this case, let us look into how discounts are calculated:
Percentage discounts are a function of the MRP / MSRP and the Selling Price. The MRP / MSRP is set by the manufacturer and the selling price is more often than not determined by the retailer.
Selling price of products being different across retailers is a well-known fact. When the MRP of the same products tend to vary across retailers, it gets confusing for a customer, which in turn leads to a brand equity dilution of the brand or manufacturer.
To analyse how deep this discord is, we decided to dive deeper into its working dynamics. Amongst all the data that we aggregate at DataWeave, analysing discounts of the same product across retailers gives us the ability to discern pricing strategies of retailers. We used this dataset to monitor and analyse MRPs.
What we found
1. We analysed MRPs of around 400 brands across 10 categories. Around 44% of products in these brands have no variance in MRPs across retailers
2. This also means there is a variance in 56% of products
3. Products in the ‘Mobile Phones and Tablets’ category have the most price variance; 65% of the products have price variance
4. Fashion and Fashion accessories have the least price variance; around 20%
5. Brands having the most variance:
6. Brands having the least variance:
What are the implications of the above insights?
Brands & manufacturers need to be aware of how their brand products are being represented and sold online
Consumers shopping online need to look at end prices, and not focus on the discount percentage, before making a purchase-decision on a particular store
This article was previously published on Yourstory
DataWeaves Brand Intelligence provides consumer brands with the ability to track their products, pricing, discoverability vis-a-vis their competitors across e-commerce platforms.
PriceWeave provides Competive Intelligence for eRetailers, brands, and manufacturers. Competitive Intelligence helps businesses understand their competition better, take timely decisions, and increase sales. Our retail pricing intelligence tool serves the following major purposes:
Compare: PriceWeave lets you access products from across any number of sources and organize them for a straightforward apples-to-apples comparison.
Monitor: Our intuitive dashboards help you monitor prices, assortments, products, brands, and deals across competition on a daily basis.
Discover: Discover gaps in your product catalog. Discover products that are unique to you. Discover new brands and categories your competitors have introduced. Find new competitors.
Analyze: Get customized alerts and reports on anything that you want to track. Access historical pricing data to understand pricing strategies. Visualize data across facets at different levels of granularity.
If you are an eRetailer, PriceWeave powers your sales, marketing, and analytics team with actionable data–for both day to day operations, as well as long term strategy. With retail pricing intelligence, an eRetailer can:
understand pricing opportunitiesand implement an effective pricing strategy
get pricing variation for the products you are tracking across competition
get apples-to-apples product comparison and historical pricing data
Research shows that the colour of the clothes we wear significantly affect our day to day lives. For instance wearing black might help us appear powerful and authoritative at the workplace, while a red dress can make us look more attractive to a date. A yellow top might brighten up one’s day and a blue one land us a nifty bonus.
Oftentimes buyers navigating the myriad nuances of current fashion look for help from friends, popular media and retailers themselves. Retailers, for their part, try to stay ahead of fashion trends by meticulously studying trends from magazines, keeping a close eye on competitors and wading through the chatter on social media and fashion blogs.
Now that most of retail is metrics driven and becoming smarter by the day, we asked ourselves whether there is a more optimal way to analyse the influence of colors on customer buying decisions. Here’s how we went about doing it:
Method:
Thanks to the internet, a huge mine of valuable fashion data is available to us through e-commerce sites, brand Pinterest pages and fashion blogs, which regularly update their content streams with the newest fashion offerings. Data ranging from featured fashion of the current season including the complete product catalogue of brands as well as combinations of dresses that go together (even between brands) are all available for us to collect and analyse.
By crawling these sites, pages and blogs periodically we can extract the colors on each of the images shared. This data is very helpful for any online/offline merchant to visualize the current trend in the market and plan out their own product offering. It is also possible to plot monthly data to capture the timeline of trends across different fashion websites.
How is it Useful?
Let us assess the applications made possible from this data. How would color analysis assist product managers, category heads and merchandising heads?
1.Spotting current trends:
Color analysis can spot current trends across brands and various filters. This gives decision makers the ability to gauge and respond to current trends and offerings. Some filters that can be used to analyse this are price, colors, categories, subcategories etc
2.Predictive trends:
Using historical color data future trends can be spotted with greater accuracy. With this data decision makers can stay ahead of the demands and the predictions of the market and gain a foothold on the ever changing nature of fashion.
3.Assortment Analysis:
Assortment Analysis can become more in depth and insightful with color analysis. Assortment comparisons of one’s offerings v/s competitor’s offerings can give a clear cut decision pointers on both one’s color offerings present and categories one can focus on to get ahead of the competition.
4.Recommendations
A strong recommendation feature is vital in driving up sales by offering the right products to buyers at the right time. Analysis of colors helps recommendations become smarter and more relevant. For instance, the algorithm can help understand what tops go with which jeans or which shirts go with what ties.
Colours add a new dimension to current business analytics. Decision makers will be able to access enhanced analytics on existing products and compare across sources based on parameters such as price, categories, subcategories etc.
Color Analysis in retail is largely unexplored and rife with possibilities. Doing it at scale presents a number of unique challenges that we are addressing. We’re excited to bring novel techniques and the power of large scale data analytics to retail.
Color analysis will add to a retailer’s understanding of consumer buying patterns. This will help retailers sell better and improve profit margins. We are currently working on integrating this feature into PriceWeave so that our customers can do a comparative assortment analysis with color as an additional dimension.
About Priceweave:
PriceWeave provides Competitive Intelligence for retailers, brands, and manufacturers. We’re built on top of huge amounts of products data to provide features such as: pricing opportunities (and changes), assortment intelligence, gaps in catalogs, reporting and analytics, and tracking promotions, and product launches. PriceWeave lets you track any number of products across any number of categories against your competitors. If you’d like to try us out request for a demo.

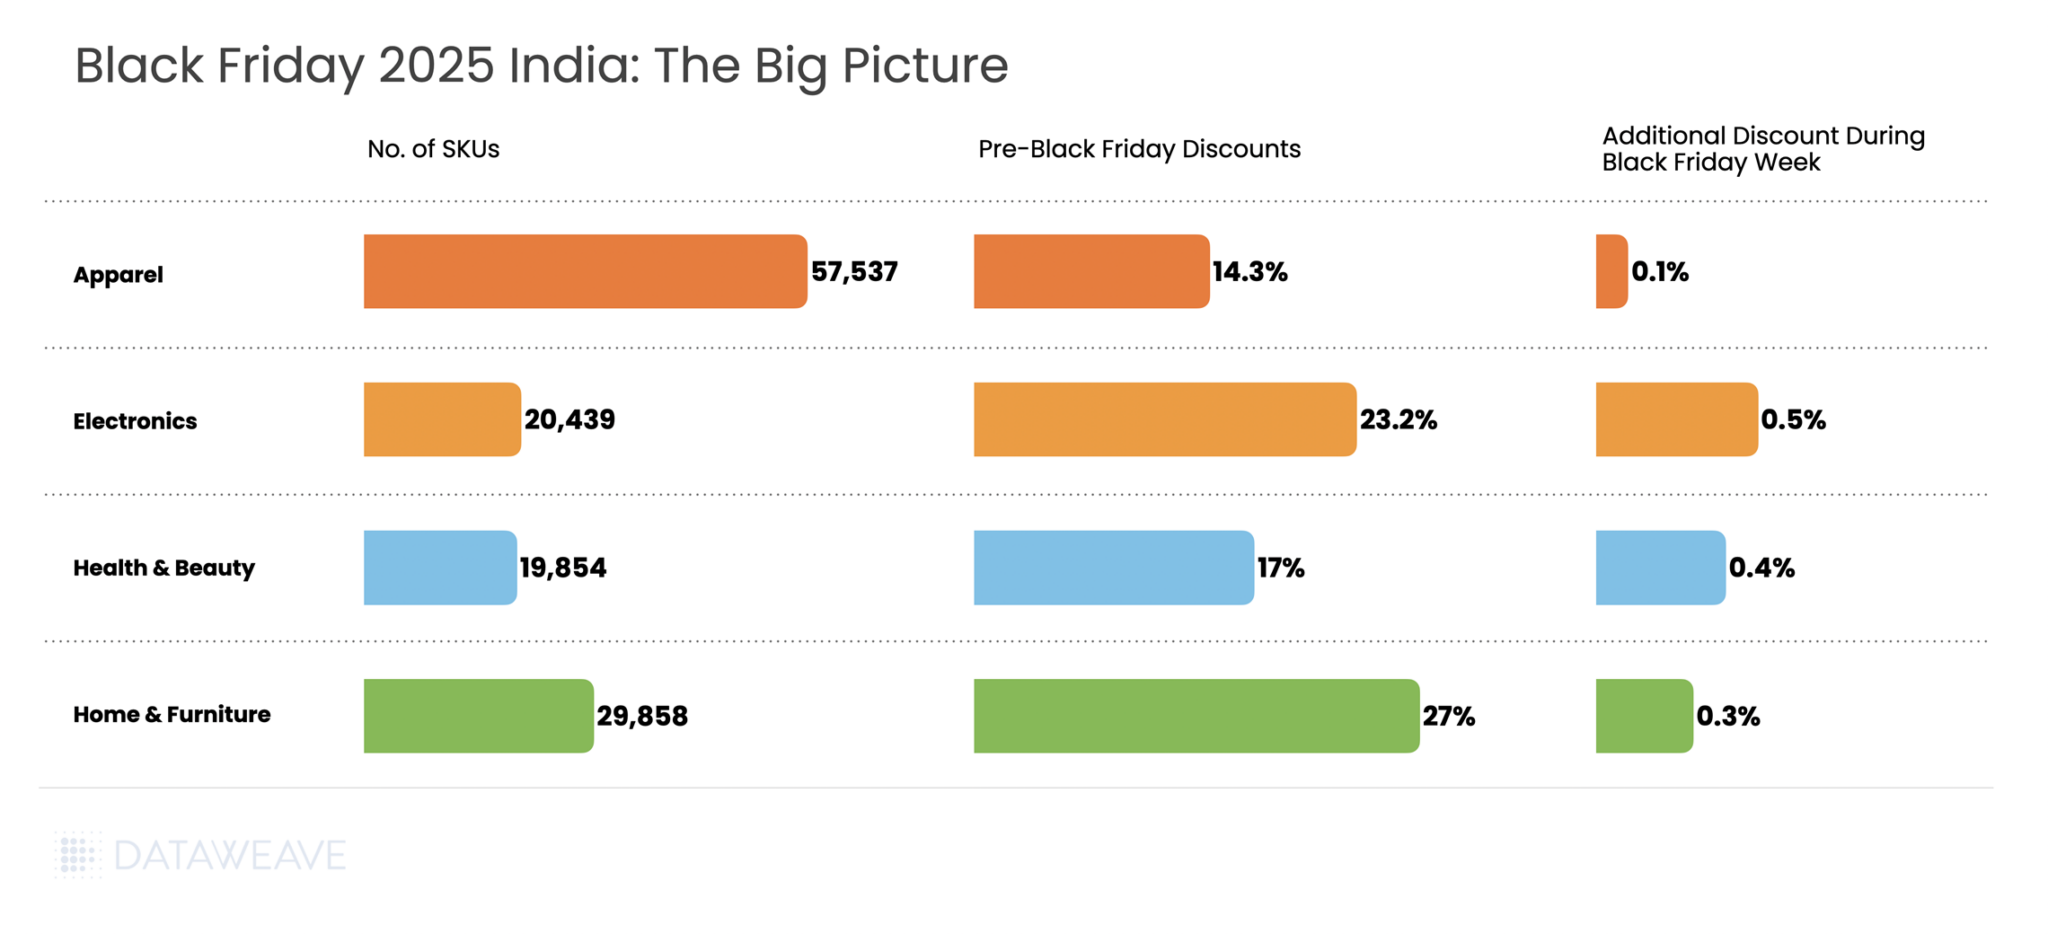
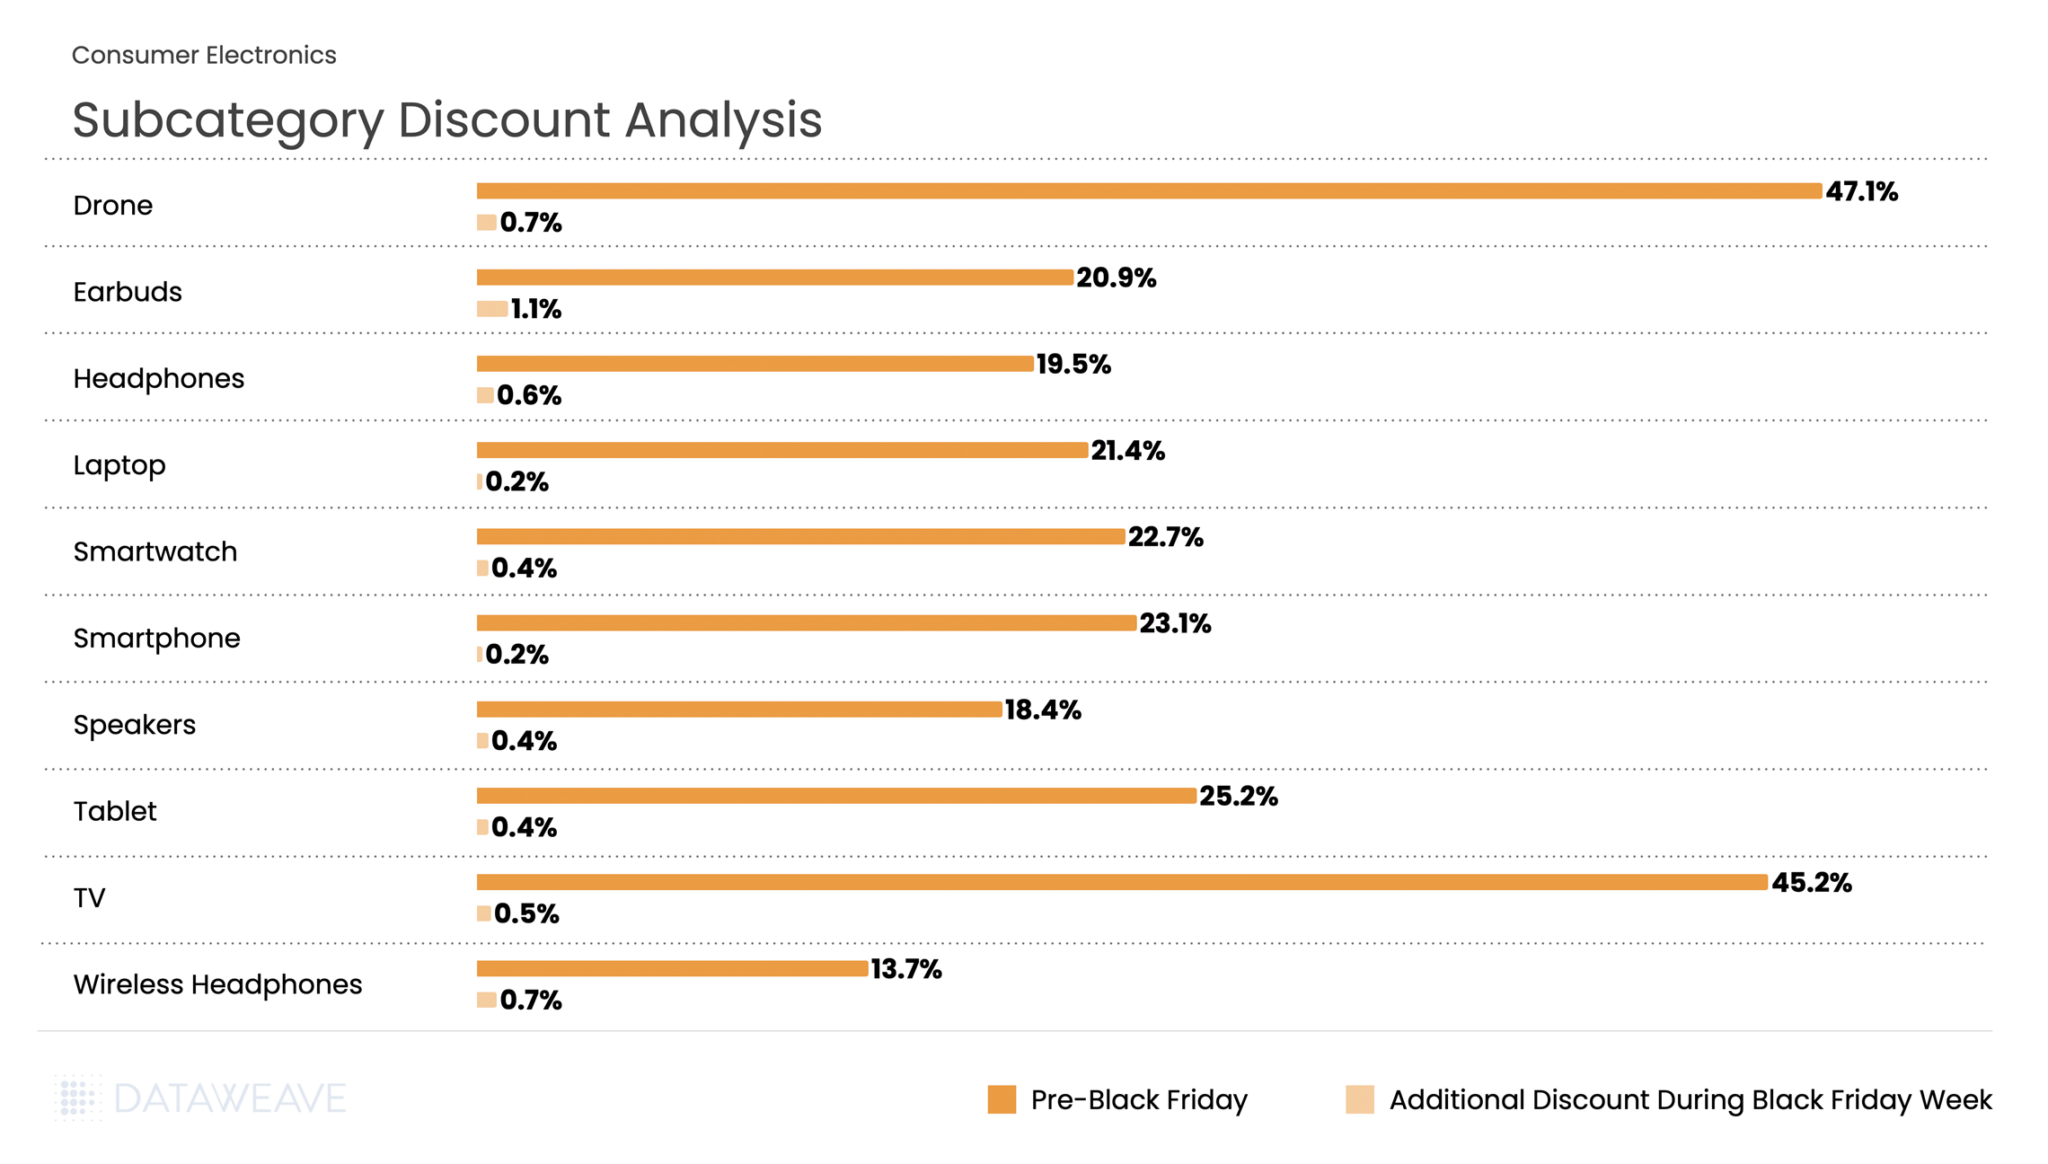
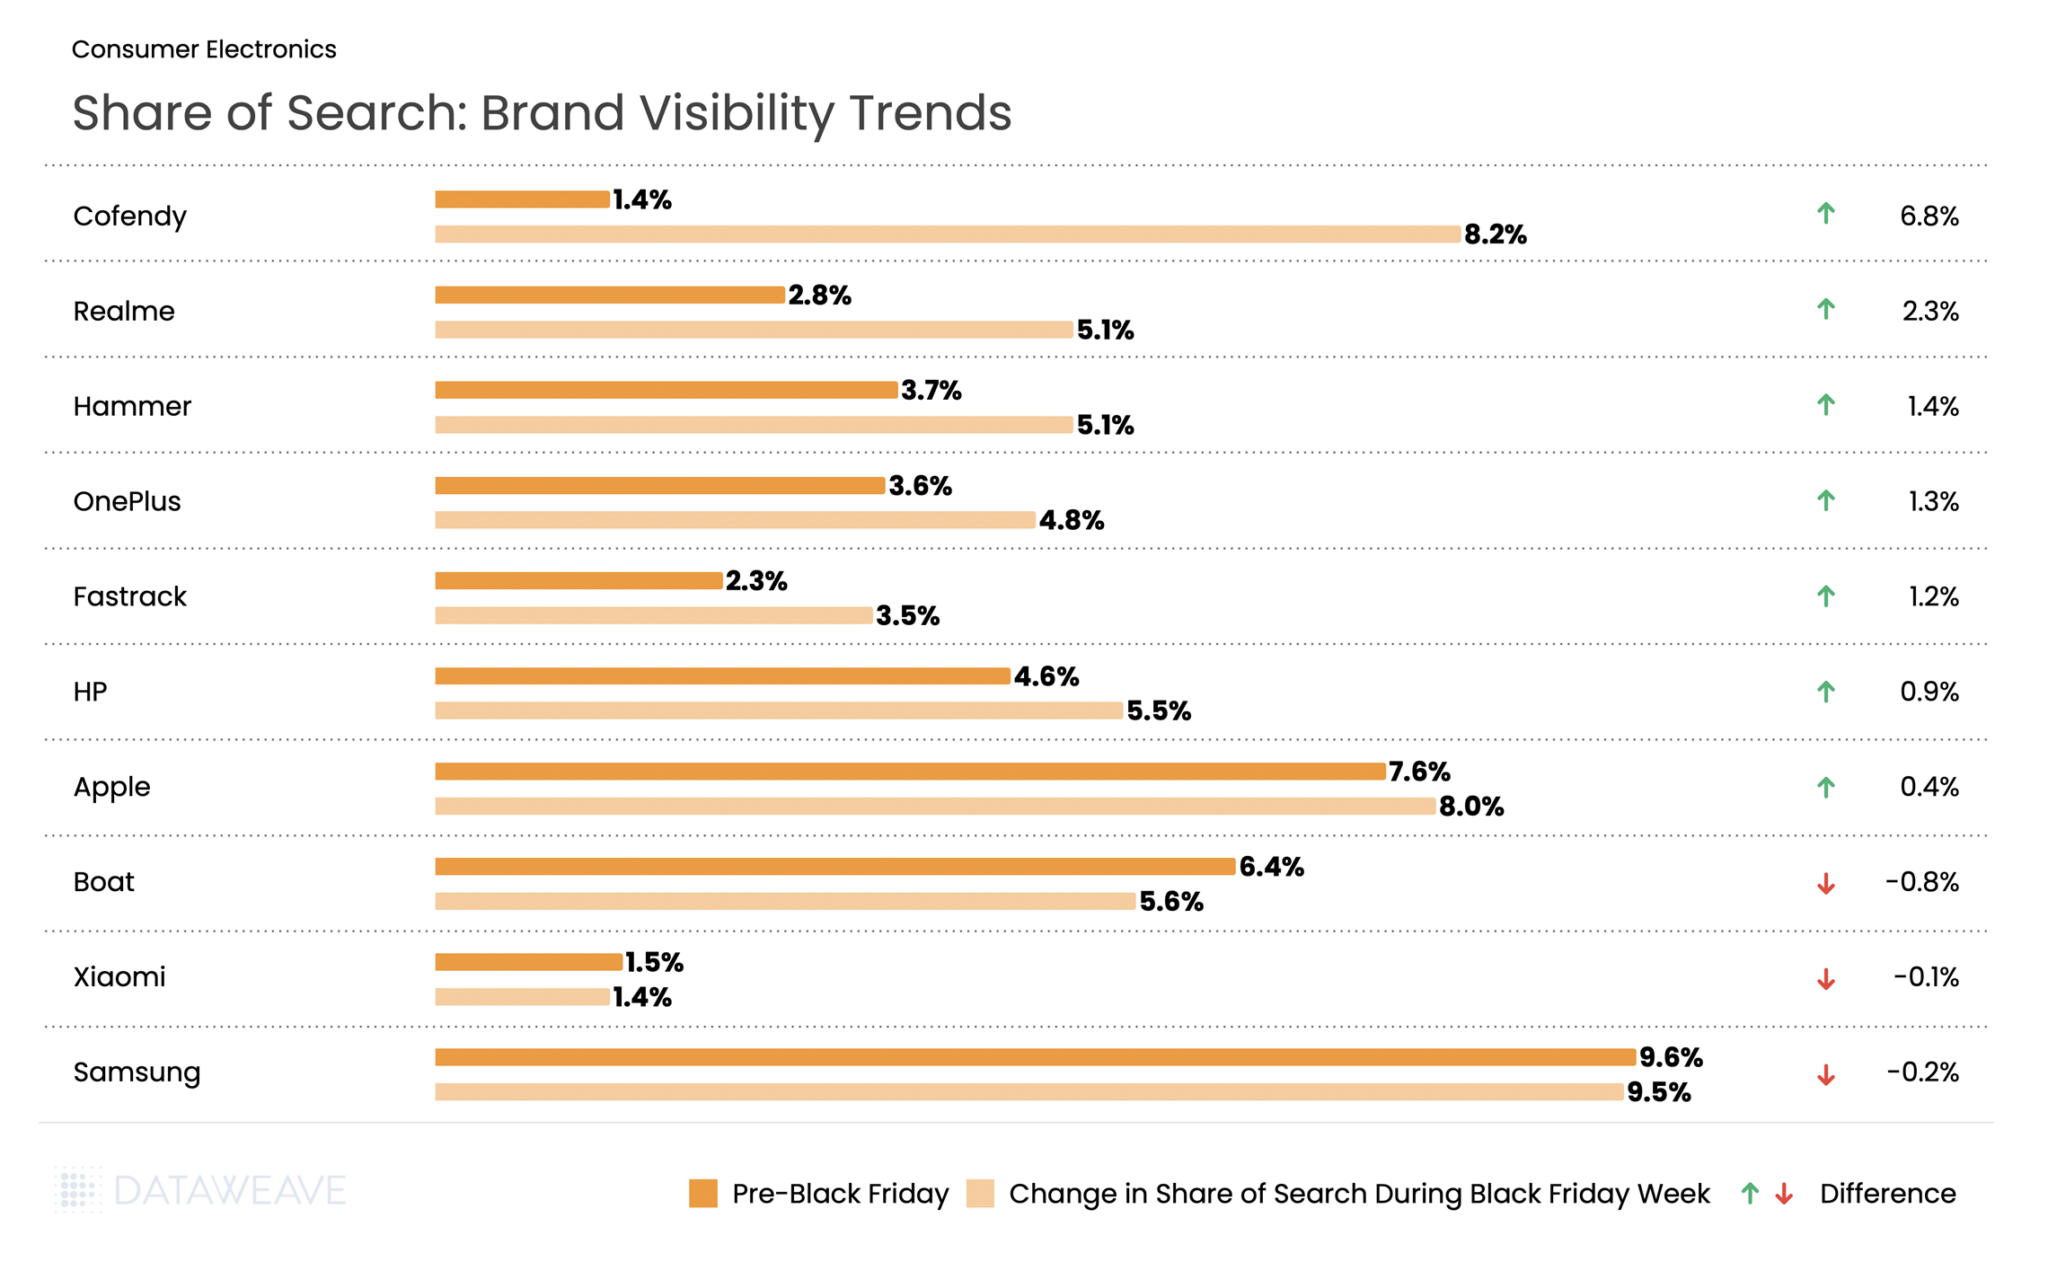
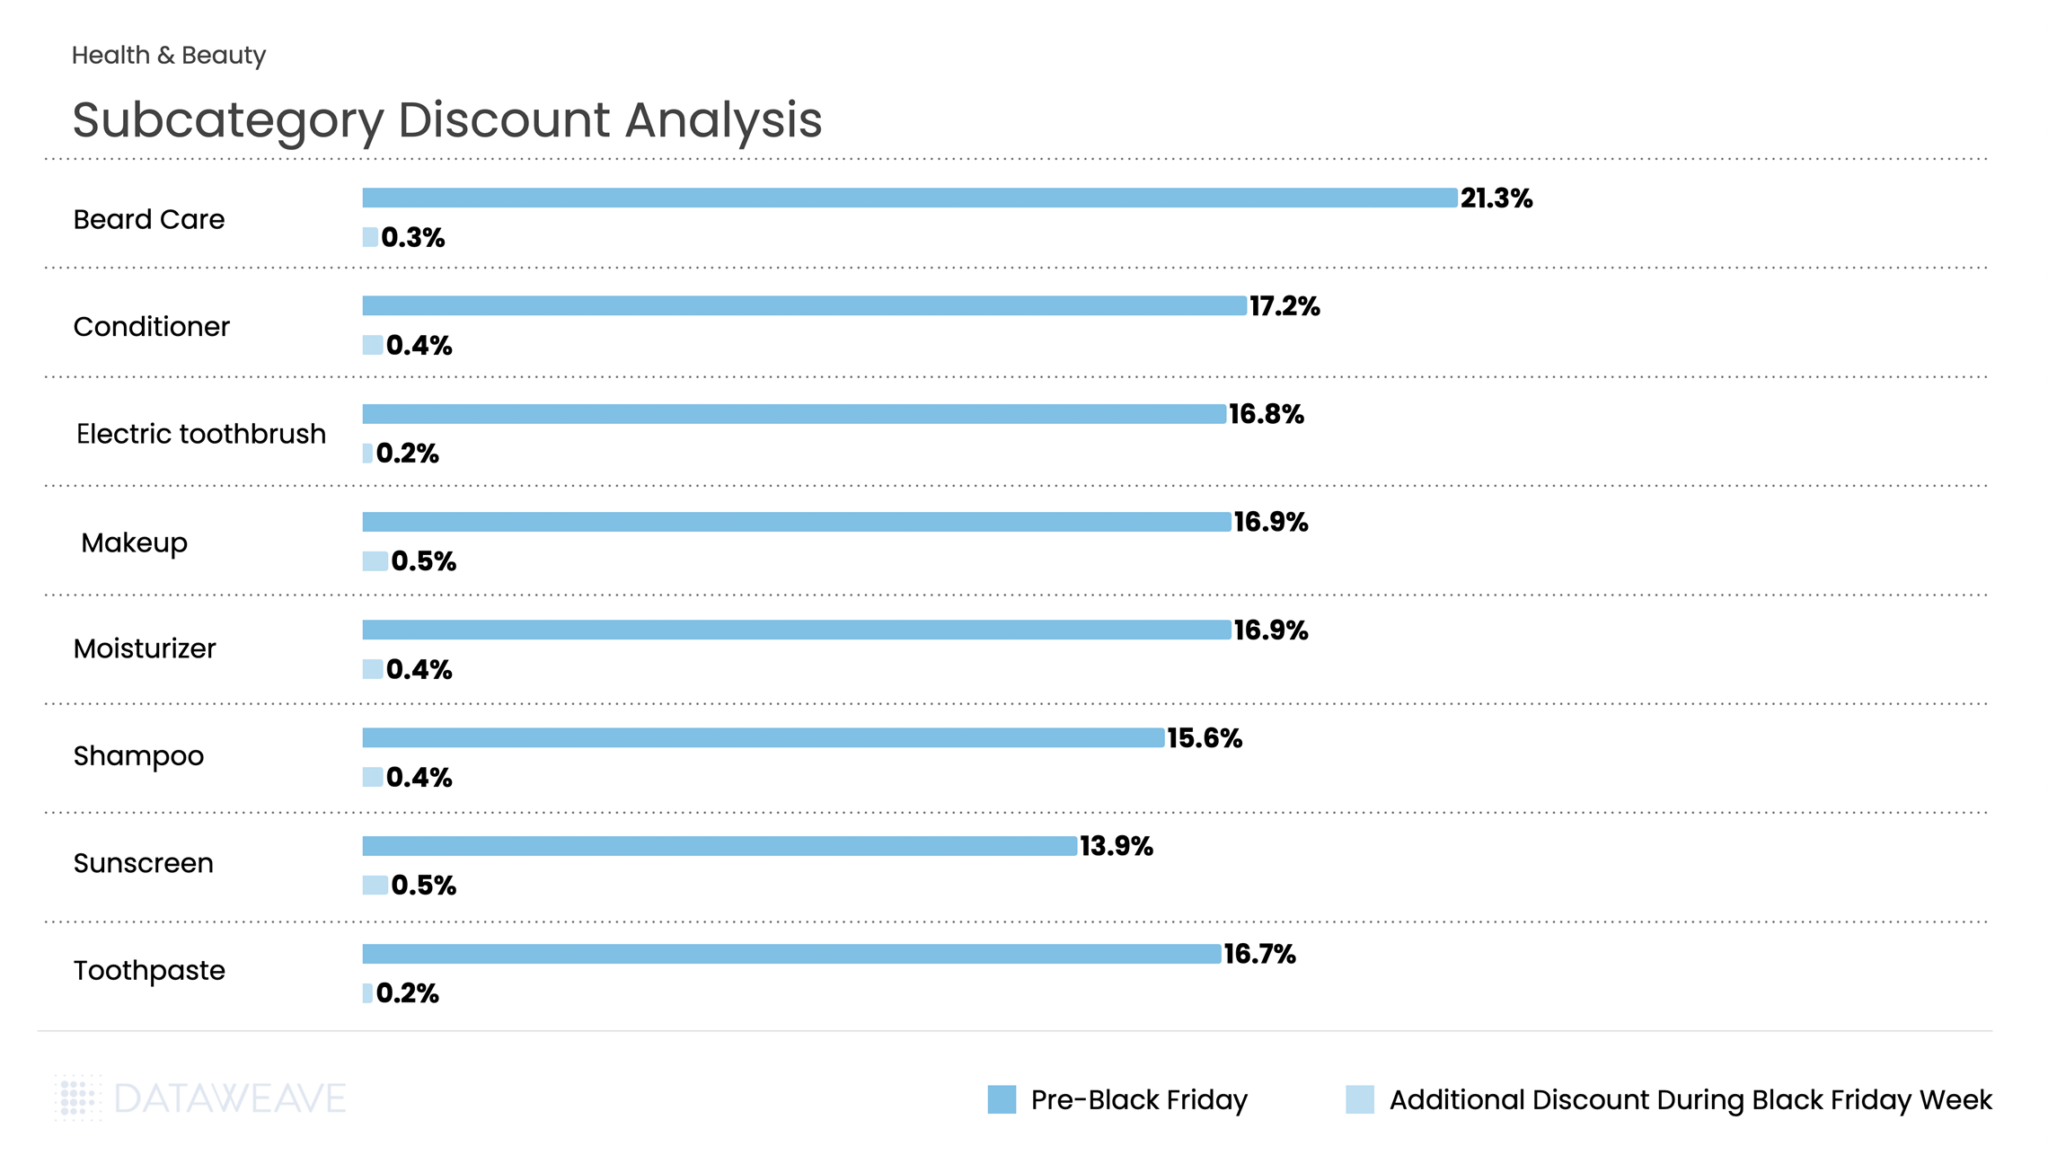
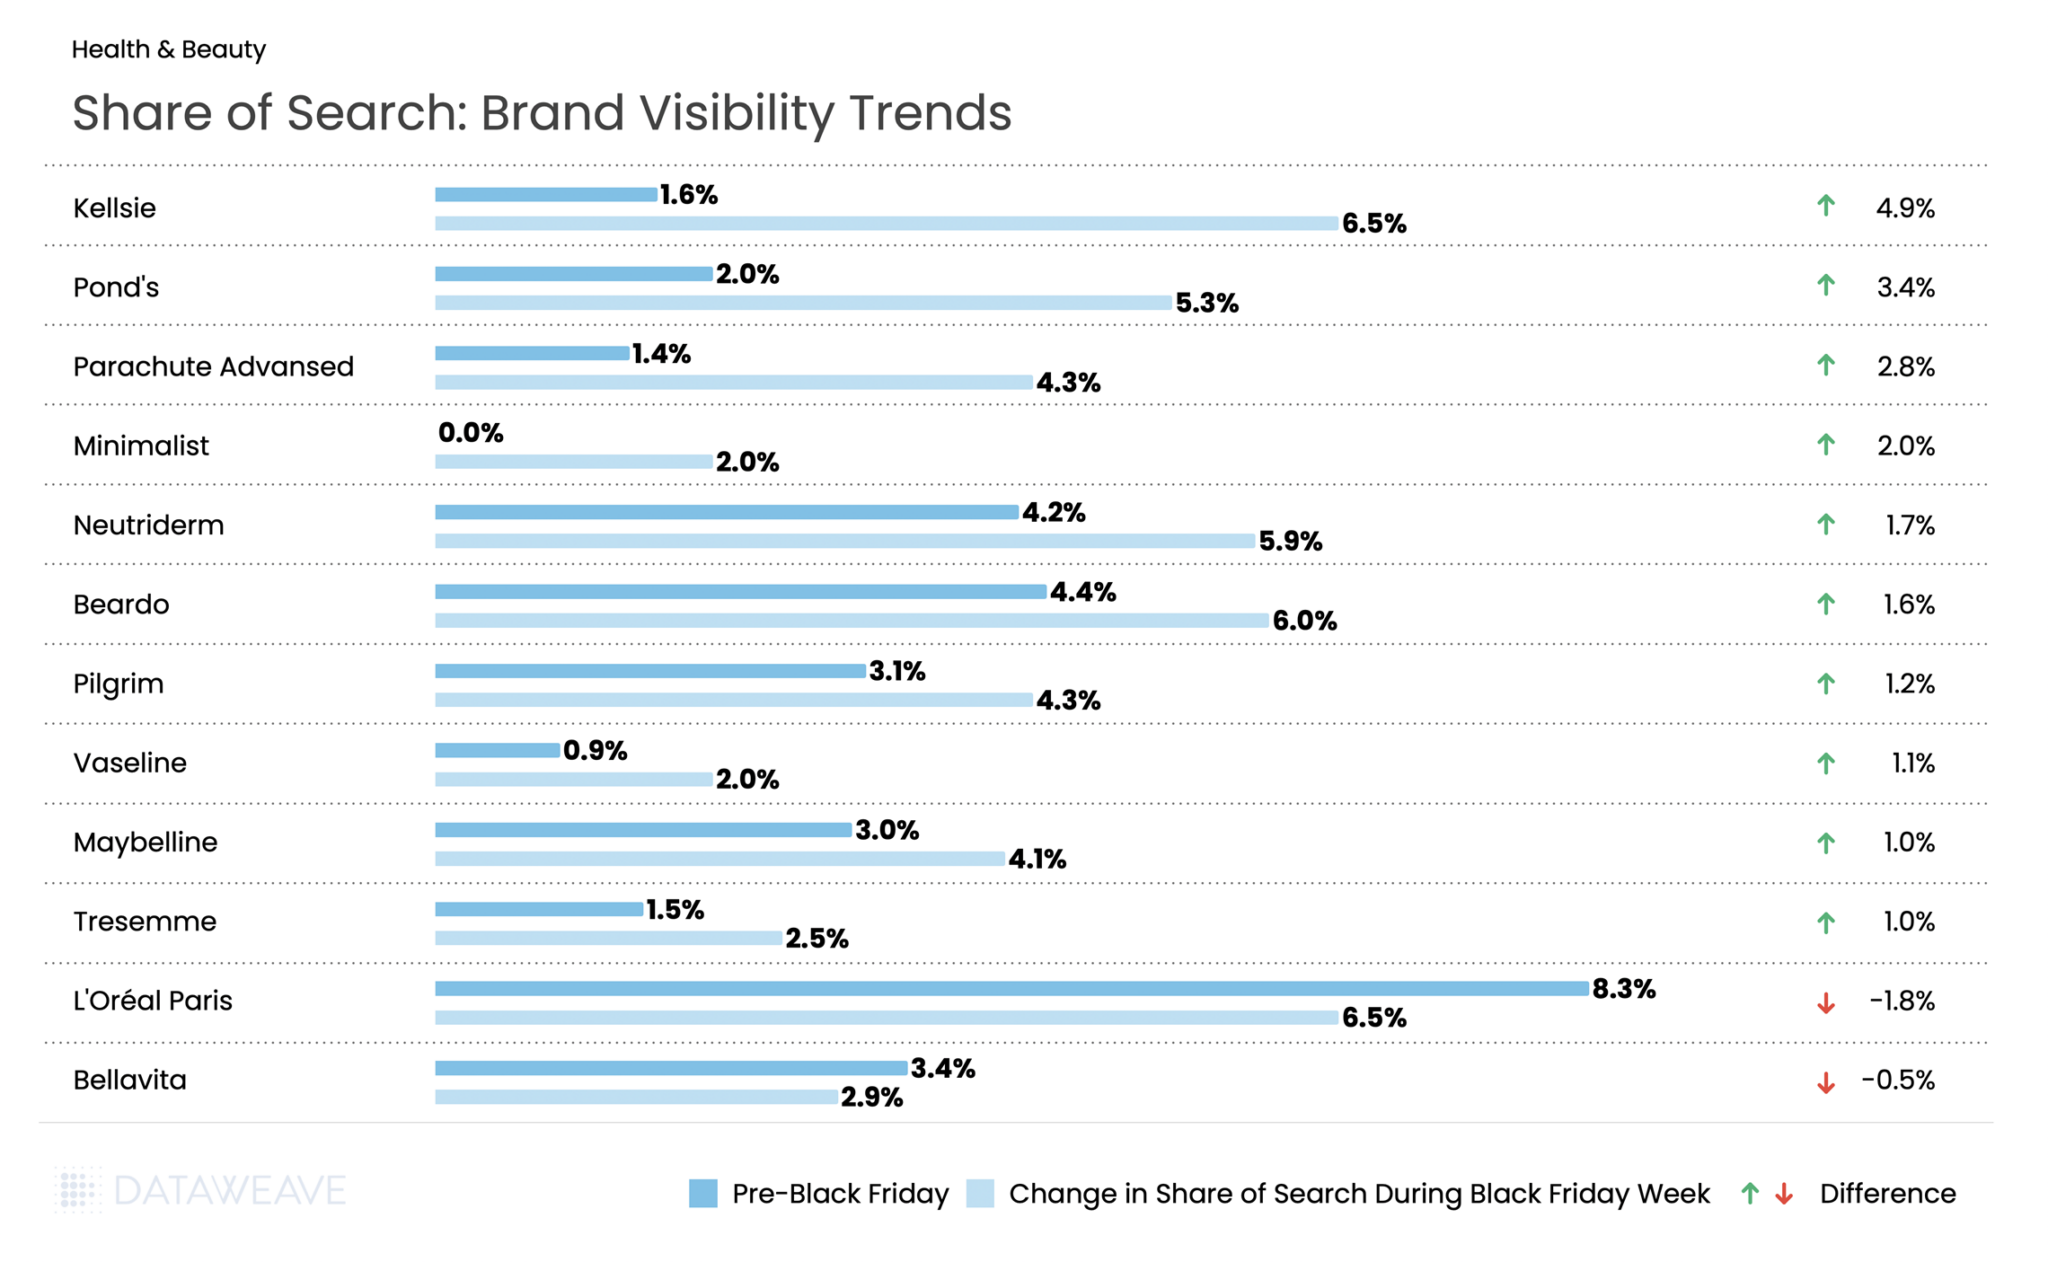
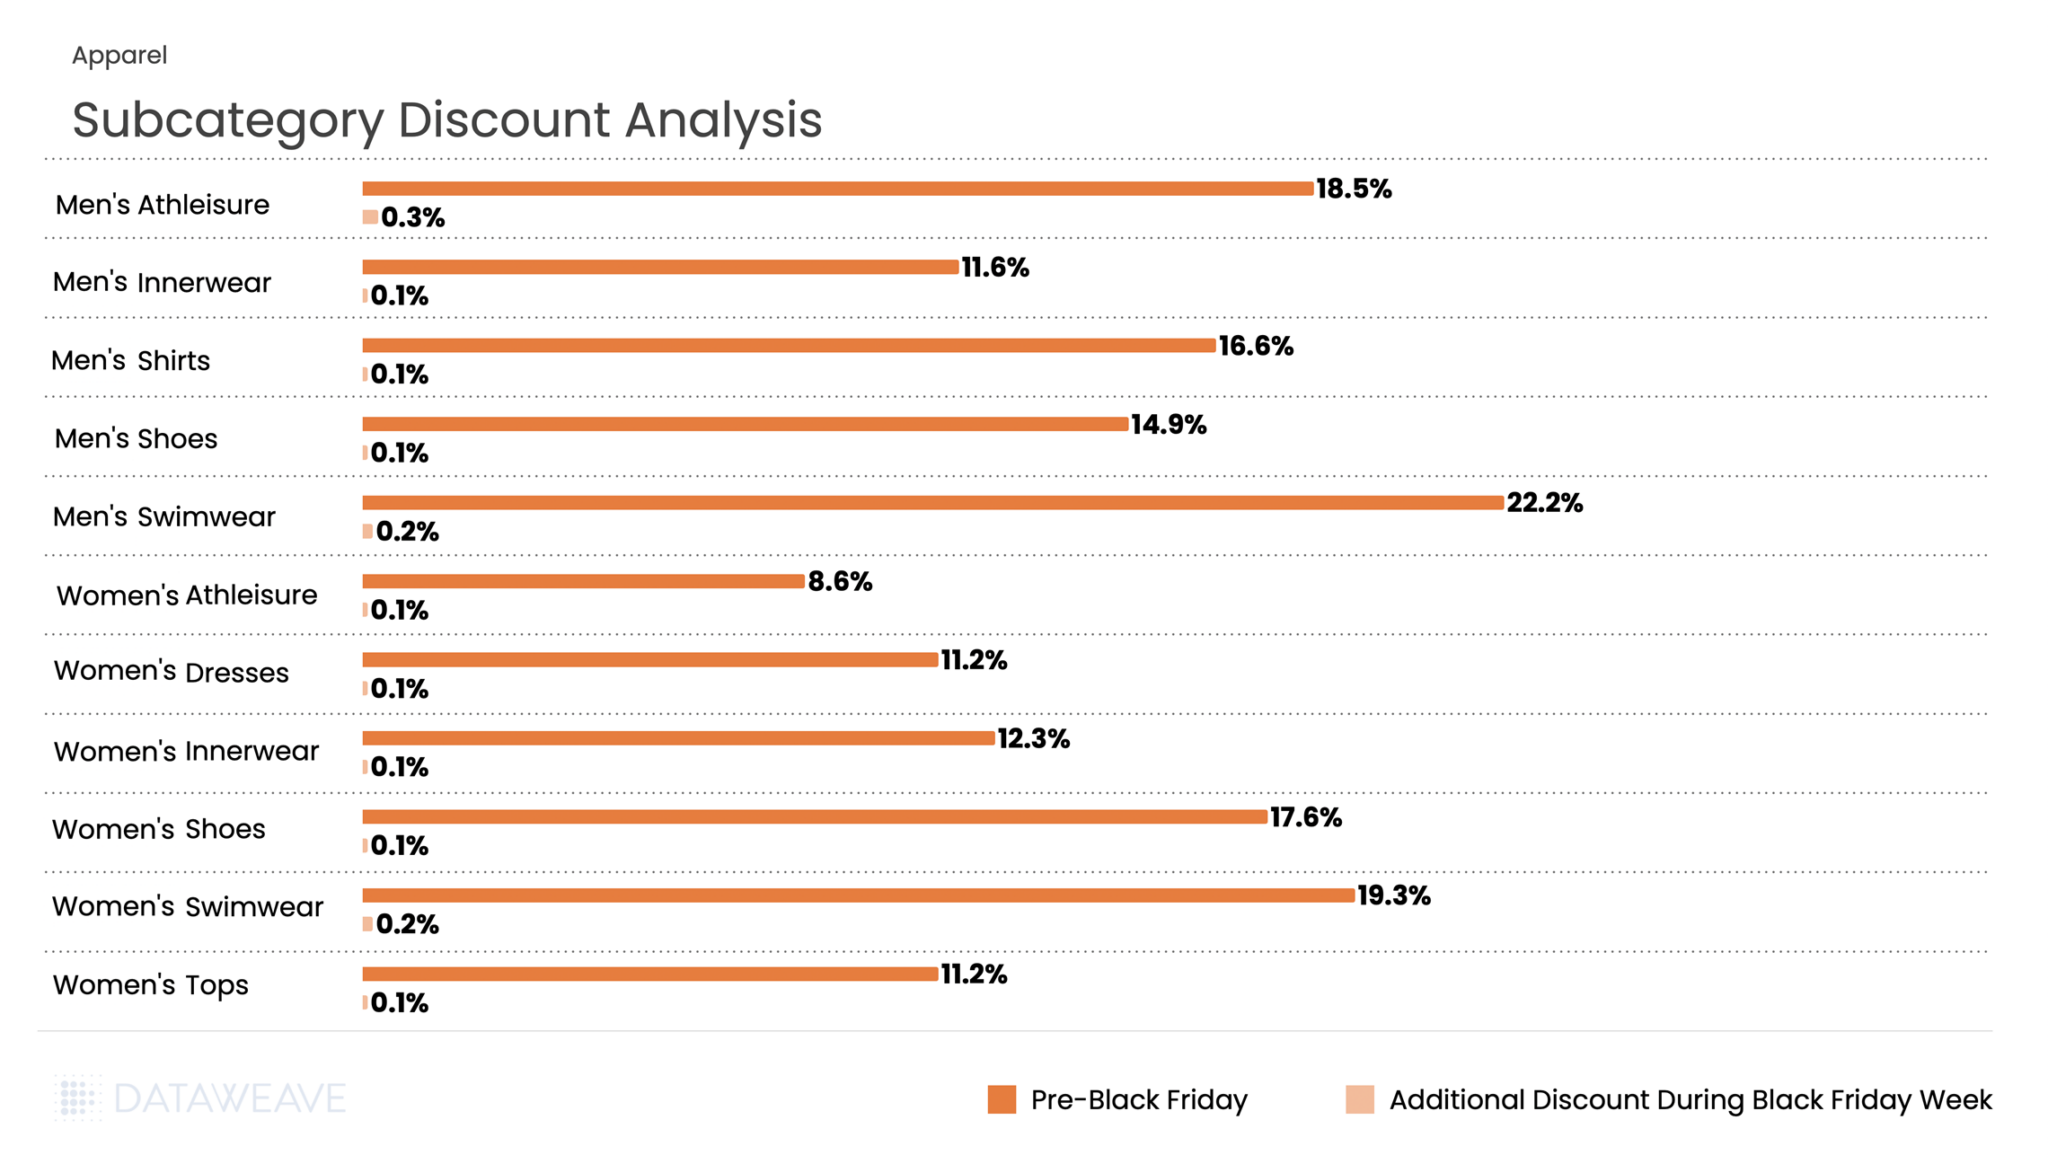
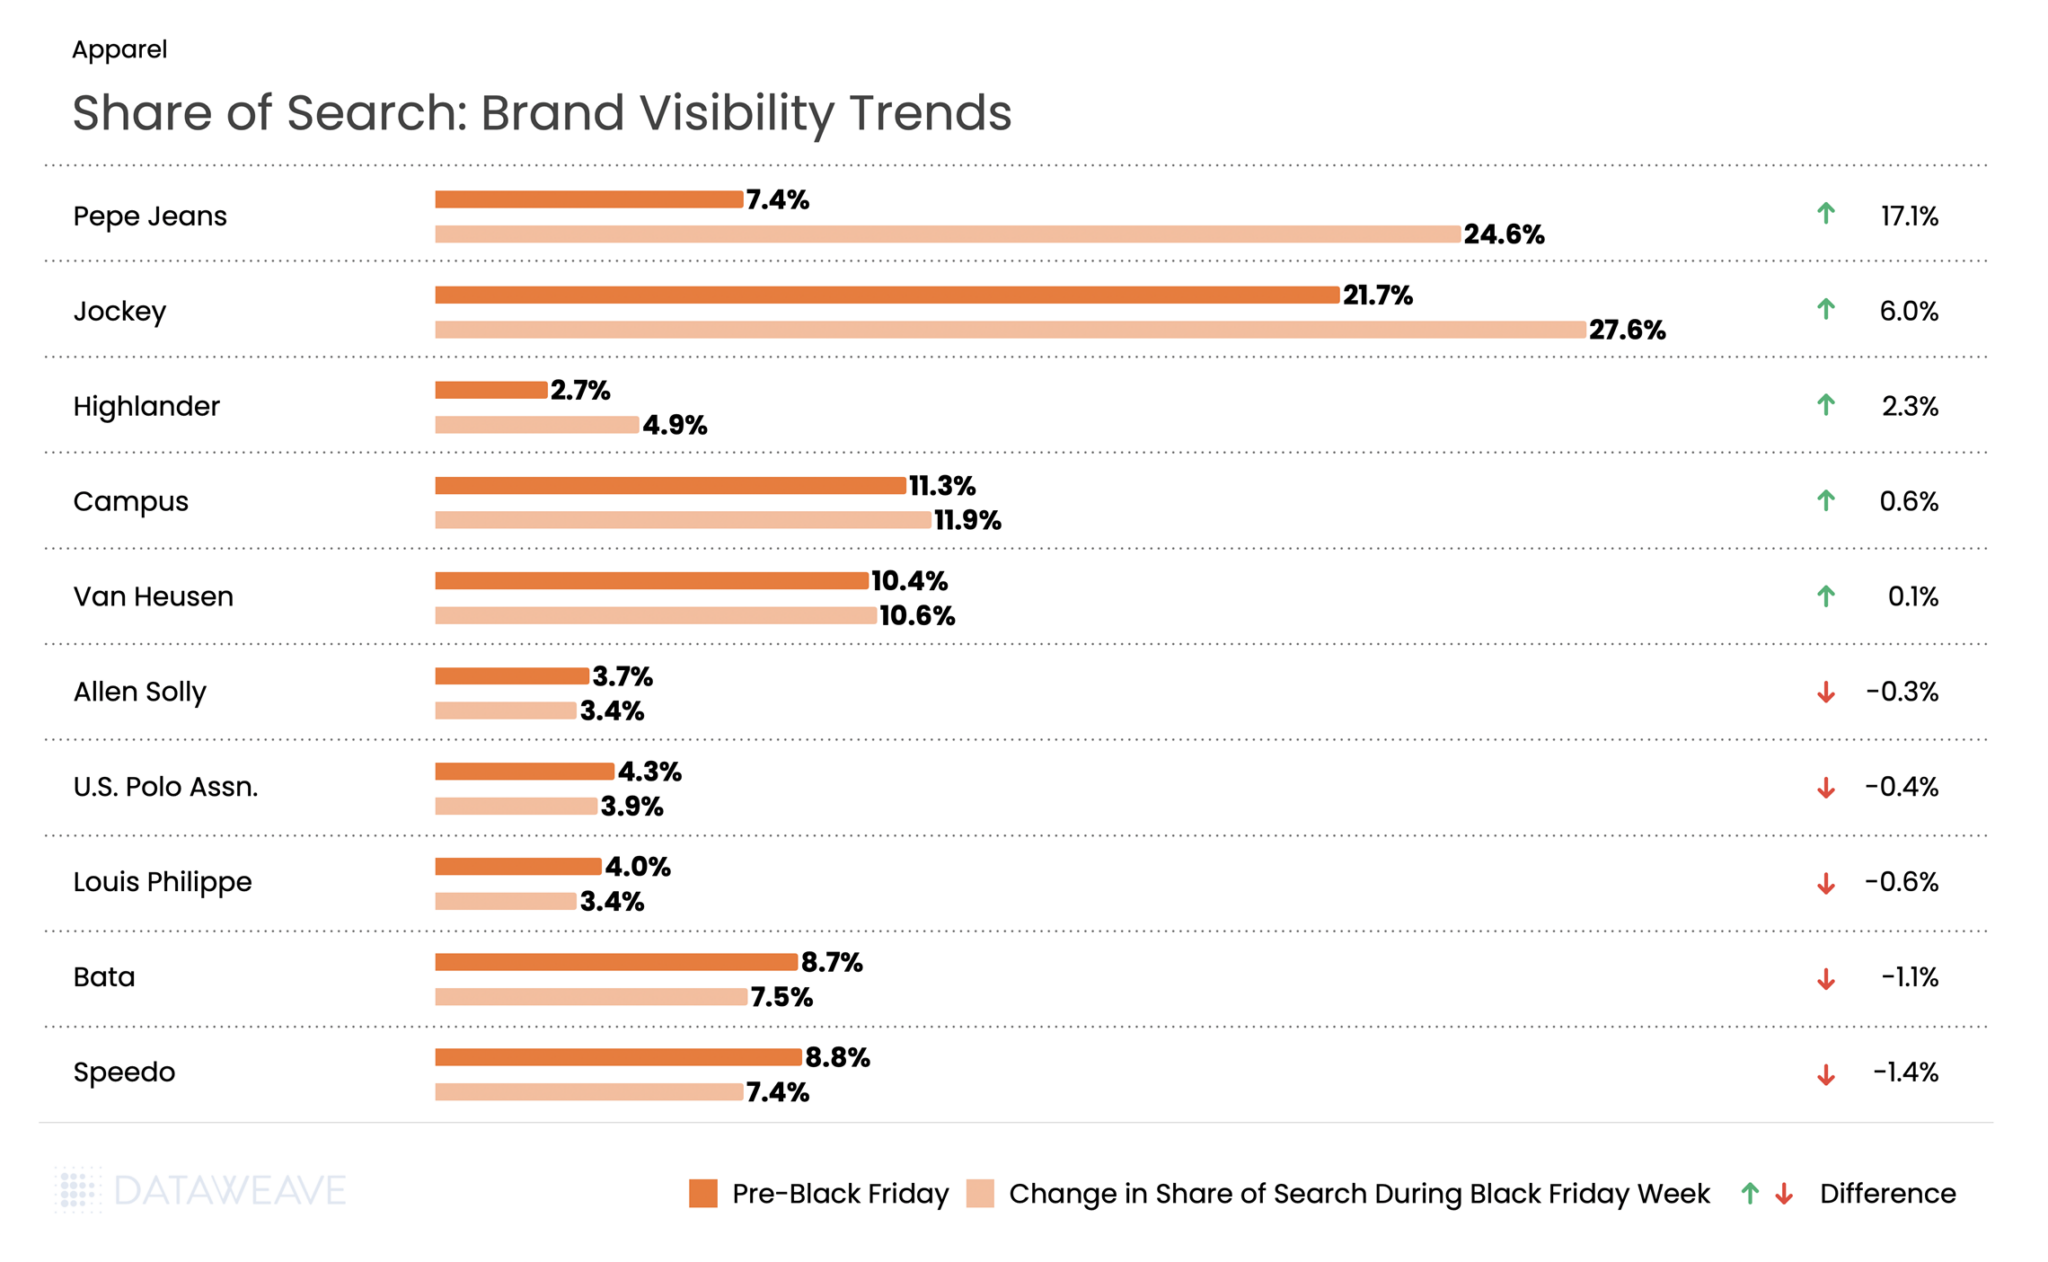
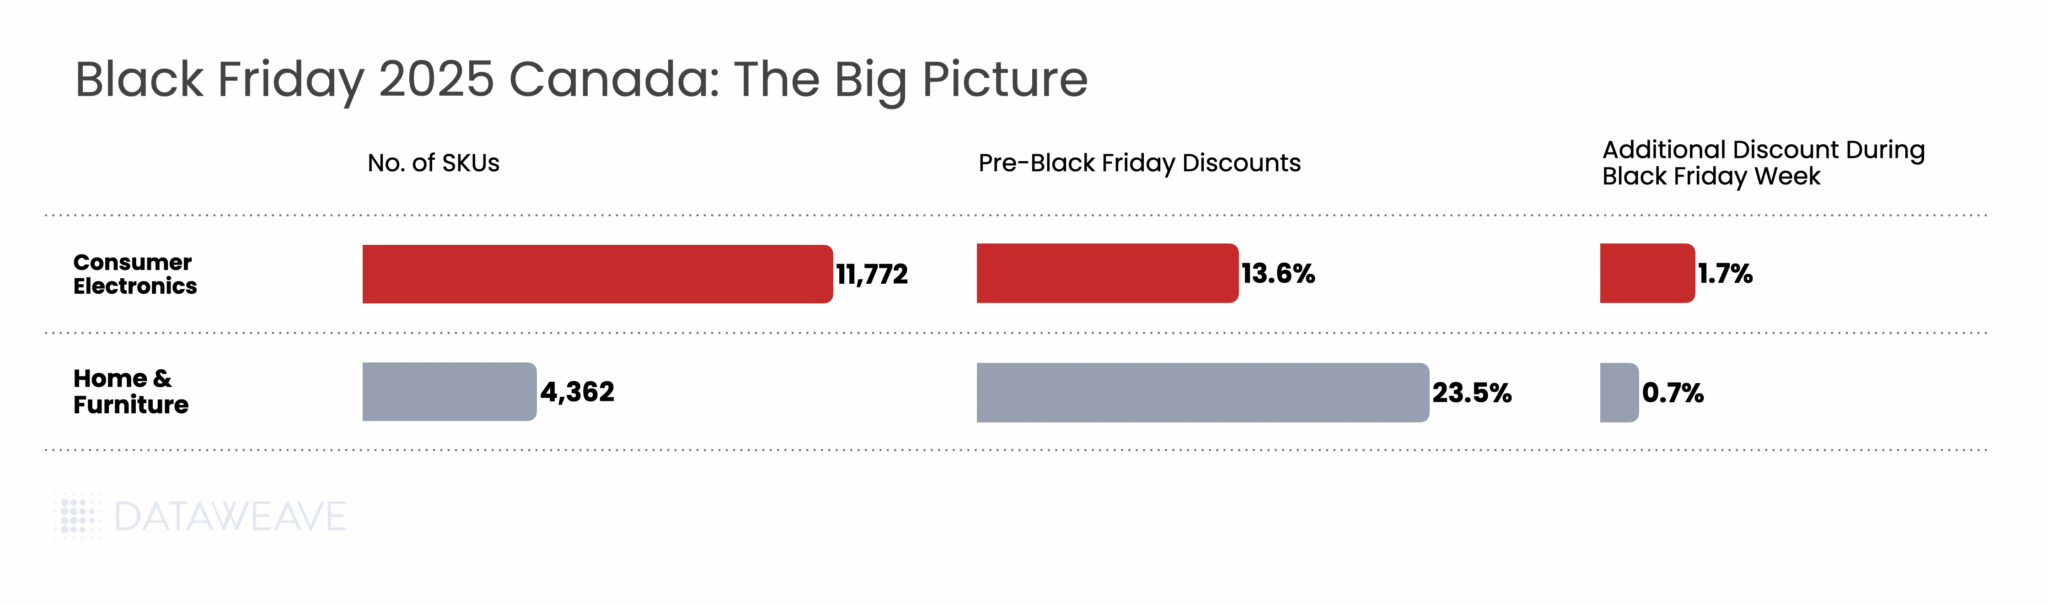
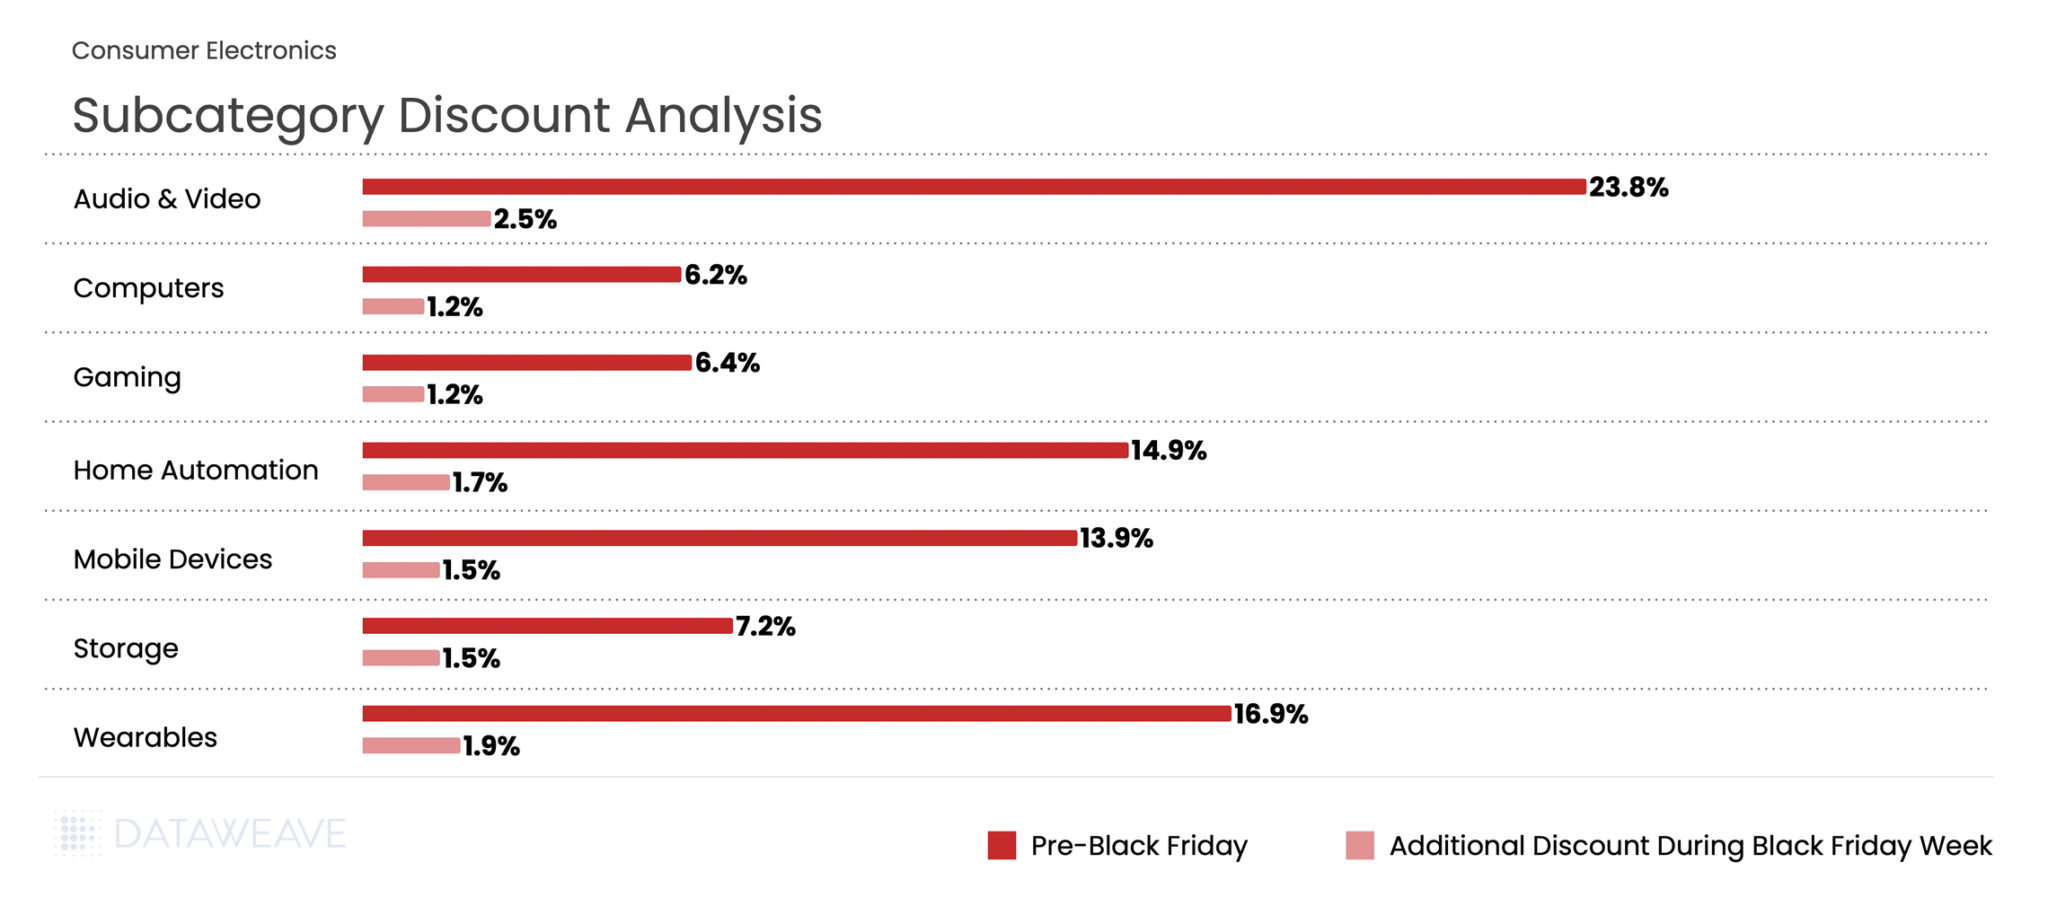
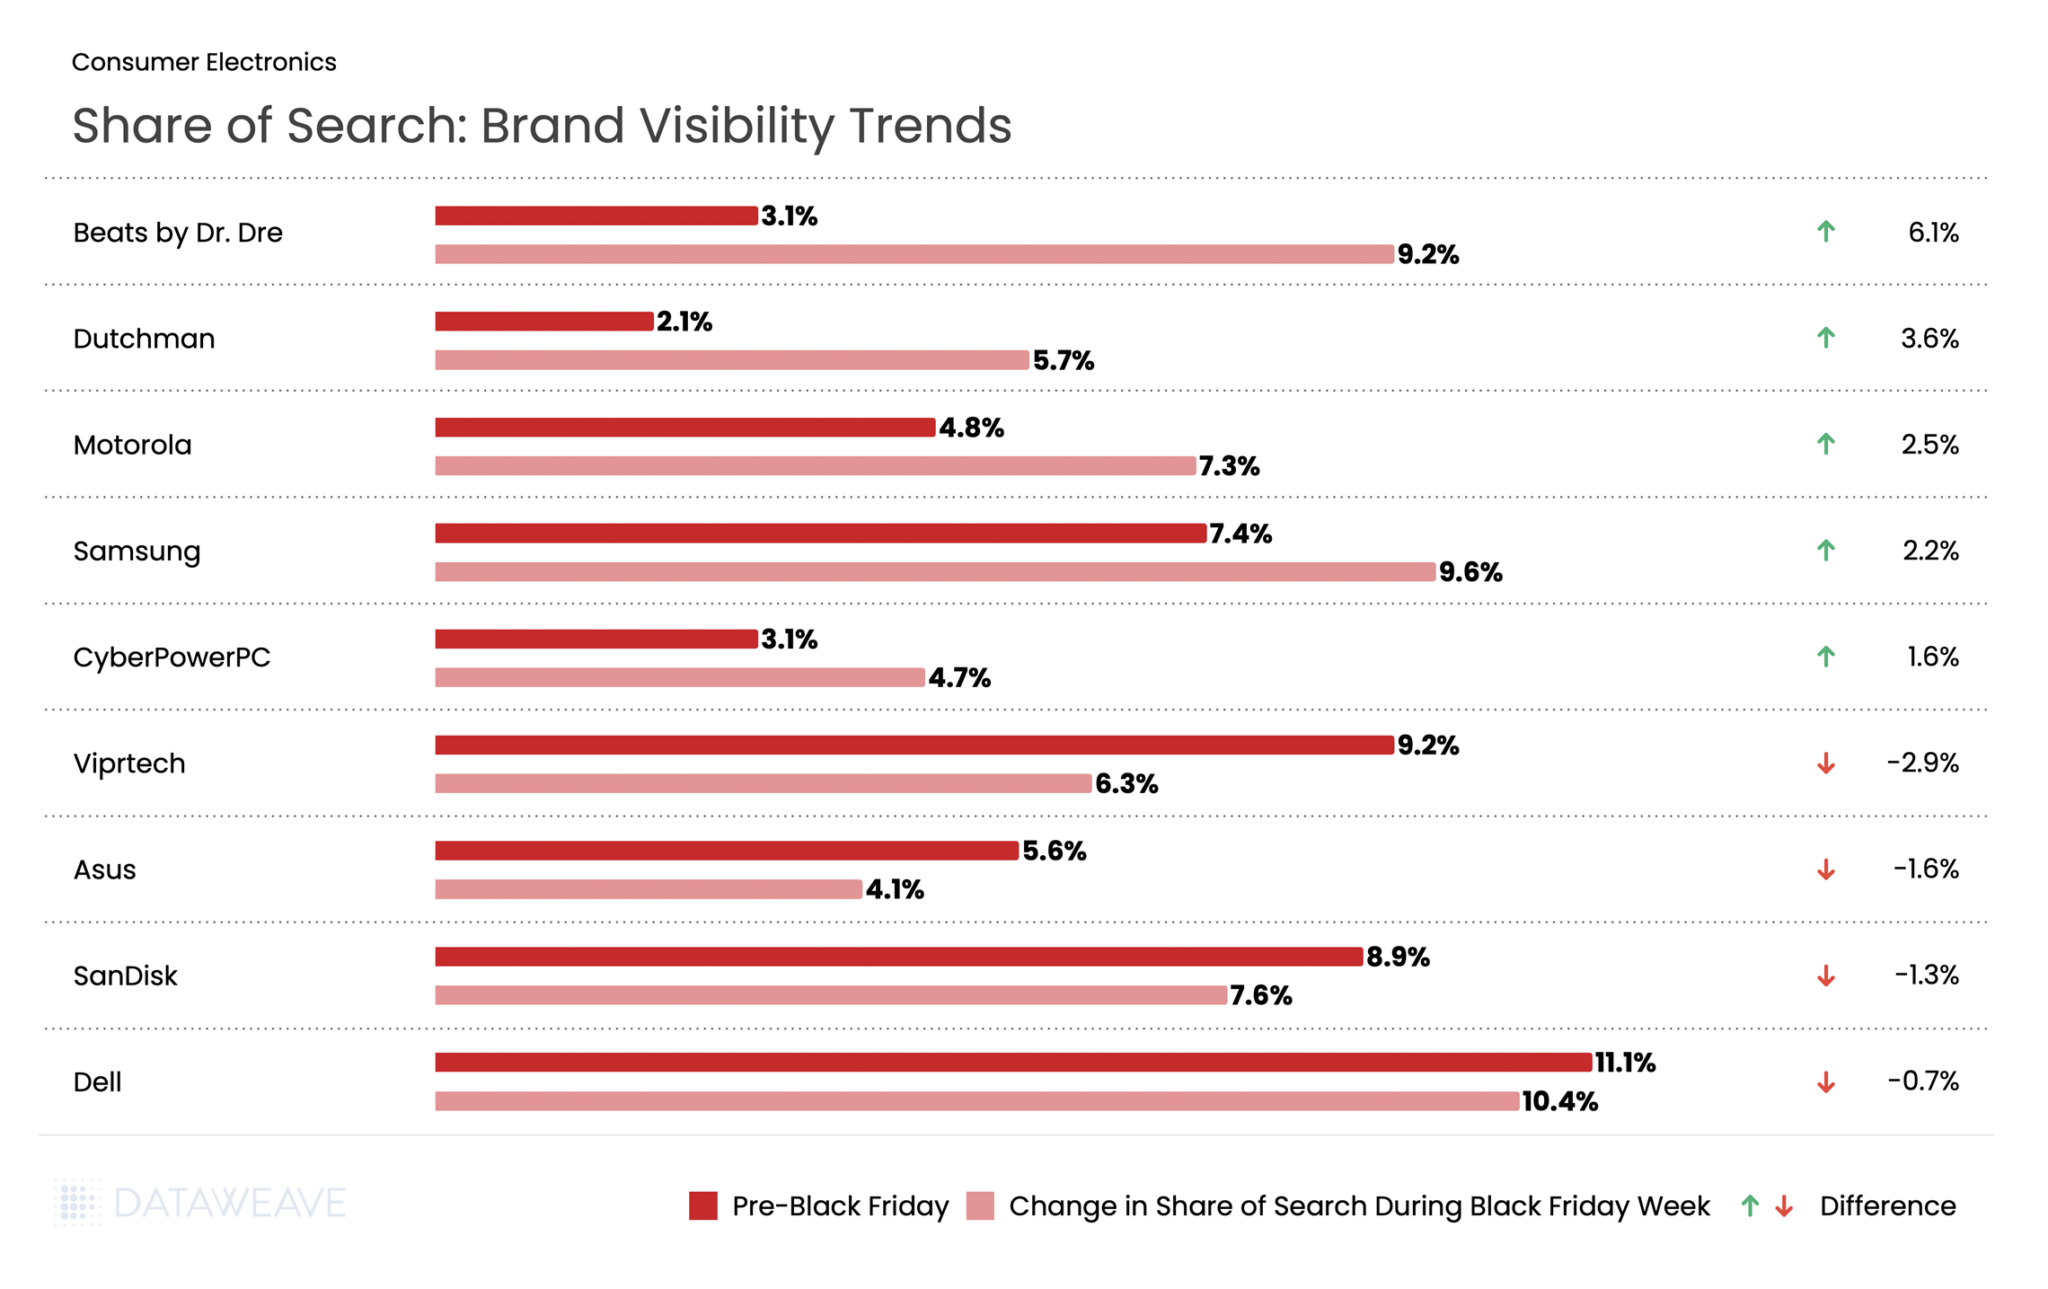
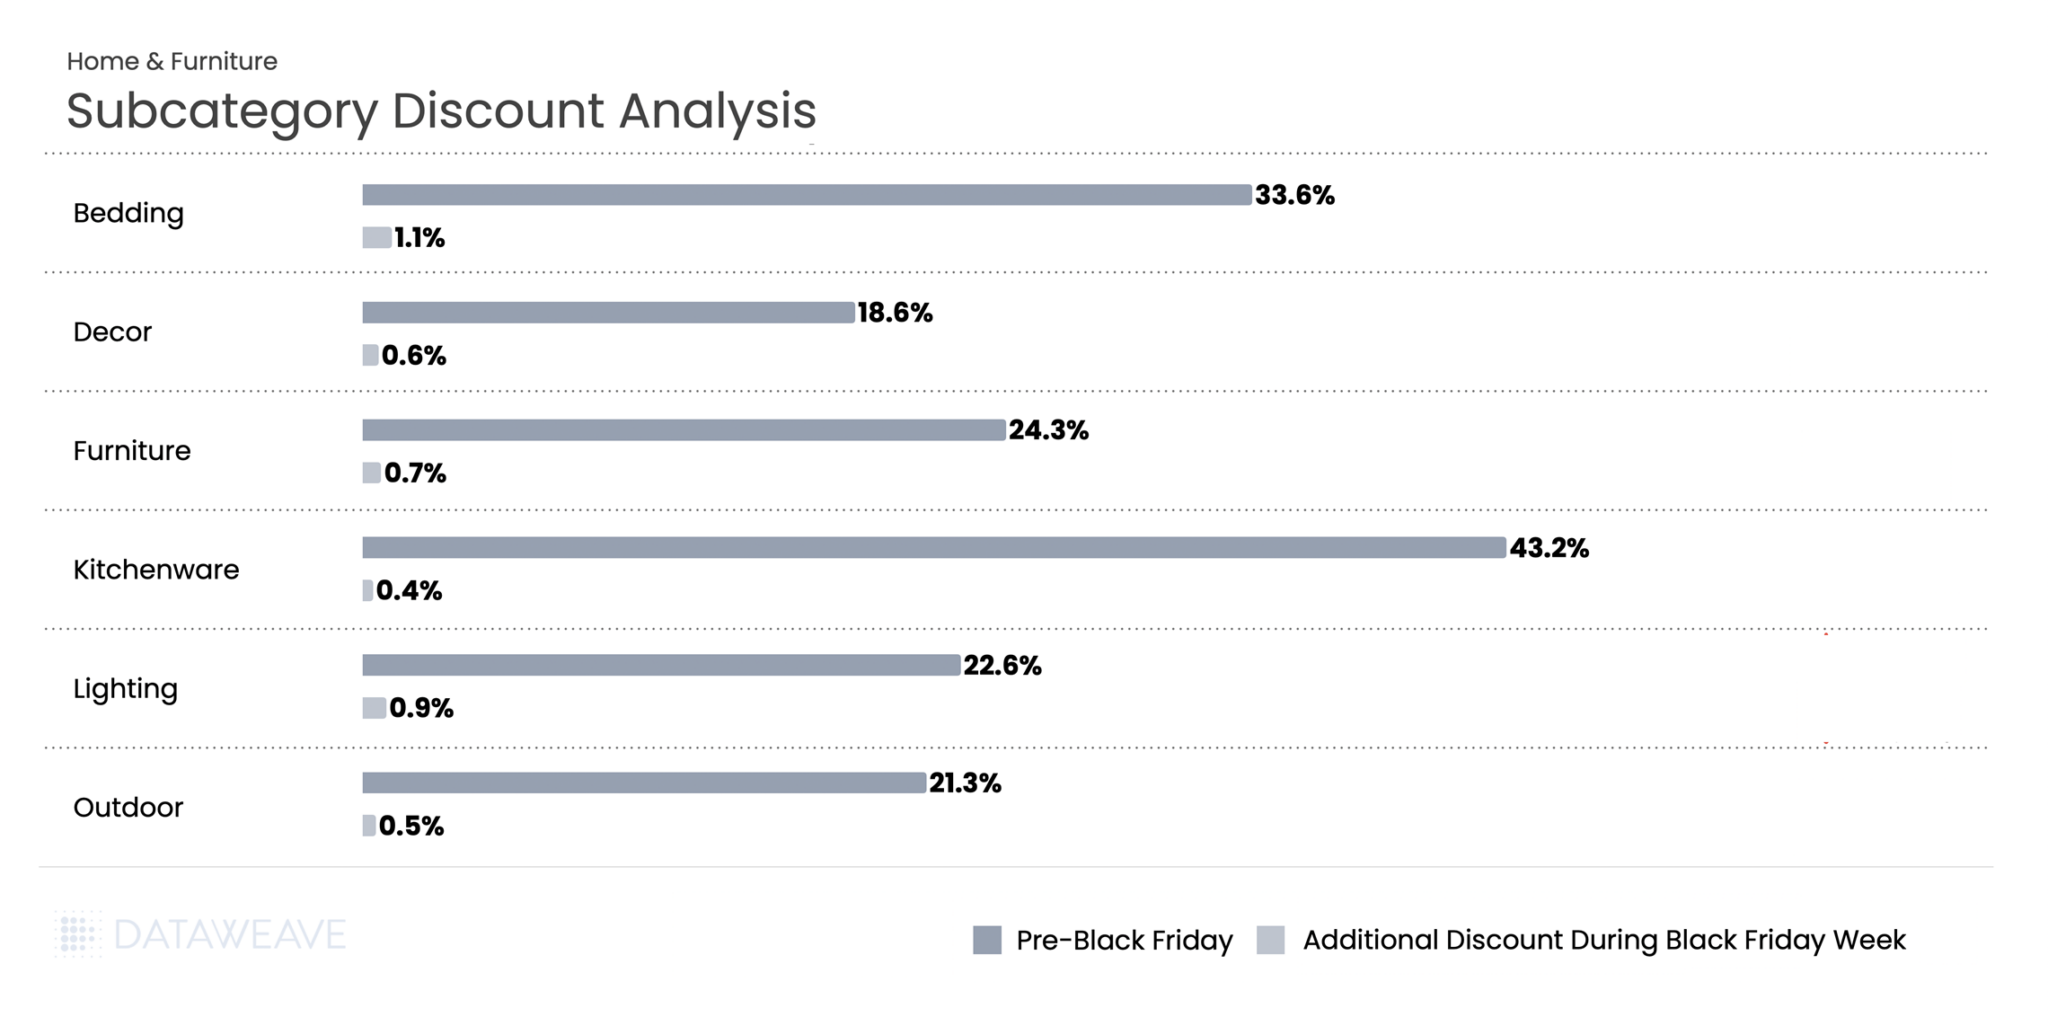
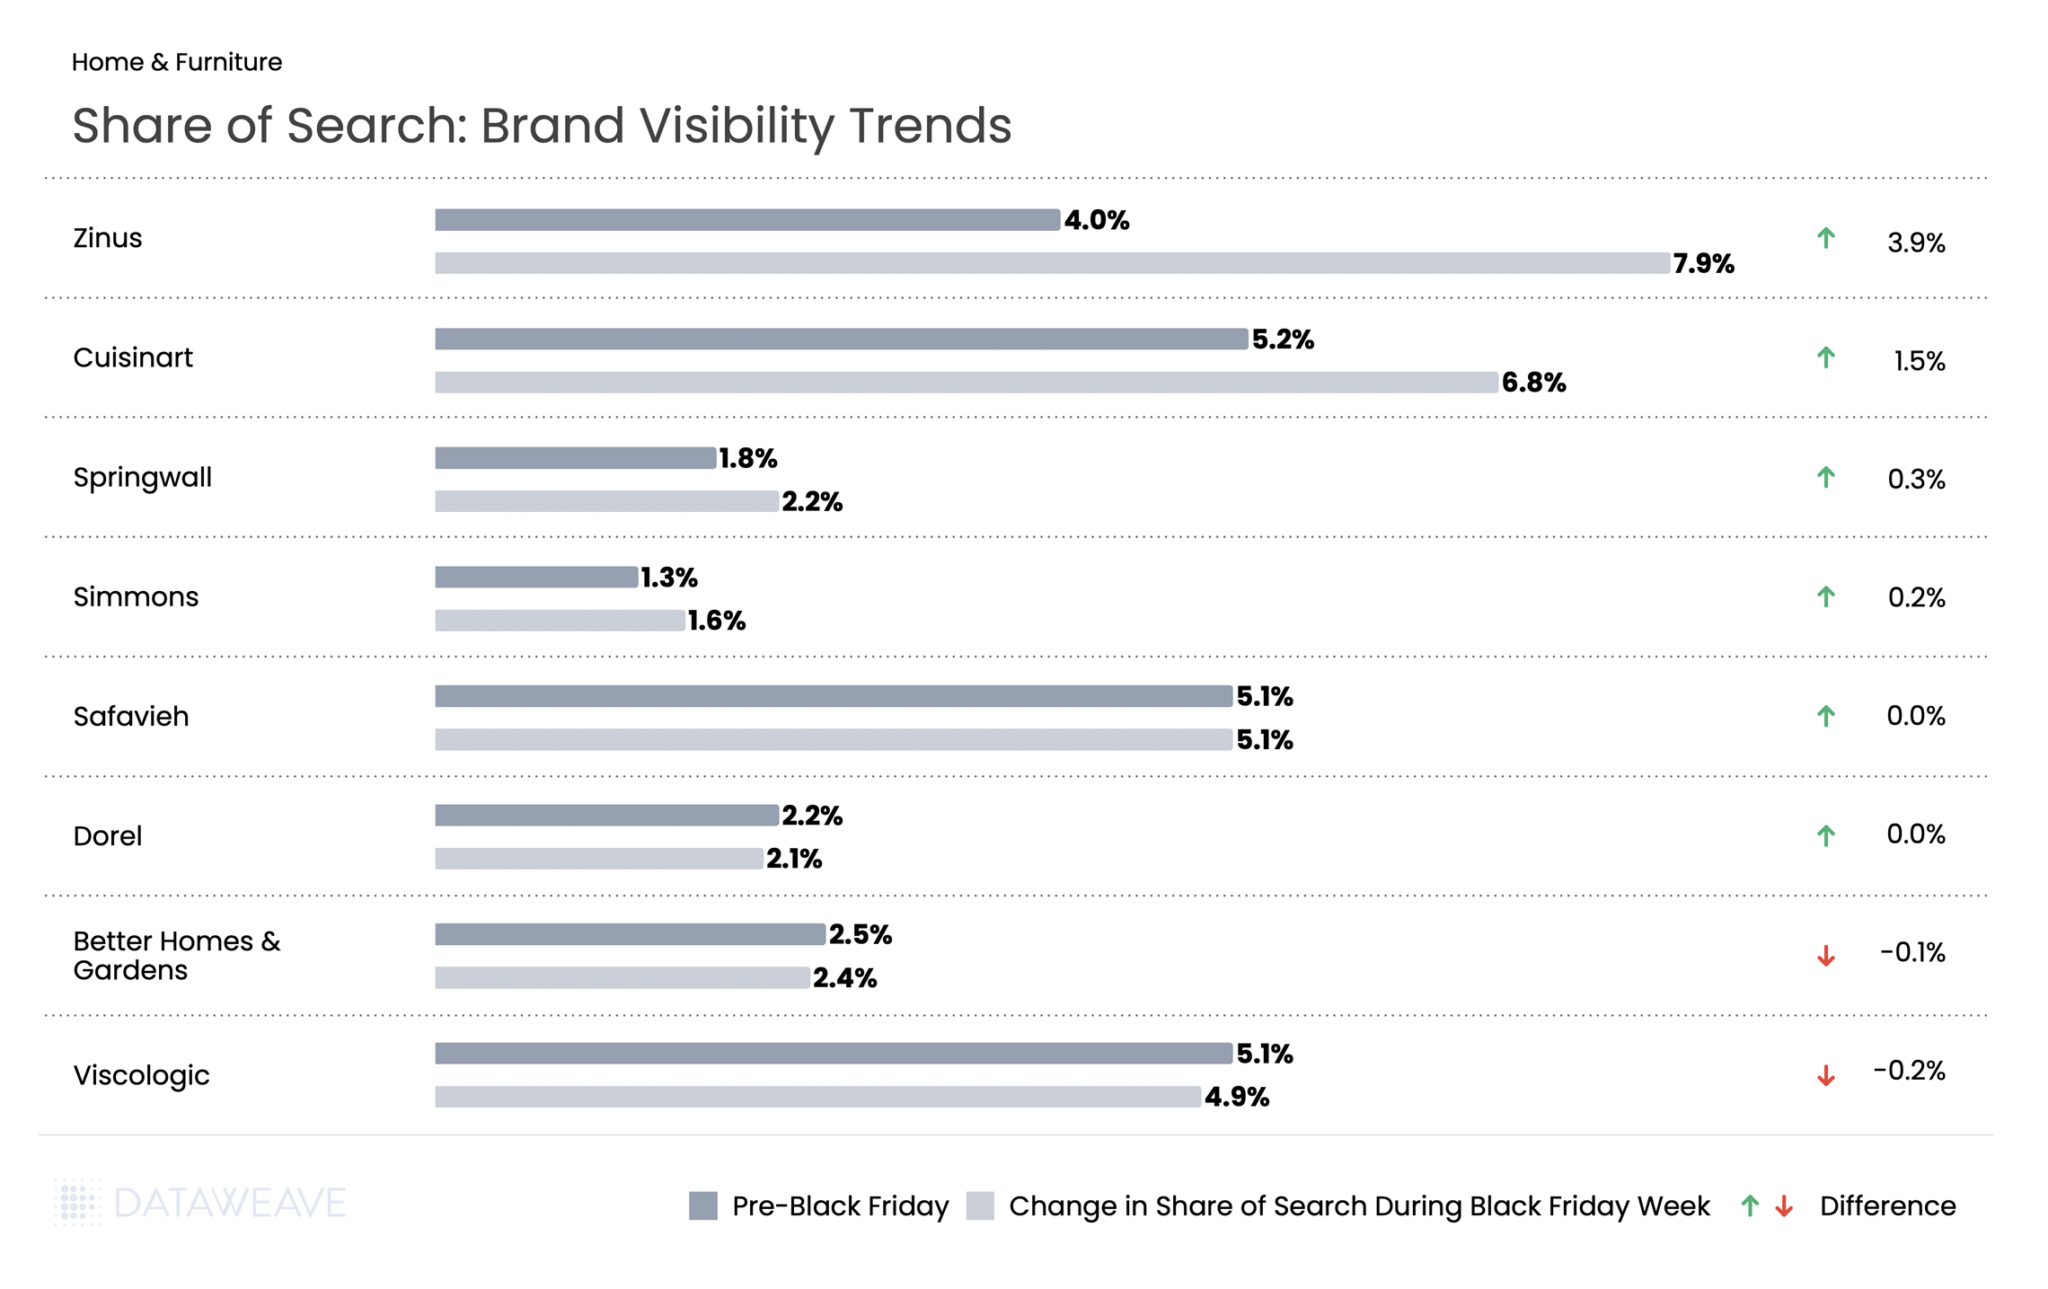
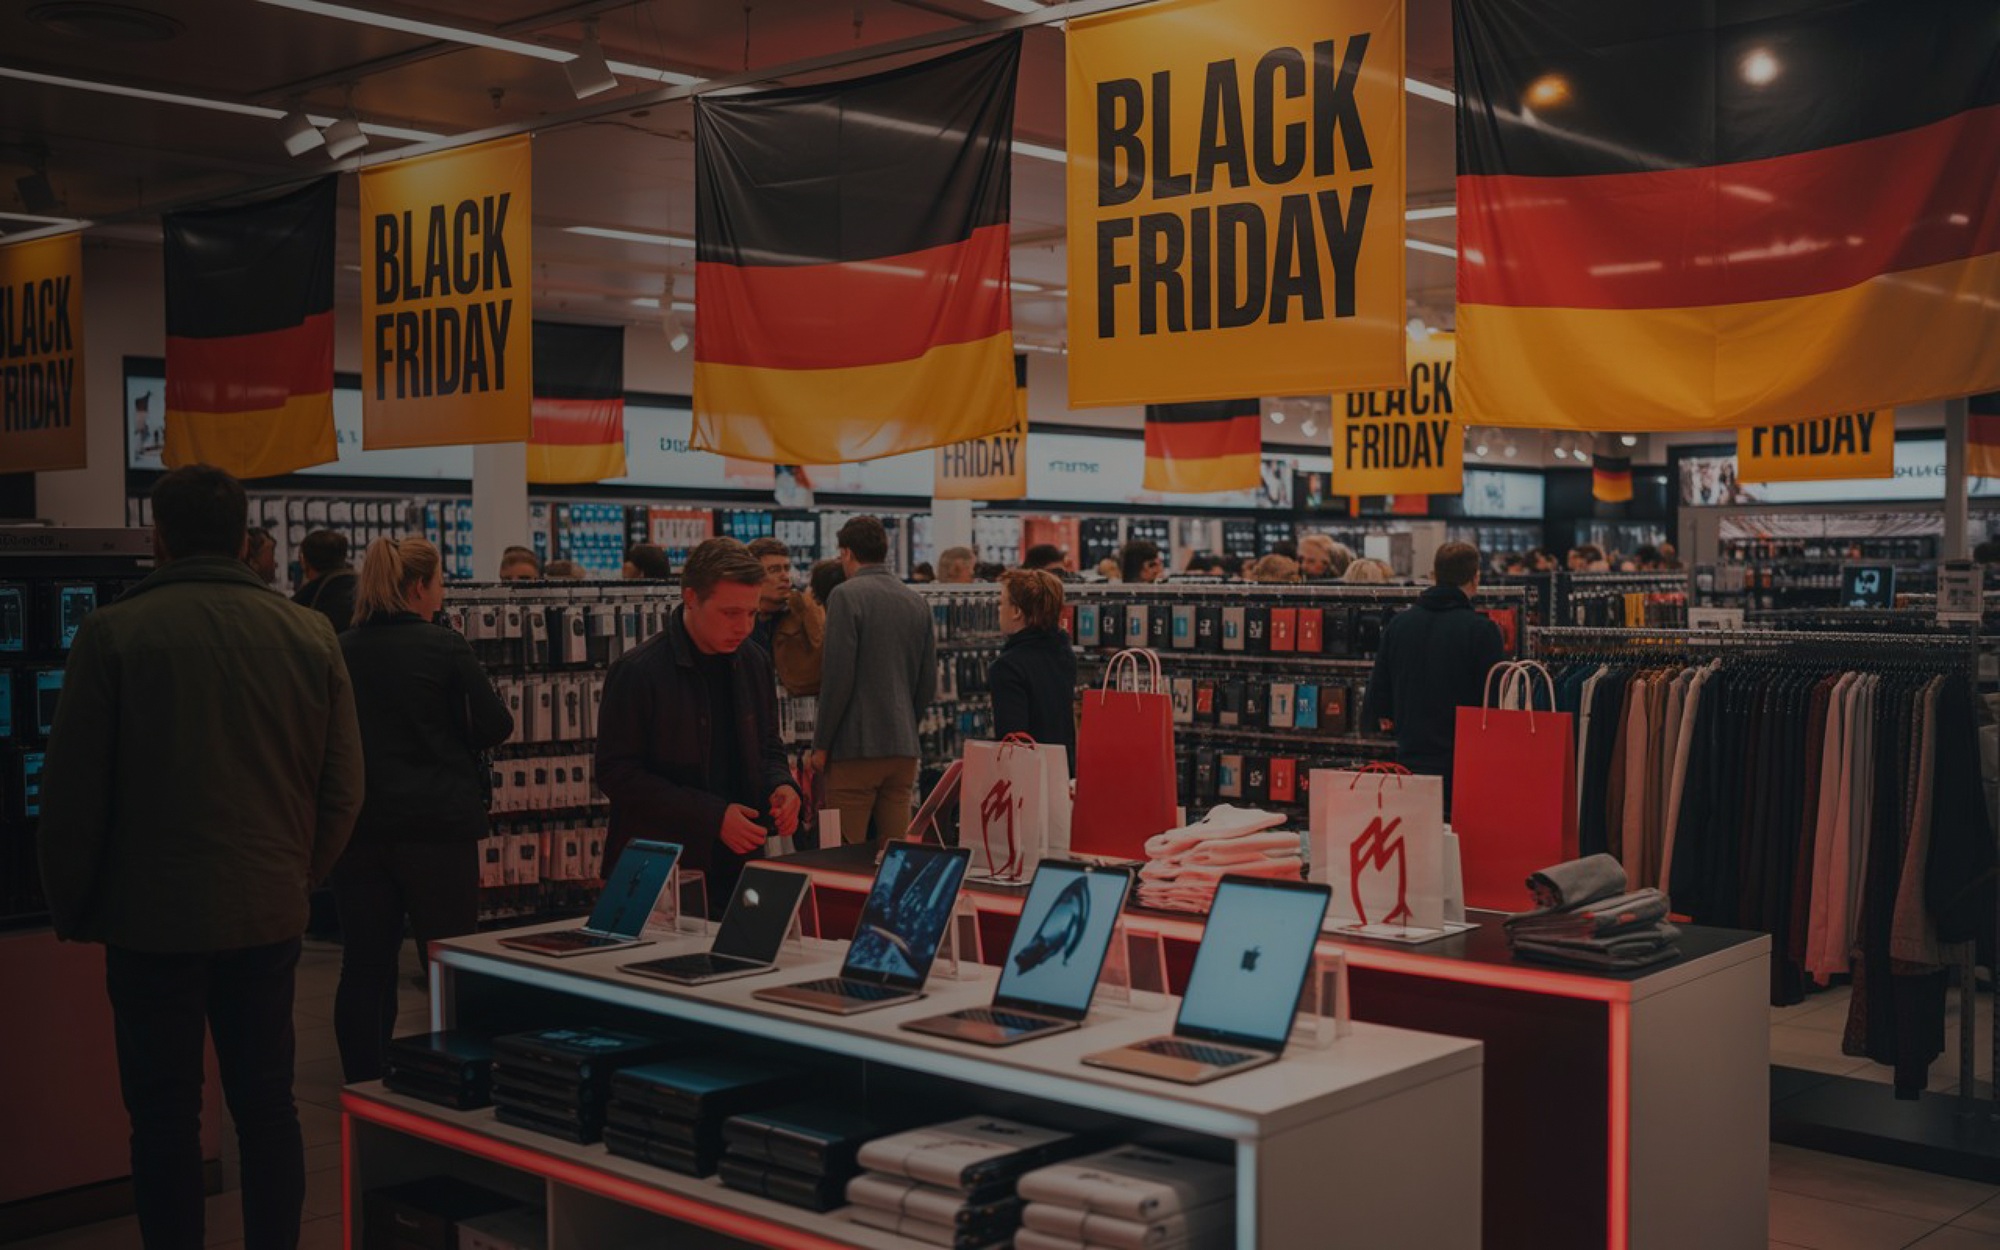
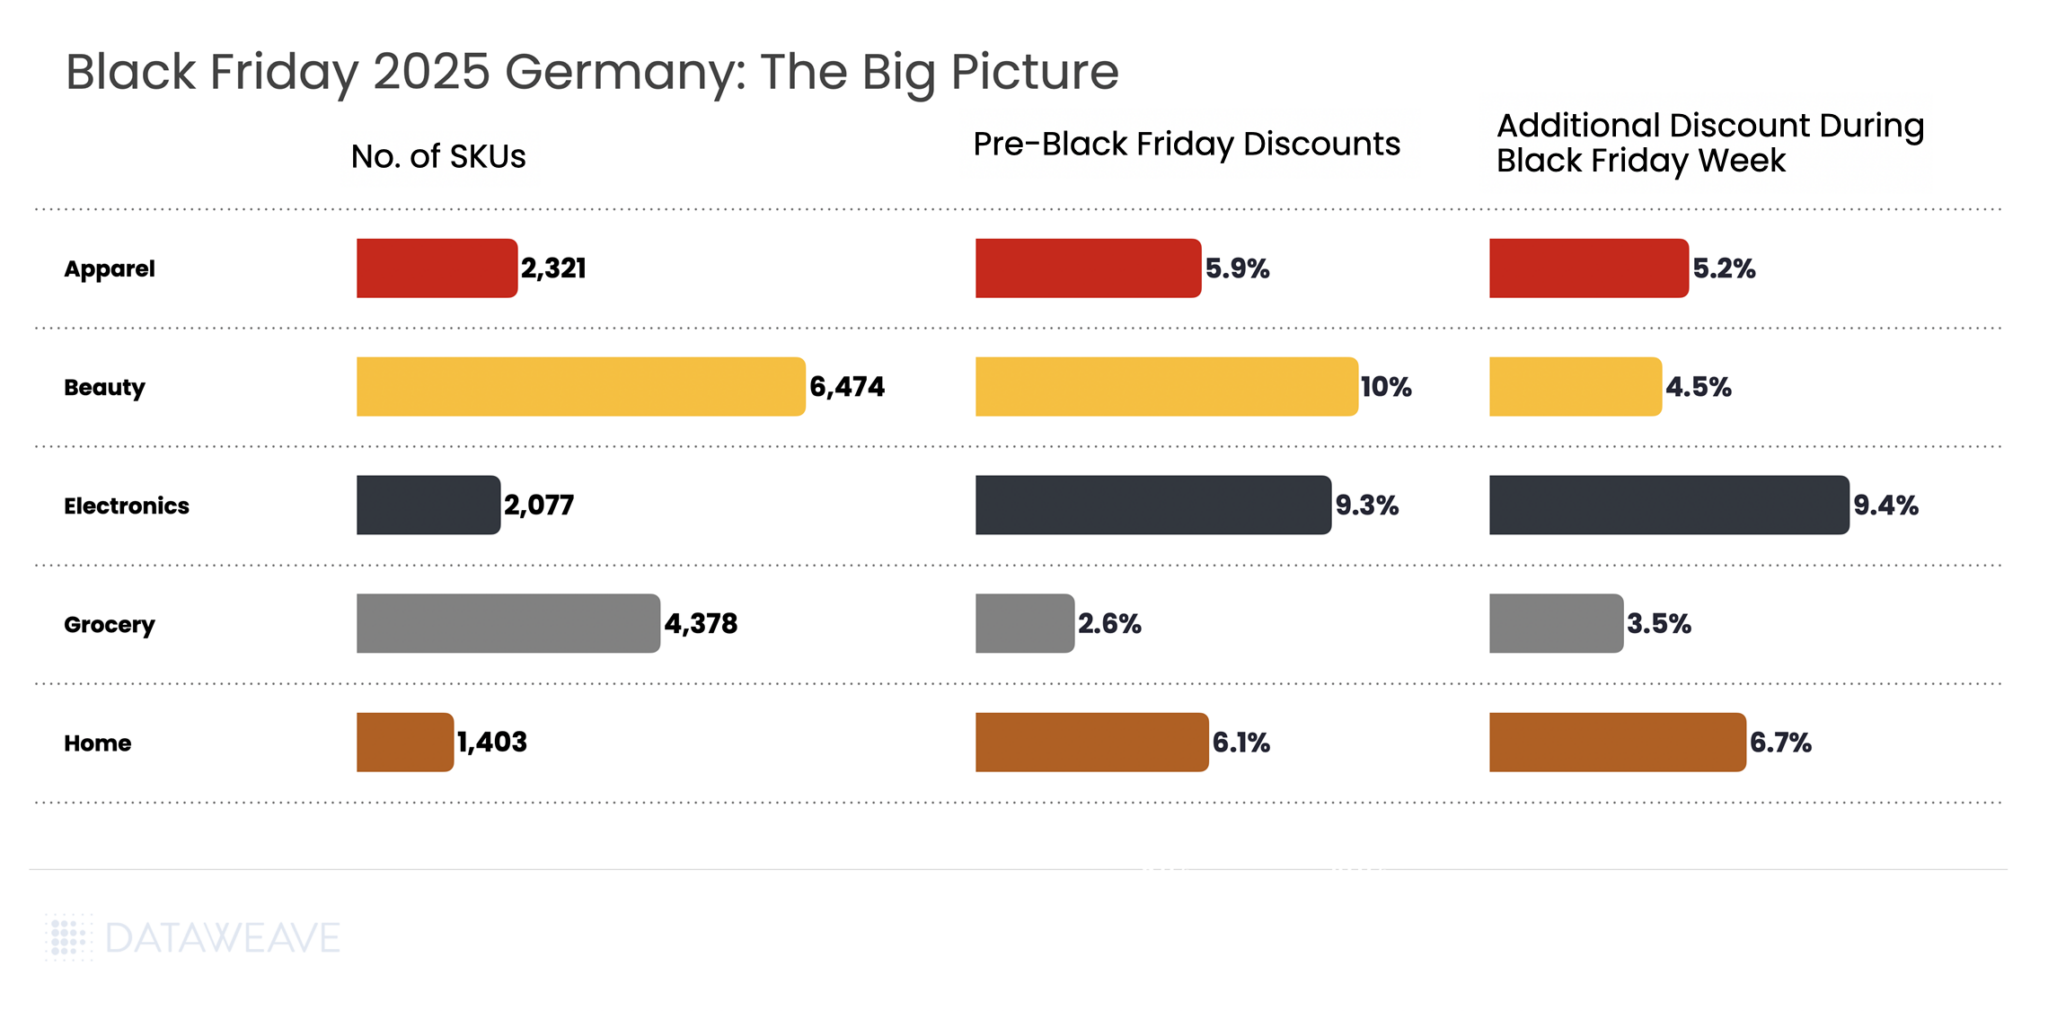
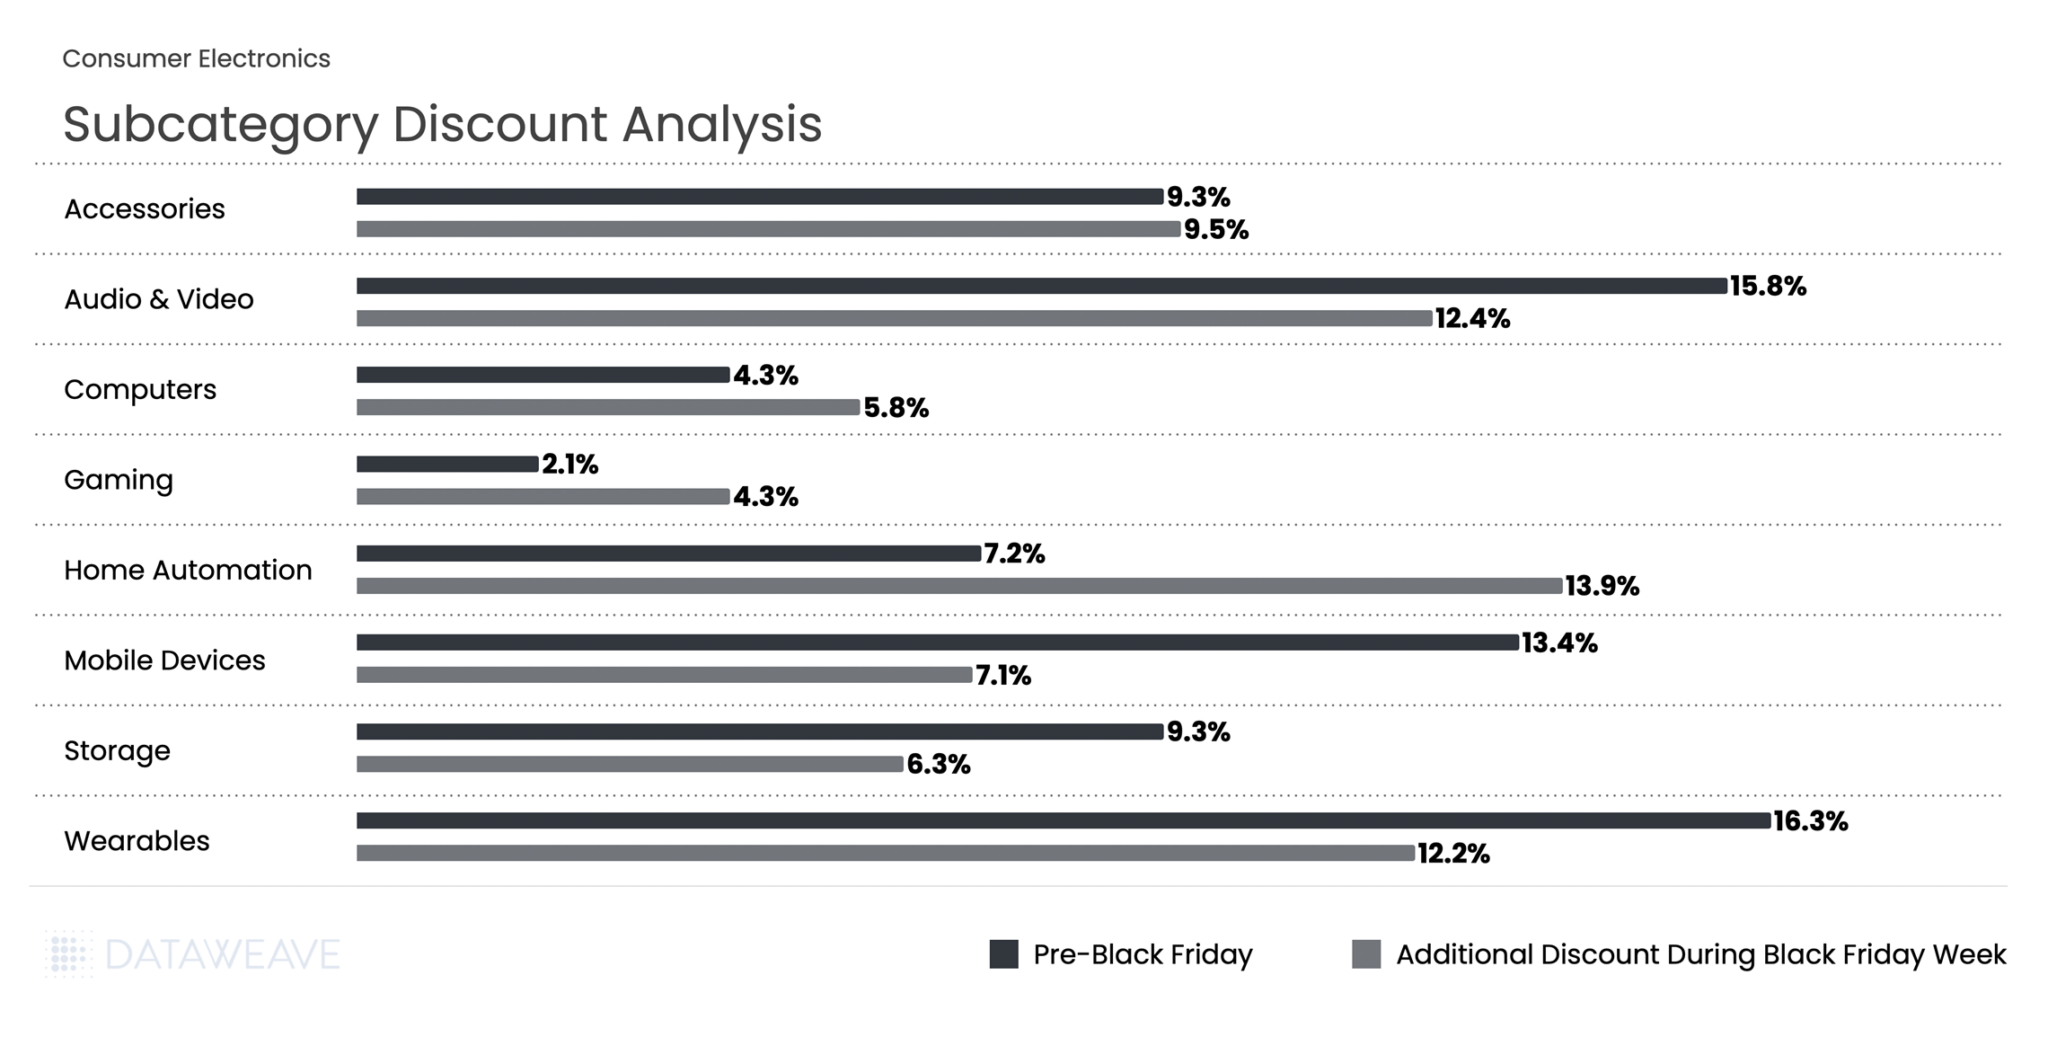
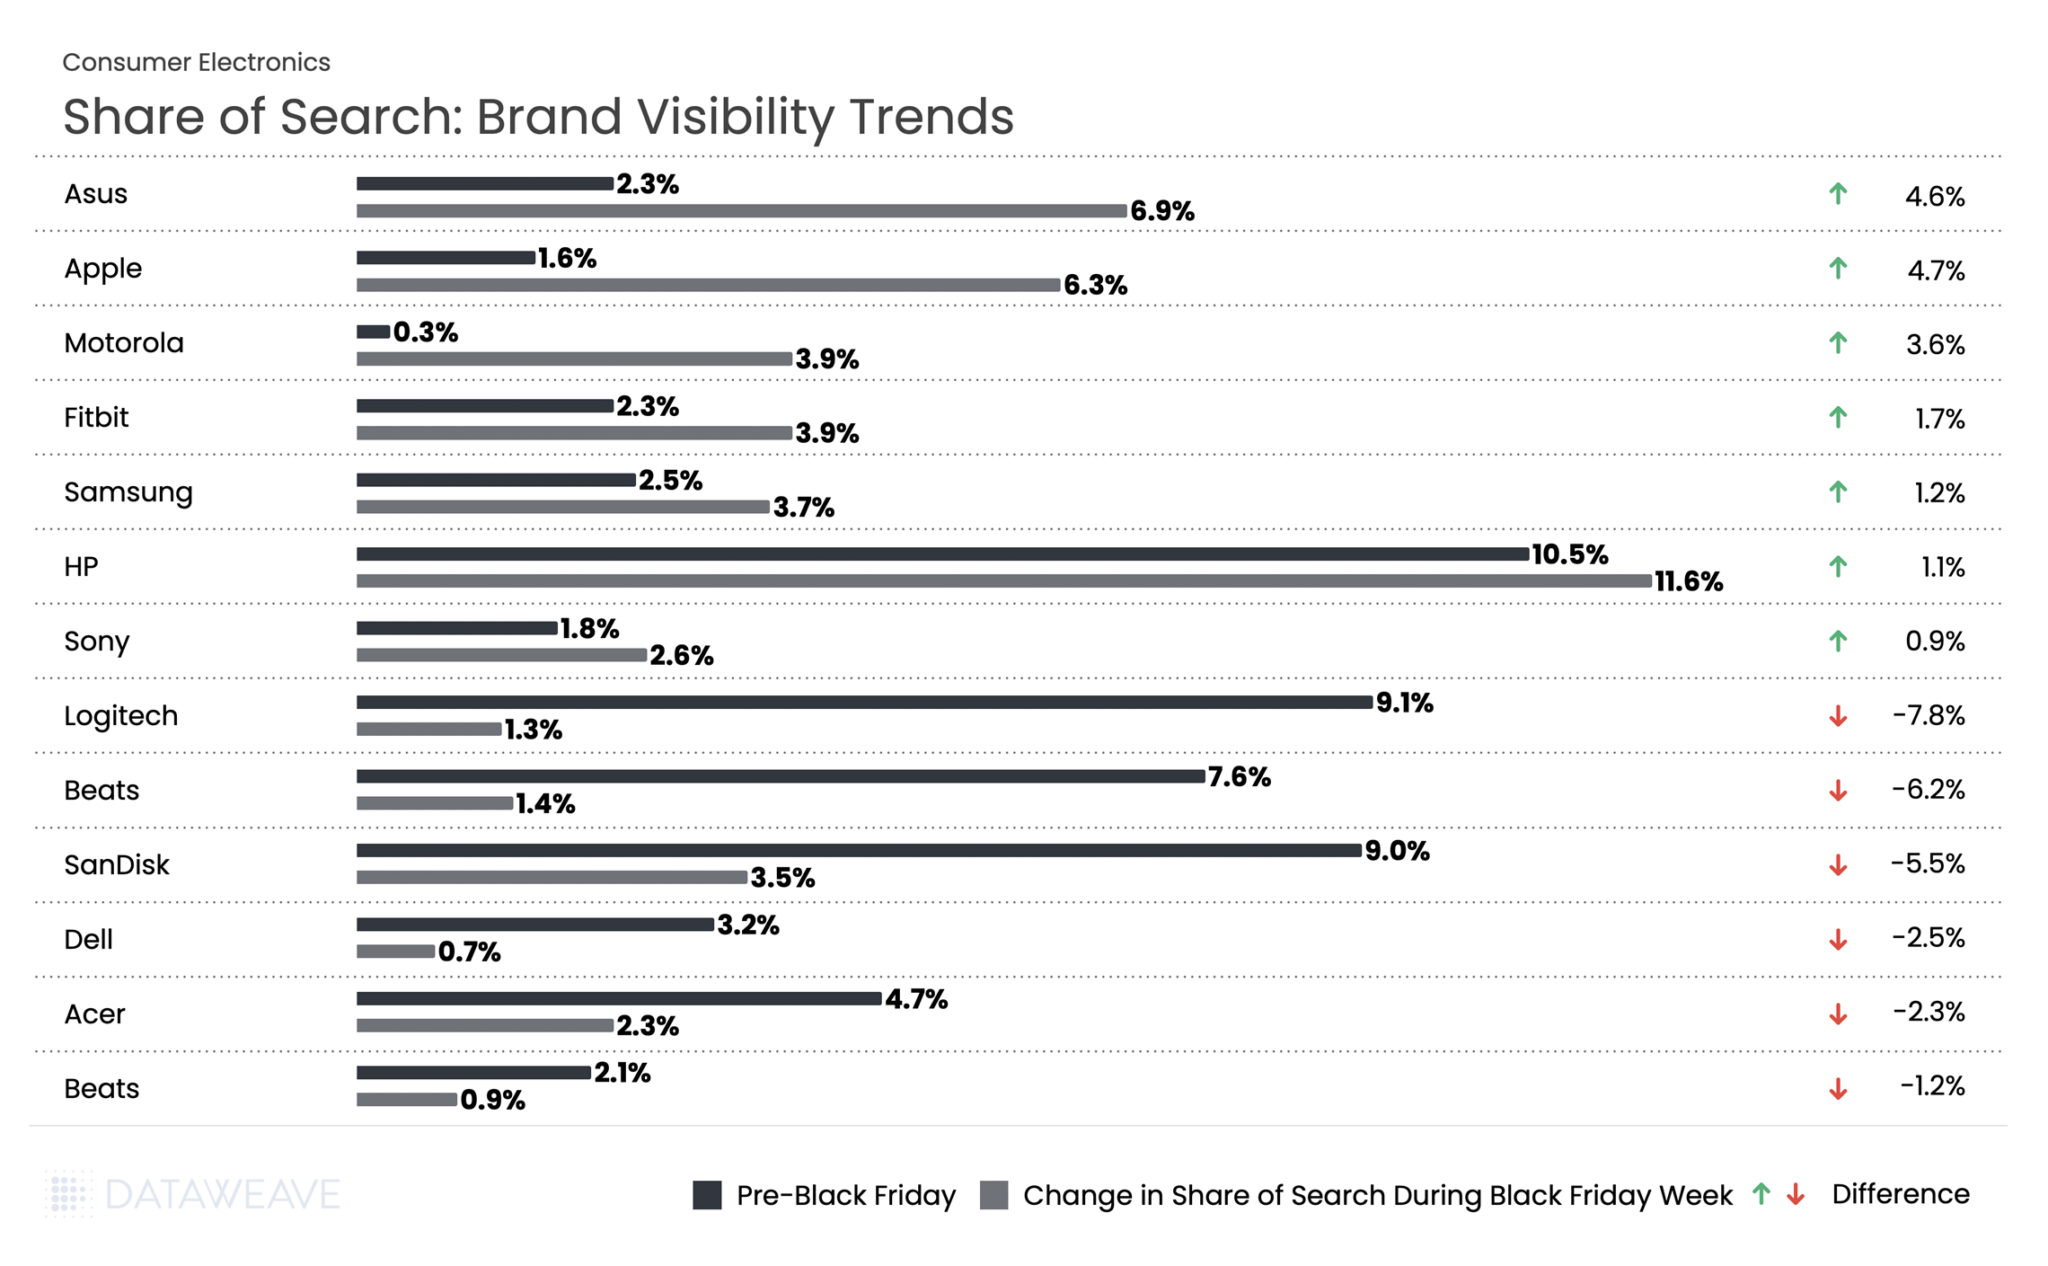

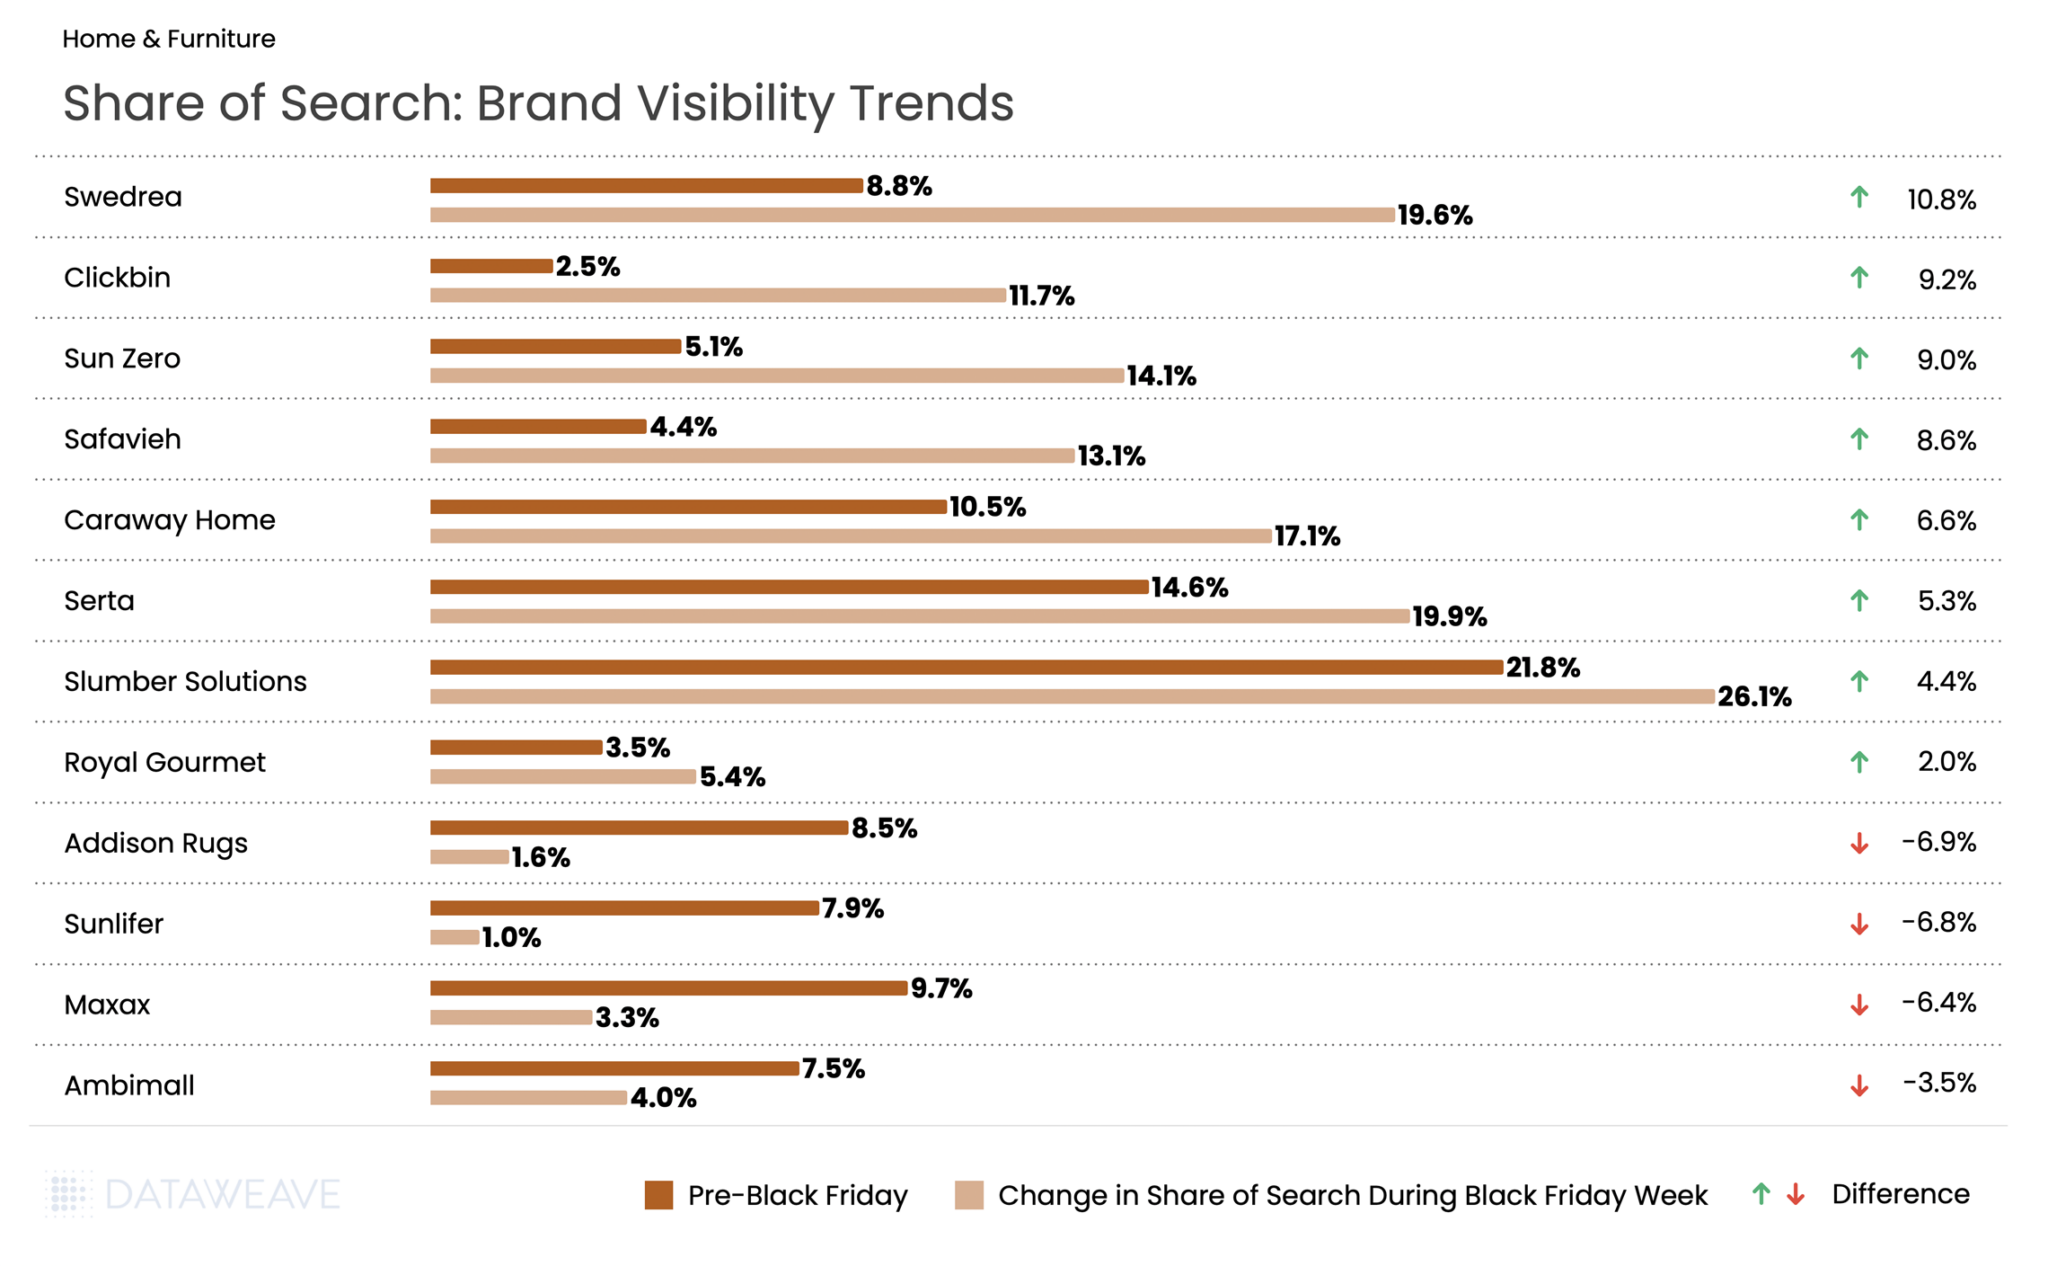
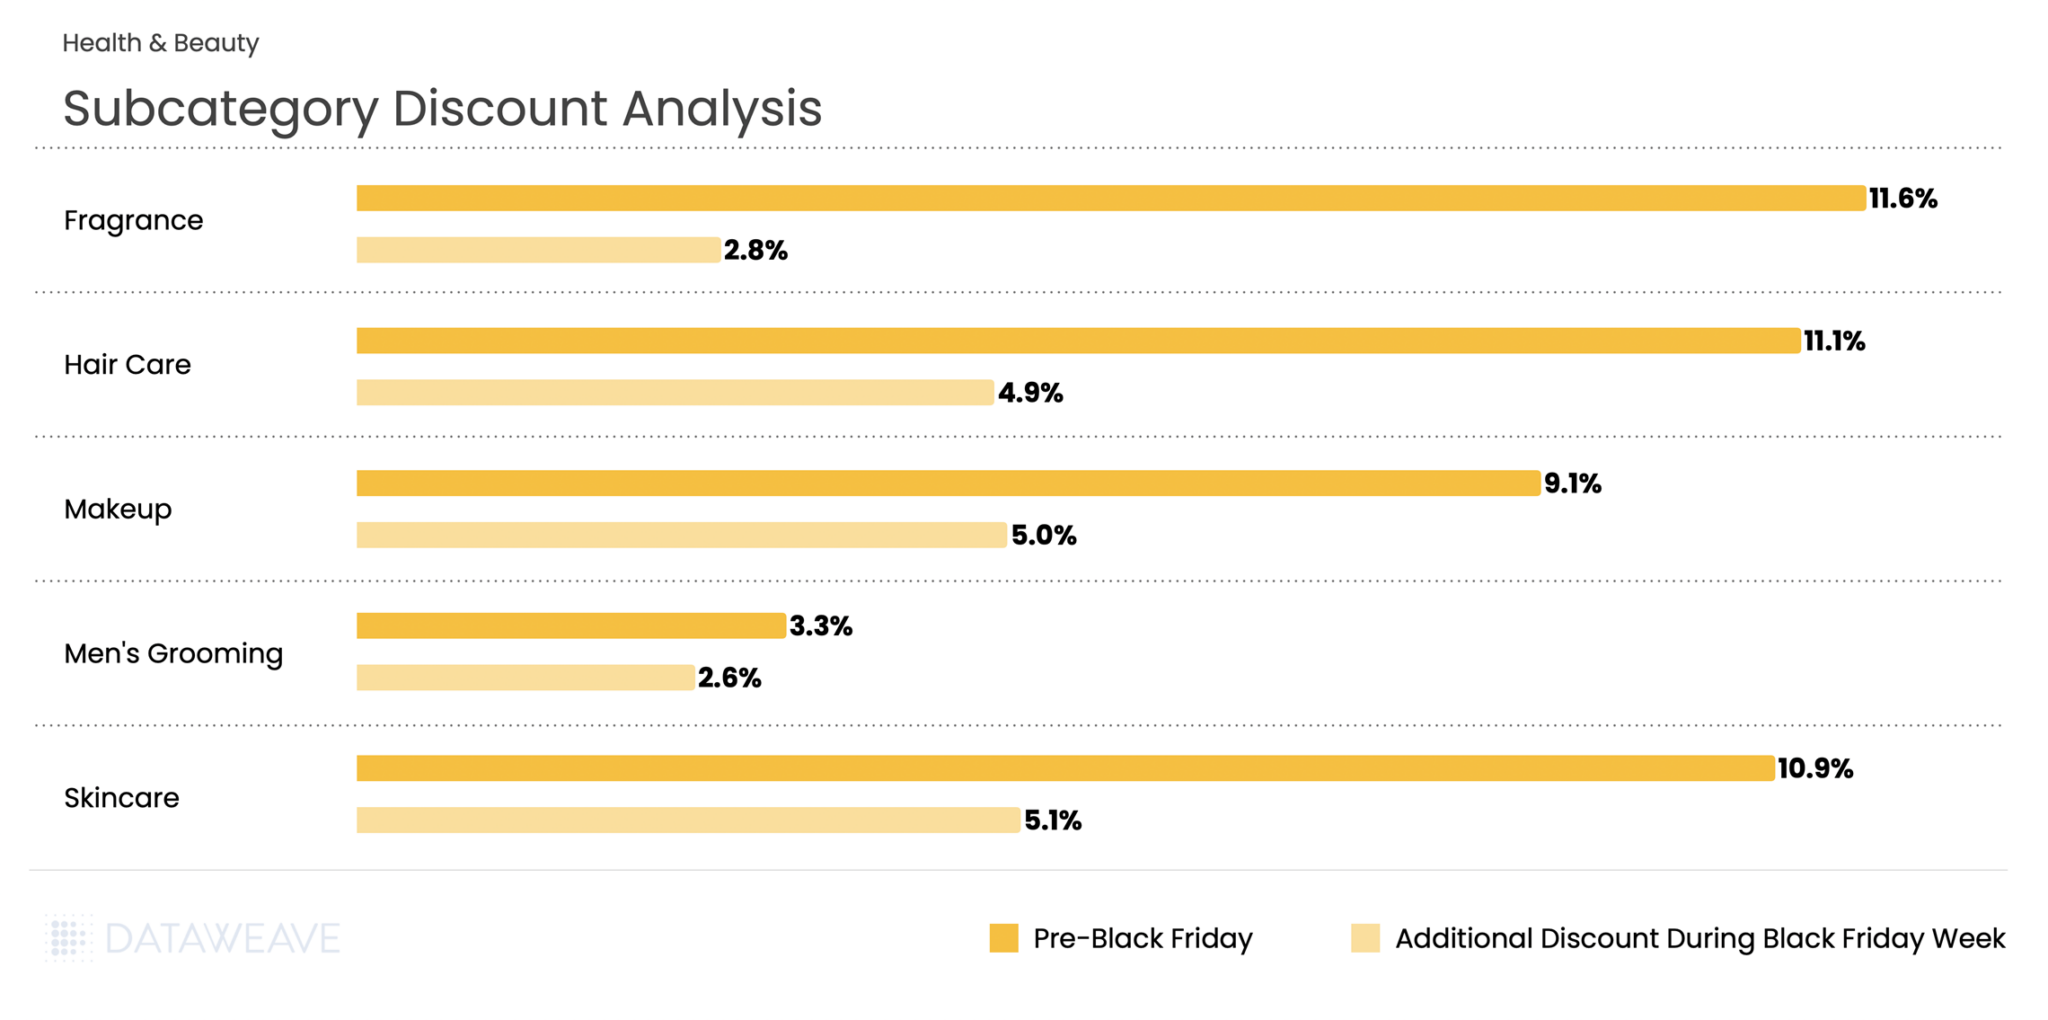
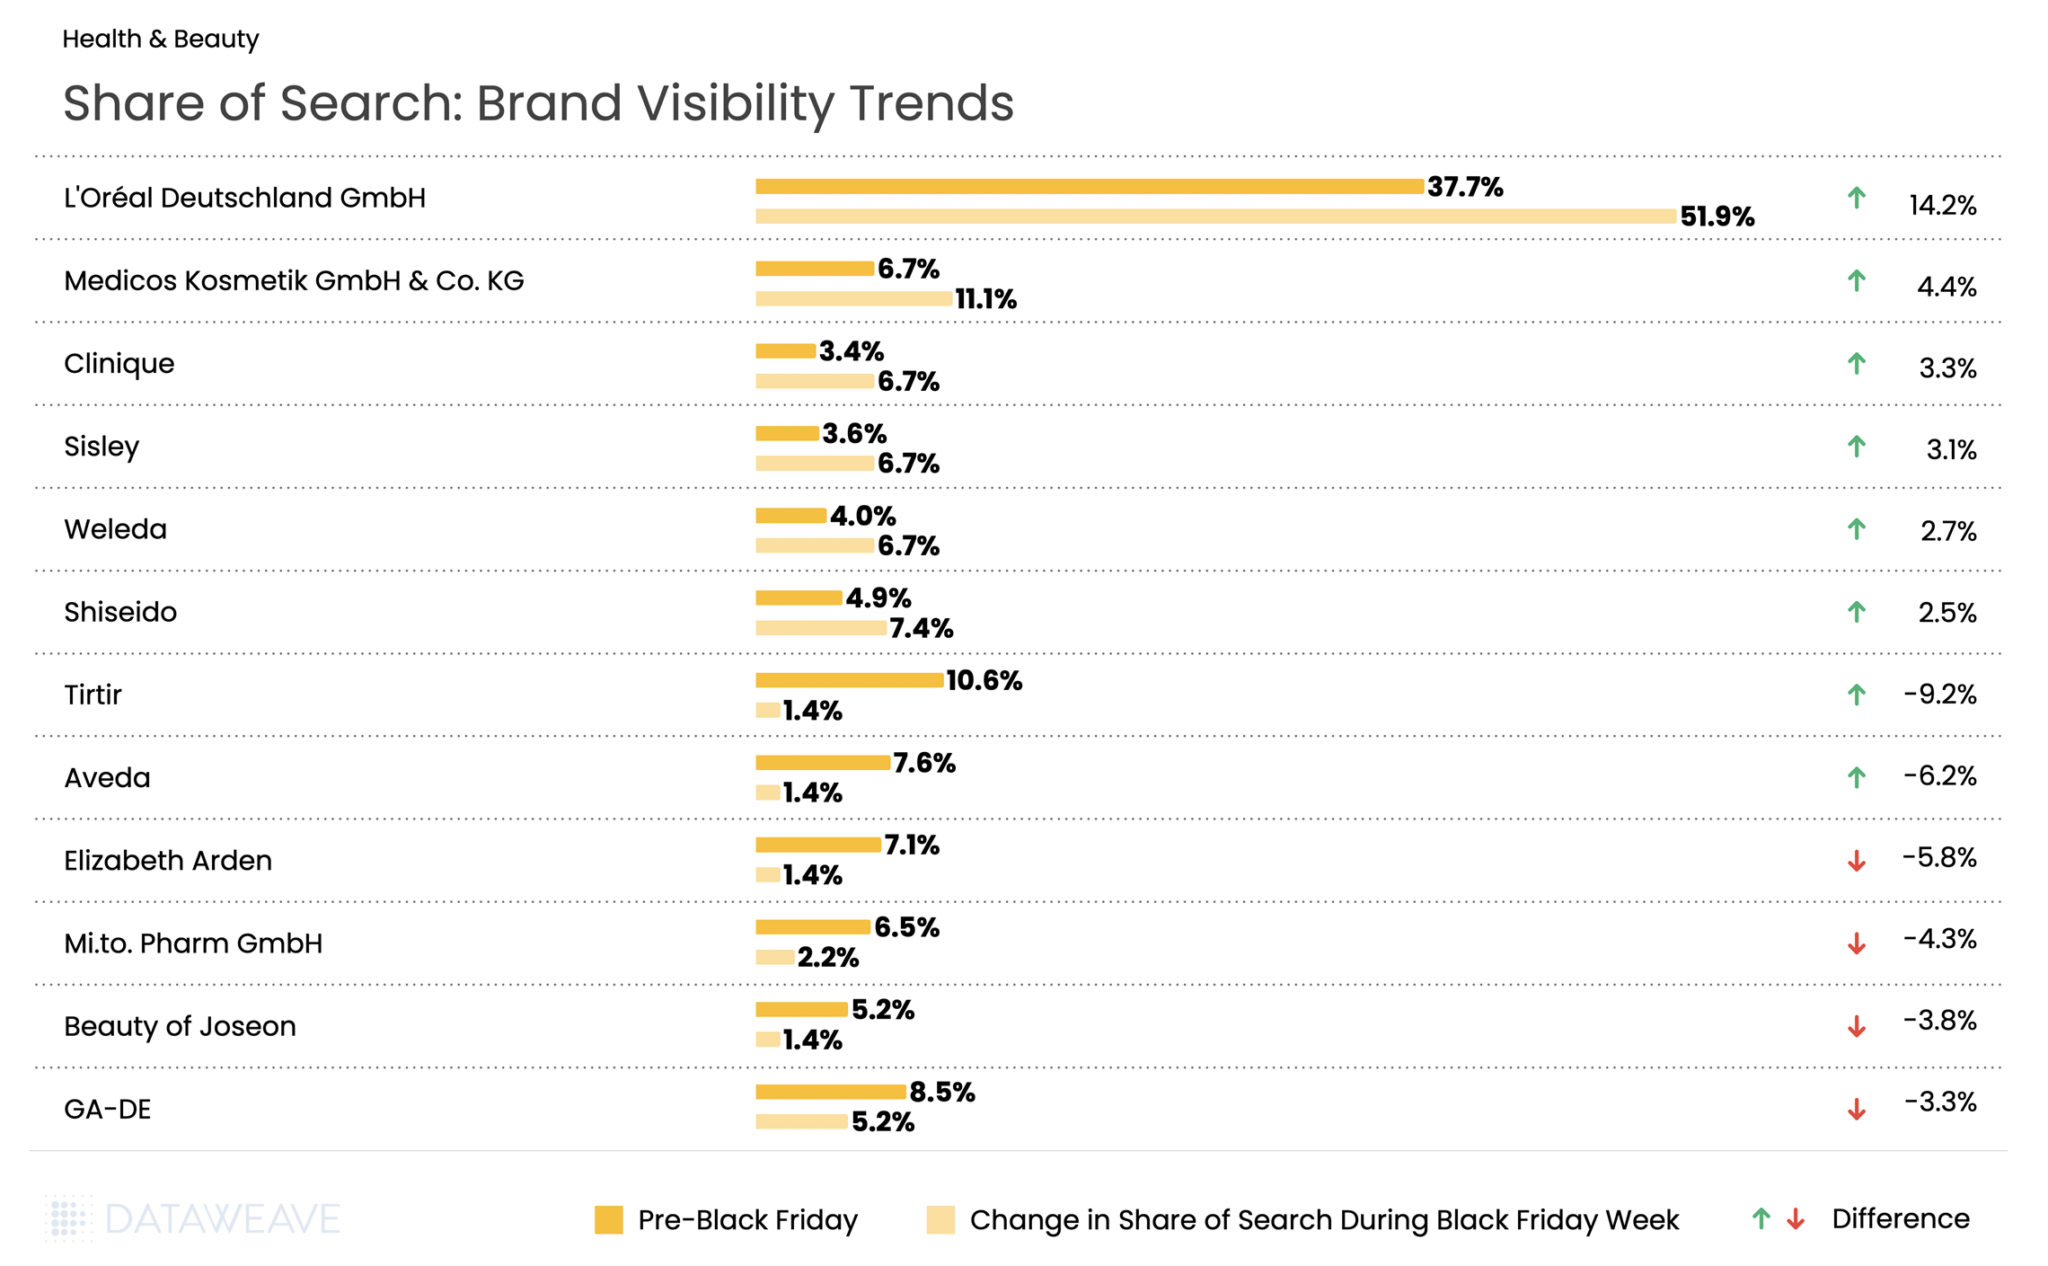
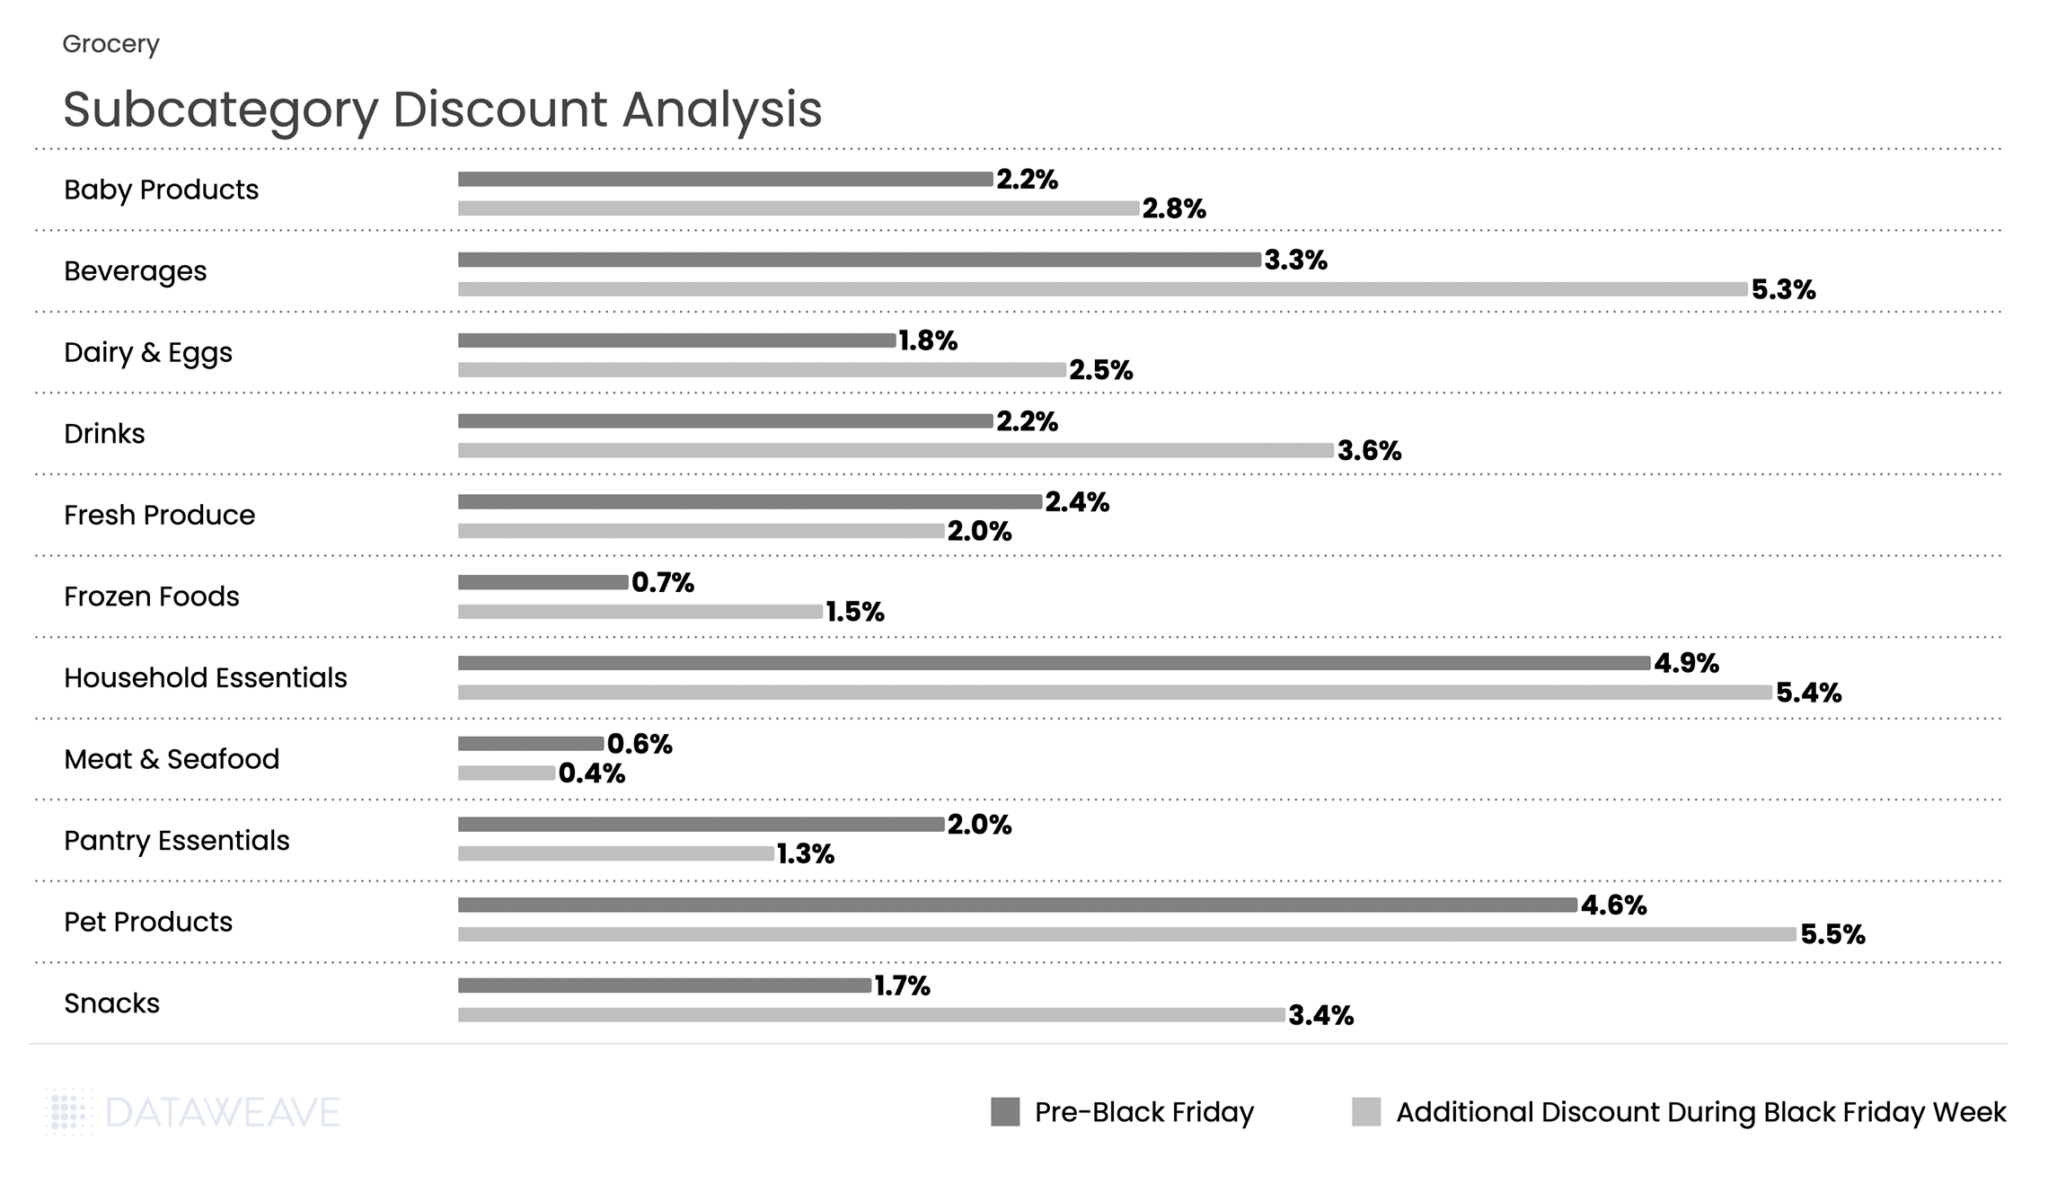
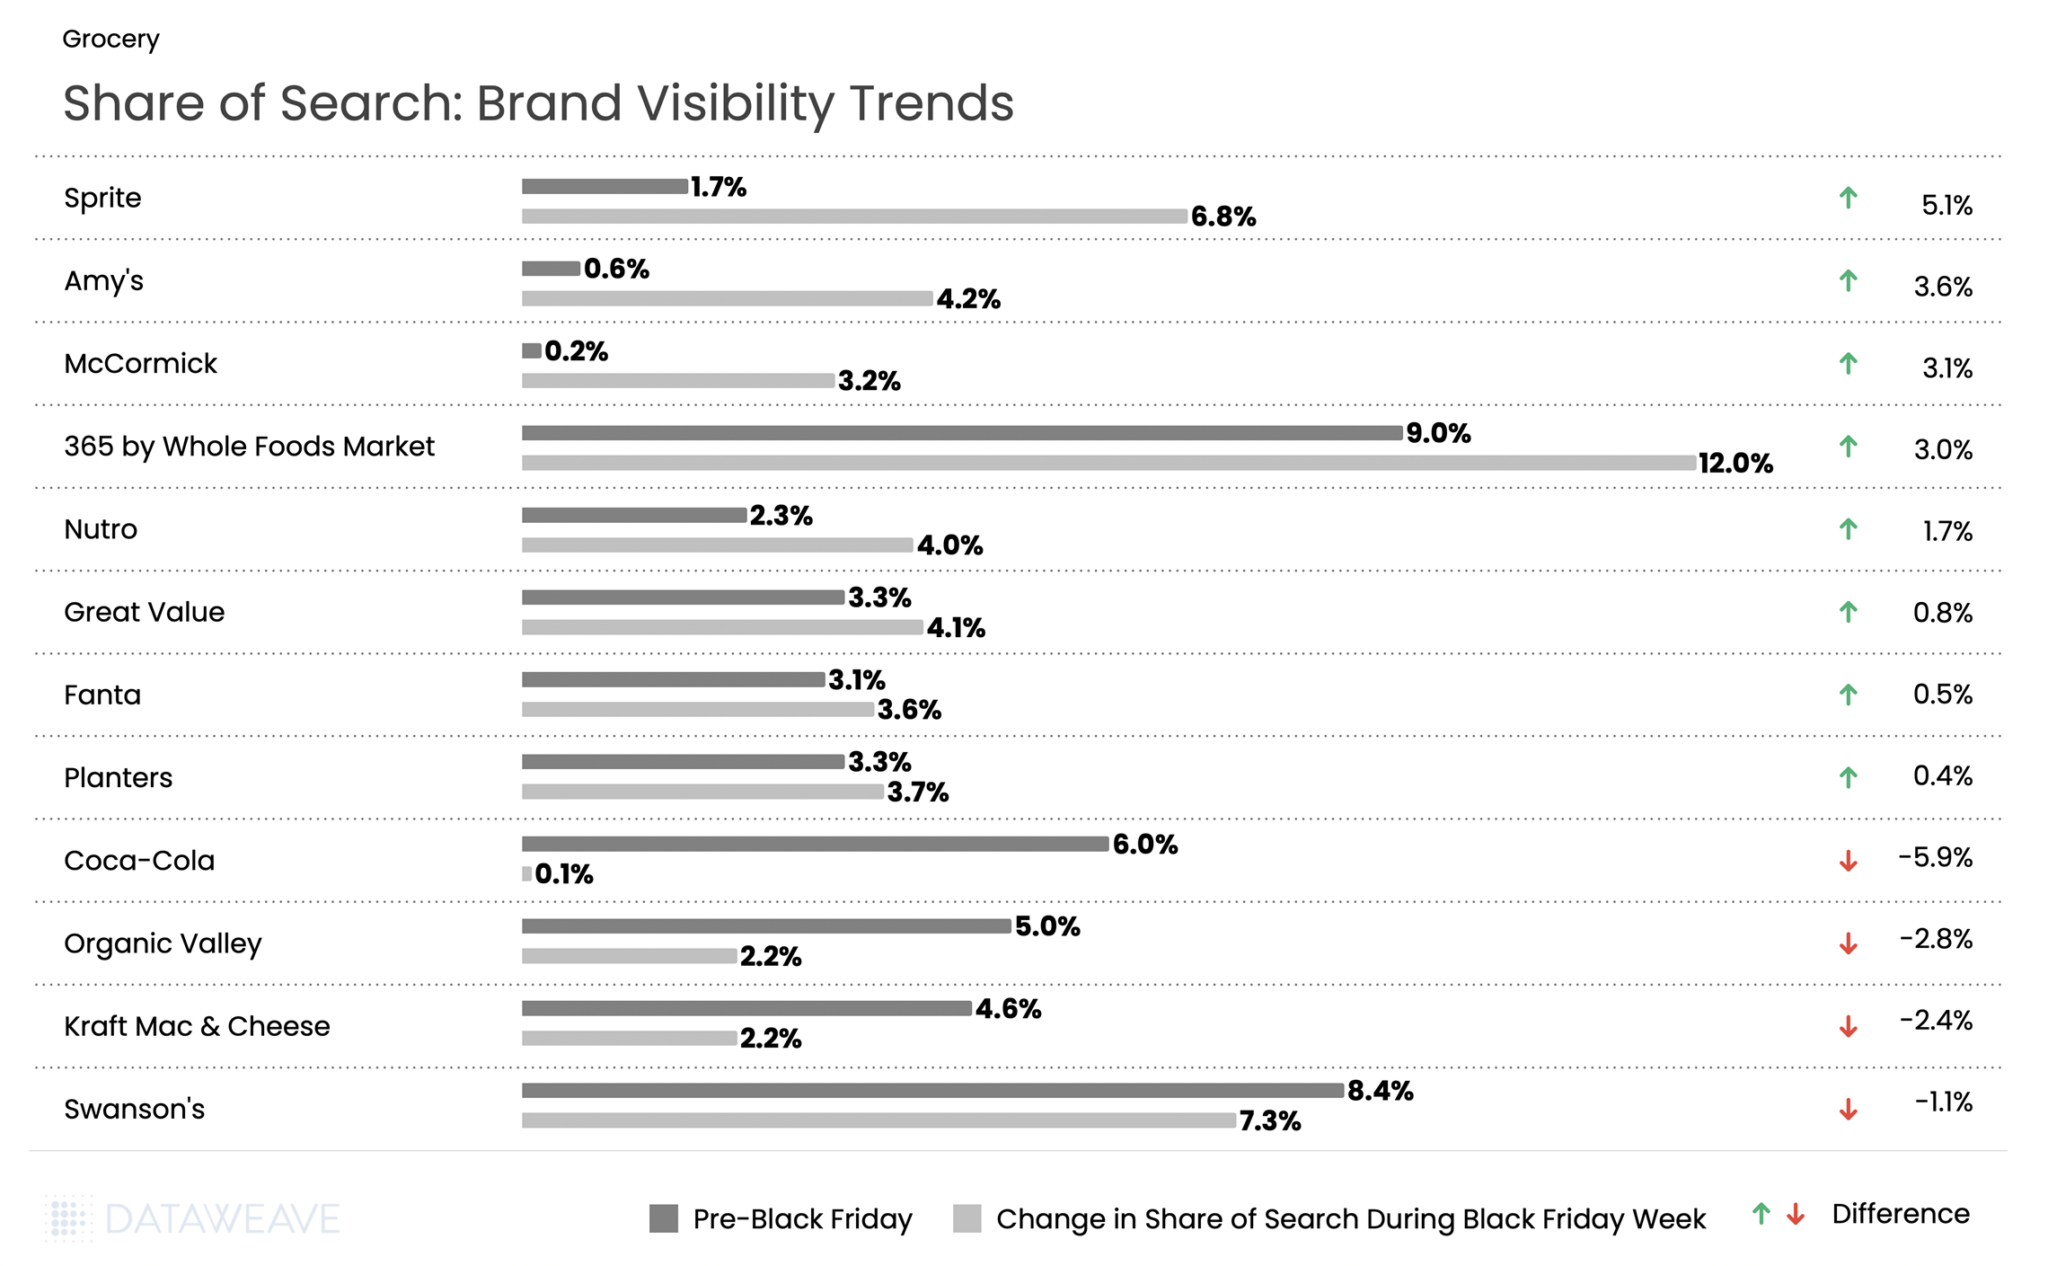
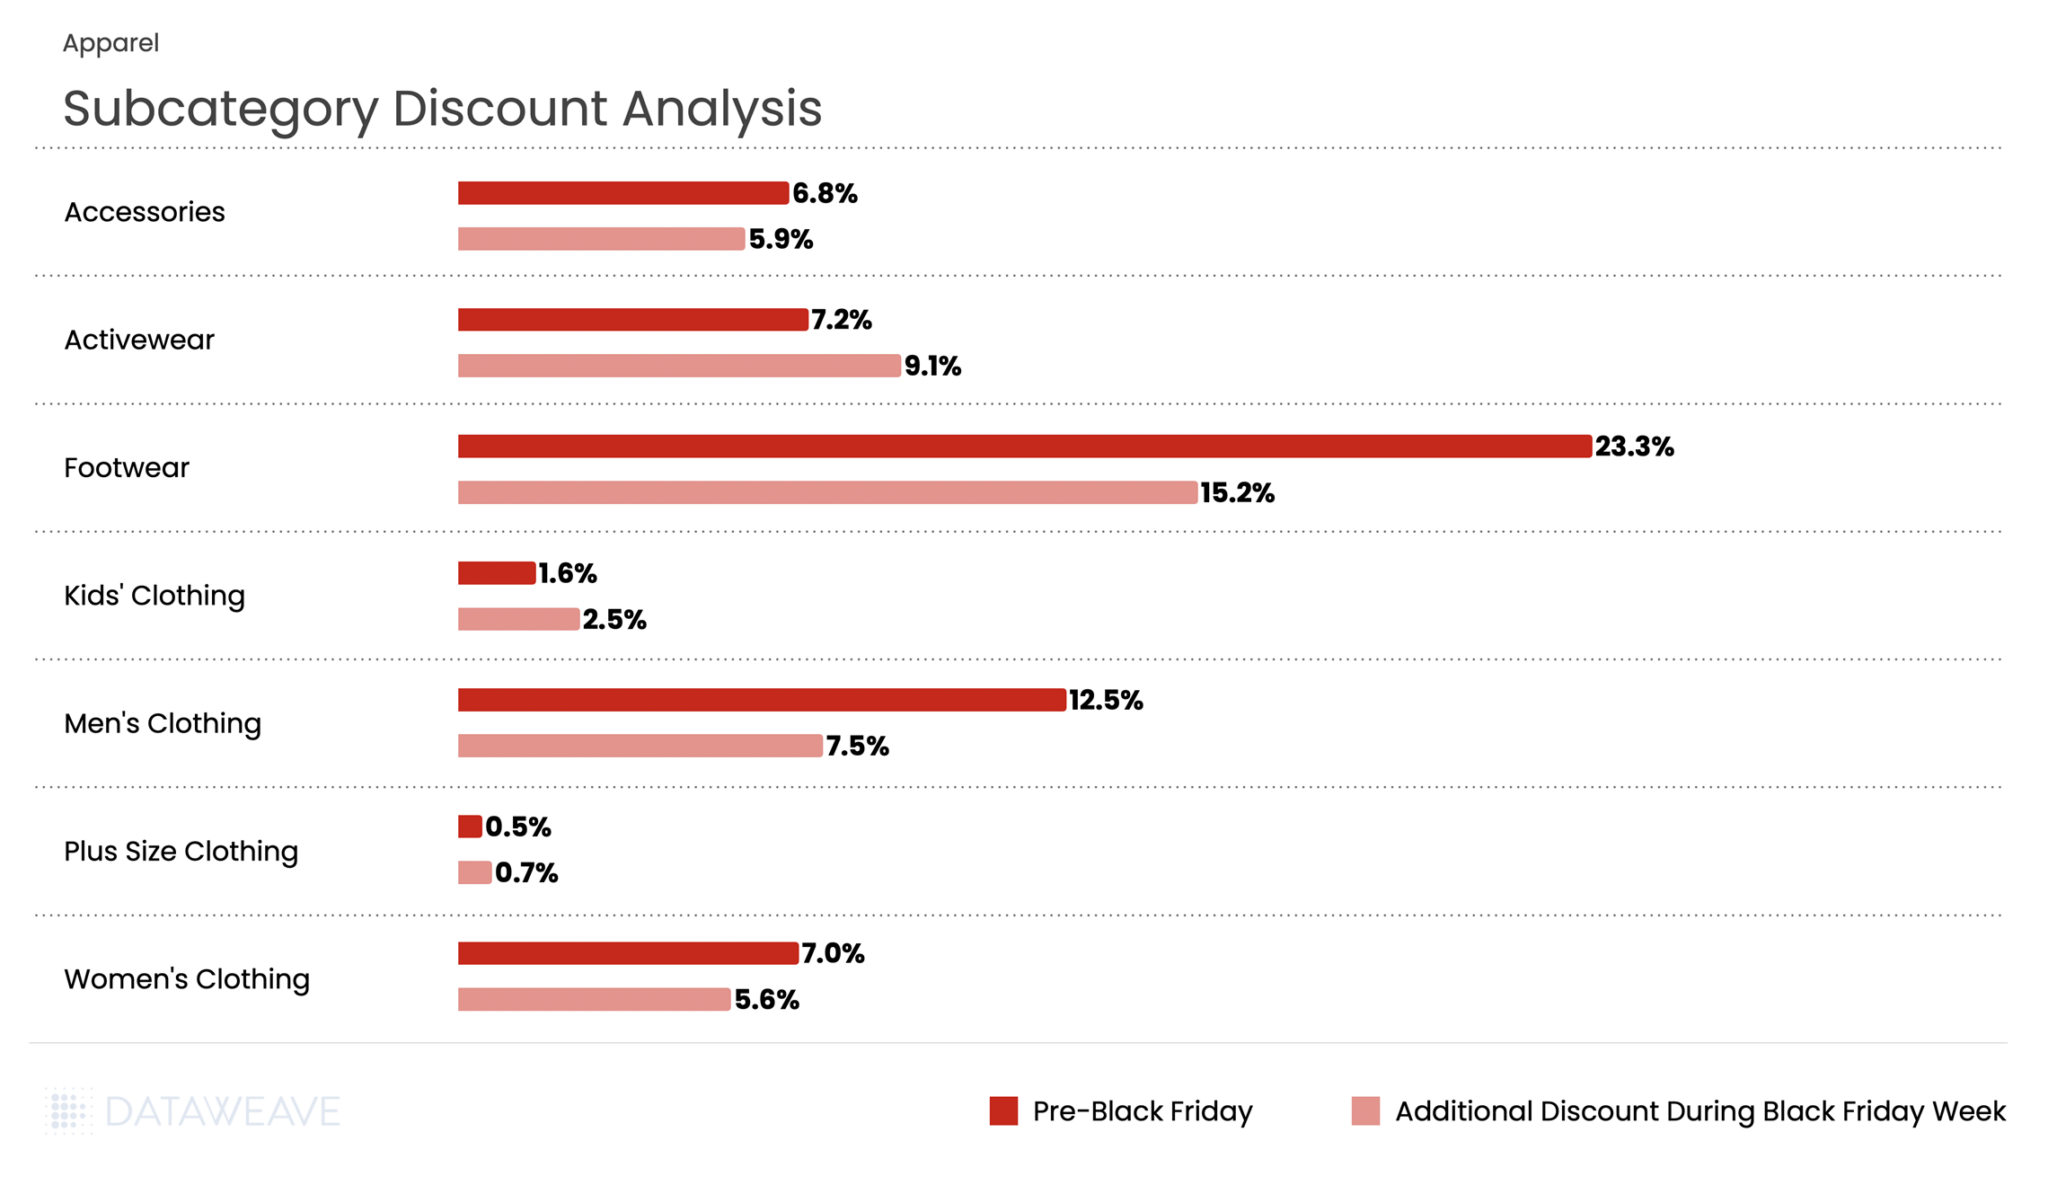
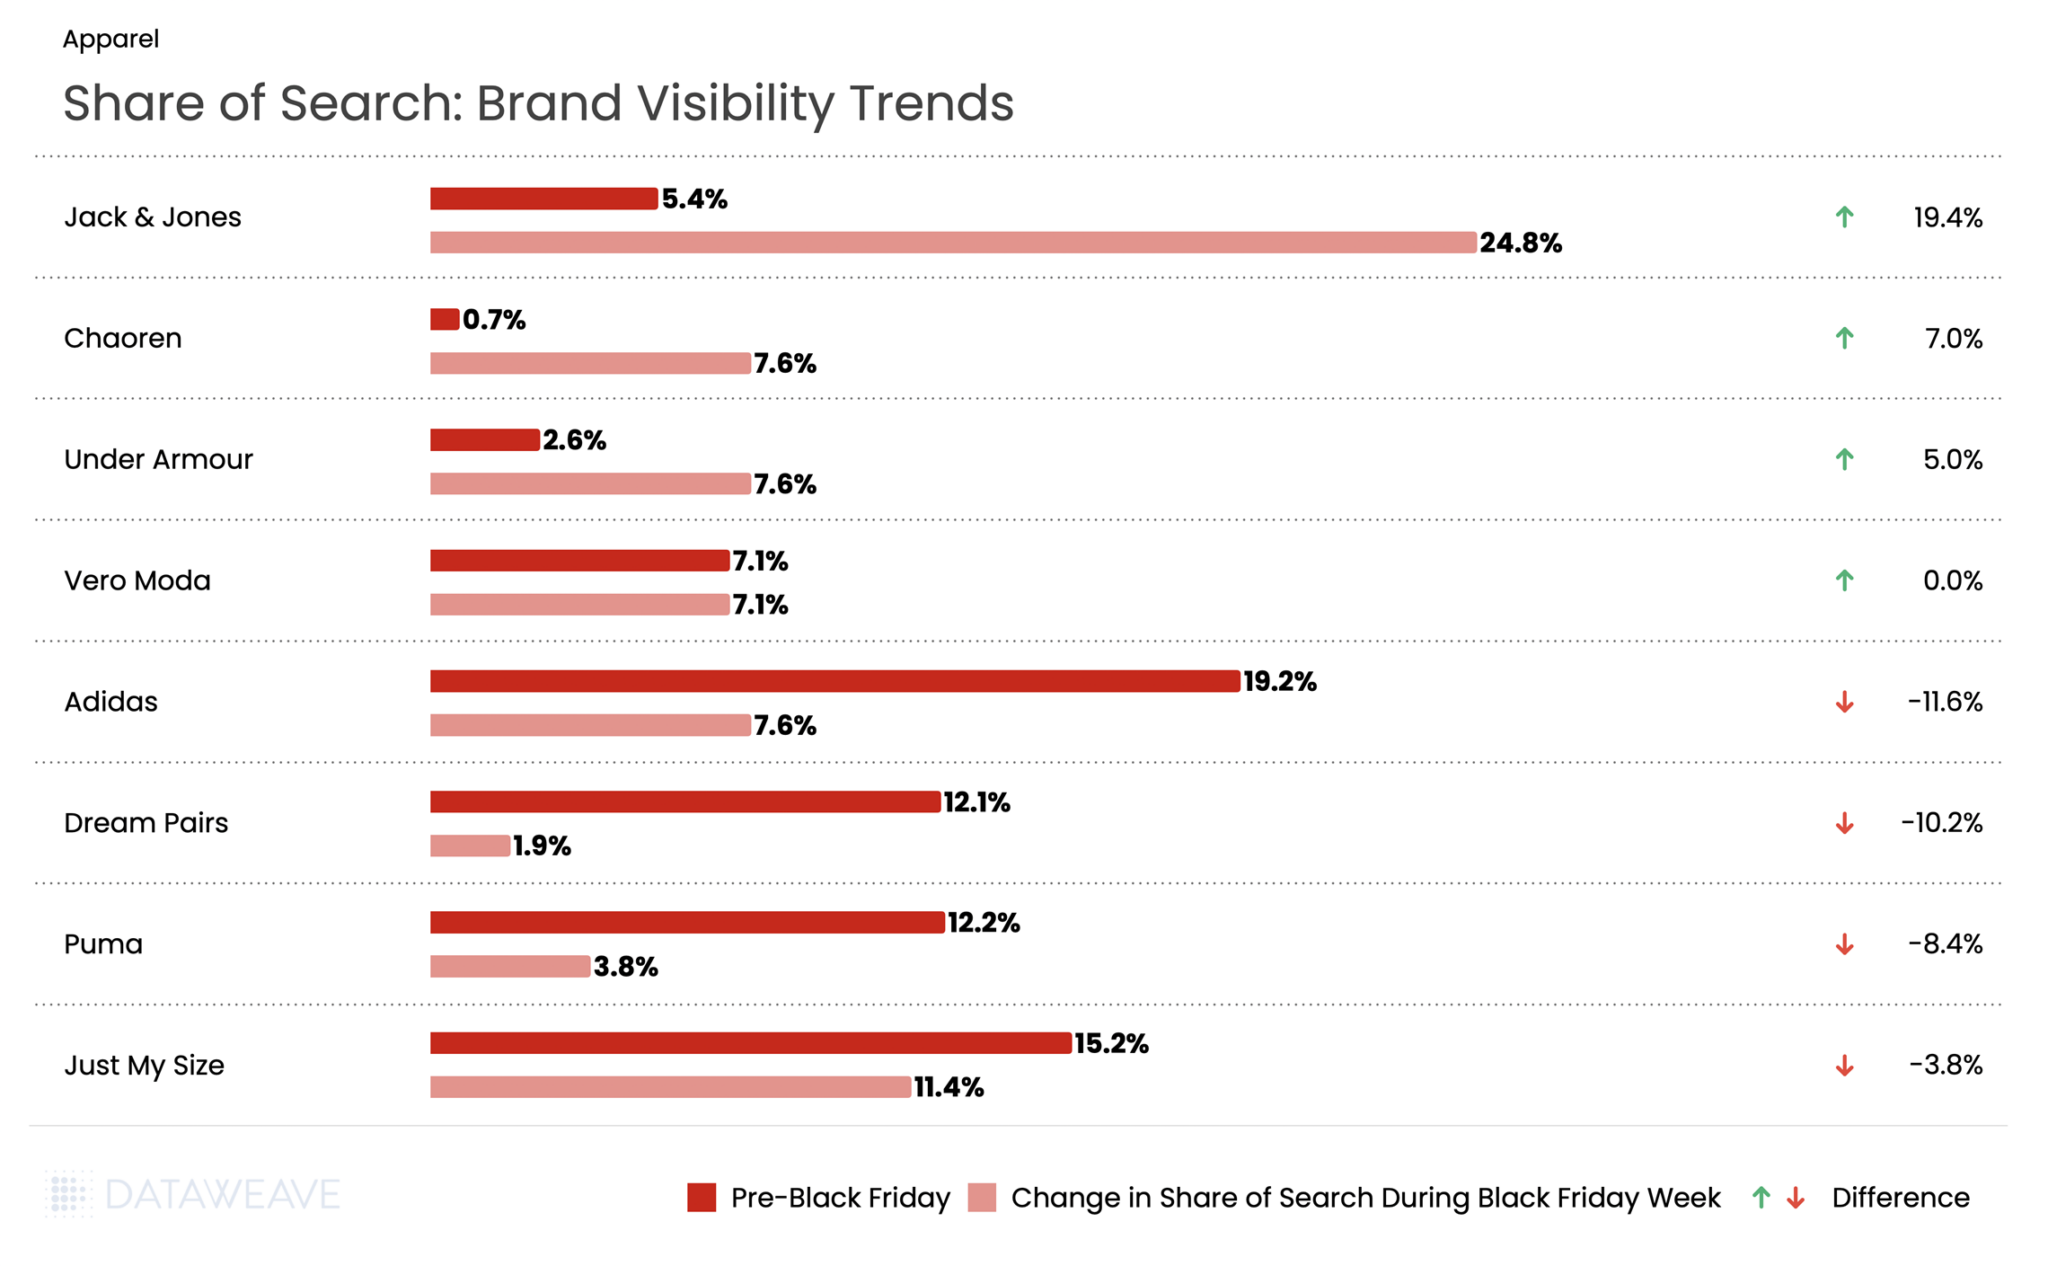
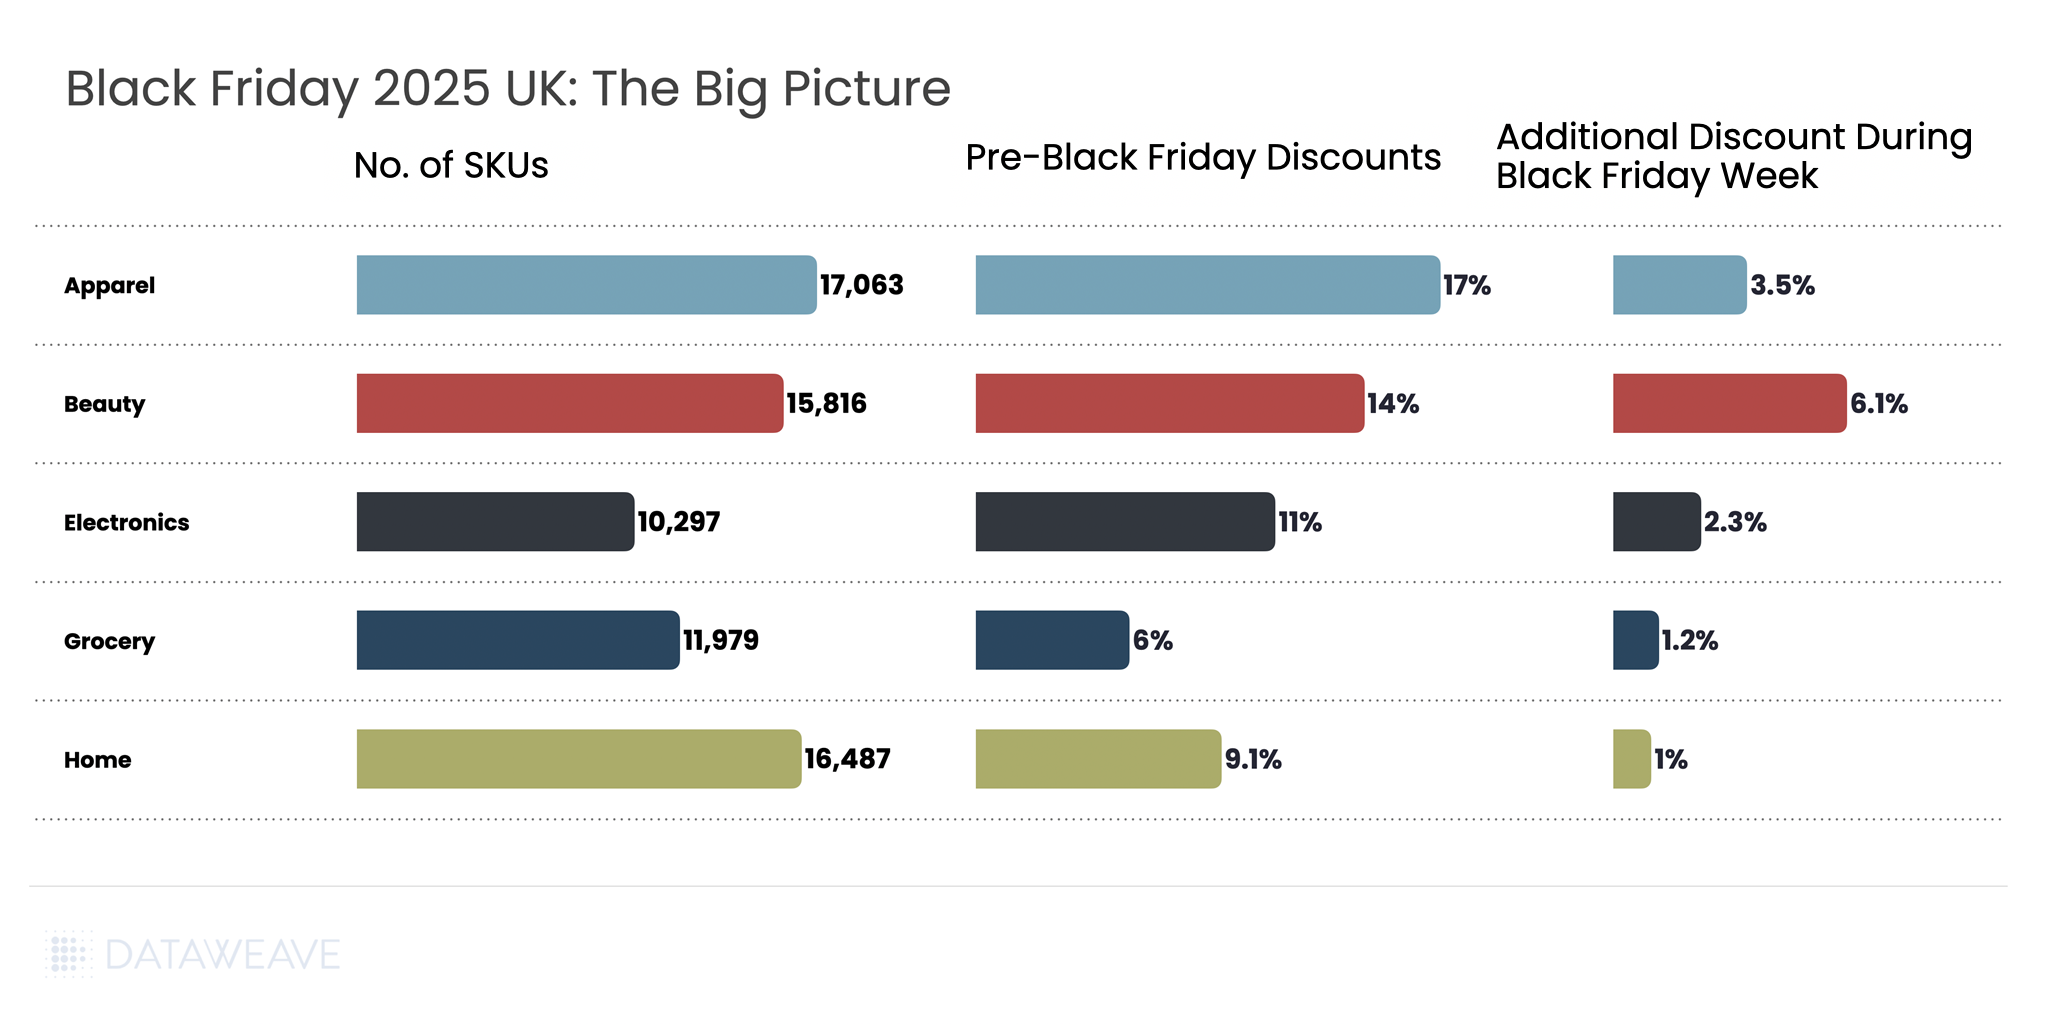
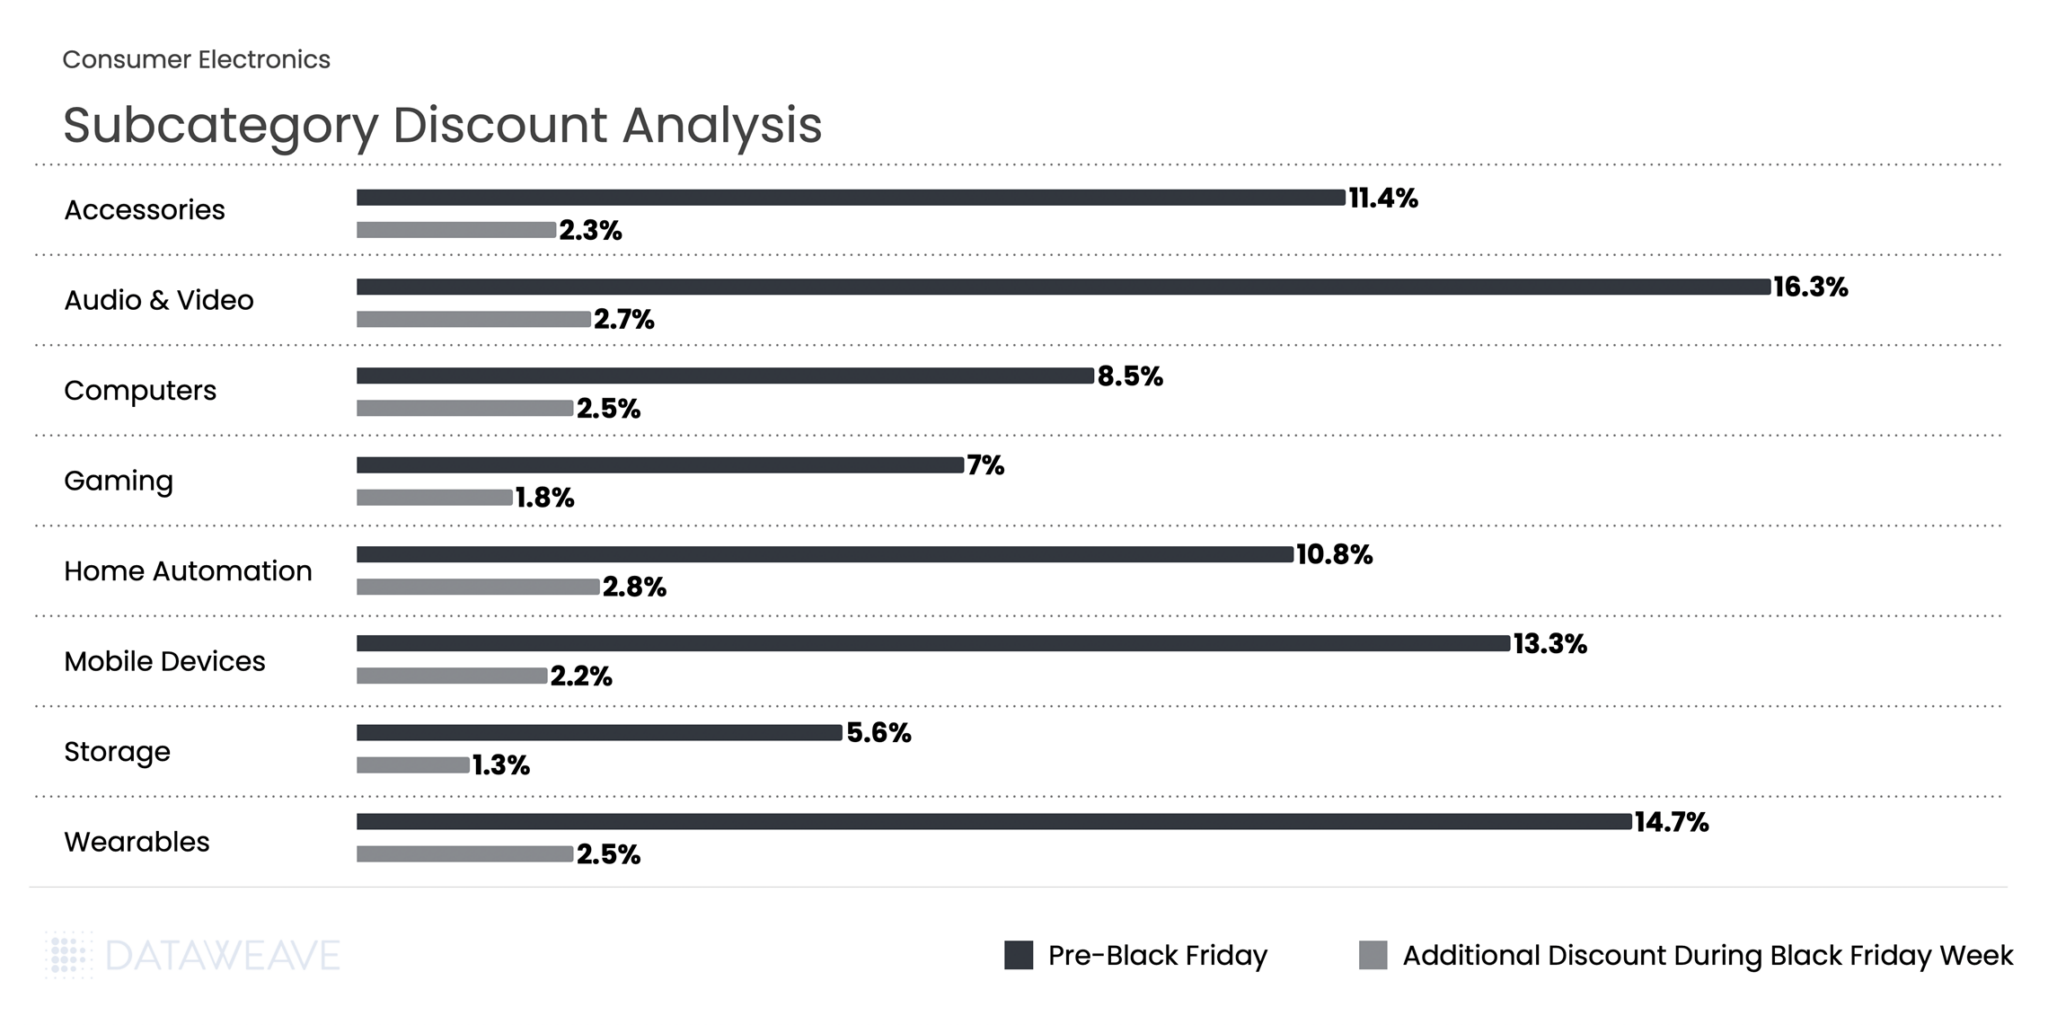
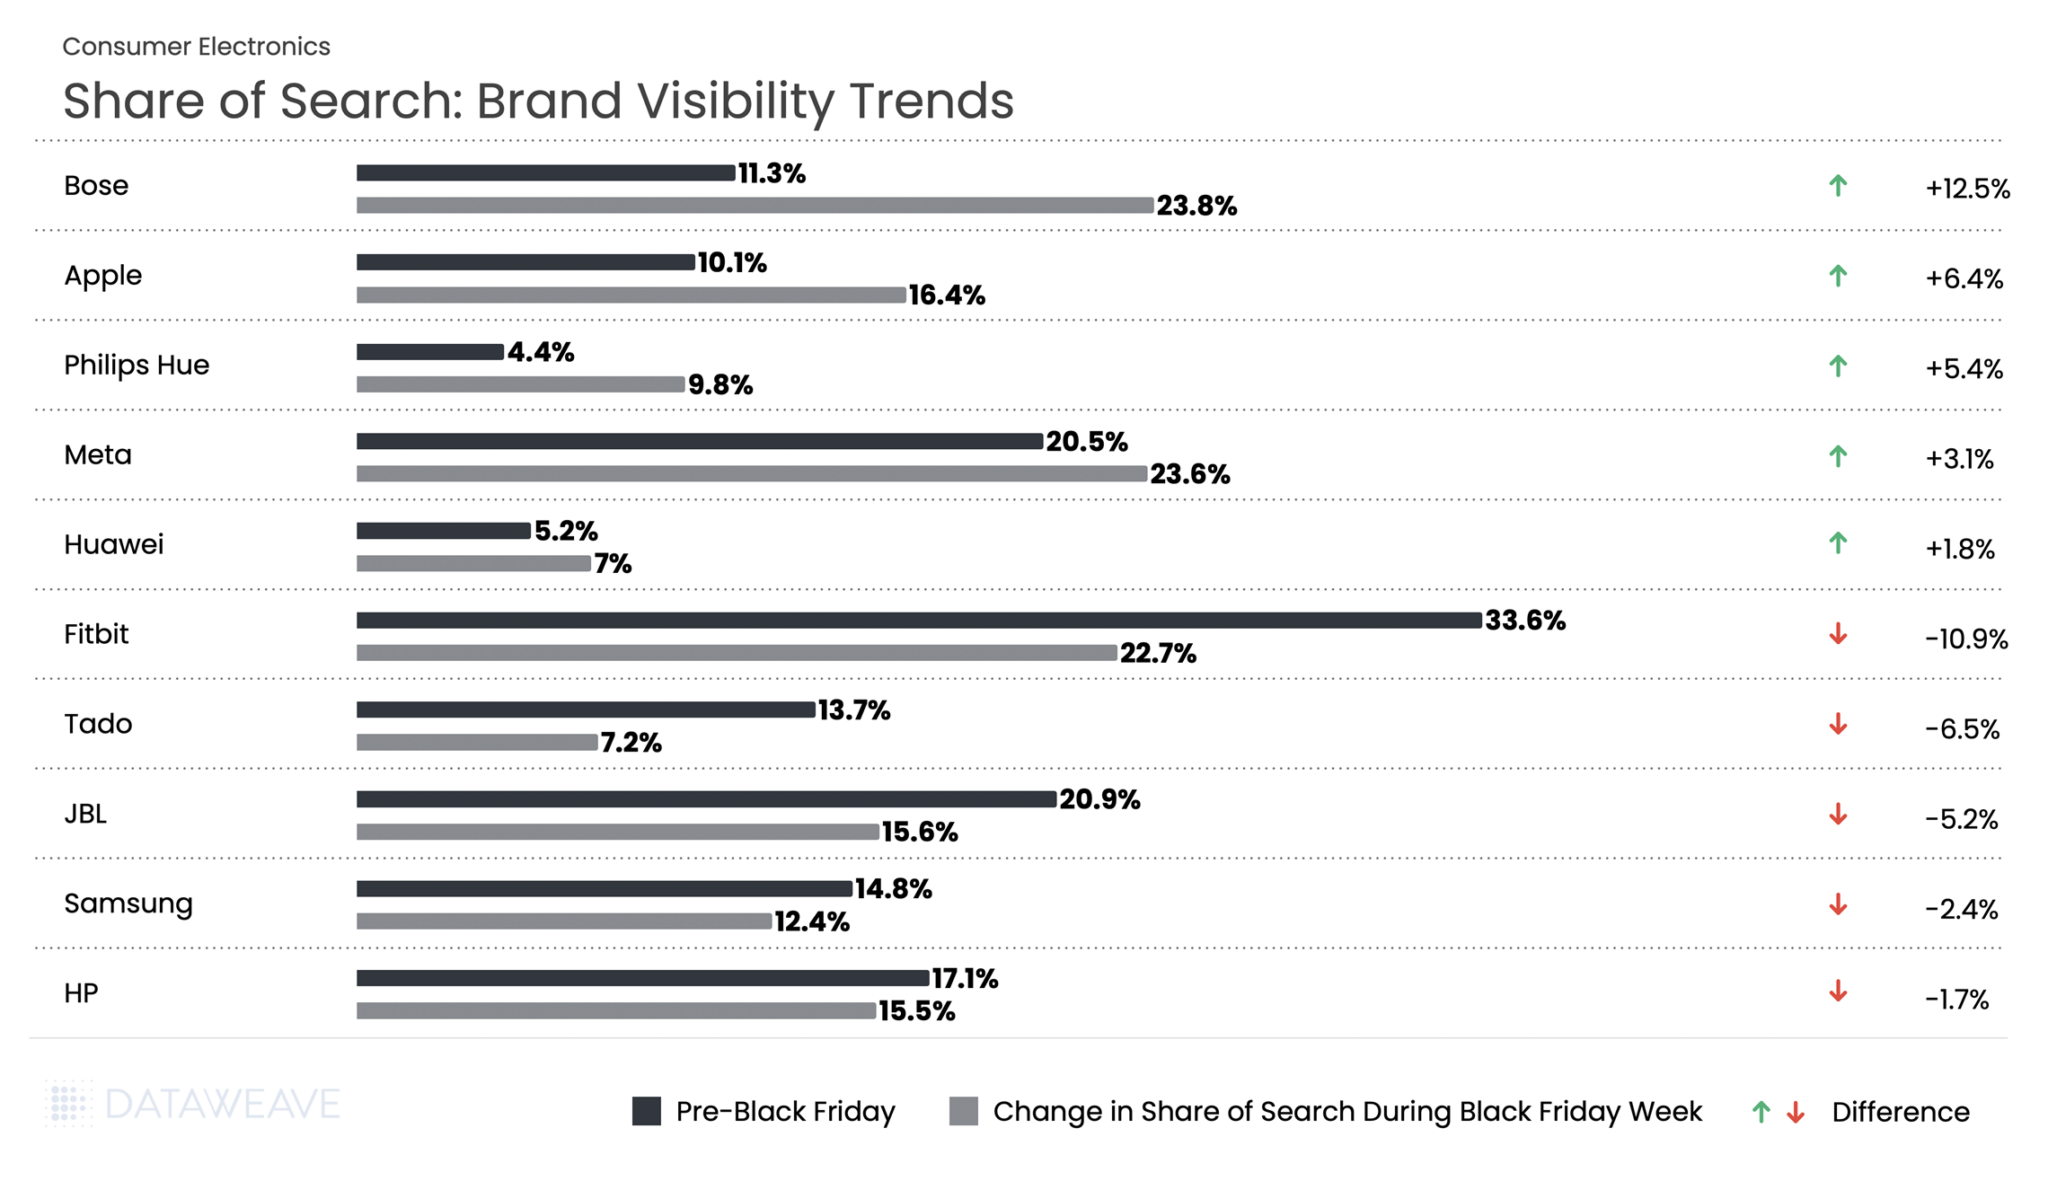
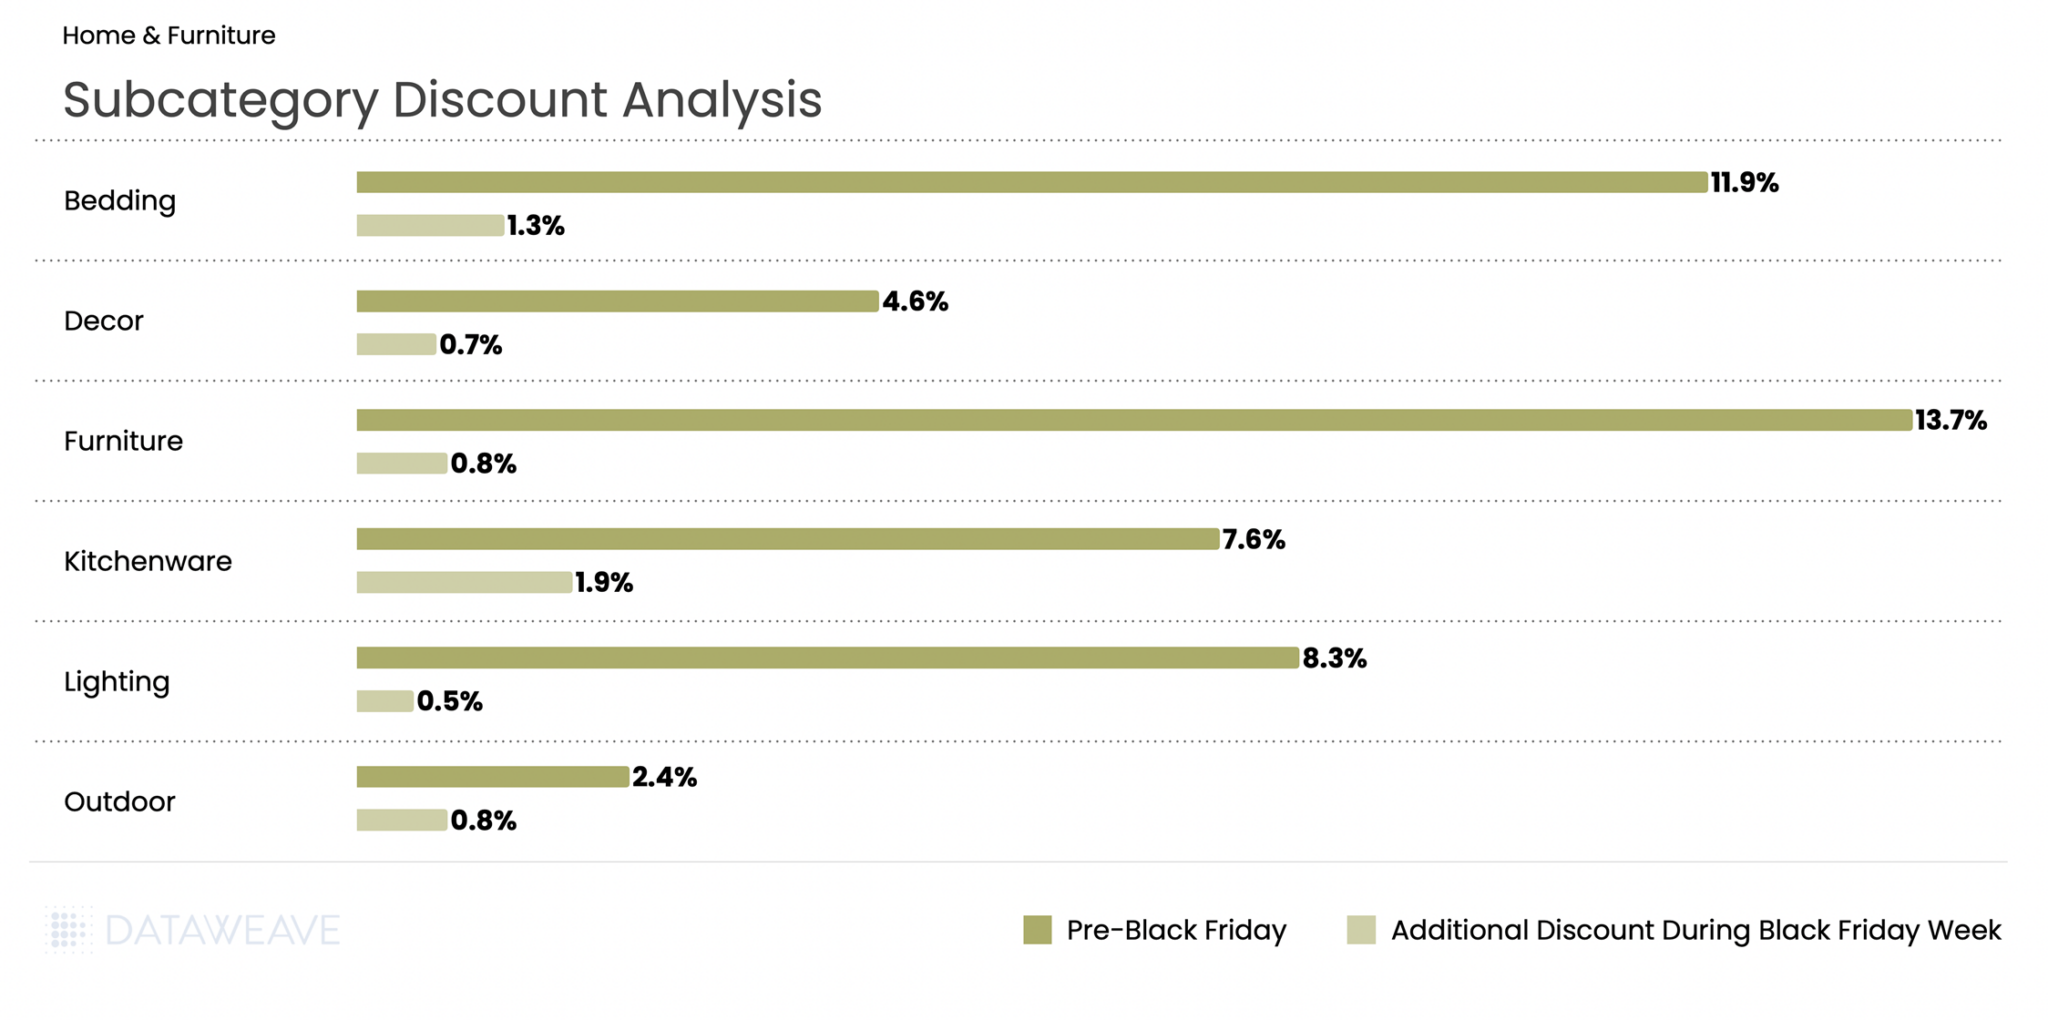

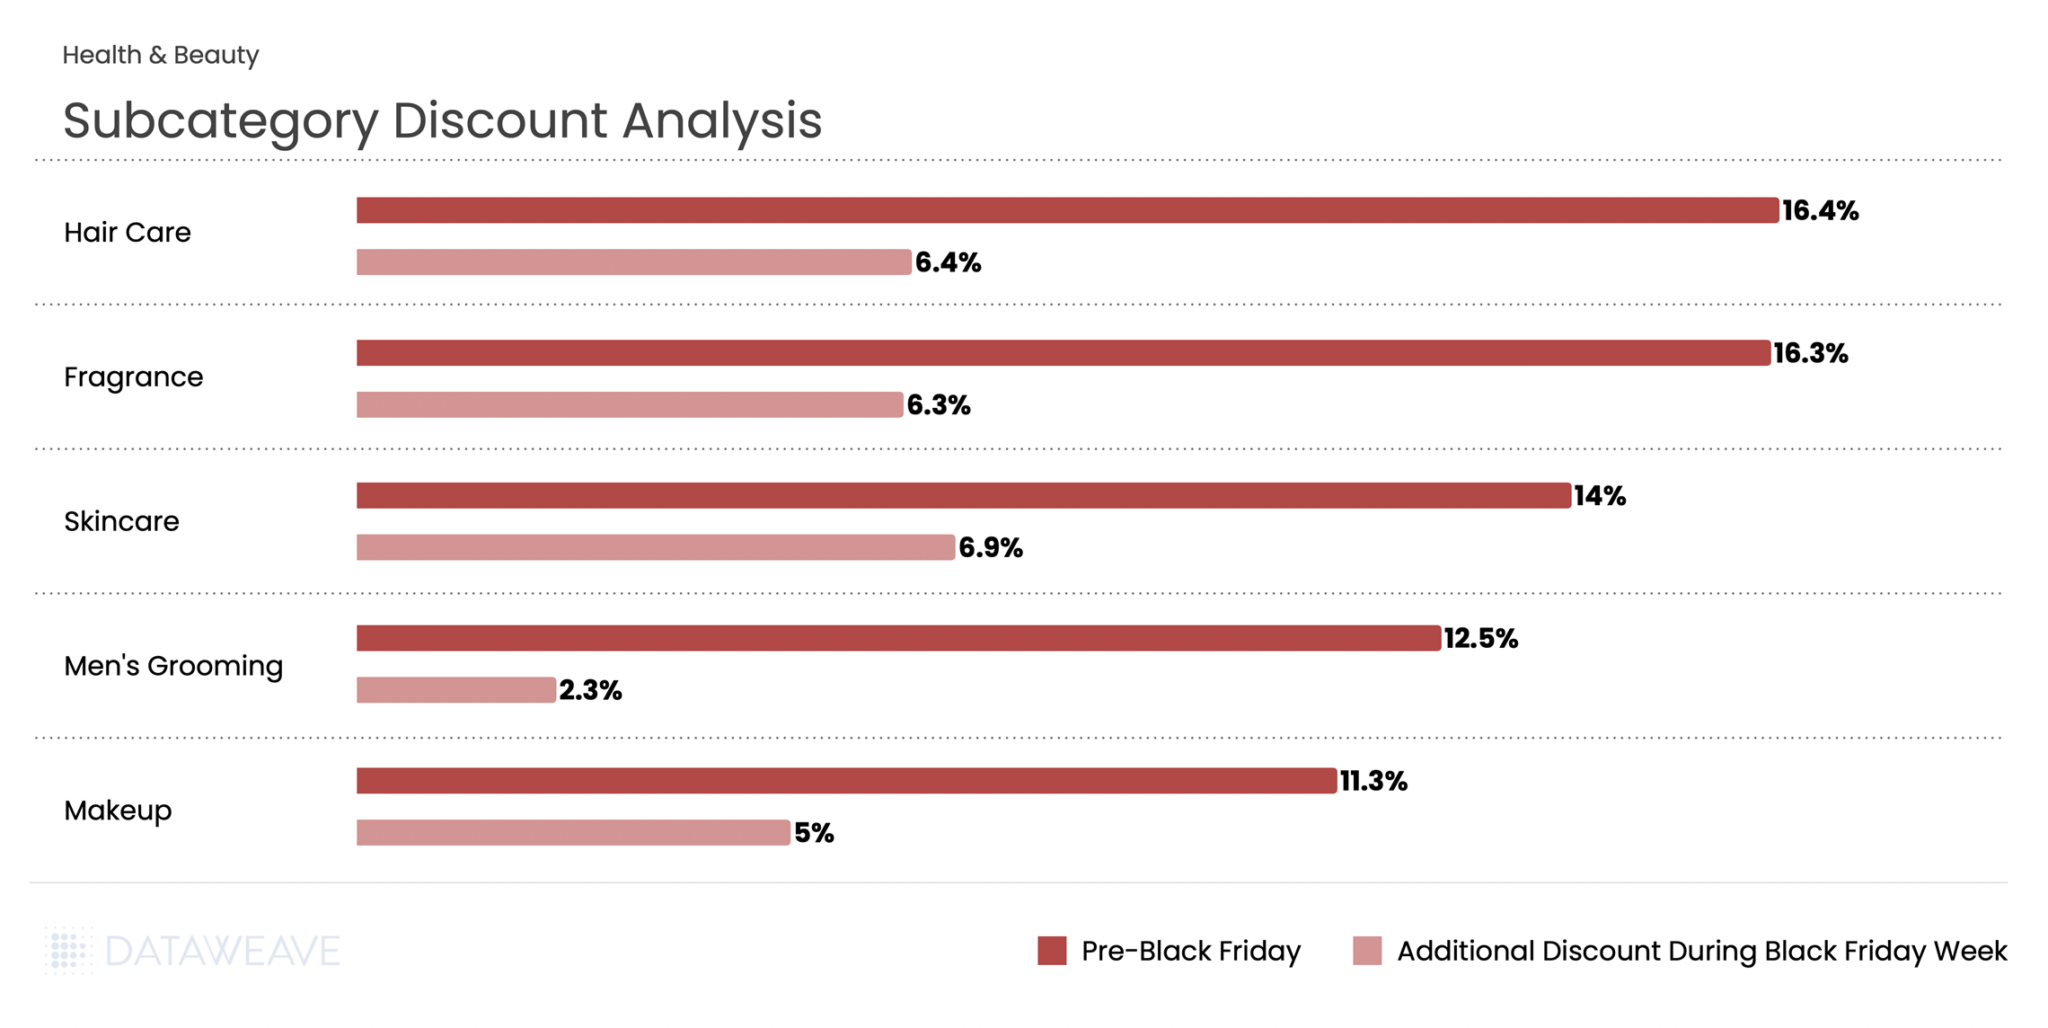
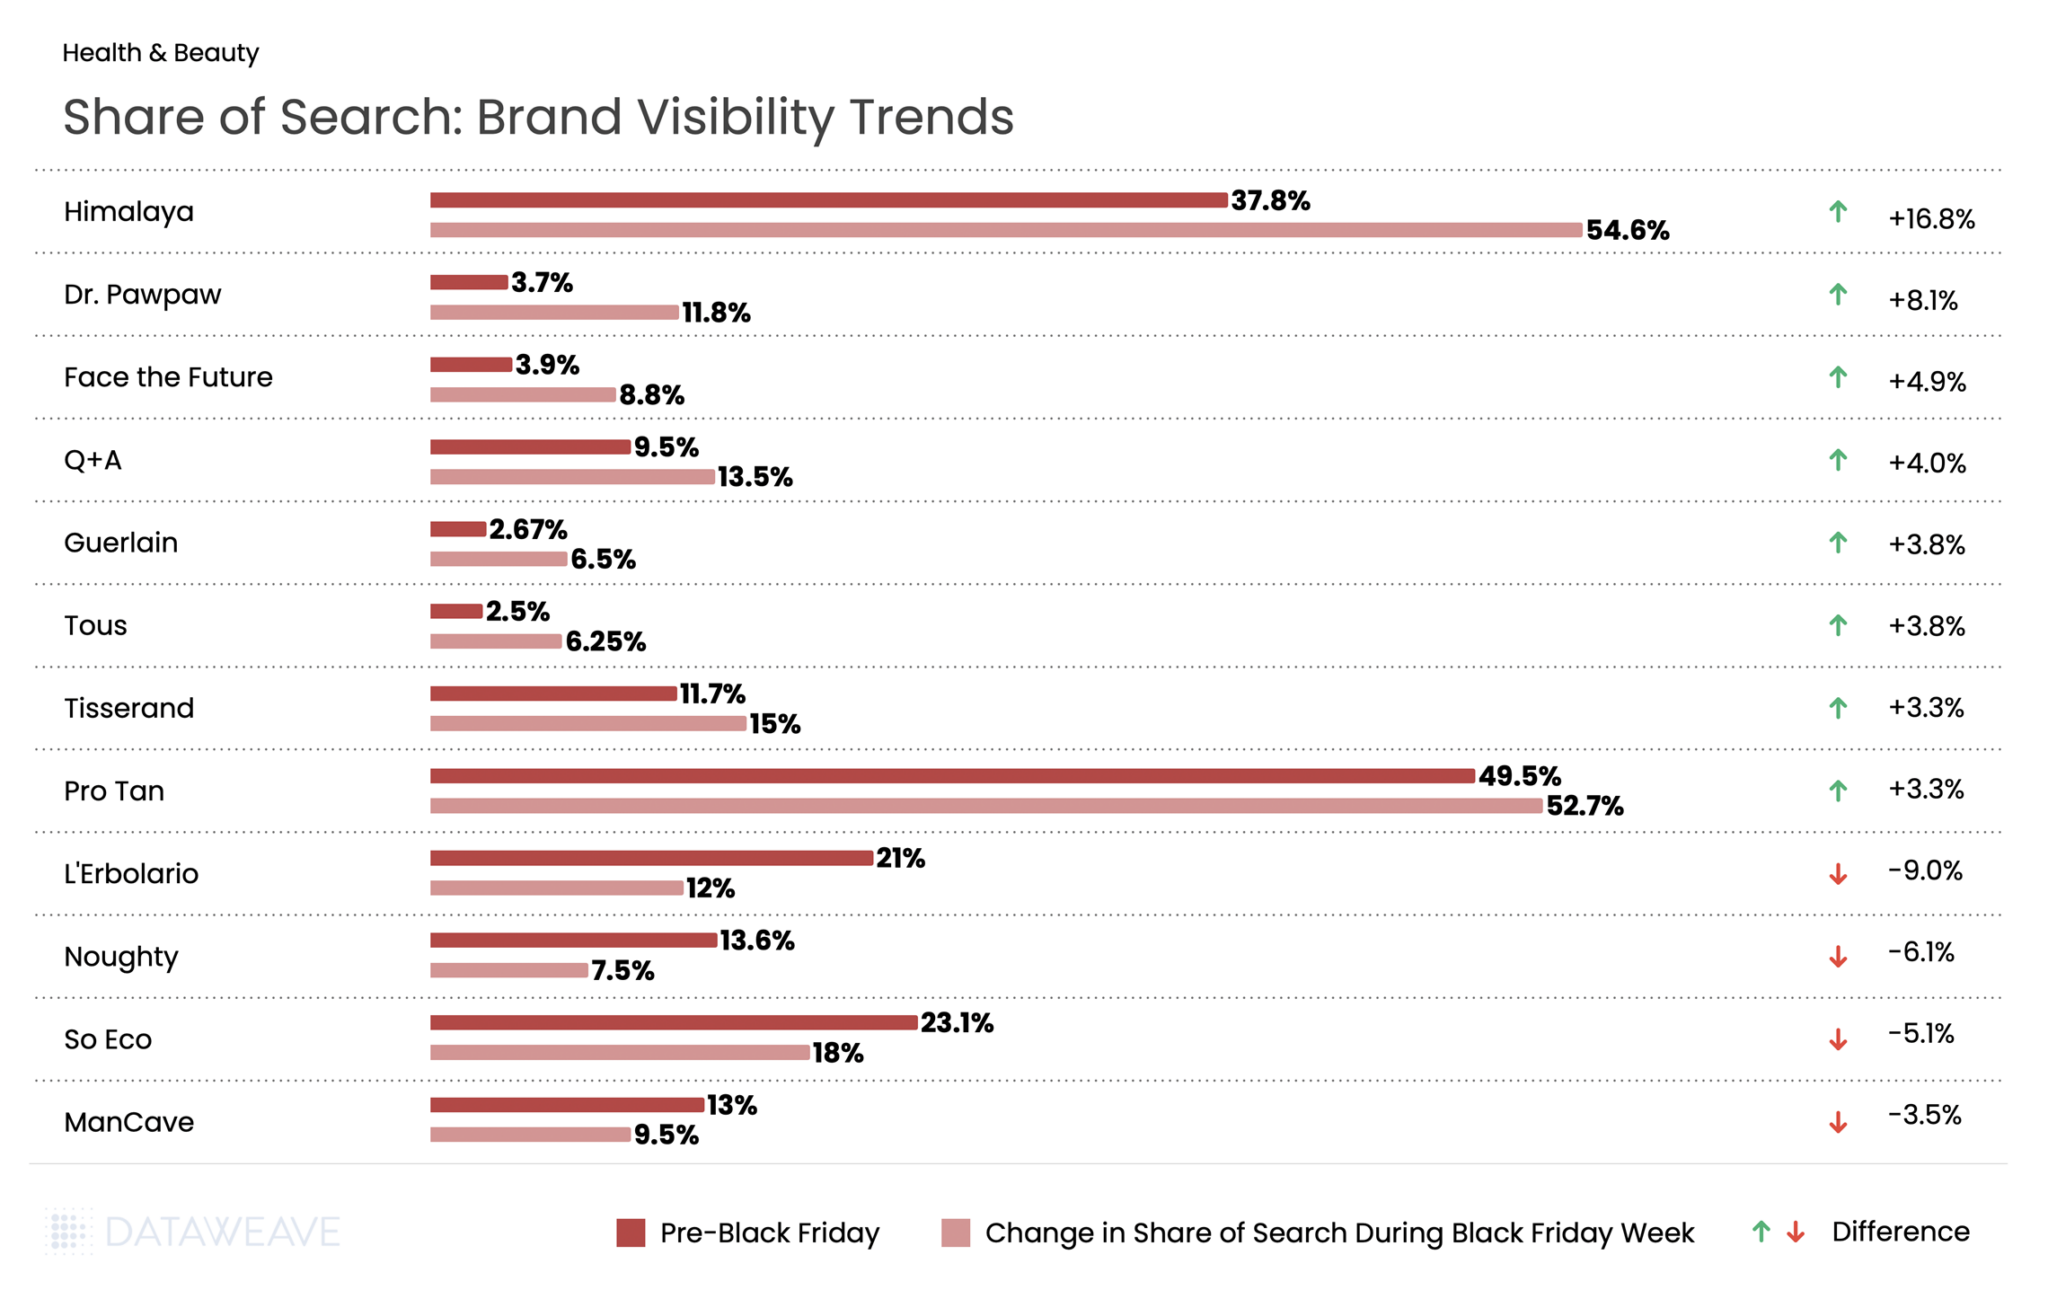
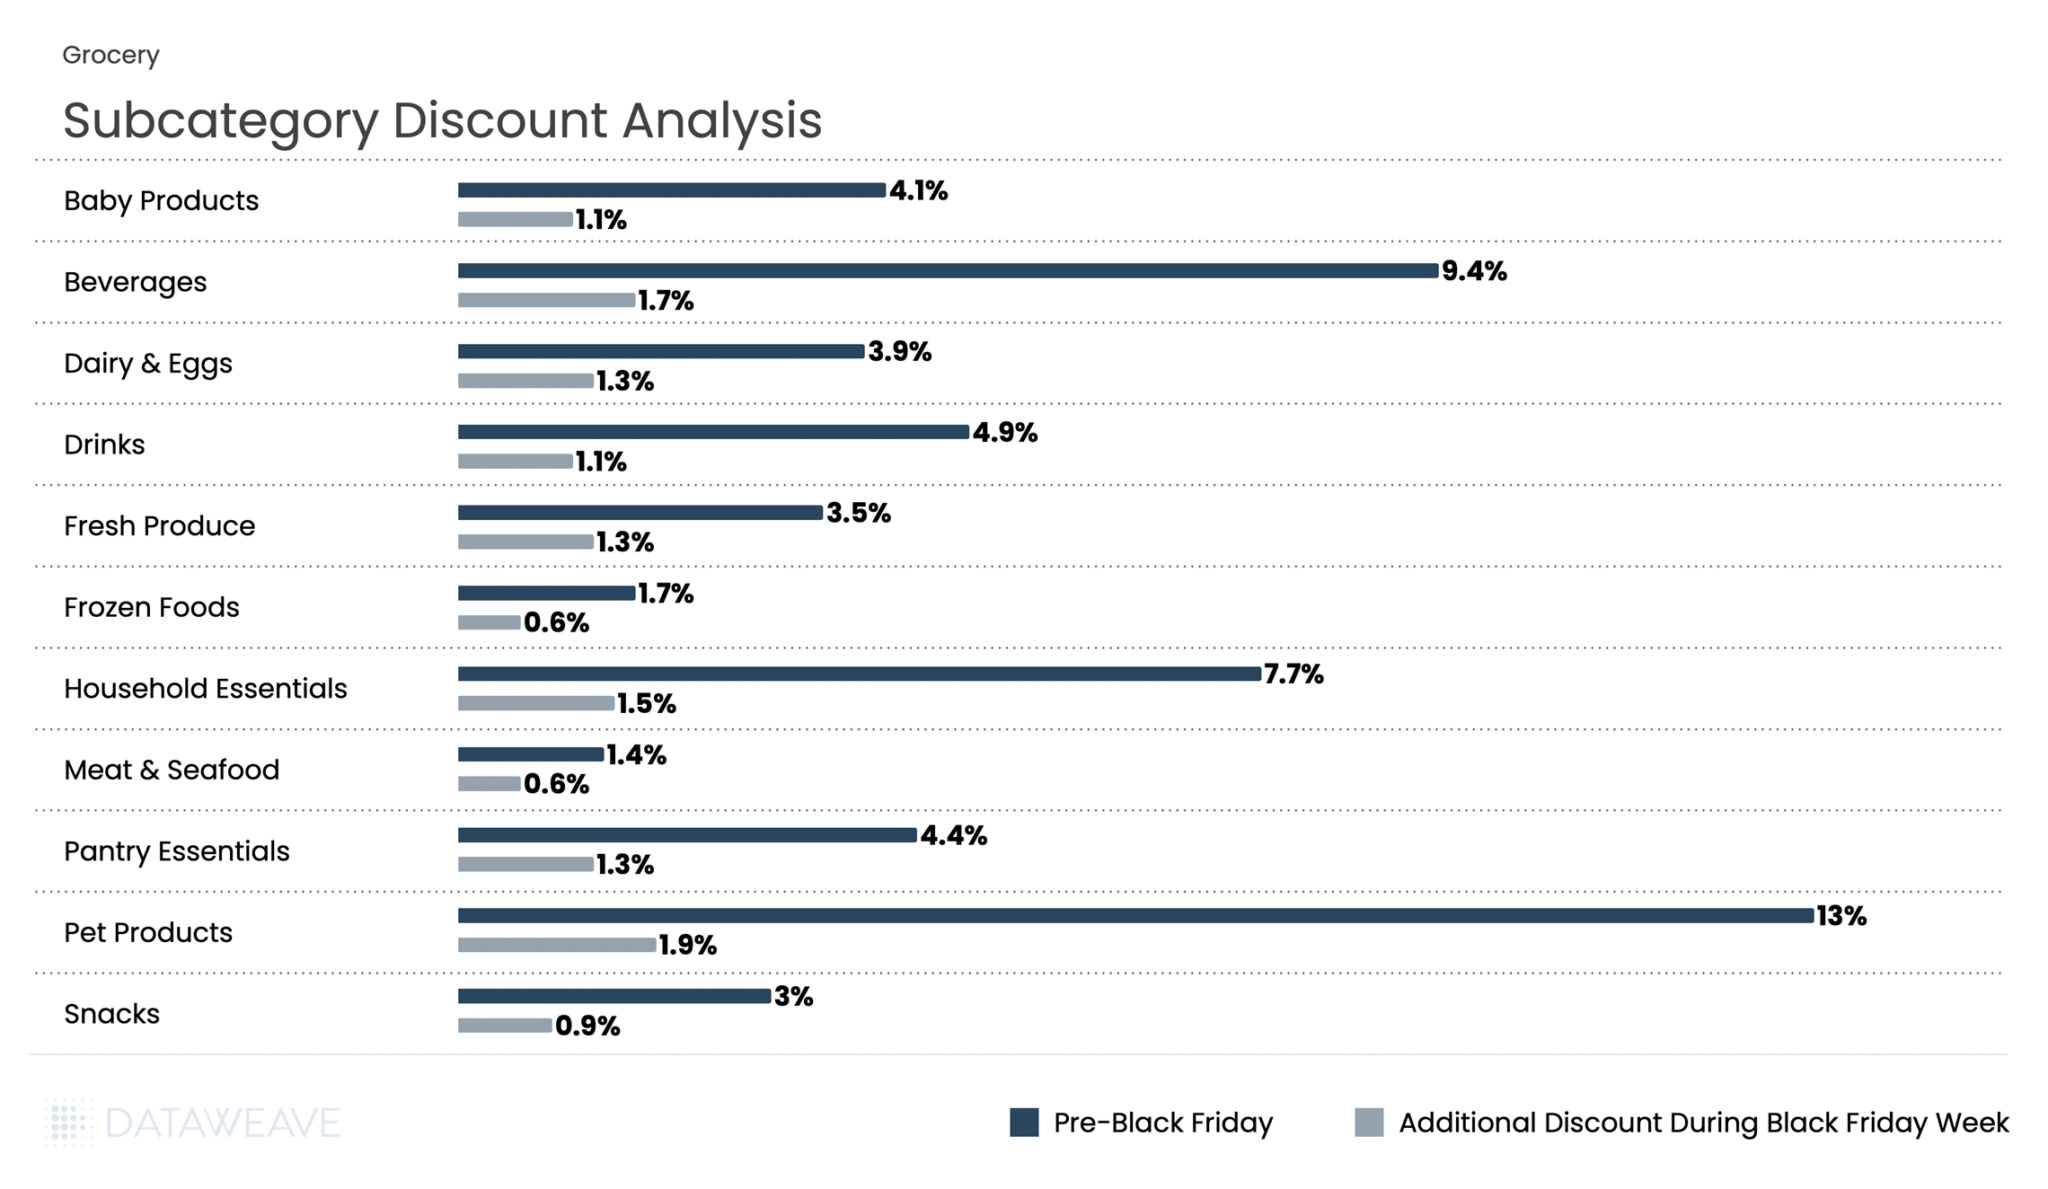

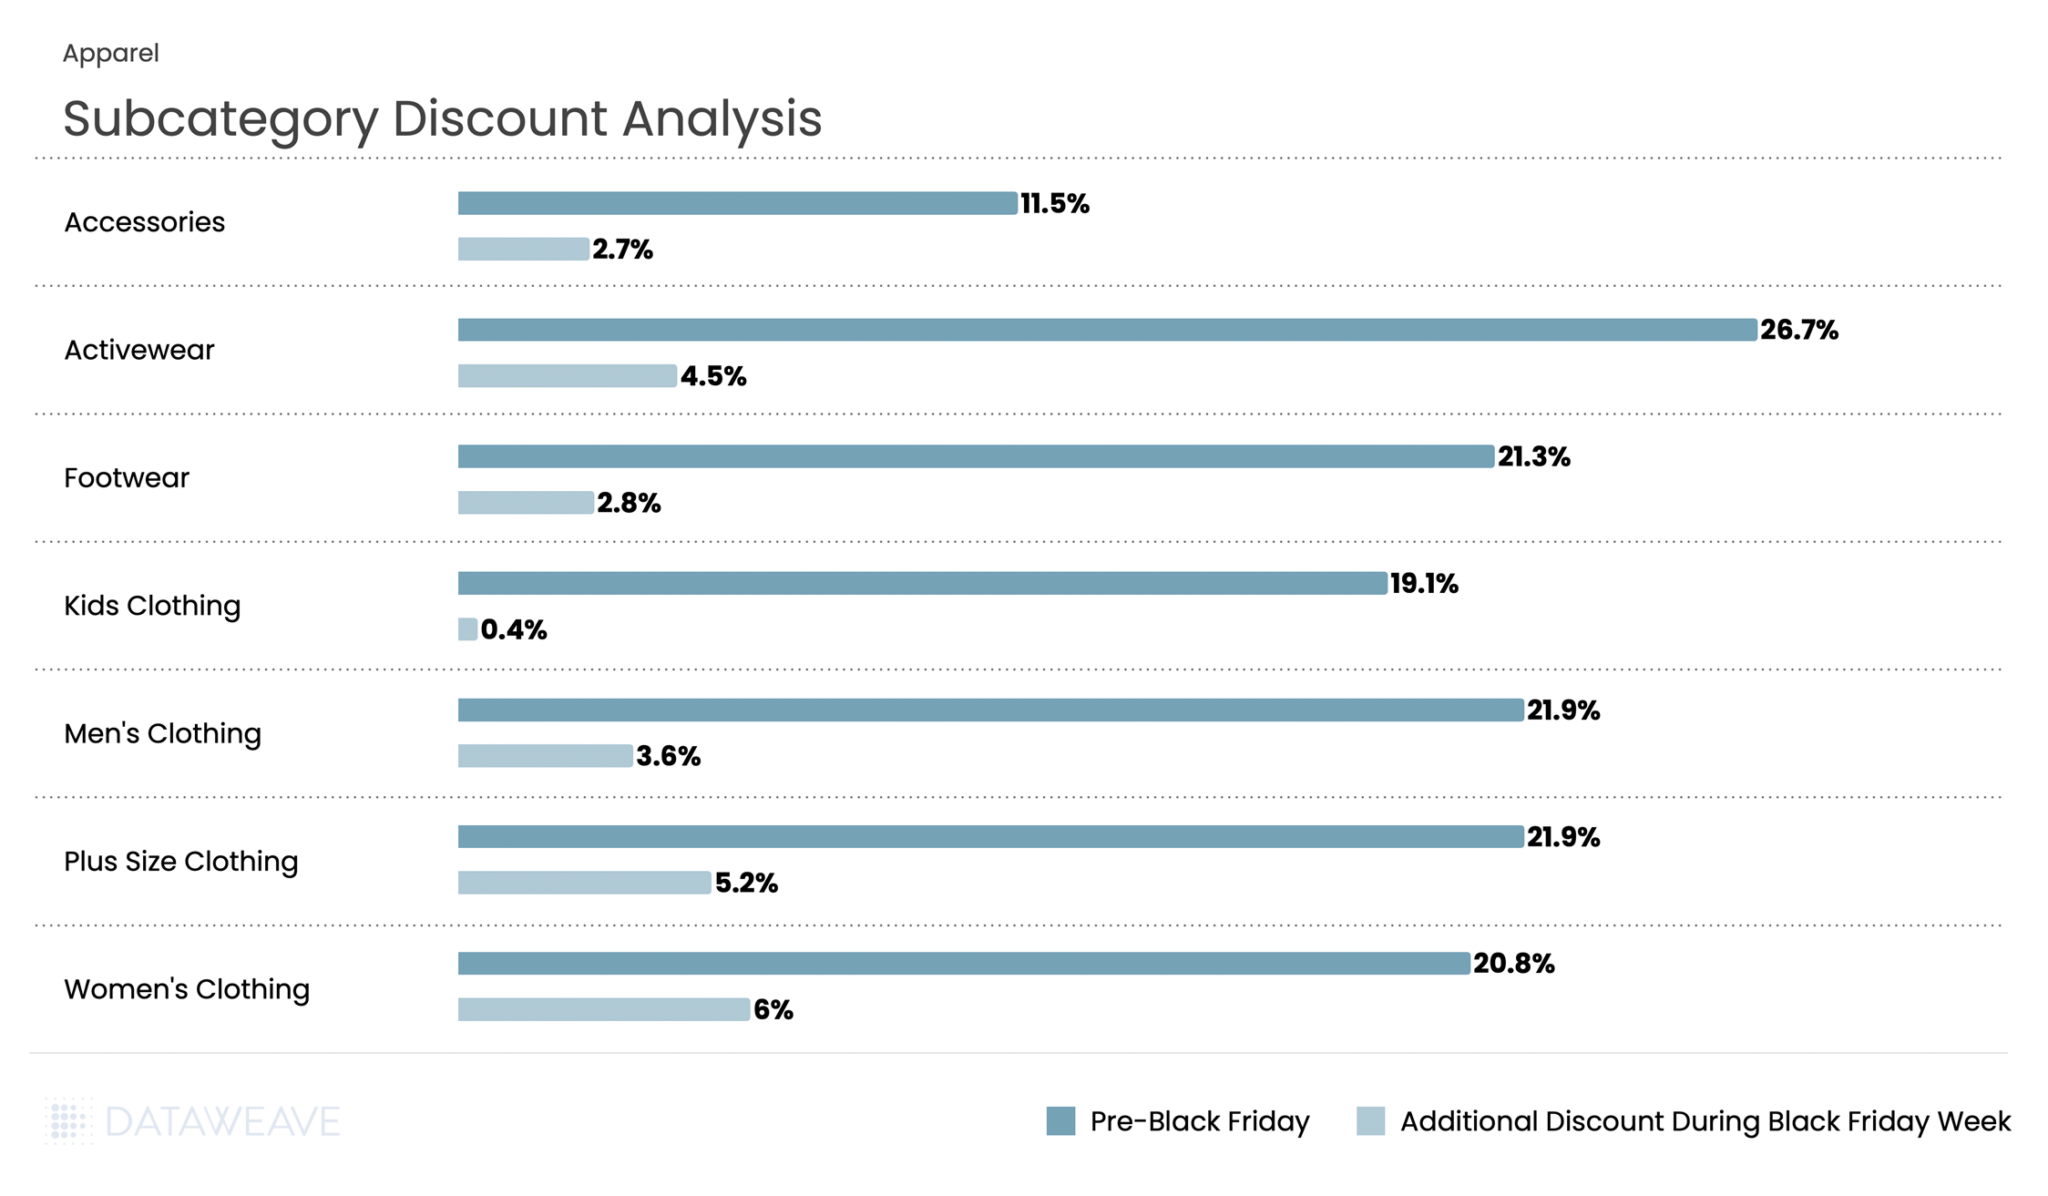
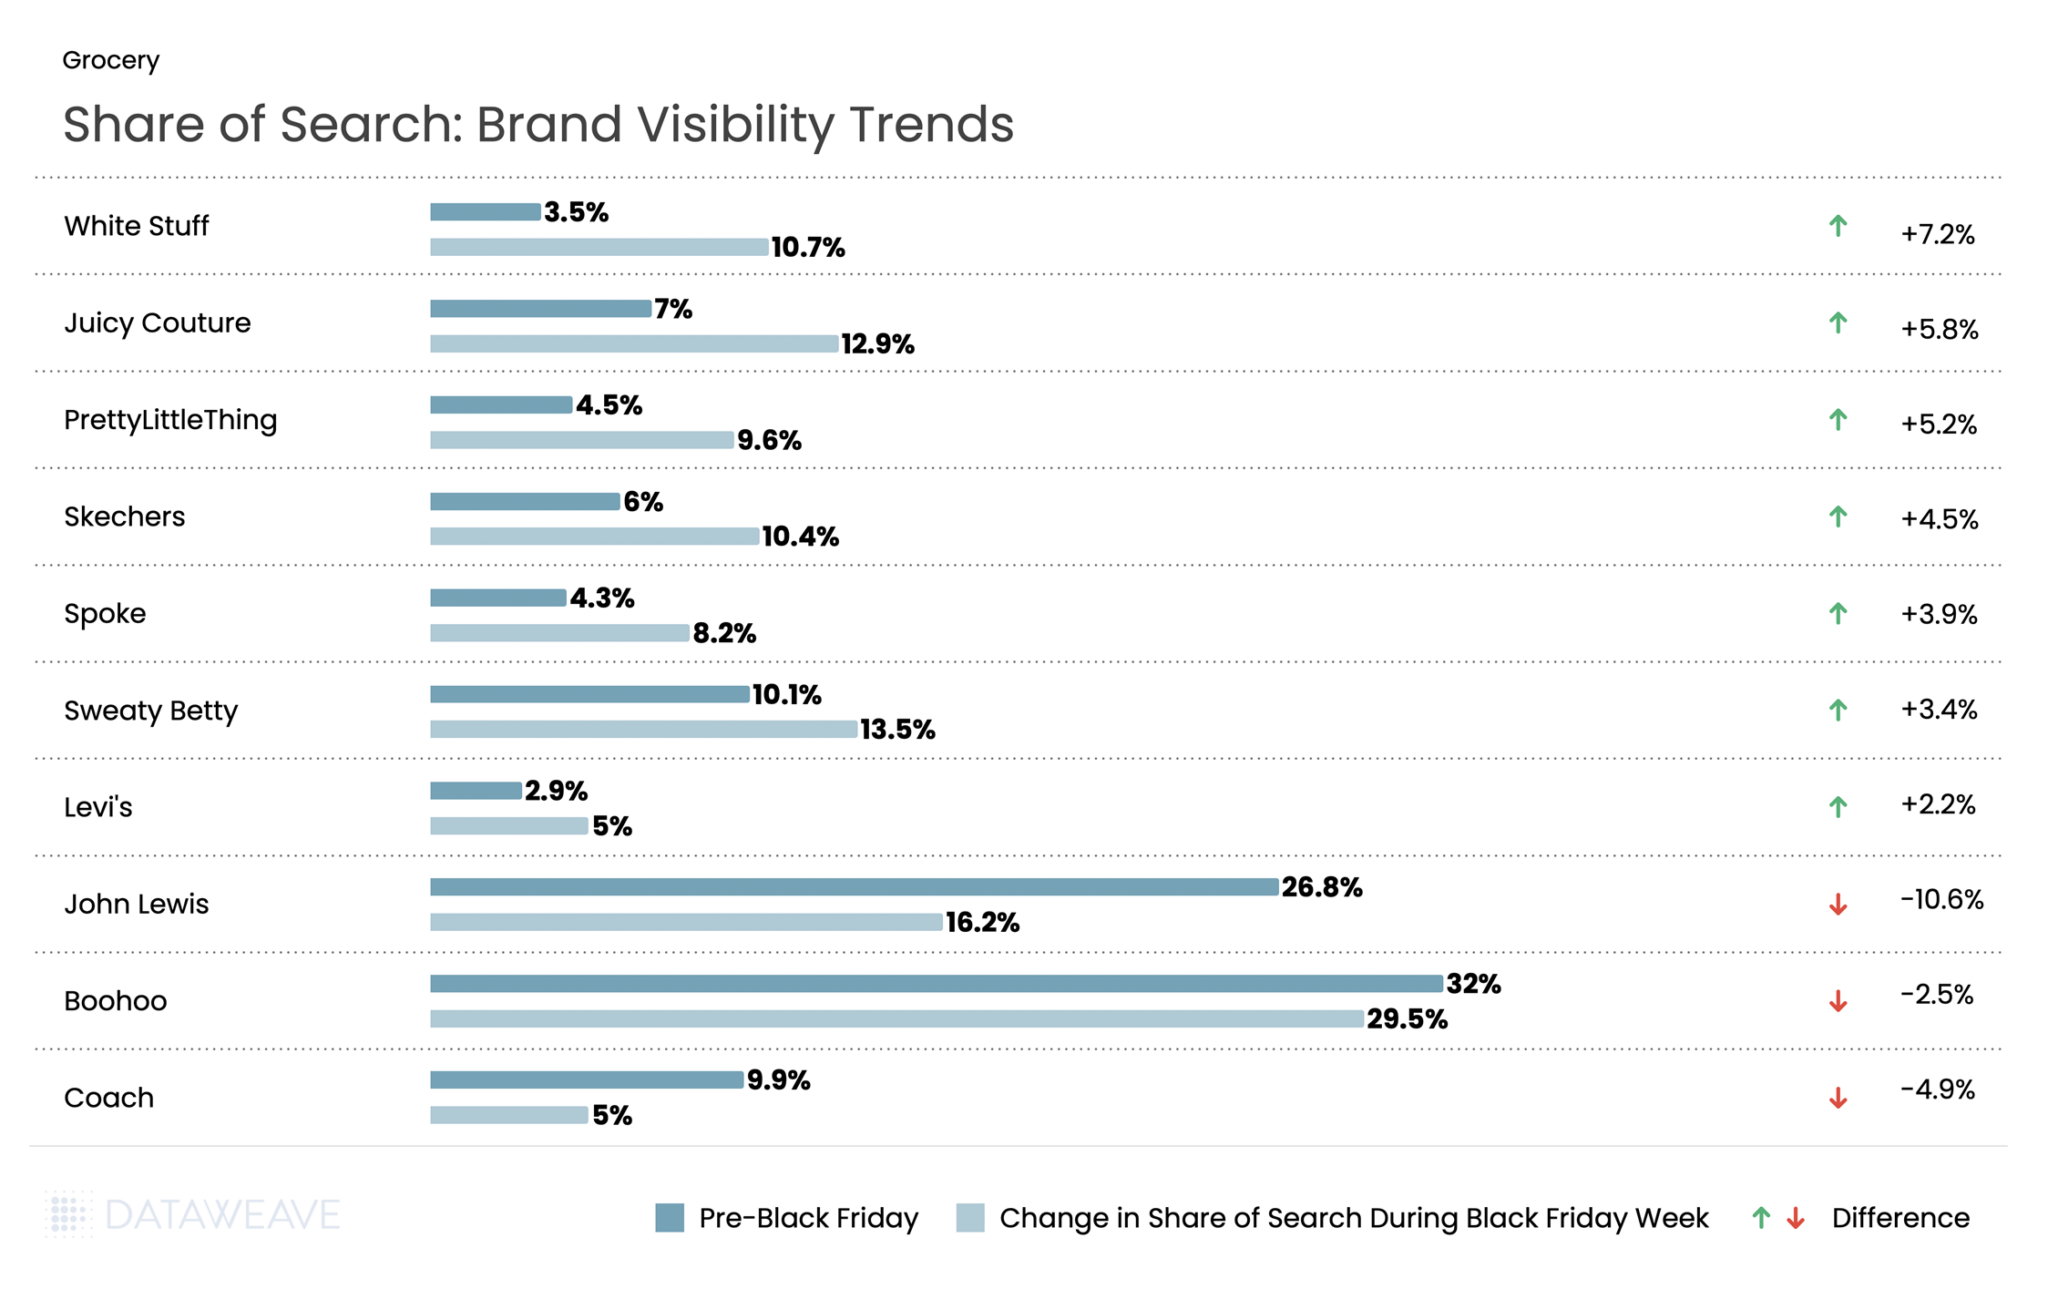


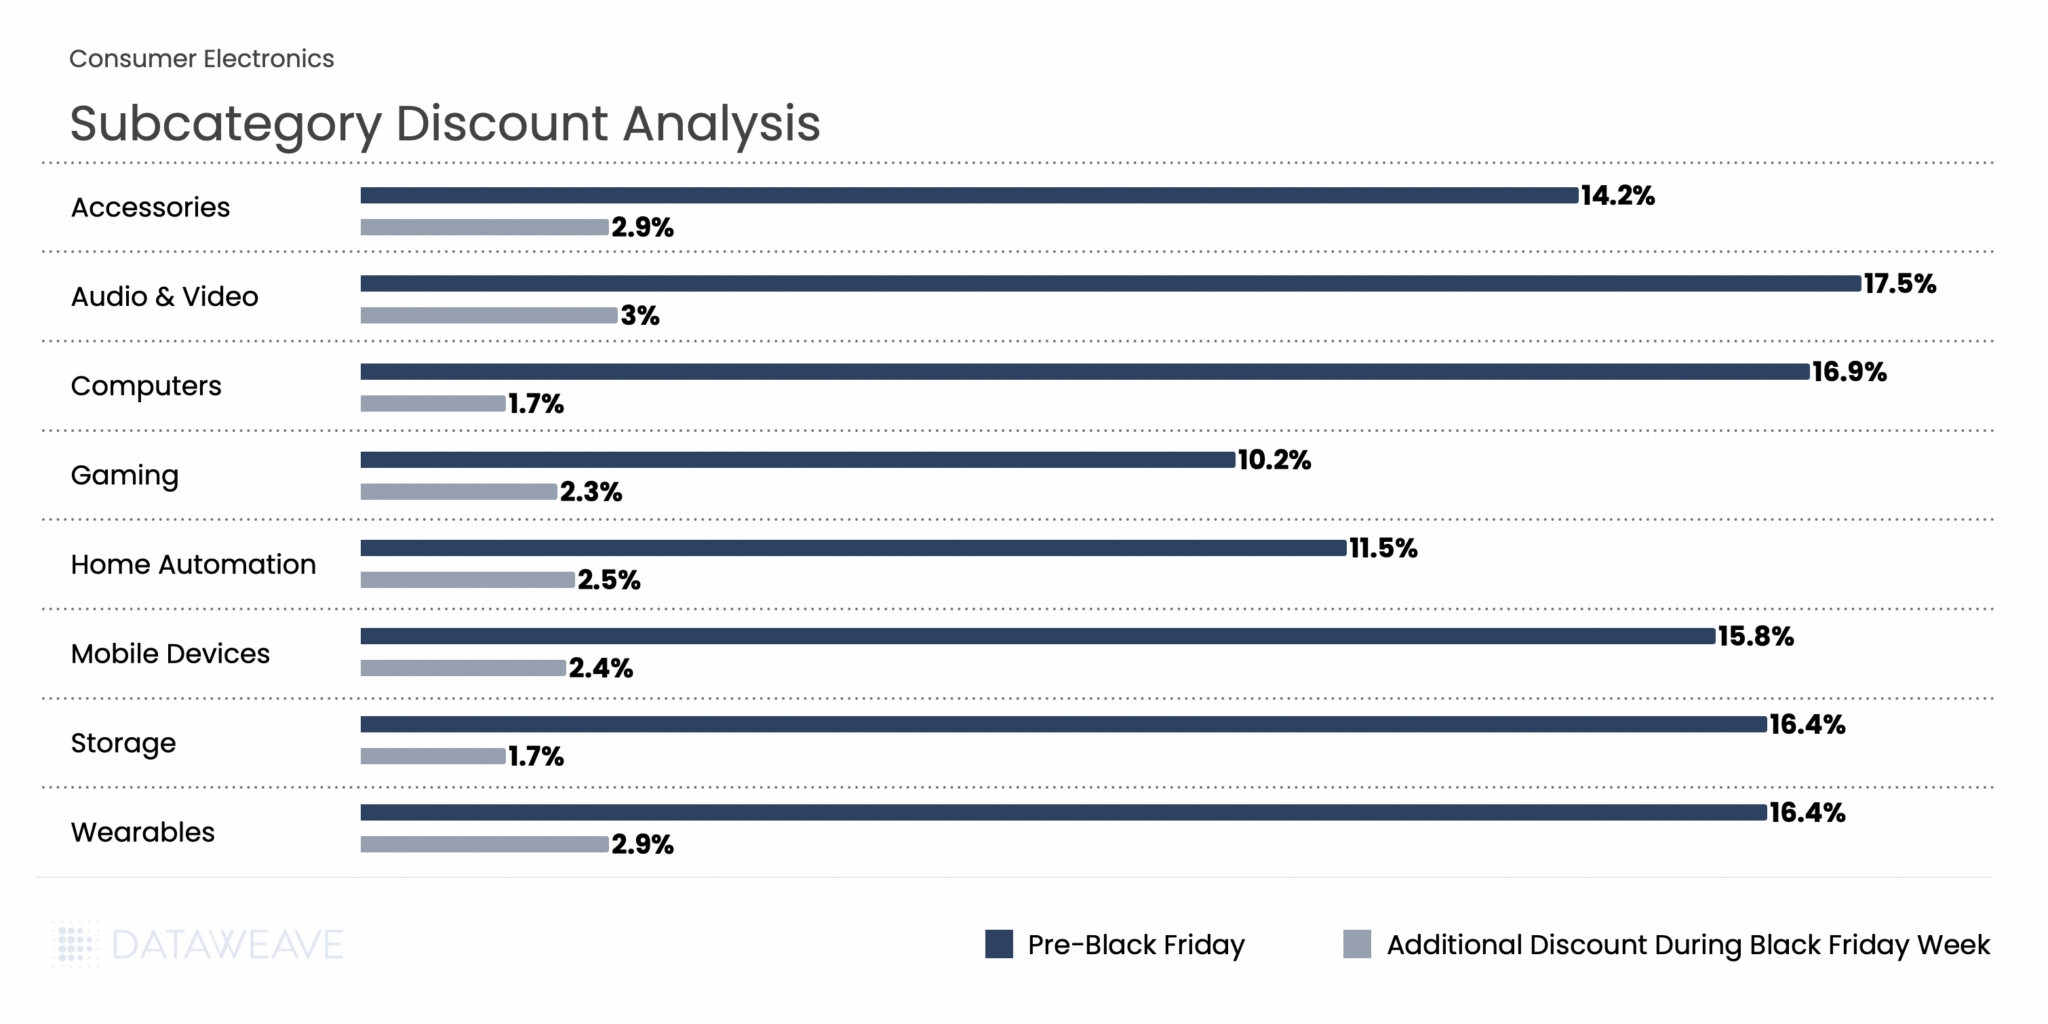
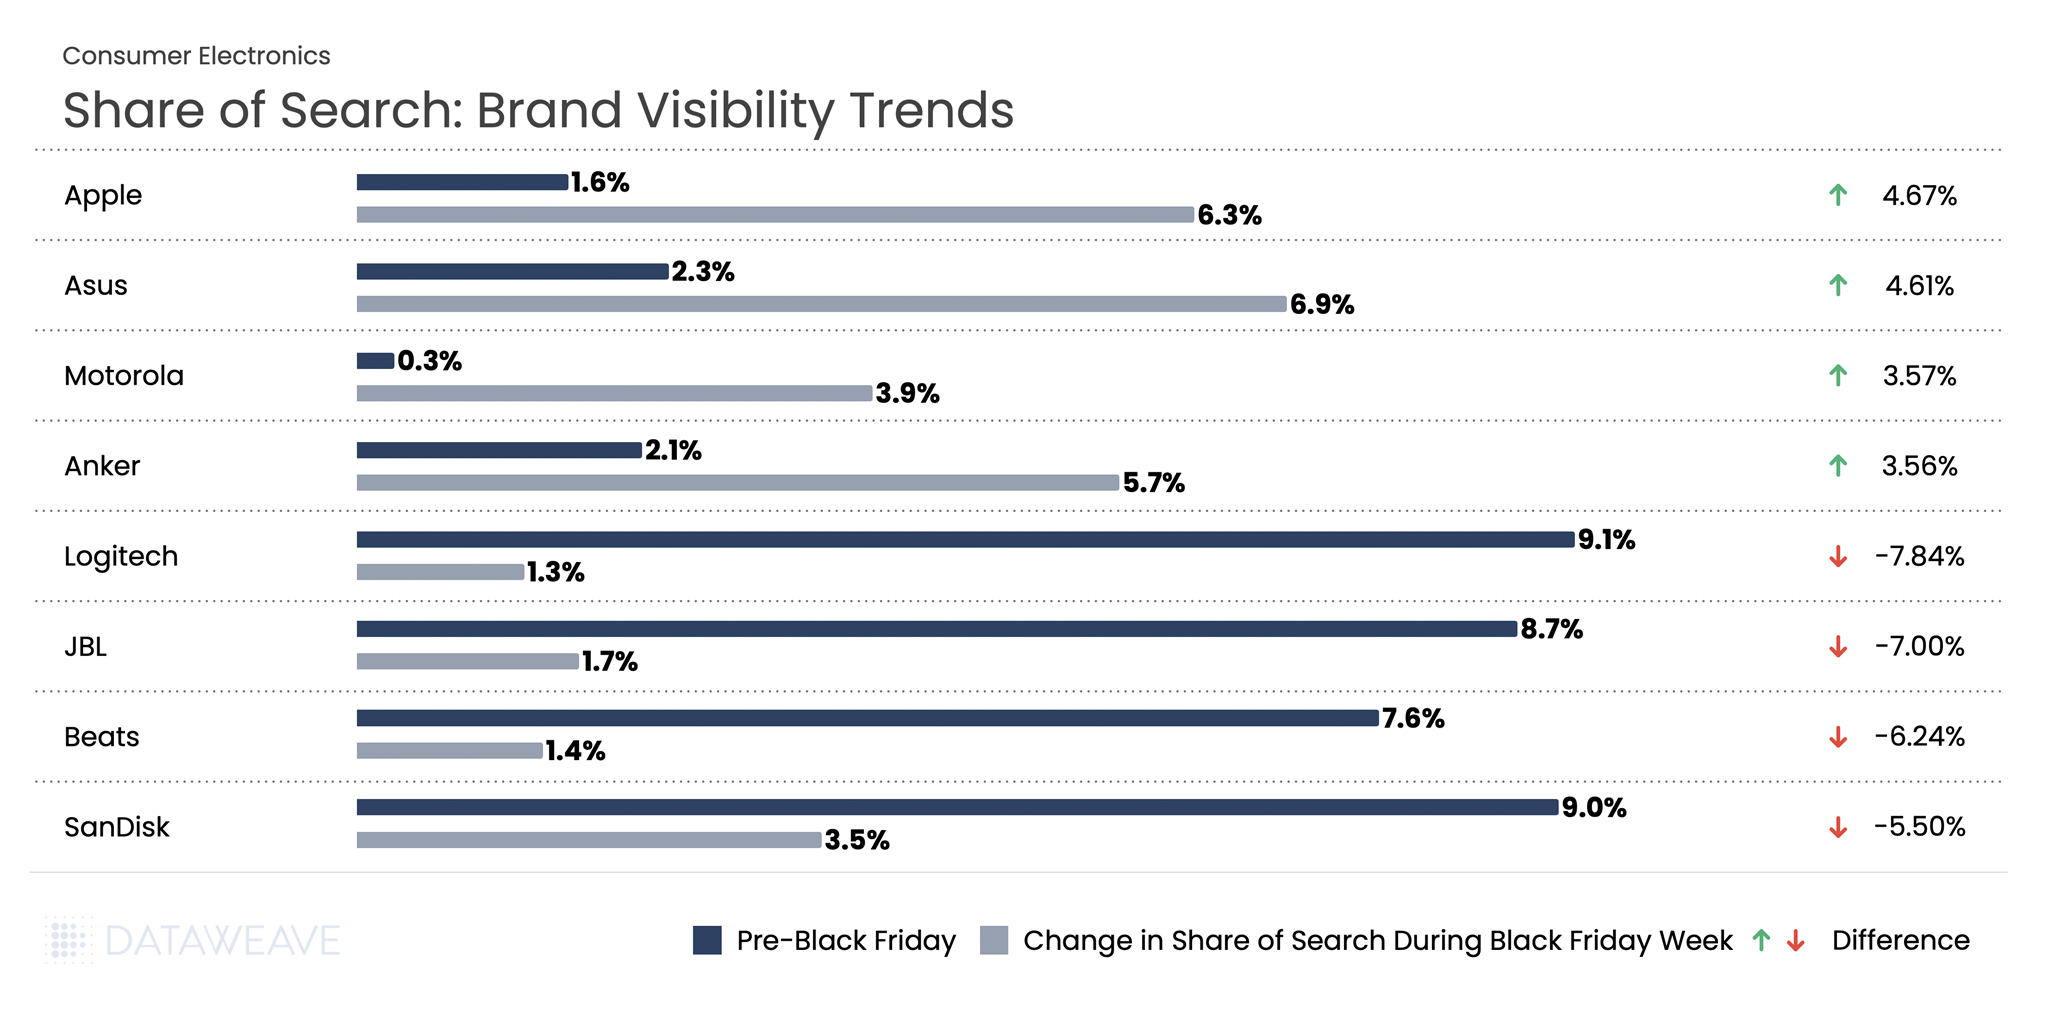
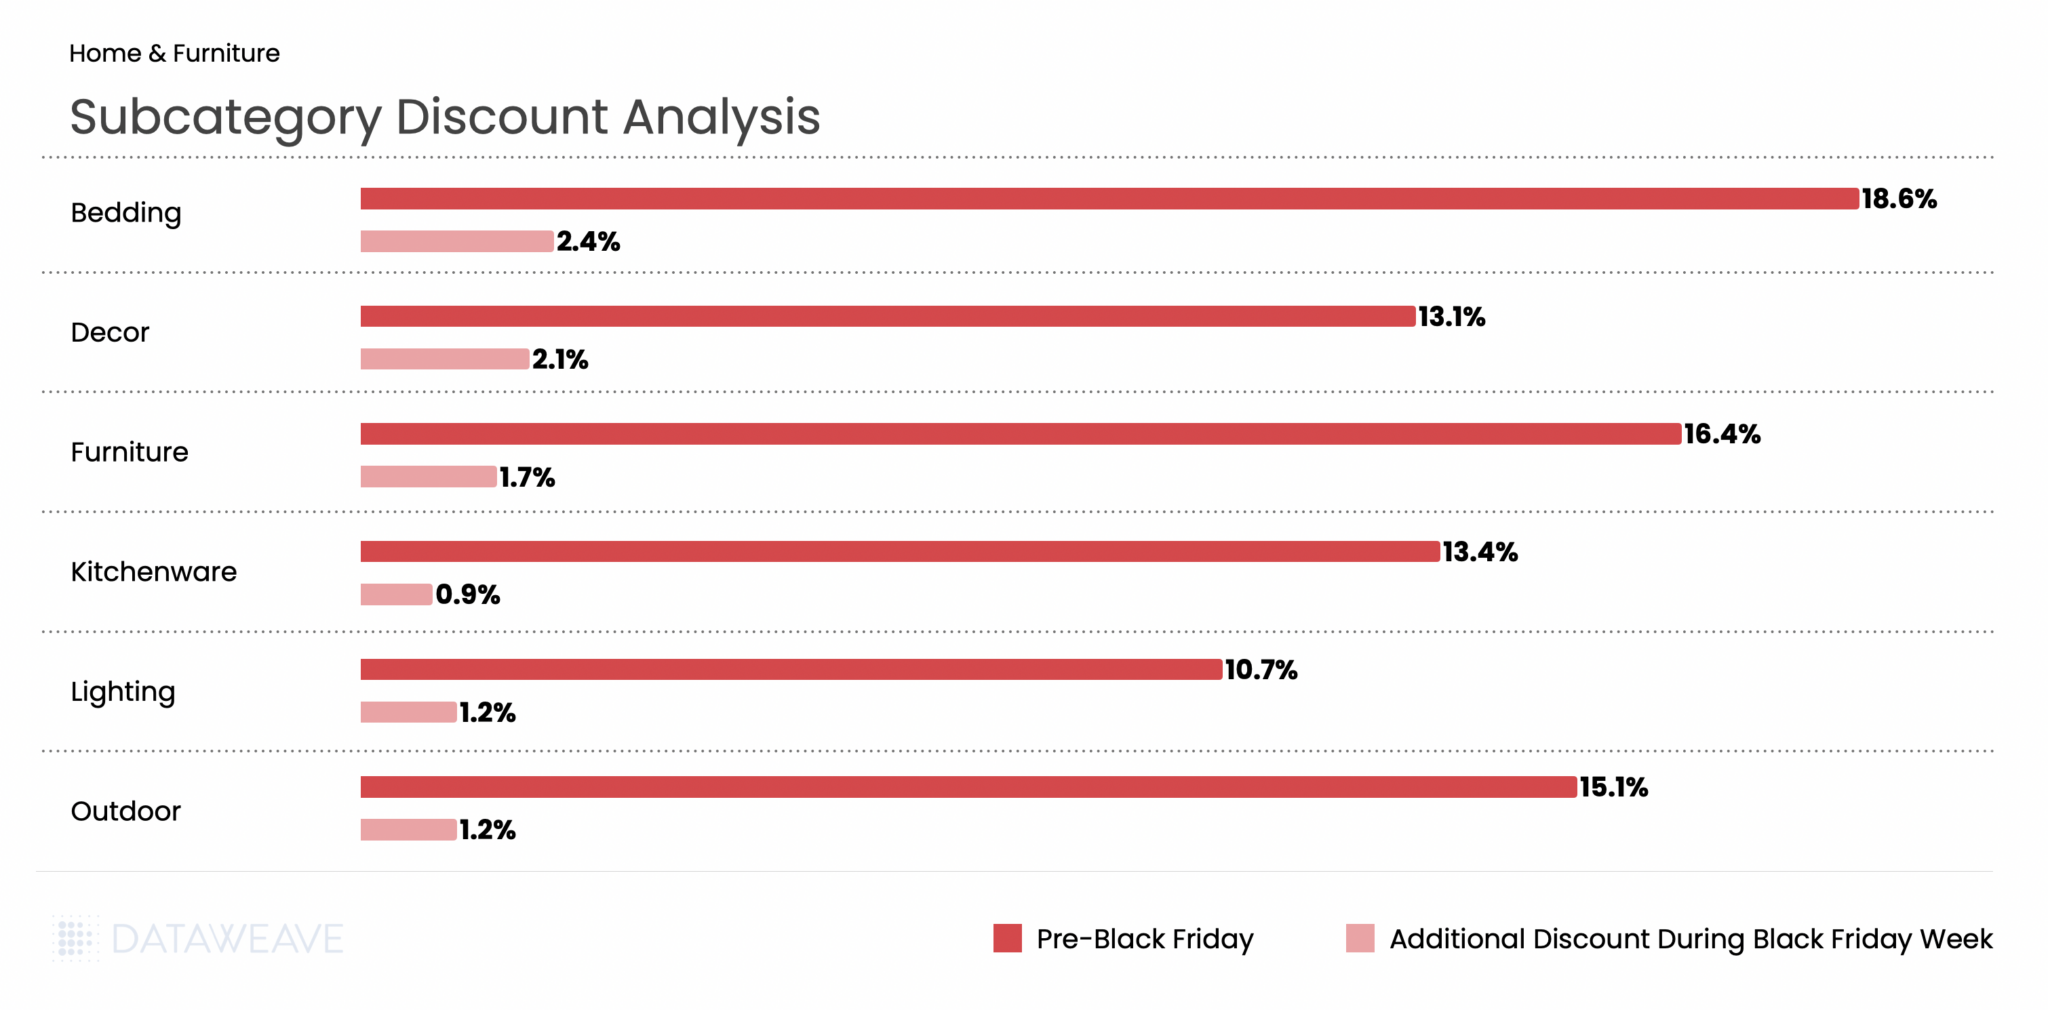
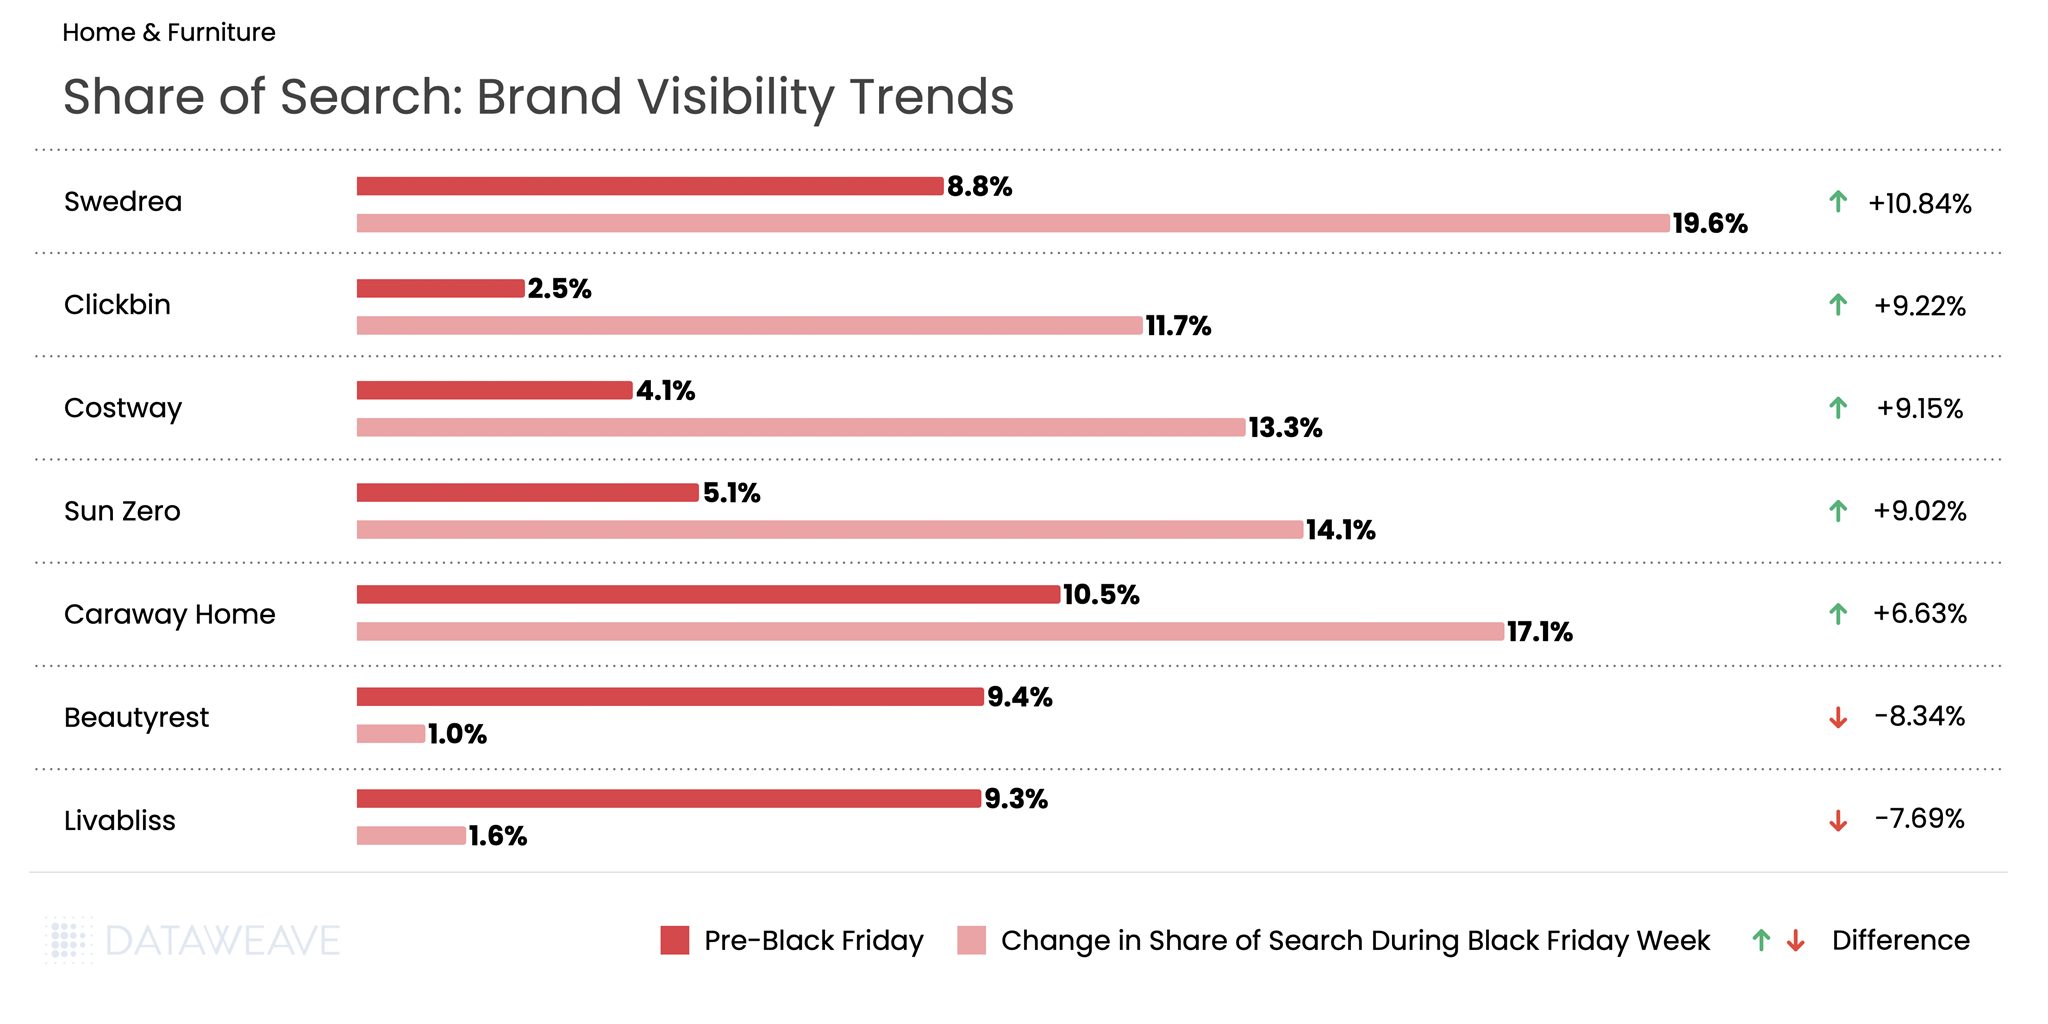
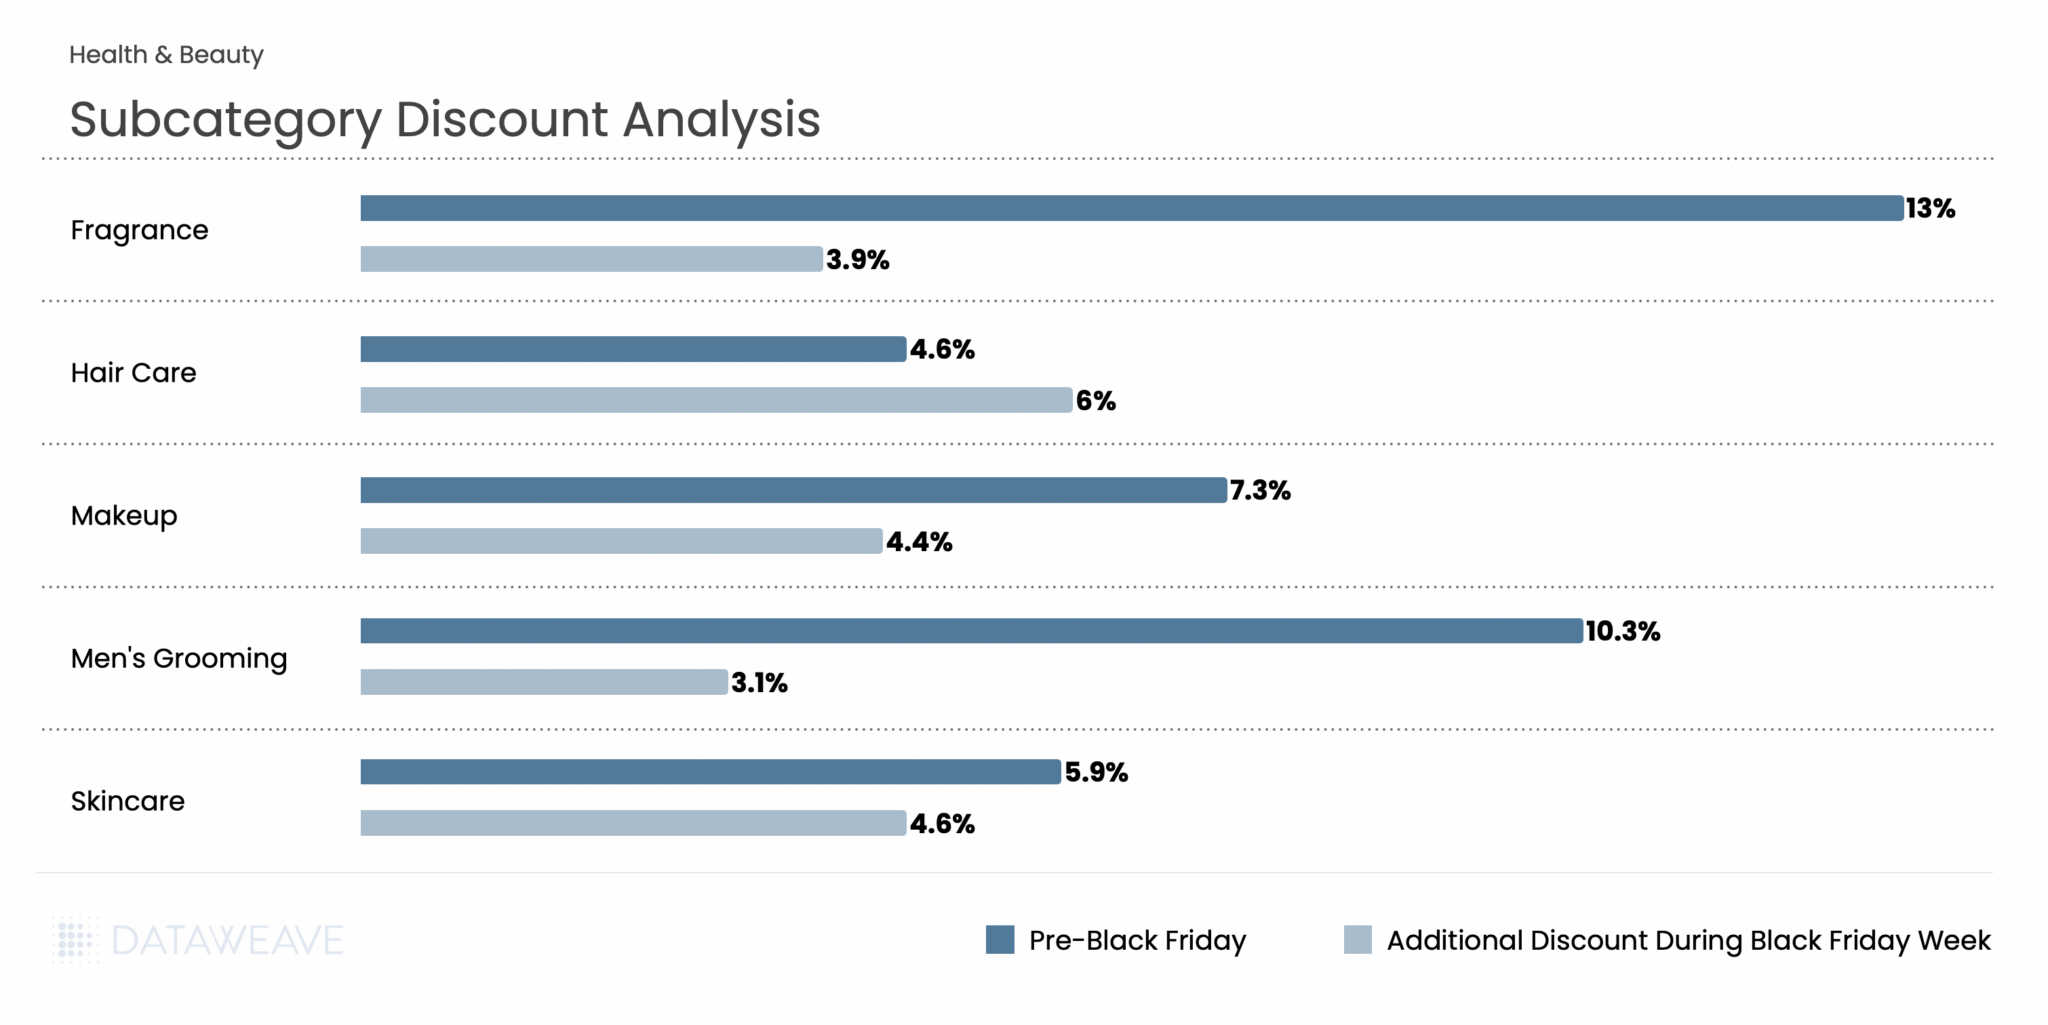
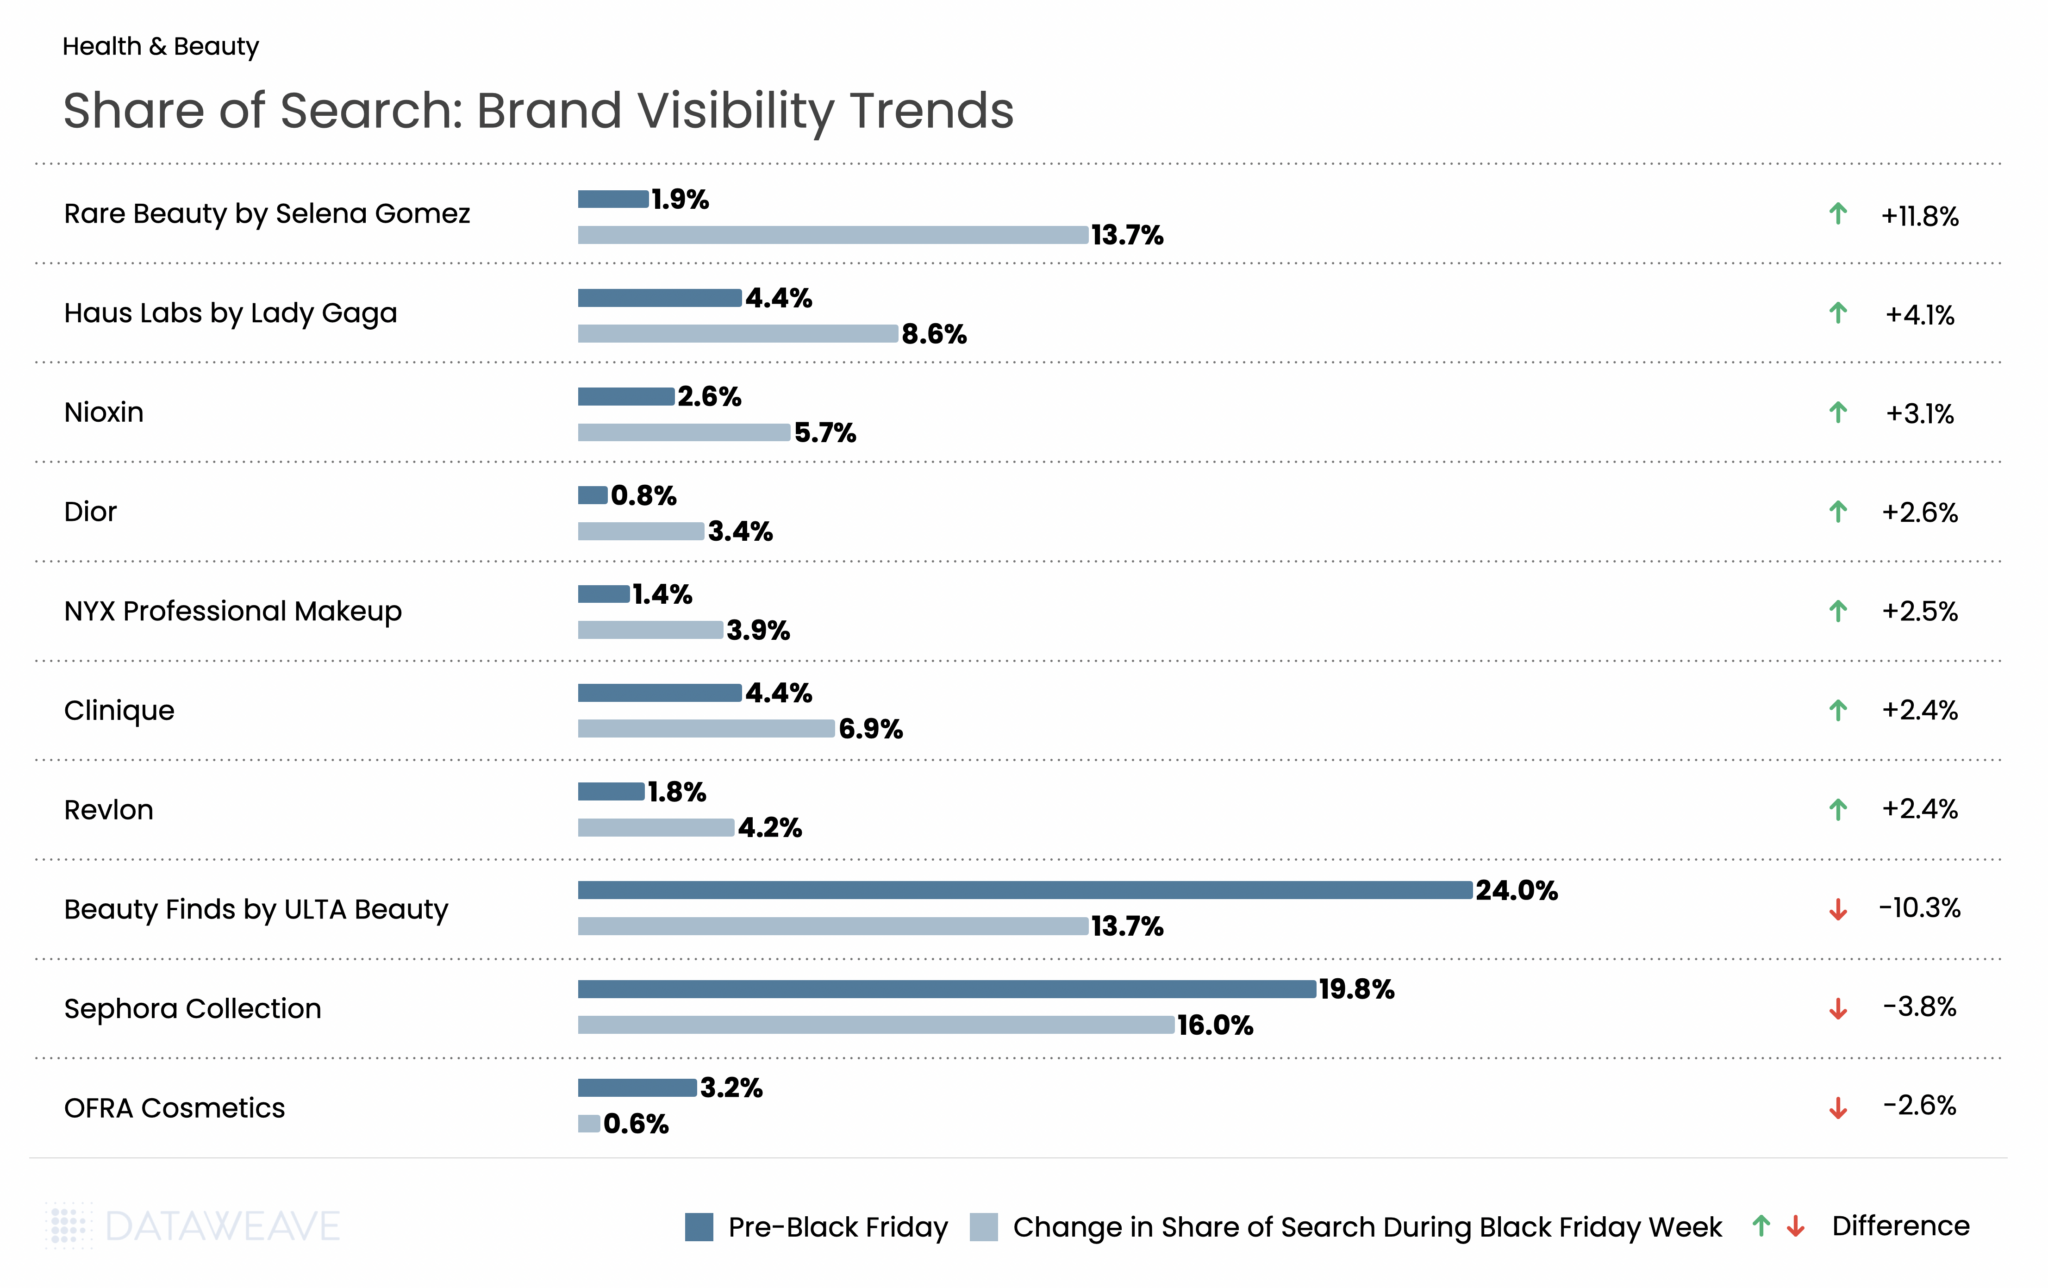
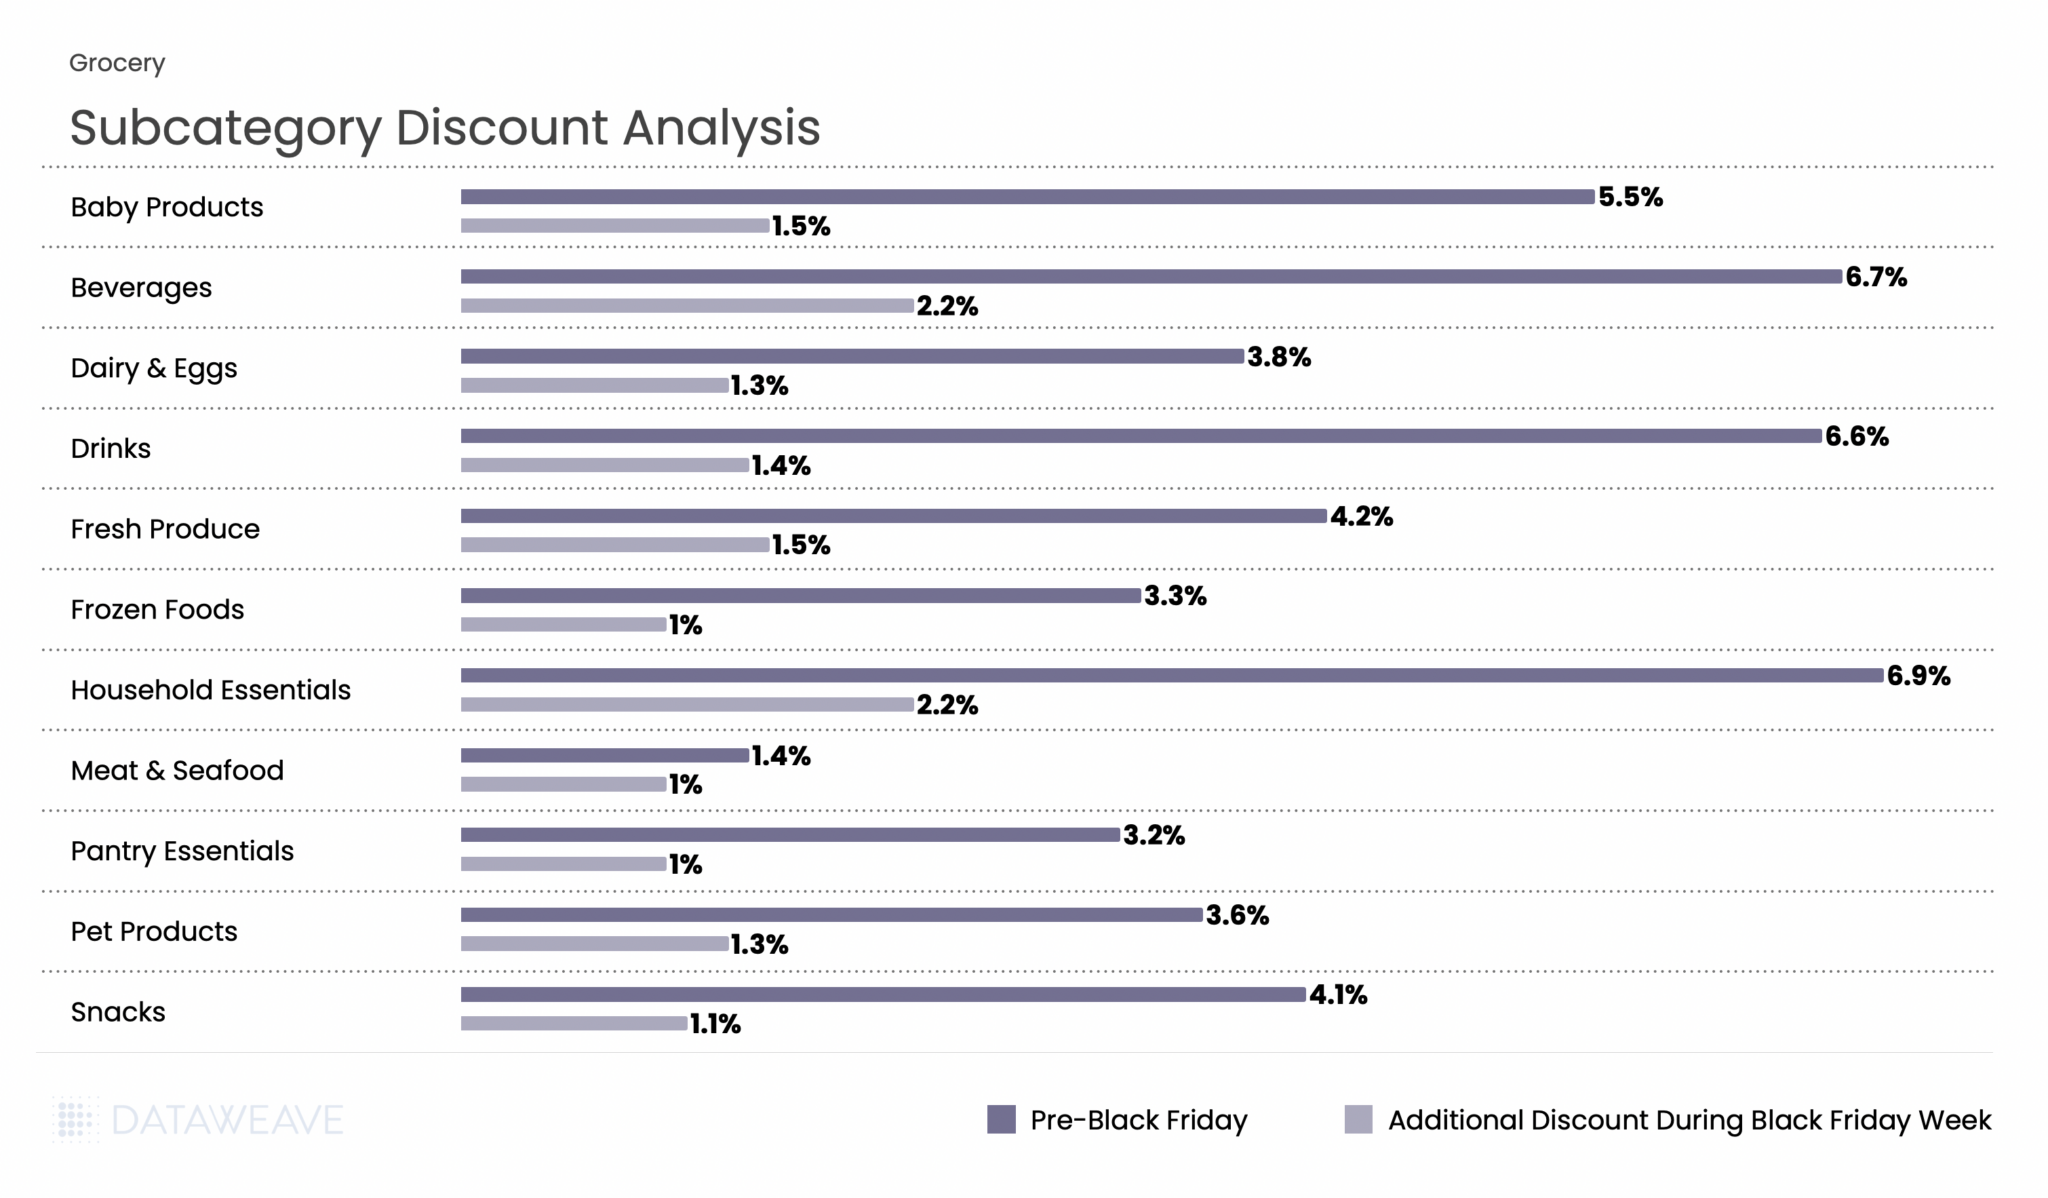

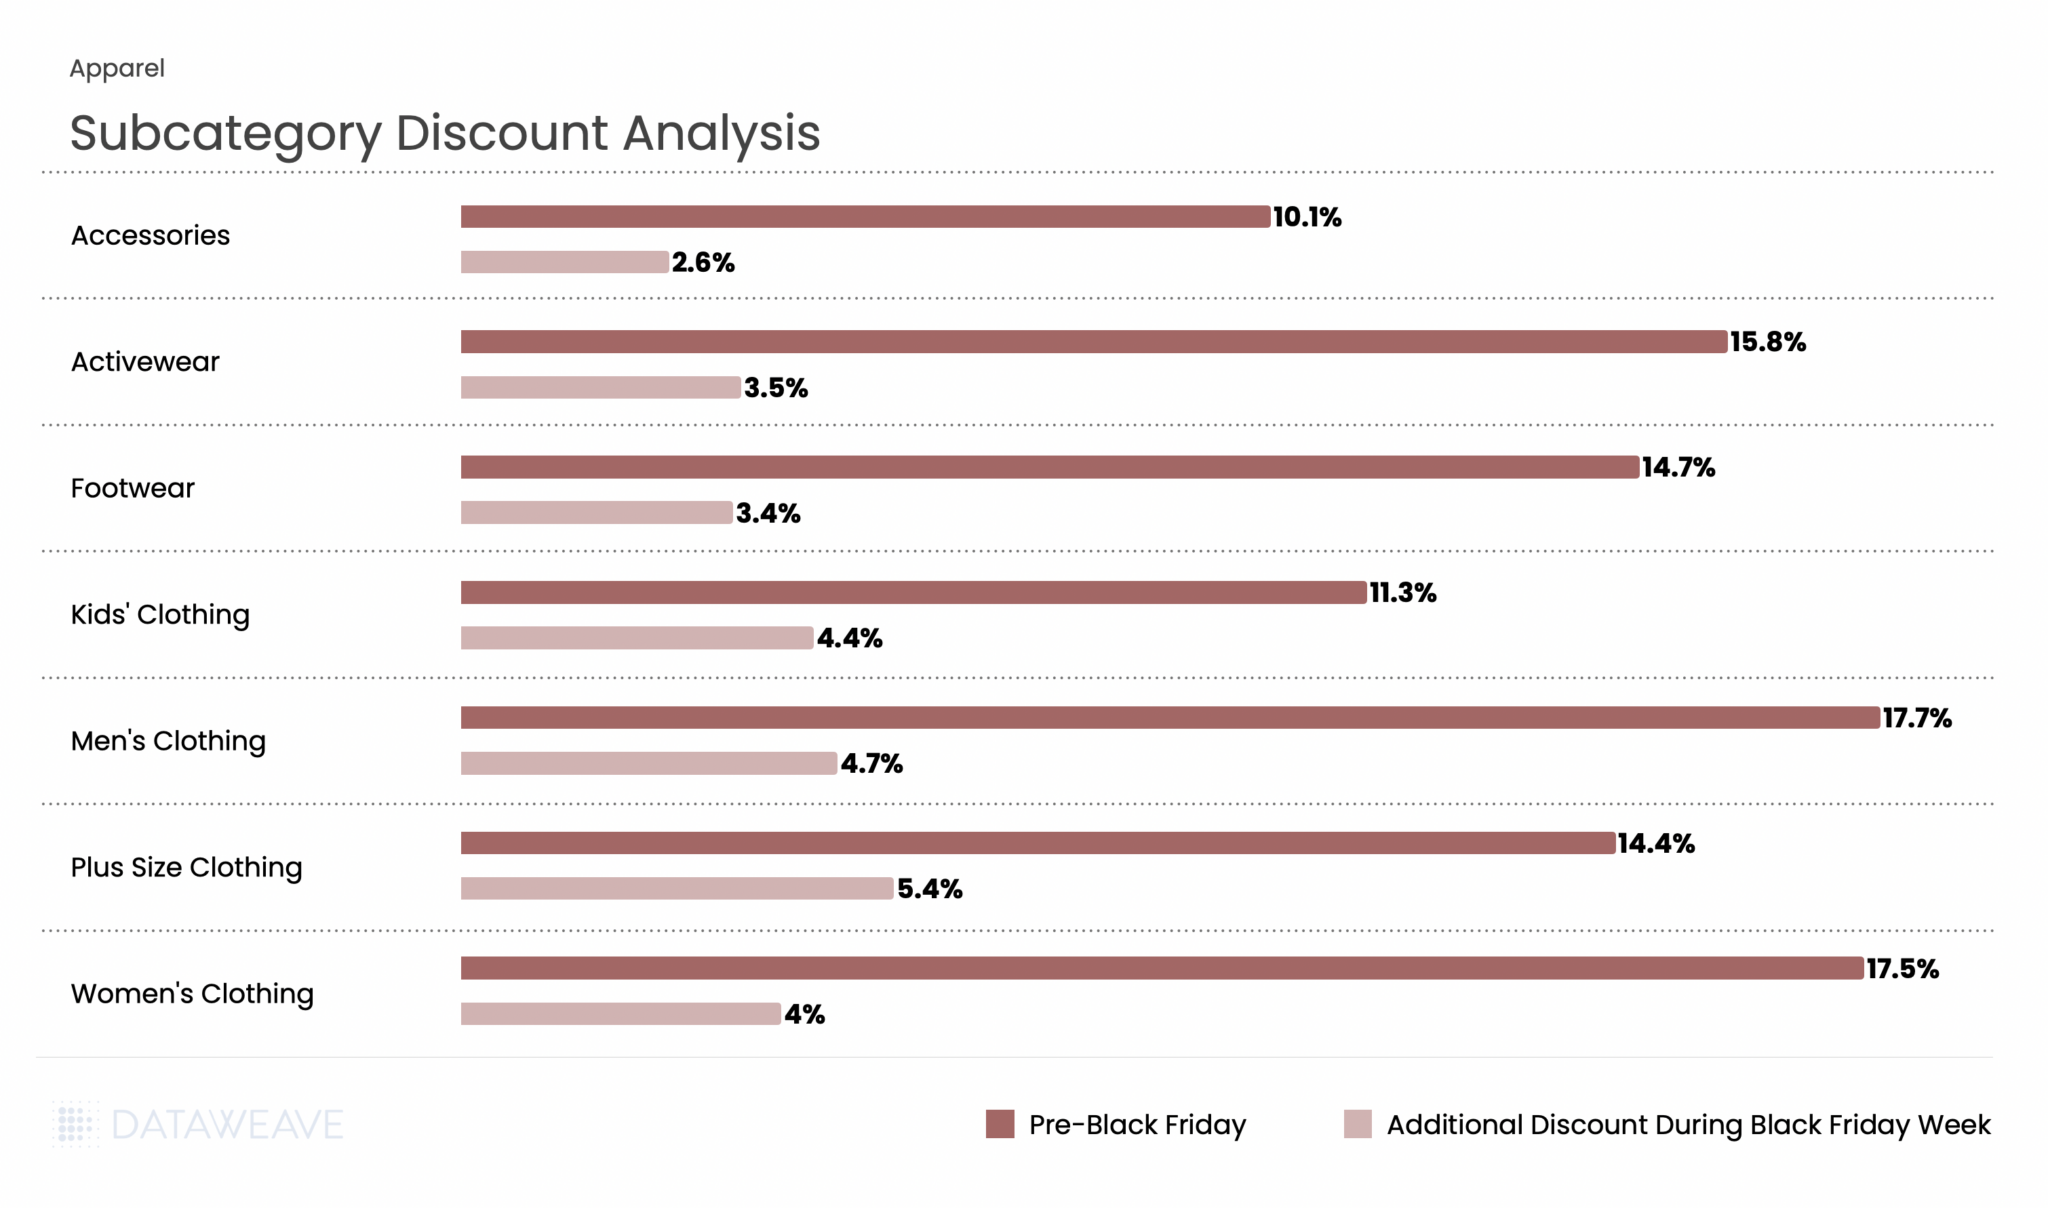
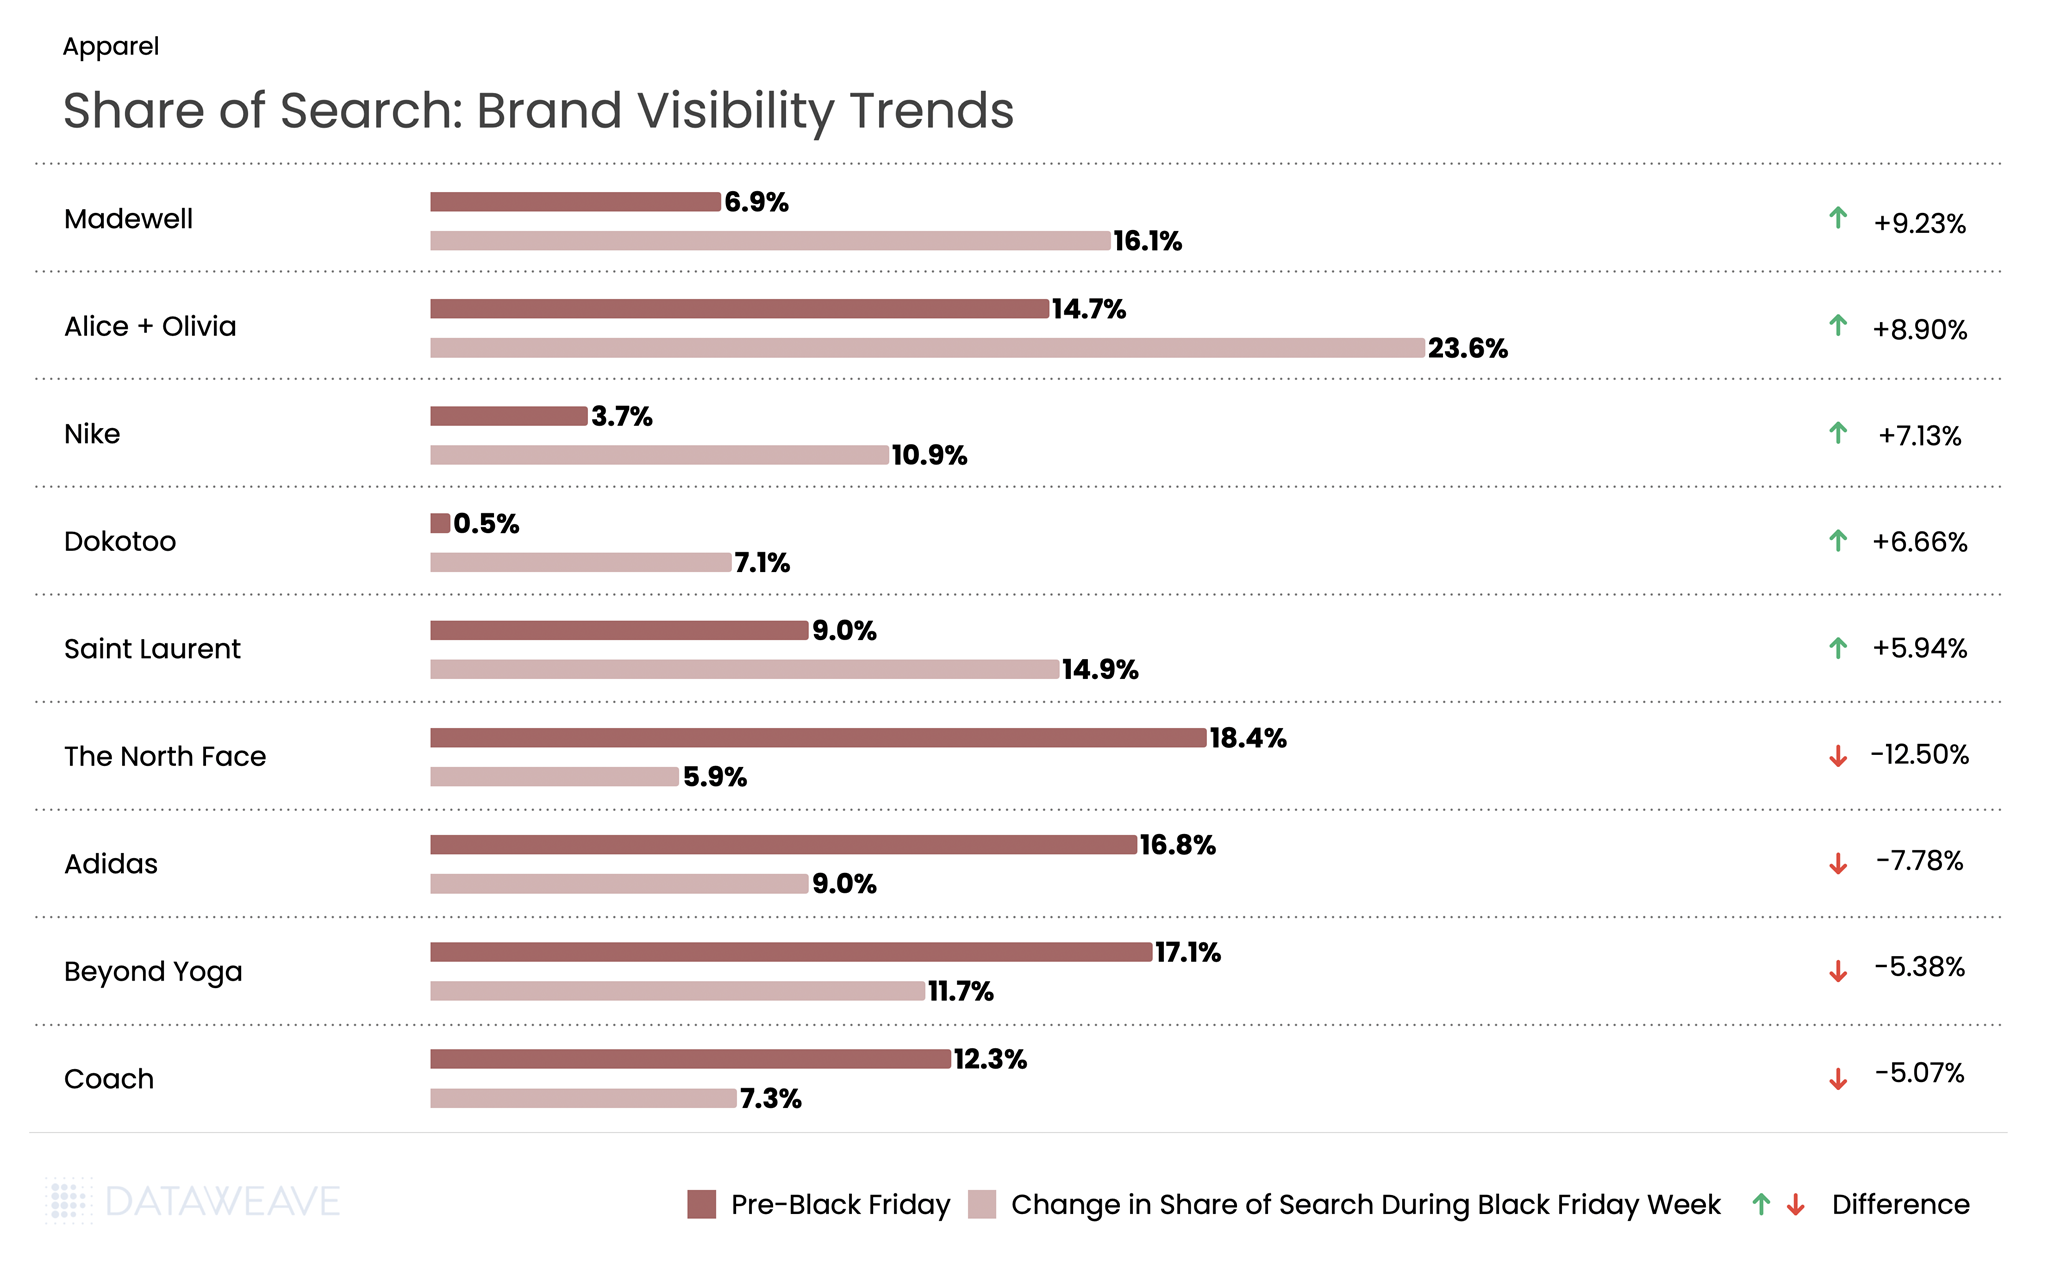

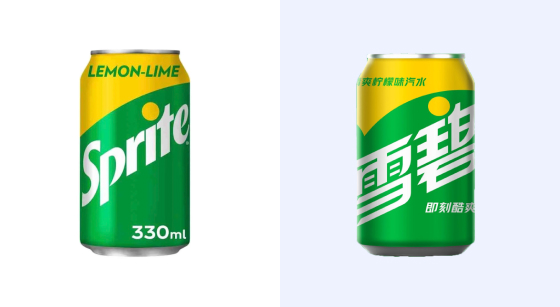
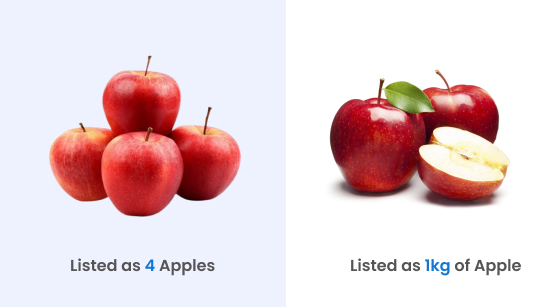
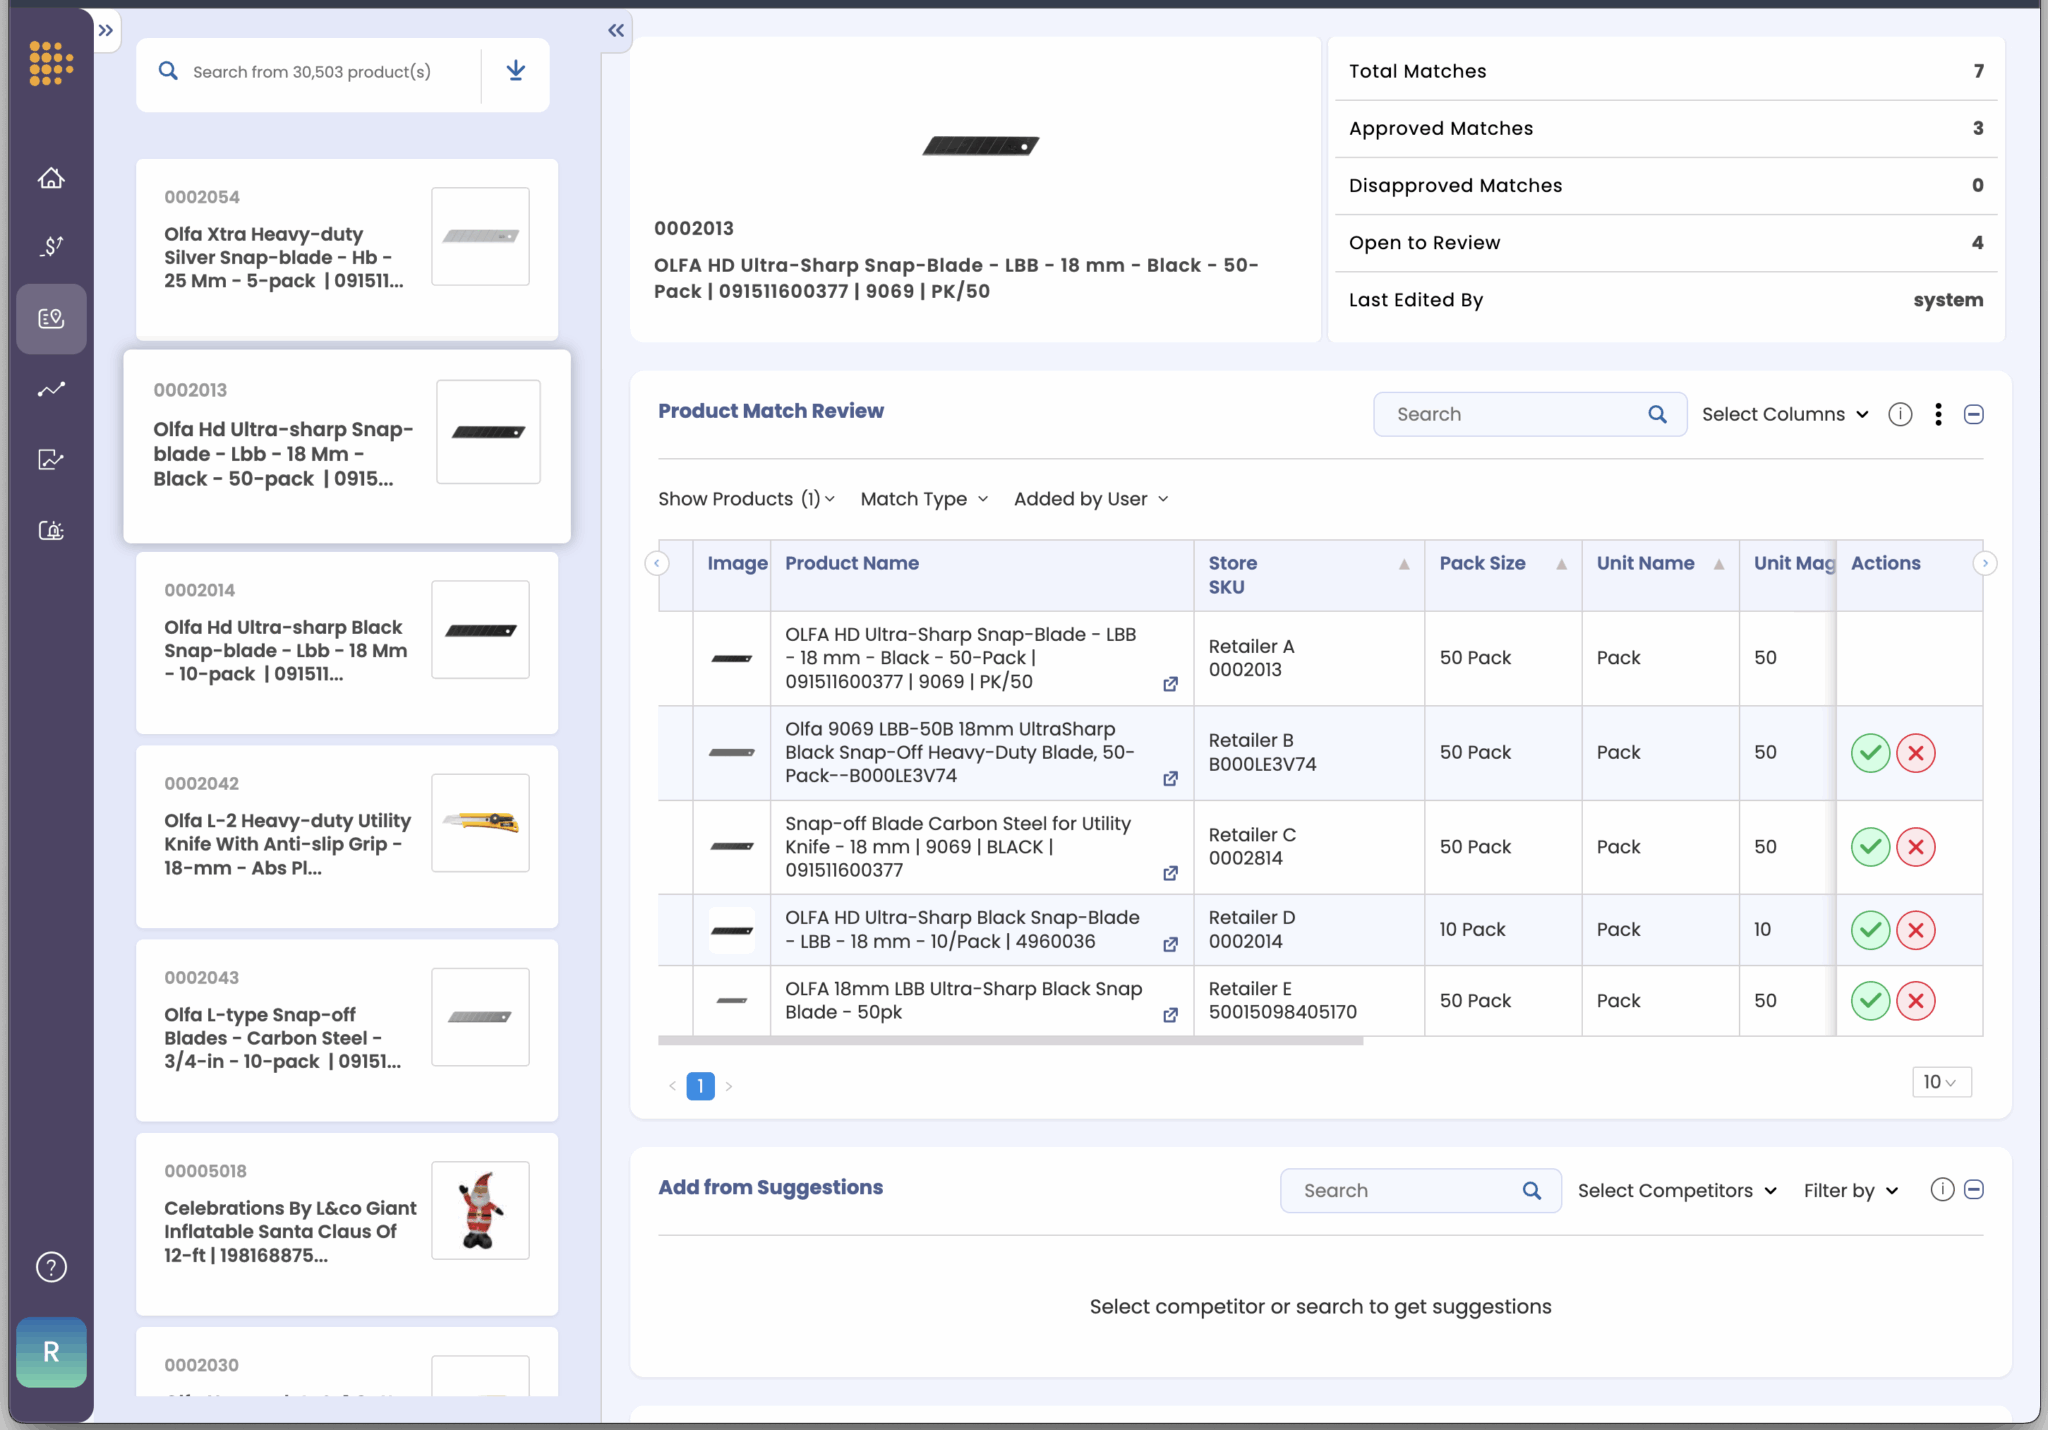
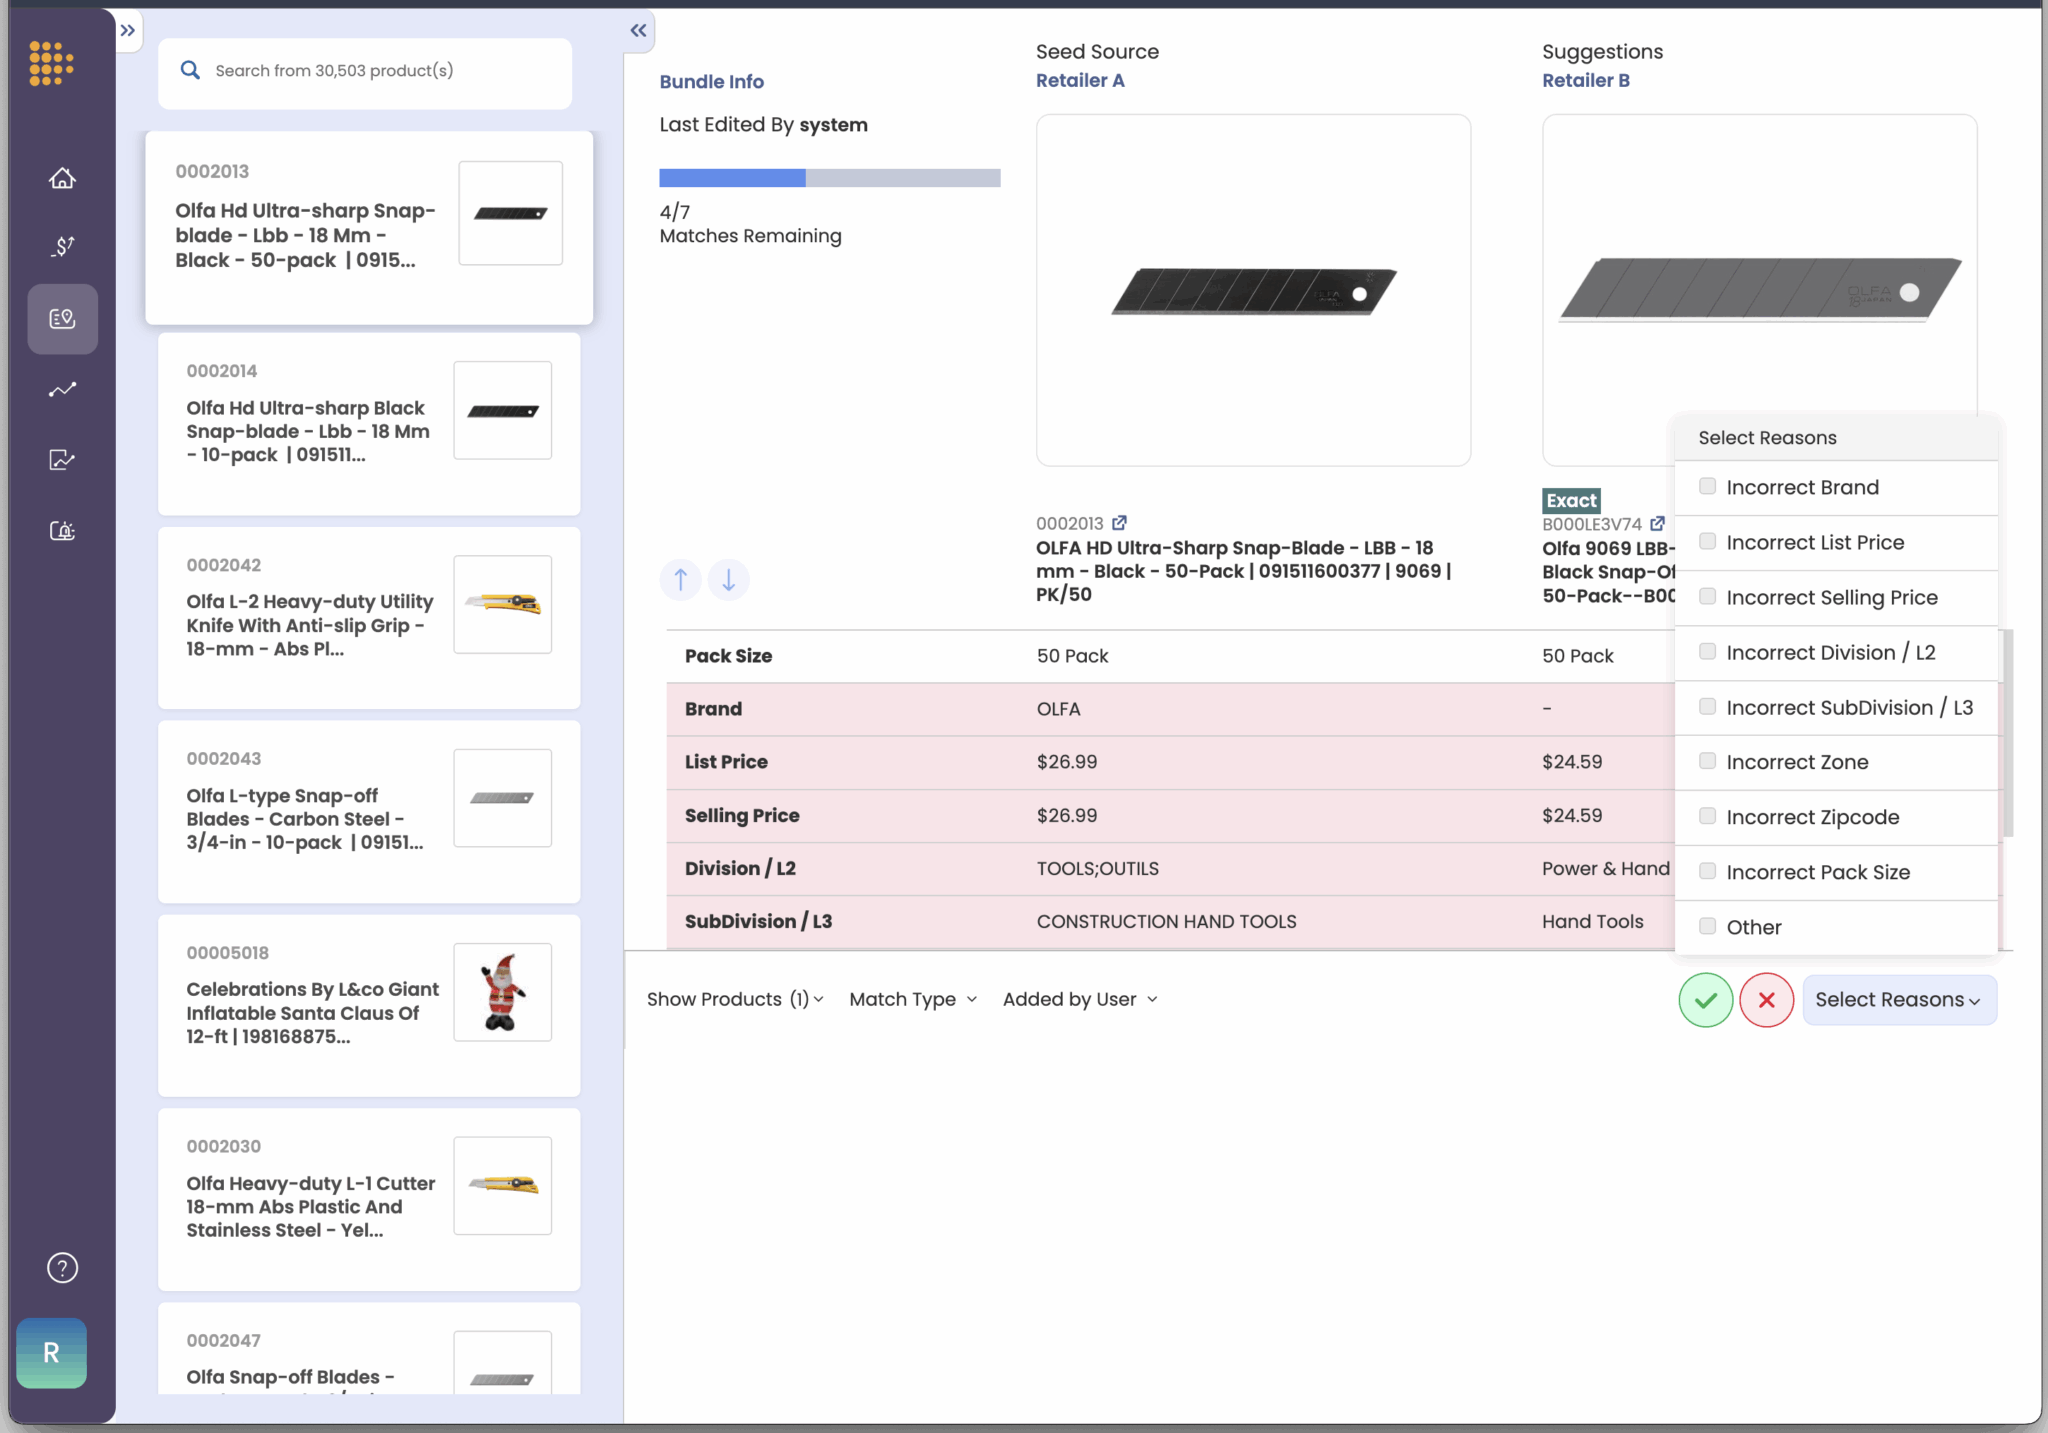
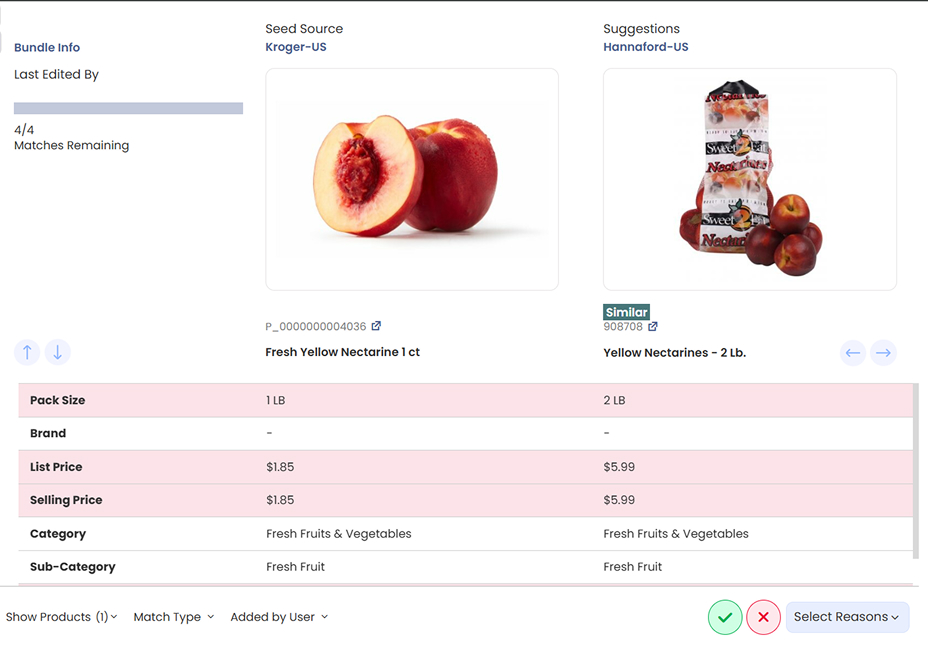
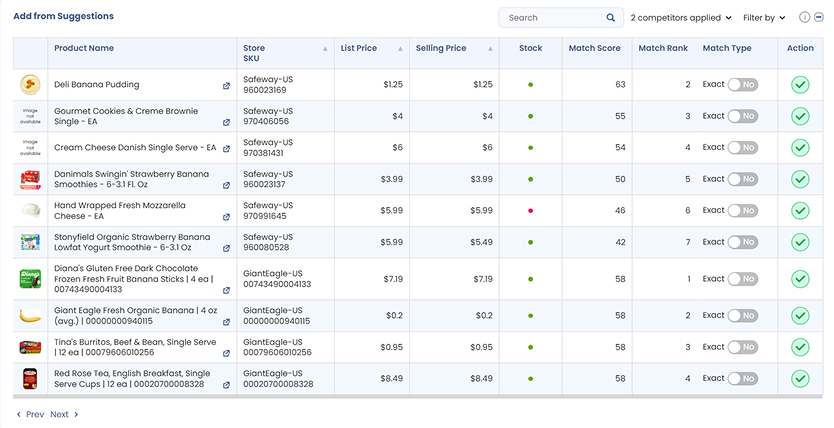
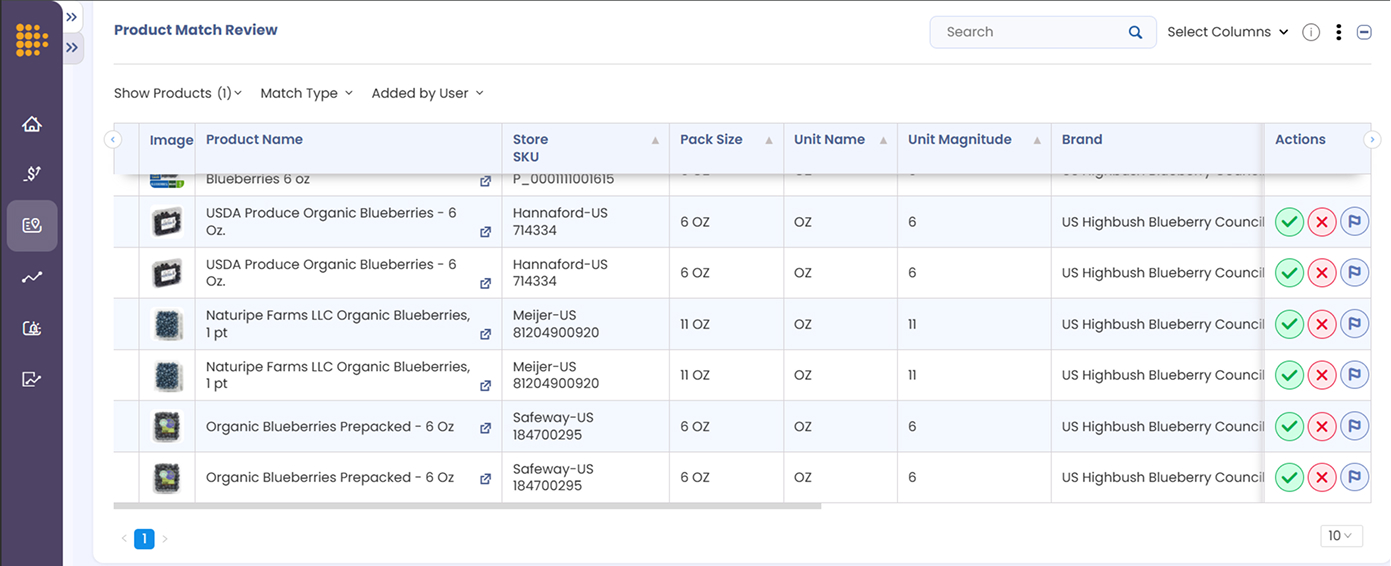
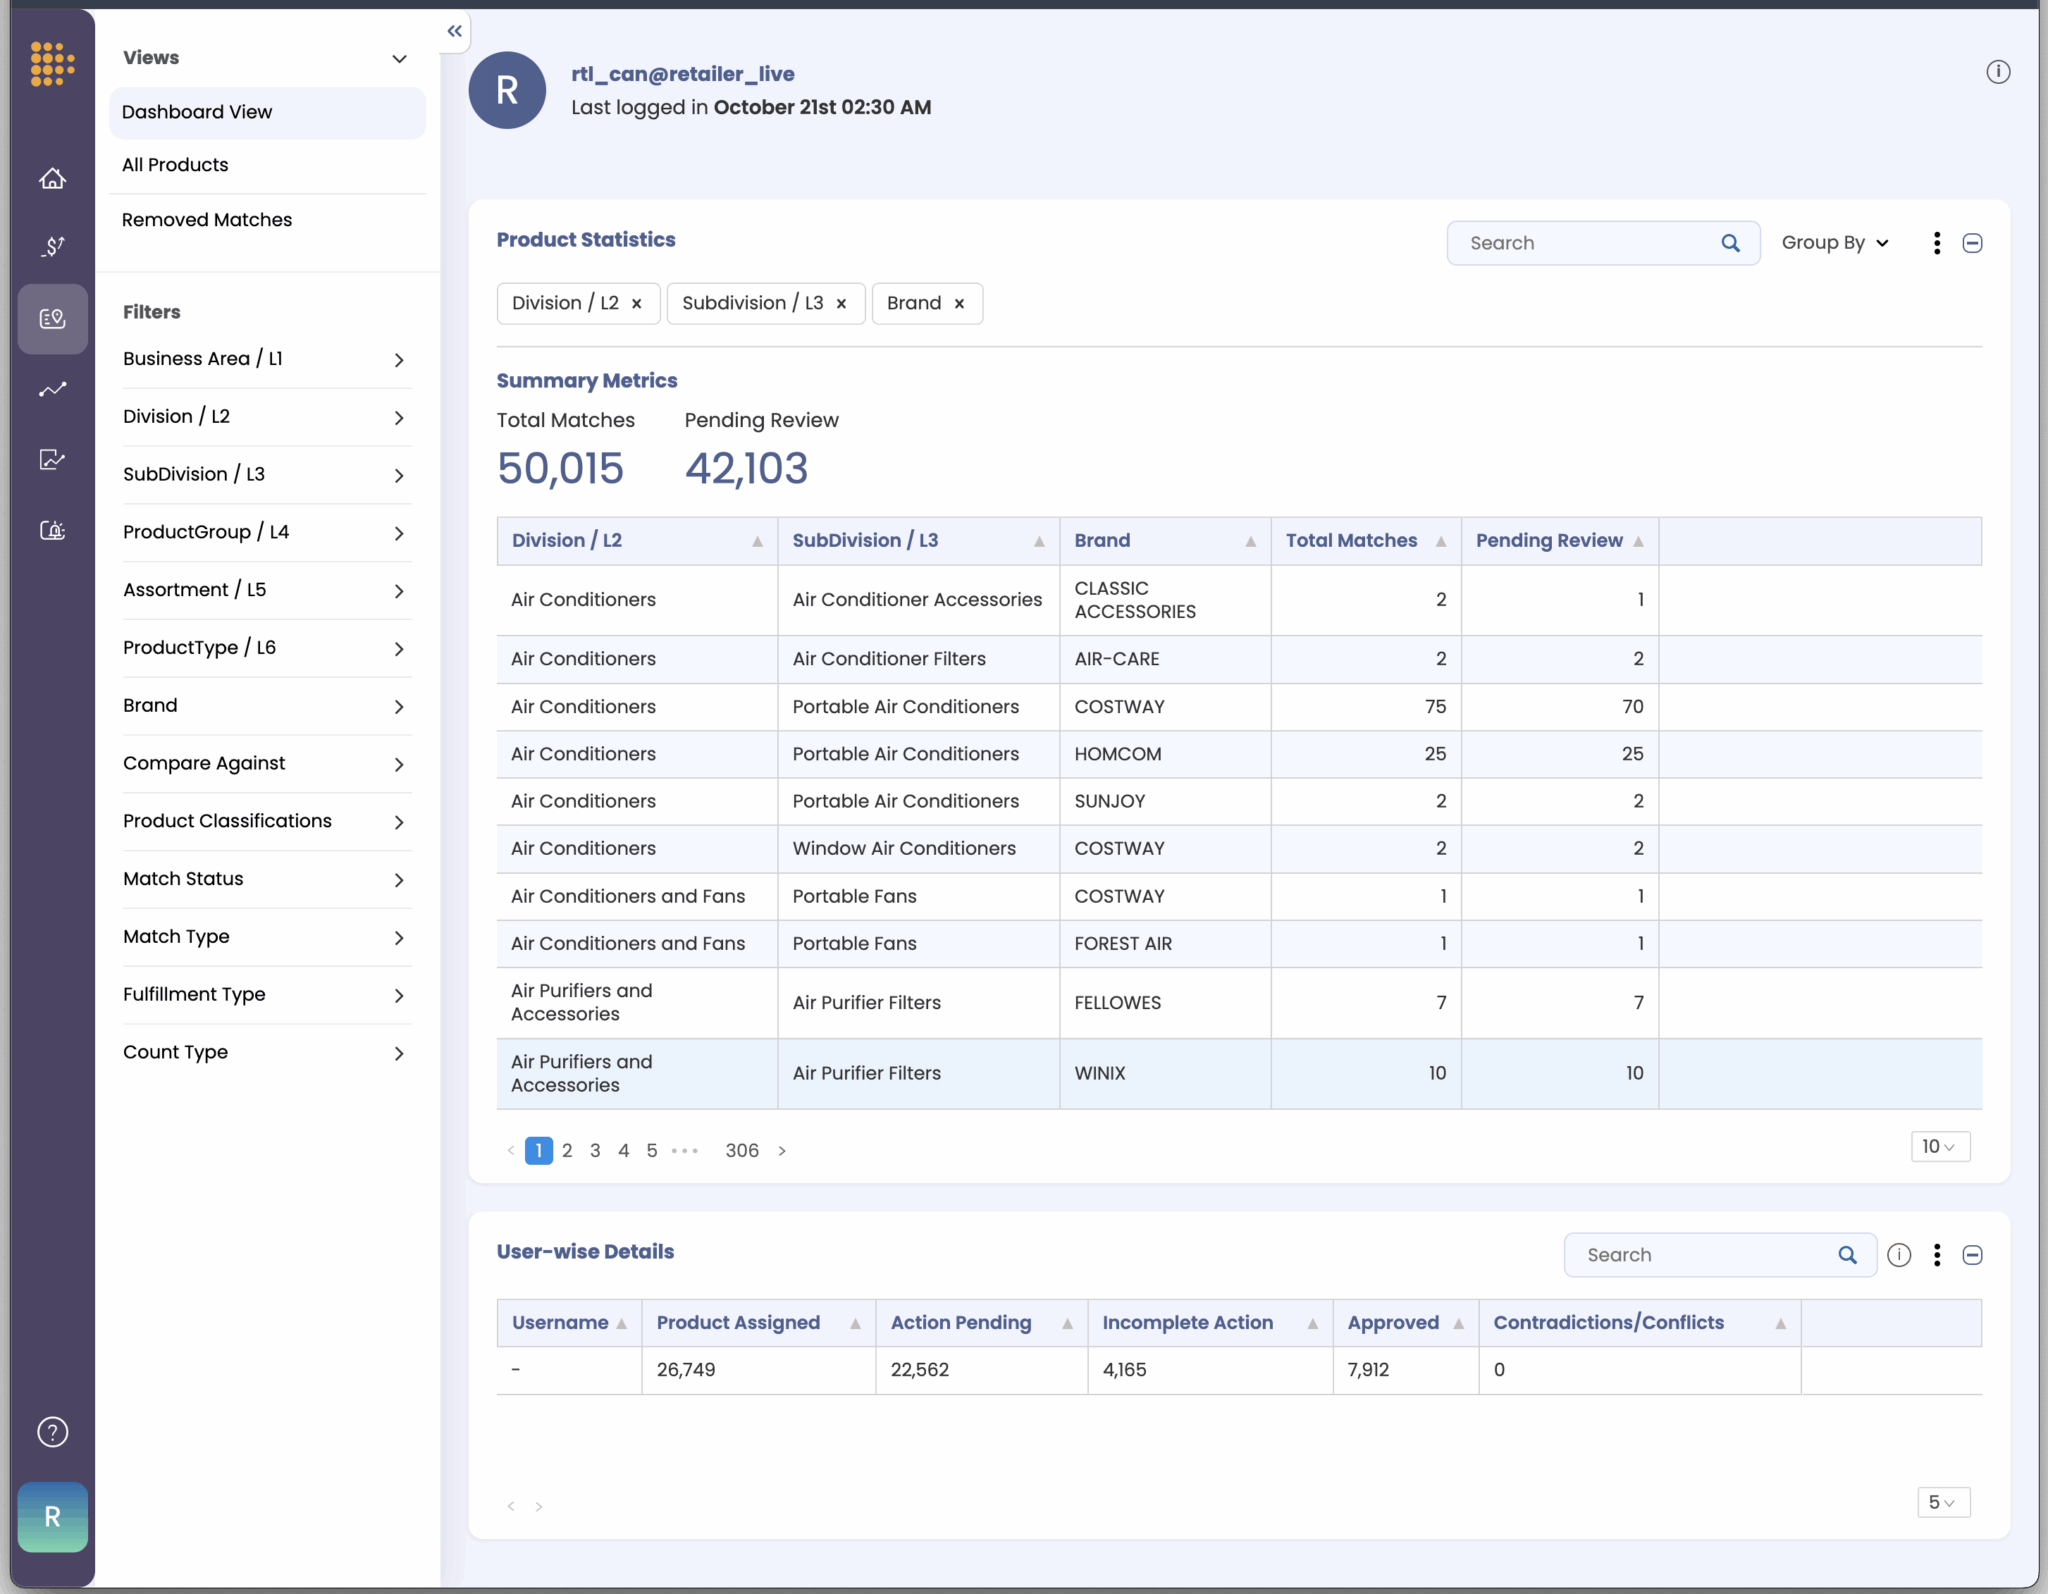

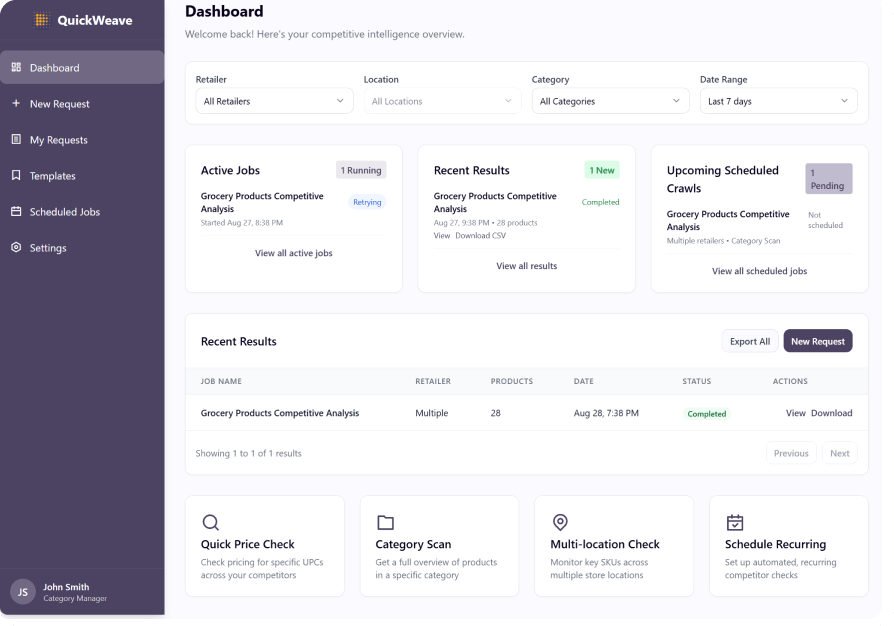
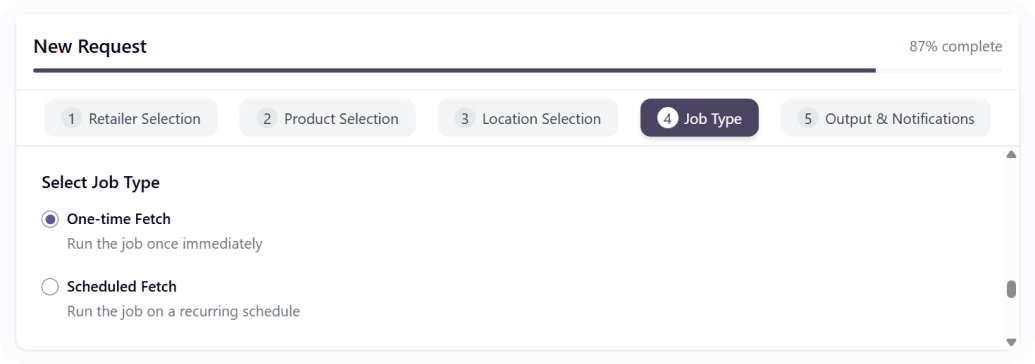
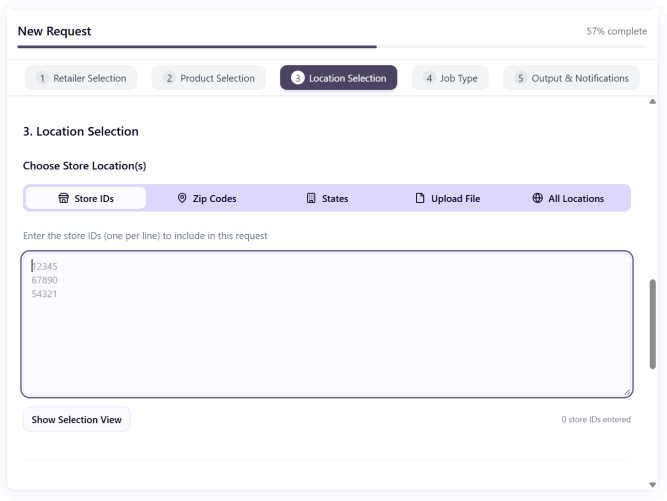
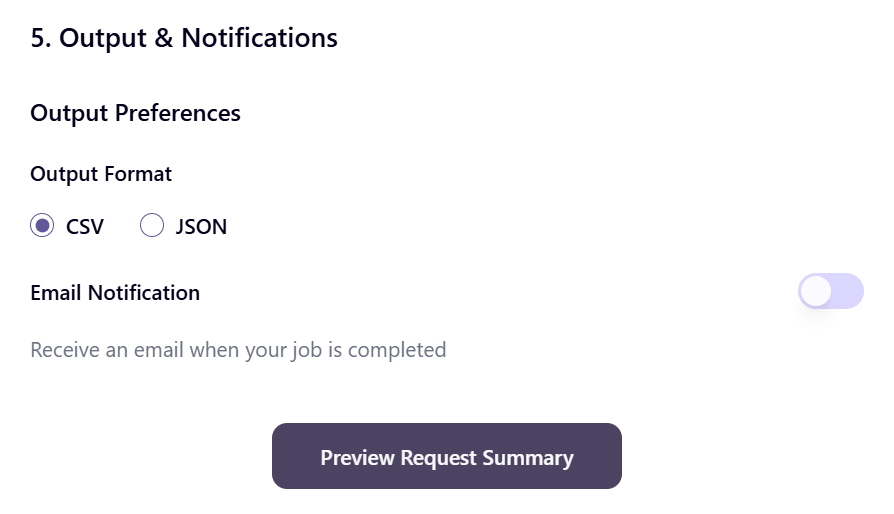


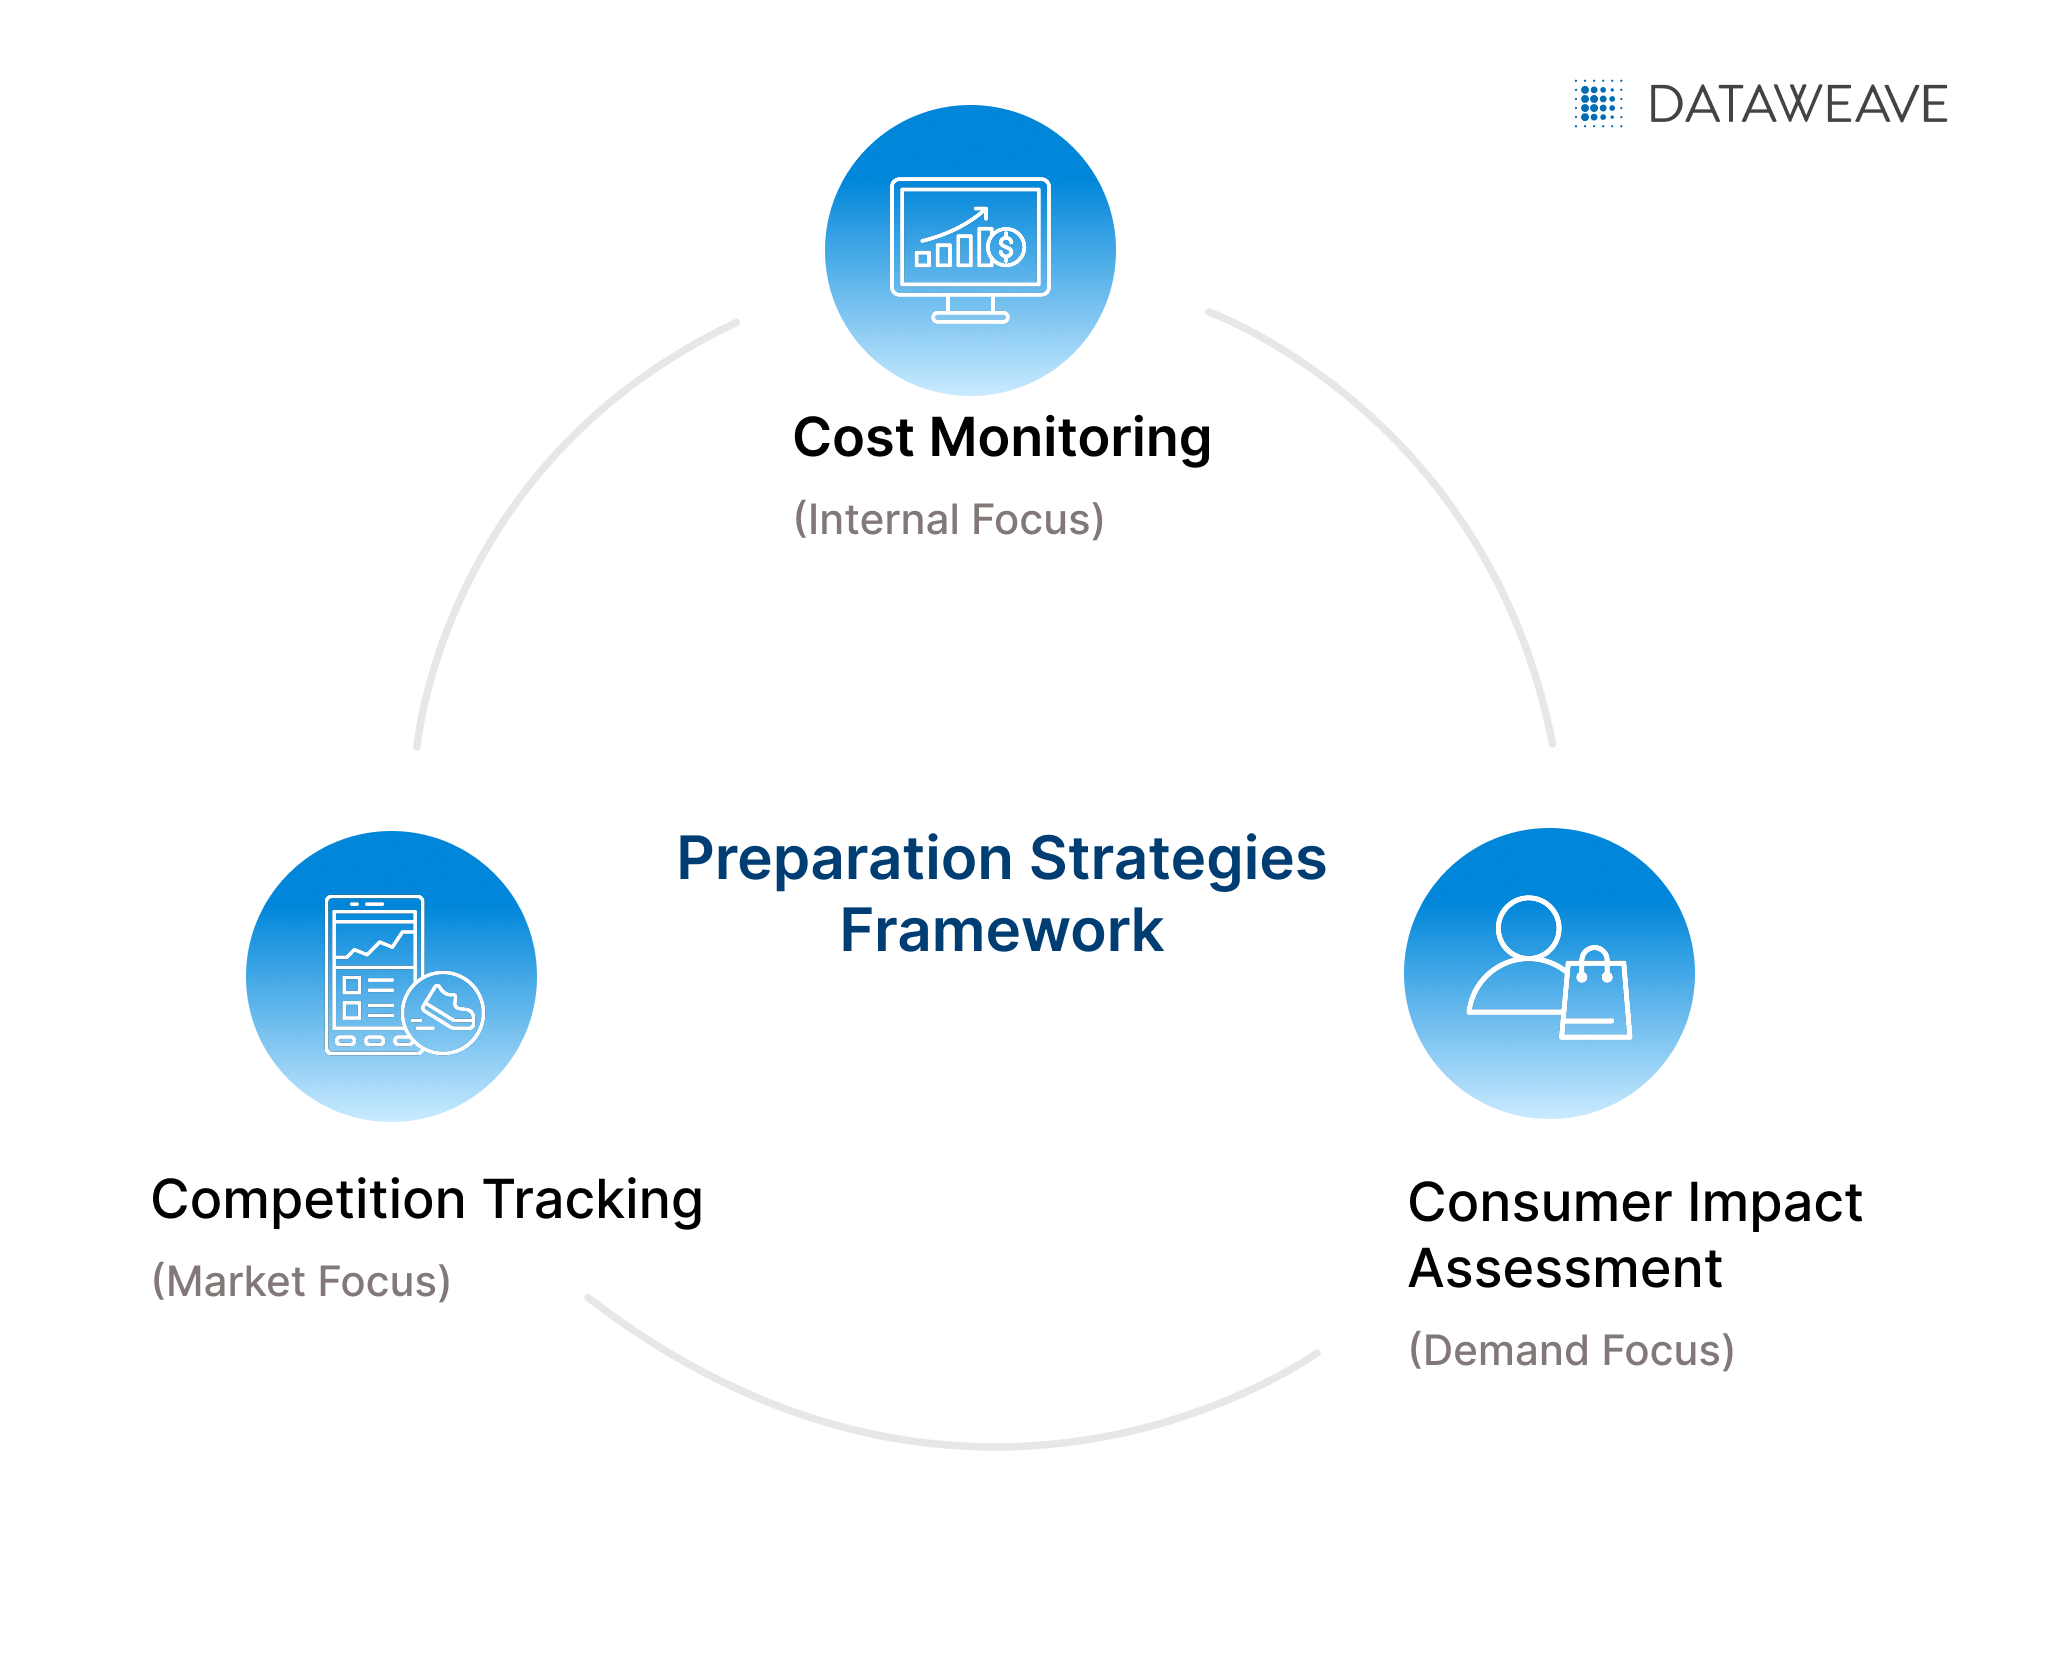
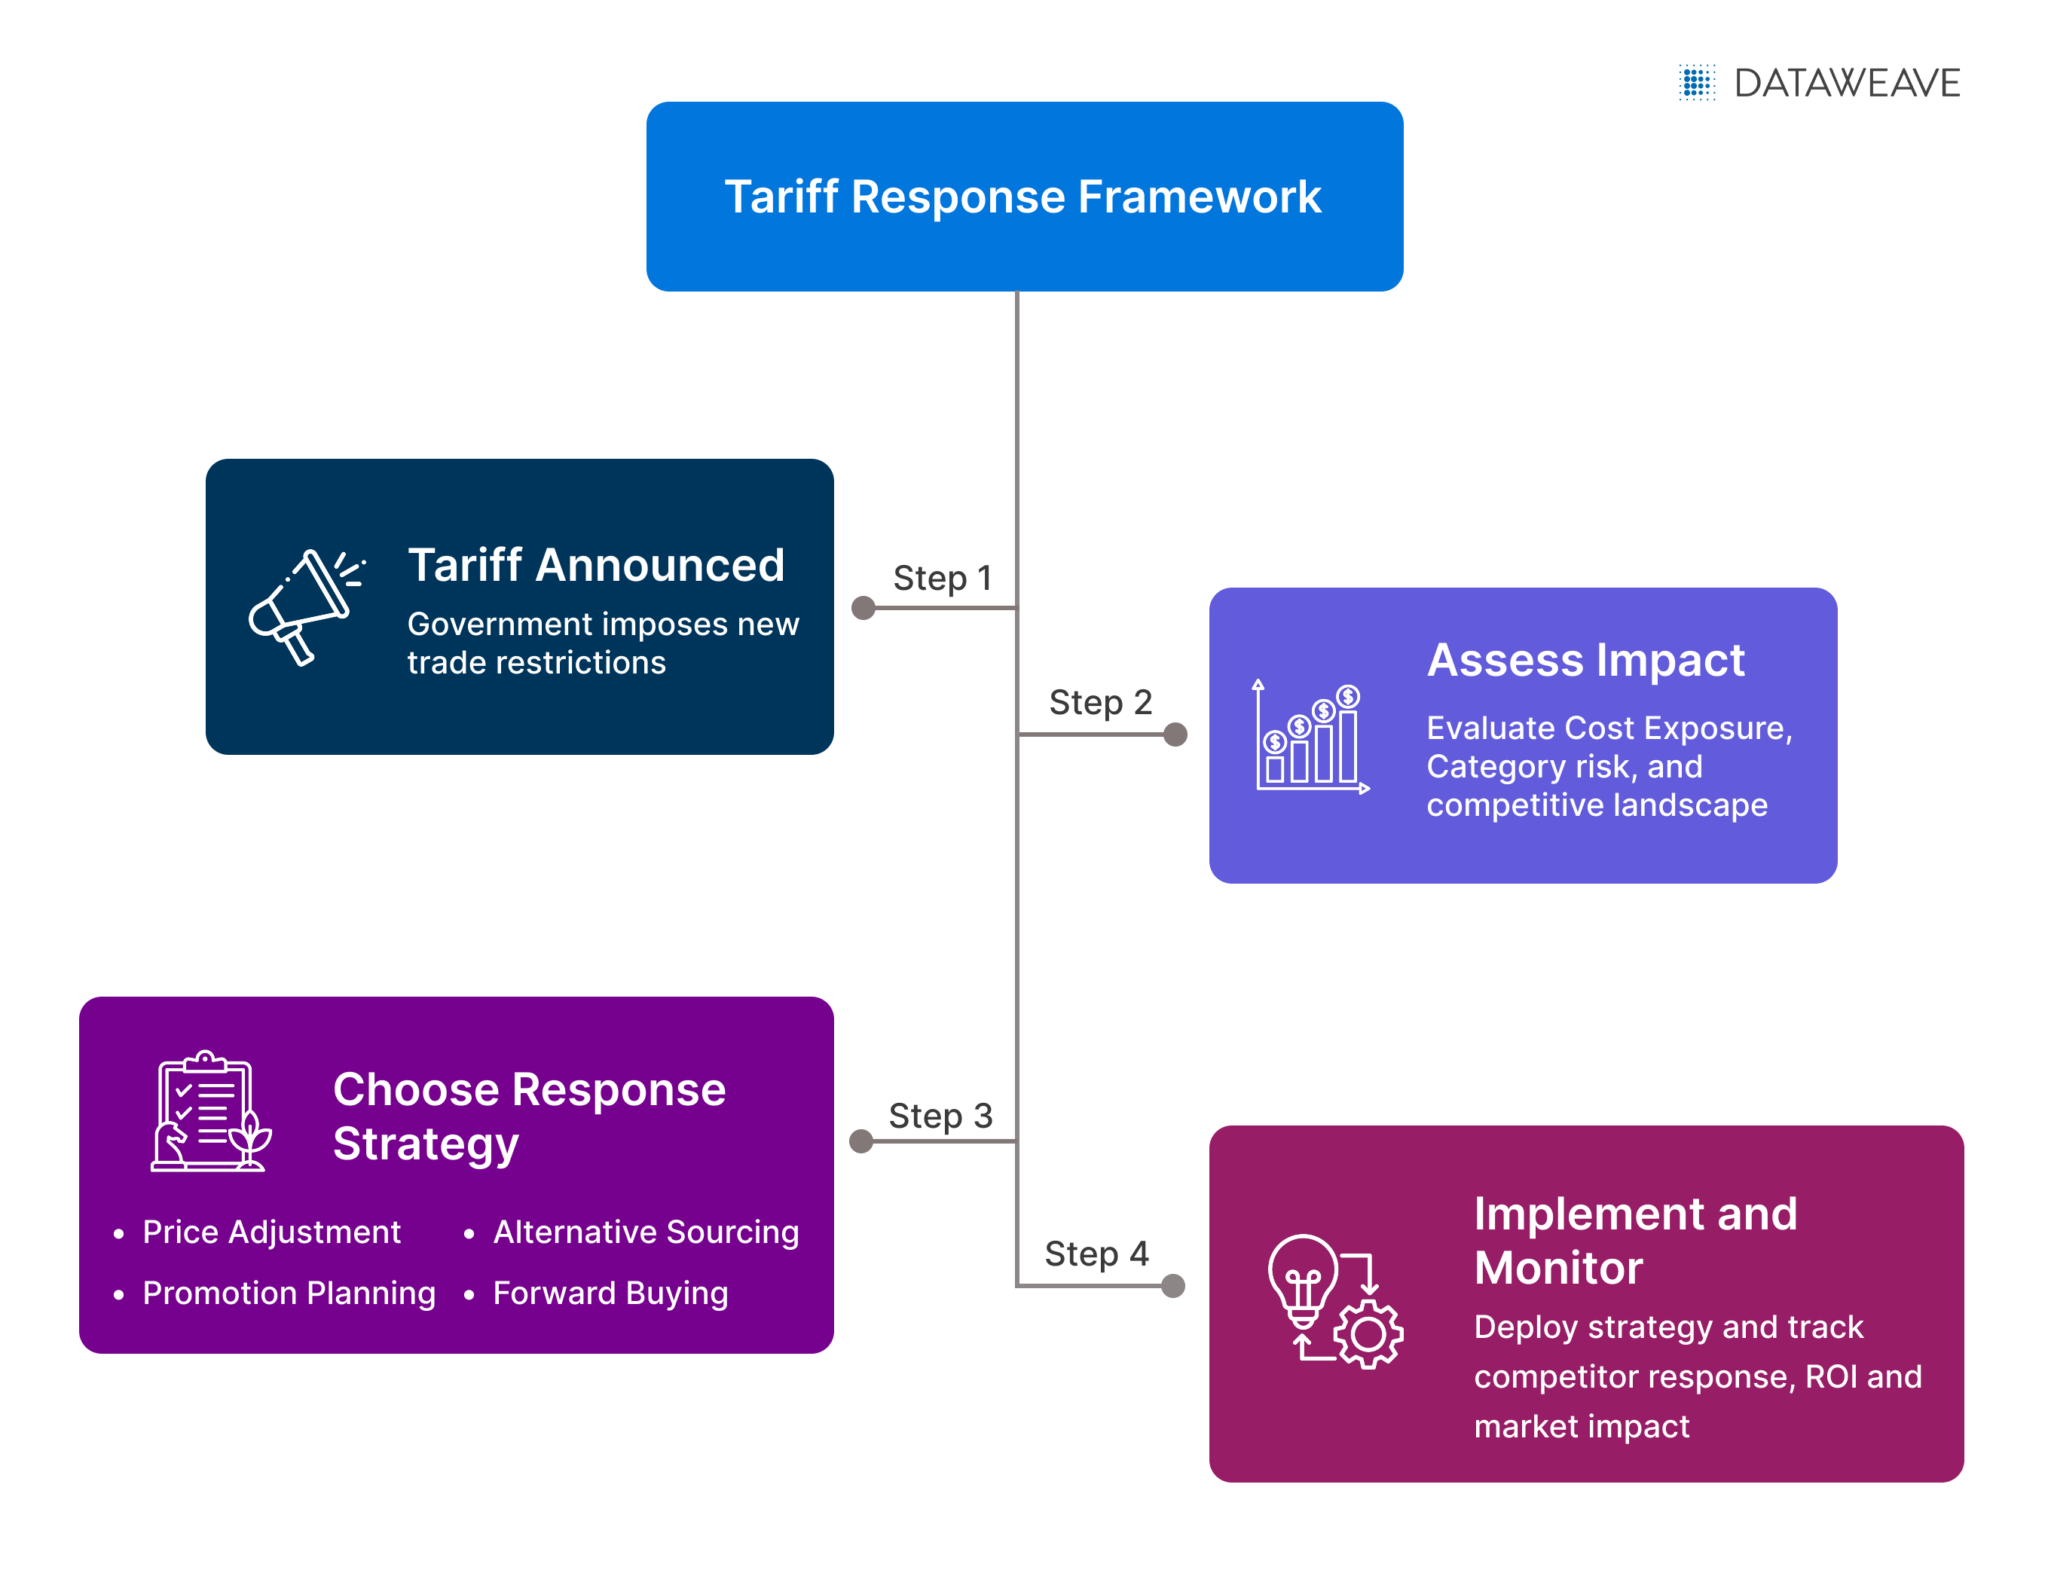


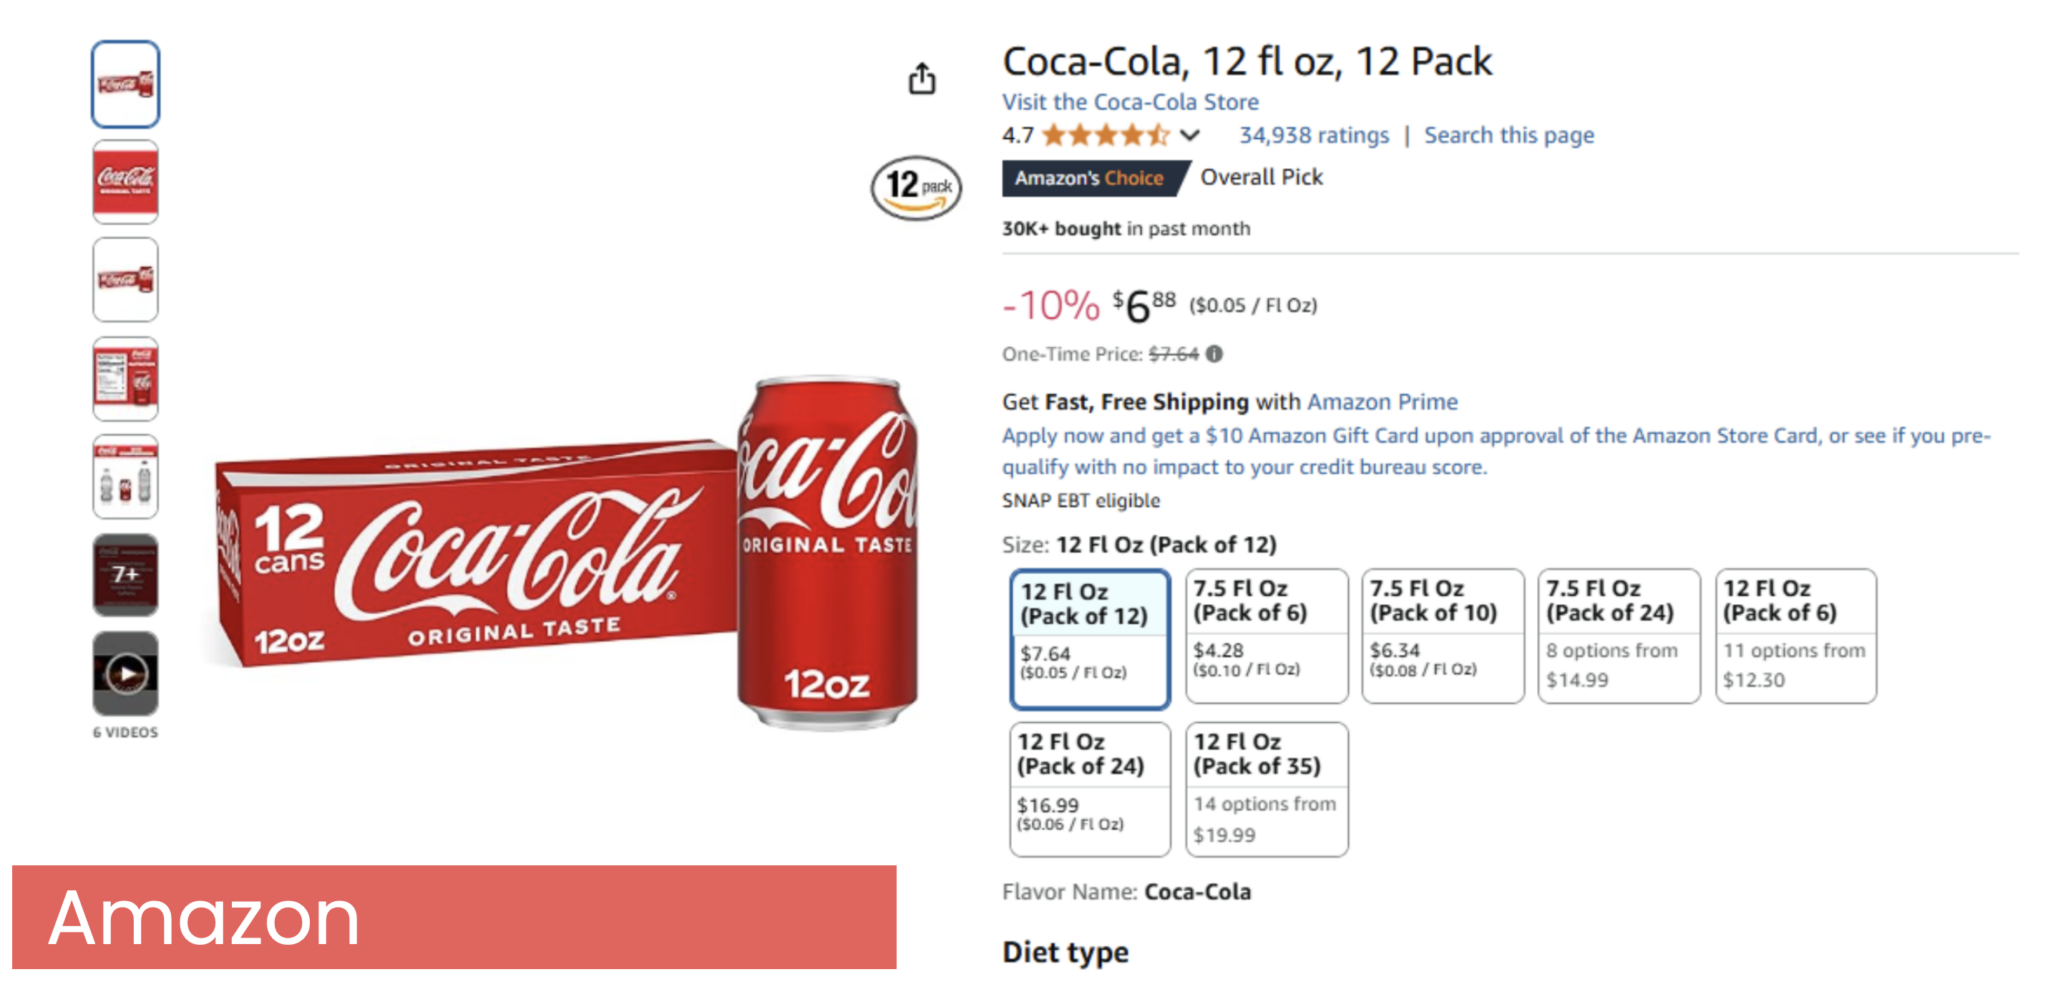
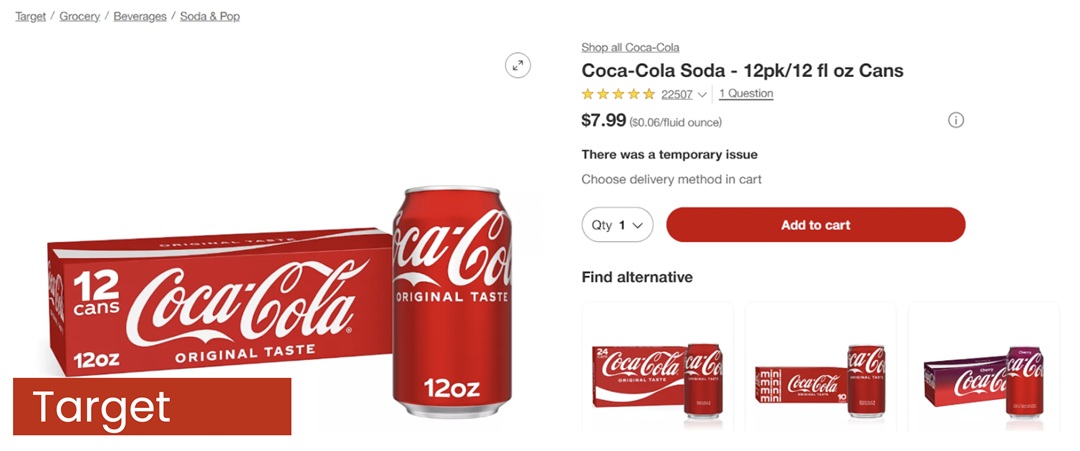
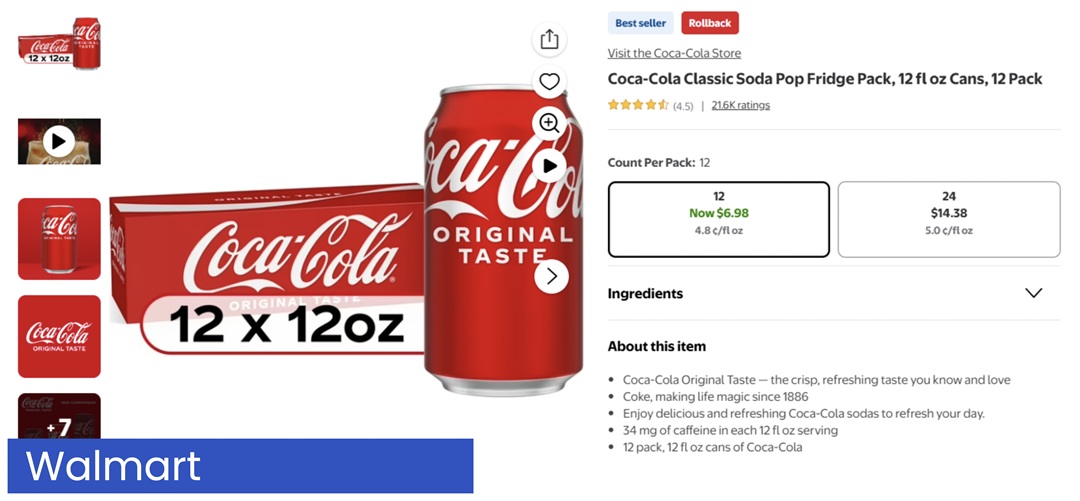

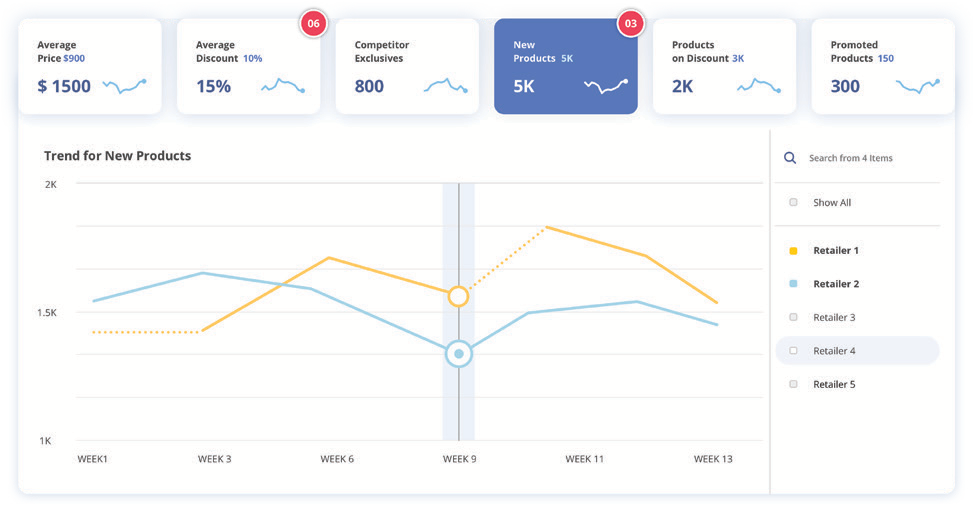

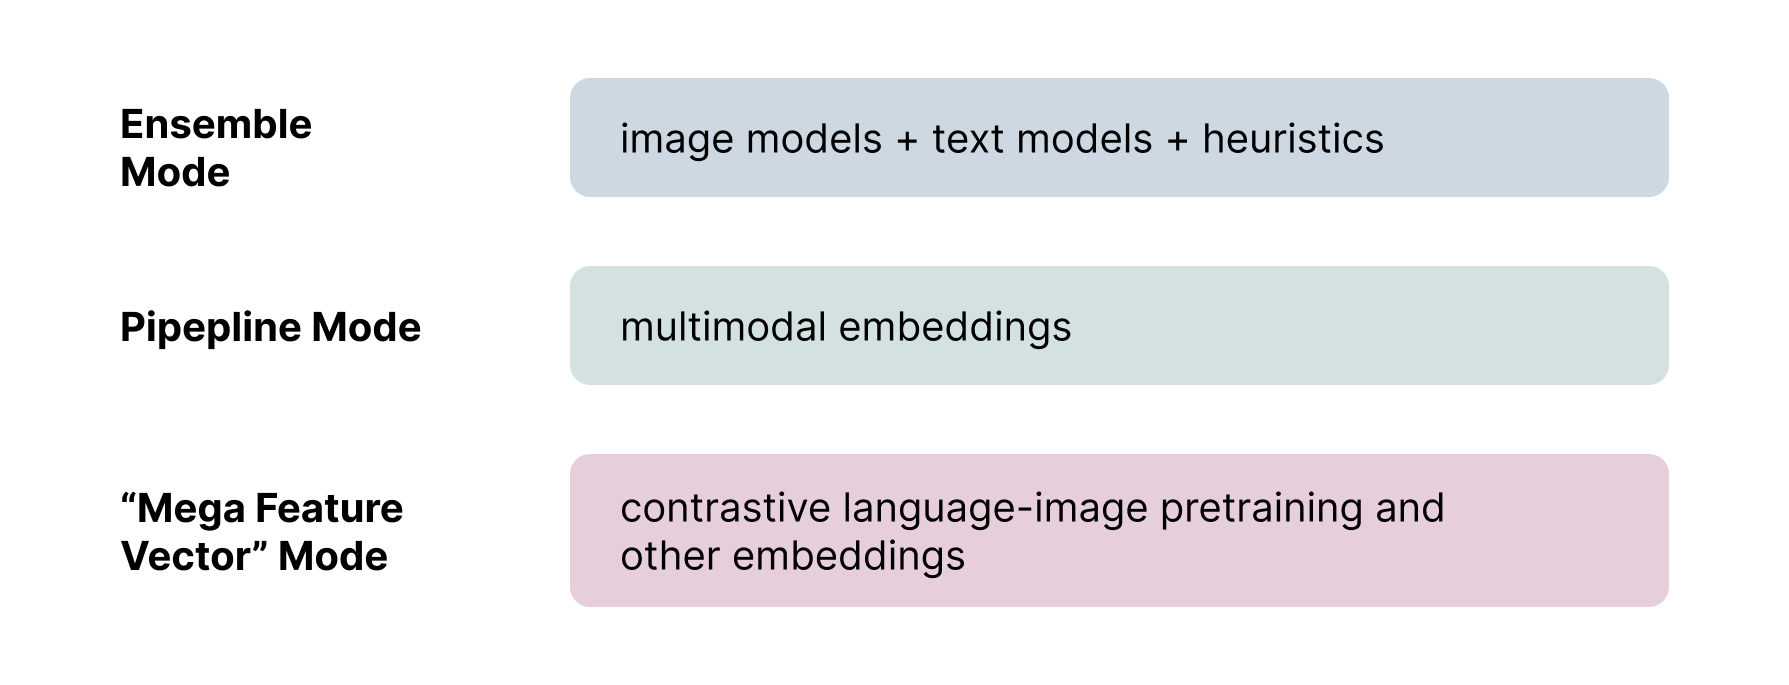
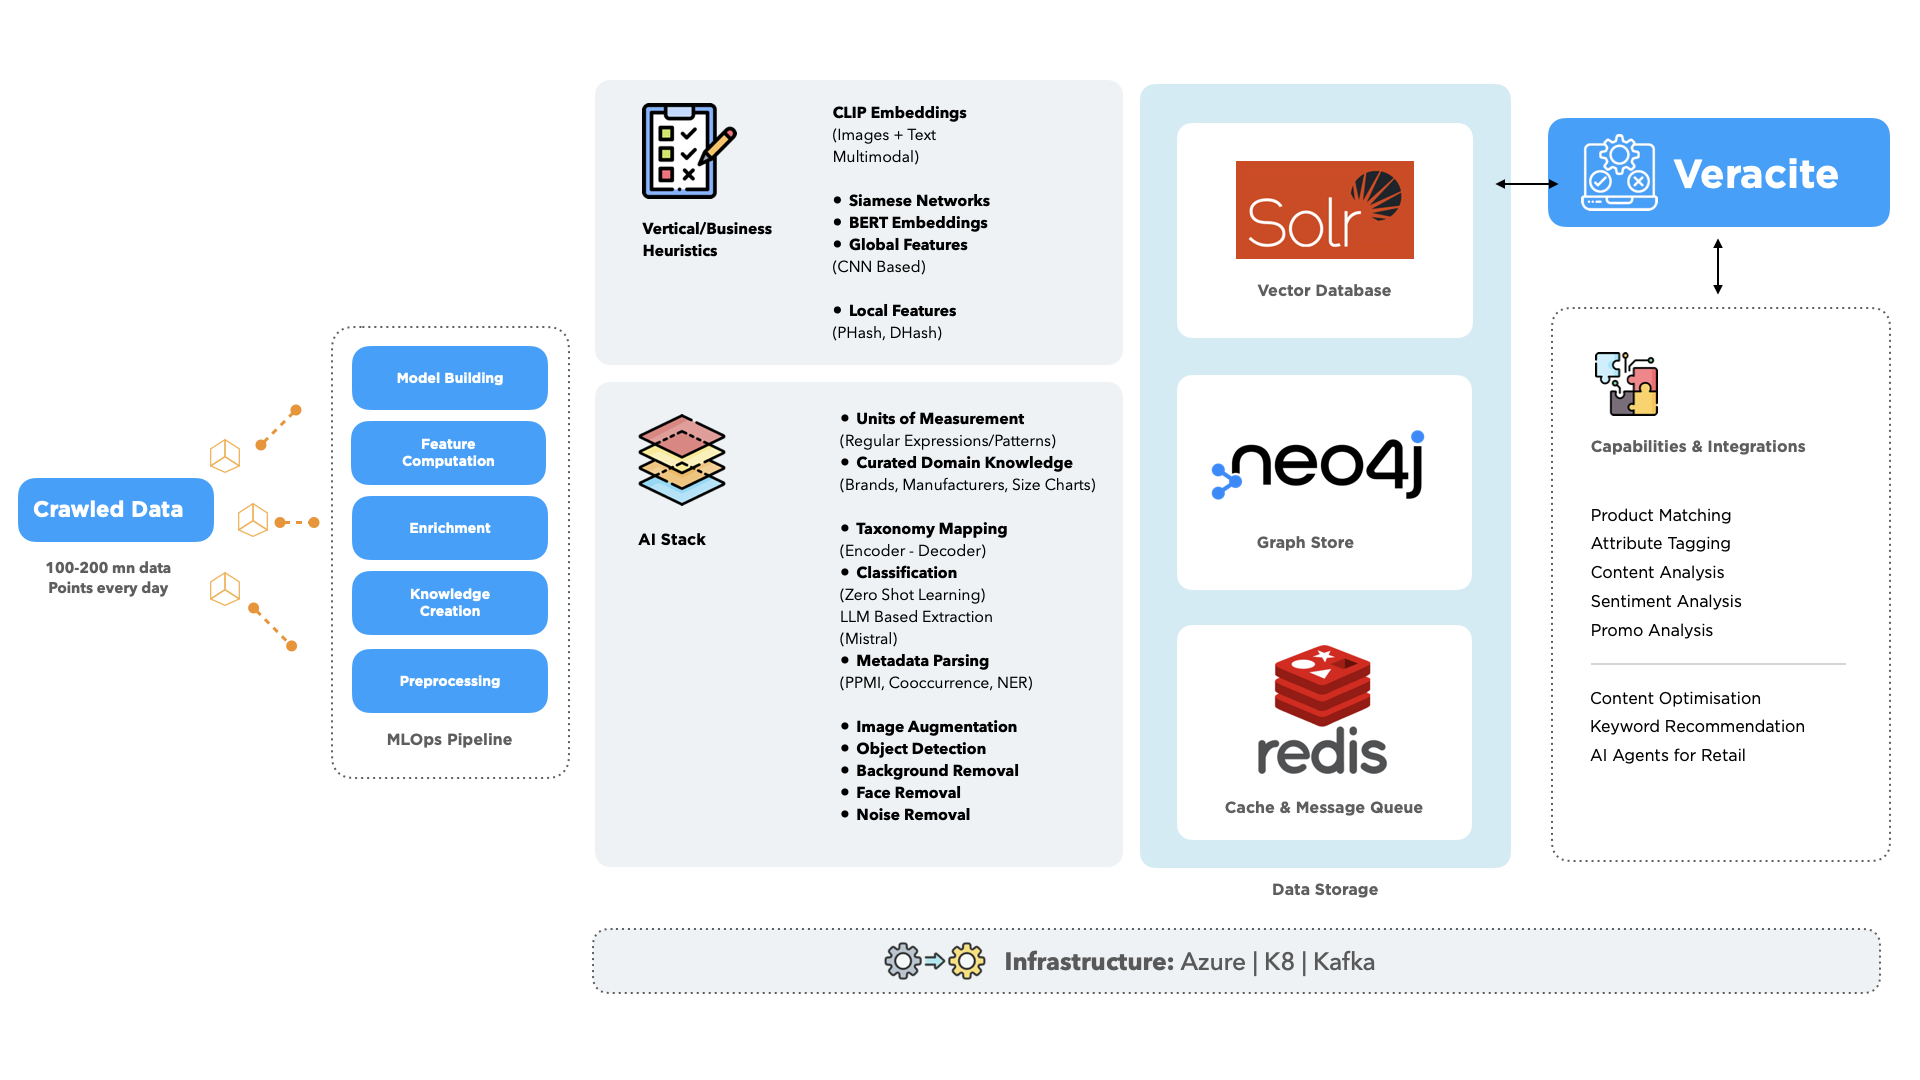
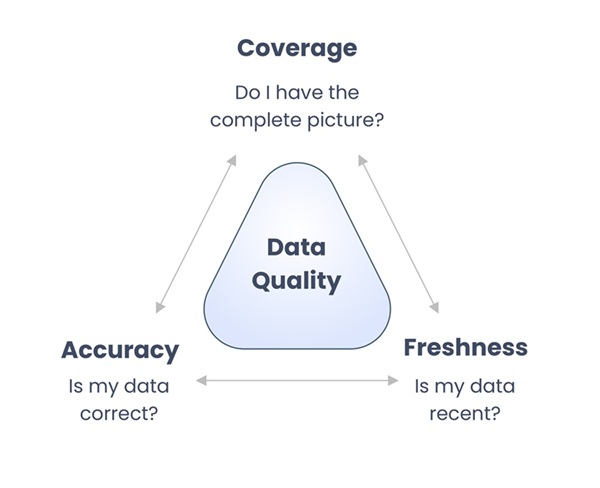
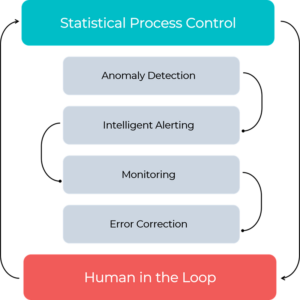
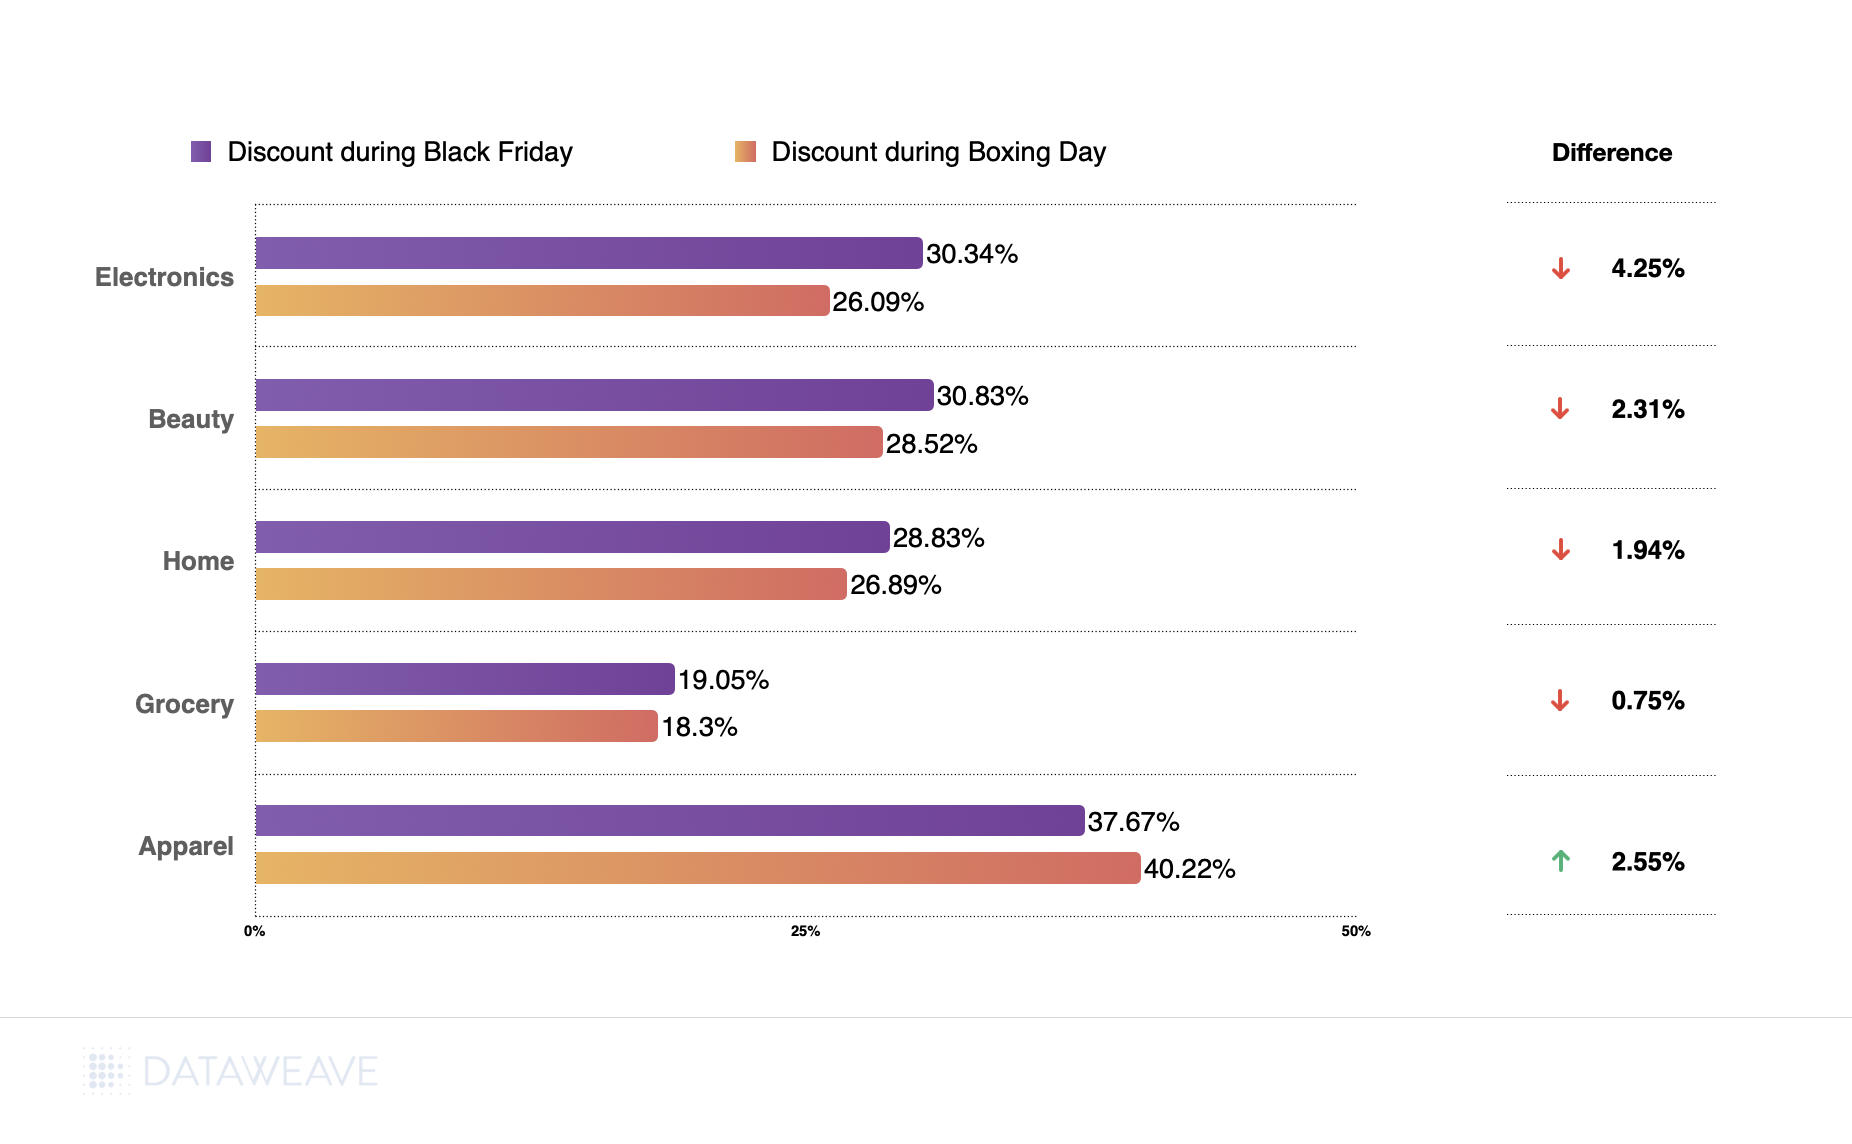
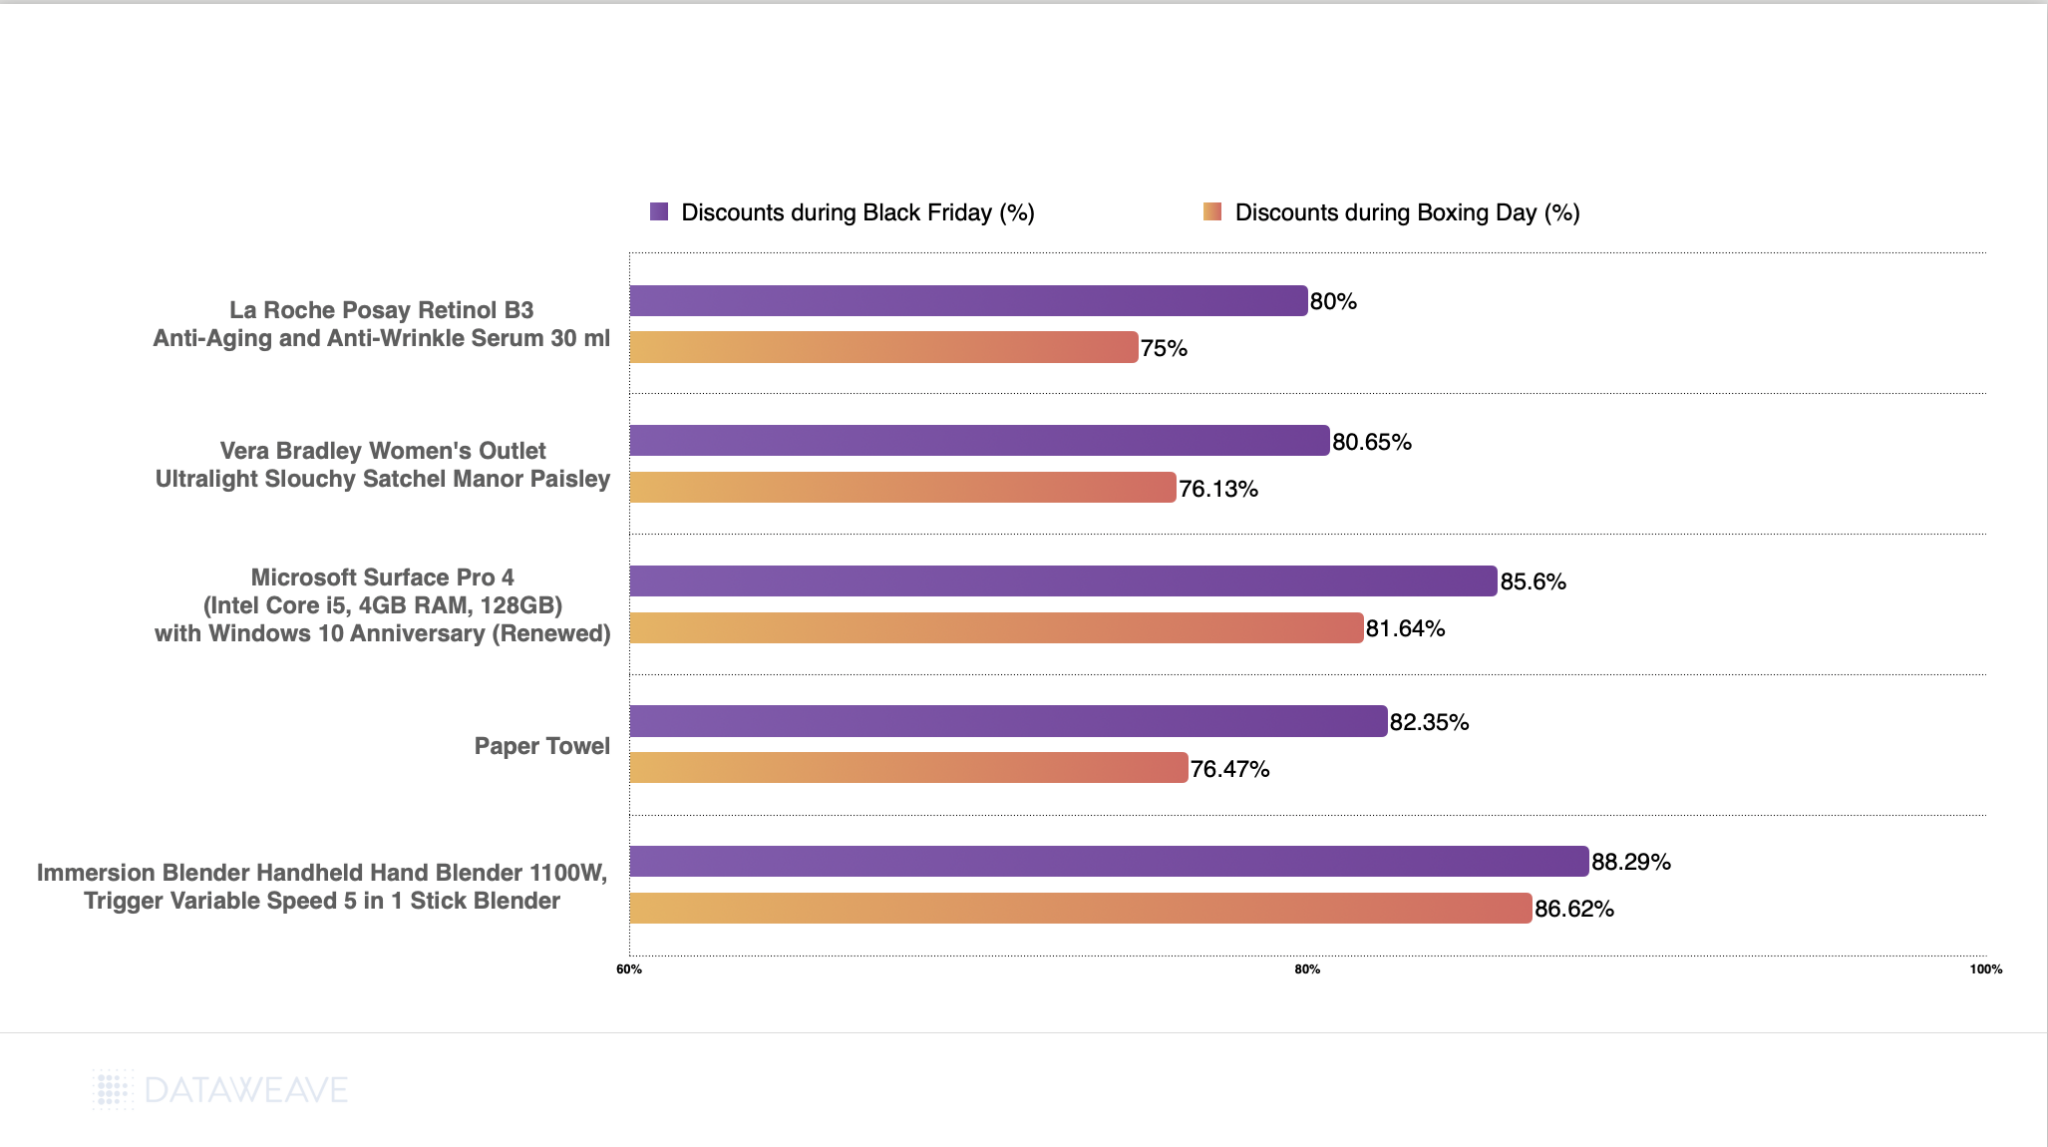
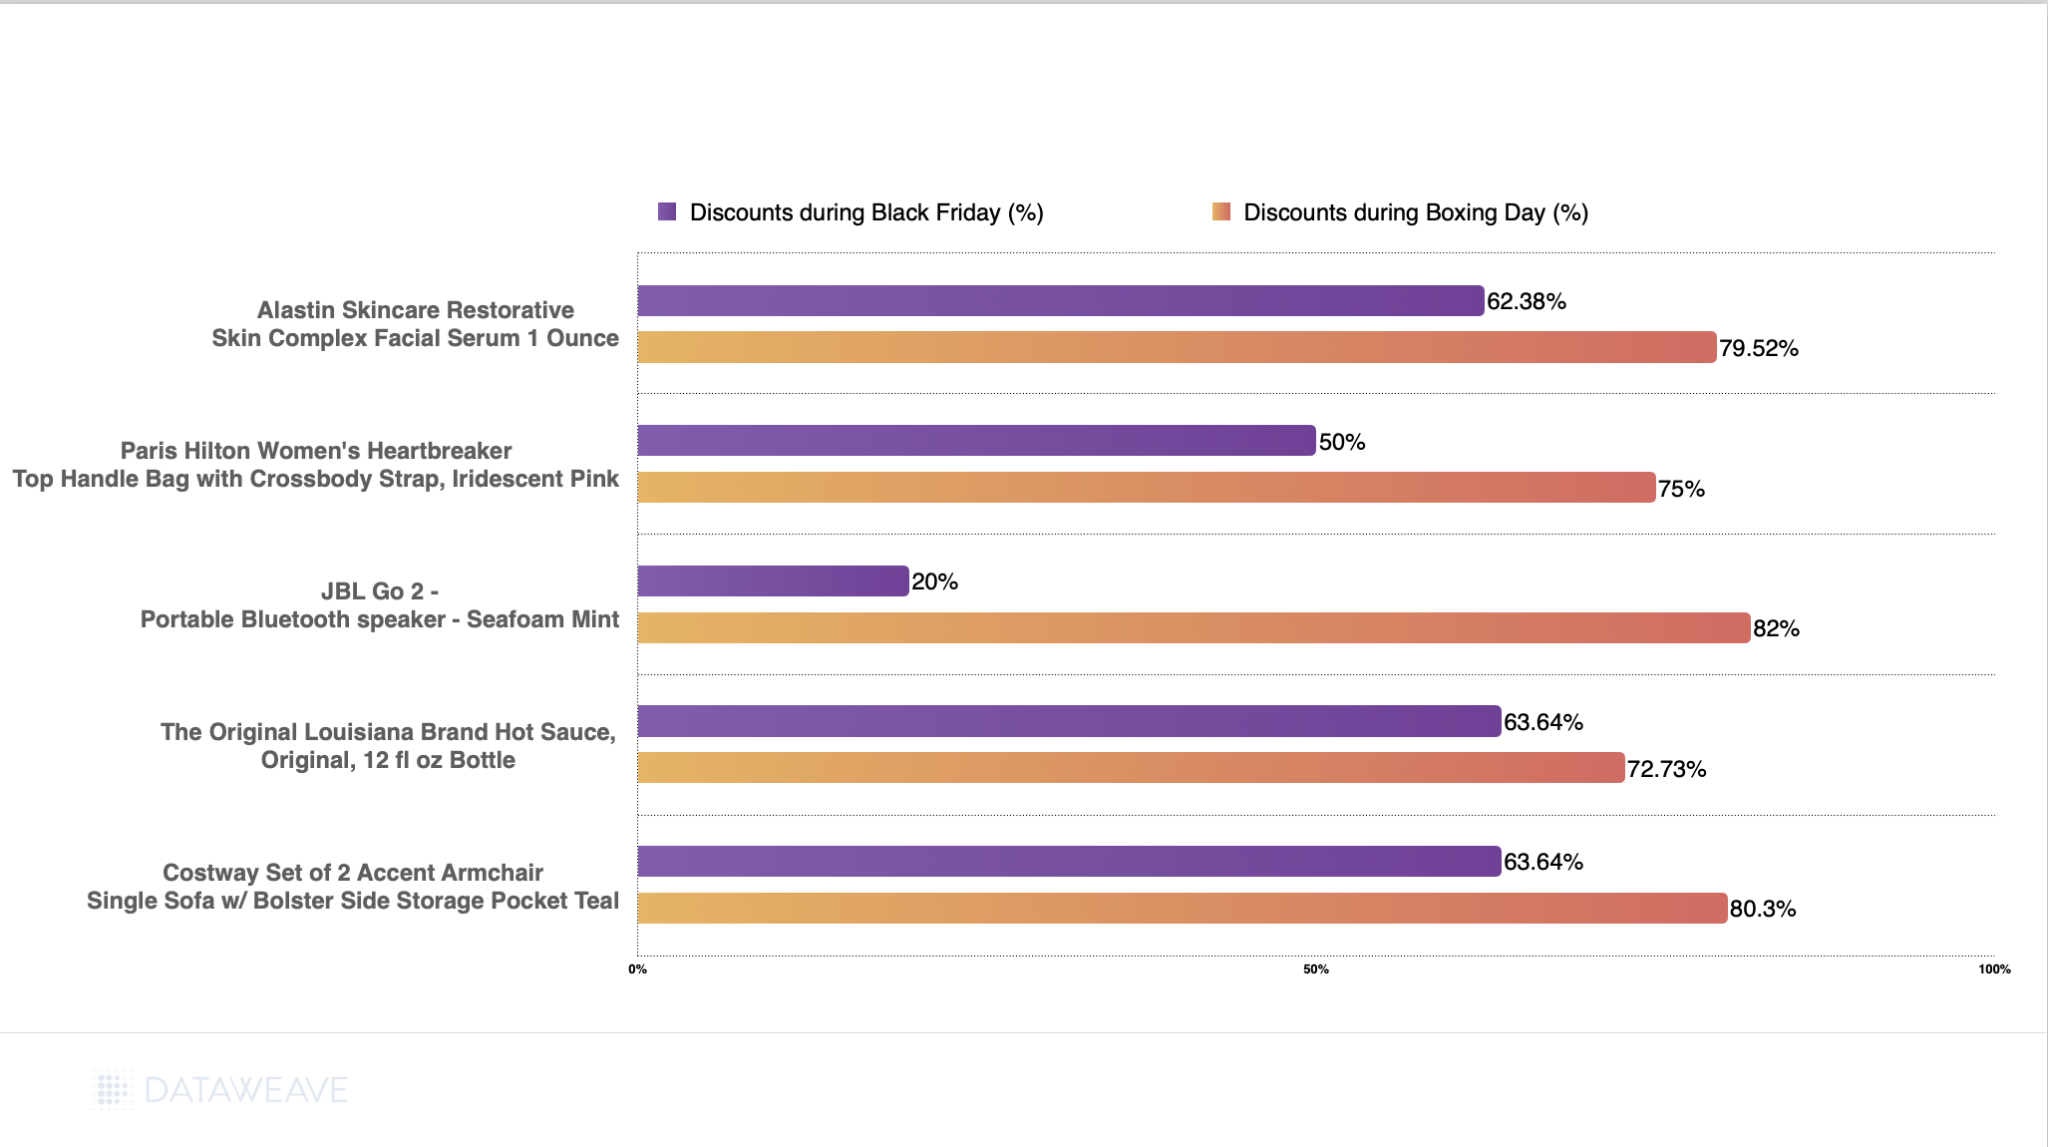

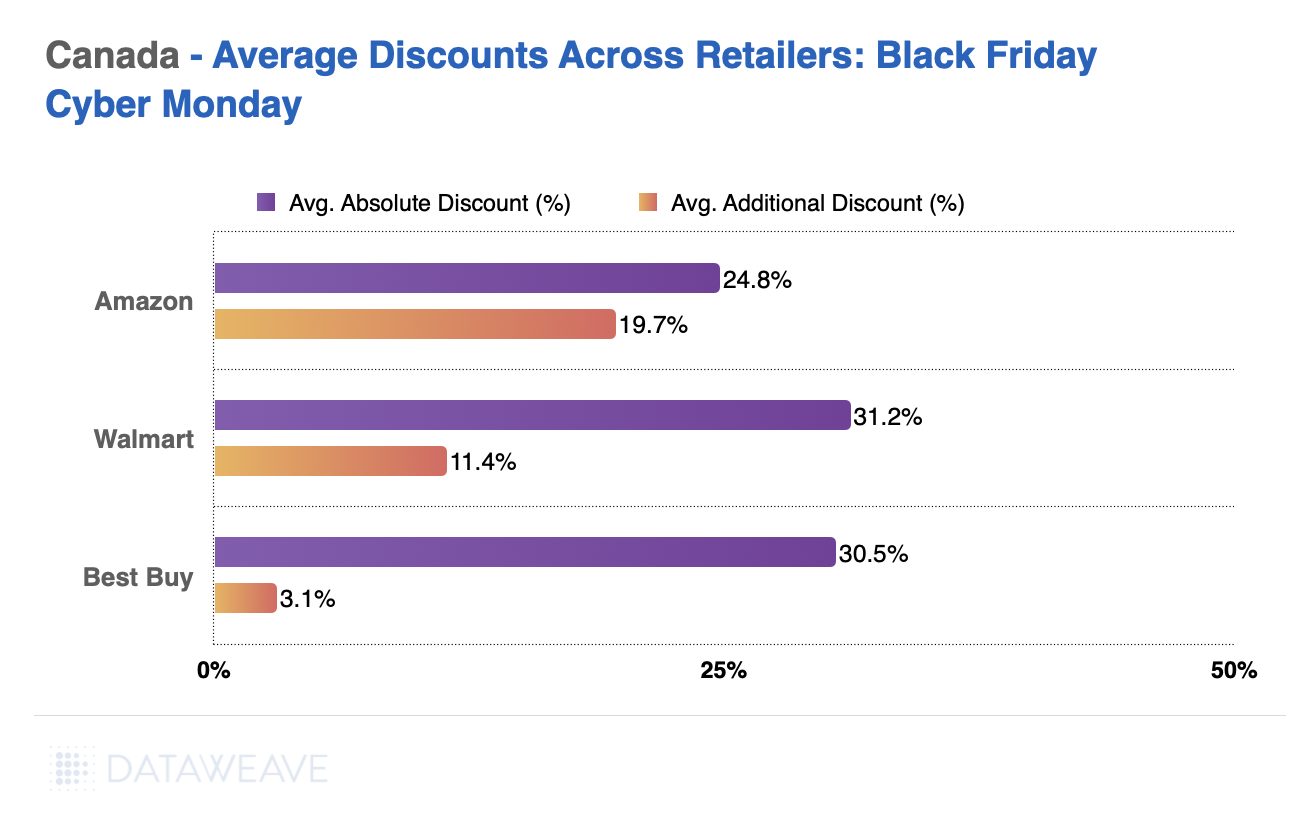
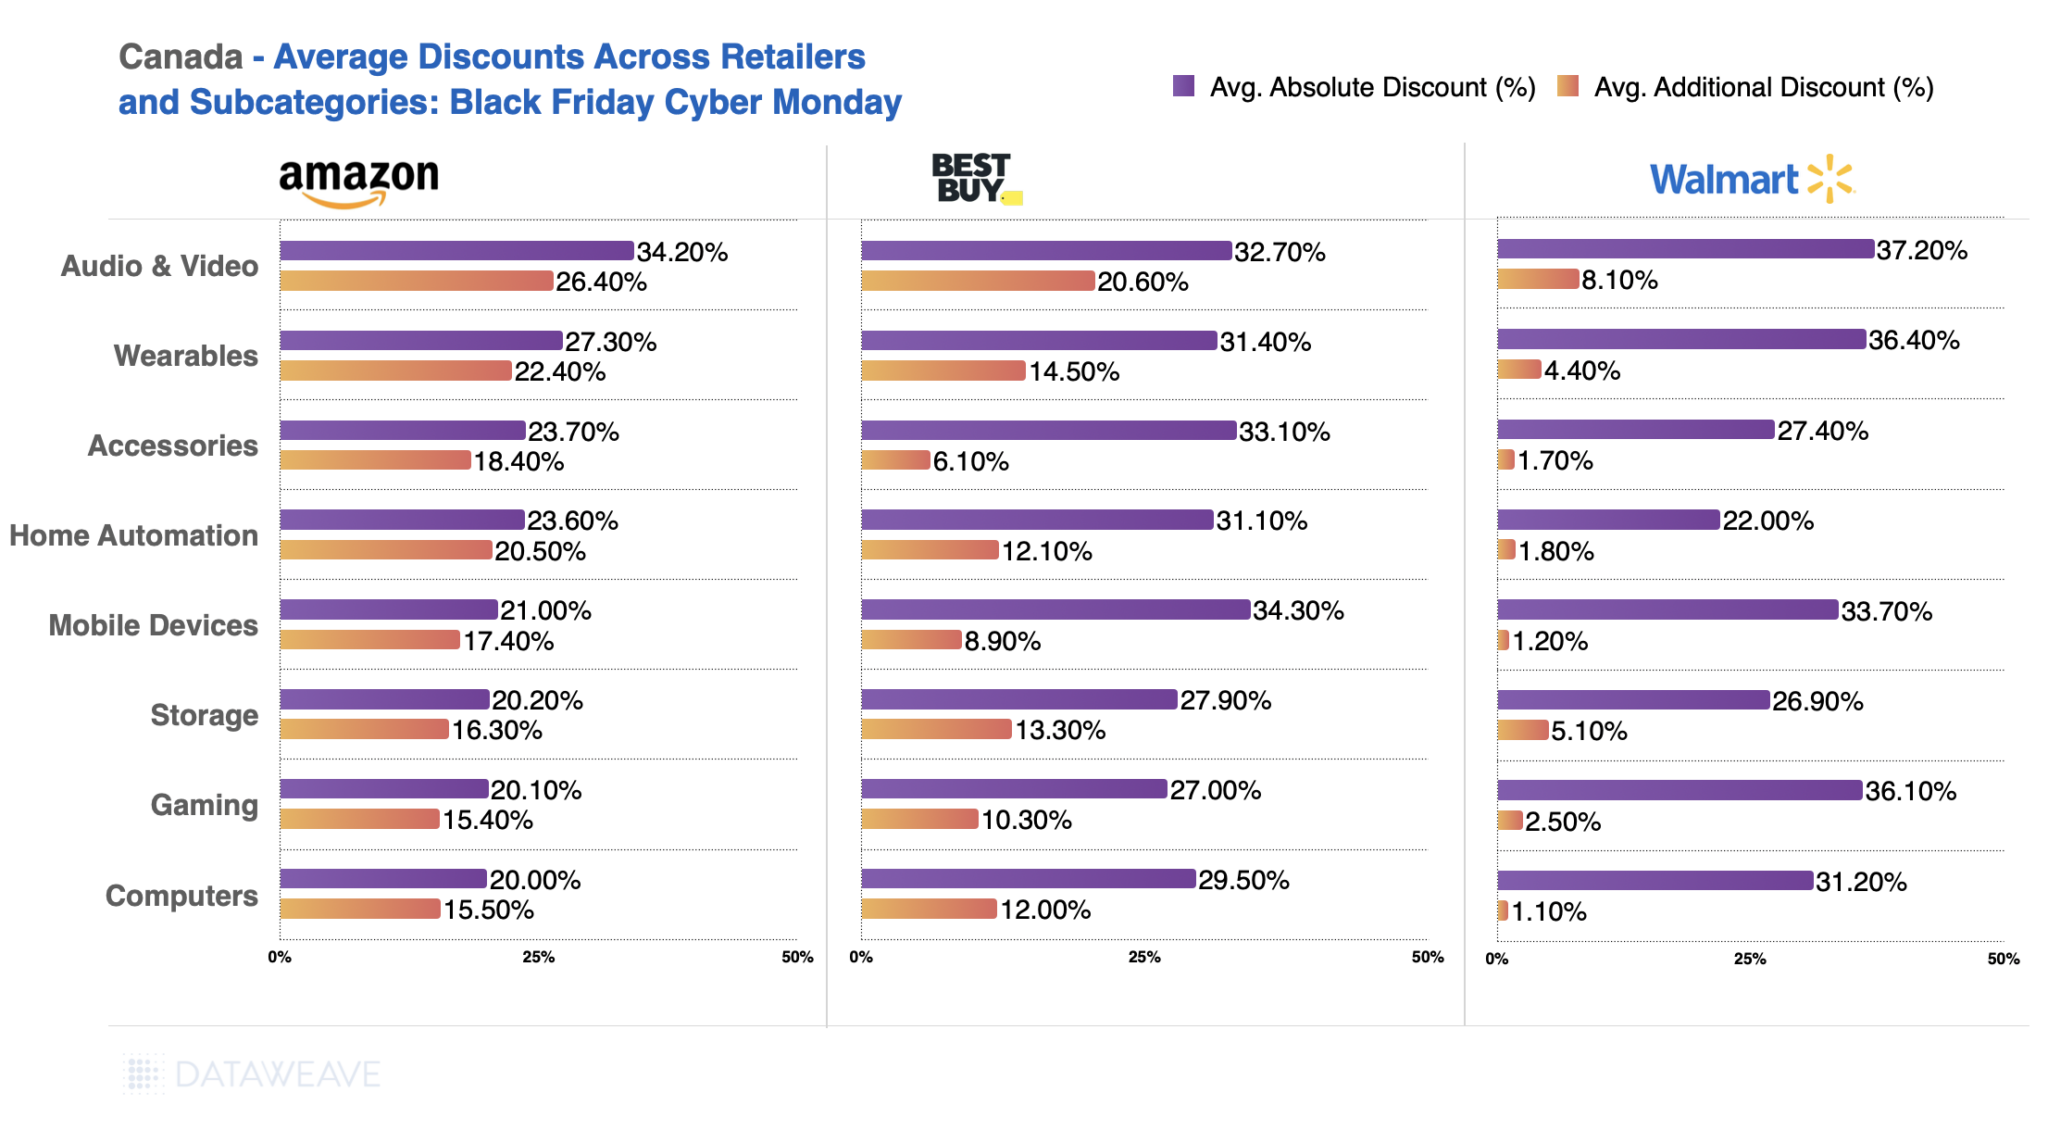
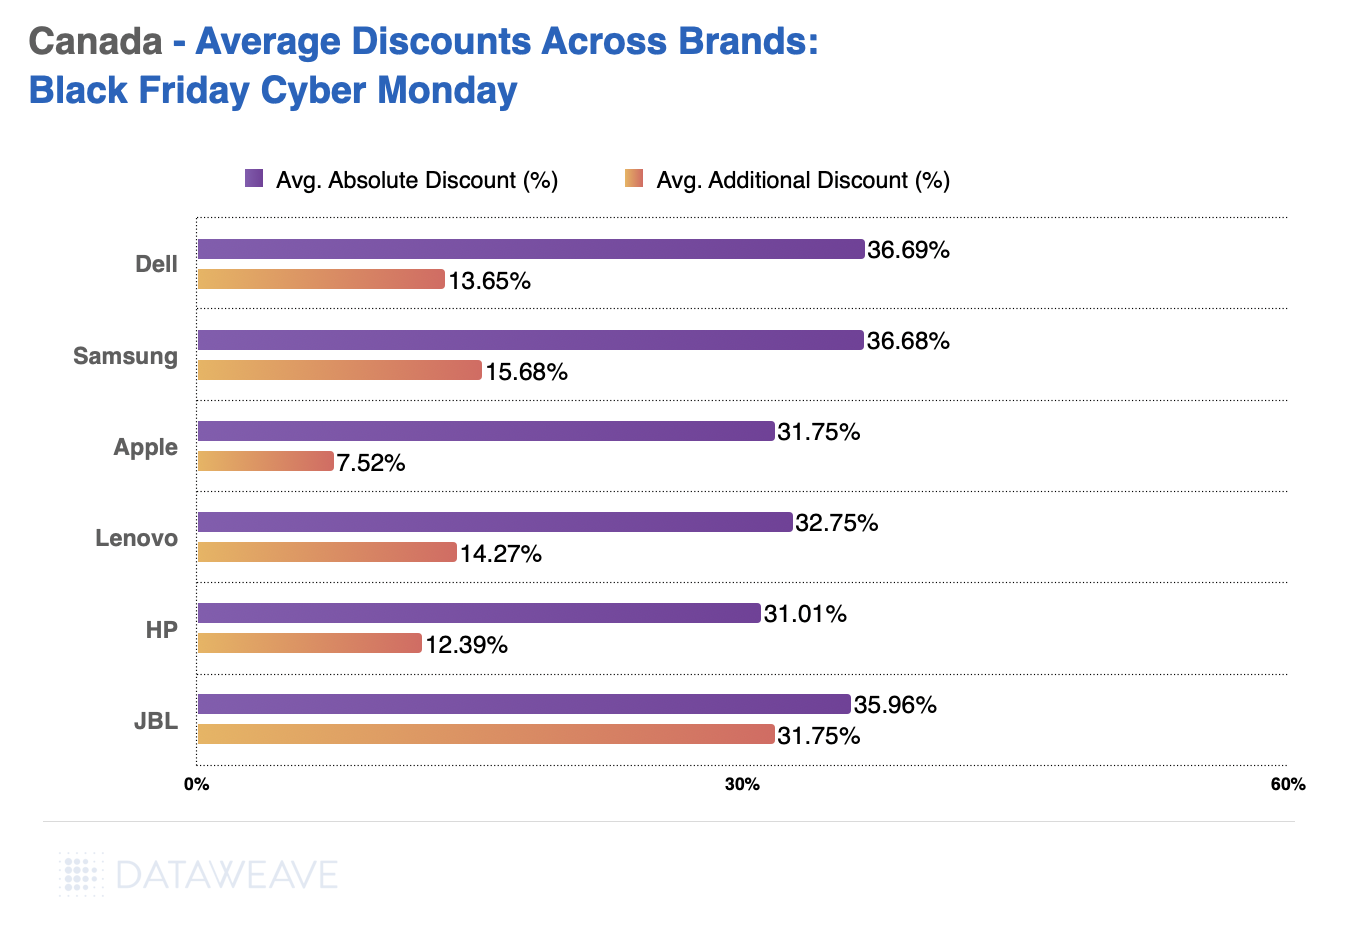
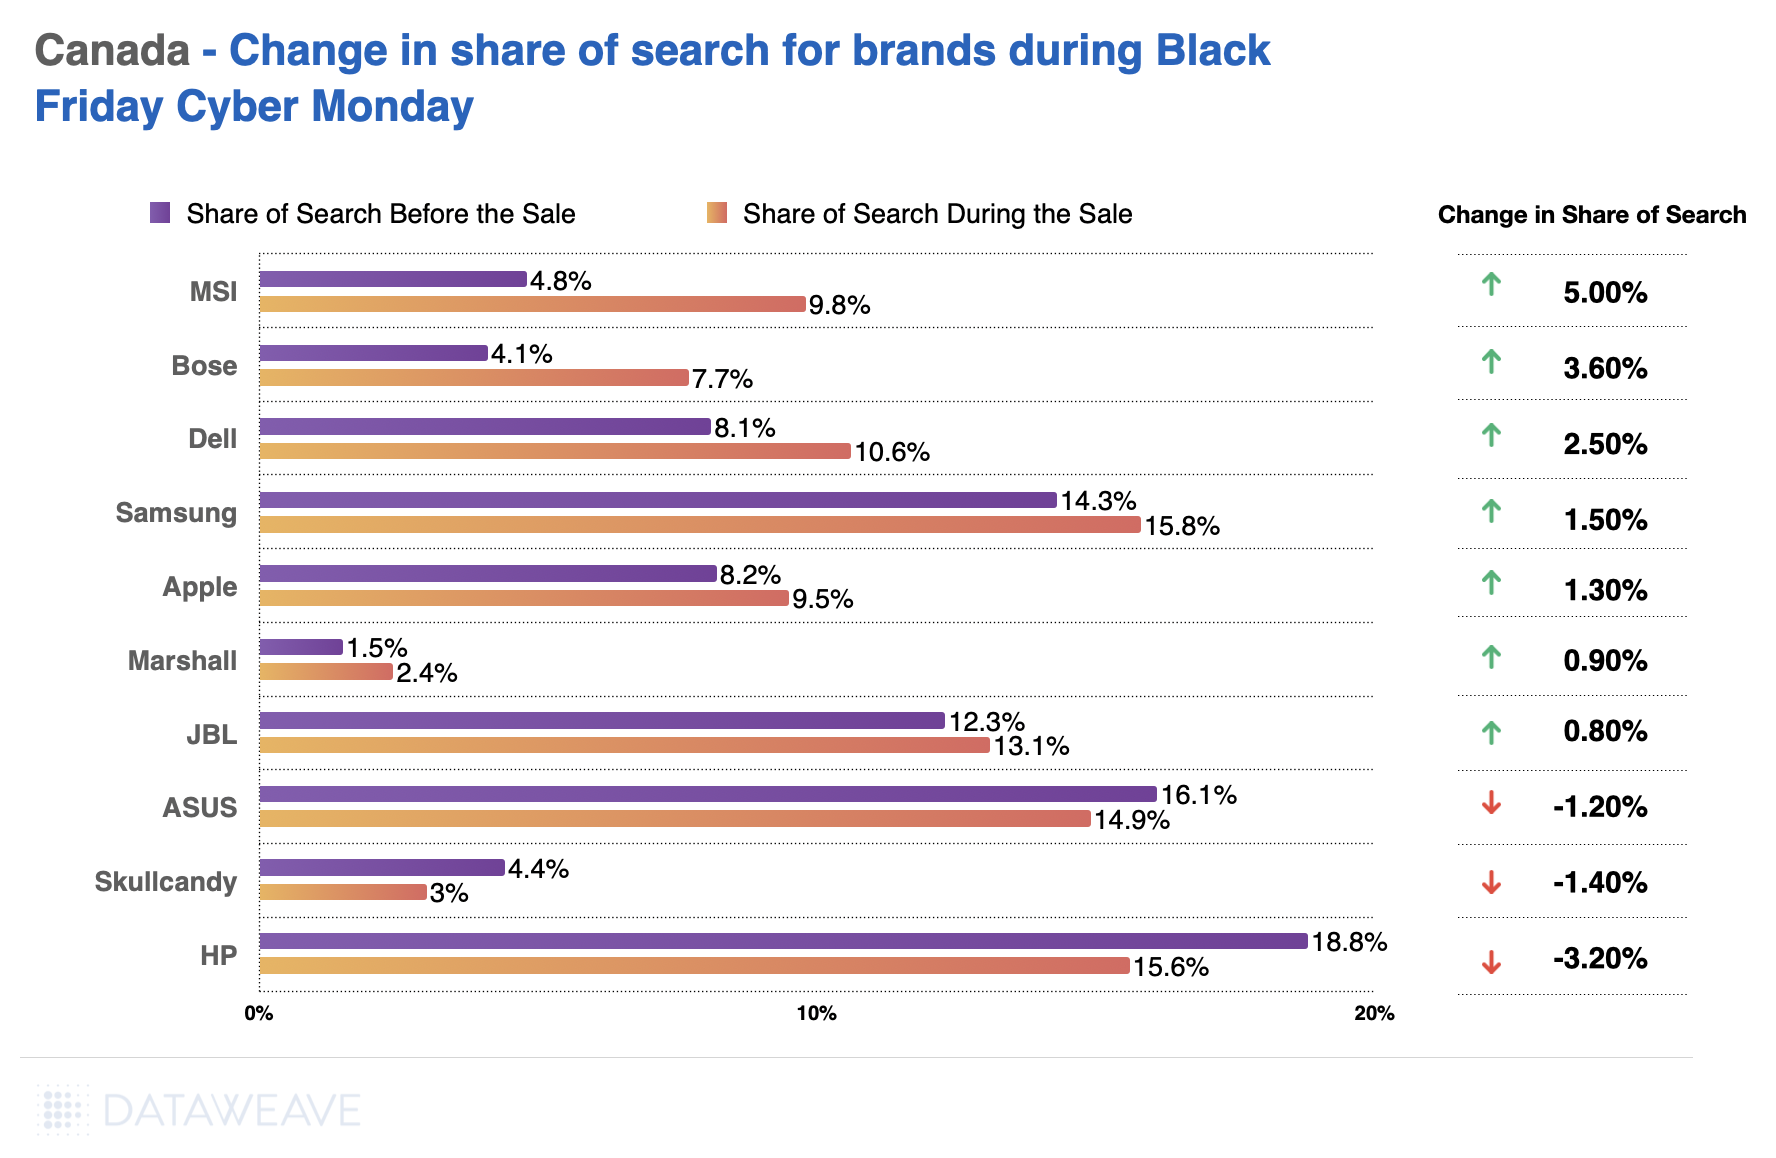
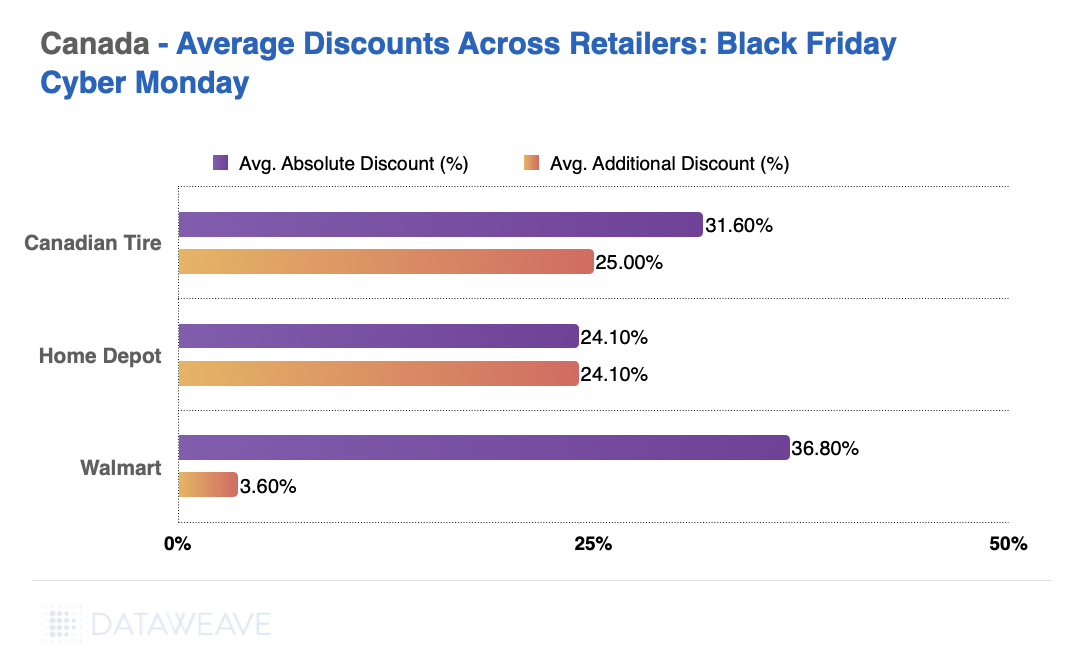
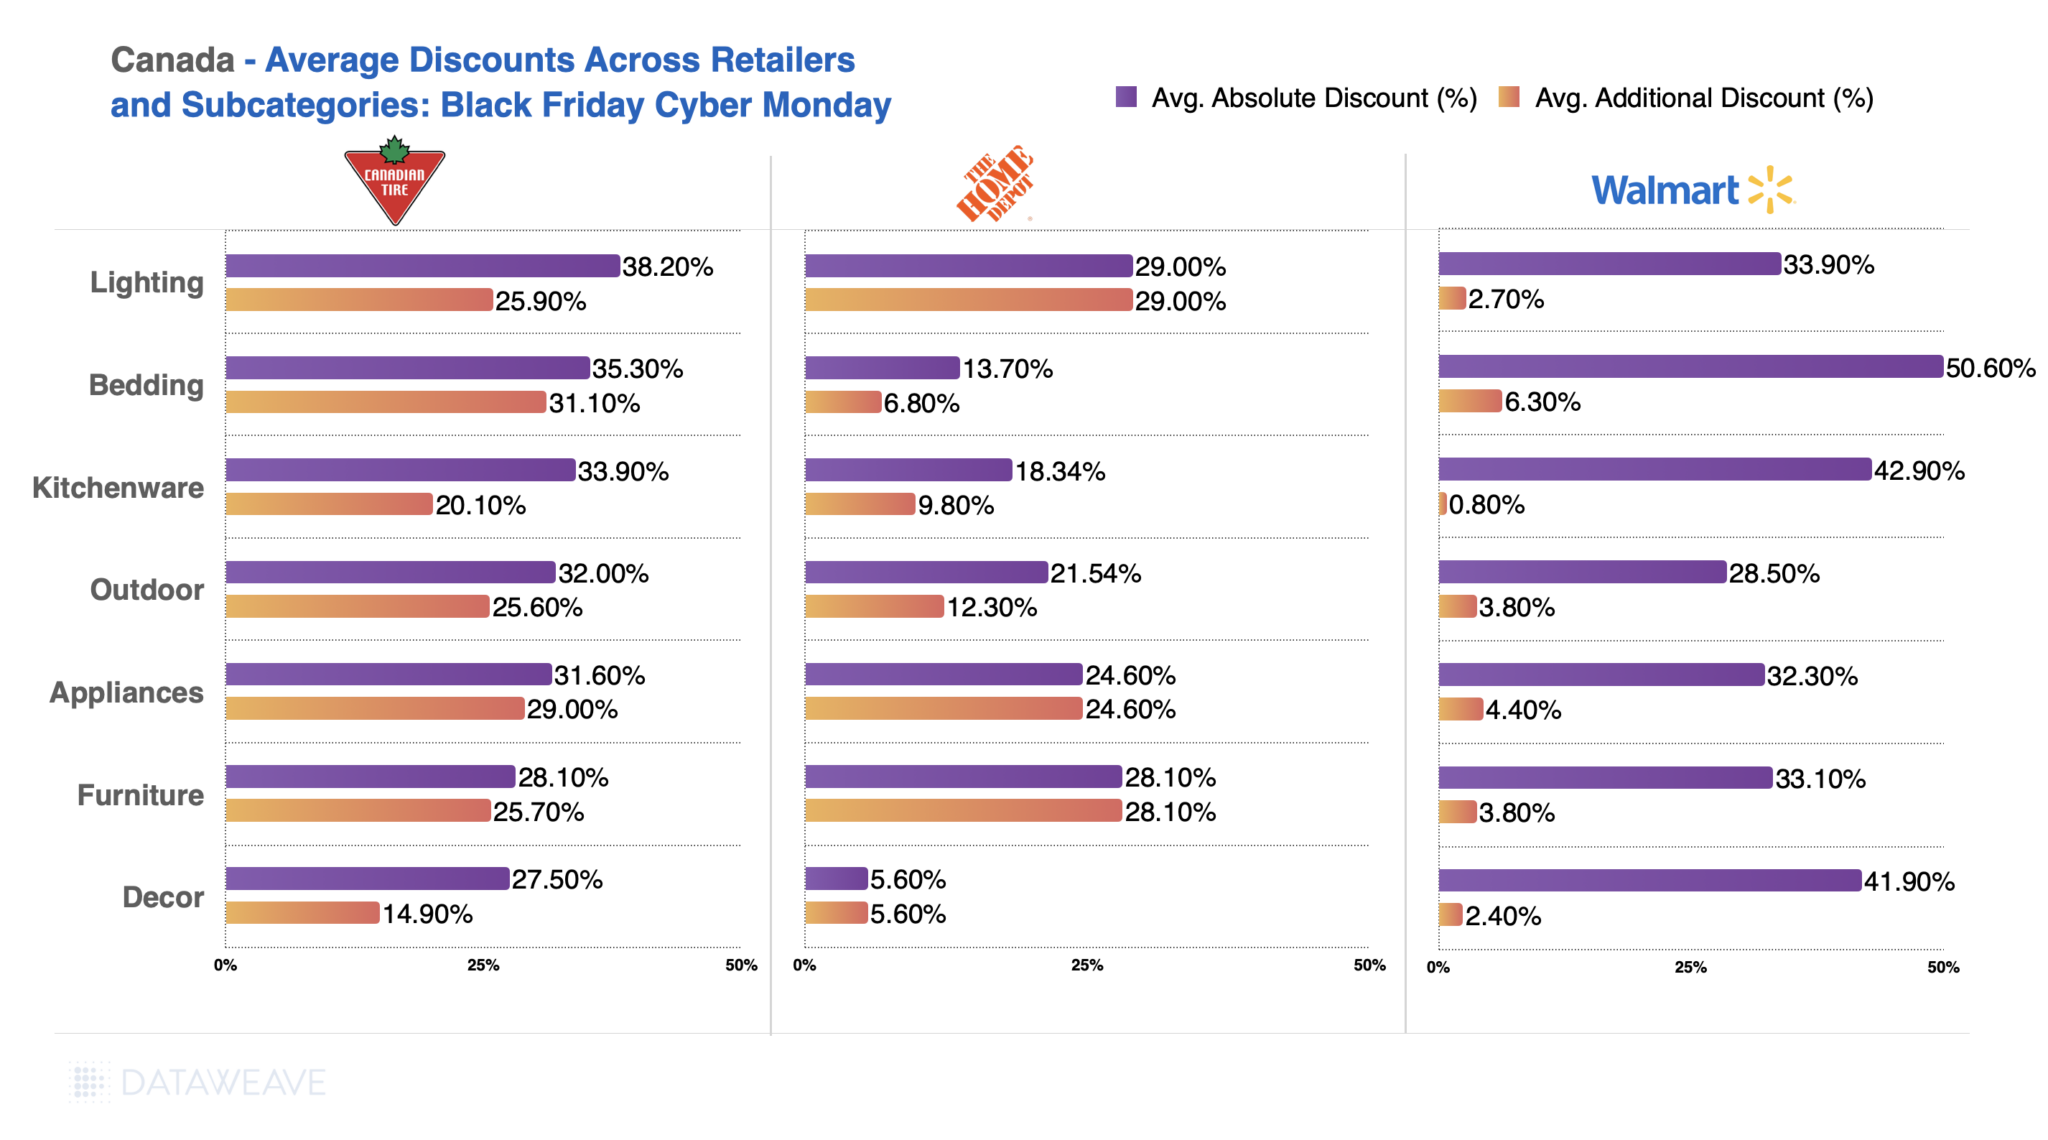
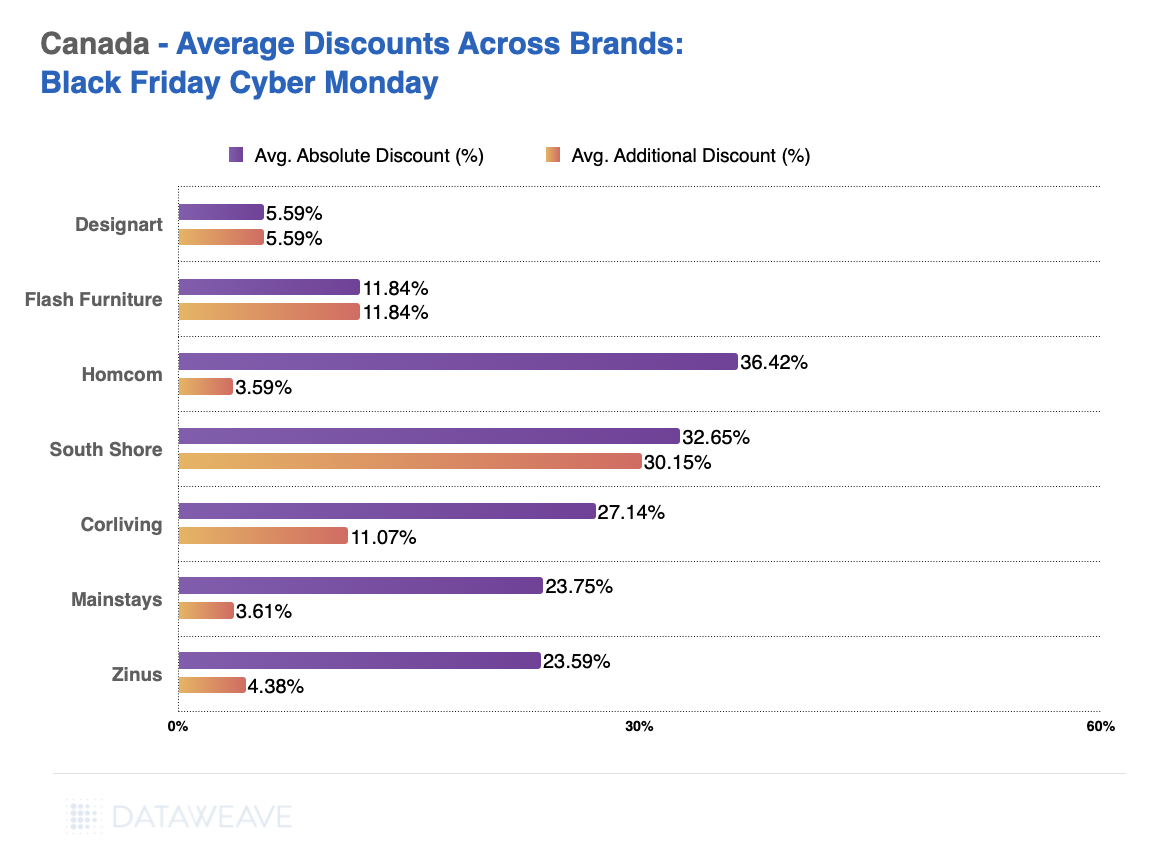
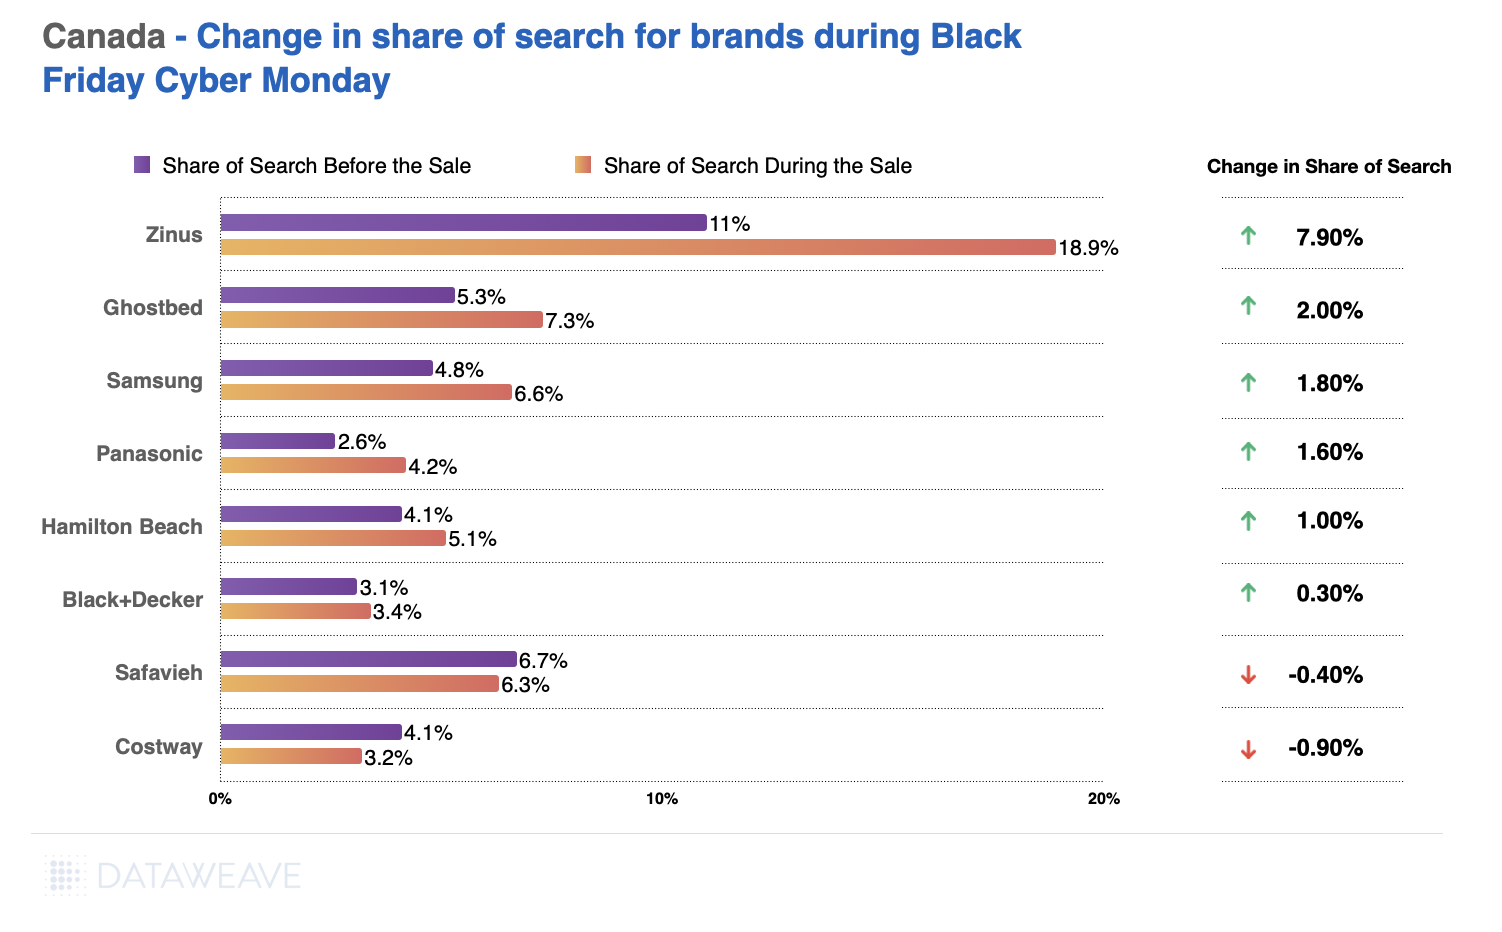

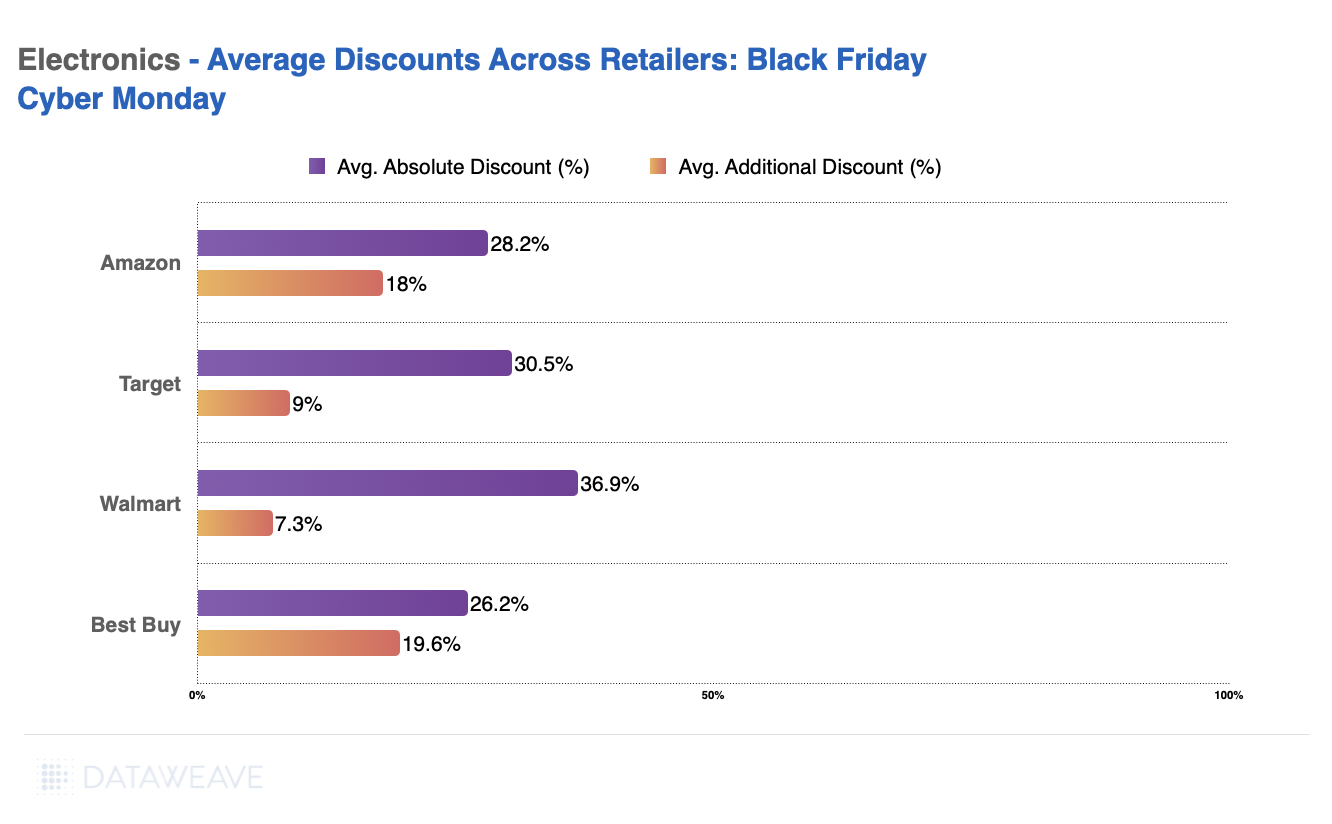
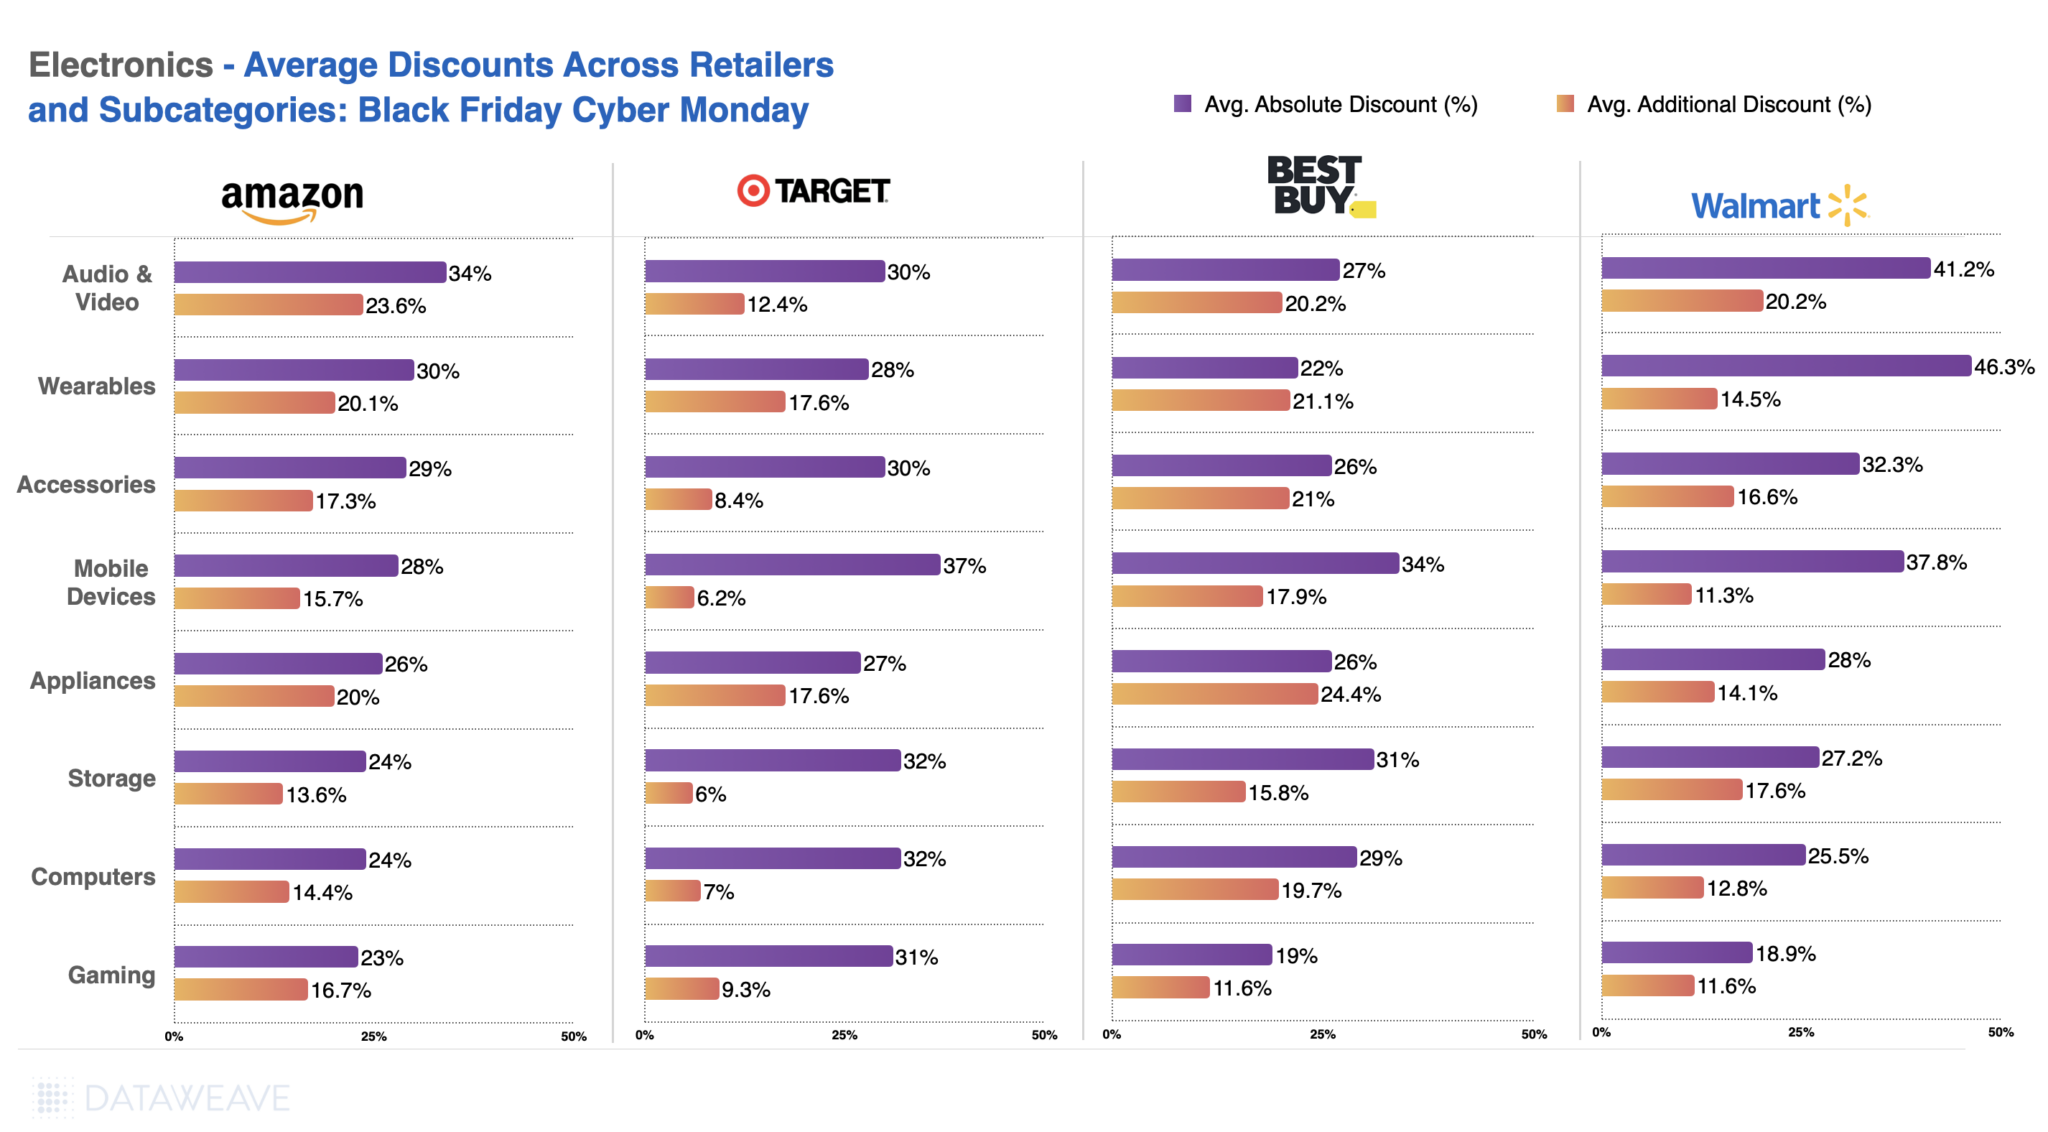
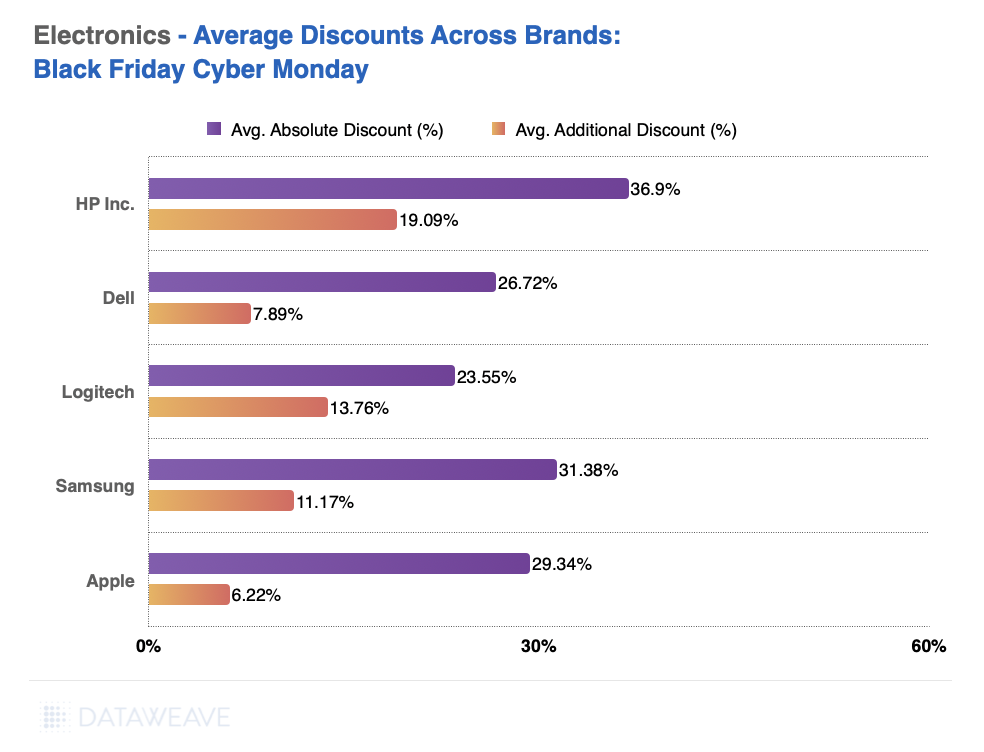
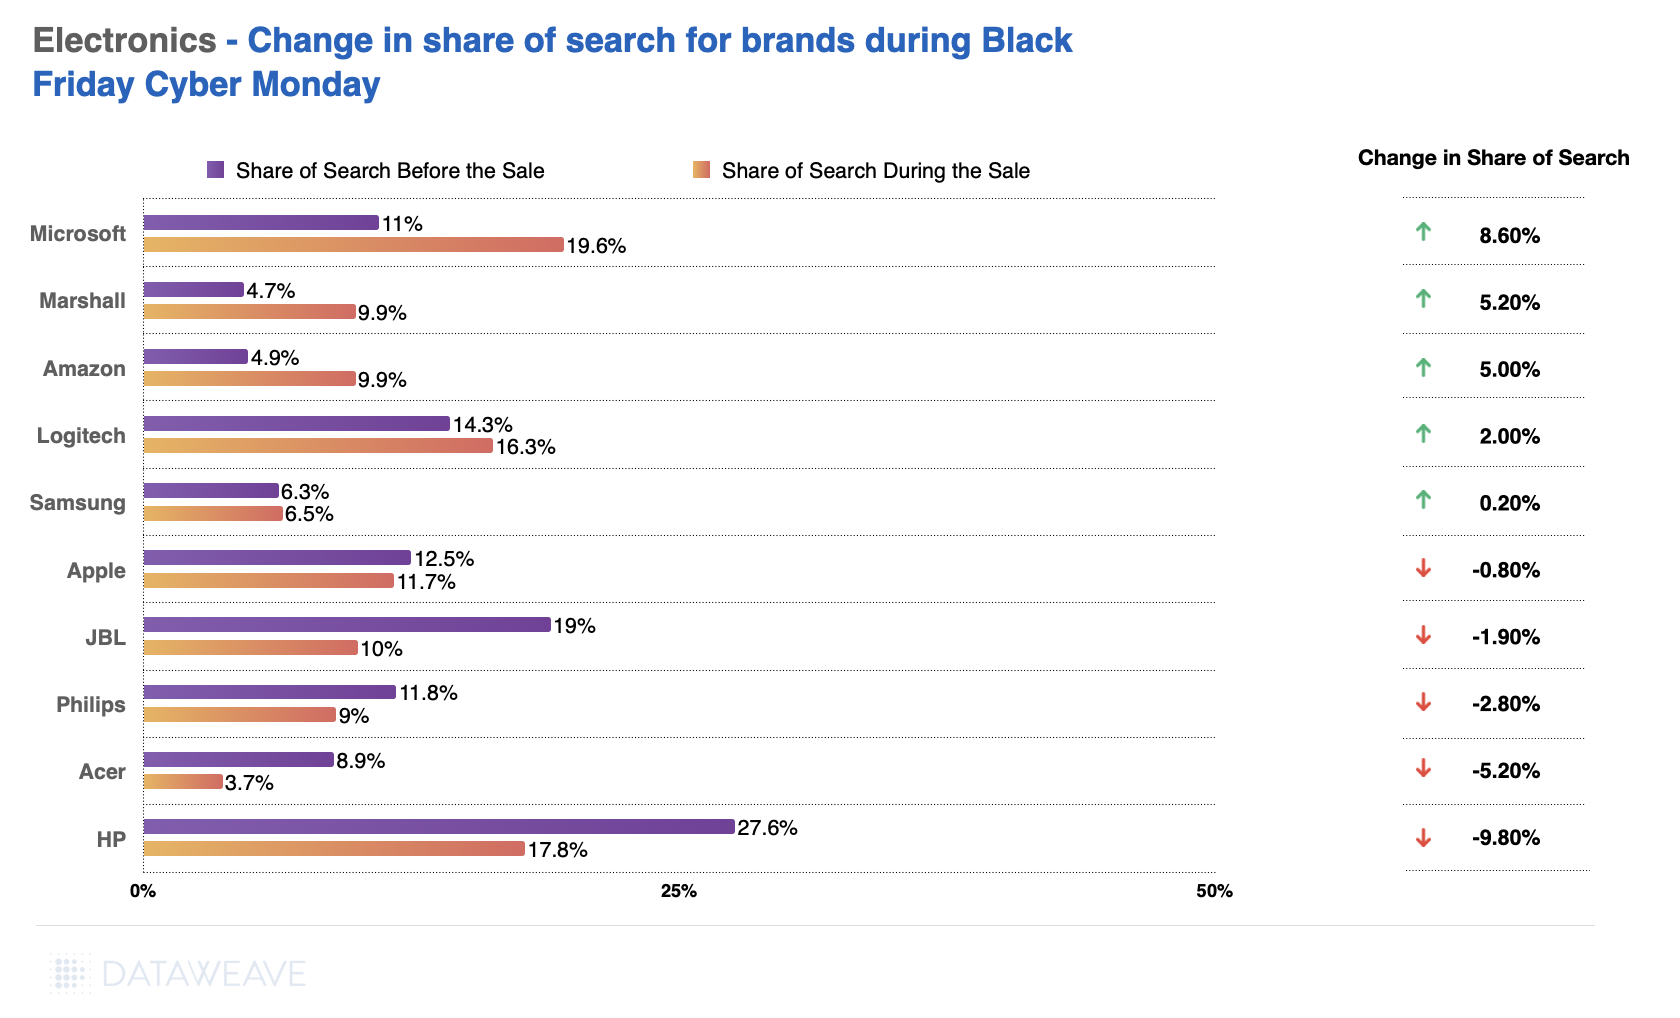
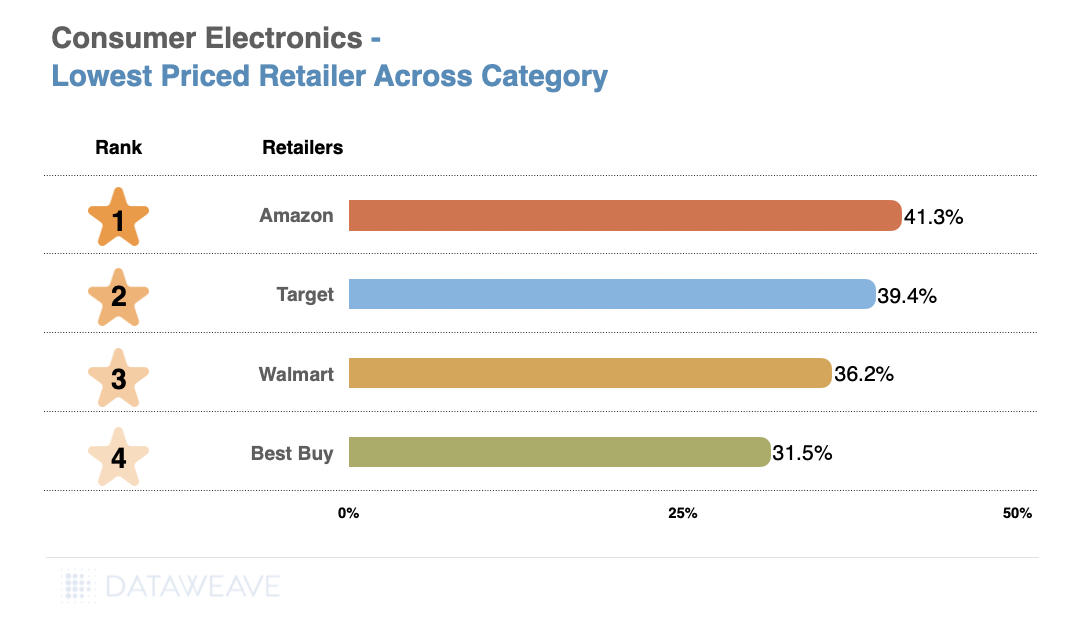
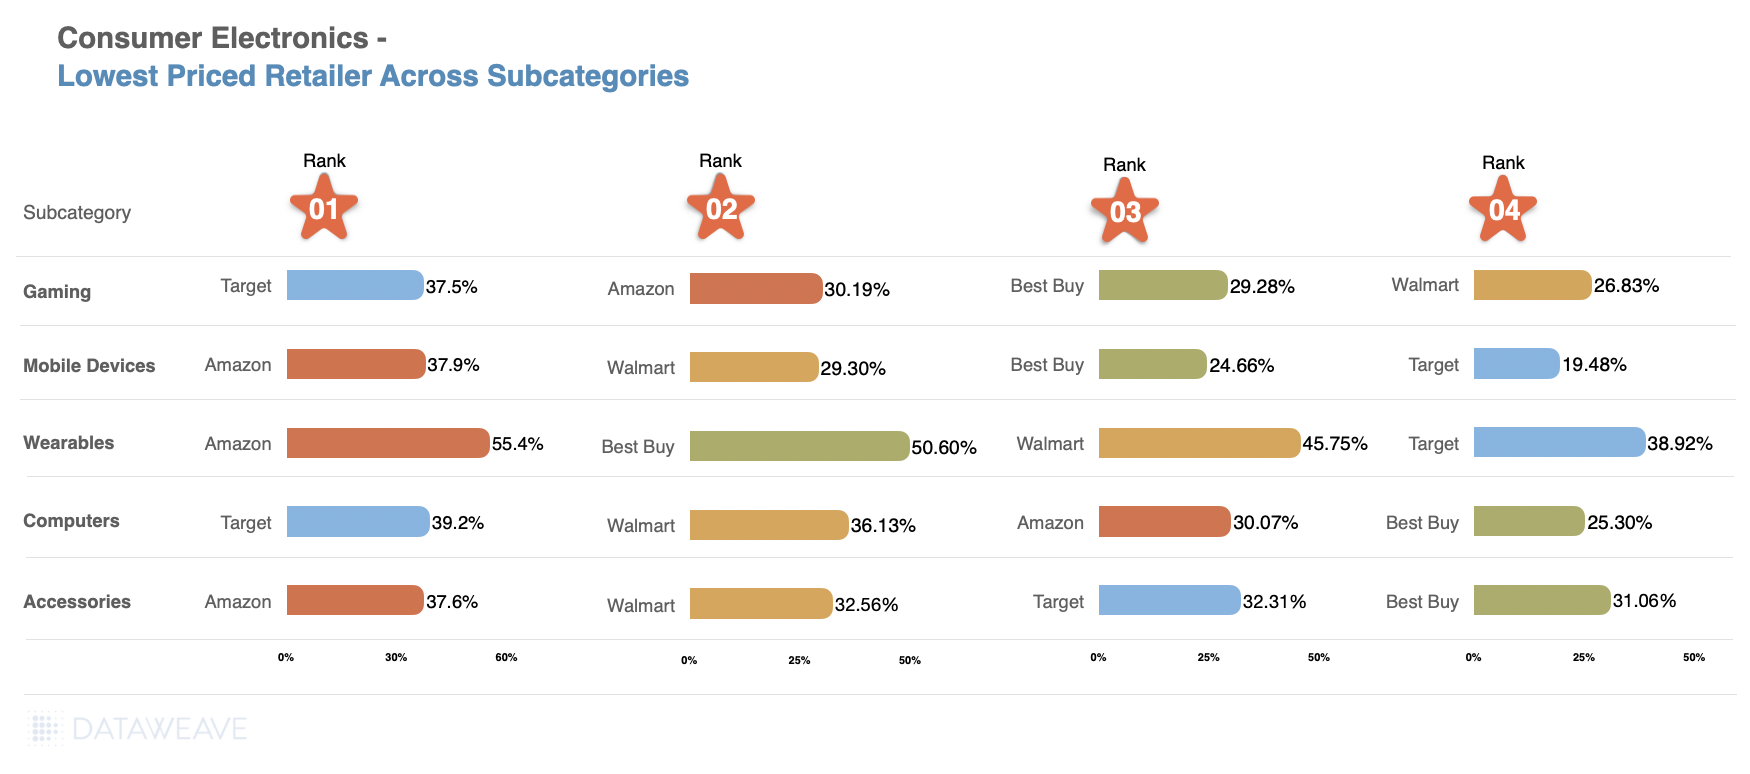
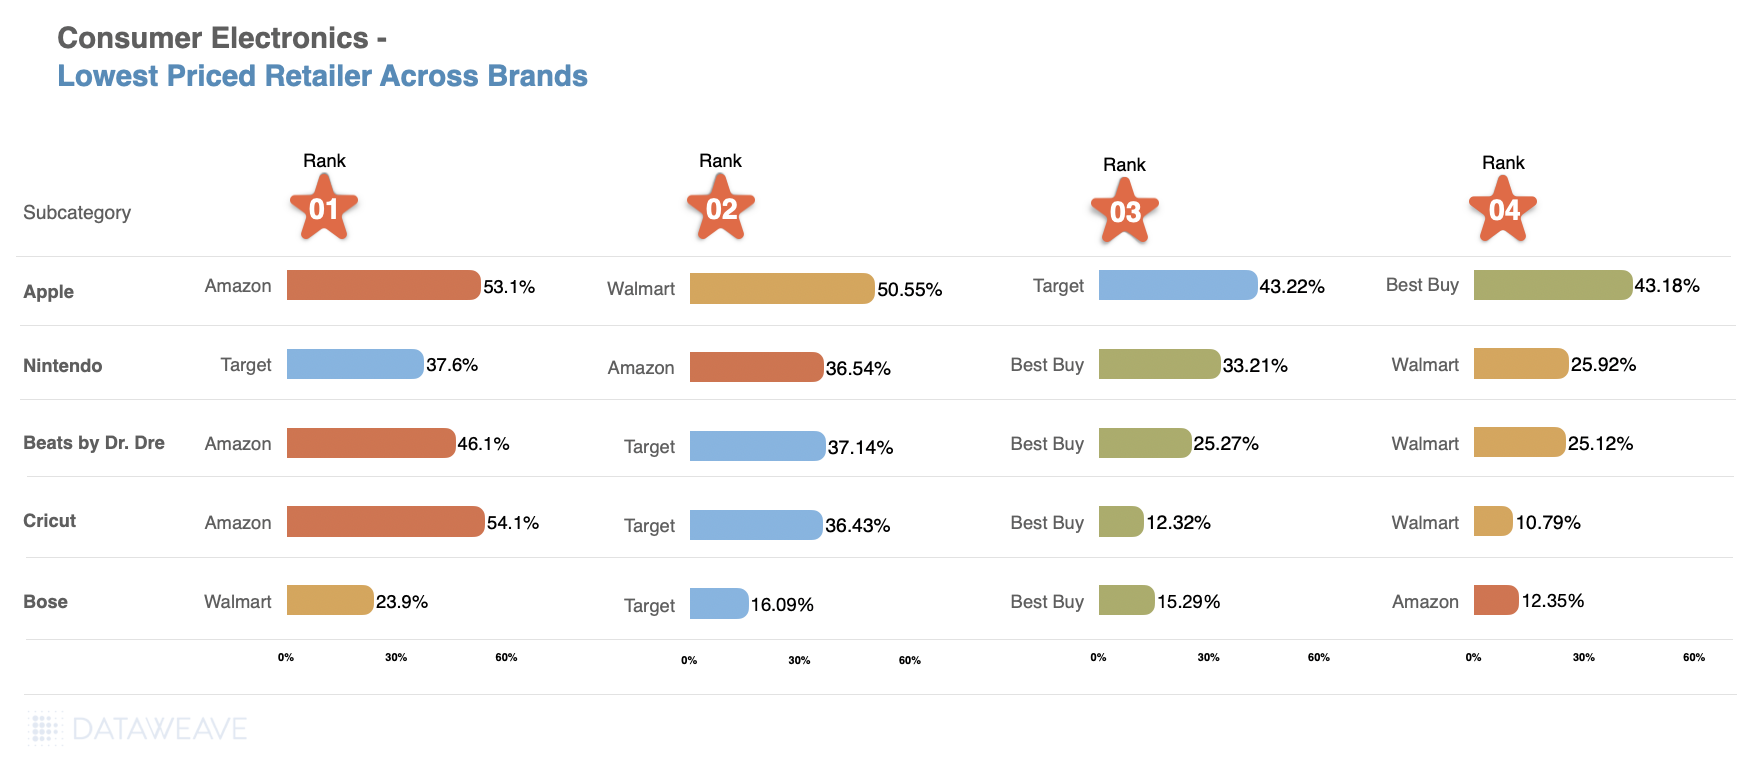

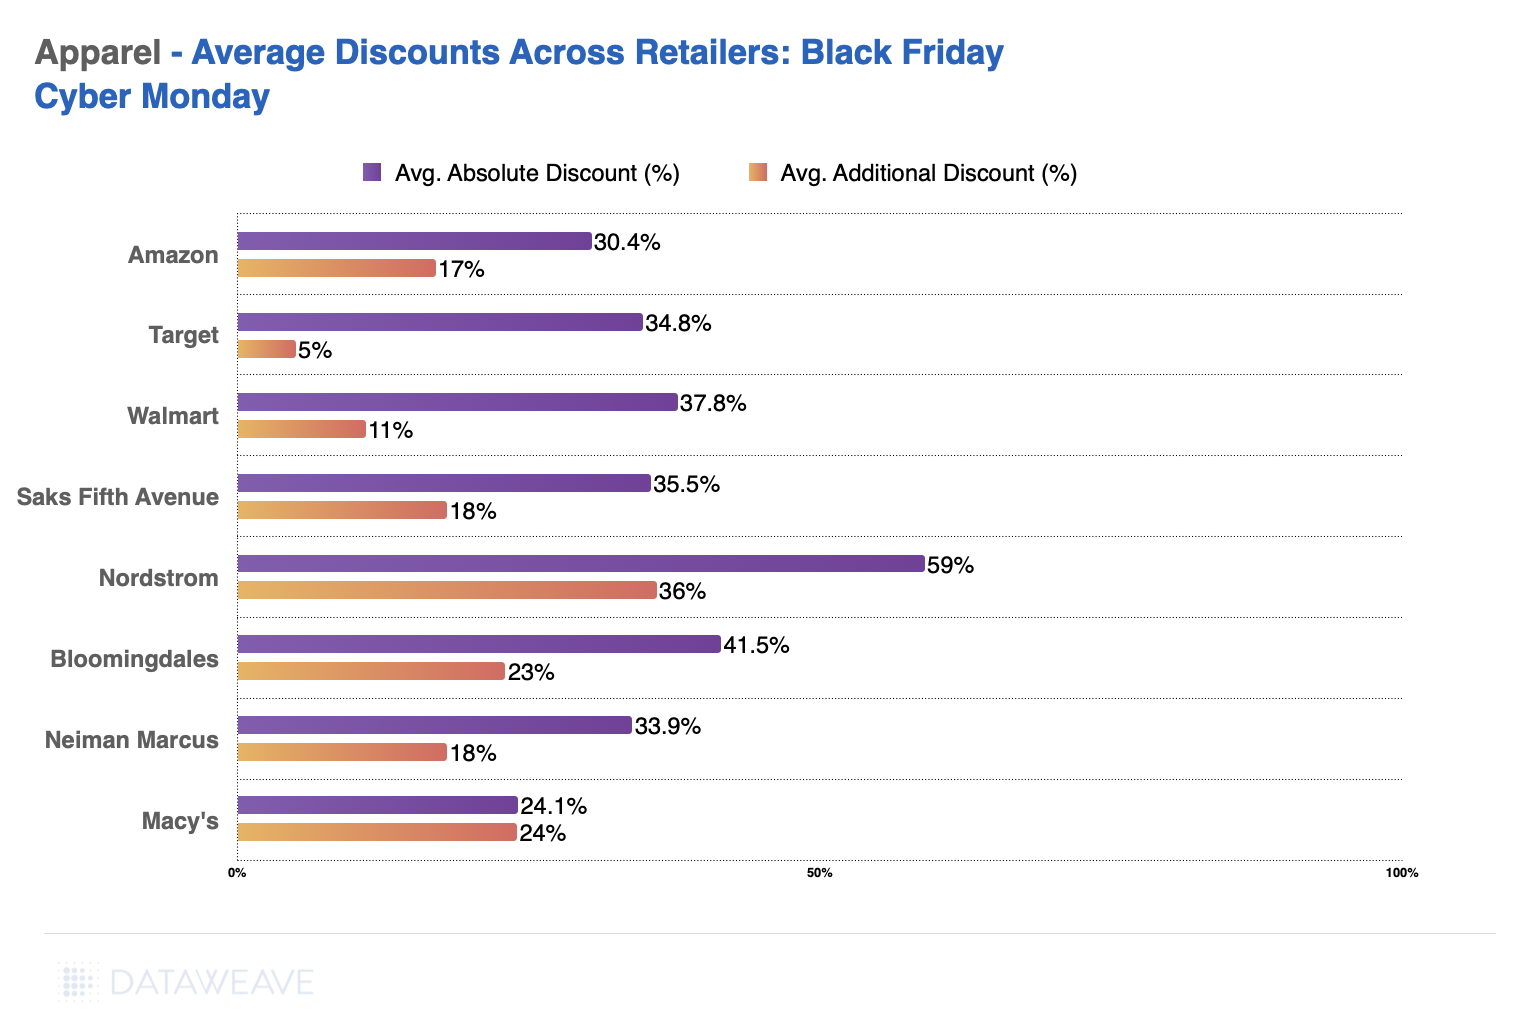
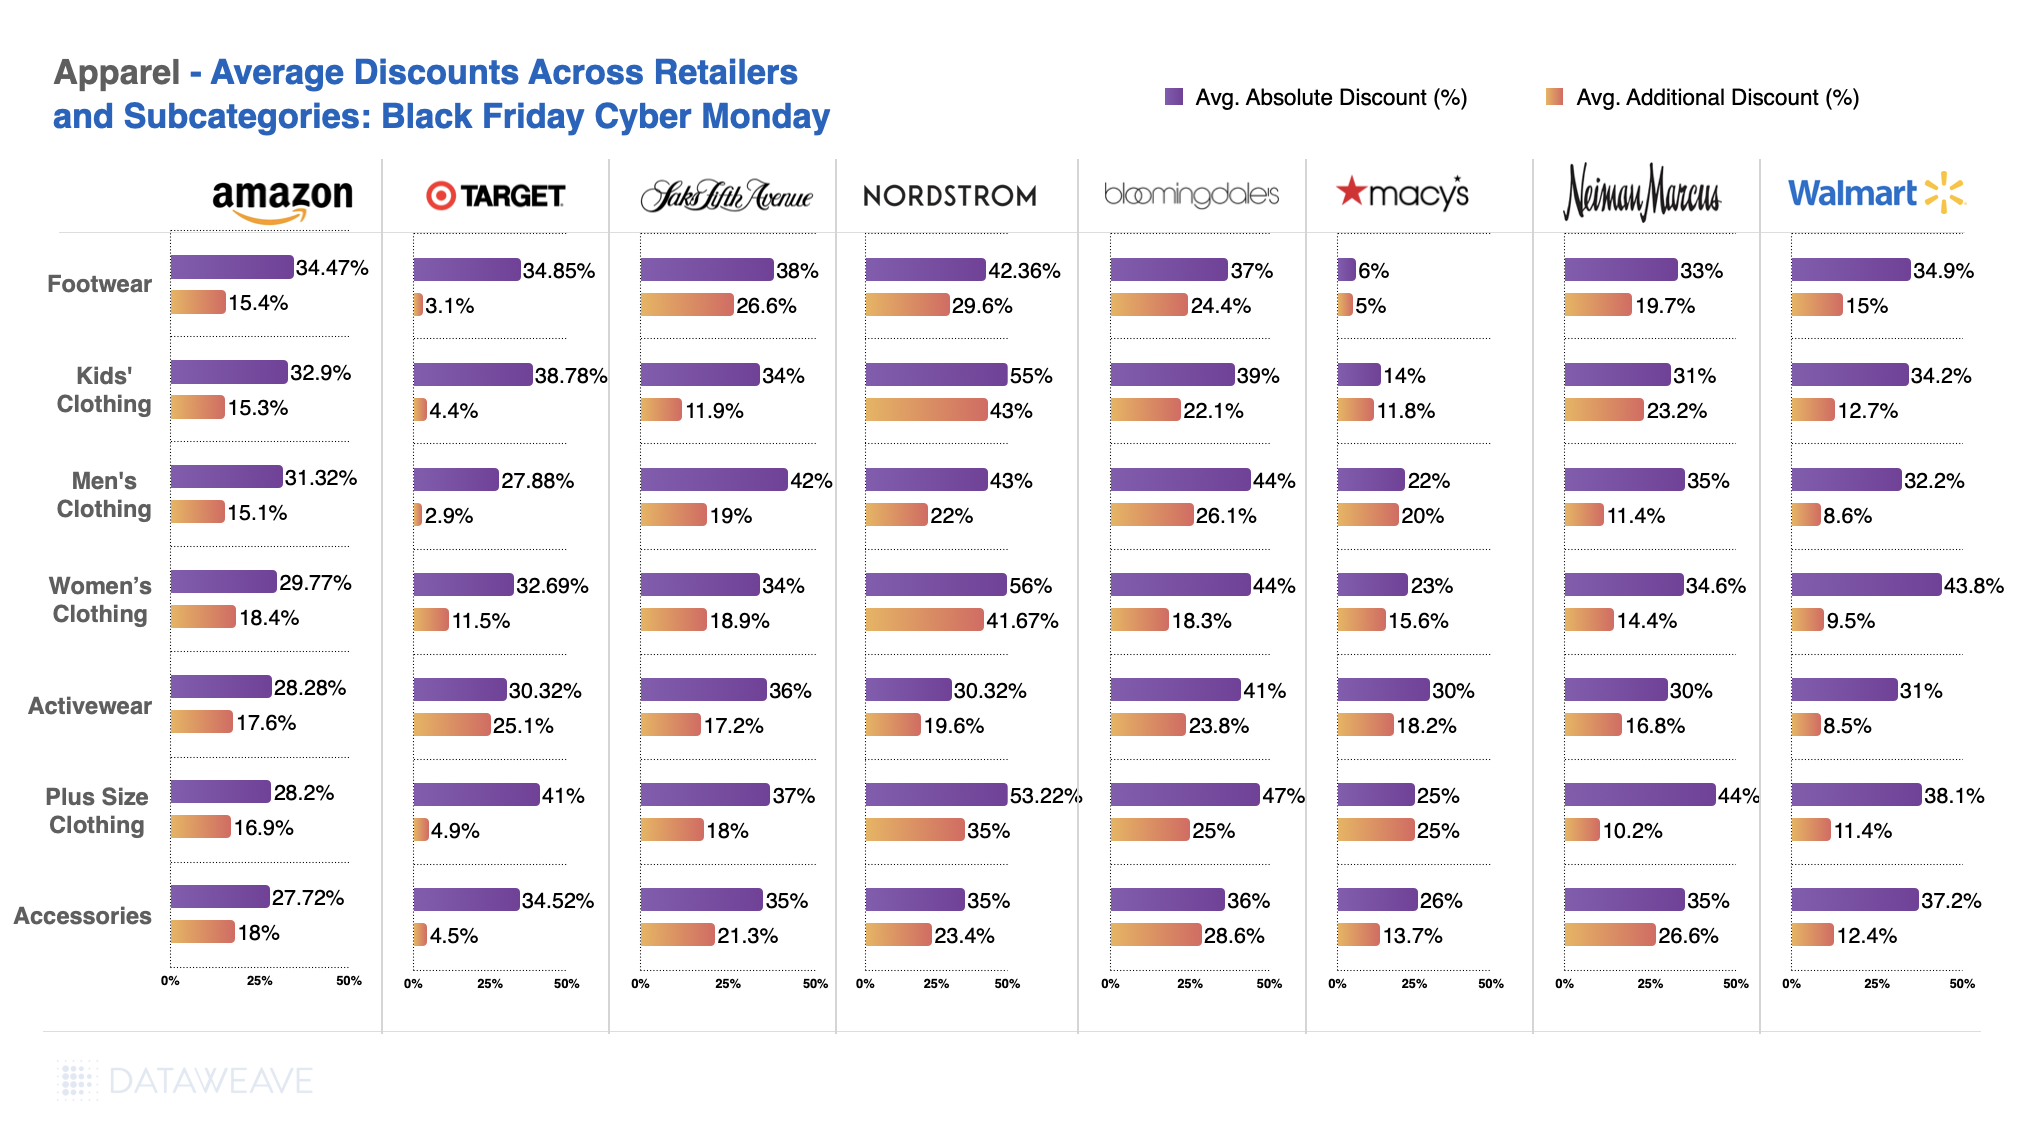
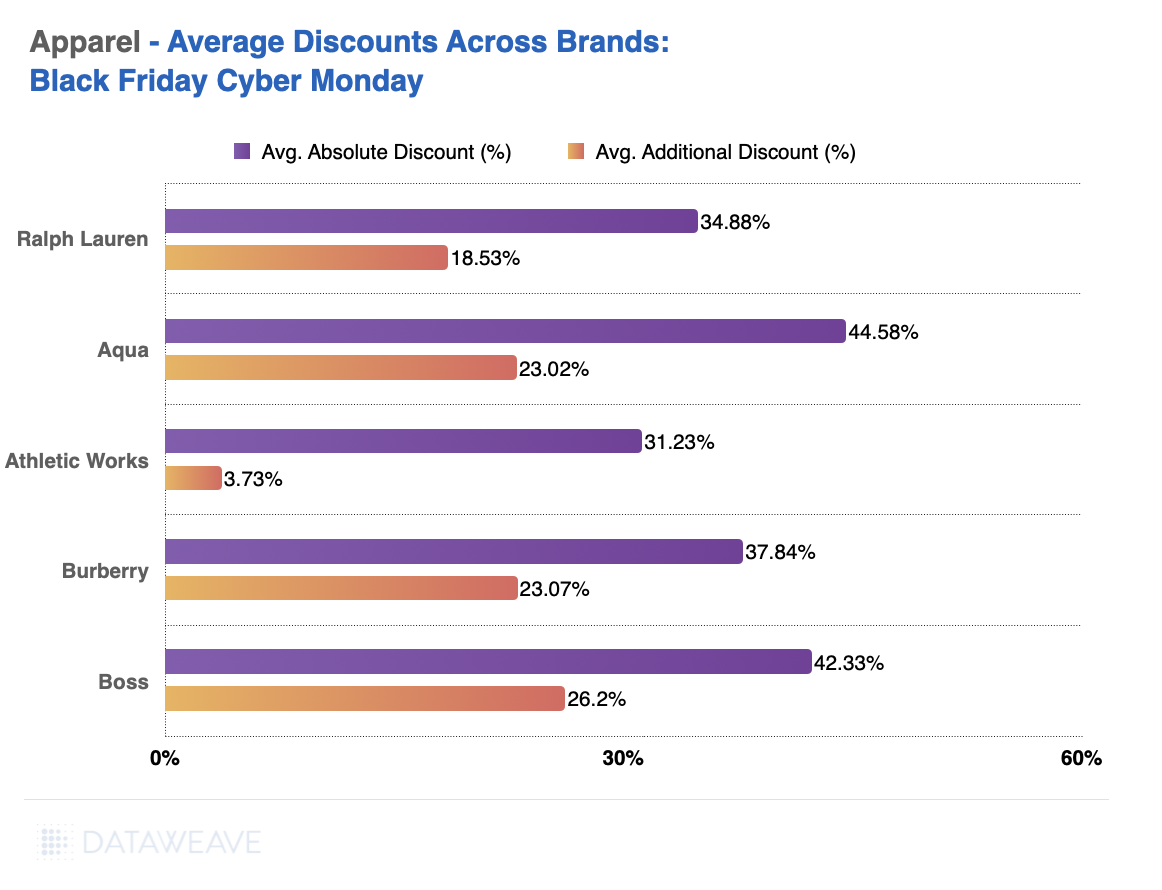
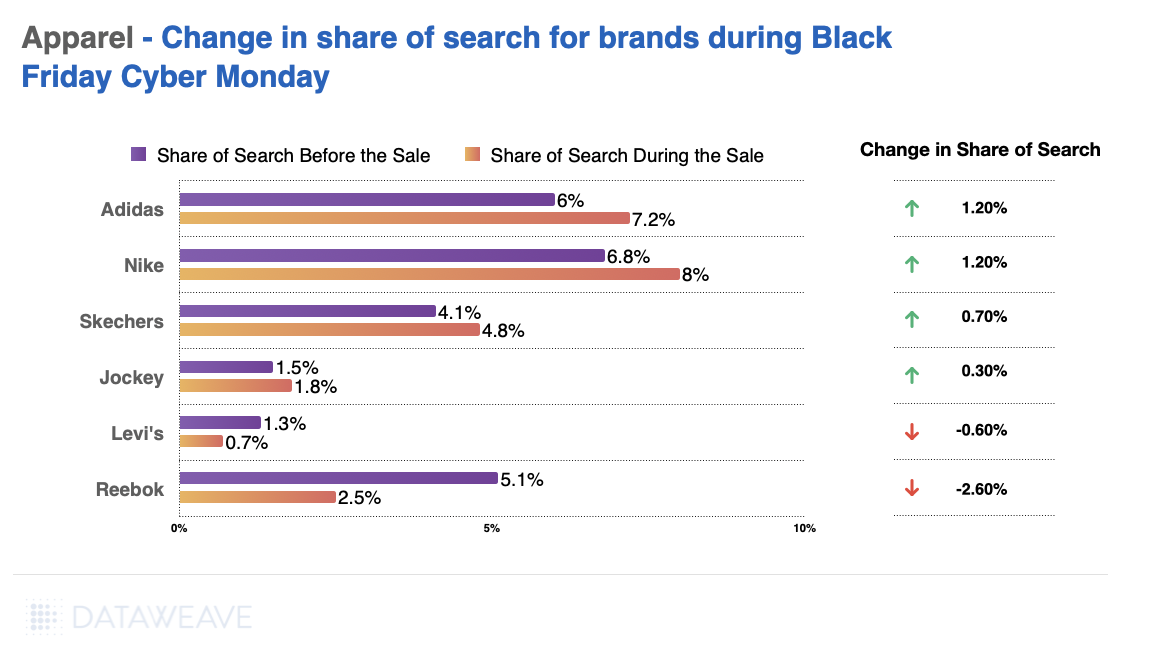
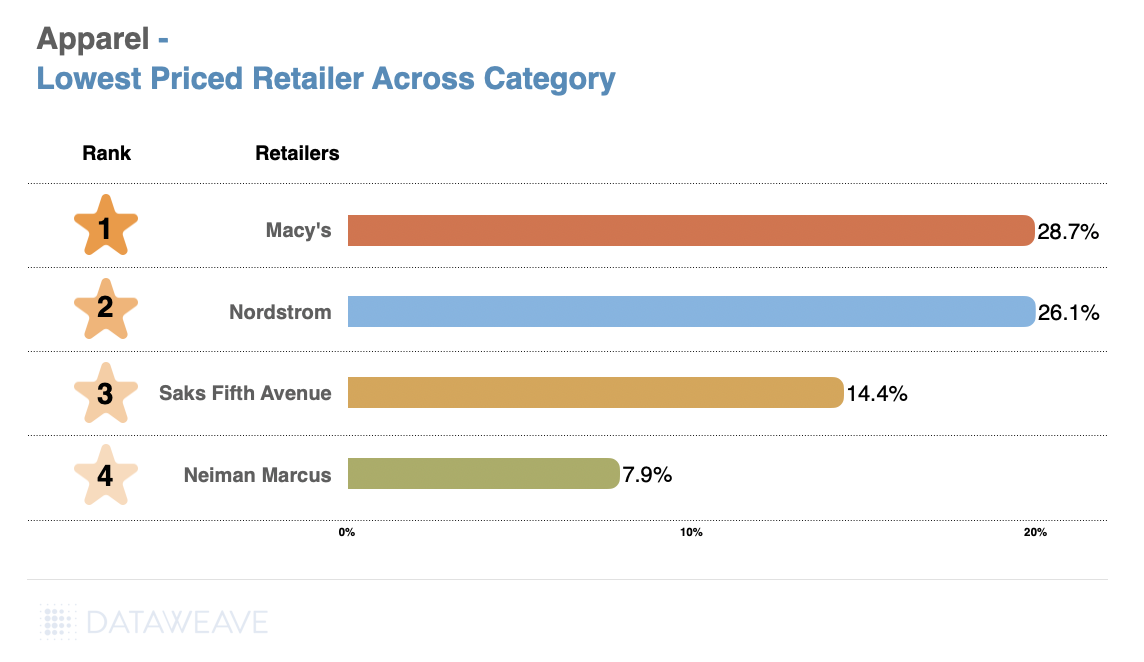
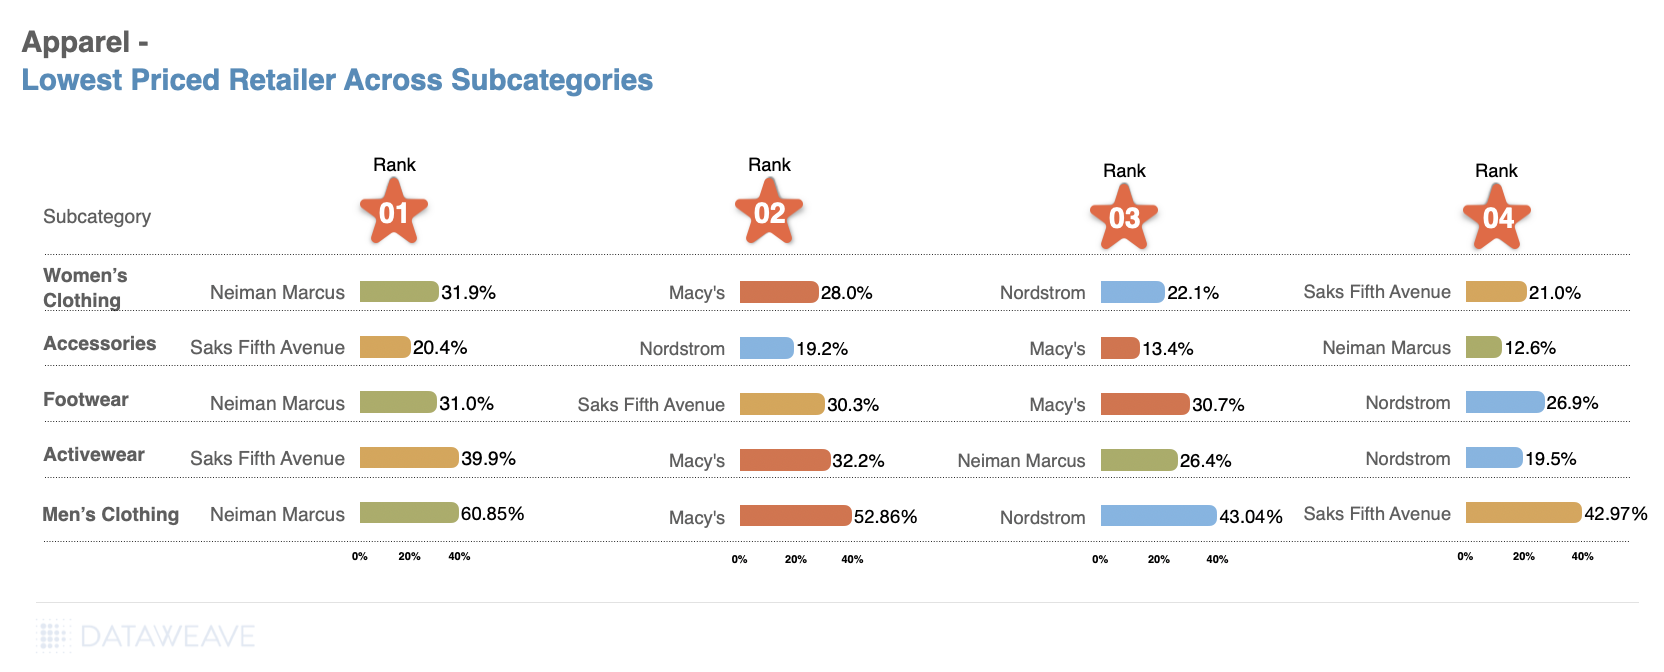
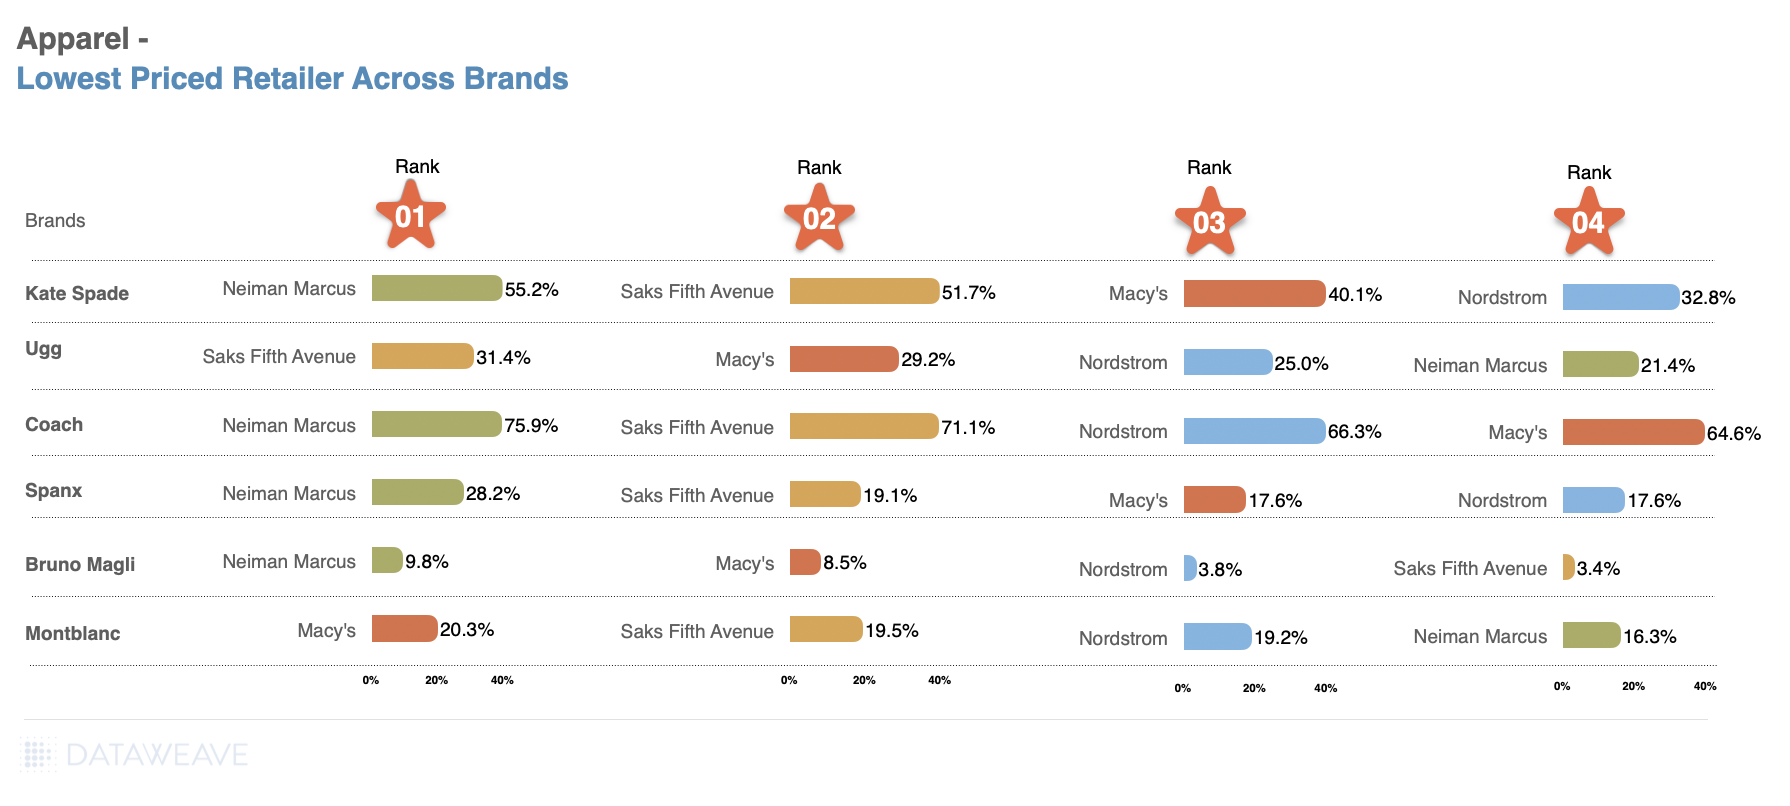

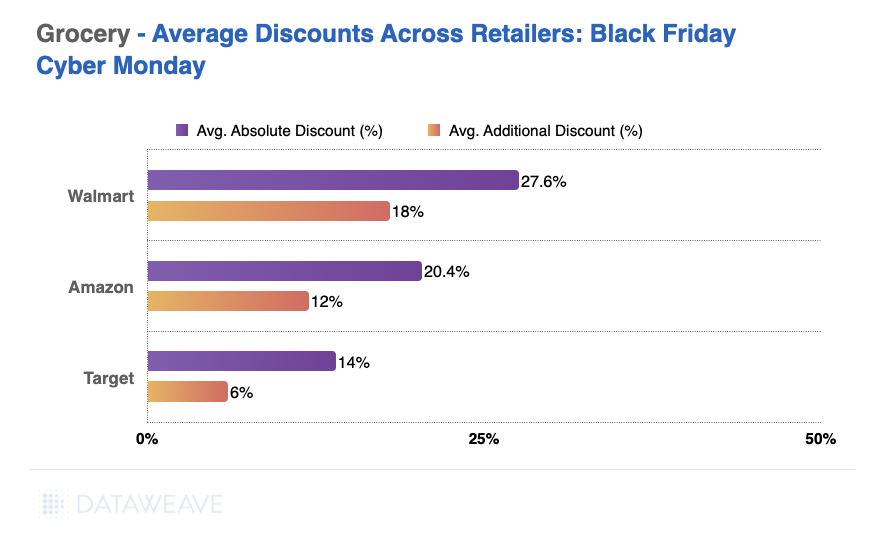
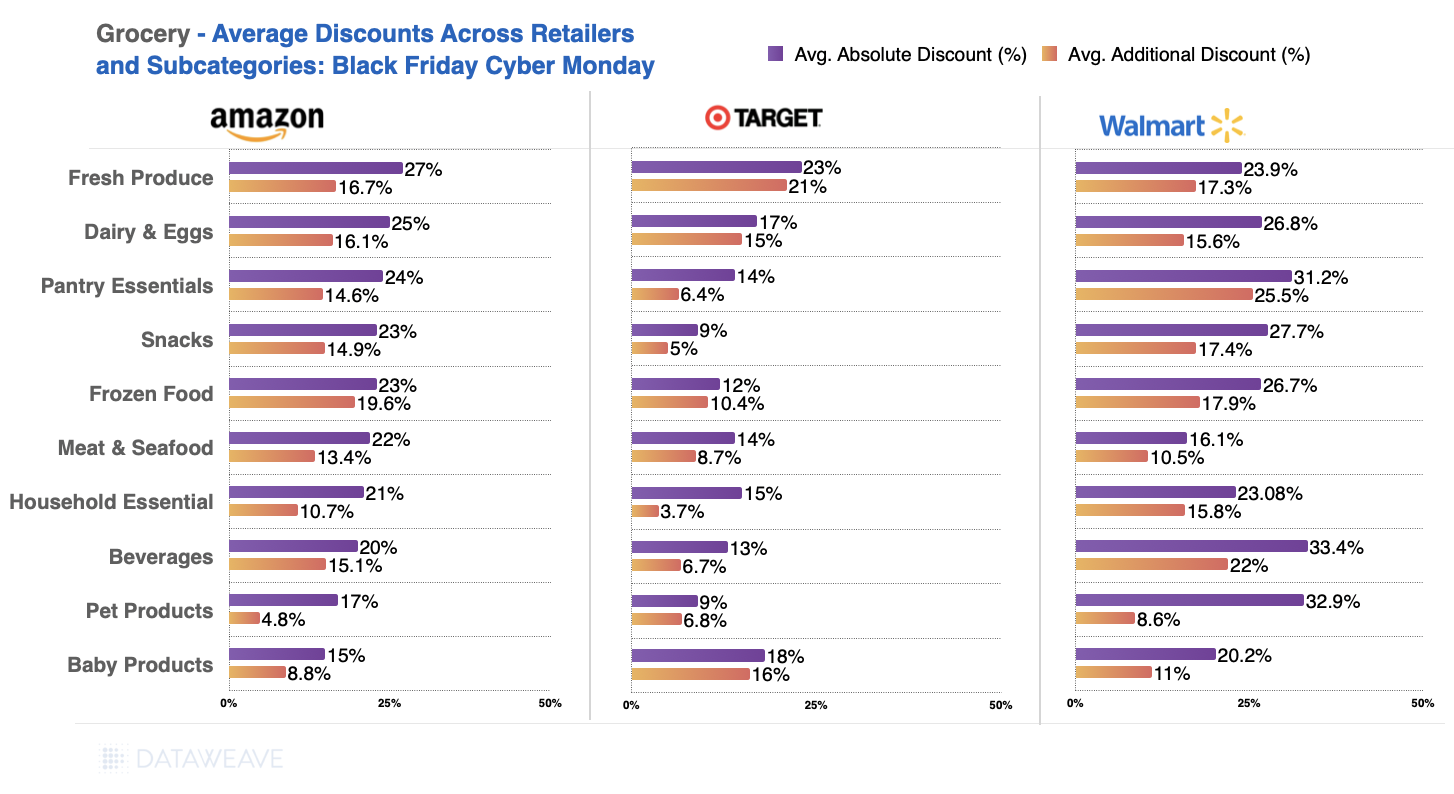
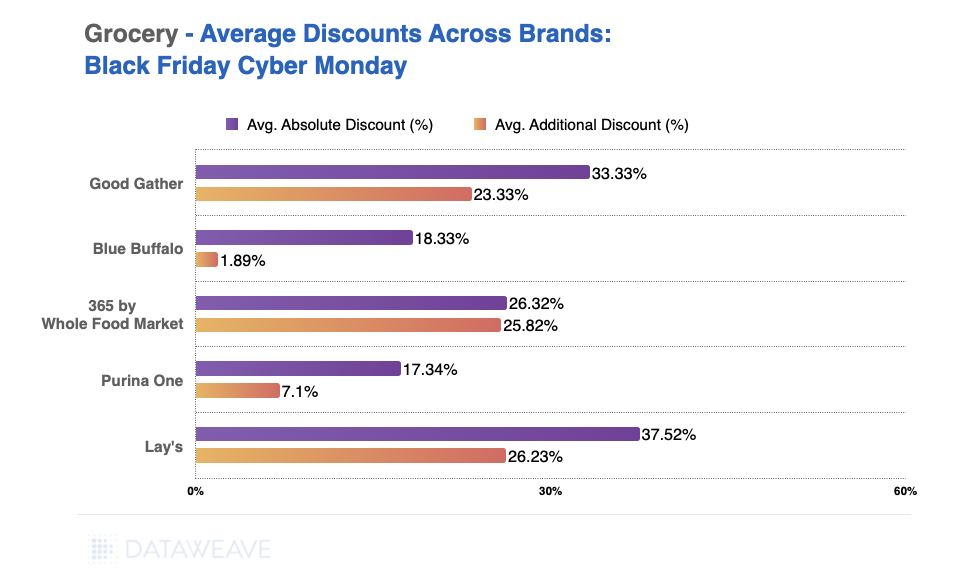
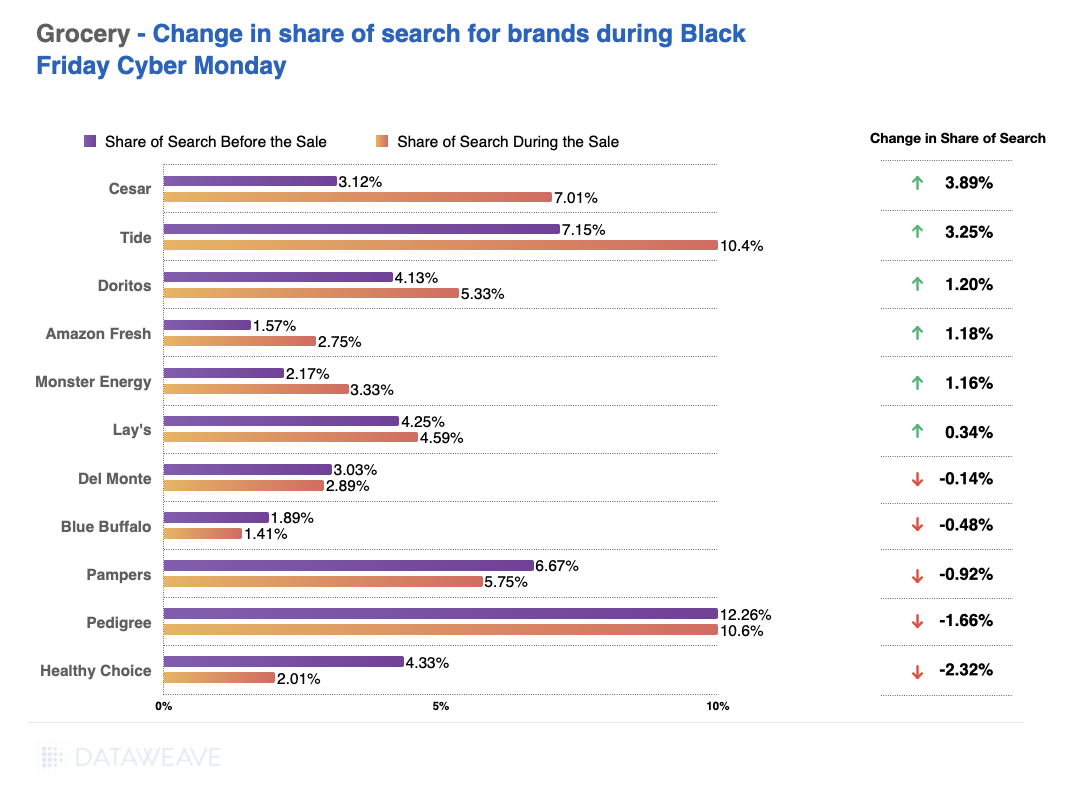
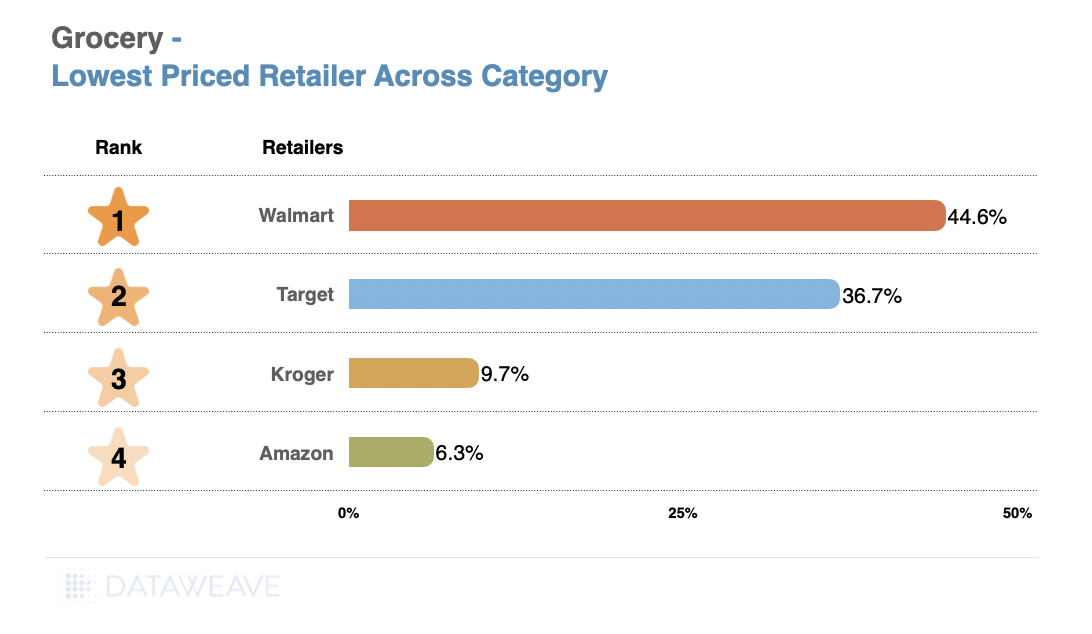
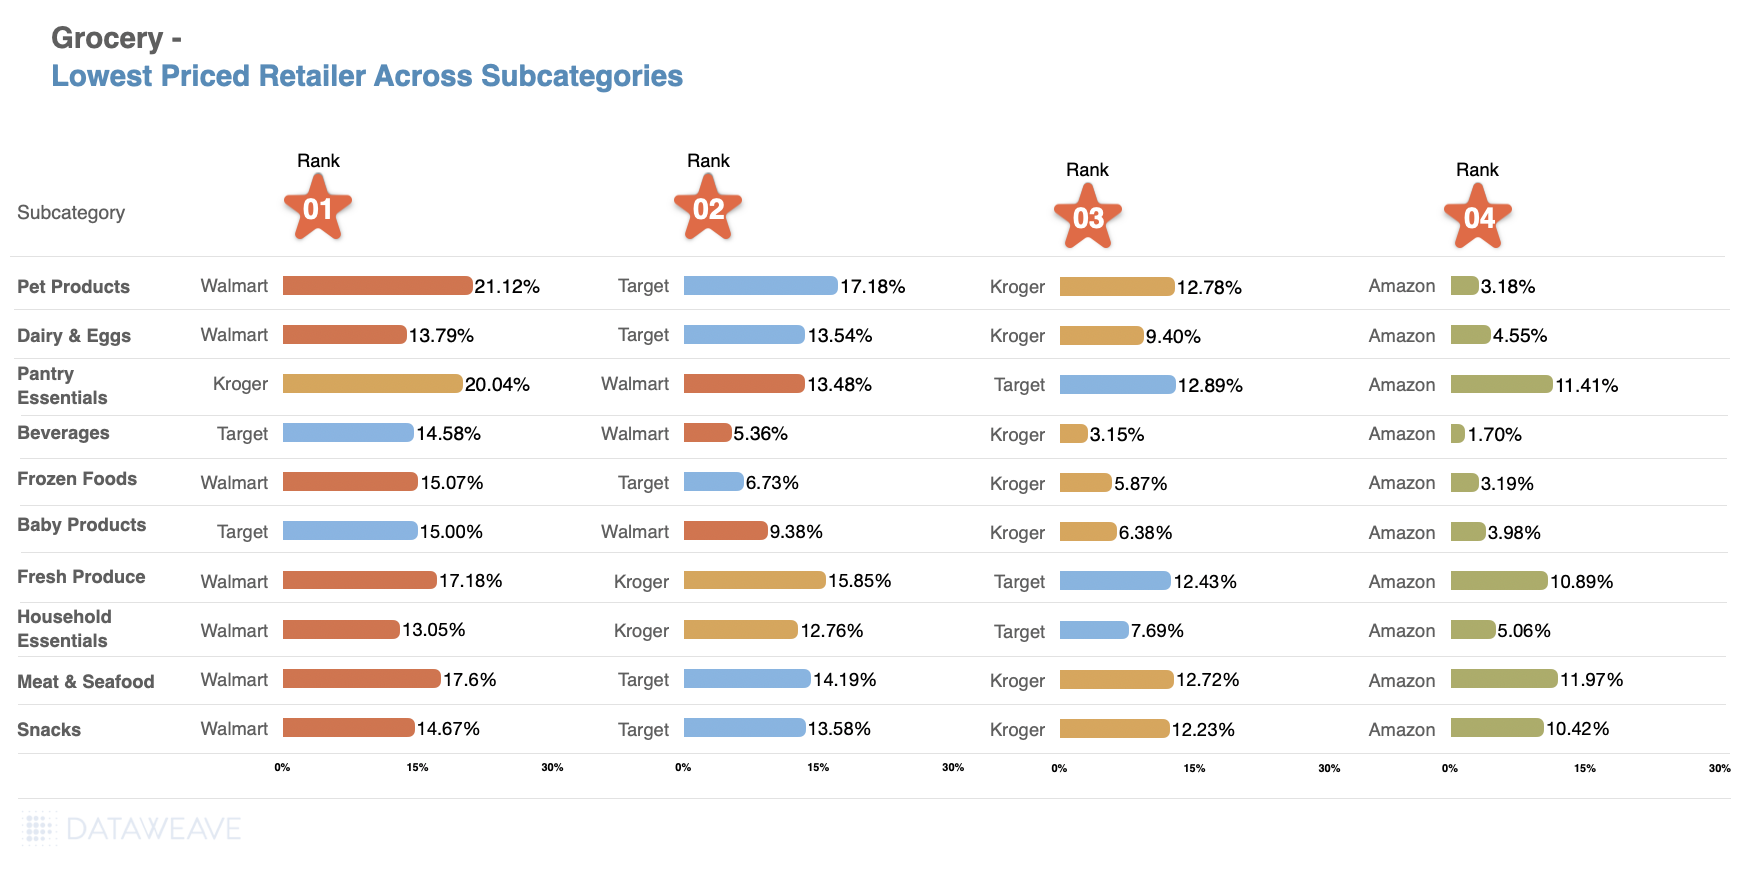
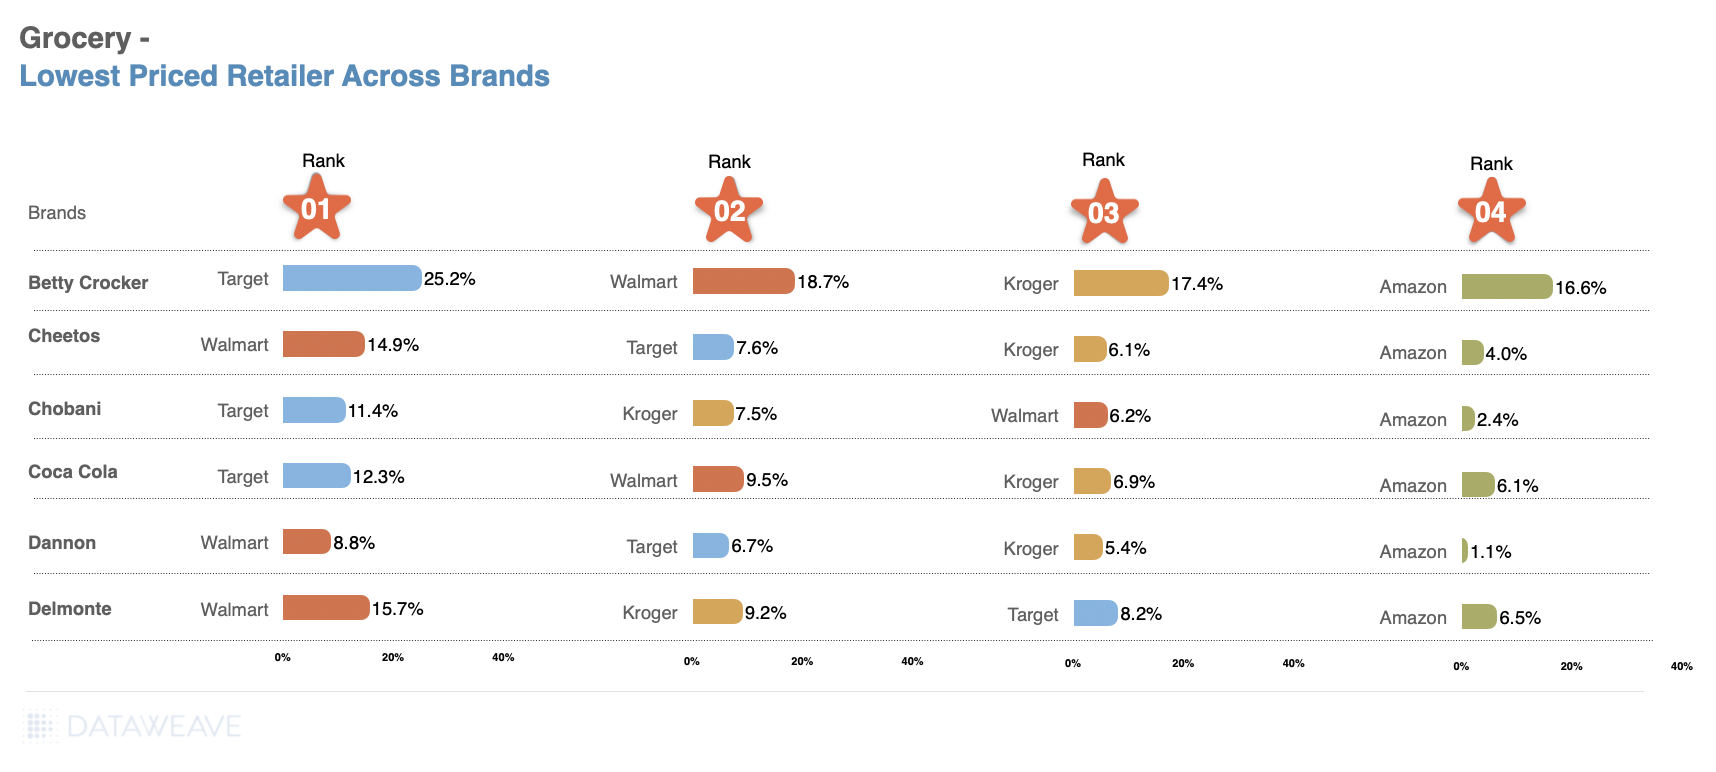

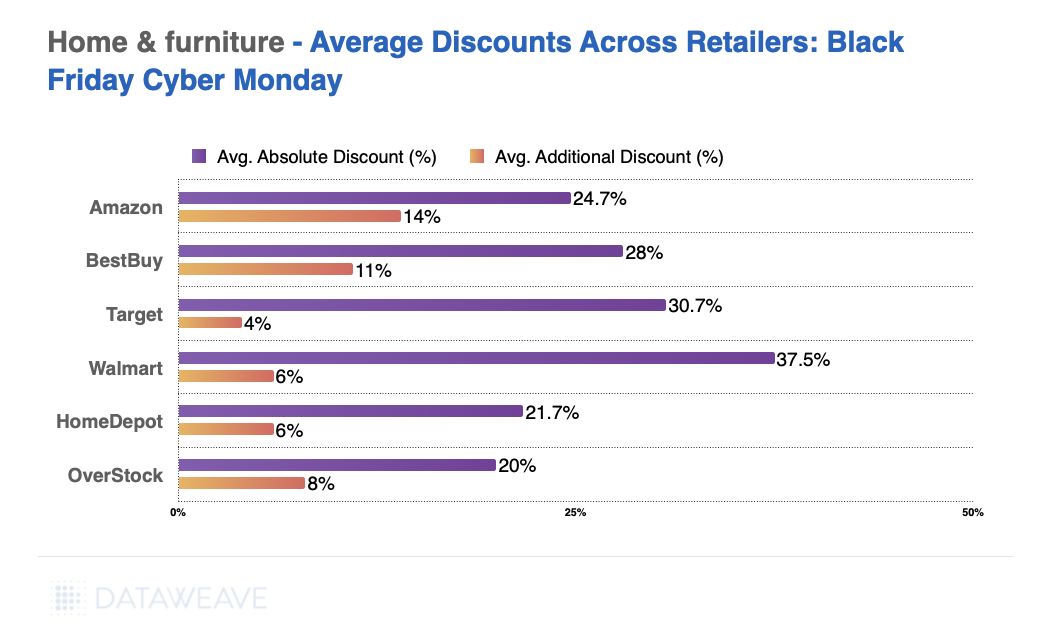
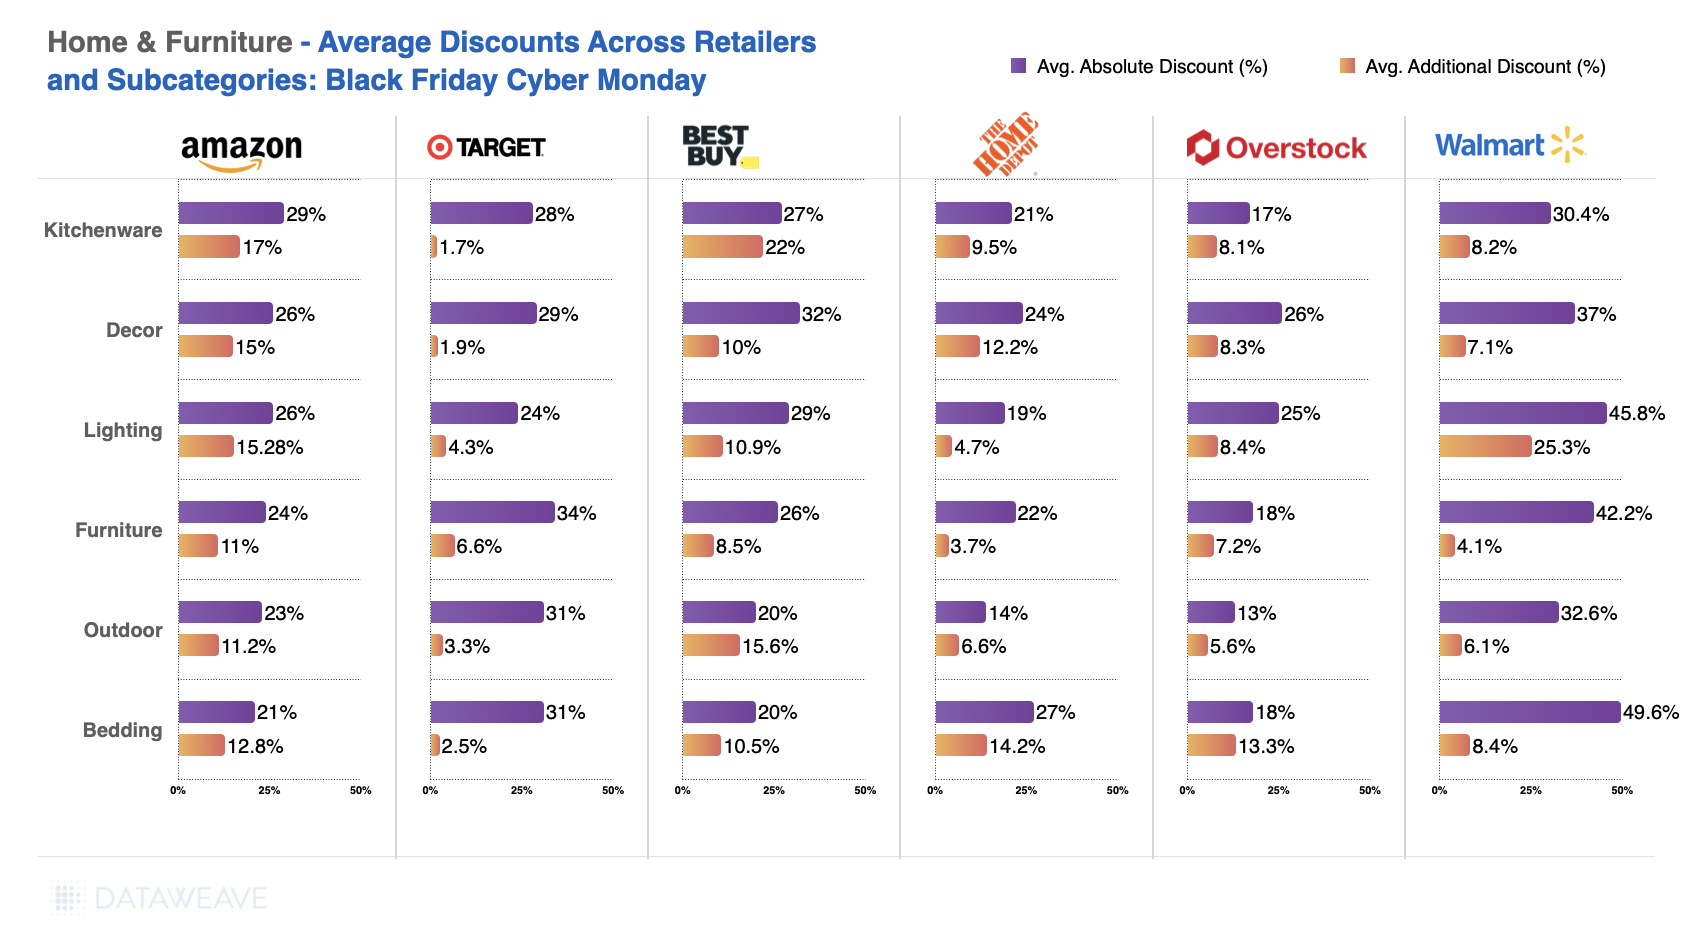

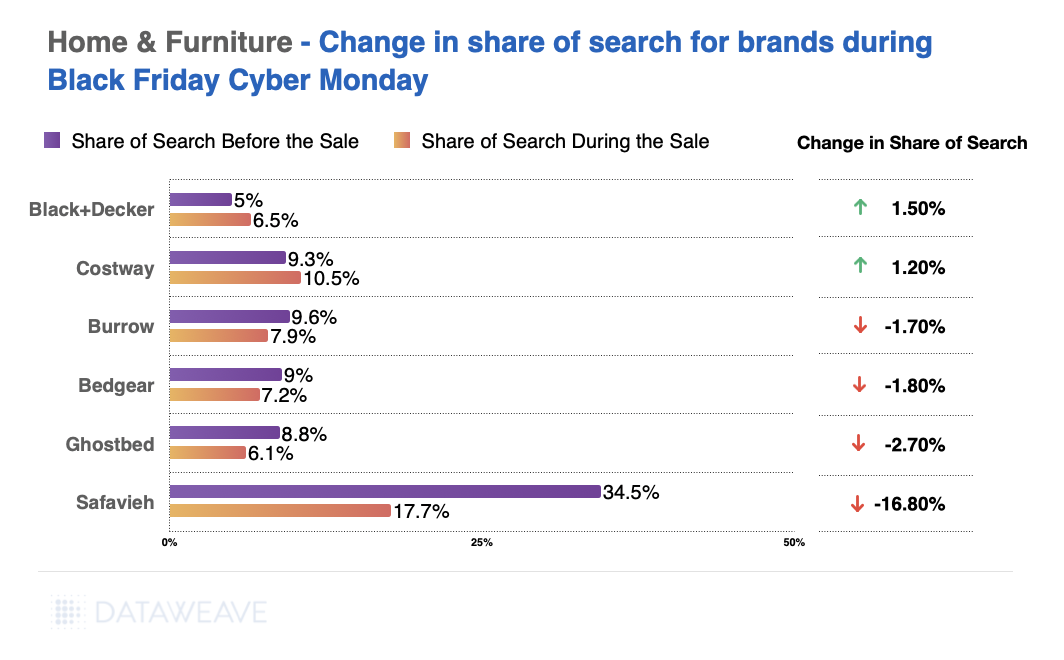
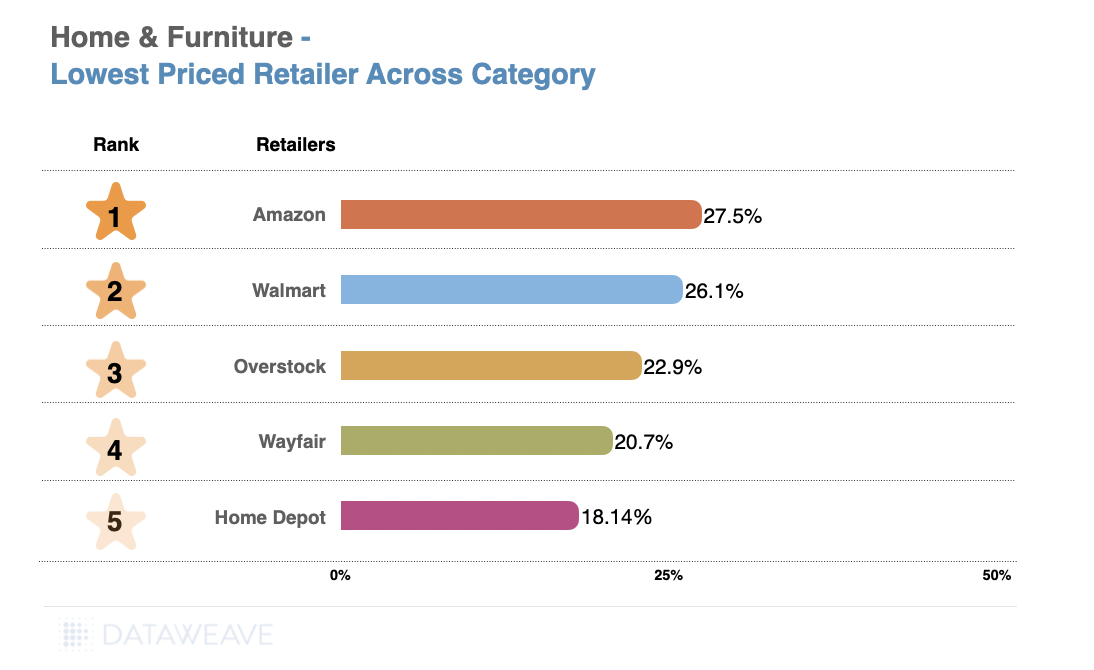
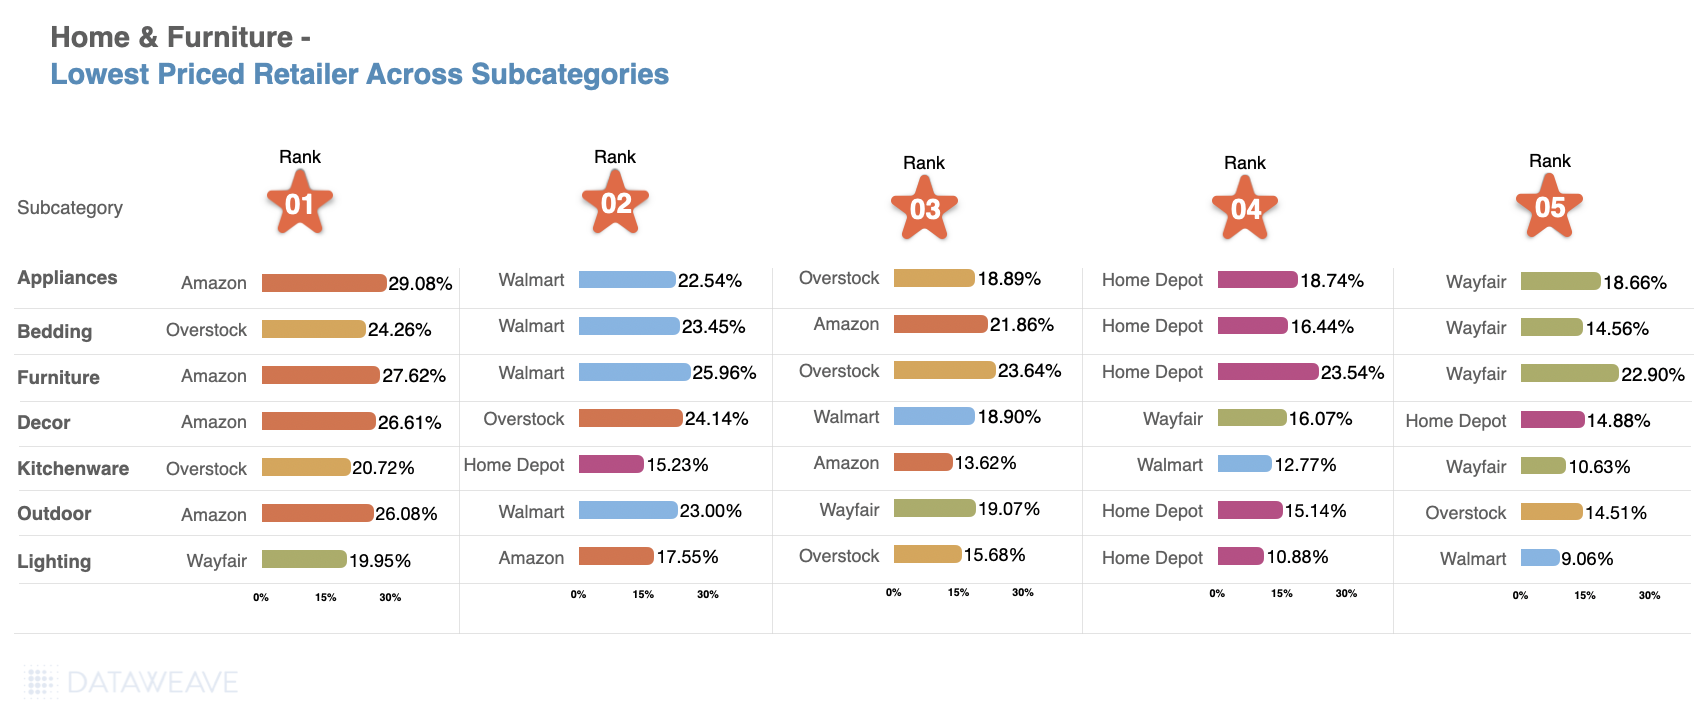

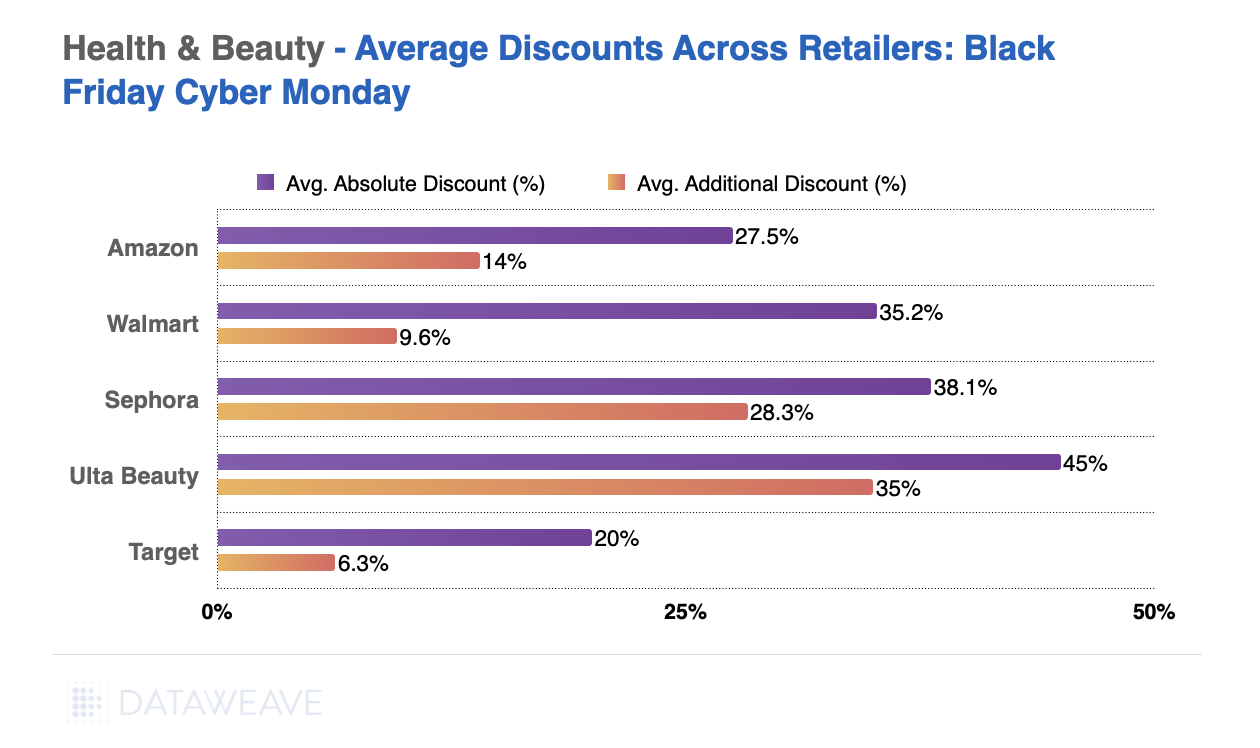

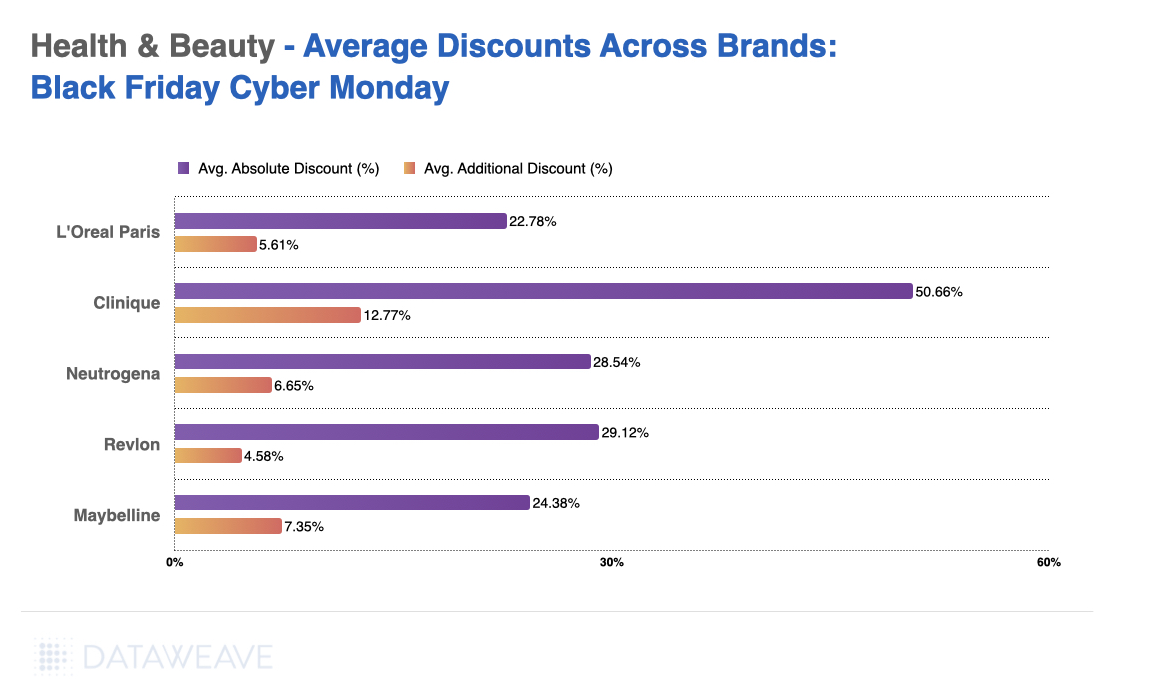
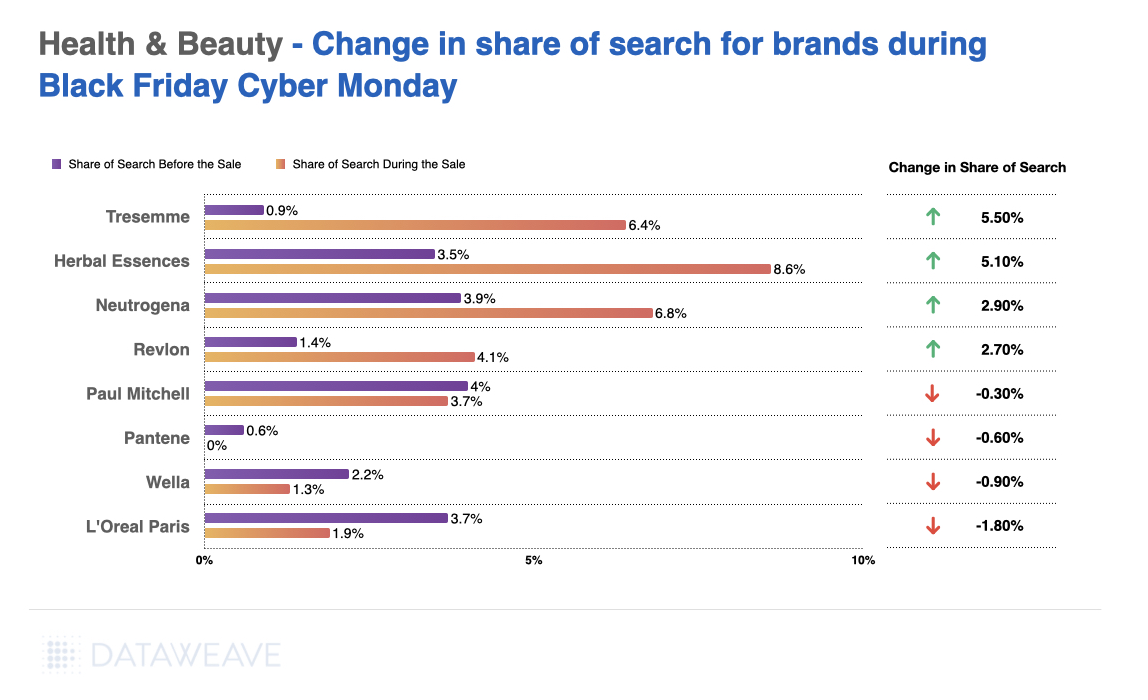
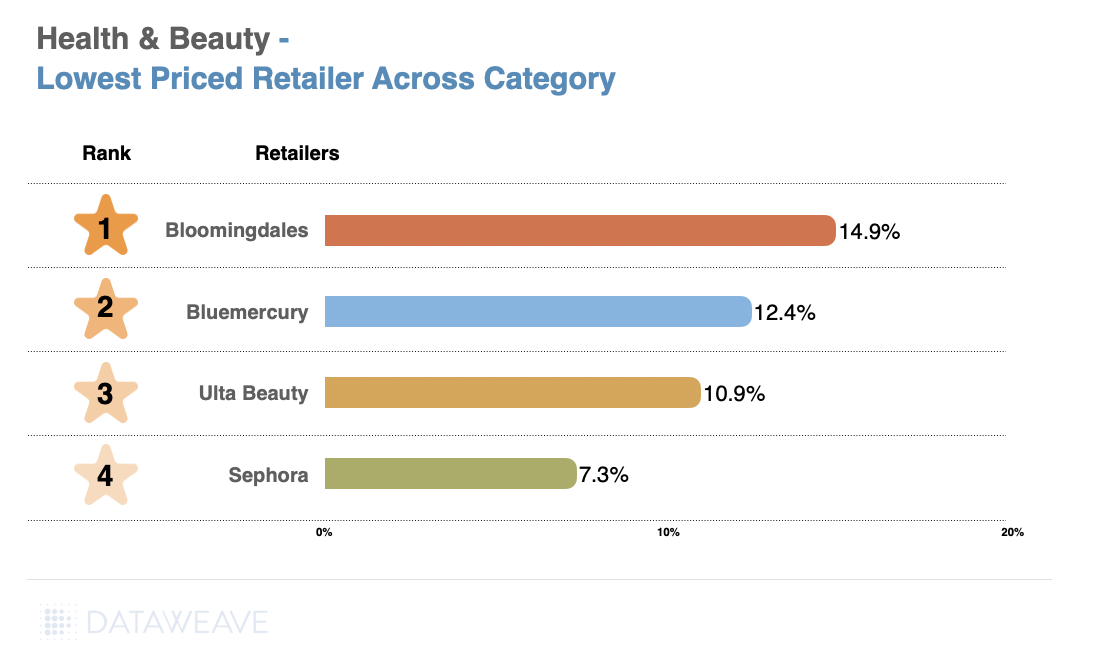
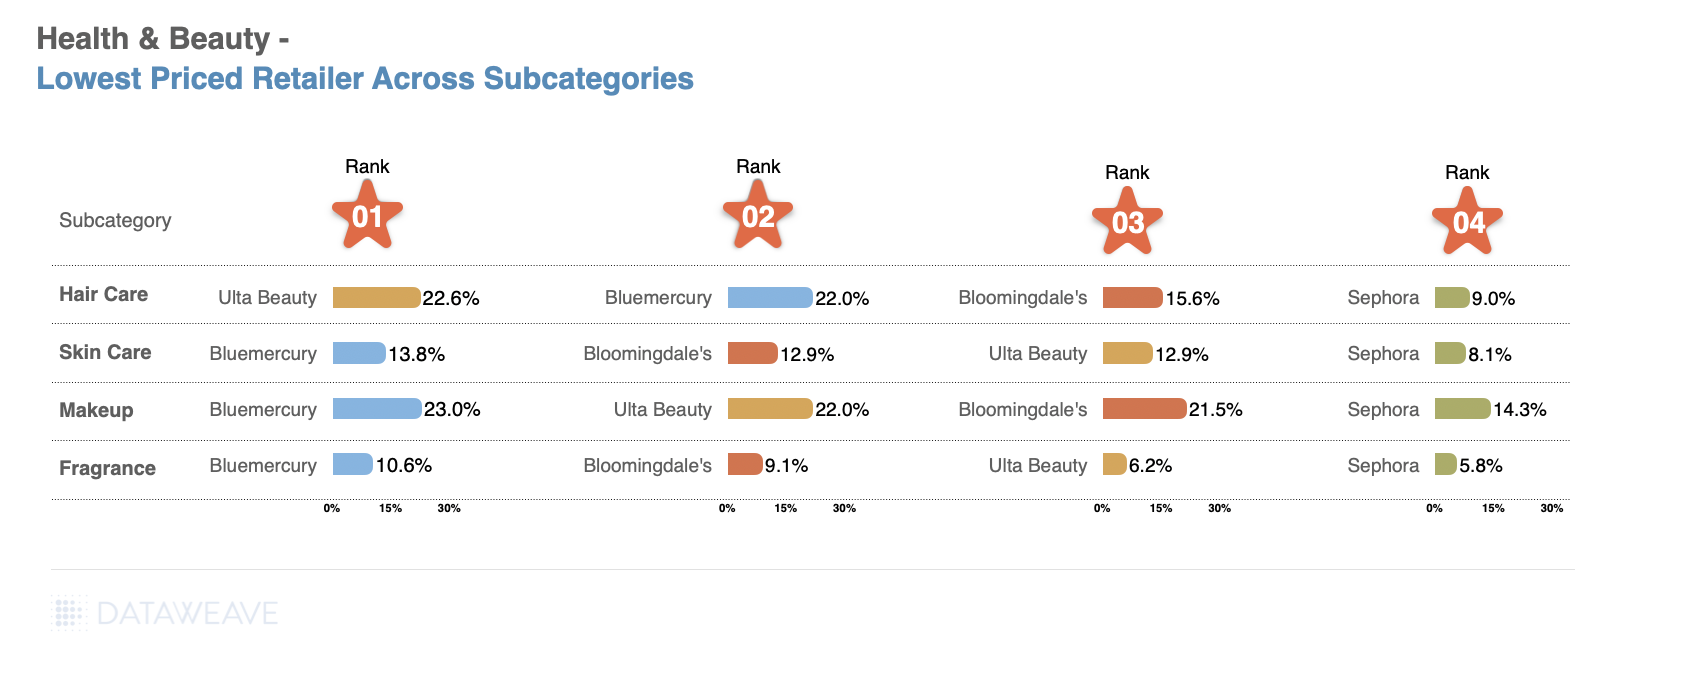
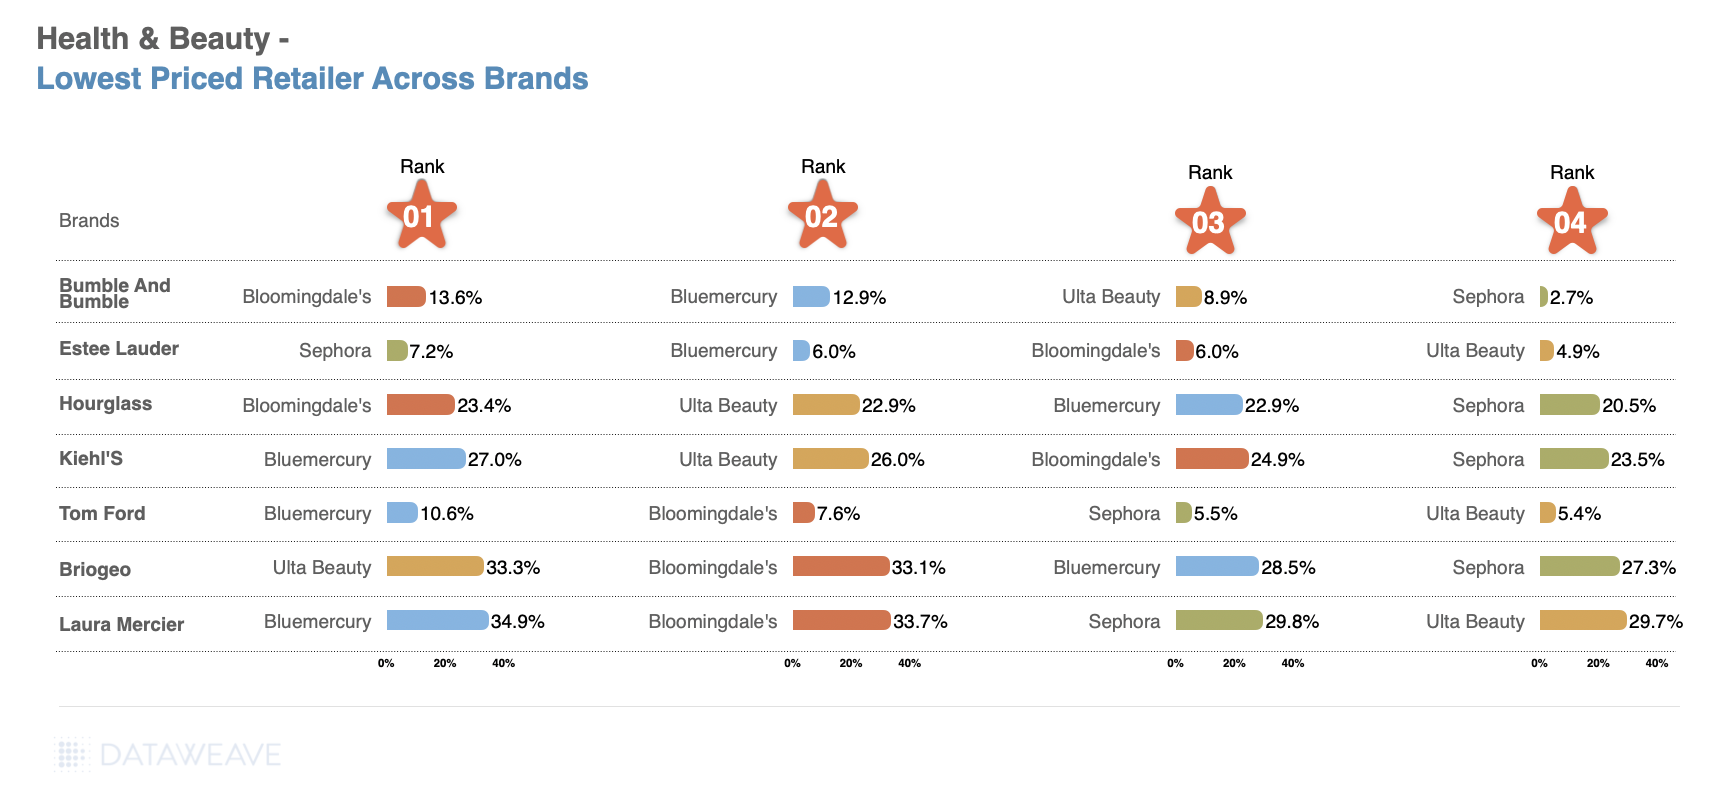

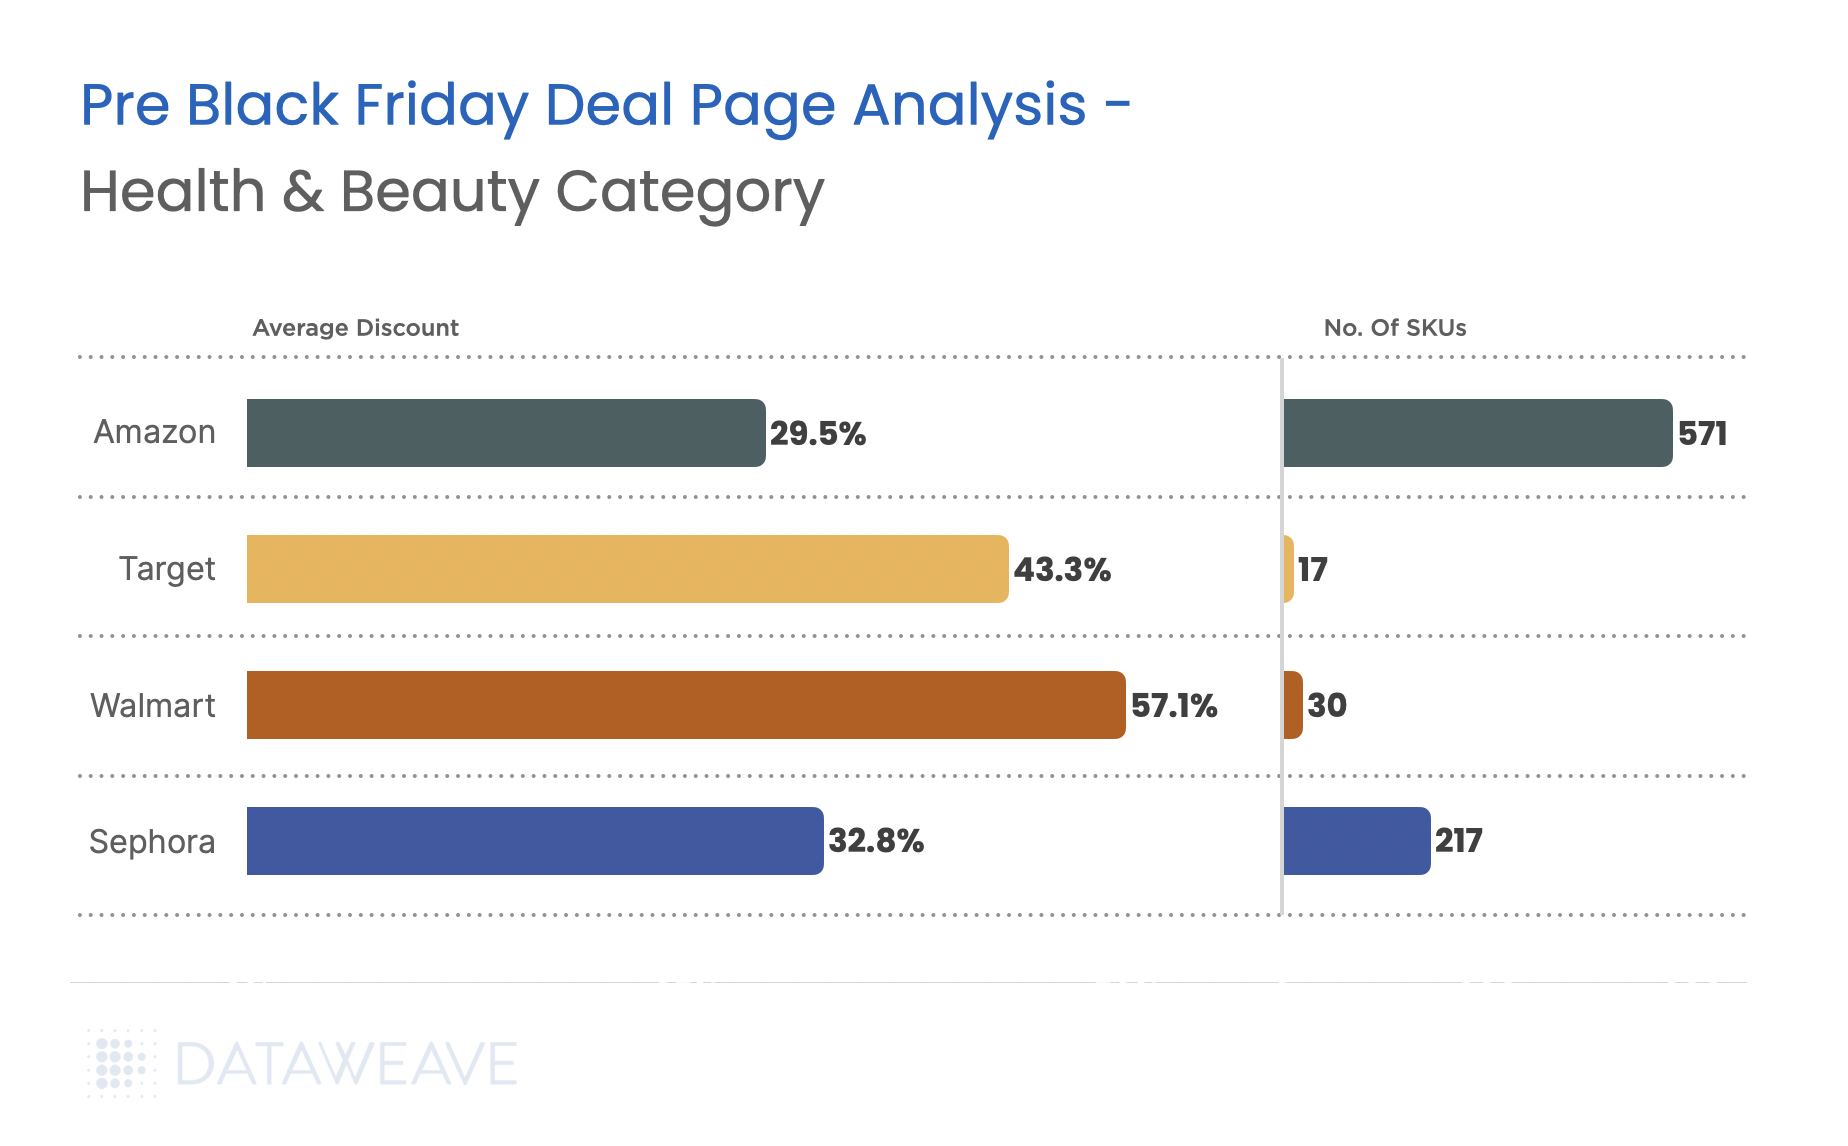
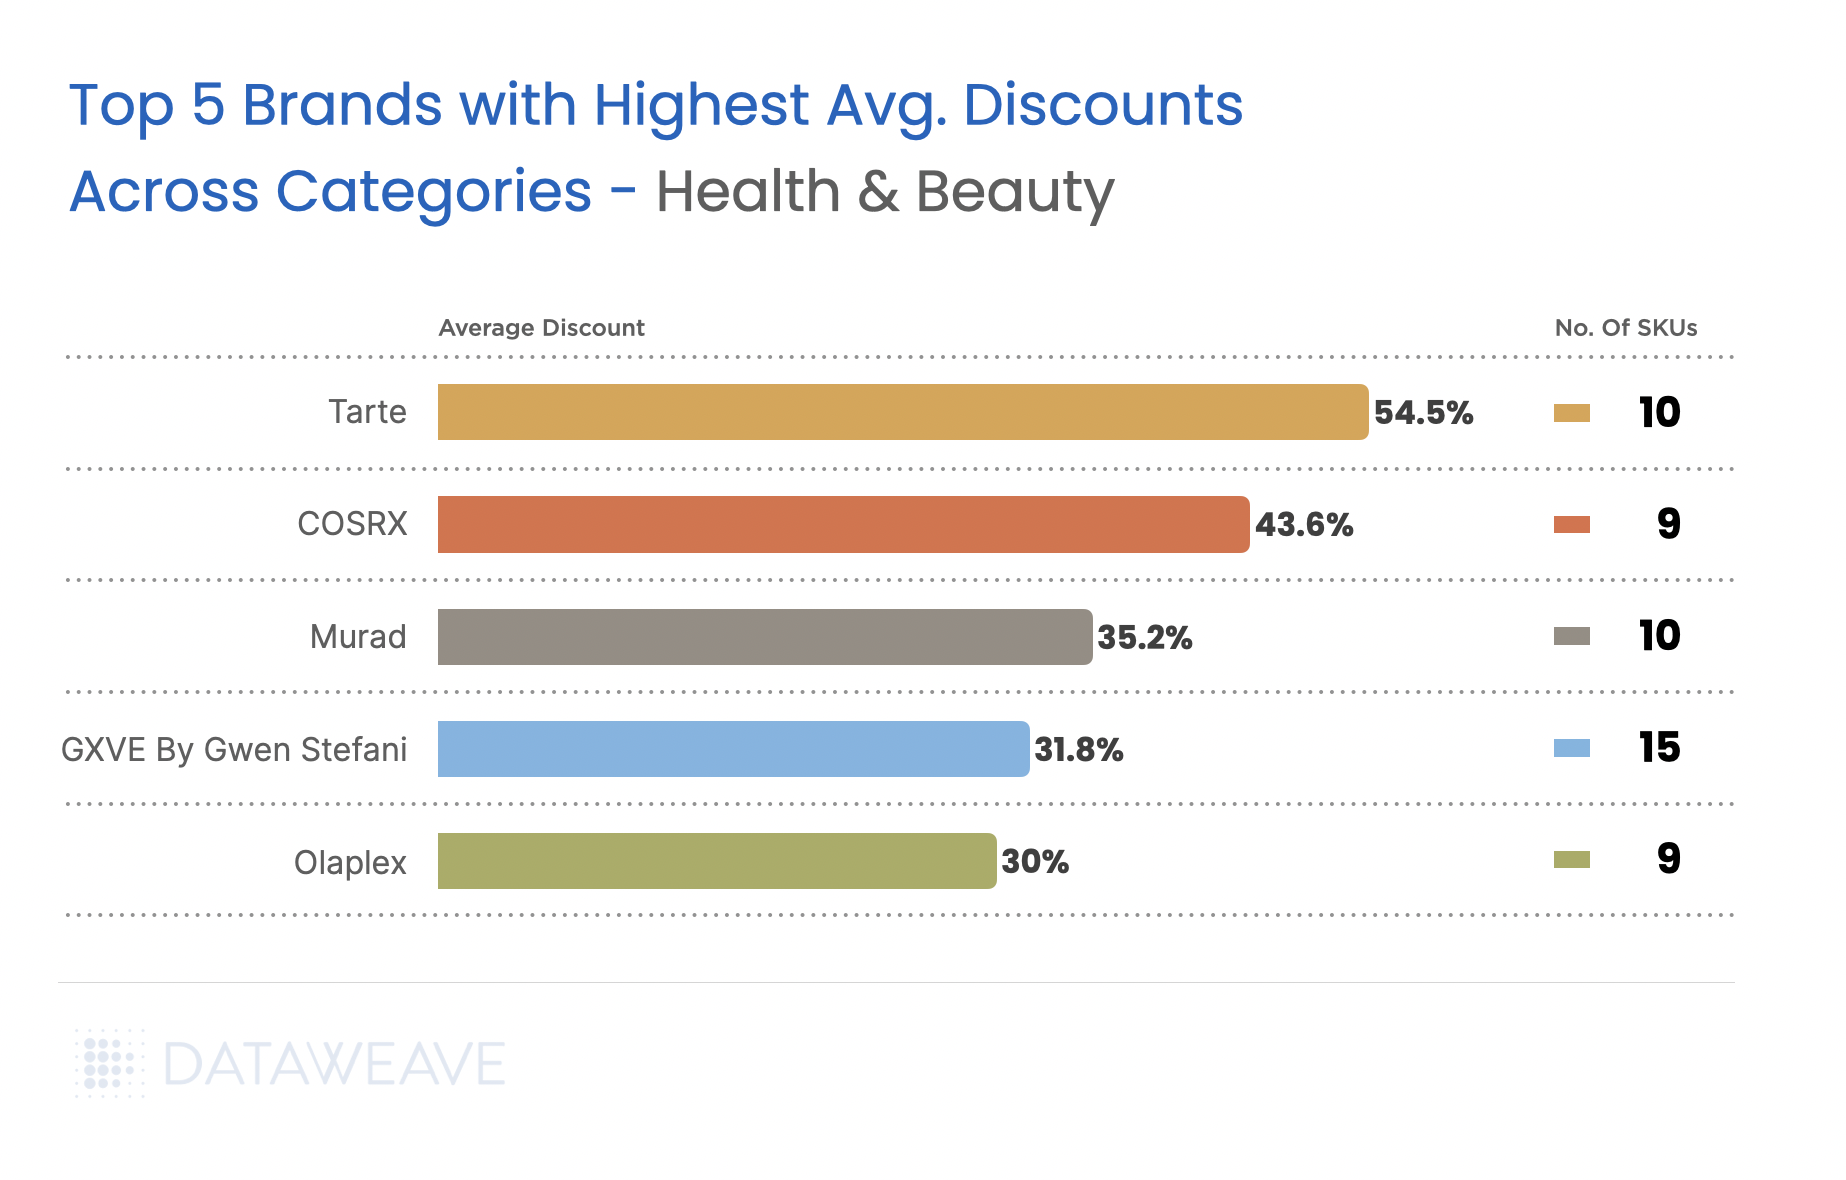
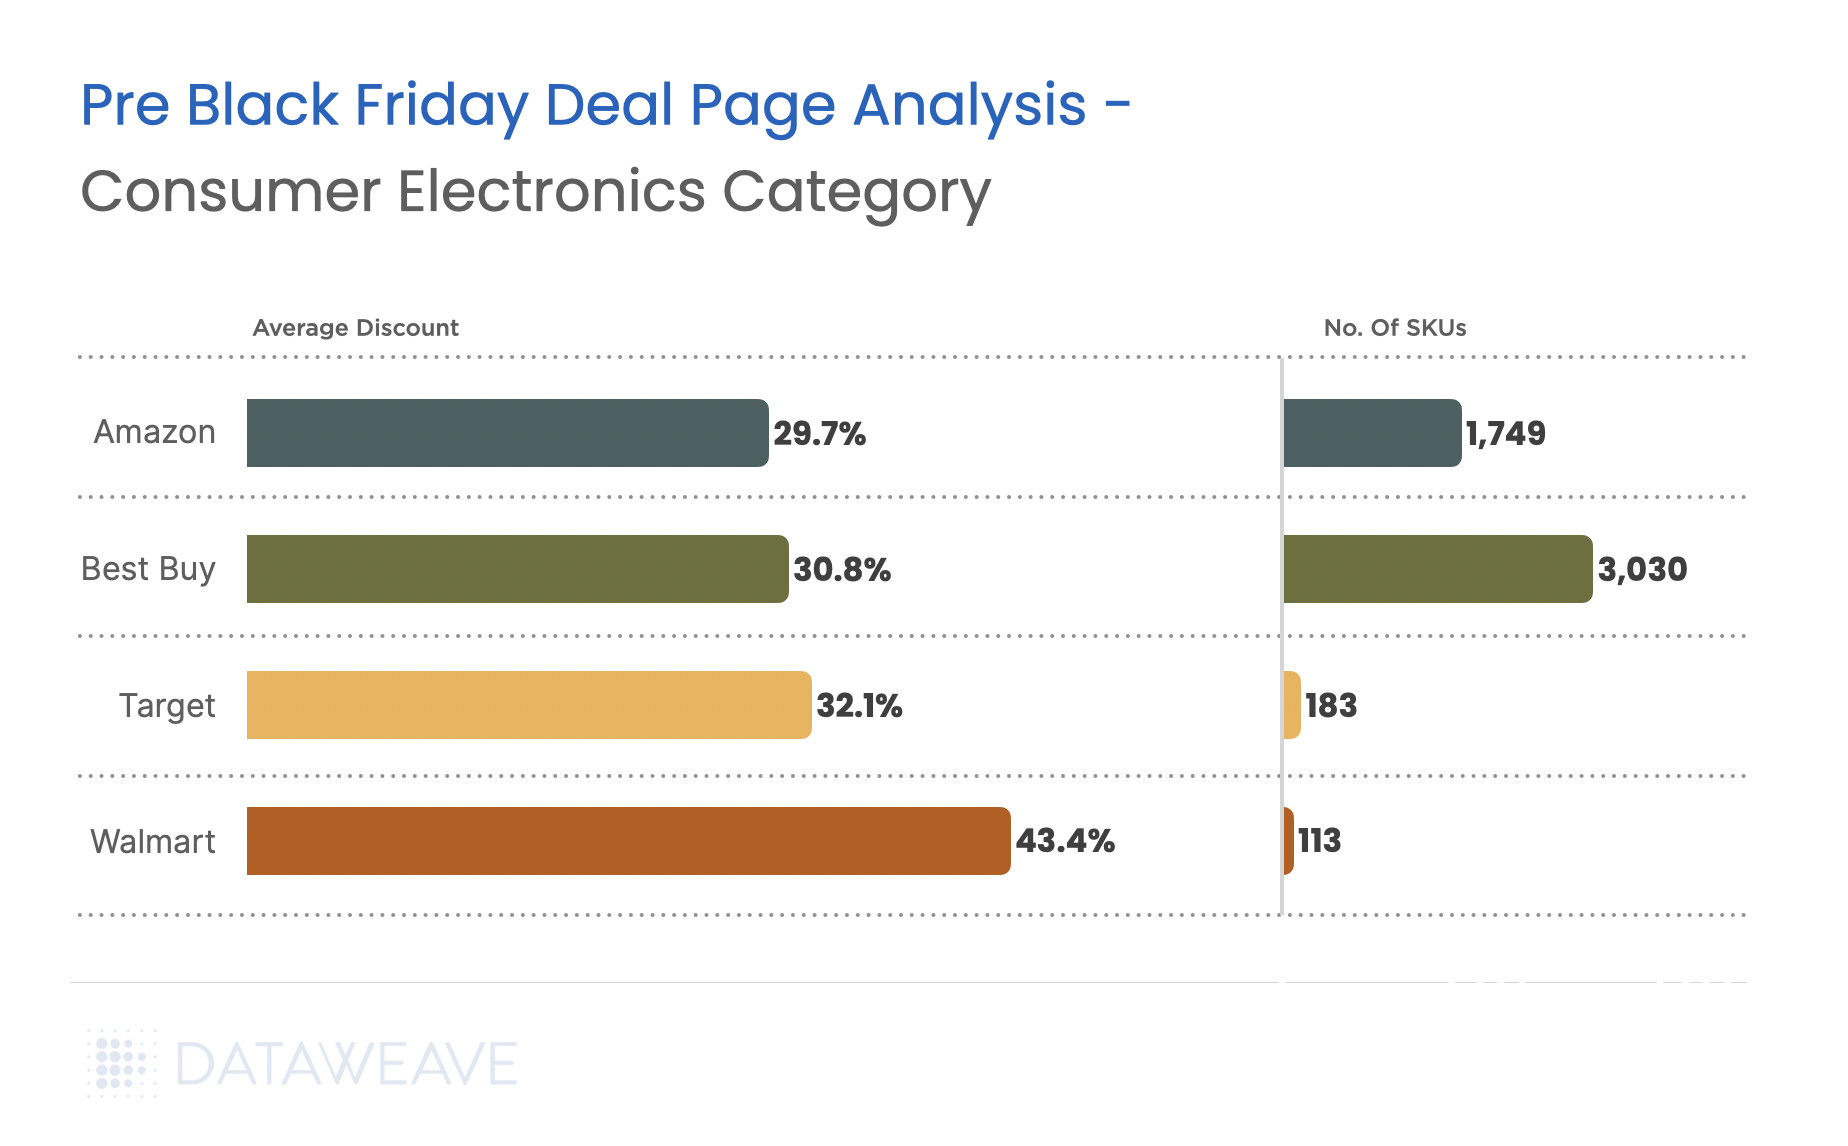
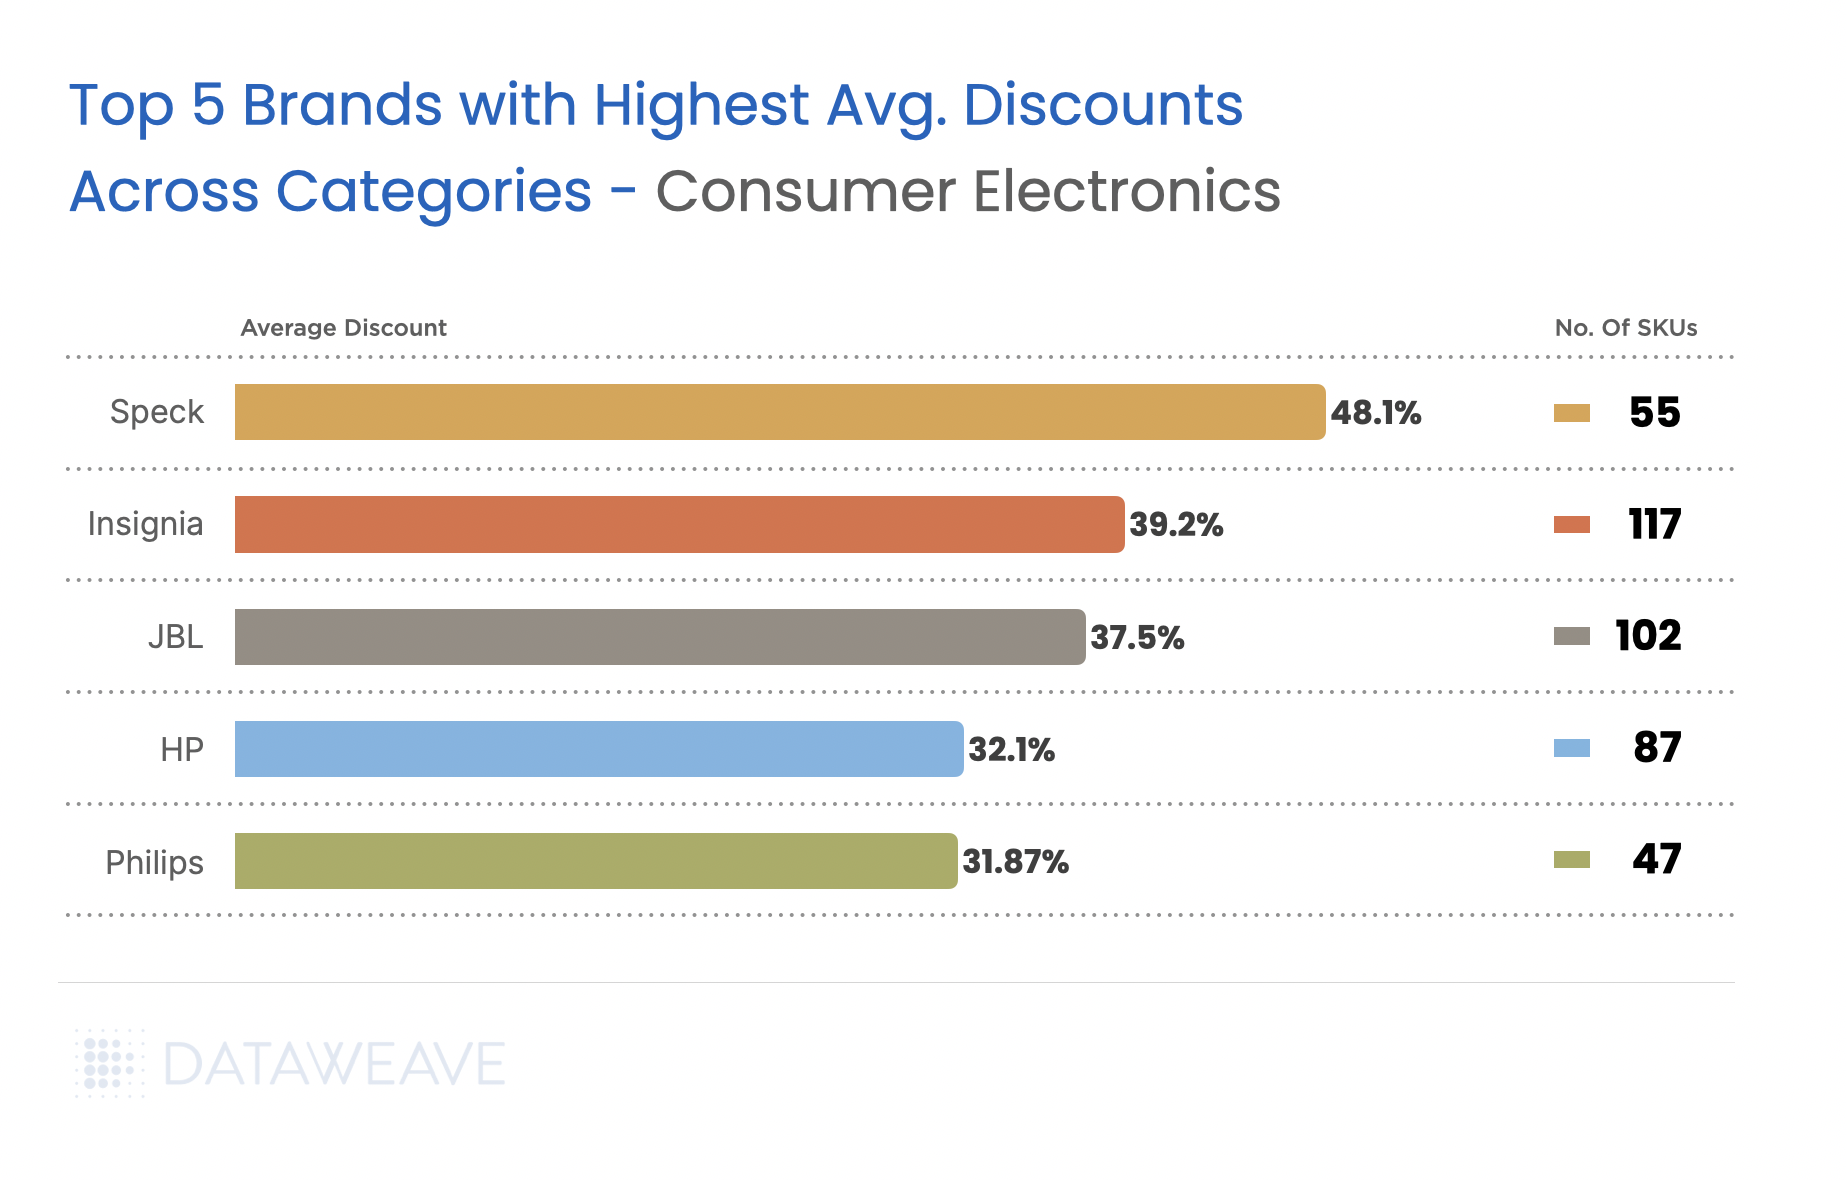
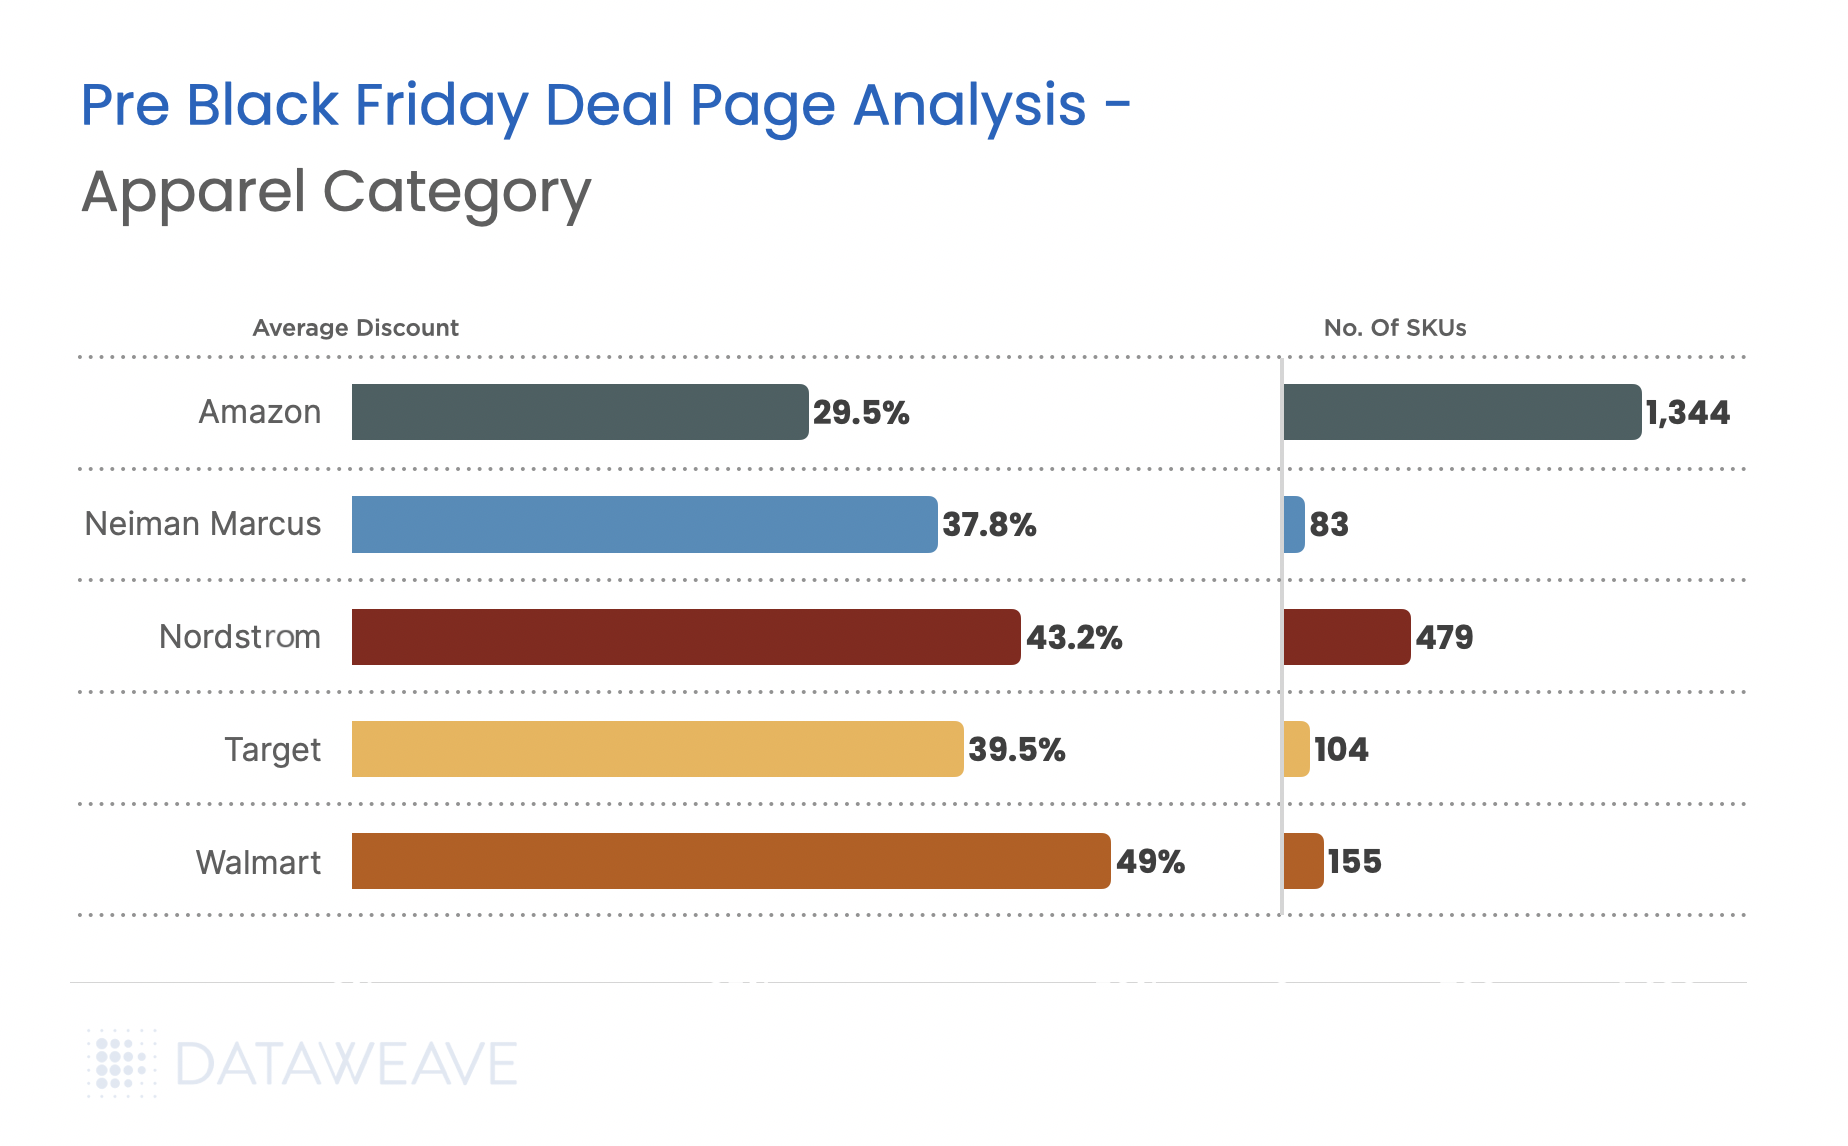
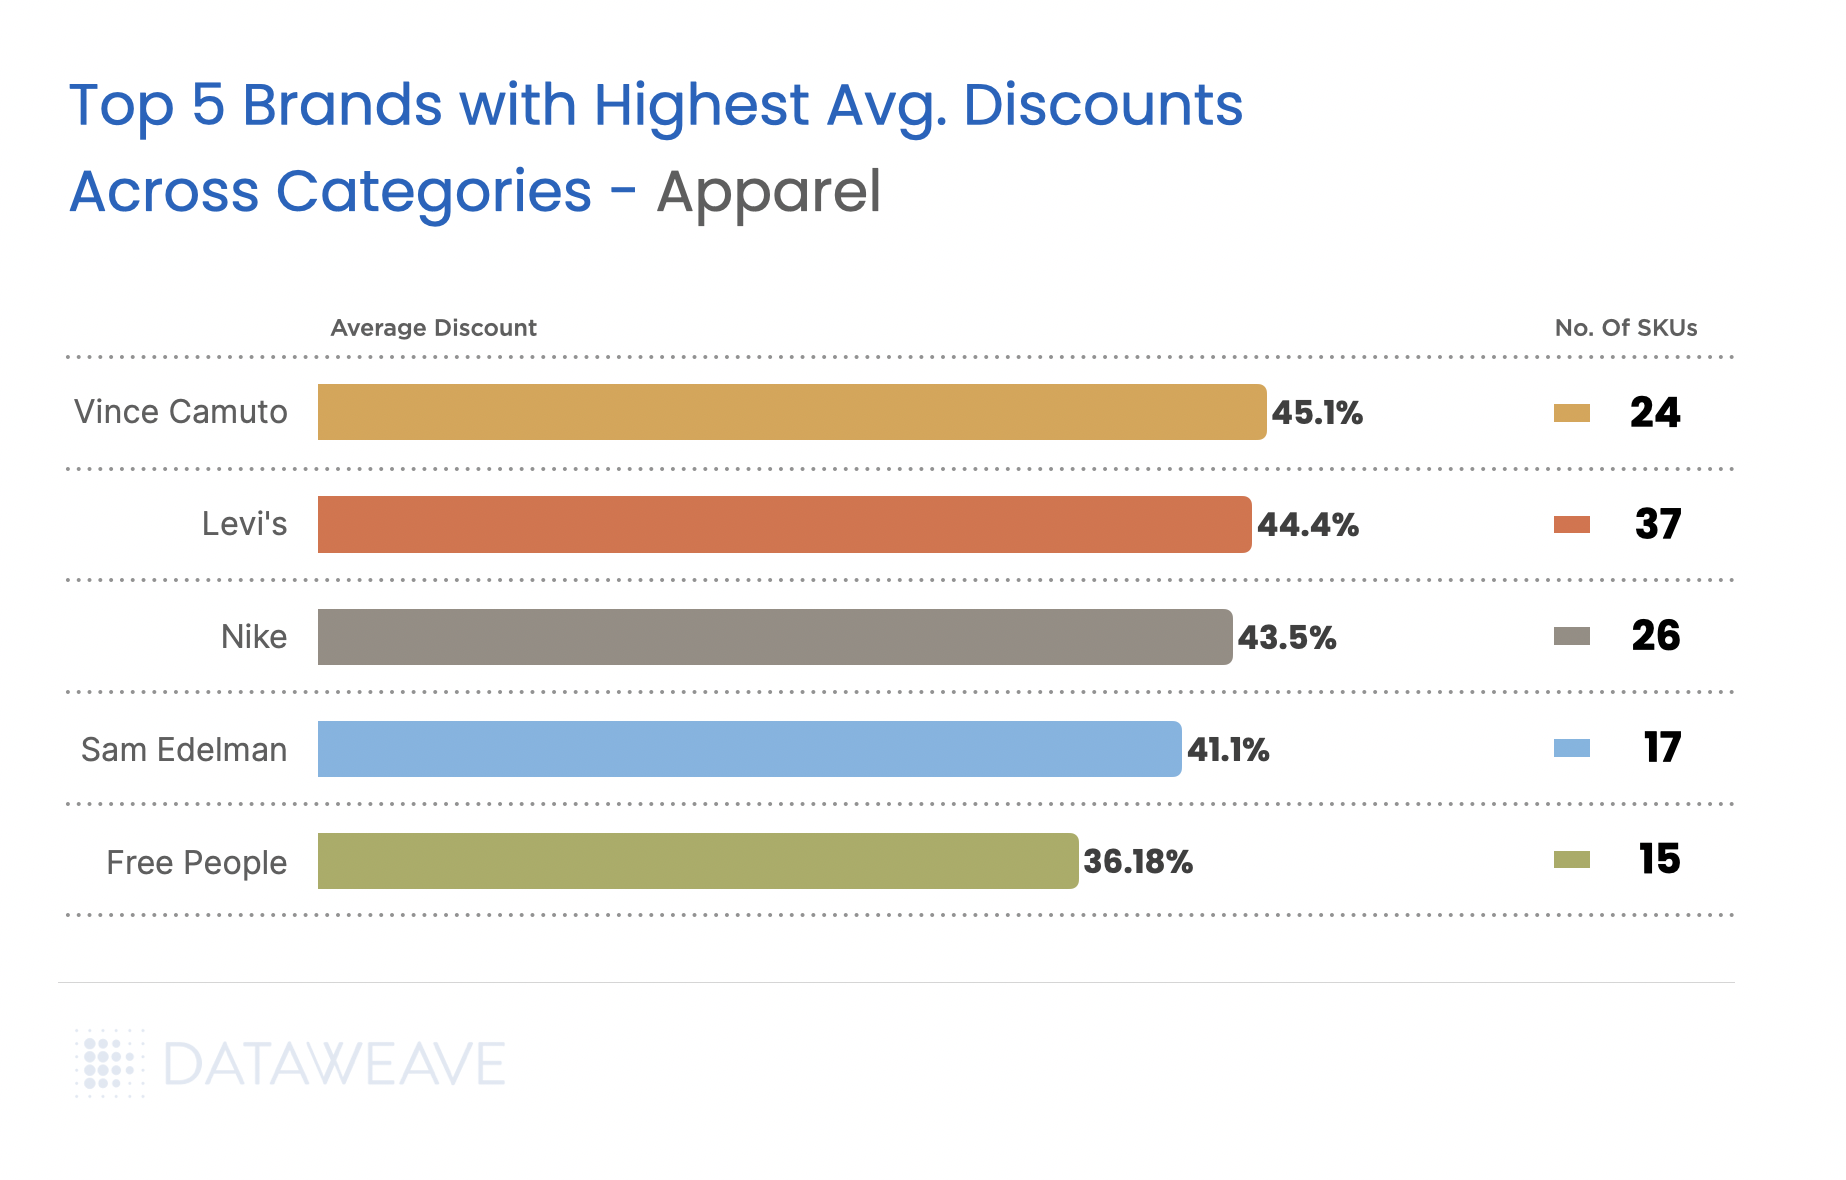
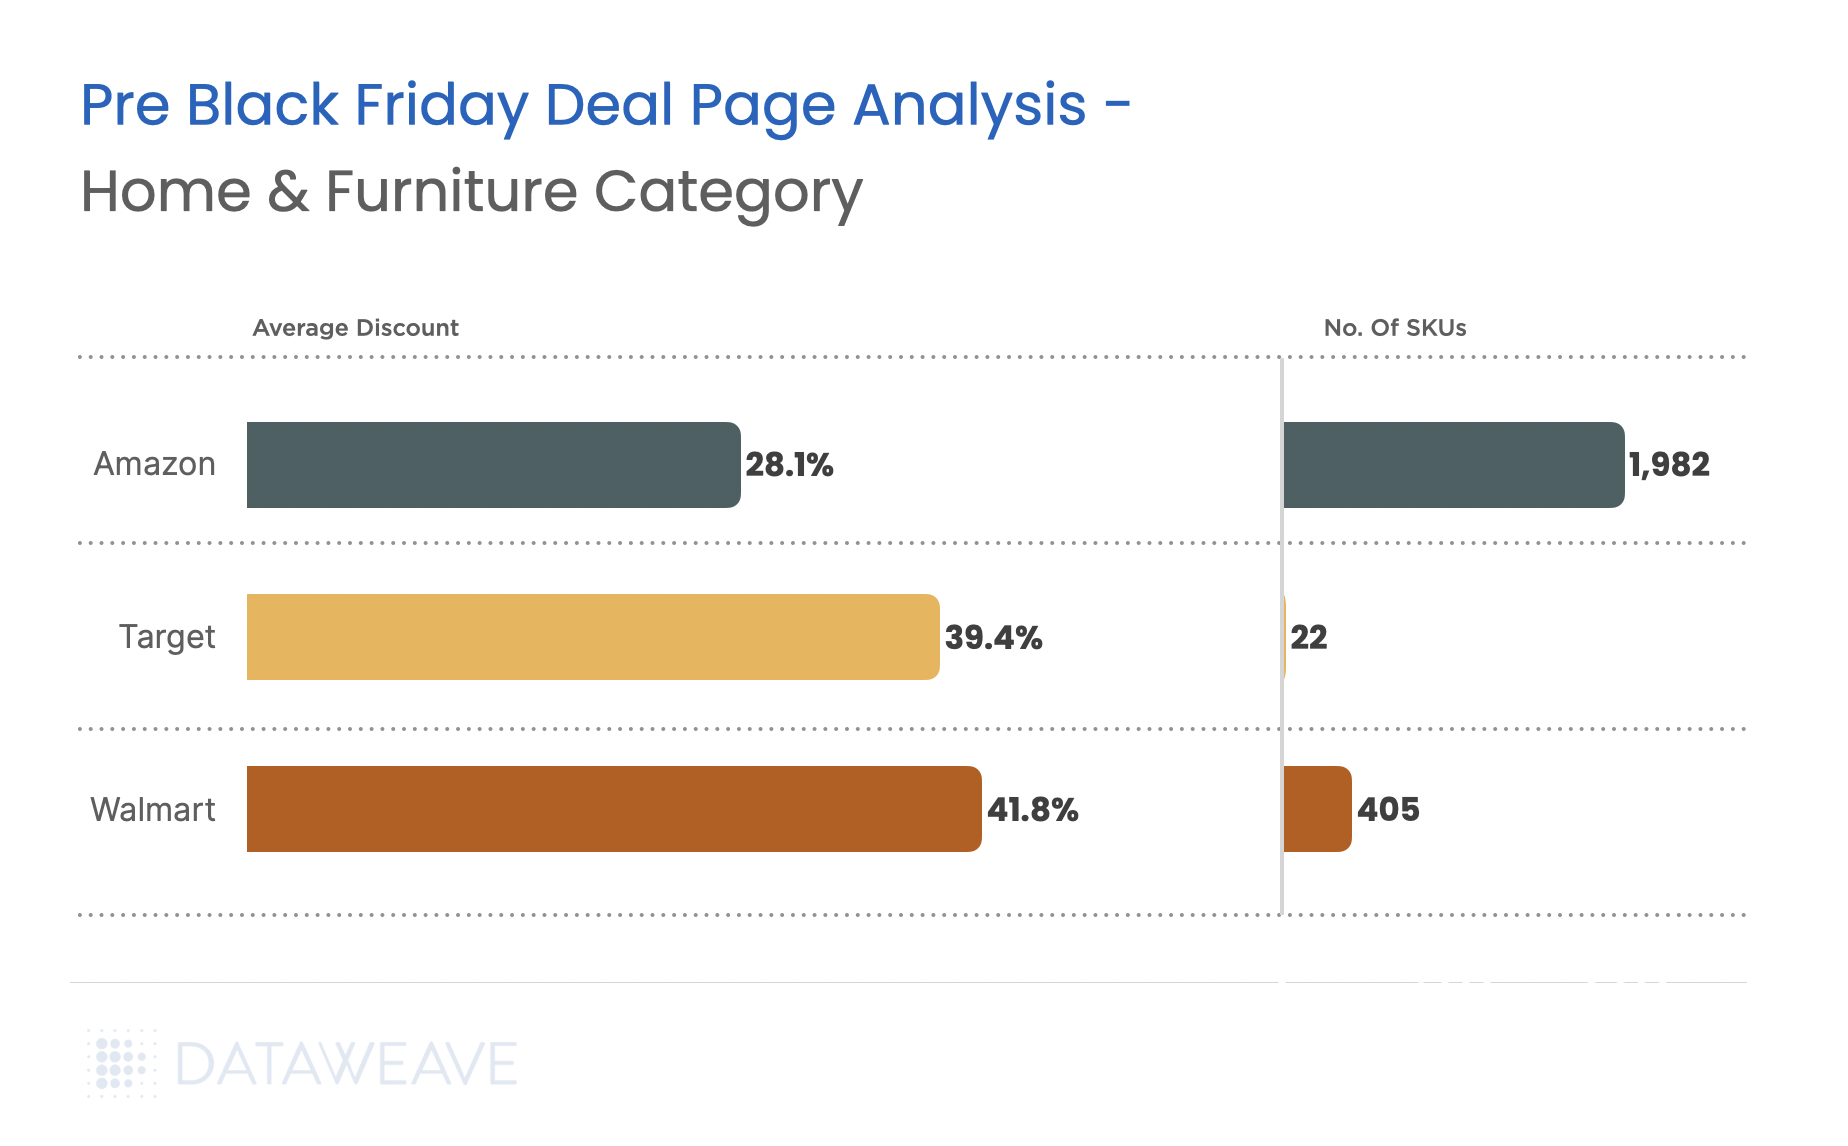
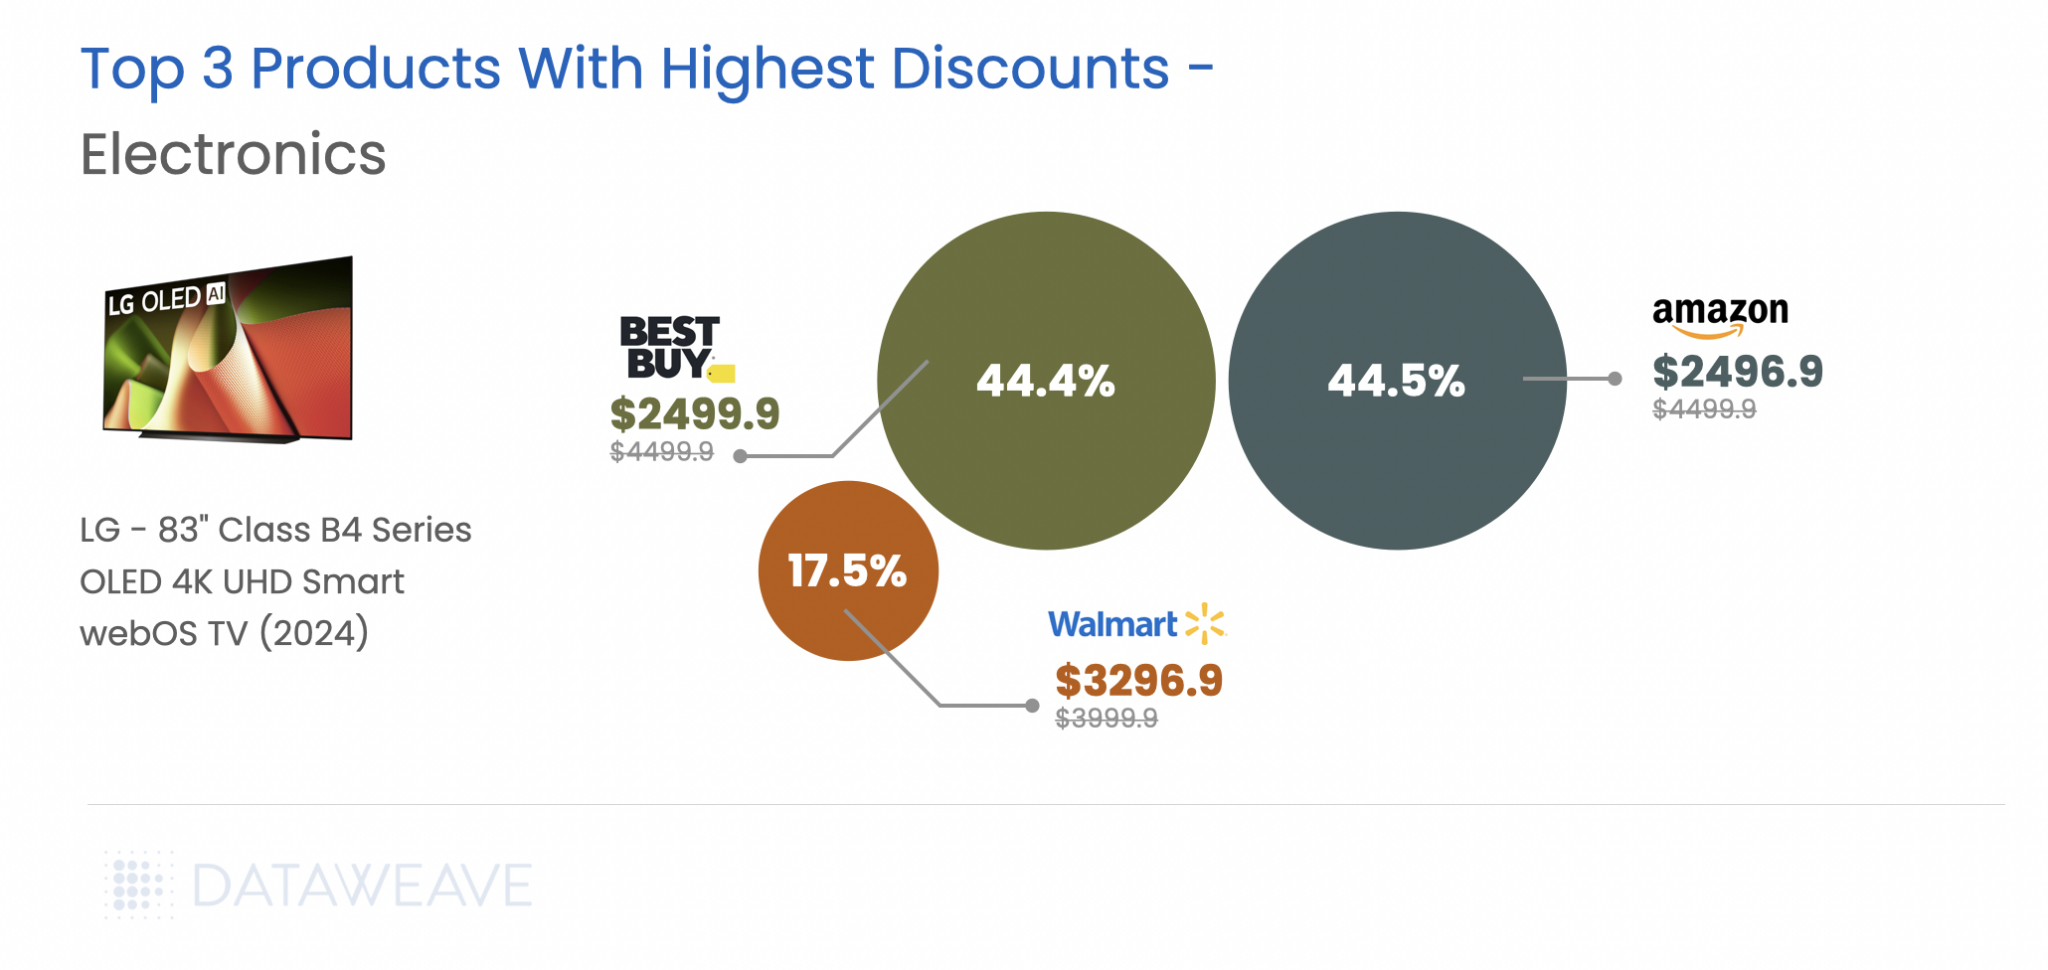
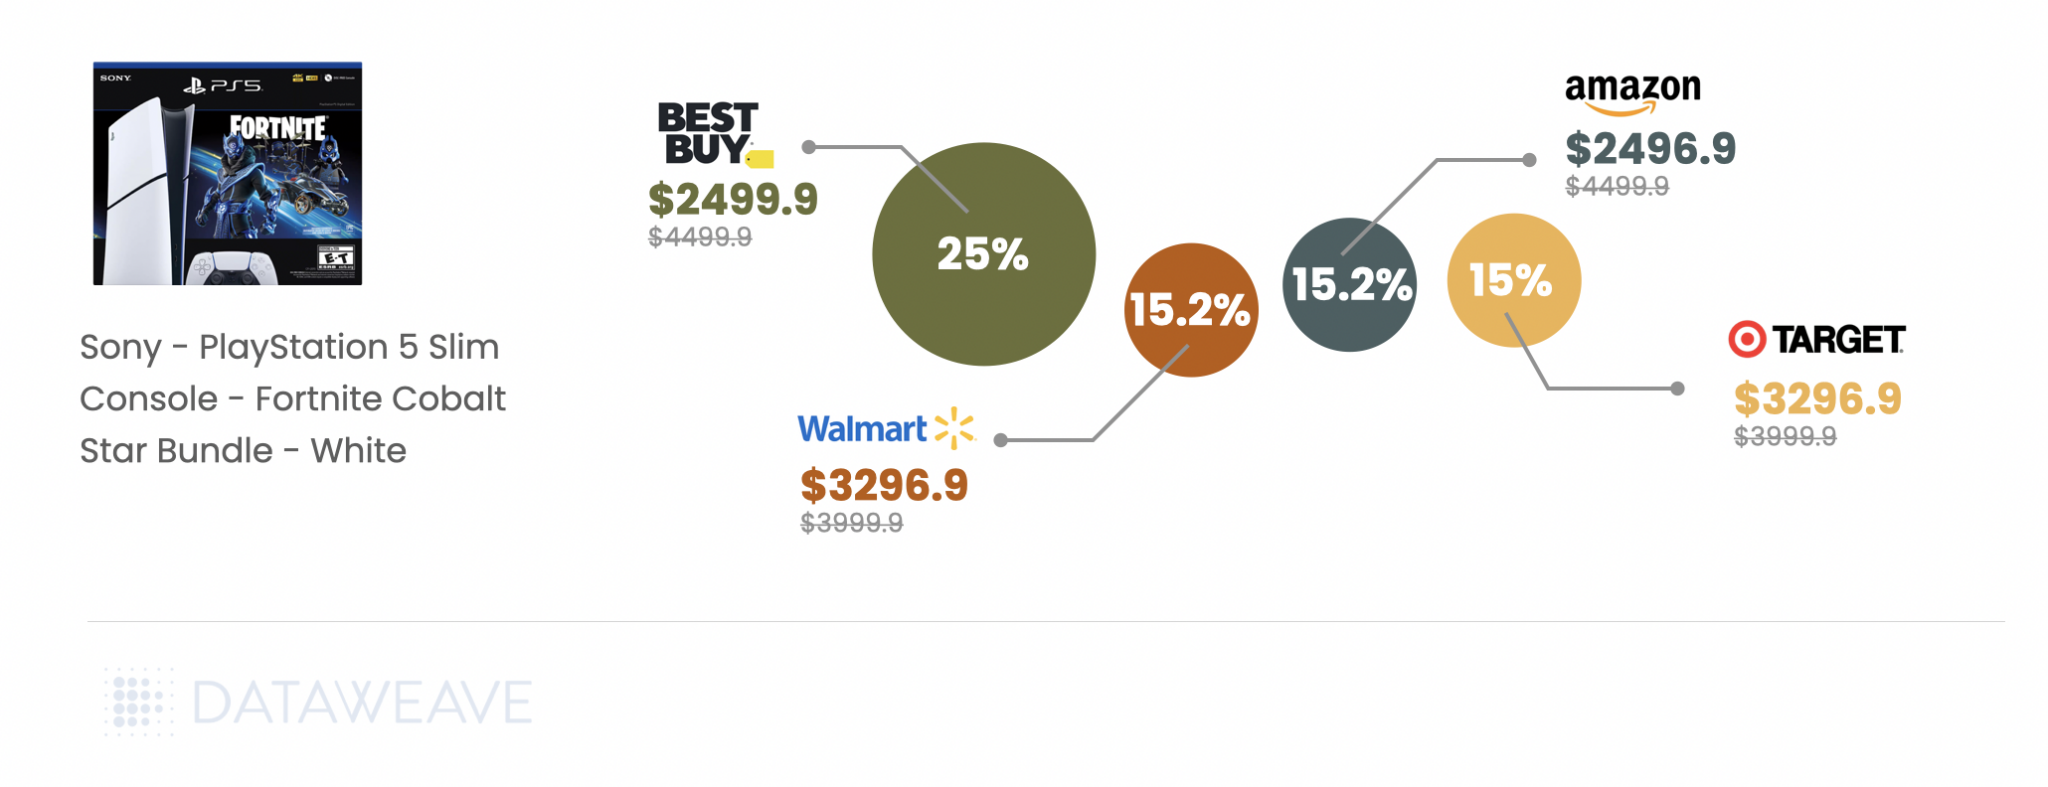
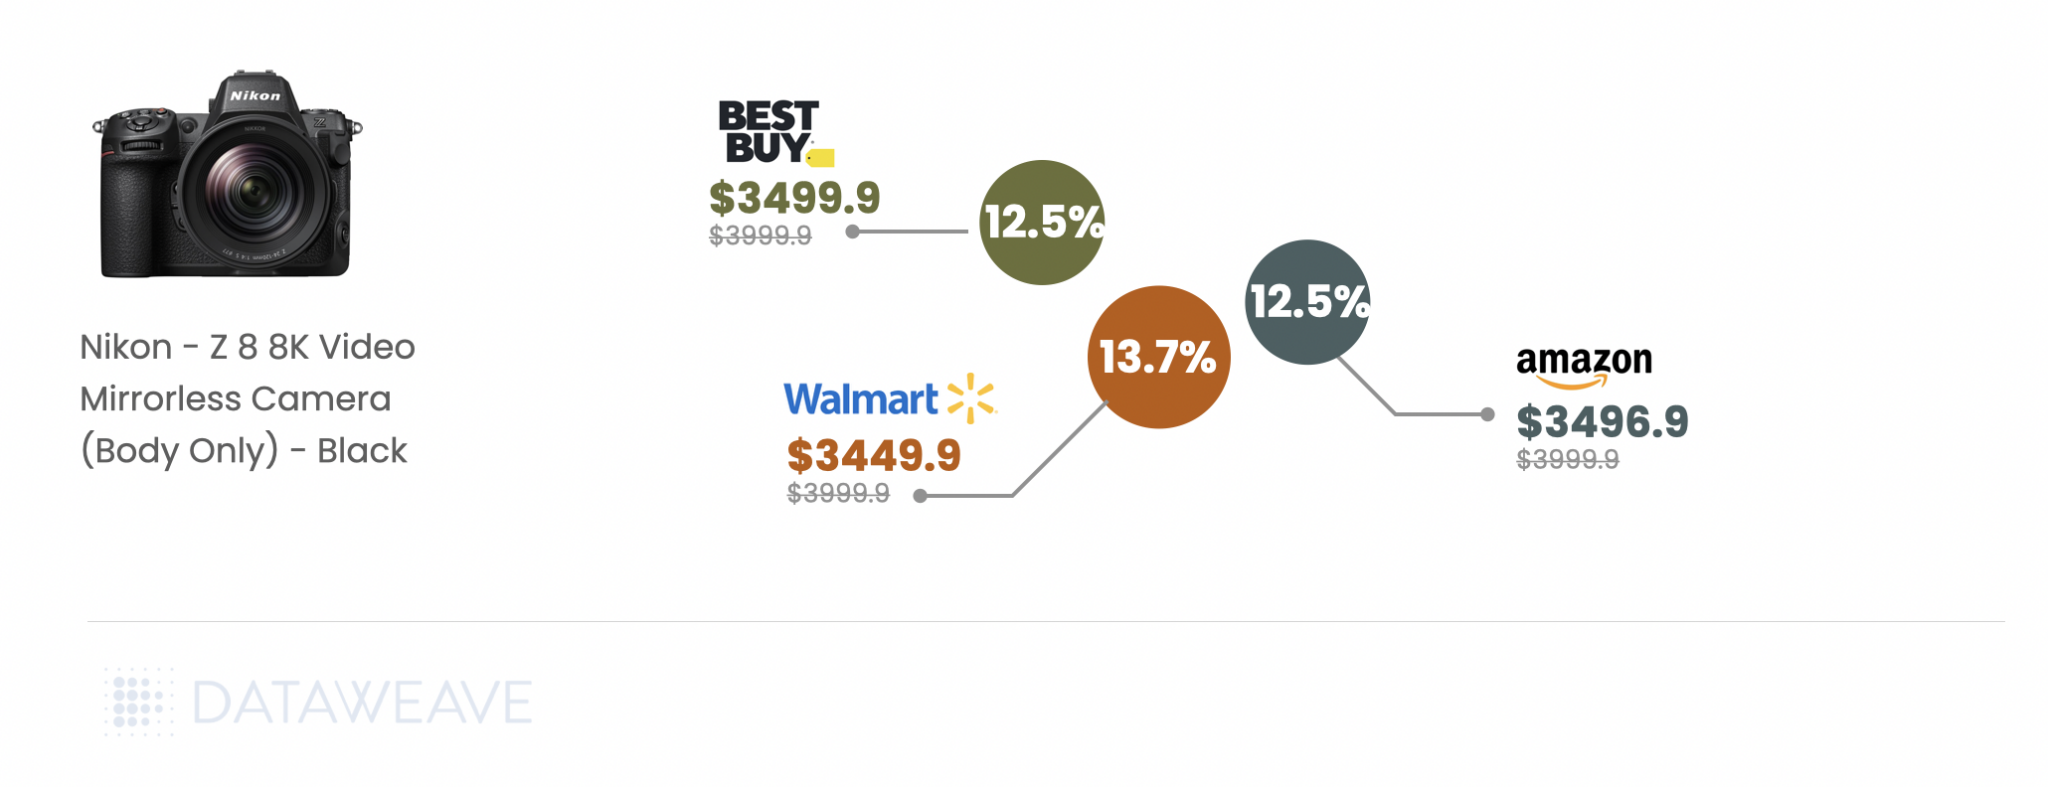
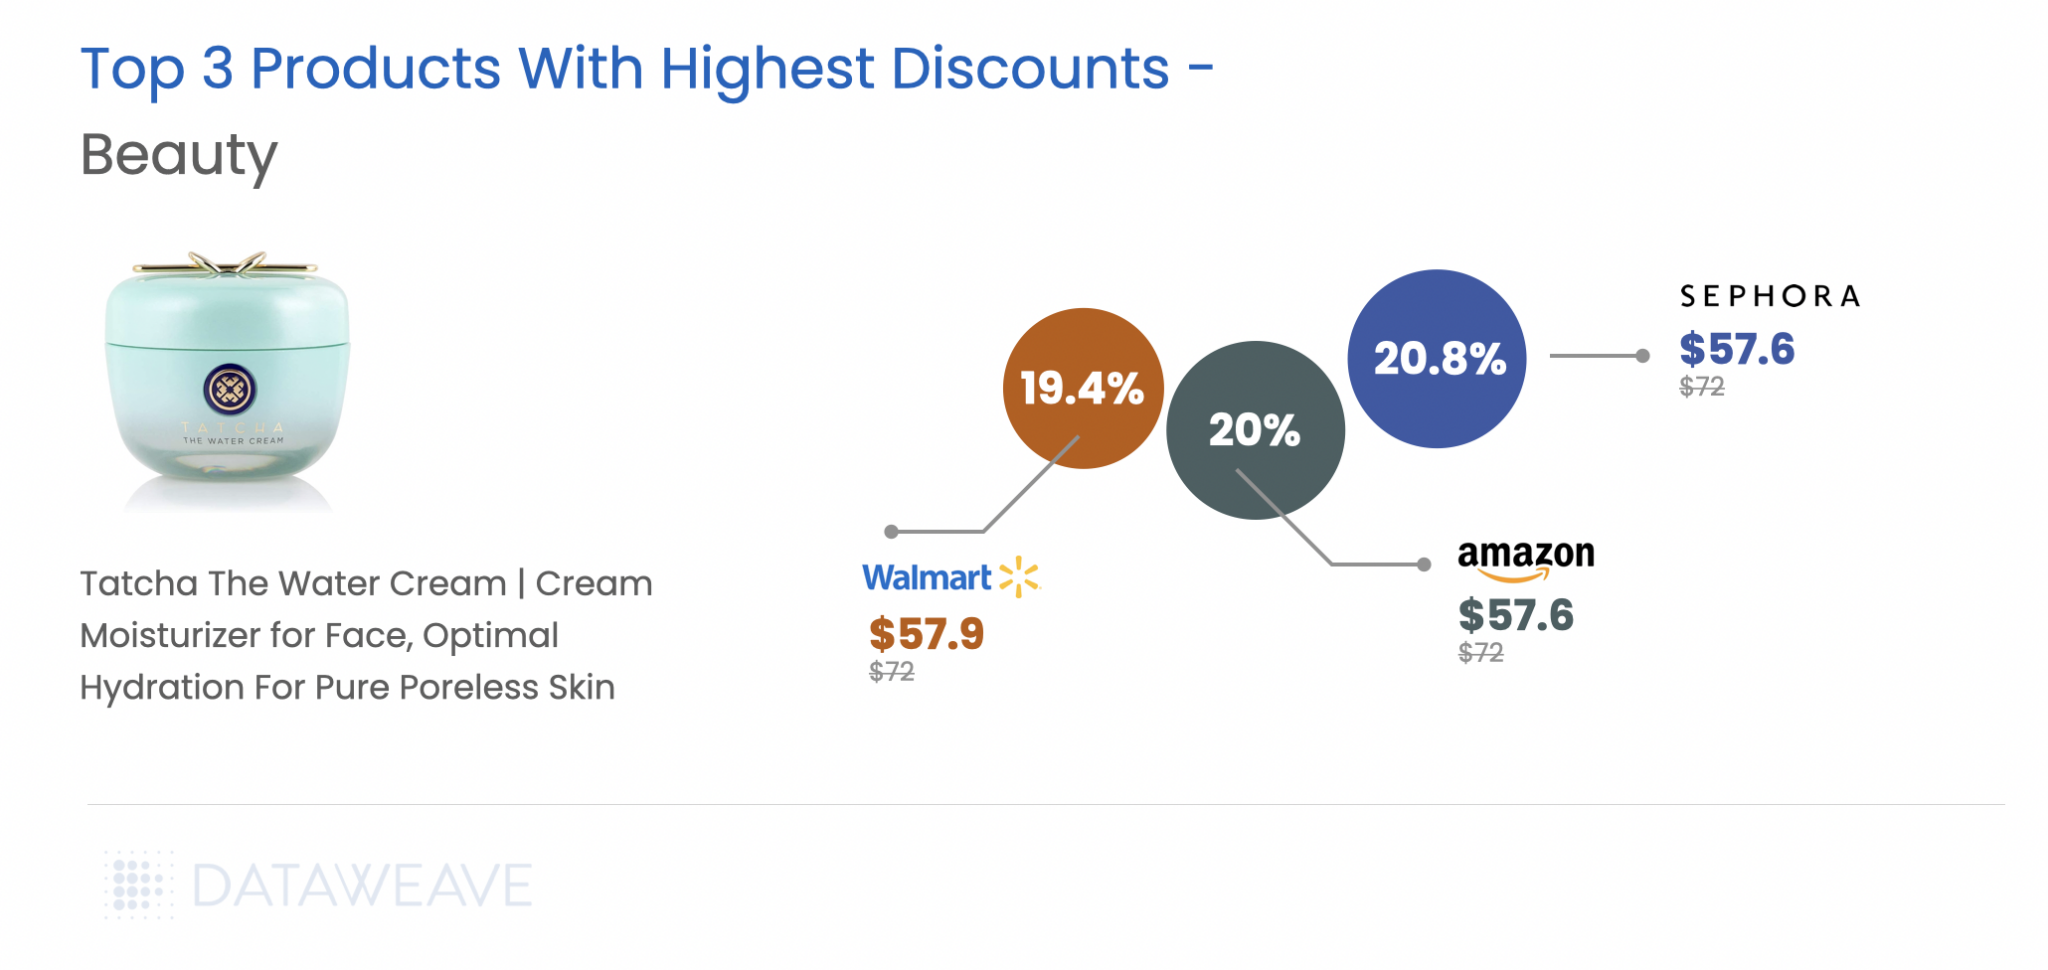
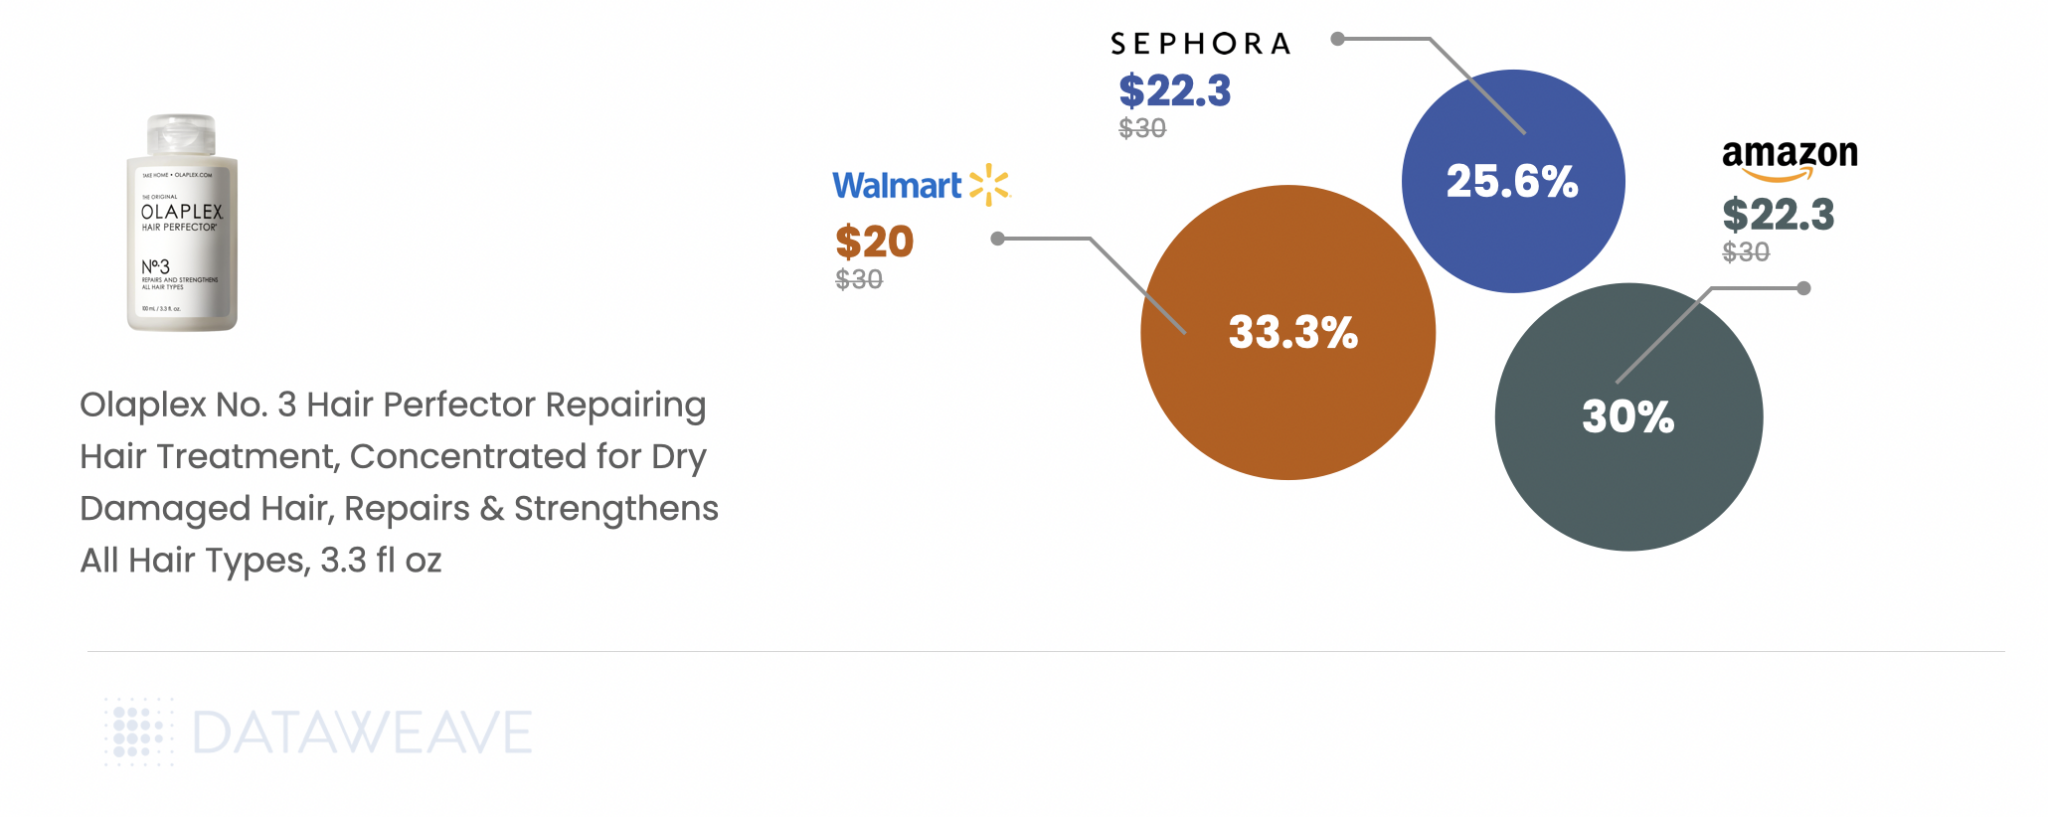
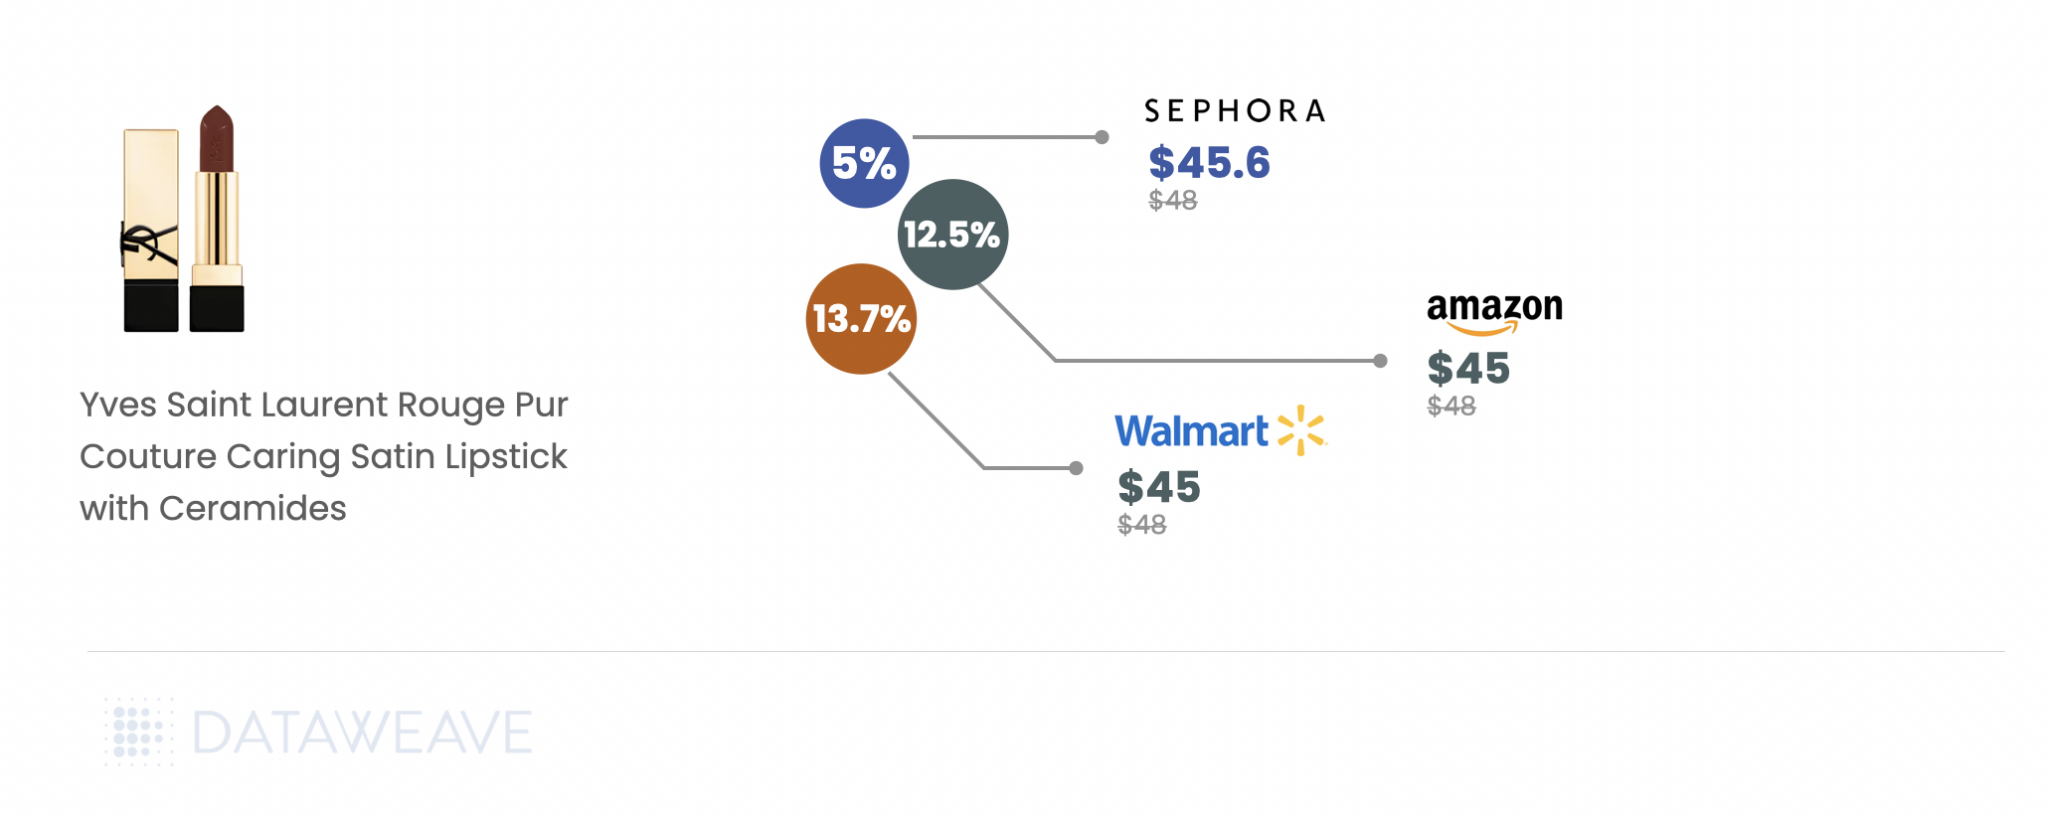

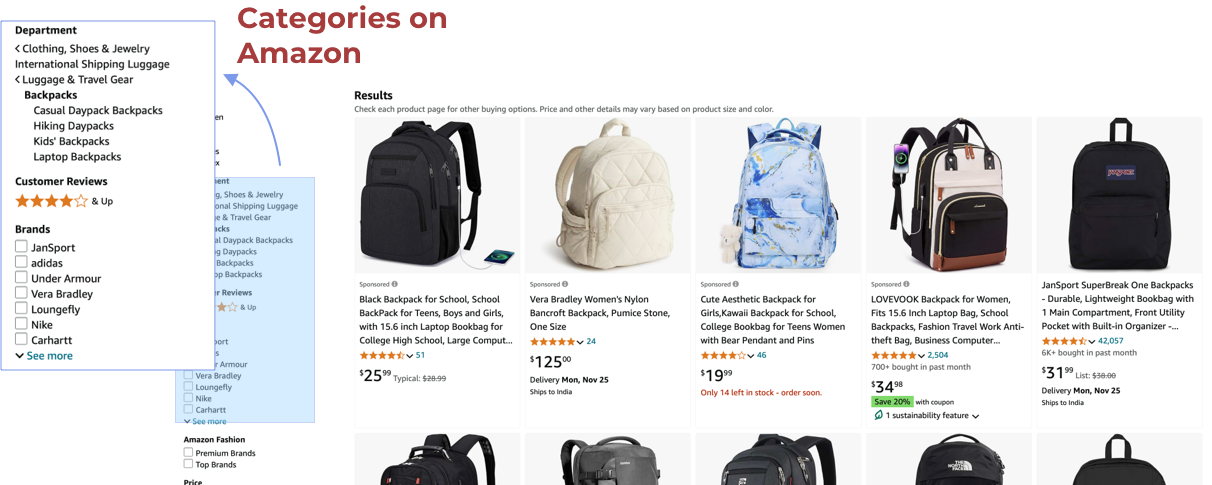
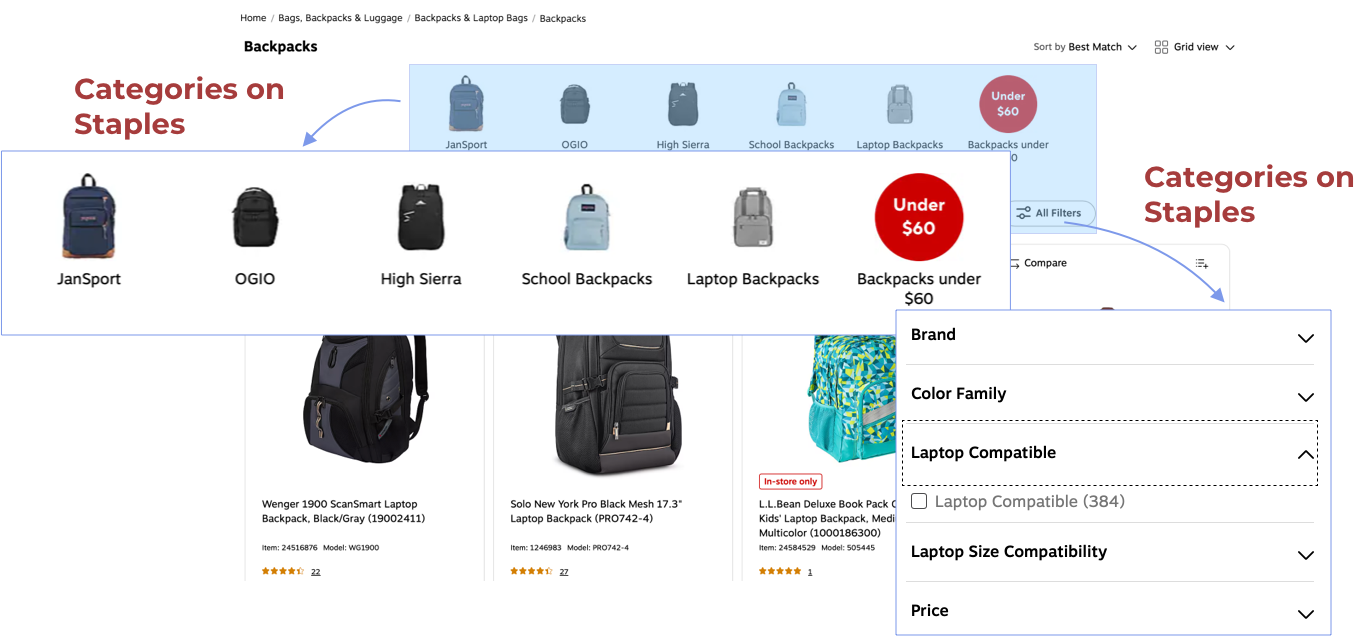
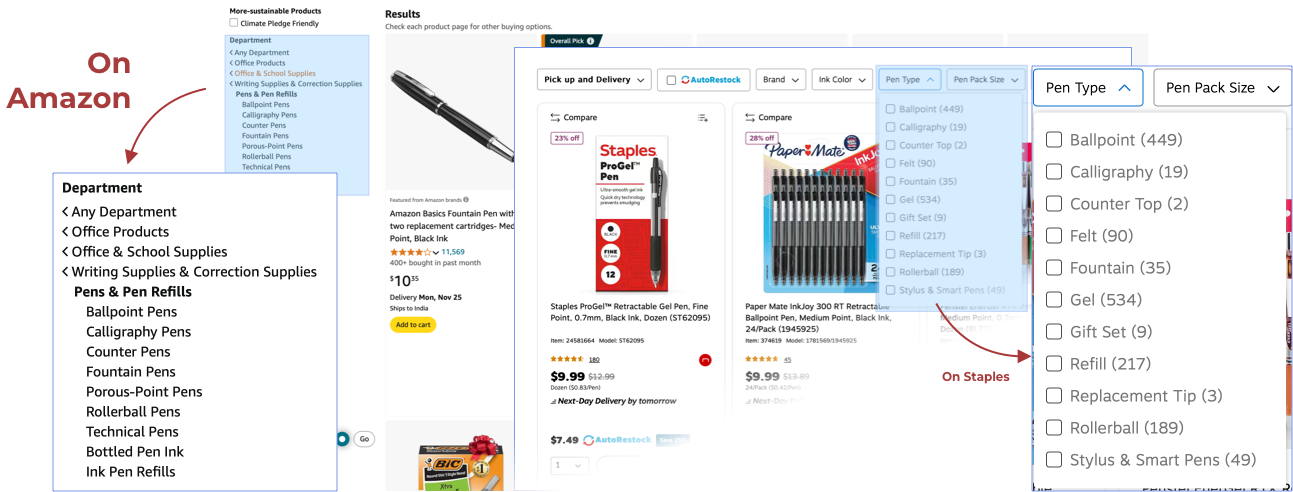
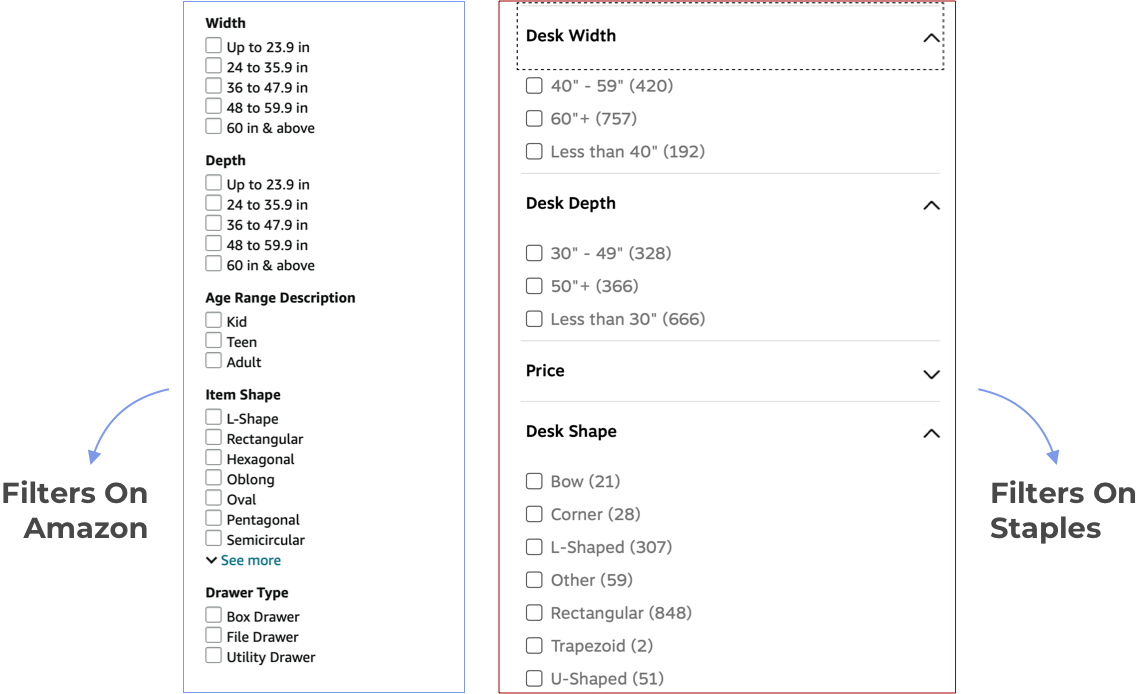
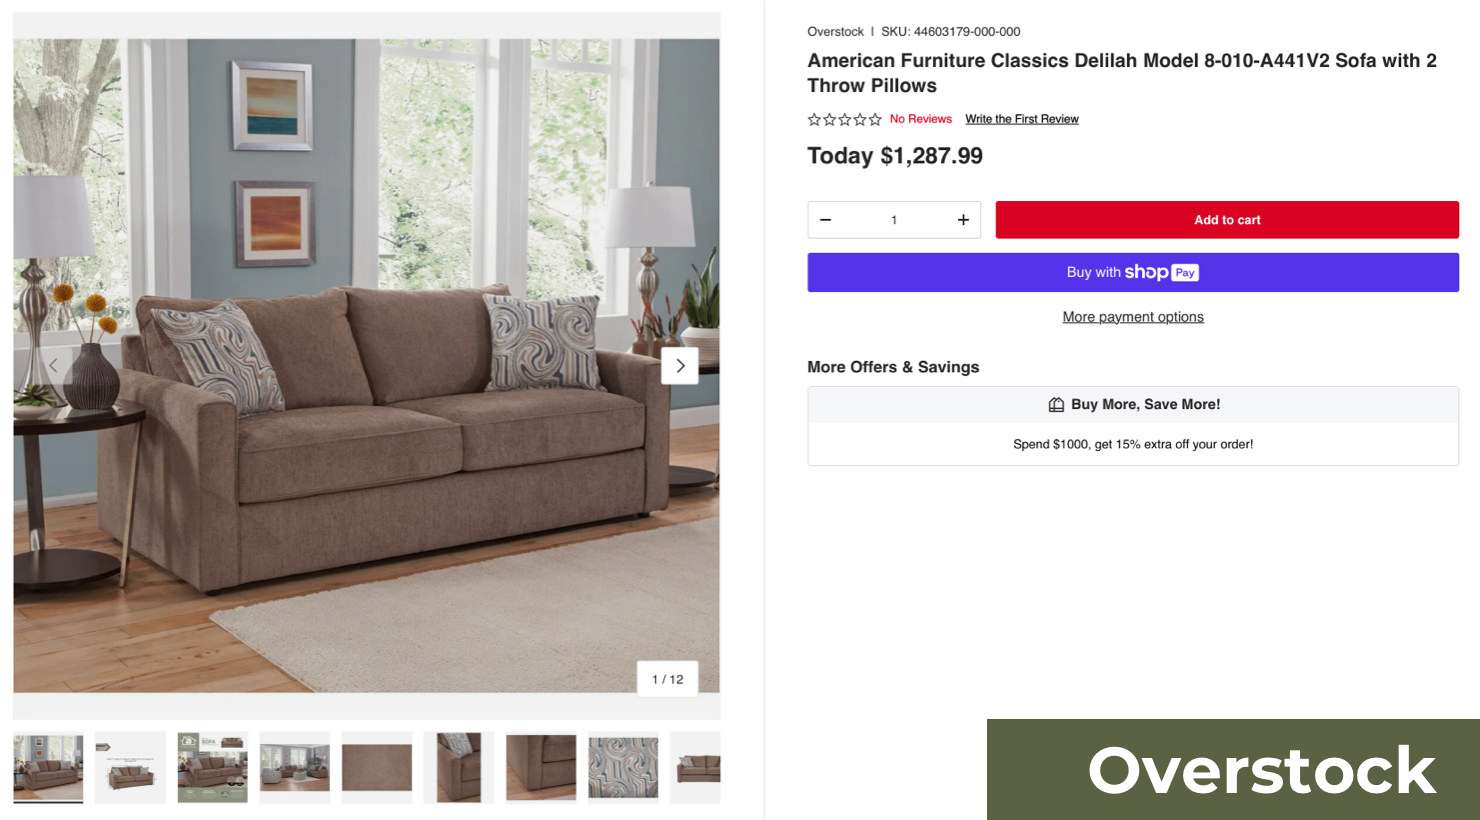
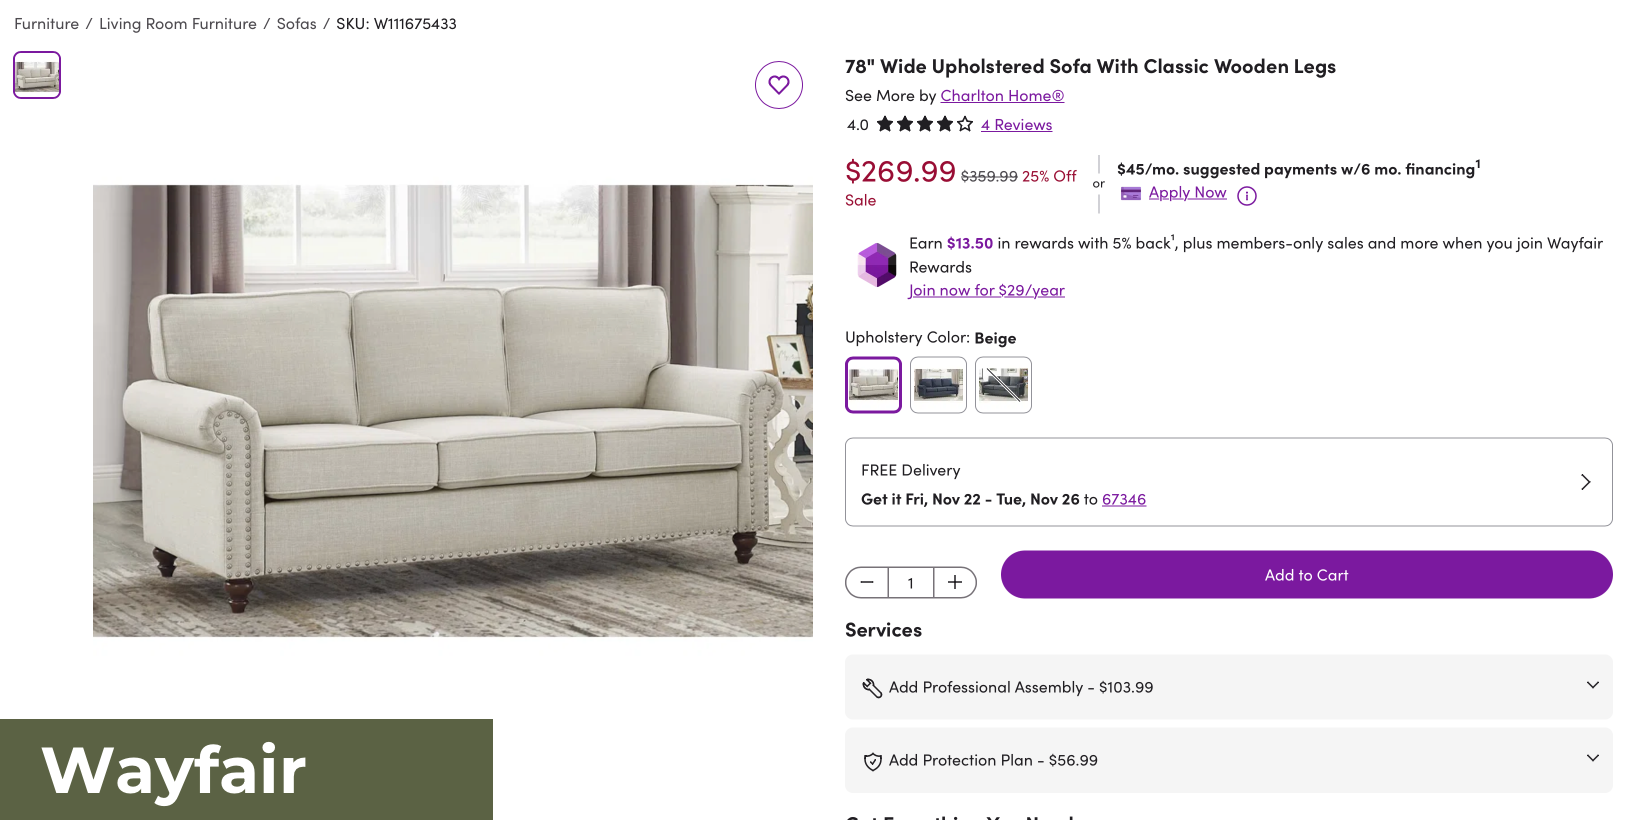


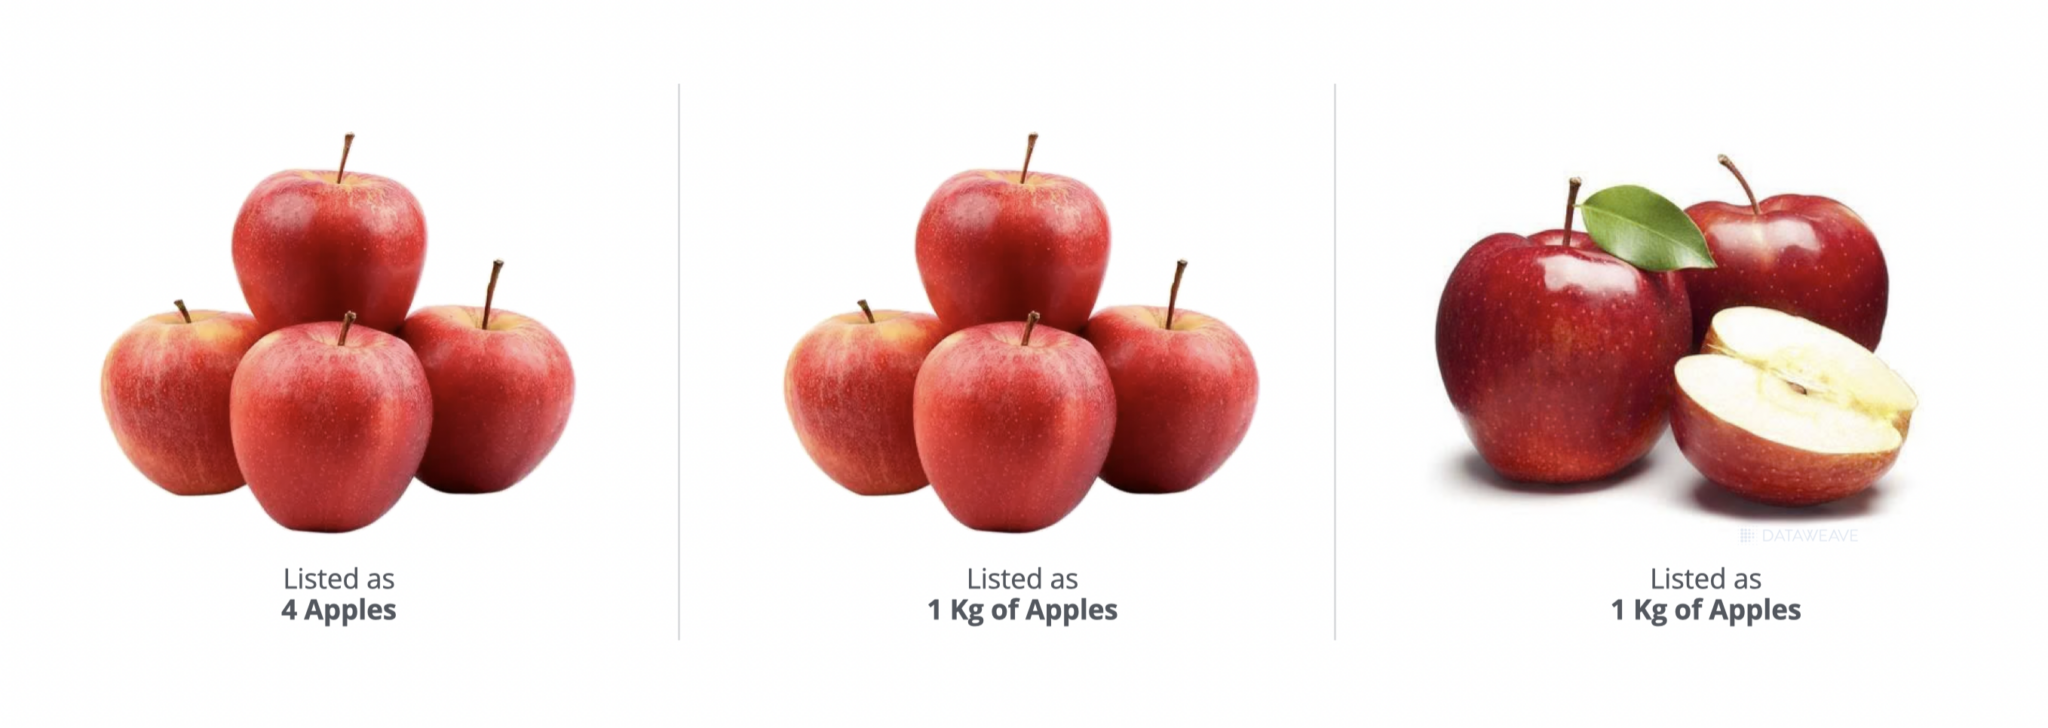
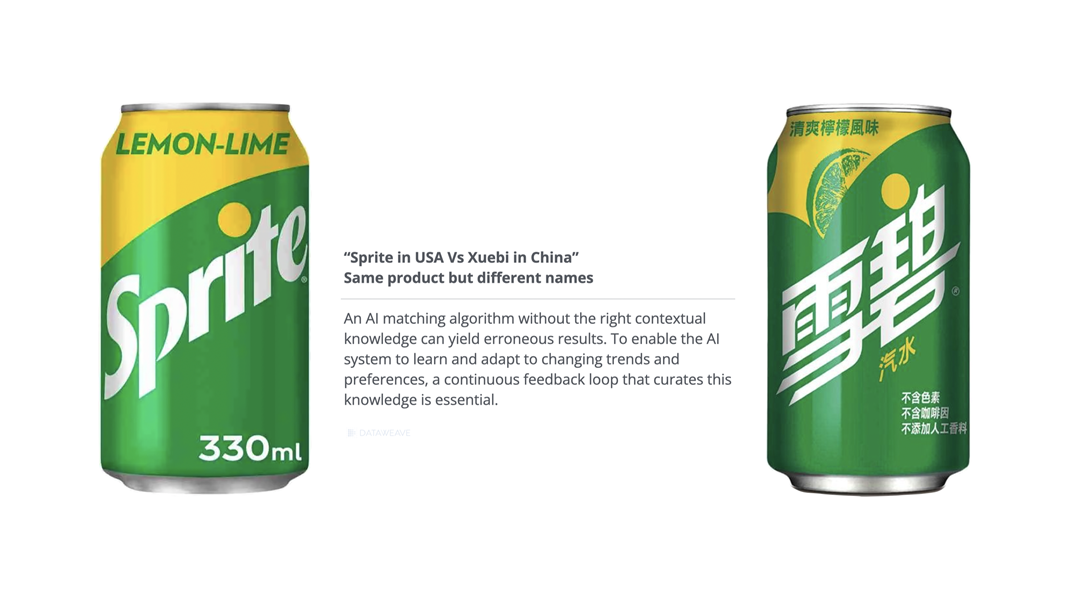
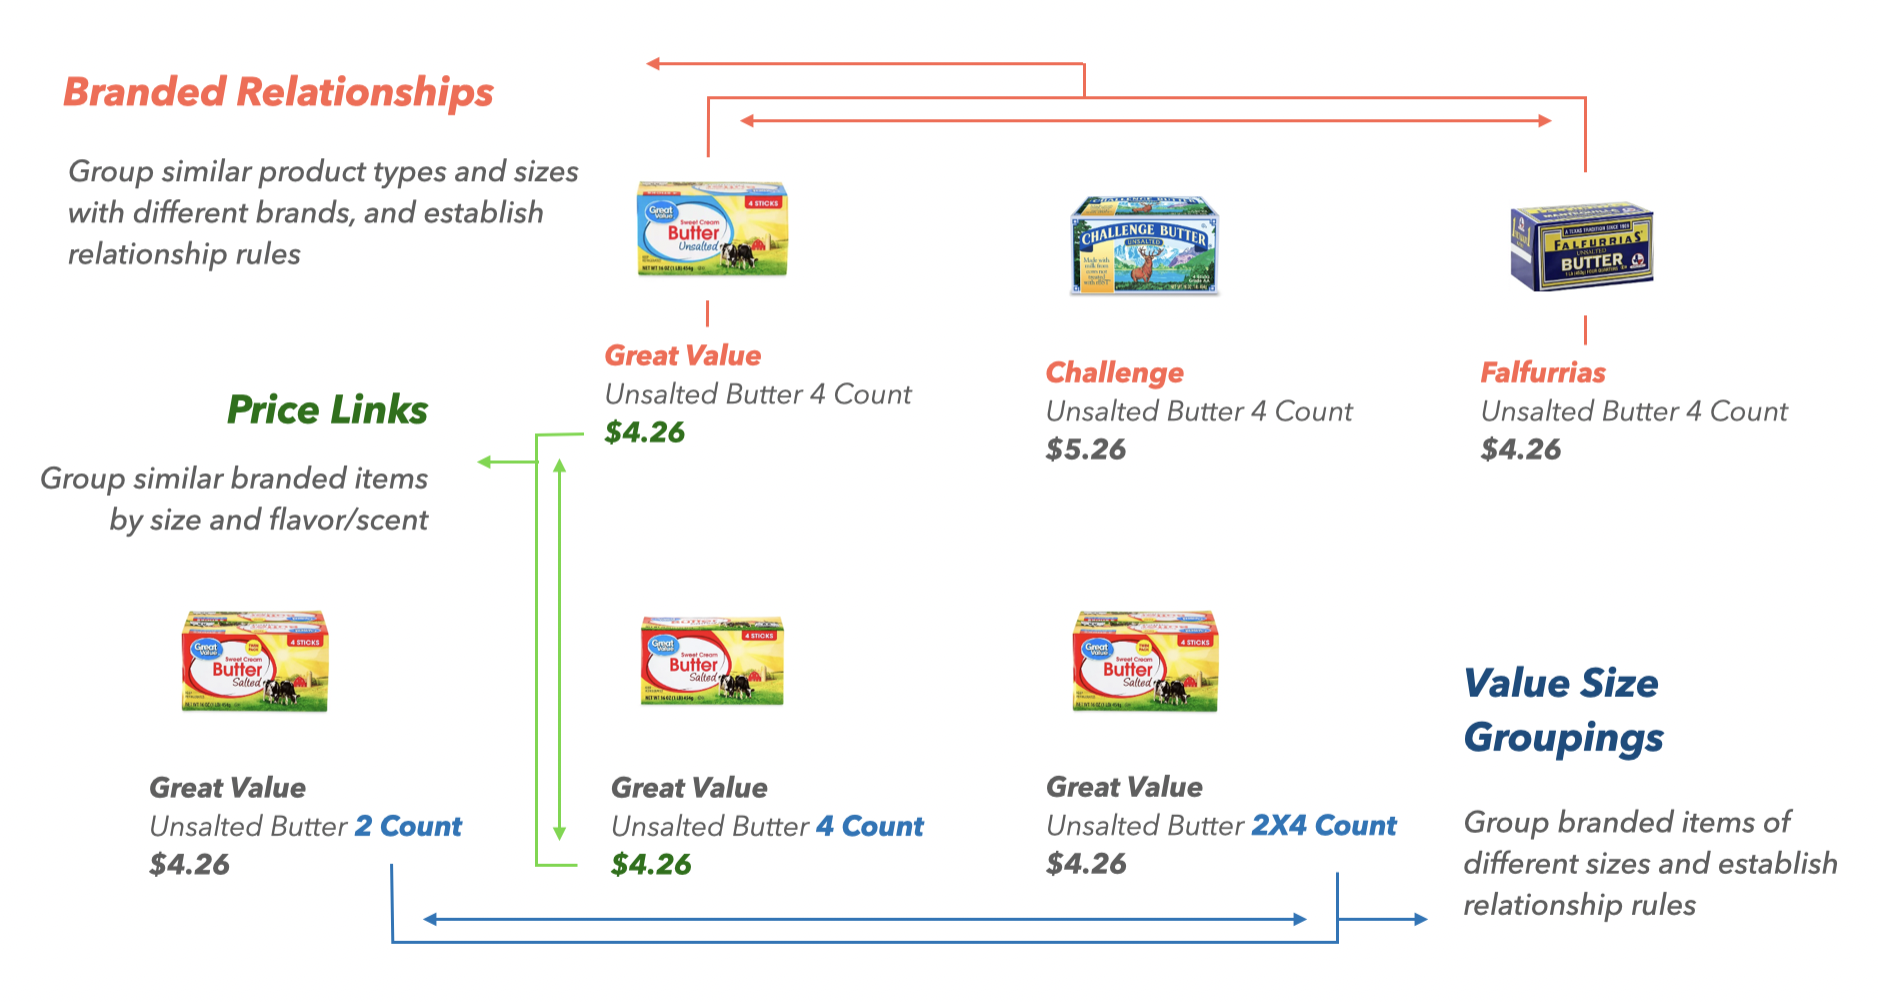


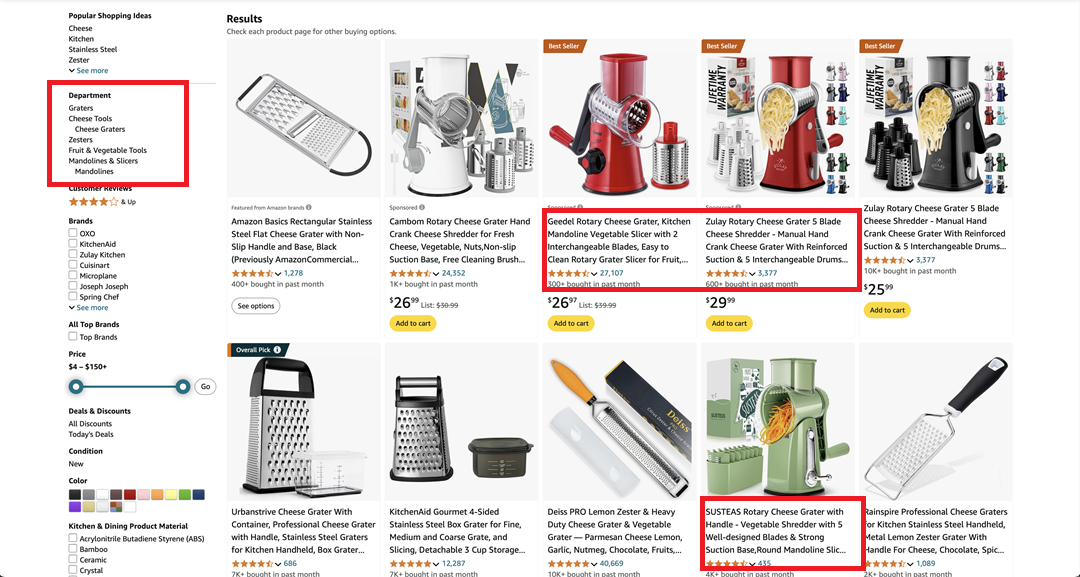
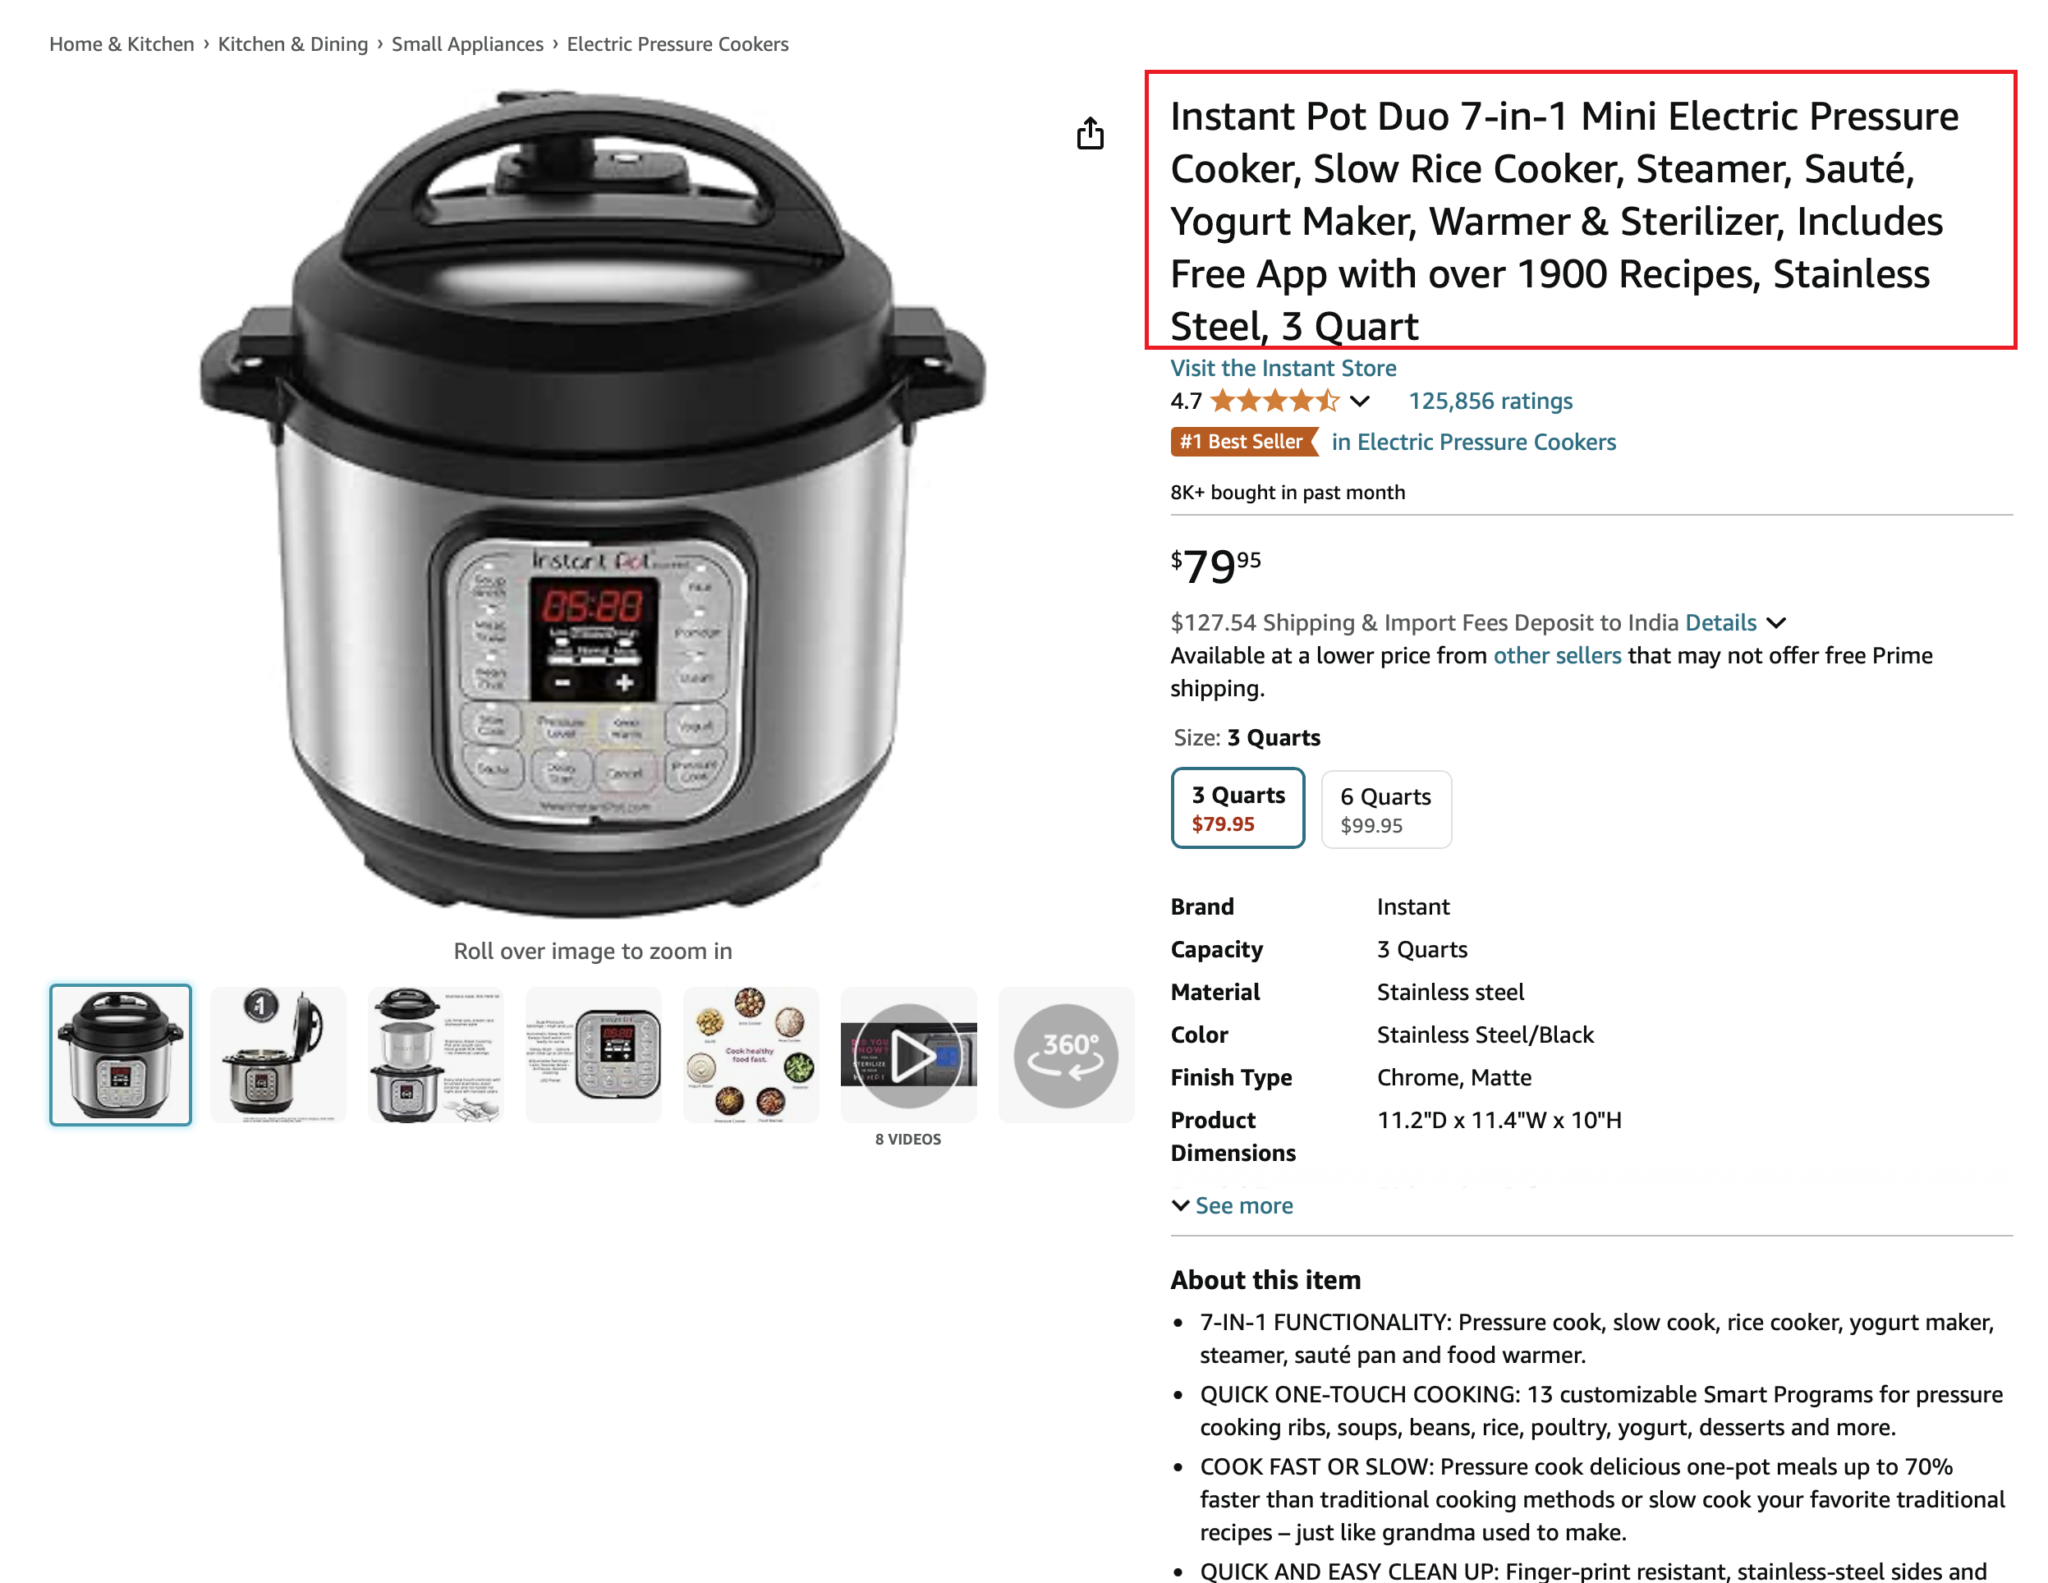
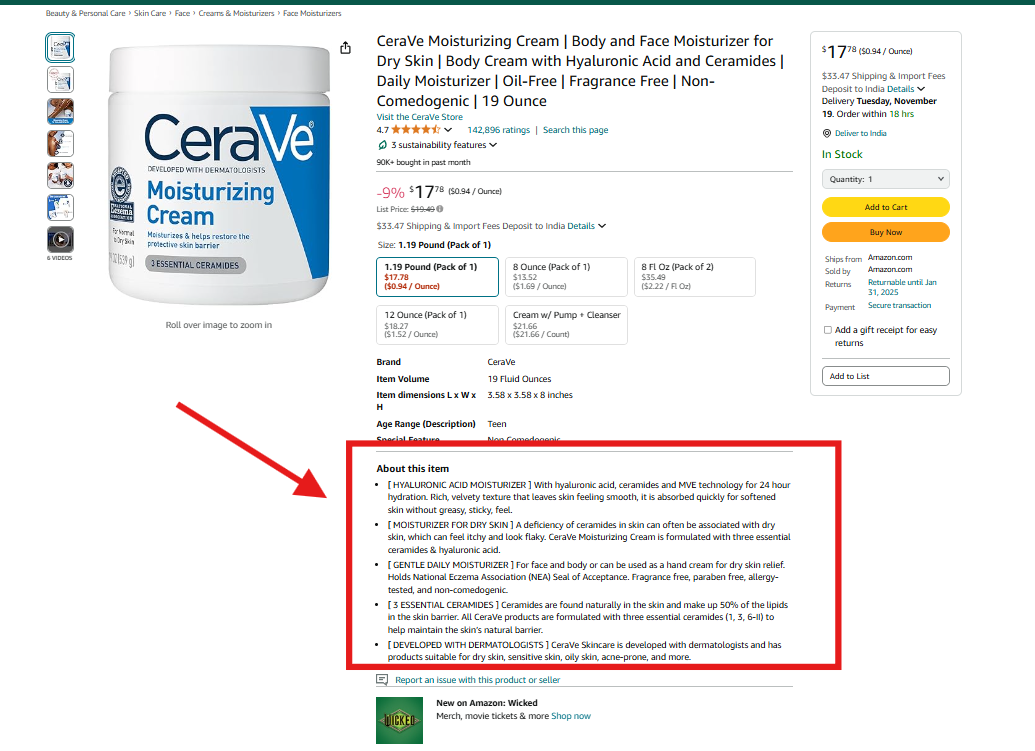


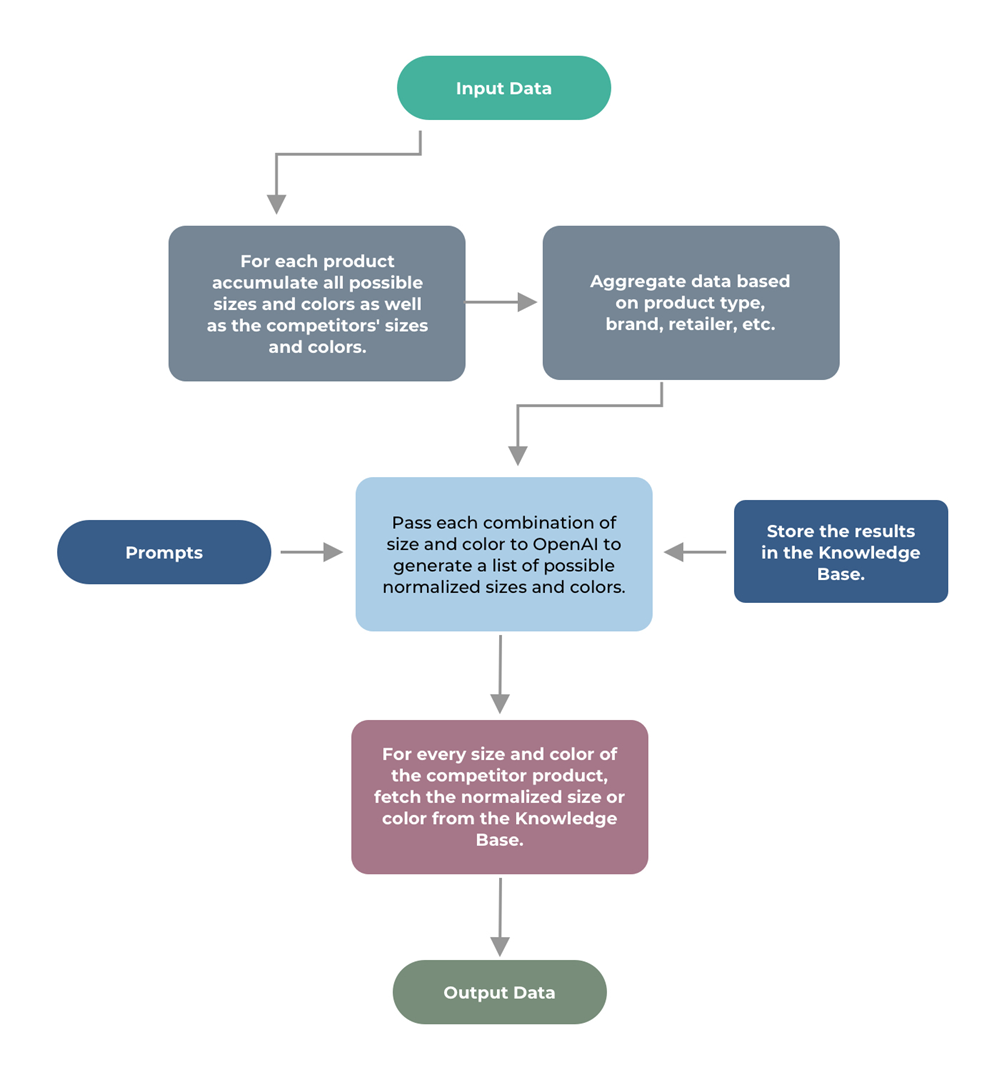

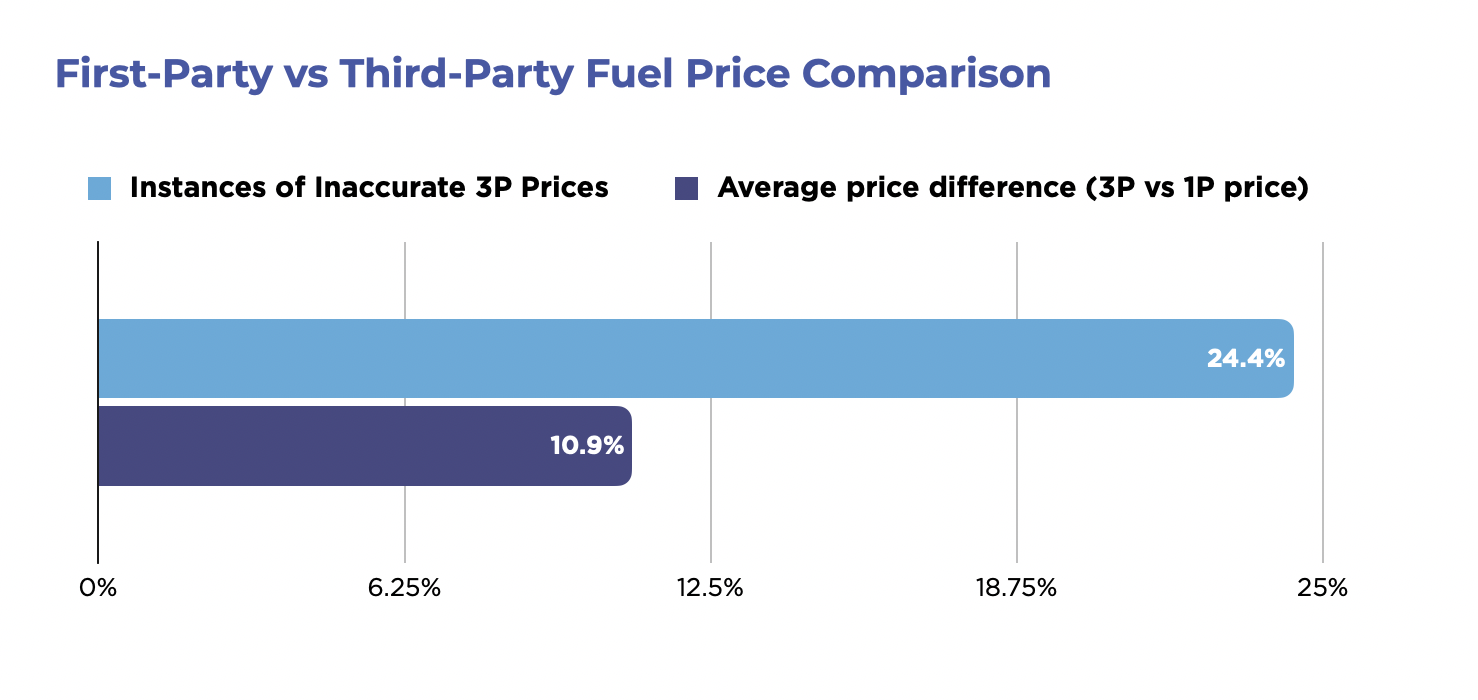
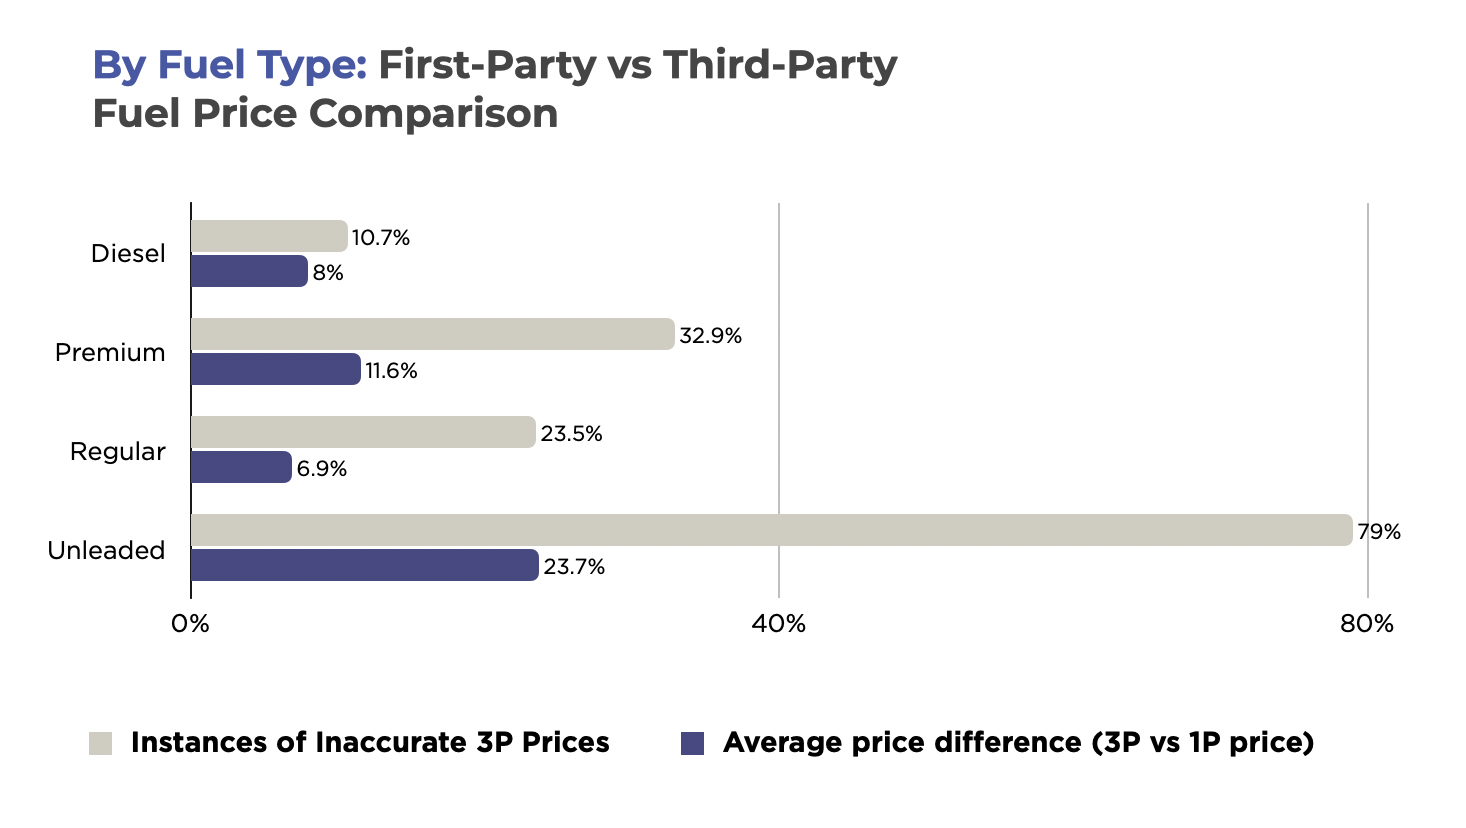
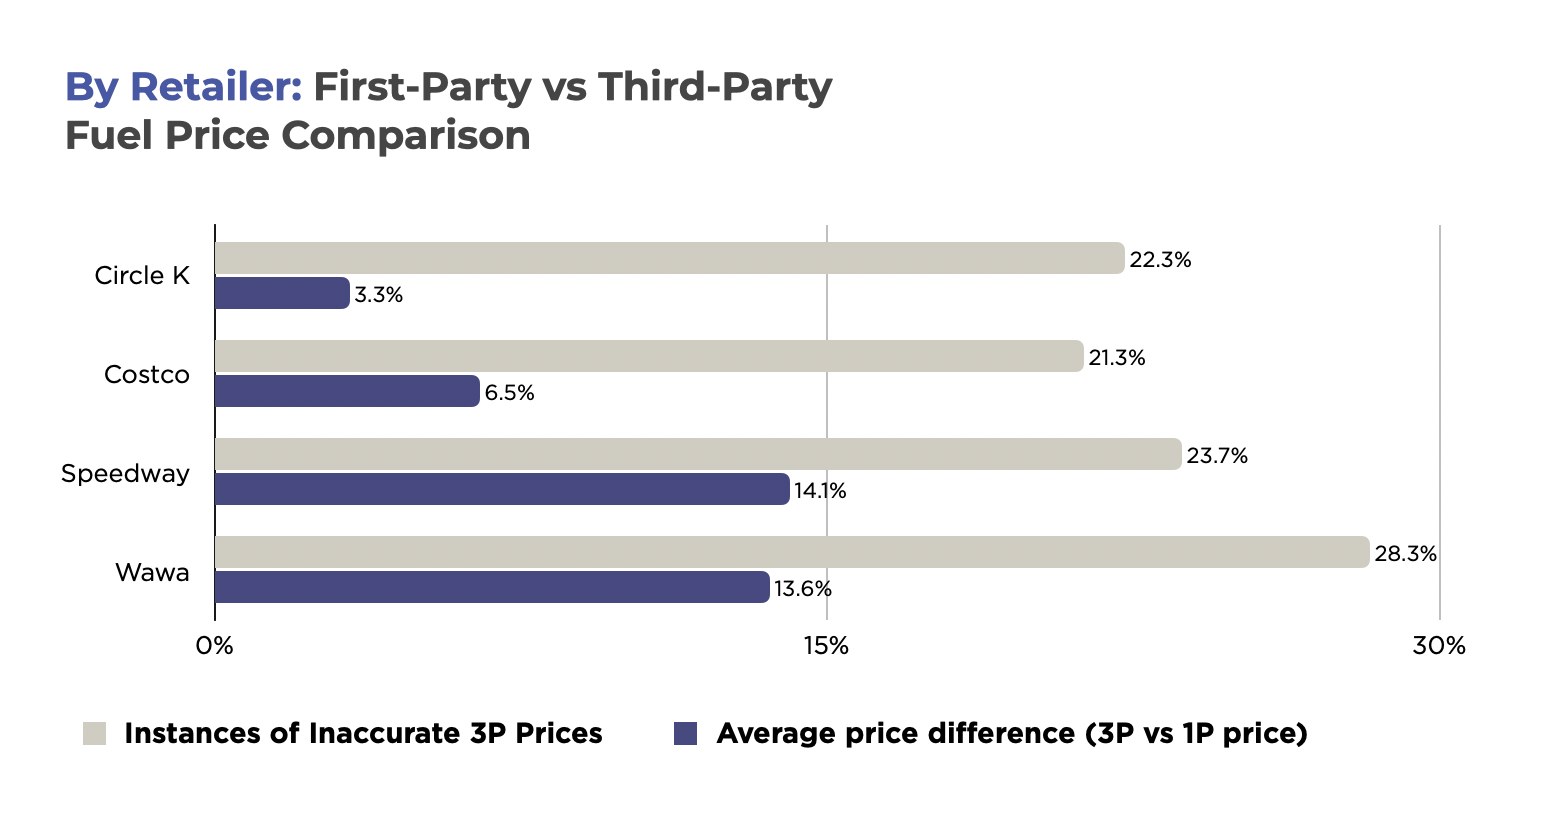

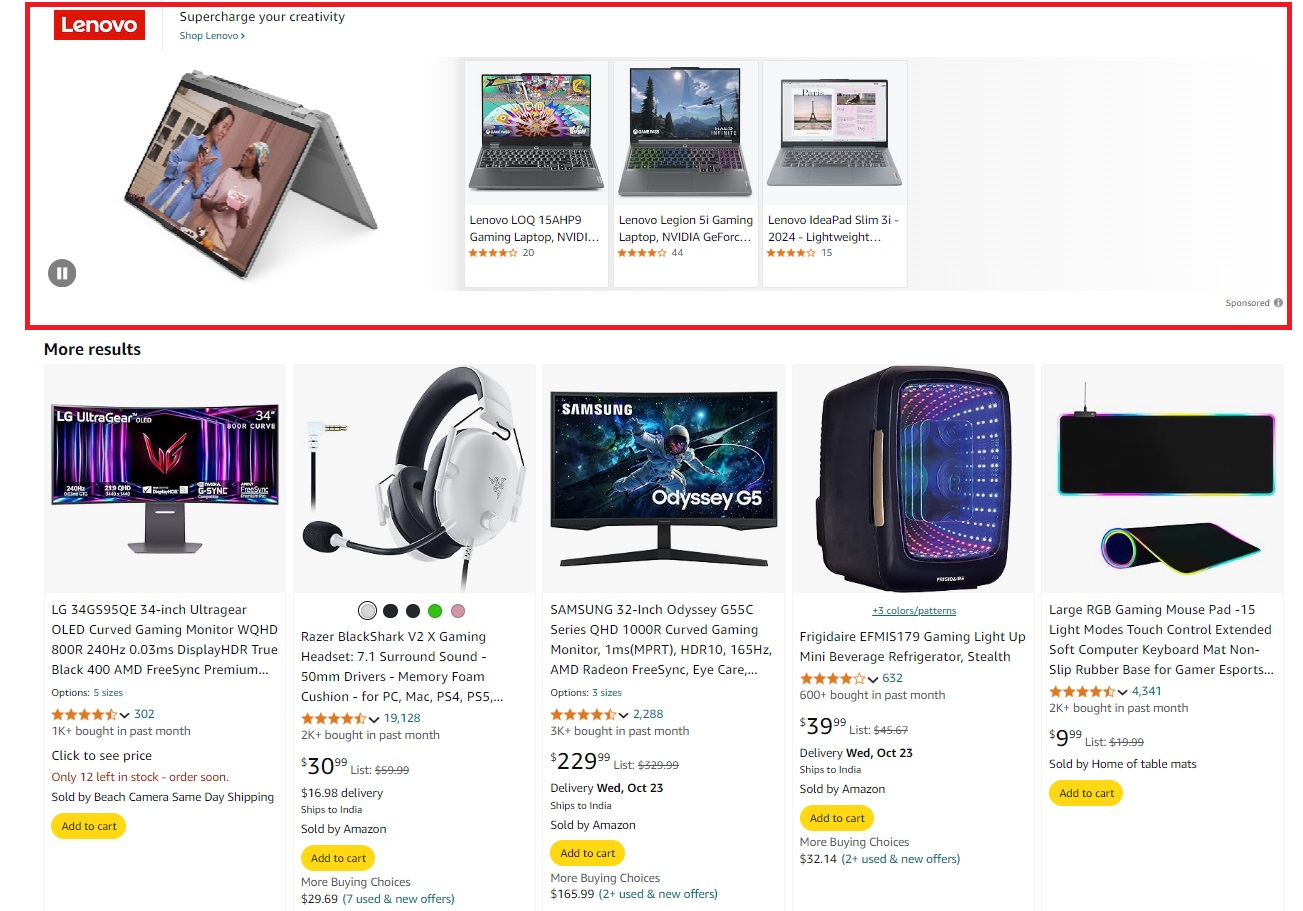
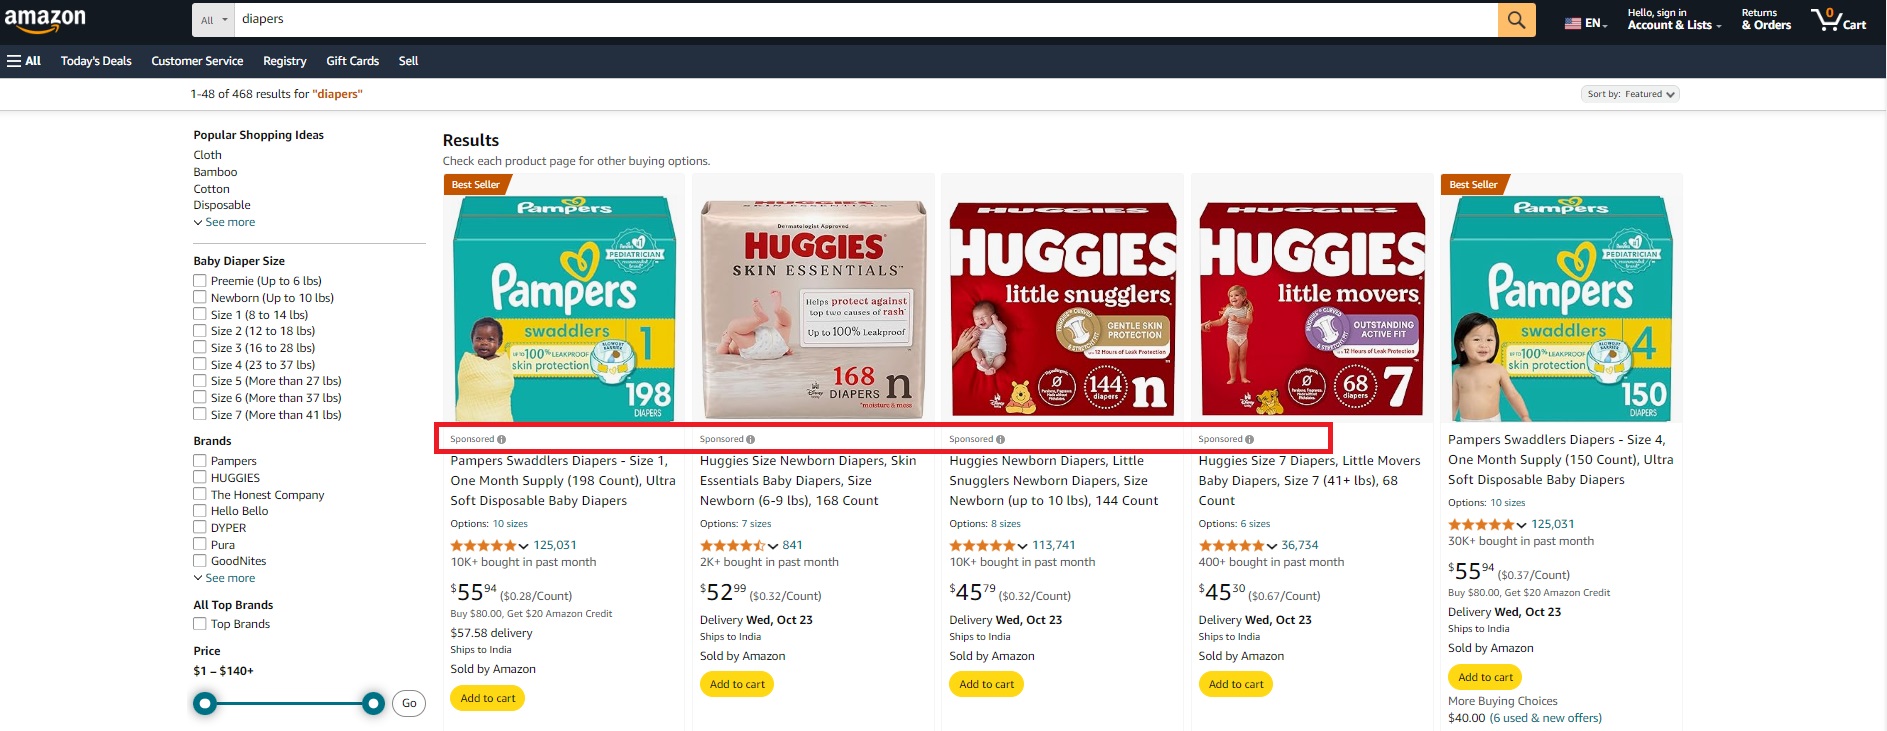
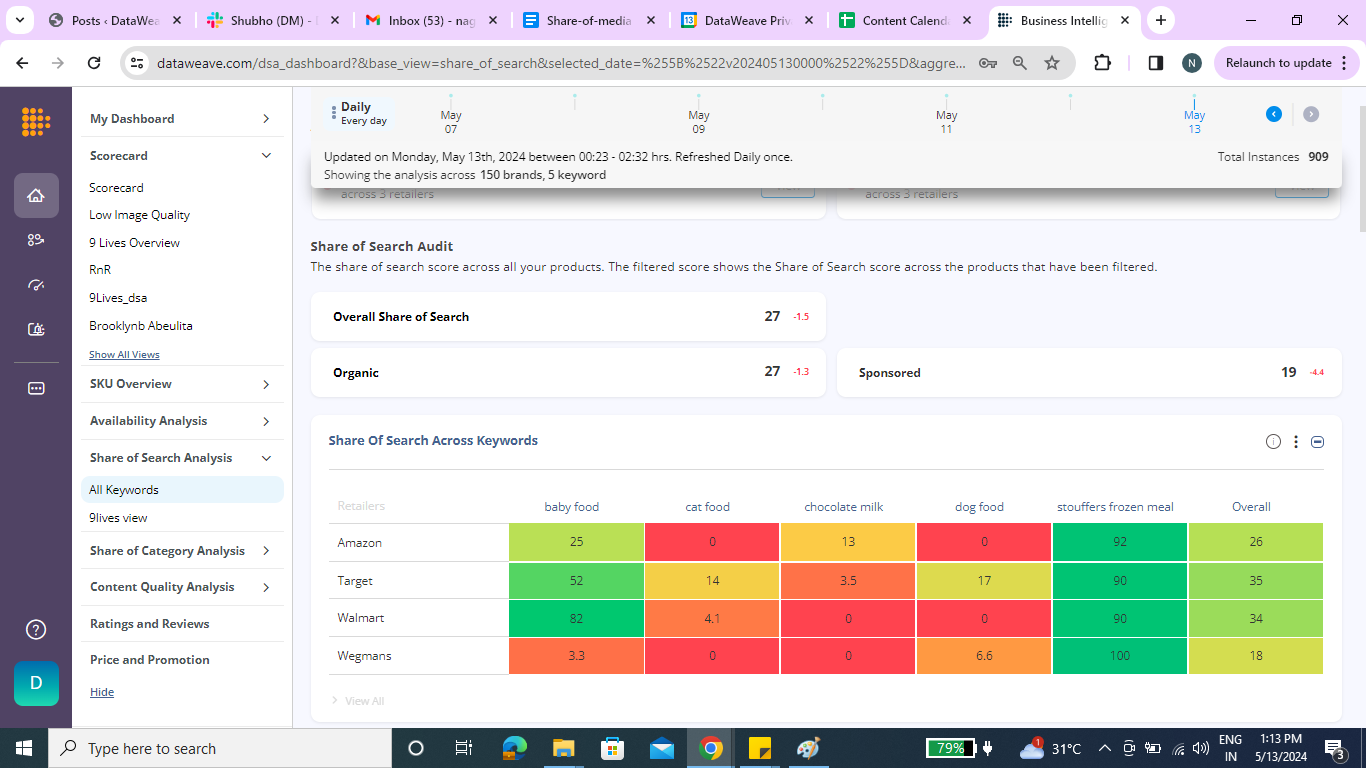


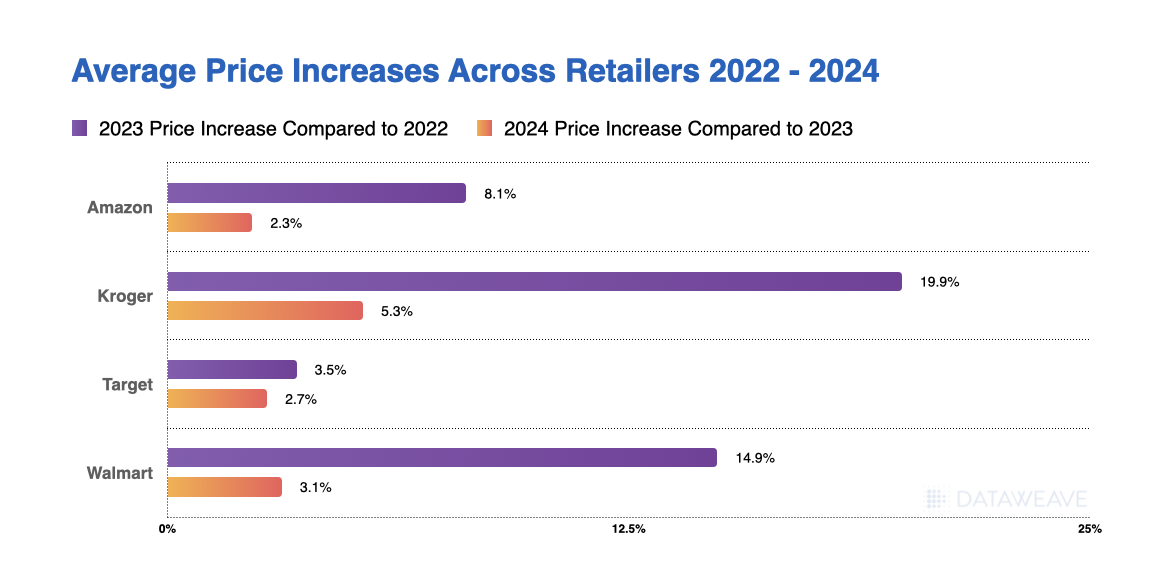
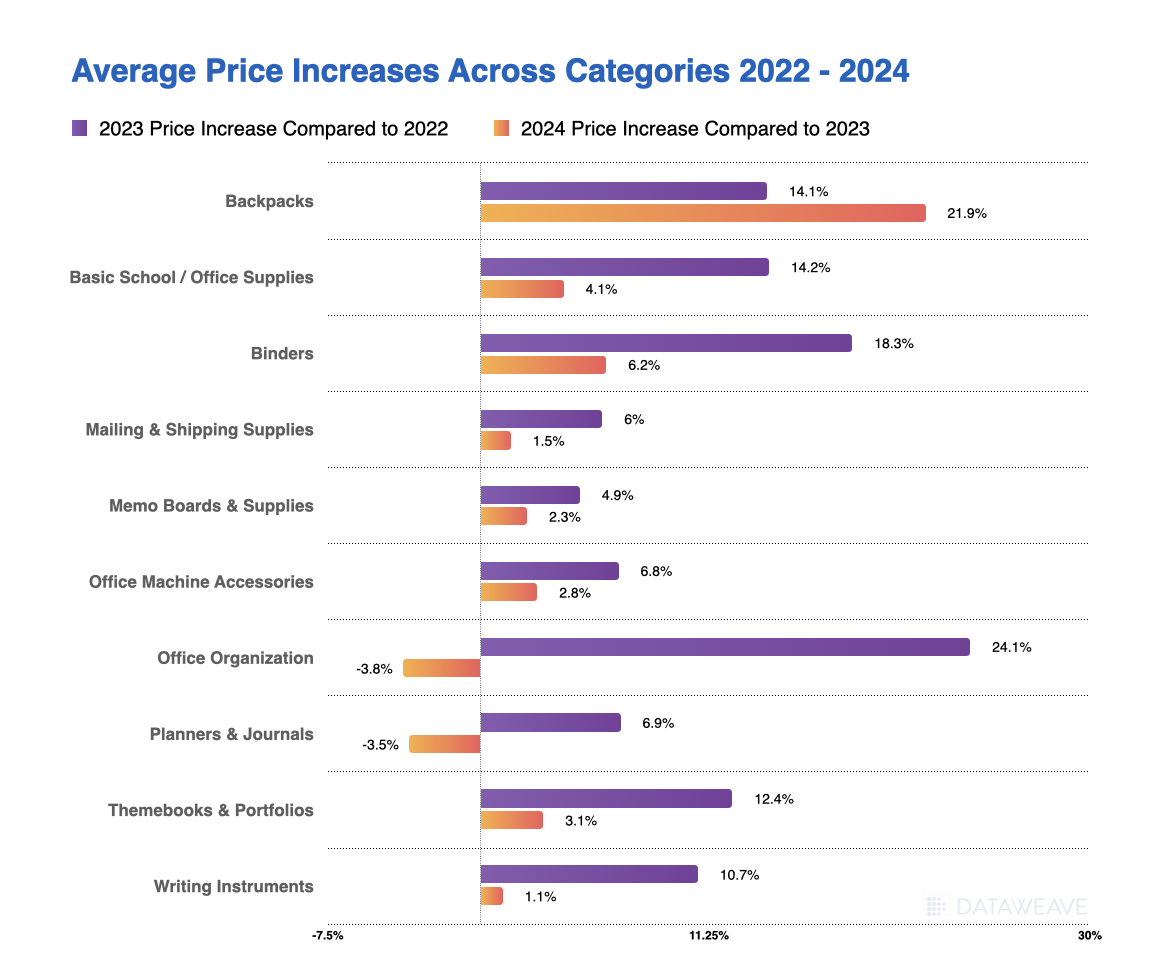
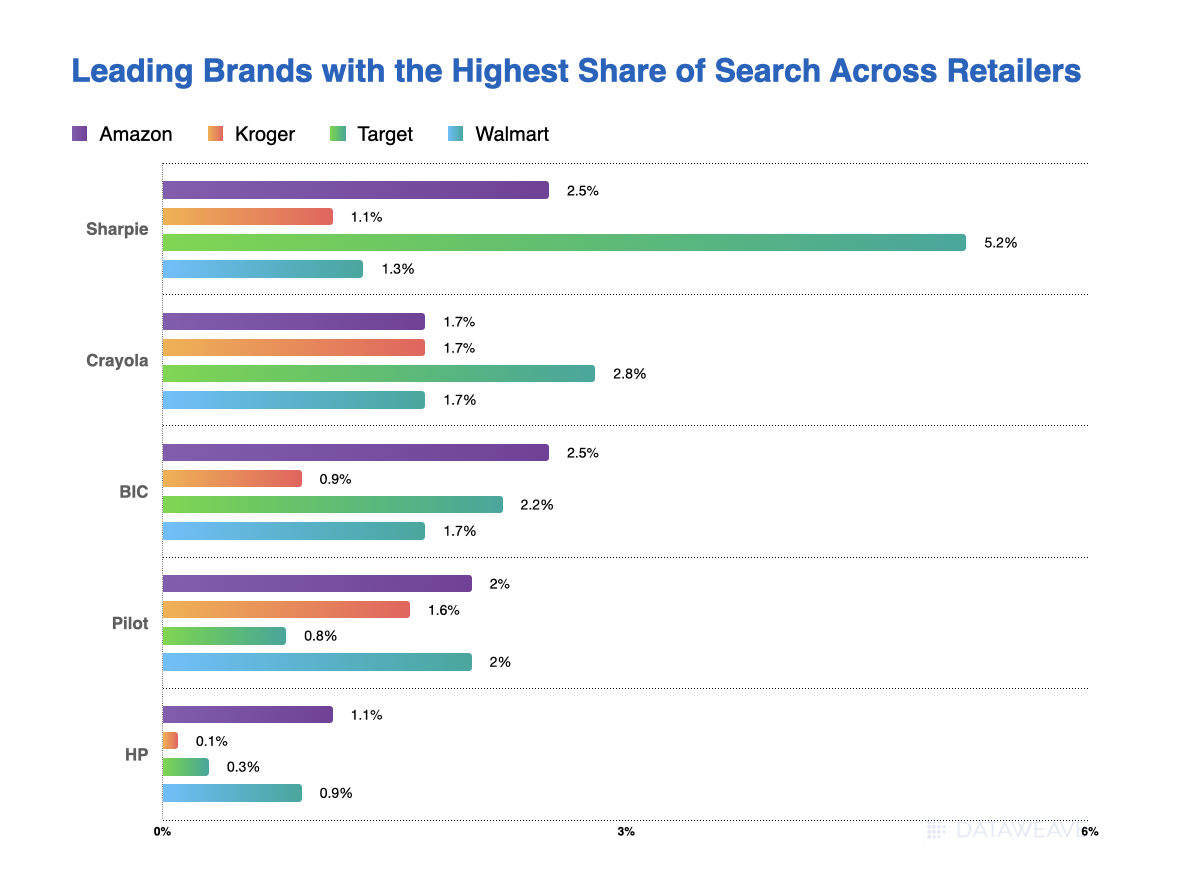
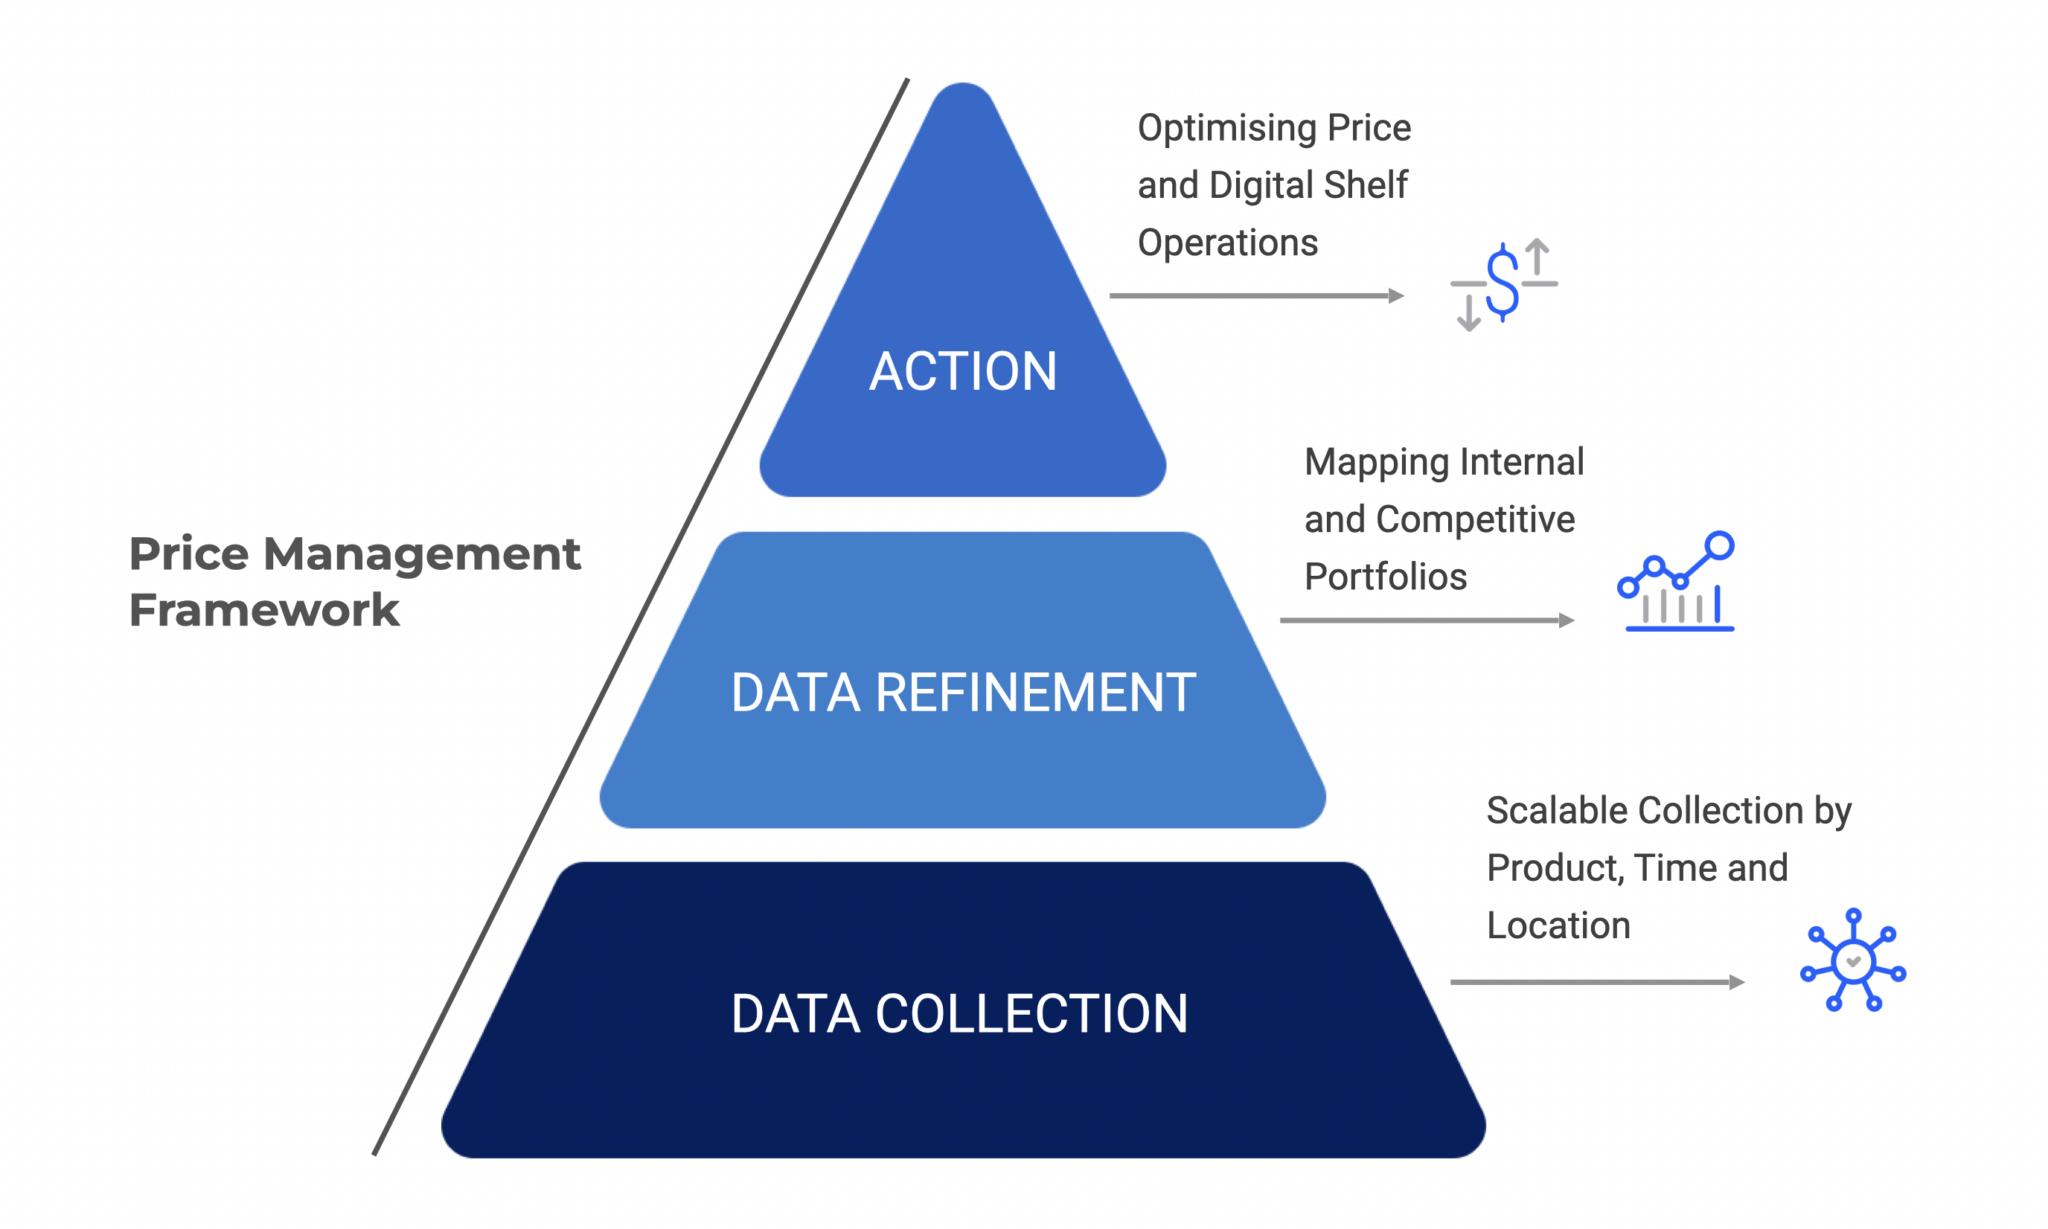

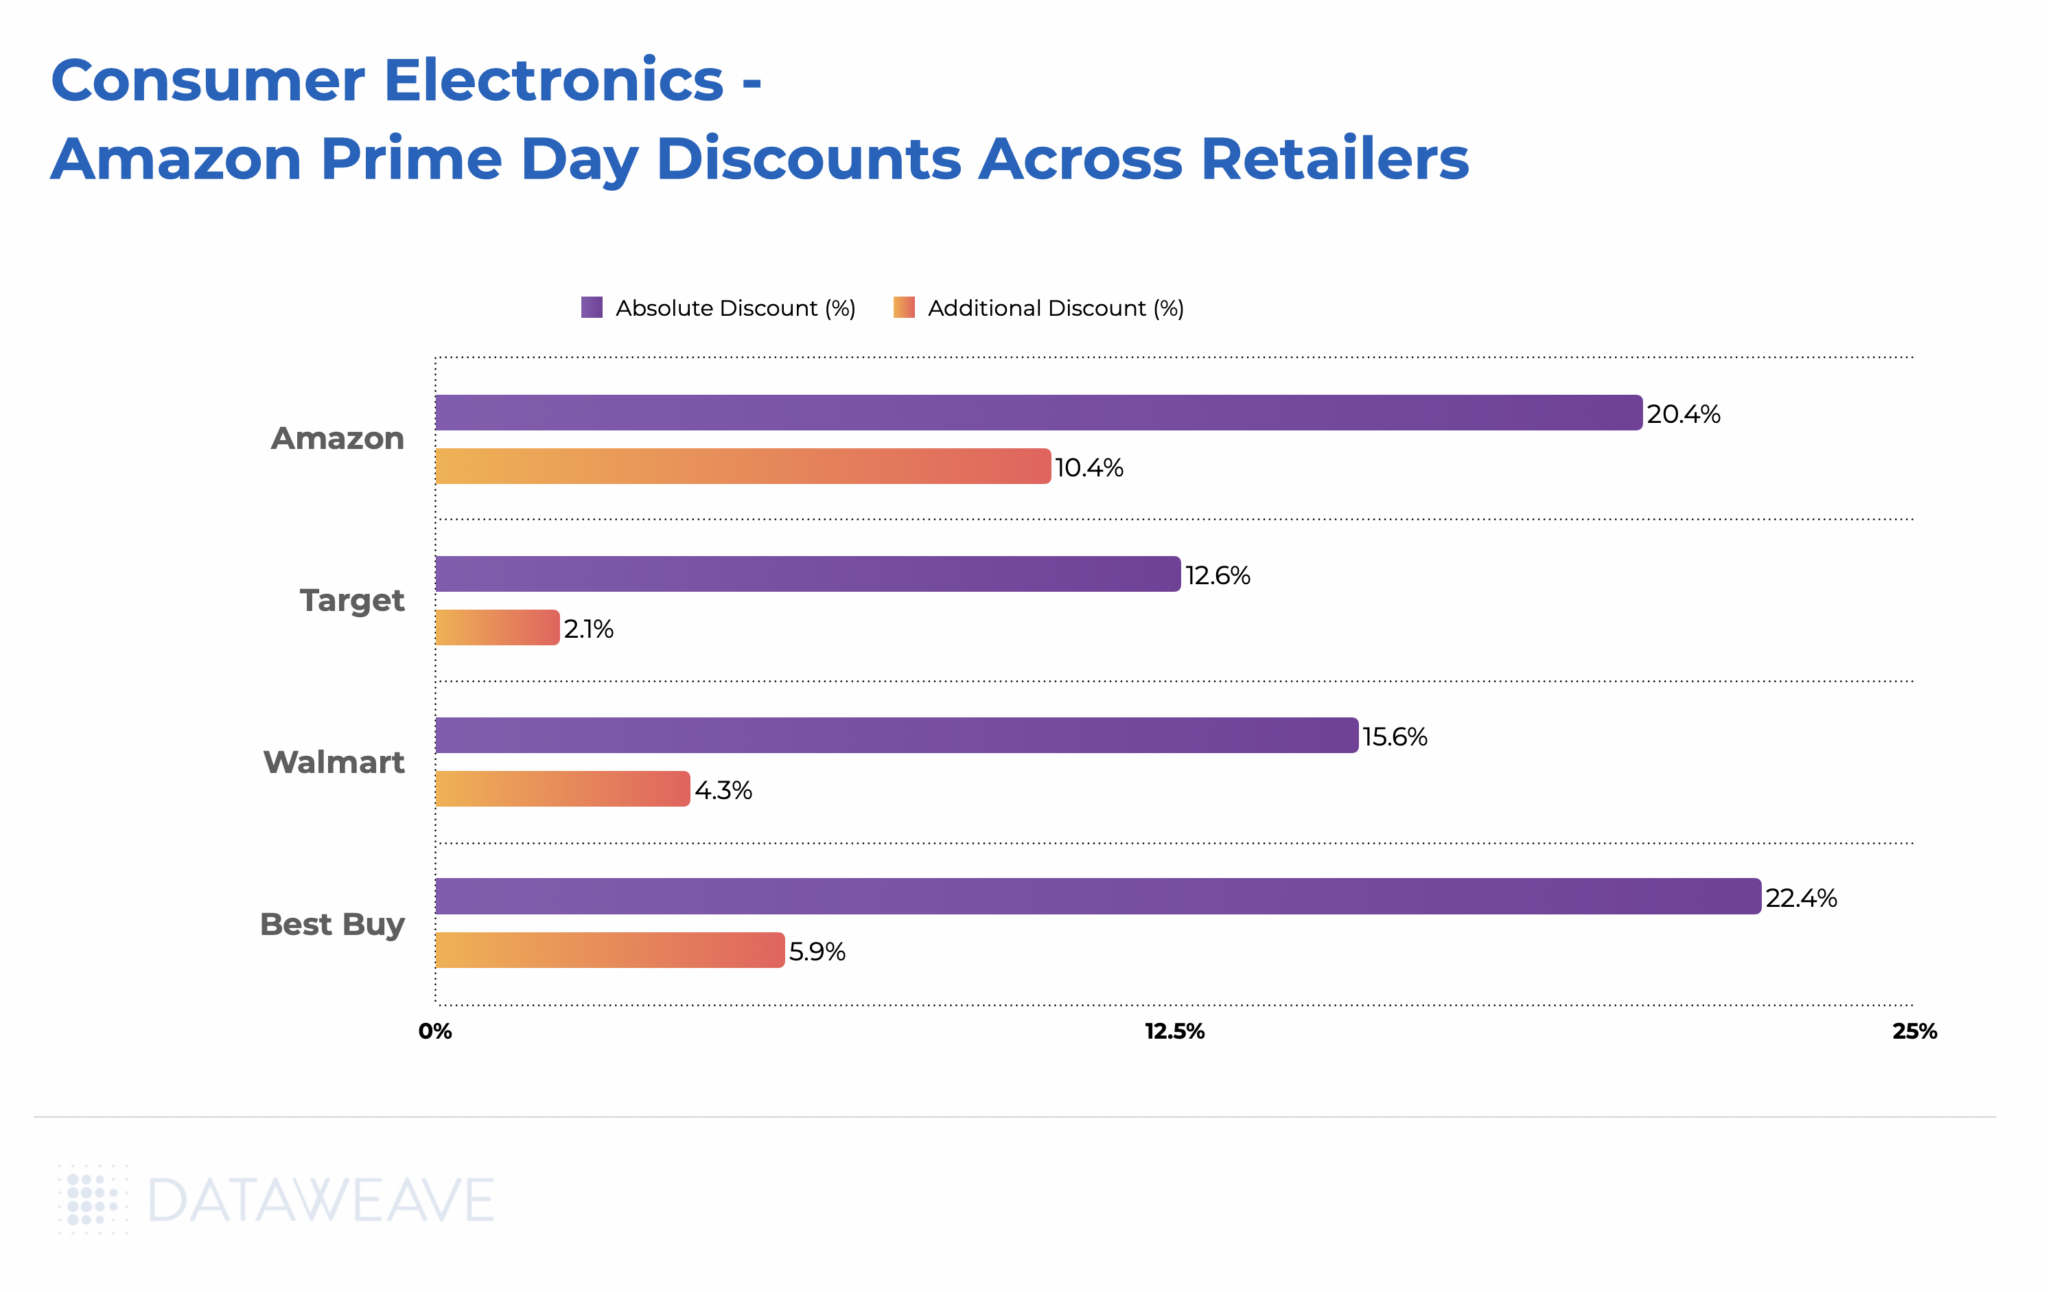
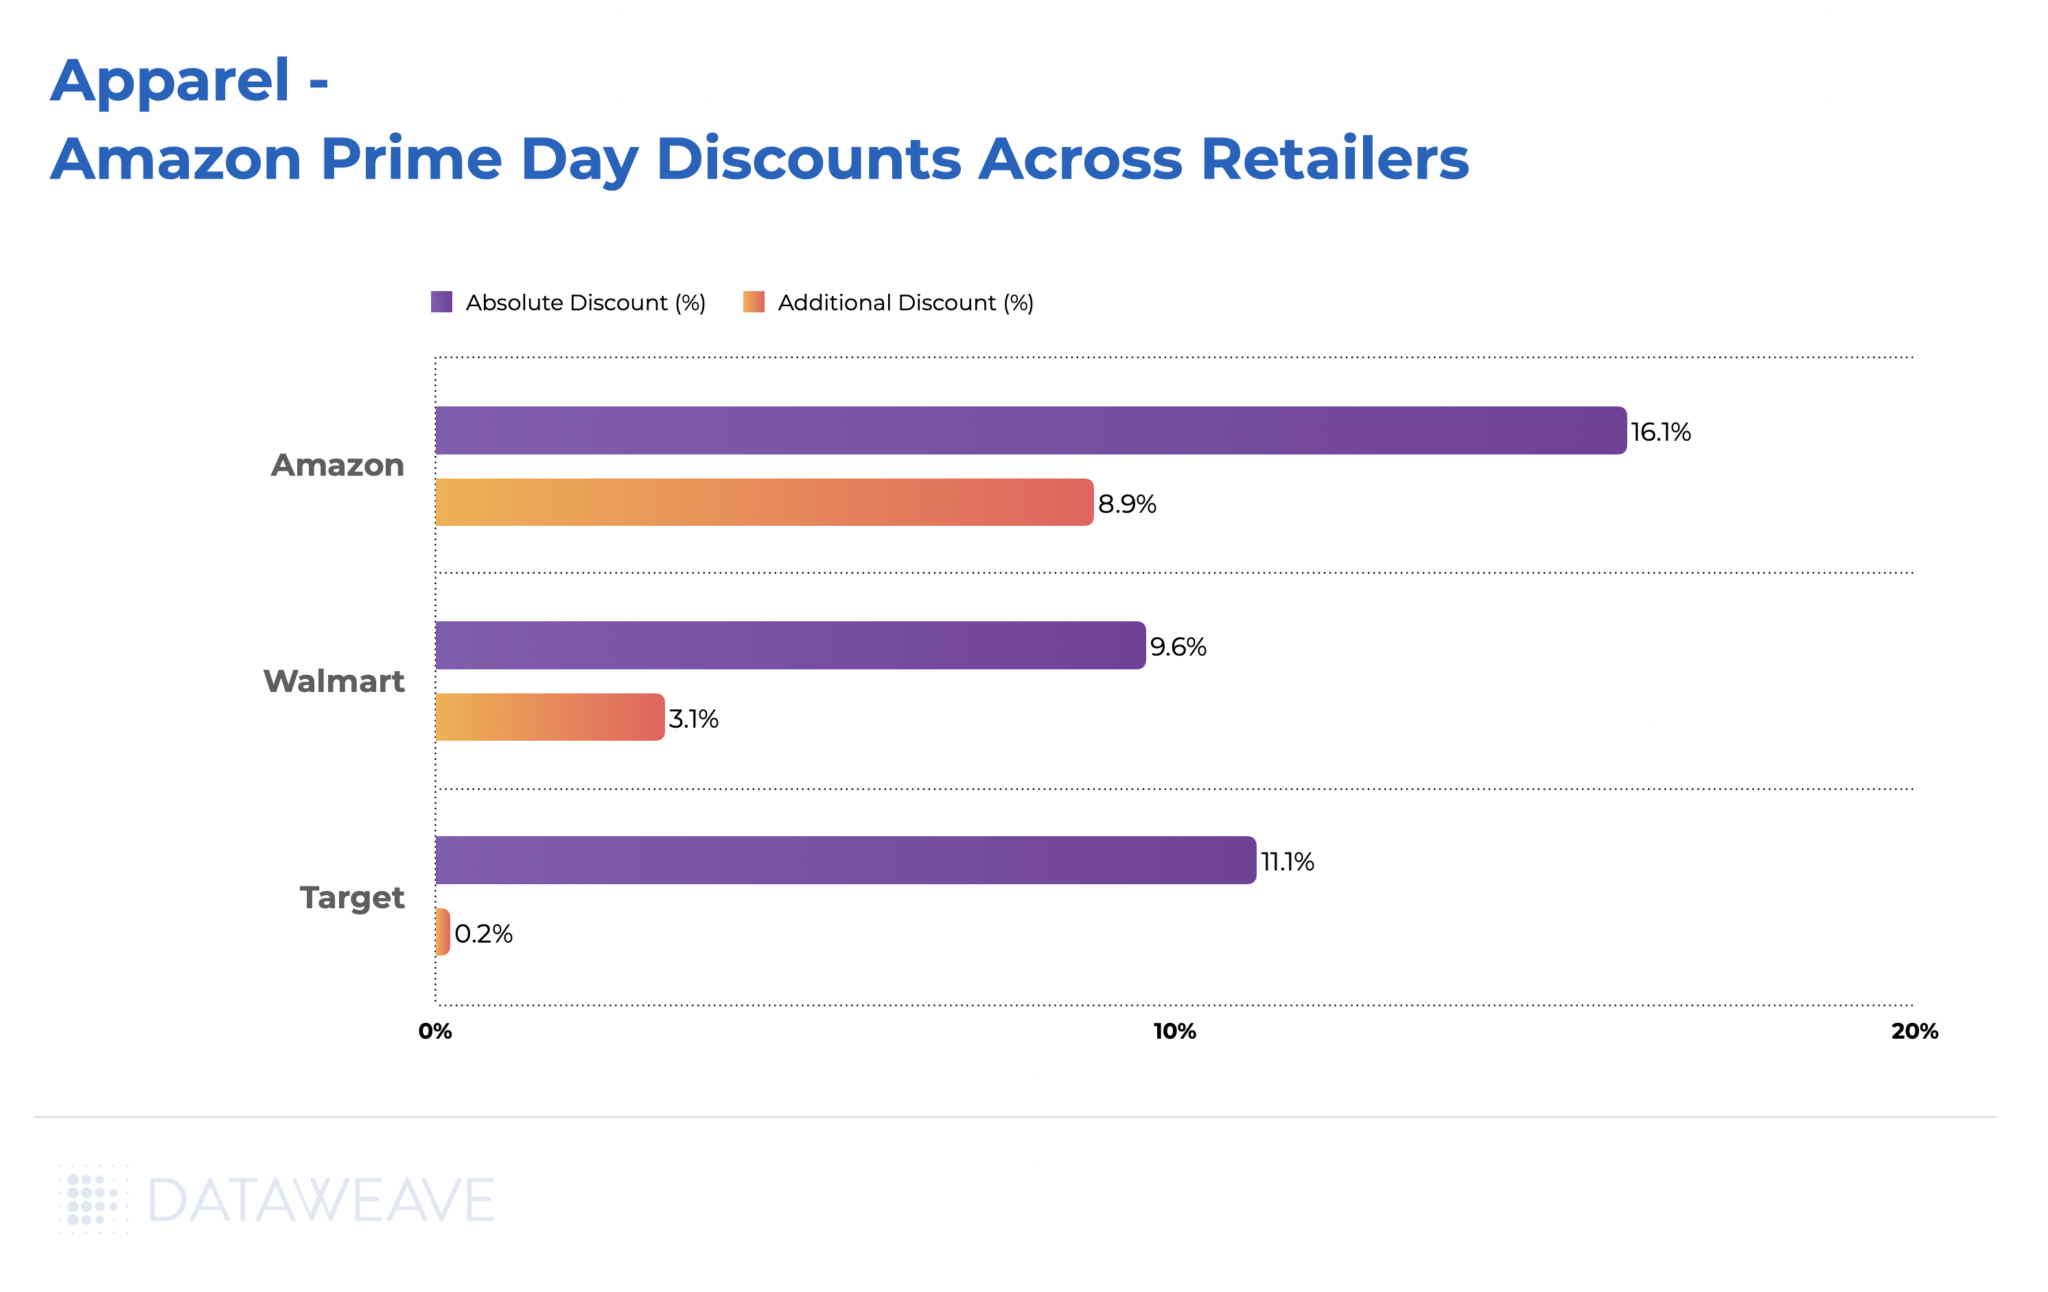
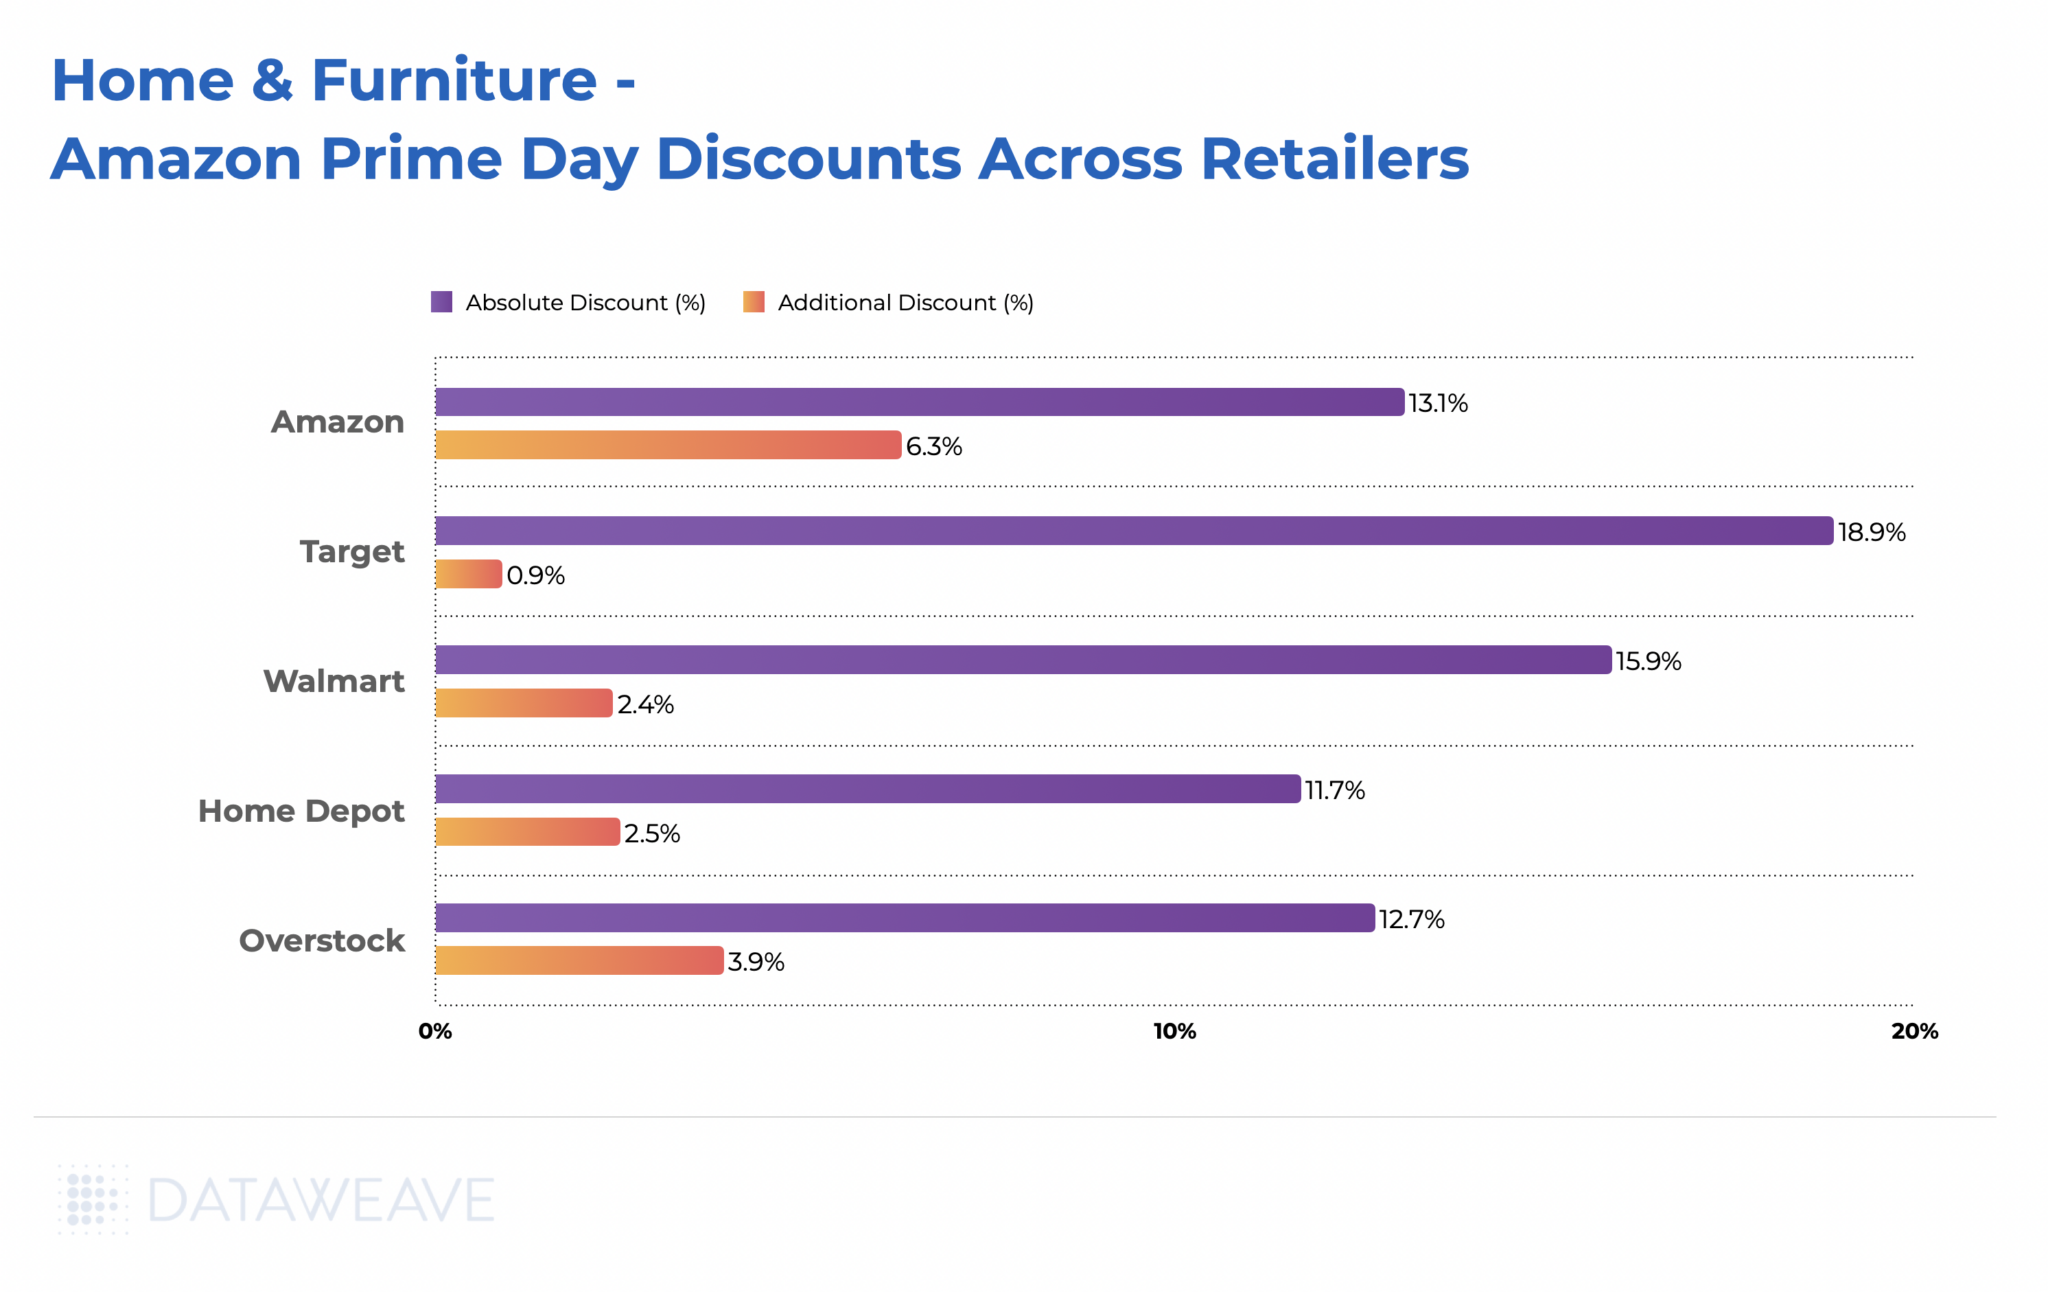
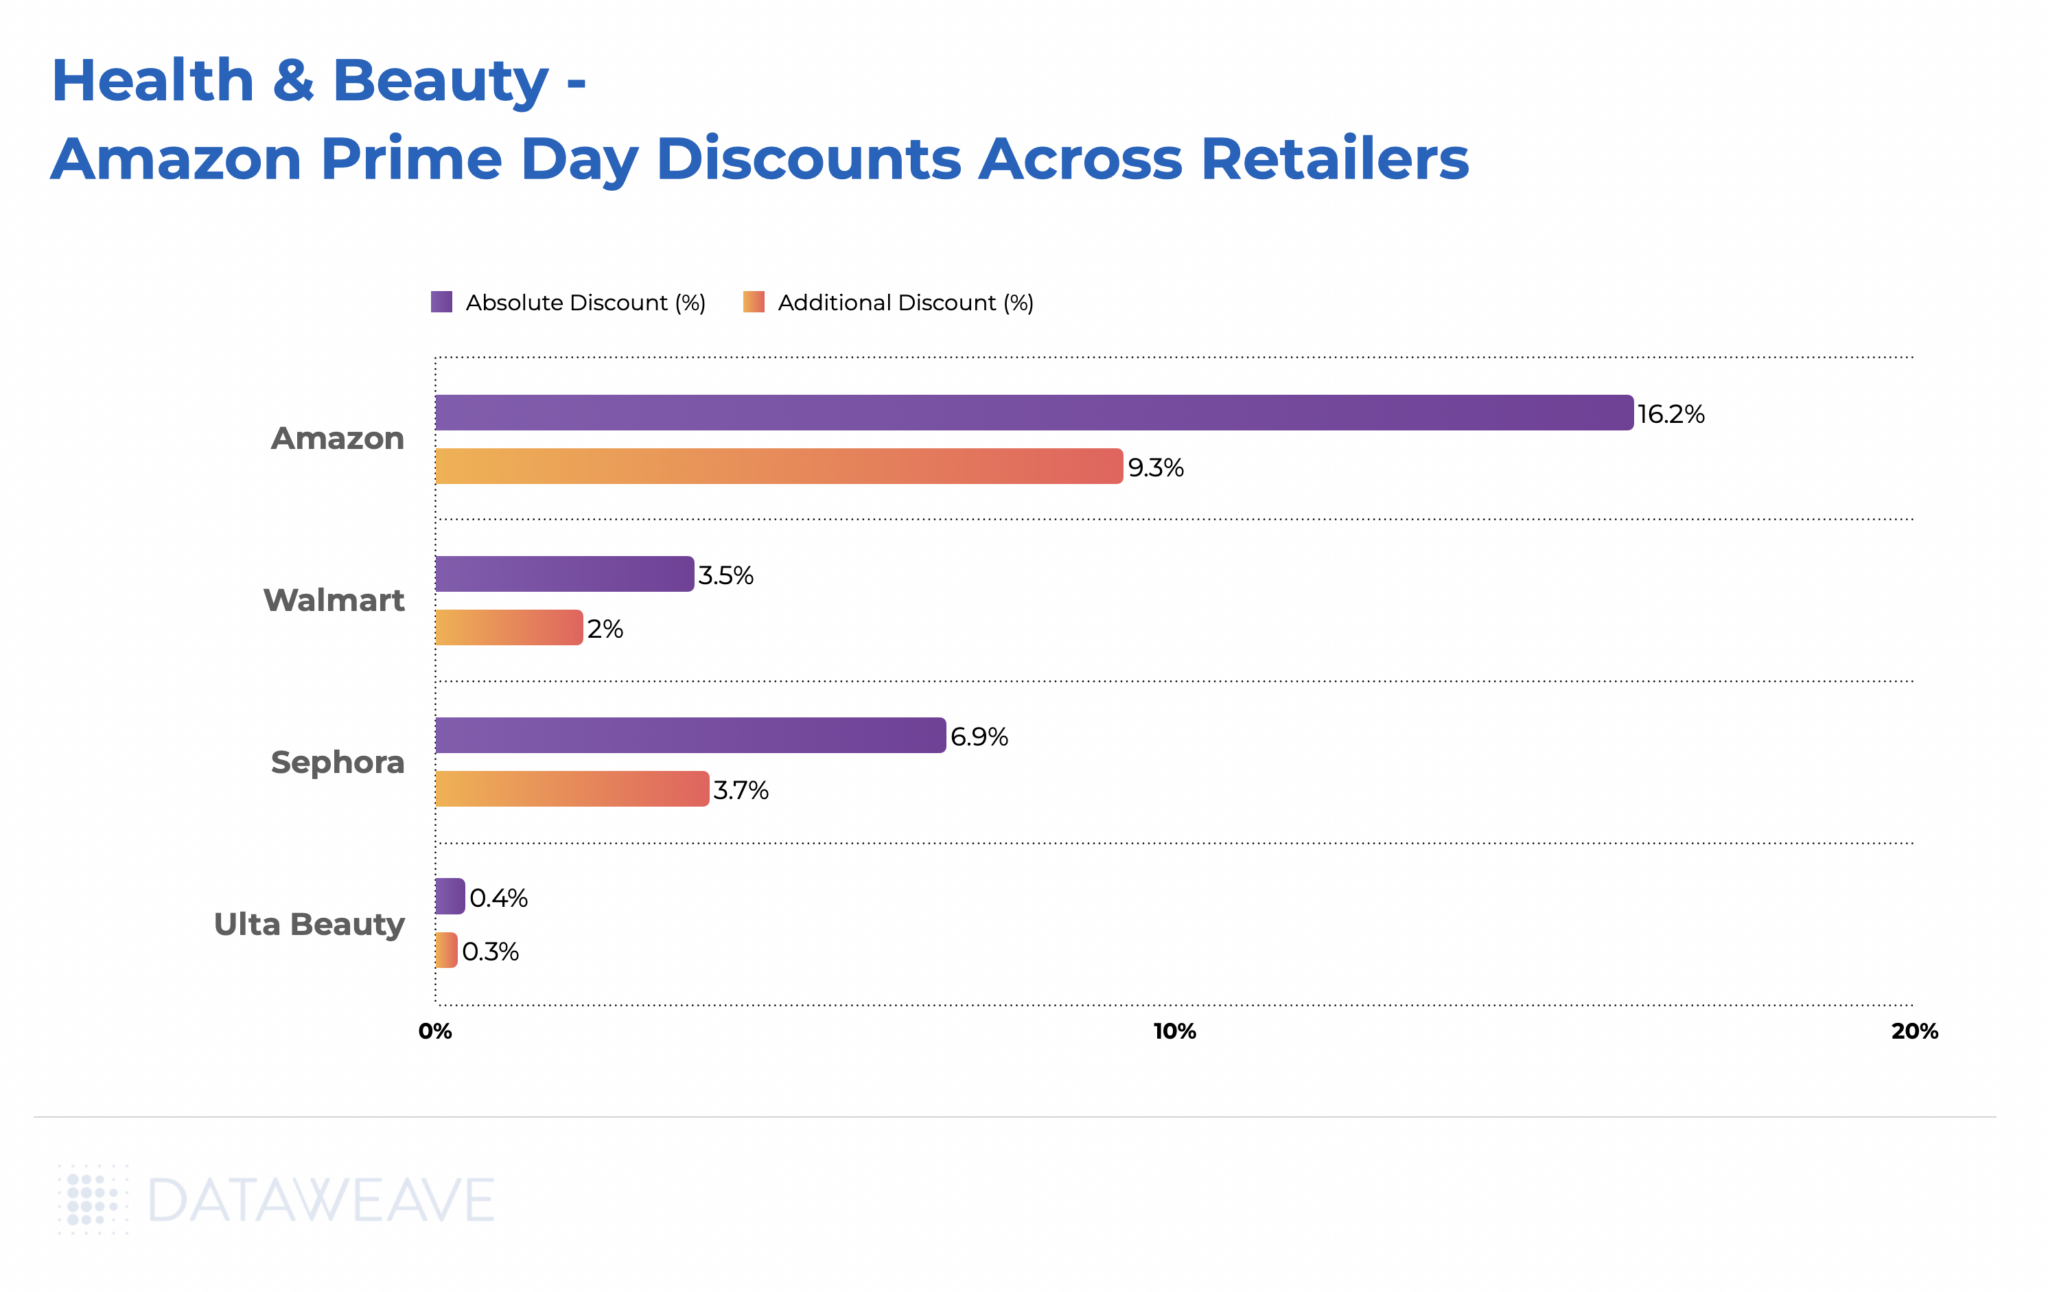

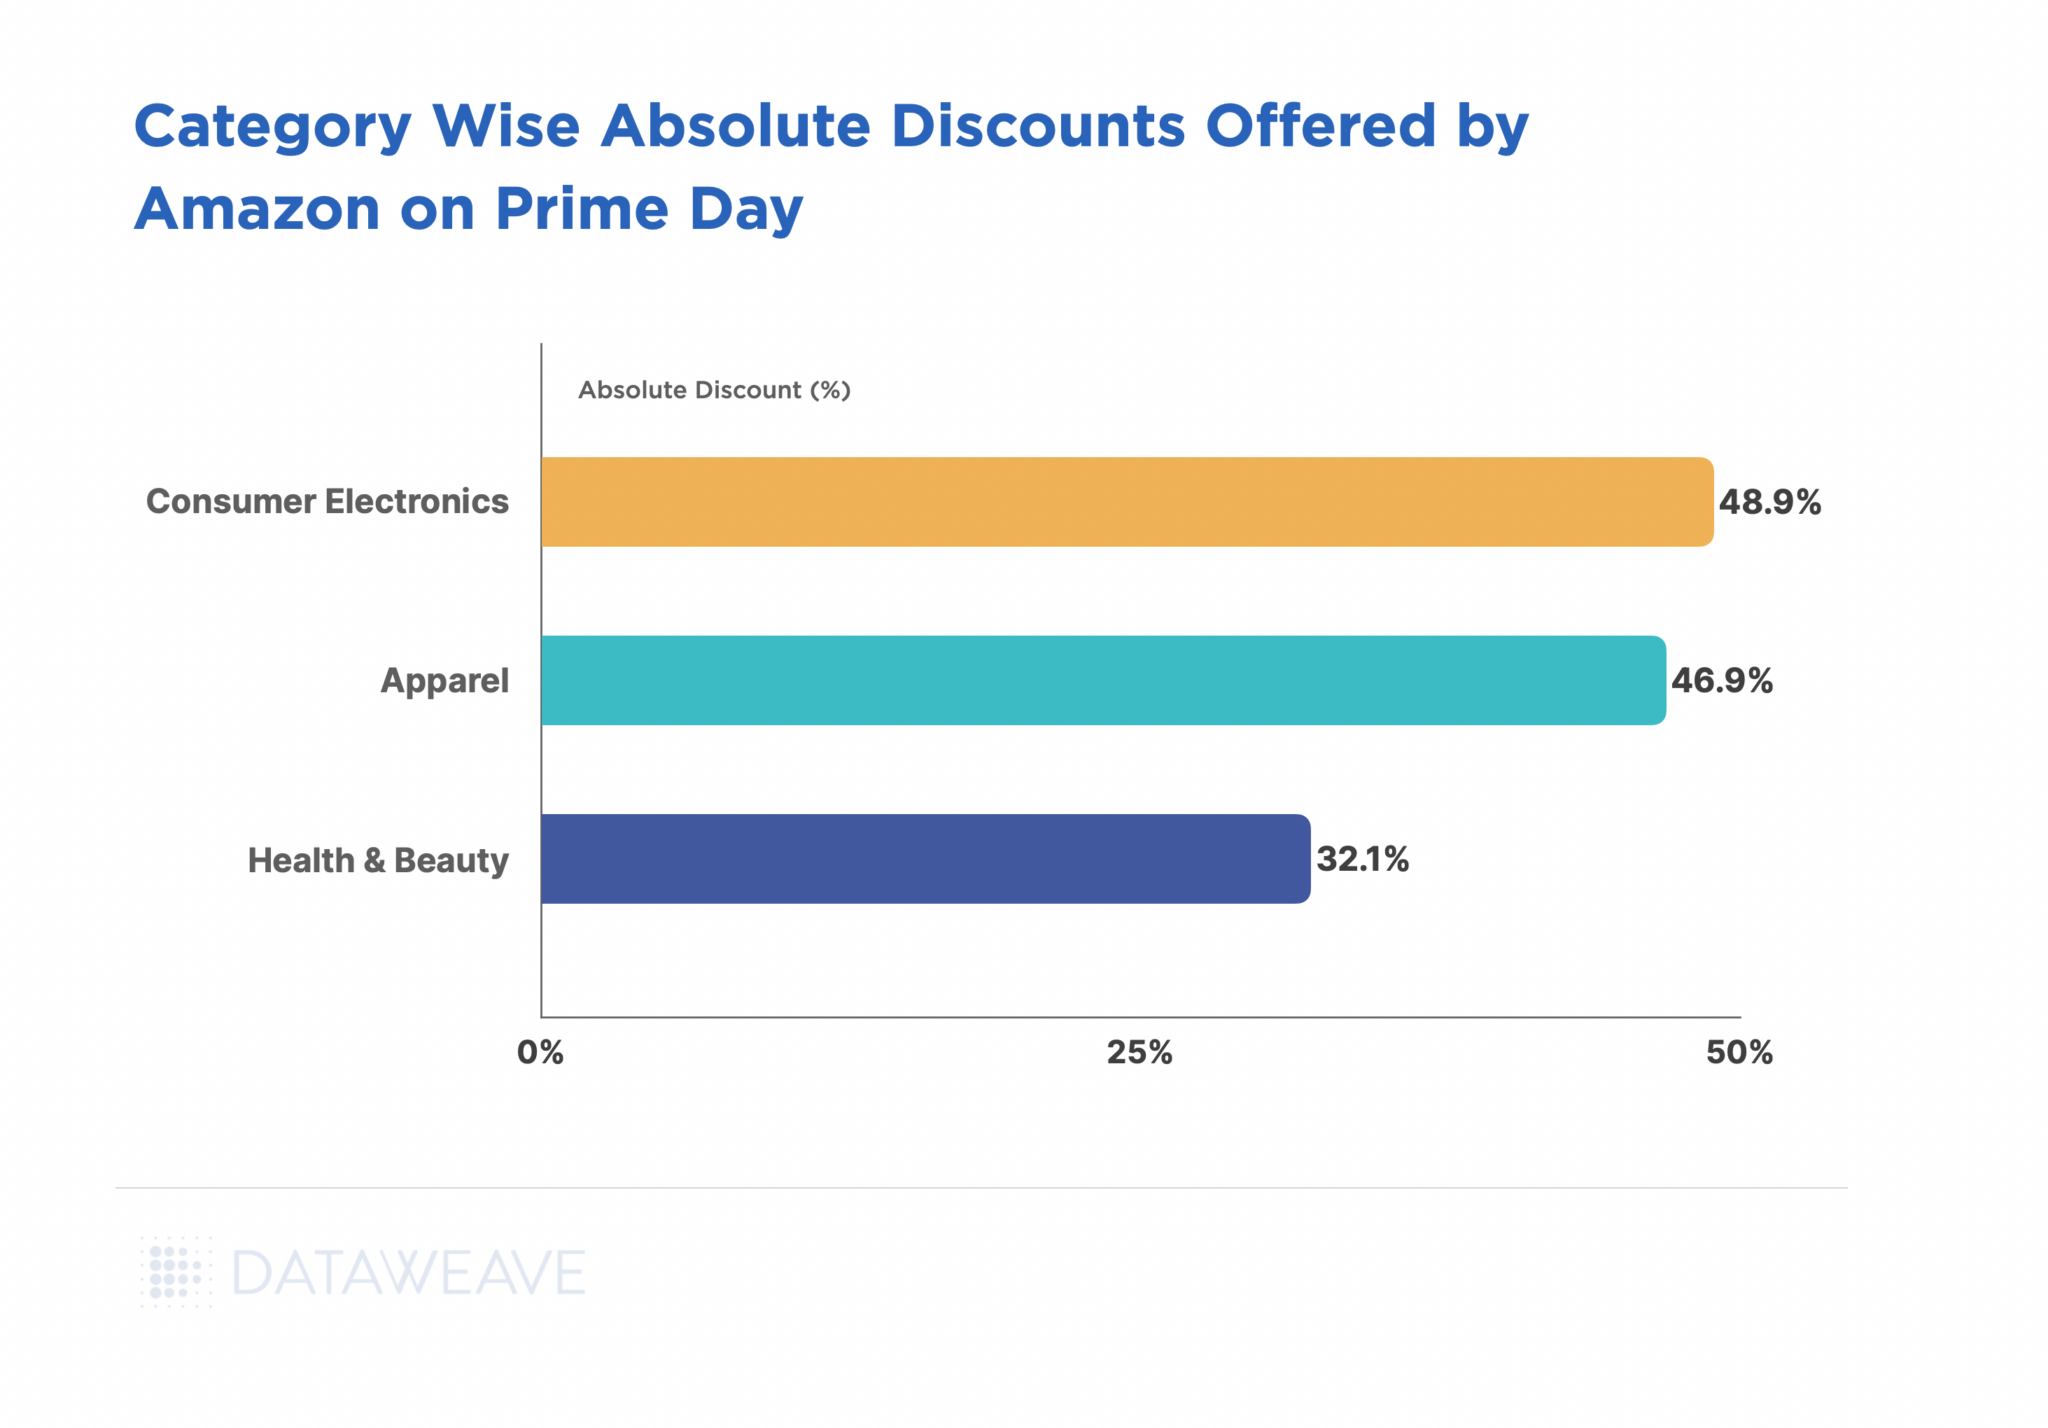
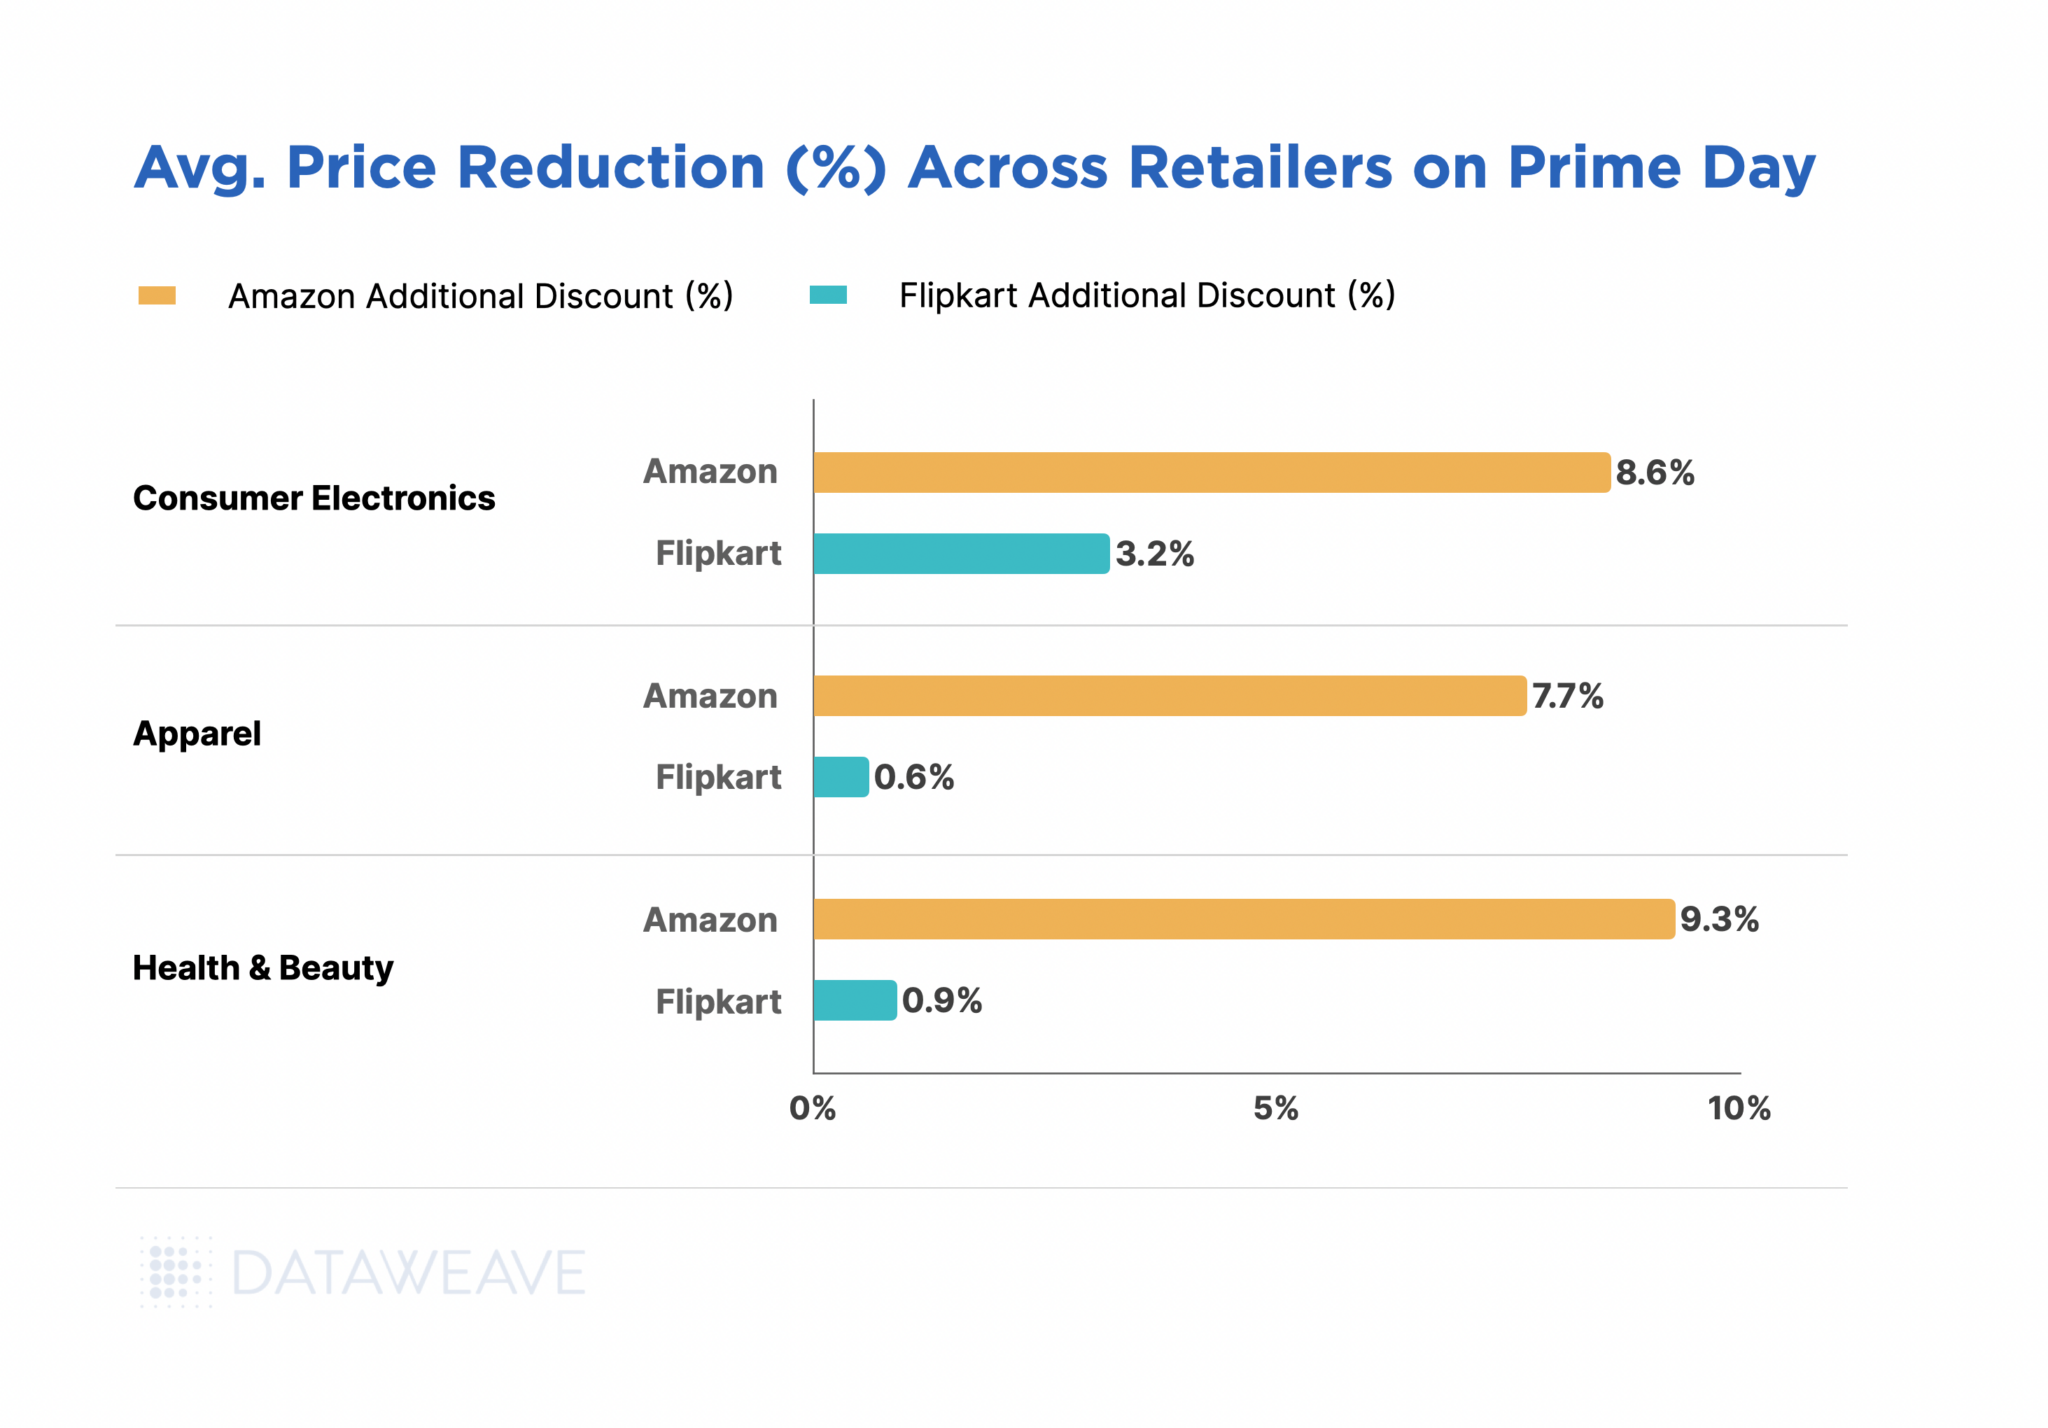
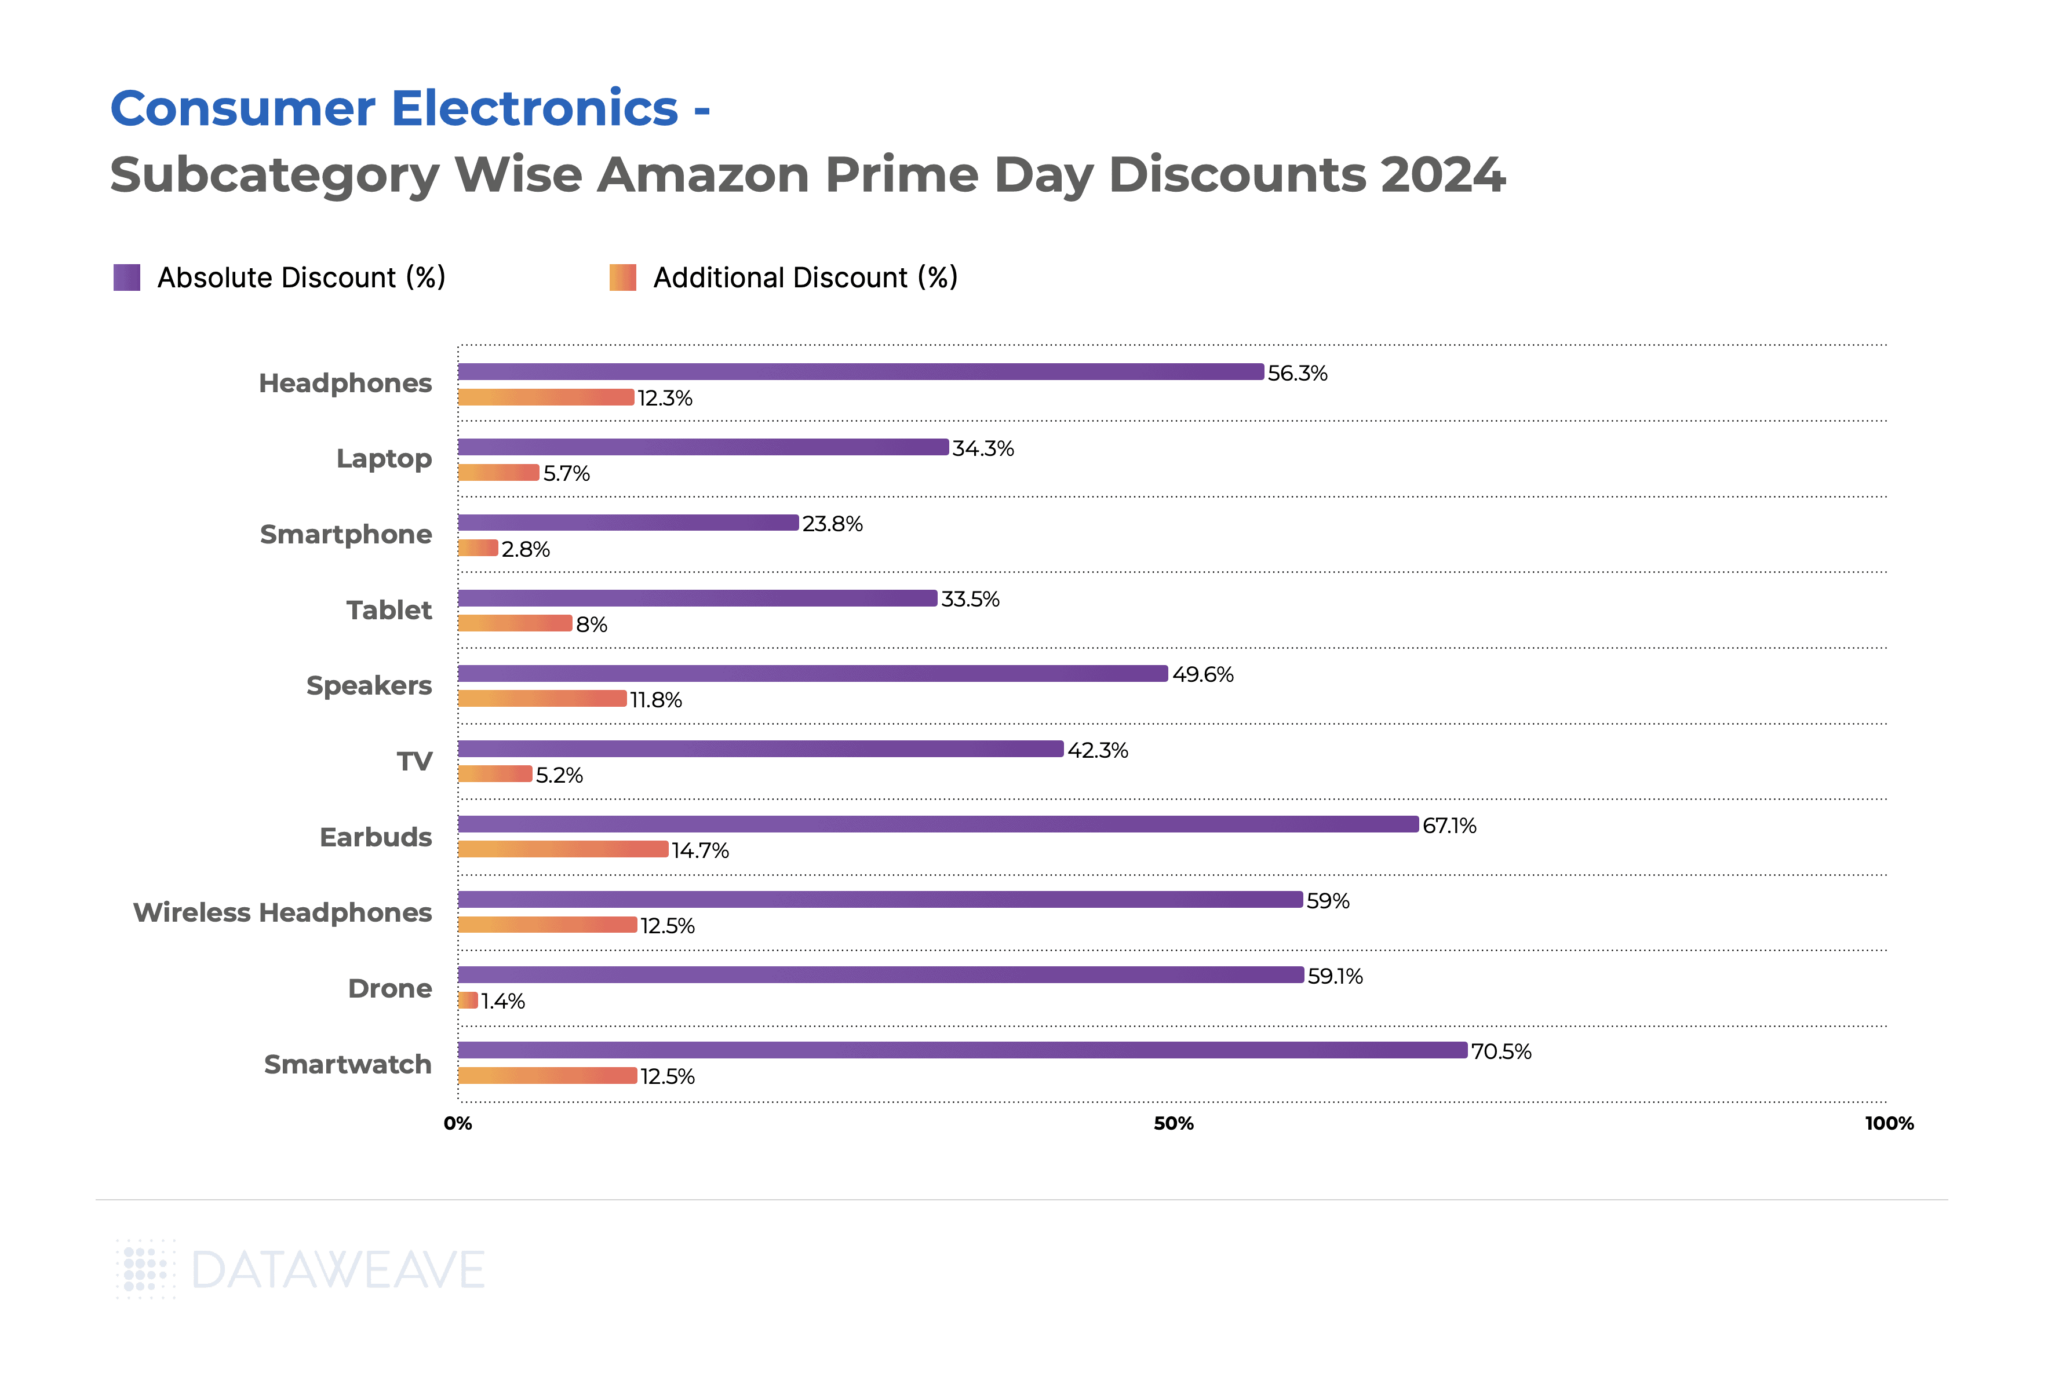
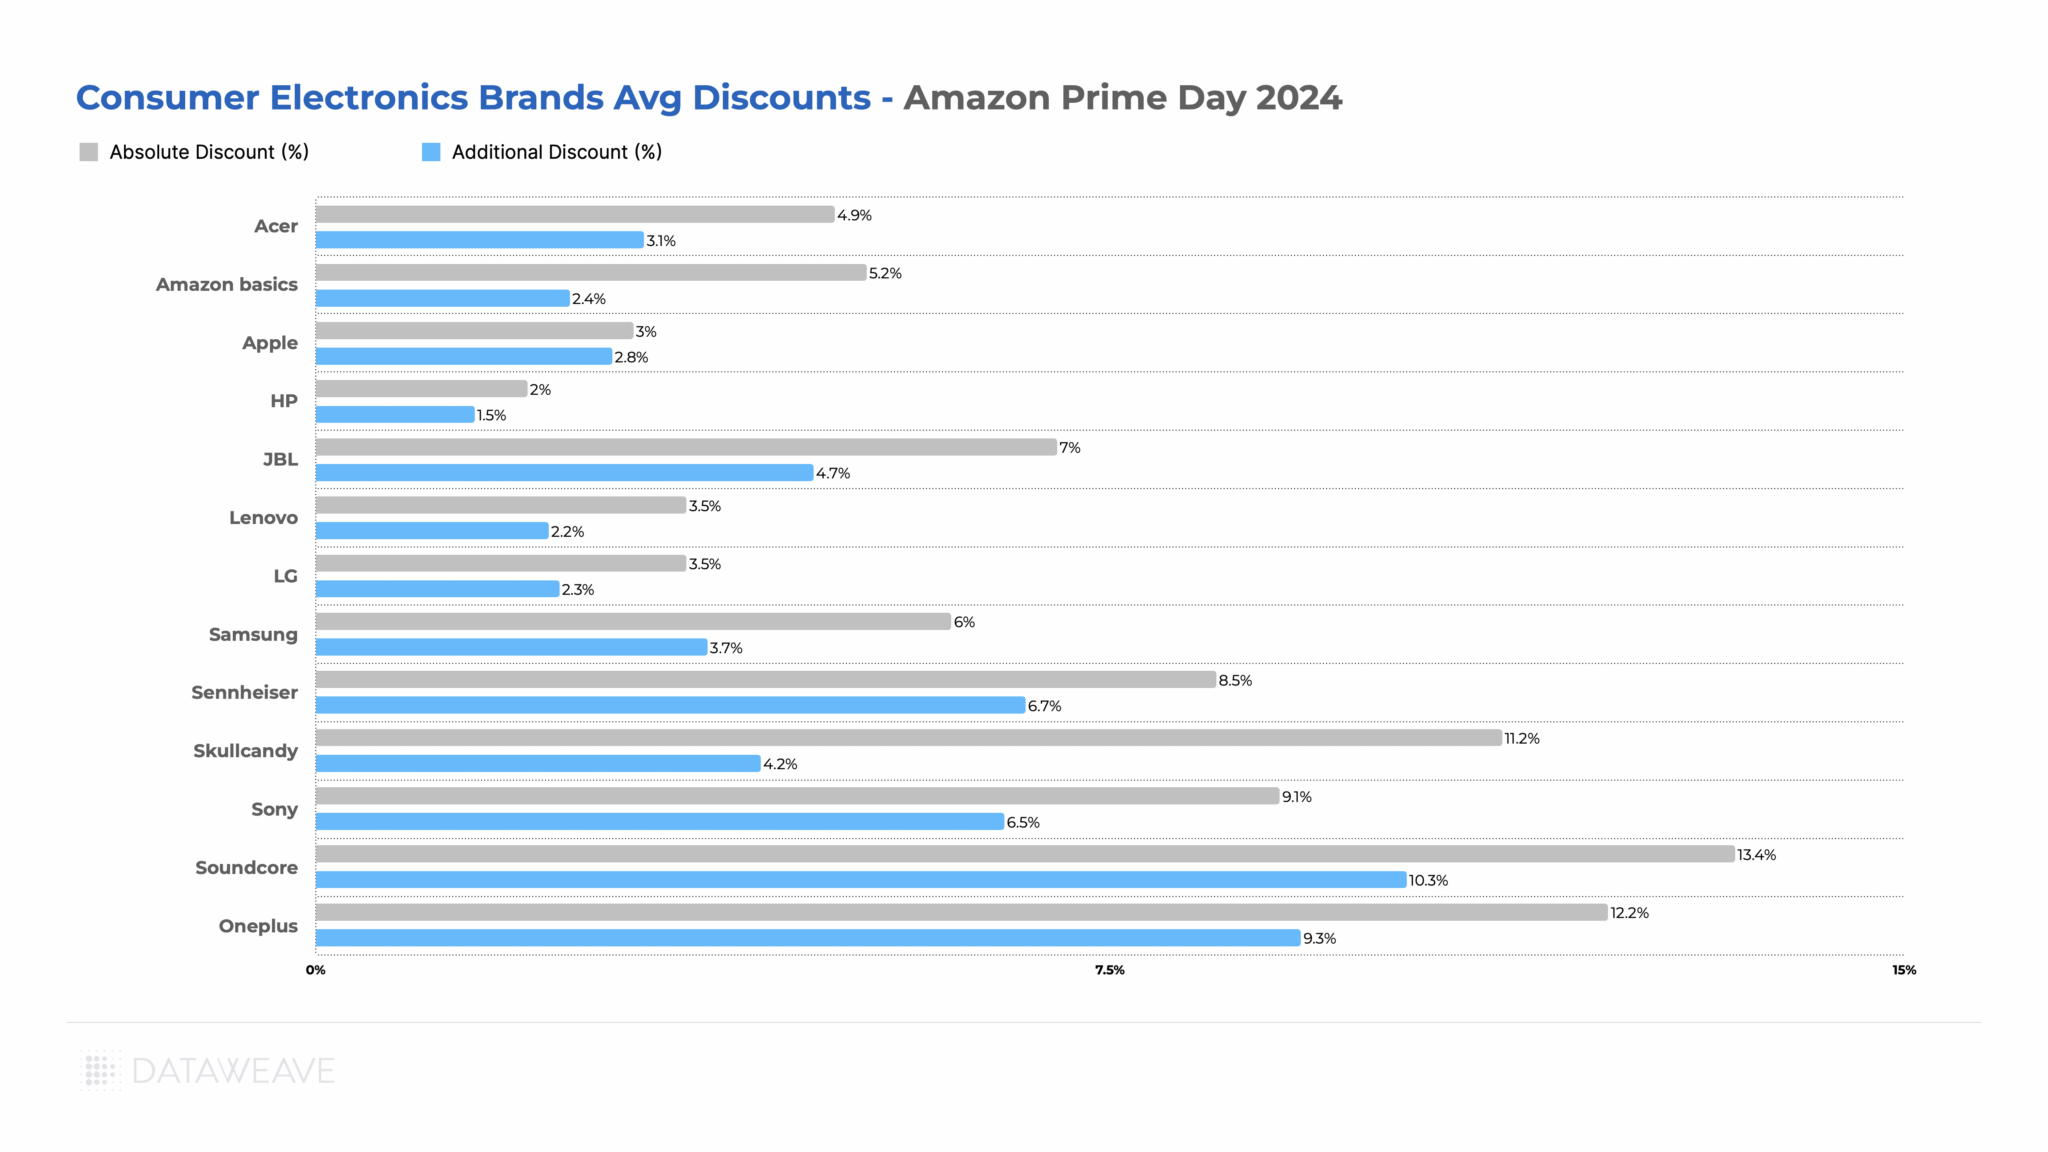
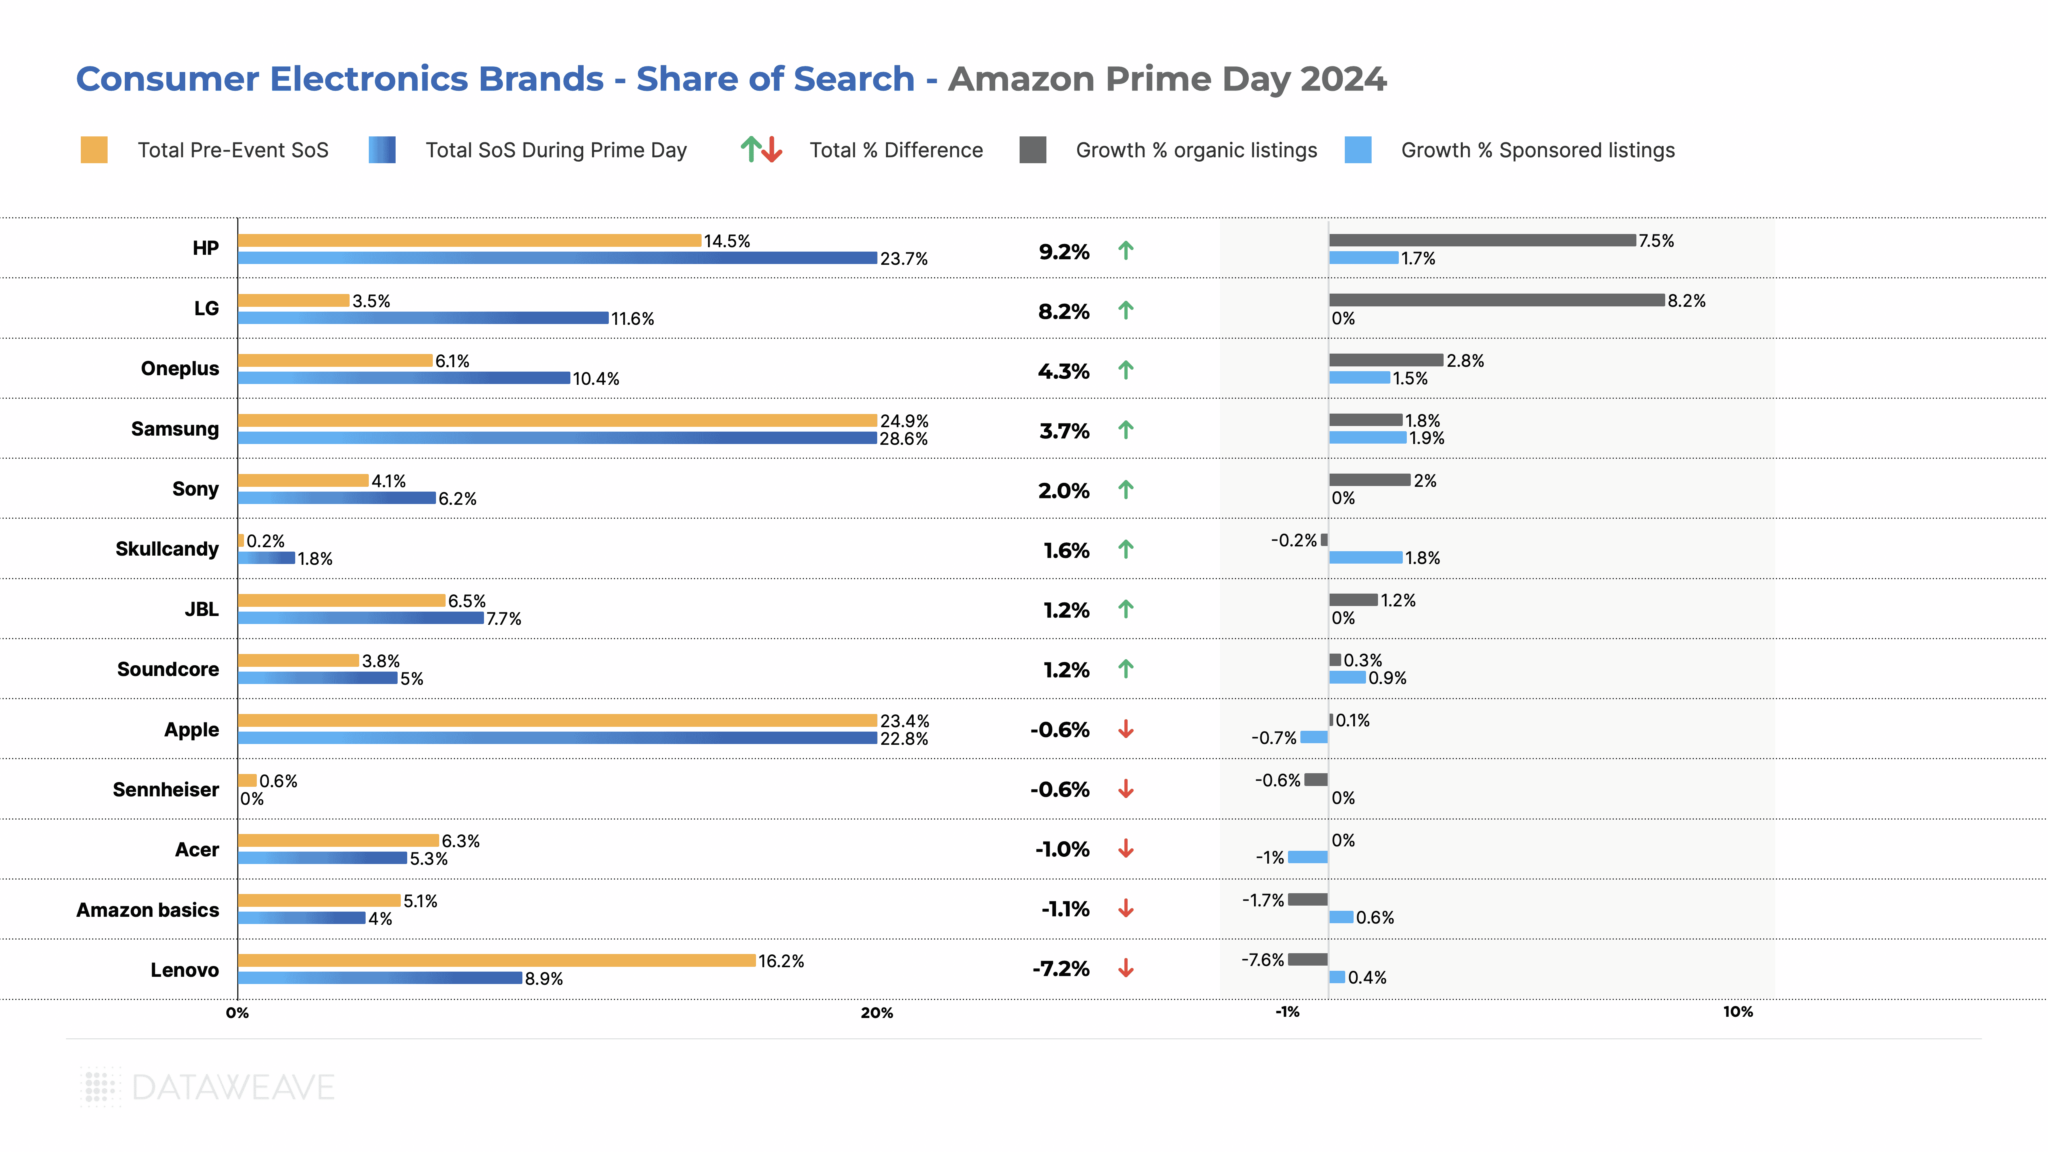
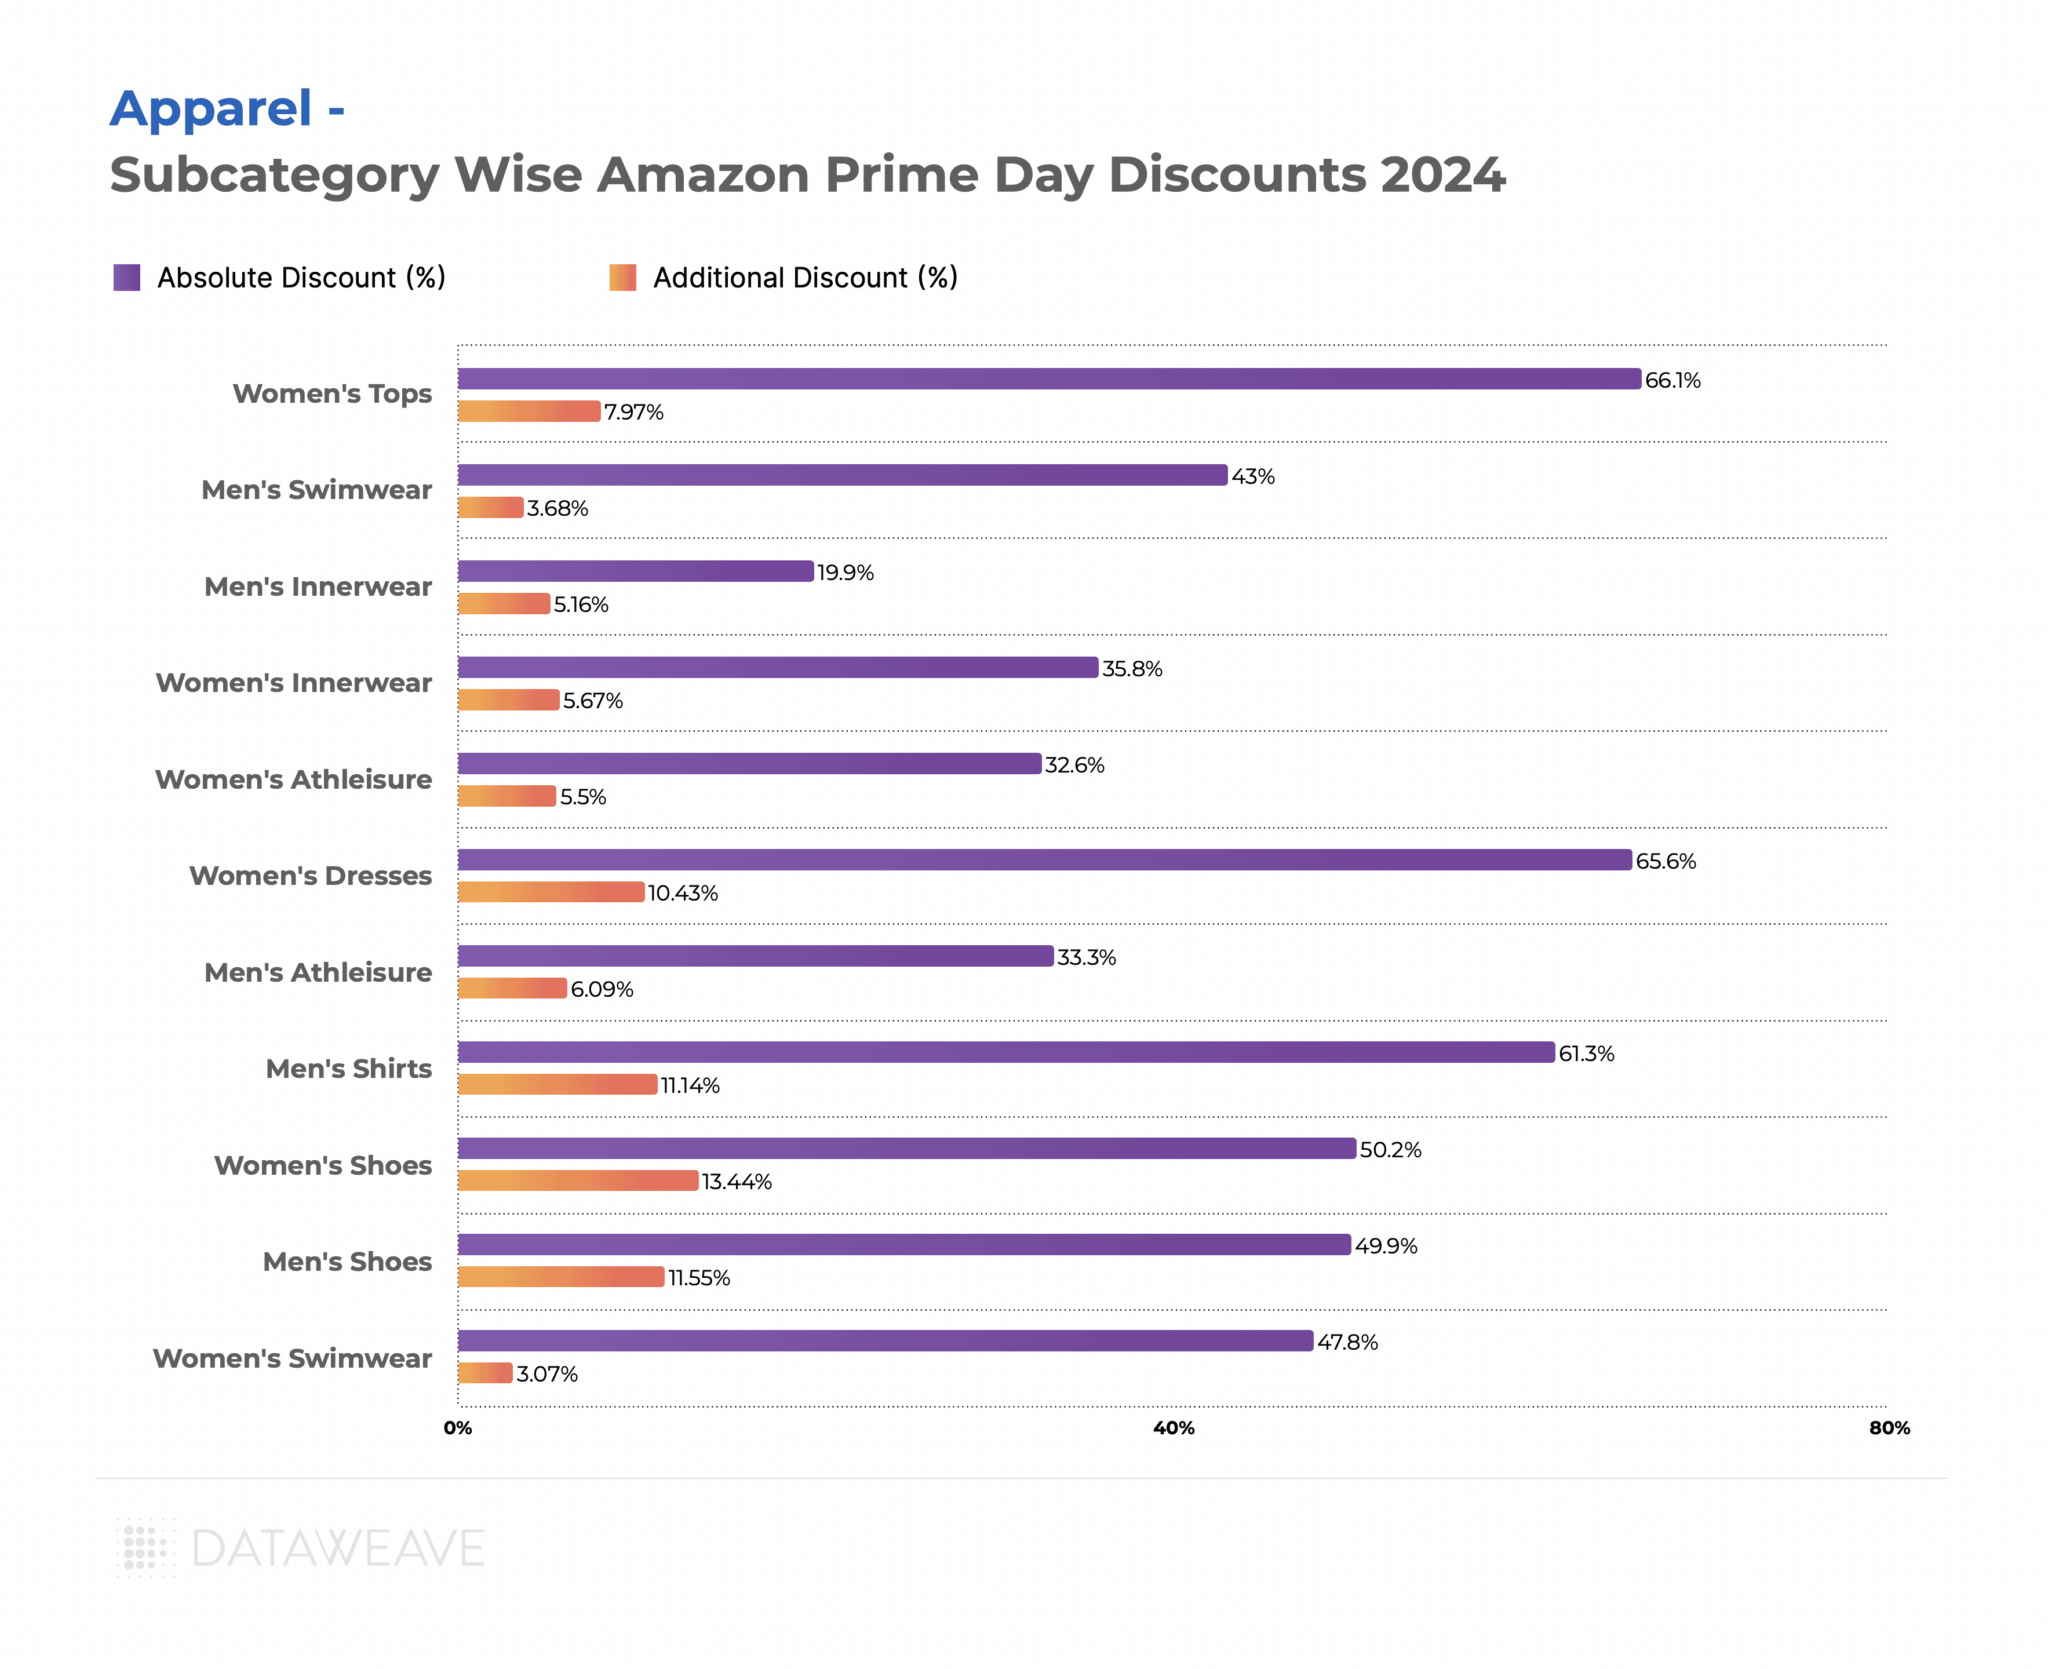
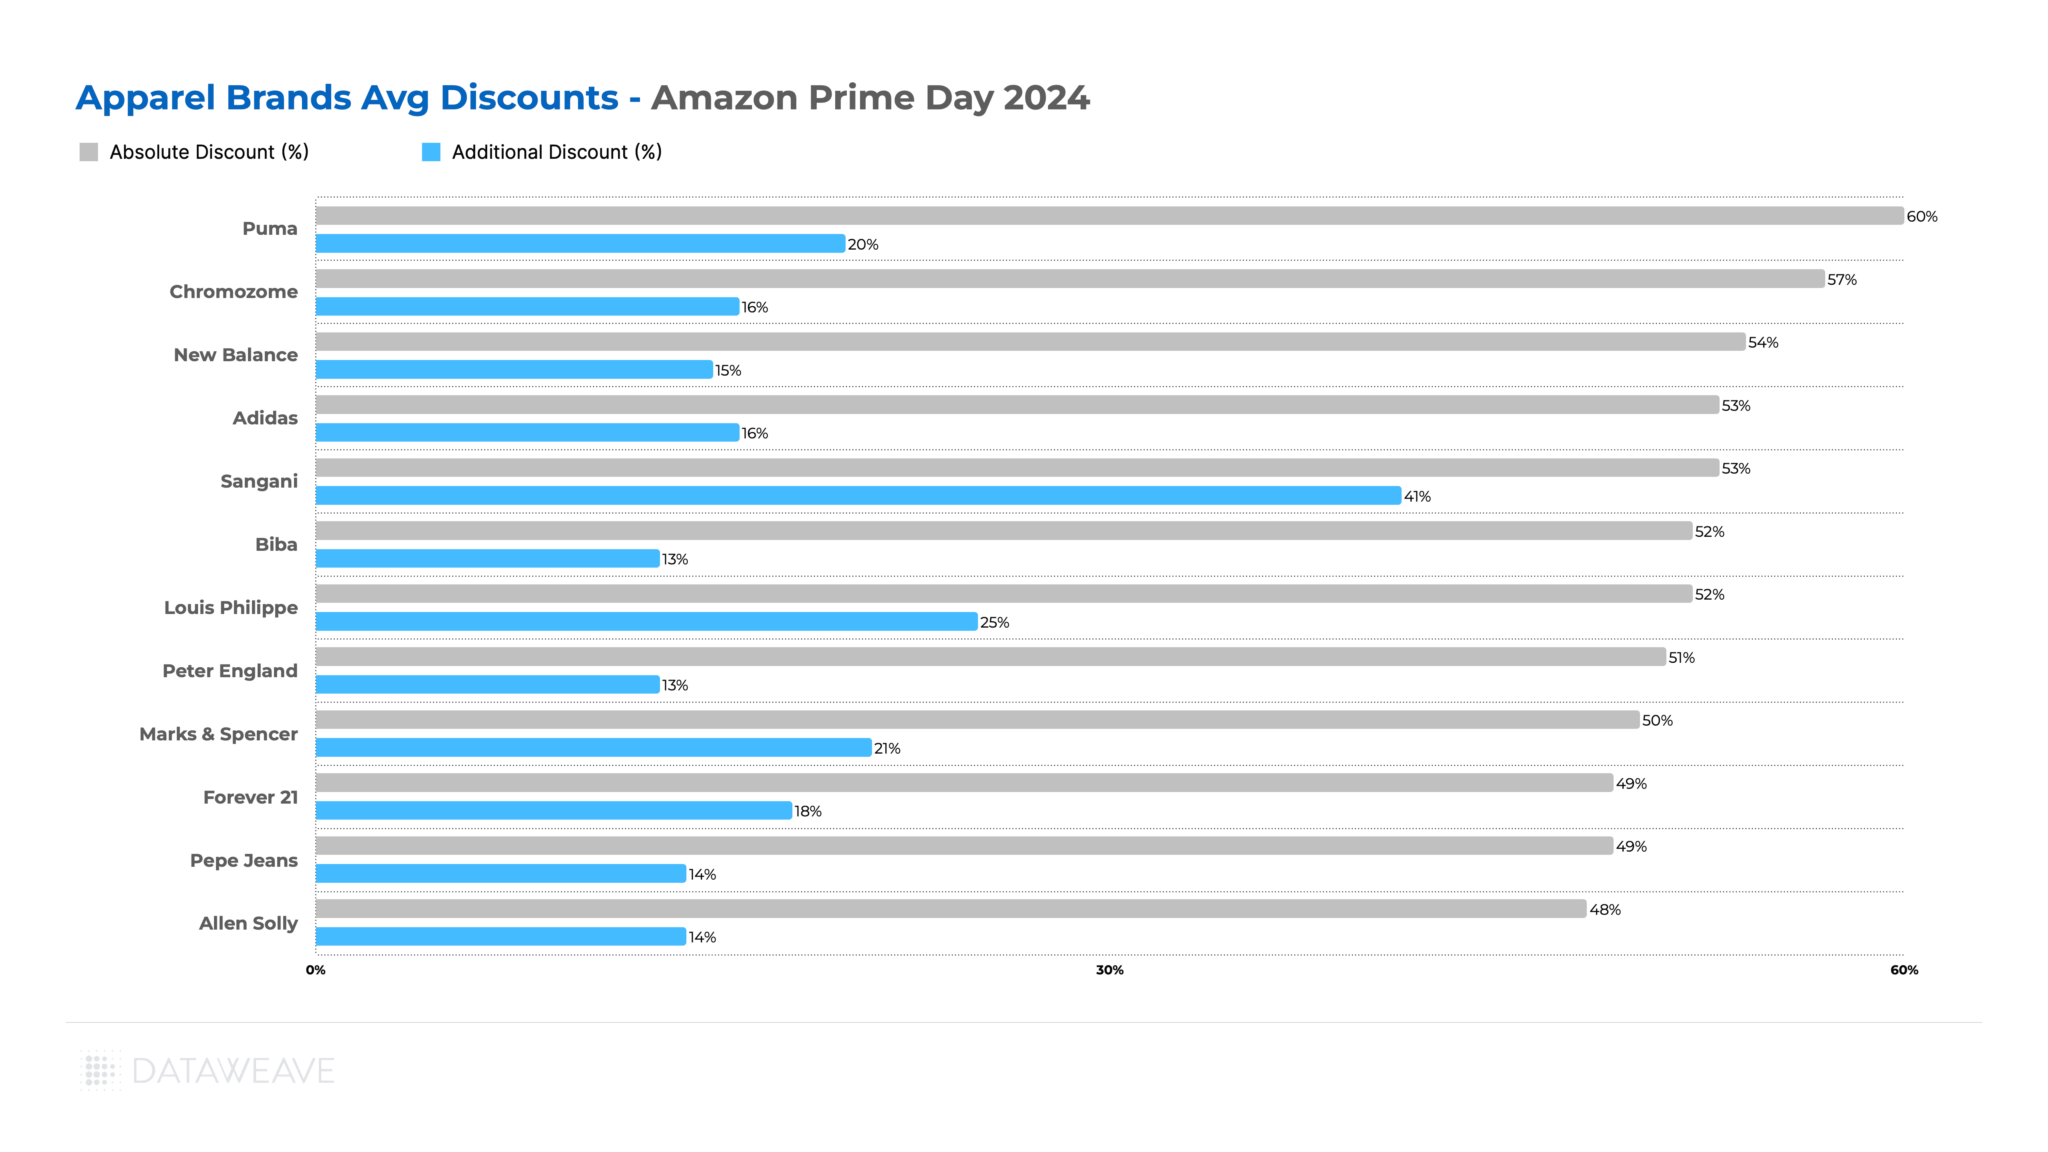
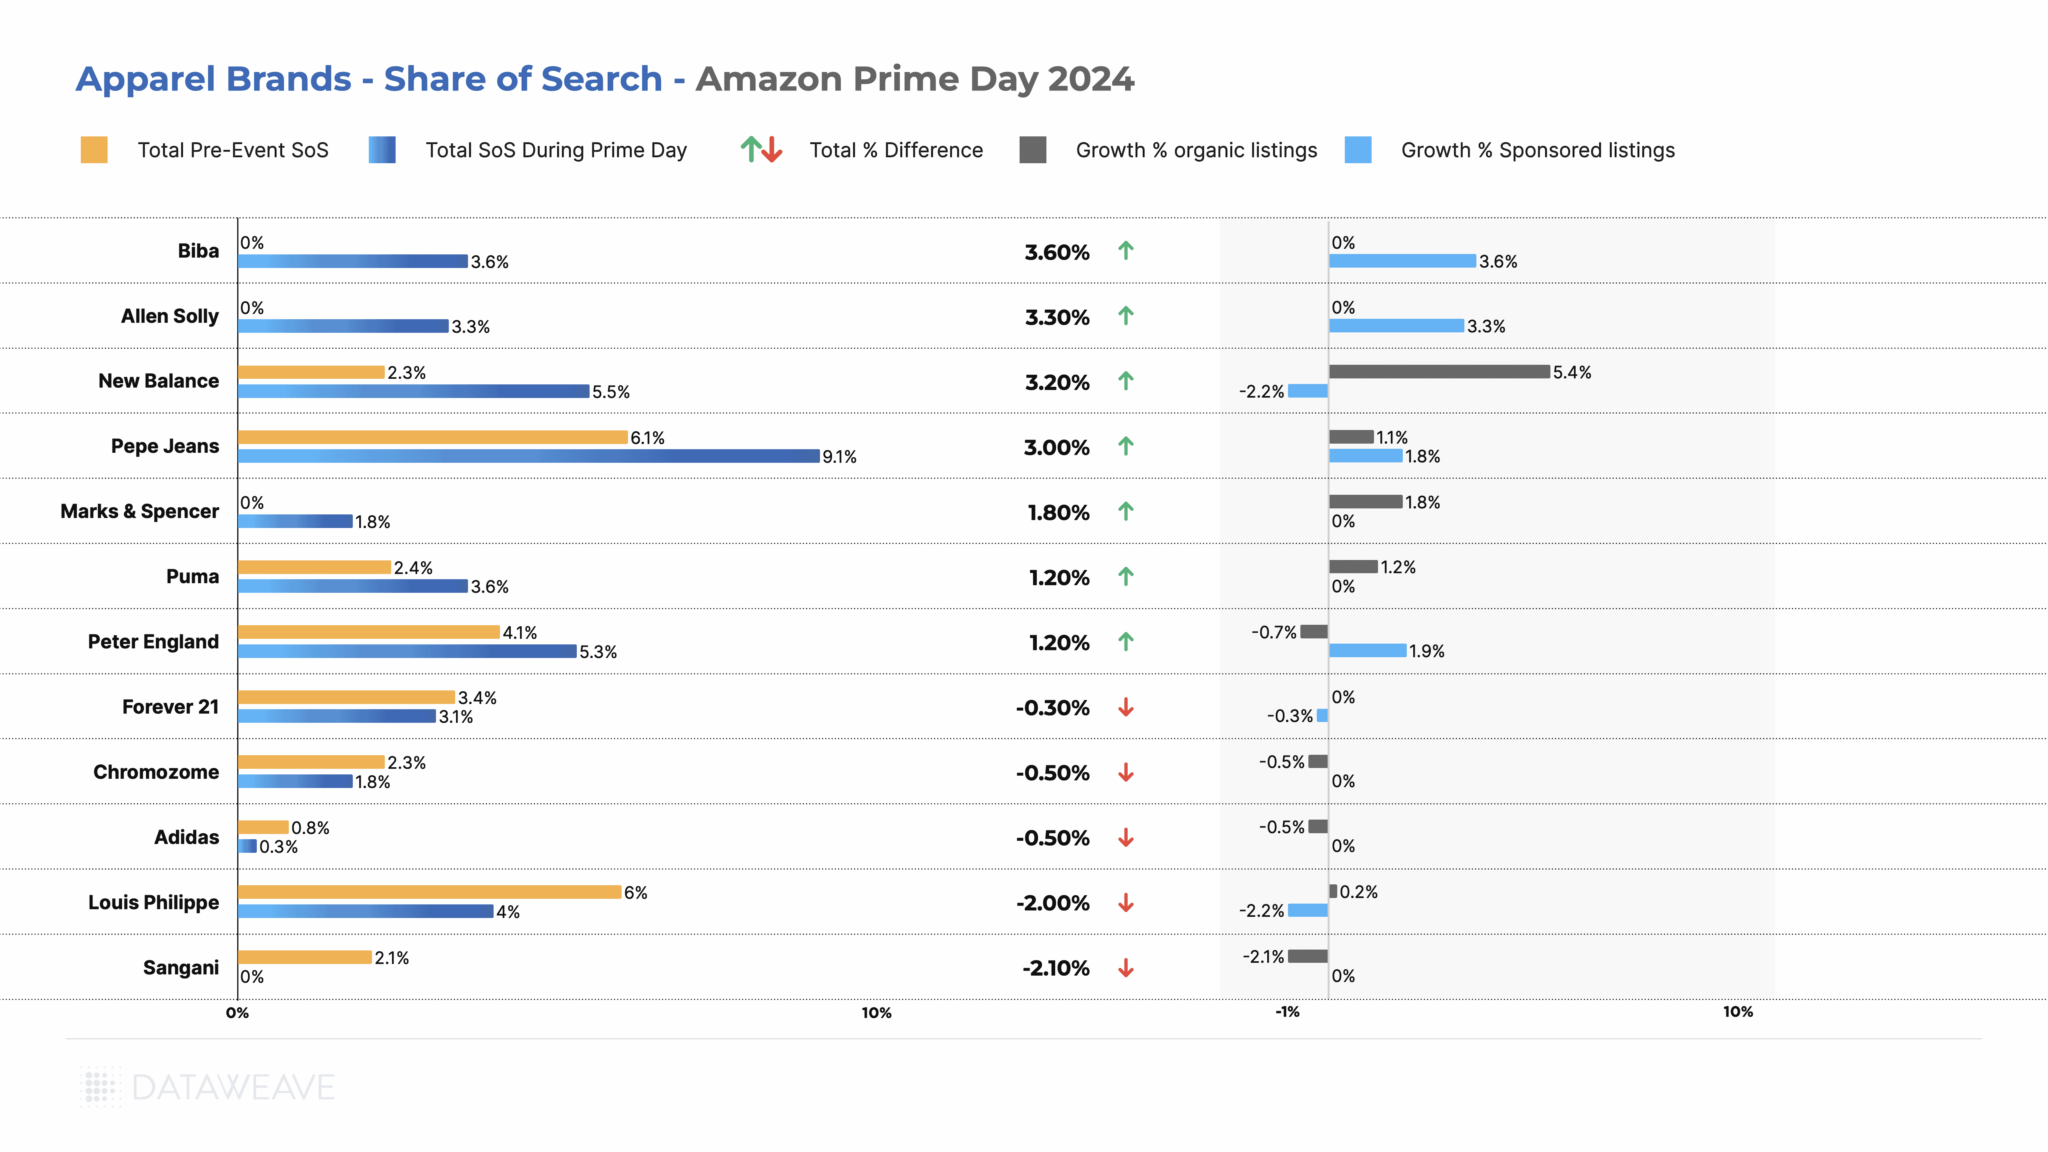
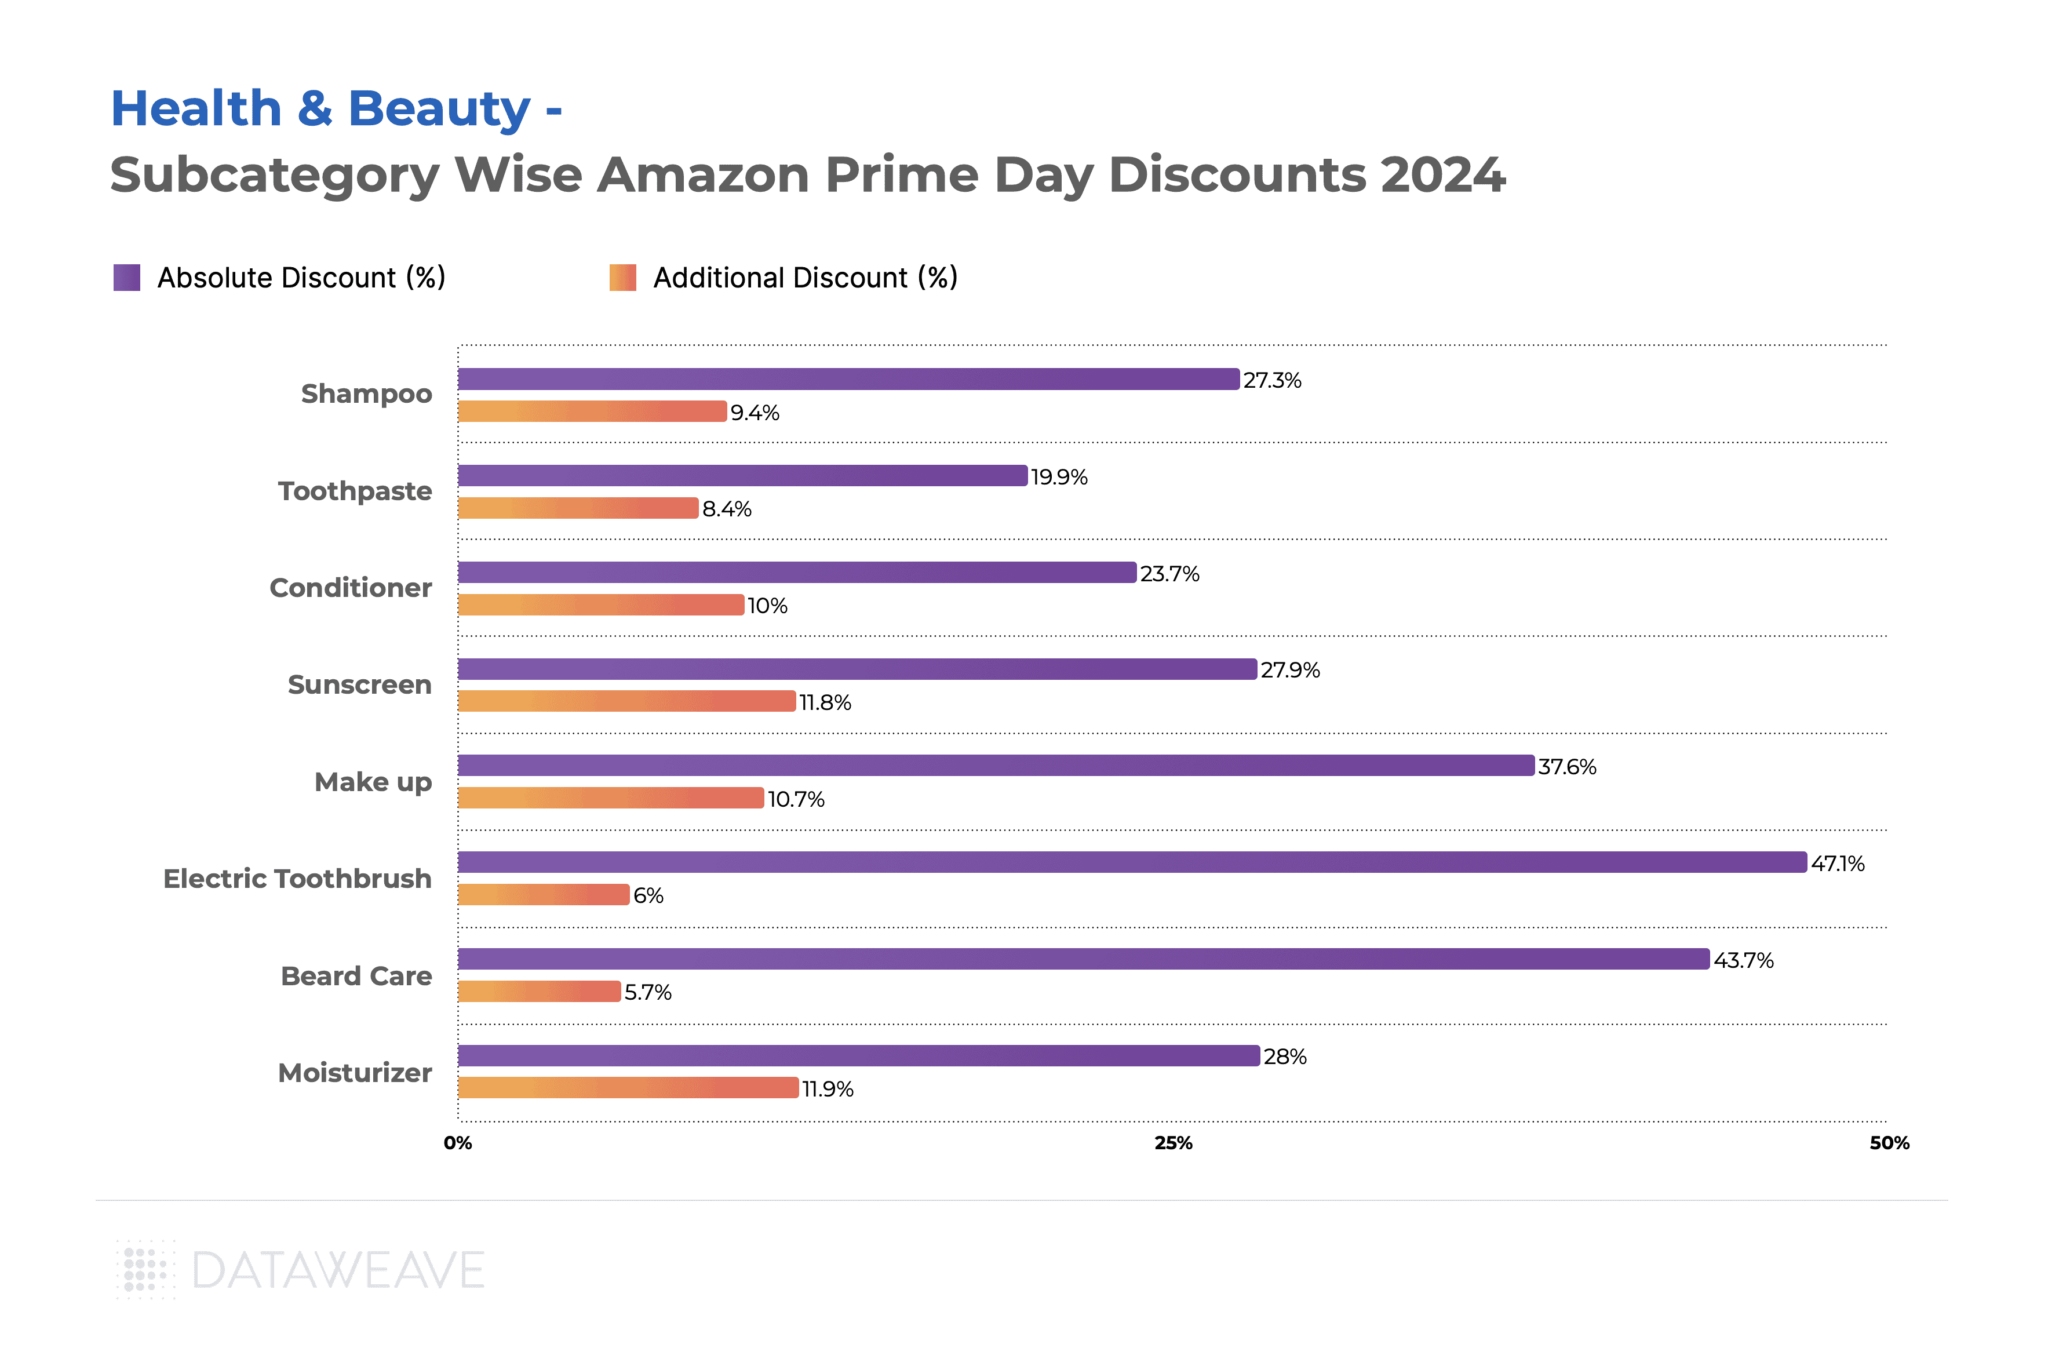
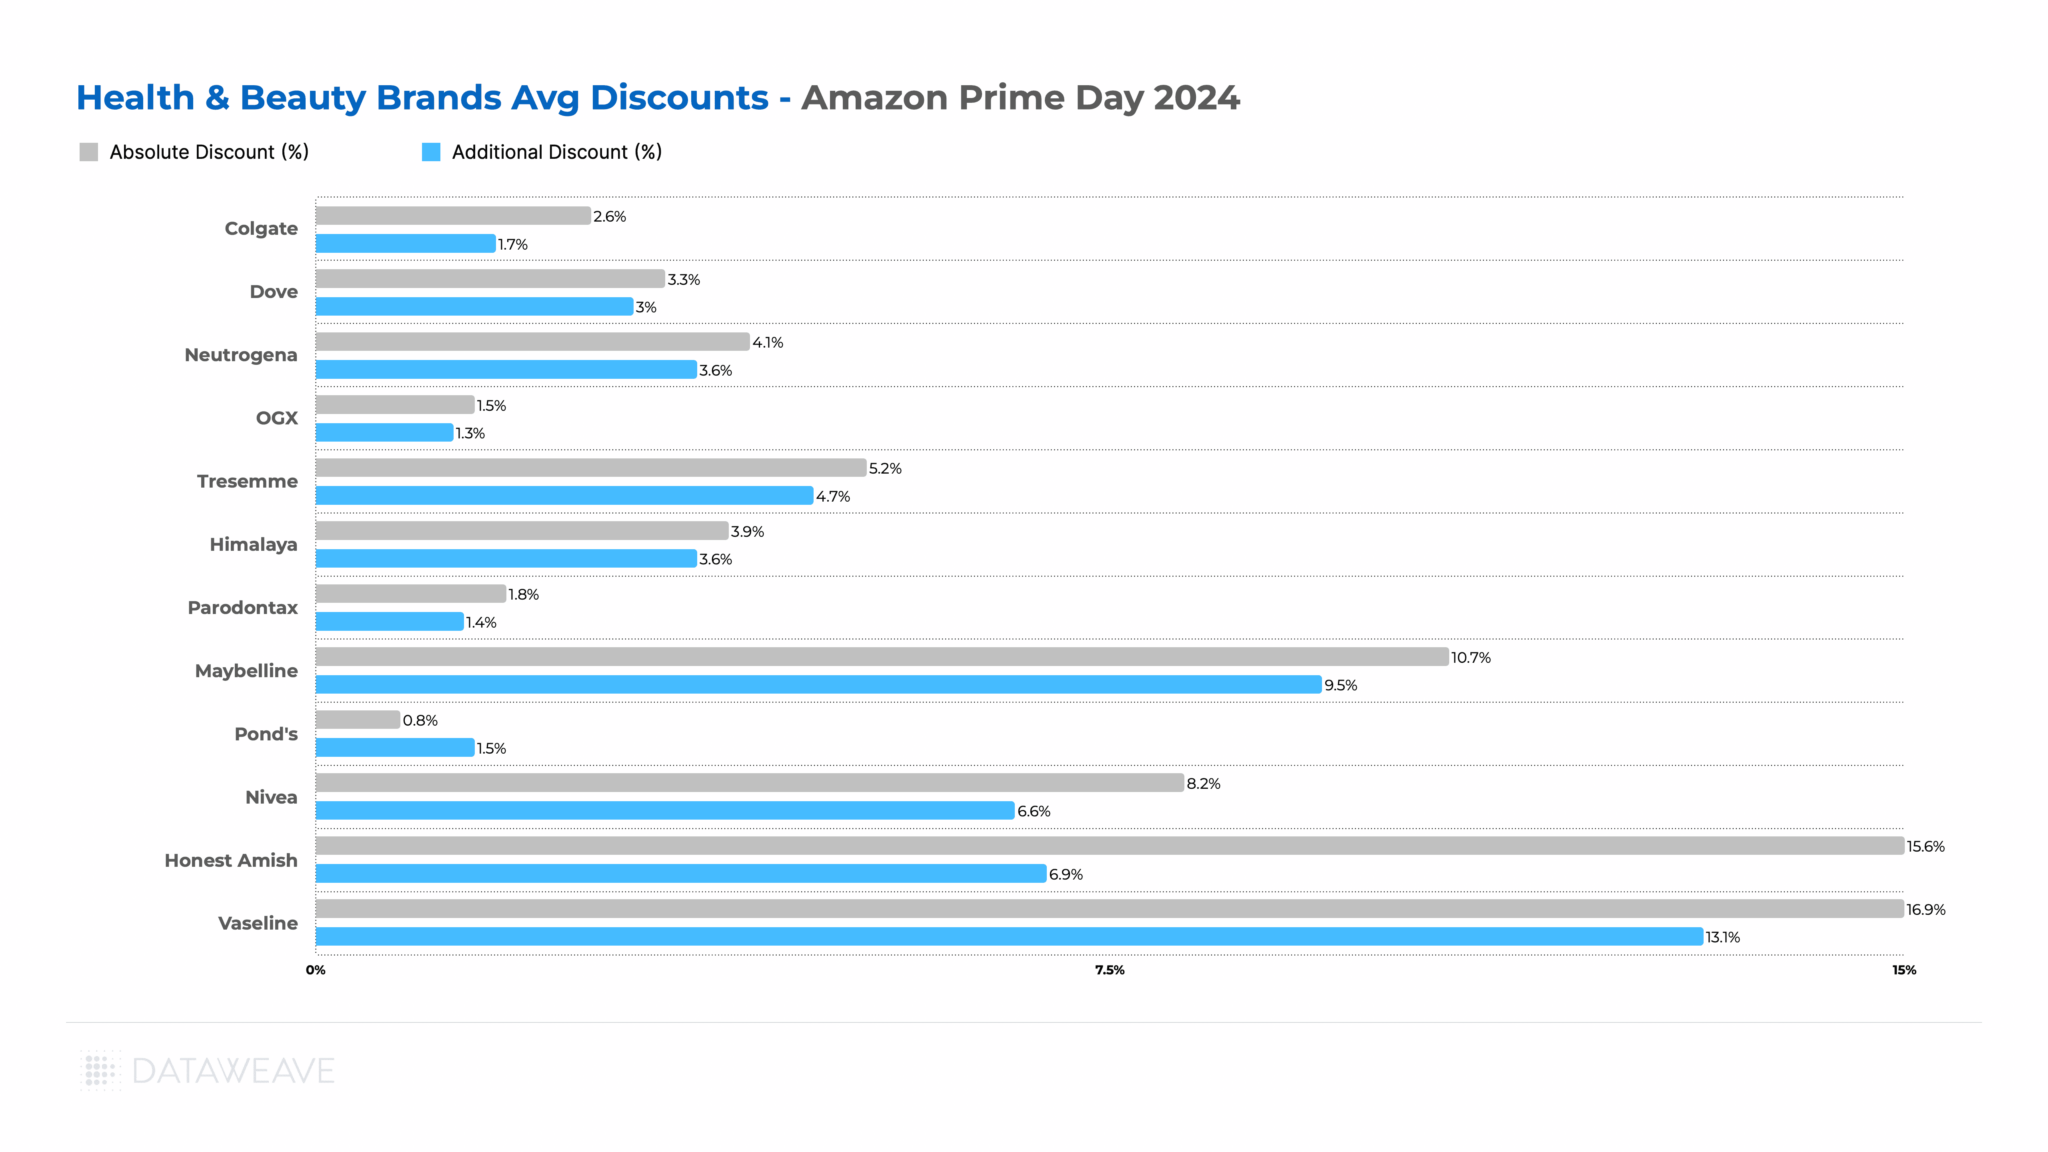
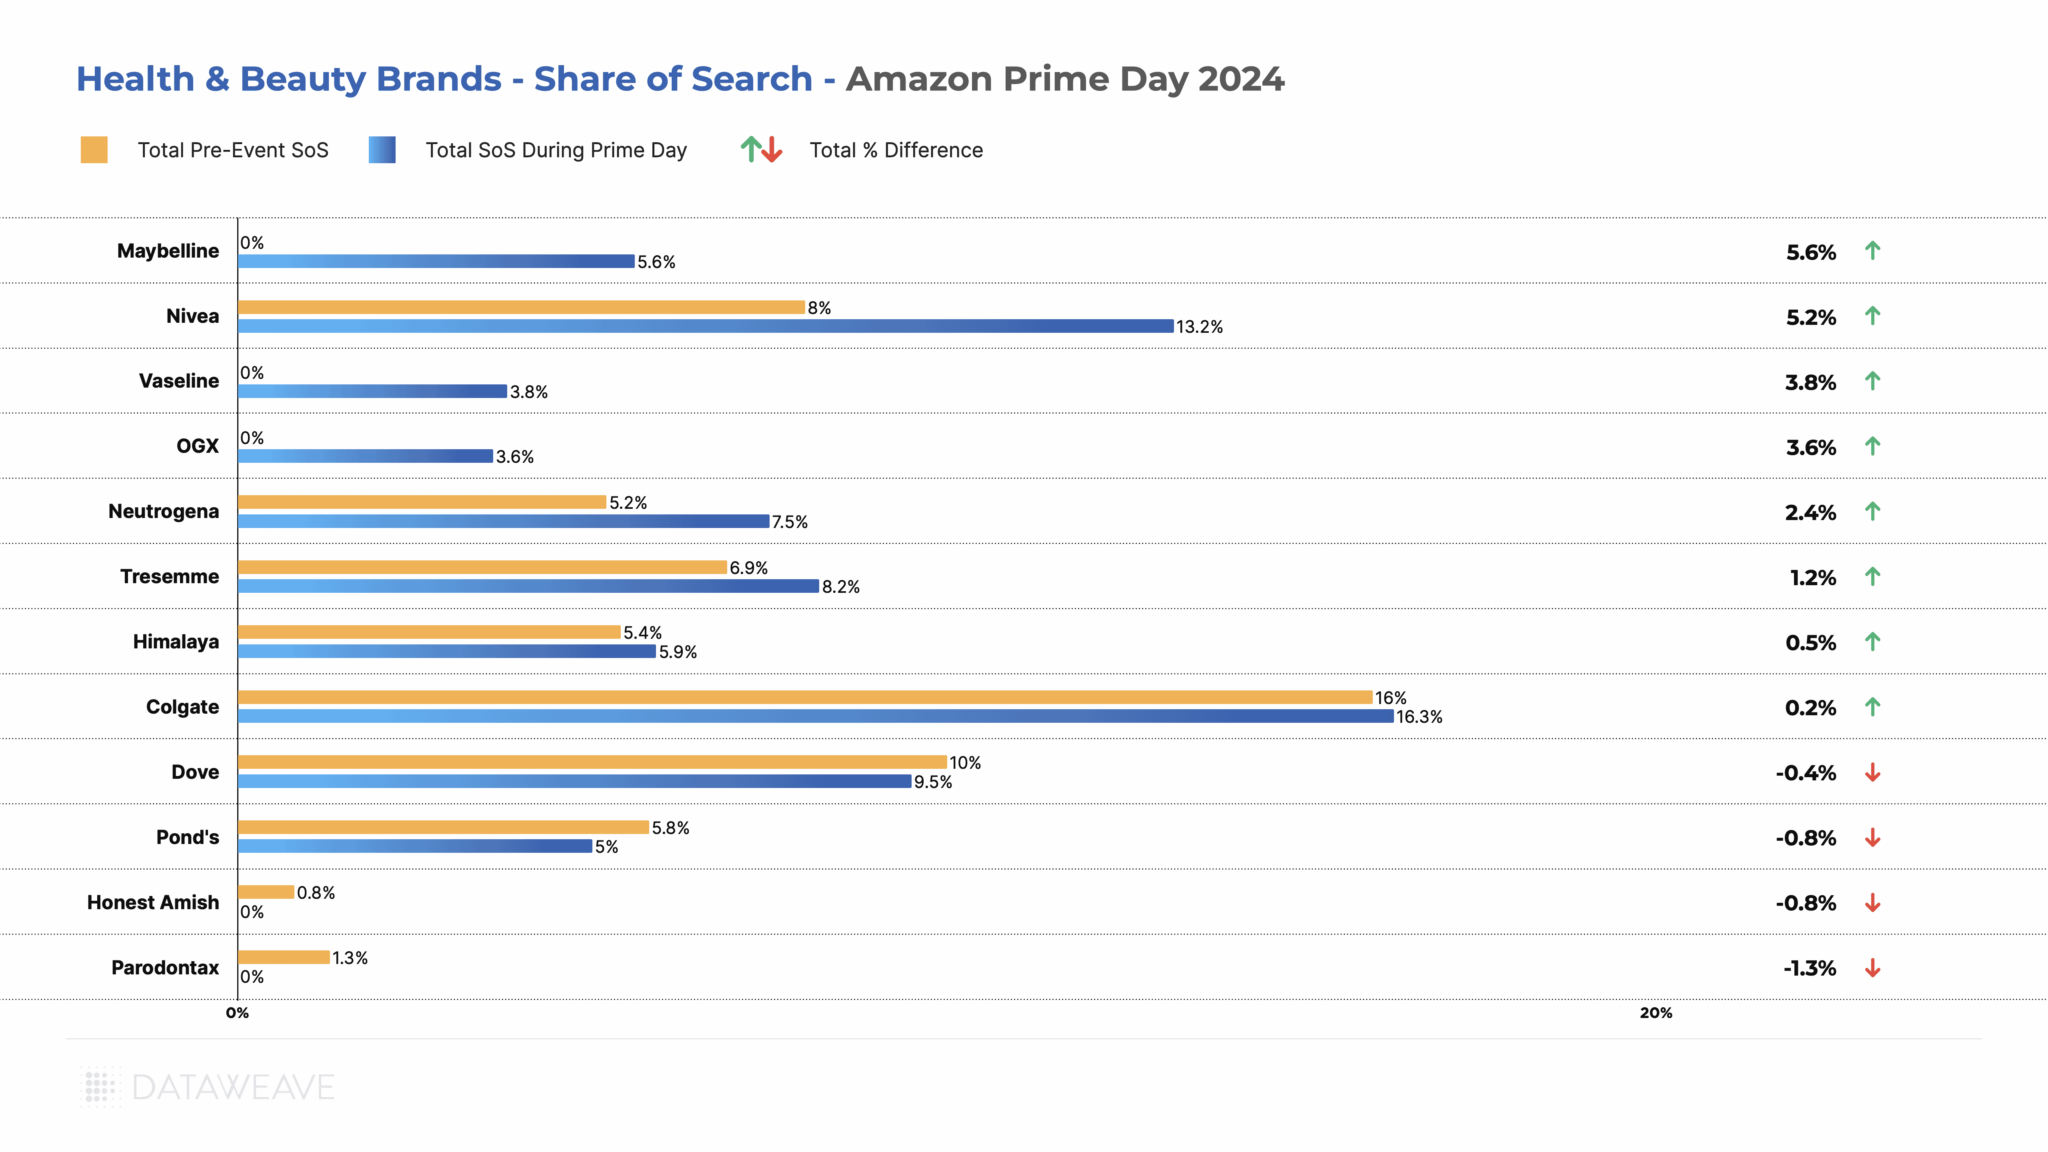
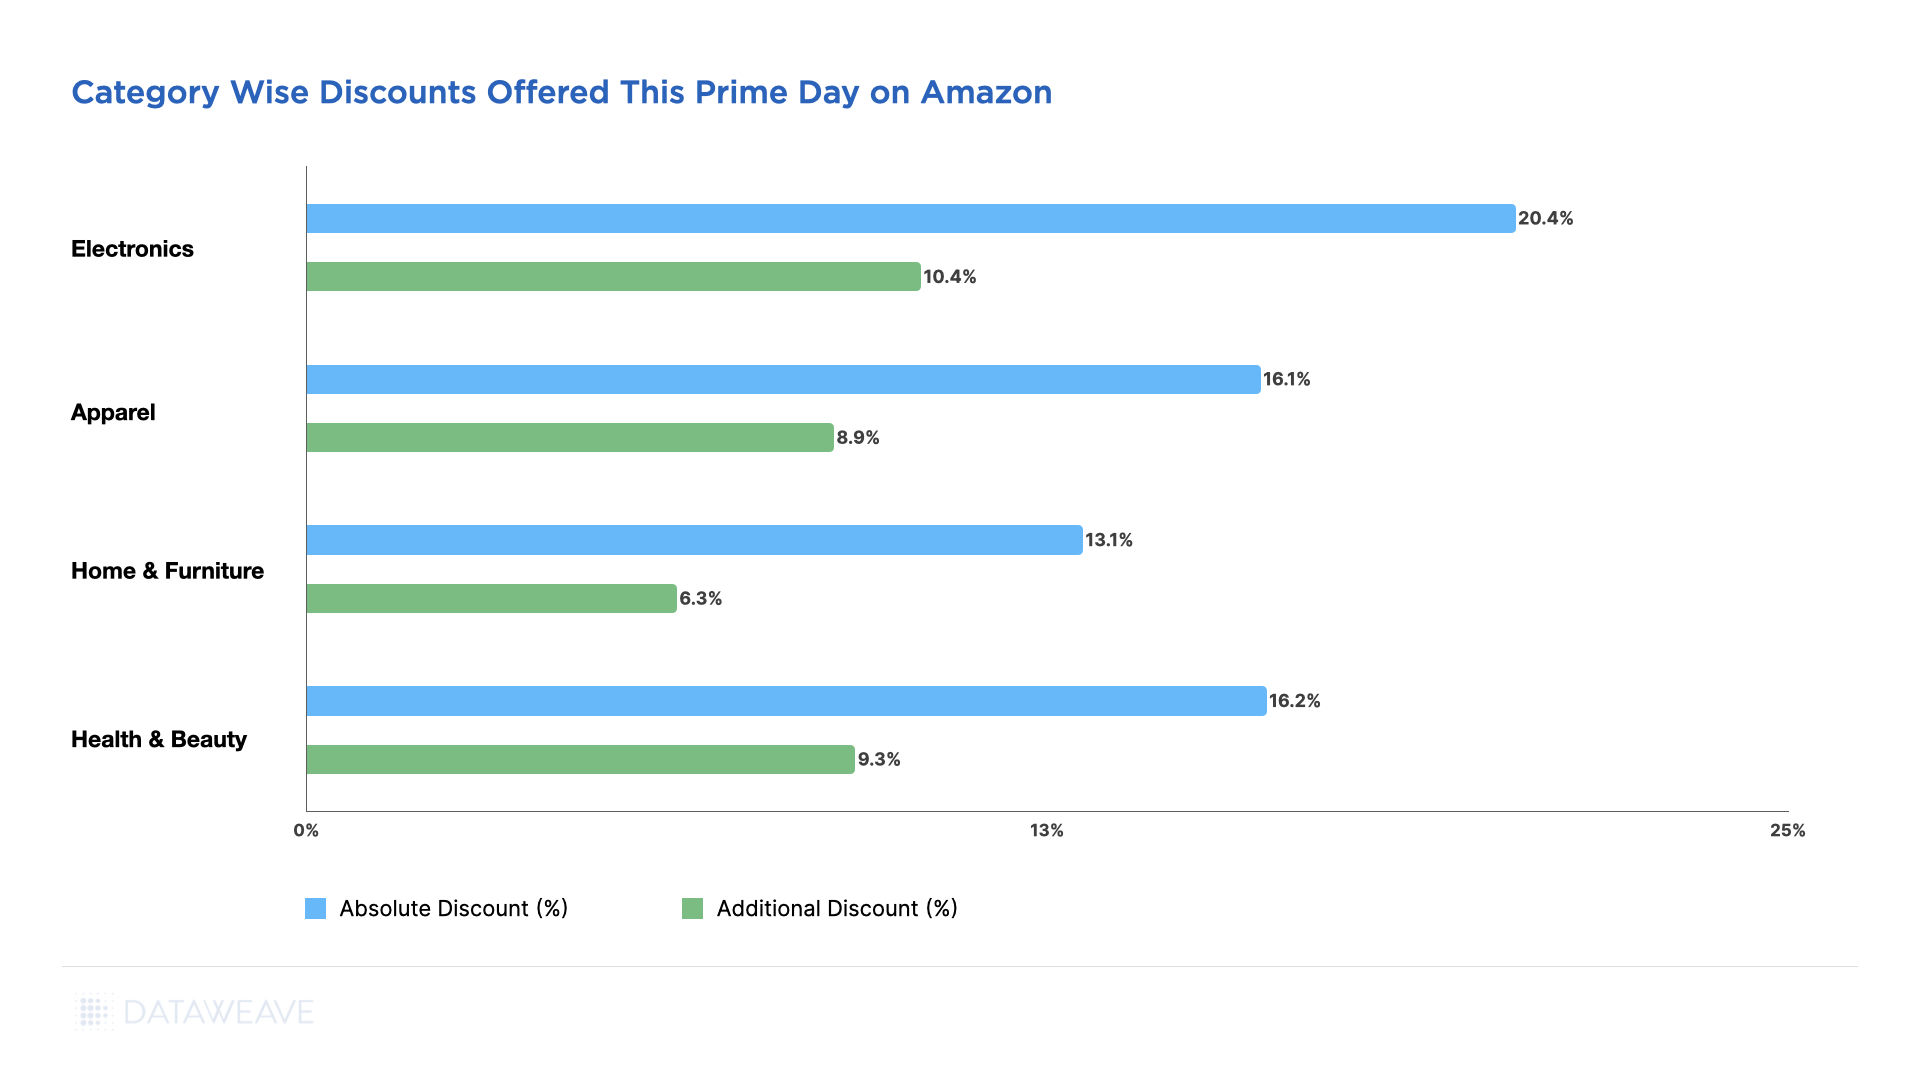
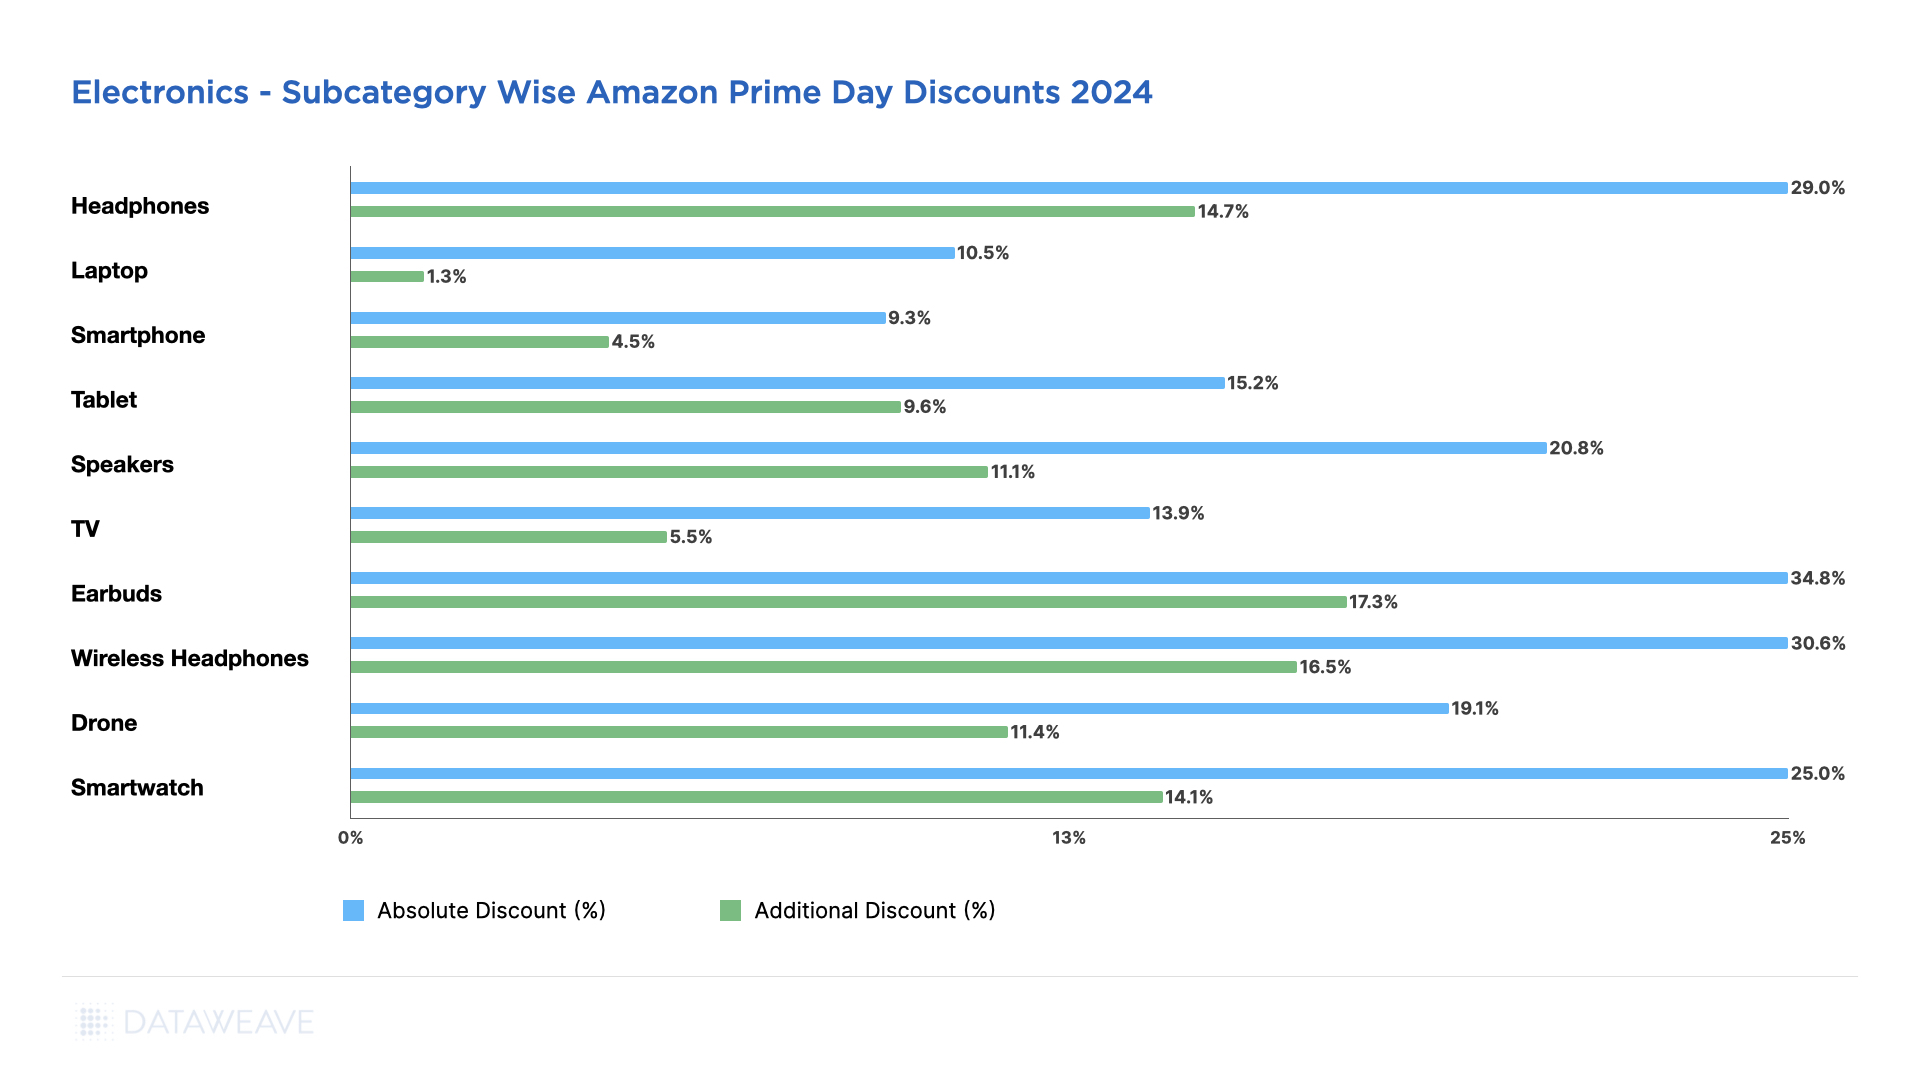
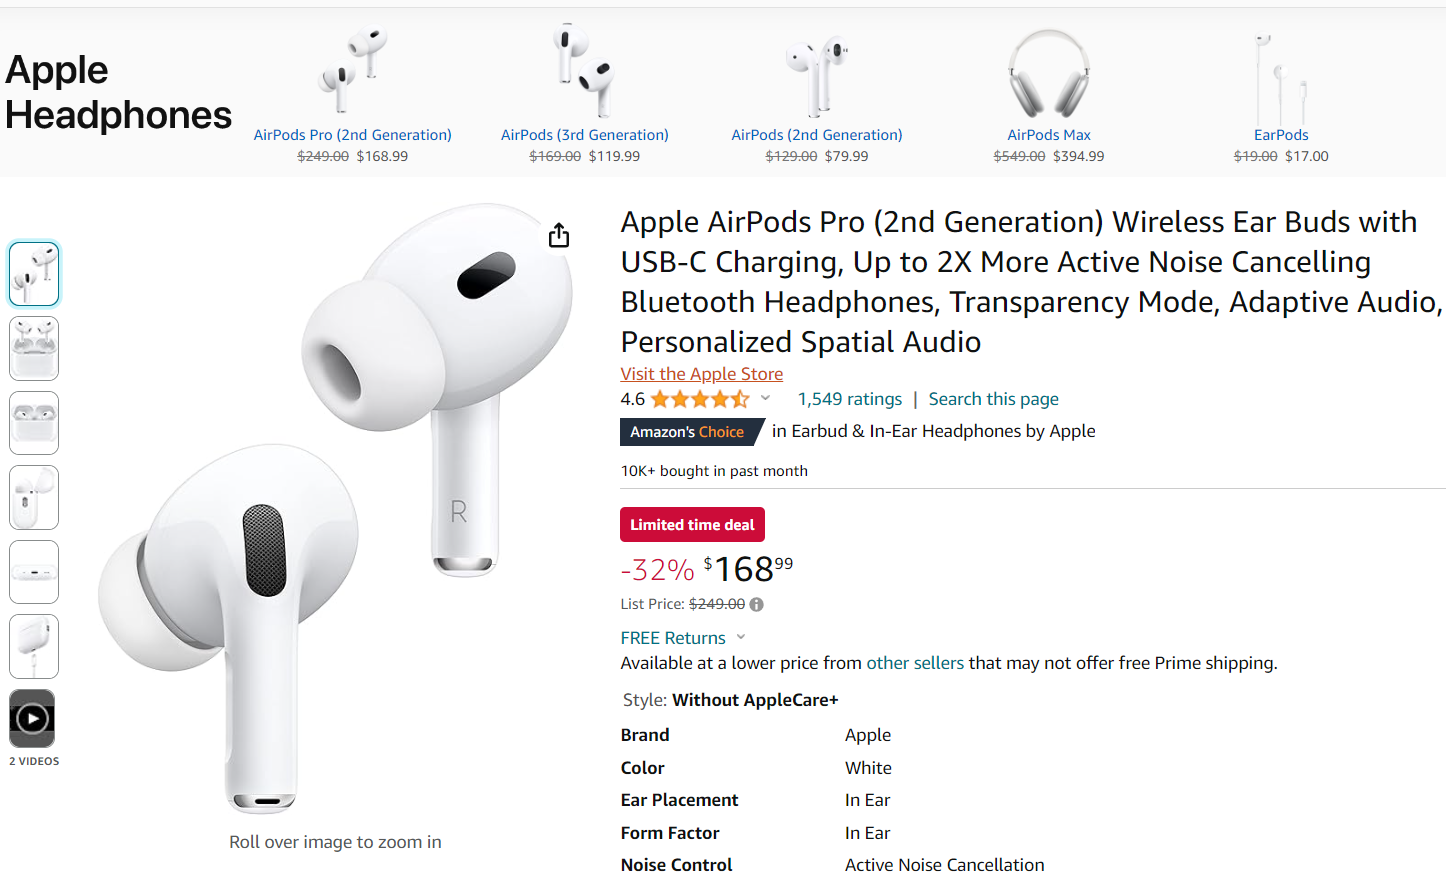

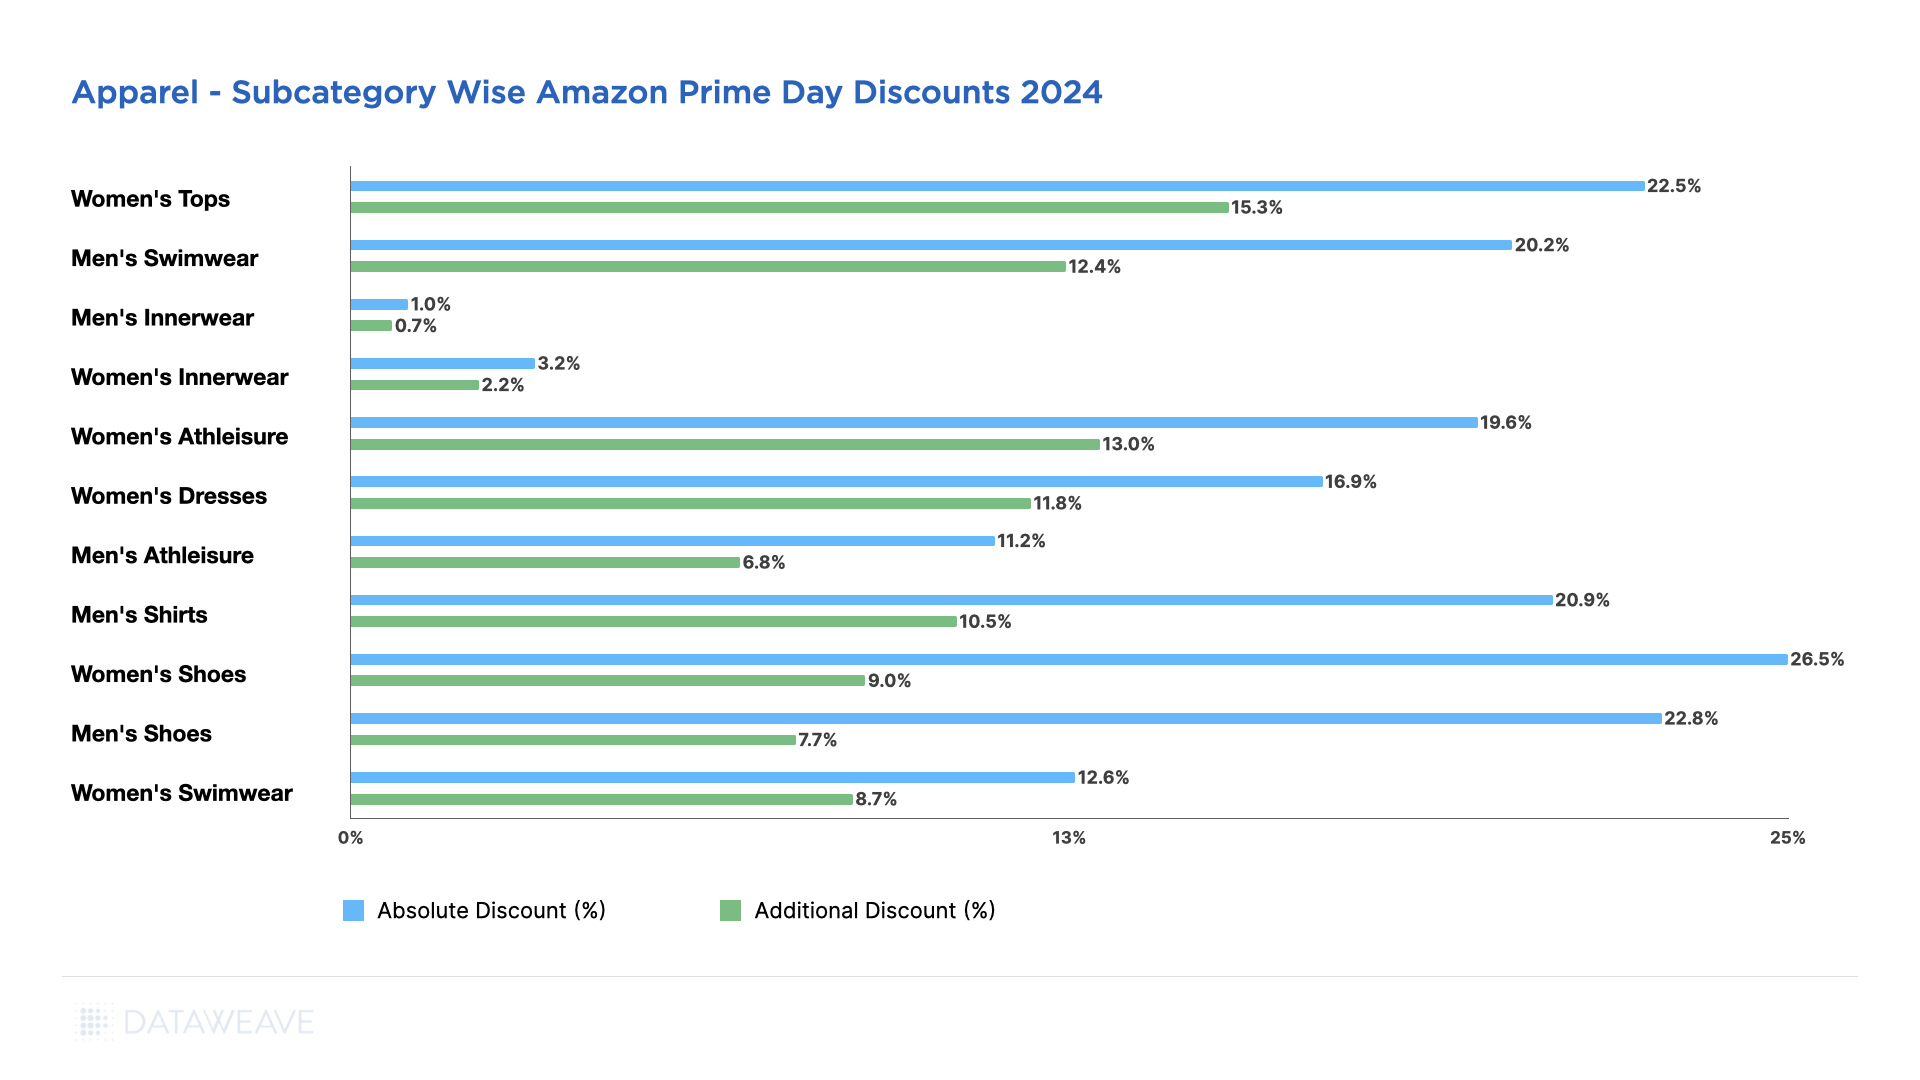
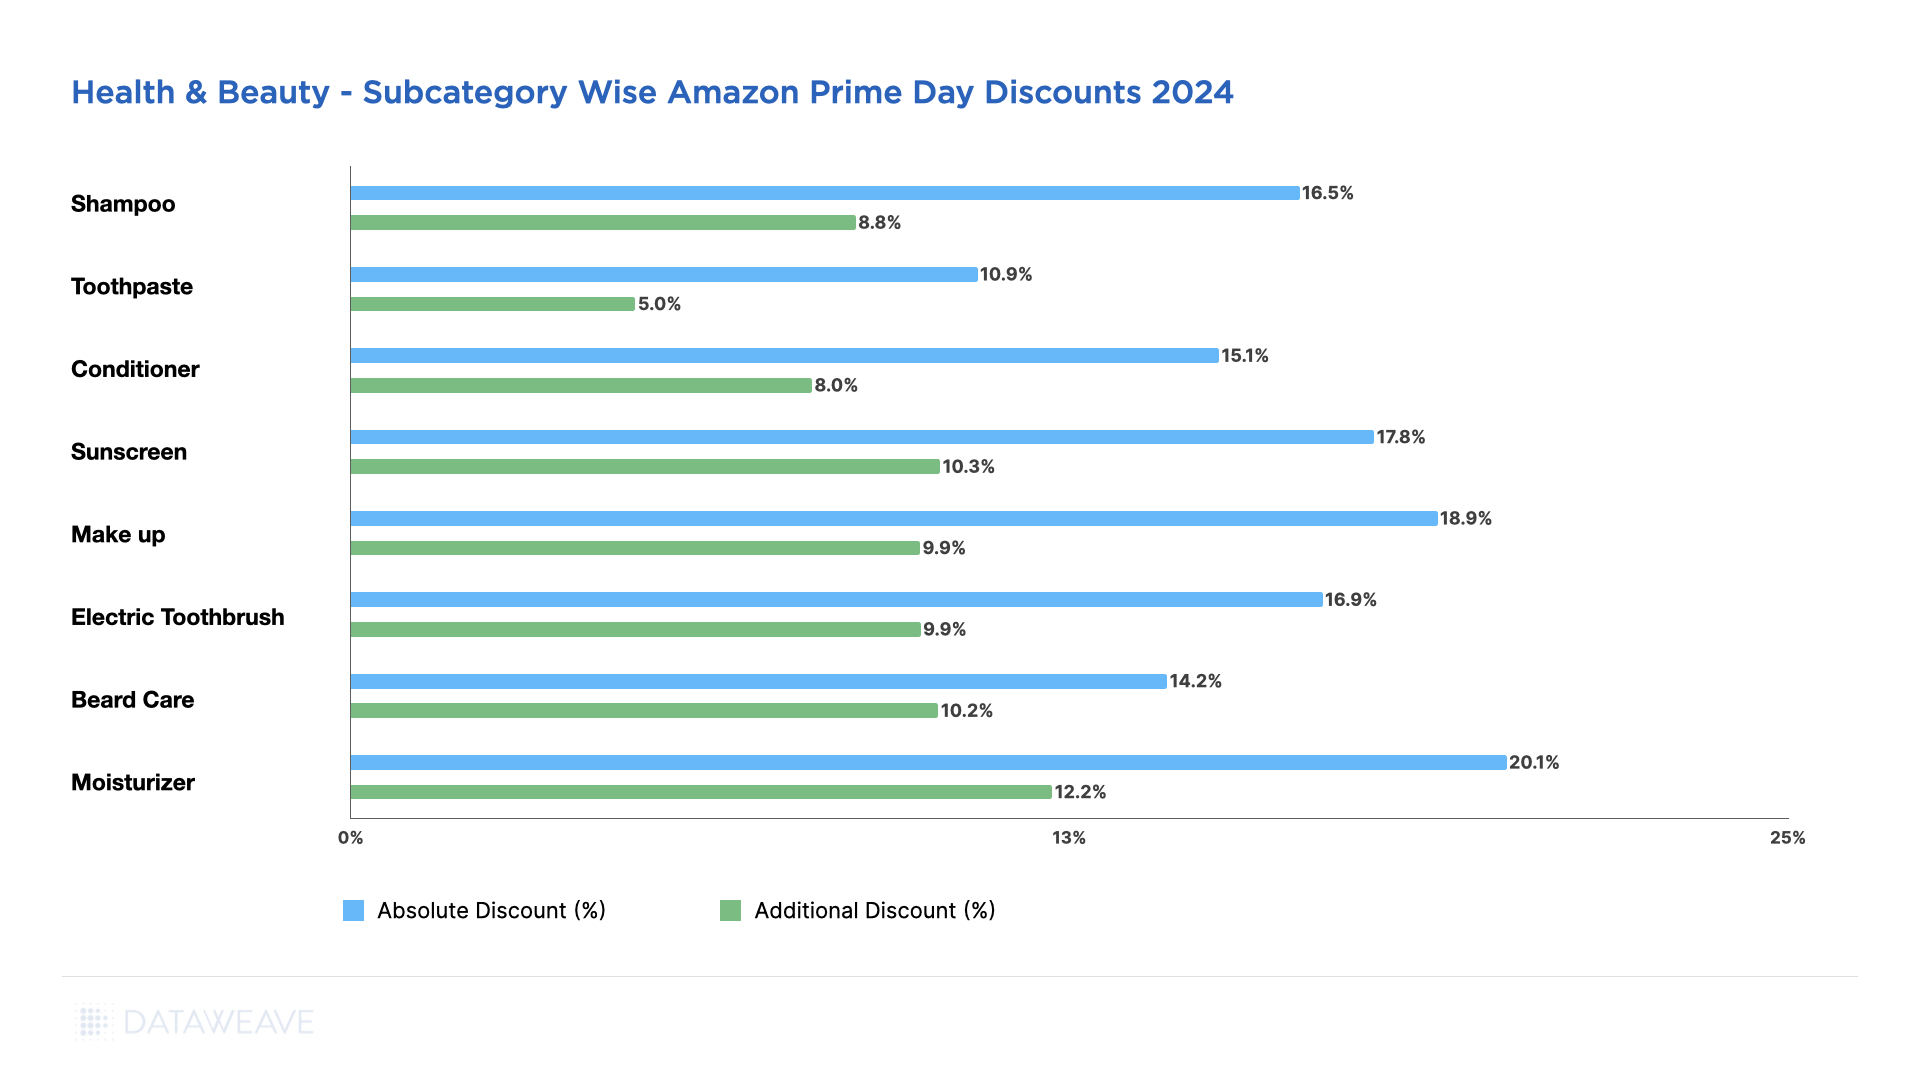
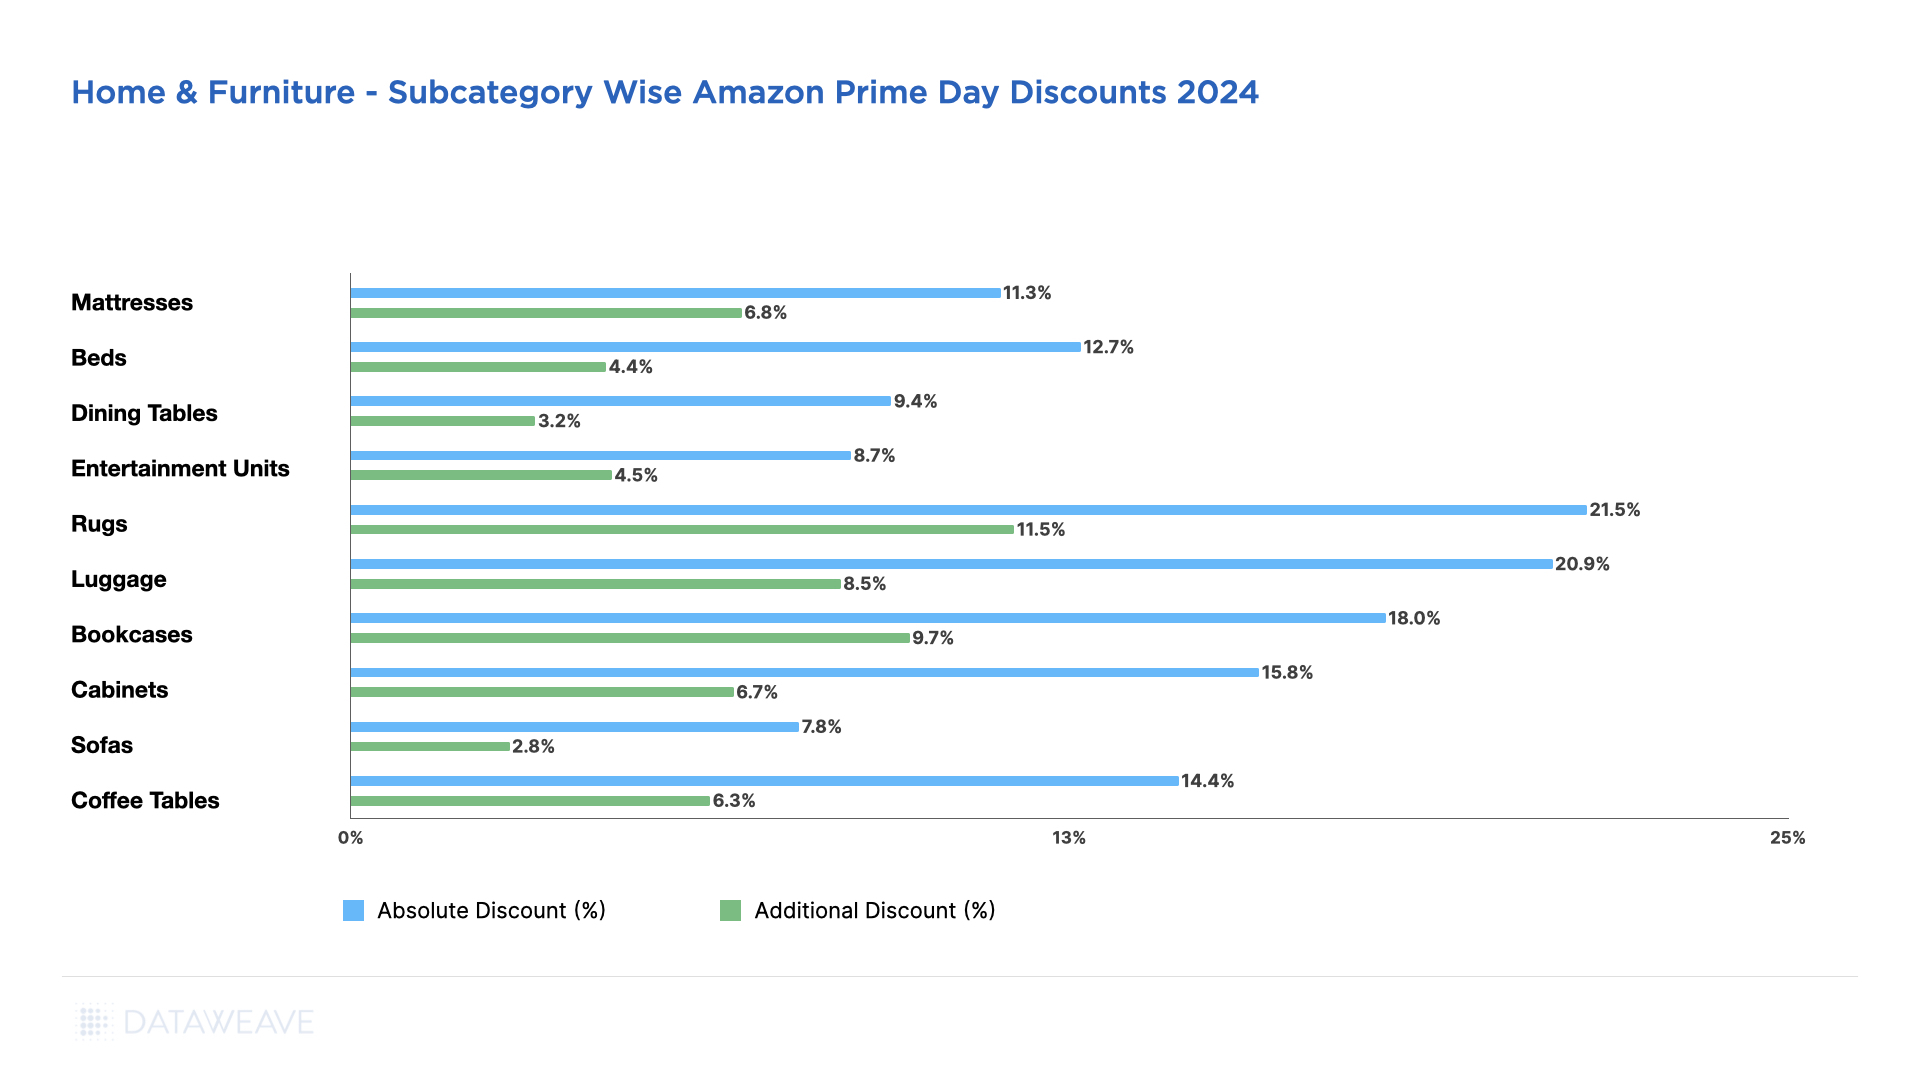

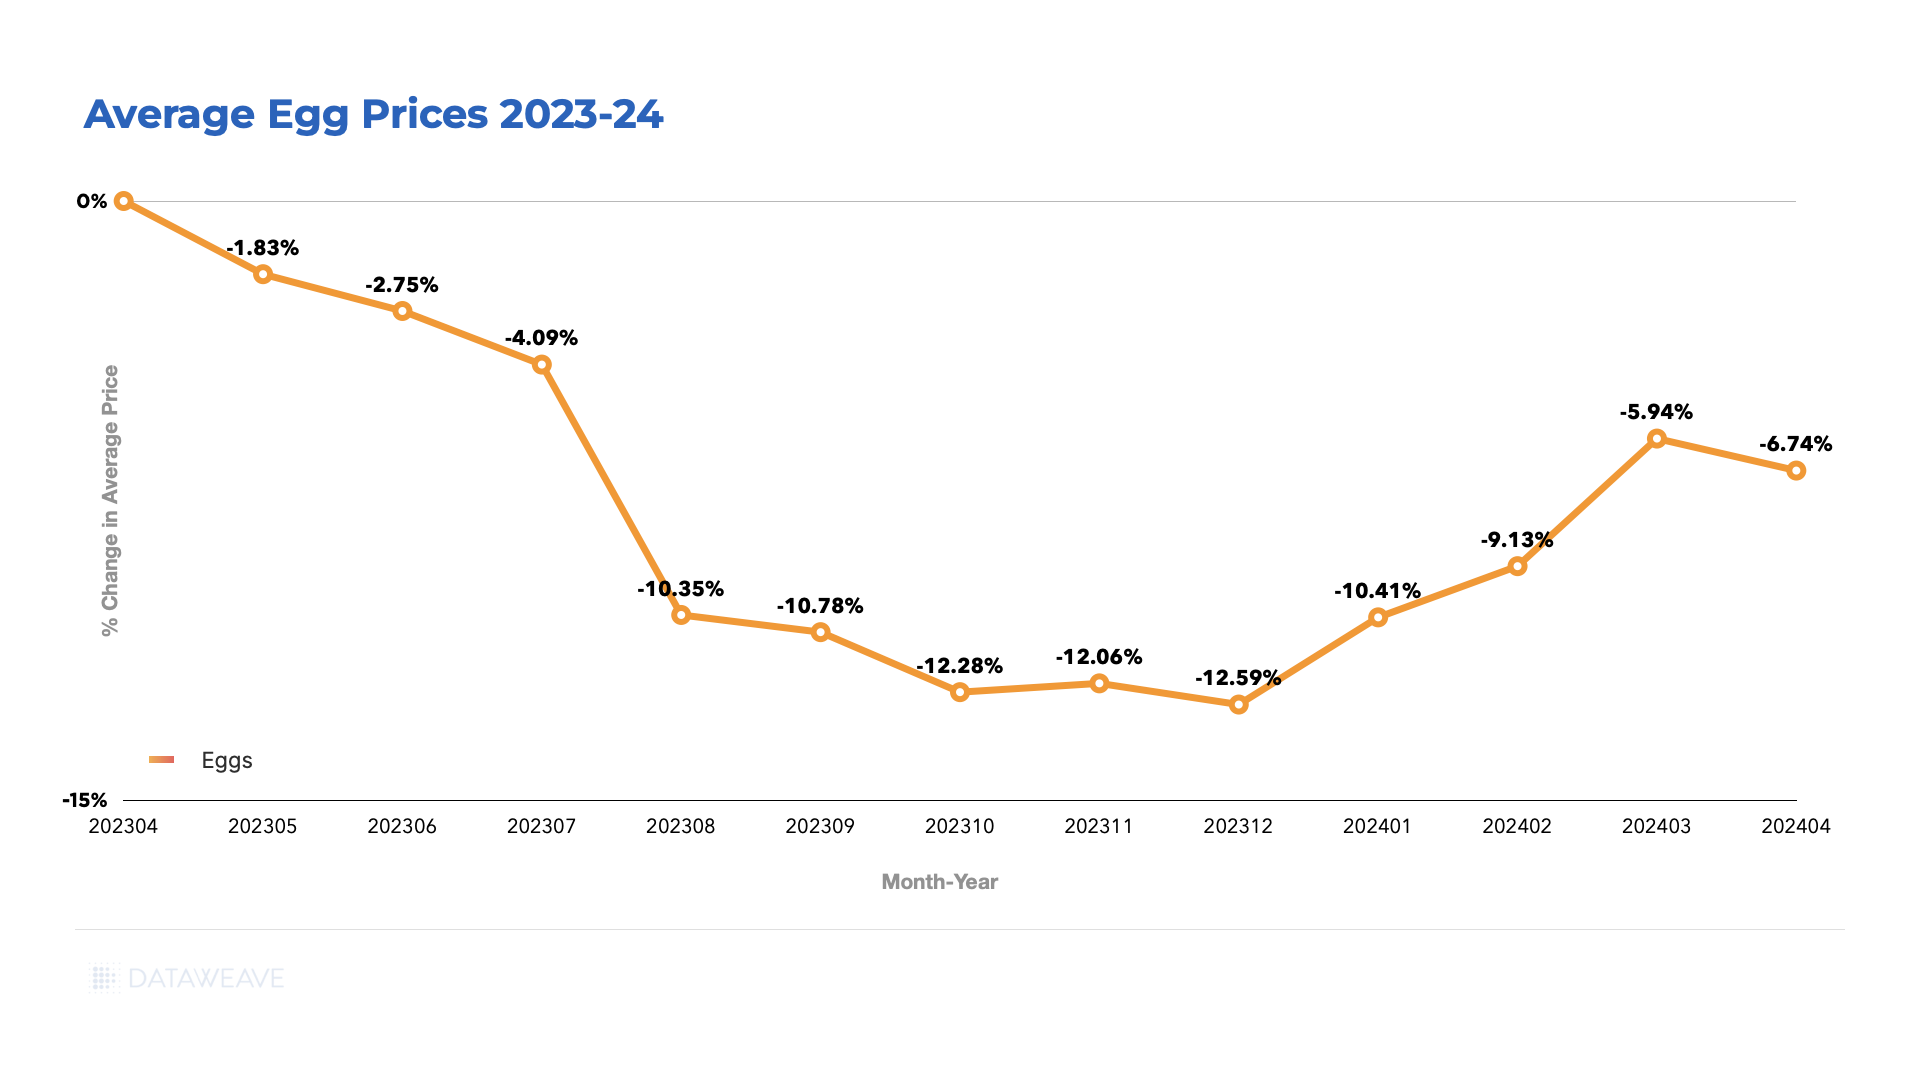
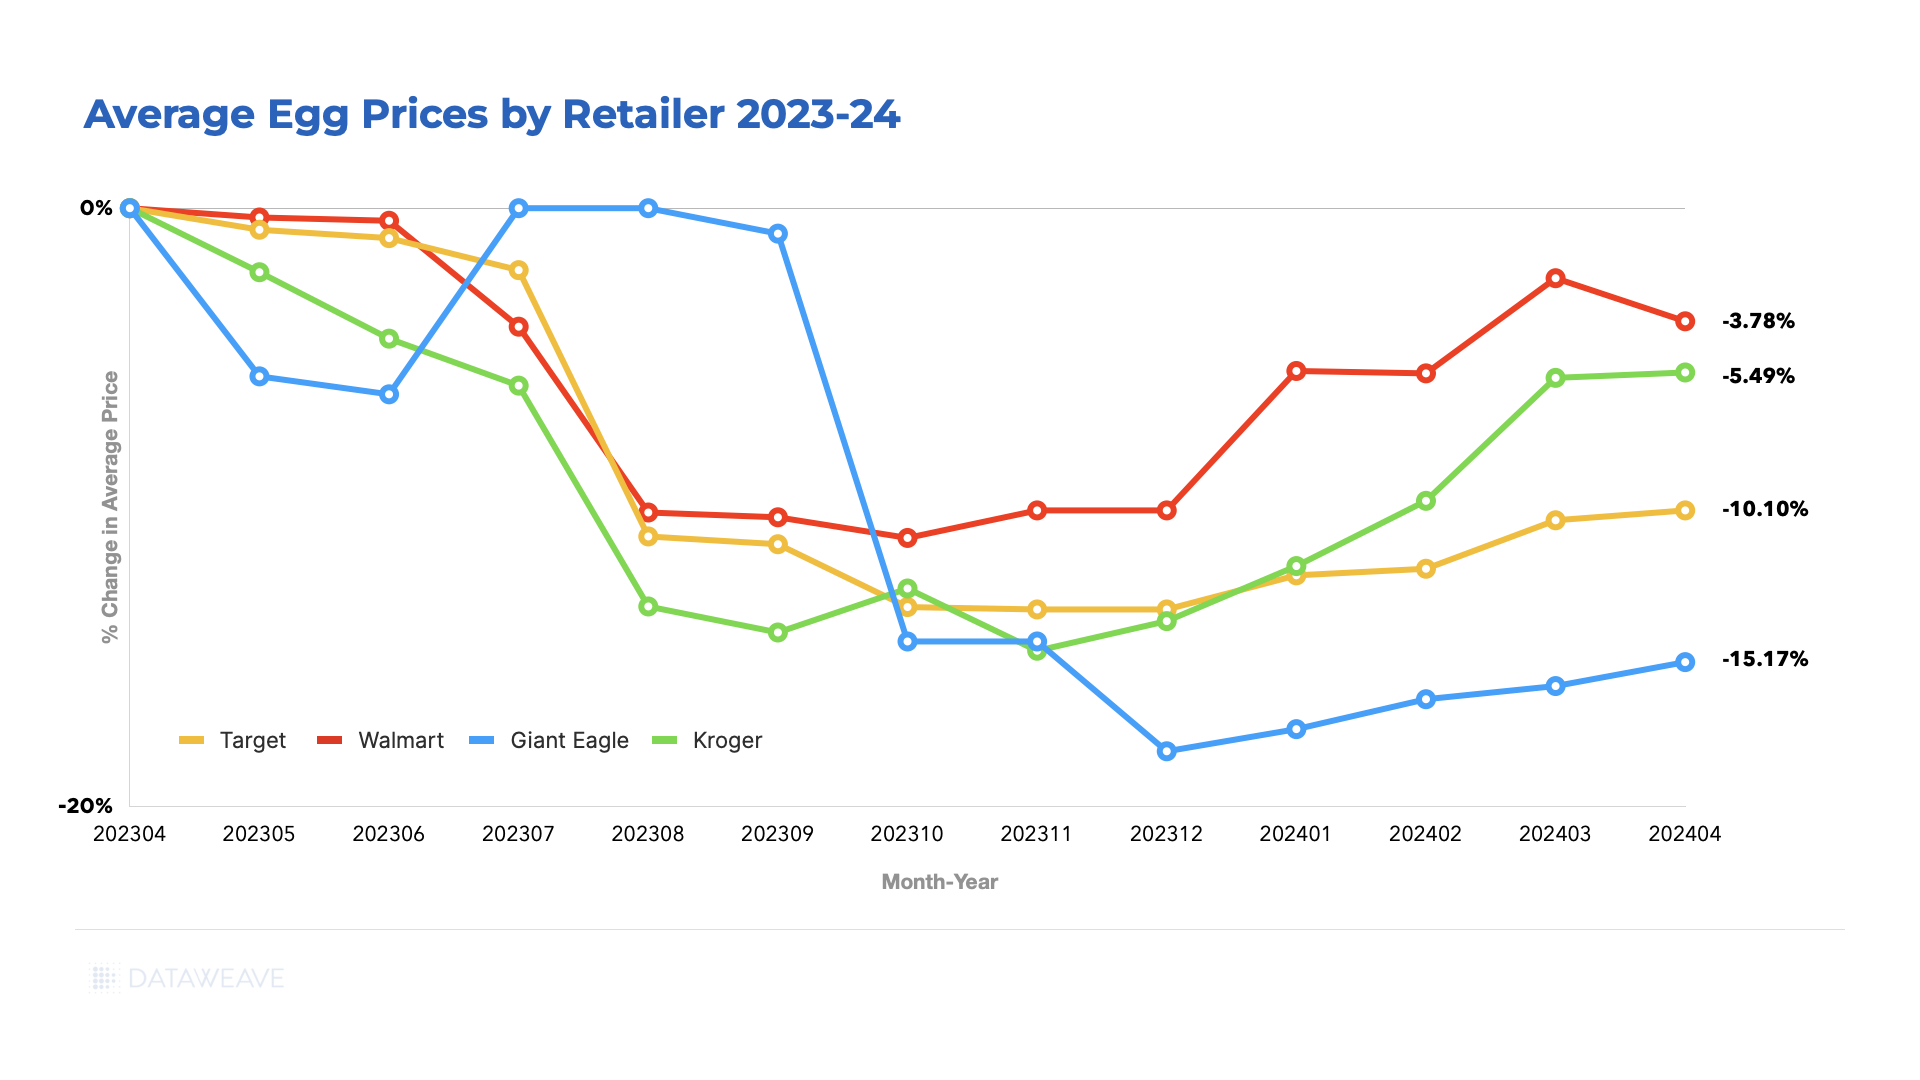
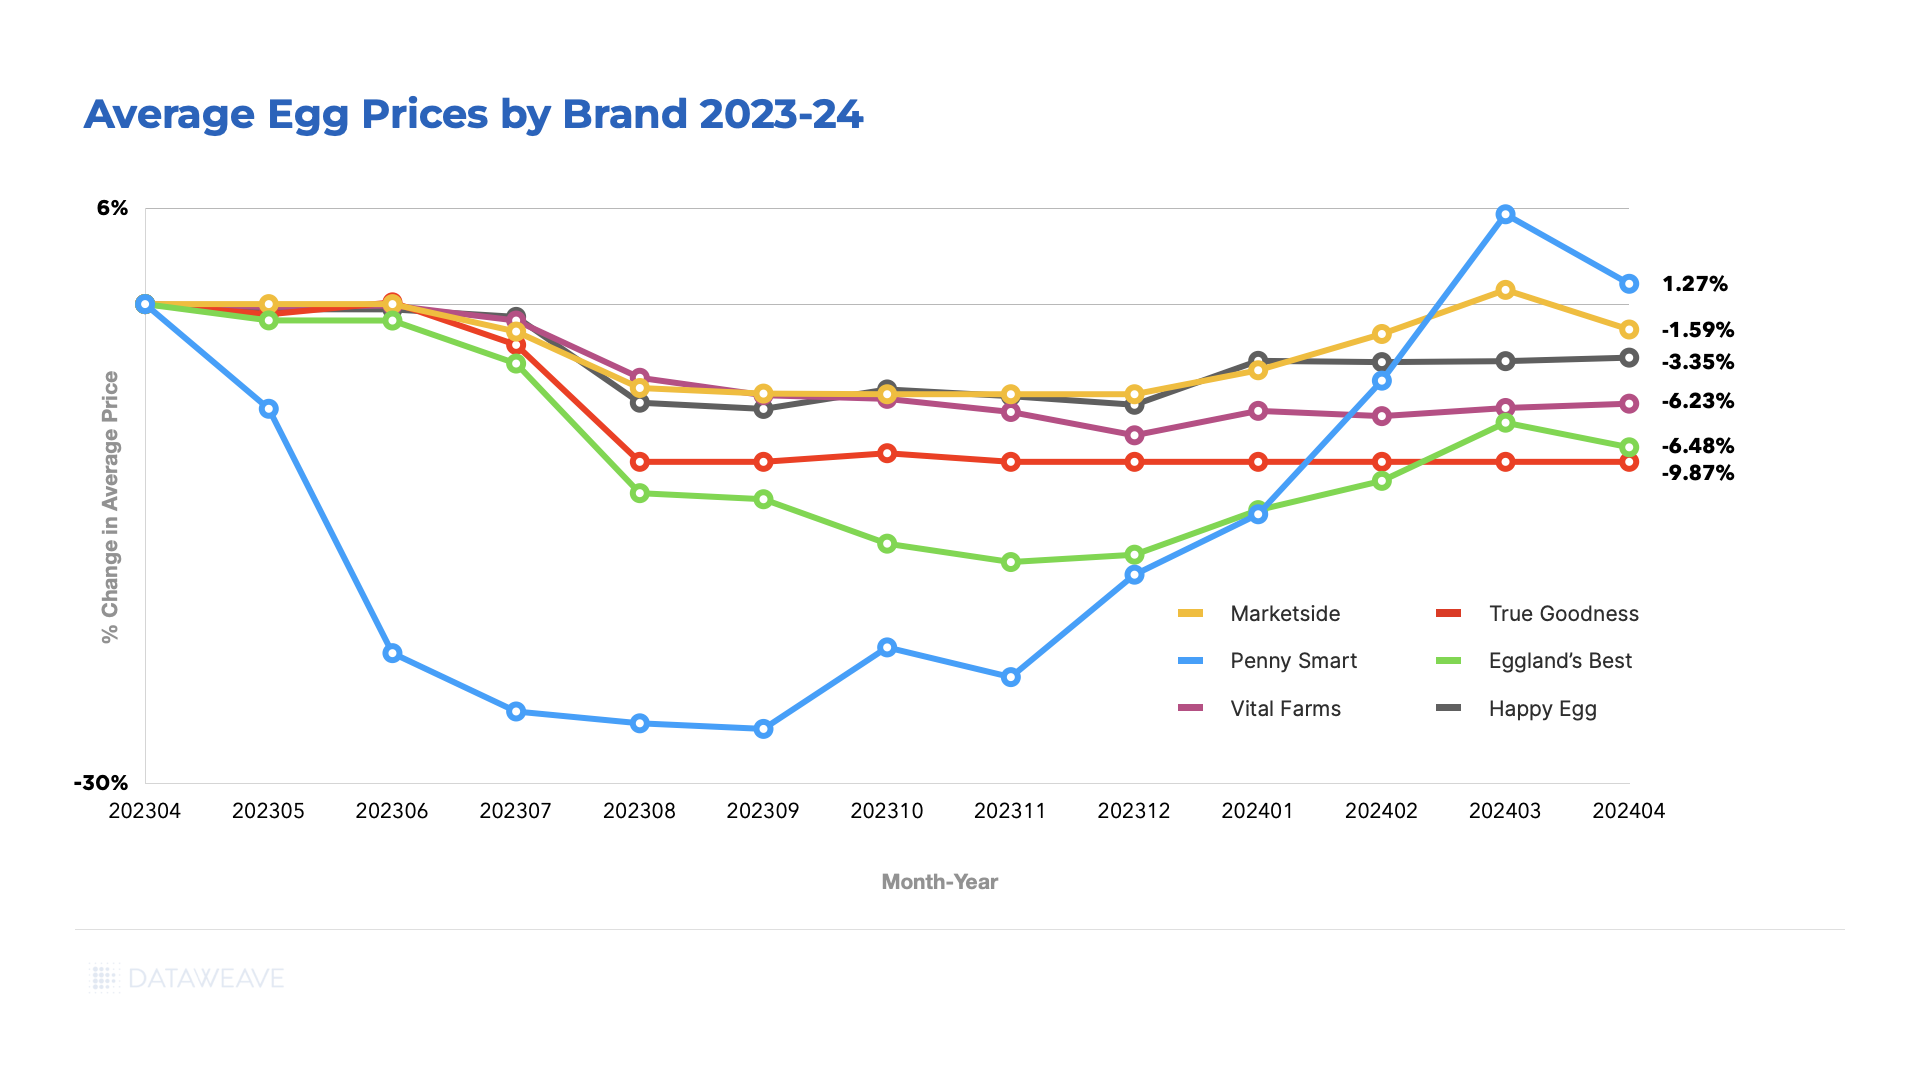


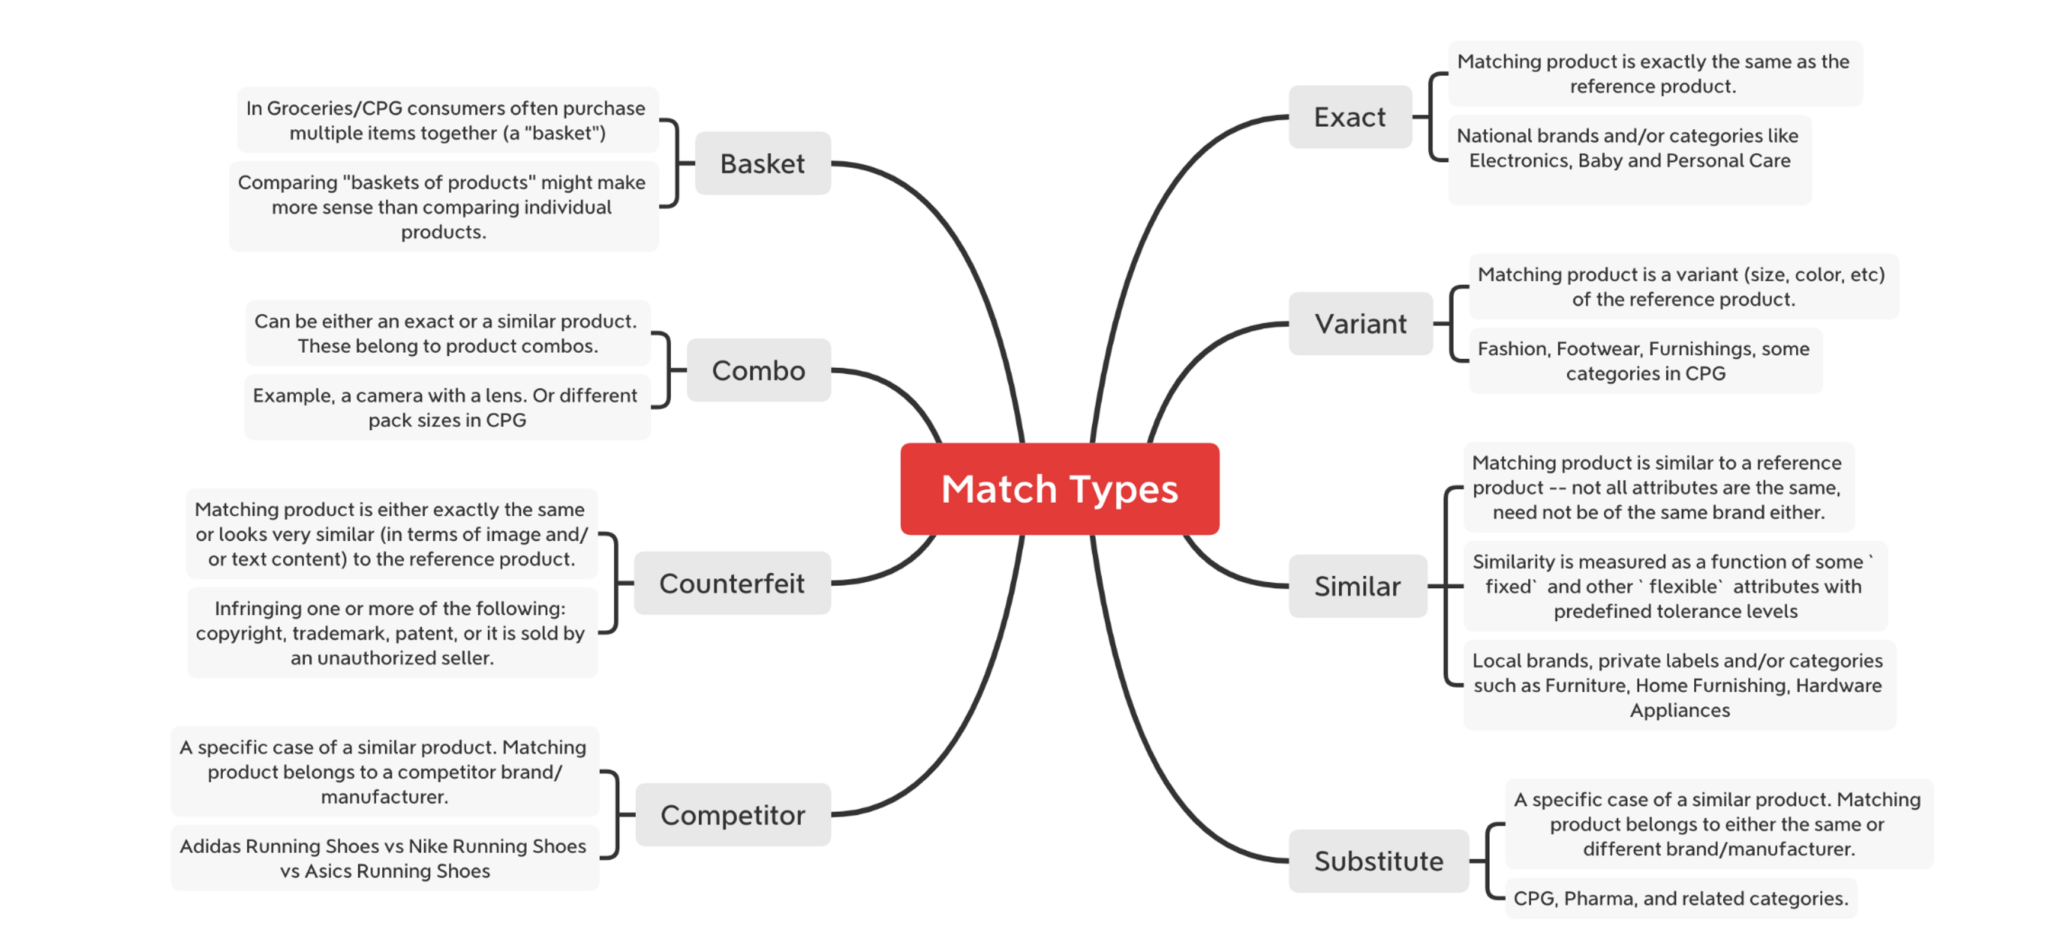
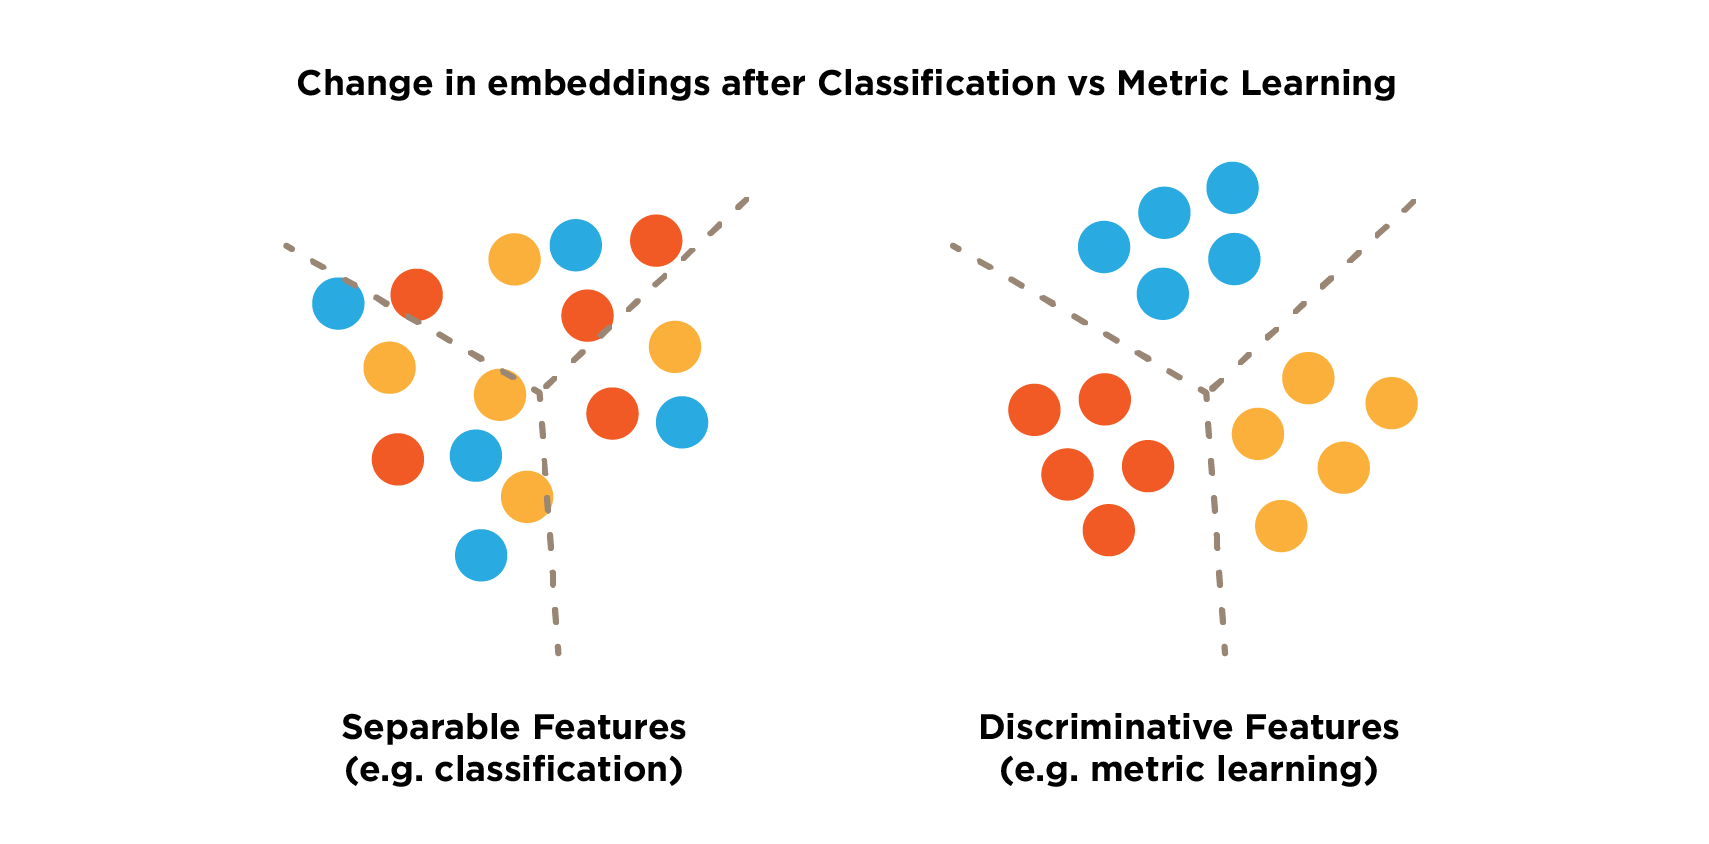

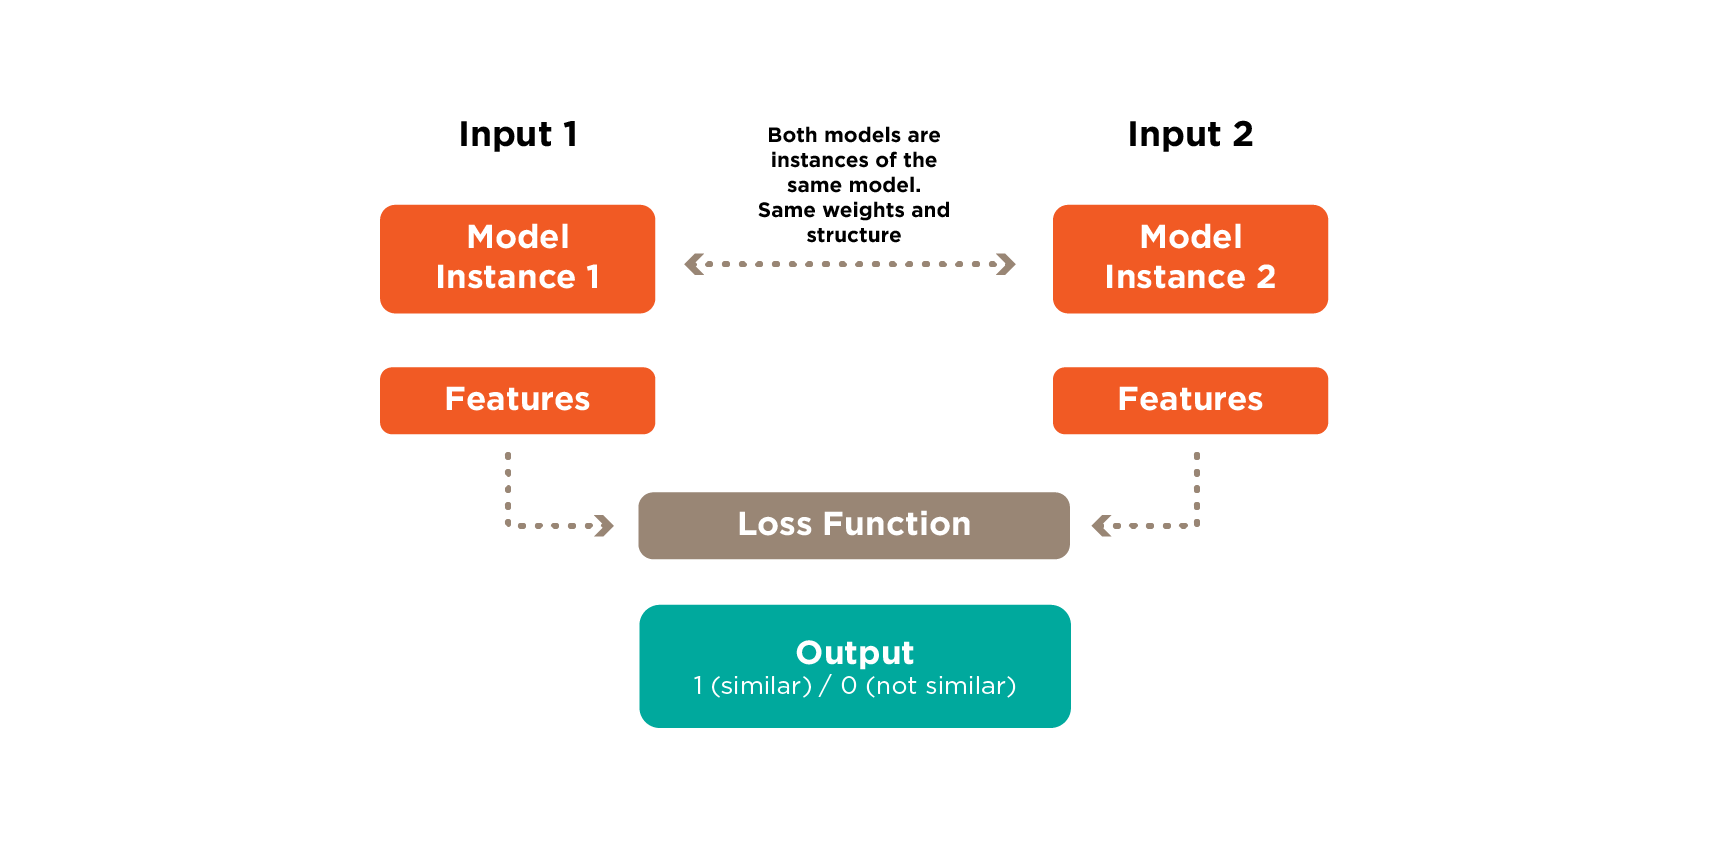
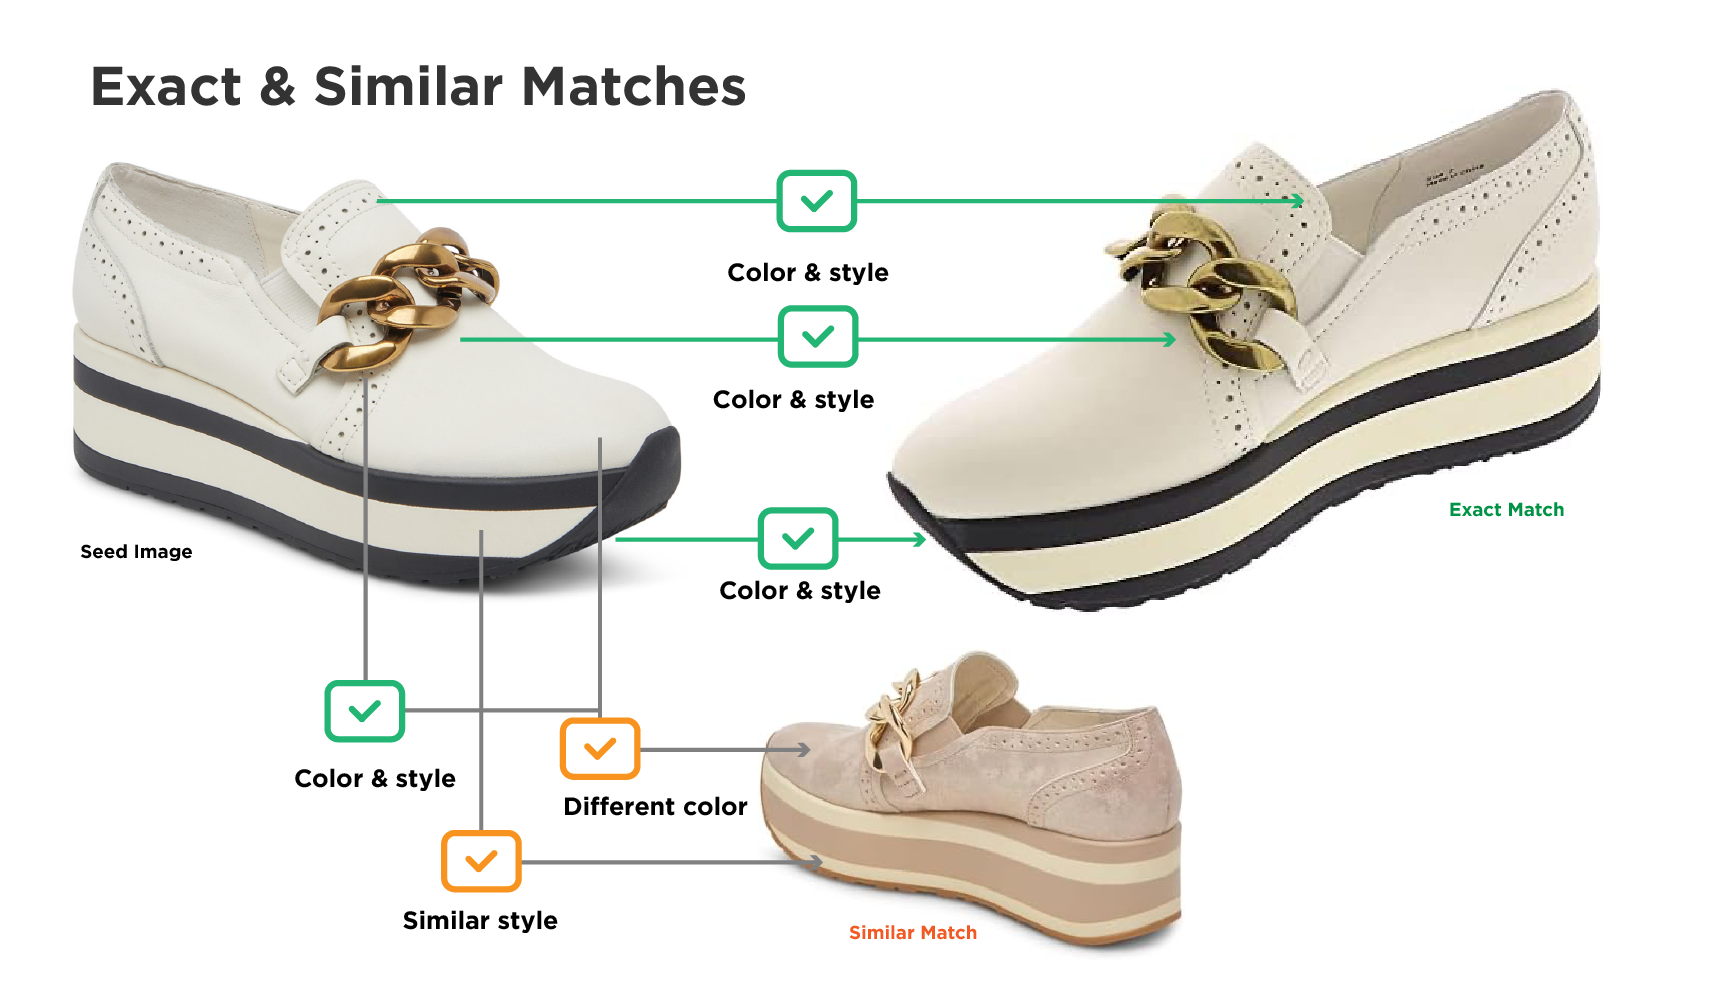
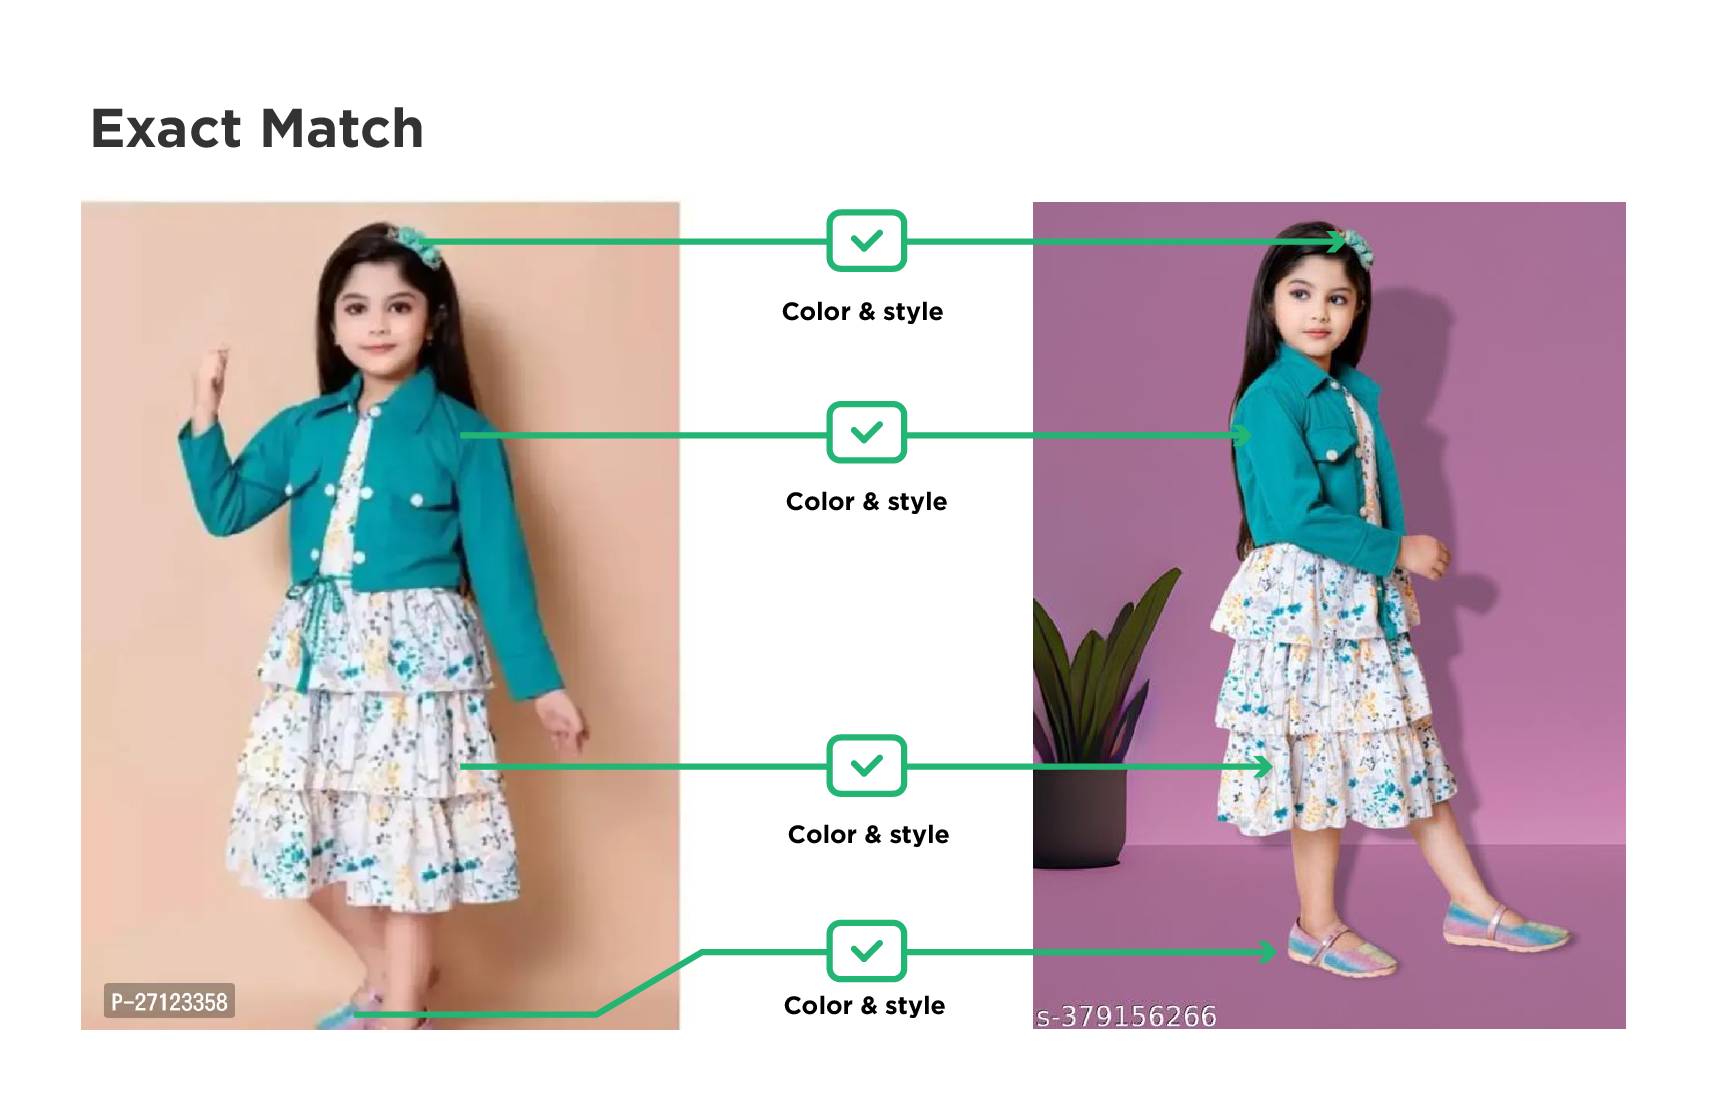

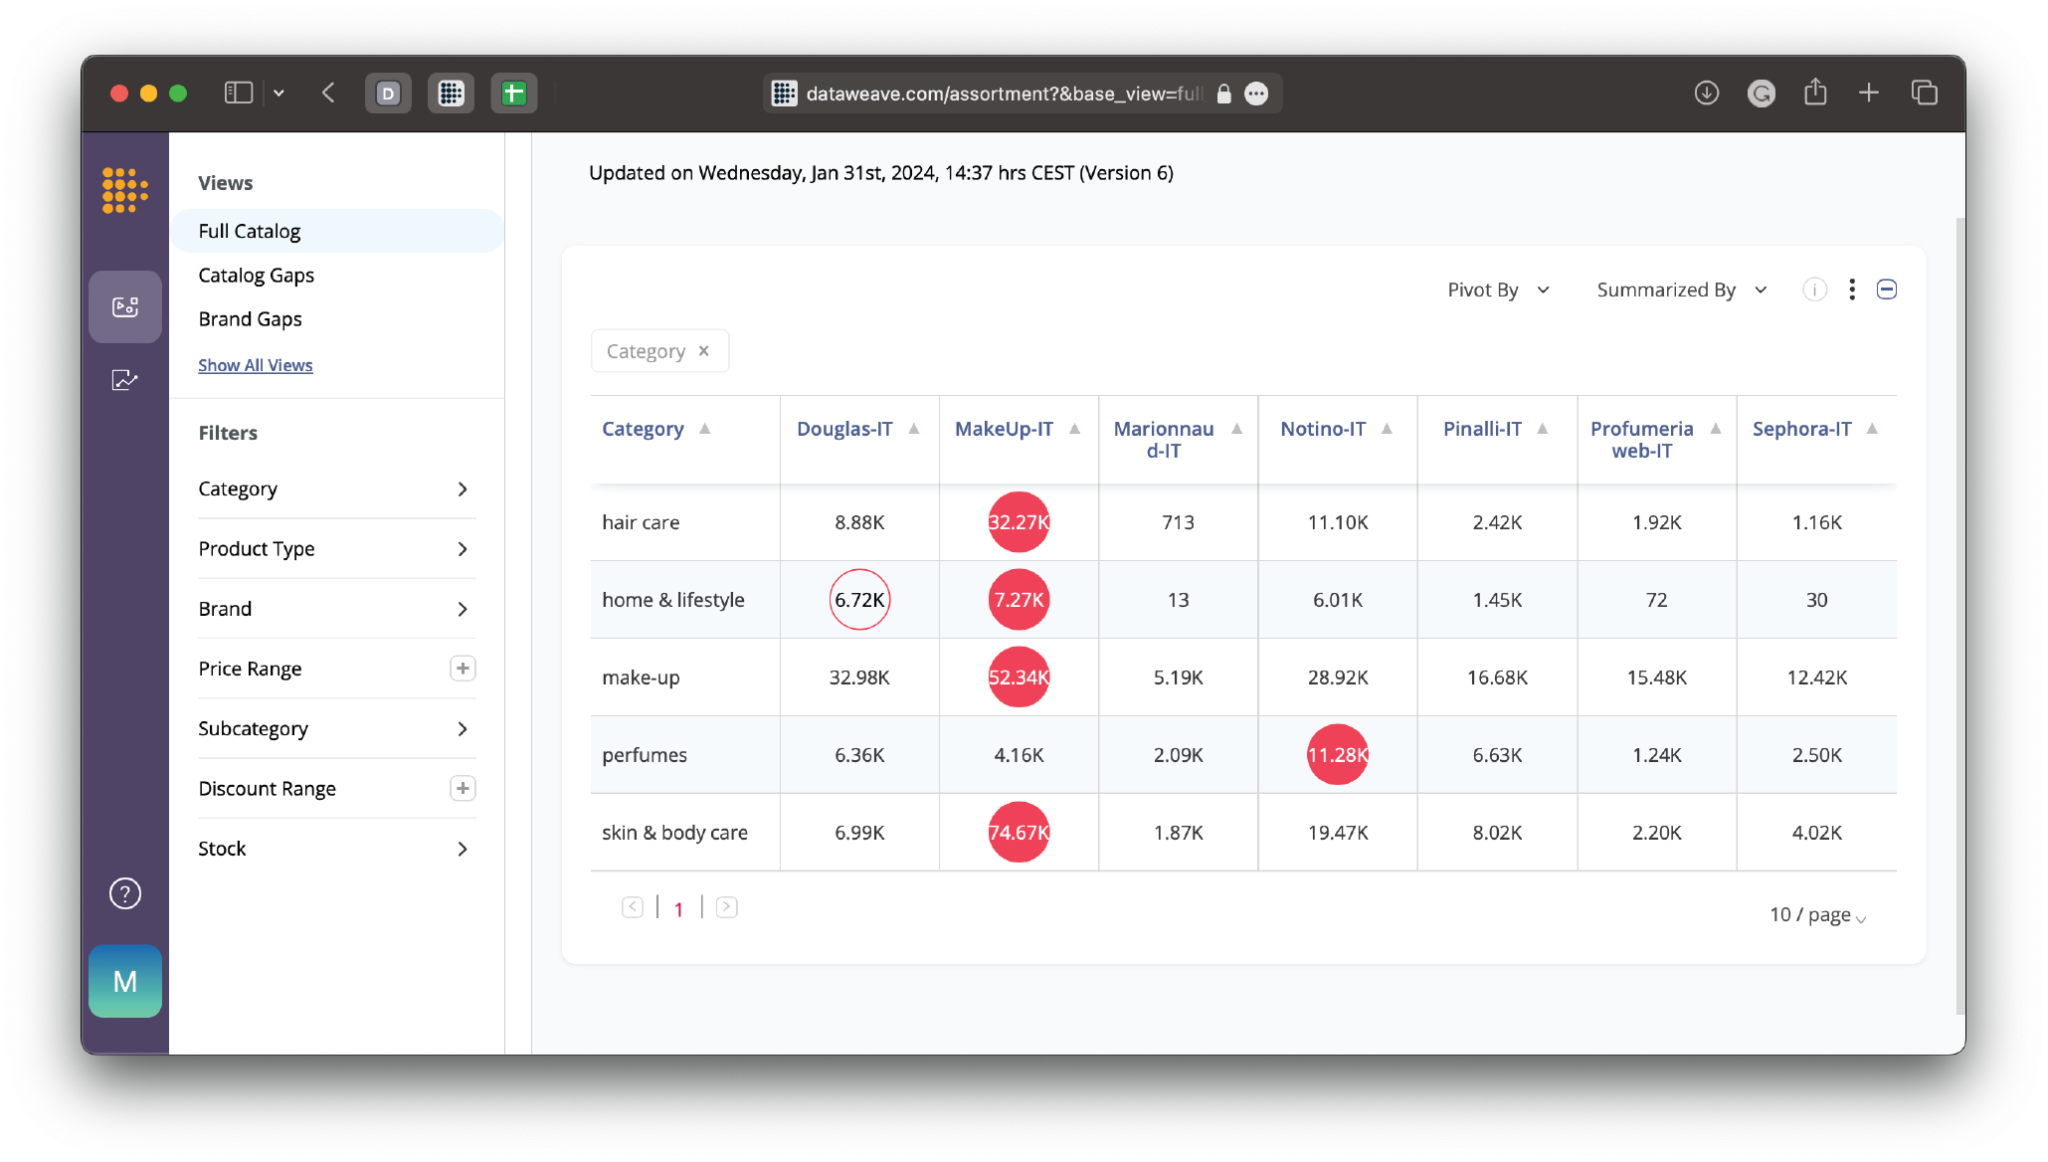
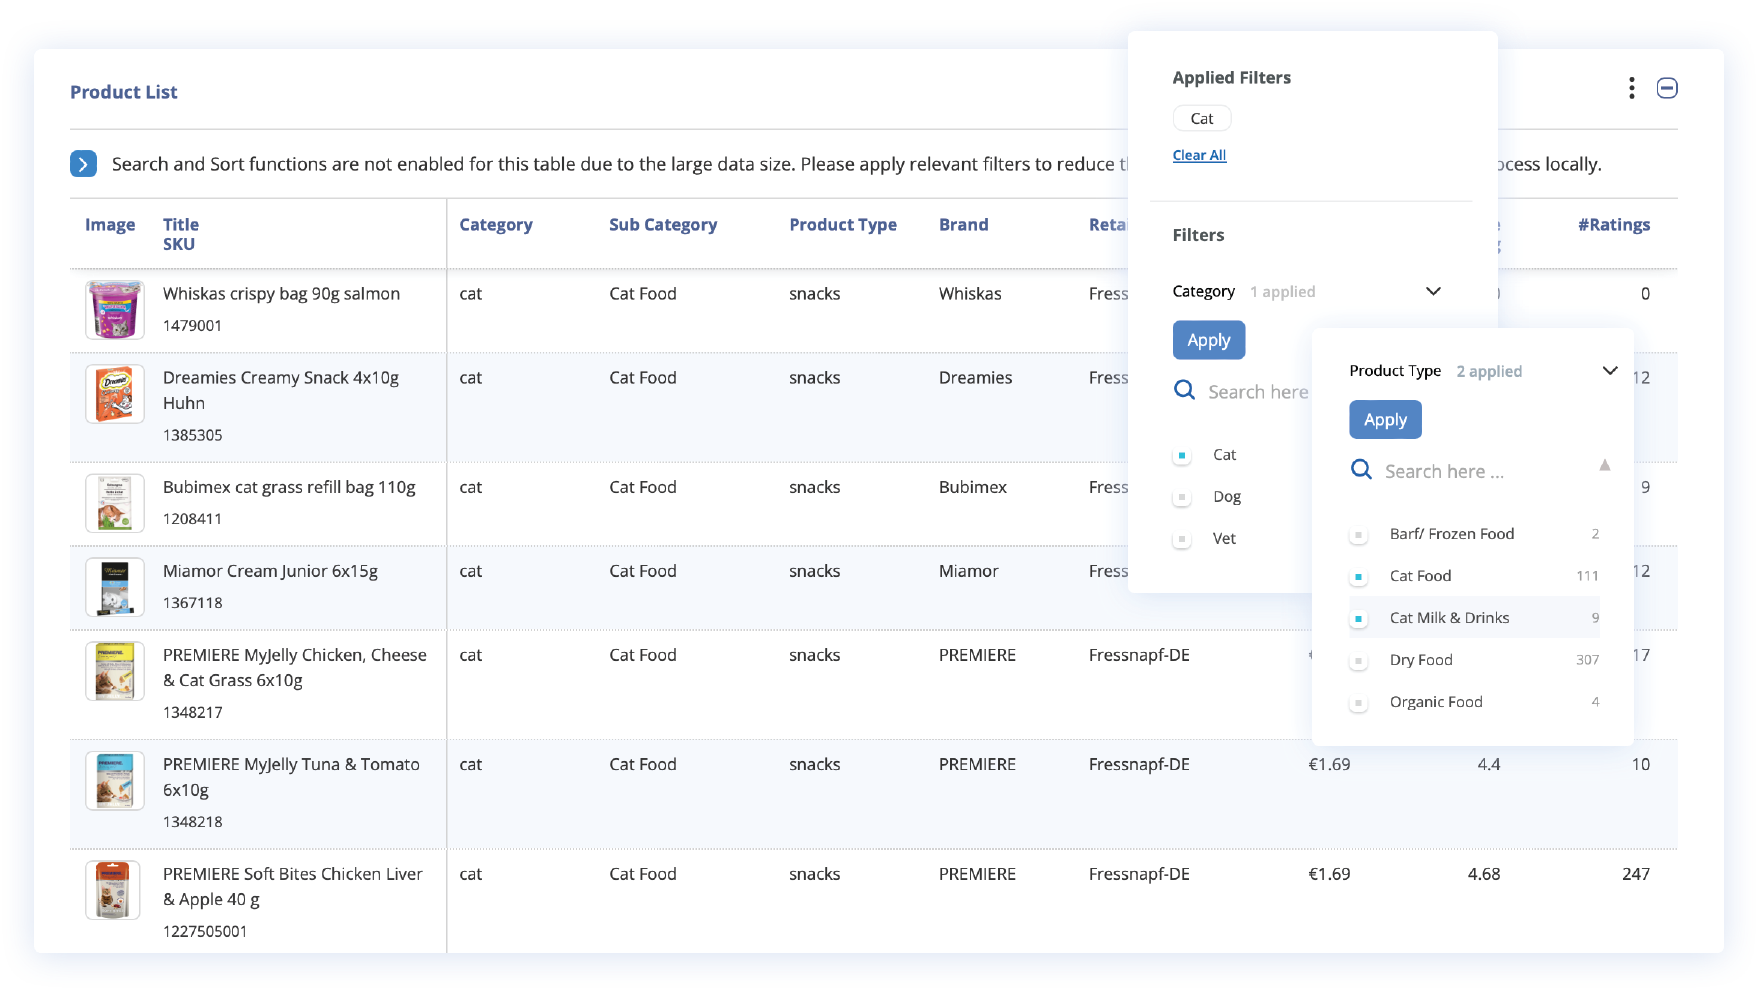
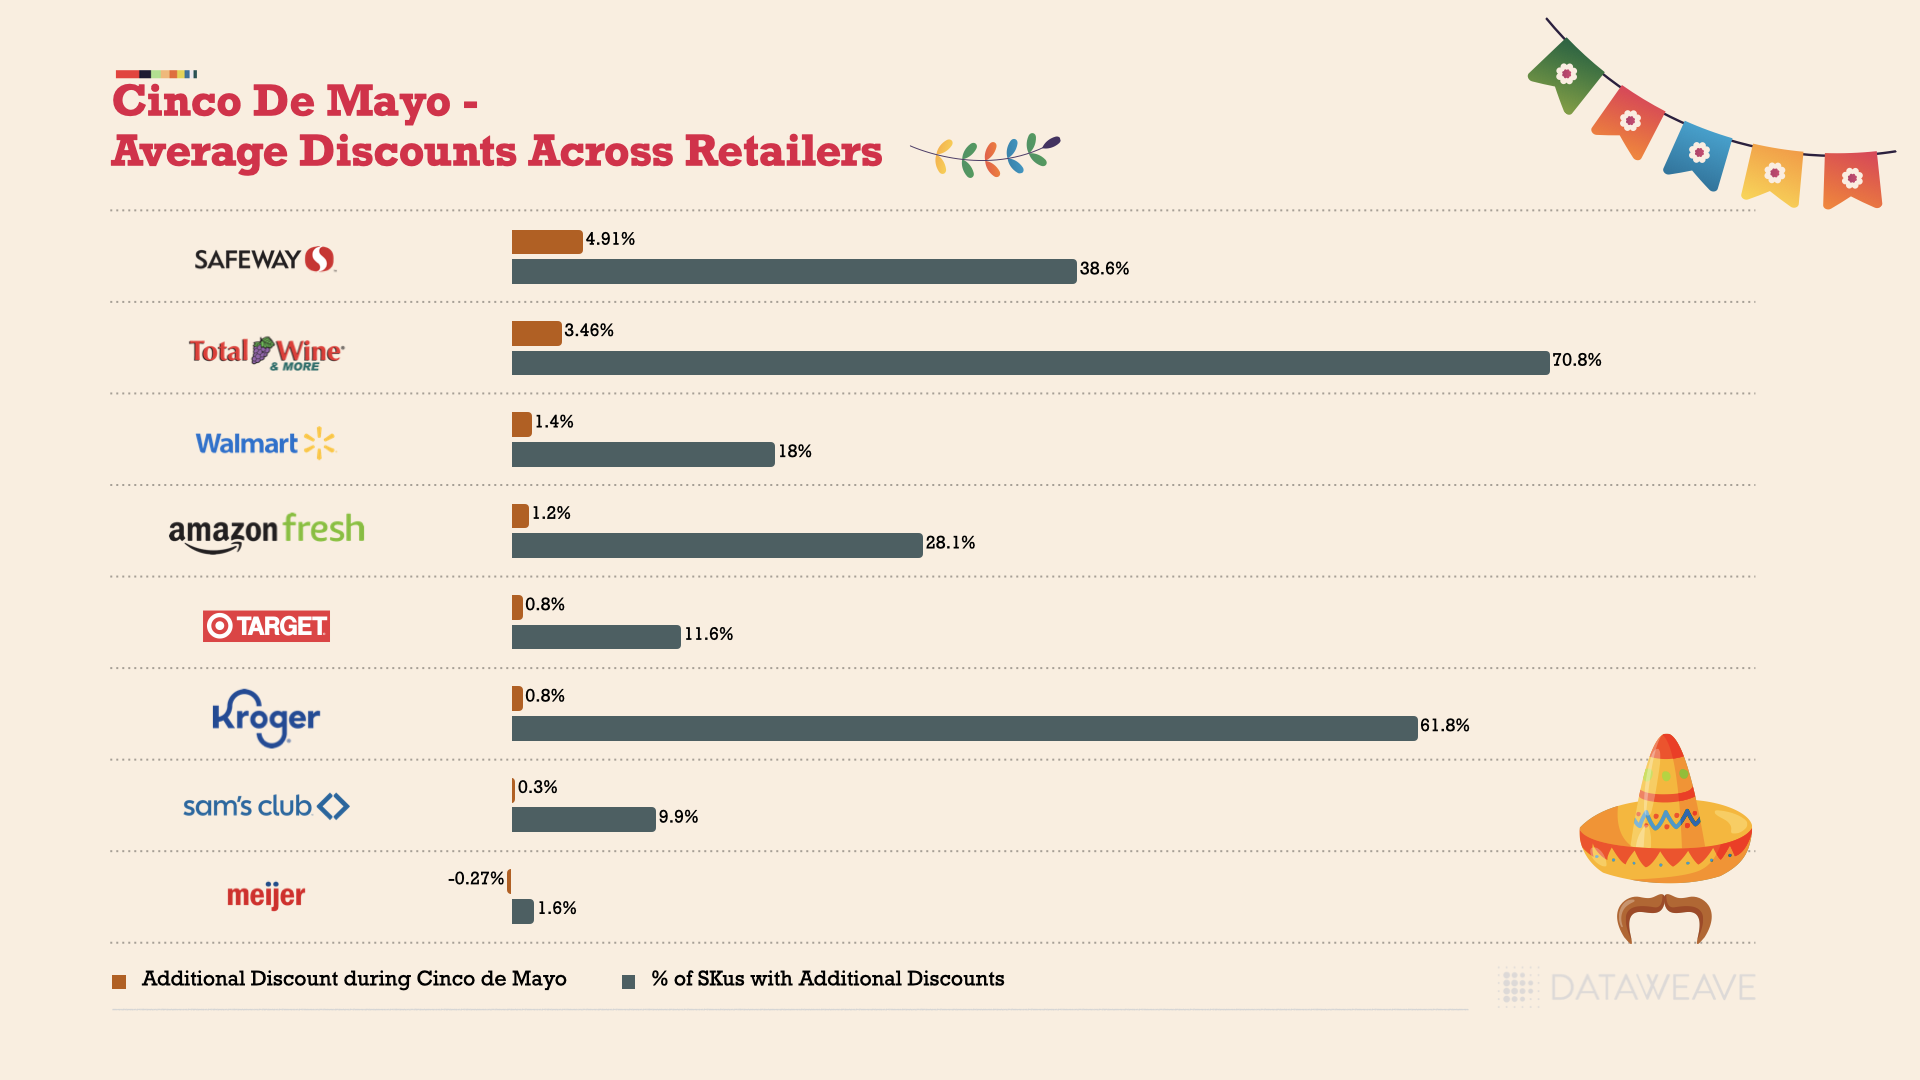
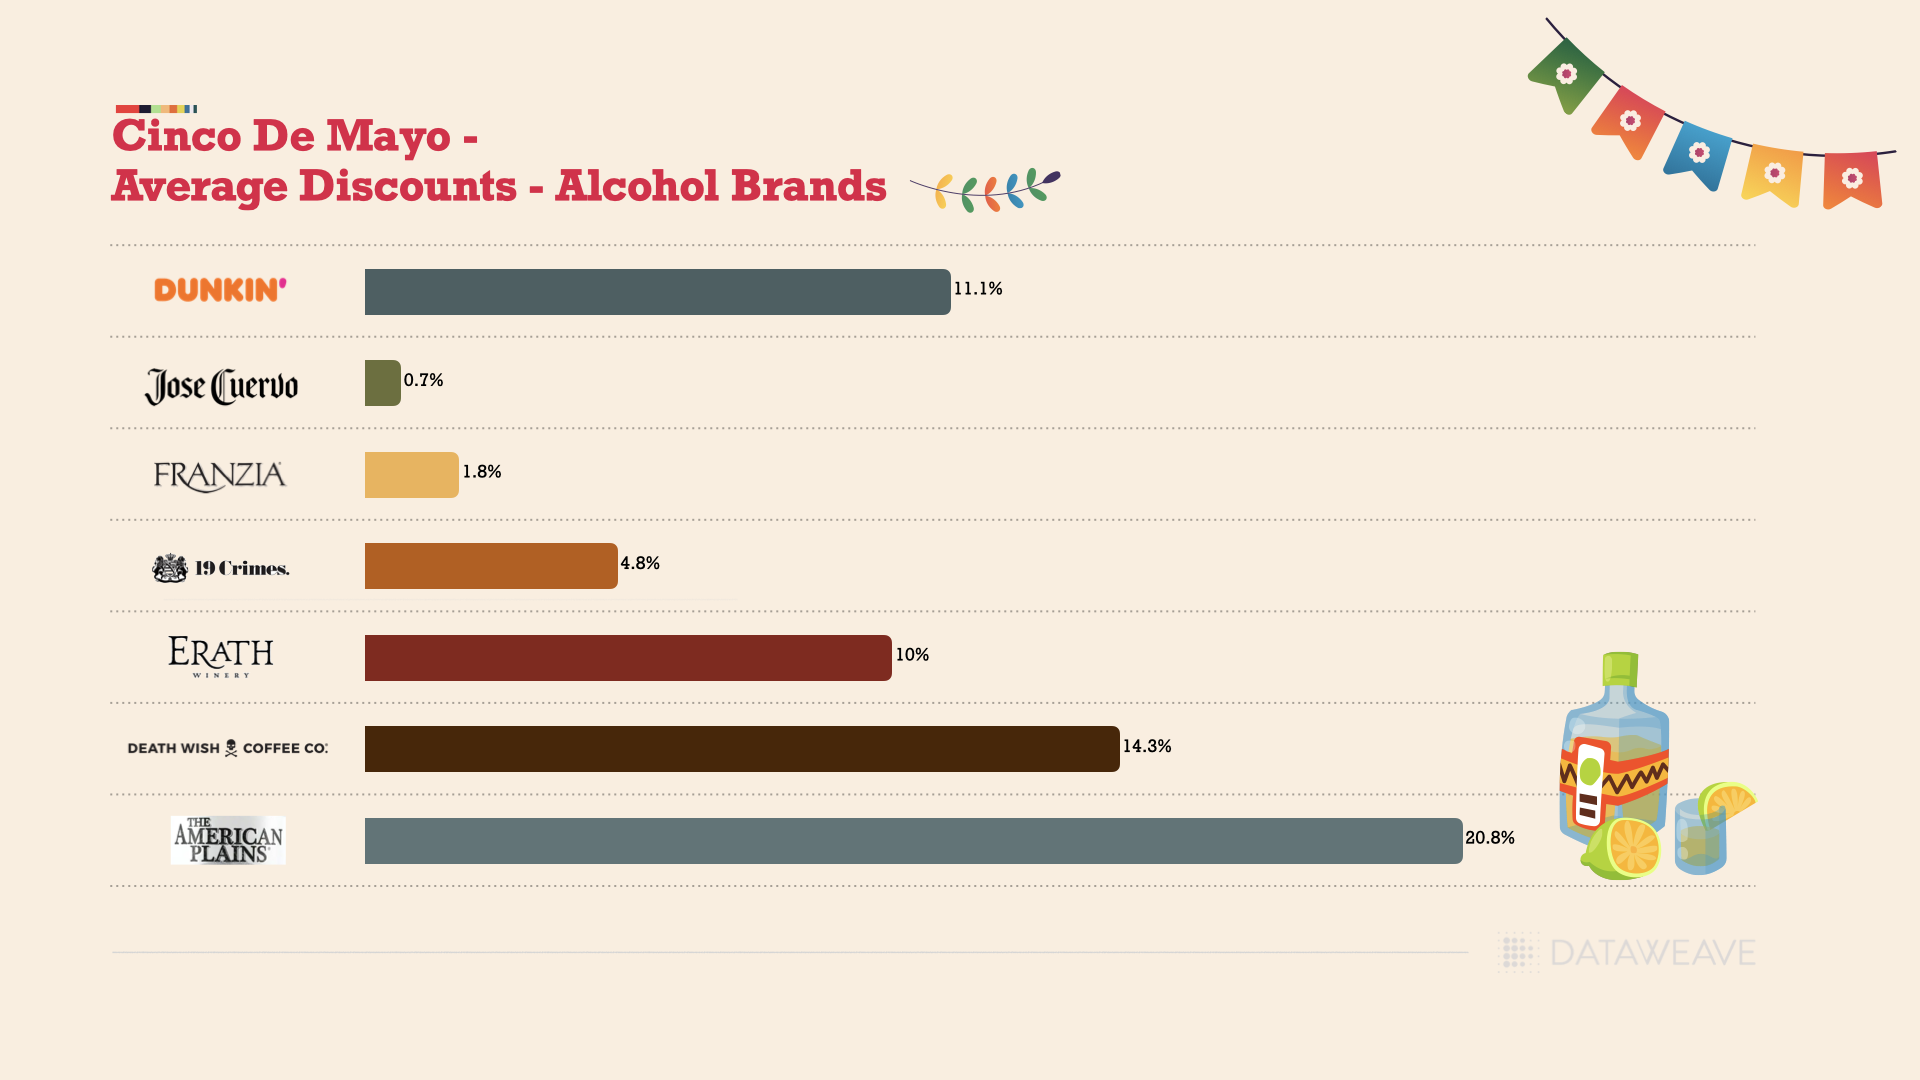
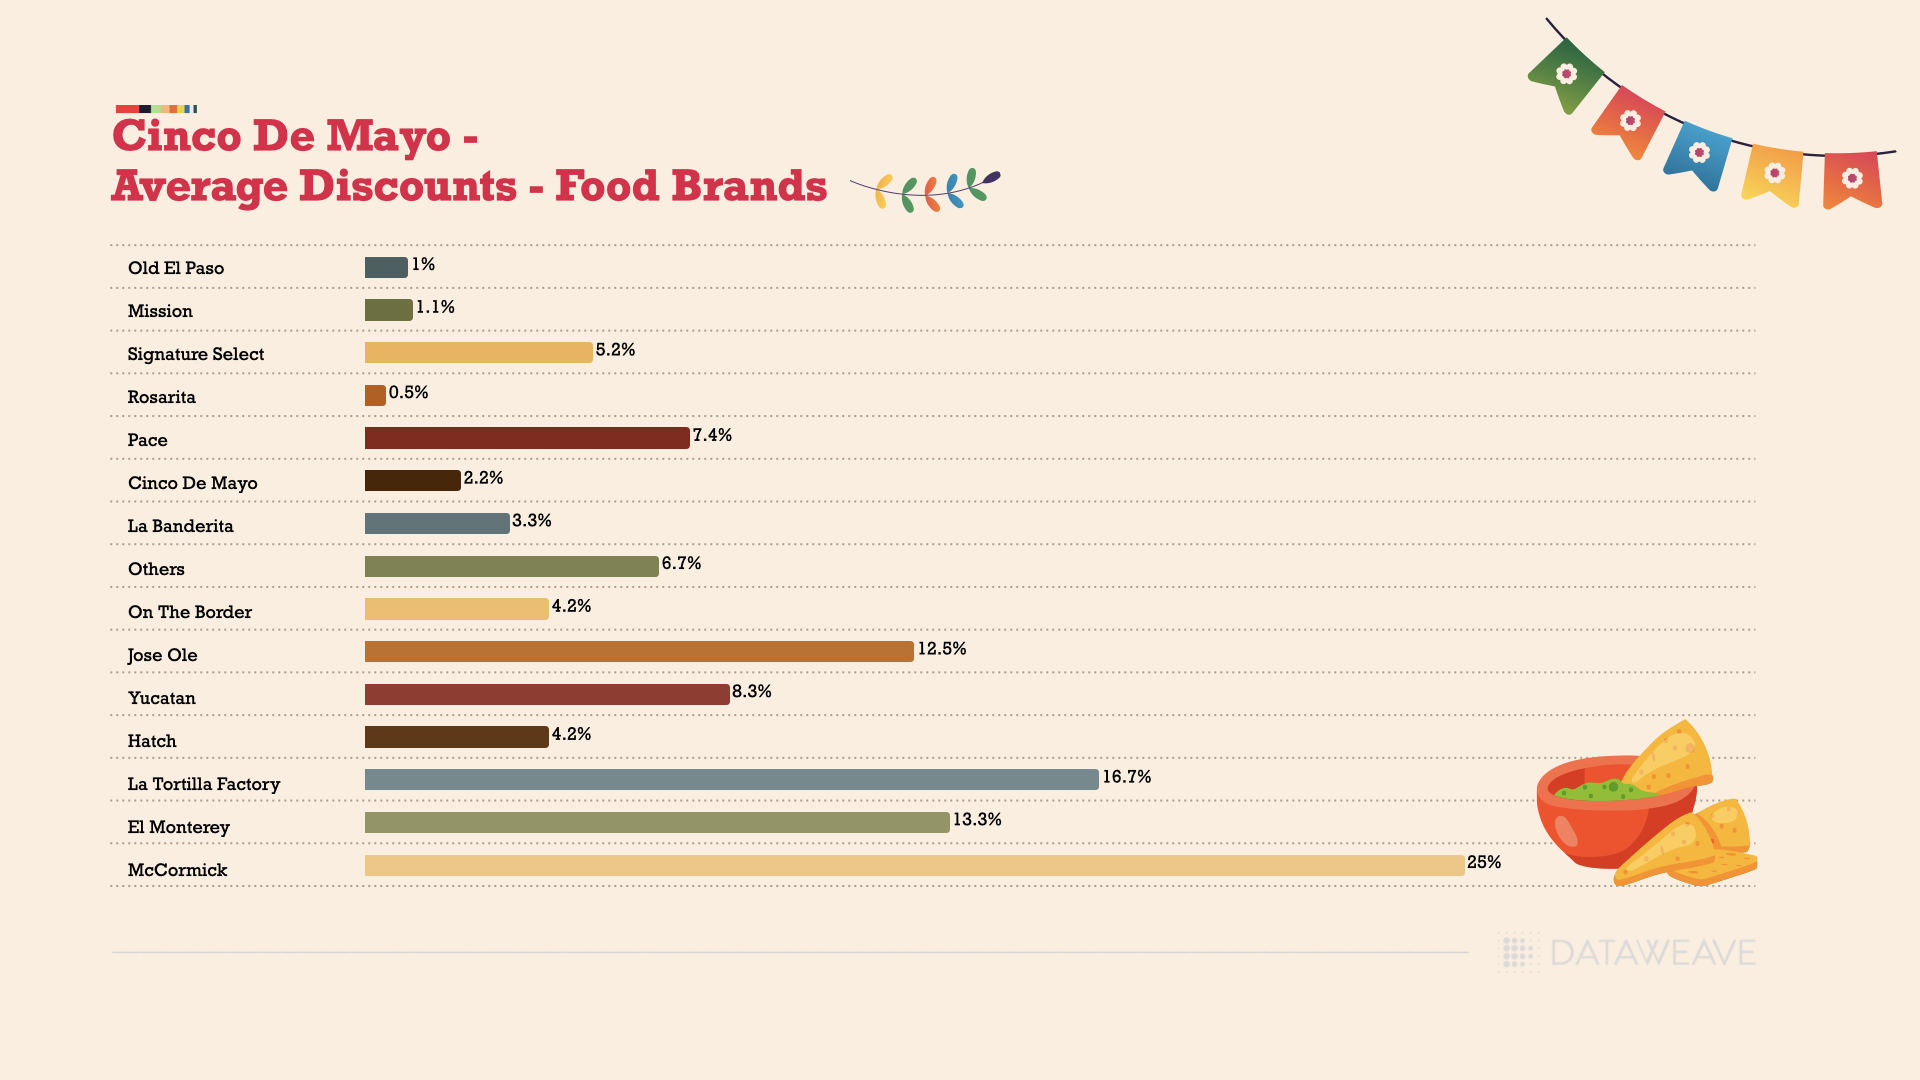
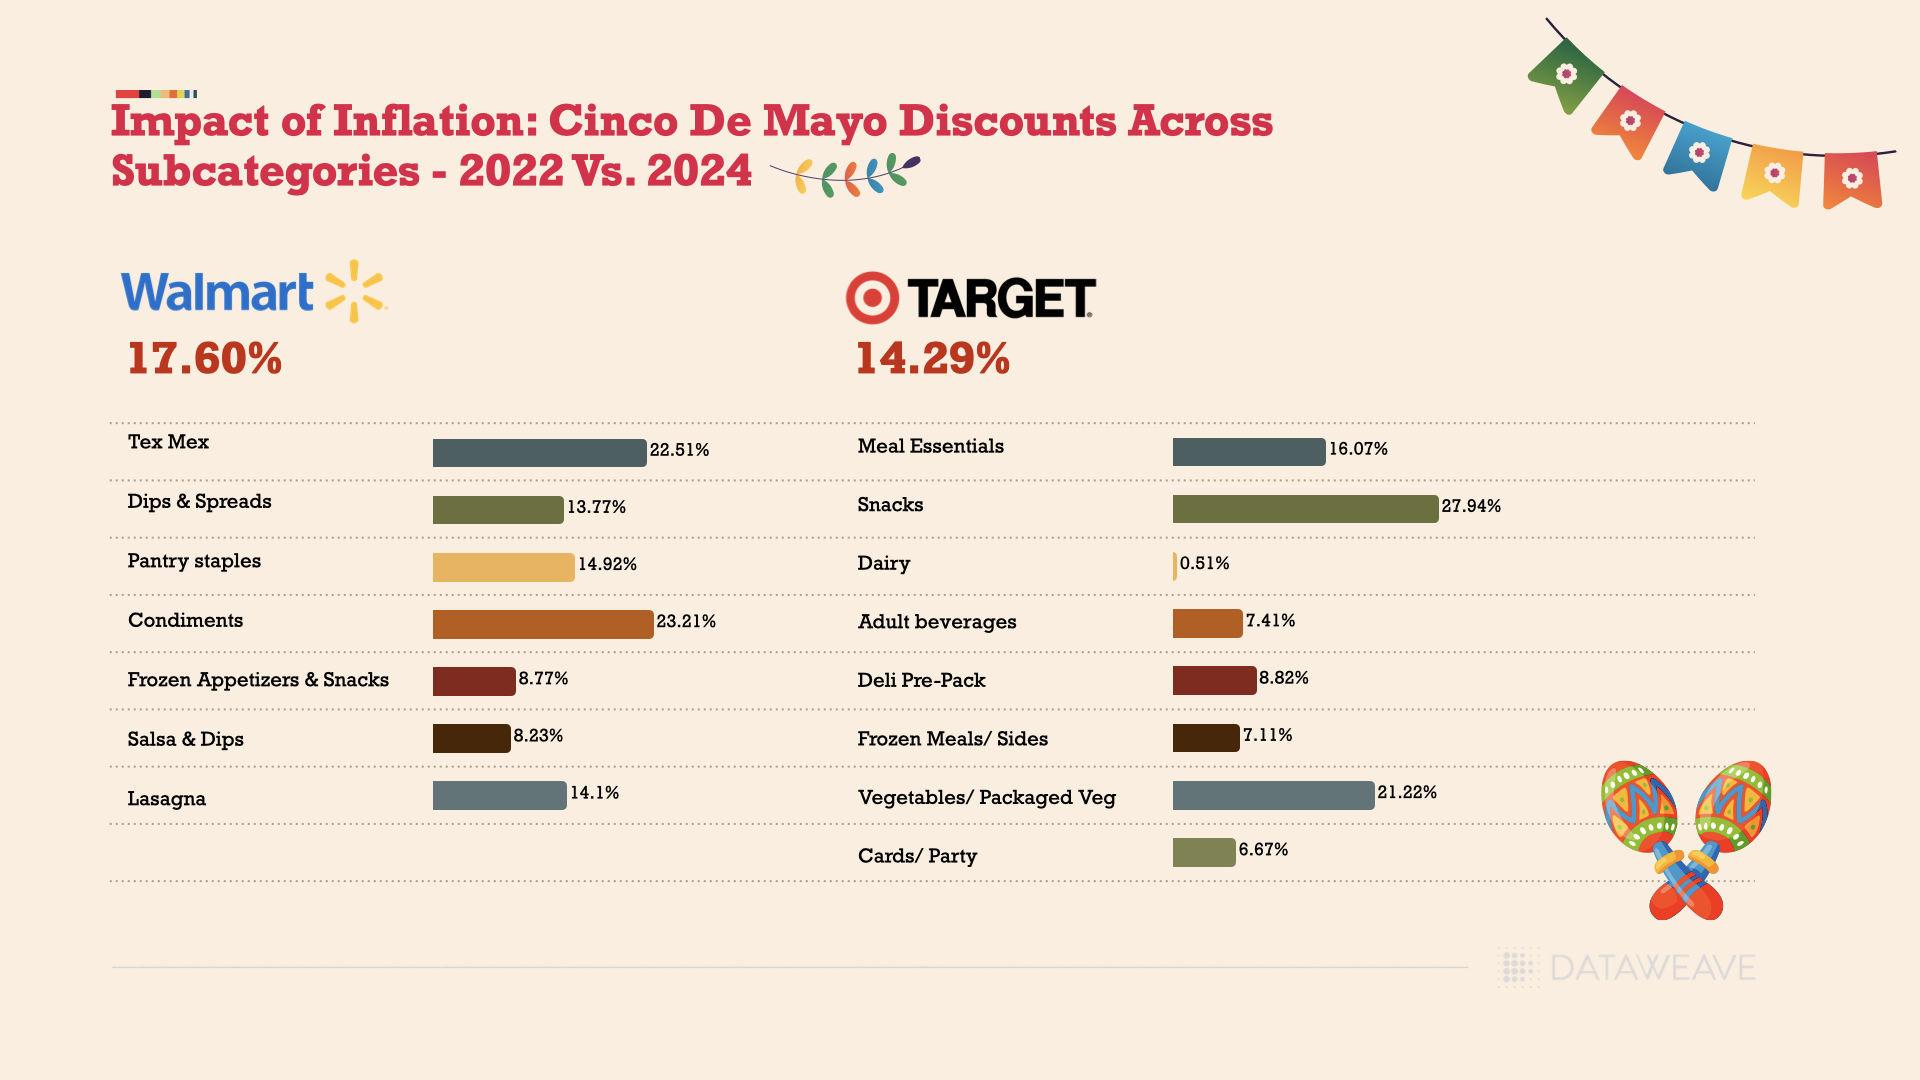
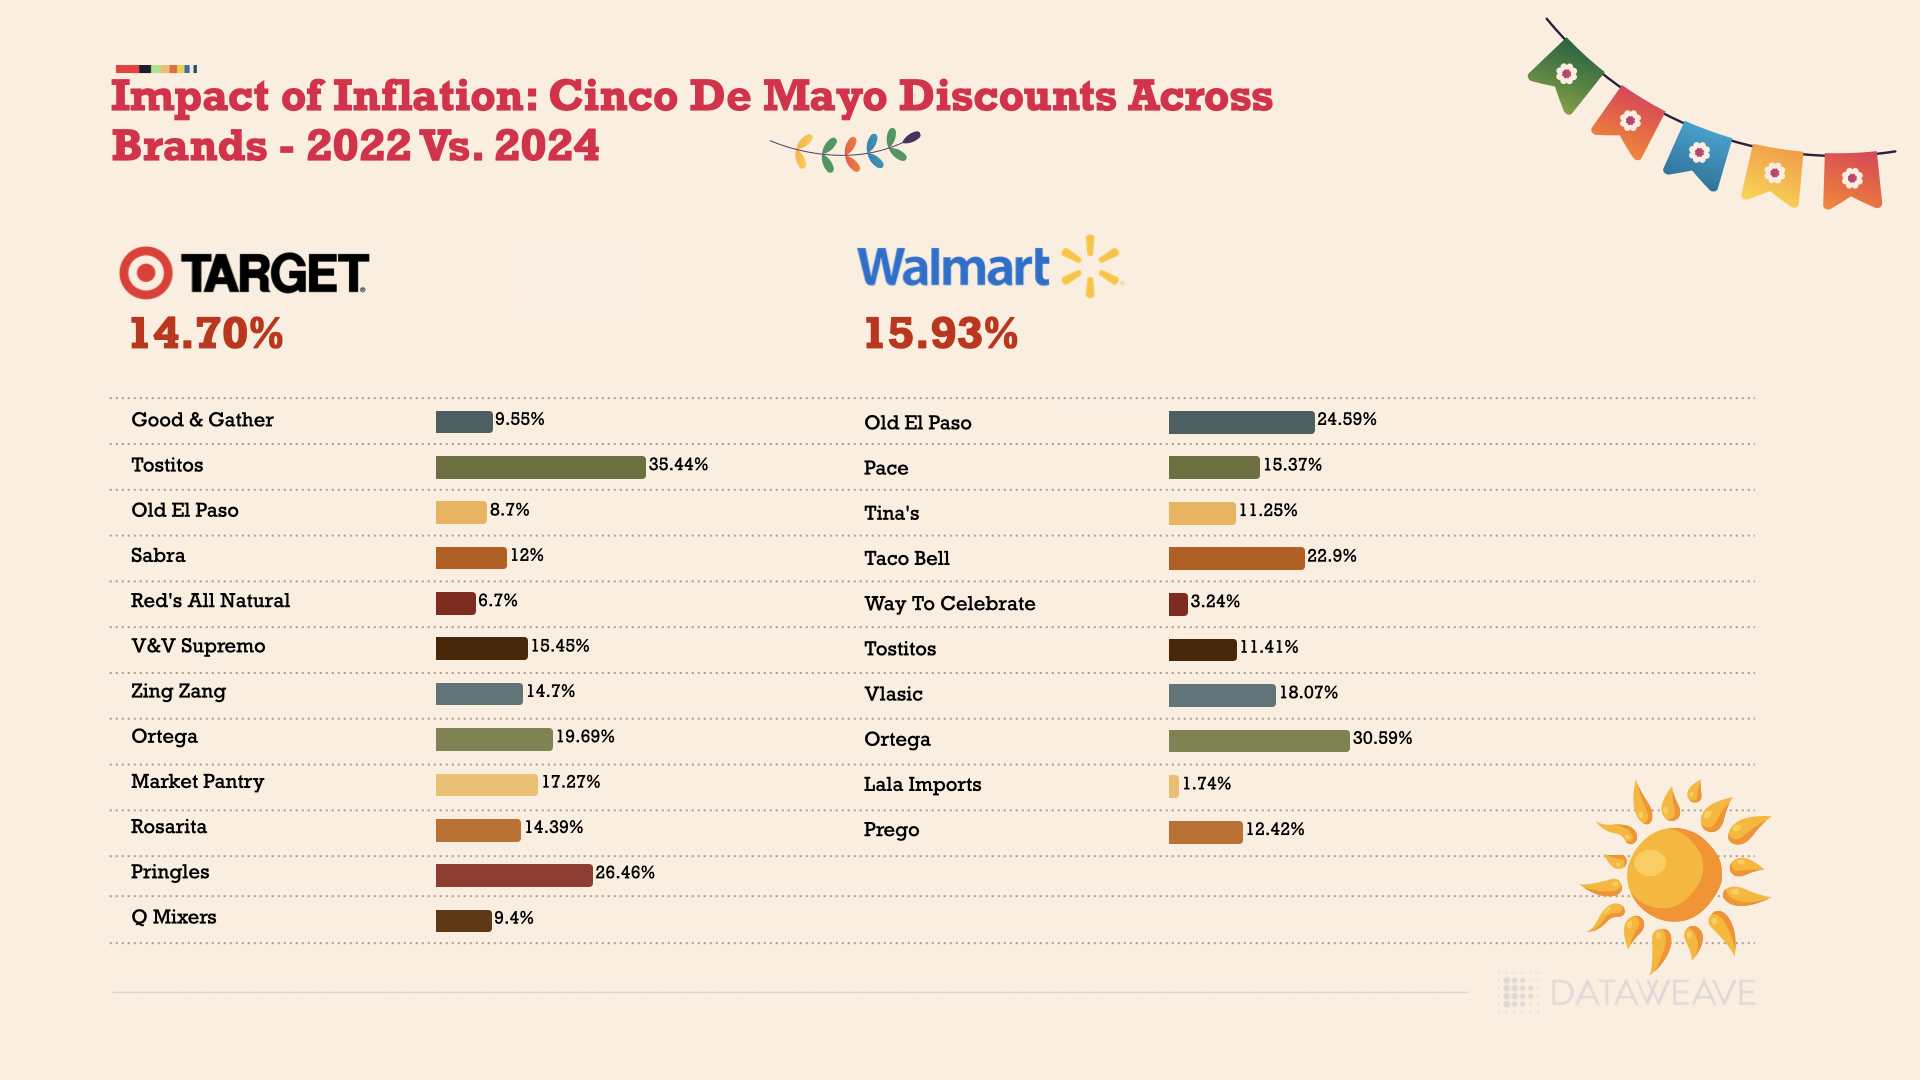
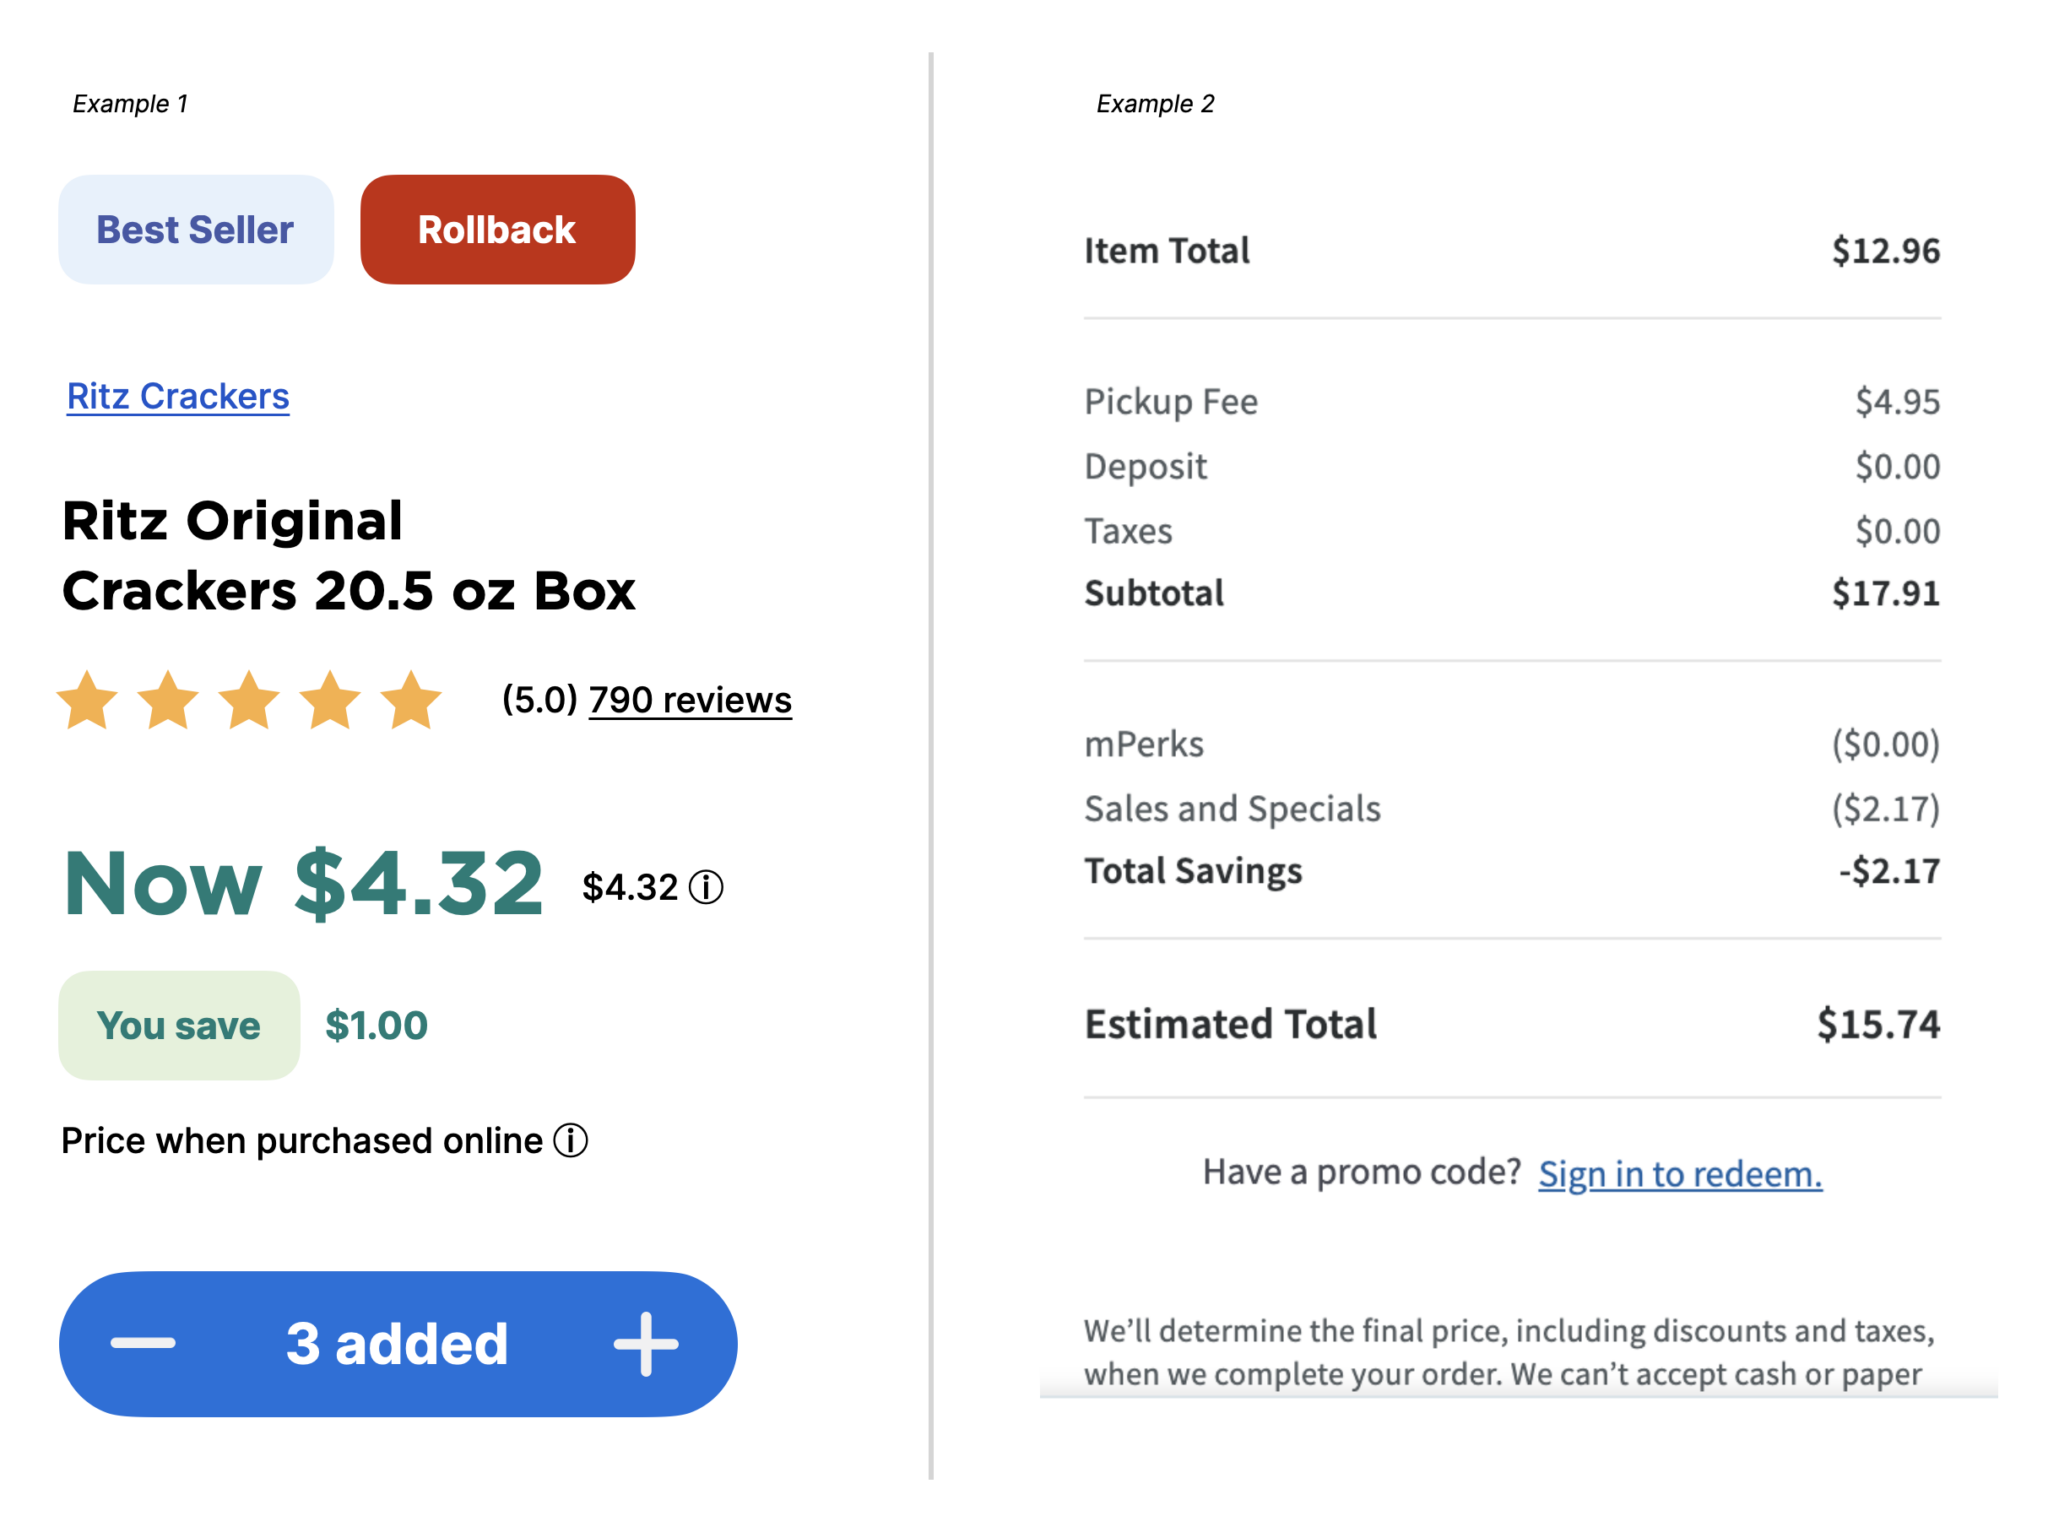
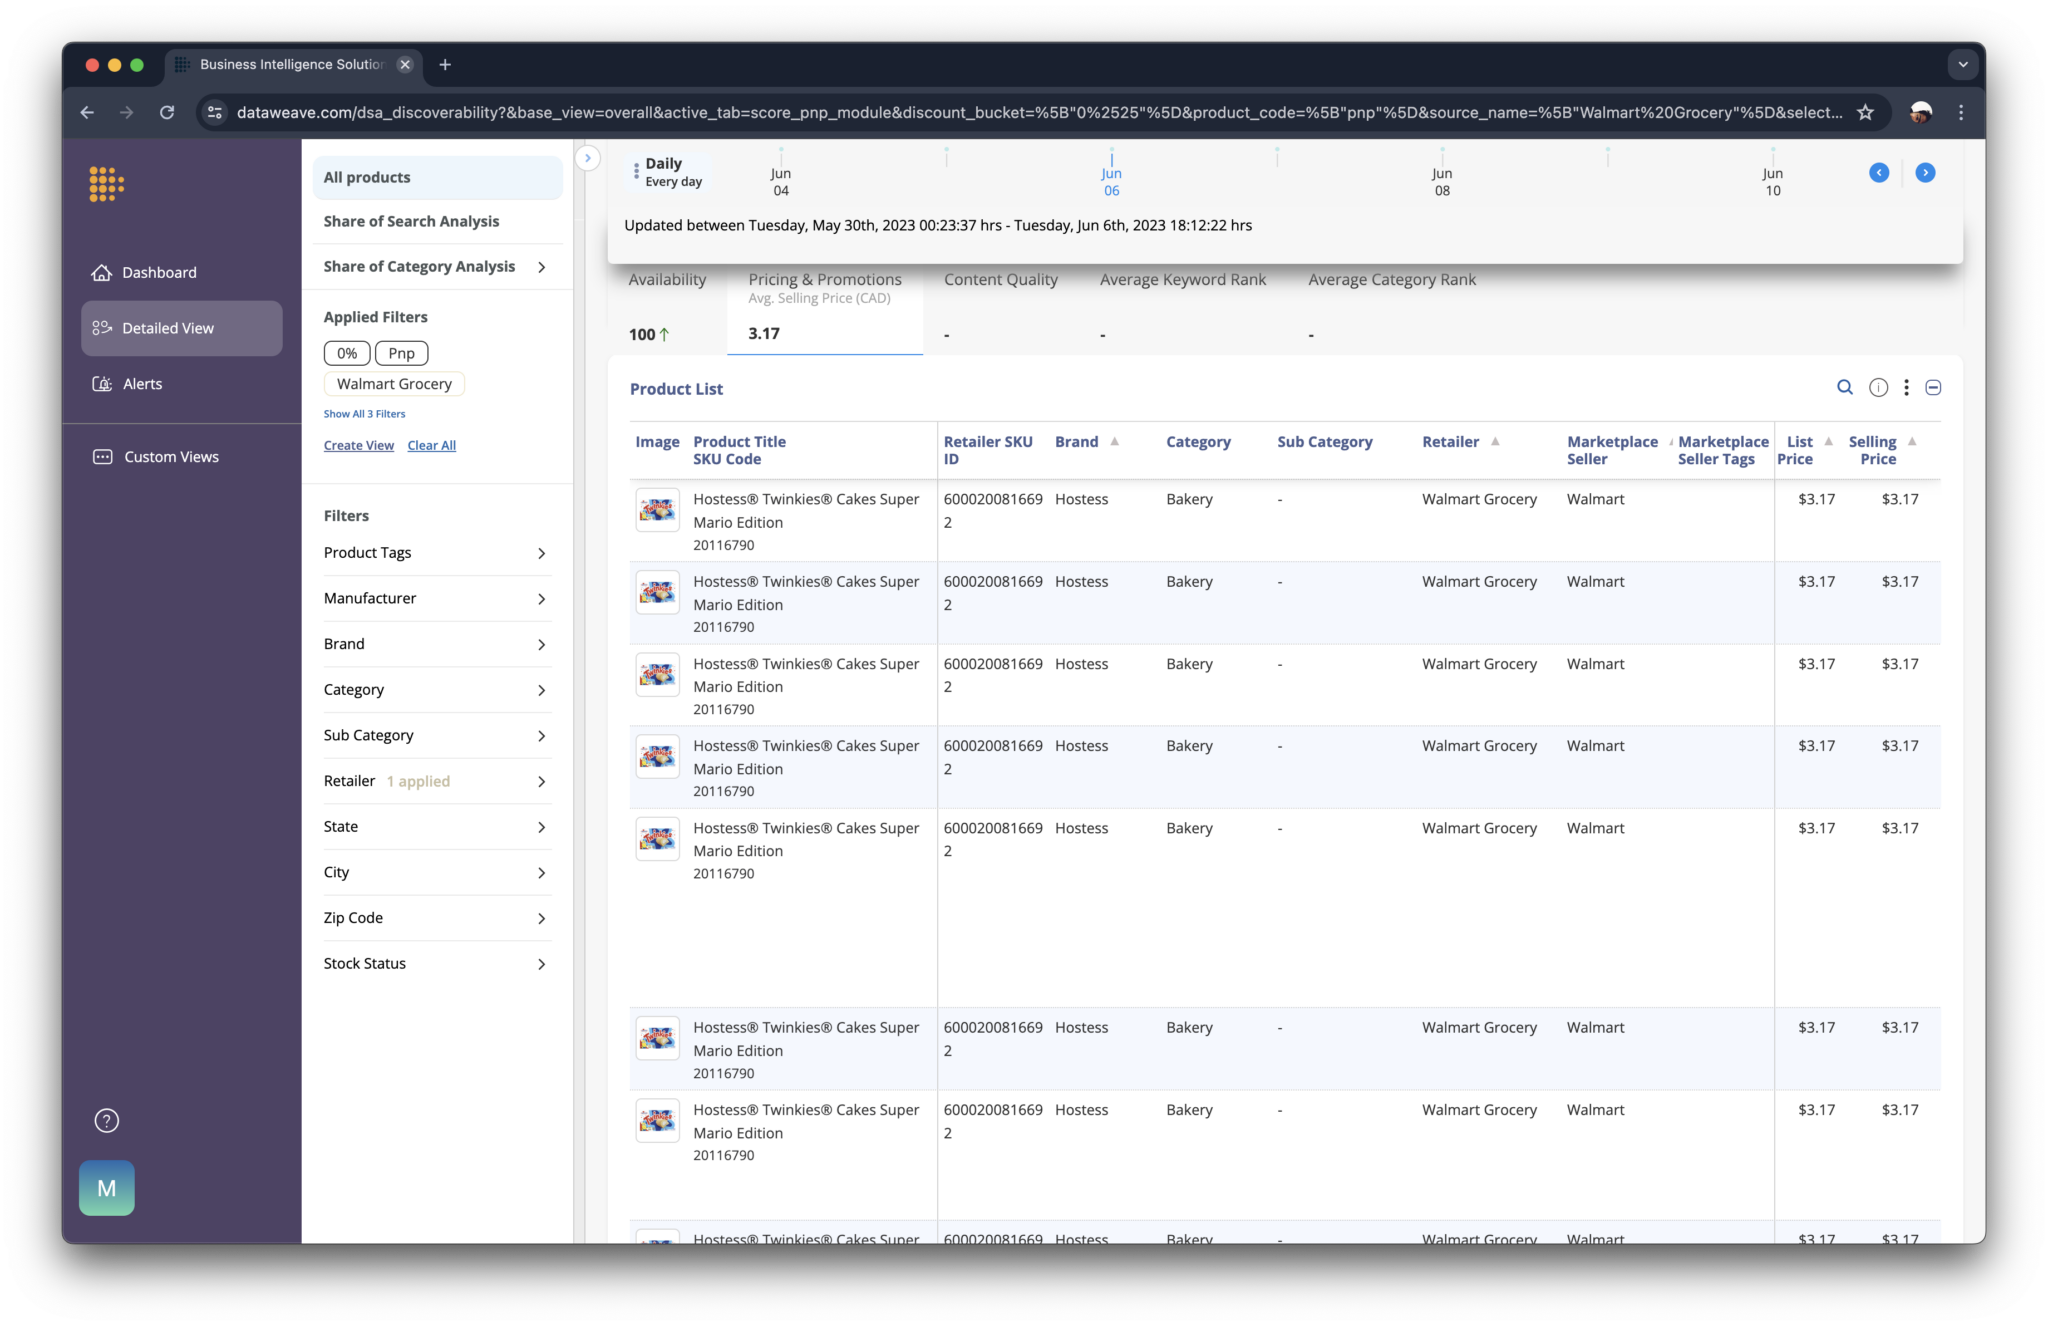


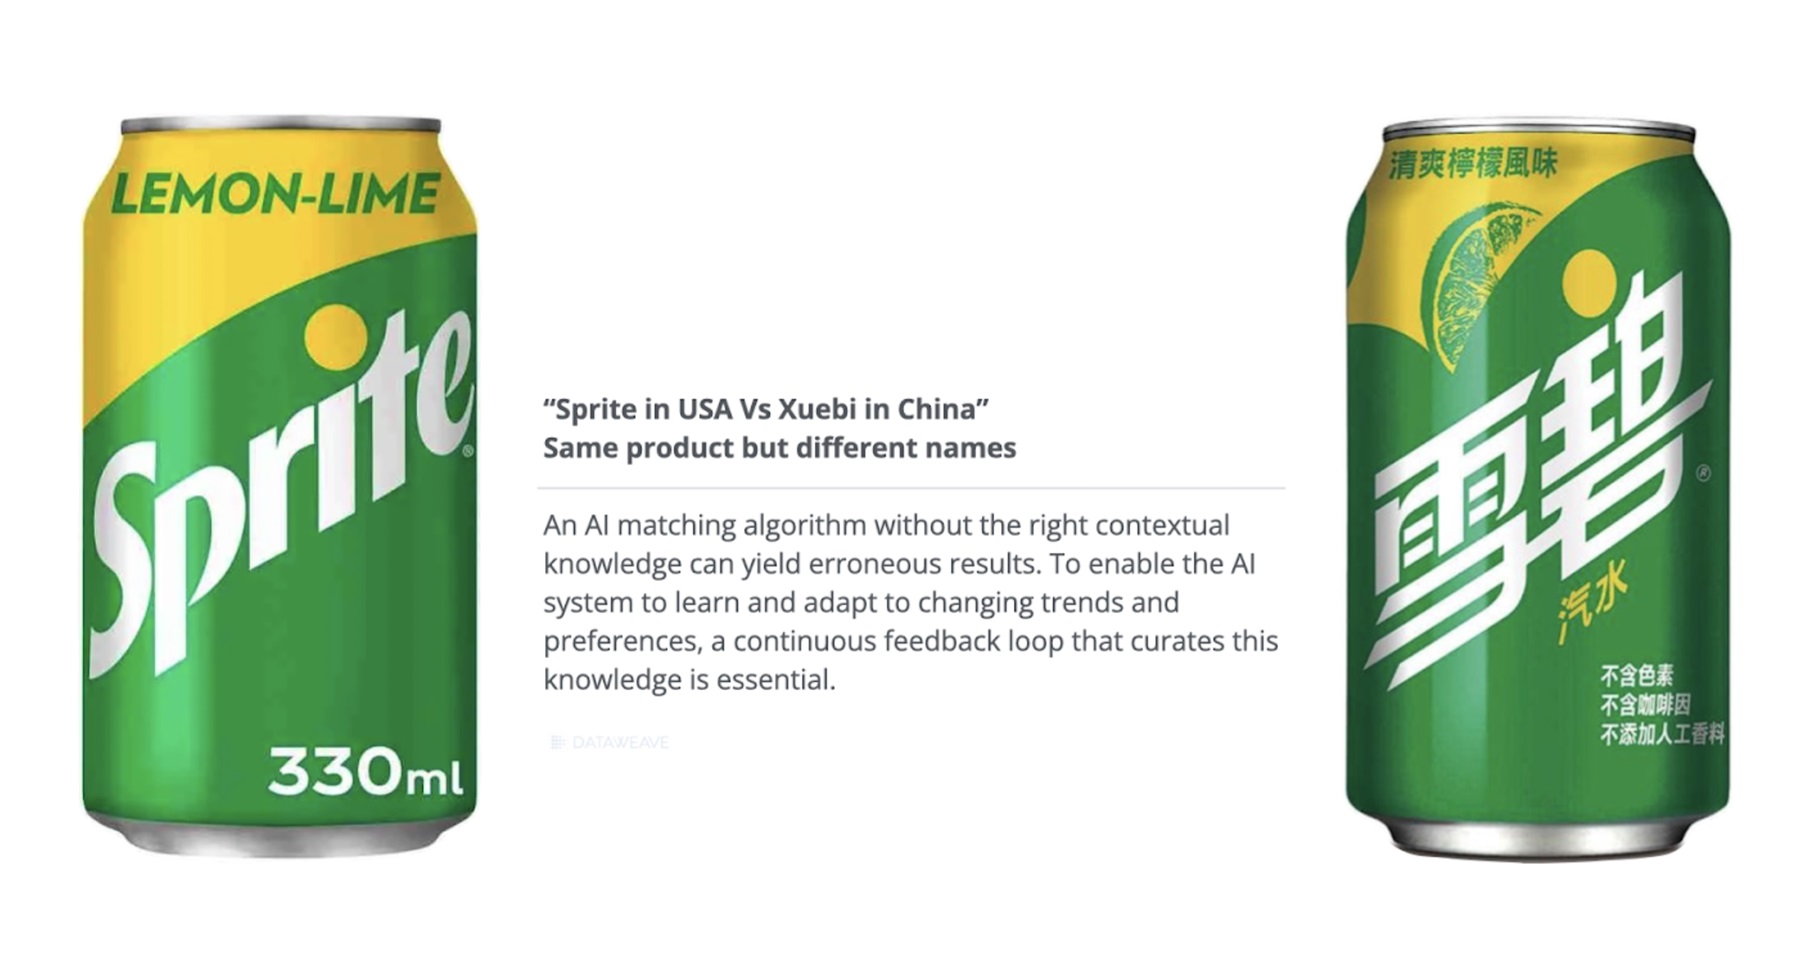


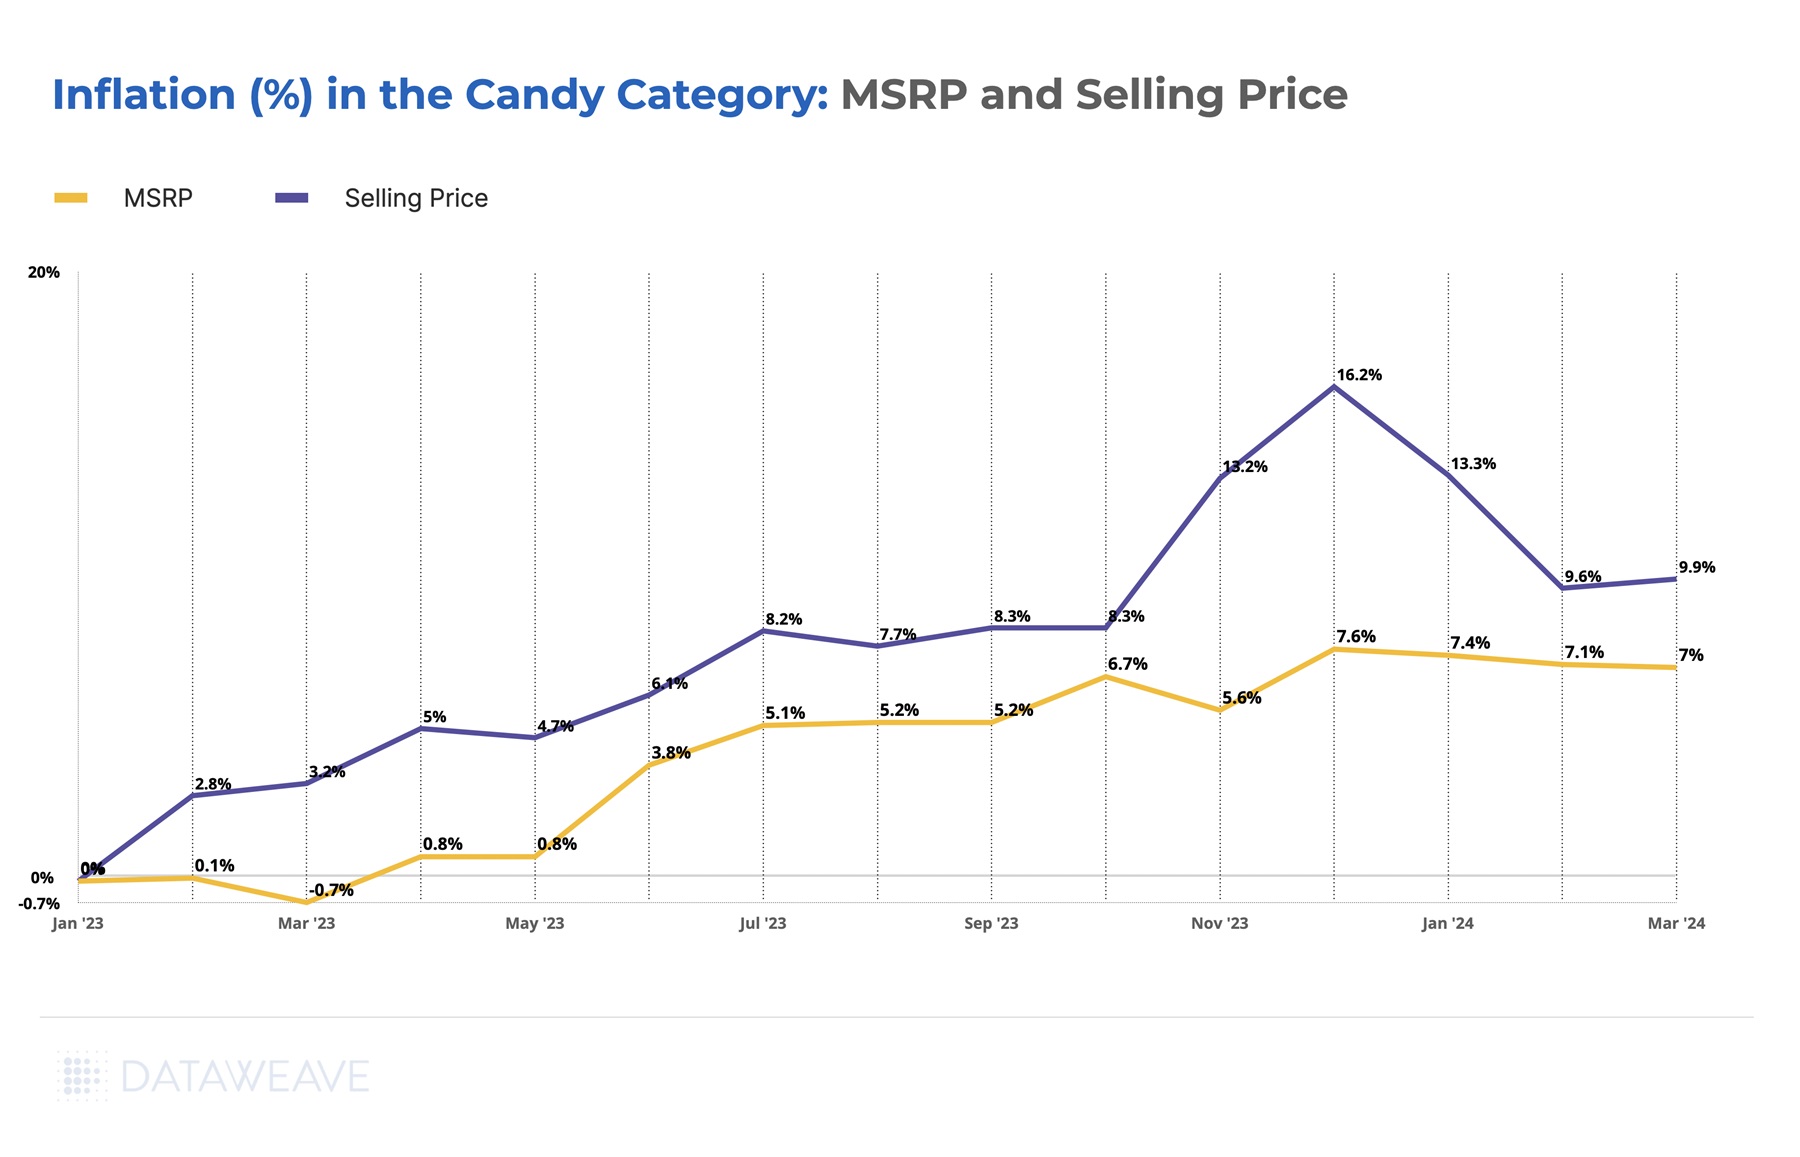
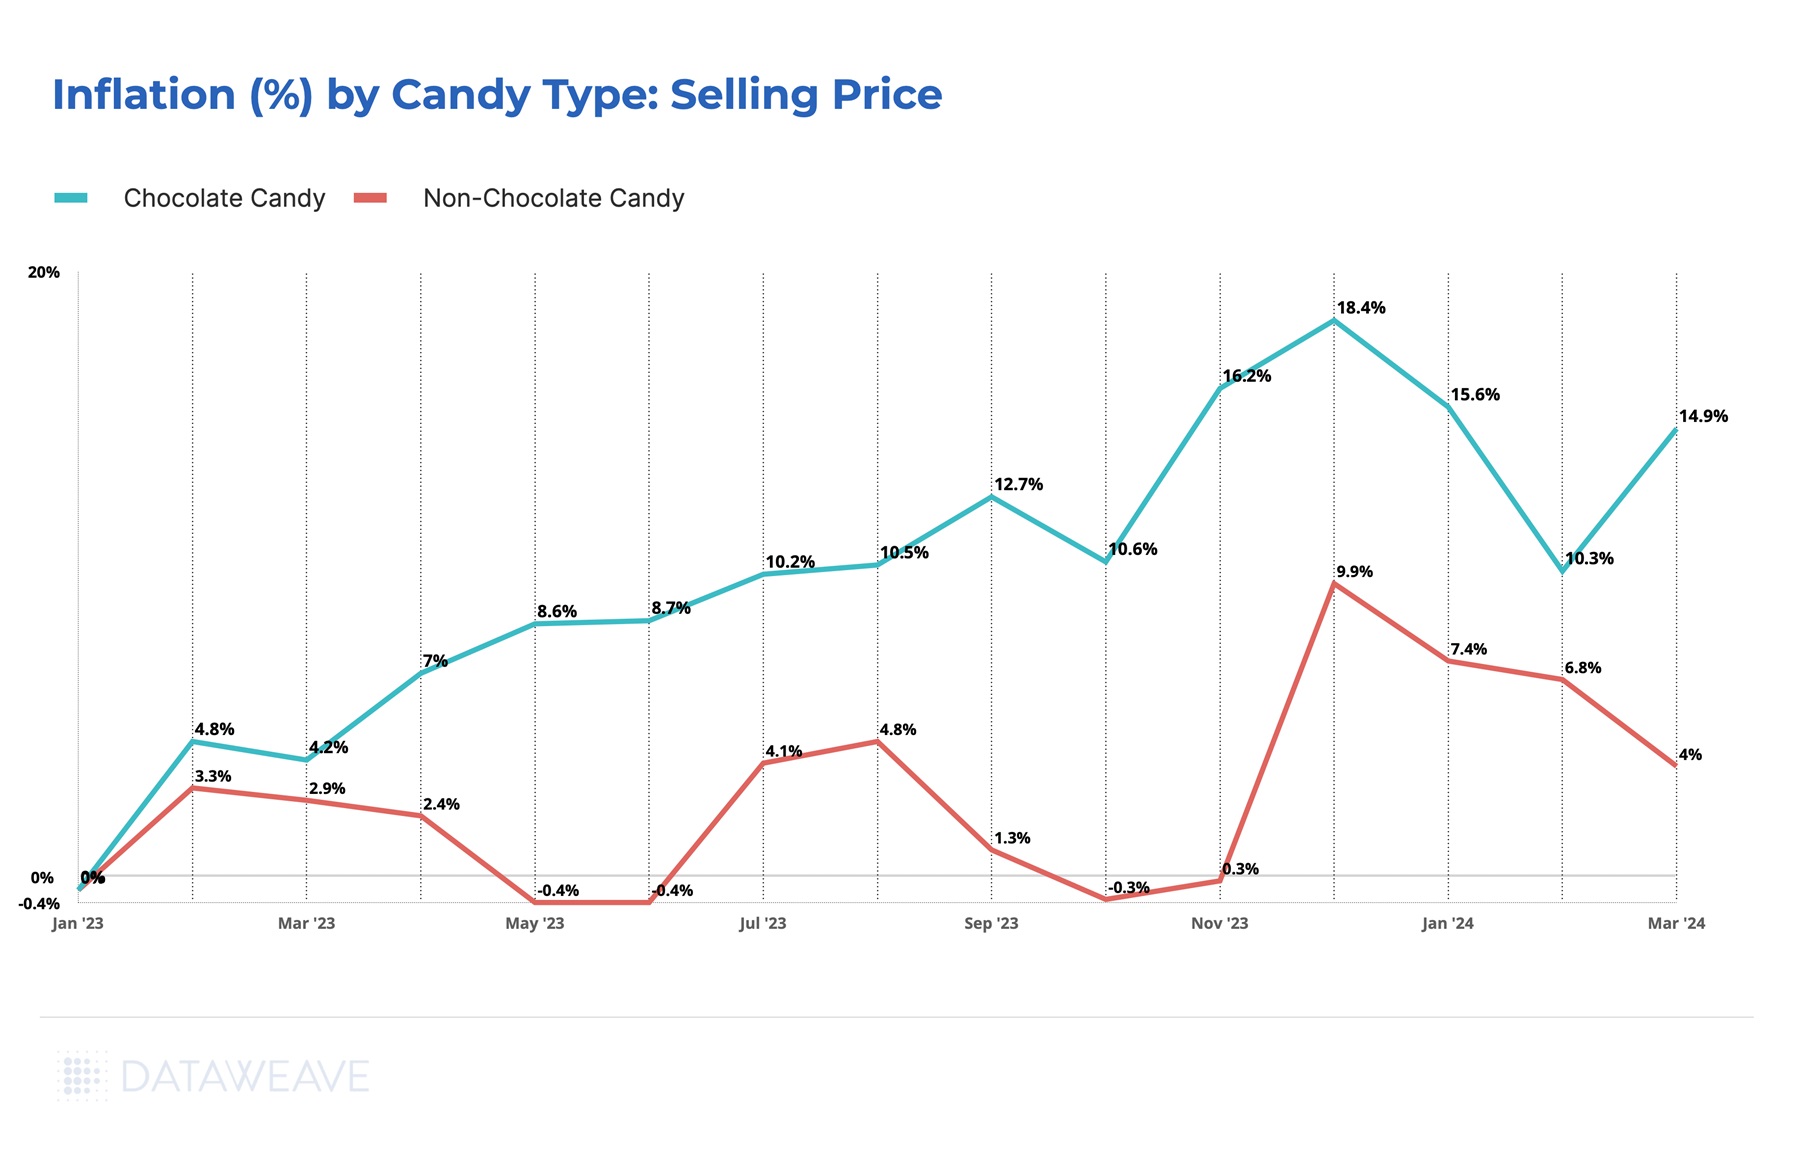
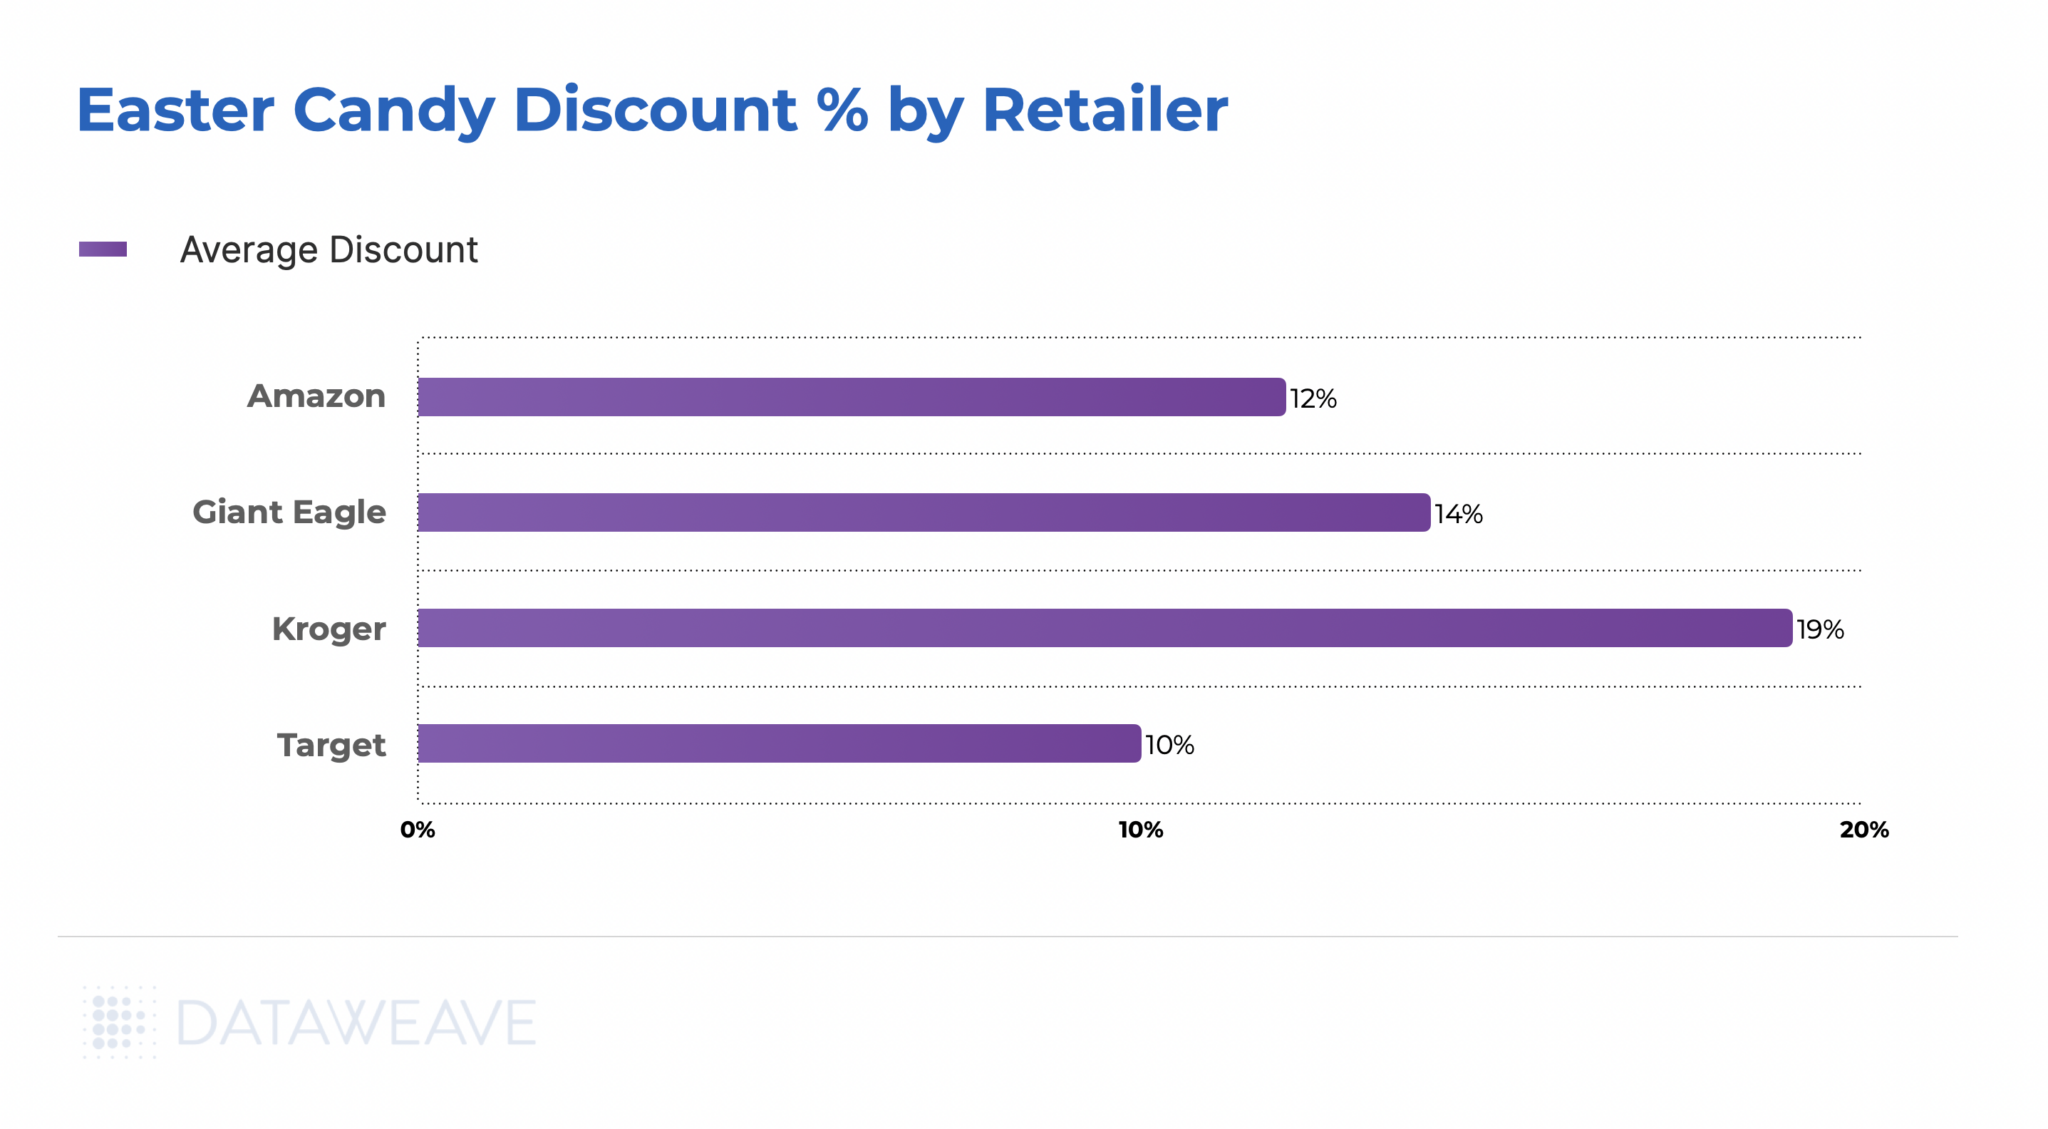
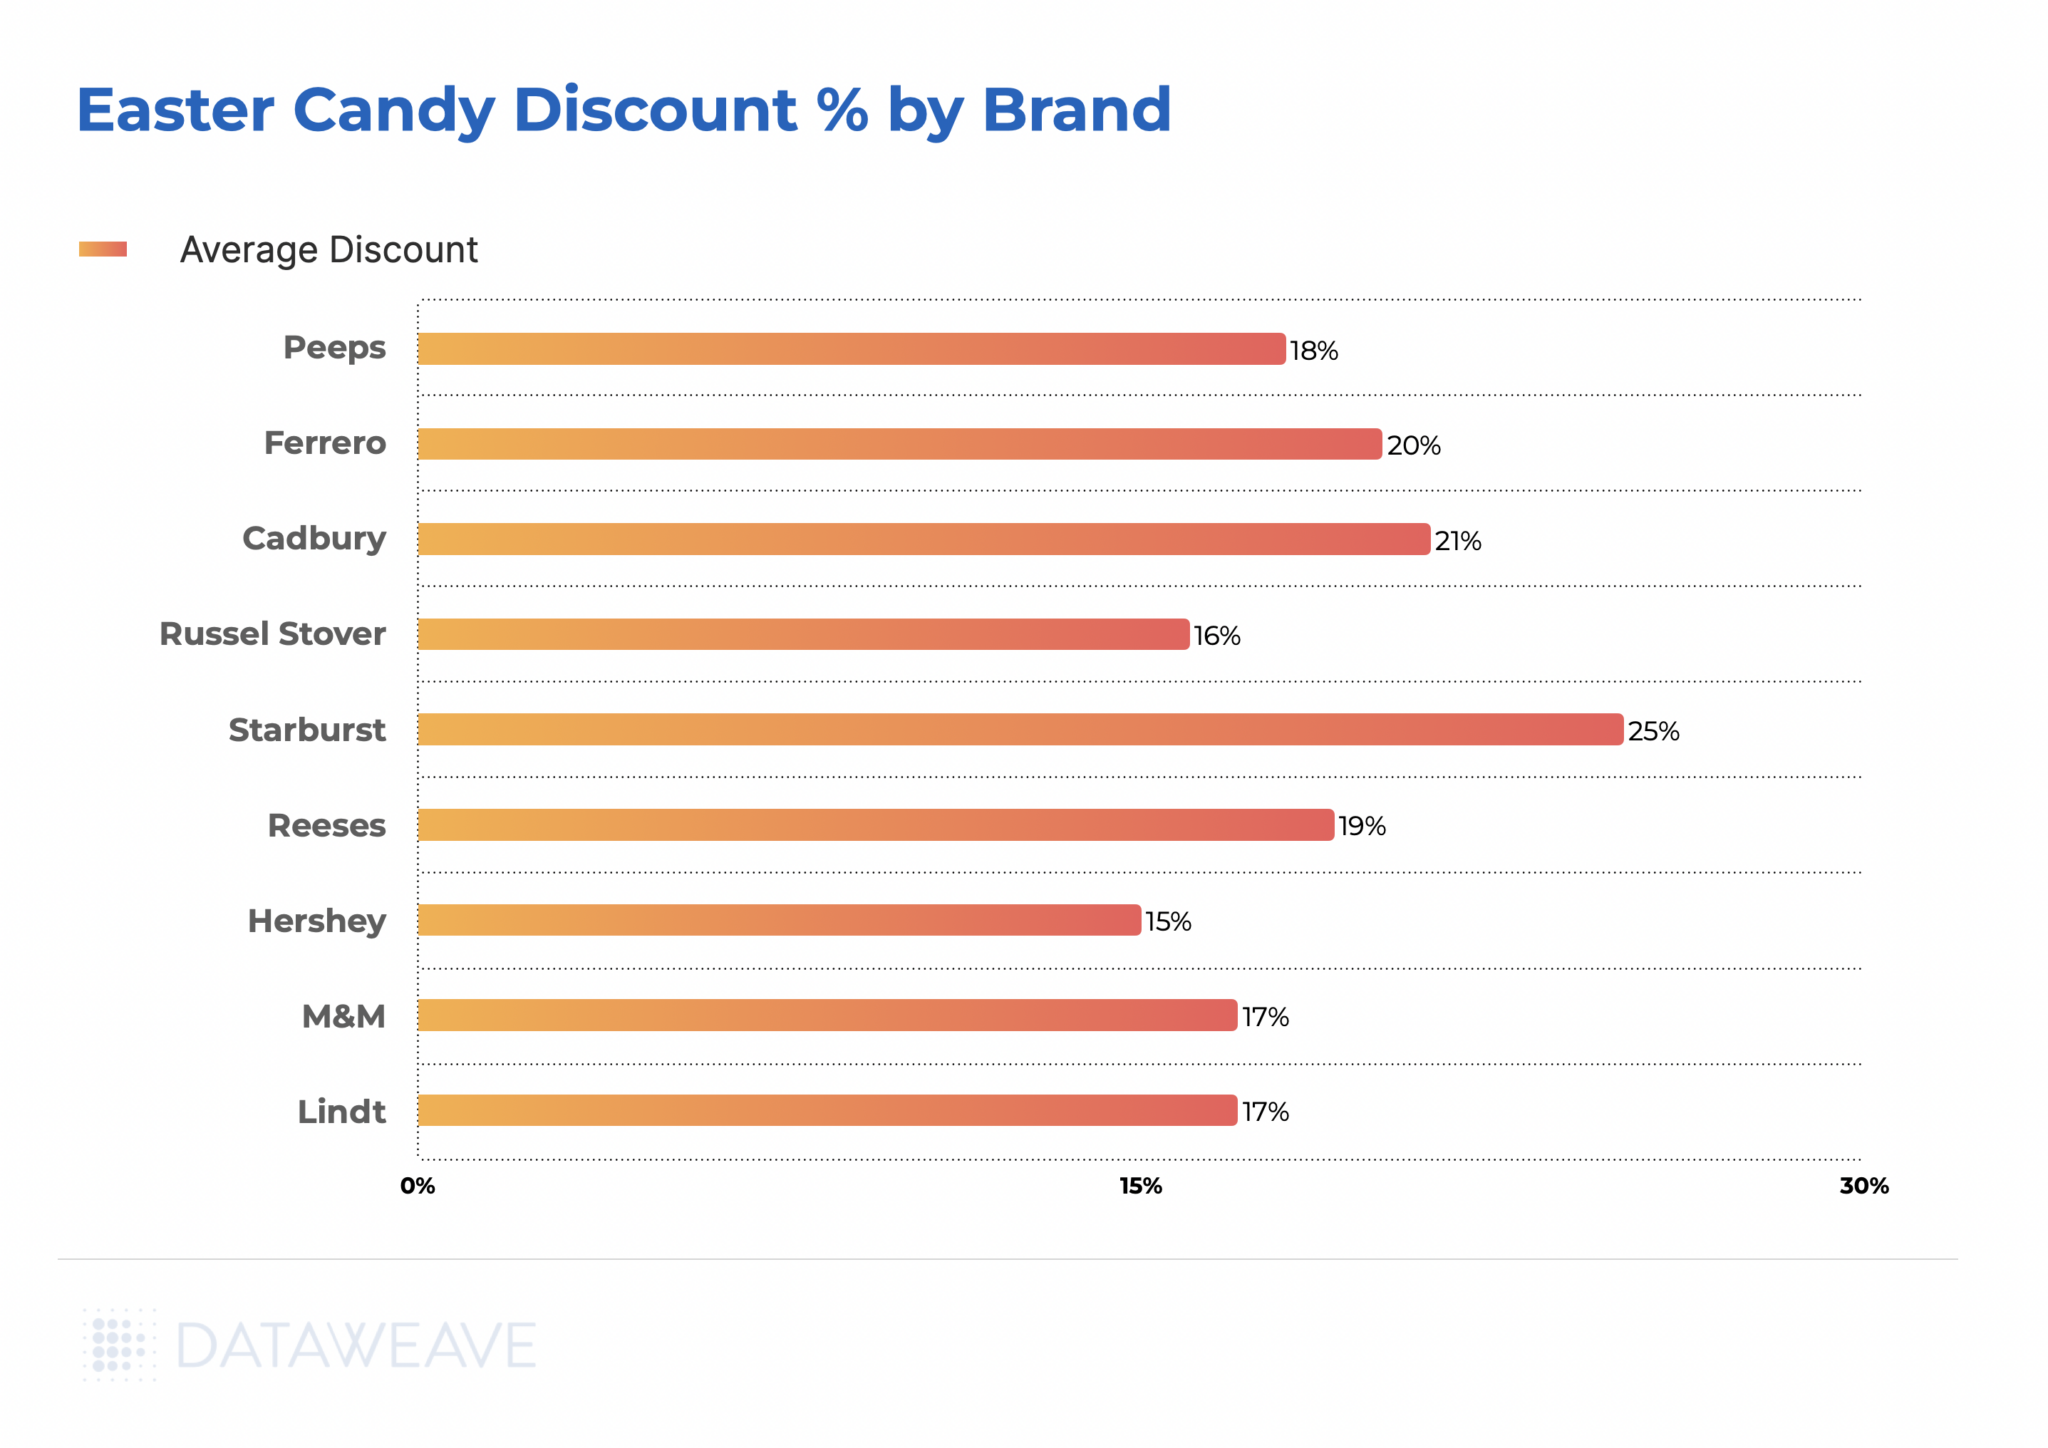

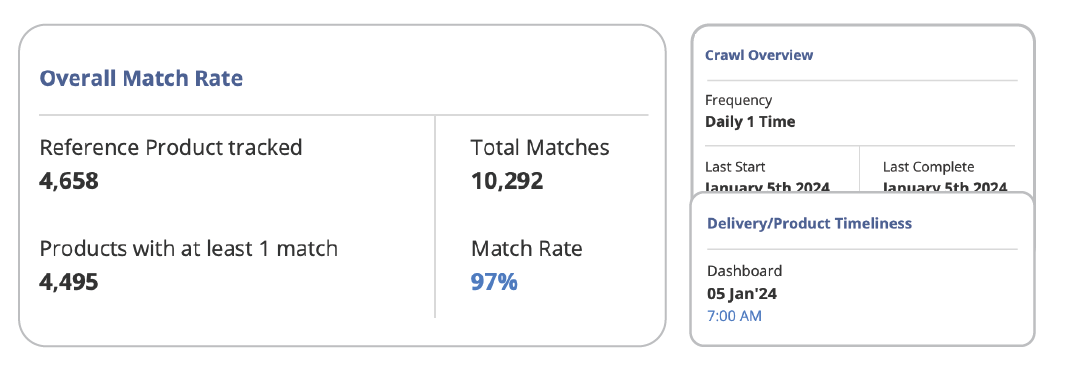
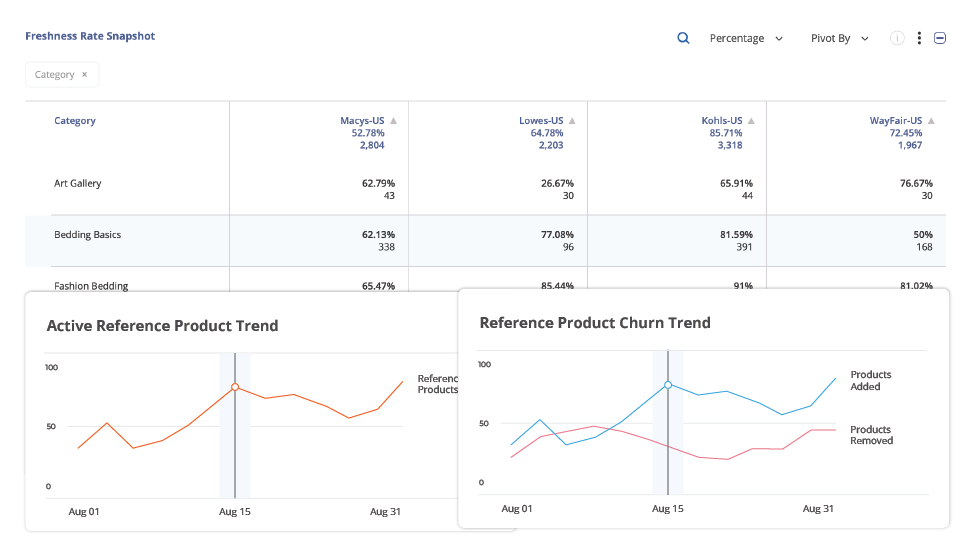
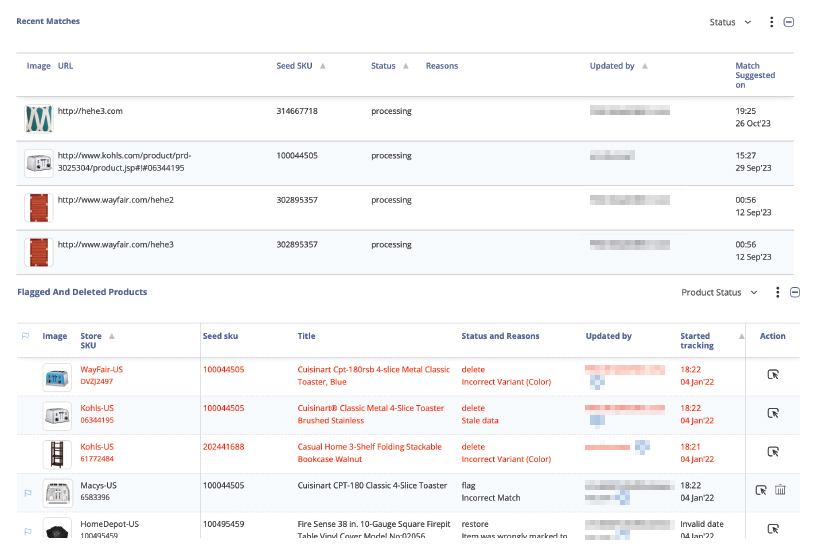


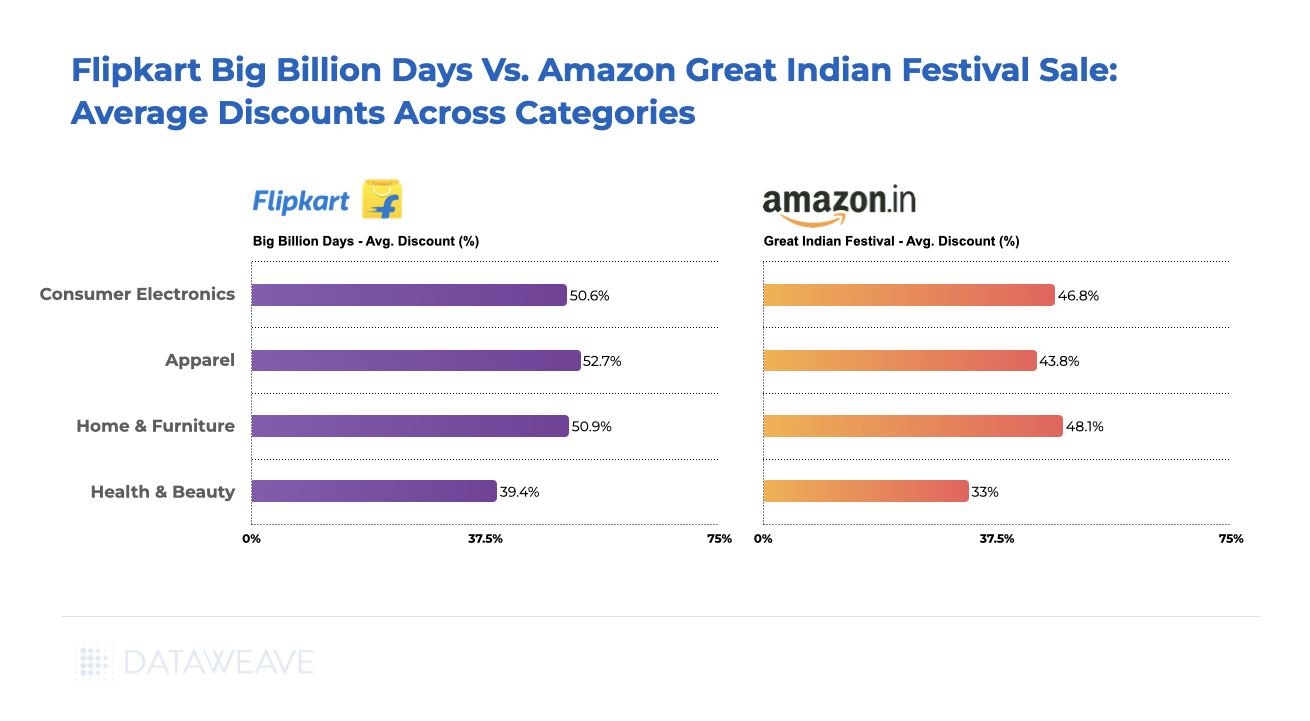
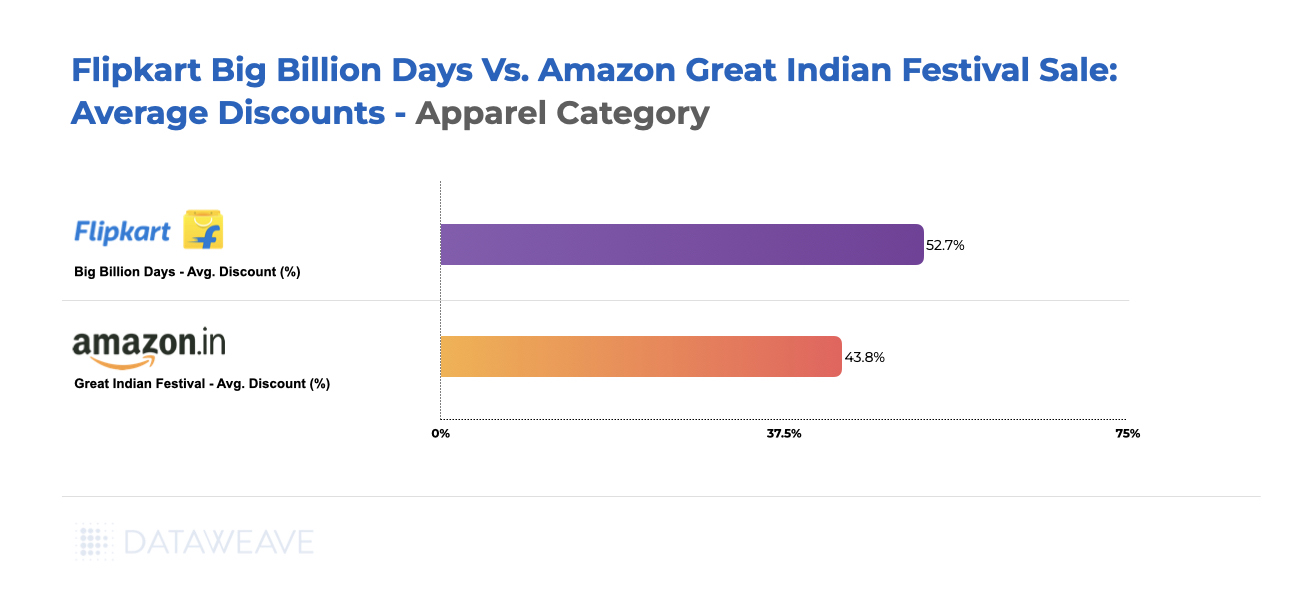
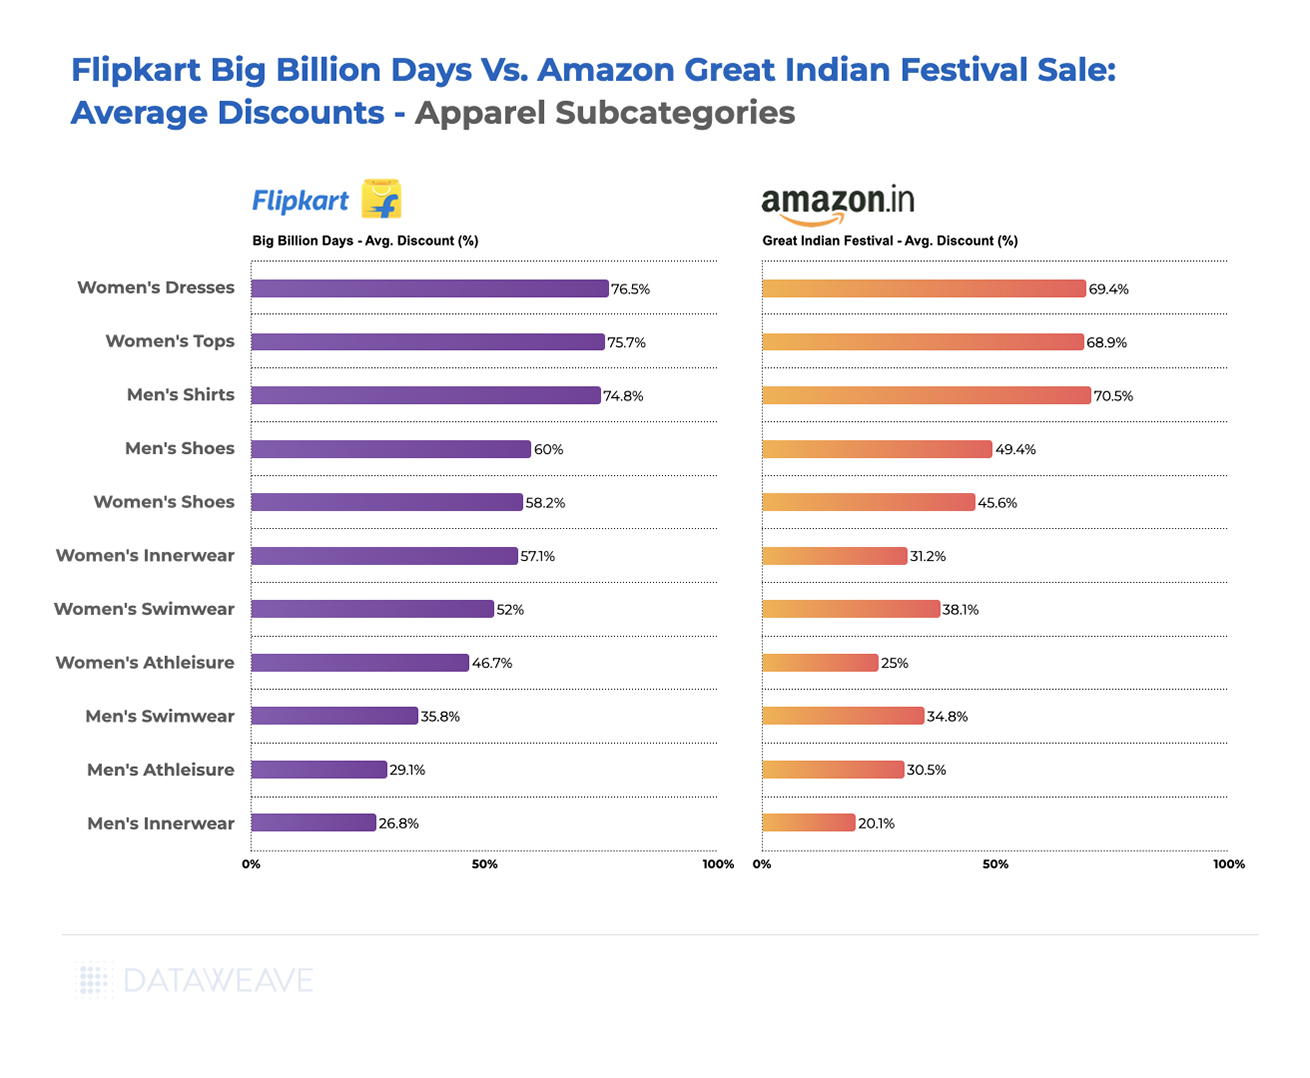
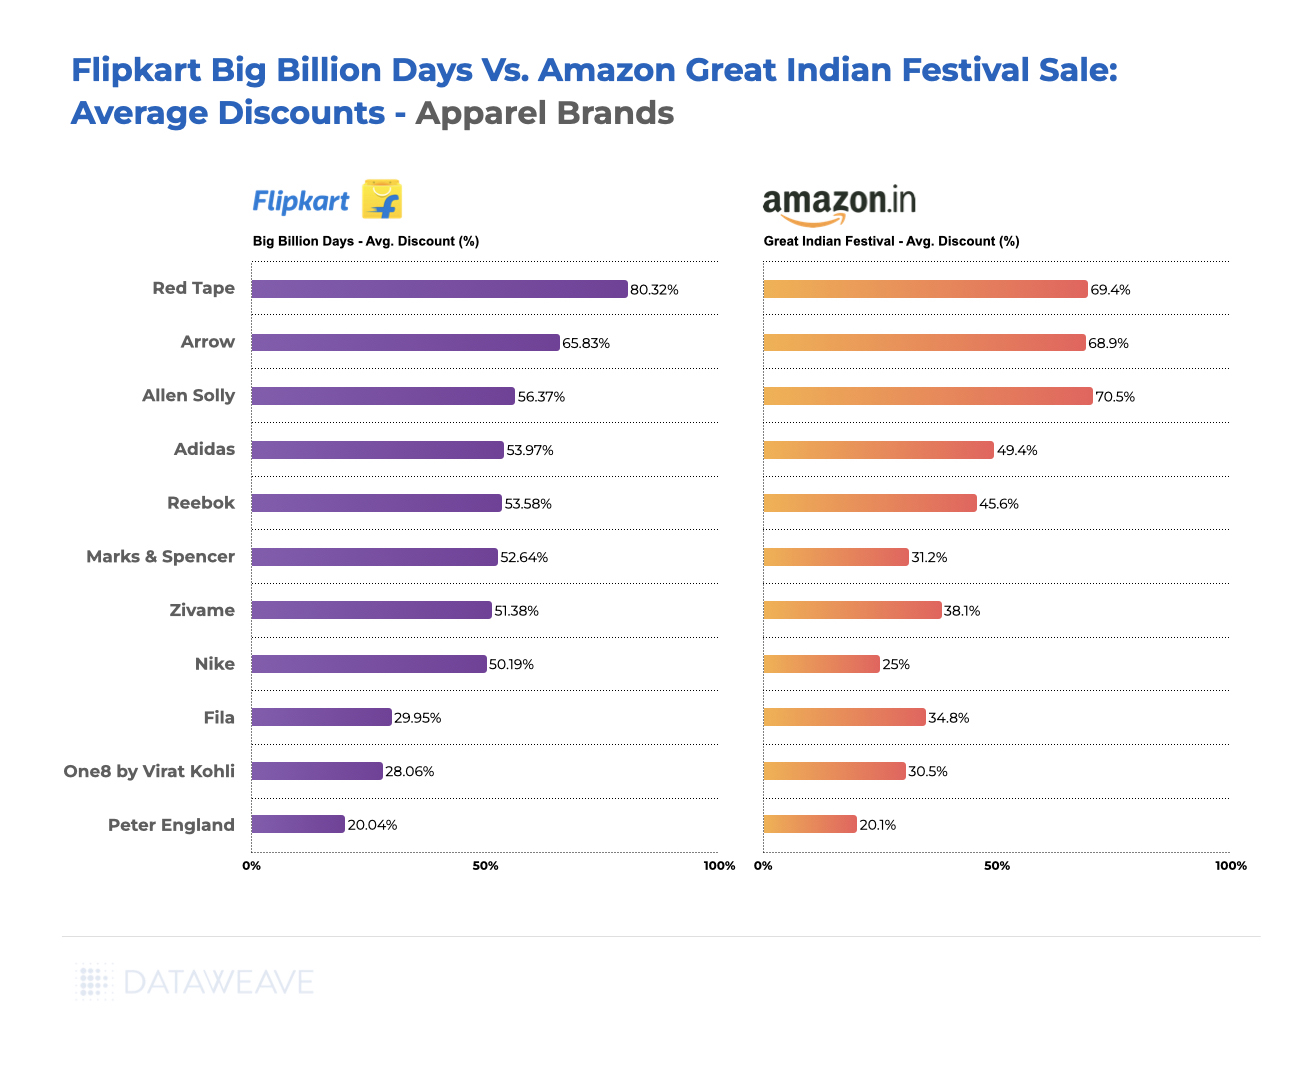
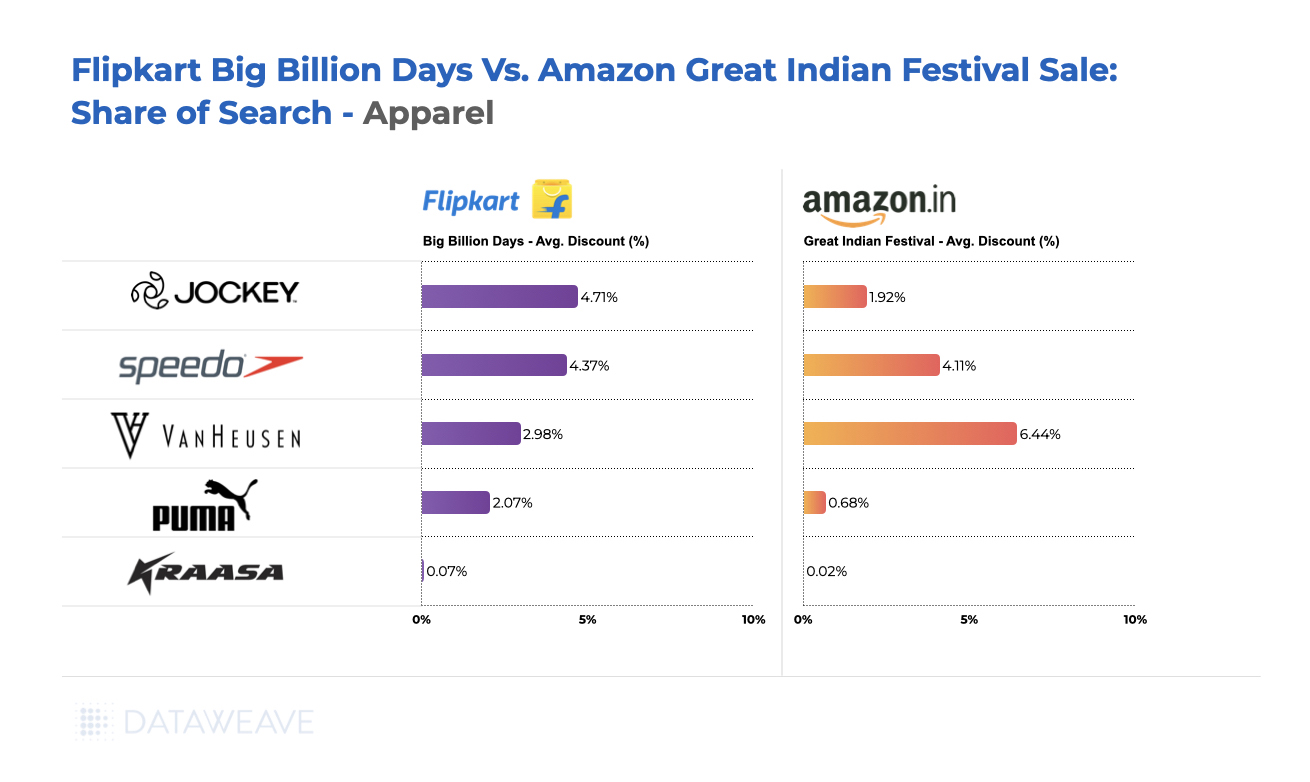
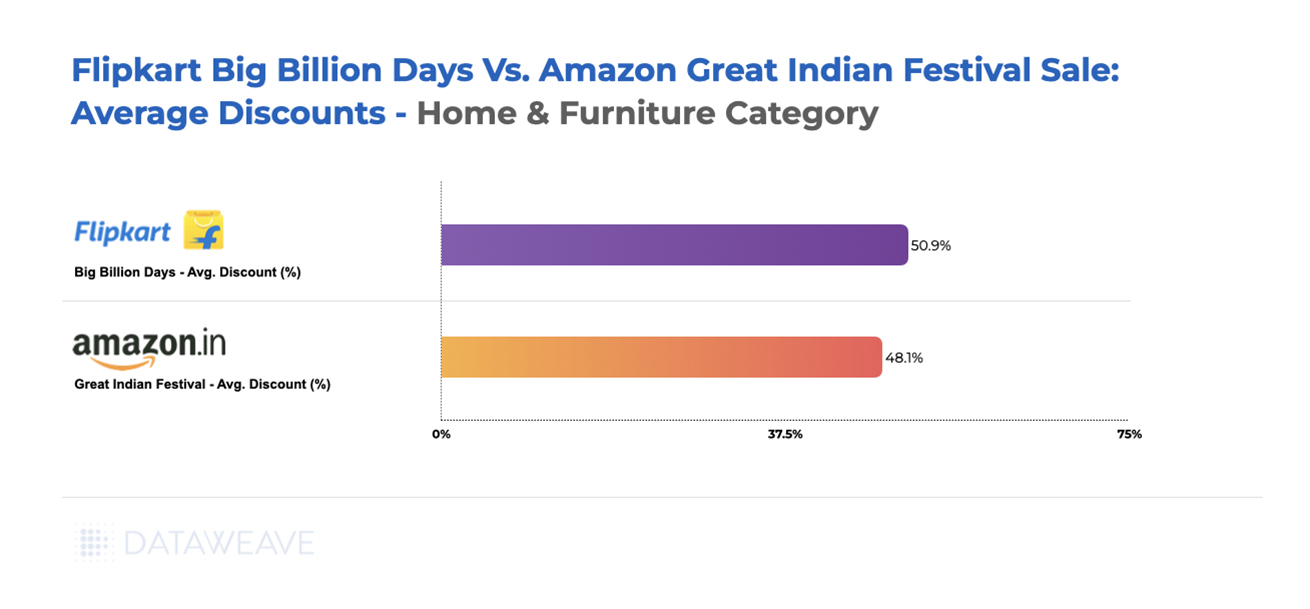
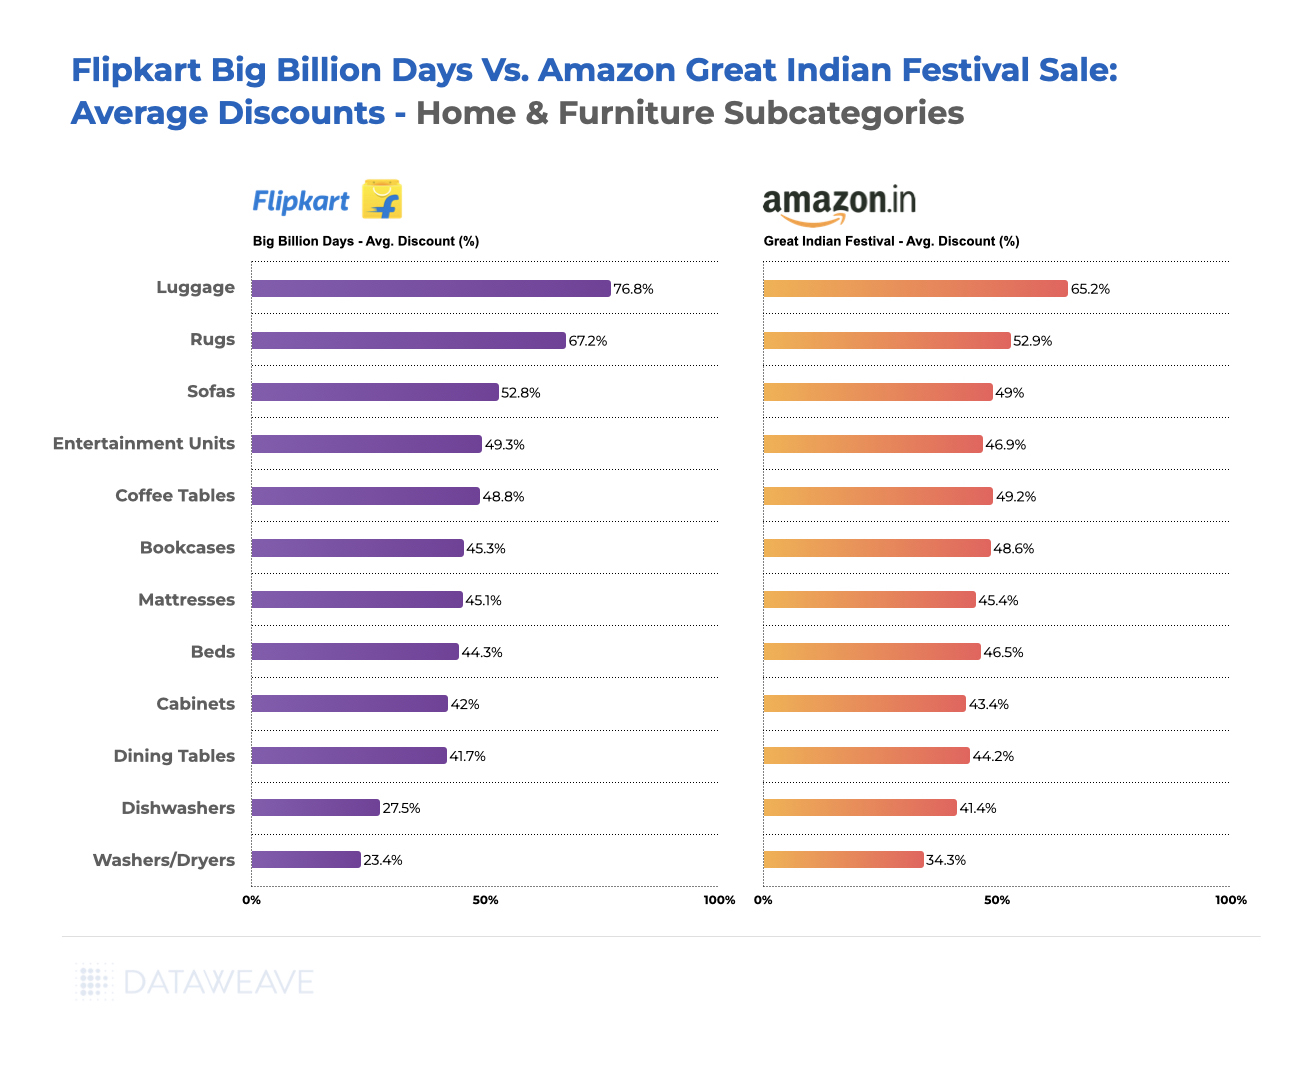
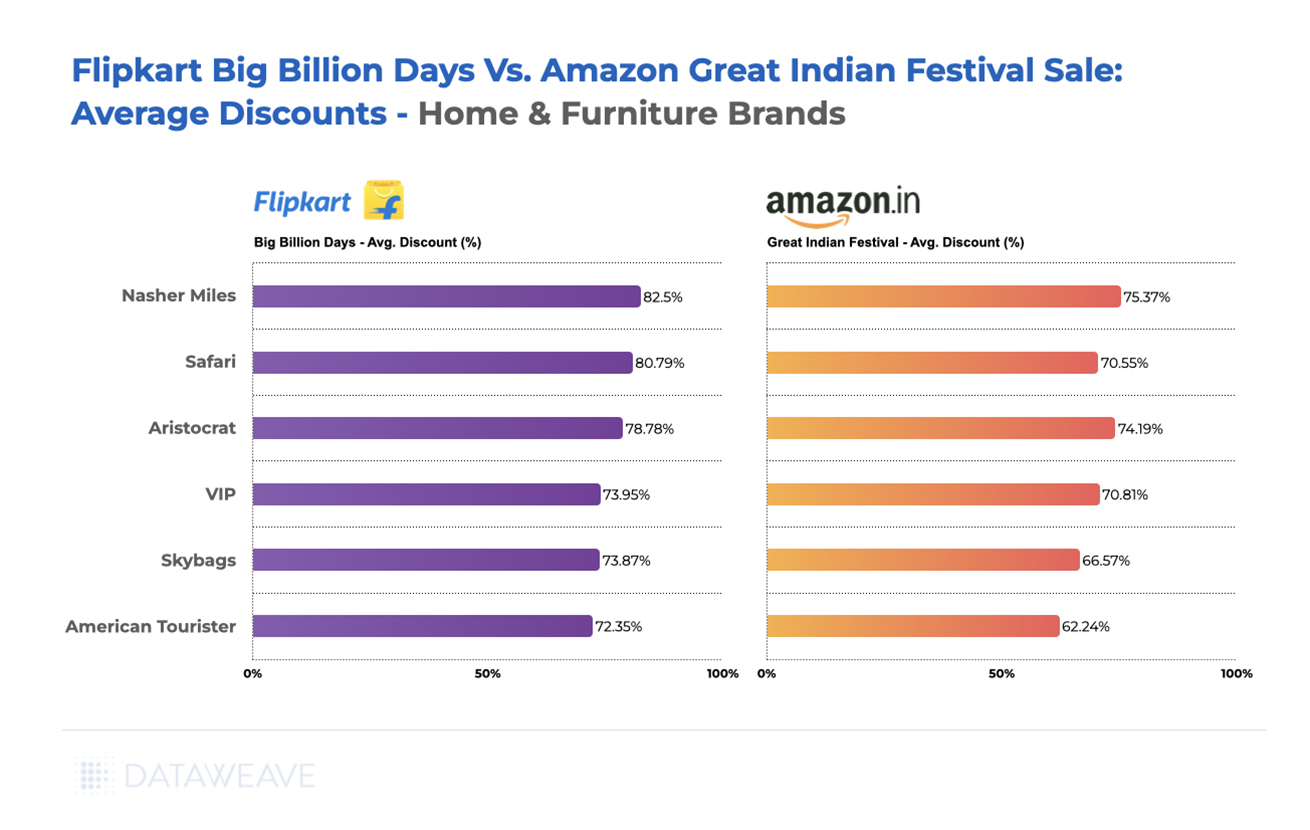
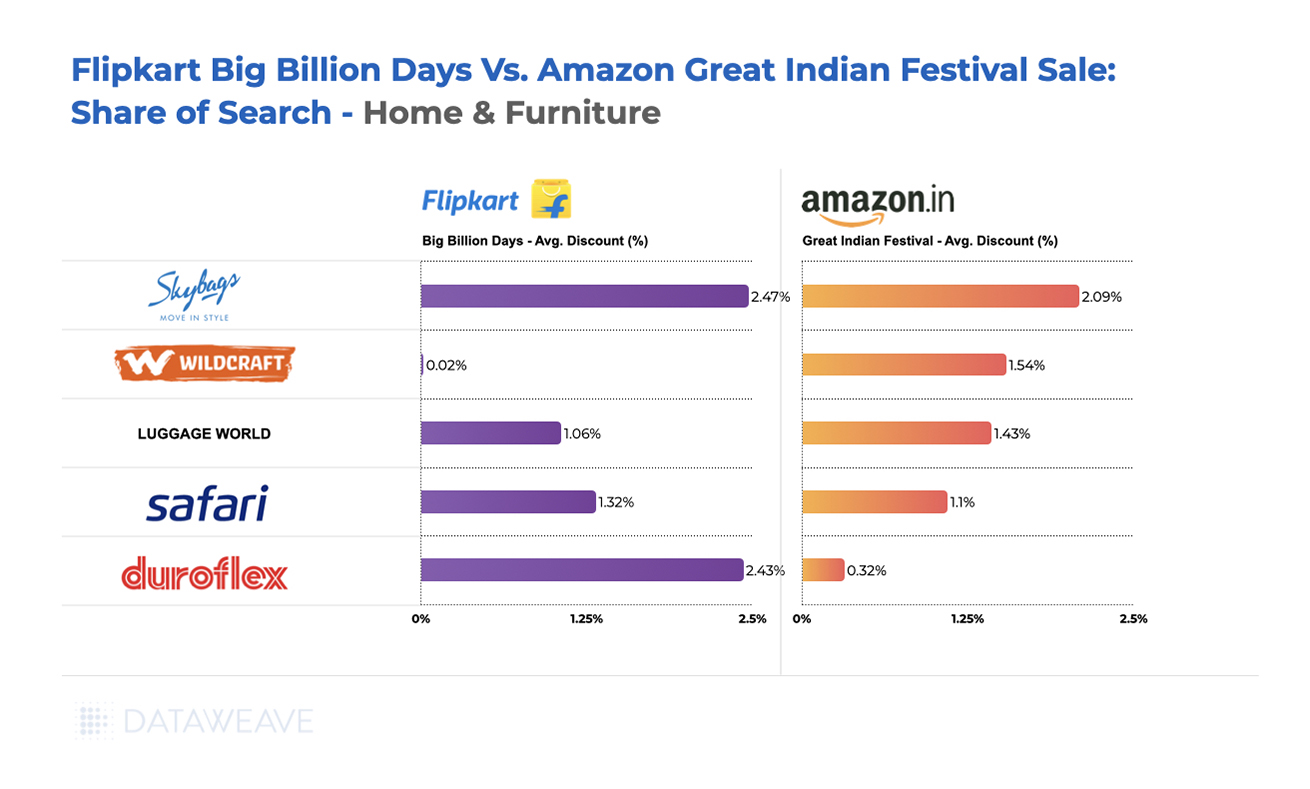
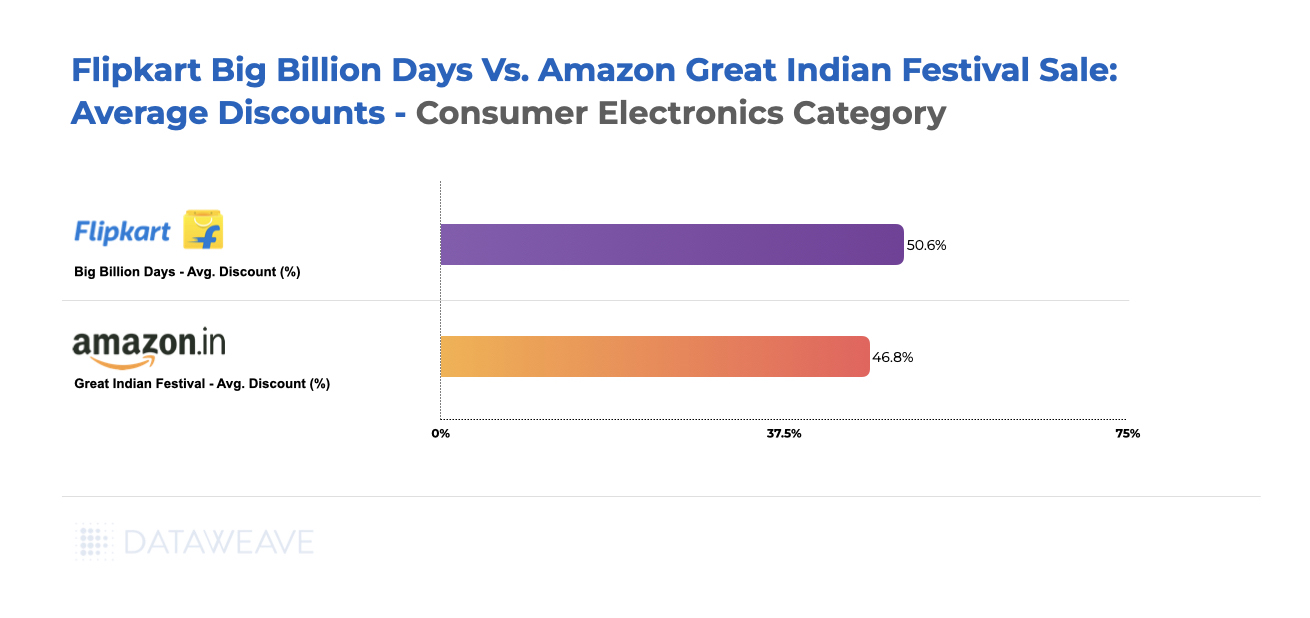
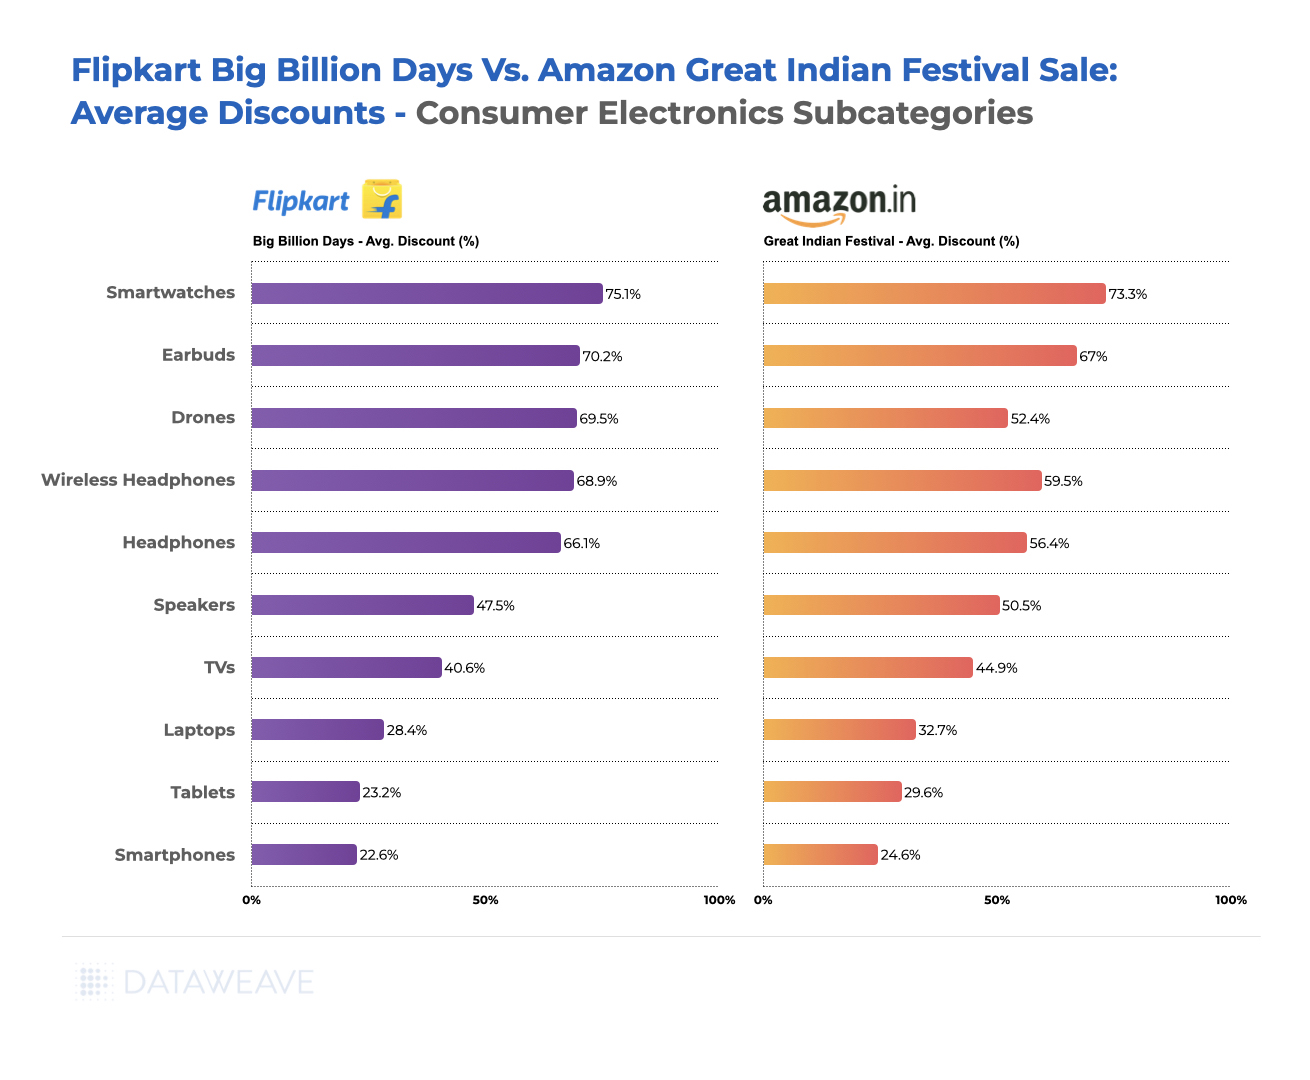
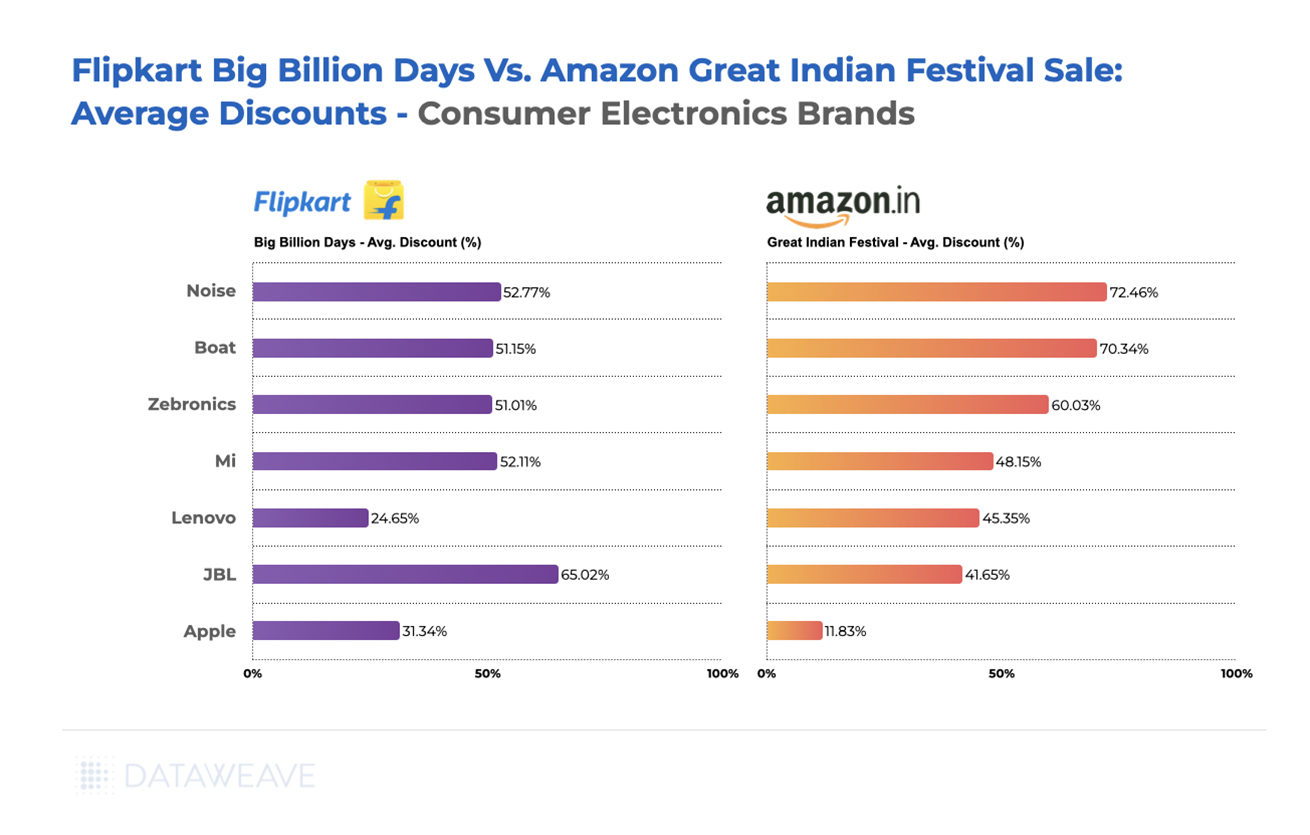
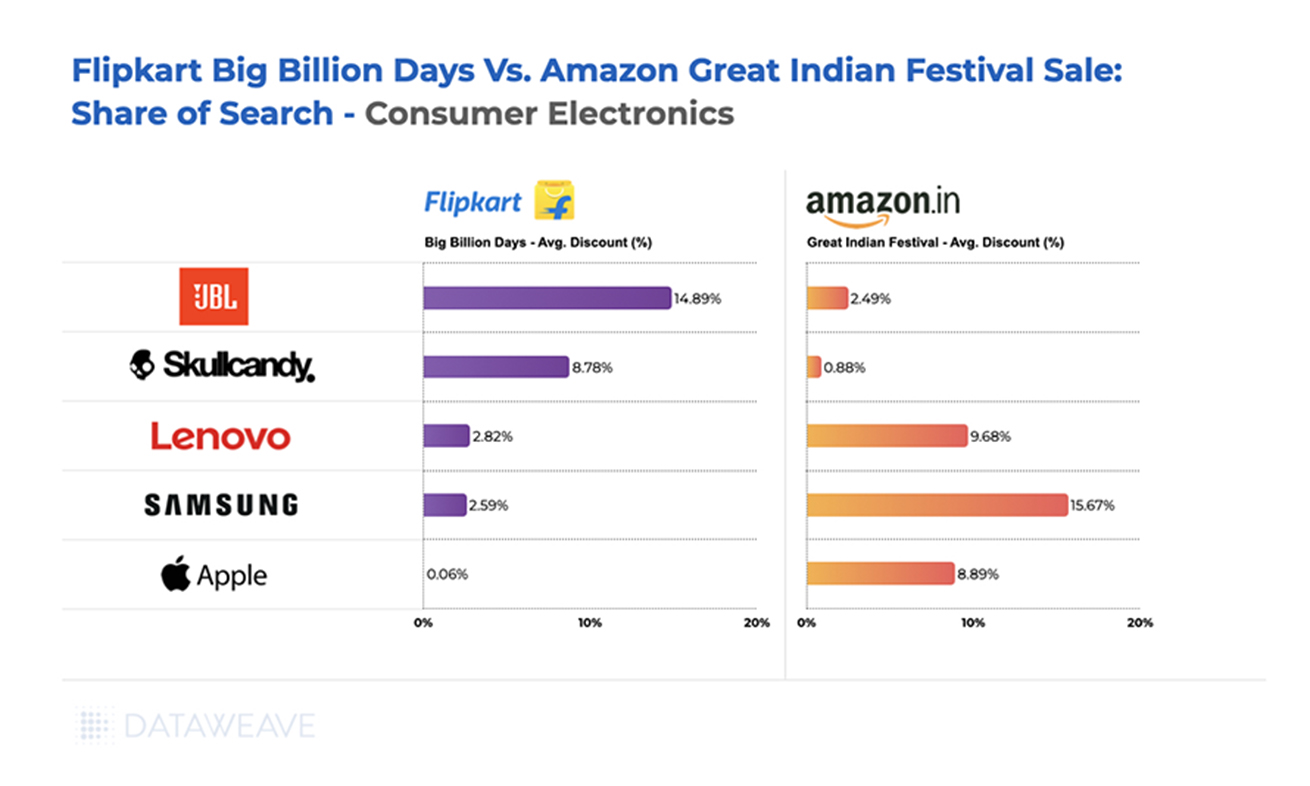
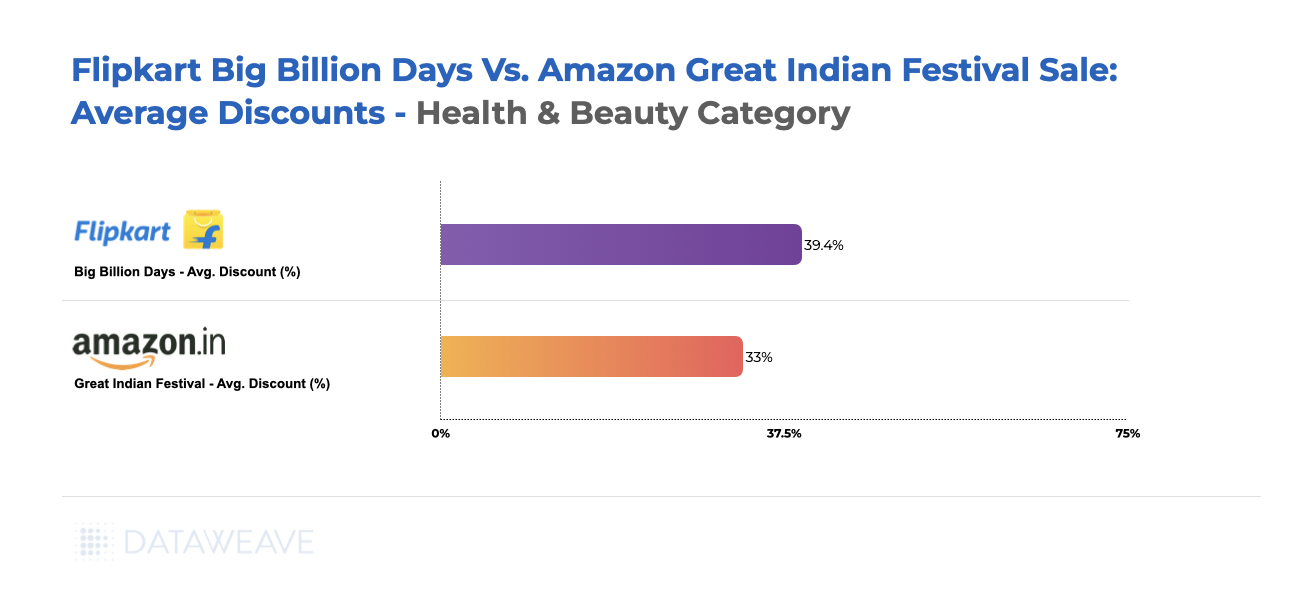
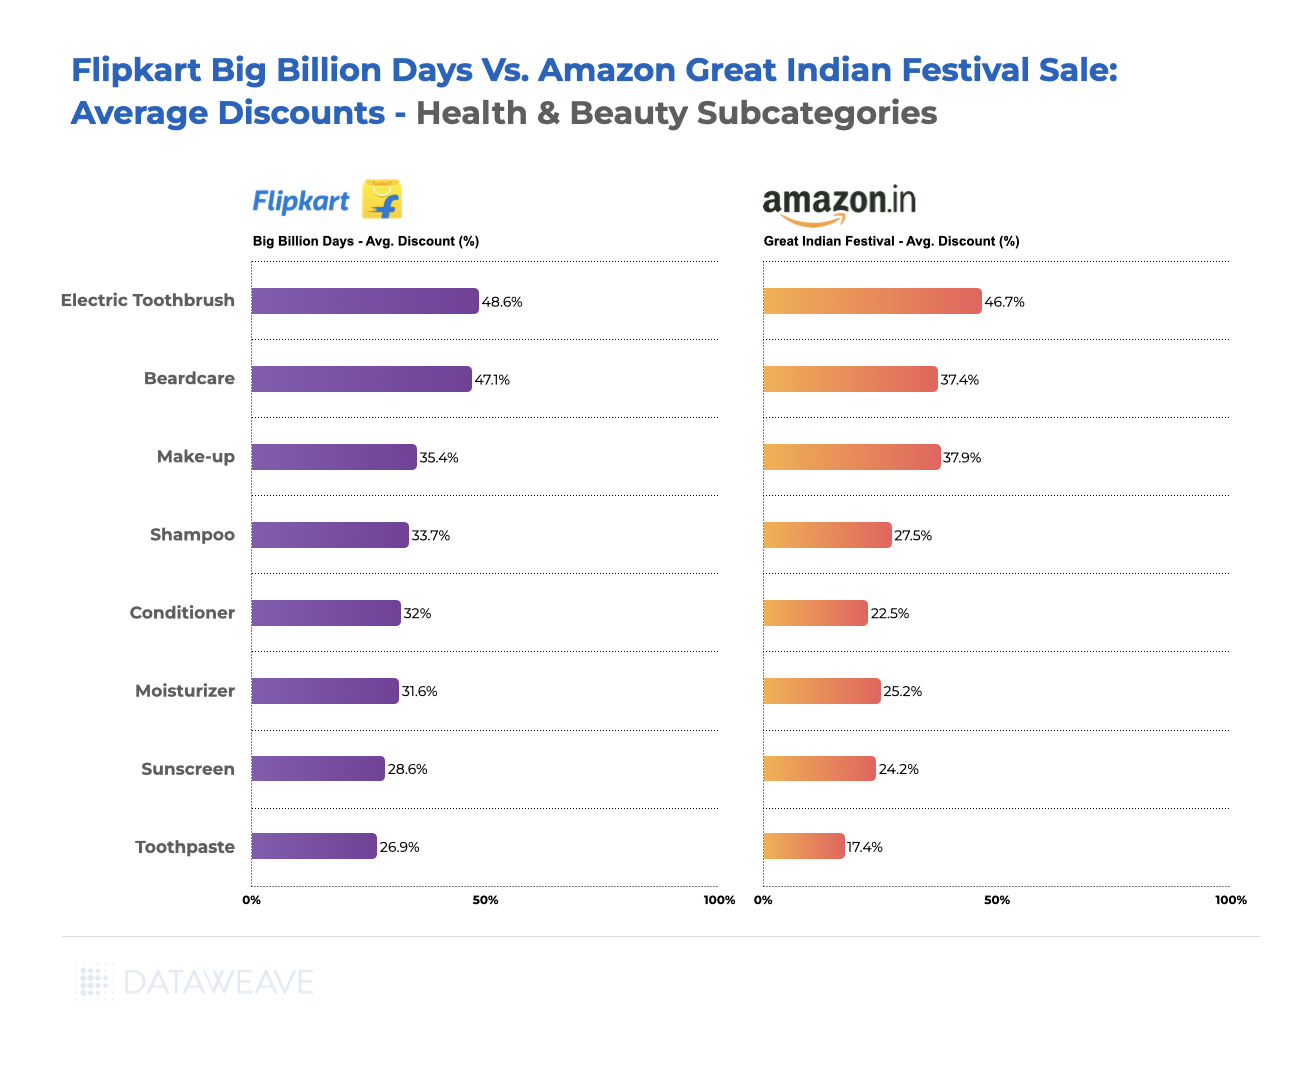
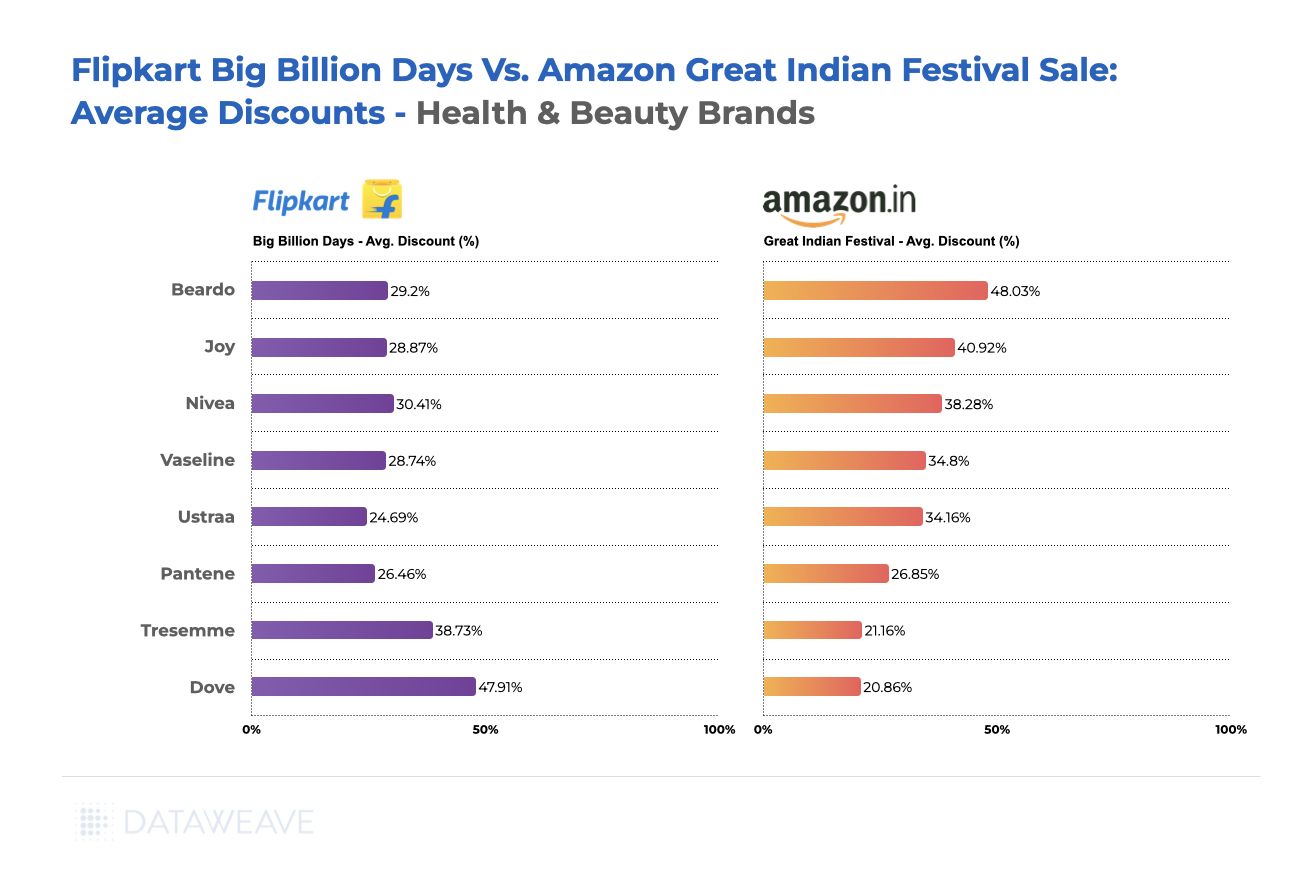
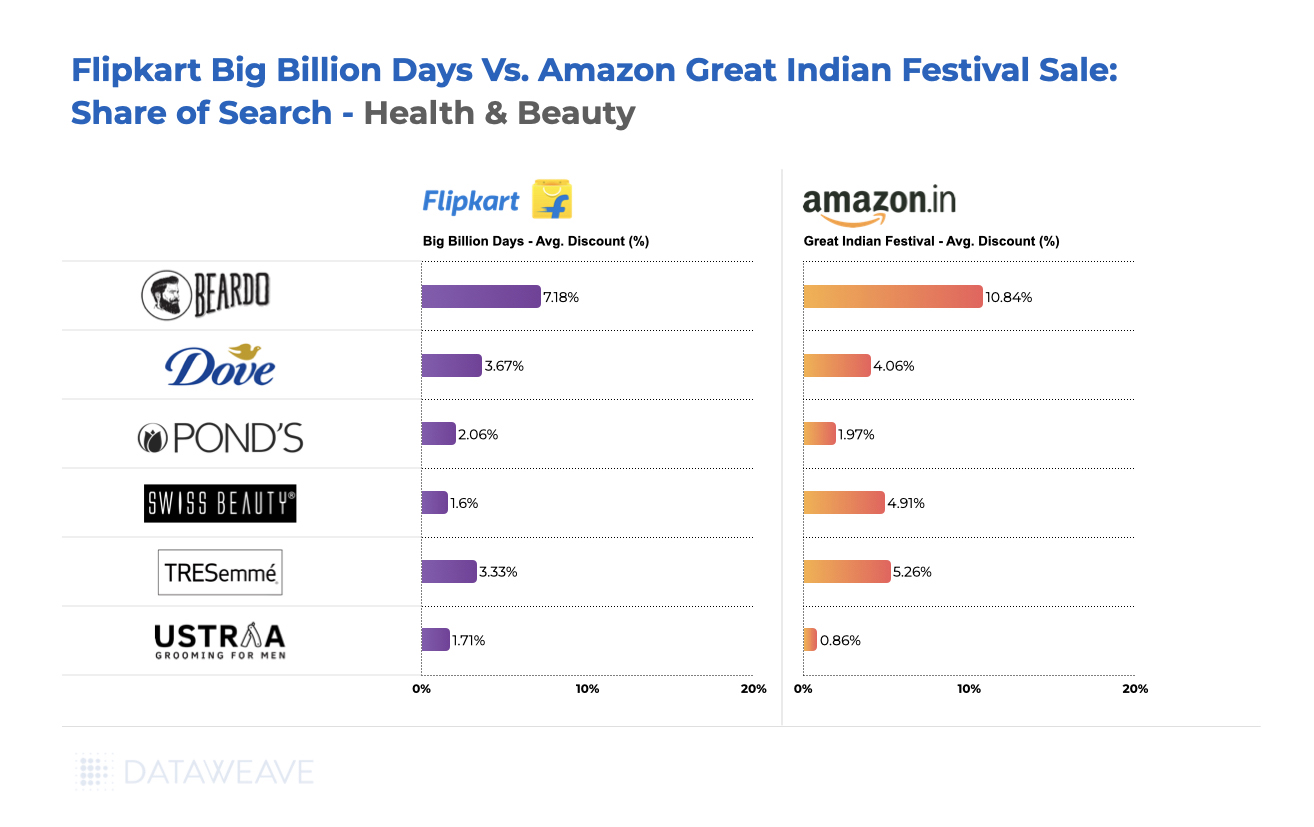


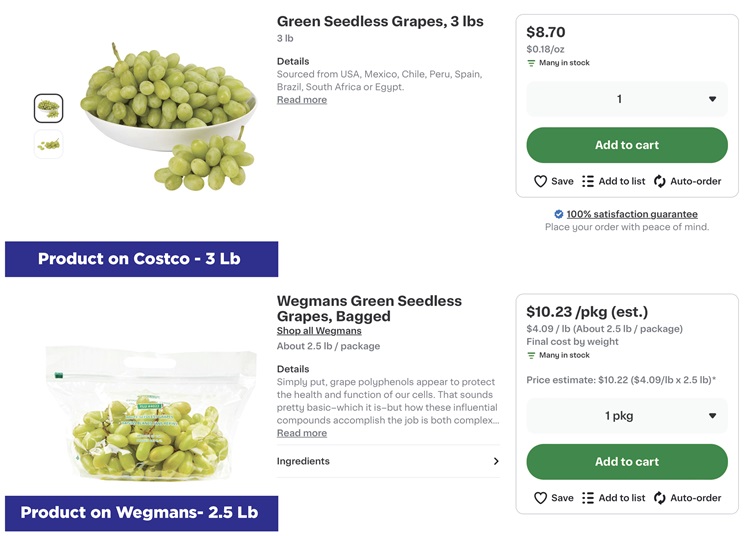
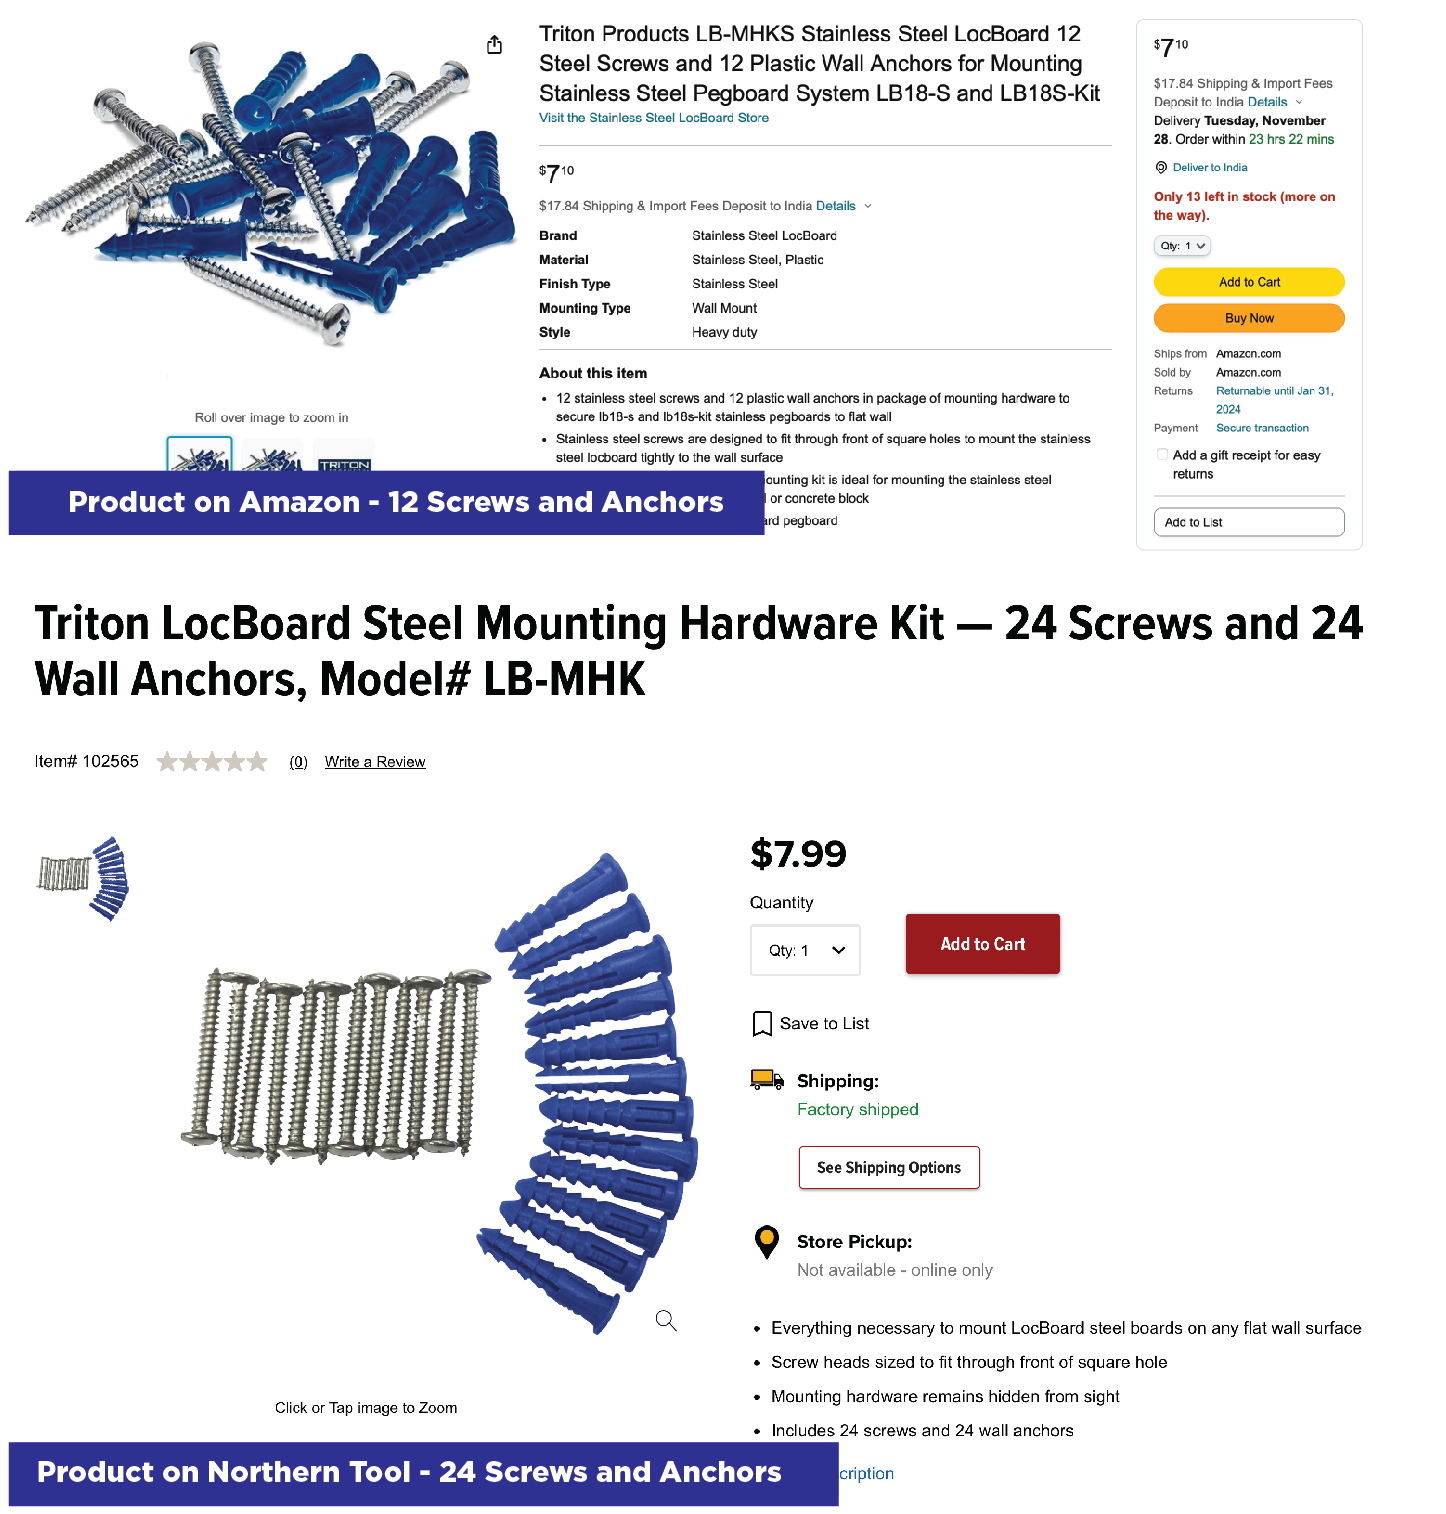
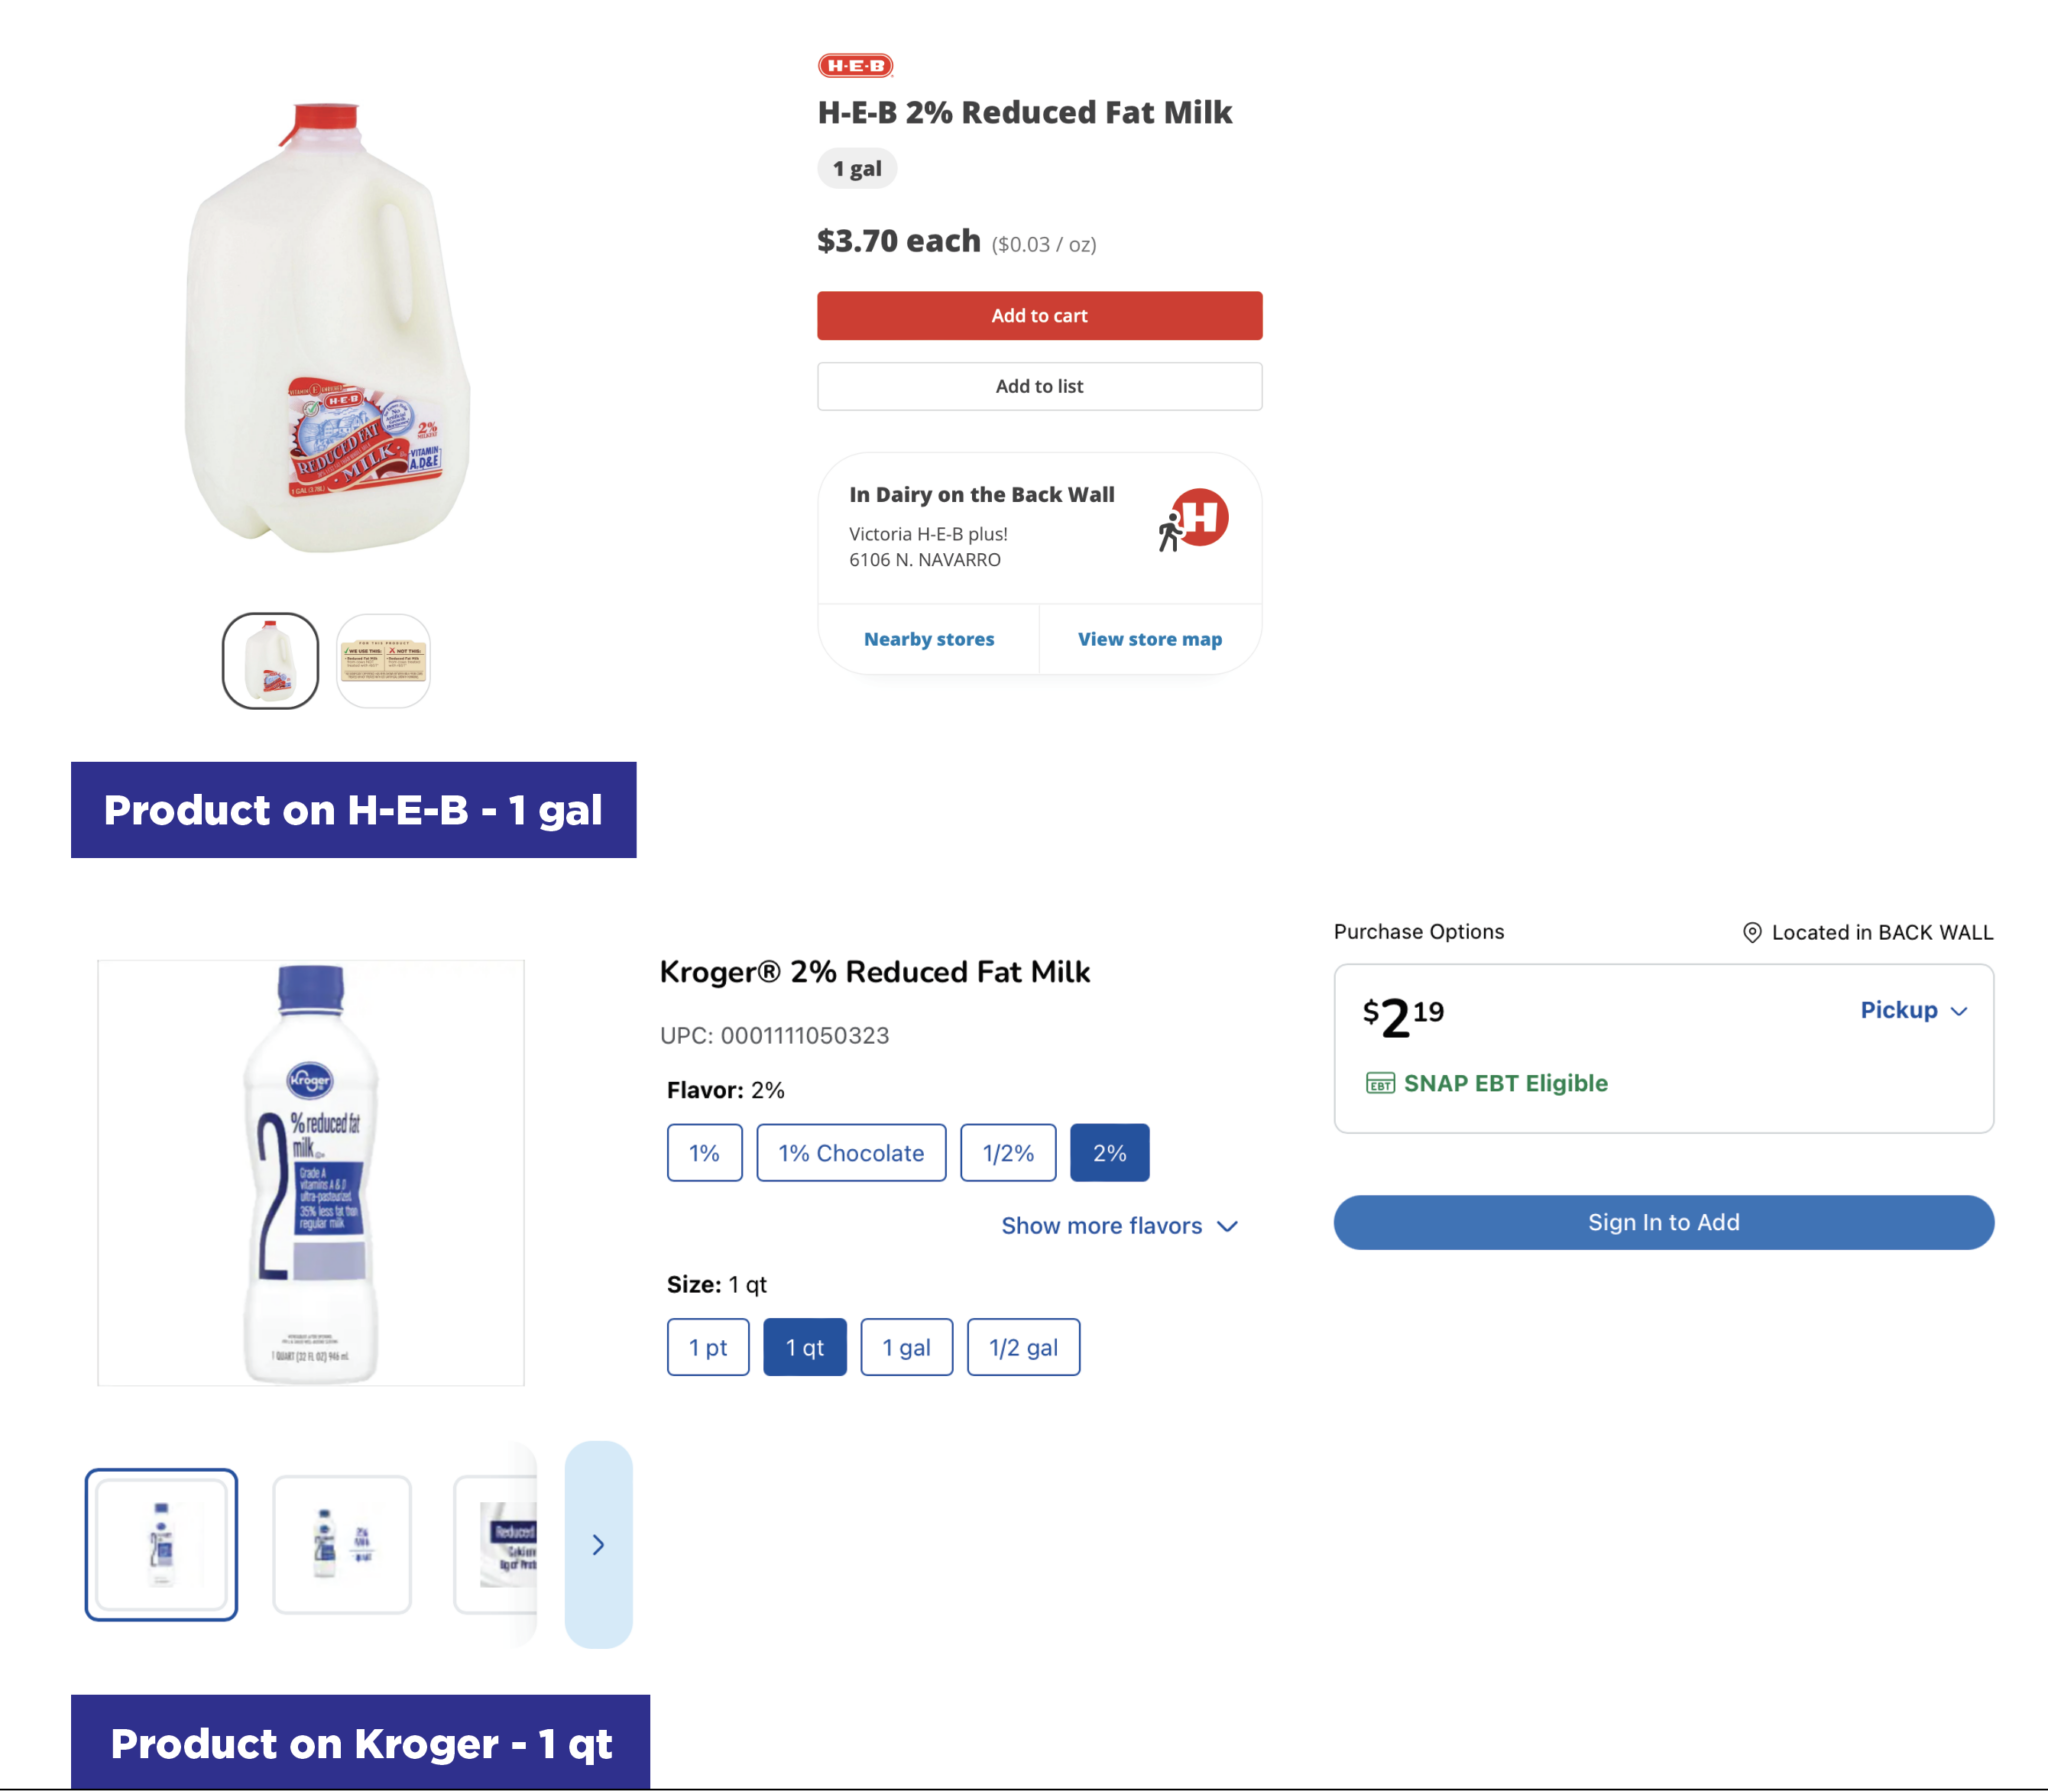
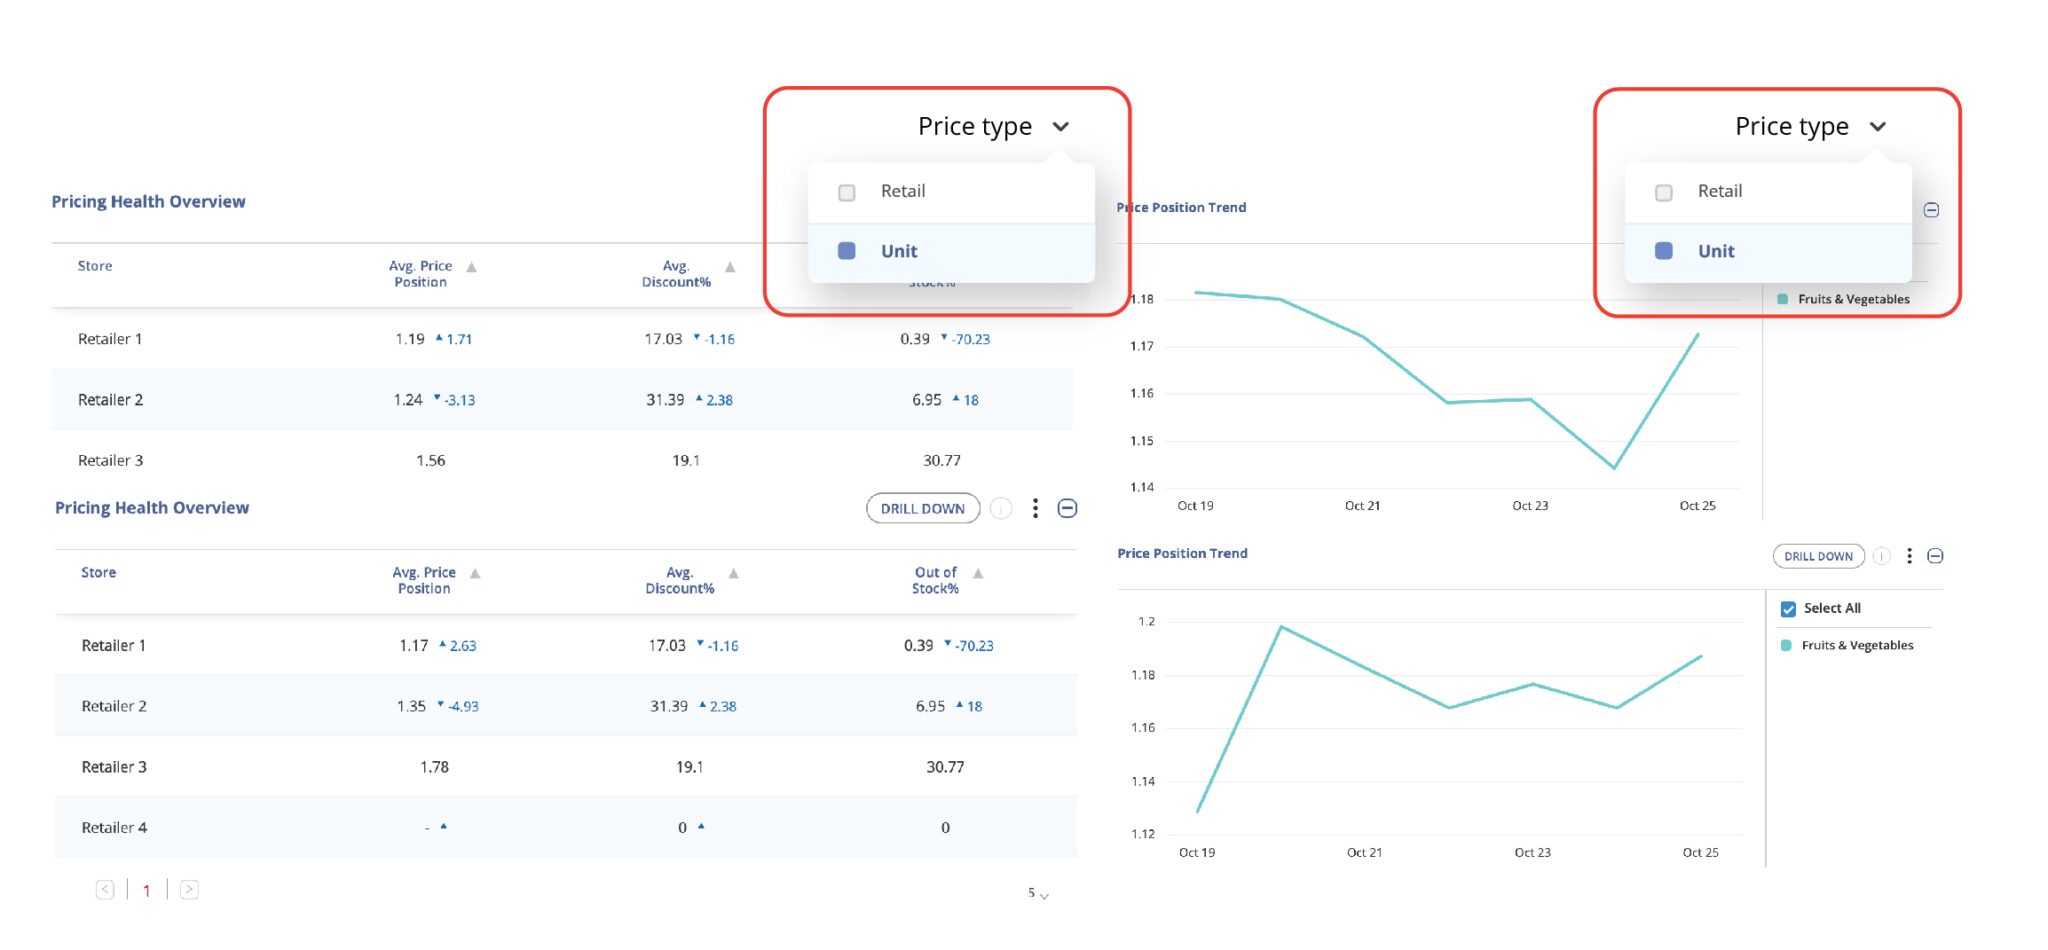
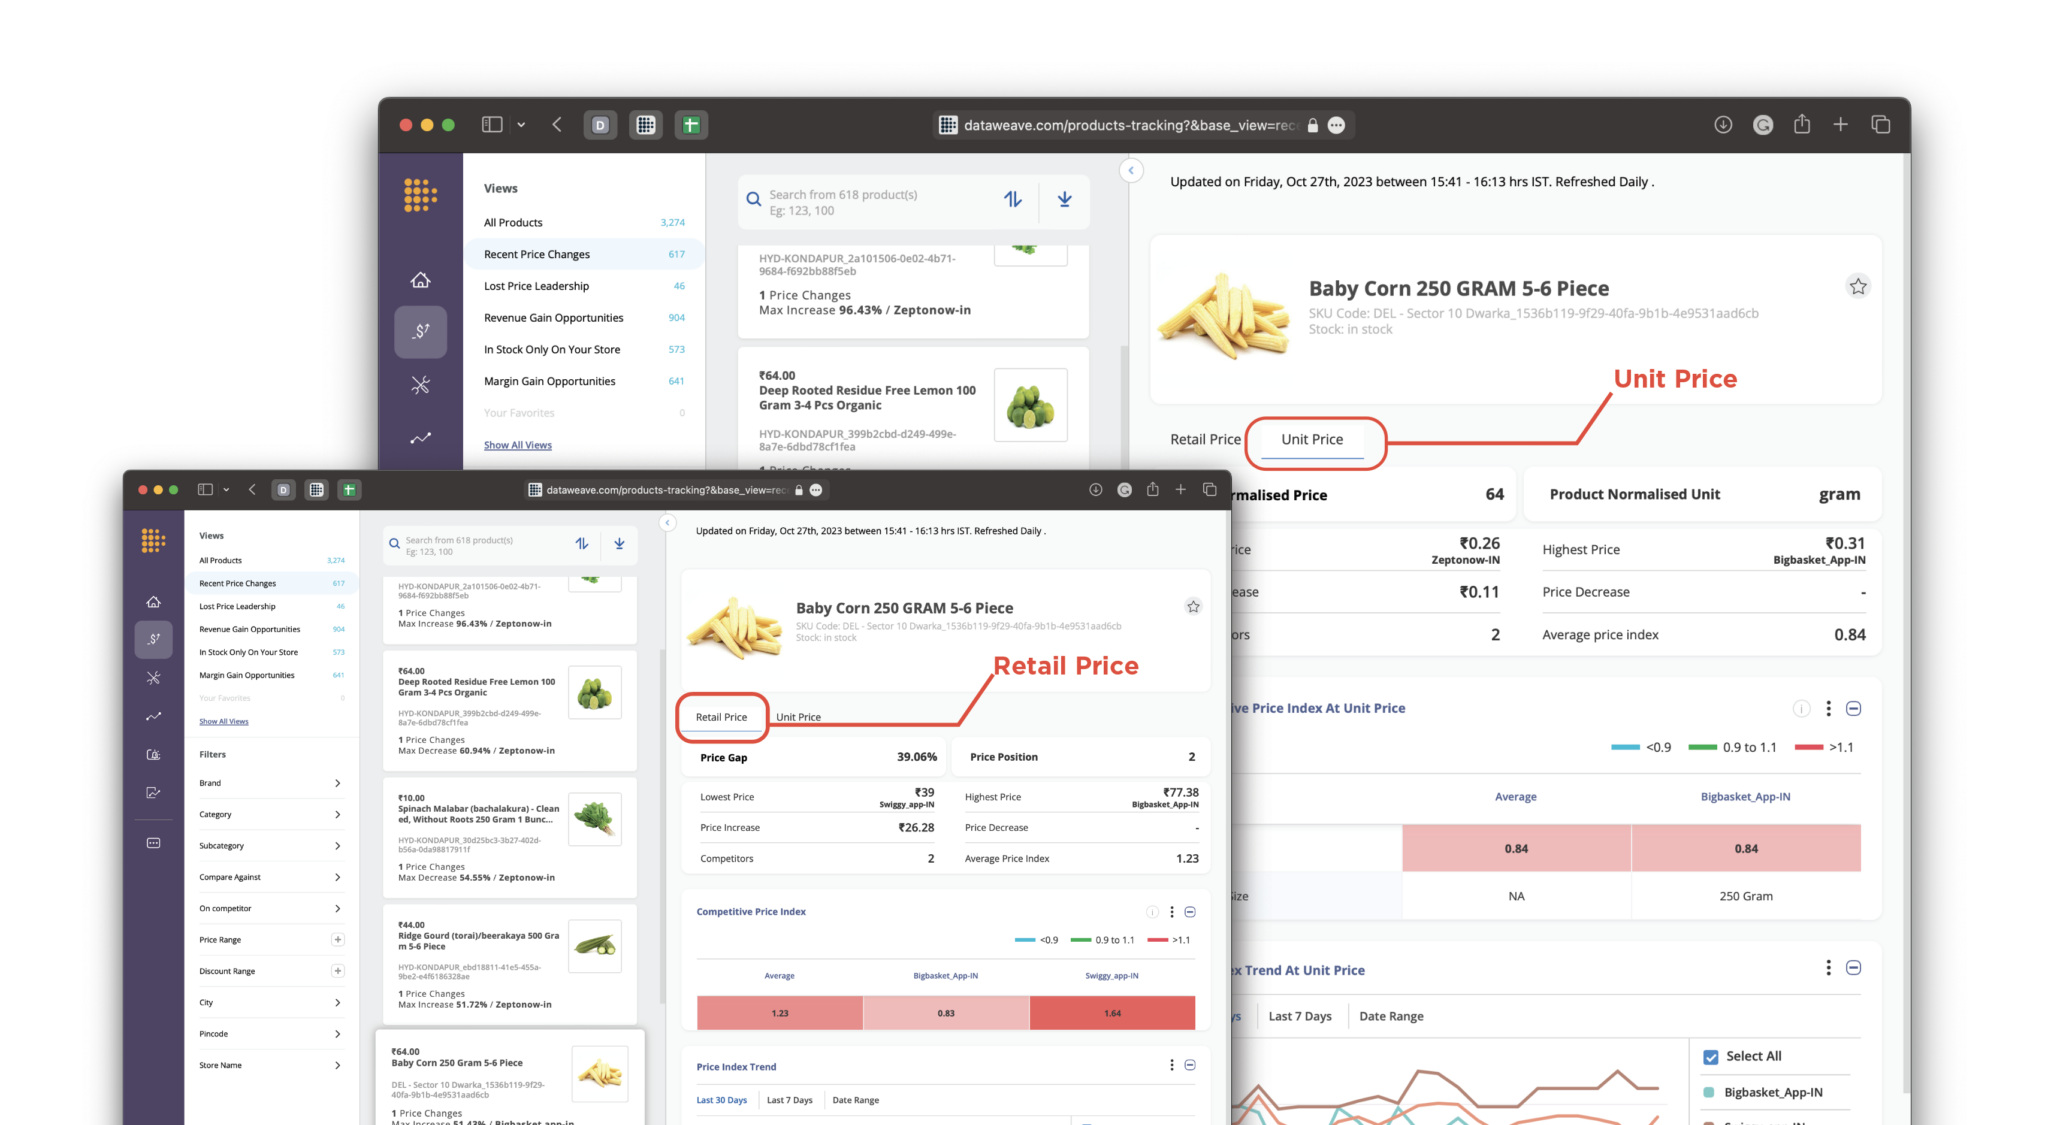
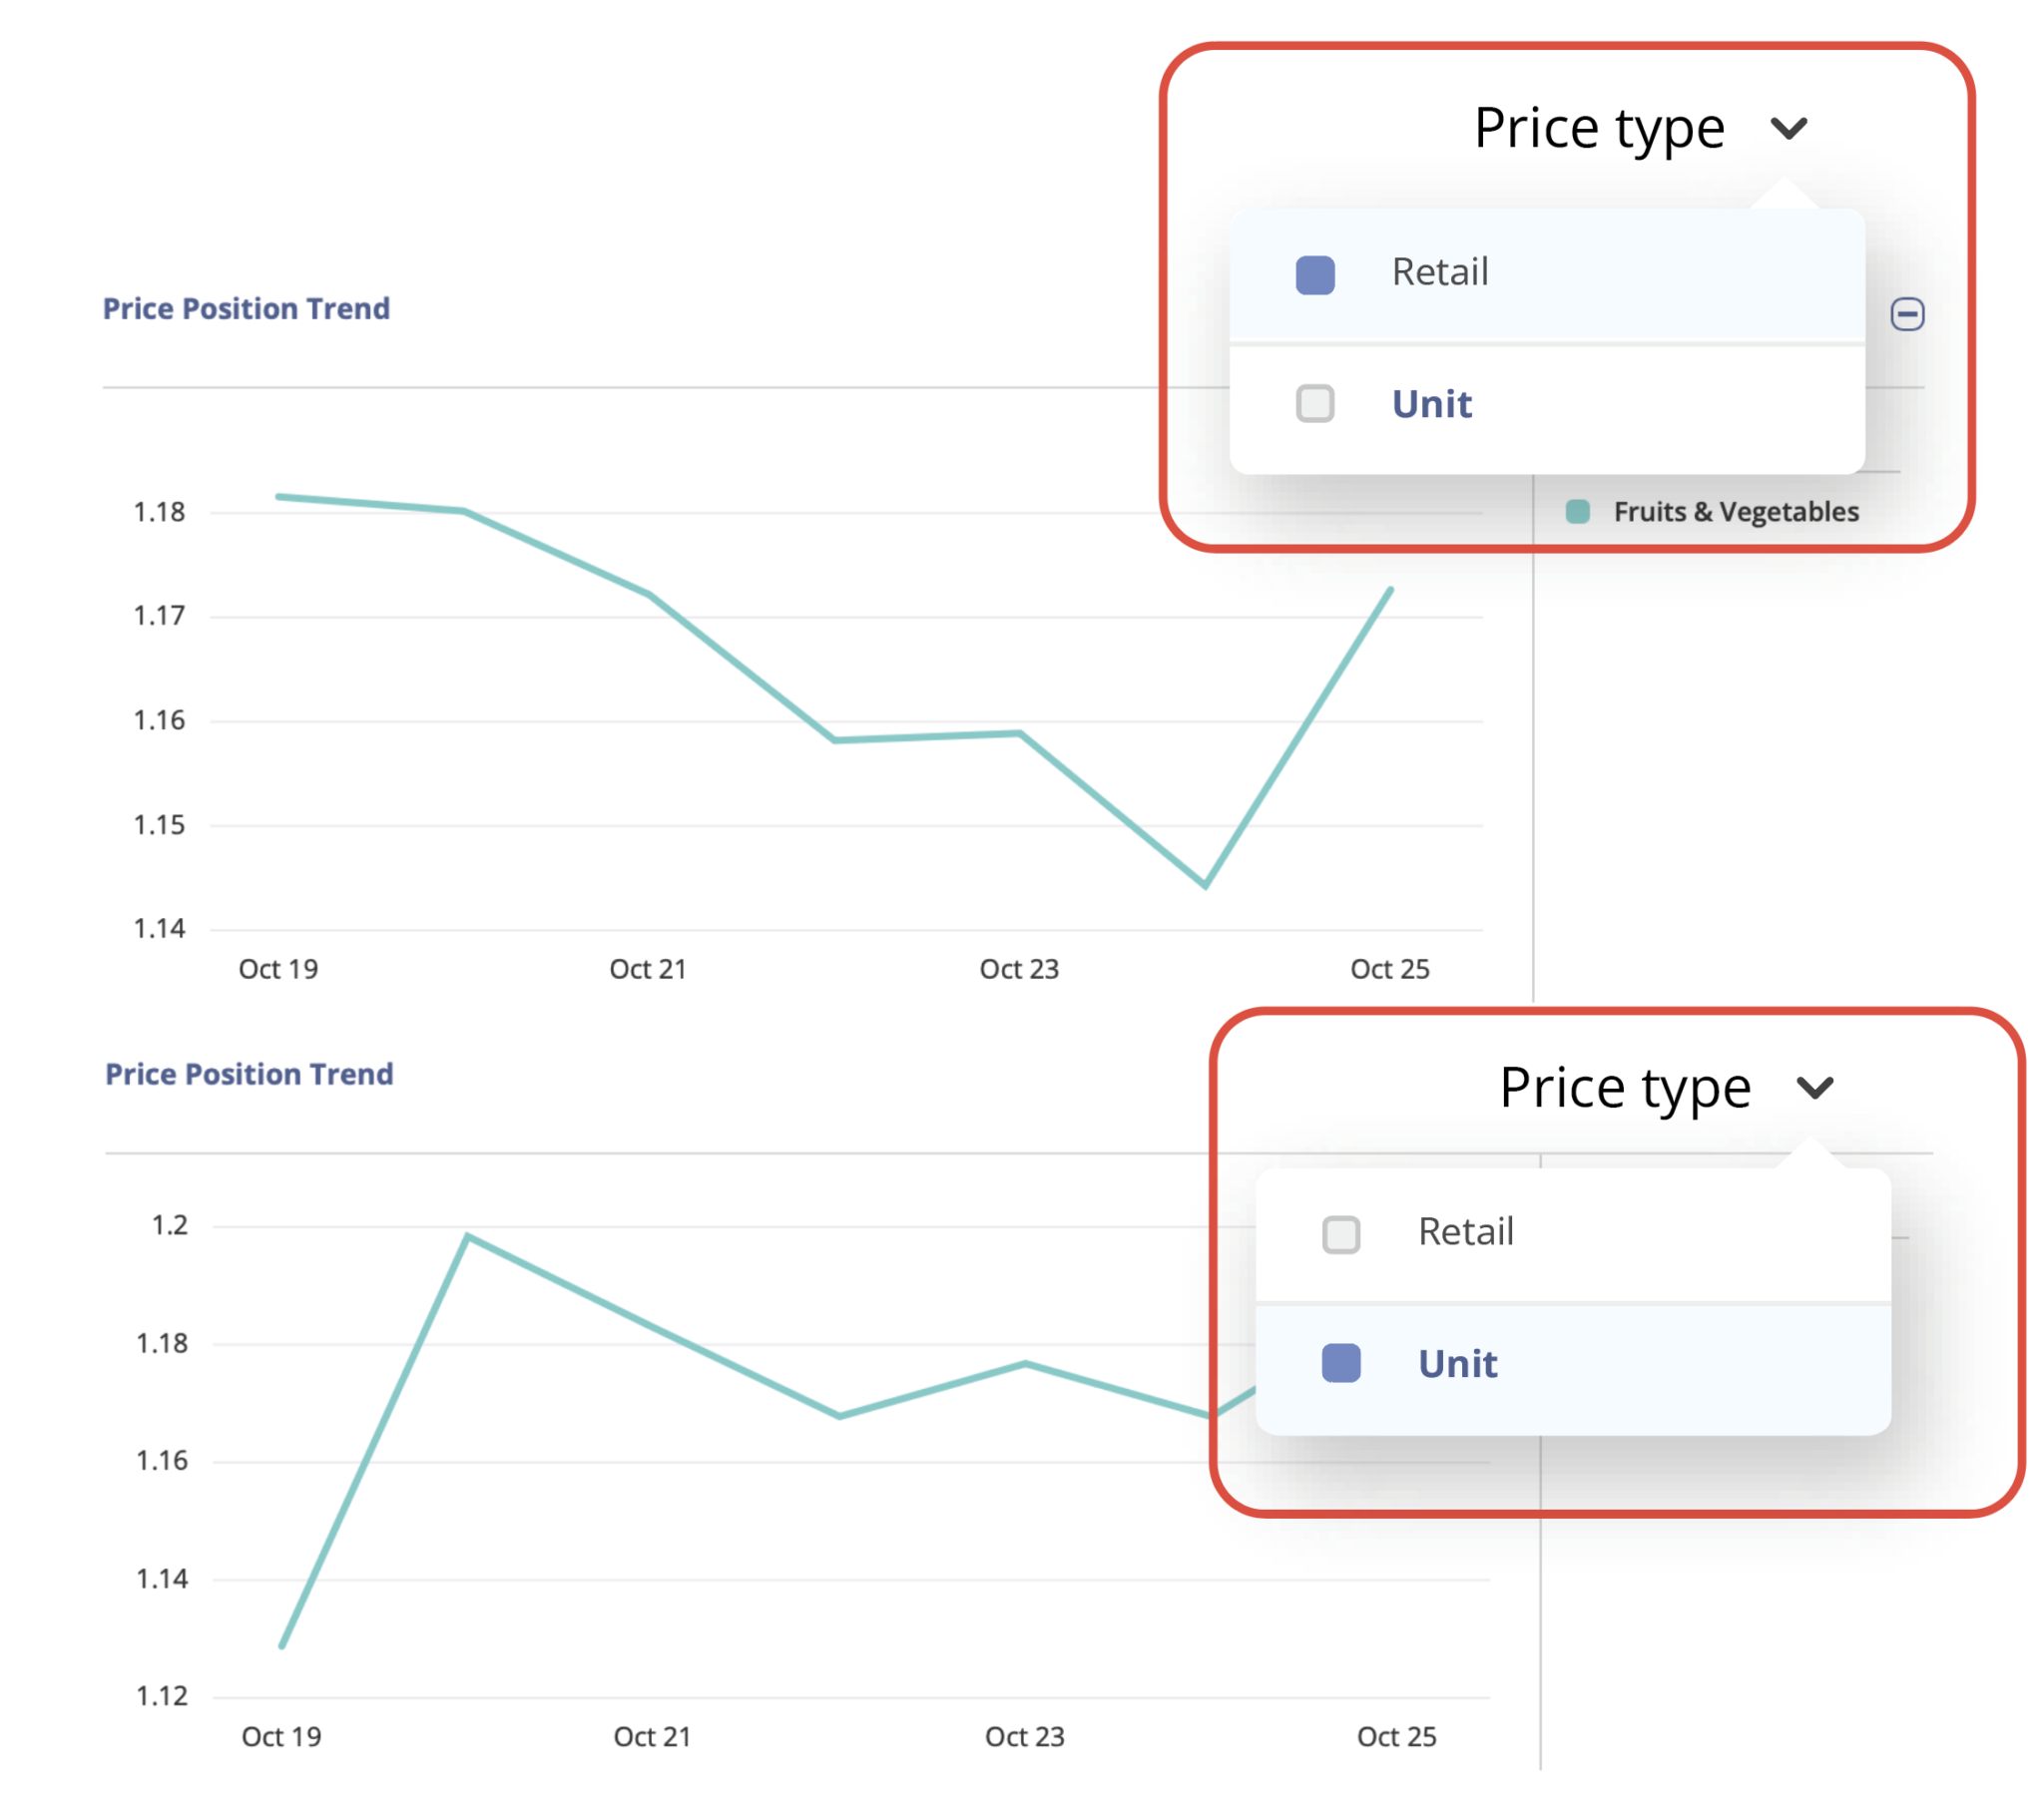


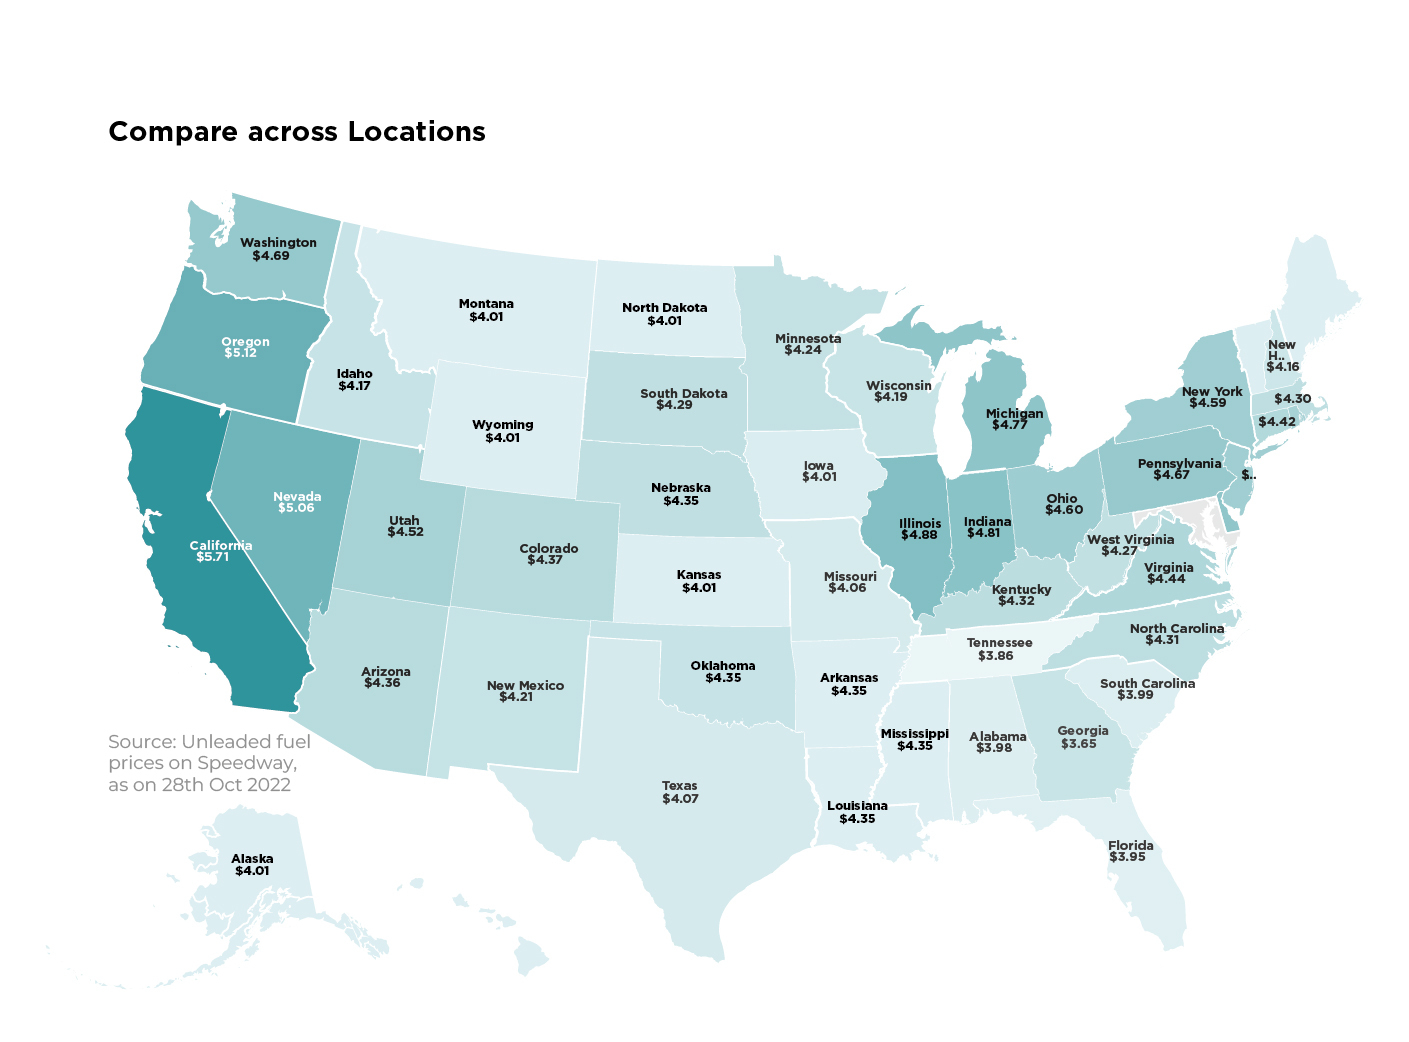

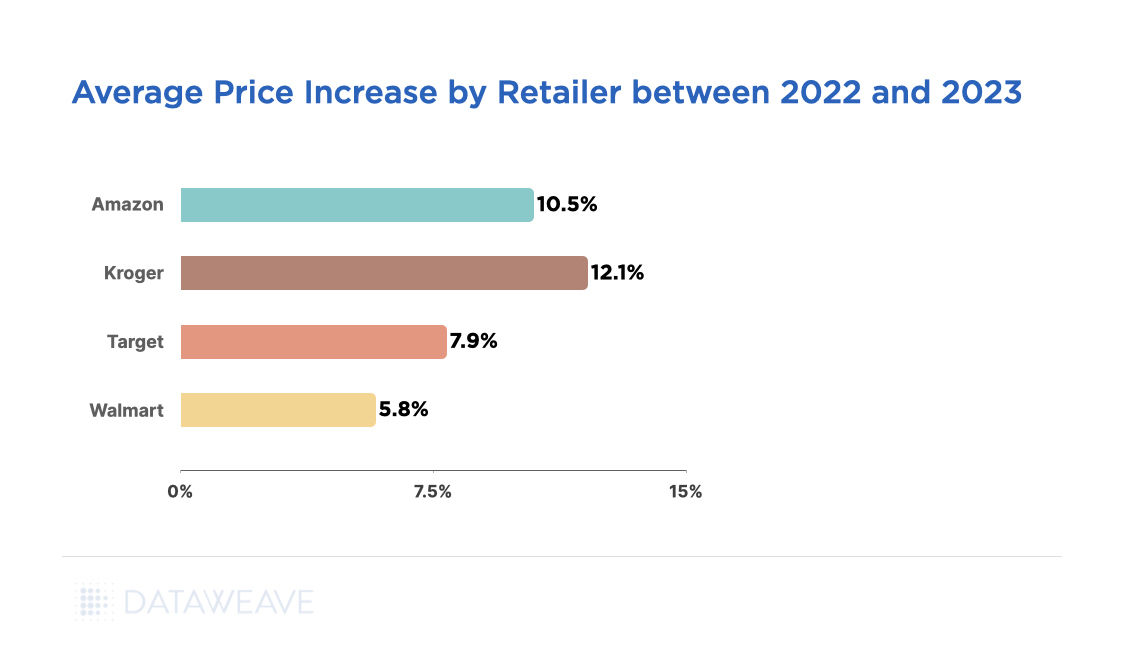
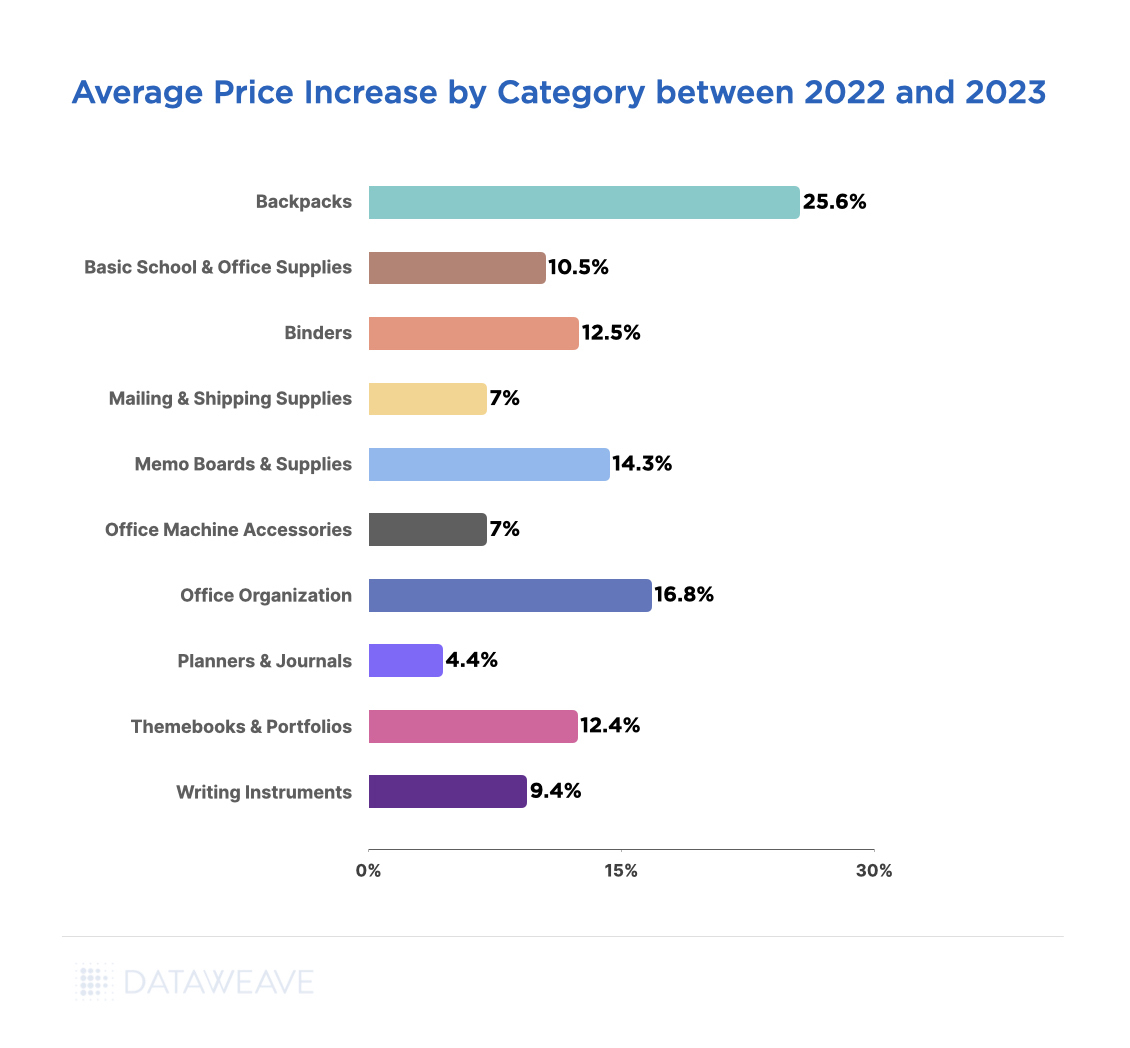
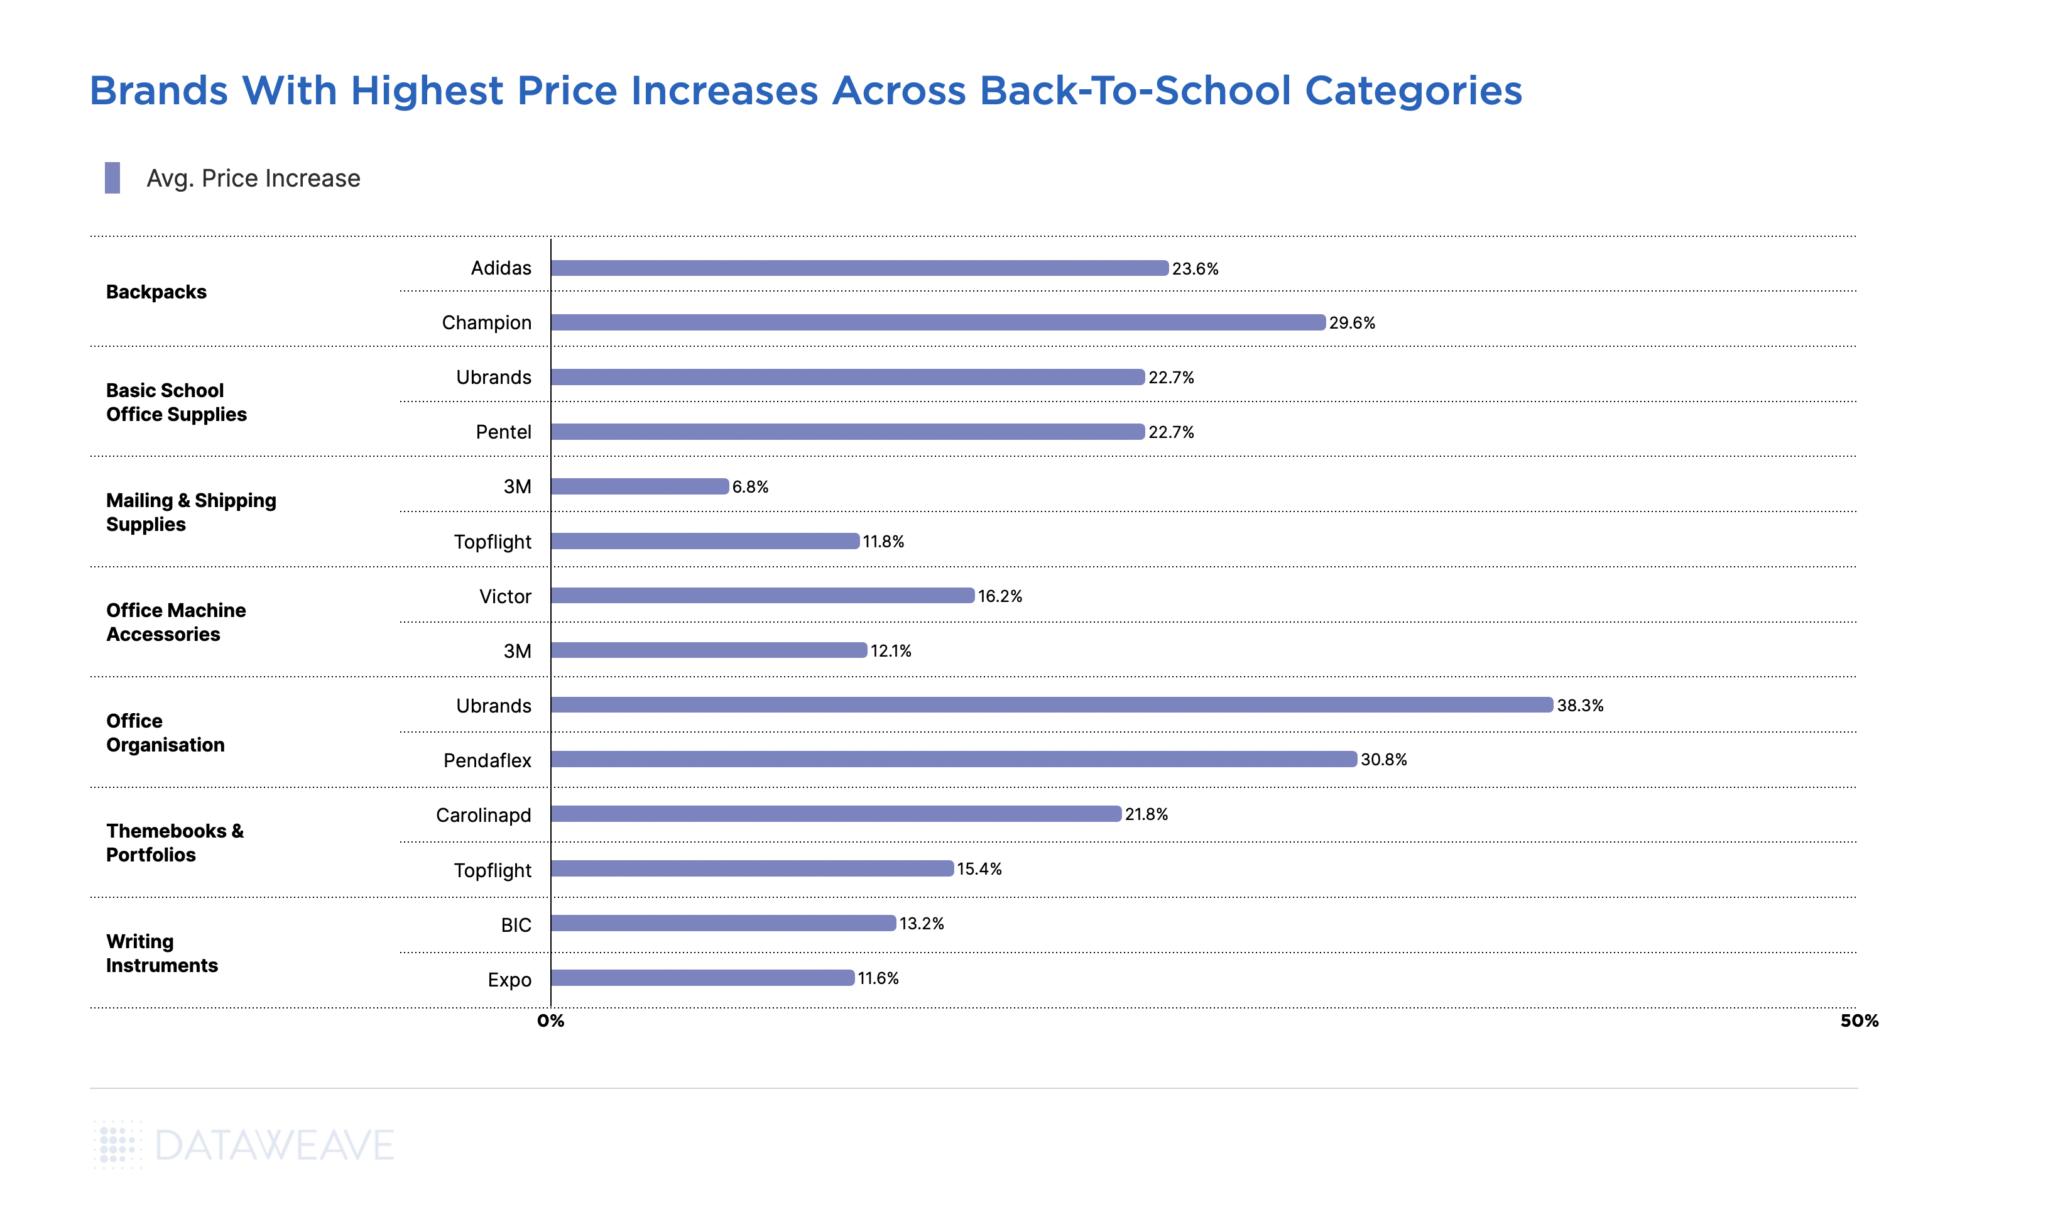

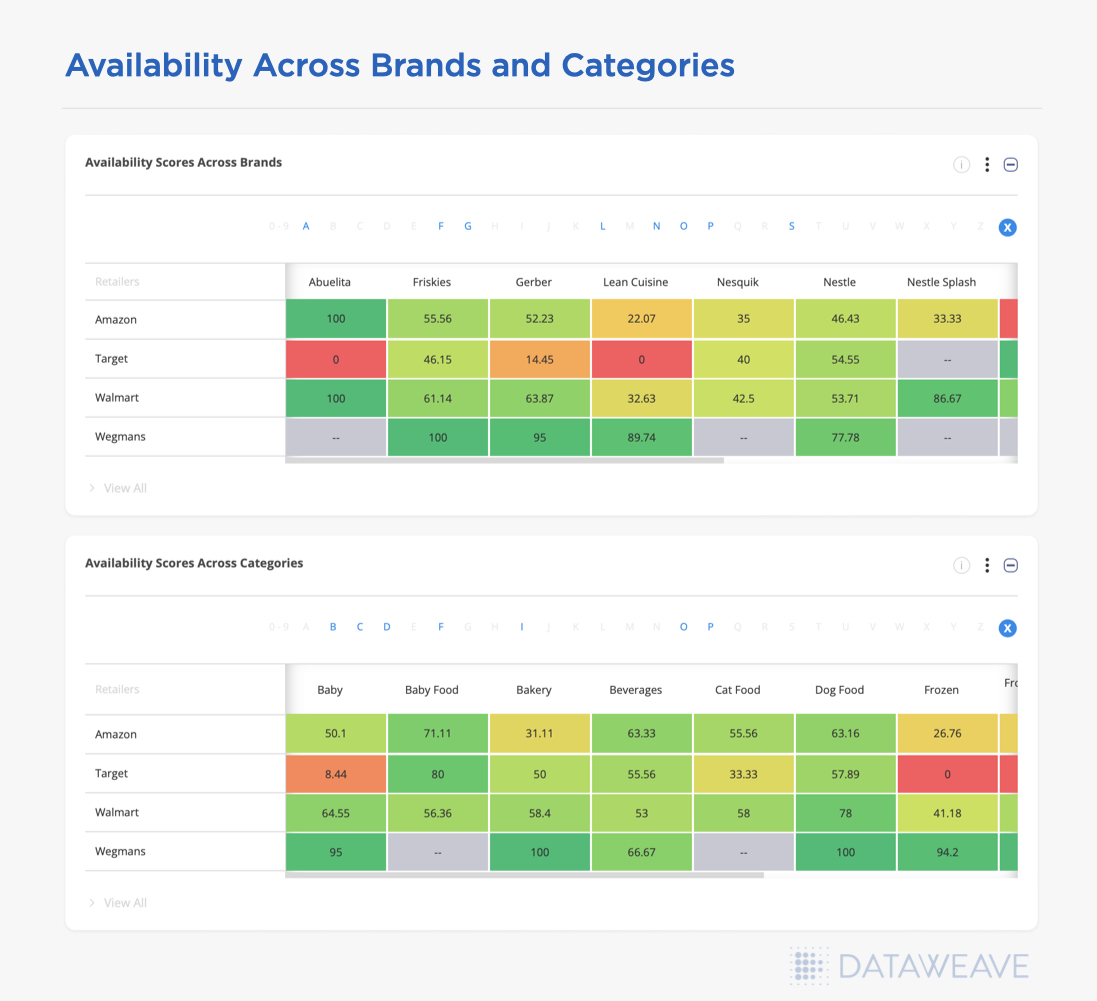
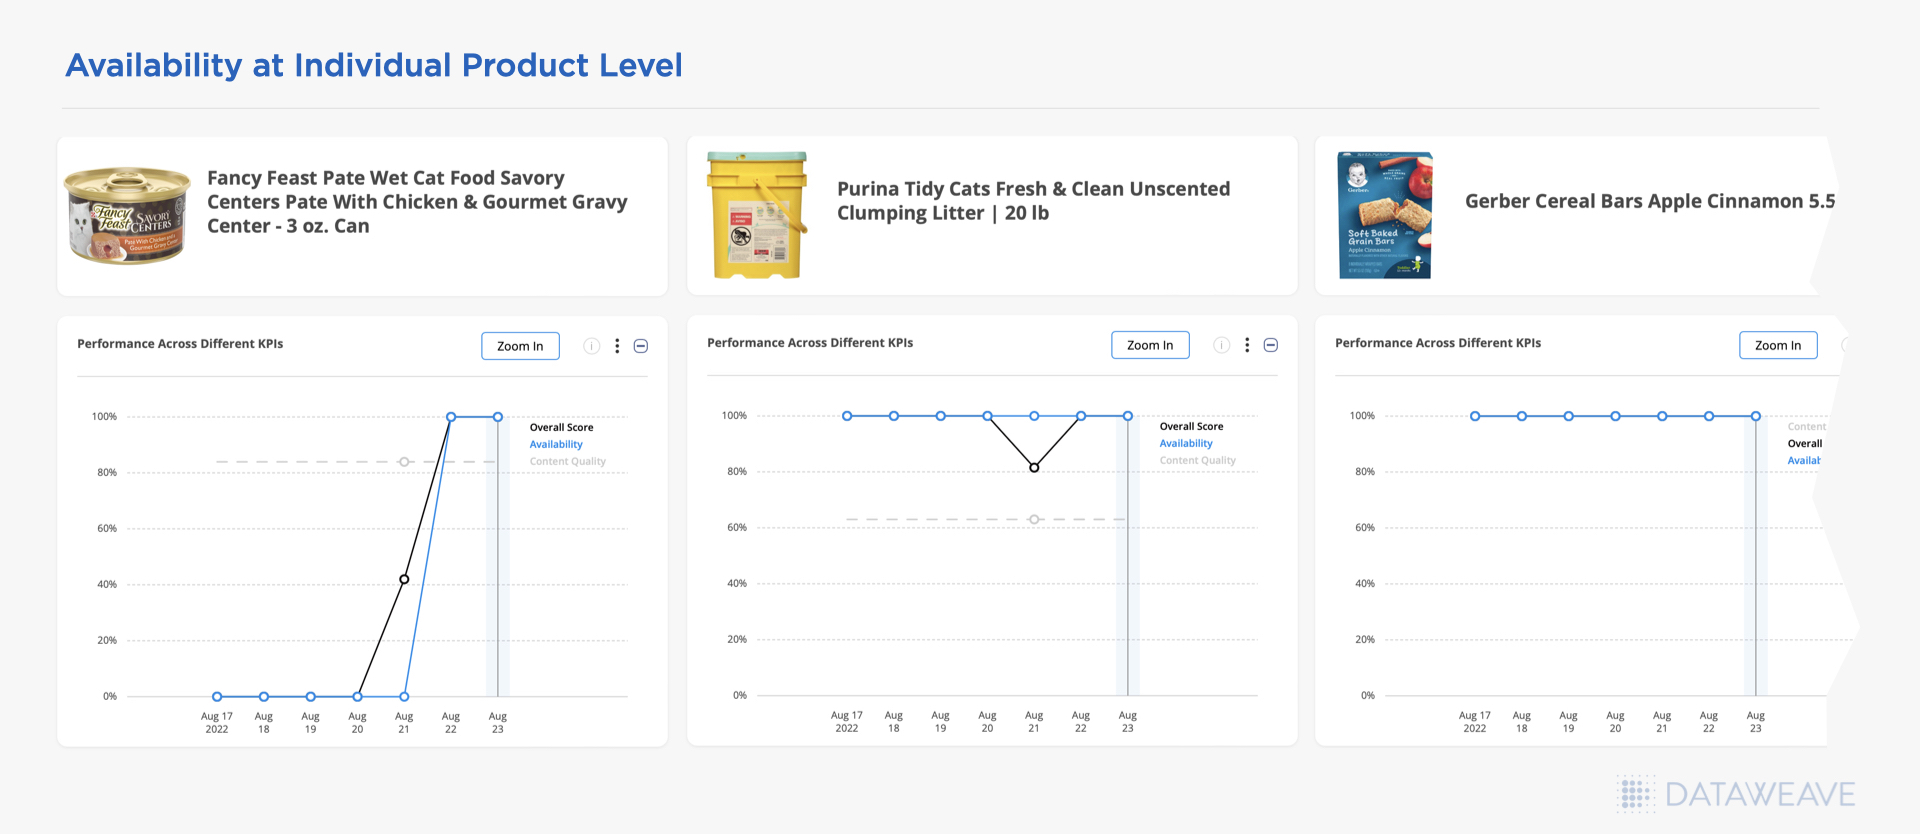
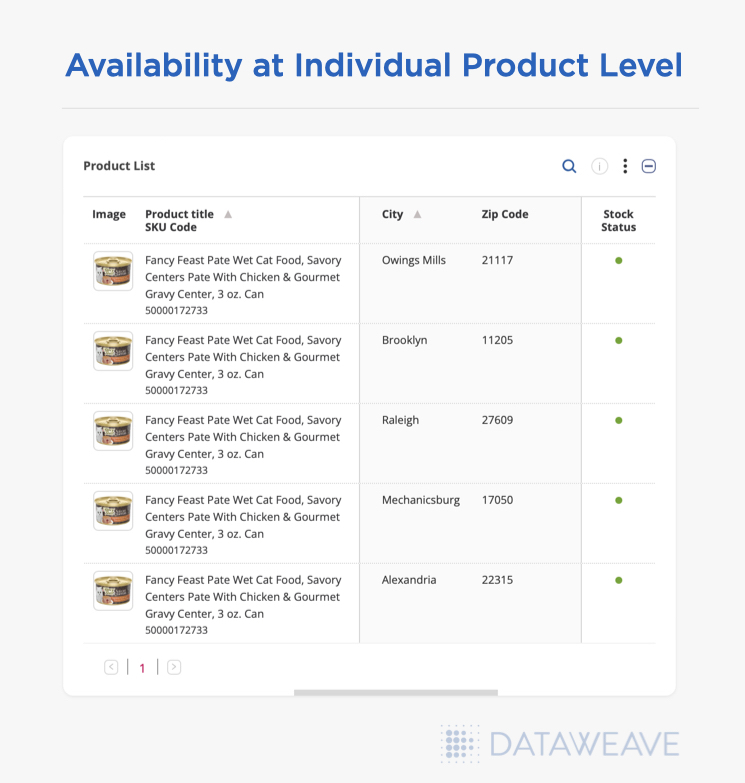


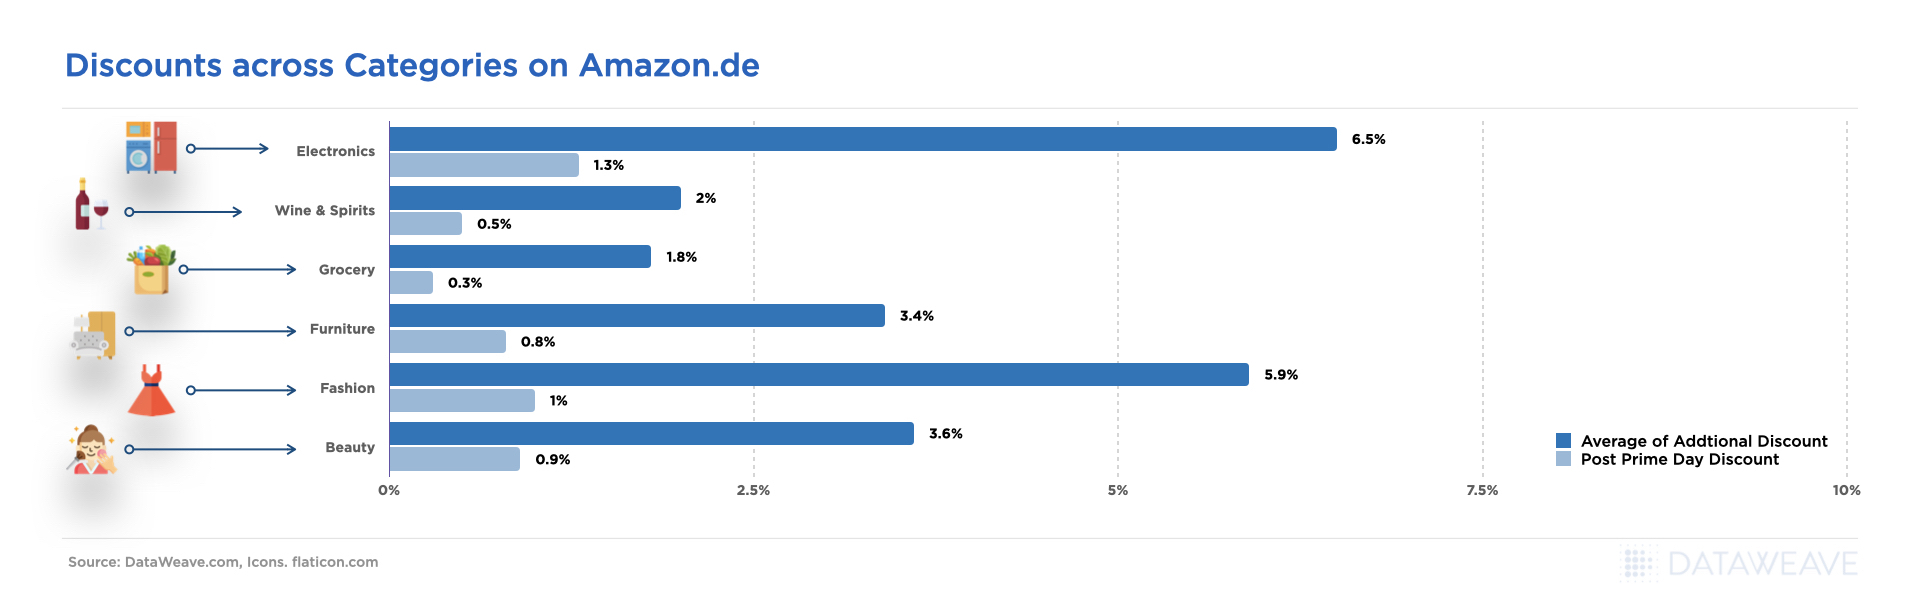
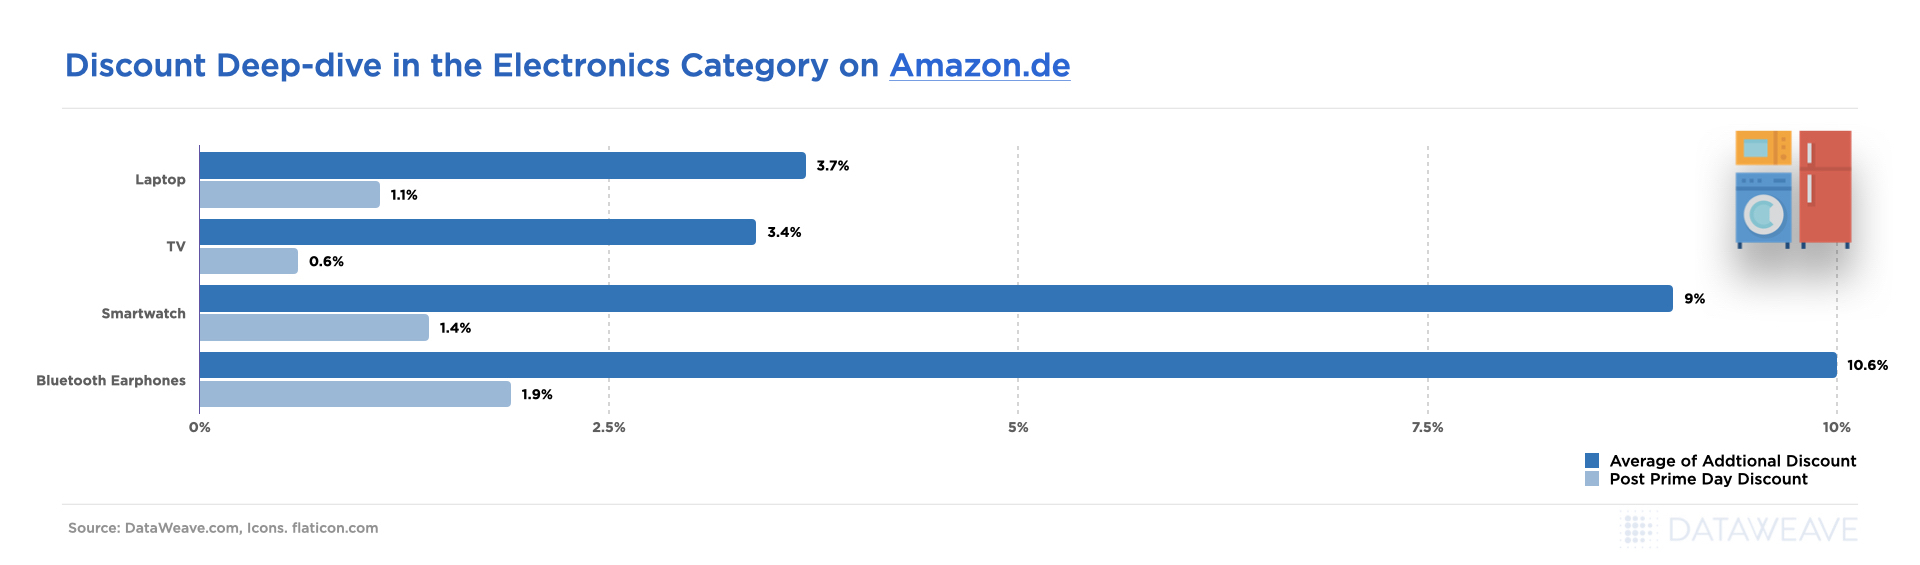
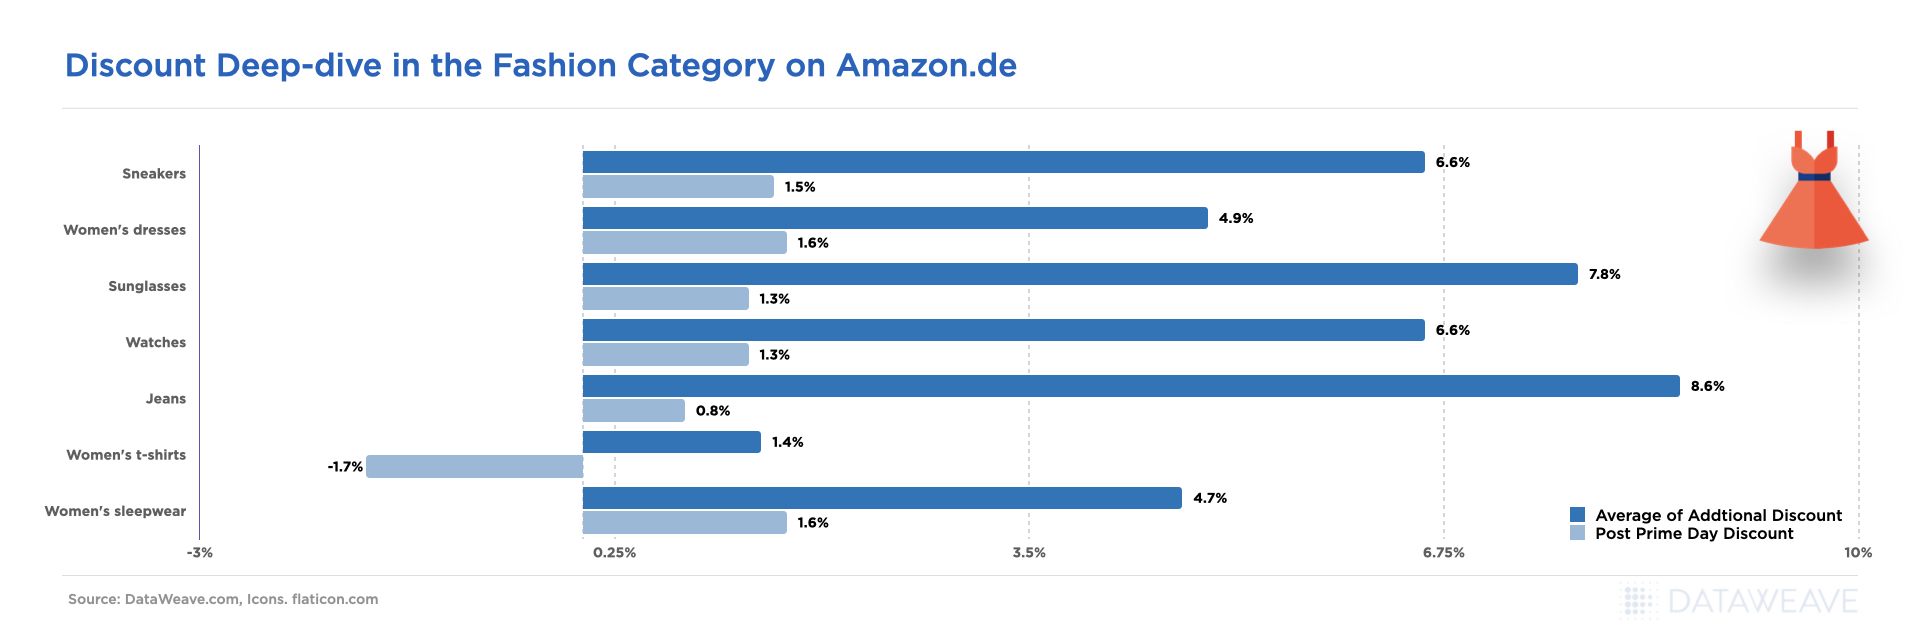
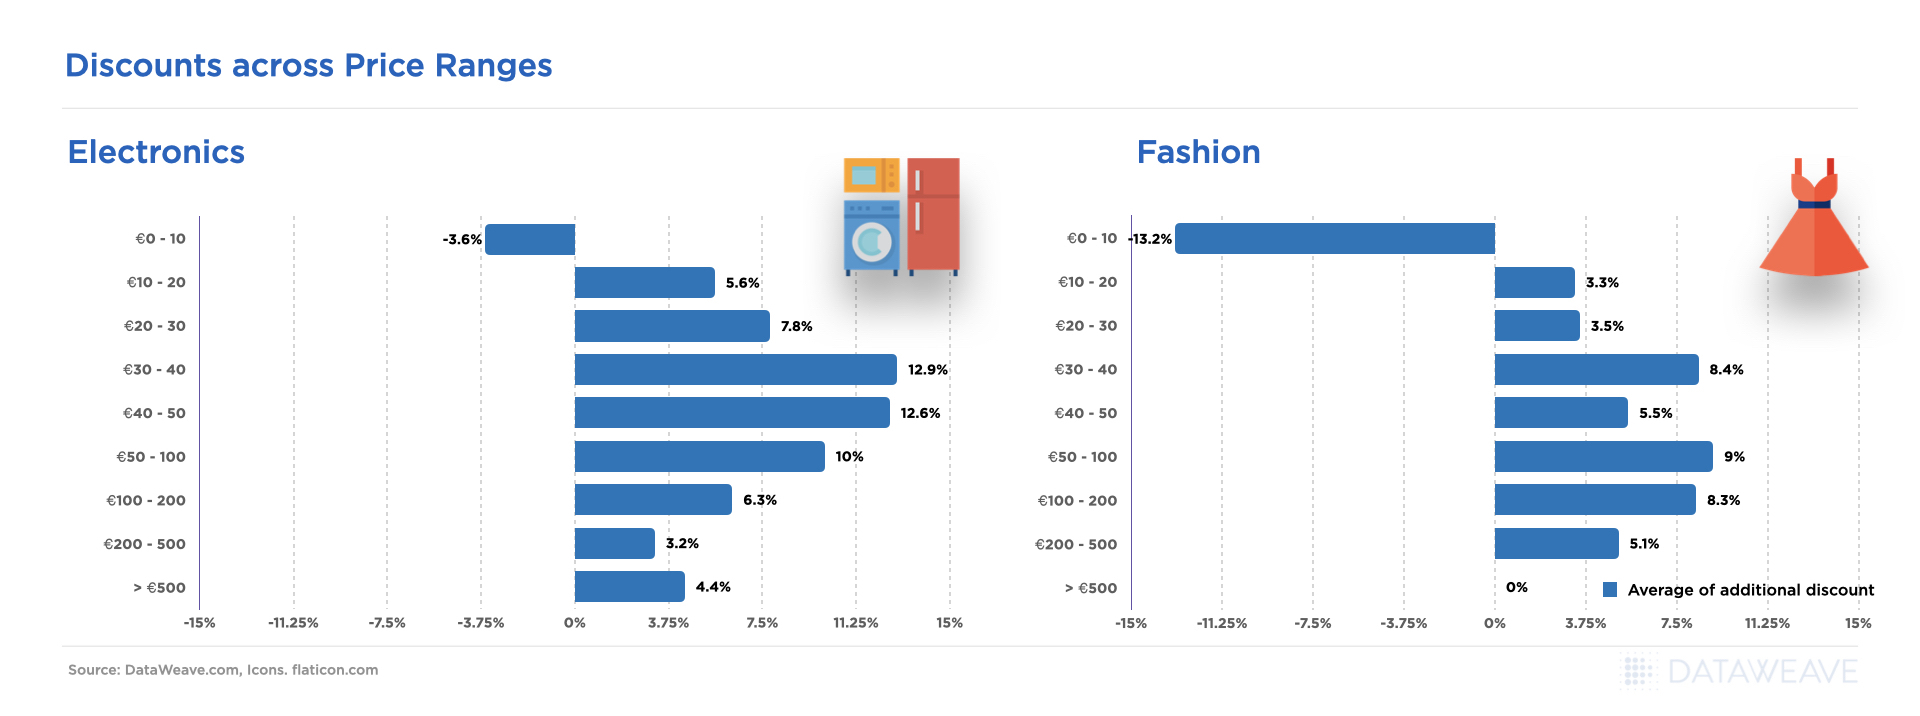
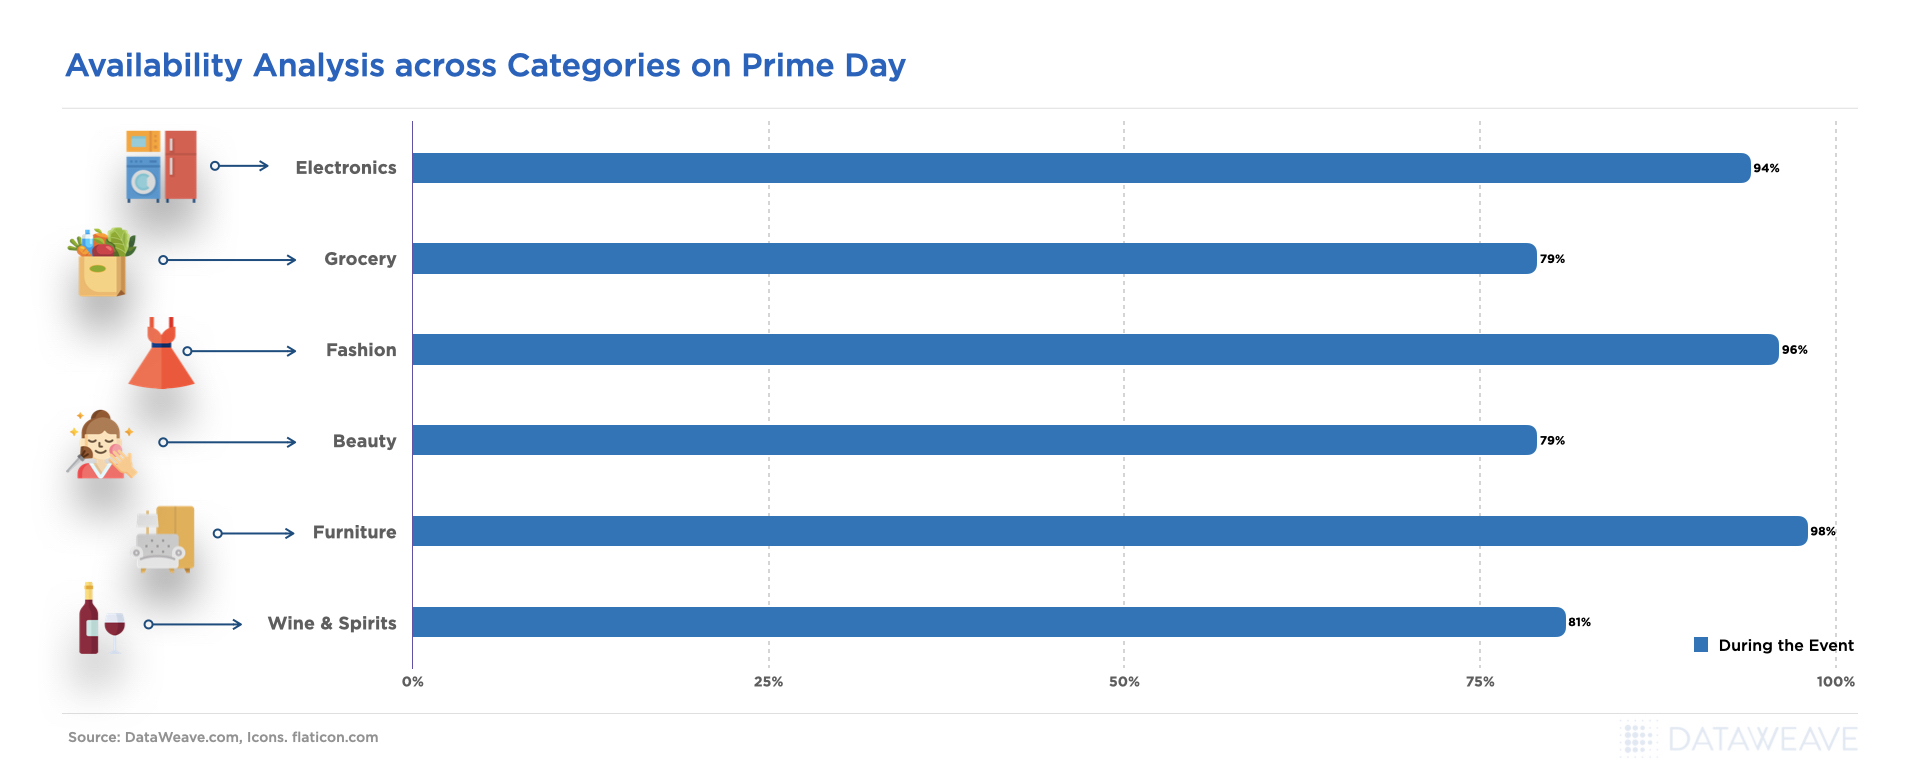

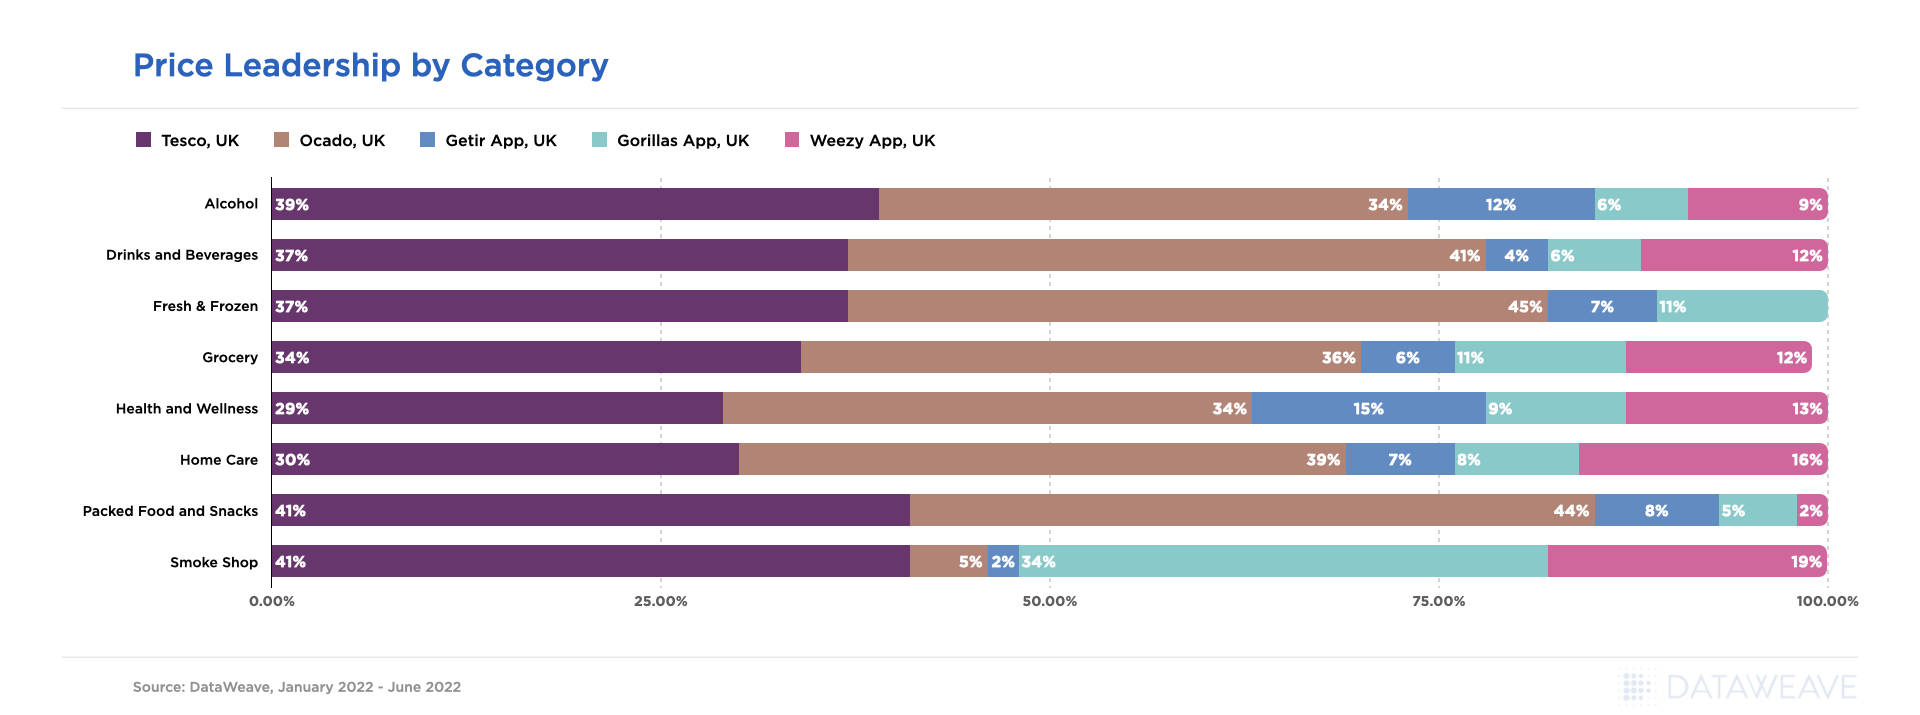
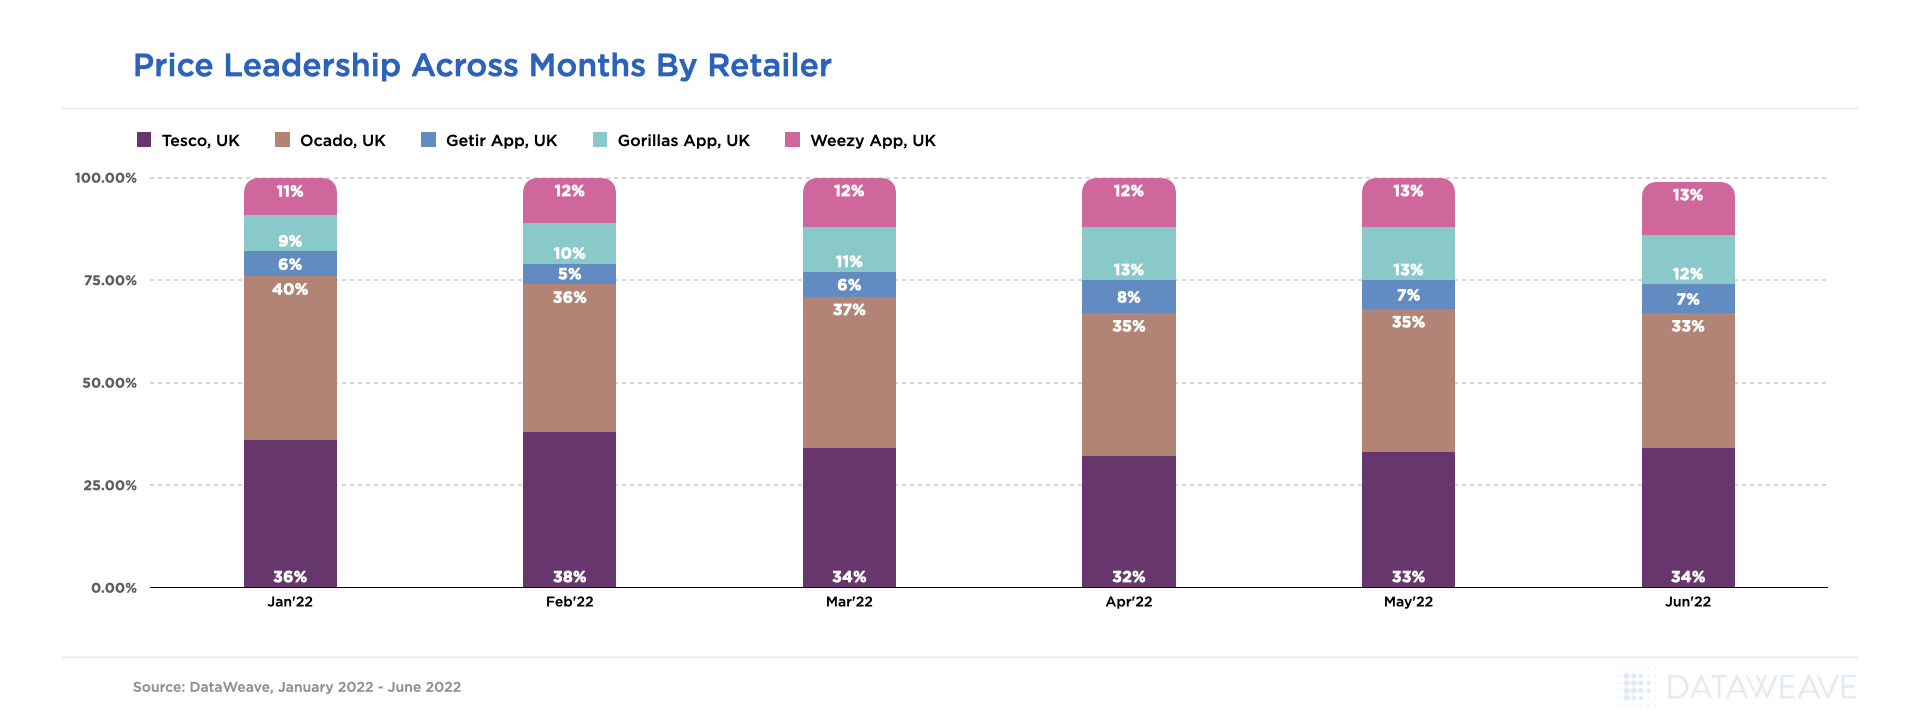
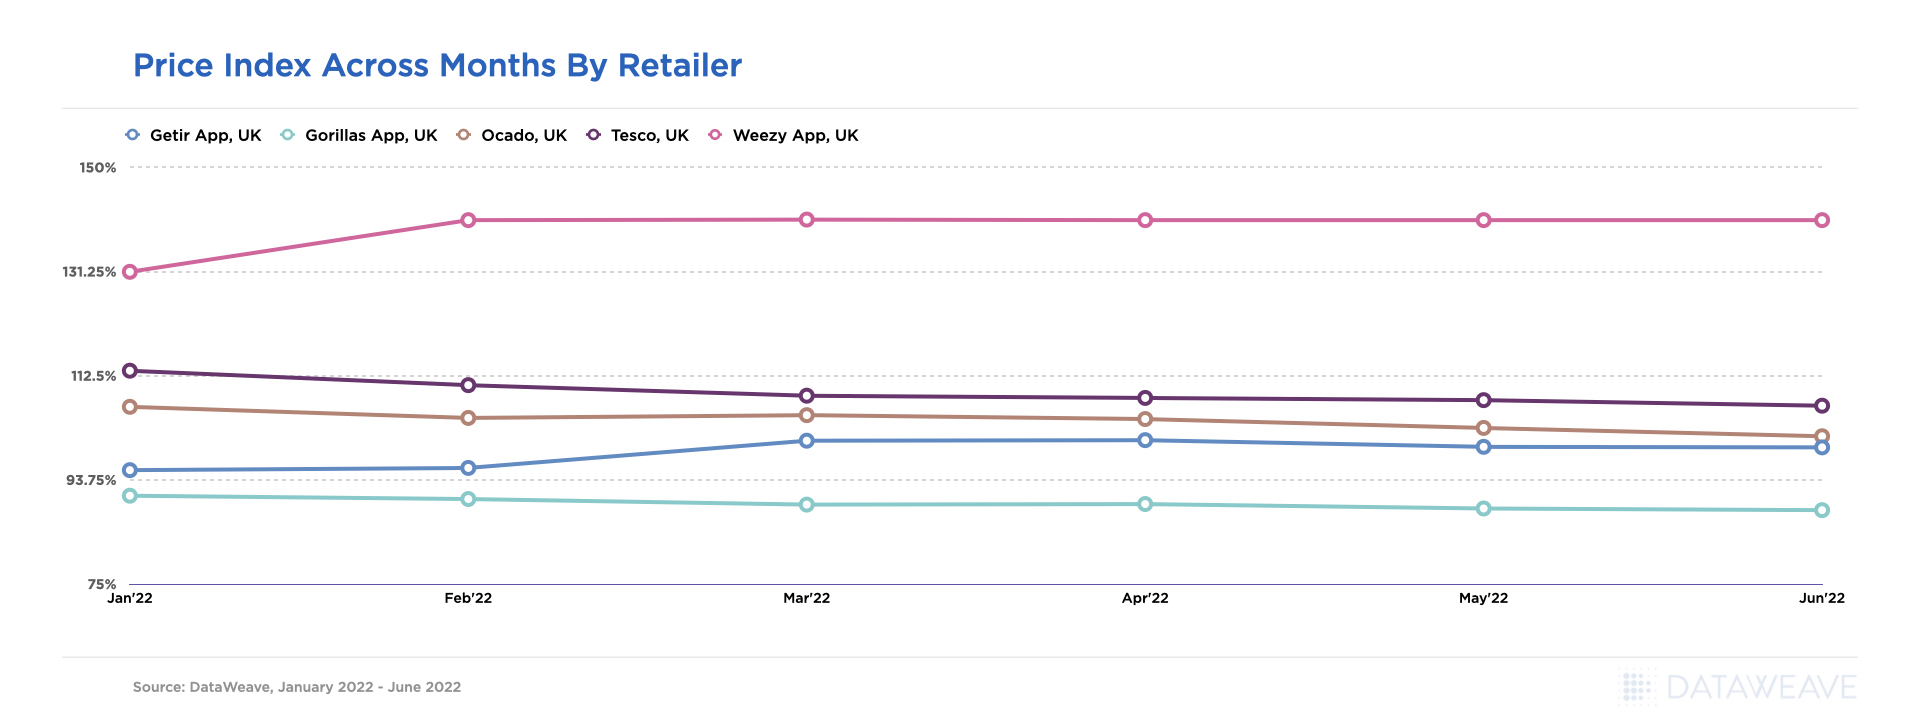
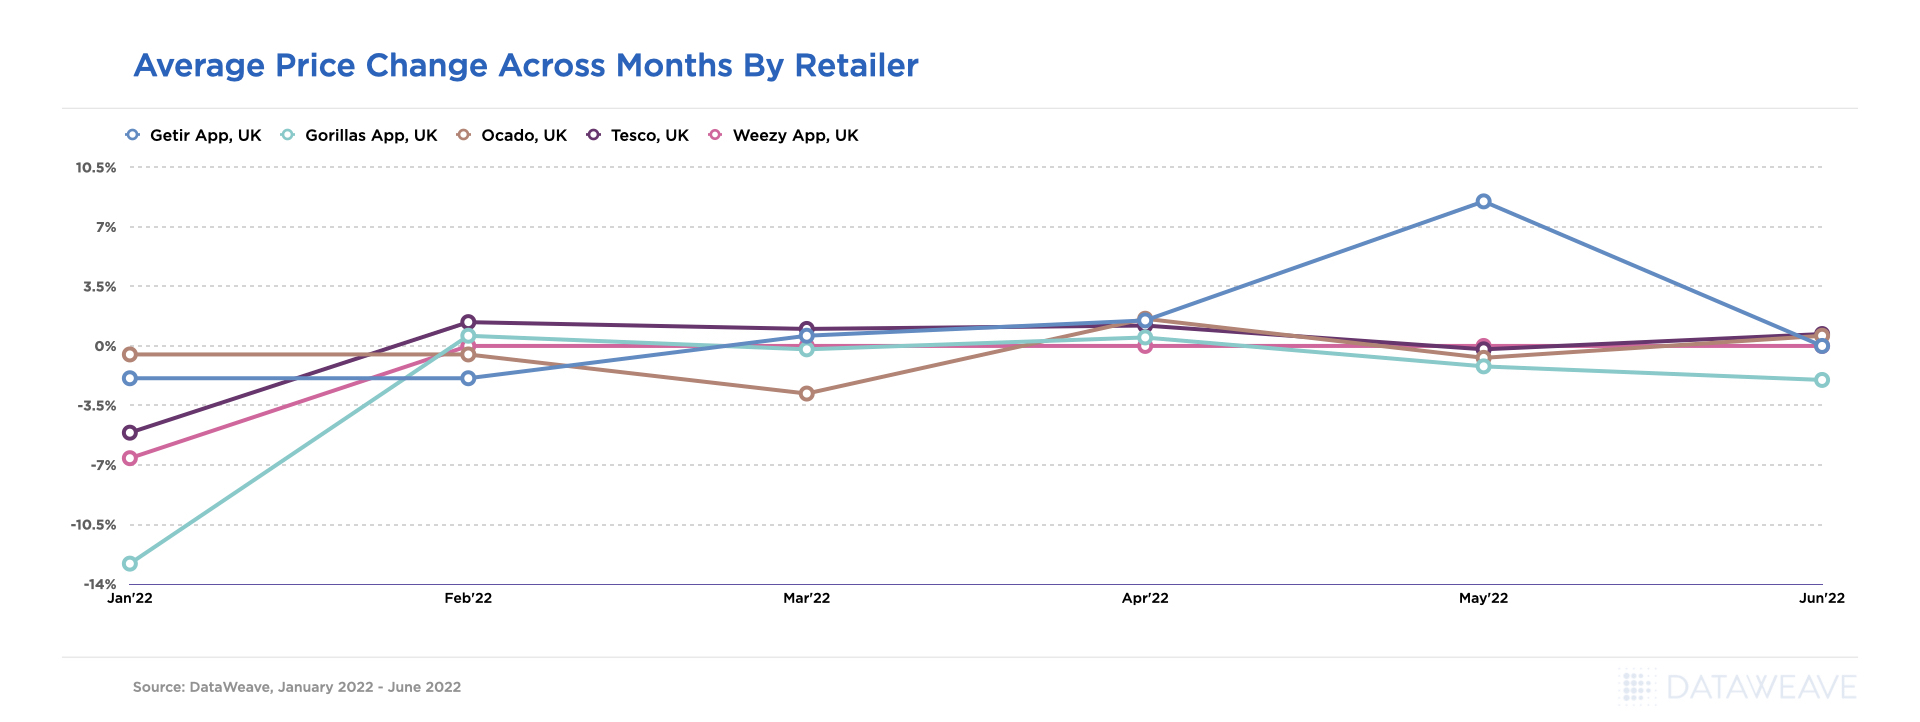
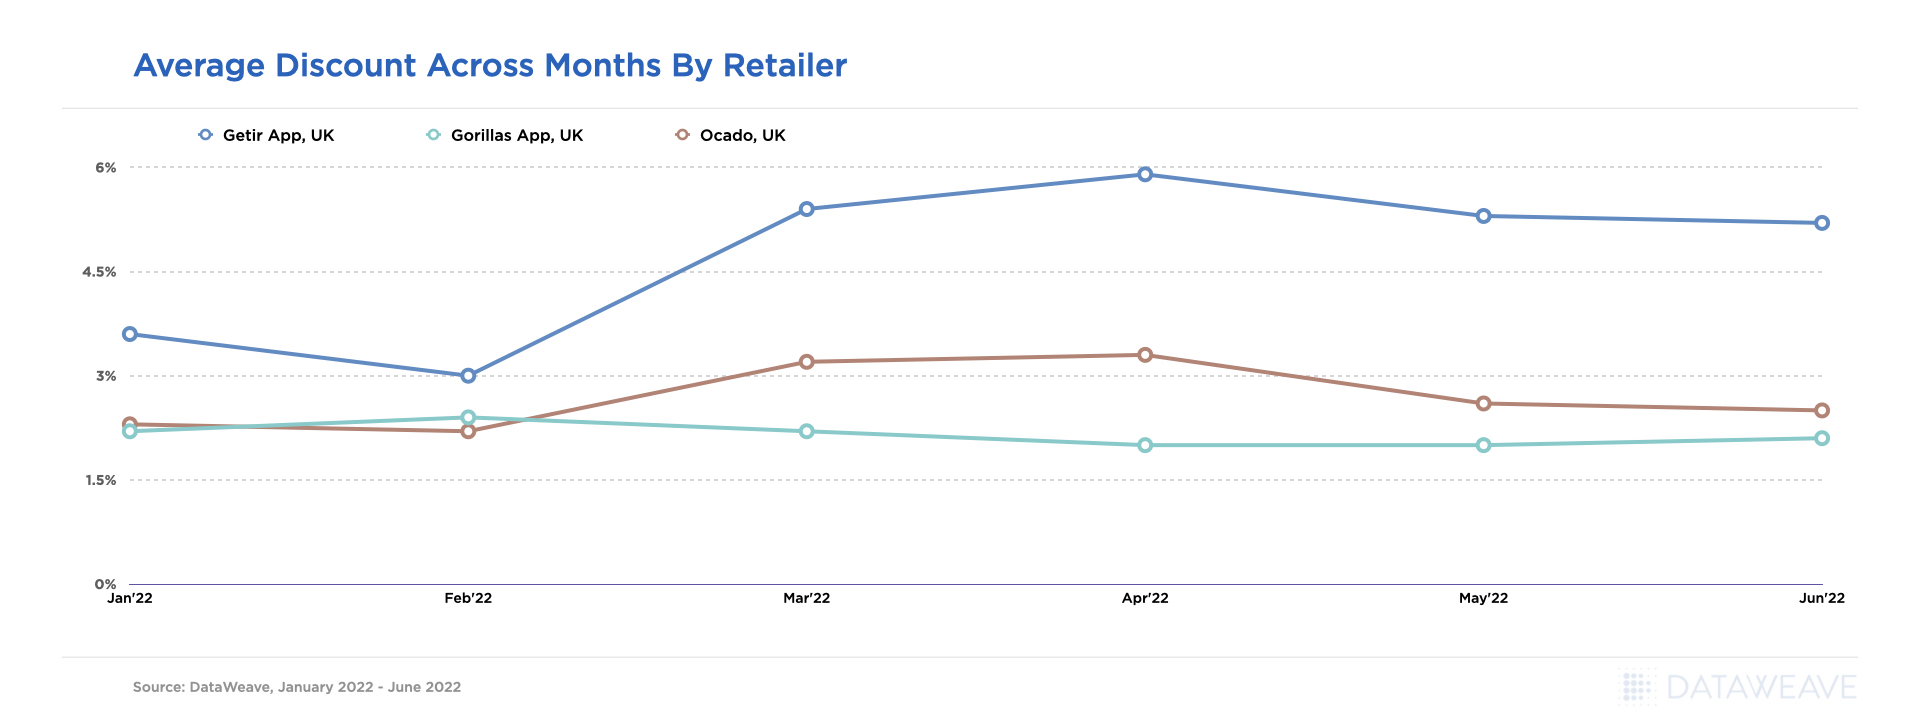


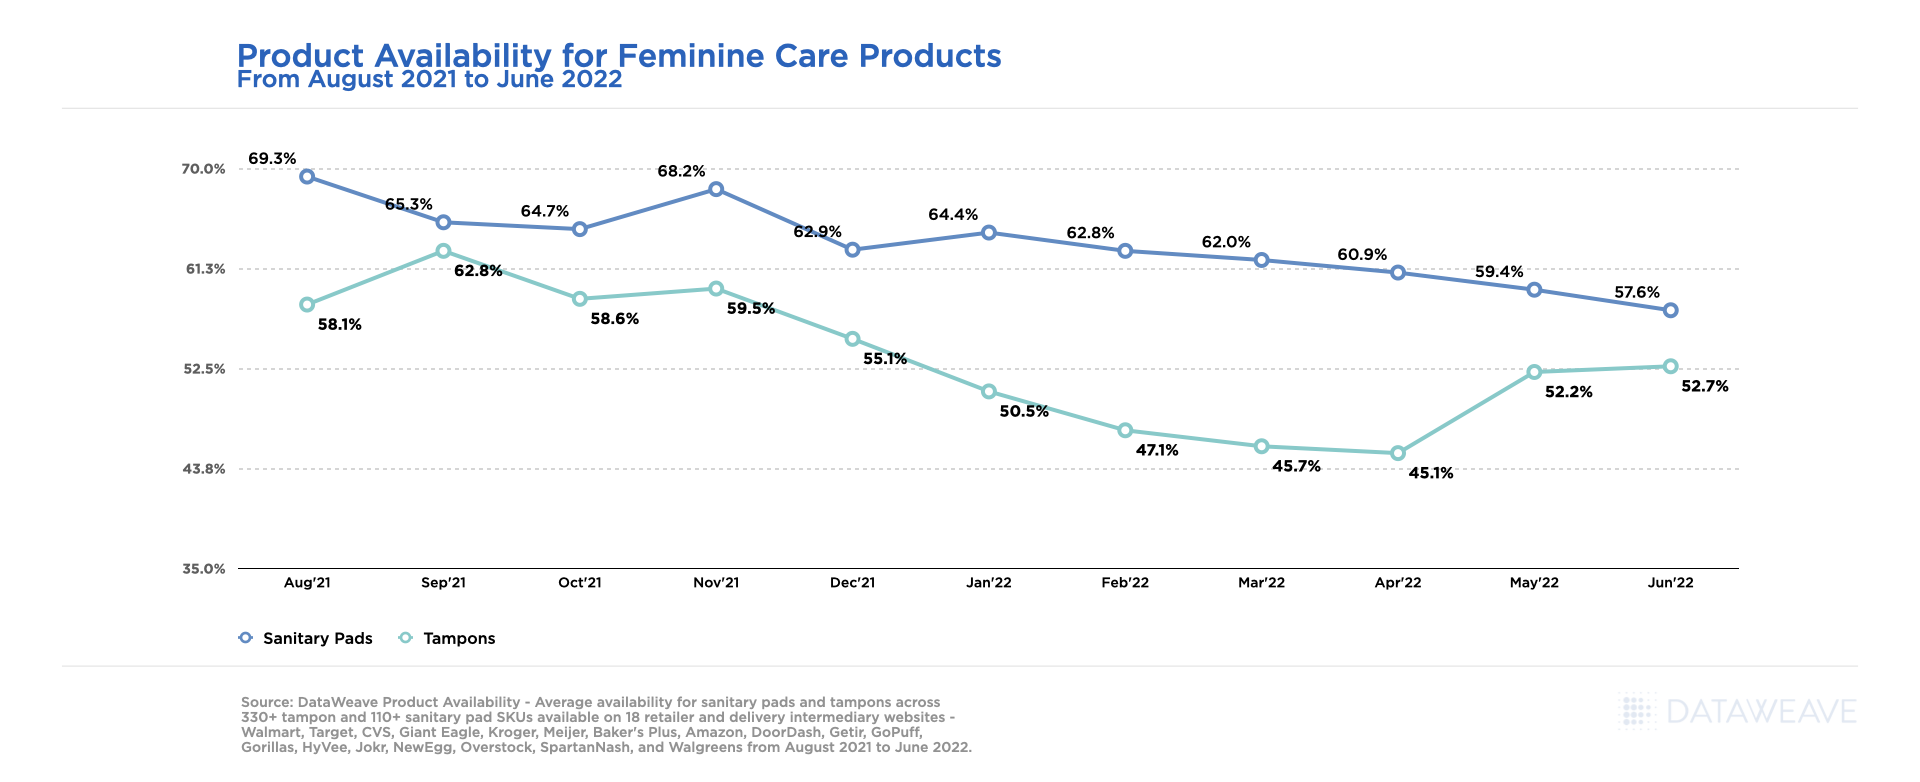
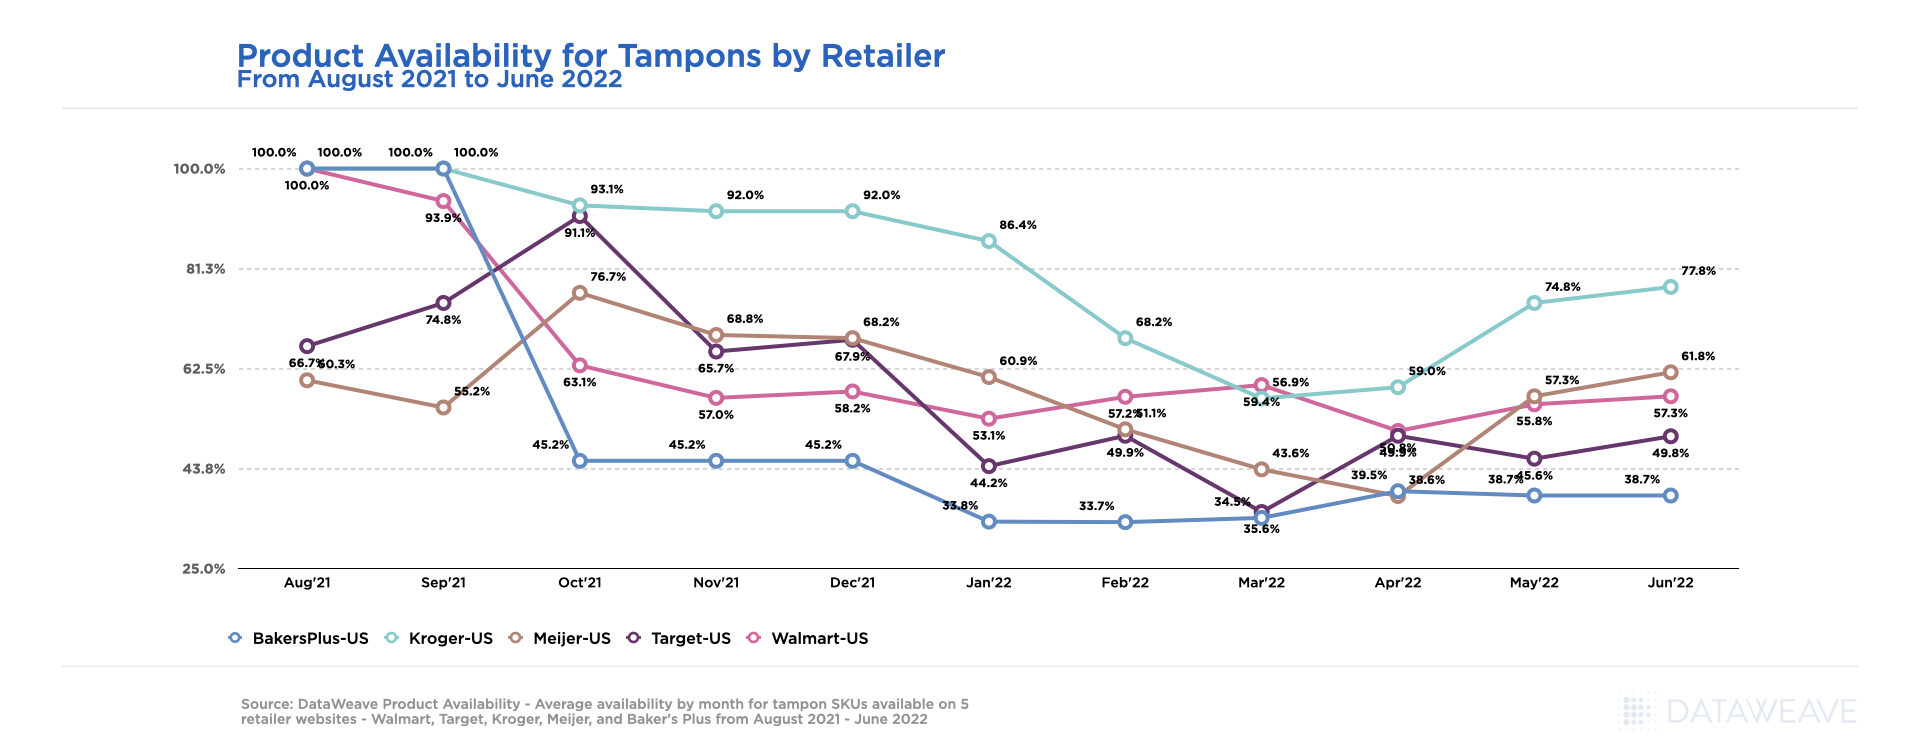
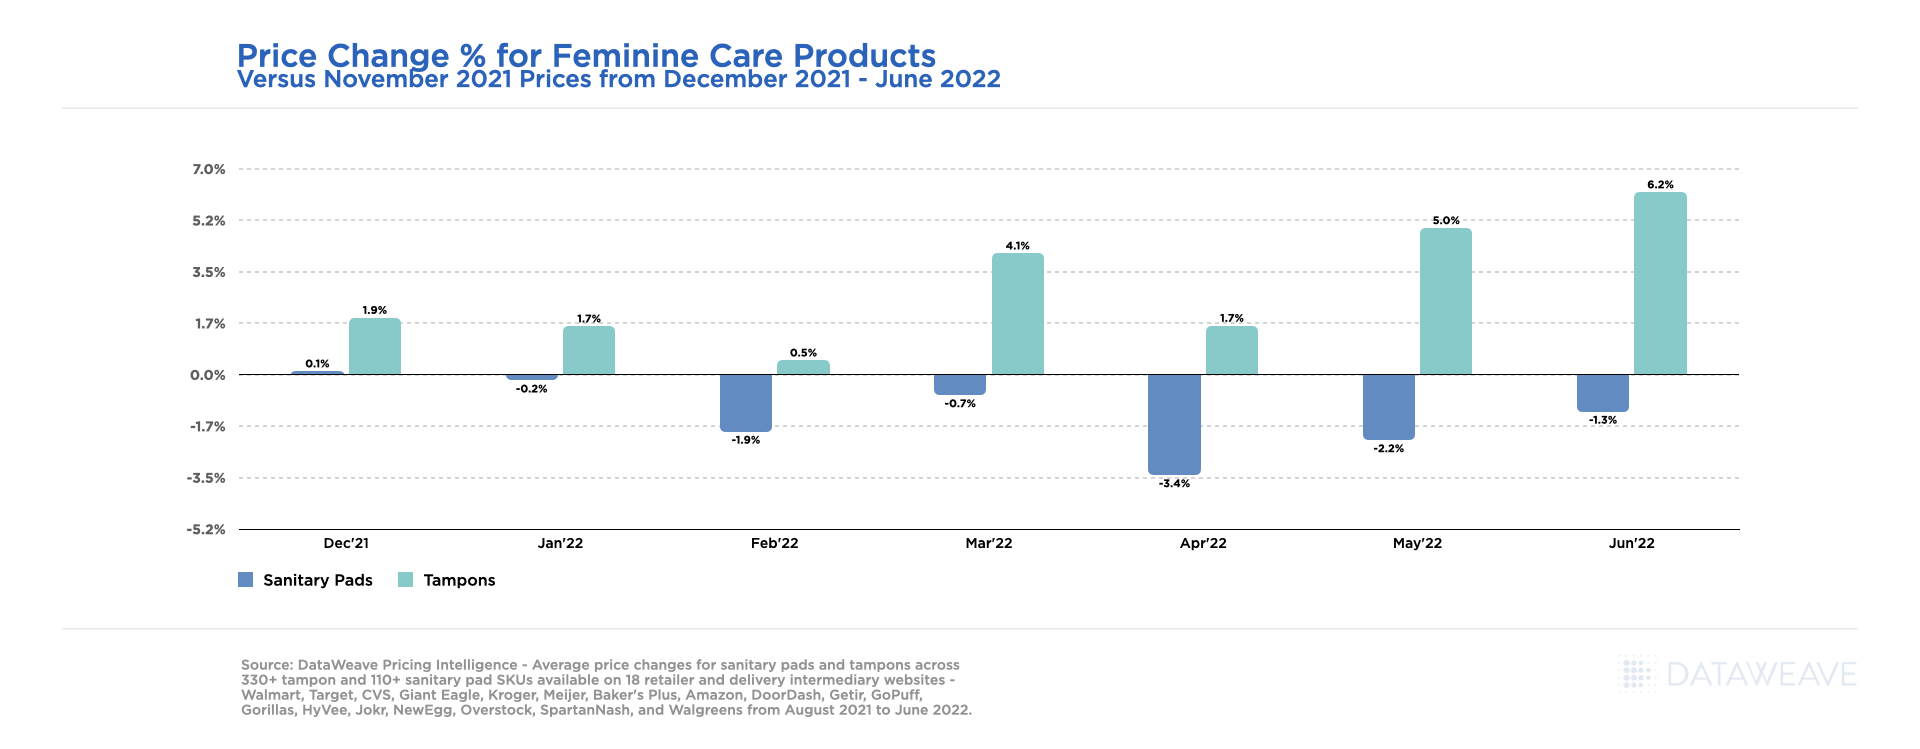
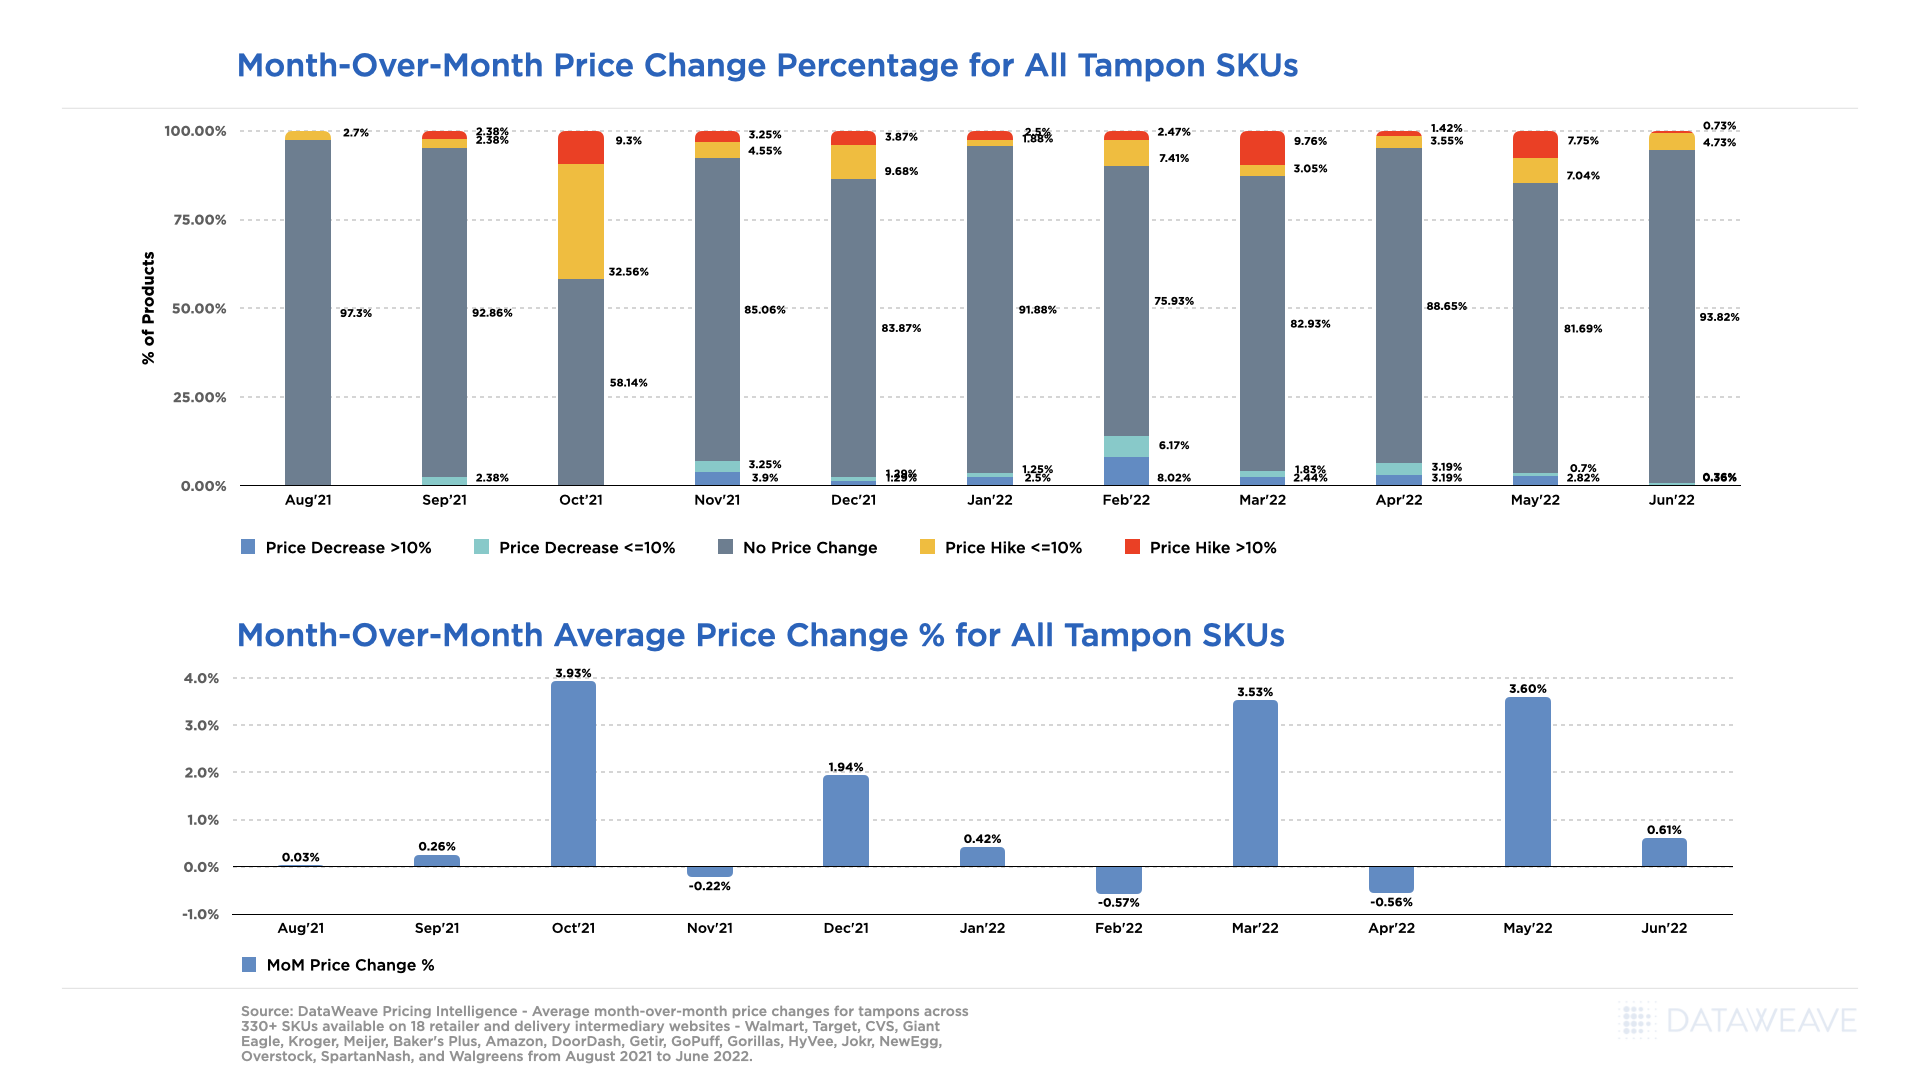
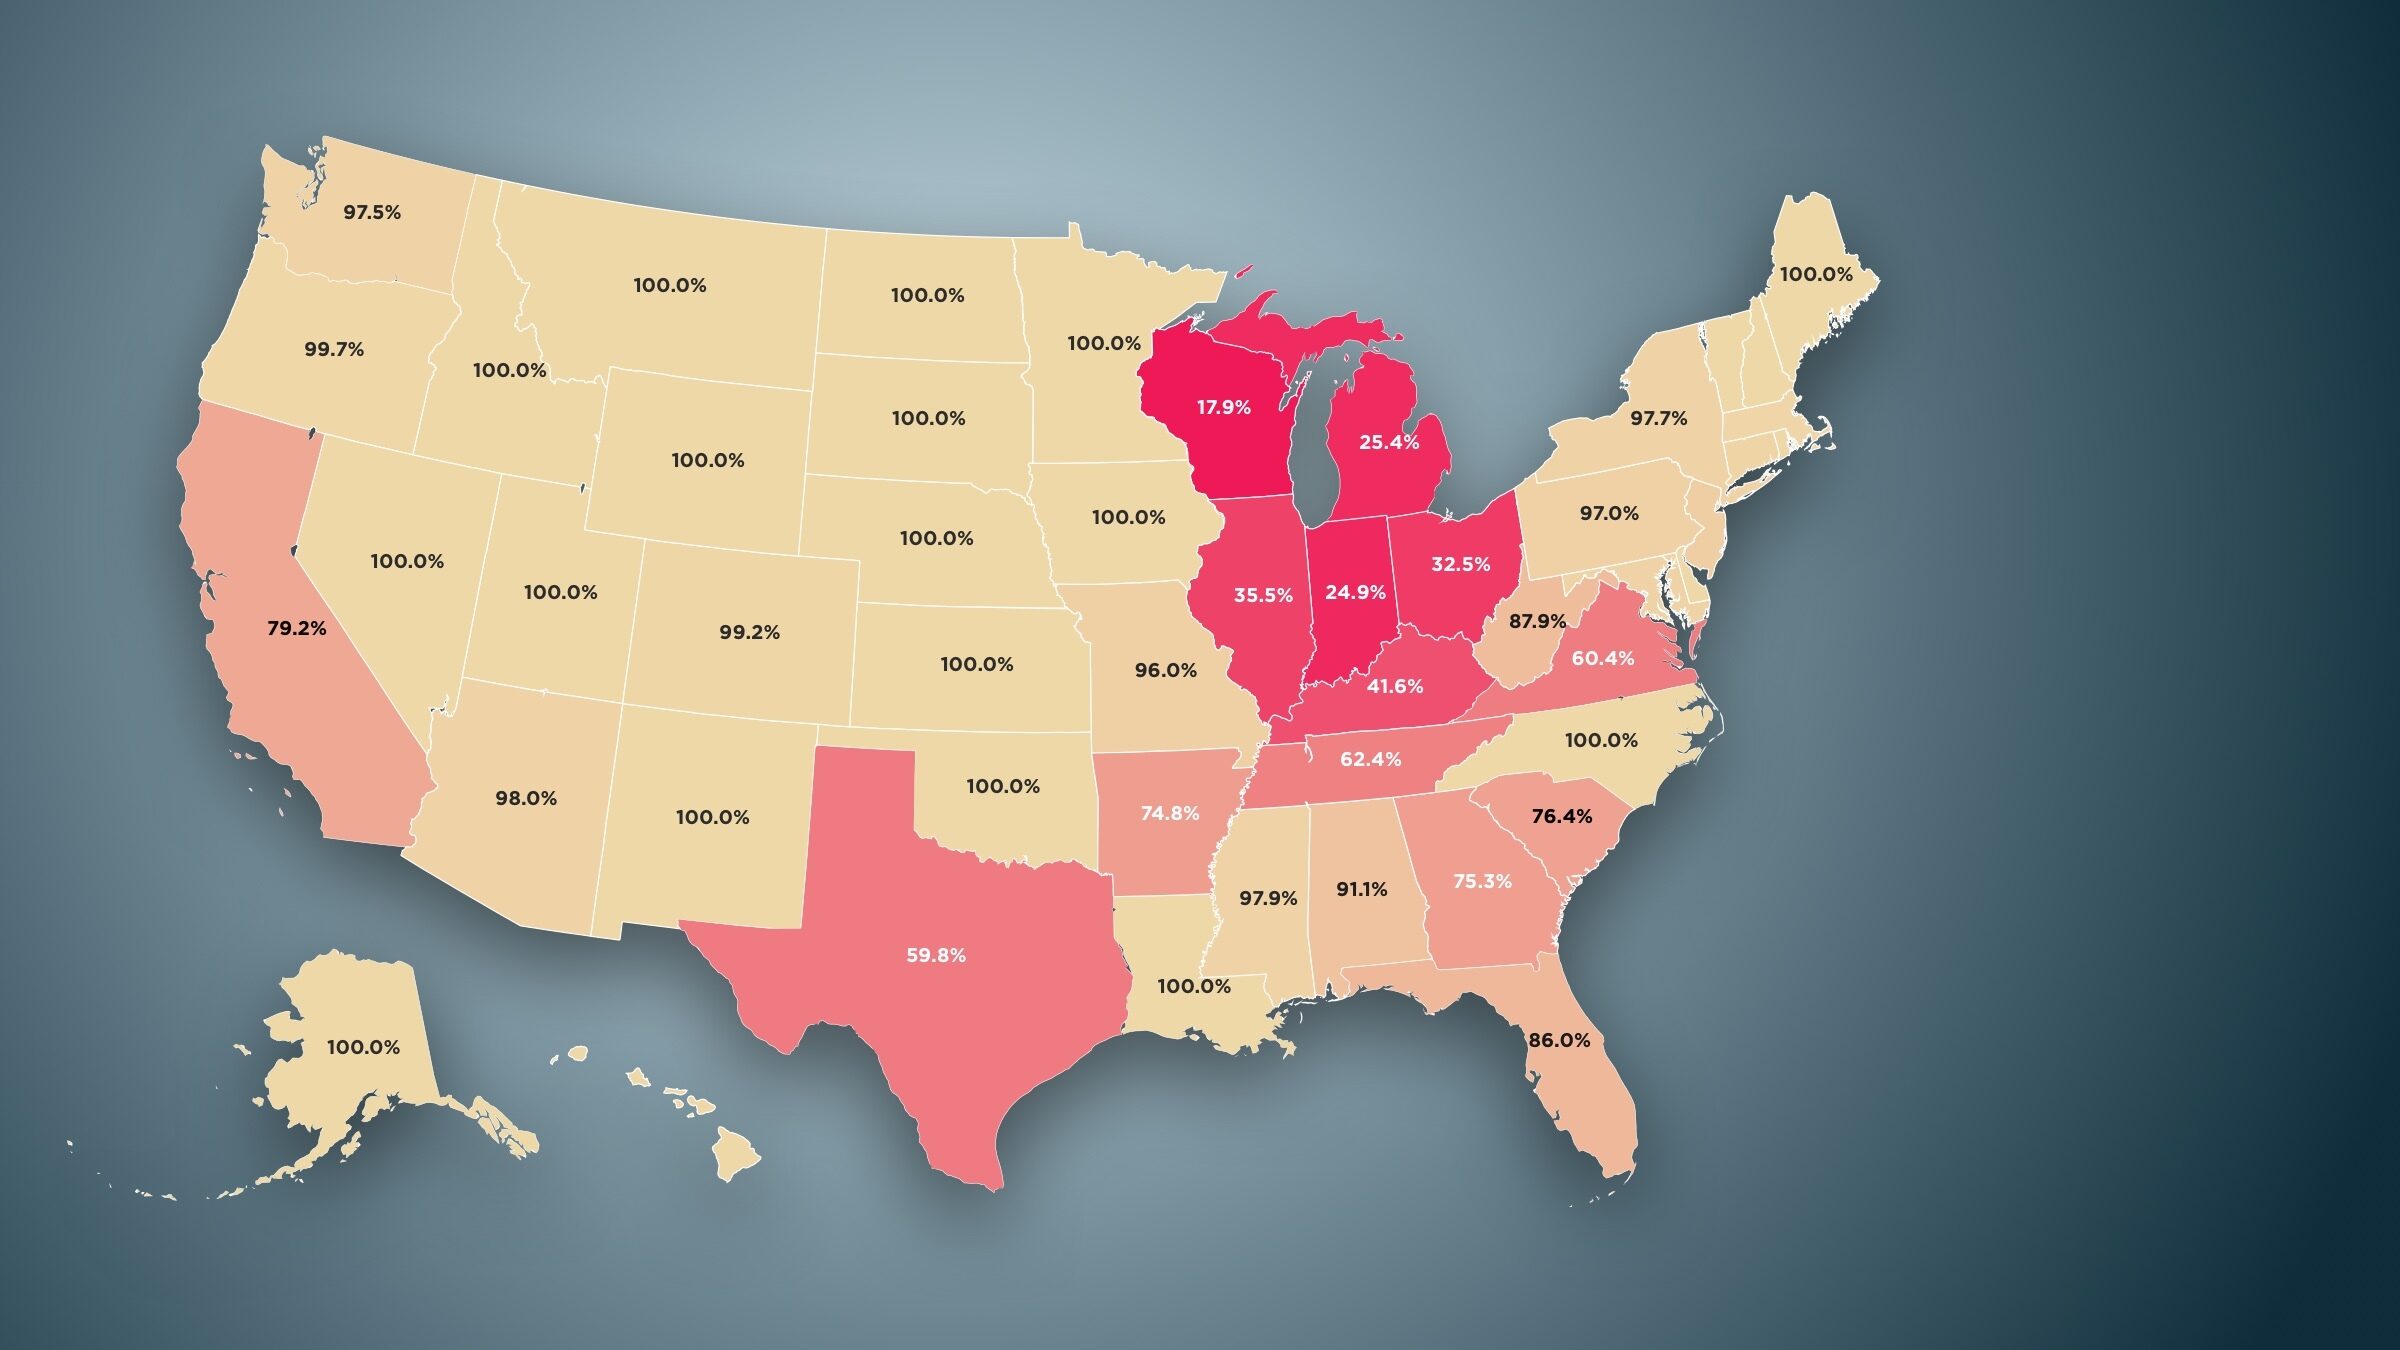
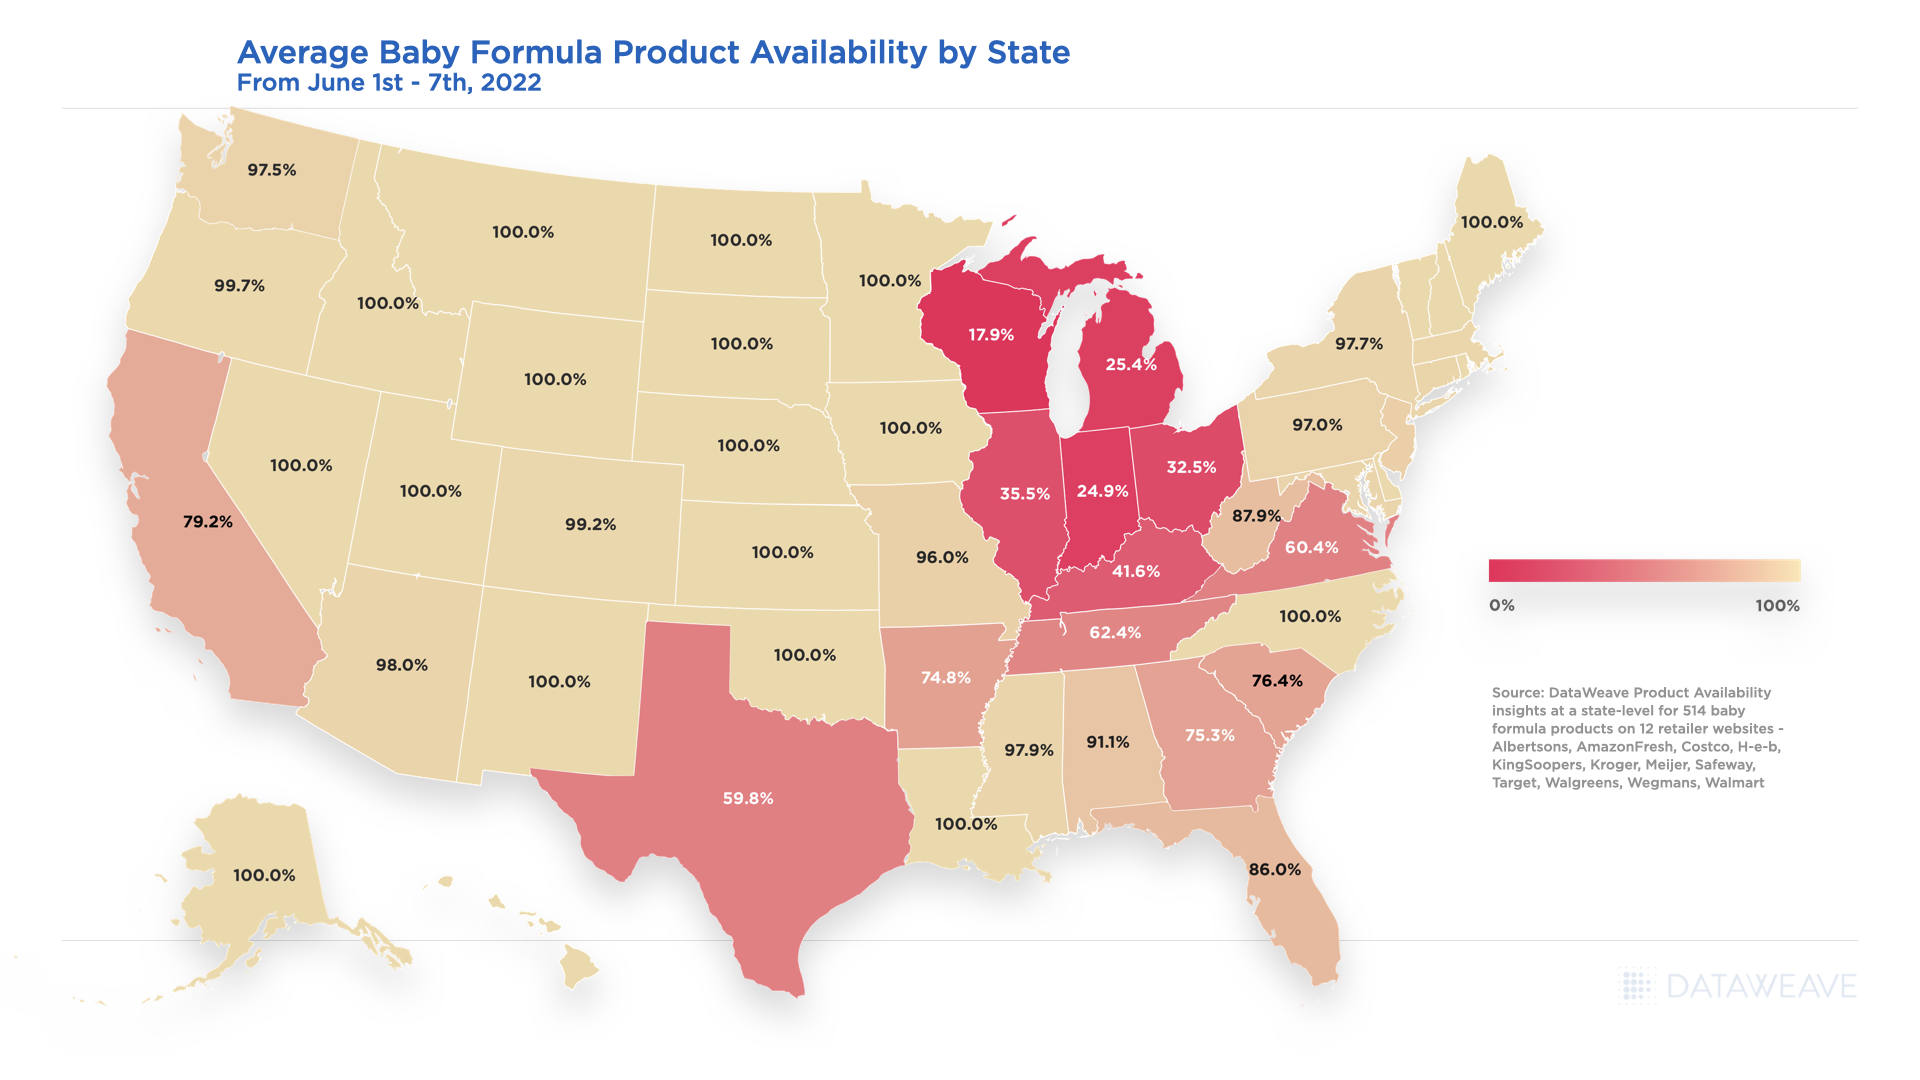
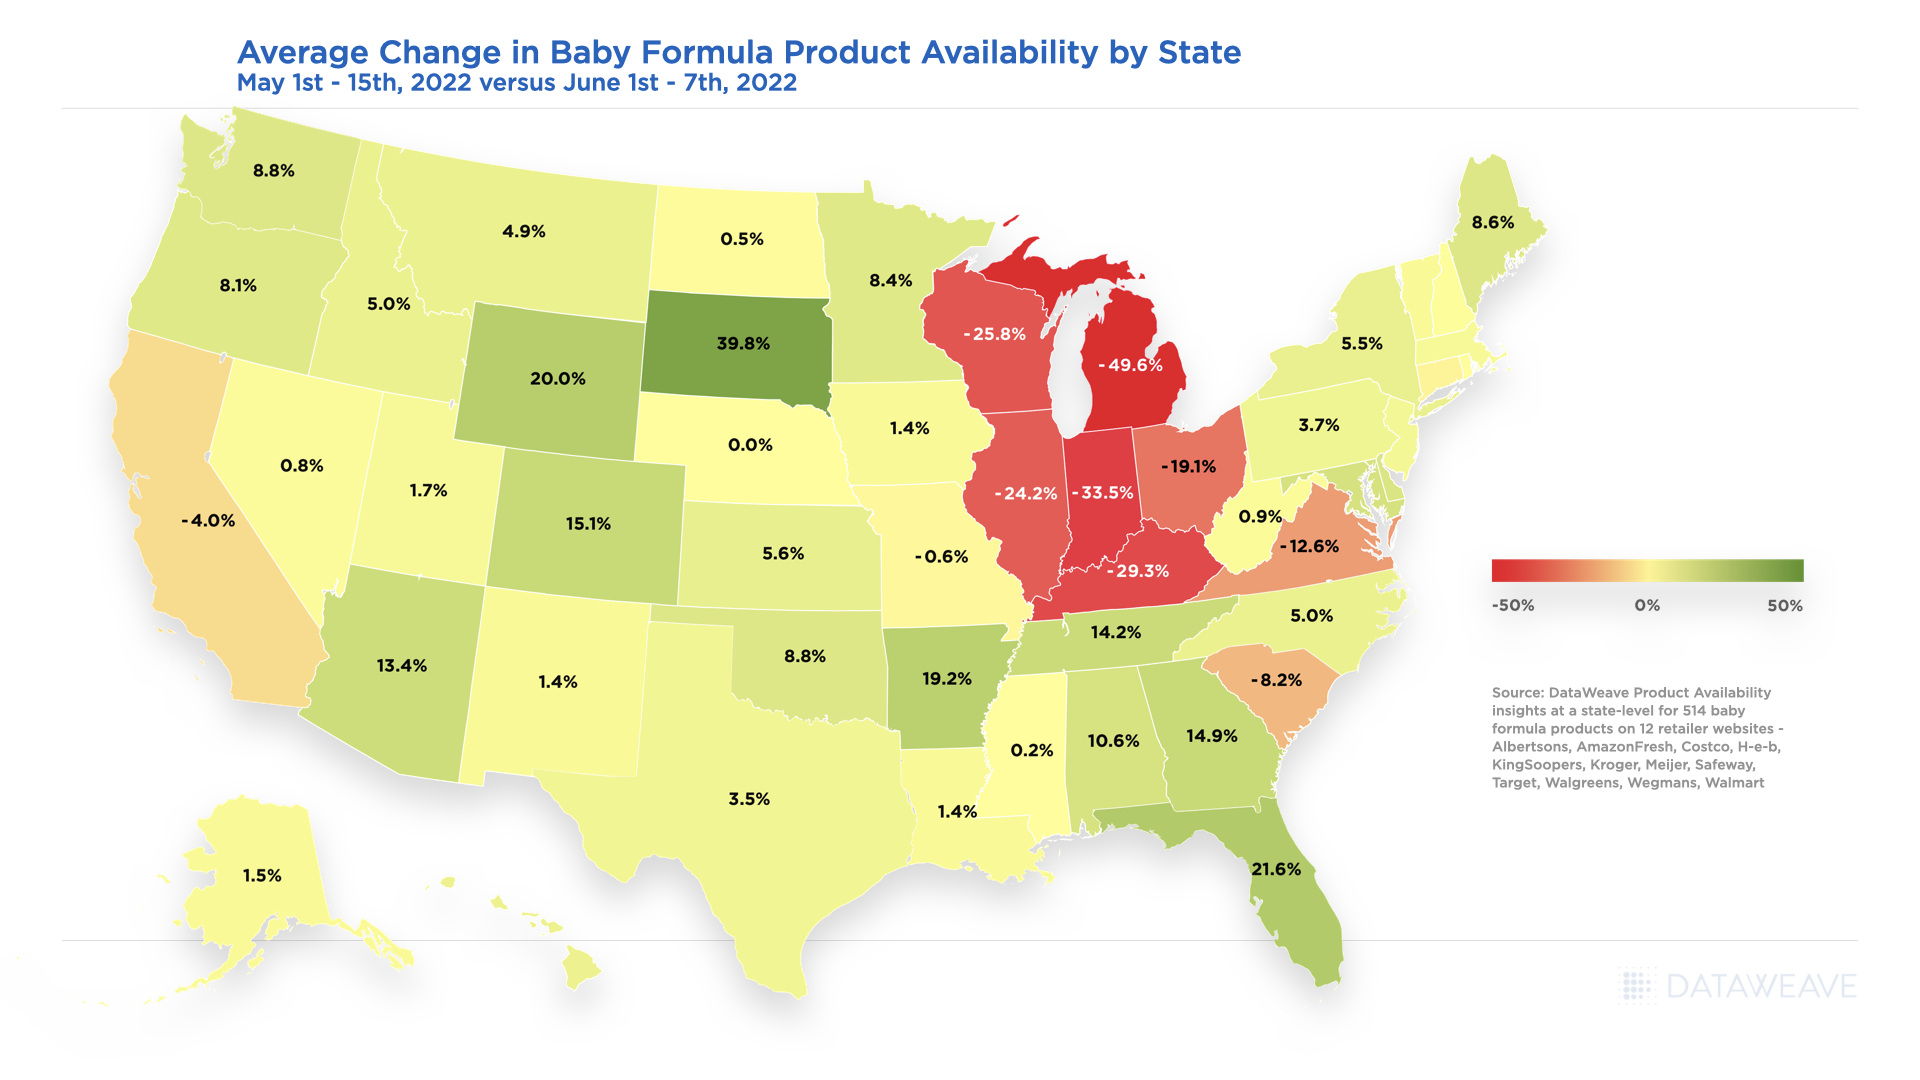
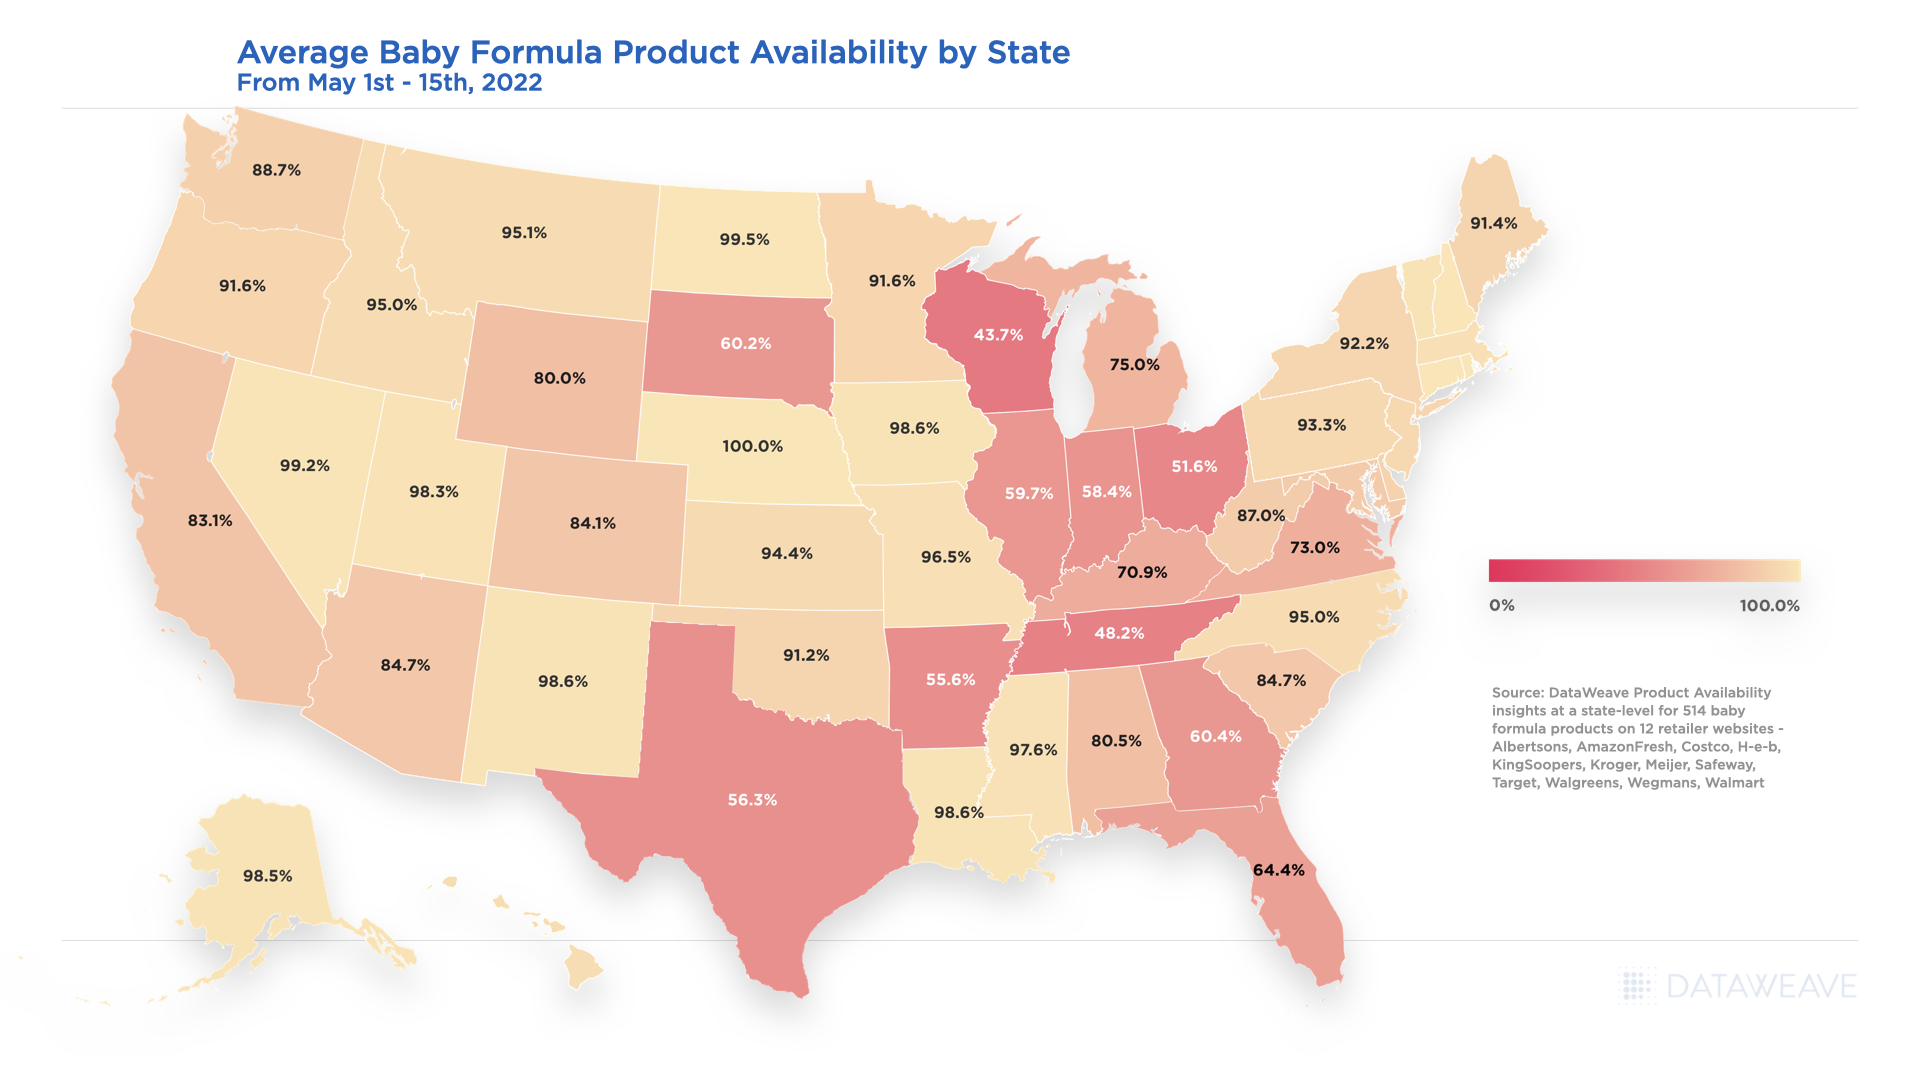
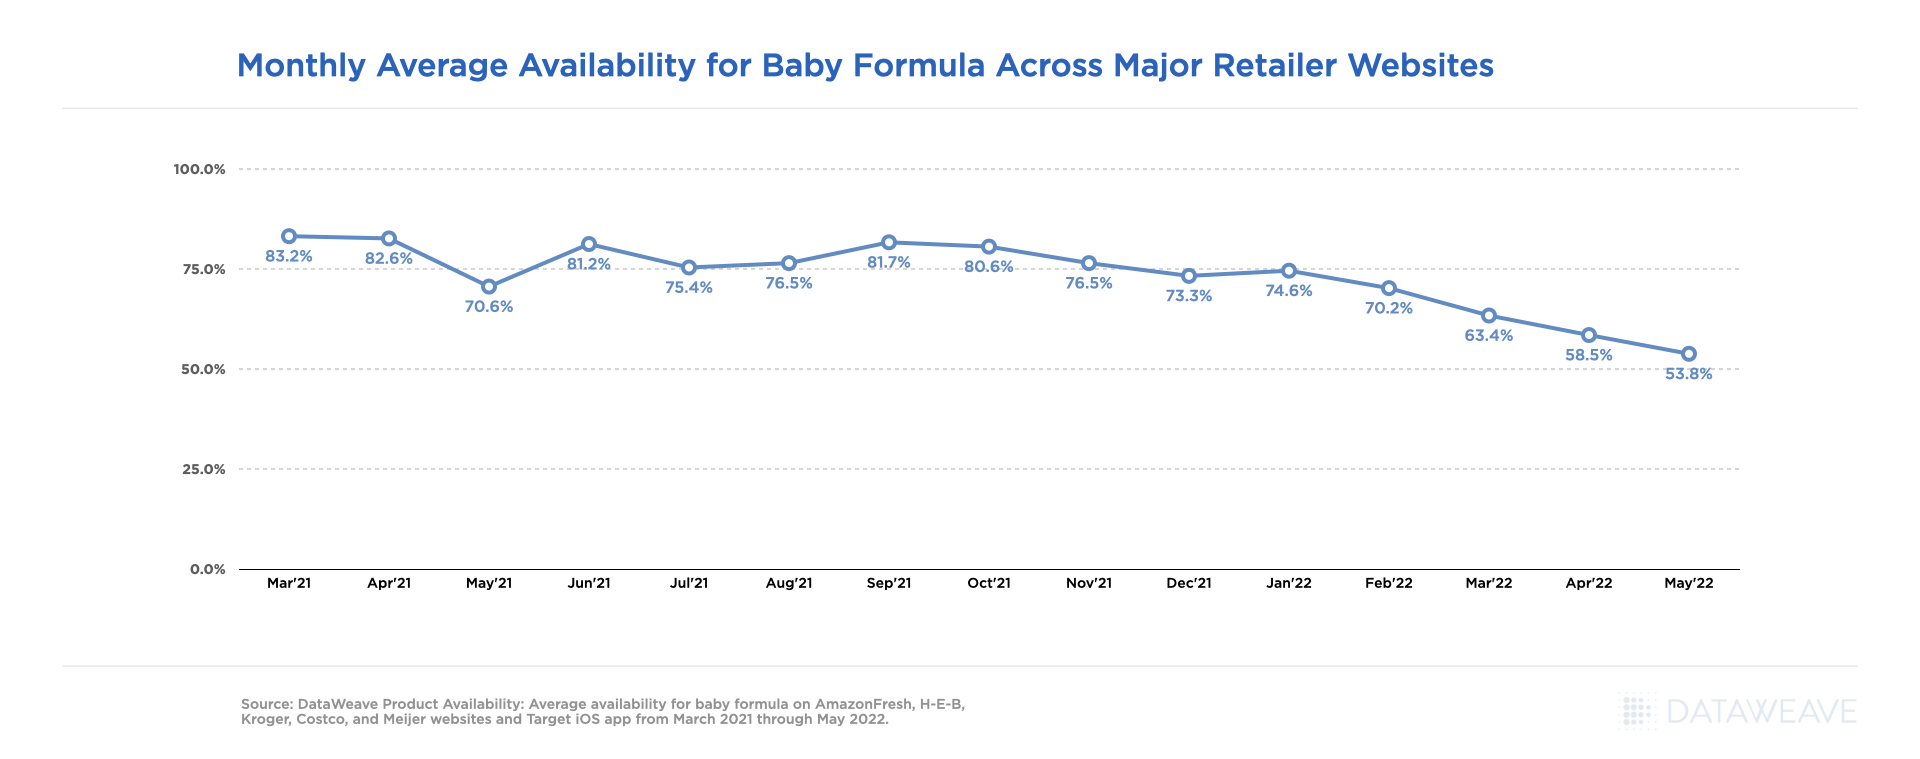
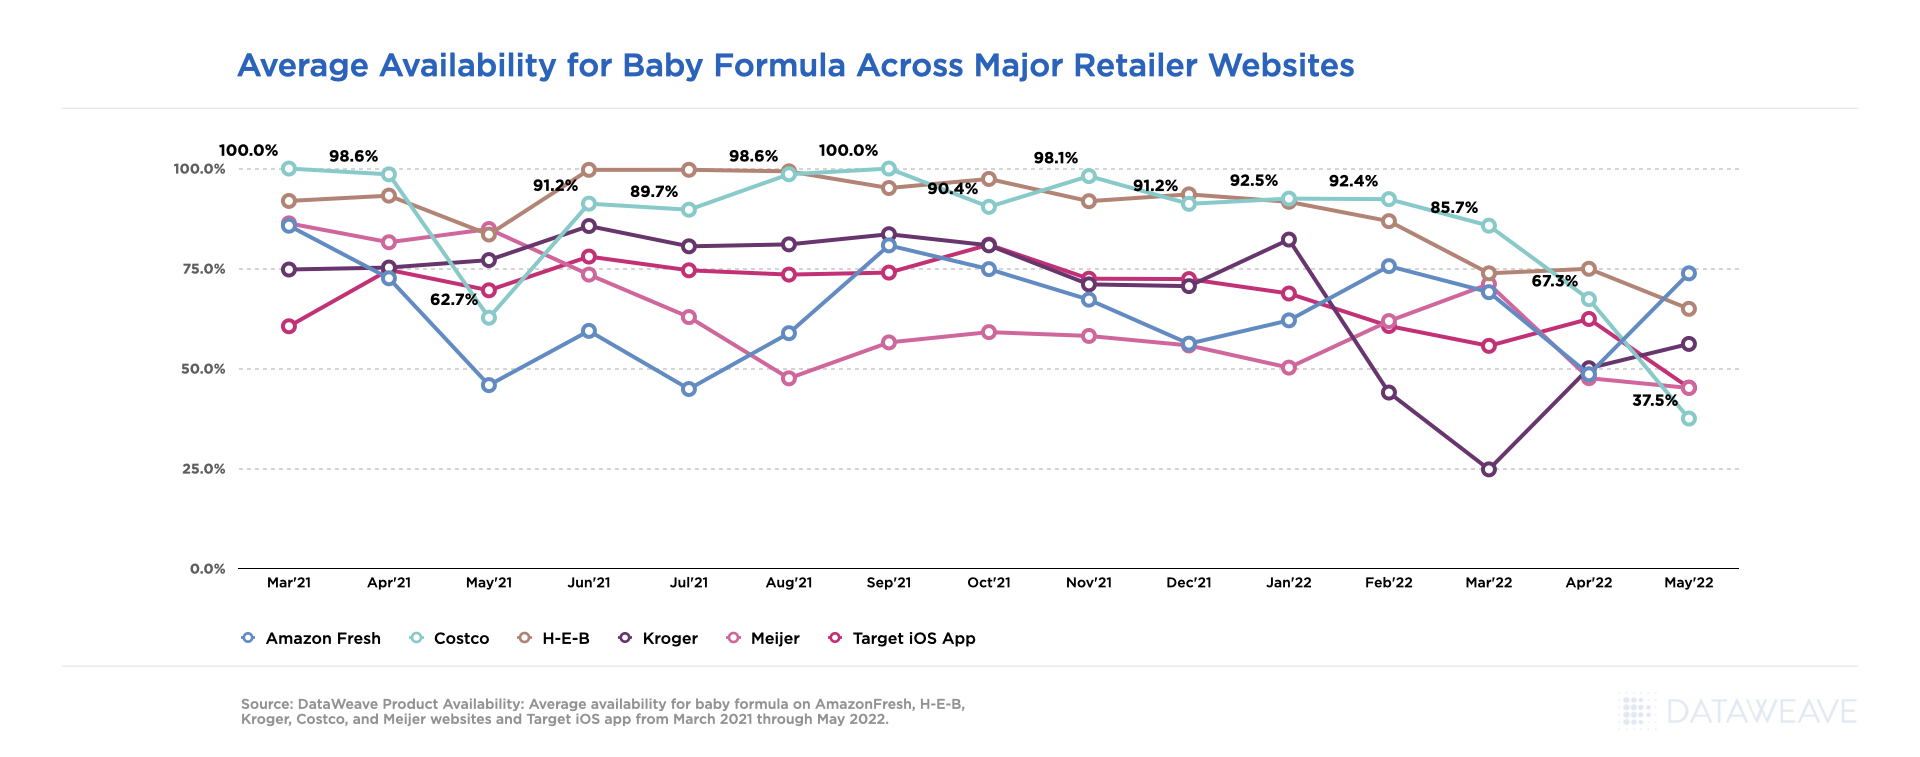
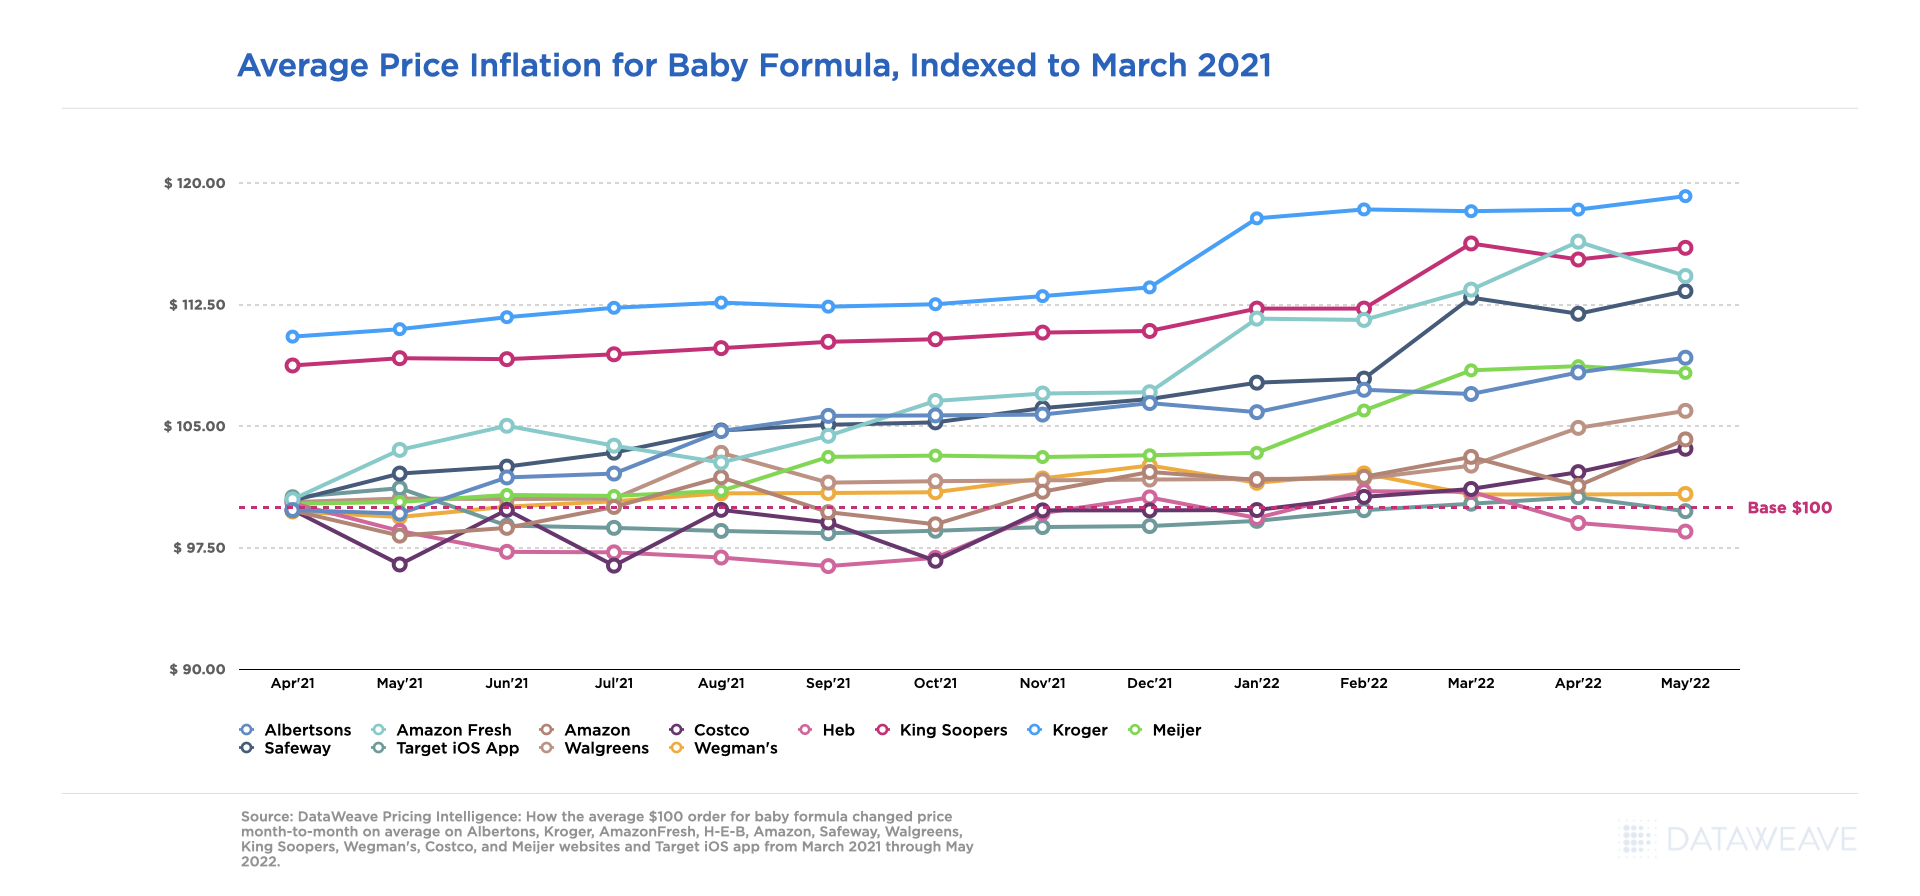

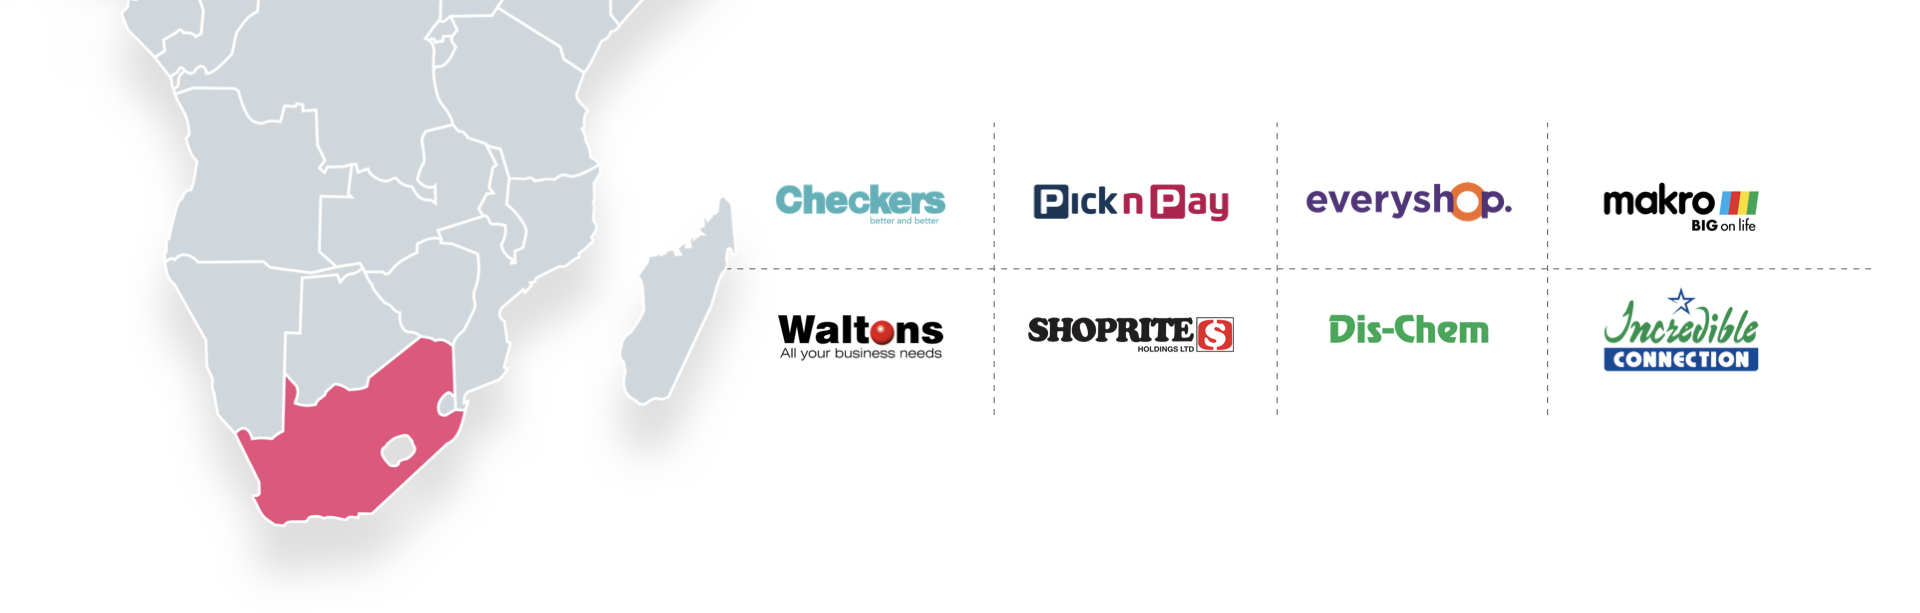
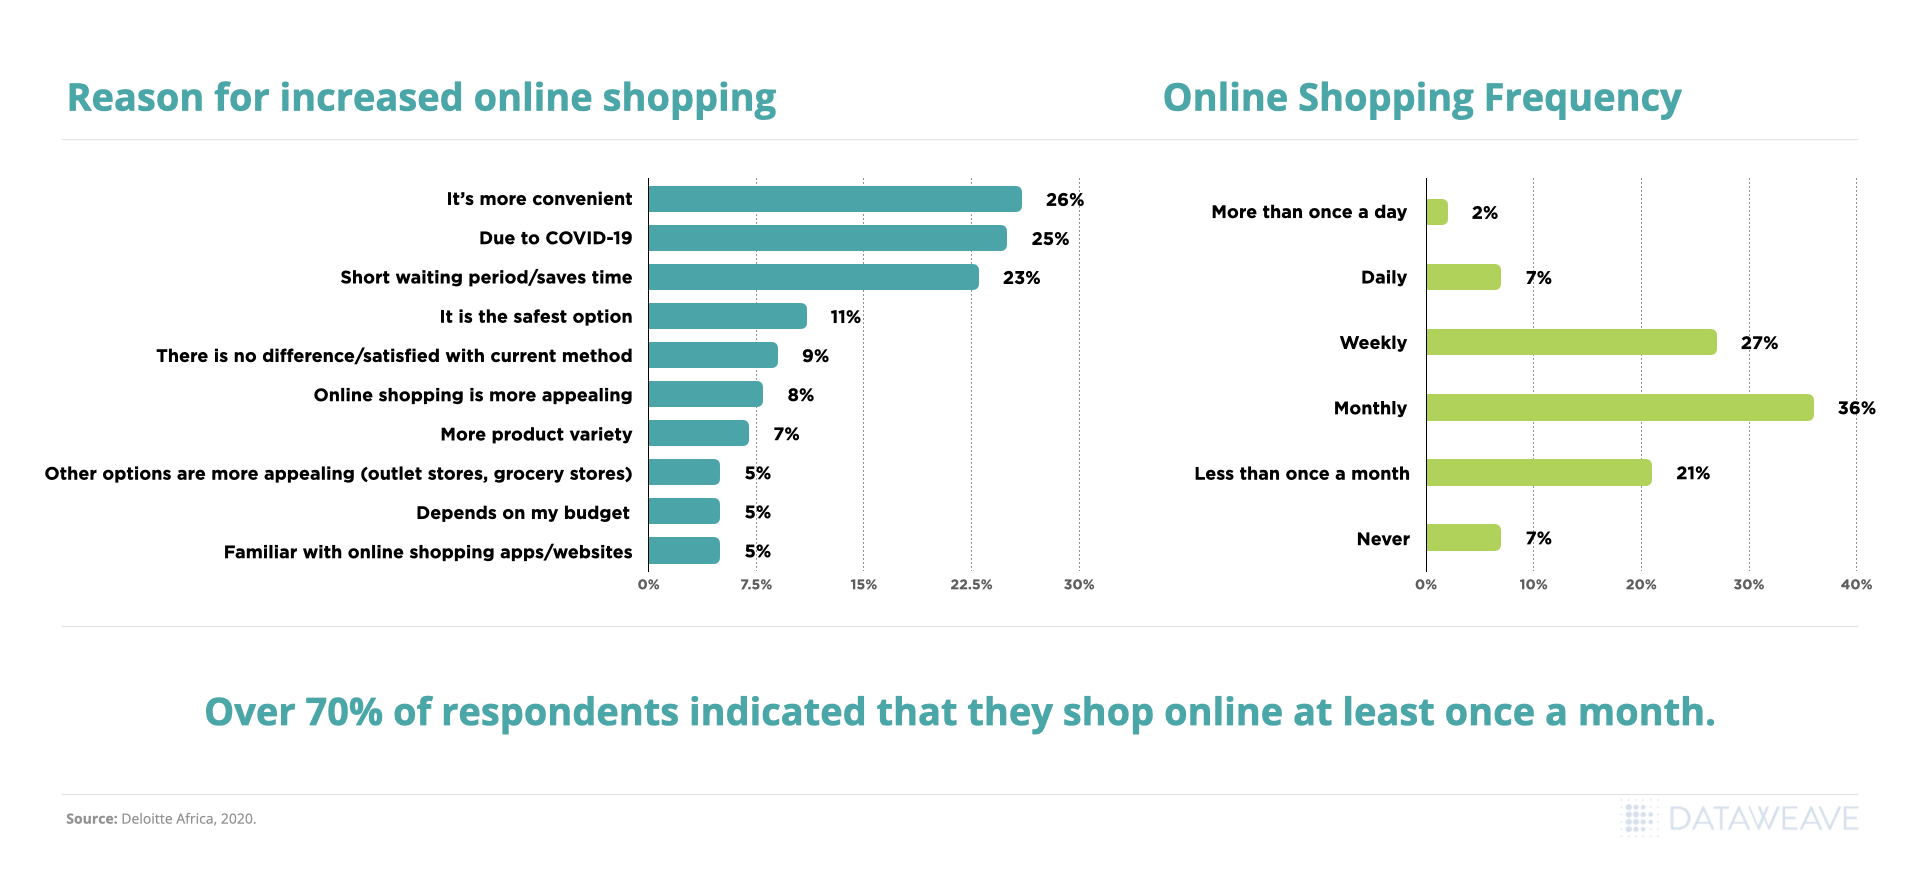
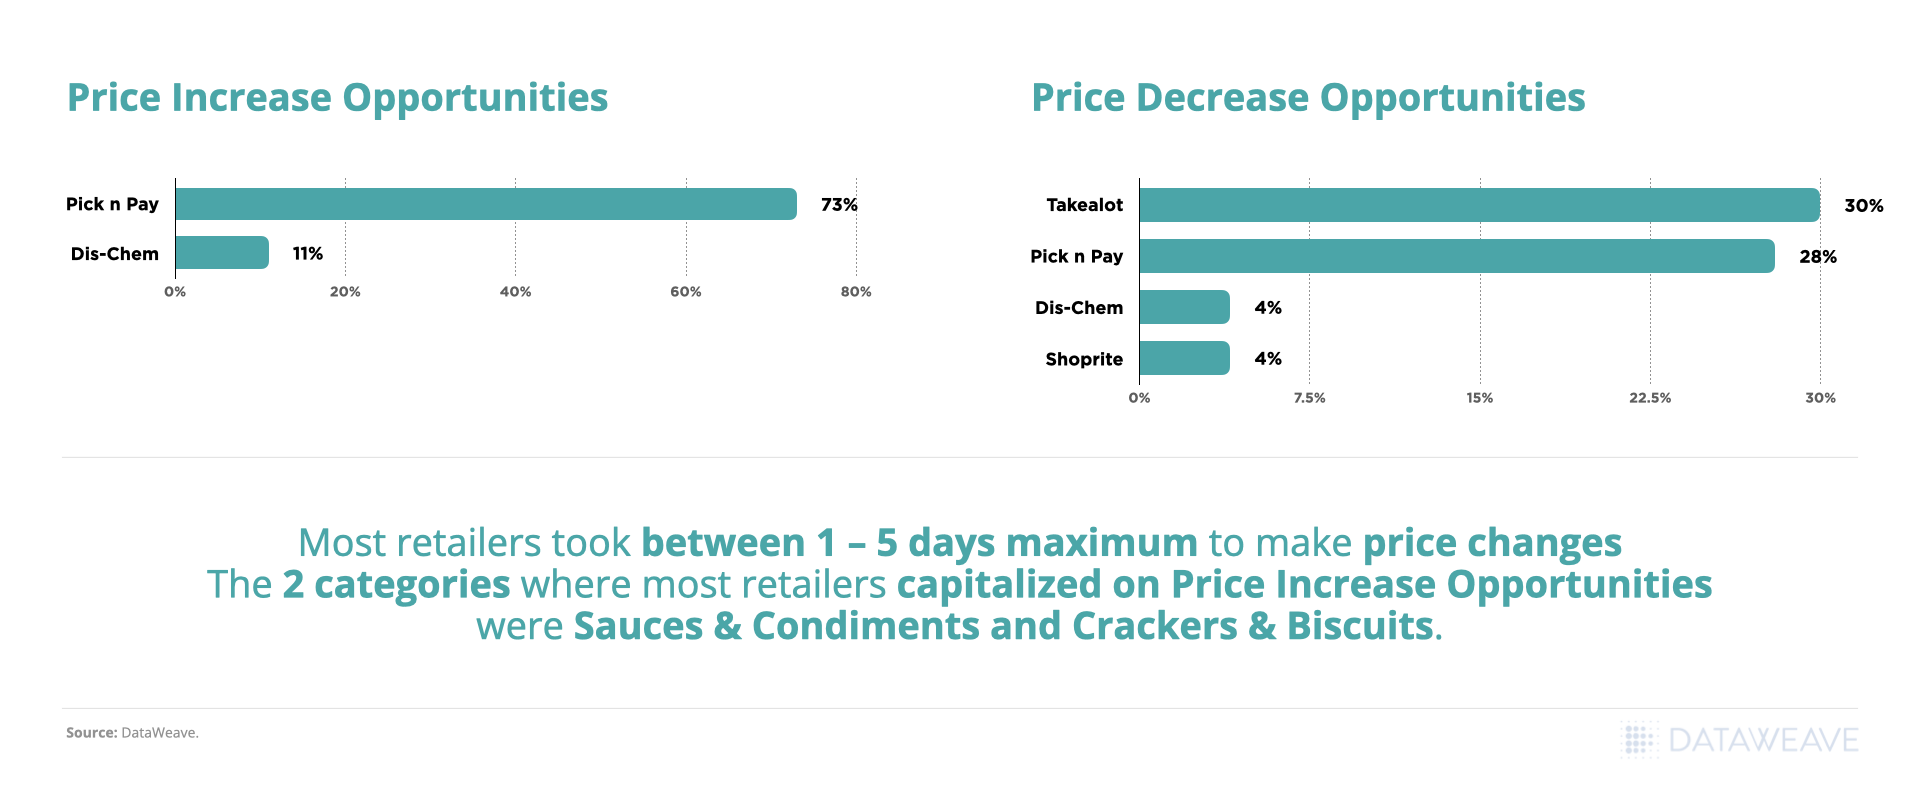

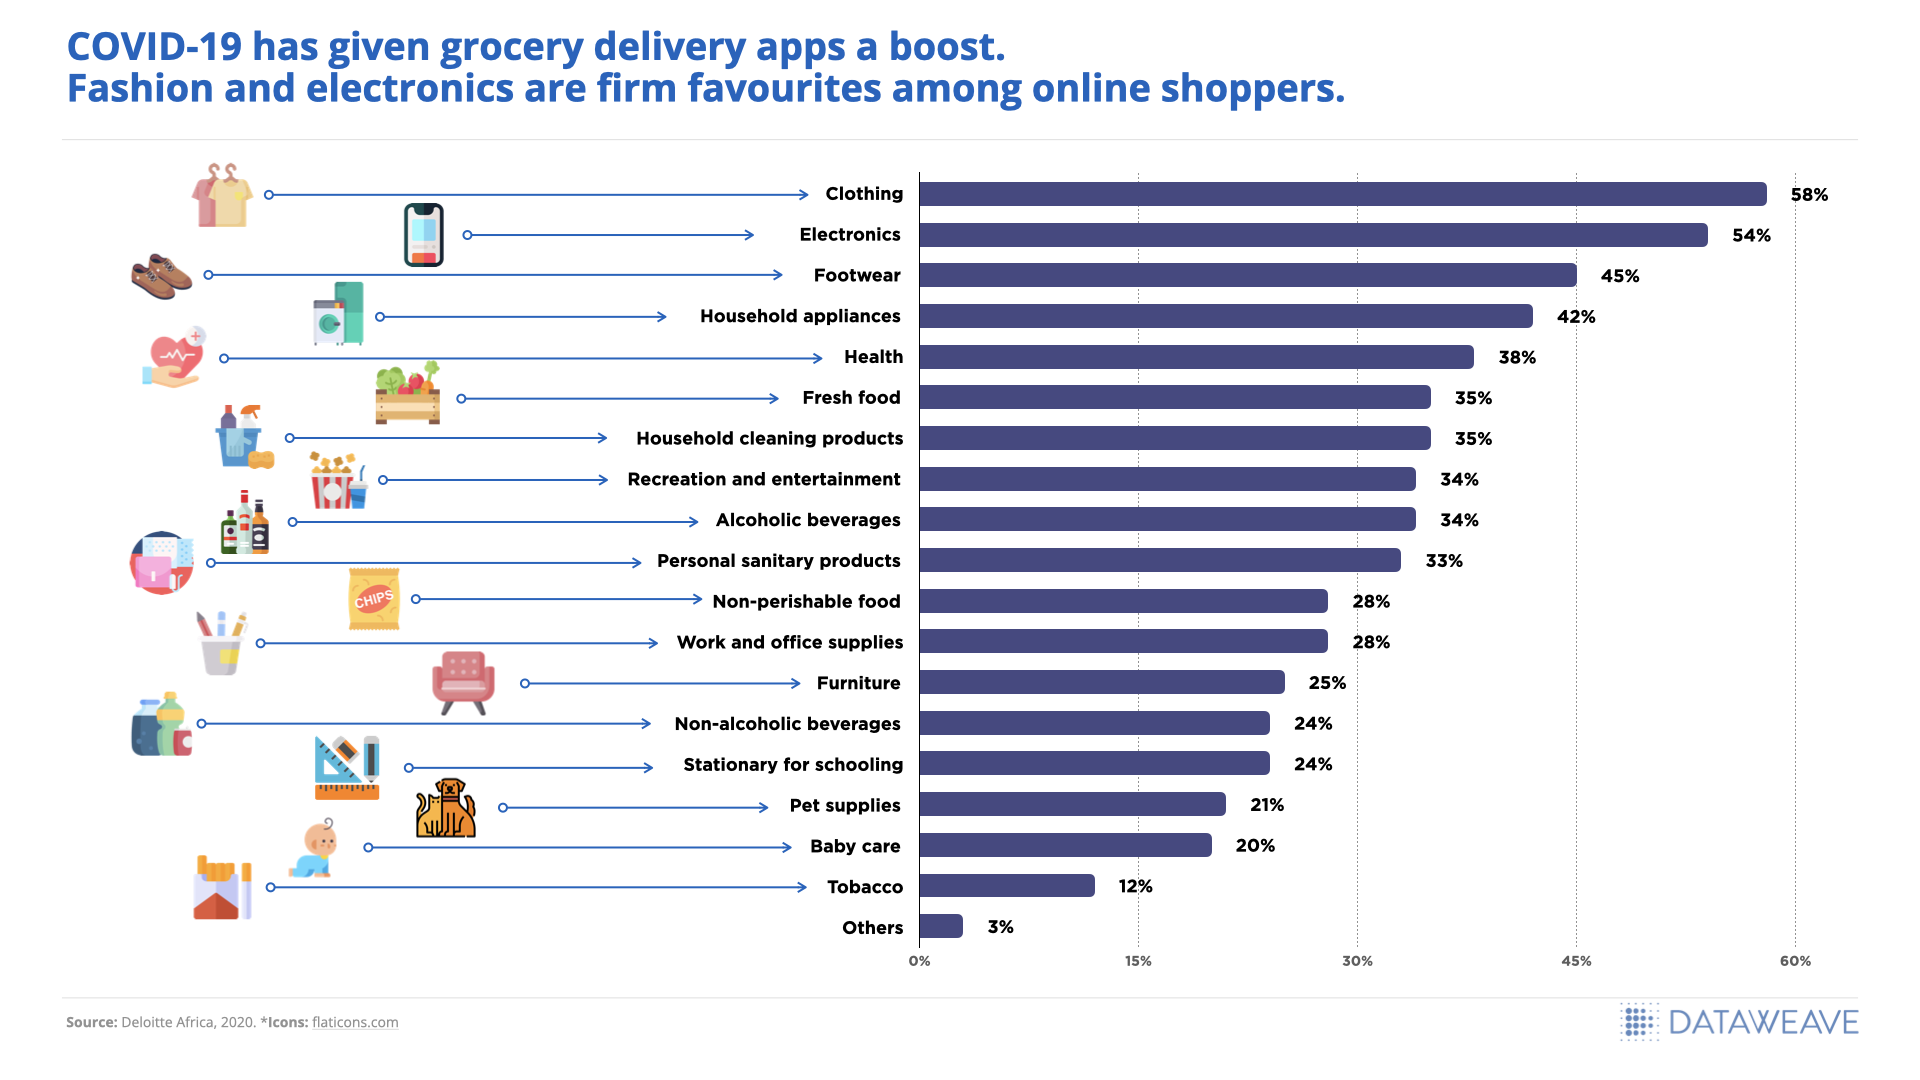
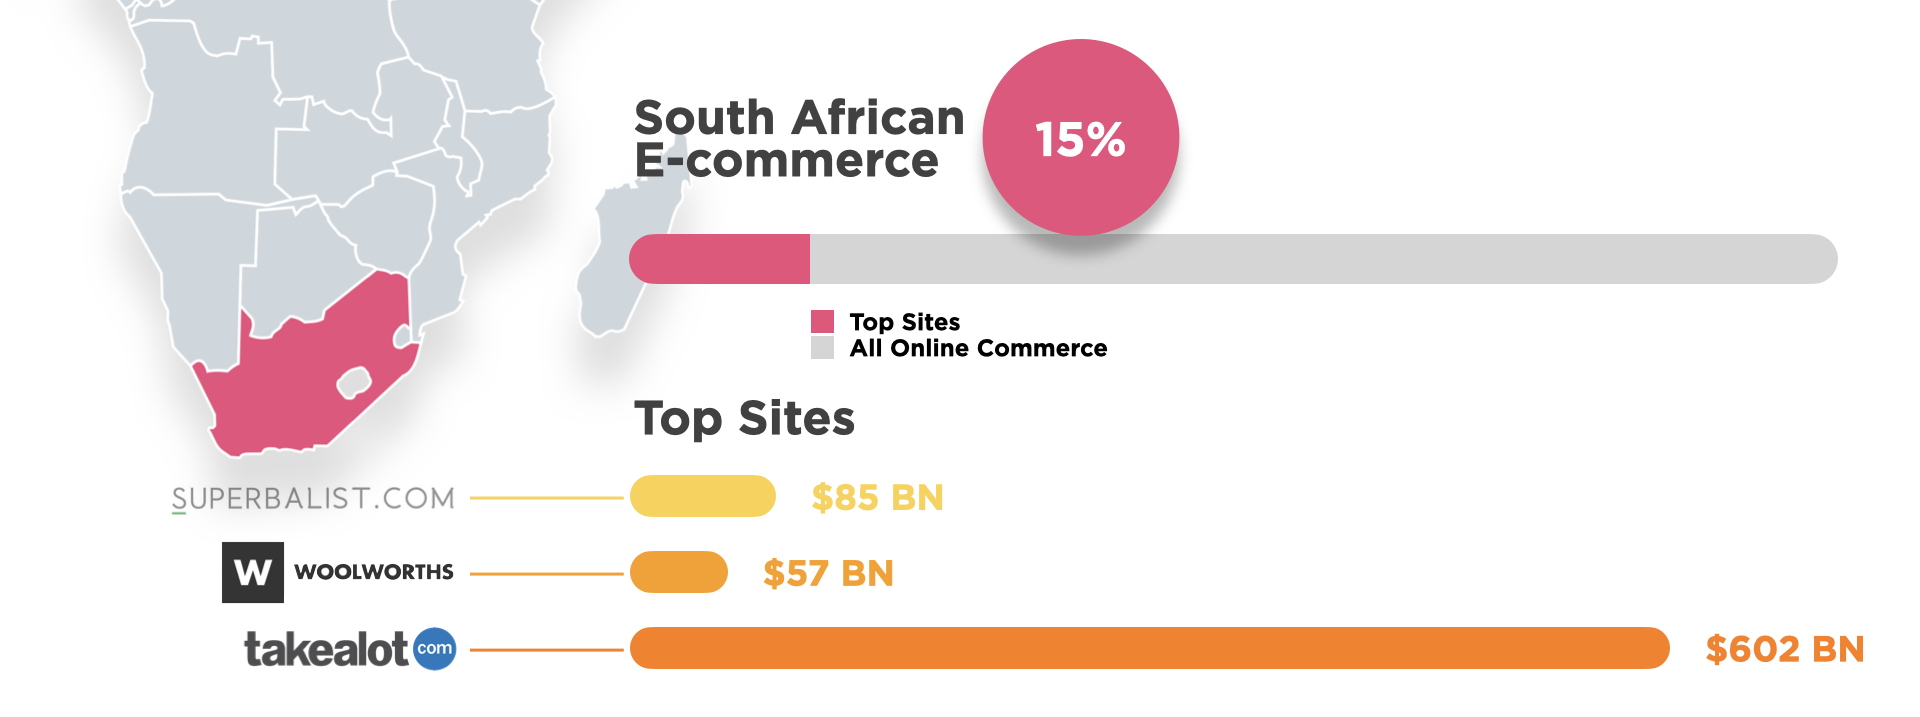
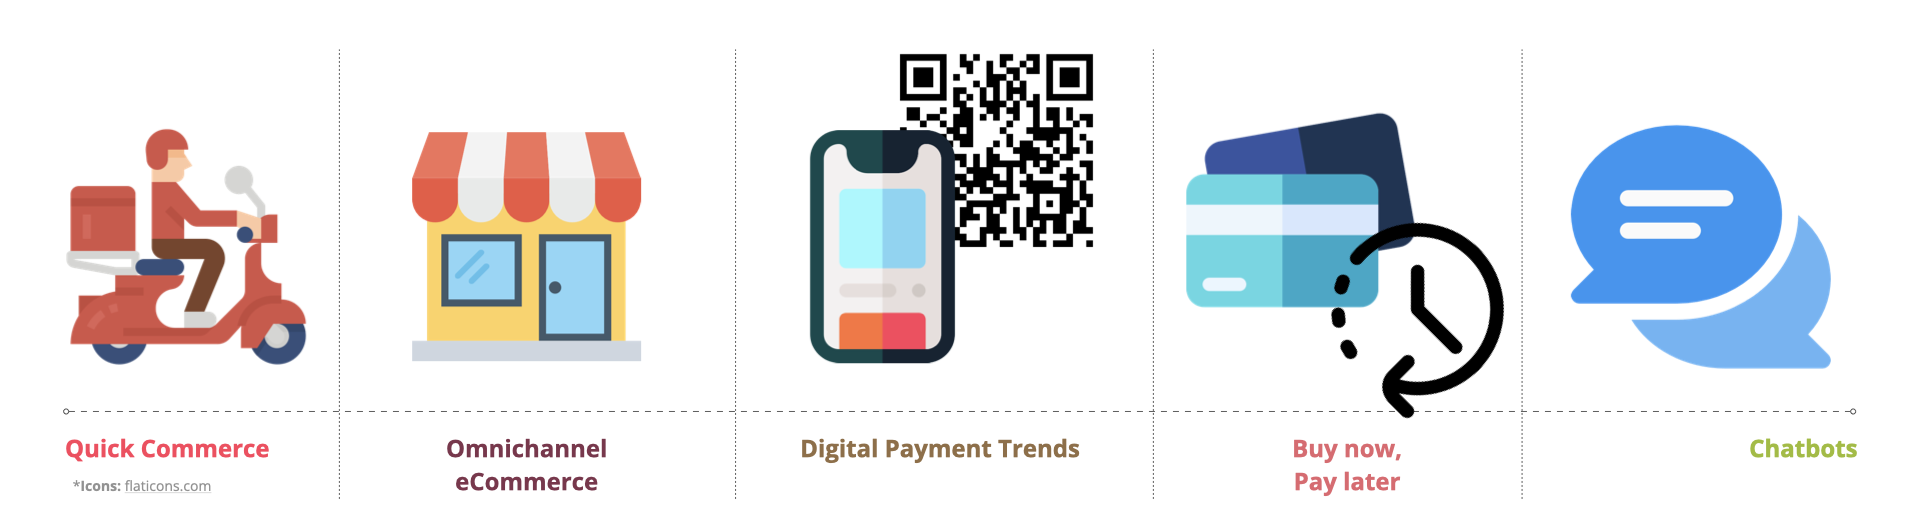
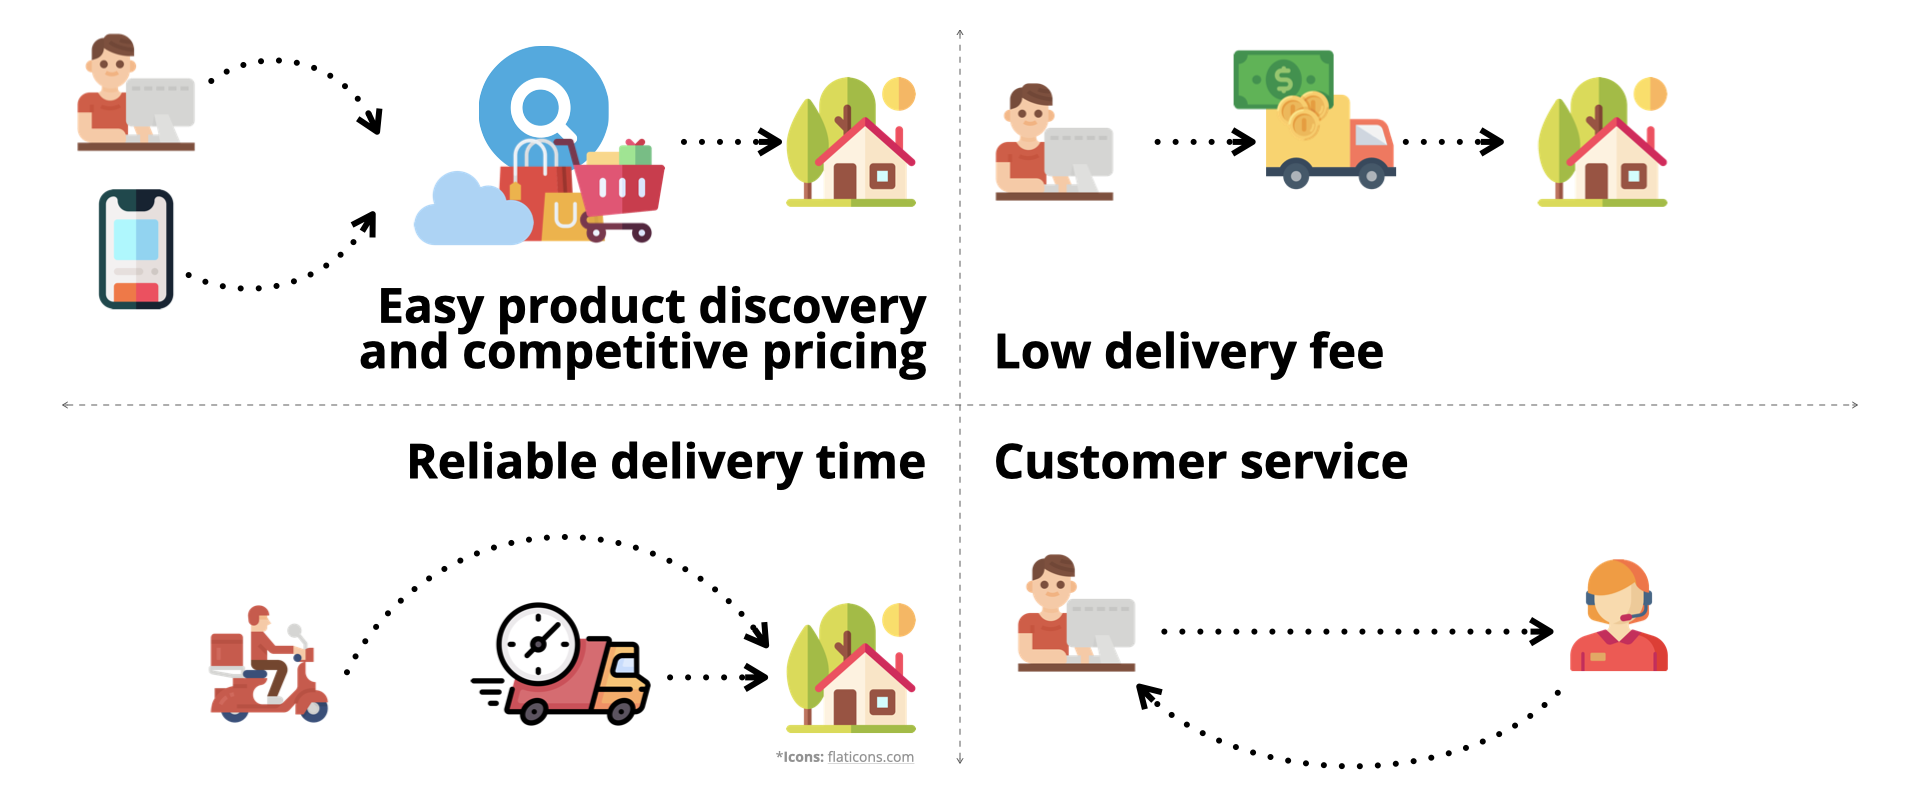

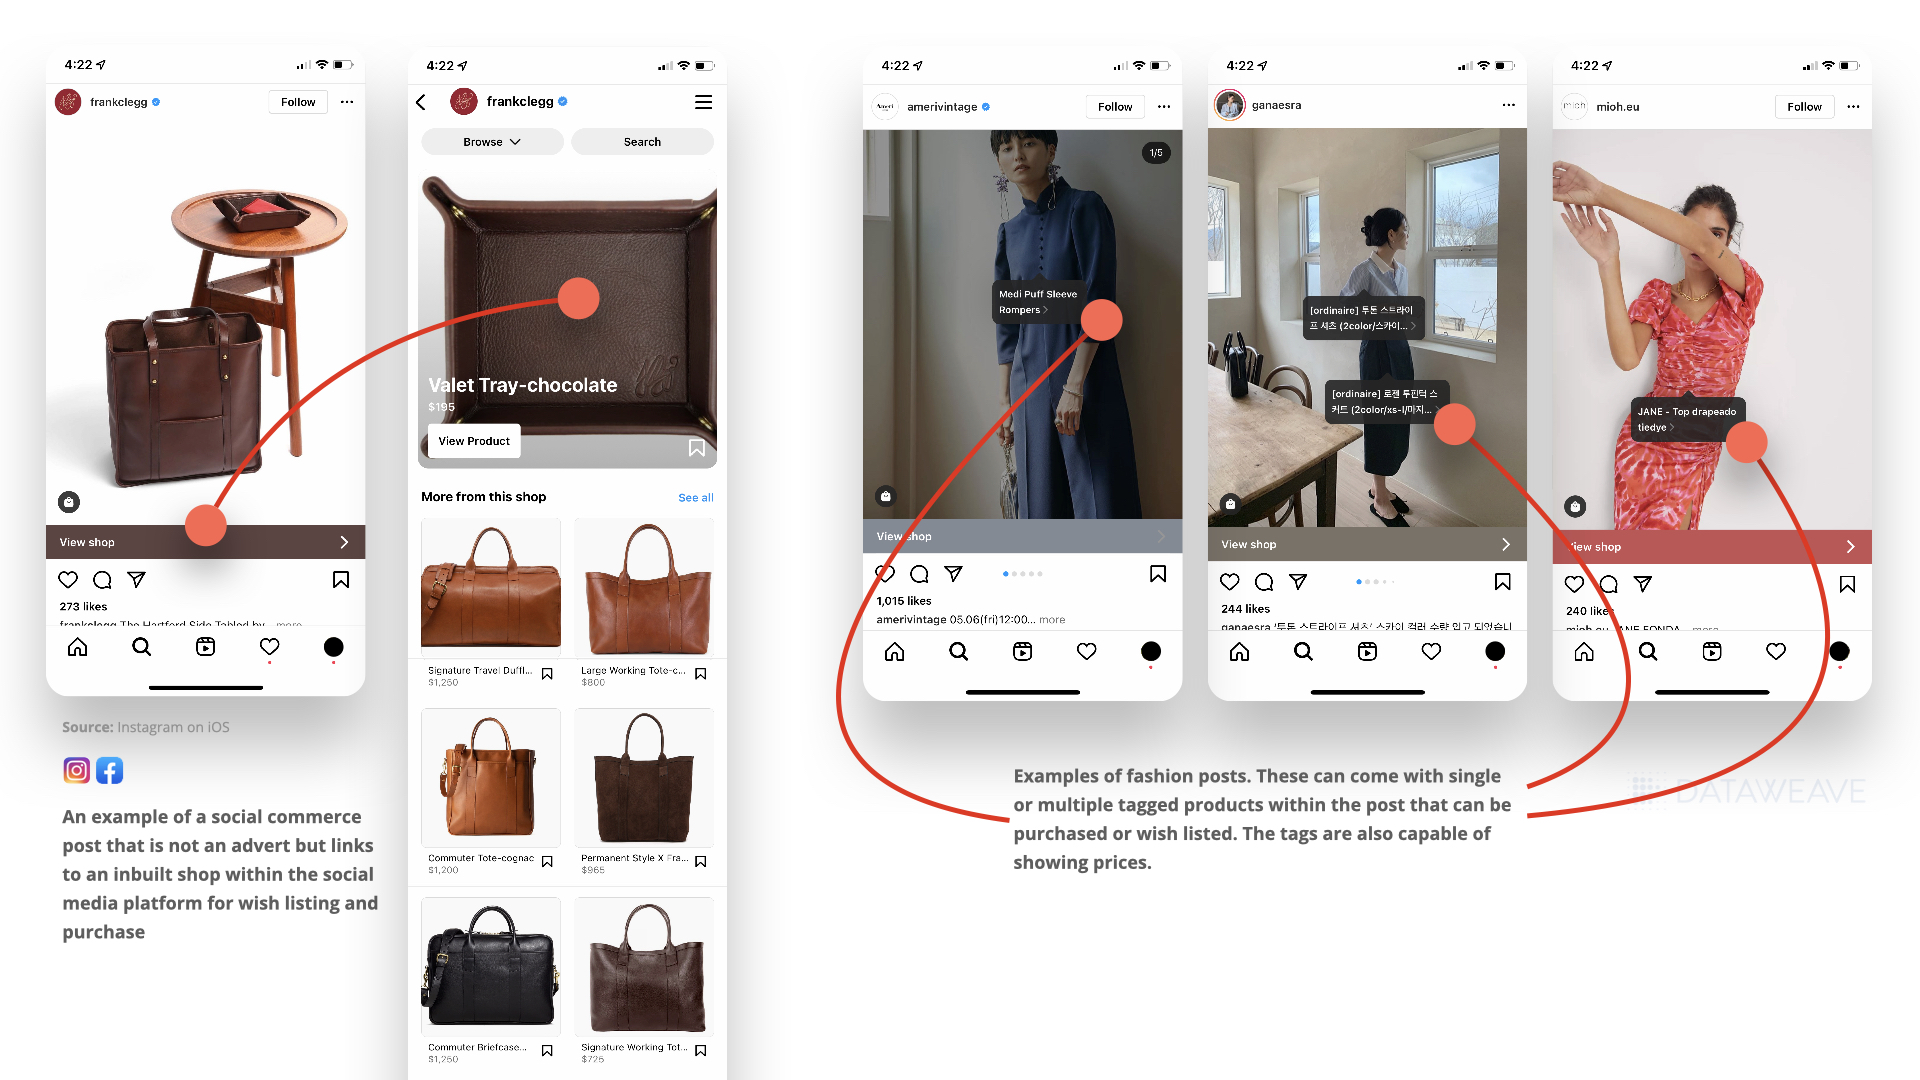
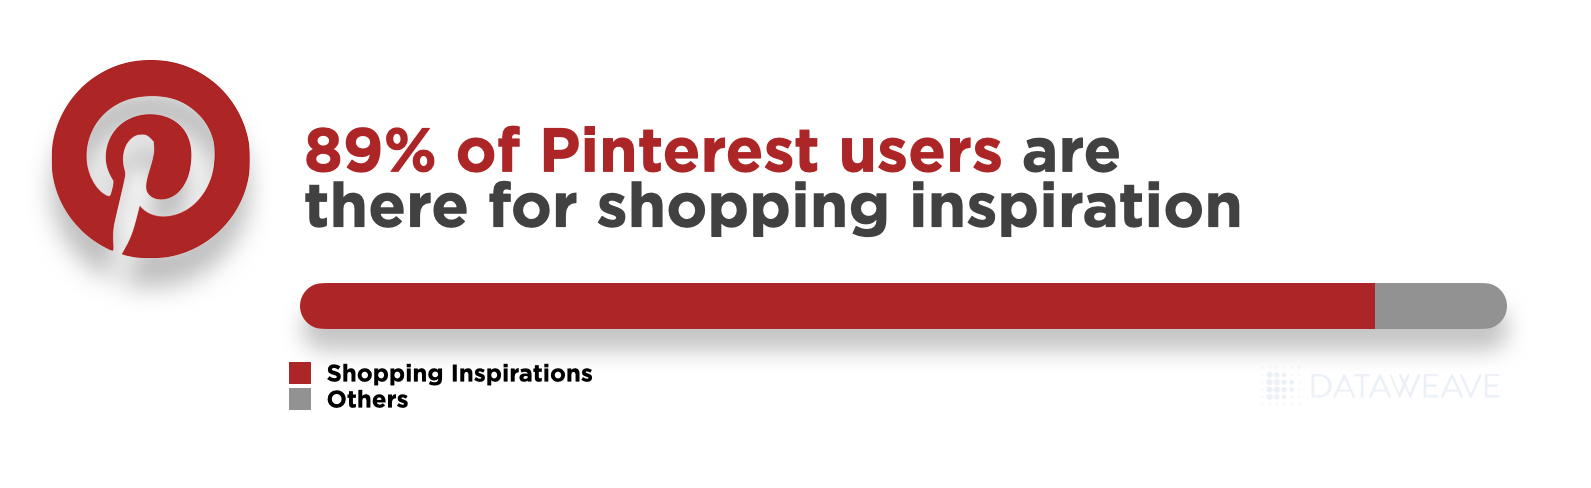
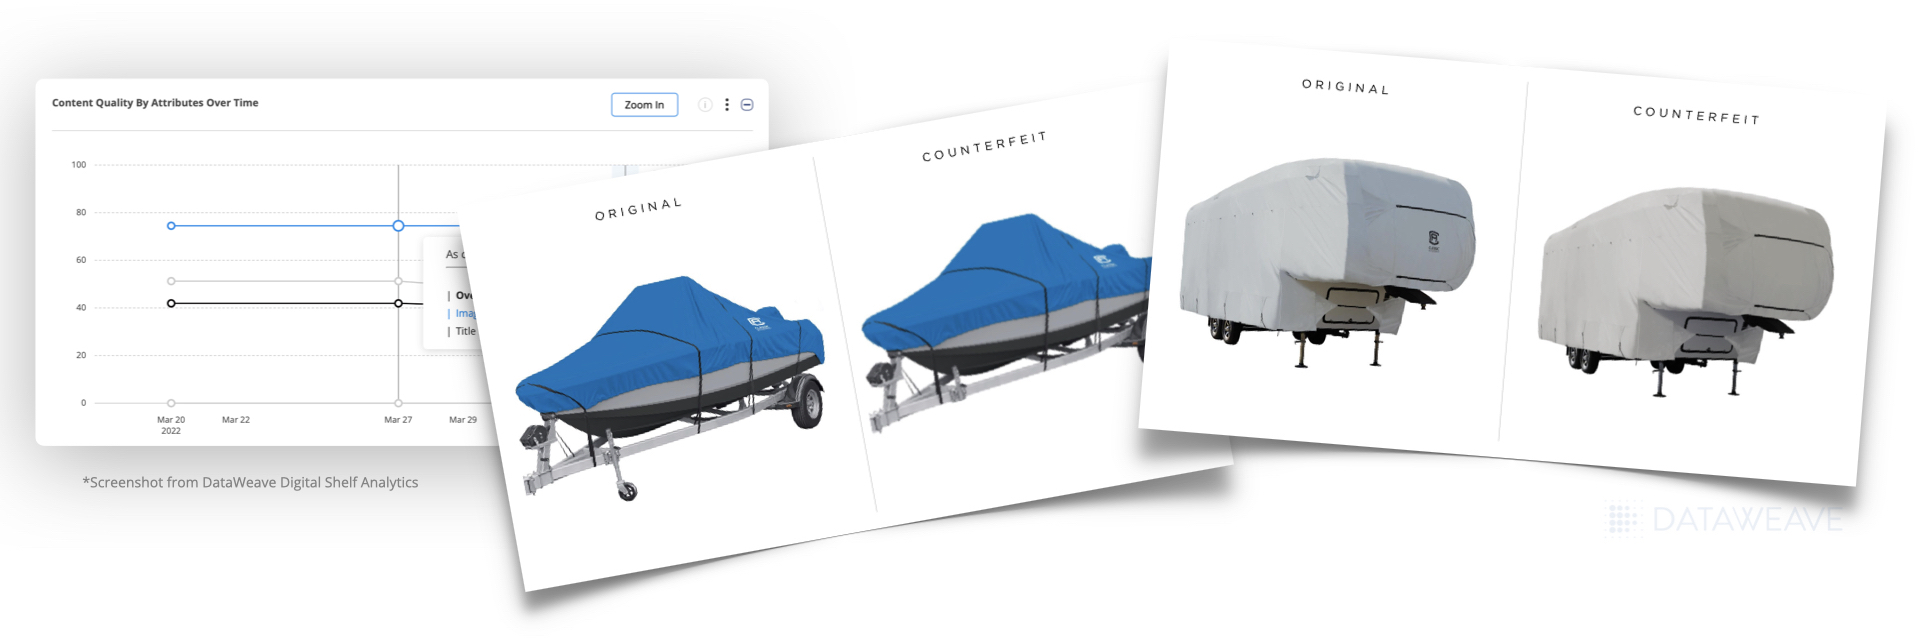

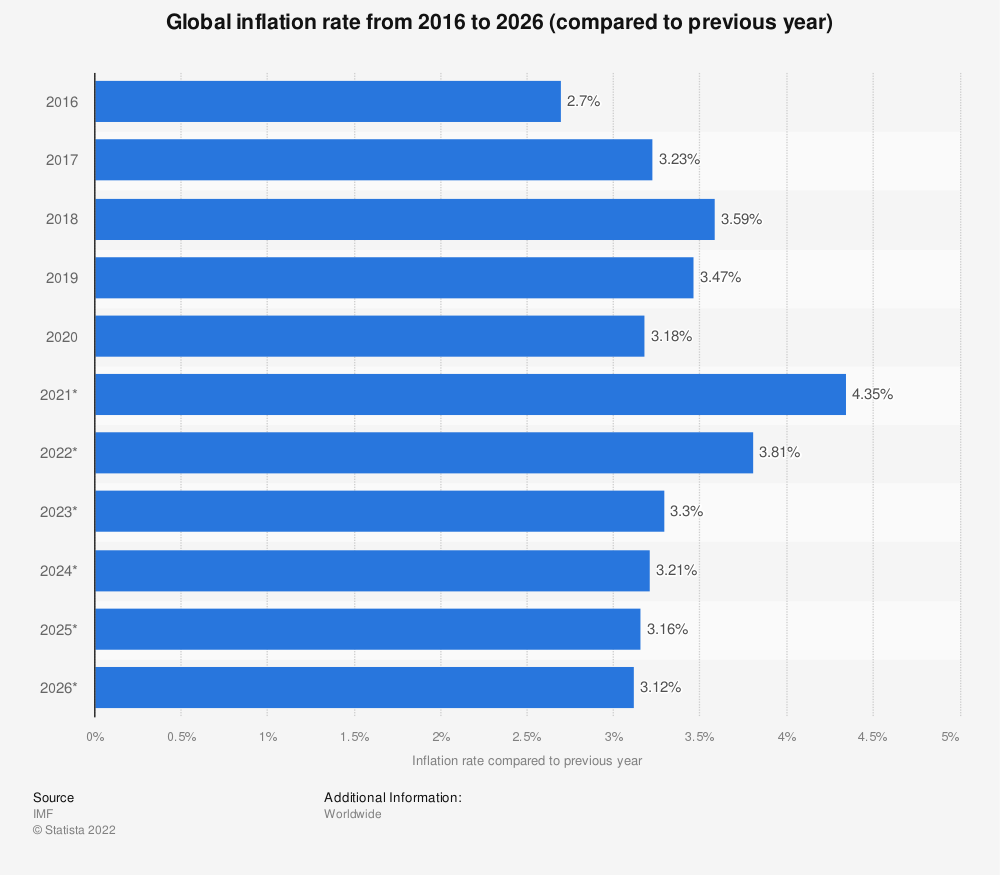
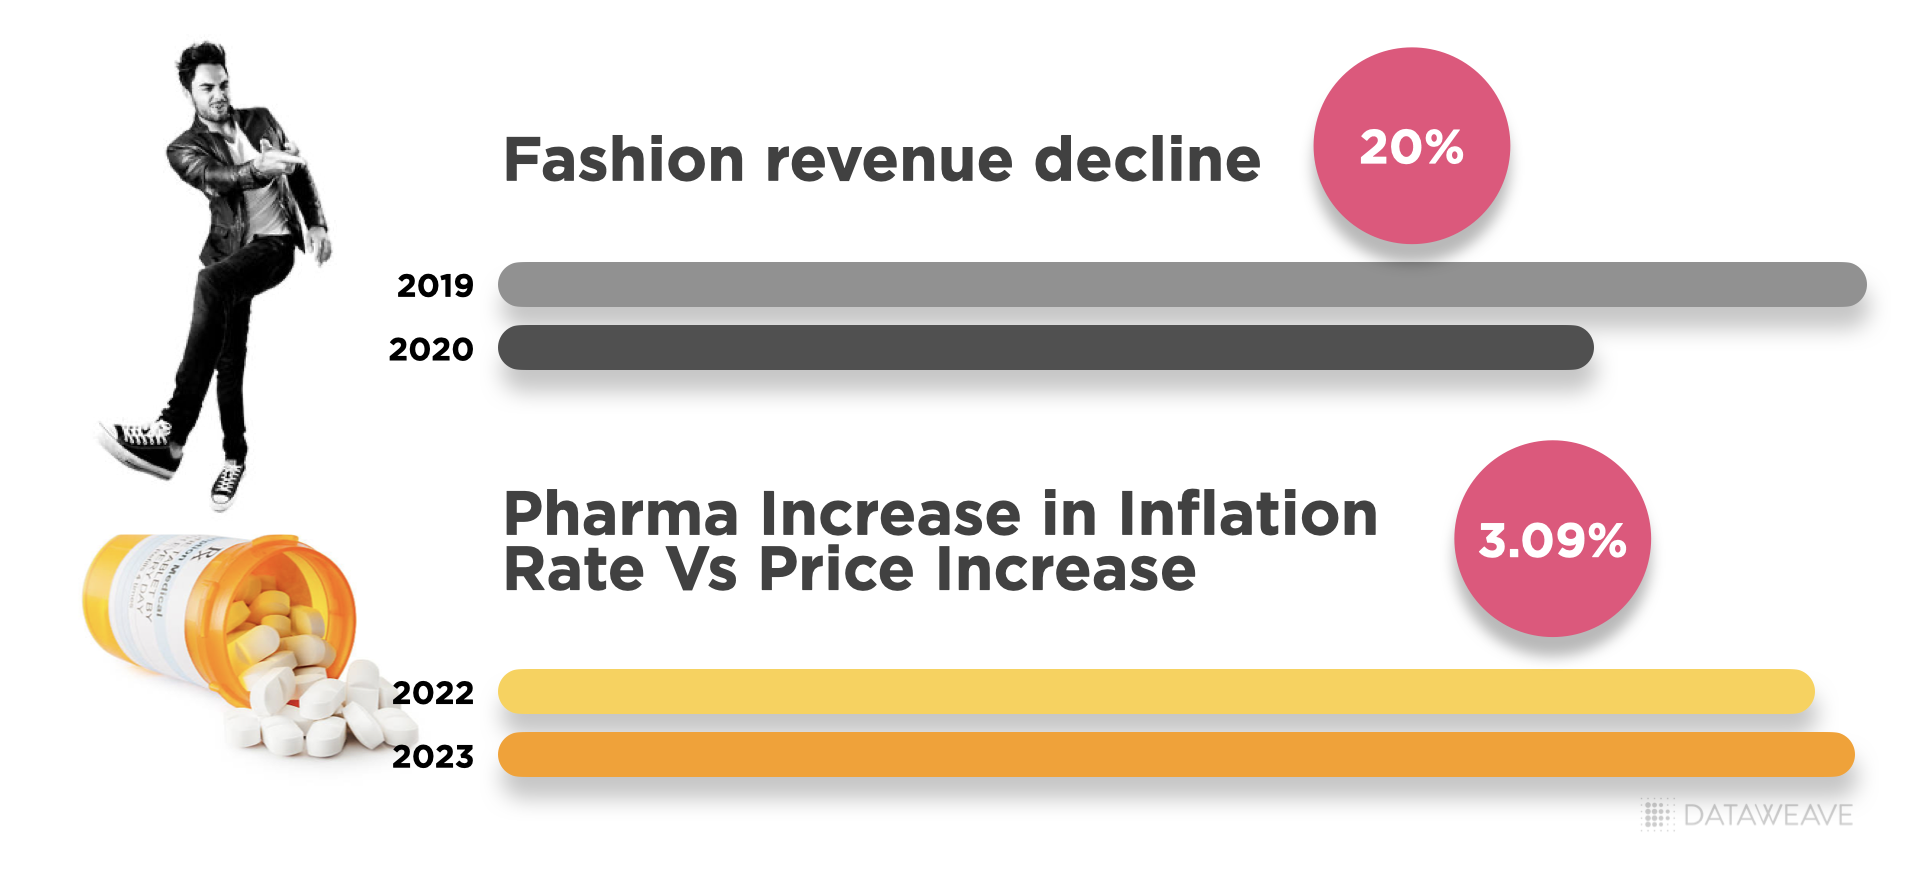
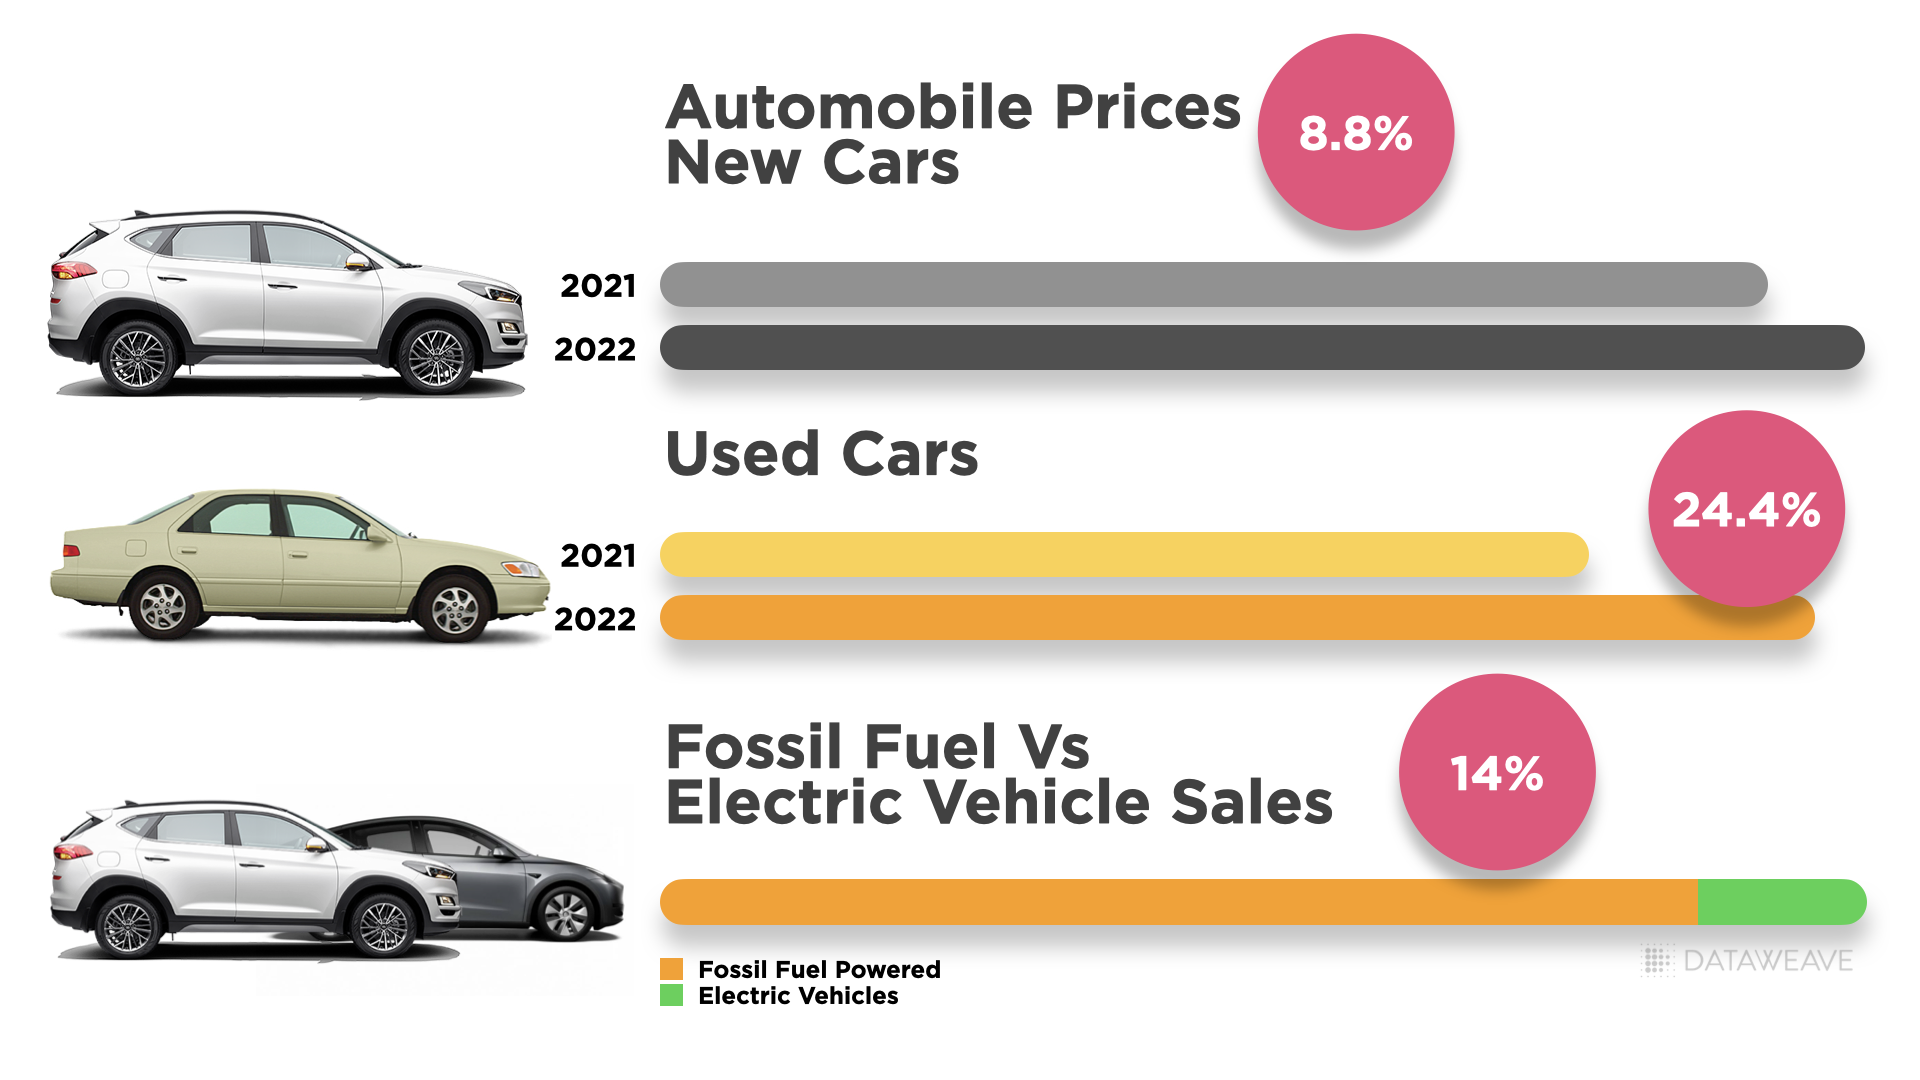
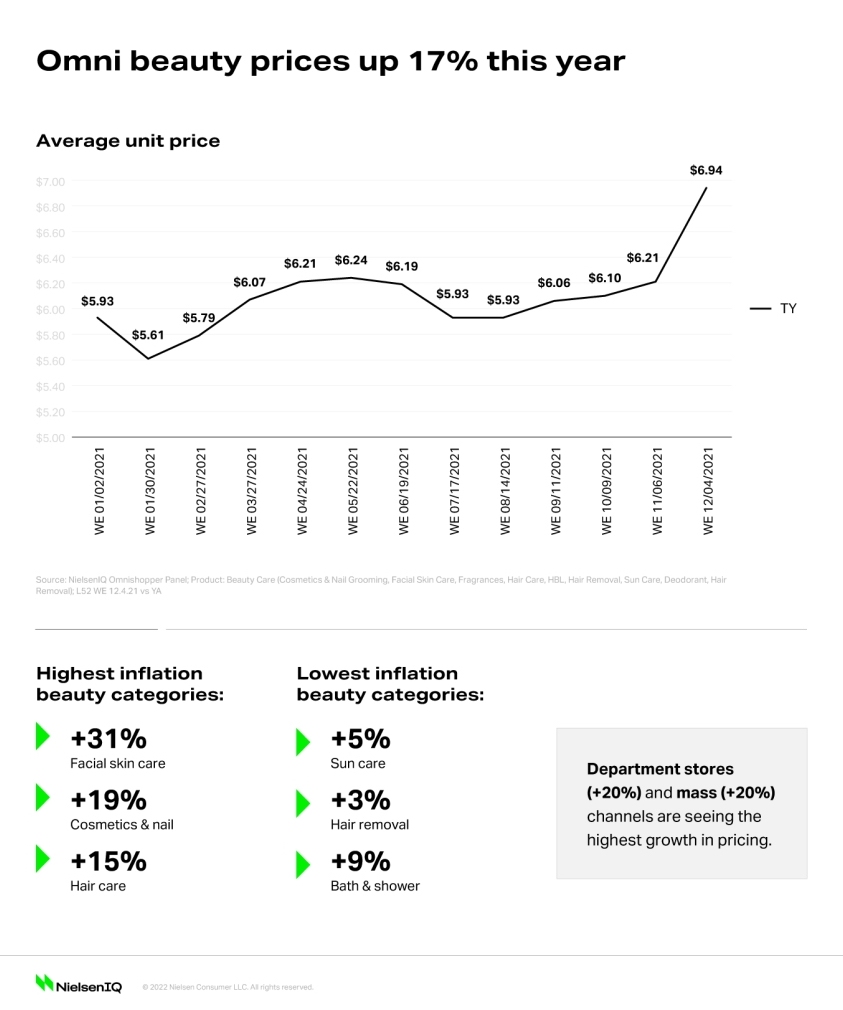
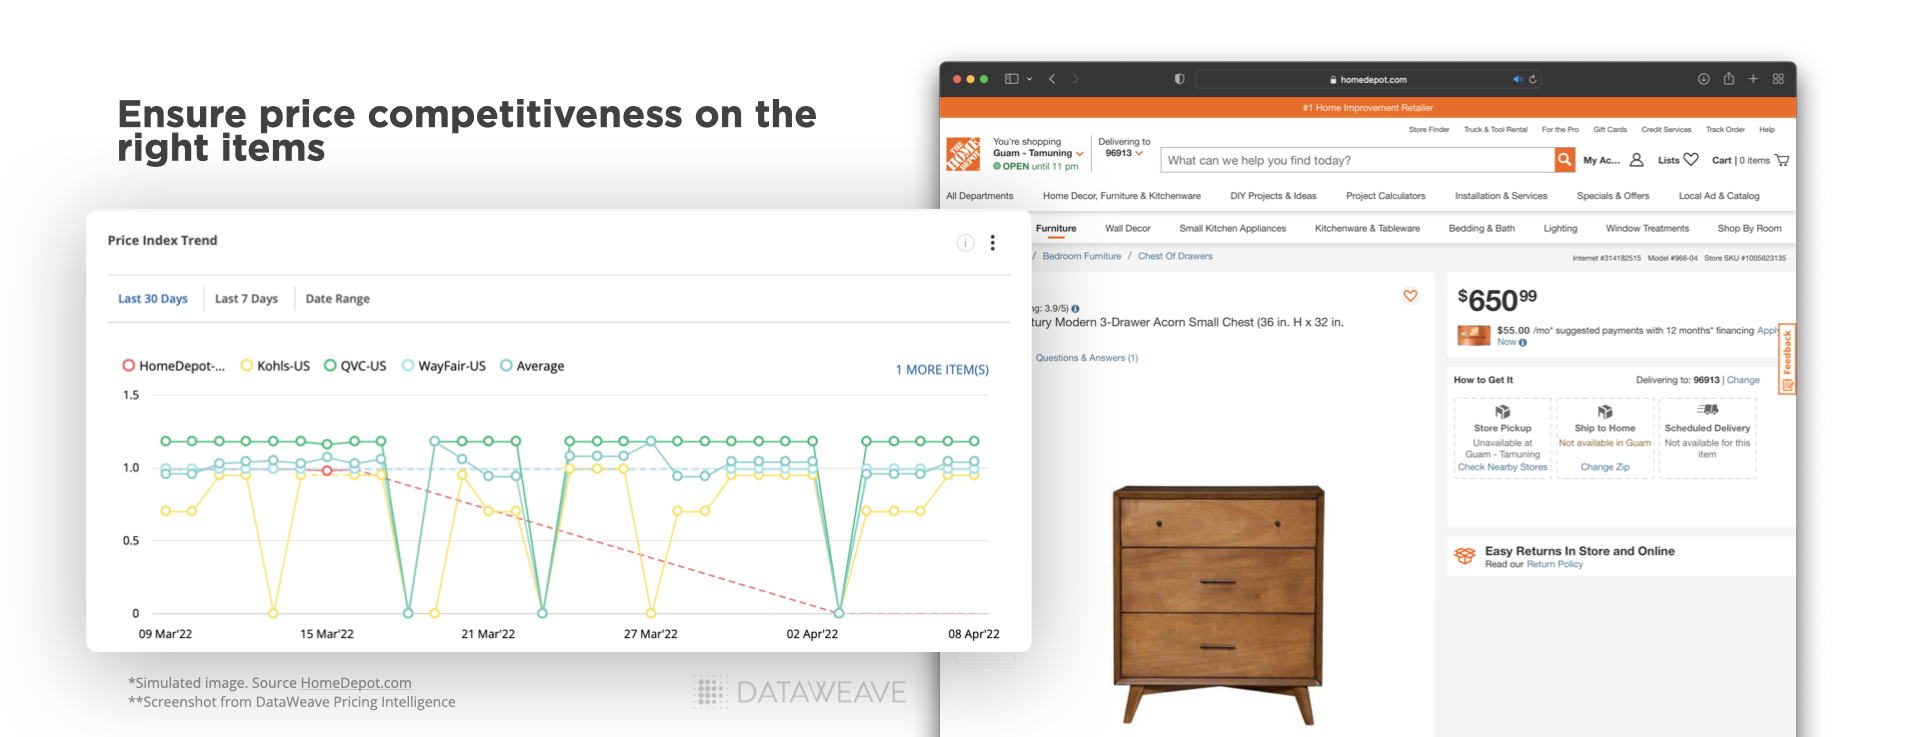

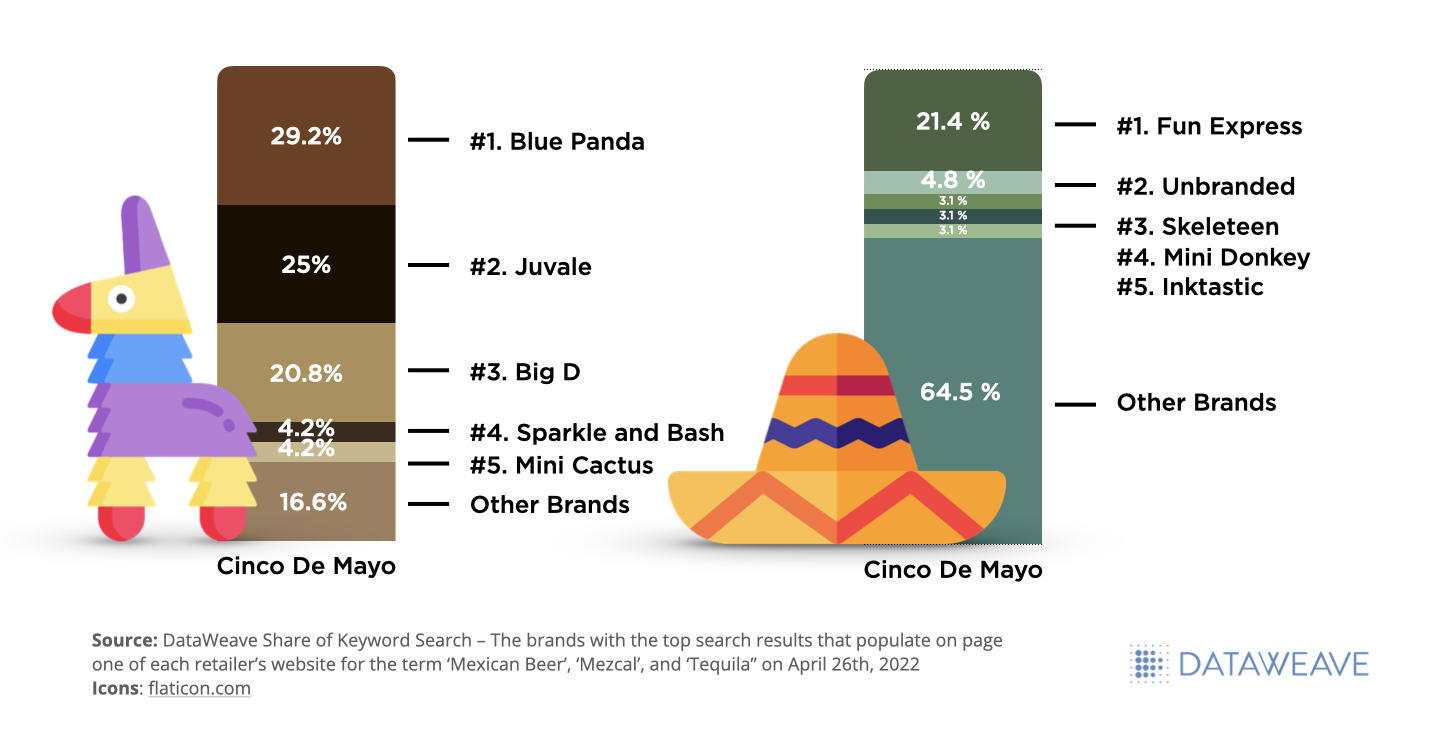
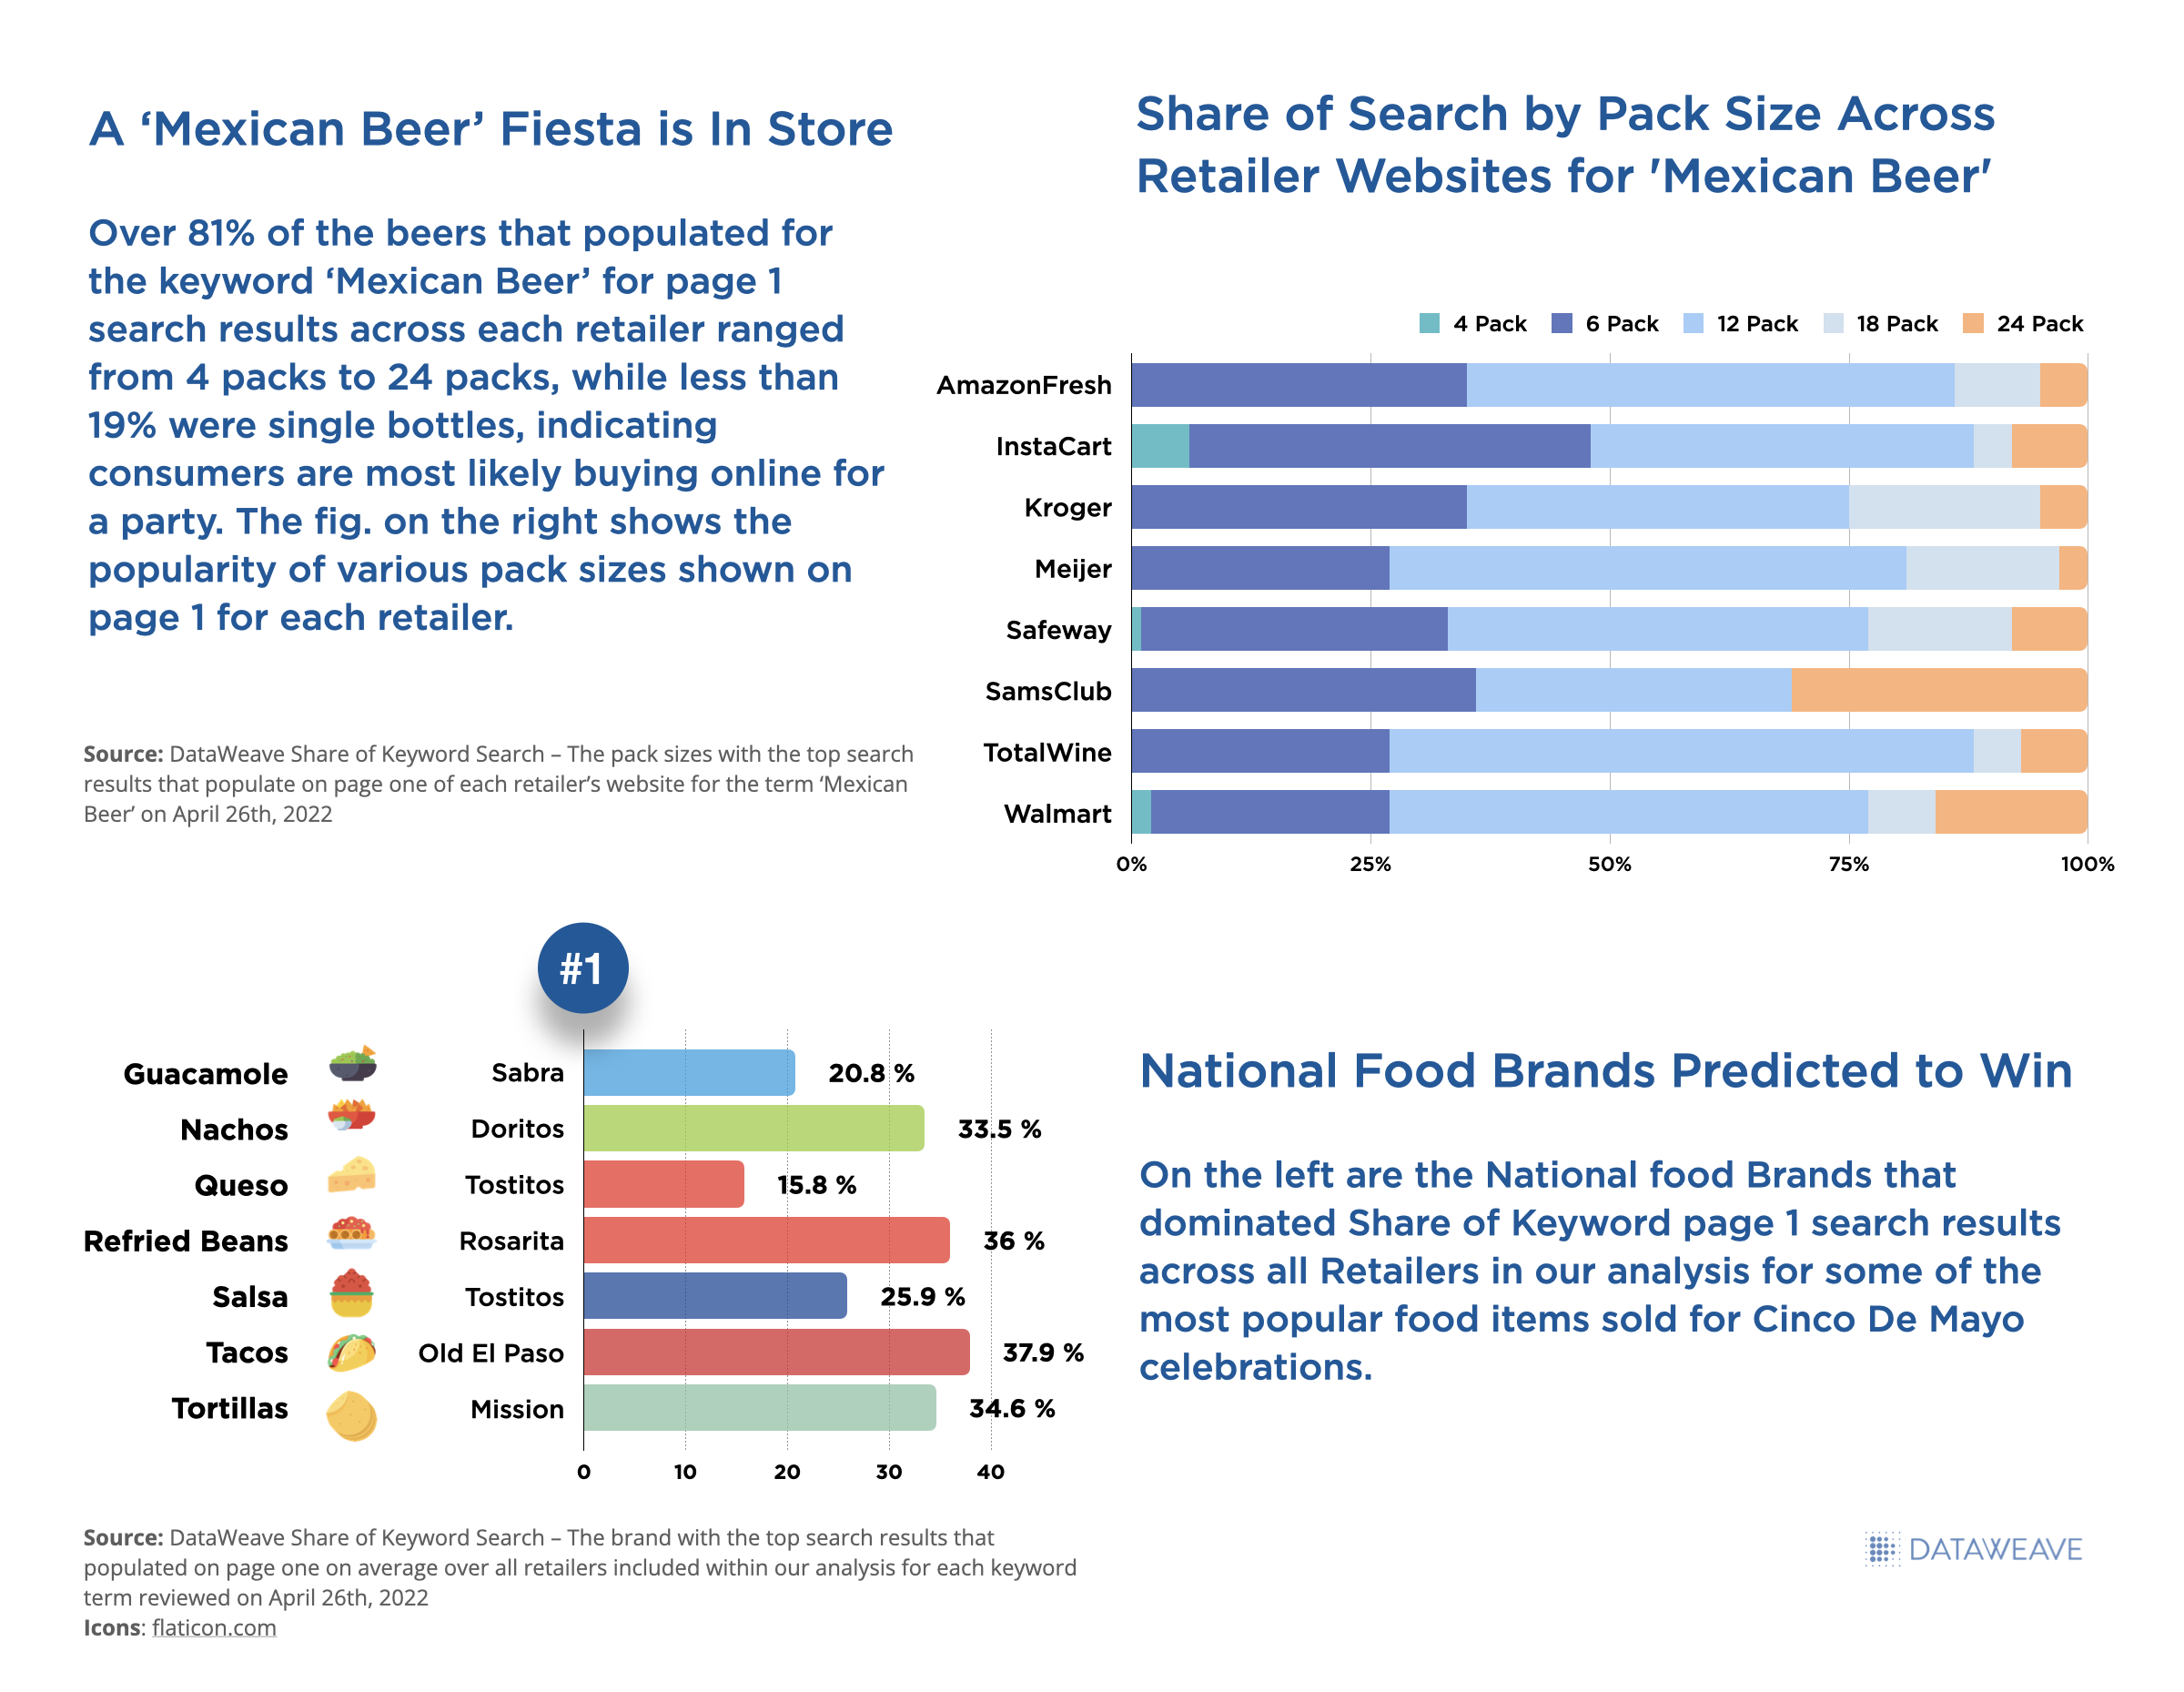
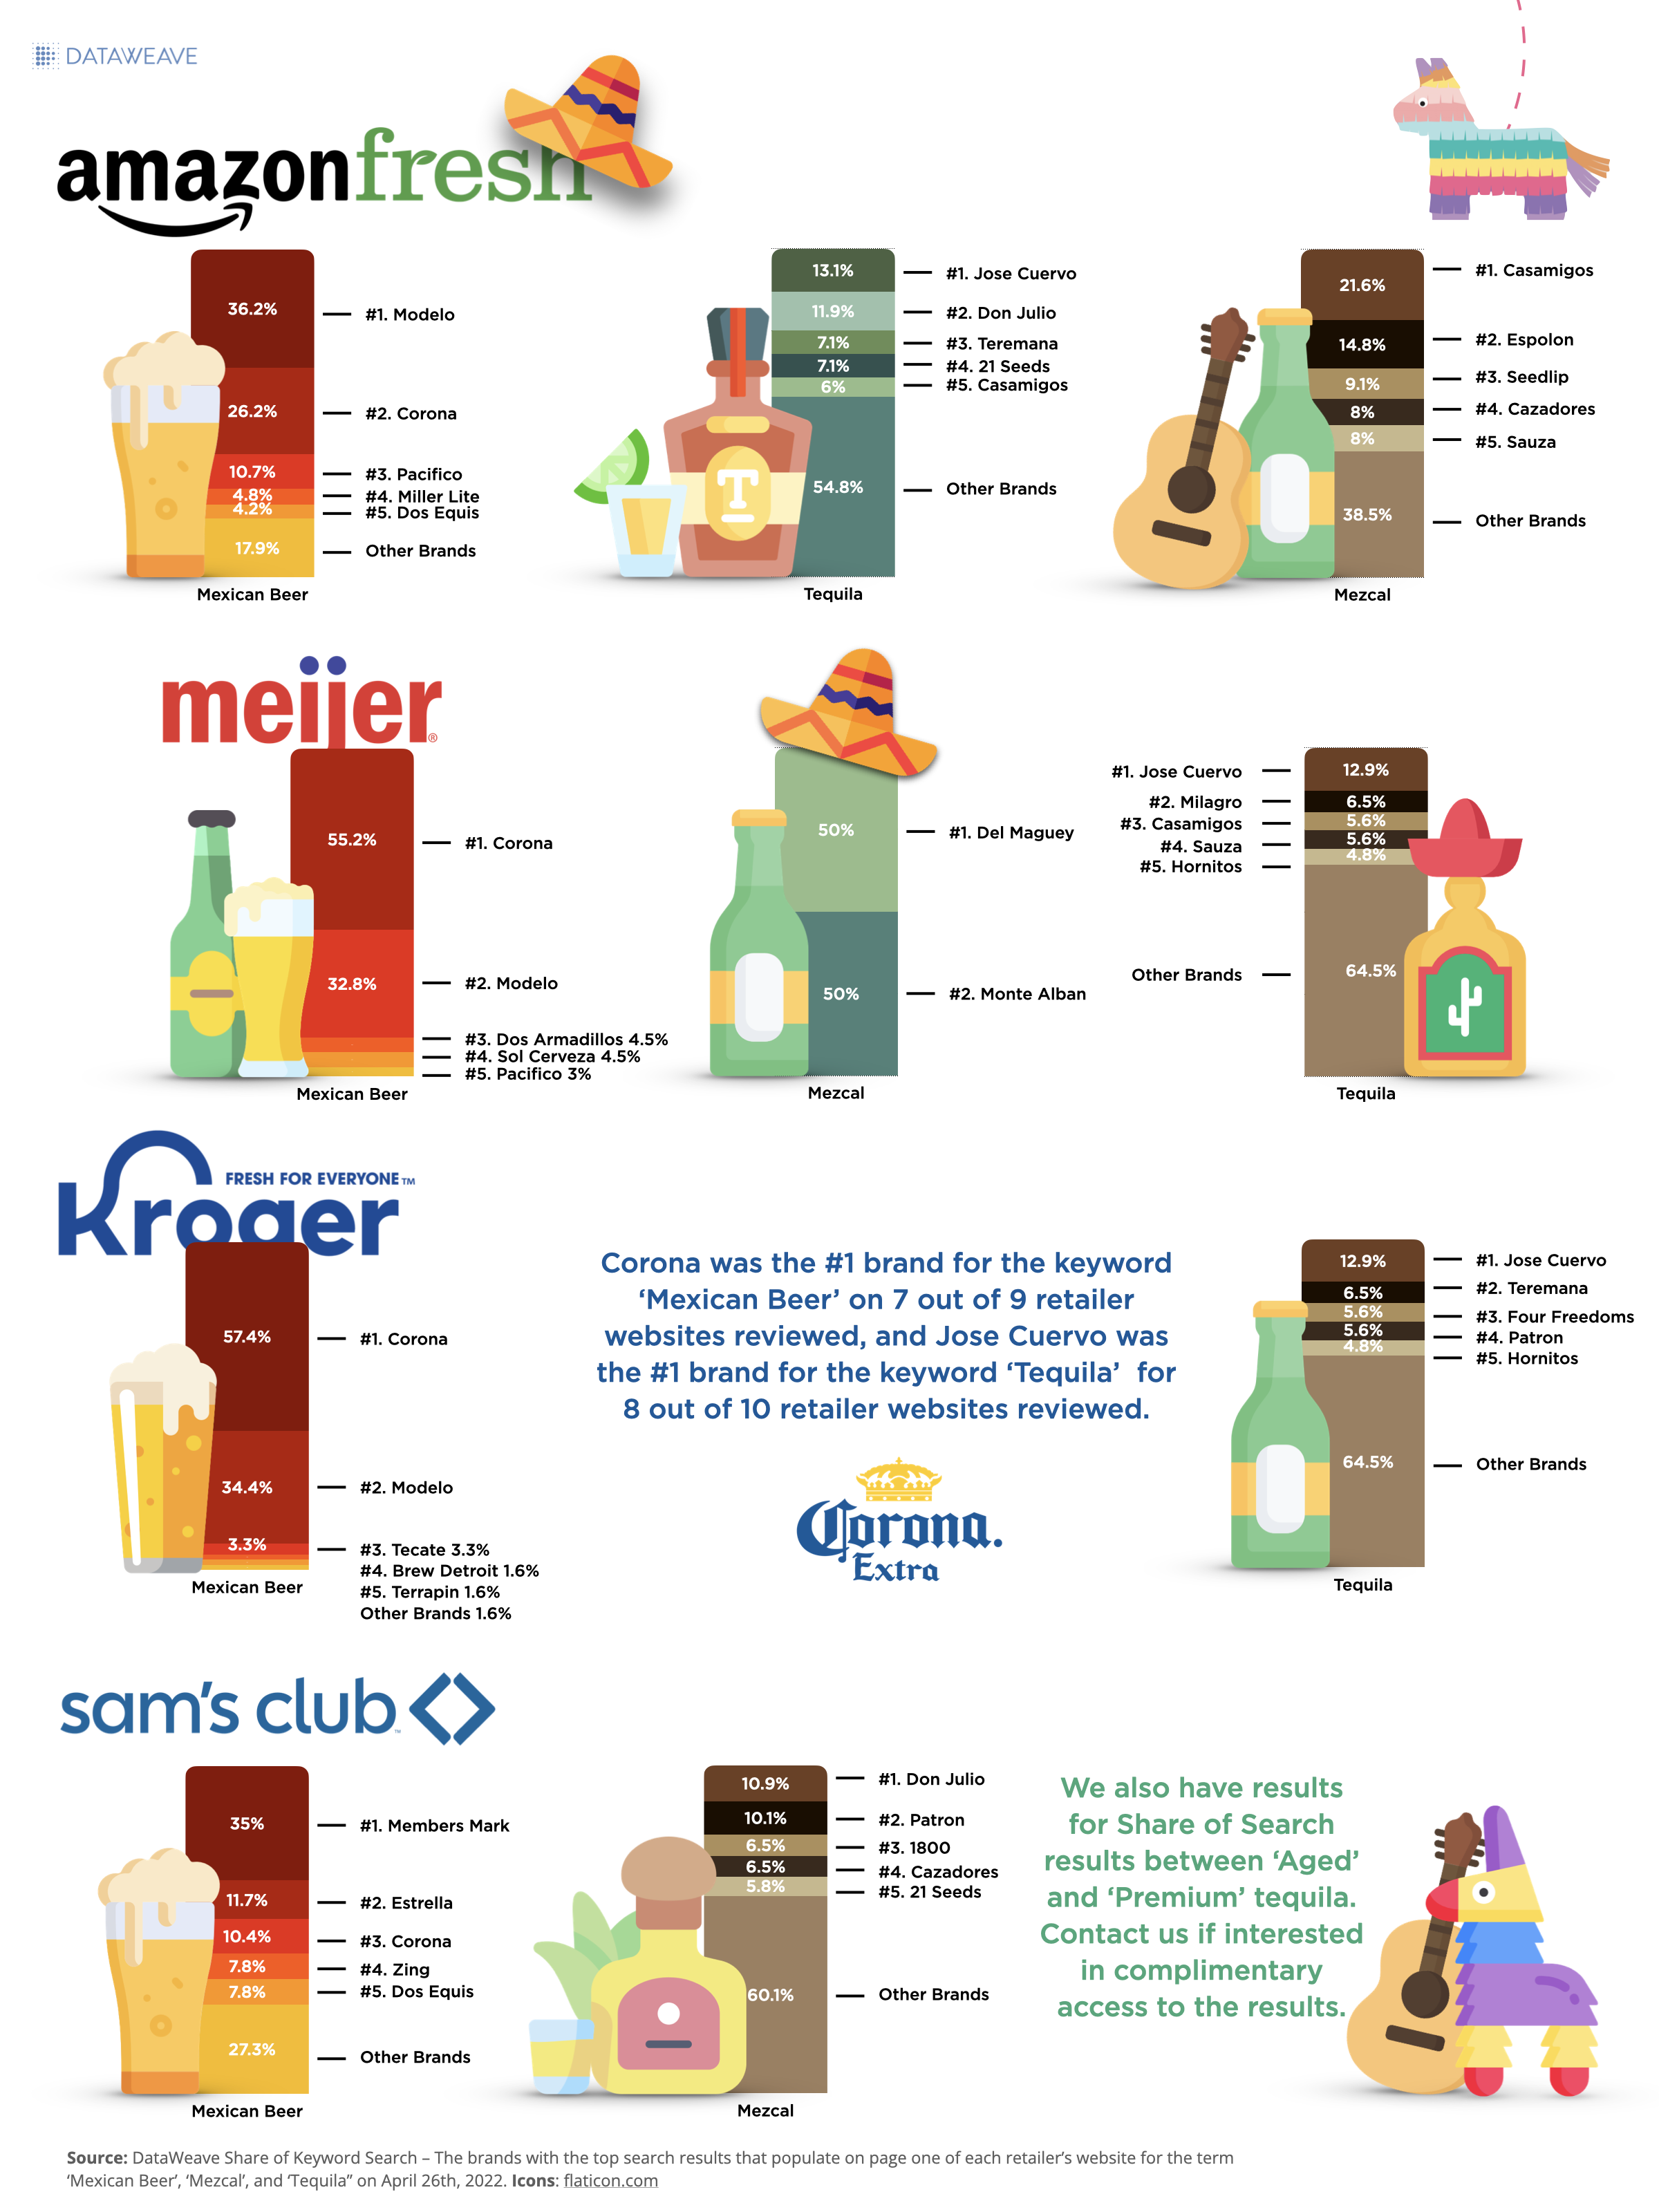
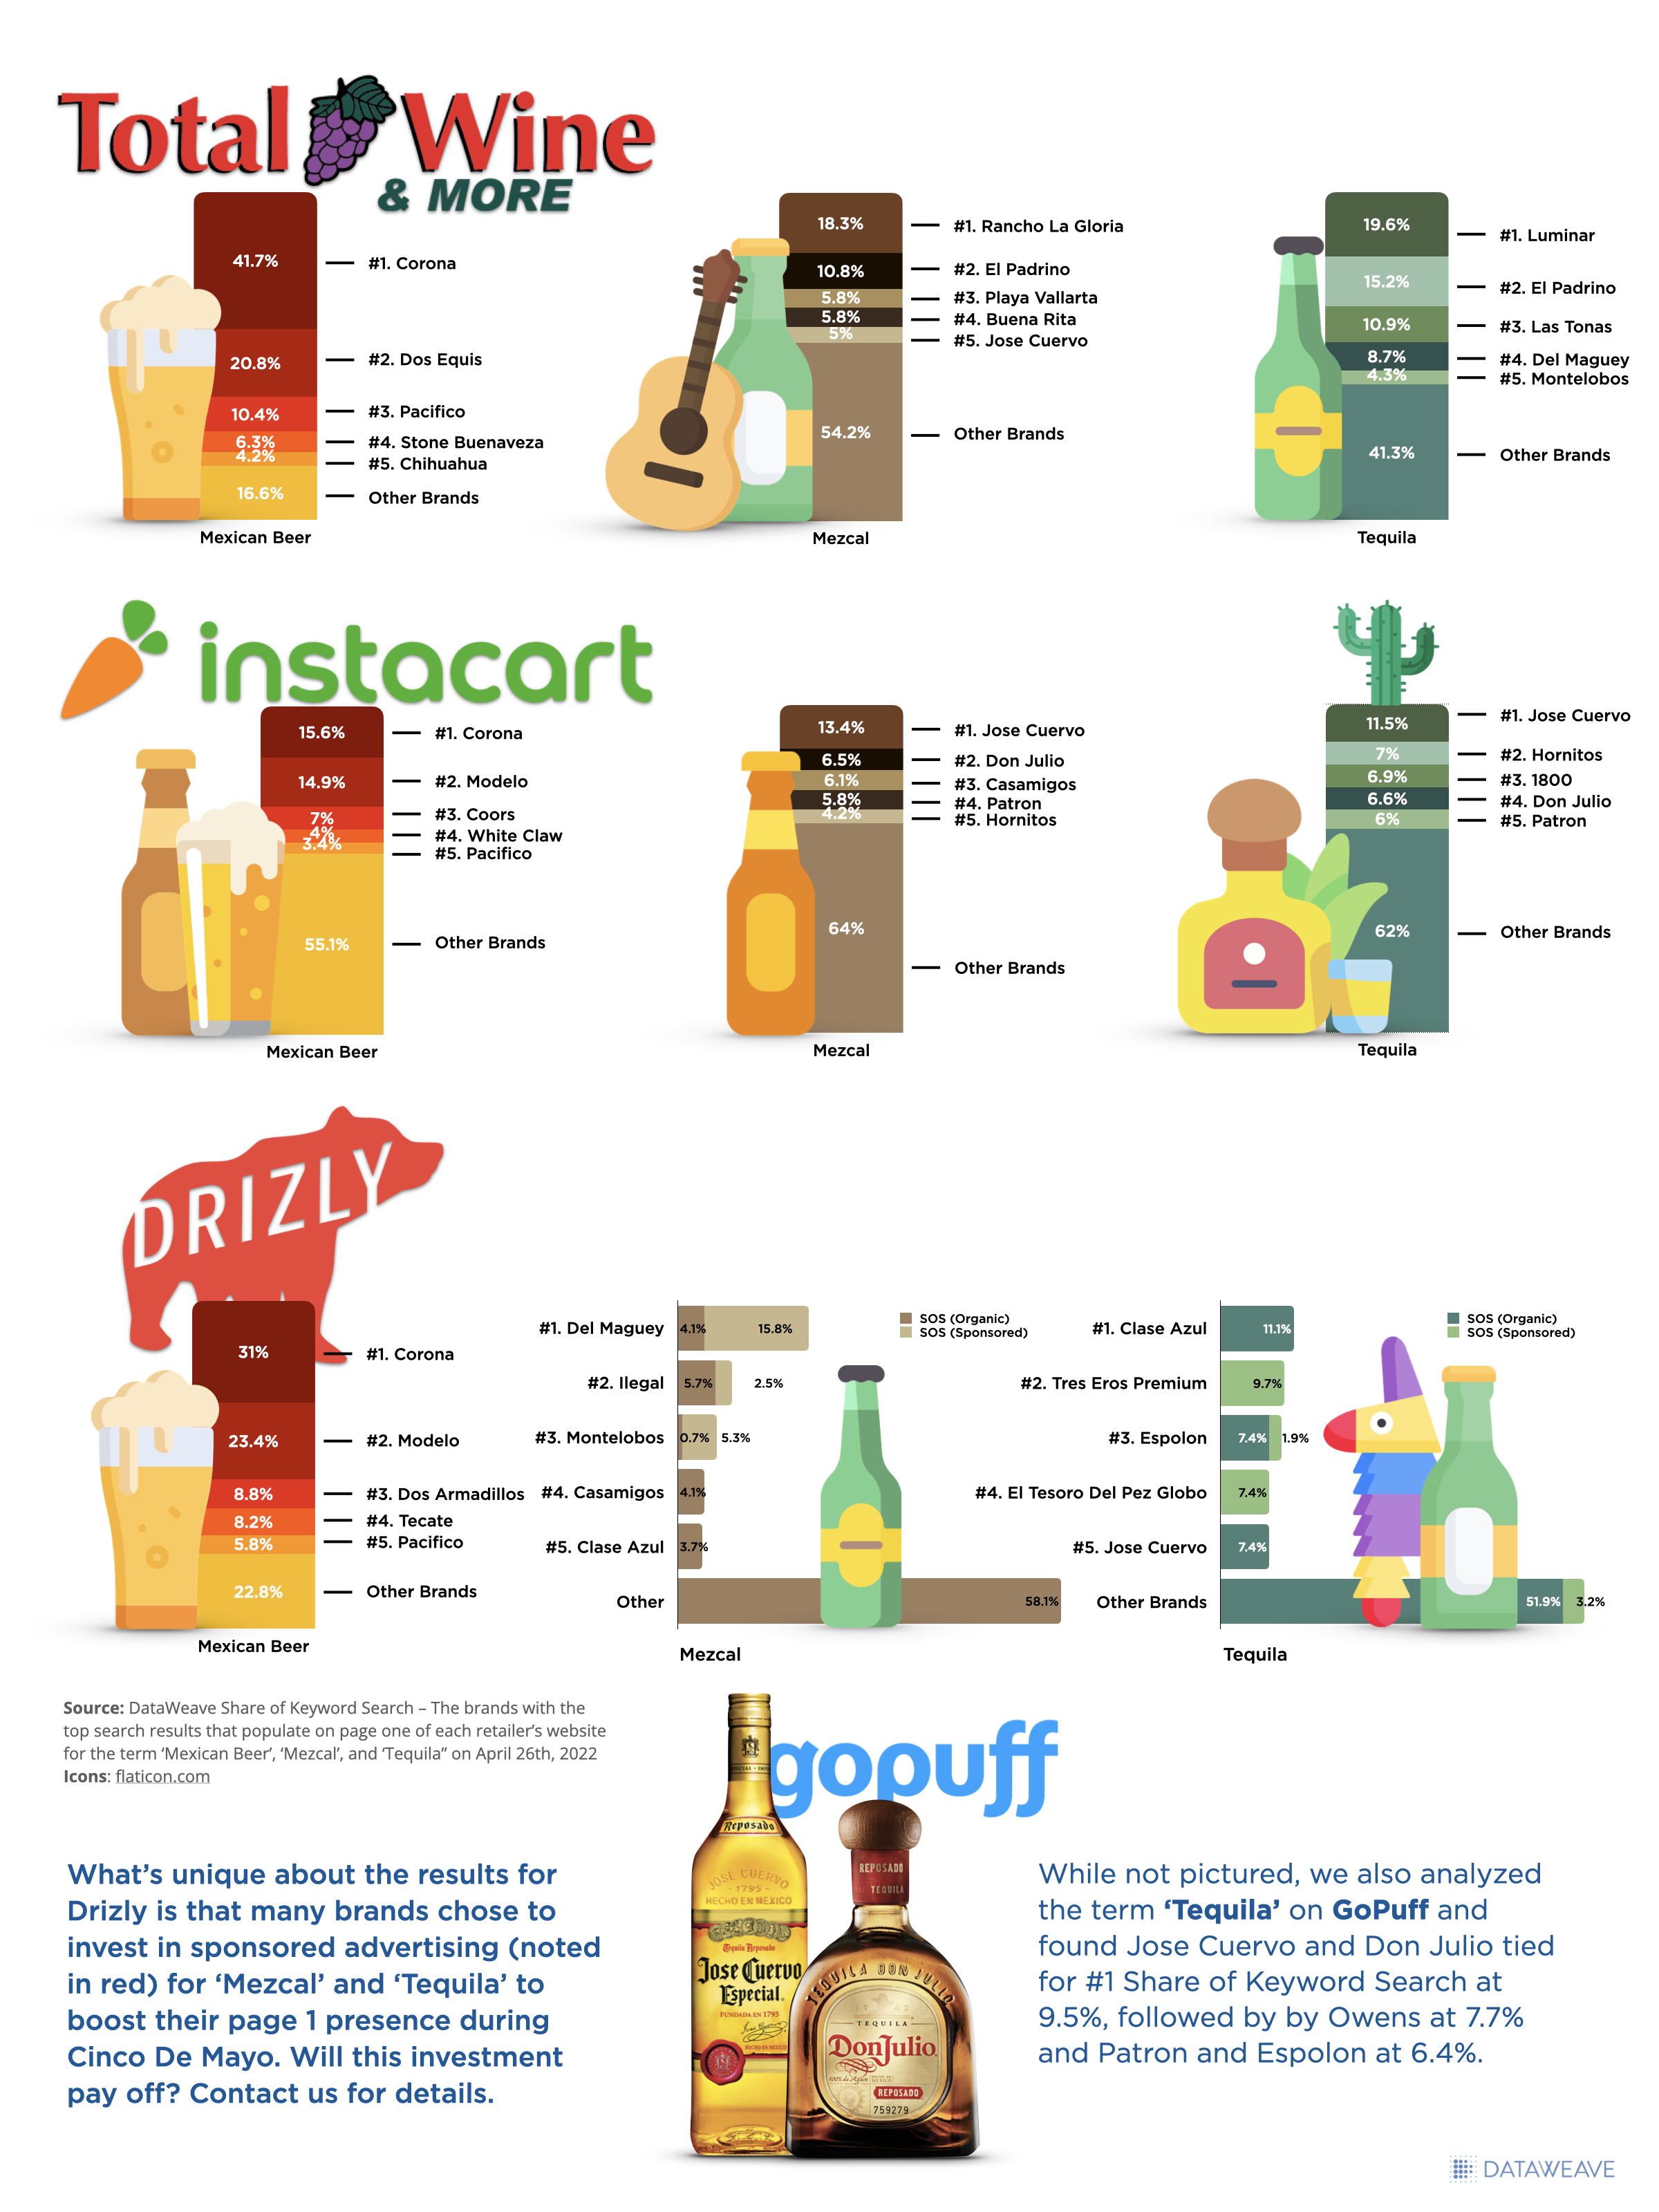
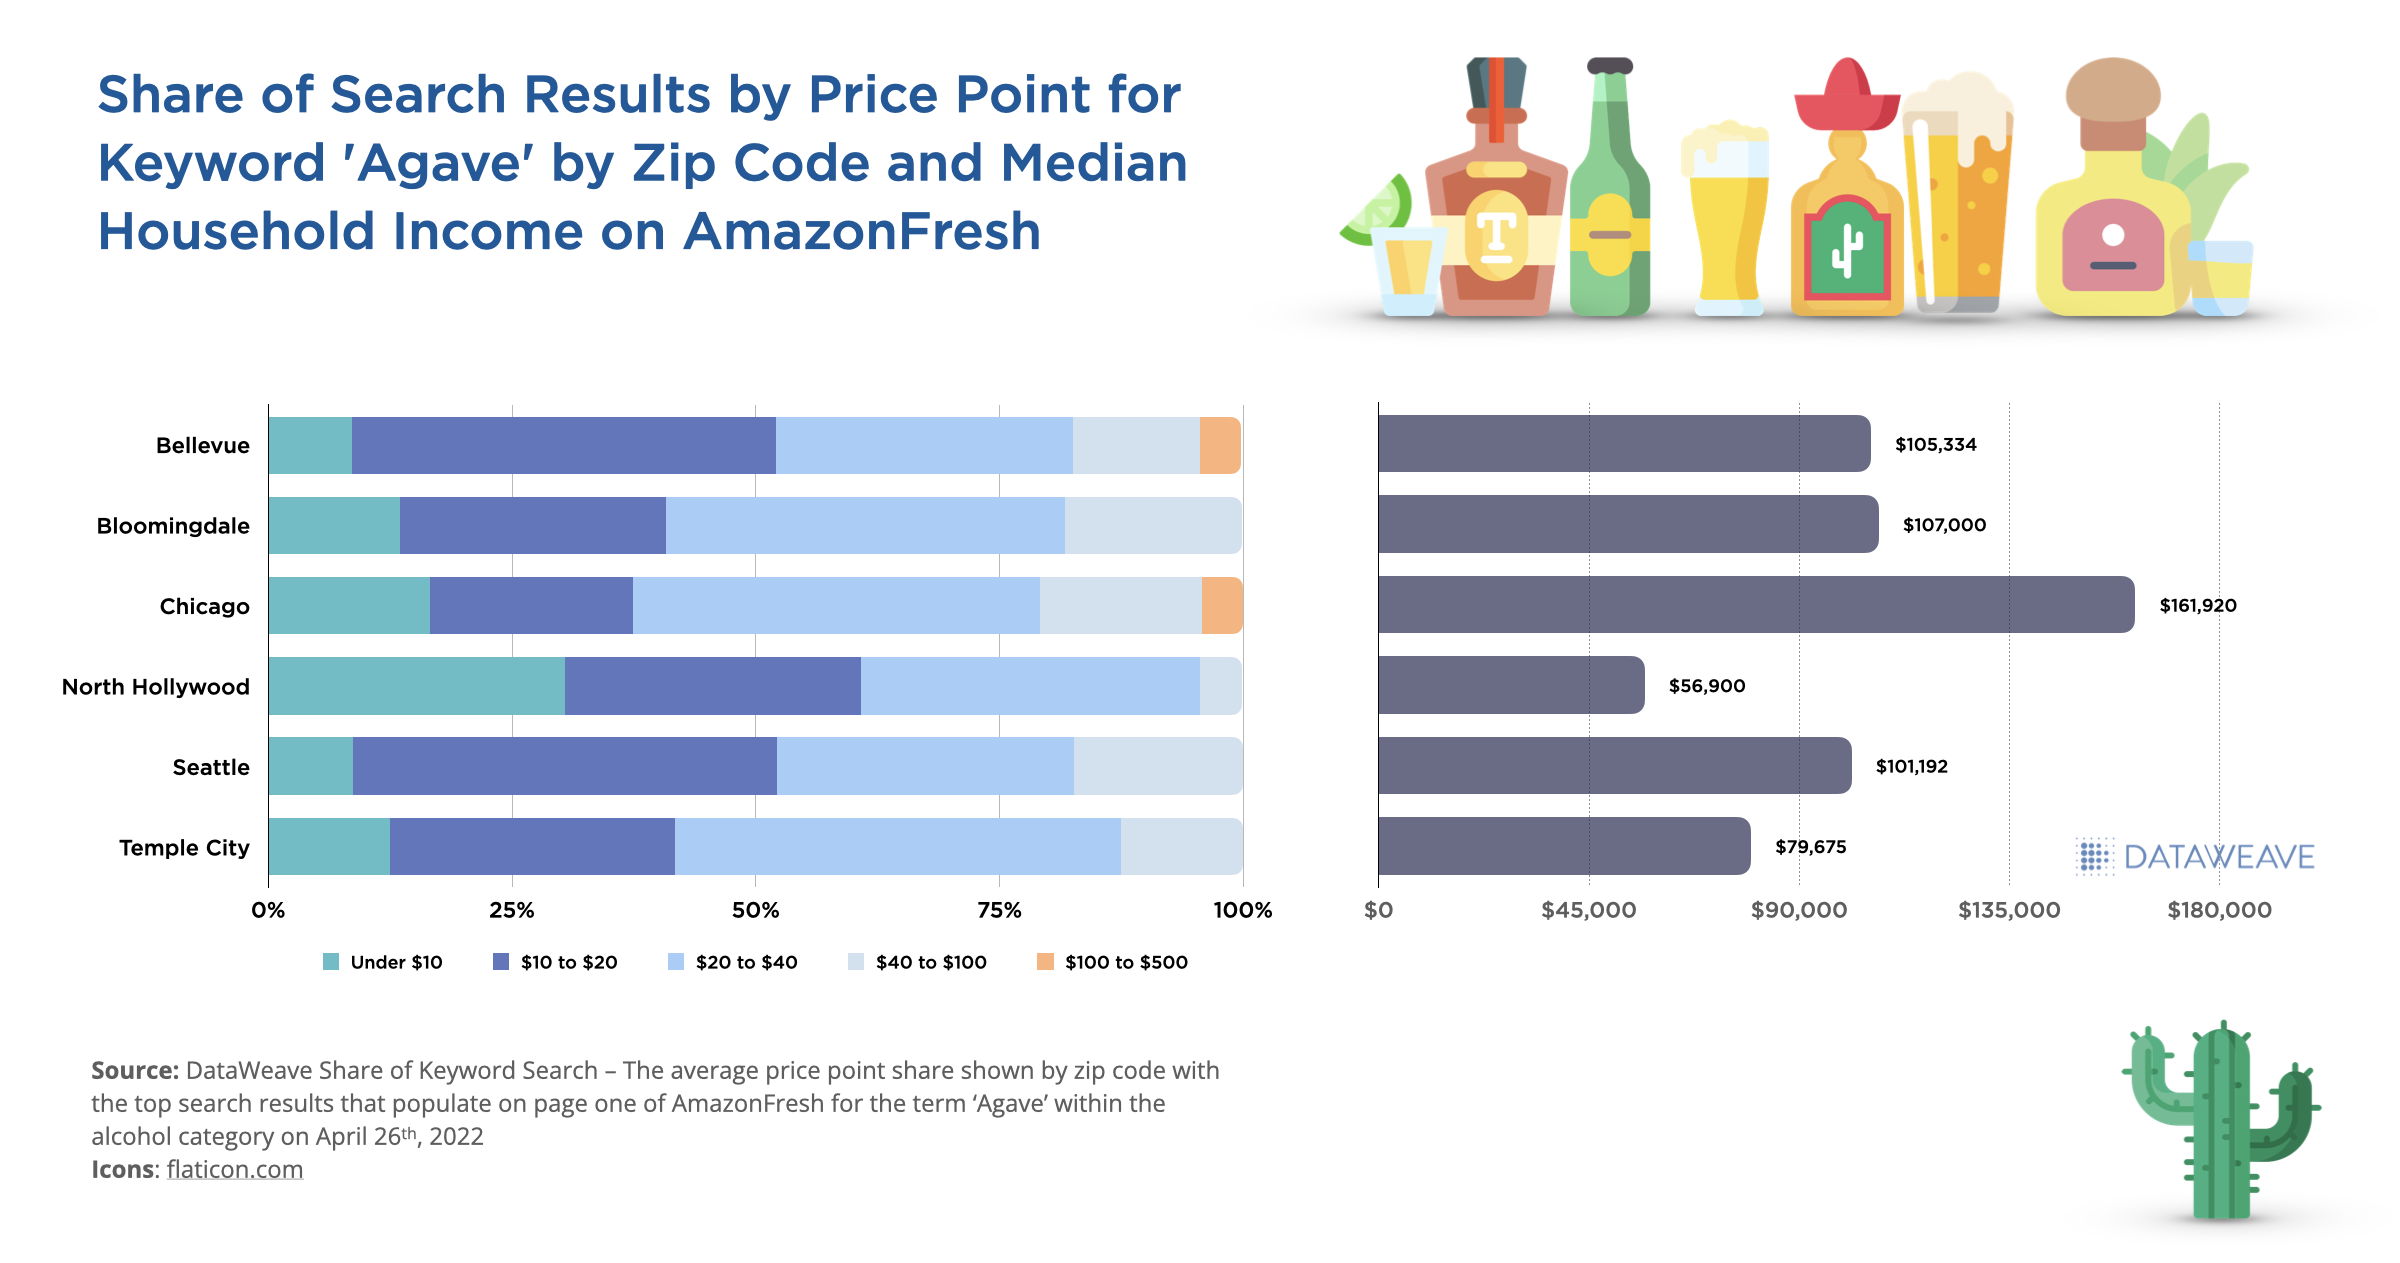
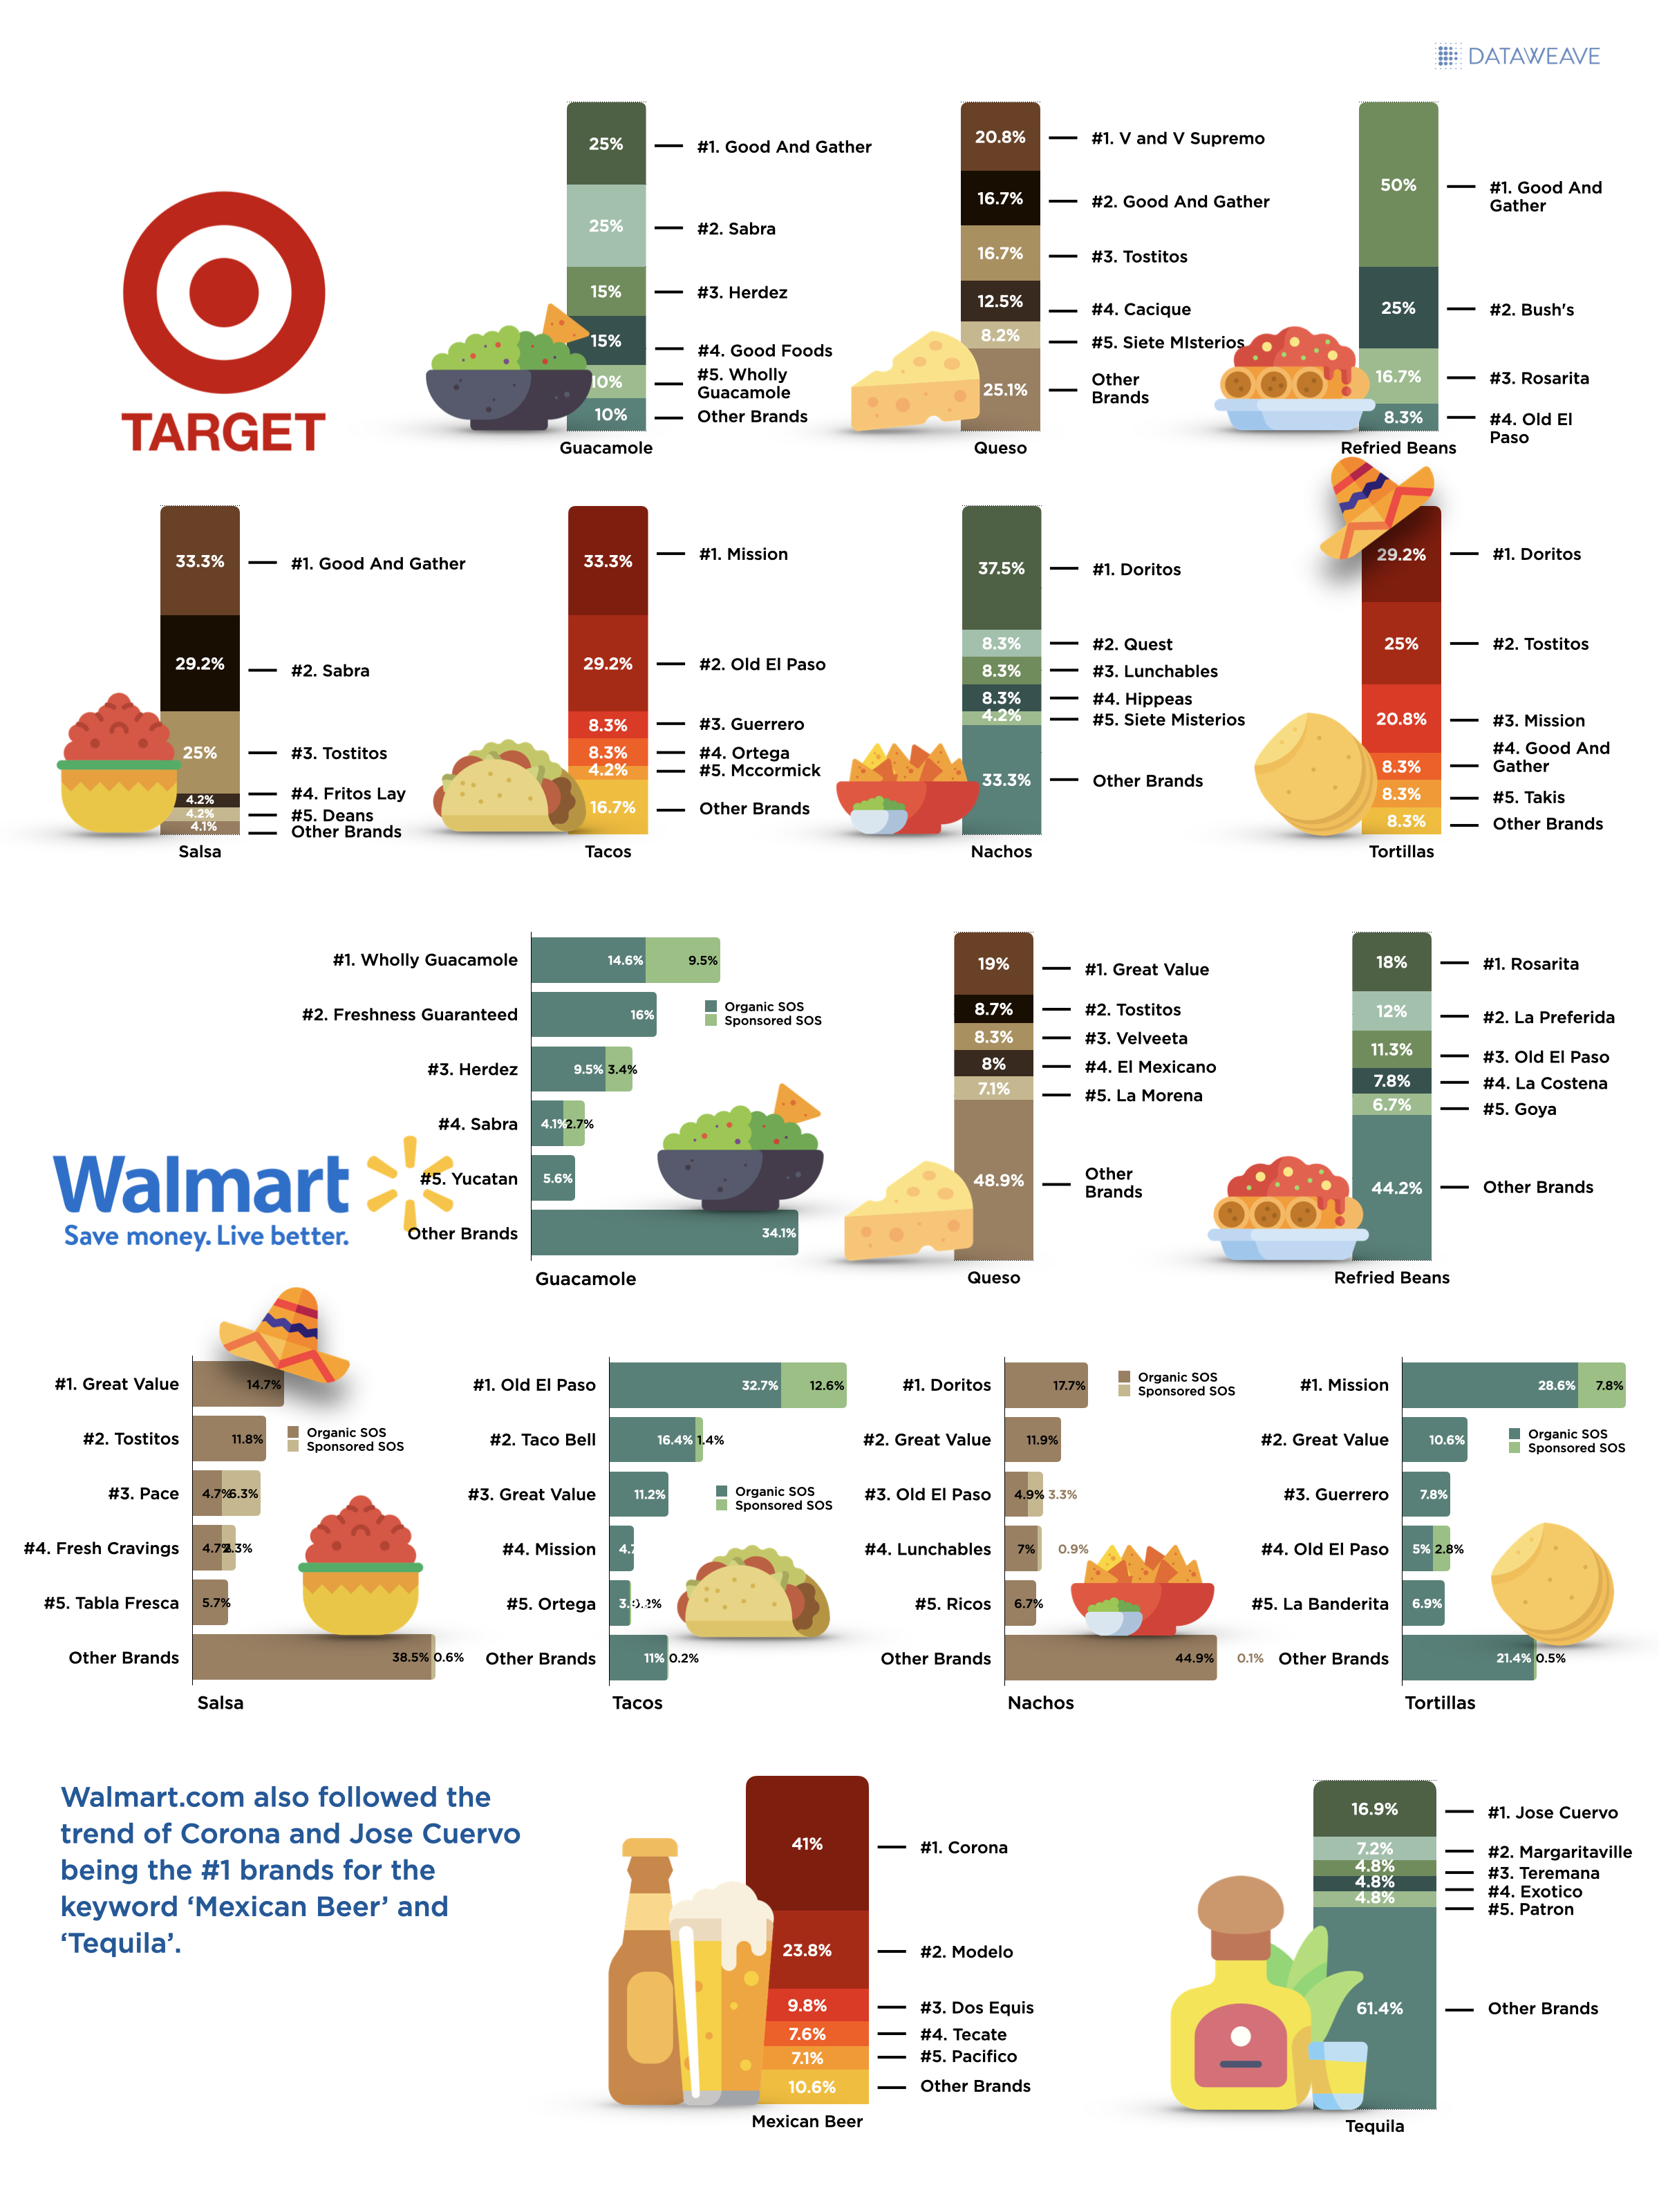
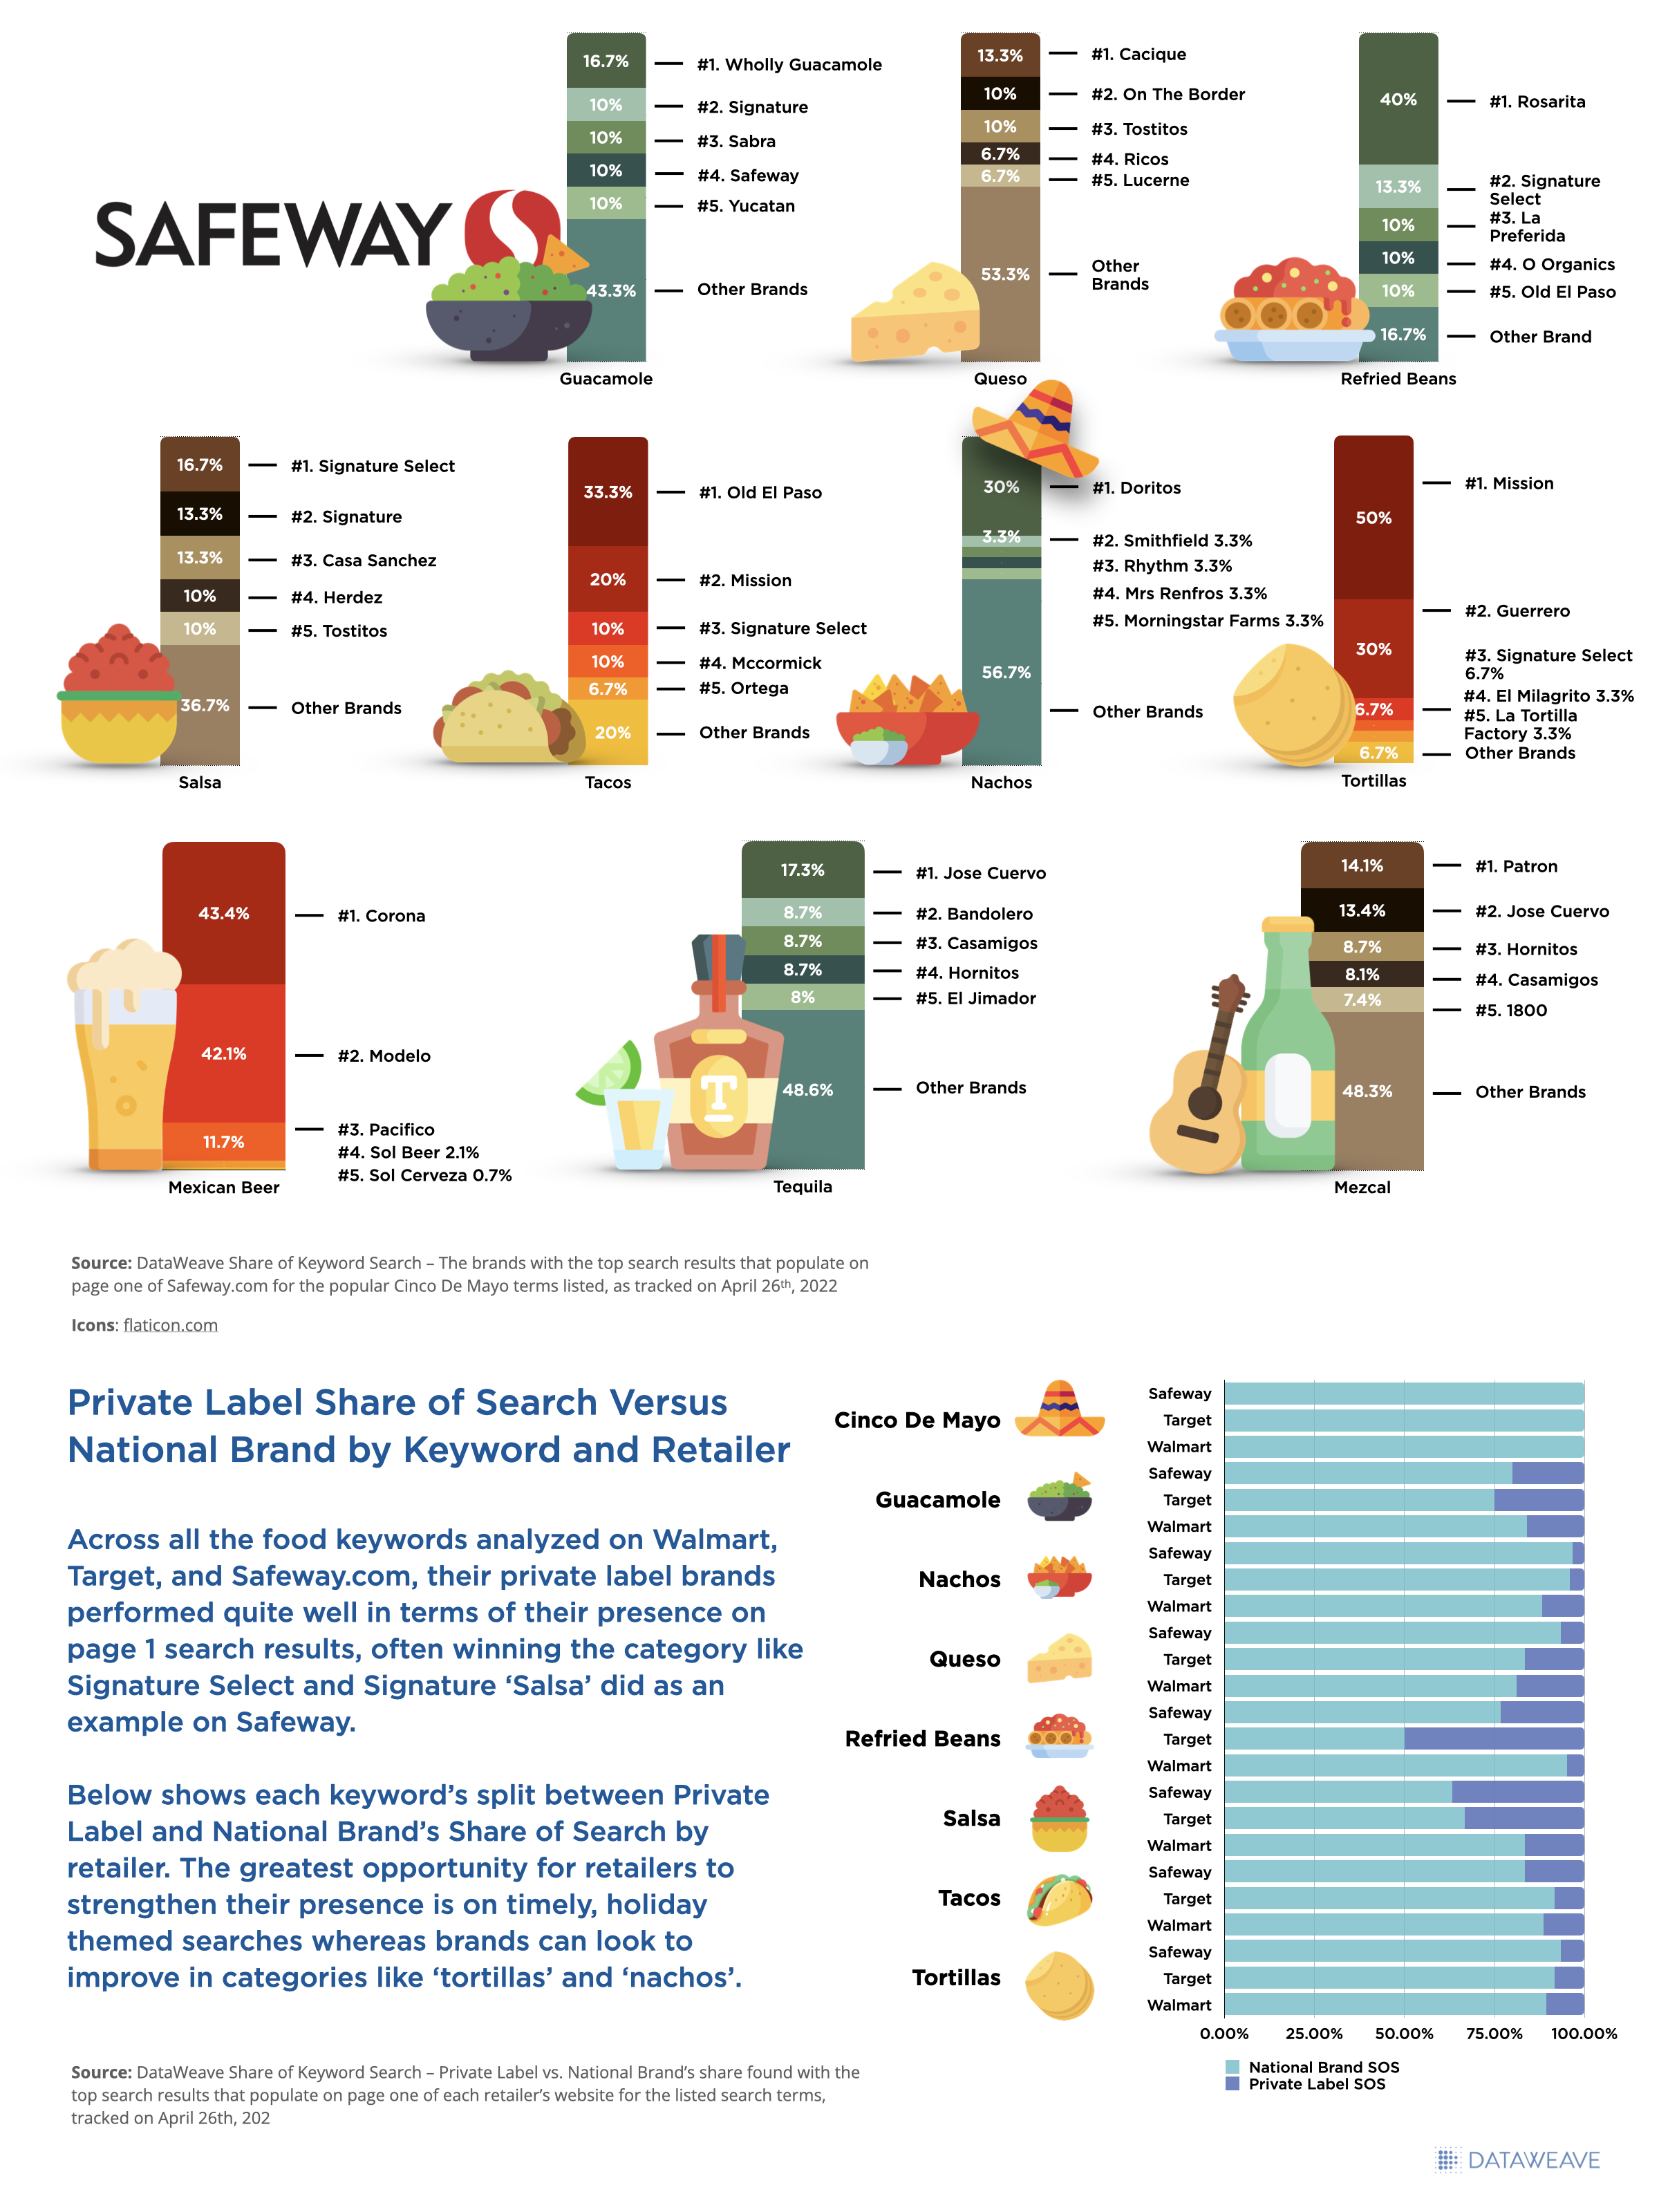
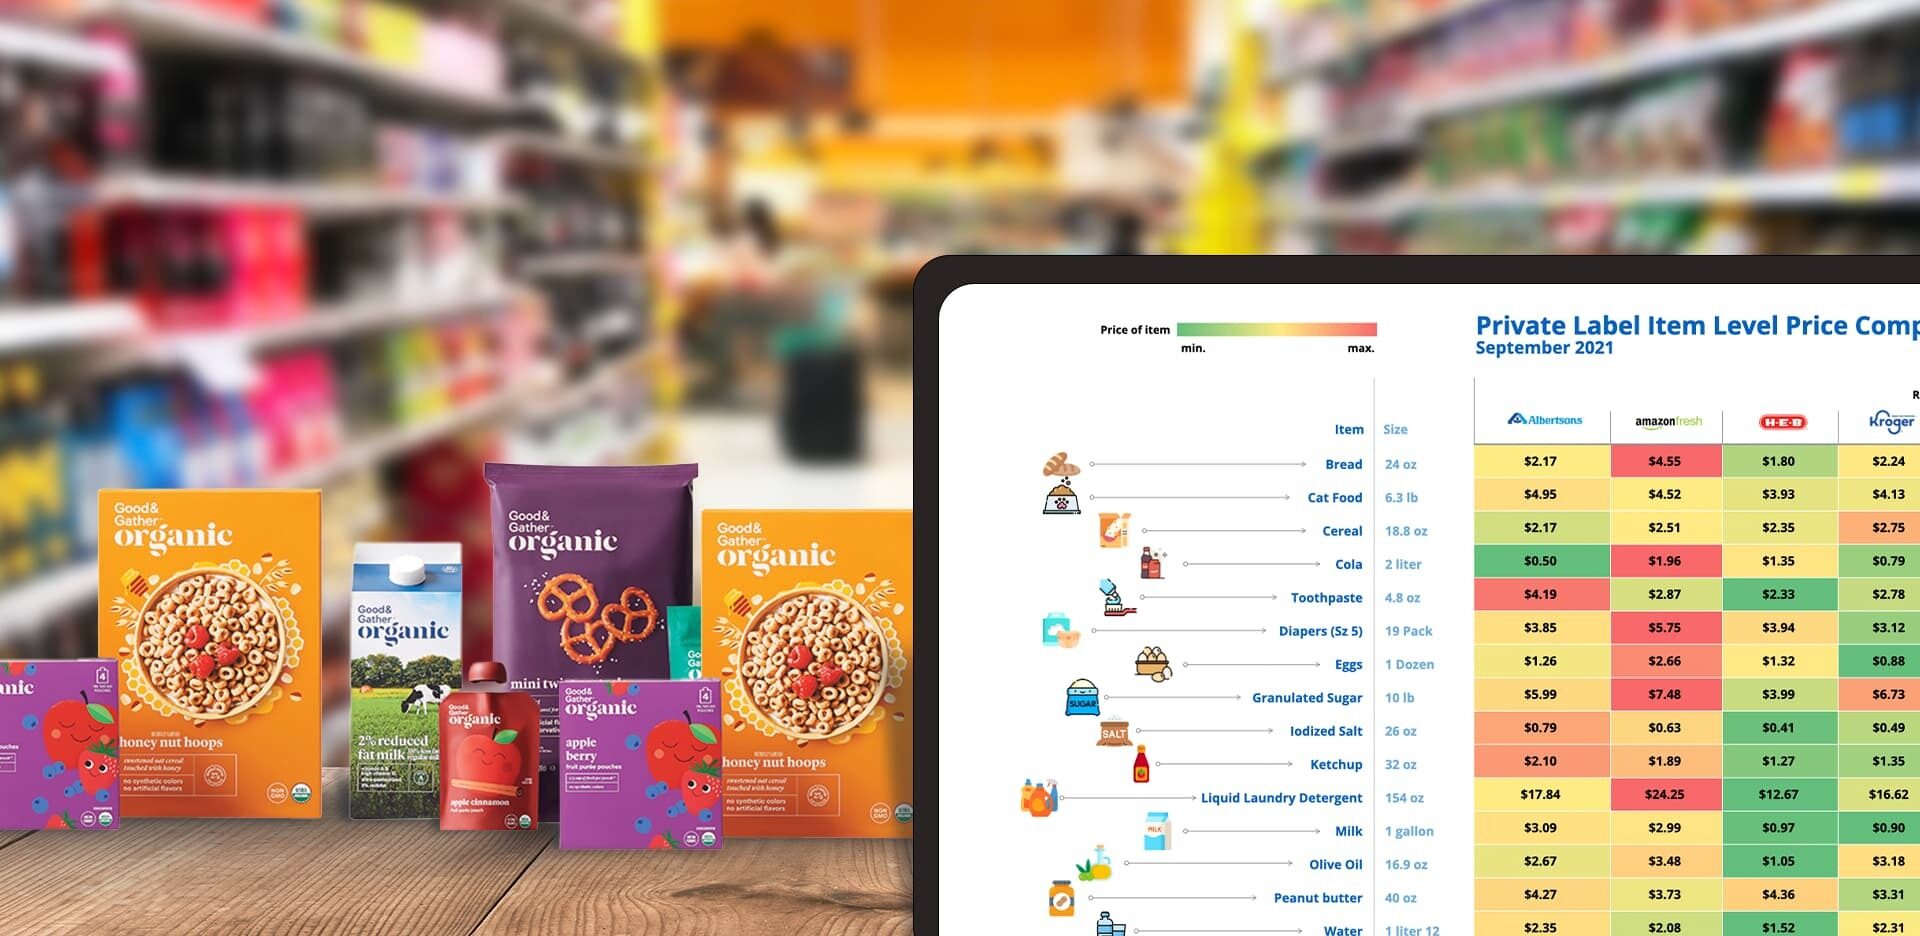
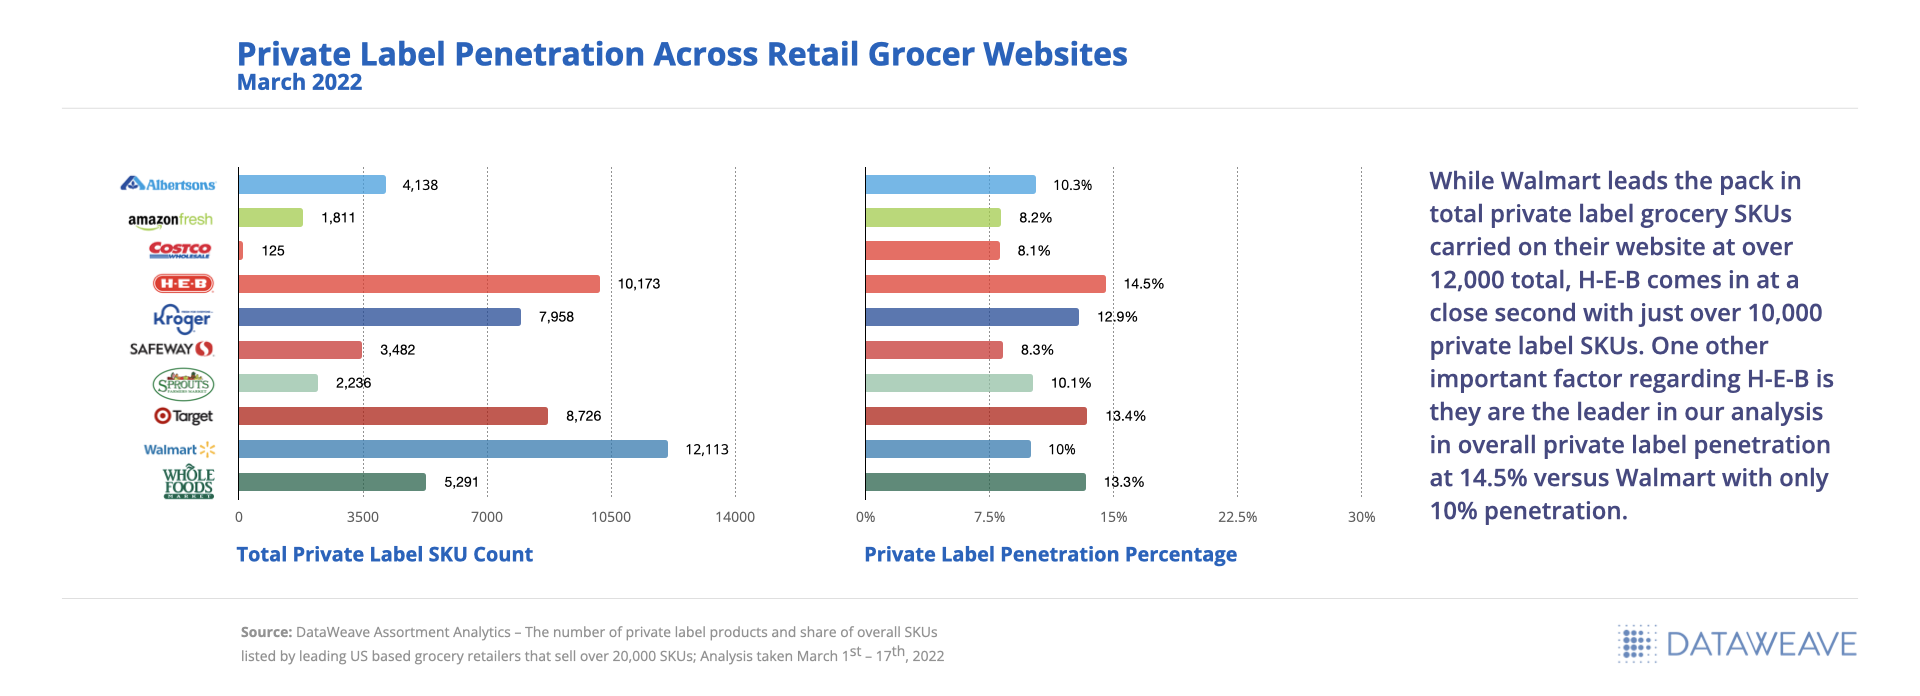
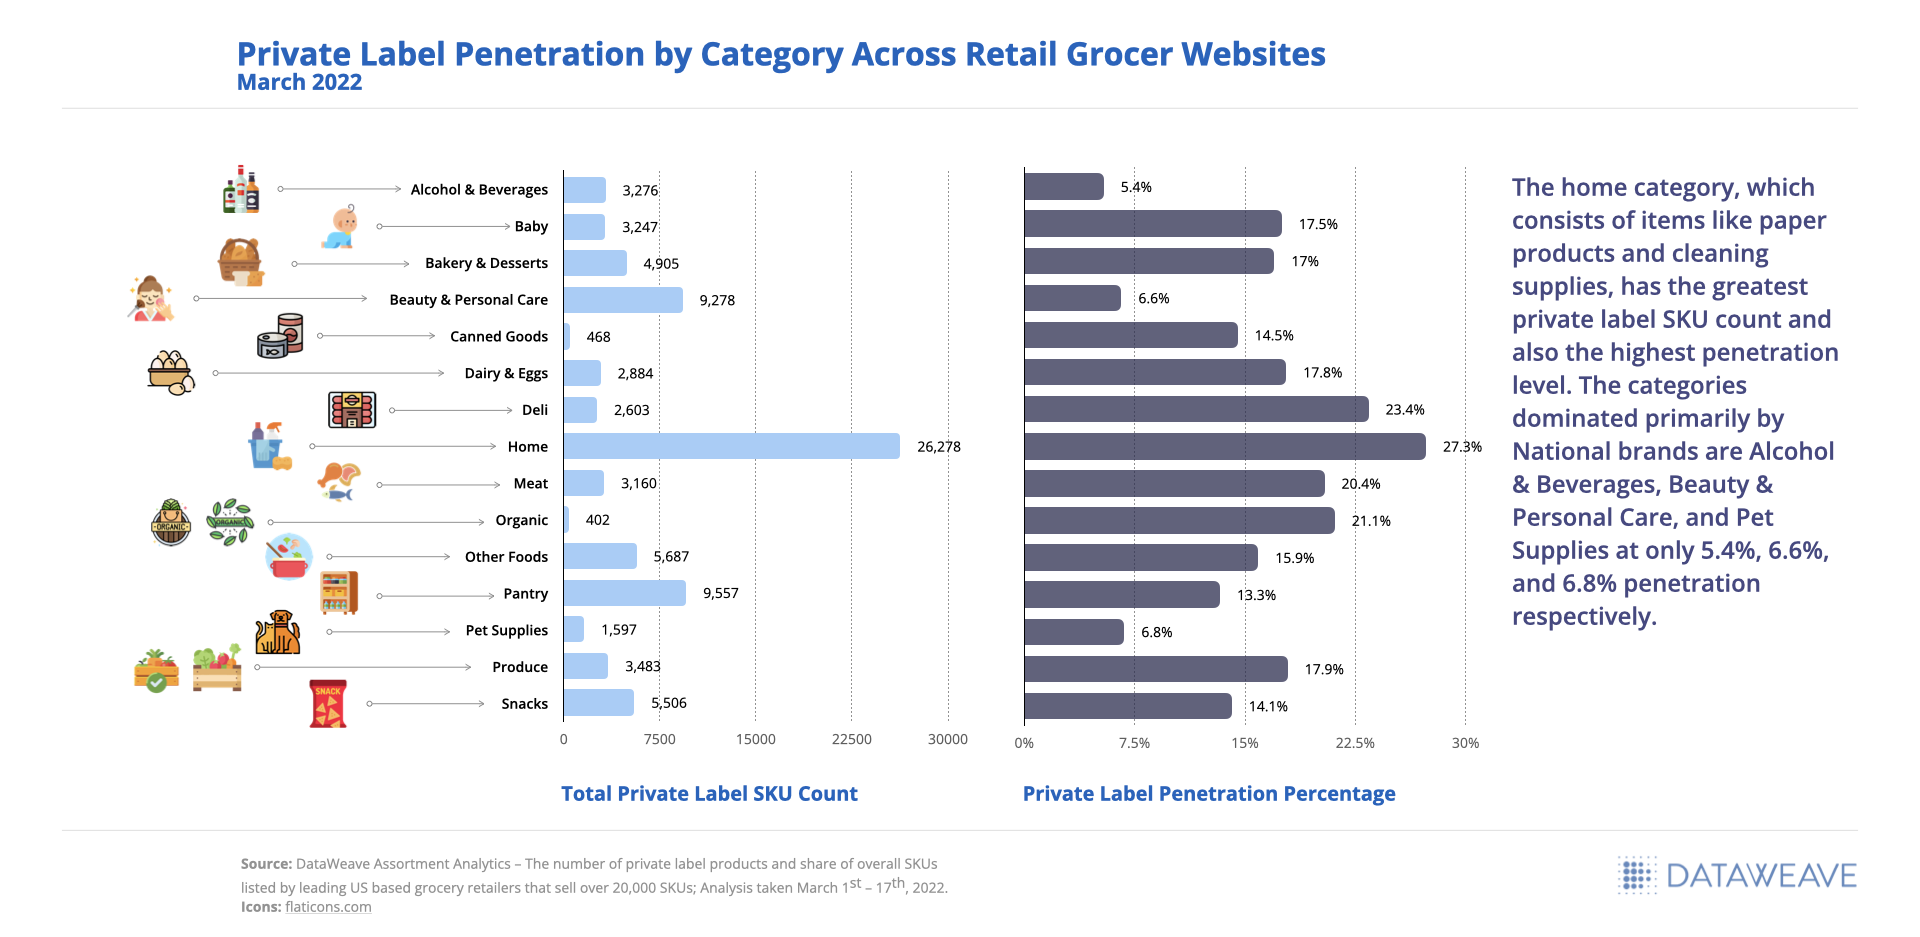
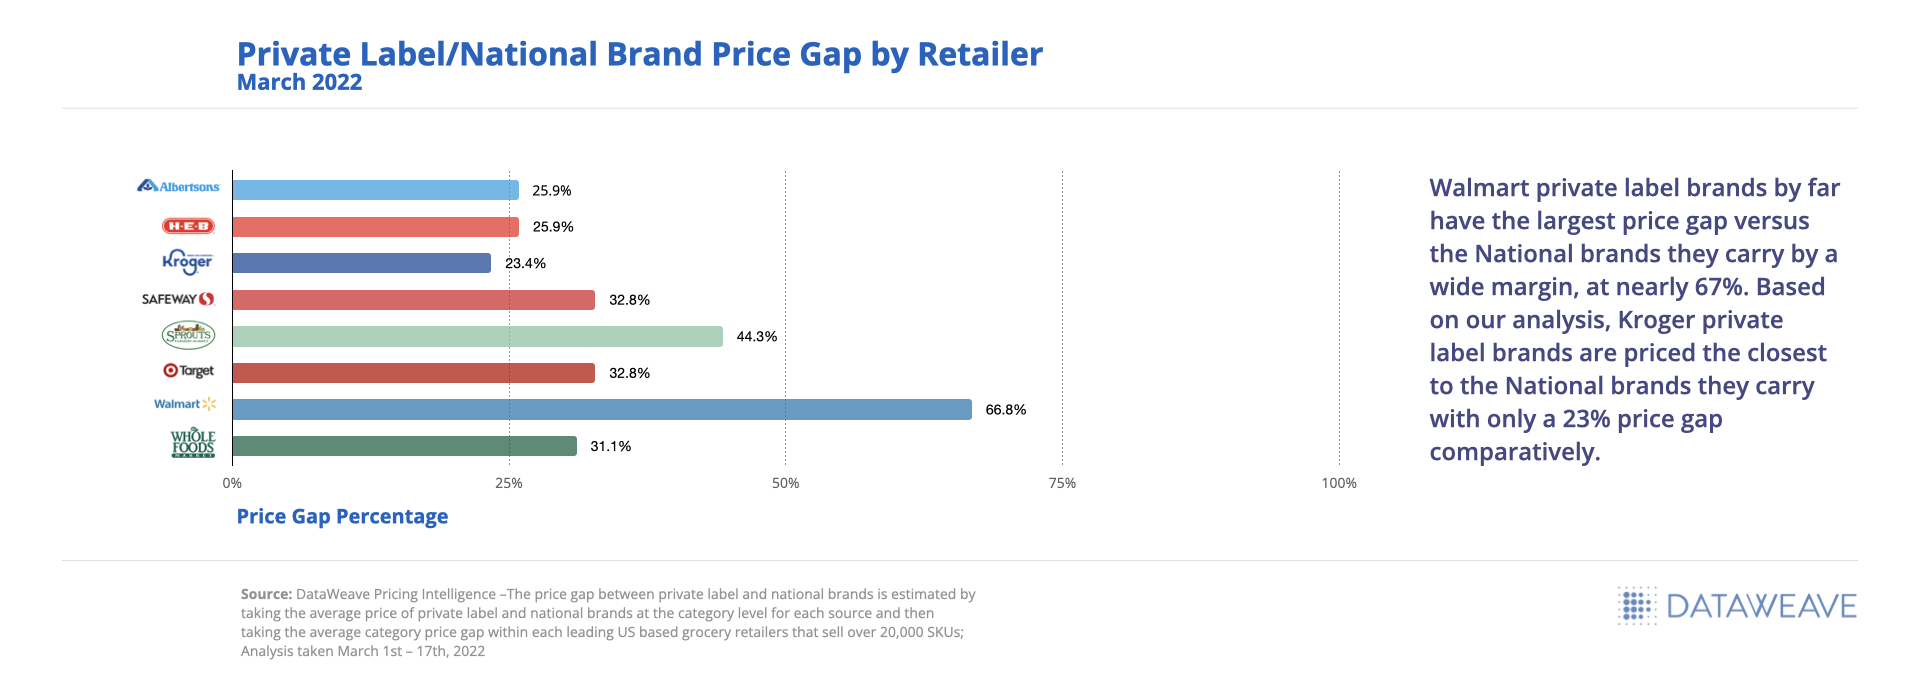
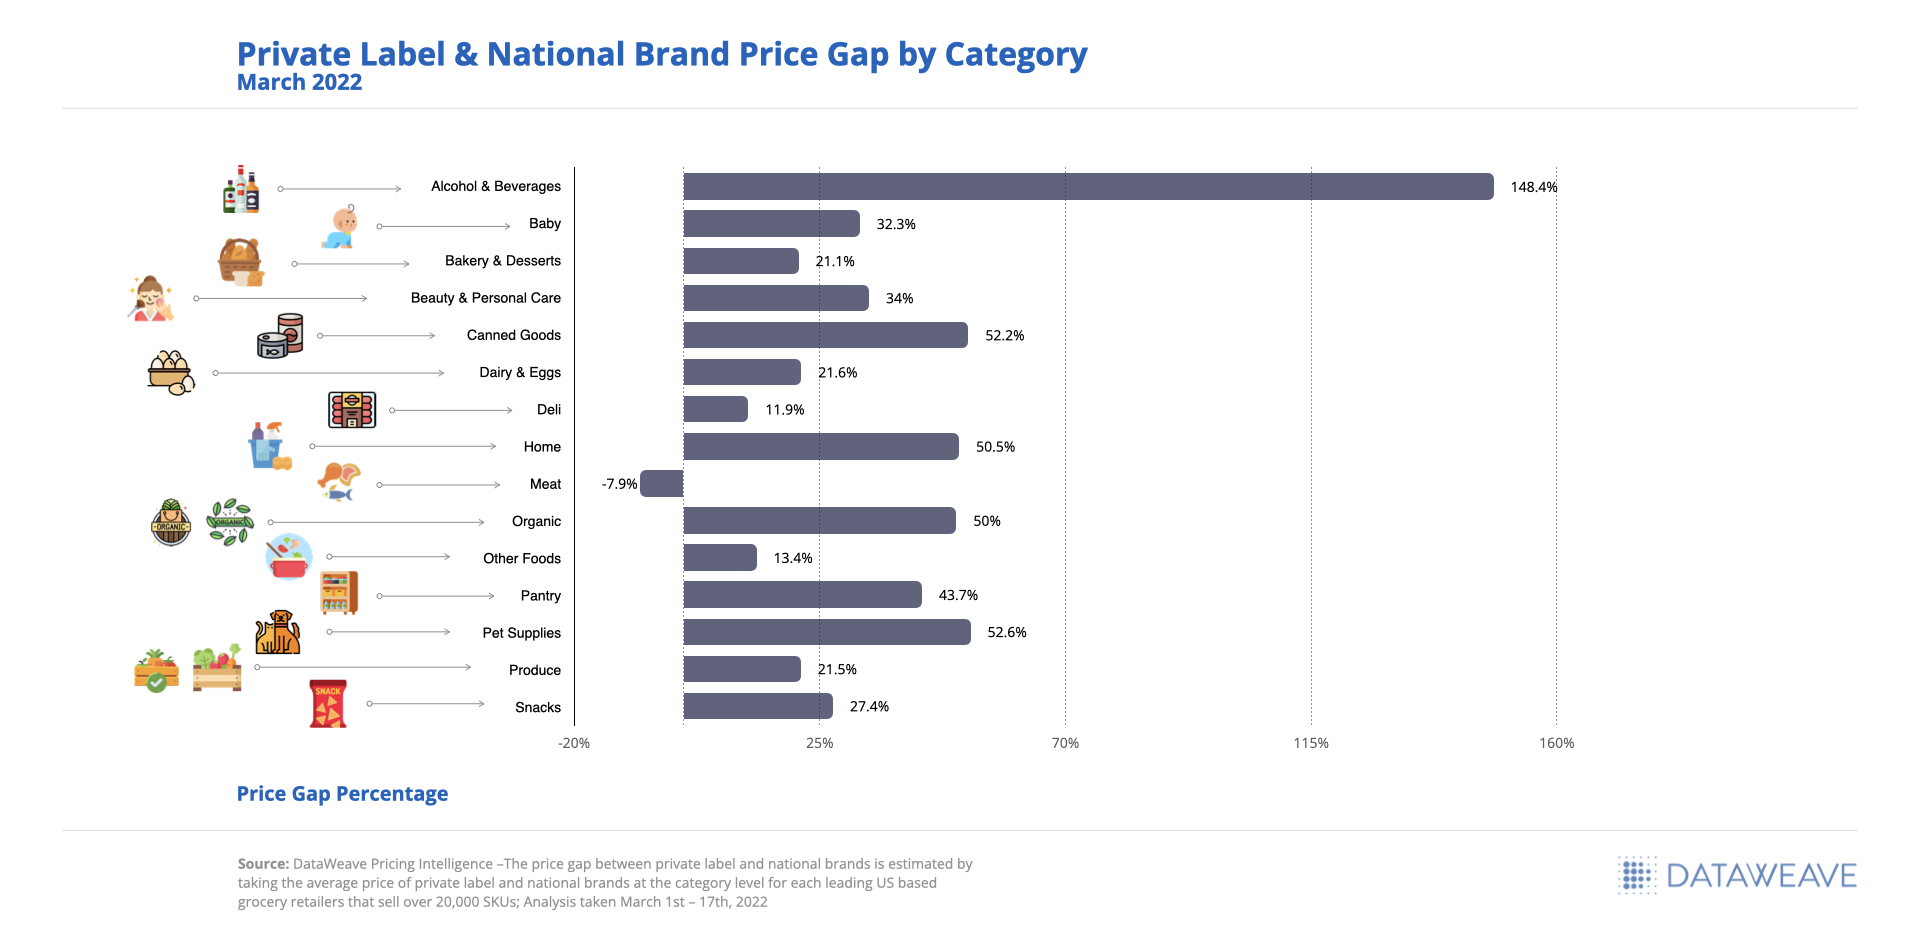
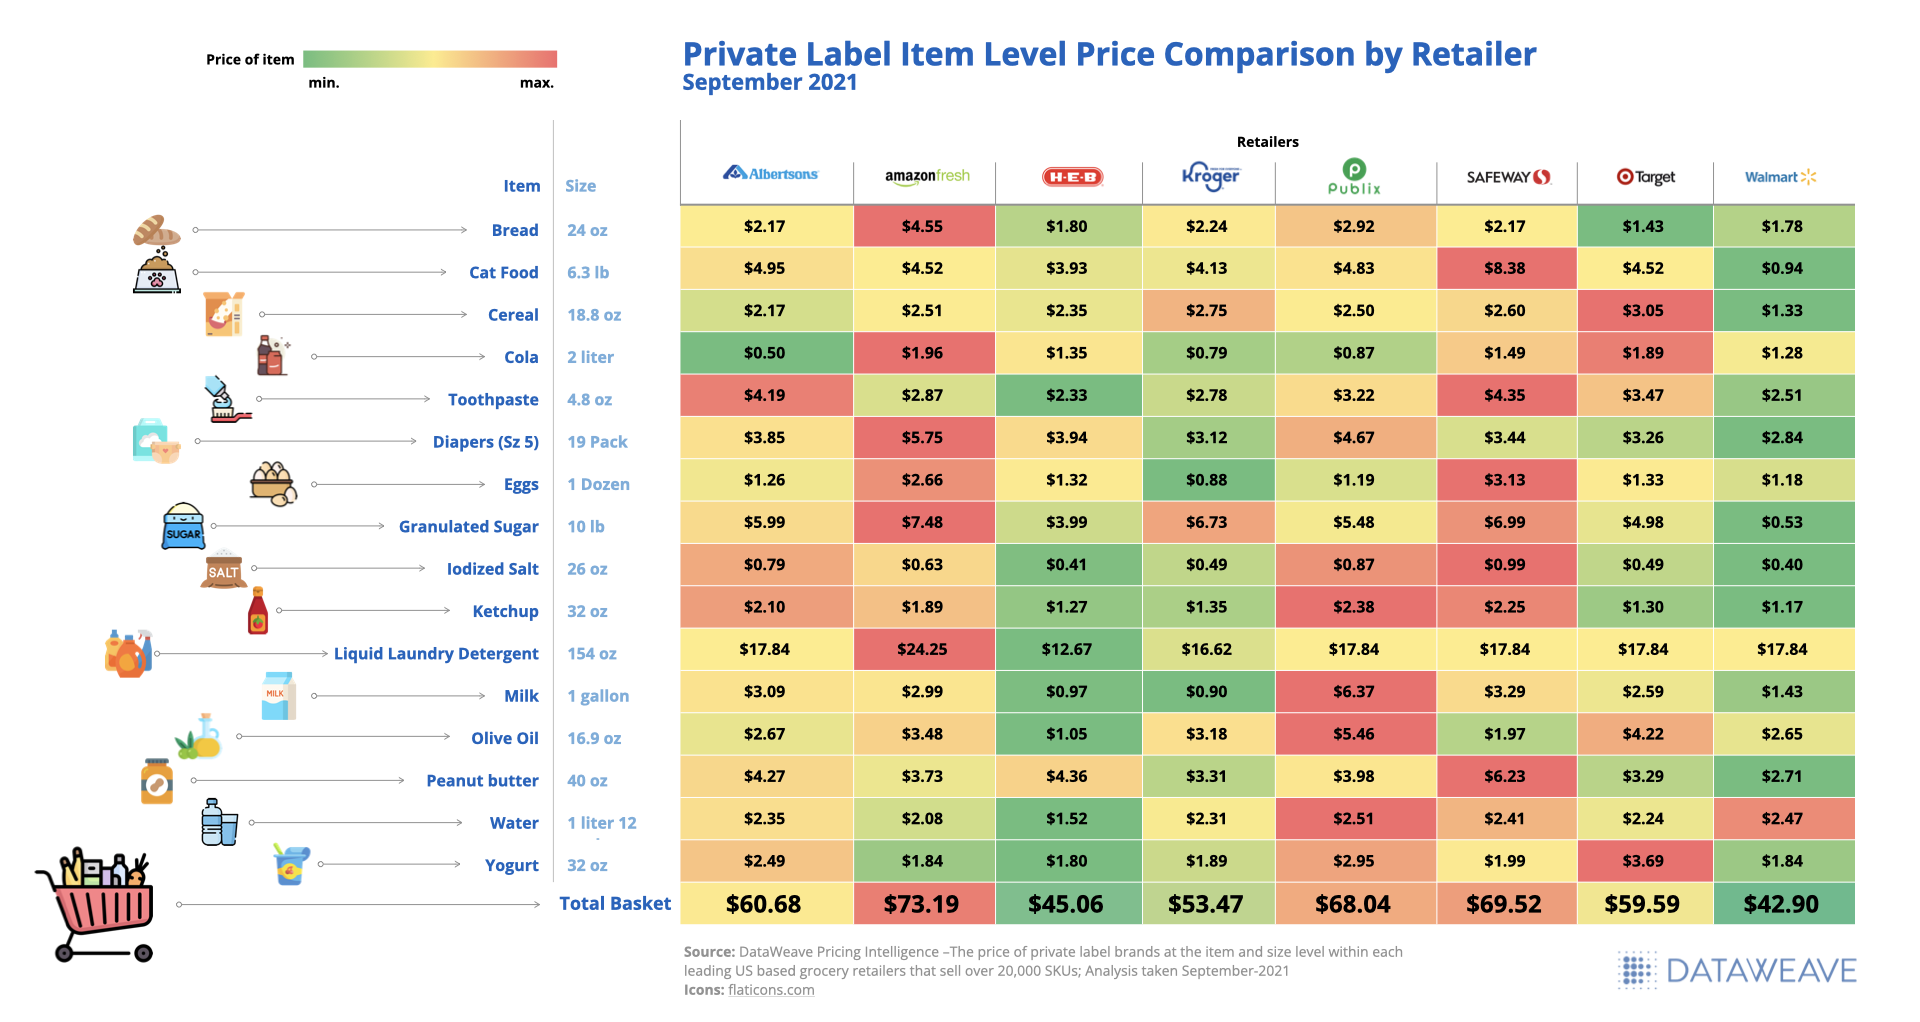
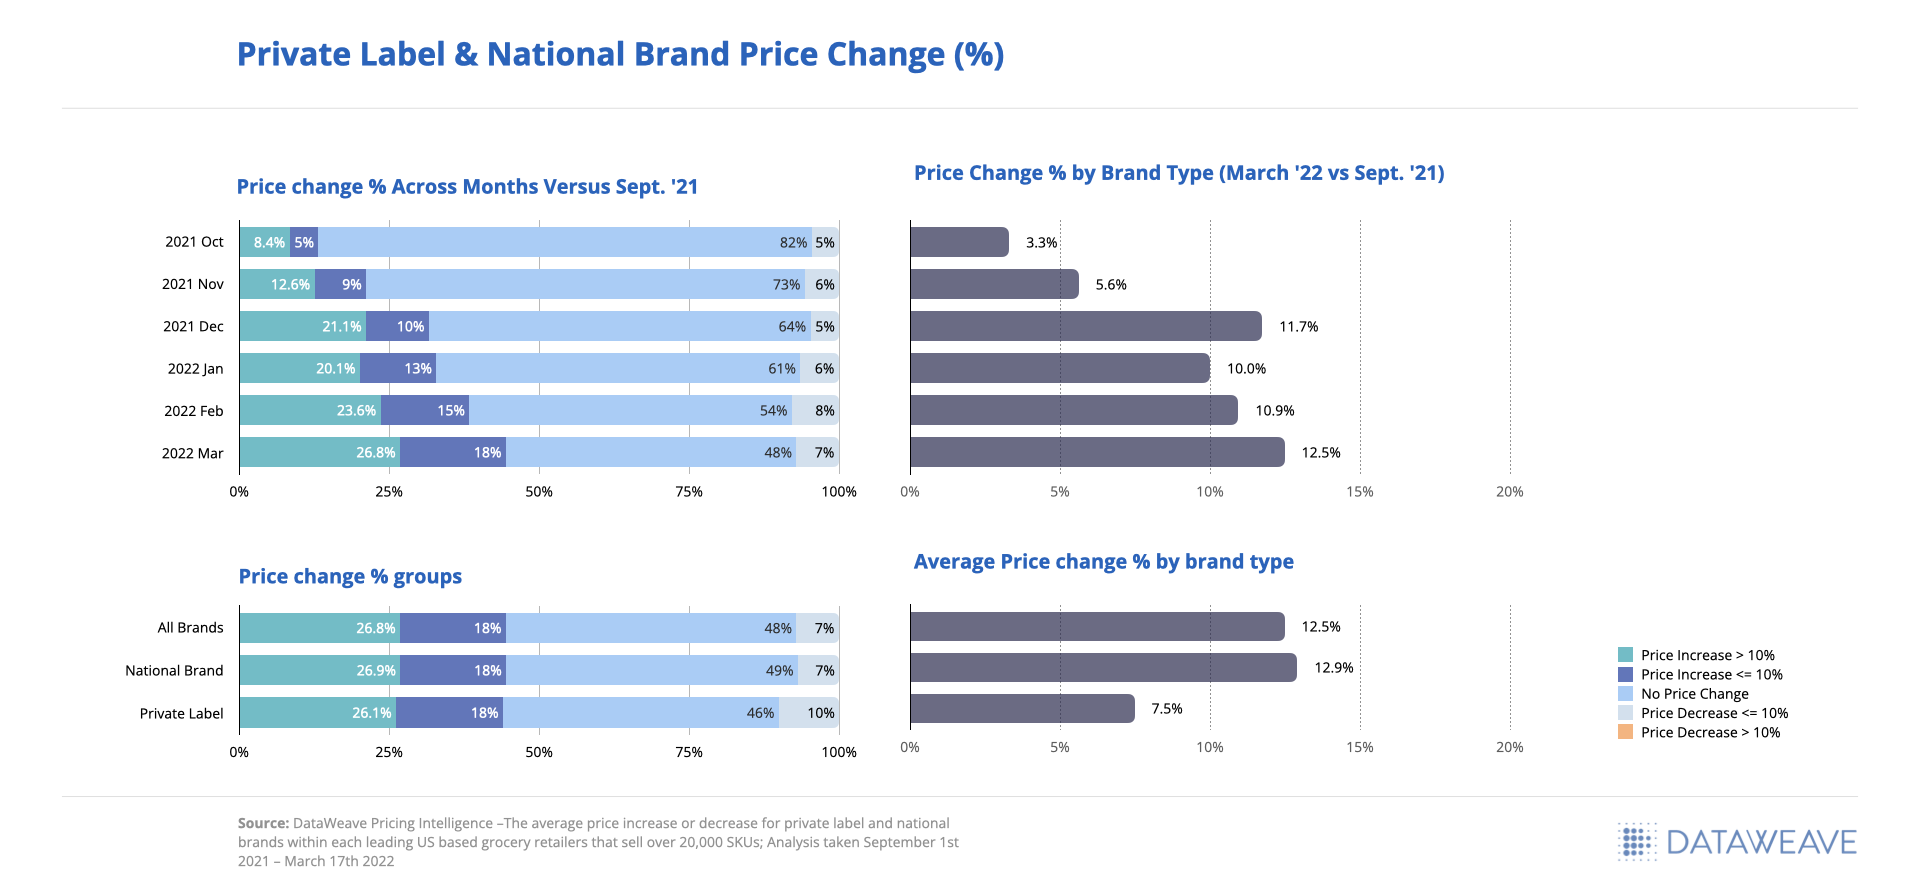
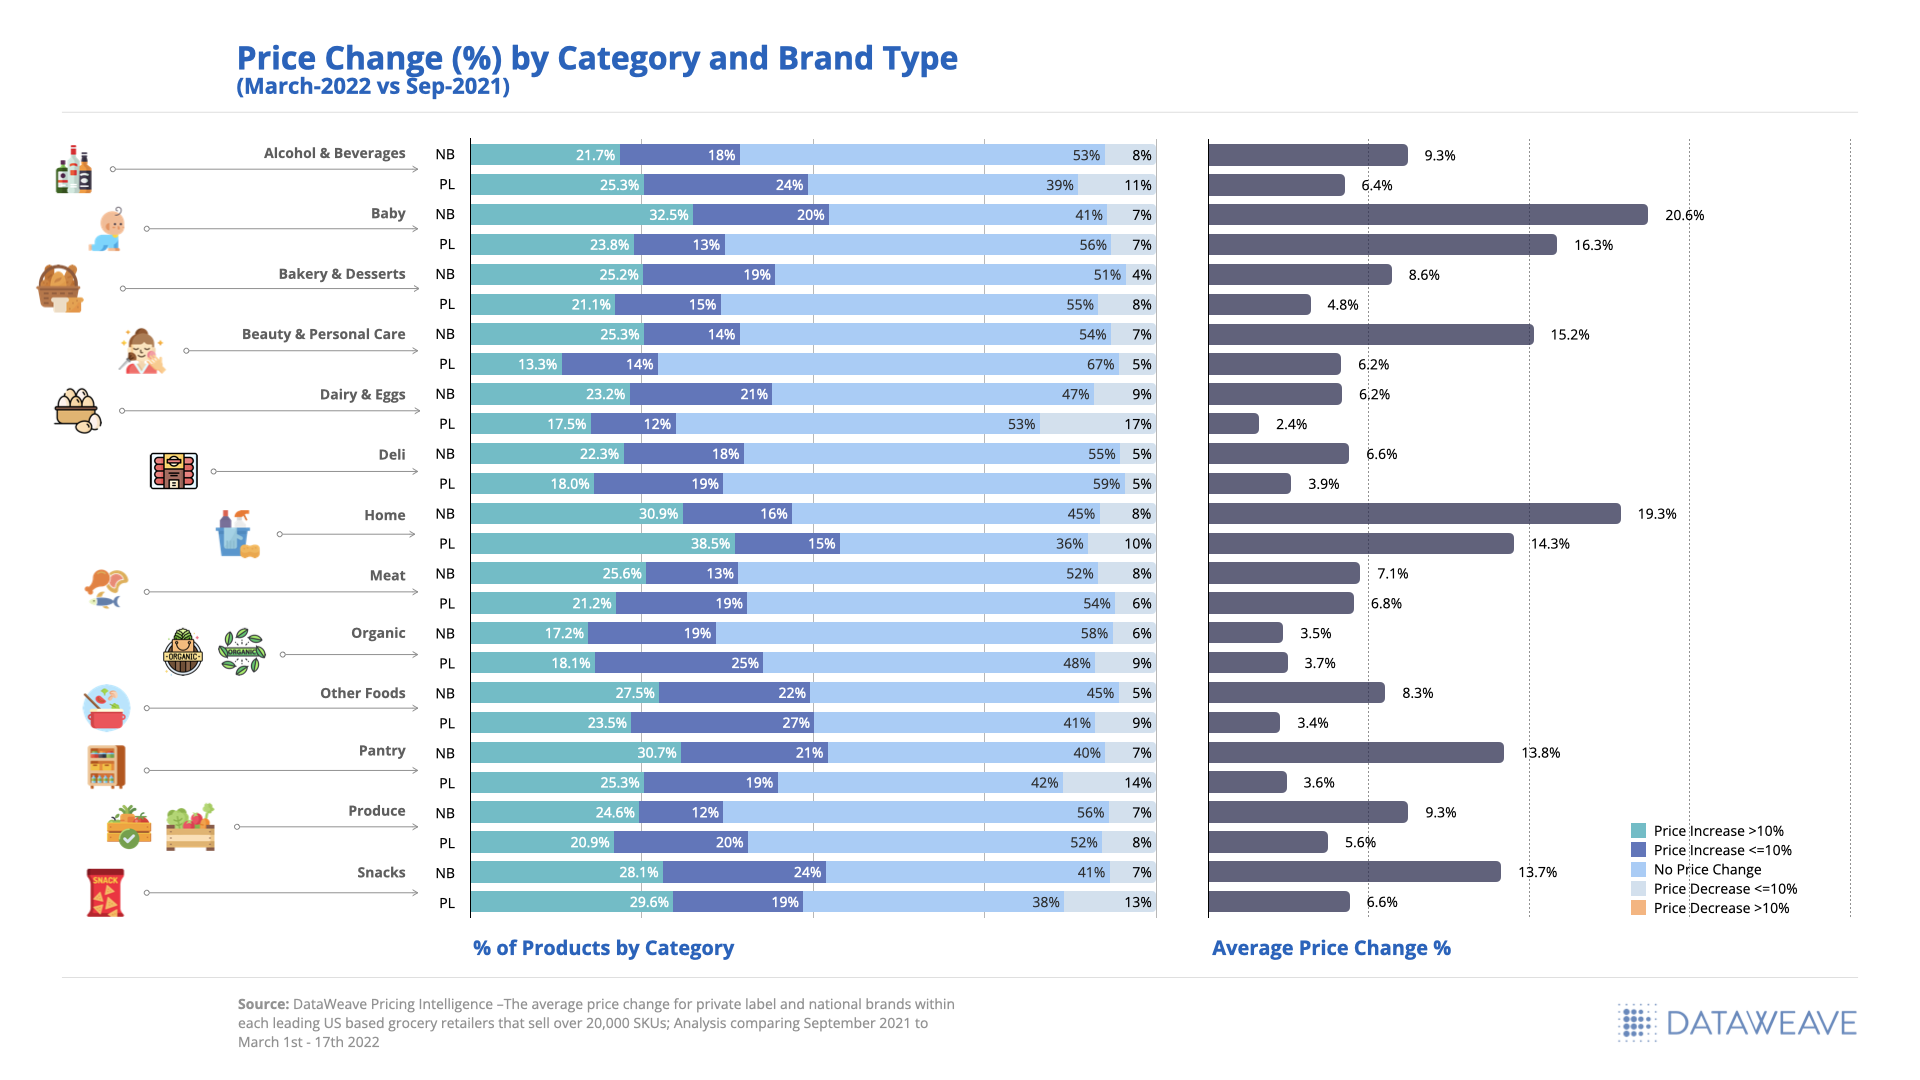
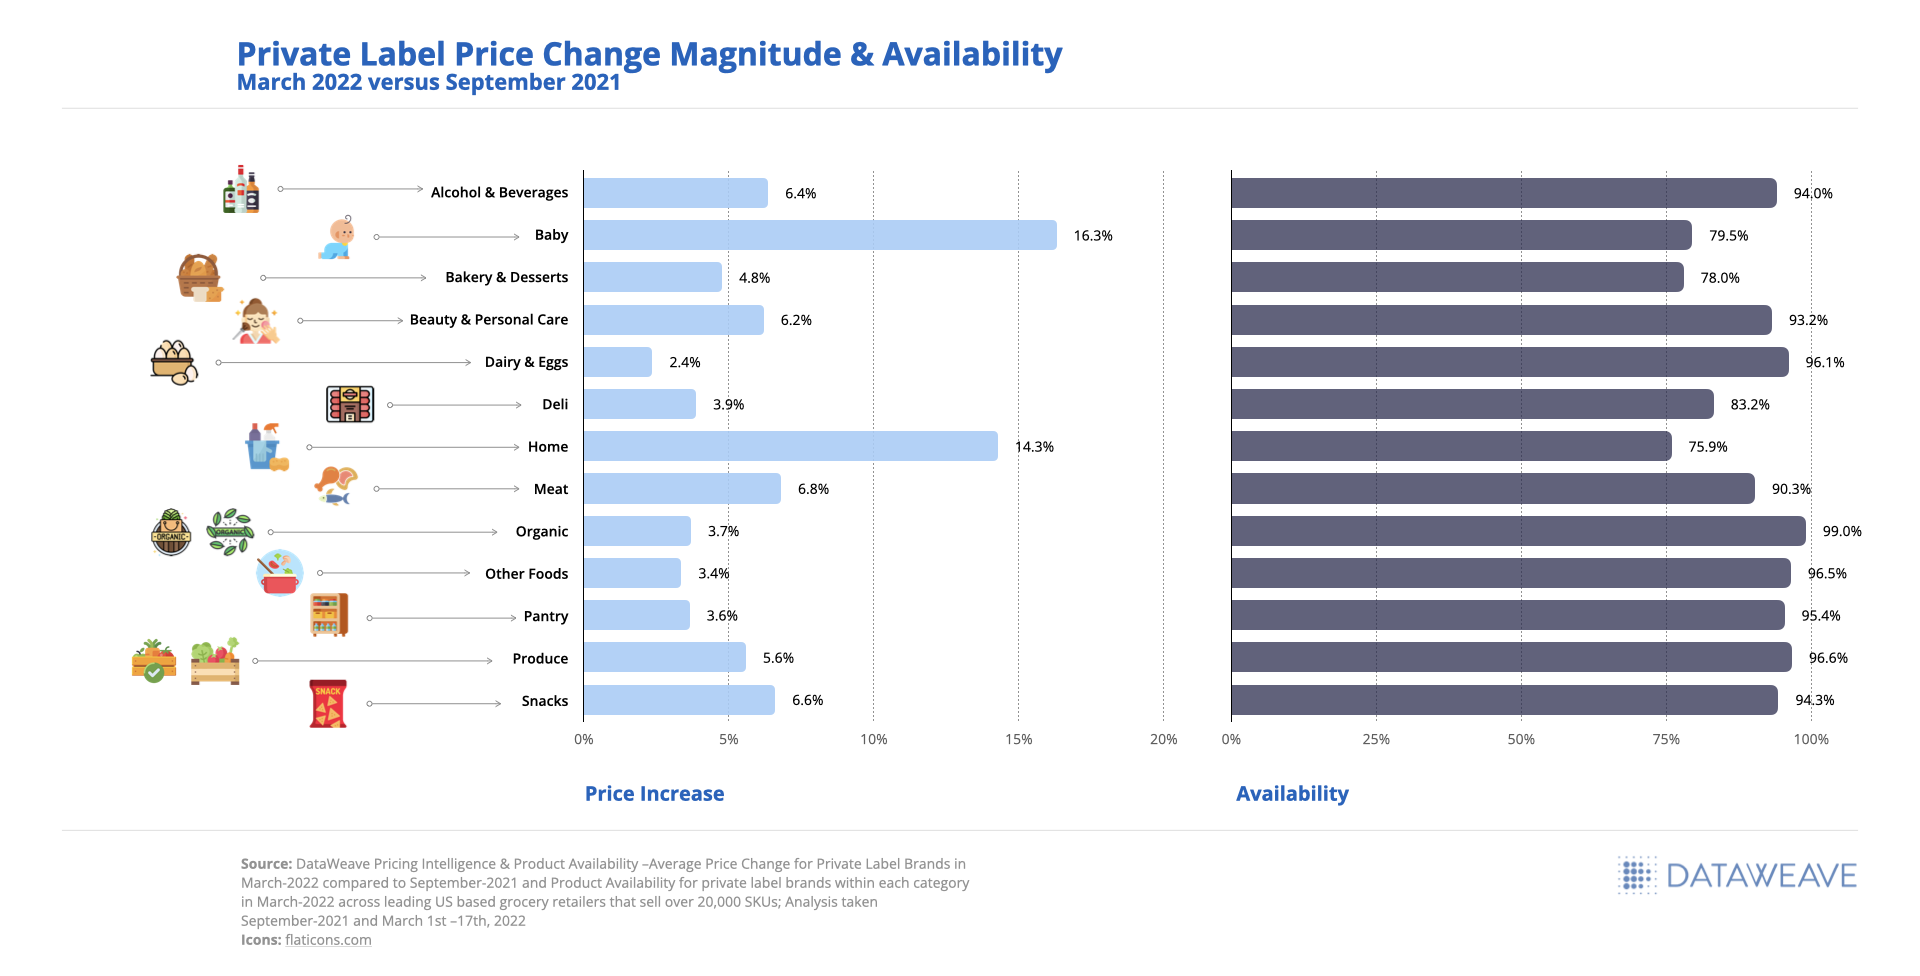
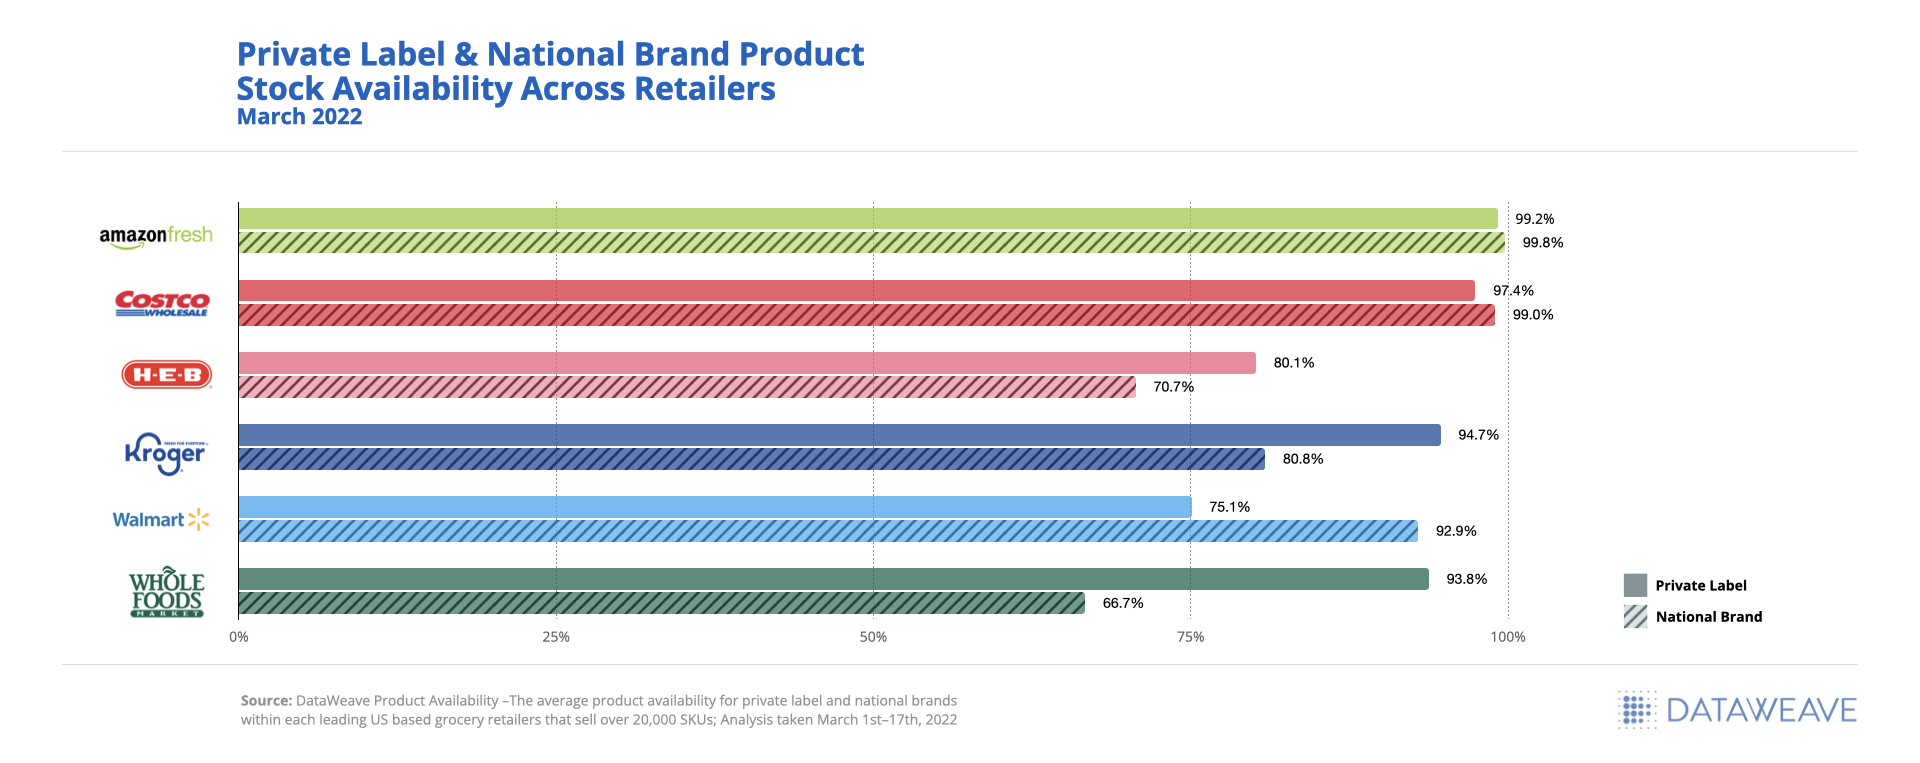

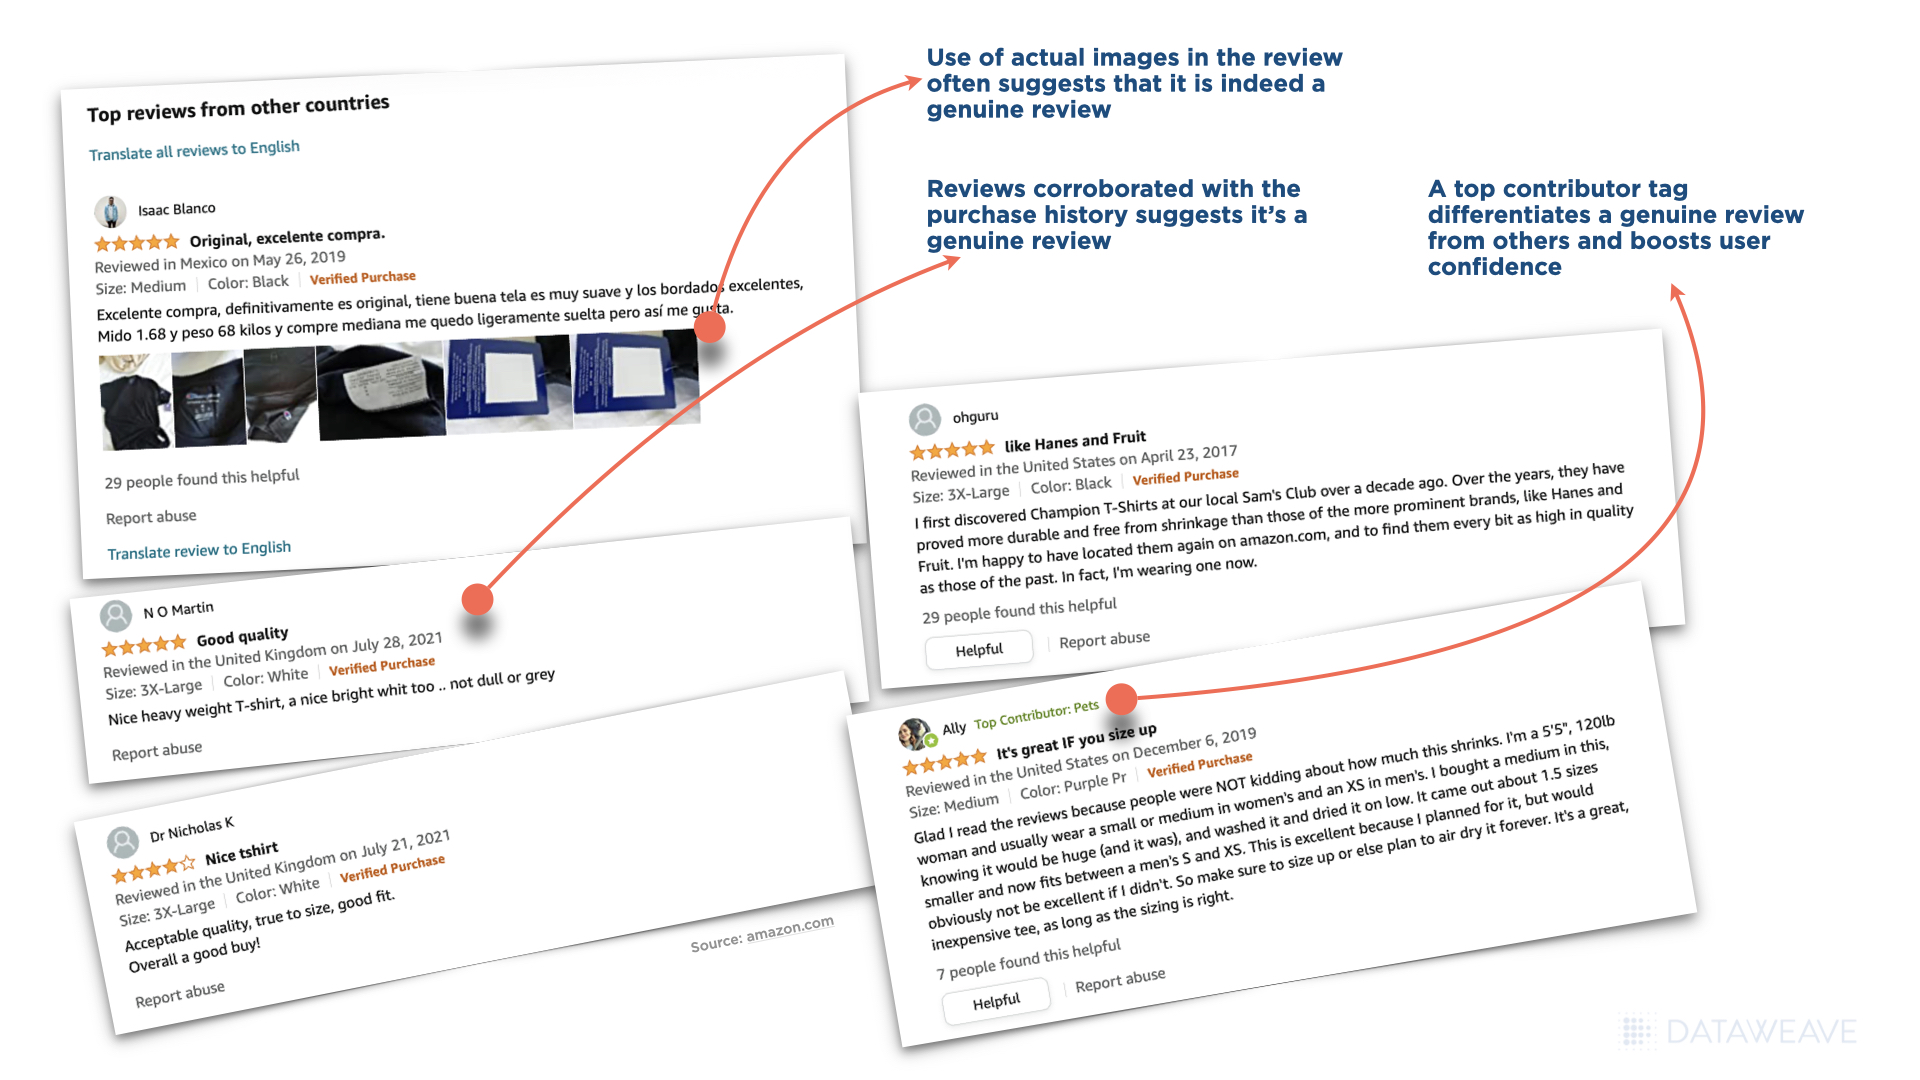

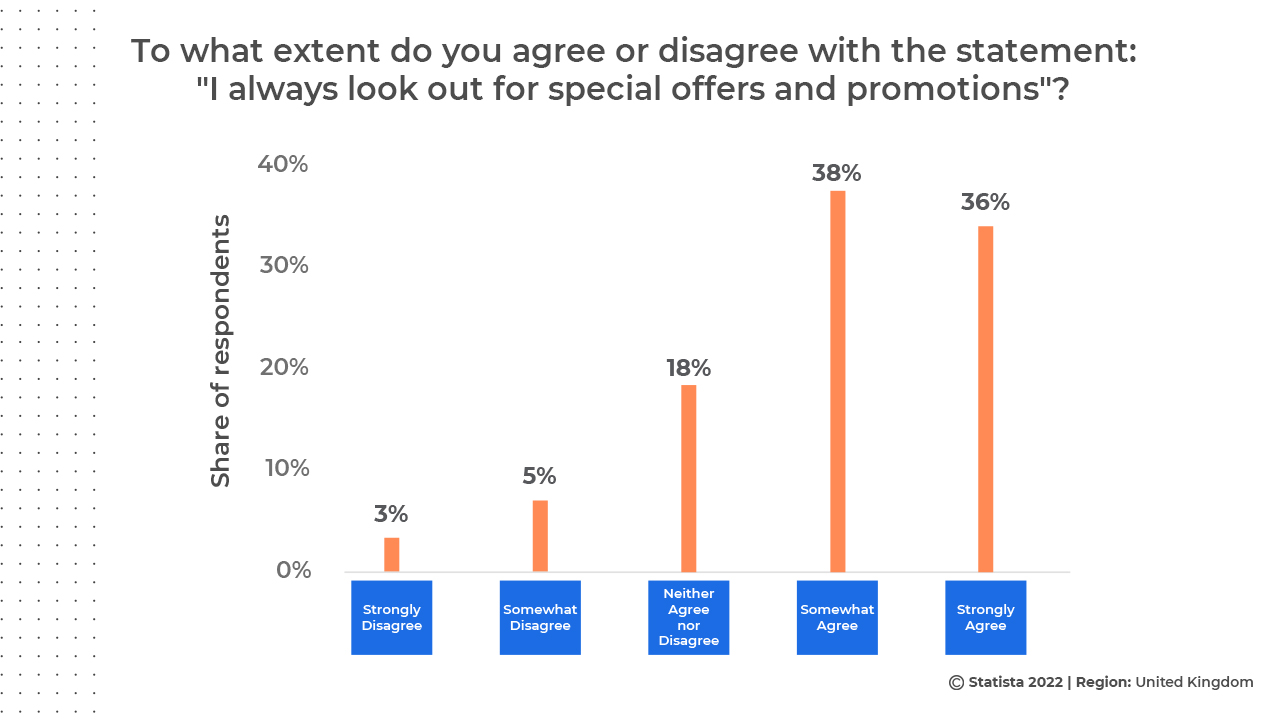
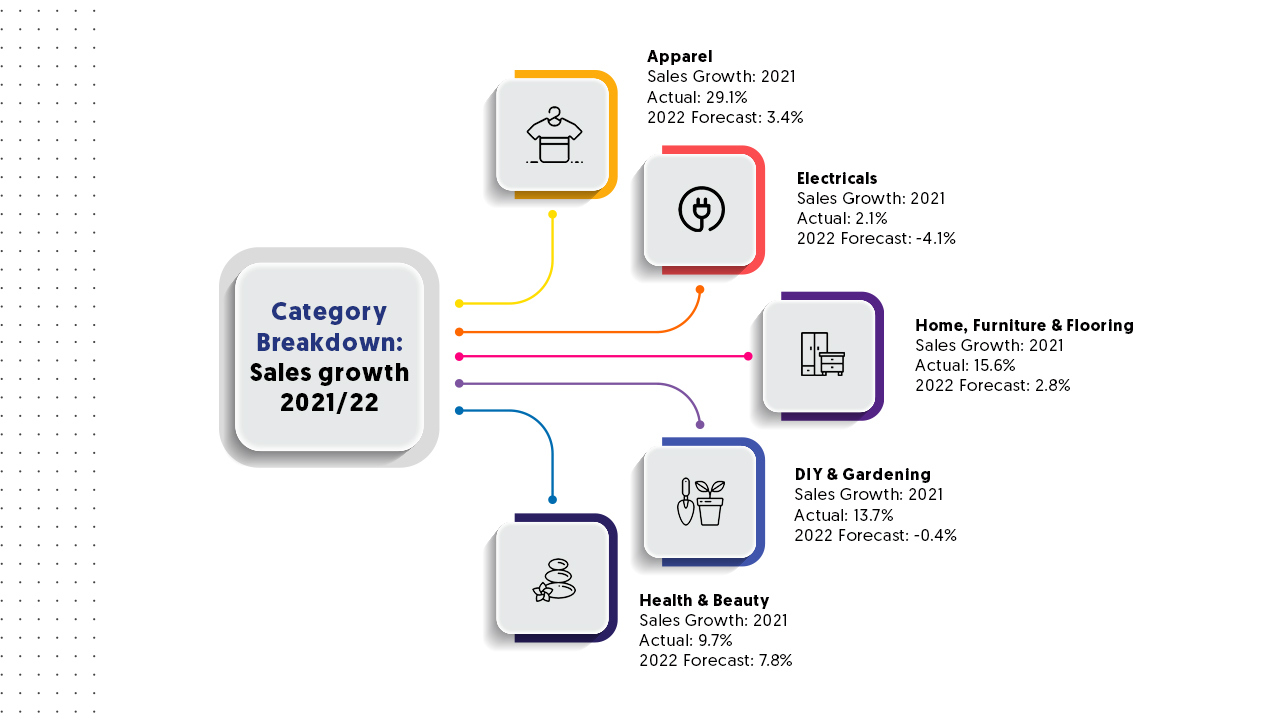
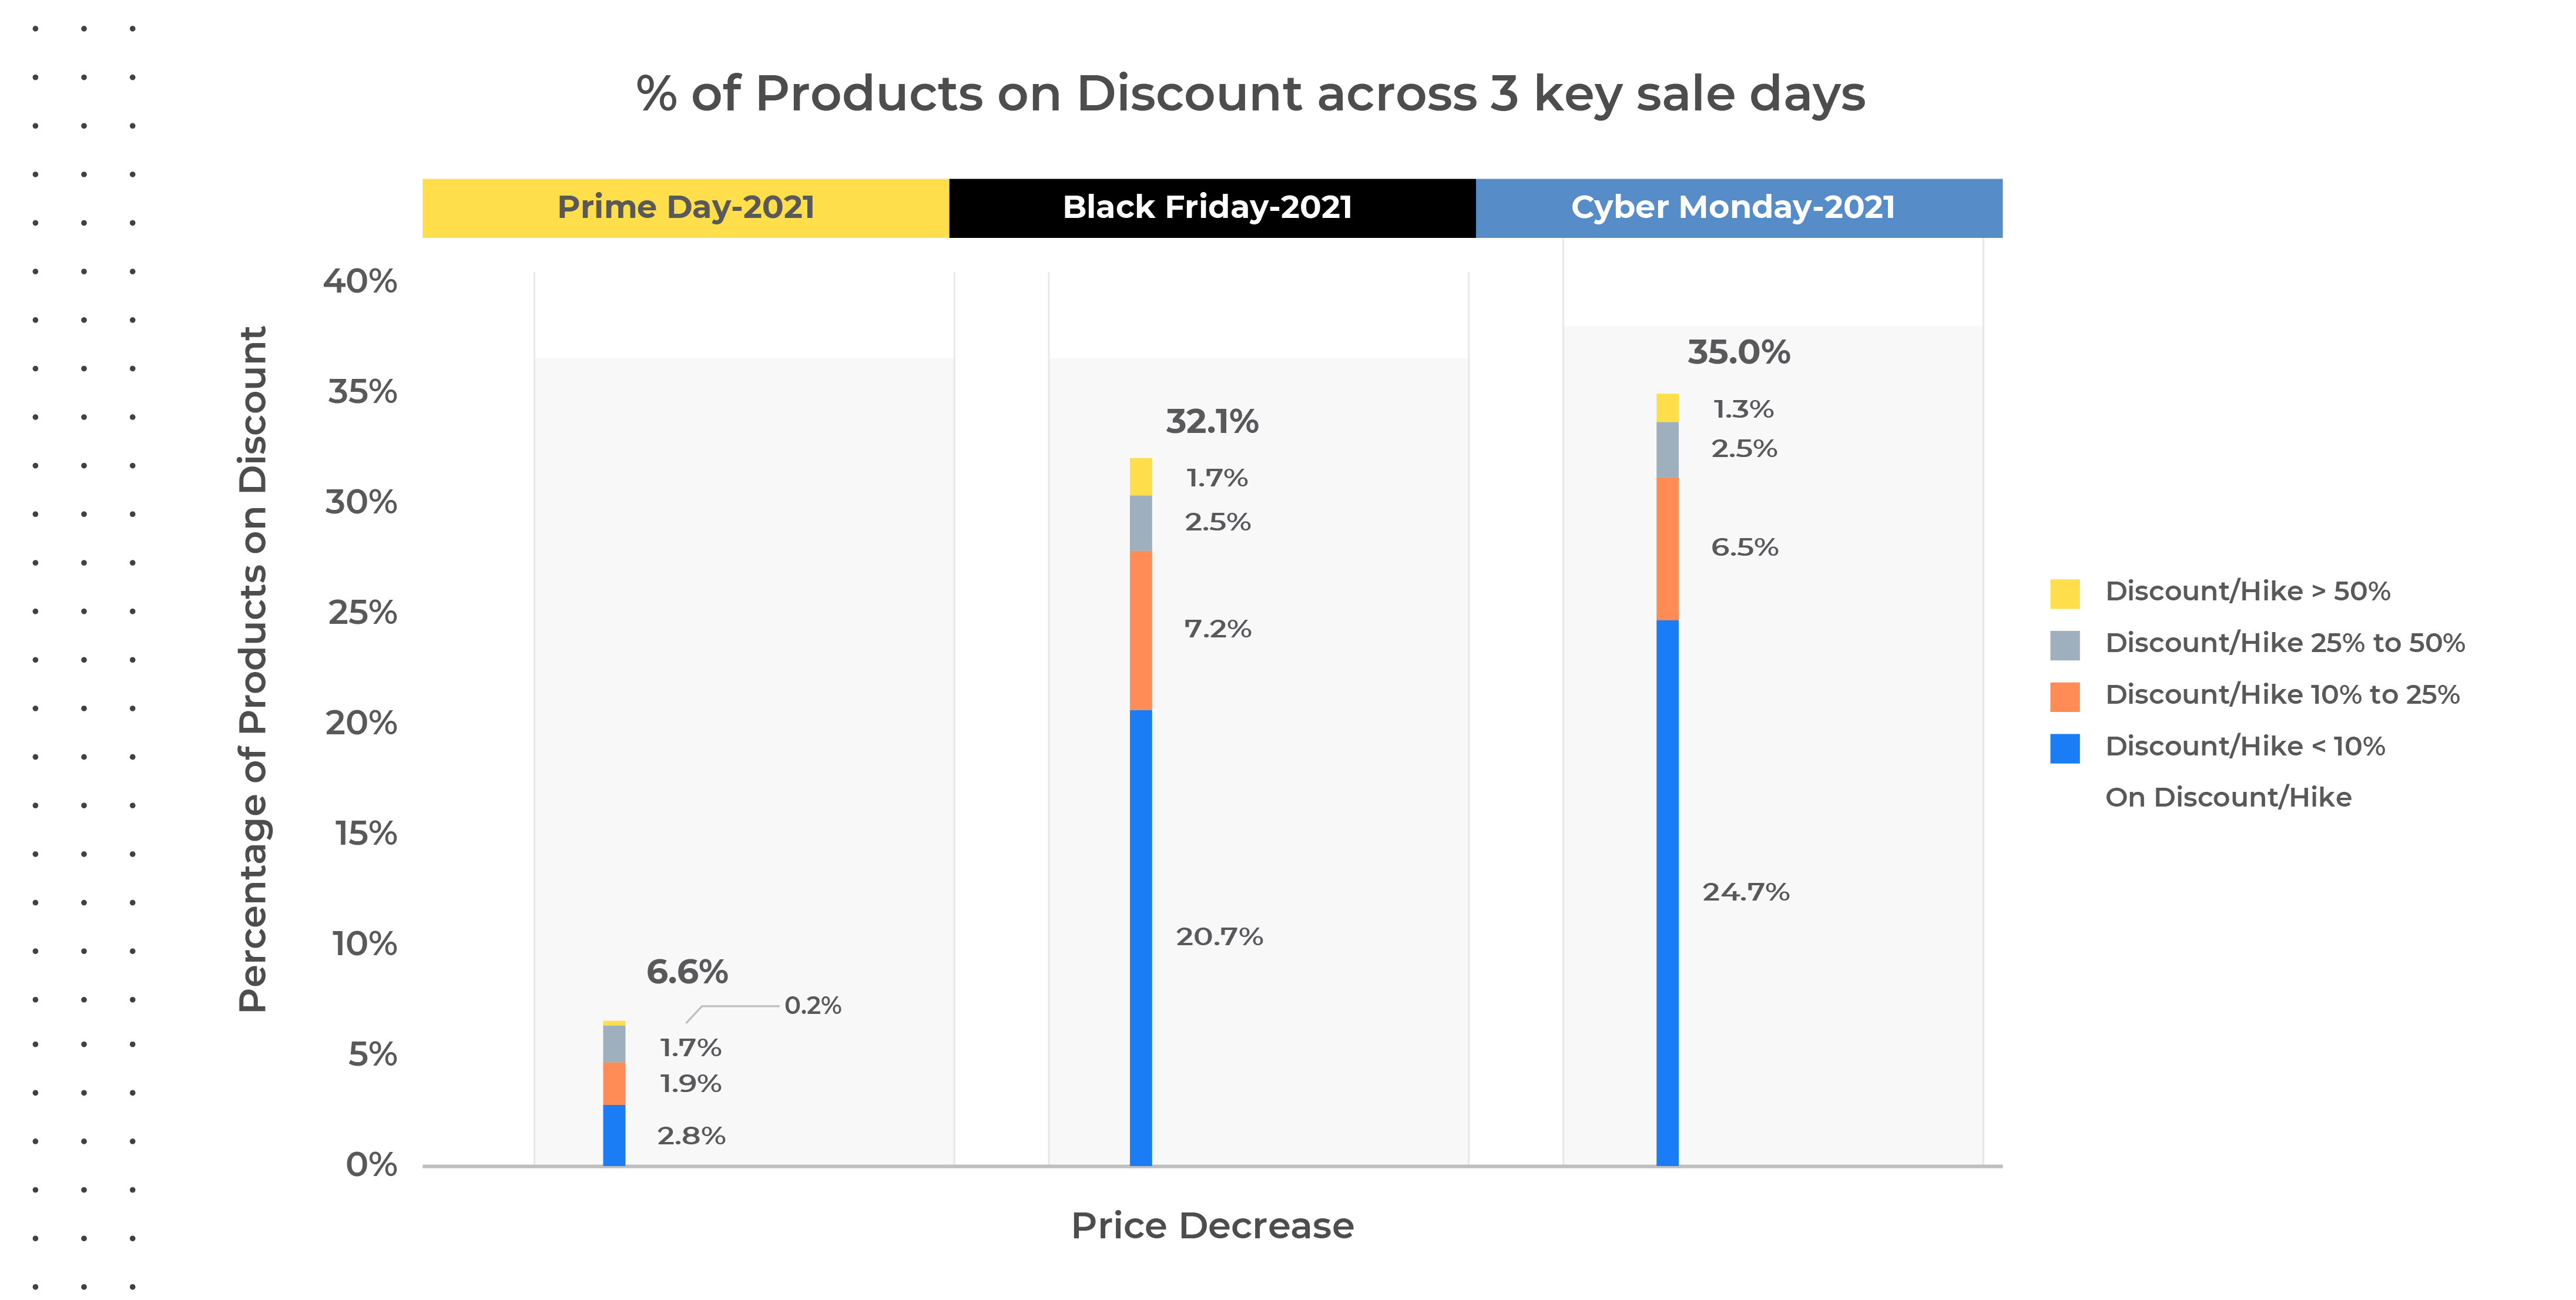
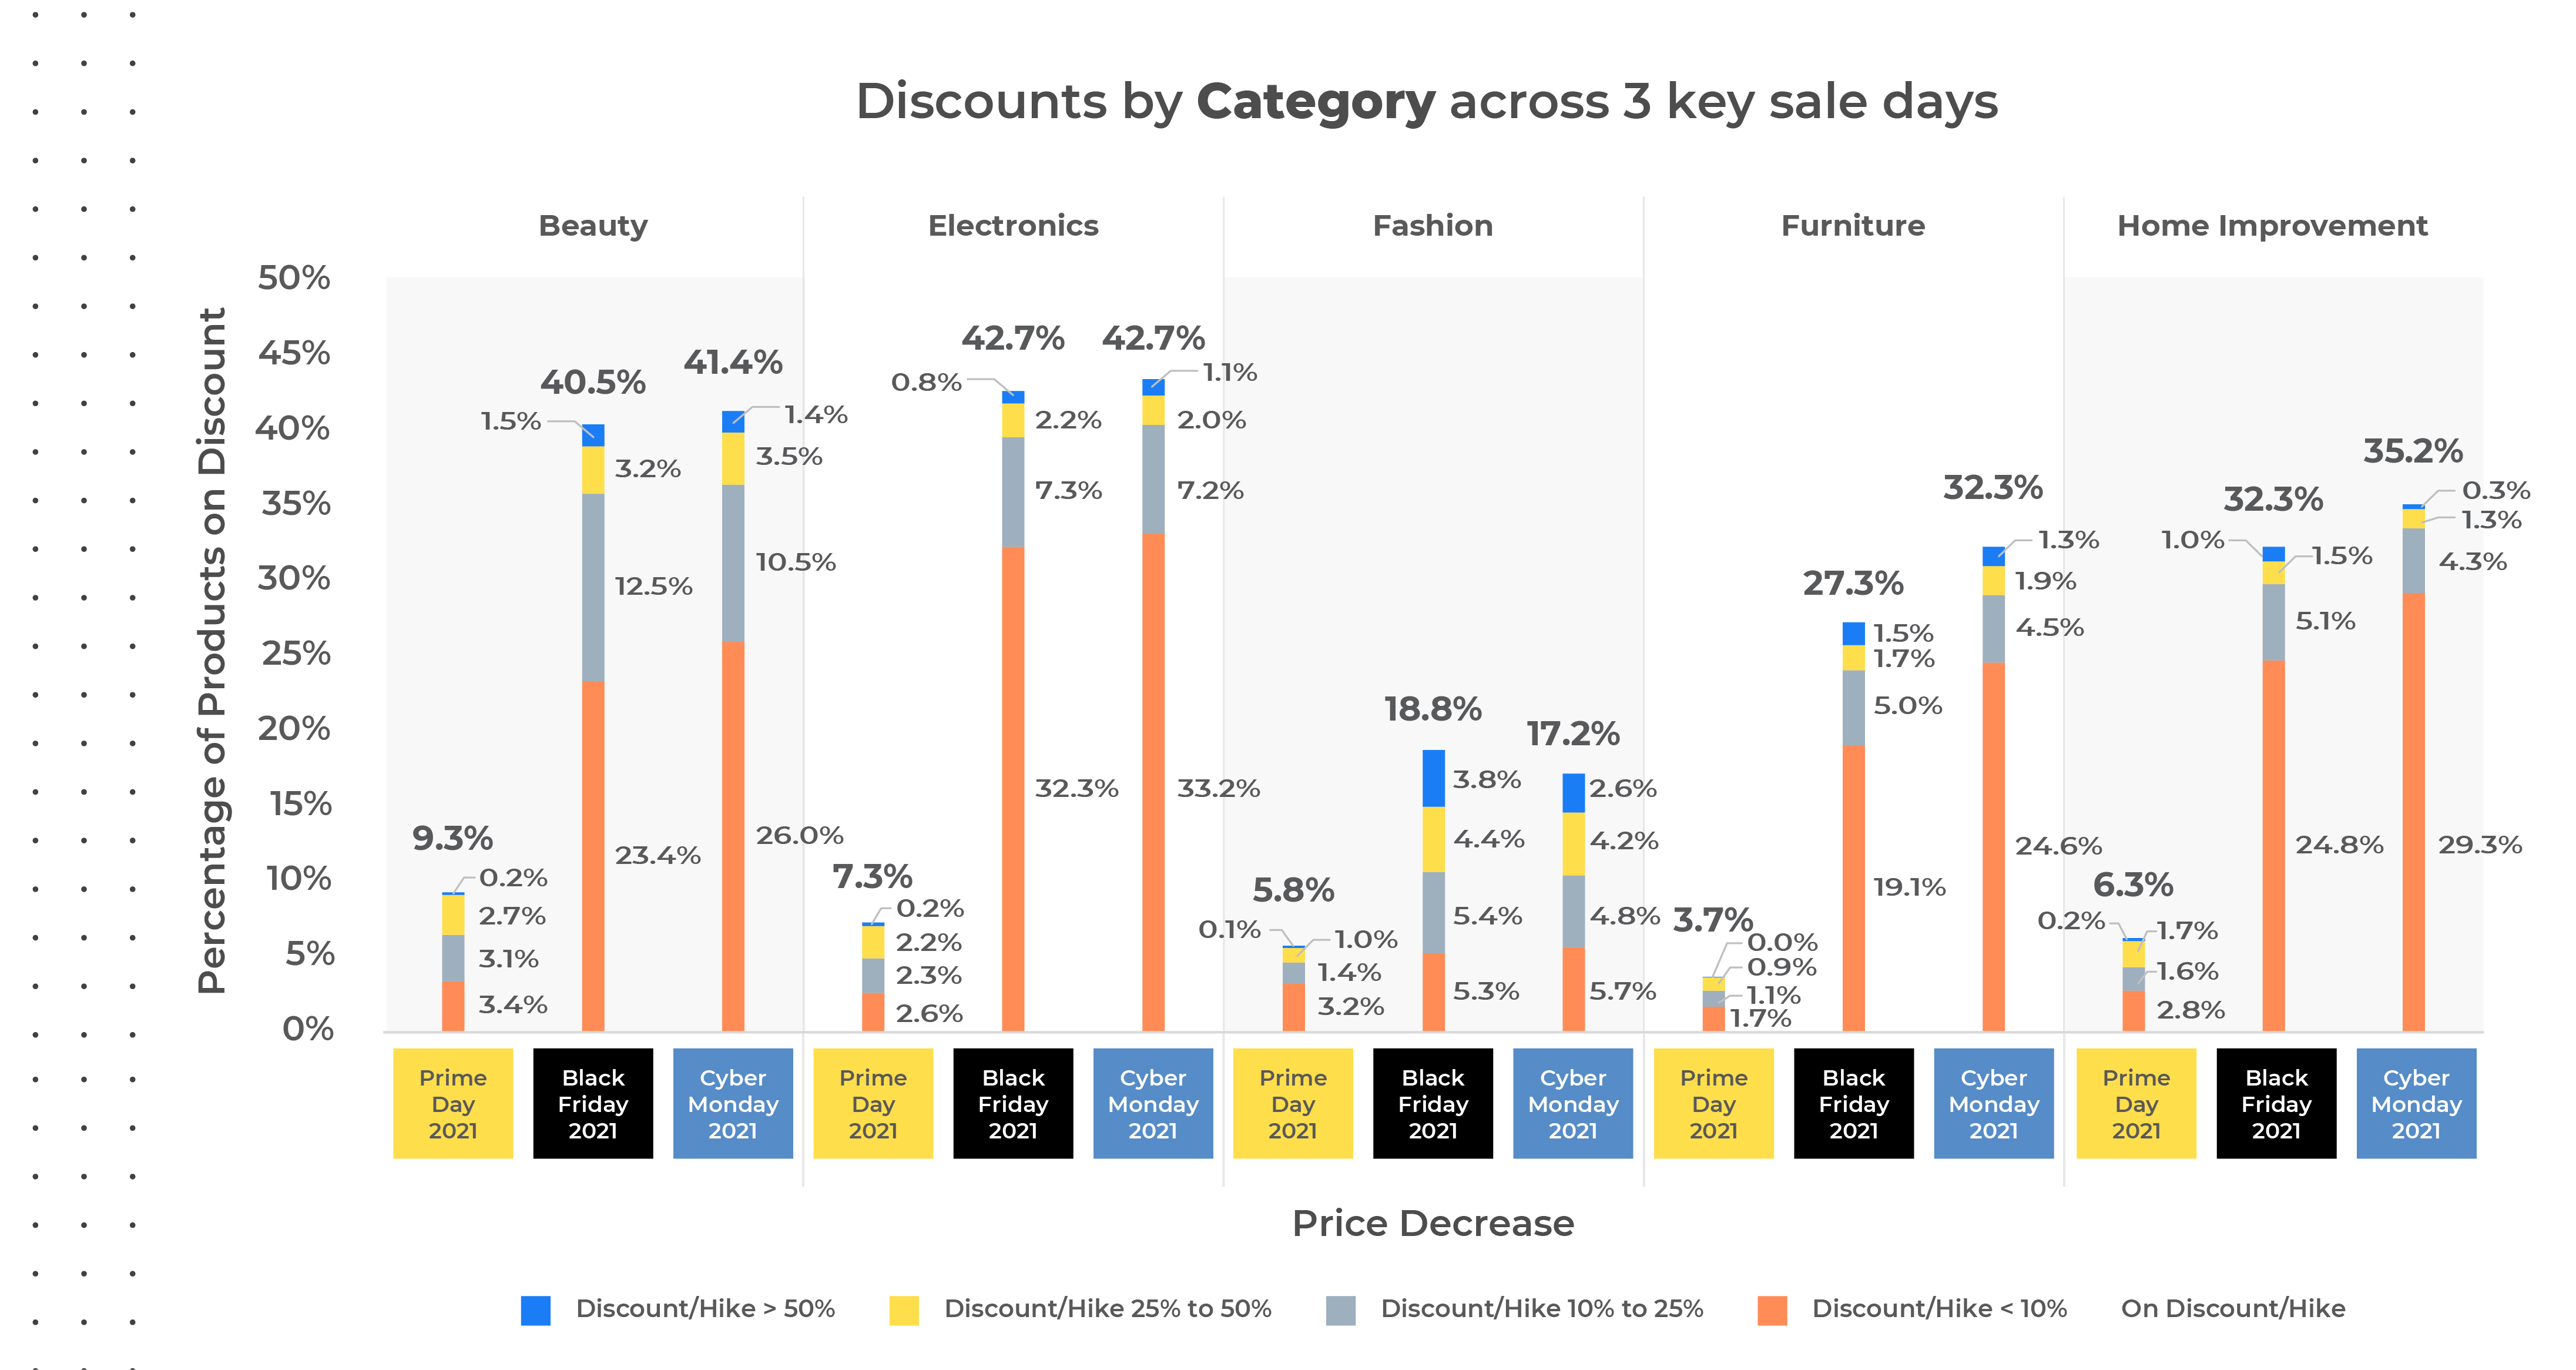
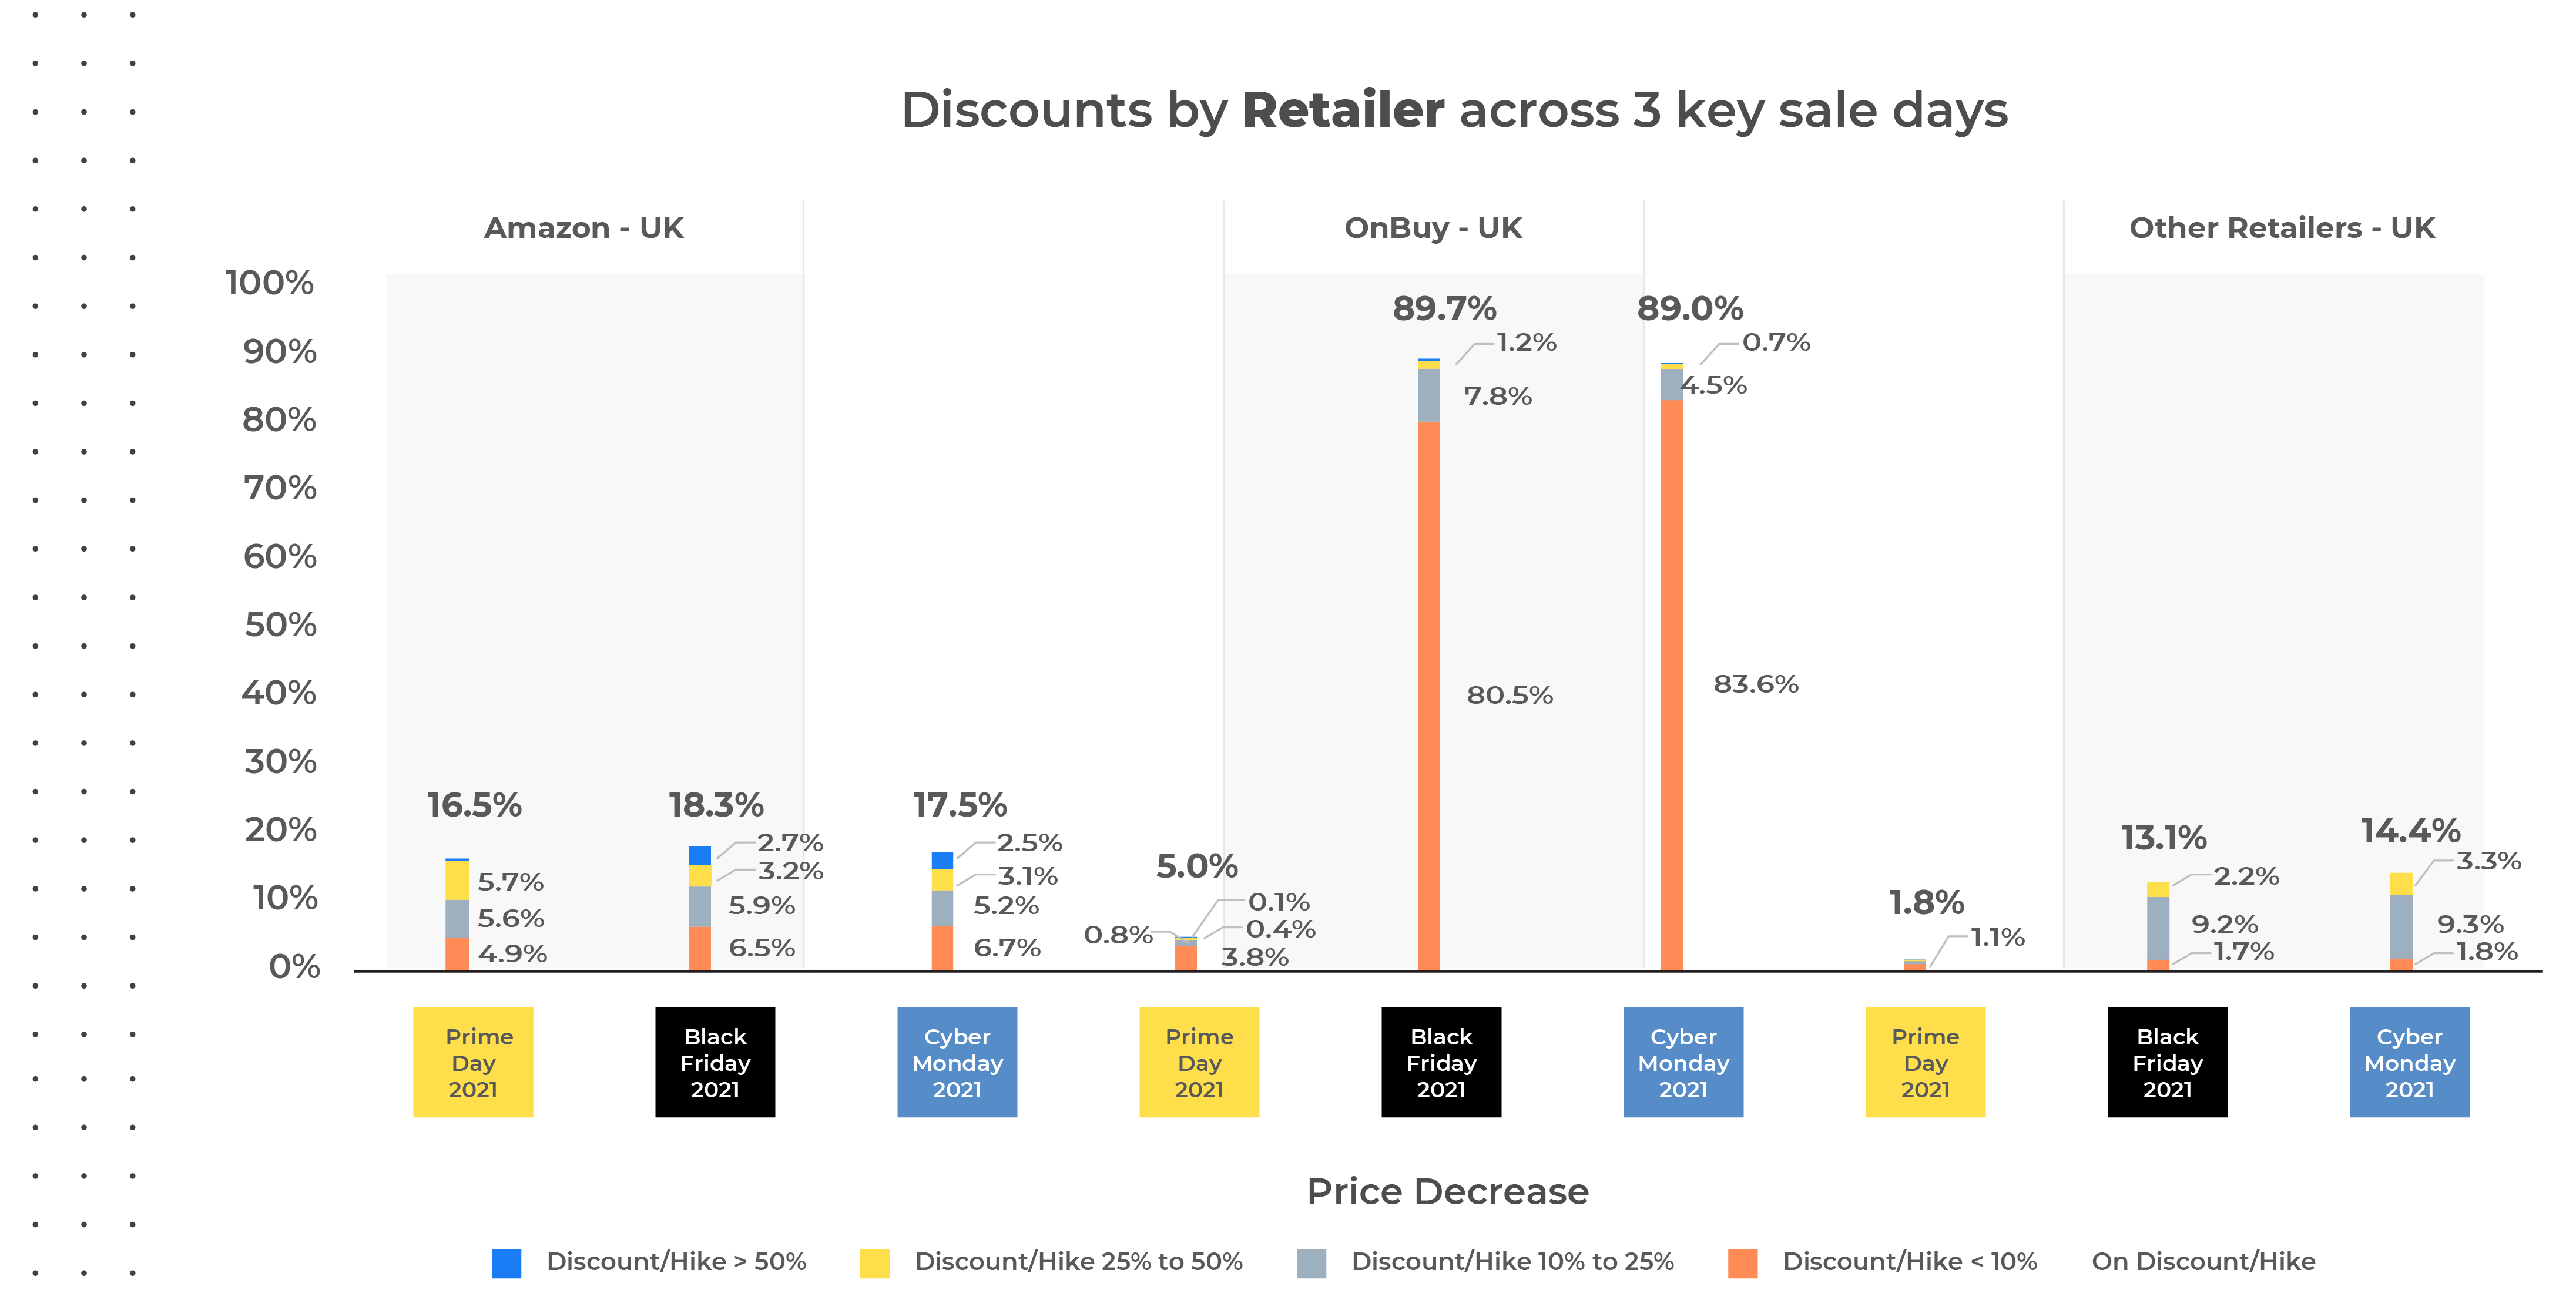
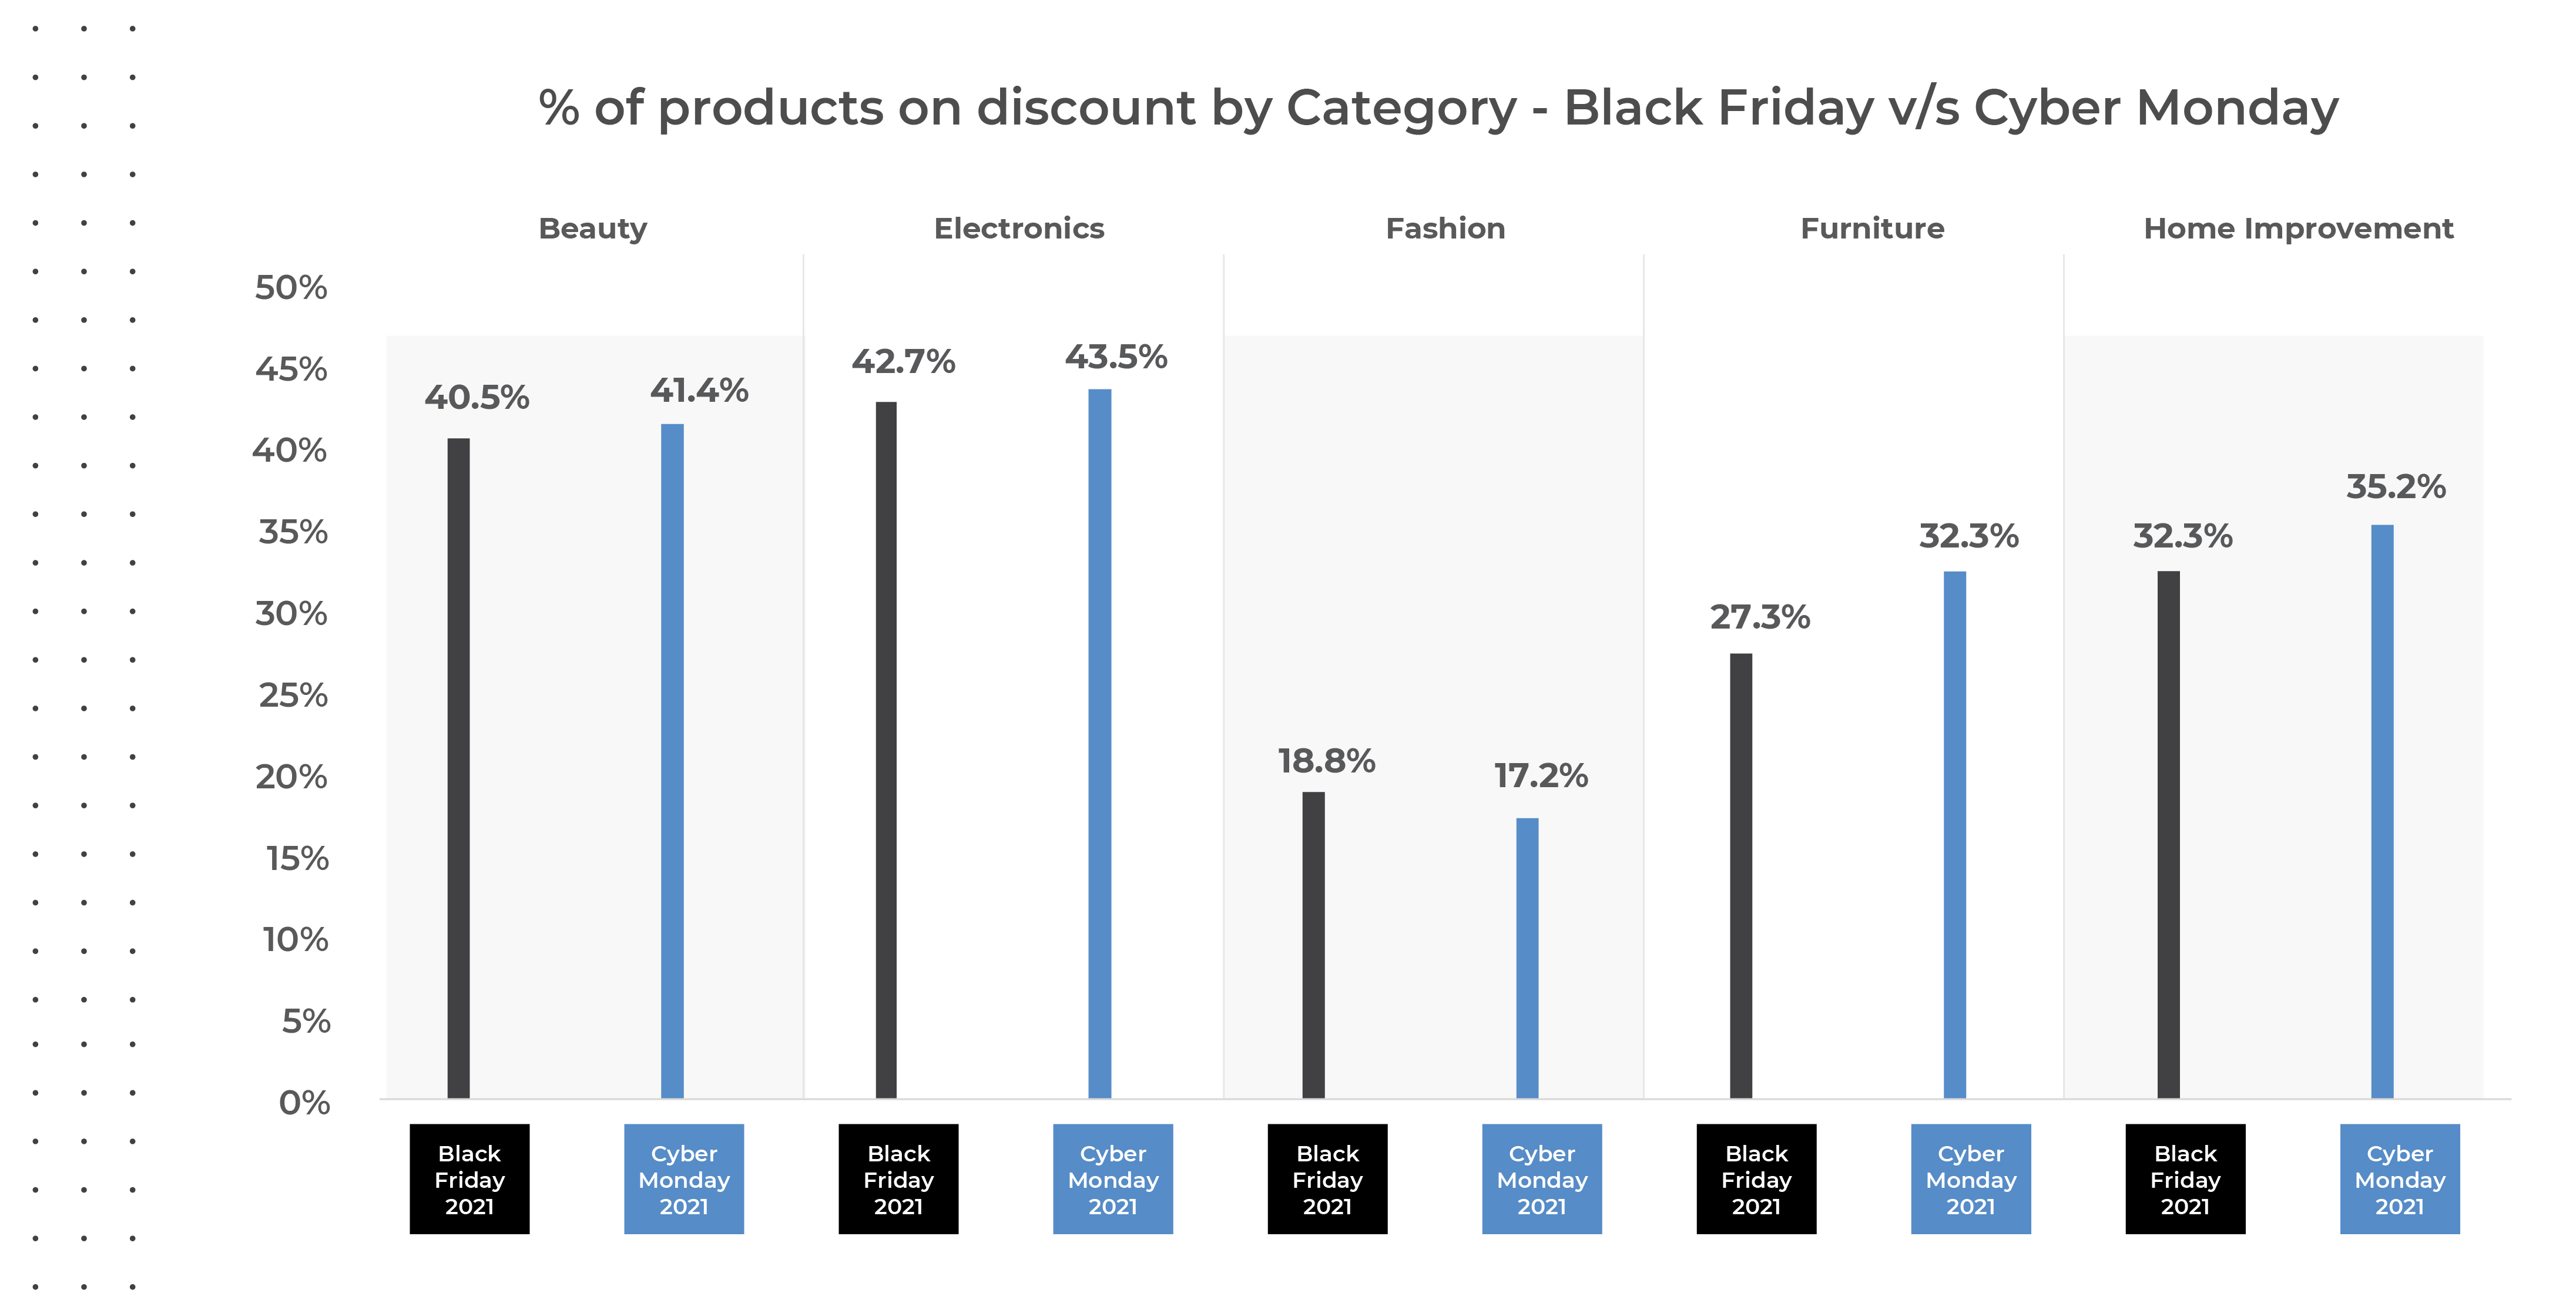
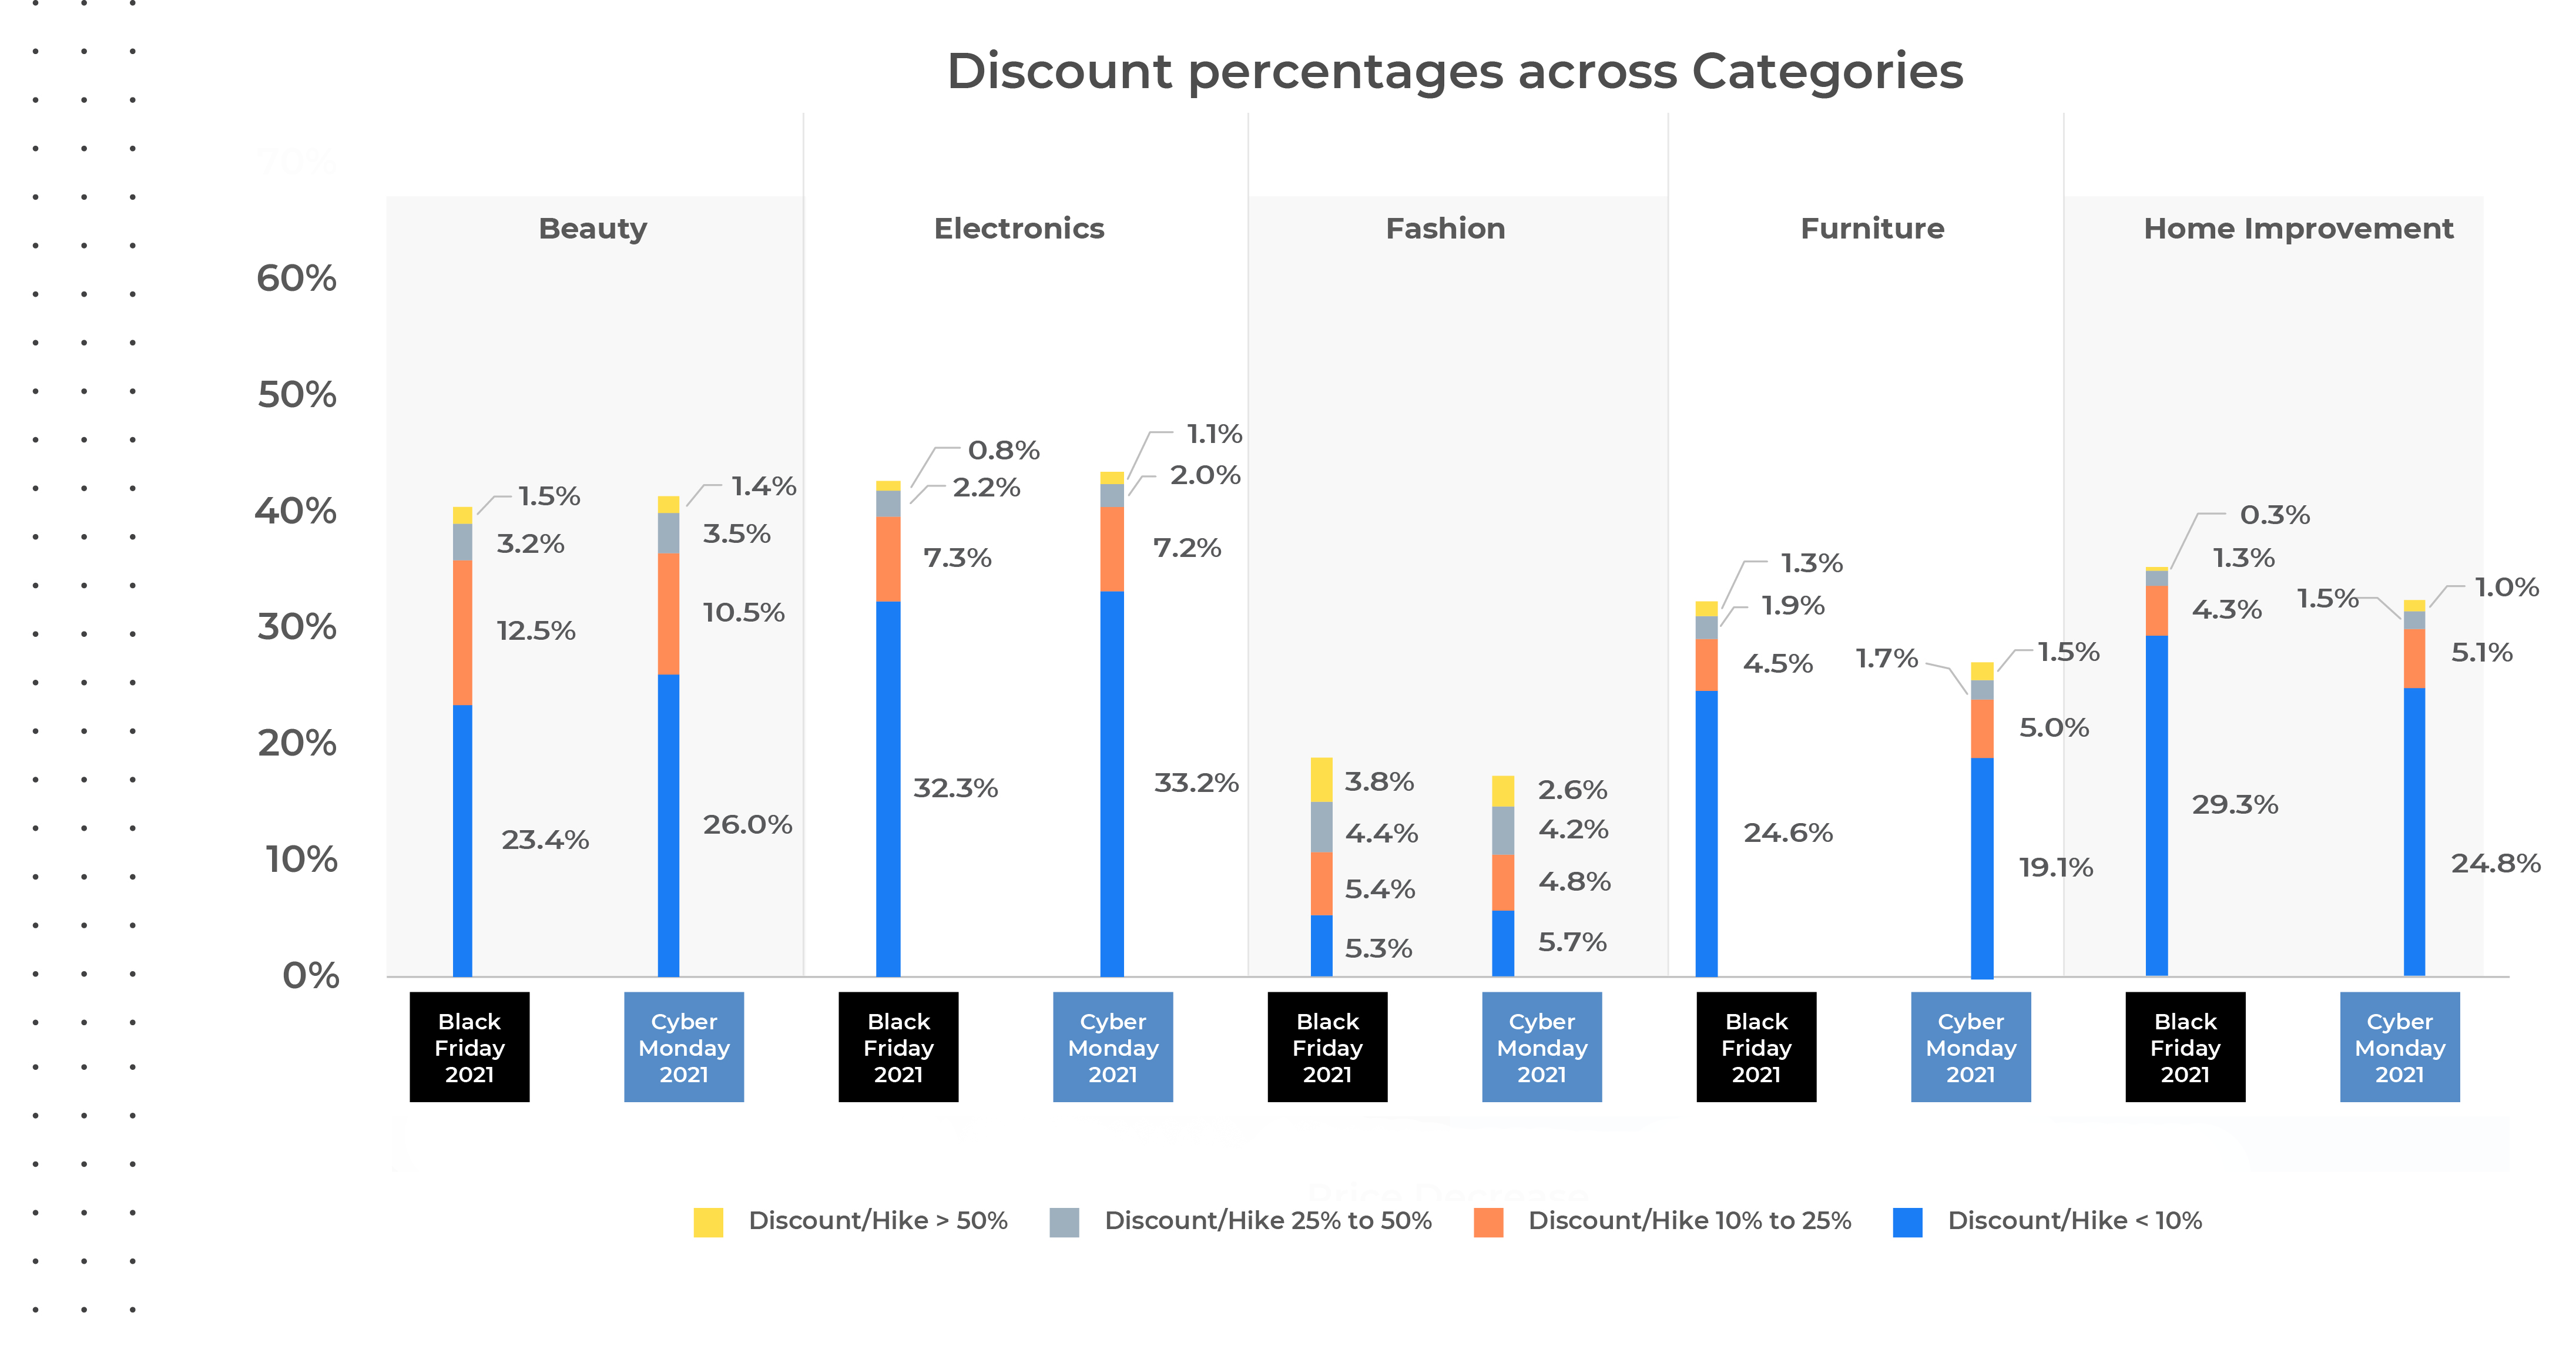

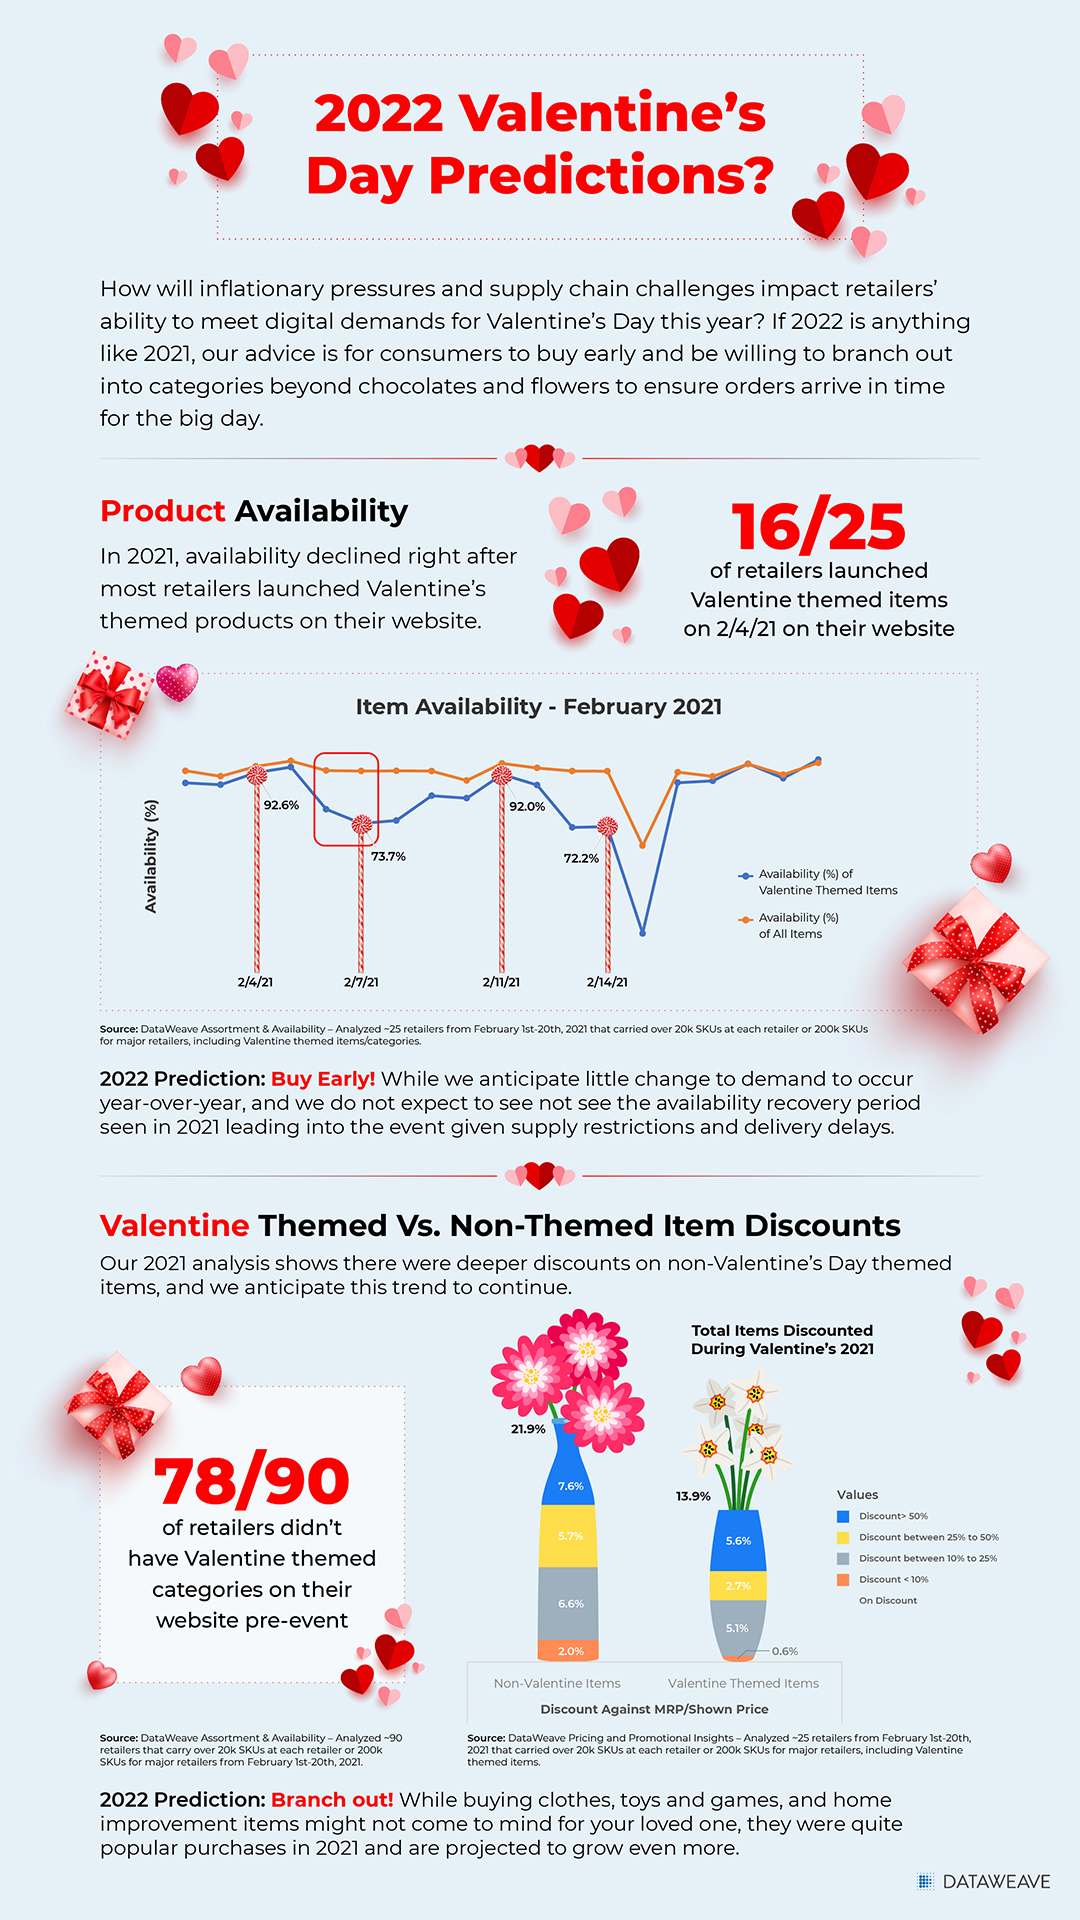
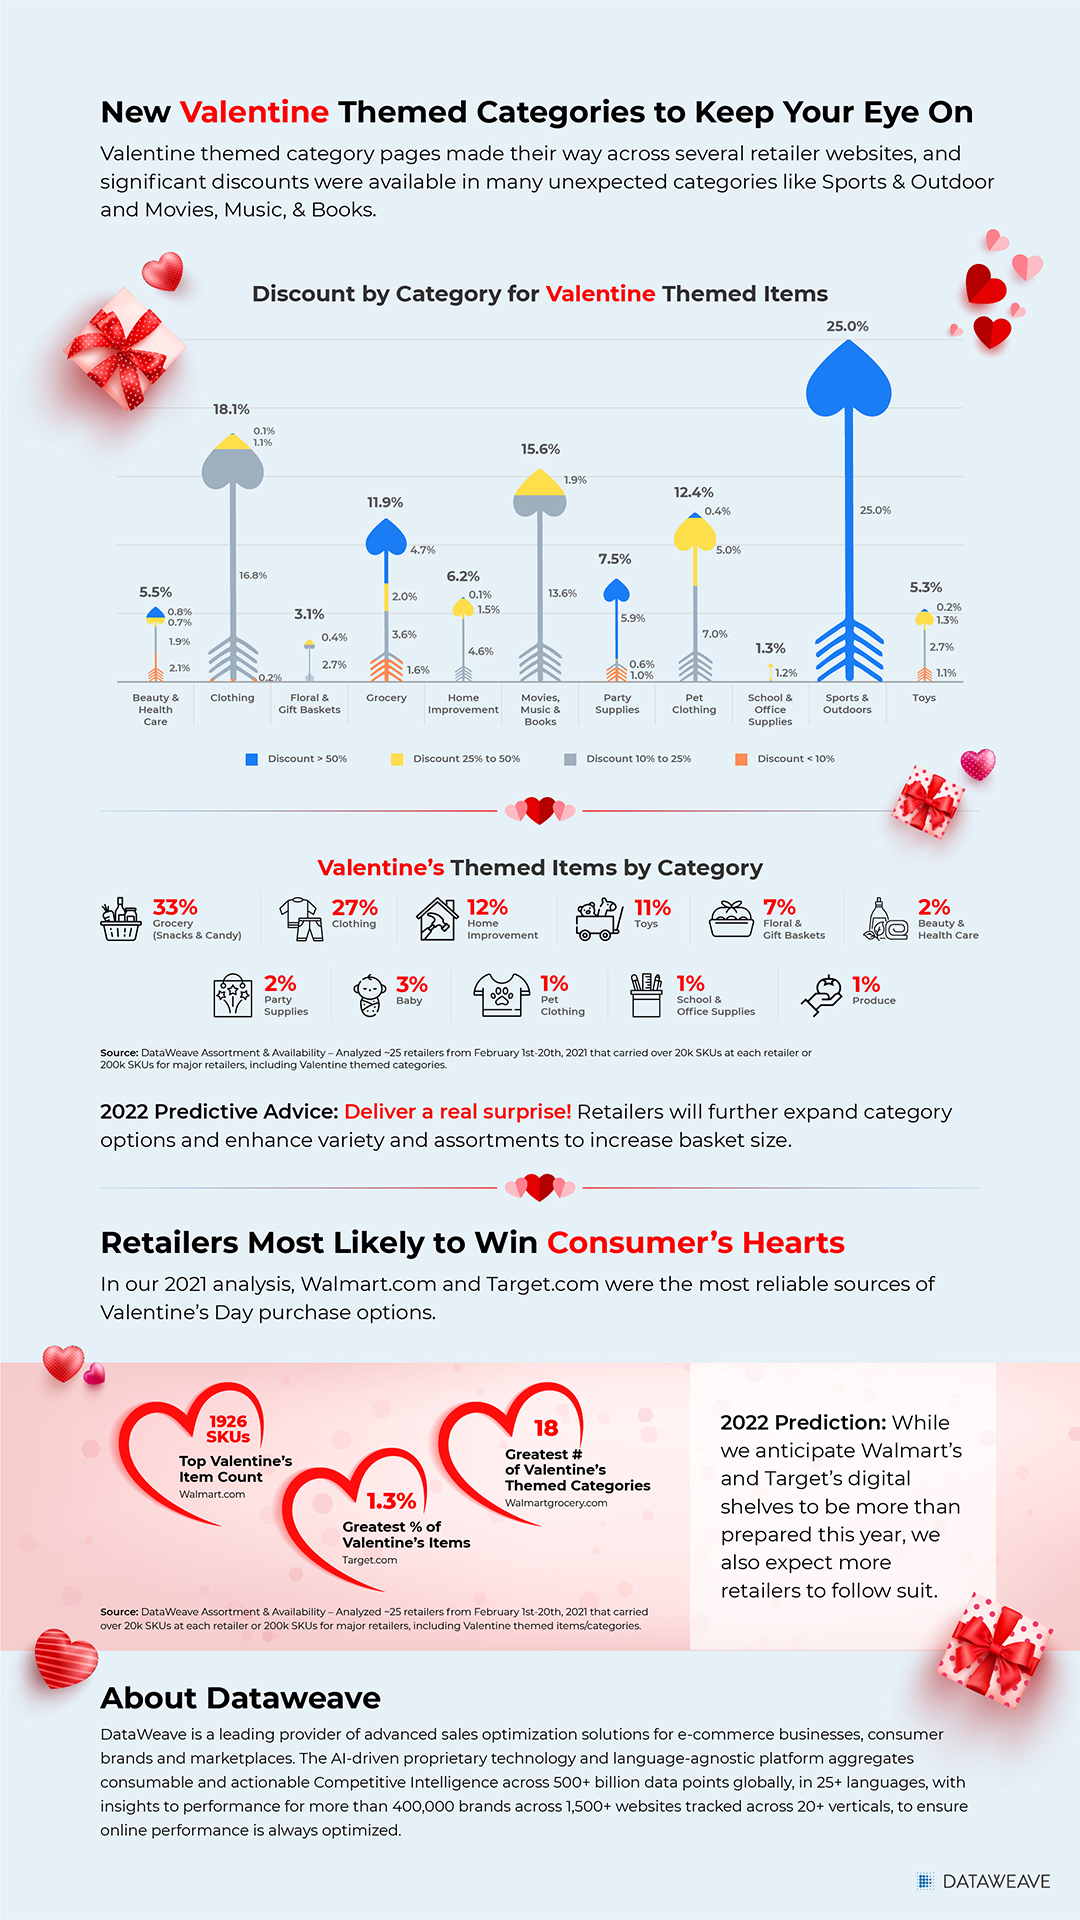

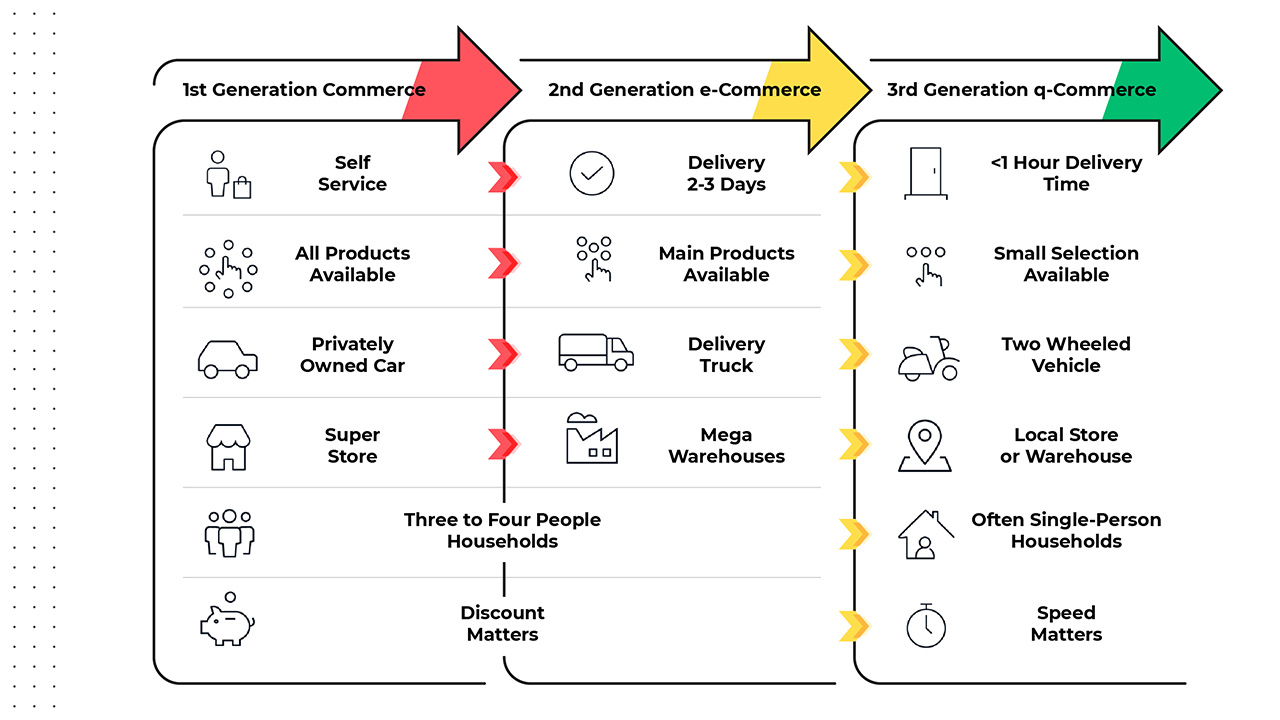
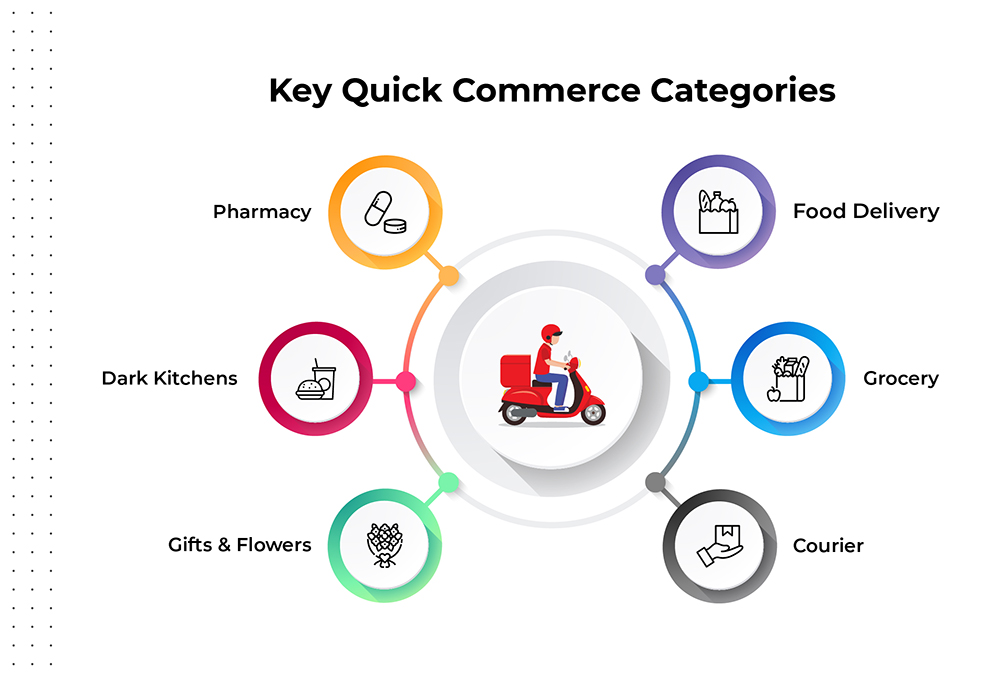
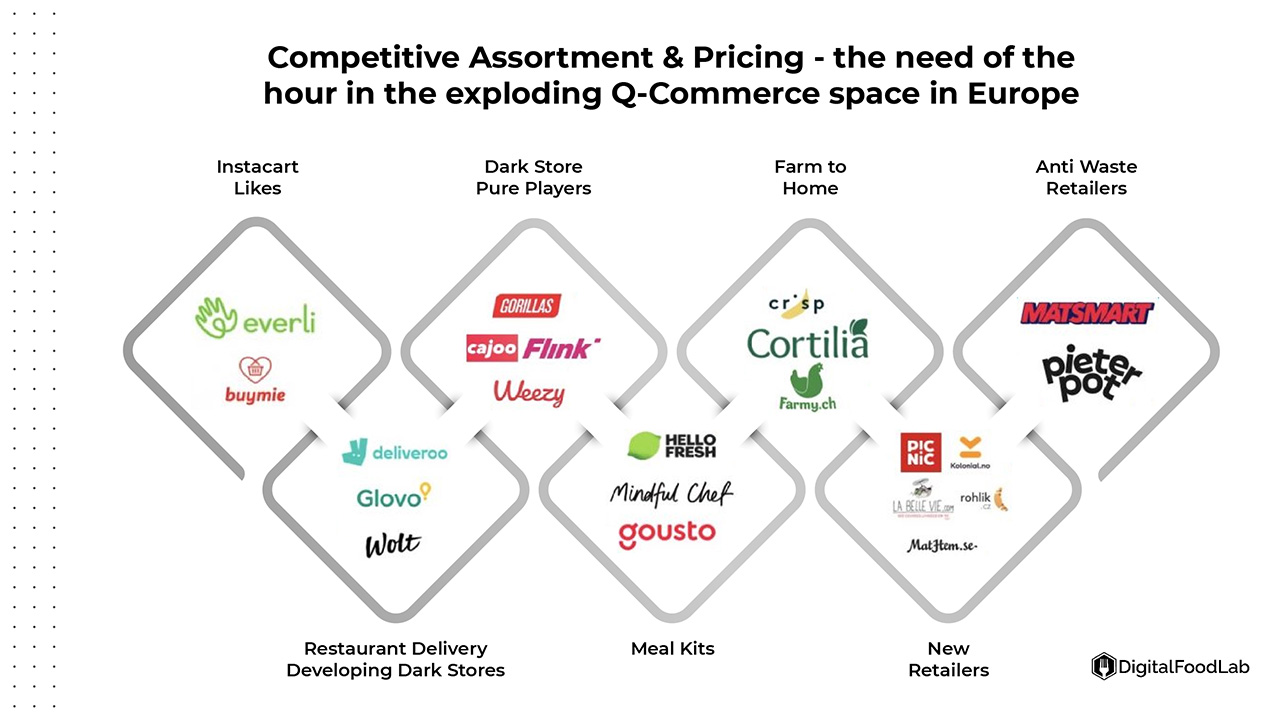
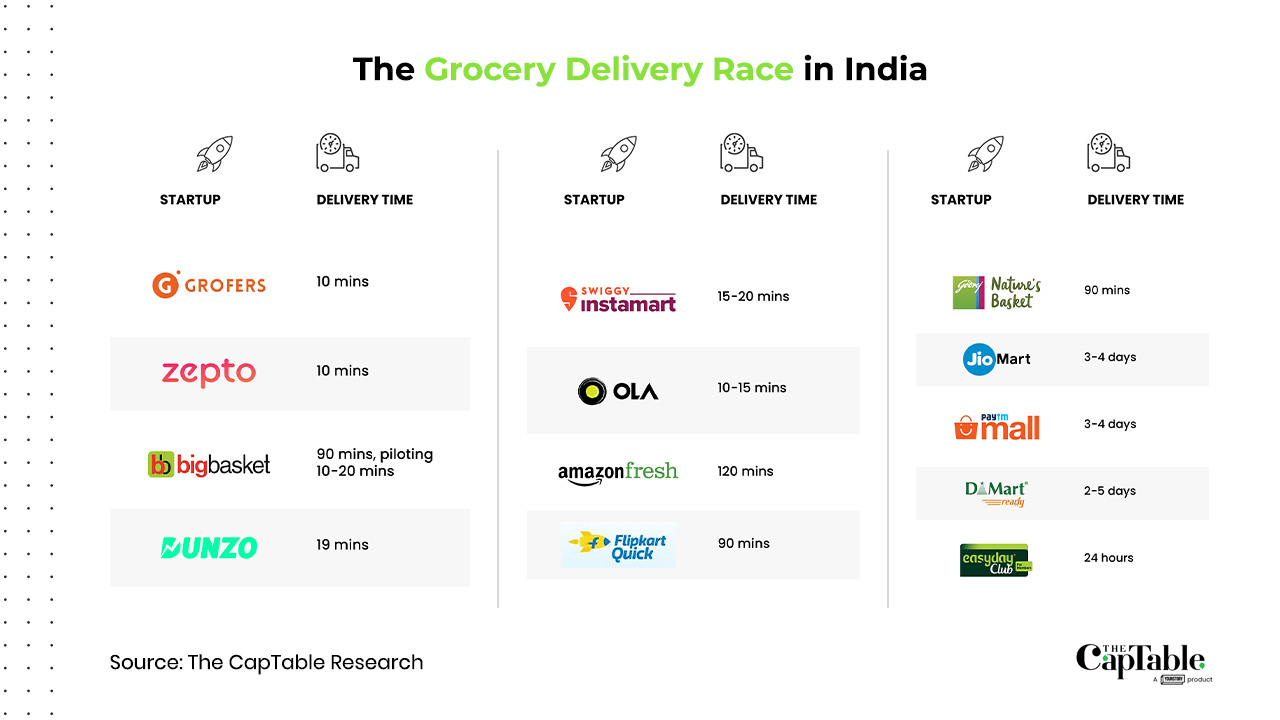


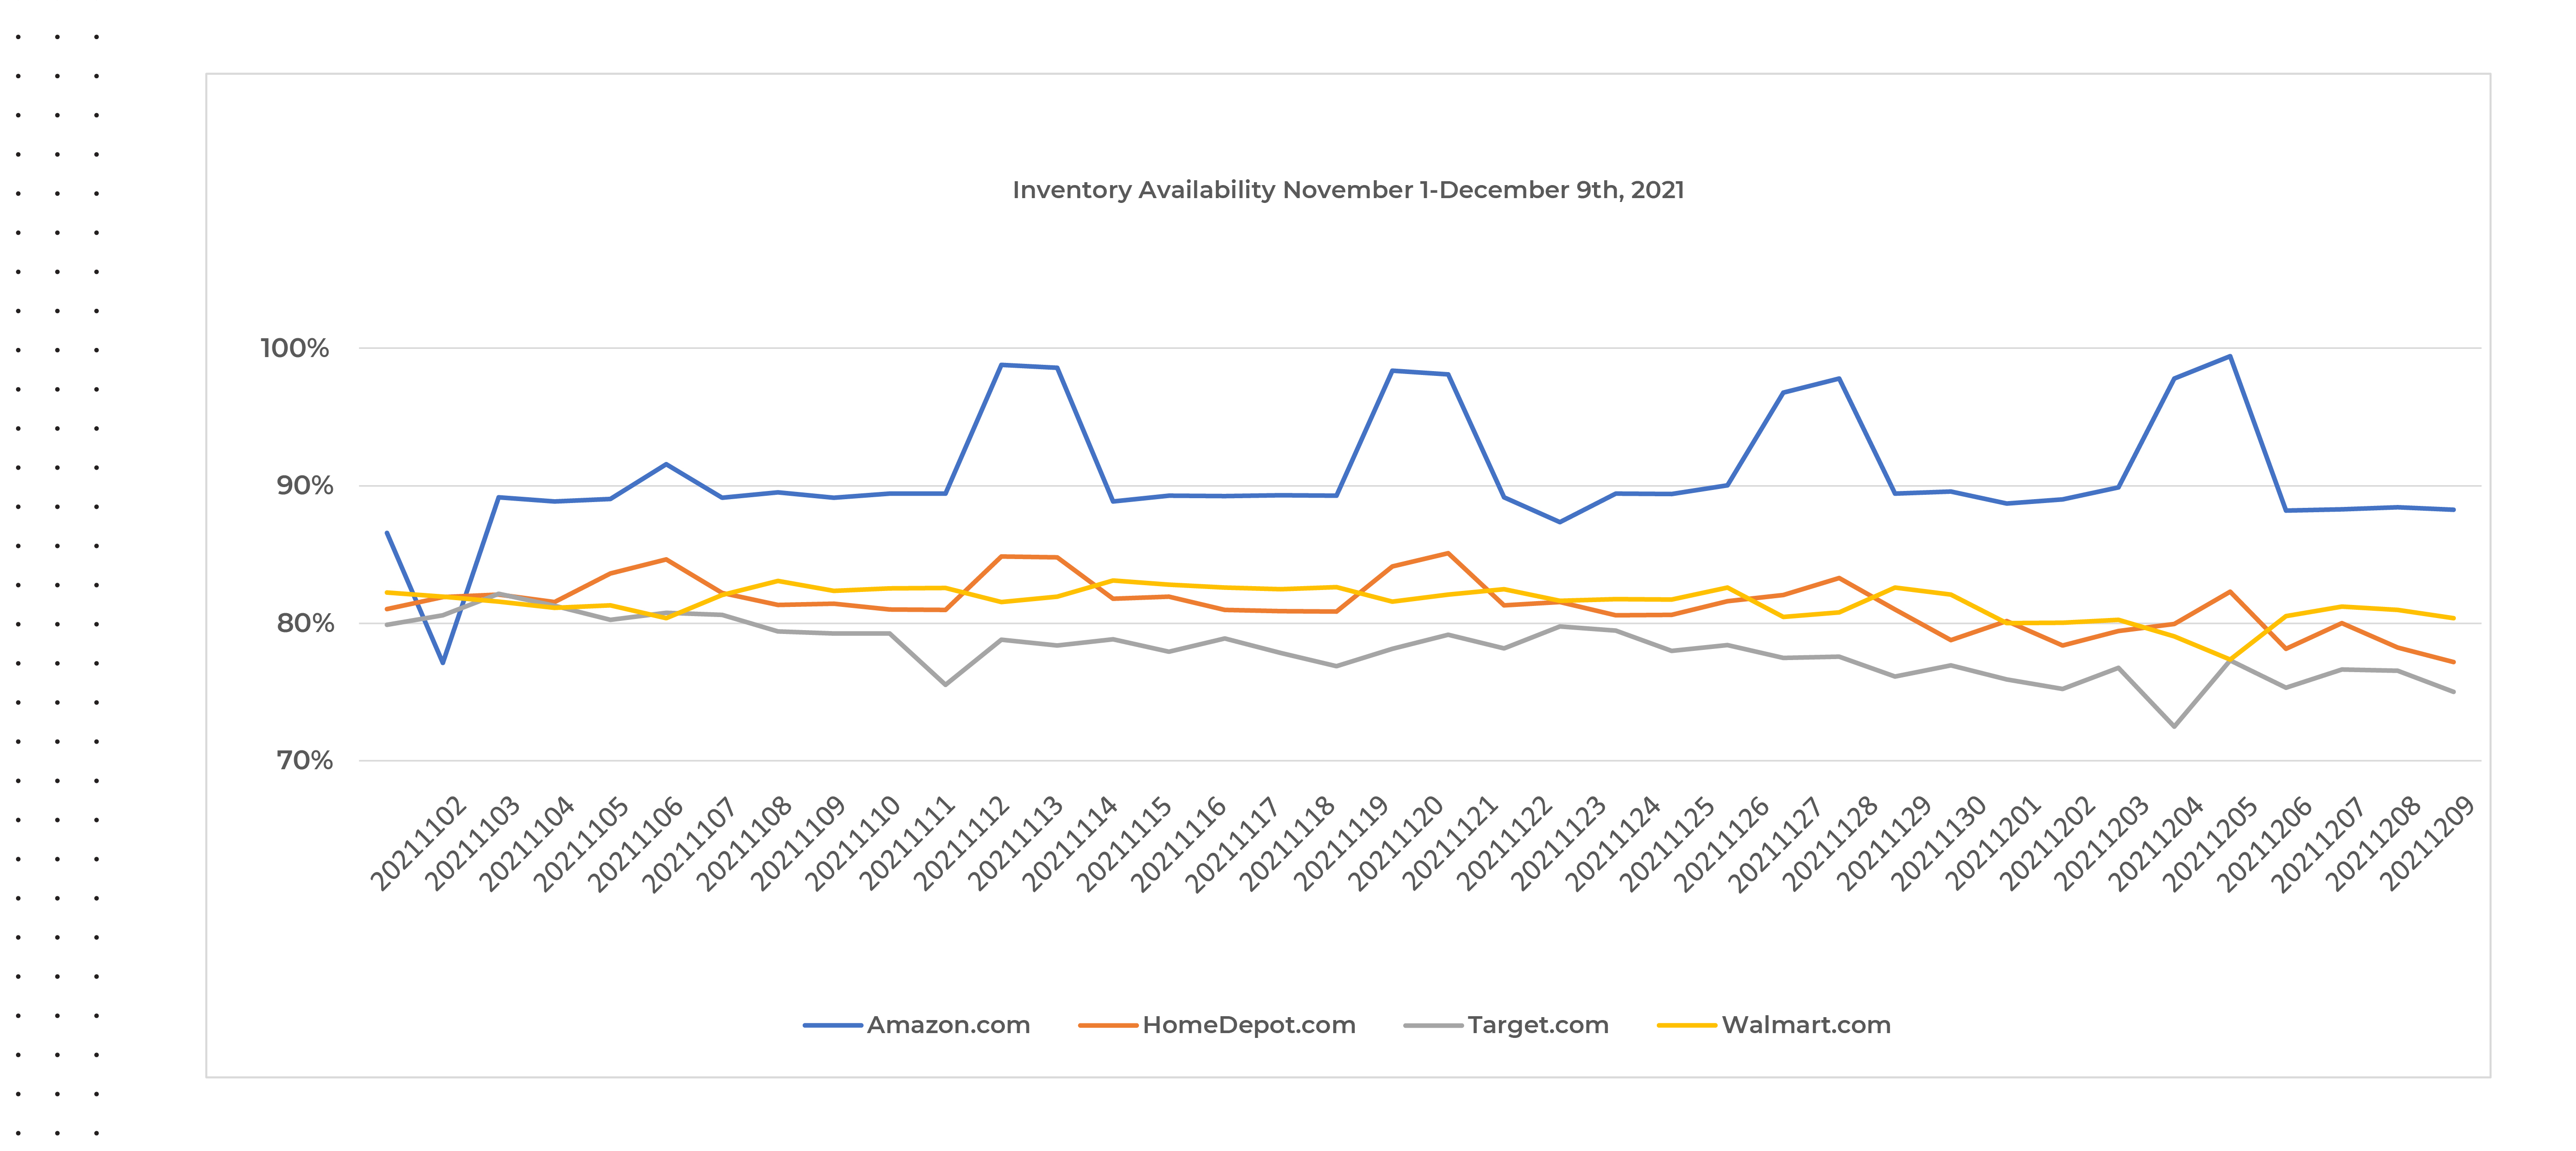
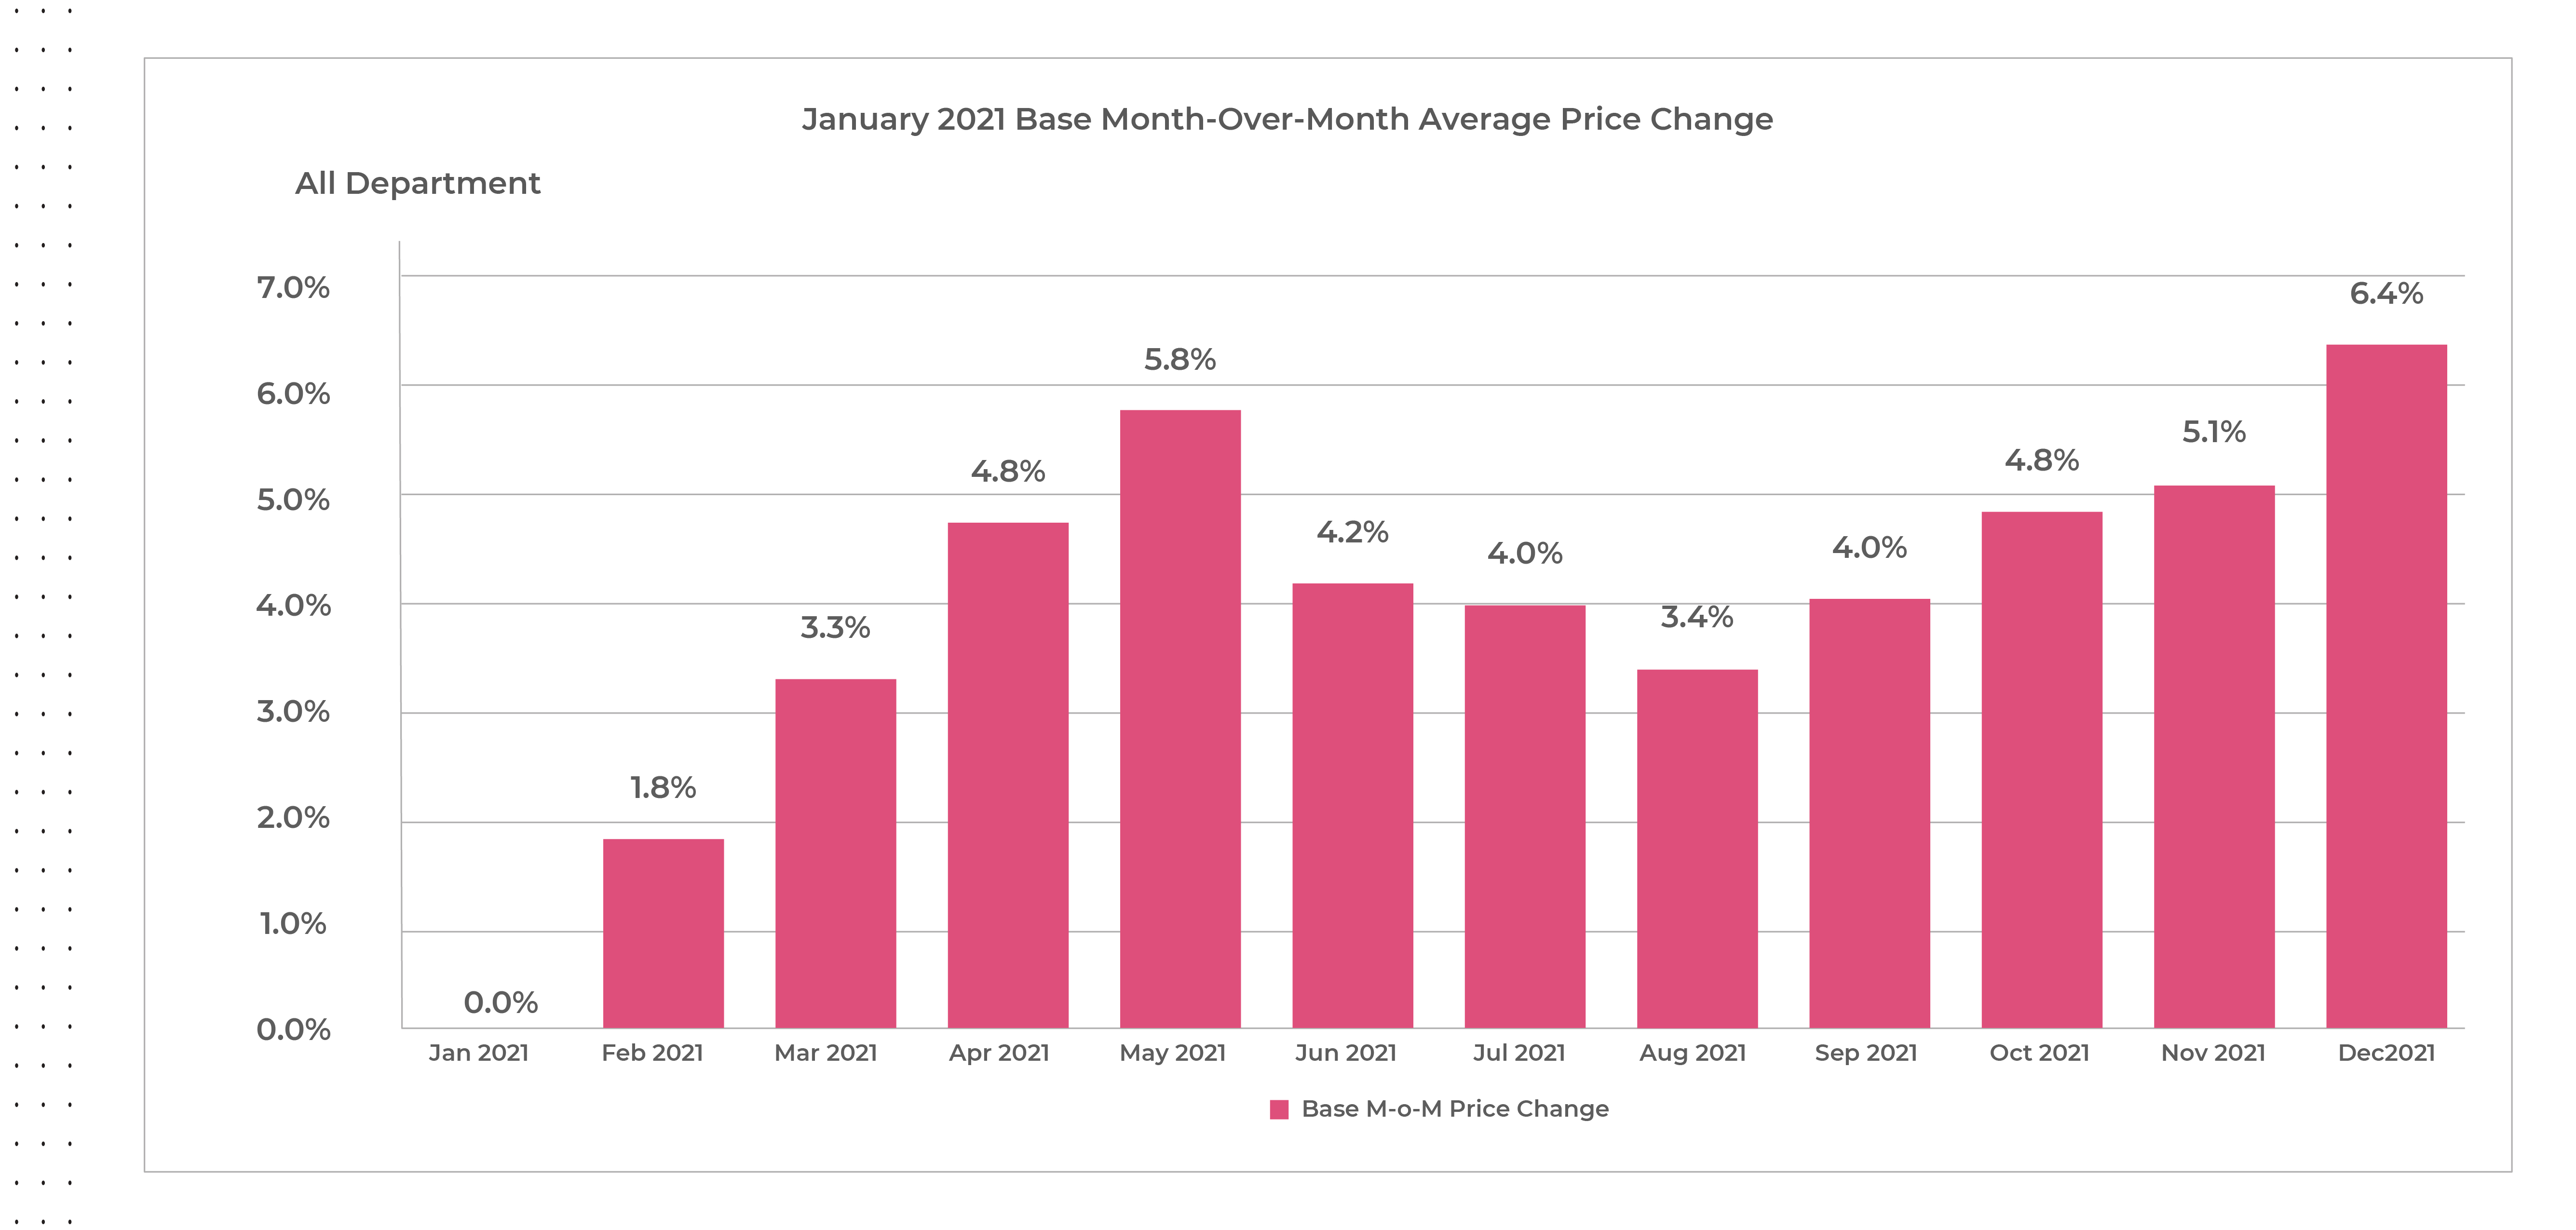
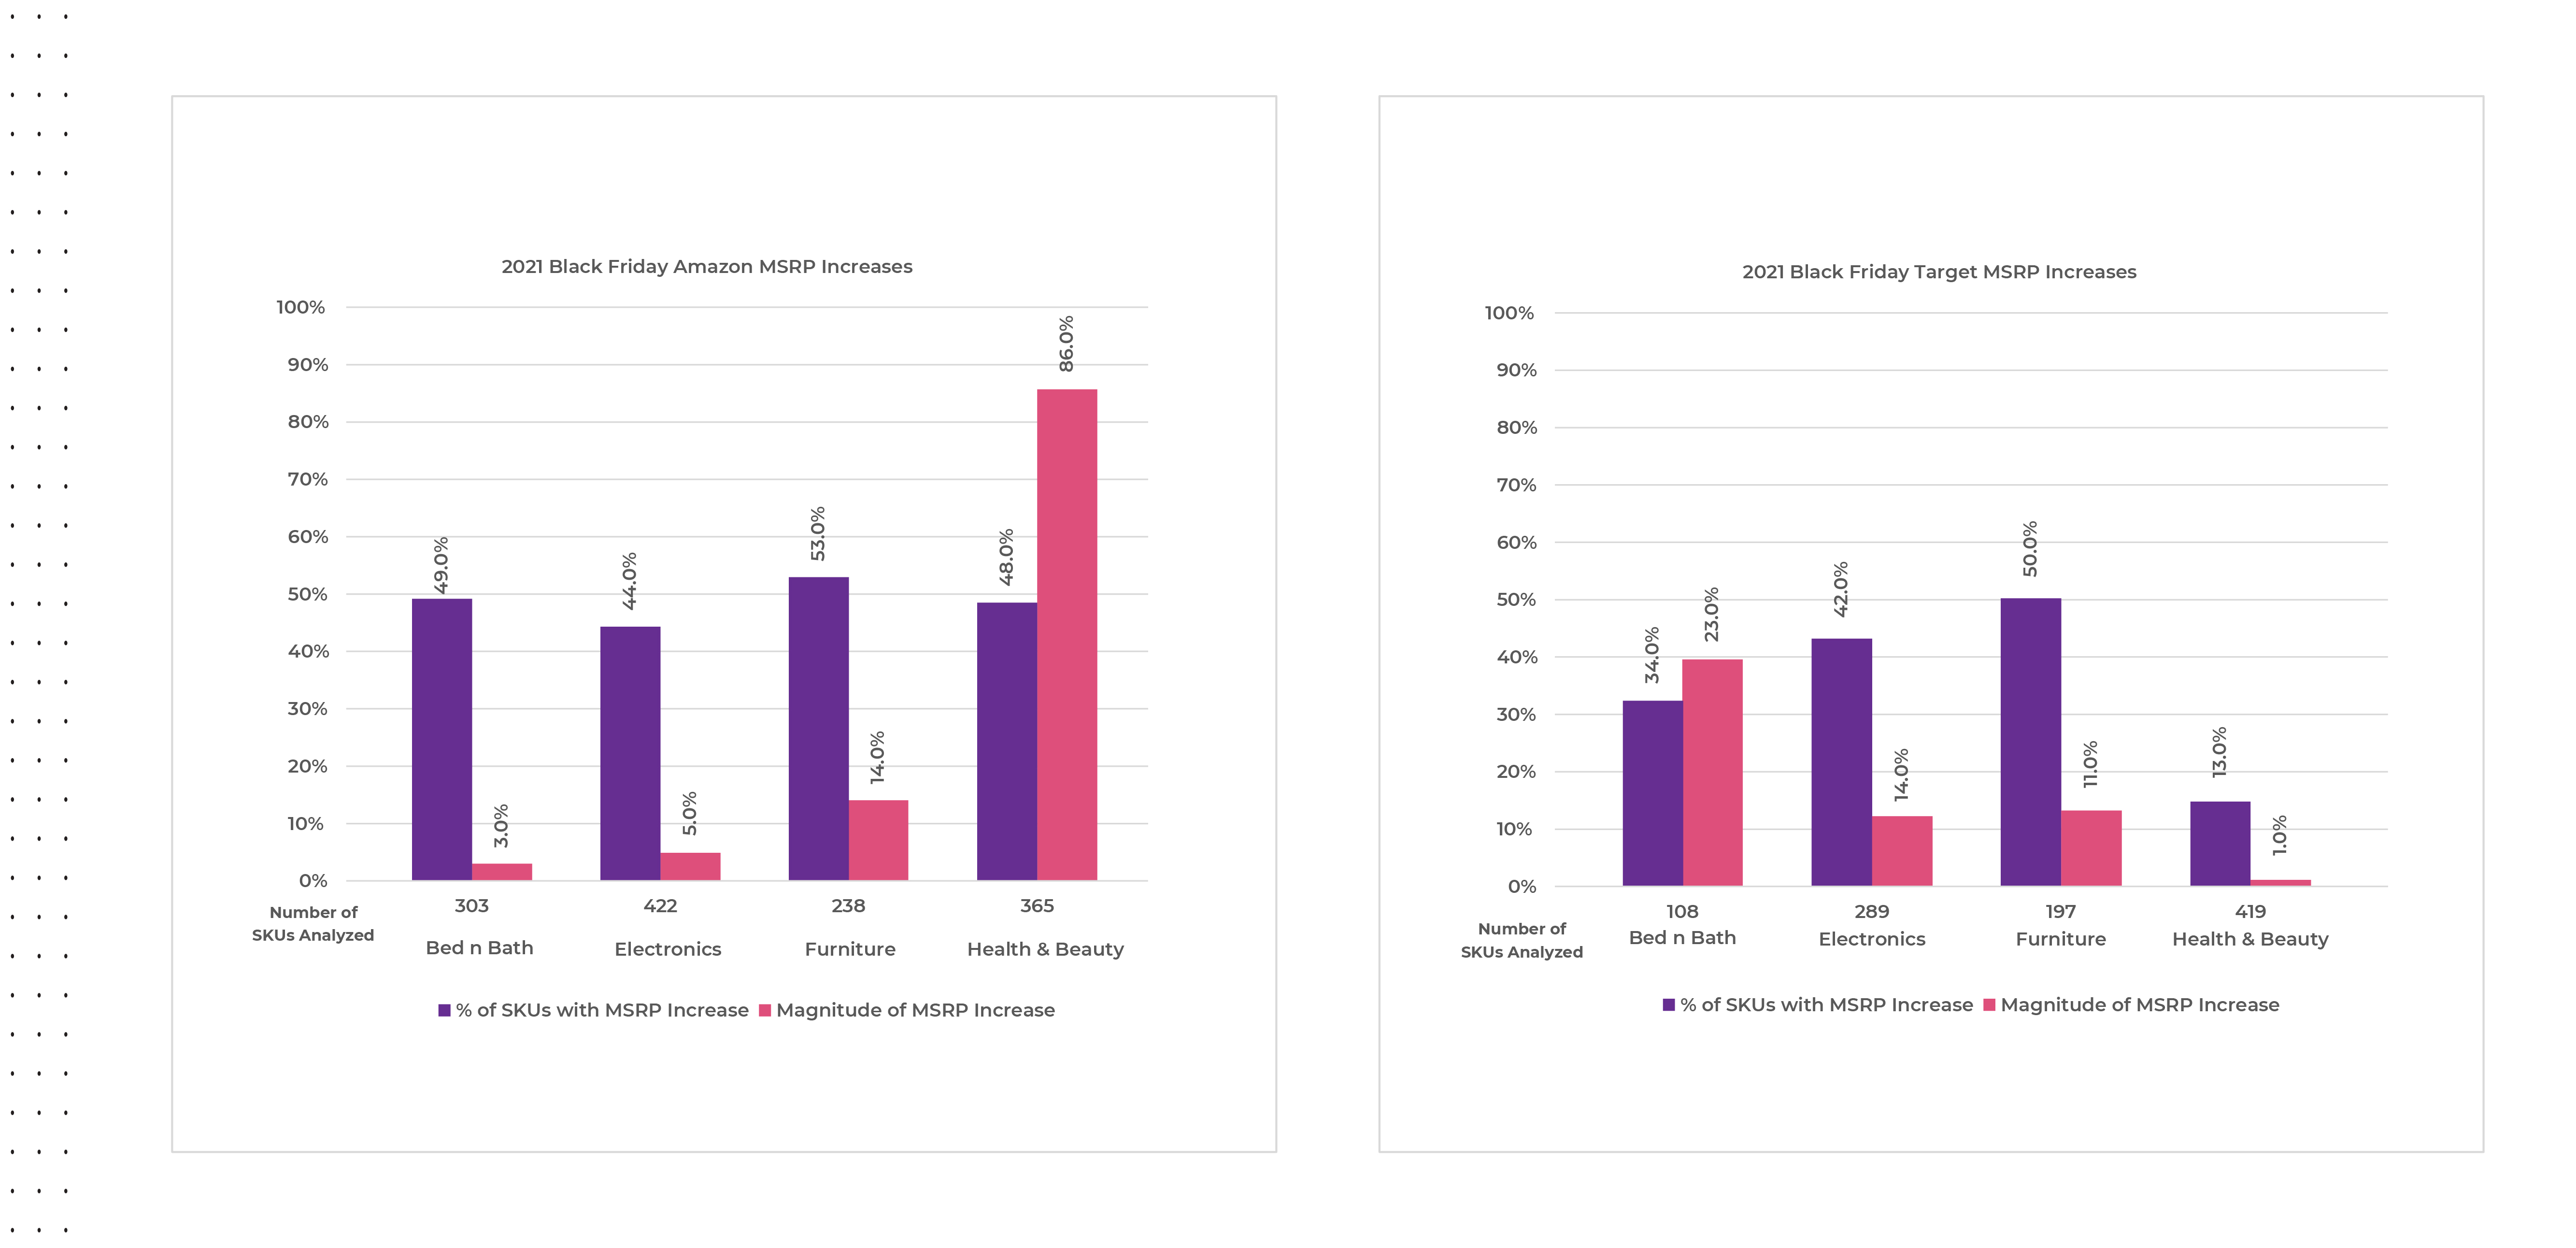
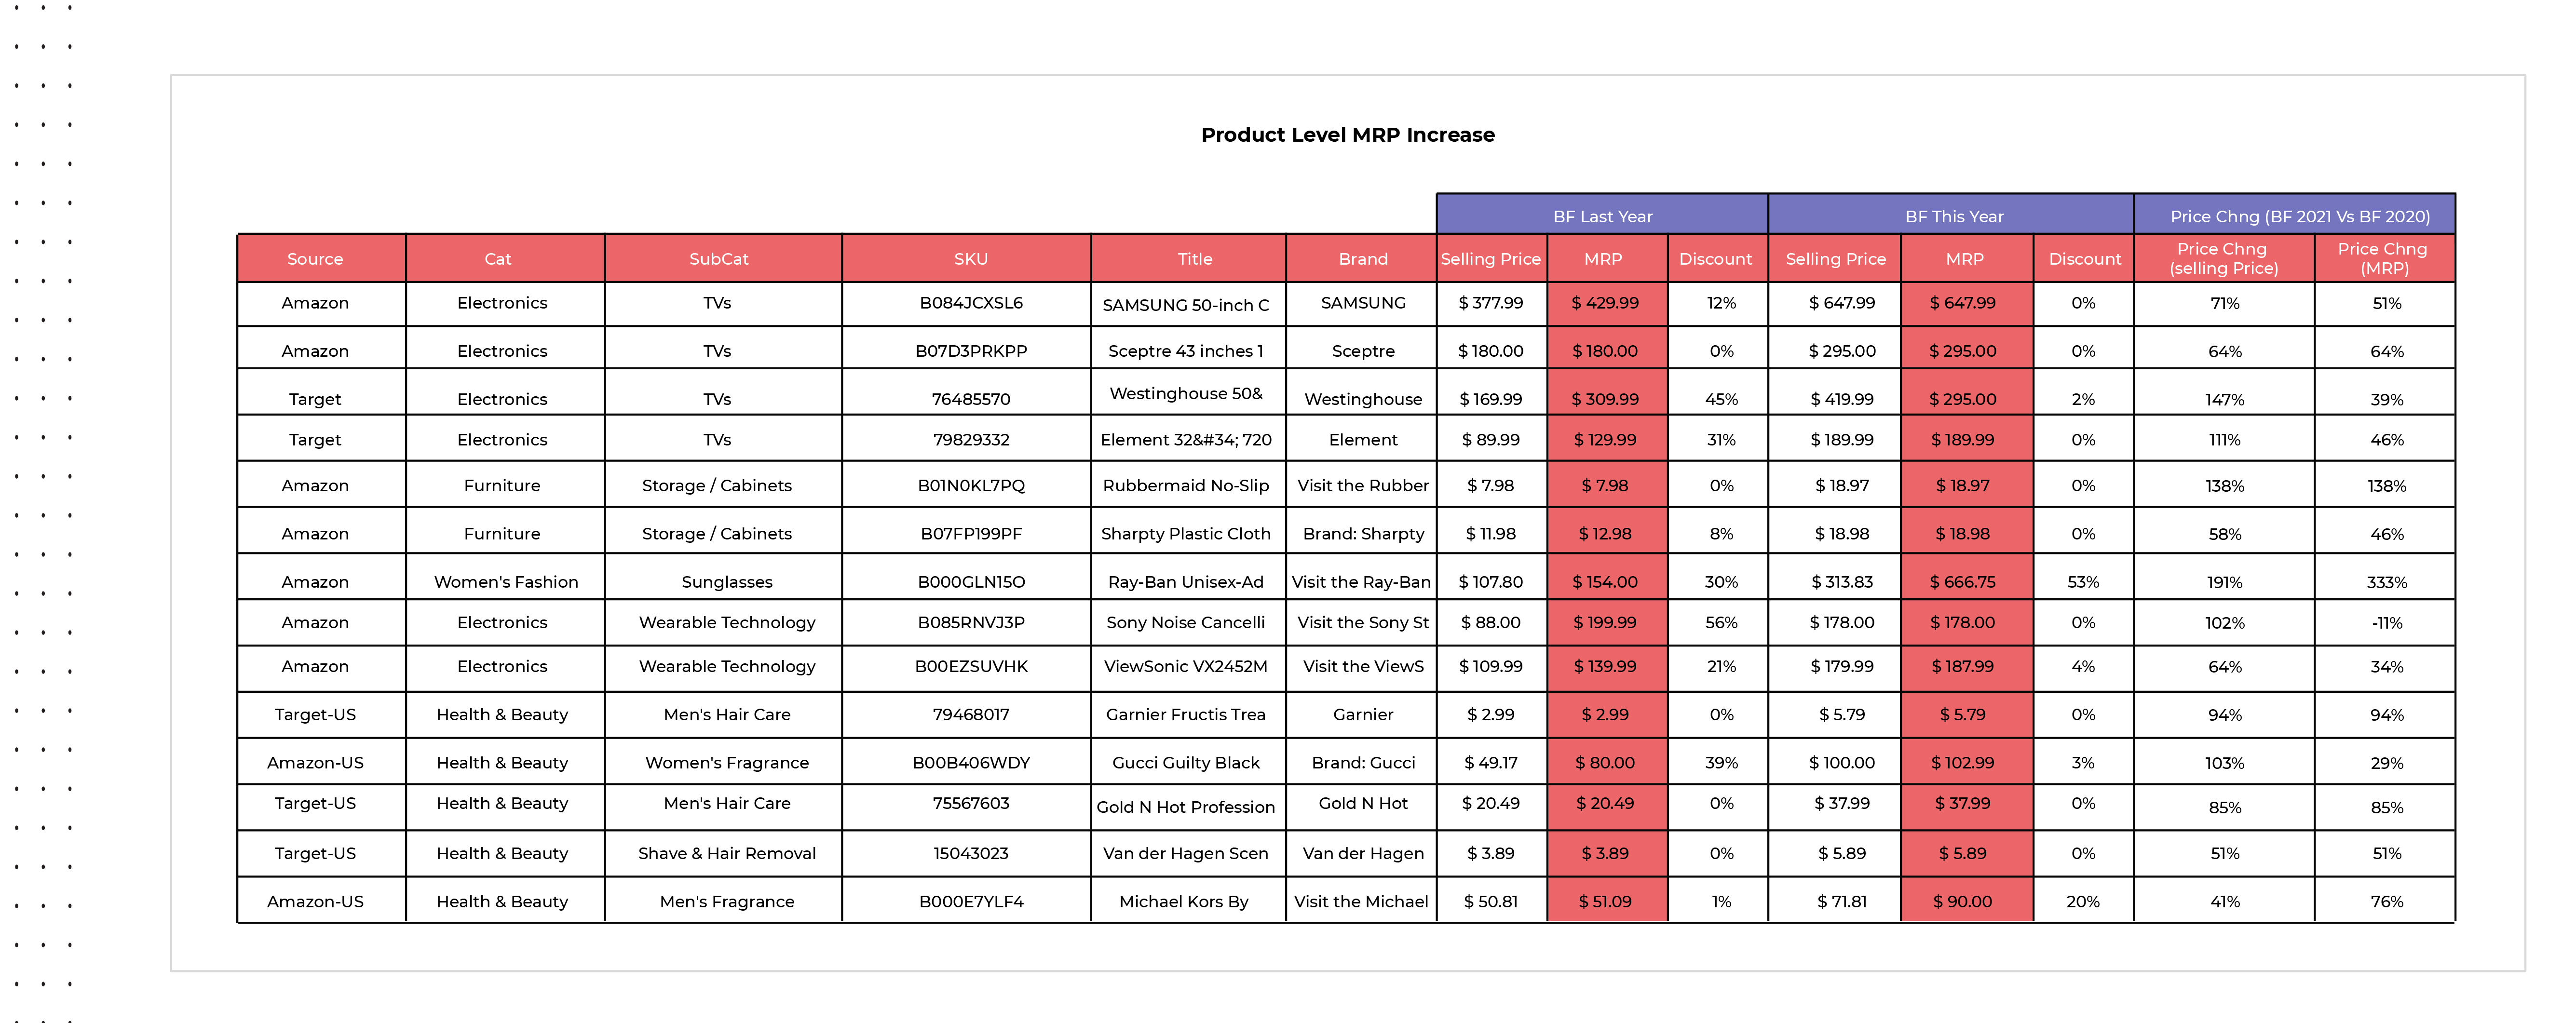
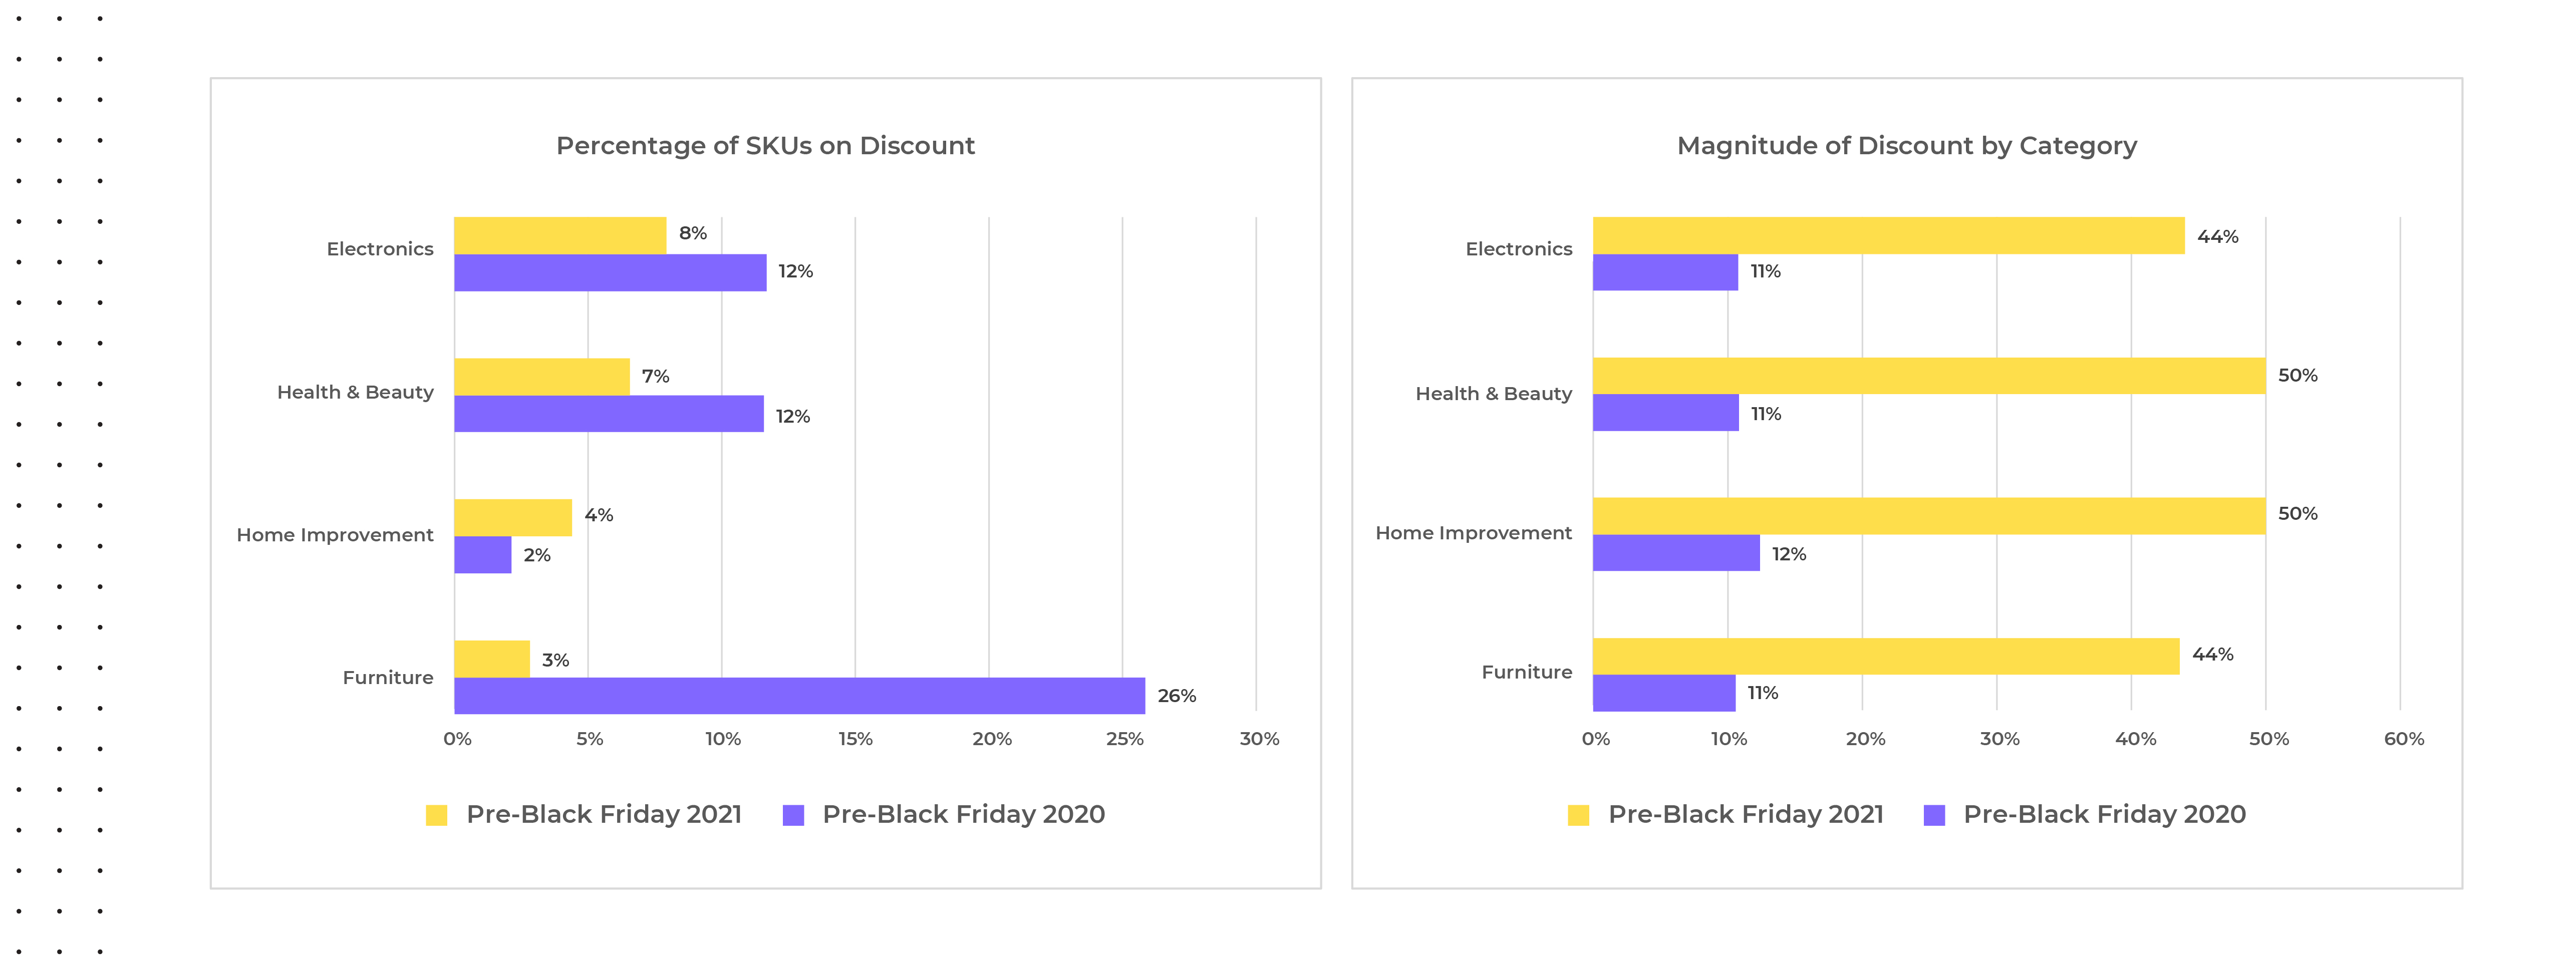
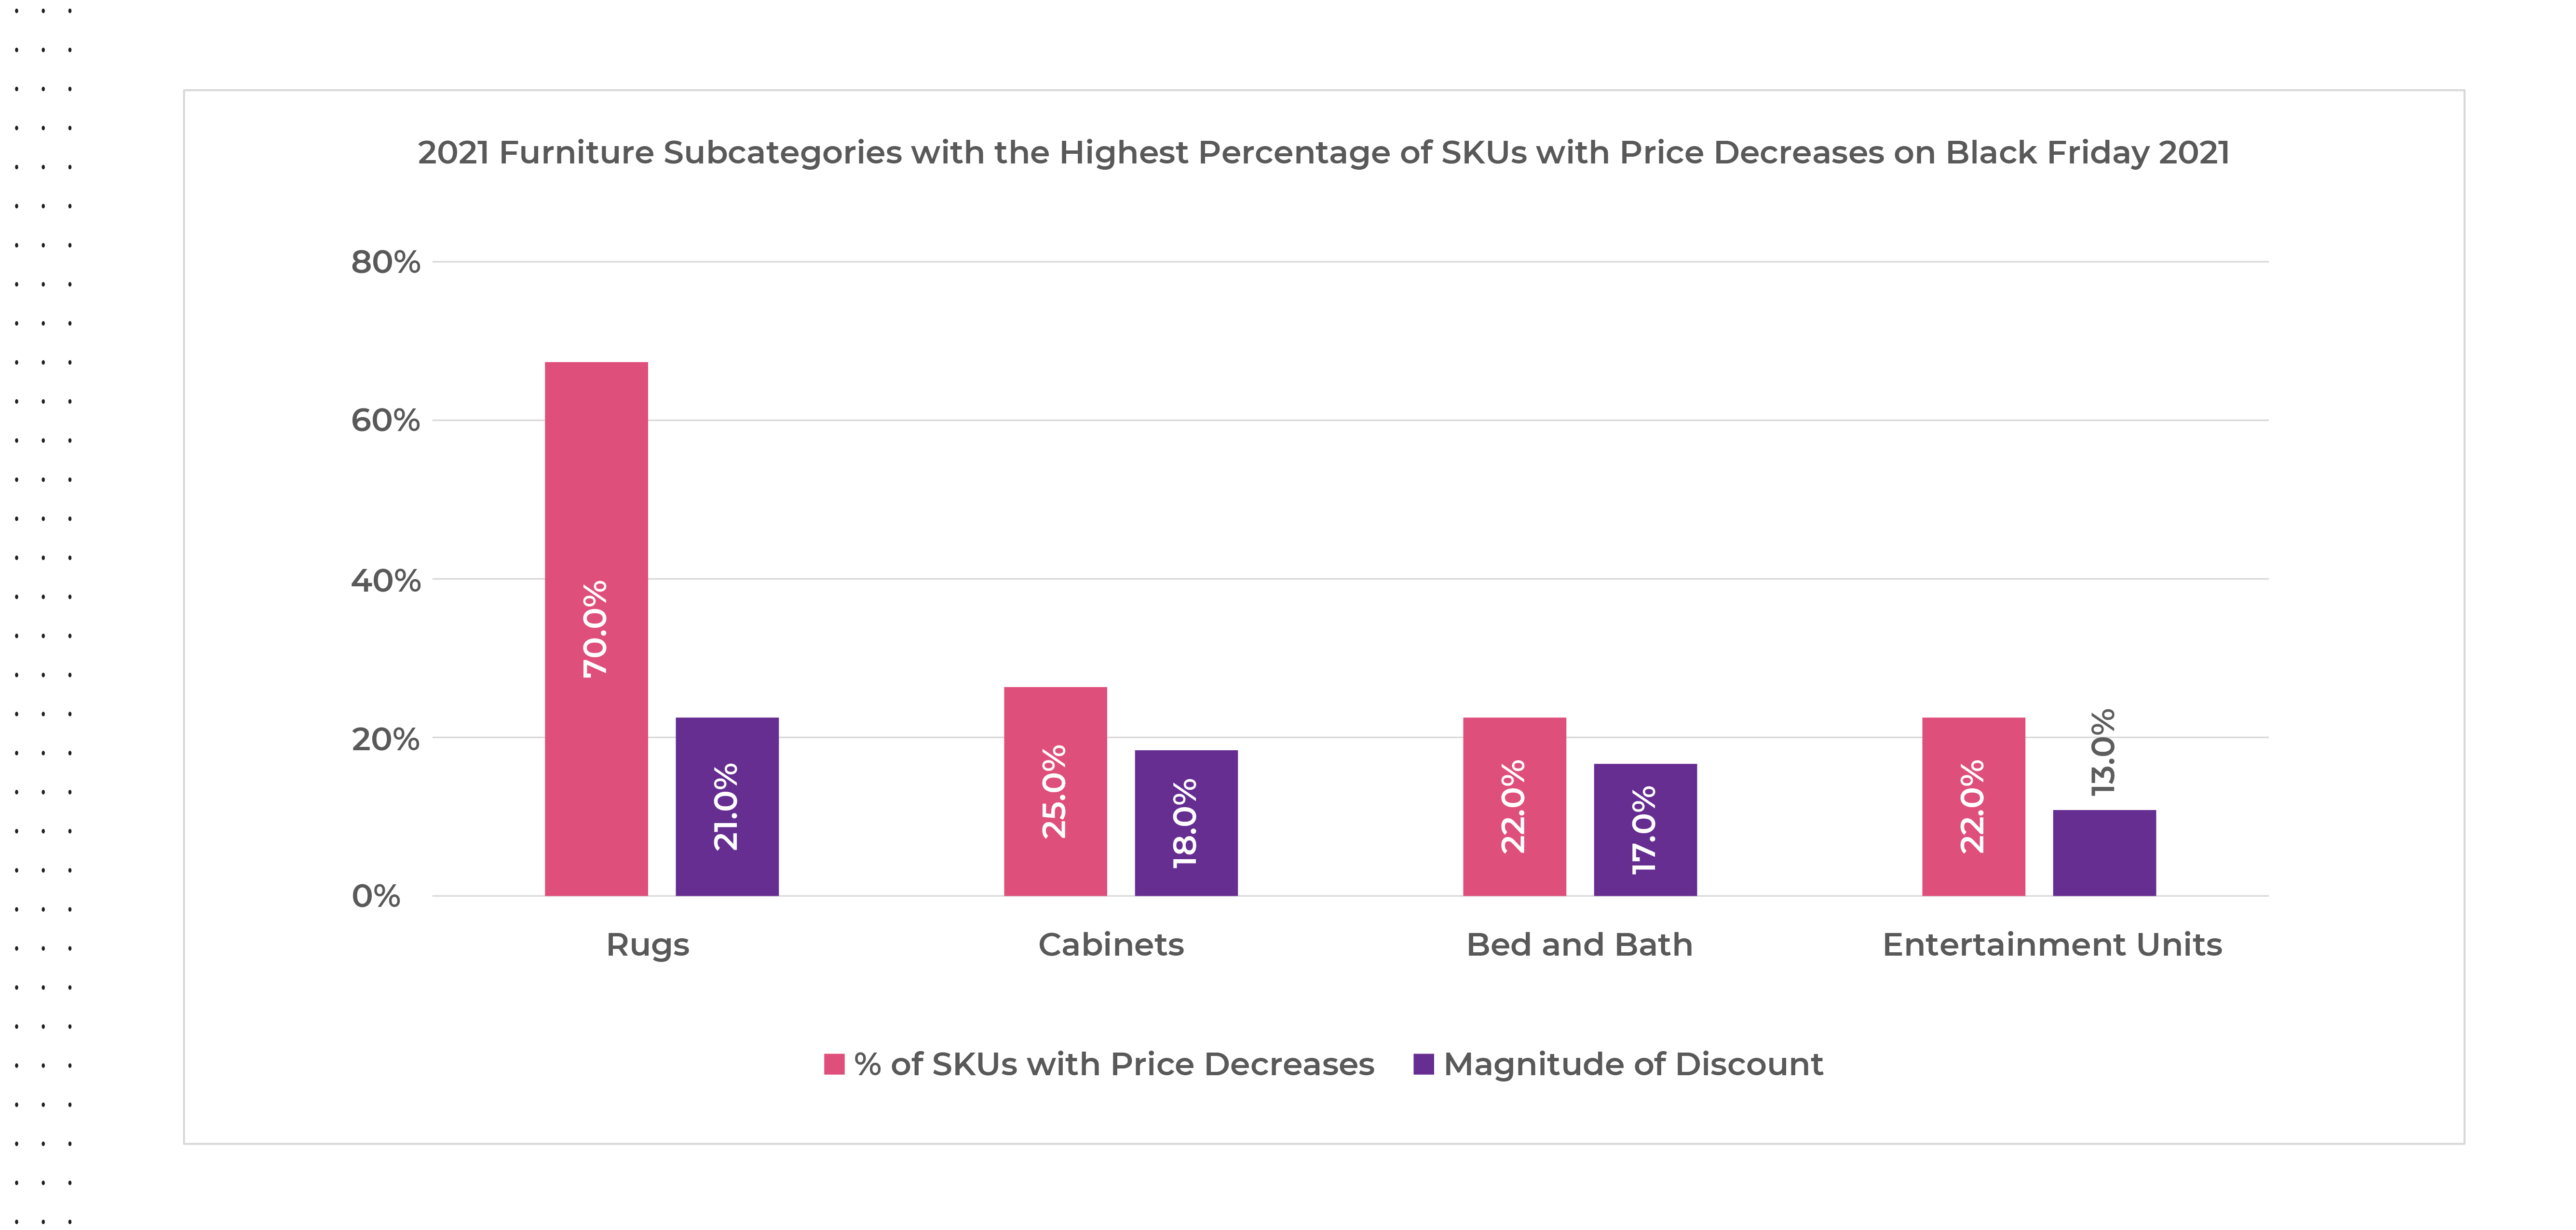
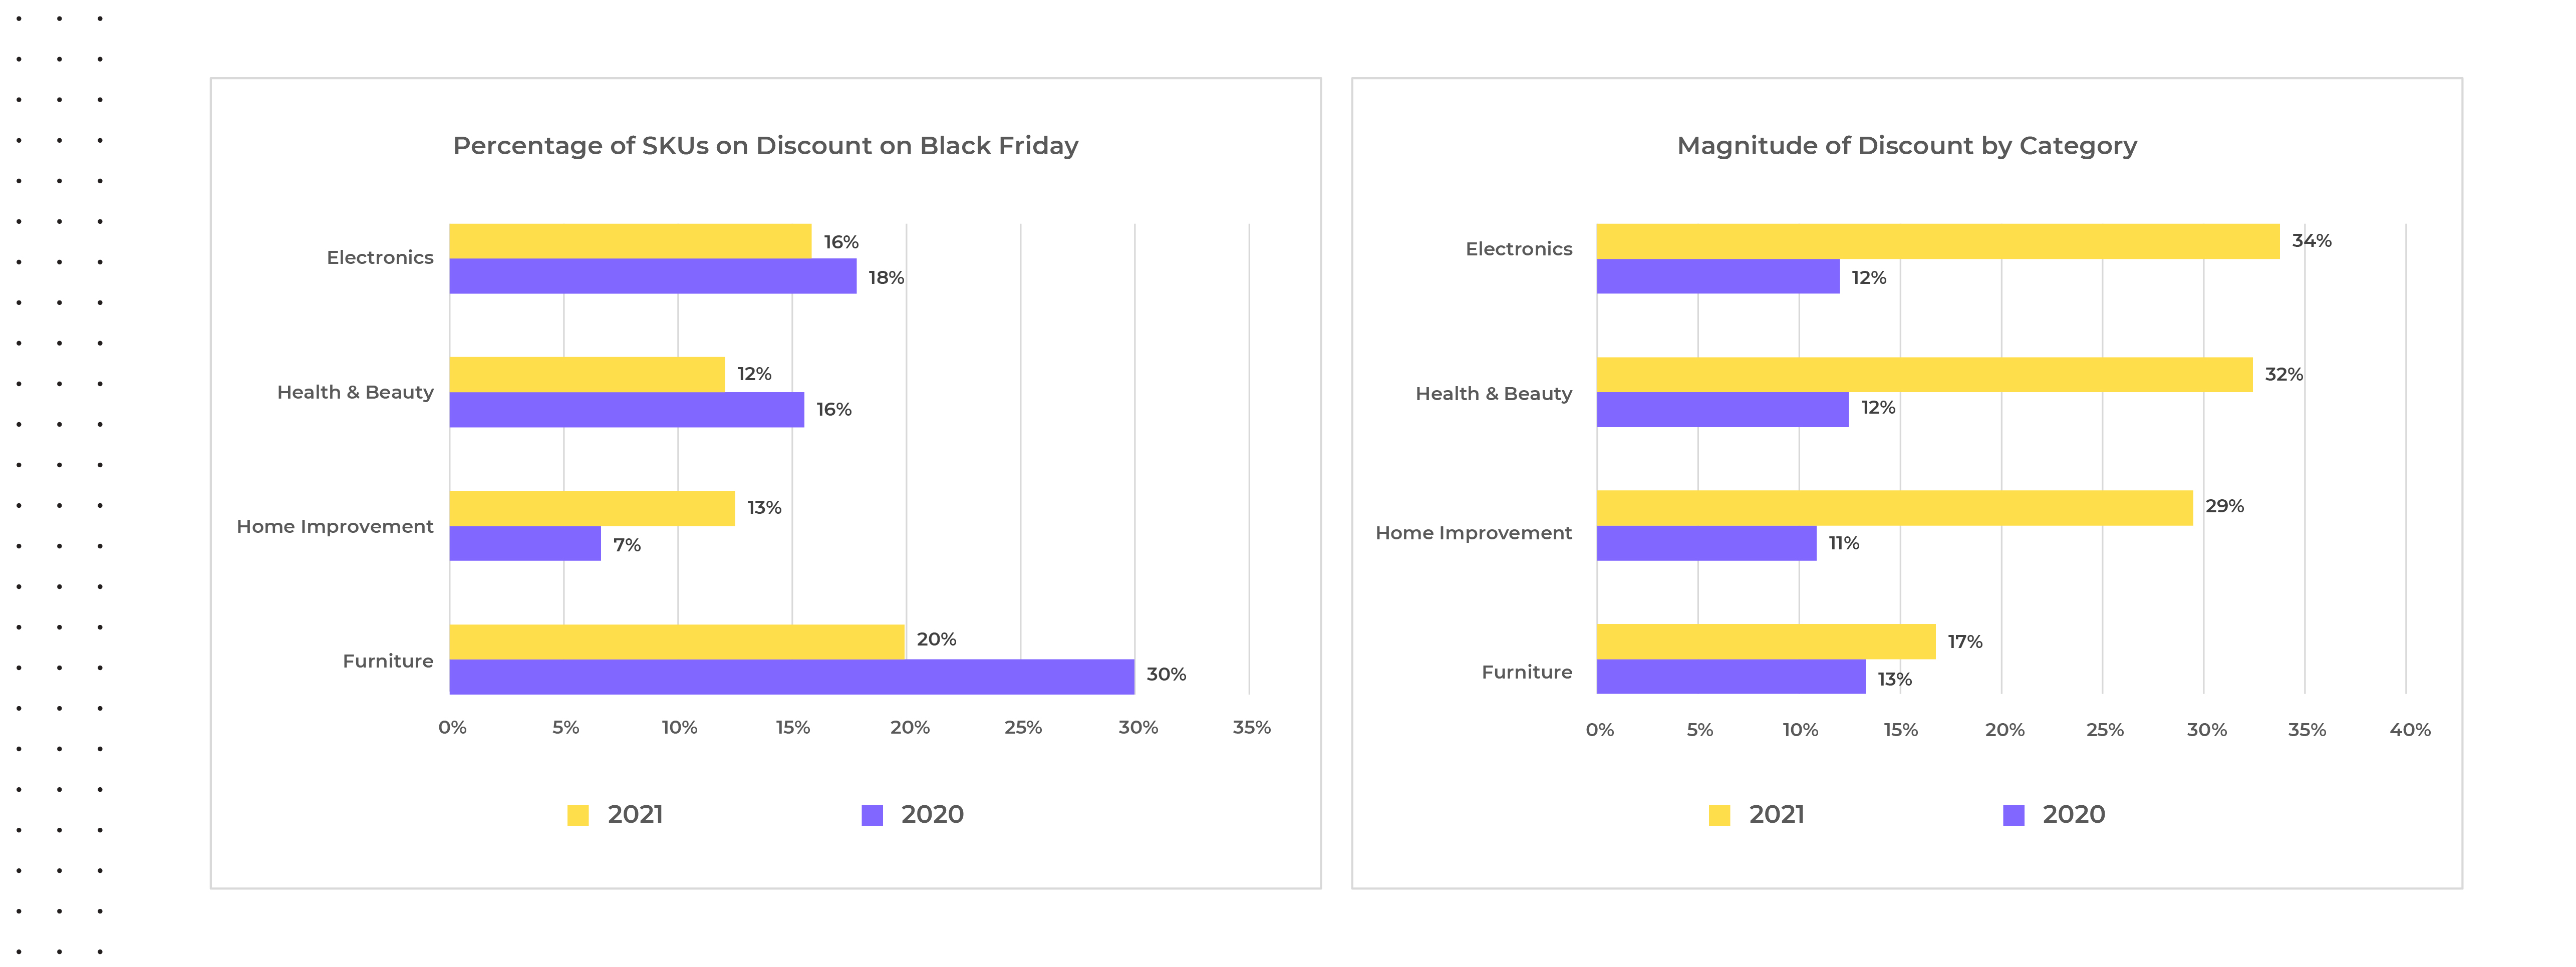
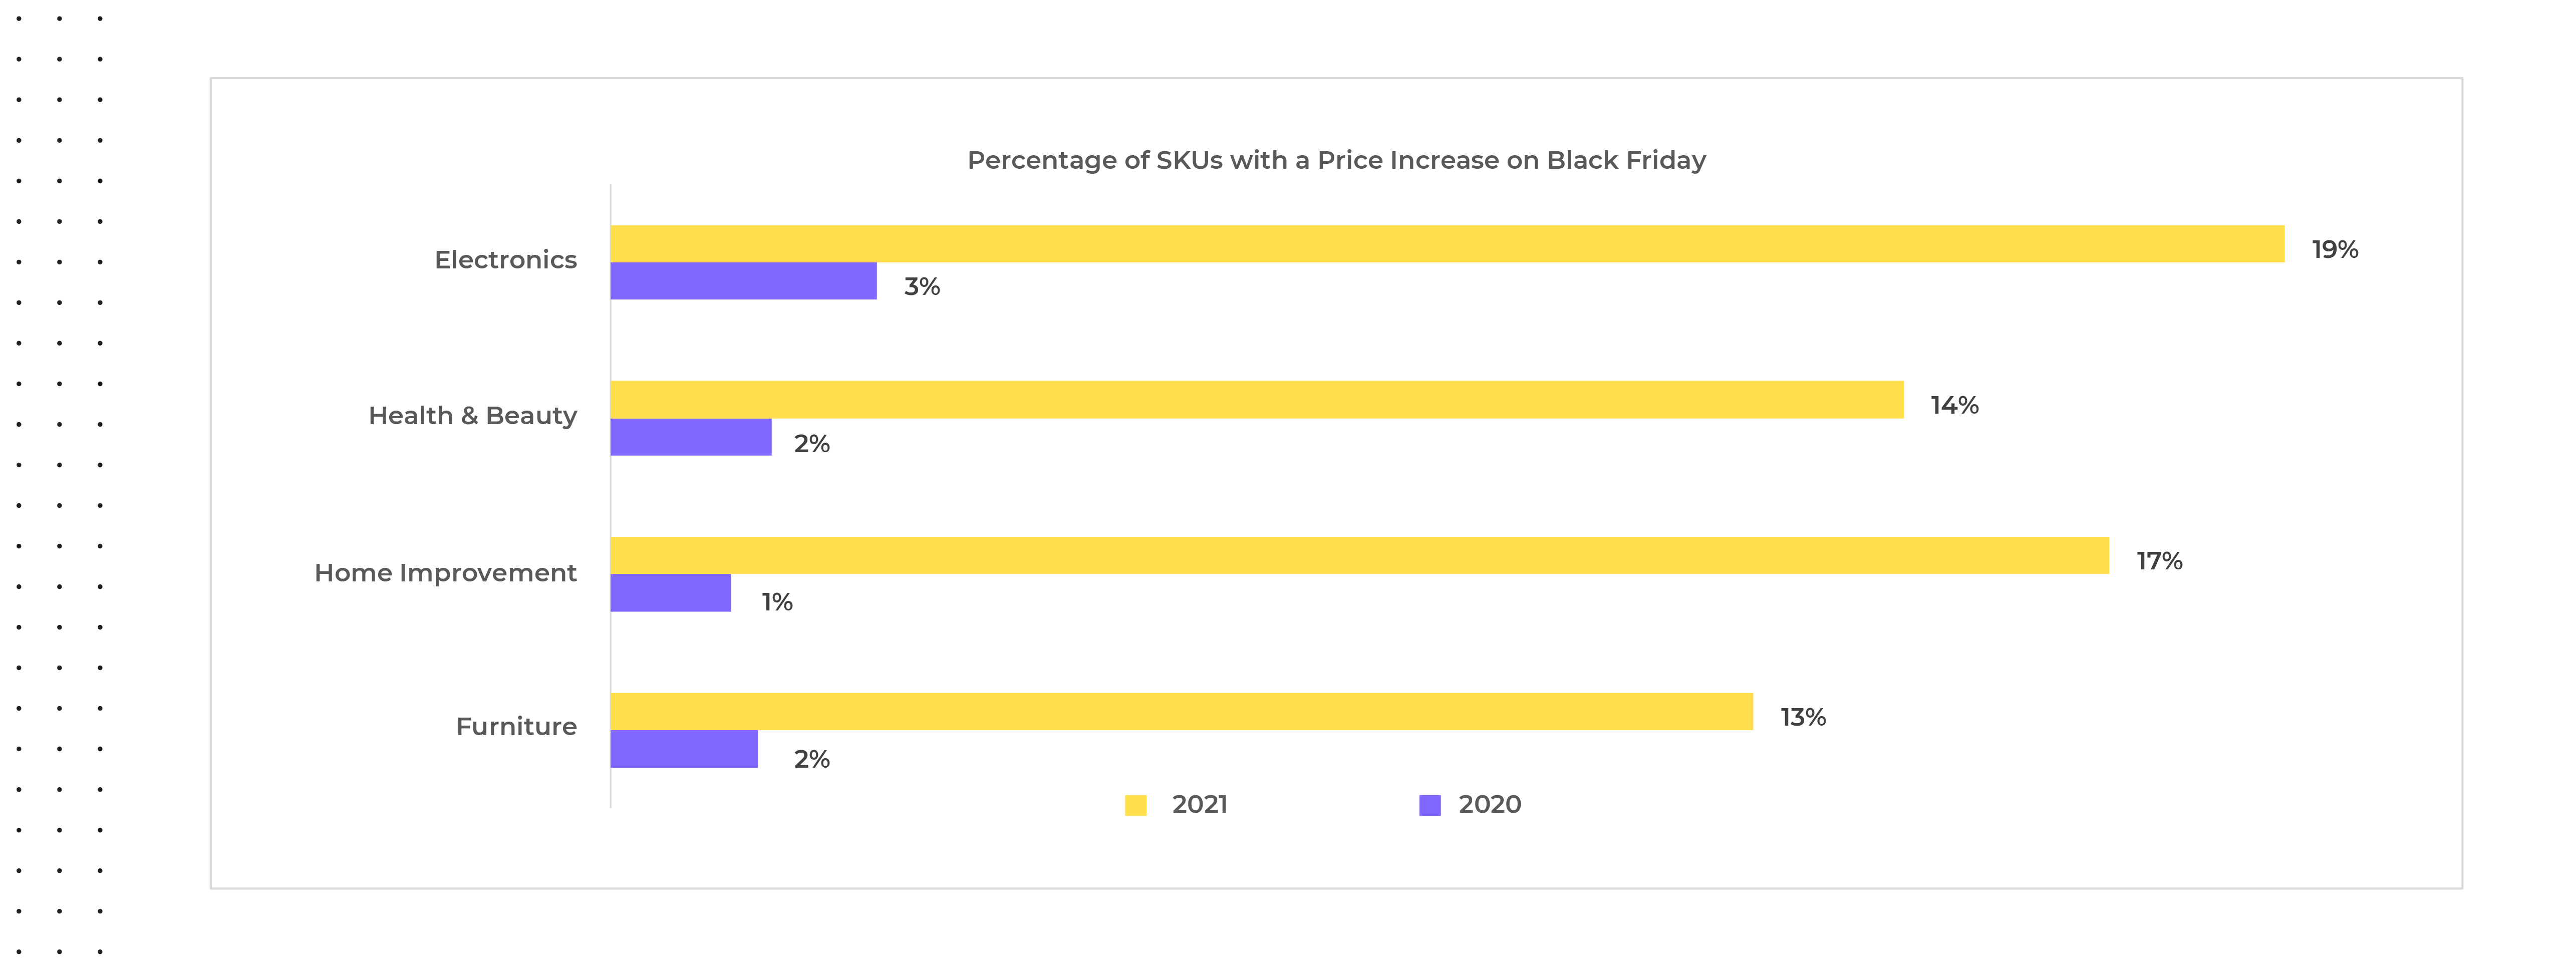
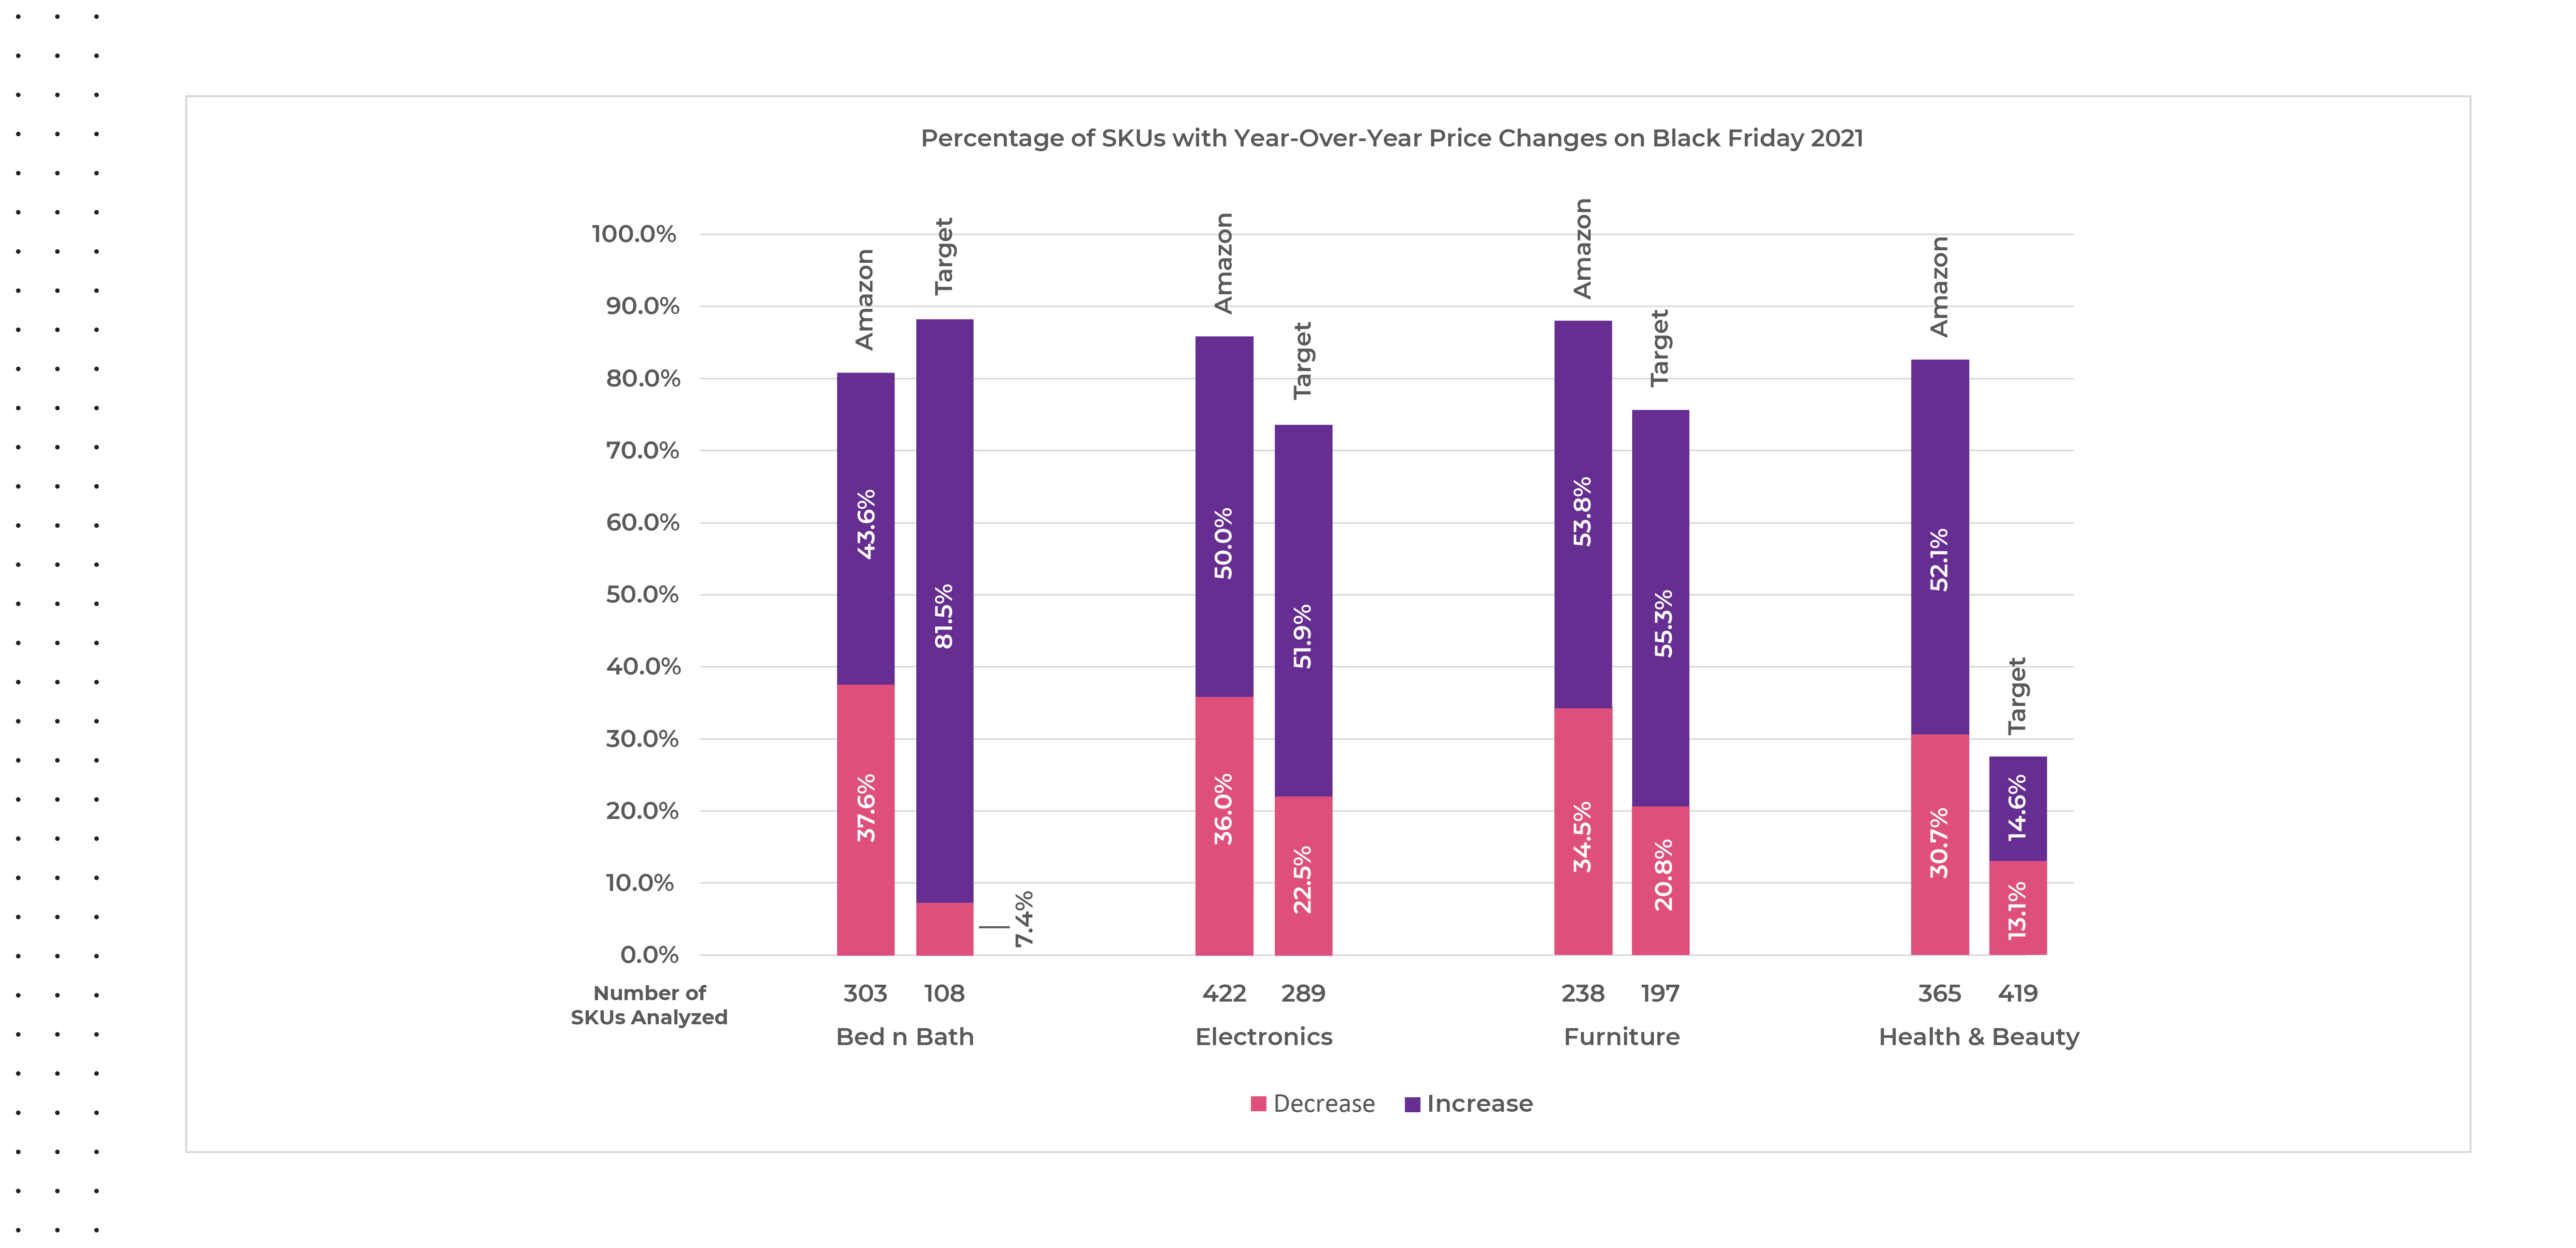
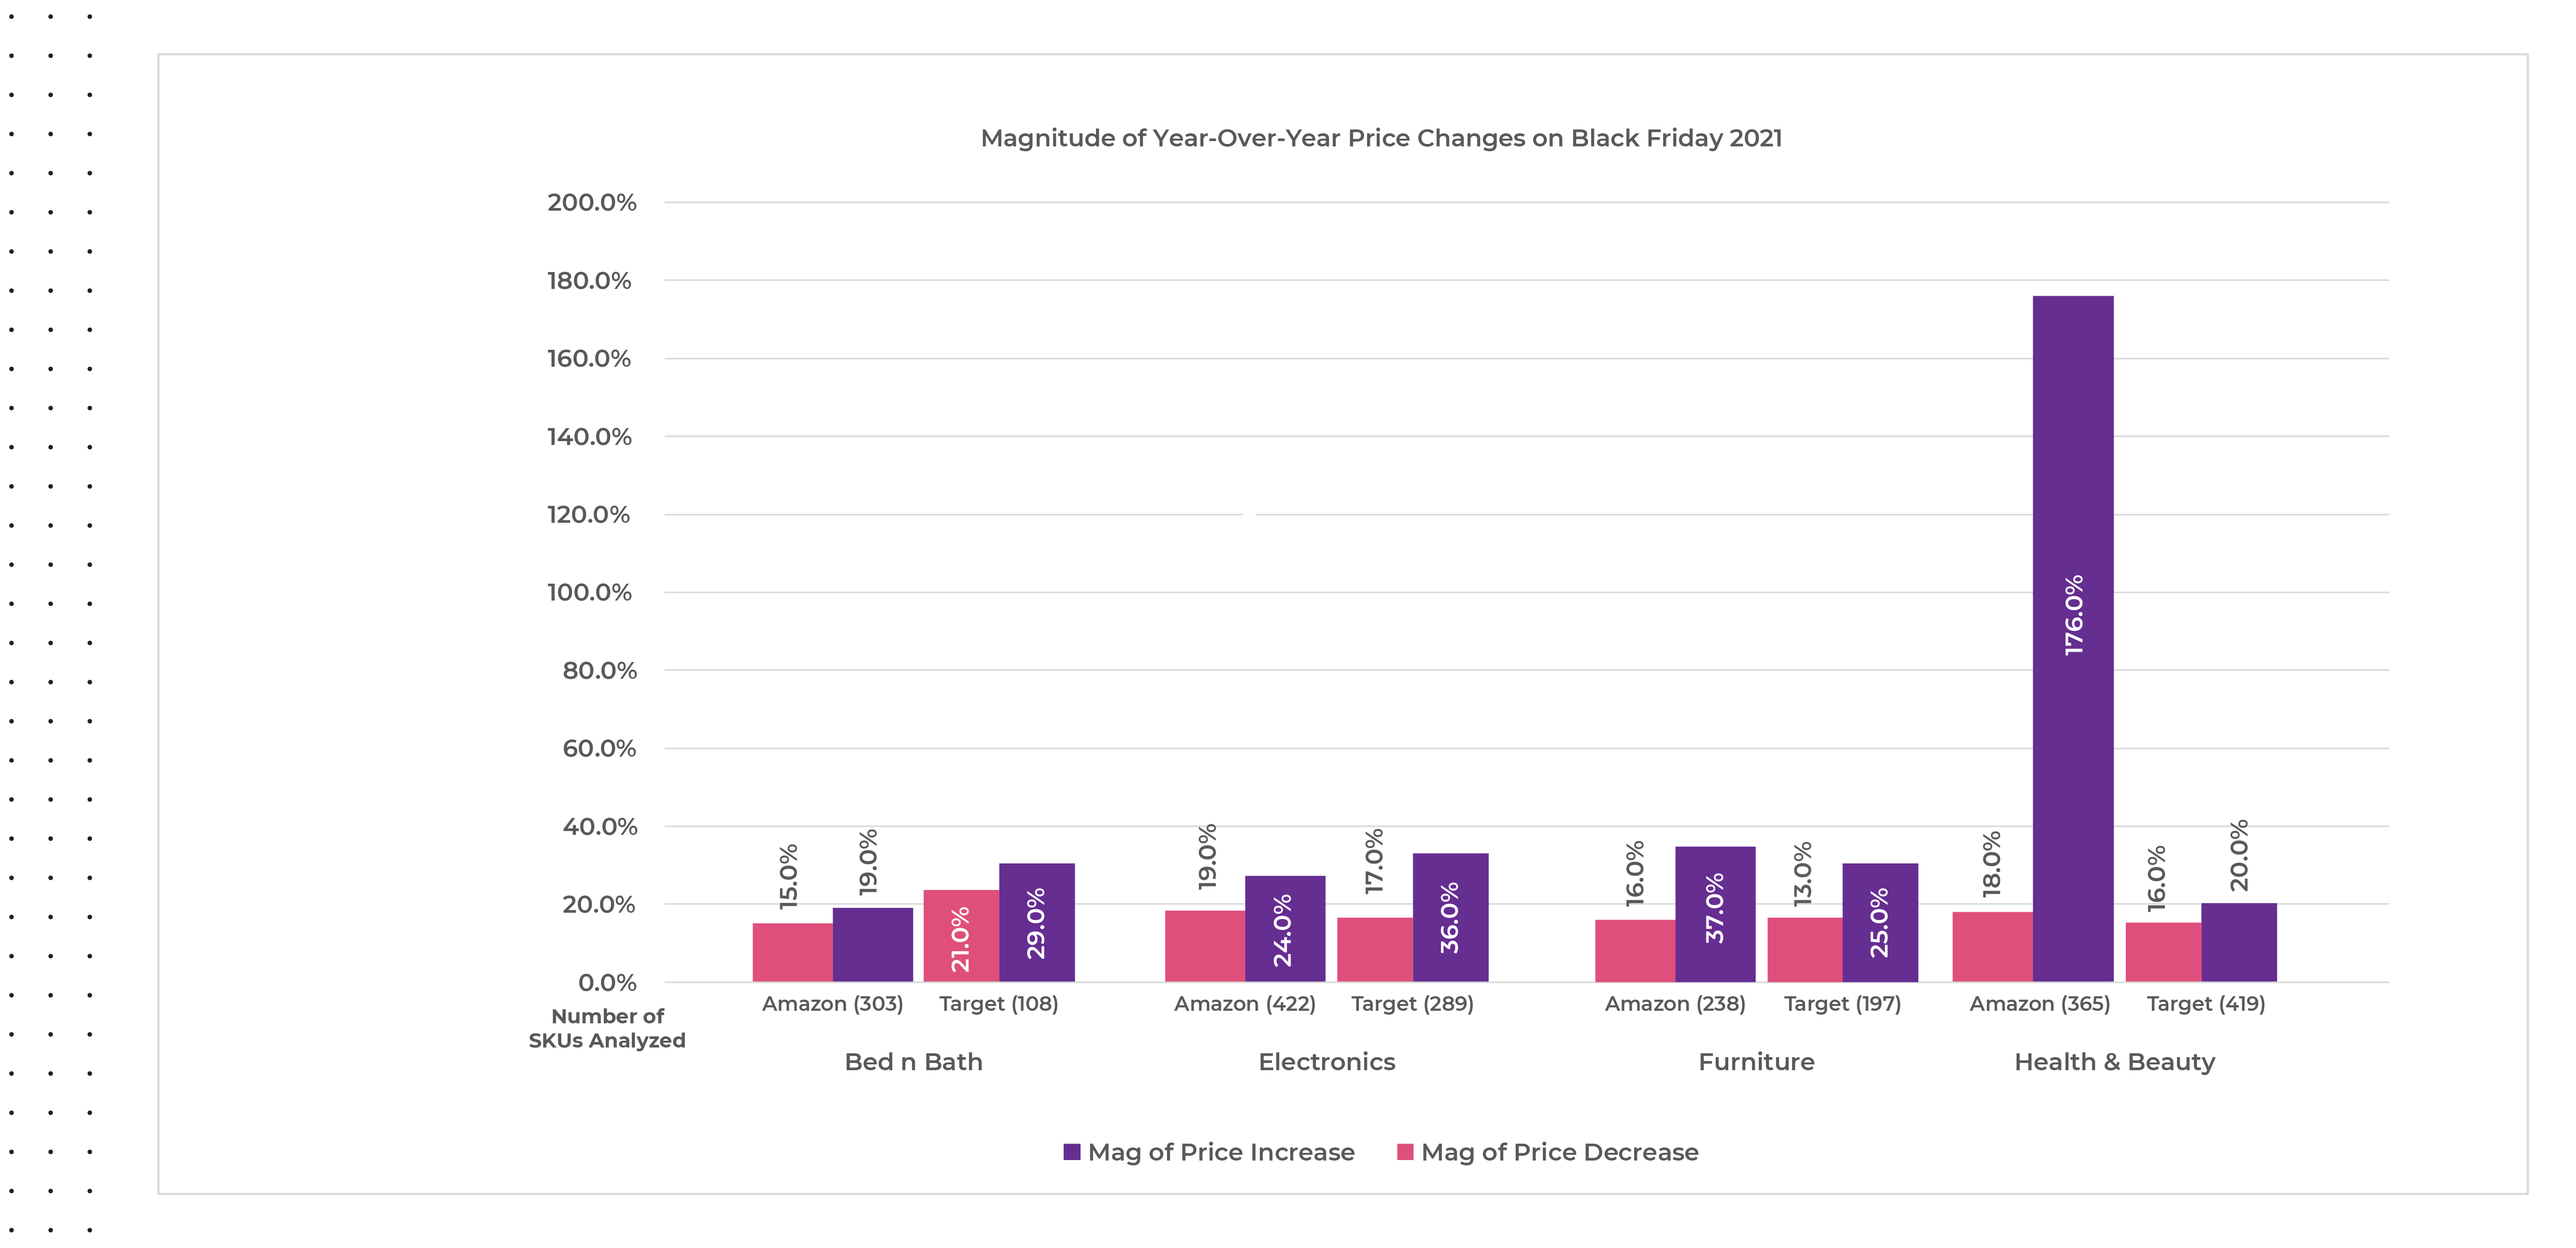
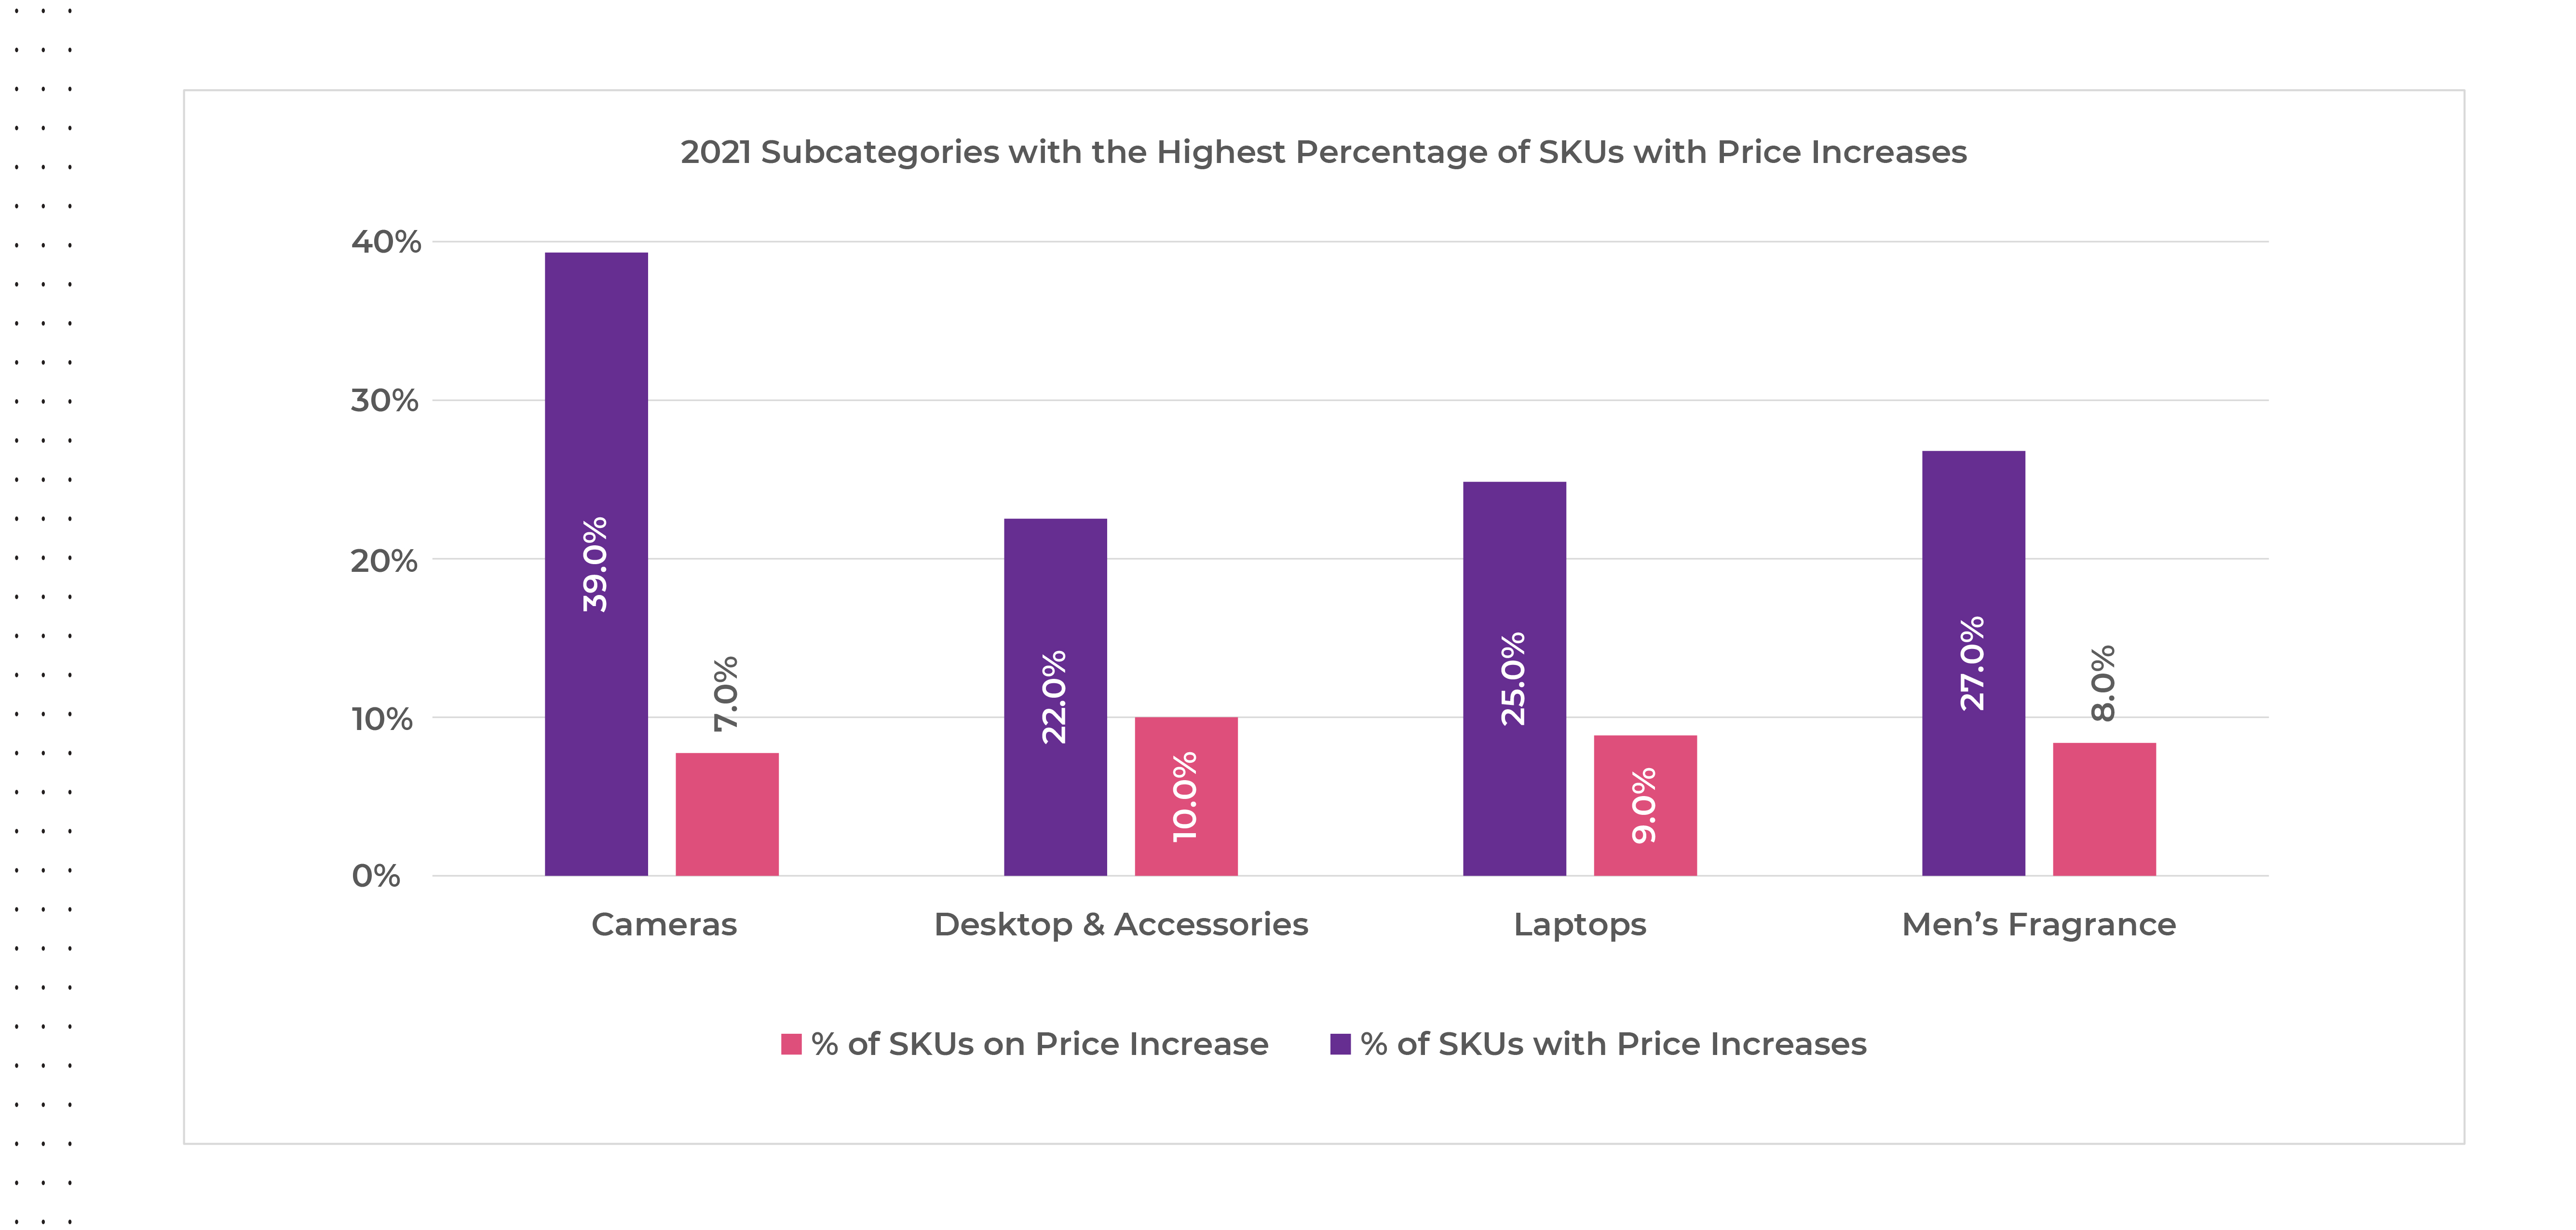
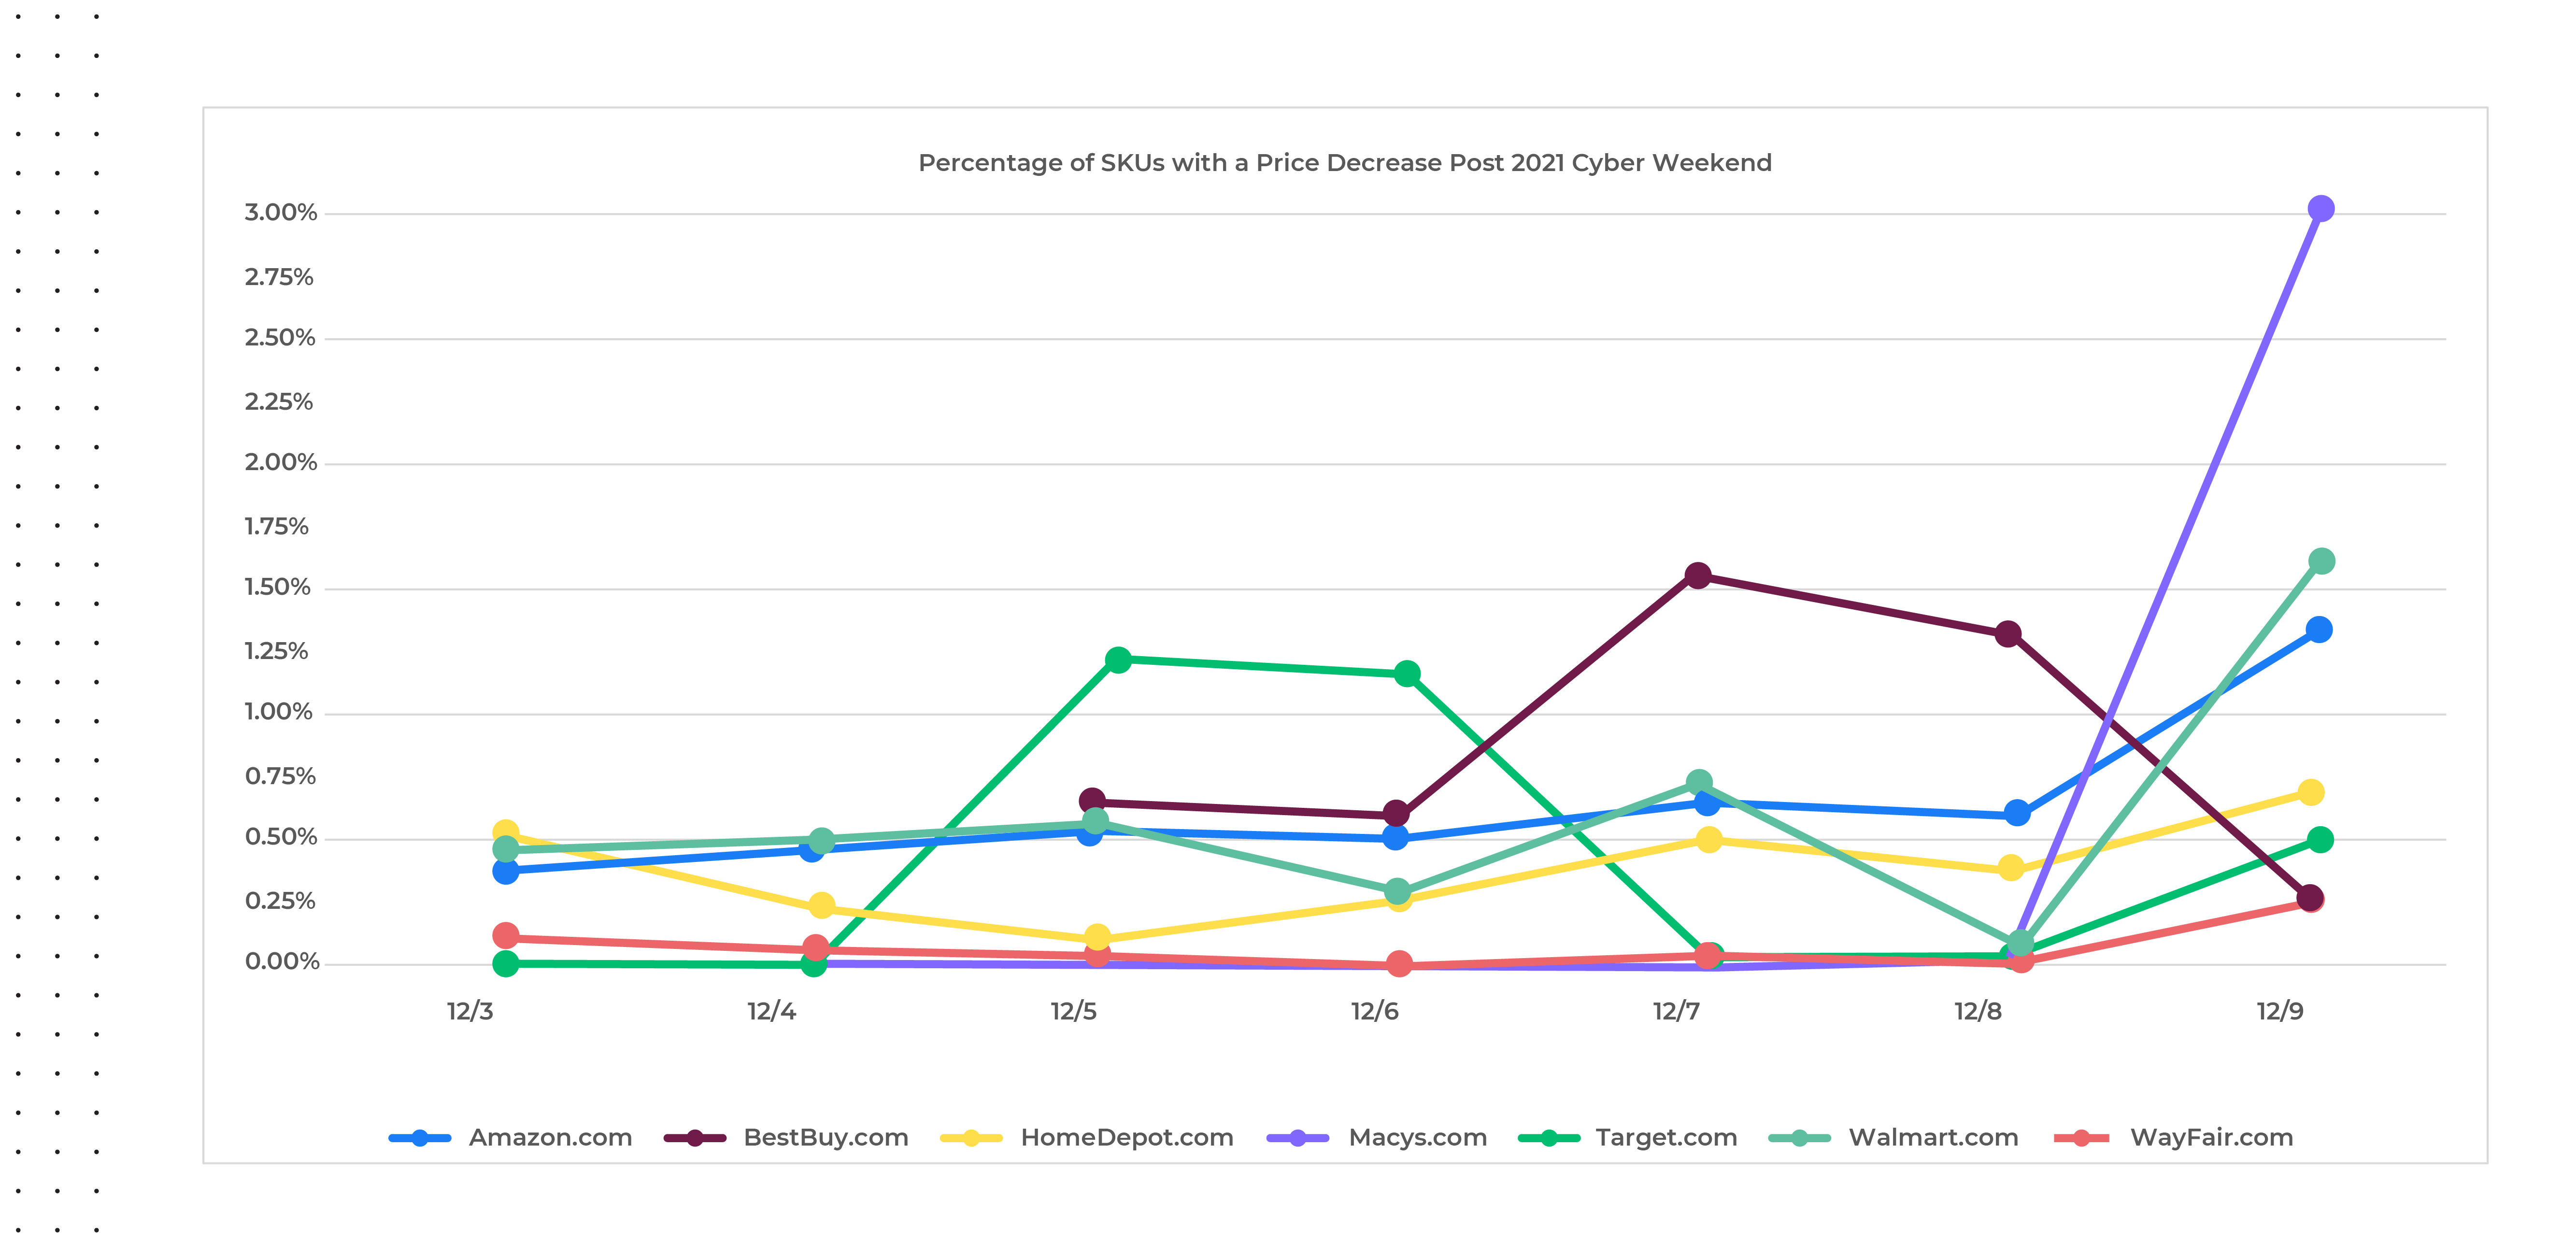

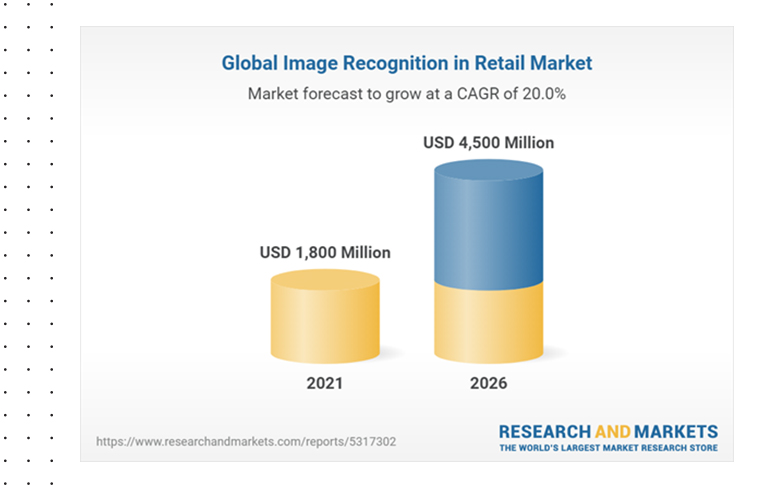


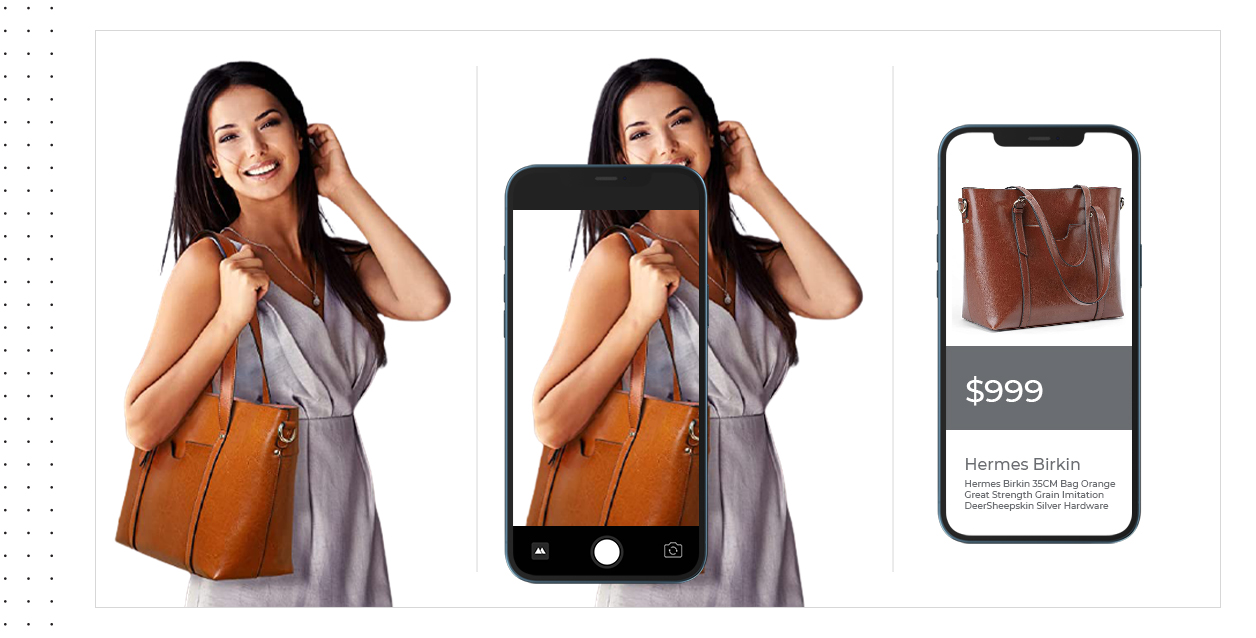
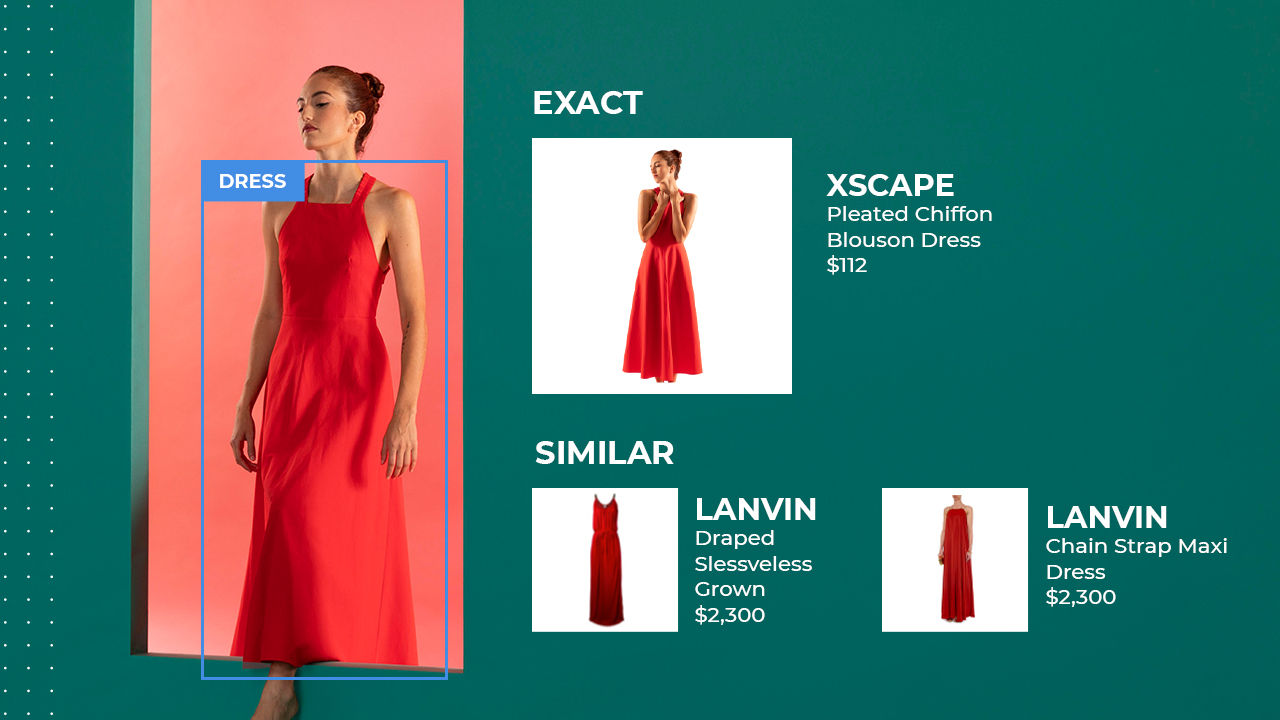


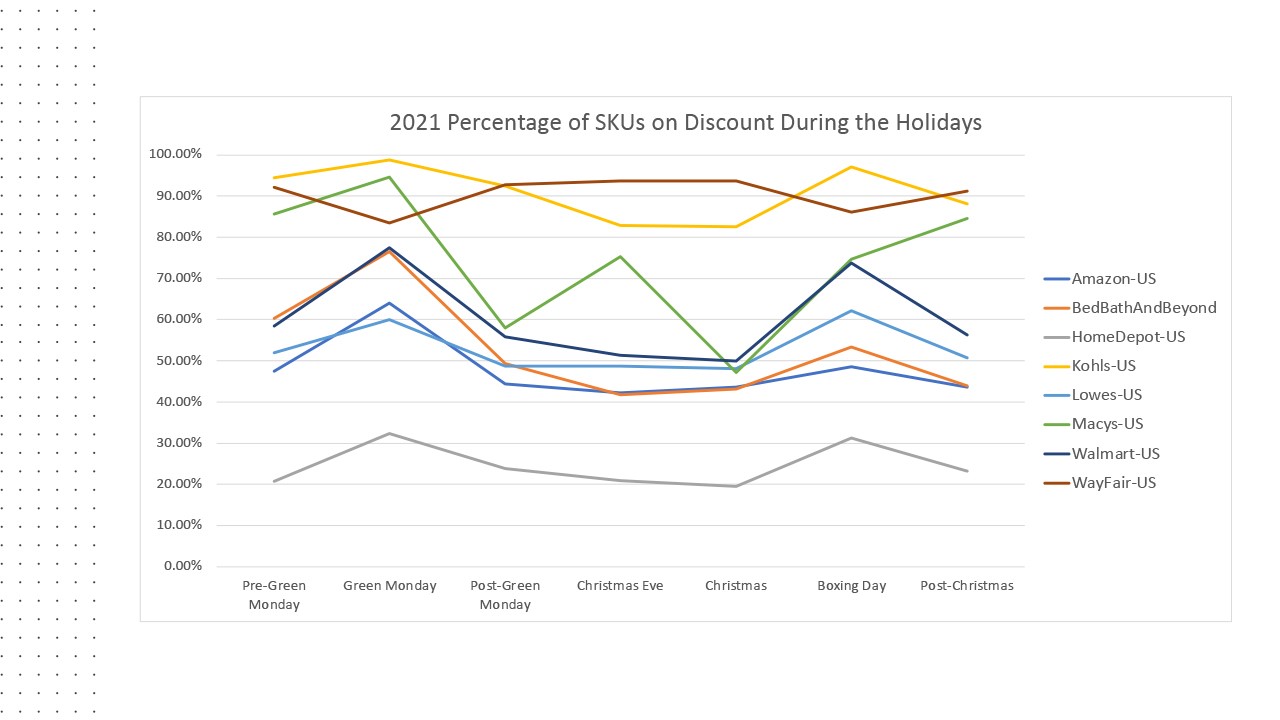

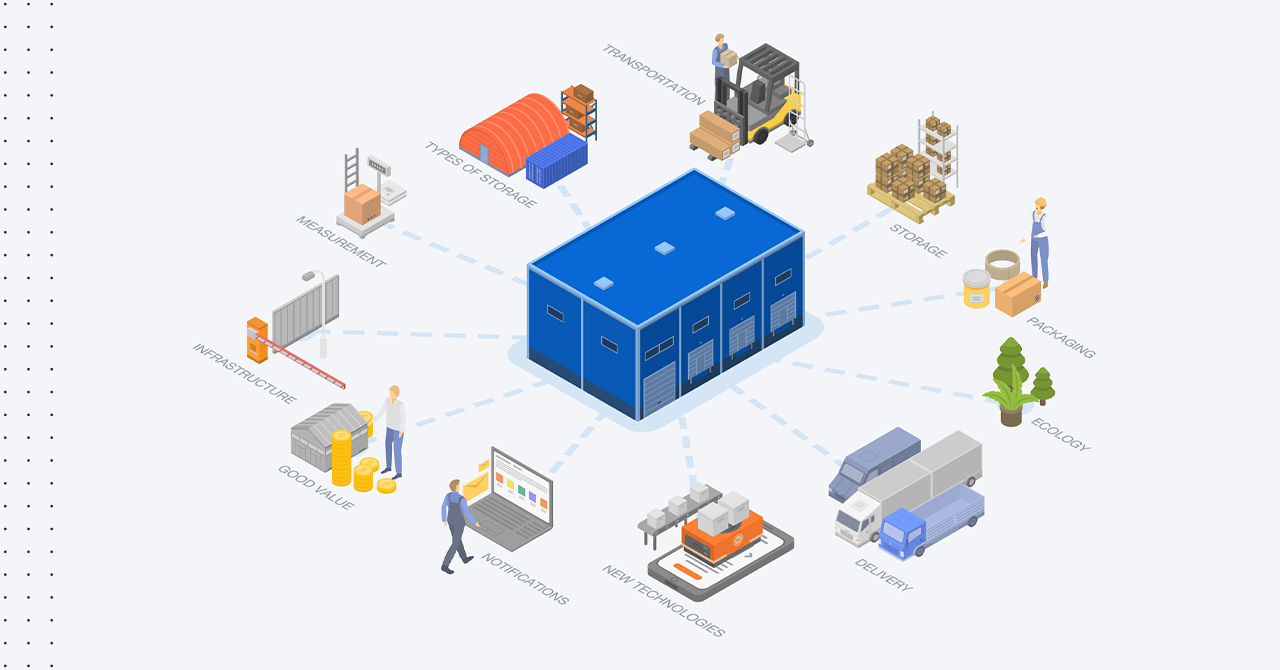
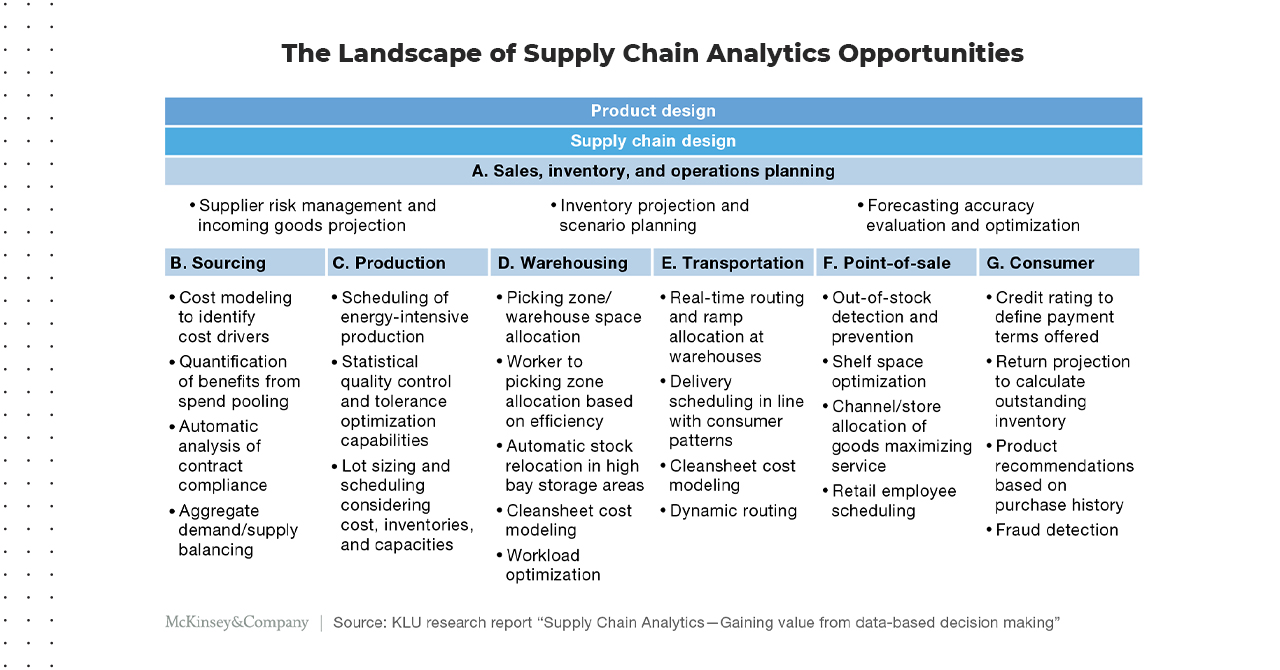

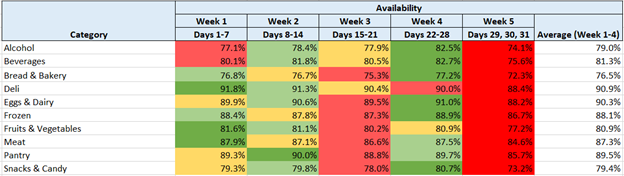
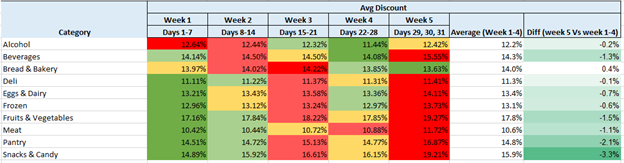
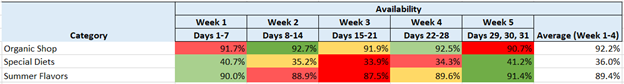
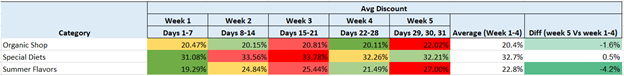
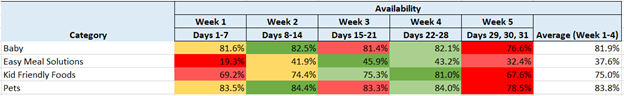
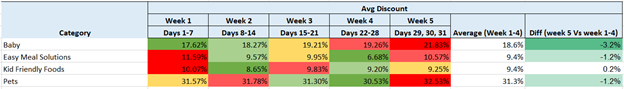
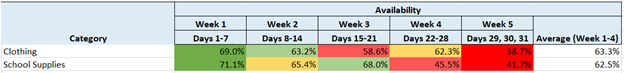
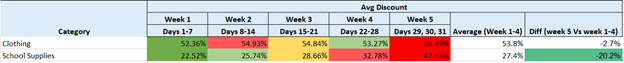


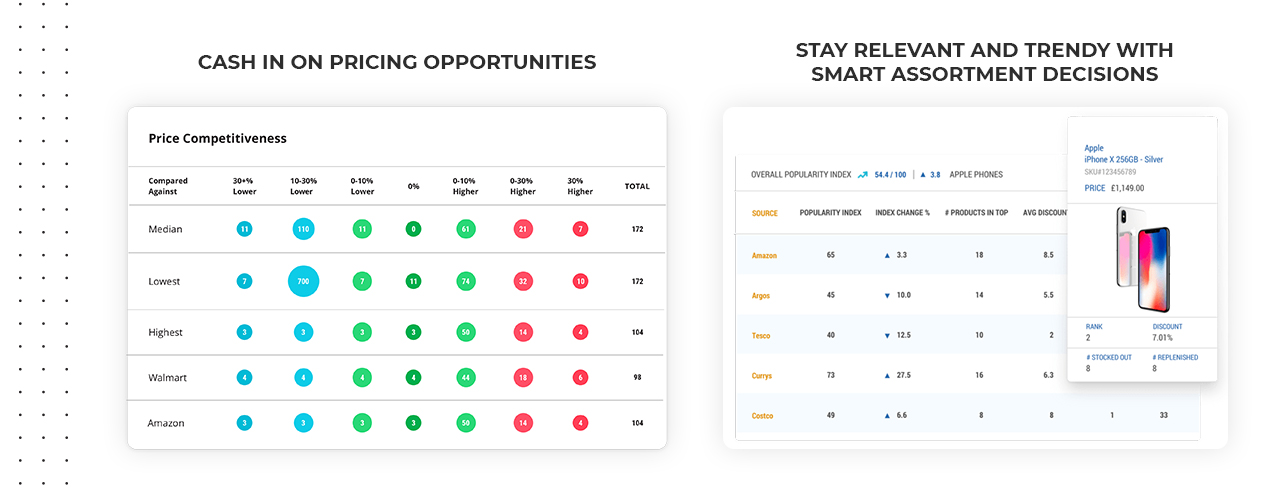


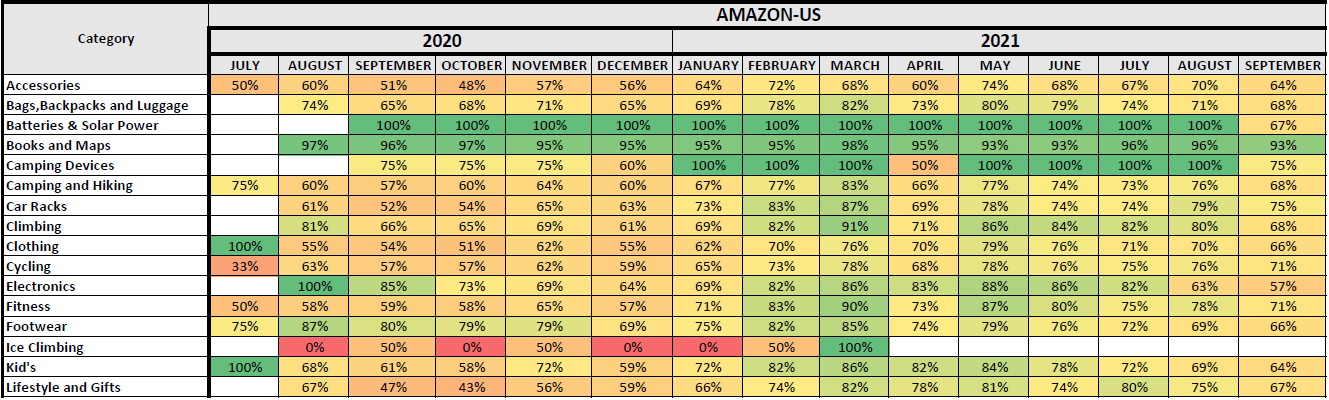
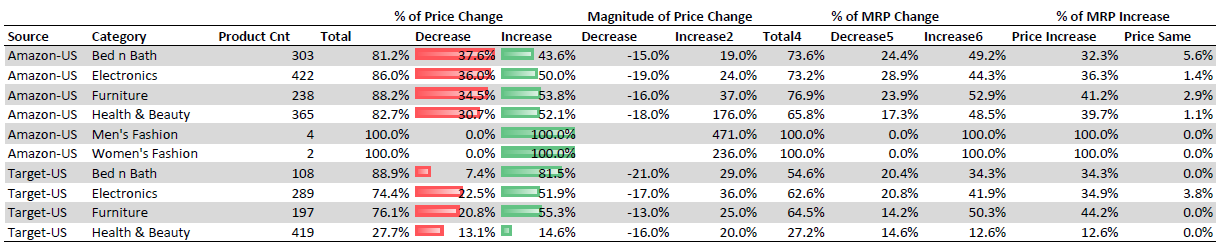
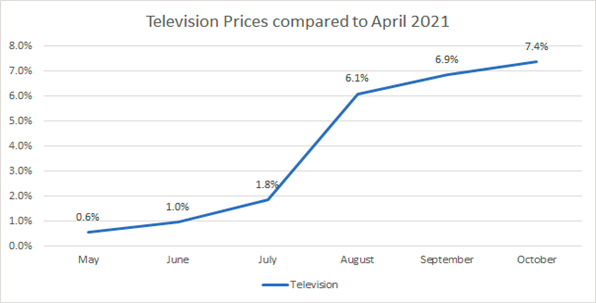
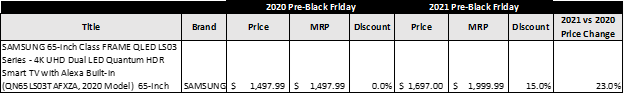
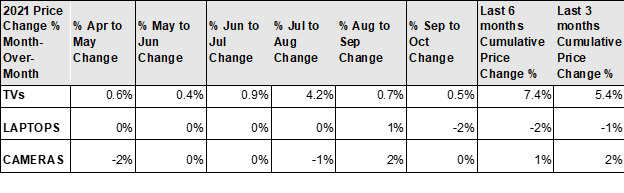
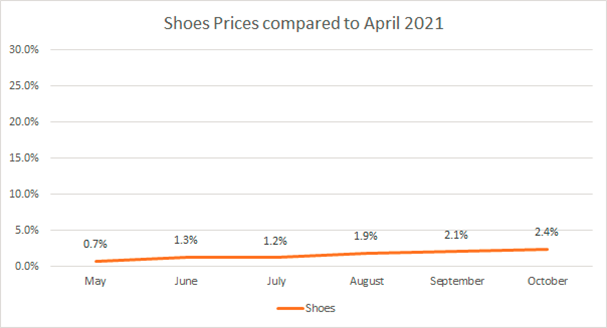
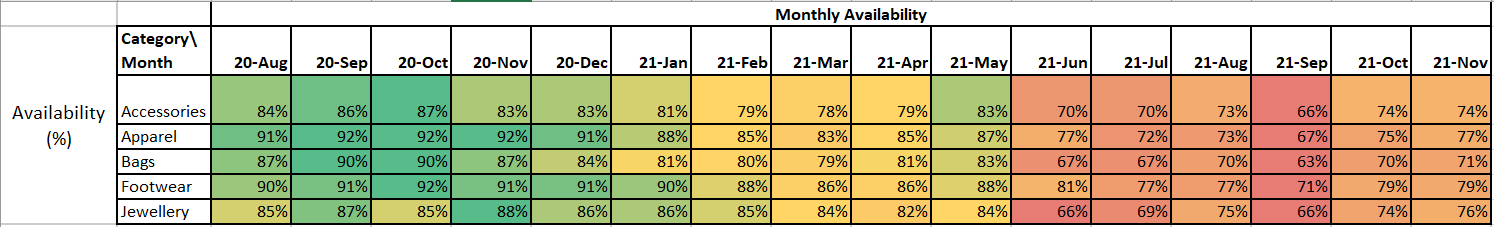
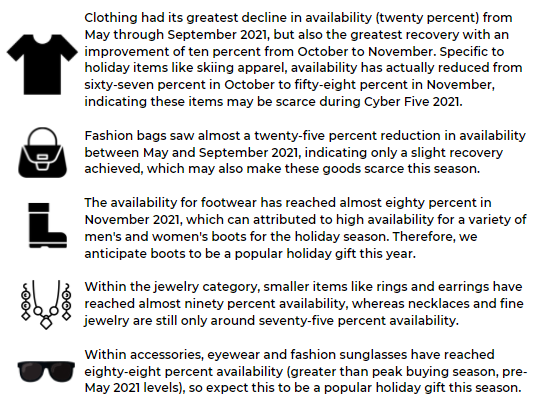


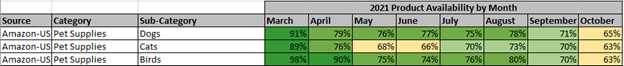
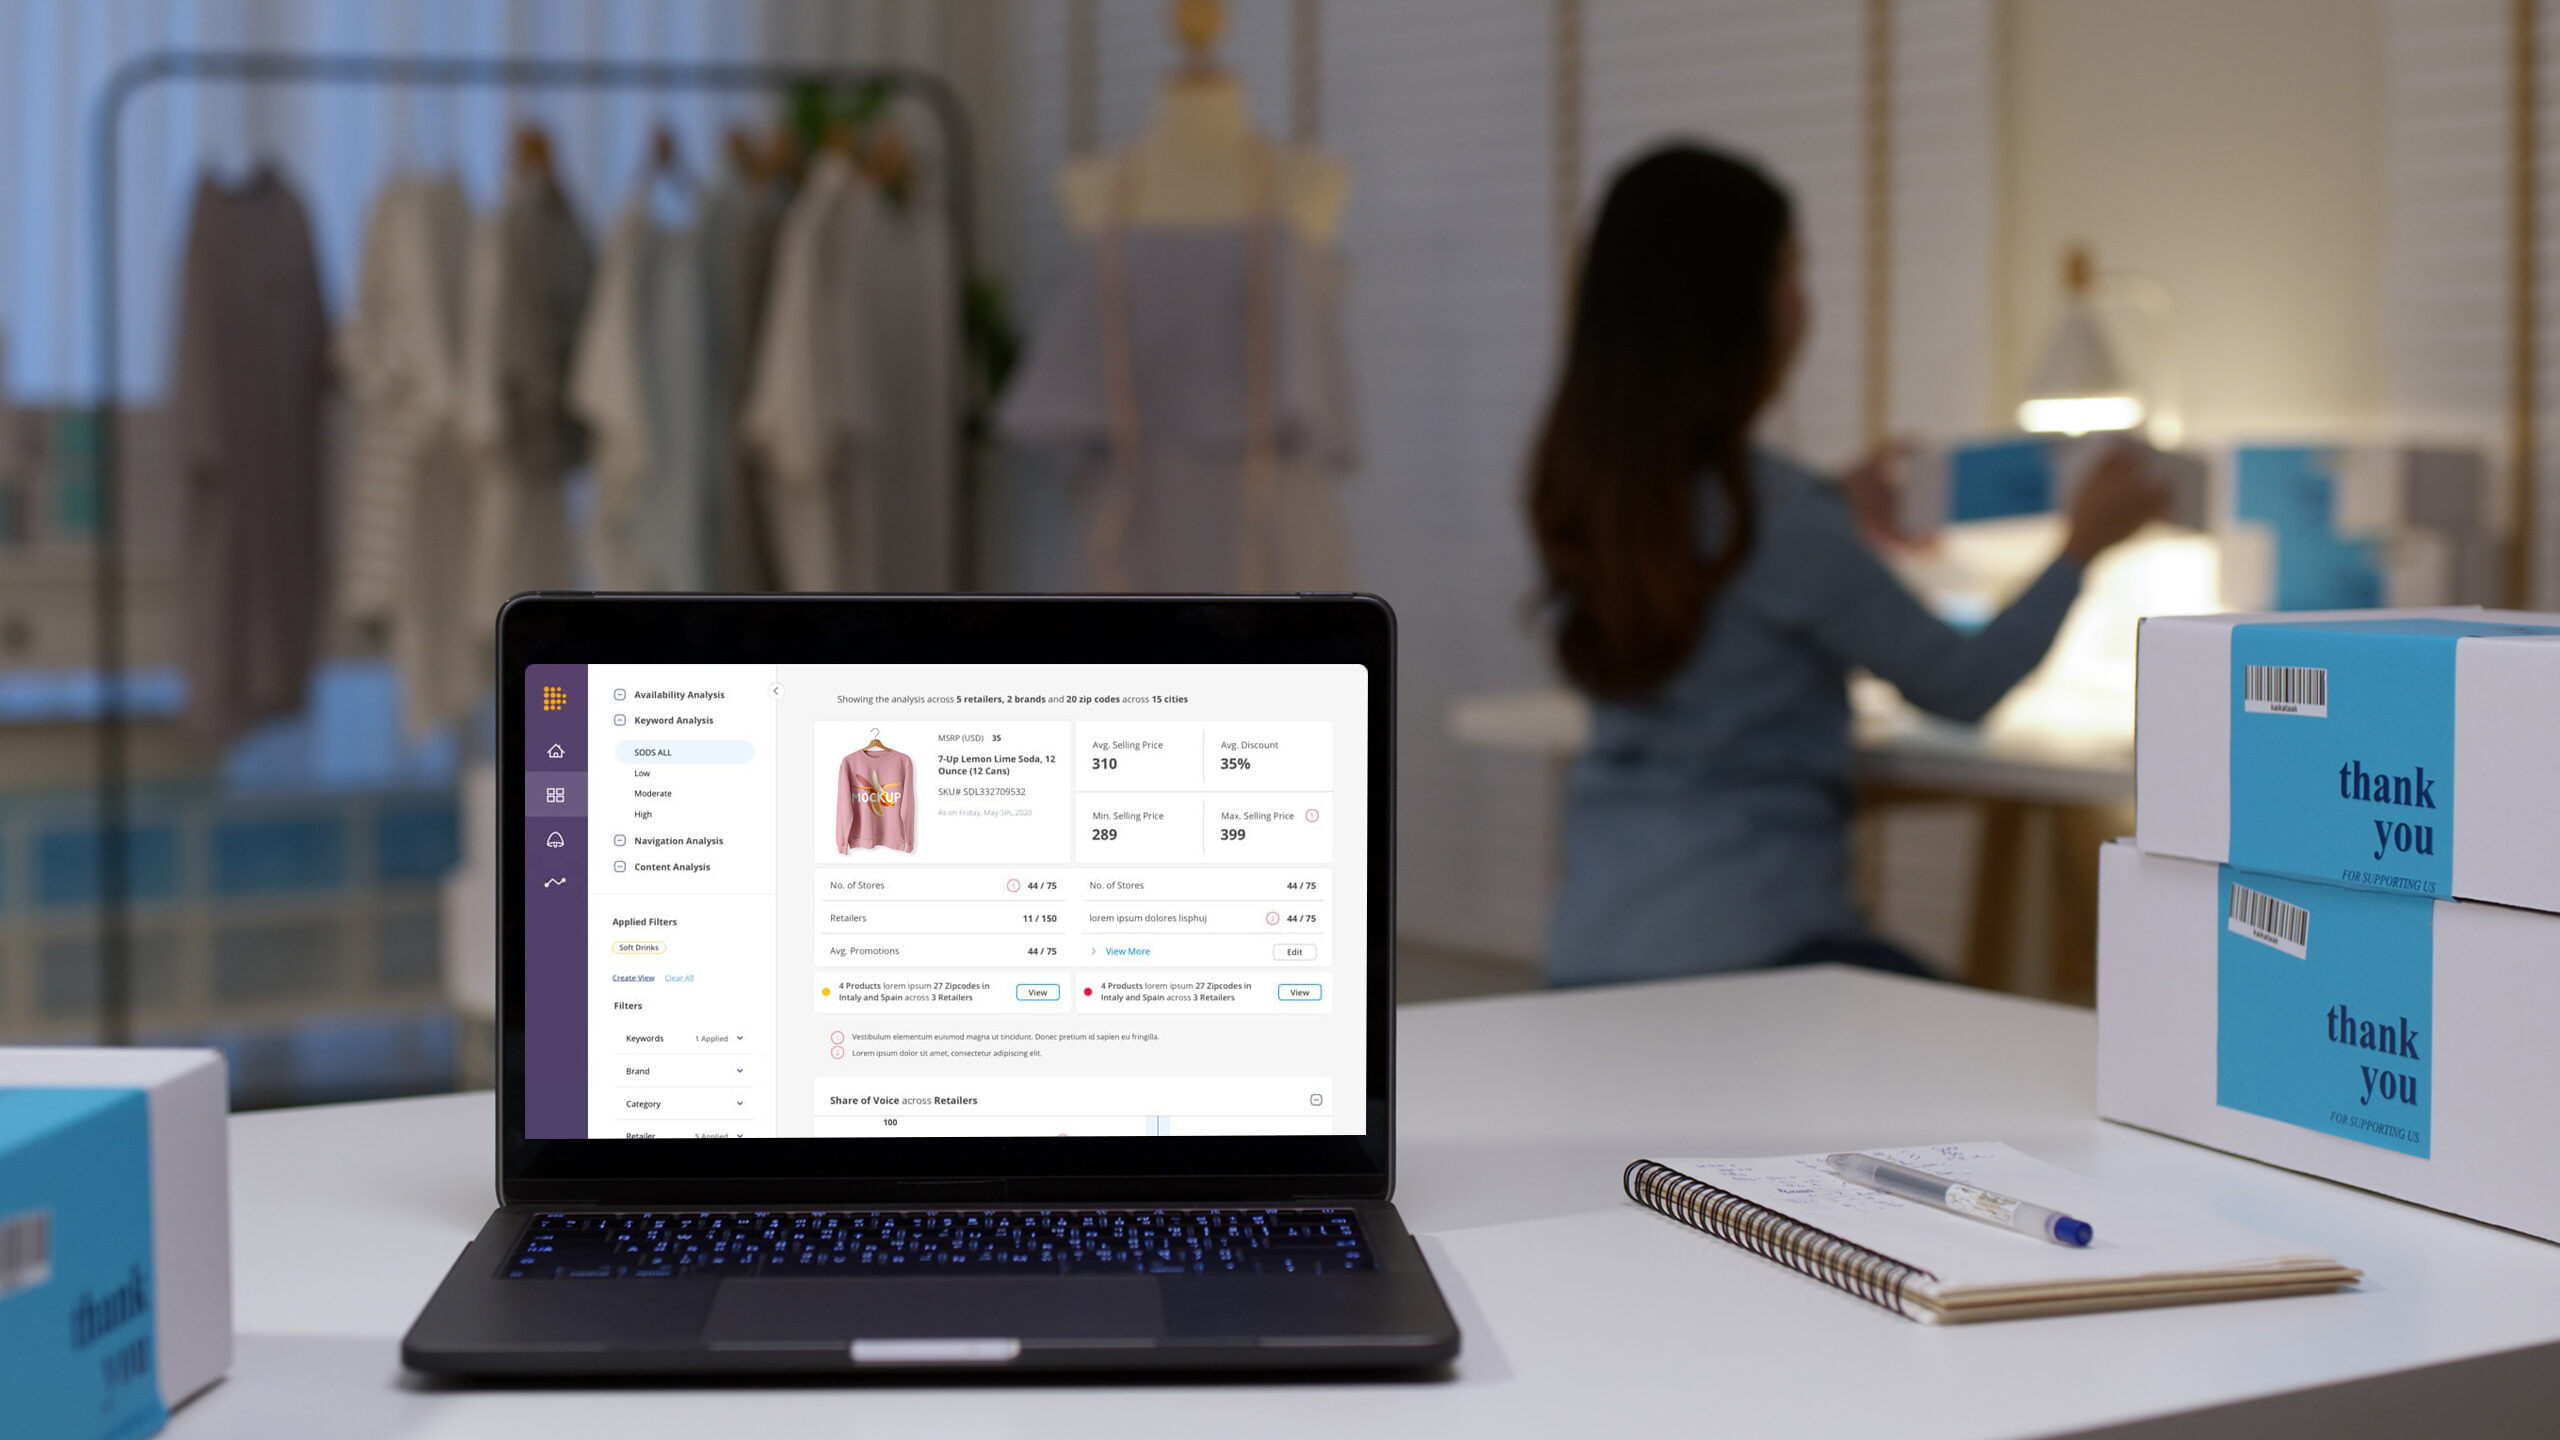
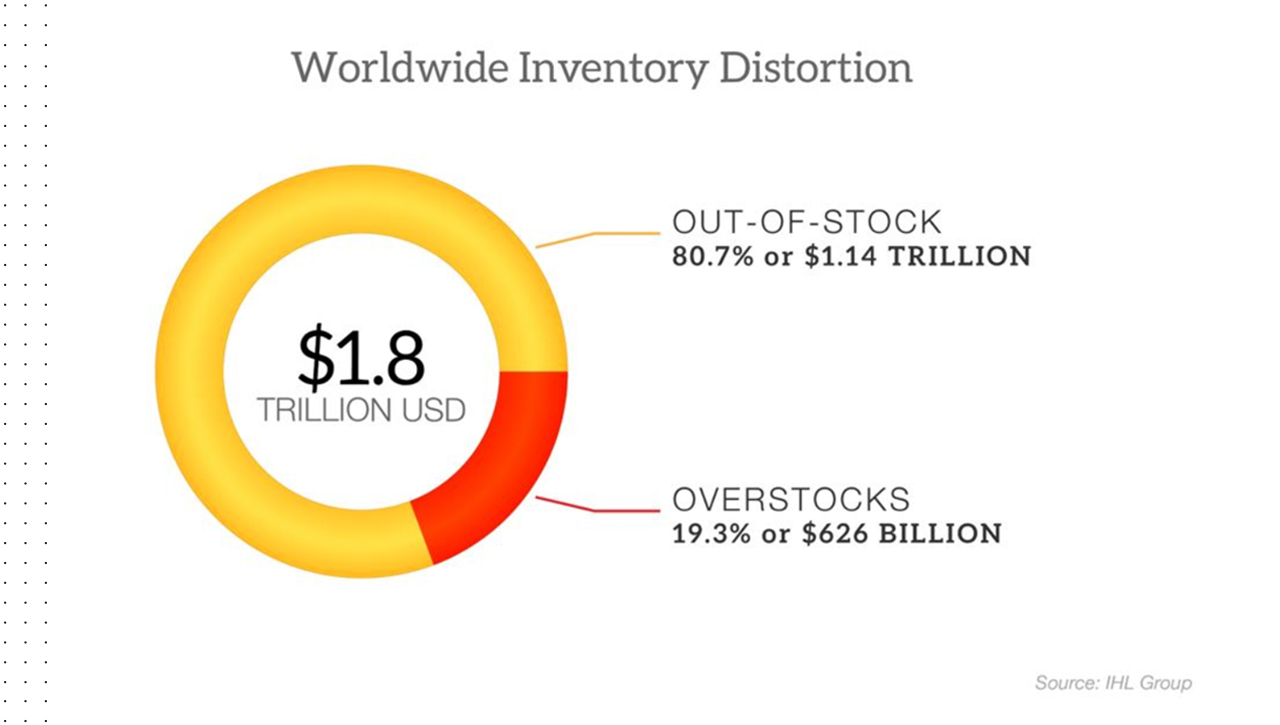


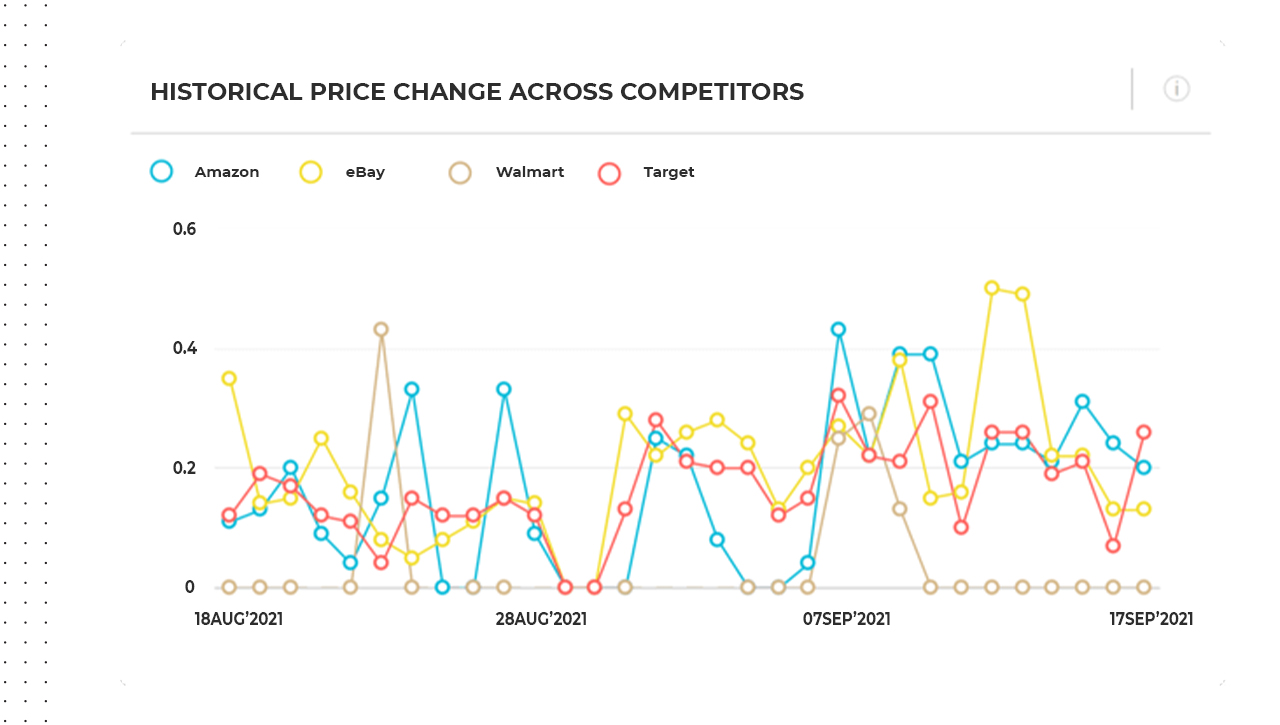
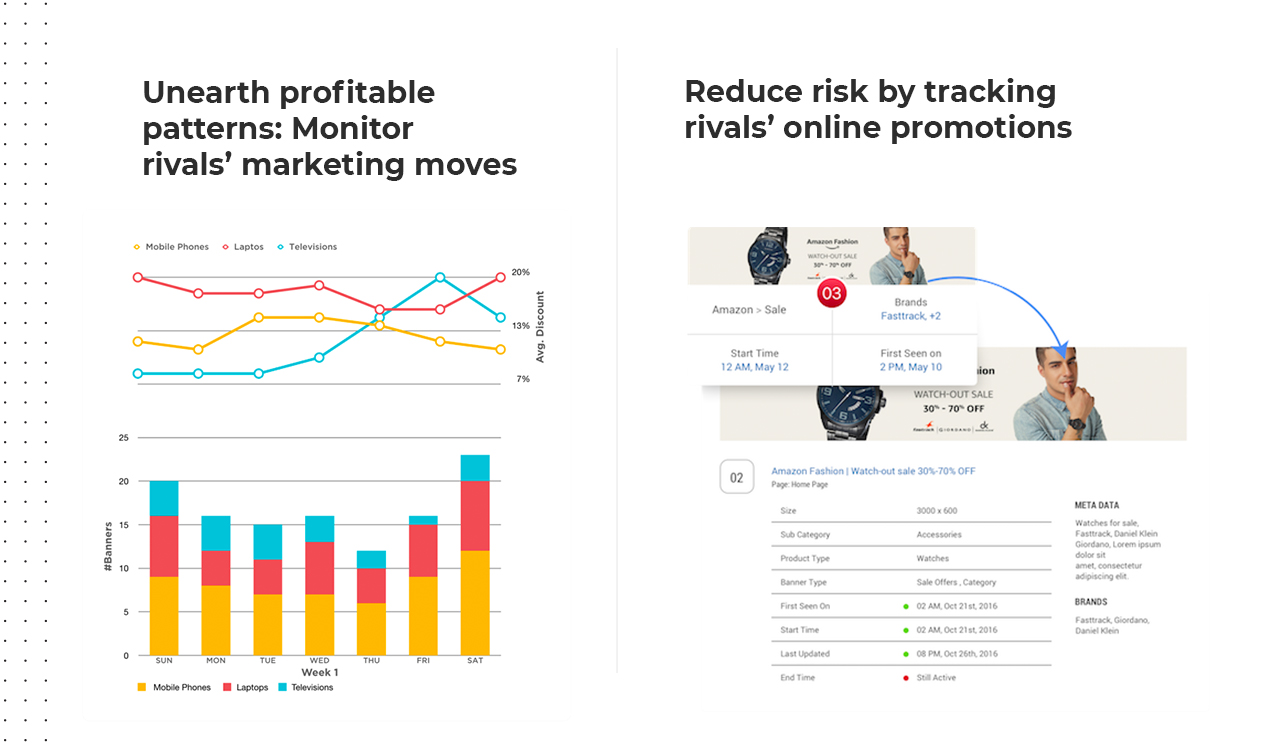

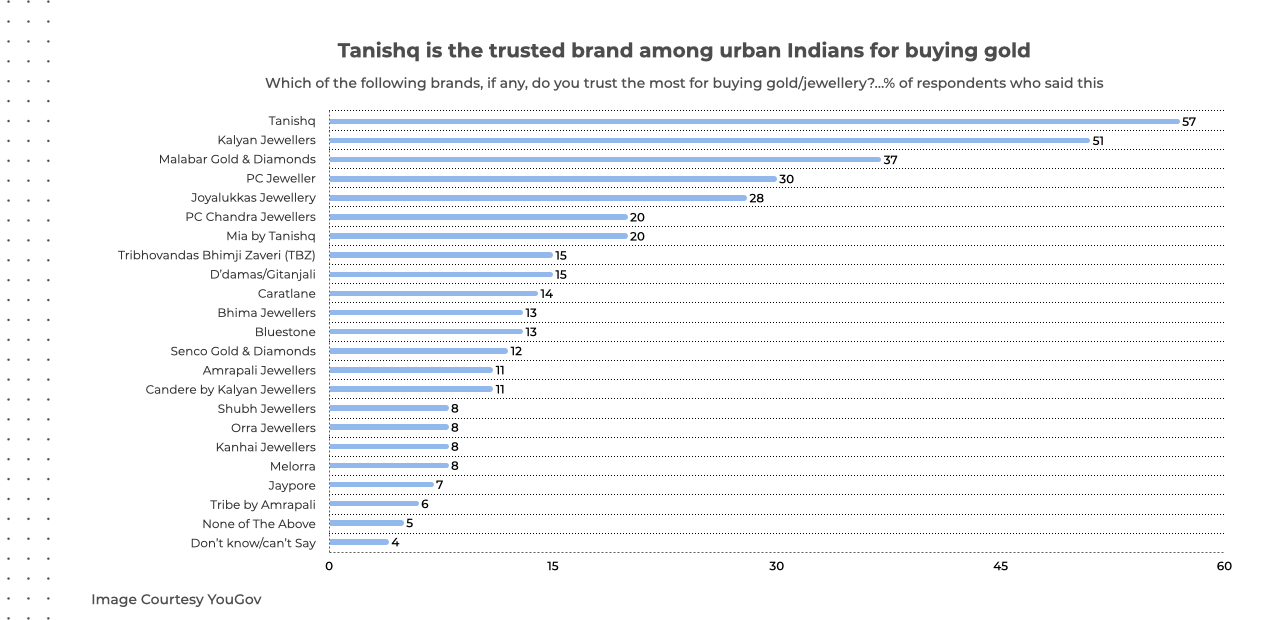
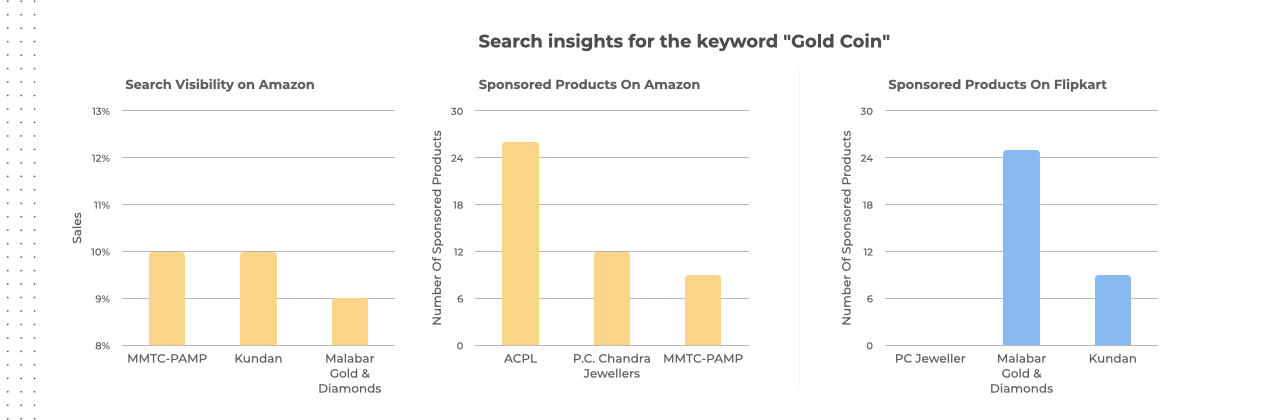

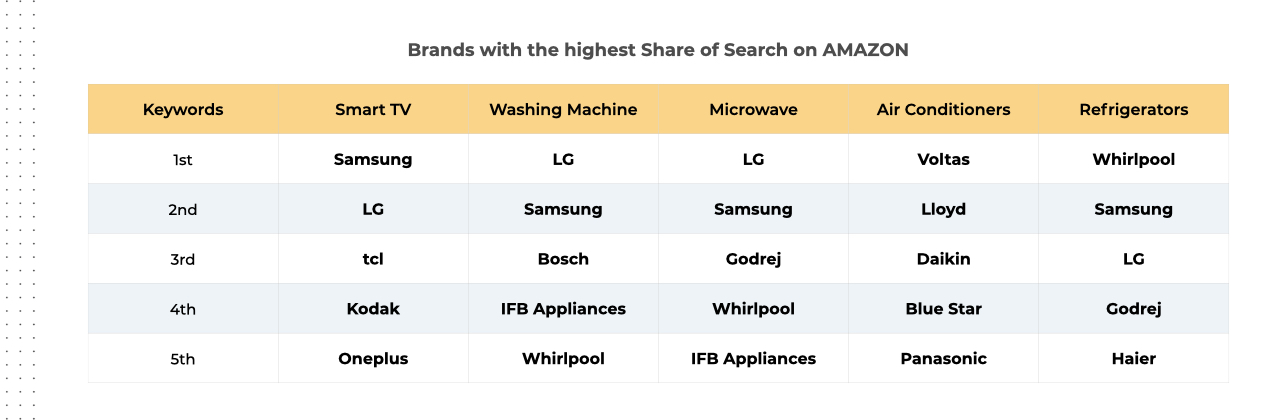
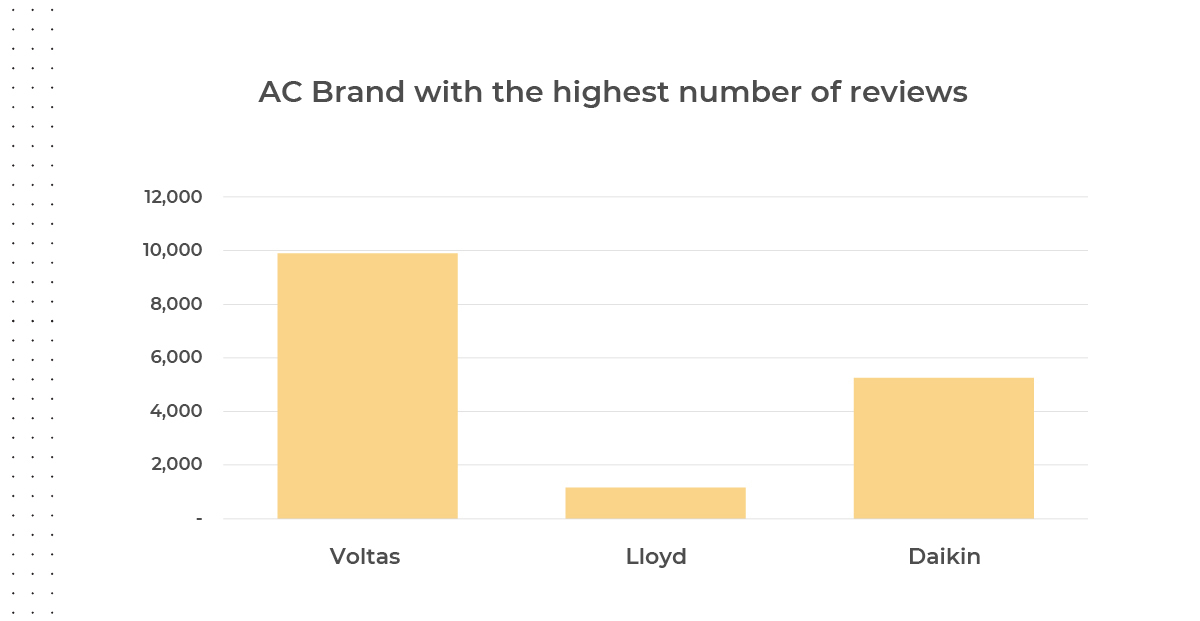
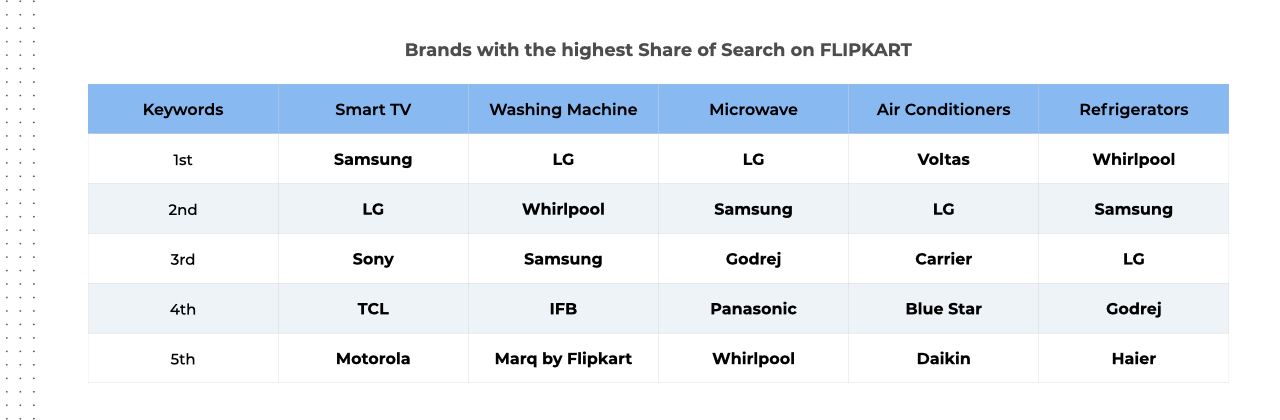
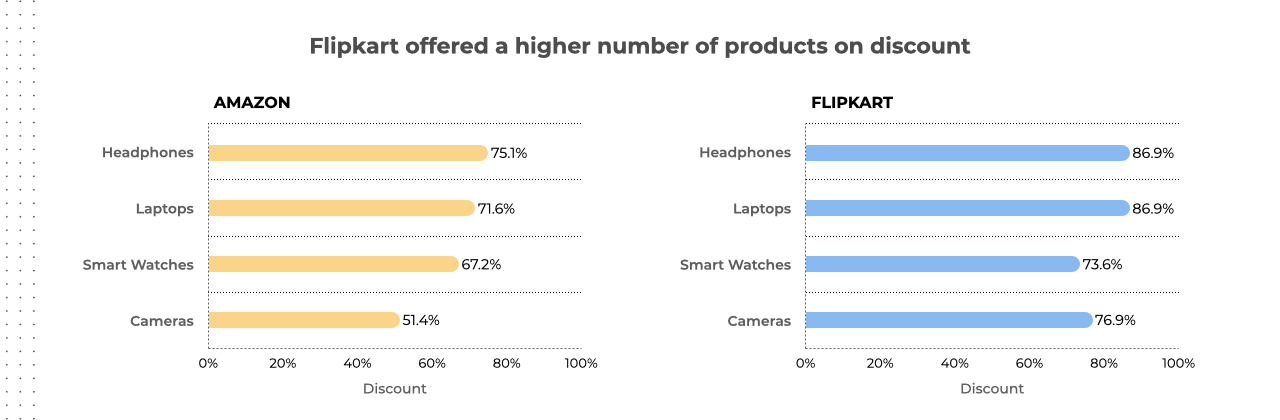
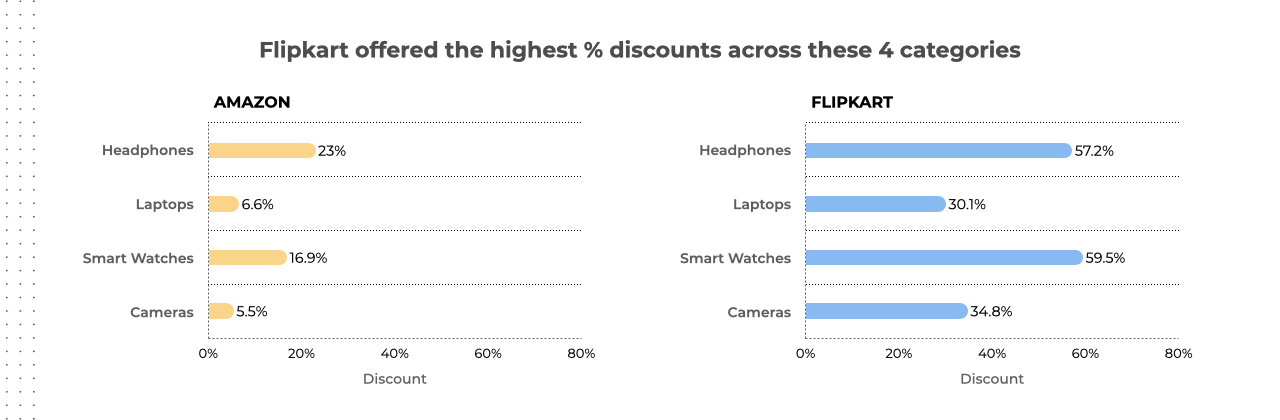


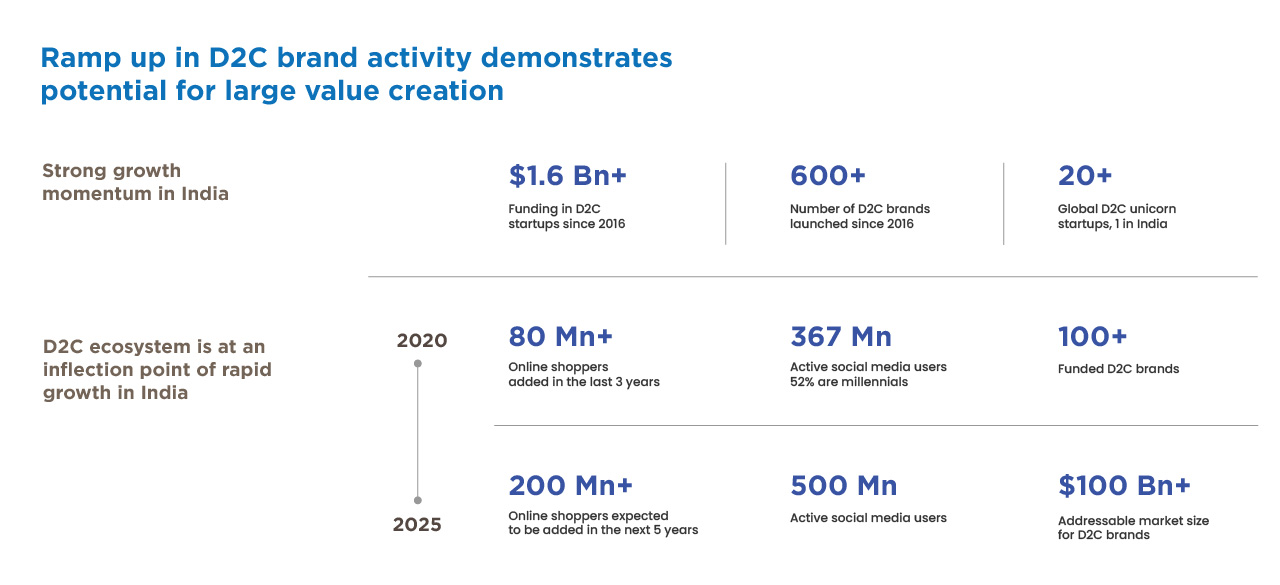


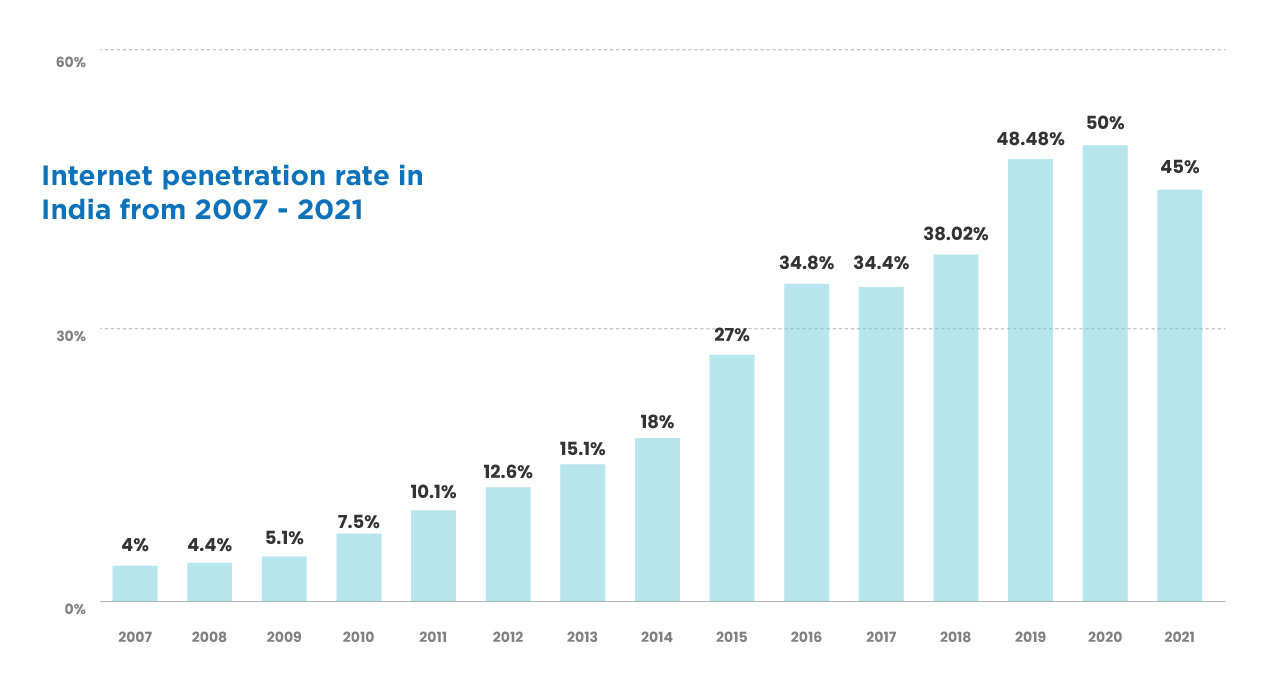


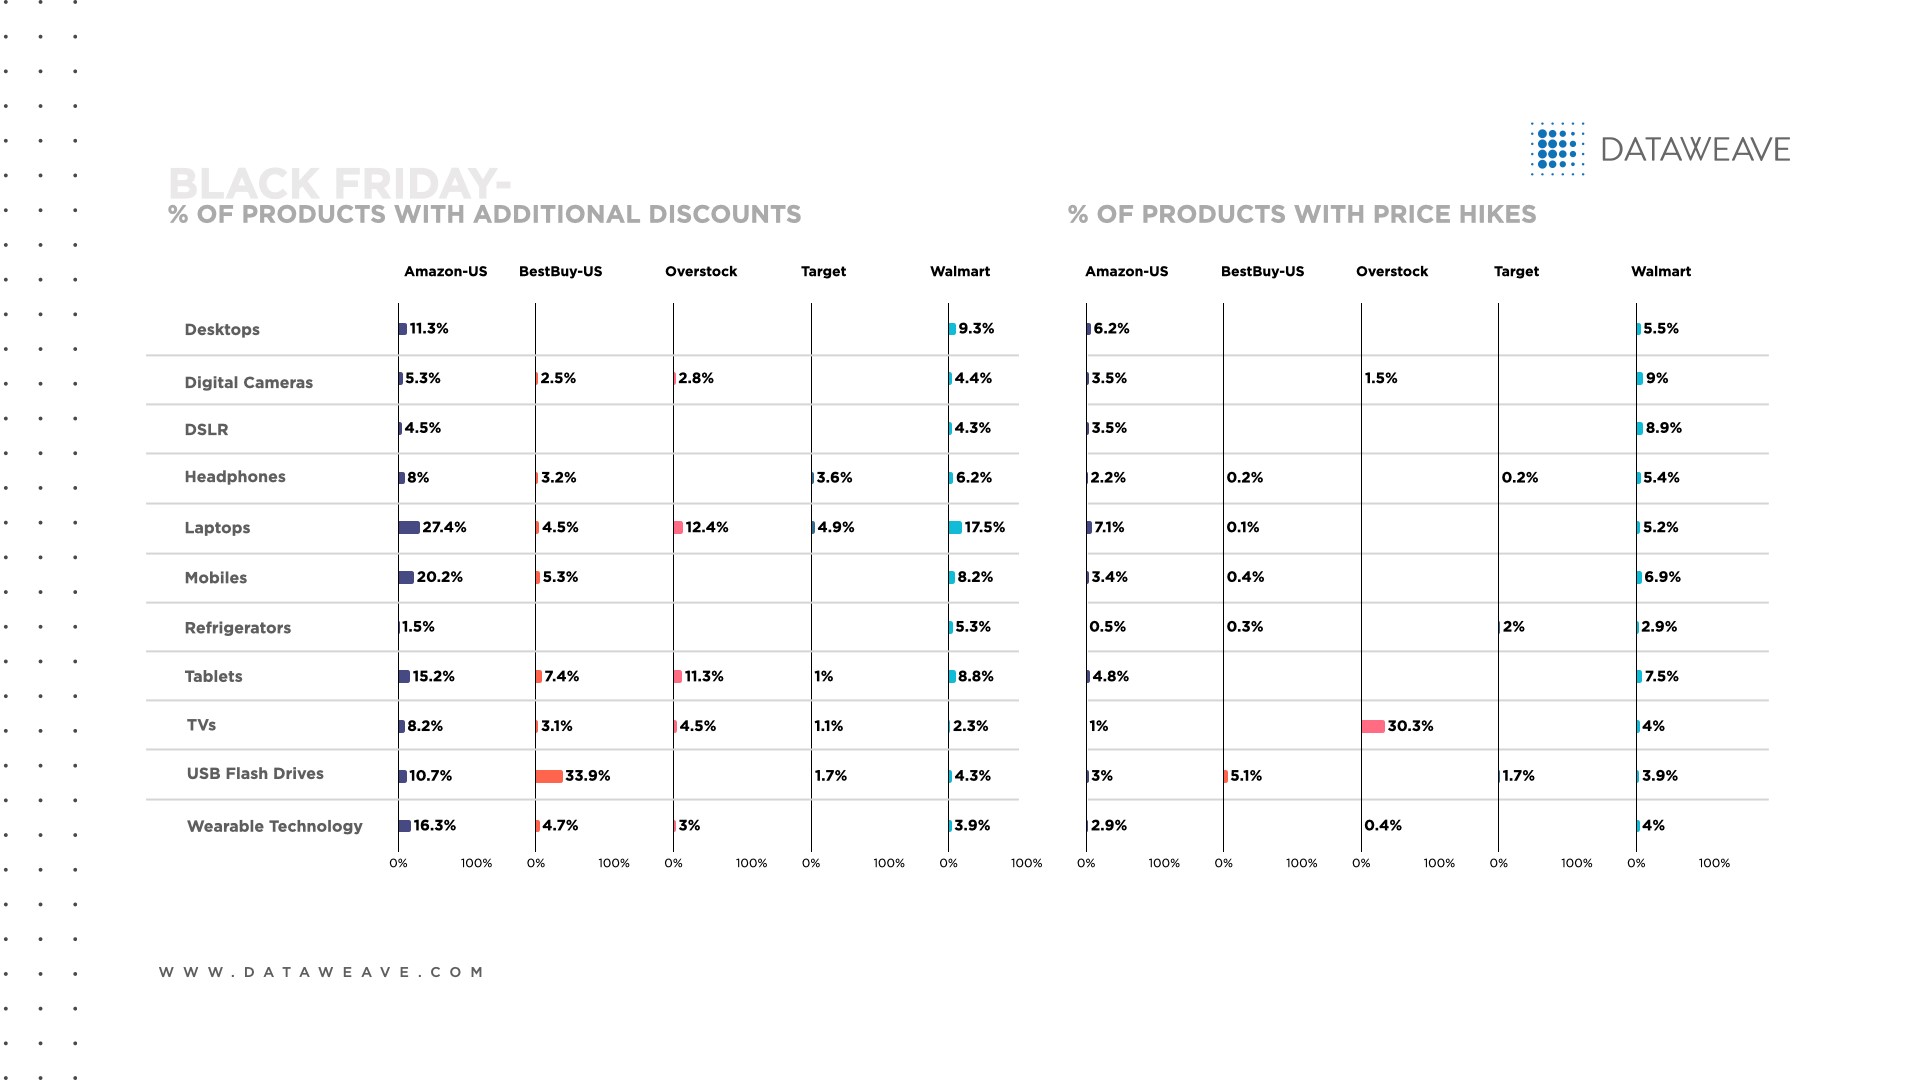
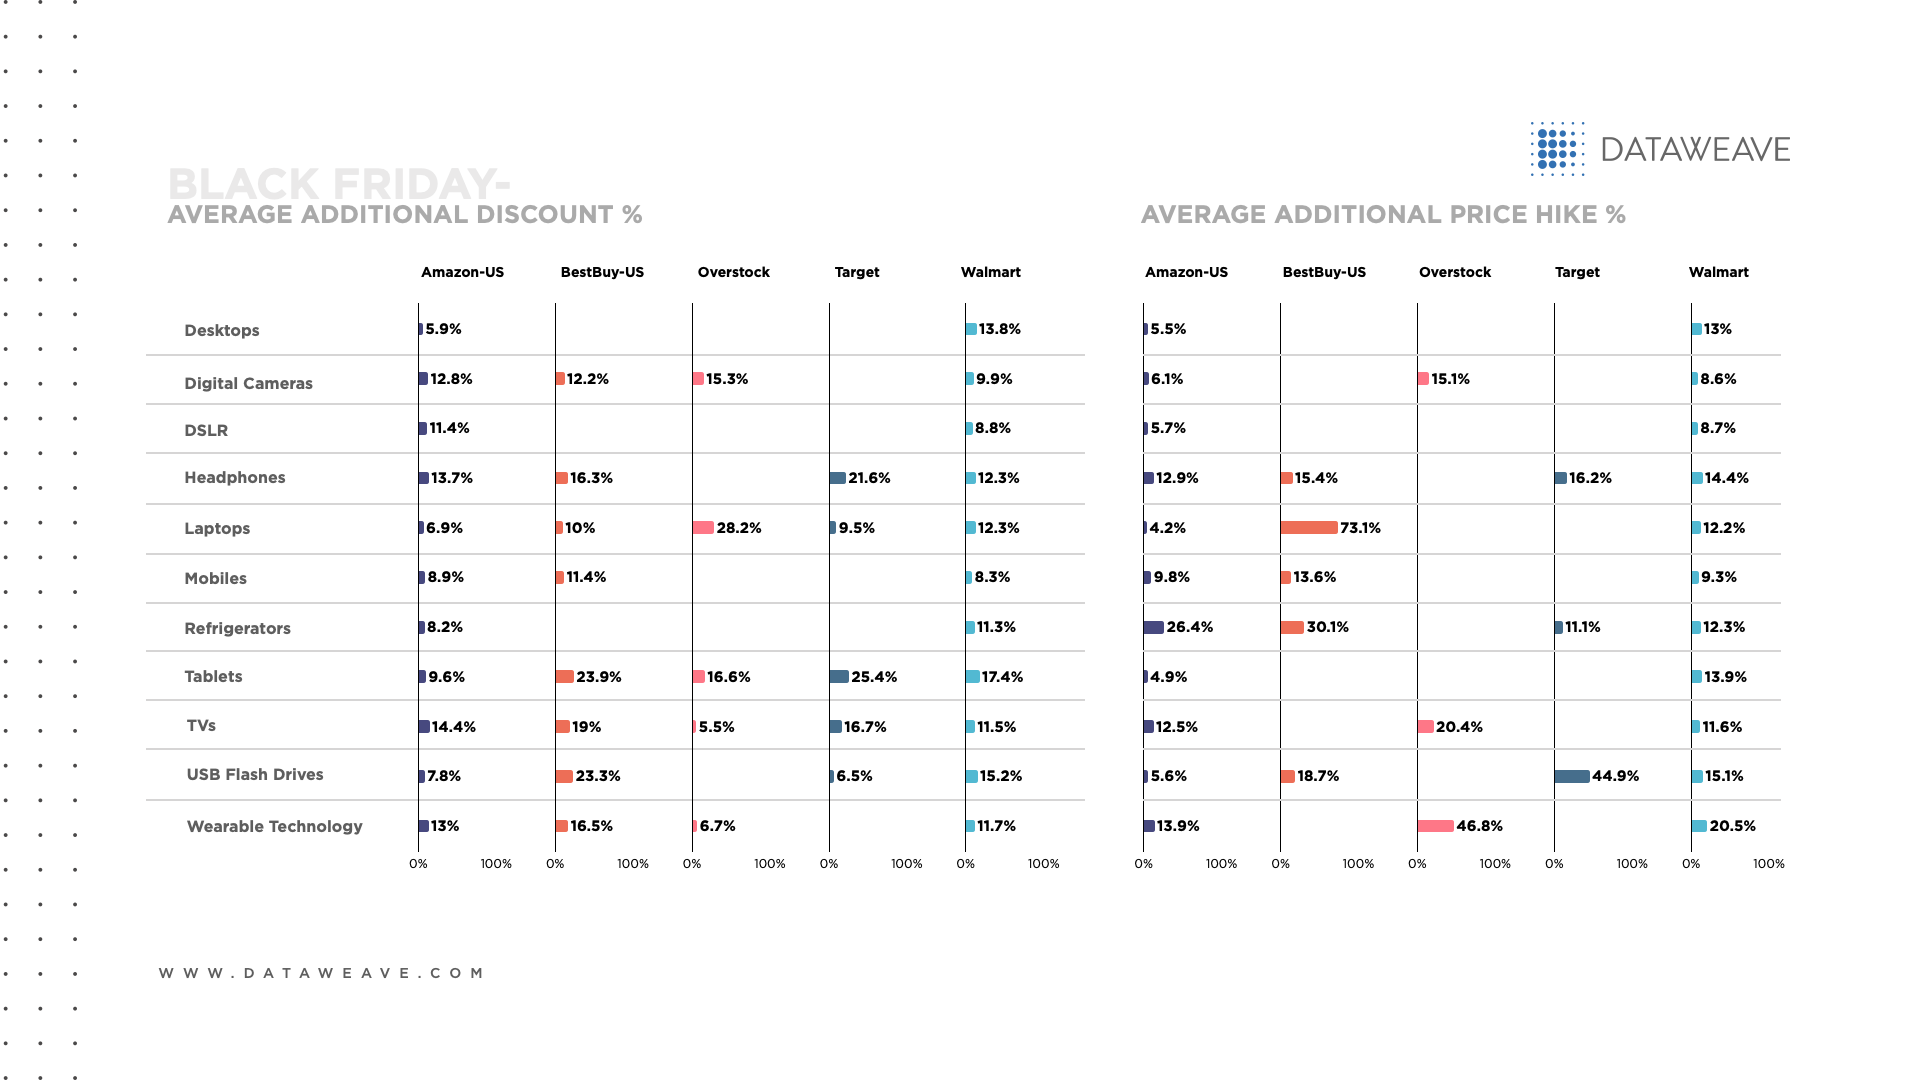
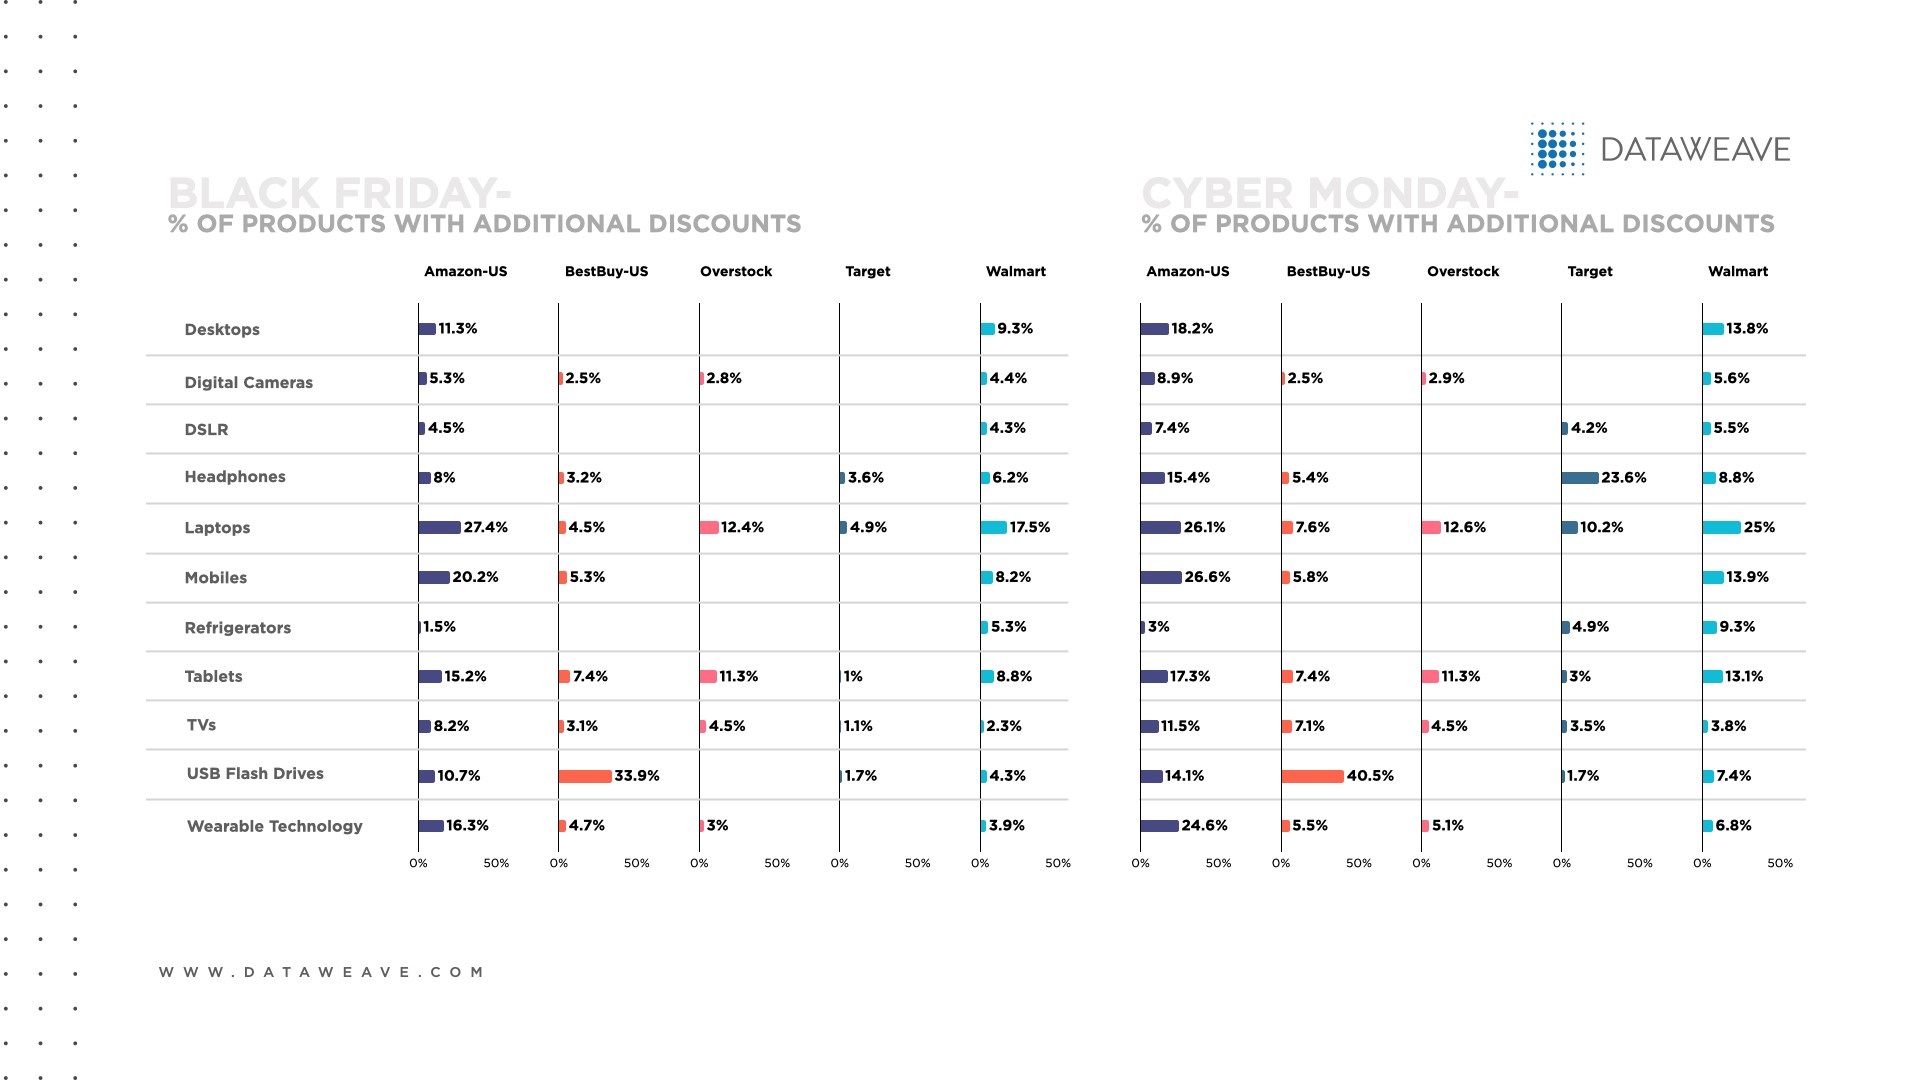
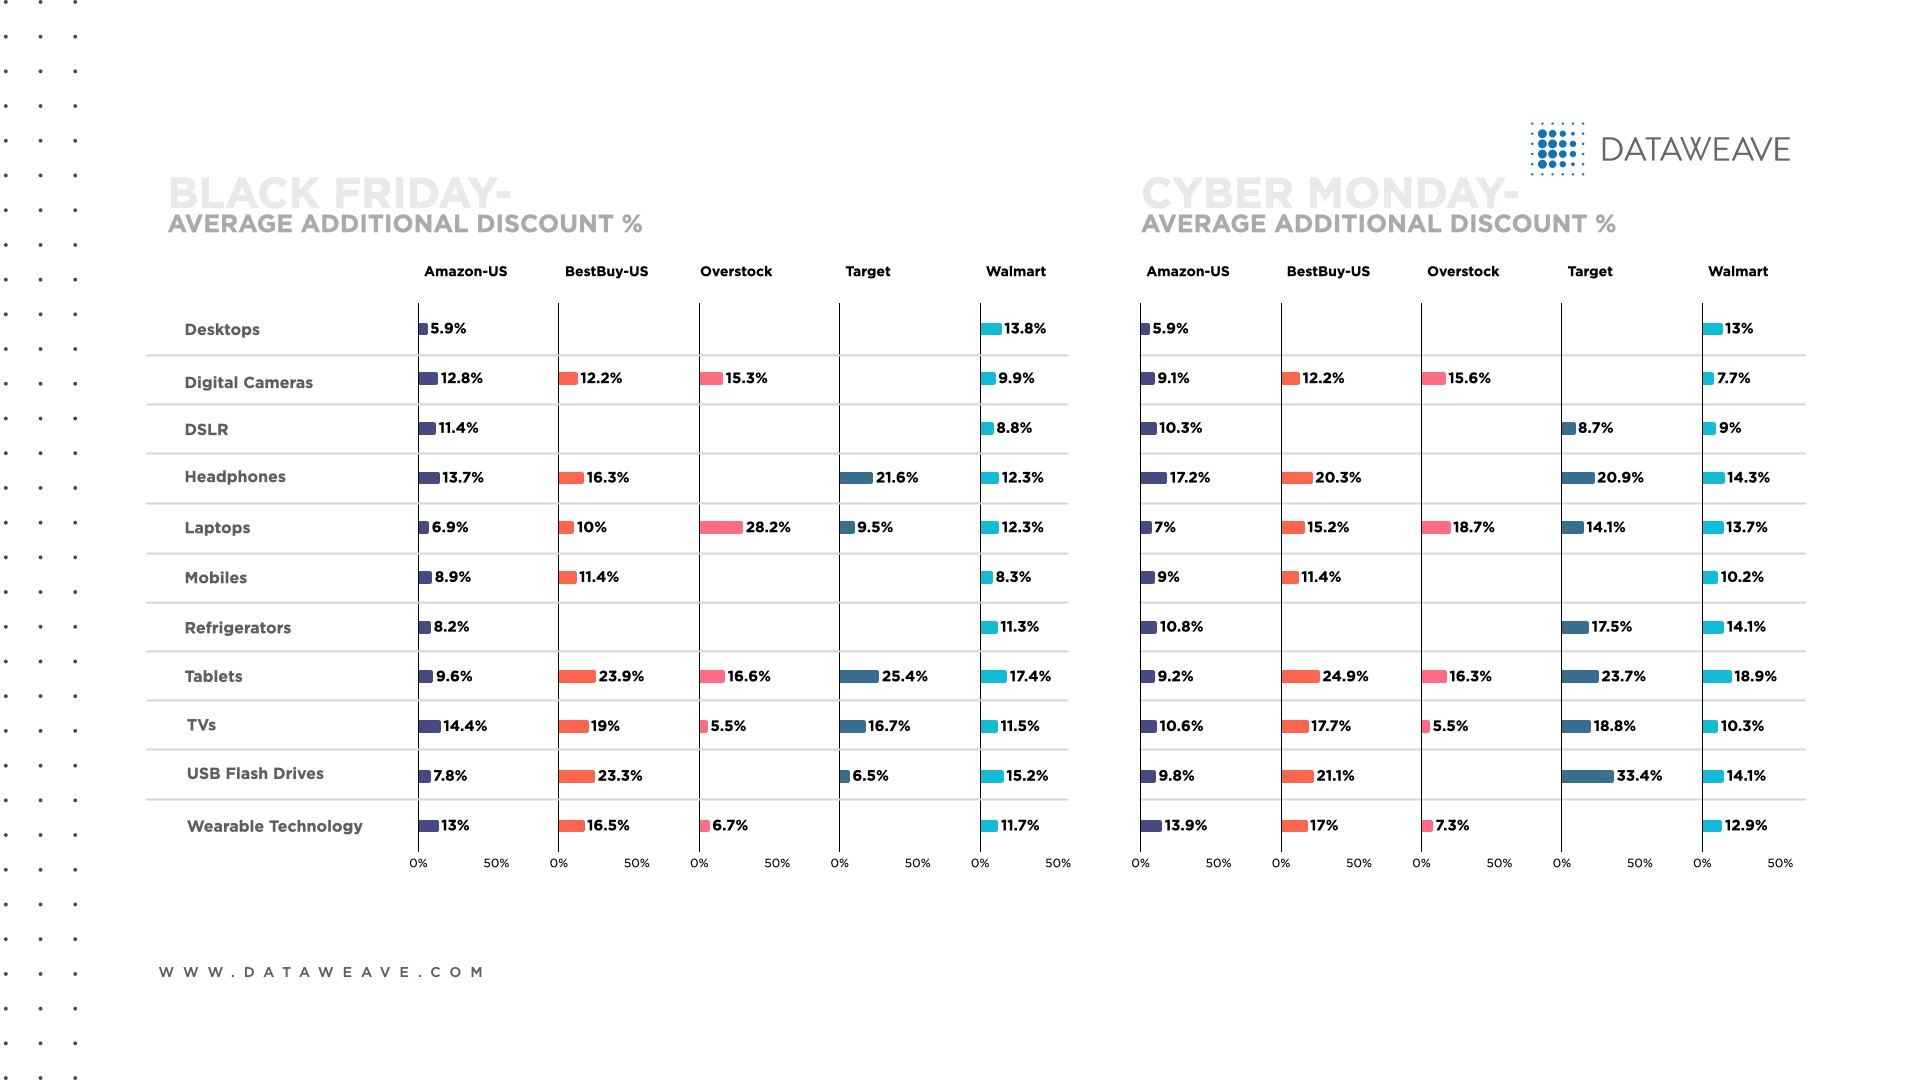
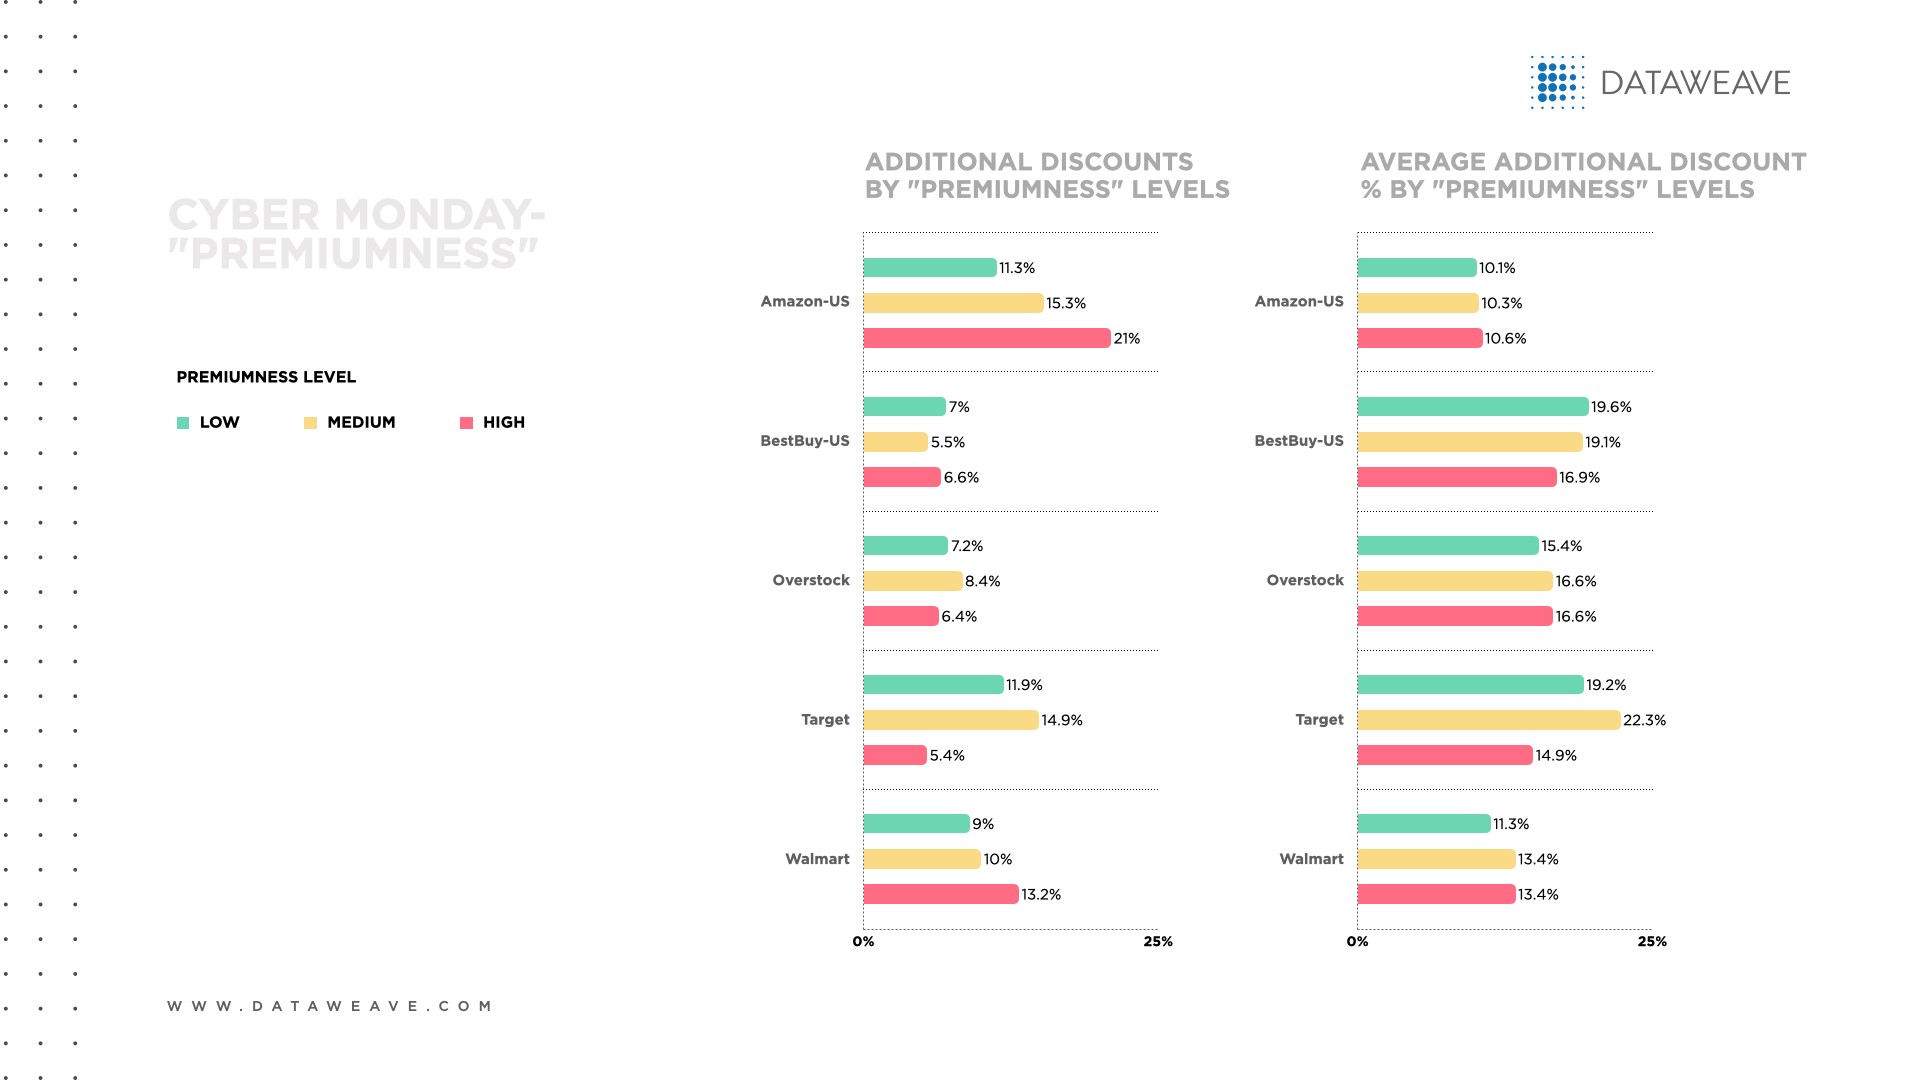
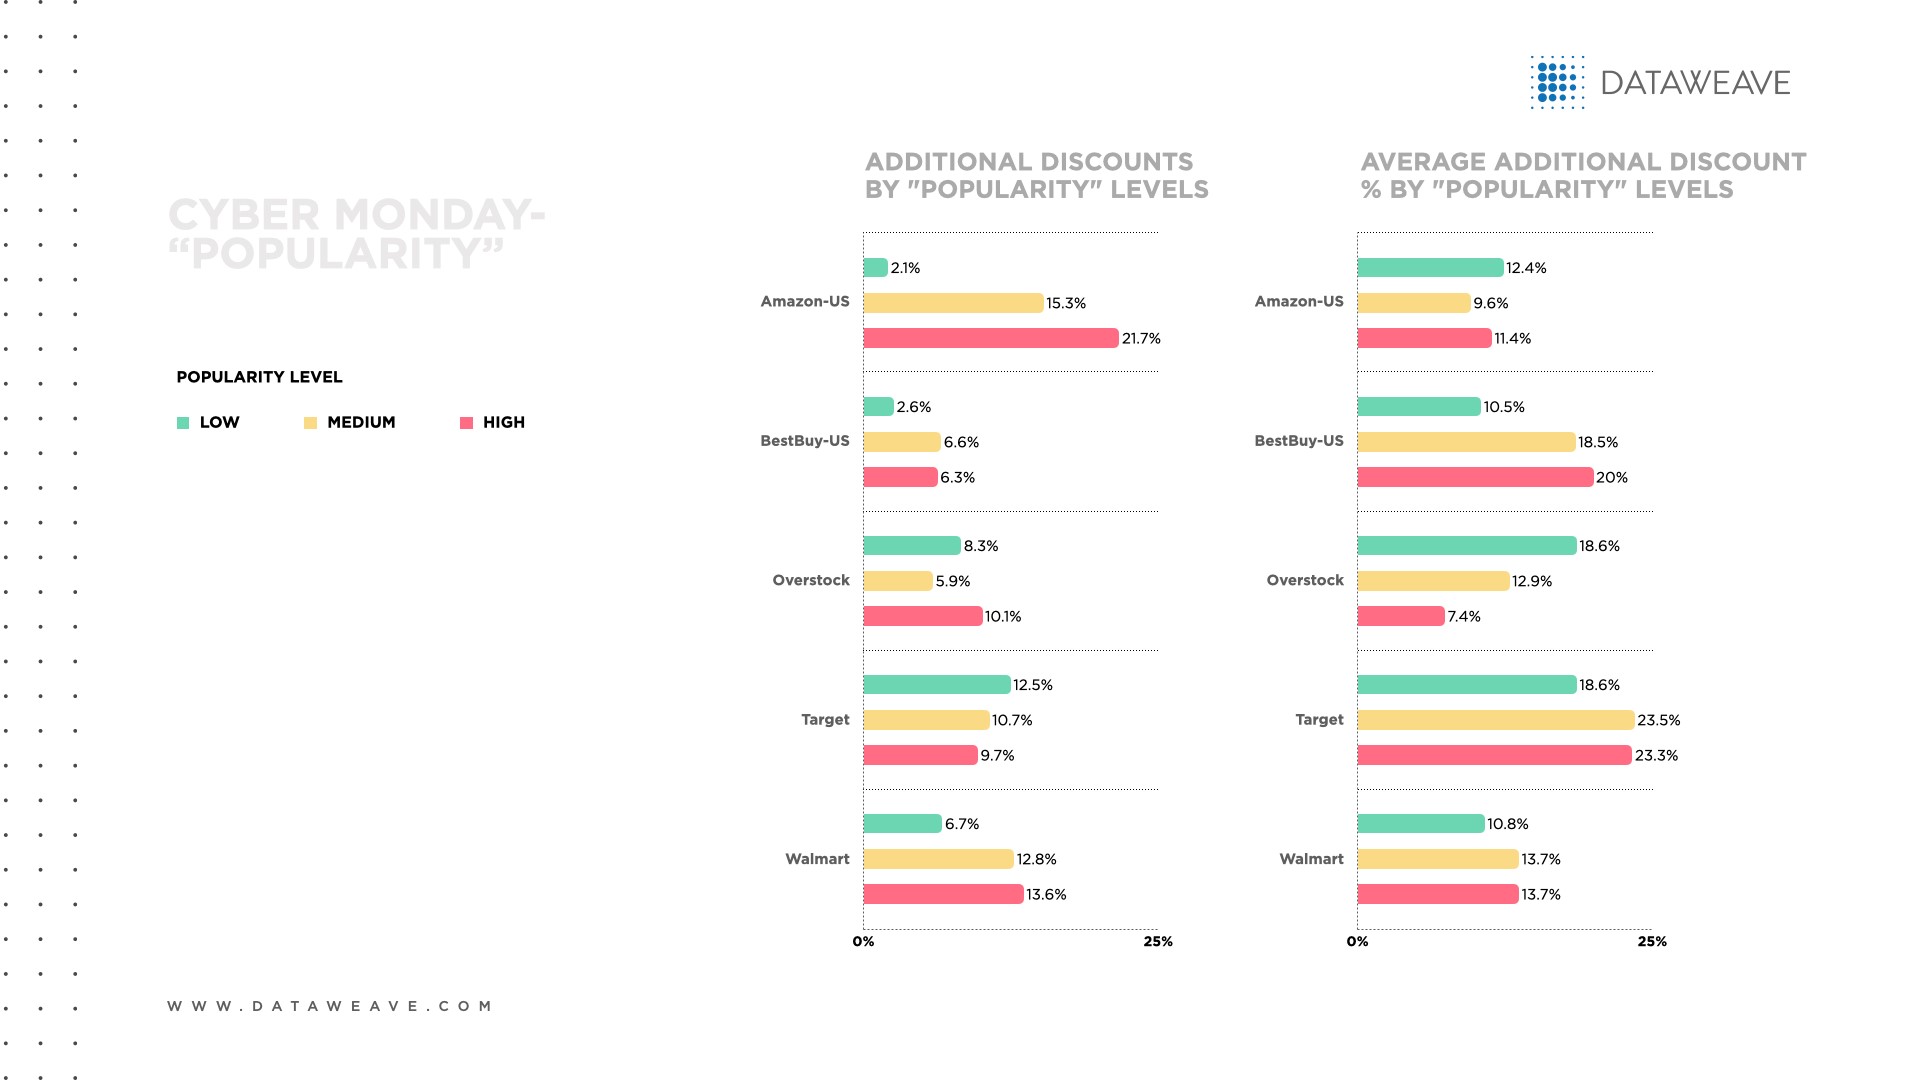
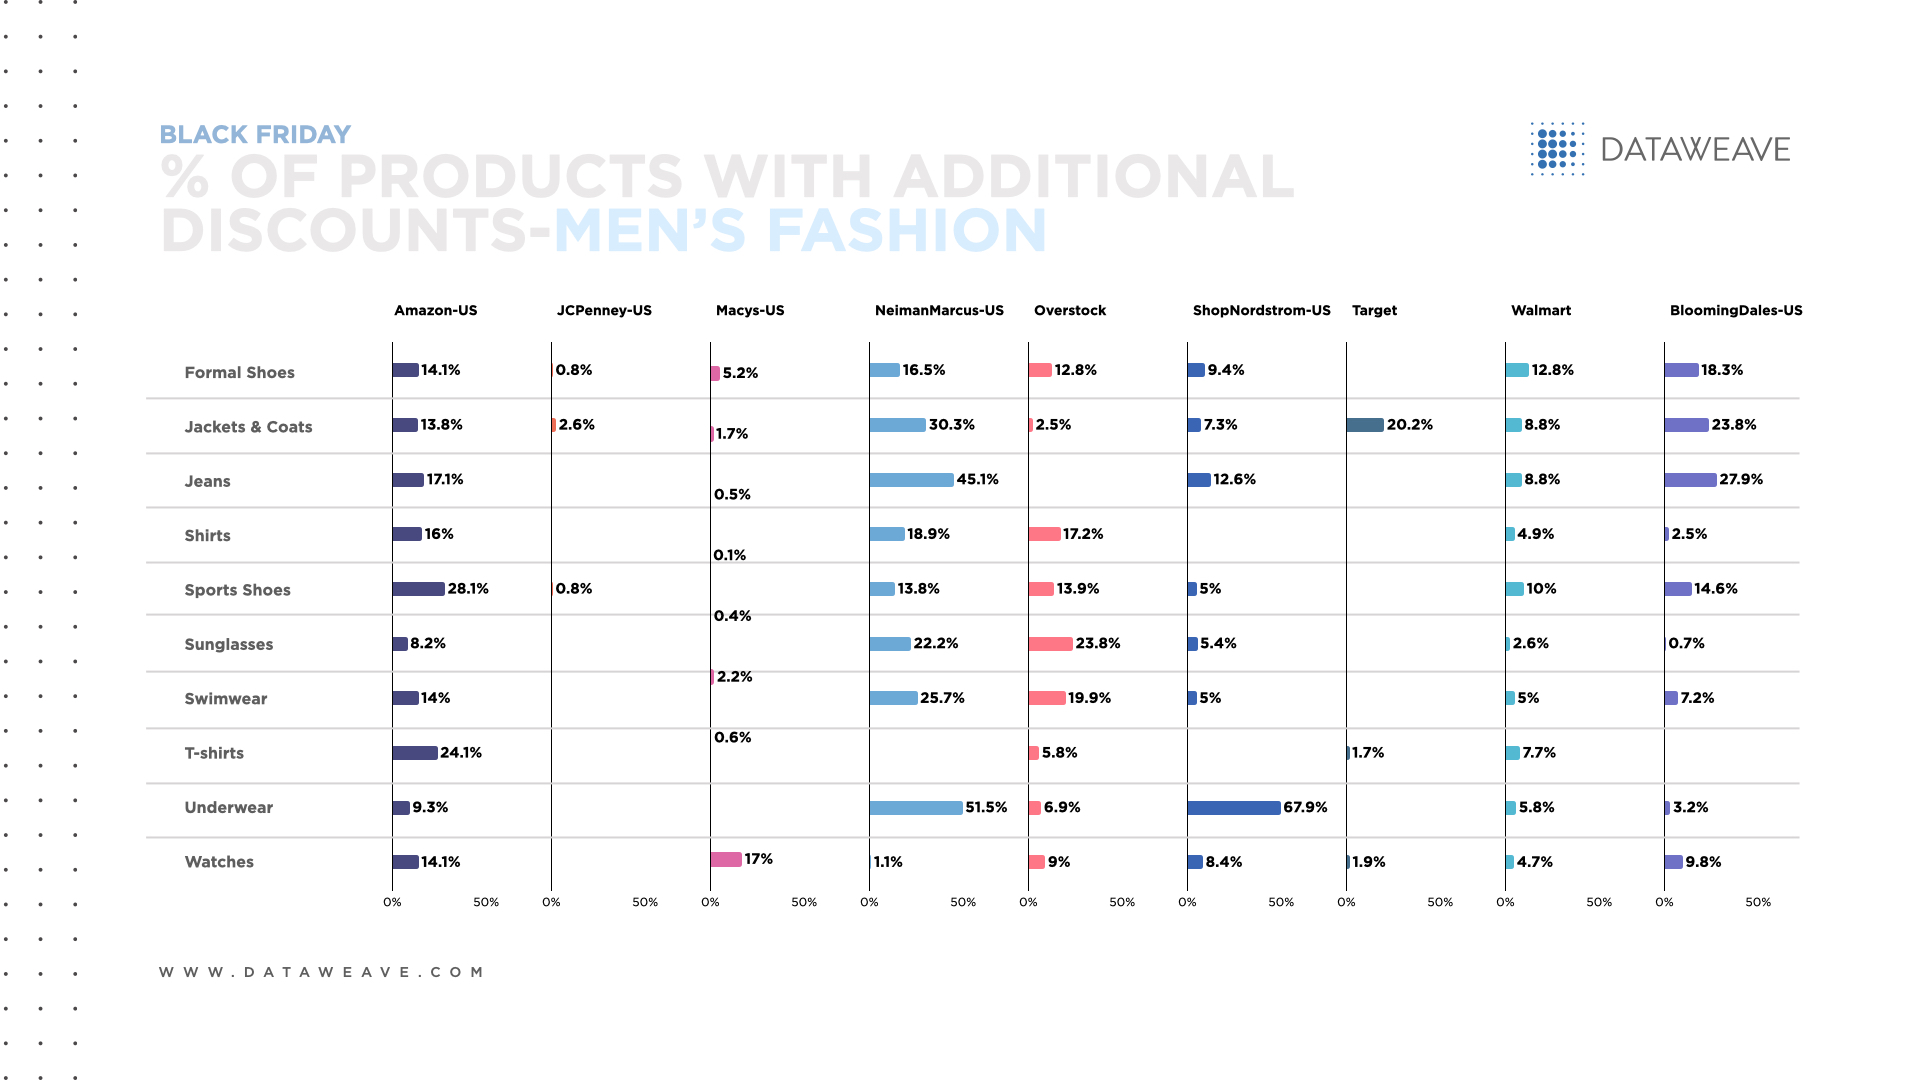
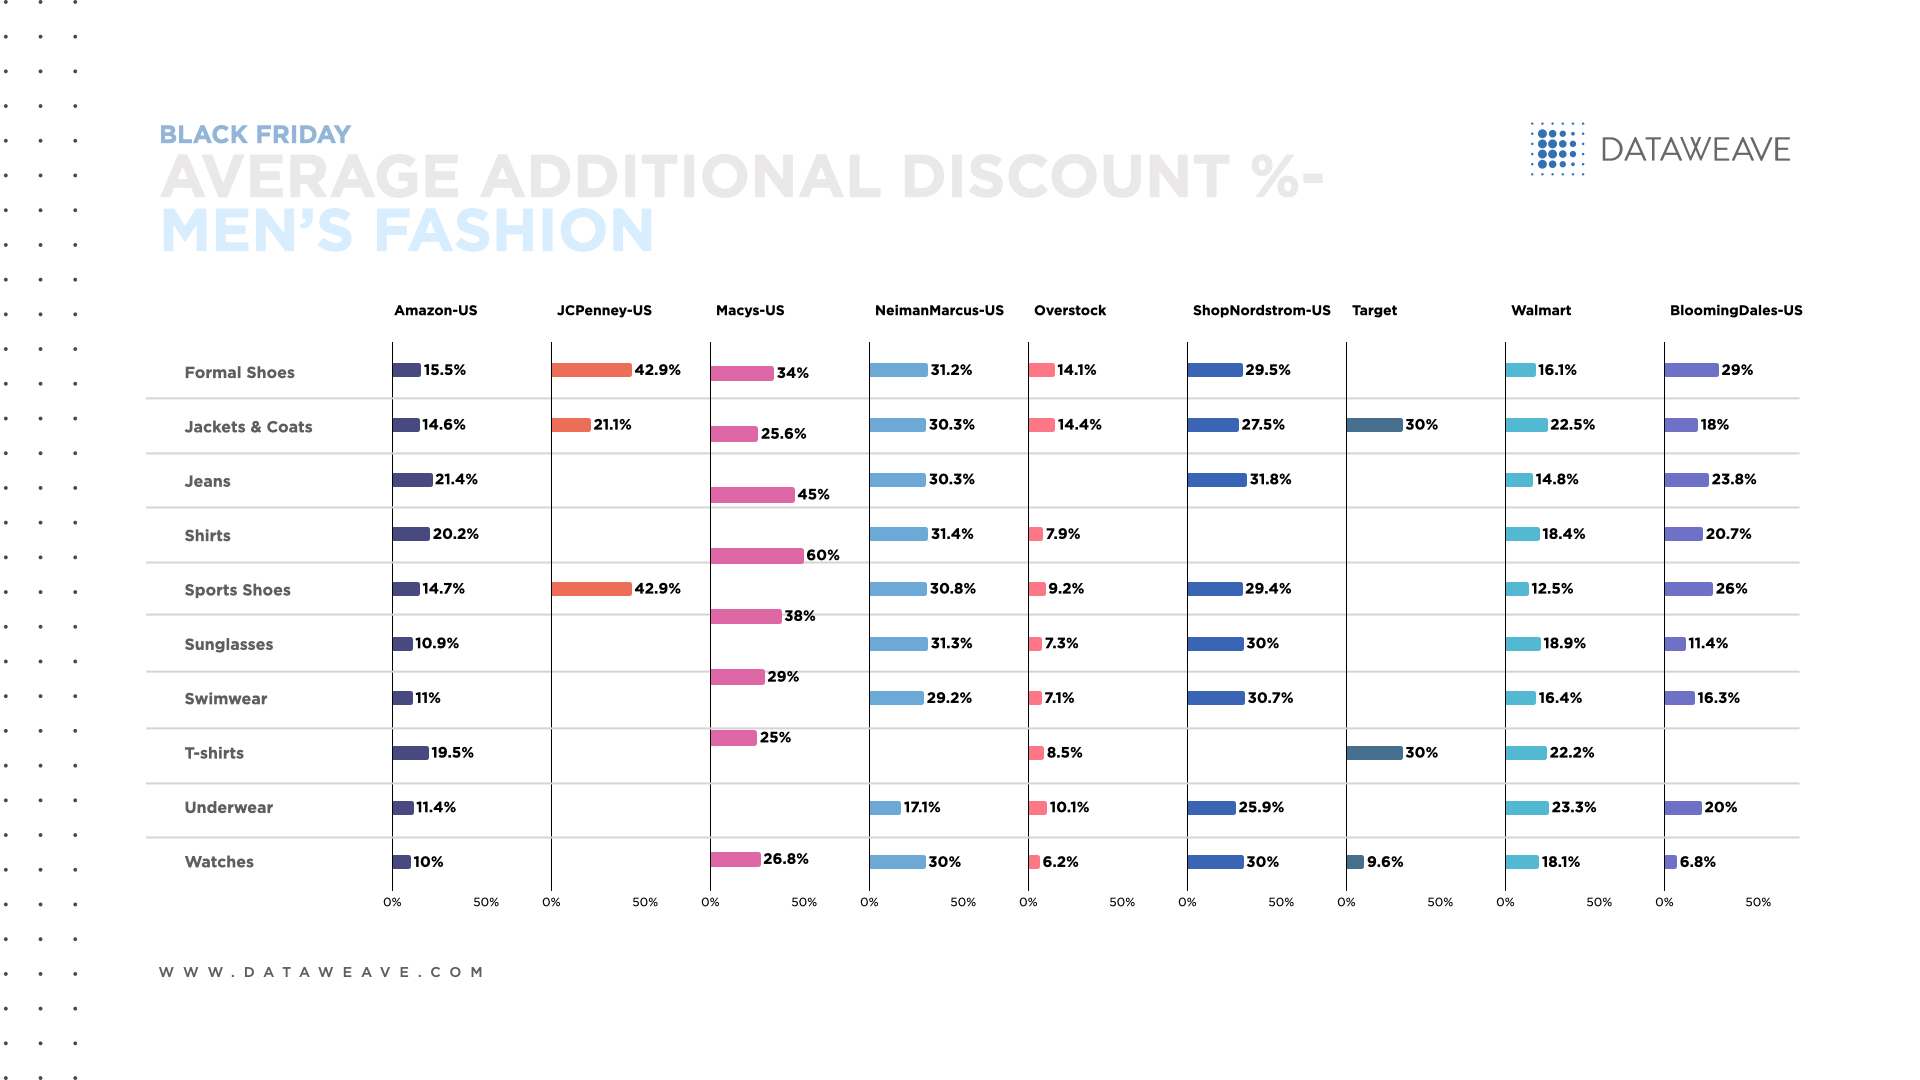
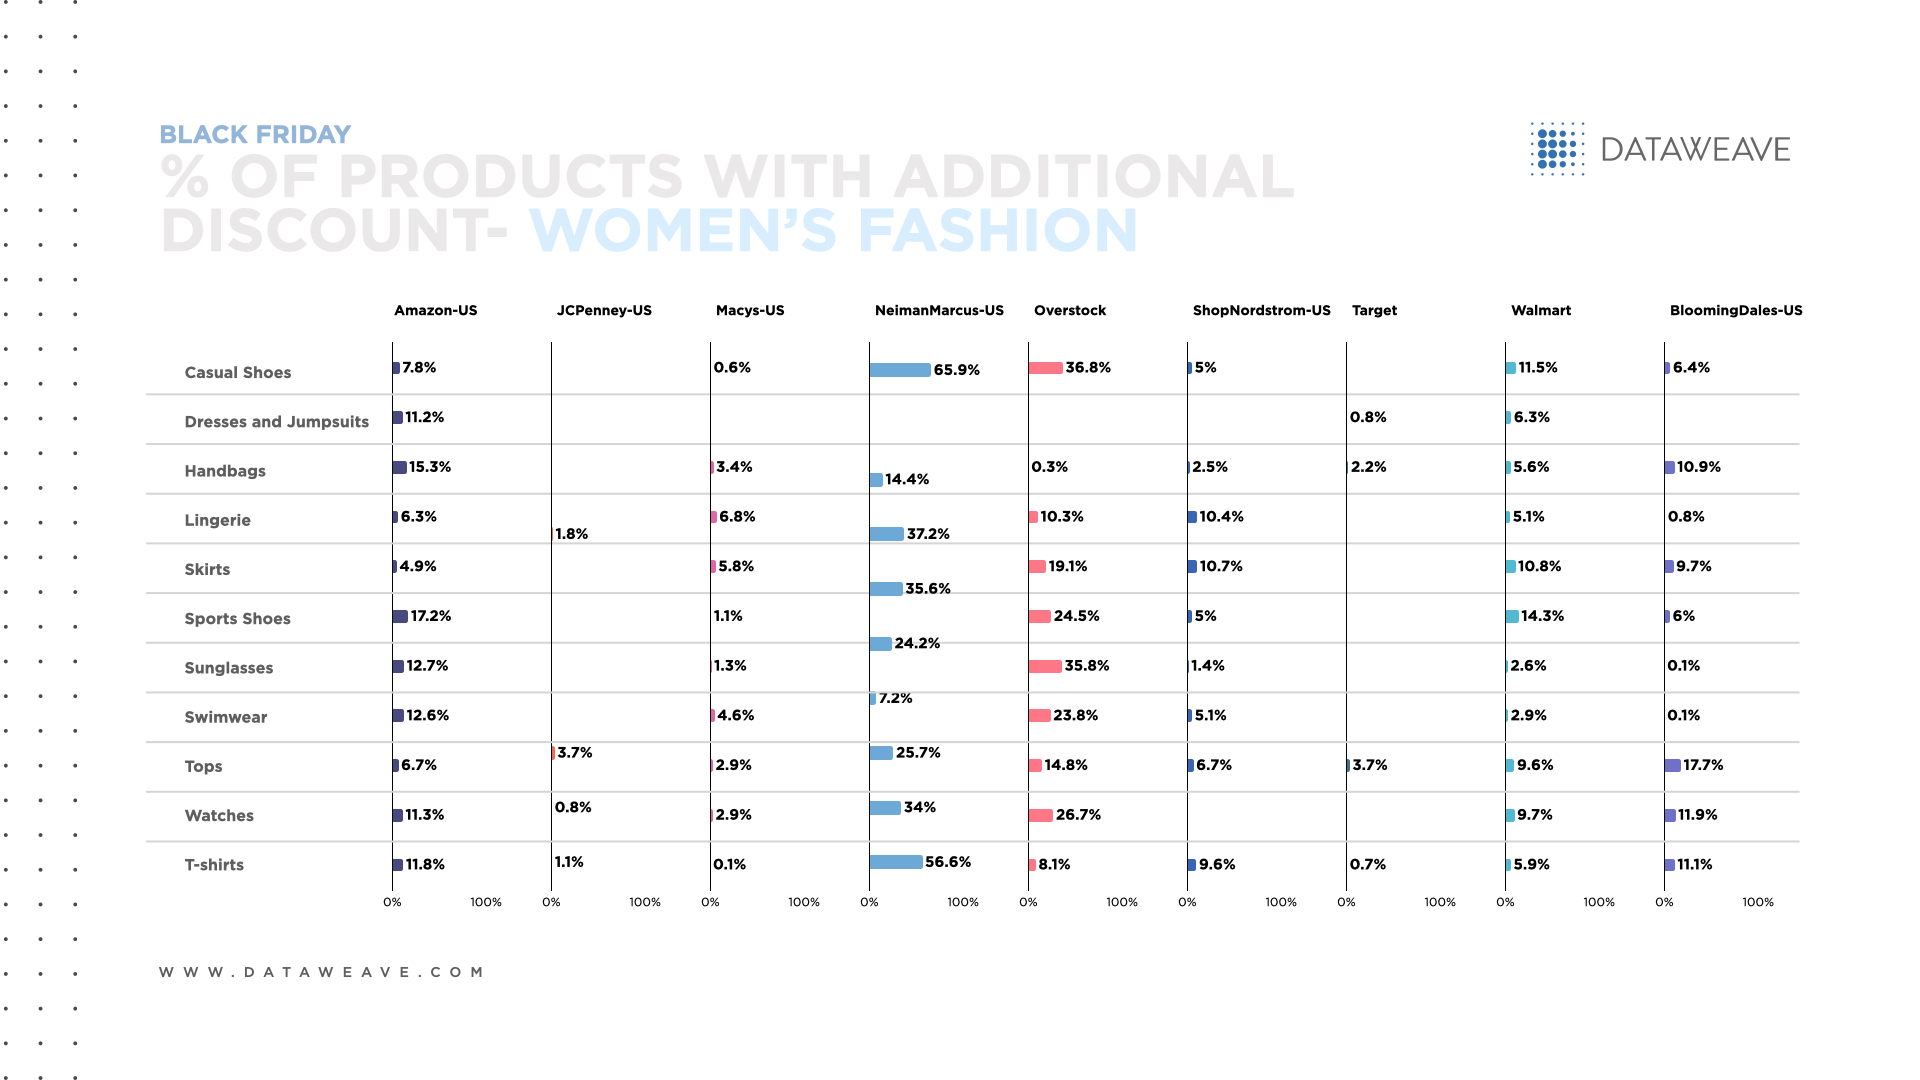
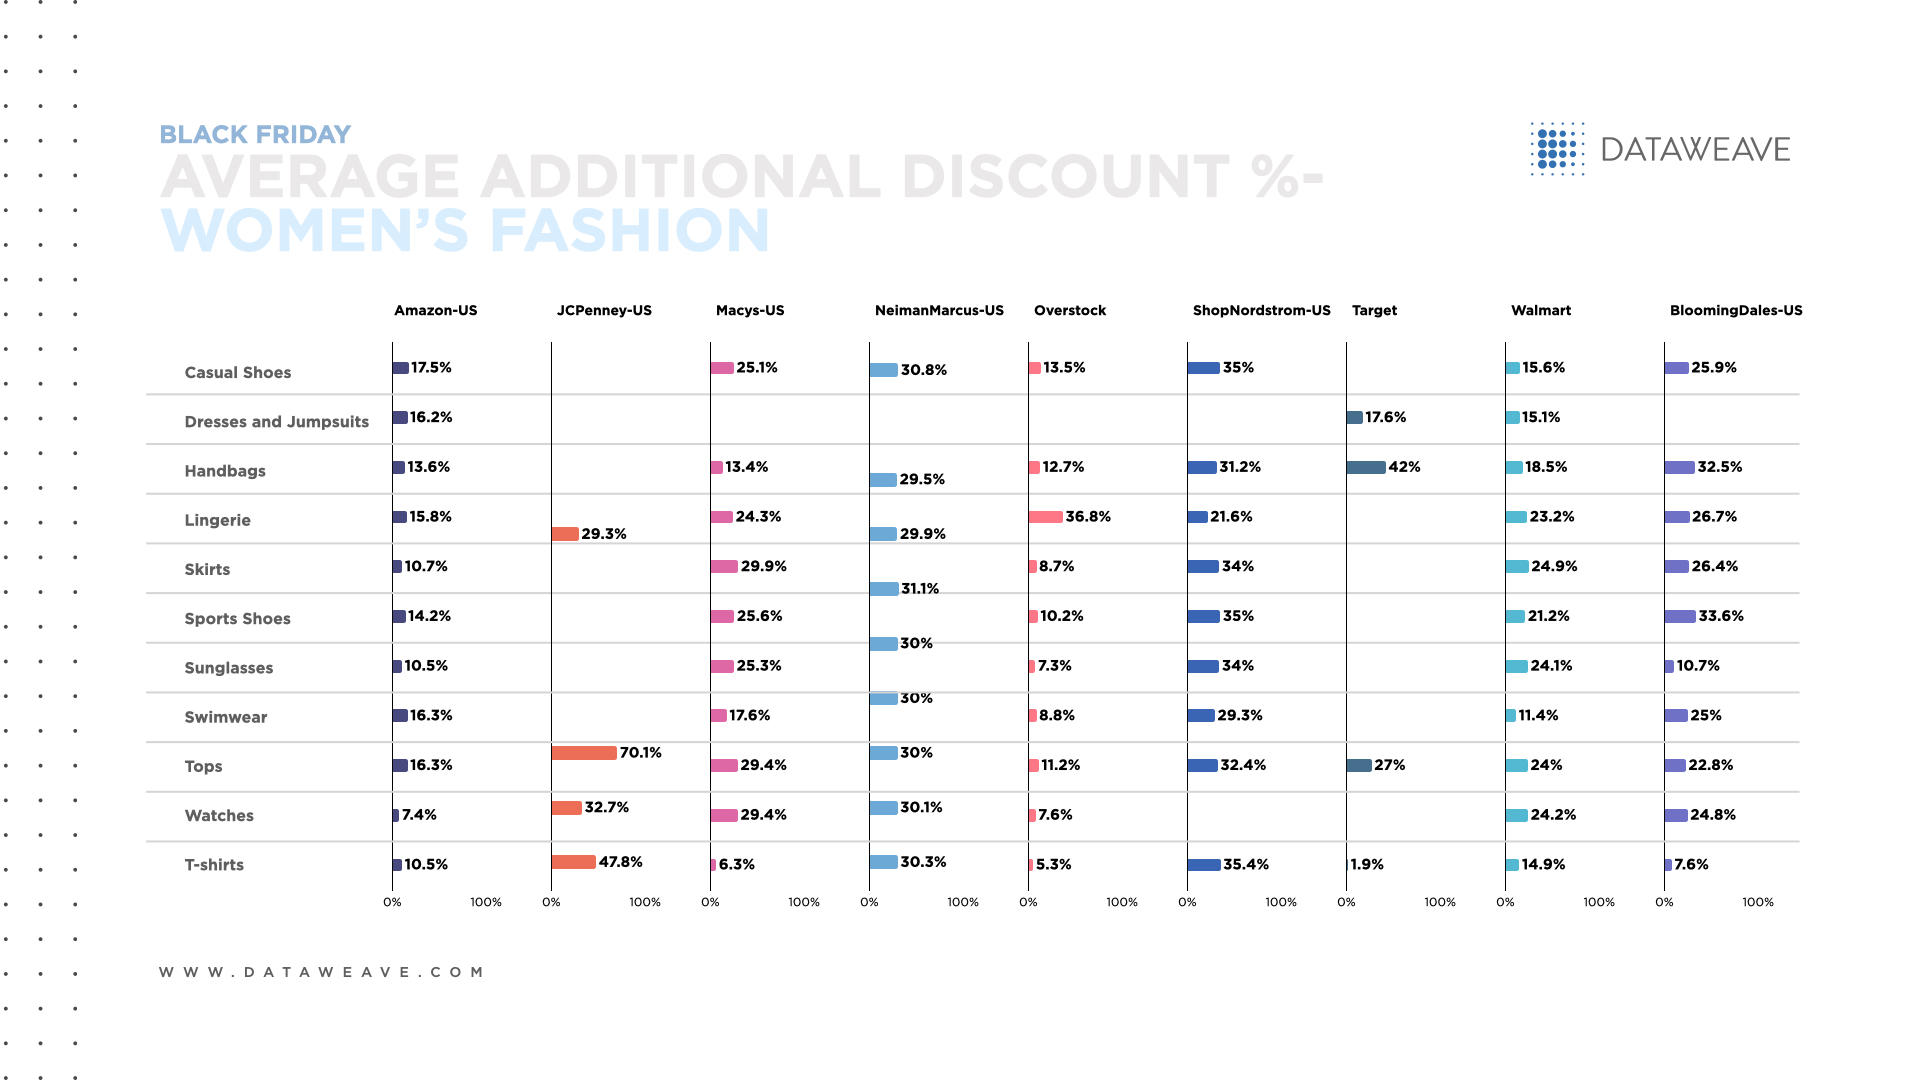
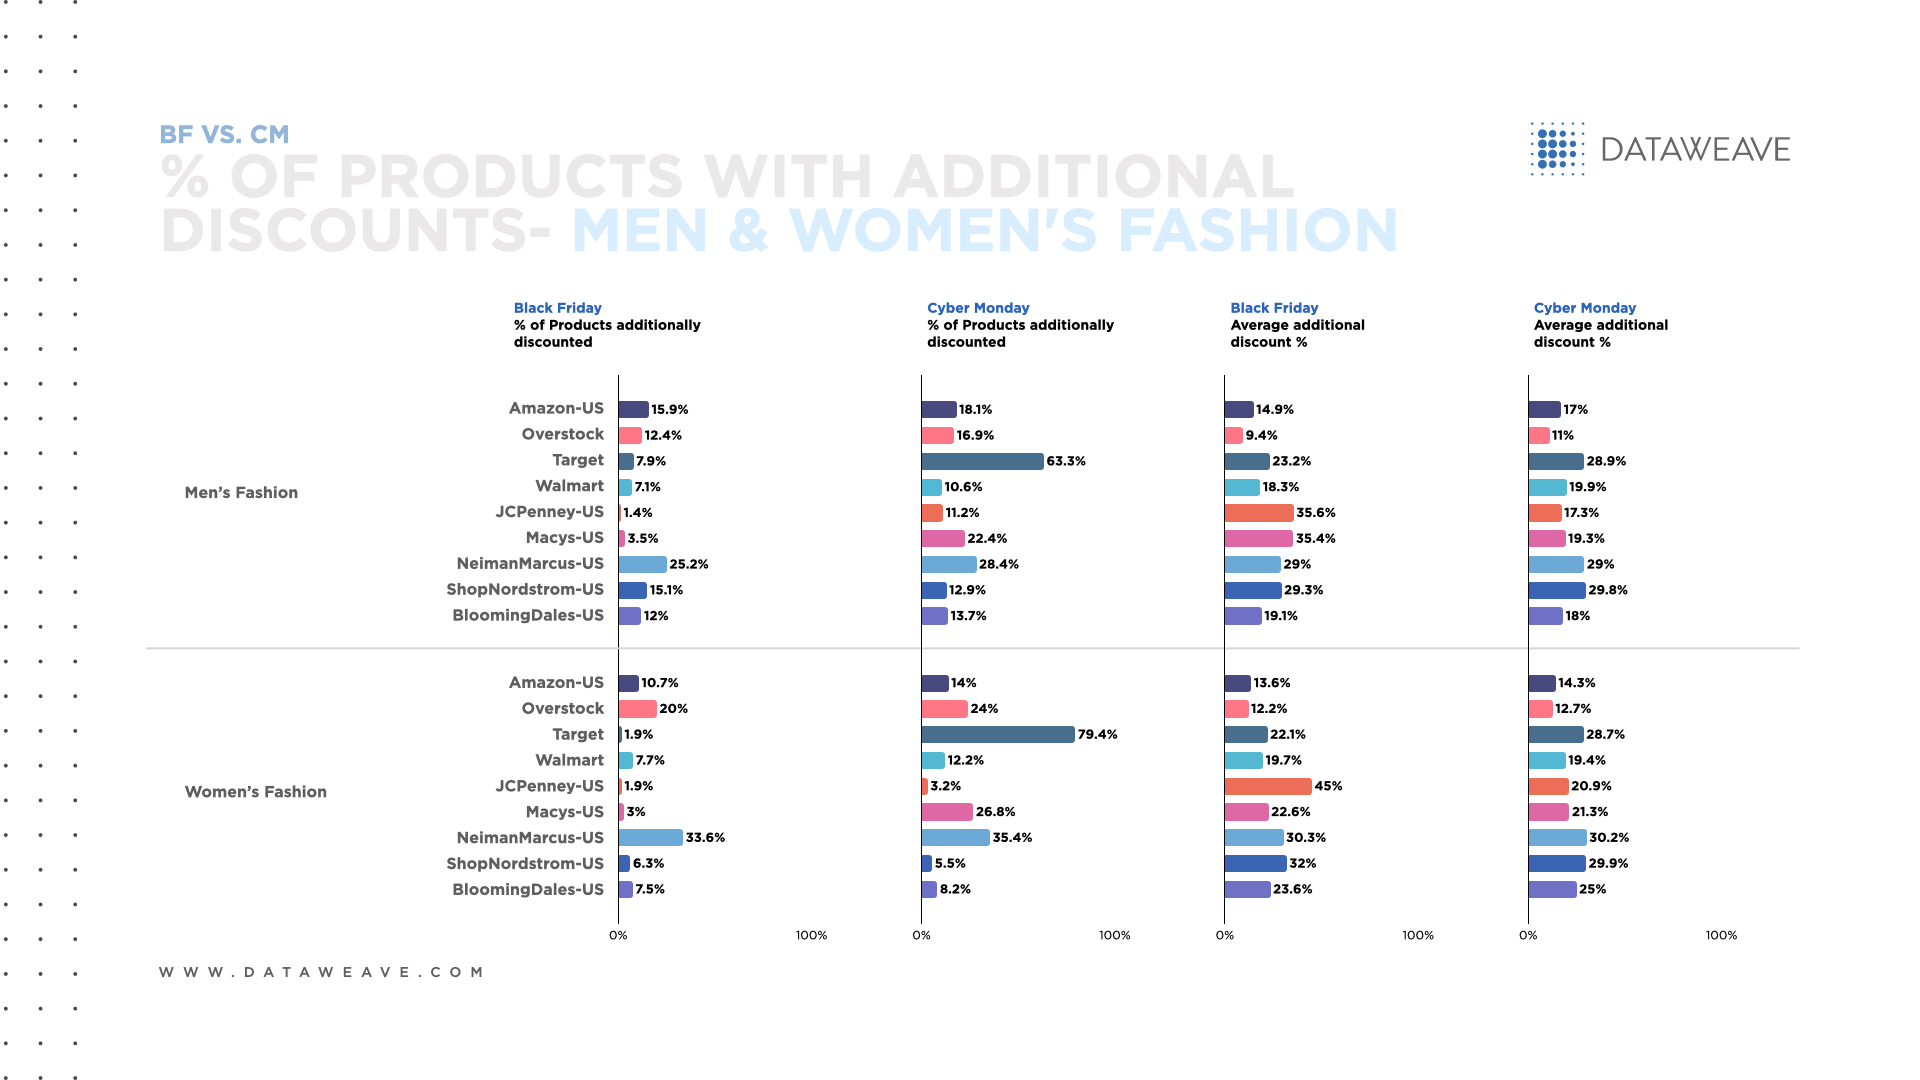

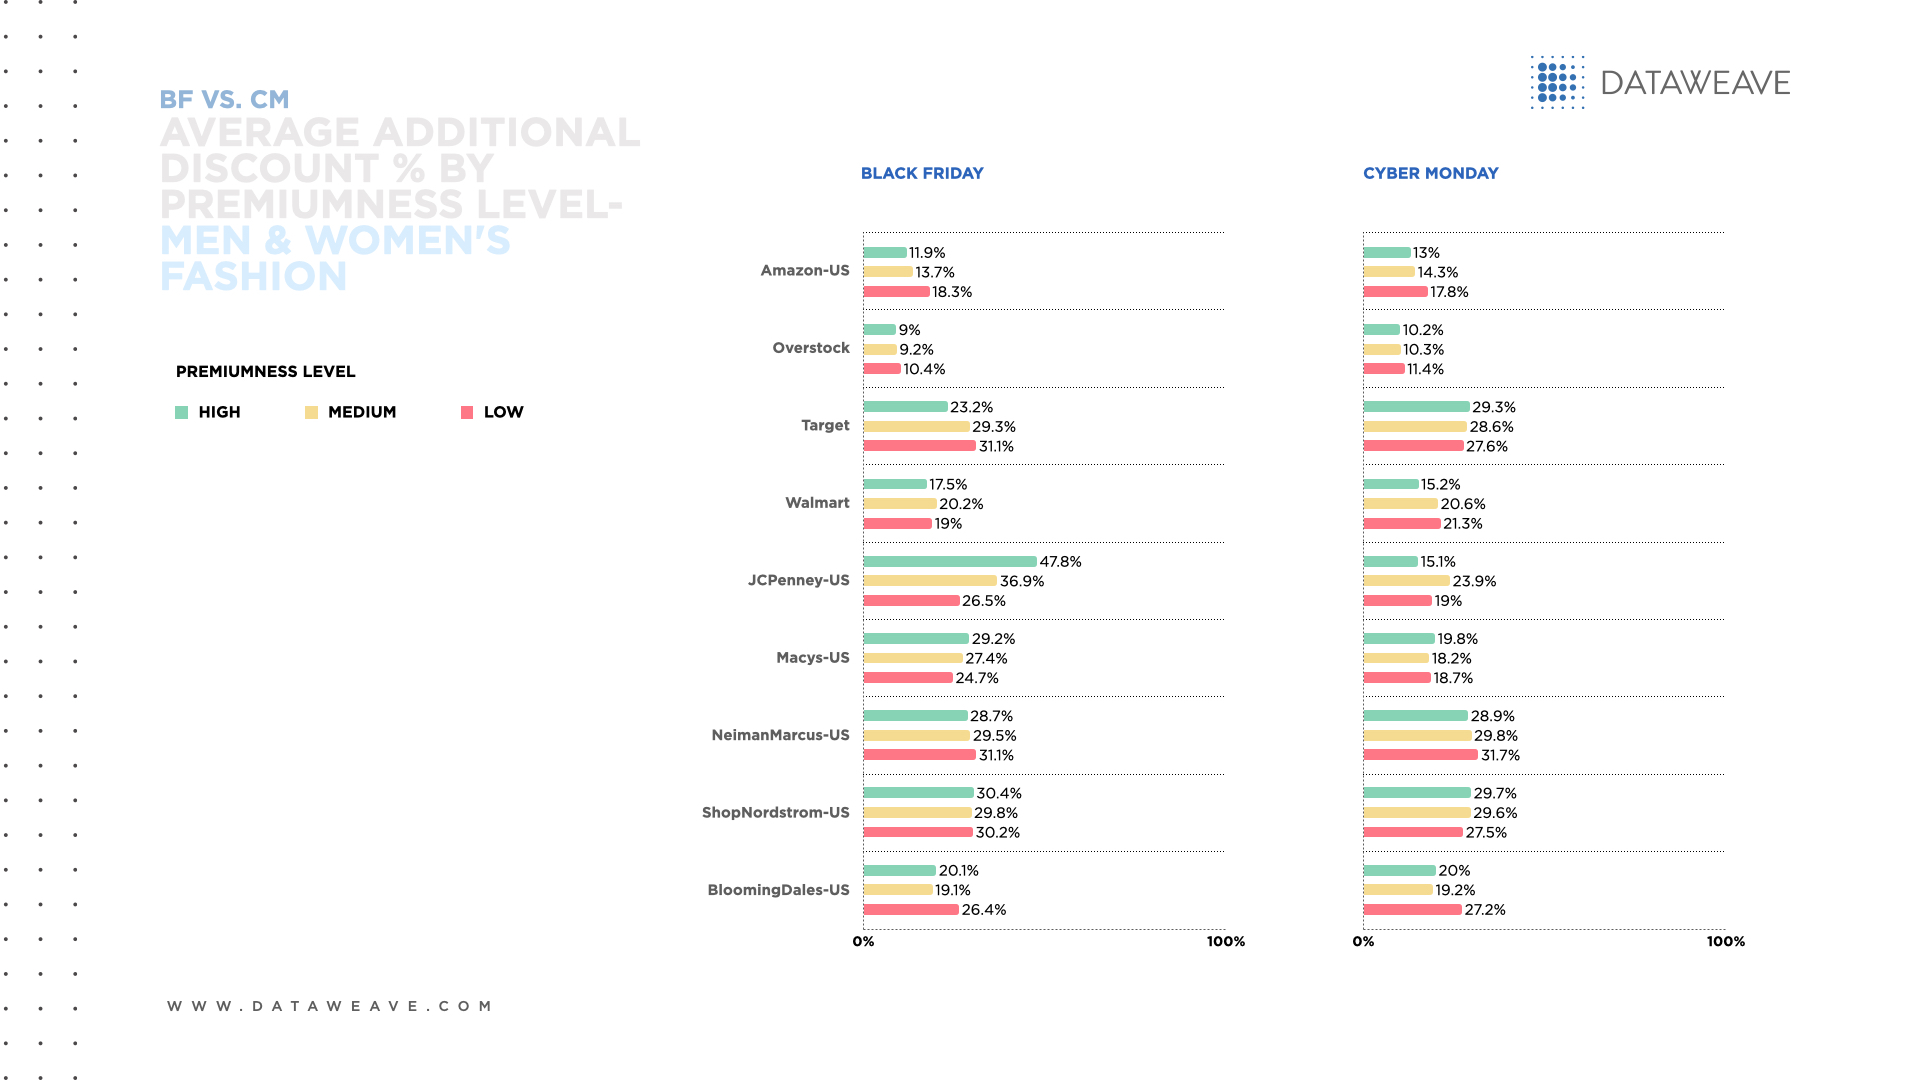
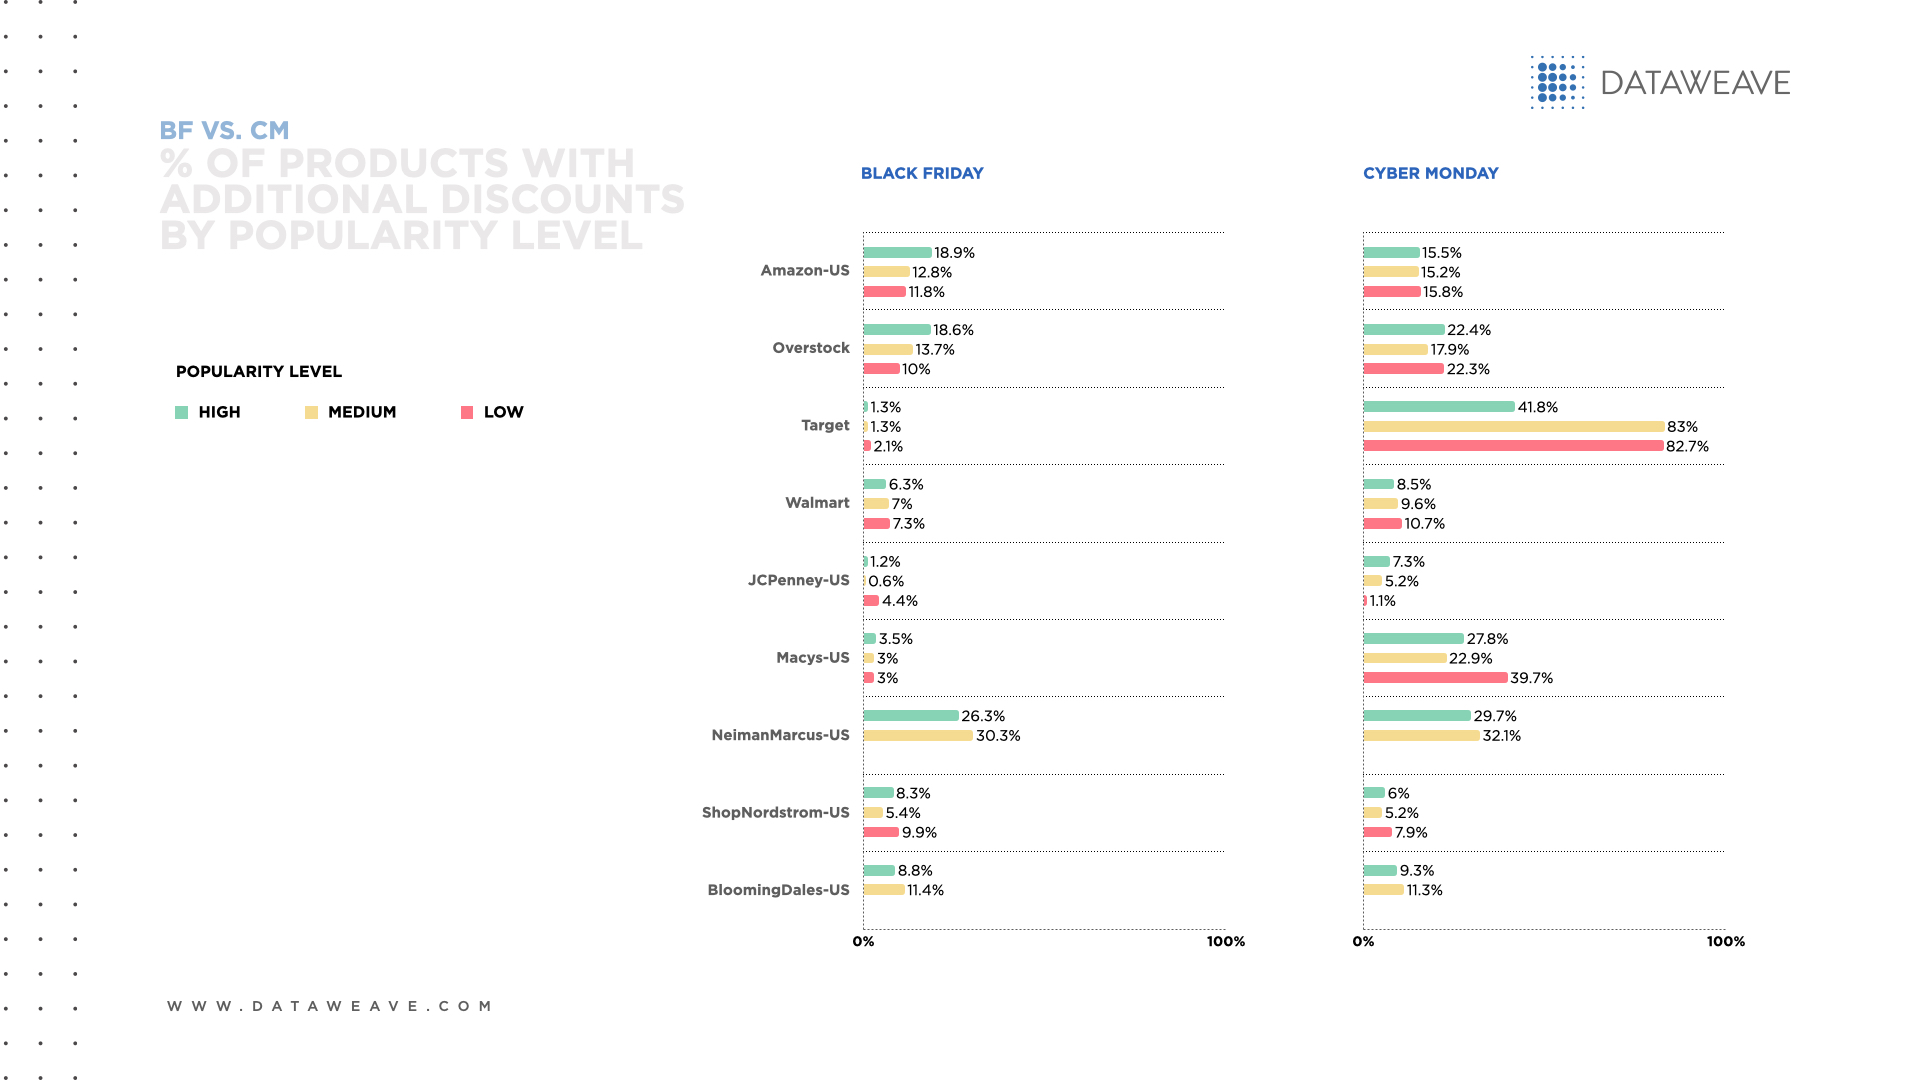
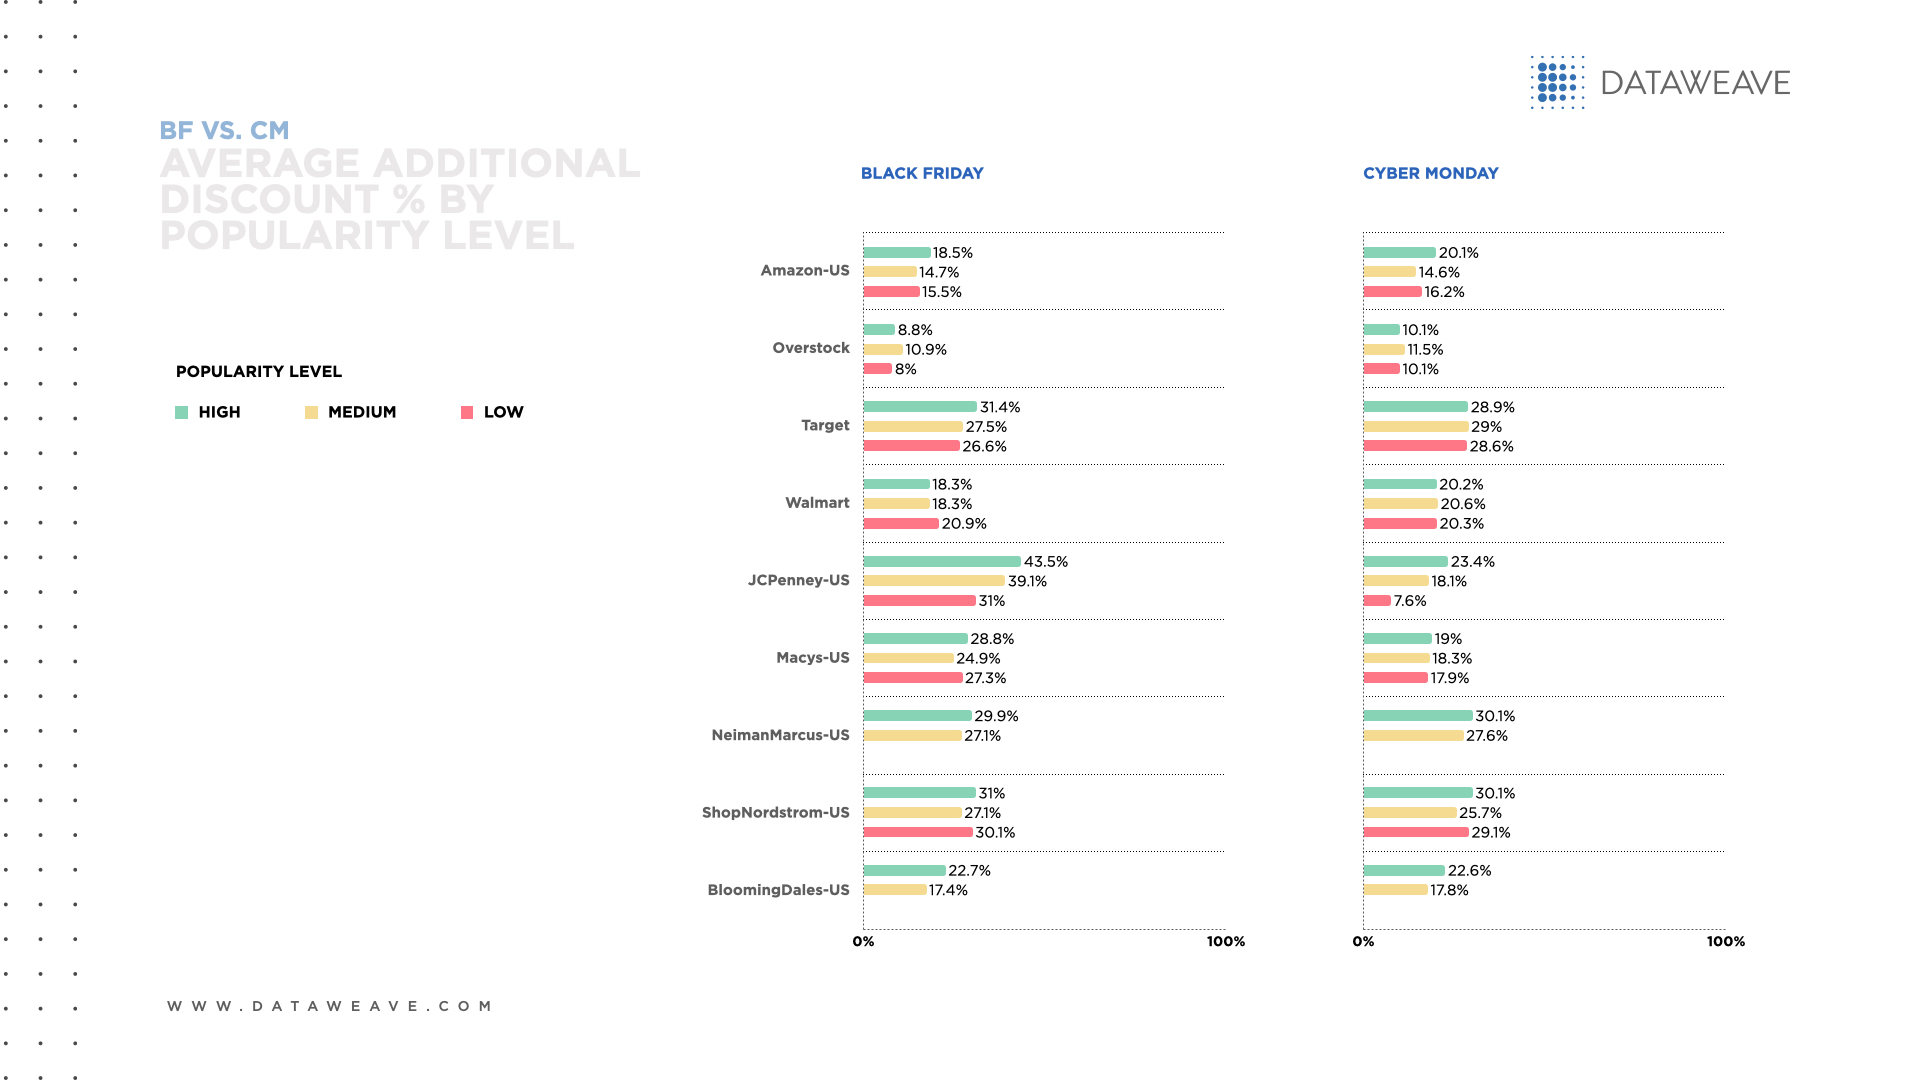

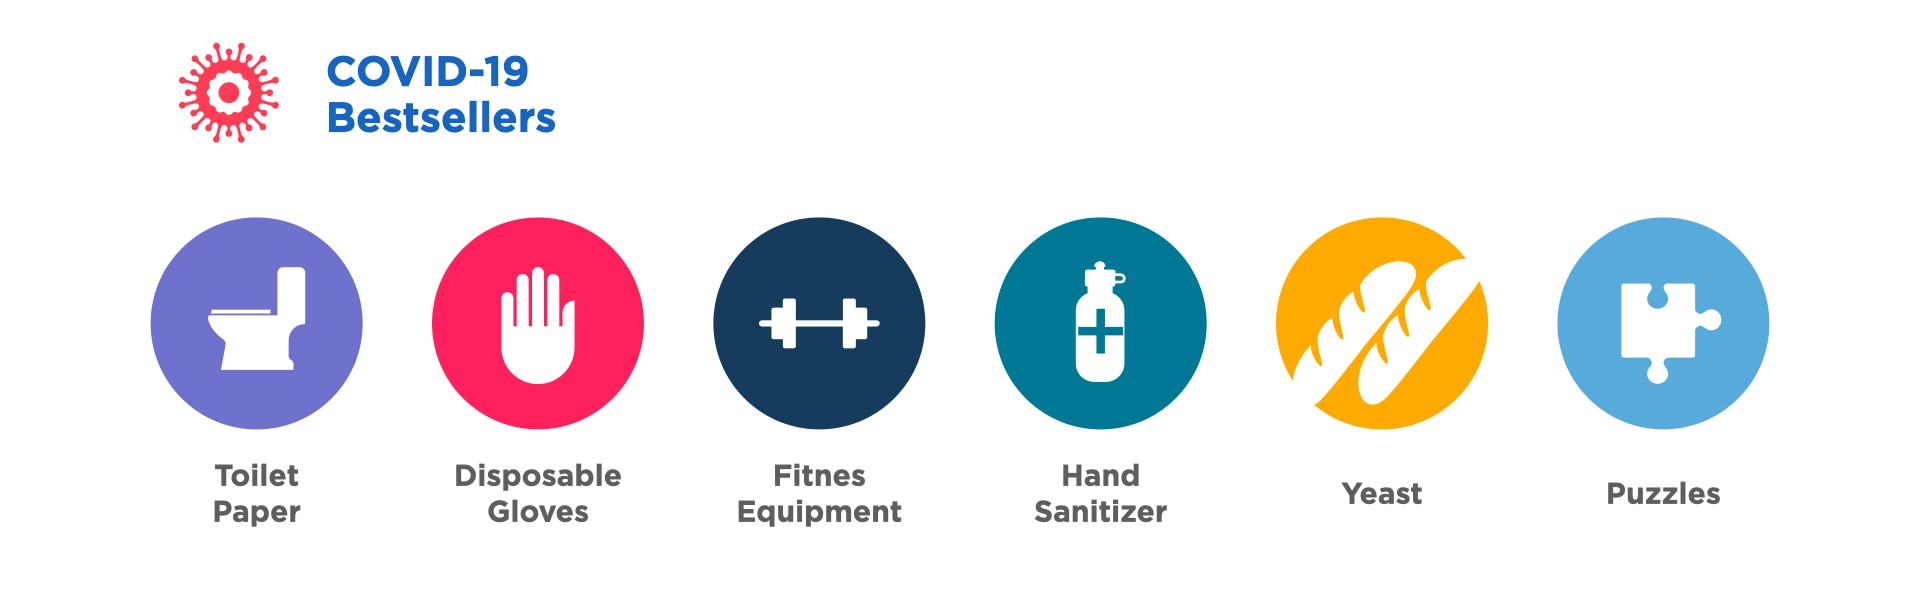

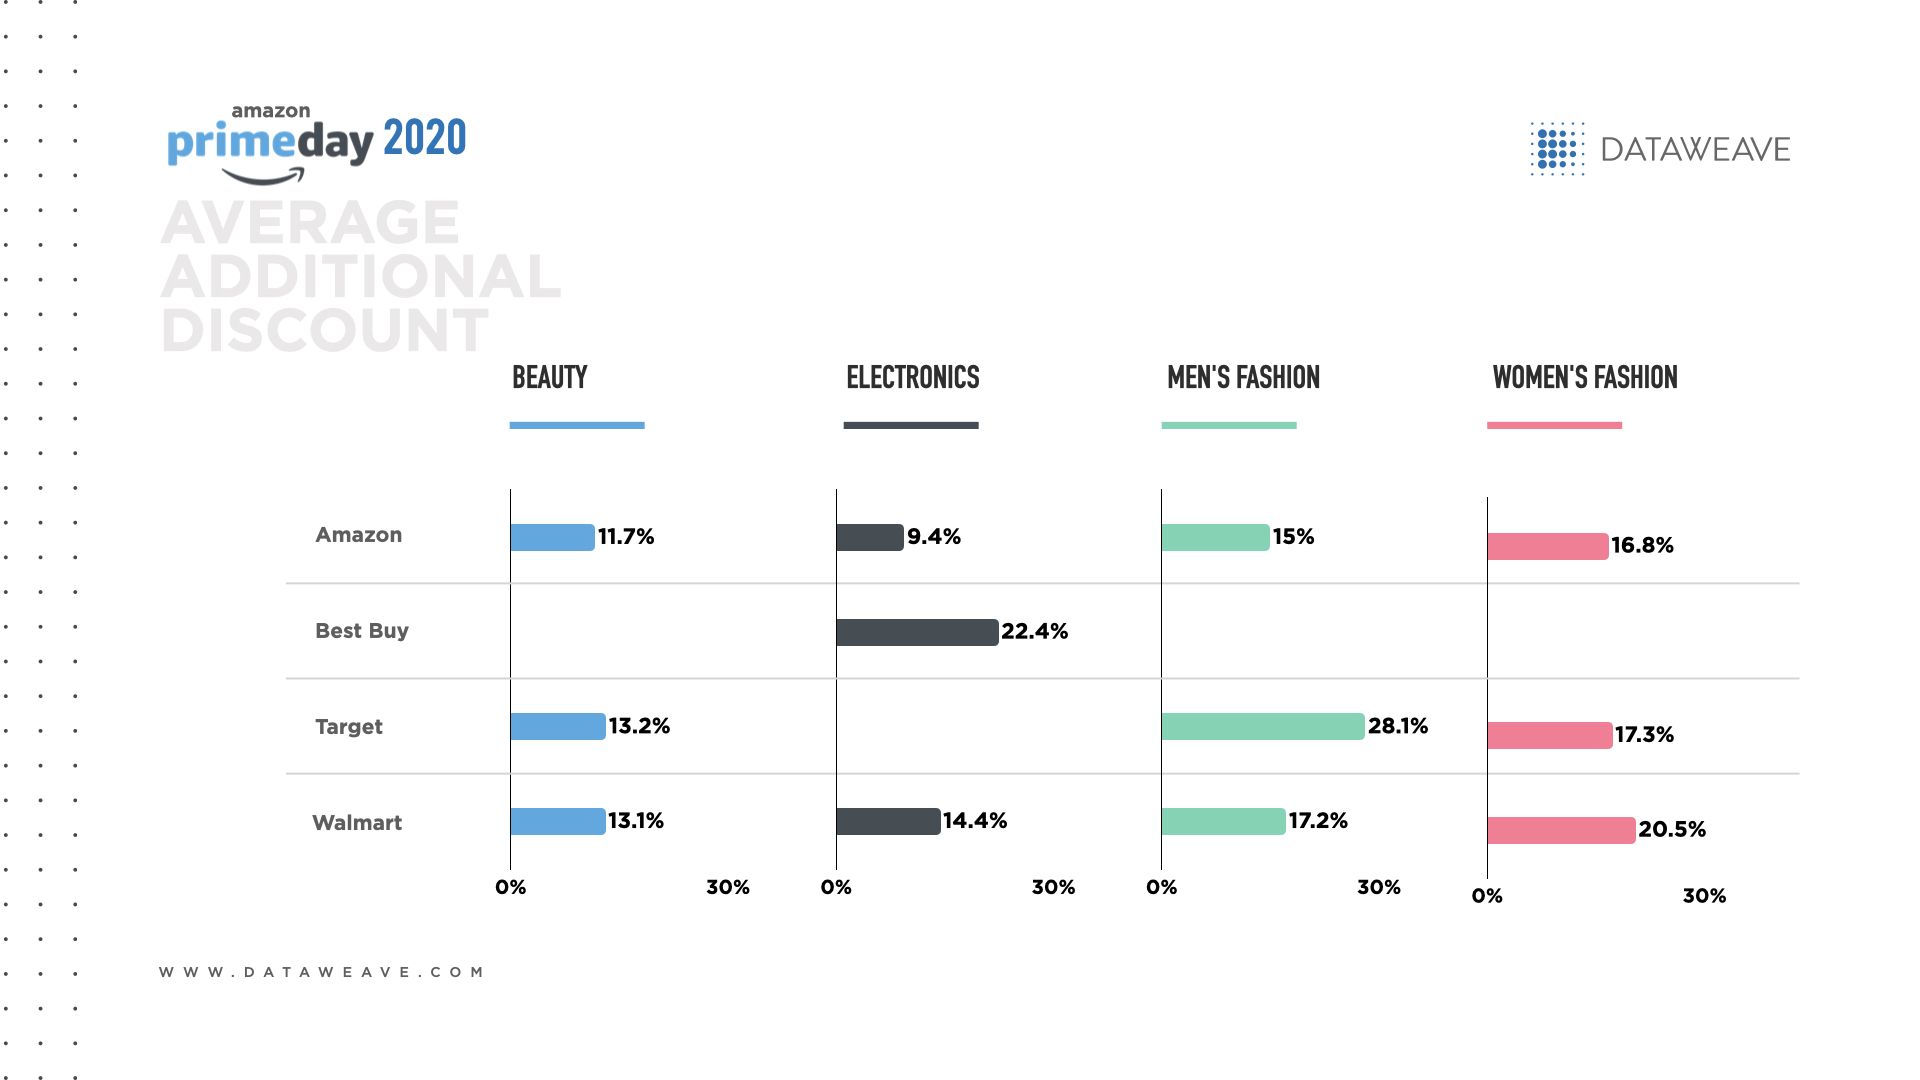
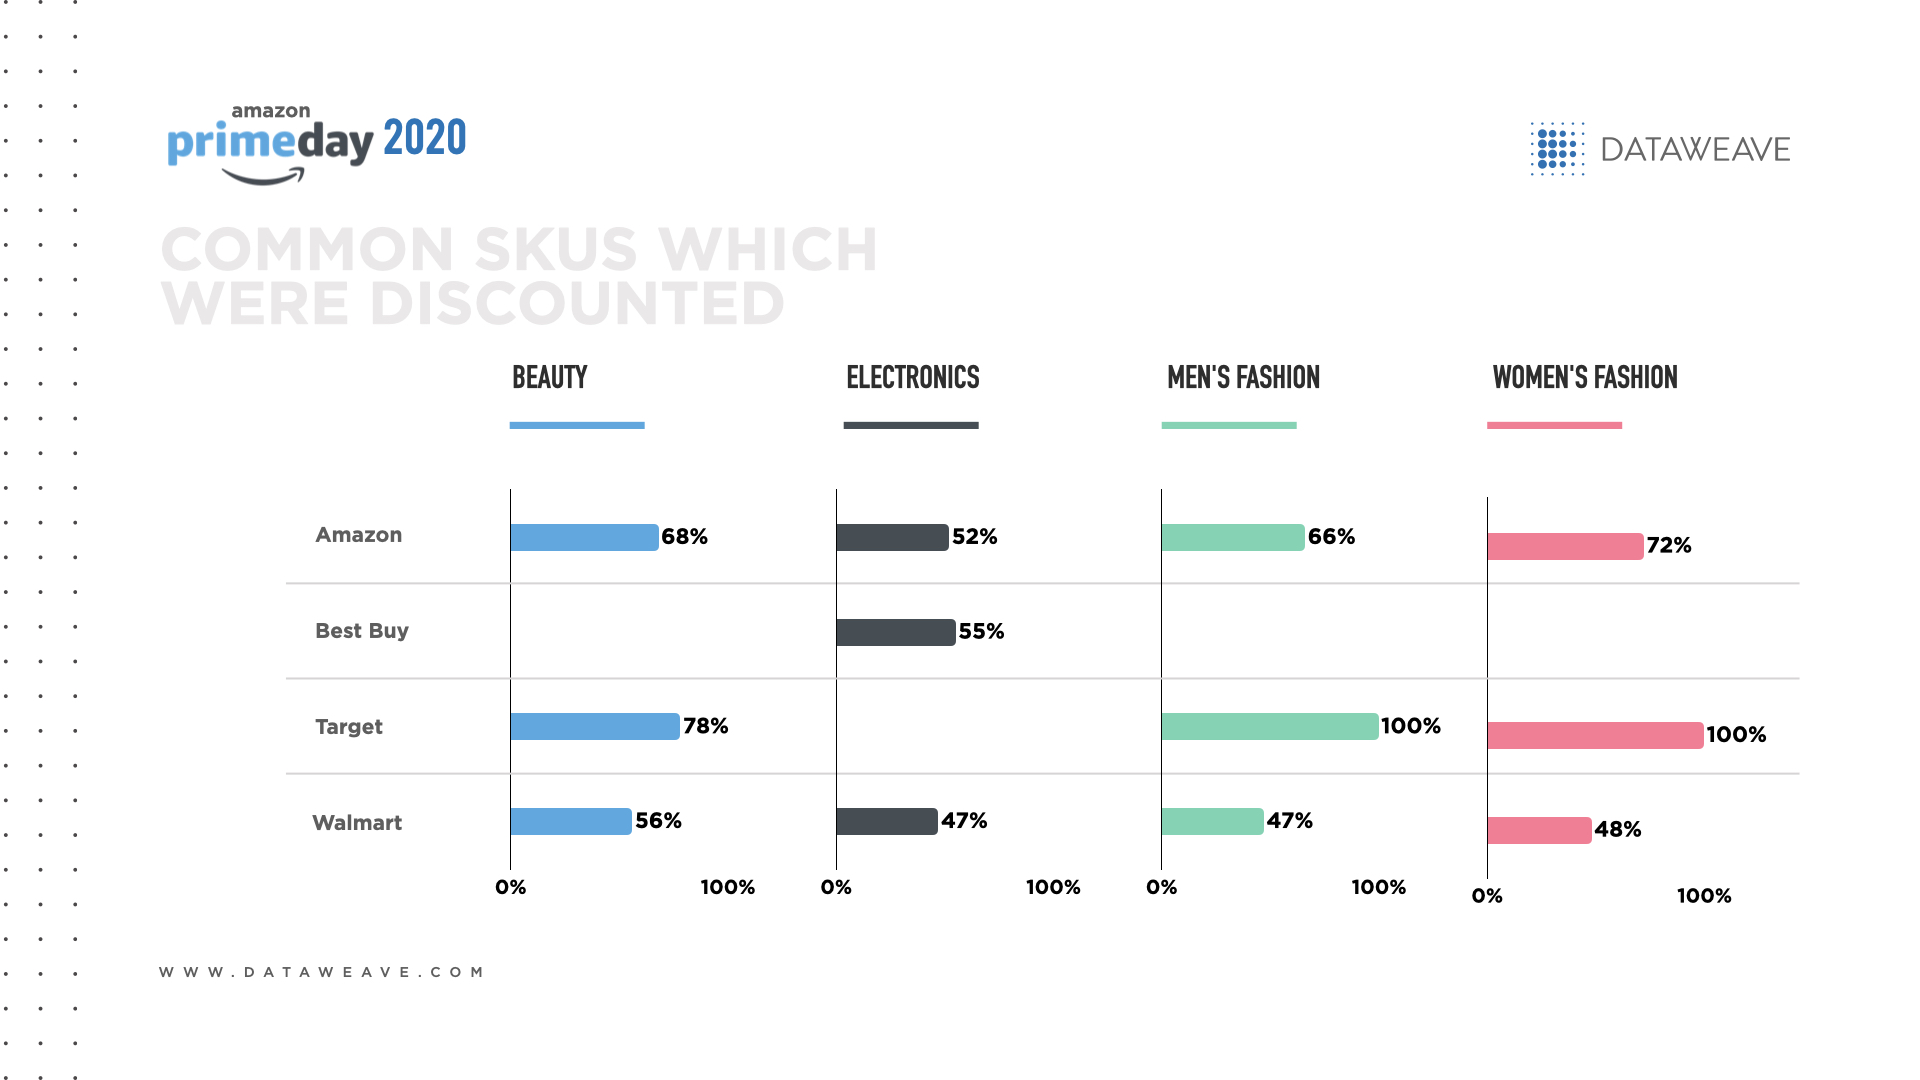
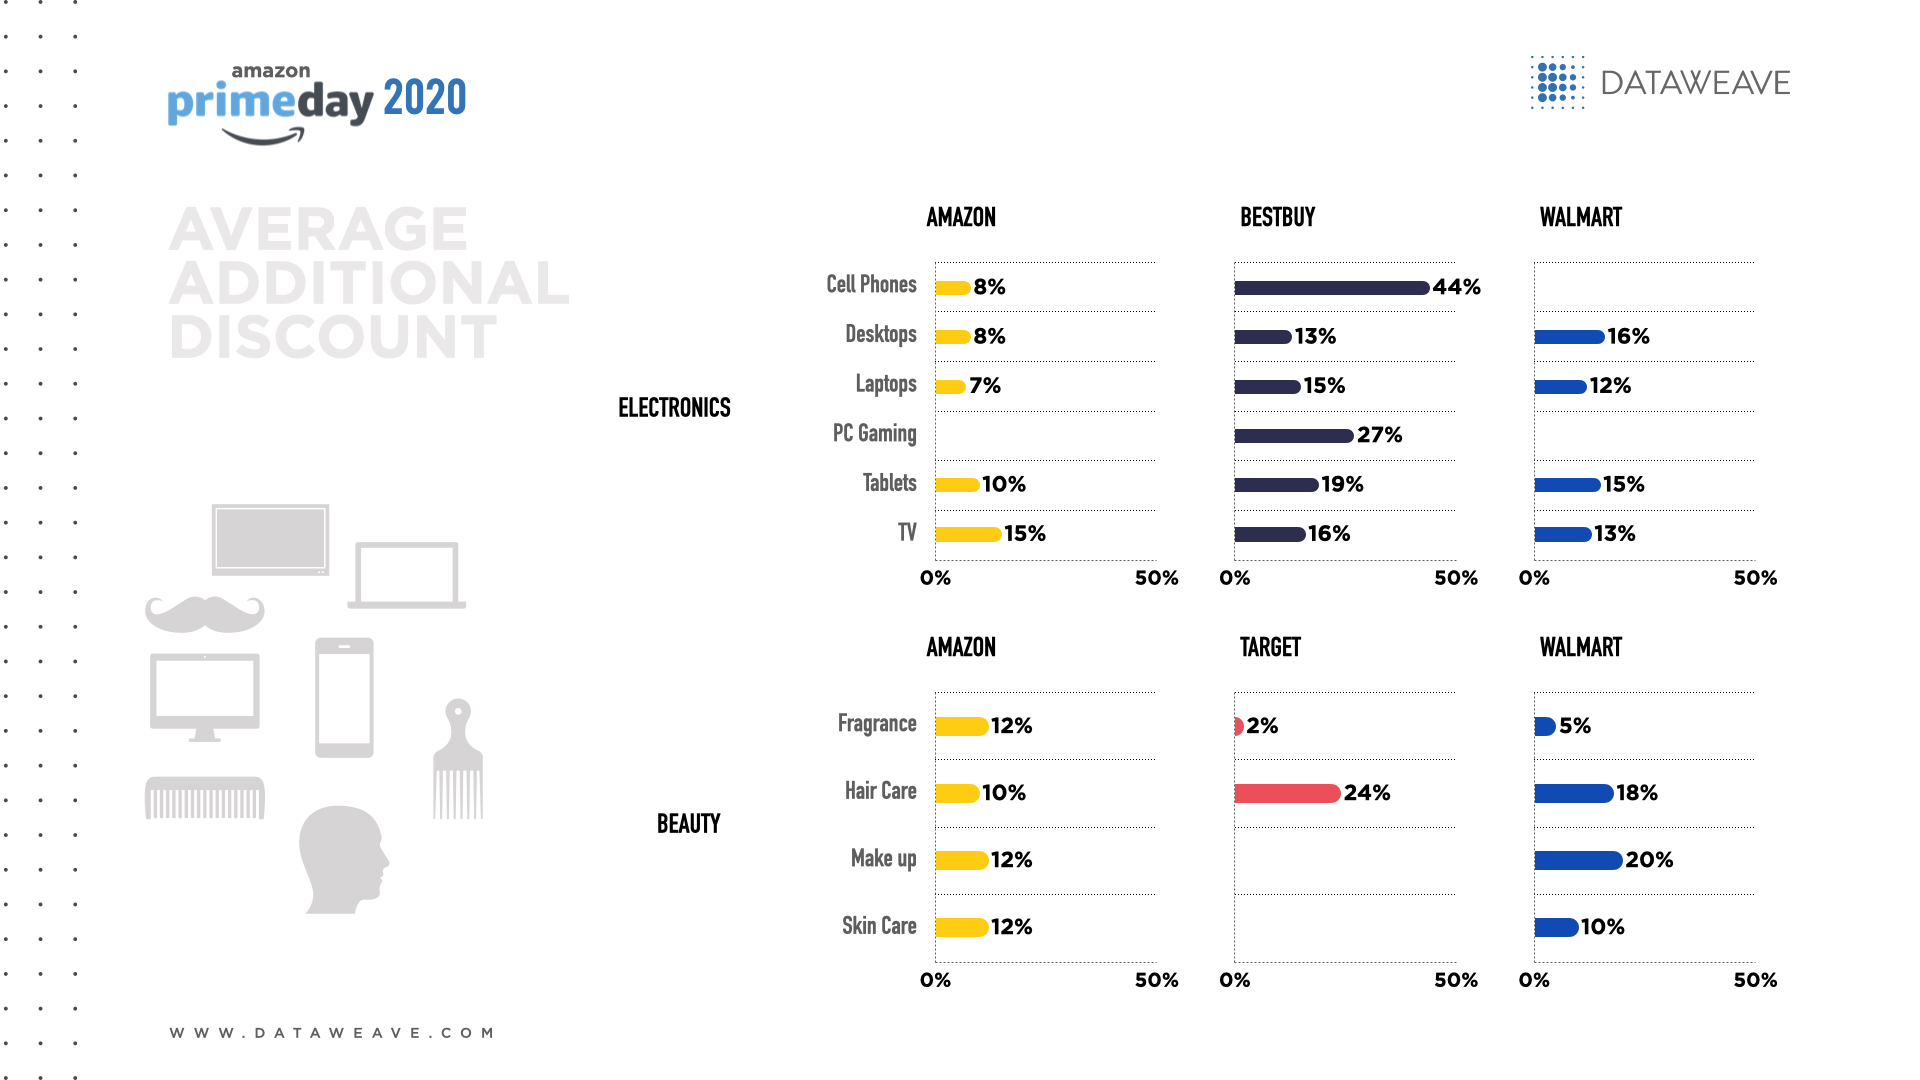
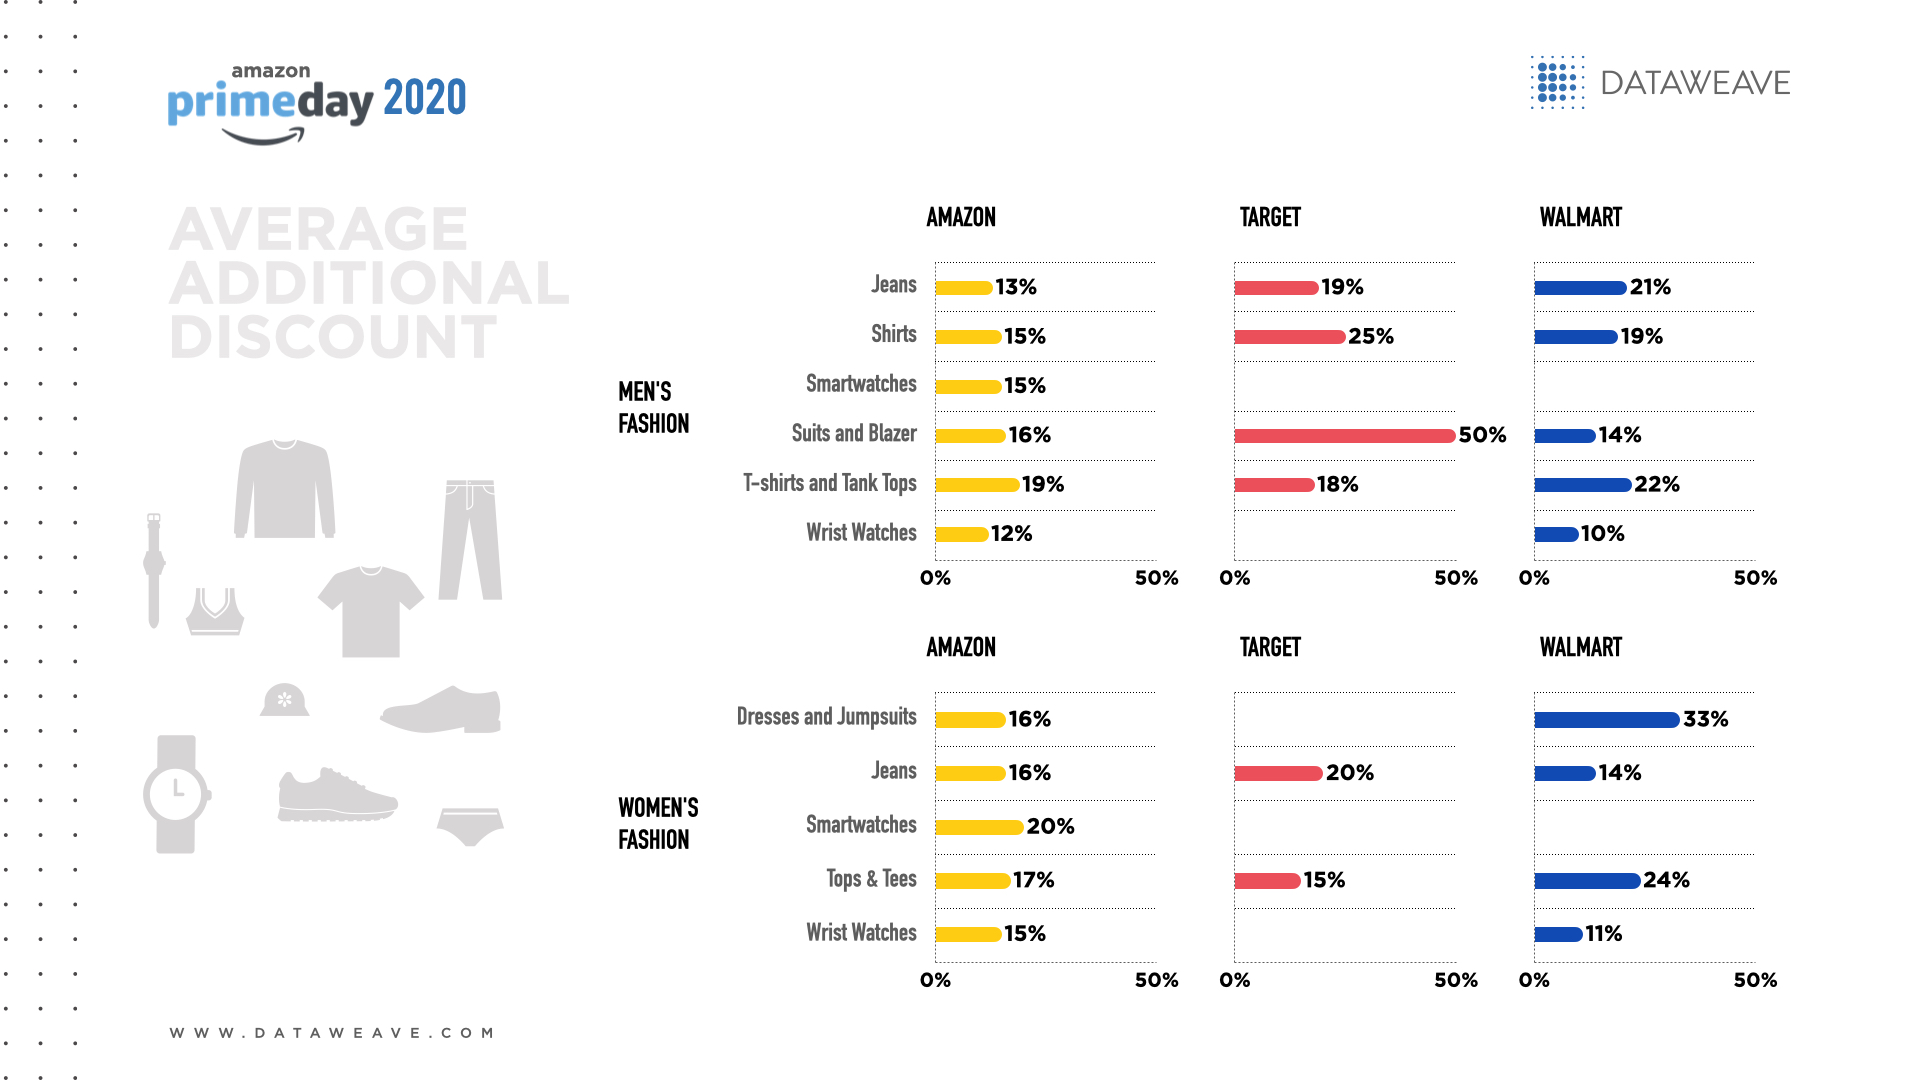
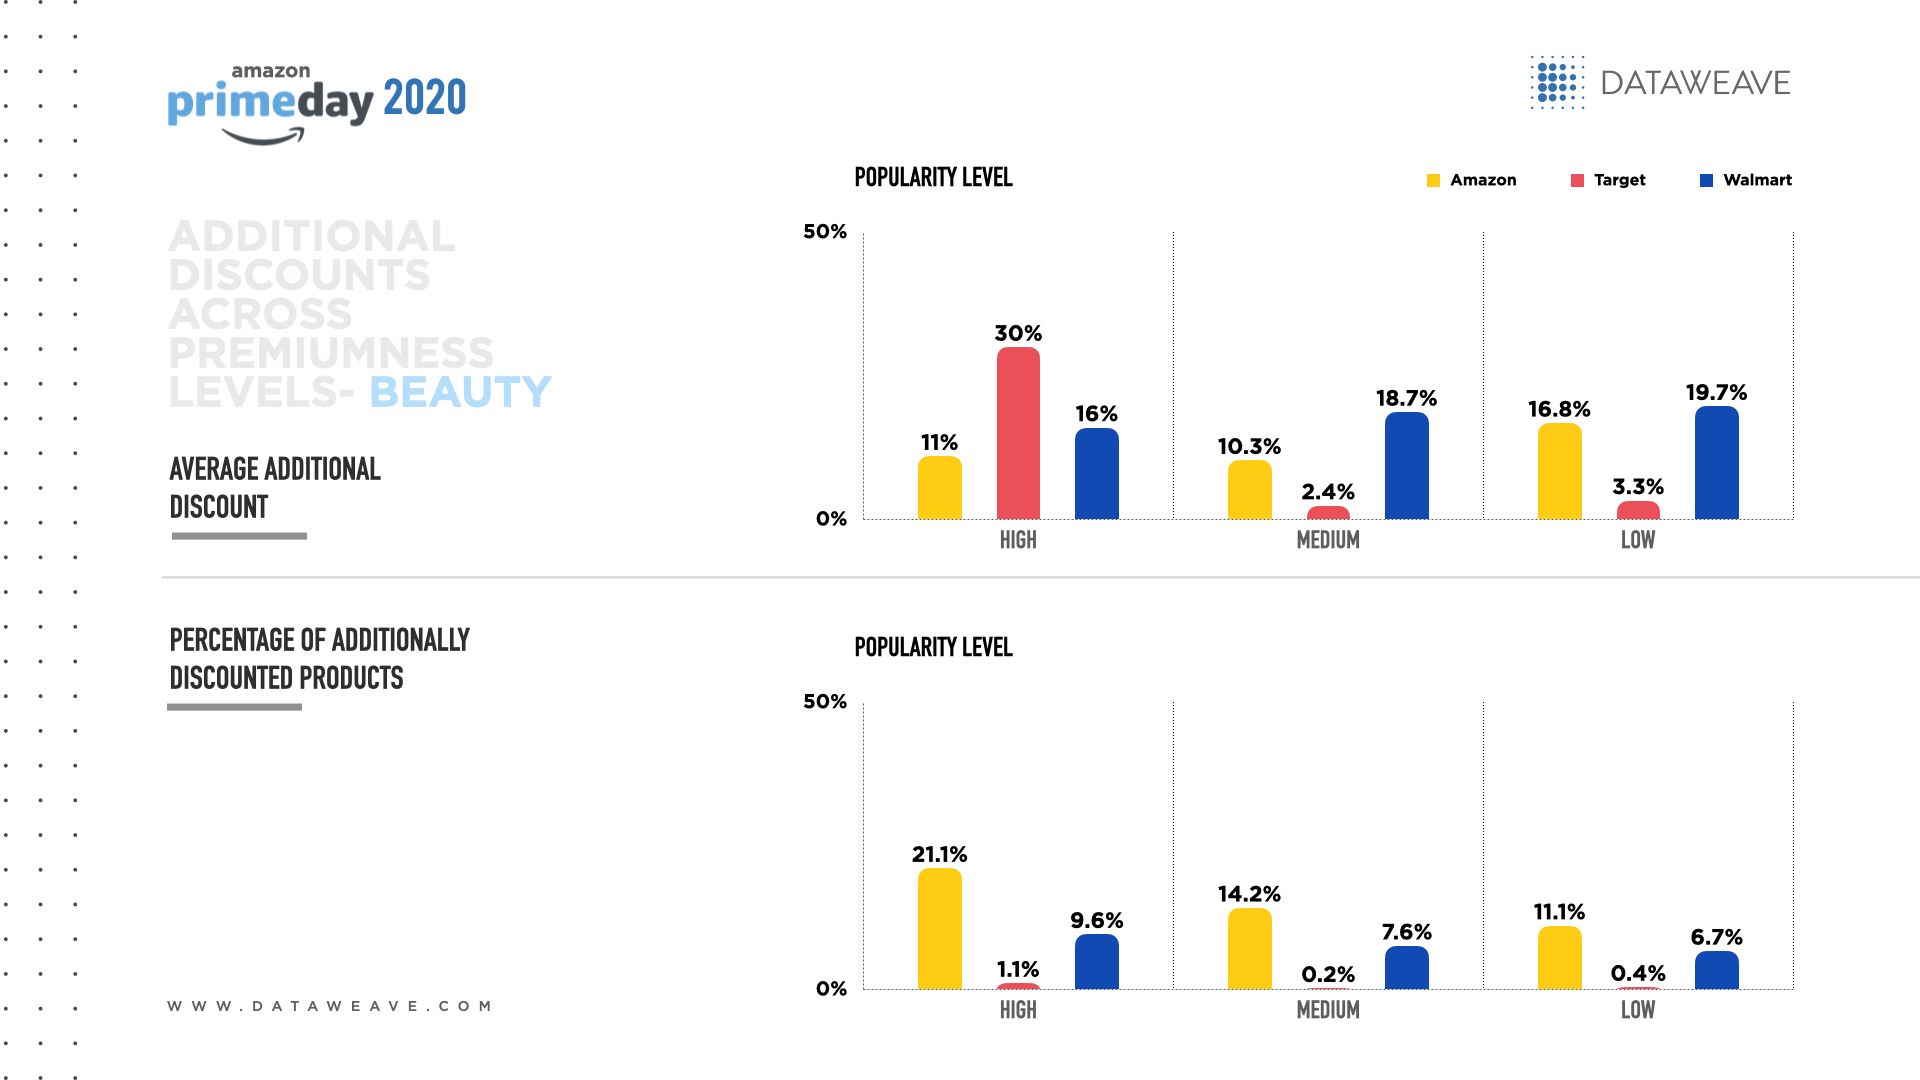
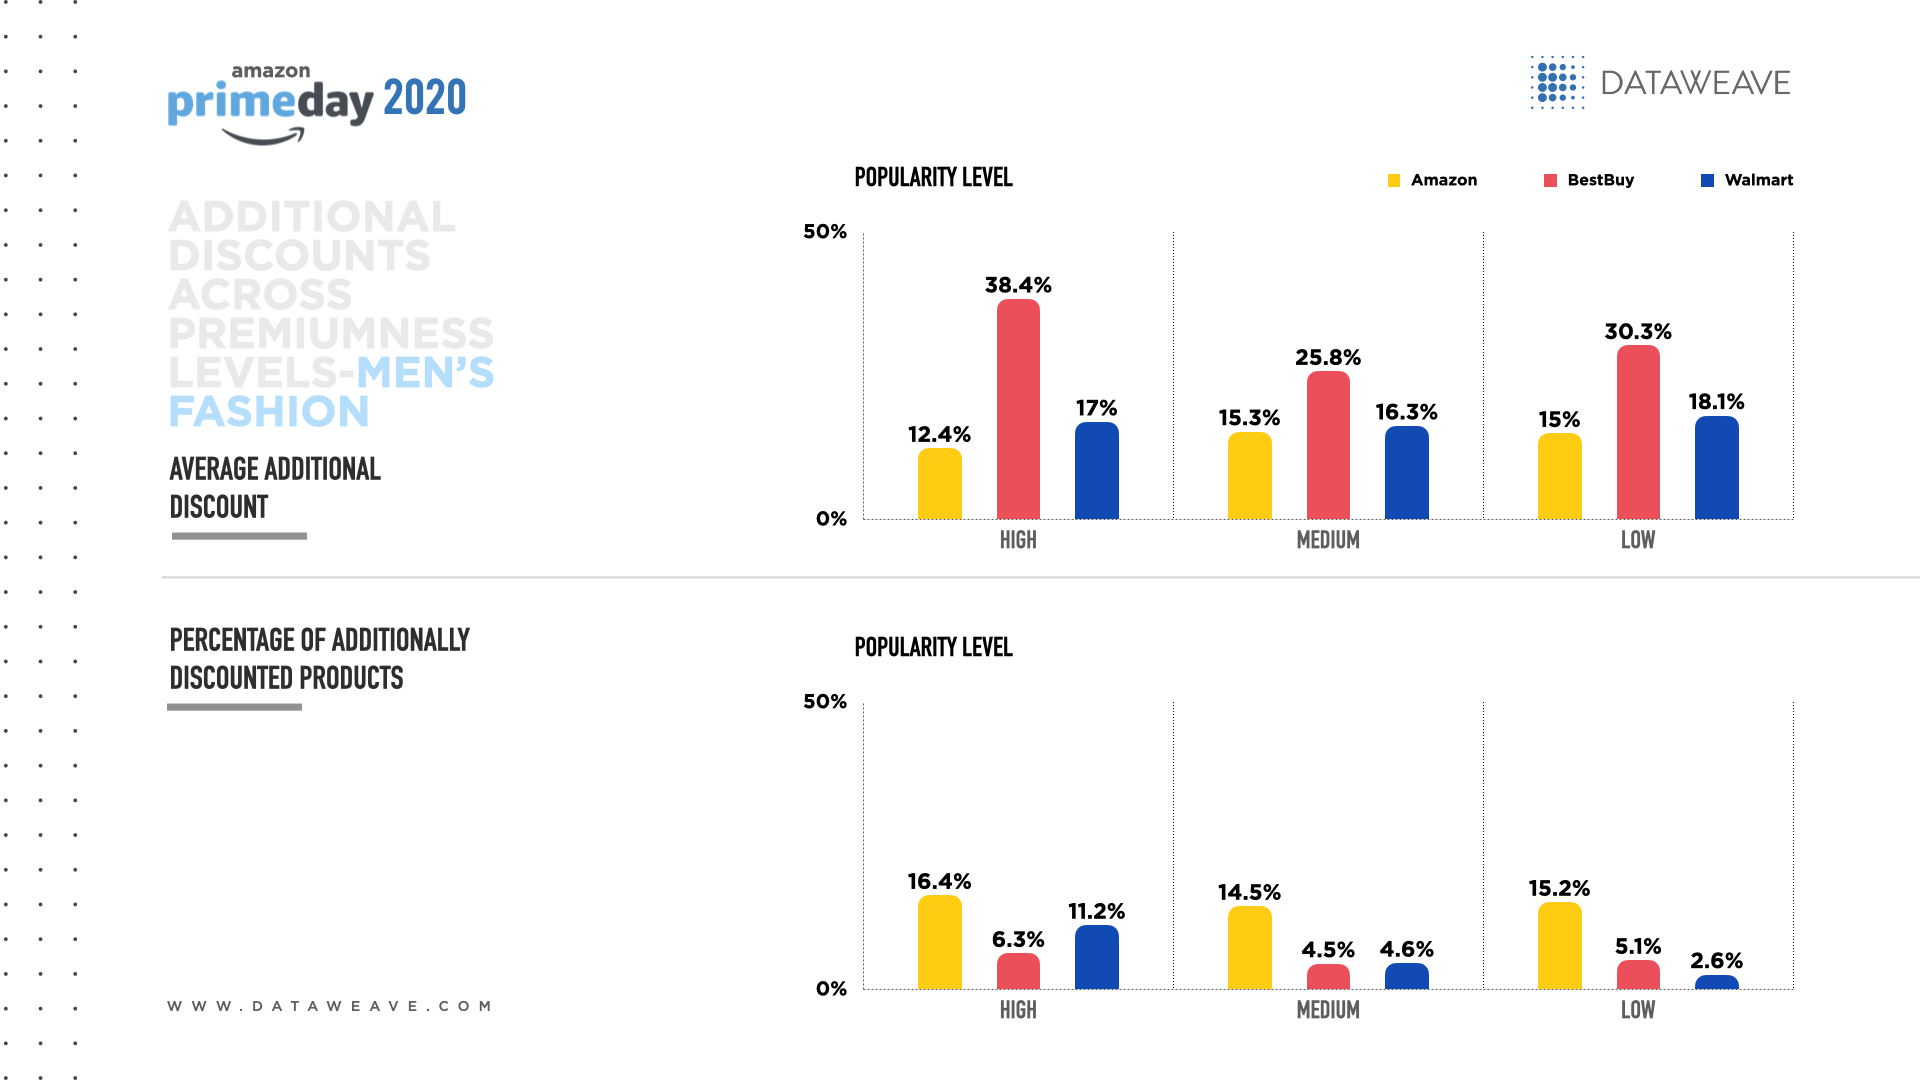

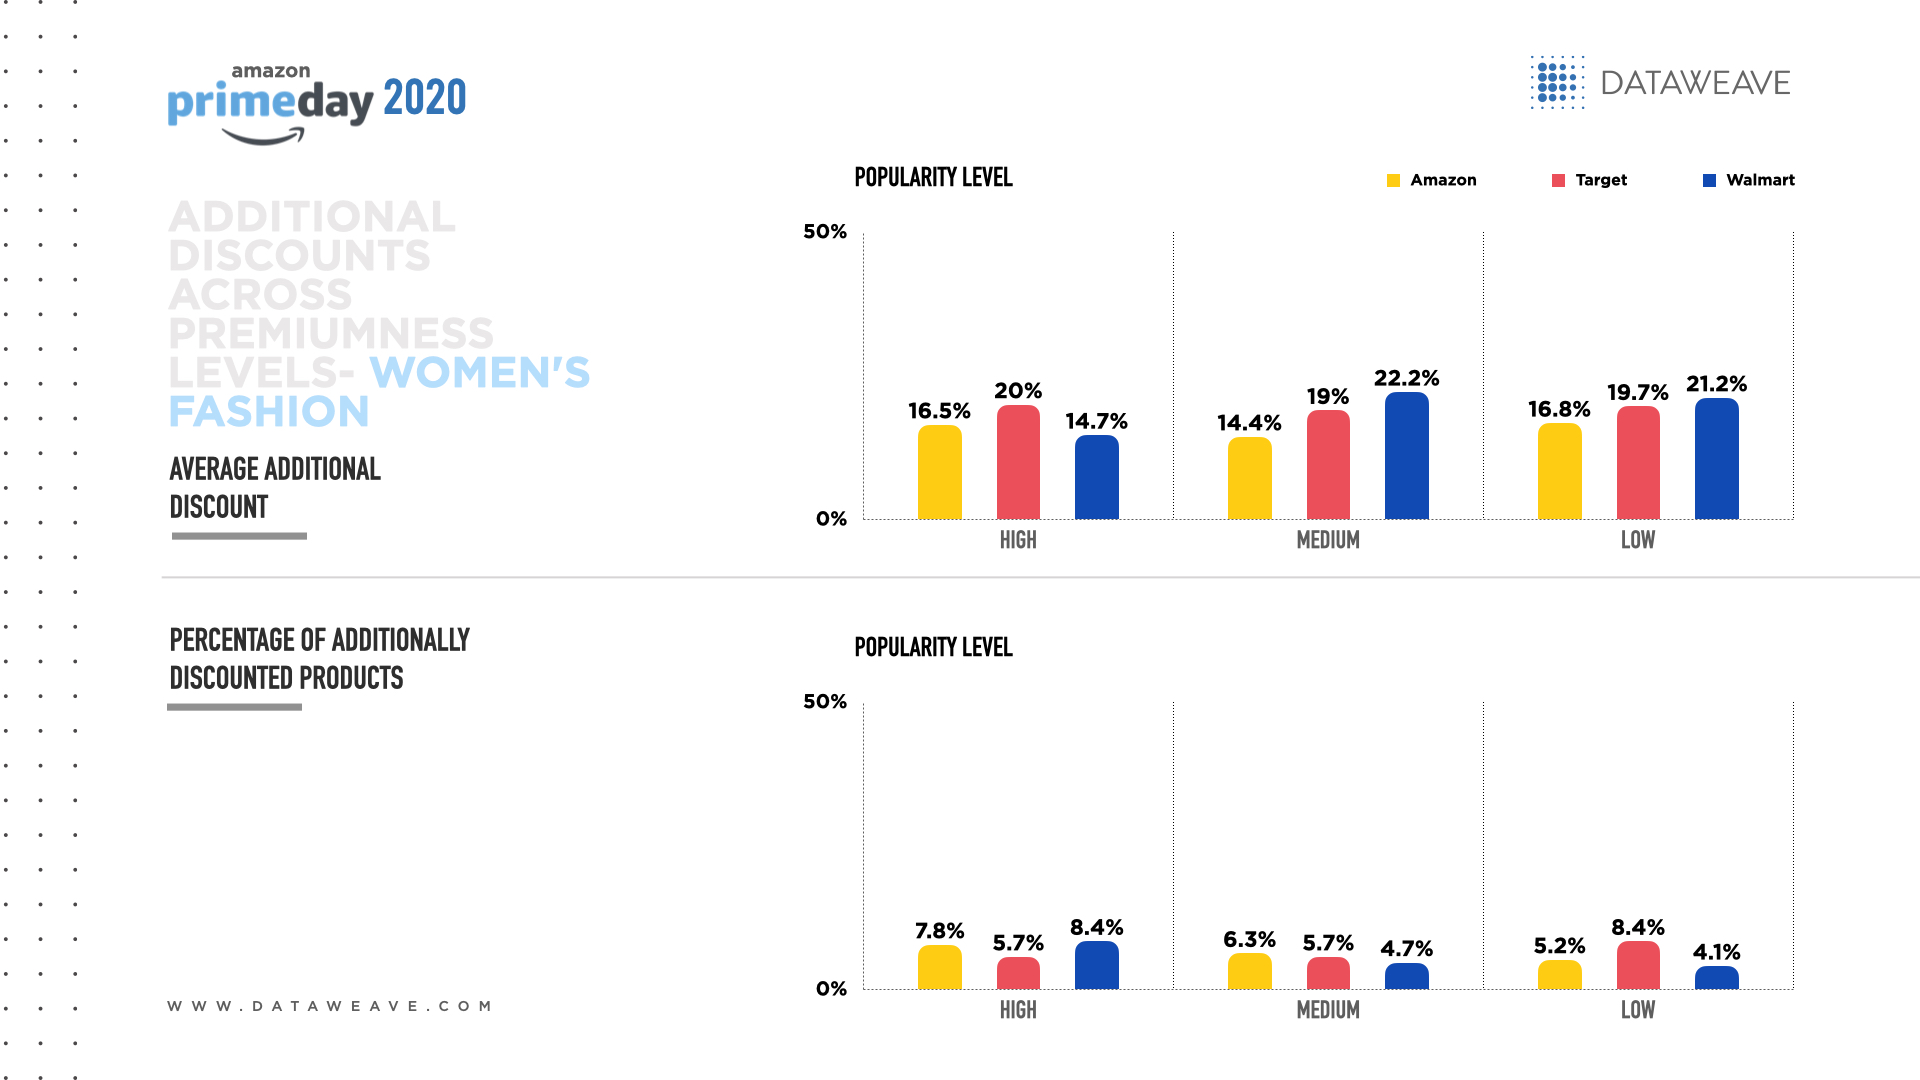
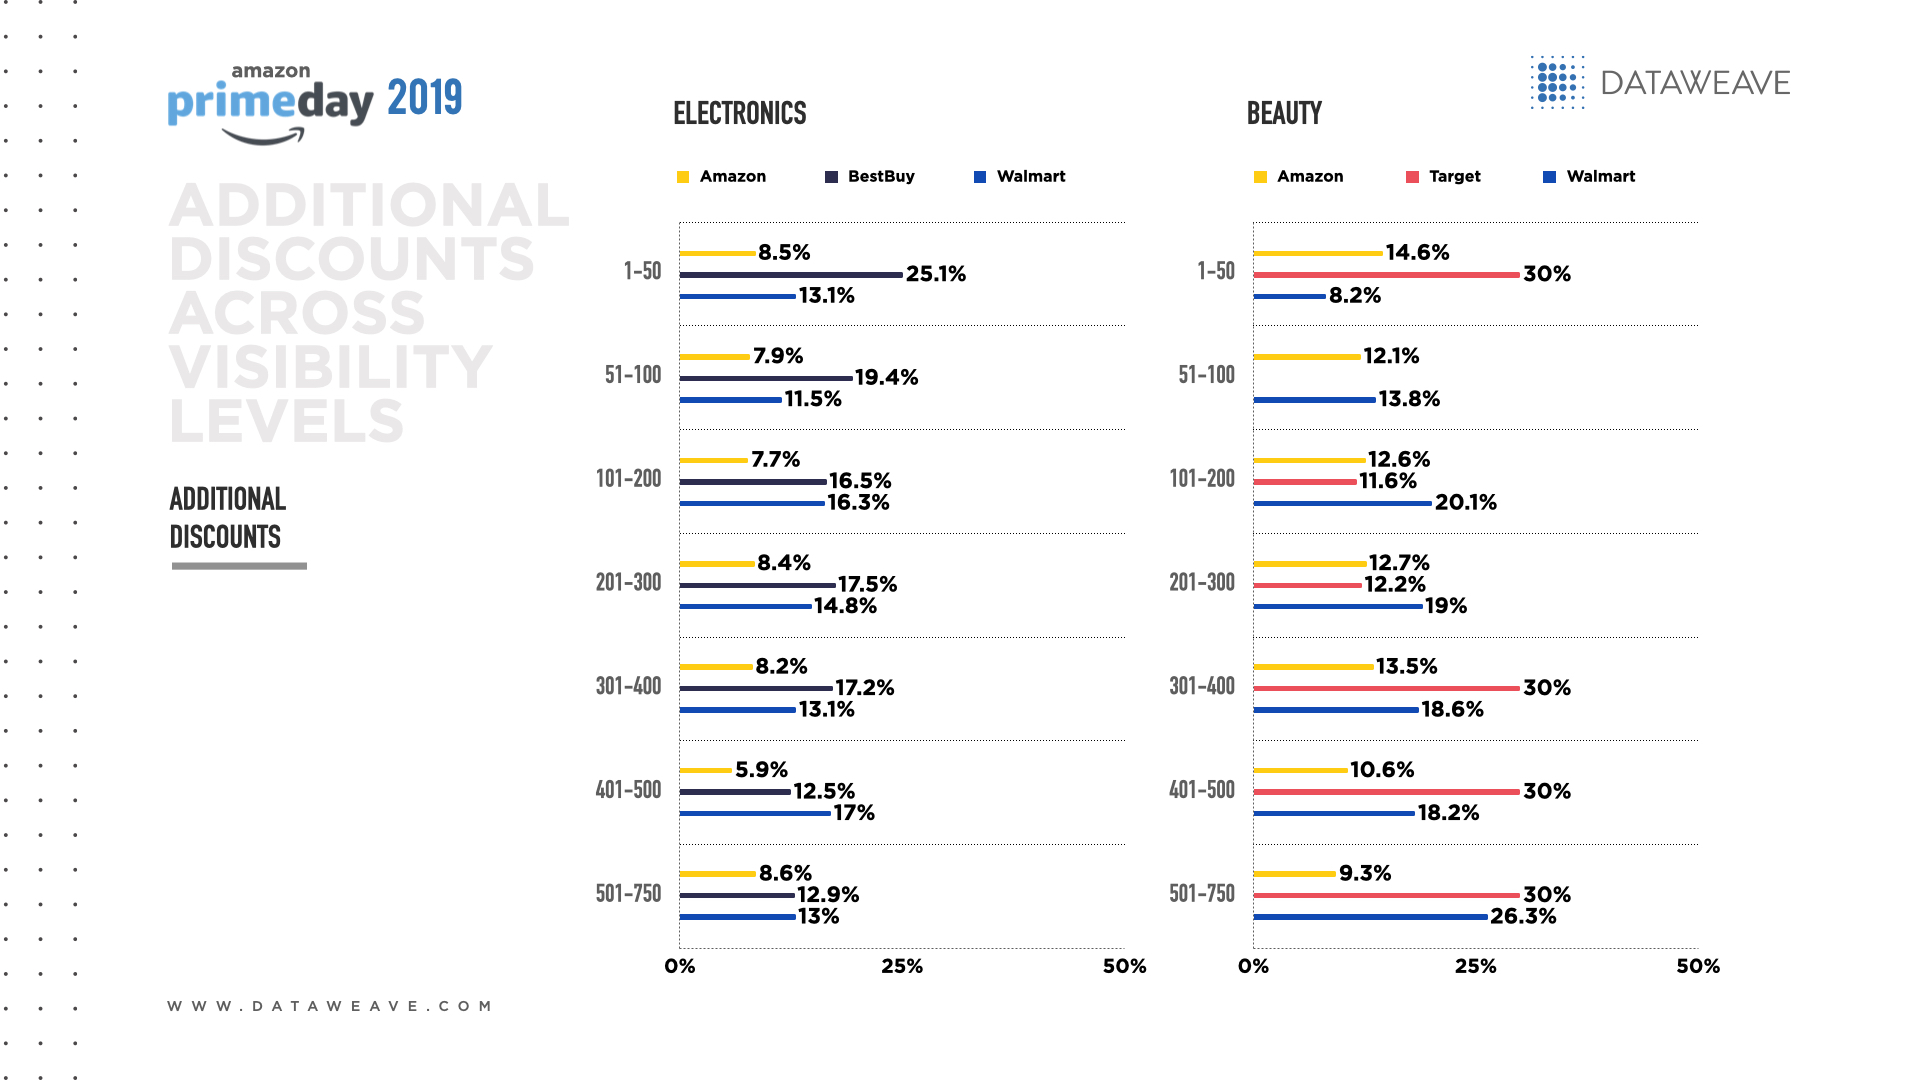
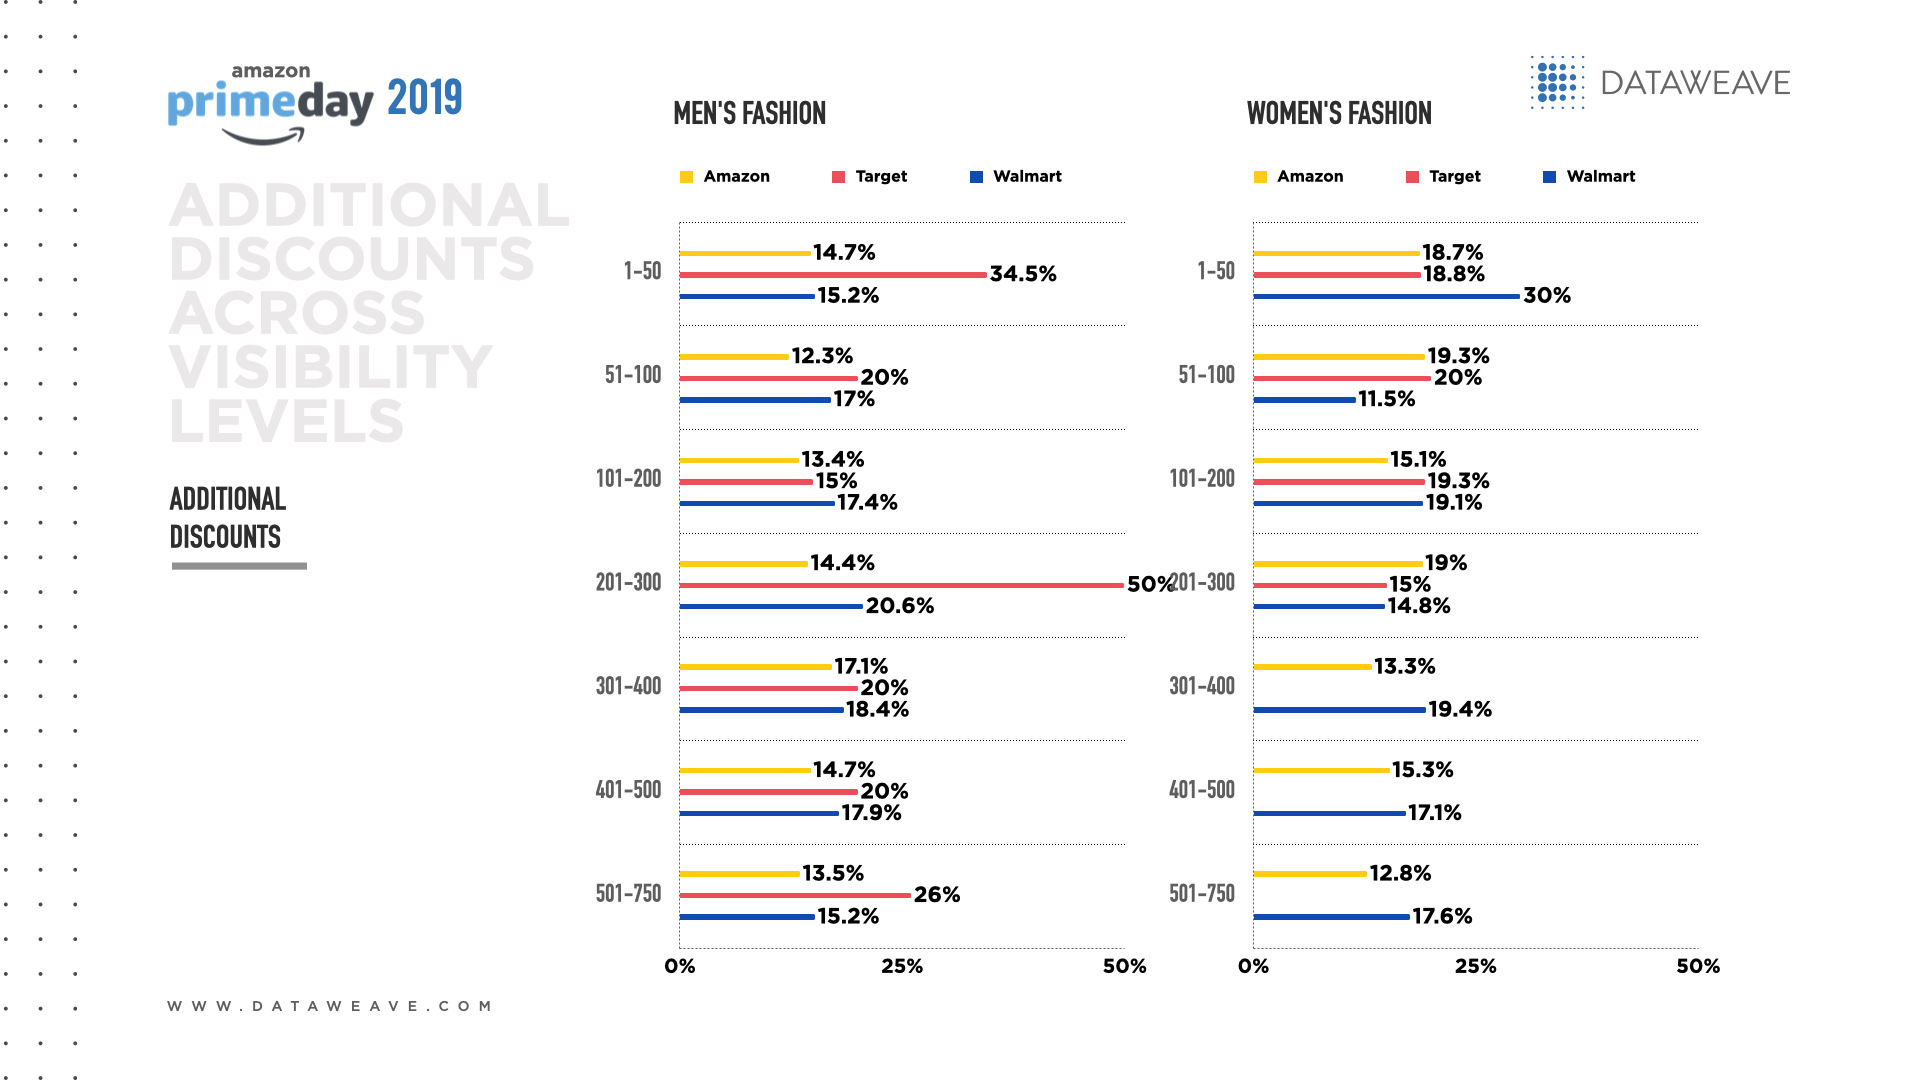

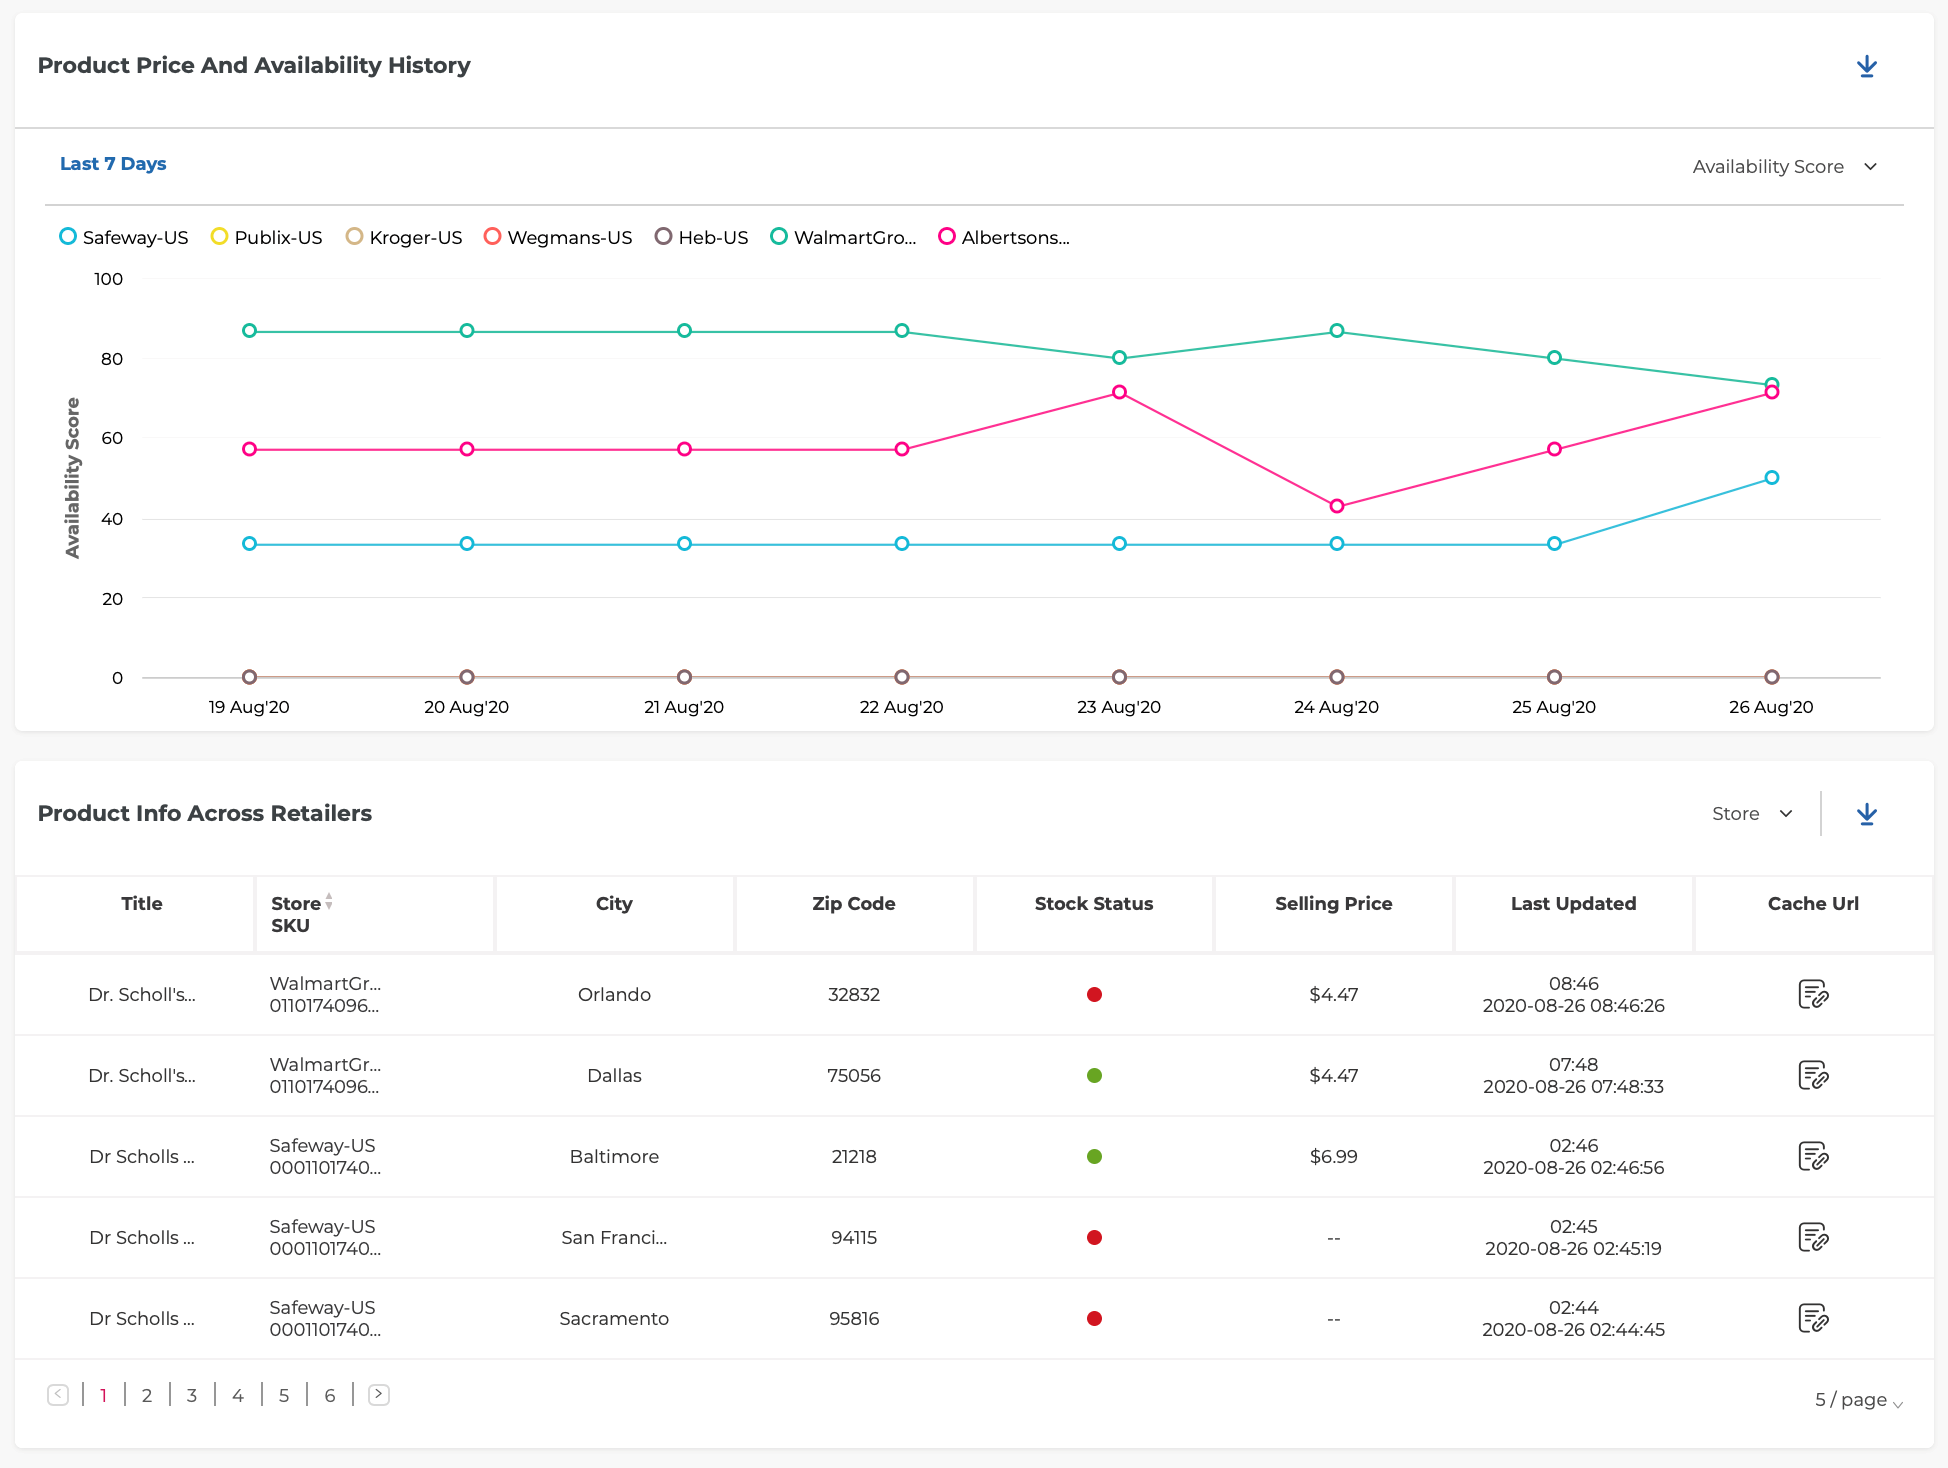

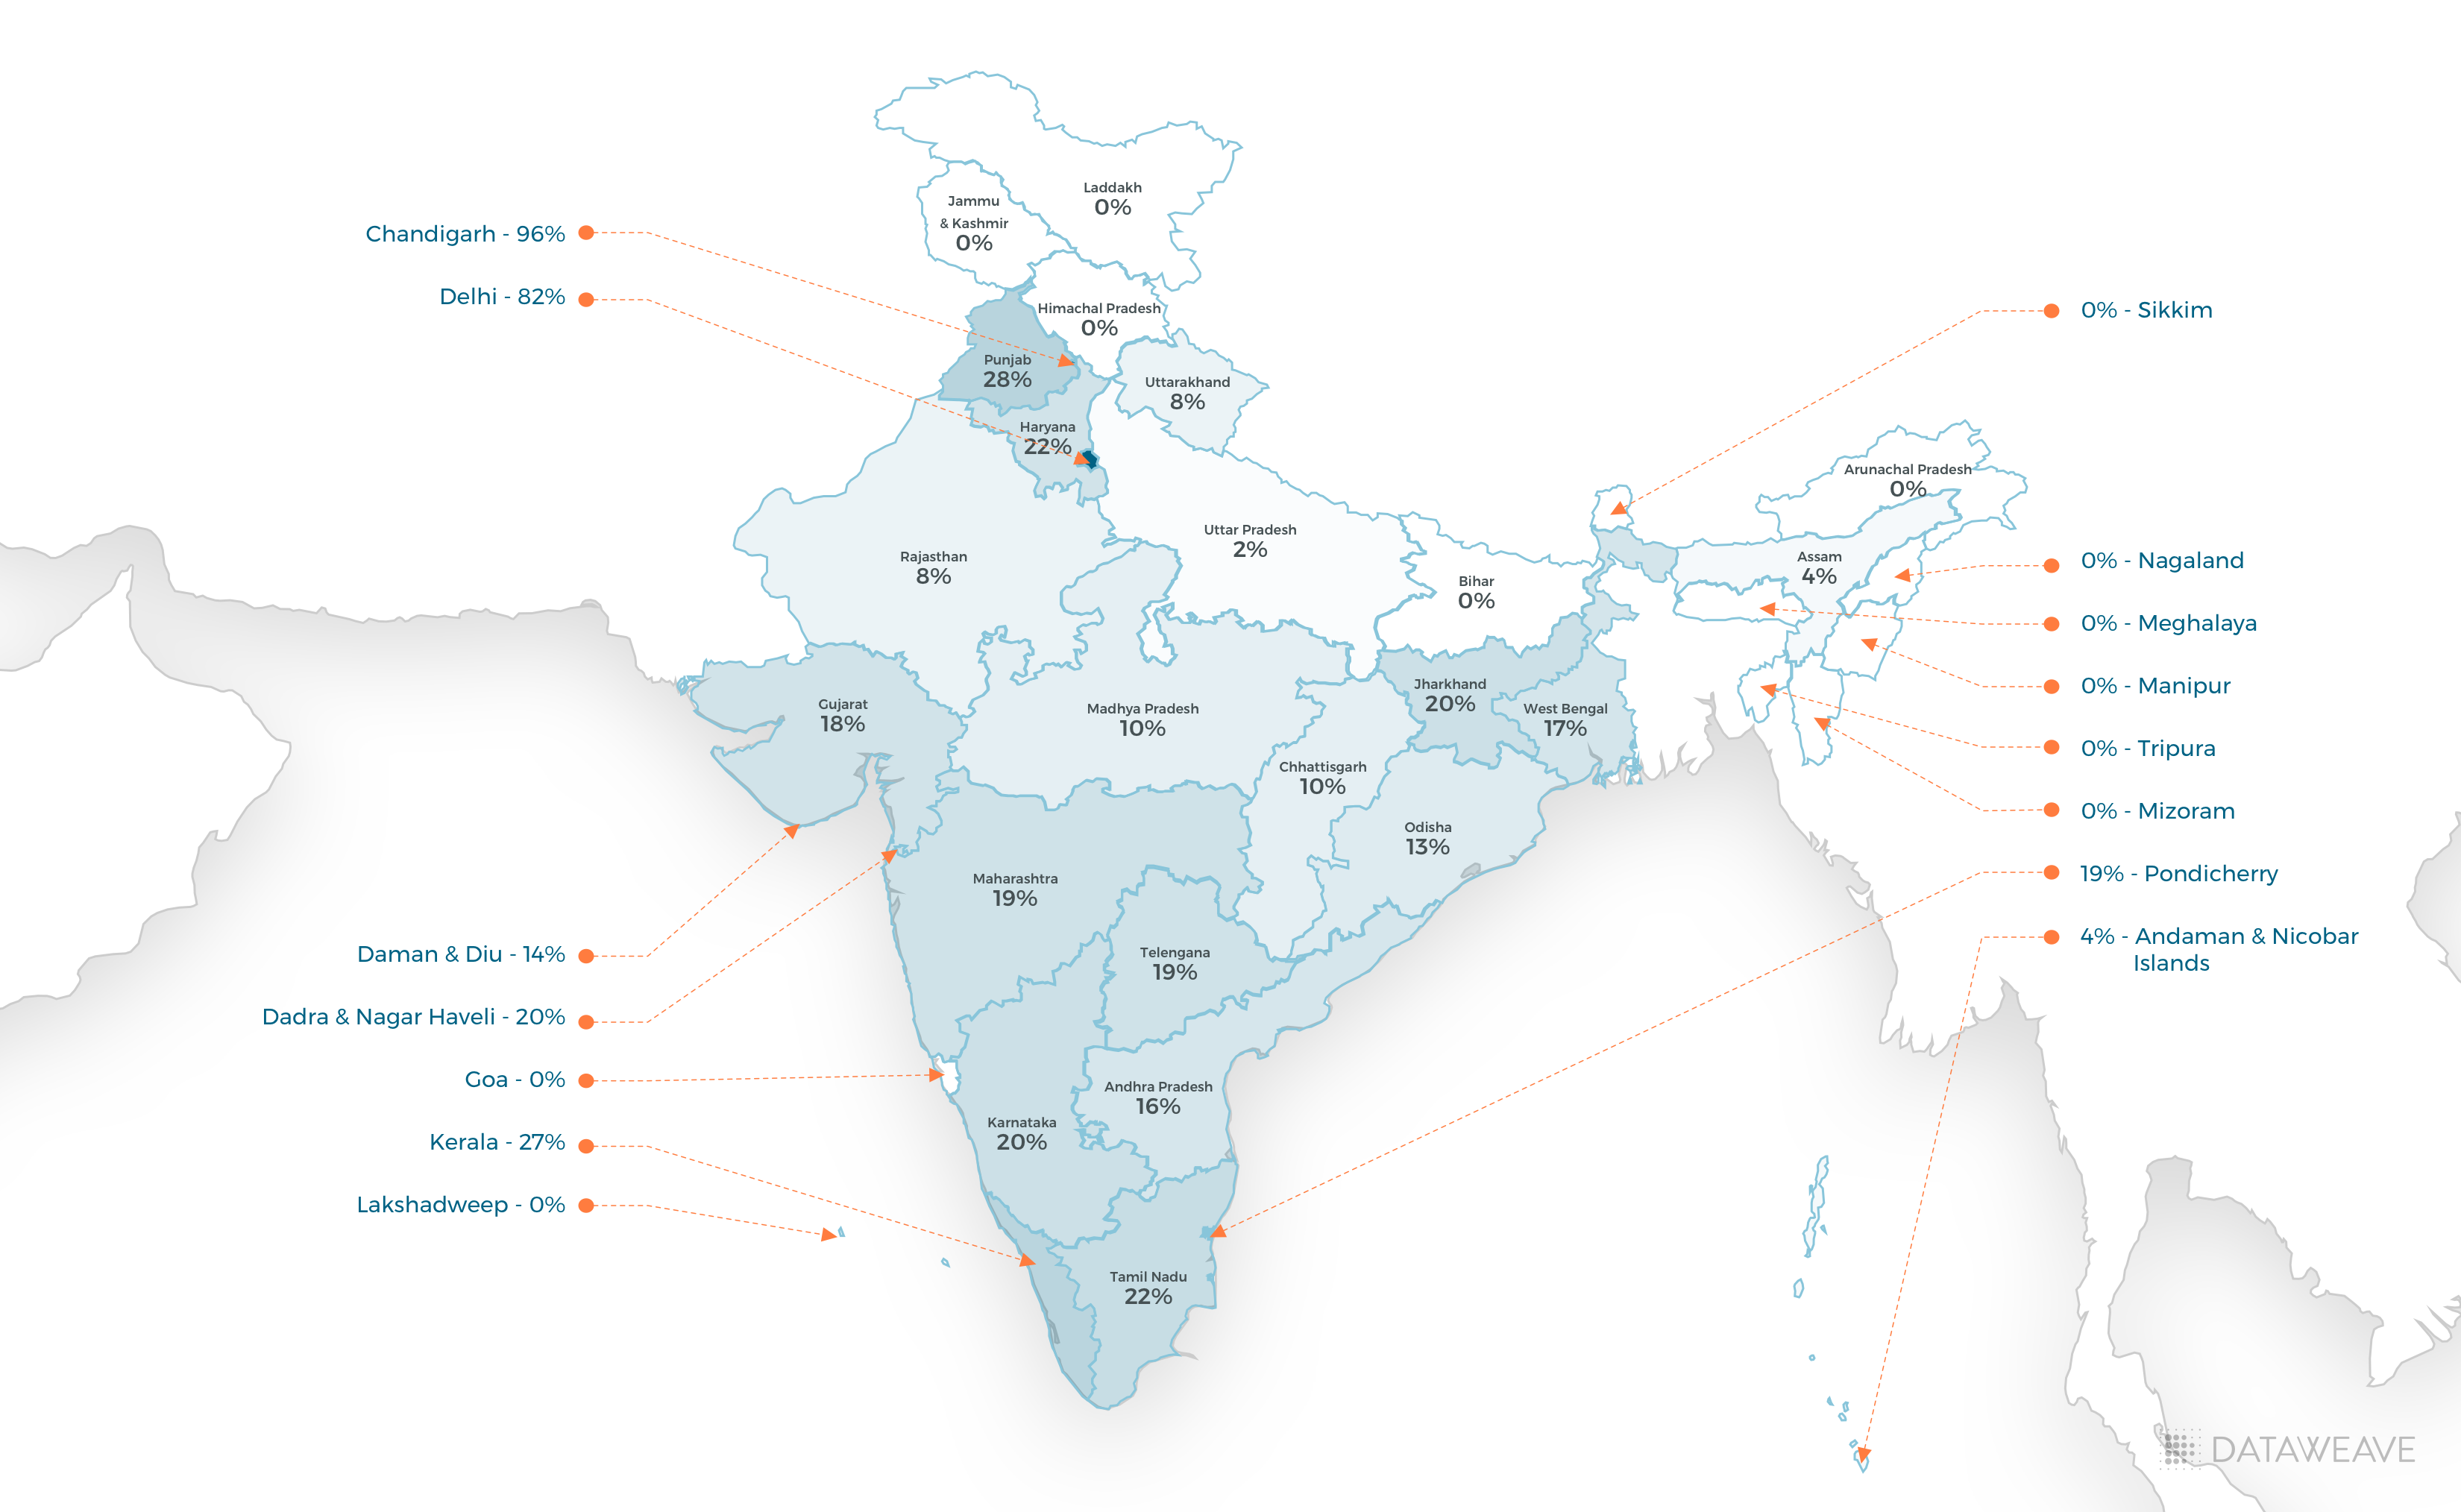
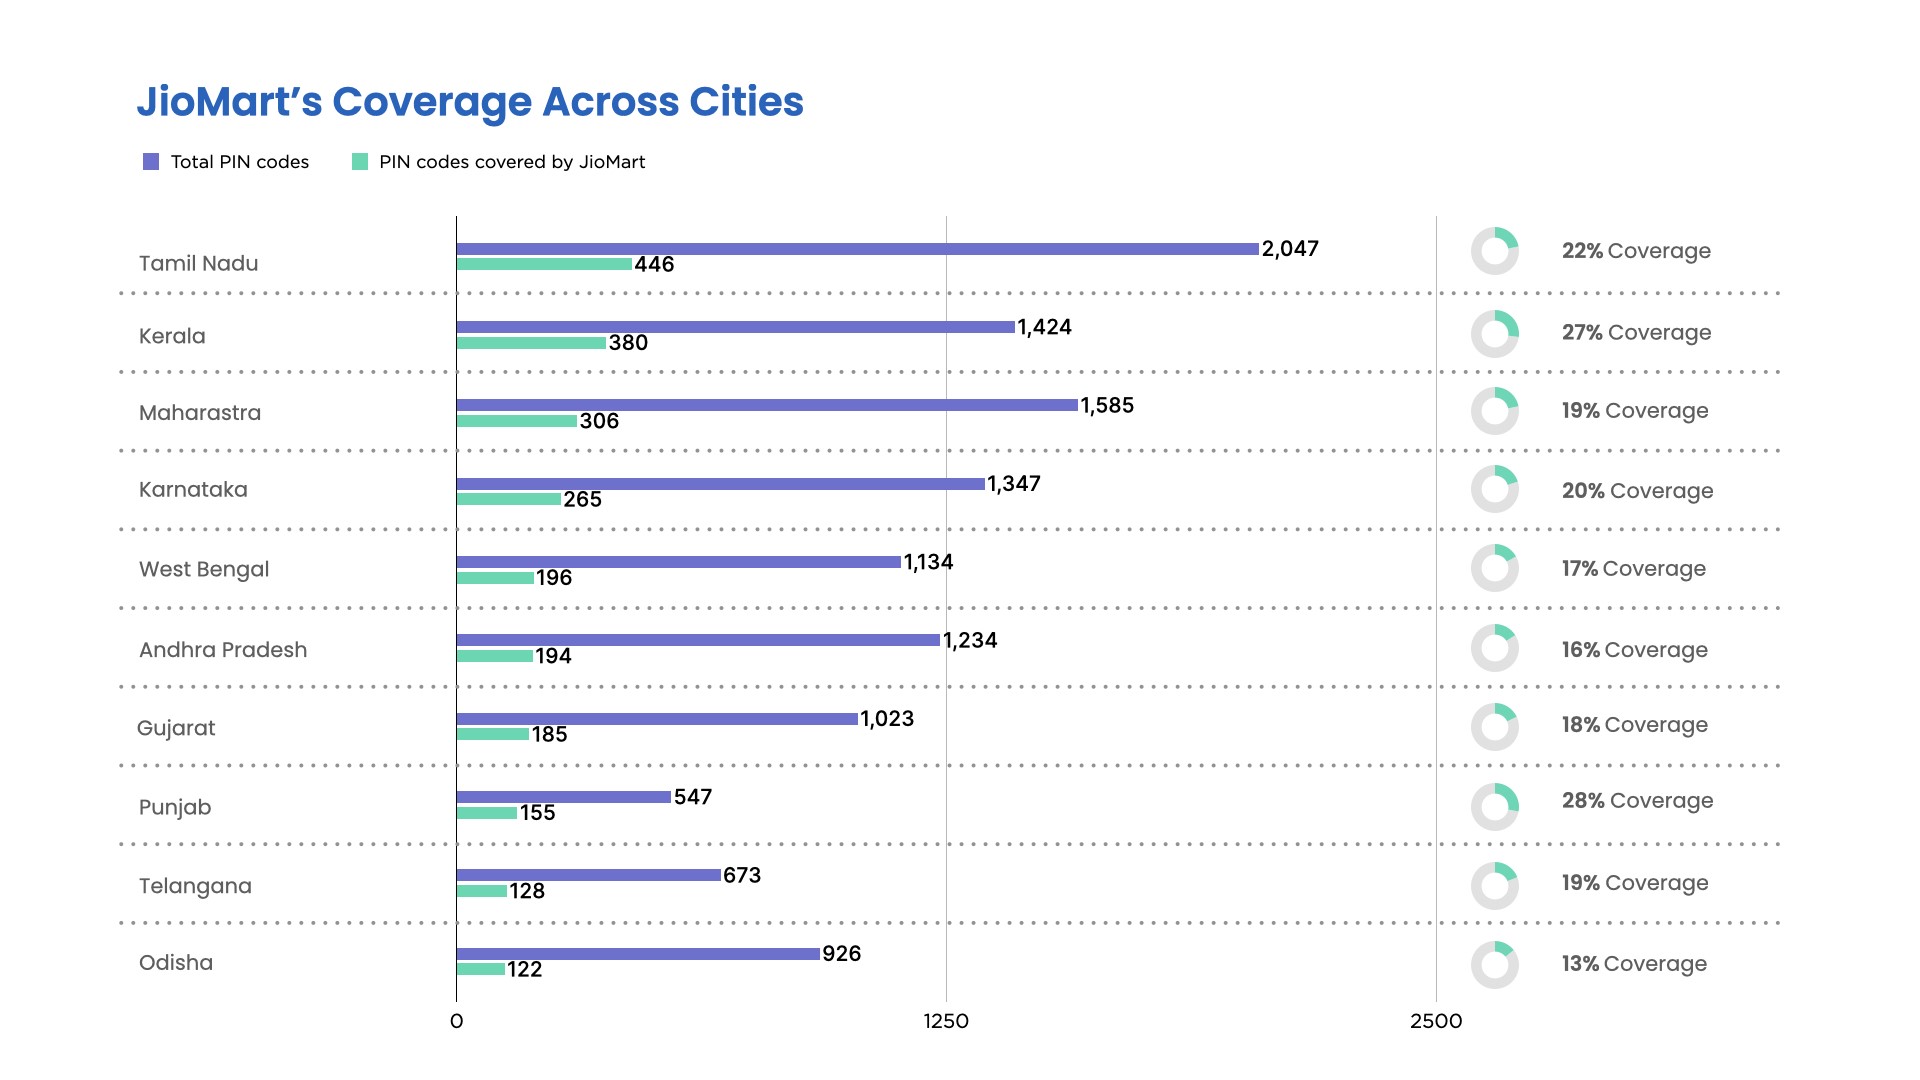
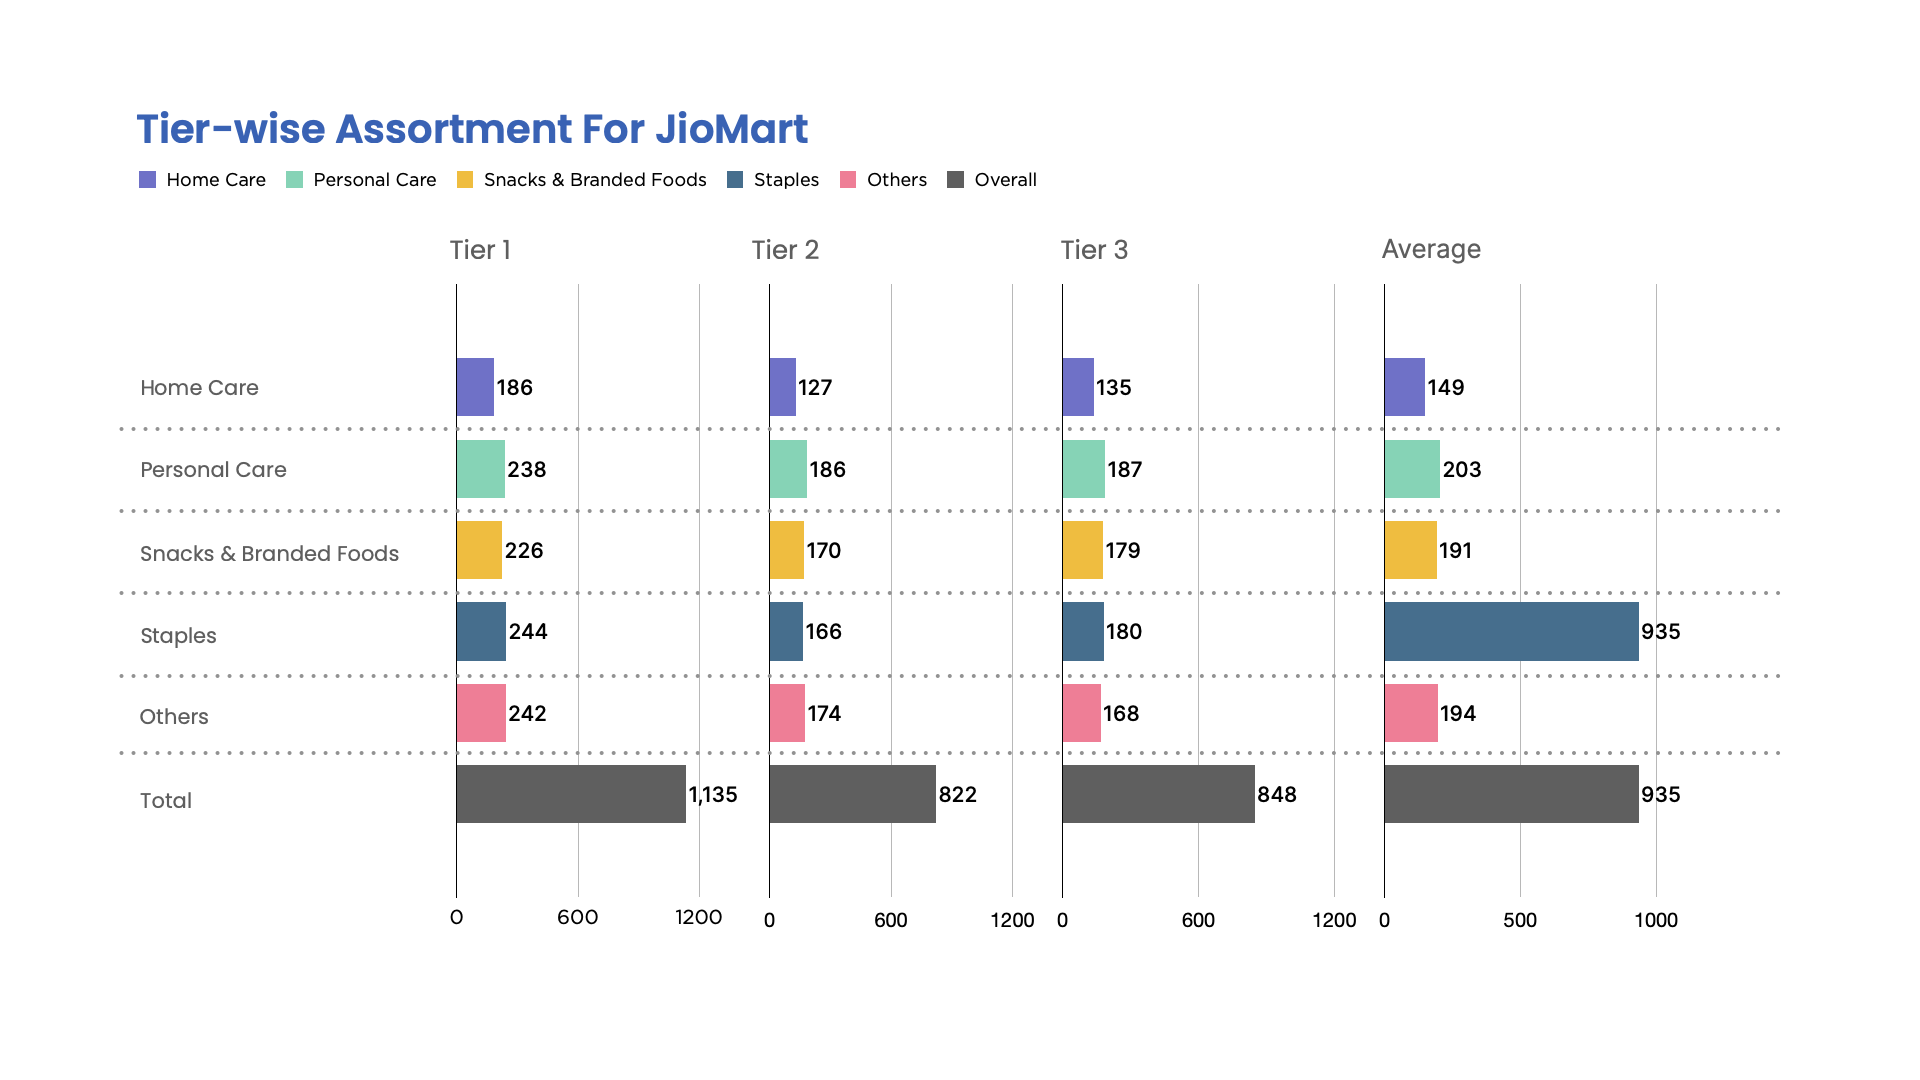
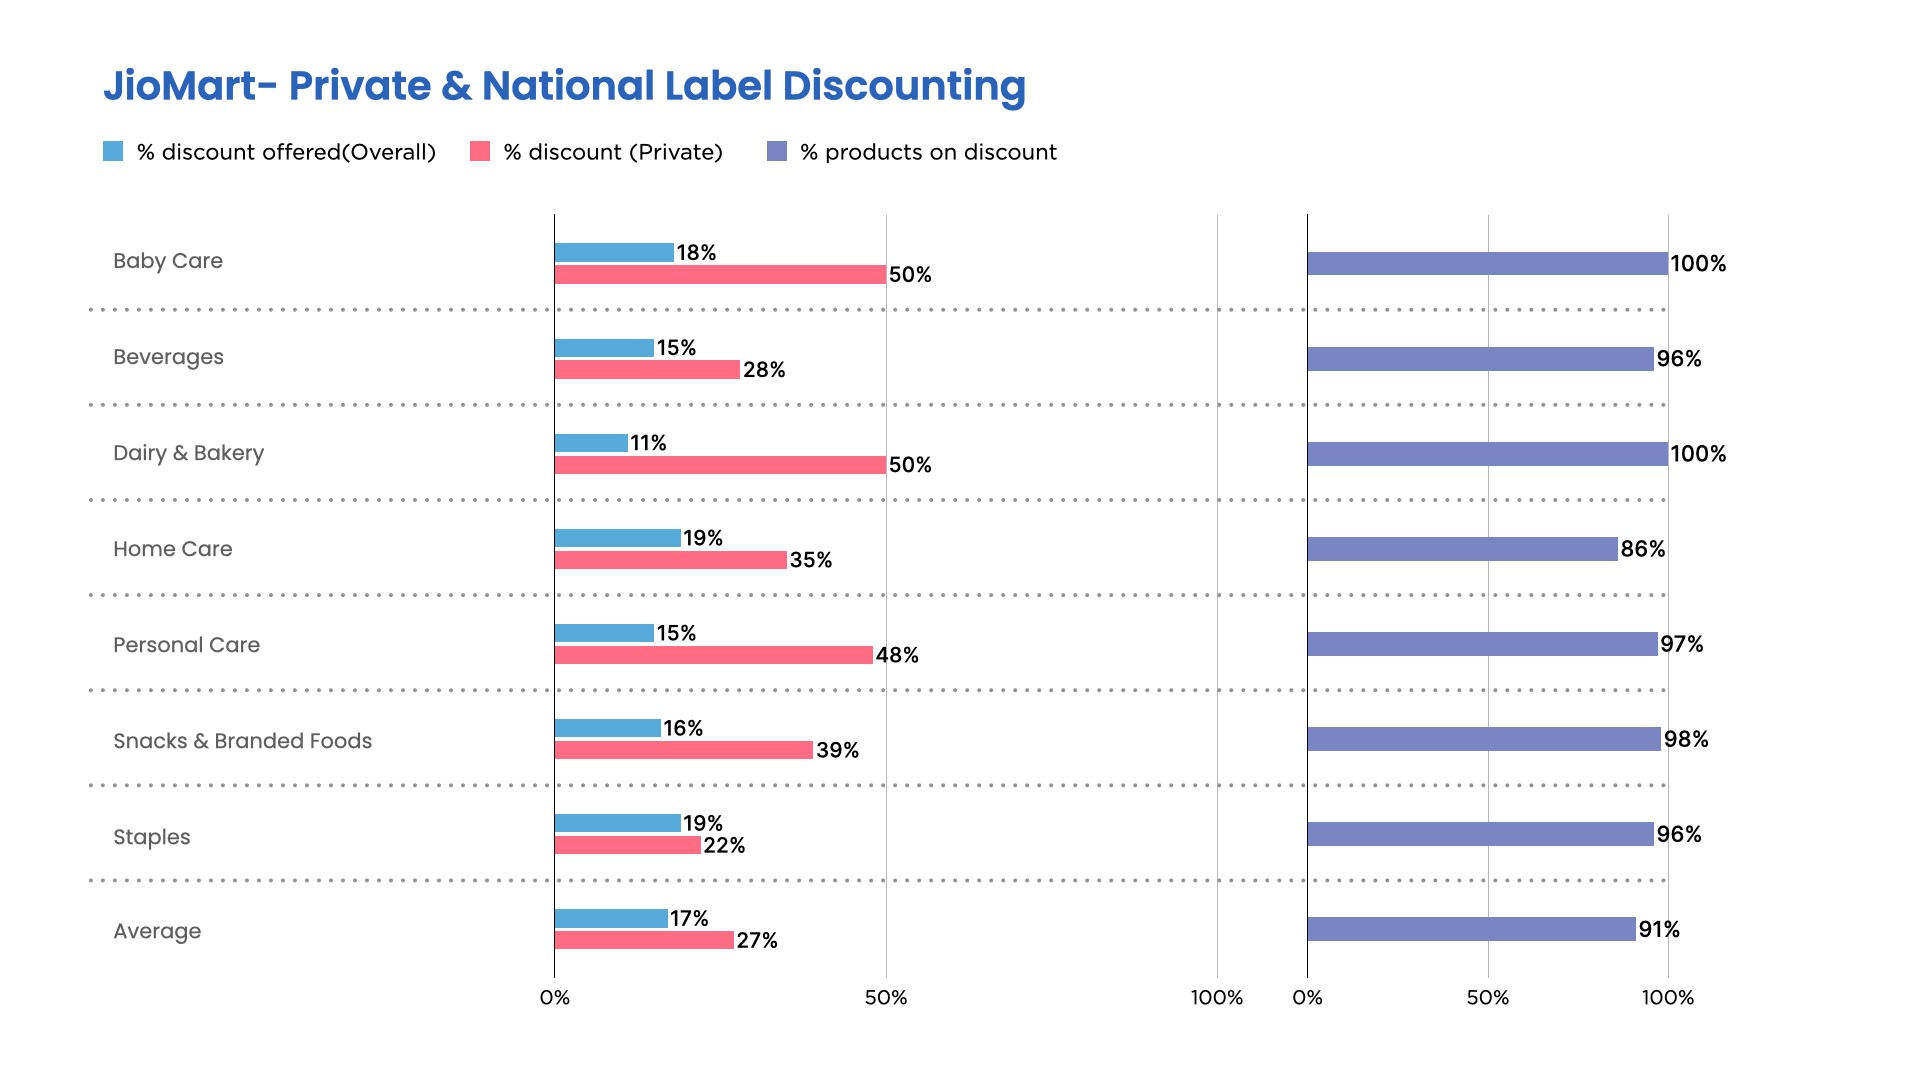
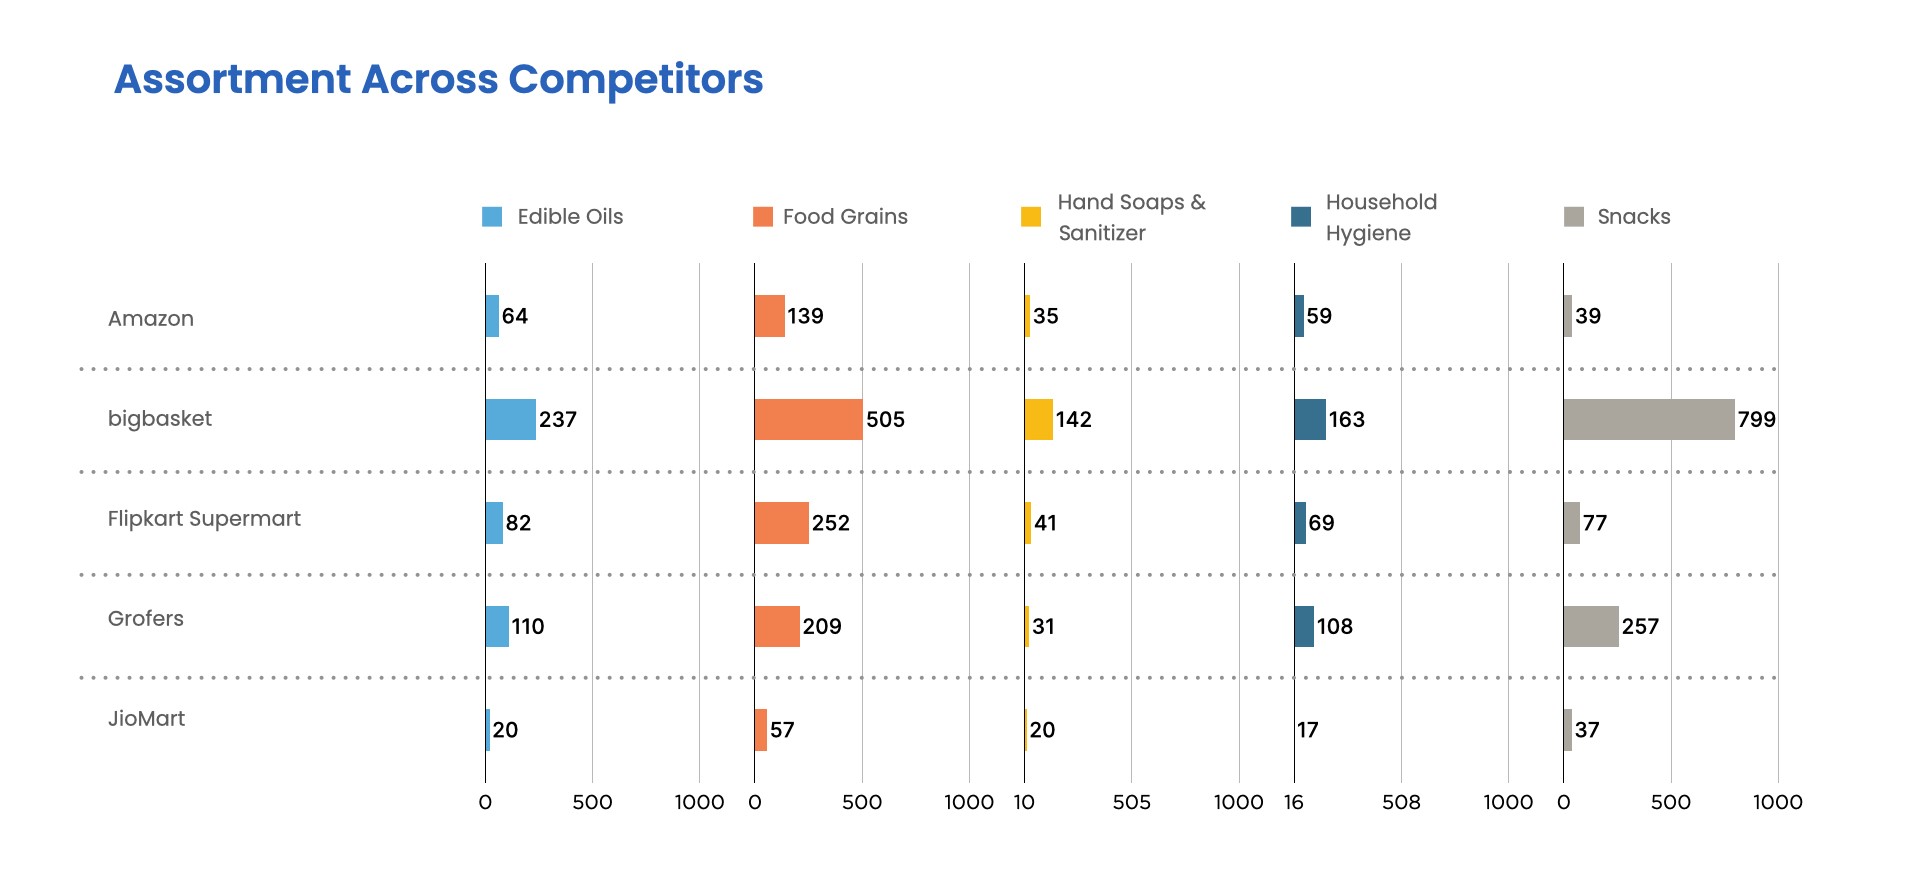
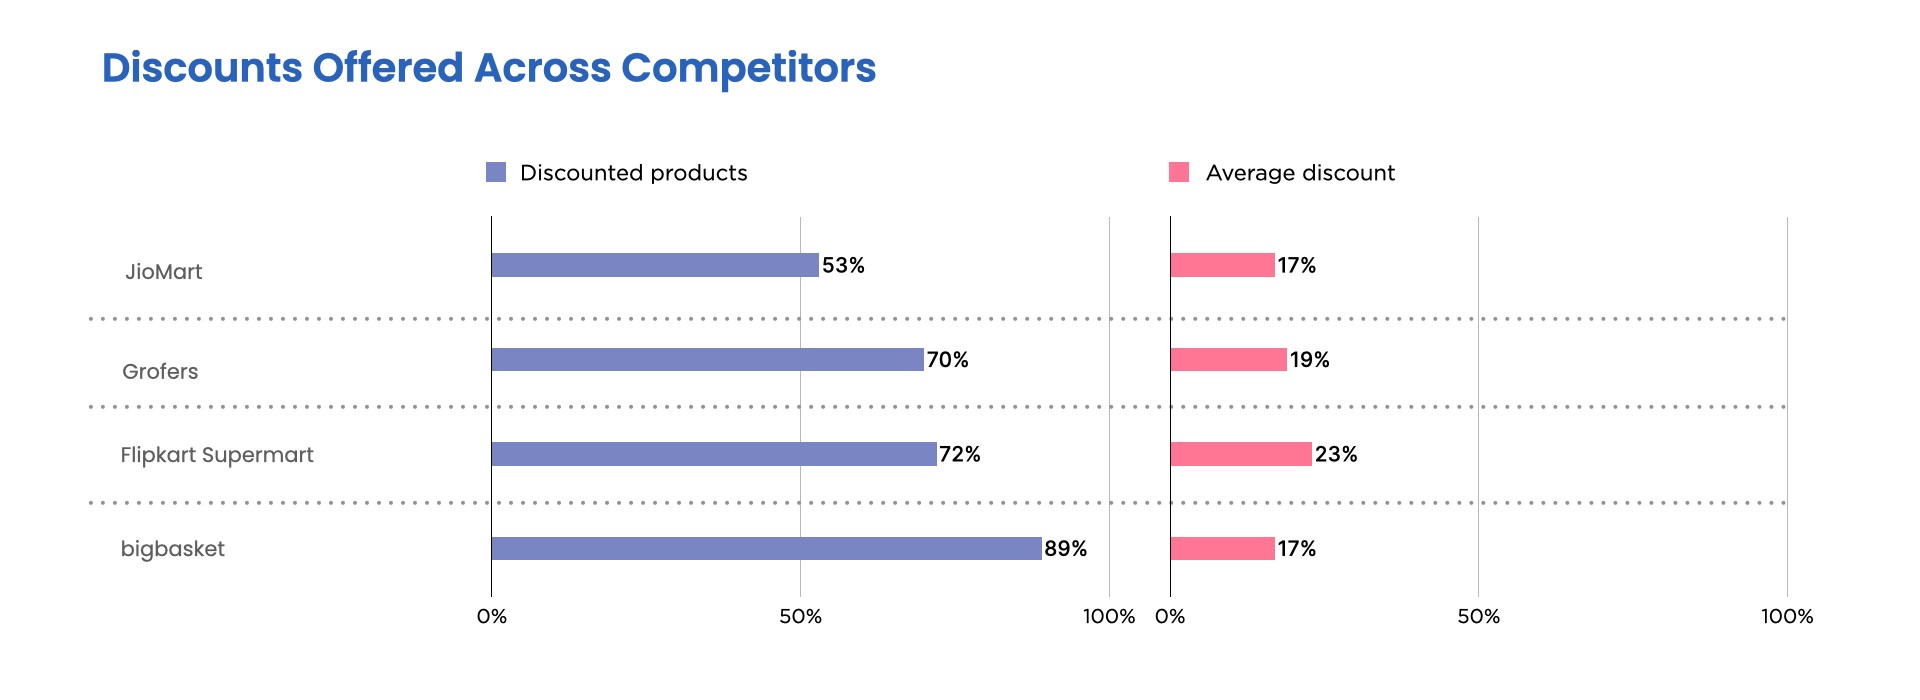


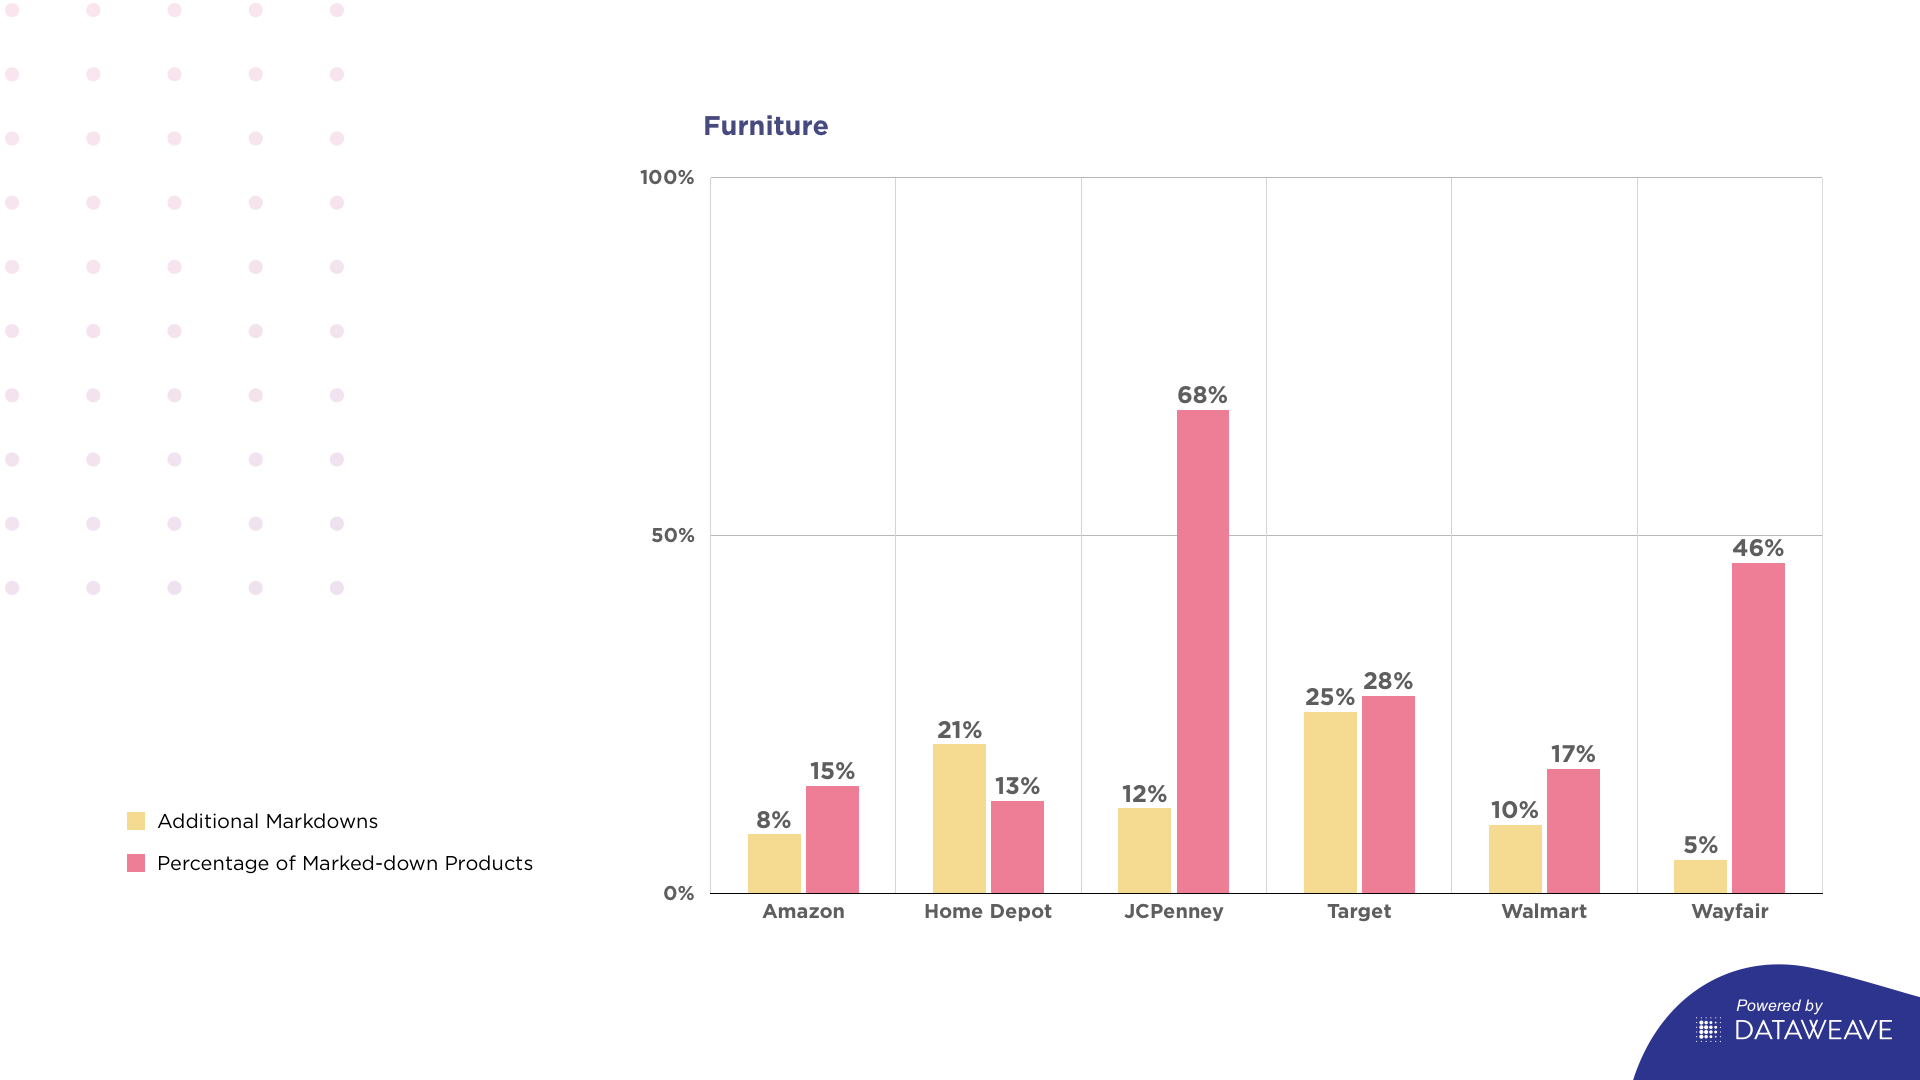
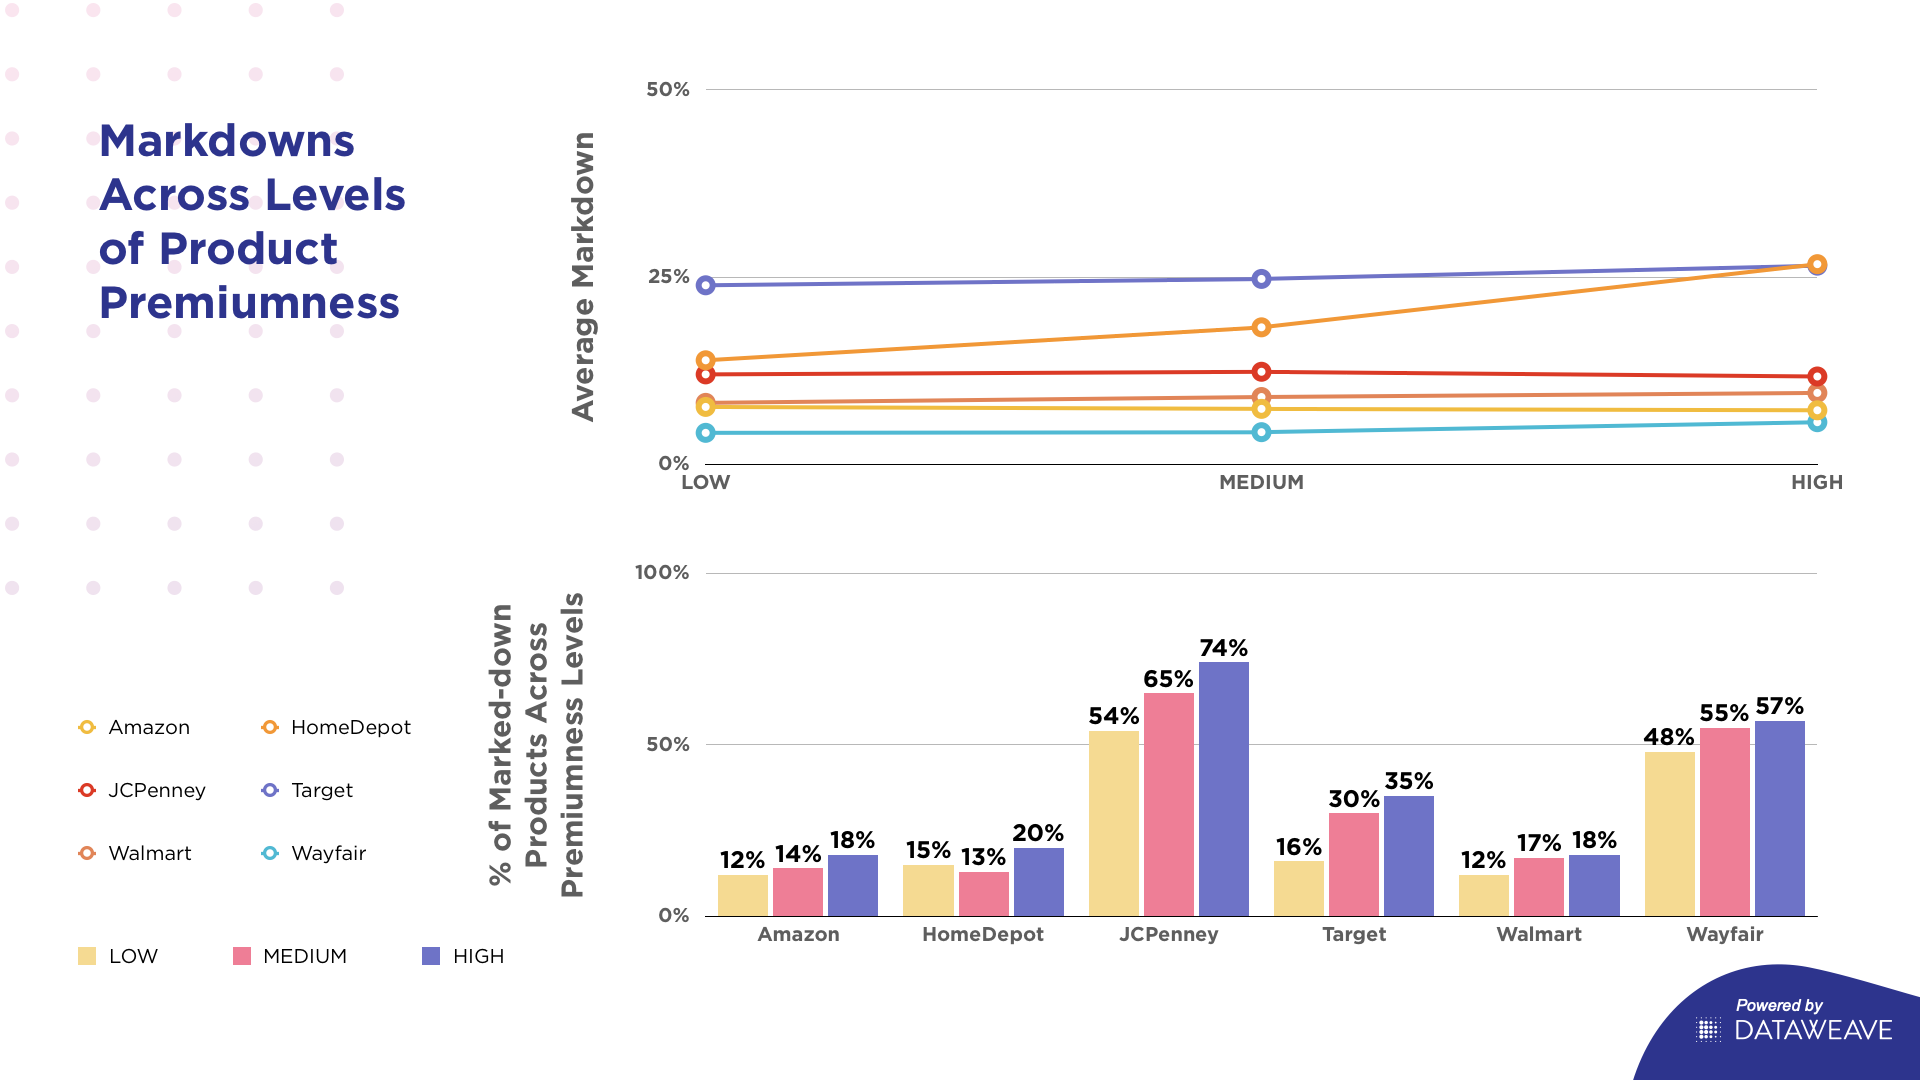

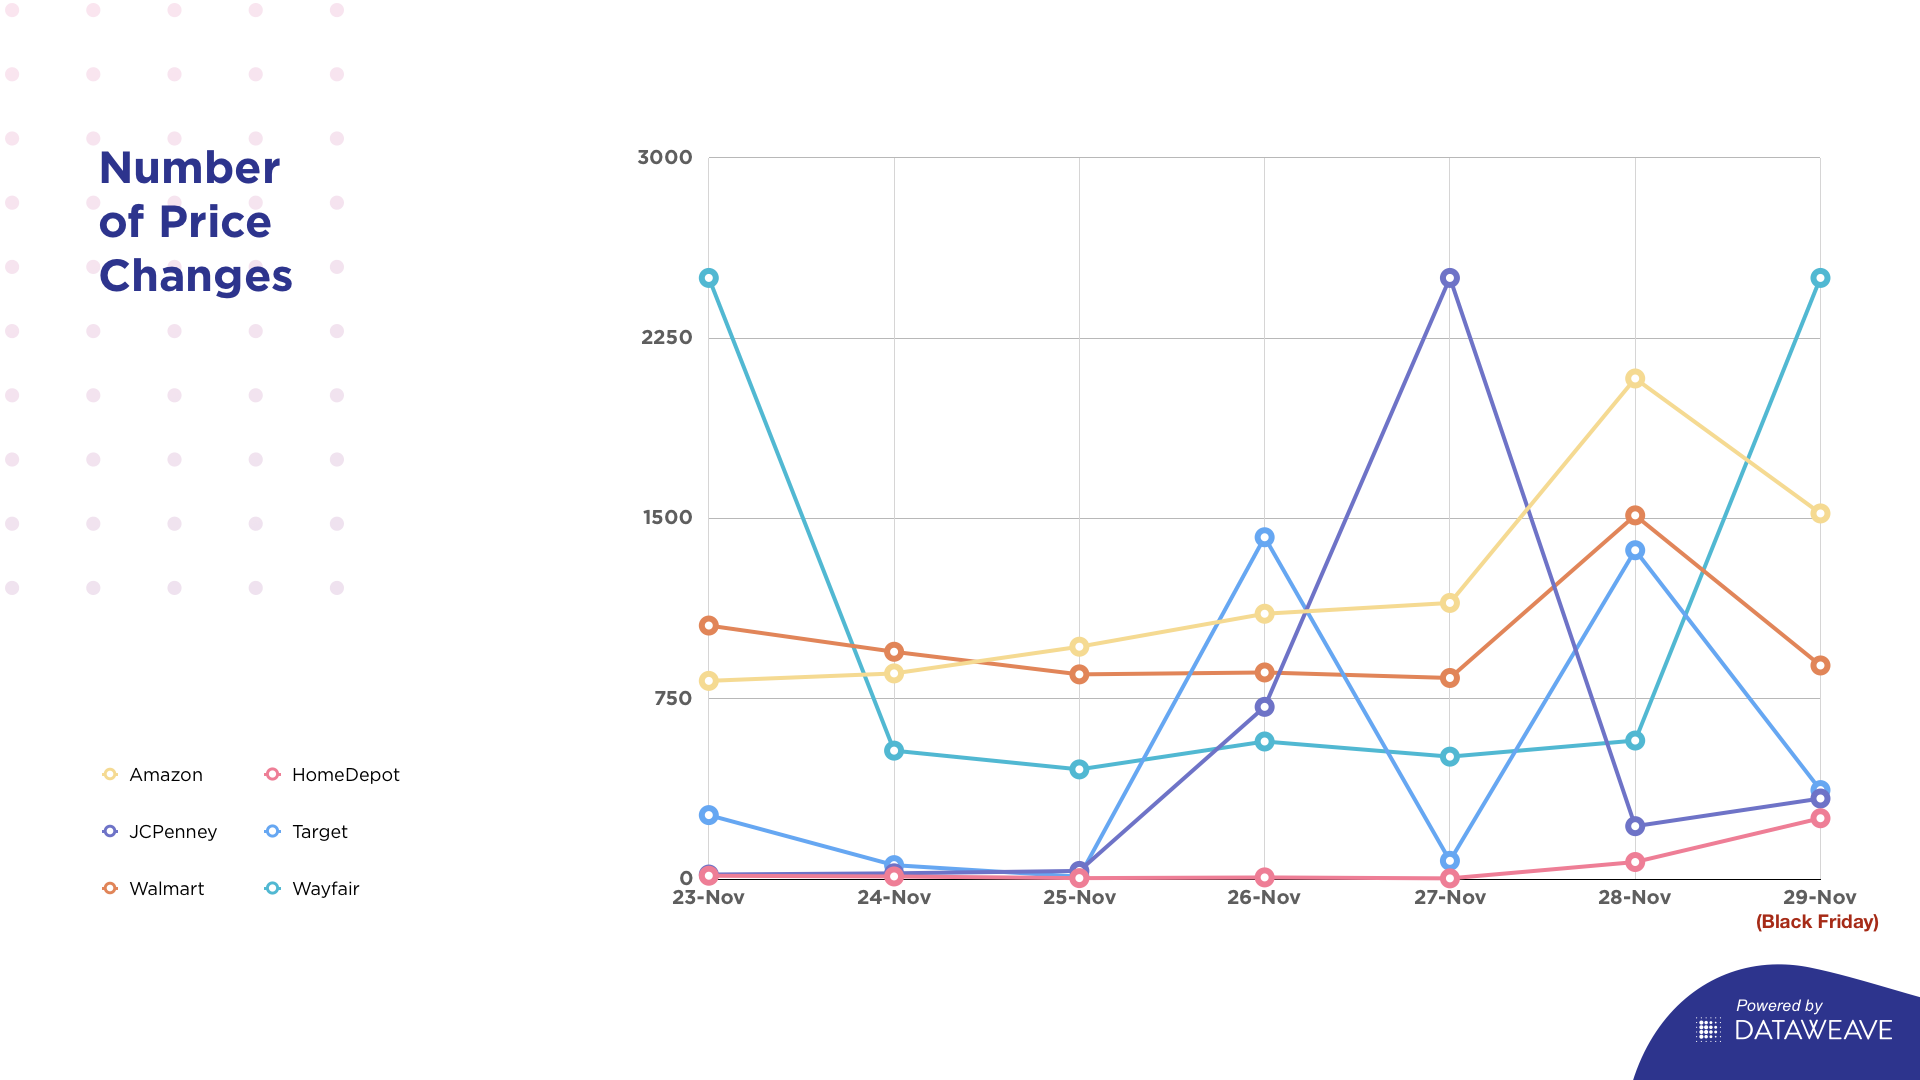
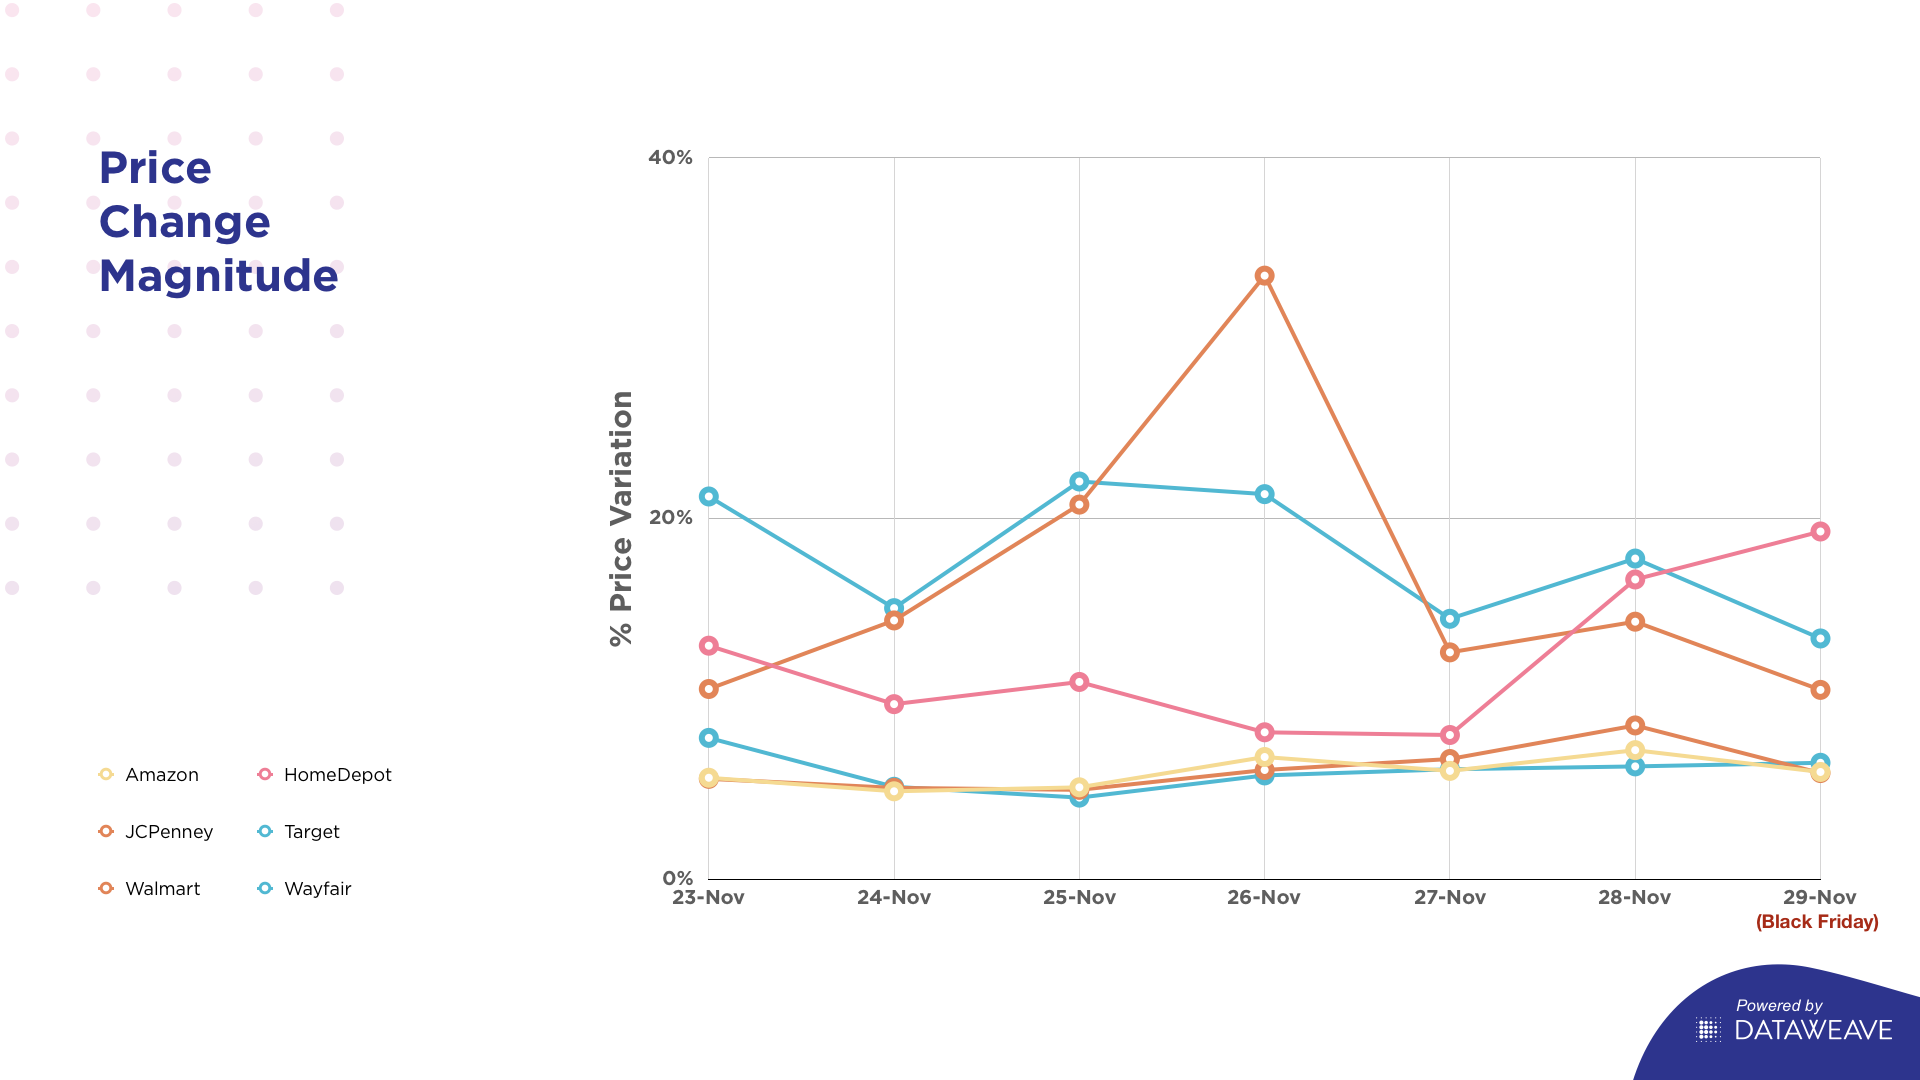
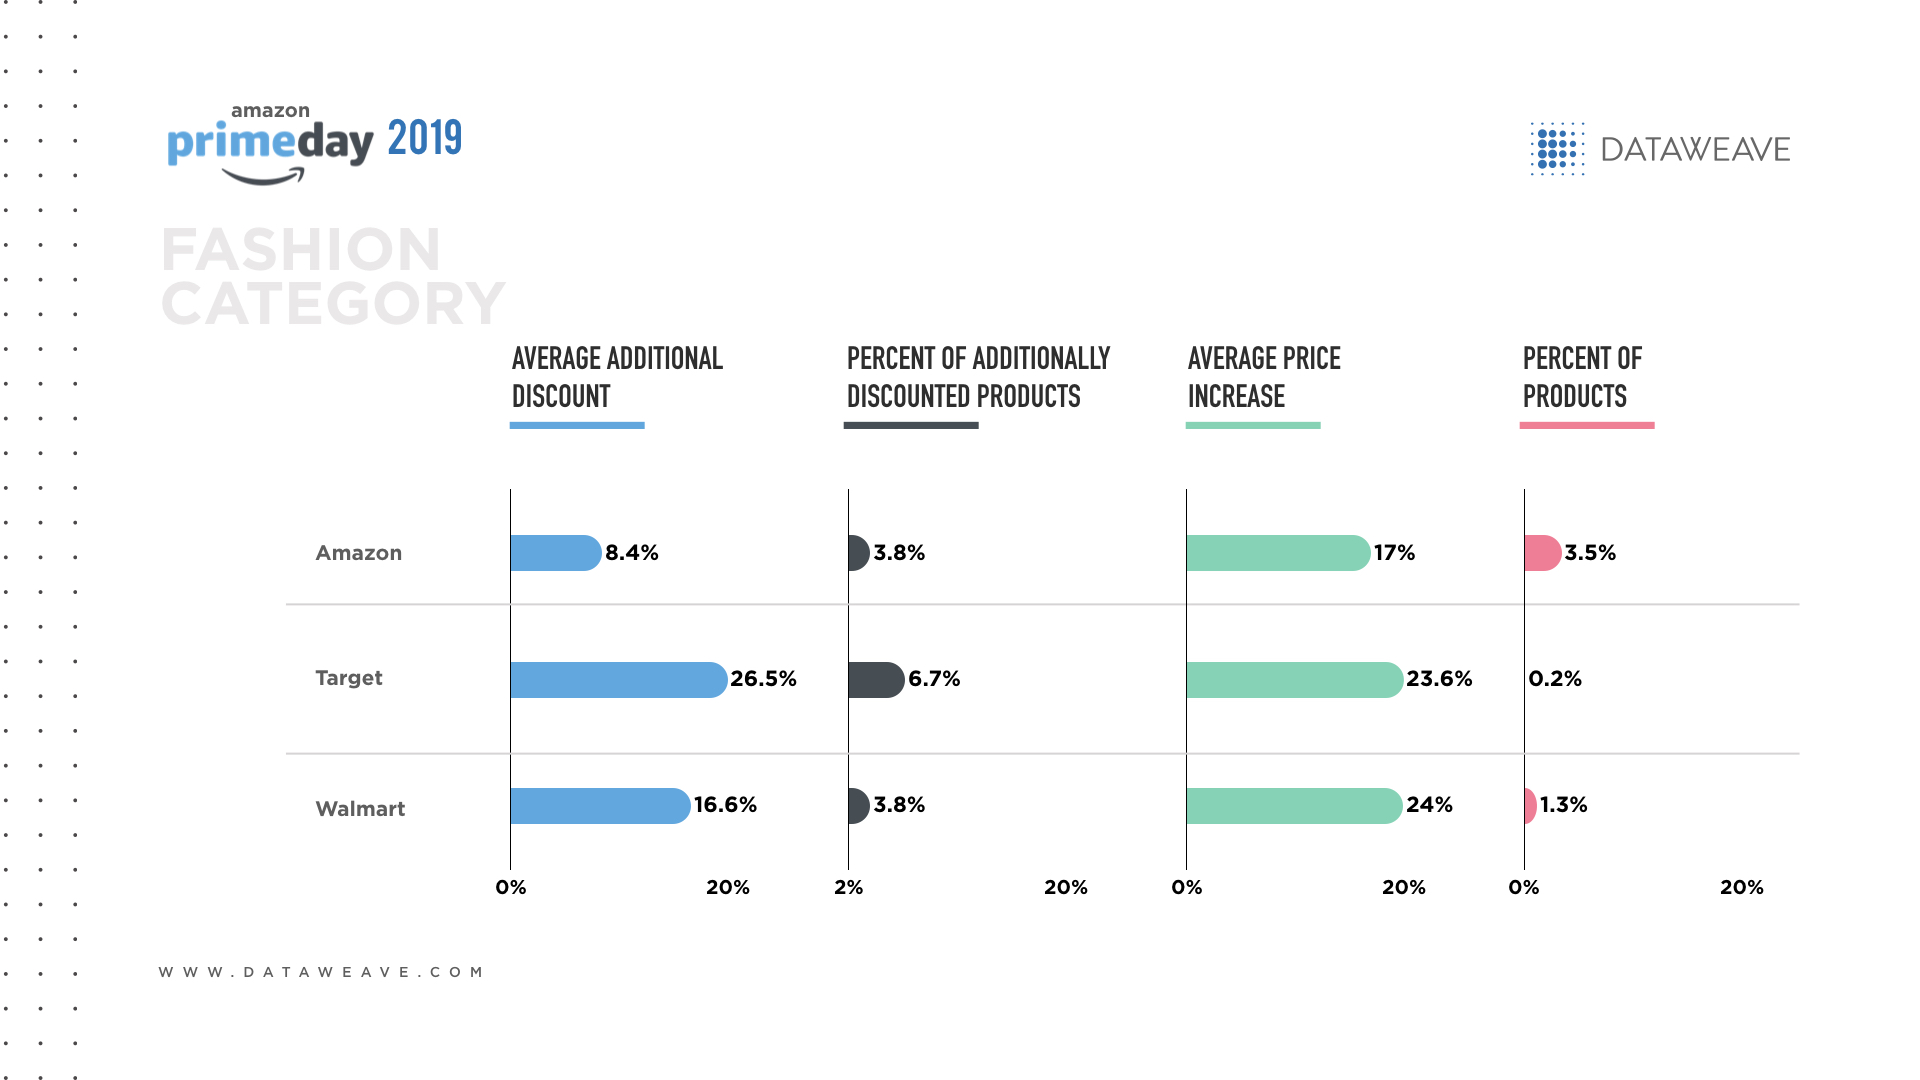
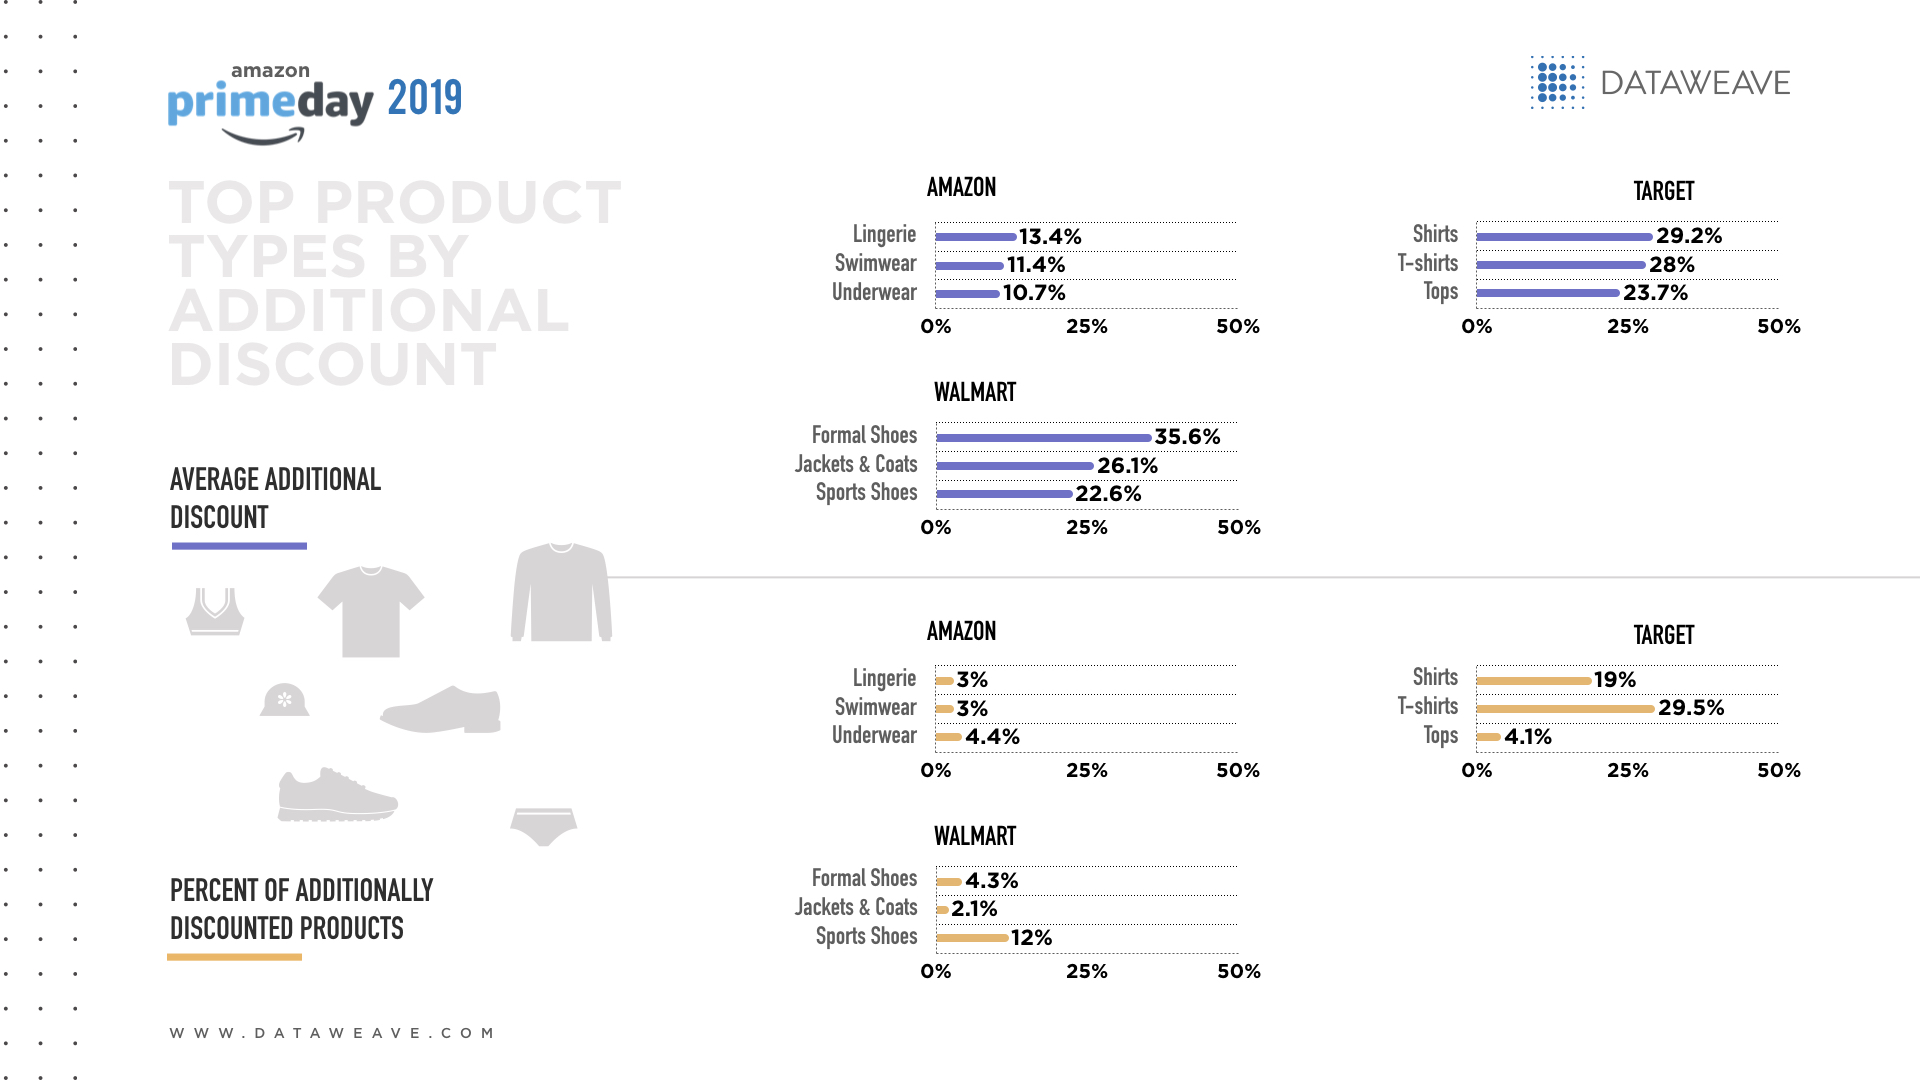
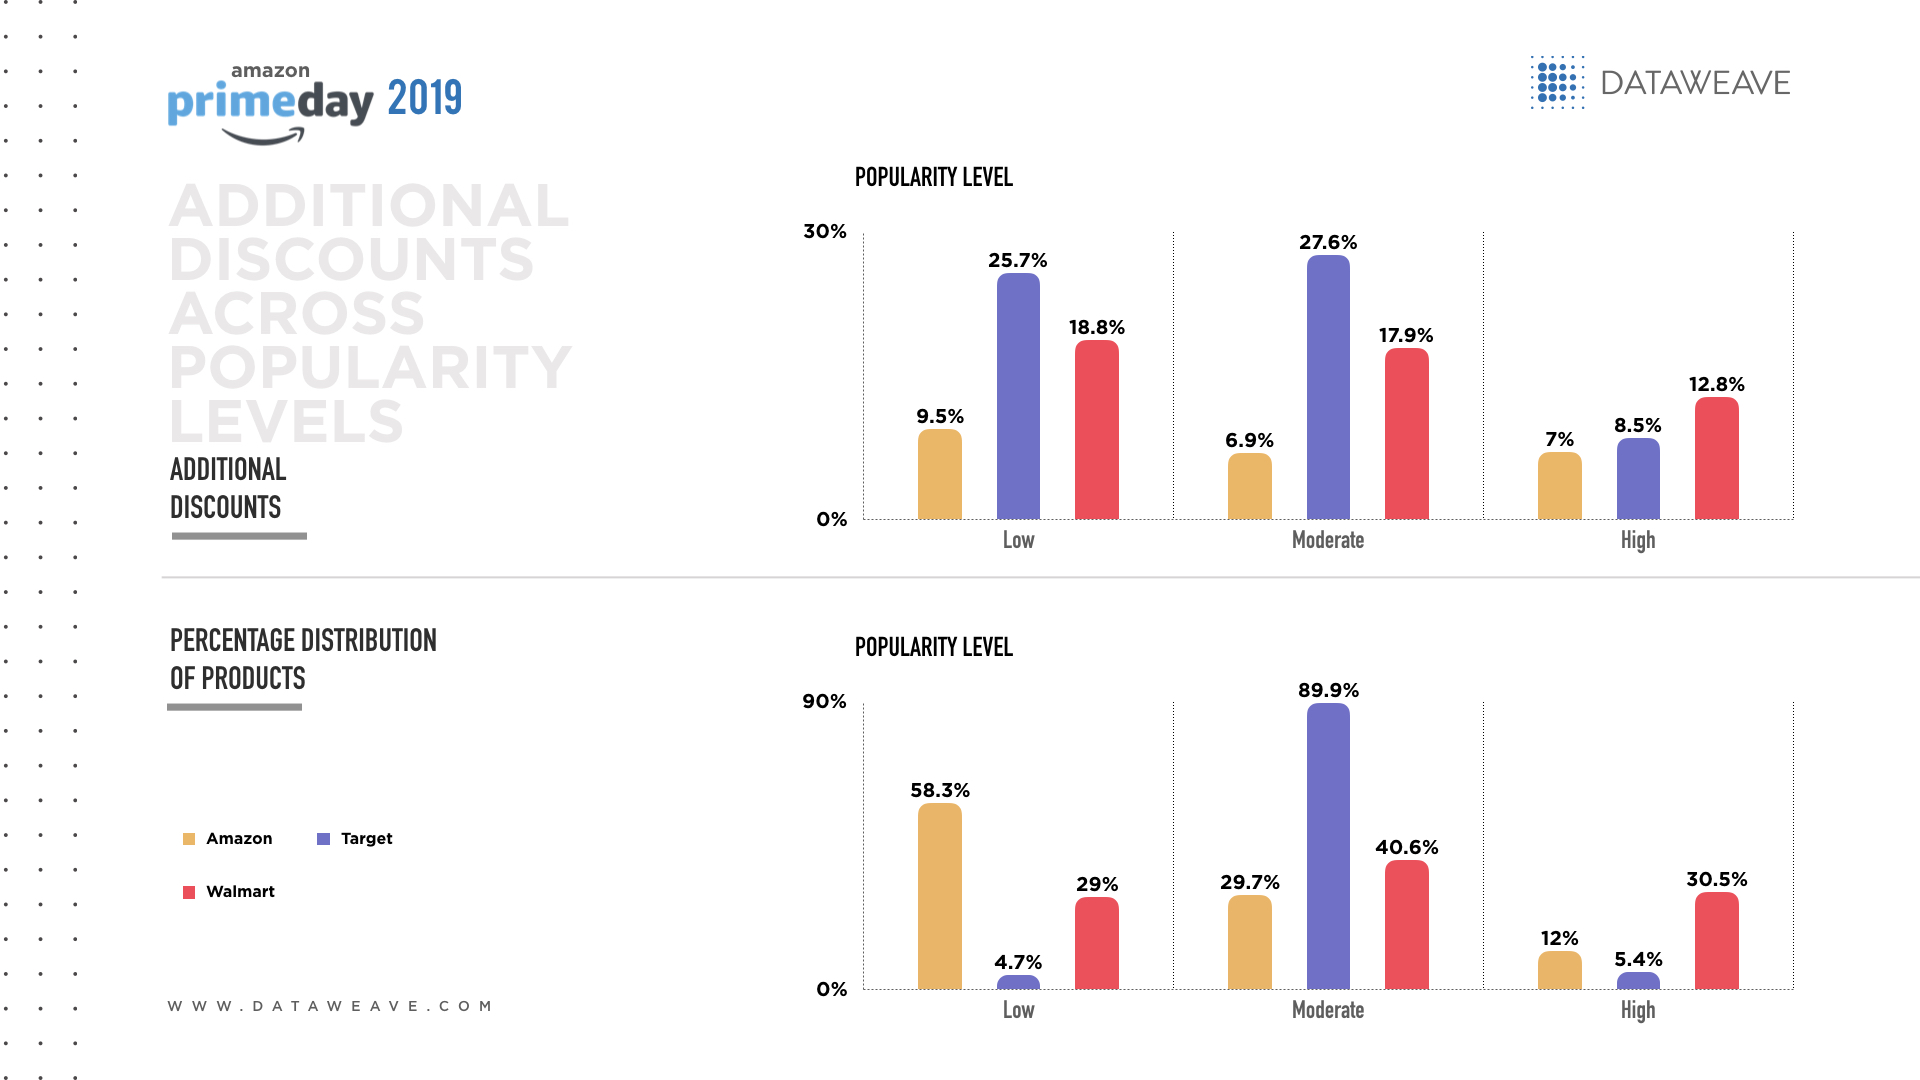
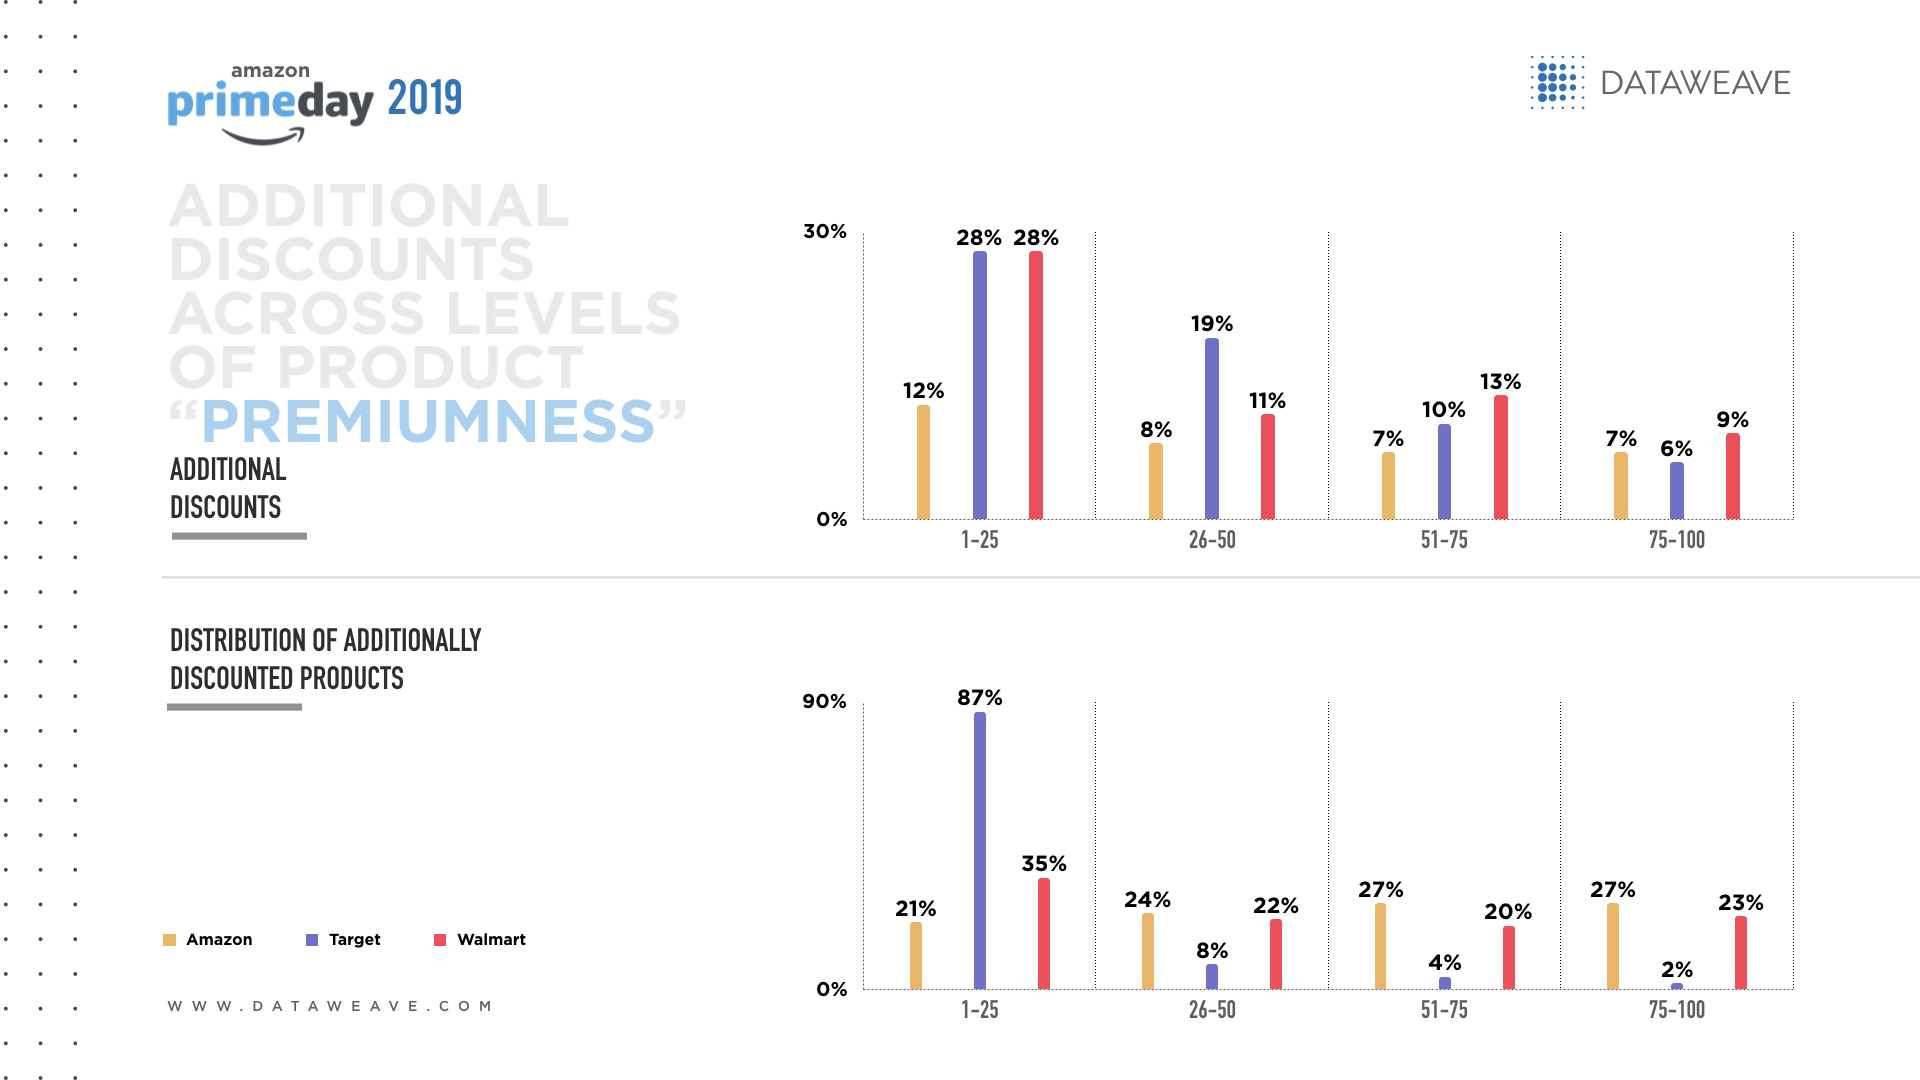
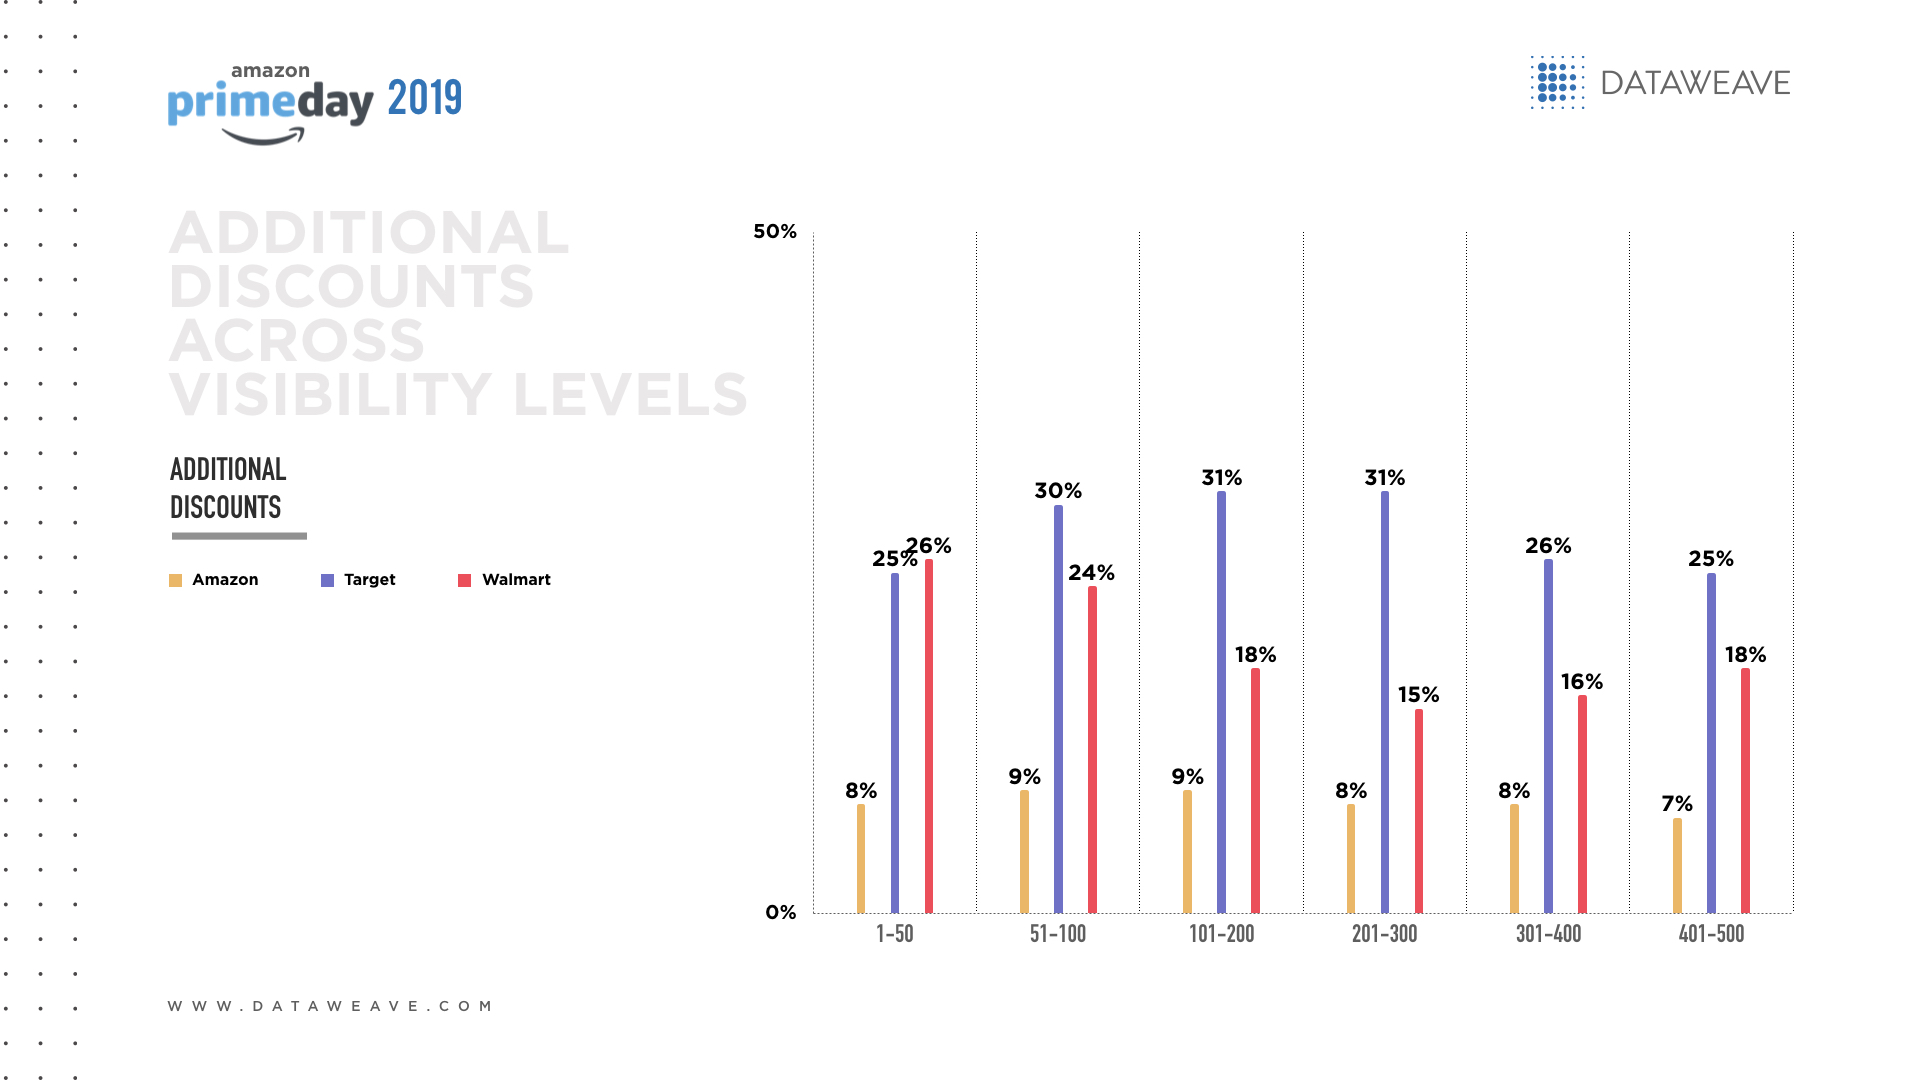


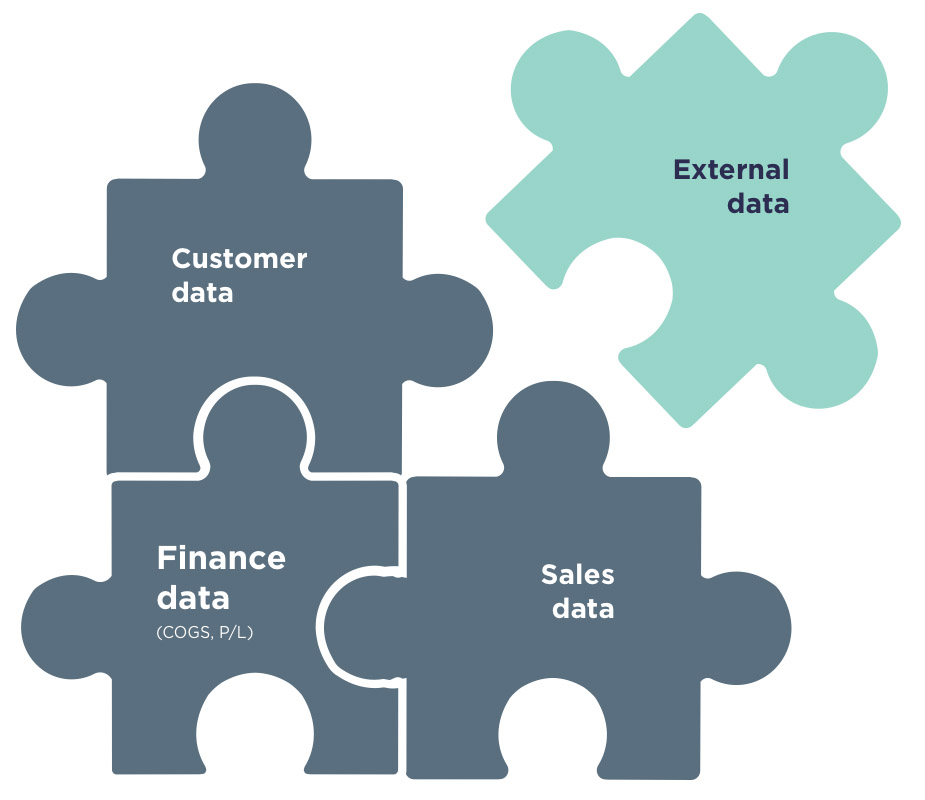
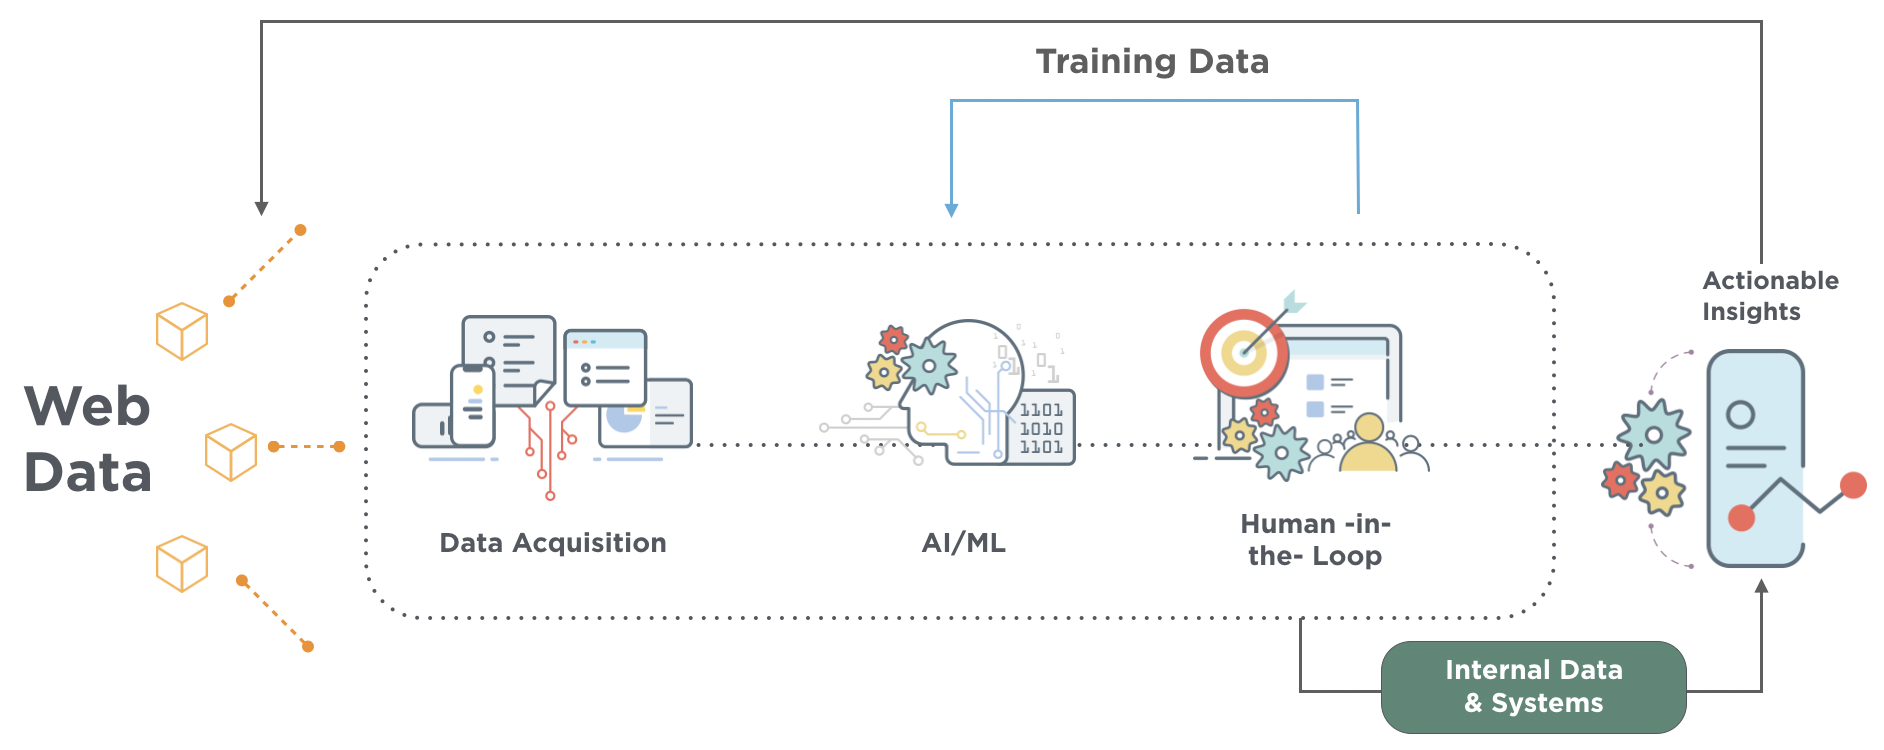
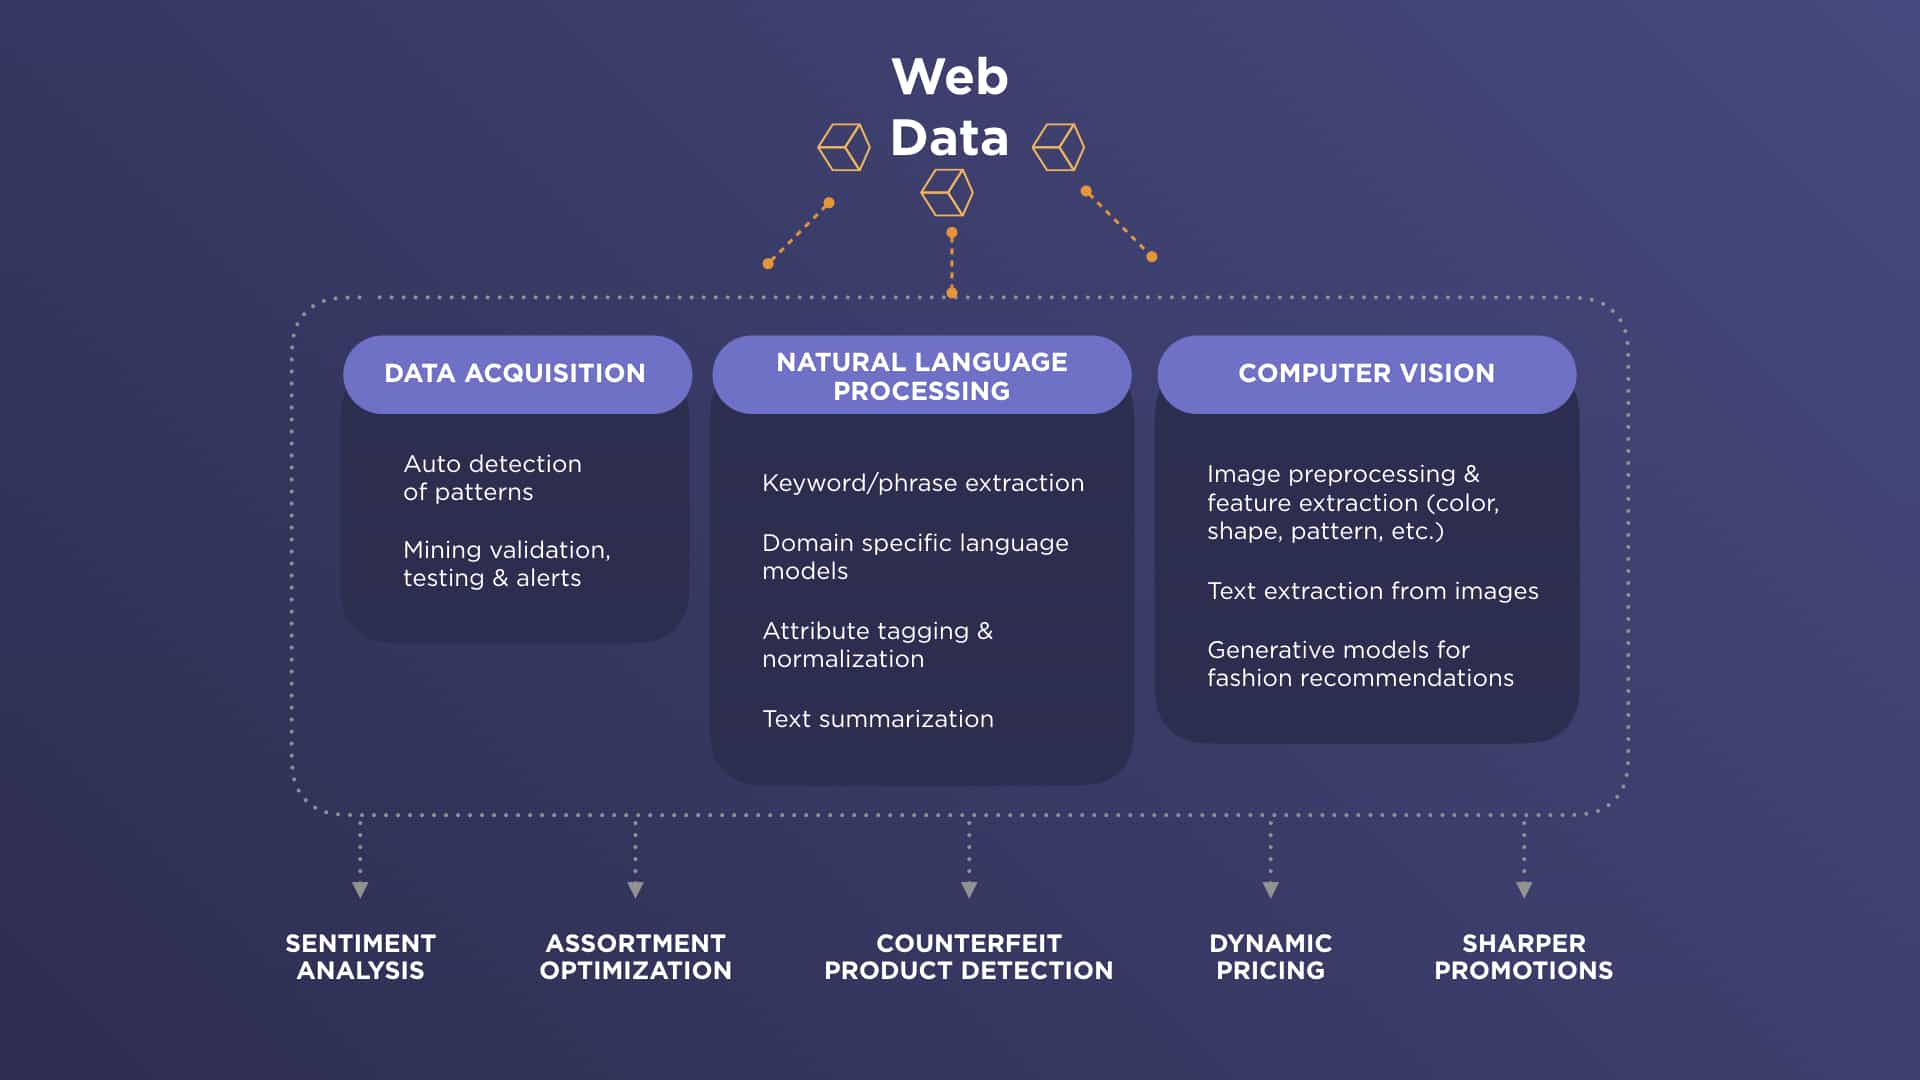

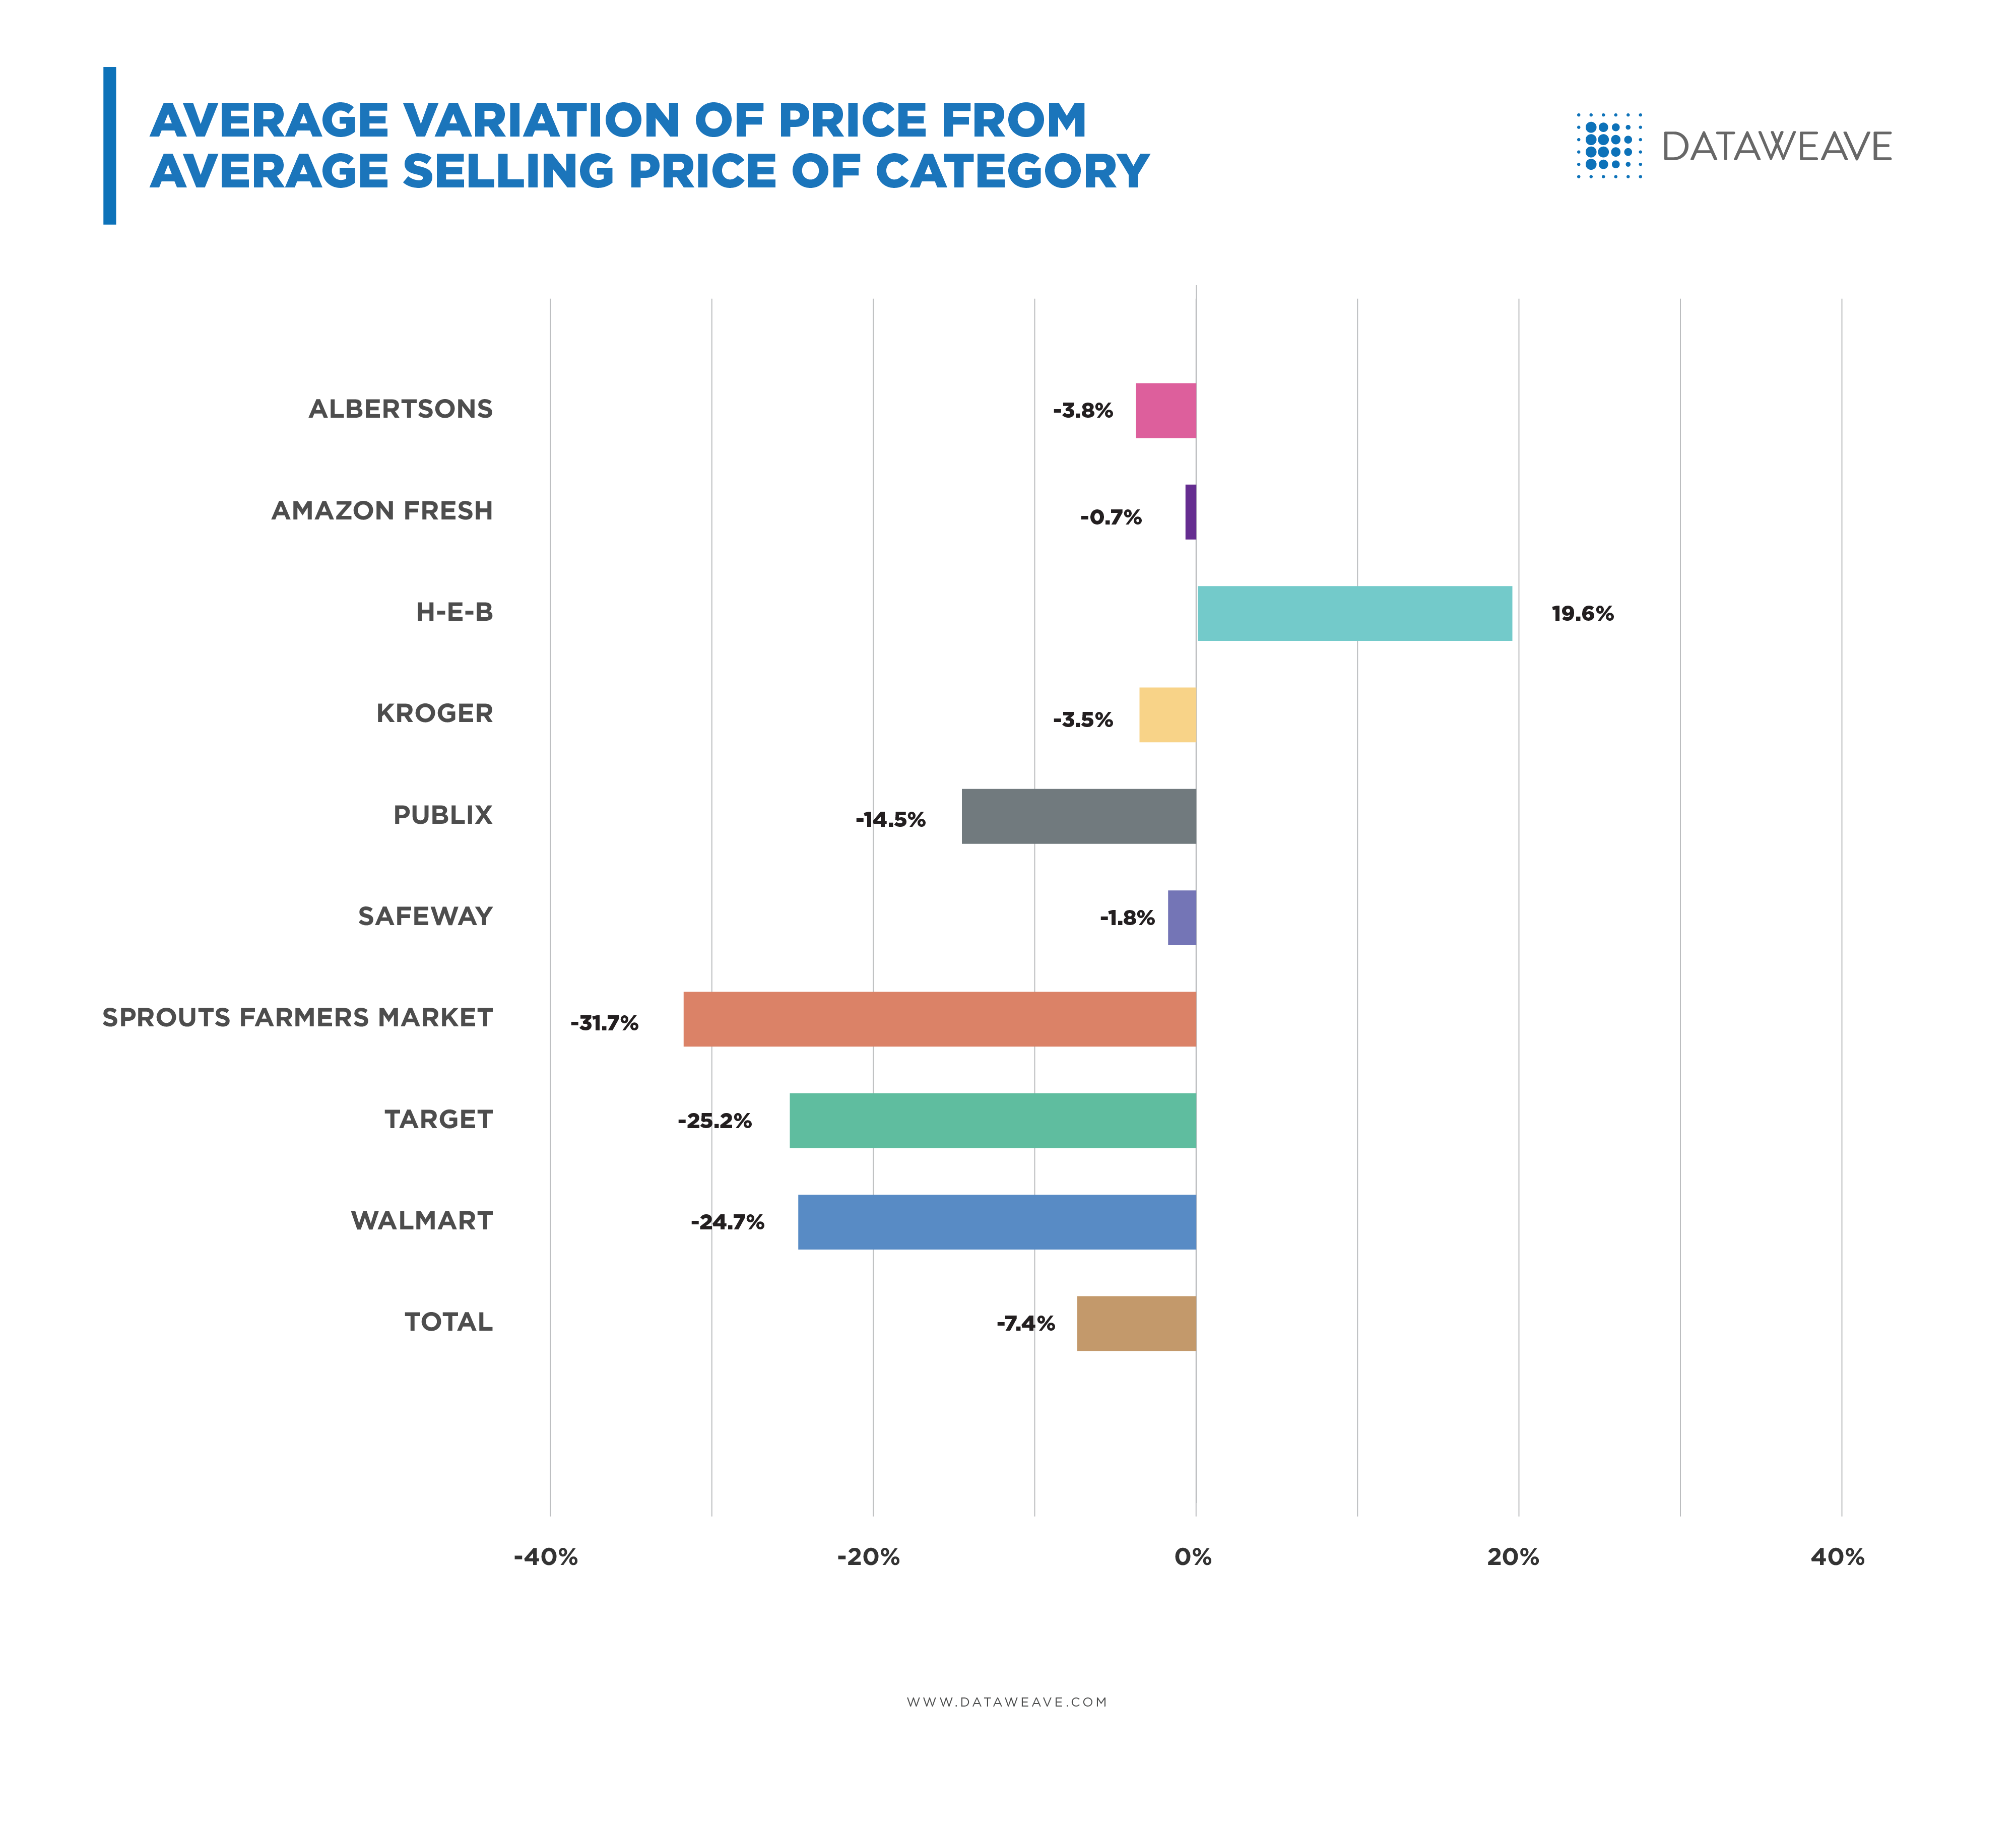

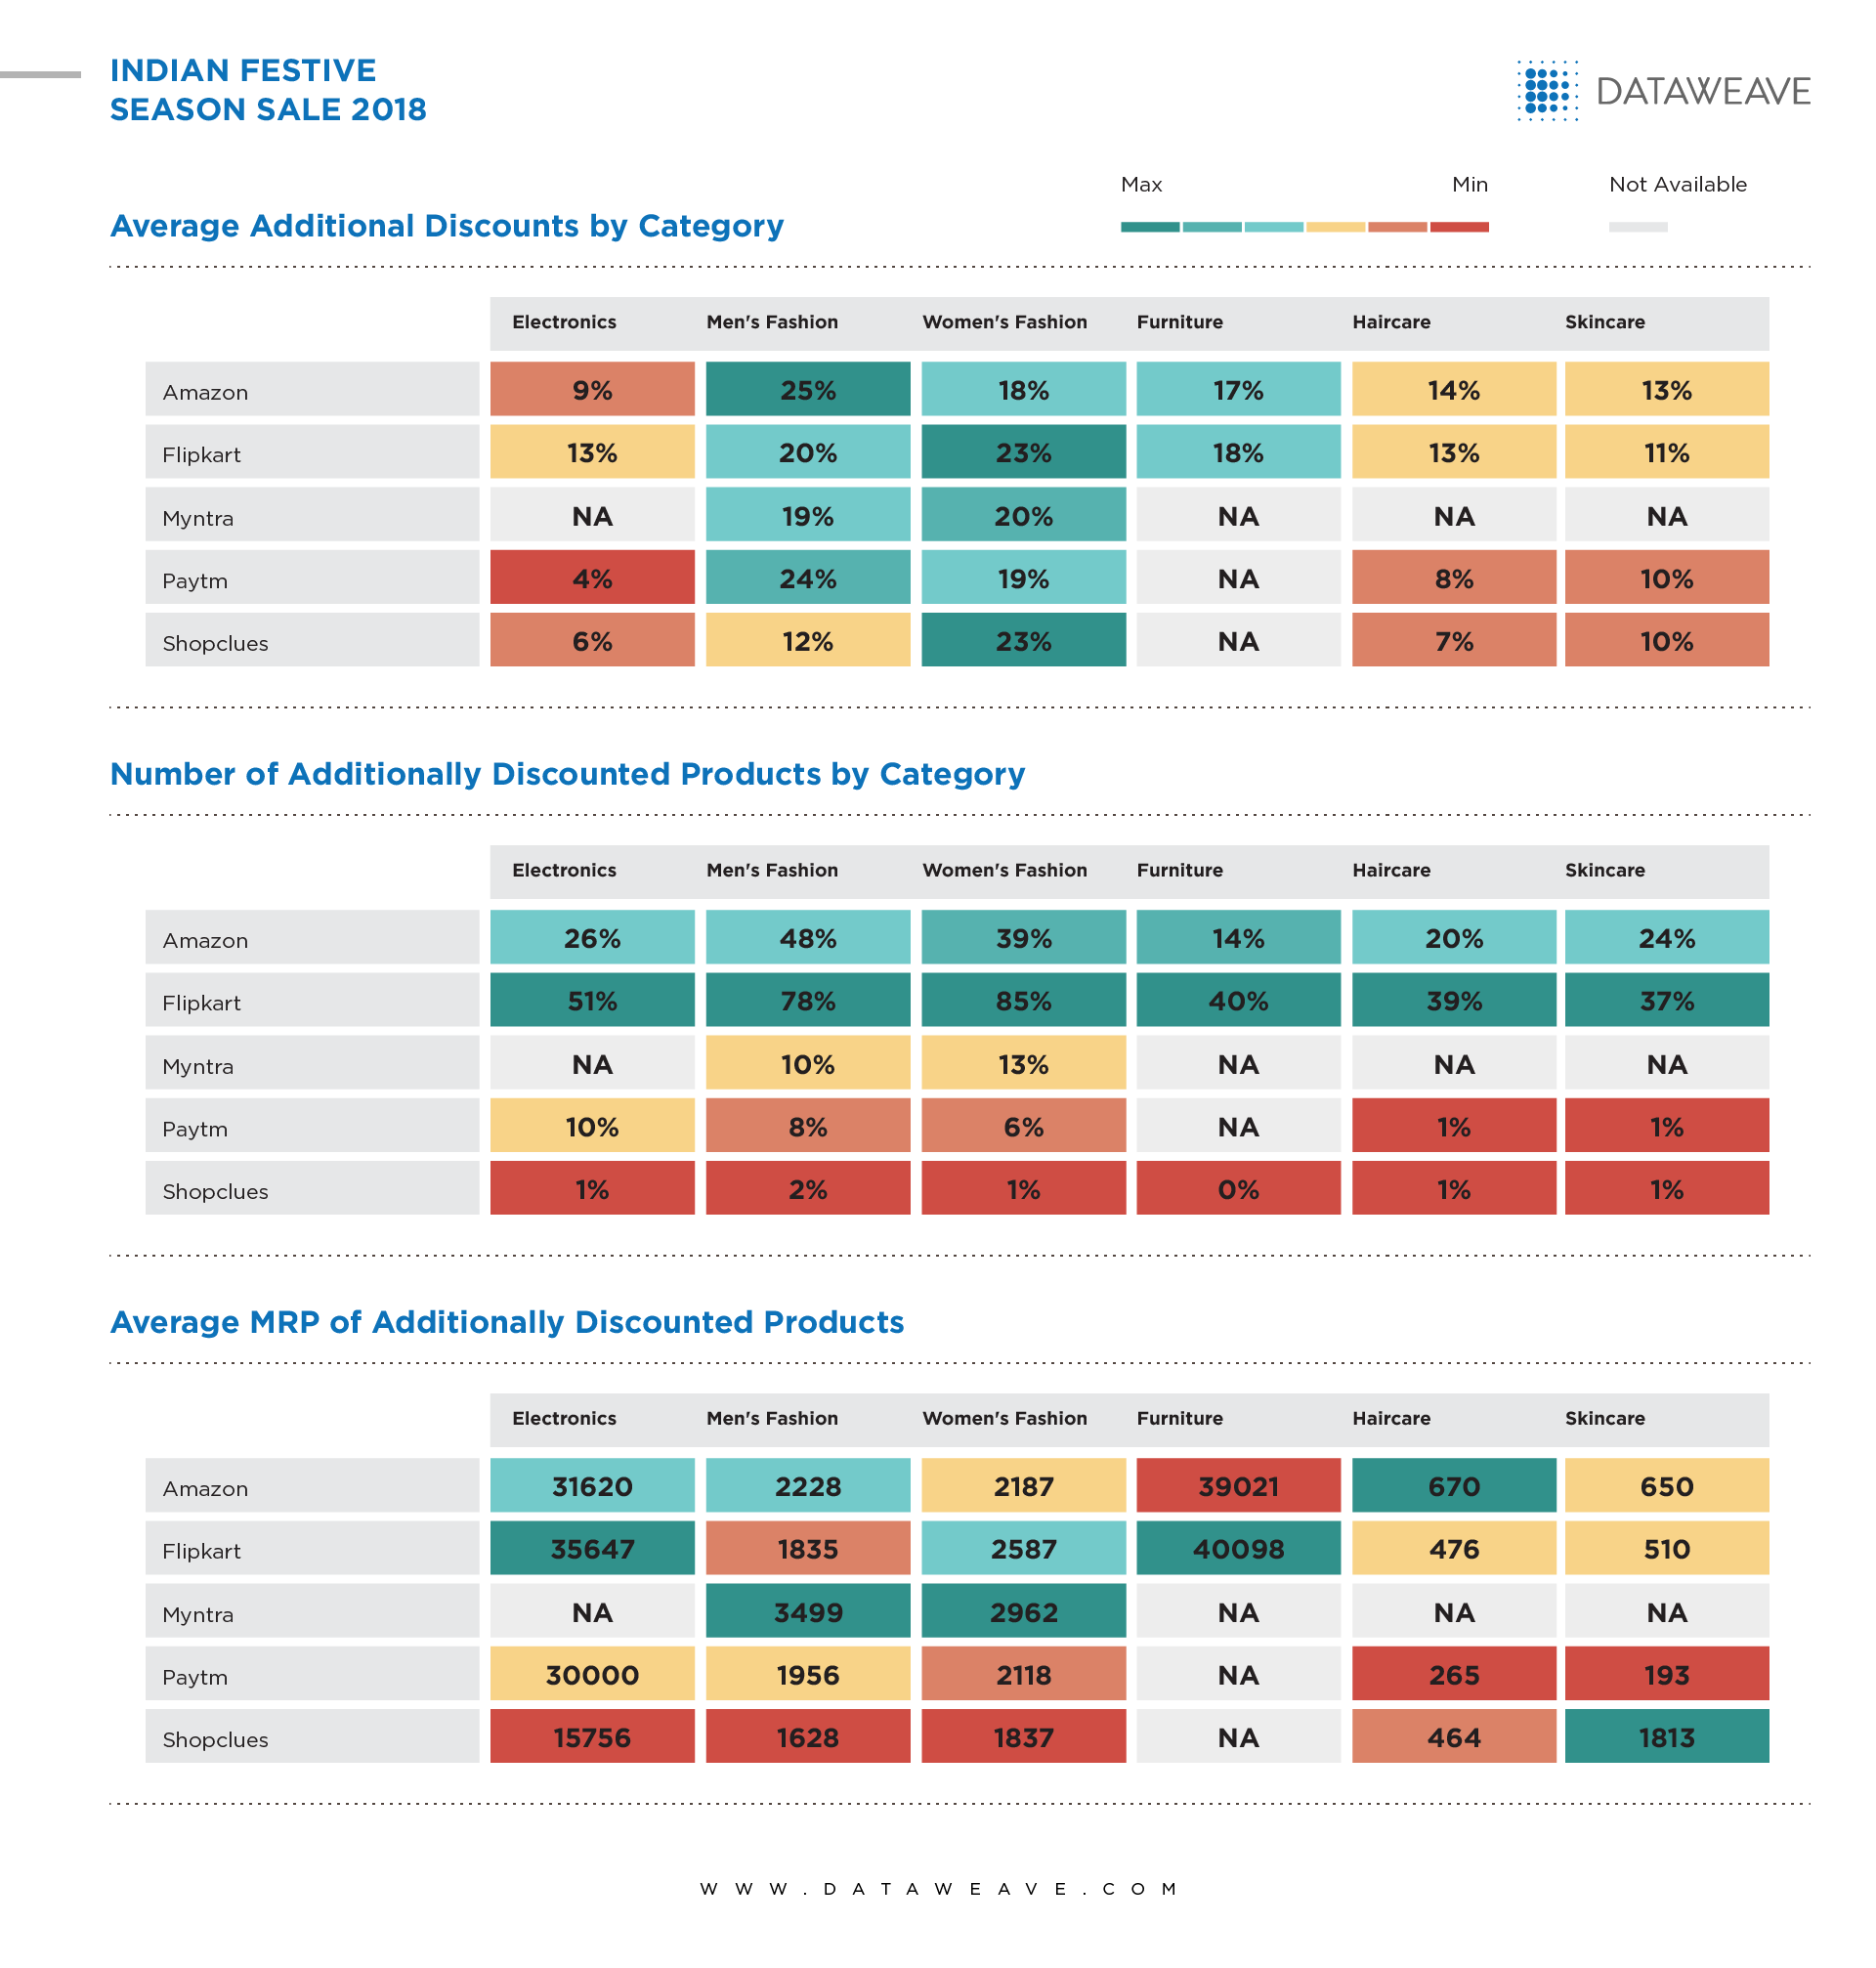
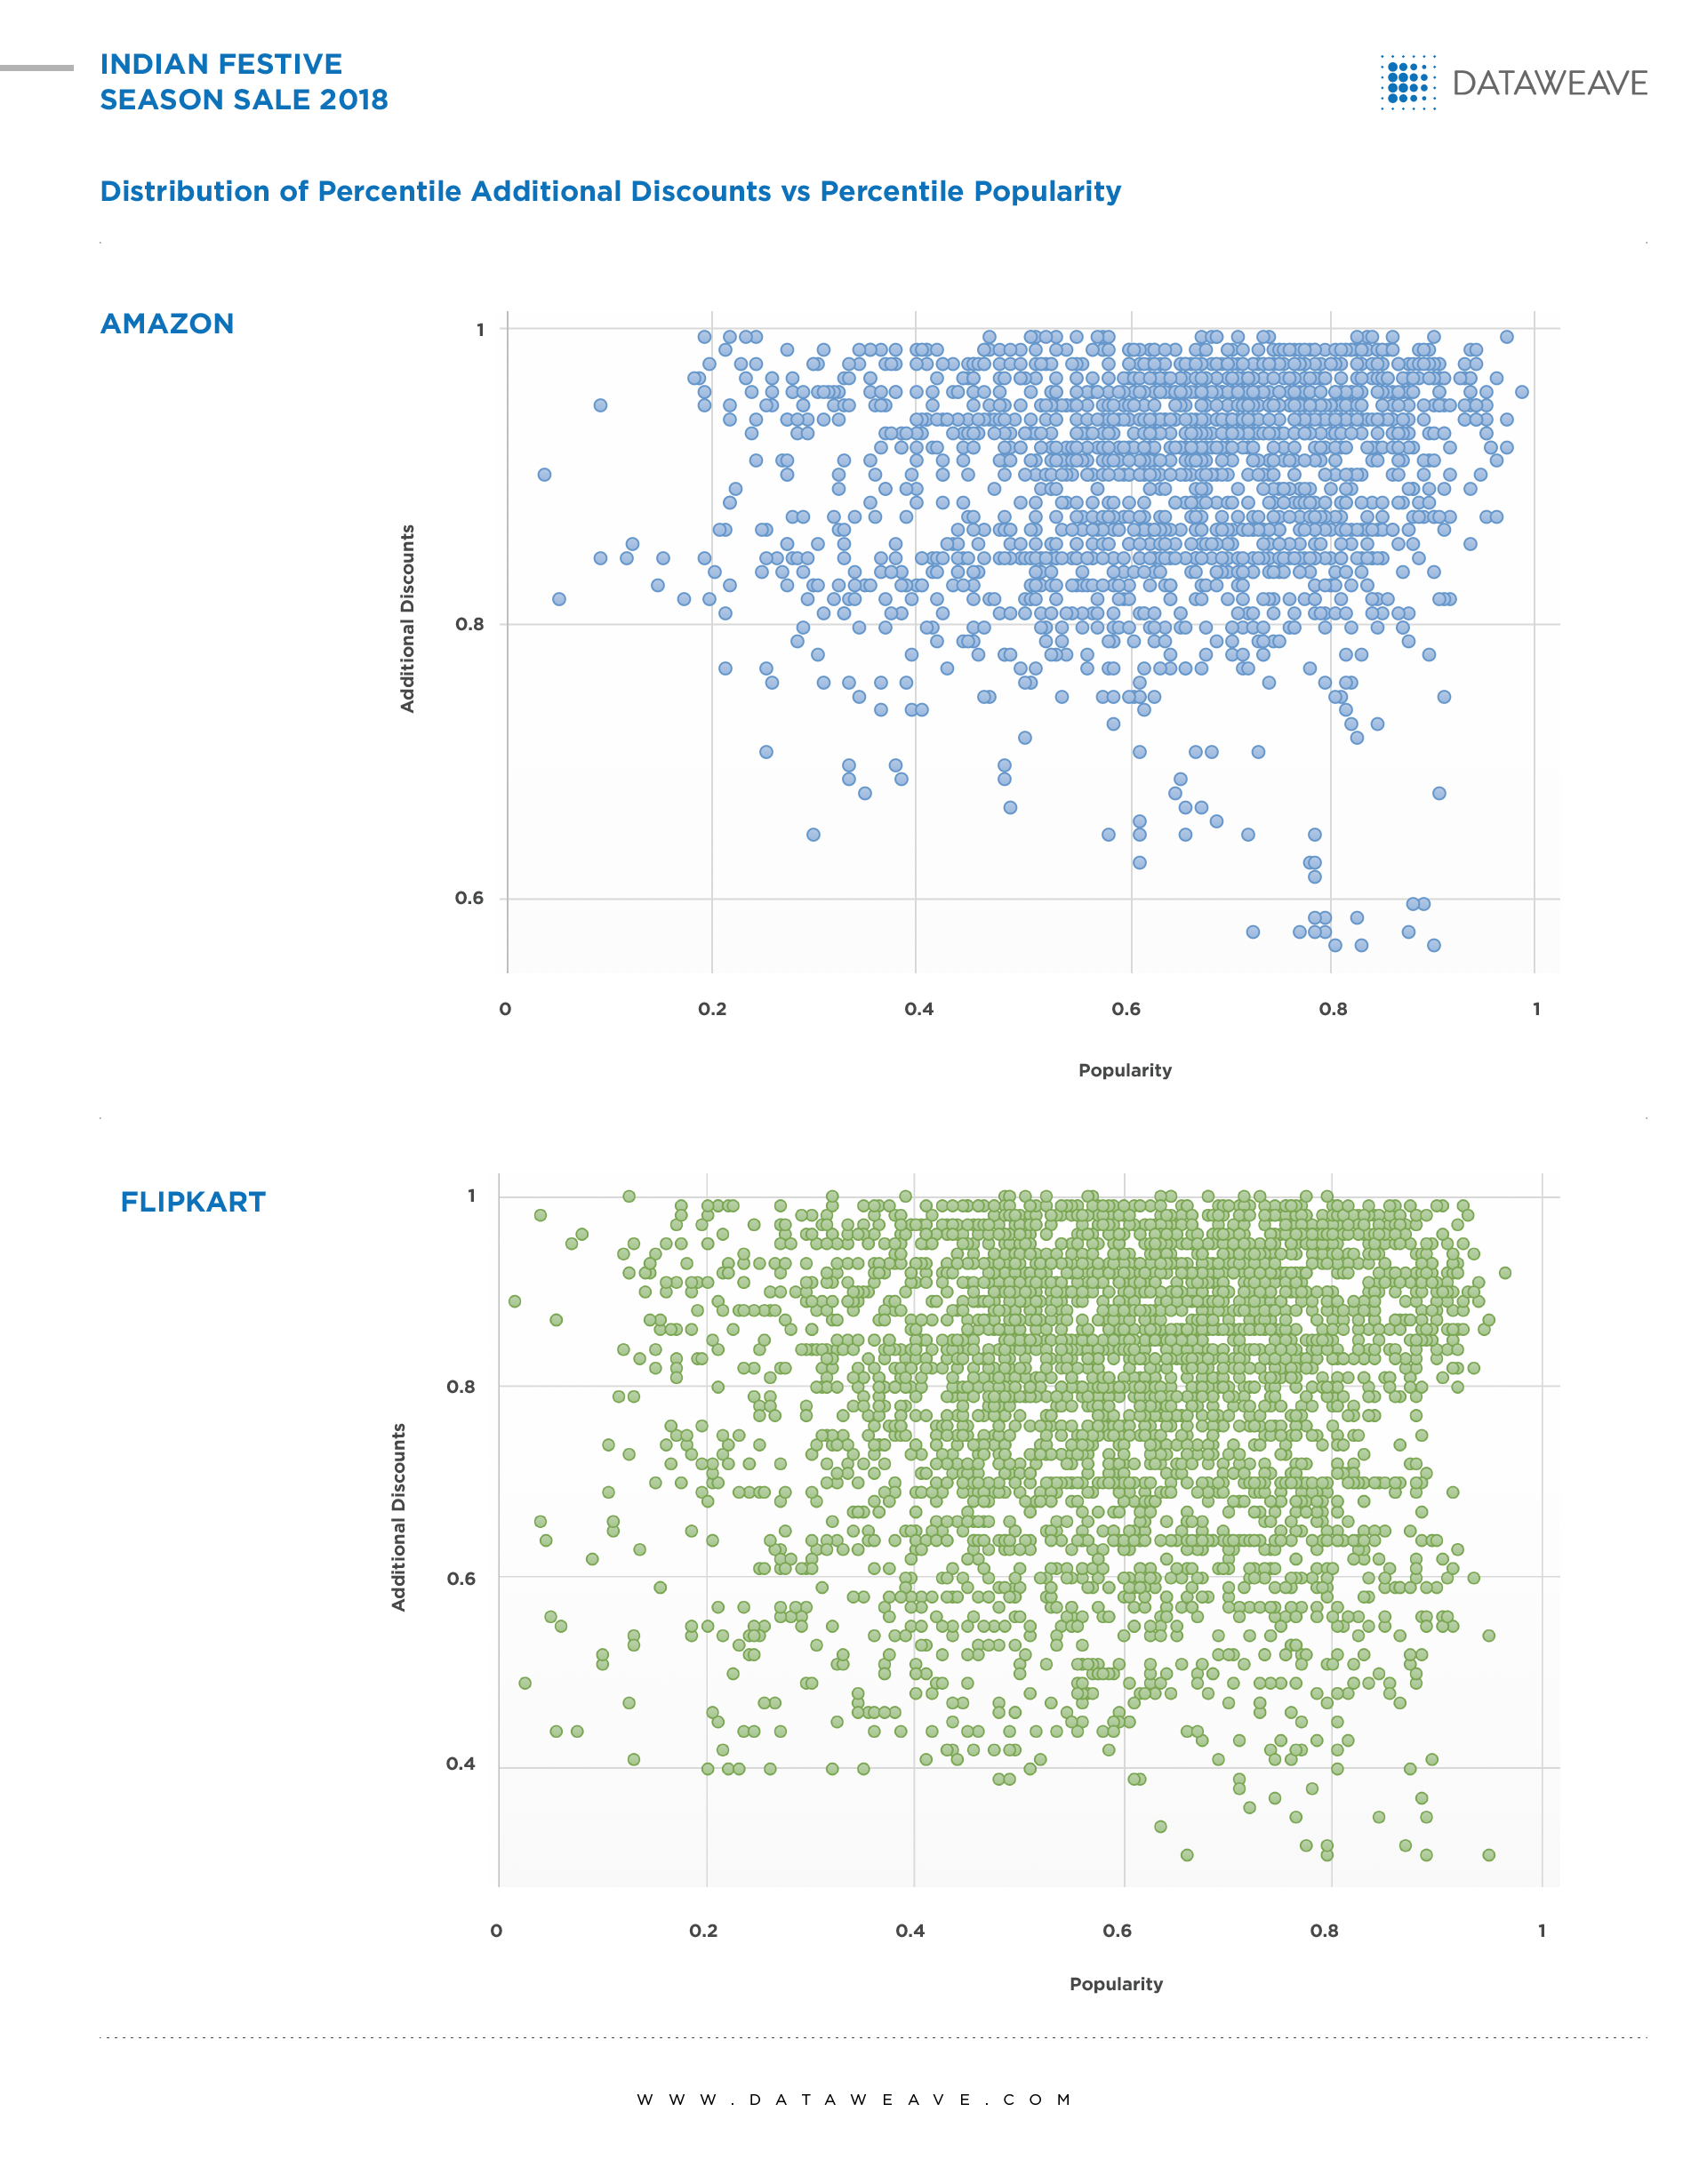

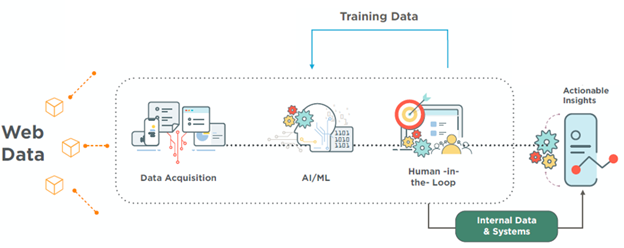

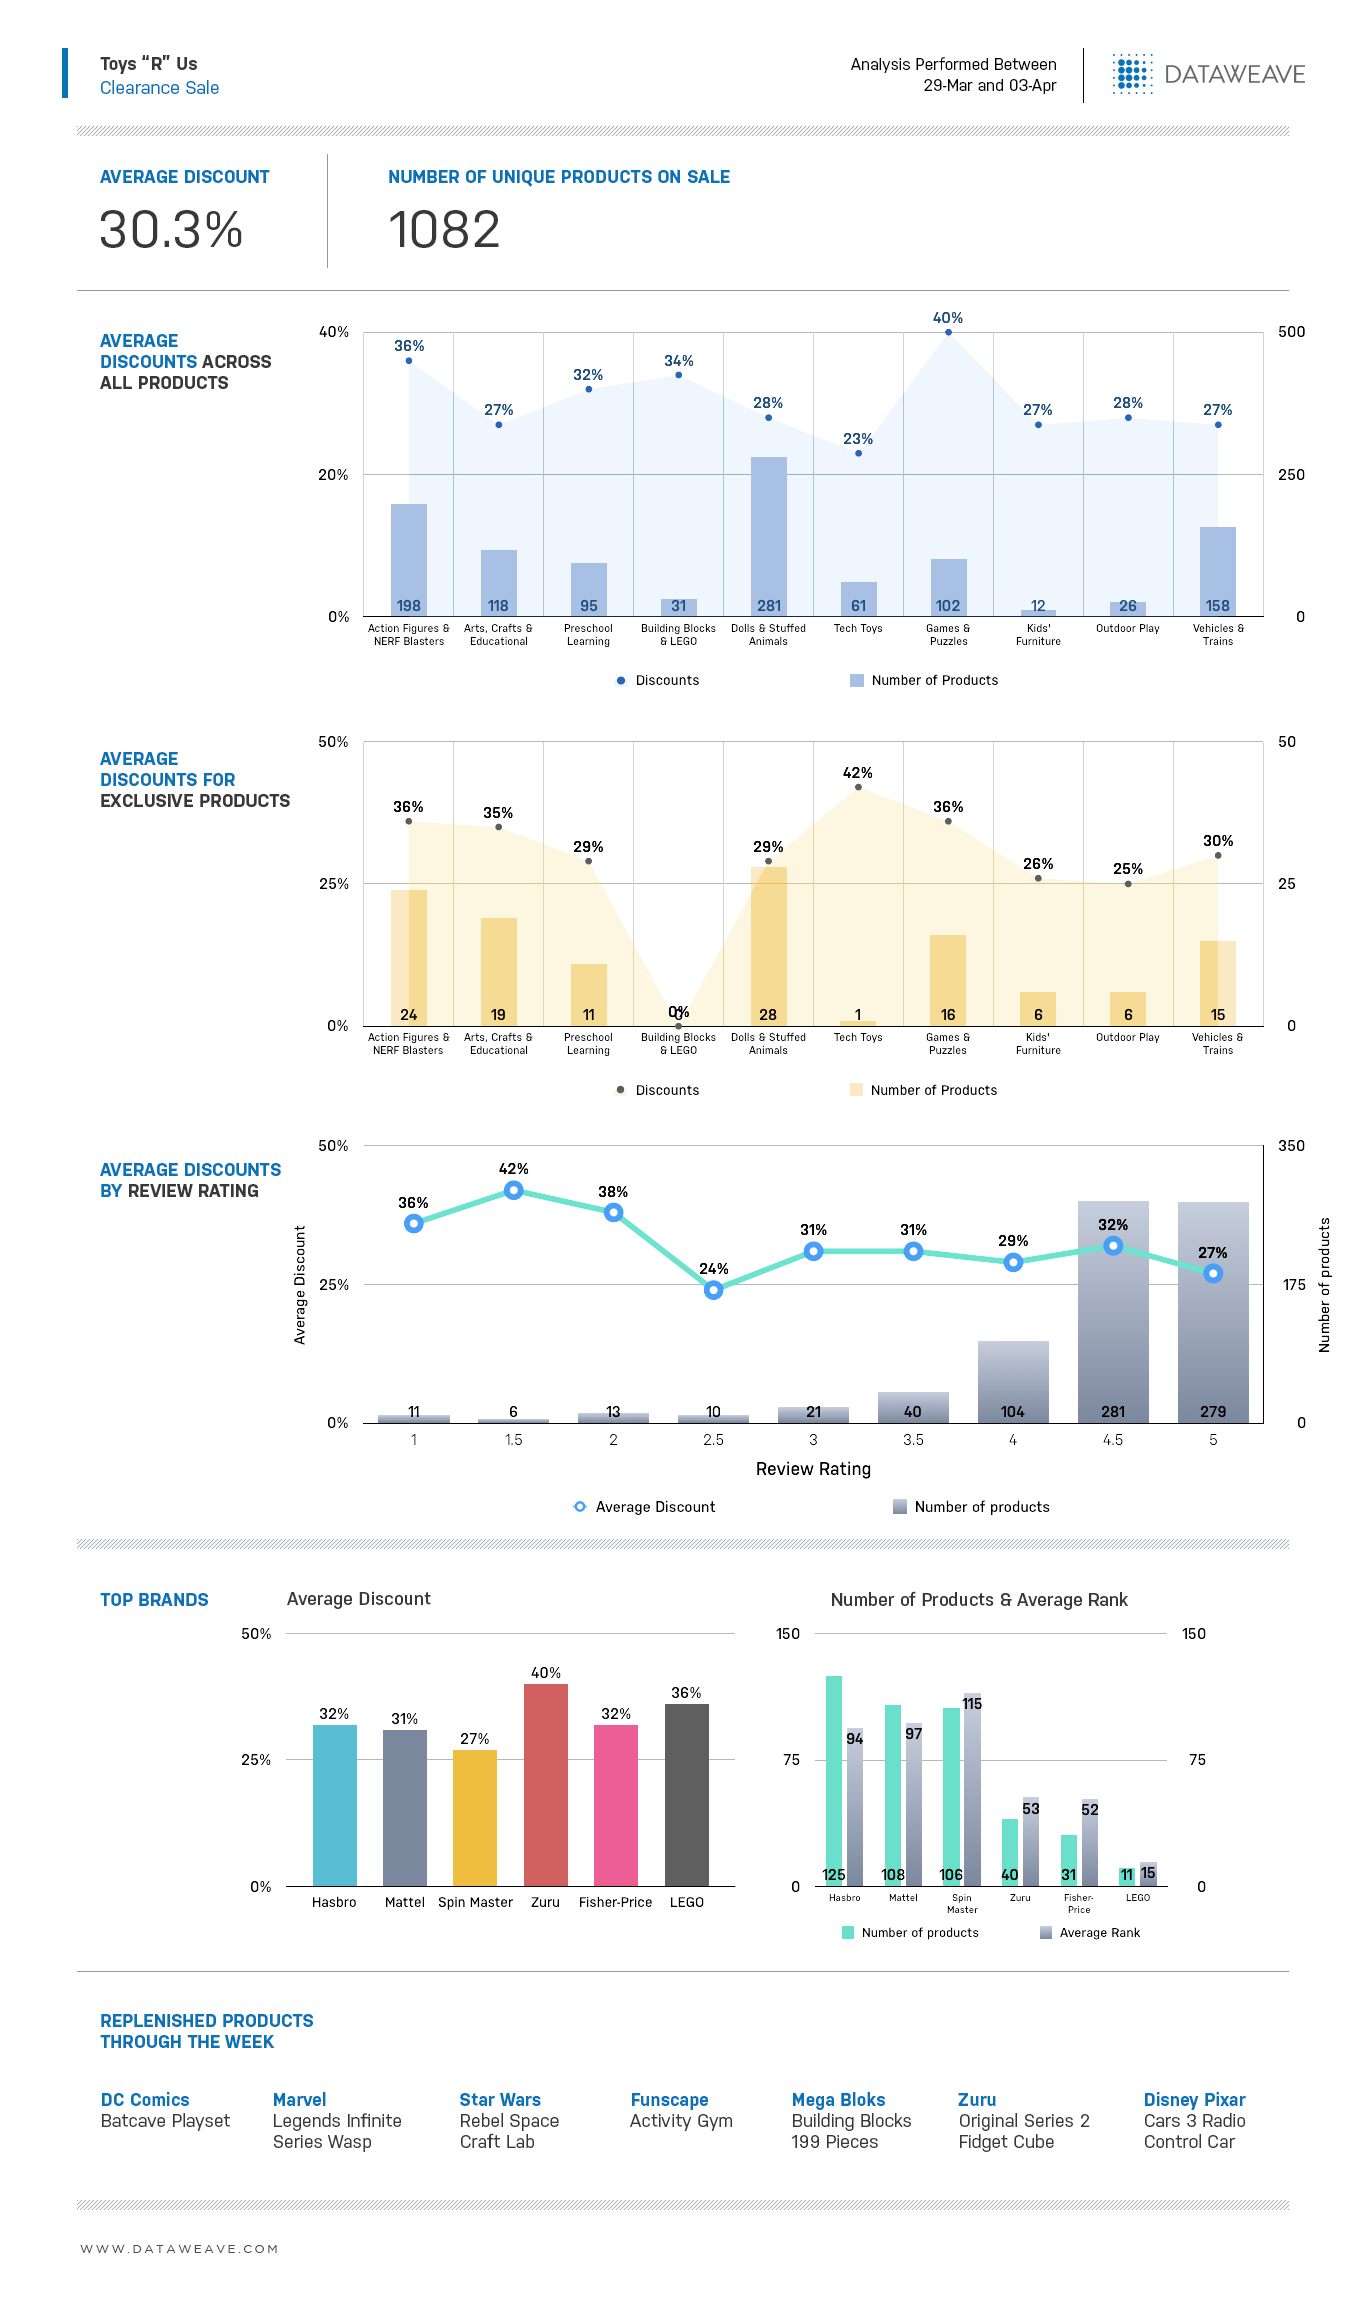
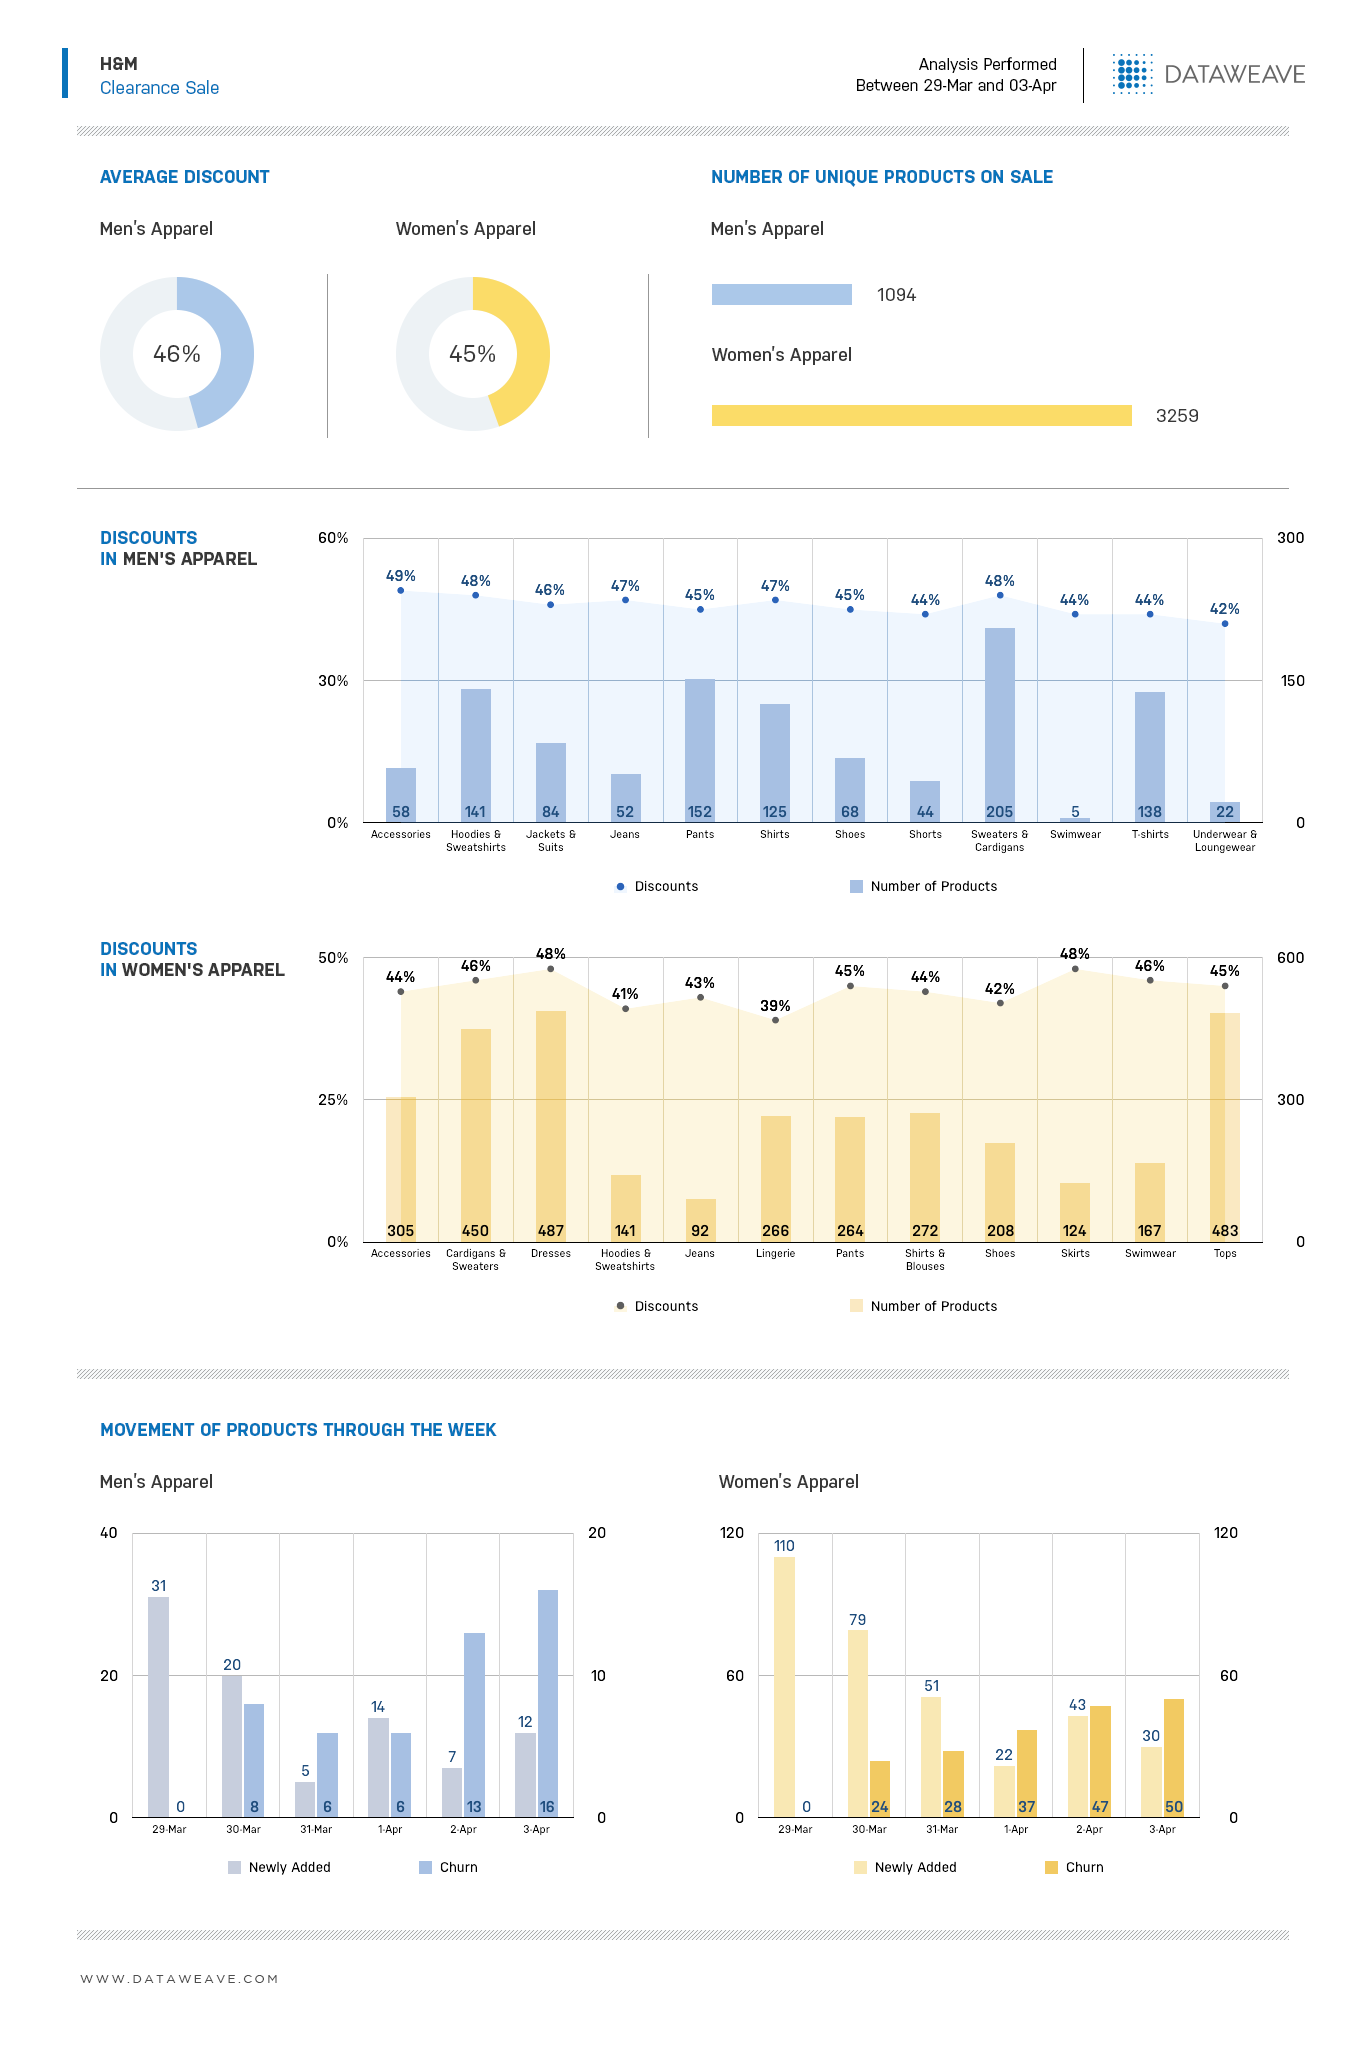

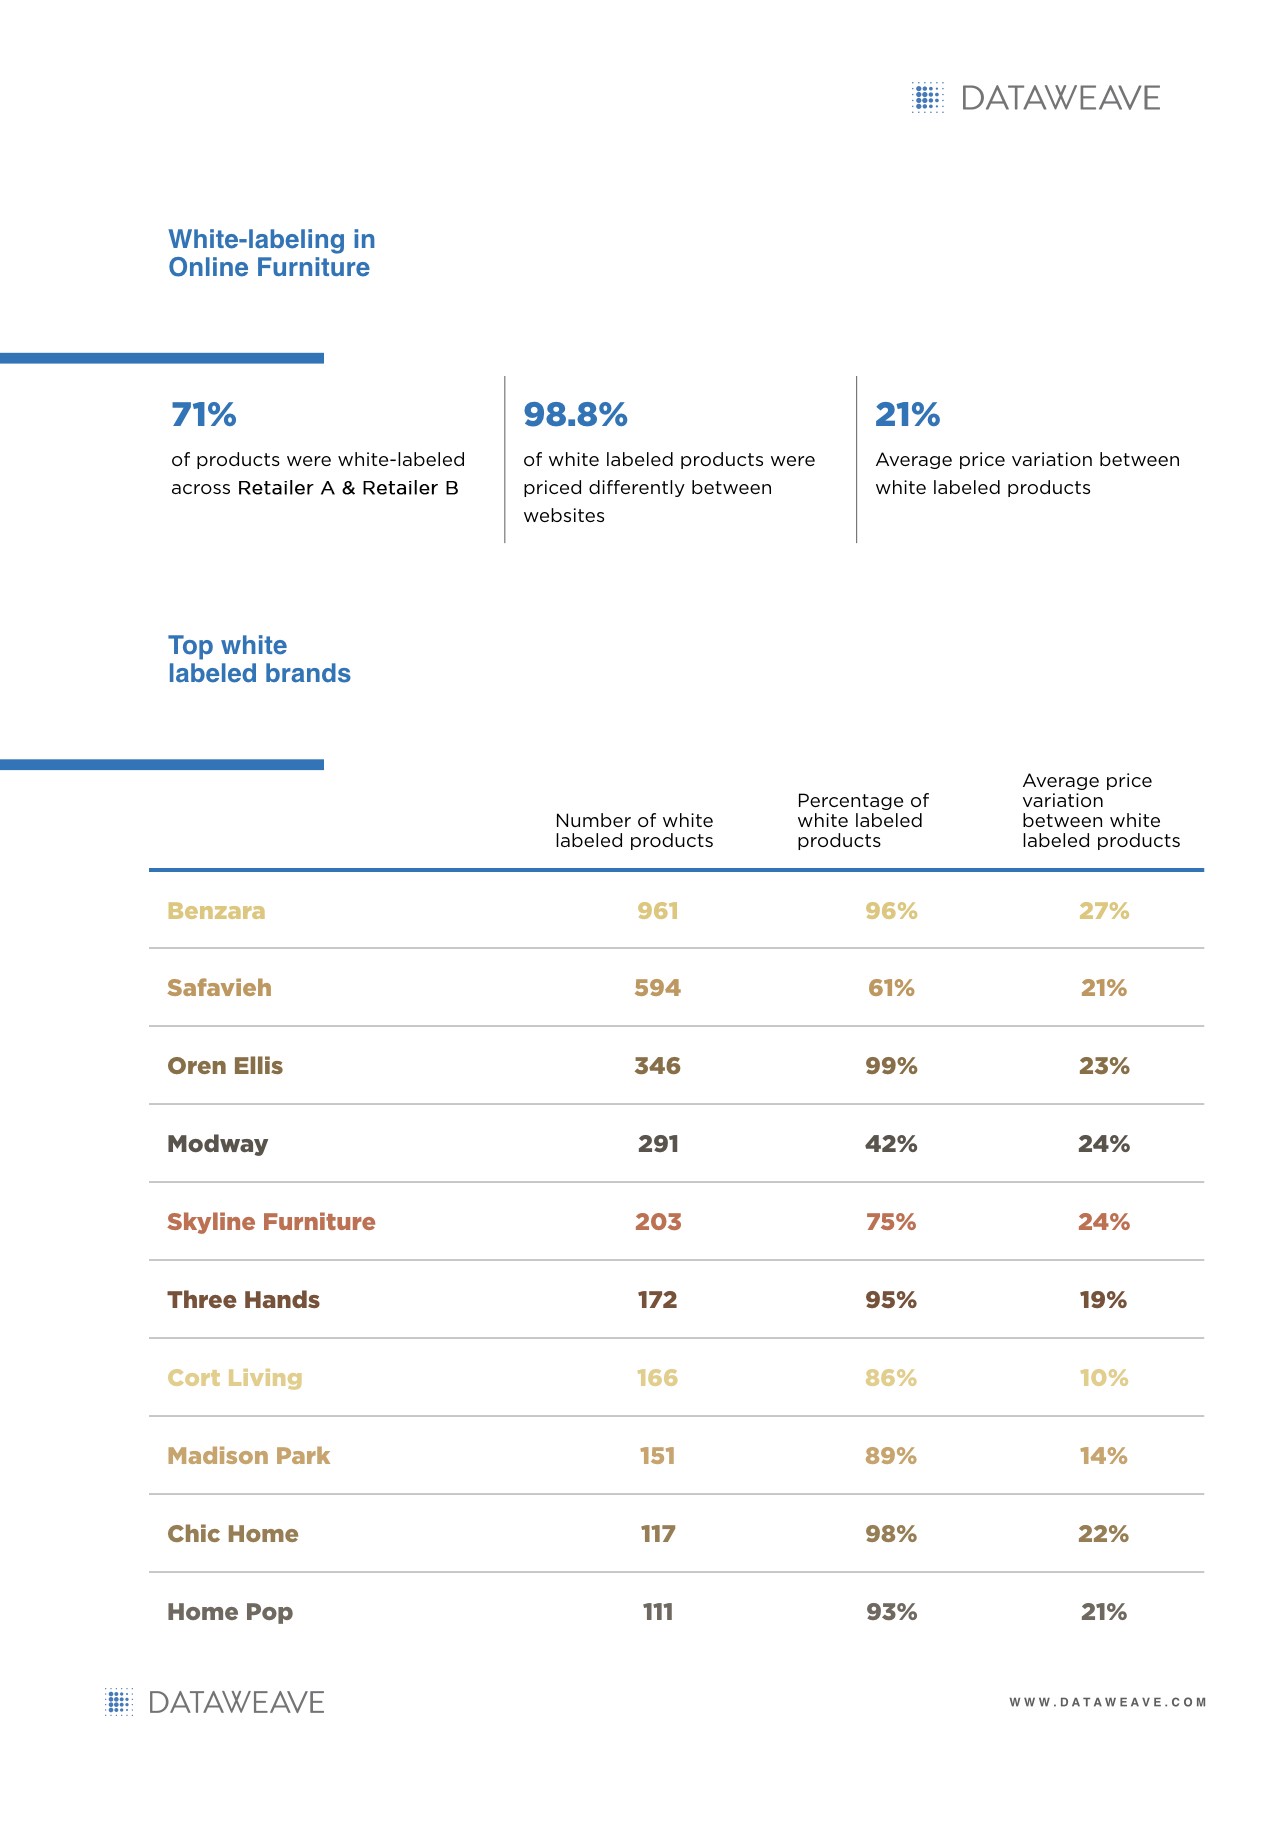
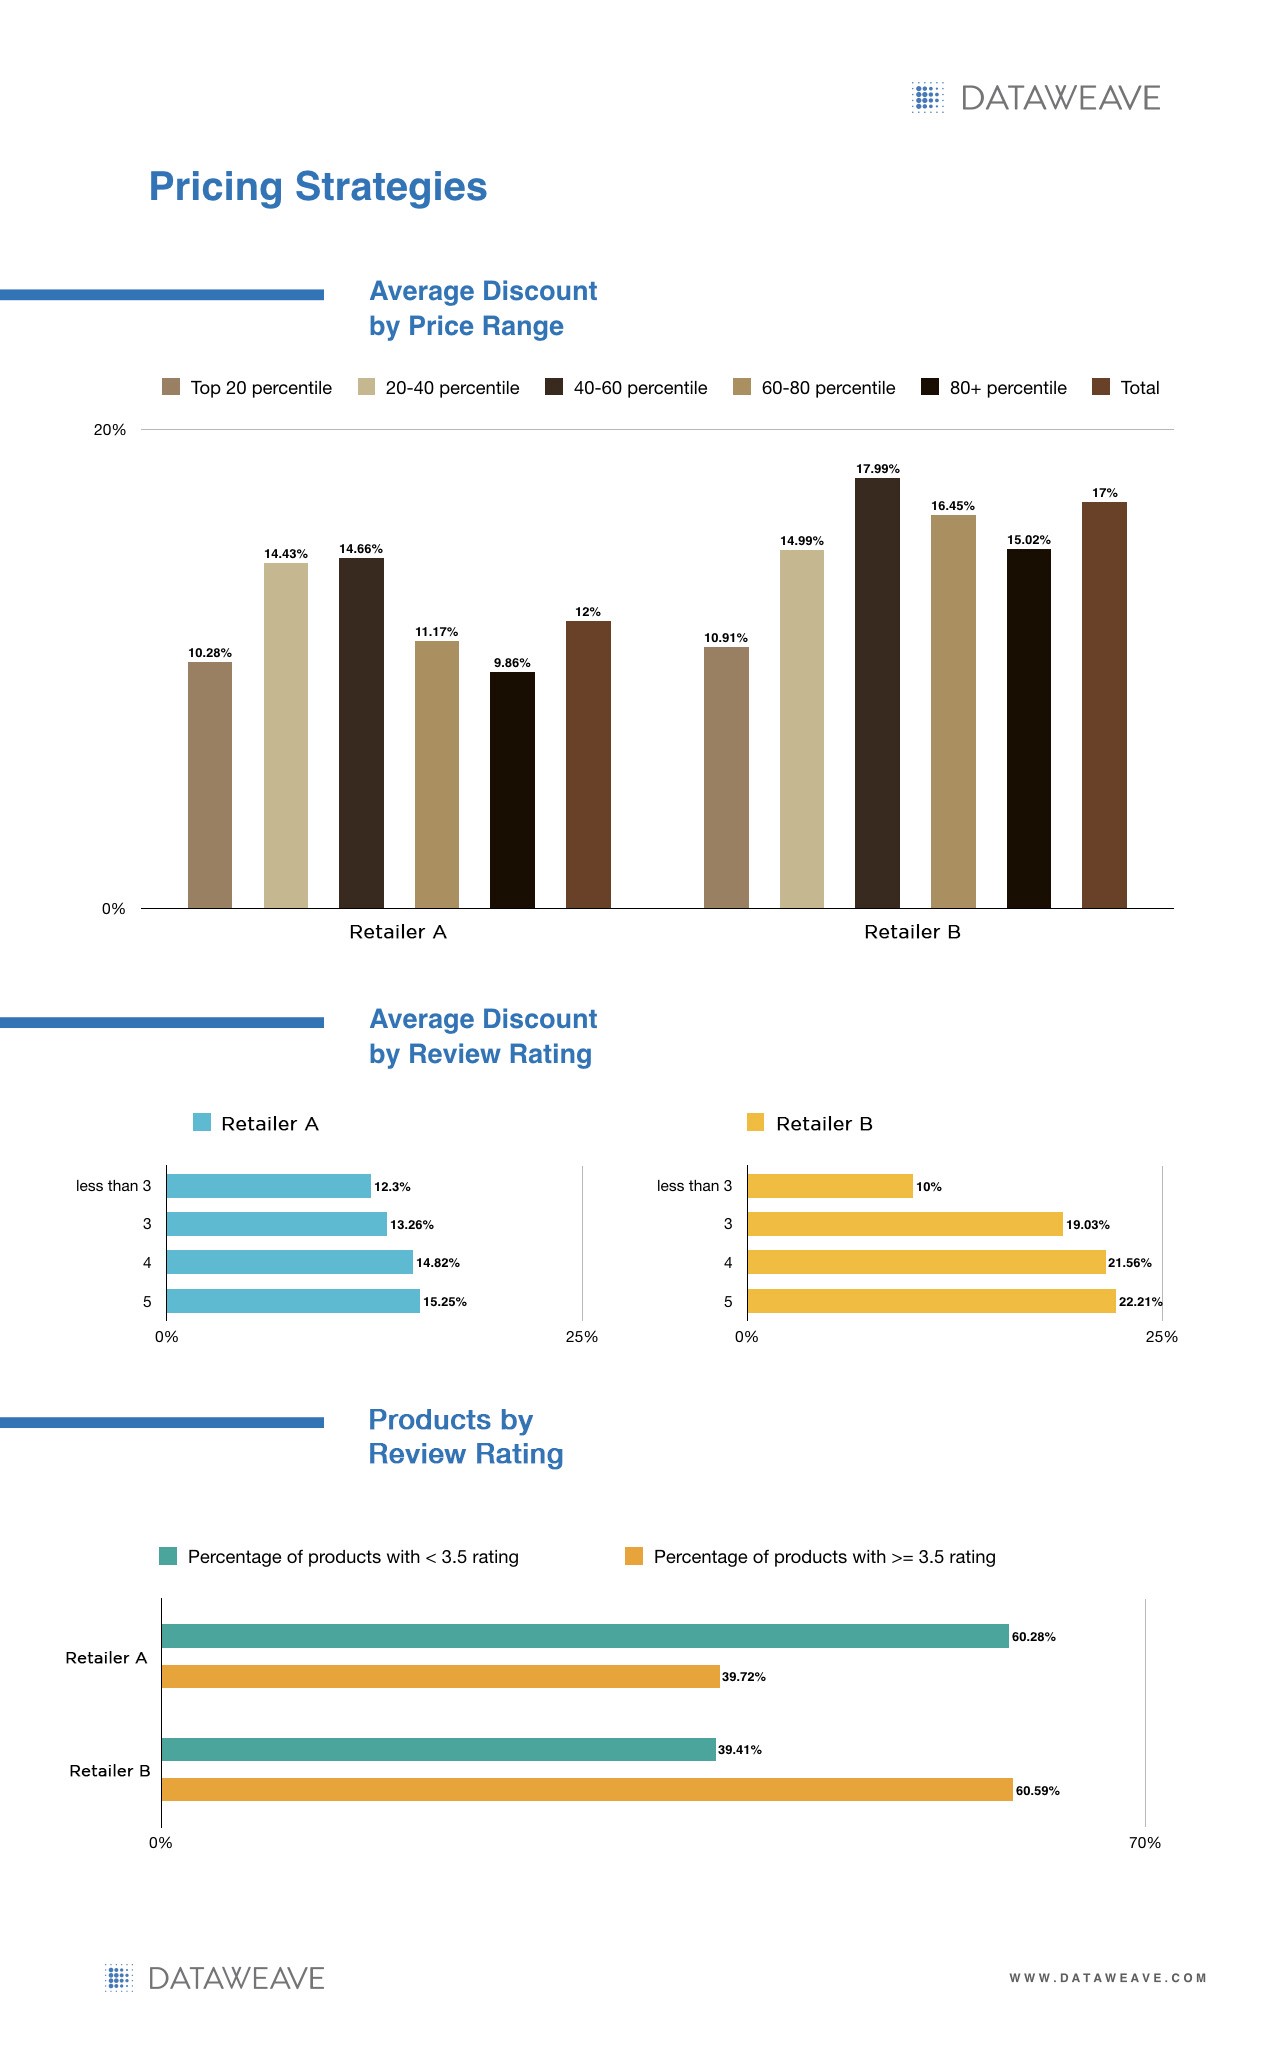

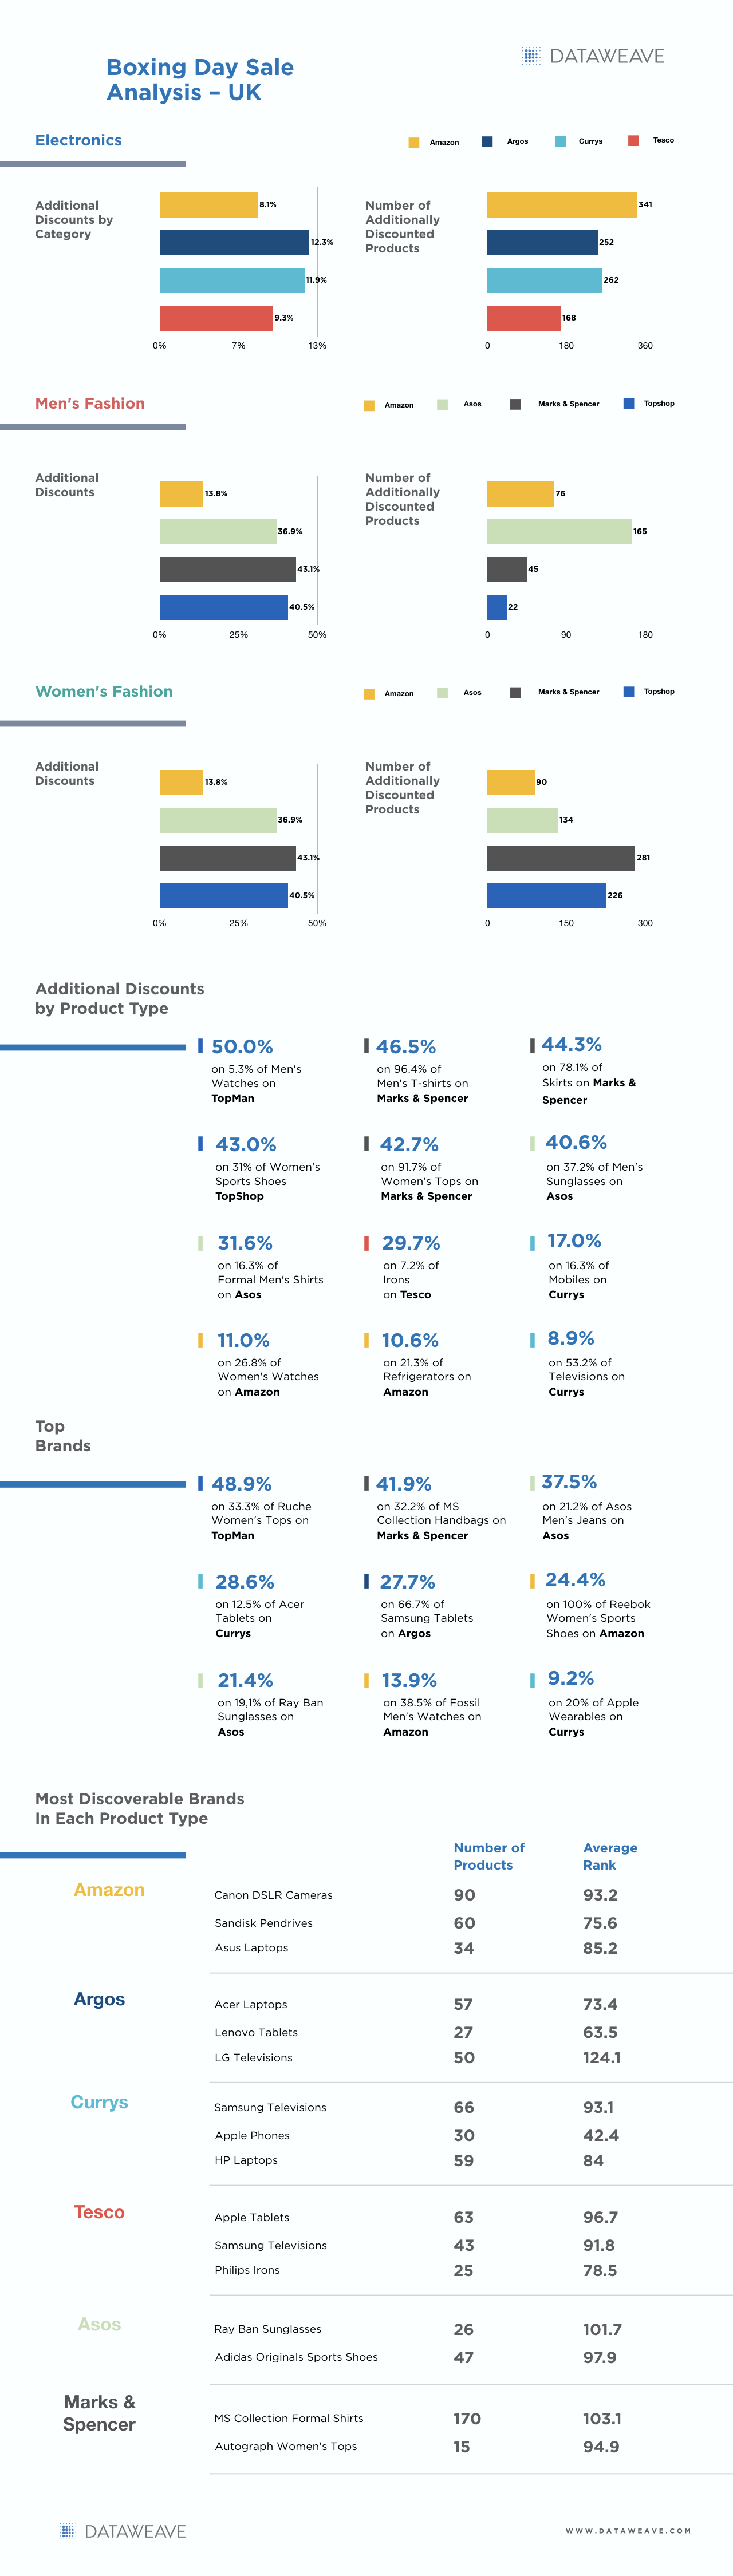

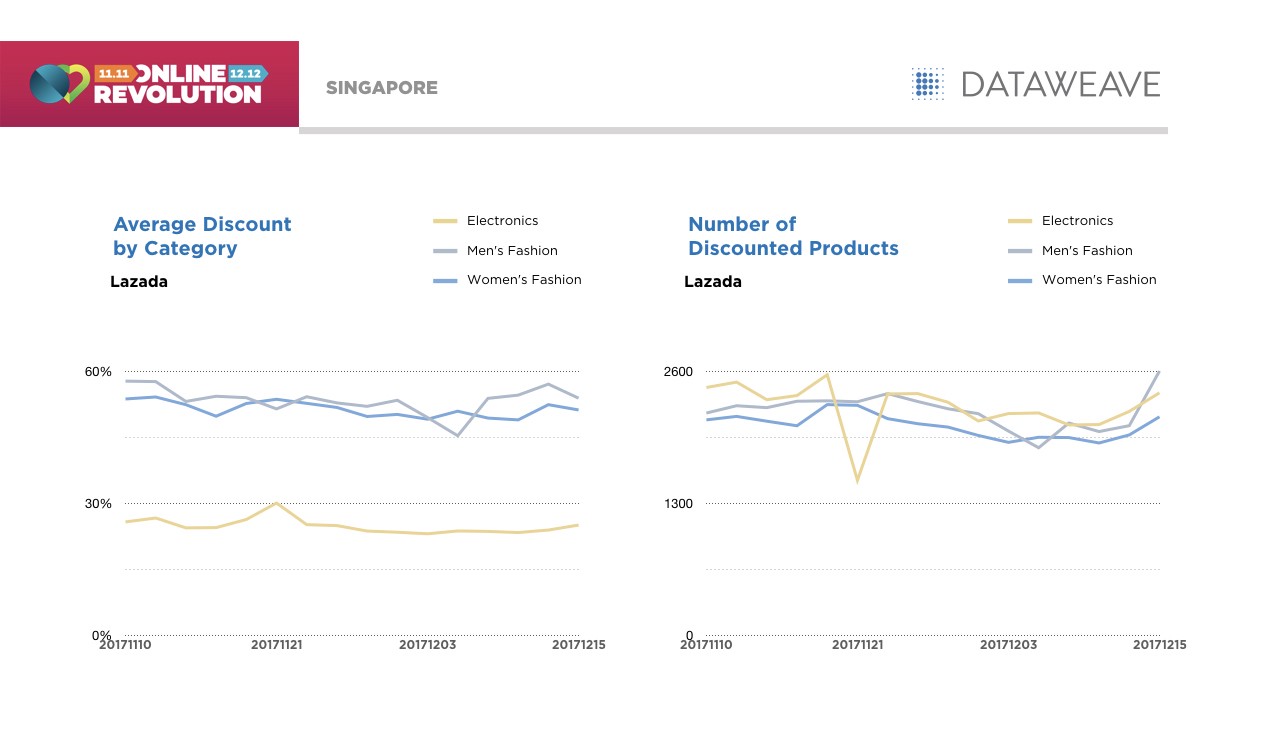
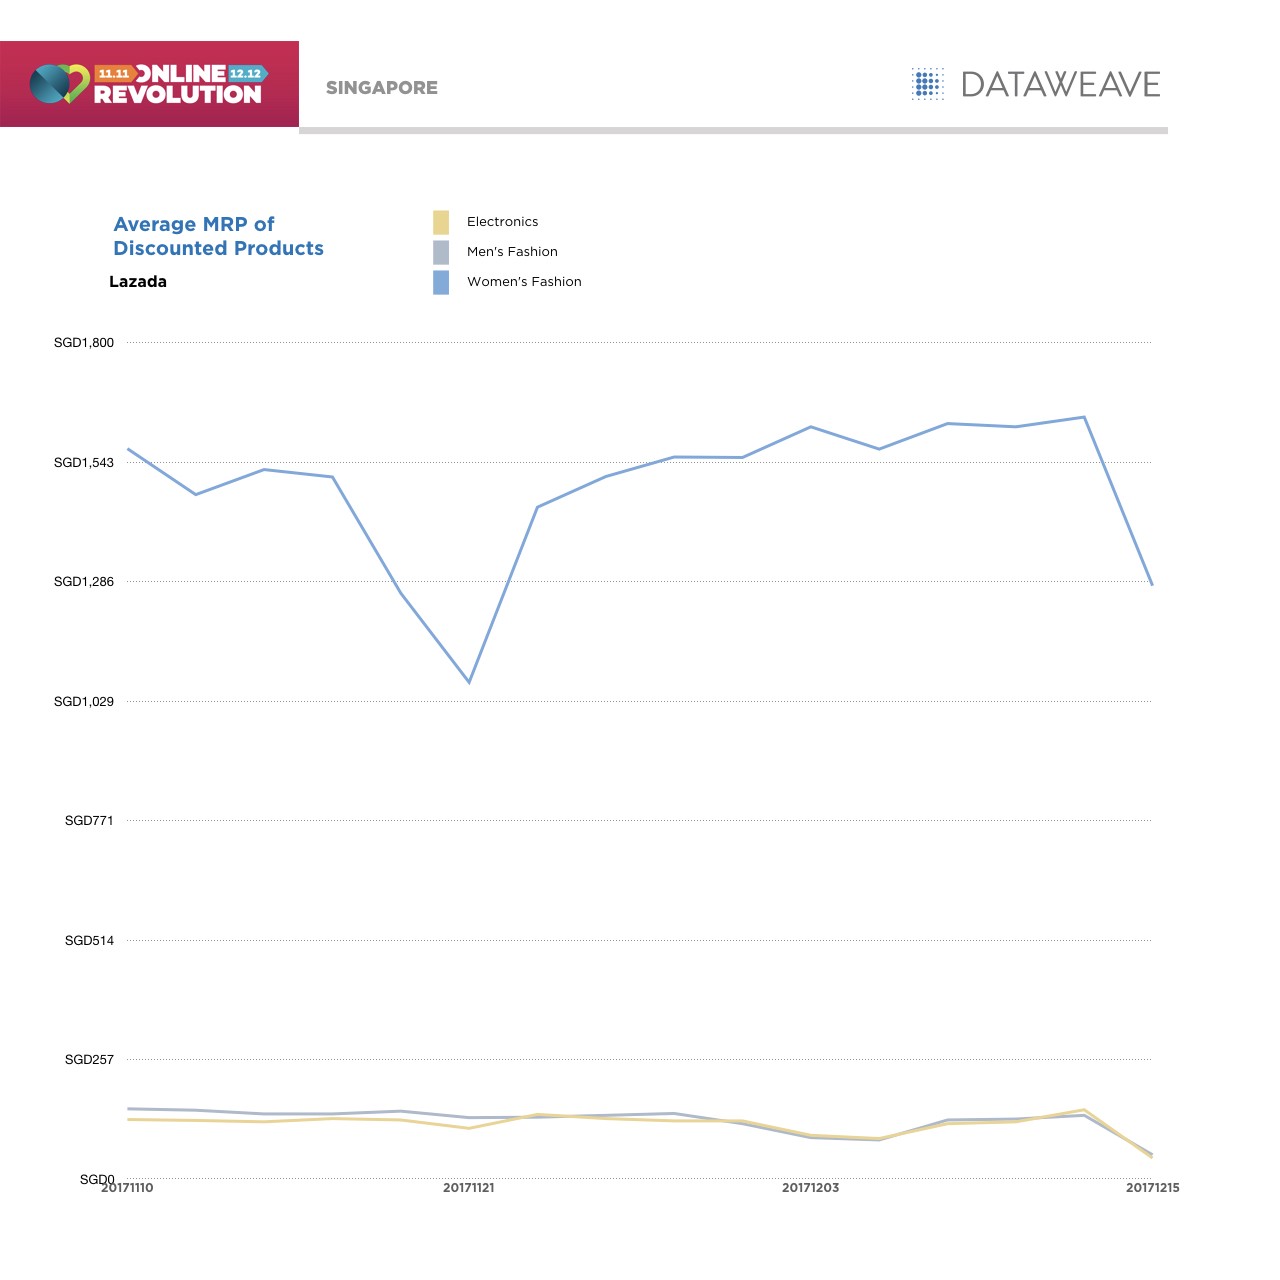
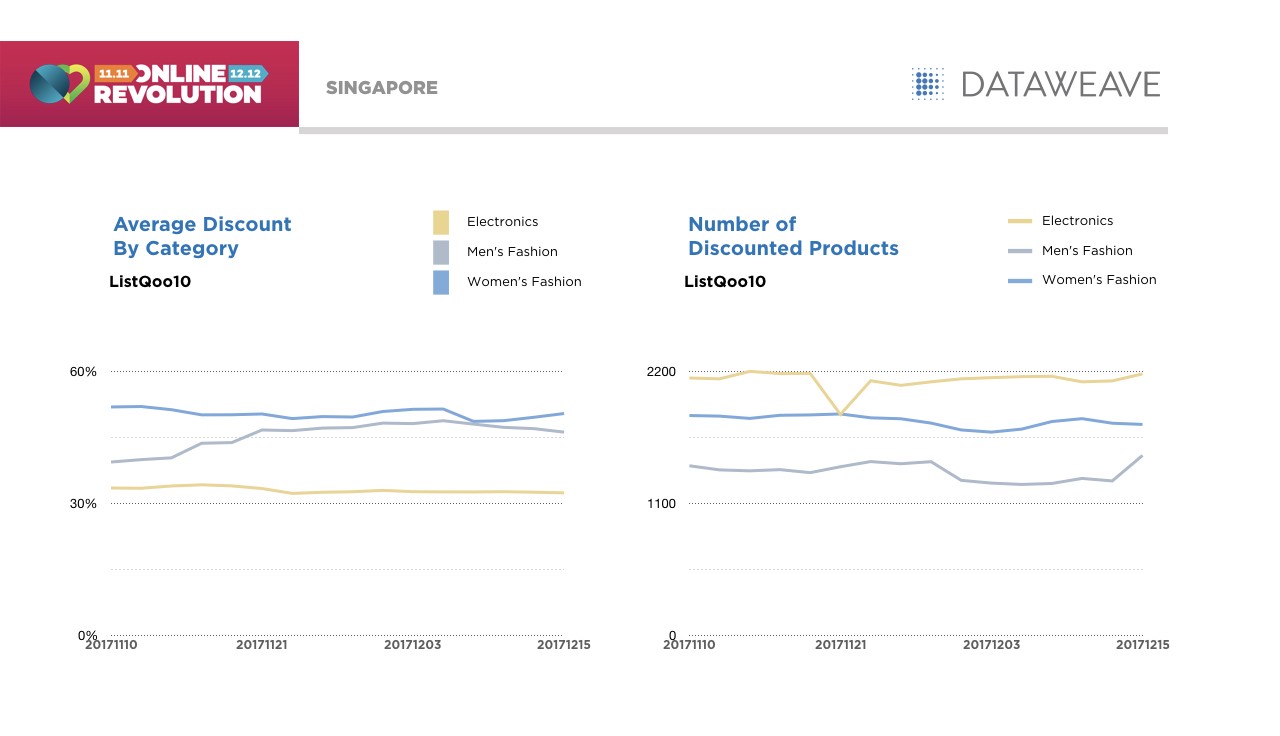
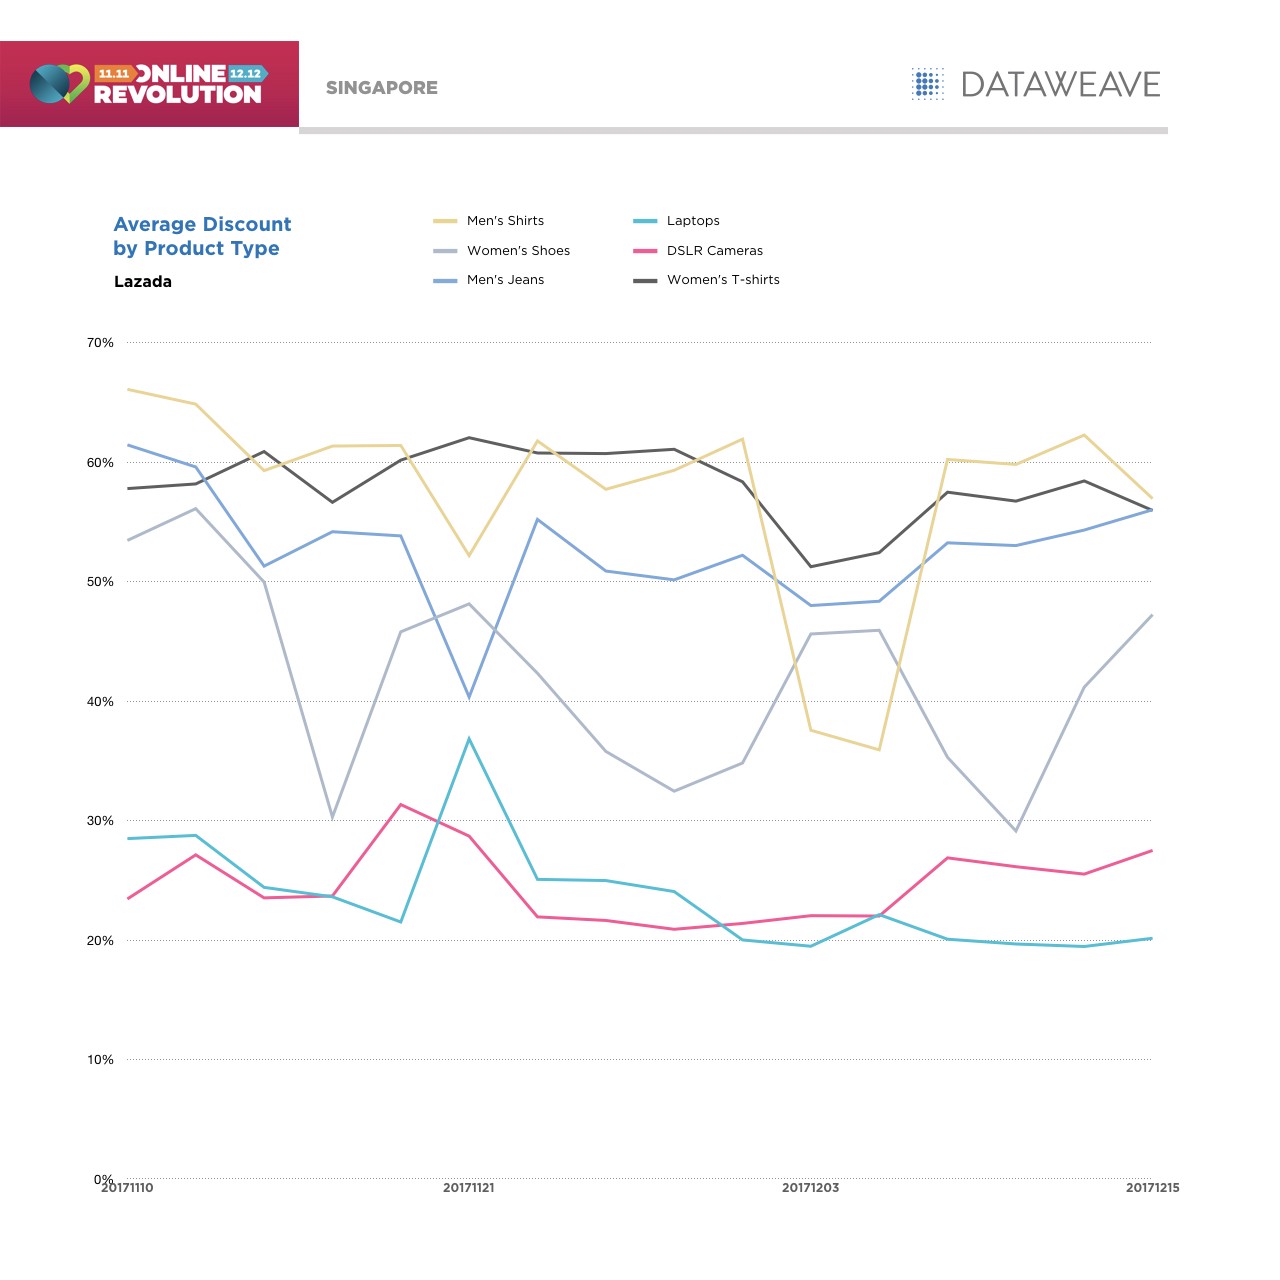
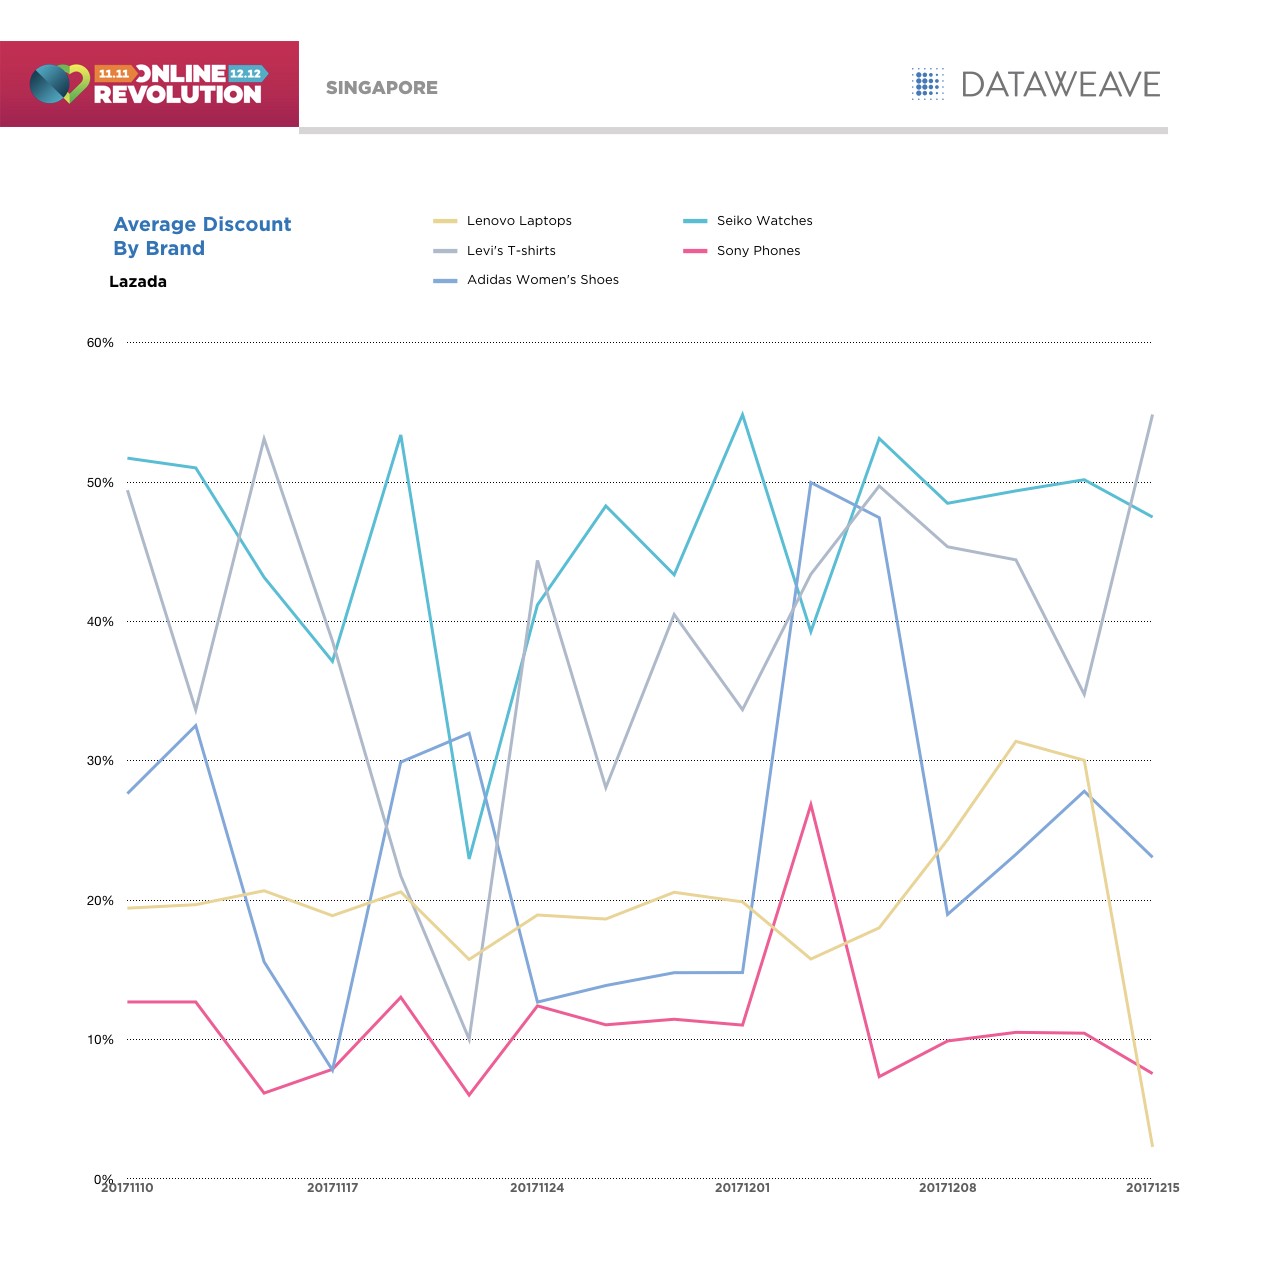
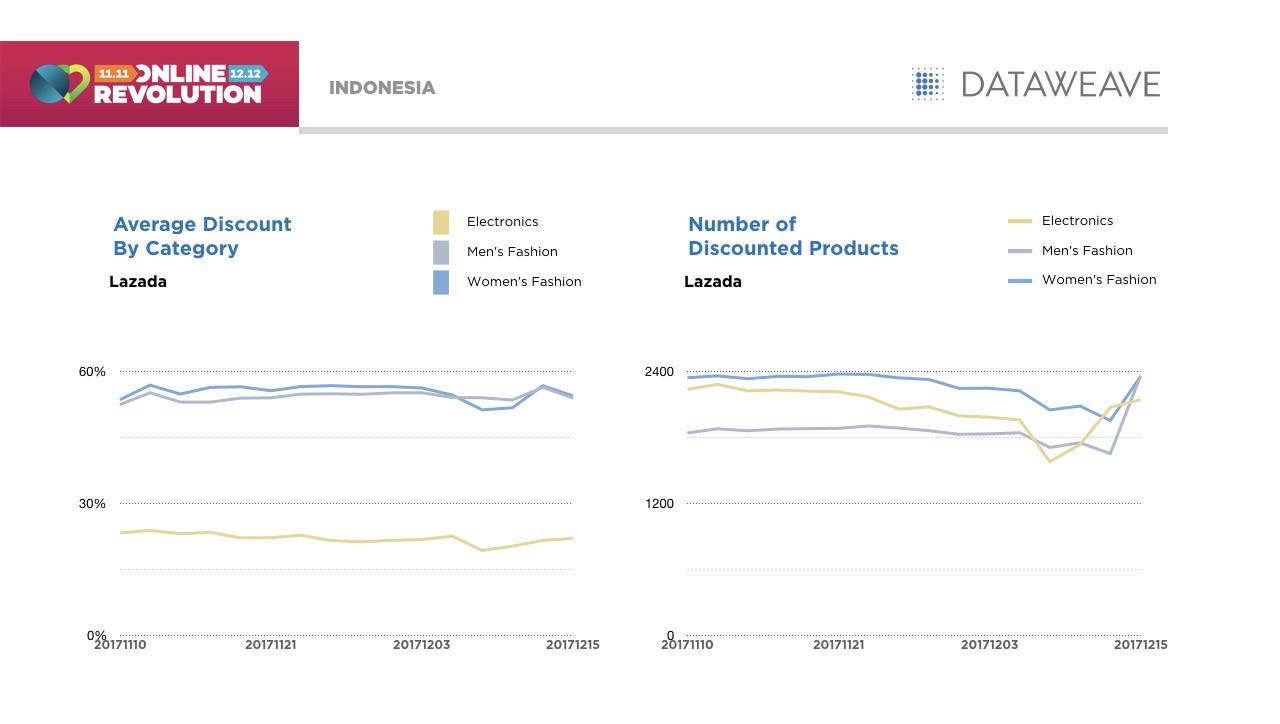
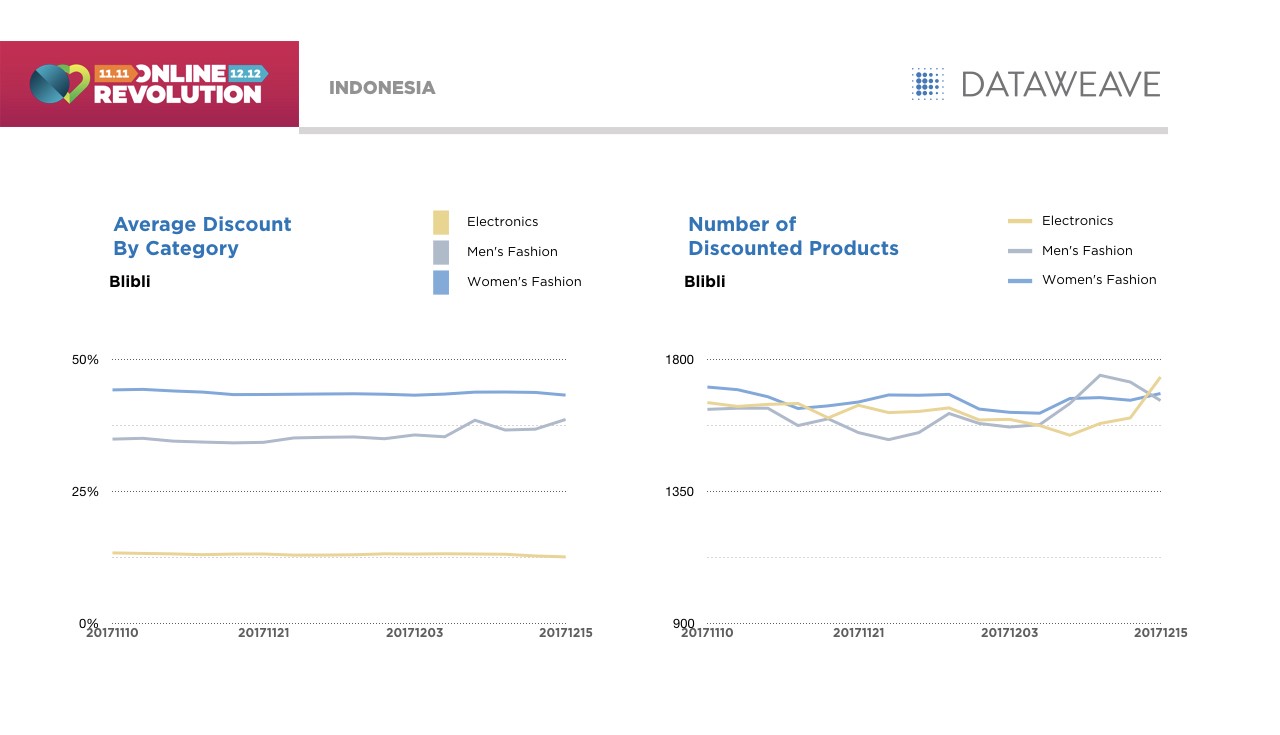
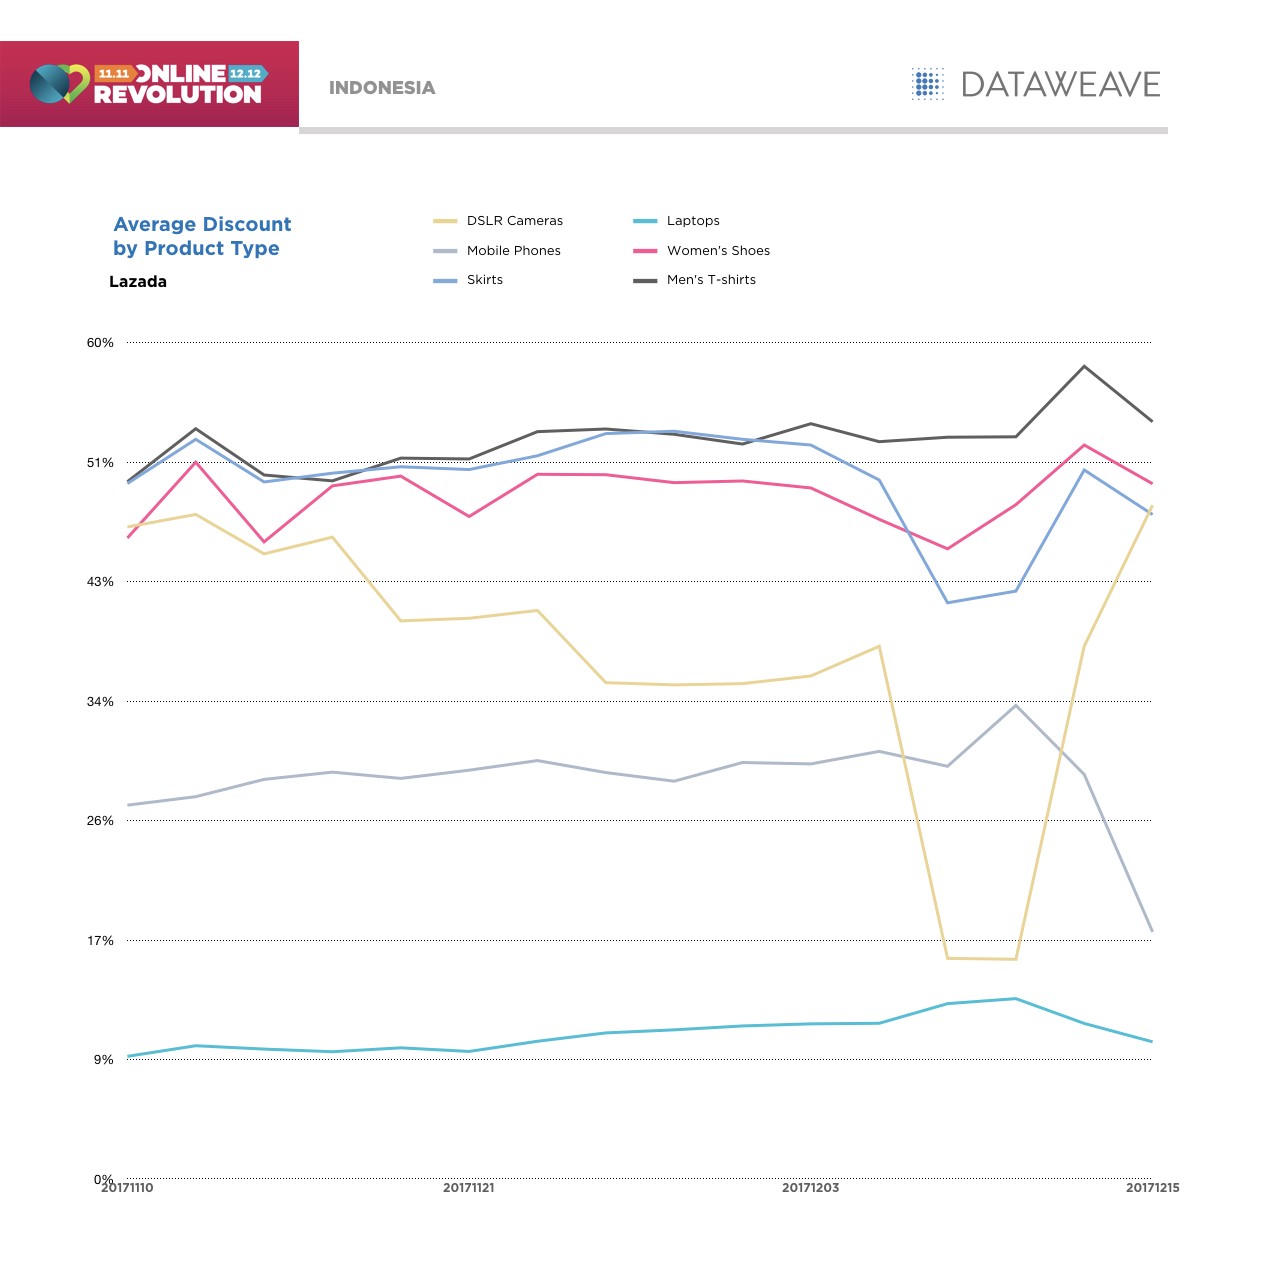
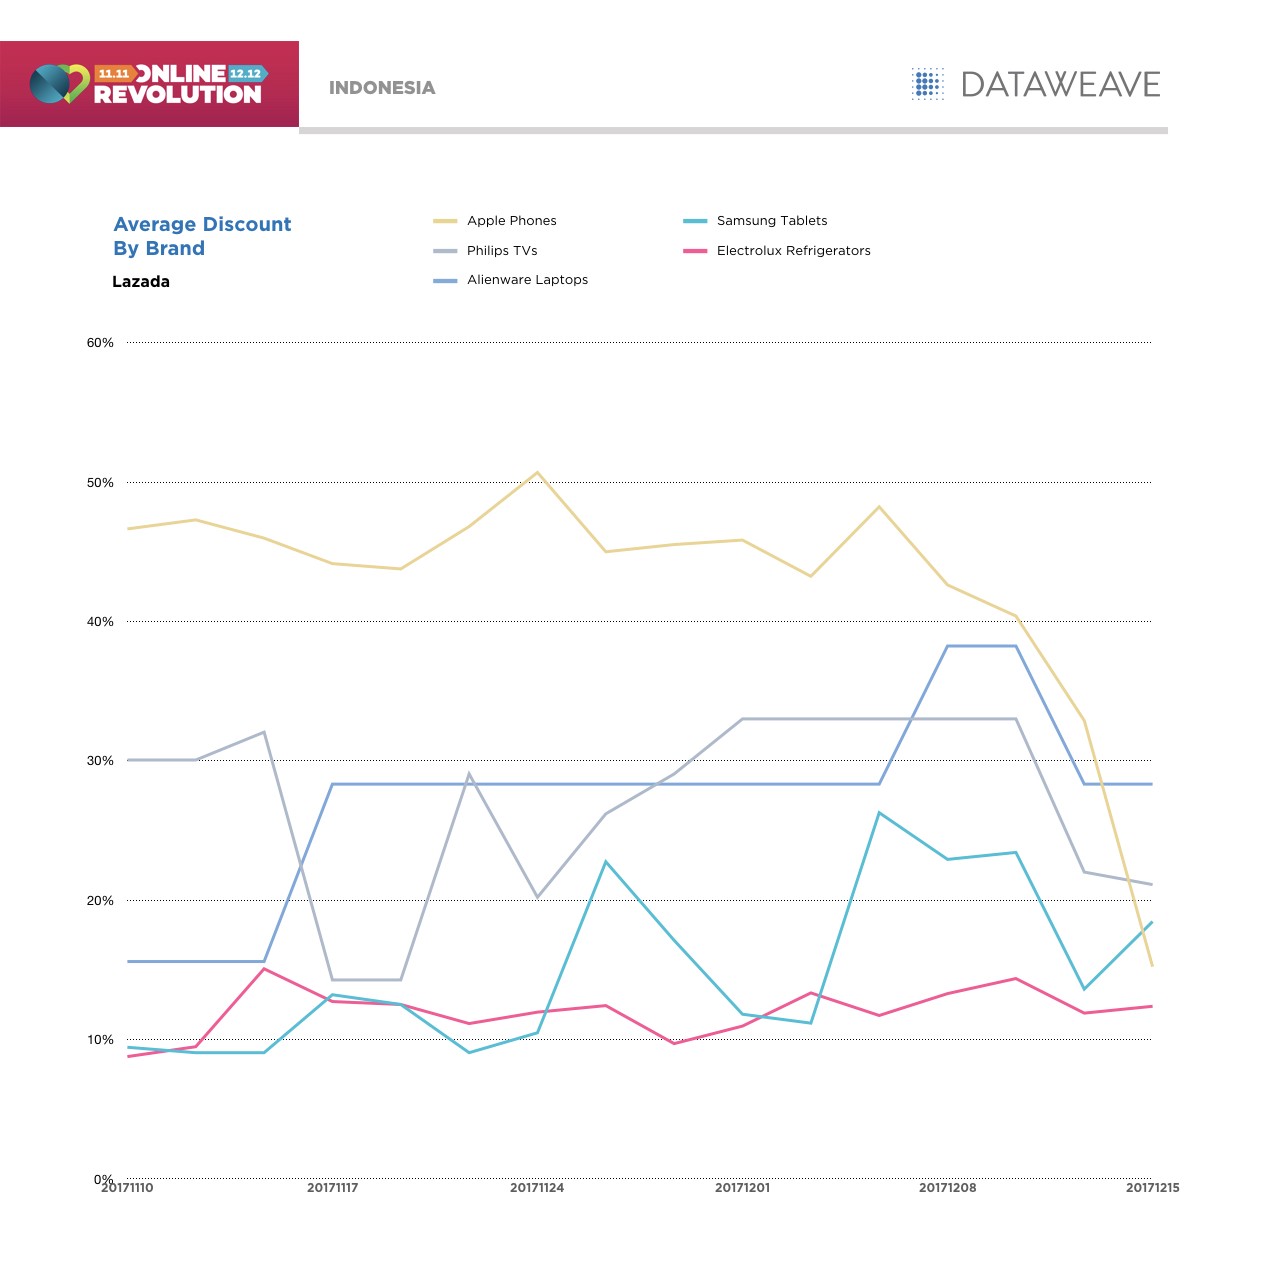

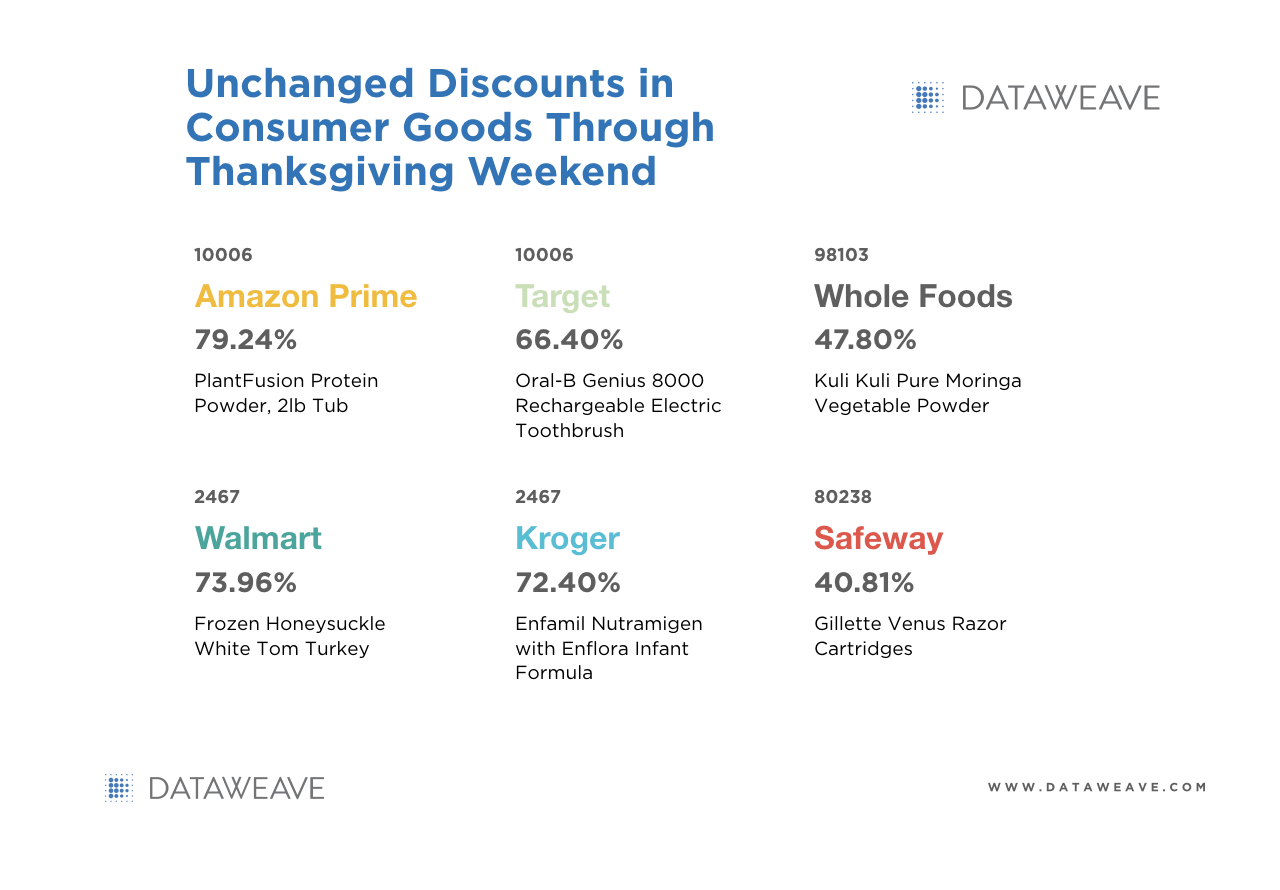
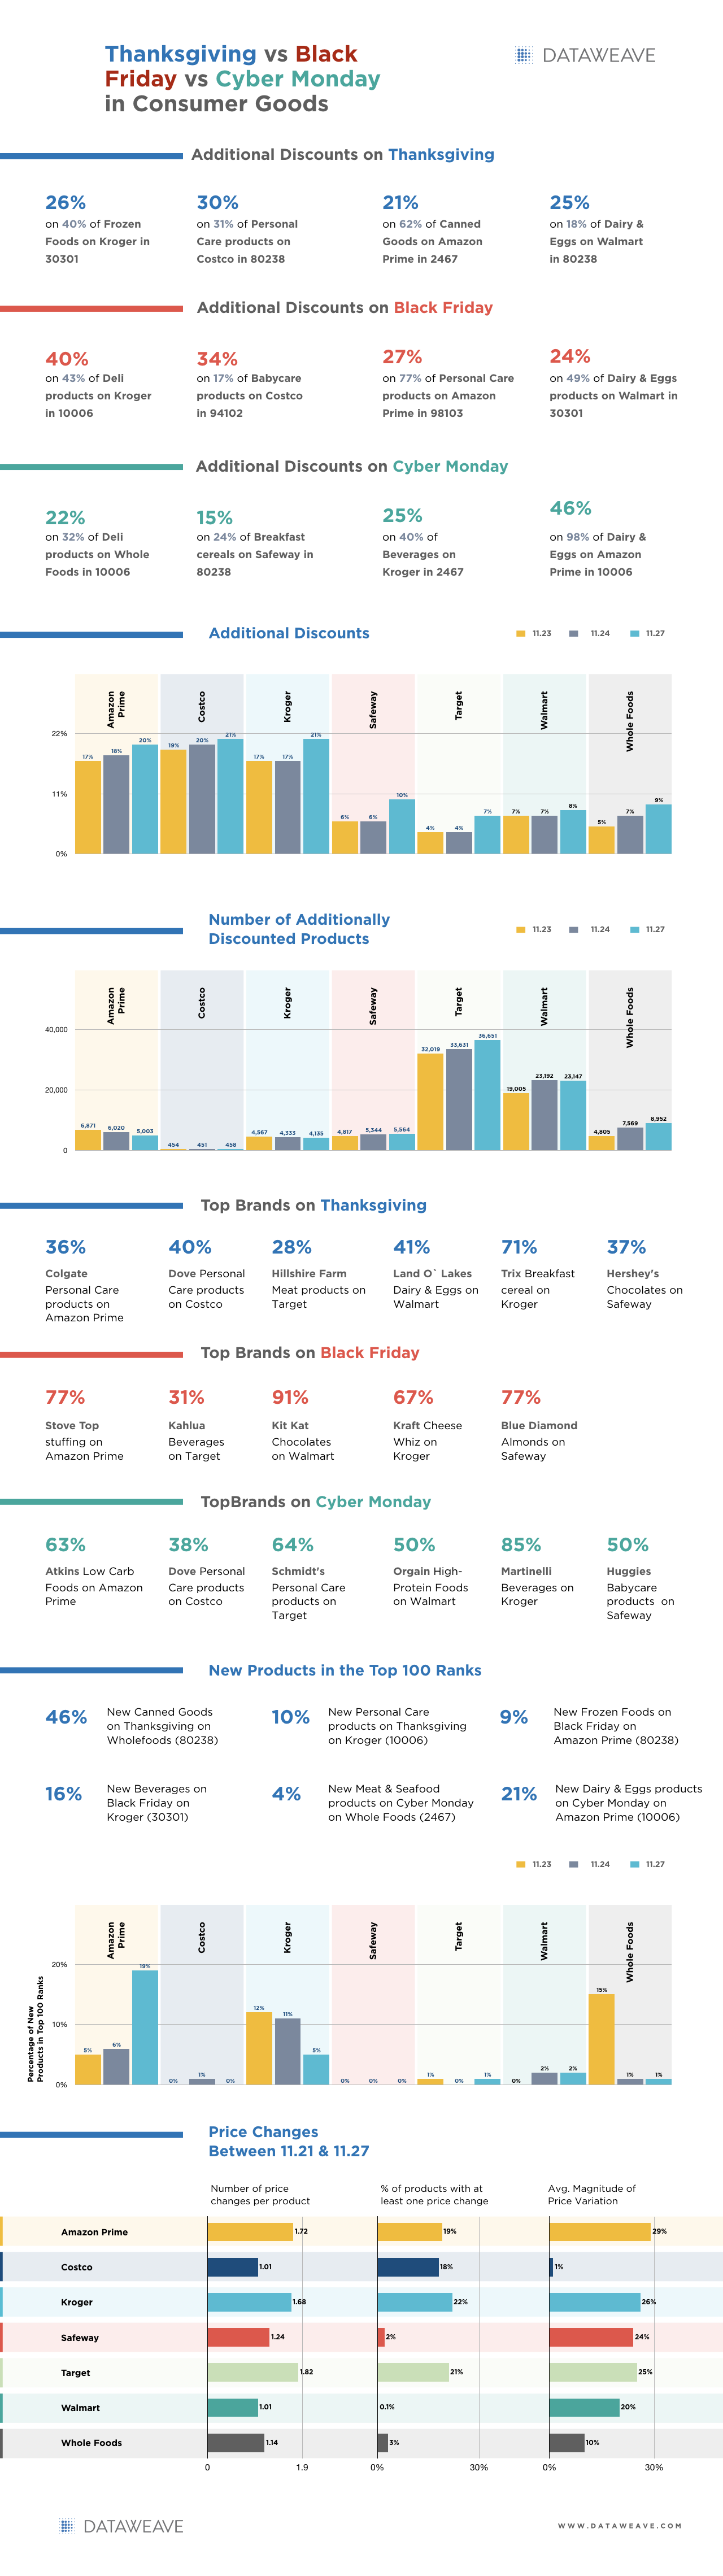

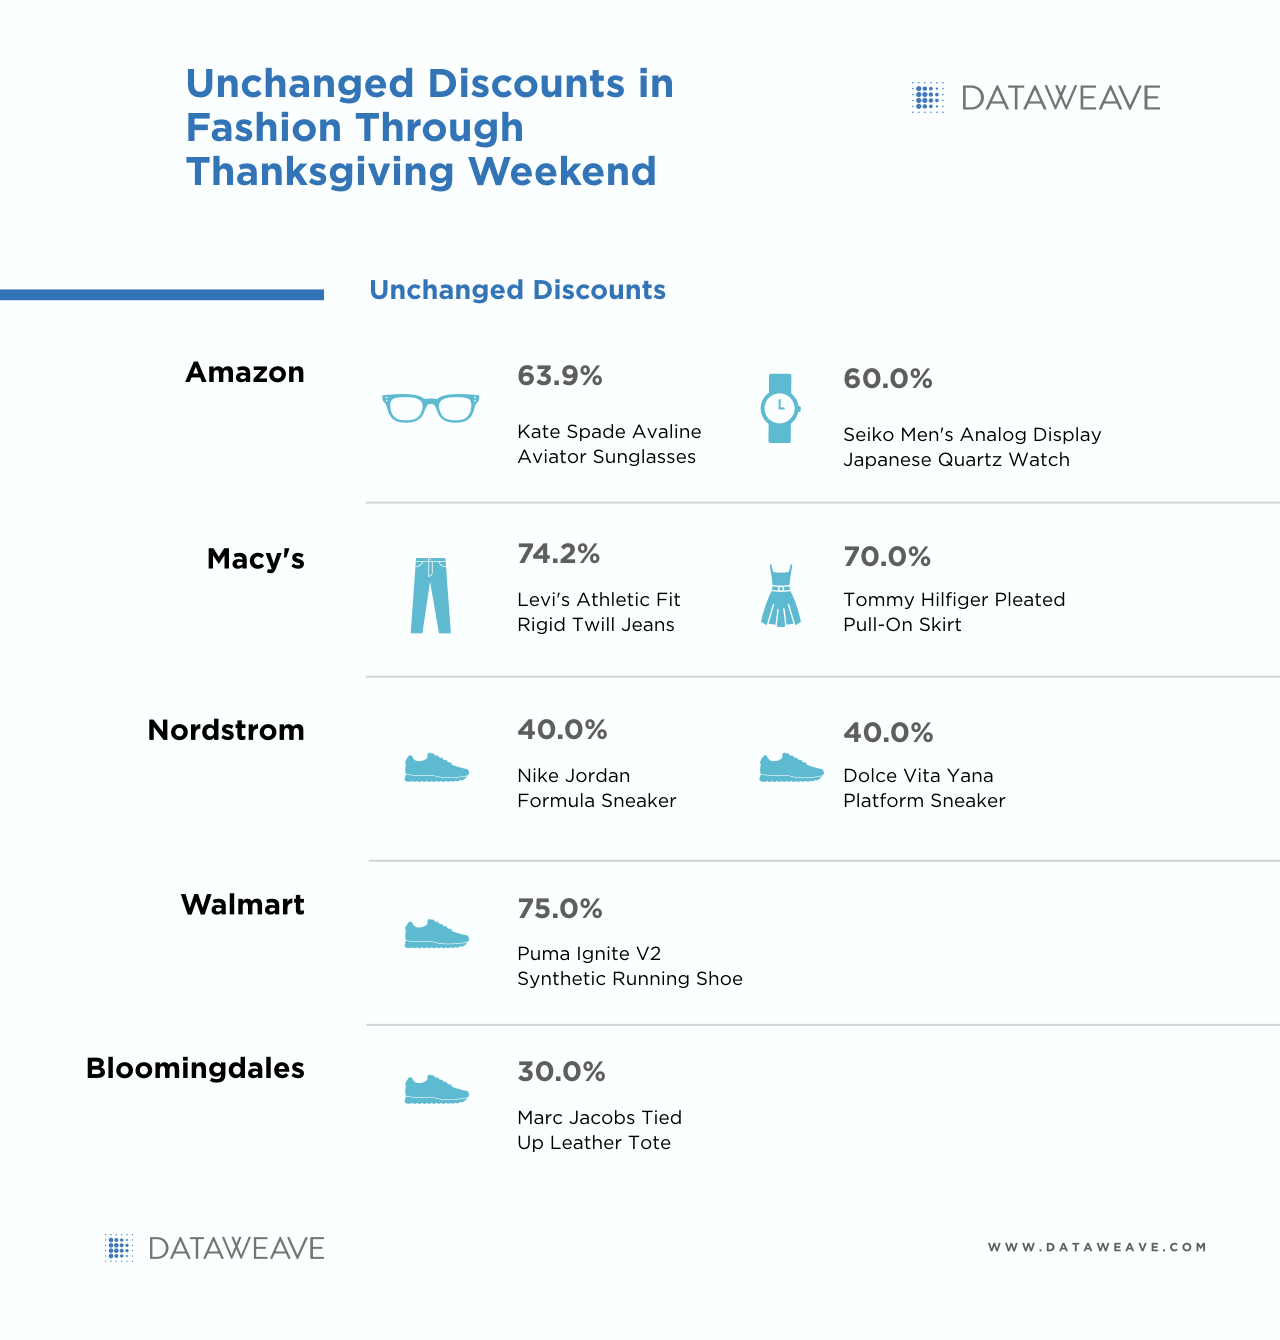
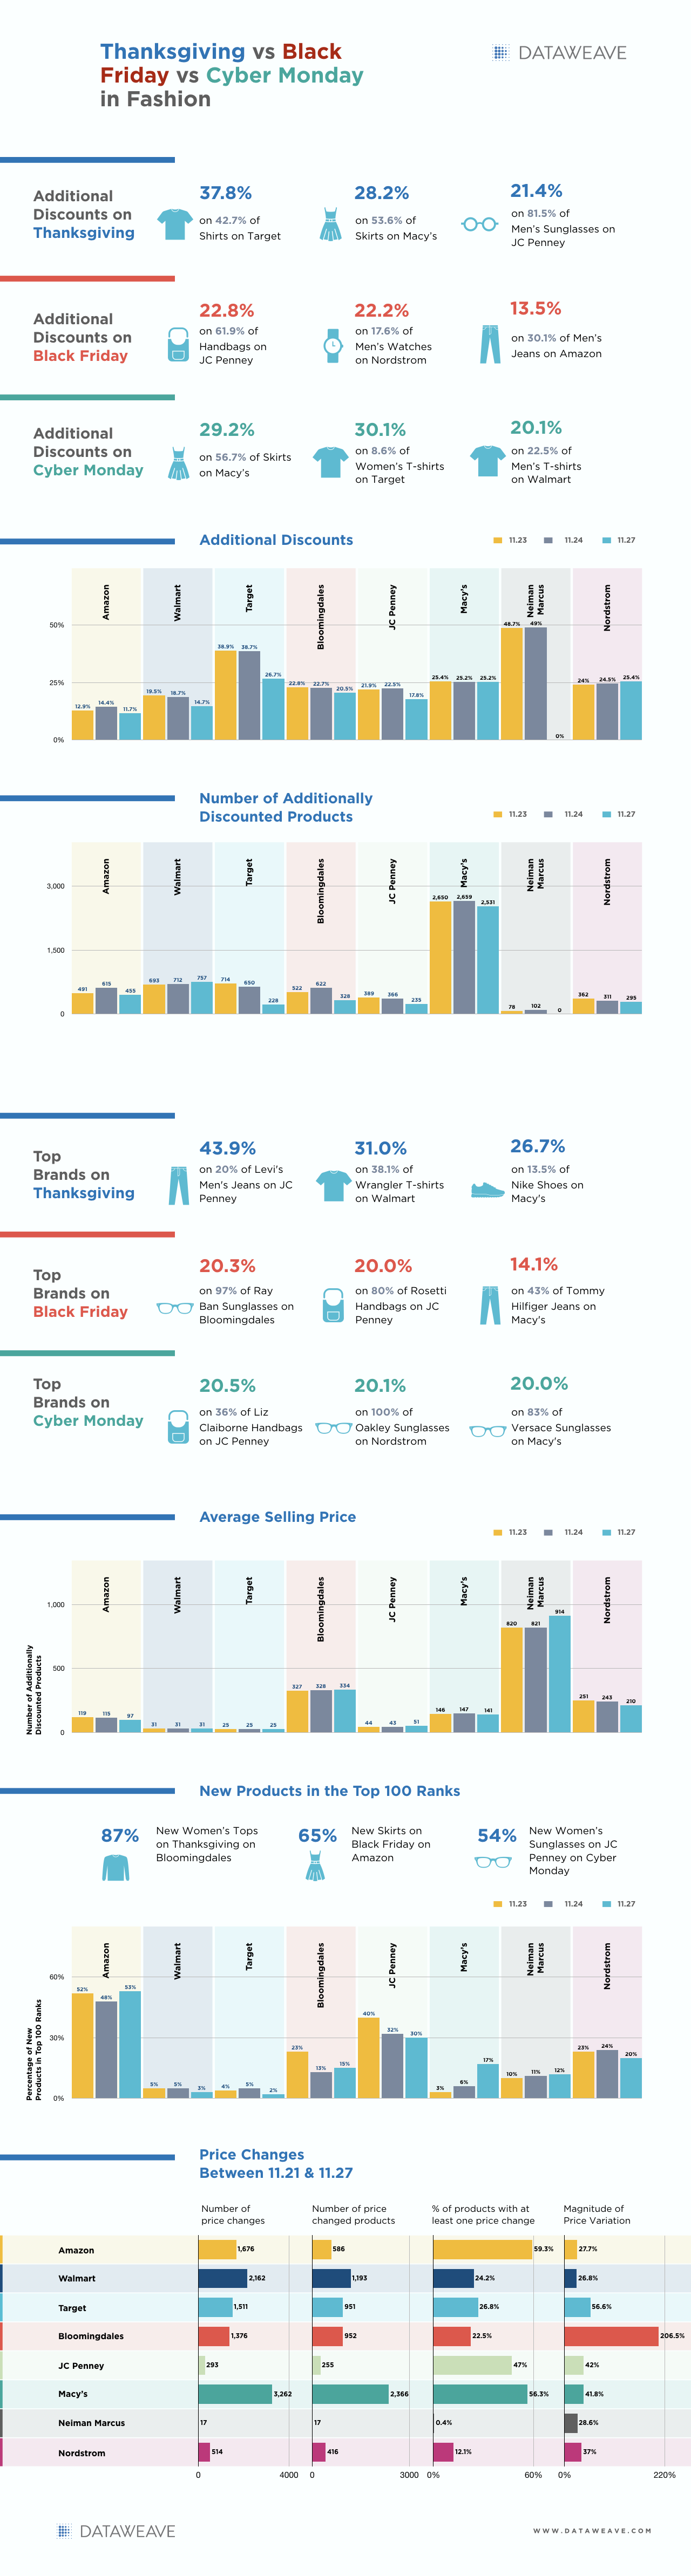
![[INFOGRAPHIC] Thanksgiving vs Black Friday vs Cyber Monday: The Electronics Price War Heats Up](https://stage-cdnblog.dataweave.com/wp-content/uploads/2018/09/a4-e1688041211819.jpeg)