As the baby formula shortage continues, retailers and brands are working quickly to meet evolving consumer demand, considering supply chain driven headwinds, a baby formula recall, and inflationary-driven impacts. The DataWeave analytics team has actively tracked marketplace changes, alongside reports from the FDA, for the baby formula category at a state-level, and has shared the latest snapshot of product availability through June 7th, 2022, below.
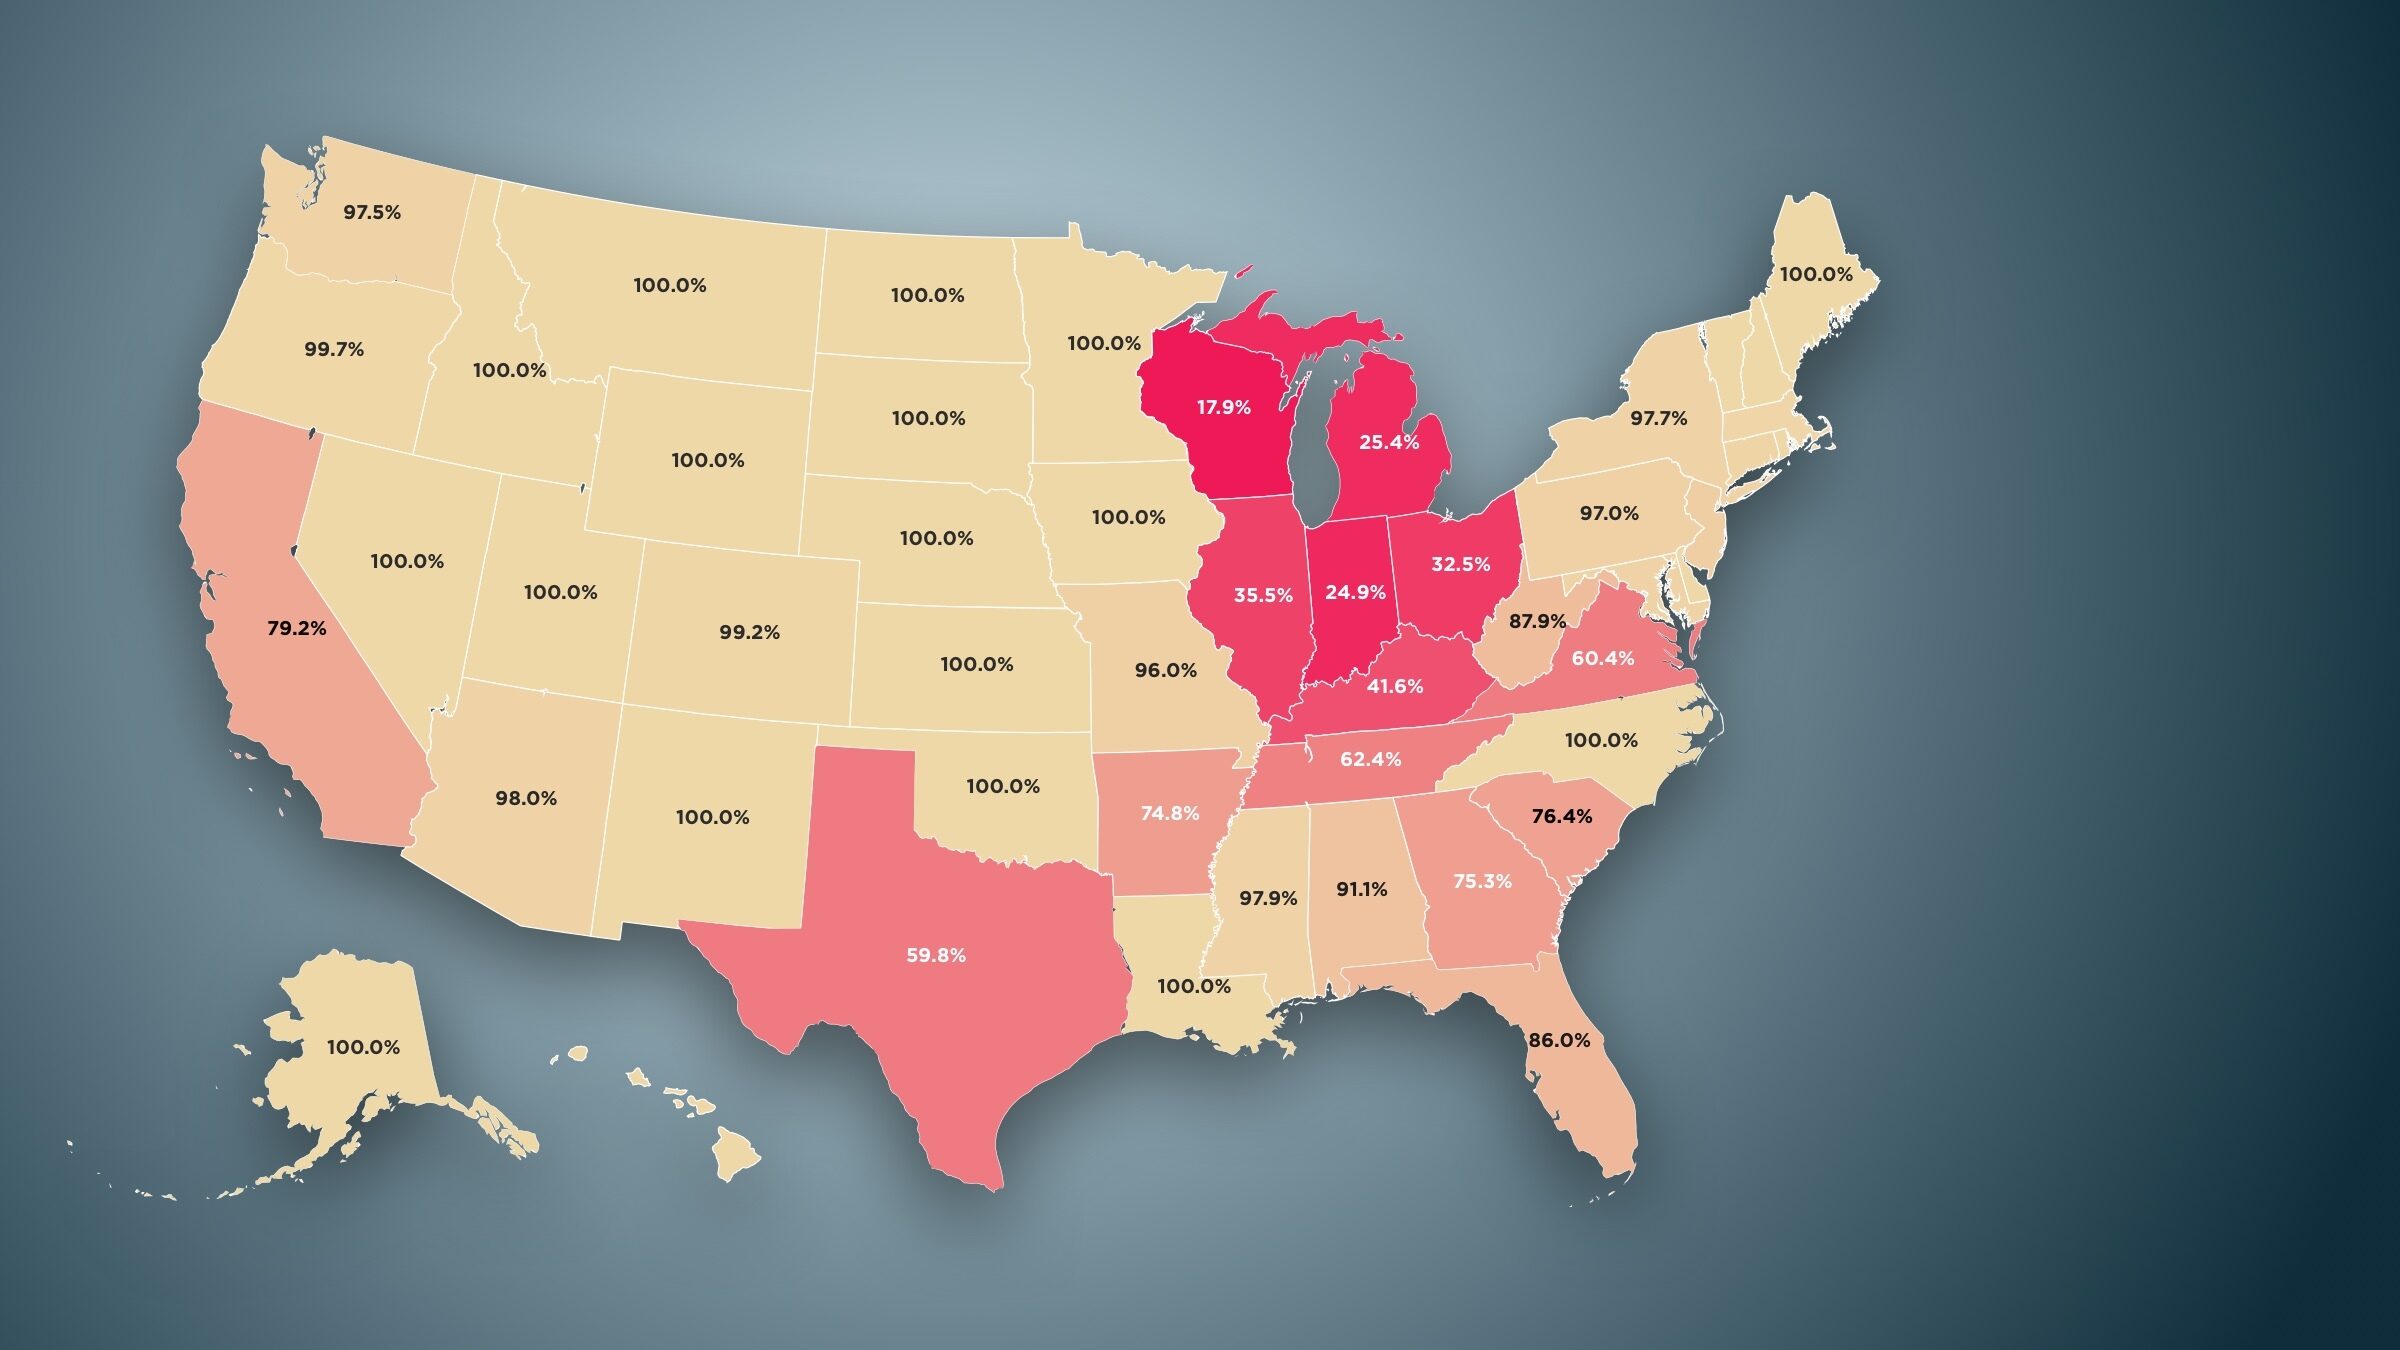
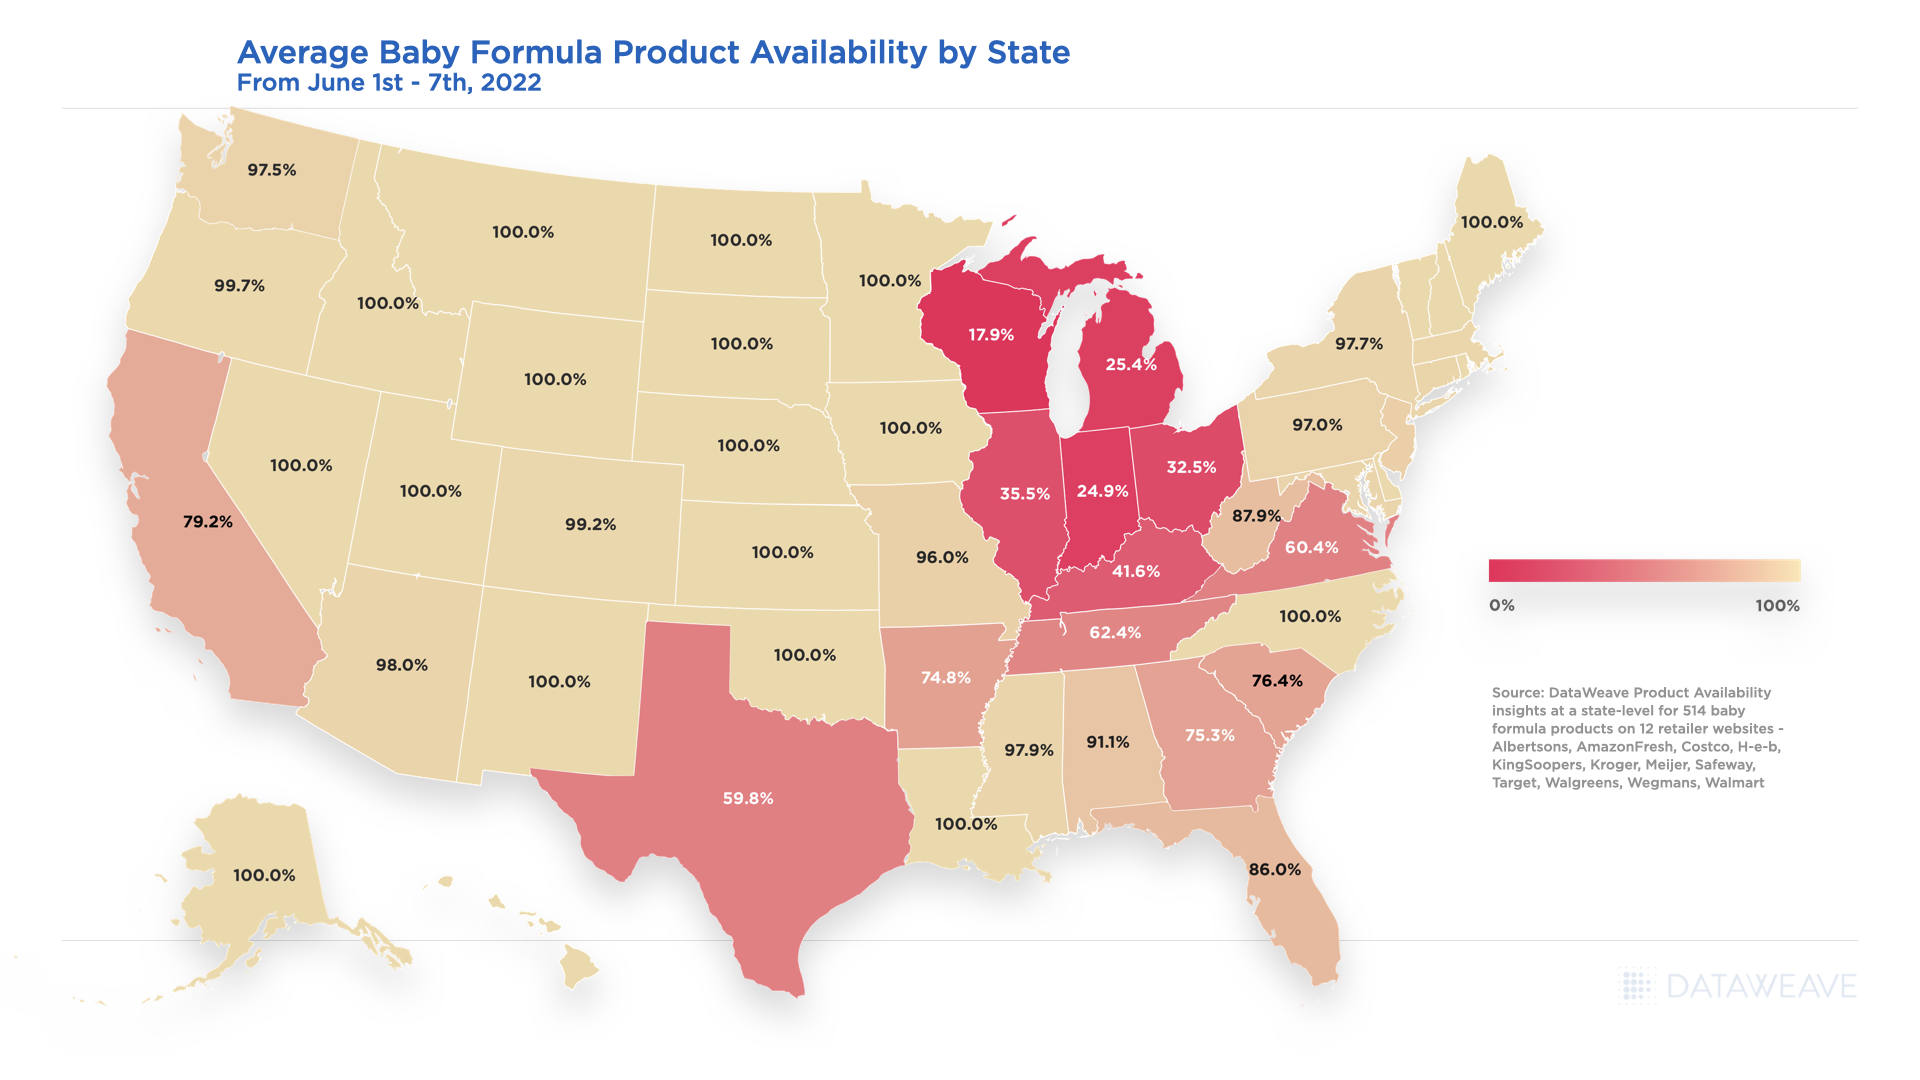
Average Baby Formula Product Availability by State – June 2022
While the U.S. has reached an average of 84% baby formula availability the first week of June 2022, given recent news headlines related to the baby formula shortage, and tracking out of stock encounters by state, we see a continued decline in availability throughout the Midwest versus product availability levels seen in May 2022.
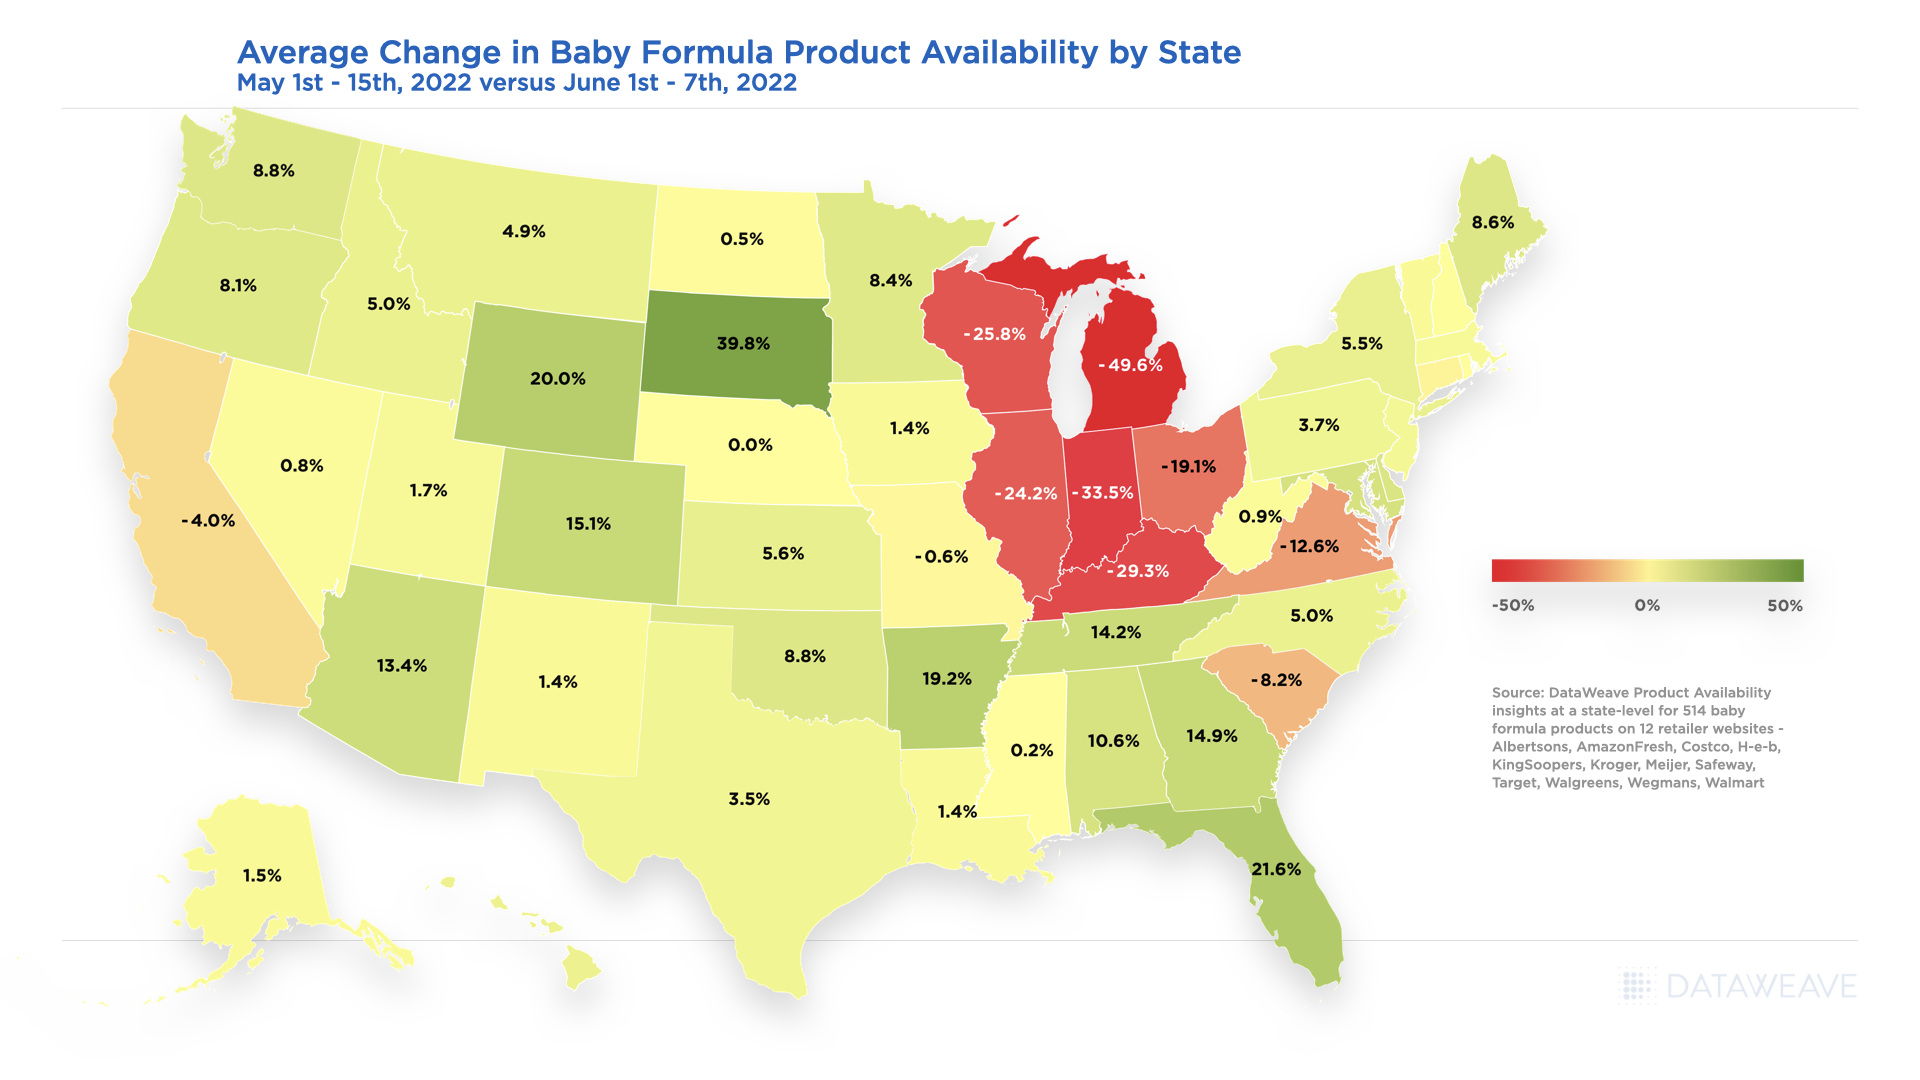
Wisconsin, Michigan, Illinois, Indiana, Ohio, and Kentucky all show average availability for baby formula to be less than 50%, with Wisconsin being impacted the most at less than 18% average availability. While Texas shows an average availability improvement of 3.5% from the first two weeks of May 2022 to the first week of June 2022 as noted in the below chart, availability is also very low overall at less than 60%.
Average Change in Baby Formula Product Availability by State – May 2022 to June 2022
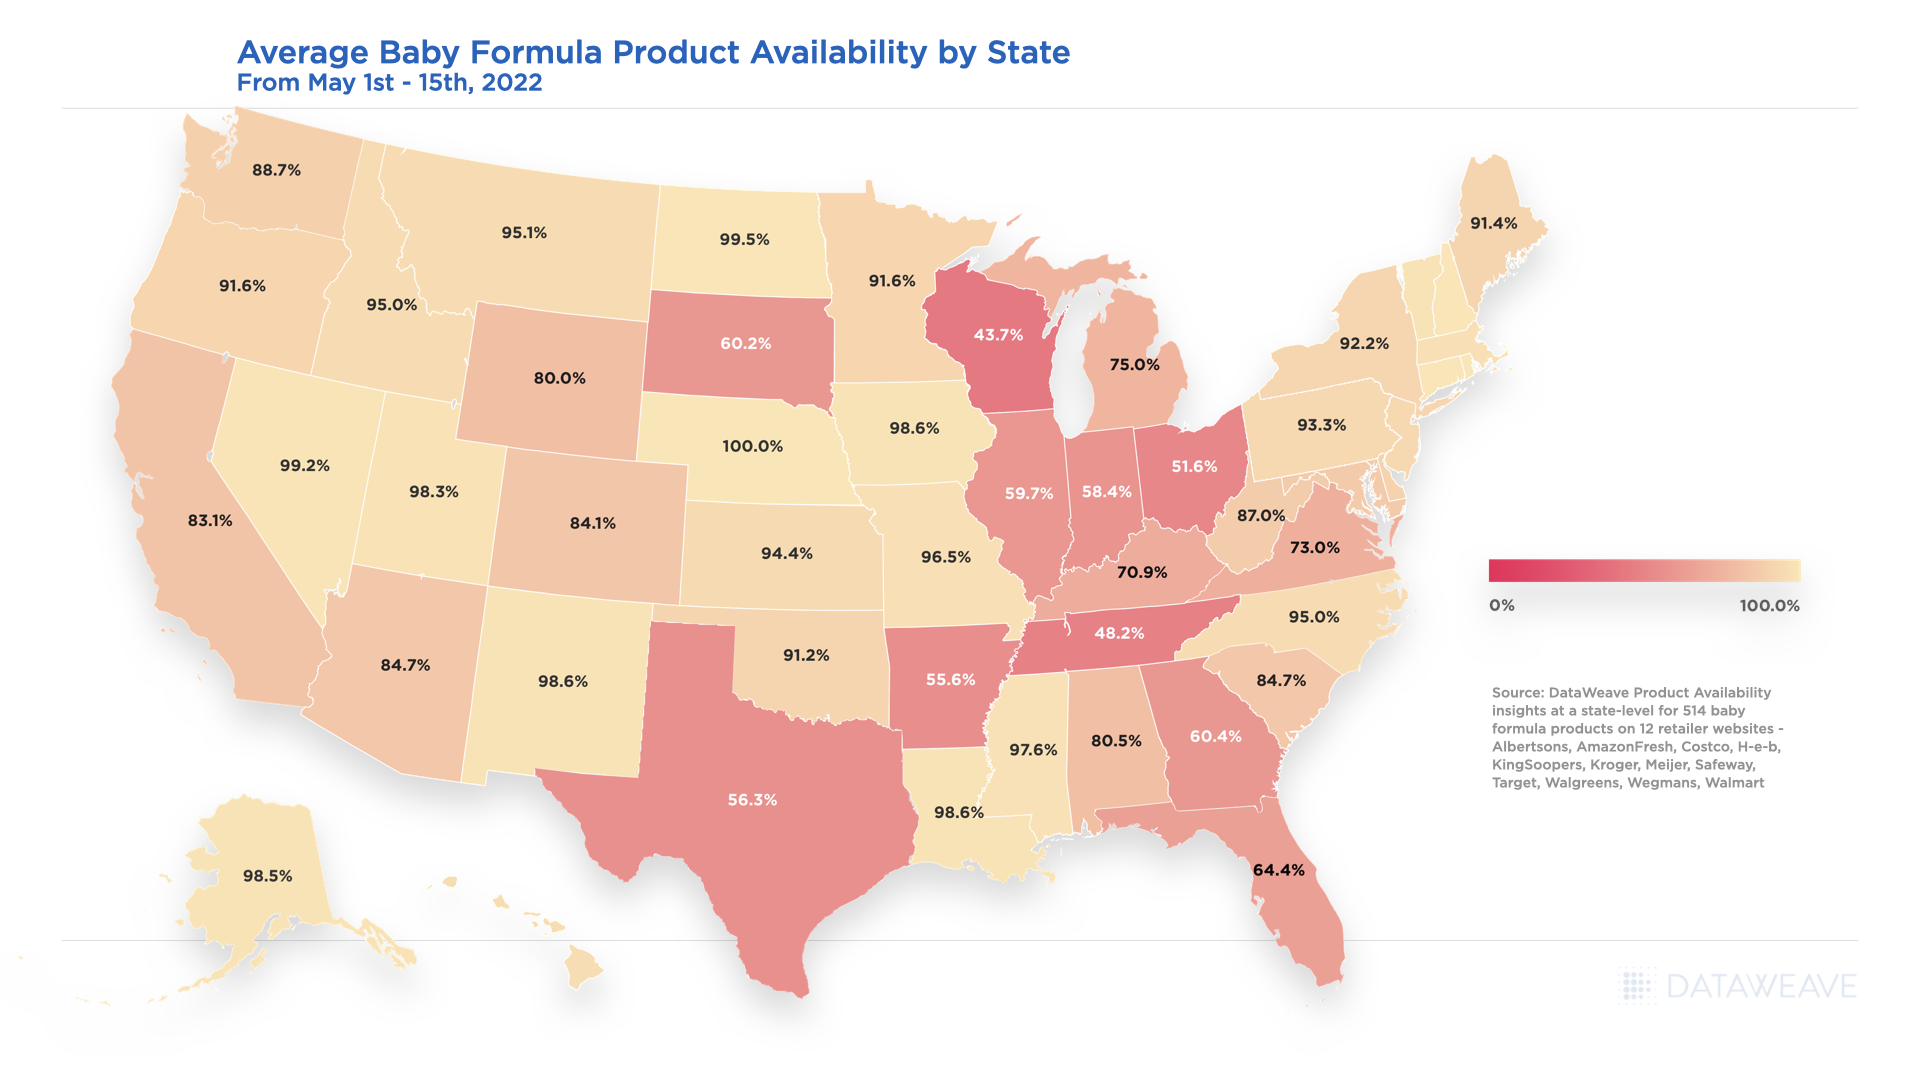
Outside of the Midwest and Texas, the other states for consumers to be cautious in are California, Virginia, and South Carolina as their month-over-month average change in availability also declined 4%, 12.6% and 8.2% respectively. Below is a snapshot of where the baby formula availability average started as of May 1st through the 15th, 2022.
Average Baby Formula Product Availability by State – May 2022
Baby Formula Product Availability Changes – March 2021 through May 2022
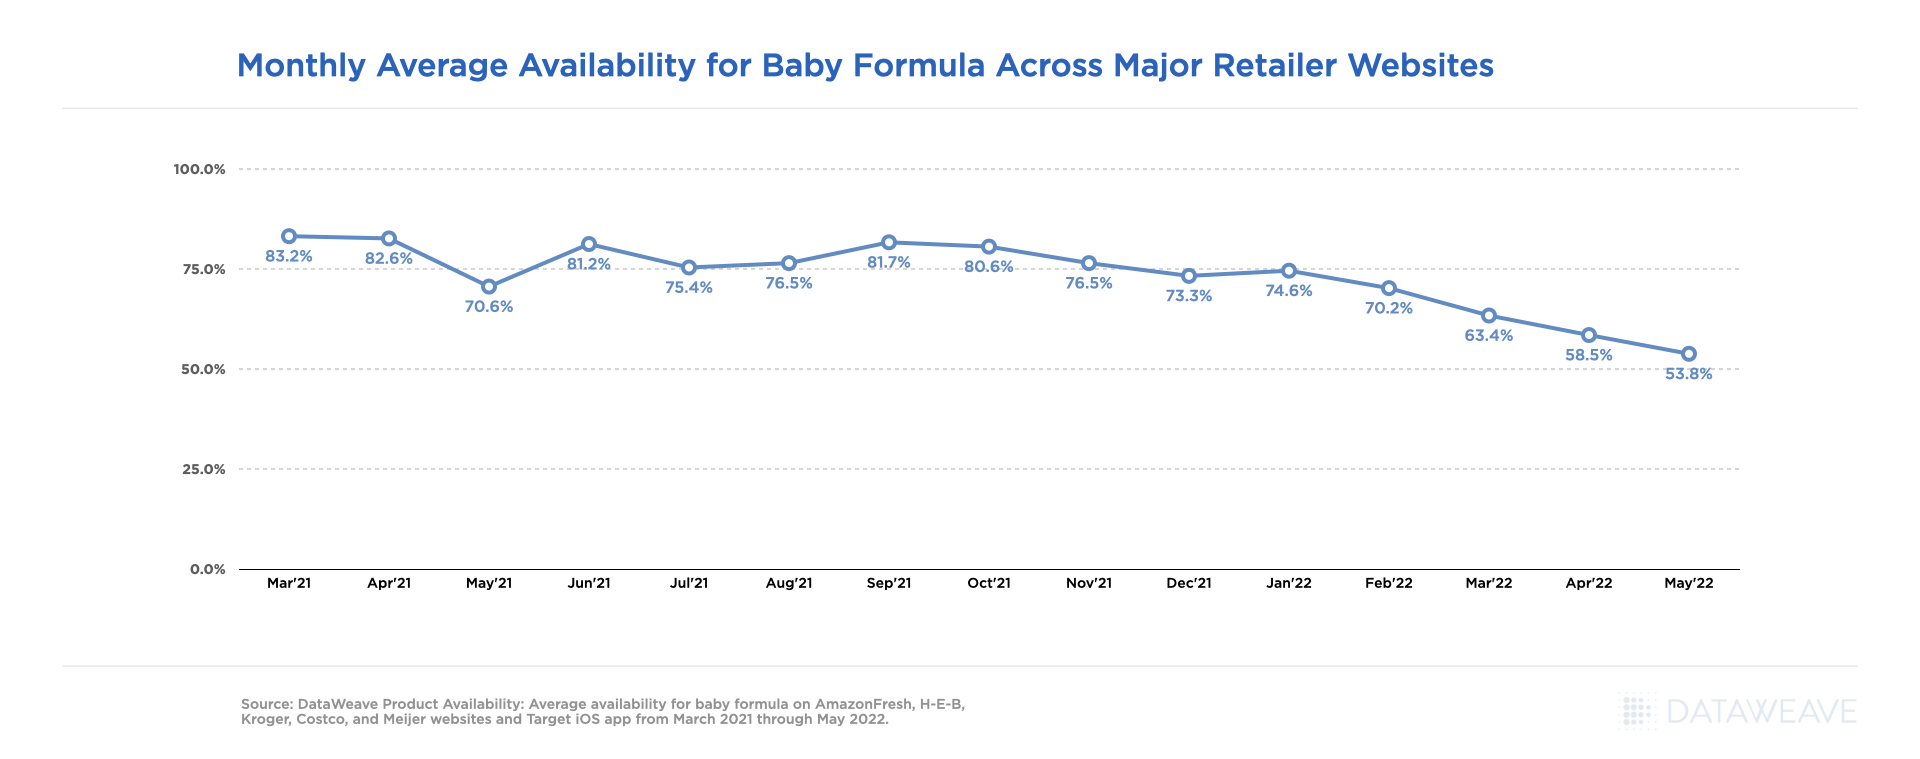
At an aggregated level overall, the availability for baby formula was relatively stable across all retailers considered within our analysis from March 2021 through September 2021, but has been on a steady decline ever since, starting at 81.7% availability in September and ending at 53.8% availability in May 2022 as noted in the below chart.
Monthly Average Availability for Baby Formula Across Major Retailer Websites
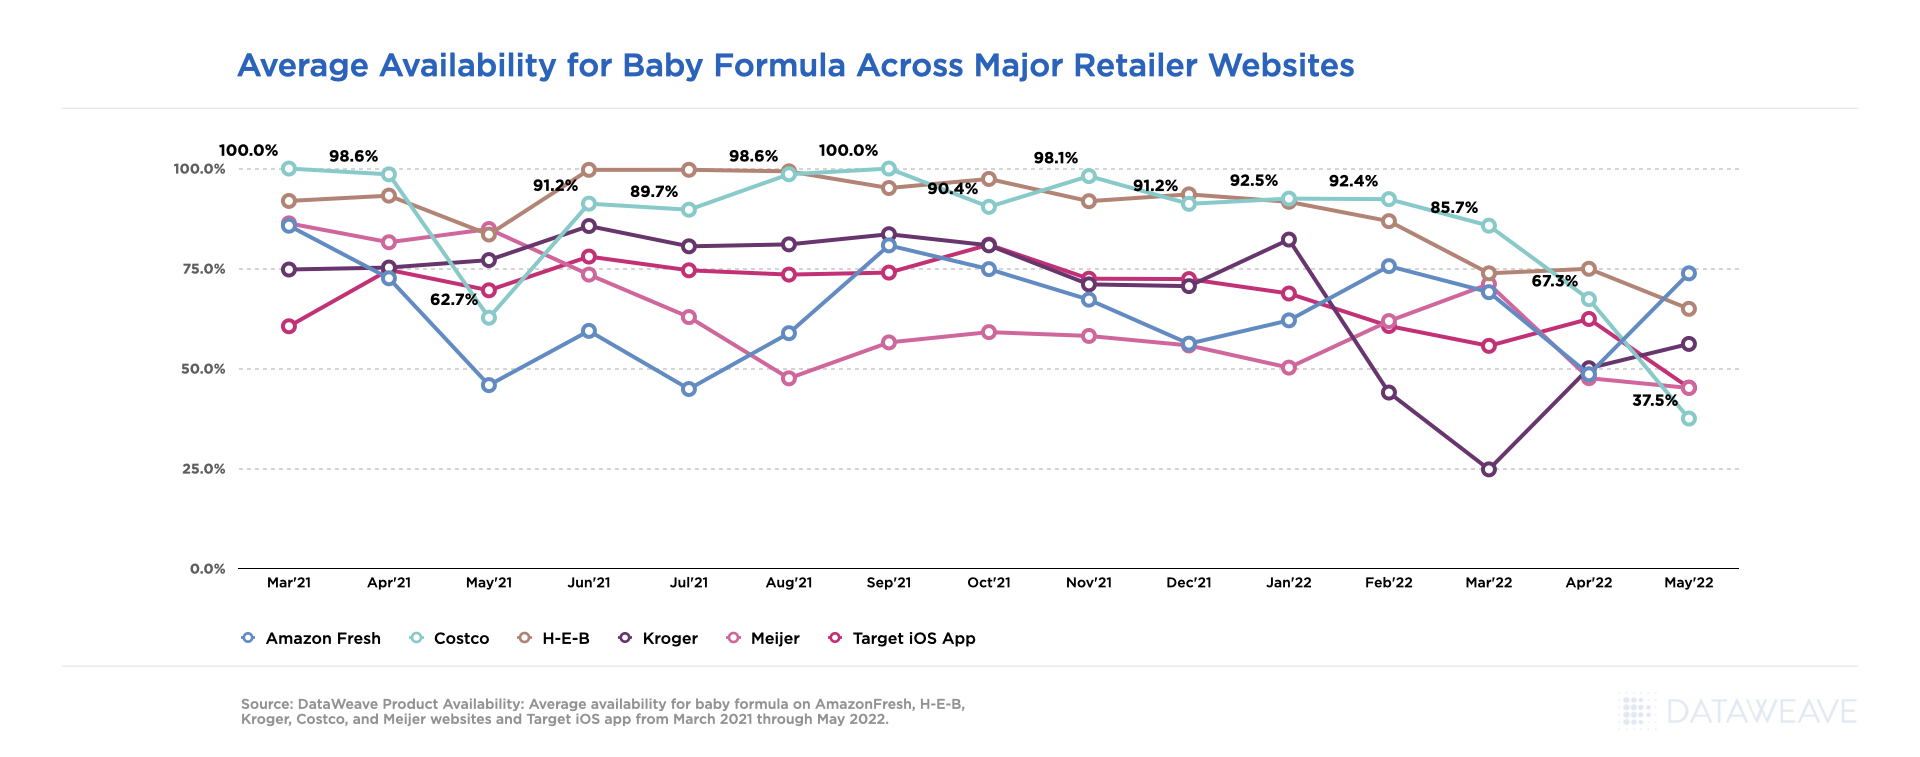
Looking at baby formula availability at a retail level, we saw yet again not all availability challenges were alike, by month or retailer. Costco.com lead the other retailers within our analysis for greatest average availability from March 2021 through May 2022, but had one of the lowest availability percentages at 62.7% in May 2021, and dropped to the lowest availability of the group in May 2022 at 37.5%.
Average Availability for Baby Formula Across Major Retailer Websites
Baby Formula Prices Increase as Availability Changes
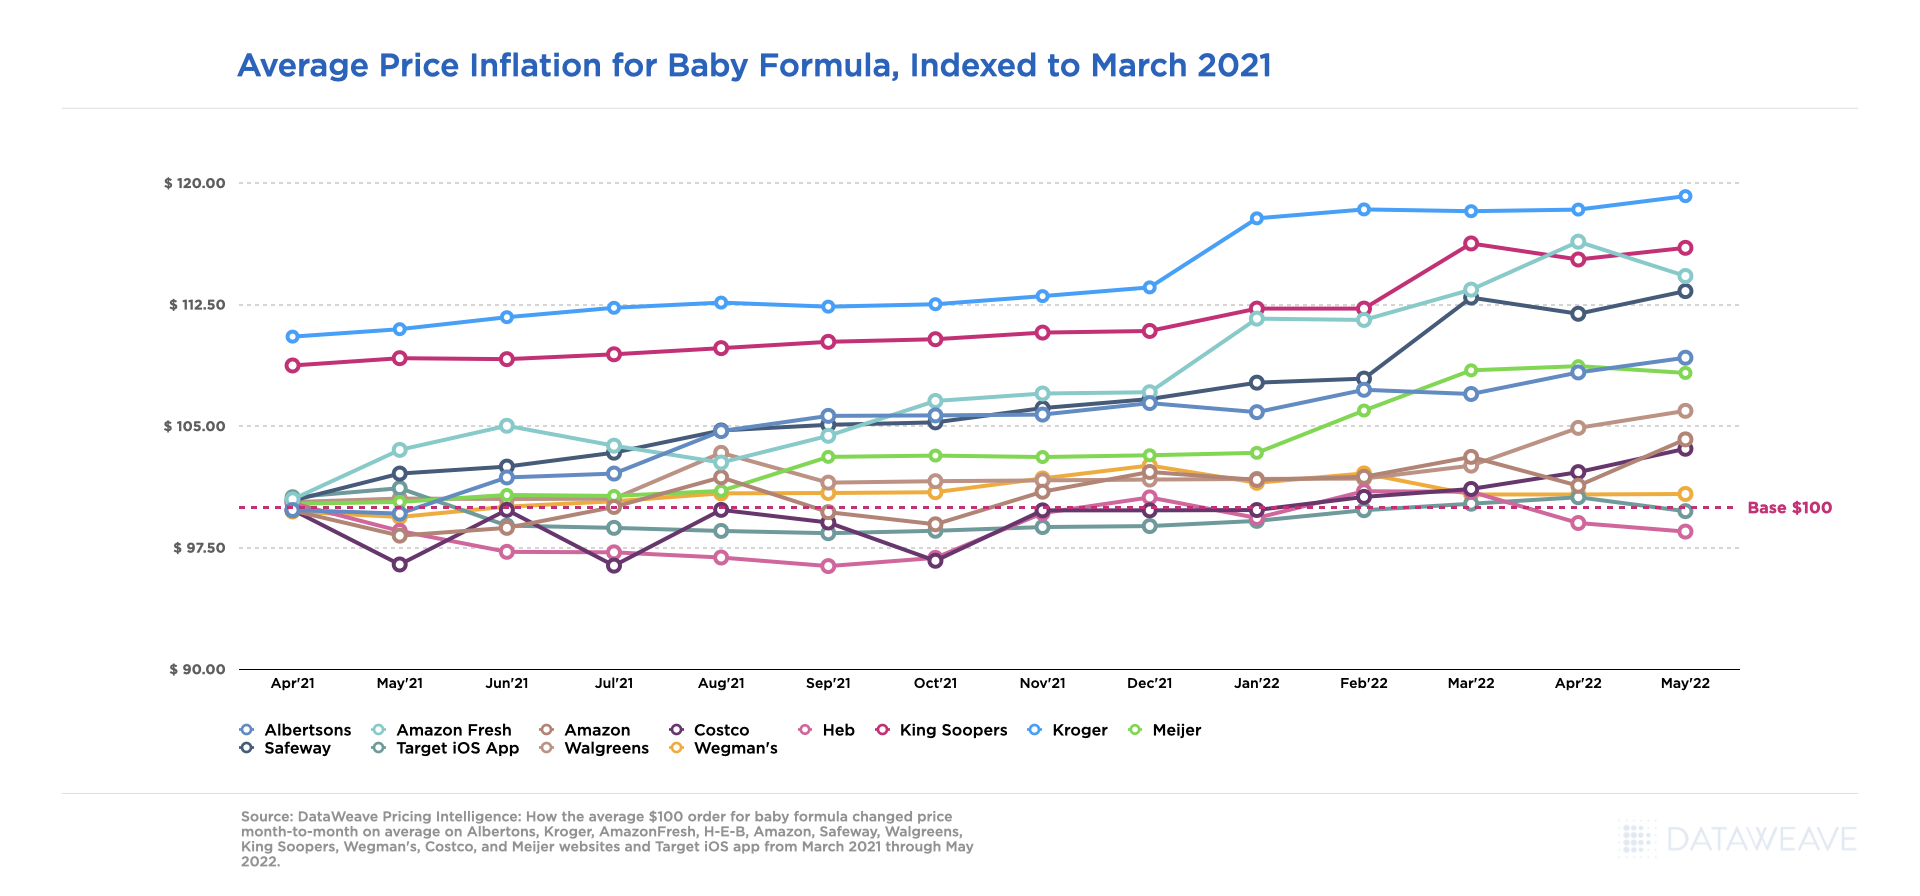
While unnecessary price gouging is prohibited, price increases are still happening at a slow and steady rate across all the accounts included within our Pricing Intelligence analysis given external market factors outside of baby formula recall related stockout scenarios.
Kroger.com experienced the greatest average price increases overall, with the peak being in May 2022 at a 19% increase, 8% higher than other retailers on average, versus prices seen in March 2021 for the same baby formula products. The most significant price hike occurred on Kroger.com from December 2021 to January 2022. Other retailers like H-E-B, Target and Wegman’s have had minimal price changes from March 2021 through May 2022.
Average Price Inflation for Baby Formula, Indexed to March 2021
Address the Baby Formula Shortage With eCommerce Intelligence
As the market continues to evolve and baby formula supply works its way to catching back up to demand, our team will continue providing critical pricing, merchandising, and competitive insights at scale, to enable retailers and brands to develop data-driven growth strategies that directly influence their eCommerce performance, accelerate revenue growth and drive profitability.
Be sure to reach out to our Retail Analytics experts for access to more details regarding the above analysis, or for more information on our Commerce Intelligence and Digital Shelf solutions, and let us know what other category insights you’d be interested in seeing this year.
Social commerce is the selling of goods and services within a social media platform. Brands use social platforms such as Instagram, Facebook, Snapchat, and Twitter to promote and sell products. These platforms have become an integral part of consumers’ everyday life because they continue to engage users with relatable content, making them scroll their feeds for hours.
The Social Commerce model capitalizes on this high user engagement & moves social media beyond its traditional role in the top-of-the-funnel marketing process by encouraging users to shop without leaving their preferred apps. According to the Social Media Investment Report, 91% of executives agree that social commerce is driving an increasing portion of their marketing revenue, and 85% report that social data will be a primary source of business intelligence.
Let’s talk a little bit about why brands should consider selling via social media platforms:
Social Commerce vs. eCommerce vs. QCommerce
While they may fall under the same umbrella of online selling, social commerce, quick commerce, and eCommerce are three very different concepts
eCommerce refers to online shopping via a (retailer or brand) website or app. Customers can access these platforms via desktop or mobile devices. However, the sales funnel generally looks the same. These brands and retailers use top-of-the-funnel tactics like social media content, digital ads, and other marketing strategies to encourage customers to visit the online store. There are three main types of eCommerce businesses: Business-to-Business (Alibaba, Amazon Business, eWorldTrade), Business-to-Consumer (websites such as Amazon, Rakuten, and Zalando), and Consumer-to-Consumer (platforms such as eBay & Etsy).
Quick Commerce (or QCommerce) refers to eCommerce businesses that deliver goods within a couple of hours or even minutes. Although it’s sometimes used interchangeably with on-demand delivery or instant commerce, the idea of quick commerce has been around in the food industry for ages now. It has been recently ushered into the mainstream by evolving consumer preferences for quicker delivery of groceries and FMCG goods.
Social commerce brings the store to the customer rather than redirecting customers to an online store. It removes unnecessary steps and simplifies the buying process by letting the customer checkout directly through social media platforms, creating a frictionless buying journey for the customer. Additionally, social media platforms are mobile-friendly, a huge benefit for brands because increasingly more and more customers are accessing the internet through mobile devices.
Social Commerce
Rise of Social Commerce
First used in 2005 by Yahoo!, ‘social commerce’ refers to collaborative shopping tools such as user ratings, shared pick lists, and user-generated content. Social media networks snowballed throughout the 2000s and 2010s, alongside a general increase in eCommerce, leading customers and merchants to quickly recognize the benefits of buying and selling through social media networks. Social media platforms have since evolved from merely a showcase tool for brands. They now serve as virtual storefronts and extensions of a company’s website or brick and mortar stores, capable of handling the buying experience.
Top Social Commerce Platforms
Social media platforms aim to keep visitors engaged on their platforms for as long as possible. Increased time in-app or on-site maximizes their opportunity to serve ads, a primary source of revenue generation. Social media platforms have millions of active users and they have a great power to help companies and individuals build their brands, interact with consumers, and support after-sales. Here are the top social commerce platforms:
Facebook
Facebook introduced Facebook Shops to capitalize on the commercial opportunity by allowing vendors to advertise and sell directly through the platform. Facebook integrates social commerce with shopping, allowing users to purchase products smoothly. Facebook shops offer a smooth user experience where users can review products and get recommendations from trusted acquaintances. Customers can directly interact with the merchant’s customer service department post-purchase.
Instagram
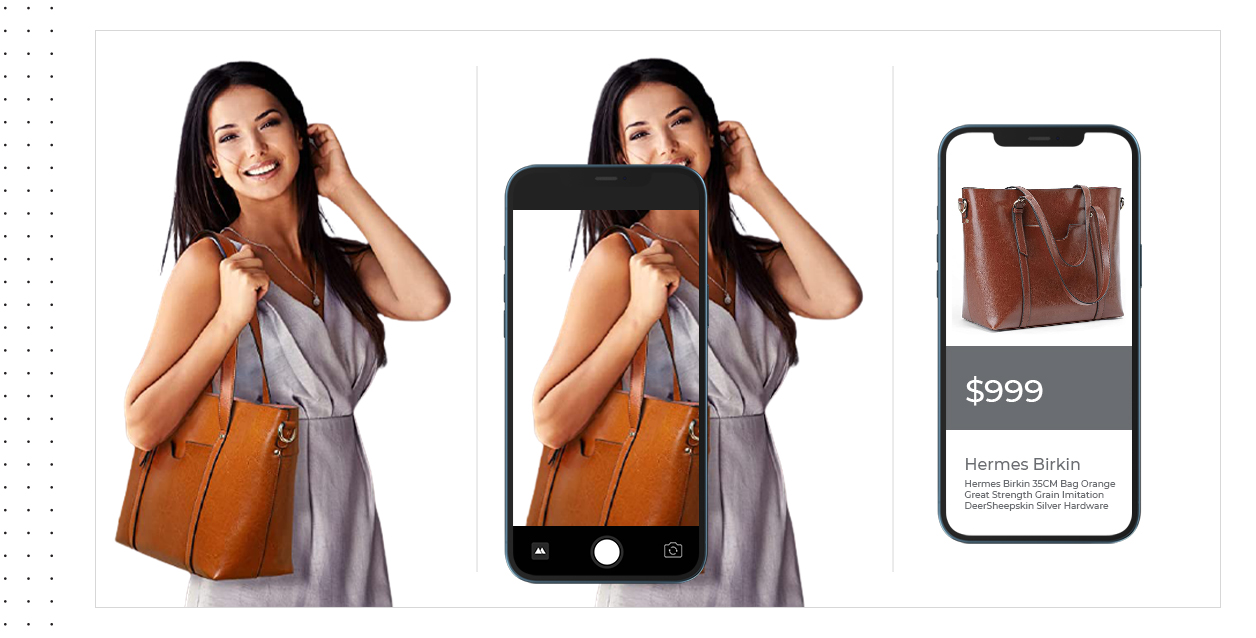
60% of people discover new products on Instagram. Owned by Facebook, Instagram facilitates in-app shopping and handles the entire transactions within the app itself. Users scrolling on Instagram often wants to follow trends and replicate the looks of their role models or favorite influencers. By offering purchasing options in the app, Instagram benefits from the platform’s rich visual imagery and videos, allowing businesses to sell an idea rather than the traditional process of selling a product.
TikTok
Shopify partnered with TikTok to introduce shopping and drive sales through the younger and seemingly ever-expanding TikTok audience. With TikTok for Business Ads Manager, brands and merchants can create in-feed video-based content depending on their product offering. This partnership allows Shopify merchants to expand to the TikTok audience.
Snapchat
Snapchat has recently launched Brand profiles, a feature that allows users to scroll through a merchant’s products and buy them in-app. This new experience is powered by Shopify too. Merchants can create Brand Profiles or Native Stores that allow users to purchase products from the app.
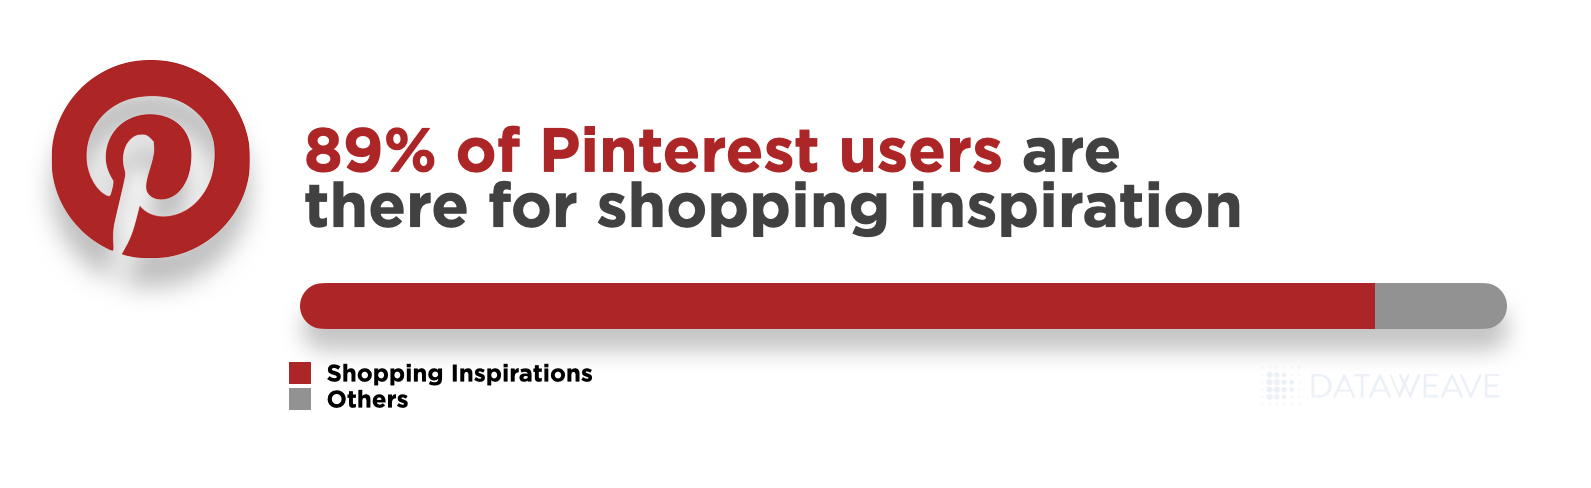
Pinterest users are there for Shopping Inspiration
Pinterest
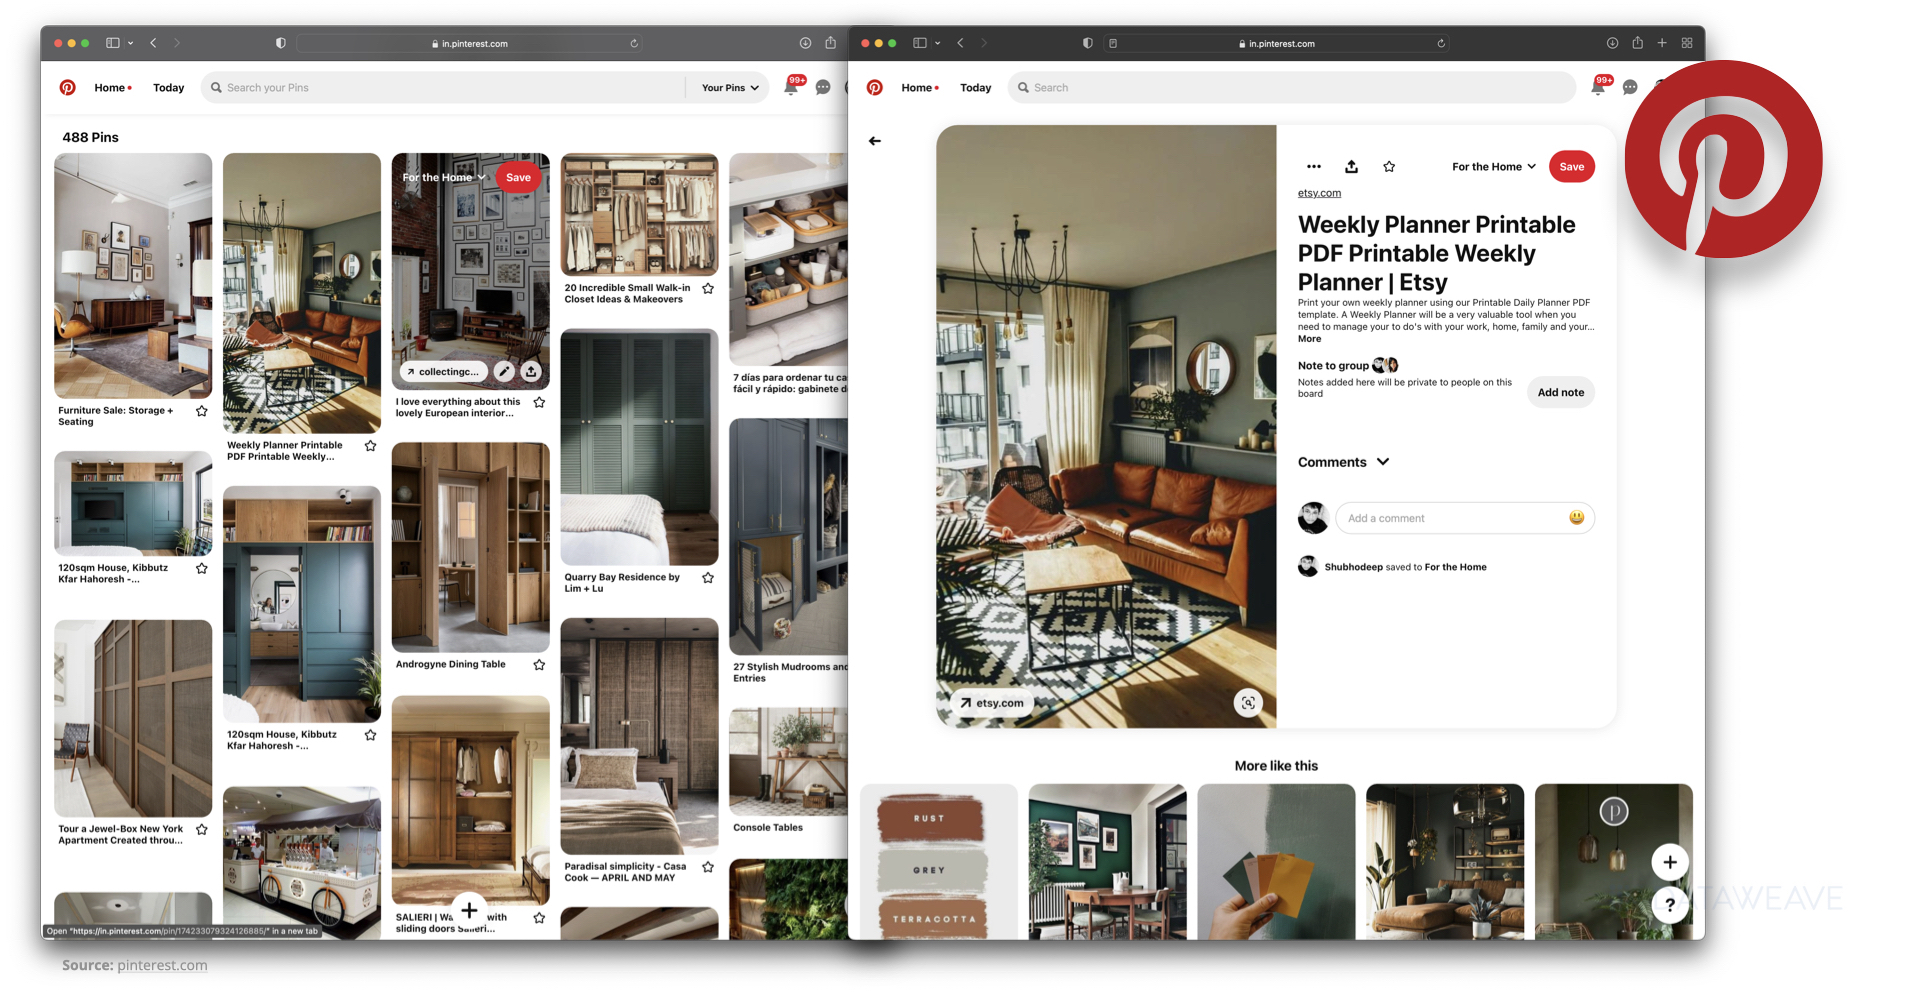
Pinterest is also an image-based platform where users create boards of their favorite wedding accessories, home decor, fashion trends, etc. Pinterest doesn’t specifically offer social commerce for the global audience. Rather, it allows business accounts to create ‘Product Pins’ that are displayed in the brand’s Pinterest shop. Only U.S. customers can purchase within the app. Users from other countries are redirected to the eCommerce site to complete the sale. We have added Pinterest to this list because 89% of Pinterest users are there for shopping inspiration.
Pinterest is an image-based platform where users create boards
Why Should Brands Care About Social Commerce
To enhance social media presence and brand awareness
If your target demographic is in the 18-to-34 age range, they’re already on social media and waiting to shop while they scroll. According to Sprout Social, over 68% of consumers have already purchased directly from social media and nearly all (98%) consumers plan to make at least one purchase through social or influencer commerce this year. You can enhance brand awareness by selling on social media platforms. Influencer marketing is an amazing way to build brand awareness since customers are now seeking authenticity from micro-influencers rather than big-name celebrities.
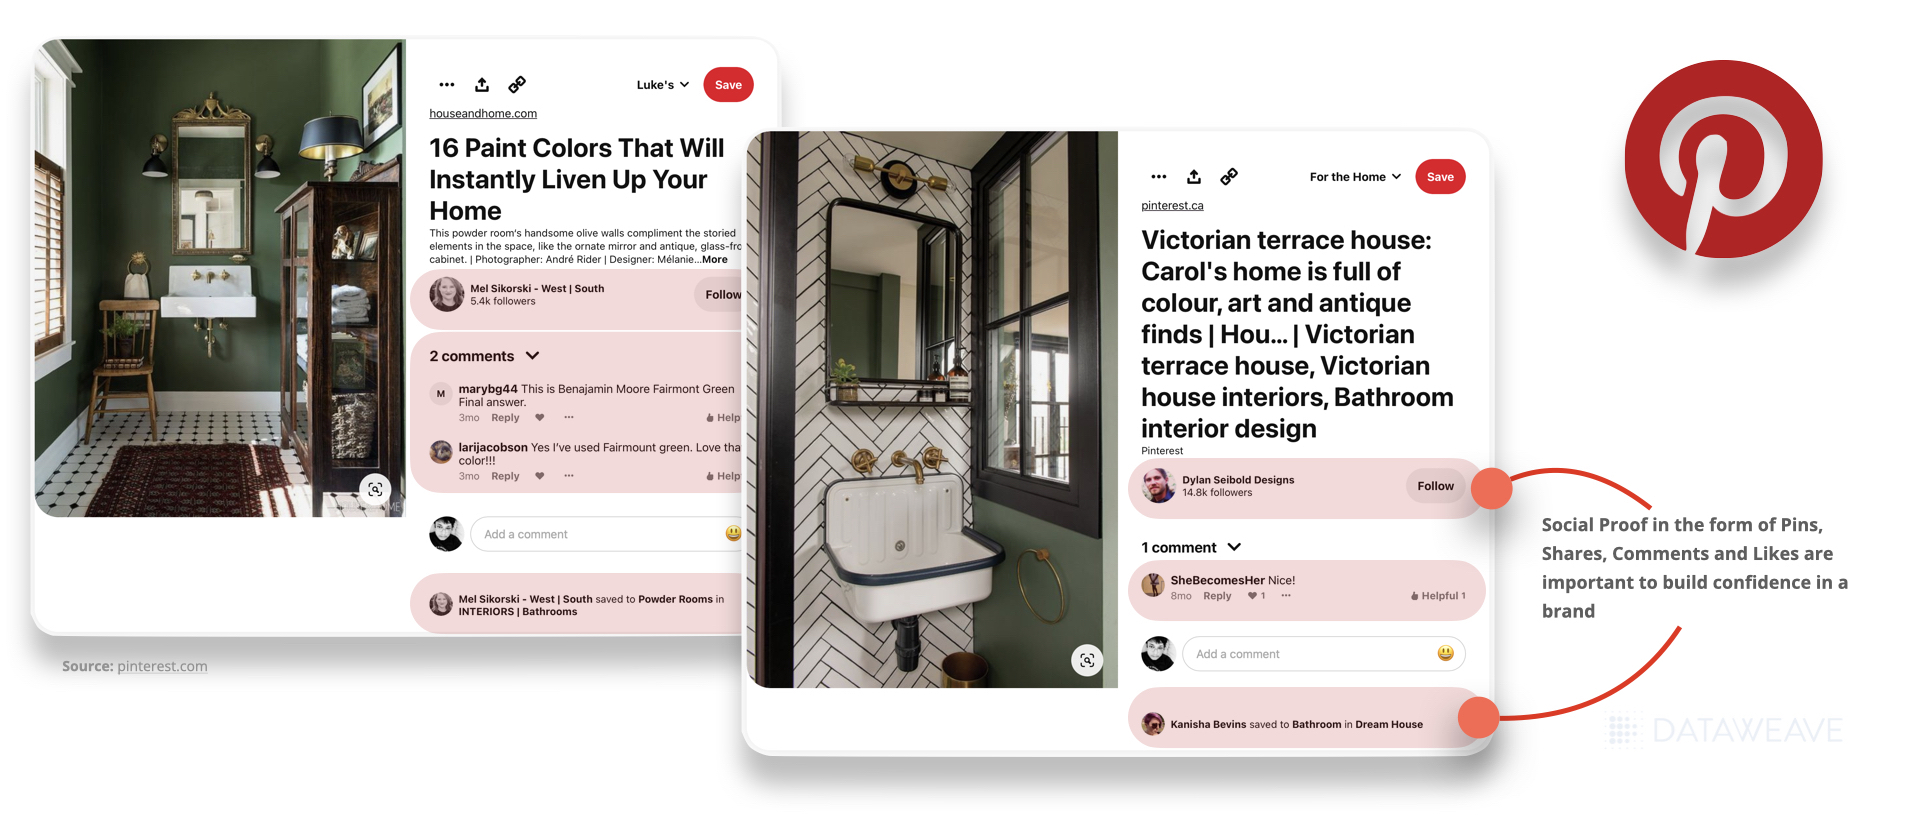
To generate social proof
90% of online shoppers say that they read online reviews before making an online purchase. Whether it’s an automated follow-up email or a message through the social media platform, ask for a review after your product has been delivered to the customer. You can also offer incentives like a contest to encourage previous customers to weigh in and share their experiences. These steps will allow you to collect social proof since it’s vital to build a positive reputation online. You can also ask customers to create small product review videos that you can share on your social feeds in creative ways. You can also post user-generated content, create a carousel of positive comments, or host a live video with happy customers.
Social Proof
To simplify the buying process for consumers
Traditional eCommerce involves several steps. It starts with displaying ads on social media platforms and customers being redirected to the business website for completing the transaction. To complete the transaction, customers also have to create an account or manually fill in the credit card details and delivery address. On the other hand, social is only a three-step process — find, click and buy.
Counterfeit Products
Conclusion
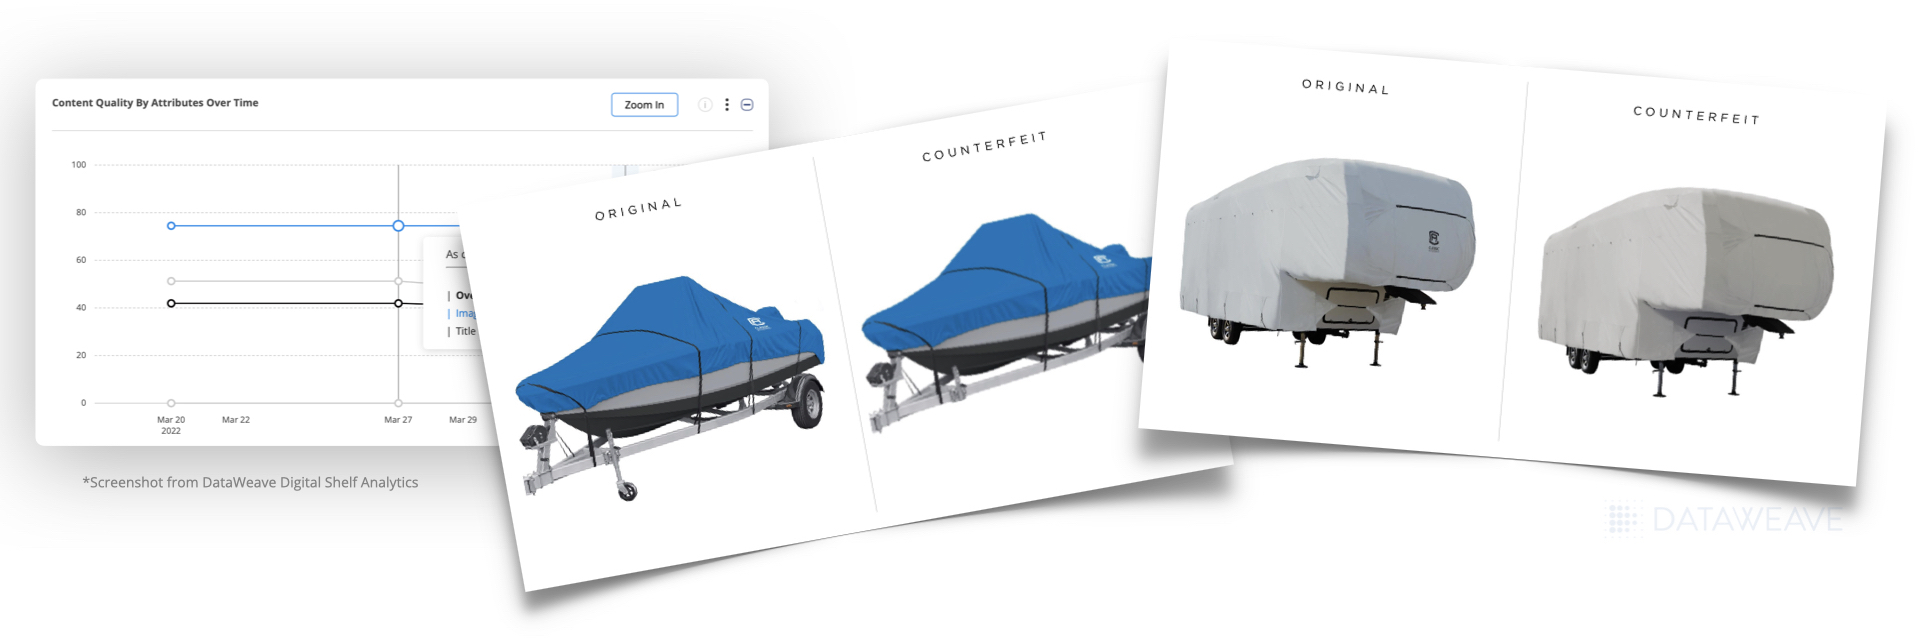
While social commerce is proliferating, it also has a few setbacks like the rise of counterfeit products. Counterfeiting has expanded into social media and has become an under-reported but vital hub for counterfeiters. A counterfeit detection solution can help brands and merchants identify & remove fake and unauthorized products. Technologies like image recognition can help in counterfeit detection by capturing fake logos and discrepancies. Removing counterfeit products will help brands safeguard customer loyalty and prevent fake products from harming your bottom line.
Here’s how DataWeave helped Classic Accessories, a leading manufacturer of high-quality furnishings & accessories identify counterfeit products across multiple retail marketplace websites eliminating 22 hours of time spent per week conducting manual audits – read the case study here.
Are you a brand or a retailer worried about counterfeits? Sign up for a demo with our team to know how we can help you track, identify and eliminate fakes!
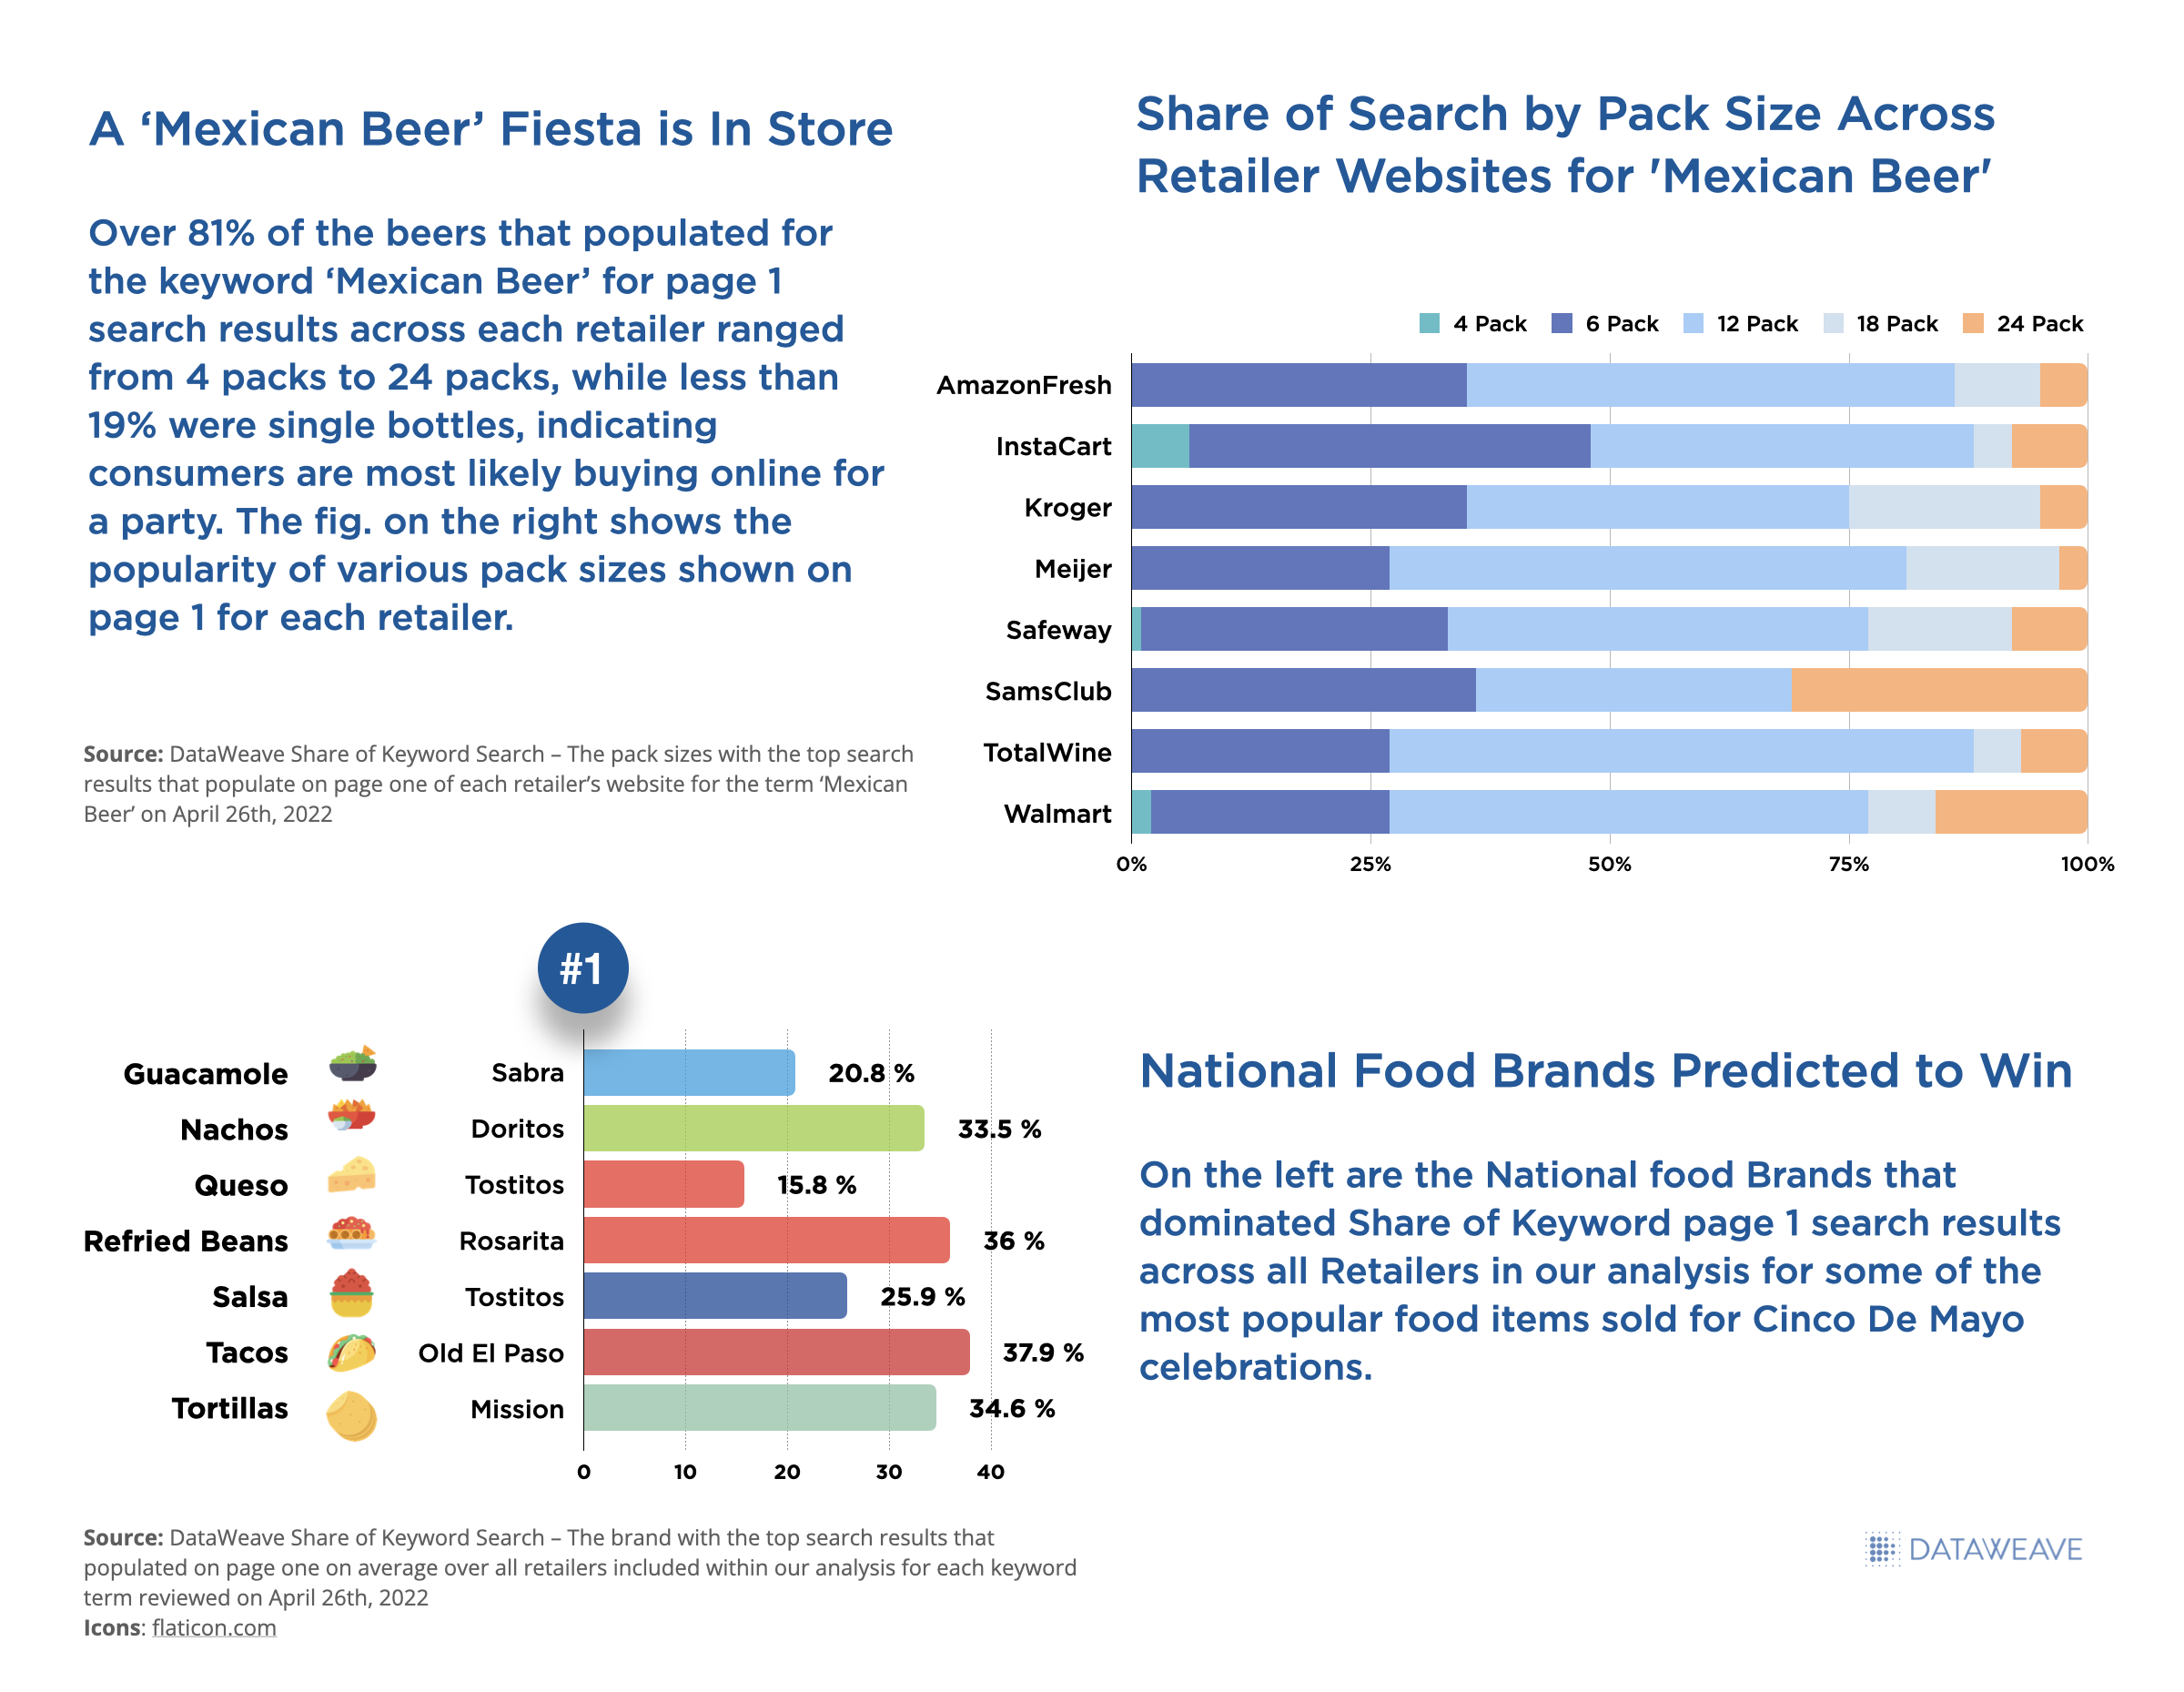
As inflation continues to hike costs for consumers and supply chains challenge them to maintain loyalty, there is still an active audience willing to pay the ultimate price for the convenience of food and alcohol delivery. That being said, we analyzed 8 popular Retail and Delivery Intermediary websites and 11 popular ‘Cinco de Mayo’ keywords to see which Brands are predicted to win the battle of Digital Shelf Share of Search this holiday.
2022 Cinco de Mayo Share of Search Insights – Top Brands for ‘Cinco de Mayo’
Opportunities for Food & Bev on Cinco de Mayo
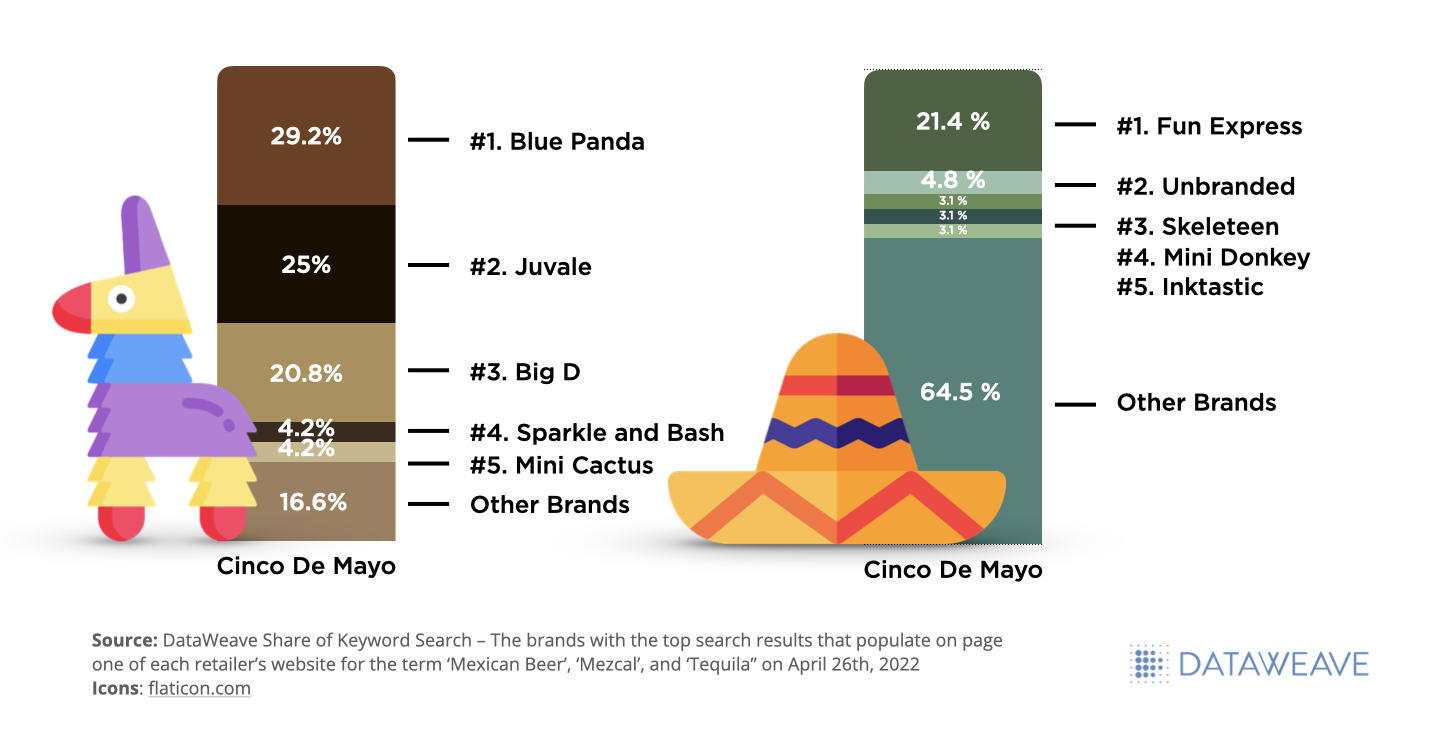
While most of our analysis focused on popular Cinco de Mayo food and beverage products, none of these brands populated on either Target (pictured on left below) or Walmart (pictured on right below) page 1 search results for the term ‘Cinco de Mayo’. Keyword search results for this term are dominated primarily by décor brands as indicated below.
Brands Achieving Top Share of Search for Food and Beverage Categories on Cinco de Mayo 2022
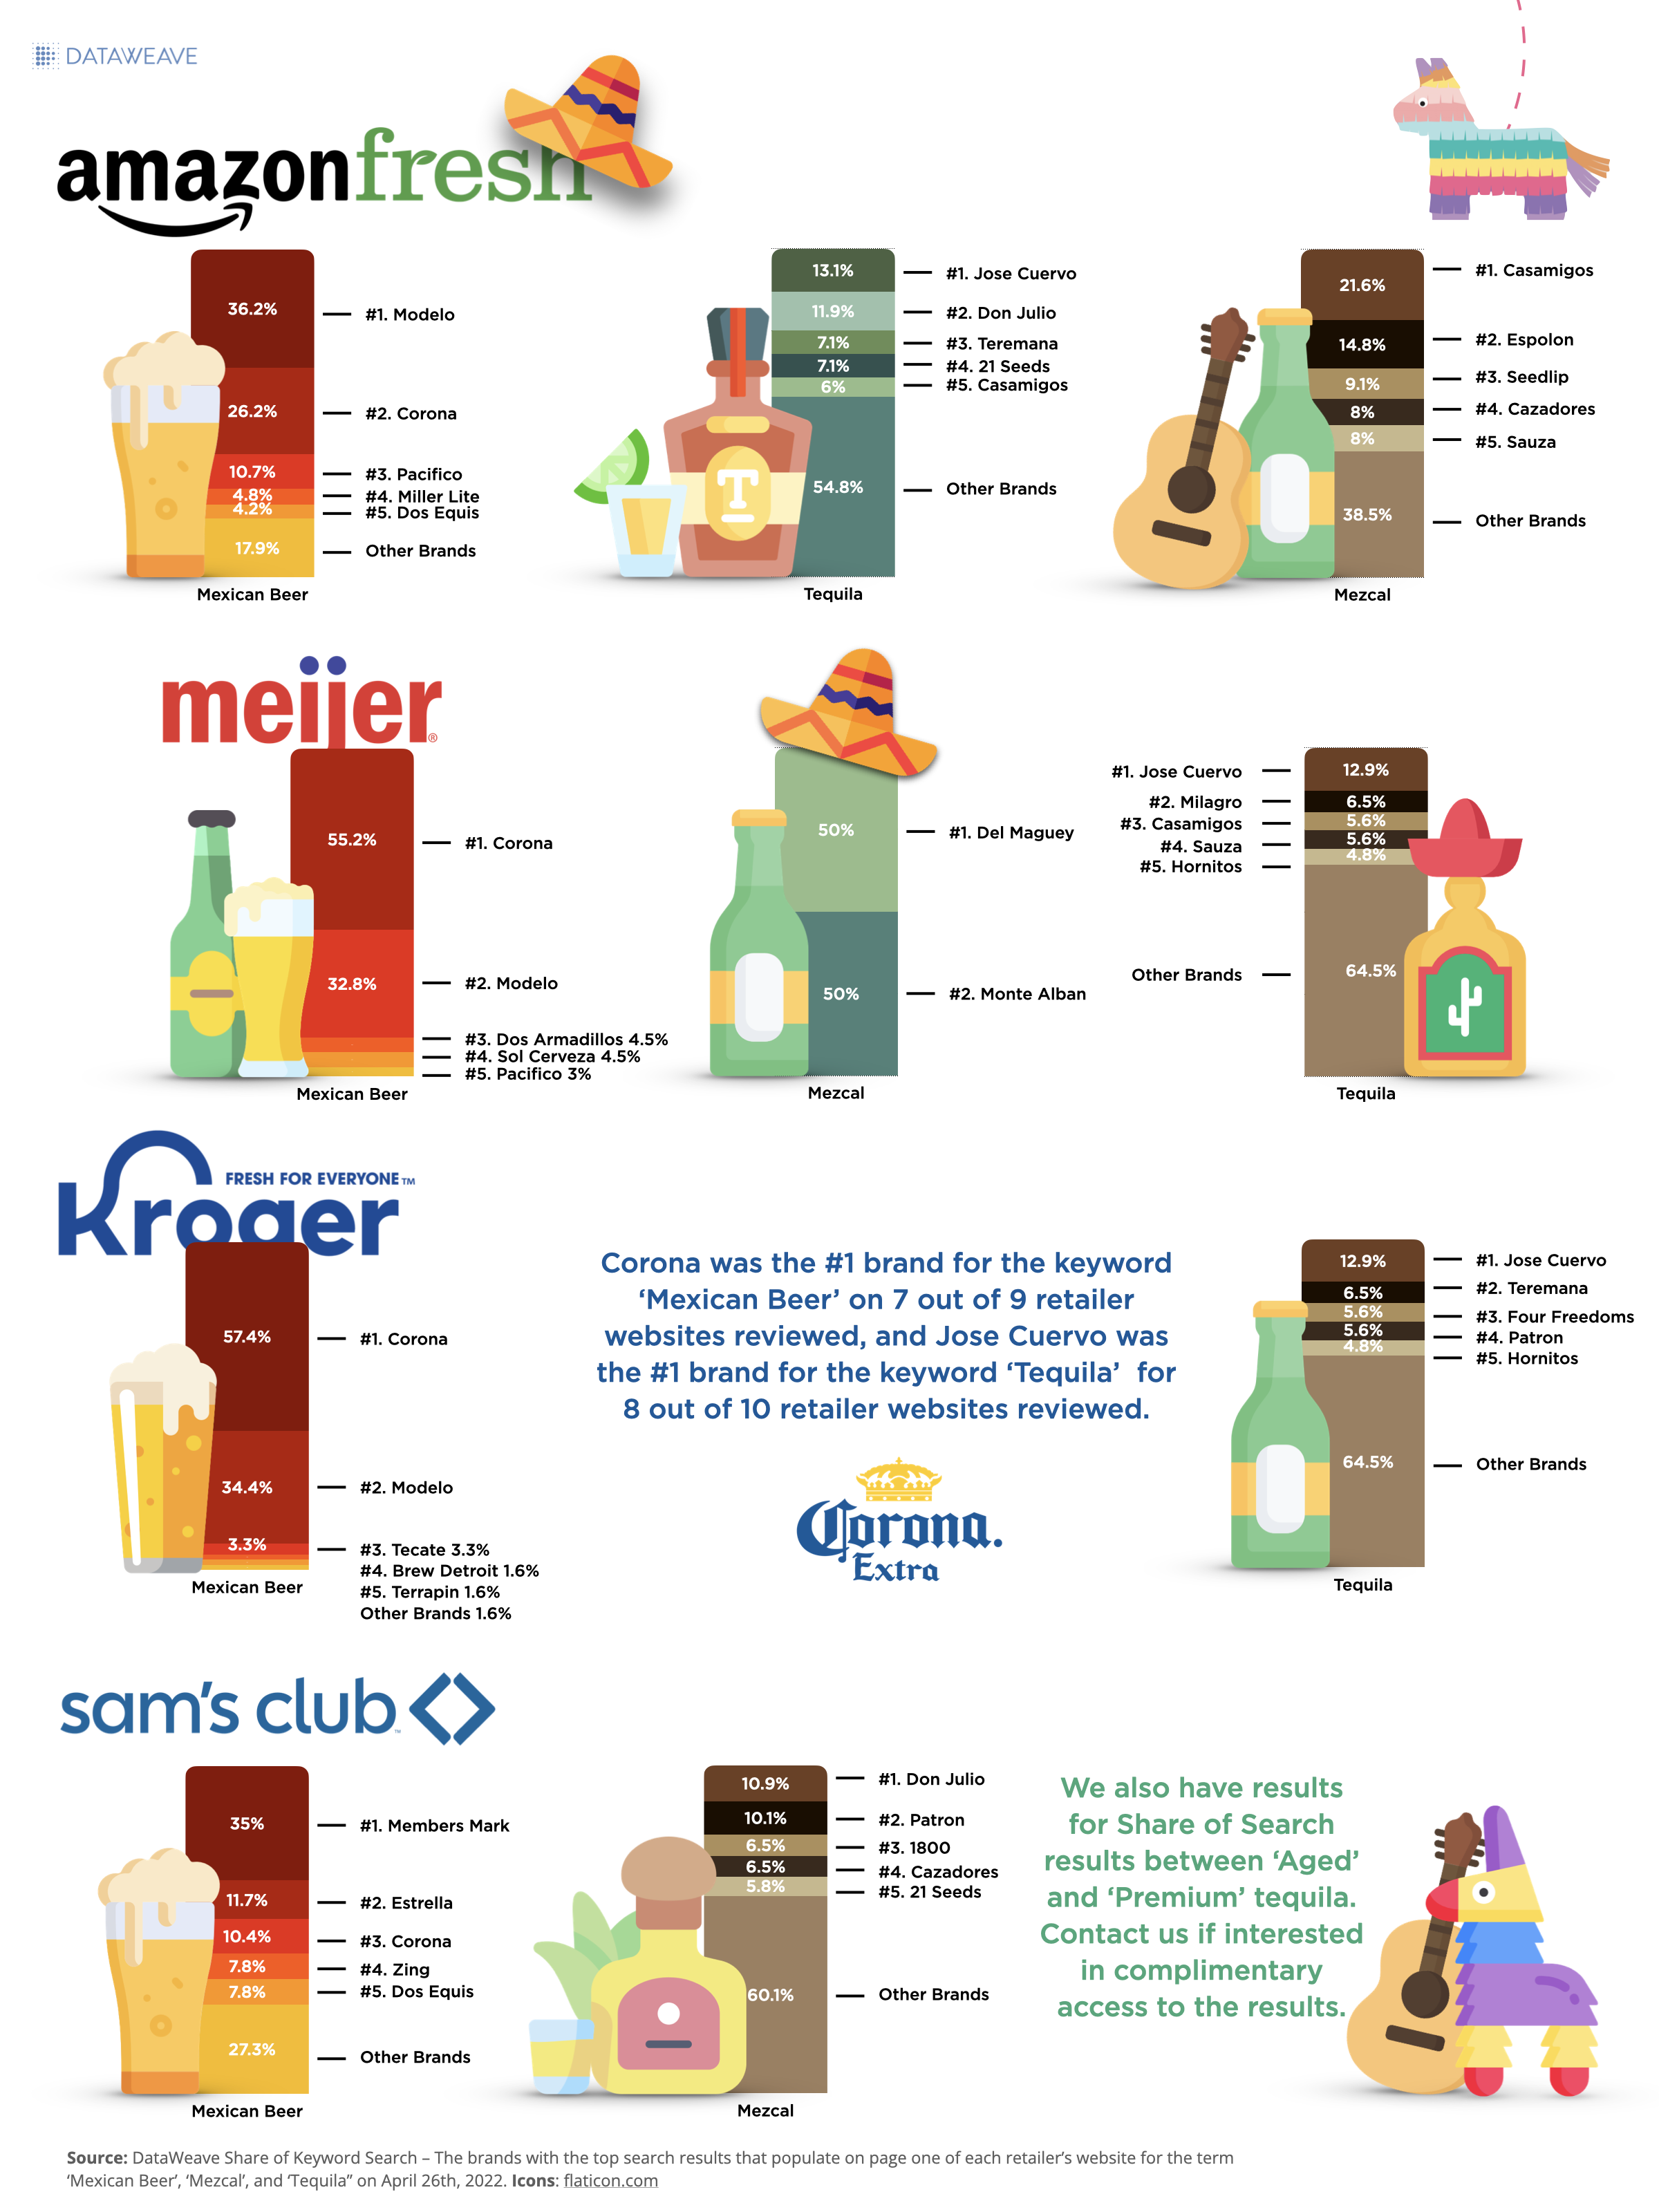
Share of Keyword Search Results – Alcohol Category
Three of the most popular alcohol types sought out during Cinco de Mayo are ‘Mexican Beer’, ‘Mezcal’, and ‘Tequila’. Below are the brands dominating Share of Keyword Search results on each of the major retail websites we researched.
AmazonFresh, Meijer, Kroger, and Sam’s Club Share of Search – Beer, Mezcal, and Tequila Keywords on Cinco de Mayo 2022
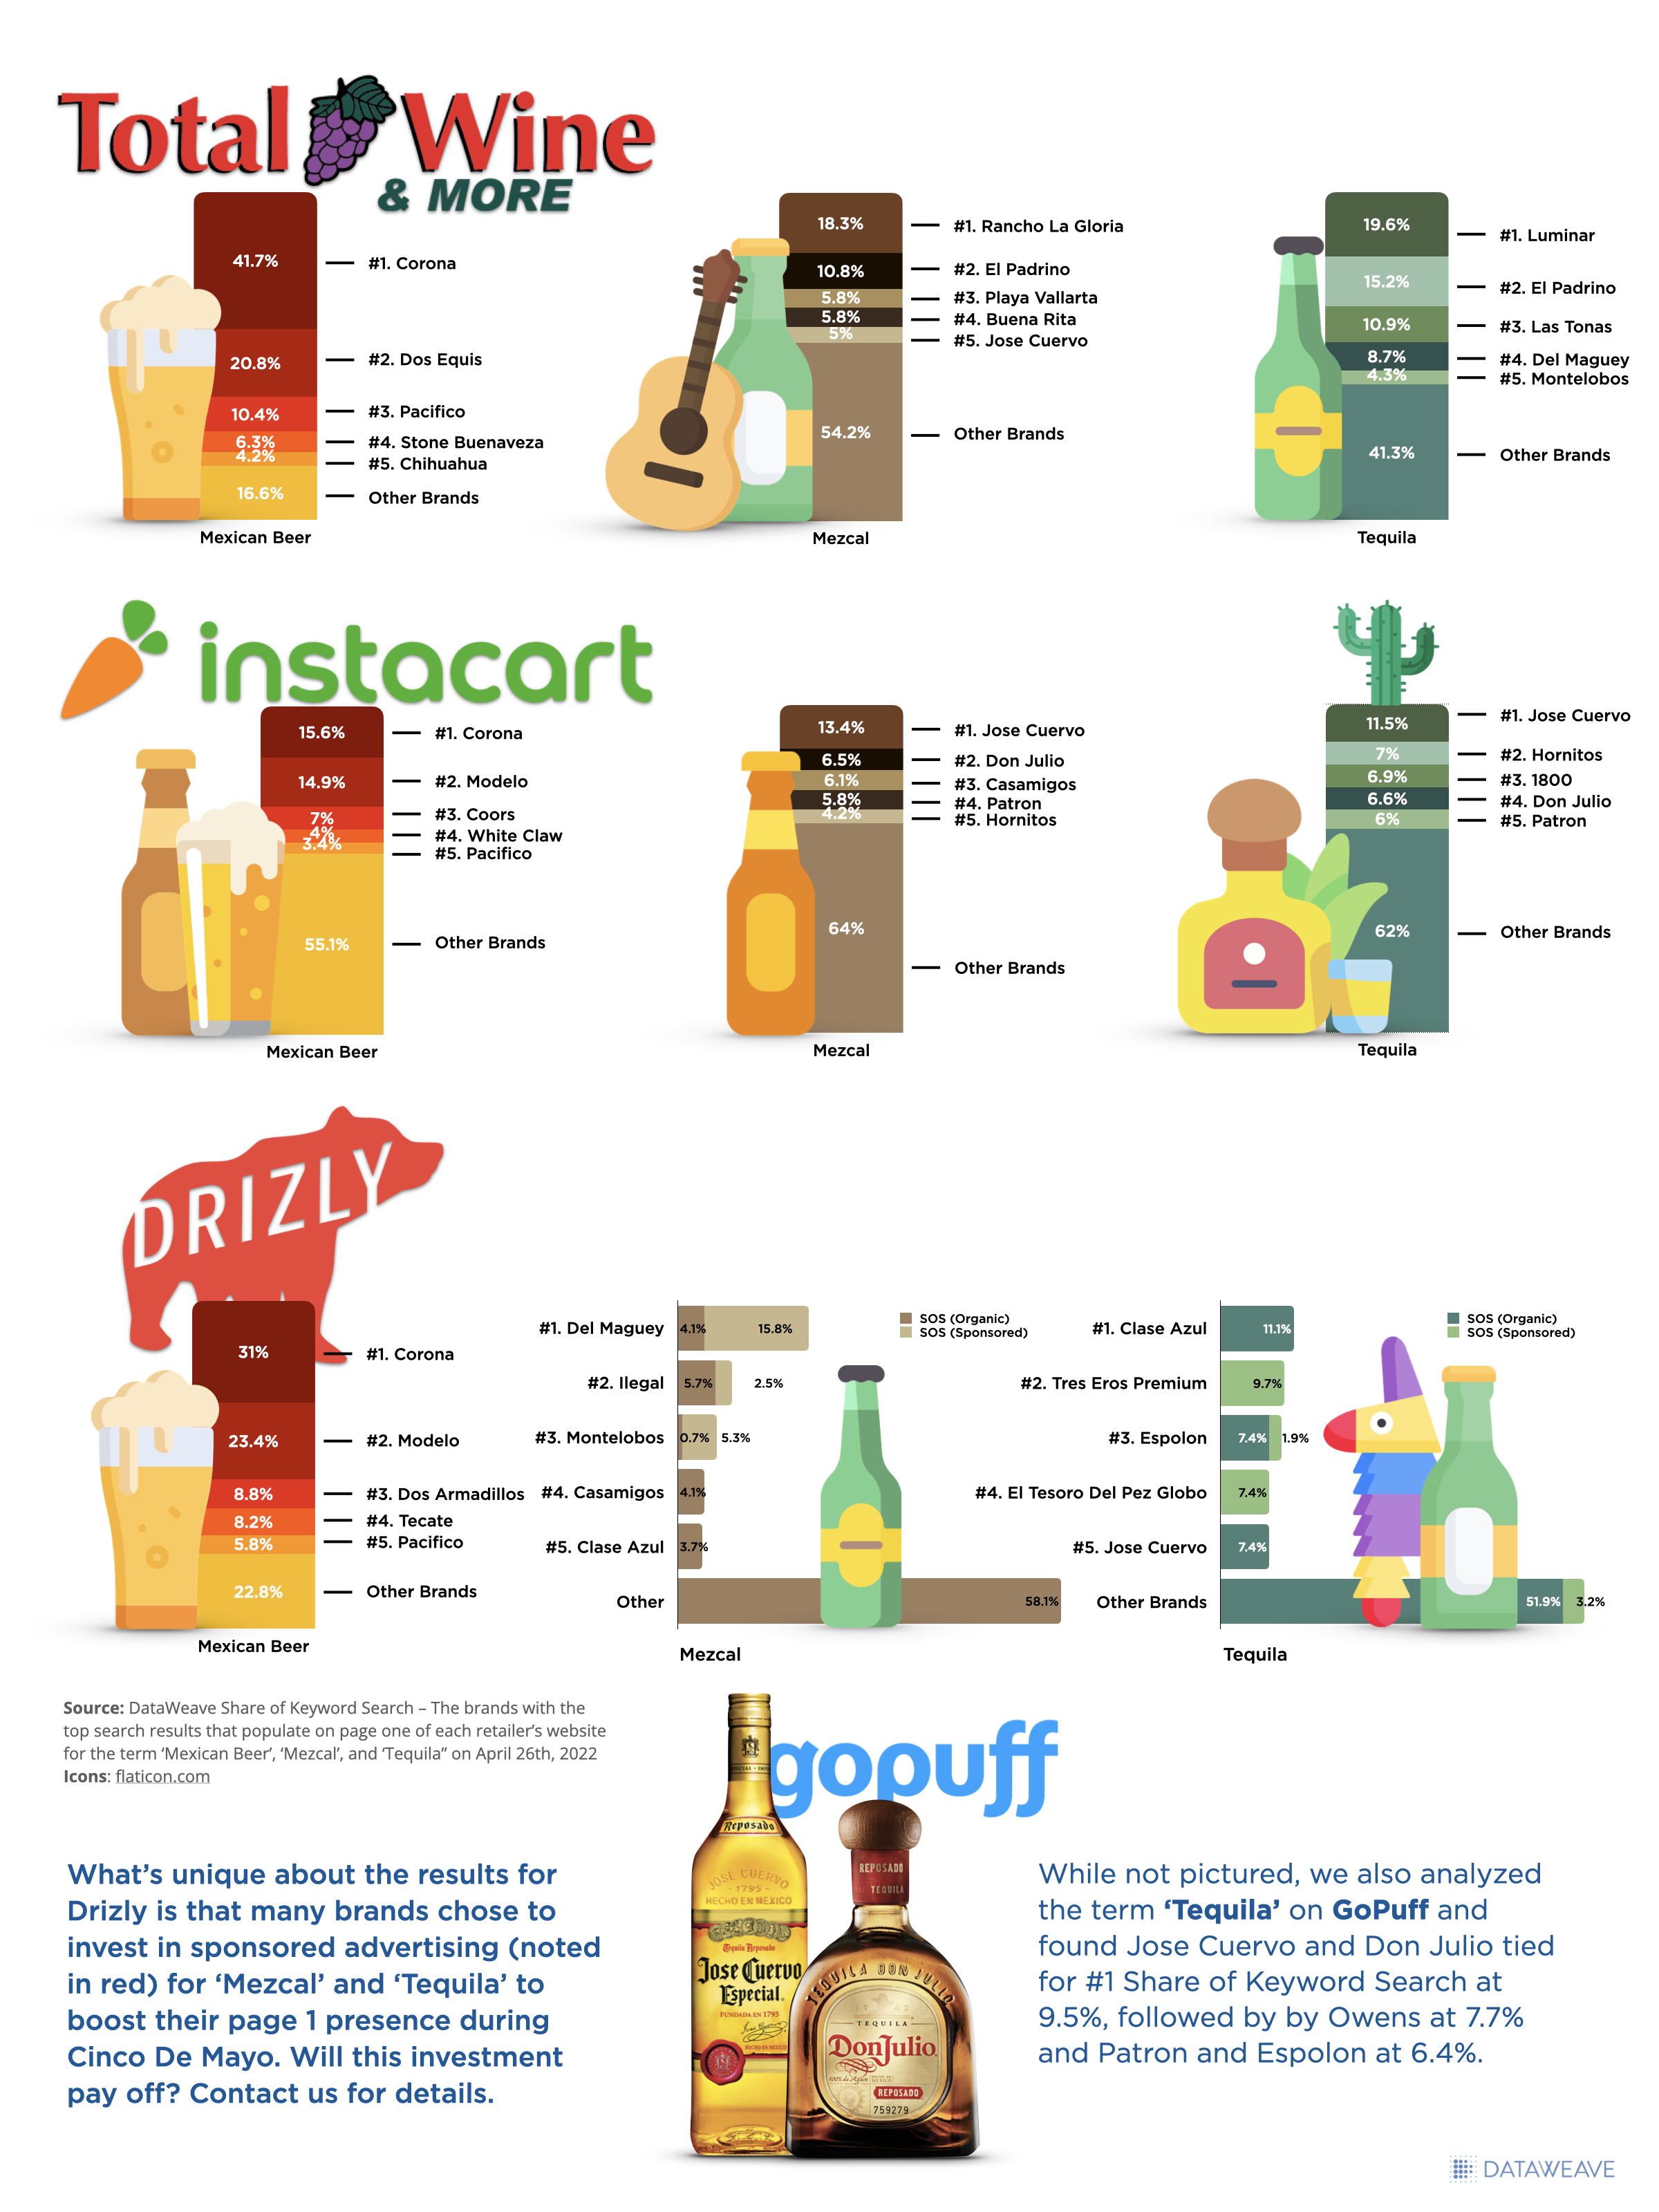
We also reviewed the same keyword performance across popular delivery intermediaries to see how Share of Keyword Search altered for ‘Mexican Beer’, ‘Mezcal’, and ‘Tequila’. The results are below for TotalWine, Instacart, Drizly and GoPuff:
TotalWine, Instacart, Drizly, and GoPuff of Search – Beer, Mezcal, and Tequila Keywords on Cinco de Mayo 2022
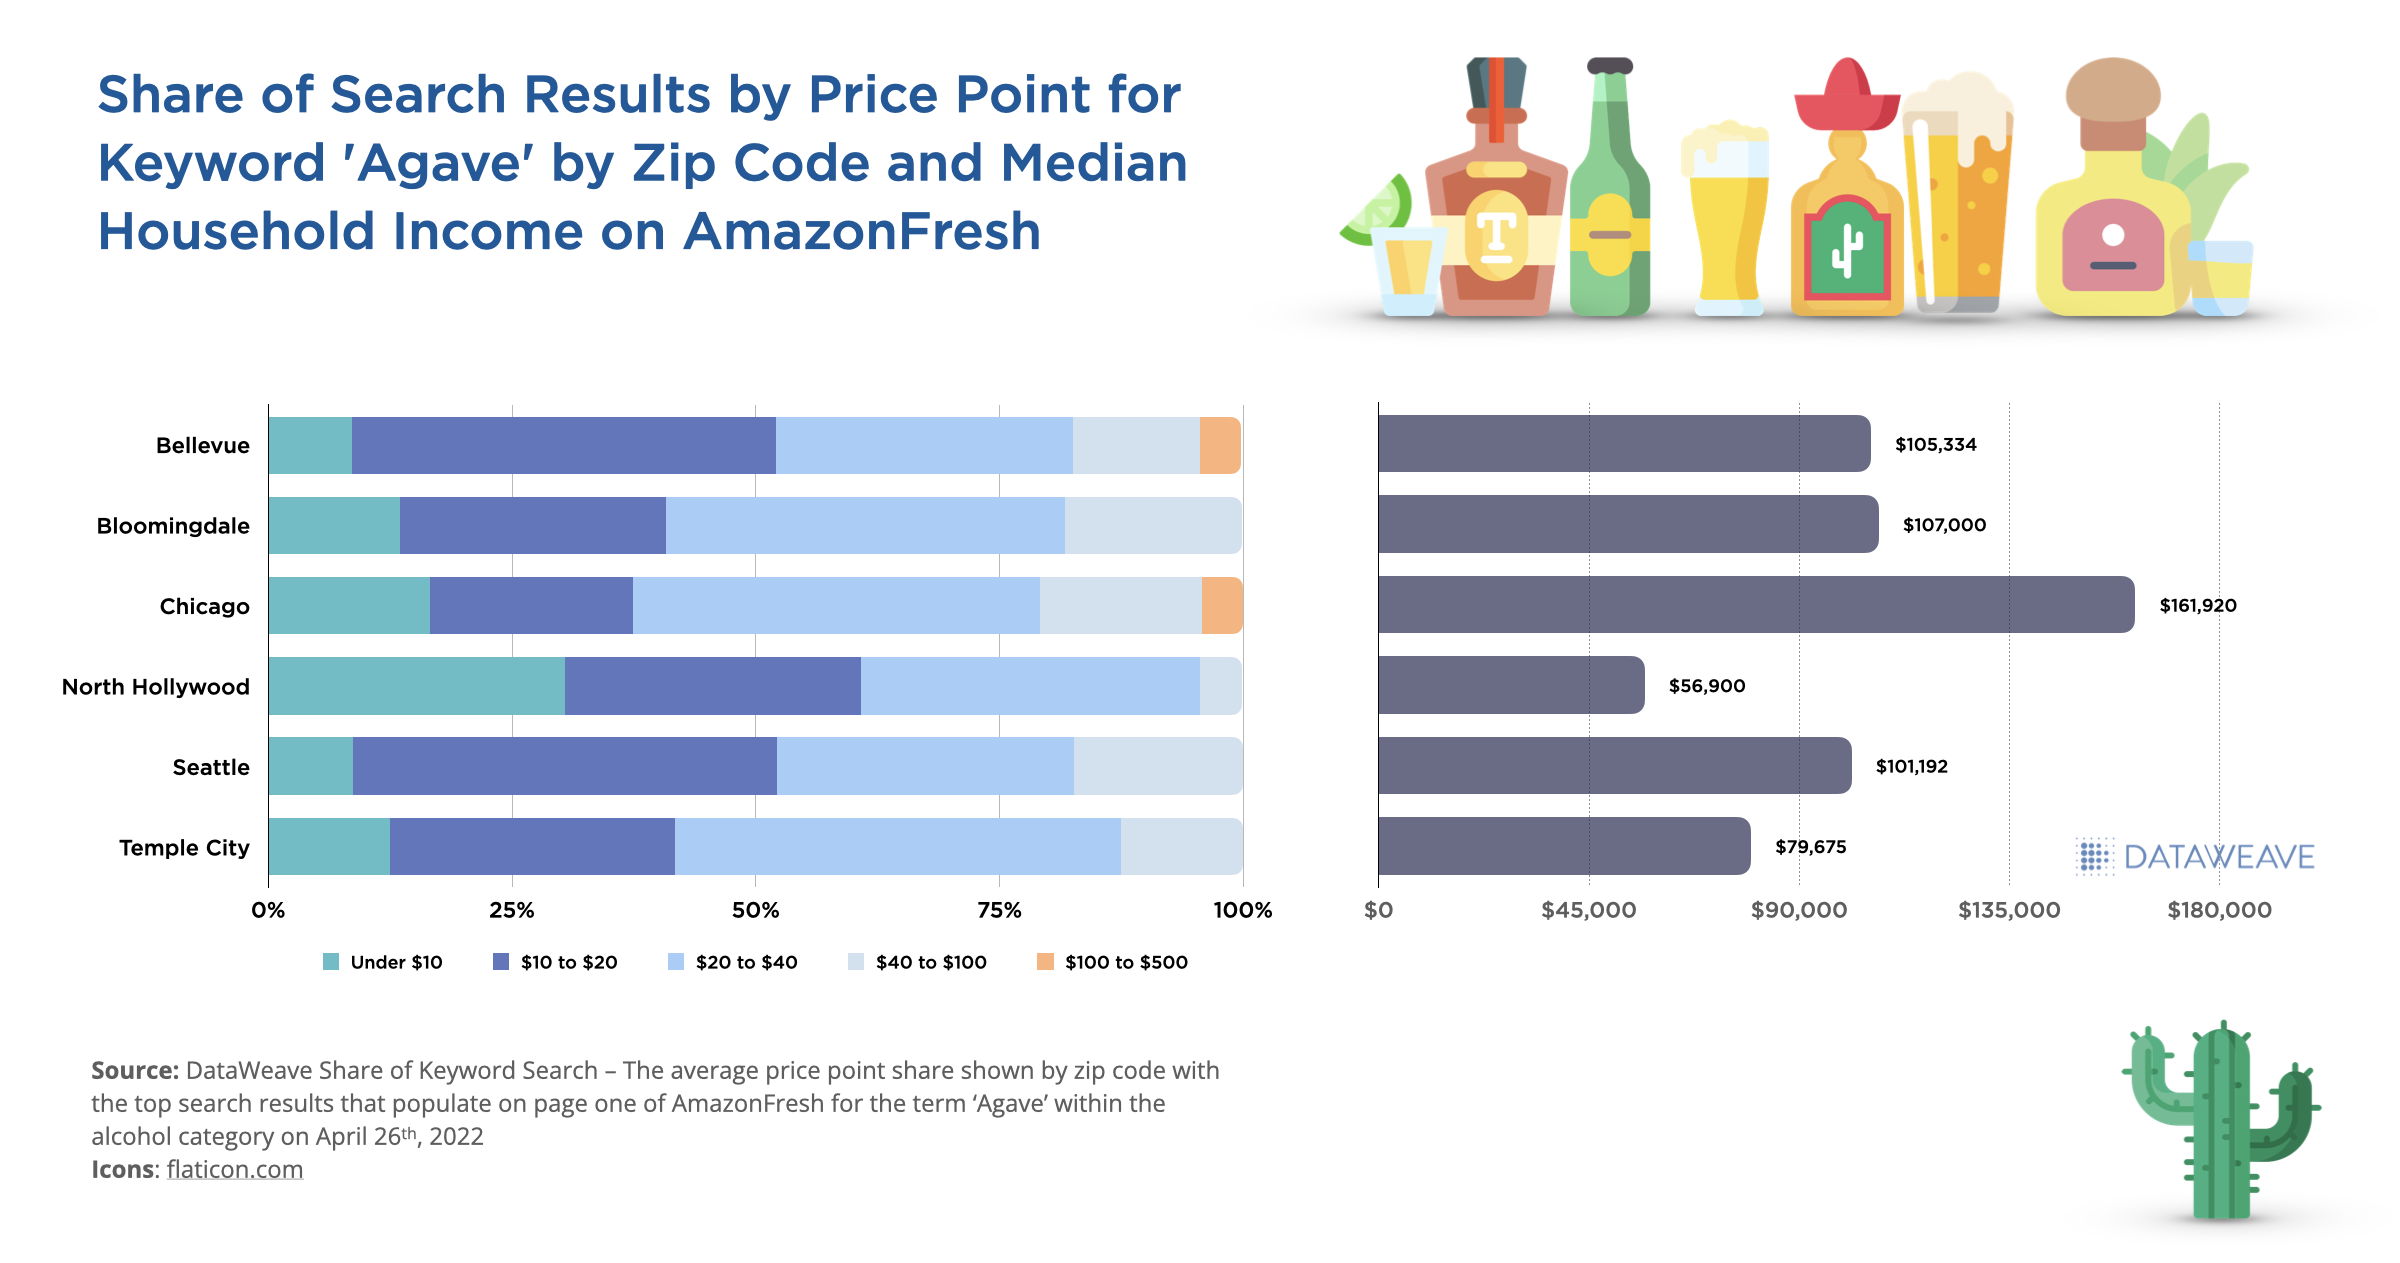
The keyword ‘Agave’ is also a popular search term within the alcohol category during the time leading up to Cinco de Mayo. We reviewed keyword search performance at various zip codes to see how price points that populated on page 1 search results varied given the change in median income. Below are the results:
Share of Search for Alcohol by Price Point and Zip Code on AmazonFresh
Share of Keyword Search Results – Grocery Categories
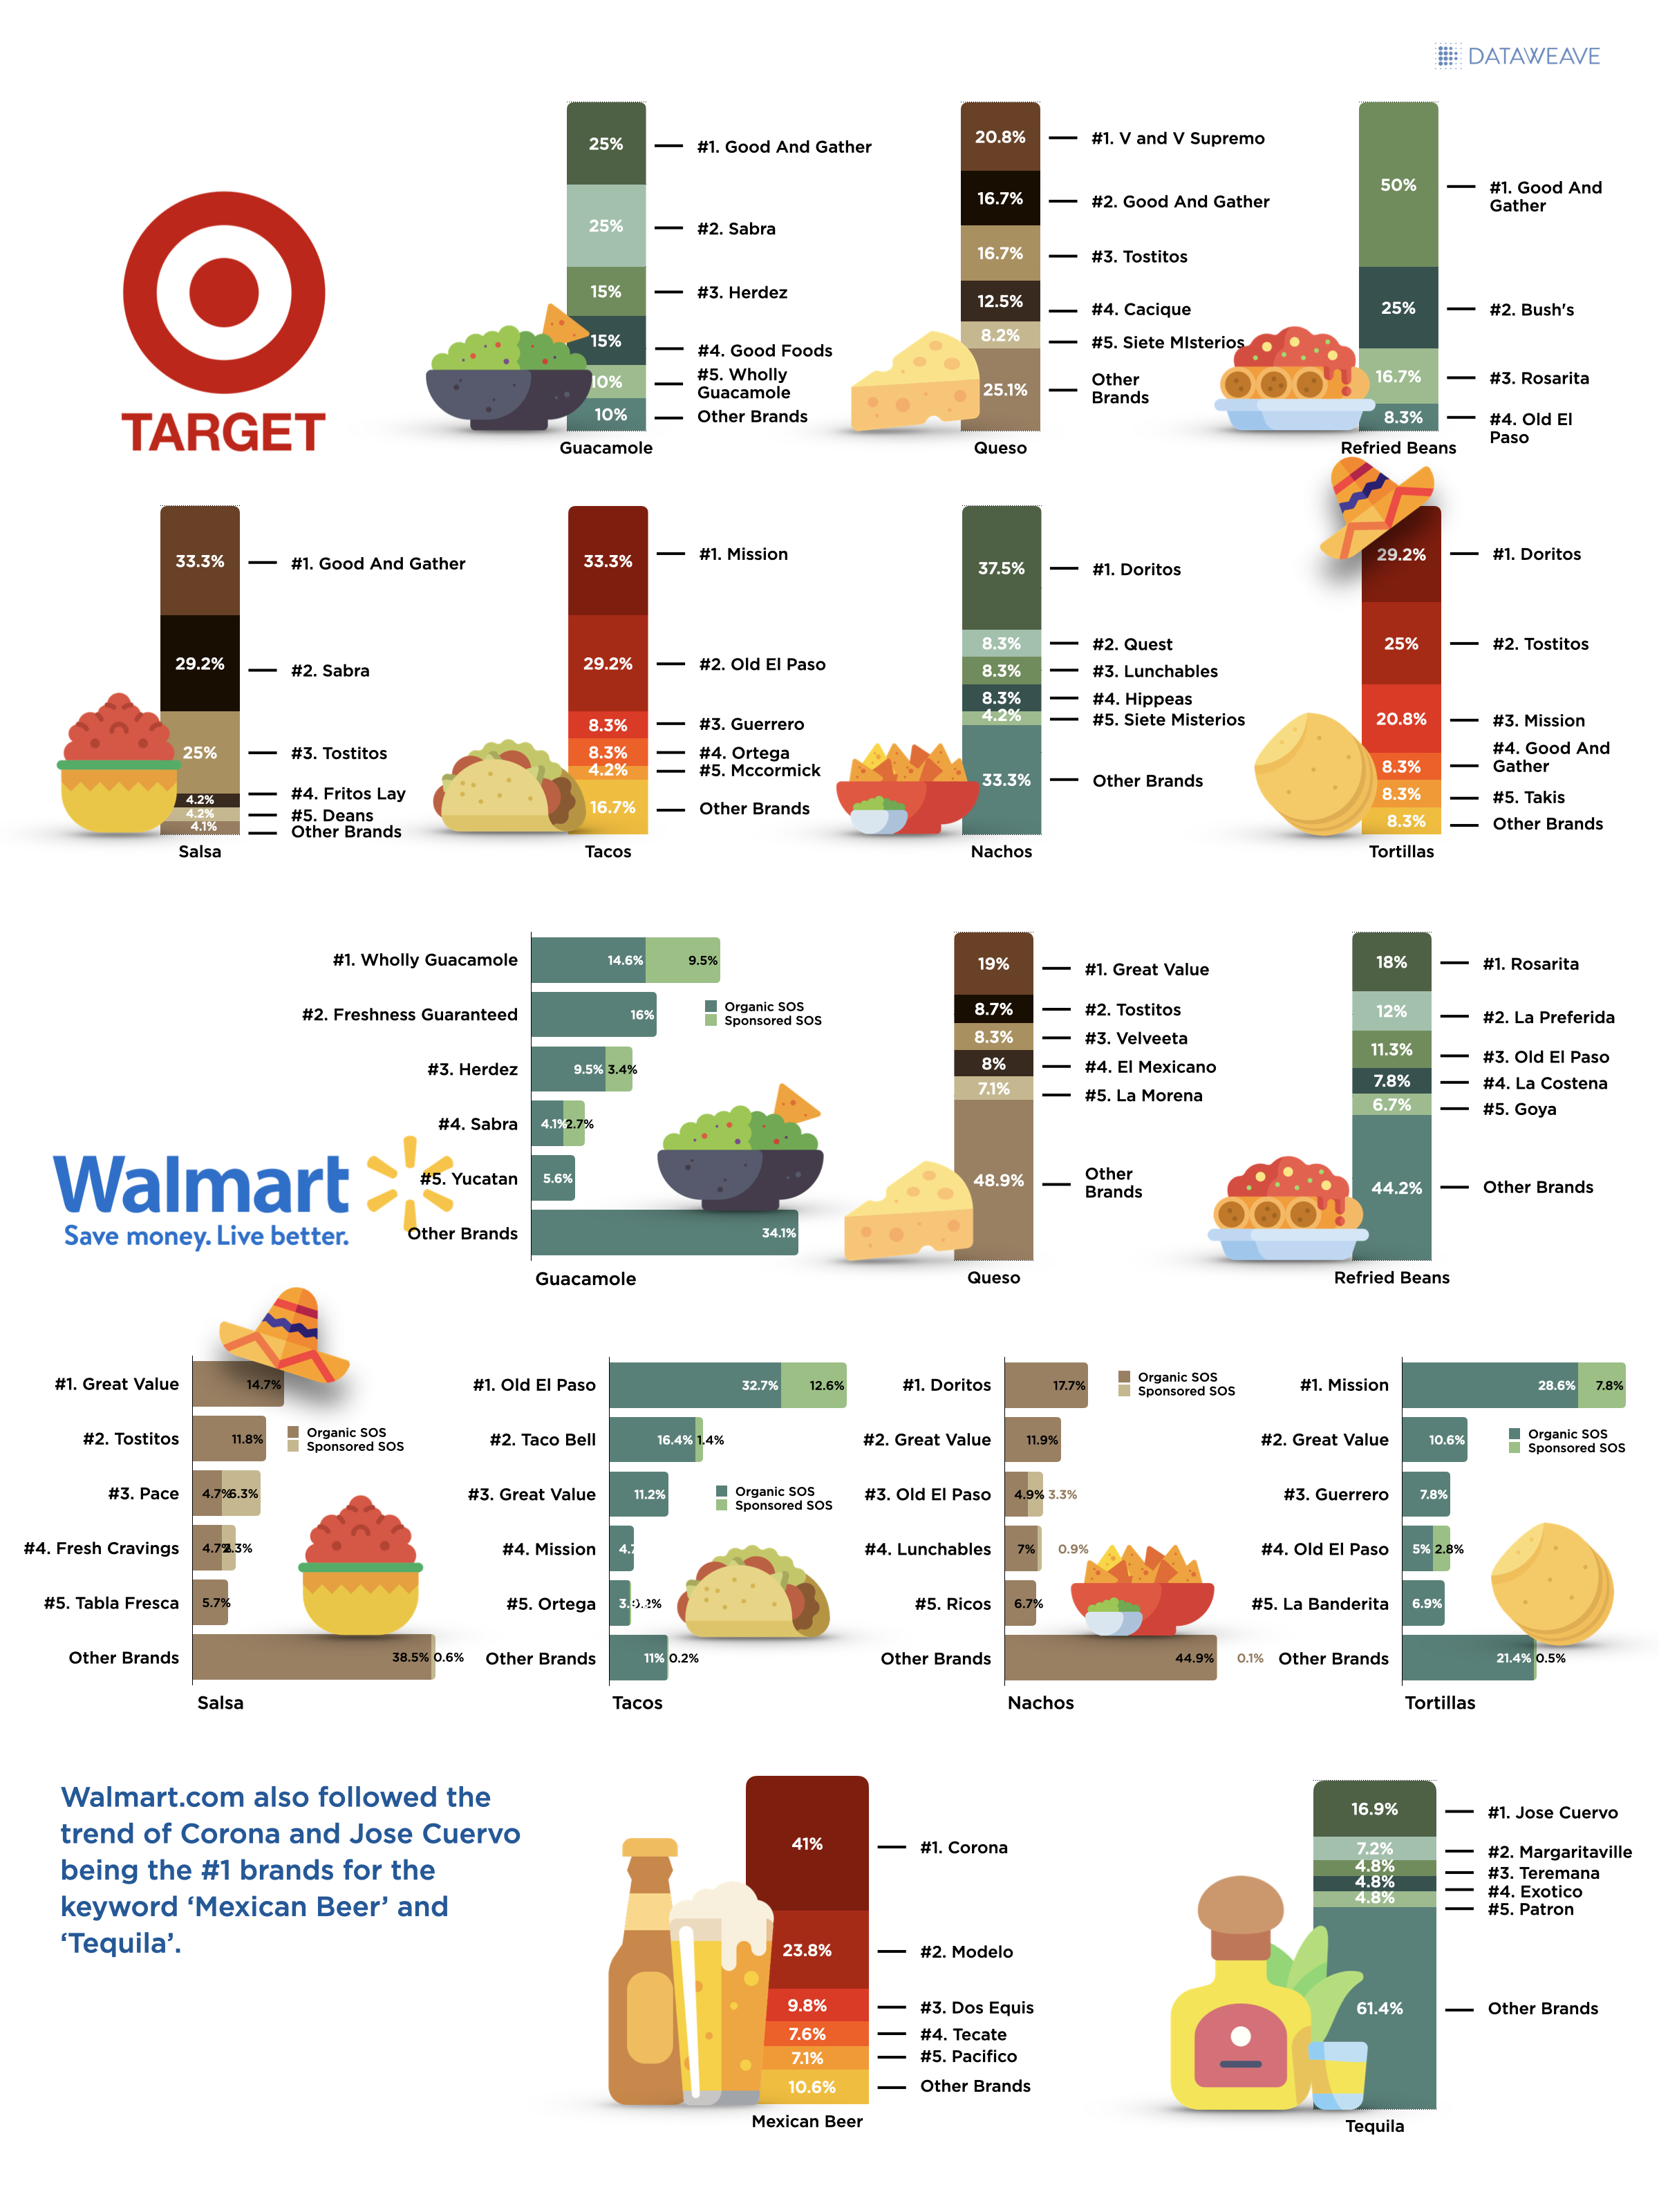
We also reviewed some of the most popular grocery items purchased during Cinco de Mayo by Keyword Share of Search results to see which brands are primed to win the Digital Shelf this year. Below are the results for Target.com and Walmart.com.
Walmart and Target Share of Search – Food and Beverage Keywords on Cinco de Mayo 2022
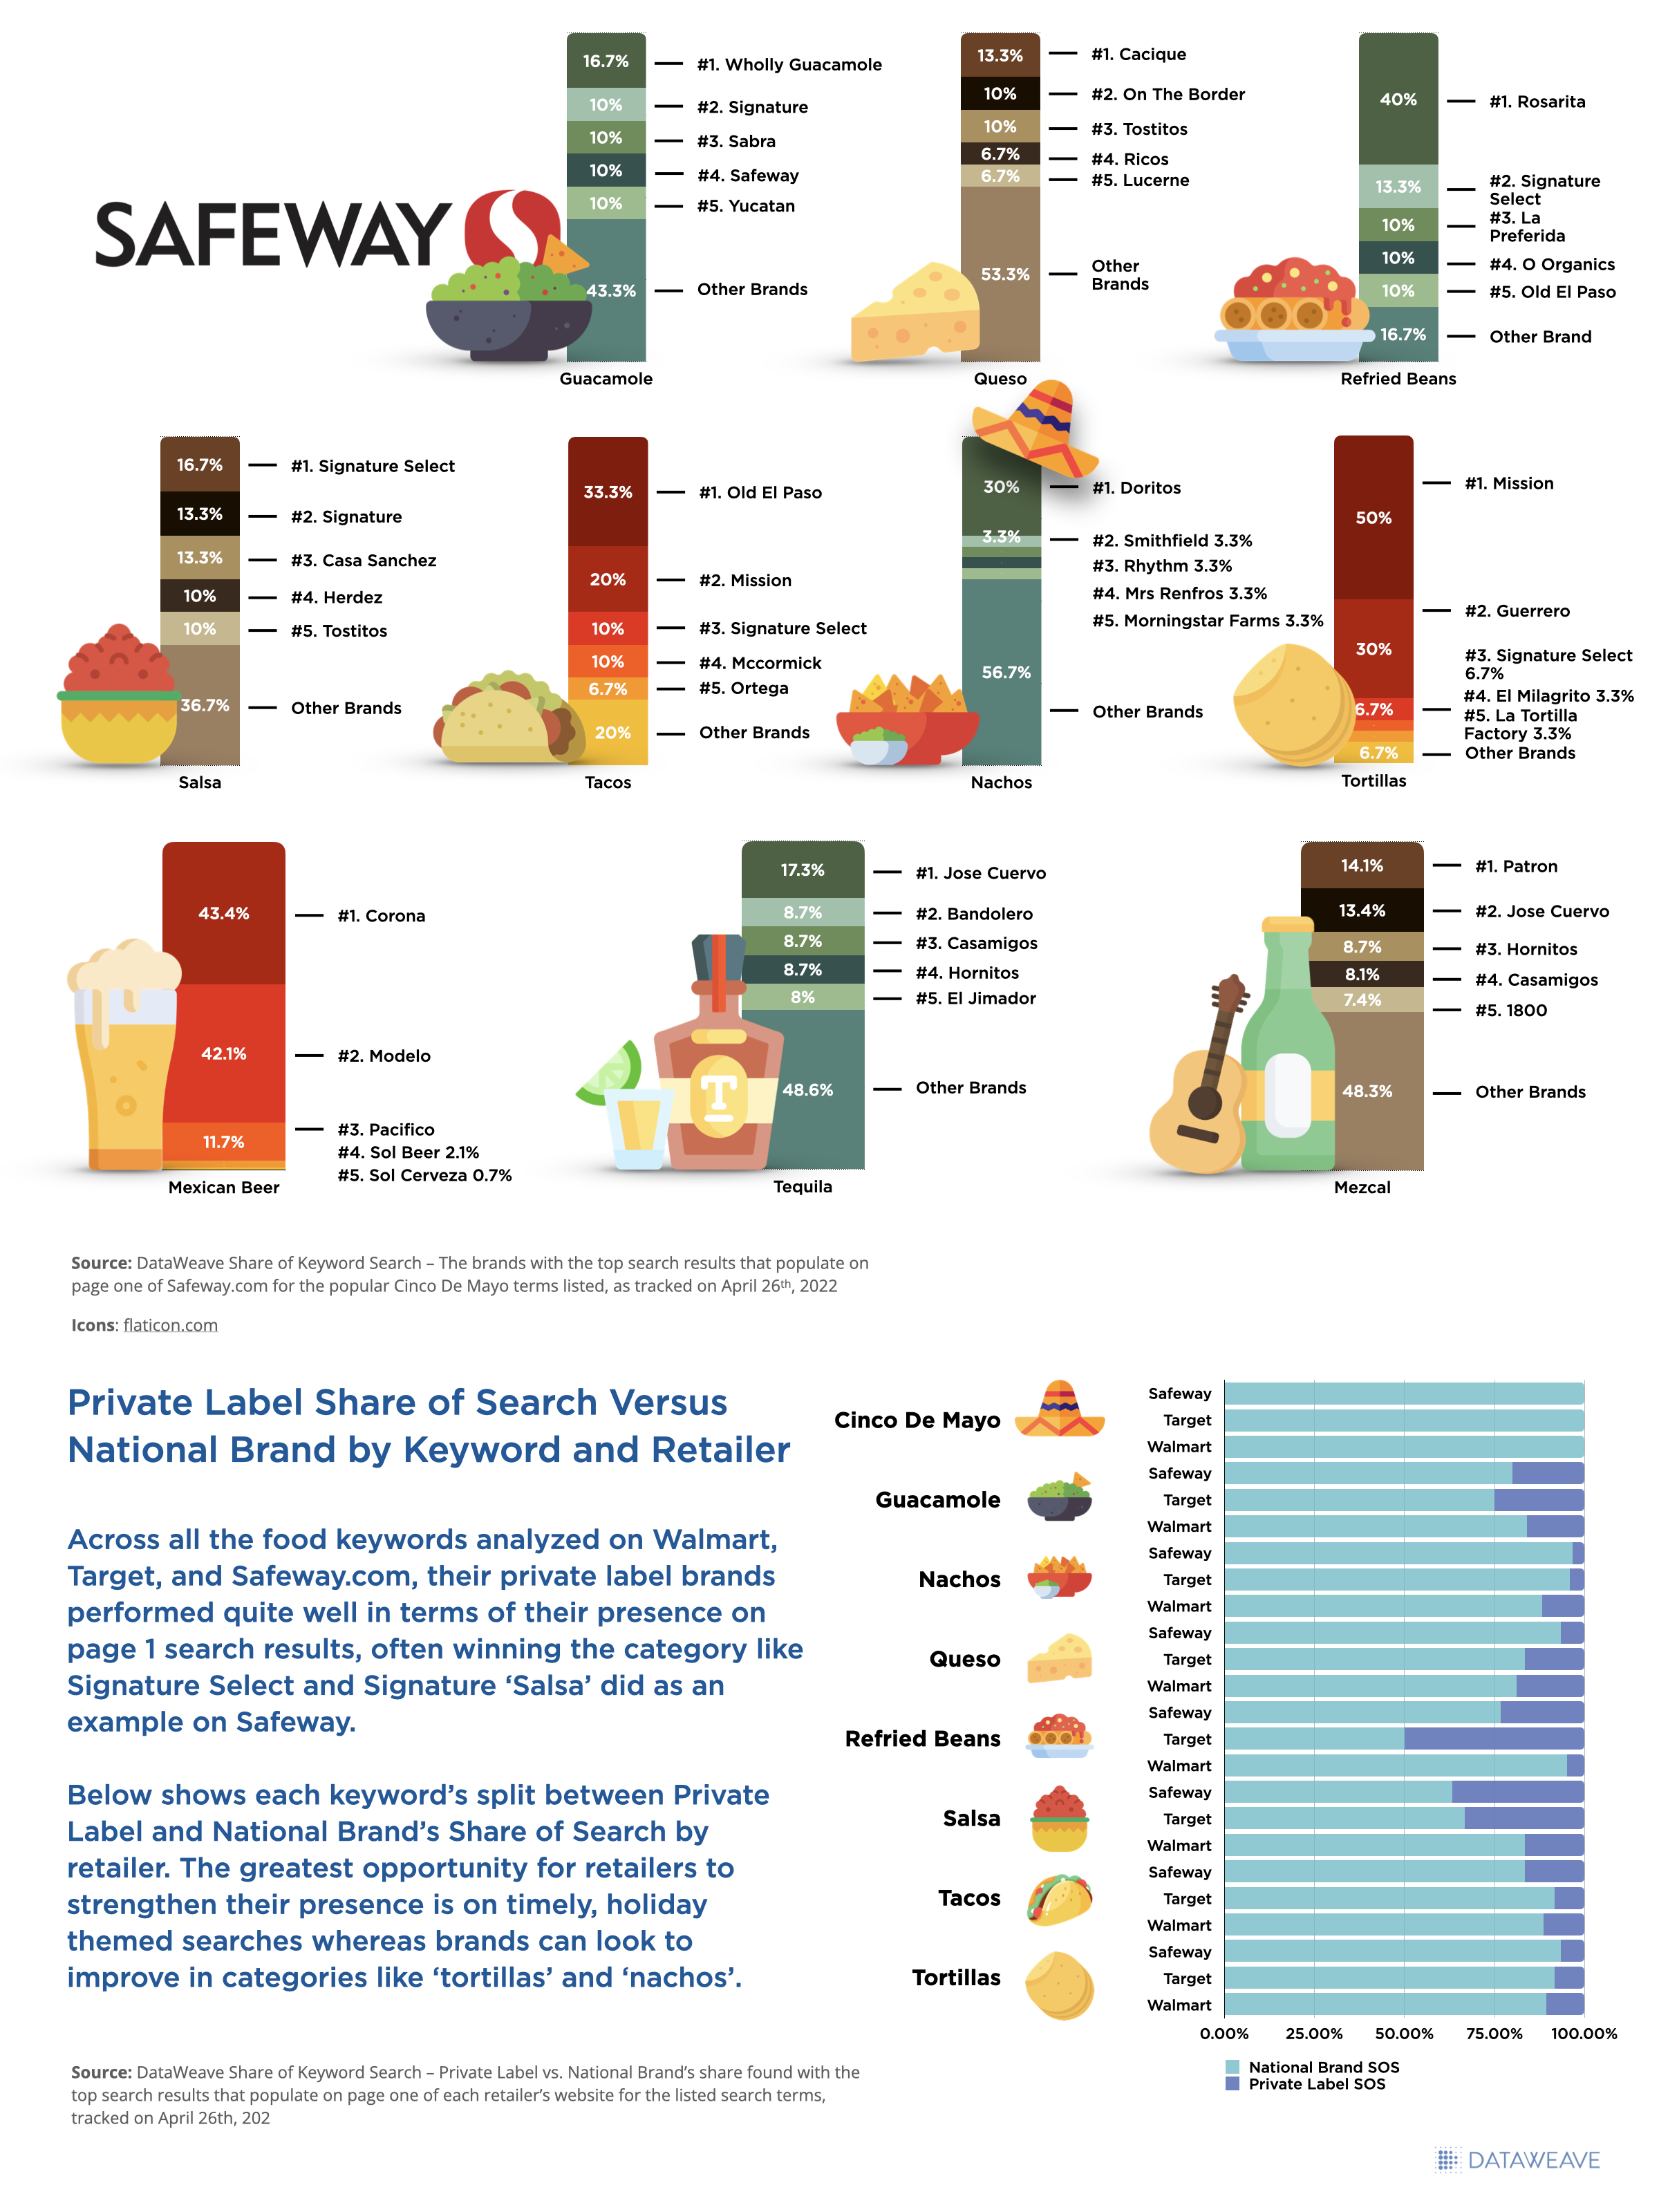
Below are the results for the same popular grocery items and alcohol keywords related to Cinco de Mayo and the page 1 results seen for Brand Share of Search on Safeway.com.
Safeway Share of Search – Food and Beverage Keywords on Cinco de Mayo 2022
Access to these types of real-time digital marketplace insights can enable retailers and brands to make strategic decisions and help drive profitable growth in an intensifying competitive environment. Be sure to reach out to our Retail Analytics experts for access to more details regarding the above analysis, and let us know what other holiday insights you’d be interested in seeing this year. Happy Cinco de Mayo!
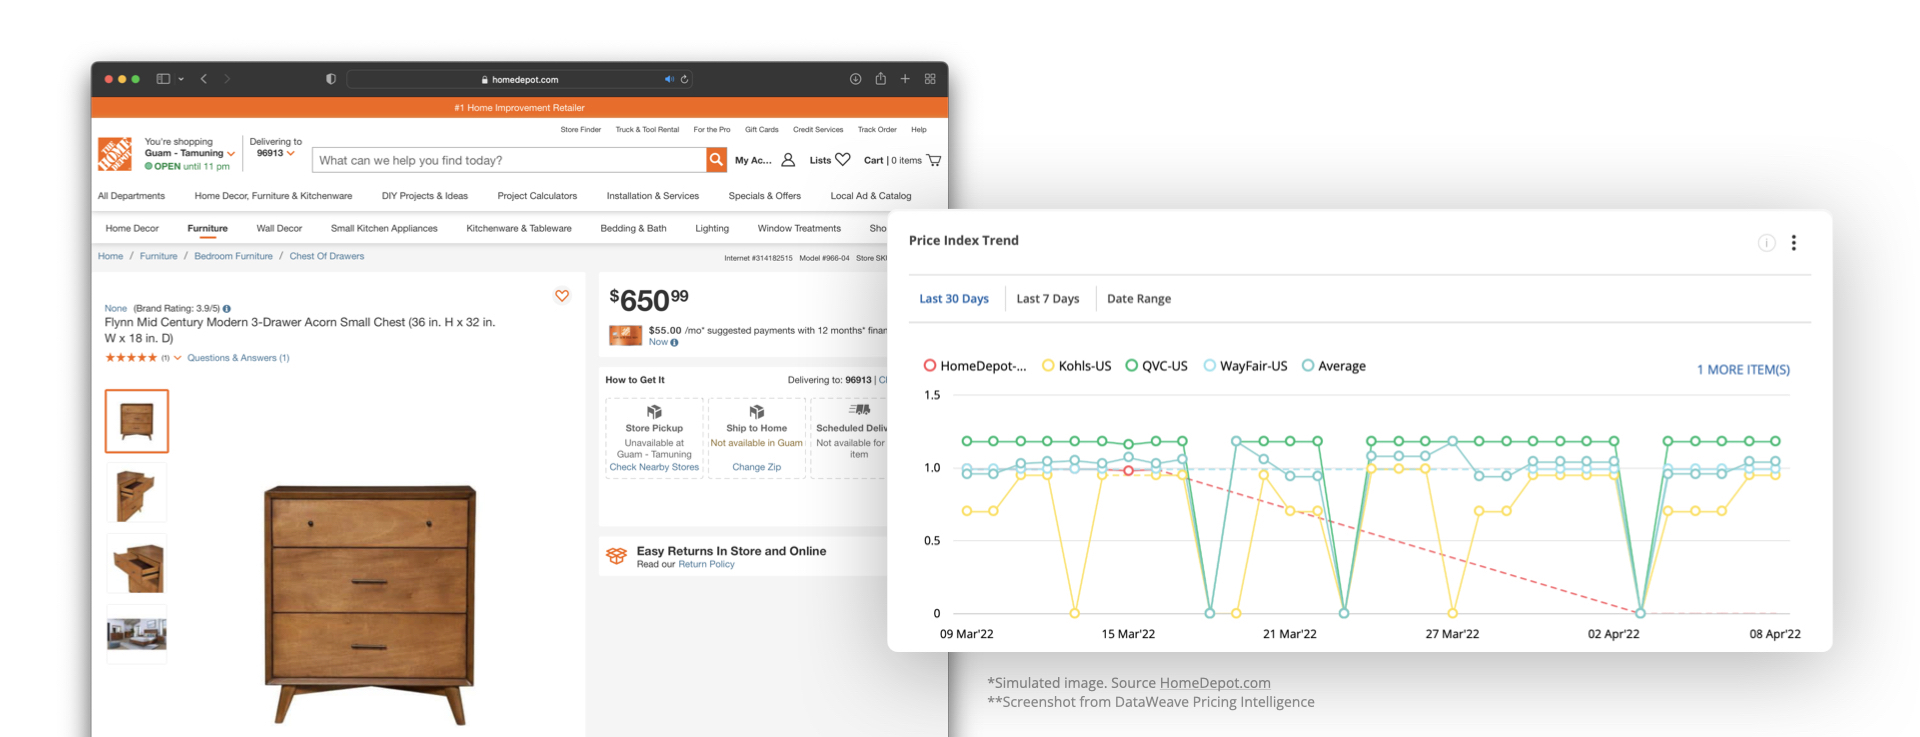
Finding the right price often requires a trade-off between margin and price perception. Brands may want to defeat competitors’ prices on all their products, but that can often lead to losses because sales directly link to price perception. Instead of trying to stay competitive across the board on all products, brands must identify key value categories (KVCs) and key-value items (KPIs) whose prices buyers tend to remember and price those products competitively. In this scenario, they can make up for lowered prices on key products by fixing higher prices on other products.
Consumers’ perception of price fairness largely determines their experience with a brand. Brands selling online can often have a disconnect between their prices and what customers expect their prices to be. However, that does not mean spiraling downwards by getting trapped in discounting cycles and heavy promotions that can harm your bottom line. Instead, brands require real-time monitoring across thousands of stock-keeping units (SKUs) to identify key categories and items they need to price with care. In this blog, you’ll learn about price perception and the factors that influence it.
What is Price Perception?
Price perception is the perceived worth of a product or service in the consumer’s mind. It is one of the leading variables in the consumer’s buying process. Buyers are unaware of the true cost of production for the products they buy. Instead, they make buying decisions based on an internal feeling about how much certain products are worth and which brand offers them the best value. To offer competitive prices and yet obtain a higher price for products, brands often pursue marketing strategies to improve the price perception of their brand and products.
Price Perception
However, brands should not fall into the trap of assuming that price perception is a competitor’s price index. It’s not about offering the lowest price on certain SKUs. Not every brand strives to offer the lowest prices. Some brands take a slightly different approach to ensure the right value for their products. For example, take a look at Trader Joe’s, a grocery chain that has never claimed low costs. They’ve always taken a holistic approach to their pricing and customers to build a loyal following. And it worked well for them. Trader Joe’s can boast one of a high-value perception score, despite not having rock-bottom prices.
Marketplaces such as Walmart and Amazon may not have the best prices on every item. Still, customer perception is that they will have the lowest prices and will often shift the share of sales towards such platforms over businesses that offer the same or even lower prices.
Some things to consider:
What do your customers think of your brand?
What are the key factors that are driving your customers’ price perceptions?
Is your product mix properly aligned with your brand perception?
Are you communicating the most important and relevant information to your customers?
Is your message being received and understood?
Who do your customers see as your competitors, and why?
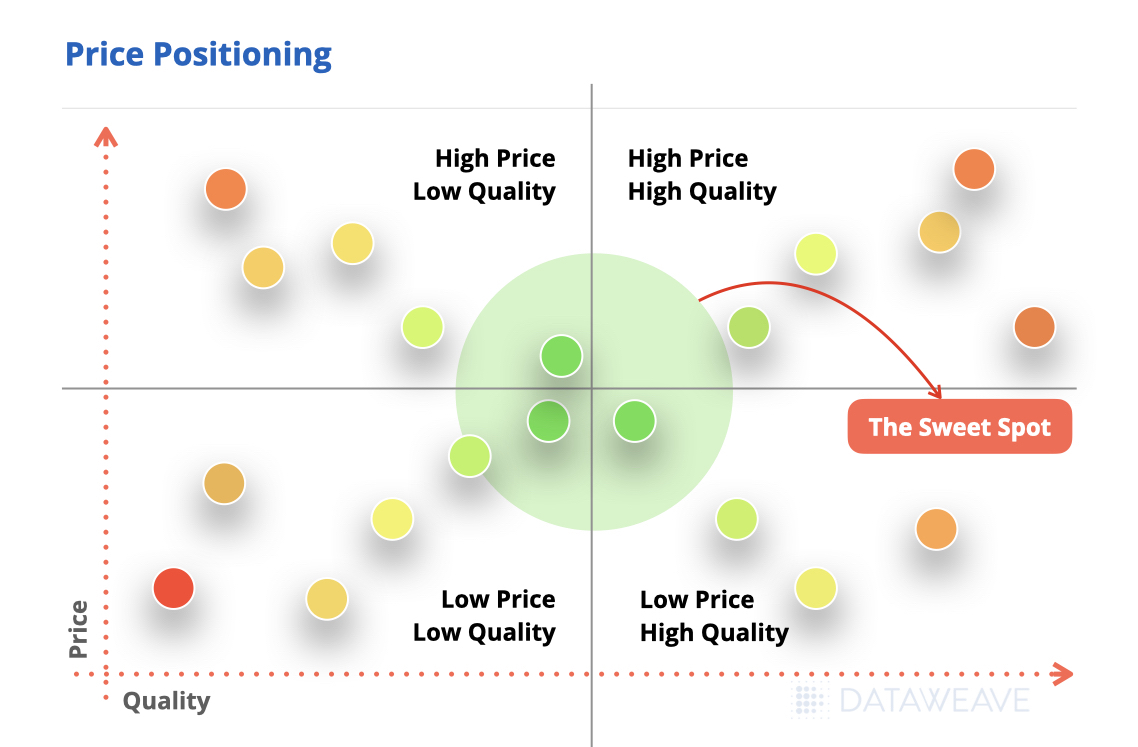
Price positioning is pricing products or services within a certain price range. It indicates where certain services or products lie in relation to competitors’ pricing and in the mind of different customers. A brand’s price positioning has a huge impact on whether the products are seen as priced low or not. The following is a great way to understand the price-value matrix:
Price Positioning
Your brand’s position in this matrix will depend on your pricing objectives, competition, and customer loyalty. Price positioning helps the marketing and operating teams understand customers’ perceptions of your brand and convince customers to buy your products. Brands need a holistic approach toward setting prices for their products in order to drive conversions through intelligent pricing and competitive insights.
Factors that influence Price Perception
Price-Quality Relationship
Price is often an indicator of product quality. The general rule is that the higher-priced products are perceived to have better quality, implying that brands should consider a rational quality-price relationship in their pricing or promo strategy. For example, it might not be best practice to have similar prices for both good and low-quality products because customers will perceive low-quality products as overpriced and might not purchase from you.
Price-Consciousness
Customers aren’t price conscious about every product. Instead, they are only price conscious about certain products under the best price guarantee or BGP. For instance, if buyers find your BGP products more expensive than your competitors, the cheaper products in your assortment will still be perceived as expensive.
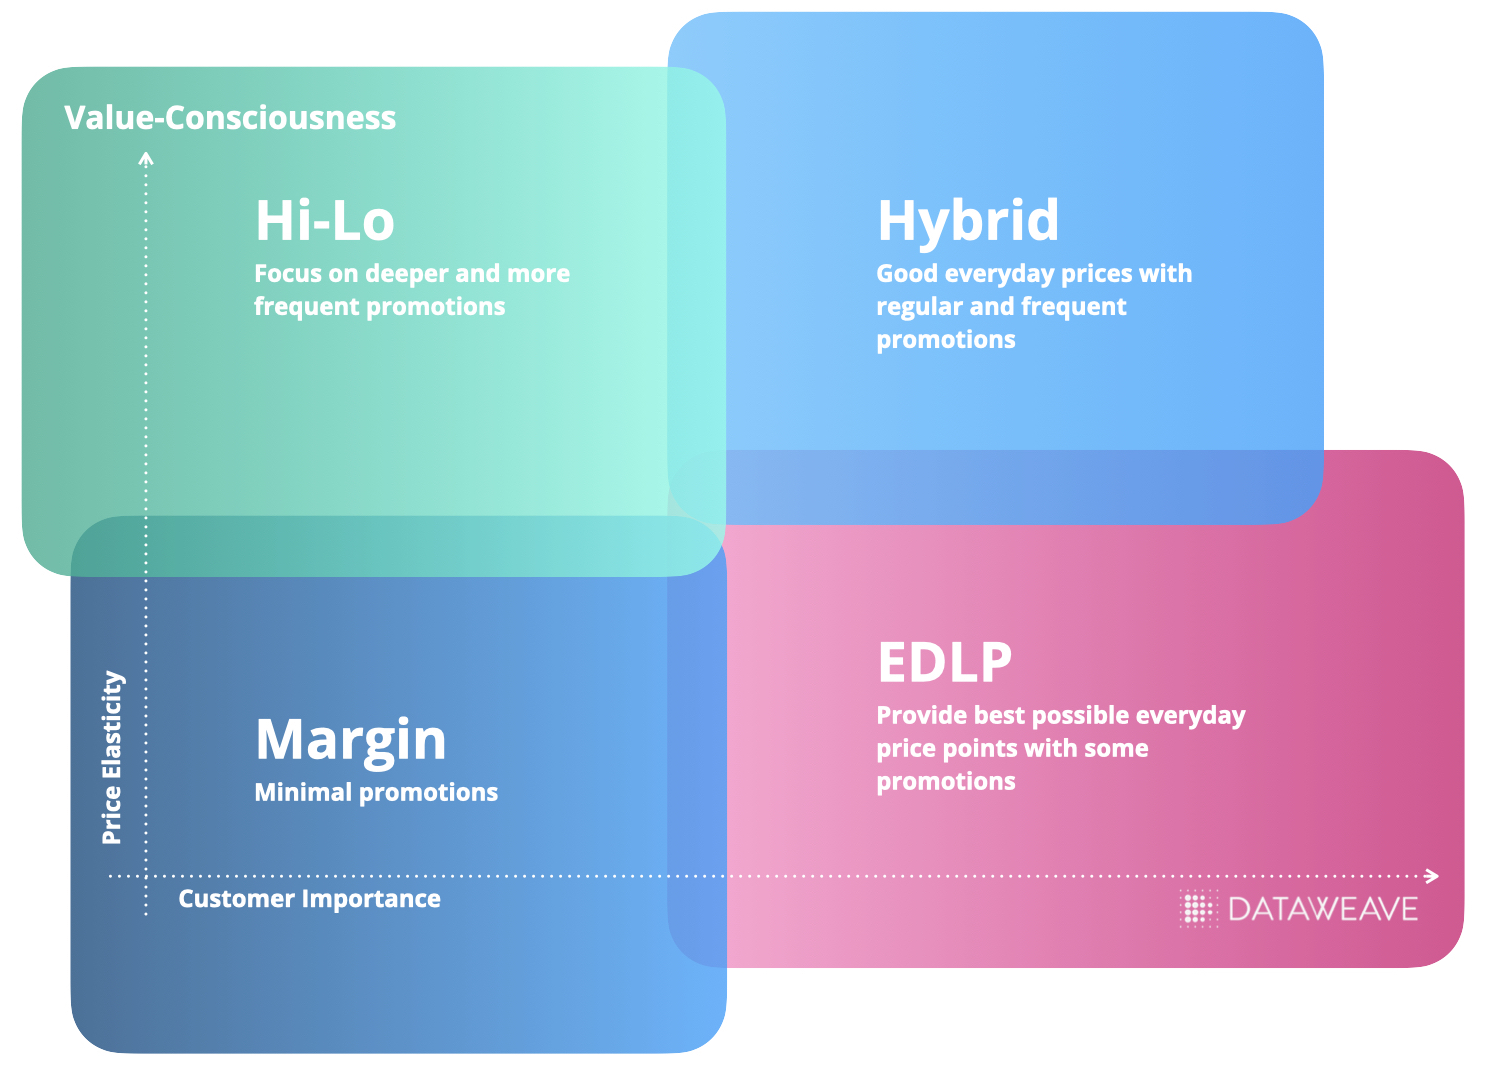
Value-Consciousness
During markdown periods, ensure that you are not undermining the efforts to shape and maintain price perception by offering extreme or complex discounts. In an attempt to clear stocks, promotions simply confuse the shopping experience for customers and further deteriorate trust in your brand. Your promotional offers should keep price perception during the holiday season or clearance sales by offering a simplified promotional program. Start by understanding which price mechanics and SKUs work best for your target customer segment. You should also reduce over-communication on hero deals else buyers will assume that you incorrectly price products during new seasonal launches.
Prestige Sensitivity
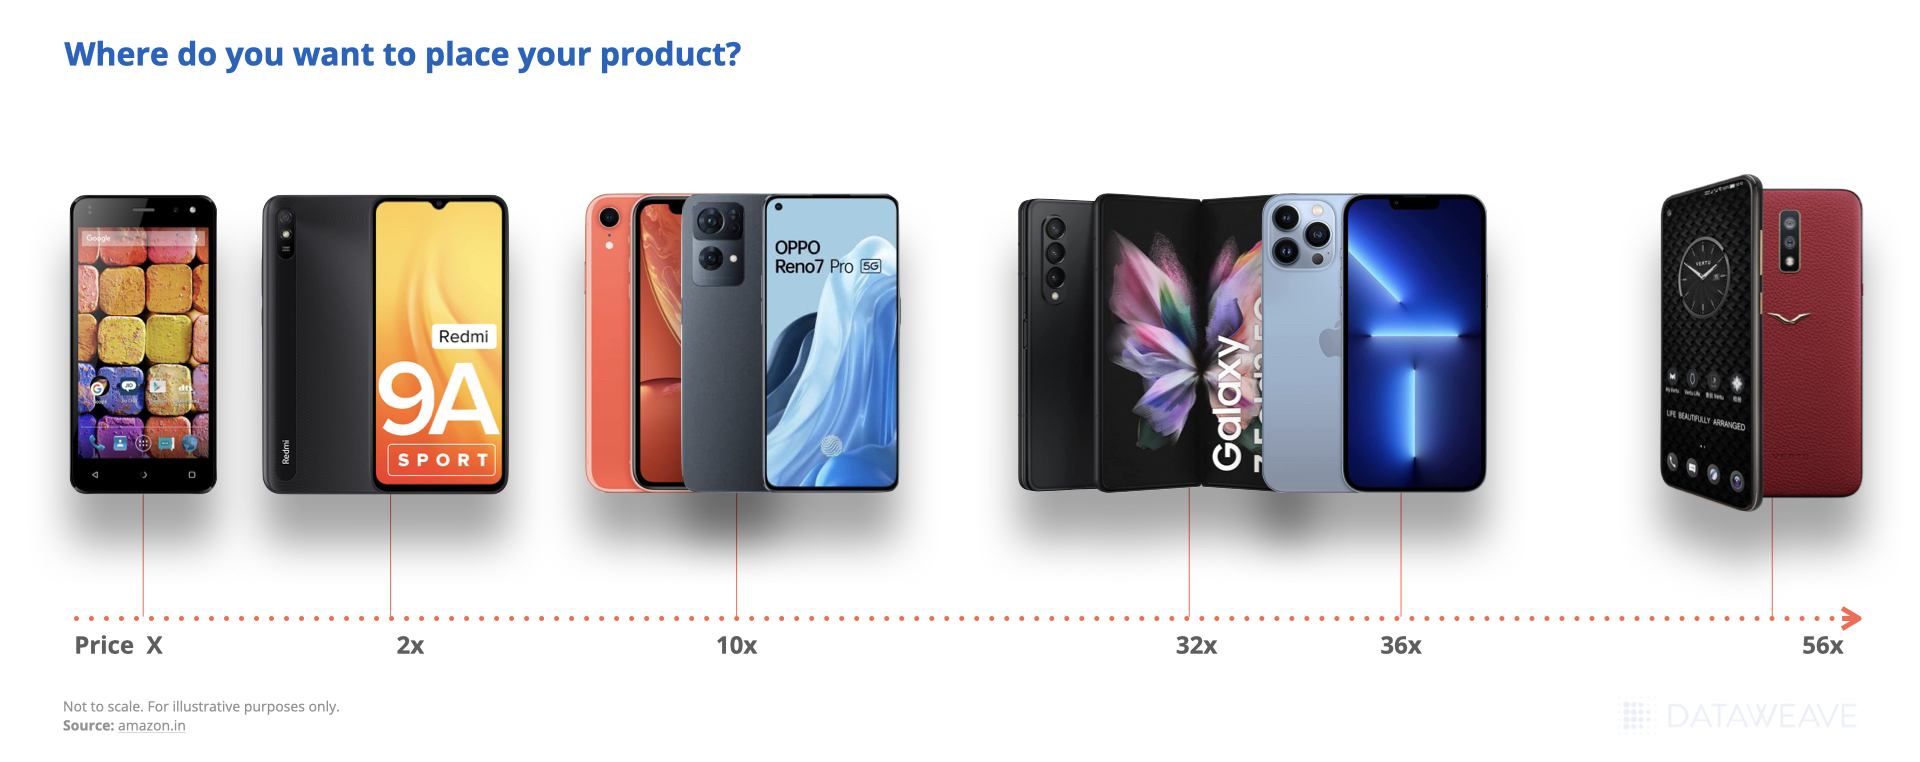
Gerald Zaltman, a Harvard professor, argues that 95% of all purchasing decisions are subconscious. Luxury brands are a great example of how psychology directly links to price perception. Customers buy premium or luxury products to demonstrate their social status. In this scenario, buyers don’t hesitate to buy expensive products from certain brands even if they are explicitly overpriced. Thus, brands selling premium products will have to ensure pricing is coherent with buyers’ expectations.
Every customer wants to know they’re getting the best value. They use the highest and lowest prices in a range to understand how expensive a product or brand is. So, by removing high price point lines with low volume, customers will see more minor price points around the store. Brands must merchandise entry price points to help customers identify the lowest prices and improve the perception of their product ranges.
Product Range
How to adjust Price Perception
Here are three ways for brands to improve price parity:
Marketing to influence Price Perception
An efficient pricing management strategy will focus on competitiveness and establishing the right price perception among your customers. You can influence customers’ price perception by improving the look and feel of your online stores since simpler designs are often reflections of lower prices. Another great way to influence price perception is to offer loyalty and reward programs that also improve brand loyalty and reinforces the vision of an economy store irrespective of the prices of your products.
Competitive Analysis
Brands can understand price differences after a competitive analysis. Customers often search for similar products across brands to find the best deals, and you will be able to understand customer opinion through competitor analysis.
Price Management Automation
A price monitoring platform can help brands to stay on top of promotions and discounts offered by their competitors. A price intelligence software will help brands associate products by similarity criteria and compare the pricing of their products with those of competitors. It offers a detailed view of the market and ensures that brands take care of their bottom line.
Conclusion
When a consumer comes across a similar low-priced product or service from a different brand, they may see it as a good deal or might perceive it not worthy of their time or money. What consumers think about your brand’s price is just as important as the actual price of that product. A buyer may sense a company as “upscale” and assume that they have high prices, or they may see a brand as a discount retailer whose prices are too high for its reputation. At times, consumers might also see cheaper alternatives as inferior. It’s not easy for a brand to understand its customers’ perception of price vs. value it offers. Brands need a long-term, dynamic pricing strategy that matches the demands and trends of a global, competitive market. And in order to drive sustainable growth, they need to make smarter pricing and promotion decisions with insights into competitive pricing.
Learn how DataWeave can help make sense of your and your competitor’s pricing & promotional strategies and help your brand build the right Price Perception. Sign up for a demo with our team to know more.
According to MarketingCharts, 63% of online shoppers start their buying journey on Amazon. This shows that customers believe they will find the products they are looking for with competitive prices and excellent customer service on Amazon. Amazon is one of the most dominant eCommerce marketplaces with 197 million users and 112 million Amazon Prime members. Brands can sell on Amazon to capitalize on this vast customer base by showcasing and promoting their products properly.
In this article, we’re going to take a look at the top 7 strategies to sell effectively on Amazon:
1. Boost Product Discoverability using Ads
Amazon Advertising helps sellers, brands, and agencies to drive profitability by making sure product discoverability is high & shoppers are able to find their brand with ease. The ads on Amazon fuel product discovery and improve conversion rate. The advertising options on Amazon are designed to help brands increase exposure, generate incremental sales, boost organic rankings, and drive growth.
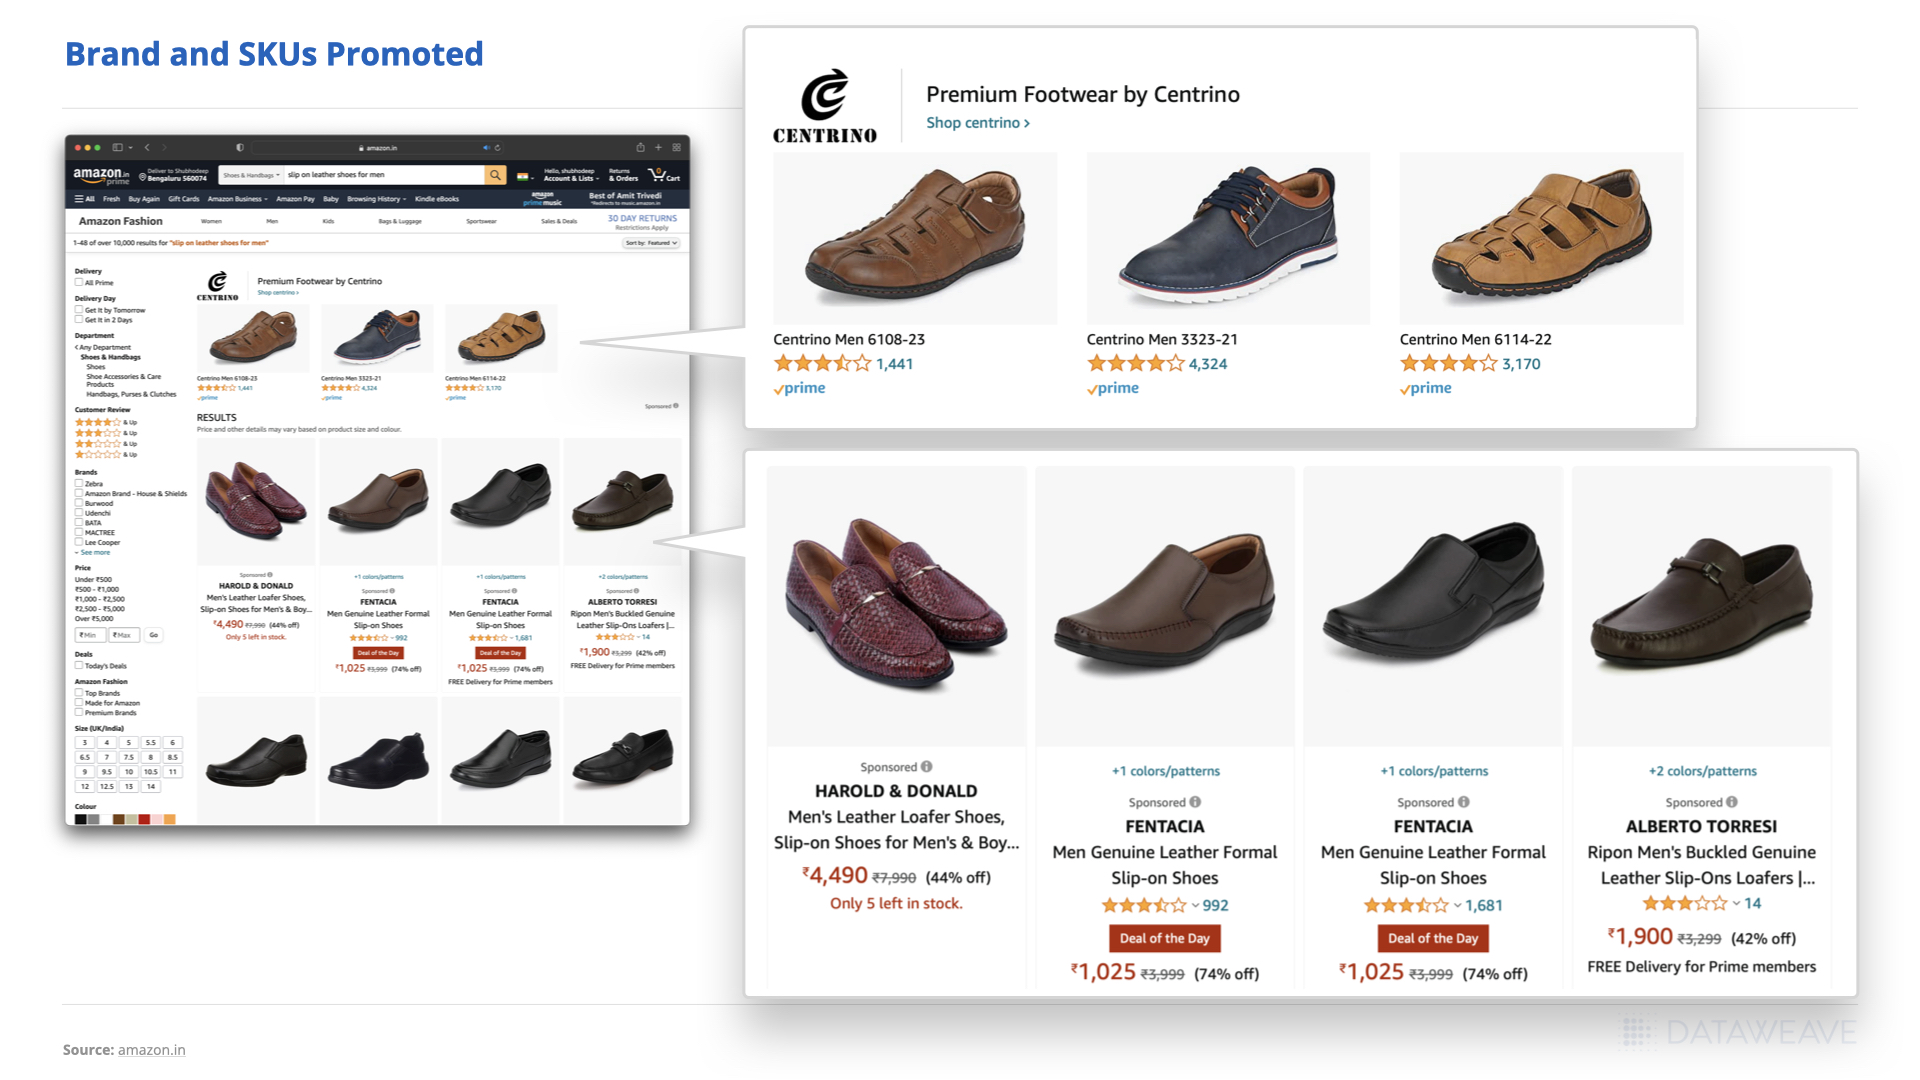
Amazon has three PPC programs: sponsored product ads, sponsored brands ads, and sponsored display ads. Brands can increase visibility on Amazon with these three paid campaigns. You can sponsor products or your brand for related searches on Amazon. Businesses only pay for clicks received.
Sponsored products are for individual product listings that appear on shopping results pages and product detail pages. Sponsored brands are for showcasing brand portfolios such as logo, custom headline, and a selection of products on the shopping results page. The last is sponsored display, a self-service advertising solution for displaying ads on and off Amazon.
Promotions for Brand and SKU’s
2. Improve your Amazon SEO using effective Product Descriptions
To effectively sell on Amazon, businesses first have to understand the A9 algorithm. Amazon uses A9 Algorithm to decide which products are ranked in search results, emphasizing sales conversions. This algorithm helps Amazon promote listings that are more likely to result in sales.
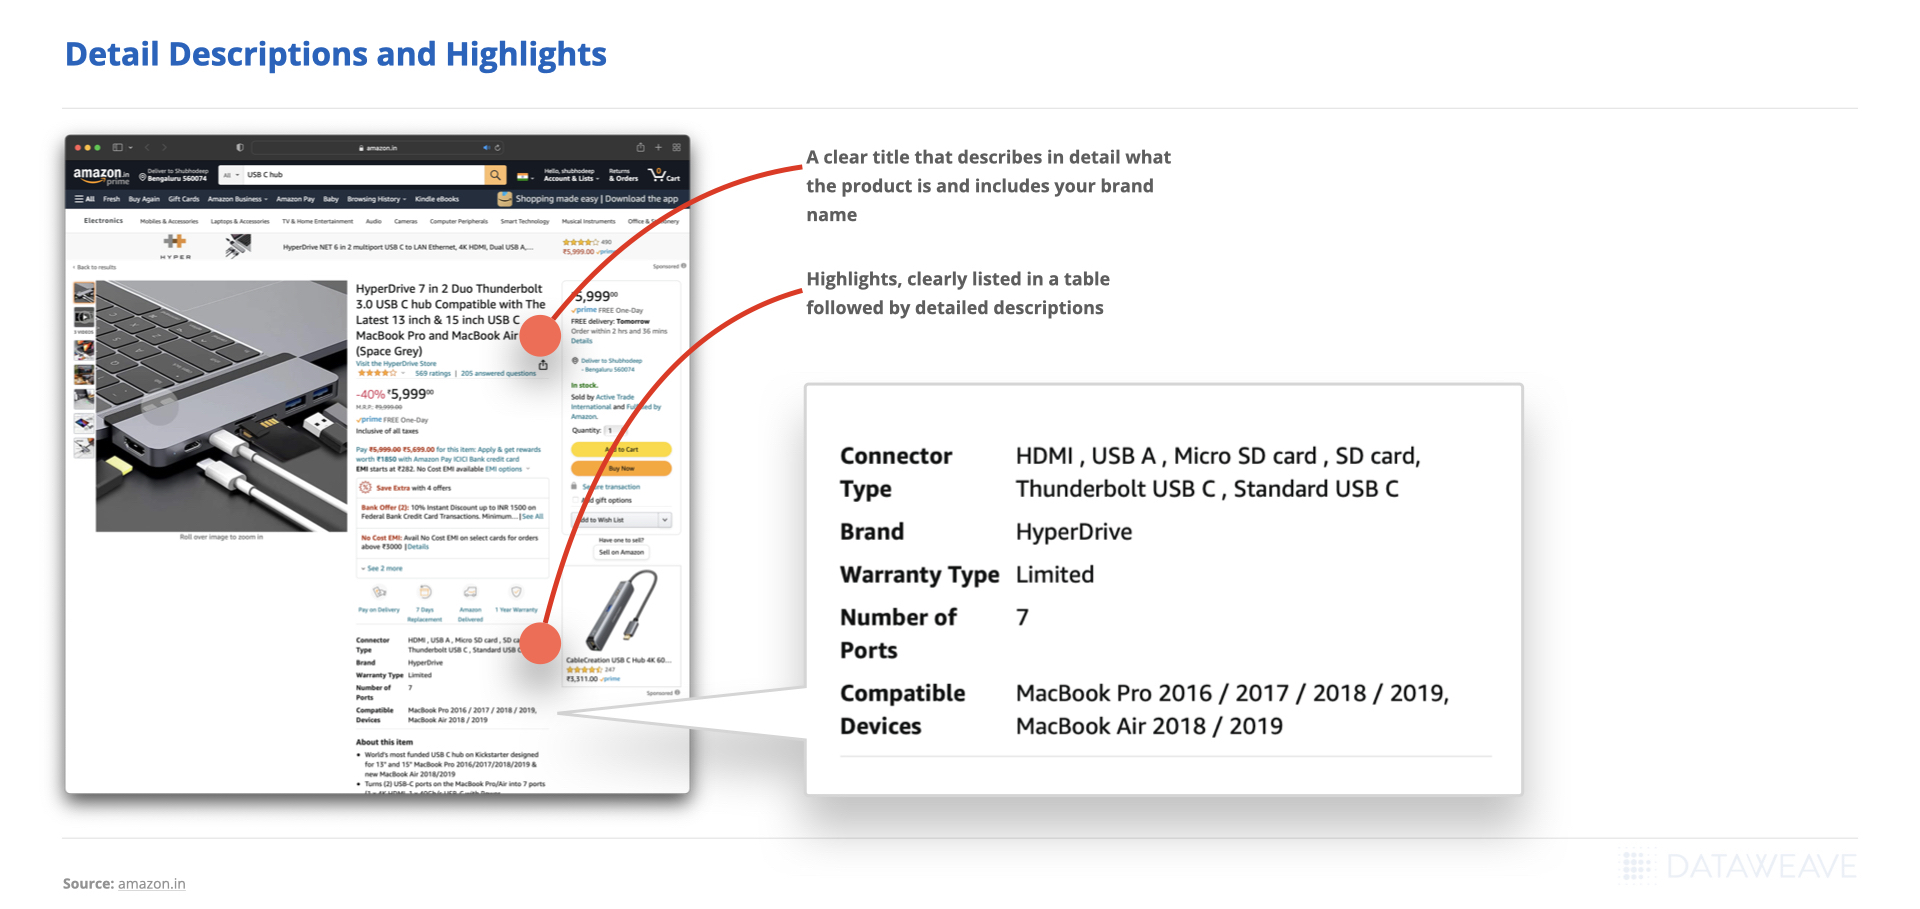
Keywords in product descriptions are one of the main driving factors that the Amazon A9 algorithm looks for in determining relevance to search queries and setting rankings on its results pages. Therefore, brands must integrate high volume and significantly relevant keywords as part of their listings. Crafting product descriptions with the right keywords will provide compelling reasons for buyers to purchase the product and for the A9 algorithm to better rank the brands. Brands can analyze and optimize their content to improve discoverability across Amazon. Accurate product descriptions help users make informed decisions and allow brands to deliver a consistent customer experience.
Detailed Descriptions and Highlights
3. Improve your Product Visuals
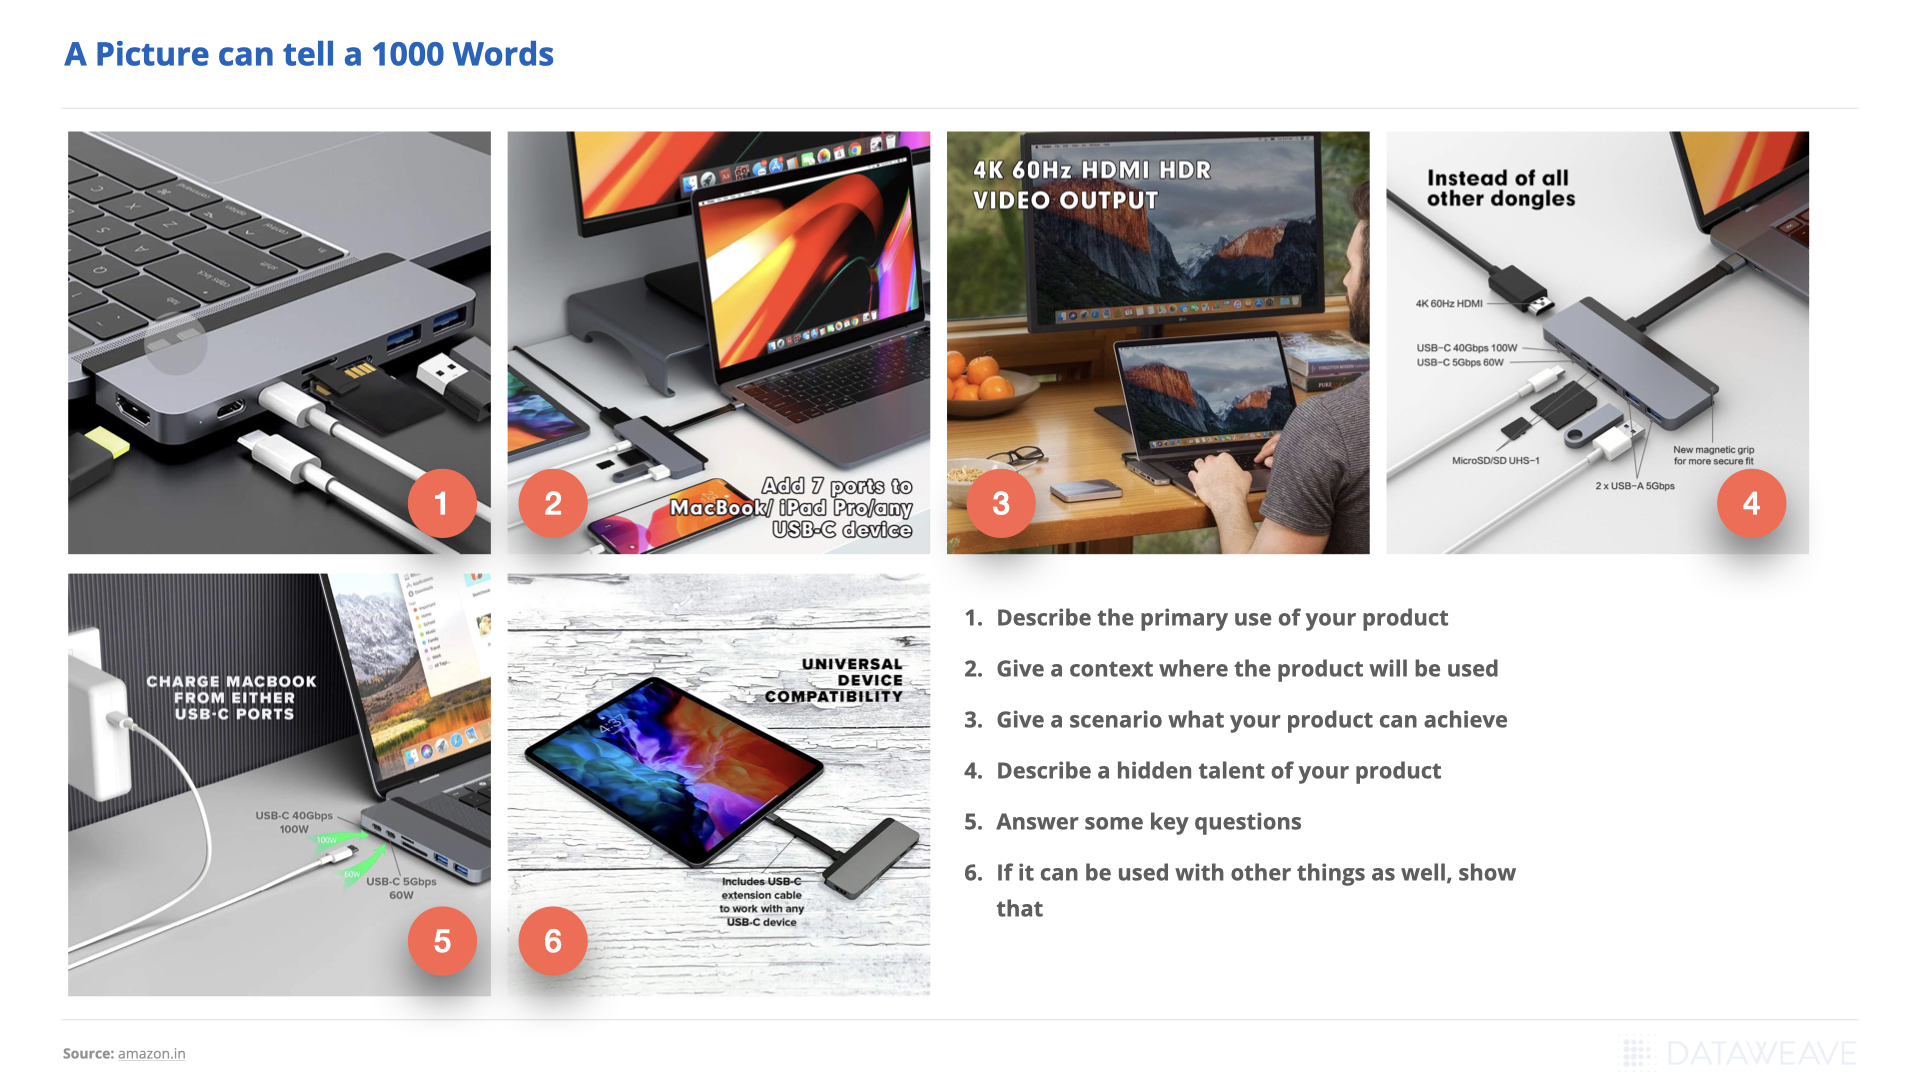
Avoid using standard visuals when displaying your products in Amazon’s image gallery. Product images are the hook that encourages visitors to click on your products. However, Amazon has specific image requirements that you’ll need to adhere to while presenting products. When shopping on Amazon, potential buyers are looking for high-definition and clearly visible photos. Thus, you will need diversity in images if you want your product and photos to stand out.
In addition to images, brands can make their product descriptions better through video content. Videos help your brand to stand out, build a more personal relationship with customers, and lead to increased sales. One study on eCommerce sellers found that using product videos increases sales for online stores by 144%.
Product Images
4. Switch to Intelligent Pricing & Win the Buy Box
Intelligent and competitive pricing is the most essential lever for revenue growth. With advanced technology like AI and analytics, brands can get insights into competitive pricing and develop an intelligent pricing strategy to calculate real-time changes in pricing optimally.
Amazon wants to give the consumer the best value for their money and thus has a Buy Box option. The white box on the right side of the Amazon product detail page is called the Buy Box, and customers can directly add items for purchase to their cart. However, not all sellers are eligible to win the Buy Box.
Thanks to Amazon’s customer-obsessed approach and high competition, only businesses with excellent seller metrics have a chance to win a share of Buy Box. Amazon weighs low prices with high seller metrics. If your brand has near-perfect performance metrics, having higher prices can still get you a share of the Buy Box. In contrast, brands with mid-range metrics will probably need to focus on offering the most competitive price.
But, why is the Buy Box important? According to BigCommerce, 82% of sales on Amazon go through the Buy Box, and the rate is even higher for mobile purchases. Getting insights into your competitor’s pricing with our Digital Shelf Solution will help you improve seller metrics and find the right pricing strategy for your products.
5. Provide Plenty of Social Proof
Testimonials can increase sales page conversions by 34%. Social proof has emerged to be of great importance in the eCommerce world, and it isn’t limited to recommendations from people customers know in the “real world.” A survey conducted by BrightLocal revealed that 31% of consumers reported that they read more online reviews in 2020 than ever due to Covid-19.
Product ratings and reviews on Amazon are at the center of the recommended products section, product listing page, and search results. Interestingly, customer feedback also has a huge impact on a brand’s ODR or Order Defect Rate. It is one of the most critical measurements tracked by Amazon. ODR is a measure of customers who have had a negative experience with you as a seller. Amazon uses it to assess a brand’s health as a seller. The ODR indicator is driven by customer feedback, so review management is the primary step for brands to avoid an Amazon ODR warning and improve their order defect.
6. Go Global
The Amazon marketplace is available in countries and markets worldwide, allowing brands to explore new territories and sell their products globally. Each foreign territory has a unique Amazon site that resonates with its culture and audience, making it easy for global sellers to compete with other brands. If your eCommerce brand has the operation capacity to expand globally, Amazon offers state-of-the-art international logistic capabilities.
Brands can expand in European countries like France, Italy, Netherlands, Germany, Spain, etc., and Asia Pacific locations like India, Japan, and Australia. Amazon is also available in emerging eCommerce locations like the Middle East, Brazil, Turkey, and Singapore.
7. Build a Branded Store
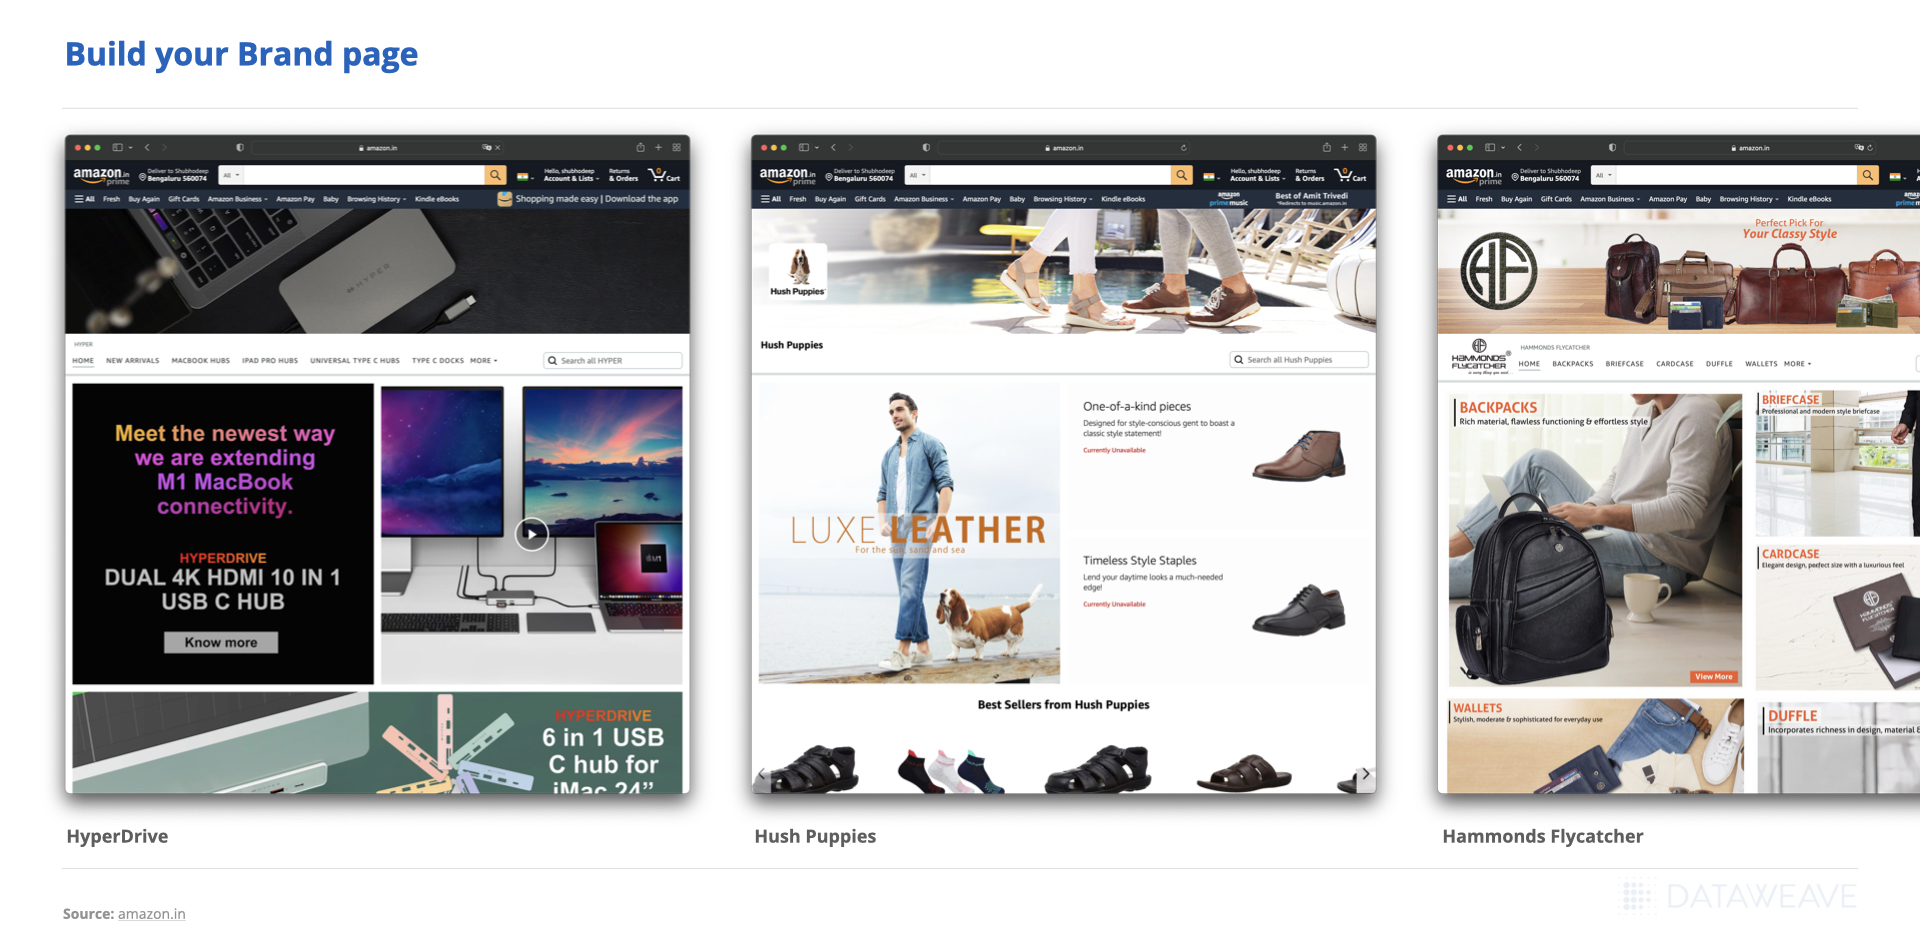
One of the best strategies to stand out on Amazon is to feature your products on a branded Store. Amazon has free tools that allow grants to build an online store where brands and sellers can showcase products and connect with customers. These stores look different from the typical Amazon listing layout and also have the option to create detailed pages with A+ content.
Build your Brand Page
For instance, Netgear, a company that offers technology-related products has an excellent branded store on Amazon. The brand has embedded images and videos that address buyers’ needs and how users’ lives are affected by using their products. The most attractive feature about this store is that they have integrated the value offered by their products into new use cases because of the current pandemic. For example, they’ve used phrases like “Make Online Learning fast and fun” and “Work from office at office speed.” Additionally, the categories and search tab help buyers search for specific products easily.
Creating branded stores allows you to build a beautiful brand experience for customers and offers a multi-page, immersive shopping experience. Brands can pick unique designs, integrate promotions, and use rich media to create a custom curation of handpicked products.
Conclusion
Amazon has 9.7 million sellers worldwide, of which 1.9 million are actively selling on the marketplace. The competition on Amazon is fierce, and it’s continuously increasing. Despite a large number of active sellers on Amazon, only a tiny fraction generates a significant portion of its total sales. Fewer than one in ten active Amazon sellers generated over $100,000 in annual sales, and only one percent of them hit the $1 million sales mark. Use these strategies to develop a comprehensive understanding of the Amazon platform and how to sell effectively on the platform while maximizing your presence amid rising competition.
No matter where your eCommerce business sells, there are some fundamentals that brands have to get right to achieve sales targets. Brands need to find the right product/market fit, nail their lead acquisition strategy, and design a qualified sales funnel to turn prospects into leads and eventually returning customers. They will also have to analyze their customer’s buying journey and get insights into competitors’ strategies to understand what works for their business.
If your eCommerce business is struggling, read this blog to learn about steps you can take to increase sales and keep your business afloat.
1. Lack of social proof
Customers often check for reviews or testimonials before making a purchase. Our decisions are consciously or unconsciously influenced by the opinions, choices, and actions of people around us. Social proof helps brands build customer trust, adds credibility to their business, improves brand presence, and validates customers’ buying decisions. 92% of consumers are more likely to trust user-generated content (UGC) and non-paid recommendations than any other type of advertising. Additionally, brands should also find ways to combat negative reviews since bad reviews can sometimes be extremely damaging.
Understanding these reviews or the impact of your brand’s social proof is critical. At DataWeave, we help brands analyze online reviews to understand customer sentiment and adapt to feedback to enhance their experience with your brand.
2. Slow site speed
Site speed of the home page and checkout page on your D2C website can be a roadblock. Slow sections on your site like My Accounts, checkout, and cart are often overlooked when it comes to tracking site speed. Brands should run their checkout process at least once a month to ensure it’s fast, smooth, and bug-free. You can optimize images, strip unused scripts, implement HTTP/2, etc., to improve site speed and performance.
3. Poor customer service
69% of US consumers say customer service is very important when it comes to their loyalty to a brand. Guaranteeing a return customer is important to maintaining customer loyalty. While the focus is on the first purchase for new customers, your brand’s customer service will determine if first-time customers become repeat buyers. Loyal customers are known to spend 67% more on a brand product than new customers, even if they make up only 20% of your audience.
Types of customer service
4. Failure to send traffic to popular products
Be it your own D2C website, or when selling on a marketplace, you should be able to drive traffic to your best-selling products. One of the best ways for sending traffic to popular products on your website is to run paid ad campaigns and reach new audiences with influencer marketing on social media. Brands can also attract customers with organic media such as writing blogs and producing podcasts.
If you’re looking at driving traffic to key products on Amazon & other such marketplaces, sponsored ads are the way to go! Sponsored ads help your best-selling products more discoverable & helps shoppers find your brand with ease.
5. Inadequate pricing
Finding the right pricing strategy for your eCommerce business is crucial for optimizing sales and increasing revenue. The first step is to perform a competitor and historical data analysis to get a general idea of the market and then develop a pricing strategy that is the right fit for your products. Brands also have to ensure that they have dynamic pricing that can adjust according to supply and demand.
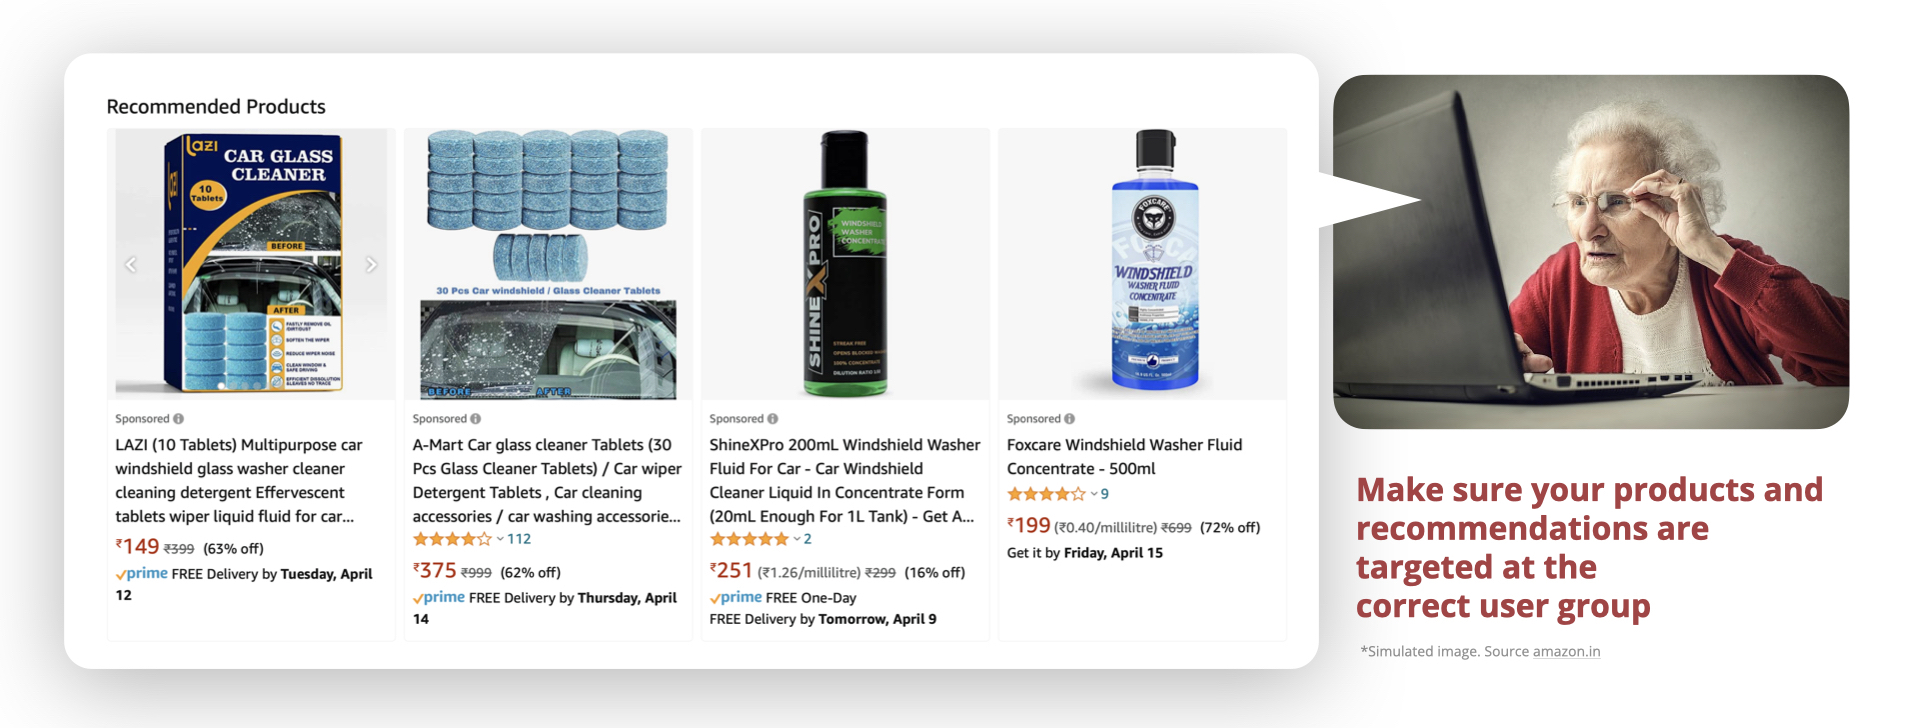
One of the biggest mistakes that eCommerce businesses can make is targeting the wrong audience. It’s crucial for brands to define that target audience and then tailor products and marketing toward them. To increase sales as an eCommerce business, brands have to understand their audience, their interests, and how to appeal to their interest. Start by creating ideal buyer personas that represent your ideal customers. Also, segmenting audiences and targeting various groups based on buyer personas for ad campaigns will lead to better sales and revenue.
Targeting the right audience
7. Poor product descriptions
One of the major and common mistakes by eCommerce brands is using irrelevant product descriptions that are not optimized for the product. Customers don’t add products to their cart if they have difficulty finding sufficient information relevant to the product. Brands should write attention-grabbing descriptions optimized for SEO that are informative for the users. Here are some tips to optimize content to drive more eCommerce sales.
Due to COVID-19, many businesses have had to modify or temporarily shut down their daily operations. However, finding new revenue streams can be a great way for eCommerce businesses to make up for the lost income and keep the company afloat. The best solution is to diversify your product offerings by offering commonly purchased products in bundles.
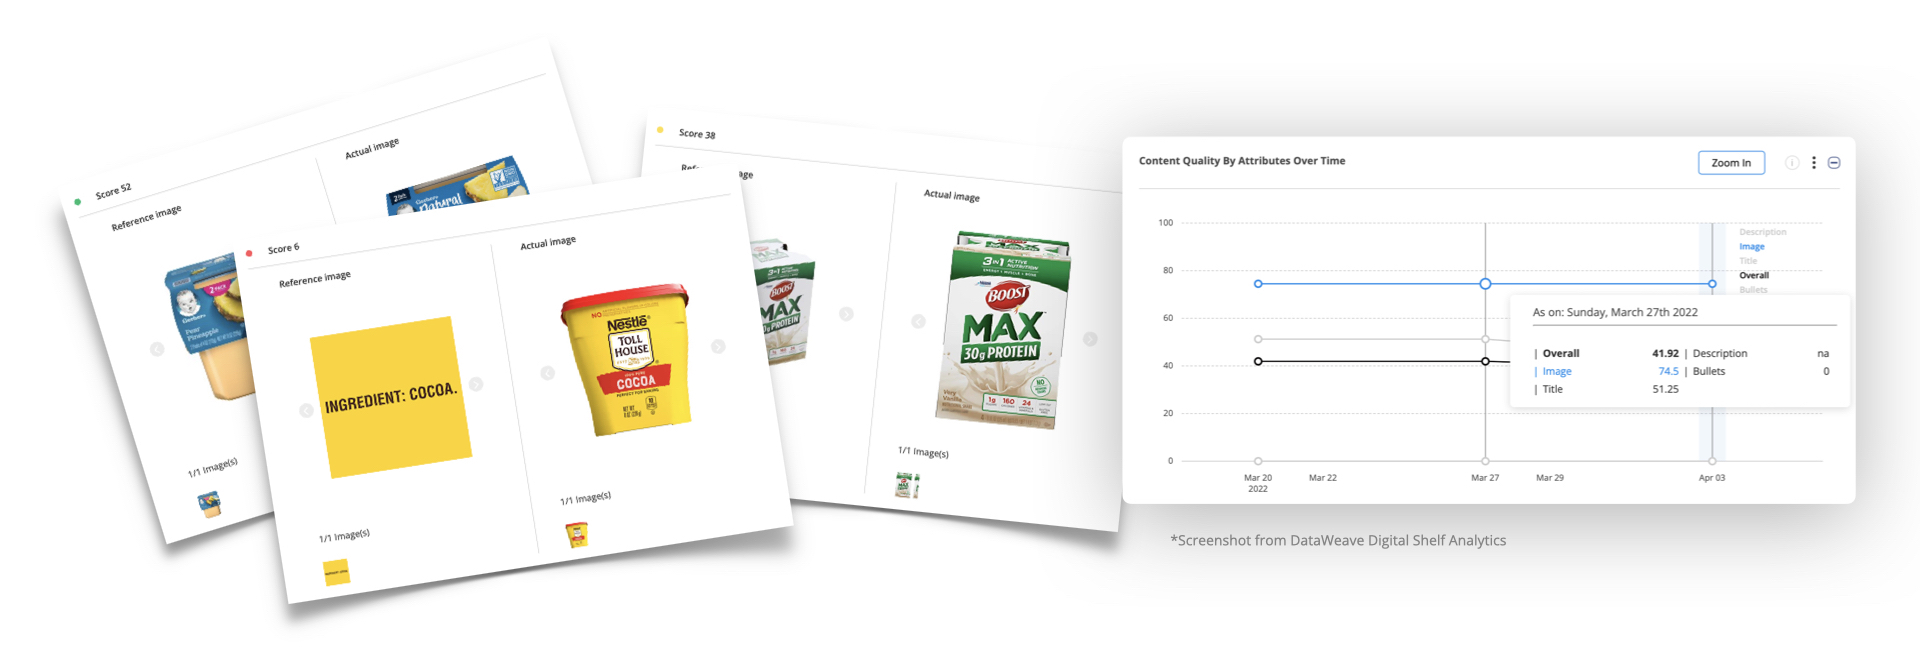
9. Low-quality visuals
Businesses fail to hit their sales targets because of low-quality visuals in product descriptions. High-quality and custom images can improve conversion rates from both marketplaces and image-based channels like social media. Social media users are attracted to exciting, high-quality content that conveys a desirable lifestyle. Brands should use high-resolution, attractive pictures of their products. Brands can also utilize UGC and influencers to help build up their content libraries.
Low-quality visuals
10. Wrong Assortment. Poor Availability
When your target audience lands on your eCommerce store and cannot find what they’re looking for, it leads to a poor shopping experience, but more importantly a lost sale for your brand! While you cannot have endless inventory, it’s essential to optimize your assortment & product availability to decrease the chances of your customer walking away. Assortment & availability optimization begins with analyzing current and historical inventory trends. If done manually, assortment can be a time-consuming task. A healthy assortment can increase retail sales by creating a positive shopping experience for your customers and encouraging them to return to your store again.
11. Bad eCommerce UX
Offering a sub-standard user experience is a common reason why eCommerce businesses find it difficult to increase sales. According to a study, the conversions can fall by up to 7% for every one-second delay in page load time. Businesses can use a countdown clock on their landing page and exit pop-ups to improve conversations. Your landing page and product descriptions should provide information that helps your users make a better and more informed decision.
Conclusion
If your eCommerce’s business sales are tanking, improving site speed, customer service, social proof, and product descriptions are some of the levers you can pull to remedy the situation. Brands should also work on improving online reviews & ratings, availability, assortment, visuals, and website UX to improve customer experience. These steps not only increase loyalty but also improve customer retention.
Need help tracking online pricing for your eCommerce business? Or decoding customer sentiment from reviews they’ve left for your products? Or do you need insights into your product assortment and availability? Sign up for a demo with our team to know how DataWeave can help!
The combination of economic uncertainty, inflation, and perceived affordability has increased consumer’s willingness to buy and try more private label products, challenging National brands to differentiate their eCommerce strategies, especially those related to price positioning, in other ways.
Our previously released report, Inflation Accelerates Private Label Share and Penetration, confirmed 8 out of 10 brands with the highest SKU count carried across all grocery retailer websites to be private label, signaling the strength of their digital Share of Voice. Given the growing shift in consumer preference toward private label brands, we are providing access to the latest trends seen from September 2021 through March 2022. Below you will find a summary of what the data revealed about the growing presence of private label brands on the Digital Shelf.
Private Label Account and Category Penetration
We analyzed private label penetration at an account level to understand which private label brands have the greatest presence on retailer digital shelves, and to see which retailers may be leaving product assortment opportunities on the table.
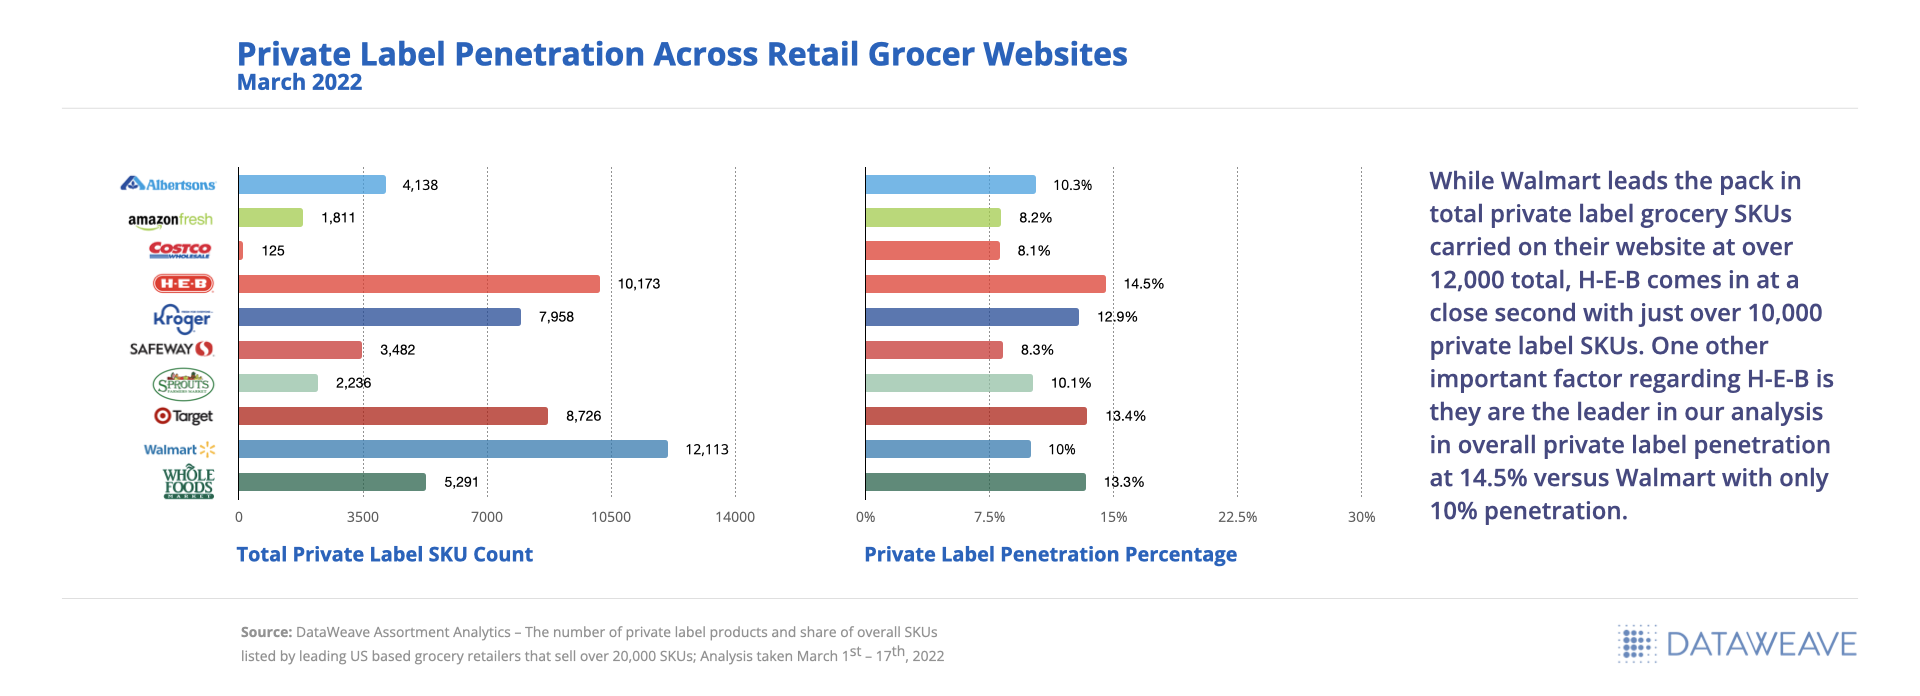
Private Label Penetration Across Retail Grocer Websites
As a retailer, it is important to understand how your private label penetration stacks up against the industry average at a category level, especially given the performance tracked for retailers included within our analysis and the vast number of SKUs they offer online (over 20,000).
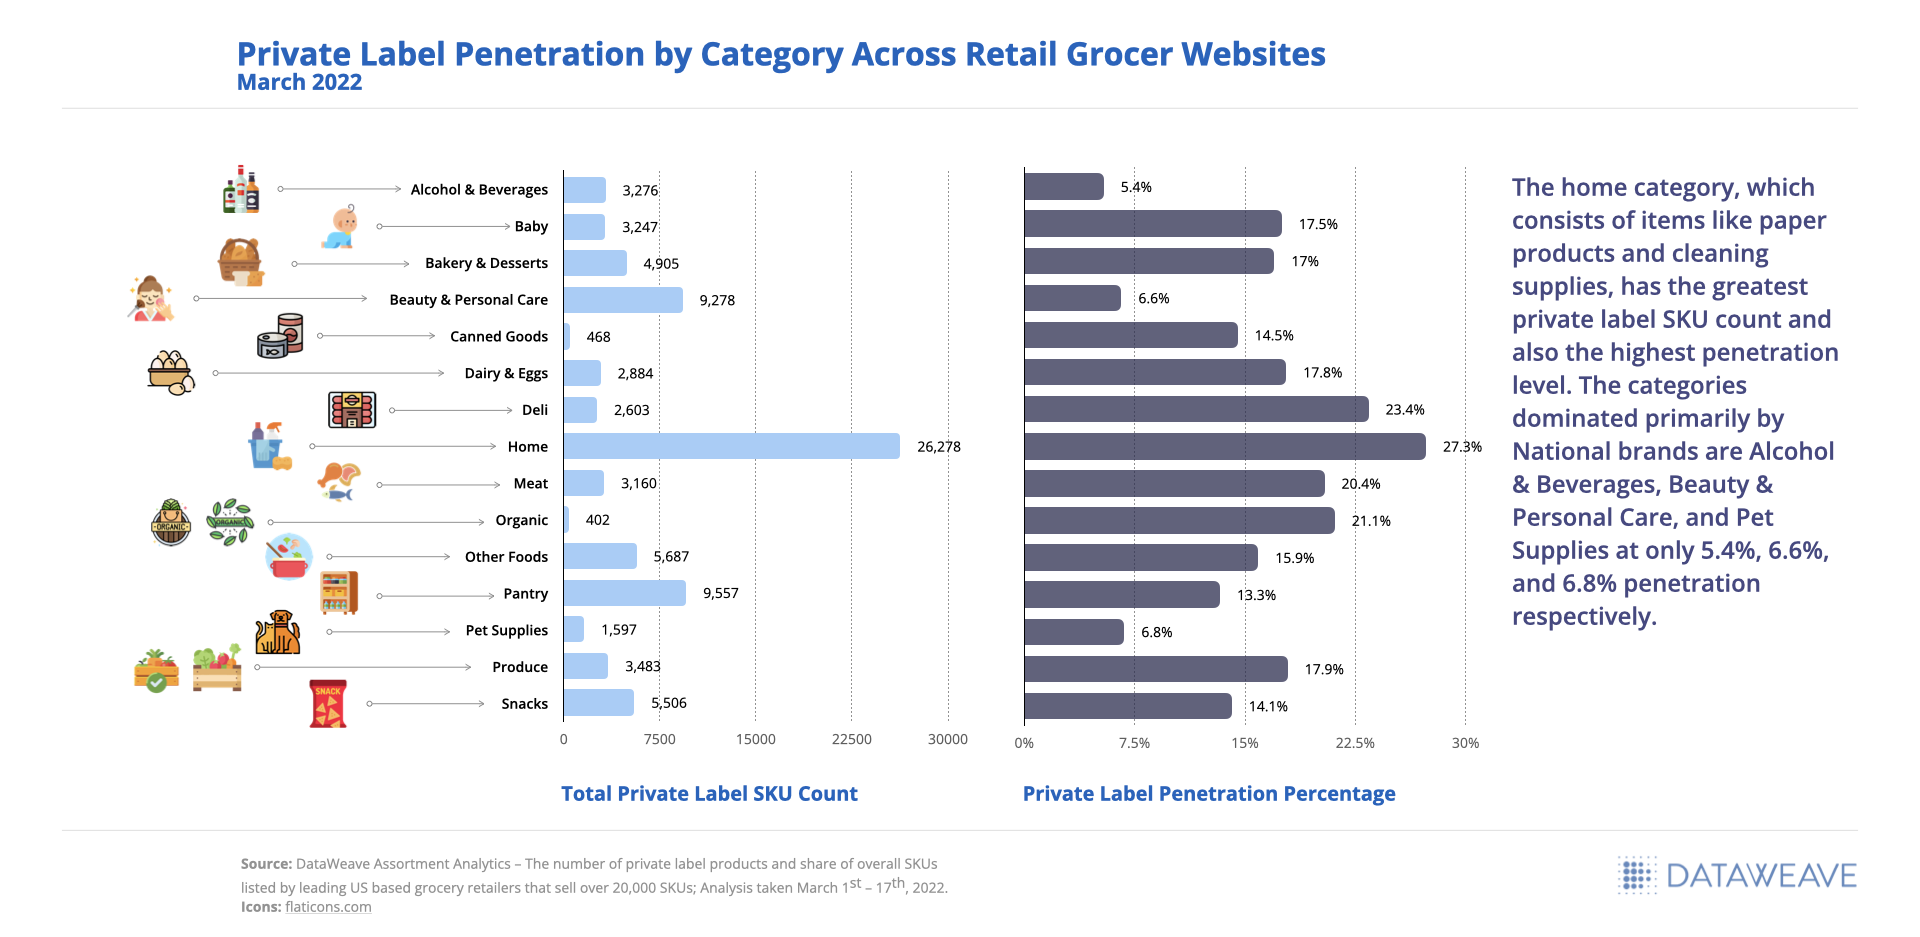
Private Label Penetration by Category Across Retail Grocer Websites
The Private Label and National Brand Price Gap Widens
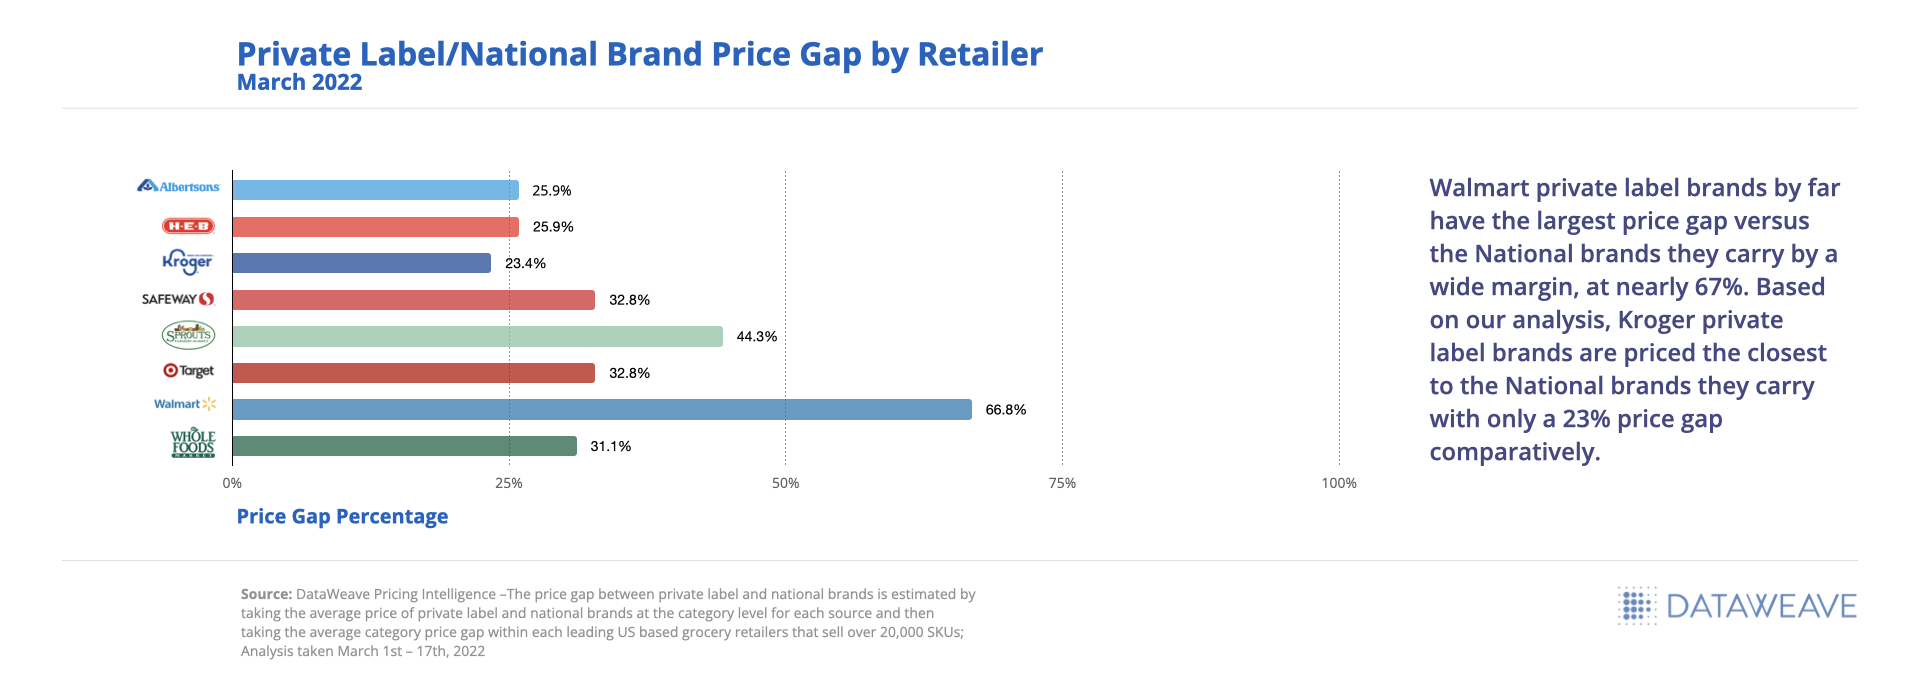
Private label brands tried out of necessity mid-pandemic increased in popularity as grocery prices continued to rise, providing an opportunity for retailers to increase brand affinity and loyalty for their online shoppers. Retailers alike were able to keep affordability at the forefront of their strategies and maintain a price gap of 23% or more, despite inflationary pressures to increase prices.
Private Label / National Brand Price Gap by Retailer
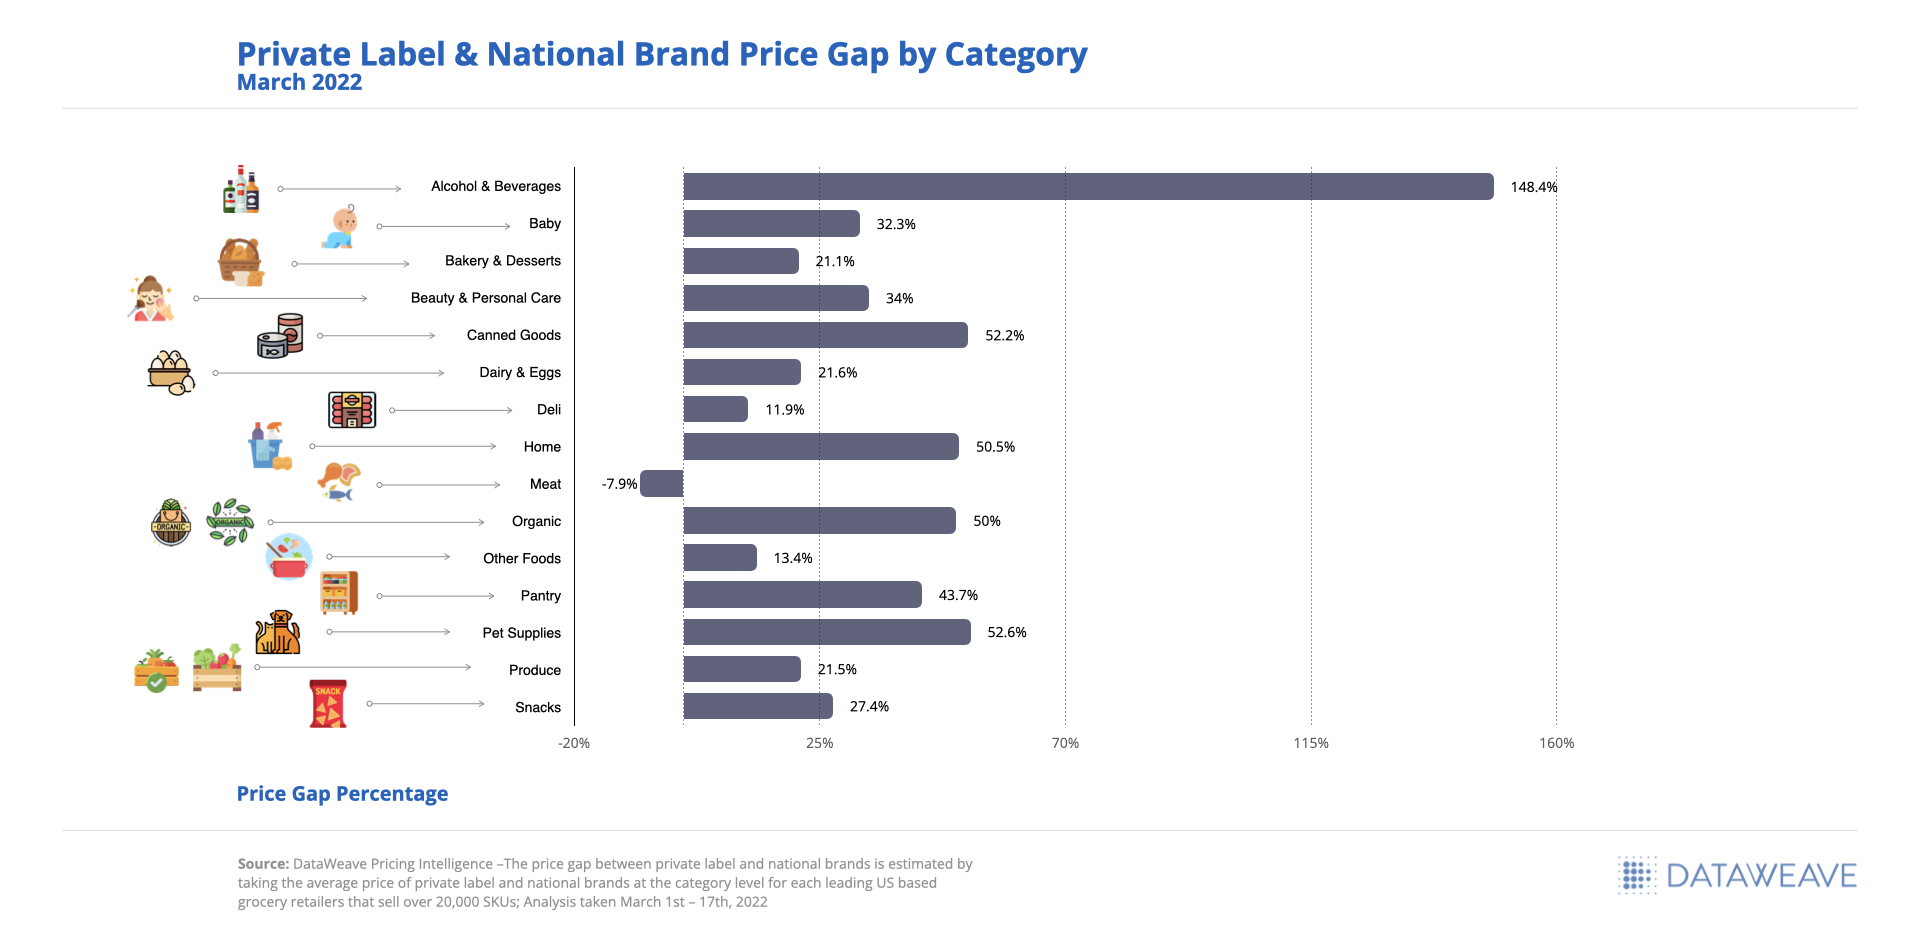
Looking at the results at a category level, we can see that Meat is the only category found within our analysis where private label brands are priced higher than National brands at an average of 8% greater. The Alcohol & Beverages category tends to always see the greatest price gap between private label and National brands given the price variances by unit (ranging from under $10 to over $100), in this case averaging a 148% price gap.
Private Label & National Brand Price Gap by Category
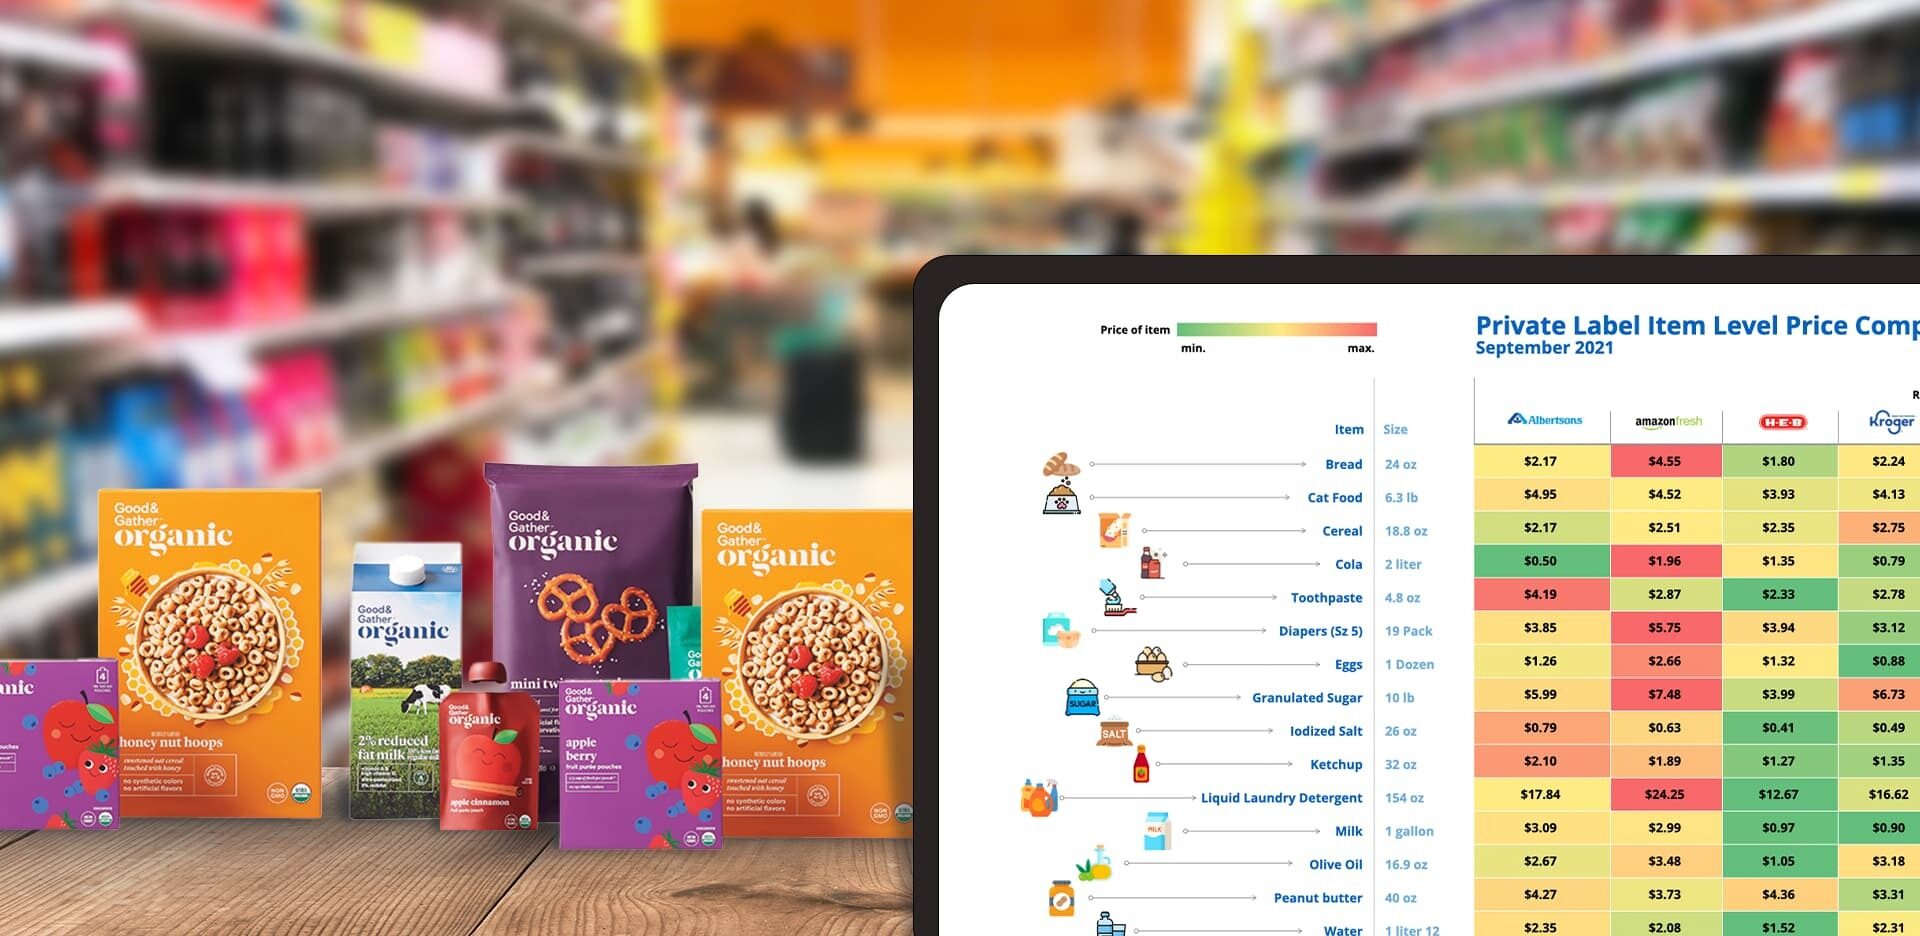
Private Label Total Basket Value Comparison Across Retailers
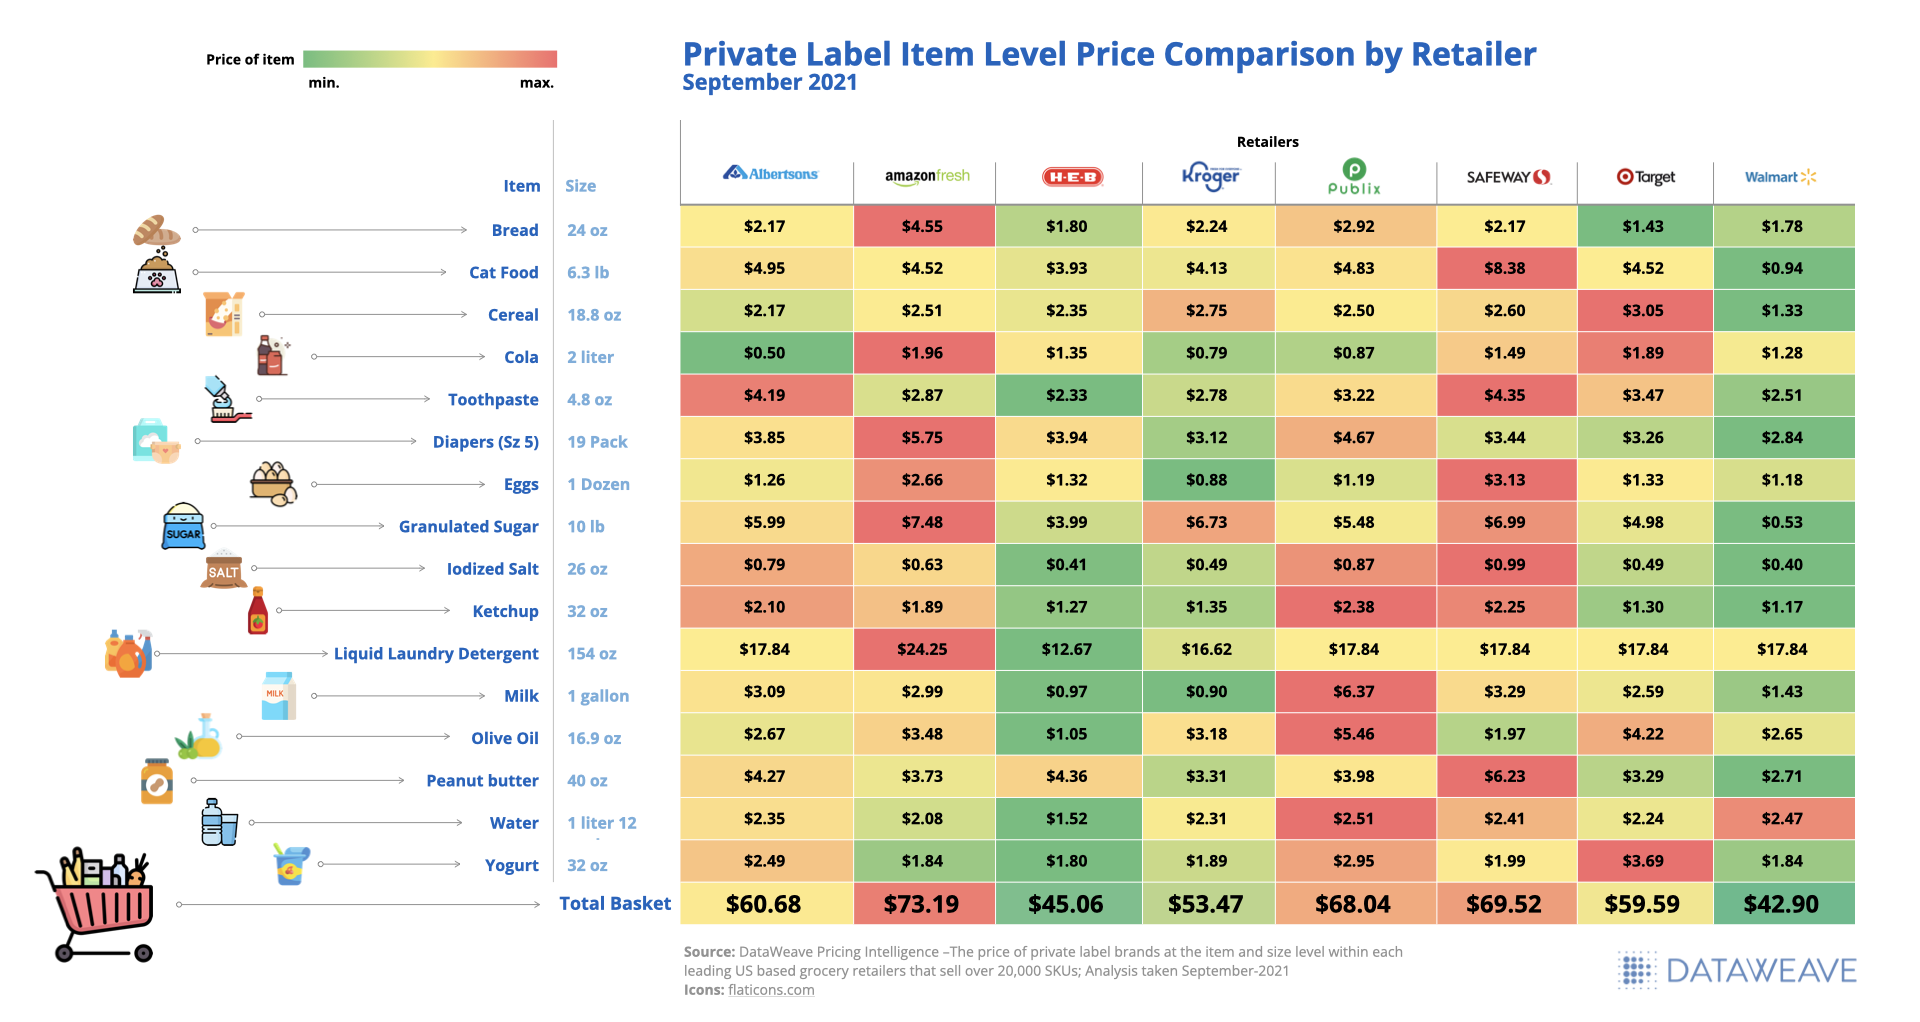
While SKU-level pricing is extremely important to product strategy, for a retailer, it is equally as important to be as mindful of the total basket value even more so now as consumers further their private label loyalty across various categories. A few SKU-level missteps in pricing decisions can exacerbate cart abandonment and negatively impact shopper loyalty in a world where prices can be compared instantly in the palm of your hand.
Based on our analysis, Walmart and H-E-B private label products offered the lowest priced total basket of goods at $42.90 and $45.06 respectively, whereas AmazonFresh and Safeway offered the highest total at $73.19 and $69.52 respectively.
Private Label Item Level Price Comparison by Retailer
Inflation-driven Price Changes are on the Rise with Room to Grow
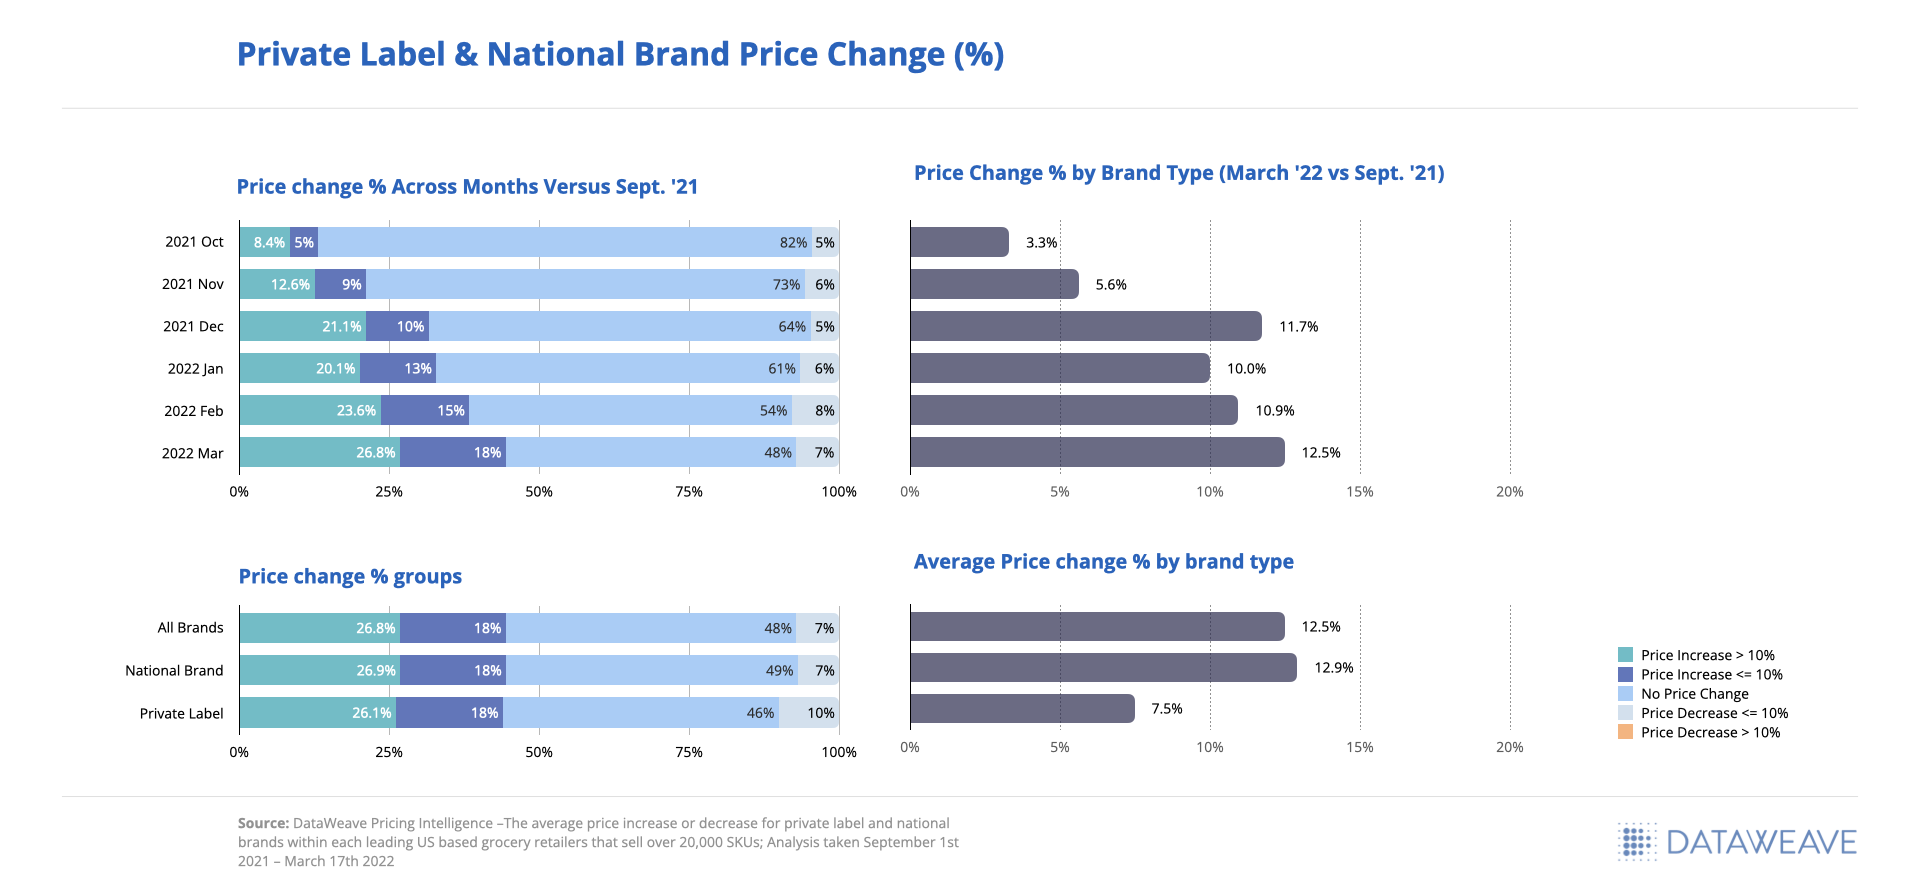
Based on the 20,000+ SKUs analyzed, we saw a continual price increase every month since September 2021 when comparing future monthly prices to those we tracked in September. The greatest price increase happened in March 2022 at 12.5% on average, however, there are still 48% of SKUs that have yet to see a price increase even as inflationary pressures rise.
When viewing the split between National and private label brand price increases in March 2022 versus September 2021, we saw National brands increased prices on average by 13% where private label brand prices only increased an average of 7%.
Private Label & National Brand Price Change (%)
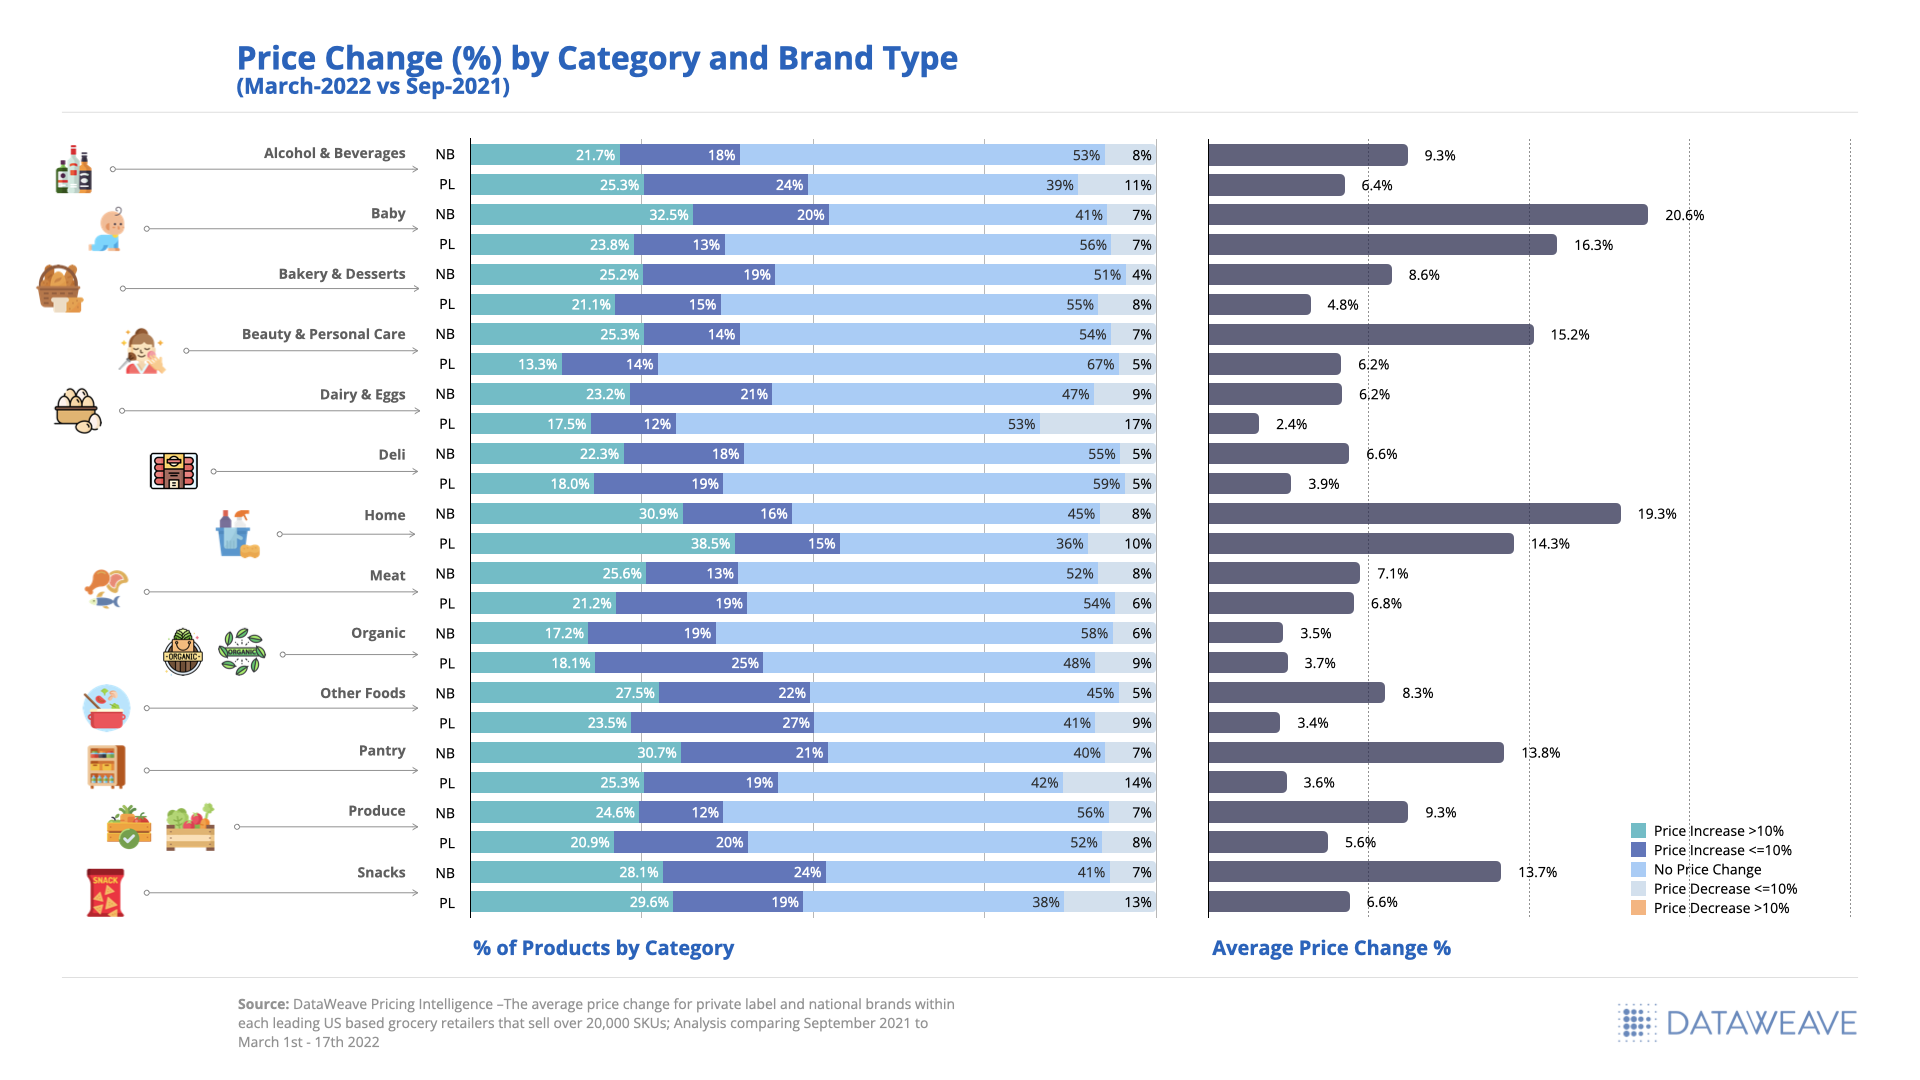
Price decreases are still occurring across all categories, despite inflation, but to varying degrees ranging from 5% for Deli items to 17% for Dairy & Eggs. Within the Dairy & Eggs and Pantry categories, private label brands reduced prices for an additional 10% of total SKUs compared to National brands.
The greatest category of opportunity for price increases within private label were found within Beauty & Personal Care with 67% of private label products yet to see a price change since September 2021.
Price Change (%) by Category and Brand Type
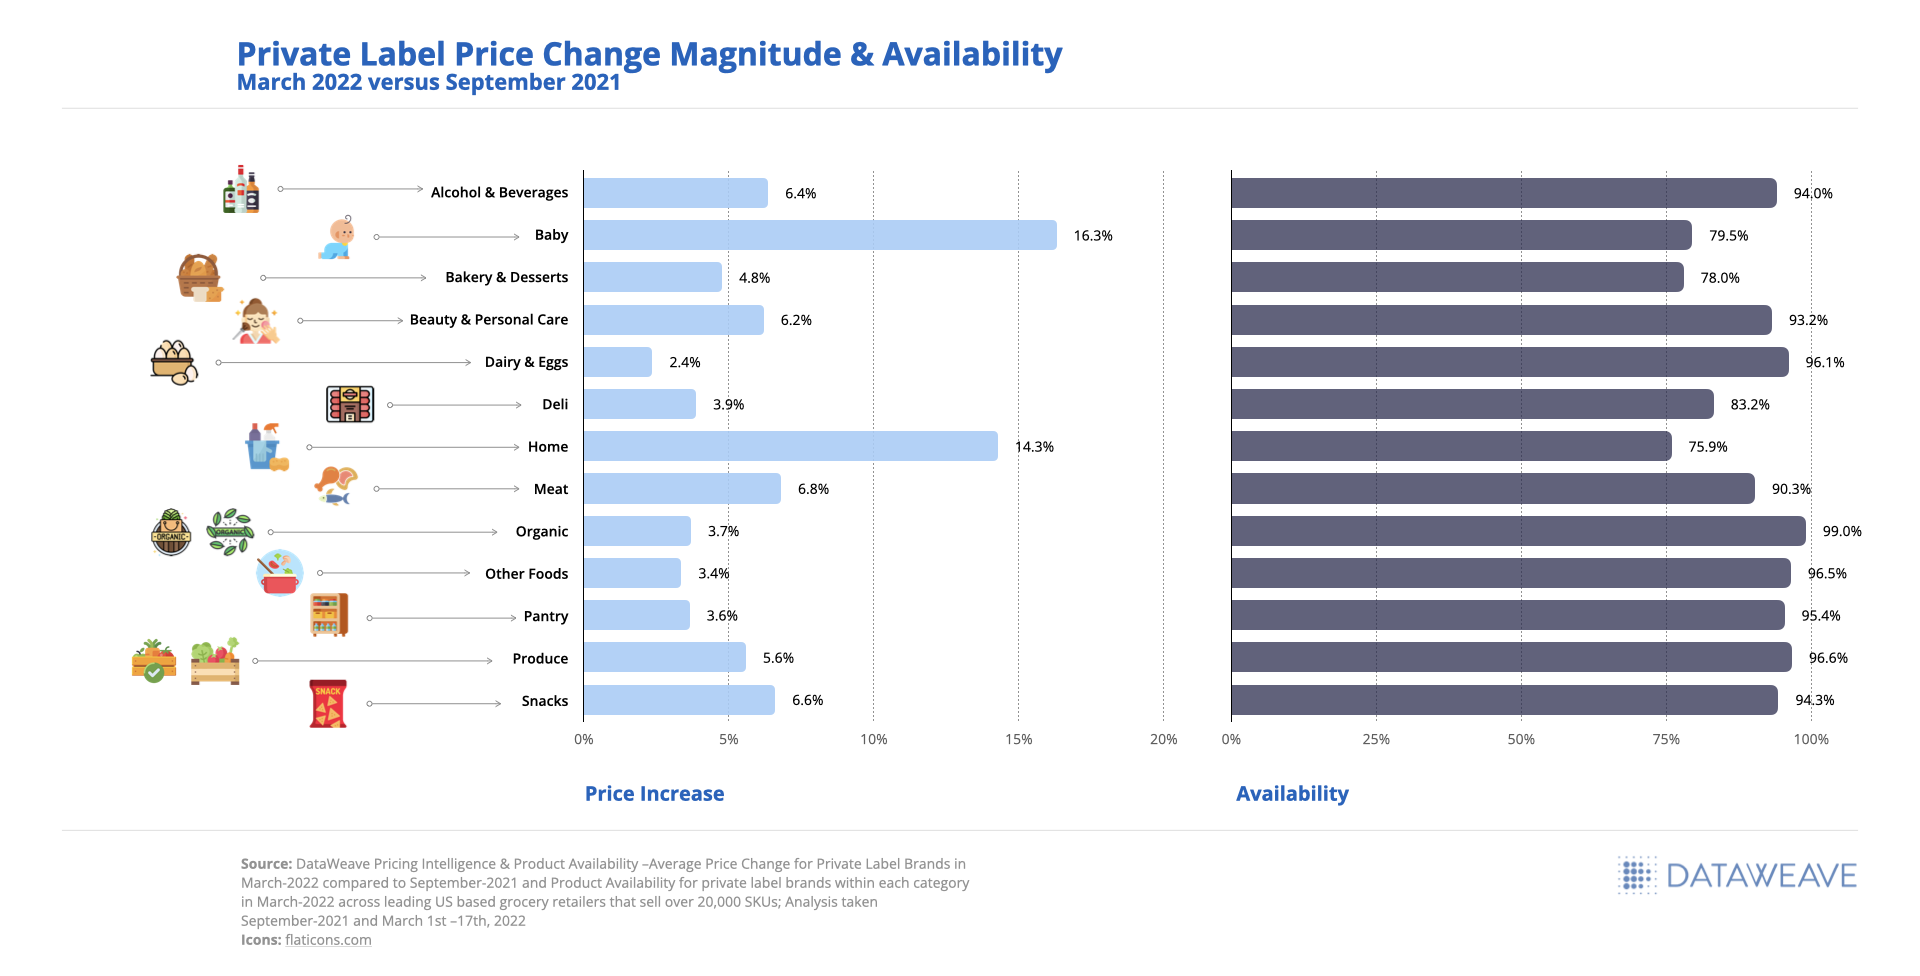
Private Label Price Change Correlation to Product Availability
The category with the greatest magnitude of price increase seen within private label brands occurred within Baby at 16.3% followed by Home at 14.3% on average. Private label products within Home and Baby categories were also showing the lowest availability rates, 75.9% and 79.5% respectively, indicating a high demand for these items even as prices increased.
The private label categories with the smallest price increase on average were Dairy & Eggs at 2.4% and Other Foods and Pantry at 3.4% and 3.6%, respectively.
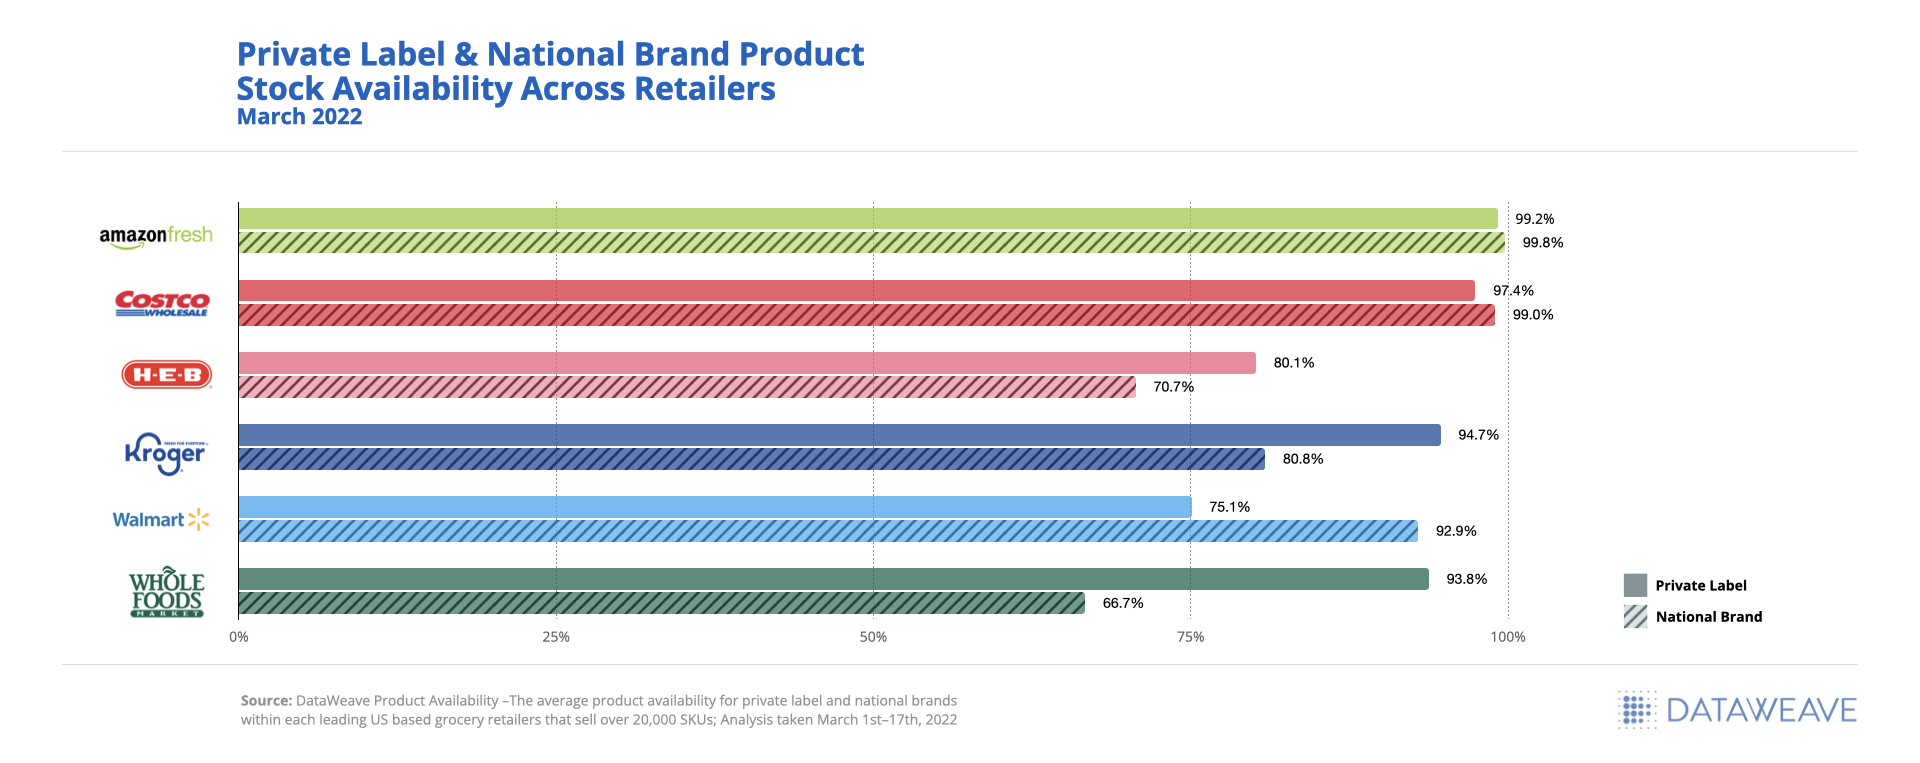
While in many accounts both private label and National brands struggled with stock availability in March 2022, National brand availability is much lower (around 10% on average) than private label availability.
H-E-B had the lowest overall product availability at 76% across both private label and National brands on average. Only Walmart had lower availability for Private Label at 75% compared to 93% for National brands, but they also had the greatest price gap between private label and National brands.
Private Label & National Brand Product Stock Availability
The Future of eCommerce Growth for Private Label
Our greatest learning from this analysis is that it’s time for retailers to start thinking and planning more like the National brands they carry when it comes to positioning their private label brands for success. Successful retailers are taking this time to reset their private-label strategies and transfer short-term switching behavior into long-term customer loyalty.
Retailers playing catch up have the opportunity to address some of the gaps highlighted throughout this analysis, for example, relative to pricing and assortment changes. Below are some of the highlighted opportunities:
Though inflation is driving price hikes, more than 50% of products analyzed have yet to see a price increase indicating an opportunity to protect margin
Narrowing the price gap between a store’s brand and National brands should not be the only focus as competitive private label brands are becoming a greater threat at a category and basket level
Modifying and expanding assortments as demand increases for private label can improve customer retention and loyalty, especially for cross-shopping consumers
According to The Food Industry Association (FMI), only 20% of food retailers currently promote private brands on their homepages, and only 48% include detailed product descriptions indicating even more opportunities left on the table for retailers to optimize private label digital performance.
Many leading retailers are leveraging real-time digital marketplace insights and eCommerce analytics solutions like ours to further their online brand presence and optimize sales performance. This report highlights only a small sample of the types of near real-time insights we provide our clients to effectively build competing strategies, make smarter pricing and merchandising decisions, and accomplish eCommerce growth goals. Be sure to reach out to our Retail Analytics experts for access to more details regarding the above analysis.
For access to a previously recorded webinar presented in partnership with the Private Label Manufacturers Association and conducted by DataWeave’s President and COO, Krish Thyagarajan, click here.
Before the pandemic, the grocery industry was set around brick-and-mortar stores, and there was a slow movement towards on-demand grocery. Online grocery delivery was still considered a peripheral channel. However, grocery shoppers started turning to on-demand platforms since the onset of COVID-19. According to Acosta’s report, since the pandemic, 45% of customers prefer online grocery shopping over physical stores.
COVID-19 drastically accelerated the online grocery delivery trend, increasing 10% and 15% of total grocery sales during the peak COVID-19 time. In the U.S., online grocery shopping reached nearly $90 billion in sales in 2020, increasing by more than $30 billion.
In this article, you’ll learn about the early pioneers of online grocery delivery in the U.S., the modern players, and the impact of COVID-19 on grocery trends.
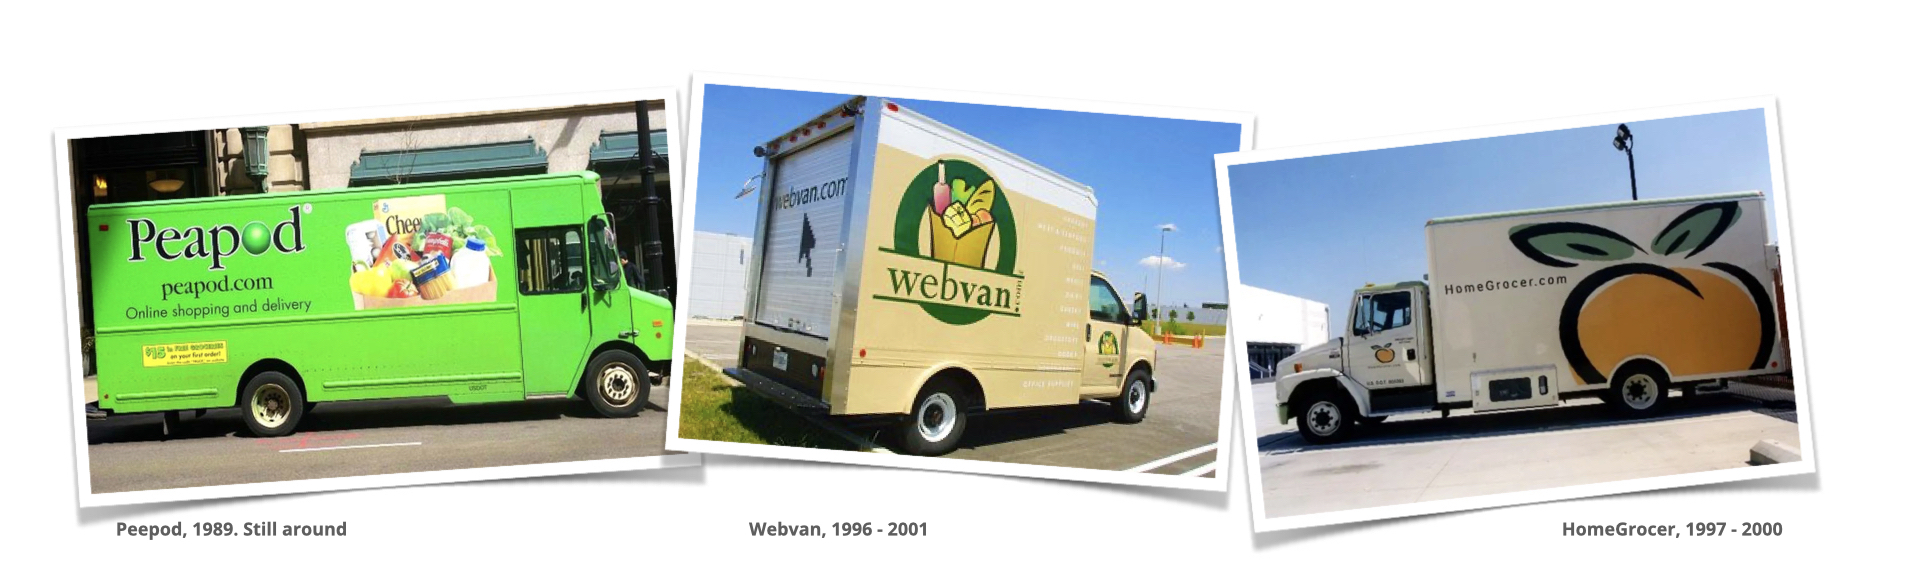
Early pioneers of online grocery delivery
Early pioneers of online grocery delivery
In the late 1990s, consumers had just started ordering products online. Online grocery shopping was an early area of focus. It offered lucrative rewards to high-spending consumers, increased convenience, and saved them time. Peapod, founded in 1989 by brothers Andrew and Thomas Parkinson, was the first online grocery delivery service. Back when they started, users had to install software from CD-ROMs and then place orders. Though it took years to become a well-known name in the industry, Peapod is still in business.
Webvan and HomeGrocer.com were two other early pioneers of online grocery delivery that started in 1996 in California and 1997 in Washington respectively. Webvan had a successful launch in California, and they had aggressive expansion plans to operate in 26 major cities around the United States. However, the company filed for bankruptcy less than two years later. HomeGrocer.com quickly created the infrastructure needed to support the business, including a fleet of vans and a huge warehouse. They had impressive early growth, and sales reached over $1 million a day by mid-2000. They expanded into other markets, including California, Georgia, Oregon, Texas, and Illinois.
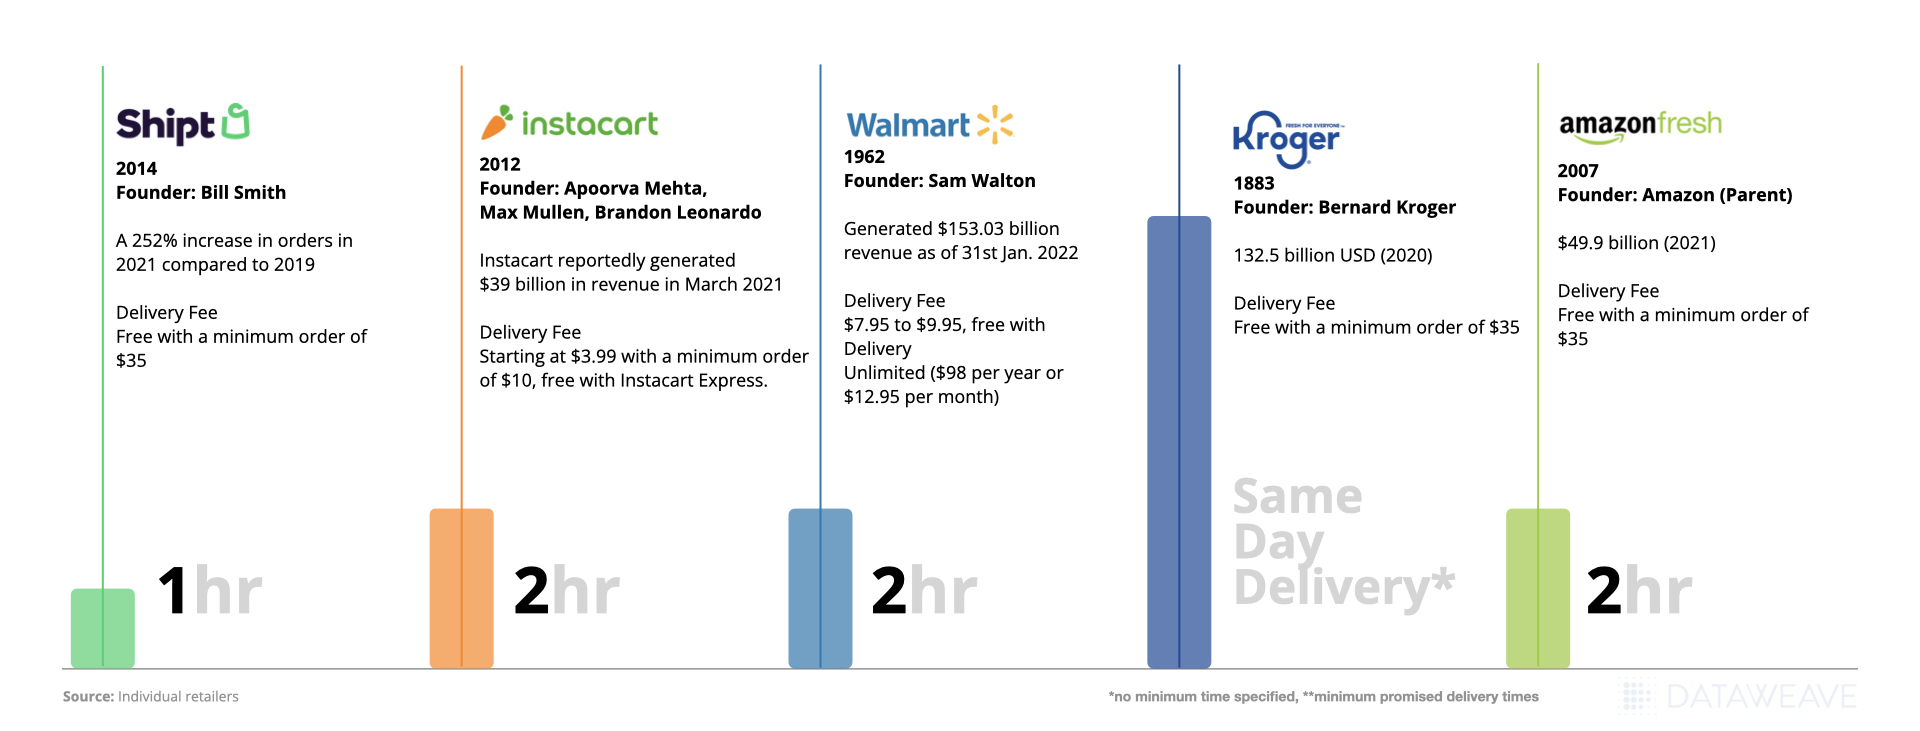
Modern players of the on-demand grocery delivery
Modern players of the on-demand grocery delivery
Online Grocery Trends Post-Pandemic
When COVID-19 first began to engulf the world, supermarkets and grocery delivery platforms like Amazon Fresh and Instamart became overwhelmed with huge demands. To handle the surge of online orders, stores had to make drastic changes to accommodate the switch to on-demand delivery requests. Popular grocery delivery brands had to introduce waitlists and online queues for new customers. According to a poll, 53% of shoppers would continue online grocery shopping because they had a good experience, indicating that the on-demand grocery trend will continue post-pandemic.
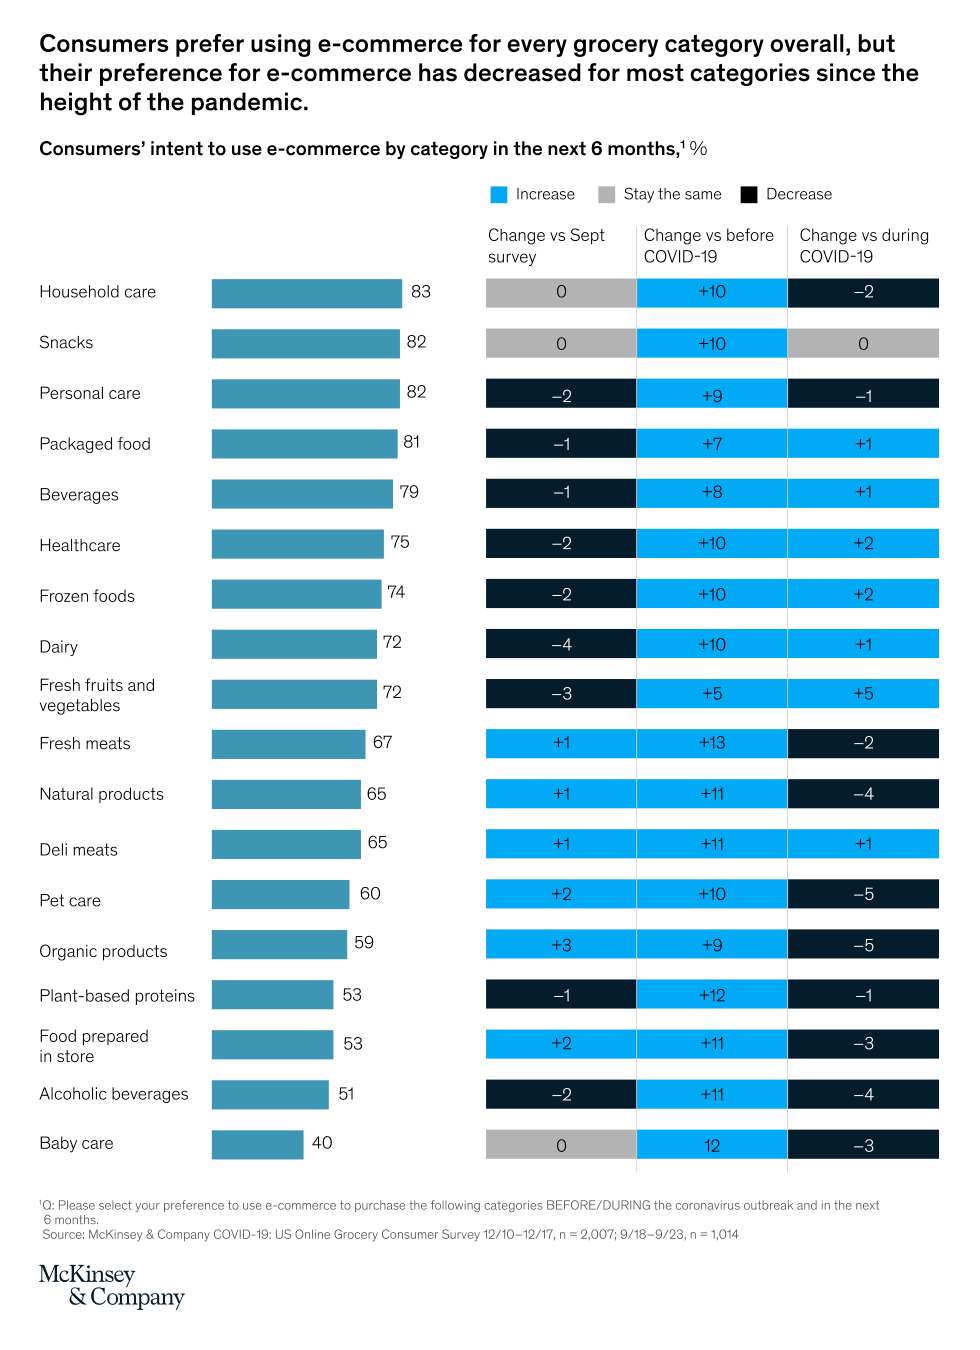
Mckinsey Grocery Report
As shoppers prefer more digital channels in their path to purchase, the on-demand grocery trend is becoming much more significant for both consumers and brands. According to a McKinsey and company survey, frozen fruits, health care items, fresh fruits and vegetables, packaged foods, household care items, beverages, and deli meats categories are likely to remain popular among U.S. consumers post-pandemic. Meanwhile, CoreSight Research found that fresh fruits and vegetables were the biggest bestsellers from 2020-to 2021 followed by fresh dairy, meat, eggs, frozen food, and bread and baked goods.
Why Grocery Shoppers are going digital
Online ordering offers a more personalized experience to shoppers as they get recommendations for products that are often bought together. When paired with data analysis and AI-powered algorithms, grocery stores could work on targeted marketing and offer quick delivery services.
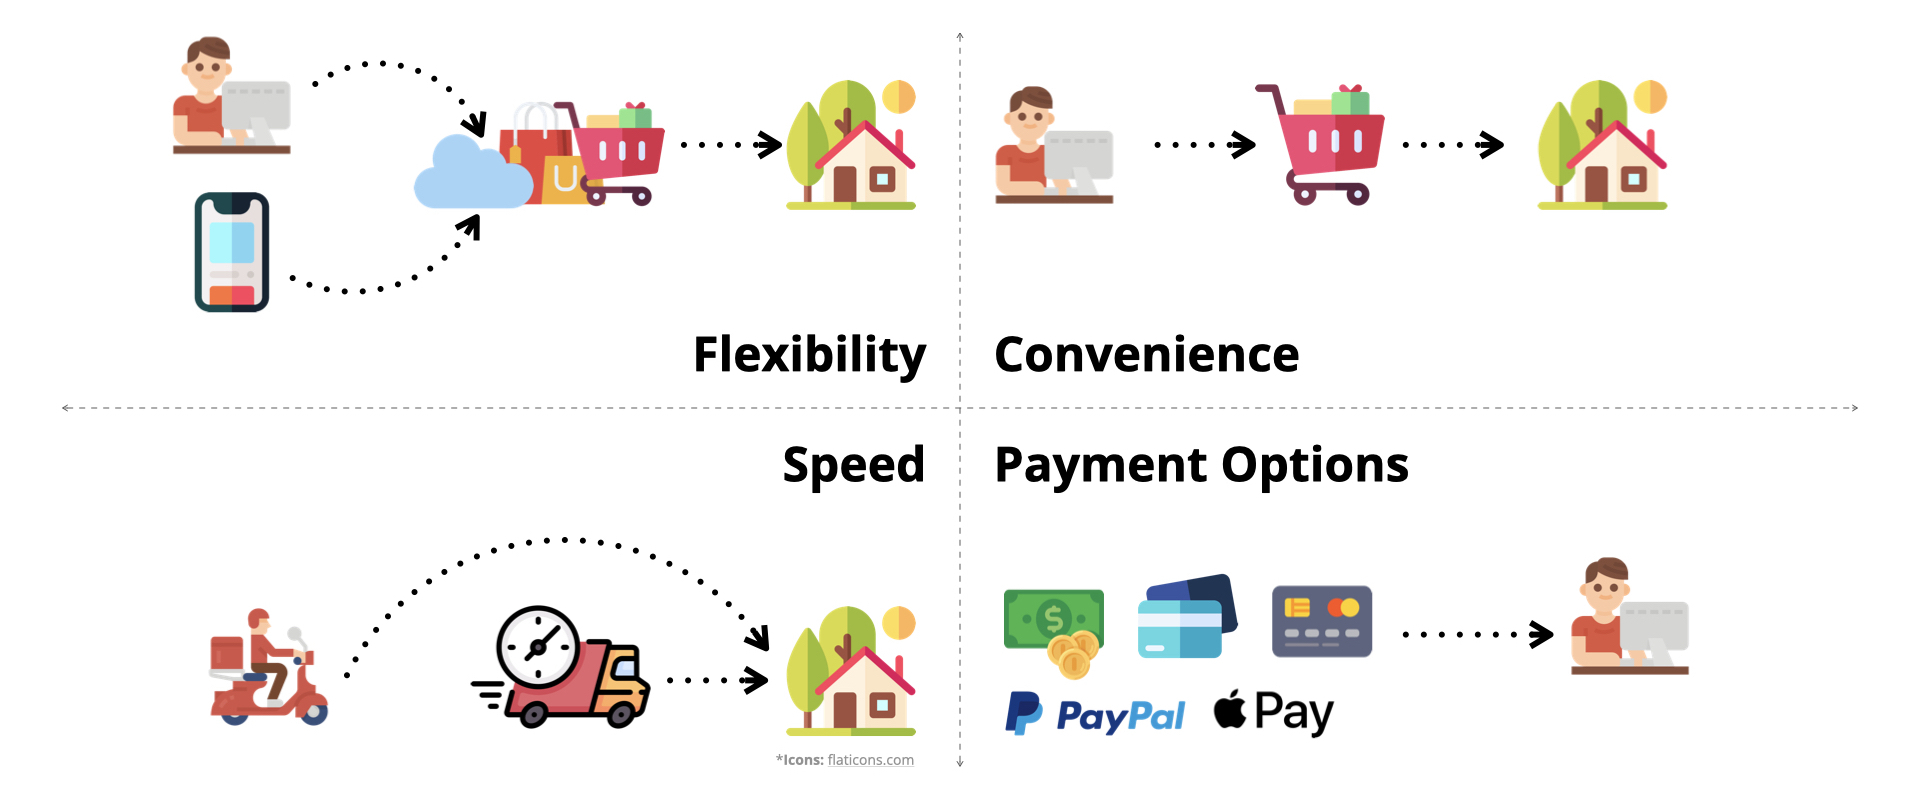
1. Flexibility
On-demand grocery shopping offers customers a wide range of delivery options, including subscription services, buy online pick up in-store, click and collect, option-based pricing, and much more. This offers choice and accessibility to modern customers looking for speed and convenience.
2. Convenience
With the increasing focus on social distancing and safety, shoppers started to rely on delivery services rather than waiting in long queues and risking exposure. The focus and priority of grocery shoppers shifted from discounts and pricing to convenience, speed, and safety. Online grocery shopping order methods also differ by generation. 40% of millennials prefer to shop groceries on mobile, and 52% prefer computers. Similarly, 66% of Gen X prefer to shop on computers, and only 27% prefer to shop on smartphones.
Grocery Shoppers are going digital
3. Speed
The fierce competition in the on-demand grocery delivery space has led to small delivery times. Startups like GoPuff (30 minutes), and Jiffy (15 minutes) are competing with the big boys like Walmart and Amazon Fresh to deliver groceries in under an hour. Quick delivery options like two-hour delivery and same-day delivery have made it easier for customers to shop for fresh produce. Customers can quickly order a few items for a specific recipe and get it delivered within a few hours.
4. Multiple payment methods
At store checkouts, cash and card are the only two acceptable options. Customers prefer to have more options in today’s modern world. Online grocery shopping makes buying easier by offering multiple payment options like PayPal, credit/debit cards, and monthly payment plans that negate the delivery fees for each delivery.
How to successfully run a Grocery Delivery Business?
The increasing demand for speed and convenience puts pressure on the grocery industry that faces inventory issues like fresh produce and product availability. However, the benefit of online grocery delivery services is that it provides insight into the end-to-end view of the customer journey. Grocery delivery brands can use the data to design services and models that meet customer demand and minimize costs across the supply and distribution chain.
According to the Statista Fashion eCommerce report 2021, the compound annual growth rate (CAGR) for online fashion is predicted to be 10.3% between 2018-2023. The widespread need for trendy fashion presents a challenge for fashion brands to succeed in a highly crowded and competitive space. With eCommerce shopping becoming more prevalent, fashion brands aren’t just competing for brick-and-mortar sales. Instead, they’re also competing for those late-night or impulse purchases from online customers.
Looking to 2022 and beyond, this blog will highlight 9 things to build a thriving fashion eCommerce brand:
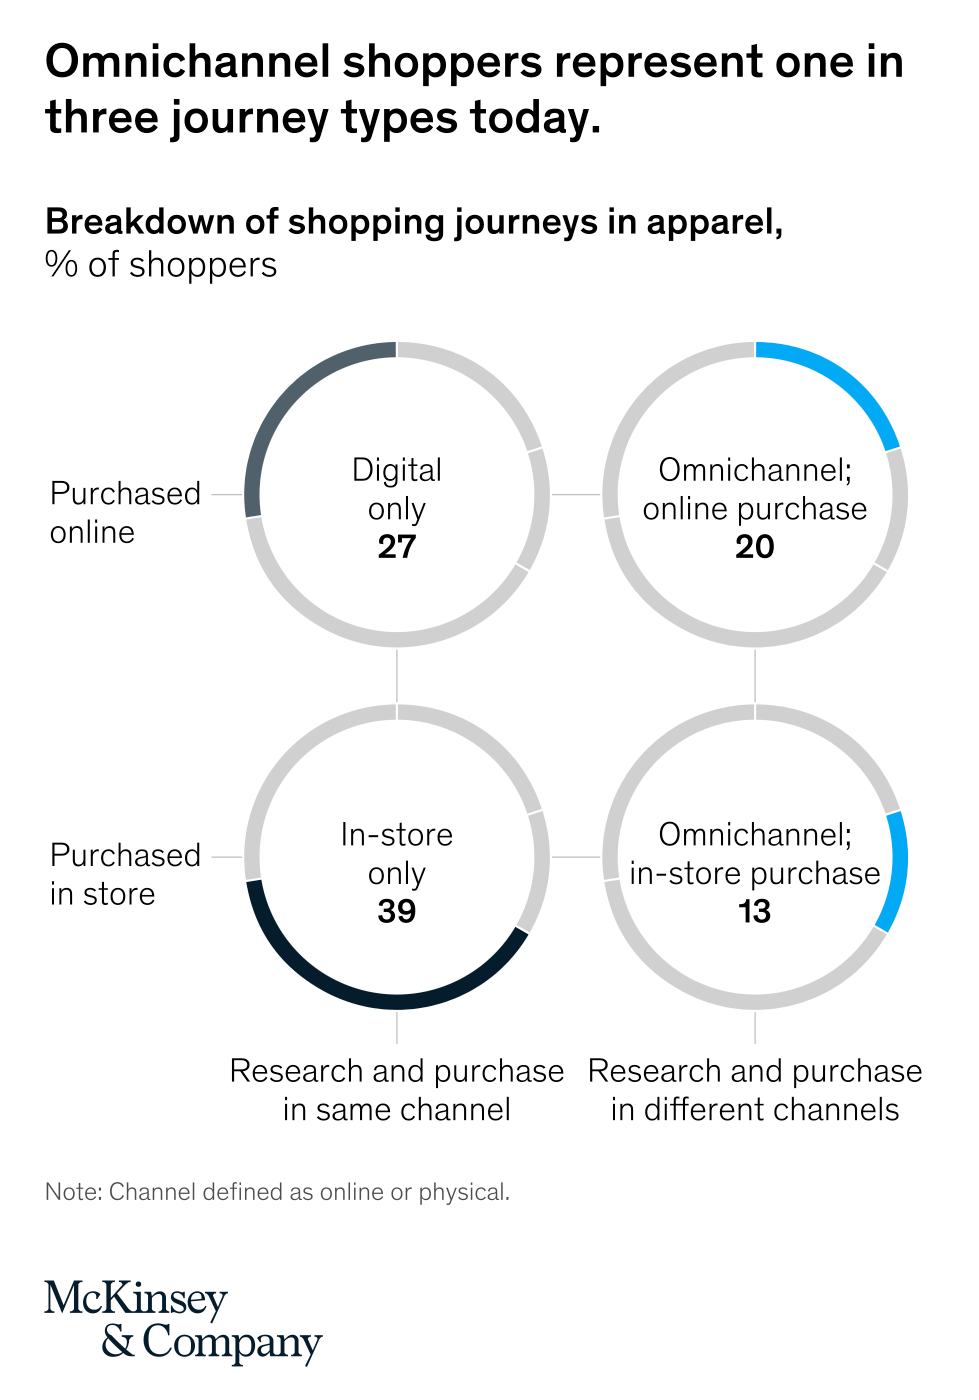
1. Allow shopping on multiple channels
Breakdown of Shopping journeys in Apparel
Typically buyers from diverse age groups prefer different sales channels. Some prefer large retailers, and some choose web stores. If you know where your customers like to purchase your products, you can leverage the power of search engines and marketplaces to improve your sales. Multi-channel retailing helps fashion eCommerce brands to sell and promote products on a platform and device of the audience’s choice.
A brand should offer support and access to its products across all platforms, channels, and devices. It helps fashion brands to reach customers where they prefer to shop. If your customers prefer to shop on a computer or an app, your brand can offer a seamless customer experience.
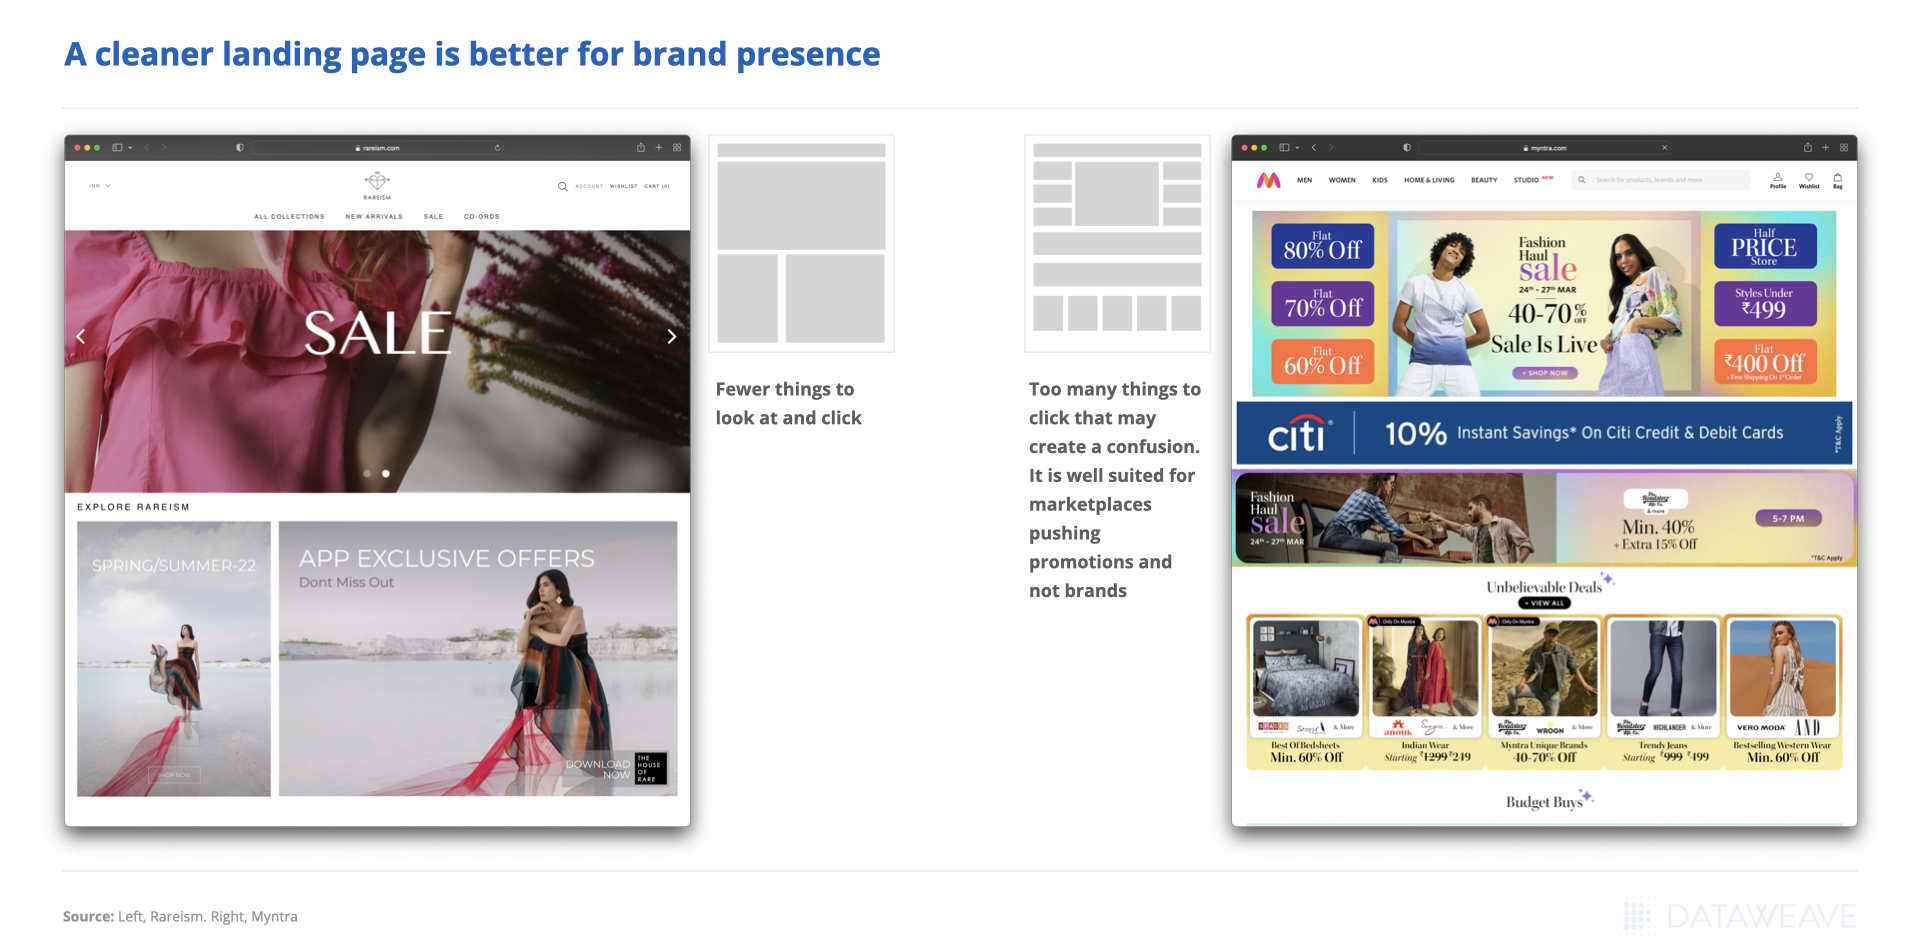
2. Don’t sell on the Homepage
Your online fashion store homepage is more about increasing credibility and trust among potential buyers. Your ideal home page shouldn’t display products or their prices. Instead, it would be best to integrate promotional and marketing strategies on the landing page to encourage visitors to explore your product categories and the rest of the website. You should have an intuitive interface that makes navigating the pages easier. You can also use the homepage to promote seasonal offers and new launches. Fashion brands can also display customer reviews, awards, brand achievements, and web security trust seals to increase the conversion rate.
Don’t sell on the homepage
3. Product Descriptions with Unique Stories
Product descriptions often get overlooked or underutilized even though they are important for eCommerce businesses. Your products won’t sell with spammy and same product descriptions. The modern product description is all about communicating a product’s worth and value with a story that captivates your buyer’s attention. Identify areas where your content & images don’t align with your product or represent it in the best light. Make sure to deliver an enhanced consistent brand experience across all online channels to improve your conversions.
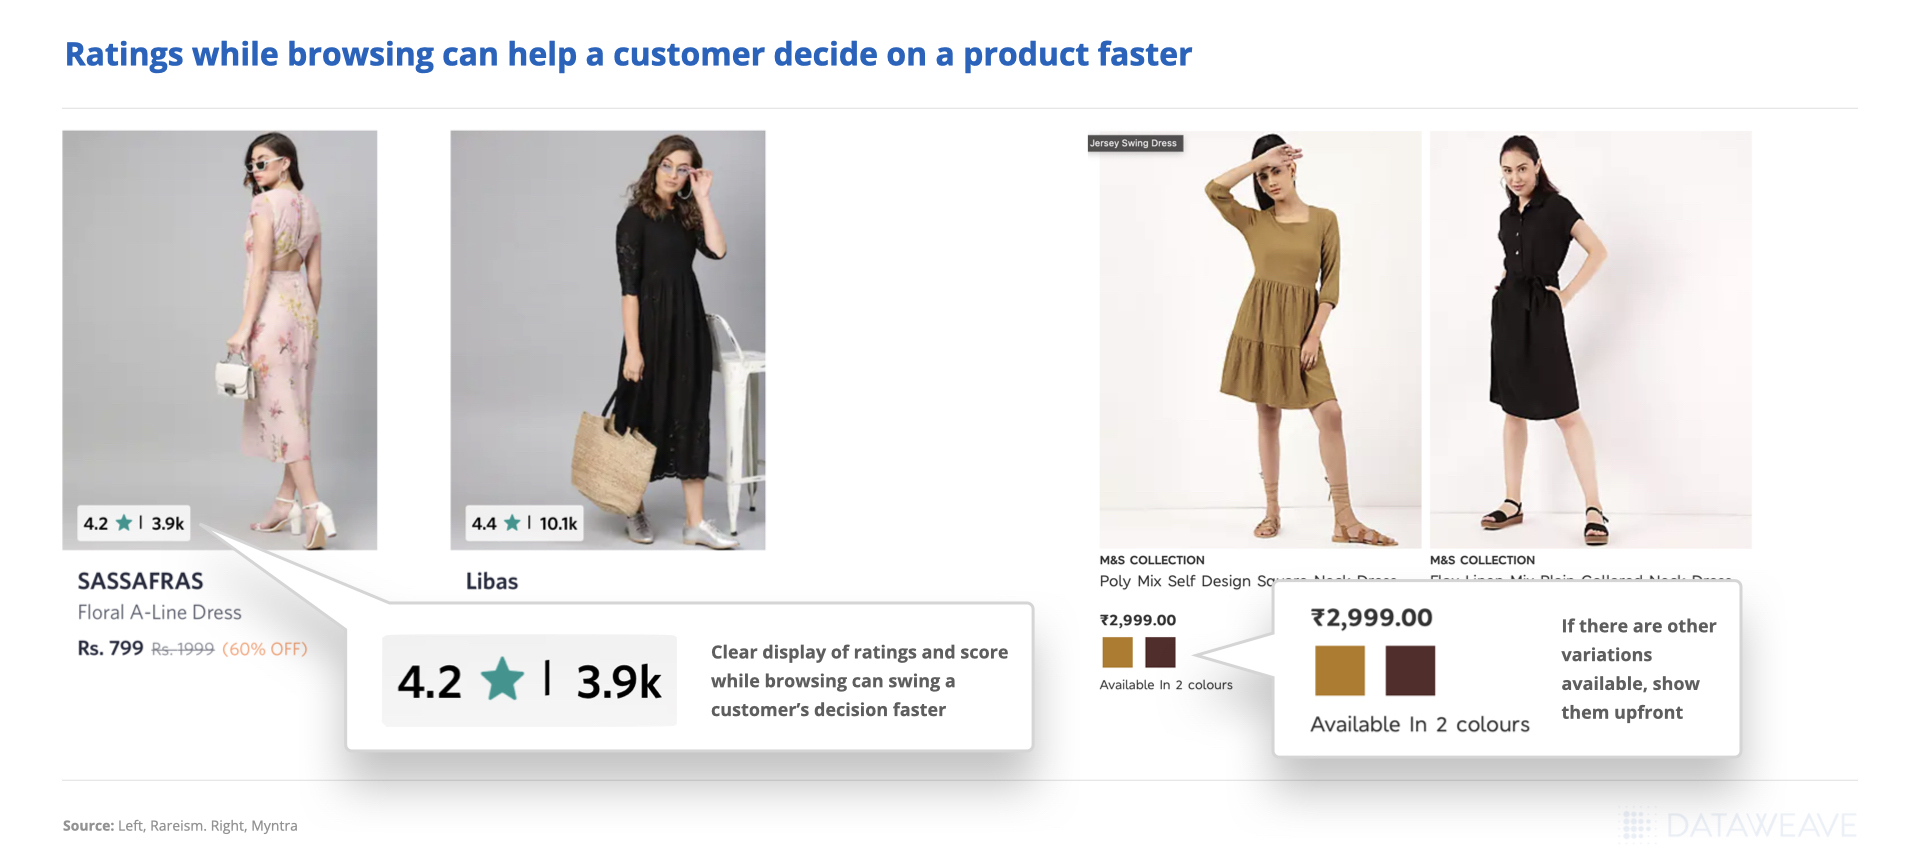
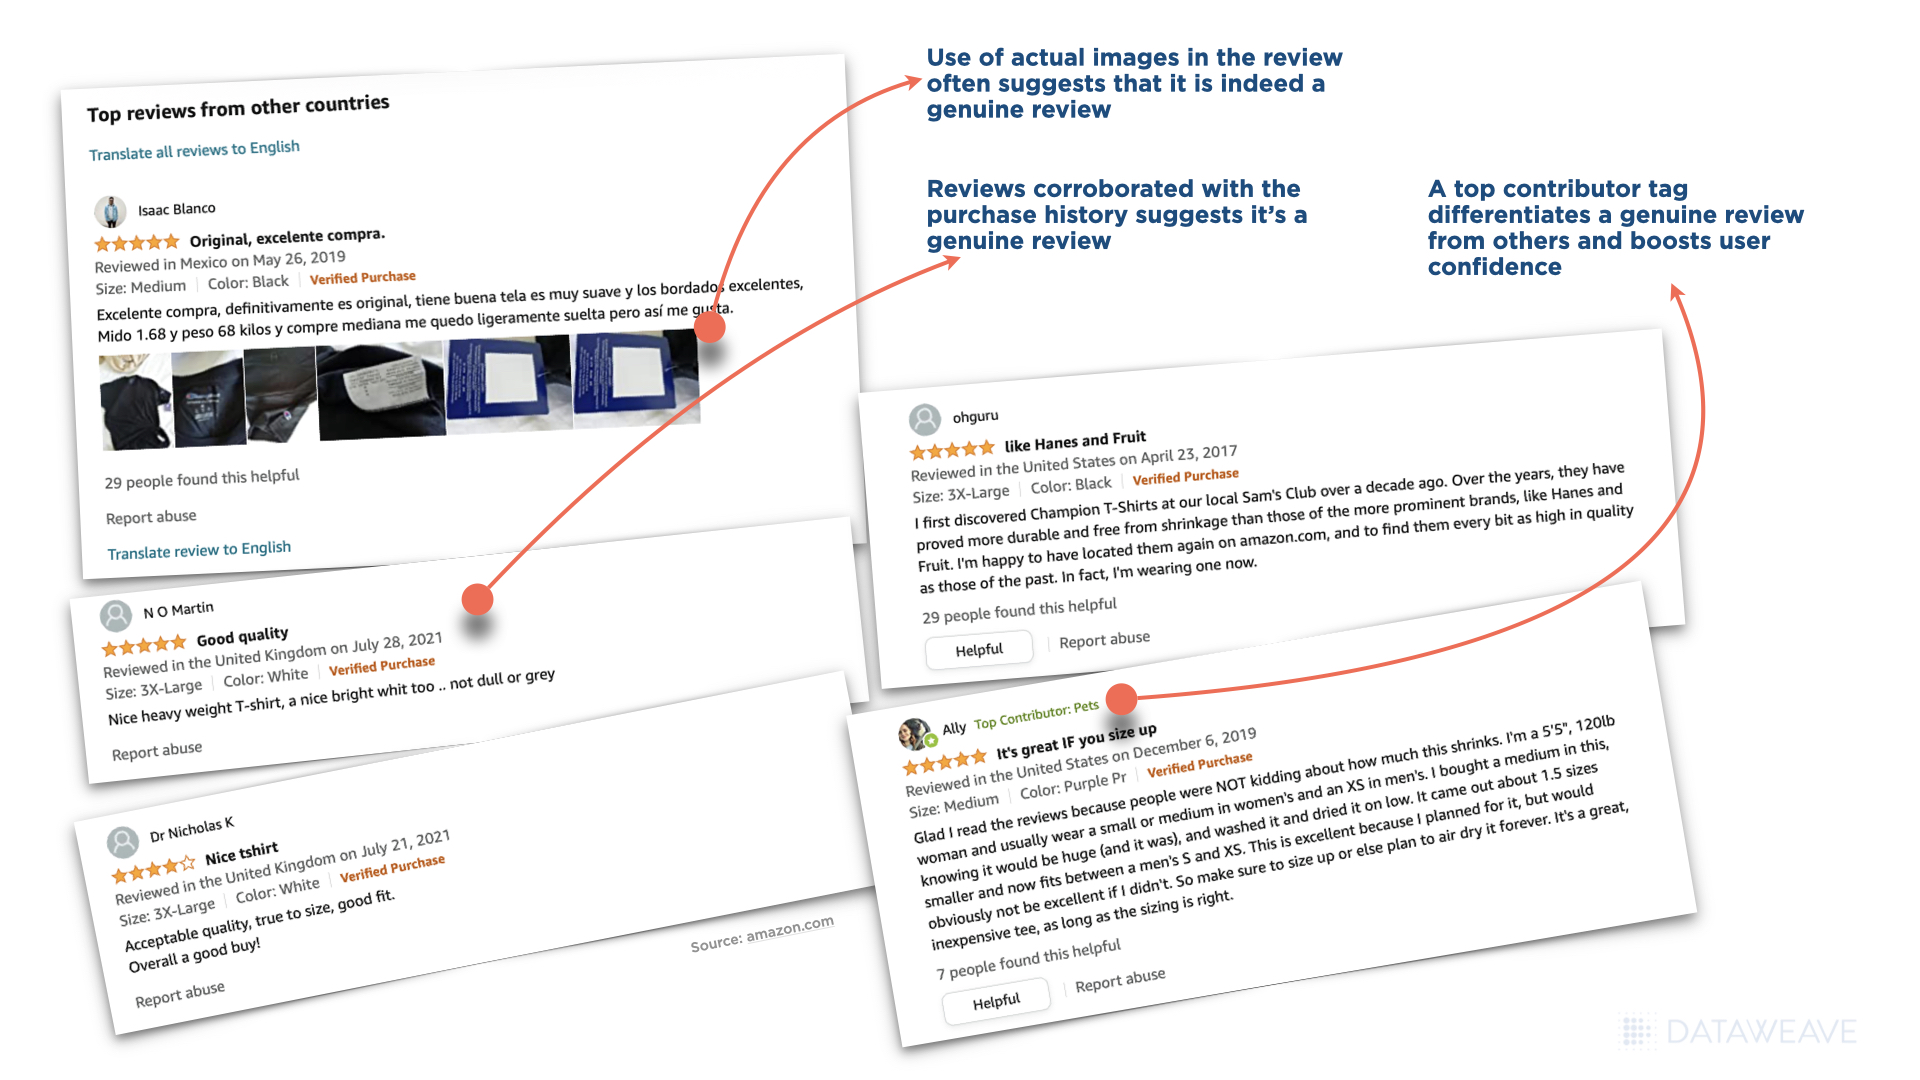
4. Focus on Review and Ratings
Rating & Review of a fashion brand
Customer reviews have a huge influence on a buyer’s purchase decision, especially in the fashion industry. Encourage your consumers to leave reviews on your brand website. Reviews help fashion brands to build trust for their products and convert customers. Legitimate customer reviews help your shoppers to get crucial insights into what previous buyers liked or disliked about a particular product.
However, you should stay away from paid-for or false reviews usually encouraged by unscrupulous sellers as they are easy to spot and hurt your rankings. You must remember that receiving reviews also includes dealing with negative comments. They should be used to improve your upcoming product offerings.
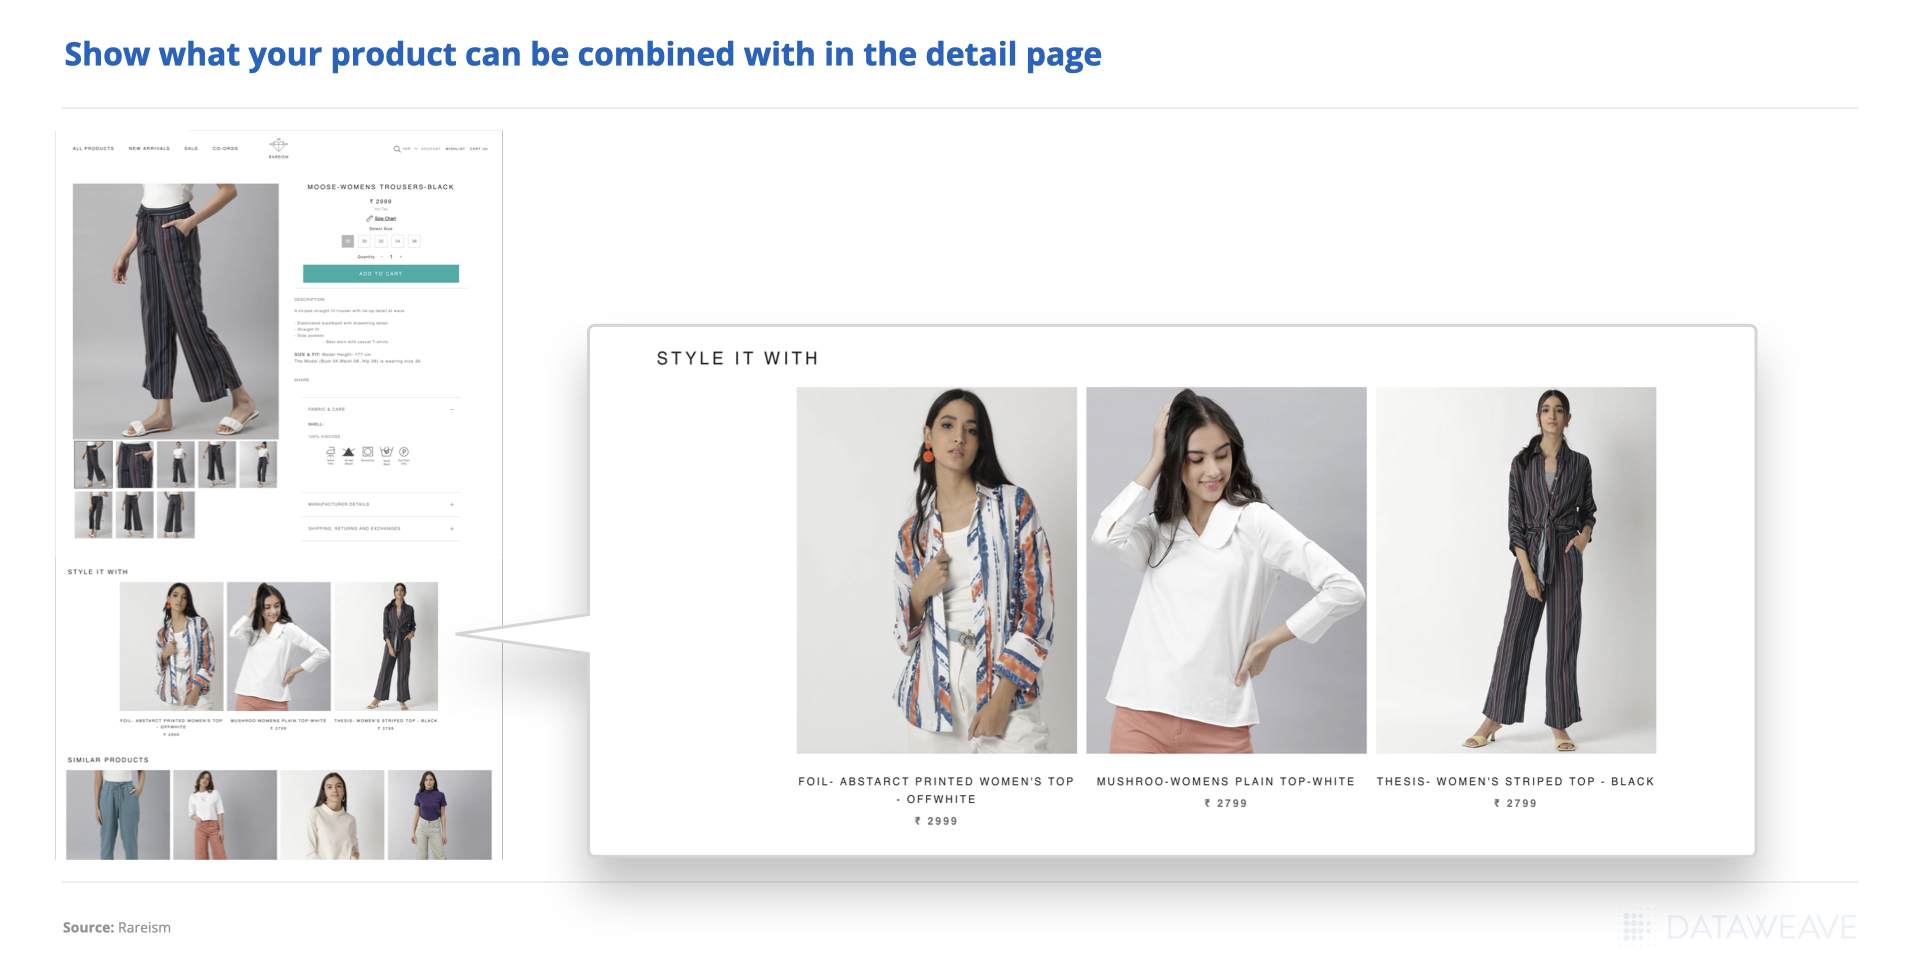
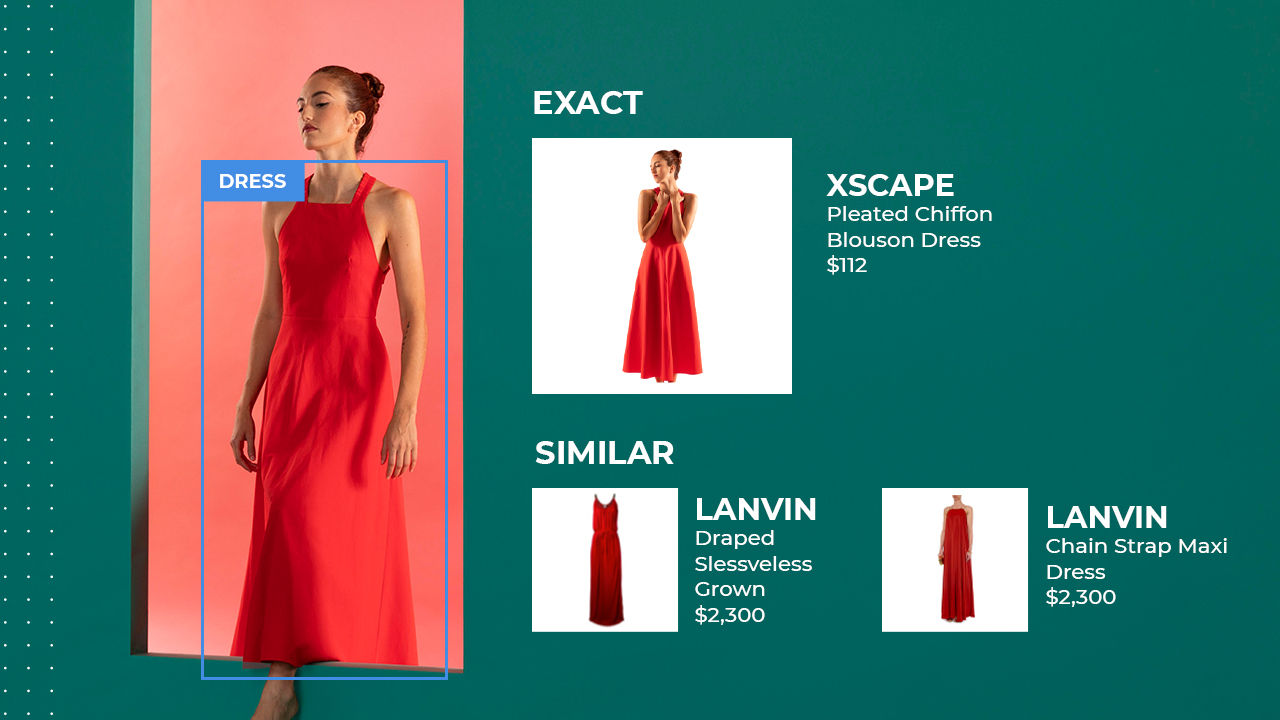
5. Sell Looks
The product can be combined with in the detail page
Successful fashion brands don’t simply sell individual products. Instead, they sell complete looks that inspire shoppers to purchase the entire stylish look. As an online fashion brand, you’re not selling clothes; you’re selling an elegant collection of wearable art. When visitors reach your online store, you should appeal to their fantasies and sentiments through aesthetic look books that are both pleasing and congruent with your brand. Most successful online fashion shops are inspirational and visual. Look books help brands pair their previous season items or dead stock with new stock and increase sales. Brands can also share these look books on social media or in their monthly newsletters to increase reach.
6. Provide Promotions and Offers
Fashion brands can take advantage of plenty of sales throughout the year, from New Year celebrations to Black Friday, Cyber Monday, and Christmas. Brands can leverage these high sales periods to sell looks and gift items to boost sales. Just make sure you’re measuring the effectiveness of your online promotions. Holiday and festive sales also offer an excellent opportunity to plan strategic discounts to get rid of old stock. Since trends in the fashion industry have been changing rapidly, you can use discounts to get rid of dead-stock or out-of-trend items each season.
7. Be active on social media
Social media is a way to promote your brand, increase trust among your audience, and entertain your audience with exciting content. You can also engage the audience by providing gift coupons or giveaways. Brands can promote products while keeping their audience engaged with engaging content and promotional offers.
Social media is a great way to get influencer support, either organically or through a paid partnership. Brands have to focus on every element of social media marketing strategy, right from choosing a platform, creating Instagram/Facebook shops, jumping on trends/events, and tracking customer sentiment.
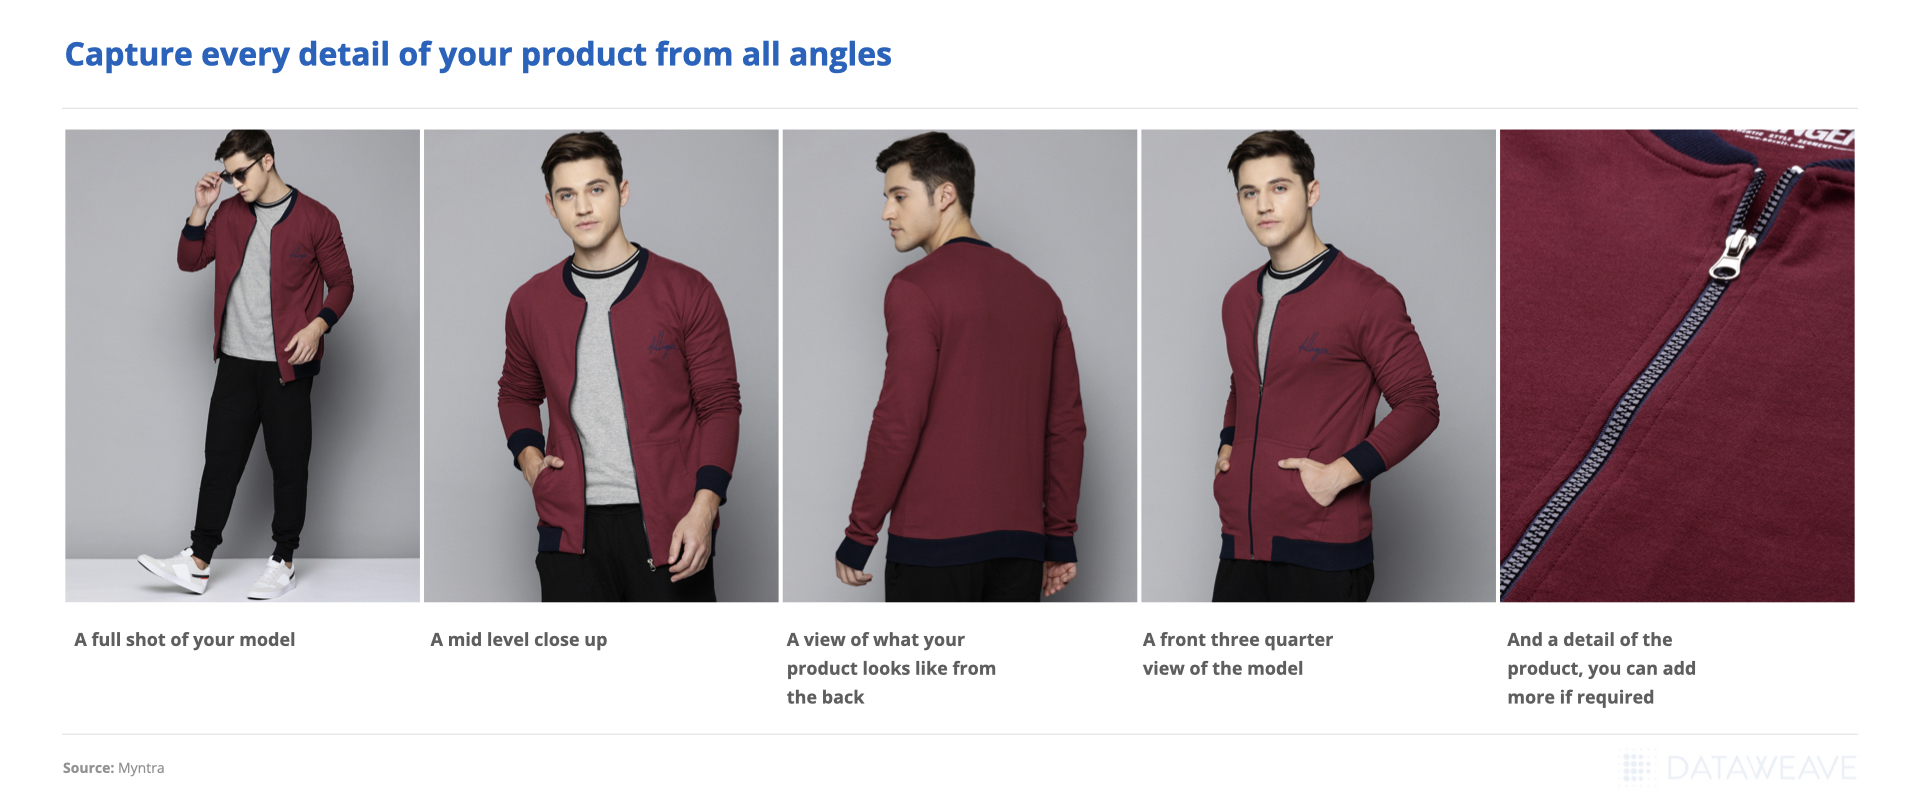
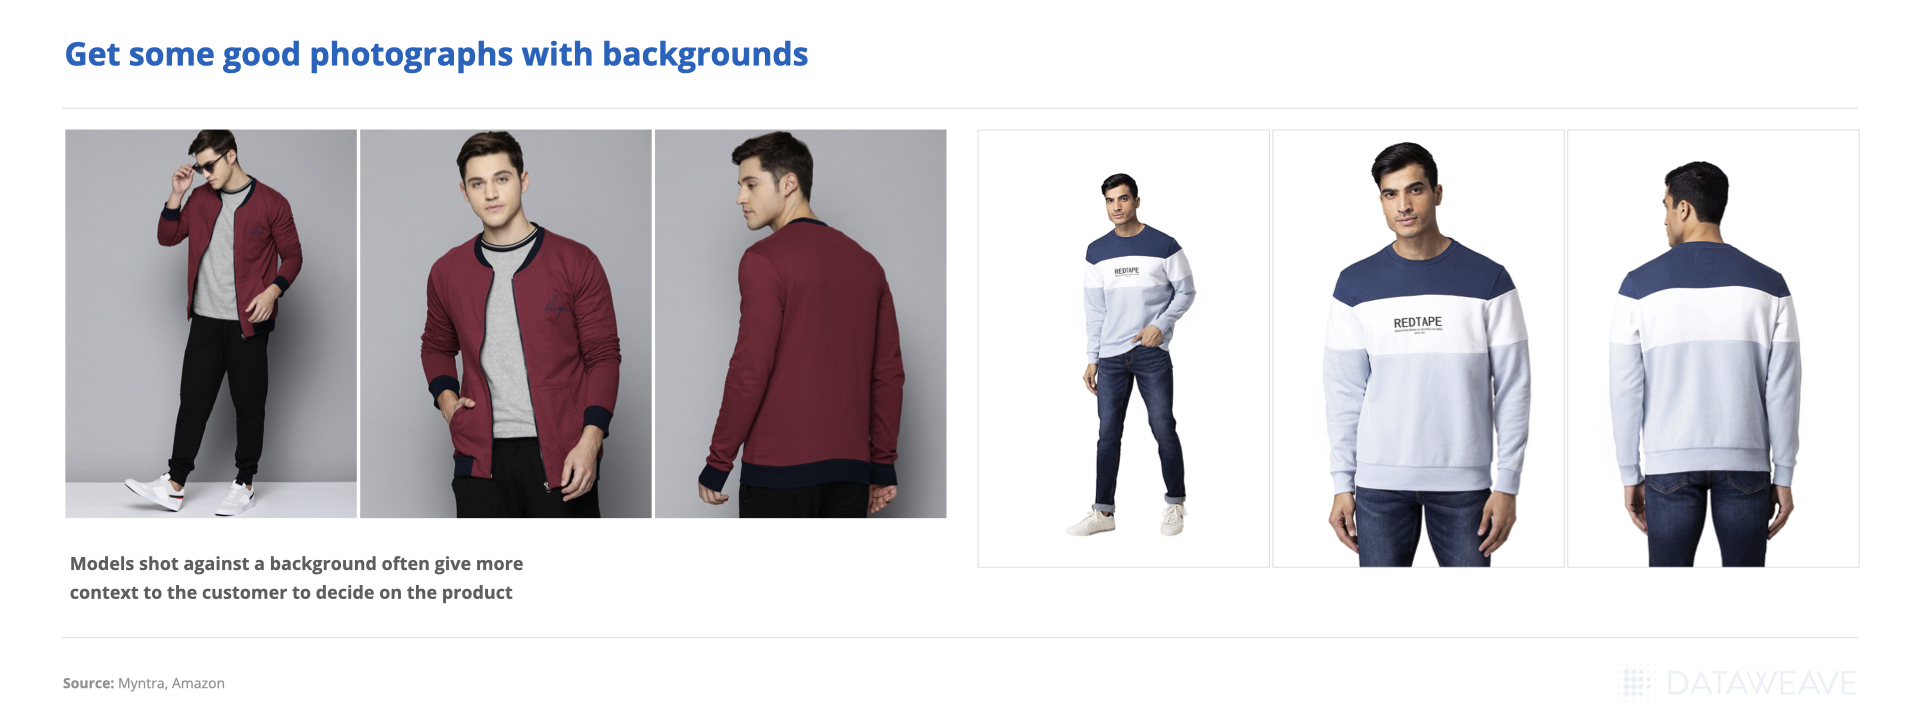
8. High-quality product photography
Capture every detail of your product
Nothing is worse than ordering a piece of clothing online and not getting what you saw on the website. Not being able to accurately convey fashion products will hurt your bottom line. Fashion brands must use top-notch product photography that includes high-quality visuals, such as multiple angle views, 360-degree images of each product, accurate depictions of all color options, and the option to zoom in on product attributes.
High-quality product photography
A recent game-changer in the fashion industry has been including different sets of models to accurately feature clothes of various shapes, heights, and weights. Instead of displaying a dress in only one size, fashion brands can have multiple models wearing various sizes for the same article of clothing.
9. Stay up to date with new trends
Fashion eCommerce brands have to be particularly careful of continuously updating their product offering with the latest fashion trends for each season. They can boost sales with an in-demand product assortment. Continuously updated fashion inventory signifies that the brand is up-to-date with the latest fashion trends in the market and has unique products to offer. You can always get creative with new styling, better looks, and personalized product recommendations.
Conclusion
Fashion eCommerce is rapidly growing and transforming at a staggering rate as technologies continue to advance. Traditional fashion brands can now expand their reach from brick-and-mortar shops to digital and eCommerce platforms to reach shoppers across the globe. The new digital selling opportunities also come with considerable challenges – from staying up to date with ever-evolving trends to managing dead stock. Are you a fashion brand that needs help monitoring your product content? Or measuring the effectiveness of your online promotions? Or decoding customer sentiment from reviews they’ve left for your products? Sign up for a demo with our team to know how DataWeave can help!
Online reviews have revolutionized how customers purchase products and services. In fact, eCommerce success for certain products hinges on the ratings and reviews. With this, have come the pitfalls of corruption in eCommerce.
New brands trying to establish a presence and capture critical mass have been known to resort to soliciting fake and paid reviews to uplift their brand in search rankings. Similarly, these brands can also encourage fake negative reviews on competitor’s listings to bring down their value. Bots and paid manual reviews are usually employed to rake up the review count. Review sites like TrustPilot, Google Reviews, and marketplaces like Amazon are littered with fraudulent reviews. In fact, Guardian calculated that 3.6% of all reviews on TripAdvisor were fraudulent. According to a 2021 report by Statista, 46% of the 2.7 million online fake reviews that were removed were five-star reviews!
Fake online reviews are misleading since customers shopping both online and offline rely on reviews to make purchase decisions. Fake reviews also pose further problems because they deceive consumers into spending money on a product or with a company they may not have otherwise chosen.
Federal Trade Commission (FTC) made a recent announcement to send penalties to over 700 brands and retailers for fake endorsements and reviews. While this notice references influencer content and testimonials, it also applies to customer reviews.
In this blog, we will discuss the importance of reviews for brands and retailers, spotting fake reviews on Amazon, and steps that eCommerce companies can take to tackle fake reviews.
Customers are more likely to purchase if other customers, even strangers, agree that it was a great purchase. Reviews also make brands more visible.
Why are fake online reviews so resilient?
A significant reason is that the ROI of getting fake reviews increases profitability & sales multifold. For example, an extra star on Yelp can increase a restaurant’s revenue by 5% to 9%. FTC has said that the expenditure on fake reviews can provide a 20x return. However, fake and incentivized reviews are a huge problem. Amazon, one of the largest eCommerce marketplaces, banned incentivized reviews in 2016. It took down suspicious reviews and has taken legal action against sellers who violate its policies.
Online Reviews
How to Spot a Fake Review on Amazon
Marketplaces, Google, and review sites like Yelp can get hundreds of thousands of reviews daily. In a survey by PCMag that interviewed 1,000 US shoppers who looked forward to shopping on Prime Day 2020, only 16% were very confident about detecting fake Amazon product reviews, and 24% were confident they could do it. The rest of the survey respondents were somewhat or not confident they could pick out the fakes on Amazon. Here are our best tips for spotting fake reviews on marketplaces like Amazon:
Duplicate Content: If you notice dozens of reviews with the same description and title as if they were copied and pasted multiple times, they’re most likely fake reviews.
Multiple Reviews on the Same Day: Another identification of fake reviews is when there are dozens or multiple reviews on a single day. There can be a bunch of both positive and negative reviews for products.
Unverified or Anonymous Reviewers: You can see if the review is from a verified buyer on Amazon. Brands can also check if they have any record of the reviewer’s purchase to weed out fake reviews.
Incorrect Language: Fake reviews can come from people outside your country. If you notice multiple reviews with similar incorrect words and common errors, there is a good chance those reviews are fake, and someone paid the reviewer to write them.
What can eCommerce brands do to protect themselves against fake reviews?
Follow a zero-tolerance policy for fake reviews.
The major step is to ensure that fake reviews are never posted on your site. Allowing fake reviews negatively affects your business and your bottom line. You can hire a third-party UGC moderator that uses data-driven, anti-fraud methods to evaluate reviews. It will be a much more successful and quicker step in protecting your brand’s reputation.
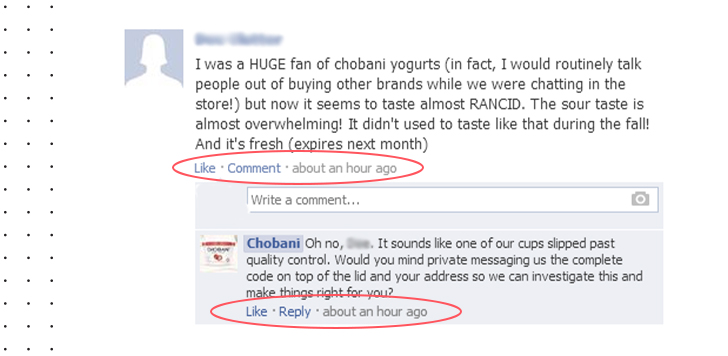
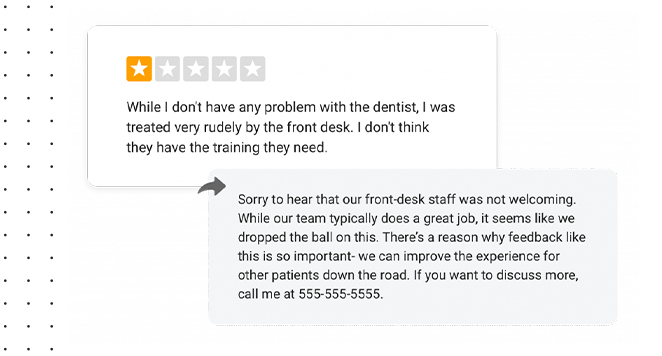
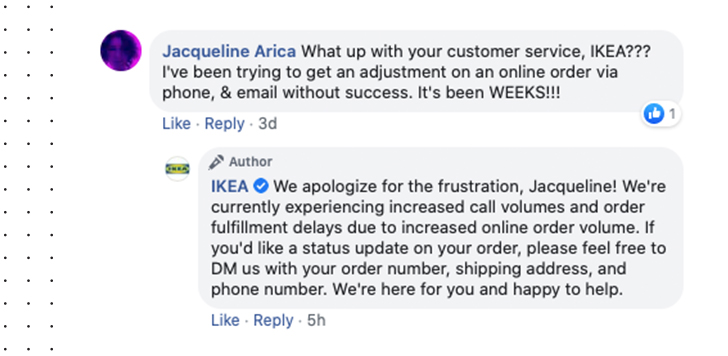
Don’t screen out negative reviews.
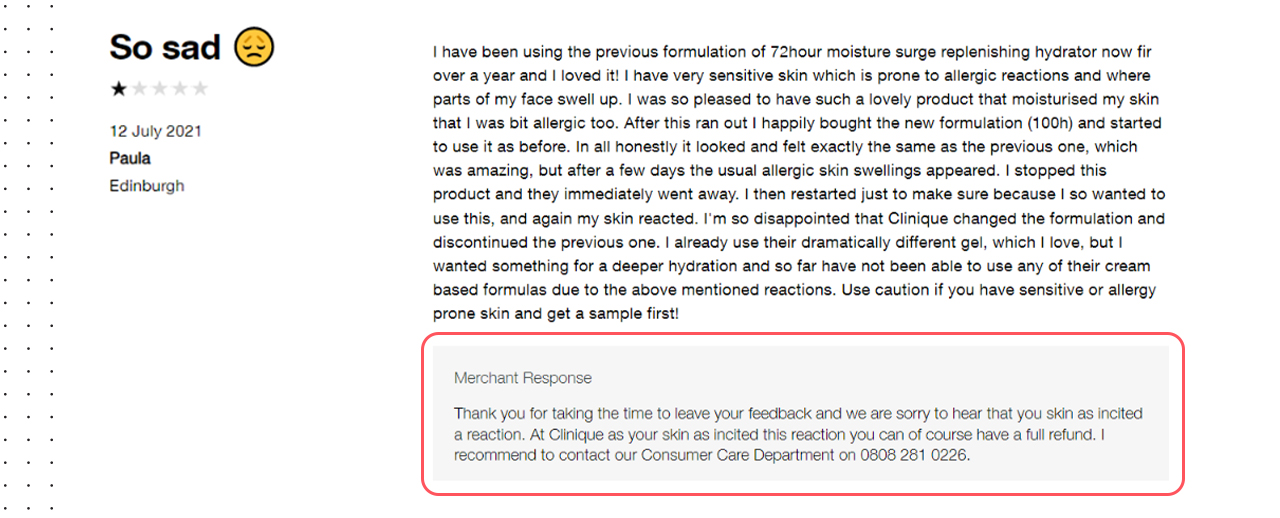
While receiving a negative review might be the worst nightmare, they’re necessary for a successful UGC program. Customers are more likely to purchase from a business that responds to all reviews, including negative reviews. Customers said that negative reviews have more detailed product information, while 32% of those customers think they’re less likely to be fake. Besides, brands that respond to negative reviews gain customers’ trust and loyalty. Here are some Tips on how to Respond to Negative reviews online.
Be transparent about how you collect UGC.
Brands can ensure that their customers trust user-generated content by being honest about how they collected it. Companies should never ask for paid or incentivized positive reviews. Instead, brands should empower their customers to leave honest feedback. If you’re offering free products, a chance to win something, or discount coupons in exchange for an unbiased review, then the review should specify how it was collected. For example, you can add indicators like “this reviewer received a coupon or a free product in exchange for honest feedback.
Maintain trust
Having fake reviews causes a loss of trust, with many consumers believing that they have seen fake reviews for online and offline businesses. Removing fake reviews doesn’t only help with revenue and brand trust, but it also helps brands to maintain trust among their existing and future customers.
Conclusion
Fake reviews are one of the biggest reputation killers and a huge problem for eCommerce platforms, brands, and customers. Brands must take the necessary steps to minimize the risk of fake reviews and expand businesses among authentic users. Although modern text generation tools are becoming more competent in writing realistic reviews, there are AI- and ML-backed tools that can accurately detect reviews written by other machines.
Need help tracking your online ratings & reviews? Or decoding customer sentiment from reviews they’ve left for your products? DataWeave offers a customizable and scaleable data solution to analyse ratings and reviews for online retailers and brands vis v vis their competitors. Sign up for a demo with our team to know how DataWeave can help.
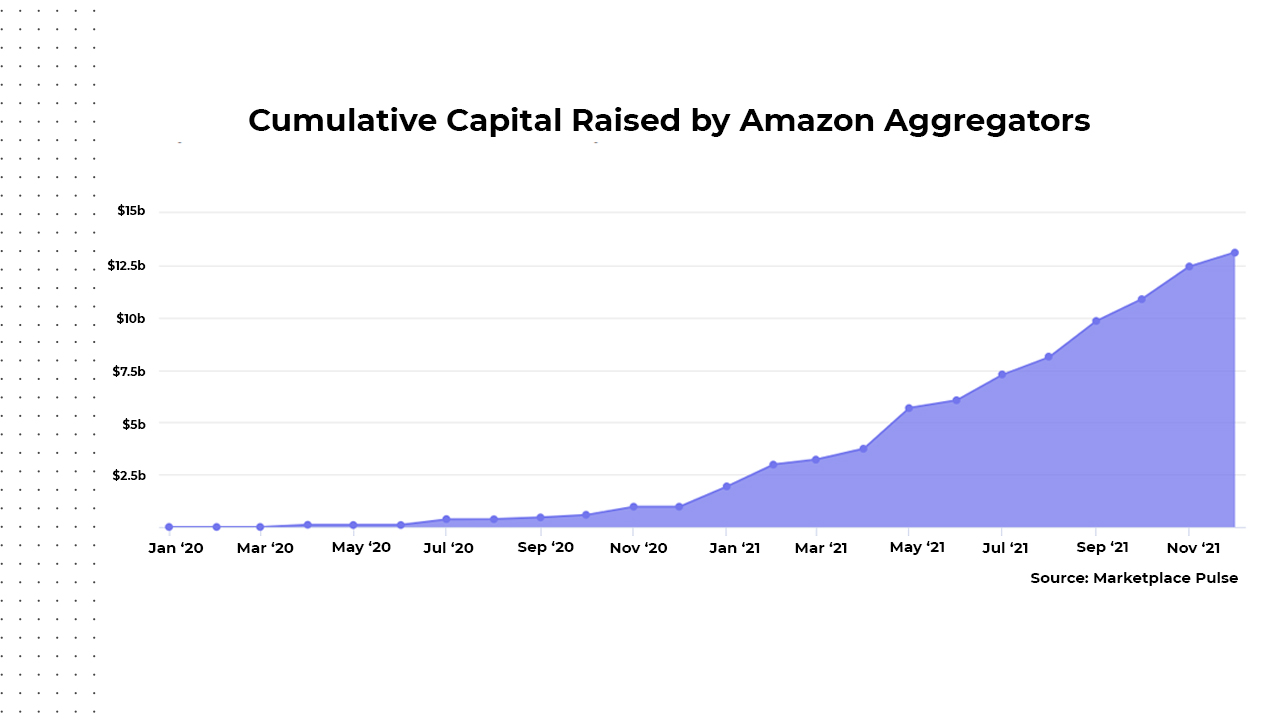
When it comes to brands – the biggest story of 2021 was the astronomical growth of Brand Roll-ups. For the uninitiated, Brand Roll-ups are companies that acquire multiple digital consumer brands and then scale these brands 100x by leveraging their own operational expertise across eCommerce platforms, Supply Chain, Warehousing, Marketing, and so on.
Thrasio is the poster boy for the Brand roll-ups and is valued at over 10 Bn USD.
Brand rollups have raised over $12 billion in 2021 and the trend only seems to be accelerating in 2022. Not only Brand Roll ups, but VCs too have been pouring money into digital brands. In India, 77+ brands have raised more than 2B USD in 2021. In the US this number is estimated to be north of $10 billion.
Cumulative capital raised by Amazon Aggregators
Scaling fast doesn’t come easy. It comes with its own set of challenges. So even with ample experience in running and scaling brands, Brand roll-ups are posed with unique challenges.
Challenge of Scouting the right brand
There are 1000s of online consumer brands and new ones are launching every day. Every Brand roll-up wants to be the first one to scout a brand – but this is not easy.
The challenge here is to identify & pick the right brands without having access to any sales or financial data. Every Brand Rollup has a wishlist with regards to the number of SKUs, price points, reviews, and ratings as well – but don’t have tools in place to scout brands with these criteria in mind. And across multiple platforms and categories, the problem gets more complicated.
This is an ongoing problem since a brand that was not selling well yesterday may start hitting higher sales numbers a week down the line – and that is why Brand scouting has to be a continuous process.
One way these aggregators have solved this challenge is by offering mouth-watering referral fees for referring a brand. But this is not a sustainable long-term solution.
Data Comes to the Rescue
What Brand Roll-ups need is a continuous and automated data first Brand Scouting solution to enable them to scout the right brands.
What are all the brands in a category of interest?
Which of these brands is within the filters of Number of SKUs, Price Range, etc.?
Which brands have shown an exceptional rise in search rankings?
Which brands have shown the most increase in the number of ratings and reviews?
Which brands have the highest gain in the customer ratings?
What are the estimated sales and market share of the brands?
DataWeave’s Brand Scouting Solution is a comprehensive solution to help Brand Rollups and VCs scout for the ideal brand that fits their acquisition profile. We leverage public data collected from multiple eCommerce platforms to get them the desired information on brands they’re looking for.
For all the focused categories (Typically 30-40) – we collect data of all the SKUs (Typically 15,000-20,000) and aggregate that at a Brand level:
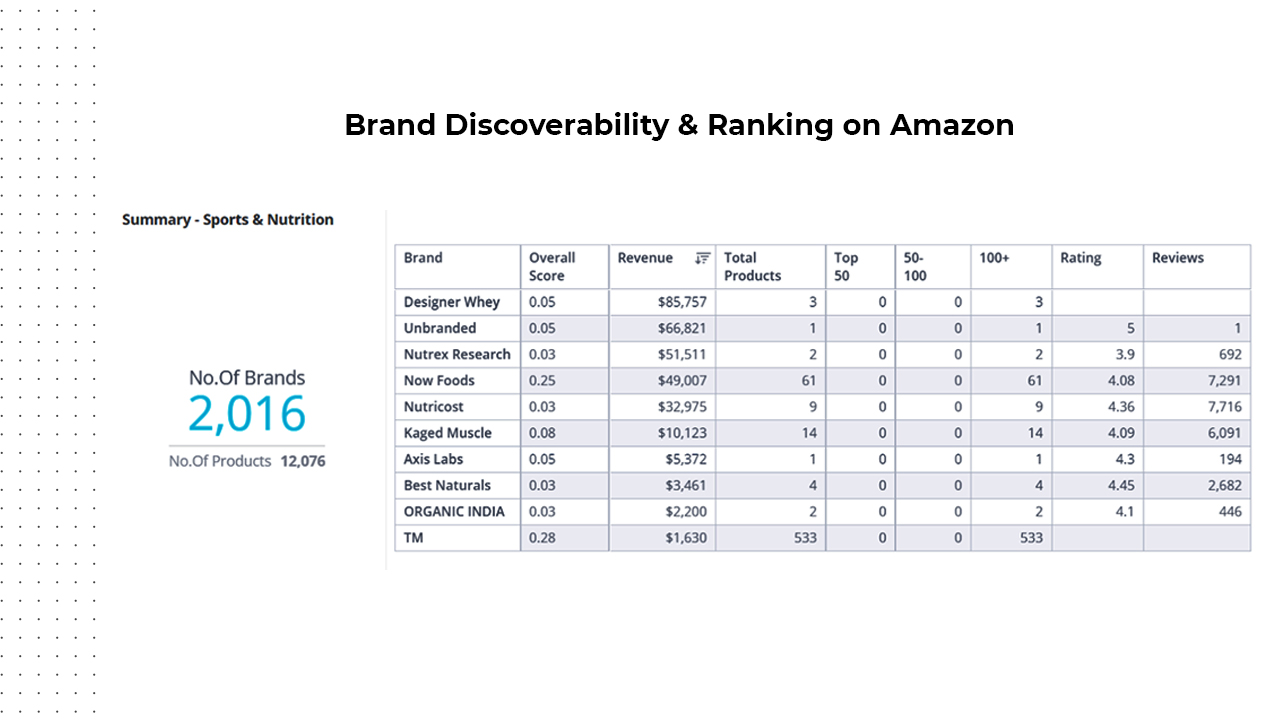
Ranking – Usually Brand Rollups are not interested in the Brands which are on the first page. But, they are interested in the brands which might be b/w 500 to 10,000 ranks but are showing an exceptional gain in ranking week on week.
Brand Discoverability & Ranking on Amazon
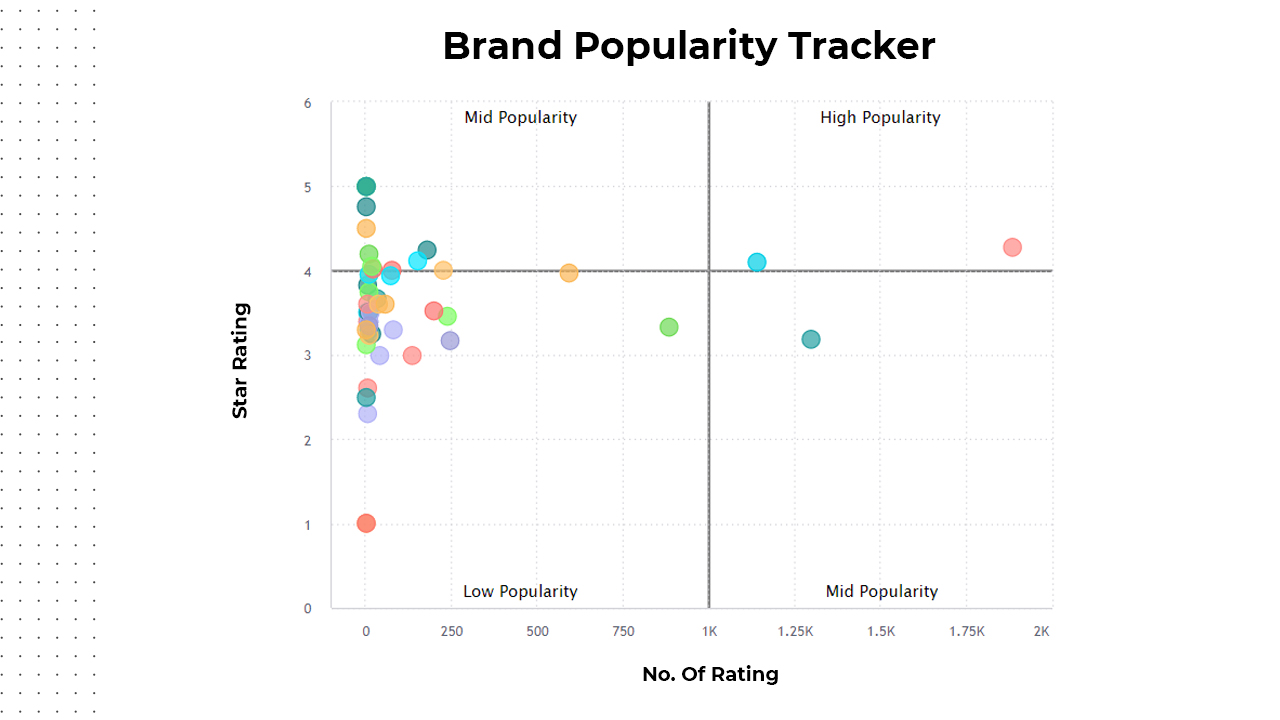
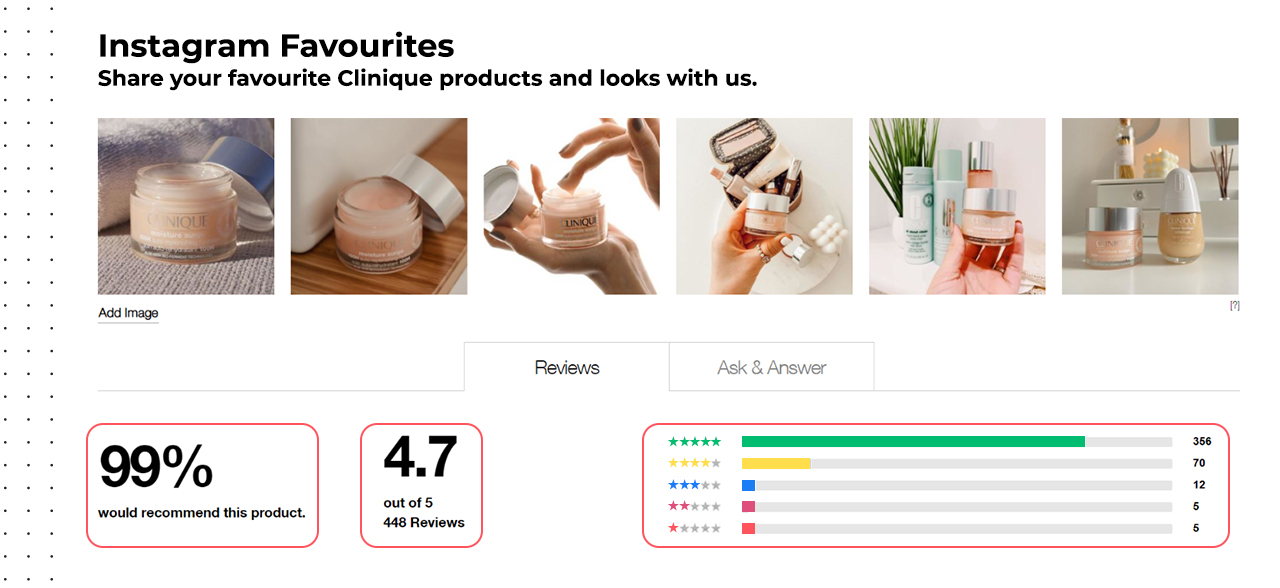
Ratings – It’s important to look at brands that are showing high improvement in ratings or have consistently shown high ratings. The proportion of 5 stars vs. 1 star is an important metric here.
Number of Reviews and Ratings – We enable you to find brands that have both high ratings as well as a high number of reviews. This is a very good metric to find the brands in a category that are getting exceptional customer love.
Brand Popularity Tracker
Filters – We enable filtering in terms of – No. of SKUs, Price Range, Rating and Reviews and even can eliminate established brands so that you only see the brands which qualify your criteria. We also enable you to separately analyze brands that are buying sponsored ads in a category, so you have a clear distinction between organic and sponsored growth of these brands.
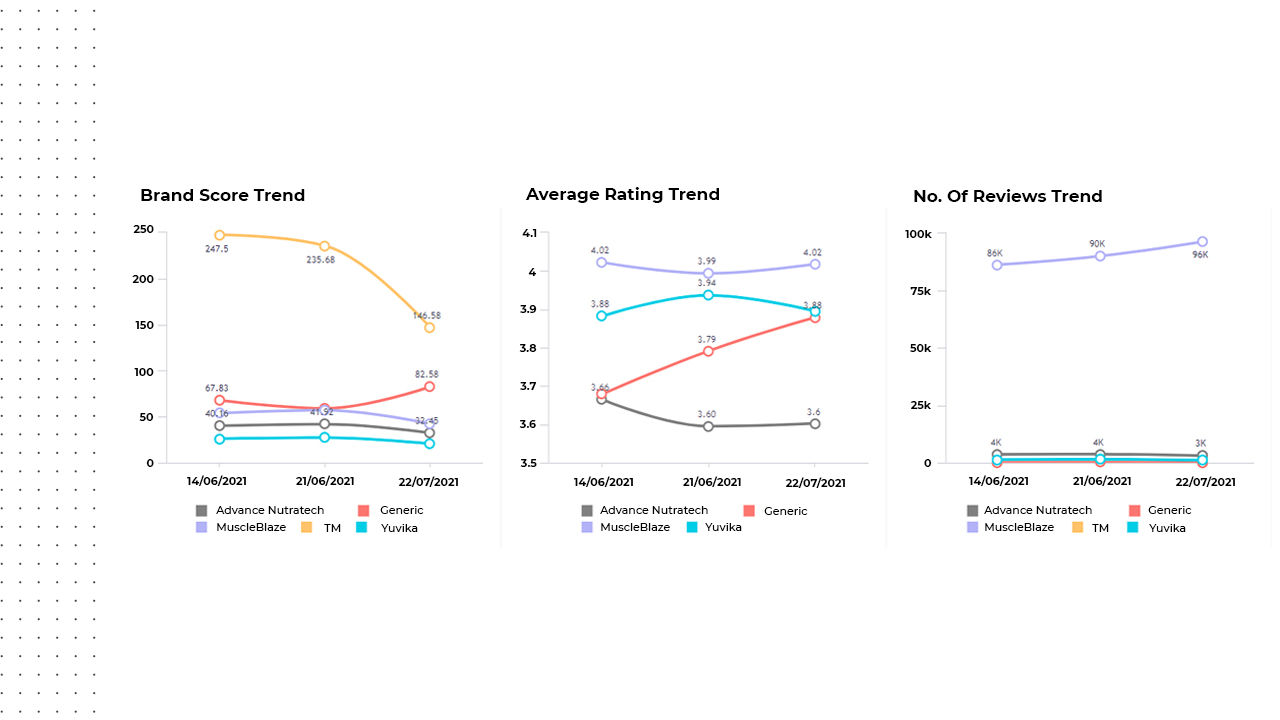
Trends – What is important is not just the static performance on the day of analysis – but a trend analysis over a period of time to find the brands which are growing exceptionally.
Brand Score Trend, Average Rating trend & No of Reviews Trend
… but, wait there’s more.
We compliment Brand Scouting with three more solutions to provide the right context and further analysis needed to provide comprehensive insights into the category and platforms where you are scouting for brands:
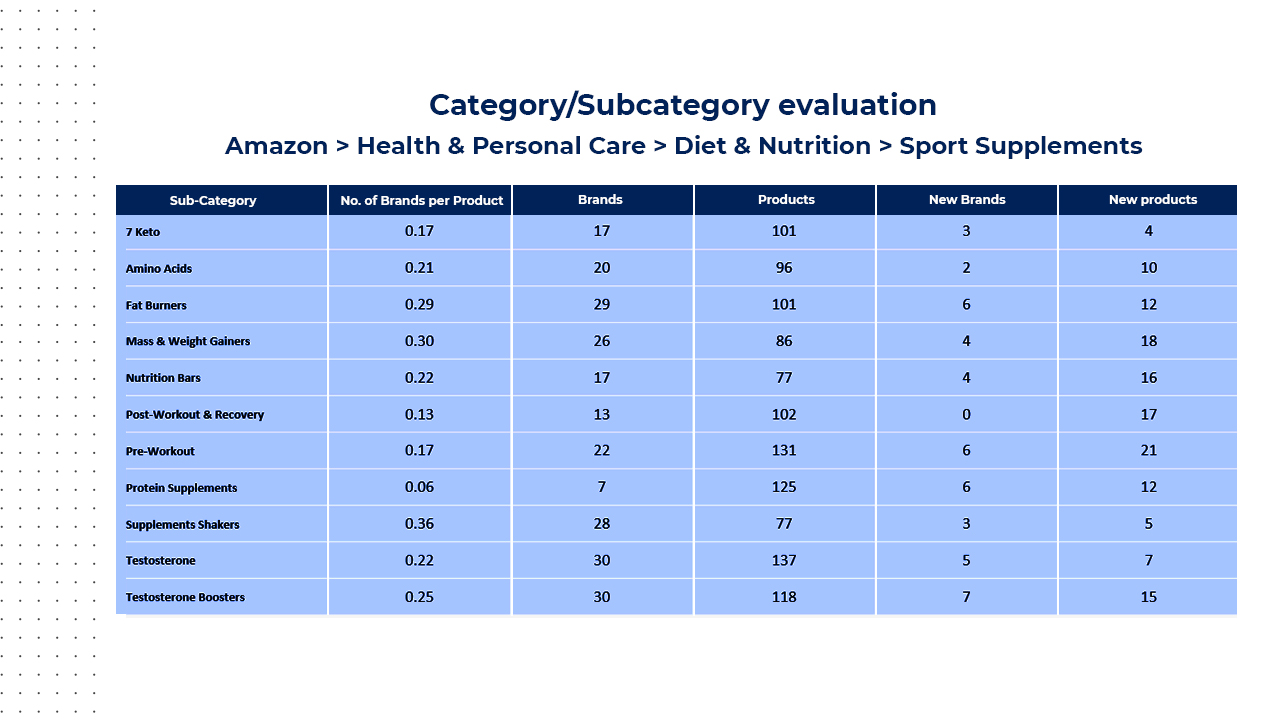
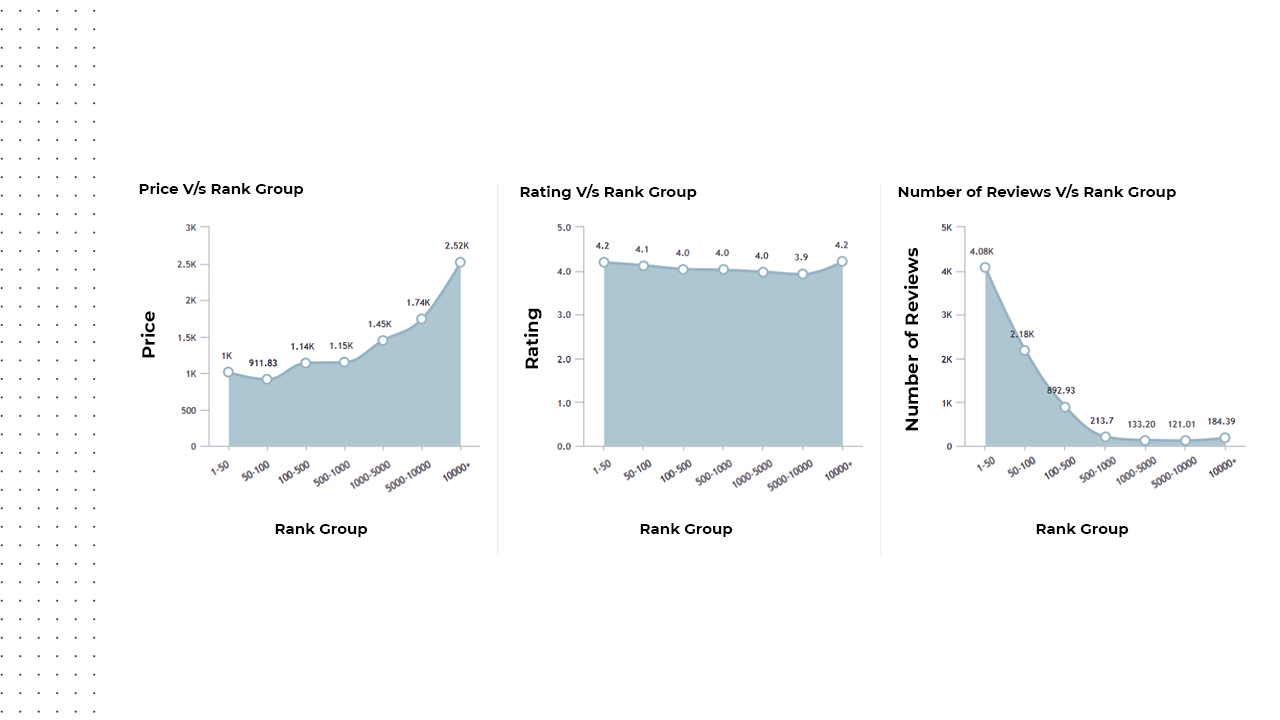
Category Analytics: When you are looking at a category and the brands in that category, it is often important to understand how dynamic that category is. We can help analyze:
If the category is crowded with more brands per product.
Does it have space for new brands?
What is the number of new brands entering that category?
We can also help with benchmarking the category – to help understand how the brand that you are scouting is doing when compared to its category peers.
Rank Group versus Price, Rating & No of Reviews
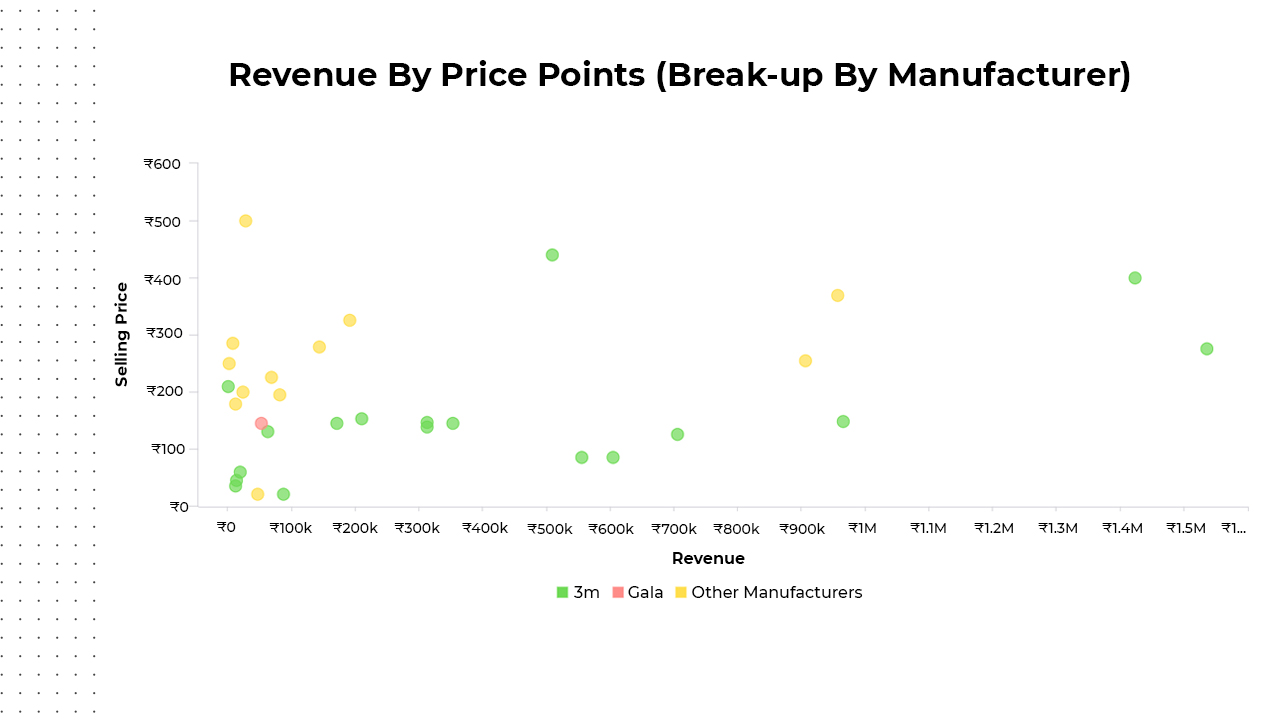
Sales & Share: We can also provide a good directional estimate of the sales and market share of all the SKUs in the category wherein you are scouting for brands. These are estimates powered by our proprietary machine learning algorithms and can help you solidify your hypothesis around a blog or a category.
Revenue by Price Points
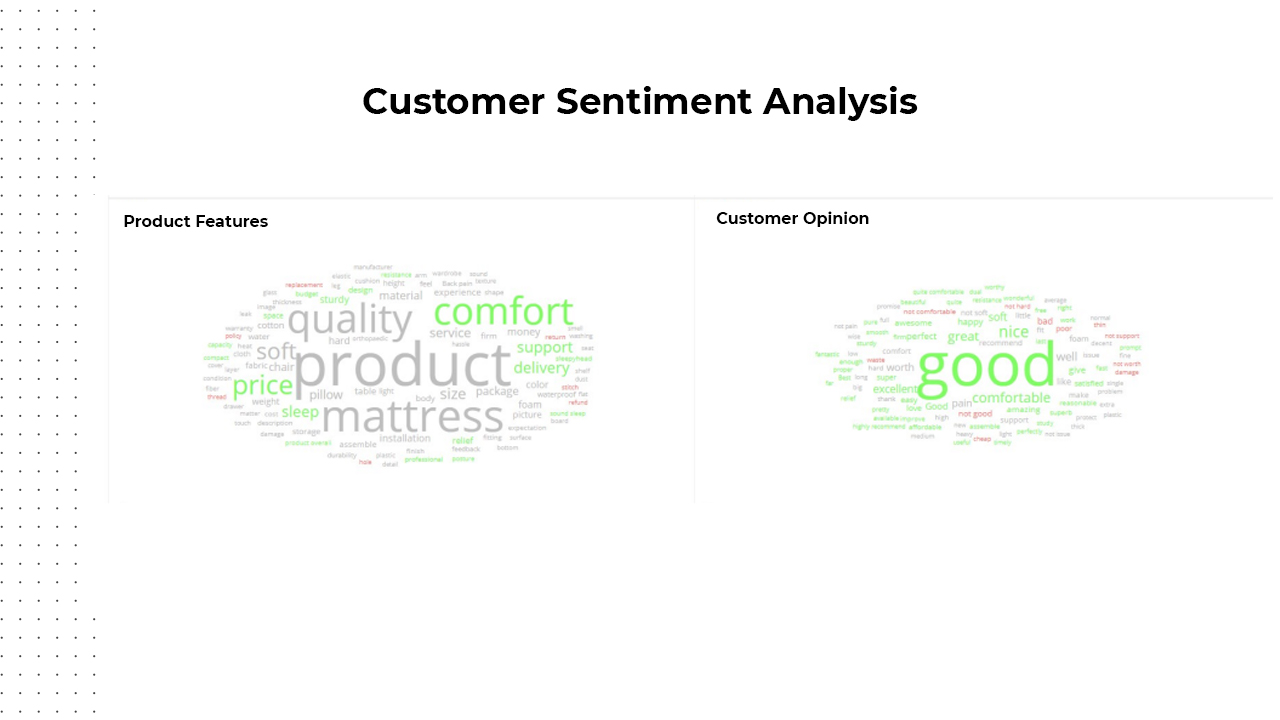
Sentiment Analysis of Reviews: Customer reviews tell more about the qualitative aspects of the SKU and the brand itself. Our algorithms can help understand what features of a brand or a product do customers really care about. We can answer questions such as:
Which features are mentioned most commonly?
Which features are mentioned positively or negatively?
What adjective is used to describe that particular feature?
Customer Sentiment Analysis
The suite of Brand Scouting and complementary solutions is evolving rapidly as the space is evolving rapidly. We are supporting several VCs and Brand Roll-ups globally to scout for brands.
The best aspect about DataWeave is our ability to scout brands across 2,000+ eCommerce platforms globally across geographies. We are super stoked to be playing an enabler in the Brand Rollup revolution.
The challenge for Brand roll-ups is not over by just scouting and acquiring a brand. The journey is just about starting – the next challenge that the Brand Rollup faces now is to scale up these brands.
The challenge the Brand Rollup face is unique and very different from a single brand operator or even traditional CPG conglomerates.
DataWeave’s flexible product philosophy enables Brand Roll-ups to diagnose and measure the performance of multiple brands across multiple platforms in one dashboard.
Quick service restaurants (QSR) are not only about delivering great food. They also have to overcome challenges like delivery, logistics, and affordable pricing, especially since covid-19 has staggered the entire industry. QSR intelligence helps restaurants get real-time insight into their performance across food delivery apps. With QSR intelligence, restaurants can identify the highest paying buyers across customer segments, demographics, and locations. Data-driven insights will help QSRs improve performance, decrease delivery time, optimize ad budget, and increase food quality – all with the goal to scale revenue and increase orders through food apps.
The global fast food and quick service restaurant market are expected to grow at a CAGR of 5.1% from 2020 to 2027. The QSR industry is rapidly growing to encompass the changing needs of customers. 60% of U.S. consumers order delivery or takeout once a week and online ordering is growing 300% faster than in-house dining. With QSR intelligence, restaurants can get insights into metrics that will drive their profitability by helping them to fine-tune menus, enhance customer interaction, improve advertisements, and adjust inventory.
Benefits of QSR Intelligence
Continuous in-depth analysis of restaurant statistical data will help companies spot trends and devise strategies to improve sales via food apps. Here are a few benefits of QSR intelligence:
a.Improve estimates & minimize wait times
QSR intelligence can help with accurate sales forecasting. With big data, restaurants can track their popular dishes or combos for various meal times to minimize wait times and increase delivery speed. It can also inform restaurants about upcoming trends, especially during holidays and festivals. Keeping an eye for trends will play a significant role in maximizing efficiency during food preparation and ensuring accurate food delivery ETAs.
b.Location-based promotions
QSR intelligence allows restaurants to target customers based on their proximity to the restaurant. The food must be delivered at a particular time to the customers to enjoy the dish at the right temperature. QSRs can apply demographic intelligence to determine cancellation rates, delivery charges, and the proportion of demand and supply. These metrics will help QSRs to improve location-based promotions.
c.Increase ROI on deliveries
To increase return on investment through food deliveries, QSRs can track metrics like location-based promotions, various payment options, ratings, etc. Tracking these metrics will help QSRs offer accurate ETAs, improve operational efficiency, and personalize services, which will increase revenue. Restaurants will also be able to understand where they can adjust their profit margins to increase revenue while maintaining a cumulative level of success.
How to use QSR Intelligence
a.Assortment and availability
The more restaurants can understand what and how their customers eat, the better they will be prepared to service those demands throughout the day. For example, QSRs can calibrate the menu, ingredients availability, and kitchen preparation time depending on their customers’ orders for lunch and dinner. This also helps optimize daily workflow, such as reorganizing staff to lower labor costs, optimizing the supply chain for ingredient delivery, and revamping the menu to offer better dishes. Another way to ensure your availability is to analyze your busiest hours and adjust the staff and delivery workforce accordingly. For example, if your customers tend to order more during breakfast, it’s worth considering opening your restaurant a bit earlier.
Availability across 4 QSR Food Delivery apps
Availability trend during peak hours – Lunch & Dinner
b.Delivery time
One of the most driving factors for the success of QSR is delivery time. Restaurants have to ensure the food is delivered as quickly as possible so customers can consume it at the right temperature. Data-driven insights can help restaurants track repeat addresses, find shortcuts or time-saving routes, and avoid unfamiliar or low delivery locations.
QSRs have to analyze the entire delivery process from time taken to order on the app, how quickly kitchens can prepare orders, hand over to delivery partners, and get them to the customers. An essential part of QSRs is throughput, the speed at which they can process and deliver orders. During peak hours like lunch and dinner, faster service and quick ETAs ensure that customers do not choose other restaurants. If you have different menus for breakfast and other meals, ensure that your foodservice app can remove such menus when they are not available.
Delivery Time Analysis Delivery Fee Analysis
c.Pricing and Promotions
QSRs have to understand customers’ price sensitivity while determining delivery costs and ensuring profitability for the business and delivery partners. Customers might look for free deliveries but not adding delivery charges might lead to loss. A deep dive into common transaction data across the locations will allow restaurants to understand the price sensitivity of all customer segments, helping them make intelligent pricing decisions.
QSR intelligence can also help restaurants determine which delivery locations are most profitable. This helps to adjust the delivery radius, fee, and promotions. Restaurants can offer promo codes, coupons, referral codes, etc., to attract customers and encourage repeat purchases.
d.Discoverability
Restaurants have to ensure that their dishes are on the first-page listing. With QSR intelligence on category analysis, keyword optimization, and competition analysis, restaurants can help their customers discover dishes. This also includes optimizing listings for pricing and rating and delivery fees and availability during peak times such as breakfast, lunch, and dinner.
e.Advertisement Optimizer
QSRs can use data to optimize the advertisement budget and adequately improve return on investment. They can track the visibility of advertisement banners across locations and optimize them for different times of the day. Data analysis can also help restaurants understand which customer segments are more likely to convert to long-term loyalists. This data will help QSRs design personalized campaigns and align advertisement budgets while converting them to long-term customers, further improving the bottom line.
Ad spends by identifying carousels with the highest visibility
Track QSRs performance across Carousels across multiple zip codes
f.Growth & Expansion
Upselling and cross-selling are two popular tactics that improve growth for quick-service restaurants. However, that requires a rich understanding of customers’ price sensitivity, preferences, and behavior. QSR intelligence can provide information about which upsell and cross-selling offers a customer segment is likely to value and which optimal channels for distributing the offer.
Conclusion
Quick service restaurants can track critical data points and use them to increase revenue and improve customer experience. Learning how to price, promote, and deliver food to customers during a pandemic can be challenging. QSR intelligence will help brands attract the right clientele, adjust inventory, reduce overall marketing costs, and increase order rates. This will also help increase customer loyalty across segments which can, in turn, increase the number of returning customers and profitability.
For many brands, pricing strategy boils down to guesswork — shooting in the dark and hoping consumers are willing and happy to pay. However, the ‘throw it at the wall, and see what sticks’ pricing strategy leads to big pricing mistakes. Pinning down an optimal price for products requires a clear picture of ideal customers, understanding each customer segment’s behavior, a solid grasp of your product’s value, and an analysis of competitors. Pricing analytics can help brands track a wide range of pricing metrics with cutting-edge analytical tools and use insights to get ahead of their competition. This analysis uses historical data to understand how previous pricing and promotion activities affect brand, sales, and customer price perception. It often involves identifying opportunities and weaknesses in competitors’ pricing strategies and exploiting them to improve sales and revenue.
Pricing analytics helps brands understand how product pricing and promotions affect profitability and the steps they can take to optimize their pricing structures. Brands can leverage their pricing and consumer data to design appropriate pricing models for achieving their sales goals.
Here is a brief overview of pricing analytics, its benefits, and ways to improve sales with historical pricing analytics.
What is historical pricing data analytics?
Historical Pricing Data Analytics
Pricing analytics uses historical pricing and demand data to understand how pricing activities have affected profitability and overall brand. It also helps to optimize a brands’ pricing strategy for maximum revenue. Manual tracking of pricing for brands with numerous product lines, multiple selling points, different customer tiers, and complex product bundles is a huge challenge. Brands from every sector and industry vertical, manufacturing and distribution to retail and eCommerce, can benefit from pricing analytics.
There are three types of pricing analysis:
Descriptive
Descriptive pricing analytics involves analyzing historical data to evaluate how customers have perceived and reacted to pricing fluctuations in the past. It analyzes metrics such as month-on-month sales growth, average revenue per customer, year-on-year pricing changes, or changes to the number of registrations to a particular service over a specific period.
Predictive
Although brands can’t accurately predict how pricing changes will reflect sales, they can use predictive pricing analytics to get insights into the best possible chance of doing so. Predictive pricing analyzes historical data with statistical algorithms and machine learning to predict the price and trends of products in the future. It also helps brands to optimize their prices with future goals.
Prescriptive
Prescriptive pricing analytics is the opposite of descriptive analytics. Unlike descriptive analytics that helps brands explore their historical data to understand customer response after an event, prescriptive analytics help brands design better and more informed strategies. With prescriptive analytics, brands can shape their growth strategies to achieve more sustainable results over the long term.
Benefits of historical pricing data analytics
Benefits of Historical Pricing Data Analytics
Acquire insights into customers price perception
While analyzing the metrics to understand pricing optimization, brands can also gather valuable insights into their customer’s price perception. Pricing analytics helps brands understand which customer segments are the most (and least) profitable and how each segment responds to specific pricing strategies. With historical pricing data analytics, brands can also intelligently link pricing and promotions by first determining customer price sensitivity then gauging the effectiveness of promotions.
Fully Optimized Pricing
Historical pricing analytics means eliminating guesswork from deciding the optimal pricing for a given product. By analyzing historical pricing data, brands can discover how their past pricing and promotional decisions impact profitability. Based on this historical data, they can also test various pricing strategies like value-based and dynamic pricing. It also allows brands to learn which customer segments are most likely to respond positively to price change. These insights from pricing analytics will drive more effective (and profitable) pricing decisions.
Recognize pricing tiers that work the best
Many brands have gaps in their pricing strategy — underpriced or overpriced tiers, pricing leaks, markup errors, or neglected upsell opportunities. Tiered pricing models are prevalent in subscription-based brands where brands offer tiers to meet the needs of diverse customer segments. With historical pricing analytics, brands can improve their pricing tiers and get insight into the right number of tiers and optimal prices for each. Pricing analytics will comb a brand’s historical data to find tier pricing mistakes to improve sales and revenue.
Planning Pricing Strategies and Promotions
Promotional pricing decisions are critical for any brand, as pricing perception is directly linked to consumer demand and profits. Brands have to carefully plan promotions that include variables such as list prices, special offers, advertisements, and discounts while ensuring profit margins. With predictive analytics, brands can determine optimal discount levels, keep a close eye on the competition, and announce promotional offers when customers are likely to purchase. Historical pricing analysis also helps predict revenue and determine optimal locations and platforms for promotional ads.
Discover profitable channels
Not all sales channels bring equal revenue to your brand. Historical pricing analysis can help you determine the most effective quality, volume, and revenue channels. Brands must understand which marketing and sales channels bring quality leads that convert to paying customers. It also helps to determine which eCommerce channels are most profitable so you can optimize your budget and identify channels you should be investing in as a part of future customer acquisition strategies.
Metrics to track
Metrics to Track
Here are a few pricing analytics metrics that can help brands to understand customer behavior towards pricing:
Willingness to Pay (WTP)
WTP, also known as price sensitivity, is the maximum price your potential customers are willing to pay for your service or product. It is an essential part of pricing strategy since you have no other way of understanding whether your product can yield an augmented product value. Numerous factors are responsible for a customer’s willingness to pay, and it’s not static. Brands must track willingness to pay for all customer segments to ensure that the product is priced competitively and drives maximum profit while staying in line with current market conditions.
Feature Value Analysis
Feature value analysis, also known as relative reference analysis, measures the most important features to customers in relation to other features of a product or service. Analyzing critical features to customer segments will help brands price products based on basic or premium components. It can also help to better bundle your services or products so you can drive the most revenue.
Average Revenue per User (ARPU)
The average revenue per user is the revenue generated from the sum of active users divided by the total number of users in a monthly time frame. Delving deeper into ARPU can help brands compare numbers with rivals and check how all products or customer segments perform.
Lifetime Value (LTV)
Lifetime Value offers a complete picture of a user’s journey and the average revenue that the user will generate throughout their engagement as a customer with your brand. It helps brands determine various economic decisions such as marketing budgets, profitability, forecasting, and resource allocation.
Customer Acquisition Cost (CAC)
A successful and profitable brand needs to balance its customer acquisition cost or CAC. It is about spending the right amount of resources and time to drive new customers without jeopardizing their lifetime value and revenue. Correct calculation of CAC helps brands to quantify their sales funnel and determine the efficiency and profitability of their strategies.
Conclusion
Historical pricing analytics is a powerful tool, and it can make a huge difference to a brand’s potential by increasing sales and unlocking incredible profitability in a relatively short time. Historical analysis of pricing and promotions data will help brands get better marketing returns than relying on traditional pricing approaches.
Leveraging pricing analytics will prevent brands from blindly reacting to competitor price changes and support solutions for scaling up price transformation efforts. By using historical pricing data, brands can more effectively segment their customers for marketing and promotion strategies. Properly utilizing predictive analytics and past sales data can help cut costs and keep profit margins high by adjusting production and prices according to market trends. Need help tracking your competitor prices? Or want historic pricing insights for your own brand? Or need to track the efficacy of your online promotions? Sign up for a demo with our team to know how DataWeave can help!
Most brand & marketing professionals fear negative feedback and reviews. Negative reviews and ratings can not only hurt your organic product visibility online, but they also impact real business outcomes and purchase decisions potential customers will make about your product.
… but getting negative reviews is not always a bad thing. These unflattering reviews help give consumers real insights into your product and help them understand their features, attributes, benefits, and downsides better as described by other customers to give them a more realistic picture. Shoppers trust user generated reviews more than content brands share with them, which is why it’s really important for brands to interject in these conversations, address negative reviews and nudge customers towards building trust in their products.
Here are a few things to keep in mind when responding to negative reviews.
Be actionable and solution-oriented with your responses!
Even the strongest brands can’t avoid negative reviews, but what sets one apart from the other is how they tackle these reviews. A prompt and solution-oriented response can actually help salvage a negative situation in a lot of cases.
Build Brand Trust
Let’s take a look at Clinique & the unique approach they took towards responding to negative reviews. Shown above is one of its bestselling products Moisture Surge™ 100H Auto-Replenishing Hydrator. This product got an average of 4.7 stars since its launch in early 2021. 99% of customers even said they would recommend this product. And, in comparison to the over 370 positive reviews, there were just 5 negative reviews! Instead of basking in the glory of the numerous positive reviews, Clinique chose to promptly reply instead & not dismiss negative reviews even if there were just a tiny number. This goes a long way for any brand.
Negative feedback
Clinique not only addressed the customer’s concerns but also offered a ‘no questions asked’ refund and insisted that the customer take the conversation offline through a customer care agent. This action will help Clinique build long-term trust with not only the customers who had given them a low rating but the new ones too, who may stumble upon these negative reviews and see first-hand how customer-centric the brand is.
Respond promptly to keep things under control
A quick response to a negative review is supercritical. Even if you’re unable to resolve the customer’s problem immediately, acknowledging the review promptly lets them know their concern is a priority. On the plus side, it may also help them calm down and hold them back from posting even nastier comments. Aim to respond within 24 – 48 hours from the time a negative review is posted.
The quicker a customer hears from you, the more sincere your words will feel to them.
Prompt Response
Here’s an example of how Chobani yoghurts tackled a negative review. You’ll notice, they responded almost immediately when a customer complained about the “RANCID” tasting yoghurt. Responding minutes after the review came in shows their seriousness towards dealing with the situation and that they value customer feedback. Apart from prompt response, they even offered to investigate and work towards a solution.
Look for a chance to take the discussion offline
Negative Feedback System
Take the conversation offline by giving a phone number or email where customers can connect with a real person or brand representative. The goal is to move the conversation from a public forum to a private channel where a personal touch can be added. It could be a customer care number, a DM on a social platform, or a direct call back to the customer to listen to the details of their complaint. Additionally, connecting offline helps resolve issues faster without letting the problem escalate.
Do NOT get defensive
When it comes to responding to negative reviews, as a thumb rule pushing back or getting defensive is an absolute no-no. Being humble and accepting of negative feedback is important, and responding with grace, is even more important.
Let’s look at this example of a negative review left by an irate customer about the terrible IKEA customer service. Instead of getting defensive, IKEA politely acknowledges the feedback, apologies for the inconvenience, and offered a solution to help the customer sort out the issue with the order immediately!
Customer Feedback
A brand’s response to a negative review not only helps the individual who left the review in the first place but actually impacts other customers who will read it months down the line.
Remember to follow-up
Many times brands jump in promptly when a customer posts a negative review. They’re solution-oriented and some help resolve customer issues immediately too. The hard part’s done! However, where a lot of brands fall short, is when it comes to following up with customers once their concern has been addressed and they’re back to being brand advocates again.
Keeping that thought in mind, if it’s possible to get a customer who left a negative review to update or change it after their concern has been resolved could be a very impactful way to build brand trust. According to the Retail Consumer Report, 33% of customers turned around and posted a positive review, and 34% deleted the original negative review after having received a response from the brand or retailer in question.
Conclusion
Even though brands have limited to almost no control over how customers perceive their products online, they can still participate and interact with customers to improve their online reputation. They can listen in on the online conversations and adapt to customer feedback promptly based on what shoppers are discussing via reviews. Also, don’t filter the types of reviews when responding to your customers, and aside from the positive and neutral reviews, treat your negative reviews with extra care. Resolve them responsibly to win a customer for life!
Competition is a fundamental and healthy part of commerce that protects customers by keeping prices low and the quality of services (and choice of goods) high.
Healthy competition drives prices down, but it can harm brands and their reputation without a pricing policy. The manufacturer or brand designs MAP or Minimum Advertised Pricing policies to stipulate retailers’ lowest price point to advertise the product. It is an agreement between distributors and manufacturers about the minimum price that retailers and resellers can advertise the product for sale.
Most legitimate brands have a MAP policy, especially brands that rely heavily on brand identity. It becomes critical that they maintain price parity across retailers. When a retailer violates MAP policies, brands can penalize them under the agreed-upon terms or terminate contracts.
In this blog, you will learn about MAP policy, its benefits, and tips on tackling MAP violations.
1. What is a MAP policy?
MAP Violations
MAP stands for Minimum Advertised Price, and brands create MAP policies to ensure that retailers don’t advertise their products below the specified price. However, it only controls advertised prices, ensuring the retailers don’t display a lower price in online listings or advertisements. Since it doesn’t cover the checkout price, retailers can sell products at a lower price through promotional offers like discounts and cashback during checkout.
MAP policies ensure a price war between eCommerce platforms does not devalue products and that an even playing field is set among retailers that allow everyone to drive margins. Brands have a legal right to withdraw products if a retailer advertises products below the minimum advertised price. Brands can also restrict future sales or refuse to replenish products after the current stock has sold out if an eCommerce platform, reseller, or distributor violates MAP policies.
In the U.S., MAP policies fall under federal antitrust law since they restrict advertisement pricing rather than the last sales price. However, in the UK and the EU, violation of minimum advertised pricing is an infringement of current competition laws.
2. Why Does Having a MAP Policy Matter?
Having a MAP policy protects both brands and retailers while ensuring consumers get the best-priced items. Following are the benefits of having a MAP policy:
a. Prevent margin erosion
Although online retailers are willing to take a margin cut to attract traffic, selling products below MAP can significantly hurt a brand’s bottom line. Setting a minimum advertised price benefits both parties. It allows shoppers to purchase products at the best-valued price & also creates a balanced economy and prevents hyper-competition of products between retailers. However, manufacturers must set a realistic pricing policy that matches current market demand, ensuring eCommerce platforms implement MAP while taking care of the margins.
b. Retain brand identity
Brand Protection
Price is one of the essential indicators consumers use to determine the authenticity and value of a product. Constant price fluctuations can negatively impact a brand’s reputation. Brands need to safeguard their pricing to create a consistent price perception. Price changes often make the buying decision complex since consumers no longer have a clear reference of prices. It also shifts purchasers’ attention from the brand and product features to its price. With price fluctuations, brands that were used to be differentiated for their features can be seen as commodities.
Low prices & MAP violations on an online platform can even be a sign of counterfeit products or unauthorized sellers. However, customers might hold the brand responsible if they purchase counterfeit products from a retailer at lower prices. A negative product experience with a retailer will also reflect the brand’s reputation. An effective MAP policy that enforces consistent pricing will ensure that customers hunting for the best deals will stick with the most legitimate retailers.
Comparing prices has become an essential and common milestone in every consumer’s purchasing journey. It’s imperative that a brand ensures price parity across platforms and stores because substantial pricing variations on different platforms can make customers suspicious of a brand. Consistent pricing across eCommerce platforms ensures brands maintain their identity. MAP policies also allow retailers to maintain profit margins while avoiding price wars.
d. Combat revenue loss from illegitimate sales
While most authorized sellers or distributors comply with pricing policies, unauthorized sellers or grey market sellers have no obligation to follow a brand’s MAP pricing infrastructure. Brands can reduce risk with an authorized seller badge on retailer websites. This will help customers to verify authorized retailers and resellers of your products & help safeguard your brand equity online.
3. Tips on Implementing MAP policy and Tackling violations
Enforcing and tackling MAPs comes down to two things: monitoring the market for infringements and then acting on those violations. Here are a few tips for tackling MAP violations:
Implementation of MAP Policy & Tracking Violations
a. Communicate actively with retailers
To maintain a positive relationship with retailers and avoid confusion, brands should create proper communication strategies and channels to accompany the launch of the MAP policy. The policy should be easy to understand, but legal advisors are necessary to understand the jargon of the document. Brands can use checklists, videos, and well-briefed brand reps to communicate their policy clearly with retailers.
b. Reward retailers for compliance
Retailers who follow MAP guidelines can lose out to platforms that do not follow these pricing guidelines. Non-MAP following platforms undercut the price of products to drive sales and secure higher traffic. In such instances, brands can incentivize MAP following retailers to encourage them to comply with MAP guidelines while not affecting the competitive edge. It can be in the form of laxity of rules during promotion seasons like New Year, Christmas, and Black Friday sales. The laxity of rules for promotional seasons should be used as an exception to the general rule, and outlined in the guidelines.
c. Implement an AI-driven MAP monitoring
When product distribution is spread across the globe through a network of resellers and retailers, keeping a close watch on all platforms for multiple products can become difficult. With the expansion of online marketplaces, manually tracking the pricing of numerous products on multiple platforms is time-consuming and unsustainable. An automated AI-driven monitoring platform can track the pricing of all products sold across hundreds of online platforms and identify violations around the clock. Such platforms can alert brands of violations, price inconsistencies, or suspicious activities in real-time.
d. Send cease and desist to MAP violators and unauthorized dealers
Brands must enforce a MAP policy to ensure price parity among retailers and resellers. Brands must systematically monitor prices across retailers, social media, marketplaces, and price comparison websites. Whenever brands encounter a MAP violation, they should take action by sending a cease and desist letter to unauthorized sellers. For legitimate sellers, brands can notify them and outline the steps that will be taken if they don’t comply. Brands must be consistent in enforcing MAP policy violations, signaling retailers and unauthorized sellers that there will be repercussions for MAP violations.
MAP Policy
4. Conclusion
The trend towards online shopping helps businesses to cut overheads, allowing their products to be sold at a significantly reduced price. Although price appears to be the most effective consumer attraction strategy, significantly lowering product prices can devalue products and hurt brand reputation in the long term. However, including and enforcing MAP policies helps brands to manage their reputation and allows retailers to manage their margins.
Want to see first-hand how DataWeave can help brands track MAP Violations, Counterfeit products, and identify unauthorized sellers? Sign up for a demo with our Digital Shelf experts to know more.
Business has been anything but usual this holiday season, especially in the digital retail world. The holiday hustle and bustle historically seen in stores was once again occurring online, but not as anticipated given the current strength of consumer demand and the reemergence of COVID-19 limiting in-store traffic. While ‘Cyber Weekend’, Thanksgiving through Cyber Monday, continues to further its importance to retailers and brands, this year’s performance fell short of expectation due to product shortages and earlier promotions that pulled forward holiday demand.
Holiday promotions were seen beginning as early as October in order to compete with 2020 Prime Day sales, but discounting, pricing and availability took an opposite direction from usual. This shift influenced our team to get a jump start on our 2021 digital holiday analysis to assess how drastic the changes were versus 2020 activity, and to understand how much of this change has been influenced by inflationary pressures and product scarcity.
Scarcity Becomes a Reality
Our initial analysis started by reviewing year-over-year product availability and pricing changes from January through September 2021, leading up to the holiday season, as detailed in our 2021 Cyber Weekend Preliminary Insights blog. We reviewed popular holiday categories like apparel, electronics, and toys, to have a broad sense of notable trends seen consistently throughout various, applicable marketplaces. What we found was a consistent decline in product availability over the last six months compared to last year, alongside an increase in prices.
Although retailers significantly improved stock availability in November and early December 2021, even digital commerce giants like Amazon and Target were challenged to maintain consistent product availability on their website as seen below. While small in magnitude, there is also a declining trend occurring again closer toward the end of our analysis period, post Cyber Weekend, across all websites included in our analysis.
Source: Commerce Intelligence – Product Availability insights for Home & Garden, Jewelry & Watches, Clothing & Shoes, Bed N Bath, Lighting & Ceiling Fans categories
Greater Discounts, Higher Prices?
With inflation at a thirty-nine year high, retailers and manufacturers have realized they can command higher prices without impacting demand as consumers have shown their willingness to pay the price, especially when threatened by product scarcity. Our assessment is that while some products and categories have responded drastically, manufacturers’ suggested retail prices (MSRPs) have increased nearly seven percent on average from January to December 2021. MSRP adjustments are not taken lightly either, as this is an indication increased prices will be part of a longer-term shift in product strategy.
Source: Commerce Intelligence – Pricing Insights for Bed & Bath, Electronics, Furniture, Healthy & Beauty, and Fashion categories on Amazon.com & Target.com each month in 2021 comparing price increases from January 2021 base
Our 2021 pre-Cyber Weekend analysis reviewed MSRP changes for select categories (Bed & Bath, Electronics, Furniture, Healthy & Beauty, and Fashion) on Amazon and Target.com, and found around forty-eight percent of products on Amazon and thirty-five percent of products on Target.com have increased their MSRPs year-over-year, but kept pre-holiday discount percentages the same.
Looking more specifically as to what year-over-year changes occurred on Black Friday in 2021, we observed MSRPs increasing across the board for all categories at various magnitudes. This indicates why 2021 discounts appeared to be greater than or equivalent to 2020 for many categories, when in reality consumers paid a higher price than they would have in 2020 for the same items.
Source: Commerce Intelligence – MSRP Pricing Insights for Bed & Bath, Electronics, Furniture, Healthy & Beauty, and Fashion categories on Black Friday November 27th, 2021, versus average MSRP pricing for the same SKU count from November 20-26th 2021
On Amazon.com, categories like health & beauty have already increase MSRPs by a much greater percentage and magnitude versus Target.com leading up to and during Black Friday 2021, while other categories like furniture have increased MSRPs evenly on average across both retail websites. The below chart cites a few specific examples of year-over-year SKU-level MSRP, promotional price, and discount changes within found within the electronics, furniture, fashion, and health & beauty categories.
Source: Commerce Intelligence – MSRP Pricing Insights for Bed & Bath, Electronics, Furniture, Healthy & Beauty, and Fashion categories on Black Friday November 27th, 2021, versus average MSRP pricing for the same SKUs on Black Friday November 26th, 2020.
Fewer, but Deeper Discounts
From October through early November 2021, fewer products were discounted compared to this same period in 2020, and the few that were saw much deeper discounts apart from the home improvement category. The most extreme example we saw in discounts offered was within furniture where only three percent of SKUs were on discount in 2021 compared to twenty-six percent in 2020. Interestingly, the magnitude of discount was also higher pre-Cyber Weekend 2021 versus 2020, but this trend was not exclusive to furniture and was also seen within electronics, health & beauty, and home improvement.
Source: Commerce Intelligence – Pricing Insights for Bed & Bath, Electronics, Furniture, Healthy & Beauty, and Fashion categories on Amazon.com & Target.com Pre-Black Friday average selling price during November 20-26th 2021 versus average selling price from November 13-19th 2021 compared to Pre-Black Friday average selling price during November 19-25th 2020 versus average selling price from November 12-18th, 2020.
Within the furniture category, the subcategories offering the greatest number of SKUs with price decreases on Black Friday 2021 were rugs by a wide margin, followed by cabinets, bed and bath, and entertainment units, but the magnitude of discounts offered were all under twenty percent.
Source: Commerce Intelligence – Pricing Insights for Bed & Bath, Electronics, Furniture, Healthy & Beauty, and Fashion categories on Amazon.com and Target.com on Black Friday November 27th, 2021, versus average pricing for the same SKUs from Pre-Black Friday November 20-26th 2021 and Black Friday November 26th, 2020, versus average pricing for the same SKUs from Pre-Black Friday November 19th-25th 2020
Accounting for this phenomenon could have been retailers’ attempts to clear inventory for SKUs which hadn’t sold even during the period of severe supply chain shortages. With more products selling at higher prices this year, retailers were also able to use fewer SKUs with greater discounts to attract buyer in hopes of filling their digital baskets with more full-priced goods, helping to protect margins heading in to Cyber Weekend. Scarcity threats also encouraged consumers to buy early, even when not on promotion, to ensure they would have gifts in time for the holidays.
The same trends seen pre-Cyber Weekend 2021 were also seen on Black Friday with a year-over-year decrease in the percentage of SKUs offered on discount versus 2020, and steeper price reductions for the discounted products which can also be attributed to the increase in MSRPs.
Source: Commerce Intelligence – Pricing Insights for Bed & Bath, Electronics, Furniture, Healthy & Beauty, and Fashion categories on Amazon.com and Target.com on Black Friday November 27th, 2021, versus average pricing for the same SKUs from Pre-Black Friday November 20-26th 2021 and Black Friday November 26th, 2020, versus average pricing for the same SKUs from Pre-Black Friday November 19th-25th 2020
2021 Black Friday Price Increases?
We all know Black Friday is all about price reductions, discounts and deals and so it’s rare to see actual price increases, yet for Black Friday 2021, trends ran counter to this. We observed price increases across all categories for around thirteen to nineteen percent of SKUs, with an average price increase of around fifteen percent in 2021 versus an average of only two percent in 2020.
Source: Commerce Intelligence – Pricing Insights for Bed & Bath, Electronics, Furniture, Healthy & Beauty, and Fashion categories on Amazon.com and Target.com on Black Friday November 27th, 2021, versus pricing for the same SKUs from Pre-Black Friday November 20-26th 2021 and Black Friday November 26th, 2020, versus average pricing for the same SKUs from Pre-Black Friday November 19th-25th 2020
At an account level, we noticed a few interesting differences happening on Black Friday 2021 versus 2020 regarding category price changes. On Target.com, almost ninety percent of the bed and bath SKUs analyzed had a price change on Black Friday in 2021 versus 2020 with eighty-two percent presenting a higher price year-over-year versus only around seven percent showing a decrease, where on Amazon nearly forty-four percent of bed and bath SKUs showed an increase in price and around thirty-eight percent showed a decrease. Except for the health and beauty category on Target.com, more than half of the SKUs in each category saw a price increase on Black Friday versus a price decrease.
Source: Commerce Intelligence – Pricing Insights for Bed & Bath, Electronics, Furniture, Healthy & Beauty, and Fashion categories on Amazon.com and Target.com on Black Friday November 27th, 2021, versus average pricing for the same SKUs on Black Friday November 26th, 2020.
The magnitude of year-over-year price changes seen on Black Friday 2021 was significant across all categories, but the magnitude of price increases found on Amazon.com within the health and beauty category outpaced the rest by far. We reviewed three hundred and sixty-five SKUs on Amazon.com within the health & beauty category and saw almost eighty-three percent of them had a price change with around thirty-one percent decreasing prices and around fifty-two percent increasing prices. This means that within the health & beauty category on Amazon.com, more than fifty percent of the SKUs tracked were sold at a one hundred and seventy-six percent higher price on average during Black Friday 2021 versus 2020.
Source: Commerce Intelligence – Pricing Insights for Bed & Bath, Electronics, Furniture, Healthy & Beauty, and Fashion categories on Amazon.com and Target.com on Black Friday November 27th, 2021, versus average pricing for the same SKUs on Black Friday November 26th, 2020.
The subcategories offering the greatest number of SKUs with price increases on Black Friday 2021 were cameras, followed by men’s fragrances, laptops, and desktops & accessories, but the magnitude of discounts offered were all under ten percent.
Source: Commerce Intelligence – Pricing Insights for Bed & Bath, Electronics, Furniture, Healthy & Beauty, and Fashion categories on Amazon.com and Target.com on Black Friday November 27th, 2021, versus pricing for the same SKUs from Pre-Black Friday November 20-26th 2021 and Black Friday November 26th, 2020, versus average pricing for the same SKUs from Pre-Black Friday November 19th-25th 2020
The Aftermath Post-2021 Cyber Weekend
Extending this analysis beyond the holiday weekend, we analyzed price change activity from December third through the ninth across the top US retailers (chart below) and found that price decreases have been very minimal, comparatively speaking. Though there was a spike in number of price decreases from December 8th to the 9th, the percentage of SKUs with price decreases was still very low (less than three percent). We anticipate this trend will continue into 2022.
Source: Commerce Intelligence – Pricing insights for Home & Garden, Jewelry & Watches, Clothing & Shoes, Bed N Bath, Lighting & Ceiling Fans categories
A Sign of Things to Come
A confluence of inflationary trends, product shortages and consumer liquidity have driven many marketplace changes to occur simultaneously. Government programs in the form of stimulus checks, have put extra money in consumers’ hands, and so they’ve been more willing to spend. That, coupled with the shock in the supply chain, has motivated people to buy far ahead of the 2021 holiday season. Hence, retailers have needed to rely much less on across-the-board discounts. Promotions have been more strategic – we’ve seen deeper discounts over fewer products, likely used to draw consumers in to buy certain items, and once they’re there, customers are buying everything else at a non-discount level. When these factors once again normalize, we could see a return to the “race to the bottom” that has occurred since the financial crisis of 2008-2009, but for once, retailers may be able to maintain some pricing power as the 2021 holiday shopping season played out.
Even though performance was not as anticipated and holiday sales did not grow as rapidly as they did in 2020, Cyber Monday was still the greatest online shopping day in 2021. Through it all, retailers managed to keep their digital shelves stocked and orders filled in time for the holidays for the most part, running the risk of housing aged inventory if goods didn’t arrive in time. Despite predictions for steep promotions in January 2022, with supply chains still challenged and inflationary pressures still full steam ahead, we don’t anticipate much in the way of enhanced discounts to continue beyond the holidays.
Access to these types of real-time digital marketplace insights can enable retailers and brands to make strategic decisions like how and when to address inflationary pressures, while also supporting many other day-to-day operations and help drive profitable growth in an intensifying competitive environment. Continue to follow us in the coming weeks for a detailed 2021 year-end review across more retailers and categories. Be sure to reach out to our Retail Analytics experts for access to more details regarding the above analysis.
When it comes to classifying and analyzing images, humans can easily recognize distinct features of objects and associate them with individual definitions. However, visual recognition is a highly complex task for machines because it involves identifying multiple objects and finding object relationships. Image recognition has been a long-standing research problem in the computer vision field. But, the recent development in AI has improved the process of object detection, image identification, and image classification. The image recognition market is assumed to rise globally to a market size of $42.2 billion by 2022. Various industries are adopting image recognition technology to improve augmented reality applications, optimize medical imagery, boost driverless car technology, predict consumer behavior, and much more.
Although image recognition is a relatively new aspect of analysis, it is also making its way into eCommerce. Image recognition is helping retailers to expand consumer reach, offer insights into trends, and improve customers’ online shopping experience for the eCommerce industry. The Global Image Recognition in Retail Market is estimated to be USD 1.8 Bn in 2021 and is expected to reach USD 4.5 Bn by 2026, growing at a CAGR of 20%.
Global Image Recognition in Retail Market
In this blog, you’ll learn about image recognition technology and its importance in the retail industry.
What is Image Recognition?
Image recognition, a subcategory of computer vision, is a technology that can identify objects, entities, or attributes in digital images or videos. However, computer vision is a broader term, including methods for gathering, processing, and analyzing data from the real world. Image recognition can be performed at varying degrees of accuracy, depending on the type of information required.
Image recognition can perform the following tasks:
Classification: It identifies the “class,” i.e., the category to which an image belongs. A picture can have only one class.
Tagging: It’s a classification task but involves a higher degree of accuracy. Tagging can recognize several concepts or objects within an image, and there can be more than one tag assigned to a particular image.
Detection and localization: This step helps locate object(s) in an image. Once the system locates the object in question, localization helps to place a bounding box around it.
Segmentation: This is also a detection task but involves a higher degree of precision. Segmentation locates element(s) to the nearest pixel in an image.
Instance segmentation: It helps differentiate multiple objects belonging to the same class.
Image Recognition in eCommerce and how it works
Nowadays, increasing competition and customer expectations are forcing online retailers to constantly monitor market dynamics wrt their pricing, promotion & product assortment in order to stay competitive. To get these insights, retailers need to match and compare their products against their competitors to see where the gaps are. That’s where product matching comes in.
Product matching refers to finding the same or similar products against a target universe of products from across the web, across multiple competing retailers. Product matching uses AI-based image recognition to determine product attributes, find patterns, and detect text, product price, shipping information, and so on.
Image recognition use-cases in the retail industry
a. Attribute tagging
Attribute Tagging
Getting shoppers to your eCommerce platform is one thing and getting them to complete a purchase is a steeper hill to climb. If your platform can’t provide search results that match with customers’ requirements, they’ll get lost, grow frustrated, and drop off. Attribute tagging with image recognition allows eCommerce stores to automatically generate attributes for all products so customers can quickly find products they are looking for.
Tags allow users to filter products based on the categories they want to explore. Product tags include everything the customer might specifically search for — color, type, size, brand, use, design, fabric, discount, etc. For example, a dress could have tags like red, evening, midi, summer, long-sleeve, silk, summer sale, etc. When a user looks for midi dresses or long-sleeve dresses, products with these tags will show up.
b. Search by image
Visual Search
Visual Search allows users to look for similar products using a reference image from their camera roll or downloaded from the internet. The visual search feature also enables eCommerce businesses to implement image-based search into their software applications. It maximizes the searchable potential of their visual data.
Meanwhile, Gartner predicts a 30% increase in digital commerce revenue by 2021 for companies who start supporting visual and voice search on their websites and apps. The benefits of visual search include more personalized, easy product recommendations and enhanced product discovery.
c. Fashion trend analysis
Similarity Matching
Tapping into trending product categories is a goldmine for any eCommerce business. Having insights into trending categories and products means less competition on search engines, fewer ads, and intelligent pricing. All of which can boost any retailer’s margins. Image recognition technology provides information about colors, styling techniques, fabric textures, prints, and more to spark consumer demand. It works by scanning social media images to pinpoint trending attributes and predict fashion trends. For instance, while scanning images, technology understands that it’s seeing a photo of a color-blocked sweatshirt because it recognizes the product has a hooded neck, full sleeves, blocks of different colors, and even the type of fabric. This technology can analyze millions of images, helping retailers analyze the volume of color-blocked sweatshirts.
We do this seamlessly at DataWeave. Our similarity matching solution helps retailers gather insights into attributes for products similar to the ones they’re carrying on their site. Similarity matching helps retailers gain visibility into their entire competitive landscape to keep their e-commerce strategy responsive to price & product assortment shifts among consumers and rivals
d. Augmented reality
According to Statista, the AR market is valued at $9.5 billion, with around 810 million active mobile users. Since shoppers want the full sensory product experience before shopping online, augmented reality (AR) can help them understand what they’re buying and how the product will work for them. There are AR applications for trying makeup, clothing, accessories, and even eyeglasses. IKEA was one of the pioneers in using AR for eCommerce retail. In 2017, IKEA launched the Place app, allowing shoppers to see how thousands of items will look in their homes, with 98% accuracy.
Image recognition helps AR applications anchor virtual content with the real world. For instance, Sephora has a Virtual Artist that allows users to try different makeup looks and even take pictures of an outfit they’re planning to wear to match the shade. Users can even check out full-face looks and learn how to do their makeup with virtual tutorials.
e. Counterfeit Detection
Counterfeit Detection
Another application of image recognition that has proven to be very successful is counterfeit product detection. It has become increasingly difficult for brands and retailers to find and eliminate fake items on eCommerce sites. U.S. Customs seized over 13,500 counterfeit goods worth $30 Million in November 2021, indicating how brands and online marketplaces have struggled in the past to find an effective solution.
Essentially, image recognition technology allows eCommerce sites to detect products with fake logos and designs attempting to sell as legitimate brands by capturing discrepancies in images and content. The system flags and delists the products and sellers when a fake is detected.
Visual content plays a vital role in eCommerce sites, especially when it comes to product photos and videos. Today, branded visual content isn’t as effective as it’s one-dimensional. As a matter of fact, 93% of marketers agree that customers trust user-generated content more than content produced by brands. However, user-generated content that features product images or videos is way more exciting, realistic, and creative. It gives customers an appealing view of products being used in real life.
The most common form of UGC, i.e., reviews and ratings, have been the key for eCommerce brands as they are quantitative and qualitative metrics about a product/service quality, worth, value, reliability, etc. With image recognition, retailers can access insights into strengths and gaps in all product offerings by understanding what consumers are saying about them.
Because of its massive influence, image recognition technology is becoming widely adopted by eCommerce companies. It benefits both retailers and customers. Image recognition based on deep learning can provide retailers with helpful capacities like customer analytics, counterfeit detection, personalized searches, and more. Retailers can also use the data gathered from image recognition eCommerce technology to design effective marketing campaigns and improve their ROI.
With super sharp image recognition capabilities, DataWeave offers 90% accuracy in matching eCommerce products, allowing us to provide comprehensive and precise insights into pricing and assortments. Sign up for a demo with our team to know more.
For eCommerce companies, holidays are the busiest season of the year. Whether creating brand awareness with your marketing campaigns or freshening up your landing pages or finding new ways to segment & understand your customers, the list of tasks seems endless. It’s the time of the year when most people look forward to shopping for friends and family.
The holiday shopping season begins with Black Friday and Cyber Monday and leads to the December holidays, including Christmas and New Year. Consequently, proper planning and marketing are essential for a successful holiday season.
In fact, holiday sales during November and December are forecasted to be between $843.4B – $859B, up 10.5% over 2020, according to the National Retail Federation (NRF). For online stores specifically, sales are predicted to increase between 11% – 15% to a total of between $218.3B and $226.2B driven by online purchases.
This guide will share eight promotional strategies retailers can use during the holiday season. We will also discuss how data analytics can help retailers improve their promotional strategies.
Using data analytics to guide promotional strategies
Promotional Strategies
Data is the foundation of every successful marketing campaign. Data analysis helps companies understand which graphics worked well and campaigns that generated the most revenue. Gathering data and running analysis helps companies improve their next marketing campaign. Retailers can also get deeper insights into campaigns/channels with the highest conversion rate or average order value (AOV).
With data analytics, retailers can prioritize campaigns and channels that resonate the most with their customers this holiday season. But, it would be best to try more than one promotional strategy to ensure you double down on what works without placing all of your eggs in one Christmas-themed basket.
Here are four ways that data analytics can help guide promotional strategies:
a. Customized alerts for listing pages
Data analysis helps retailers determine if certain products are out of stock on their rival’s website and adjust their own pricing accordingly. It allows retailers to grab market share for trending items. For example, if you get an out-of-stock alert for a particular product at competitors’ stores, you can invest more in advertising that product on your online store. In addition, customized alerts keep retailers informed about their inventory status, allowing them to plan promotions and ads. They can see which products are becoming commoditized due to intense competition and which ones offer better revenue opportunities.
b. Maximize conversions by tracking product trends
Assortment Analytics
Customers are always looking for products that are currently trending. With assortment analytics, eCommerce companies can get insights into hot trends, allowing them to stock in-demand categories and products. Integrating assortment analytics with AI-powered image analytics can also provide insights into attributes that are popular among customers. By filling gaps in their current assortments, retailers can improve conversion rates and increase revenue.
Here’s a case study on how DataWeave helped Douglas, a luxury beauty retailer in Germany boost sales by building an in-demand product assortment
c. Monitor competitor promotions
Promotional Insights
With increased competition and consumer demand for deals, it has become important for retailers to monitor their competitor’s promotions. Monitoring promotions helps retailers to optimize their ad spend accordingly. AI-powered image analysis tools can capture important information from competitors’ ad banners and deliver insights into metrics that are working to deliver sales.
d. Optimize margins with a data-driven pricing strategy
Pricing Intelligence
It has become challenging to price products in recent years since digital tools enable price transparency across channels. Although this trend is excellent for consumers, it makes competition fierce for retailers. A data-driven pricing strategy incorporates a variety of factors, including industry needs, competitor analysis, consumer demand, production costs, and profit margins.
With data-driven competitive pricing, retailers can keep pace with the changing eCommerce environment with real-time pricing updates. It also helps them optimize margins and quickly respond to changes in prices on rival stores.
Promotional Strategies for the Holiday Season
a. Virtual Webrooms
When customers want to see a product in-person, they go to a store showroom. It helps them make a purchase decision. However, with the Internet, eCommerce companies can bring this tactic online. The only difference between showrooming and webrooming is that the former takes in-person, whereas the latter happens digitally. Webrooming grew in popularity during the COVID-19 pandemic. Instead of spending weekends browsing stores, consumers took to the Internet for most of their product research.
A webroom allows customers to explore products from every angle, providing them with the complete in-person showroom experience online. Webrooming is a powerful holiday marketing strategy, especially regarding expensive purchases. Customers prefer to understand how the product will look. However, building a webroom is extensive and requires retailers to hire developers and professional photographers.
Webrooms allow retailers to share their collections, schedule virtual appointments, share 3D product images, set up virtual fitting rooms for clothing products, and accept purchase orders. For example, in 2015, Tommy Hilfiger launched its first digital showroom in Amsterdam to improve sustainability and minimize its carbon footprint. Through remote wholesale selling and digital product creation, a digital showroom helped Tommy Hilfiger transform the buying journey and retail value chain.
b. Loyalty-rewarding sales and perks
Customer Loyalty
Consider building customer loyalty during your holiday promotions. First, encourage your holiday shoppers to become loyal customers by offering bonus rewards, contests, or giveaways when they sign up for your loyalty program. You can encourage them to purchase right away by providing instant discount coupons or points for a reward to redeem on their next purchase. For maximum impact, you should run this promotion throughout the holiday season.
Second, you should attract your current loyalty program members with discount codes. Offer free shipping or provide a one-day-only discount code to ensure your customers choose you during their last-minute purchases. With these rewards, you’ll attract customers who are window shopping and simultaneously bring your loyal customers back throughout the holiday season.
c. Charitable Tie-Ins
AmazonSmile
Research shows that customers are four times more likely to purchase from brands with a strong sense of purpose. With the festive season being the time of giving, working with a charity and giving back to your community is a great way to reach out to customers.
After a tough one and half years because of the pandemic, people want to give back and help those in need this holiday season. You can partner with a non-profit and run campaigns that allow customers to give back. It’s also great for sharing your brand mission with your customers. For instance, Amazon allows customers to shop from AmazonSmile, which donates 0.5% of their eligible Charity List purchases to a selected charity, at no extra cost to the customers.
Consider partnering with an organization within your industry. For example, you can pair up with a non-profit that collects and gives clothes to the needy if you sell clothes. You can involve customers by asking them to exchange old dresses for coupons or cash discounts.
d. Omni-channel customer experience
Omni-channel marketing provides customers with a seamless, consistent, and cohesive experience over multiple marketing channels. Omnichannel marketing aims to provide a meaningful and cohesive experience that inspires your customers to make a purchase. Unlike multichannel marketing, this strategy puts the customer at the center of marketing campaigns and elevates the cross-channel customer experience.
Omnichannel shoppers spend 10% more money and purchase 15% more items than the original shoppers. eCommerce companies can use historical data to analyze successful channels and create a more transparent marketing strategy for the holiday season. Omnichannel analytics will provide a holistic picture of customer data that will help retailers to better meet the customer’s requirements and predict inventory.
e. Buy now, pay later (BNPL)
Buy Now Pay Later (BNPL)
Technically, buy now, pay later isn’t a promotional idea since your customers will still be paying the full price. However, BNPL allows them to delay their payments and not pay in full right away at checkout. Buy now, pay later needs to be on every eCommerce company’s holiday promotions plans. Various retailers, including Walmart, offer affordable monthly payments at the pace of 3 to 24 months with Affirm. Target also has a similar scheme with Sezzle and Affirm. Whereas Sephora and Macy’s offer 4 interest-free payments with Klarna.
BNPL is especially popular with millennials and Gen Z shoppers and will factor into their 2021 holiday shopping plans. Research showed 62% growth in the use of buy now, pay later service in consumers aged 18 to 24. Giving customers a means to manage their budgets during holidays while still taking home their purchases will attract more customers. While the customer doesn’t pay the full price right away for their purchase, businesses still get the total worth of the item. In the eCommerce industry—nearly 50% of BNPL users say they use it while shopping online, and among them, 45% use the service frequently.
f. Buy One, Get One
The last promotional idea is a classic buy one, get one offer. Everyone likes a good BOGO promotional offer. In fact, 66% of shoppers from a survey preferred BOGO over other promotions. It’s a win-win promotional strategy for retailers and customers. With this offer, people shop and stock up on gifts for their friends and family, while retailers make a more significant profit than 50% off sales. People prefer to get 100% off on a product over 50% on two items.
BOGO sales are best to move inventory by giving shoppers a deal they can’t pass up. If you have stocked up extra items during Black Friday, you can move those last-minute gifts as end-of-year BOGO sales, making room for new merchandise in January.
Conclusion
In this post, you saw that there’s more to holiday marketing than a few social media posts. eCommerce companies can use these holiday promotional ideas to offer Loyalty-rewarding sales and perks, buy now pay later service, and an omnichannel customer experience. Regardless of which strategies you’re using, remember that historical data analytics and early planning will play a significant role in increasing your sales and revenue.
Proper planning backed by insights into key metrics will help your team develop a one-of-a-kind holiday marketing strategy to drive your holiday sales upward. From sharing gratitude to offering personalized experiences, retailers have various options for promoting business this holiday season.
Learn how DataWeave can help make sense of your and your competitor’s pricing, promotional, and assortment data this holiday season. Sign up for a demo with our team to know more.
Traditionally, retailers have staged multiple promotions between Black Friday and before Christmas Day to keep consumers excited about holiday shopping, so it’s easy to see why one more promotional day might fall into relative obscurity. As if ‘Early Start’ offers to Black Friday and extended ‘Cyber Weekend’ promotions weren’t enough to plan for, eBay added another day into the mix called ‘Green Monday’, much to the benefit of consumers, as it furthers the window of opportunity to secure a bargain during the holiday season.
Green Monday falls on the second Monday of December and has historically been one of the greatest sales days of the year for eBay, often attracting last-minute shoppers or those searching for last-minute deals. However, because of the 2021 Global Shipping Crisis, there is speculation that Green Monday may be the last chance this year to have items delivered in time for Christmas. For this reason, we believe it could turn into quite a fruitful event for participating retailers if it encourages procrastinating shoppers that traditionally spend closer to December 25th to buy earlier in the season.
This isn’t the first year retailers outside of eBay have offered Green Monday promotions, however. Our team has been actively monitoring activity on this day from 2017 through present, to not only assess which retailers participate in the event, but also to understand how the discounts may change surrounding the event. The categories monitored include Apparel (Clothing, Shoes & Jewelry), Bed and Bath, and Home and Garden, and we’ve identified products offered on discount by comparing each applicable product’s price on Green Monday versus the most commonly seen price for the product offered throughout the month of December.
Better Promotions Than Boxing Day
Taking a closer look at 2020 Green Monday discounts within the categories and retailers analyzed, apart from Wayfair.com, we see all offered more SKUs on discount on Green Monday versus the days leading up to and out of the event. Kohls.com led the pack with around 93% of SKUs offered on discount, followed by Macys.com with 95%, and Wayfair.com with 83%. Overall, the number of SKUs on discount on Green Monday were greater than the SKUs offered on discount on Boxing Day, which is traditionally known as a great day to bargain shop.
Source: DataWeave Commerce Intelligence – Promotional Insights tracking Apparel, Bed & Bath, and Home & Garden category product’s online price on Green Monday 2020 in the US versus regular prices for the same products in the month of December each year.
What’s in Store for Green Monday 2021?
The insights we’ve tracked over the last four years have not indicated any signs to an end for Green Monday any time soon. As we see it, for consumers it is an extremely convenient time to order holiday gifts, and for retailers it is a good time to build brand trust and loyalty by fulfilling last minute orders at a great value, in time for the holidays.
Our prediction for the categories analyzed is to expect to see more retailers participate in Green Monday 2021 to a greater degree (more SKUs on sale and enhanced promotions). For retailers in this analysis, we would anticipate HomeDepot.com to enhance the number of offers to match 2020 competitive activity, and for Wayfair.com to look at increasing the number of offers on Green Monday versus the period leading into the event.
If you are interested in learning more about the details behind this analysis or our Promotional Insights solution, be sure to contact us. We can help you evaluate the effectiveness of your holiday promotional spend with access to near real-time marketplace insights on the brands, categories, and products your rivals promote, including discounts, campaign frequency and duration and more.