Category: United Kingdom

  • Revolutionizing Fuel Pricing: How Fuel Retailers and Convenience Stores Can Gain a Winning Edge with DataWeave

    Revolutionizing Fuel Pricing: How Fuel Retailers and Convenience Stores Can Gain a Winning Edge with DataWeave

    Consider this scenario: A retailer establishes its fuel prices using pricing data that’s a few days old, only to subsequently discover that a nearby competitor is offering substantially lower prices. The result? Lost customers, decreased foot traffic, and diminished sales. This serves as a stark reality that retailers must confront and address today.

    In the fiercely competitive realm of retail, where every decision holds weight, maintaining a competitive edge is paramount. The fuel category, frequently underestimated, has the potential to significantly impact a retailer’s revenue stream. This challenge is not unique; retailers worldwide, particularly in North America, grapple with a common hurdle: mastering the intricate art of real-time fuel pricing.

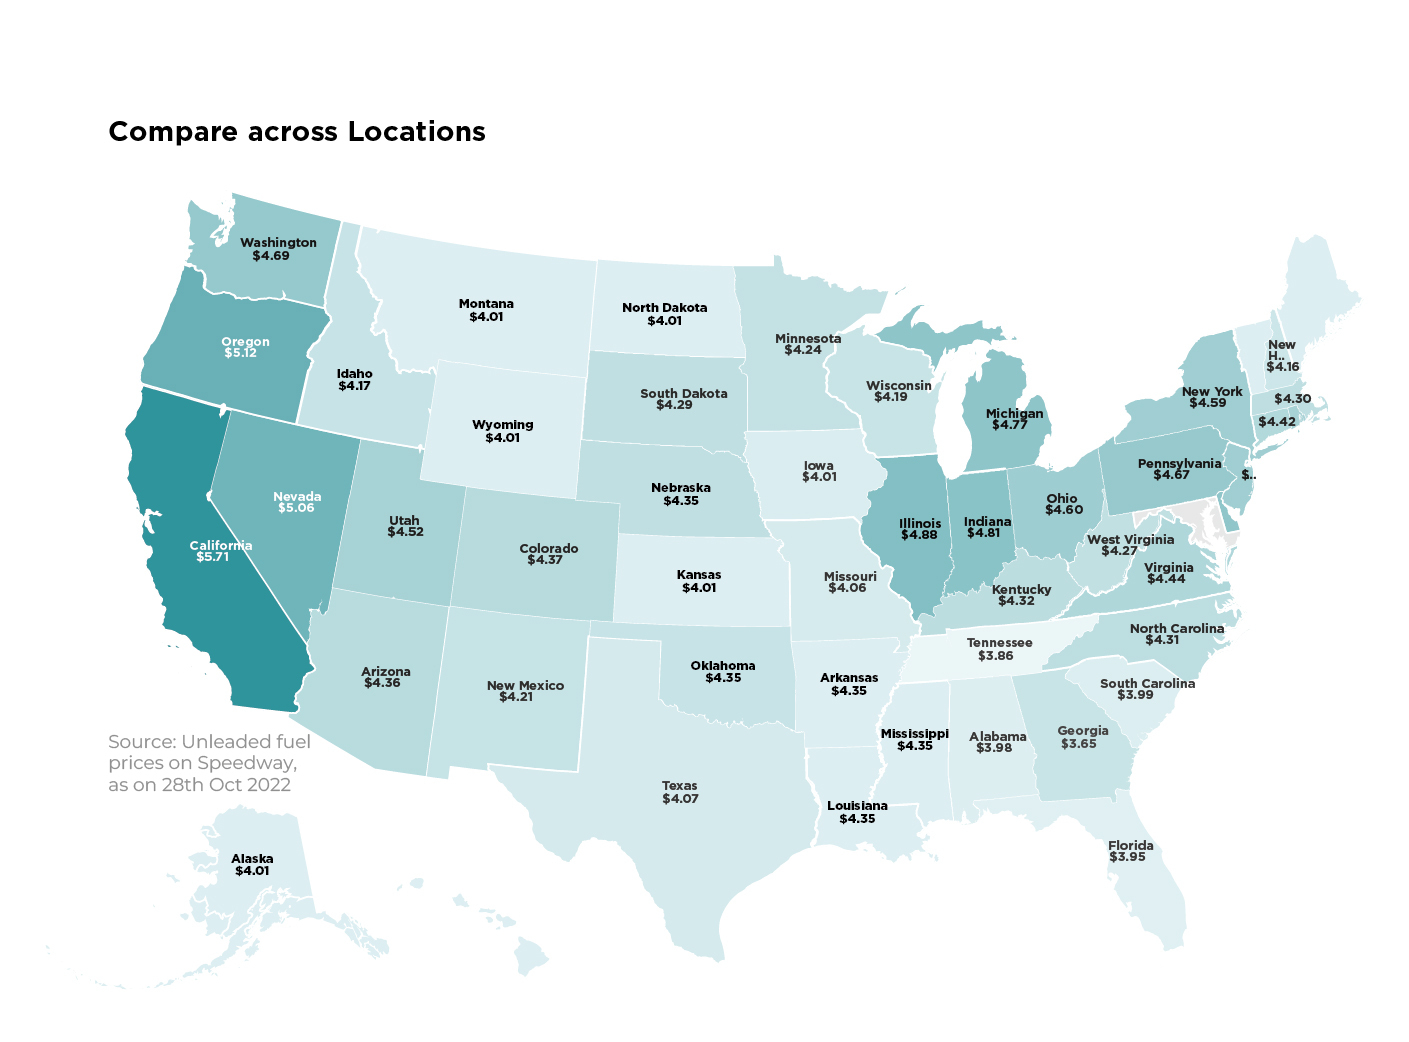
    The Quest For Reliable, Real-Time Fuel Pricing Data

    For retailers, traditional methods for procuring and analyzing fuel price data have proven to be both expensive and error-prone, often relying on manual data collection or third-party data providers. These outdated approaches yield frustrating delays, inaccuracies, and missed opportunities. When it comes to obtaining timely fuel pricing intelligence, the majority of fuel retailers grapple with three central challenges:

    • Low Accuracy: Ensuring that fuel pricing information remains up-to-date, dependable, and actionable, even when sourced from complex web-based platforms.
    • Less Coverage: Acquiring comprehensive data that encompasses all of North America, spanning across retailers, convenience stores, fuel stations, and beyond.
    • High Cost: Effectively managing the substantial costs associated with acquiring and processing this vital information.

    DataWeave’s Fuel Pricing Intelligence Solution

    Comprehensive, accurate, and real-time fuel pricing intelligence can play a huge role in the profitability of retailers throughout North America. DataWeave takes the forefront in delivering this transformative Data-as-a-Service (DaaS) solution to some of the most prominent retailers in the region, including the top 20 fuel retail behemoths.

    With a rich and extensive history spanning over a decade in the realm of competitive intelligence, DataWeave boasts an impressive track record of empowering well-informed decision-making in retail. We leverage state-of-the-art technology to bring an unparalleled level of accuracy, timeliness, and coverage to fuel pricing intelligence.

    The following are some compelling advantages offered by our solution:

    Accurate and Real-Time First Party Data

    We deliver retailers an unparalleled advantage through real-time, first-party fuel price data. Our data originates directly from the retailer’s own channels, encompassing websites and mobile apps, rendering it the industry’s foremost and most reliable source.

    Imagine having access to fuel pricing information that updates as frequently as every 30 minutes. This rapid update cadence guarantees that you, as a retailer, constantly possess the latest pricing insights at your fingertips, empowering you to respond swiftly to market fluctuations and competitor manoeuvres. Our comprehensive data spans a wide spectrum of fuel types, including:

    • Gasoline: Be it regular, mid-grade, super, premium, ethanol-free, ethanol blends, methanol blends, or reformulated gasoline, we have got you covered.
    • Diesel: Our data encompasses biodiesel, biodiesel off-road, biodiesel blends, biodiesel ultra-low sulfur (ULS), diesel ultra-low sulfur (ULS), diesel off-road, standard diesel, and premium diesel.

    Armed with our real-time, first-party data, you can make pricing decisions with unwavering confidence, secure in the knowledge that you possess access to the most current, authoritative, and extensive fuel pricing intelligence in North America.

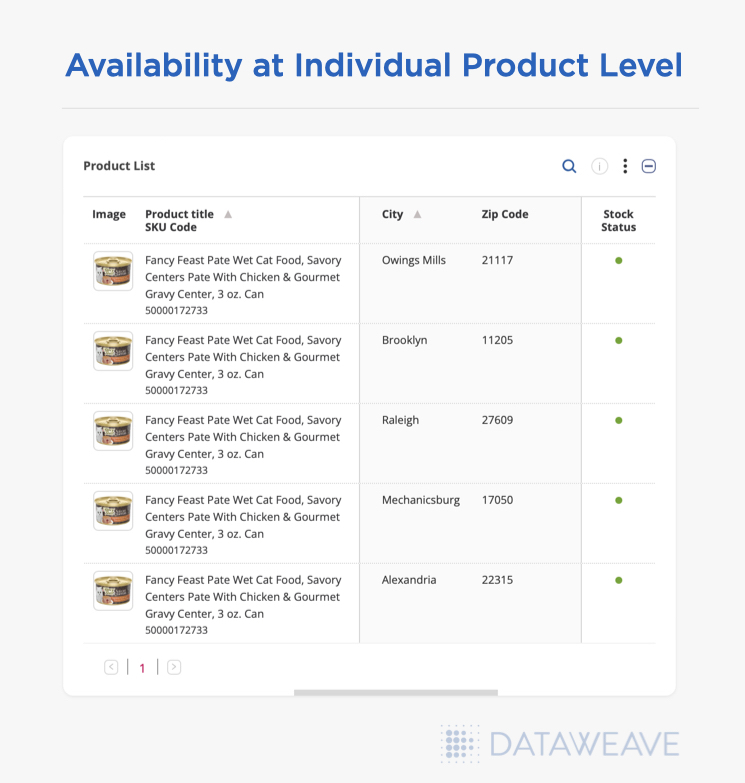
    The data points we capture directly from relevant web sources include: gas station postal code, store name and code, location, city, state, ZIP code, fuel type, competitor name, regular price, member price (if available), time and date of data capture, and more.

    Click here if you wish to access a sample report of our fuel pricing data.

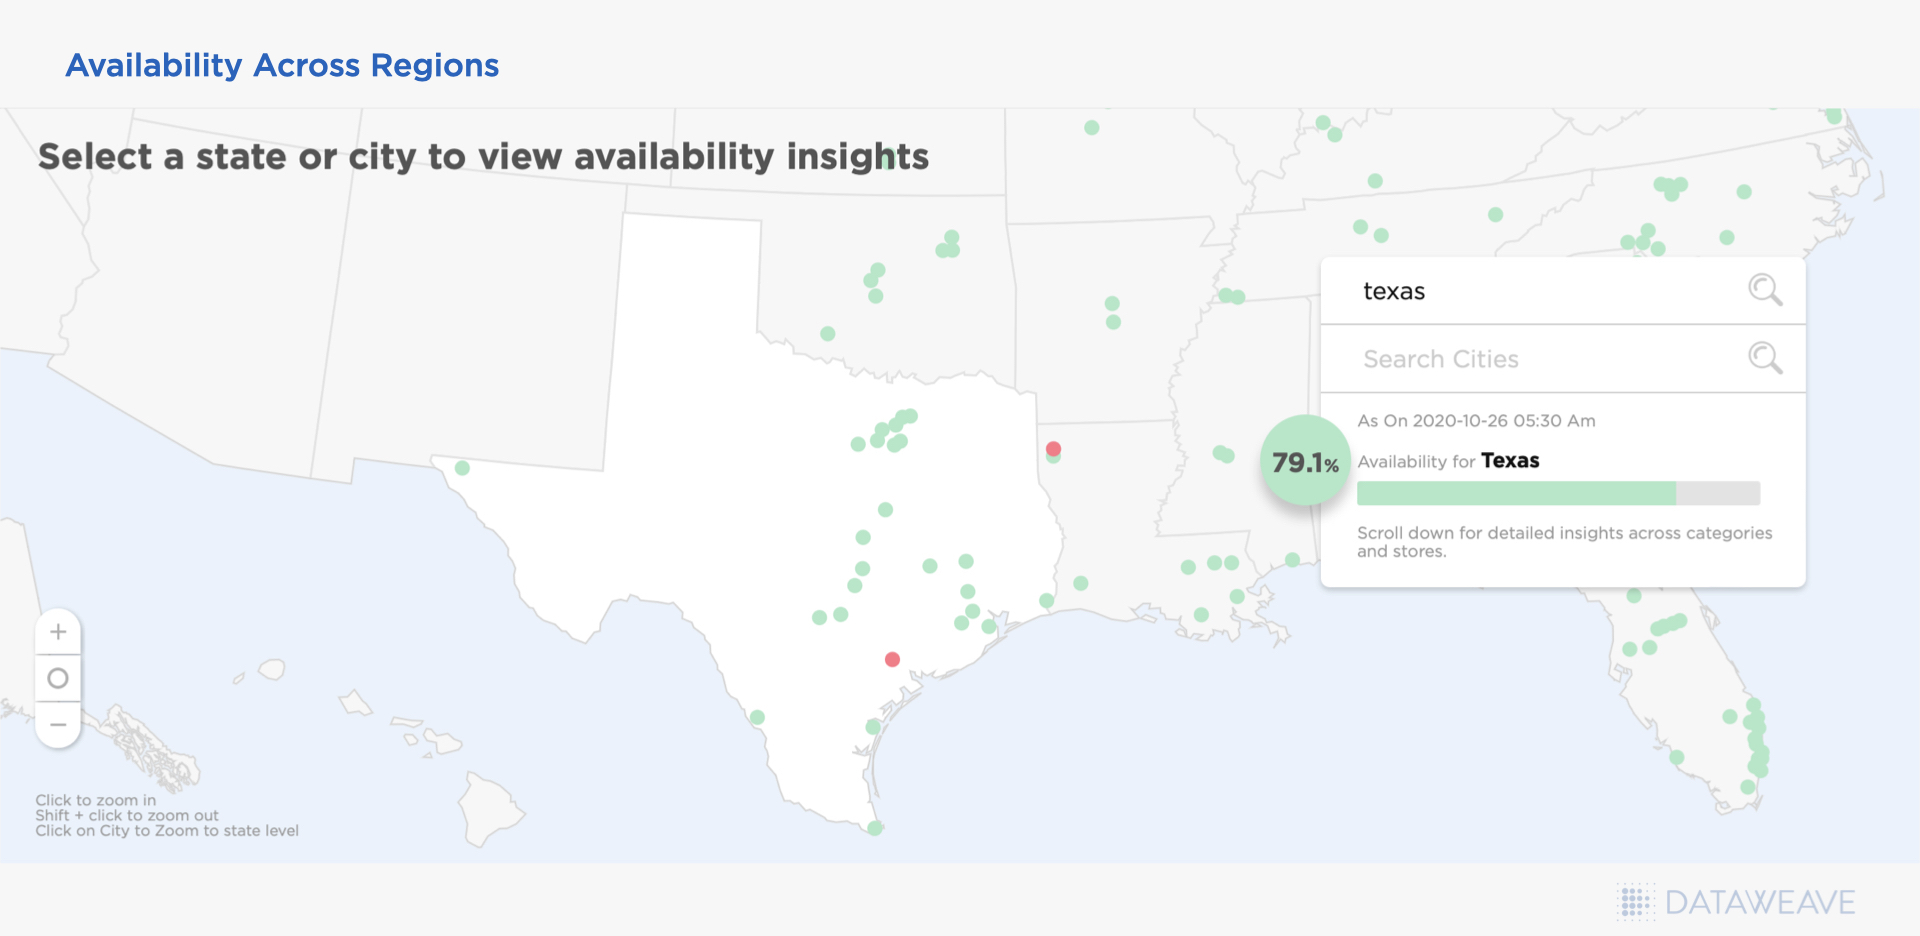
    Unrivaled Geographical Coverage

    Our extensive coverage of fuel data spans over 30,000 ZIP codes and encompasses the top 100 retailers across the western, mid-western, and eastern regions of the United States.

    Retailers benefit from the flexibility to configure and tailor the solution to their precise needs, whether it involves adding more locations or selectively acquiring specific segments of the data. This far-reaching coverage guarantees that retailers, whether situated in bustling urban centers or remote areas, can readily access the essential data required to maintain their competitive edge.

    Moreover, if you currently source your fuel pricing data from alternative providers, our solution seamlessly integrates, amplifies, and complements your existing array of data sources, ensuring a harmonious and unified approach to data acquisition.

    Optimization of Dynamic Pricing Strategies

    In the world of retail, the importance of timing cannot be overstated. Even a mere difference of a few cents can translate into millions of dollars in revenue impact. With DataWeave, retailers gain the capability to make data-driven decisions that provide them with a competitive edge around the clock, every single day.

    Our platform empowers you to unearth margin gaps by pinpointing opportunities to raise prices while maintaining your competitive pricing position. It also identifies instances where you may be substantially overpriced, prompting necessary price adjustments to ensure competitiveness within the market. All these valuable insights are available at a hyperlocal level, facilitating pricing efficiency and optimization across your various regions of coverage. Equipped with this real-time data, you can swiftly adapt to ever-changing market conditions.

    Furthermore, our comprehensive competitive data seamlessly integrates into your existing pricing systems through APIs, facilitating quick and informed pricing actions based on robust data.

    Reliable and Customer-First Tech Platform

    Our platform boasts a remarkable level of sophistication when it comes to data aggregation, normalization, visualization, and integration capabilities. It stands as a massively scalable system with the capacity to aggregate billions of data points daily, spanning thousands of web sources. This includes the intricate handling of sources like mobile apps and websites known for frequently altering their site structures, among others.

    What truly sets us apart is our proficiency in addressing these challenges through a blend of human expertise and large-scale machine learning. Additionally, our commitment to delivering unmatched service extends to round-the-clock, 24/7 support. This comprehensive approach makes our fuel pricing intelligence solution not only effective but also cost-efficient in meeting your fuel data requirements.

    We also provide a variety of options for you to consume our data, which includes receiving our reports via email, SFTP, S3 buckets, data lakes like Snowflake, and APIs.

    Enhance your Fuel Pricing Strategies with DataWeave

    In the ever-competitive world of retail, staying ahead is not just a goal; it’s a necessity. The fuel pricing landscape, often overlooked, holds immense power to impact a retailer’s profitability. DataWeave’s real-time, comprehensive, and accurate fuel pricing intelligence solution is the key to securing this advantage. Retailers and convenience stores now have a powerful platform at their disposal, offering unparalleled precision, comprehensive coverage, and the agility needed to navigate this landscape.

    Join the ranks of industry leaders who have already harnessed the potential of DataWeave. Reach out to us today to redefine your approach to fuel pricing and propel your business to new heights!

  • DataWeave Launches PricingPulse: Empowering Retail Leaders With Comprehensive and Strategic Pricing Insights

    DataWeave Launches PricingPulse: Empowering Retail Leaders With Comprehensive and Strategic Pricing Insights

    In the evolving retail landscape, success often hinges on a singular focal point: pricing. A recent Statista survey revealed that 70% of US online users prioritize competitive pricing in their digital shopping choices. In this cutthroat arena, where surpassing rivals is paramount, a deep comprehension of pricing nuances is no longer just an edge, but a necessity.

    Retailers are increasingly adopting pricing intelligence solutions that meticulously dissect competitor pricing data in comparison to their own, down to the SKU level. This analysis empowers their pricing teams with the insights they need to price their products competitively on a day-to-day basis.

    However, in a landscape where a staggering 50 million price changes occur daily, reliance on a reactive pricing intelligence solution, though effective in many ways, often falls short. To develop a strategic and predictive pricing engine, retailers also need the ability to track historical pricing relative to market conditions, competitor actions, seasonality, promptness of competitor pricing actions, and more. This would be particularly useful for senior retail pricing and business unit leaders as they look to gain a strategic perspective on their competitive pricing health. However, even today’s leading providers of retail pricing intelligence solutions lack in this area. This results in a relatively myopic view of competitive pricing even in large retail organizations.

    Introducing DataWeave’s PricingPulse

    DataWeave’s PricingPulse helps retail leaders better understand their competitive pricing strategies in comparison to relevant market dynamics over time. The capability bridges the gap between day-to-day competitive pricing operations and long-term strategic pricing analysis and actions, enabling senior retail pricing leaders to untangle the complexities of their pricing strategies. Delivered as a dashboard, the view offers an elevated vantage point for industry-wide pricing dynamics, empowering retailers with the foresight needed to navigate market shifts, predict vulnerabilities, and capitalize on new opportunities.

    PricingPulse is provided to all DataWeave retail customers as an add-on to our Pricing Intelligence solution.

    The insights offered by PricingPulse enable retailers to answer pivotal questions about competitor pricing behaviors, price leadership across categories, timing of price changes, and the effectiveness of capitalizing on price improvement opportunities. Some of the questions that PricingPulse offers answers to include:

    • How frequently are my competitors changing prices and for which products?
    • How does my price leadership vary across key product categories?
    • Which day of the week or month do my competitors change their pricing most and least frequently?
    • How well do I seize on price improvement opportunities over time?

    Strategic Pricing Views Via PricingPulse

    In the following section, we share a few views available to retail leaders via our PricingPulse dashboard. For a complete list of insights available on the dashboard, request a demo today.

    Competitive Price Leadership Across Retailers and Categories

    This view provides retailers with an overview of the price leaders across various product categories and how it changes with time. More often than not, retailers would aim to gain price leadership in certain categories, while maintaining healthy margins in others.

    Retailers can also gauge their consistency and effectiveness in maintaining a competitive edge for key categories over time. They can fortify areas of strength and identify opportunity areas to optimize their pricing.

    In addition, the dashboard tracks a retailer’s price index across categories, a measure that determines its price competitiveness.

    The price index is determined by dividing the retailer’s price by the lowest price offered by any of its competitors. A ratio lesser than 1 indicates that the retailer is the lowest priced in the market. This measure is also presented for competitors, providing insights into competitors that are most attractively priced in the market. A timeline trend of this metric helps track how price leadership among retailers changes over time.

    Price Change Trends

    This view provides a summary of the level of price changes by a retailer and its competitors over a period of time, which includes the average magnitude of price changes as well as the proportion of the retailer’s assortment that underwent these price changes.

    In addition, the number of price changes each month are provided for each retailer. This is further broken down into the total number of price changes during each day of the week.

    These insights help retailers determine which competitors are most and least active in their pricing activities, how aggressive the pricing actions are, and if there are any specific price change patterns followed in terms of the days of the week or month.

    Price Improvement Opportunities and Actions

    The dashboard actively reports on price improvement opportunities, which could include either a price increase opportunity or a price decrease opportunity, for a retailer and its competitors across categories over time. A price increase opportunity occurs when a product is significantly under priced (by more than 2%) and a price decrease opportunity occurs when a product is significantly overpriced (by more than 2%).

    Further, the retailer gains insight into how many price improvement opportunities were actually acted on within 15 days of the opportunity presenting itself. This “action rate” helps retailers quantify how well they seize on price improvement opportunities, which eventually result in higher sales and margins. The dashboard also reports on the average number of days it took for a retailer to act on a price improvement opportunity, thereby quantifying the responsiveness and agility of pricing teams.

    This is especially useful for pricing leaders to “audit” or evaluate the performance of their pricing teams. When similar insights are viewed for a set of competitors as well, retailers can better understand the level of sophistication of their competitors’ pricing operations.

    Ready to Elevate Your Pricing Game?

    The launch of DataWeave’s PricingPulse marks a significant advancement in the realm of pricing solutions for retail leaders. As the retail landscape undergoes continuous transformation, the significance of precise pricing strategies cannot be overstated. PricingPulse is the first and only pricing view in the industry to bridge the gap between tactical pricing decisions and comprehensive strategic analysis.

    In a world where agility and foresight are crucial, PricingPulse equips retail leaders with the ability to predict competitor actions, optimize pricing strategies, and stay ahead of the competition.

    If you are a senior pricing leader or retail business unit head, reach out to us today to either sign up or learn more!

  • Impact of Inflation on Grocery: Pricing Insights on Leading US Retailers

    Impact of Inflation on Grocery: Pricing Insights on Leading US Retailers

    Inflation, like an invisible force, silently shapes the dynamics of economies, gradually eroding the purchasing power of consumers and leaving its imprint on various industries. High costs, hiring lags, and stagnating earnings pose severe challenges to businesses. One industry segment that intimately feels the impact of inflation is grocery, where price increases can be extremely concerning for the average consumer.

    Over the last 12-plus months, the US has experienced a notable rise in inflation, stirring up concerns and influencing the way we shop for everyday essentials. Rising costs of raw materials, transportation, and labor have all played a role in driving up prices. Additionally, disruptions in global supply chains and fluctuations in currency exchange rates have further exacerbated the situation, creating a complex web of interdependencies.

    To understand the magnitude of this phenomenon across leading e-retailers, we delved into an in-depth analysis of four major retail giants: Walmart, Amazon, Target, and Kroger.

    Each of these retailers possesses a unique business model and competitive strategy, as well as faces unique challenges. This leads to distinct approaches to managing inflationary pressures. Walmart for instance, expects operating income growth to outpace sales growth in 2023. Given the persistence of high prices and the potential for further macro pressures, the retailer is taking a cautious outlook. In 2022, Amazon’s eCommerce business swung to a net loss of $2.7 billion, compared to a profit of $33.4 billion the previous year.

    Amid these challenging circumstances, understanding the grocery pricing trends and strategies becomes imperative for retailers, both online and in stores to adapt and thrive in the current economic landscape. By examining their pricing trends, we can gain valuable insights into how these companies navigate the turbulent waters of the grocery industry against the backdrop of inflation.

    Our Research Methodology

    The data collected for our analysis encompassed a diverse range of products, from pantry staples like flour and rice to perishable goods like dairy and produce – a basket of around 600 SKUs matched across Amazon, Kroger, Target and Walmart, between January 2022 to February 2023.

    Further, we separately focused on the prices of a smaller subset of 30+ high-volume daily staples that are likely to yield higher sales and margins for these retailers.

    Average Selling Price of a Broad Set of Grocery Items

    Our analysis reveals that Walmart consistently offers the lowest prices, with an average of 8% below its closest competitor, Target, despite an annual price increase of about 5%. Walmart seems to prioritize a “stability and predictability” strategy over margin optimization. The retailer’s 8% growth last quarter indicates that this strategy is bearing fruit. However, it’s important to note that this approach may have its drawbacks as Walmart’s margins come under pressure.

    Average selling price trend across a basket of 500+ SKUs across Target, Walmart, Kroger, Amazon in the grocery category from Jan ’22 to Feb ’23.

    In order to weather inflationary pressures, Walmart may adopt a cautious approach to growth while also focusing on securing margins. Reports suggest that the retailer has been pushing back against consumer packaged goods (CPG) manufacturers following a series of price hikes to counter inflationary cost pressures in early 2023. One of the reasons behind Walmart’s growth and increased sales can be attributed to ‘non-traditional’ higher-income households now seeking deals and discounts at Walmart as their spending power declines.

    Interestingly, Amazon emerges as the highest-priced retailer, followed by Kroger, which increased its prices by 10% throughout the year. Consumer perception commonly associates Amazon with the lowest prices, but the data tells a different story. In fact, Amazon has been charging 12% to 18% higher prices than Walmart for groceries and is still maintaining its success.

    While the company’s online sales declined by 4%, it saw a significant 9% increase in revenue from third-party seller services, such as warehousing, packaging, and delivery, in 2022. Amazon’s strong logistics and same-day delivery services give it a competitive advantage over other retailers, contributing to its revenue growth and margins. Interestingly, this presents an opportunity for Walmart and other retailers to increase prices while maintaining their strong competitive price positions.

    Kroger, on the other hand, seems to be aiming for a premium price perception, consistently raising prices almost every month. Kroger’s pricing strategy appears to be closer to Amazon’s.

    Average Selling Price for High-Volume Daily Staples

    Pricing strategies often change for different categories of products. To better understand this, we focused our analysis further on a small subset of 30+ high-volume staples across retailers. These include baked goods, popular beverages, canned food, frozen meals, dairy, cereals, detergents, and other similar items.

    Average selling price trend of 30+ high-volume daily staples across Target, Walmart, Kroger, Amazon in the grocery category from Jan ’22 to Feb ’23.

    Walmart, possibly overestimating the impact of inflation, has continued to keep its prices the lowest, potentially aiming to increase margins through volume.

    The level of price disparity across retailers is expectedly lower here, with Amazon and Kroger closely tracking Walmart’s average prices.

    Target’s pricing strategy stands out as it consistently emerges as the highest-priced retailer for daily staples, despite being one of the lower-priced retailers for a broader basket of grocery items. This suggests that Target’s underlying technology may not be as optimized to address market dynamics compared to other leading retailers. In our opinion, Target may want to strengthen its efforts to track pricing more intensely for this sub-category.

    A Data-fuelled Approach is the Need of the Hour

    In the challenging economic landscape, retailers and grocery stores are under pressure to maintain their revenues and margins. Adopting a comprehensive and dynamic pricing strategy is crucial. Understanding which product categories are experiencing price increases among competitors can help retailers make informed decisions on pricing at both the category and product level.

    Retailers should consider their balancing margin performance with consumers’ willingness to pay, rather than implementing broad price increases that may harm customer trust. Price increases can be challenging for both customers and merchants. Retailers who employ a data-driven and insight-based approach are more likely to succeed.

    Keep an eye on the DataWeave blog for analysis on pricing, discounting, stock availability, discoverability, and more, across retailers and brands from other industry segments as well.

    For immediate insights, subscribe to our interactive grocery price tracking dashboard. Better still, reach out to us to speak to a DataWeave expert today!

  • The Rapid Rise of Alcohol eCommerce in the UK

    The Rapid Rise of Alcohol eCommerce in the UK

    Alcohol eCommerce has been rapidly growing over the years, and like a lot of other industries, the pandemic accelerated its growth. Convenience, safety & home delivery became important criteria for customers in the post pandemic era and so the sale of alcohol via eCommerce went up. Kantar reported that UK booze sales were up £261m & online and convenience stores were the biggest winners. The latest IWSR Drinks Market Analysis Report 2022 reported on another interesting trend – when ordering alcohol online, consumers prefer using websites v/s apps in most parts of the world except China and Brazil. In the UK the largest chunk of online alcohol purchases happens on a retailer website instead of an app. 

    Platform used for last online alcohol purchase. Source

    To get a better understanding of this, we tracked 2 grocery retailers and 3 grocery Q-Commerce apps in the UK to get insights into Alcohol sales, pricing, trends & more! 

    Methodology

    • Data Scrape time period: Feb 2022 – June 2022
    • Grocery Retailers tracked: Tesco & Ocado
    • Grocery Apps trackedGorillasWeezy & Getir
    • Category tracked: Alcohol

    Which retailer was the Price Leader in the alcohol category? 

    Before the pandemic Tesco was the only Big 4 retailer to increase their alcohol market share & Waitrose was the biggest loser, with its share of booze sales falling from 5.4% to 4.7%. Maintaining Price Leadership is a critical element and plays a big role in increasing sales & market share because consumers will buy the most competitively priced product. We wanted to track and see which retailer was the Price Leader in the alcohol category – i.e., had the most number of lower-priced items in the alcohol category. We also wanted to see if & how Tesco’s position had changed post pandemic. 

    Price Leadership
    • Tesco enjoyed price leadership in the Alcohol category from Feb – June 2022 with 38.9% products priced the lowest. This, followed by Ocado at 33.8%. Gorillas had price leadership for the least amount of products in the alcohol category at 5.6%. Tesco was the clear winner! 
    • Tesco’s Price Leadership kept declining through the months though – at the beginning of the year in Feb, Tesco had 44% products priced the lowest but by June, that number fell to a little over 36%. Ocado showed a reverse trend – in Feb they had price leadership on 32% items and by June that number rose to 35.3%.
    • One player Tesco could’ve potentially lost price leadership to was Getir. In Feb, Getir had price leadership on only 8.2% products but that increased gradually over the months to land on 14.5% in June. 

    Which retailers focused on Discounts to perk up alcohol sales? 

    Discounts are a great way to draw in inflation-hit shoppers. Loyalty card discounts, reward vouchers, and other promotional strategies retailers offer help make their products more competitive & attractive to customers. To stay competitive, retailers need to be aware of the discounts their competition is offering. They also need to understand the risk of deep discounting and the impact on margins. We wanted an insight into alcohol related discounts in the UK so we dug into our data. Here’s what we saw. 

    Average discounts across months by retailers
    • A host of European and UK based startups like Jiffy, Dija, Weezy, Zapp, Getir & Gorillas launched with the promise of delivering groceries the fastest & cheapest
    • Our data showed that Gorillas offered discounts in line with the competition, however, Getir likely went the deep discounting route. 
    • Getir offered the highest discounts across all months. And in the month of April they offered almost 9% more discount than Ocado – the retailer with the 2nd highest discounts. 
      Like we discussed above, Getir gained price Leadership from Feb to June. Deep discounting could have potentially played a role. 
    • Gorillas on the other hand had the lowest, almost non-existent discounts.

    Let’s look at Price Index trends across 5 months 

    We tracked the Price Index (PI) across these 5 retailers to measure how alcohol prices changed over a 5 month period from Feb – June 2022. 

    Note: Retailers selling at the 100% mark were selling at an optimal price & did not undercut the market. The pricing sweet spot is 95% – 105%. Anything lower would compromise margins, and higher would mean the retailer was not competitive. 

    Price Index across months by retailers
    • Weezy had a Price Index that was the most optimal, sitting in the 100% – 102% range.
    • Gorillas had the lowest Price Index, between 89% – 91%.
    • Getir had a low price index in Feb (96.1%) but slowly kept increasing to cross 110% in April, May & June.
    • What was interesting to see was the competition between the 2 retail giants Ocado & Tesco. Ocado had a lower price index at the start of the year at 105.1%, while Tesco was at 109.8%. In the subsequent months, Ocado kept increasing prices to be competitive with Tesco and Tesco decreased prices to likely match Ocado’s pricing. By June BOTH Tesco & Ocado had the exactly the same price index – 108.7%

    Which retailers were the quickest to make price changes?

    Competitive pricing is critical to eCommerce success. Competitive pricing involves tracking your competitor’s pricing & strategically tweaking your own prices without hurting margins. We tracked the month-wise average Price change from Feb – June across all 5 retailers to see which retailer was making price changes and at what frequency. 

    Average price change across months by retailers
    • Most retailers did not make massive prices changes, they were ballpark competitive with each other from a pricing standpoint. 
    • However, Gorillas made significant changes in the month of March when they dropped prices by 3.8% and in May when they increased prices by 5.5%!
    • In May, the same month Gorillas made a big price hike, Weezy dropped their prices significantly by 10% widening the gap between the 2 retailers. 

    Which retailers avoided lost sales by maintaining stock availability?

    Having a near real time view on stock availability is crucial to driving sales. Customers can buy products only when they’re available! So, we went ahead, looked into our data to see how each of these retailers managed stock availability from Feb to June.

    Average availability across months by retailers
    • Our data showed varying availability levels across retailers with Ocado having the highest availability across all 5 months. They had a robust stock at the beginning of the year at 100% but kept dwindling through the months to land at 95.8% by June. 
    • Tesco had a sharp drop in availability in May & June – from 97% at the beginning of the year to the 92-93% range.
    • Gorillas had the lowest availability across months between 90 & 94%.
    • Weezy consistently maintained availability at 95% across all 5 months.

    Conclusion

    For the most part, the UK market has a positive outlook towards buying alcohol online thanks to changes to shopper behavior arising from the pandemic. As per the IWSR Drinks Market Analysis Report 2022 in website-led markets, such as the UK, breadth of product range is important to customers along with price. These 2 play a key factor in purchase decisions. By contrast, consumers in app-driven markets have different preferences. While price matters, it is less important than convenience and speed. 

    As an alcohol retailer, if you need help tracking your competitor prices, discounts and product assortment, reach out to the team at DataWeave to learn how we can help!

  • 5 Ways to Manage and Improve Stock Availability

    5 Ways to Manage and Improve Stock Availability

    Stock availability is the degree to which a brand or retailer has inventory of all their listed items to meet customer demand. Product availability becomes even more critical when they have to respond to unforeseen changes in demand and supply. To maintain the ideal stock availability levels for all items, they need robust inventory management tools to ensure real-time updates on current stock and accurate insights into upcoming demand.

    However, managing stock availability is not a clear-cut science. Retailers must balance the change in demand and keep stock availability in check

    Why Stock Availability Matters

    One of the challenges of running a retail business is to optimize inventory and associated costs. Maintaining stock availability in stores is critical for offline retail businesses. And when selling online, making sure products are available across different retailers and marketplaces can have a huge impact on sales and conversions. 

    1. Understocking: It’s when a brand’s product fails to meet consumer demand. If this happens often enough, customers may not return to the brand’s website or app because of the initial experience. Understocking is not a brand’s fault entirely since they might not always be able to anticipate a change in demand. However, it’s about a their ability to adapt to a quick change in the market trends through historical analysis and accurate forecasting. 
    2. Overstocking: It’s when a company orders too much inventory. Holding too much stock will lead to higher storage costs, shrinkage, and obsolescence losses. Another loss occurs if the brand can’t quickly sell the items — diminishing the value of the products. 

    We gathered data to see the impact of a short-term stockout on Amazon for one of our customers. Read more about what we uncovered & how deep the damage was, here.

    7 Ways to improve stock availability 

    1. Collect Accurate Data

    Availability across Brands and Categories

    When multiple items are moving through a supply chain, companies can easily run into inventory inaccuracies. Discrepancies between the values of your system and the actual inventory of products can lead to understocking or overstocking. The best way to avoid discrepancies in inventory is to invest in an inventory management tool that gives you real-time updates on your stock. This is applicable for offline retail businesses. 

    2. Managing eCommerce inventory

    Availability at Individual Product Level
    Availability at Individual Product level by regions

    Effective eCommerce inventory management is as important as making sure products are available in stores. Keeping track of your inventory levels and ensuring that you’re always well-stocked can avoid lost sales and keep your company running smoothly. Brands must ensure their stock is available across all the online platforms they sell. Access to real-time inventory data can help to keep a close eye on stock status across all marketplaces & retailers the product is available. Retailers also need to keep track of market trends to ensure they have the right inventory assortment to match customers’ demands. 

    3. Understand Consumer Demand

    The only way to accurately predict future demand is to rely on historical data about your customer purchase trends. What do your customers purchase during holiday seasons? What are the upcoming trends in your category? Having data-backed answers to such questions will help brands and retailers properly stock up their inventory.

    4. Adequate forecasting 

    Anticipating demand will help determine which products should be stocked during which seasons. Tracking past sales and metrics such as economic conditions, seasonality, peak buying months, and promotions will help brands predict demand. Analyzing such statistics will also help you get insights into the target market.

    Availability across regions

    5. Improve supplier relationships

    It’s important to rely on a supply chain that delivers your shipment promptly. In fact, you should foster close relationships with your suppliers to trim costs and improve stock availability. You should be able to share key details such as future demands, so suppliers can ensure timely delivery. 

    Availability Analysis
    Availability Analysis across Retailers and Categories

    Consequences of Inefficient Inventory Management

    What are the effects of overstocking?

    Tied-up cash: Money spent on overstocking is tied-up money that your company could have put to better use. You can use it to pay off debts, wages, and rent. Inventory often has a limited shelf life due to material degradation, changing consumer trends, spoilage, and obsolescence.

    Product expiration: If your brand offers time-sensitive goods or perishable items, overstocking can lead to product obsolescence and expiry. eCommerce platforms that also sell time-sensitive goods or grocery delivery apps are forced to sell products at below-margin prices to free up resources, leading to losses. 

    What are the effects of understocking?

    Poor customer experience: Poor product availability will lead to low customer satisfaction & dropping customer loyalty. 

    Missed sales: Customers could gravitate towards the competition to make their current purchase if a product is unavailable at your online store. The more freequent the stockouts, the more lost sales. 

    Conclusion

    To avoid the knock-on effects of overstocking and understocking, companies need a real-time view of their inventory, both online & offline. At DataWeave, we help companies decrease their latency period between stock replenishment and efficiently plan their supply chain. If you need help tracking your eCommerce product availability, reach out to the experts at DataWeave to know how we can help!

  • 5 Ways DataWeave Helps Brands Drive Growth With Amazon Ads

    5 Ways DataWeave Helps Brands Drive Growth With Amazon Ads

    Consumers are discovering and trialing new eCommerce marketplaces, brands and products at a faster rate than ever before, given the vast amount of choices encountered browsing for products online. A recent analysis shows how events like Amazon Prime Day, Black Friday, and Cyber Monday are especially fruitful for new-to-brand customer advertising, encouraging B2C marketers to increase their digital advertising spend to fuel product discovery, sales and market share for their brands.

    Amazon advertisers grow market share and brand loyalty with ecommerce intelligence
    DataWeave joins Amazon Advertising partner network

    The majority of eCommerce consumers are discovering products via relevant keywords attributable to their needs, with most clicks happening on page one results for the first few products listed. Simplifying the digital shopping experience is critical for brands to be in the consideration set for the majority of consumers who won’t venture past page one results. 

    An internal analysis conducted shows getting a product to page one on retailer websites can improve sales by as much as 50 percent, but figuring out the right levers to pull to get there organically—without paid advertising—is a real challenge, especially given fast-changing algorithms. While more than half of all retail related online browsing sessions are “organic”, sometimes brands need to boost their product visibility by investing in sponsored (paid) opportunities to improve a product’s rank.

    Data analytics can equip brands with intelligence to help them decide when, where, and how to make digital advertising investments profitably, while simultaneously acting on insights that help drive organic growth. Considering a majority of U.S. consumers begin their product discovery on marketplaces like Amazon, it makes sense for brands to prioritize digital advertising opportunities with Amazon.

    Maximize Return on Ad Spend (ROAS) with Amazon Ads

    Brands use Amazon Ads to drive brand awareness, acquire new customers, drive sales and gain market share, with the goal of furthering their marketing return on investment. Top performing advertisers average 40 percent greater year-on-year (YoY) sales growth, 50 percent greater YoY growth in customer product page viewership on Amazon, and 30 percent higher returns on ad spend (ROAS) with Amazon Ads, according to a recent analysis. Sponsored Products, Sponsored Brands, Amazon DSP and Sponsored Display are among the types of Amazon Ads options cited that produce maximum return.

    Ensuring your product listings appear at the top of page one results on Amazon for the most relevant discovery keywords is therefore the most important determinant for maximizing ROAS. DataWeave has become a vetted partner and measurement provider in the Amazon Advertising Partner Network, with the goal of supporting brands to optimize digital advertising campaigns by providing visibility to Digital Shelf Analytics (DSA) key performance indicators (KPIs), like Share of Search, Pricing and Product Availability, Content Audits, Ratings and Reviews, and Sales Performance and Market Share.

    Below is a summary of how our Digital Shelf solutions, in partnership with Amazon Ads, can improve the performance of your Amazon Ads campaigns

    1. Keyword Recommendations Improve Share of Search

    With the DataWeave Share of Search solution, brands can monitor their placement of both organic and paid discovery keywords relative to their competition. Once your keywords are determined, you are also provided a weighted Share of Search score that helps measure how well each keyword performs relative to product discoverability. Below is an example of insights you’d gain.

    Share of Keyword Search

    Brands can provide their own list of keywords to monitor, or through our Amazon Ads collaborative solution, learn which keywords are the “best” for them to measure in the realm of Amazon. Performance results are based on data that shows which keywords consumers are actually using when browsing online alongside other keywords brands request to measure. Users are able to see exactly which keywords are most popular, competitive (and even unexpected), and relevant at an Amazon Standard Identification Number (ASIN) level of granularity. 

    We can also estimate the degree of relevance and estimated traffic for the recommended keywords. Brands can then use these insights to adjust campaign strategies based on these parameters, which can boost product discoverability and rank visibility. A brand could assume people find its products by brand name, yet traffic insights may reveal a majority of people look for a generic product type before they end up buying that particular brand. 

    2. Content Audits Increase Discovery Relevancy Scores

    Strong product content is critical to succeeding on Amazon. Thorough, accurate, and descriptive content leads to better click through rates (CTR), conversion rates, more positive reviews, and fewer returns, which results in increased discoverability. DataWeave’s Content Audit solution reviews existing copy and images on a per-attribute basis to highlight any gaps essential to improving visibility, as seen in the example below.

    Content Analysis

    To further growth, it is equally as important that your product content aligns with your advertising strategy. With Amazon Ads partner add-on, our solution can also audit your content to measure how effectively you are incorporating Amazon Ads keywords into your product content to enhance discovery relevancy.

    3. Discover More Opportunities with Pricing and Product Availability Insights

    Quality content and keyword updates will only get you so far if your products are not consistently available and priced competitively. With DataWeave’s Pricing and Promotions and Product Availability modules, advertisers can monitor their selling prices and availability trends alongside their competitors to uncover more opportunities to incorporate into advertising campaigns, as seen in the Pricing and Promotions dashboard example below.

    Promotion Analysis

    Additionally, product targeting recommendations can be utilized to target a competitor’s ASIN that may be overpriced or that is having issues staying in stock. Alternatively, broaden your strategy to target specific brands, complementary products, or category listing pages.

    You can also create alerts on your own products to monitor when items are low on inventory or out of stock to ensure key products are consistently available when customers are shopping.

    4. Leverage Ratings and Reviews to Increase Conversion

    Product ratings and reviews are also a critical component to running a successful Amazon Ads campaign. A large number of reviews and a positive star rating will provide customers with the confidence to purchase, resulting in higher conversion rates. Conversely, negative feedback can have a detrimental impact, resulting in lost sales and wasted ad spend. DataWeave’s Ratings and Reviews module can help you monitor your reviews and extract attribute-level insights on your products. This information can then be utilized to further optimize your advertising strategy.

    If you see consistent feedback in your reviews on aspects of a product not meeting customer expectations, address them in your product content to prevent potential misplaced expectations. Alternatively, if customer reviews are raving about certain product features, ensure these are promoted and relevant keywords are populated throughout your descriptions and feature bullets. Below is an example of insights seen within the DSA Ratings & Reviews dashboard.

    Ratings and Reviews

    5. Correlate Digital Shelf KPIs to Sales Performance and Market Share

    The newest DSA module, Sales Performance and Market Share, provides SKU, sub-category, and brand-level sales and market share estimates on Amazon for brands and their competitors, via customer defined taxonomies, to easily benchmark performance results.

    This data can also be correlated with other Digital Shelf KPIs, like Content Audit and Product Availability, giving brands an easy way to check the effect of attribute changes and how they impact sales and market share. Similarly, brands can see how search rank, both organic and sponsored, affects sales and market share estimates.

    Understanding the correlation between your advertising campaigns and your Digital Shelf brand visibility will help you identify which areas to prioritize to drive sales and win more market share.

    Digital Shelf Insights Help Brands Win with Amazon Ads

    The need for access to flexible, actionable eCommerce insights is growing exponentially as a way to help brands drive growth, increase their Share of Voice, and to gain a competitive edge. As a result, more global brands are seeking Digital Shelf Analytics for access to near real-time marketplace changes and to develop data-driven growth strategies that leverage pricing, merchandising, and competitive insights at scale.

    By monitoring, measuring and analyzing key performance indicators (KPIs) like Sales Performance and Market Share, Share of Search, Content Audits, Product Availability, Pricing and Promotions and Ratings and Reviews alongside competitors, brands will know what actions to take to boost brand visibility, customer satisfaction, and online sales. 

    DataWeave’s acceptance into the Amazon Advertising Partner Network enables Amazon advertisers to effectively build their Amazon growth strategies and determine systems that enable faster and smarter advertising and marketing decision-making to optimize product discoverability and overall results.

    Connect with us now to learn how we can scale with your brand’s analytical needs, or for access to more details regarding our Amazon Ads Partnership or Digital Shelf solutions.

    UPDATED: Read the full press release here

  • UK’s Biggest Sale Days: What we saw in 2021 and trends for 2022

    UK’s Biggest Sale Days: What we saw in 2021 and trends for 2022

    Customers love discounts, and promotions are the most effective tool to attract shoppers and increase sales during the holiday season and clearance sales. According to a survey, 76% of UK customers look for discounts before purchasing a product. Promotional discounts encourage customers to try new brands. And this is why brands often have a special coupon for first-time users. 

    According to Software Advice, discounting tops the pricing strategy for retailers across all industries. It is preferred by 97% of survey respondents over other promotional strategies

    Share of Respondents
    Share of Respondents

    Retail Trends in the UK for 2022

    The arrival of the Omicron variant in December 2021 slashed the shopping mood of UK customers and led to a 3.7% monthly drop in retail sales, but sales were still higher than February 2020 levels when Covid-19 first hit worldwide. Sales during the holiday season in 2021 took a hit due to a consistent decline in product availability and an increase in prices.  Inflation too started to rise in 2021 and is expected to increase by 7% by spring 2022. However, despite inflation, retail sales jumped back in January 2022. In fact, it is predicted that inflation will be a key driver of sales growth, with underlying demand across categories being uneven. Keeping that in mind, let’s look at sales growth across categories in 2021 and projected growth in 2022.

    Category Breakdown: Sales growth 2021/22
    Category Breakdown: Sales growth 2021/22

    Discounting Trends we saw in the UK in 2021

    Methodology

    • We tracked prices on the three biggest Sales Days in the UK
      – Amazon Prime Day, June 21st & 22nd 2021
      – Black Friday, Nov 26th, 2021
      – Cyber Monday, Nov 29th, 2021
    • Categories tracked: Beauty, Fashion, Electronics, Home Improvement, Furniture 
    • Websites tracked: Amazon UK, OnBuy, eBay UK, Etsy, Wayfair, Selfridges, John Lewis

    Prime Day, Black Friday, and Cyber Monday are three of the biggest sales days with comparable discounts. However, according to new research, in 54% of cases, it depends on the category of product you’re after that determines the volume of discount you get. For example, tech items such as smartphones, laptops, games consoles, smartwatches, and wireless speakers were cheaper on Black Friday but may not necessarily have been cheaper on the other sale days. 

    We wanted to see which sale period had the most number of products on discount during the three big sale events. We also wanted to see which of those three sales would’ve been the best for consumers to get a higher section of products at a discount. 

    How Big were the Discounts?

    Discount across 3 key Sale Days
    Discount across 3 key Sale Days

    32% of products went on discount during Black Friday, 35% on Cyber Monday, and only 6.6% on Prime Day. One factor contributing to the low Prime Day percentage is the fact that not all retailers participate in discounting wars during Prime Day since it’s an exclusive Amazon-only sale. Customers looking for the best deals would’ve gotten them during the holiday season with a combination of the Black Friday & Cyber Monday sales. 

    Another interesting thing to note is the percentage discount – on Prime Day, only 0.2% of products had a discount of over 50% of all the discounted products. While on Black Friday & Cyber Monday that number was 1.7% & 1.3% respectively. 

    In conclusion, more products were offered at a discount on Black Friday & Cyber Monday; and the total percentage discount on those products was also higher.

    Which Categories had the Maximum Discount?

    Discounts by category
    Discounts by category

    On Black Friday, an estimated 47% of consumers in the UK planned to shop for electronics, whereas 40% of customers planned to shop for clothing and footwear during Black Friday to Cyber Monday.  The top-selling categories across the 48 hours of Amazon UK’s Black Friday 2021 sale included Home, Toys, Beauty, Books, and Health & Personal Care.

    Our data shows that Categories with the highest discounts were Beauty and Electronics with the highest discount on all 3 sale events. These 2 categories had discounts on over 40% products on Black Friday & Cyber Monday while categories like Home Improvement were in the 30 – 35% range, Furniture in the 27 – 32% range and Fashion has the least products on discounts at a little over 15%

    In the fashion category in the UK, Amazon UK offered the highest percentage of items with a price decrease (31.6%), whereas eBay offered the most significant magnitude of price decrease (14.3%). 

    Which UK Retailers gave the most discounts?

    OnBuy is an emerging marketplace in the UK that offers impressive discounted prices and is taking on top UK marketplaces like Amazon. It’s ranked Britain’s fastest-growing eCommerce platform in 2020 and also the fastest grower by traffic. The low listing fees starting at 5% allow sellers to competitively price their products, making them more accessible to a greater number of buyers with huge discounts. The most prominent deals and discounts are highlighted on the landing page and featured across OnBuy’s social pages to grab the audience’s attention. 

    Discounts by Retailer
    Discounts by Retailer

    This was clearly reflective in the data we gathered from the 3 big sales in 2021. Most retailers in the UK, including Amazon offered at best 20% of their products, in the categories we tracked, at discount. The only outlier was OnBuy – OnBuy offered close to 90% of their products at discount! 

    OnBuy was able to offer a comparatively high number of discounted products than their competition because the magnitude of the discount was much much lower. The platform offered minimal discounts; out of the 90% of discounted products, 80% of those products had discounts that were less than 10%. As opposed to other retailers who had under 7% of their products on discounts of less than 10%.

    OnBuy’s discounting strategy built a perception that they were the biggest discounters, even when the discounts were not as deep.

    Black Friday v/s Cyber Monday – which one was better for holiday shoppers?

    Discount by category- Black Friday VS Cyber Monday
    Discount by category- Black Friday VS Cyber Monday

    Black Friday kicks off the holiday shopping season and is synonymous with some of the most significant sales after Thanksgiving. But until recently, Cyber Monday has become a great way for eCommerce retailers to capitalize on holiday discounts and expand their most beneficial sales events of the year.

    In 2021, retailers pulled in $8.9 billion in Black Friday online sales and a total sales of $10.7 billion on Cyber Monday. In the YOY review, Black Friday saw a decline of 1.3% from 2020’s record of $9.03 billion, and Cyber Monday saw a drop of 1.4%, only $100 million shy of $10.8 billion in 2020. 

    Across Beauty, Home Improvement, Electronics & Furniture categories, we saw that more products were on discount on Cyber Monday v/s Black Friday. However, the opposite was true for the Fashion Category. In the Fashion Category, we saw a marginally higher number of products on Discount during Black Friday than Cyber Monday.

    Discount percentages across categories
    Discount percentages across categories

    Across both sales, the Electronics category offered the highest discounts at over 40% of products discounted compared to other categories on both Black Friday & Cyber Monday. However, a very small fraction of the products had a discount of over 50%, indicating the lack of ‘BIG blockbuster deals’ in this category. At the same time, the Fashion category offered the least number of deals with less than 20% products on discount, but the highest magnitude of discount across the board! On Black Friday, 3.8% of products had discounts higher than 50%, and 2.6% of products on Cyber Monday. In most other categories, between 1 – 1.5% of products had over 50% discount. However, Fashion brands offered more than 50% discount on 2x the average number of products on both sale days.

    Why did the Fashion Category offer such high discounts? Brands are now capitalizing on customers’ need for instant gratification in the age of see-now, buy-now fashion trends by offering their products at high discounts. It also allows them to quickly eliminate overstock. However, this has given rise to fast fashion, a trend that focuses on rapidly producing low-quality clothes in huge volume. Fast fashion focuses on replicating trendy pieces like streetwear and fashion week designs, not four times a year but every week, if not daily. Fast fashion promotes brands to manufacture and sell low-quality merchandise that goes out of trend as soon as buyers wear it once. There is little to no time for quality control, and pieces are thrown away after a few wears. In the UK alone, 300,000 tonnes of used clothes are buried or burned in landfills each year. However, every element of fast fashion from rapid production, competitive pricing, to trend replication has a detrimental impact on the planet.

    Conclusion  

    The effects of COVID-19 can be seen far and wide in the UK retail industry, especially with a steep rise in inflation. Fortunately, even though retail sales in the UK declined during the 2021 holiday season due to the Omicron variant, they increased during Black Friday and Cyber Monday. Sales also jumped back in January 2022 and are further projected to grow by 5% in 2022. Additionally, brands can sustain the impact of disruptive factors throughout 2022 by ensuring their Digital Shelf is updated and flexible enough to react swiftly to both threats and opportunities in order to maximize the chances of success. 

    Reach out to the team at DataWeave if you’d like to make smarter pricing & discounting decisions with up-to-date competitive insights. 

  • Best Practices to avoid MAP Violations

    Best Practices to avoid MAP Violations

    Competition is a fundamental and healthy part of commerce that protects customers by keeping prices low and the quality of services (and choice of goods) high.

     Healthy competition drives prices down, but it can harm brands and their reputation without a pricing policy. The manufacturer or brand designs MAP or Minimum Advertised Pricing policies to stipulate retailers’ lowest price point to advertise the product. It is an agreement between distributors and manufacturers about the minimum price that retailers and resellers can advertise the product for sale. 

    Most legitimate brands have a MAP policy, especially brands that rely heavily on brand identity. It becomes critical that they maintain price parity across retailers. When a retailer violates MAP policies, brands can penalize them under the agreed-upon terms or terminate contracts. 

    In this blog, you will learn about MAP policy, its benefits, and tips on tackling MAP violations. 

    1. What is a MAP policy?

     MAP policy
    MAP Violations

    MAP stands for Minimum Advertised Price, and brands create MAP policies to ensure that retailers don’t advertise their products below the specified price. However, it only controls advertised prices, ensuring the retailers don’t display a lower price in online listings or advertisements. Since it doesn’t cover the checkout price, retailers can sell products at a lower price through promotional offers like discounts and cashback during checkout. 

    MAP policies ensure a price war between eCommerce platforms does not devalue products and that an even playing field is set among retailers that allow everyone to drive margins. Brands have a legal right to withdraw products if a retailer advertises products below the minimum advertised price. Brands can also restrict future sales or refuse to replenish products after the current stock has sold out if an eCommerce platform, reseller, or distributor violates MAP policies. 

    In the U.S., MAP policies fall under federal antitrust law since they restrict advertisement pricing rather than the last sales price. However, in the UK and the EU, violation of minimum advertised pricing is an infringement of current competition laws.

    2. Why Does Having a MAP Policy Matter?

    Having a MAP policy protects both brands and retailers while ensuring consumers get the best-priced items. Following are the benefits of having a MAP policy:

    a. Prevent margin erosion

    Although online retailers are willing to take a margin cut to attract traffic, selling products below MAP can significantly hurt a brand’s bottom line. Setting a minimum advertised price benefits both parties. It allows shoppers to purchase products at the best-valued price & also creates a balanced economy and prevents hyper-competition of products between retailers. However, manufacturers must set a realistic pricing policy that matches current market demand, ensuring eCommerce platforms implement MAP while taking care of the margins. 

    b. Retain brand identity

    pricing policy
    Brand Protection

    Price is one of the essential indicators consumers use to determine the authenticity and value of a product. Constant price fluctuations can negatively impact a brand’s reputation. Brands need to safeguard their pricing to create a consistent price perception. Price changes often make the buying decision complex since consumers no longer have a clear reference of prices. It also shifts purchasers’ attention from the brand and product features to its price. With price fluctuations, brands that were used to be differentiated for their features can be seen as commodities.

    Low prices & MAP violations on an online platform can even be a sign of counterfeit products or unauthorized sellers. However, customers might hold the brand responsible if they purchase counterfeit products from a retailer at lower prices. A negative product experience with a retailer will also reflect the brand’s reputation. An effective MAP policy that enforces consistent pricing will ensure that customers hunting for the best deals will stick with the most legitimate retailers.

    Read how DataWeave helped Classic Accessories, a leading manufacturer of high-quality accessories detect counterfeits and identify unauthorized sellers.

    c. Ensure price parity across retailers

    Comparing prices has become an essential and common milestone in every consumer’s purchasing journey. It’s imperative that a brand ensures price parity across platforms and stores because substantial pricing variations on different platforms can make customers suspicious of a brand. Consistent pricing across eCommerce platforms ensures brands maintain their identity. MAP policies also allow retailers to maintain profit margins while avoiding price wars.

    d. Combat revenue loss from illegitimate sales

    While most authorized sellers or distributors comply with pricing policies, unauthorized sellers or grey market sellers have no obligation to follow a brand’s MAP pricing infrastructure. Brands can reduce risk with an authorized seller badge on retailer websites. This will help customers to verify authorized retailers and resellers of your products & help safeguard your brand equity online

    3. Tips on Implementing MAP policy and Tackling violations

    Enforcing and tackling MAPs comes down to two things: monitoring the market for infringements and then acting on those violations. Here are a few tips for tackling MAP violations:

     price parity
    Implementation of MAP Policy & Tracking Violations

    a. Communicate actively with retailers

    To maintain a positive relationship with retailers and avoid confusion, brands should create proper communication strategies and channels to accompany the launch of the MAP policy. The policy should be easy to understand, but legal advisors are necessary to understand the jargon of the document. Brands can use checklists, videos, and well-briefed brand reps to communicate their policy clearly with retailers.

    b. Reward retailers for compliance

    Retailers who follow MAP guidelines can lose out to platforms that do not follow these pricing guidelines. Non-MAP following platforms undercut the price of products to drive sales and secure higher traffic. In such instances, brands can incentivize MAP following retailers to encourage them to comply with MAP guidelines while not affecting the competitive edge. It can be in the form of laxity of rules during promotion seasons like New Year, Christmas, and Black Friday sales. The laxity of rules for promotional seasons should be used as an exception to the general rule, and outlined in the guidelines.  

    c. Implement an AI-driven MAP monitoring

    When product distribution is spread across the globe through a network of resellers and retailers, keeping a close watch on all platforms for multiple products can become difficult. With the expansion of online marketplaces, manually tracking the pricing of numerous products on multiple platforms is time-consuming and unsustainable. An automated AI-driven monitoring platform can track the pricing of all products sold across hundreds of online platforms and identify violations around the clock. Such platforms can alert brands of violations, price inconsistencies, or suspicious activities in real-time. 

    d. Send cease and desist to MAP violators and unauthorized dealers

    Brands must enforce a MAP policy to ensure price parity among retailers and resellers. Brands must systematically monitor prices across retailers, social media, marketplaces, and price comparison websites. Whenever brands encounter a MAP violation, they should take action by sending a cease and desist letter to unauthorized sellers. For legitimate sellers, brands can notify them and outline the steps that will be taken if they don’t comply. Brands must be consistent in enforcing MAP policy violations, signaling retailers and unauthorized sellers that there will be repercussions for MAP violations. 

    Market Demand
    MAP Policy

    4. Conclusion

    The trend towards online shopping helps businesses to cut overheads, allowing their products to be sold at a significantly reduced price. Although price appears to be the most effective consumer attraction strategy, significantly lowering product prices can devalue products and hurt brand reputation in the long term. However, including and enforcing MAP policies helps brands to manage their reputation and allows retailers to manage their margins. 

    Want to see first-hand how DataWeave can help brands track MAP Violations, Counterfeit products, and identify unauthorized sellers? Sign up for a demo with our Digital Shelf experts to know more.