By 2028, Fortune Business Insights projects that the global bakery products market will reach USD 590 billion. The CAGR (Compounded annual growth rate) for 2021-28 is estimated at 5.12%. Products in this segment include bread, buns, cookies, tortillas, salted snacks, English muffins, bagels, confectionery food, hot dogs, cakes, popcorn, and so on.
Due to disruptions in the global supply chain caused by lockdowns and border closures, the pandemic has had a negative impact on the demand for bakery products and snacks worldwide. However, the market is not only changing, but consumer demand is increasing. Post-pandemic, health, food, and safety have gained renewed attention.
People across the world are making healthier choices with a focus on wellness.
A growing number of people are interested in plant-based foods and beverages, reducing sugar consumption, and understanding the link between lifestyle and health, including obesity and diabetes. As a result of these trends, food producers are reshaping their product strategies to meet new consumer demands.
In this article, we take a look at the ways companies can leverage data to inform their e-commerce strategy.
What’s driving up the demand for bakery products?
More people are choosing easy-to-use bakery products and snacks over other foods due to urbanization, convenience, western diets, and women’s participation in the workforce. Additionally, innovations in baking systems, food technologies, ingredients, formulations, and product ideas are providing customers with a greater level of choice, flexibility, and freedom.
How is e-commerce changing the game for bakery product companies?
To optimize their supply chains, bakery food and snack companies must better understand e-commerce metrics given the wide variety of products available and eventually convert sales. There are several measures that companies need to pay attention to.
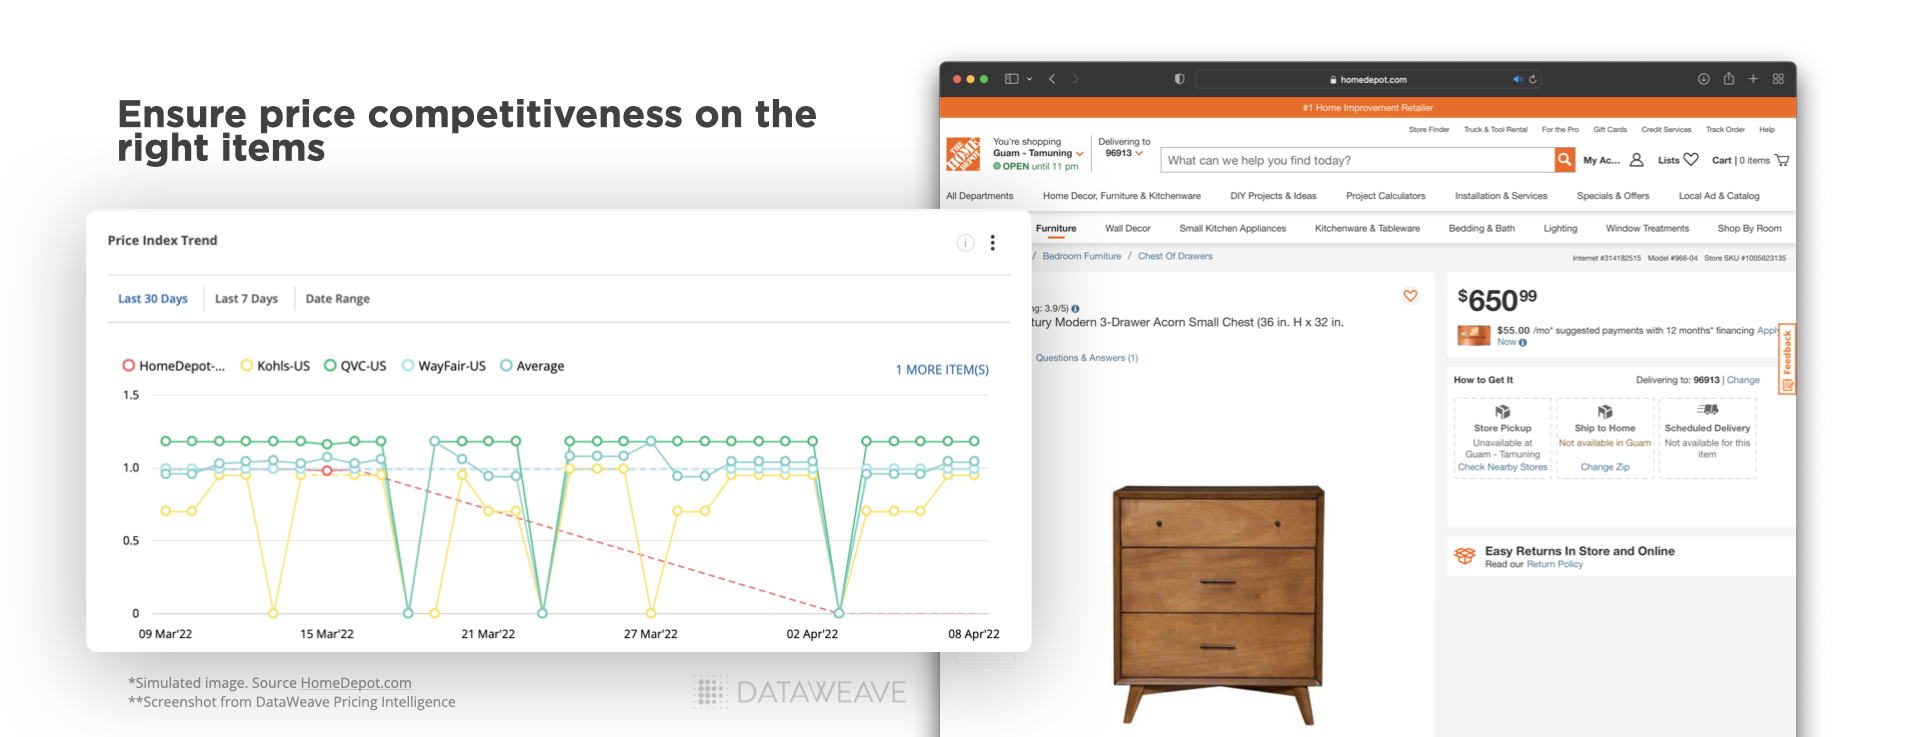
Stock availability metrics, discounts across locations, and share of search results – are all critical metrics companies need to track. In addition to providing manufacturers and retailers with an insight into the trends, DataWeave’s tools also allow them to make better business decisions and ultimately improve their bottom line.
Methodology
- Data Scrape period: February 2022 to September 2022
- Country: Canada
- Grocery Retailers tracked: Atlantic Superstore, Fortinos, InstaCart, Loblaws, Voila, Walmart Grocery, Zehrs.
- Bakery brands: Betty Crocker, Dempsters, Hostess, No Name, Presidents Choice, Quaker, Vachon, Doritos.
- Category tracked: Bread and Bakery, Chips, Crackers, Deserts, Snacks.
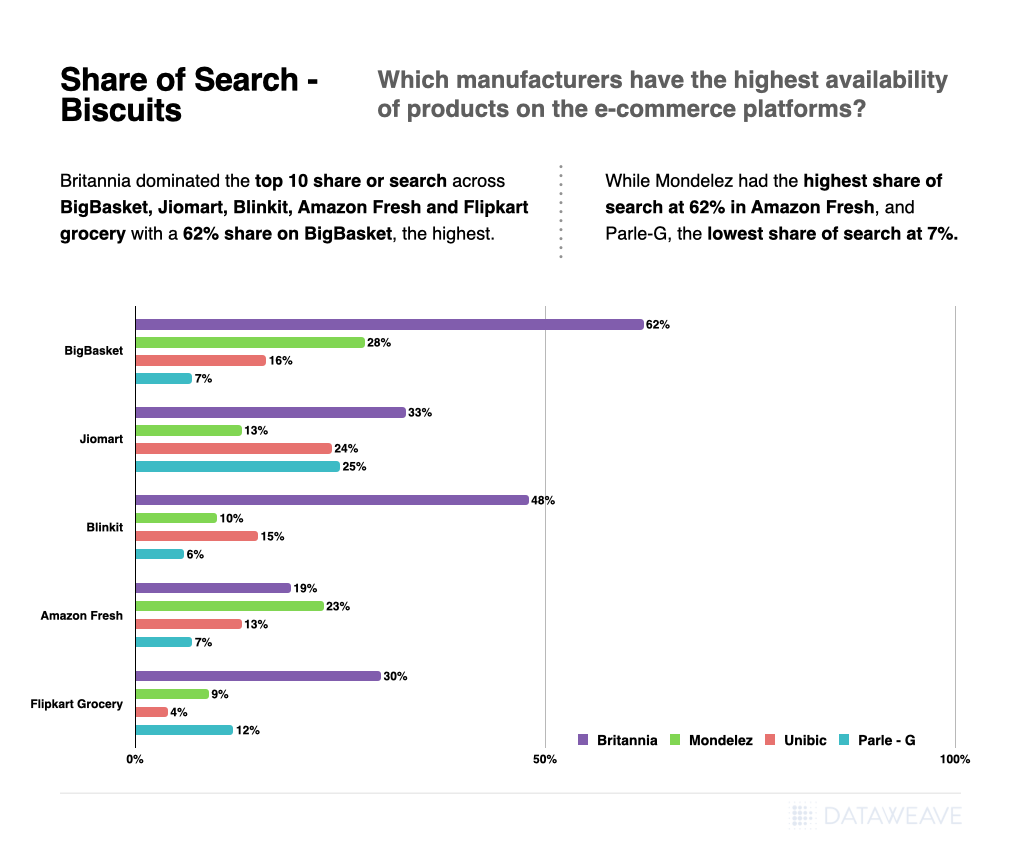
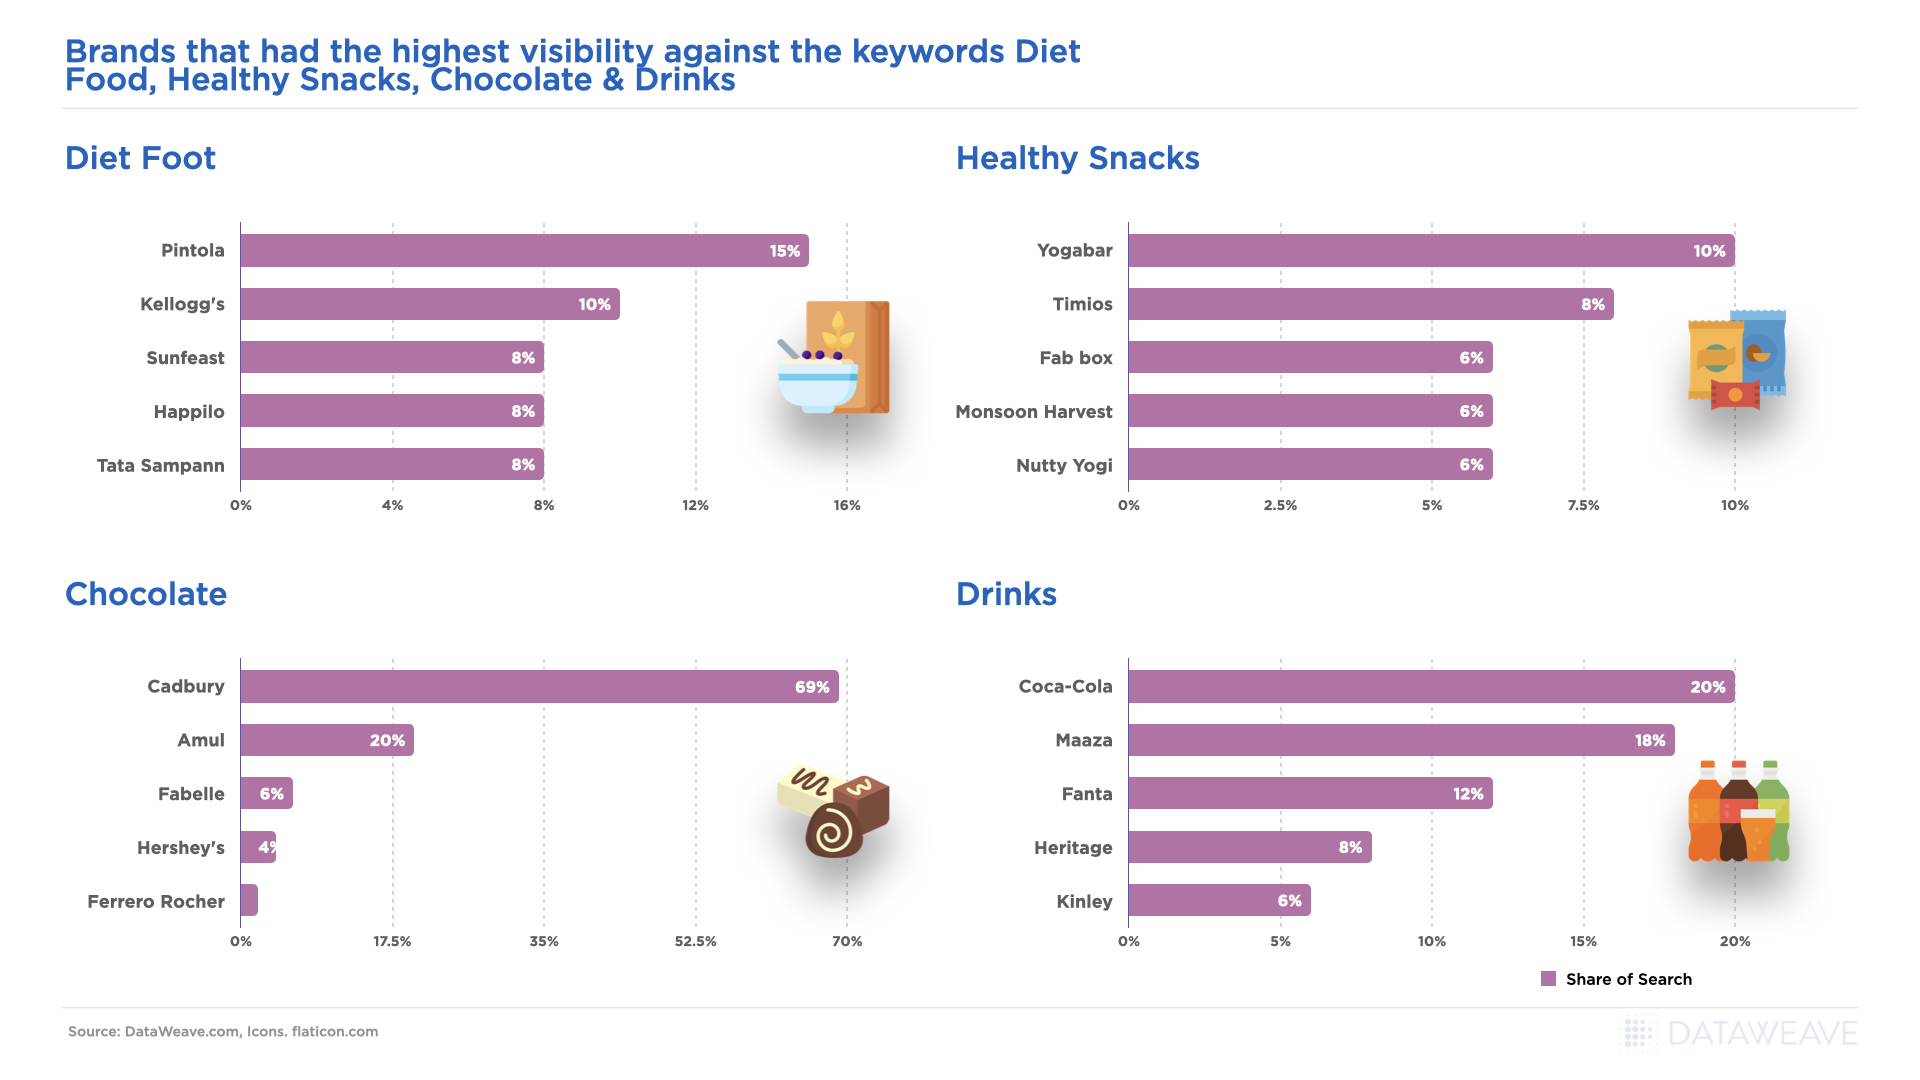
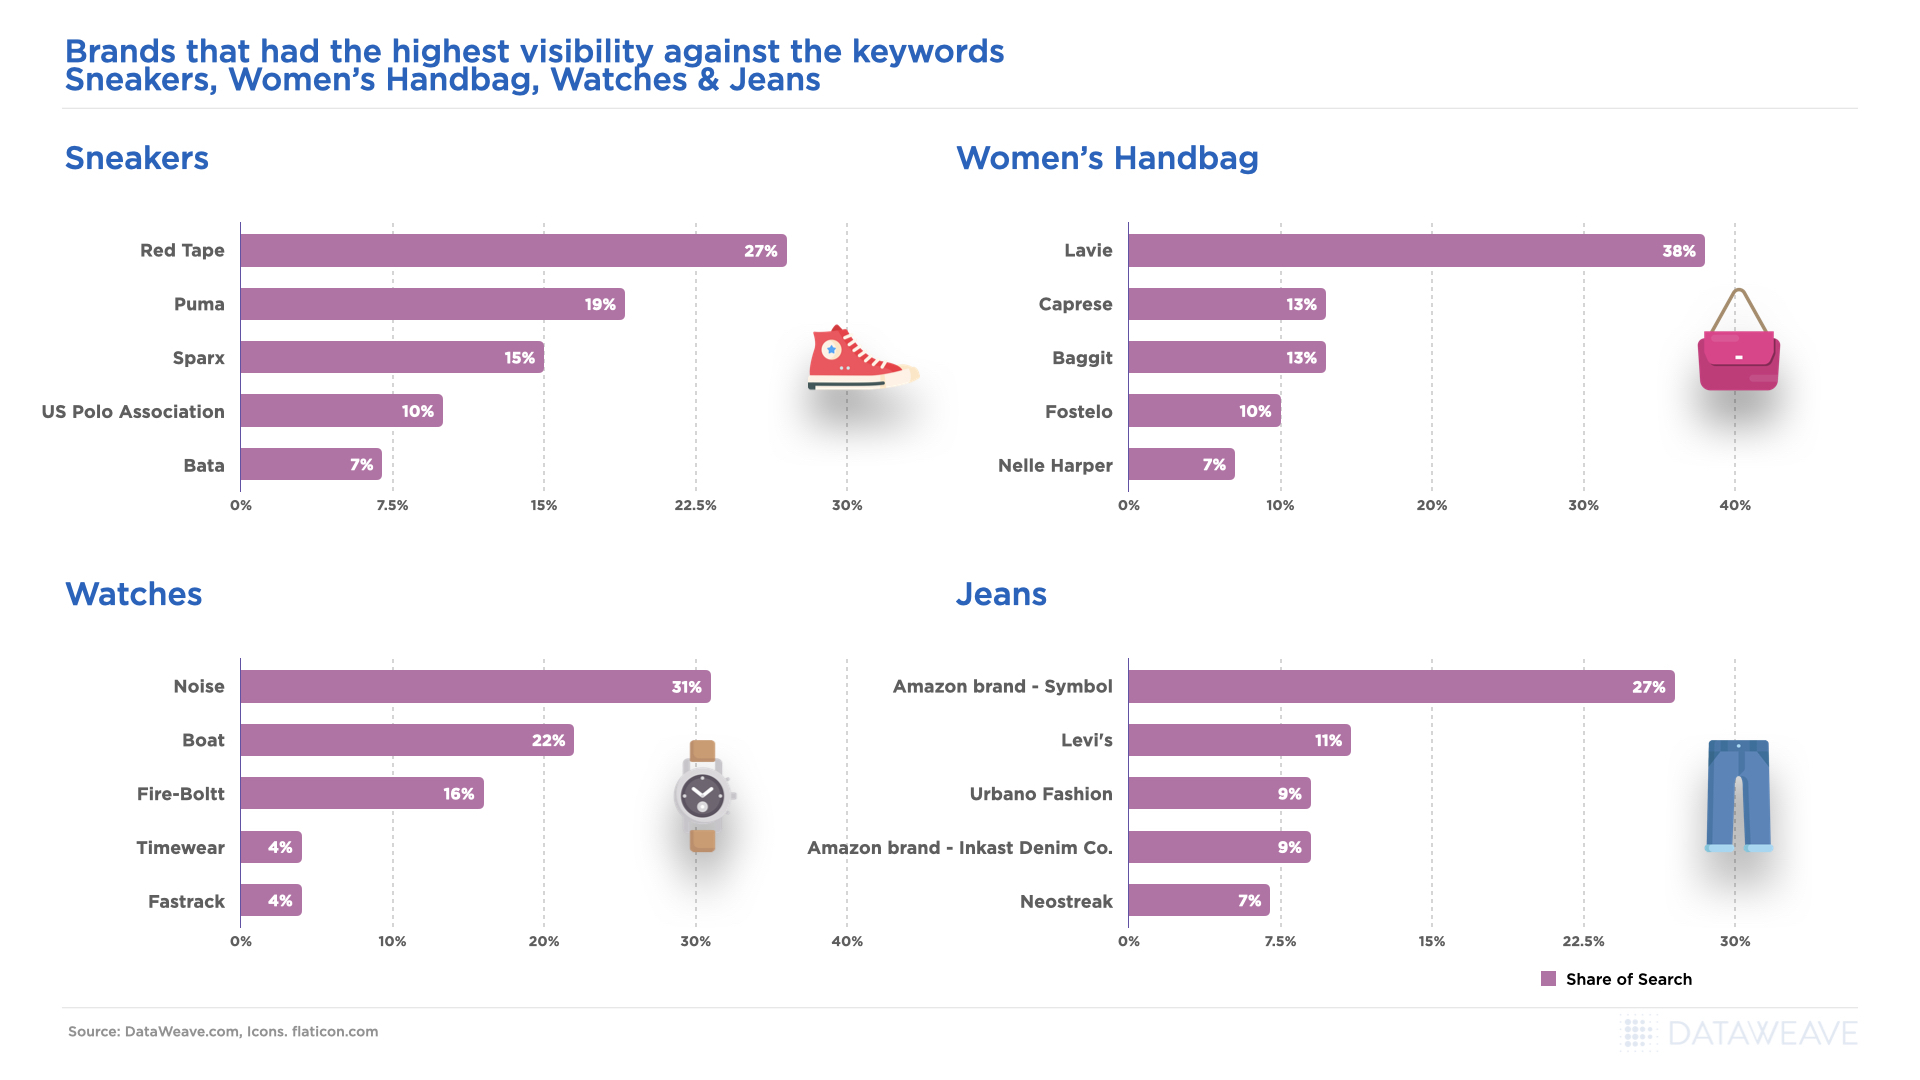
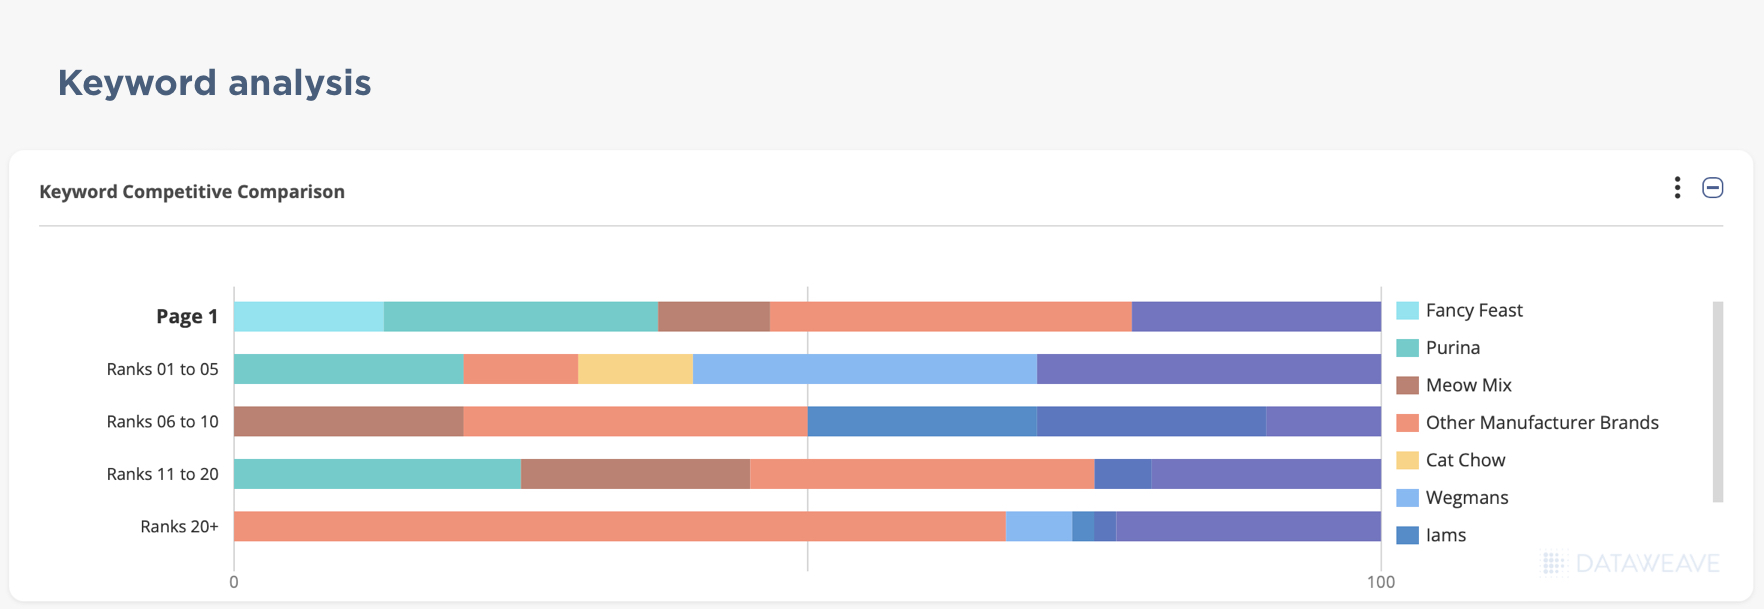
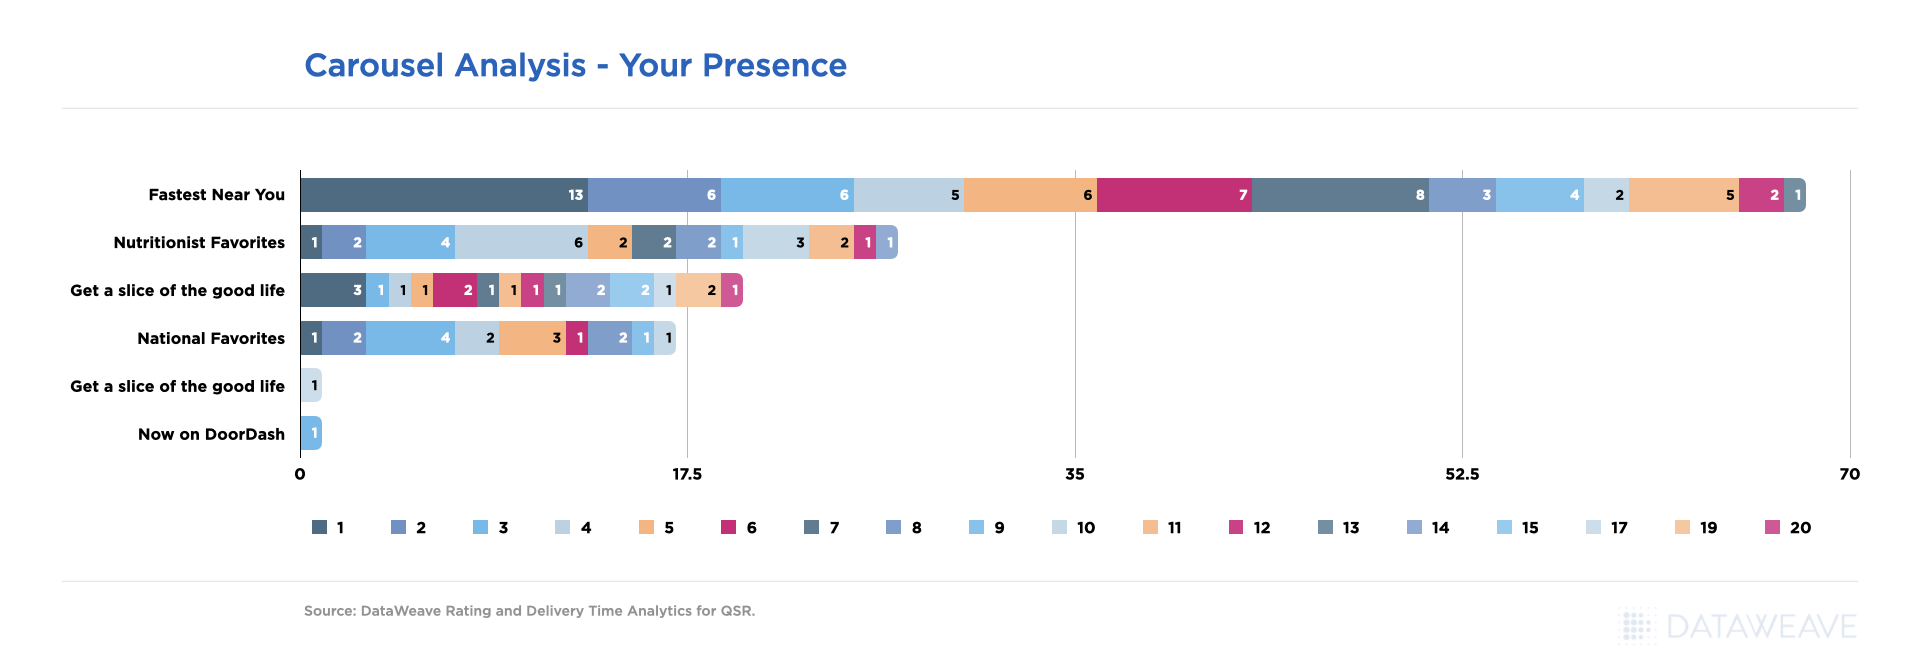
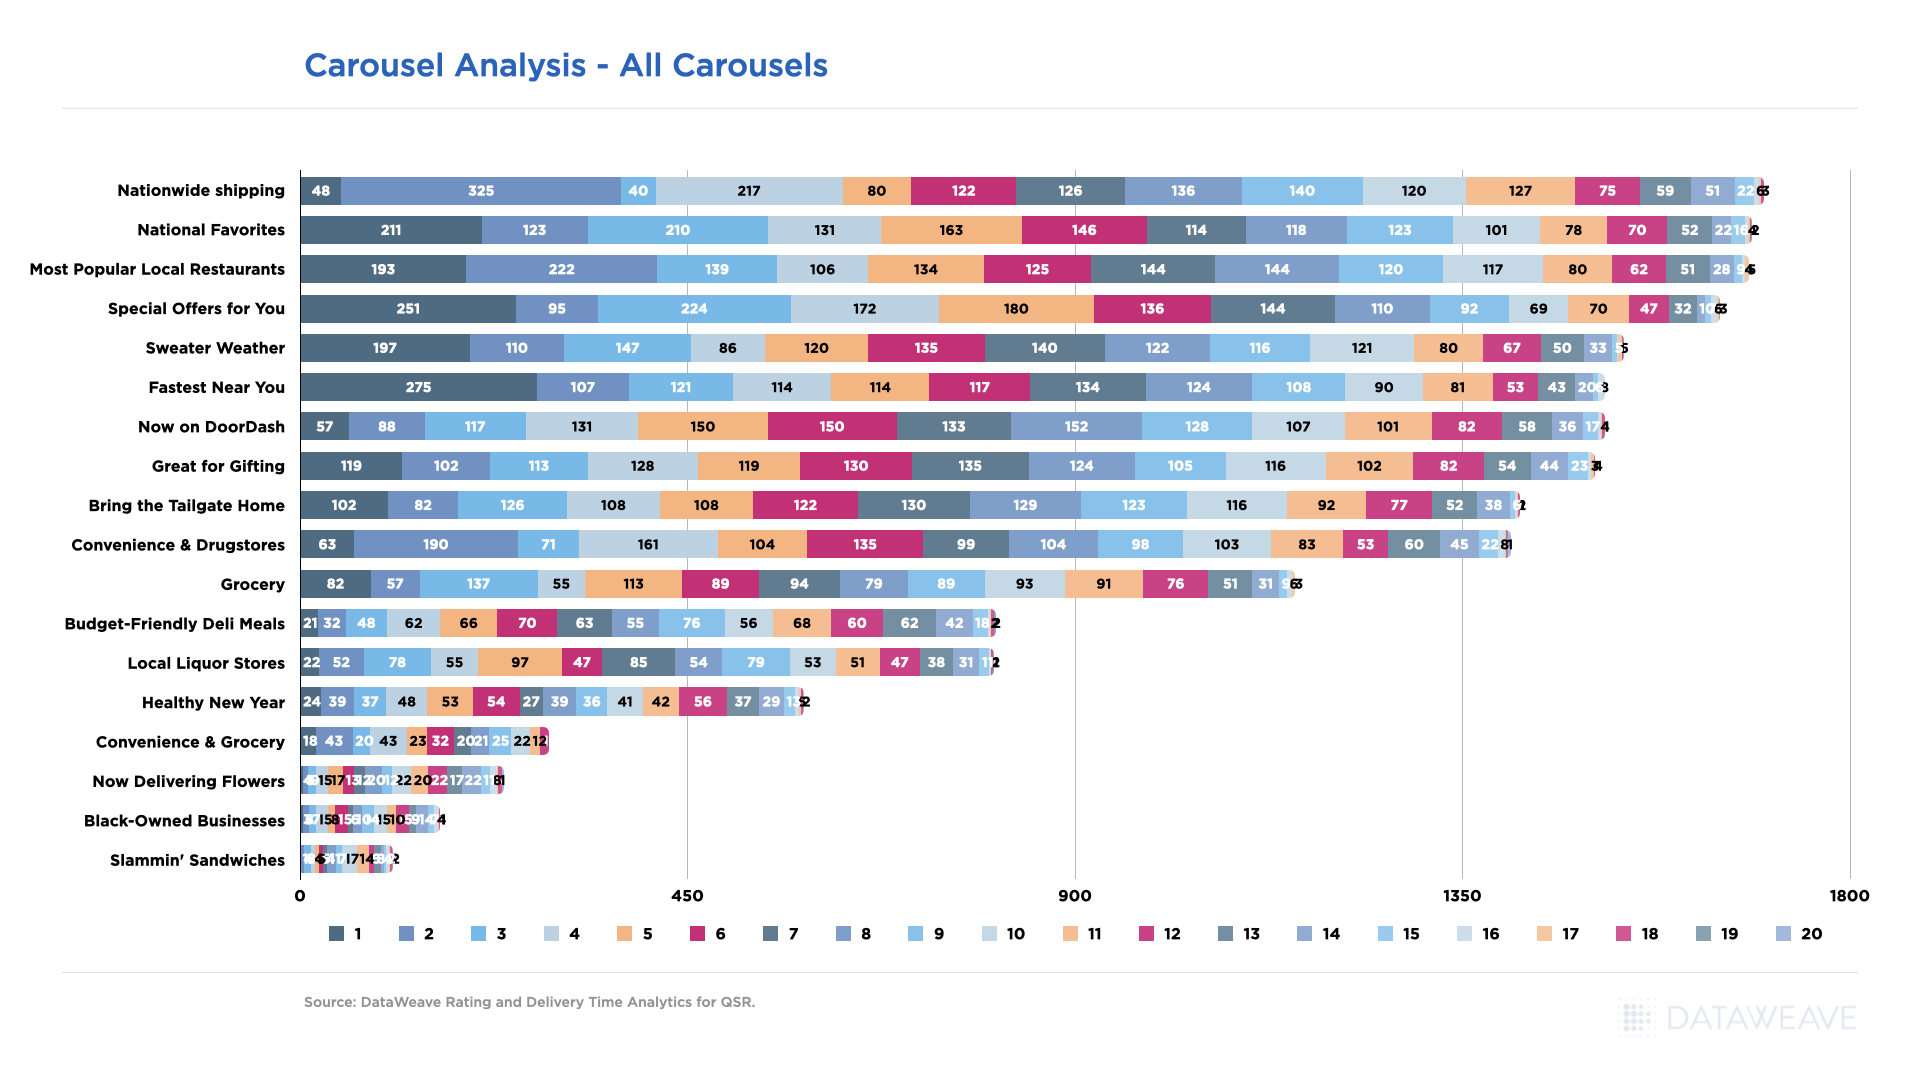
Share of Search Analysis
Which brands feature the most on e-commerce portals?
When listing items on e-commerce platforms, share of search is crucial. The highest share of the top ten or top twenty items available on these platforms is correlated with how many times the item may be viewed. As a result, it would have a greater chance of being selected by the customer.
By Retailer for Category “Desserts”
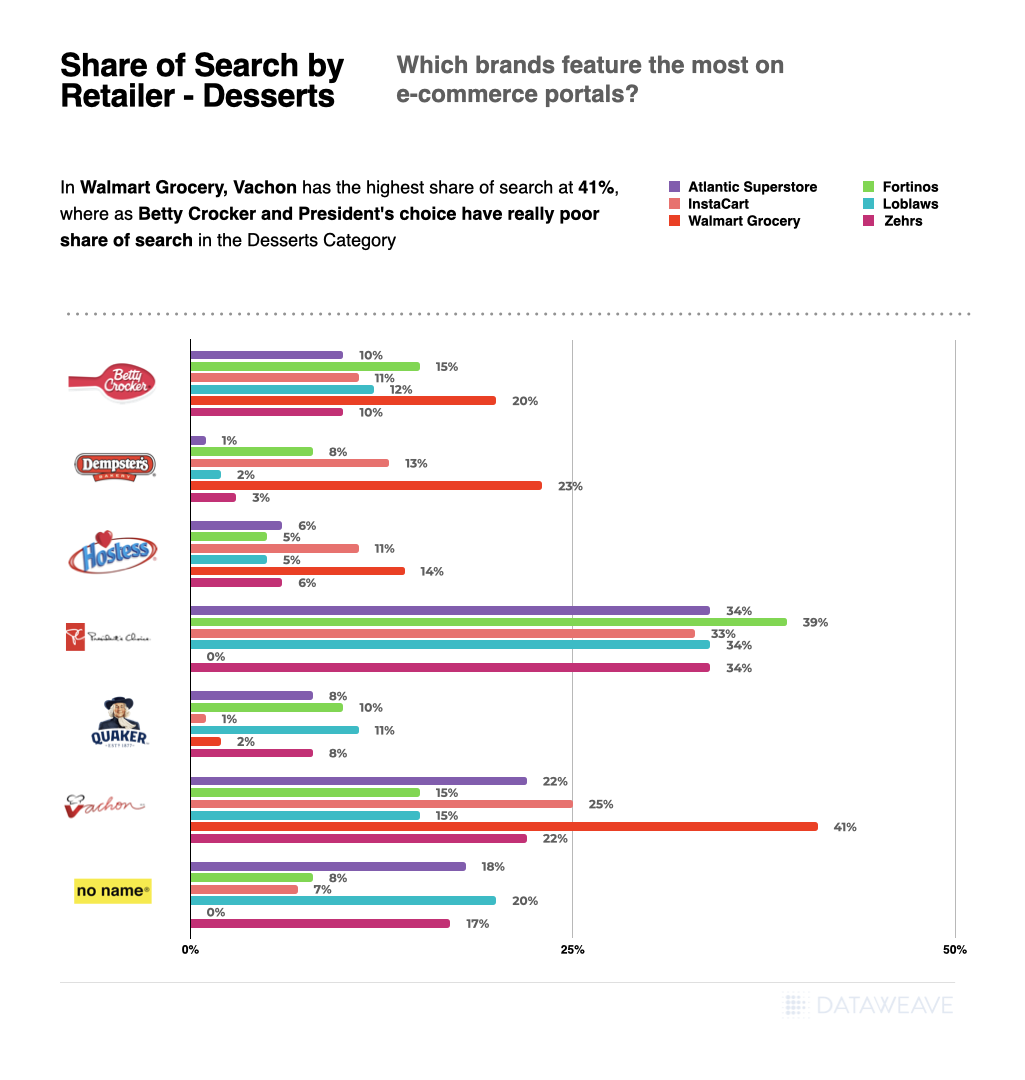
- In Walmart Grocery, Vachon has the highest share of search at 41%, whereas Betty Crocker, Presidents Choice and No Name had the lowest share of search at 0%, in the Desserts Category.
- In Loblaws, Presidents Choice had the highest share of search of 34%, whereas Dempsters had the lowest share of search of 2% in the Desserts Category.
- The brand Presidents Choice consistently ranks high in the share of search results for Desserts across multiple retailers, including Atlantic Superstore, Fortinos, Instacart, Loblaws, and Zehrs – except at two retailers, Voila and Watlmart Grocery, where its share is zero.
Trend of Share of Search for “Desserts”
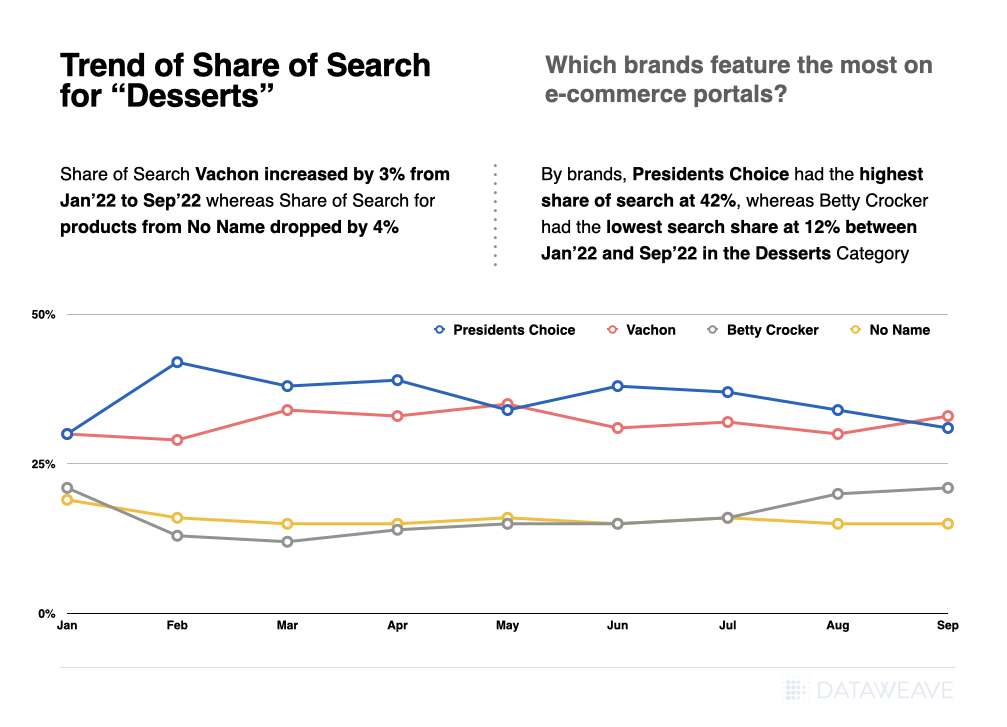
- Share of search had dropped by around 4% for No Name, whereas for Vachon, it increased by 3% from Jan’-22 to Sep’ 22
- By brands, Presidents Choice had the highest share of search at 42%, whereas Betty Crocker had the lowest share of search at 12% between Jan’ 22 and Sep’ 22 in the Desserts Category.
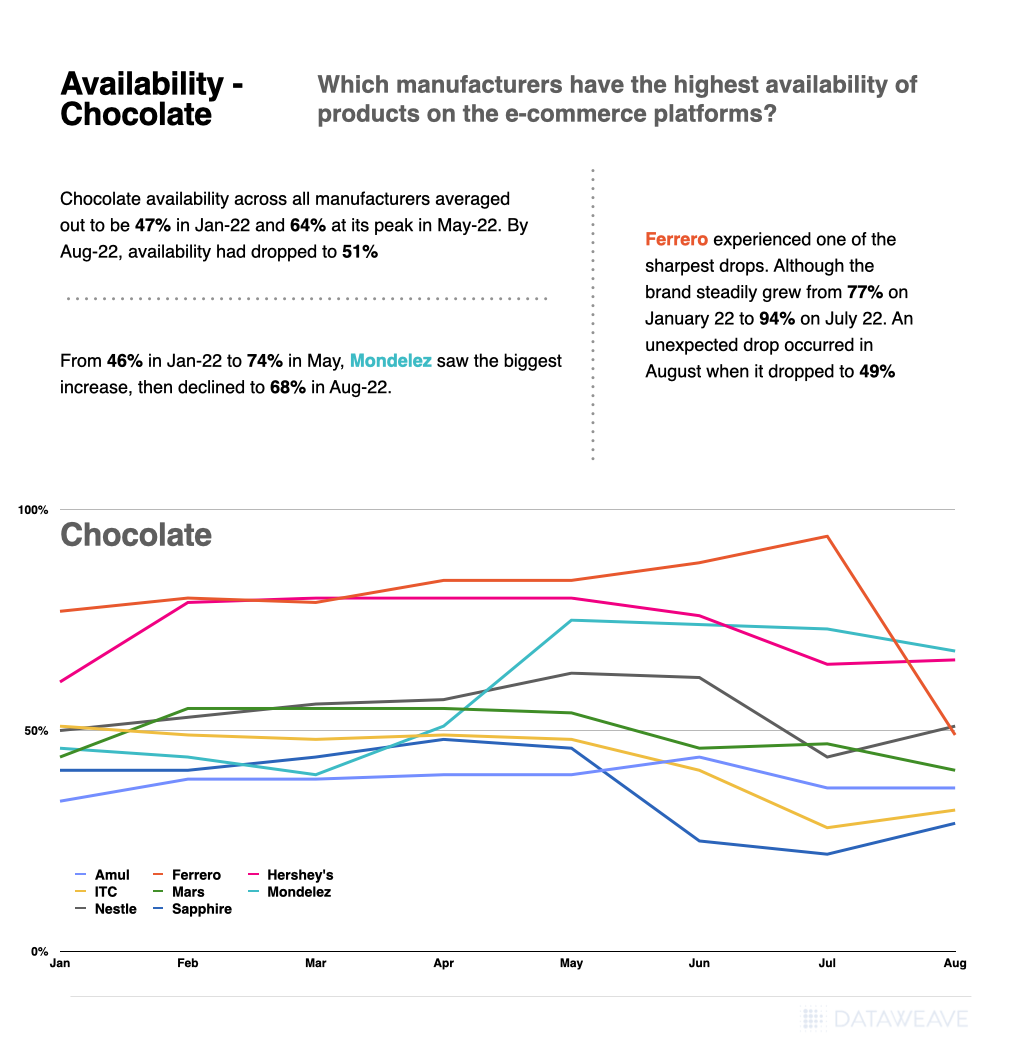
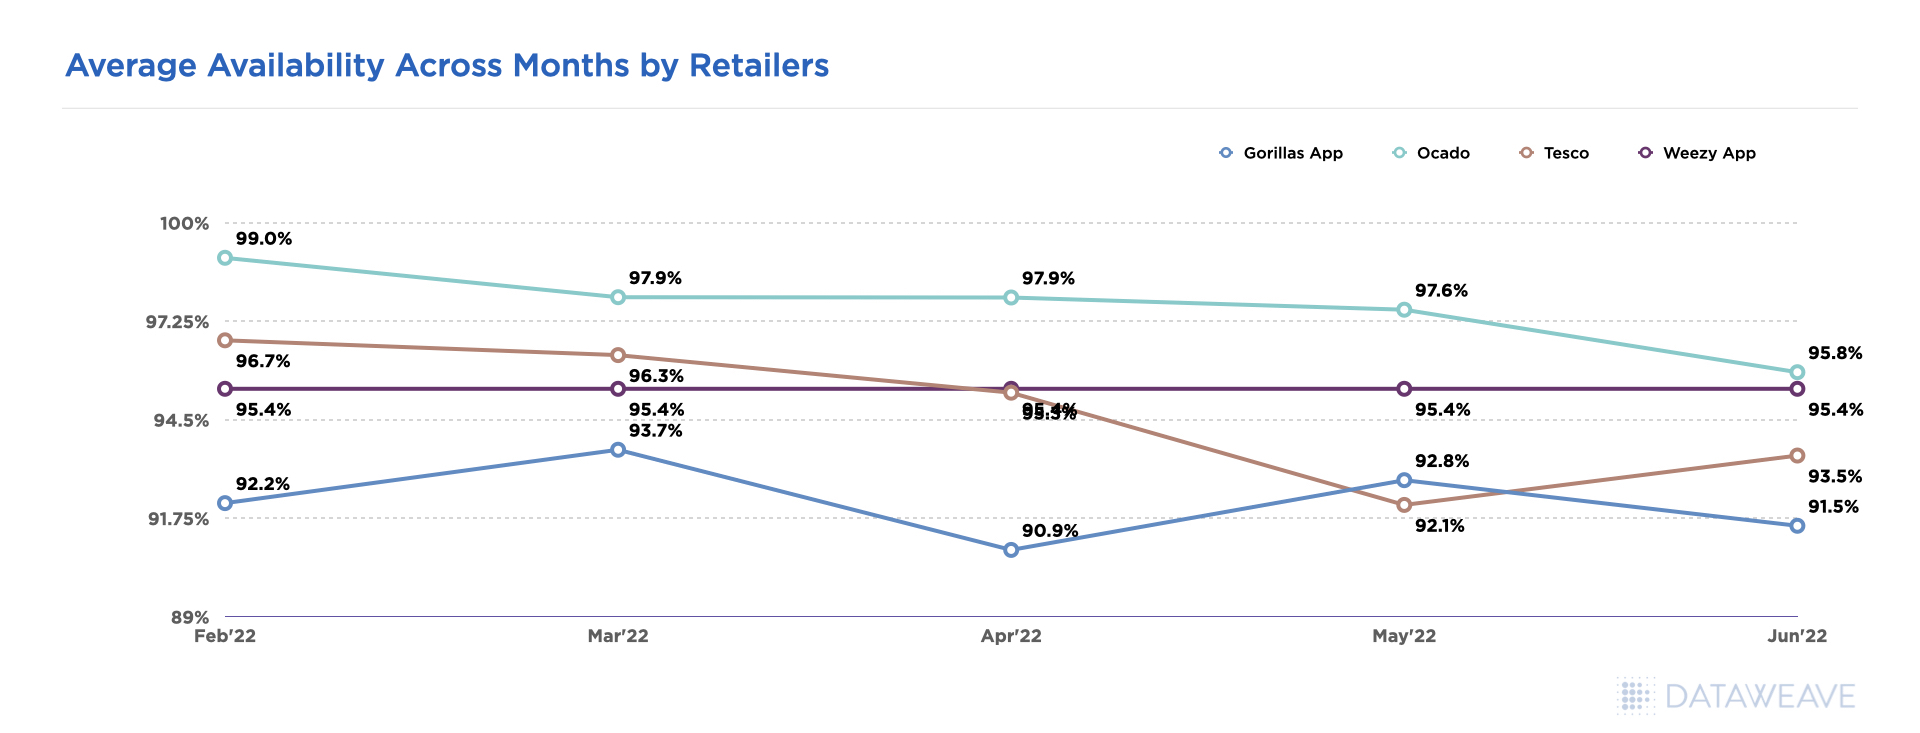
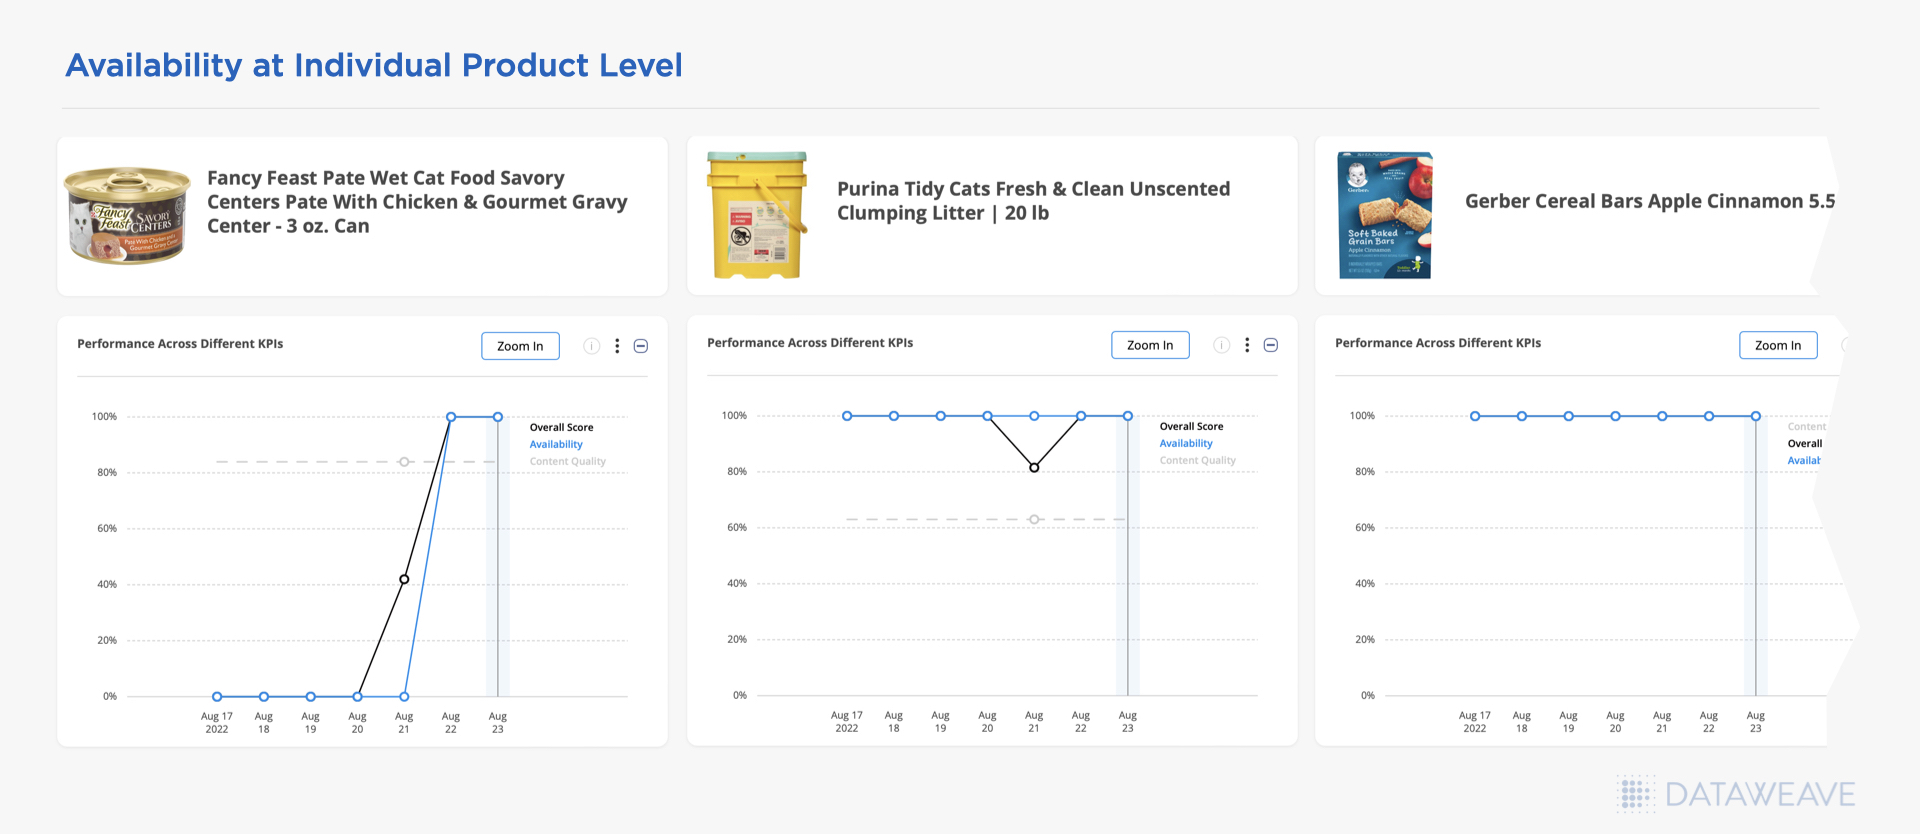
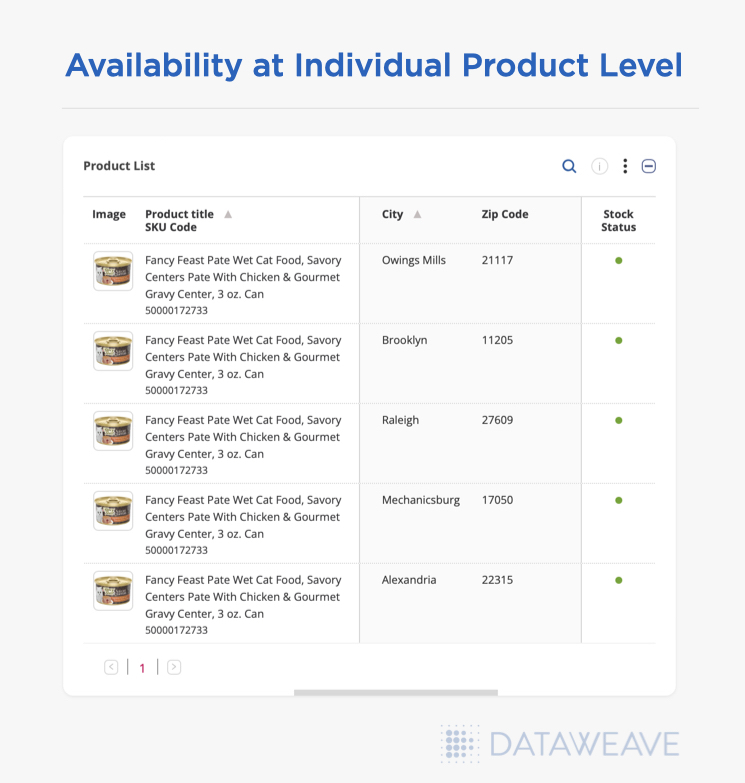
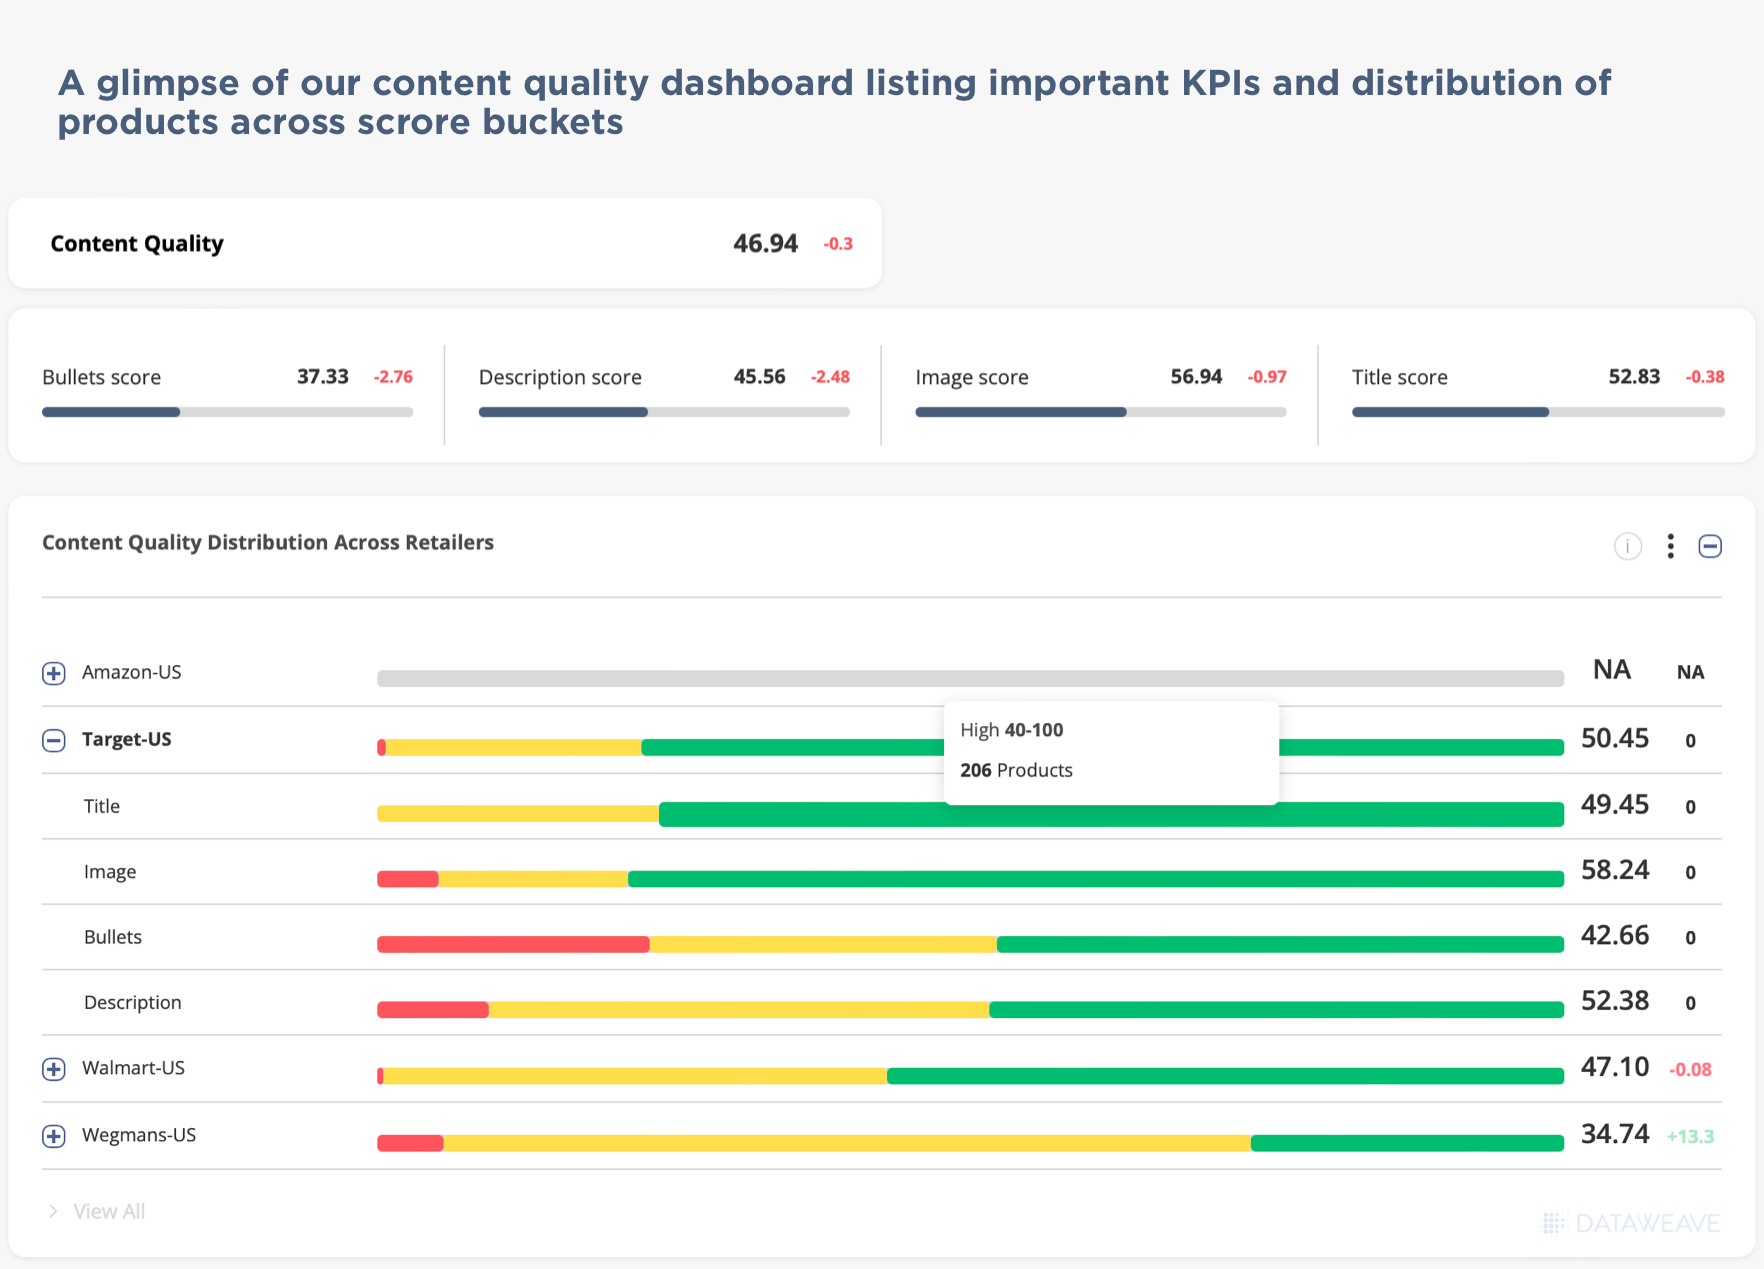
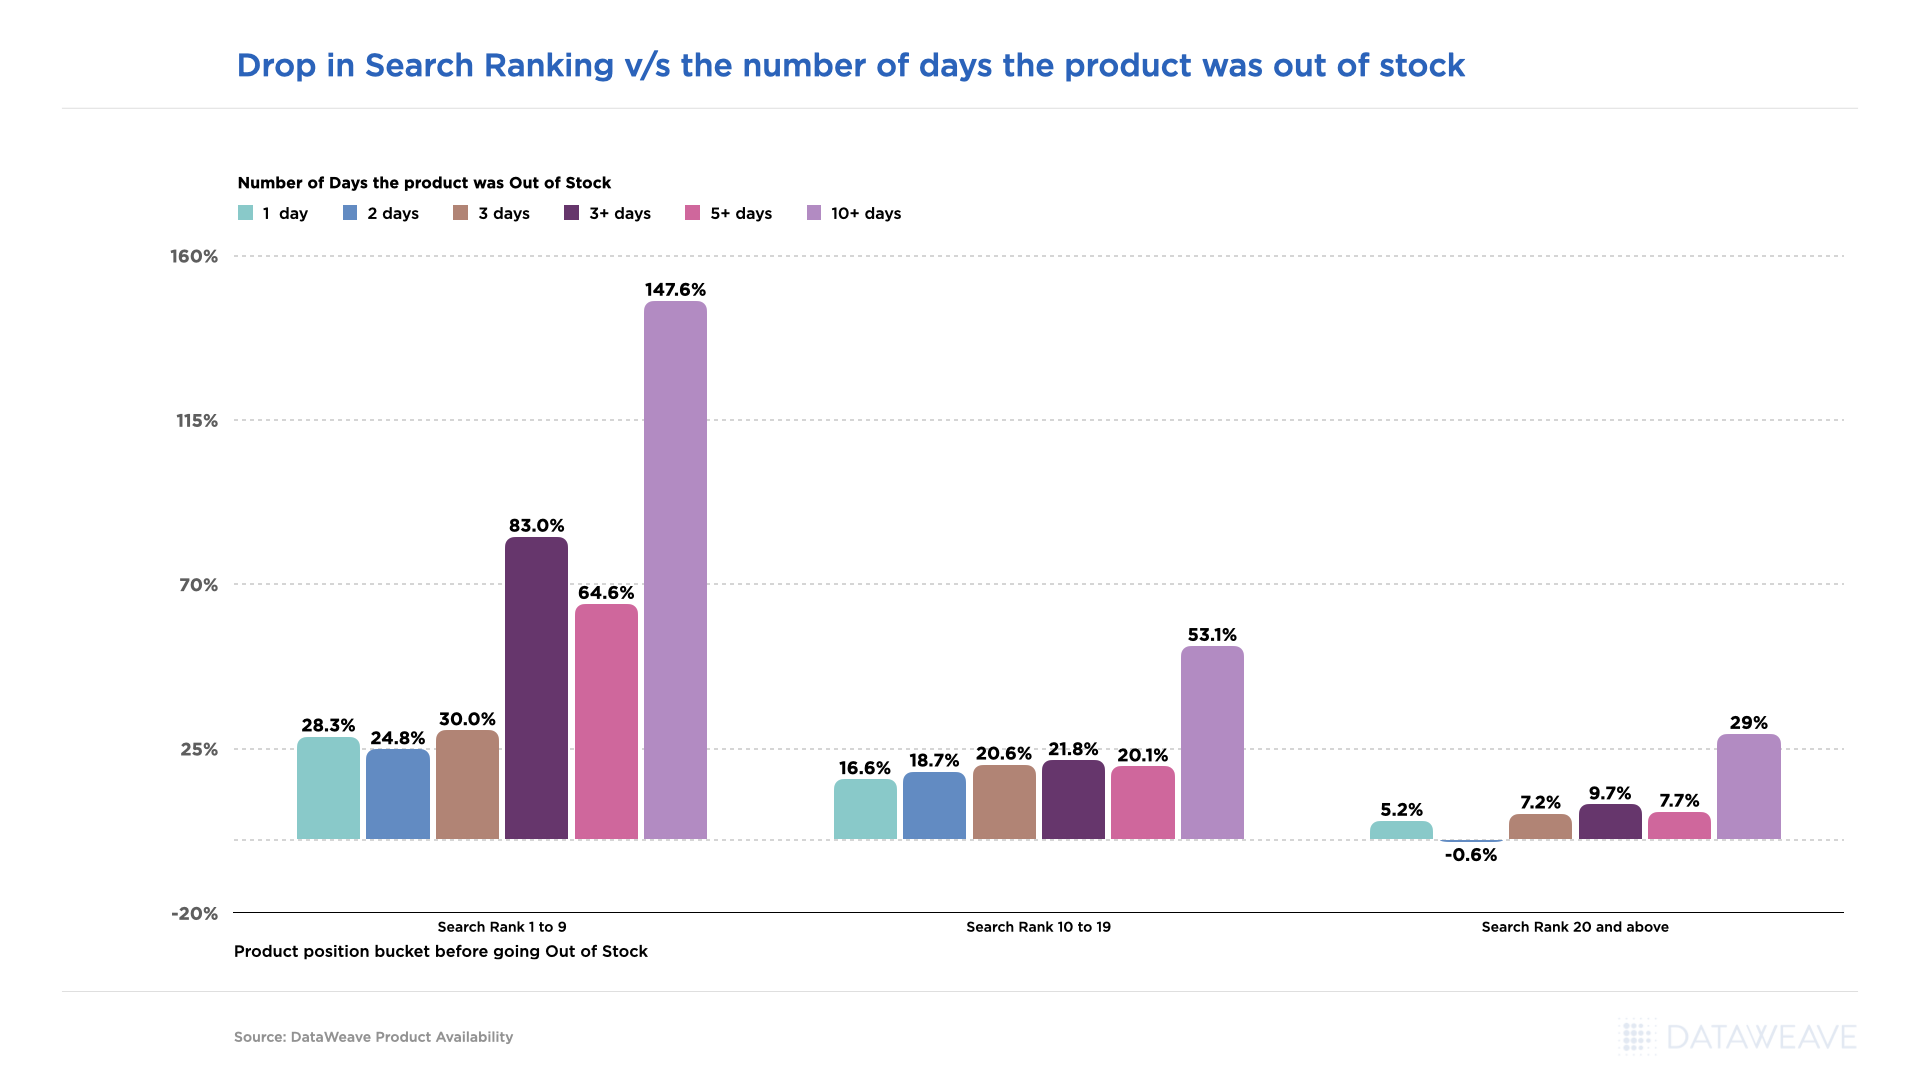
Availability Analysis
Which products are widely available across e-commerce portals?
The availability of the product on the e-commerce portal is one of the key indicators of meeting customer demand. Brands can use insights from DataWeave to strategize how to restock their inventory and ease customer demand. Based on data analysis, brands can also determine which products to prioritize on which platforms.
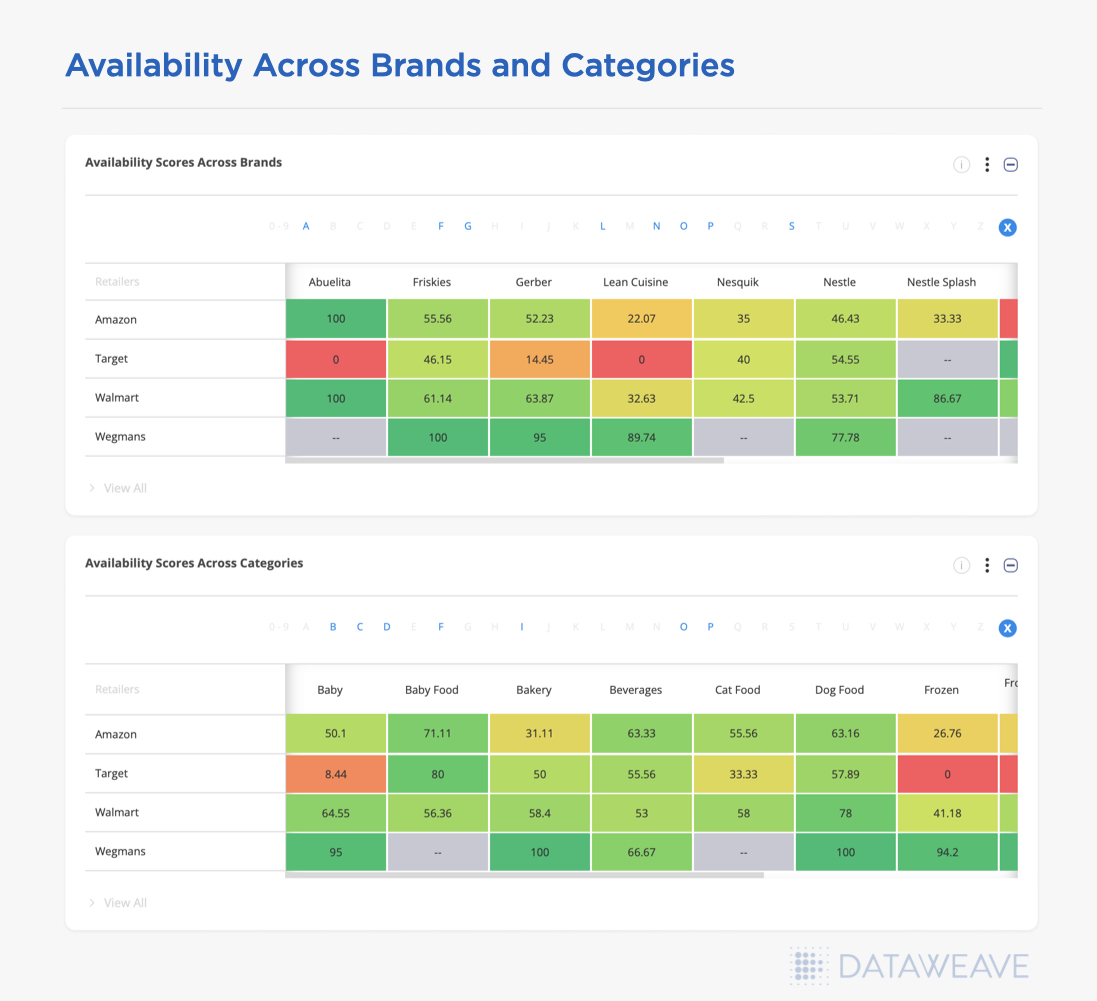
By Category
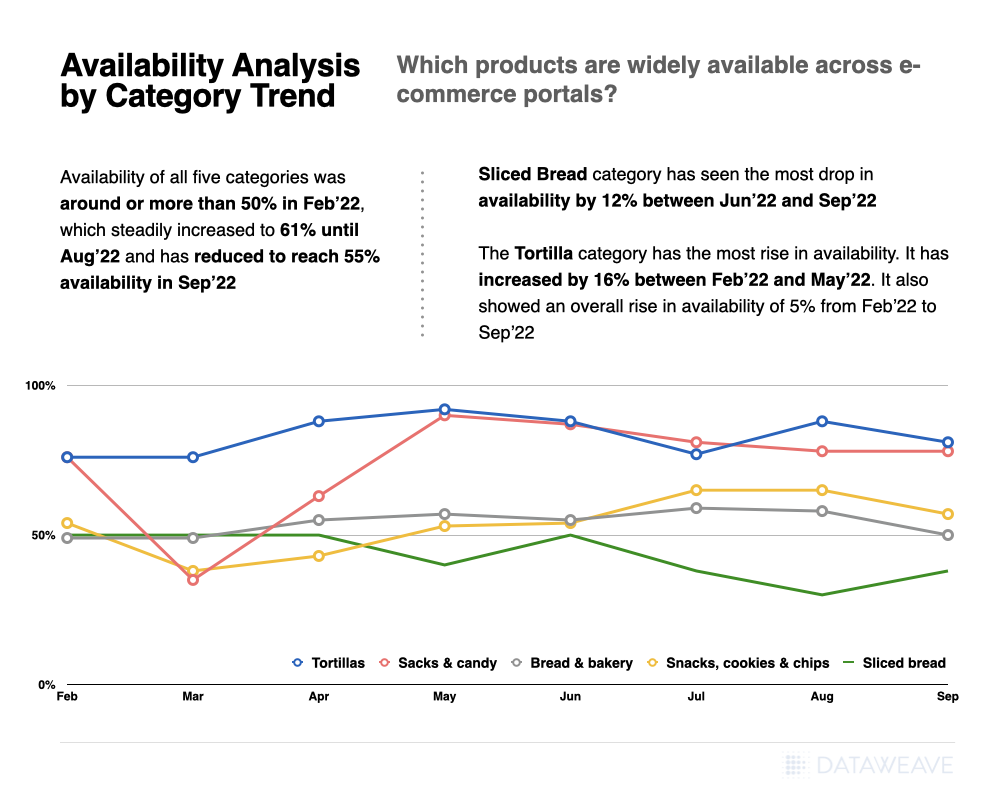
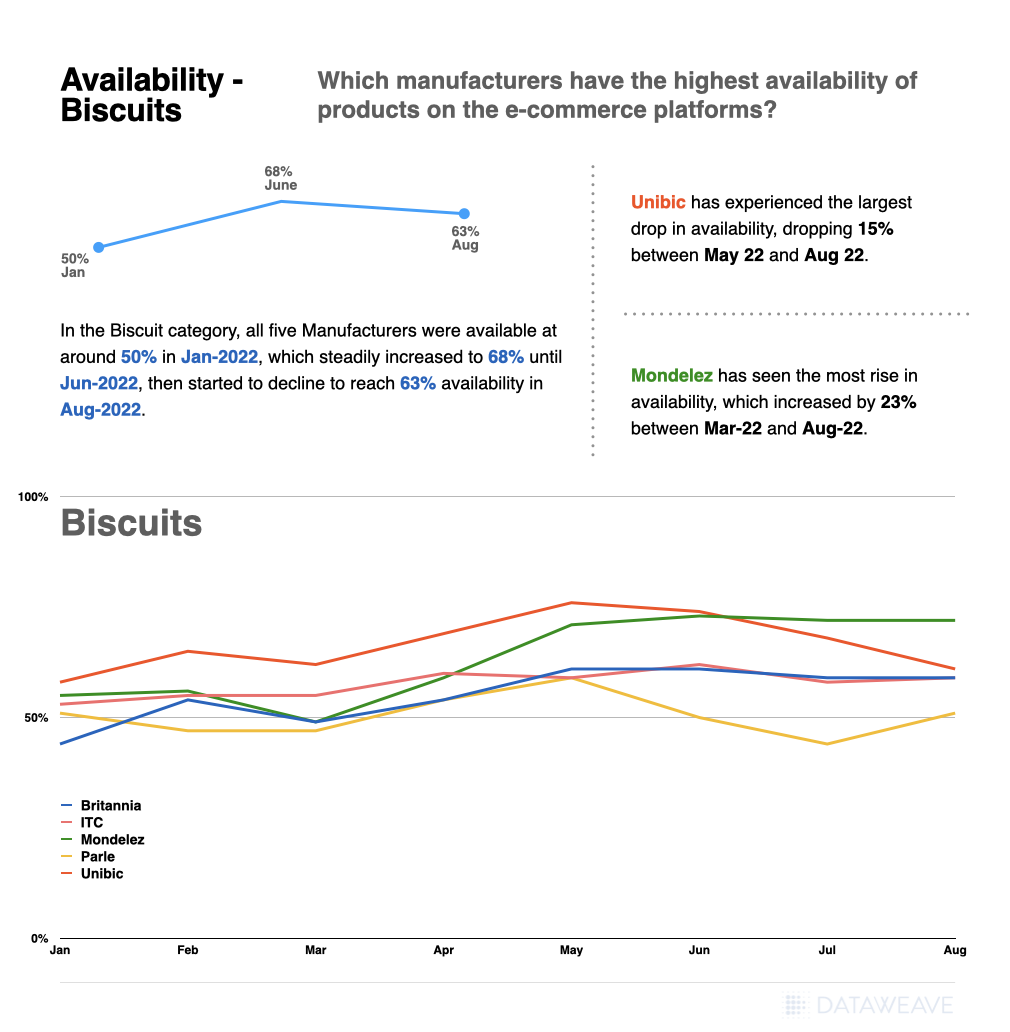
- Availability of all five categories was around 52% in Feb’ 22, which steadily increased to 61% until Aug’ 22 and has reduced to reach 55% availability in Sep’ 22
- Sliced Bread category has seen the most drop in availability by 12% between Jun’ 22 and Sep’ 22
- The tortilla category has the most rise in availability. It has increased by 16% between Feb-22 and May-22. It also showed an overall rise in availability of 5% from Feb-22 to Sep-22
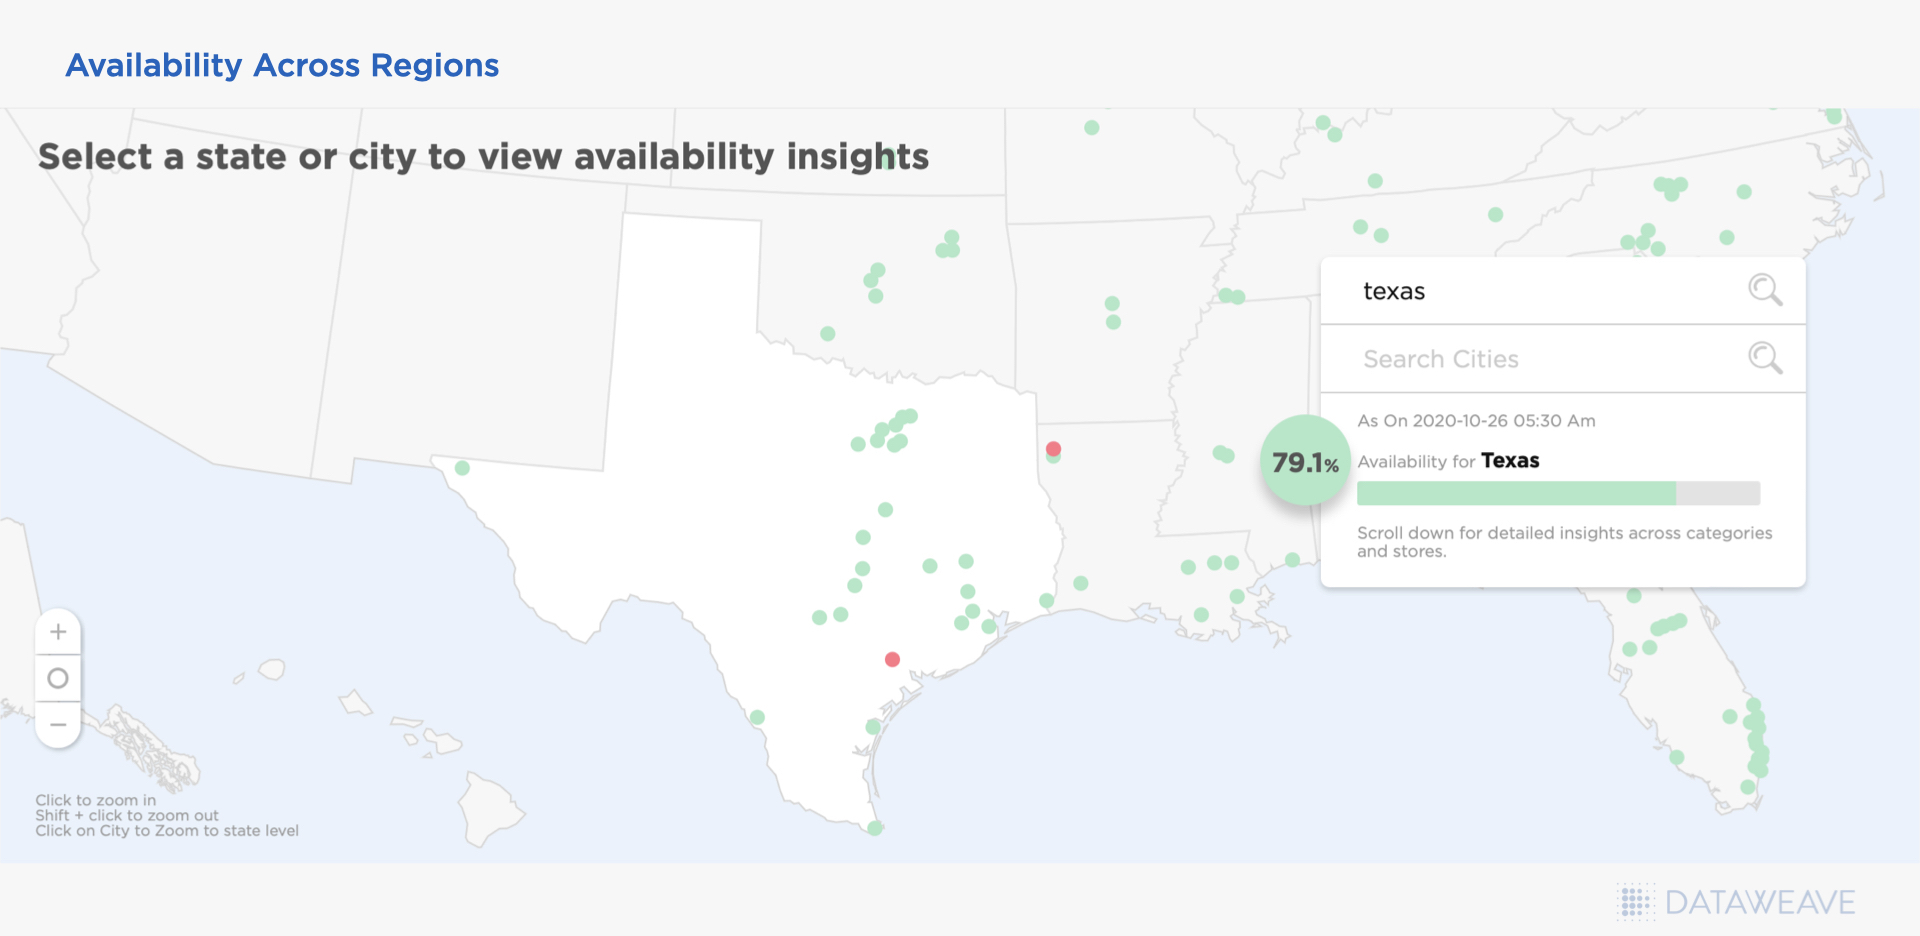
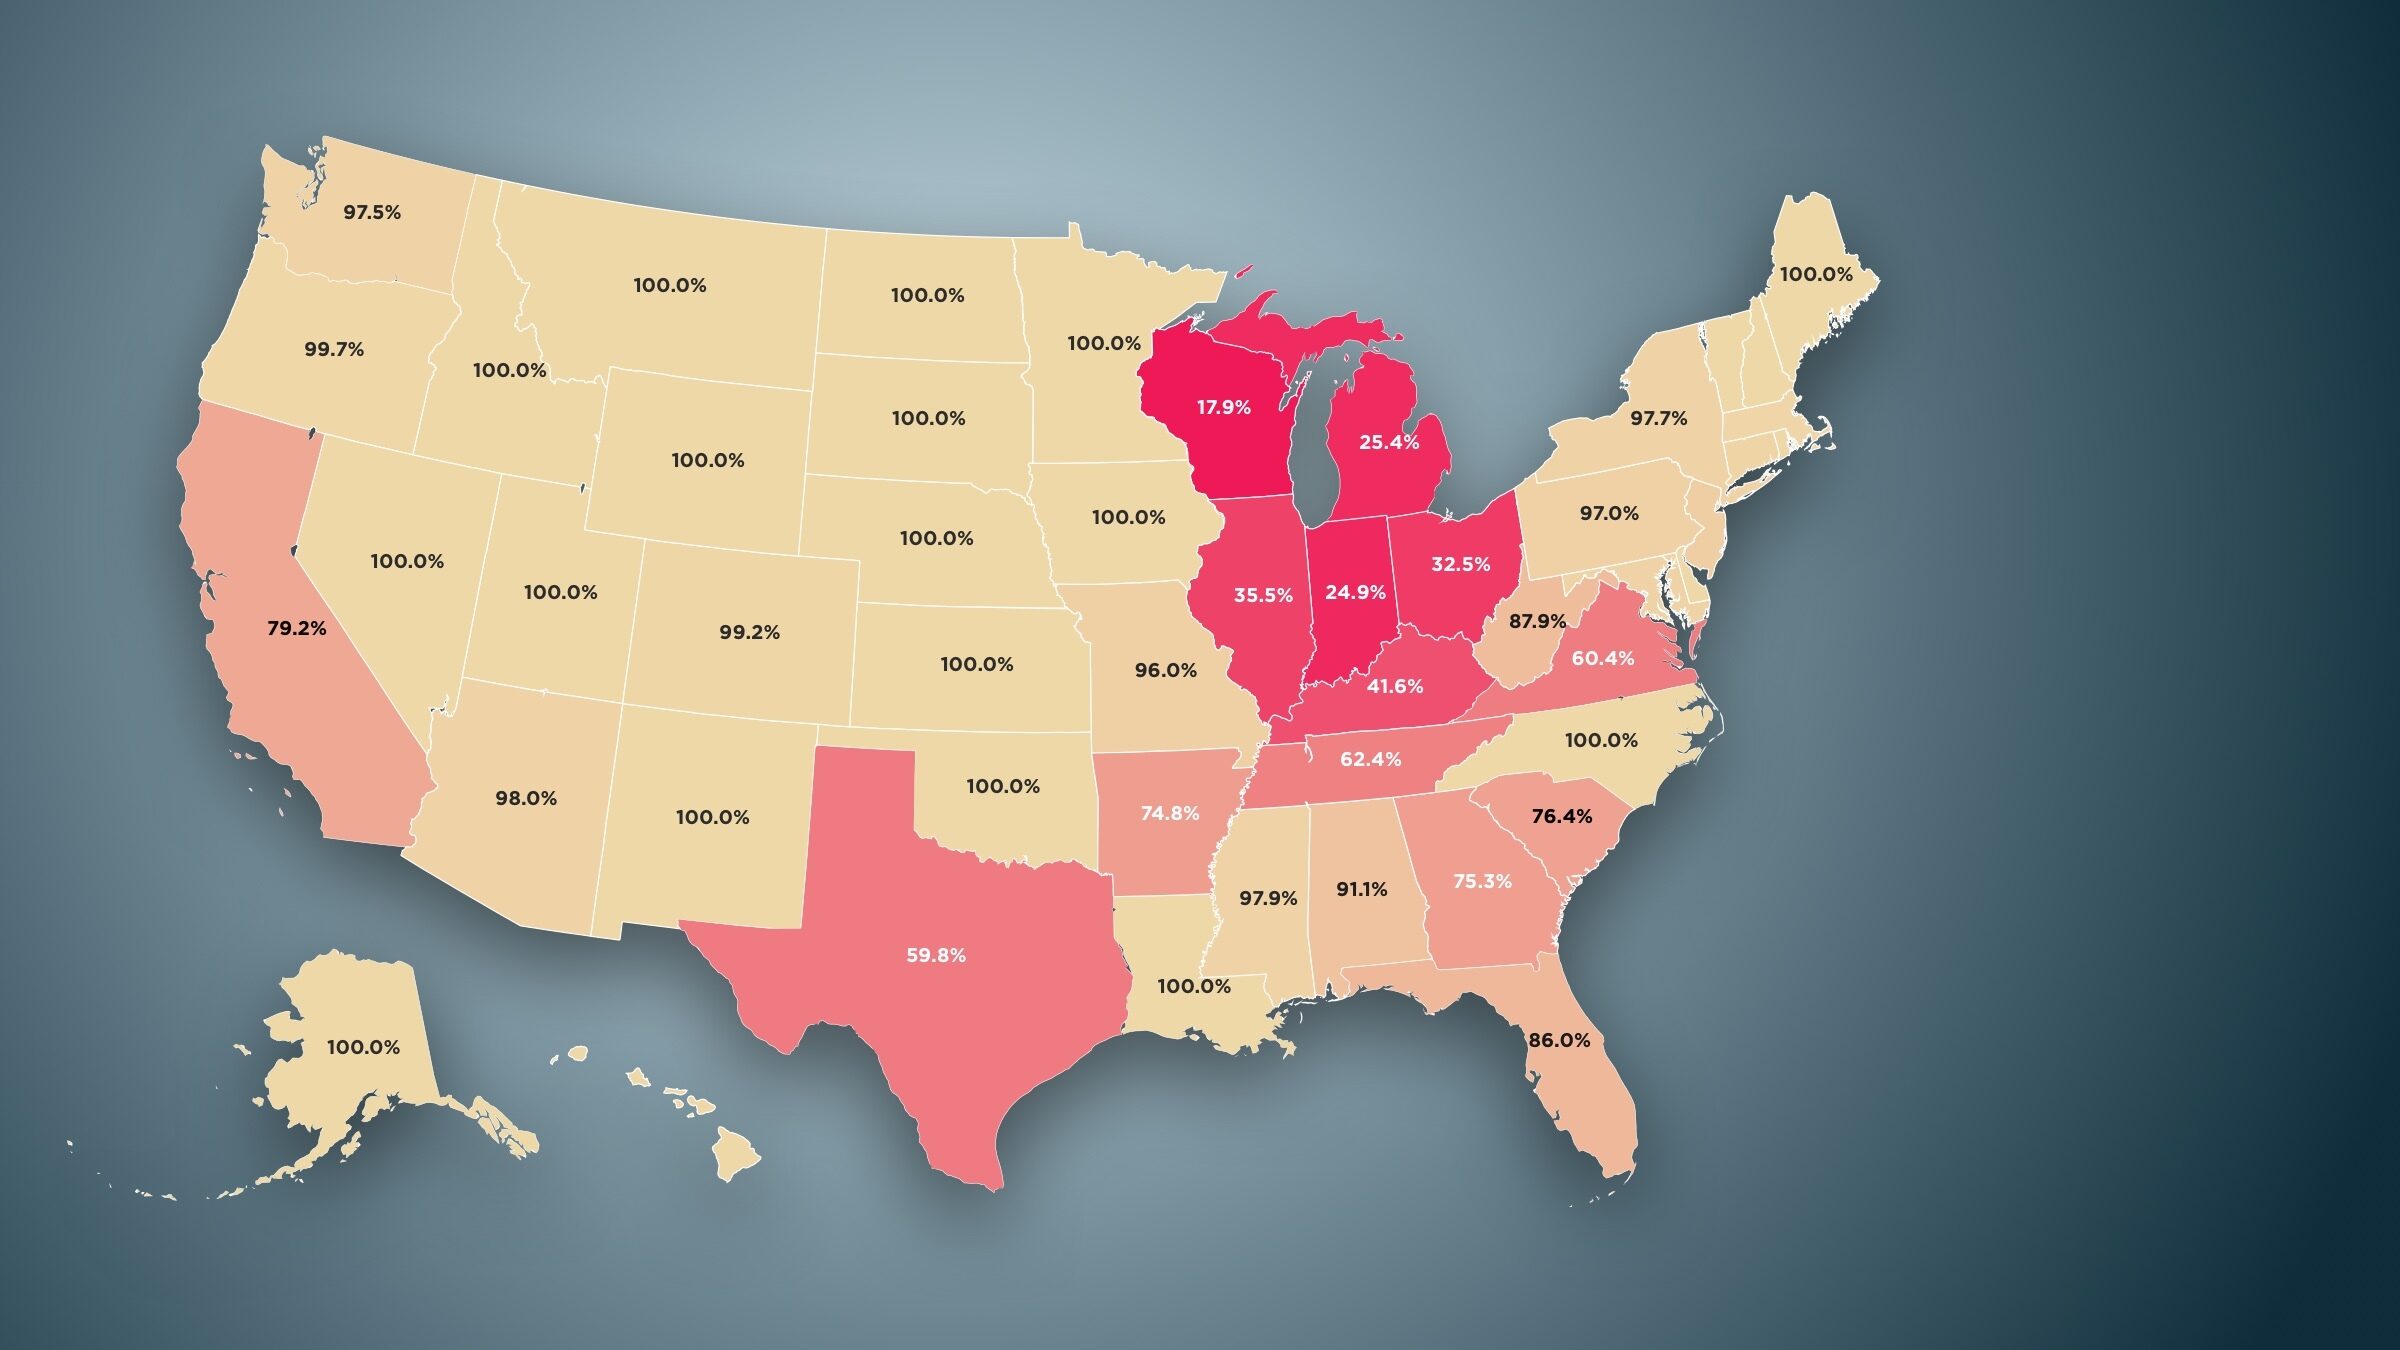
By Location
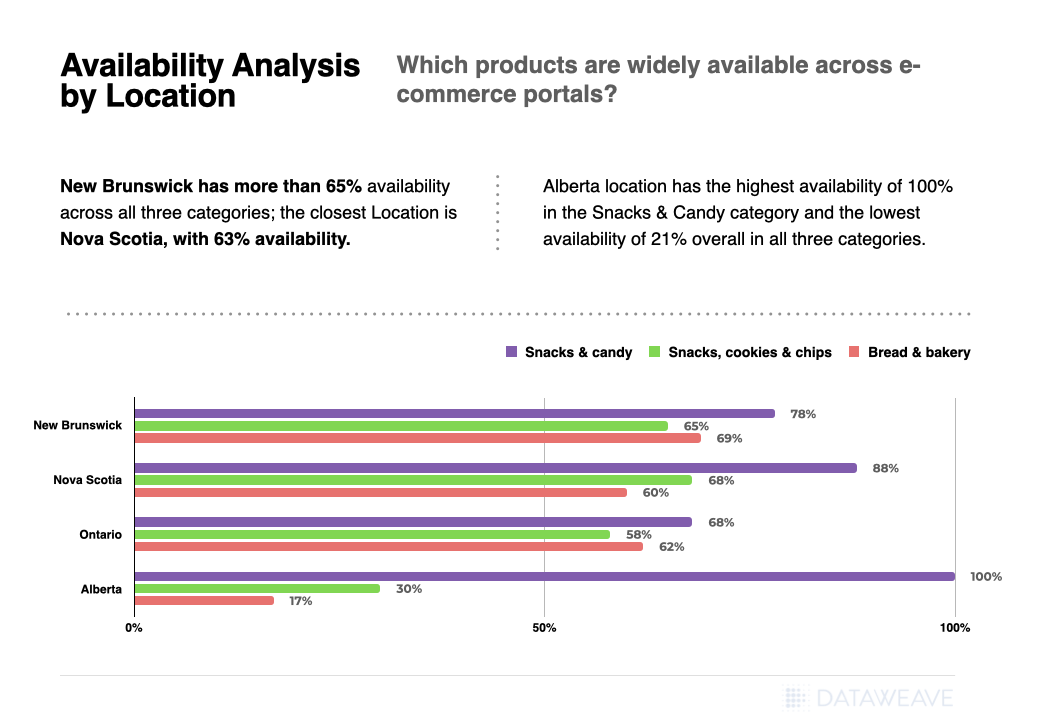
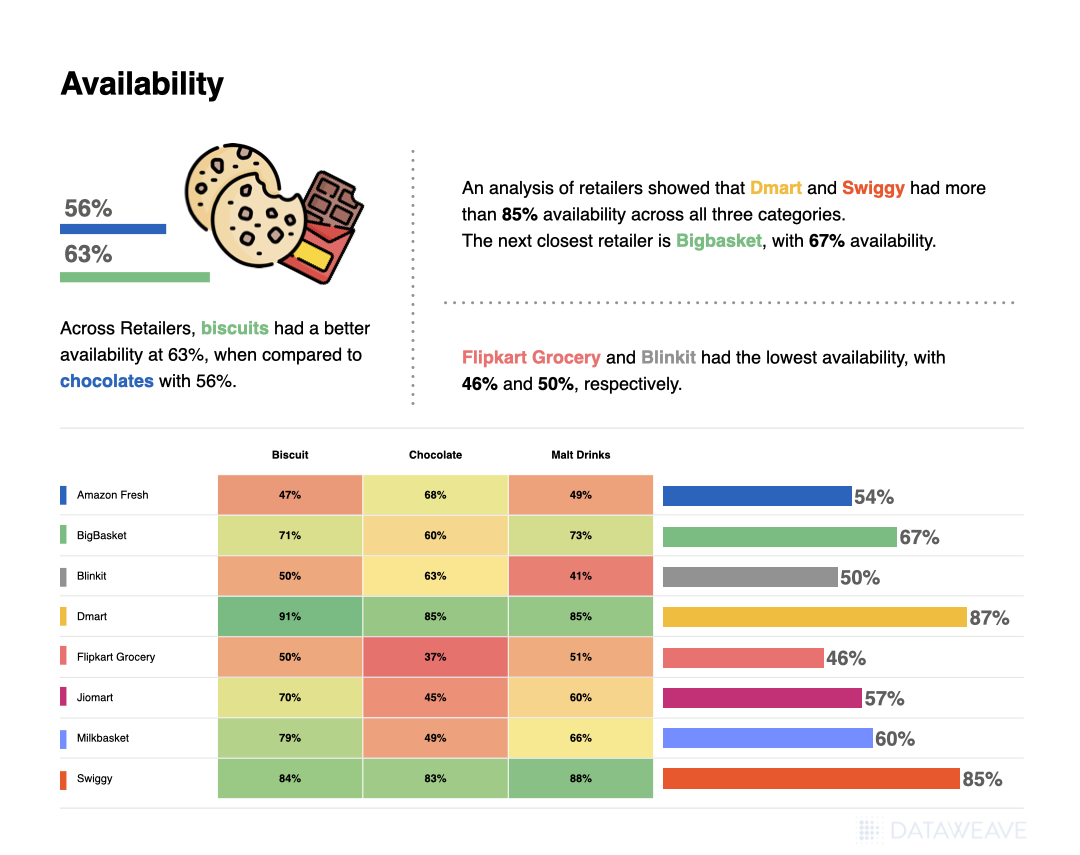
- Across categories, Snacks & Candy had better availability at 73% than Bread & Bakery, with 56% availability.
- By Location, New Brunswick had more than 65% availability across all three categories; the closest Location is Nova Scotia, with 63% availability.
- Alberta had the highest availability of 100% in the Snacks & Candy category and the lowest availability of 21% overall in all three categories (weighted aggregate)
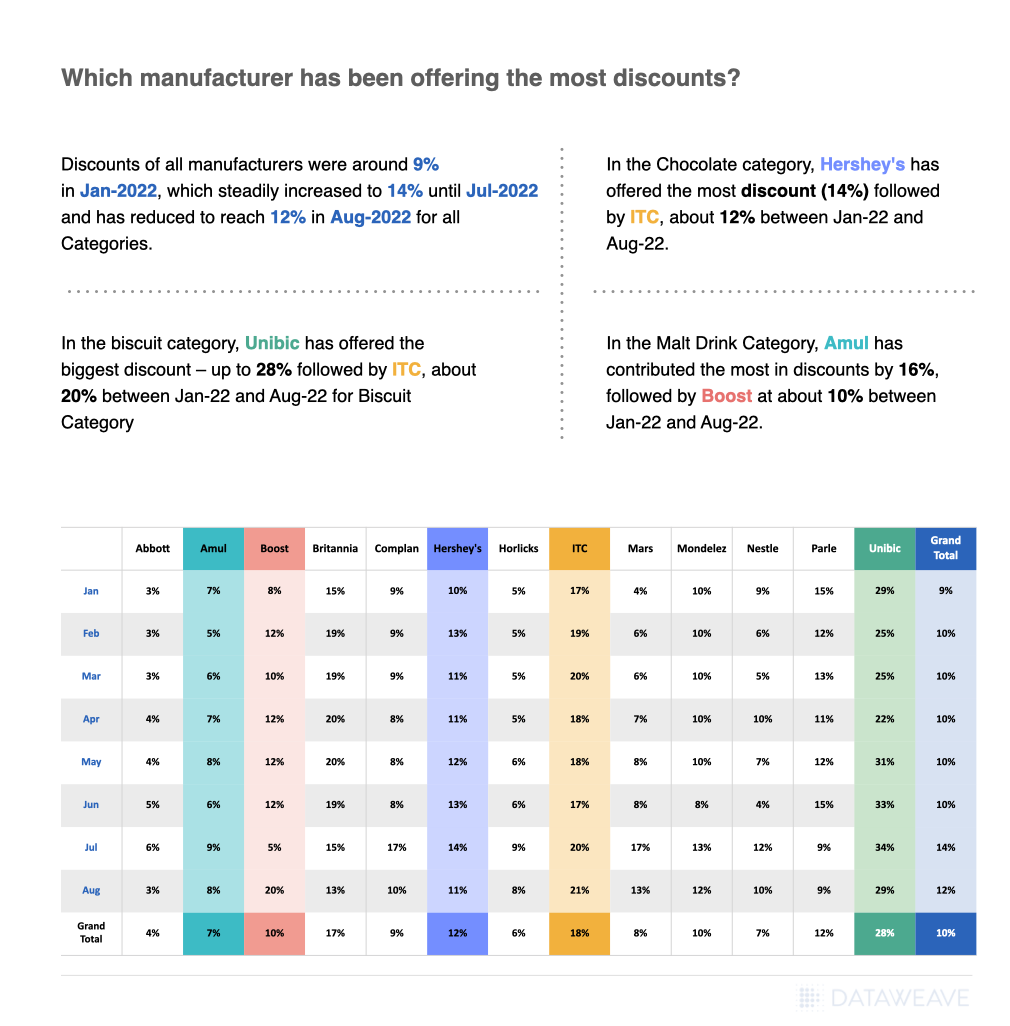
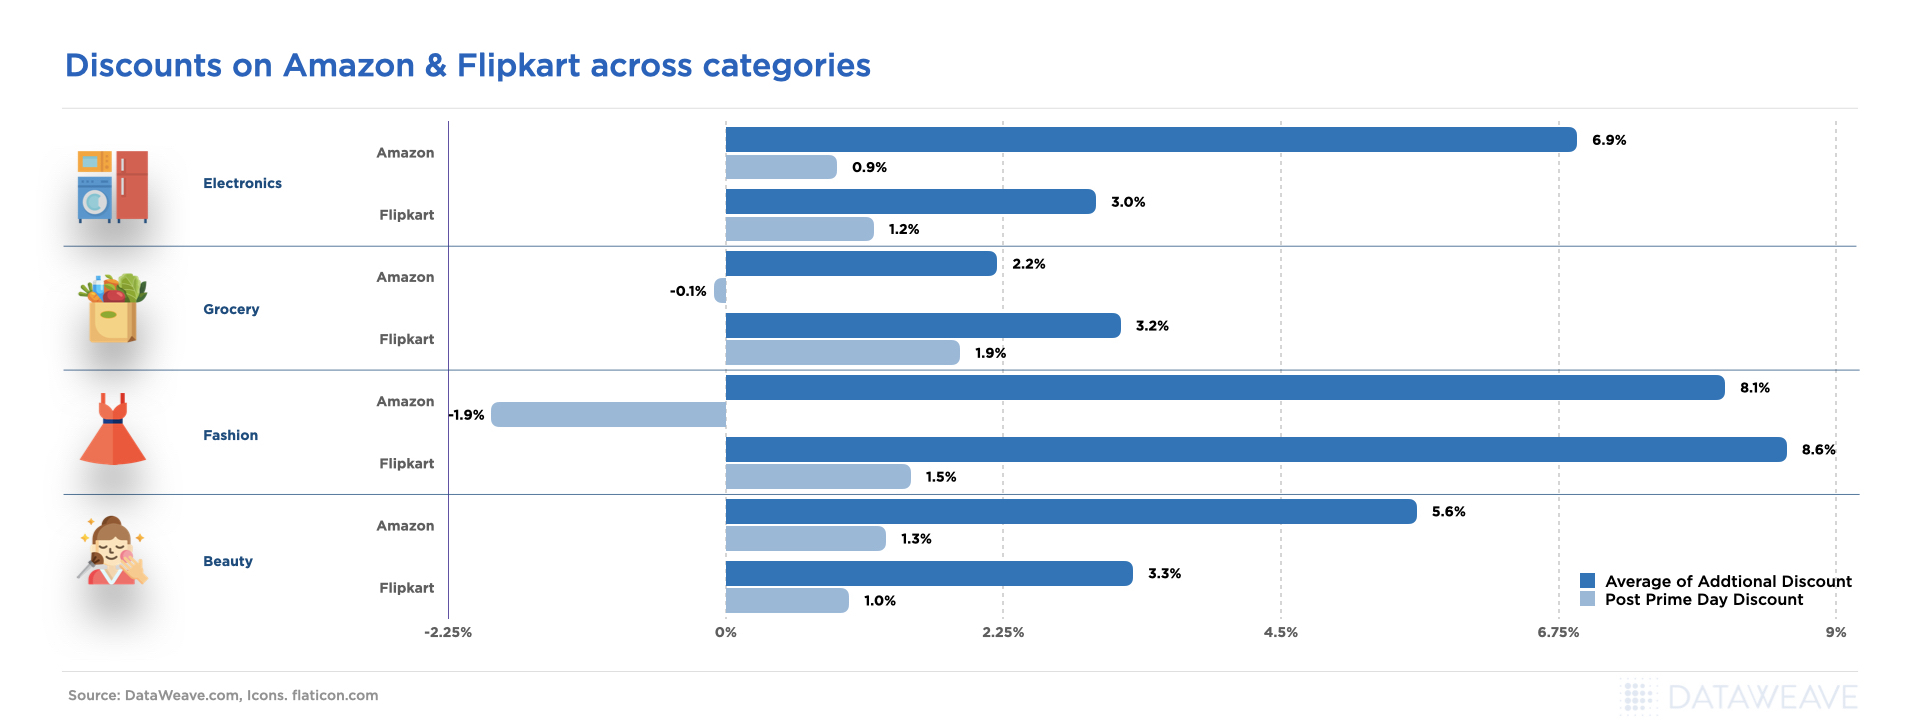
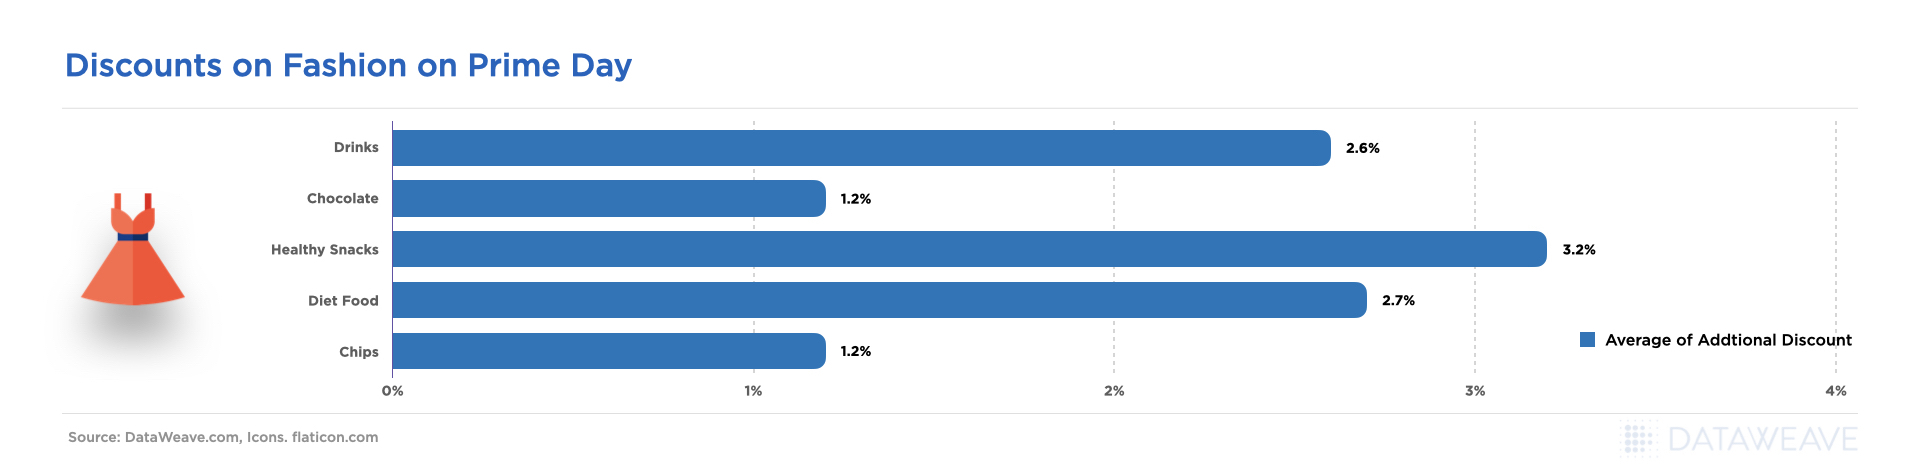
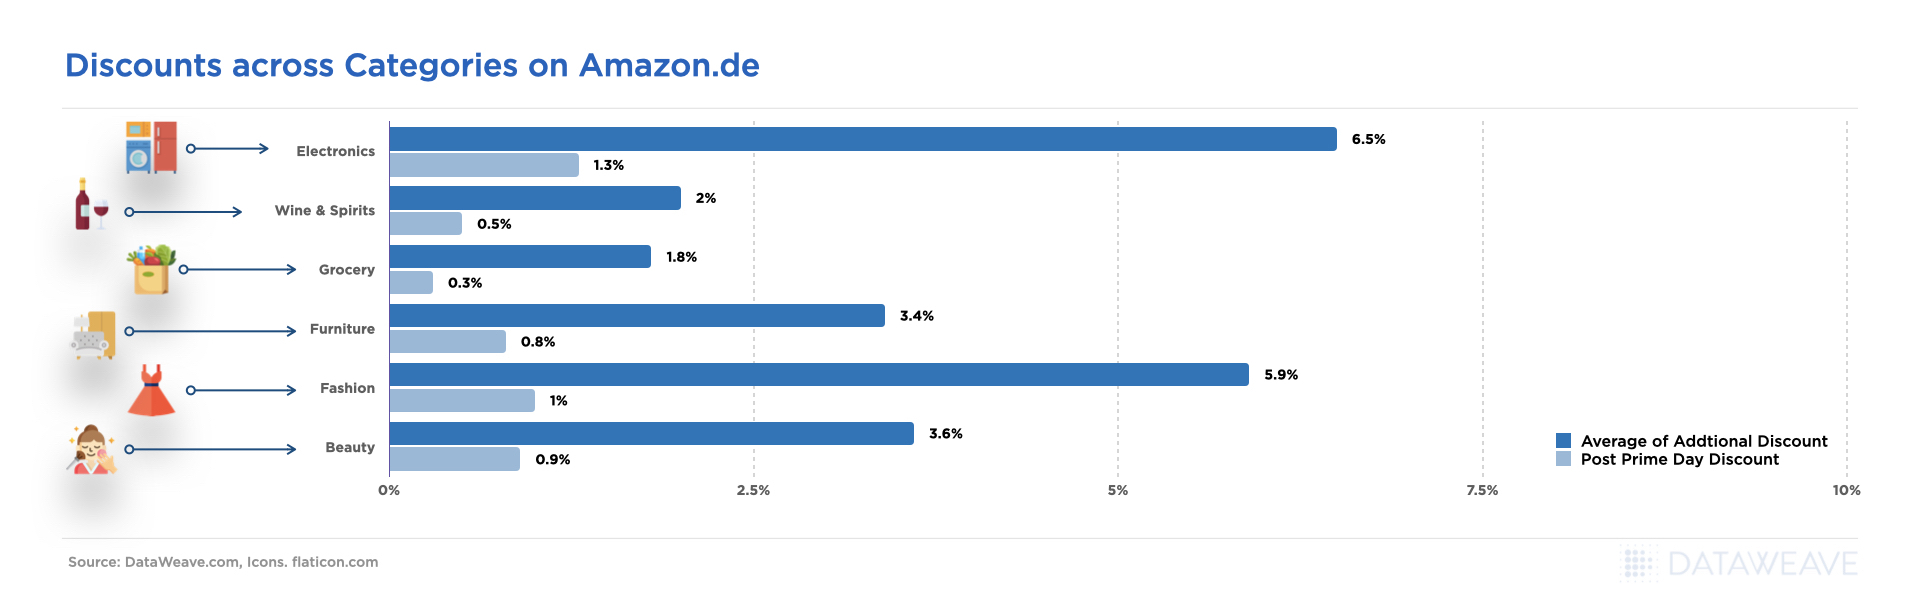
Discounts Analysis
Several discount-based insights can be studied on e-commerce platforms. From location-based trends, retailer-based trends, and manufacturer-based insights. These insights can help companies make the most of the revenue opportunity while creating an attractive value proposition for the retail consumer.
By Category
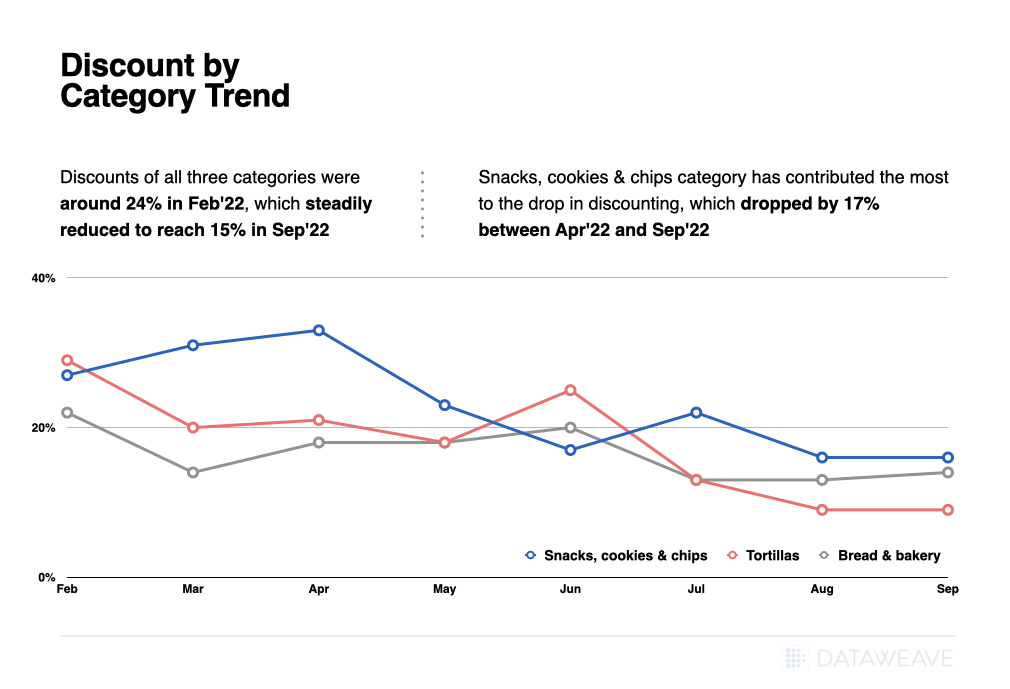
- Discounts of all three categories were around 24% in Feb’ 22, which steadily reduced to reach 15% in Sep’ 22
- Snacks, cookies & chips category has contributed the most to the drop in discounting, which dropped by 17% between Apr’ 22 and Sep’ 22
- The Tortilla Category does not have any discount in the month of Jul’ 22
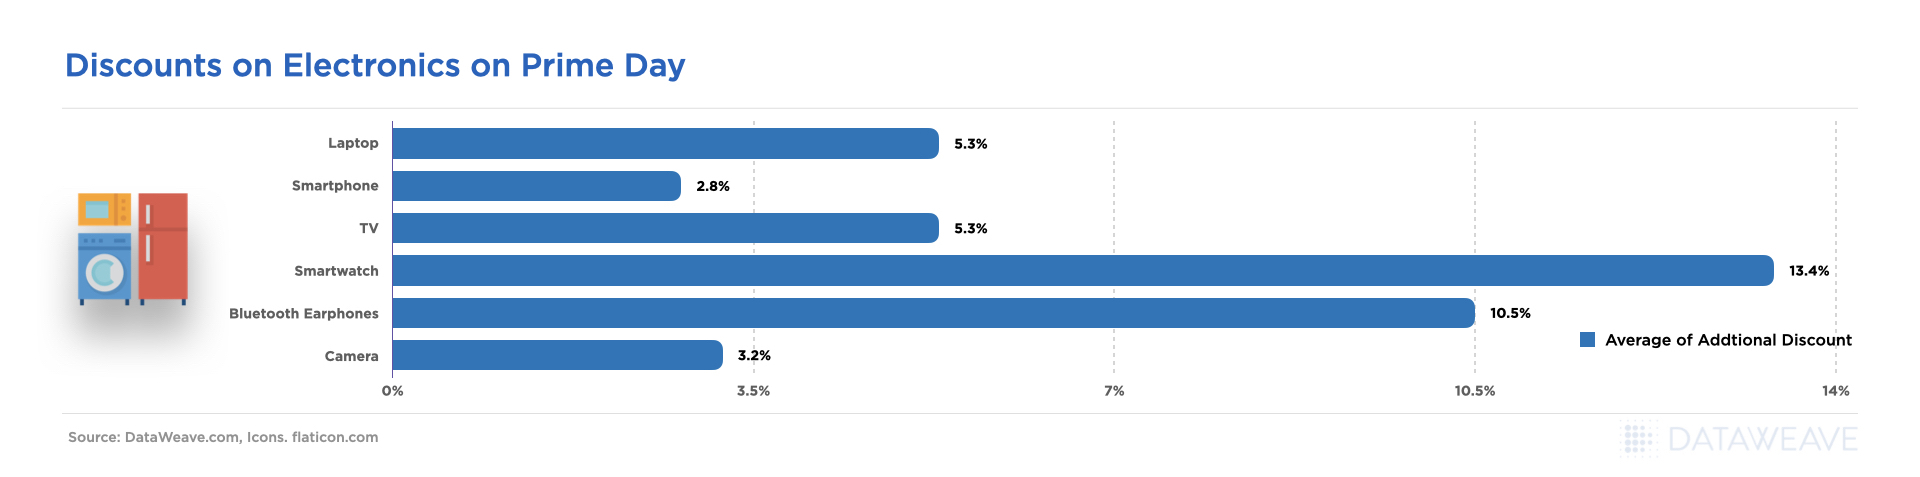
By Retailer
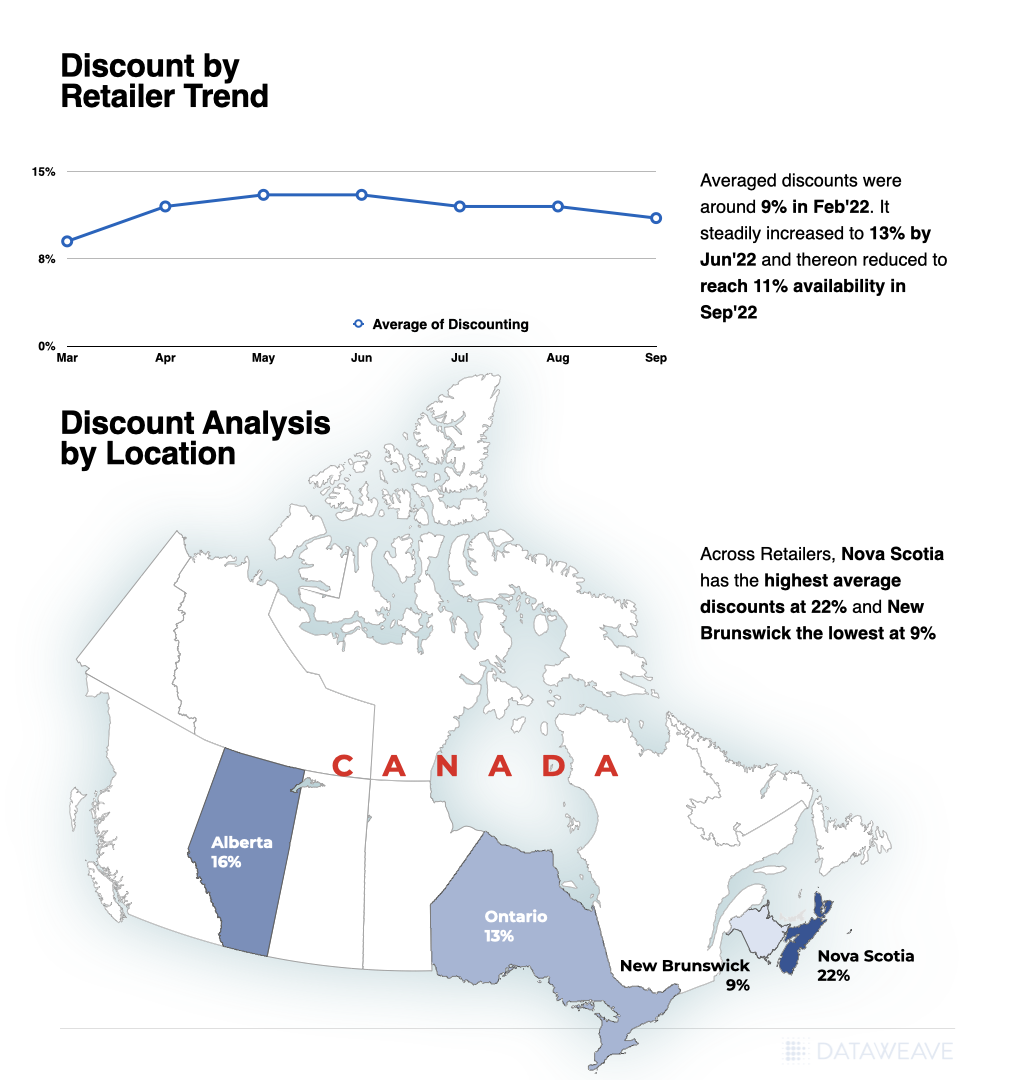
- Discount on Bread & Bakery category in Walmart Grocery was around 9% in Feb’ 22. It steadily increased to 13% by Jun’ 22 and thereon reduced to reach 11% availability in Sep’ 22.
By Location
- Across Retailers, Nova Scotia had the highest availability of discounts at 22%, whereas New Brunswick had the lowest with discounts at 9% in Bread & Bakery category.
Note: Analysis does not cover all locations
Bakery and snack product manufacturers on e-commerce platforms have access to a rich trove of insights they can leverage to benchmark their strategies. They can better understand customer demands, align their supply chain and critically understand the trends impacting their bottom line. Engaging with a third-party platform like DataWeave’s Digital Shelf Analytics can help brands unlock tremendous value.