Retailers heavily depend on pricing intelligence solutions to consistently achieve and uphold their desired competitive pricing positions in the market. The effectiveness of these solutions, however, hinges on the quality of the underlying data, along with the coverage of product matches across websites.
As a retailer, gaining complete confidence in your pricing intelligence system requires a focus on the trinity of data quality:
Accuracy: Accurate product matching ensures that the right set of competitor product(s) are correctly grouped together along with yours. It ensures that decisions taken by pricing managers to drive competitive pricing and the desired price image are based on reliable apples-to-apples product comparisons.
Freshness: Timely data is paramount in navigating the dynamic market landscape. Up-to-date SKU data from competitors enables retailers to promptly adjust pricing strategies in response to market shifts, competitor promotions, or changes in customer demand.
Product matching coverage: Comprehensive product matching coverage ensures that products are thoroughly matched with similar or identical competitor products. This involves accurately matching variations in size, weight, color, and other attributes. A higher coverage ensures that retailers seize all available opportunities for price improvement at any given time, directly impacting revenues and margins.
However, the reality is that untimely data and incomplete product matches have been persistent challenges for pricing teams, compromising their pricing actions. Inaccurate or incomplete data can lead to suboptimal decisions, missed opportunities, and reduced competitiveness in the market.
What’s worse than poor-quality data? Poor-quality data masquerading as accurate data.
In many instances, retailers face a significant challenge in obtaining comprehensive visibility into crucial data quality parameters. If they suspect the data quality of their provider is not up to the mark, they are often compelled to manually request reports from their provider to investigate further. This lack of transparency not only hampers their pricing operations but also impedes the troubleshooting process and decision-making, slowing down crucial aspects of their business.
We’ve heard about this problem from dozens of our retail customers for a while. Now, we’ve solved it.
DataWeave’s Data Statistics and SKU Management Capability Enhances Data Transparency
DataWeave’s Data Statistics Dashboard, offered as part of our Pricing Intelligence solution, enables pricing teams to gain unparalleled visibility into their product matches, SKU data freshness, and accuracy.
It enables retailers to autonomously assess and manage SKU data quality and product matches independently—a crucial aspect of ensuring the best outcomes in the dynamic landscape of eCommerce.
Beyond providing transparency and visibility into data quality and product matches, the dashboard facilitates proactive data quality management. Users can flag incorrect matches and address various data quality issues, ensuring a proactive approach to maintaining the highest standards.
Retailers can benefit in several ways with this dashboard, as listed below.
View Product Match Rates Across Websites
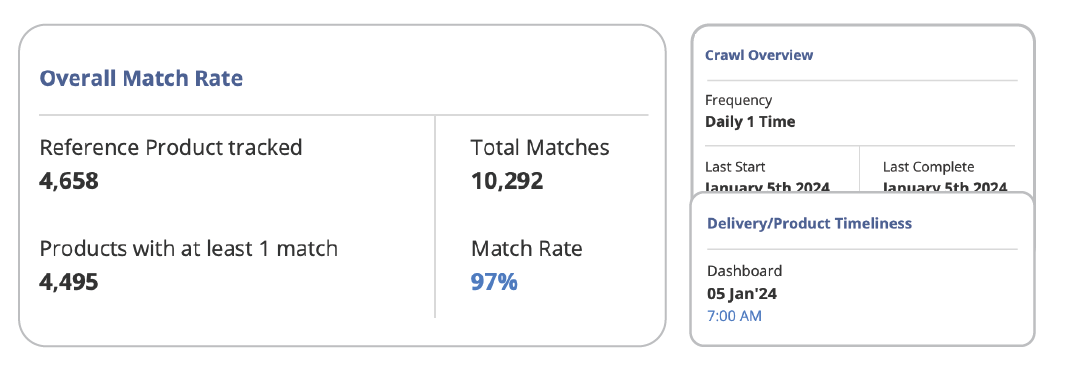
The dashboard helps retailers track match rates to gauge their health. High product match rates signify that pricing teams can move forward in their pricing actions with confidence. Low match rates would be a cause for further investigation, to better understand the underlying challenges, perhaps within a specific category or competitor website.
Our dashboard presents both summary statistics on matches and data crawls as well as detailed snapshots and trend charts, providing users with a holistic and detailed perspective of their product matches.
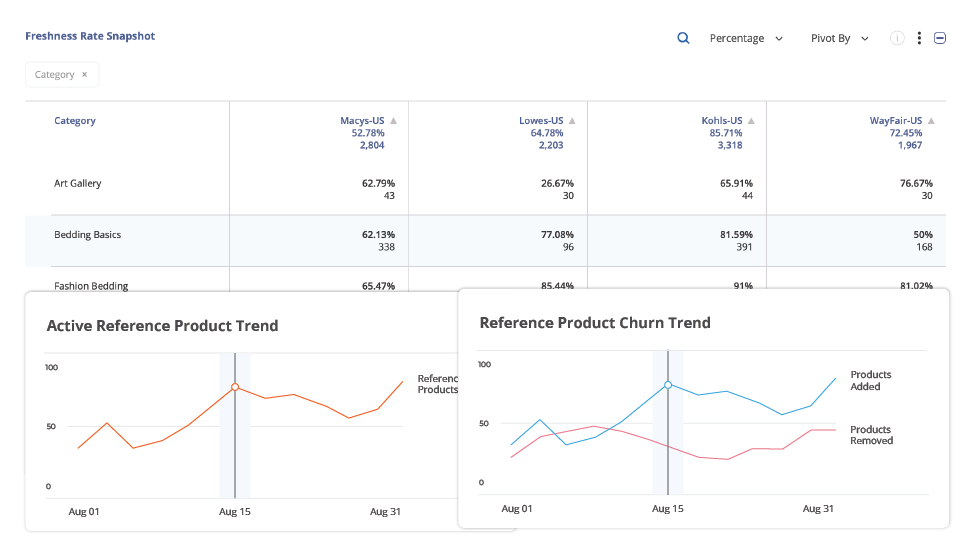
Additionally, the dashboard provides category-wise snapshots of reference products and their matching counterparts across various retailers, allowing users to focus on areas with lower match rates, investigate underlying reasons, and develop strategies for speedy resolution.
Track Data Freshness Easily
The dashboard enables pricing teams to monitor the timeliness of pricing data and assess its recency. In the dynamic realm of eCommerce, having up-to-date data is essential for making impactful pricing decisions. The dashboard’s presentation of freshness rates ensures that pricing teams are armed with the latest product details and pricing information across competitors.
Within the dashboard, users can readily observe the count of products updated with the most recent pricing data. This feature provides insights into any temporary data capture failures that may have led to a decrease in data freshness. Armed with this information, users can adapt their pricing decisions accordingly, taking into consideration these temporary gaps in fresh data. This proactive approach ensures that pricing strategies remain agile and responsive to fluctuations in data quality.
Proactively Manage Product Matches
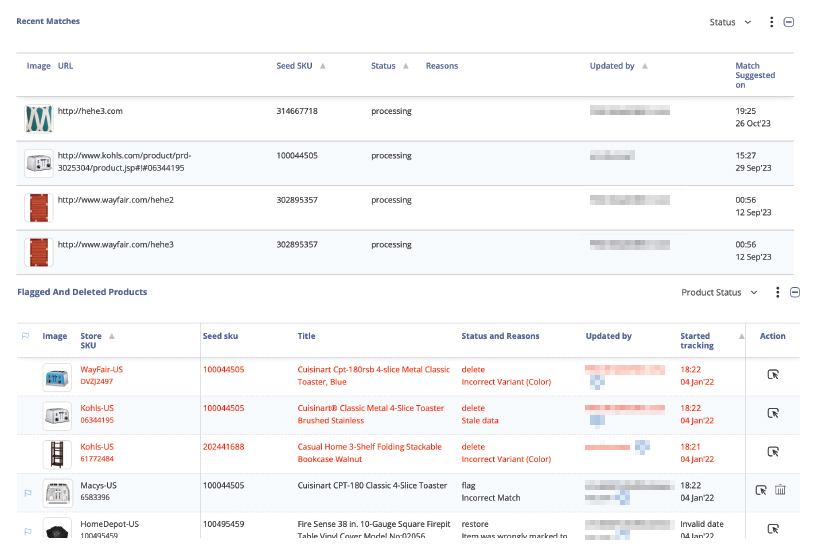
The dashboard provides users with proactive control over managing product matches within their current bundles via the ‘Data Management’ panel. This functionality empowers users to verify, add, flag, or delete product matches, offering a hands-on approach to refining the matching process. Despite the deployment of robust matching algorithms that achieve industry-leading match rates, occasional instances may arise where specific matches are overlooked or misclassified. In such cases, users play a pivotal role in fine-tuning the matching process to ensure accuracy.
The interface’s flexibility extends to accommodating product variants and enables users to manage product matches based on store location. Additionally, the platform facilitates bulk match uploads, streamlining the process for users to efficiently handle large volumes of matching data. This versatility ensures that users have the tools they need to navigate and customize the matching process according to the nuances of their specific product landscape.
Gain Unparalleled Visibility into your Data Quality
With DataWeave’s Pricing Intelligence, users gain the capability to delve deep into their product data, scrutinize match rates, assess data freshness, and independently manage their product matches. This approach is instrumental in fostering informed and effective decisions, optimizing inventory management, and securing a competitive edge in the dynamic world of online retail.
Consumer brands around the world increasingly recognize the vital role of tracking and optimizing their digital shelf KPIs, such as Content Quality, Share of Search, Availability, etc. These metrics play a crucial role in boosting eCommerce sales and securing a larger online market share. With the escalating requirements of brands, the sophistication of top Digital Shelf Analytics providers is also on the rise. Consequently, the adoption of digital shelf solutions has become an essential prerequisite for today’s leading brands.
As brands and vendors continue to delve further and deeper into the world of Digital Shelf Analytics, a significant and often overlooked aspect is the analysis of digital shelf data on mobile apps. The ability of solution providers to effectively track and analyze this mobile-specific data is crucial.
Why is this emphasis on mobile apps important?
Today, the battle for consumer attention unfolds not only on desktop web platforms but also within the palm of our hands – on mobile devices. As highlighted in a recent Insider Intelligence report, customers will buy more on mobile, exceeding 4 in 10 retail eCommerce dollars for the first time.
Moreover, thanks to the growth of delivery intermediaries like Instacart, DoorDash, Uber Eats, etc., shopping on mobile apps has received a tremendous organic boost. According to an eMarketer report, US grocery delivery intermediary sales are expected to reach $68.2 billion in 2025, from only $8.8 billion in 2019.
In essence, mobile is increasingly gaining share as the form factor of choice for consumers, especially in CPG. In fact, one of our customers, a leading multinational CPG company, revealed to us that it sees up to 70% of its online sales come through mobile apps. That’s a staggering number!
The surge in app usage reflects a fundamental change in consumer behavior, emphasizing the need for brands to adapt their digital shelf strategies accordingly.
Why Brands Need To Look at Apps and Desktop Data Differently
Conventionally, brands that leverage digital shelf analytics rely on data harnessed from desktop sites of online marketplaces. This is because capturing data reliably and accurately from mobile apps is inherently complex. Data aggregation systems designed to scrape data from web applications cannot easily be repurposed to capture data on mobile apps. It requires dedicated effort and exceptional tech prowess to pull off in a meaningful and consistent way.
In reality, it is extremely important for brands to track and optimize their mobile digital shelf. Several digital shelf metrics vary significantly between desktop sites and mobile apps. These differences are natural outcomes of differences in user behavior between the two form factors.
One of these metrics that has a huge impact on a brand’s performance on retail mobile apps is their search discoverability. Ecommerce teams are well aware of the adverse impact of the loss of even a few ranks on search results.
Anyone can easily test this. Searching something as simple as “running shoes” on the Amazon website and doing the same on its mobile app shows at least a few differences in product listings among the top 20-25 ranks. There are other variances too, such as the number of sponsored listings at the top, as well as the products being sponsored. These variations often result in significant differences in a brand’s Share of Search between desktop and mobile.
Share of Search is the share of a brand’s products among the top 20 ranked products in a category or subcategory, providing insight into a brand’s visibility on online marketplaces.
Picture a scenario in which a brand heavily depends on desktop digital shelf data, confidently assuming it holds a robust Share of Search based on reports from its Digital Shelf Analytics partner. However, unbeknownst to the team, the Share of Search on mobile is notably lower, causing a detrimental effect on sales.
To fully understand the scale of these differences, we decided to run a small experiment using our proprietary data analysis and aggregation platform. We restricted our analysis to just Amazon.com and Amazon’s mobile app. However, we did cover over 13,000 SKUs across several shopping categories to ensure the sample size is strong.
Below, we provide details of our key findings.
Share of Search on The Digital Shelf – App Versus Desktop
Our analysis focused on three popular consumer categories – Electronics, CPG, and Health & Beauty.
In the electronics category, brands like Apple, Motorola, and Samsung, known for their mobile phones, earbuds, headphones, and more, have a higher Share of Search on the Amazon mobile app compared to the desktop.
Meanwhile, Laptop brands like Dell, Acer, and Lenovo, as well as other leading brands like Google have a higher Share of Search on the desktop site compared to the app. This is the scenario that brands need to be careful about. When their Share of Search on mobile apps is lower, they might miss the chance to take corrective measures since they lack the necessary data from their provider.
In the CPG category, Ramen brand Samyang, with a lot of popularity on Tiktok and Instagram, shows a higher Share of Search on Amazon’s mobile app. Speciality brands like 365 By Whole Foods, pasta and Italian food brands La Moderna, Divinia, and Bauducco too have a significantly higher Share of Search on the app.
Cheese and dessert brands like Happy Belly, Atlanta Cheesecake Company, among others, have a lower Share of Search on the mobile app. Ramen brand Sapporo is also more easily discovered on Amazon’s desktop site. Here, we see a difference of more than 5% in the Share of Search of some brands, which is likely to have a huge impact on the brand’s mobile eCommerce sales levels and overall performance.
Lastly, in the Health & Beauty category, Shampoos and hair care brands like Olaplex, Dove, and Tresemme exhibited a higher Share of Search on the mobile app compared to the desktop.
On the other hand, body care brands like Neutrogena and Hawaiian Tropic, as well as Beardcare brand Viking Revolution displayed a higher Share of Search on Amazon’s desktop site.
Based on our data, it is clear that there are several examples of brands that do better in either one of Amazon’s desktop sites or mobile apps. In many cases, the difference is stark.
So What Must Brands Do?
Our findings emphasize the imperative for brands to move beyond a one-size-fits-all approach to digital shelf analytics. The striking variations in Share of Search between mobile apps and desktops conclusively demonstrate that relying solely on desktop data for digital shelf optimization is inadequate.
If brands see that they’re falling behind on the mobile digital shelf, there are a few things they can do to help boost their performance:
If a brand’s Share of Search is lower on the mobile app, they can divert their retail spend to mobile in order to inorganically compensate for this difference. This way, any short-term impact due to lower discoverability is mitigated. This is also likely to result in optimized budget allocation and ROAS.
Brands also need to ensure their content is optimized for the mobile form factor, with images that are easy to view on smaller screens, and tailored product titles that are shorter than on desktops, highlighting the most important product attributes from the consumer’s perspective. Not only will this help brands gain more clicks from mobile shoppers, but this will also gradually lead to a boost in their organic Share of Search on mobile.
CPG brands, specifically, need to optimize their digital shelf for delivery intermediary apps (along with marketplaces). The grocery delivery ecosystem is booming with companies like DoorDash, Delivery Hero, Uber Eats, Swiggy, etc. leading the way. Using Digital Shelf Analytics to optimize performance on delivery apps is quite an involved process with a lot of bells and whistles to consider. Read our recently published whitepaper that specifically details how brands can successfully boost their visibility and conversions on delivery apps.
But first, brands need to identify and work with a Digital Shelf Analytics partner that is able to capture and analyze mobile app data, enabling tailored optimization approaches for all eCommerce platforms.
DataWeave leads the way here, providing the world’s most comprehensive and sophisticated digital shelf analytics solution, rising above all other providers to provide digital shelf insights for both web applications and mobile apps. Our data aggregation platform successfully navigates the intricacies of capturing public data accurately and reliably from mobile apps, thereby delivering a comprehensive cross-device view of digital shelf KPIs to our brand customers.
So reach out to us today to find out more about our digital shelf solutions for mobile apps!
With thousands of products and hundreds of online retailers to choose from, the average modern-day shopper usually compares prices across several e-commerce sites effortlessly before often settling for the lowest priced option. As a result, retailers today are forced to execute millions of price changes per day in a never-ending race to be the lowest priced – without losing out on any potential margin.
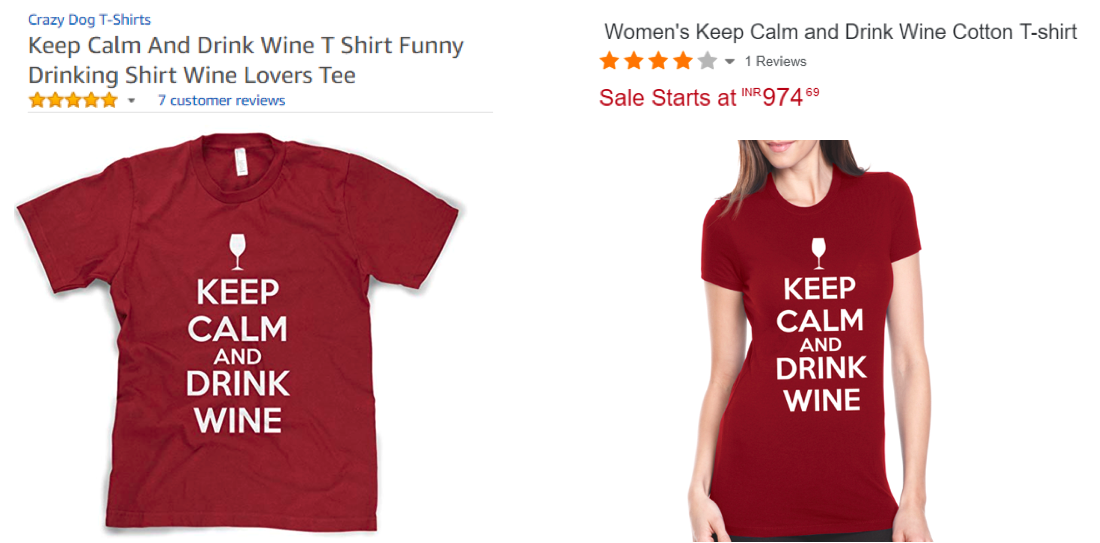
Identifying, classifying, and matching products is the first step to comparing prices across websites. However, there is no standardization in the way products are represented across e-commerce websites, causing this process to be fairly complex.
Here’s an example:
What’s needed is a pricing intelligence solution that first matches products across several websites swiftly and accurately, and then enables automated tracking of competitor pricing data on an ongoing basis.
Pricing intelligence solutions already exist. What’s wrong with using them?
There are several challenges with the incumbent solutions in the market – the biggest one being that they don’t work in a timely manner. In essence, it’s like deferring the process of finding actionable information that helps retailers acquire a competitive advantage, and instead doing it in hindsight. Like an autopsy of sorts.
Here are the various solution types we have in the market today:
Internally developed systems – Solutions developed by retailers themselves often rely on heavy manual data aggregation and have poor product matching capabilities. Since these solutions have been developed by professionals not attuned to building data crunching machines, they pose significant operational challenges in the form of maintenance, updates, etc.
Web scraping solutions – These solutions have no data normalization or product matching capabilities, and lack the power to deliver relevant actionable insights. What’s more, it’s a struggle to scale them up to accommodate massive volumes of data during peak times such as promotional campaigns.
DIY solutions – These solutions require manual research and entry of data. It goes without saying that due to the level of human intervention and effort required, they’re expensive, difficult to scale, slow, and of questionable accuracy.
As common as it is nowadays, AI has the answer
DataWeave’s competitive pricing intelligence solution is designed to help retailers achieve precisely the competitive advantage they need by providing them with accurate, timely, and actionable pricing insights enabled by matching products at scale. We provide retailers with access to detailed pricing information on millions of products across competitors, as frequently as they need it.
Our technology stack broadly consists of the following.
1. Data Aggregation
At DataWeave, we can aggregate data from diverse web sources across complex web environments – consistently and at a very high accuracy. Having been in the industry for close to a decade, we’re sitting on a lot of data that we can use to train our product matching platform.
Our datasets include data points from tens of millions of products and have been collected from numerous geographies and verticals in retail. The datasets contain hierarchically arranged information based on retail taxonomy. At the root level, there’s information such as category and subcategory, and at the top level, we have product details such as title, description, and other <attribute, value> relationships. Our machine learning architectures and semi-automated training data building systems, augmented by the skills of a strong QA team, help us annotate the necessary information and create labeled datasets using proprietary tools.
2. AI for Product Matching
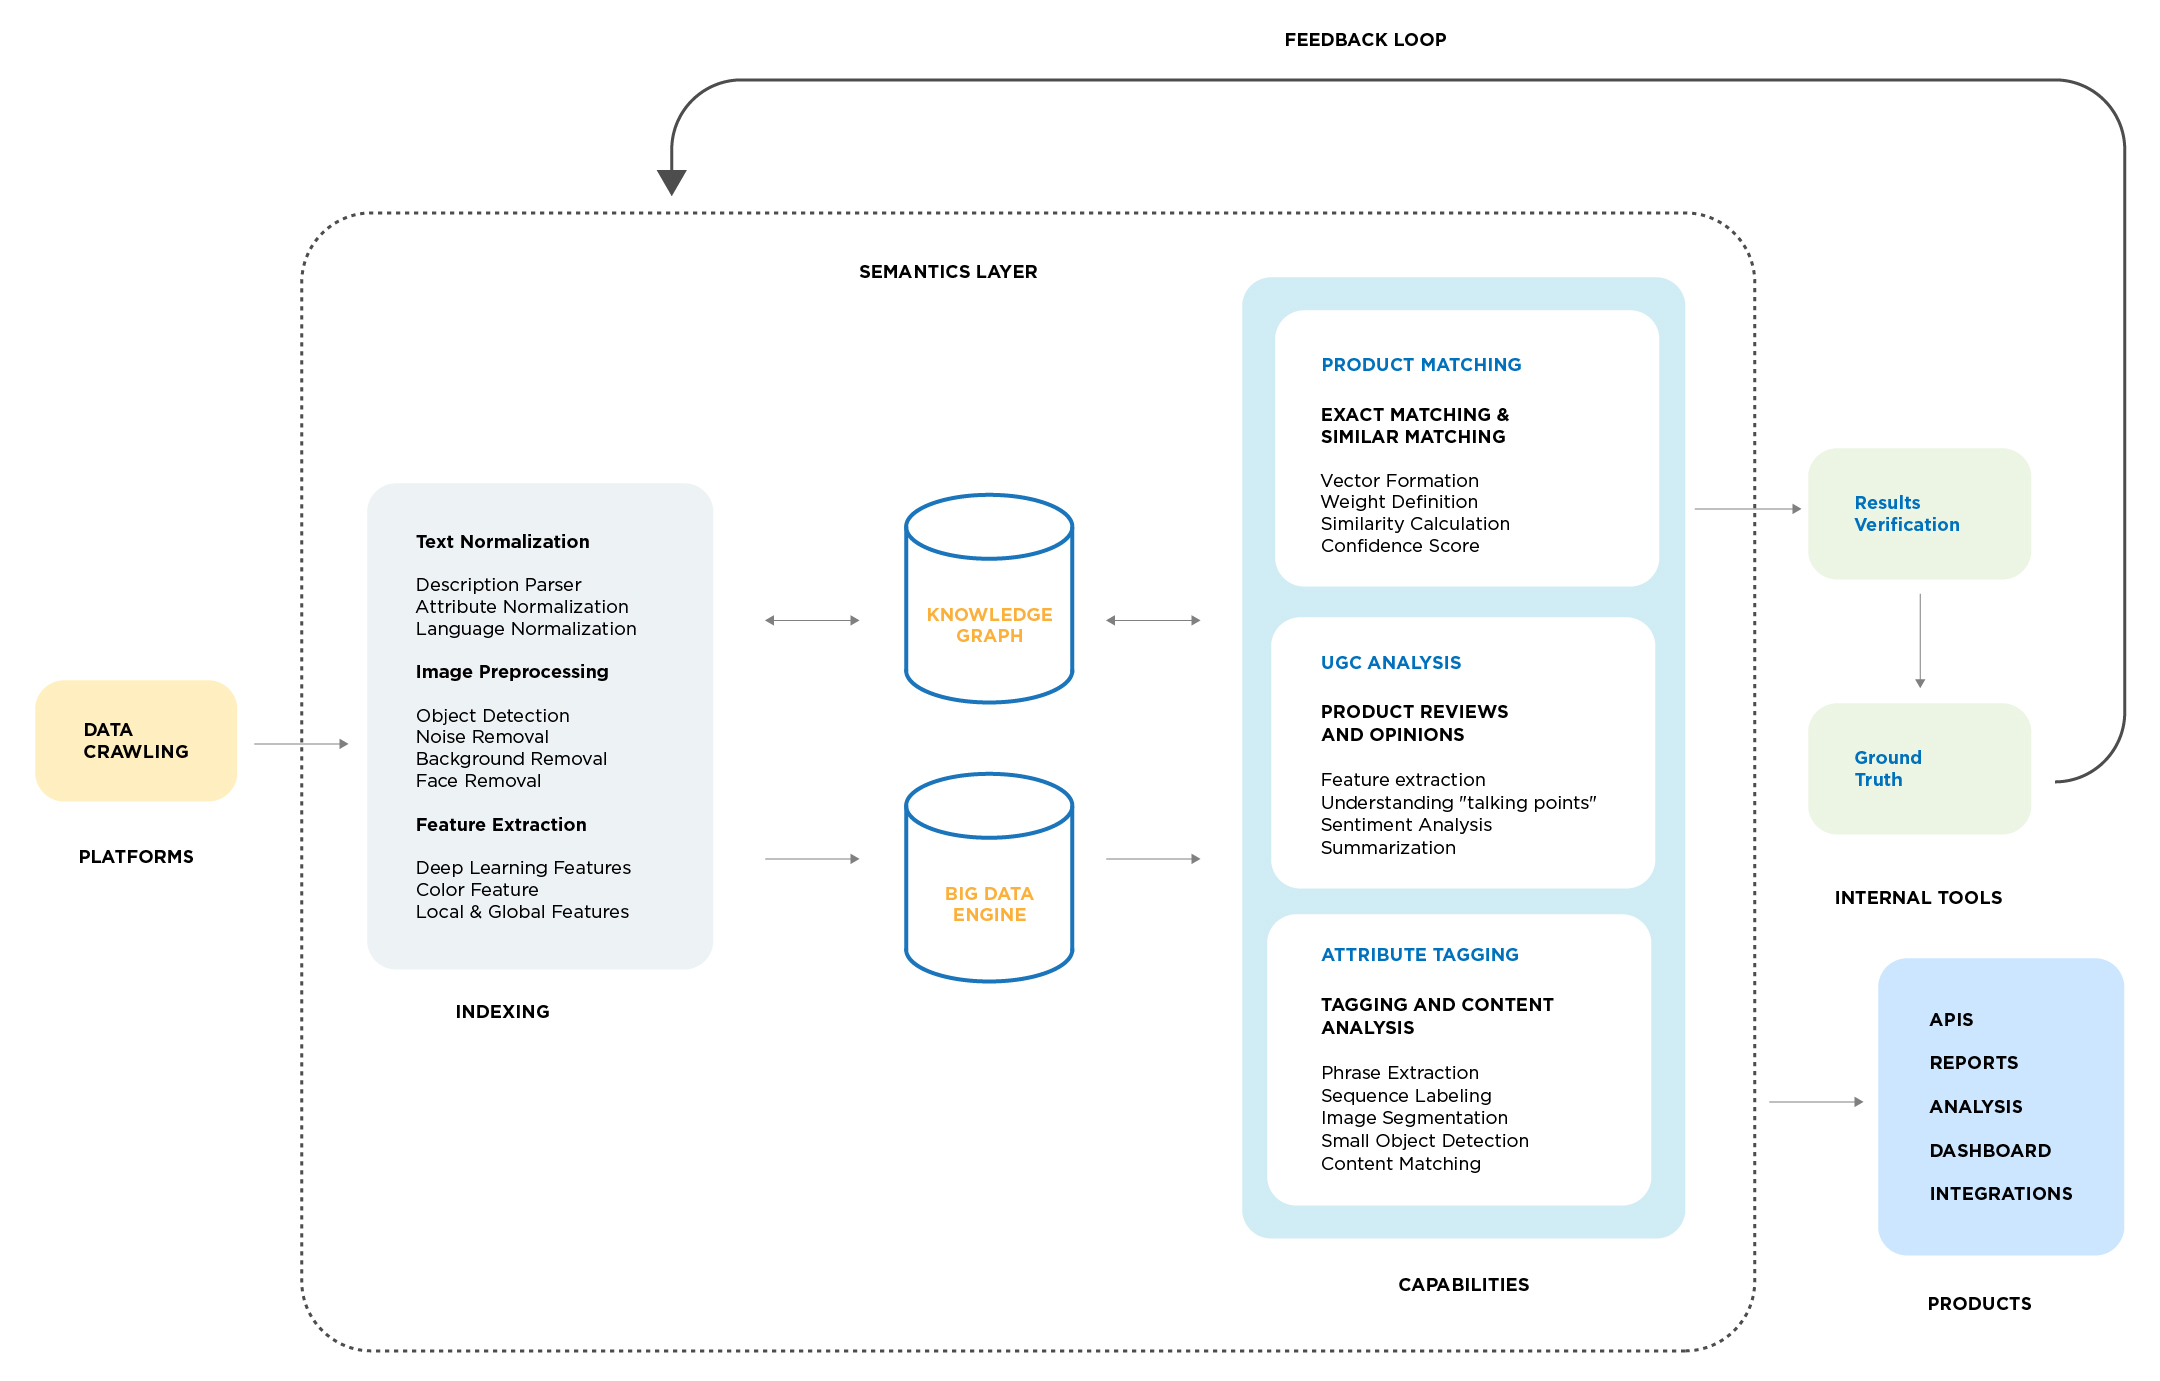
Product matching at DataWeave is done via a unified platform that uses both text and image recognition capabilities to accurately identify similar SKUs across thousands of e-commerce stores and millions of products. We use an ensemble deep learning architectures tailored to NLP and Computer Vision problems specific to us and heuristics pertinent to the Retail domain. Products are also classified based on their features, and a normalization layer is designed based on various text/image-based attributes.
Our semantics layer, while technically an integral part of the product matching process, deserves particular mention due to its powerful capabilities.
The text data processing consists of internal, deep pre-trained word embeddings. We use state-of-the-art, customized word representation techniques such as ELMO, BERT, and Transformer to capture deeply contextualized text with improved accuracy. A self-attention/intra-attention mechanism learns the correlation between the word in question and a previous part of the description.
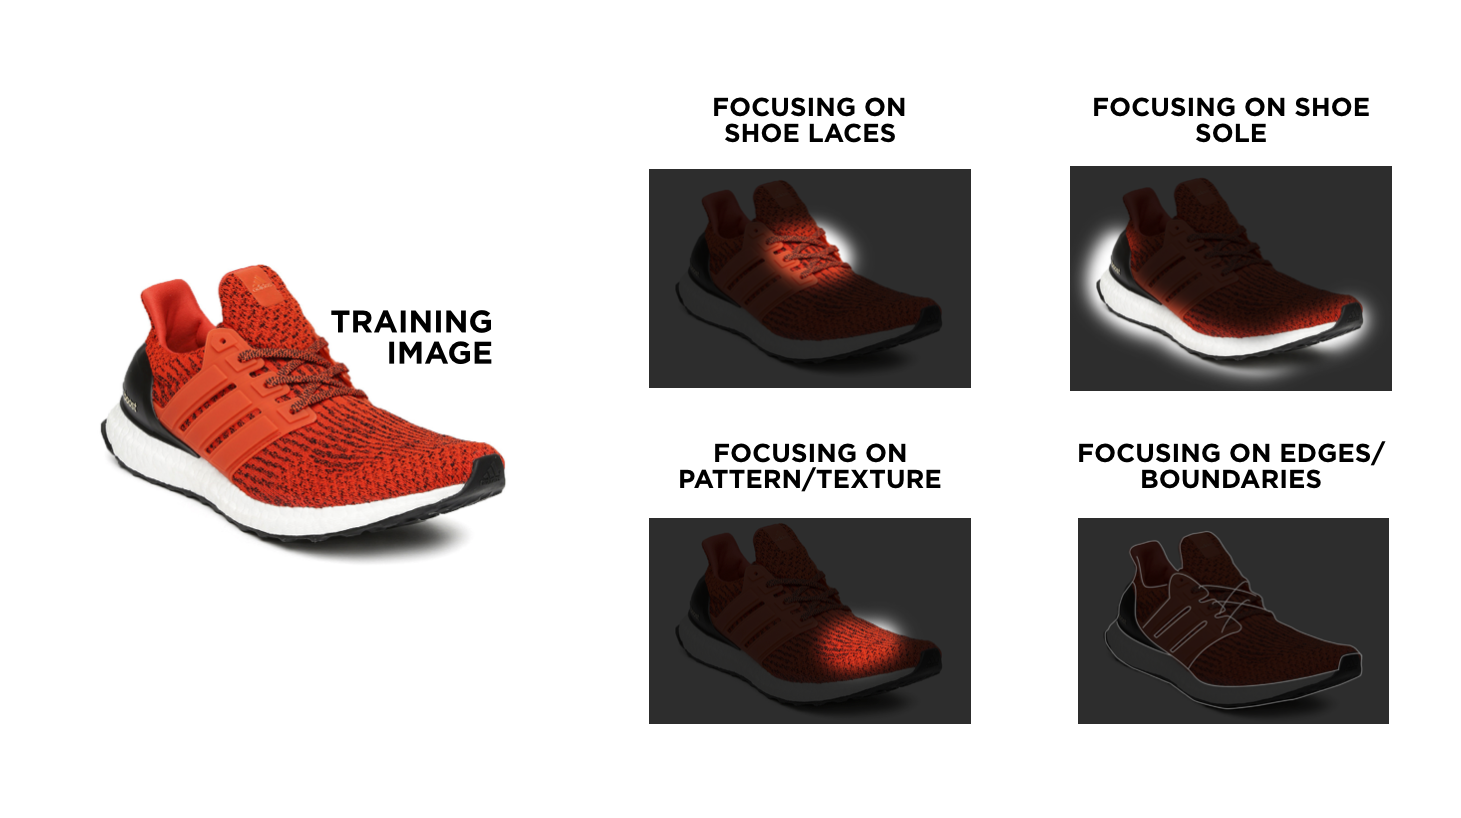
Image data processing starts with object detection to identify the region of interest of a given product (for example, the upper body of a fashion model displaying a shirt). We then leverage deep learning architectures such as VggNet, Inception-V3, and ResNet, which we have trained using millions of labeled images. Next, we apply multiple pre-processing techniques such as variable background removal, face removal, skin removal, and image quality enhancing and extract image signatures via deep learning and machine learning-based algorithms to uniquely identify products across billions of indexed products.
Finally, we efficiently distribute billions of images across multiple stores for fast access, and to facilitate searches at a massive scale (in a matter of milliseconds, without the slightest compromise on accuracy) using our image matching engine.
3. Human Intelligence in the Loop
In scenarios where the confidence scores of the machine-driven matches are low, we have a team of Quality Assurance (QA) specialists who verify the output.
This team does three things:
Find out why the confidence score is low
Confirm the right product matches
Figure out a way to encode this knowledge into a rule and feed it back to the algorithm
In this way, we’ve built a self-improving feedback loop which, by its very nature, performs better over time. This system has accumulated knowledge over the 8 years of our operations, which is going to be hard for anyone to replicate. Essentially, this process enables us to match products at massive scale quickly and at very high levels of accuracy (usually over 95%).
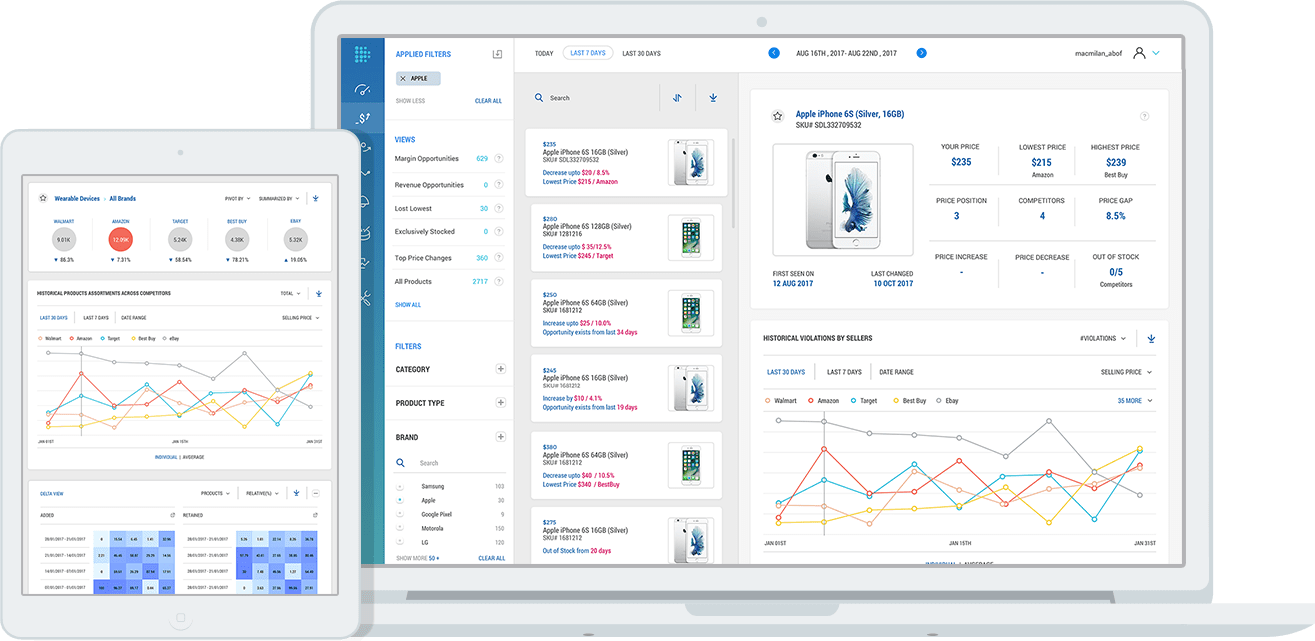
4. Actionable Insights Via Data Visualization
Once the matching process is completed, the prices are aggregated at any frequency, enabling retailers to optimize their prices on an ongoing basis. Pricing insights are typically consumed via our SaaS-based web-portal, which consists of dashboards, reports, and visualizations.
Alternatively, we can integrate with internal analytics platforms through APIs or generate and deliver spreadsheet reports on a regular basis, depending on the preferences of our customers.
To summarize
The benefits of our solution are many. Detailed price improvement opportunity-related insights generated in a timely manner empower retailers to significantly enhance their competitive positioning across categories, product types, and brands, as well as ability to influence their price perception among consumers. These insights, when leveraged at a higher granularity over the long term, can help maximize revenue through price optimization at a large scale.
Our solution also helps drive process-based as well as operational optimizations for retailers. Such modifications help them better align themselves to effectively adopt a data-driven approach to pricing, in turn helping them achieve much smarter retail operations across the board.
All of this wouldn’t be possible if the product matching process, inherent to this system, was unreliable, expensive, or time-consuming.
If you would like to learn more about DataWeave’s proprietary product matching platform and the benefits it offers to eCommerce businesses and brands, talk to us now!
India’s homegrown eCommerce giant Flipkart, now backed by Walmart, reported a record 1.4 Billion customer visits during the early access phase and throughout the seven days of its premier shopping event, the Big Billion Days, launched on 8th October 2023. Competing with Flipkart, Amazon’s Great Indian Festival sale event started on October 8th as well and saw a whopping 95 Million customer visits to the website within the first 48 hours of the event.
For consumers, the most pressing question was, “Who offered more attractive deals and lower prices during these sale events?”
To answer this question, we leveraged our proprietary data aggregation and analysis platform and analyzed the prices and discounts on Amazon and Flipkart across key product categories..
The details of our sample are mentioned below:
Number of SKUs Analyzed: 30,000+
Websites: Amazon.com and Flipkart.com
Categories: Apparel, Home & Furniture, Electronics, Health & Beauty
Dates: 7th Oct 2023 to 22nd Oct 2023
Key Findings
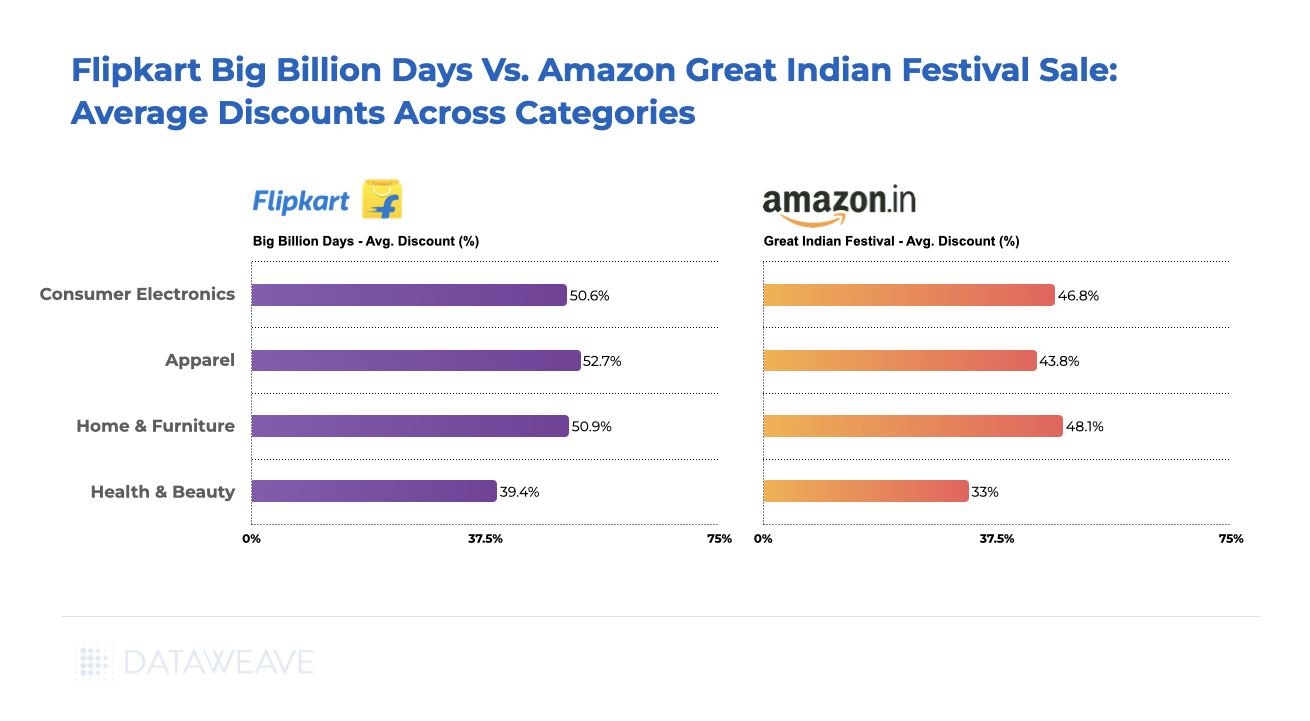
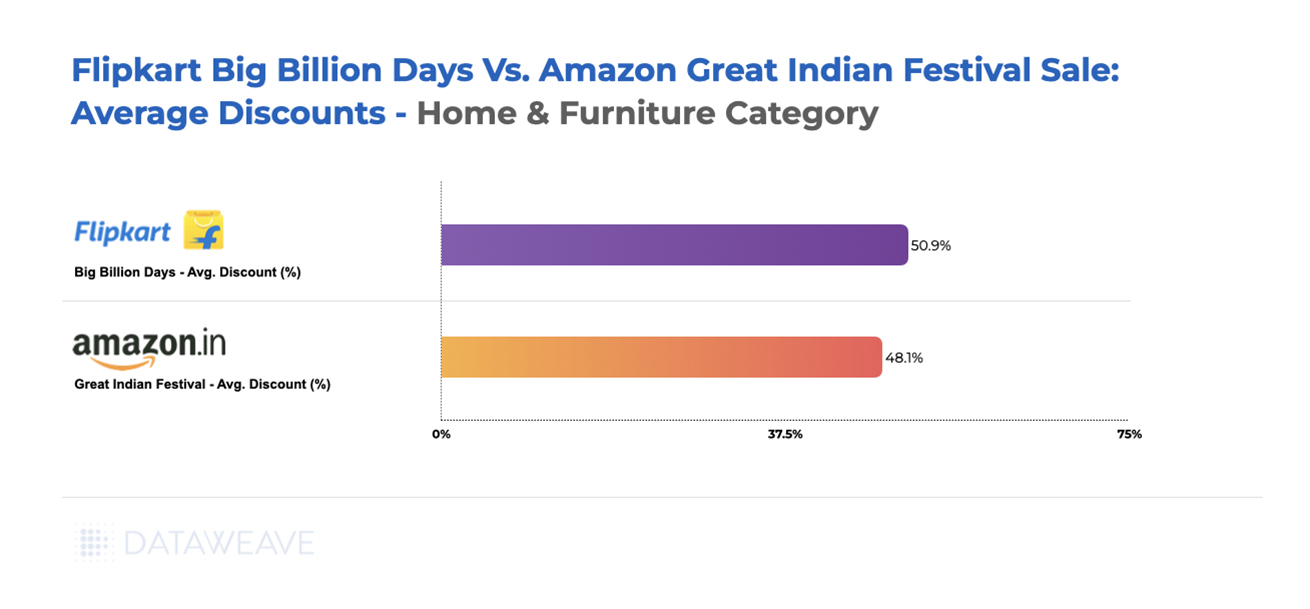
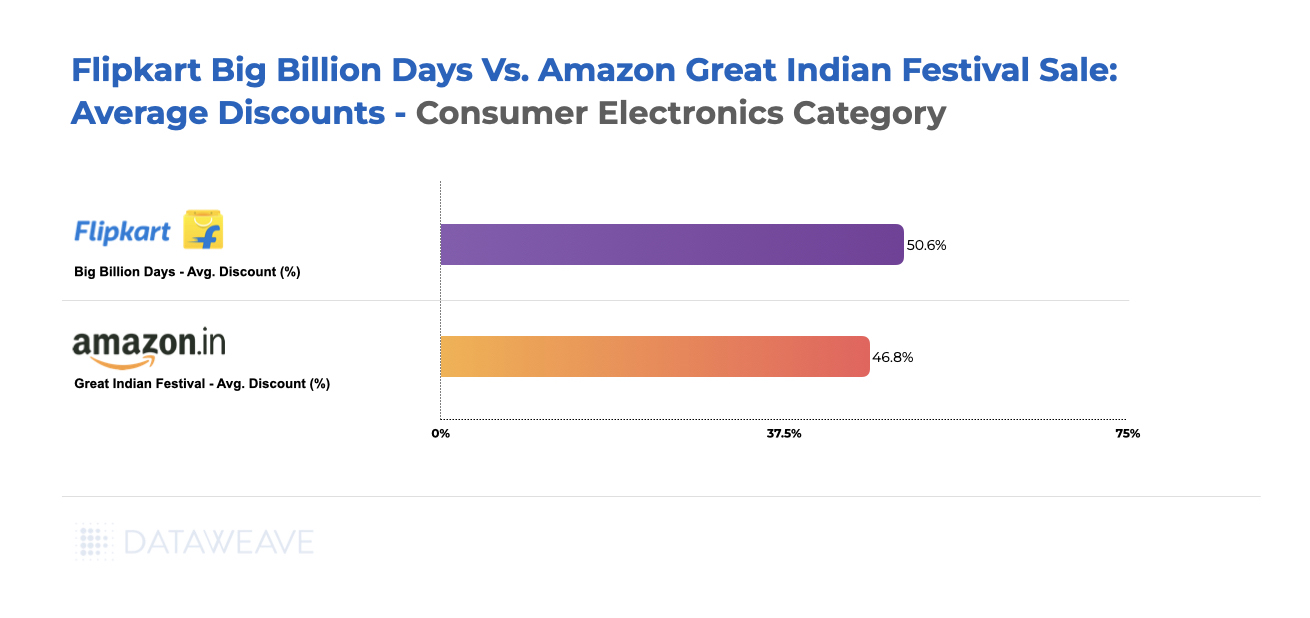
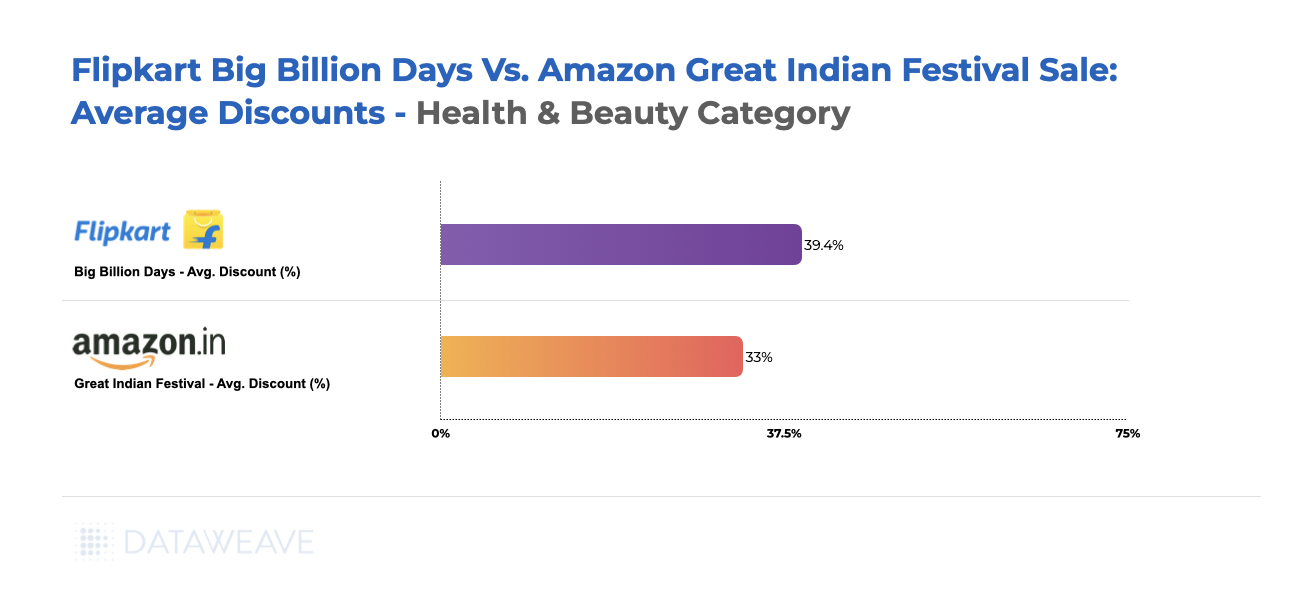
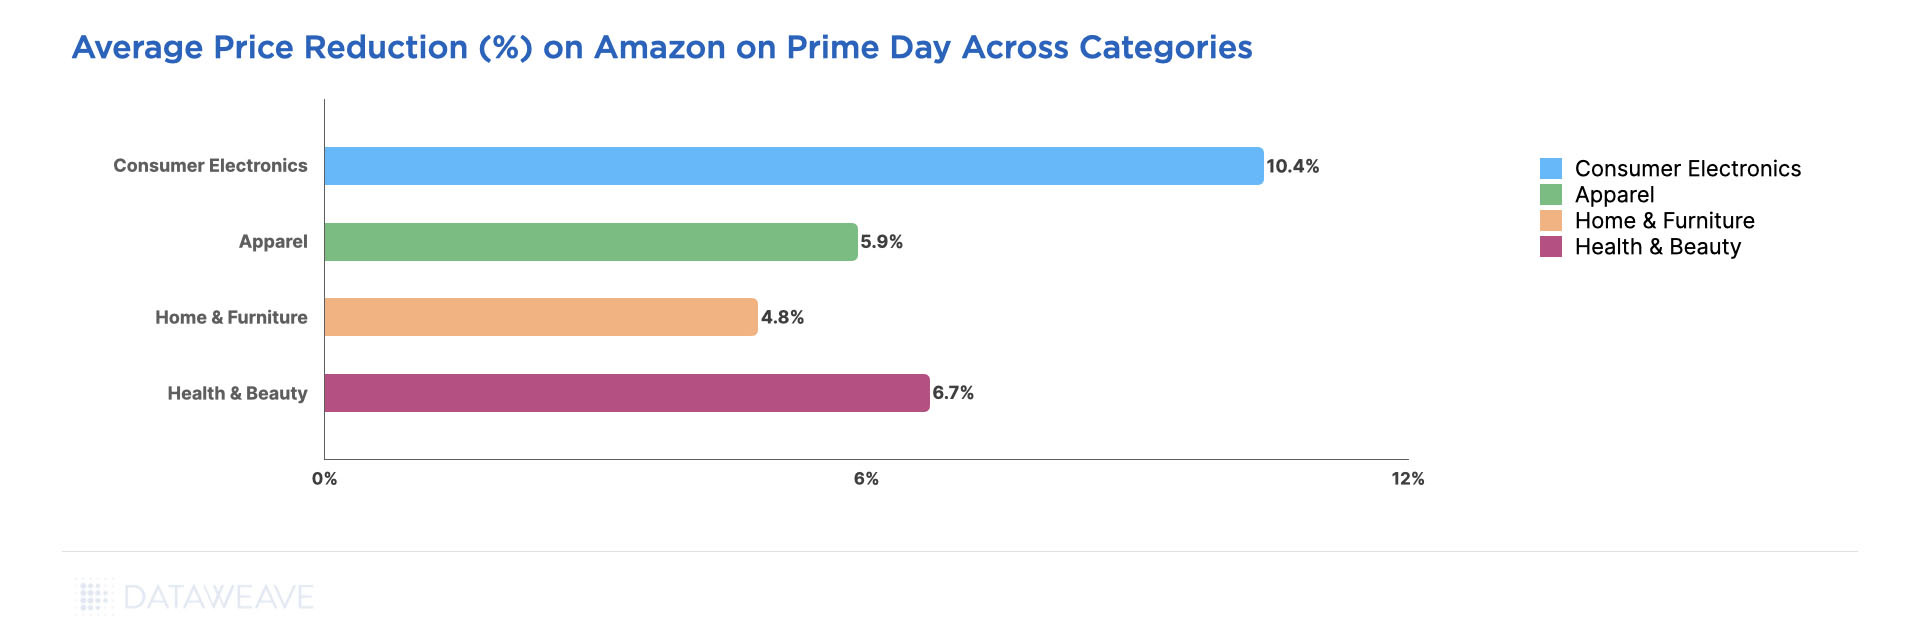
Based on our analysis, the Big Billion Days by Flipkart showcased relatively higher price reductions across categories compared to the Great Indian Festival sale by Amazon. The Apparel category on Flipkart saw the highest average discount at 50.6%. The Health & Beauty category had the lowest discount across Flipkart at 39.4% and Amazon at 33%.
Overall, Flipkart offered higher discounts in each product category. It is clear that the retailer invested heavily in leveraging its supplier partnerships with key brands or sellers to enable them to offer higher discounts, thereby attracting more customers.
Next, let’s take a closer look at each product category.
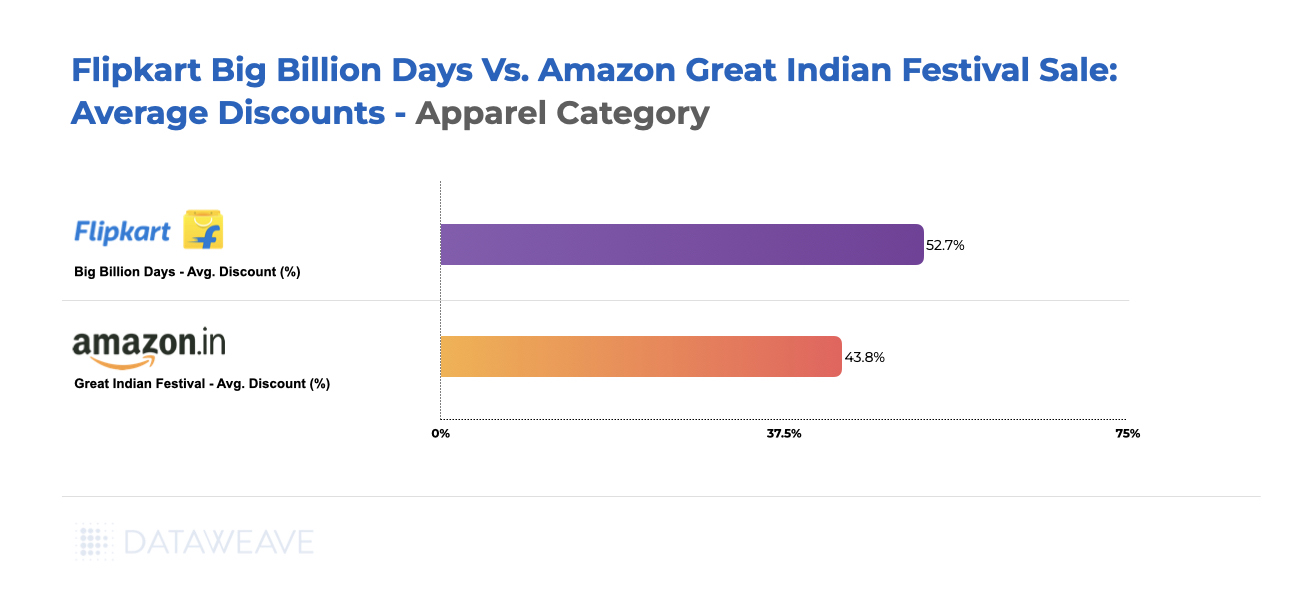
Apparel
While a majority of retailers expected demand for apparel and clothing to dip this festive season in India, eCommerce giants like Amazon and Flipkart are likely to recognize the strong consumer inclination towards apparel during this period.
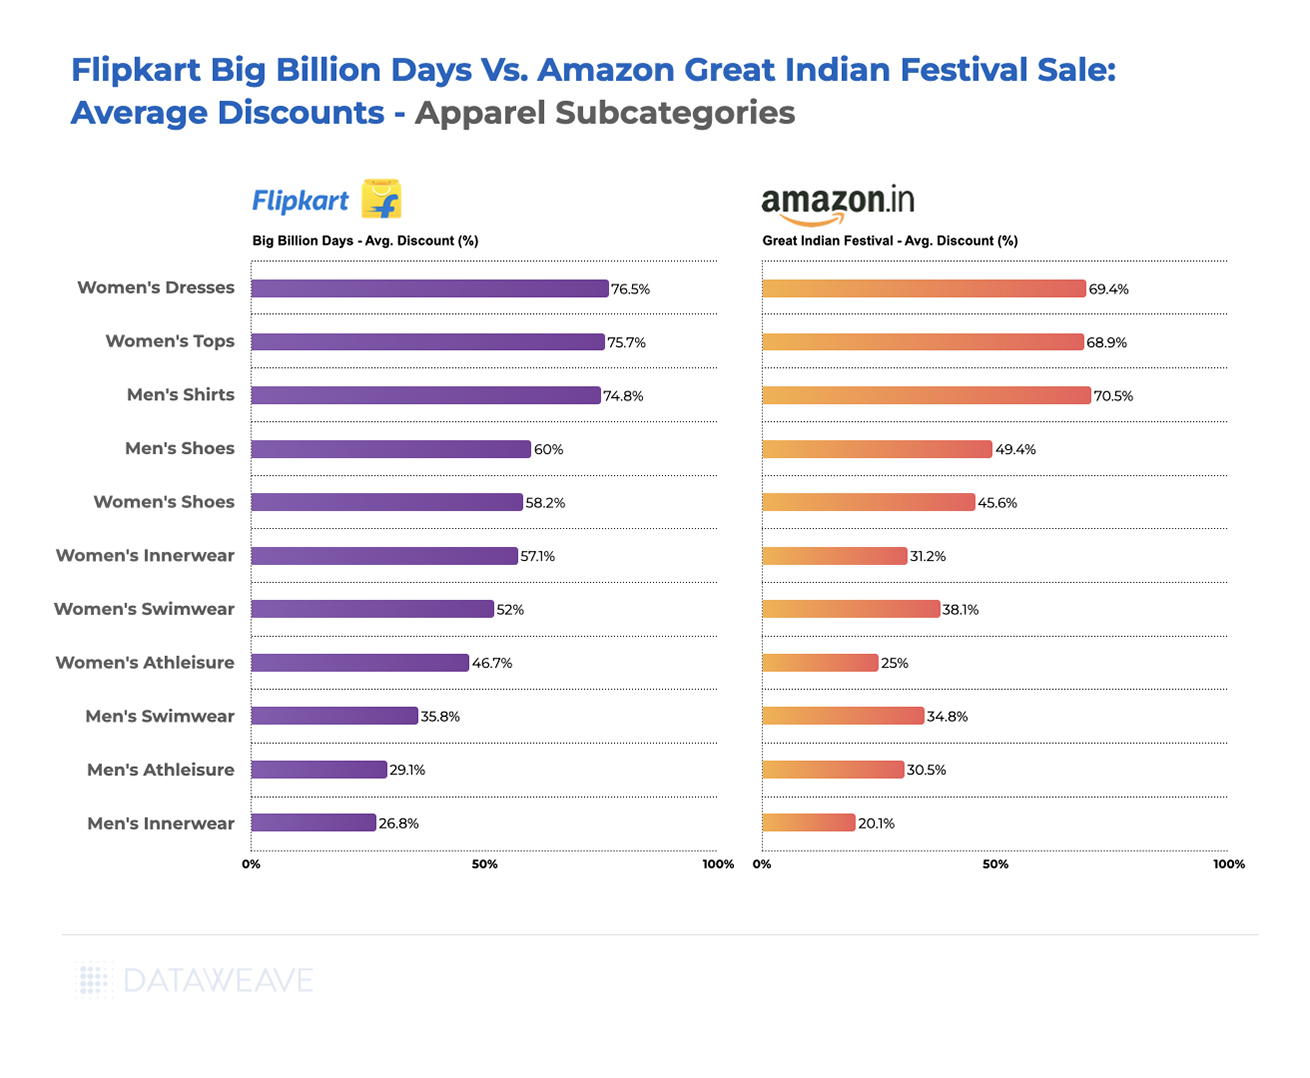
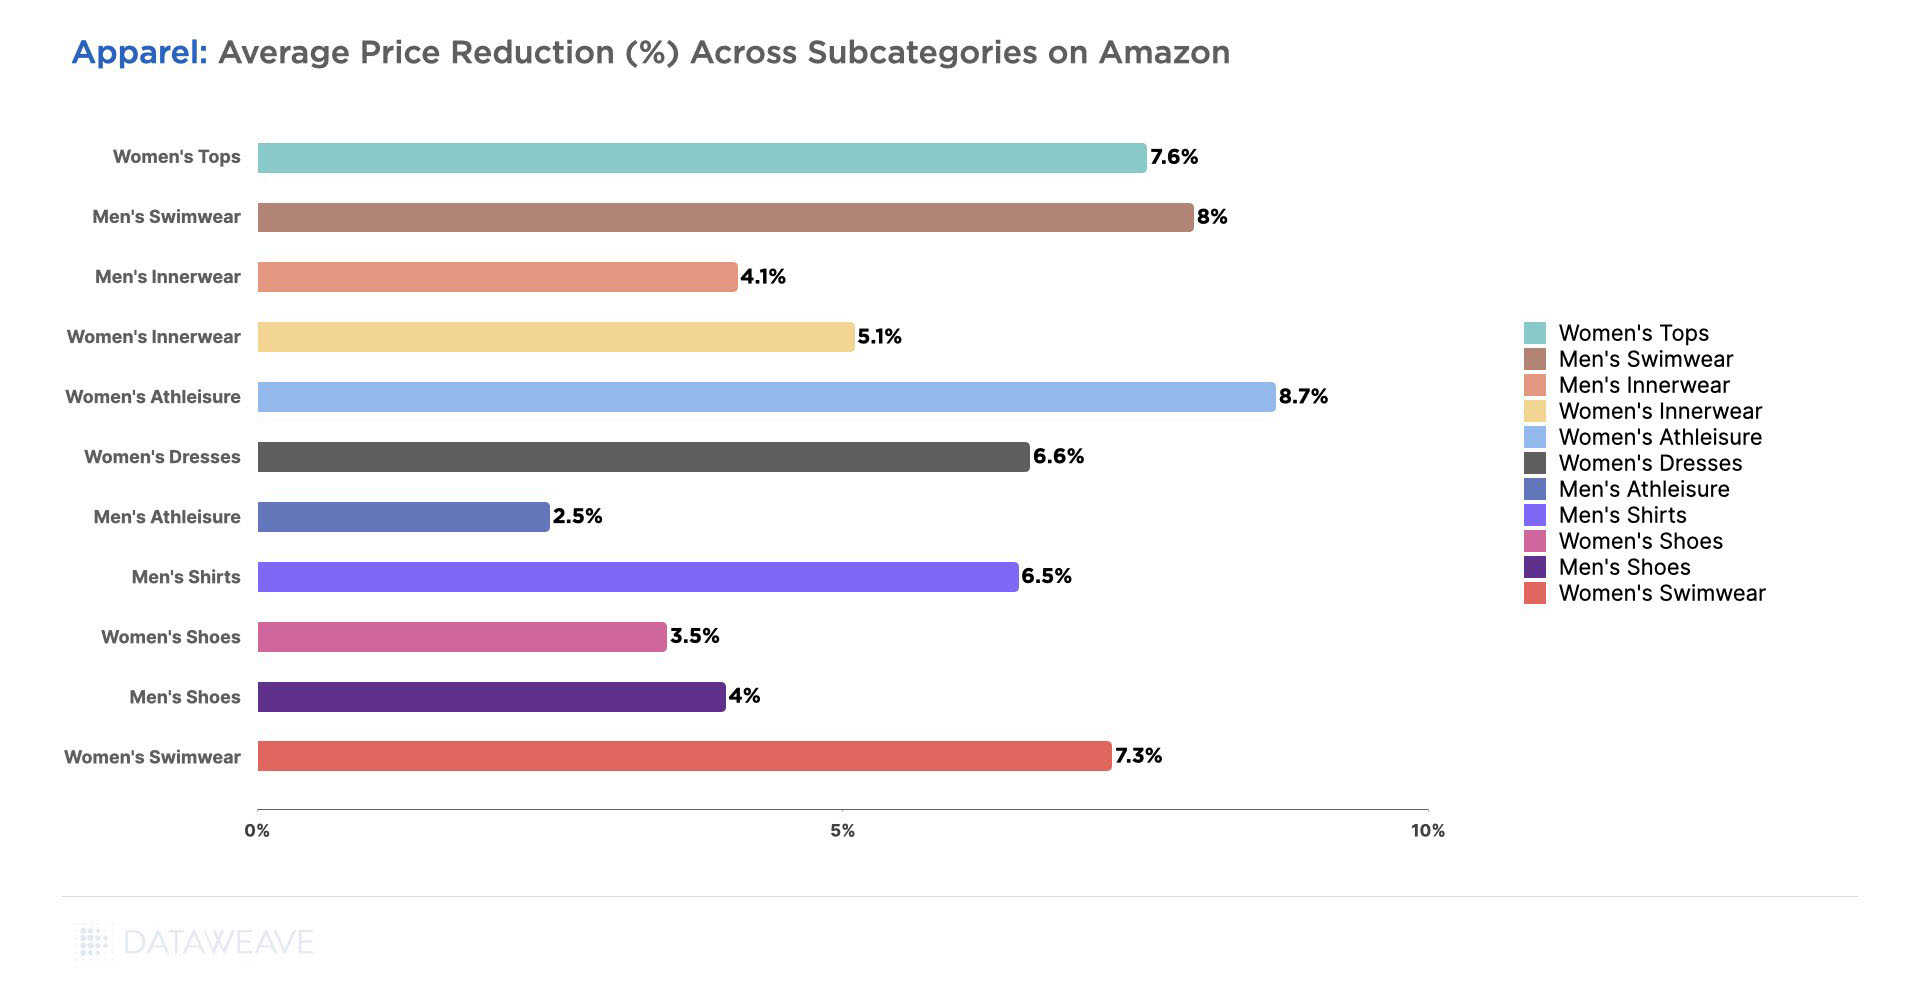
In the detailed assessment of Apparel sub-categories, Women’s Dresses, Women’s Tops, Men’s Shirts, Men’s Shoes, and Women’s Innerwear emerged as the segments showcasing the most substantial discounts during the sale events. While Flipkart offered higher average discounts across all sub-categories, Amazon offered competitive discounts as well.
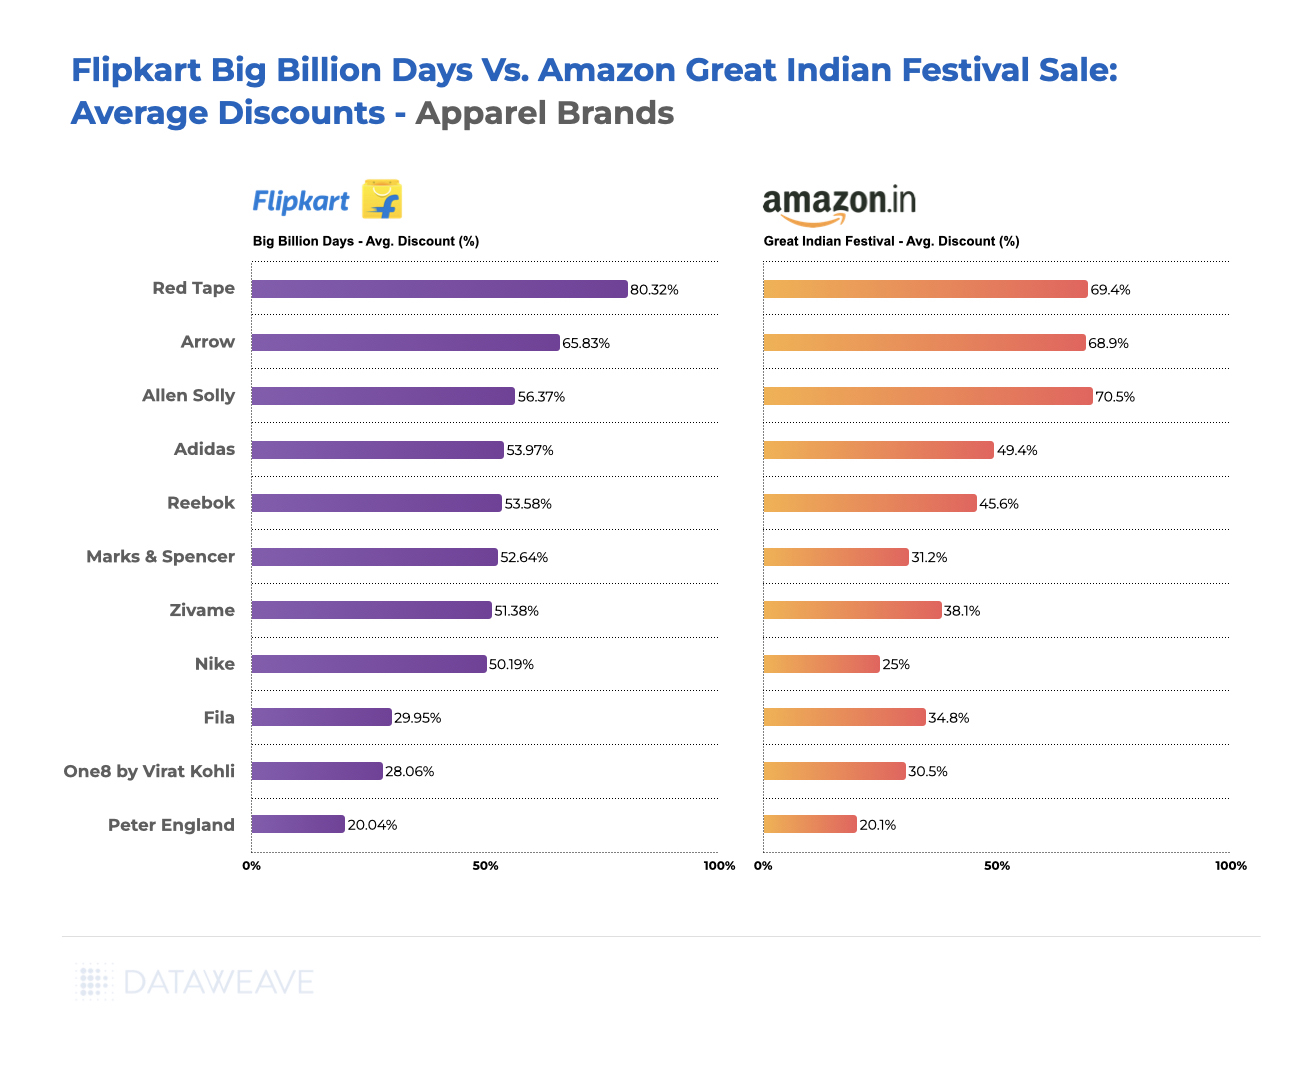
We observed significant differences in the average discounts across brands between Flipkart’s Big Billion Days and Amazon’s Great Indian Festival. Reinforcing the significant discounts on the Shoes subcategory, brands like Red Tape, Arrow, Adidas, Reebok, Nike, and more offered extensive discounts on both Flipkart and Amazon. Notably, Adidas and Reebok offered better deals on Amazon’s Great Indian Festival as compared to Flipkart.
One8 by Virat Kohli had a significantly lower discount on Amazon compared to Flipkart, indicating an exclusive partnership.
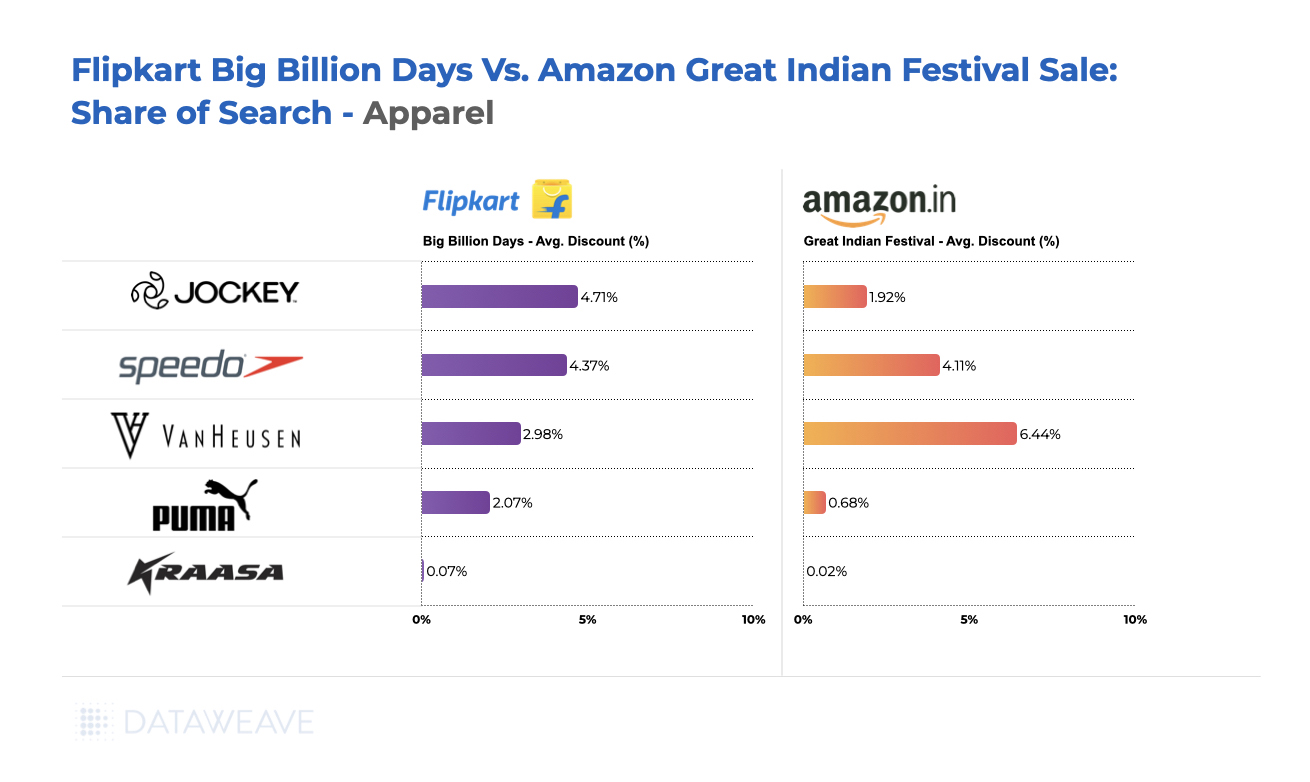
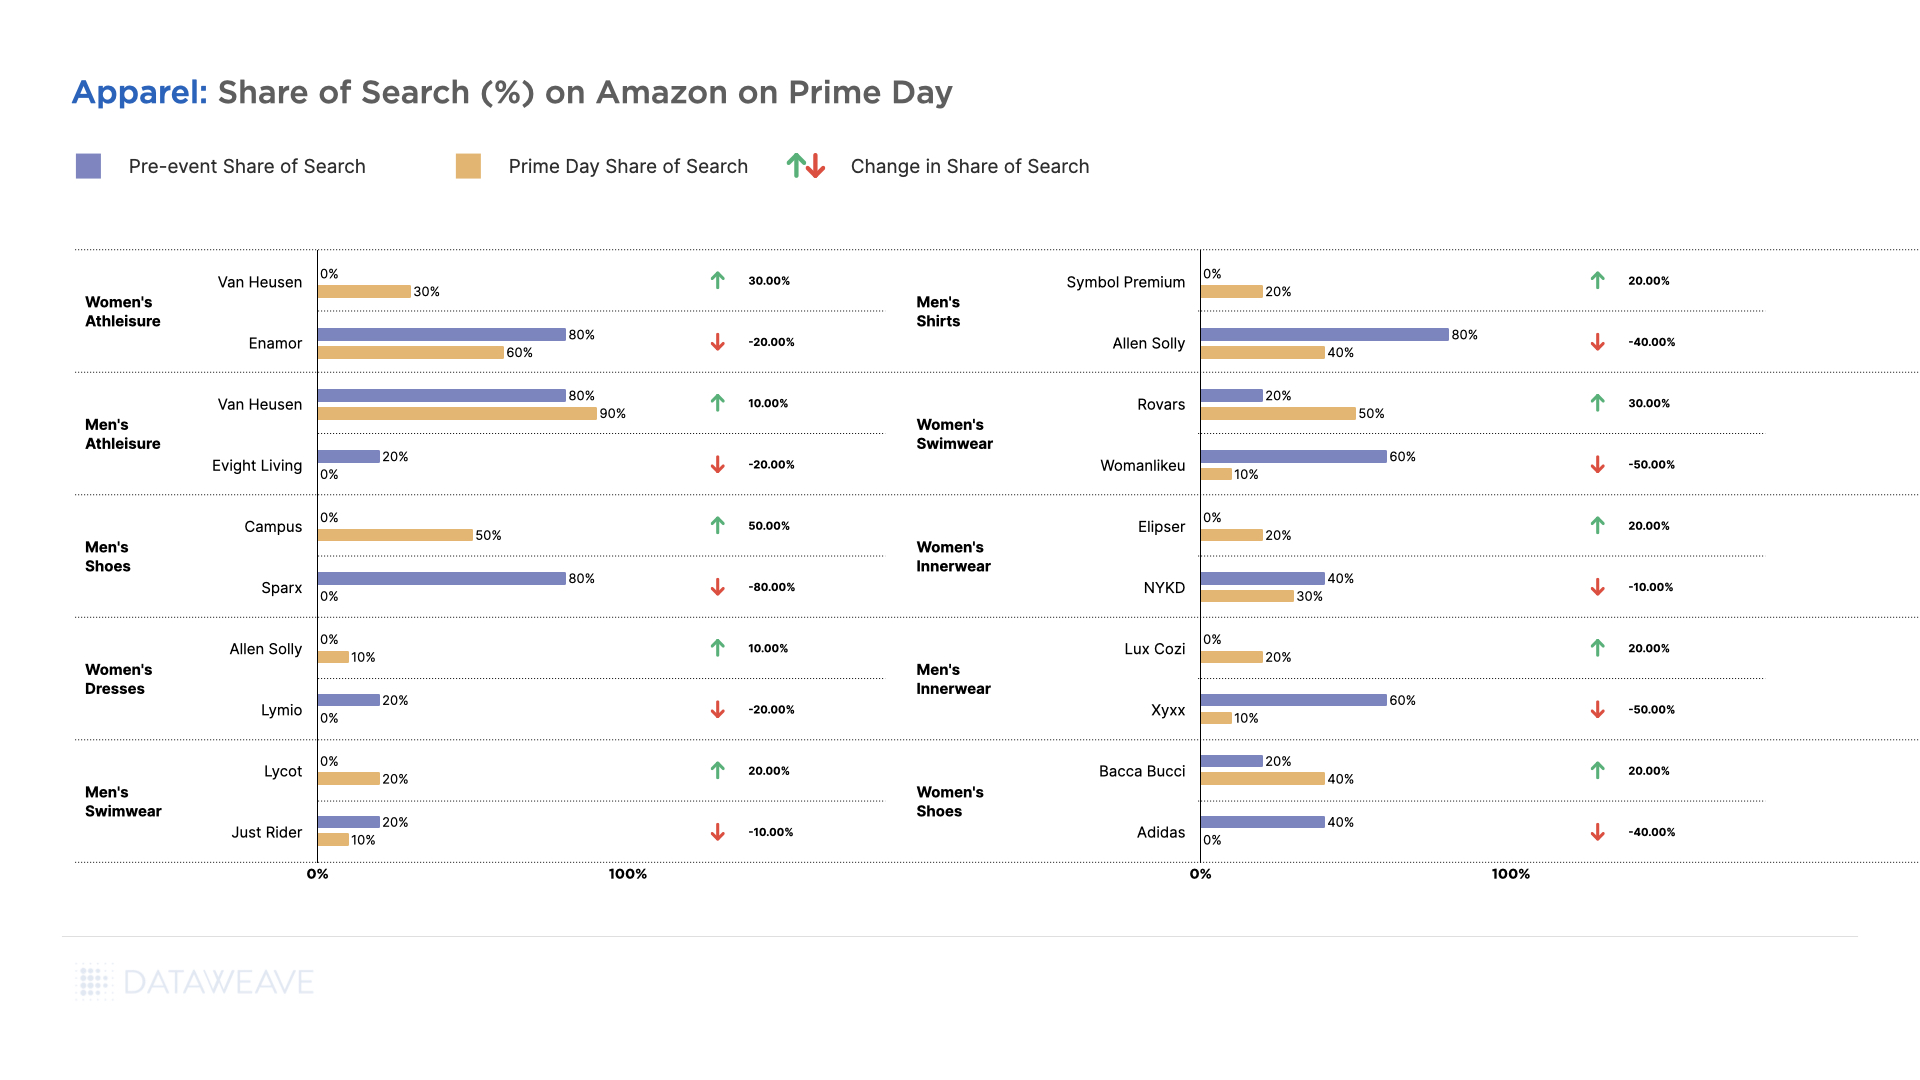
For brands, however, reducing prices is just one approach to entice shoppers. They must also guarantee their prominent presence and easy discoverability within Amazon and Flipkart search results. To gain insight into this, we monitored brands’ Share of Search across various frequently used search terms in addition to the discounts they provided. The Share of Search denotes the portion of a brand’s products within the top 20 search results for a specific search query.
Our data indicates that Jockey and Speedo gained in Share of Search on Flipkart, but reduced discoverability on Amazon. Van Heusen fell behind in search results on Flipkart but showed a higher Share of Search on Amazon.
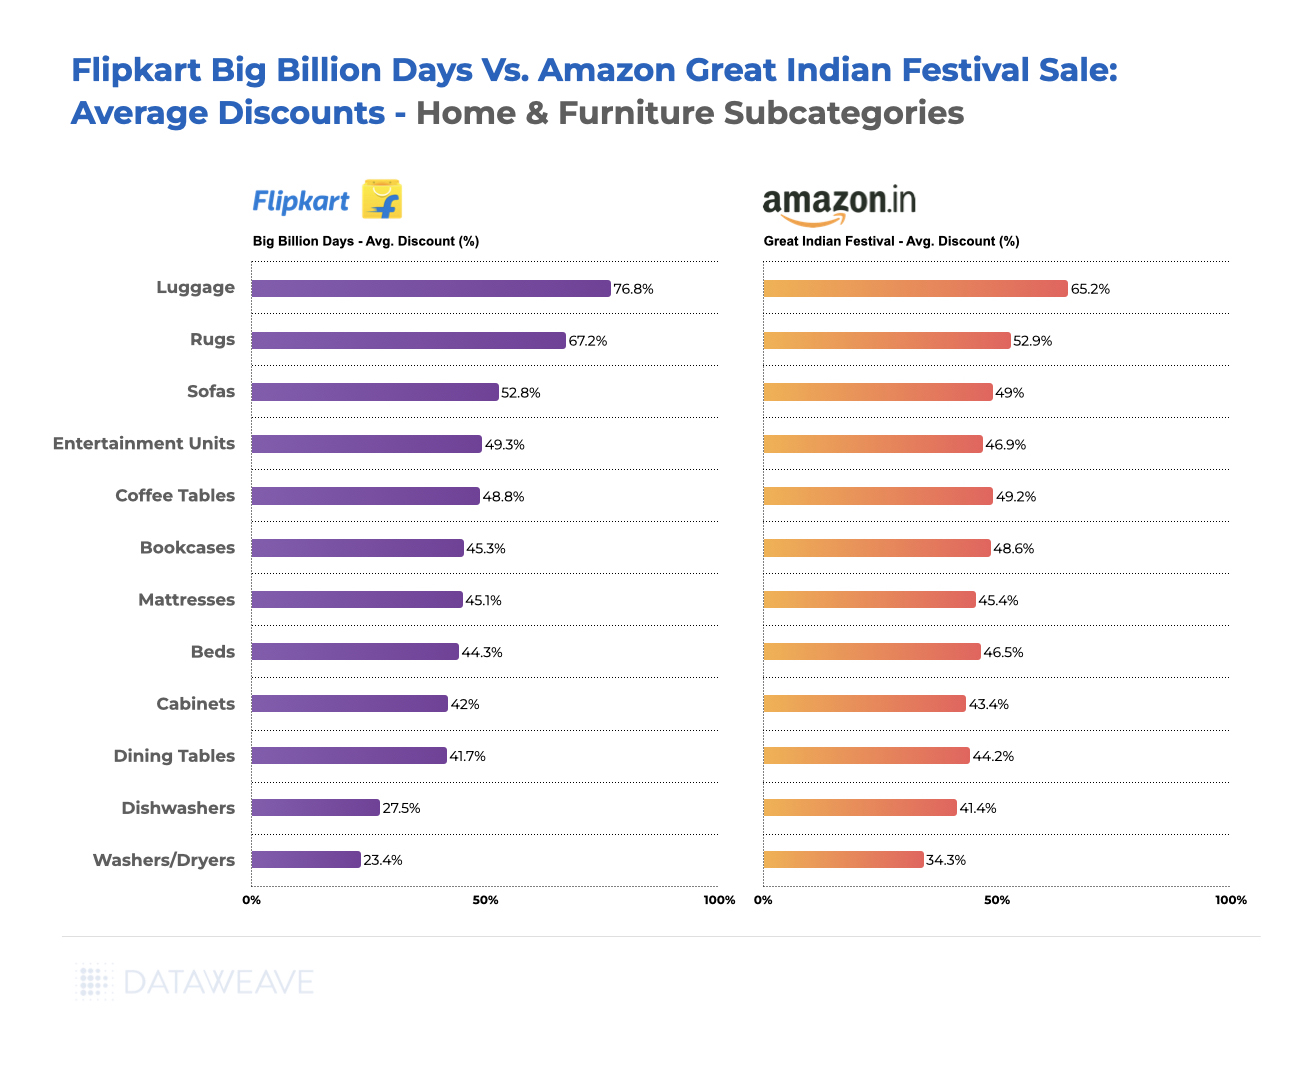
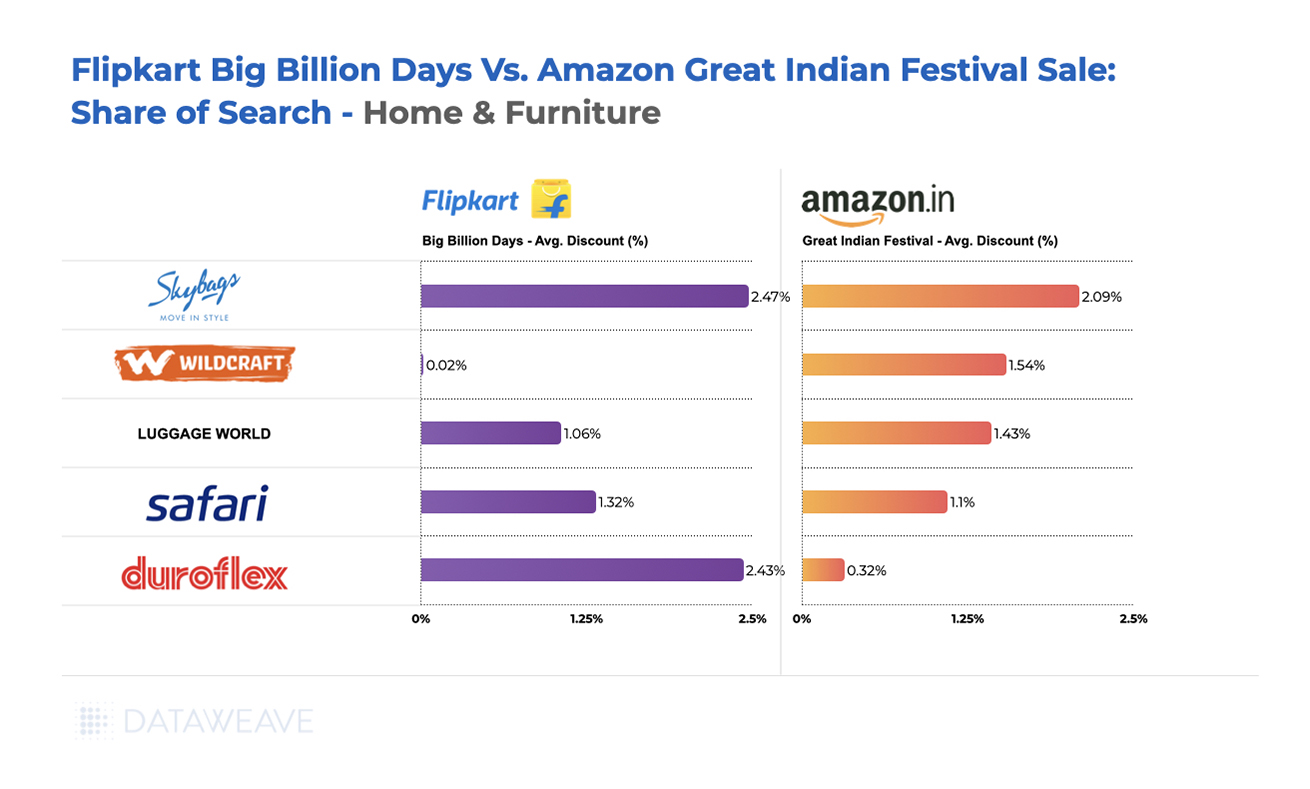
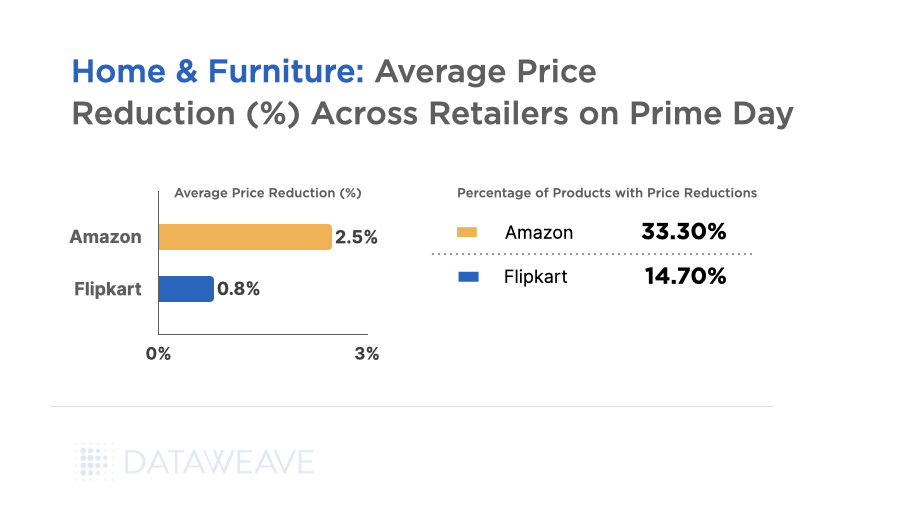
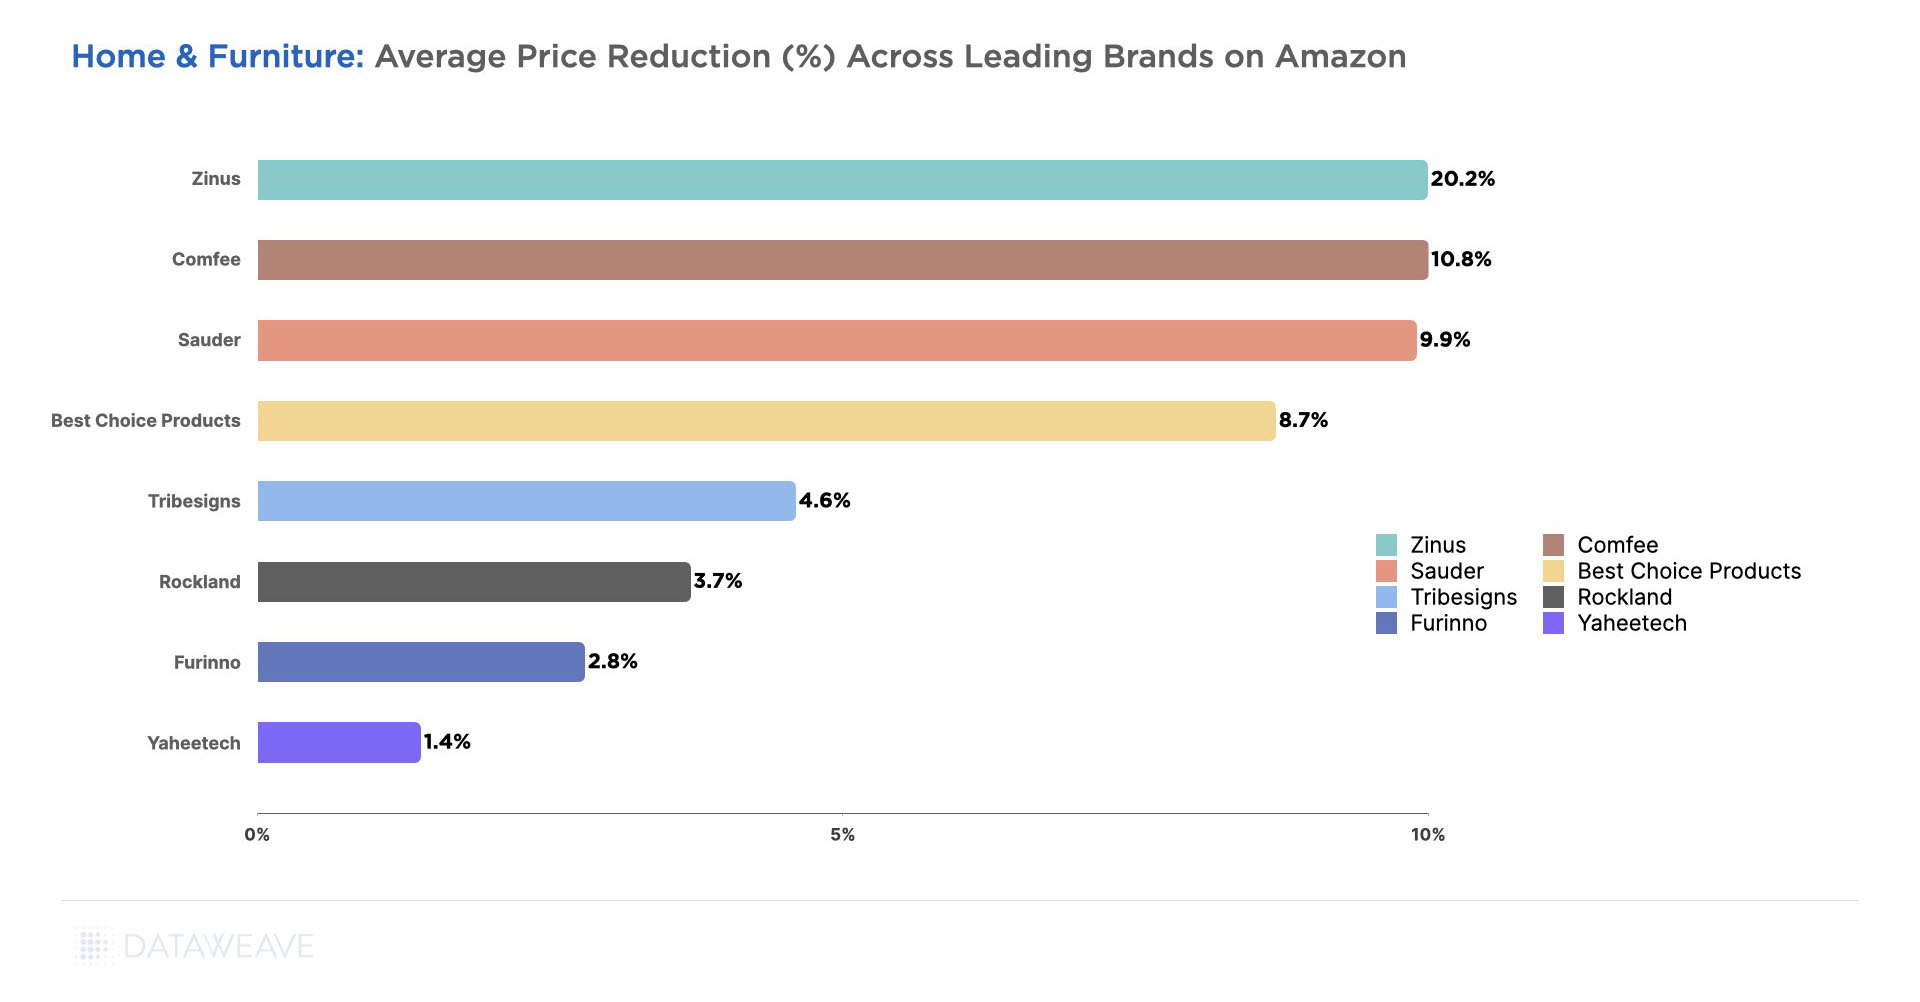
Discounts on both Amazon and Flipkart hovered around 50%. Across a few subcategories, Flipkart offered slightly lower discounts compared to Amazon. Only Luggage, Rugs, Sofas, and Entertainment Units saw lower markdowns on Flipkart during the Big Billion Days.
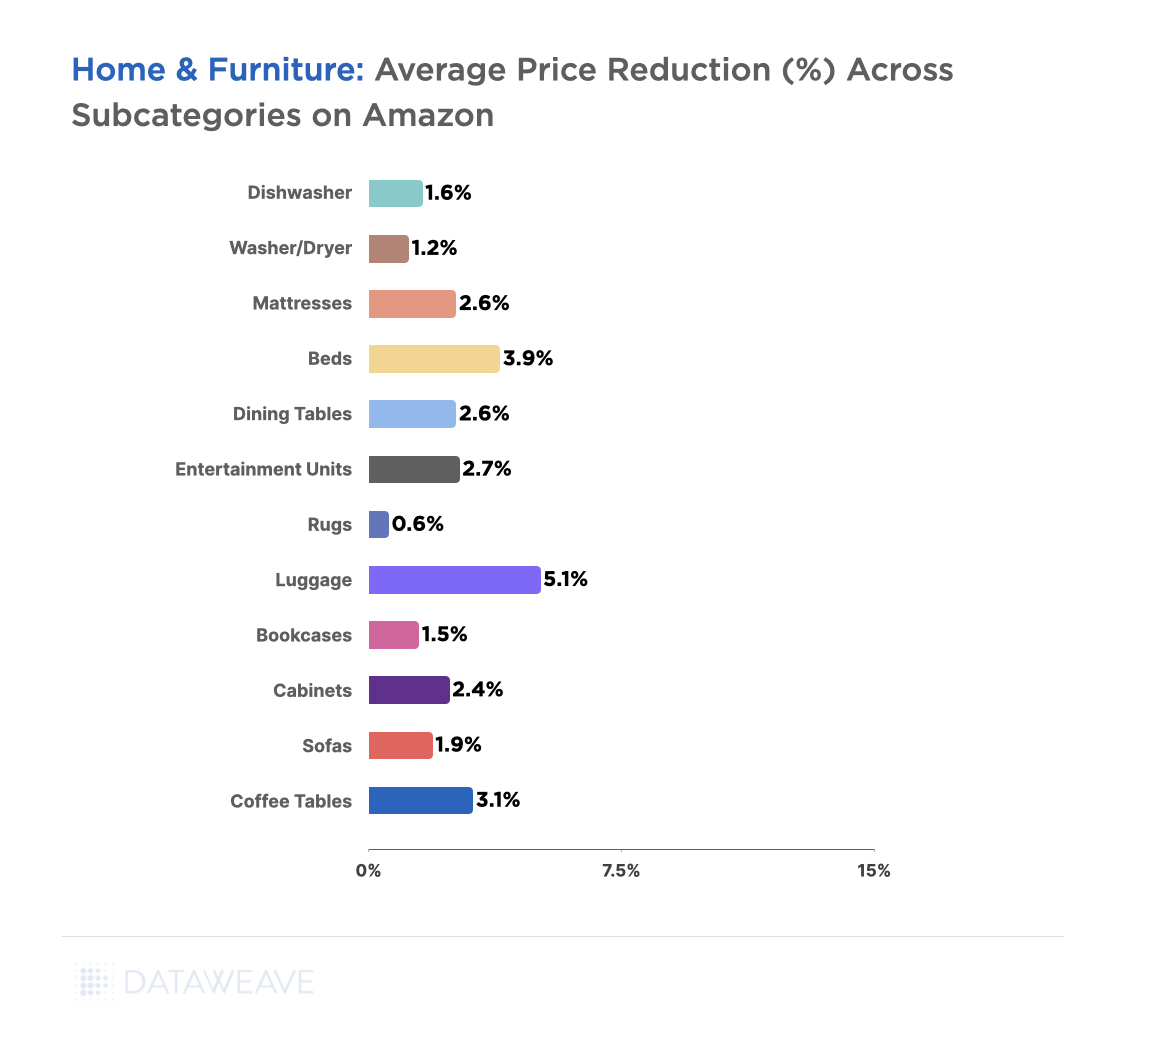
Dishwashers and Washer/ Dryers saw higher discounts on Amazon compared to Flipkart. The significant discounts on these products on Amazon possibly point to changing consumer preferences, as demand for these products is traditionally low in India, but seems to be growing.
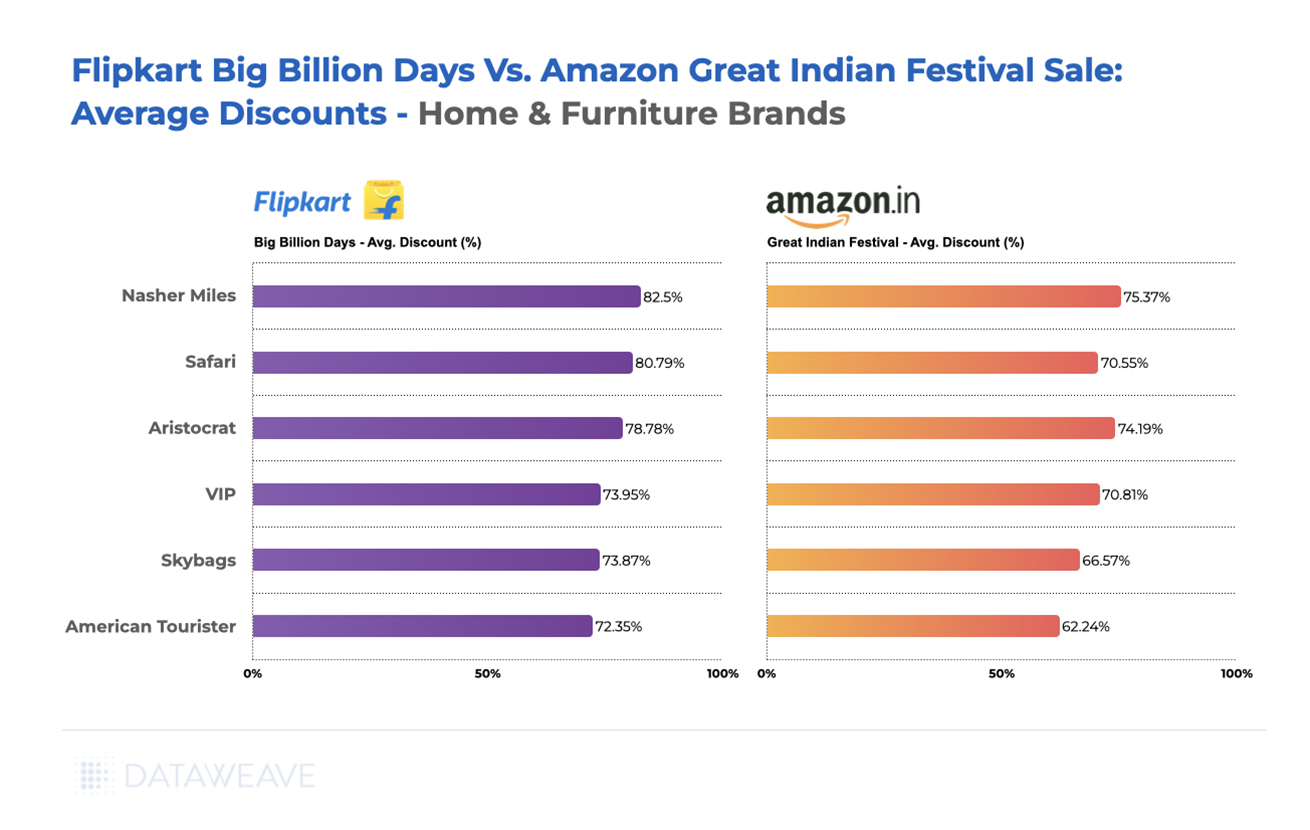
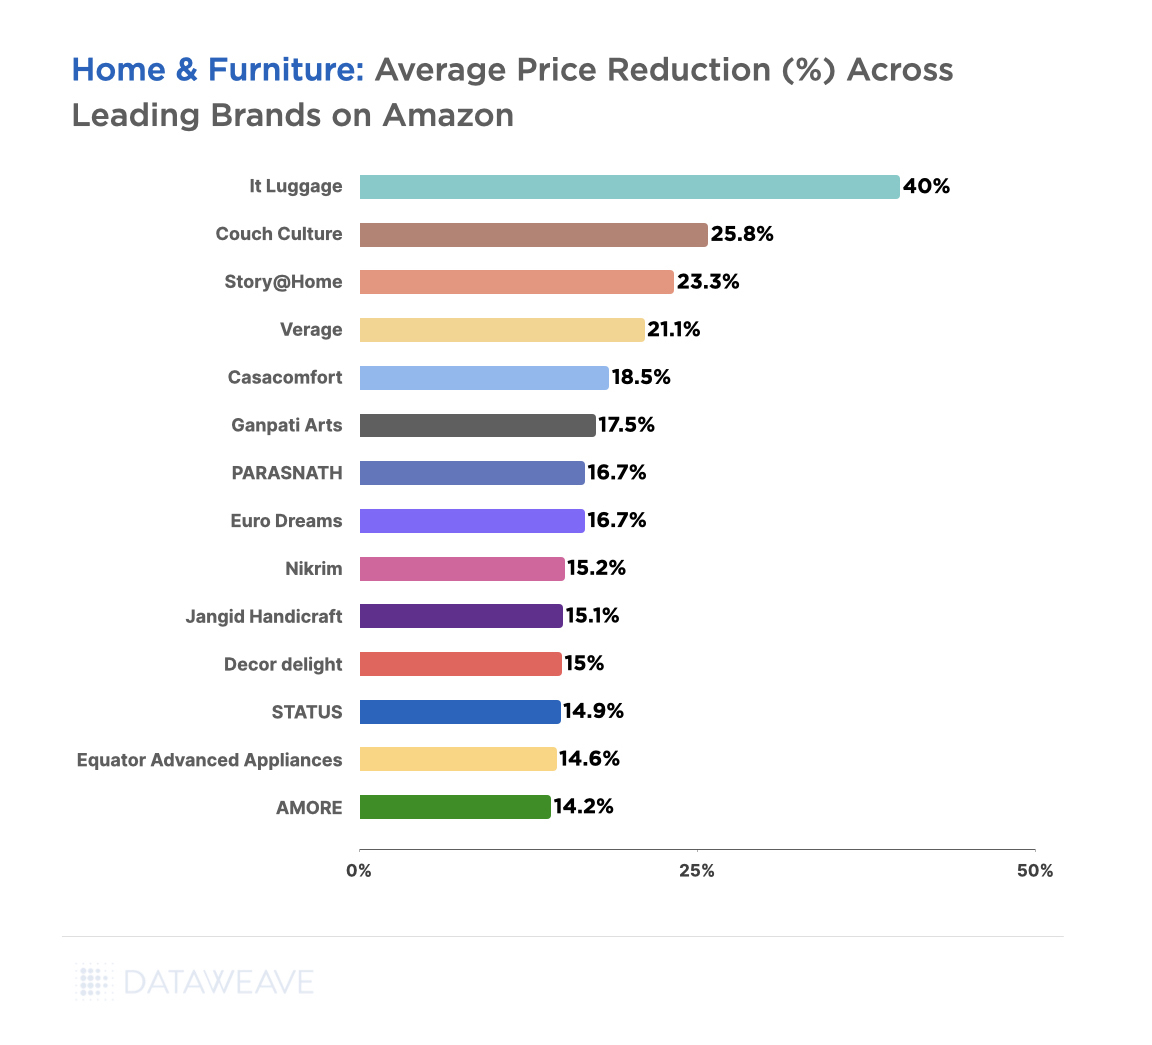
When it comes to Home & Furniture brands, Nasher Miles, Safari, Aristocrat, VIP, and American Tourister, luggage brands mostly, offered higher discounts on Flipkart, followed closely by Amazon.
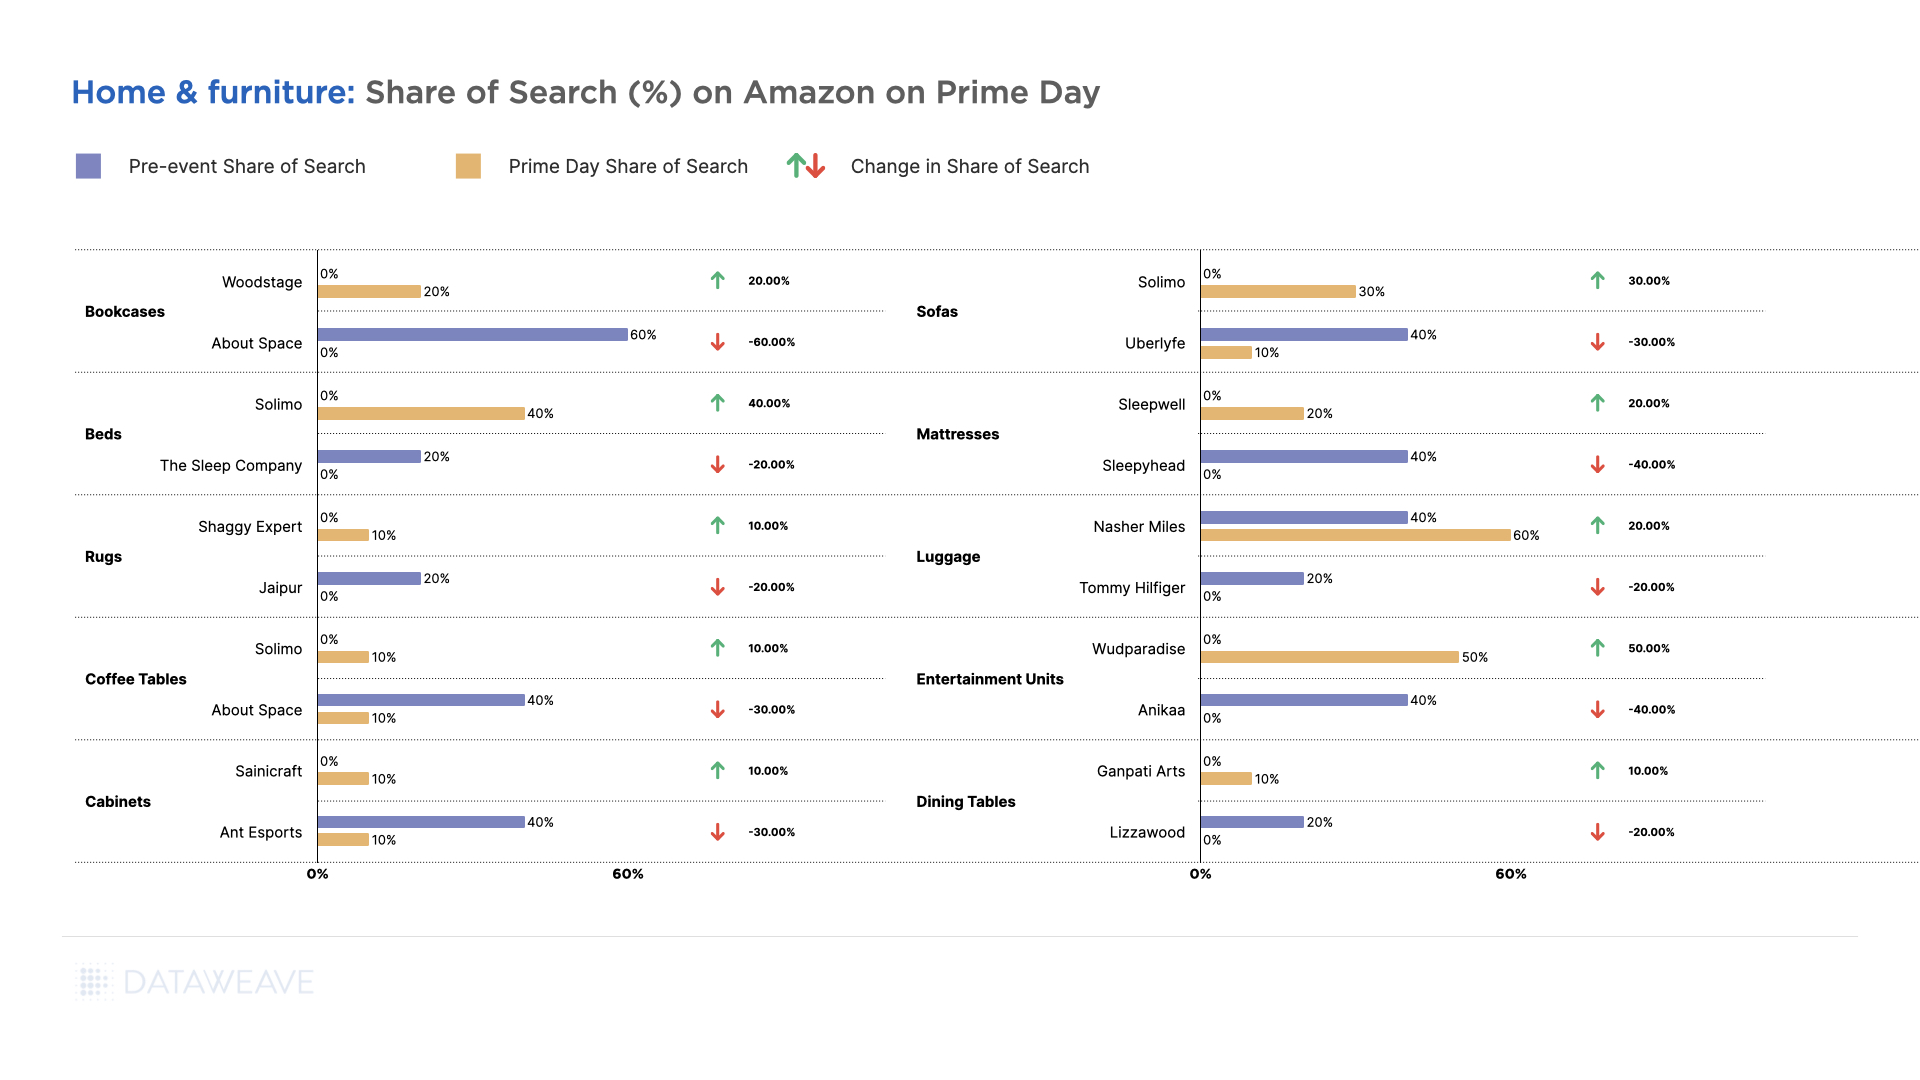
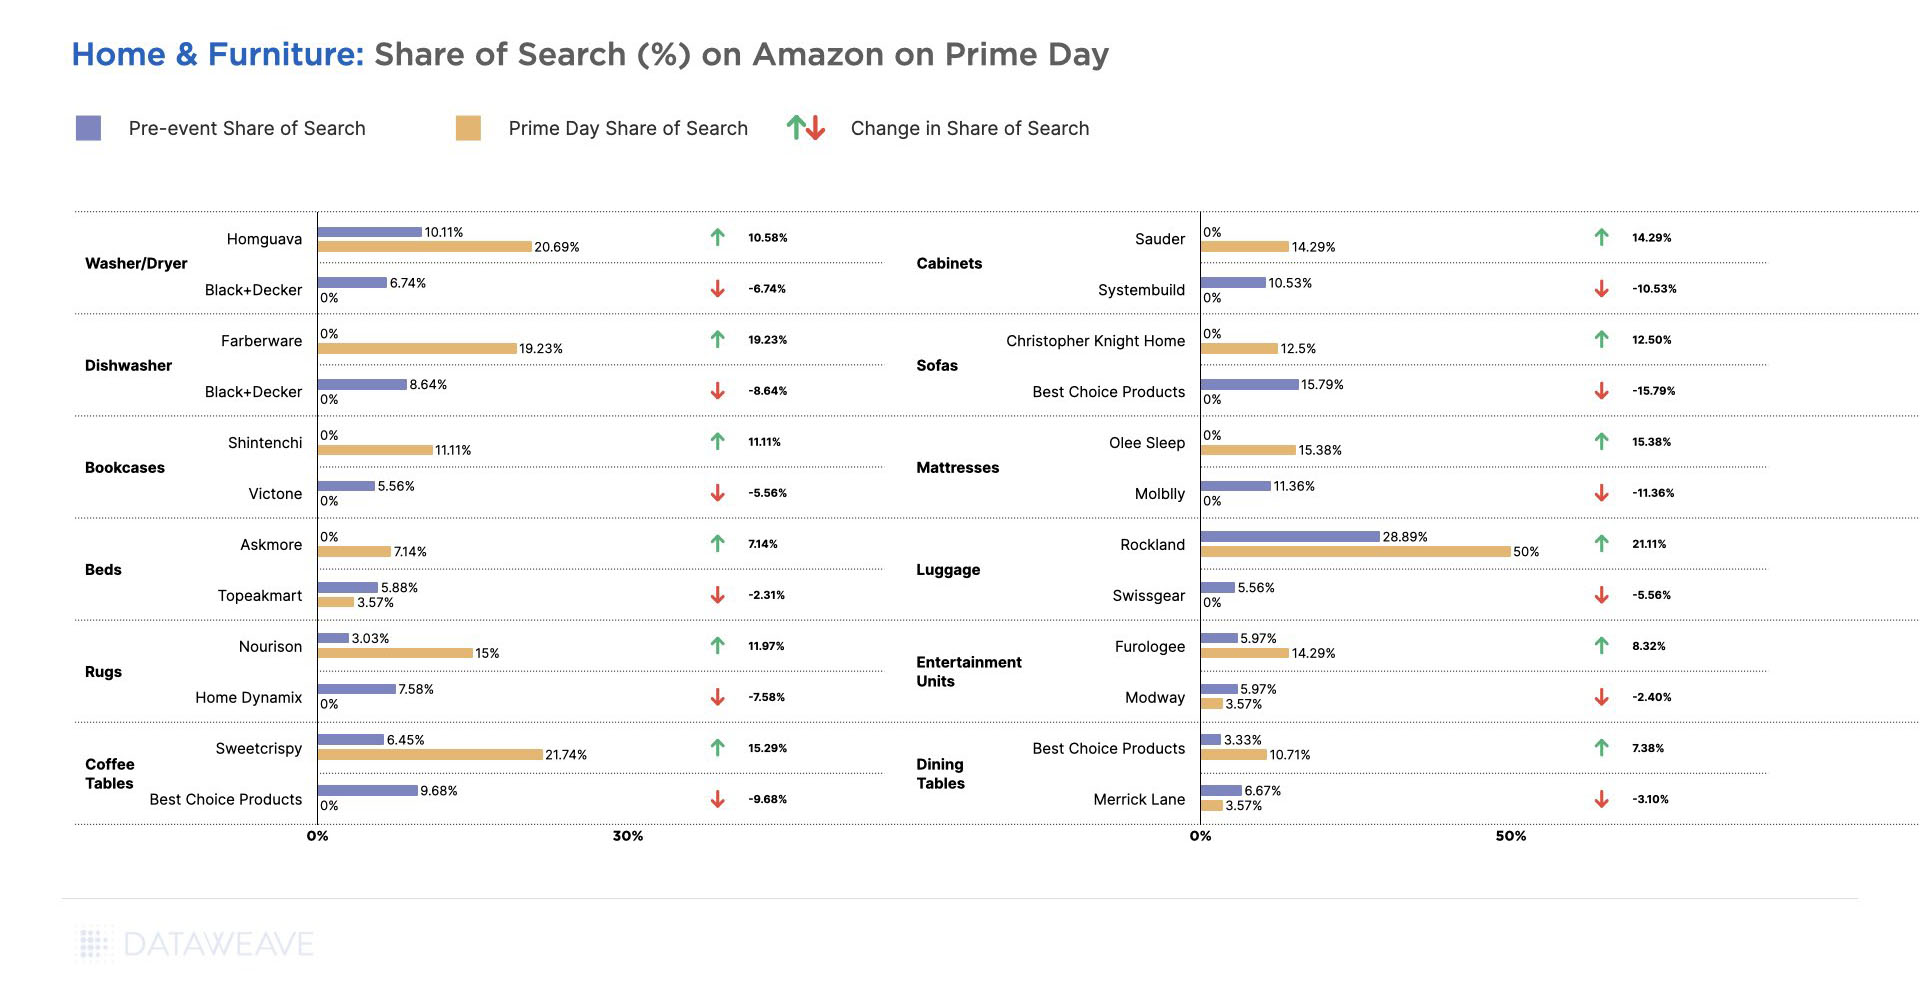
In terms of Share of Search, Skybags had high discoverability on both Flipkart and Amazon. The brand leveraged a strategy of offering big discounts this festive season as well as ensuring prominent placement in search results. Wildcraft lost out on its discoverability on Flipkart in contrast to its prominence on Amazon. Duroflex saw lower searchability on Amazon compared to Flipkart’s Big Billion Days.
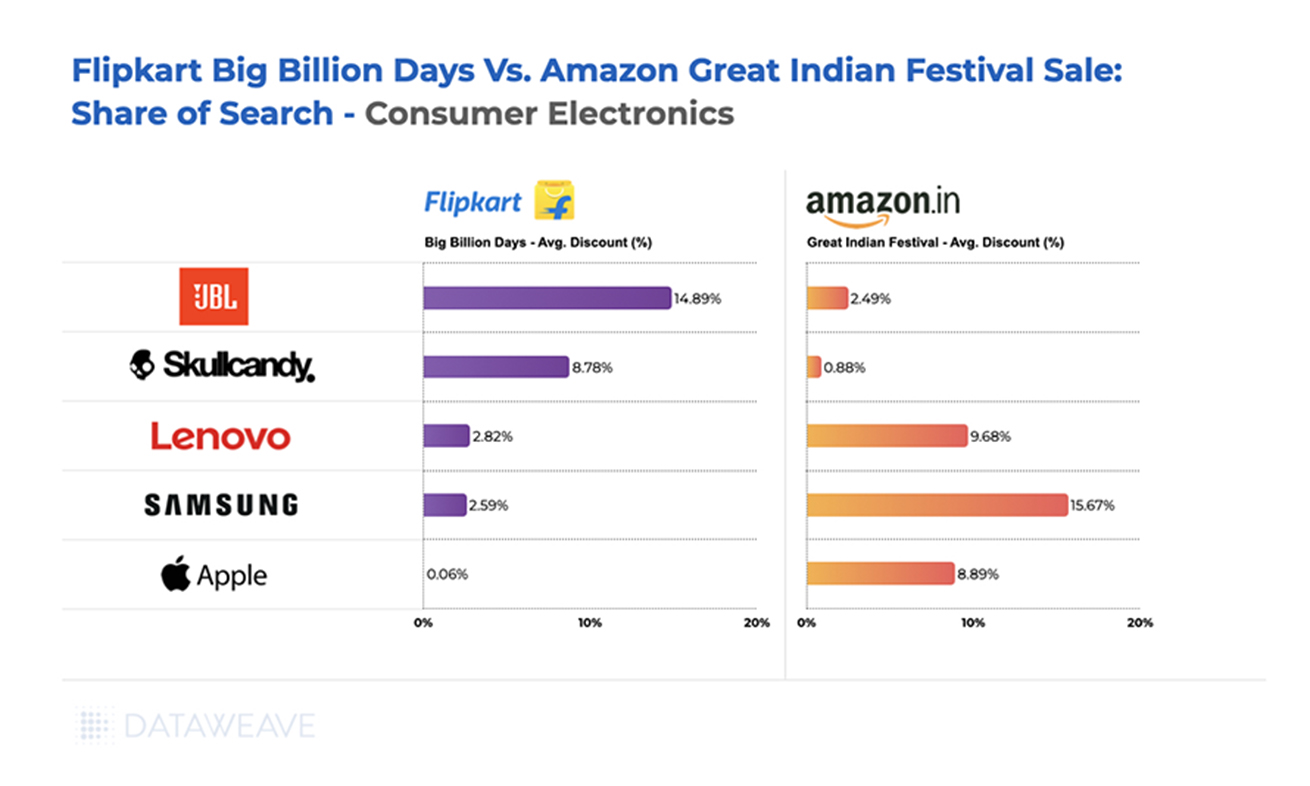
Consumer Electronics
The Consumer Electronics and Appliances Manufacturers Association (CEAMA) expected an uptick in sales of consumer electronics products this festive season in India. With more consumers buying premium products using credit cards and EMIs, demand for expensive, high-end electronics was expected to increase.
Again, average discounts in this category hovered around 50% on Flipkart and Amazon.
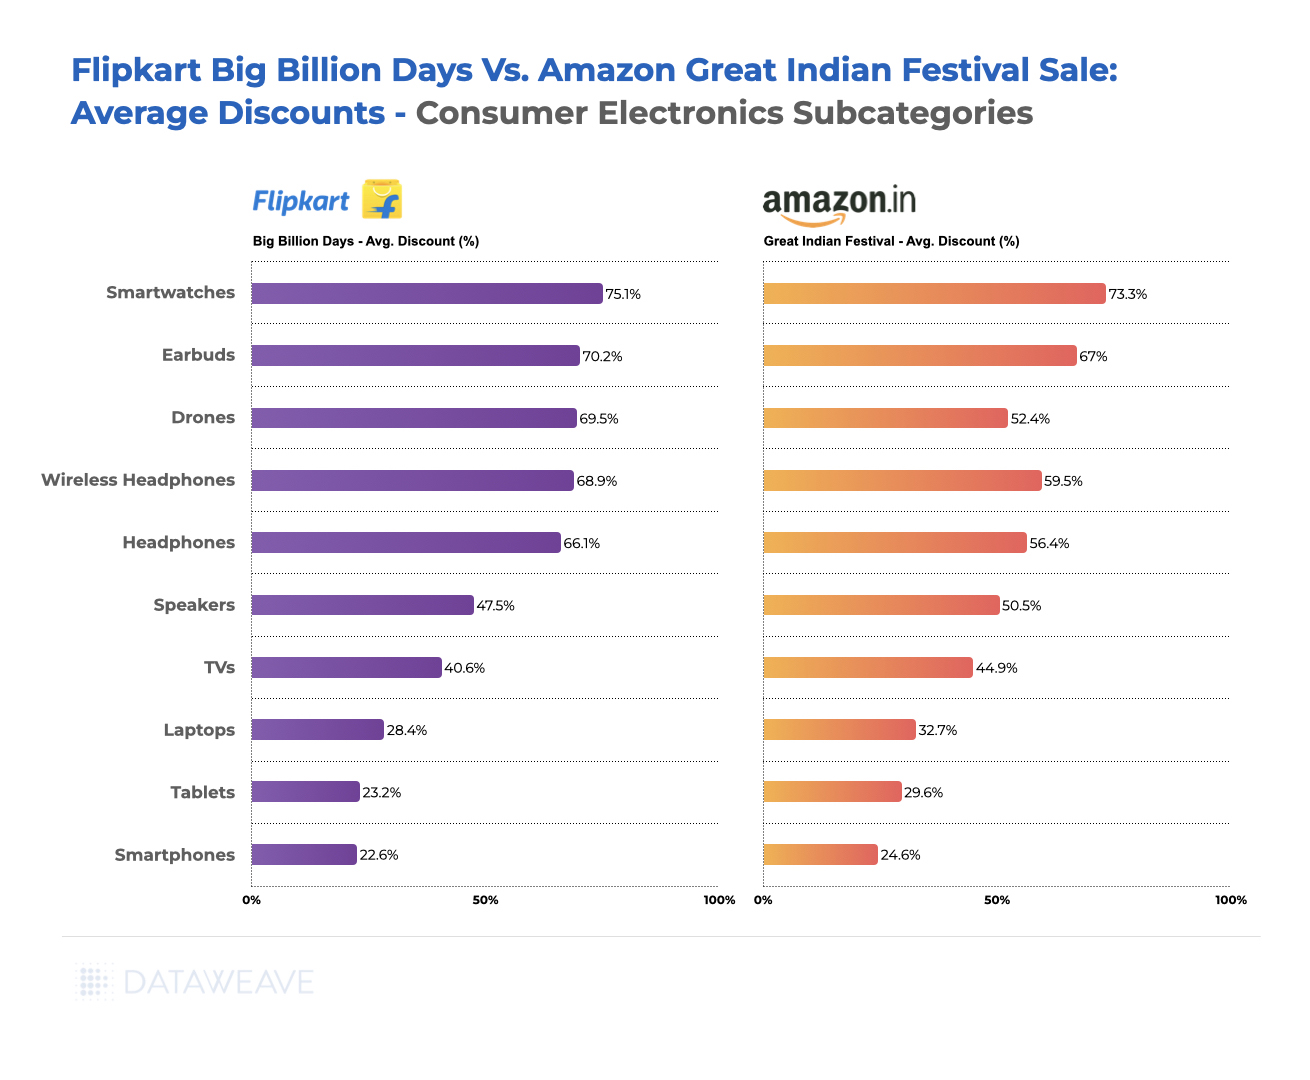
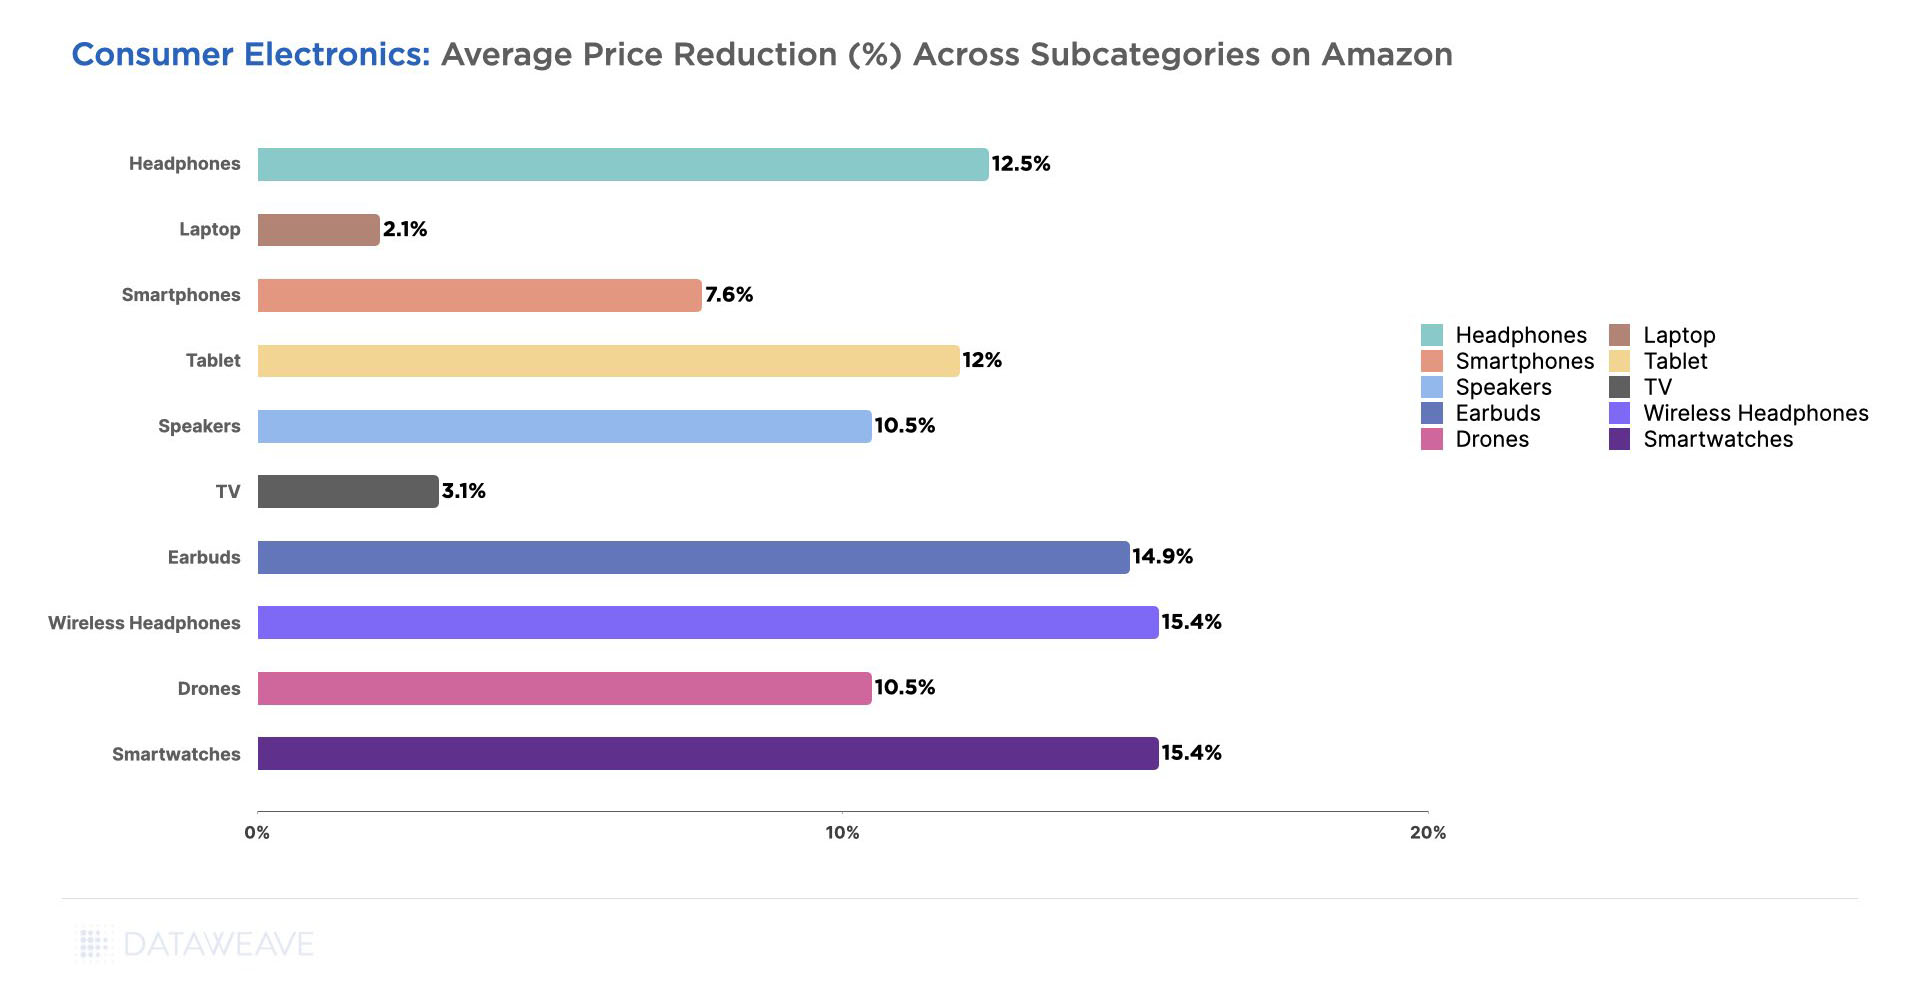
Across electronics subcategories, Smartwatches, Earbuds, and Drones had the highest markdowns with Flipkart leading the pack during the Big Billion Days. Amazon offered relatively higher discounts at 44.9% on the TV subcategory, compared to Flipkart’s 40.6%.
Speakers, Laptops, Smartphones, and Tablets also saw lower markdowns on Amazon compared to Flipkart. Amazon was the official partner for the launch of many high-level smartphones and products in September-October, contributing to the higher markdowns in the subcategory.
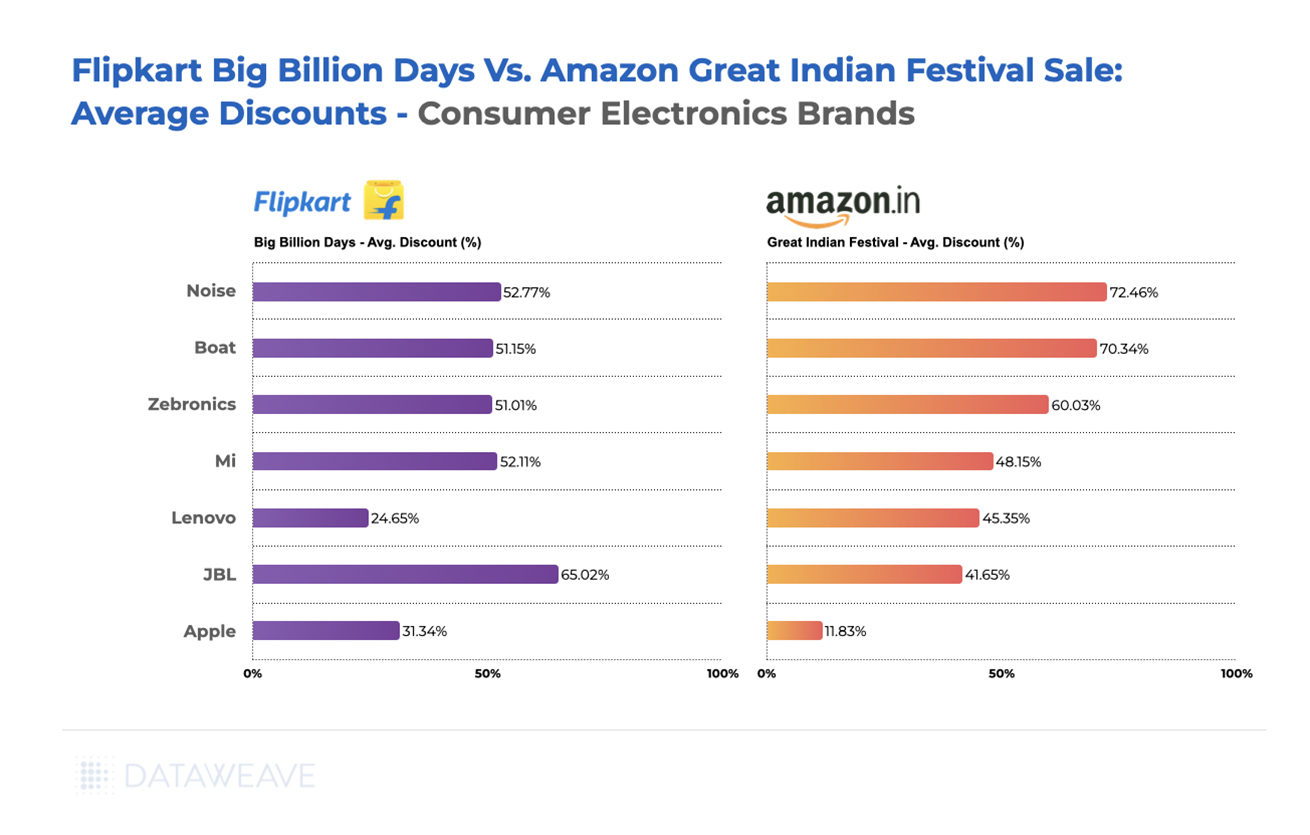
Across brands, Lenovo’s discounts were the most differentiated between the two sites, with the brand offering higher discounts on Amazon (45.4%) compared to Flipkart (24.7%). Noise offered the highest discounts at 72.5% on Amazon and 52.8% on Flipkart. Brands like Boat and Zebronics, also saw lower discounts on Flipkart.
Mi and JBL offered deeper discounts on Flipkart’s Big Billion Days. Apple meanwhile stands out with only 11.83% discounts on Amazon, but the brand offered impressive 31.4% discounts on Flipkart.
Samsung dominated the Share of Search on Amazon at 15.7%, compared to only 2.6% on Flipkart. Apple and Lenovo also saw higher discoverability on Amazon. On Flipkart, JBL and Skullcandy stand out as brands with high search visibility.
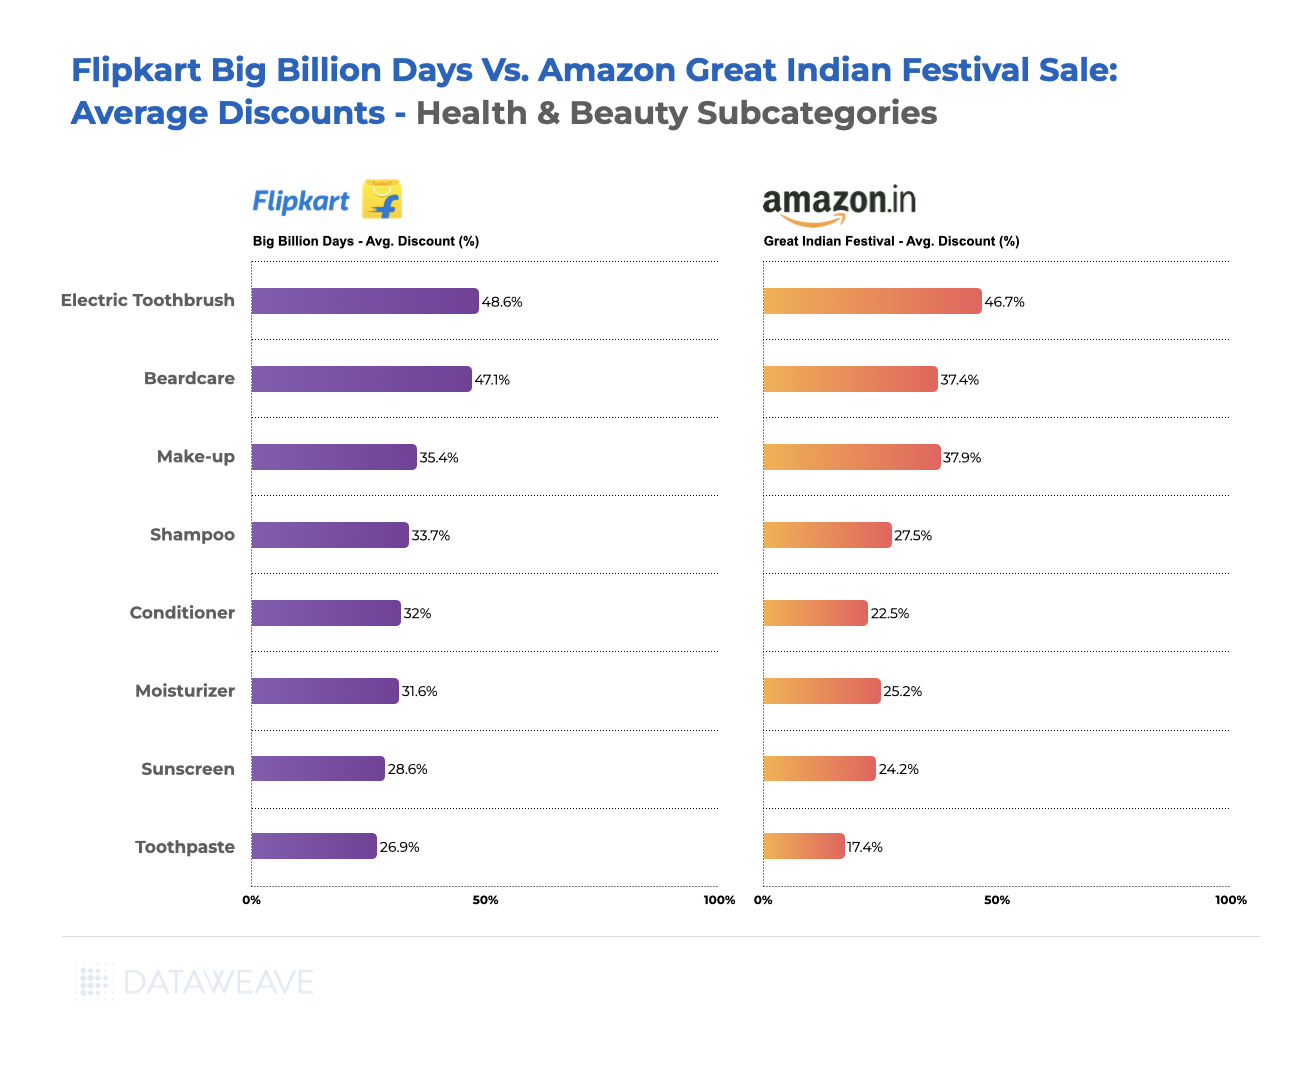
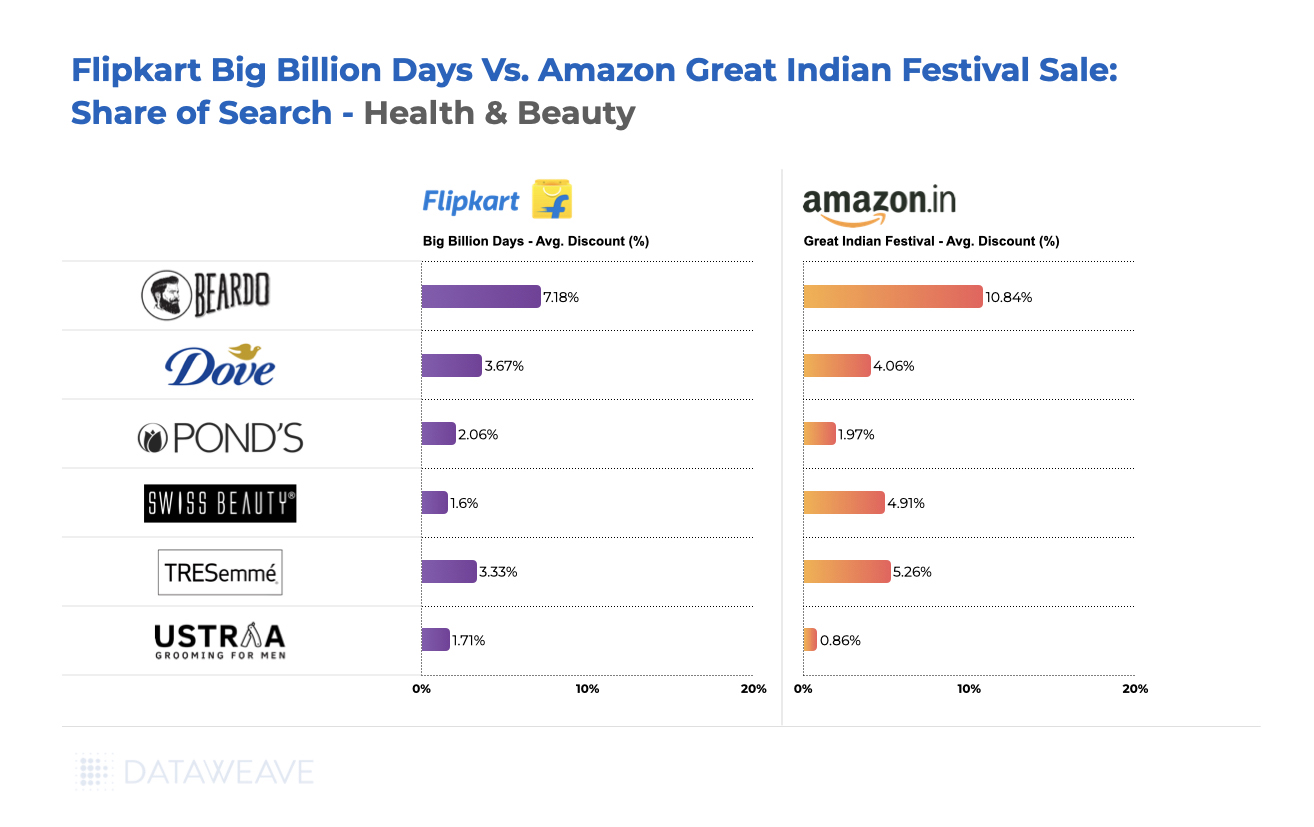
Health & Beauty
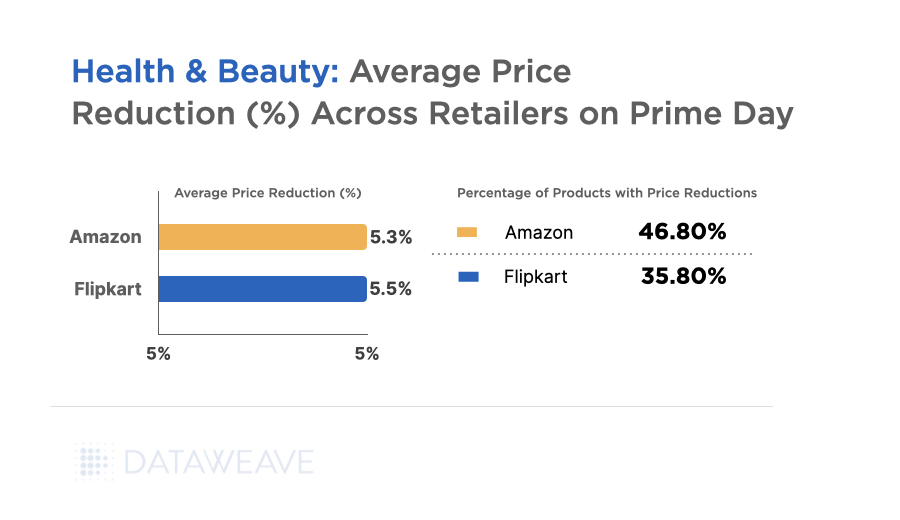
The Health & Beauty category saw the lowest markdowns with only 39.4% discounts on Flipkart and 33% on Amazon.
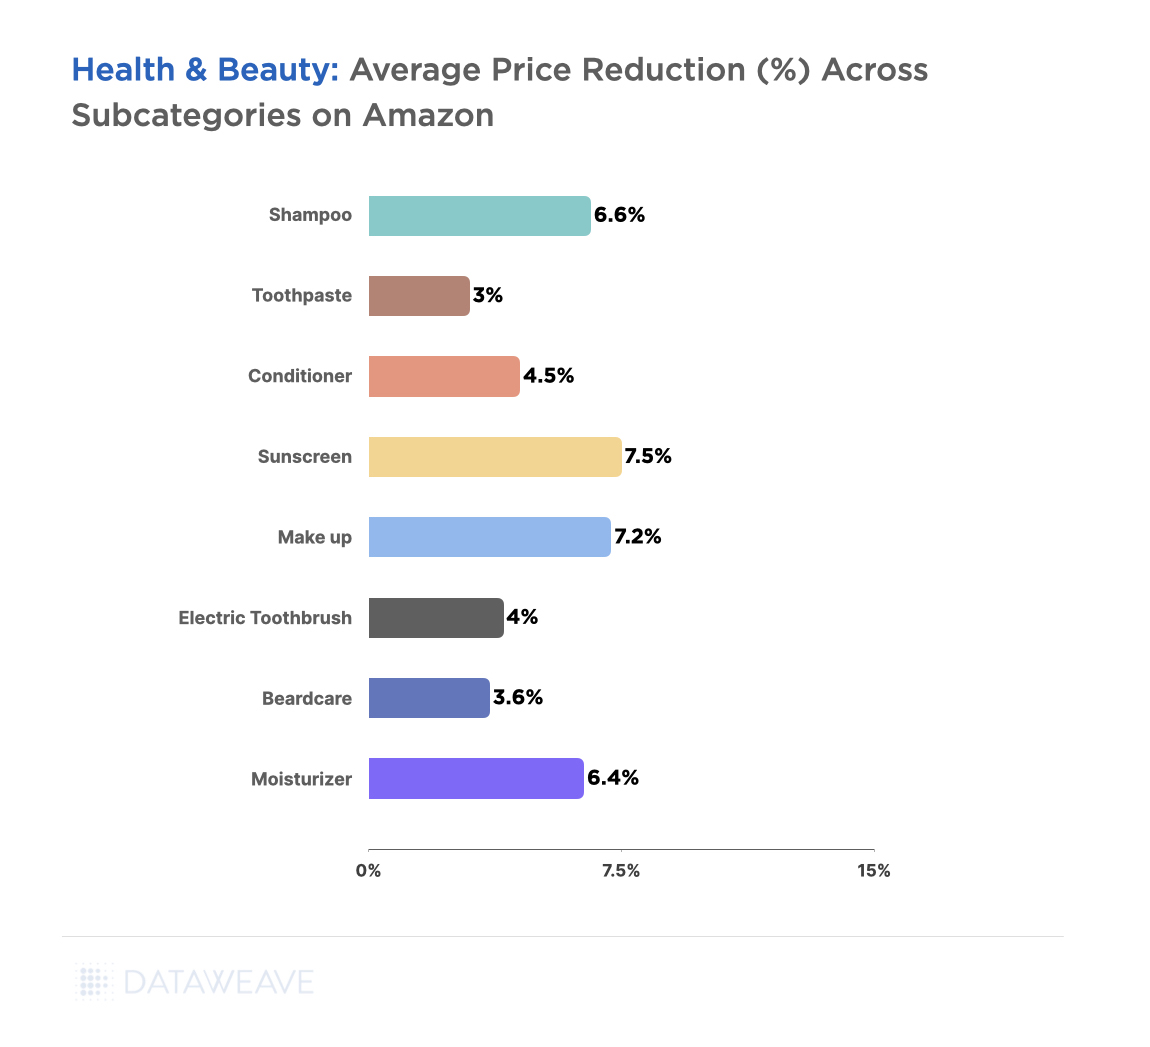
In the subcategories analyzed, Electric Toothbrushes had relatively high markdowns across both sites. Staple and lower priced subcategories like Toothpaste had the lowest markdowns across both sale events, with Amazon offering only 17.4% average discounts.
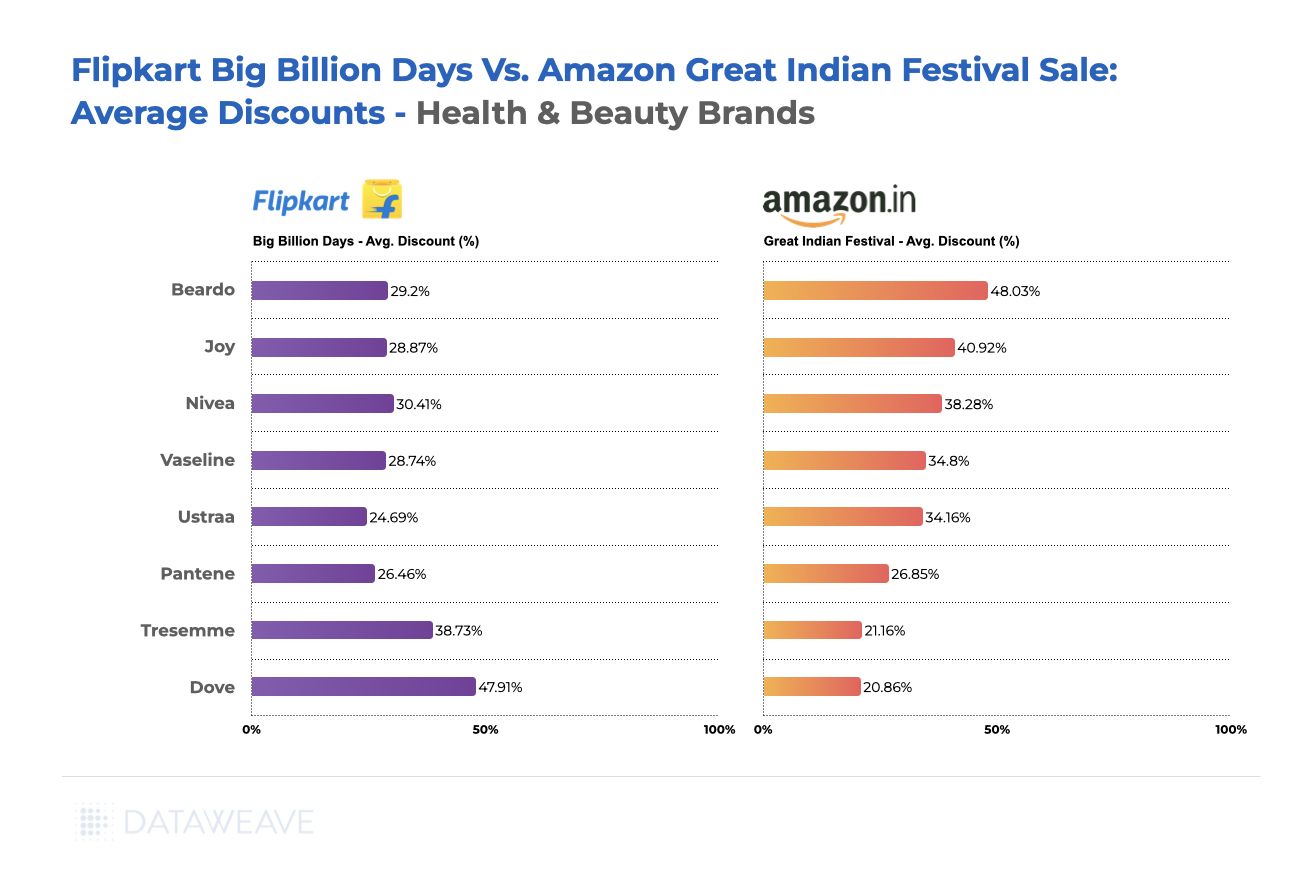
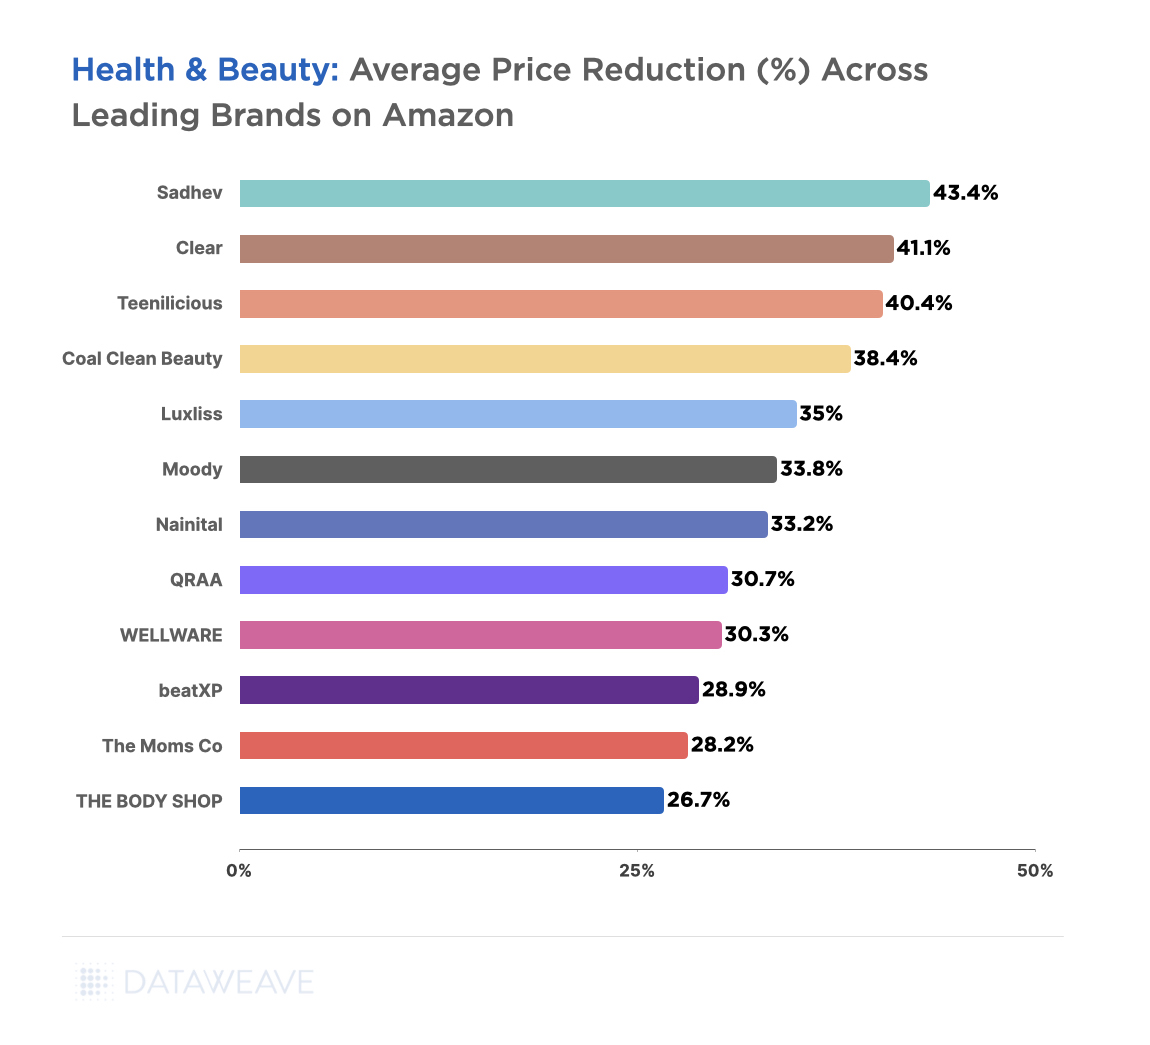
Across brands, Beardo, a leading beard care brand, offered significantly higher discounts on Amazon compared to Flipkart. Most other well-known brands, including Nivea and Vaseline, saw higher discounts on Amazon compared to Flipkart. Only Tresmme and Dove were exceptions with higher discounts on Flipkart.
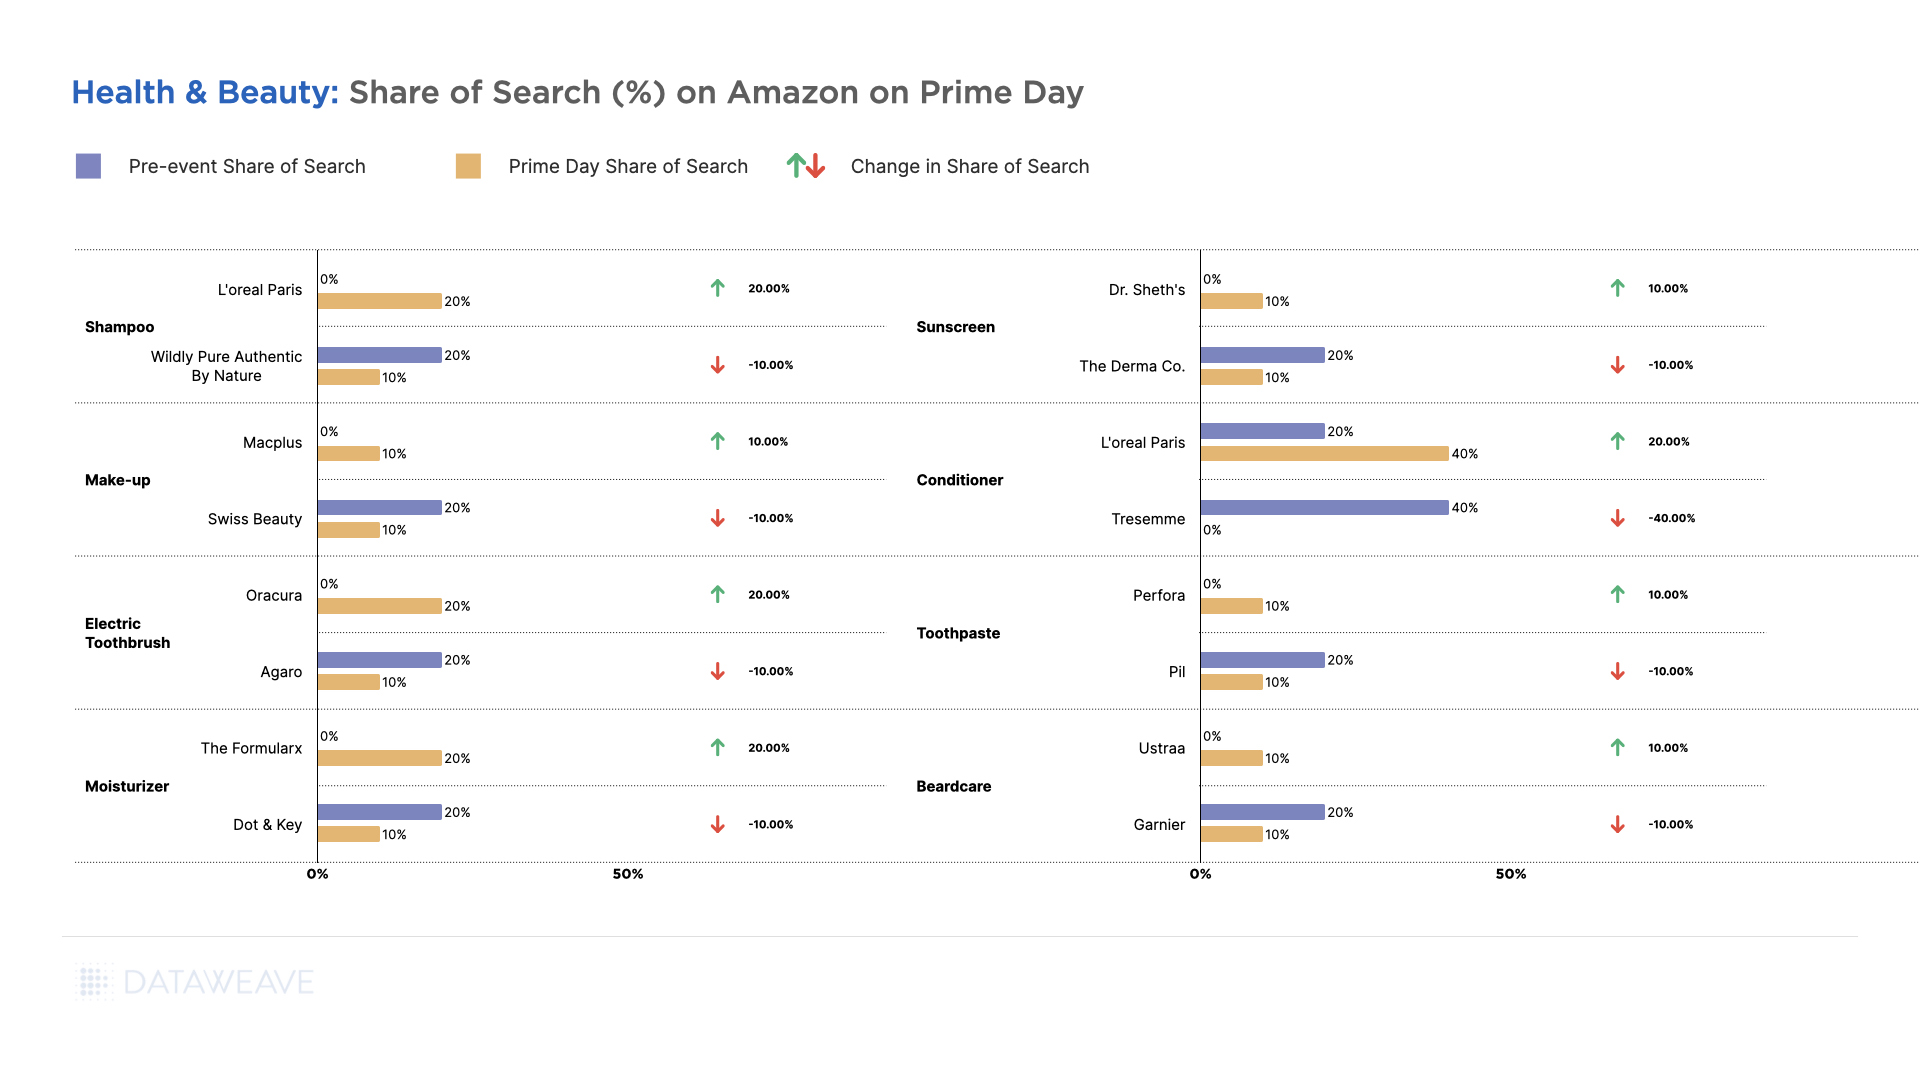
In terms of Share of Search, once again, Beardo was the most discoverable brand in this category. Brands like Dove, Pond’s, Swiss Beauty, and Tresemme saw a lower Share of Search on Flipkart compared to Amazon.
Navigating the Competitive Landscape: How To Thrive During Sale Events
Amazon and Flipkart’s strategic pricing during the Big Billion Days and the Great Indian Festival Sale reflects a balance of profitability, inventory, and competition. Competitive pricing insights empower retailers to make informed decisions, optimize strategies, and thrive during high-stakes sale events with timely and relevant insights at a massive scale.
To learn more about how you can leverage competitive pricing insights to stay ahead of the game during sale events, reach out to us today!
On Black Friday this year, Health & Beauty brands saw a significant increase with a 13% jump in foot traffic, according to a report by RetailNext. Despite caution from various sources, higher prices for everyday goods, and high interest rates, consumers chose to spend big this cyber week.
So what kind of deals did top retailers and brands offer in the Health & Beauty category this BFCM? At DataWeave, we harnessed the power of our proprietary data aggregation and analysis platform to track and analyze the prices and deals of Health & Beauty products across prominent retailers to uncover unique insights into their price competitiveness this BFCM, as well as understand how pricing strategies varied across diverse subcategories and brands.
For this analysis, we tracked the average discounts among leading US retailers in the Health & Beauty category during the Thanksgiving weekend sale, including Black Friday and Cyber Monday. We noticed prices and discounts didn’t change significantly over the course of the weekend, and hence the average prices of products between the 24th and 27th of November are being reported. Our sample was chosen to encompass the top 500 ranked products in each product subcategory across leading retailers during the sale.
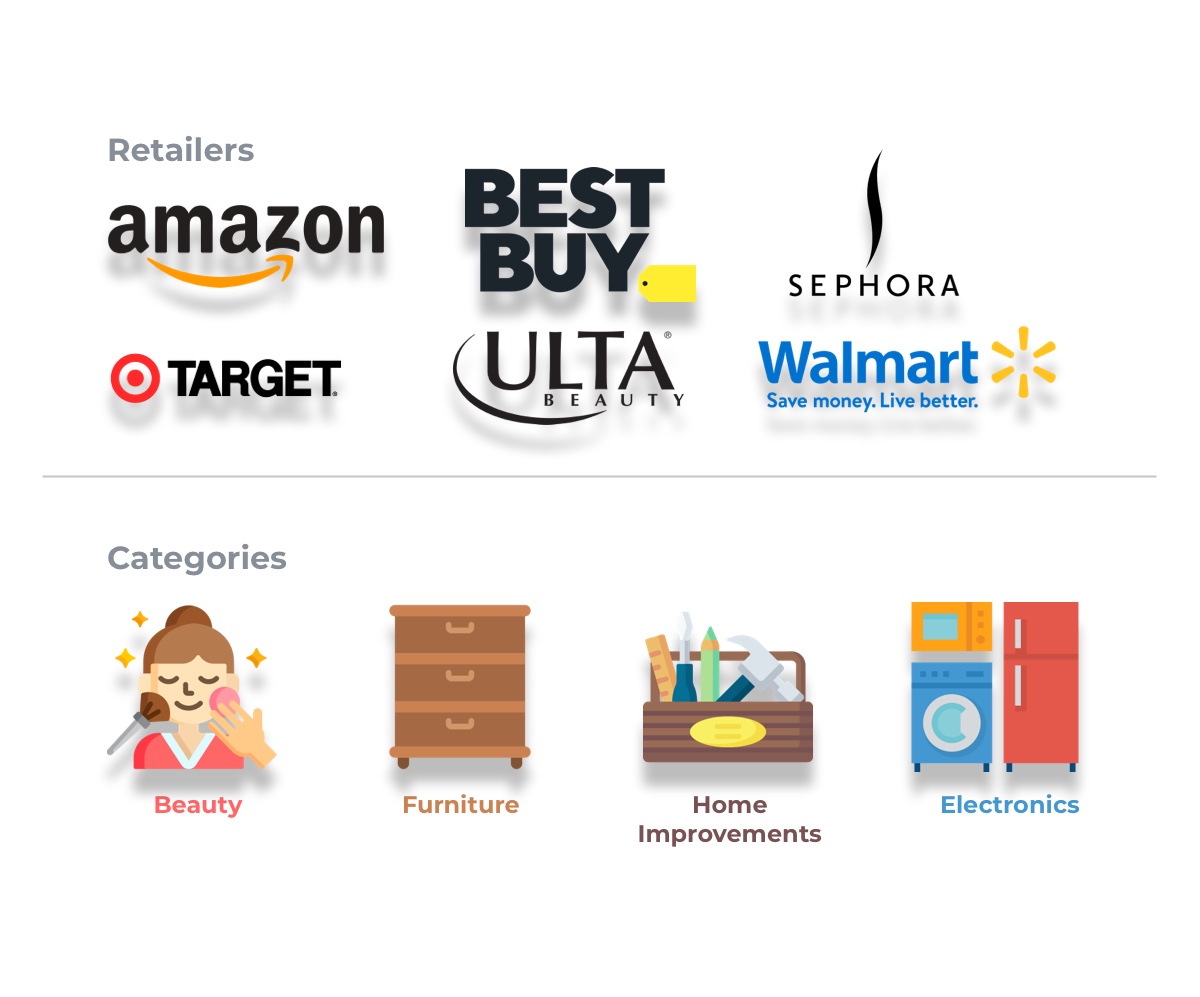
Subcategories reported on: Shampoo, Toothpaste, Conditioner, Sunscreen, Makeup, Electric Toothbrush, Beard Care, Moisturizer
Timeline of analysis: 24 to 27 November 2023
Our Key Findings
Average Discounts Across Retailers
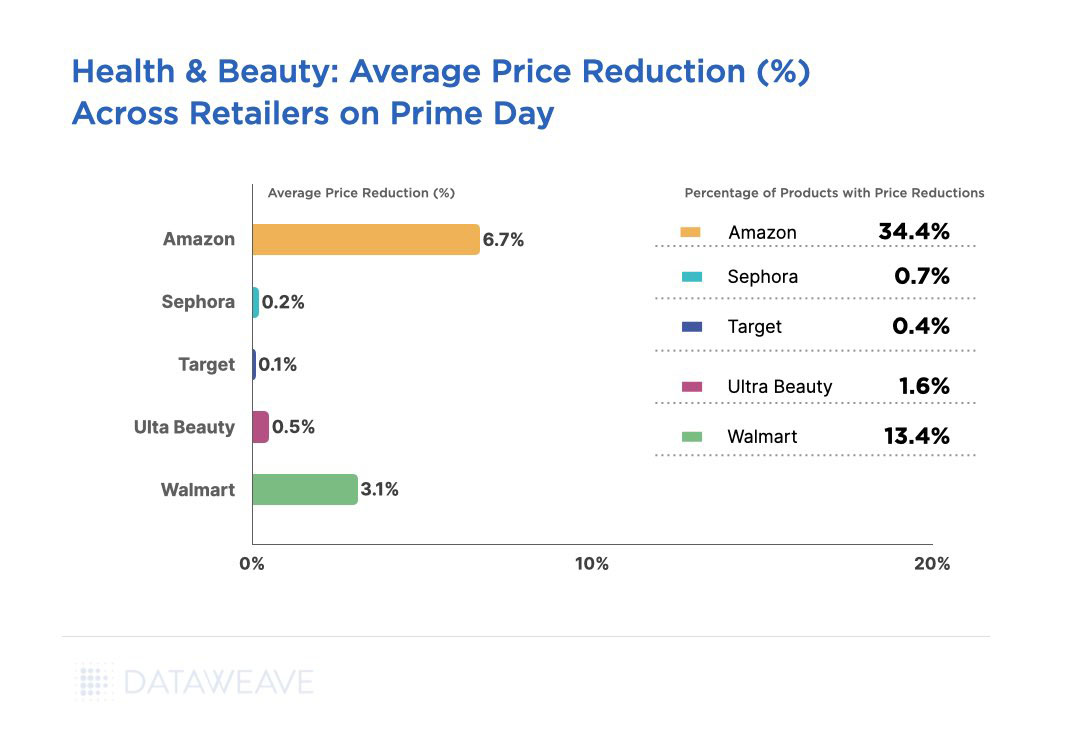
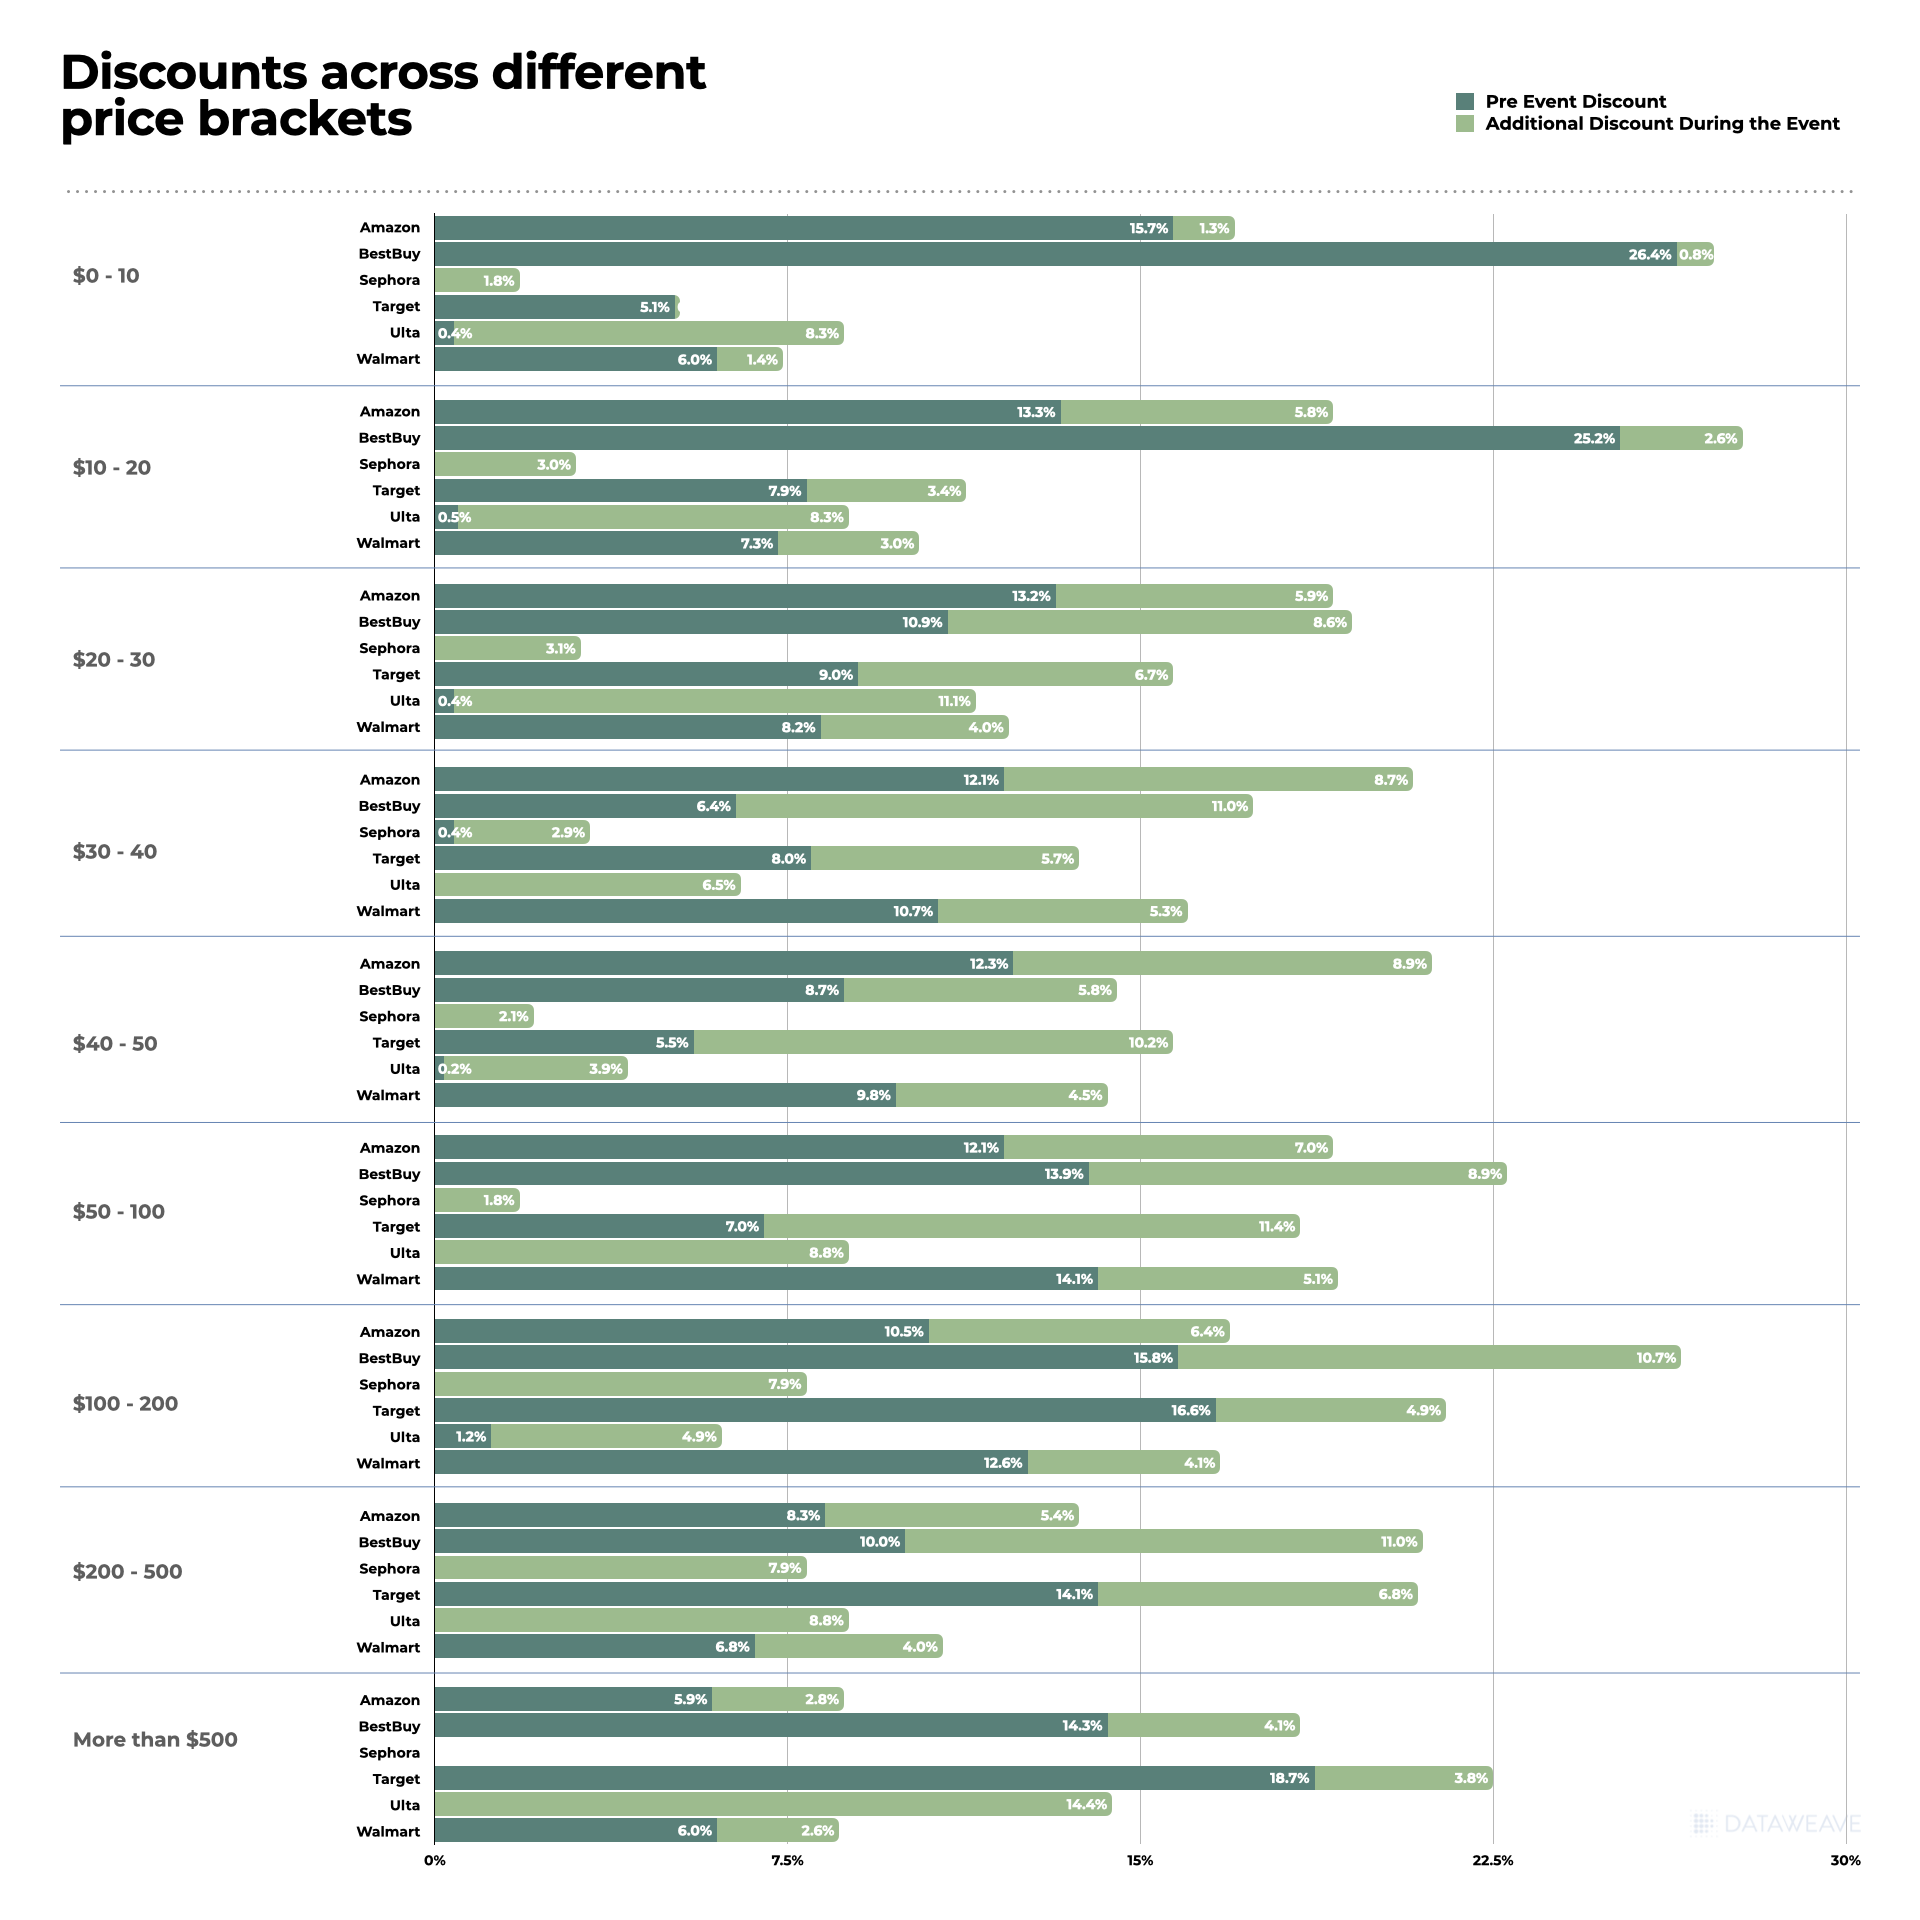
Amazon leads the pack with a huge margin, offering an average discount of 31.9%, covering 62% of its products analyzed. Target follows an 18.8% average discount across only 5% of its analyzed assortment. The other retailers aren’t even close.
Ulta Beauty was the next in line, providing a 9.2% average discount followed by Walmart with a 6.8% average discount. Sephora, known for its premium beauty offerings, adopted a more conservative approach with a 3.5% average discount, targeting only 9% of its top products
Across retailers, it is clear that Amazon led the charge by far this cyber week, with the other retailers choosing to markdown prices conservatively in the Health & Beauty category.
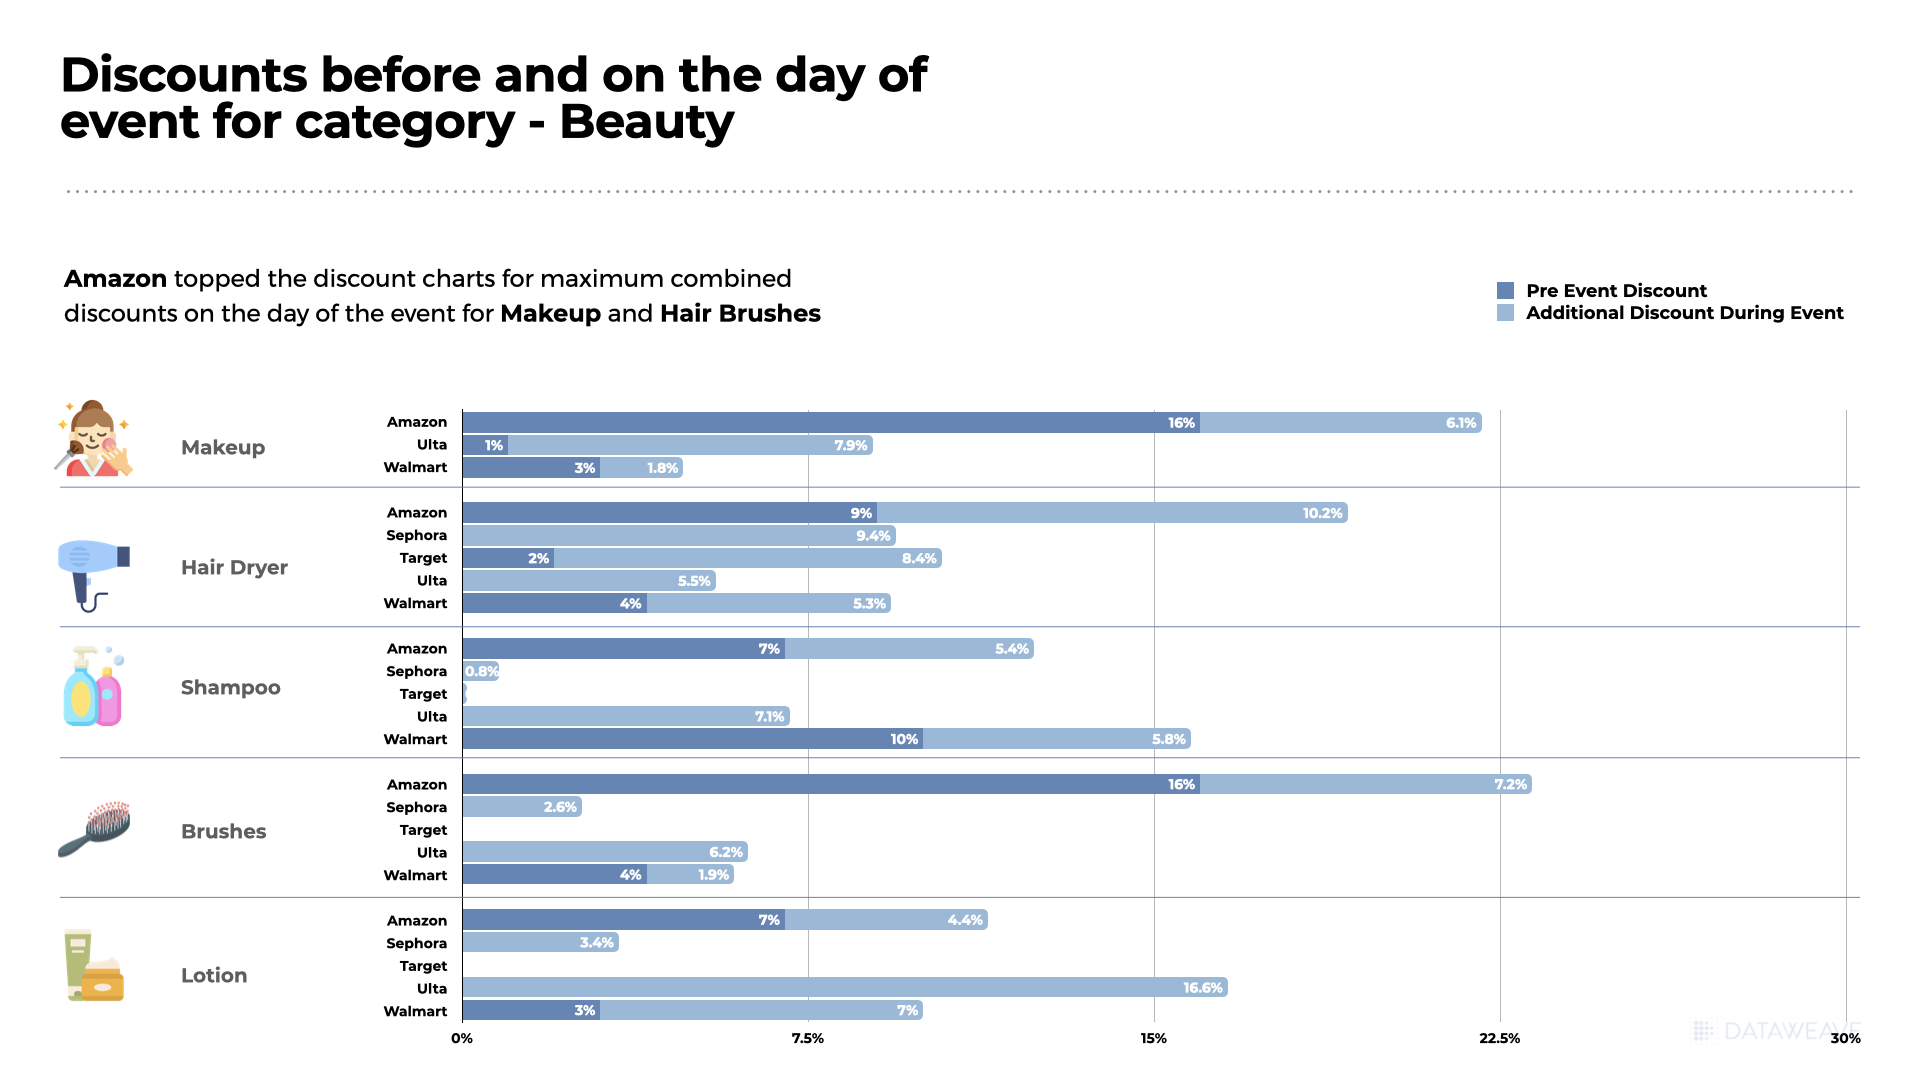
Average Discounts: Subcategories
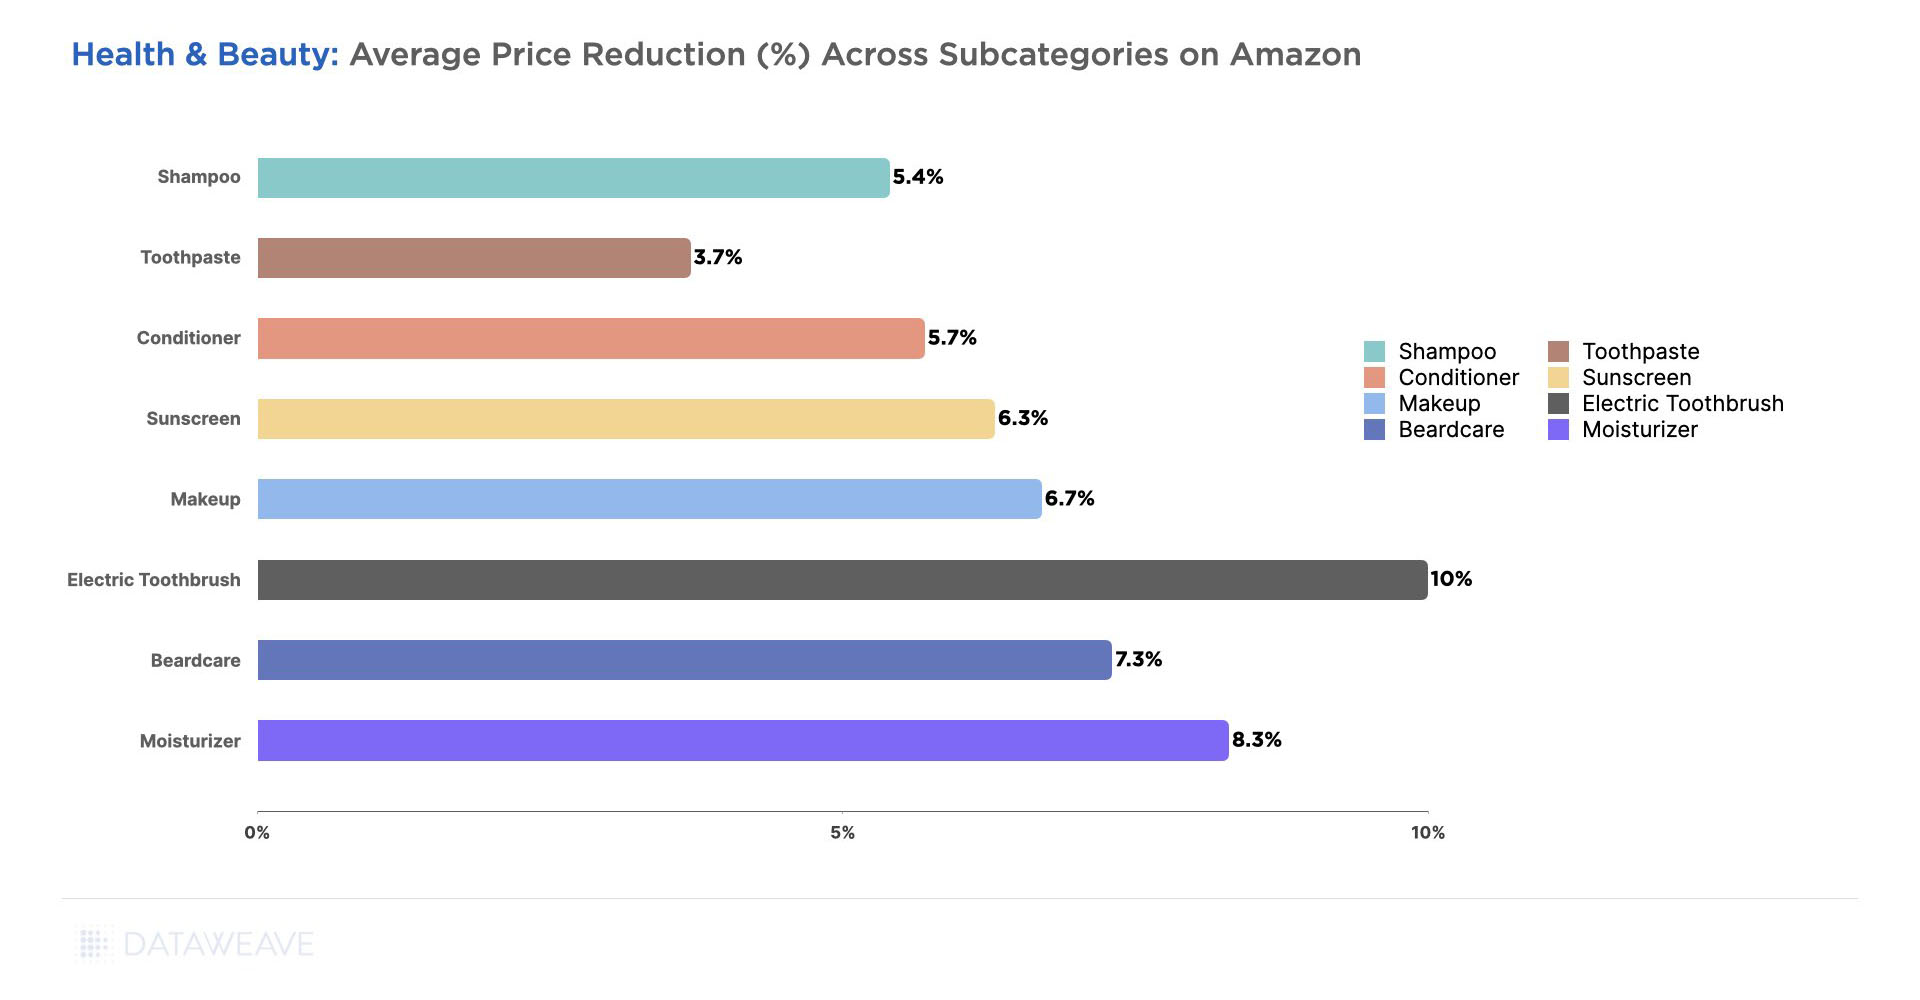
Amazon offered high discounts on lower priced subcategories like Toothpaste (49.4%), Sunscreen (46.3%), Moisturizers (38.5%), and Conditioners (37.5%), highlighting its focus on products with high demand that consumers would look to stock up on. Ulta Beauty also focused its discounts on Toothpaste (15.6%), Moisturizers (14.9%), and Conditioners (12.6%), targeting skincare and grooming.
Sephora, meanwhile, offered the most attractive deals on the Makeup subcategory at 5.3% across 12.67% of its analyzed assortment, banking on the demand generated due to the brand’s popularity in this subcategory.
Target prioritized discounts on Toothpaste (22.5%), Shampoo (21.6%), and Moisturizers (18.9%). Walmart too offered significant discounts on Shampoo (21.6%) and Toothpaste (22.5%).
Retailers prioritized staple subcategories like Toothpaste and Moisturizer with substantial discounts during this Black Friday Cyber Monday, ensuring a broad consumer appeal. In contrast, discretionary items like Makeup may be less motivated by discounts alone, and hence saw lower discounts during the sale.
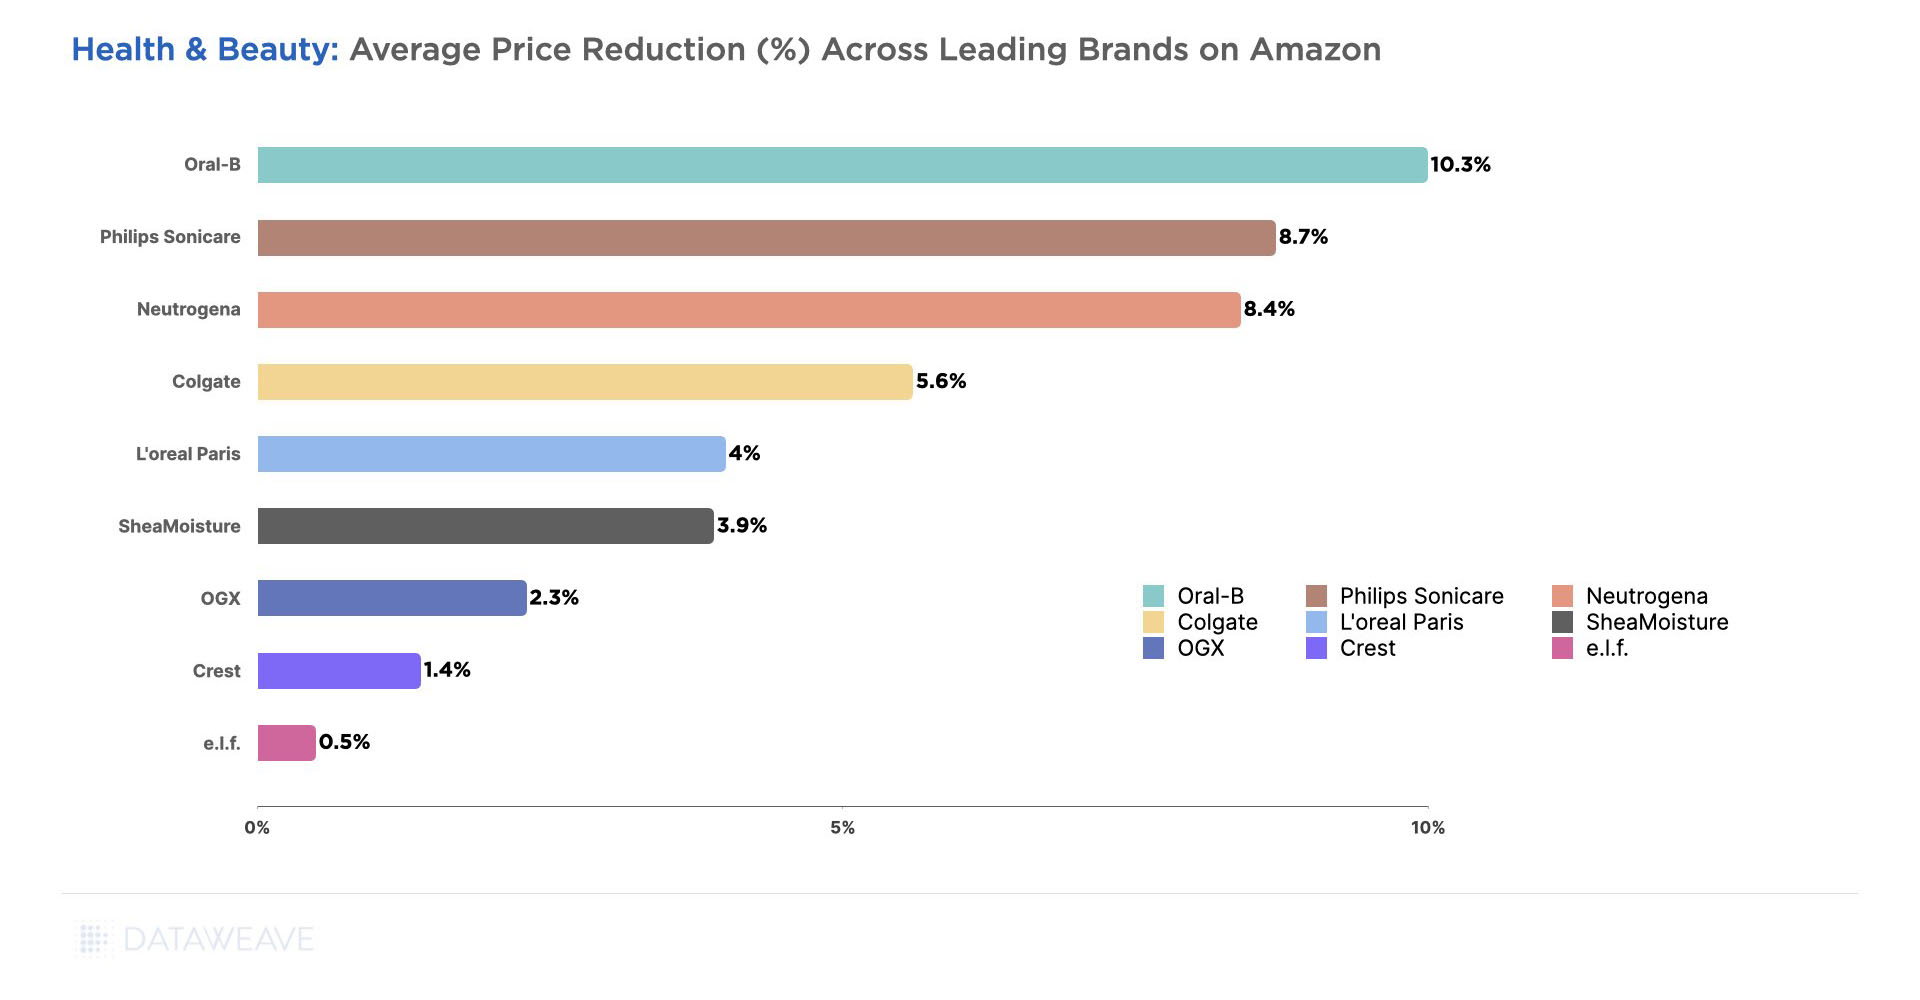
Average Discounts: Brands
Brands offered the most attractive deals on Amazon, with OGX leading the pack at 58.4% average discount. Neutrogena and Colgate followed with an average discount of 50.4% and 44%. This mirror’s Amazon’s subcategory focus on shampoos, conditioners, and toothpastes.
Other instances of brands offering attractive deals across retailers include Belif (27.9%) and Anastasia Beverly Hills (17.6%) on Sephora, Johnson’s (20%) and Philips Sonicare (18.8%) on Target, and Olay (12.2%) and Colgate (10.6%) on Walmart.
Ulta Beauty hosted several attractive deals by specific brands, including Moon (30.7%), Joico (24%), and Clinique (22.3%).
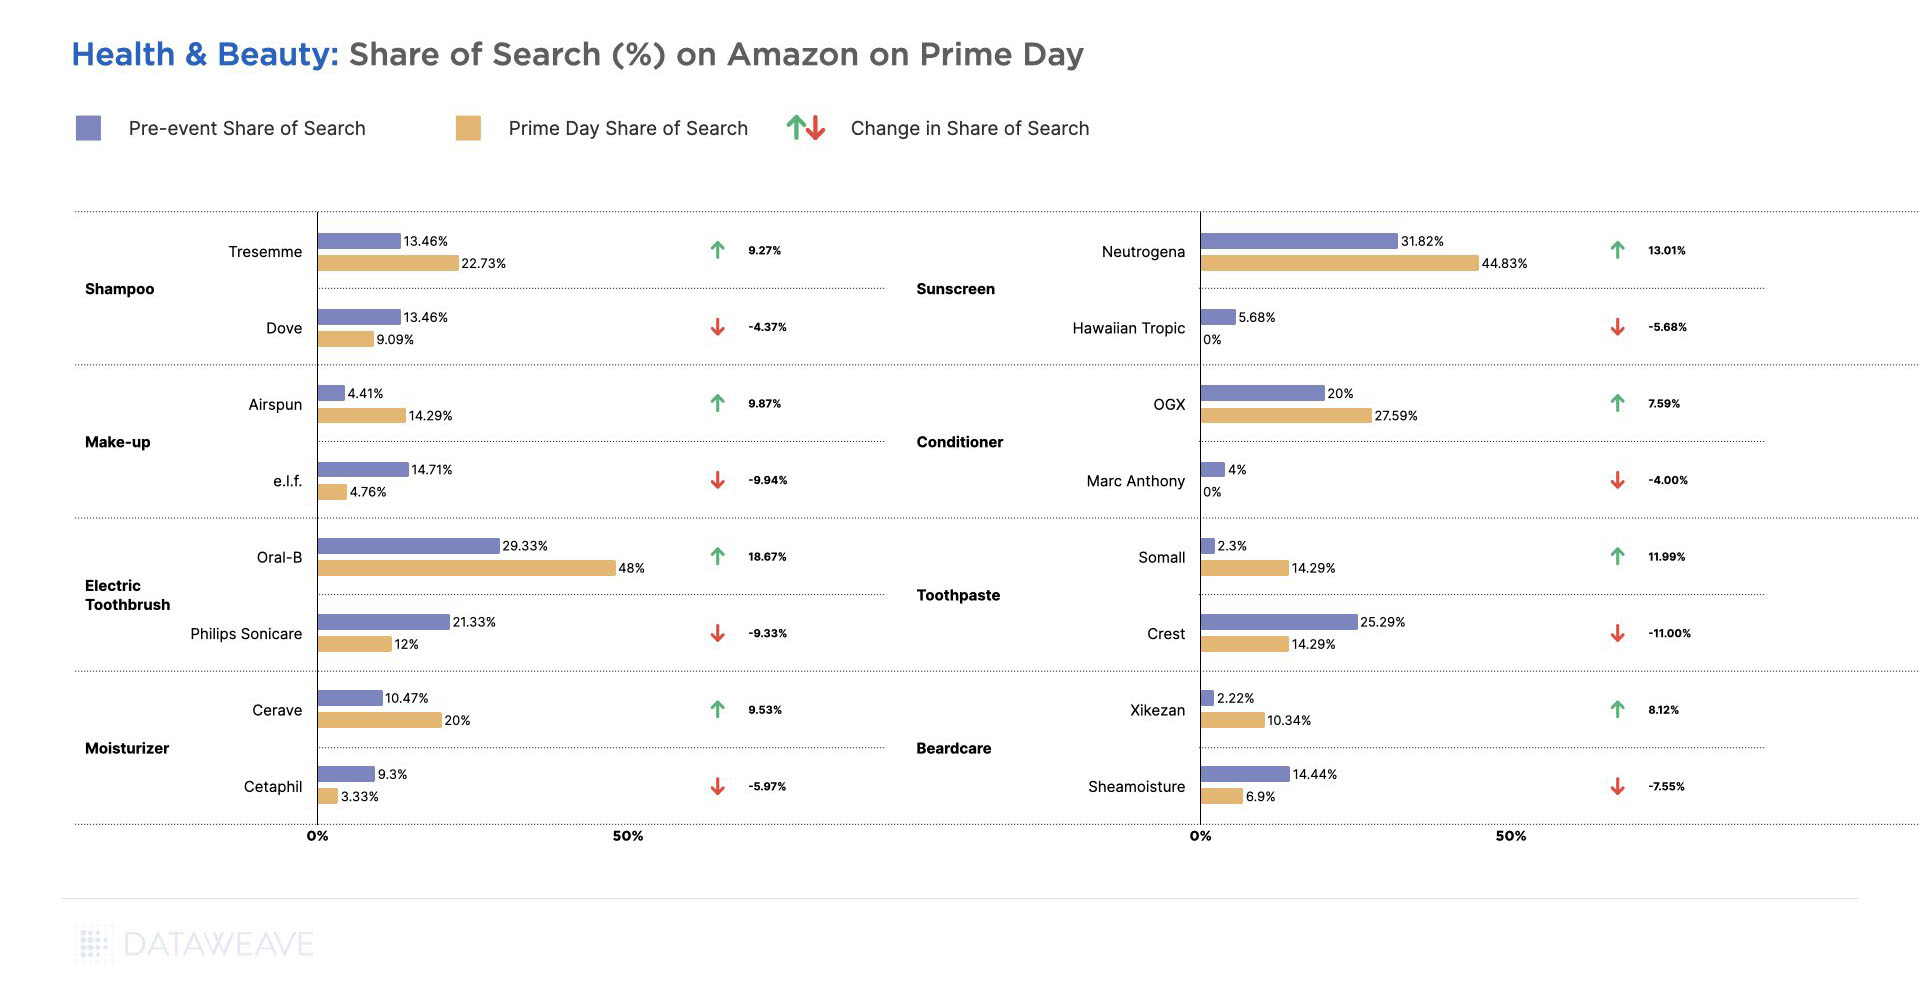
Share of Search For Health & Beauty Brands Across Subcategories
Our Share of Search analysis illuminates the strategic moves made by brands to enhance their visibility, playing a crucial role in influencing consumer choices during Black Friday and Cyber Monday.
Among some of the leading brands, Head & Shoulders and Oral-B increased their Share of Search by 2.3% and 1% respectively, reflecting a successful strategy to boost brand visibility during the Black Friday and Cyber Monday shopping events. On the other hand, L’Oreal Paris, Colgate, and Neutrogena faced marginal decreases in Share of Search.
Overall, since the difference in Share of Search values did not change dramatically, the visibility levels of leading brands across key subcategories remained consistent during the Thanksgiving weekend.
—
For deeper insights on pricing and discounting trends across a diverse range of shopping categories during Black Friday and Cyber Monday, check out our blog!
To learn more about our AI-powered Pricing Intelligence and Digital Shelf Analytics platform, contact us today!
Insider Intelligence‘s forecast of a 4.5% growth in US Holiday Sales this year has been validated by the sustained robust spending observed during Black Friday and Cyber Monday. Despite multiple challenges impacting consumer spending, such as escalating prices of everyday products and elevated interest rates, shoppers continued to spend significantly, aligning with these earlier predictions.
However, in response to these projections, retailers strategically adjusted their approach. Our analysis indicates substantial discounts prevalent in the Consumer Electronics and Home & Furniture segments during Cyber Week. Prominent retailers specializing in Home & Furniture, such as Wayfair, Overstock, and Home Depot, notably led the charge in offering attractive discounts.
At DataWeave, we harnessed the power of our proprietary data aggregation and analysis platform to track and analyze the prices and deals of home & furniture products across prominent retailers to uncover unique insights into their price competitiveness this BFCM, as well as understand how pricing strategies varied across diverse subcategories and brands.
We’ve also recently published our analysis of the Consumer Electronics and Apparel categories this Black Friday and Cyber Monday.
Our Methodology
For this analysis, we tracked the discounts offered by leading US retailers in the Home & Furniture category during the Thanksgiving weekend sale, including Black Friday and Cyber Monday. We noticed prices and discounts didn’t change significantly over the course of the weekend, and hence the average prices of products between the 24th and 27th of November are being reported. Our sample was chosen to encompass the top 500 ranked products in each product subcategory across leading retailers during the sale.
Sample size: 44,716 SKUs
Retailers tracked: Amazon, Walmart, Target, Best Buy, Overstock, Wayfair, Home Depot
Subcategories reported on: Dishwasher, Washer/Dryer, Mattresses, Beds, Dining Tables, Entertainment Units, Rugs, Luggage, Bookcases, Cabinets, Sofas, Coffee Tables
Timeline of analysis: 24 to 27 November 2023
Our Key Findings
Discounts Across Retailers
Wayfair led the pack with the highest average discount of 27.5%, covering an impressive 88% of its Home & Furniture inventory. This bold strategy positions Wayfair as a go-to destination for consumers seeking substantial savings on high-quality Home & Furniture items during Black Friday and Cyber Monday.
Home Depot offered an average discount of 17.5%, covering a substantial 69% of the products analyzed, choosing to cash in on the Cyber Week madness. Overstock followed next with an average discount of 16.6%.
Interestingly, Home & Furniture happens to be one of the few categories in which Amazon did not offer the highest discount among the analyzed retailers, choosing a moderate average discount of 13.8%.
Best Buy also maintained a competitive stance in the category, providing an average discount of 12.8% across 58% of their assortment. Target adopted a conservative markdown strategy, offering a relatively low average discount of 6.5%.
In summary, the Home & Furniture category exhibited a diverse range of discounting strategies among retailers, reflecting a balance between competitiveness and profit margins. Consumers could have chosen from a spectrum of discounts based on their preferences and budget considerations during Black Friday and Cyber Monday.
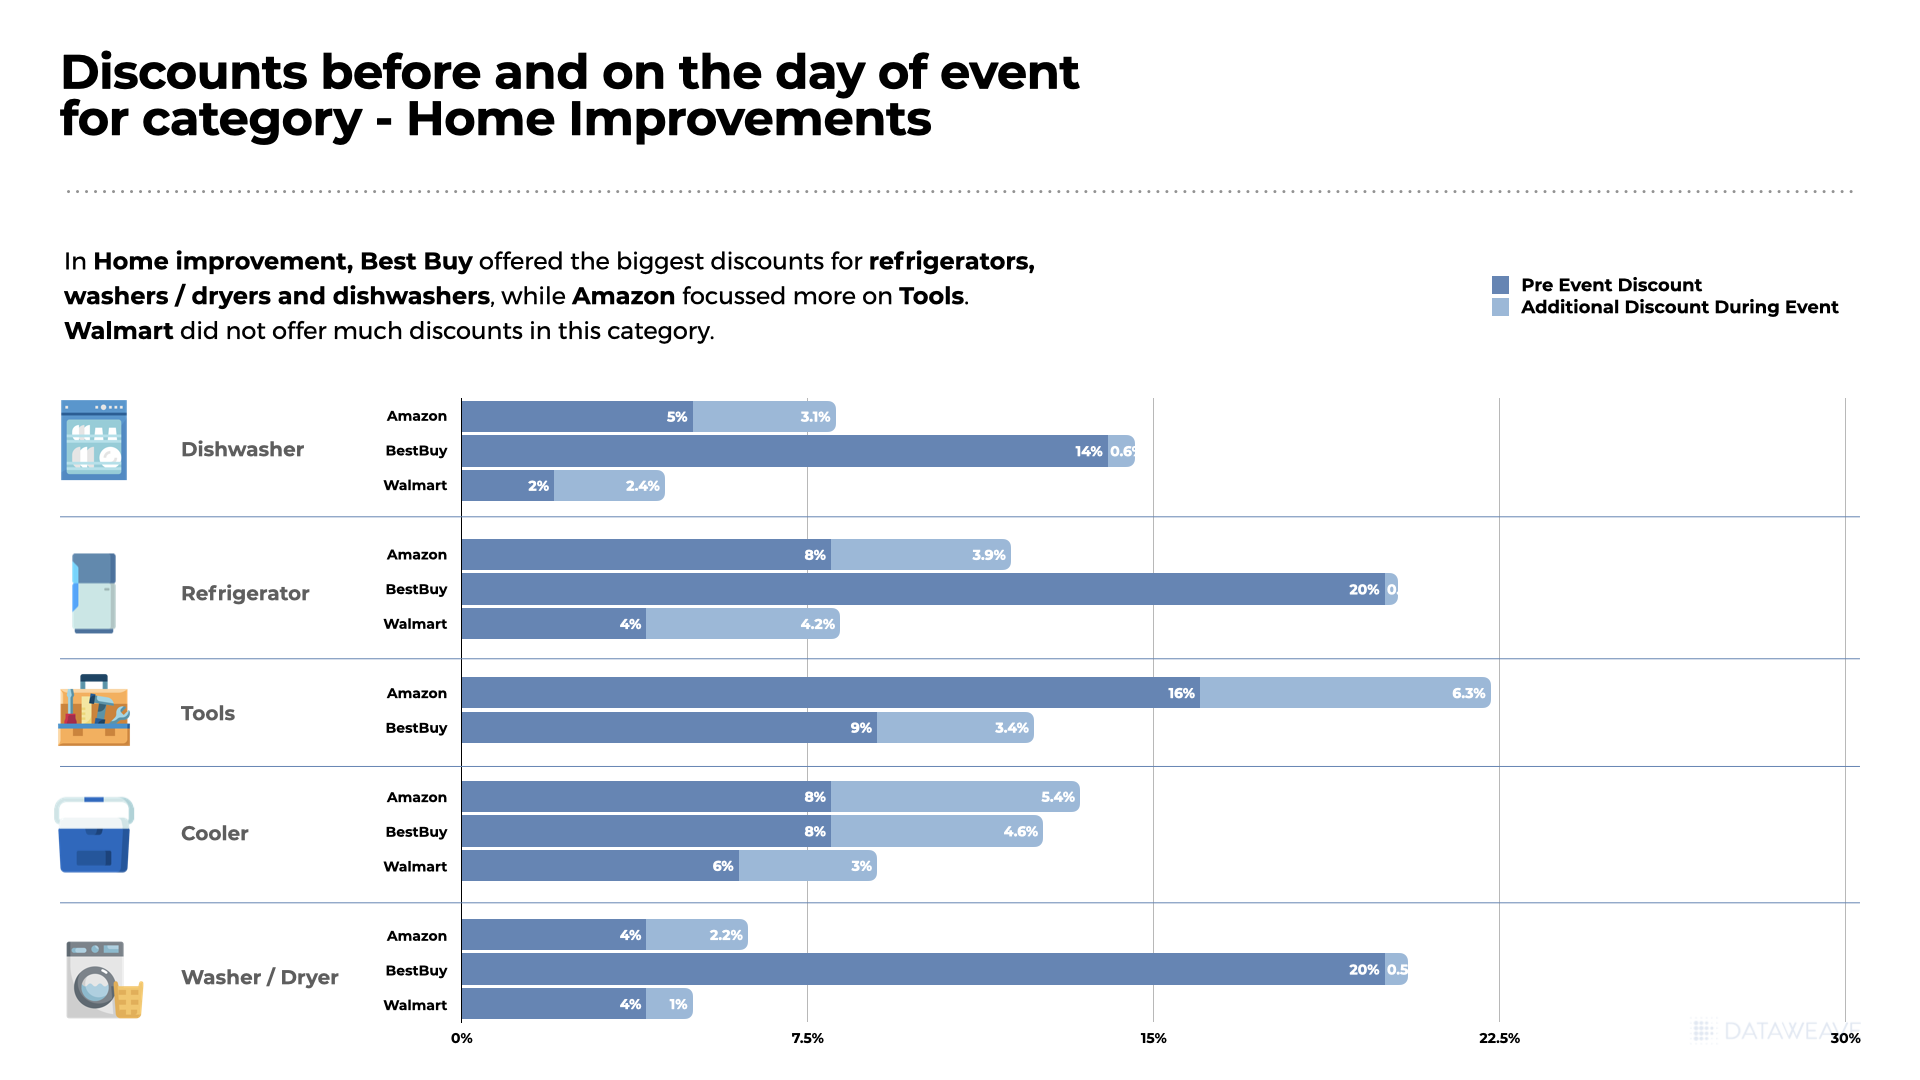
Average Discounts: Subcategories
Among subcategories, Amazon offered a moderate 8.3% average discount on 32.9% of its products in this Dishwasher category, while Best Buy took a more aggressive stance with a 14.7% average discount covering 55.9% of its products.
Home Depot emerged as a standout player in the Washer/Dryer category, providing a substantial 21.3% discount on 78.4% of its analyzed inventory. Best Buy closely followed with a 15.1% average discount targeting 67.6% of its products.
Wayfair grabbed attention with a generous 36.9% average discount on Mattresses, covering almost all (99%) of its analyzed products. In addition, Wafair led the discount war in Beds, Dining Tables, Cabinets, Sofas, Coffee Tables, and Entertainment Units. Overstock took an aggressive pricing stance on Rugs, offering a substantial 52.3% average discount, covering 100% of its Rugs inventory.
Average Discounts: Brands
Among brands, Signature Design by Ashley maintained a consistent presence with substantial discounts on both Best Buy (25.24%) and Overstock (16.19%). This could be indicative of the brand’s commitment to appealing to a diverse customer base through varied retail channels. Costway emerges as a standout brand offering exceptionally high discounts at both Target (61.6%) and Walmart (51.7%).
Home Decorators Collection, Home Depot’s in-house brand, offered a significant 30.9% discount at Home Depot. High-margin private label brands like these afford retailers the opportunity to offer markdowns while retaining significant margins.
Strategic positioning on specific platforms, as seen with Alwyn Home on Wayfair and Noble House at Home Depot, suggests brands tailor their approach to the strengths and customer demographics of each retailer. The data suggests a nuanced interplay between brand positioning, discount strategies, and the perceived value offered.
Share of Search For Home & Furniture Brands
The Share of Search data for the Home & Furniture category unveils intriguing insights into brand visibility and performance during the Black Friday and Cyber Monday events. In this competitive landscape, where consumer decisions are influenced not only by discounts but also by brand visibility, the dynamics of Share of Search become pivotal.
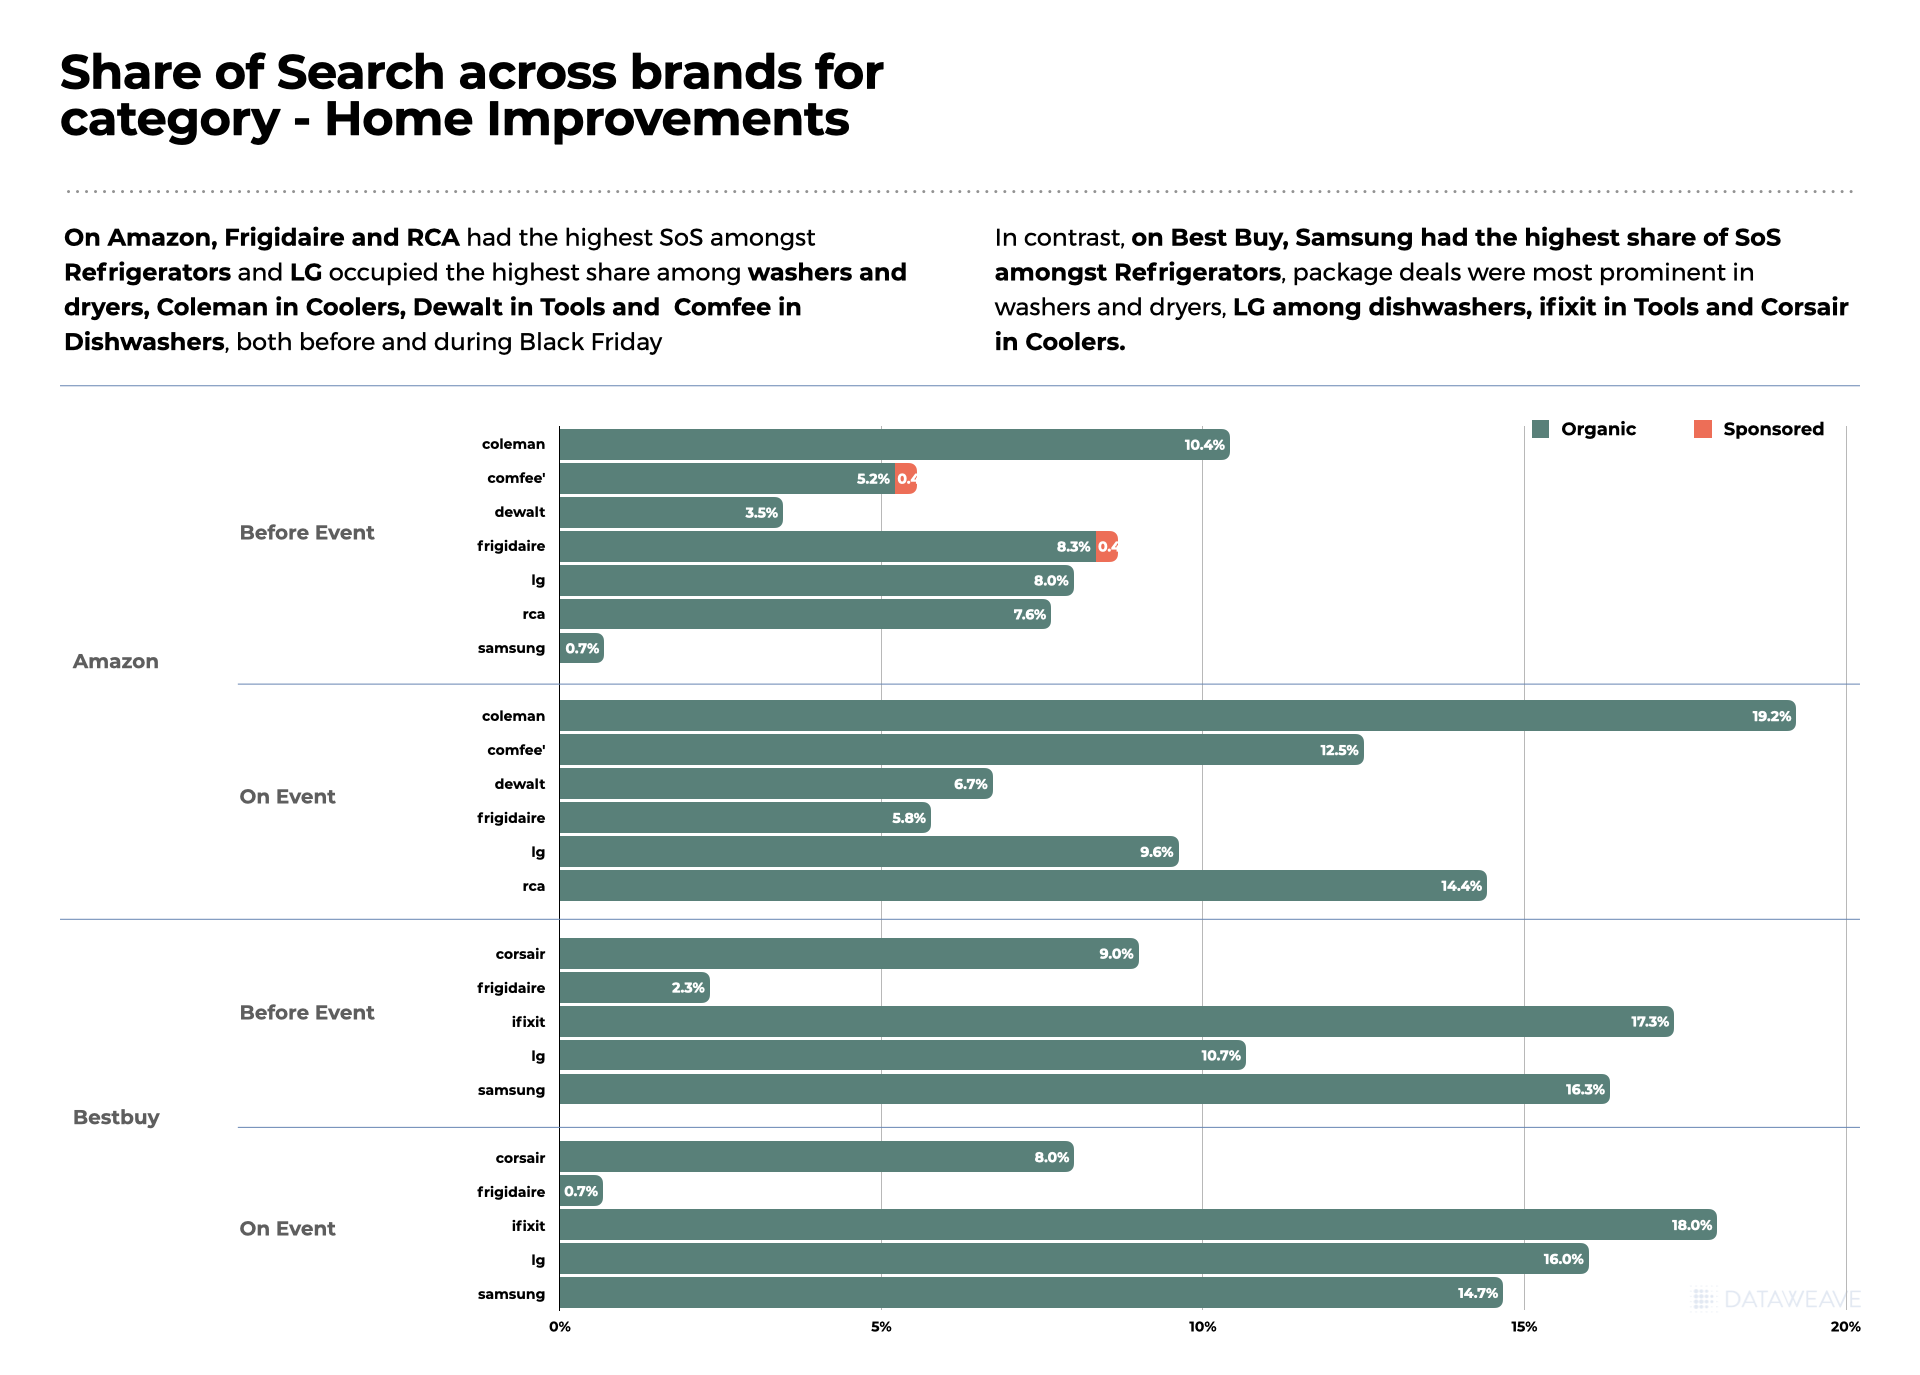
Samsung strategically increased its Share of Search during the sale, showcasing a 1.2% improvement. This suggests a deliberate effort to reinforce brand visibility and capture the attention of potential buyers actively searching for Home & Furniture products, in this case, Washer/Dryers and Dishwashers.
Bosch too experienced a notable surge in Share of Search by 1.1%. LG, meanwhile, maintained a consistent Share of Search, with a marginal decrease of 0.1%. American Tourister experienced a modest increase in Share of Search by 0.4%.
Like in the other categories analyzed, the dynamics of Share of Search in the Home & Furniture category reflect brand strategies aimed at not only offering discounts but also ensuring heightened visibility during the critical Black Friday and Cyber Monday shopping events. Positive shifts indicate effective marketing efforts, while stable performers demonstrate a resilient brand presence in a competitive online marketplace.
To explore how our insights can help retailers and brands boost their pricing strategies during sale events, reach out to us today!
For more in-depth analyses and trends across various shopping categories, stay tuned to our blog.
As the highly anticipated shopping season approached, industry analysts, including Deloitte, had forewarned consumer spending caution owing to persistent inflationary pressures tightening budgets. Despite these concerns, the holiday spirit was buoyed by sensational deals that delighted bargain-hunting shoppers.
According to the National Retail Federation (NRF), over 200 million consumers participated in both in-store and online shopping activities over the Thanksgiving weekend. This marked an almost 2% uptick from the previous year, surpassing the NRF’s initial estimates of 182 million and showcasing a robust start to the holiday shopping season.
So what was all the hype about this Black Friday and Cyber Monday? How did top retailers react to reports of possibly decreased consumer spending? At DataWeave, we harnessed the power of our proprietary data aggregation and analysis platform to track and analyze the prices and deals of products across prominent retailers and categories to uncover unique insights into their price competitiveness this BFCM, as well as understand how pricing strategies varied across diverse subcategories and brands.
In this article, we focus on the pricing and discounting strategies of Amazon, Walmart, and Target in the Apparel category.
Stay tuned to our blog for insights on other shopping categories like Home & Furniture, and Health & Beauty!
Our Methodology
For this analysis, we tracked the average discounts of apparel products among leading US retailers during the Thanksgiving weekend sale, including Black Friday and Cyber Monday. We noticed prices and discounts didn’t change significantly over the course of the weekend, and hence the average prices of products between the 24th and 27th of November are being reported. Our sample was chosen to encompass the top 500 ranked products in each product subcategory across during the sale.
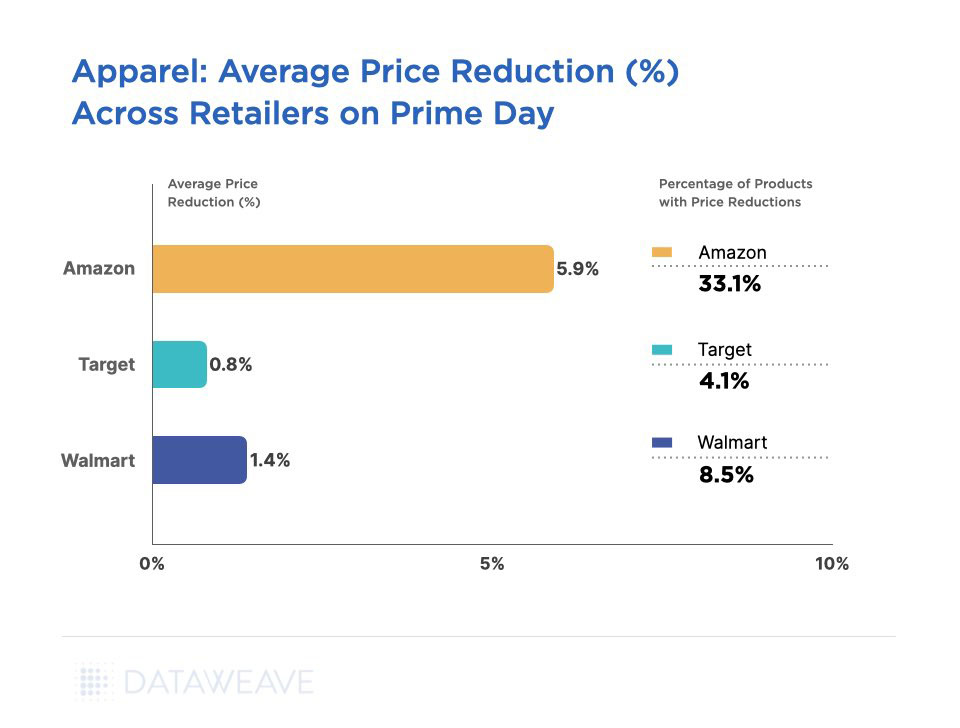
Amazon offered the most attractive deals, showcasing an average discount of 19.5%, applying to a substantial 61% of their apparel inventory.
Trailing closely behind was Target, offering an average discount of 14.8% across 52% of the products analyzed. Walmart, however, took a more conservative approach, providing an average discount of 8.5%, applicable to 29% of its products.
The contrast in discounting strategies highlights the diverse tactics employed by retailers to entice Black Friday and Cyber Monday shoppers within the Apparel category. Amazon remains the forerunner, balancing competitive discounts with a significant coverage of discounted items.
Target follows suit with a competitive stance, while Walmart opts for a more reserved markdown approach, given that the retailer tends to carry a large number of products in the affordable price ranges.
Average Discounts: Subcategories
Examining the Black Friday and Cyber Monday discount landscape within the Apparel category reveals intriguing patterns among major retailers. Amazon led the charge, boasting an impressive 24.9% average discount on Women’s Tops, covering a substantial 76.5% of its products. In the same subcategory, Target competed fiercely with a 25.1% average discount, covering 87.5% of its products. Walmart, taking a measured approach, presented a 14.6% average discount across 45.1% of its Women’s Tops inventory.
Notably, Men’s Swimwear at Target has no discounts. Meanwhile, Amazon remained aggressive across various subcategories, particularly in Women’s Shoes and Women’s Tops, aiming to capture a significant market share through both competitive pricing and a broad coverage of discounted items.
Average Discounts: Brands
Across brands, Tommy Hilfiger and Jockey took the lead on Amazon with an enticing average discount of 28.3% and 24.6% respectively, appealing to savvy shoppers. Calvin Klein followed closely with a 17.3% discount, offering a balance of style and affordability.
In Walmart, Crocs stood out with a 39.9% average discount, followed by Reebok (15.7%) and Hanes (14.9%) Xhilaration, Target’s in-house brand, stole the spotlight on the retailer platform with an impressive 50% average discount. Reebok (32.3%) and Levi’s (22.9%) maintained competitive discounts, appealing to diverse tastes.
Our analysis sheds light on the dynamic landscape of apparel discounts, showcasing how brands adopt varying pricing strategies to position themselves competitively for Black Friday and Cyber Monday shoppers.
Share of Search For Apparel Brands Across Subcategories
The dynamics of Black Friday and Cyber Monday extend beyond price reductions, with brands strategically vying for increased visibility through Share of Search metrics. This metric signifies a brand’s prominence among the top 20 ranked products in a given subcategory, offering valuable insights into their online marketplace visibility.
Among the standout performers in the Apparel category, Jockey experienced a significant surge in Share of Search, leaping from 1.70% before the event to an impressive 13.30% during the Black Friday and Cyber Monday sales. Speedo, in the Women’s Swimwear subcategory, demonstrated a substantial increase from 4.40% to 13.30%, solidifying its presence and gaining an 8.90% boost in Share of Search.
Tommy Hilfiger and Adidas also exhibited notable gains in Share of Search, increasing by 5.30% and 5.60%, respectively. However, some brands experienced a slight dip, with Speedo in the Men’s Swimwear subcategory seeing a 2.50% dip in their search visibility, and Reebok in Men’s Shoes witnessing a 3.3% decrease.
These fluctuations highlight the dynamic nature of brand strategies during Black Friday and Cyber Monday in the Apparel category, where gaining visibility also proves to be crucial alongside offering competitive discounts.
—
For a deeper dive into the world of competitive pricing intelligence and to explore how our solutions can benefit apparel retailers and brands, reach out to us today!
Stay tuned to our blog for forthcoming analyses on pricing and discounting trends across a spectrum of shopping categories, as we continue to unravel the intricacies of consumer behavior and market dynamics.
As Black Friday and Cyber Monday unfolded across the globe, there was a noticeable subdued atmosphere compared to previous years. TD Cowen brokerage adjusted its forecast for US holiday spending, revising it down from an initial 4-5% growth to a more conservative estimate of 2-3%.
Compounded by persistent inflation and elevated interest rates, many consumers find themselves financially strained, leading to the projection of the slowest growth in US holiday spending in five years.
In this context, it would be relevant to investigate whether this restrained reaction from consumers had an influence on the extent of attractive deals and discounts provided by top retailers and brands during the sale event.
At DataWeave, we harnessed the power of our proprietary data aggregation and analysis platform to track and analyze the prices and deals of consumer electronics products across prominent retailers to uncover unique insights into their price competitiveness this BFCM, as well as understand how pricing strategies varied across diverse subcategories and brands.
Keep an eye on our blog for insights on other shopping categories like Apparel, Home & Furniture, and Health & Beauty!
Our Methodology
For this analysis, we tracked the average discounts among leading US electronics retailers during the Thanksgiving weekend sale, including Black Friday and Cyber Monday. We noticed prices and discounts didn’t change significantly over the course of the weekend, and hence the average prices of products between the 24th and 27th of November are being reported. Our sample was chosen to encompass the top 500 ranked products in each product subcategory across leading retailers during the sale.
Sample size: 23,505 SKUs
Retailers tracked: Amazon, Walmart, Target, Best Buy
The observed Black Friday and Cyber Monday discount strategies reveal a distinct competitive landscape among major retailers. Amazon emerged as the frontrunner, offering the highest average discounts at 23.30%, spanning a significant 74% of their consumer electronics inventory. Best Buy closely followed, with an average discount of 19.40% across 76% of their products.
On the other hand, Target and Walmart adopted a more conservative stance, providing lower average discounts at 14.8% and 12%, respectively, with Target discounting 51% of its products and Walmart discounting 41%. This variation in discounting strategies highlights the diverse approaches retailers take to attract and retain Black Friday and Cyber Monday shoppers, balancing competitiveness with profit margins.
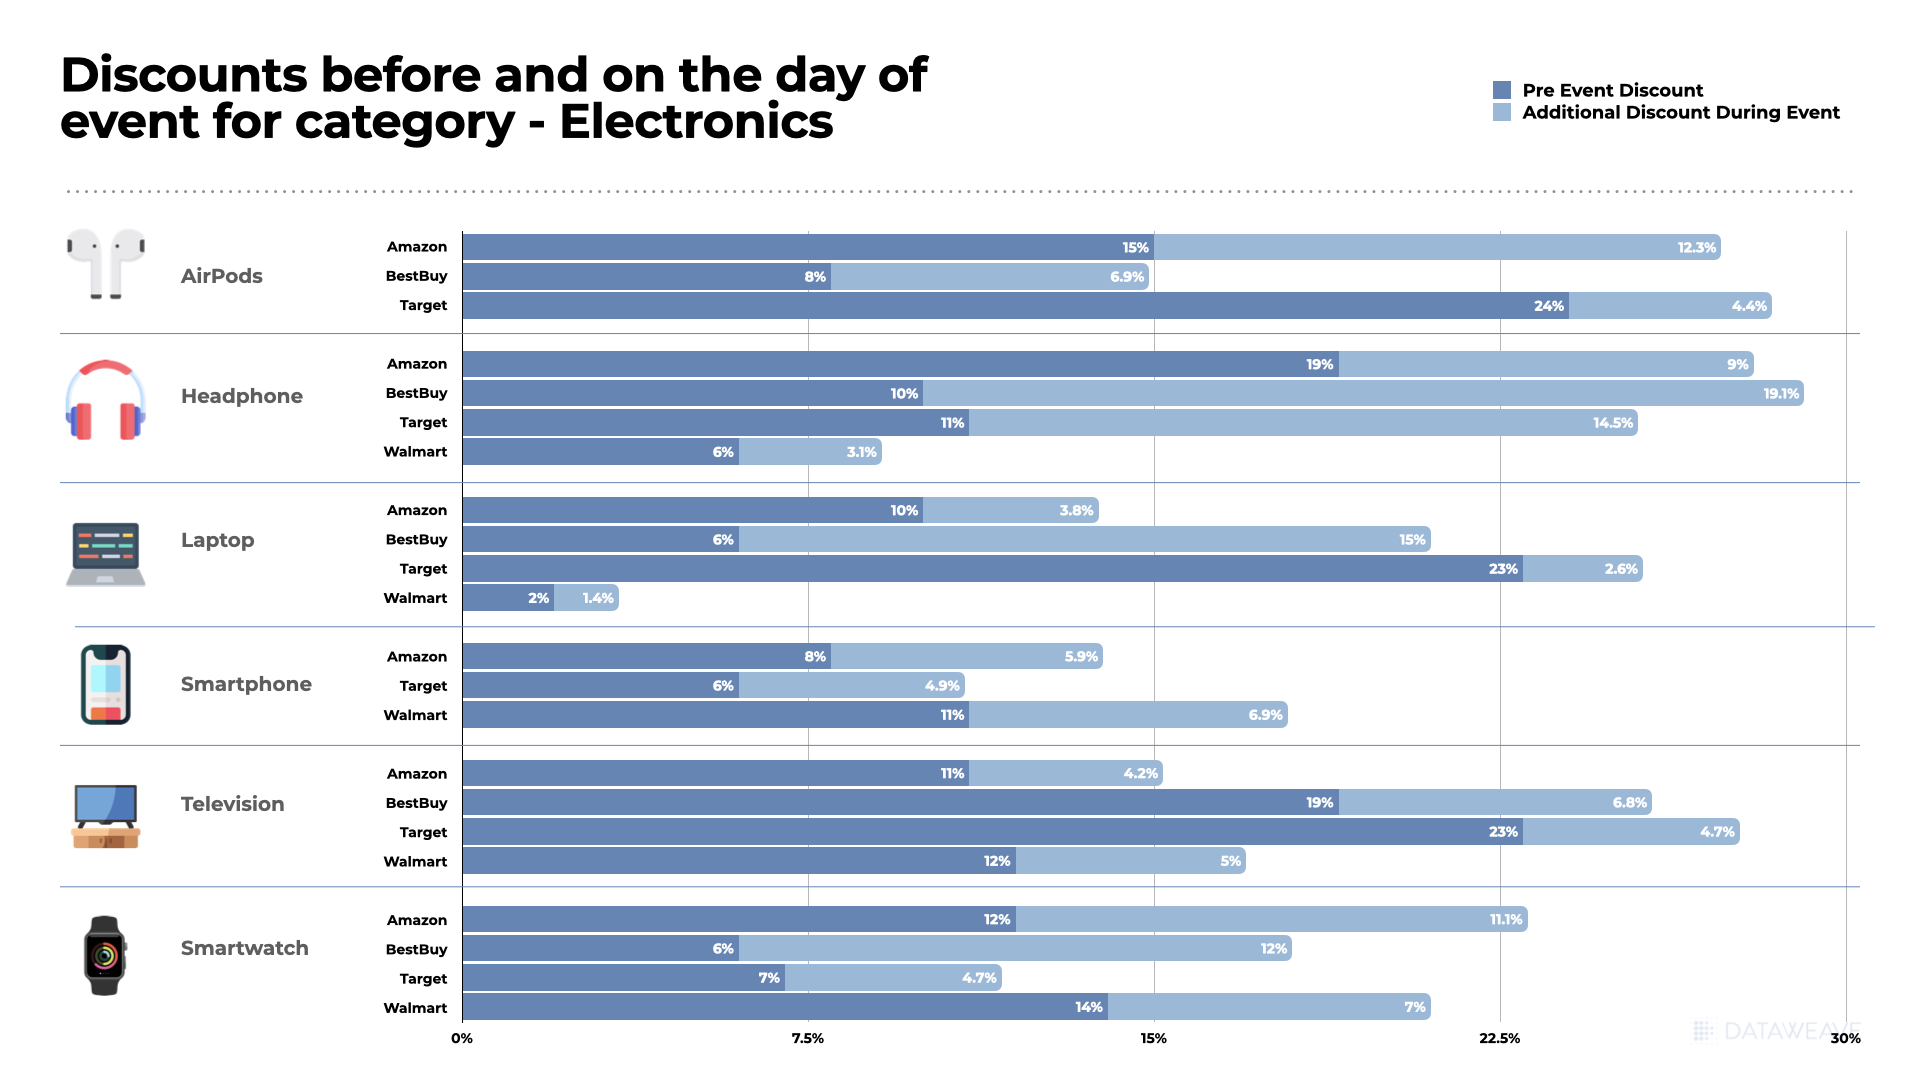
Average Discounts: Subcategories
In the Headphones subcategory, Amazon stands out with a substantial 31.40% average discount, targeting 84.69% of SKUs, showcasing an aggressive discounting strategy. Best Buy follows closely, demonstrating competitive pricing with a 21.80% average discount on 67.03% of products.
Meanwhile, in TVs, Best Buy offered a significant 17.9% average discount across 89% of its products, signaling a targeted effort to capture a broad market share in this subcategory.
In the Laptop subcategory, Target was highly conservative, with only a 4.1% average discount covering 14.3% of its products, while Walmart positioned itself with a moderate 9.5% average discount, targeting 39.8% of its inventory.
Among Smartphones, Amazon (14.7%) was third to Best Buy and Target, which offered average discounts of 20.5% and 18.1%, respectively. Walmart, with an average discount of only 9.9% in the subcategory opted for a relatively muted approach.
Average Discounts: Brands
The discount strategies across top electronics brands during Black Friday unveil distinct approaches. Samsung emerges as a focal point across Amazon, Best Buy, Walmart, and Target. The brand was most attractively priced on Best Buy, with an average discount of 25.3%, followed by Target (18.3%) and Amazon (17.9%).
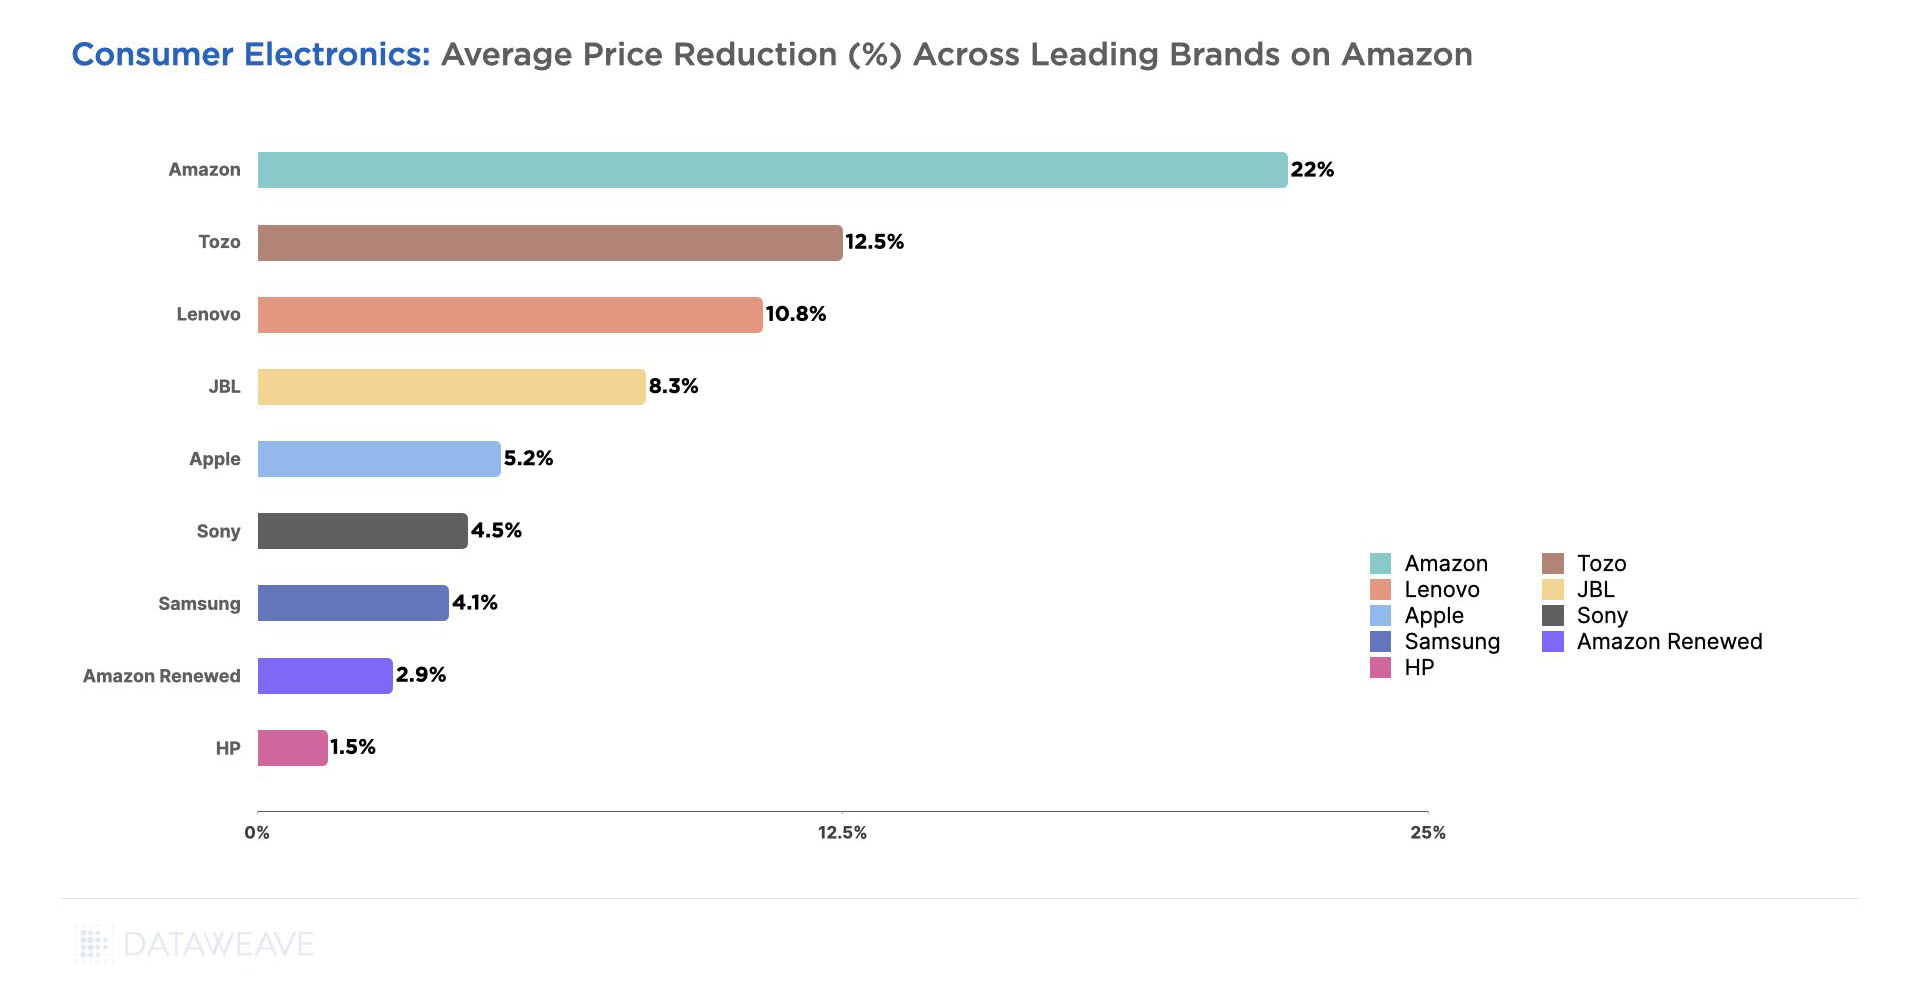
Apple’s discounts were quite consistent across Amazon (17.6%), Best Buy (16.1%), and Target (17.8%), with the exception of Walmart (8.1%). JBL, interestingly, opted to discount very heavily on Best Buy, at an average of 38.8%, resulting in several attractive deals for shoppers on the website. Sony, too, offered impressive discounts at over 23% on Amazon and Best Buy, followed by 16% on Walmart. On Amazon, Amazon Renewed (13.9%) was among the most aggressively discounted products, highlighting an effort to further appeal to cost-conscious consumers.
Overall, our analysis throws light on the nuanced strategies employed by leading brands on Amazon, Best Buy, Walmart, and Target, reflecting a delicate interplay between brand positioning, pricing competitiveness, and customer appeal.
Share of Search For Consumer Electronics Brands Across Subcategories
The Share of Search data reflects intriguing shifts in brand strategies during the Black Friday and Cyber Monday events. During sale events, brands looking to entice shoppers don’t rely only on price but also on search visibility to help drive awareness and conversion. Share of Search is defined as the share of a brand’s products among the top 20 ranked products in a subcategory, thereby providing insight into a brand’s visibility on online marketplaces.
Some of the brands that improved their Share of Search the most include LG, Skullcandy, Asus, JBL, and Samsung. On the other hand, prominent brands like Sony and Apple actually lost ground on this metric by 0.4% and 2% respectively.
At DataWeave, our commitment to empowering retailers and brands with actionable competitive and digital shelf insights remains unwavering. Our AI-powered platform provides a comprehensive view of market dynamics for our customers, enabling informed decision-making. As a partner in your journey, we offer tailored solutions to enhance your competitive edge, drive sales, and elevate your brand presence. To find out more about our solution, reach out to us today!
To learn more about pricing and discounting trends during Black Friday and Cyber Monday across various other shopping categories, stay tuned to our blog!
Amazon reported a record-breaking Prime Day this July, marking it as the biggest sales event in the company’s history. So when the eCommerce giant announced the Prime Big Deal Days this fall, we were curious to find out how big a deal it really is.
The Prime Big Deal Days, similar in magnitude to the Summer Prime Day, promised to present substantial savings across a diverse range of categories, including electronics, toys, home, fashion, beauty, and Amazon products.
However, for a shopper, an important question is: Does the Prime Big Deal Days in October offer lower prices than Amazon’s mega Prime Day event in July?
To answer this question, we turned our data aggregation and analysis platform to focus on these two sale events and analyzed which event offered better deals across key categories and brands.
TL;DR: Surprisingly, the Prime Big Deal Days in October offered, on average, 2.02% higher discounts than its counterpart event in July.
Read on for details on how we went about our analysis and how discounts vary across categories, sub-categories, and brands.
Our Methodology
We tracked the prices and discounts of a large sample of products during both Prime Day events. The following are some relevant details about our sample:
Number of products analyzed: 1500+
Categories: Apparel, Consumer Electronics, Home & Furniture, Health & Beauty
Prime Day Sale Analysis: 11-12 July 2023
Prime Big Deal Days Analysis: 10-11 Oct 2023
Website: Amazon.com
Our analysis focused on the differences in the prices and discount levels of products between the two sale events.
Our Key Findings
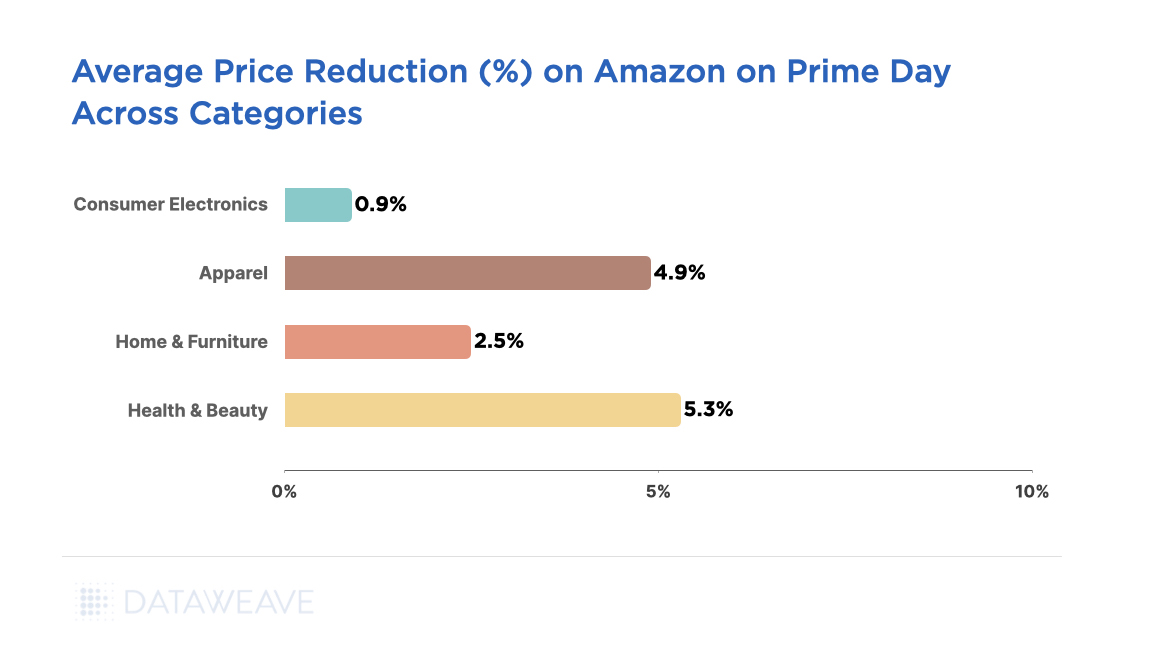
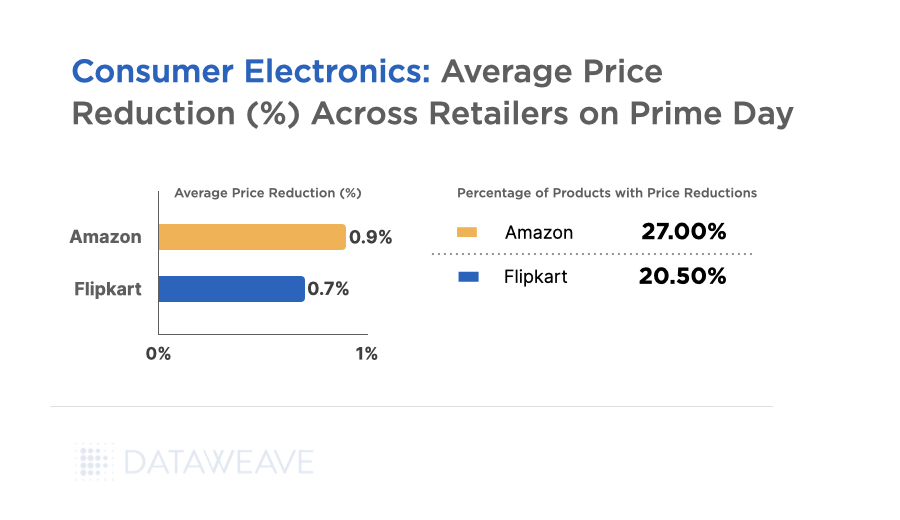
The average discount during the Prime Big Deal Days in October was 29.44%, which was 2.02% higher than the average discount during the Prime Day sale in July (27.42%). Interestingly, the October event offered better deals across each product category analyzed, albeit at slightly varying levels.
By offering deeper discounts in October, Amazon may have aimed to encourage early holiday shopping, thereby capturing a larger share of the consumer wallet before competitors intensify their promotional activities closer to the festive season.
As other retailers and online marketplaces gear up for their own holiday promotional events, Amazon’s decision to provide heightened discounts in October could serve as a preemptive move to secure customer loyalty and drive sales momentum before the onset of the peak shopping period.
Additionally, Amazon’s strategic push to amplify the visibility of its diverse product offerings, including exclusive launches and partnerships during the October event might have contributed to the higher discounts.
Next, let’s take a closer look at each product category.
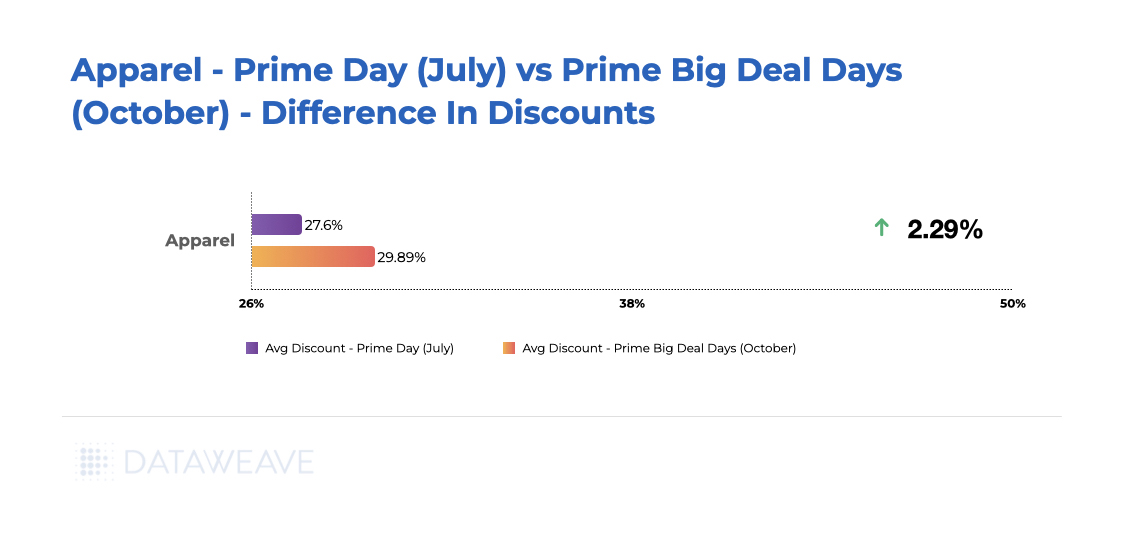
Apparel
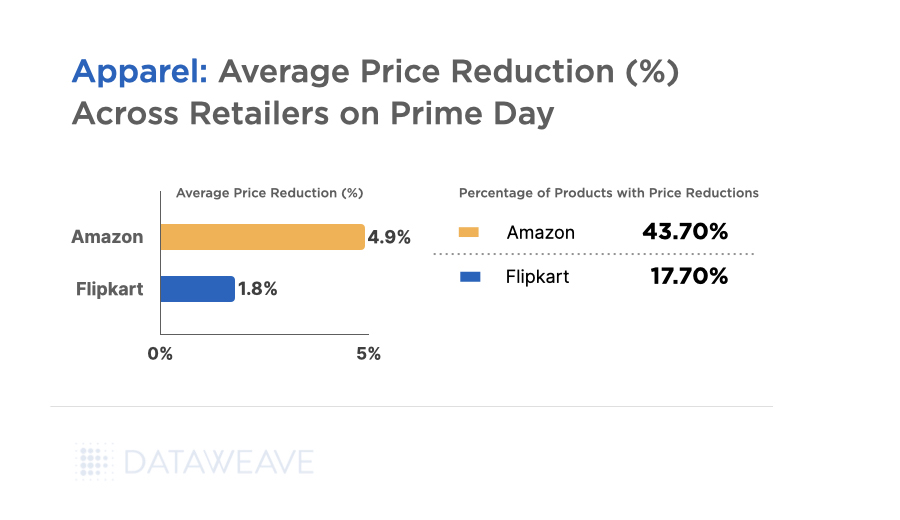
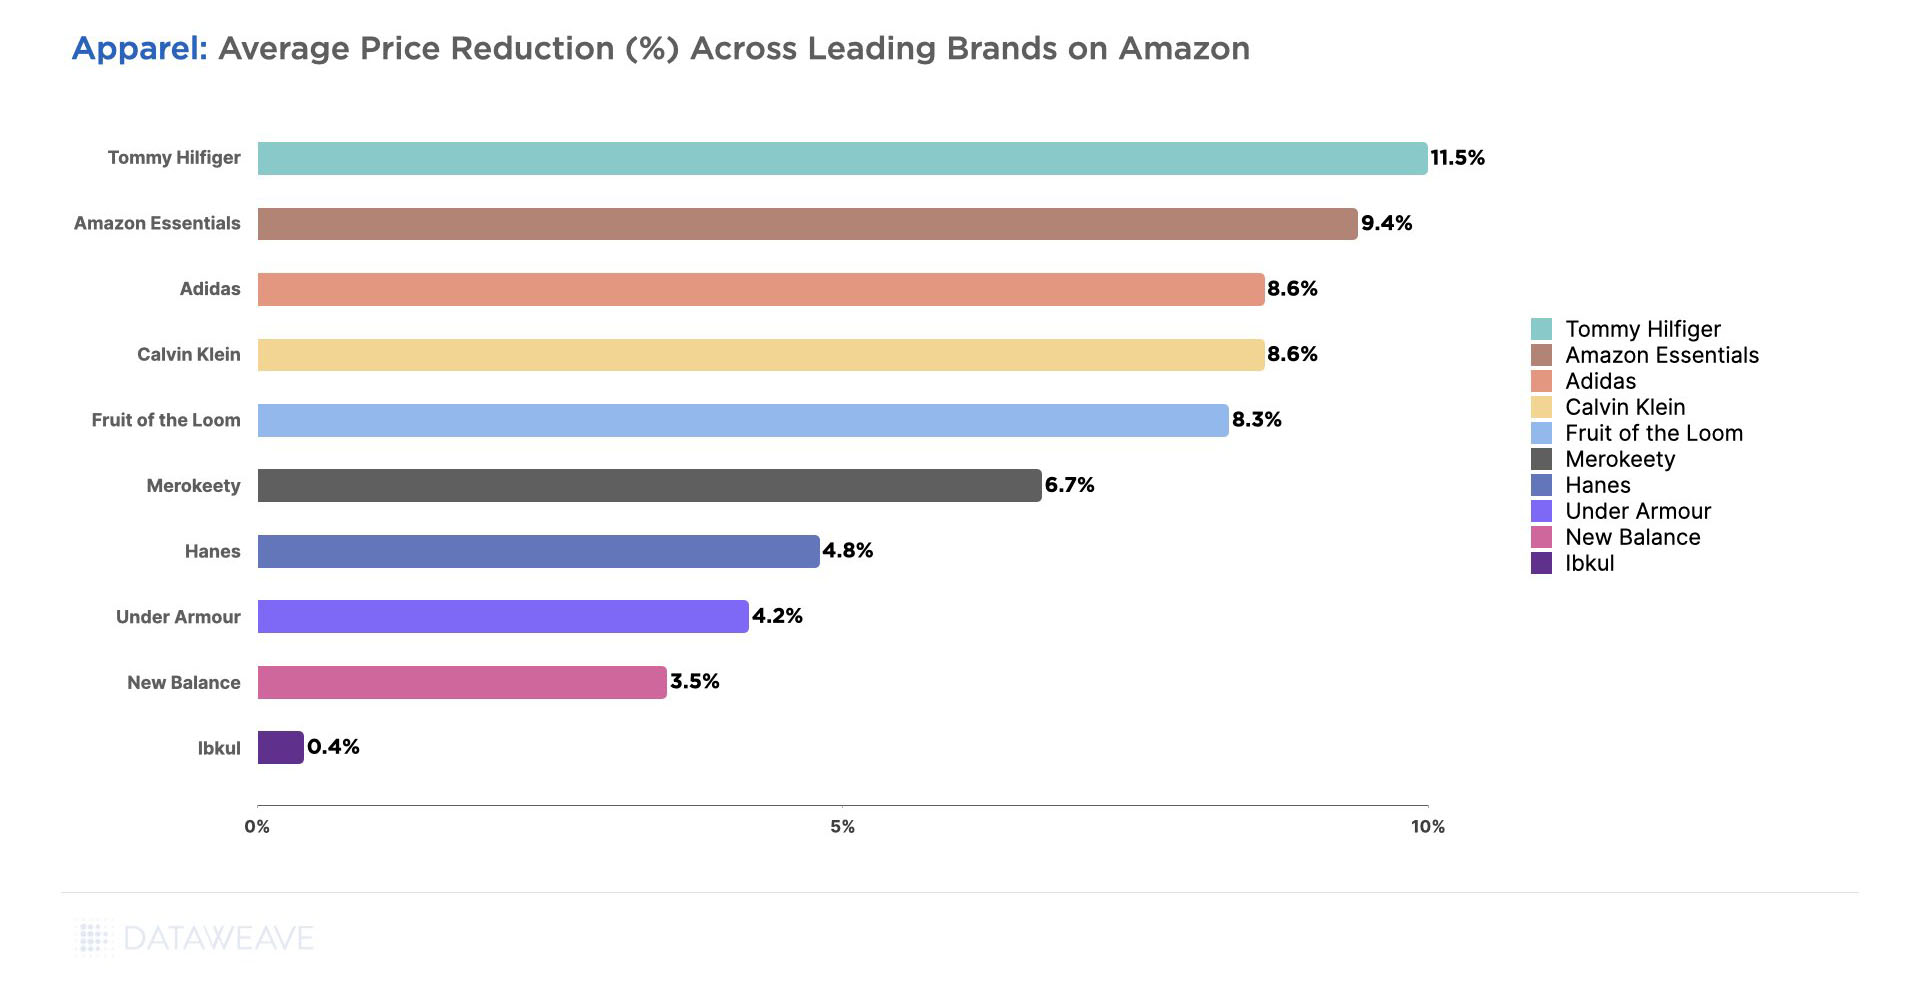
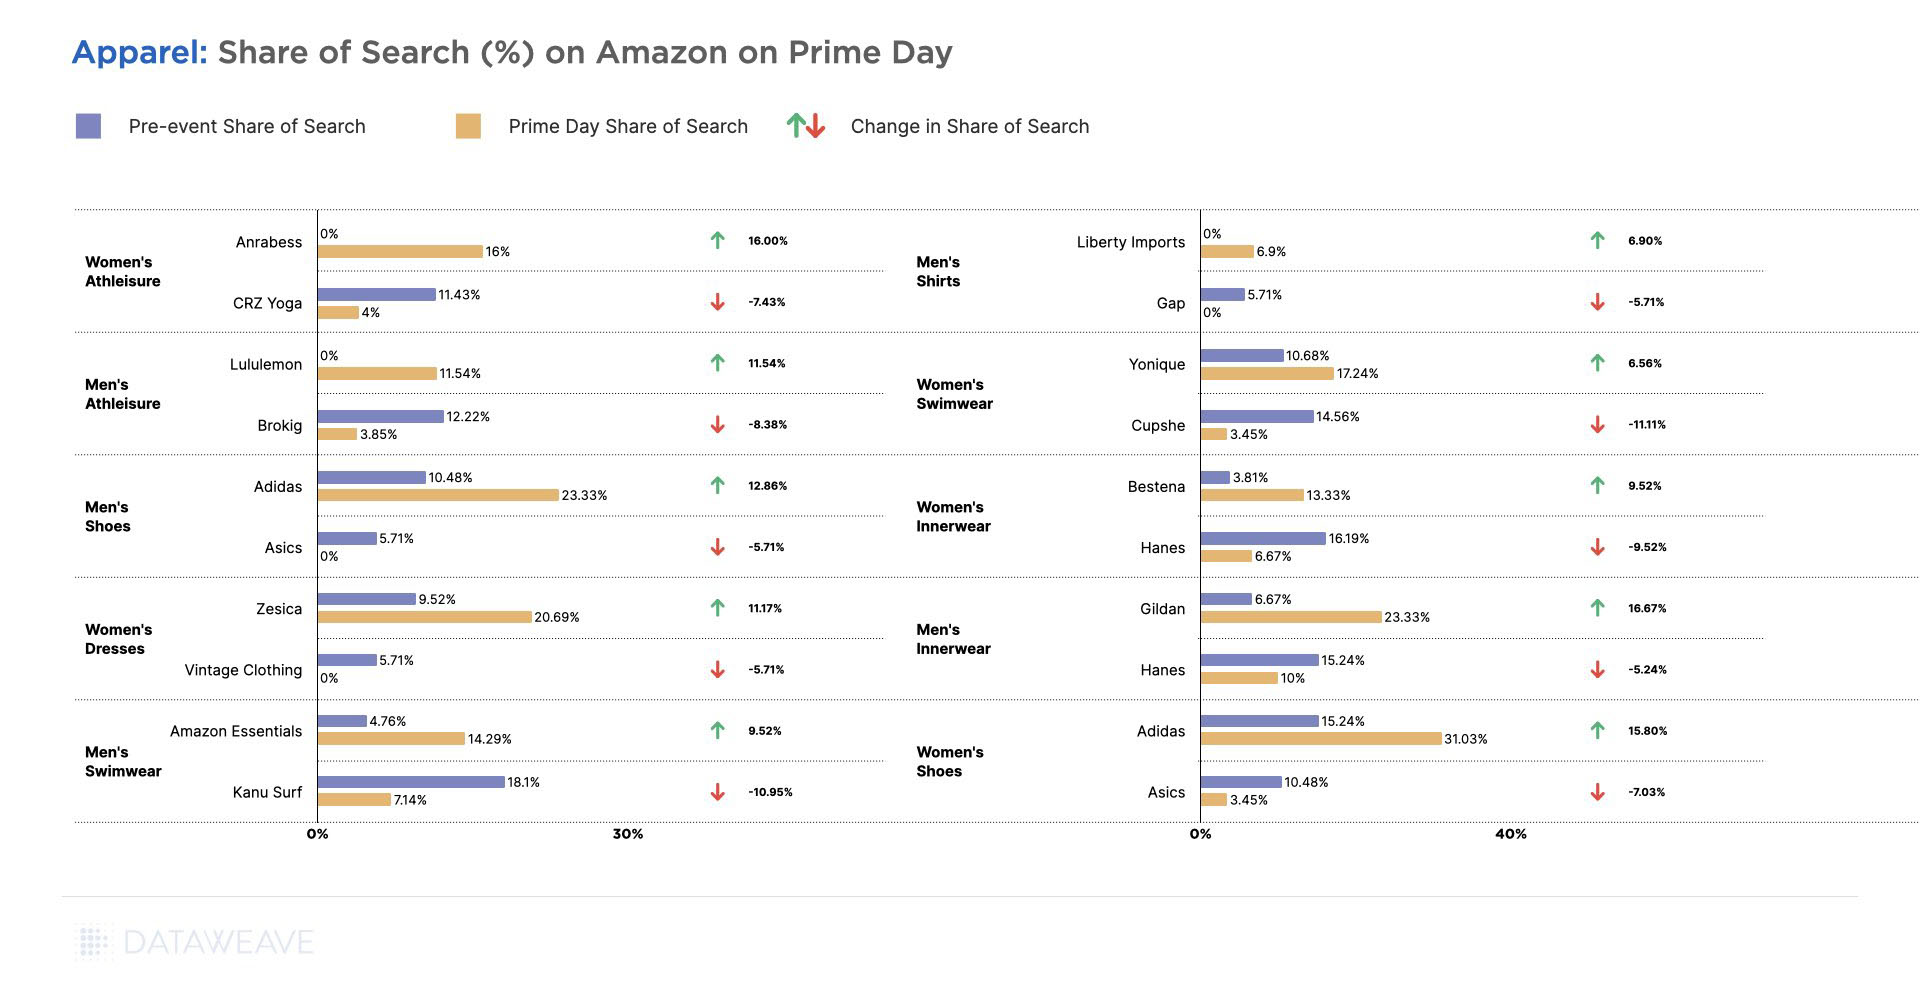
During October’s Prime Big Deal Days, the Apparel category experienced a notable uptick, boasting a 2.29% increase in discounts compared to the earlier Prime Day event in July.
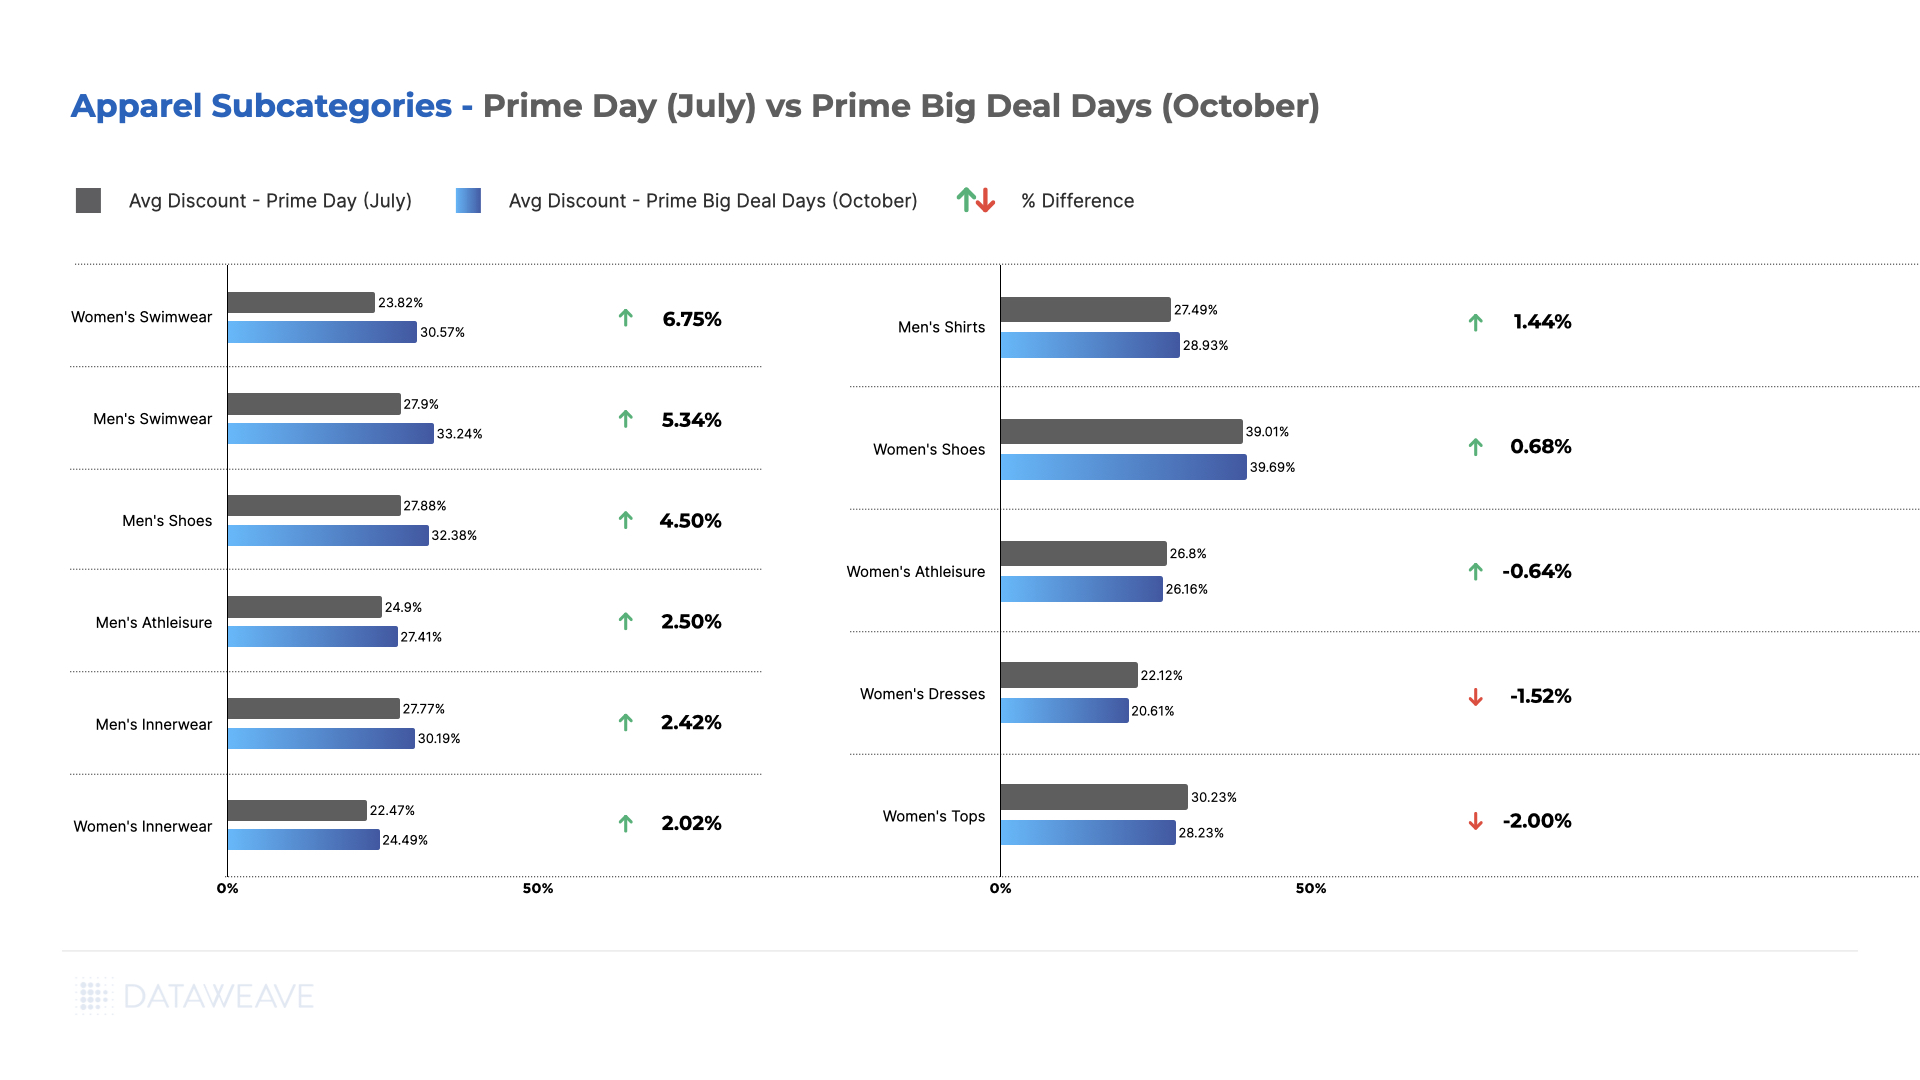
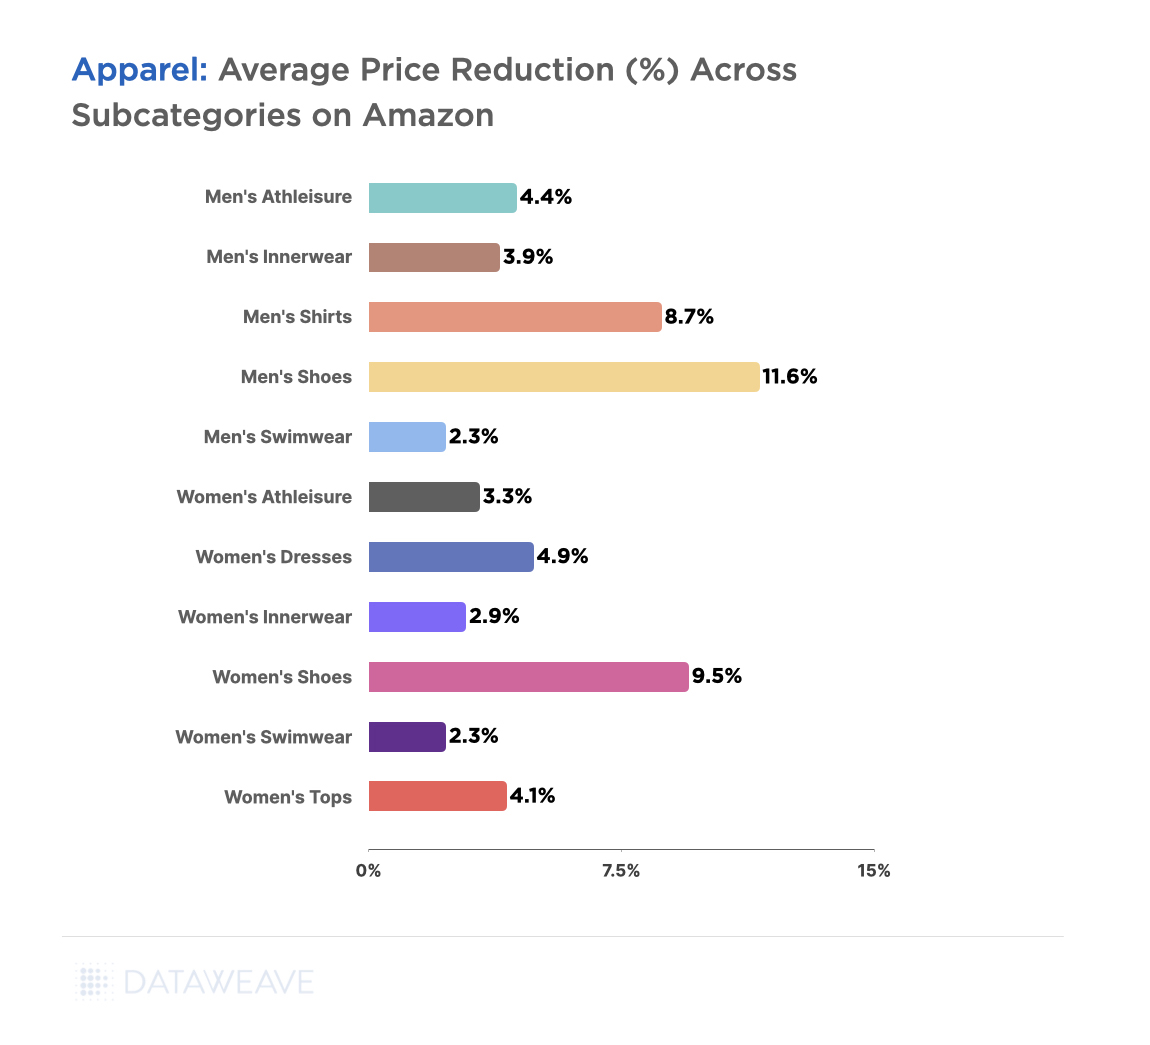
In the detailed assessment of Apparel sub-categories, Men’s and Women’s Swimwear, alongside Men’s Shoes, Innerwear, and Athleisure, emerged as the segments showcasing the most substantial average discounts during October. Fall also brought about more affordable prices for Women’s Innerwear and Men’s Shirts. However, Women’s Athleisure, Dresses, and Tops displayed diminished average discounts during this Prime Big Deal Days event.
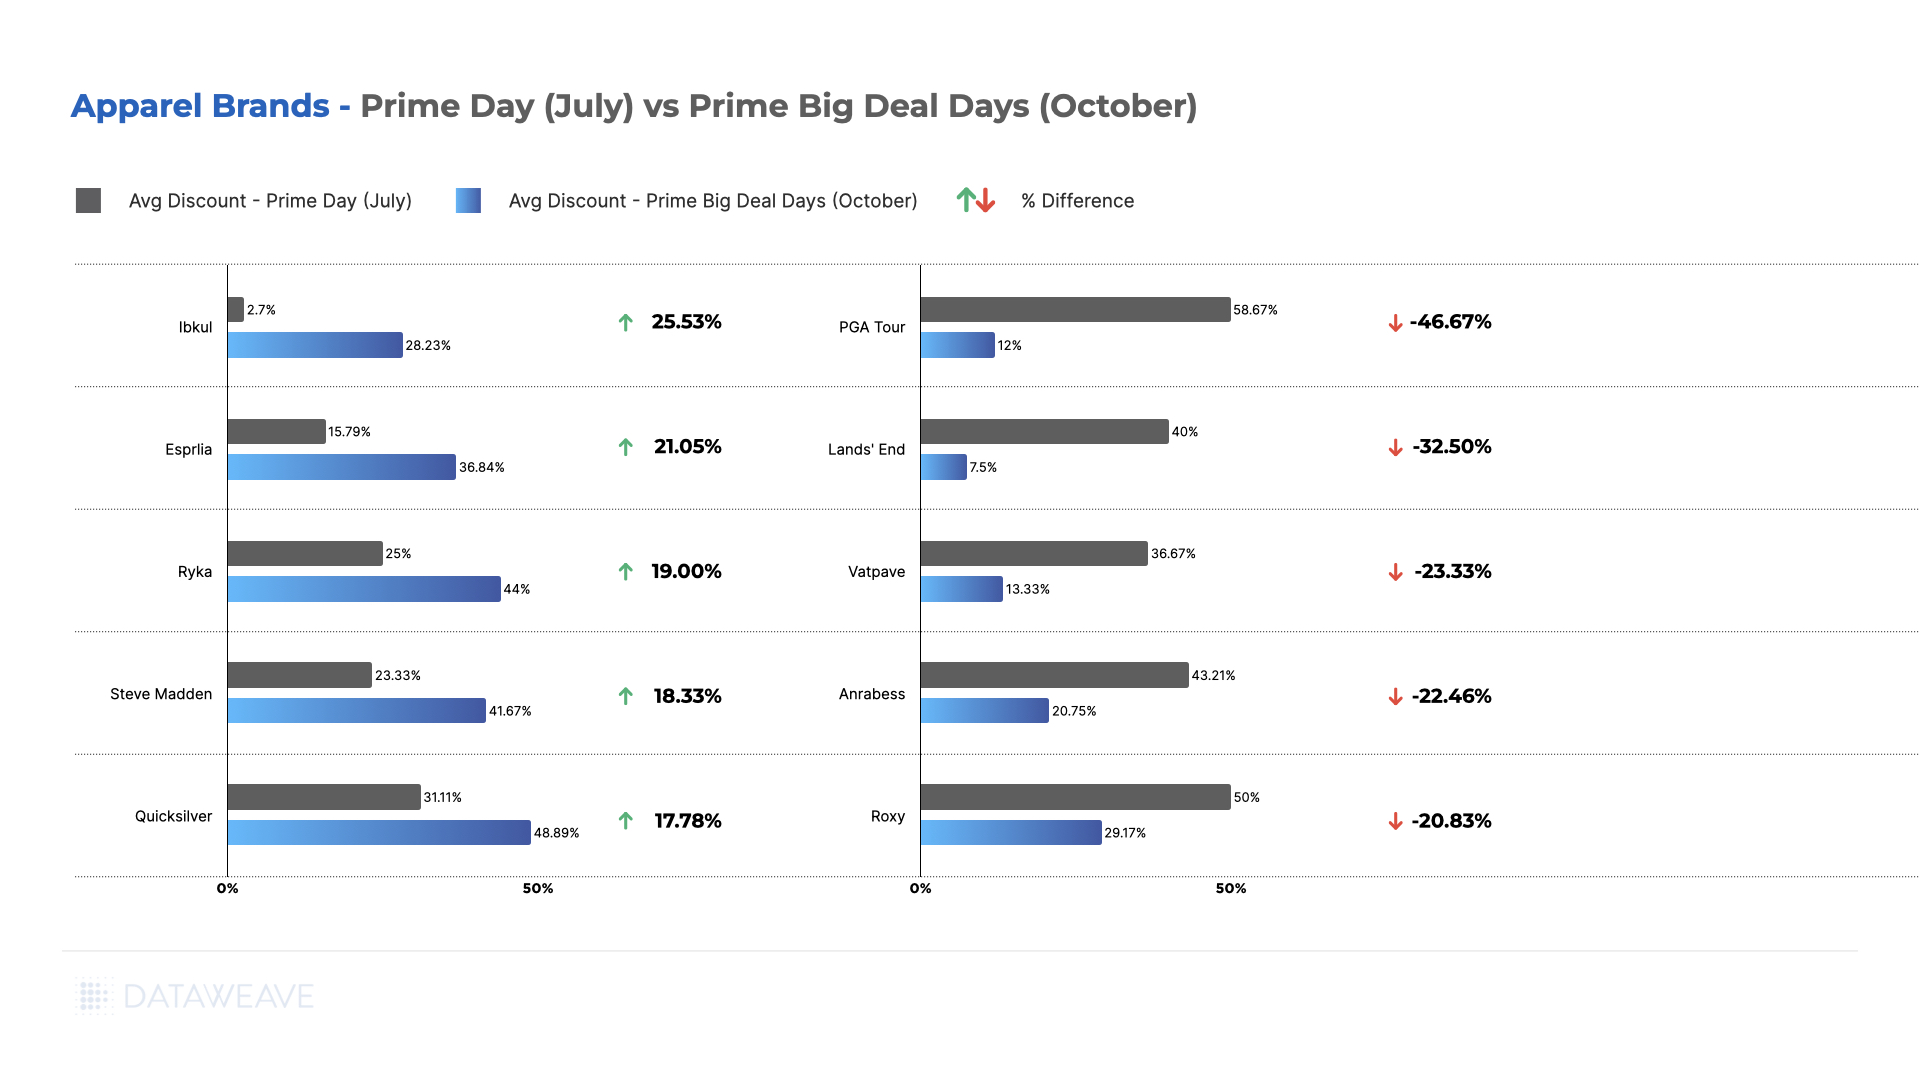
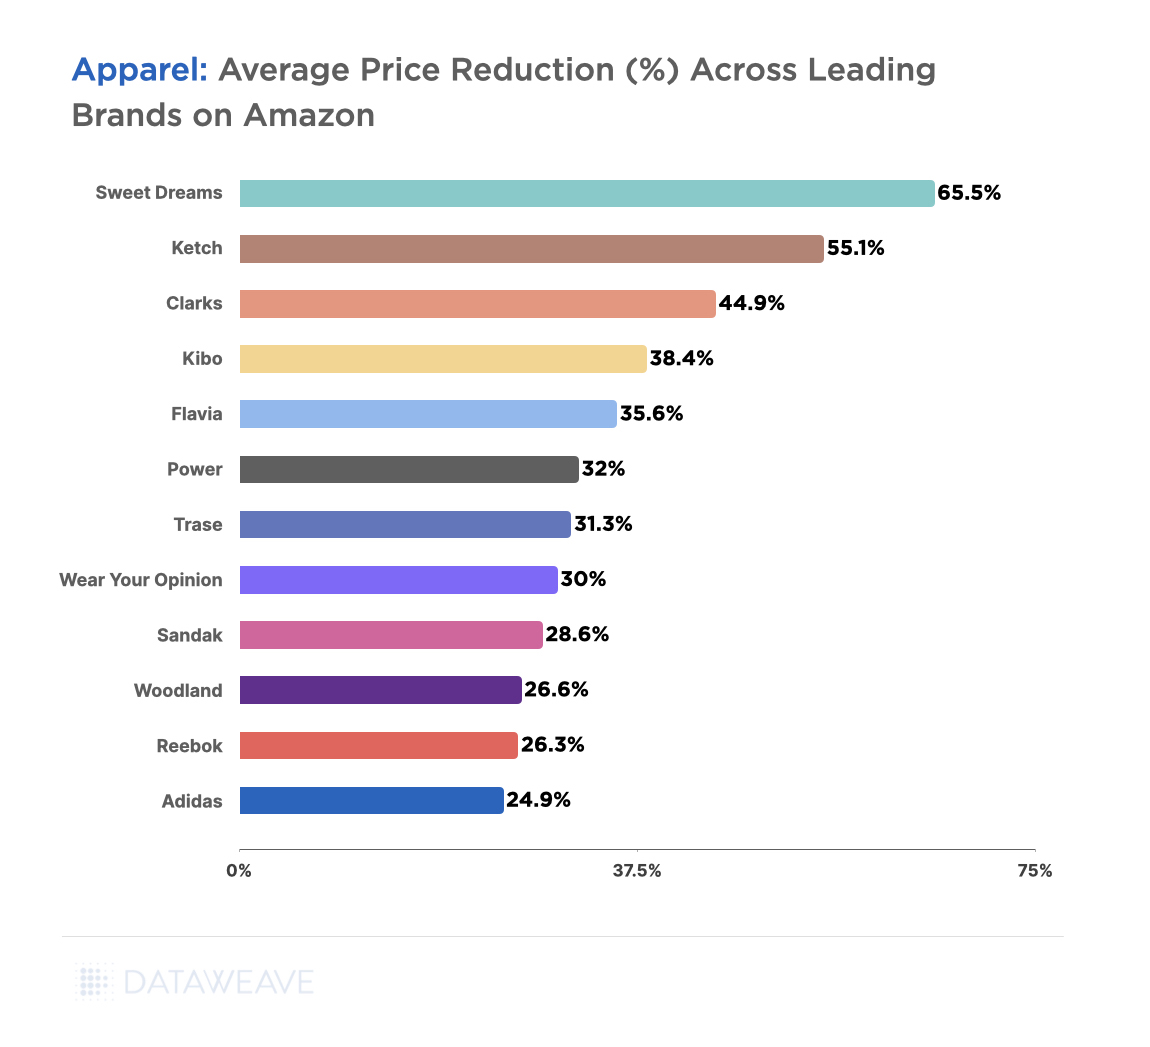
Delving into brand-specific analyses revealed intriguing trends. Athleisure brands such as Ibkul, Esprlia, and Ryka notably escalated their discounts in October after minimal markdowns during the Summer Prime Day sale.
Steve Madden, witnessing heightened discounts in October, hinted at a growing demand for boots and footwear in the Autumn and Winter seasons. For instance, the Steve Madden Men’s Fenta Fashion Sneaker was priced at $46 during the Summer Prime Day, and only at $35 during the Prime Big Deal Days in October.
Conversely, brands like PGA Tour, Land’s End, Roxy, and Anrabess offered more substantial discounts during the Summer compared to the October event.
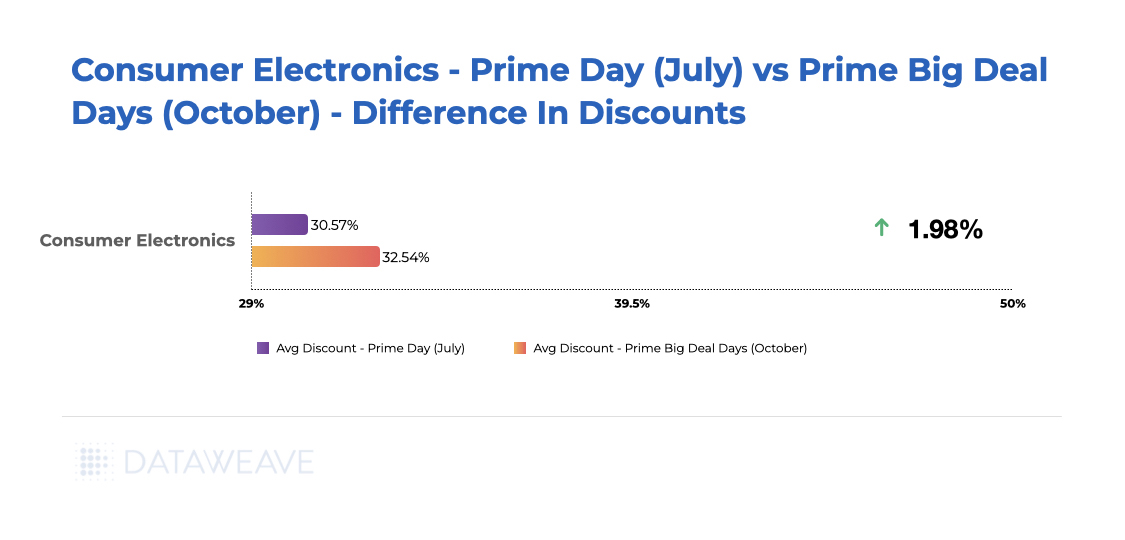
Consumer Electronics
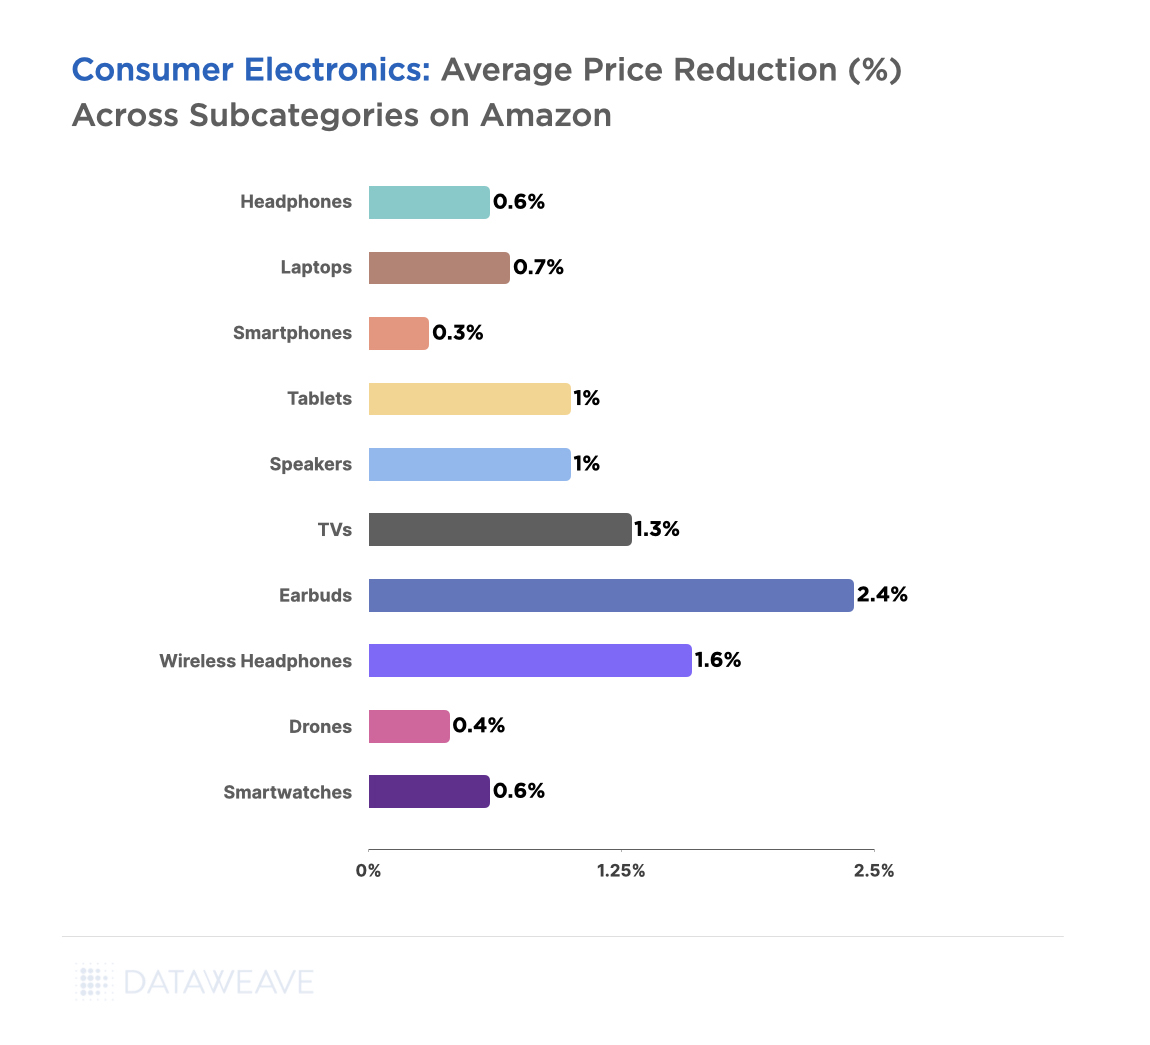
The Consumer Electronics segment during October’s Prime Big Deal Days showcased an average price decrease of 1.98% compared to the Prime Day event in July.
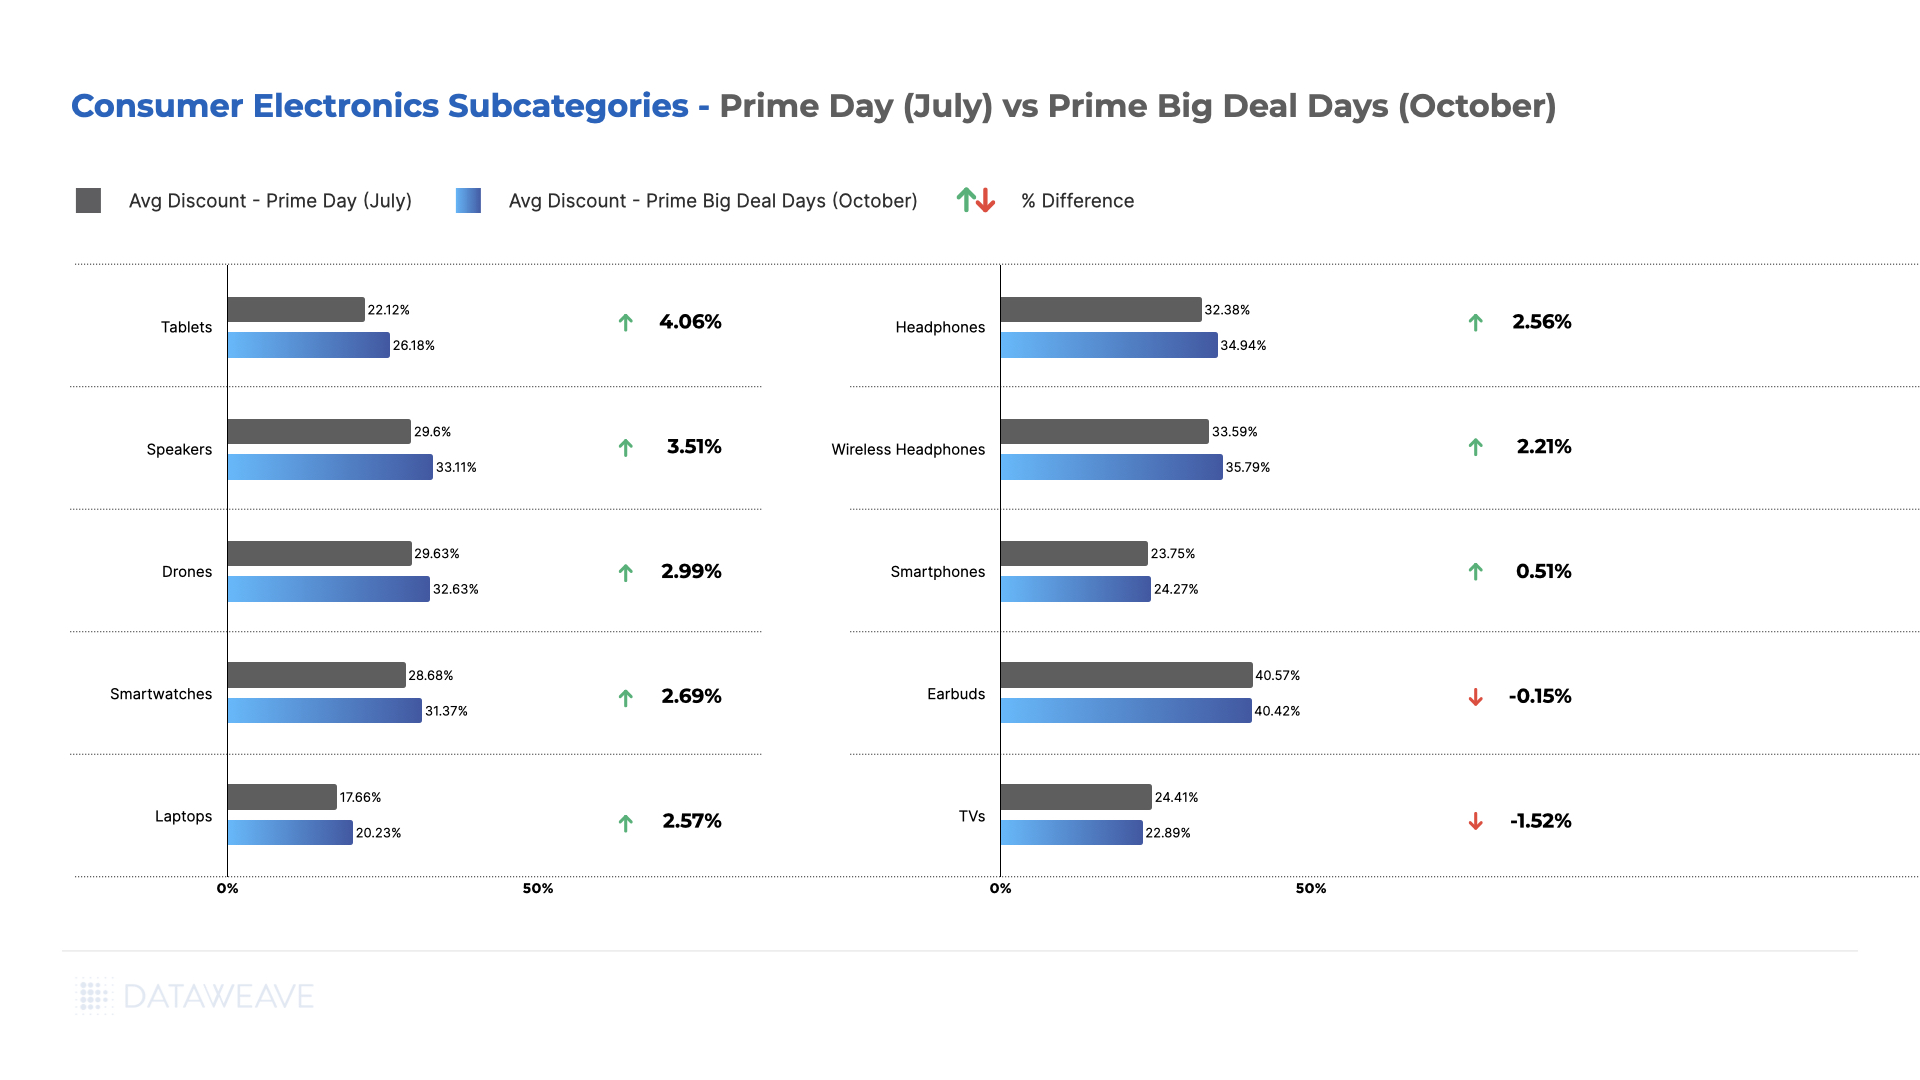
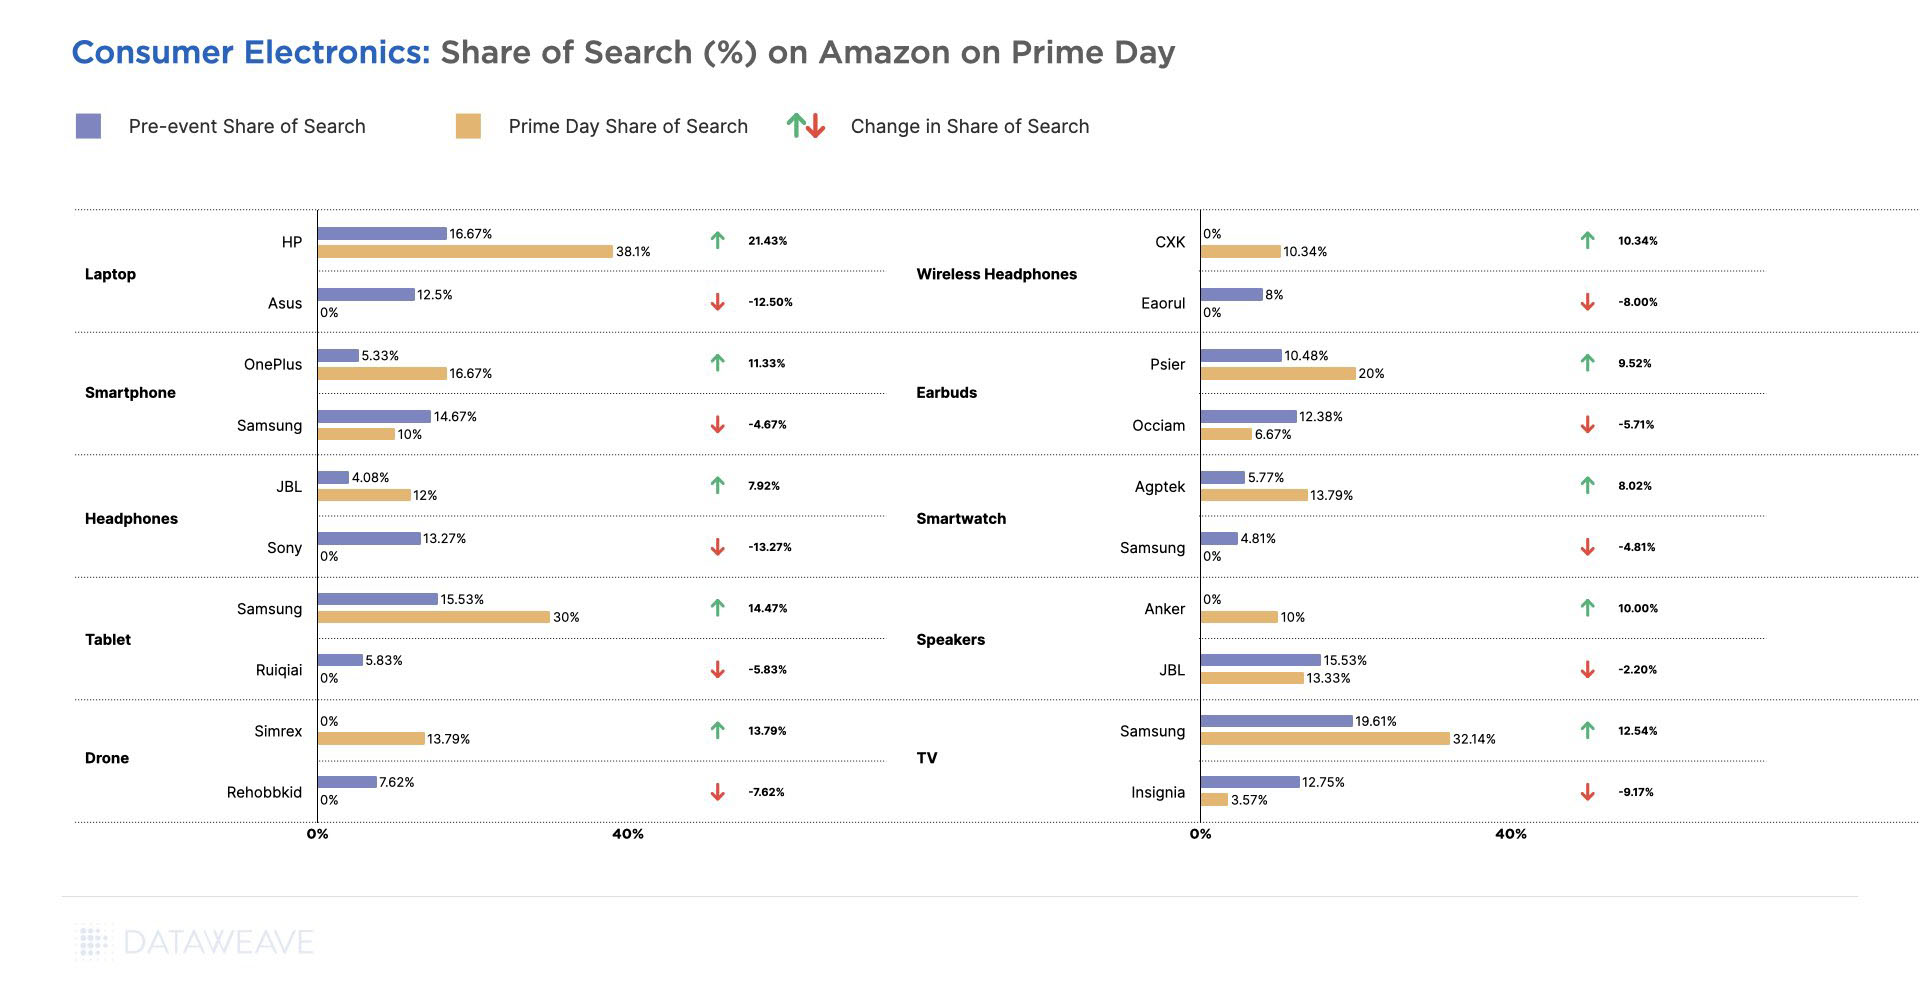
Nearly all scrutinized subcategories experienced heightened discounts during the Fall Prime Big Deal Days in October. Tablets, Speakers, Drones, and Smartwatches notably presented higher discounts of 4.06%, 3.51%, 2.99%, and 2.69%, respectively, in October. However, more enticing deals were found on Earbuds and TVs during July’s event.
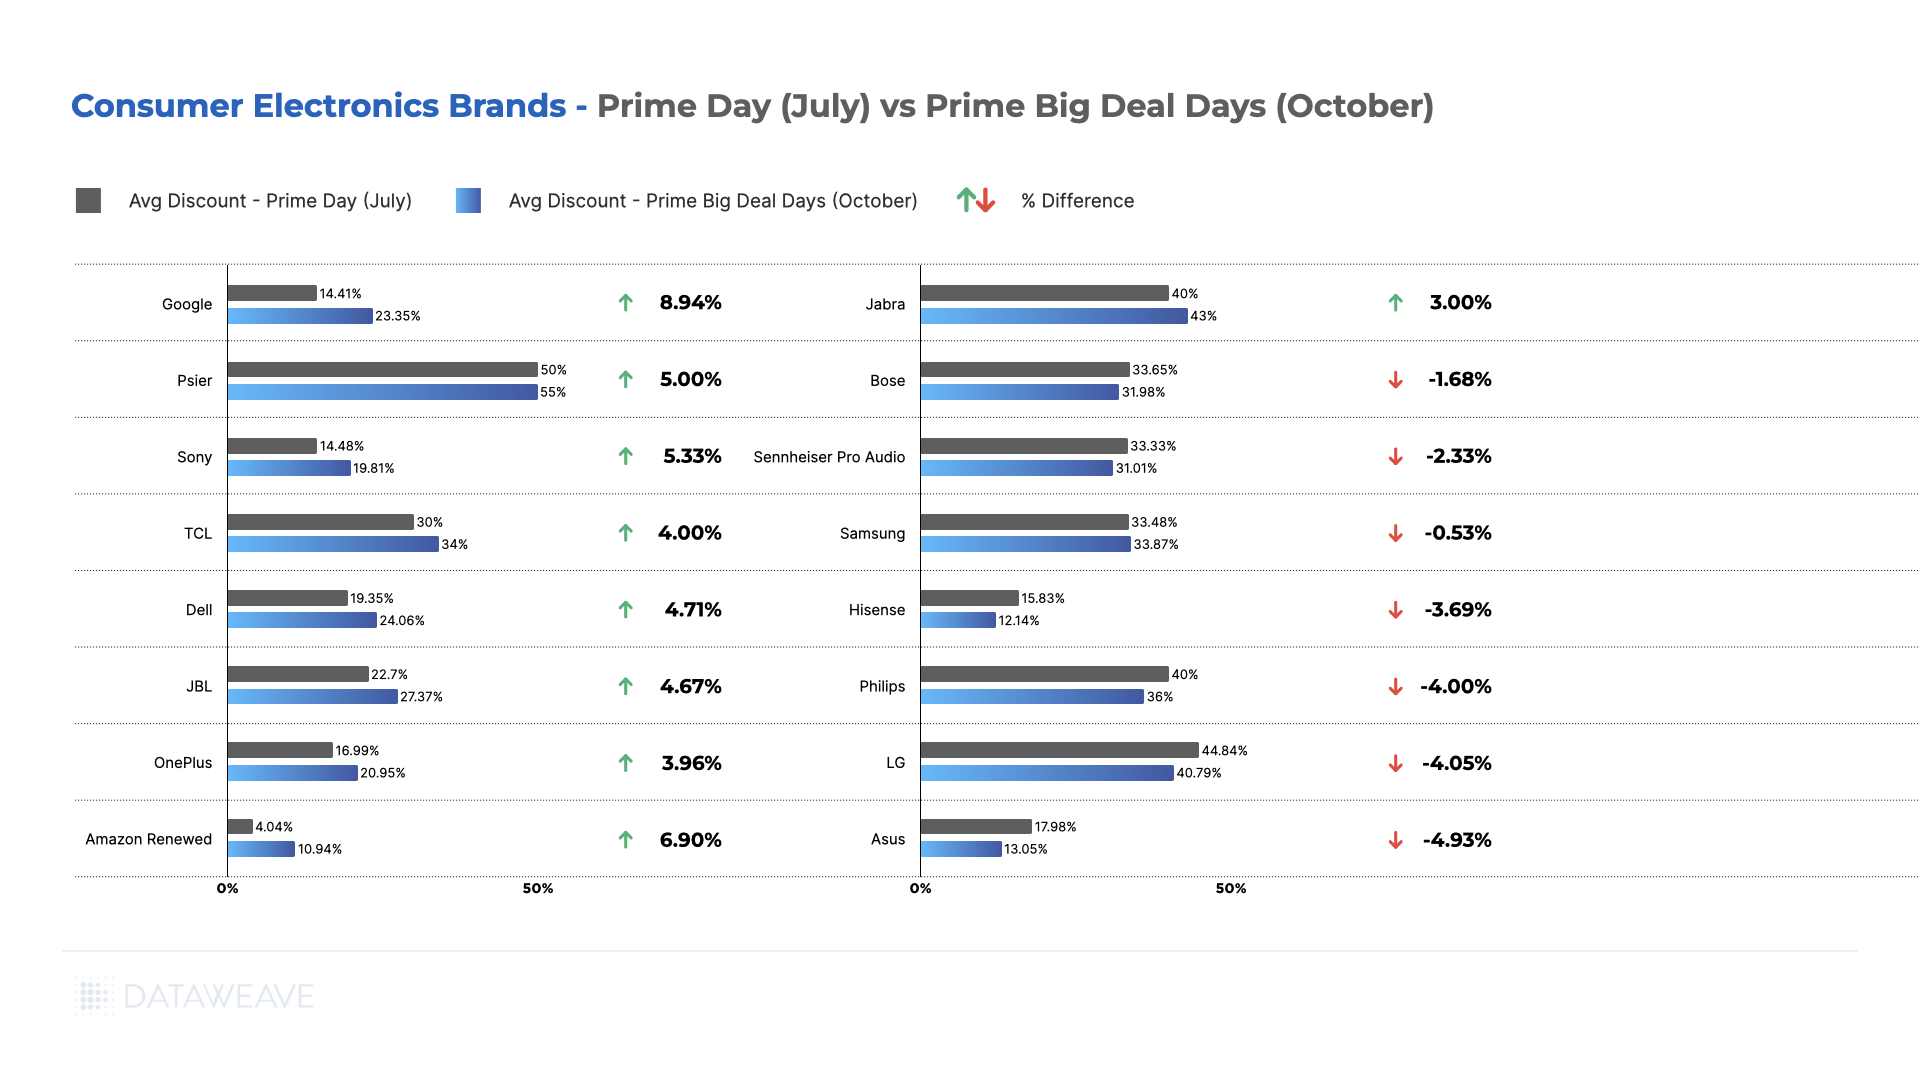
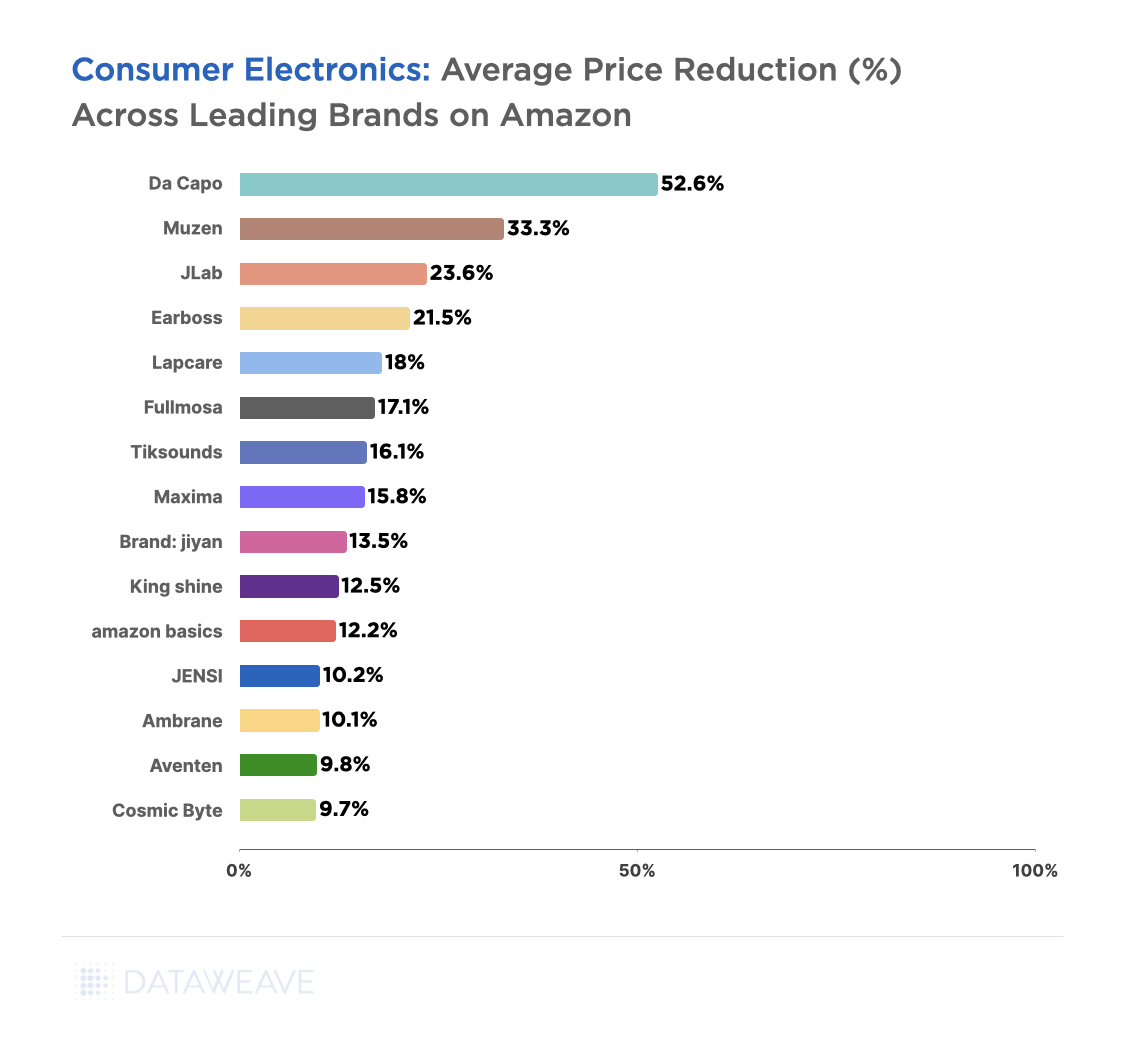
Examining consumer electronics brands, Google stood out by offering the most compelling deals in October, boasting an average discount of 23.35%, marking an 8.94% increase from the Summer Prime Days’ 14.41%. Psier, Sony, and OnePlus also featured significantly reduced prices during the Fall. For example, the OnePlus 10 Pro | 8GB+128GB was $500 during the sale in July and only $440 during the Prime Big Deal Days in October.
Conversely, prominent brands such as Bose, Sennheiser, Samsung, LG, and Asus opted to offer heavier discounts in July. Notably, the Samsung All-in-One Soundbar w/Dolby 5.1 was priced at $218 in October but only $168 in July.
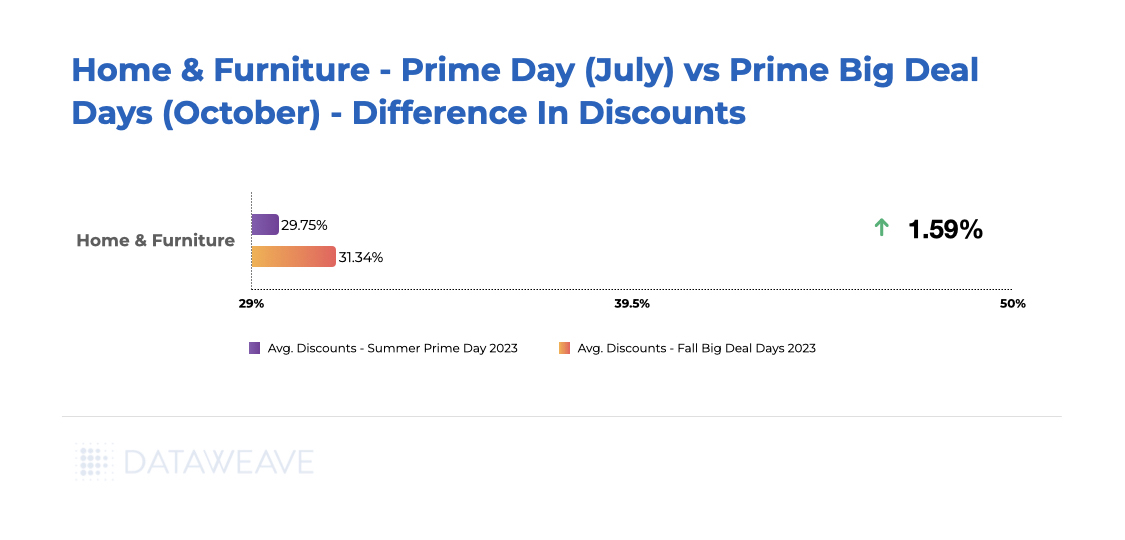
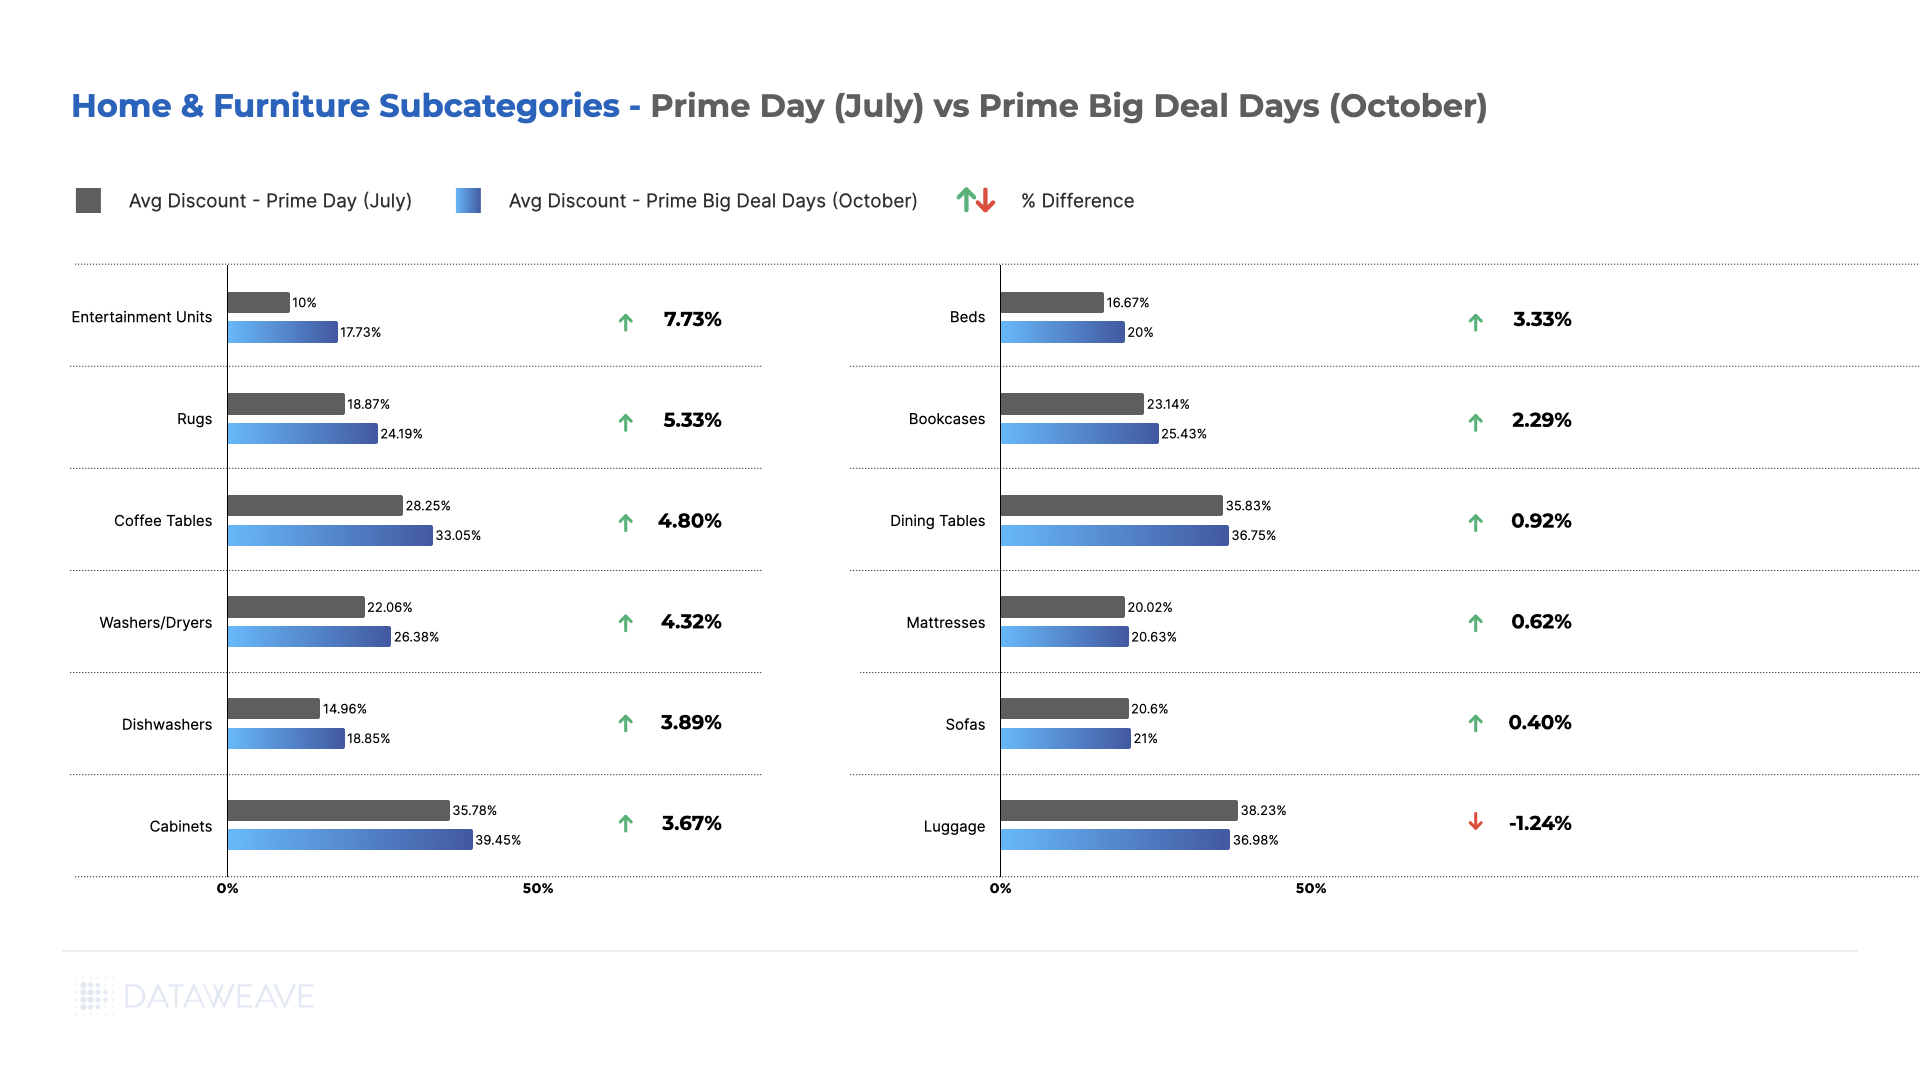
Home & Furniture
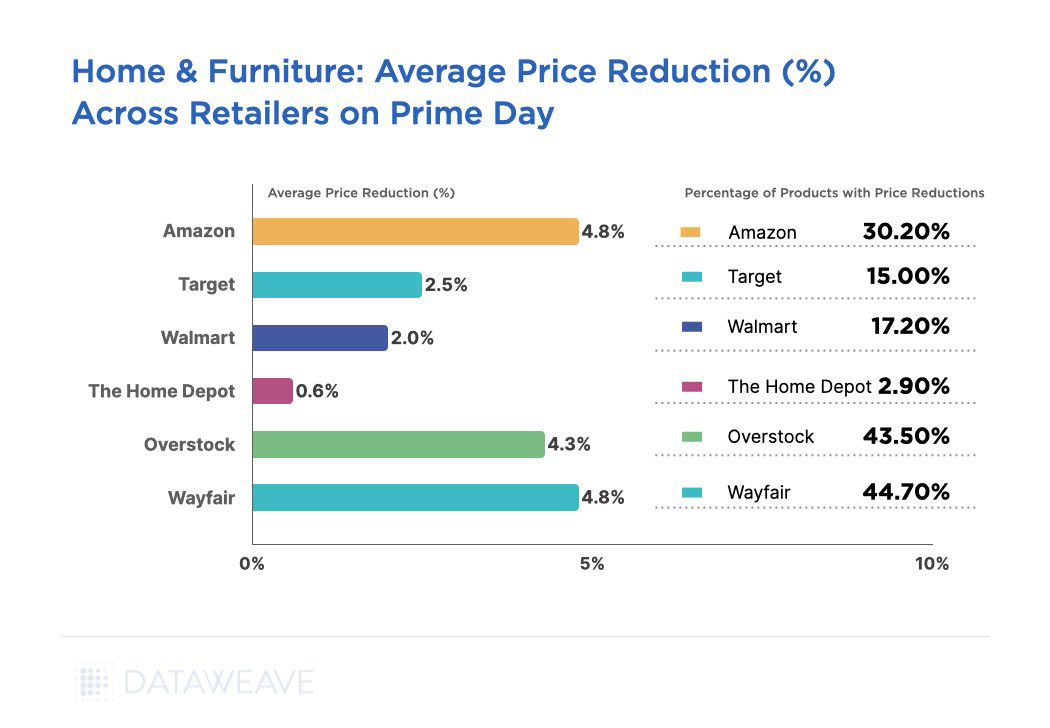
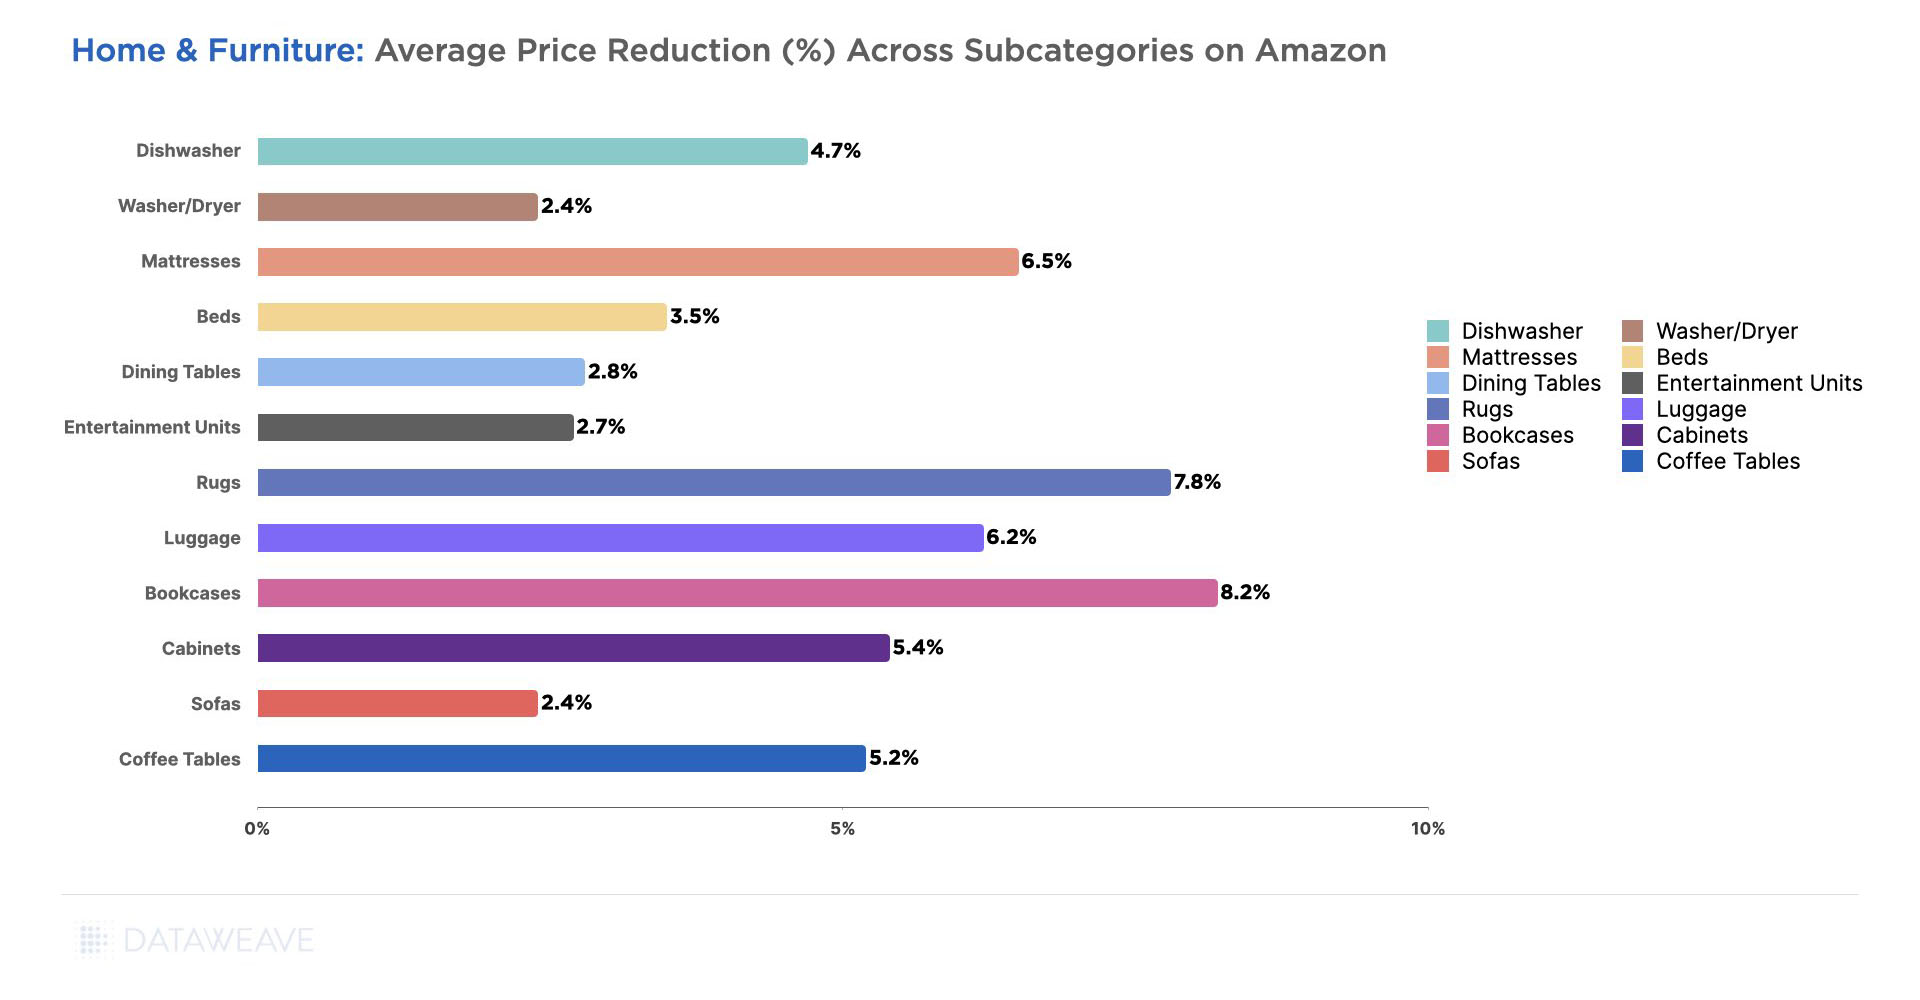
During October’s Prime Big Deal Days, the Home & Furniture category experienced a notable 1.59% increase in average discounts compared to the Prime Day event held in July.
Notably, Entertainment Units, Rugs, and Coffee Tables emerged as standout sub-categories that were more attractively priced in October, exhibiting price differences of 7.73%, 5.33%, and 4.80%, respectively.
Interestingly, among the scrutinized sub-categories, only Luggage showed a lower price during the Prime Day sale in July compared to the October event. This shift likely reflects evolving consumer demand as the holiday season approaches, with items like rugs and entertainment units becoming increasingly sought-after categories for purchase.
If you’re keen to explore how these trends vary across brands within this category, reach out to us for more insights.
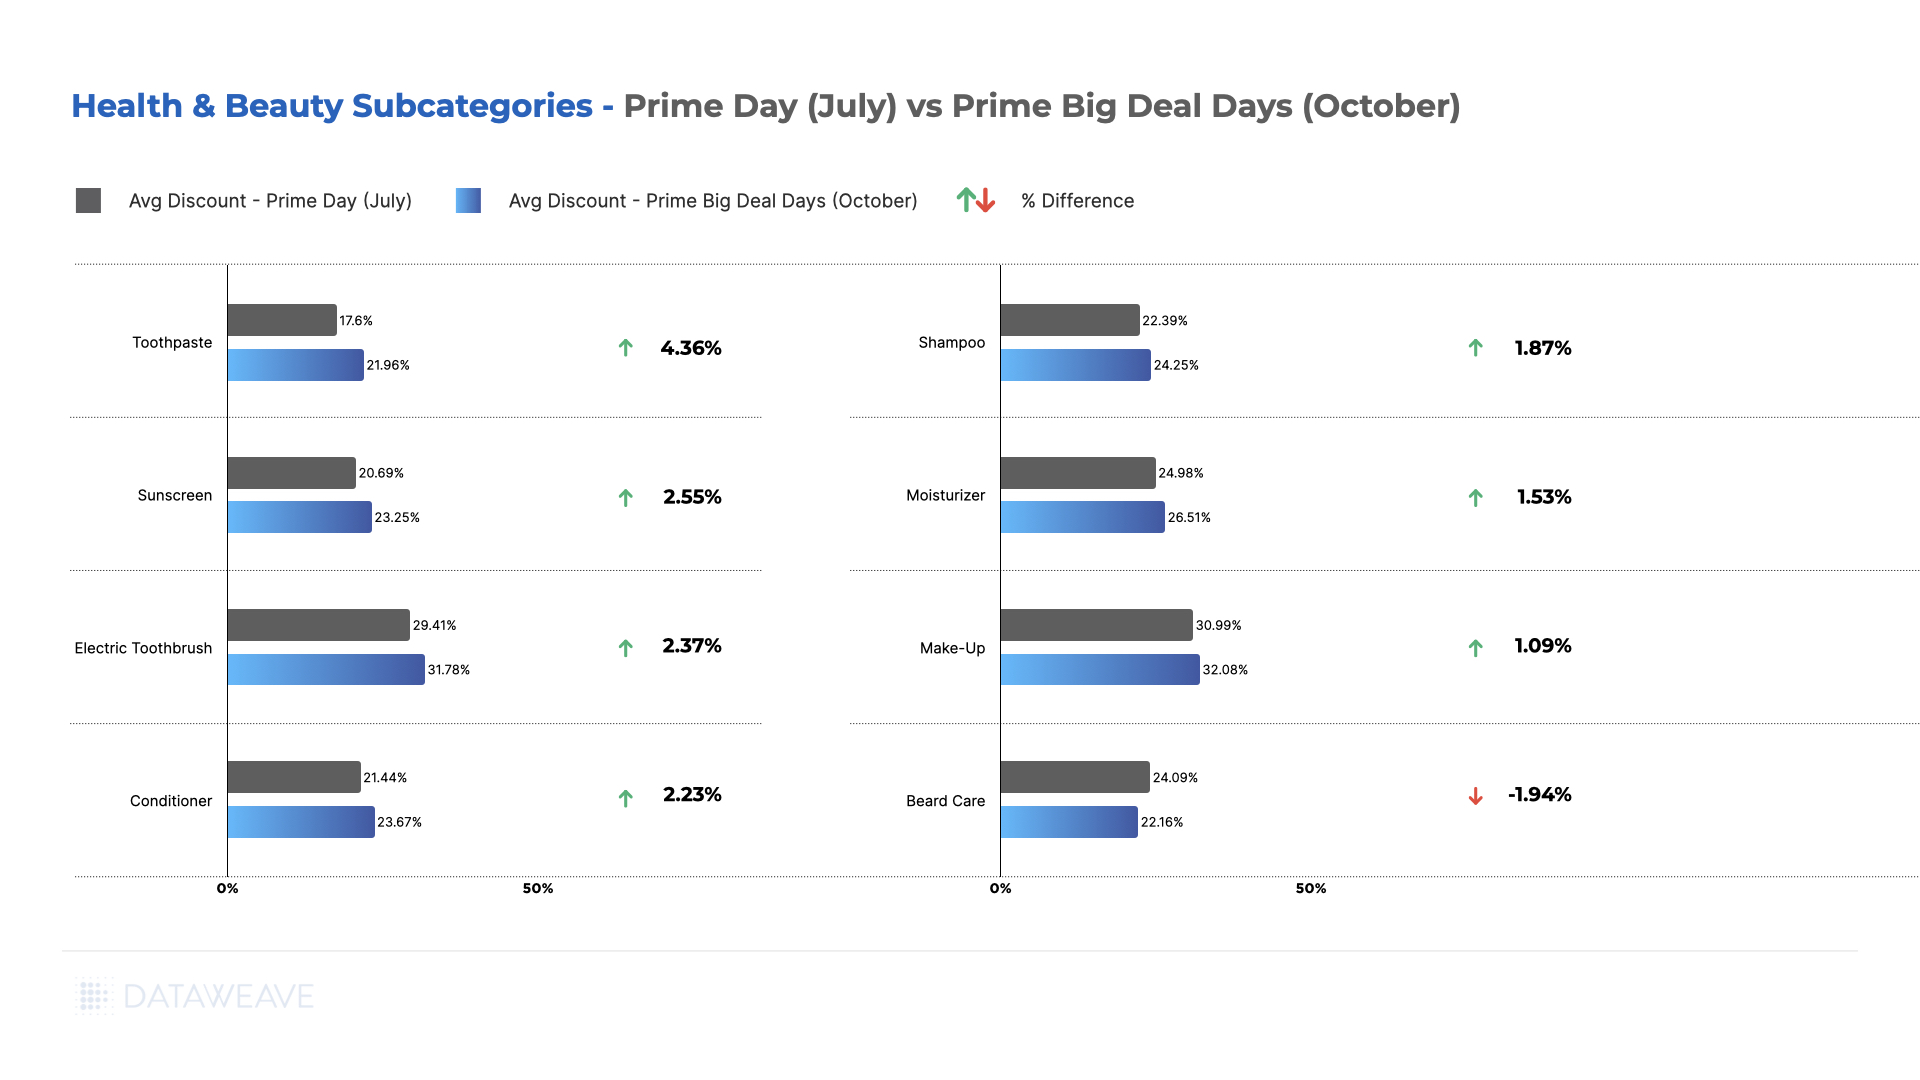
Health & Beauty
During October’s Prime Big Deal Days, the Health & Beauty category showcased products at an average of 1.99% lower prices compared to the Prime Day event held in July.
Our analysis of Health & Beauty reveals that a majority of the subcategories presented higher discounts during the October Big Deal Days event. Essential items such as Toothpaste, Sunscreen, and Electric Toothbrushes notably stood out as significantly more affordable during the Fall event, reflecting not only consistent demand but also a seasonal emphasis on these products. For instance, the Oral B iO Series 3 Limited Edition Electric Toothbrush, priced at $140 during the summer Prime Days, was further discounted to $120 in the fall event.
Interestingly, Beard Care emerged as an exception, displaying higher discounts during the Prime Day sale in Summer compared to Fall’s Prime Big Deal Days.
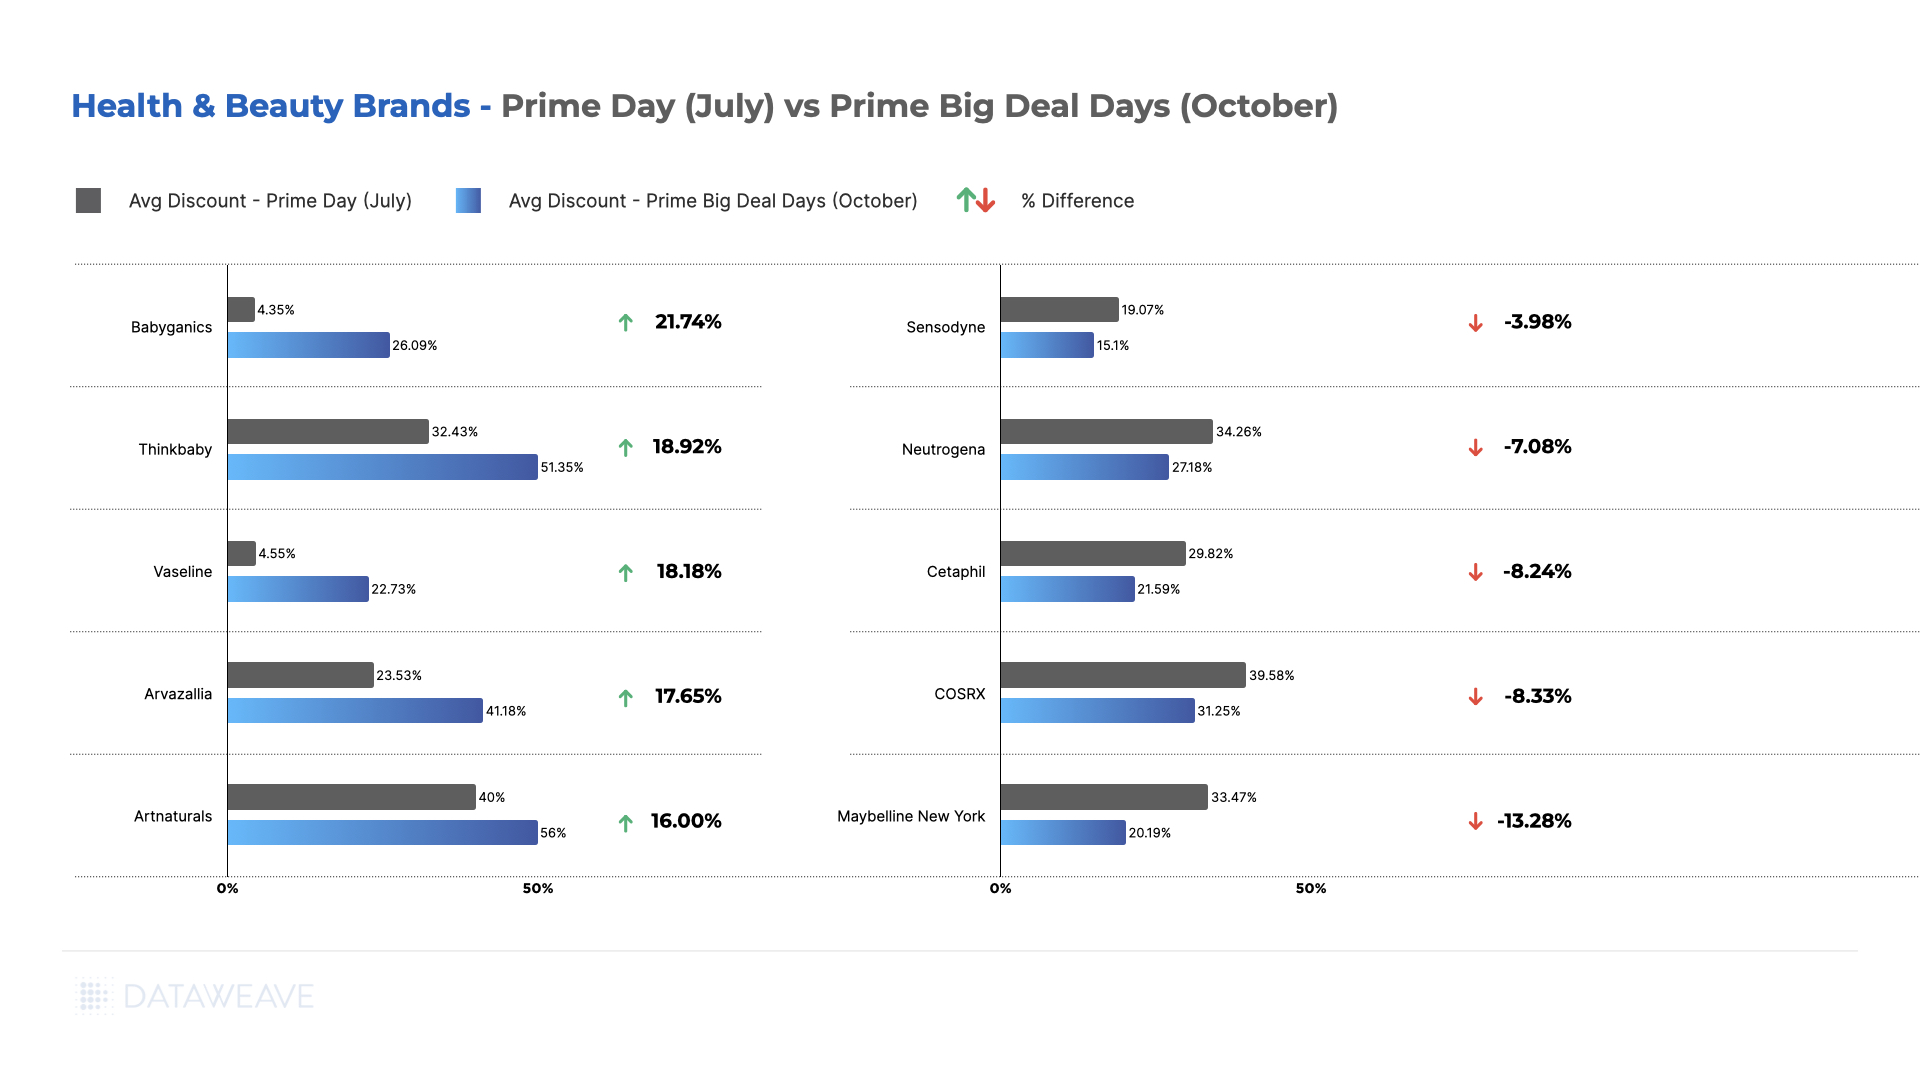
Examining brands within the category, Babyganics, Thinkbaby, and Vaseline showcased substantial increases in average additional discounts during October’s Prime Big Deal Days.
Conversely, prominent brands like Maybelline, Neutrogena, and Cetaphil offered lower discounts during the fall event.
Competitive Insights to Drive Optimized Sale Event Pricing
At DataWeave, we understand the pivotal role of competitive pricing insights in empowering retailers and brands to gain a competitive edge, especially during significant events like Prime Day. Our commitment lies in providing retailers with precise and extensive competitor price tracking on a large scale. This empowers them to devise impactful pricing strategies and consistently uphold a competitive stance in the market. To learn more about how this can be done, talk to us today!
Competitive pricing intelligence is pivotal for retailers seeking to analyze their product pricing in relation to competitors. This practice is essential for ensuring that their product range maintains a competitive edge, meeting both customer expectations and market demands consistently.
Product matching serves as a foundational element within any competitive pricing intelligence solution. Products are frequently presented in varying formats across different websites, featuring distinct titles, images, and descriptions. Undertaking this process at a significant scale is highly intricate due to numerous factors. One such complication arises from the fact that products are often displayed with differing units of measurement on various websites.
The Challenge of Varying Units
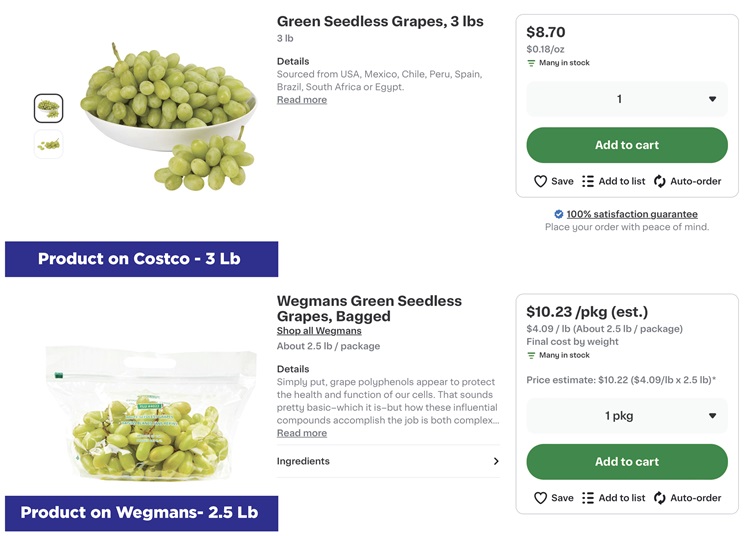
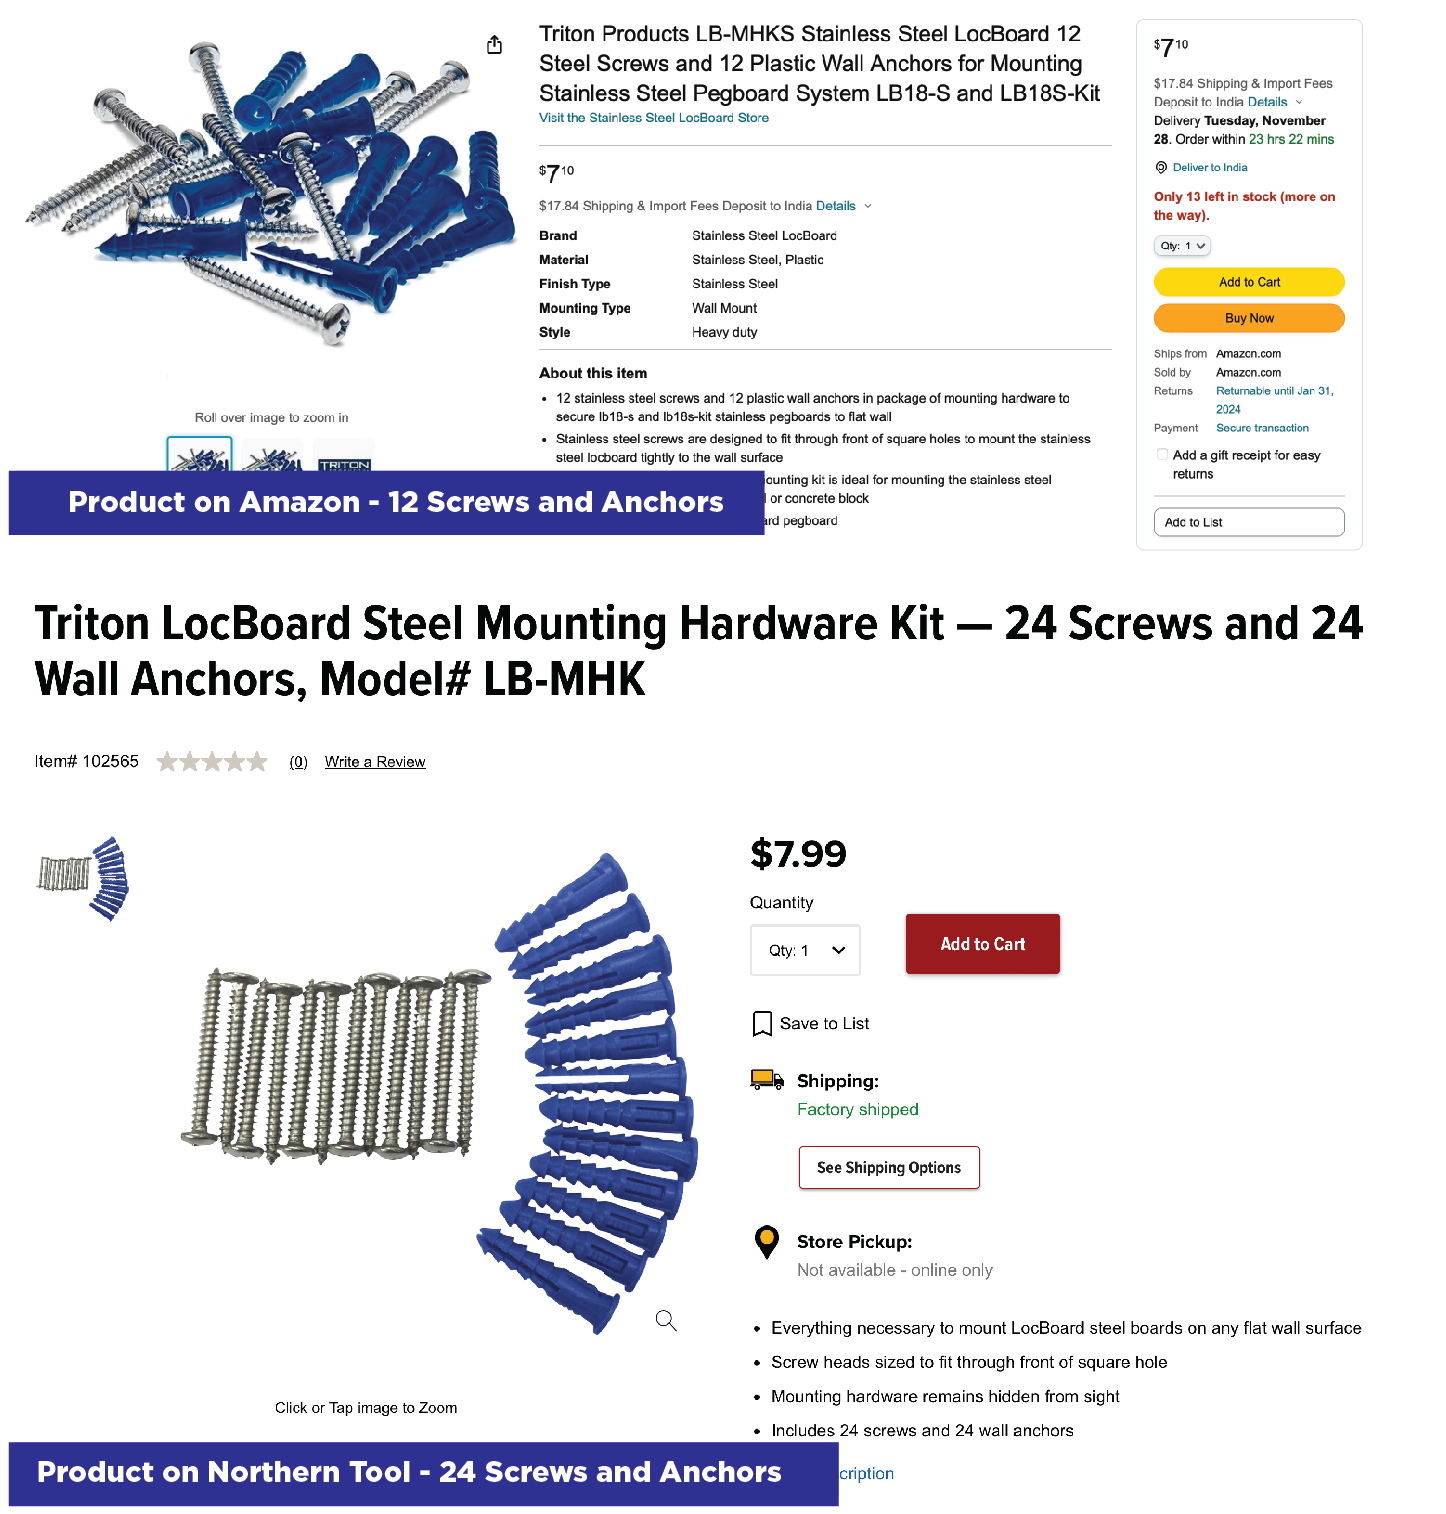
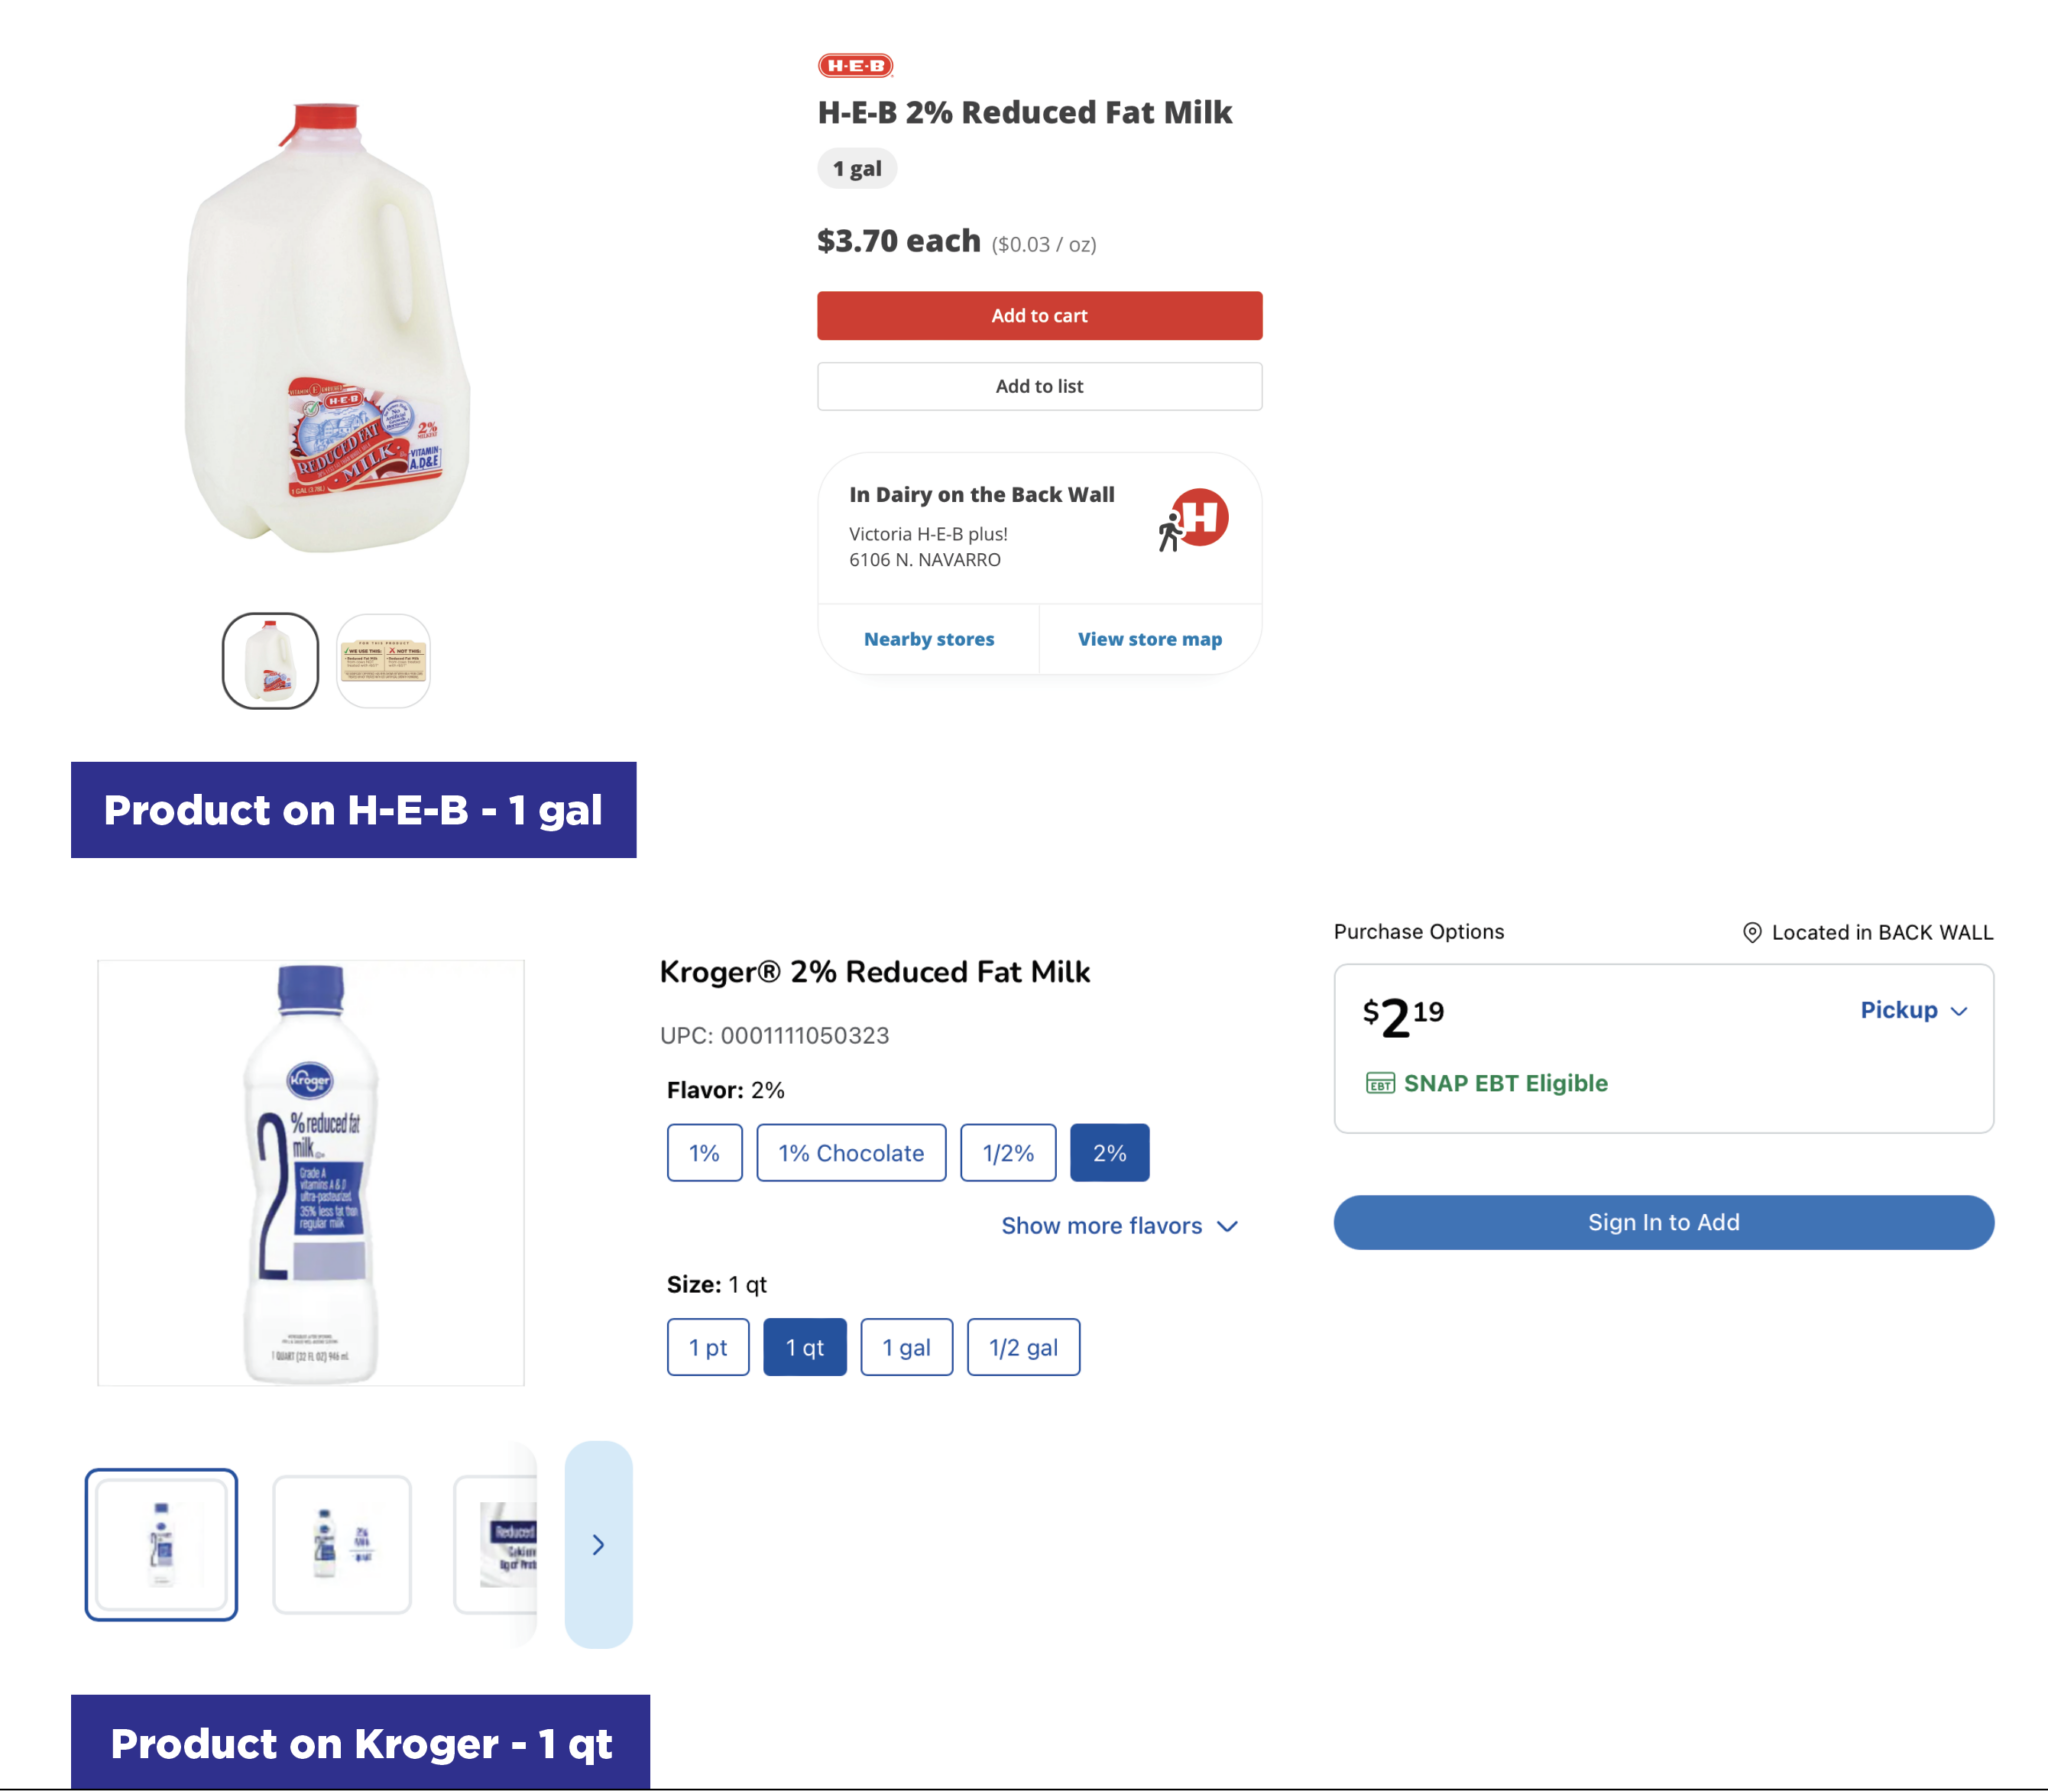
In certain product categories, retailers often offer the same item in varying volumes, quantities, or weights. For instance, a clothing item might be available as a single piece or in packs of 2 or 3, while grocery brands commonly sell eggs in counts of 6, 12, or 24.
Consider this example: a quick glance might suggest that an 850g pack of Kellogg’s Corn Flakes priced at $5 is a better deal than a 980g pack of Nestle Cornflakes priced at $5.2. However, this assumption can be deceptive. In reality, the latter offers better value for your money, a fact that only becomes evident through price comparisons after standardizing the units.
This issue is particularly relevant due to the prevalence of “shrinkflation,” where brands adjust packaging sizes or quantities to offset inflation while keeping prices seemingly low. When quantities, pack sizes, weight, etc. reduce instead of prices increasing, it’s important that this change is considered while analyzing competitive pricing.
Normalizing Units of Measure
In order to effectively compare prices among different competitors, retailers must standardize the diverse units of measurement they encounter. This standardization (or normalization) is crucial because price comparisons should extend beyond individual product SKUs to accommodate variations in package sizes and quantities. It’s essential to normalize units, ranging from “each” (ea) for individual items to “dozen” (dz) for sets, and from “pounds” (lb), “kilograms” (kg), “liters” (ltr), to “gallons” (gal) for various product types.
For example, a predetermined base unit of measure, such as 100 grams for a specific product like cornflakes, serves as the reference point. The unit-normalized price for any cornflake product would then be the price per 100 grams. In the example provided, this reveals that Kellogg’s is priced at $0.59 per 100 grams, while Nestle is priced at $0.53 per 100 grams.
Various Categories of Unit Normalization
1. Weight Normalization
Retailers frequently feature products with weight measurements expressed in grams (g), kilograms (kg), pounds (lbs), or ounces (oz).
2. Quantity or Pack Size Normalization
Products are also often featured with varying pick sizes or quantities in each SKU.
3. Volume or Capacity Normalization
Products can also vary in volumes or capacities with units like liters (L) or fluid ounces (fl oz).
DataWeave’s Unit Normalized Pricing Intelligence Solution
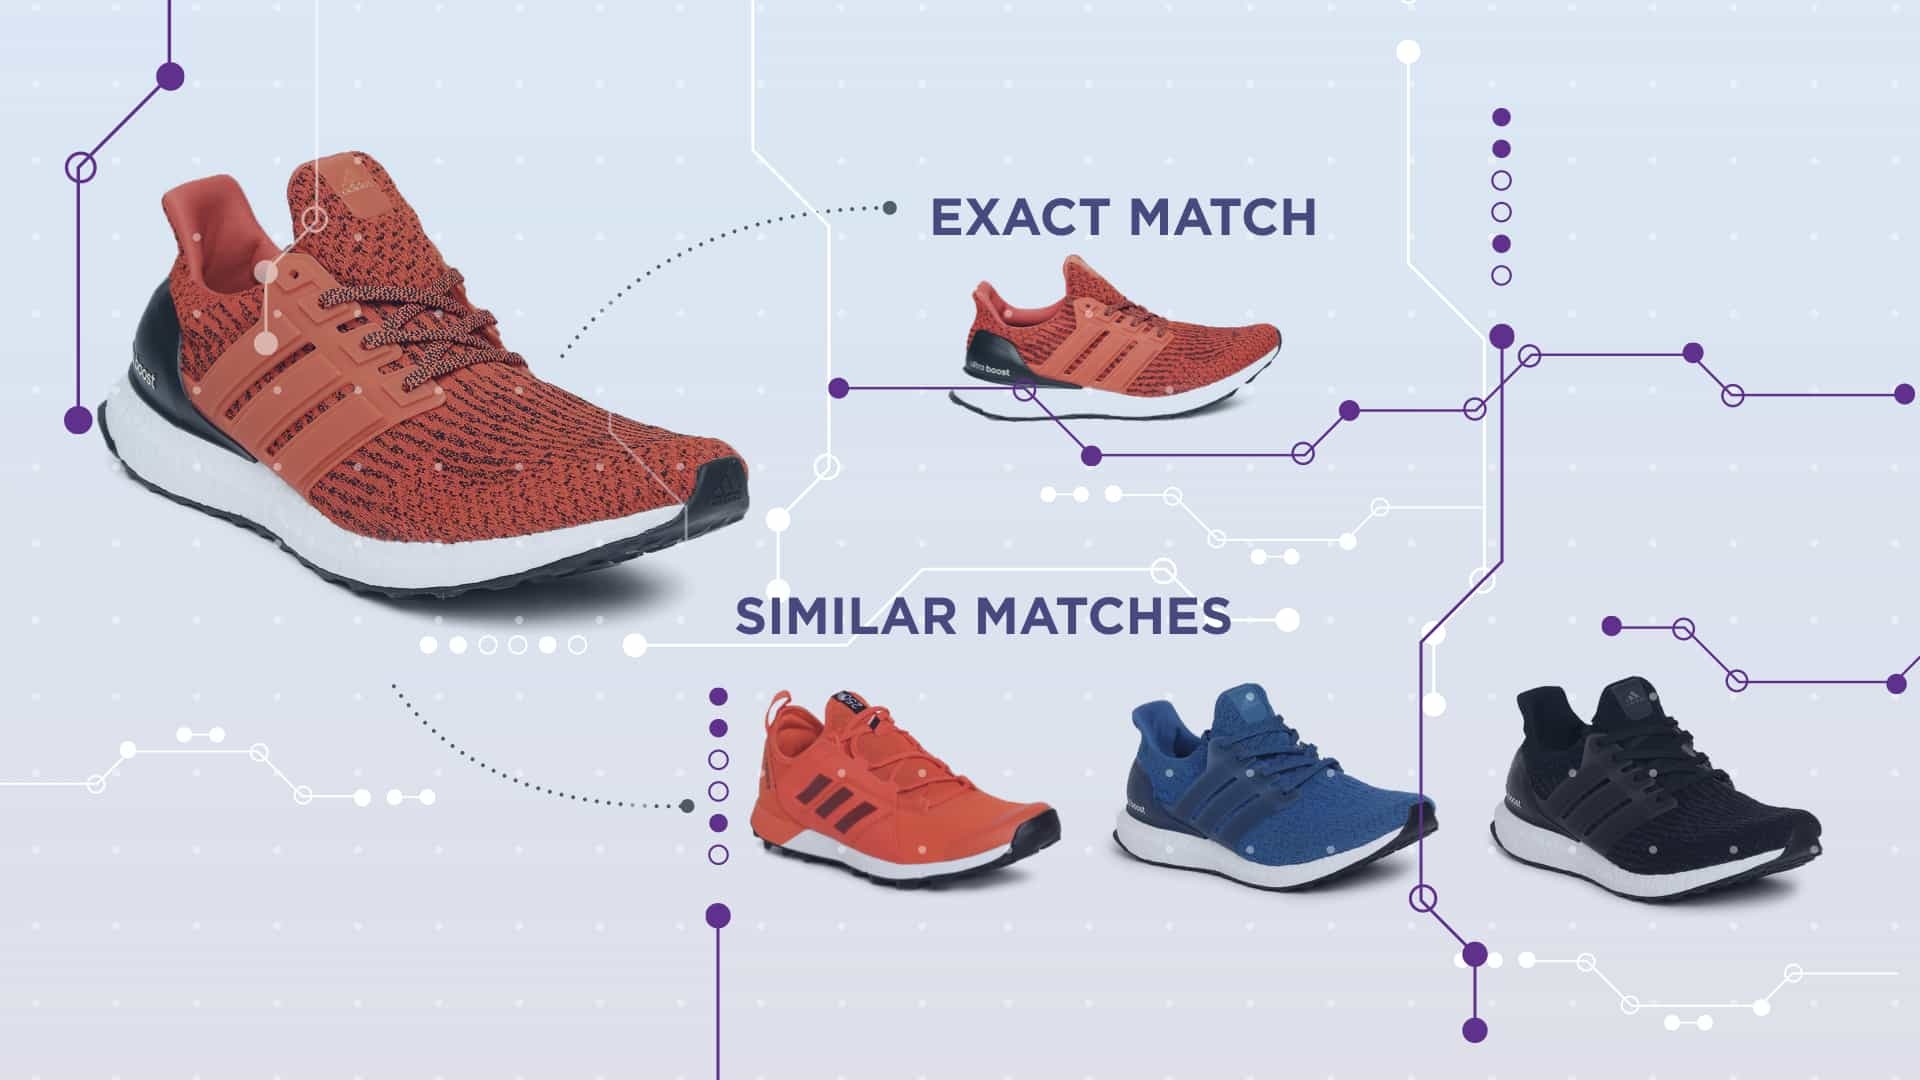
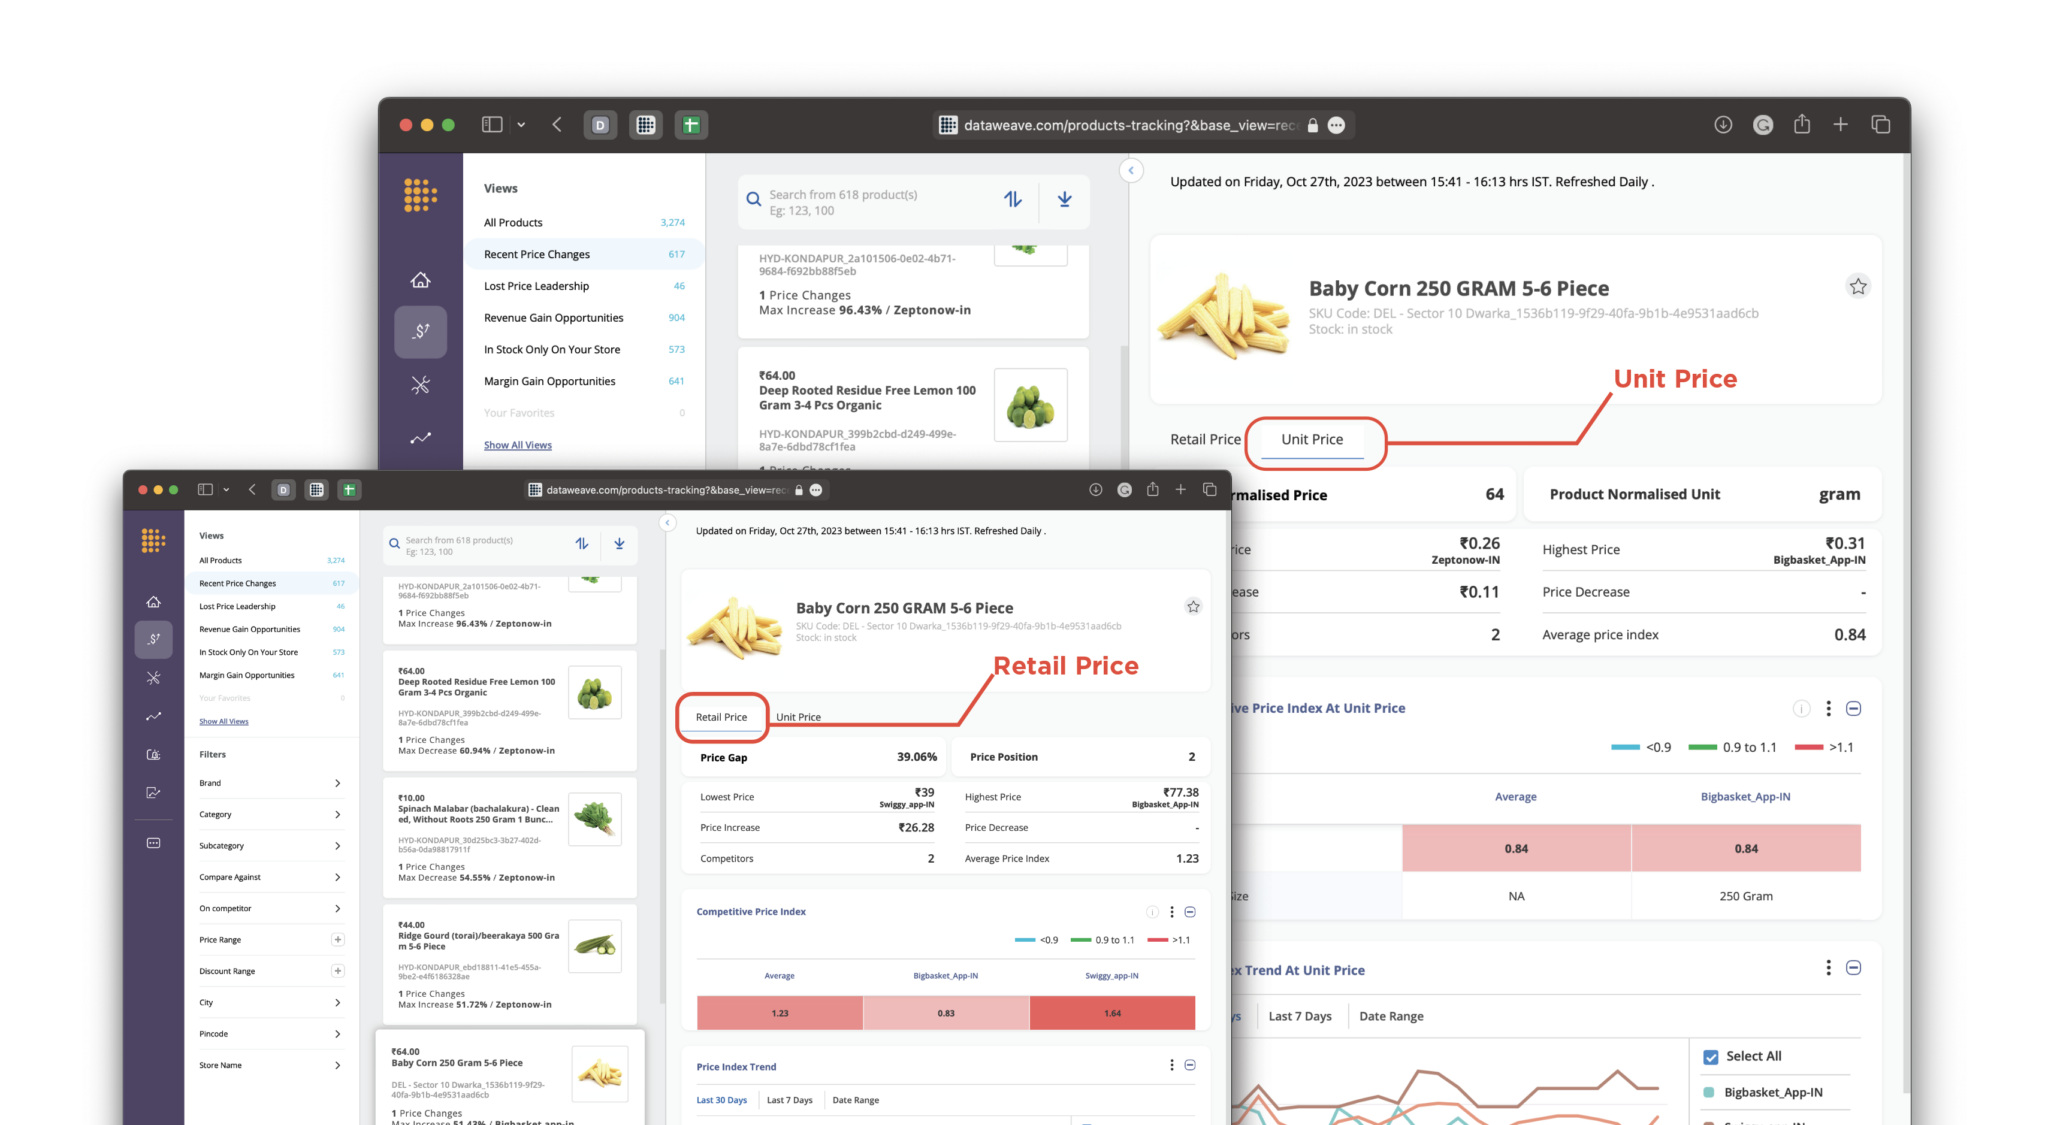
DataWeave’s highly sophisticated product matching engine can match the same or similar products and normalize their units of measurement, leading to highly accurate and actionable competitive pricing insights. It standardizes different units of measurement, like weight, quantity, and volume, ensuring fair comparisons across similar and exact matched products.
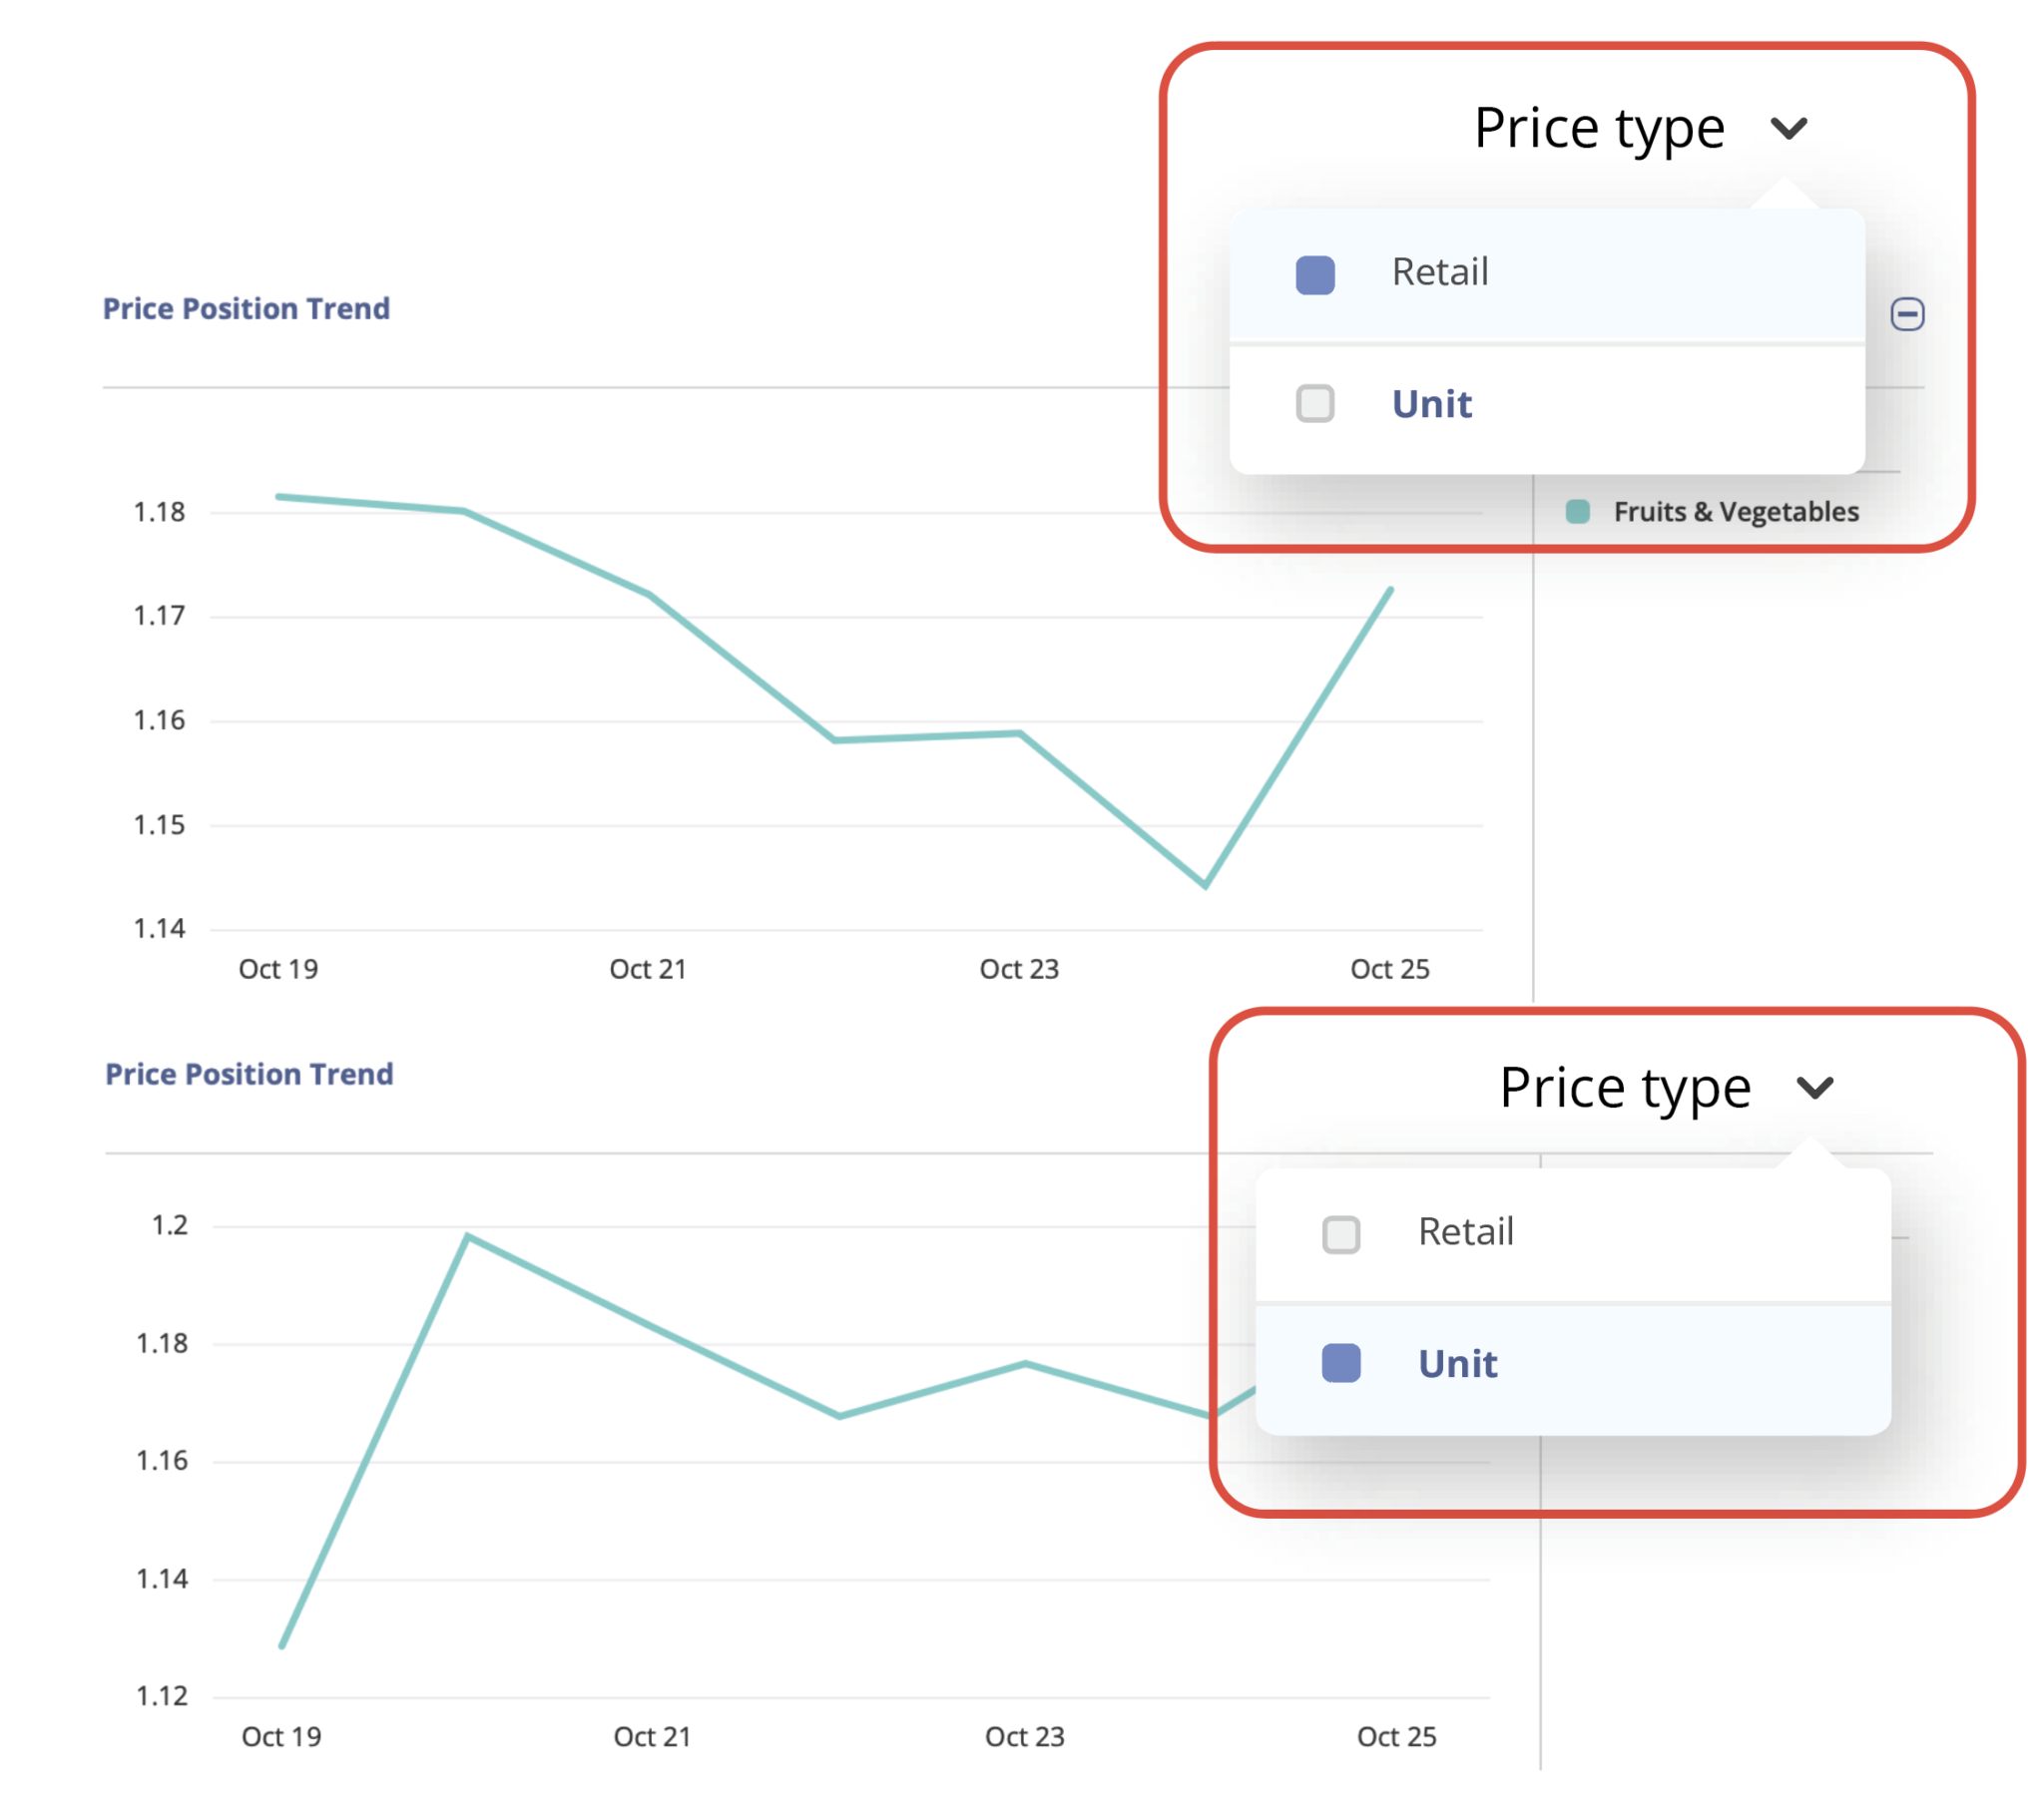
Retailers have the flexibility to view pricing insights either with retailer units or normalized units. This capability empowers retailers and analysts to perform accurate, in-depth analyses of pricing information at a product level.
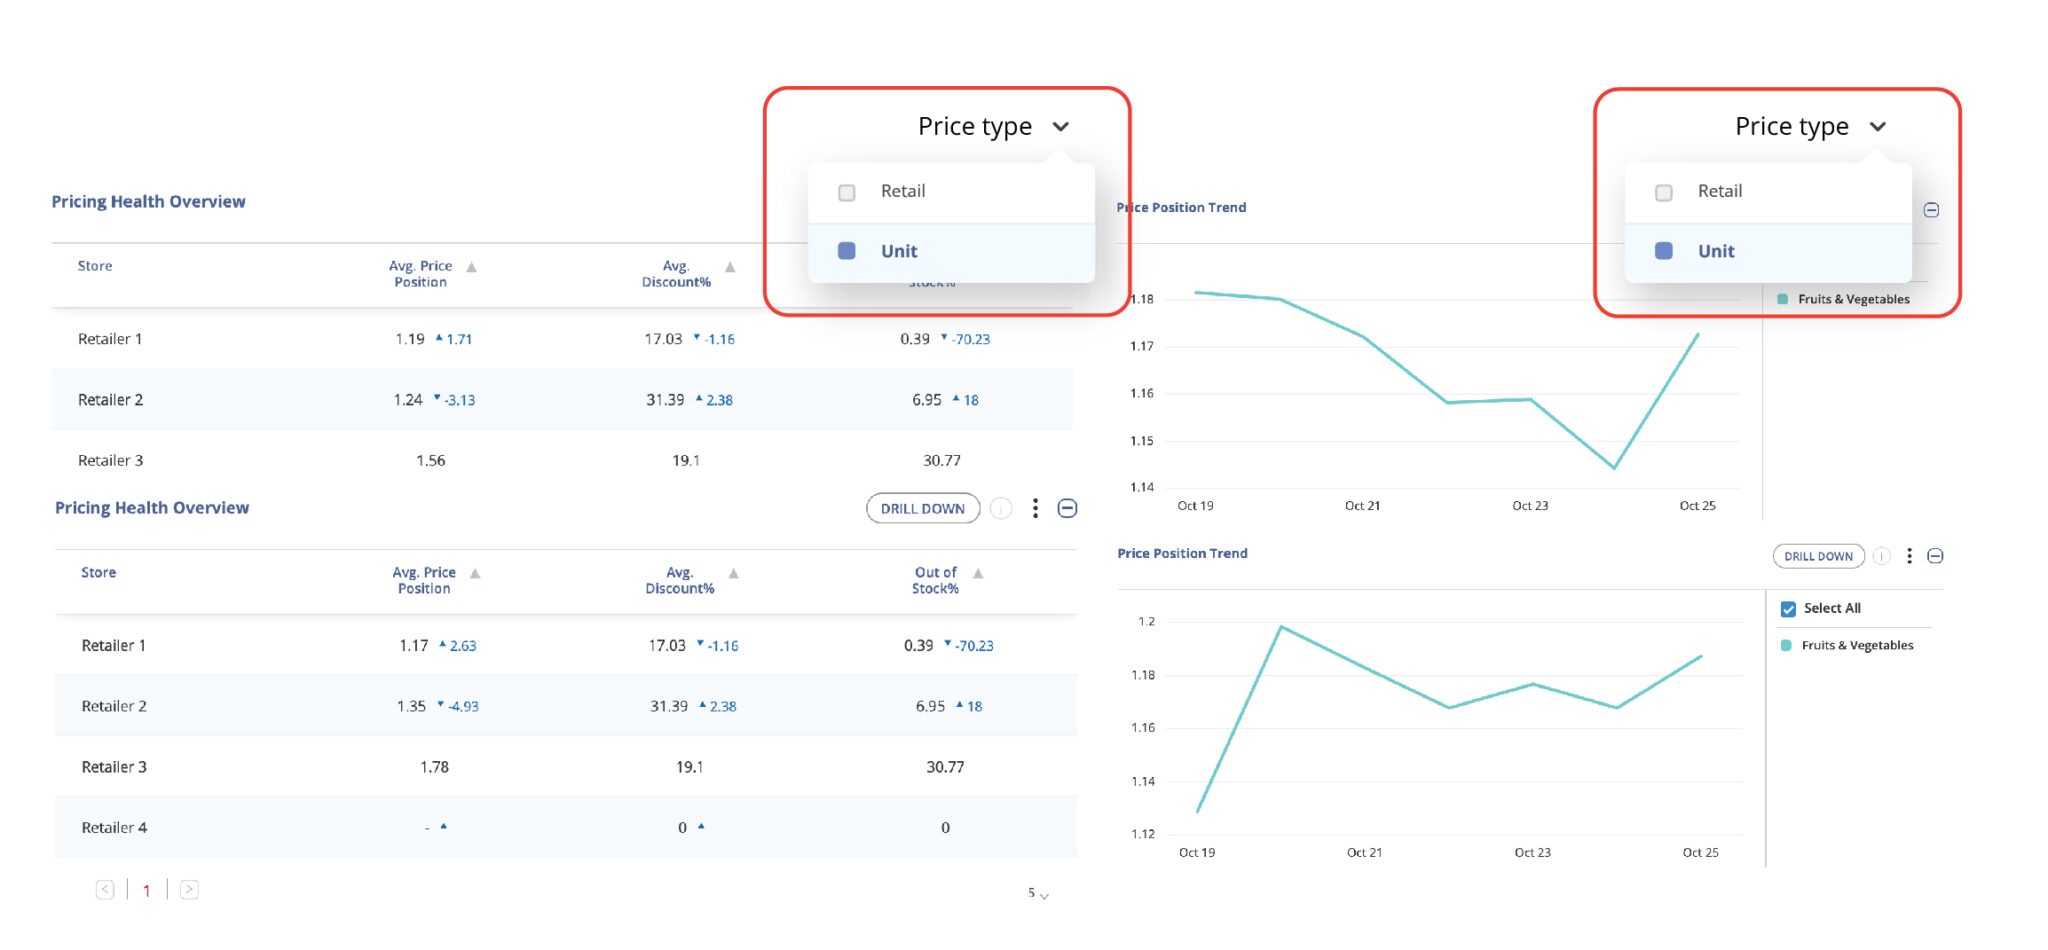
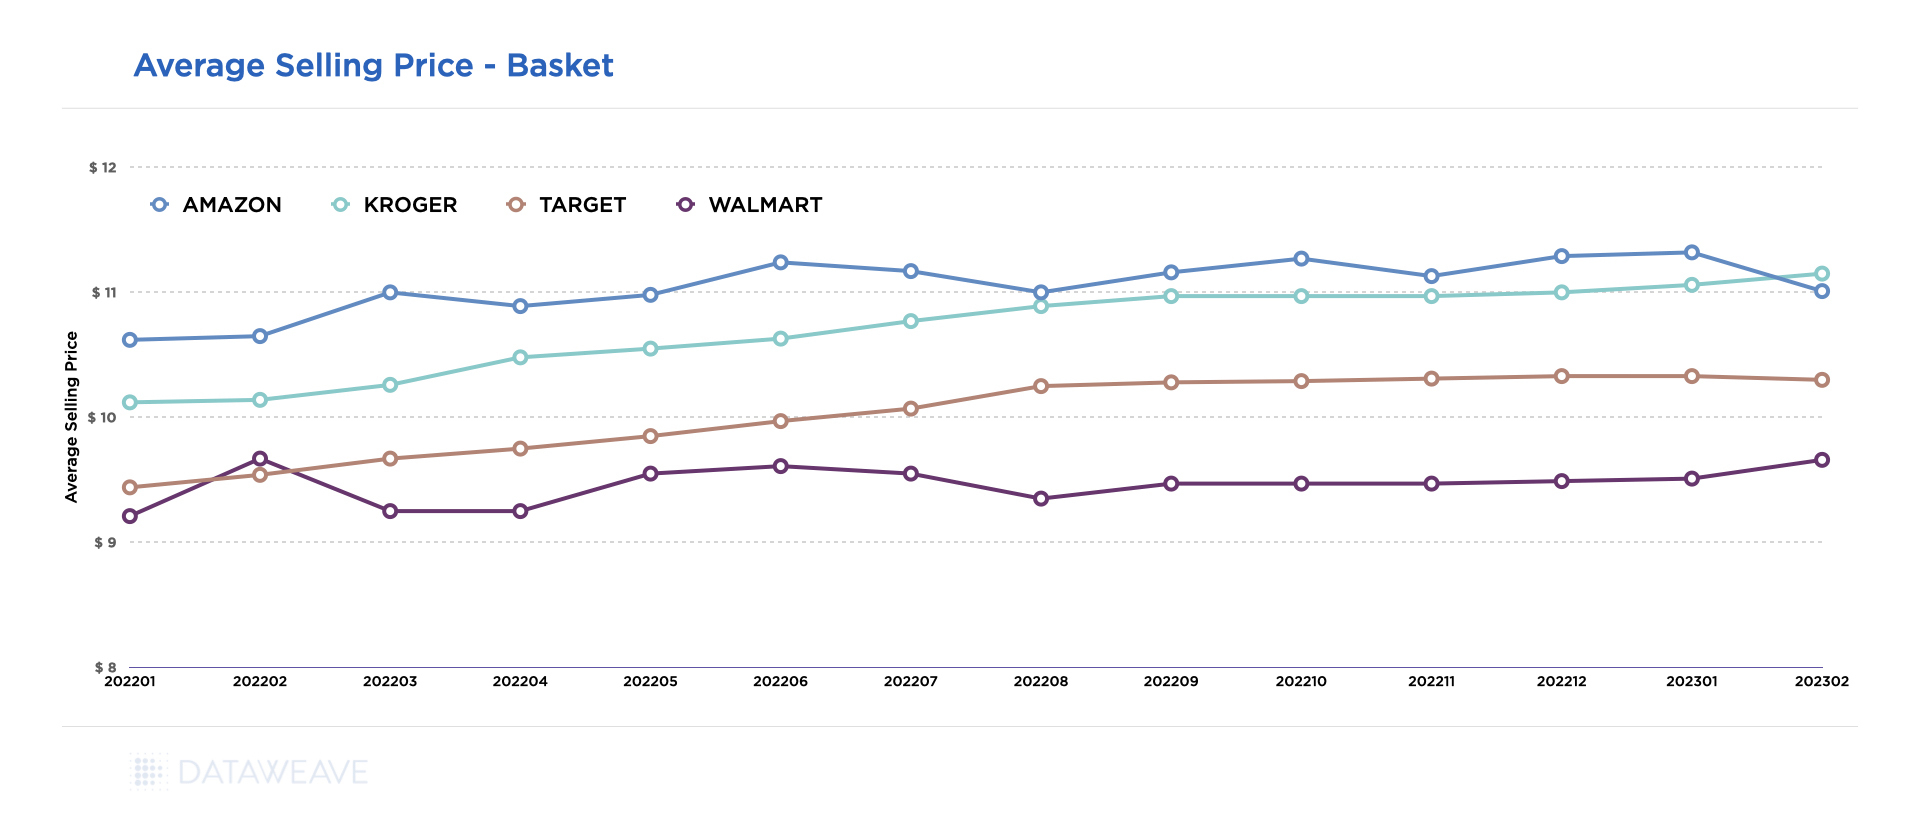
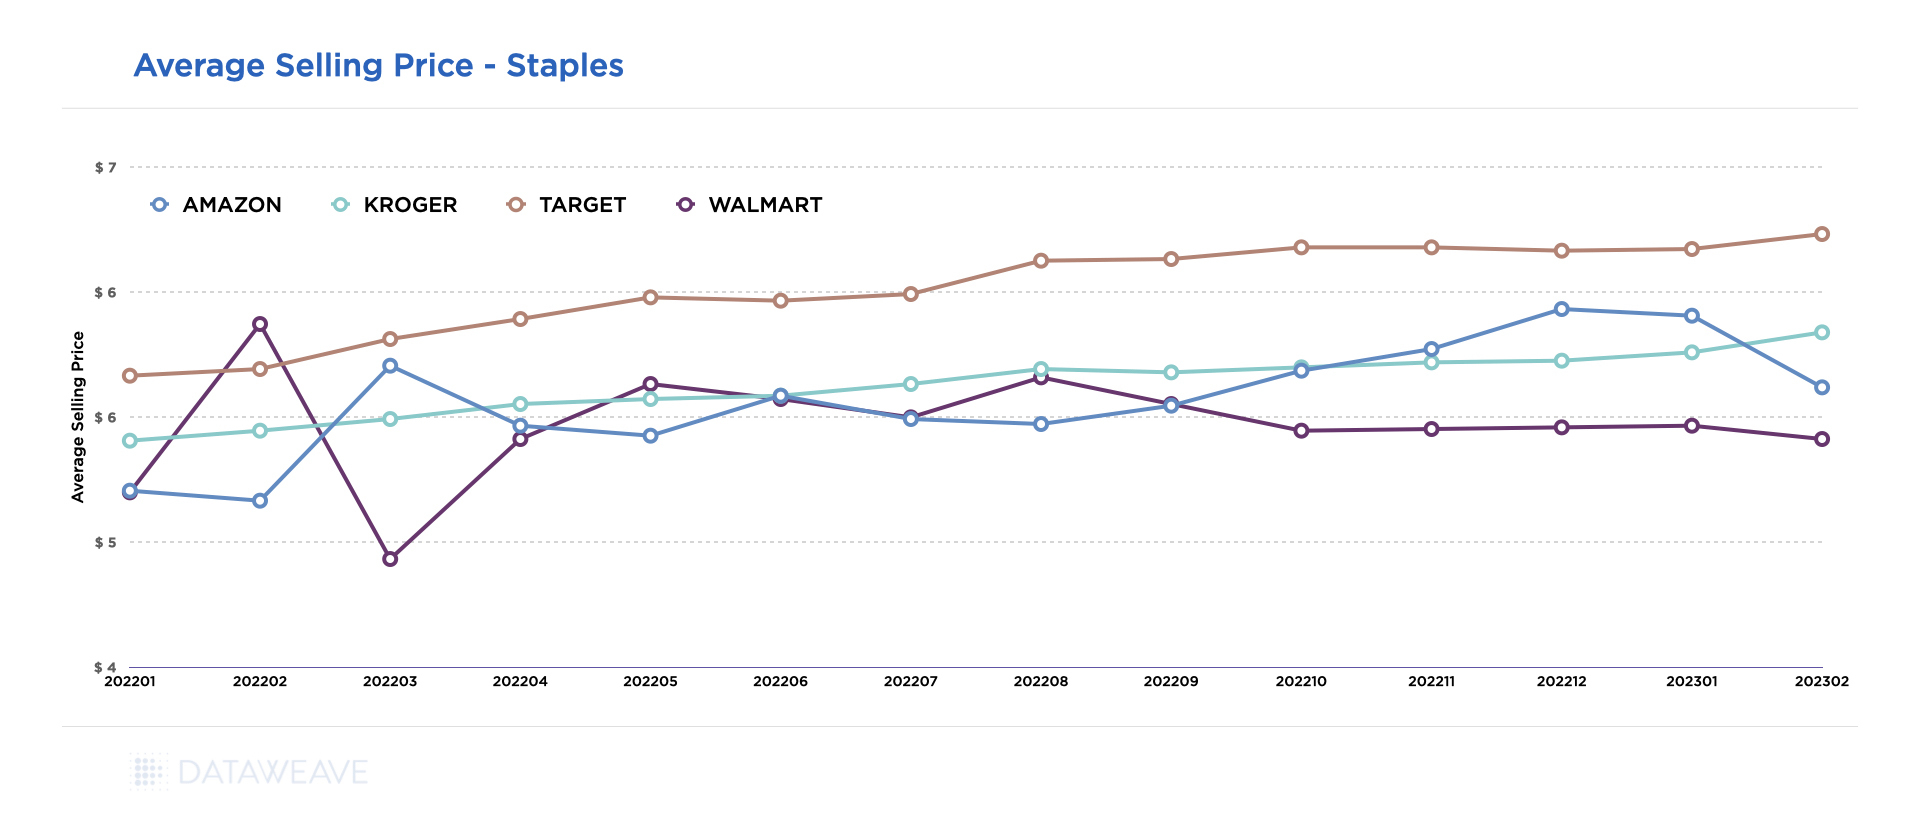
In some scenarios, analyzing unit normalized pricing reflects pricing trends and competitiveness more accurately than retail price alone. This is particularly true for categories like CPG, where products are sold in diverse units of measure. For instance, in the example shown here, we can view a comparison of price position trends for the category of Fruits and Vegetables based on both retail price and unit price.
The difference is striking: the original retail price based analysis shows a stagnation in price position, whereas unit normalized pricing analysis reflects a more dynamic pricing scenario.
With DataWeave, retailers can specify which units to compare, ensuring that comparisons are made accurately. For example, a retailer can specify that unit price comparisons apply only to 8, 12, or 16-ounce packs, as well as 1 or 3-pound packs, but not to 10 and 25-pound bags. This precision ensures that products are matched correctly, and prices are represented for appropriately normalized units, leading to more accurate pricing insights.
For consumer brands, the digital marketplace presents an unparalleled landscape of opportunities for engaging with consumers and expanding their market presence. Within this dynamic environment, Digital Shelf Analytics has emerged as a crucial pillar in a brand’s eCommerce strategy. This technology provides valuable insights into a brand’s organic and paid visibility on marketplaces, content quality, pricing strategies, promotional efforts, and product availability. These insights help brands gain a comprehensive understanding of their competitive positioning and overall market performance.
Nevertheless, many brands often grapple with the question of whether this understanding translates into tangible actions that drive real business impact and return on investment (ROI). This uncertainty stems from a lack of clarity about the direct correlation between digital shelf insights and key metrics such as enhanced sales conversions.
Nonetheless, there is compelling evidence that when these insights are effectively harnessed and strategic actions are taken, brands can realize significant, measurable benefits.
So, the question arises: does Digital Shelf Analytics genuinely deliver on its promises?
At DataWeave, we’ve partnered with numerous brands to fuel their eCommerce growth through the application of digital shelf analytics. In this article, we will delve into these insights, uncovering the concrete and quantifiable results that brands can achieve through their investments in digital shelf analytics.
Digital Shelf KPIs and Their Impact
Digital Shelf Analytics is a robust system that analyzes specific key performance indicators (KPIs) about the digital shelf, furnishing brands with precise recommendations to not only bolster these KPIs but also to monitor the enhancements over time. The following is a brief explanation of digital shelf KPis and their expected impact areas:
Product Availability: Ensuring Shoppers Never Hear “Out of Stock” Again
Timely insights on the availability of products ensures brands reduce replenishment times at scale, which can significantly impact sales, creating an unbreakable link between product availability and revenue. With Digital Shelf Analytics, procurement and replenishment teams can set up notifications to promptly identify low or out-of-stock items and take swift action. This can also be done for specific ZIP codes or individual stores. In addition, availability plays a crucial role in a brand’s Share of Search and search rankings, as online marketplaces often ensure only in-stock products are shown among the top ranks.
If a product isn’t visible, does it even exist? In fact, 70% of consumers never go beyond the first page of search results on major online marketplaces. Therefore, as a brand, the visibility of your products for relevant search keywords and their appearance on the first page can heavily determine your awareness metrics. This is where the concept of Share of Search comes into play. Think of it as securing prime shelf space in a physical store. Digital shelf insights and benchmarking with category leaders for Share of Search help ensure your products command relevant attention on the digital shelf.
Content Quality: Crafting the Perfect Product Story
Creating engaging product descriptions and visuals is akin to giving your products a megaphone in a crowded marketplace. By enhancing content quality, including product names, titles, descriptions, and images, brands can climb the search result rankings, leading to increased visibility and subsequently, more sales.
Ratings and Reviews: The Power of Social Proof
Public opinion holds immense sway. Research indicates that a single positive review can trigger a 10% surge in sales, while a multitude of favorable reviews can propel your product to a 44% higher trajectory. The correlation between ratings and sales is not surprising—each step up the rating ladder can translate to substantial revenue growth.
While it’s reasonable to anticipate a connection between these KPIs and downstream impact metrics such as impressions, clicks, and conversions, we were driven to explore this correlation through the lens of real-world data. To do so, we meticulously monitored the digital shelf KPIs for one of our clients and analyzed the improvements in these metrics.
It’s essential to acknowledge that not all observed impact areas can be solely attributed to enhancements in digital shelf KPIs. Still, it’s evident that a robust correlation exists. The following section presents an in-depth case study, shedding light on the results of this analysis.
A Success Story: Real-World Impact of Digital Shelf Analytics
Let’s dive into the journey of one of our clients – a prominent CPG brand specializing in the sale of baked goods and desserts. Through their experience, we will illustrate the transformative impact of our DataWeave Digital Shelf Analytics product suite.
Over a period of one year, from August 2022 to July 2023, the brand leveraged several key modules of Digital Shelf Analytics for Amazon, including Share of Search, Share of Category, Availability, Ratings and Reviews, and Content Audit. Each of these digital shelf KPIs played a vital role in shaping the brand’s performance across various stages of the buyer’s journey.
The buyer’s journey is typically delineated into three key stages:
Awareness: At this stage, shoppers peruse multiple product options presented on search and category listing pages, gaining an initial understanding of the available choices.
Consideration: Here, shoppers narrow down their selections and evaluate a handful of products, moving closer to a purchase decision.
Conversion: In this final stage, shoppers make their ultimate product choice and proceed to complete the purchase.
Let’s now examine the data to understand how digital shelf KPIs helped drive tangible ROI on Amazon for the brand across the stages of the buyer journey.
Stage 1: Raising Awareness
Enhancing Share of Search and Share of Category can help brands boost product visibility and raise brand awareness. The following chart demonstrates the steady, incremental improvements in our client’s Share of Search and Share of Category (in the top 20 ranks of each listing page) throughout the analyzed period. These enhancements were achieved through various measures, including product sponsorship, content enhancement, price optimization, promotional initiatives, and more.
This amplified Share of Search and Share of Category directly translates into improved product discoverability, as evident from the surge in impressions depicted in the chart below.
Stage 2: All Things Considered
In the consideration stage, shoppers make their product selections by clicking on items that meet their criteria, which may include factors like average rating, number of ratings, price, product title, and images. For brands, this underscores the importance of crafting meticulously detailed product content and accumulating a substantial number of ratings.
The subsequent chart illustrates the year-long trend in both average ratings and the number of ratings, both of which have displayed steady improvement over time.
The enhancements in the number of ratings and the average rating have a direct and positive impact on product consideration. This, in turn, has led to a noticeable year-over-year increase in page views, as indicated in the chart below.
These improvements are likely to have also been influenced by the overall enhancement of content quality, which is detailed separately in the section below.
Stage 3: Driving Decisions
As buyers progress to the next stage, they reach the pivotal point of making a purchase decision. This decision is influenced by multiple factors, including product availability, content quality, and the quality of reviews, reflecting customer sentiment.
Our client effectively harnessed our Availability insights, significantly reducing the likelihood of potential out-of-stock scenarios and enhancing replenishment rates, as highlighted in the chart below. The same chart also indicates improvements in content quality, measured by the degree to which the content on Amazon aligns with the brand’s ideal content standards.
Below, you’ll find the year-over-year growth in conversion rates for the brand on Amazon. This metric stands as the ultimate measure of business impact, directly translating into increased revenue for brands.
As the data uncovers, growth in key digital shelf KPIs cumulatively had a strong correlation with impressions, page views, and conversion rates.
It is also important to note that the effect of each KPI cannot be viewed in isolation, since they are often interdependent. For example, improvement in content and availability could boost Share of Search. Accurate content could also influence more positive customer feedback. Brands need to consider optimizing digital shelf KPIs holistically to create sustained business impact.
Impact on eCommerce Sales
After the implementation of digital shelf analytics, the results spoke for themselves. Sales consistently outperformed the previous year’s records month after month. As shown in the chart below, the diligent application of DataWeave’s recommendations paved the way for an impressive 8.5% year-over-year increase in sales, leaving an indelible mark on the brand’s eCommerce success.
From boosting product visibility to catapulting conversion rates, Digital Shelf Analytics serves as the key to unlocking unparalleled online success.
While the success story detailed above does not establish a direct causation between Digital Shelf Analytics and sales revenue, there is undoubtedly a strong correlation. It’s evident that digital shelf KPIs play a pivotal role in optimizing a brand’s eCommerce performance across all stages of the buyer journey. Hence, for brands, it is vital that they collaborate with the right partner and harness digital shelf insights to fine-tune their eCommerce strategies and tactics.
That said, the eCommerce landscape is in a constant state of flux, and there is still much to learn about how each digital shelf KPI influences brand performance in the online realm. With more data and an increasing number of brands embracing Digital Shelf Analytics, it’s only a matter of time before a direct causation is firmly established.
Reach out to us today to know more about how your brand can leverage Digital Shelf Analytics to drive higher sales and market share in eCommerce.
Consider this scenario: A retailer establishes its fuel prices using pricing data that’s a few days old, only to subsequently discover that a nearby competitor is offering substantially lower prices. The result? Lost customers, decreased foot traffic, and diminished sales. This serves as a stark reality that retailers must confront and address today.
In the fiercely competitive realm of retail, where every decision holds weight, maintaining a competitive edge is paramount. The fuel category, frequently underestimated, has the potential to significantly impact a retailer’s revenue stream. This challenge is not unique; retailers worldwide, particularly in North America, grapple with a common hurdle: mastering the intricate art of real-time fuel pricing.
The Quest For Reliable, Real-Time Fuel Pricing Data
For retailers, traditional methods for procuring and analyzing fuel price data have proven to be both expensive and error-prone, often relying on manual data collection or third-party data providers. These outdated approaches yield frustrating delays, inaccuracies, and missed opportunities. When it comes to obtaining timely fuel pricing intelligence, the majority of fuel retailers grapple with three central challenges:
Low Accuracy: Ensuring that fuel pricing information remains up-to-date, dependable, and actionable, even when sourced from complex web-based platforms.
Less Coverage: Acquiring comprehensive data that encompasses all of North America, spanning across retailers, convenience stores, fuel stations, and beyond.
High Cost: Effectively managing the substantial costs associated with acquiring and processing this vital information.
DataWeave’s Fuel Pricing Intelligence Solution
Comprehensive, accurate, and real-time fuel pricing intelligence can play a huge role in the profitability of retailers throughout North America. DataWeave takes the forefront in delivering this transformative Data-as-a-Service (DaaS) solution to some of the most prominent retailers in the region, including the top 20 fuel retail behemoths.
With a rich and extensive history spanning over a decade in the realm of competitive intelligence, DataWeave boasts an impressive track record of empowering well-informed decision-making in retail. We leverage state-of-the-art technology to bring an unparalleled level of accuracy, timeliness, and coverage to fuel pricing intelligence.
The following are some compelling advantages offered by our solution:
Accurate and Real-Time First Party Data
We deliver retailers an unparalleled advantage through real-time, first-party fuel price data. Our data originates directly from the retailer’s own channels, encompassing websites and mobile apps, rendering it the industry’s foremost and most reliable source.
Imagine having access to fuel pricing information that updates as frequently as every 30 minutes. This rapid update cadence guarantees that you, as a retailer, constantly possess the latest pricing insights at your fingertips, empowering you to respond swiftly to market fluctuations and competitor manoeuvres. Our comprehensive data spans a wide spectrum of fuel types, including:
Gasoline: Be it regular, mid-grade, super, premium, ethanol-free, ethanol blends, methanol blends, or reformulated gasoline, we have got you covered.
Diesel: Our data encompasses biodiesel, biodiesel off-road, biodiesel blends, biodiesel ultra-low sulfur (ULS), diesel ultra-low sulfur (ULS), diesel off-road, standard diesel, and premium diesel.
Armed with our real-time, first-party data, you can make pricing decisions with unwavering confidence, secure in the knowledge that you possess access to the most current, authoritative, and extensive fuel pricing intelligence in North America.
The data points we capture directly from relevant web sources include: gas station postal code, store name and code, location, city, state, ZIP code, fuel type, competitor name, regular price, member price (if available), time and date of data capture, and more.
Click here if you wish to access a sample report of our fuel pricing data.
Unrivaled Geographical Coverage
Our extensive coverage of fuel data spans over 30,000 ZIP codes and encompasses the top 100 retailers across the western, mid-western, and eastern regions of the United States.
Retailers benefit from the flexibility to configure and tailor the solution to their precise needs, whether it involves adding more locations or selectively acquiring specific segments of the data. This far-reaching coverage guarantees that retailers, whether situated in bustling urban centers or remote areas, can readily access the essential data required to maintain their competitive edge.
Moreover, if you currently source your fuel pricing data from alternative providers, our solution seamlessly integrates, amplifies, and complements your existing array of data sources, ensuring a harmonious and unified approach to data acquisition.
Optimization of Dynamic Pricing Strategies
In the world of retail, the importance of timing cannot be overstated. Even a mere difference of a few cents can translate into millions of dollars in revenue impact. With DataWeave, retailers gain the capability to make data-driven decisions that provide them with a competitive edge around the clock, every single day.
Our platform empowers you to unearth margin gaps by pinpointing opportunities to raise prices while maintaining your competitive pricing position. It also identifies instances where you may be substantially overpriced, prompting necessary price adjustments to ensure competitiveness within the market. All these valuable insights are available at a hyperlocal level, facilitating pricing efficiency and optimization across your various regions of coverage. Equipped with this real-time data, you can swiftly adapt to ever-changing market conditions.
Furthermore, our comprehensive competitive data seamlessly integrates into your existing pricing systems through APIs, facilitating quick and informed pricing actions based on robust data.
Reliable and Customer-First Tech Platform
Our platform boasts a remarkable level of sophistication when it comes to data aggregation, normalization, visualization, and integration capabilities. It stands as a massively scalable system with the capacity to aggregate billions of data points daily, spanning thousands of web sources. This includes the intricate handling of sources like mobile apps and websites known for frequently altering their site structures, among others.
What truly sets us apart is our proficiency in addressing these challenges through a blend of human expertise and large-scale machine learning. Additionally, our commitment to delivering unmatched service extends to round-the-clock, 24/7 support. This comprehensive approach makes our fuel pricing intelligence solution not only effective but also cost-efficient in meeting your fuel data requirements.
We also provide a variety of options for you to consume our data, which includes receiving our reports via email, SFTP, S3 buckets, data lakes like Snowflake, and APIs.
Enhance your Fuel Pricing Strategies with DataWeave
In the ever-competitive world of retail, staying ahead is not just a goal; it’s a necessity. The fuel pricing landscape, often overlooked, holds immense power to impact a retailer’s profitability. DataWeave’s real-time, comprehensive, and accurate fuel pricing intelligence solution is the key to securing this advantage. Retailers and convenience stores now have a powerful platform at their disposal, offering unparalleled precision, comprehensive coverage, and the agility needed to navigate this landscape.
Join the ranks of industry leaders who have already harnessed the potential of DataWeave. Reach out to us today to redefine your approach to fuel pricing and propel your business to new heights!
This year’s back-to-school shopping season has presented a considerable challenge for inflation-weary parents in the US. Despite chatter about alleviating inflation rates, the reality of rising prices tells a different story.
As families hunt for school supplies, apparel, and other essential items for the academic year, the financial strain remains palpable. Experts note that elevated prices coupled with extensive shopping lists have compelled many parents to be more discerning about their purchases, expenditure thresholds, and preferred shopping venues. Essentially, shoppers are looking for more value for their money with every purchase. According to the National Retail Federation’s 2023 projection, this back-to-school season is poised to be the most financially demanding one to date. The forecast anticipates total spending exceeding $135 billion, marking an increase of over $24 billion compared to the previous year.
At DataWeave, we continually monitor and analyze pricing activity among retailers across popular shopping categories. Our recent study delved into the pricing trends in the back-to-school category, which includes backpacks, fundamental school supplies, binders, planners, writing instruments, and more. The aim was to understand how the costs of back-to-school essentials have shifted in 2023 in comparison to 2022.
Pricing of Back-to-School Products in 2023
Our analysis, spanning 1200 products across major retailers such as Amazon, Walmart, Kroger, and Target reveals an average price surge of 9.8% in 2023 compared to the previous year.
This upward pricing trend can be attributed to retailers’ strategic efforts to guarantee product availability and uphold quality during a period of heightened demand. As the back-to-school season sparks a surge in shopping activity, retailers like Kroger, Amazon, and Walmart are likely adjusting prices strategically to align with the expenses incurred in securing adequate supplies, managing logistics, and meeting operational demands.
Kroger led the way with a 12.1% price hike, the most significant among the scrutinized retailers. It was followed by Amazon with an average increase of 10.5% and Target with 7.8%. Walmart remains the outlier, with the smallest price increases for back-to-school products in 2023.
Pricing across Categories and Subcategories
Among the various categories examined, backpacks have experienced the most pronounced escalation, with prices soaring by a substantial 25%. Within the top 10 highest priced backpacks we looked at, the most substantial price hikes were observed for brands like The North Face (44%) and Fjallraven (33%).
The Office Organization category also witnessed a significant price surge of 16.8%, attributed to subcategories like File Folders and Desk Accessories, which saw respective price hikes of 31.3% and 25.2%.
Categories like Memo Boards & Supplies (14.3%), Binders (12.5%), and Themebooks & Portfolios (12.4%) have likewise encountered notable price hikes. On the other end of the spectrum, Planners and Journals saw a modest rise of 4.4%, while Mailing and Shipping Supplies and Office Machine Accessories experienced comparatively lower price increases at 7% each.
Interestingly, while items like Journals and Writing Instruments maintain popularity year-round, Backpacks and Memo Boards are particularly sought after during the back-to-school season, contributing to more substantial price hikes in these categories.
On the other hand, consumers are consistently on the lookout for cost savings and deals from retailers, especially as they deal with inflationary pressures. In response, Kroger, Target, and Walmart have introduced back-to-school savings initiatives. For instance, Kroger is offering more than 250 items for less than $3 and some items for just $1, encompassing essentials such as paper, pencils, and glue sticks. Lower price increases across categories like journals and writing essentials could be attributed to these initiatives.
Brands with the Highest Price Increases across Categories
Across various back-to-school categories, some brands stand out with significant price increases. For instance, in the Office Organization category, Ubrands leads the pack with a substantial 38.30% surge, followed by Pendaflex at 30.80%. Meanwhile the Backpacks category sees Champion and Adidas recording significant price jumps of 29.6% and 23.6%, respectively.
Ubrands and Pentel from Basic School and Office Supplies Category also record high price increases at 22.70%, followed by Carolinapd from the Themebooks & Portfolios Category at 21.08%. 3M in Mailing in Shipping Supplies shows the lowest price increase at 6.80%.
Interestingly, the ever popular Writing Instruments category showcases BIC at the forefront, exhibiting the most notable price escalation of 13.2%. Expo trails closely at 11.6%, while Uniball demonstrates an 11.4% increase. Even Sharpie, a beloved writing brand, displays a modest price uptick of 9.3%.
The average price increments seen across brands mirror the overarching trend of increased costs throughout back-to-school categories.
Navigating the Competitive Pricing Landscape During the Back-To -School Season
Given the challenging pricing landscape during the back-to-school season, retailers would be wise to provide lower-cost alternatives alongside popular brand names. This allows parents to easily make substitutions while adhering to a school supplies list.
With our competitive pricing intelligence solution, retailers can confidently analyze and monitor their prices relative to competition, ensuring they maintain a leadership position in pricing within their desired set of products, while posturing for margins with other products.
In the evolving retail landscape, success often hinges on a singular focal point: pricing. A recent Statista survey revealed that 70% of US online users prioritize competitive pricing in their digital shopping choices. In this cutthroat arena, where surpassing rivals is paramount, a deep comprehension of pricing nuances is no longer just an edge, but a necessity.
Retailers are increasingly adopting pricing intelligence solutions that meticulously dissect competitor pricing data in comparison to their own, down to the SKU level. This analysis empowers their pricing teams with the insights they need to price their products competitively on a day-to-day basis.
However, in a landscape where a staggering 50 million price changes occur daily, reliance on a reactive pricing intelligence solution, though effective in many ways, often falls short. To develop a strategic and predictive pricing engine, retailers also need the ability to track historical pricing relative to market conditions, competitor actions, seasonality, promptness of competitor pricing actions, and more. This would be particularly useful for senior retail pricing and business unit leaders as they look to gain a strategic perspective on their competitive pricing health. However, even today’s leading providers of retail pricing intelligence solutions lack in this area. This results in a relatively myopic view of competitive pricing even in large retail organizations.
Introducing DataWeave’s PricingPulse
DataWeave’s PricingPulse helps retail leaders better understand their competitive pricing strategies in comparison to relevant market dynamics over time. The capability bridges the gap between day-to-day competitive pricing operations and long-term strategic pricing analysis and actions, enabling senior retail pricing leaders to untangle the complexities of their pricing strategies. Delivered as a dashboard, the view offers an elevated vantage point for industry-wide pricing dynamics, empowering retailers with the foresight needed to navigate market shifts, predict vulnerabilities, and capitalize on new opportunities.
PricingPulse is provided to all DataWeave retail customers as an add-on to our Pricing Intelligence solution.
The insights offered by PricingPulse enable retailers to answer pivotal questions about competitor pricing behaviors, price leadership across categories, timing of price changes, and the effectiveness of capitalizing on price improvement opportunities. Some of the questions that PricingPulse offers answers to include:
How frequently are my competitors changing prices and for which products?
How does my price leadership vary across key product categories?
Which day of the week or month do my competitors change their pricing most and least frequently?
How well do I seize on price improvement opportunities over time?
Strategic Pricing Views Via PricingPulse
In the following section, we share a few views available to retail leaders via our PricingPulse dashboard. For a complete list of insights available on the dashboard, request a demo today.
Competitive Price Leadership Across Retailers and Categories
This view provides retailers with an overview of the price leaders across various product categories and how it changes with time. More often than not, retailers would aim to gain price leadership in certain categories, while maintaining healthy margins in others.
Retailers can also gauge their consistency and effectiveness in maintaining a competitive edge for key categories over time. They can fortify areas of strength and identify opportunity areas to optimize their pricing.
In addition, the dashboard tracks a retailer’s price index across categories, a measure that determines its price competitiveness.
The price index is determined by dividing the retailer’s price by the lowest price offered by any of its competitors. A ratio lesser than 1 indicates that the retailer is the lowest priced in the market. This measure is also presented for competitors, providing insights into competitors that are most attractively priced in the market. A timeline trend of this metric helps track how price leadership among retailers changes over time.
Price Change Trends
This view provides a summary of the level of price changes by a retailer and its competitors over a period of time, which includes the average magnitude of price changes as well as the proportion of the retailer’s assortment that underwent these price changes.
In addition, the number of price changes each month are provided for each retailer. This is further broken down into the total number of price changes during each day of the week.
These insights help retailers determine which competitors are most and least active in their pricing activities, how aggressive the pricing actions are, and if there are any specific price change patterns followed in terms of the days of the week or month.
Price Improvement Opportunities and Actions
The dashboard actively reports on price improvement opportunities, which could include either a price increase opportunity or a price decrease opportunity, for a retailer and its competitors across categories over time. A price increase opportunity occurs when a product is significantly under priced (by more than 2%) and a price decrease opportunity occurs when a product is significantly overpriced (by more than 2%).
Further, the retailer gains insight into how many price improvement opportunities were actually acted on within 15 days of the opportunity presenting itself. This “action rate” helps retailers quantify how well they seize on price improvement opportunities, which eventually result in higher sales and margins. The dashboard also reports on the average number of days it took for a retailer to act on a price improvement opportunity, thereby quantifying the responsiveness and agility of pricing teams.
This is especially useful for pricing leaders to “audit” or evaluate the performance of their pricing teams. When similar insights are viewed for a set of competitors as well, retailers can better understand the level of sophistication of their competitors’ pricing operations.
Ready to Elevate Your Pricing Game?
The launch of DataWeave’s PricingPulse marks a significant advancement in the realm of pricing solutions for retail leaders. As the retail landscape undergoes continuous transformation, the significance of precise pricing strategies cannot be overstated. PricingPulse is the first and only pricing view in the industry to bridge the gap between tactical pricing decisions and comprehensive strategic analysis.
In a world where agility and foresight are crucial, PricingPulse equips retail leaders with the ability to predict competitor actions, optimize pricing strategies, and stay ahead of the competition.
If you are a senior pricing leader or retail business unit head, reach out to us today to either sign up or learn more!
Amazon’s India Prime Day 2023 shattered previous records with a peak of 22,190 orders received in a minute. An important aspect of Amazon’s India Prime Day was the benefits it offers to Prime Members. Thousands of sellers, brands, and bank partners collaborated to help Prime members save a staggering sum of over Rs. 300 Crores. The 2 day (July 15-16) event even witnessed strong growth in Prime membership, with 14% more members shopping than last year’s Prime Day event. 45,000+ new products were launched by over 400+ top Indian and global brands.
However, our analysis reveals that Amazon was able to make a huge splash despite adopting a relatively modest discounting strategy for the event.
Pricing and Discounts on Prime Day 2023
While Prime Day is Amazon’s showstopper, bringing huge benefits to partner brands and sellers, it’s interesting to also see how Flipkart responded to such a massive sale by its biggest competitor. Therefore, we leveraged our proprietary data aggregation and analysis platform to analyze the prices and discounts of Amazon and Flipkart across key product categories – Apparel, Home & Furniture, Consumer Electronics, and Health & Beauty – during Prime Day.
Since products on Amazon and other eCommerce websites are often sold at discounts even on normal days not linked to a sale event, we delved into the real value that Prime Day offers to shoppers by focusing on price reductions or additional discounts during the sale compared to the week before. As a result, our approach highlights the genuine benefits of the event for shoppers who count on lower prices during the sale.
Research Methodology
For our analysis, we tracked the prices of a large number of products across Amazon and Flipkart during Prime Day as well as the week prior to the event. The details of our sample are mentioned below:
Number of SKUs: 85,000+
Retailers: Amazon, Flipkart
Categories: Apparel, Home & Furniture, Consumer Electronics, Health & Beauty
Pre-event Analysis:10-14 July 2023
Prime Day Analysis: 15-16 July 2023
Our Findings
Based on our analysis, Prime Day showcased relatively higher price reductions in the Health and Beauty category, offering an average additional discount of 5.3%. In comparison, the Apparel category had lower discounts at 4.90%, followed by the Home & Furniture category at 2.50% during the sale event.
The Consumer Electronics category, known for attractive prices during sale events, featured only 0.9% price reductions. This is due to the fact that the category was already being sold at a very high average discount of around 44.8% the week prior to Prime Day.
Below, we delve deeper into our analysis of each category to better understand how price reductions were distributed across key subcategories on Amazon. We also report on the degree to which Flipkart responded to Amazon’s pricing actions during the event.
Apparel
As Amazon grappled with heightened costs and reduced profit margins in apparel (like most other retailers), its average discount before Prime Day was already at 36.5%. Then, on Prime Day, Amazon’s apparel deals were tempered at around 4.9% average price reduction across 43.7% of its assortment.
Flipkart, on the other hand, offered only a modest additional discount of 1.8% across 17.7% of its Apparel assortment. It’s clear that while Flipkart took steps to compete against Amazon in this category, it was done to a lower extent on fewer products than Amazon.
Across all the apparel subcategories we analyzed, Men’s Shoes (11.6%), Women’s Shoes (9.5%), and Men’s Shirts (8.7%) were among the ones with the highest price reductions. On the other hand, Men’s and Women’s Swimwear (2.3%), Women’s Innerwear (2.9%), and Women’s Athleisure (3.3%) had conservative markdowns.
Pricing choices within different subcategories likely stemmed from a range of factors, such as inventory quantities, trends in demand, and the aim to harmonize competitive deals with the maintenance of viable profit margins. These decisions reflect Amazon’s attempt to cater to a consumer base that is particularly conscious of pricing.
Across all apparel subcategories, leading brands that offered the highest markdowns were Sweet Dreams (65.5%), Ketch (55.1%), Clarks (44.9%), and Kibo (38.4%). Meanwhile, Reebok and Adidas offered significant additional discounts at 26.3% and 24.9%, respectively, as well.
For brands, however, reducing prices is just one approach to entice shoppers. They must also guarantee their prominent presence and easy discoverability within Amazon’s search results. This significantly amplifies their potential to generate higher clicks and conversions. In our analysis, we monitored brands’ Share of Search across various frequently used search terms in addition to the discounts they provided. The Share of Search denotes the portion of a brand’s products within the top 20 search results for a specific search query.
Our data indicates that certain brands gained ground in their discoverability during Prime Day, while others fell behind. Van Heusen in Women’s Athleisure (30%), Campus in Men’s Shoes (50%), and Rovar’s (30%) in Women’s Swimwear among others, improved their Share of Search by significant levels during Prime Day.
On the other hand, brands like Sparkx in Men’s Shoes, Xyxx in Men’s Innerwear, WomanLikeU in Women’s Swimwear, and Adidas in Women’s Shoes lost around 40%-80% in their Share of Search during the event. This is likely to have impacted their sales volumes adversely.
Home & Furniture
The Home & Furniture industry faced challenges of reduced demand and overstocked inventory over the past year. Therefore, even before Prime Day, discounts offered in this category on Amazon averaged a staggering 45.3%. Consequently, on Amazon Prime Day, additional discounts averaged only 2.5% on Amazon, offered across 33.3% of its assortment. Flipkart opted, in effect, not to compete with Amazon in this category, offering a negligible additional discount of 0.8% across 14.70% of its assortment.
Of all the Home & Furniture subcategories we analyzed, Luggage (5.1%), Beds (3.9%), and Coffee Tables (3.1%) had high price reductions, while Rugs (0.6%), Bookcases (1.5%), and Washer/Dryers (1.2%) had lower markdowns. This highlights the difference in consumer preferences across geographies, with rugs being more discretionary in India but staple in the US.
The Home & Furniture category is not known for its brand loyalty among shoppers. Therefore, brands often rely on attractive pricing to gain shopper interest. This Prime Day, brands that offered the highest markdowns in this category include It Luggage (40%), Couch Culture (25.8%), Story@Home (23.3%), and Verage (21.2%).
In terms of Share of Search, Wudparadise in Entertainment Units gained the highest (50%). Solimo (an Amazon Brand) in Beds (40%), Sofas (30%), and Coffee Tables (10%) gained significant ground in its respective categories too. In contrast, About Space in Bookcases (-60%), Anika in Entertainment Units (-40%), and Sleepyhead in Mattresses (-40%) lost out on their discoverability in their respective categories during the event.
To gain a competitive edge during sale events like Prime Day, brands need to monitor their Share of Search closely, especially in categories like Home & Furniture with low brand loyalty.
Consumer Electronics
This Prime Day, five smartphones got sold every second with 70% of the demand coming from Tier 2 & 3 cities in India, largely comprising of foldable smartphones and newly launched smartphones (OnePlus Nord 3 5G, Samsung Galaxy M34 5G, Motorola Razr 40 Series, Realme Narzo 60 Series and iQOO Neo 7 Pro 5G). Multiple new products were launched this Prime Day, by brands such as OnePlus, iQOO, Realme Narzo, Samsung, Motorola, boAt, Sony, and more in India.
Despite the high demand and new product launches, Amazon’s price reductions in the Consumer Electronics category averaged only 0.9% across 27% of its assortment. Similar to what we observed in the Home & Furniture category, this can be attributed to the prevailing high average discount of 44.8% the week prior to Prime Day. Essentially, in Consumer Electronics, shoppers needn’t always wait till sale events like Prime Day to view the most attractive deals. Several are offered even during the days leading up to the sale.
Across subcategories, Earbuds (2.4%), Wireless Headphones (1.6%), and TVs (1.3%) received the highest price reductions due to their popularity and high sales volumes during sales events. On the other hand, Smartwatches (0.6%), Drones (0.4%), and Smartphones (0.3%) had lower markdowns.
In terms of price reductions across brands, Da Capo (52.6%), Muzen (33.3%), JLab (23.6%), and Earboss (21.5%) offered the most attractive deals in the Consumer Electronics category. Notably, Amazon Basics also offered modestly attractive deals (12.2%), highlighting Amazon’s strategy of promoting in-house brands.
The Consumer Electronics category has a loyal shopper base, but generic search keywords like earbuds, headphones, and tablets remain essential for attracting high-intent shoppers and increasing brand awareness. So when it comes to Share of Search, Noise in Smartwatches, Samsung in Smartphones and Tablets, and HP in Laptops, all made strong strides in building their discoverability on Amazon during Prime Day.
Xiaomi in Laptops, Ekko in Earbuds, OnePlus in Smartphones and Apple in Tablets, lost out to other brands during the sale.
Health & Beauty
Health & Beauty emerged as the top-performing category in terms of additional discounts during Prime Day in India. Our data shows that Amazon offered an average additional discount of 5.3% on almost half of its products (46.8%) in this category. Competing head to head with Amazon in this category, Flipkart offered 5.5% additional discounts across 35.8% of its assortment.
Within all the subcategories we analyzed, Sunscreen (7.5%), Make-Up (7.2%), Shampoo (6.6%), and Moisturiser (6.4%) saw the highest price reductions on Amazon. Conversely, staple items like Toothpaste (3.%) and Beardcare (3.6%) had lower markdowns.
During the sale event, brands like Sadhev (43.4%), Clear (41.1%), Teenilicious (40.4%), and Coal Clean Beauty (38.4%), offered the most attractive deals.
In terms of significant gains in Share of Search for brands, L’Oreal Paris in Shampoo and Conditioner led the pack along with Oracura in Electric toothbrushes and The Formularx in Moisturiser. Perfora in Toothpastes and Ustraa in Beardcare also gained more than 10% in their Share of Search during the sale event.
Other popular brands like Tresemme in Conditioners, and Swiss Beauty in Make-Up surprisingly had reduced visibility among the top search results for relevant subcategories.
Navigating the Competitive Landscape: How To Thrive During Sale Events
Amazon’s strategic pricing during Prime Day reflects a balance of profitability, inventory, and competition. Competitive pricing insights empower retailers to make informed decisions, optimize strategies, and thrive during high-stakes events. Prime Day serves as a crucial opportunity to drive sales, attract new customers, and boost loyalty. Therefore, monitoring competitor prices accurately, at scale, is essential for impactful pricing strategies.
For more insights on staying ahead during sale events, reach out to us today!
If you’d like to learn about Amazon’s pricing and discounts during Prime Day 2023 in the US, check out our analysis here.
Amazon’s Prime Day this year proved to be a record-breaking success, becoming the largest Prime Day event in the company’s history. Over the two-day extravaganza, shoppers in the US spent a staggering $12.7 billion, a 6.1% increase from the previous year. Amid inflationary pressures and supply chain disruptions, Amazon adopted a bold discounting strategy, offering steeper discounts compared to Prime Day 2022.
An interesting aspect of Amazon’s approach is their loyalty based offerings. In the weeks leading to Prime Day on July 11-12, members of the loyalty program were given access to “invite-only deals” where shoppers could request invites to specific products that they were looking to purchase on deals. Overall, Amazon’s pricing and discount strategies during Prime Day were carefully designed to create a buzz among shoppers, generate increased sales, and maintain a competitive advantage in the market.
While Prime Day is Amazon’s showstopper, it’s interesting to also see how other leading retailers respond to such a massive sale by their biggest competitor. Do they also lower their prices during the event, or are they happy to take a backseat? To answer these questions, we leveraged our proprietary data aggregation and analysis platform to analyze the prices and discounts of Amazon and its leading competitors across key product categories – Apparel, Home & Furniture, Consumer Electronics, and Health & Beauty – during Prime Day.
Since products on Amazon and other eCommerce websites are often sold at discounts even on normal days not linked to a sale event, we delved into the real value that Prime Day offers to shoppers by focusing on price reductions or additional discounts during the sale compared to the week before. As a result, our approach highlights the genuine benefits of the event for shoppers who count on lower prices during the sale.
Research & Methodology
For our analysis, we tracked the prices of a large number of products across several leading retailers during Prime Day as well as the week prior to the event. The details of our sample are mentioned below:
Number of SKUs: 110,000+
Websites: Amazon, Walmart, Target, Overstock, The Home Depot, Wayfair, Ulta Beauty, Sephora
Categories: Apparel, Home & Furniture, Electronics, Health & Beauty
Pre-event Analysis: 4-10 July 2023
Prime Day Analysis: 11-12 July 2023
Our Key Findings
Our data reveals that Amazon’s price reductions were most aggressive in the Consumer Electronics category, with an average price reduction of 10.4% on Prime Day, due to the category’s popularity and high demand.
The Health & Beauty (6.7%), Apparel (5.9%), and Home & Furniture (4.8%) categories offered relatively modest deals during the sale event.
Below, we delve deeper into our analysis of each category to better understand how price reductions were distributed across key subcategories on Amazon as well as the discounting strategies of Amazon’s leading competitors.
Apparel
As Amazon grappled with surplus inventory, heightened storage costs, and reduced profit margins in apparel (like most other retailers), its average discount before Prime Day was already as high as 13.3%. Then, on Prime Day, Amazon’s apparel deals were tempered at around 5.9% across an impressive 33.1% of its assortment, while Target and Walmart chose not to compete in a meaningful way.
Unlike Prime Day 2022, when Target competed with Amazon with high discounts, the retailer offered only 0.8% additional discount across 4.4% of its assortment in this category. Walmart, too, reduced its prices by only 1.4% on 8.5% of its assortment during Prime Day.
Across all the apparel subcategories we analyzed, Women’s Athleisure (8.7%), Men’s Swimwear (8%), and Women’s Tops (7.6%) were among the ones with the highest price reductions. On the other hand, Men’s Athleisure (2.5%), Women’s Shoes (3.5%), and Men’s Innerwear (4.1%) had conservative markdowns.
Pricing decisions across the various subcategories are likely to have been influenced by several factors like inventory levels, demand patterns, and the need to balance competitive offers with maintaining reasonable profit margins, as Amazon tried to cater to a more price-sensitive consumer.
Across all apparel subcategories, leading brands that offered the highest markdowns were Tommy Hilfiger (11.5%), Amazon Essentials (9.4%), Adidas (8.6%), and Calvin Klein (8.6%).
For brands, however, lowering prices is only one lever to attract and convert shoppers. They also need to ensure they’re highly visible and discoverable on Amazon’s search listings. This exponentially improves their chances of driving more clicks and conversions. In our analysis, we tracked the Share of Search of brands across several popular search keywords. Share of Search for a brand is defined as the proportion of the brand’s products in the top 20 search results for a search query.
Our data indicates that several brands gained impressive ground in their discoverability during Prime Day, while others fell behind. Gildan in Men’s Innerwear, Adidas in Men’s and Women’s Shoes, Anrabess in Women’s Athleisure, and Lululemon in Men’s Athleisure, among others, improved their Share of Search by significant levels during Prime Day.
On the other hand, brands like Hanes in Men’s and Women’s Innerwear, Kanu Surf in Men’s Swimwear, Cupshe in Women’s Swimwear, and others lost around 10% in their Share of Search during the event. This is likely to have impacted their sales volumes adversely.
Home & Furniture
The Home & Furniture industry has been challenged with reduced demand due to inflationary pressures over the past year or so. Leading retailers in the category overestimated the demand, leading to overstocking of inventory. As a result, Home & Furniture is one of the few categories that saw Amazon’s competitors participate at a significant level on Prime Day in order to ensure they don’t fall behind on liquidating their stock.
Amazon’s additional discounts averaged 4.8% across 30.2% of its assortment. Wayfair and Overstock too reduced their prices by 4.8% and 4.3% on around 44% of their respective assortments. Wayfair’s move is likely a part of their strategy to attract new customers and expand their market share, in response to a decline in their consumer base. Last year, Wayfair experienced a loss of 5 million out of its 1.3 billion consumers due to weakening demand.
Target and Walmart did offer additional discounts, but they were not at a competitive level. The Home Depot effectively opted not to compete at all during the sale event. Overall, the pricing actions of these retailers are in stark contrast to the highly conservative pricing strategies observed on Prime Day last year.
Our recent pricing analysis of the Home & Furniture category revealed more interesting insights and pricing dynamics over the past year.
Across all the subcategories we analyzed, Bookcases (8.2%), Rugs (7.8%), Mattresses (6.5%), and Luggage (6.2%) were among the ones with high price reductions.
Meanwhile, Sofas (2.4%), Washer / Dryers (2.4%), and Entertainment Units (2.7%) had lower markdowns. These are large and substantial purchases, making retailers more cautious about deeply discounting them while still ensuring profitability.
The brands that stepped up and offered the highest markdowns in this category include Zinus (20.2%), Comfee (10.8%), Sauder (9.9%), and Best Choice Products (8.7%).
In terms of Share of Search, Rockland in Luggage gained the highest (21%), followed by Farberware in Dishwasher, Olee Sleep in Mattresses, and Homeguave in Mattresses gained significant ground in their respective categories as shown in the image below.
Brands like Best Choice Products in Coffee Tables, Molblly in Mattresses, and Black+Decker in Washer/Dryers and Dishwashers lost a good portion of their Share of Search during the event. Due to high competition for visibility during sale events, brands that fail to keep an eye on their Share of Search stand to take a hit in their sales, especially in categories like Home & Furniture that tend to have low brand loyalty.
Consumer Electronics
2023 was the year of consumer electronics on Amazon Prime Day. Amazon’s price reduction during the sale averaged 10.4% across 54.5% of its assortment in the category. Target and Walmart, on the other hand, offered significantly lower additional discounts of 1.9% and 2.7% on 10.4% and 19.1% of their assortment, respectively.
The consumer electronics category often witnesses aggressive price reductions during Prime Day and other sale events due to its popularity and high demand. In addition, since retailer margins are usually low in this category, shoppers often have to wait for sale events like Prime Day (when brands markdown their wholesale rates) to have several attractive deals to choose from.
Across all the subcategories we analyzed, Smartwatches (15.4%), Wireless Headphones (15.4%), Earbuds (14.9%), Headphones (12.5%), and Tablets (12.0%), were among the ones with the highest price reductions. All of these subcategories are quite popular that tend to sell in large volumes during sale events.
Meanwhile, Laptops (2.1%), TVs (3.1%), and Smartphones (7.6%) had lower markdowns. A lower markdown on smartphones may reflect steady demand throughout the year, reducing the urgency to offer significant discounts during the short Prime Day window.
Amazon (22%), Tozo (12.5%), Lenovo (10.8%), JBL (8.3%), and Apple (5%) offered the highest price reductions in Consumer Electronics as a whole. Clearly, Amazon didn’t hold back on offering attractive deals on its own private label products in this category.
Consumer Electronics as a category tends to have a brand loyal shopper base. However, Share of Search generic search keywords are still very important for keywords like earbuds, headphones, and tablets that result in relatively lower priced products. HP in Laptops, Samsung in Tablets and TVs, and Oneplus in Smartphones all made strong strides in building their discoverability on Amazon during Prime Day. Beyond just driving more sales, this also has the intended effect of boosting brand awareness among high-intent shoppers.
Sony in Headphones, Asus in Laptops, and Insignia in TVs lost out to other brands in terms of their discoverability during the sale. Sony and Asus, especially would be hurting as they are prominent brands in their respective categories.
Health & Beauty
The Health & Beauty category is a favorite among consumers during Prime Day, as it encompasses a wide range of products like skincare, cosmetics, and grooming items. As shoppers often tend to stock up during the sale, brands and retailers are willing to offer competitive discounts and gain an edge over their competitors.
Our data reveals that the average additional discount on Amazon was 6.7%, offered on a little over a third of its assortment. Walmart reduced its prices sizably as well, by an average of 3.1% on 13.4% of its assortment.
Interestingly, Sephora and Ulta Beauty, leading retailers in the Health & Beauty category did not compete on price at all this Prime Day. It is likely they are confident their loyal customer base will not be influenced by Amazon’s Prime Day deals and be driven away merely by lower prices. In addition, keeping their prices steady during Prime Day might have been a strategic choice to protect their brand reputation and premium positioning.
Relatively premium subcategories like Electric Toothbrushes (10%), Moisturizer (8.3%), Beardcare (7.3%), and Make Up (6.7%) saw the highest price reductions on Amazon.
In contrast, staple items like Toothpaste (3.7%), Shampoos (5.4%), and Conditioners (5.7%) had lower markdowns.
Among the leading brands in this category, Oral-B (10.3%), Philips Sonicare (8.7%), Neutrogena (8.4%), and Colgate (5.6%) offered the most attractive deals during the sale event.
In terms of significant gains in Share of Search for brands, Oral-B in Electric Toothbrushes led the pack again. Neutrogena in Sunscreens and Somall in Toothpastes also gained more than 10% in their Share of Search during the sale event, followed by Tresemme in Shampoos and Airspun in Make-Up products.
Other popular brands like Crest in Toothpastes, e.l.f in Make-Up, Philips Sonicare in Electric Toothbrushes, and Sheamoisture in Beradcare surprisingly had reduced visibility among the top search results for relevant subcategories.
Staying Ahead of the Curve During Sale Events
This Prime Day, Amazon leveraged its scale to offer aggressive discounts across key product categories, while several competing retailers chose to sit back and let the sale play out. Others chose a selective discounting strategy that focused their modest price reductions on a small set of items.
At DataWeave, we understand the pivotal role competitive pricing insights play in empowering retailers and brands to gain a competitive edge, especially during crucial events like Prime Day. For retailers, the ability to track competitor prices accurately, at scale, in a timely manner is essential to plotting and acting on impactful pricing strategies and staying ahead of the curve.
The home and furniture retail industry is going through a turbulent time. As inflation reared its head mid-2022, leading retailers in the category have been grappling with the higher costs associated with producing and distributing their products, as well as reduced shopper demand. The rising costs of raw materials, transportation, and labor have had a direct impact on the pricing dynamics within the industry. For example, reports indicate container rates soared to nearly 10 times pre-pandemic levels towards the end of 2021.
Furthermore, shoppers’ spending power has been constrained, while higher interest rates have suppressed demand. Retailers have had to adapt their assortment and pricing strategies to cater to a wider range of shopper preferences driven by changing lifestyles and a growing emphasis on sustainability. Post-pandemic, demand has been primarily driven by affluent shoppers.
Towards the end of 2021, due to supply delays and disruptions, retailers heavily stocked up on available products. However, when demand subsequently decreased in 2022, they were left with a significant amount of unsold stock that was purchased at high rates. This put them in a difficult situation, as they had an excess of products but were unable to sell them even at reduced prices without impacting their profit margins. Additionally, staying competitive in a rapidly changing market environment was equally important.
Given this context, it is crucial for home and furniture retailers to adopt a data-driven approach that utilizes competitive and market insights to consistently maintain or increase their online sell-through rates. DataWeave’s Commerce Intelligence solution offers exactly that, empowering retailers across various industry segments to stay updated on evolving consumer trends and competitor actions.
To gain a better understanding of the pricing strategies employed by leading home and furniture retailers throughout the past year, we leveraged our proprietary data aggregation and analysis platform to track and analyze the pricing of a wide range of products across multiple retailers and subcategories within the industry.
Our Research Methodology
Number of SKUs: 400,000+
Key retailers tracked: Amazon, Wayfair, Home Depot, Overstock, Target, Walmart
Key categories reported: Home and Office, Bed and Bath, Bathroom, Bedroom, Decorative, Dining Room, Kitchen, Garden & Patio, Hardware
Timeline of analysis: April 2022 to April 2023
Our Findings
Interestingly, our analysis indicates that average prices in the home and furniture category rose by around 5% between March 2022 and April 2023. However, there have been seasonal fluctuations in the prices over the course of the year.
Among the various subcategories, the most substantial price surge was observed in home office equipment, with an uptick of 9.3% in January 2023 when compared to March 2022. The surge in demand for home office furniture, fueled by the widespread adoption of work from home arrangements, played a pivotal role in depleting inventories and consequently driving up prices. Additionally, the shift towards collaborative workspaces and the gradual expansion of office environments have contributed to the sustained demand for office furniture.
Avg. price changes MoM across home and furniture subcategories from April 2022-23.
While prices for several subcategories rose significantly, others experienced subdued growth, such as bed and bath. The subcategory experienced the lowest price increment, registering a modest 2.8% increase annually. This can be attributed to the impact of a subdued housing market and a decrease in first-time buyers, which may partly be due to the global recession and inflationary pressures.
Moreover, retailers overestimated the demand for home furniture during the holiday season, leading to an overstocking of inventory. Consequently, prices experienced a dip from October to December 2022. In fact, this was a common trend across all home and furniture subcategories. As retailers emerged from the holiday season, prices rose to their highest level in January 2023, and have stayed relatively stable since.
Some of these trends vary among retailers as each faces different challenges and responds in distinct ways.
Wayfair, for example, shows a significant dip in pricing after October 2022, with prices stabilizing in 2023. This could be in response to the retailer’s shrinking consumer count, losing 5 million of its 1.3 billion consumers in 2022 due to declining demand.
Avg. price change MoM within the home and furniture sector across retailers from April 2022-23.
In fact, online furniture retailers like Wayfair and Overstock reported declines in annual revenue in 2022, as the furniture sector continued to normalize from the high spending seen during COVID-era lockdowns. Wayfair reported that its 2022 net revenue was $12.2 billion, down almost 11% from the year prior. The company also laid off 10% of its workforce in August 2022. Overstock’s reported annual net revenue in 2022 was $1.9 billion, a 30% decrease year-over-year.
Interestingly, both companies took contrasting approaches in response to this situation. Wayfair opted for aggressive cost-cutting measures, including layoffs and a reduced marketing budget. On the other hand, Overstock focused on attracting new customers through influencer marketing and improving their app, aiming to expand their customer base. With a strategy geared towards younger buyers, Overstock allocated a larger marketing budget than ever before. Our data supports the fact that Overstock did not rely on price reductions to entice shoppers.
Target has consistently maintained lower price increases compared to Walmart, defying the common perception of Walmart being more conservative in its pricing. Notably, Amazon also stood out minimal price increases throughout the year, being surpassed only by Wayfair since November 2022.
As price sensitive shoppers increasingly compare prices before making a purchase decision, retailers need to ensure they are priced competitively in the market on a consistent basis to liquidate stock and gain market share without compromising significantly on margins.
A Sophisticated and Versatile Product Matching Solution is Essential to Achieving Price Leadership
Product matching plays a vital role in monitoring competitive prices and analyzing price leadership. Within the home and furniture category, there is often a multitude of representations for the same product across various online platforms. Furthermore, eCommerce websites offer a wide array of options, including variations in size, color, material, and similar products. Without an accurate and comprehensive method of matching these products, it becomes impossible to track and compare prices effectively, especially on a large scale. Thus, a versatile product matching engine tailored to the unique requirements of the home and furniture sector becomes essential.
DataWeave offers an industry-leading product matching platform that harnesses advanced AI models specifically trained to identify and leverage multiple product attributes extracted from titles, descriptions, and images to accurately match products across websites. Additionally, our platform intelligently matches similar products based on a diverse range of extracted attributes. This empowers our retail partners to gain competitive pricing intelligence not only on exact product matches but also on similar and substitute products, as well as their respective variants.
With our competitive pricing intelligence solution, retailers in the home and furniture industry can confidently analyze and track prices, ensuring they stay at the forefront of price leadership in their market.
The fashion industry is currently undergoing a period of stabilization after facing significant disruptions in recent years. Fashion retailers find themselves navigating not only changing consumer preferences but also the challenges brought about by inflation and supply chain issues that are remnants of the COVID-19 era.
The effects of inflation have raised concerns regarding overabundance, rise of sustainable and pre-used fashion and declining sales, creating a mismatch between supply and demand within the market. As consumers scale back on spending due to rising prices, fashion retailers are left grappling with surplus inventory, heightened storage costs, and reduced profit margins.
Consequently, these market dynamics have significantly impacted the pricing strategies employed by fashion retailers, resulting in dynamic shifts in pricing and competitiveness across different time periods, subcategories, and individual retailers.
Counteracting this impact requires fashion retailers to adopt a data-driven approach that leverages competitive and market insights. They must adopt agile and versatile pricing strategies that enable advanced pricing and assortment management. By understanding their market position and the competitive landscape, retailers can effectively react to reduced demand and inflationary pressures without compromising heavily on their top line and profitability.
At DataWeave, we harnessed the power of our proprietary data aggregation and analysis platform to track and analyze the prices of prominent fashion retailers to uncover unique insights into their price competitiveness over the past year, as well as understand how pricing strategies varied across diverse subcategories.
Our Methodology
For this analysis, we tracked the average price changes among leading US fashion retailers over 12 months to understand how their pricing across several fashion subcategories altered in response to supply chain inefficiencies, inflationary pressures, seasonal effects, and changing consumer preferences.
Sample: 88,000+ SKUs matched across 5 leading retailers
While prices have generally been rising in several industry segments, such as groceries, due to inflation, the fashion sector has experienced relatively stable prices, with even a few periods of price drops. In fact, average prices in April 2023 are 1.2% lower than those in April 2022. The main reason for this trend is that consumers have become cautious about discretionary spending on fashion in order to prioritize other necessities, resulting in lower demand and overstocking by retailers.
In the first quarter of 2022, clothing accounted for only 3.9% of total expenditure by US consumers, down from 4.3% in 2019 before the pandemic. Additionally, in March 2023, 60% of fashion retailers in the US still had surplus goods, accounting for almost 20% of their entire stock. As demand decreased, fashion retailers started offering freebies with purchases, bundling products, giving away unwanted items, and notably, slashing prices.
Subcategory level analysis of Average Price Change Month-on-Month between April 2022 – April 2023
Our analysis at a subcategory level reveals that in winter 2022, seasonal demand led to the largest price increases of 6-11% in coats, boots, and jackets. However, these prices quickly declined afterward. In 2023, stabilization of raw material costs and a continuing decline in demand for non-essential apparel and fashion accessories are factors contributing to a significant drop in prices.
Some of these trends vary among retailers as each faces different challenges and responds in distinct ways. Our data indicates that some retailers have chosen to increase their prices from Q3 2022 due to mounting pressure on profit margins, while others have further lowered prices due to increasing inventory levels.
Average Price Change Month-on-Month Across Amazon, Macy’s, Walmart, Target, and Zappos between April 2022 – April 2023
_____________
Capability Spotlight
Matching products across competitor websites is an essential part of tracking competitive prices and analyzing price leadership. In fashion, matching exact products is no mean feat. Websites often host a slew of variants in terms of size, color, material, etc. without any form of standardization in the way the products are represented. So fashion retailers often struggle with simply unusable pricing insights resulting from inaccurate and incomplete product matching.
DataWeave’s industry-leading product matching algorithm recognizes and leverages dozens of product attributes extracted from product titles, descriptions, and images to match products at very high levels of accuracy and coverage. What’s more, our platform can also match similar products based on a large variety of parameters, so our customers can benefit from a comprehensive competitive perspective.
_____________
For example, in August, Target reported a 90% plunge in profits during the second quarter of 2022, as shoppers concerned about inflation reduced spending on nonessential items. The company stated that its price cuts did not have the desired impact, resulting in a 1.5% increase in inventory compared to three months prior. As a result, we can see that Target’s average fashion prices spiked in August 2022 and have remained steady since then. Walmart also faced similar challenges and increased its prices in October 2022.
However, during the same period in August 2022, Macy’s announced increased discounts to clear out excess inventory in preparation for the holiday shopping season. In the same announcement, Macy’s highlighted how the rising cost of groceries, which had experienced a double-digit increase, was impacting consumers’ budgets, changing their behaviors, and increasing the need for discounts. Our data reflects this, showing a significant drop in prices from October 2022 to January 2023.
However, in January 2023, Macy’s successfully managed its inventory levels, reducing them from $6.4 billion in October 2022 to $4.3 billion in January 2023. As a result, average prices at Macy’s have started to rise.
_____________
For today’s fashion retailers, achieving a balance between expansion goals and profitability is crucial. It requires a meticulous examination of competitive and market insights on a regular basis to mitigate competitive pressures and navigate through these challenging times successfully.
DataWeave’s platform offers retailers the insights they need to gain a competitive advantage. With access to accurate, timely, and actionable pricing and assortment insights, retailers can make informed decisions and stay ahead of the competition. To learn more, reach out to us today!
Inflation, like an invisible force, silently shapes the dynamics of economies, gradually eroding the purchasing power of consumers and leaving its imprint on various industries. High costs, hiring lags, and stagnating earnings pose severe challenges to businesses. One industry segment that intimately feels the impact of inflation is grocery, where price increases can be extremely concerning for the average consumer.
Over the last 12-plus months, the US has experienced a notable rise in inflation, stirring up concerns and influencing the way we shop for everyday essentials. Rising costs of raw materials, transportation, and labor have all played a role in driving up prices. Additionally, disruptions in global supply chains and fluctuations in currency exchange rates have further exacerbated the situation, creating a complex web of interdependencies.
To understand the magnitude of this phenomenon across leading e-retailers, we delved into an in-depth analysis of four major retail giants: Walmart, Amazon, Target, and Kroger.
Each of these retailers possesses a unique business model and competitive strategy, as well as faces unique challenges. This leads to distinct approaches to managing inflationary pressures. Walmart for instance, expects operating income growth to outpace sales growth in 2023. Given the persistence of high prices and the potential for further macro pressures, the retailer is taking a cautious outlook. In 2022, Amazon’s eCommerce business swung to a net loss of $2.7 billion, compared to a profit of $33.4 billion the previous year.
Amid these challenging circumstances, understanding the grocery pricing trends and strategies becomes imperative for retailers, both online and in stores to adapt and thrive in the current economic landscape. By examining their pricing trends, we can gain valuable insights into how these companies navigate the turbulent waters of the grocery industry against the backdrop of inflation.
Our Research Methodology
The data collected for our analysis encompassed a diverse range of products, from pantry staples like flour and rice to perishable goods like dairy and produce – a basket of around 600 SKUs matched across Amazon, Kroger, Target and Walmart, between January 2022 to February 2023.
Further, we separately focused on the prices of a smaller subset of 30+ high-volume daily staples that are likely to yield higher sales and margins for these retailers.
Average Selling Price of a Broad Set of Grocery Items
Our analysis reveals that Walmart consistently offers the lowest prices, with an average of 8% below its closest competitor, Target, despite an annual price increase of about 5%. Walmart seems to prioritize a “stability and predictability” strategy over margin optimization. The retailer’s 8% growth last quarter indicates that this strategy is bearing fruit. However, it’s important to note that this approach may have its drawbacks as Walmart’s margins come under pressure.
Average selling price trend across a basket of 500+ SKUs across Target, Walmart, Kroger, Amazon in the grocery category from Jan ’22 to Feb ’23.
In order to weather inflationary pressures, Walmart may adopt a cautious approach to growth while also focusing on securing margins. Reports suggest that the retailer has been pushing back against consumer packaged goods (CPG) manufacturers following a series of price hikes to counter inflationary cost pressures in early 2023. One of the reasons behind Walmart’s growth and increased sales can be attributed to ‘non-traditional’ higher-income households now seeking deals and discounts at Walmart as their spending power declines.
Interestingly, Amazon emerges as the highest-priced retailer, followed by Kroger, which increased its prices by 10% throughout the year. Consumer perception commonly associates Amazon with the lowest prices, but the data tells a different story. In fact, Amazon has been charging 12% to 18% higher prices than Walmart for groceries and is still maintaining its success.
While the company’s online sales declined by 4%, it saw a significant 9% increase in revenue from third-party seller services, such as warehousing, packaging, and delivery, in 2022. Amazon’s strong logistics and same-day delivery services give it a competitive advantage over other retailers, contributing to its revenue growth and margins. Interestingly, this presents an opportunity for Walmart and other retailers to increase prices while maintaining their strong competitive price positions.
Kroger, on the other hand, seems to be aiming for a premium price perception, consistently raising prices almost every month. Kroger’s pricing strategy appears to be closer to Amazon’s.
Average Selling Price for High-Volume Daily Staples
Pricing strategies often change for different categories of products. To better understand this, we focused our analysis further on a small subset of 30+ high-volume staples across retailers. These include baked goods, popular beverages, canned food, frozen meals, dairy, cereals, detergents, and other similar items.
Average selling price trend of 30+ high-volume daily staples across Target, Walmart, Kroger, Amazon in the grocery category from Jan ’22 to Feb ’23.
Walmart, possibly overestimating the impact of inflation, has continued to keep its prices the lowest, potentially aiming to increase margins through volume.
The level of price disparity across retailers is expectedly lower here, with Amazon and Kroger closely tracking Walmart’s average prices.
Target’s pricing strategy stands out as it consistently emerges as the highest-priced retailer for daily staples, despite being one of the lower-priced retailers for a broader basket of grocery items. This suggests that Target’s underlying technology may not be as optimized to address market dynamics compared to other leading retailers. In our opinion, Target may want to strengthen its efforts to track pricing more intensely for this sub-category.
A Data-fuelled Approach is the Need of the Hour
In the challenging economic landscape, retailers and grocery stores are under pressure to maintain their revenues and margins. Adopting a comprehensive and dynamic pricing strategy is crucial. Understanding which product categories are experiencing price increases among competitors can help retailers make informed decisions on pricing at both the category and product level.
Retailers should consider their balancing margin performance with consumers’ willingness to pay, rather than implementing broad price increases that may harm customer trust. Price increases can be challenging for both customers and merchants. Retailers who employ a data-driven and insight-based approach are more likely to succeed.
Keep an eye on the DataWeave blog for analysis on pricing, discounting, stock availability, discoverability, and more, across retailers and brands from other industry segments as well.
Contrary to popular speculation of lukewarm online sales owing to the weak economy, high inflation, and stretched wallets, Black Friday this year recorded a whopping $9 billion in e-commerce sales. Despite the lull in online shopping across many retailers in the months preceding Thanksgiving and weakened consumer sentiment, US online merchants saw a sizable boost in sales during and after Thanksgiving, albeit at a slower growth of 2.3%, as reported by Adobe Analytics.
This article looks closely at the Black Friday data to understand which brands, retailers, and product categories were key players. Through DataWeave’s innovative Digital Shelf Analytics product, we deep dive into the availability, discount, and share-of-search data to deduce why some product categories and retailers fared better than others.
Who: Retailers and Brands that had the Highest Presence
Black Friday sales this year were driven by consumers grabbing the biggest and best deals to make the most of their already stretched wallets. Many shoppers opted for flexible payment schemes, and Buy Now Pay Later (BPNL) payments rose by 78% compared to the week before Thanksgiving. Surprisingly, Amazon, which was the most searched retailer during Black Friday last year, came only fourth this year, as reported by the Search Intelligence company, Captify.
According to Captify, Walmart was the most searched retailer for Black Friday deals, followed by Target, Kohls, and Amazon in that order. Amazon, however, has reported its biggest Thanksgiving sale this year, with independent retailers selling through Amazon seeing a total sales of $1 billion. With the economic slowdown and thin wallets looming large, discount rates greatly influenced consumer spending. Mobile shopping accounted for 55% of digital sales, 8.5% more than the previous year.
As told by Adobe, Electronics were the significant sales driver, reporting 221% higher sales than in October this year, with smart home items and audio equipment playing an important role with 271% and 230% higher sales. Toys ( popular purchases were Fortnite, Roblox, Bluey, Funko Pop!, and Disney Encanto) and exercise equipment also registered a substantial growth of 285% and 218%, respectively.
Other top-selling items included gaming consoles (Xbox Series X and PlayStation 5 devices, games including FIFA 23, NBA 2k23, and Pokemon Scarlet & Violet), drones, Apple MacBooks, and Dyson products (airwrap and vacuum). Amazon’s most popular items were reported to be Apple Airpods, Nintendo Switches, Echo Dot smart speakers, and Fire TV sticks.
What: Top Selling Product Categories
Electronics, closely followed by home appliances (robotic vacuum cleaners), toys, and exercise equipment, were popular product categories in demand during Black Friday this year. Several retailers, including Amazon, Walmart, Target, Kohls, BestBuy, and Home Depot, offered lucrative pre-Black Friday discounts to trigger early sales kick-off.
Amazon carried an early discount of 50% on its Echo smart speaker, Target offered 30% off on Dyson vacuum cleaners, Walmart offered 25-35% off on Apple ipads and watches, and Kohls offered 51% off on the iRobot Roomba.
Amazon’s top ten best-selling products ranged from Amazon devices like Echo Dot speakers, Fire TV sticks, and Echo Show to Apple AirPods, Nintendo Switches, New Balance sneakers, Champion Apparel, and Burt’s Bees Lotions. The popular product categories were home, fashion, toys, beauty & health, and Amazon devices. Consumers heavily supported small businesses, contributing to $1 billion in sales. Top sellers from small businesses included card and board games.
Briefly correlating the discounts offered with the best-selling product categories, one can notice that the deals have largely influenced Black Friday sales this year. Popular categories are those that have had deep discounts, reflecting the consumer’s tendency to wait and grab the best deals.
How: Role of Digital Shelf Analytics – Key Performance Indicators
DataWeave’s Analysis Methodology
We have seen a summary of the Black Friday 2022 statistics – sales recorded, top-selling products, product categories, and retailers. Using DataWeave’s e-commerce analytics product, we track and study the variations in digital shelf KPIs across retailers before Thanksgiving and during Thanksgiving to understand how these influence sales.
Availability scores, discount rates, and share of search data are analyzed for top retailers in the US for key product categories. Data is tracked and analyzed across two time periods – before Thanksgiving (Nov 10 – Nov 21) and during Thanksgiving (Nov 21 – Nov 25).
Methodology
Retailers tracked: Amazon, Best Buy, Sephora, Target, Ulta, Walmart
Product Categories tracked: Electronics, Home Improvement, Beauty, Furniture
Digital Shelf KPIs tracked: Availability, Discount rates, Share of Search
Location: USA
Amazon maintained good availability across all product categories – Beauty ranks the highest.
Salient Insights
Amazon maintained good overall availability – an improvement of 3% over Prime day.
Beauty had the highest availability of 95%, with none and Lotion & Brushes reporting 97% and 95% availability, respectively. Shampoo reported the lowest availability at 92%
Home Improvement had the least availability at 87%, with dishwashers (68%) and washers and dryers (78%) having the lowest availability.
Unlike Furniture and Home Improvement, most categories maintained similar availability scores before and during Black Friday.
Furniture improved its availability during Black Friday by 4%, while Home Improvement reported a decrease in availability during Black Friday by 4%.
Electronics, which was a major sales driver, had an availability of > 90% across all sub-categories except for Television, which had a low availability of 70%
Tables and chairs registered 99% availability under Furniture
The above data indicates that Amazon ensured the high availability of utility products that consumers would buy even during a slow economy. Other retailers showed similar availability trends, with scores being similar prior to and during the event.
Discounts Drove Sales – Best Buy offered the Highest Discounts
Highlights
Best Buy offered the highest early Black Friday discount of 30%, followed by an additional 9% discount around Black Friday. Walmart followed next with 21% early discounts and an extra 4.5% discount during the event. Amazon came next with 17% early discounts and a 5% discount during Black Friday. Discount rates seem to strongly correlate with online searches, with Walmart beating Amazon this year as the most searched retailer for Black Friday deals.
Electronics was the most discounted category across Amazon, Best Buy, and Target, with an average discount of 21%. Walmart gave lower deals on electronics (12%). Electronics also had heavy early discounts of 12%, with most retailers giving an additional discount of 7-8% closer to Thanksgiving.
Best Buy offered early discounts of 10% and further upped their discounts by another 12% closer to Thanksgiving. Being the most discounted category, electronics was also a significant sales driver this Black Friday.
Amazon offered the highest discounts for Beauty products (18%), followed by Ulta at 10% and Walmart at 8%. Sephora and Target gave minimal discounts on beauty products (3%)
Best Buy gave the maximum discounts on Home Improvement products (16%), followed by Amazon at 14%. Walmart gave much lower discounts of 7% on Home Improvement products.
Furniture is another category with 12-13% discounts at both Amazon and Walmart.
Best Buy’s strategy this year has been to offer heavily discounted early deals to boost their sales.
Airpods and headphones were the most discounted item under Electronics, with Amazon and Target offering a whopping 27-29% discount. This clearly resulted in heavy sales of AirPods this Thanksgiving.
Best Buy and Target had good discounts on all electronic items, while Amazon gave heavier discounts on AirPods, headphones, and smartwatches.
Walmart did not offer hefty discounts on laptops and headphones, instead focused on Smartwatches, smartphones, and television.
In Home improvement, Best Buy offered the biggest discounts for refrigerators, washers and dryers, and dishwashers, while Amazon focussed more on Tools.
Walmart did not offer many discounts in this category.
Amazon topped the discount charts for maximum combined discounts for makeup and hair brushes on the day of the event.
All retailers offered better discounts for utility products like tables, chairs, and cots (~15-17%), while dressers and couches carried lower discounts (~6-10%).
Highlights
Different companies had different discount strategies based on price buckets.
Amazon gave heavier discounts in the lower price buckets (< 200$) and lower discounts for products priced higher than 200$.
Best Buy offered the heaviest early discounts of >25% on products priced under 20$ but provided a few additional discounts during the event. For products priced higher than 20$, Best Buy uniformly offered substantial early discounts as well as further discounts during the event.
On the other hand, Target focussed on mid and high-priced items, offering heavy early discounts of 16-18% on products priced higher than 100$ and early discounts of ~7% for middle and lower-priced items. For middle-priced products (40-100$), it offered heavier discounts of 10-12% during the event.
Walmart focussed on mid-priced products, offering the highest discounts (both early (~12%) and additional discounts (5%)). It offered the least discounts (~8-9%) on products priced higher than 200$.
Share of Search – Amazon is the only retailer with sponsored searches; Apple AirPods rule the roost.
Salient Insights
Amazon is the only retailer with sponsored searches, with HP, Lenovo laptops, and Apple AirPods occupying the highest share. This correlates with AirPods being one of the most sold products.
HP laptops had the highest share on Amazon pre-Event but gave the spot to Lenovo during Thanksgiving.
Tracphone and Motorola smartphones, Insignia Televisions, and JBL headphones had a good SoS on Amazon.
On Best Buy, HP and Dell laptops featured most in searches, with HP ruling the roost during the event. Lenovo had a small presence.
Samsung smartwatches, televisions, and Apple AirPods have a big chunk of the search at Best Buy.
On Target, pop sockets, smartphones, Apple smartwatches, headphones, and AirPods have the most prominent presence. Apple was the most featured brand in this segment.
Note: The share of search percentage reported here is the average score across all subcategories (makeup, lotion, shampoo, hair dryers and hair brushes) of Beauty.
Salient Insights
Amazon, Target, Sephora, and Ulta sold beauty products, with Amazon being the only retailer with sponsored products.
Ogx, bs-mall, conair, hywestger were popular brands on Amazon, with interest-based ads occupying a substantial part of the search results, especially in Lotions (~40-50%)
Tresemme, Scotch Brite, Revlon and Cerave were popular brands in Target
Dyson products (brushes and hair dryers) are featured at Ulta’s top of the search, followed by Pureology shampoos.
Sephora’s own collection of brushes featured prominently on their website both before and during the event, followed by Dyson and T3 brushes and hair dryers.
Note: The share of search percentage reported here is the average score across all subcategories (refrigerator, washers/dryers, dishwashers, tools and coolers) of Home Improvements.
Salient Insights
In Amazon, Frigidaire and RCA had the highest SoS amongst Refrigerators, and LG occupied the highest share among washers and dryers, Coleman in Coolers, Dewalt in Tools, and Comfee in Dishwashers, both before and during Black Friday.
In contrast, on Best Buy, Samsung had the highest share of SoS amongst Refrigerators, package deals were most prominent in washers and dryers, LG among dishwashers, ifixit in Tools, and Corsair in Coolers.
Note: The share of search percentage reported here is the average score across all subcategories (bed, chair, couch, dresser, and table) of Furniture.
Salient Insights
Interest-based ads occupied the highest SoS on Amazon for Beds.
Urban shop and Amazon basics were popular in Chairs, Lifestyle in Couches, WLive in Dressers both before and during the event.
Vasagle was more popular during the event than Furrion in Tables, though the reverse was true prior to the event.
Summary & Key Takeaways
Black Friday this year was a pleasant surprise to Brands and Retailers, reporting much larger sales than predicted. After experiencing a slump in sales in the months leading up to Thanksgiving, e-commerce vendors have a reason to be optimistic about their holiday season sales forecasts.
A record-breaking $9.2 Billion in online sales was reported by Adobe Analytics, a growth of 2.3 % compared to the previous year.
Mobile shopping accounted for 55% of digital sales, a rise of 8.5% compared to last year.
Retailers wooed customers through deep discounts (~30%) prior to Thanksgiving and around Black Friday. Heavily discounted items like Apple AirPods were the most popular.
Thanks to inflation and stretched wallets, consumers were willing to spend but waited to grab the best and biggest deals. Utility products had better sales.
With tough competition between retailers on who offers the best discounts, Amazon slid down to the fourth position, and Walmart was the most searched retailer.
DataWeave, through its Digital Shelf Analytics and Commerce Intelligence solutions, gleans useful insights from e-commerce data and breaks down trends during global shopping events like Prime Day, Black Friday, and Cyber Monday. If you are a brand or a retailer who would like to know more about our products and solutions, contact us at contact@dataweave.com.