Category: QSR

  • 7 Key Metrics that QSRs want (but may not get) from Food Delivery Apps

    7 Key Metrics that QSRs want (but may not get) from Food Delivery Apps

    The Quick Service Restaurant market is projected to be valued at $691 billion by 2022. As the QSR industry grows and the market becomes even more competitive, restaurant chains continuously seek ways to increase sales via food aggregators to market their business. To improve ROI and sales, having data and insights into key metrics could help QSRs to boost their success rate.

    QSRs would like to know how they stack up against their competition regarding discoverability on cluttered food aggregator apps. Restaurants want to know the gaps in their product assortment to understand what drives customers to their competitors. Getting insights into delivery time and competitors’ delivery fees will help QSR improve delivery ETAs and optimize fees. They can also set competitive pricing with insights into their competitors’ pricing. In addition, they can use data to optimize their ad spending on food apps and improve marketing ROI.

    In this blog, we will discuss the relationship between QSRs and food aggregators and how getting data about key metrics from these food delivery platforms can help QSRs scale their revenue. 

    Data: The Key Ingredient to increasing sales

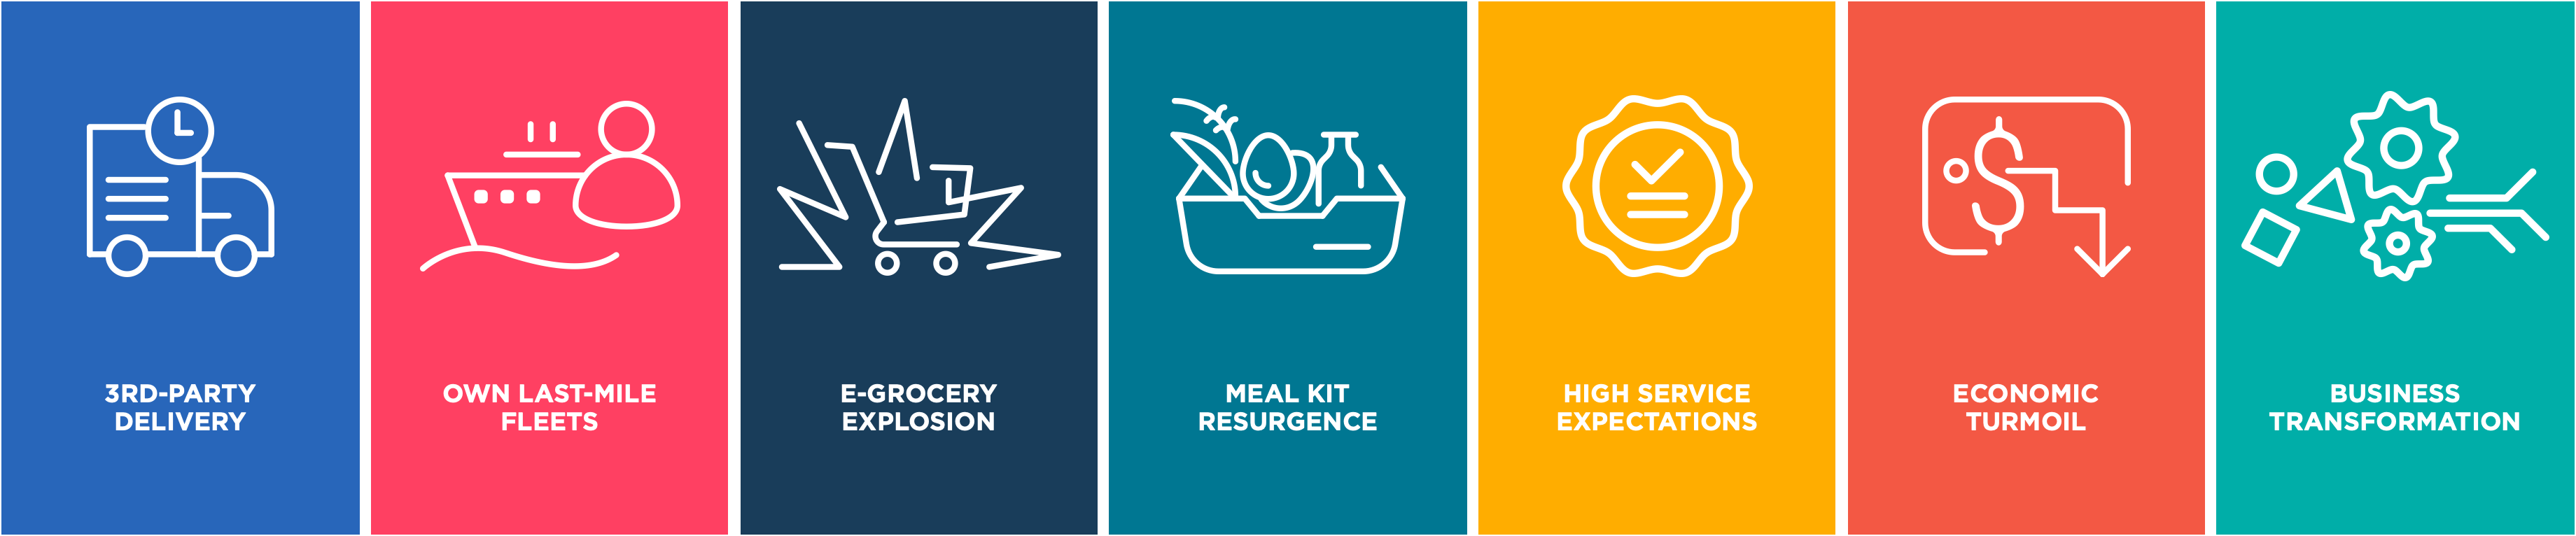
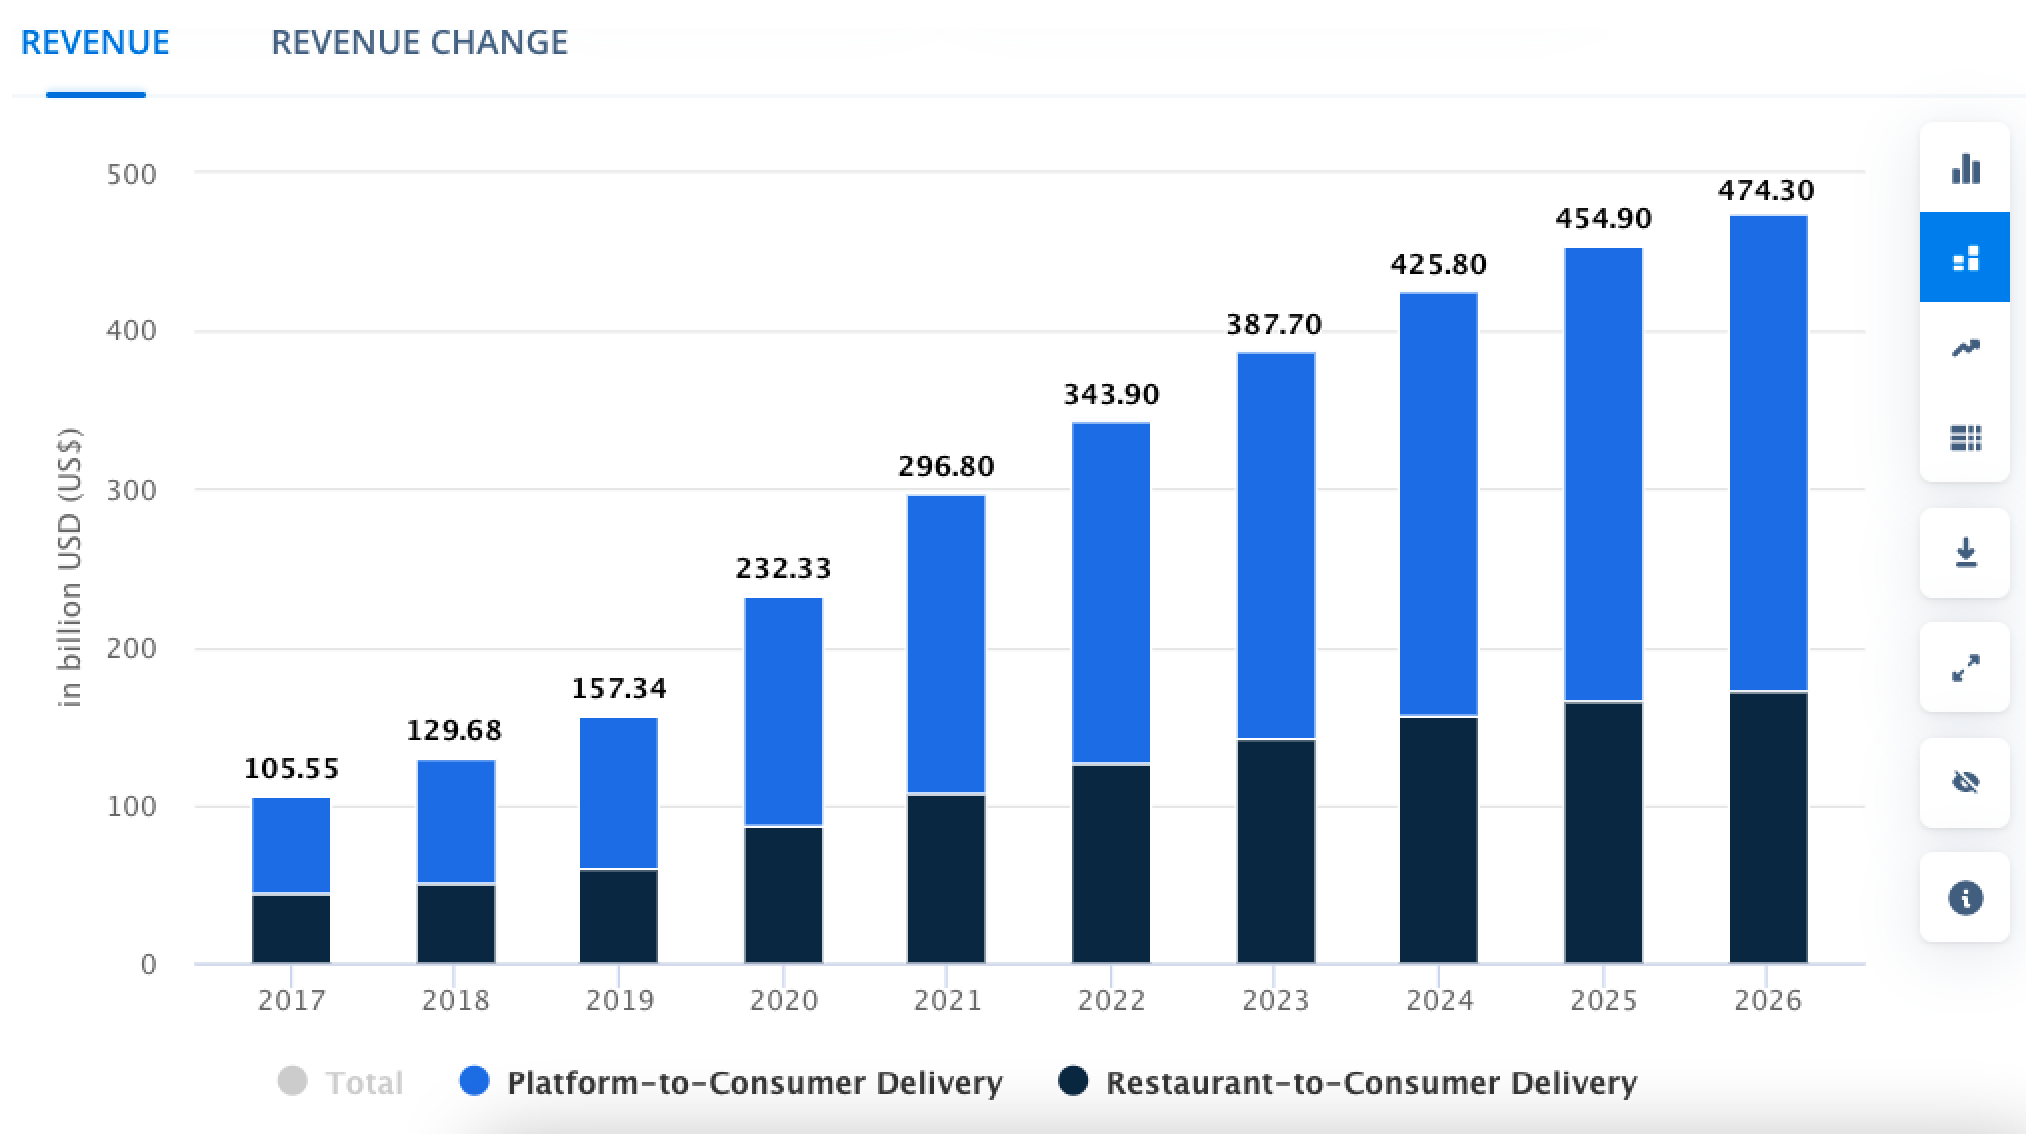
    According to Statista, online food ordering revenue is expected to grow at a robust CAGR of 10.39% between 2021 and 2025. Food Aggregators apps like Uber Eats, DoorDash, and GrubHub offer convenient meal delivery options from various QSRs within a single app. Food aggregators provide a multitude of benefits for QSRs. They give access to a huge customer base, quick delivery, and an easy entry into quick commerce, helping QSRs increase visibility. Although QSRs rely on food aggregator platforms for hassle-free ordering, tracking, and delivery, they can’t always rely on them to share critical data that could help them optimize their operations & increase sales. 

    Online food ordering revenue
    Online food ordering revenue

    1. Data on Product Assortment

    QSRs need assortment insights to understand their competitor’s menu assortment. Assortment analytics plays a crucial role in ensuring that QSRs aren’t losing sales because their competitors are offering cuisines and dishes that they aren’t. Understanding gaps in menus helps QSRs to better plan their menu. However, food aggregator apps can’t share competitors’ assortment data with QSRs for a multitude of reasons, guidelines, and privacy laws. Thankfully, at DataWeave, our QSR intelligence solution can! We help restaurants improve their assortment by sharing insights into the dishes and cuisines their competitors’ have on display.

    Menu Assortment
    Menu Assortment

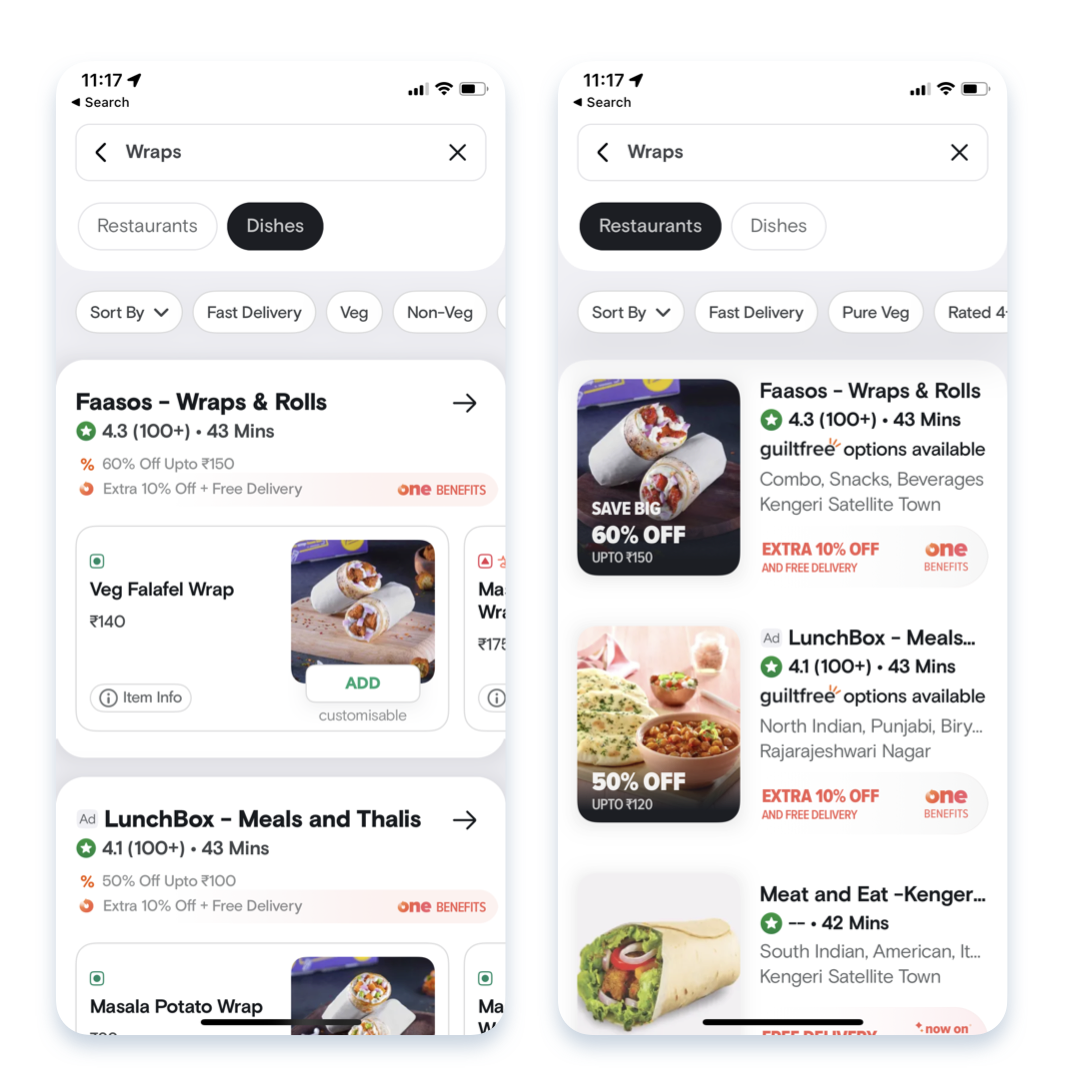
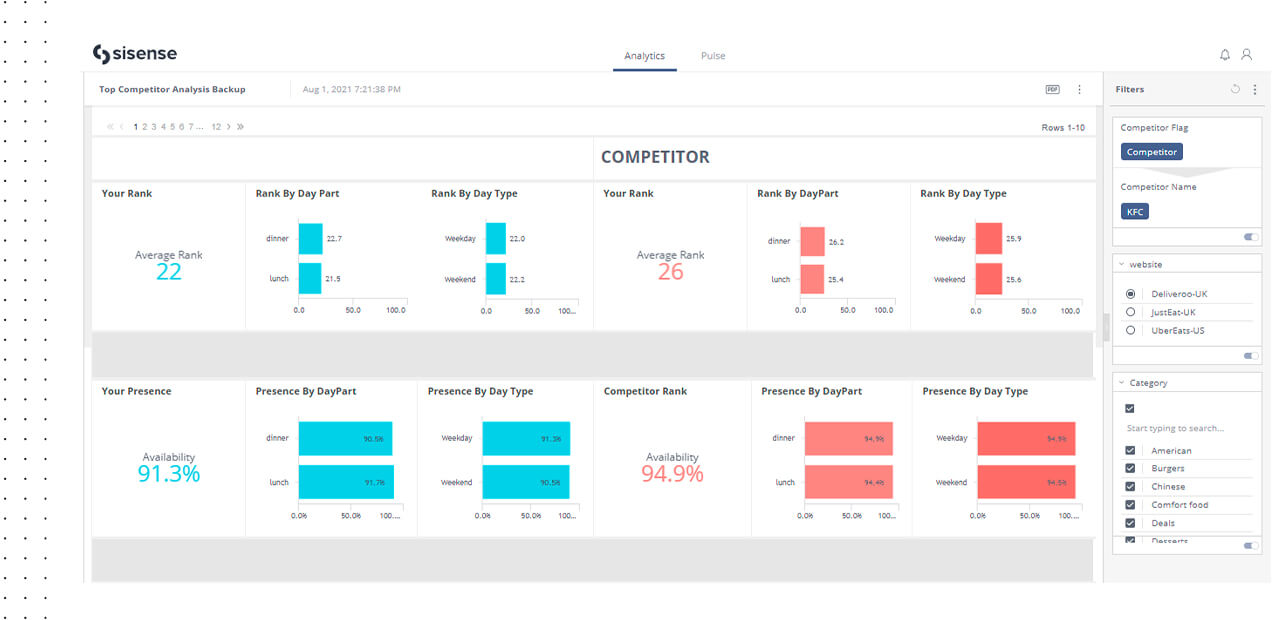
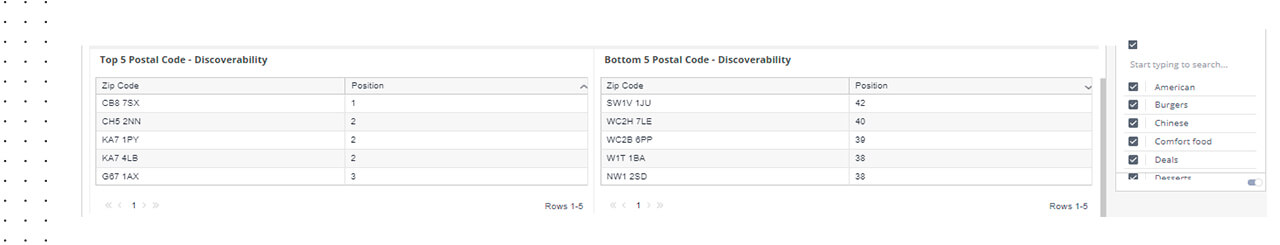
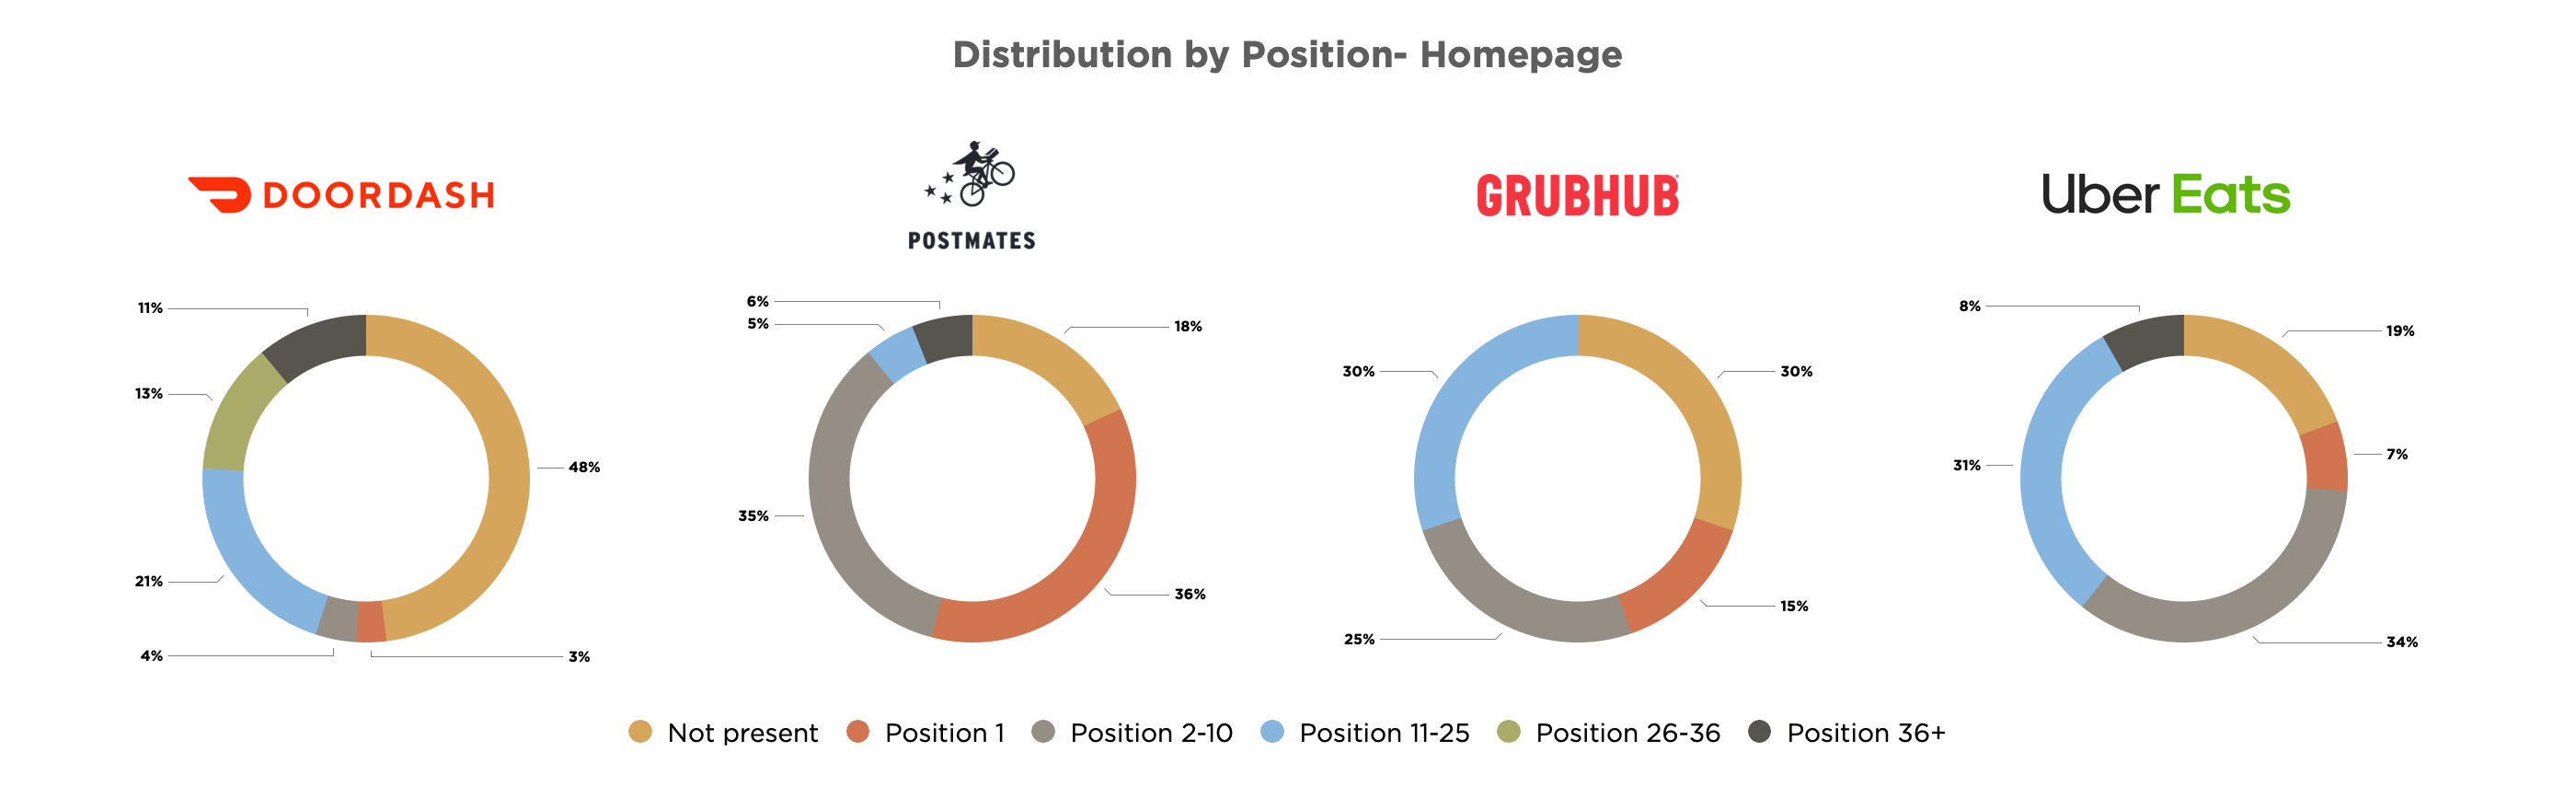
    2. Data on QSR Discoverability

    QSRs would love to know how to increase discoverability on food aggregators, as it will help them to appear ahead in search results and beat the competition. Improving visibility on these apps directly impacts sales and drives more orders for restaurants. Some aggregators offer discoverability information but give it on demand, usually after 20-30 days, making it irrelevant due to the enormous time gap. They also don’t provide information about the change in the discoverability of your competition. All these data points are so critical, and understandably so, Food Apps can’t share this level of information with restaurants. However, DataWeave’s QSR Intelligence solution can! It provides real-time discoverability insights into your restaurant and competitor’s visibility so that the data is actionable, and QSRs can use insights to improve visibility

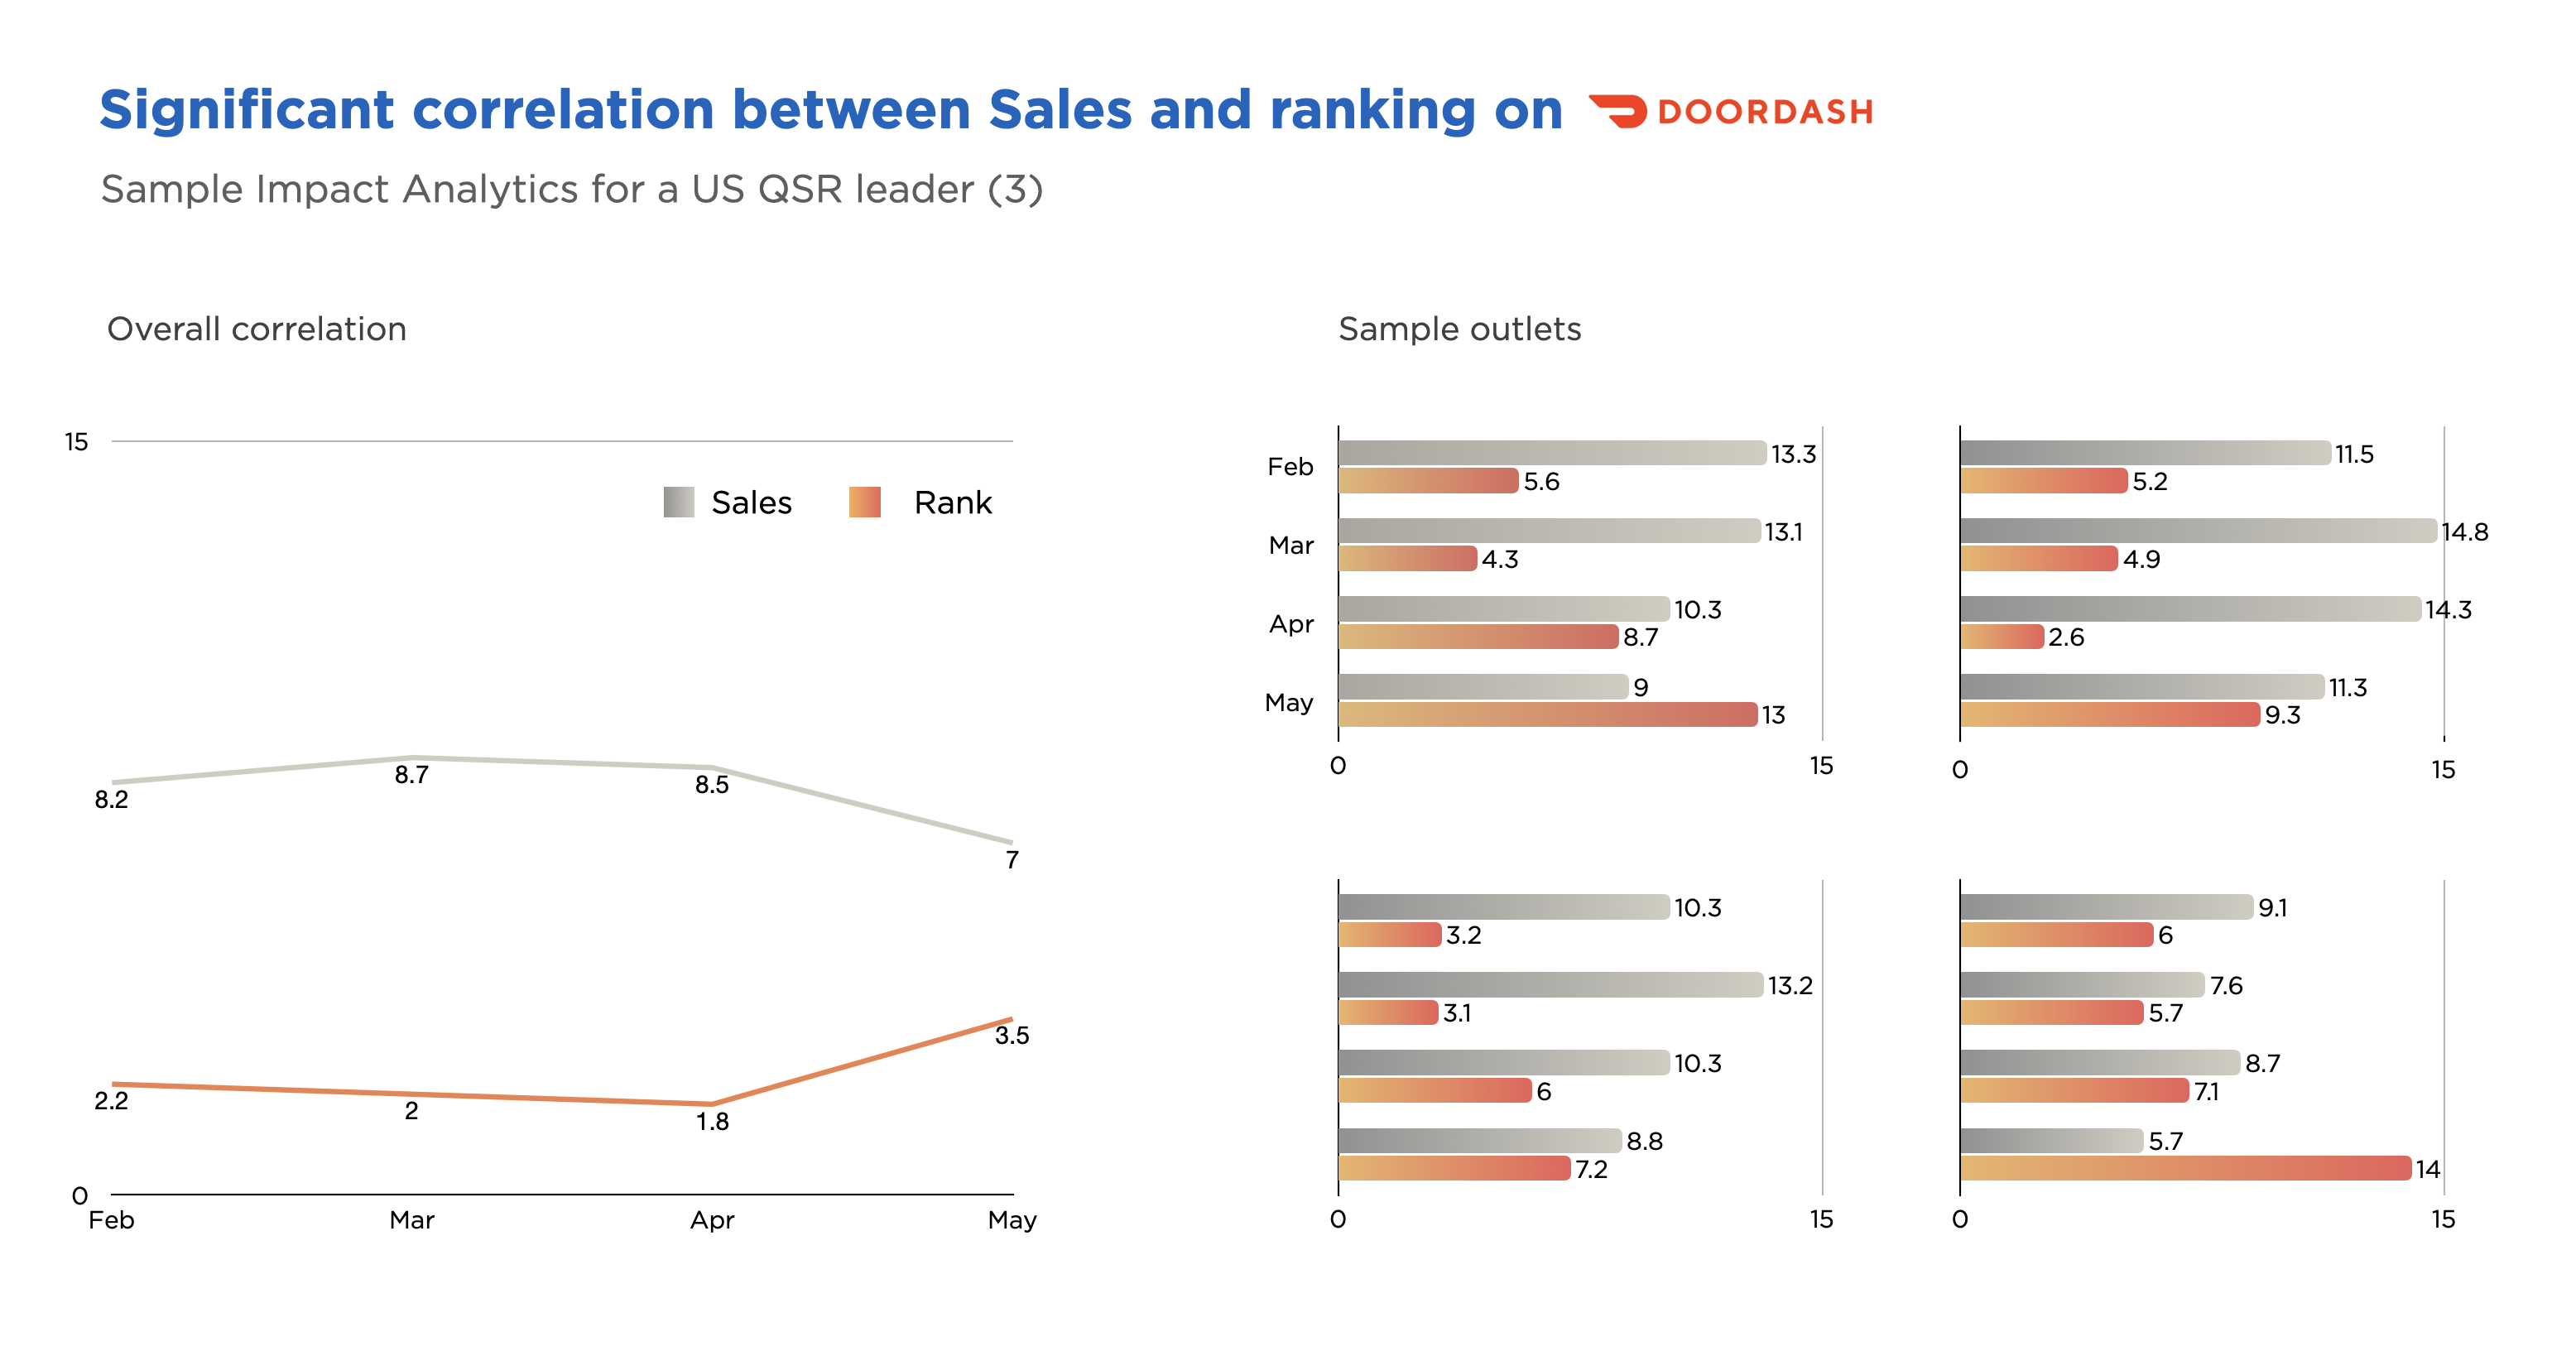
    Read how DataWeave’s QSR Intelligence helped an American QSR Chain and how their ranking on search results page on Ube rEats, DoorDash & Grubhub impacted outlet discoverability & sales!

    3. Data on Pricing & Promotions

    Pricing a QSR’s menu is tricky. If you price too high, you’ll turn off new customers. If you price too low, you’ll cut margins & may even come off as low-qualify. Customer Price Perception is greatly influenced by the Price-Quality relationship. To add to this, restaurants are often up against stiff competition from restaurants with similar cuisine offerings so it’s critical that prices are competitive. Understanding competitor pricing doesn’t imply that you have to beat their prices. You can compensate for any price differences by offering higher quality cuisines, better customer service, and quicker delivery. Once again, food apps can’t share competitors’ pricing data with QSRs. But DataWeave’s QSR & Pricing Intelligence solution can! QSRs can use these insights to drive more revenue & margins by pricing their menu right.

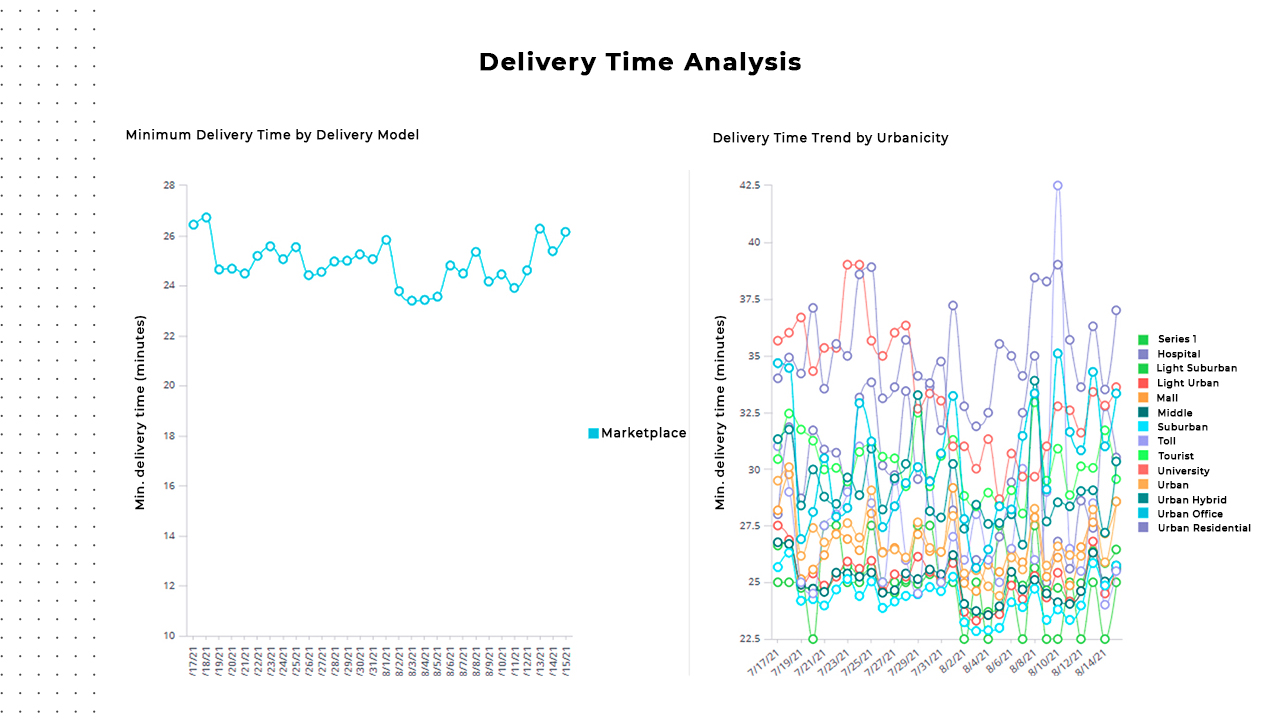
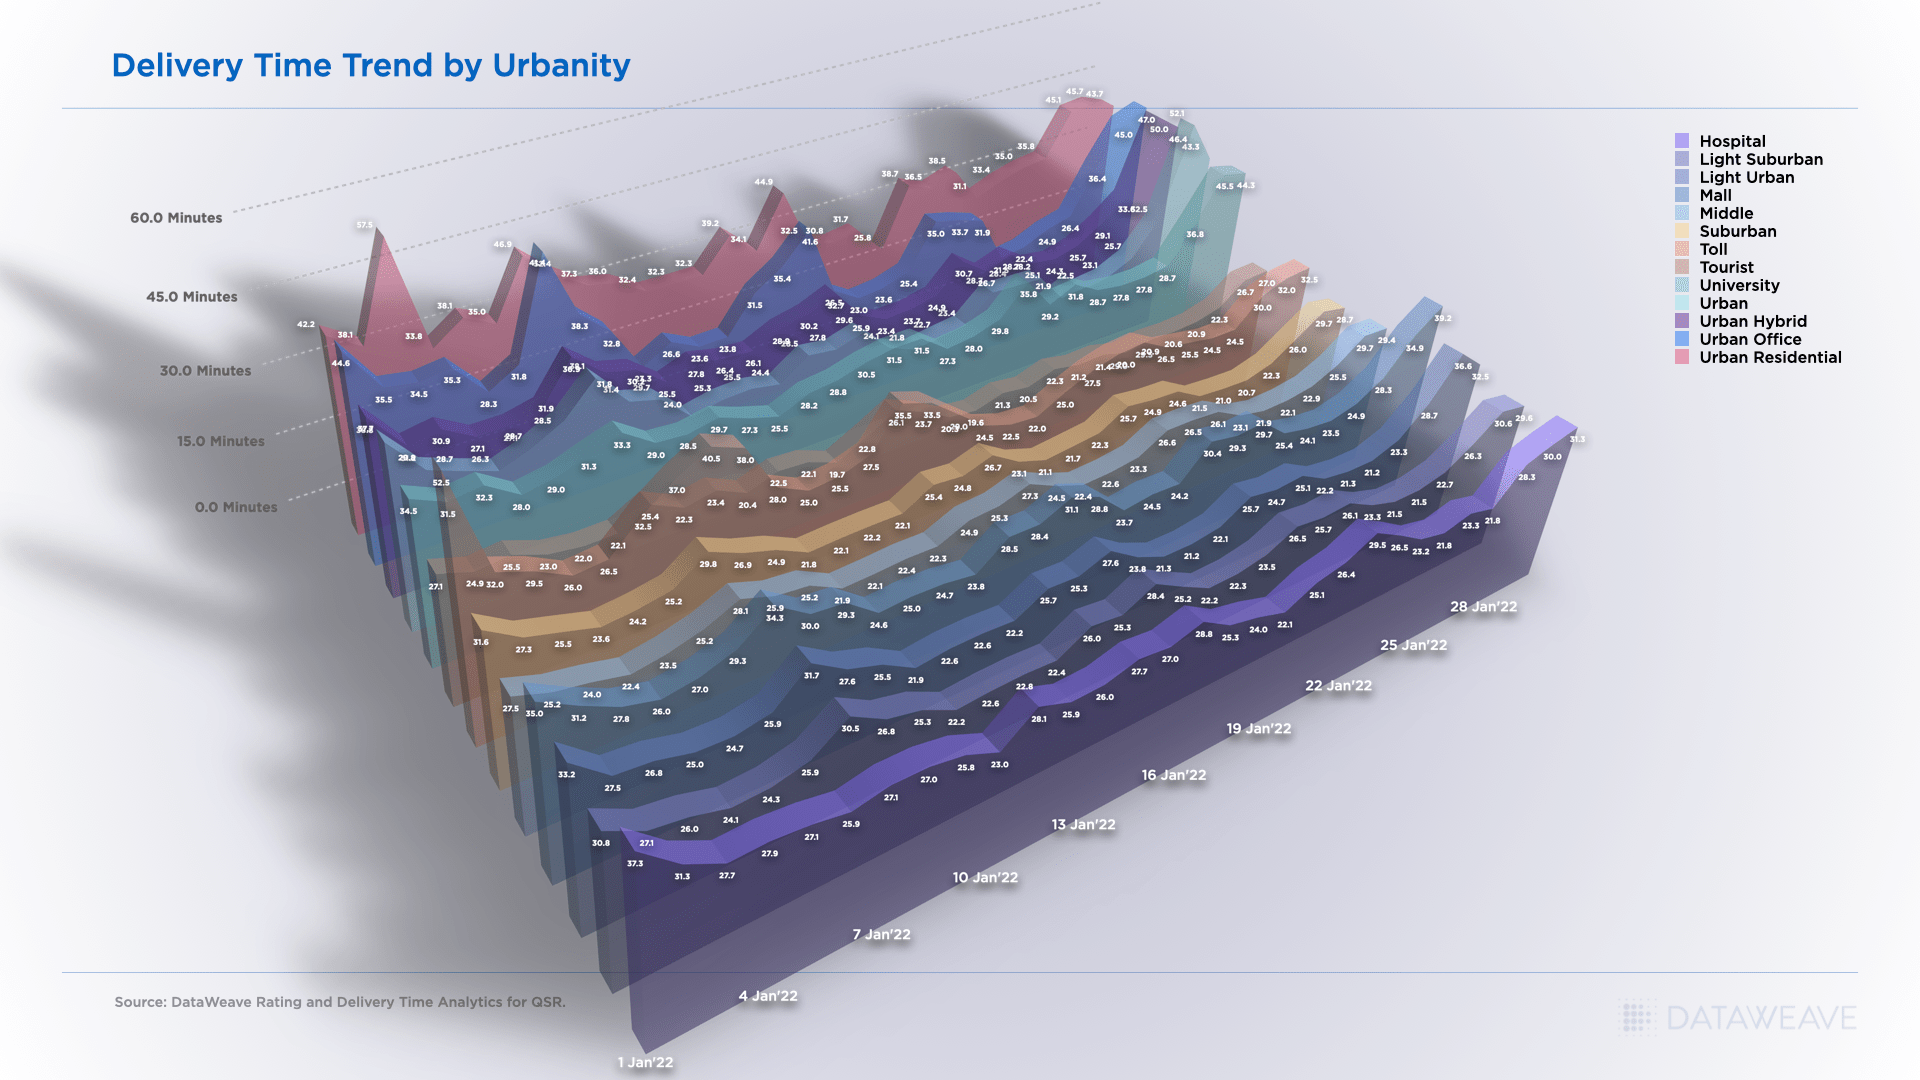
    4. Data on Delivery Time

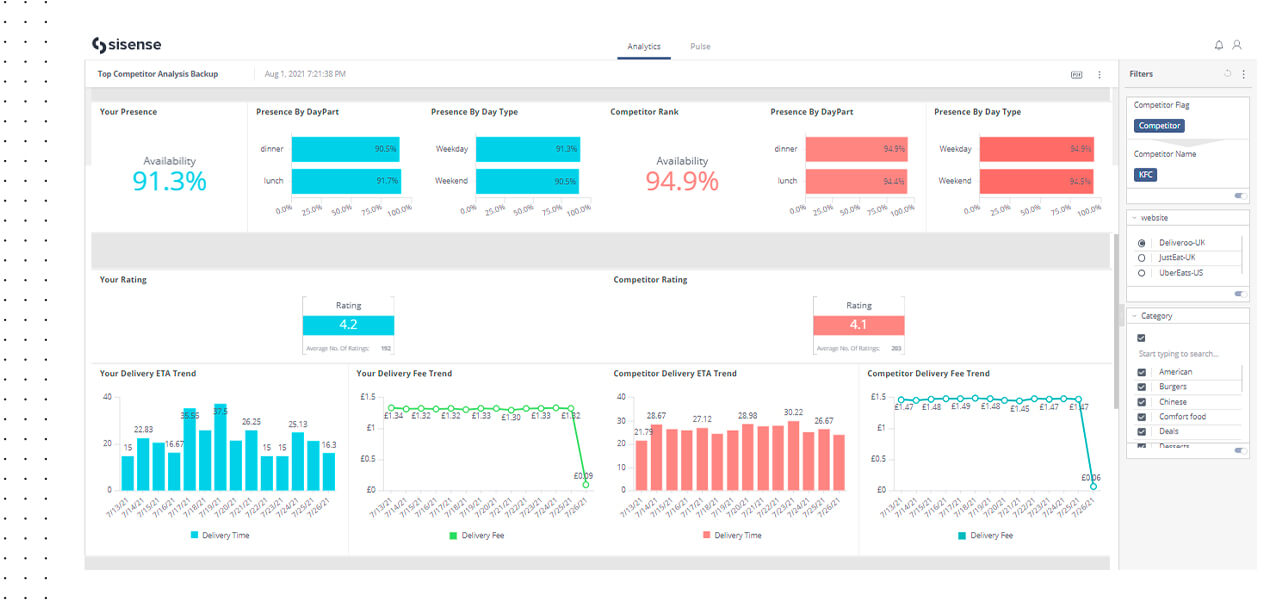
    QSRs must be able to deliver hot meals, in a timely manner to customers because customers want to quickly dig into the delicious food they ordered. Quicker deliveries within the ETA will also help earn the trust and loyalty of customers. However, food aggregators don’t share information on the delivery times with restaurants – not their own delivery time or their competitors. DataWeave can help QSRs to understand their peak hours and optimize their service to ensure quick ETAs. They can also get detailed insights into competitors’ delivery times to make sure they’re competitive. This is important because customers will often pick restaurants with quicker ETAs.


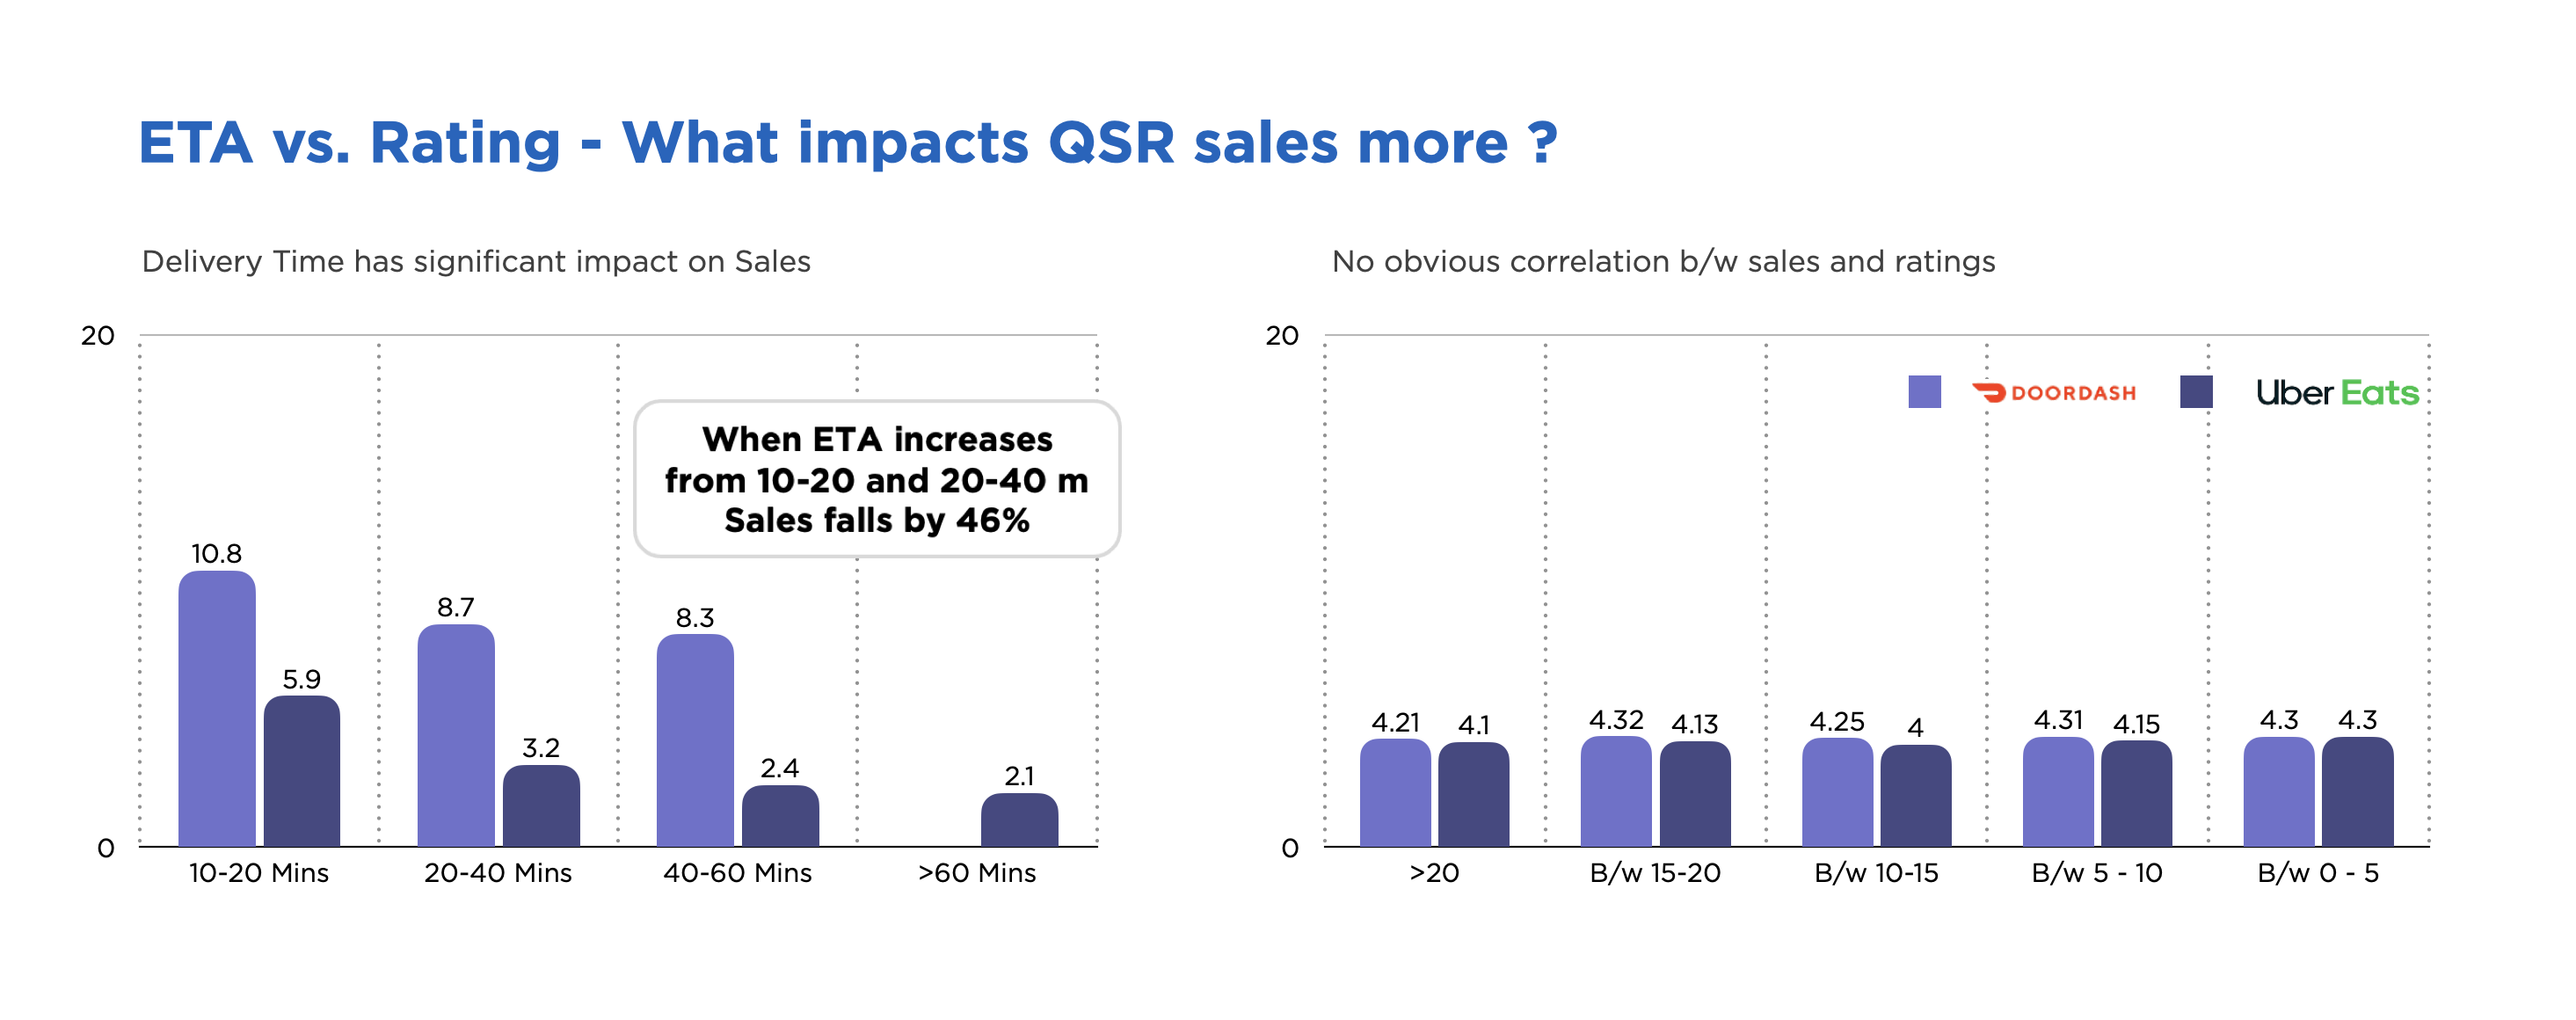
    Read how DataWeave’s QSR Intelligence helped an American QSR Chain understand the correlation between delivery time & sales volumes

    Delivery time trend by urbanity
    Delivery time trend by urbanity

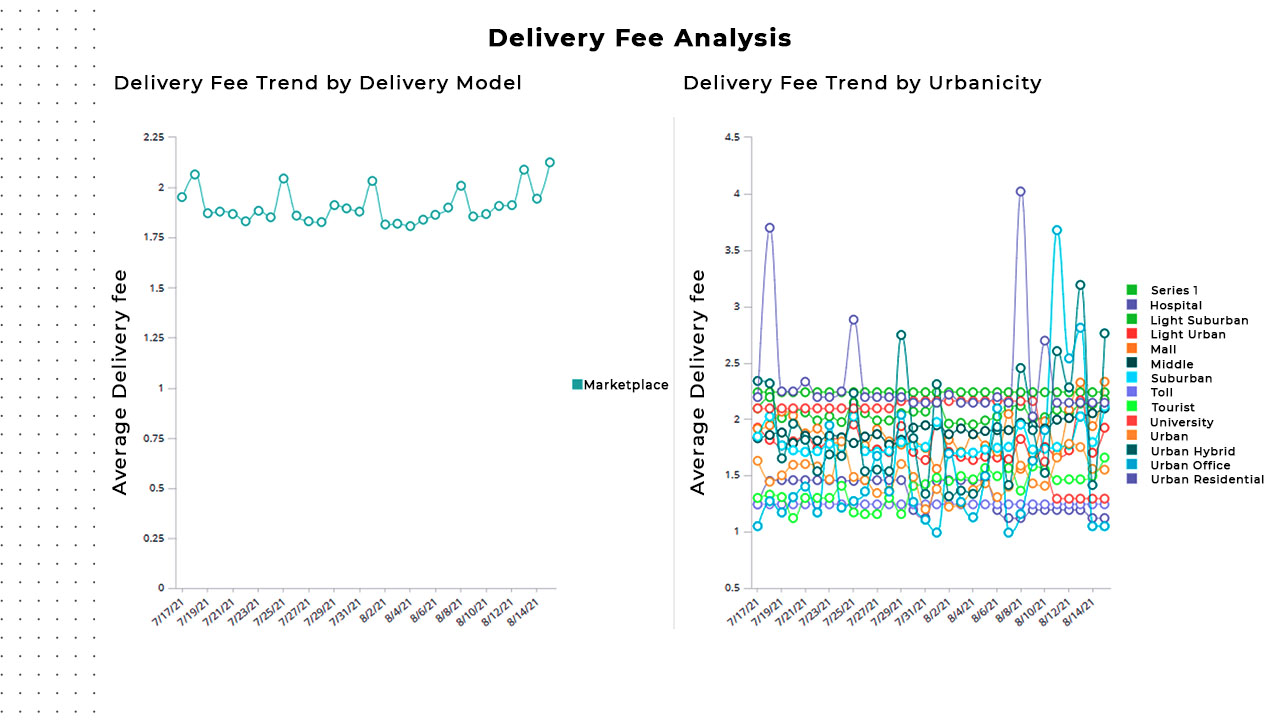
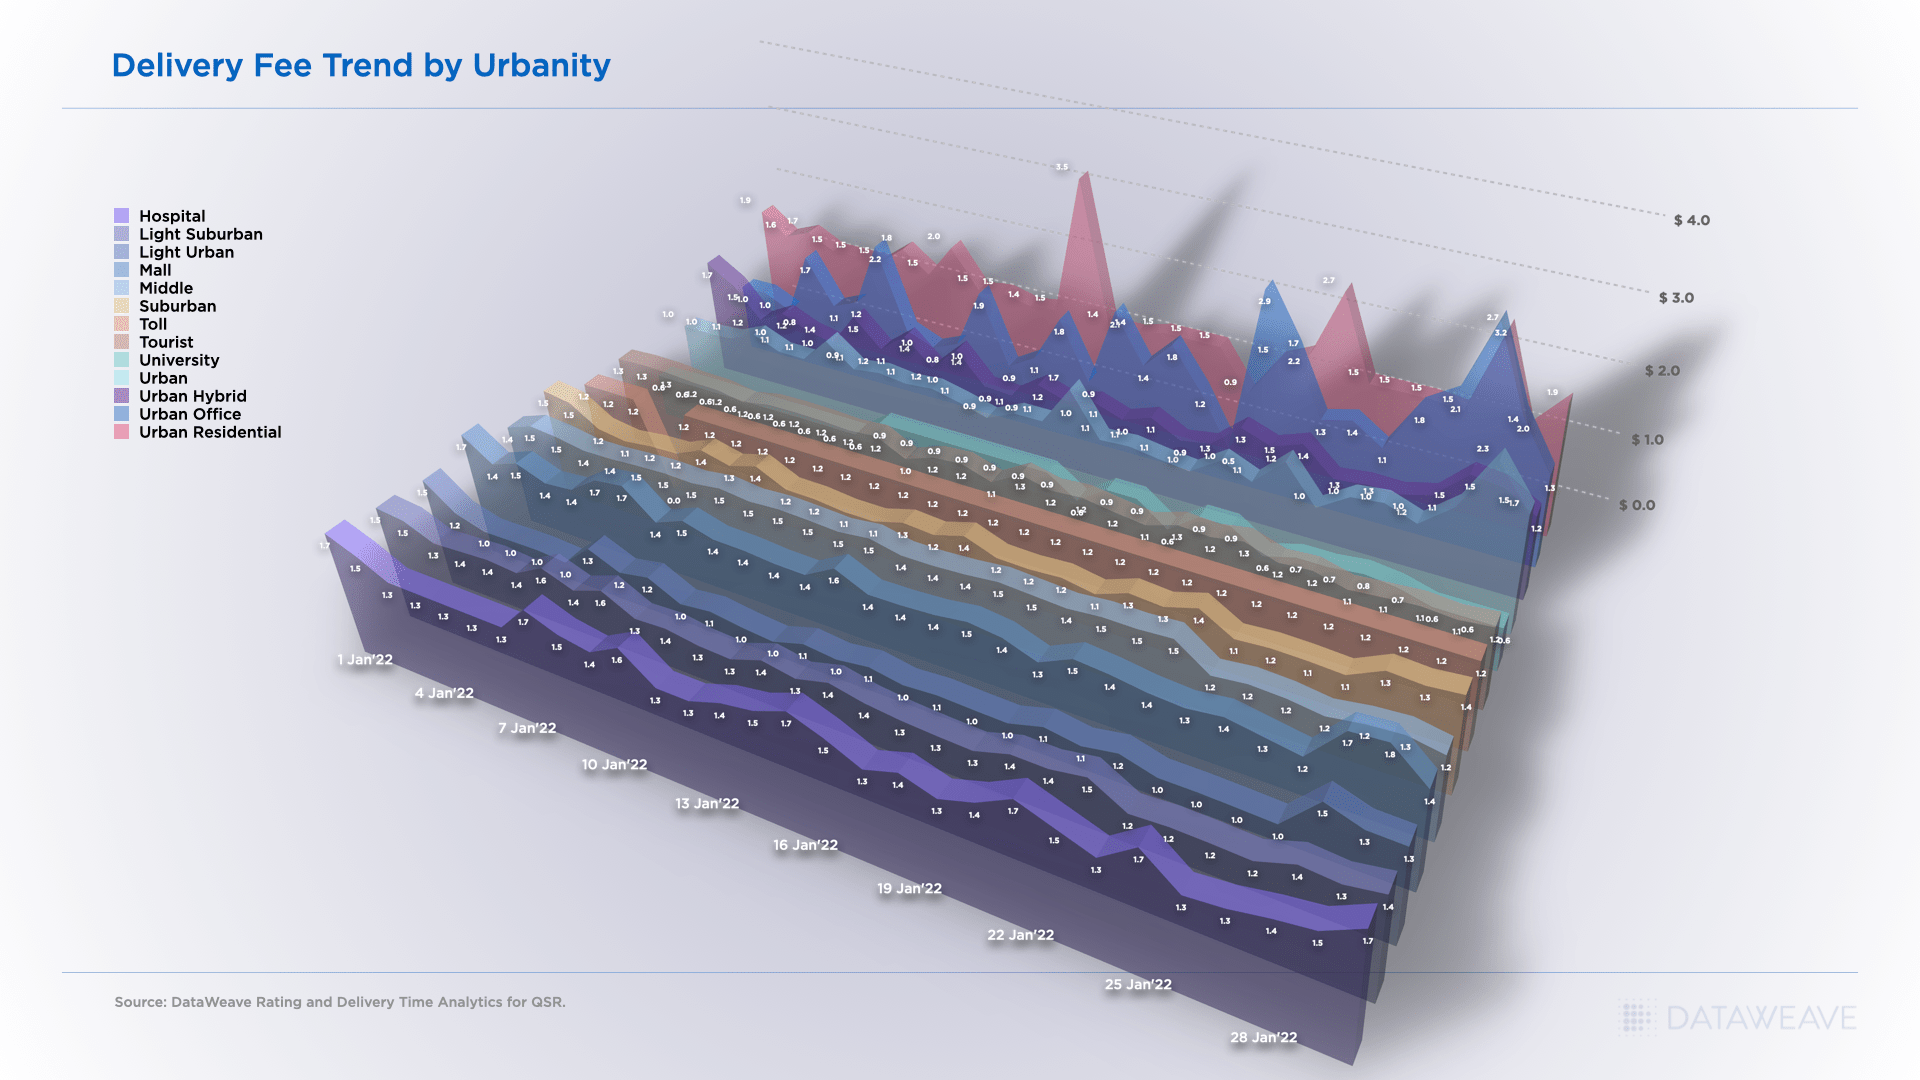
    5. Data on Delivery Fee

    As a thumb rule, customers will always compare delivery fees across apps. They’re conscious of delivery dollars included in their bill and often choose a restaurant with lesser delivery fees. This makes it even more critical for restaurants to understand how they stack up against their competitors. Understanding competitors’ delivery fees could potentially help QSRs to optimize their rates. And once again, food aggregators can’t share information on competitors’ delivery fees with restaurants. However, DataWeave’s QSR Intelligence can provide all delivery-related insights – be it Delivery etas or fees. 

    Delivery fee trend by urbanity
    Delivery fee trend by urbanity

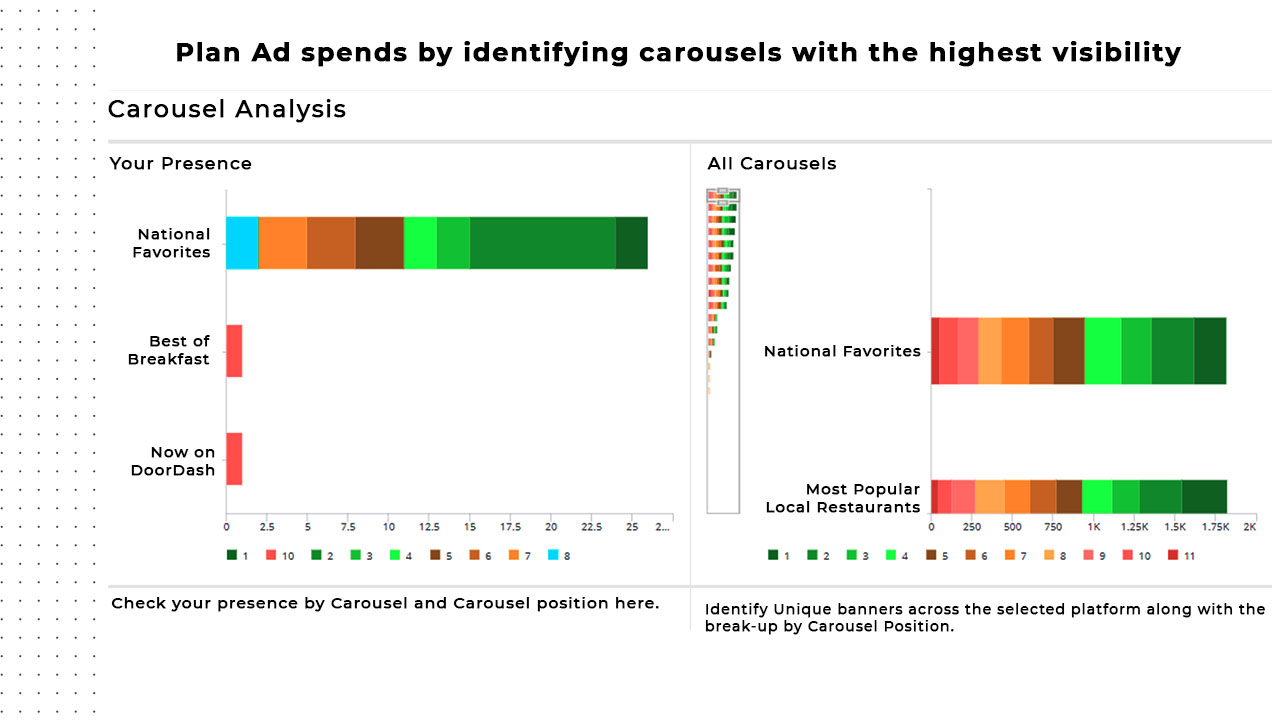
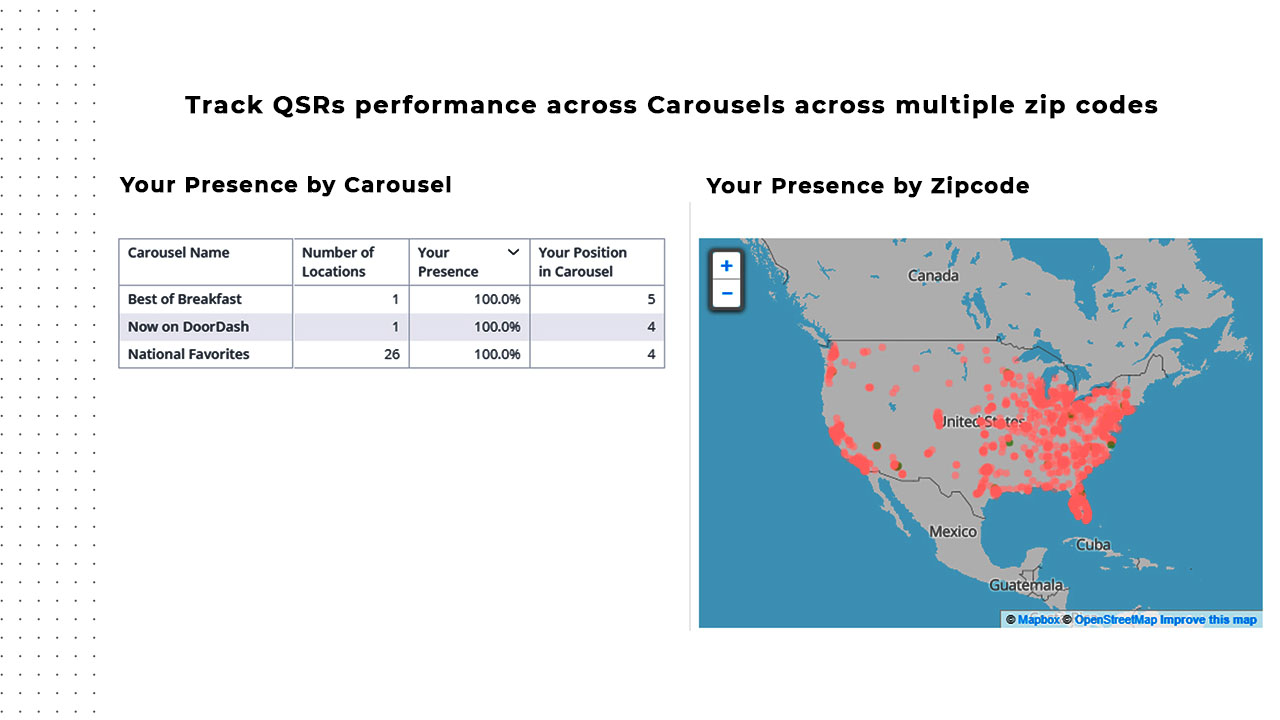
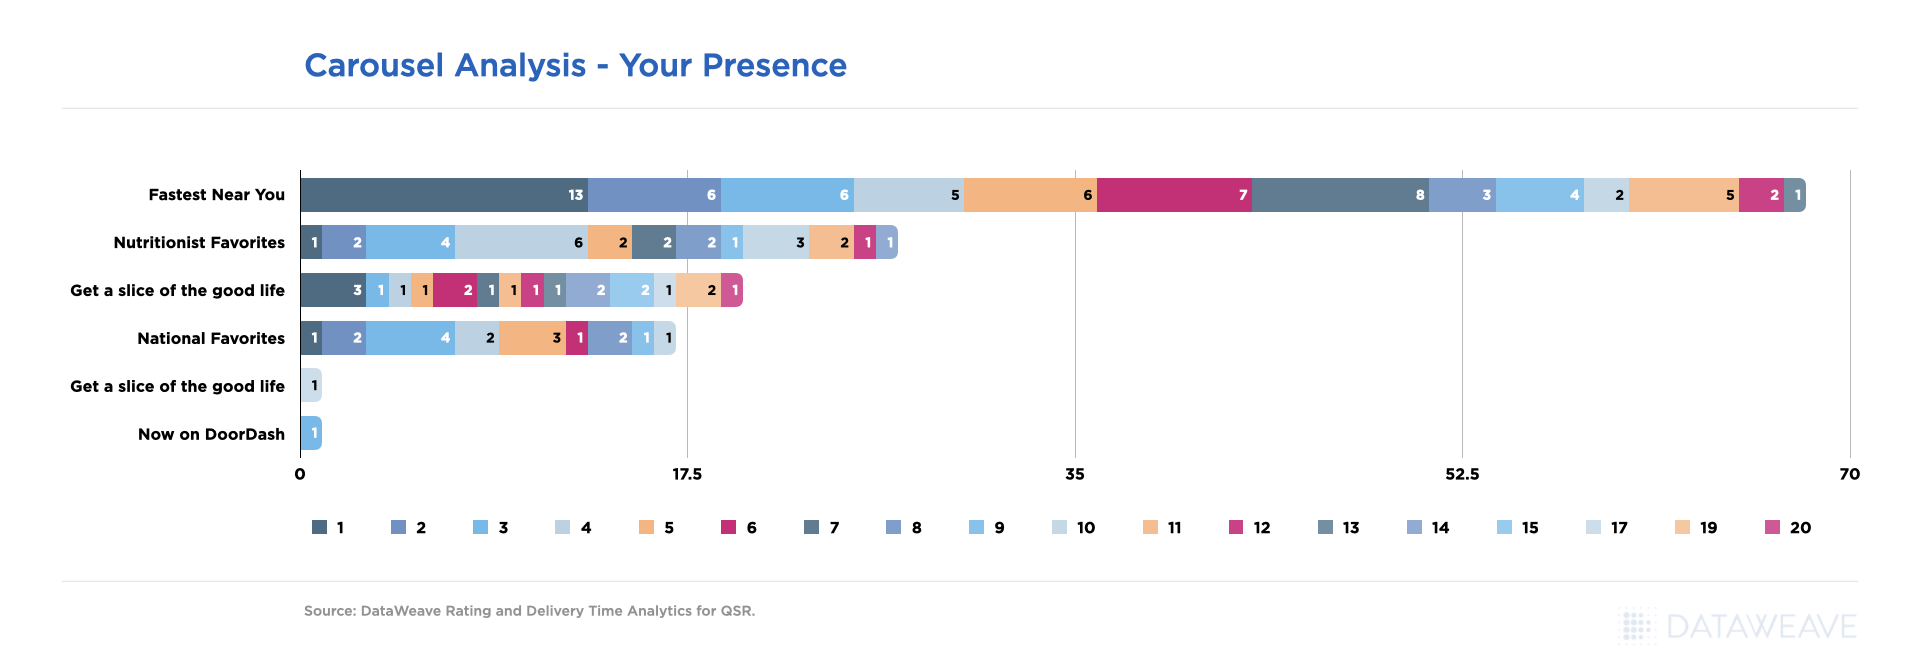
    6. Data on Ad Performance & ROI

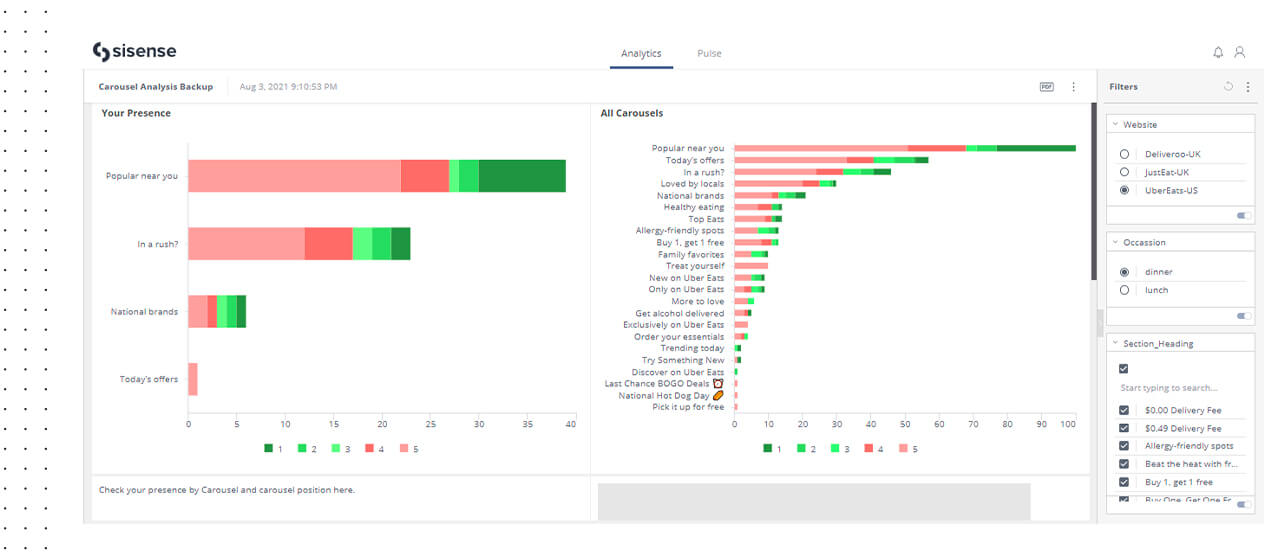
    Getting ad analytics will help QSRs better manage their budgets & increase the ROI on their Ad spends. For example, wouldn’t it be great if QSRs were able to understand which ad formats or promotions led to the most sales? Or which carousal ads had the most visibility in key zip codes where your QSR is expected to do maximum business? Or even insights into a competitor’s ads and promotions on food apps. Knowing this information will help restaurants spend sensibly when buying media on Food Apps & get the most bang for their advertising buck. Food apps do provide standard ad analytics – a number of clicks, CTR, and so on, but for more complex, insightful & actionable insights, there’s DataWeave’s QSR Intelligence

    Read how DataWeave’s QSR Intelligence helped an American QSR Chain understand the ROI delivered on ad spends across Food Delivery apps.

    Insightful & actionable insights for QSR Chains
    Insightful & actionable insights for QSR Chains
    Insightful & actionable insights for QSR Chains
    Insightful & actionable insights for QSR Chains

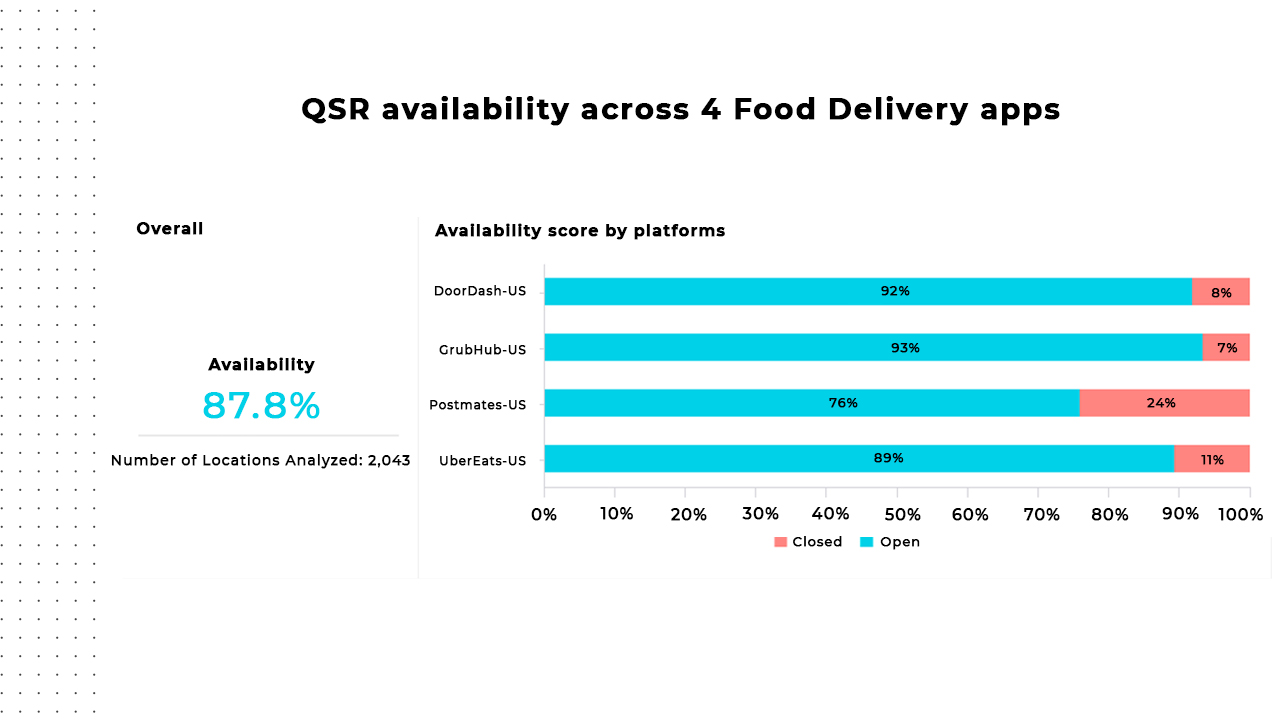
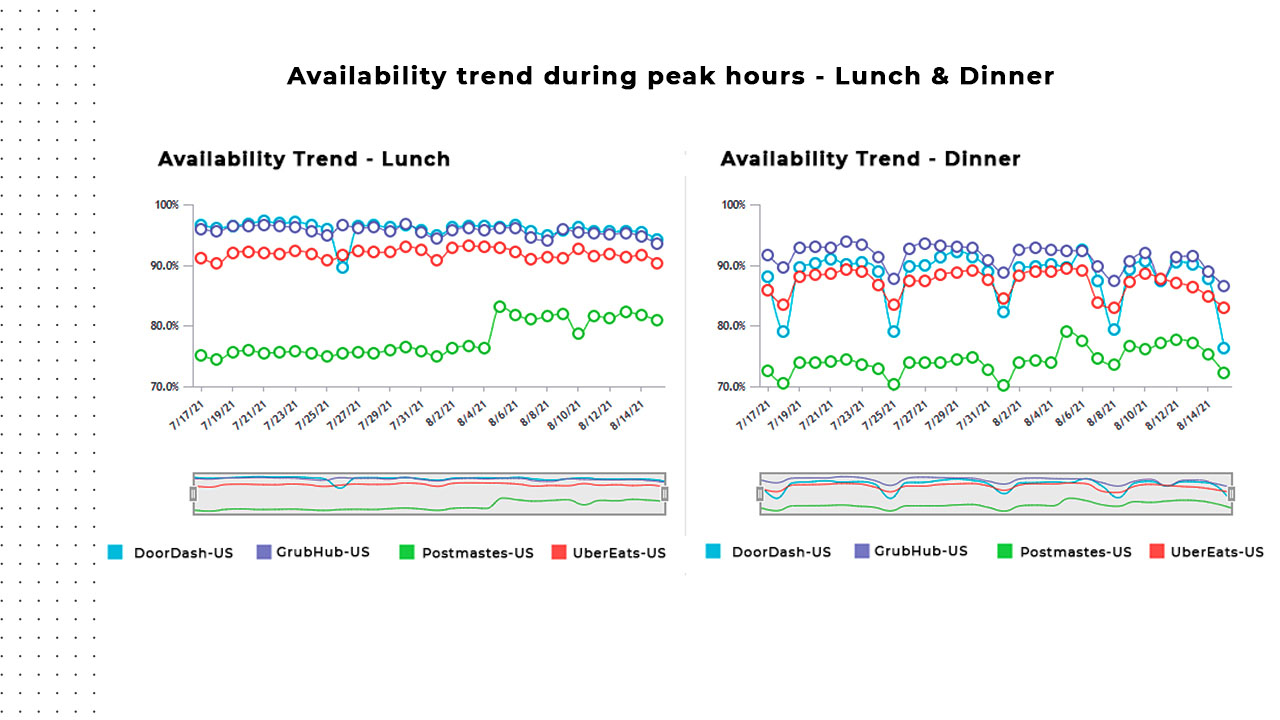
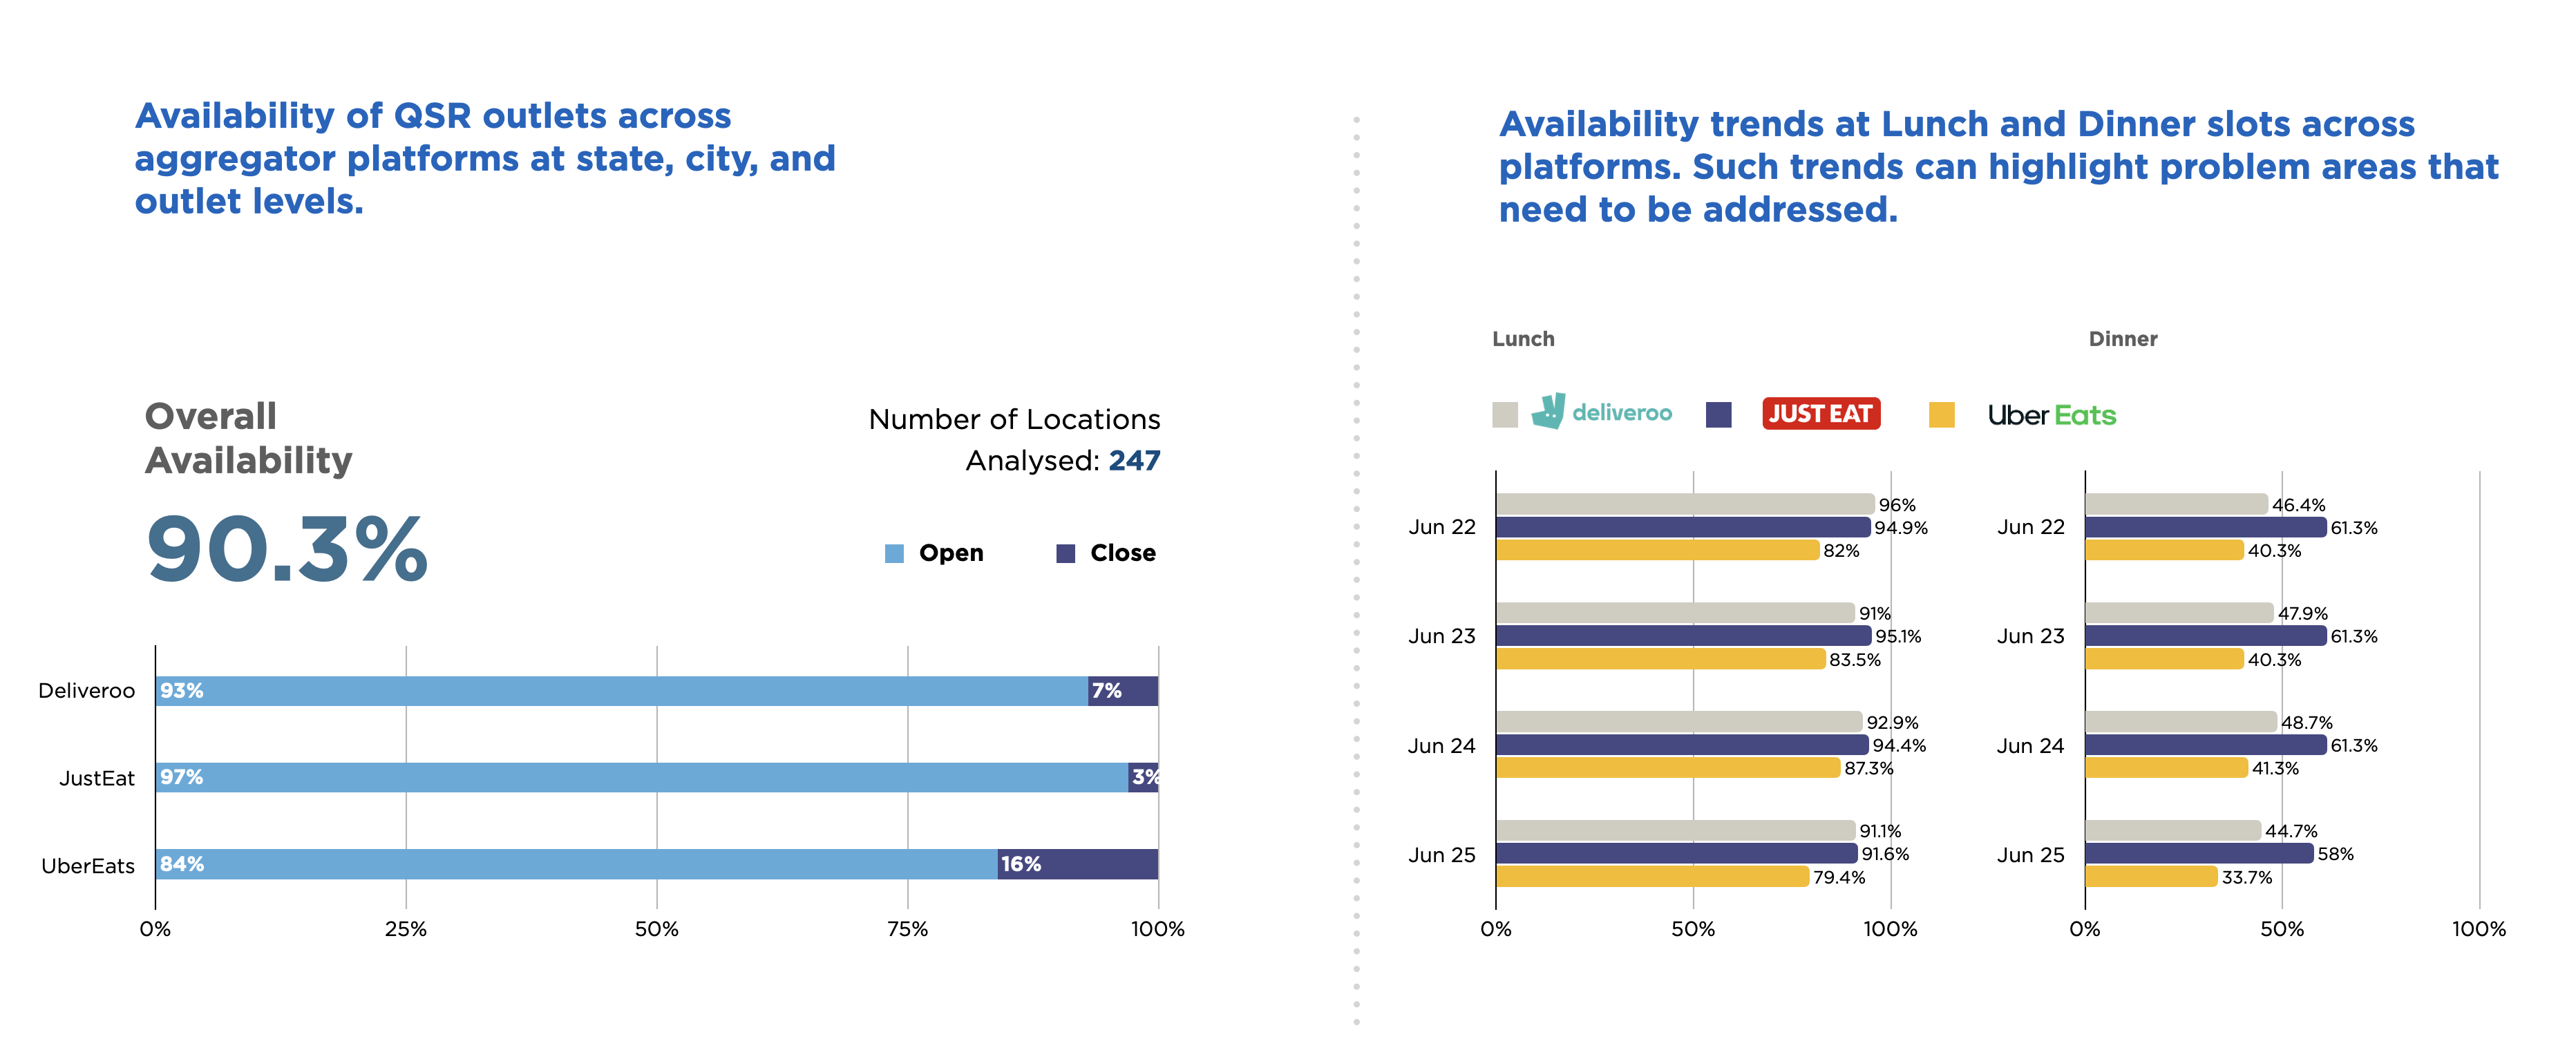
    7. Data on Outlet Availability / Availability Audit

    To avoid lost sales, being available & “open for business” on Food Apps during peak lunch & dinner hours is critical. Also on weekends, when order volumes are usually high. Sometimes because of technical glitches, QSR outlets appear unavailable on Food Apps. A glitch like that can lead to lost business, and the longer the glitch stays undiscovered, the greater the impact on revenue. While Food Aggregators do their best to make sure all QSRs are up and running on their app, using DataWeave’s QSR Intelligence, restaurants can now do an outlet audit to make sure that’s the case. With just a mere 2.8% unavailability, we saw a 28% drop in the sales for one of our QSR customers! That’s how critical Availability insights are. 

    Conclusion

    Analyzing and optimizing sales, delivery, discoverability, availability & customer data is one of the fastest ways to help grow your QSRs revenue. However, the biggest challenge QSRs face is that it isn’t always easy to get this information. With DataWeave’s QSR Intelligence now some of that data is a little more accessible as we discussed in this blog. And additionally, here are the 7 Tricks we recommend QSRs to use to win on Food Apps

  • How Restaurants can use QSR Intelligence to Drive Sales

    How Restaurants can use QSR Intelligence to Drive Sales

    Quick service restaurants (QSR) are not only about delivering great food. They also have to overcome challenges like delivery, logistics, and affordable pricing, especially since covid-19 has staggered the entire industry. QSR intelligence helps restaurants get real-time insight into their performance across food delivery apps. With QSR intelligence, restaurants can identify the highest paying buyers across customer segments, demographics, and locations. Data-driven insights will help QSRs improve performance, decrease delivery time, optimize ad budget, and increase food quality – all with the goal to scale revenue and increase orders through food apps.

    The global fast food and quick service restaurant market are expected to grow at a CAGR of 5.1% from 2020 to 2027. The QSR industry is rapidly growing to encompass the changing needs of customers. 60% of U.S. consumers order delivery or takeout once a week and online ordering is growing 300% faster than in-house dining. With QSR intelligence, restaurants can get insights into metrics that will drive their profitability by helping them to fine-tune menus, enhance customer interaction, improve advertisements, and adjust inventory.

    Benefits of QSR Intelligence

    Continuous in-depth analysis of restaurant statistical data will help companies spot trends and devise strategies to improve sales via food apps. Here are a few benefits of QSR intelligence:

    a.    Improve estimates & minimize wait times

    QSR intelligence can help with accurate sales forecasting. With big data, restaurants can track their popular dishes or combos for various meal times to minimize wait times and increase delivery speed. It can also inform restaurants about upcoming trends, especially during holidays and festivals. Keeping an eye for trends will play a significant role in maximizing efficiency during food preparation and ensuring accurate food delivery ETAs.

    b.    Location-based promotions

    QSR intelligence allows restaurants to target customers based on their proximity to the restaurant. The food must be delivered at a particular time to the customers to enjoy the dish at the right temperature. QSRs can apply demographic intelligence to determine cancellation rates, delivery charges, and the proportion of demand and supply. These metrics will help QSRs to improve location-based promotions.

    c.    Increase ROI on deliveries

    To increase return on investment through food deliveries, QSRs can track metrics like location-based promotions, various payment options, ratings, etc. Tracking these metrics will help QSRs offer accurate ETAs, improve operational efficiency, and personalize services, which will increase revenue. Restaurants will also be able to understand where they can adjust their profit margins to increase revenue while maintaining a cumulative level of success.

    How to use QSR Intelligence

    a.    Assortment and availability

    The more restaurants can understand what and how their customers eat, the better they will be prepared to service those demands throughout the day. For example, QSRs can calibrate the menu, ingredients availability, and kitchen preparation time depending on their customers’ orders for lunch and dinner. This also helps optimize daily workflow, such as reorganizing staff to lower labor costs, optimizing the supply chain for ingredient delivery, and revamping the menu to offer better dishes. Another way to ensure your availability is to analyze your busiest hours and adjust the staff and delivery workforce accordingly. For example, if your customers tend to order more during breakfast, it’s worth considering opening your restaurant a bit earlier.

    QSR availability across 4 Food Delivery apps
    Availability across 4 QSR Food Delivery apps
    Availability trend during peak hours - Lunch & Dinner
    Availability trend during peak hours – Lunch & Dinner

    b.    Delivery time

    One of the most driving factors for the success of QSR is delivery time. Restaurants have to ensure the food is delivered as quickly as possible so customers can consume it at the right temperature. Data-driven insights can help restaurants track repeat addresses, find shortcuts or time-saving routes, and avoid unfamiliar or low delivery locations.

    QSRs have to analyze the entire delivery process from time taken to order on the app, how quickly kitchens can prepare orders, hand over to delivery partners, and get them to the customers. An essential part of QSRs is throughput, the speed at which they can process and deliver orders. During peak hours like lunch and dinner, faster service and quick ETAs ensure that customers do not choose other restaurants. If you have different menus for breakfast and other meals, ensure that your foodservice app can remove such menus when they are not available.

    Delivery Time Analysis
    Delivery Time Analysis
    Delivery Fee Analysis
    Delivery Fee Analysis

    c.    Pricing and Promotions

    QSRs have to understand customers’ price sensitivity while determining delivery costs and ensuring profitability for the business and delivery partners. Customers might look for free deliveries but not adding delivery charges might lead to loss. A deep dive into common transaction data across the locations will allow restaurants to understand the price sensitivity of all customer segments, helping them make intelligent pricing decisions.

    QSR intelligence can also help restaurants determine which delivery locations are most profitable. This helps to adjust the delivery radius, fee, and promotions. Restaurants can offer promo codes, coupons, referral codes, etc., to attract customers and encourage repeat purchases.

    d.    Discoverability

    Restaurants have to ensure that their dishes are on the first-page listing. With QSR intelligence on category analysis, keyword optimization, and competition analysis, restaurants can help their customers discover dishes. This also includes optimizing listings for pricing and rating and delivery fees and availability during peak times such as breakfast, lunch, and dinner.

    e.    Advertisement Optimizer

    QSRs can use data to optimize the advertisement budget and adequately improve return on investment. They can track the visibility of advertisement banners across locations and optimize them for different times of the day. Data analysis can also help restaurants understand which customer segments are more likely to convert to long-term loyalists. This data will help QSRs design personalized campaigns and align advertisement budgets while converting them to long-term customers, further improving the bottom line.

    Ad spends by identifying carousels with the highest visibility
    Ad spends by identifying carousels with the highest visibility
    Track QSRs performance across Carousels across multiple zip codes
    Track QSRs performance across Carousels across multiple zip codes

    f.     Growth & Expansion

    Upselling and cross-selling are two popular tactics that improve growth for quick-service restaurants. However, that requires a rich understanding of customers’ price sensitivity, preferences, and behavior. QSR intelligence can provide information about which upsell and cross-selling offers a customer segment is likely to value and which optimal channels for distributing the offer.

    Conclusion

    Quick service restaurants can track critical data points and use them to increase revenue and improve customer experience. Learning how to price, promote, and deliver food to customers during a pandemic can be challenging. QSR intelligence will help brands attract the right clientele, adjust inventory, reduce overall marketing costs, and increase order rates. This will also help increase customer loyalty across segments which can, in turn, increase the number of returning customers and profitability.

  • How an American QSR (Quick Service Restaurants) improved its Business ROI Food Apps

    How an American QSR (Quick Service Restaurants) improved its Business ROI Food Apps

    Traditionally, Quick Service Restaurants (QSRs) such as McDonald’s or Burger King, have been strategically operating on a brick and mortar model. However, according to some studies, an average QSR generates as much as 75% of its sales from online orders.

    With the advent of delivery apps such as Uber Eats and Doordash, a significant portion of QSRs’ business has moved to these platforms. The war to top rank on one of these platforms is an even greater feat. With each brand competing for the top listing, it’s much less about the dollars you pay and much more about optimizing your investments.

    The relationship between QSR chains and food delivery apps has its advantages and disadvantages. One of the critical grouses QSRs have against food apps is the incremental marketing spend required to participate on the platform and the inability to measure the impact of their investment. What makes matters worse is the limitation in metrics even available to measure the impact – neither the food apps provide them, nor does anyone else.

    At DataWeave, we have made it our mission to enable QSRs to not only define measurable metrics to achieve a positive ROI for food app marketing investments, but we also equip QSRs with the tools to track their competitive performance at granular, zip code-based level so that localized strategies can be modified as needed. Below is an example of a 1000+ store chain QSR we partnered with to optimize a pre-existing investment made with a large food aggregator app. Within months of engagement with us, they were able to achieve a 3X increase in sales without adding any additional marketing dollars.

    Below are the pain points we identified and solved together:

    1. No Defined Metric

    Problem – No leading metric to track marketing performance

    One of the first issues we realized was that sales was not a good metric for tracking marketing performance as it’s a lagging metric and doesn’t capture the issues that help grow or suppress sales.

    Most of the sales are driven by rank in the cuisine category and searches for branded keywords. But, the QSR chain had no way to track these ranks.

    In fact, 70%+ sales go to the first five restaurants for the category and keyword

    Comparing ranking on food delivery platforms
    Comparing ranking on food delivery platforms across different categories and times

    Solution – Establish ranking as a clear marketing metric

    By aggregating data across different food app platforms comprehensively, i.e. across locations, at different times of the day, we established the ranking of the QSR chain in critical categories and for priority keywords, identifying where they under or over-performed relative to the competition. As we did this daily- this became a straightforward metric that helped establish the performance of their marketing campaign.

    2. Geographical & Categorical Challenges

    Problem: Identifying poor-performing stores and zip codes

    We realized  it was not a simple exercise to identify well performing stores on food apps since sales depend on many factors such as competition, population of the area, local cuisine preference, etc.

    Solution: Zip Code Ranking and Attributes

    We tracked the ranking of each store within each Zip Code for keywords and created a list of poor-performing stores. We also extracted attributes such as estimated time of arrival (ETAs), Delivery Fee, Ratings, Reviews, etc., for each of these poor performing stores, to identify the reasons for the poor ranking. 

    Analysing key metrics at a store level
    Analysing key metrics at a store level – identifying worst & best performing stores

    E.g., We realized 356 of the stores were not populating on first page results, primarily because of poor ratings and High ETAs. After the focused initiative, 278 of these stores started showing on the first page and increased sales by 23%. 

    3. Sensitivity Analysis Deficiency

    Problem: Not clear about the contribution of Rating, ETAs, Fees, etc. on the Ranking

    The exact ranking algorithms of these food apps are not publicly shared – so the QSR chain wasn’t clear which variable of rating, ETAs, fees, ad spend, or availability contributed more or less to the overall ranking. 

    Solution: Sensitivity analysis for measuring contribution 

    Comprehensive data for multiple zip codes in various timestamps was analyzed to determine which variable contributes most significantly to the rankings and when. We also conducted A/B testing – simultaneously testing two different variables, such as reducing ETAs at one store and improving ad spend at another, calculating which led to greater rank and sales impact.

    For example, we realized reducing publicized ETA’s (even by decreasing the delivery radius) contributed much more to improve the rankings than changes to ratings.

    4. An Unknown Competitive Landscape

    Problem: Tracking competitor performance

    For example, we found the QSR chain performed well in key urban centers, but the competition was doing even better, but there wasn’t a good way to track and compare the performance of the competitors.

    Solution:

    We started tracking the QSR chain and the competition for each of the metrics and started comparing performance.

    Analysing competitive performance
    Analysing competitive performance on key metrics such as ETA, Availability etc

    We quickly realized ranking started quickly improving as we gained a slight edge in each metric against the competitors. For example, 5 minutes less ETA adds to higher ranking.

    In six months of this exercise with the QSR chain, we improved the average ranking from 24 to 11 for the QSR chain, getting them featured on the first page.

    5. Blind Advertising Investment Opportunities

    Problem: 

    The QSR chain was not clear on which banners (Popular near you, National Favorites, etc.)  to choose to invest in, and had to depend on the recommendations of the food platforms entirely. 

    They weren’t even provided a clear view of which position made the banner visible and at what rank among those banners was their promo visible. They were at times the 7th promo in the 6th banner, which has almost zero probability of being discovered by the user – this happened despite paying heavily for the banners.

    Solution: 

    We aggregated data for all banners populated within each zip code and found out the ranking and in which position the QSR chain was visible.

    Analysing right banners
    Identifying and analysing right banners for advertising spends

    The QSR chain invested in 630 zip code-based banners with guaranteed visibility, but our assessment indicated the banners were only visible in 301 zip codes. After selecting suitable banners for promotions, we improved visibility to 533 zip codes within enhancing the budget.  

    We are now using the same strategy for refining discounts, offers, promotions, and coupons. 

    6. Lack of Campaign Performance Monitoring

    Problem: Unsure of the long-term impact of marketing spend

    In general, increasing marketing spend does give a temporary boost to sales, but the QSR chain’s question was, how can we measure the long-term impact i.e., ranking keywords and the targeted zip codes.

    Solution: 

    We created a simple widget for every marketing campaign which showed the rank for the keywords for selected zip codes before the campaign, during the campaign, and post the campaign, clearly establishing the midterm impact of the campaign. This constant monitoring allowed the QSR to also quickly pivot on their strategy on account of national holidays etc, and act accordingly.

    7. Non-Existent ROI Measurement

    Problem: Establishing the impact of ranking on sales

    Though the QSR chain could track sales that were coming via the food app channel, they had no way of knowing incremental organic volume driven by marketing efforts. 

    One missing variable here was how much of extra sales could be attributed to improvement of QSR ranking? 

    Solution: 

    By combining the sales data with aggregated insights over time, we established for the QSR chain how much increase in sales they could anticipate from an increase in ranking, also knowing which changed variables led to the percentage of change increase.

    So, in essence, we were able to tell the QSR chain that for each store how much sales would increase by improving ETAs, rating, ad visibility, availability, etc., enabling precise ROI calculations for each intervention they make for their stores.

    Increasing sales by 3x within six months was only the beginning, and the journey of driving marketing efficiency using competitive and channel data has only just begun. 

    DataWeave for QSRs

    DataWeave has been working with global QSR chains, helping them drive their growth on aggregator platforms by enabling them to monitor their key metrics, diagnose improvement areas, recommend action, and measure interventions’ impact. DataWeave’s strategy eliminates the dependence on food apps for accurate data. We aggregate food app data and websites to help you with analysis and the justification of marketing spend and drive 10-15% growth.

    DataWeave’s strategy eliminates the dependence on food apps for accurate data. We aggregate food app data and websites to help you with analysis and the justification of marketing spend and drive 10-15% growth.

    If you want to know learn how your brand can leverage Dataweave’s data insights and improve sales, then click here to sign up for a demo

  • Seven tricks to win food wars on food aggregators apps

    Seven tricks to win food wars on food aggregators apps

    Food aggregators have emerged as a critical channel for Quick Service Restaurant (QSR) chains to grow their business – especially post-pandemic. Quick Service Restaurants, QSRs, as we call them, are capitalizing on the opportunity too. For many chains, as high as 50% of their revenue now comes via aggregator channels.

    However, most QSR chains are only beginning to leverage data and analytics to drive business on the food aggregator apps.

    Currently, QSRs spend vast amounts on marketing on Food apps but are always unsure of the return on their investment. Aggregators share some data, but they have an inherent motive to entice QSRs to buy more advertisements. They cannot share competitive insights as well. Moreover, as QSRs work with several platforms at once, it gets difficult to collate and analyze data from all these platforms together. These issues make leveraging data for QSR chains difficult. At Dataweave, we have collated some insights from our recent experience of working with global QSR chains helping them improve their sales on different food applications using data:

    1. Availability

    Availability of QSR and Availability Trends
    (L) Availability of QSR outlets across aggregator platforms at state, city, and outlet levels. (R) Availability trends at Lunch and Dinner slots across platforms. Such trends can highlight problem areas that need to be addressed.

    The easiest and most impactful fix is to ensure that all your outlets are available on the app at the peak slots, typically lunch and dinner. Availability increase of ~2% at peak times results in order volume increase by ~5%-7%.

    The reasons for unavailability range from lack of riders, overwhelming orders at the outlet, or just plain technical glitches. Tracking this metric and actively engaging with your stores and aggregator platforms to resolve any issues should be a daily priority.

     2. Monitoring Keyword Ranks

    High correlation between ranking and sales
    Illustrative chart showing a high correlation between ranking and sales

    If you are a Pizza chain but don’t show up among the first five ranks when your target customer is searching for Pizza, the chances of a sale are lower.

    What helps is to track the ranking for your brand, and your competitor brands, in different category listings across different keywords.

    Your ranking may differ a lot by region, markets, and Zip codes depending on consumer tastes, competitors, and your brand presence, and it’s helpful to track it granularly. 

    No surprises here – but rank is strongly correlated with your order volumes!

    3. Tracking competitors

    QSR chain rank
    Illustrative chart showing the rank of key QSR chains on the home page and various categories

    One of the tricks to rapidly gain in ranking is to monitor competitors in your category and ensure that you are doing better on each attribute – ranking, rating, ETAs (estimated time of arrival), fees, discounts, etc.

    A slight edge across your outlets translates to rapid gain in ranking and order volumes.

    4. Choosing suitable banners for promotions

    Position of banners
    Position of various banners at various zip codes. Important to choose banners that rank higher.

    Choosing banners is an essential strategy to gain visibility – but it’s vital to know two factors: 

    • At what rank does the banner you are choosing show up on the App/Website.
    • At what position does your brand show up in the banner?

    If you are on a 5th rank on the 4th banner, your marketing spend is probably going down the drain.


    5. A/B Testing

    Before starting an effective marketing campaign, it helps to do A/B testing by running two different banners in the same city one week apart to see which yields more impact.

    A/B testing can also be a tool to choose banners, discounts, offers, signature images, etc.

    6. Sensitivity analysis

    Delivery time impact
    Illustrative chart showing that ETAs are highly correlated with sales, whereas ratings do not have much impact.
    • What has more impact on sales – Ratings or ETAs? 
    • What will be the likely impact on sales of the marketing campaign in New York vs. Denver? 
    • What is the likely impact of competitors’ ad blitz on your sales?

    Data can answer these and many more questions, and this sensitivity analysis should be part of the QSR chain’s decision-making

    7. Monitoring campaign performance

    QSR chains spend millions of dollars of ad budget running campaigns on aggregator platforms combining banner ads, discounts, offers, etc.

    It’s a great idea to measure QSRs rank on these aggregator’s platforms before, during, and post the campaign in focus Zip Codes for priority keywords to see if the gain in ranking is temporary or lasts for a while.

    The ultimate factors for QSRs to win will remain the quality of food and consistency of the brand’s messaging. Leveraging the power of data can help understand the aggregator platform’s characteristics, competitor’s strengths, weaknesses, & strategy, and consumer behavior trends.

    Also, data can help better direct ad dollars and the eCommerce teams’ focus on the right initiatives to drive maximum sales and growth.

    DataWeave for QSRs

    DataWeave has been working with global QSR chains, helping them drive their growth on aggregator platforms by enabling them to monitor their key metrics, diagnose improvement areas, recommend action, and measure interventions’ impact. 

    DataWeave’s strategy eliminates the dependence on food apps for accurate data. We directly crawl food aggregators apps and websites and help you with data and analysis to solve the aforementioned issues and drive 10-15% growth.

  • Food Delivery Gives Moms a Delicious Break On Mother’s Day

    Food Delivery Gives Moms a Delicious Break On Mother’s Day

    Moms deserve a scrumptious celebration. In time for Mother’s Day, restaurants and their food delivery partners can unburden mothers from the chore of cooking by delivering the gifts of ease, convenience and nourishment.

    Over the past year, moms have been starved for time amid the disruption of working from home and supporting their children’s virtual schooling. Meanwhile, grandmothers have been starved for social connection, as many of them have only seen their loved ones on Zoom.

    Restaurants can satisfy consumers’ unmet needs. Using timely, empathetic digital marketing can help restaurant operators stand out on food delivery apps (like DoorDash, Uber Eats, Grubhub and Postmates) and sell more online this Mother’s Day – and all year round.

    Delight moms with what they really want

    According to the NRF, 83% of consumers plan to celebrate Mother’s Day in 2021. On average, shoppers plan to spend $220.48 (up $16 since last year), the highest amount in the history of NRF’s Mother’s Day surveys. 1


    Most (62%) moms say they would love to eliminate the chore of cooking on Mother’s Day. Dinner is the most important meal on Mother’s Day, and most moms prefer restaurant meals (53%) to home cooked meals (39%). 2

    Given consumers’ willingness to spend and Mom’s appetite for restaurants, Mother’s Day 2021 is poised to be a powerful sales event for restaurants.

    Restaurants need new ways to navigate market trends

    The restaurant industry faces consolidation, as 17% (110,000) of U.S. restaurants permanently closed in 2020, and 87% of full-service restaurants reported an average 36% drop in revenue. 3 These figures prove restaurant operators need help to boost their top line and cut costs as they adapt to intense rivalry and shifting market conditions.

    During the pandemic, many consumers have embraced home for health or financial reasons or a creative outlet. Although 55% of consumers have been eating at home more often since the pandemic began, 65% say they are tired of cooking at home. 4

    Fortunately, consumers are in a celebratory mood. Last year, Mother’s Day was a top sales day, as consumer spending at restaurants soared 103% on Mother’s Day Sunday and 63% on Saturday. 5 Restaurants can relieve consumers of the chore of cooking and add variety to dining occasions like Mother’s Day.


    Successful restaurants gain a digital data advantage

    To satisfy consumers’ needs and outplay rivals, restaurants now turn to data analytics from DataWeave to protect their profitability with effective pricing, menu and promotion decisions. 

    Pricing analytics

    Restaurant operators can optimize their pricing to stay competitive. For instance, restaurants can compare their offerings and delivery fees with those of rivals to pinpoint and fill any gaps. Monitoring rivals’ pricing moves also helps restaurant operators stay flexible by keeping their prices affordable, so they can attract online sales growth.

    Menu analytics

    To minimize costs, more restaurants are streamlining their menus. Menu analytics can help operators spot the optimal mix of bestselling items and emerging food trends, like plant-based, vegan, gluten-free and local sourcing. To know which items to keep, operators can even use data insights on menu items down to the ZIP code level to localize their offerings and adapt to diverse tastes to drive online sales.

    Promotion analytics

    As consumers embrace home entertaining this Mother’s Day, restaurant operators can use data insights to boost sales. They can monitor rivals’ moves and compare their promotional strategies with those of competitors. Evaluating their digital marketing performance (like their brand’s discoverability and visibility ranking on food apps’ homepages) helps restaurants show up more prominently online and sell more.


    Savvy restaurants welcome celebrations as lucrative sales occasions

    Restaurants can spice up Mom’s life by letting her relax and receive the gifts of tasty meals, time savings and family festivities. Operators can simplify Mother’s Day celebrations by giving consumers a hassle-free dining experience so families can focus on connecting rather than cooking.

    For a business advantage, restaurant operators can apply digital marketing insights to boost their agility in responding to consumers’ needs and rivals’ moves.

    To stay agile and competitive as the food delivery market booms, leading restaurant chains and food delivery providers are collaborating with DataWeave to make data-driven pricing, menu and promotional decisions that fuel online sales.


    1 Retail Holiday and Seasonal Trends: Mother’s Day. NRF. 2021
    2 New Study Shows What Moms Really Want On Mother’s Day. US Foods. May 2020.
    3 Valinsky, Jordan. 10,000 of America’s restaurants have closed in the past three months. CNN. December 9, 2020.
    4 Contreras, Tricia. How the pandemic is shaping home cooking trends. SmartBrief. September 30, 2020.
    5 Lalley, Heather. Despite pandemic, Mother’s Day was huge for restaurants. Restaurant Business. May 18, 2020.

  • Food Delivery Boom Fuels Competition Among Restaurants

    Food Delivery Boom Fuels Competition Among Restaurants

    This year, homebound consumers crave the convenience of food delivery.
    Growing 20% since 2015, restaurant delivery has sparked intense rivalry to reach consumers’ homes. Although the pandemic led to $165 billion in lost sales industry-wide between March and July, experts predict online food delivery sales will reach $220 billion by 2023, accounting for 40% of total restaurant sales.[1,2]

    This massive market opportunity makes food delivery an urgent priority for restaurants to stay competitive and solvent during the pandemic. This year nearly one in six U.S. restaurants have closed either permanently or long-term.[3]

    Also, 40% of U.S. operators say they will likely be out of business within six months if economic conditions persist and 60% of Canadian restaurants could close permanently by November.[4,5]


    COVID-19 compounds market complexity

    Powerful market trends are rattling restaurants. During the pandemic, nearly 70% of operators have added third-party delivery to lift sales.[6]

    This year, third-party delivery from food delivery apps like Uber Eats, Grubhub and DoorDash will grow 21% over 2018.[7] The global market for cloud kitchens (also called ghost kitchens or virtual kitchens), commercial kitchens intended for delivery-only orders, will grow from $650 million in 2018 to $2.6 billion by 2026.[8]


    To avoid the need to rely on delivery partners, many chains invest in their own last-mile delivery capability to serve their fleet of restaurants.
    E-grocery sales are poised to surge 40% in 2020 and meal kits have boomeranged back into popularity, nearly doubling 2019 sales.[9, 10]

    Consumers demand speed to keep their food fast, fresh and hot. Prompt service matters, as one survey found when consumers face a food delivery issue, 93% want it resolved within 10 minutes.[11]

    The recession and job losses mean more consumers now need affordable food options. Meanwhile, restaurants are investing more in technology to modernize operations for efficient omnichannel service.

    How restaurants are adapting to 2020’s disruption


    Restaurant prices have risen during the pandemic to cover operating costs. Third-party delivery fees have led 41% of consumers to prefer to order food by contacting the restaurant directly (vs. 16% for third-party delivery).[12] To optimize pricing competitiveness, more restaurants now compare their delivery fees and offerings with rivals’ to spot and correct gaps, and keep their prices affordable.

    To streamline operational processes and costs during the pandemic, 28% of restaurants shrank their menus.[13]

    For clarity on which items to keep, operators now use data insights on restaurant listings and menu items down to the ZIP code level. This information also helps them decide whether to adapt to consumers’ diverse tastes, including vegan, gluten-free and organic, for competitive local assortments.


    Outperform rivals: Restaurant operators seek proof of their brand visibility on food delivery apps’ homepages.


    Restaurants have discovered consumers welcome reasons to celebrate at home this year. One chain’s weekly virtual happy hours on Facebook Live drew 80,000 participants and a $40,000 sales increase from delivery and takeout orders.[14]

    More restaurants now compare their promotional strategies with rivals’ to evaluate marketing performance, including homepage discoverability and visibility ranking, to ensure consumers find their brand online with ease.

    Delivery speed and precision also matter. A survey found 70% of consumers had food delivery order complaints, including late delivery (50%), incorrect order (37%) and cold or stale food (36%).[15] Using accurate geographic data can help restaurants improve speed and the customer experience.

    To gain a competitive advantage in today’s booming food delivery market, a growing number of leading chains and food delivery providers are collaborating with DataWeave to access actionable insights to make better strategic and operational decisions faster. Using trusted insights to make data-driven pricing, menu and promotional decisions help restaurants save time, reduce risk and gain clarity in today’s evolving market.

    Applying DataWeave’s accurate, up-to-date information also helps restaurants deliver affordability, convenience and variety to remain responsive to consumers and agile among competitors. To see how DataWeave helps restaurants stay relevant and competitive, contact us today.


    [1] Rogers, Kate. Winter is coming, bringing a new challenge to already-struggling restaurants. CNBC. September 14, 2020.
    [2] Zahava Dalin-Kaptzan. Food Delivery: Industry Trends for 2020 and beyond. Bringg. April 30, 2020.
    [3] Klein, Danny. 100,000 Restaurant Closures Expected in 2020. QSR. September 14, 2020.
    [4] Rogers, Kate. Winter is coming, bringing a new challenge to already-struggling restaurants. CNBC. September 14, 2020.
    [5] Charlebois, Sylvain. Don’t Want to Save the Restaurant Industry? Fine, but Use it to Save the Canadian Economy. Retail Insider. September 11, 2020.

    [6] Rogers, Kate. Winter is coming, bringing a new challenge to already-struggling restaurants. CNBC. September 14, 2020.
    [7] US Food Delivery App Usage Will Approach 40 Million Users in 2019. eMarketer. July 2, 2020.
    [8] Levy, Ari. Virtual Kitchen, founded by ex-Uber execs to help restaurants with delivery, raises $20 million. CNBC. Sept. 8 2020
    [9] Redman, Russell. Online grocery sales to grow 40% in 2020. Supermarket News. May 11, 2020.
    [10] De Leon, Riley. How the coronavirus pandemic delivery surge created a lifeline for Blue Apron meal kits. CNBC. May 22, 2020.
    [11] Guszkowski, Joe. Delivery services have room to improve, consumers say. Restaurant Business Online. Sept. 1, 2020.
    [12] Guszkowski, Joe. Consumers’ desire to order directly from restaurants is a big opportunity. Restaurant Business Online. Aug. 27, 2020.
    [13] Romeo, Peter. Best practices for weathering a second COVID wave. Restaurant Business Online. Aug. 28, 2020.
    [14] Ibid. 
    [15] Guszkowski, Joe. Delivery services have room to improve, consumers say. Restaurant Business Online. Sept. 1, 2020.