Amazon’s Prime Day this year proved to be a record-breaking success, becoming the largest Prime Day event in the company’s history. Over the two-day extravaganza, shoppers in the US spent a staggering $12.7 billion, a 6.1% increase from the previous year. Amid inflationary pressures and supply chain disruptions, Amazon adopted a bold discounting strategy, offering steeper discounts compared to Prime Day 2022.
An interesting aspect of Amazon’s approach is their loyalty based offerings. In the weeks leading to Prime Day on July 11-12, members of the loyalty program were given access to “invite-only deals” where shoppers could request invites to specific products that they were looking to purchase on deals. Overall, Amazon’s pricing and discount strategies during Prime Day were carefully designed to create a buzz among shoppers, generate increased sales, and maintain a competitive advantage in the market.
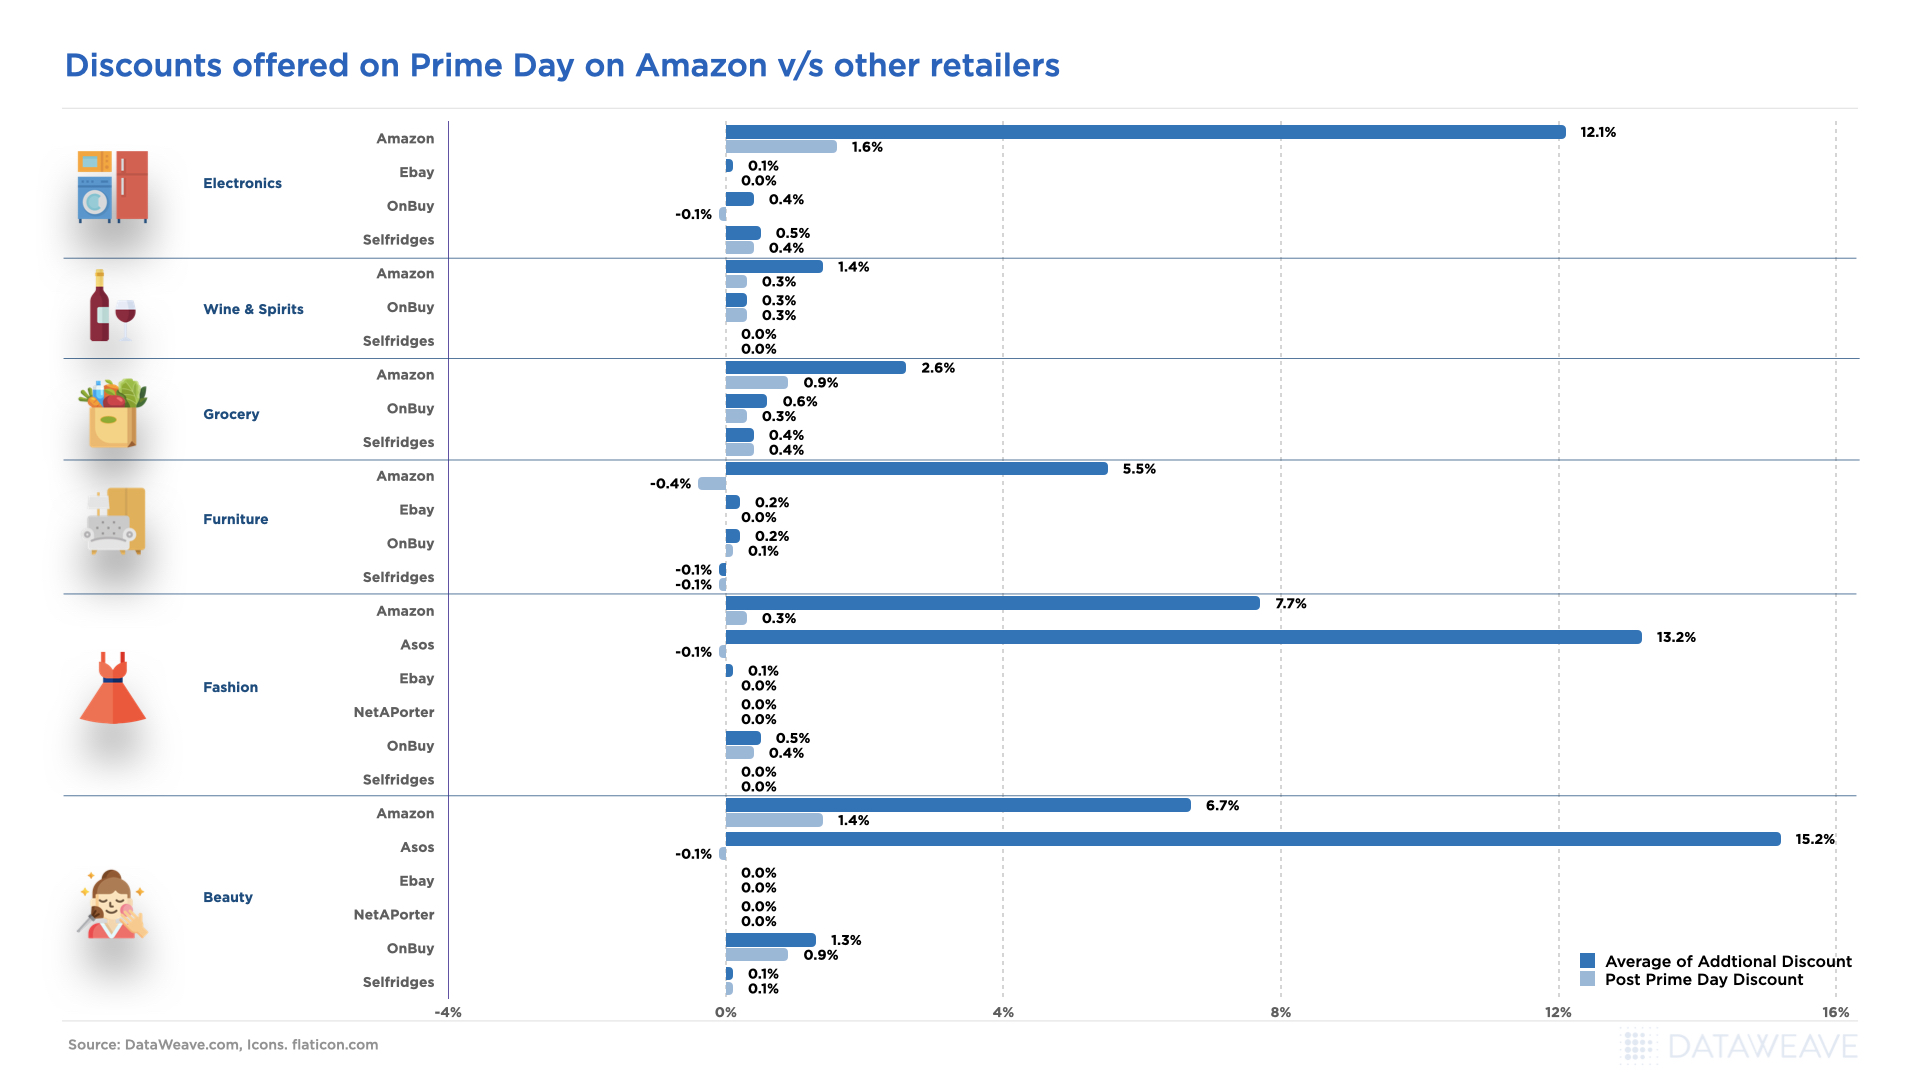
While Prime Day is Amazon’s showstopper, it’s interesting to also see how other leading retailers respond to such a massive sale by their biggest competitor. Do they also lower their prices during the event, or are they happy to take a backseat? To answer these questions, we leveraged our proprietary data aggregation and analysis platform to analyze the prices and discounts of Amazon and its leading competitors across key product categories – Apparel, Home & Furniture, Consumer Electronics, and Health & Beauty – during Prime Day.
Since products on Amazon and other eCommerce websites are often sold at discounts even on normal days not linked to a sale event, we delved into the real value that Prime Day offers to shoppers by focusing on price reductions or additional discounts during the sale compared to the week before. As a result, our approach highlights the genuine benefits of the event for shoppers who count on lower prices during the sale.
Research & Methodology
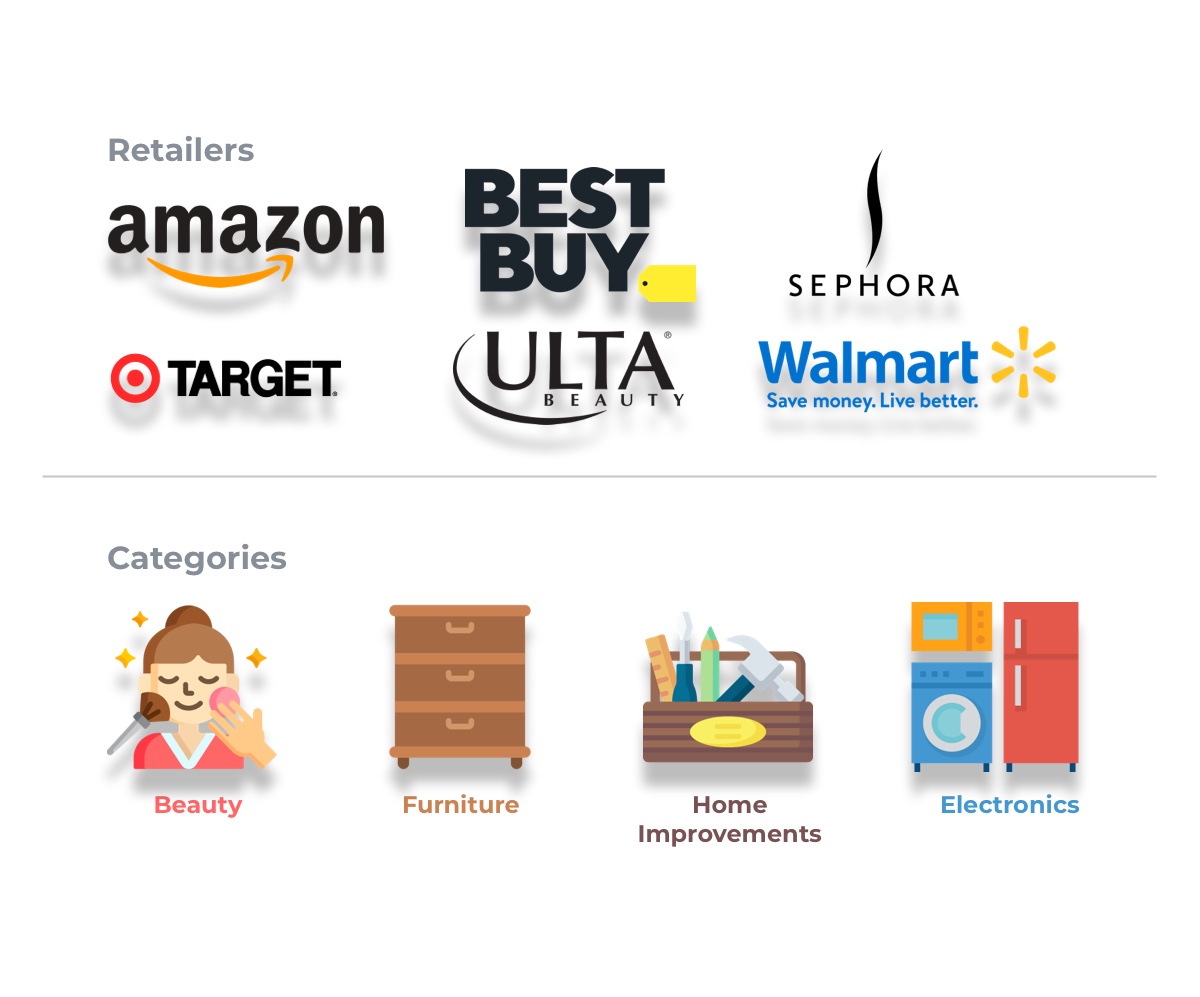
For our analysis, we tracked the prices of a large number of products across several leading retailers during Prime Day as well as the week prior to the event. The details of our sample are mentioned below:
- Number of SKUs: 110,000+
- Websites: Amazon, Walmart, Target, Overstock, The Home Depot, Wayfair, Ulta Beauty, Sephora
- Categories: Apparel, Home & Furniture, Electronics, Health & Beauty
- Pre-event Analysis: 4-10 July 2023
- Prime Day Analysis: 11-12 July 2023
Our Key Findings
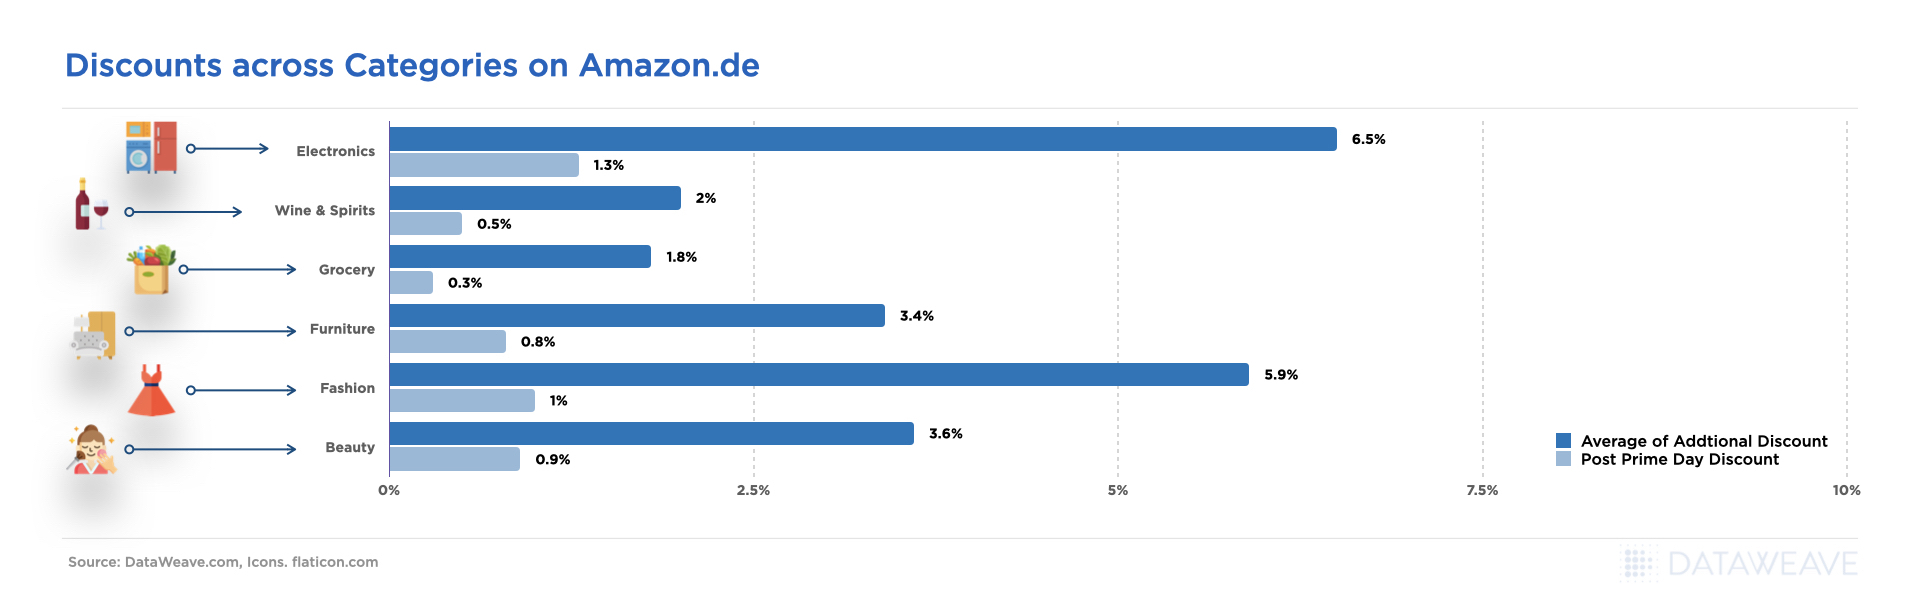
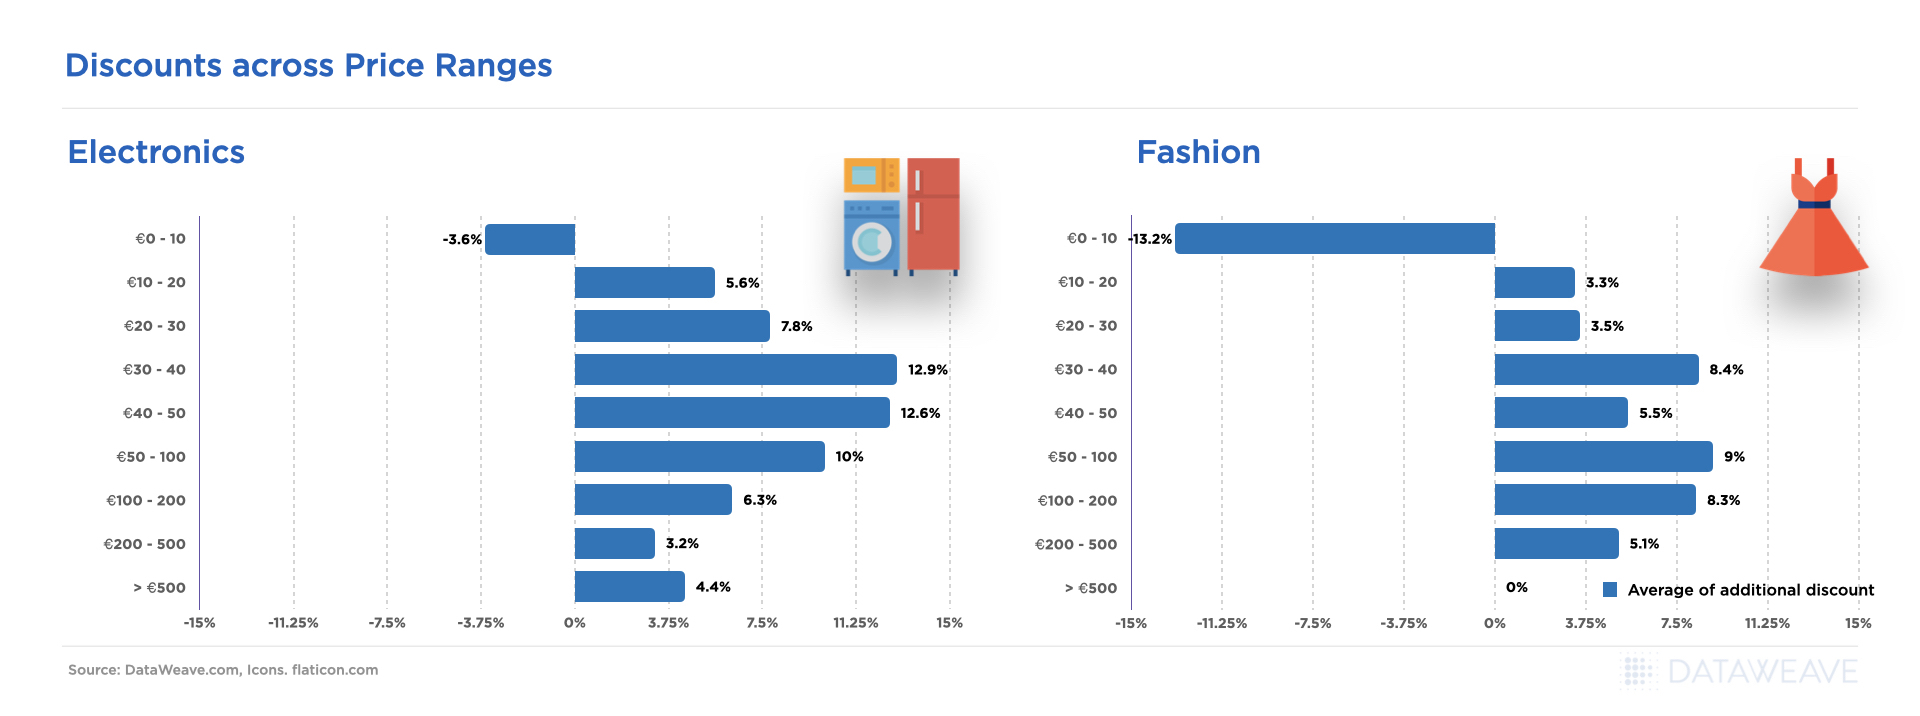
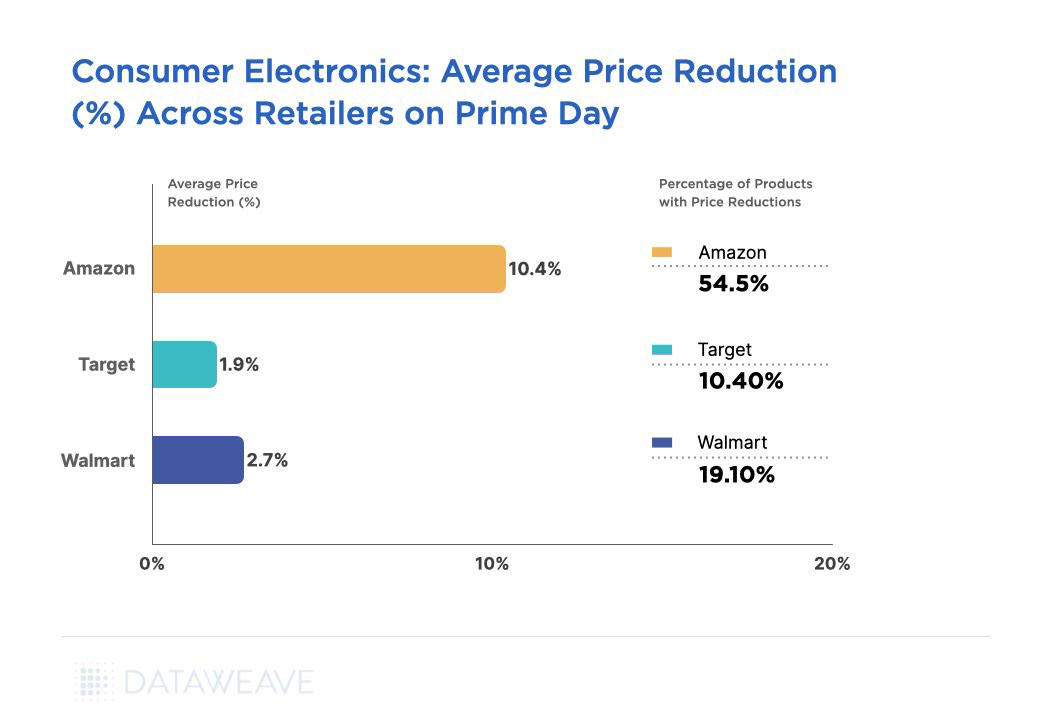
Our data reveals that Amazon’s price reductions were most aggressive in the Consumer Electronics category, with an average price reduction of 10.4% on Prime Day, due to the category’s popularity and high demand.
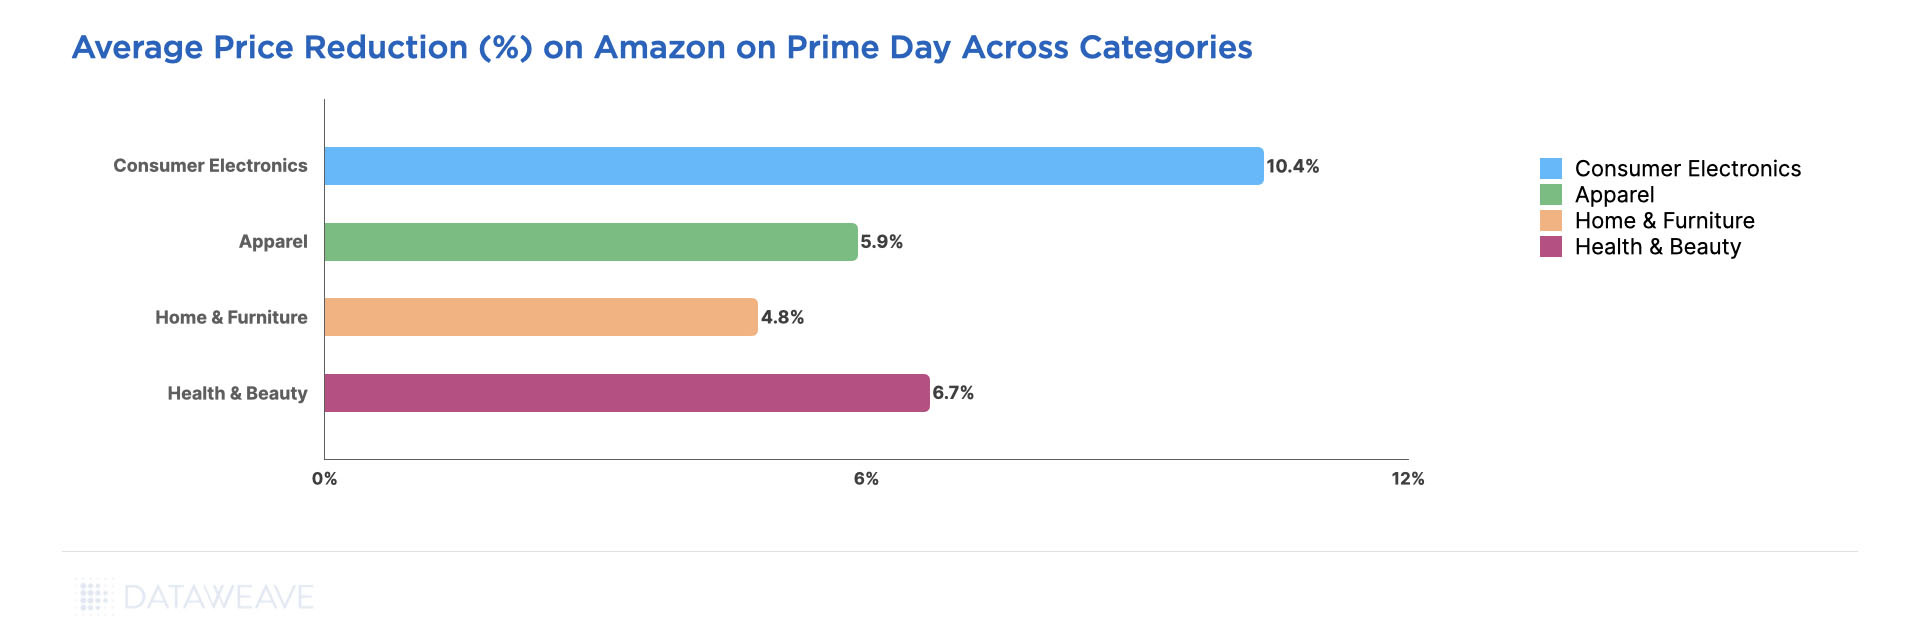
The Health & Beauty (6.7%), Apparel (5.9%), and Home & Furniture (4.8%) categories offered relatively modest deals during the sale event.
Below, we delve deeper into our analysis of each category to better understand how price reductions were distributed across key subcategories on Amazon as well as the discounting strategies of Amazon’s leading competitors.
Apparel
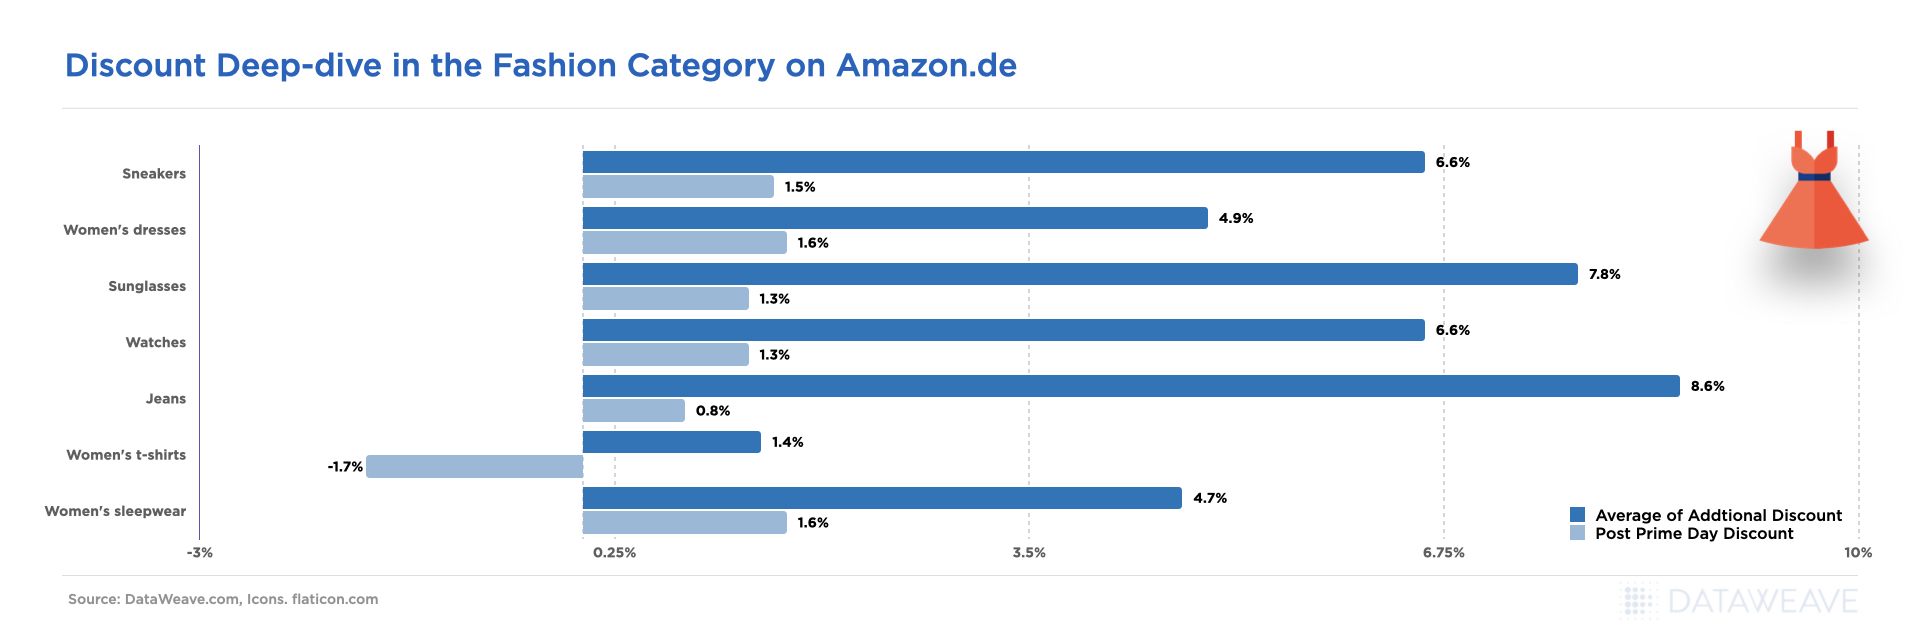
As Amazon grappled with surplus inventory, heightened storage costs, and reduced profit margins in apparel (like most other retailers), its average discount before Prime Day was already as high as 13.3%. Then, on Prime Day, Amazon’s apparel deals were tempered at around 5.9% across an impressive 33.1% of its assortment, while Target and Walmart chose not to compete in a meaningful way.
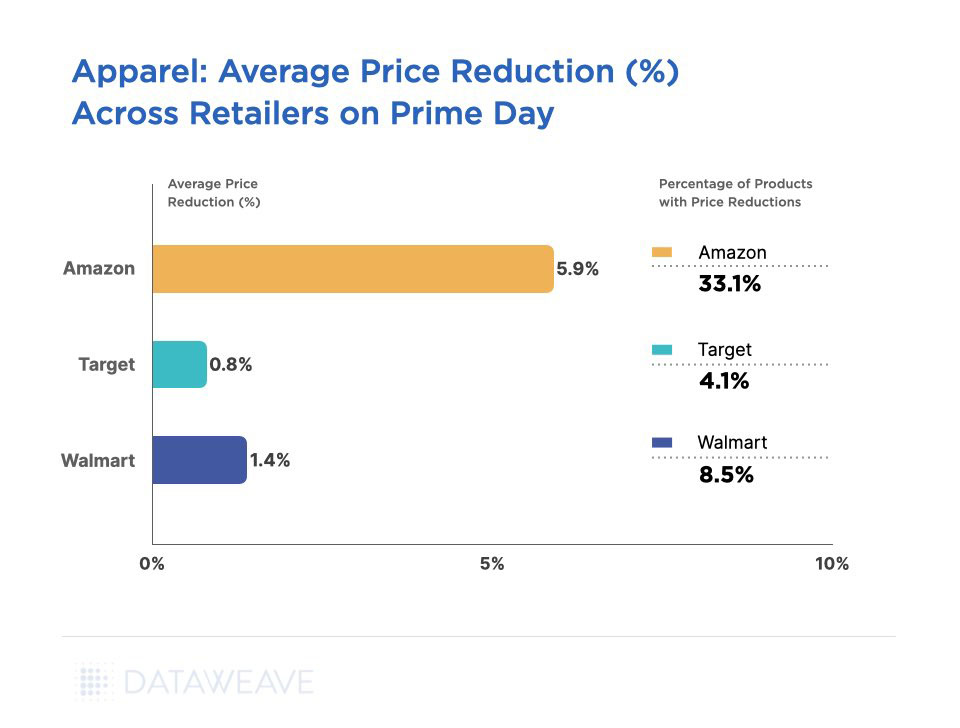
Unlike Prime Day 2022, when Target competed with Amazon with high discounts, the retailer offered only 0.8% additional discount across 4.4% of its assortment in this category. Walmart, too, reduced its prices by only 1.4% on 8.5% of its assortment during Prime Day.
Check out our latest analysis on fashion pricing trends across 2022-23 to better understand the pricing dynamics in this category in greater detail.
Across all the apparel subcategories we analyzed, Women’s Athleisure (8.7%), Men’s Swimwear (8%), and Women’s Tops (7.6%) were among the ones with the highest price reductions. On the other hand, Men’s Athleisure (2.5%), Women’s Shoes (3.5%), and Men’s Innerwear (4.1%) had conservative markdowns.
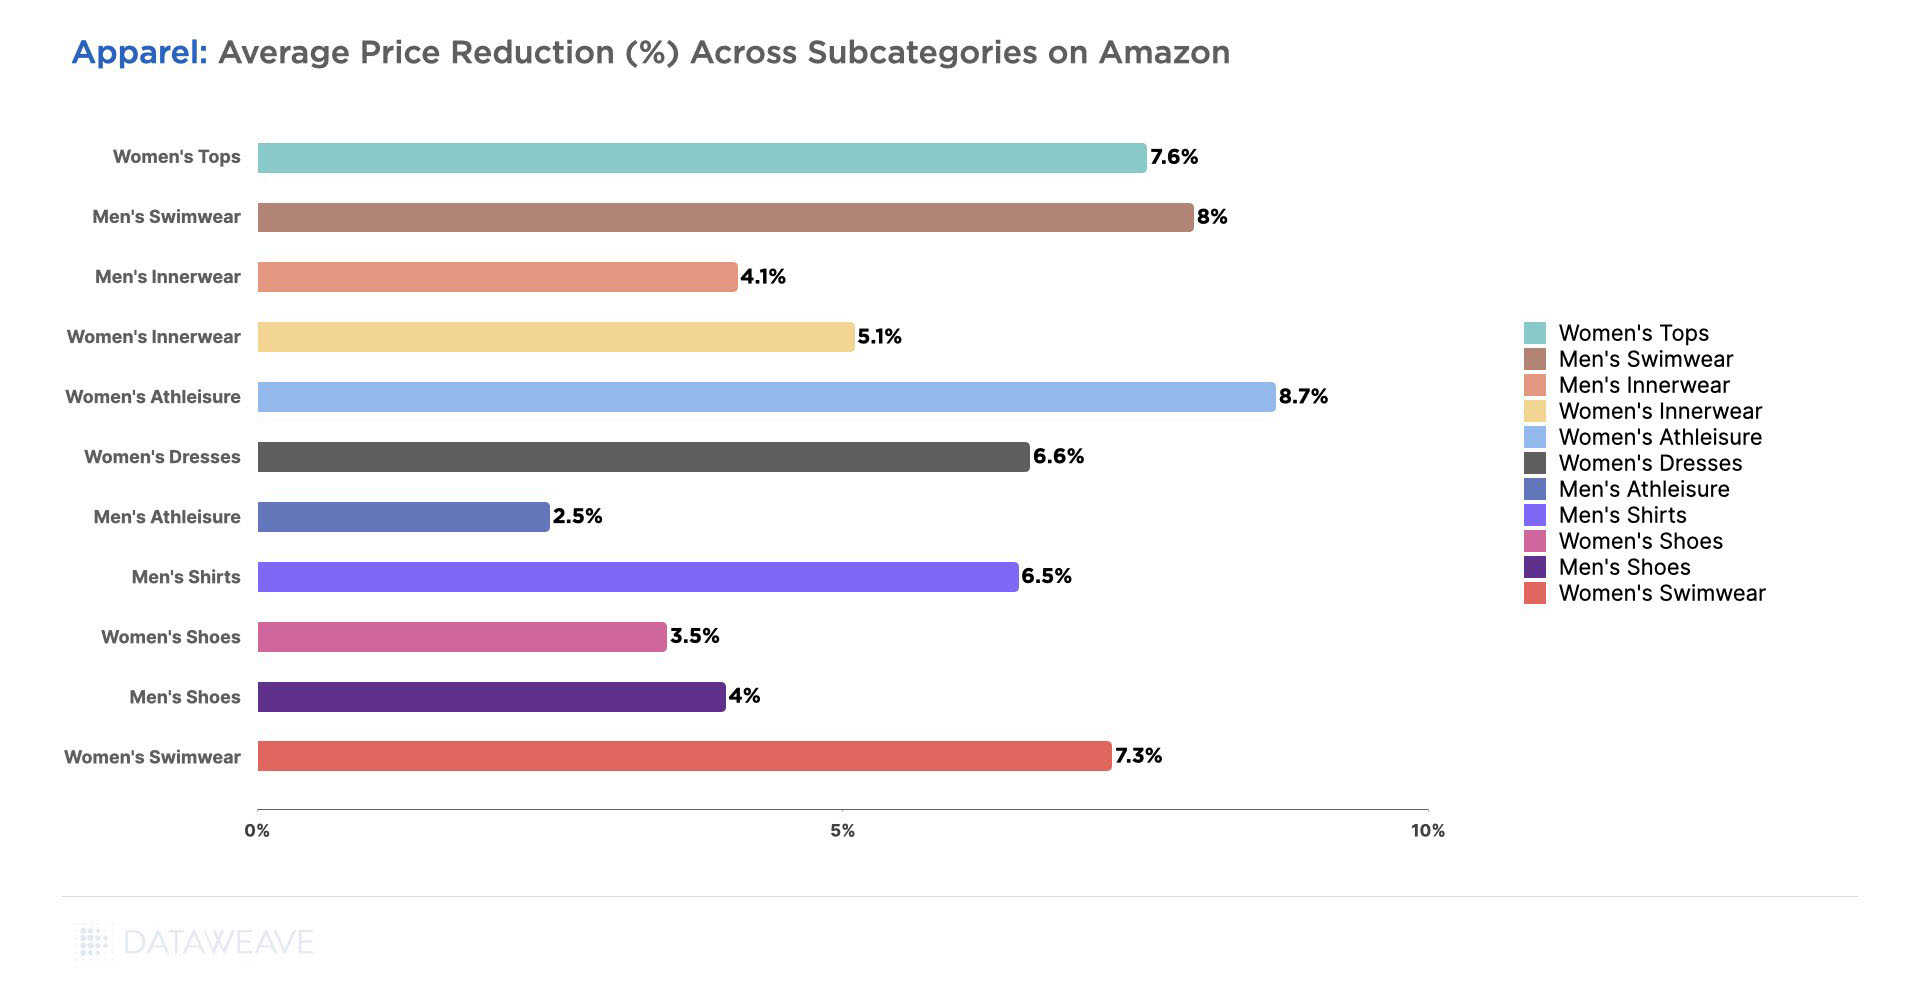
Pricing decisions across the various subcategories are likely to have been influenced by several factors like inventory levels, demand patterns, and the need to balance competitive offers with maintaining reasonable profit margins, as Amazon tried to cater to a more price-sensitive consumer.
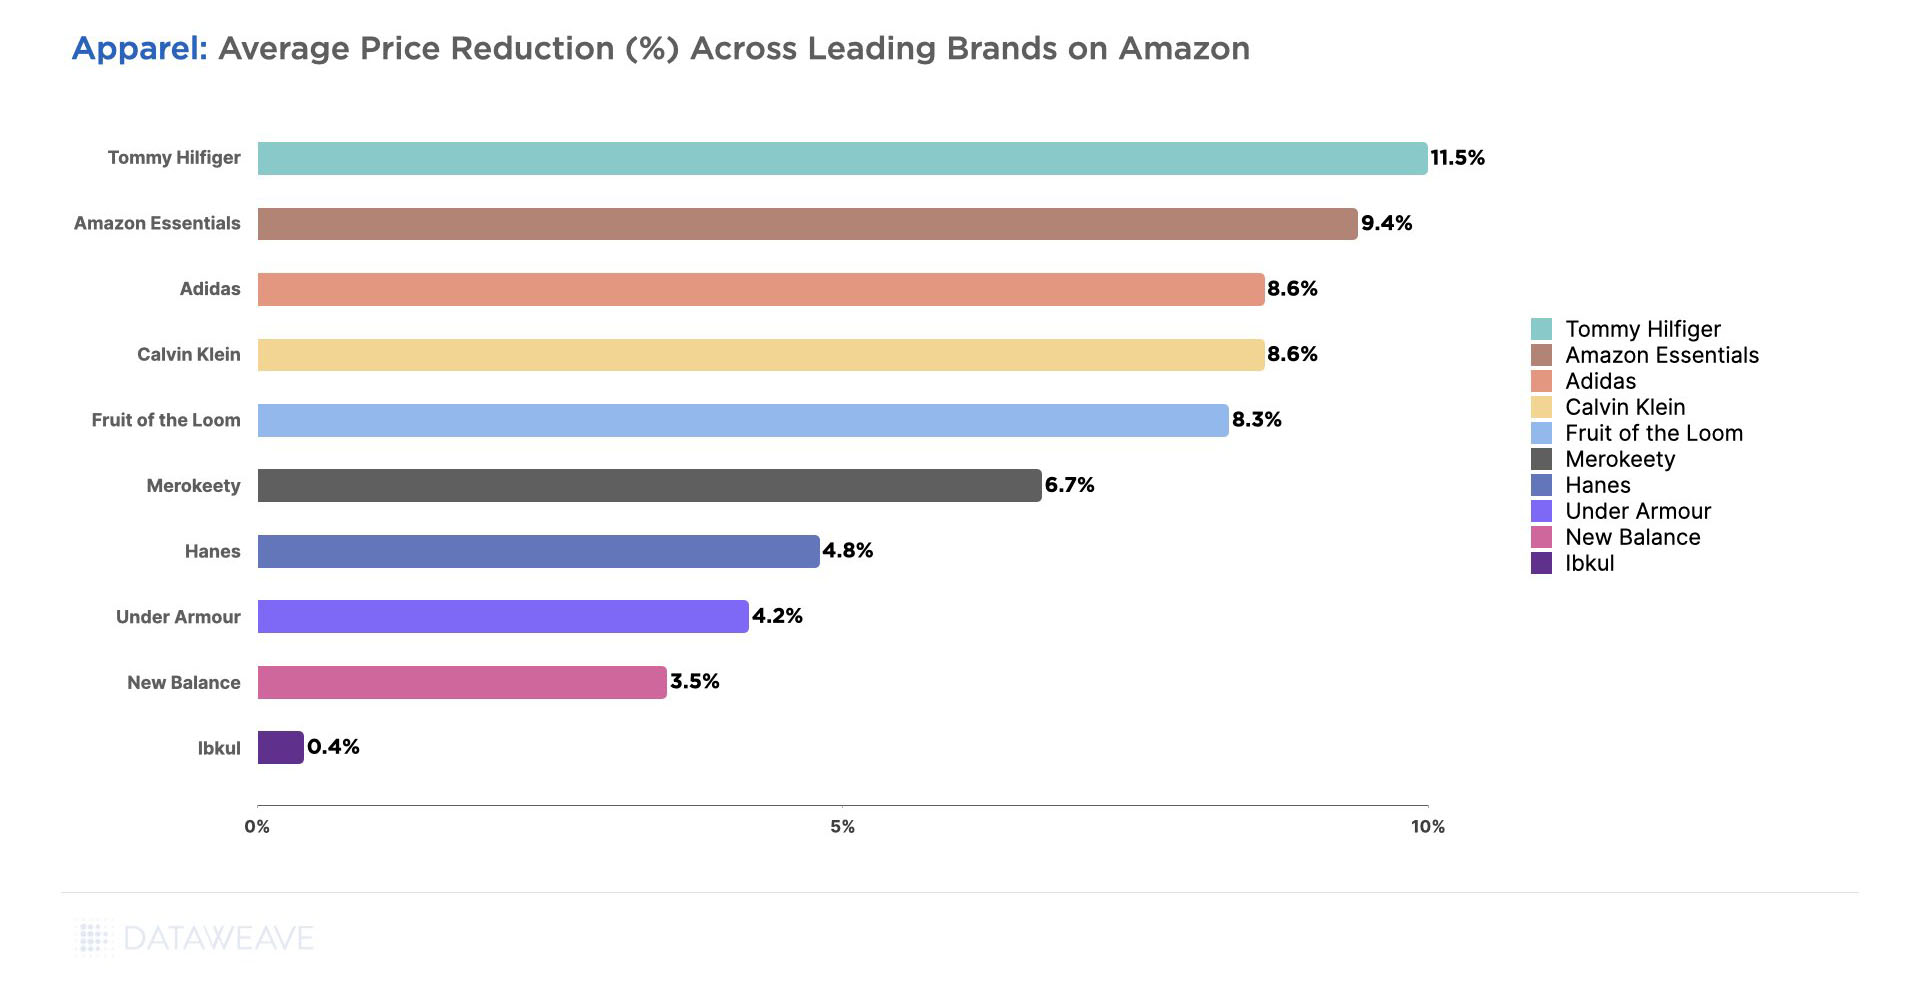
Across all apparel subcategories, leading brands that offered the highest markdowns were Tommy Hilfiger (11.5%), Amazon Essentials (9.4%), Adidas (8.6%), and Calvin Klein (8.6%).
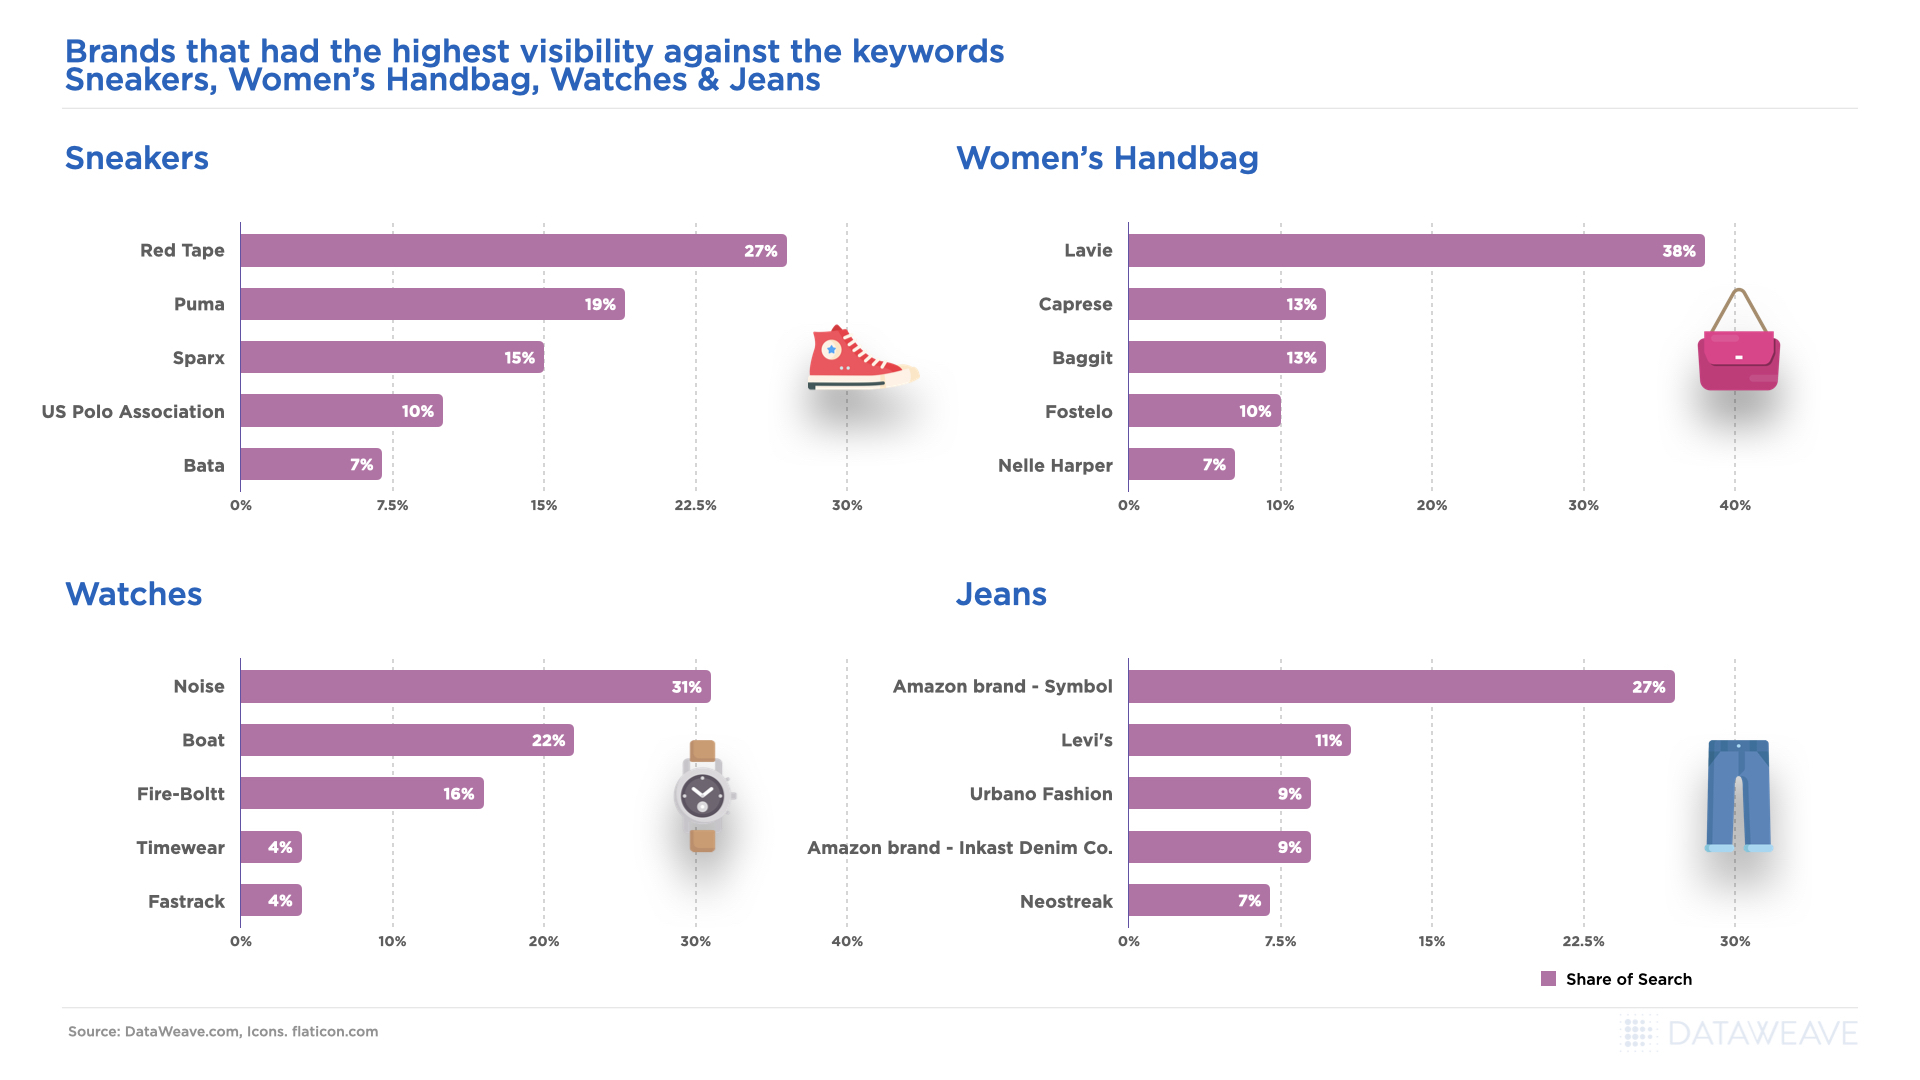
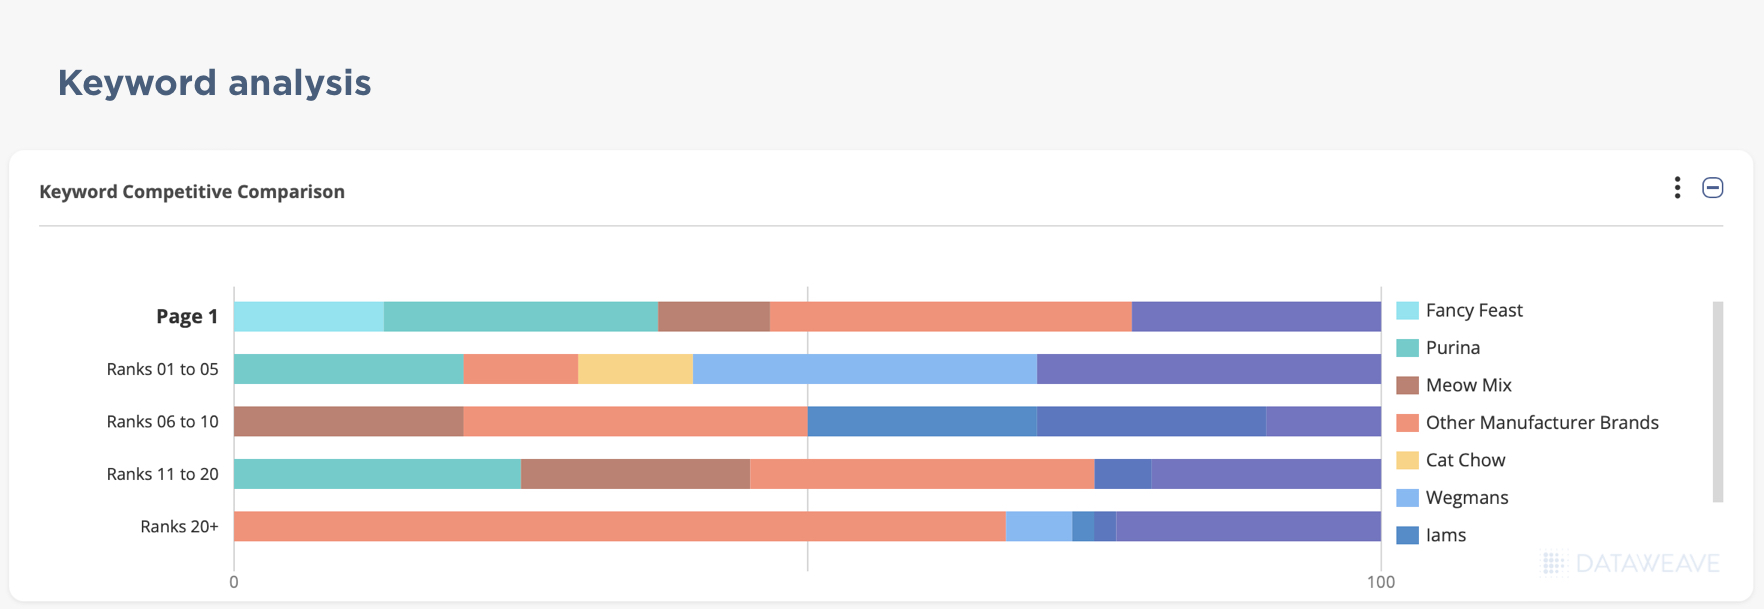
For brands, however, lowering prices is only one lever to attract and convert shoppers. They also need to ensure they’re highly visible and discoverable on Amazon’s search listings. This exponentially improves their chances of driving more clicks and conversions. In our analysis, we tracked the Share of Search of brands across several popular search keywords. Share of Search for a brand is defined as the proportion of the brand’s products in the top 20 search results for a search query.
Our data indicates that several brands gained impressive ground in their discoverability during Prime Day, while others fell behind. Gildan in Men’s Innerwear, Adidas in Men’s and Women’s Shoes, Anrabess in Women’s Athleisure, and Lululemon in Men’s Athleisure, among others, improved their Share of Search by significant levels during Prime Day.
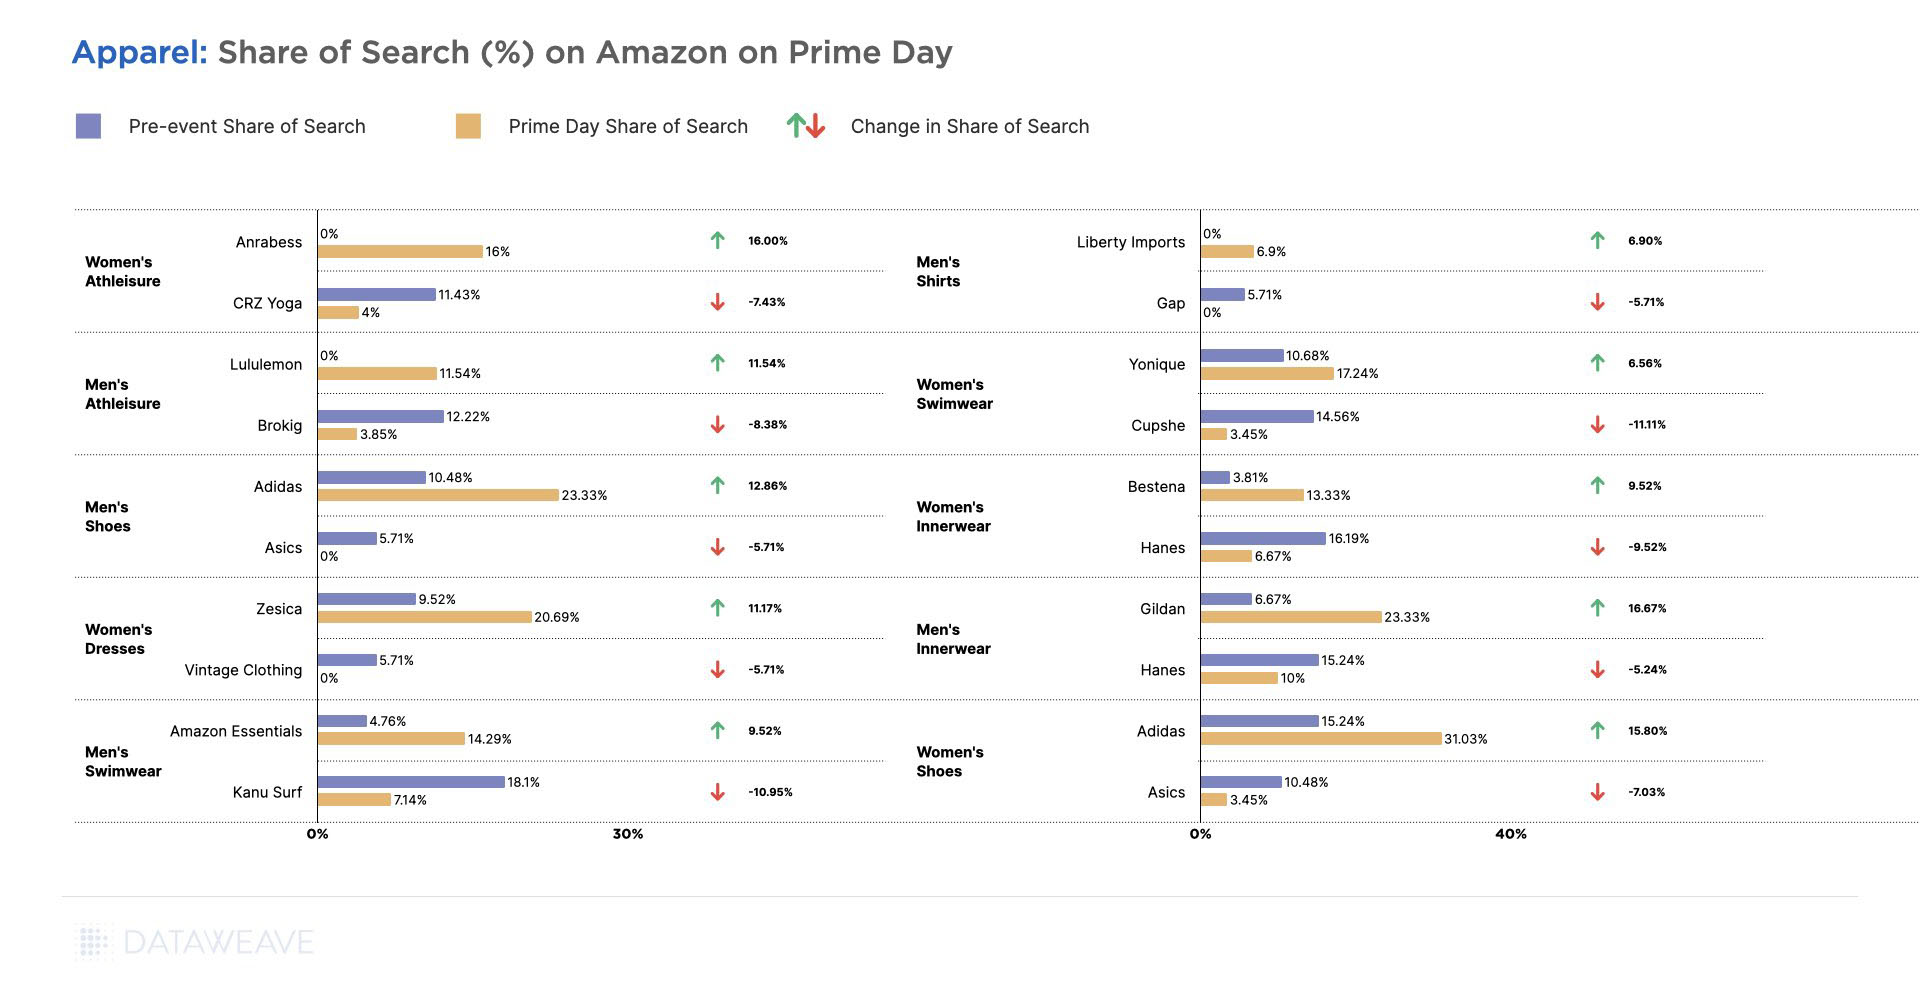
On the other hand, brands like Hanes in Men’s and Women’s Innerwear, Kanu Surf in Men’s Swimwear, Cupshe in Women’s Swimwear, and others lost around 10% in their Share of Search during the event. This is likely to have impacted their sales volumes adversely.
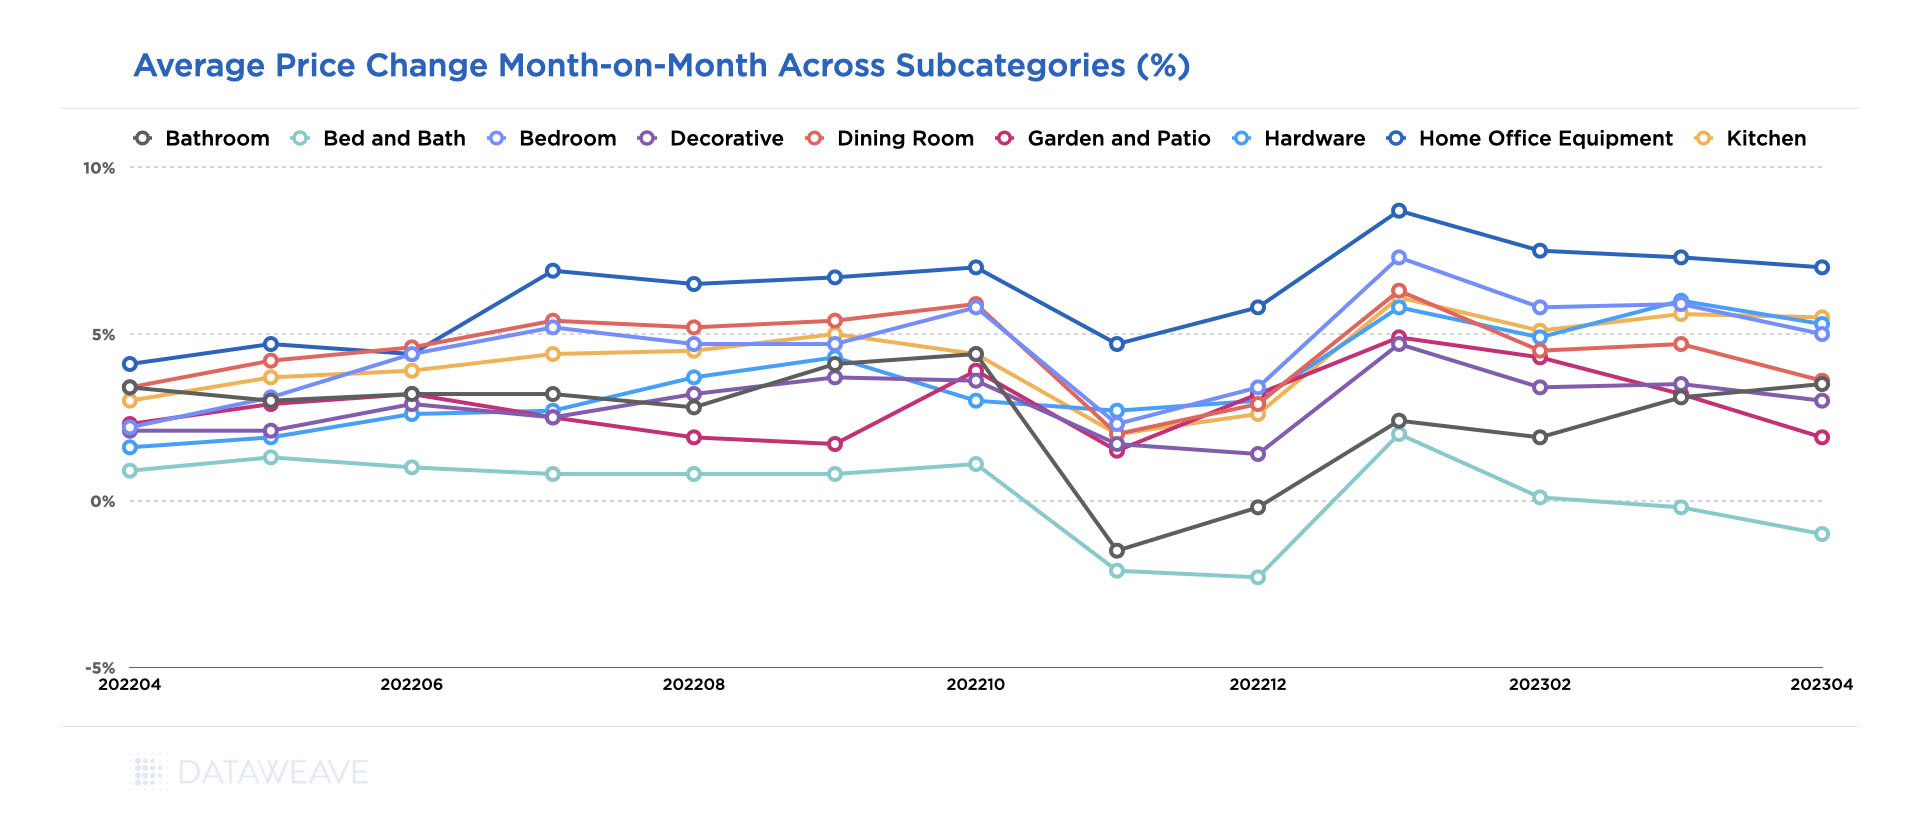
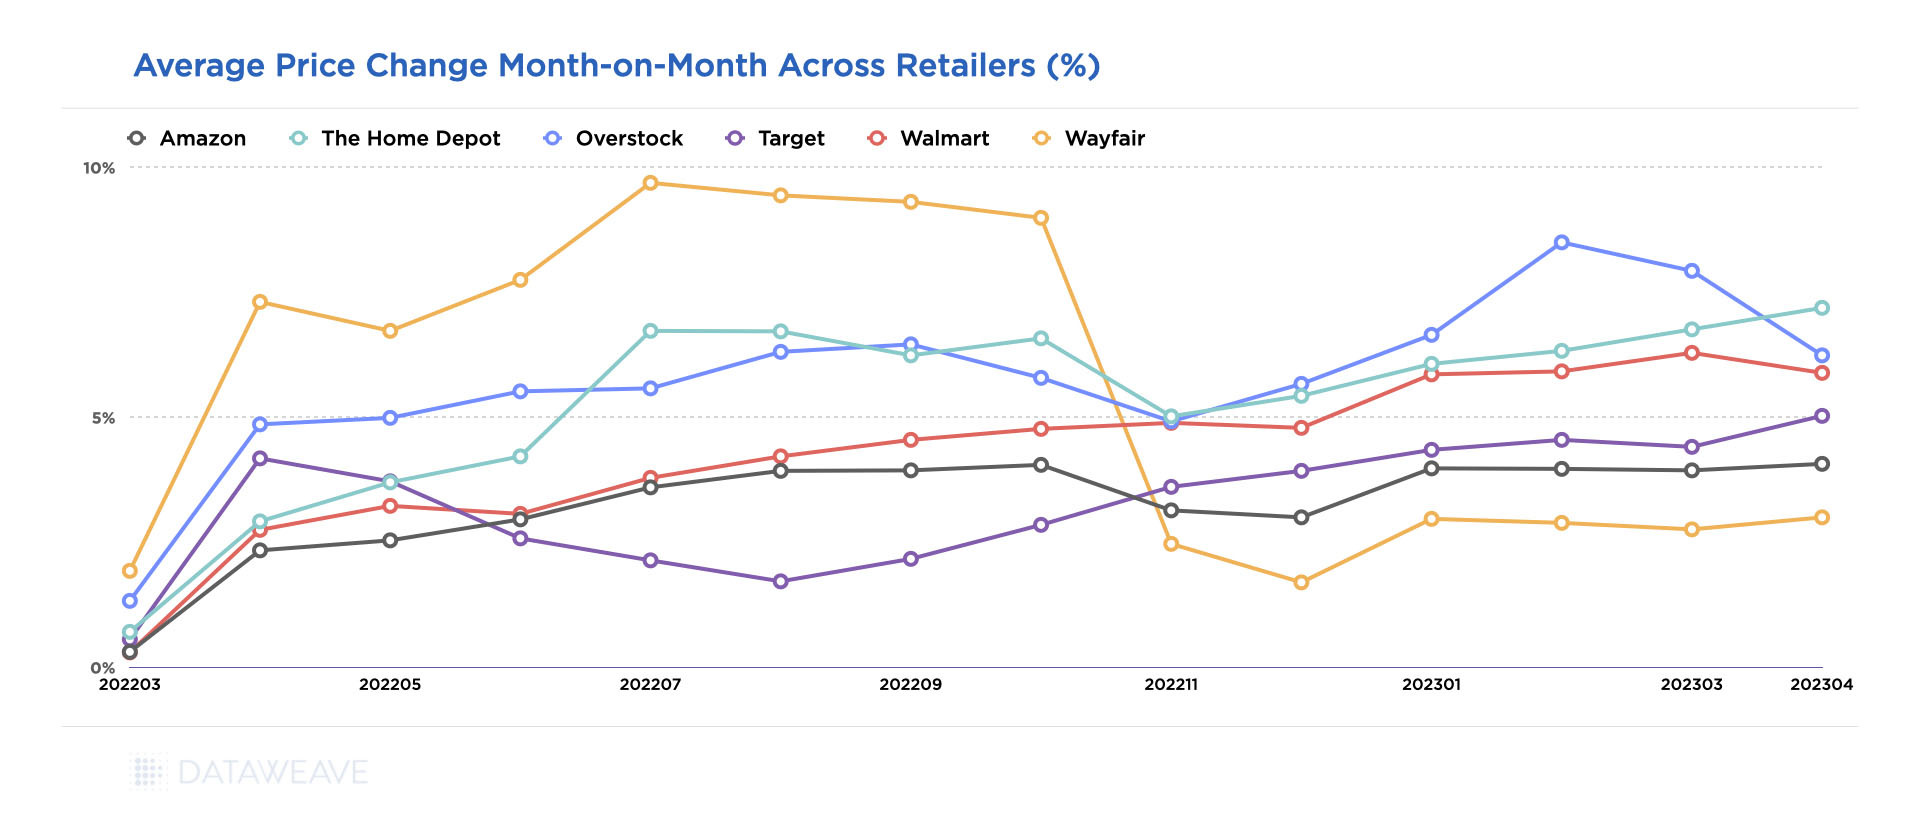
Home & Furniture
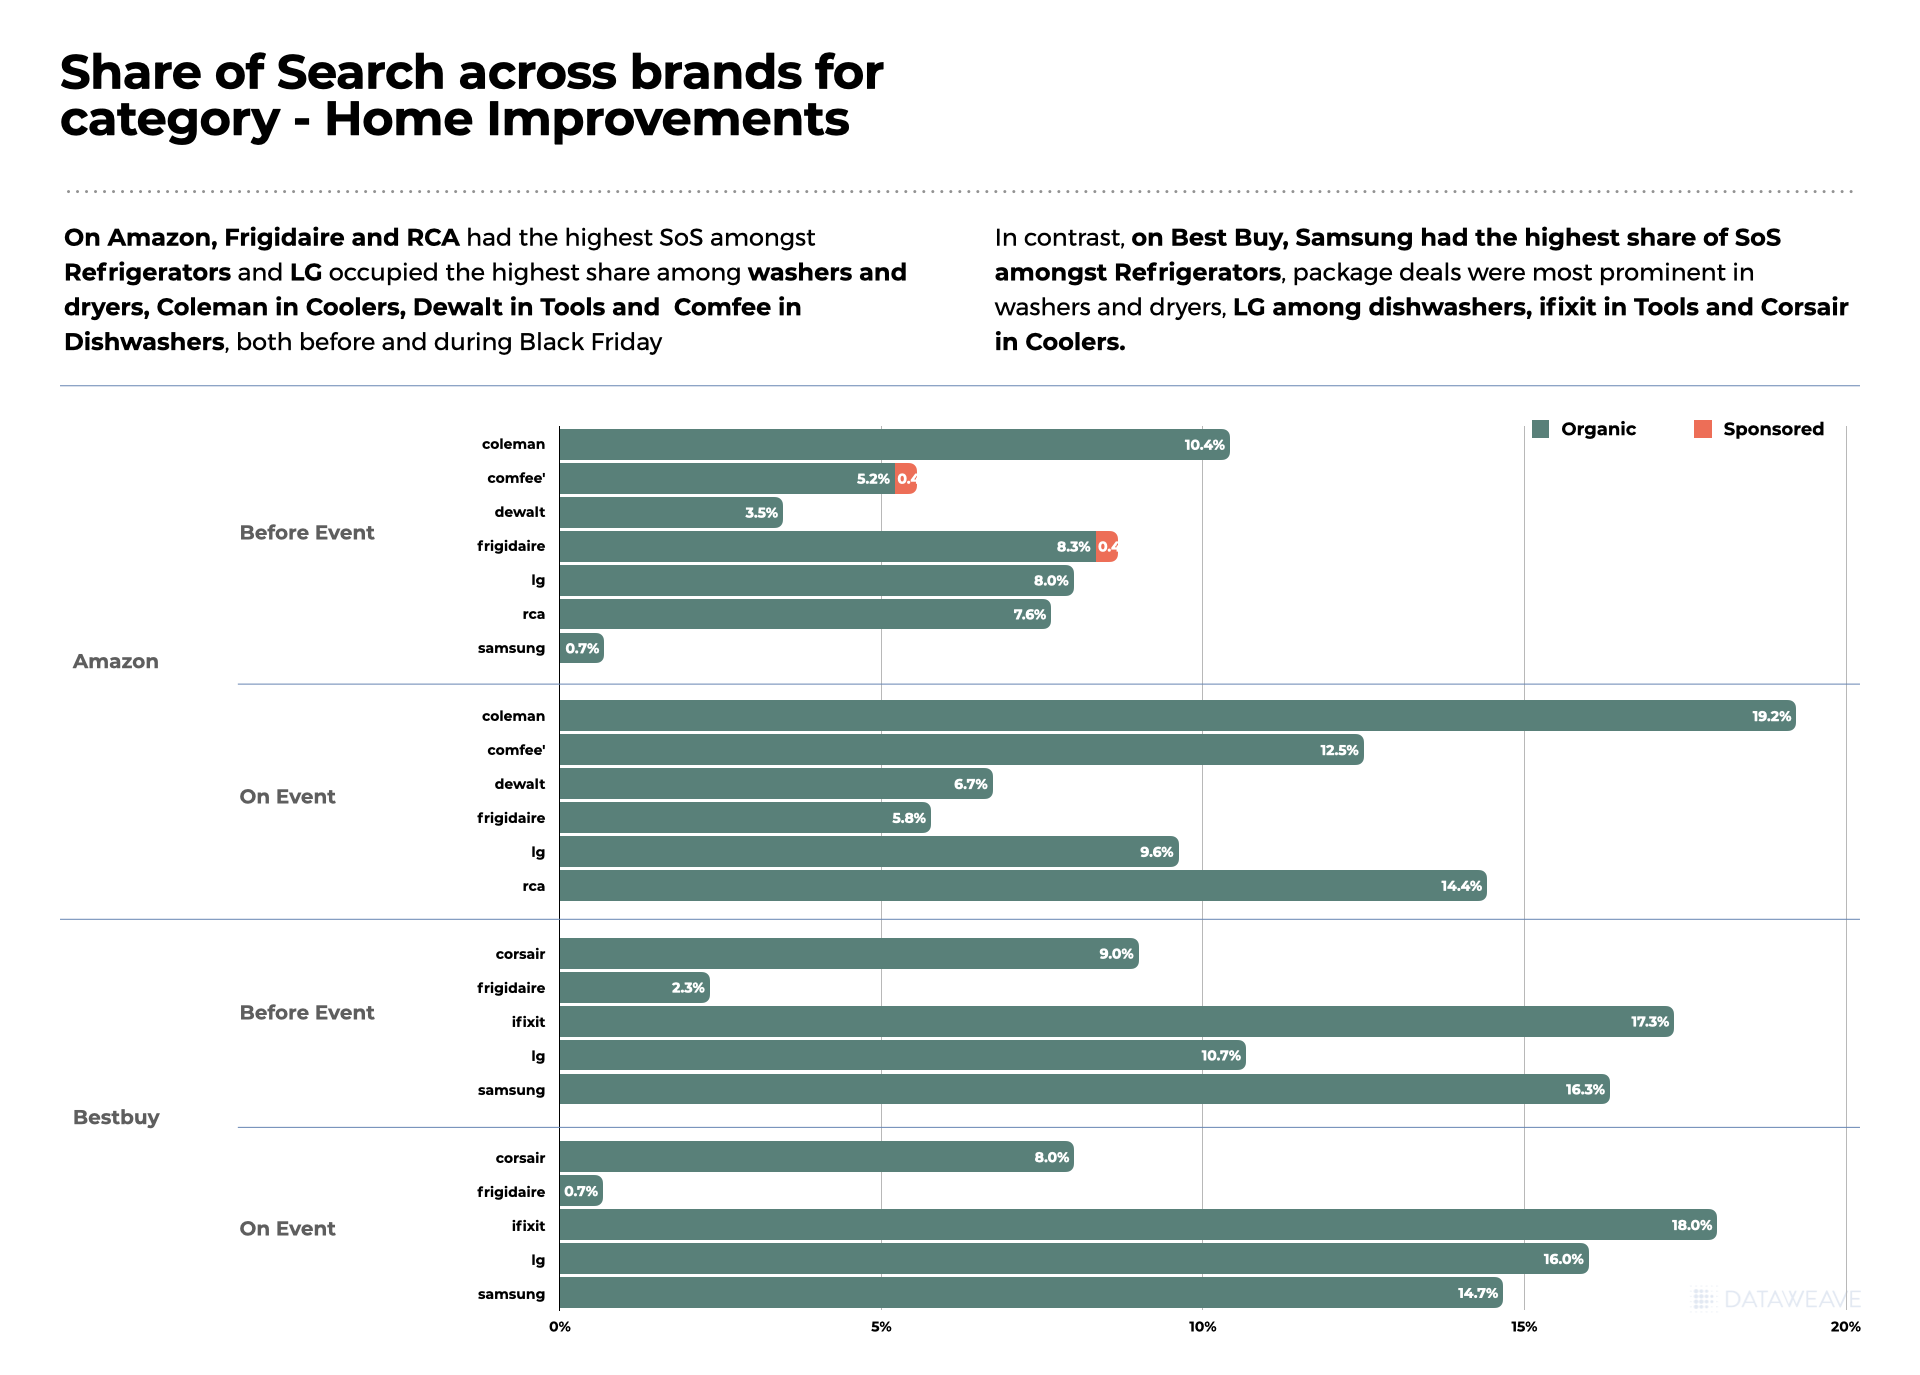
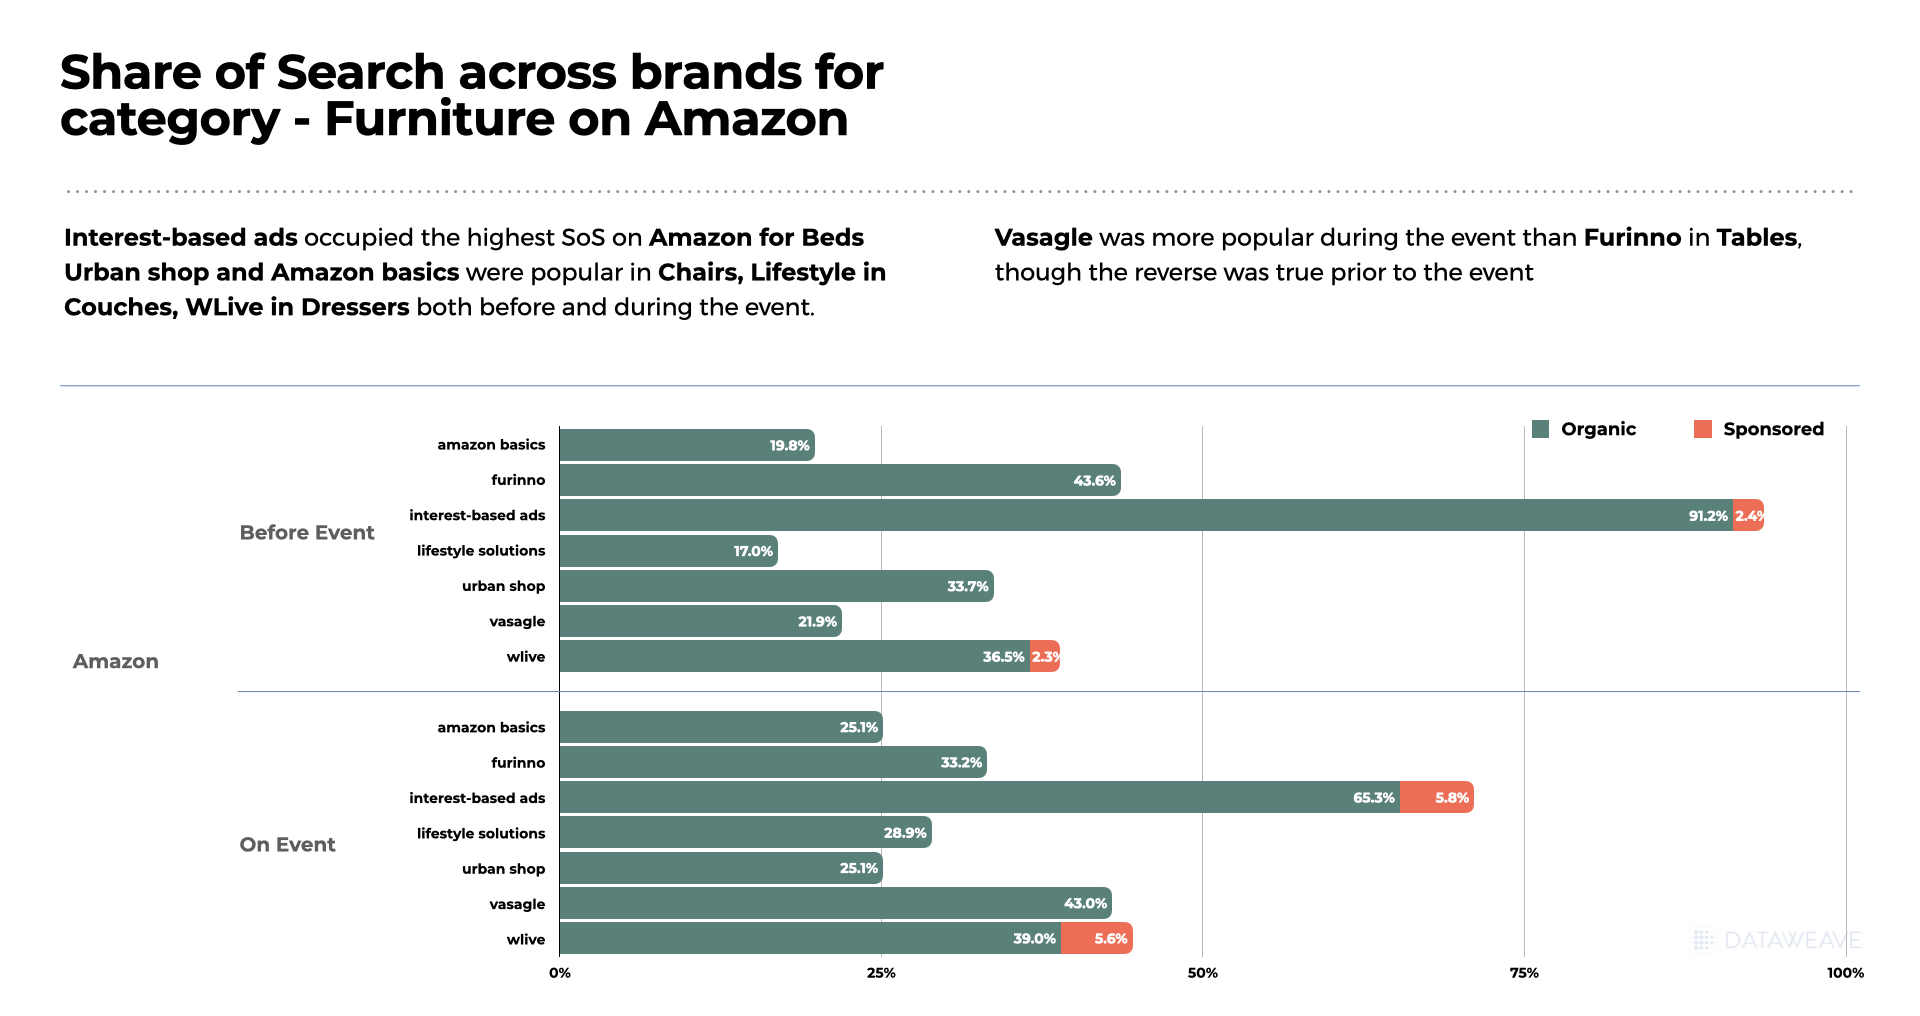
The Home & Furniture industry has been challenged with reduced demand due to inflationary pressures over the past year or so. Leading retailers in the category overestimated the demand, leading to overstocking of inventory. As a result, Home & Furniture is one of the few categories that saw Amazon’s competitors participate at a significant level on Prime Day in order to ensure they don’t fall behind on liquidating their stock.
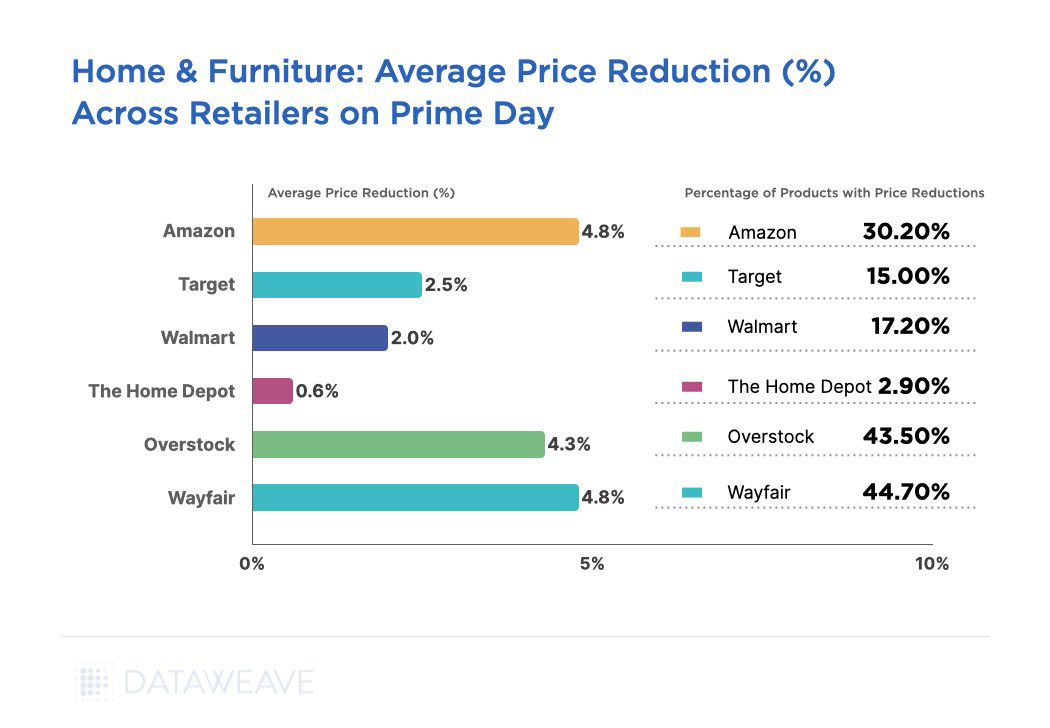
Amazon’s additional discounts averaged 4.8% across 30.2% of its assortment. Wayfair and Overstock too reduced their prices by 4.8% and 4.3% on around 44% of their respective assortments. Wayfair’s move is likely a part of their strategy to attract new customers and expand their market share, in response to a decline in their consumer base. Last year, Wayfair experienced a loss of 5 million out of its 1.3 billion consumers due to weakening demand.
Target and Walmart did offer additional discounts, but they were not at a competitive level. The Home Depot effectively opted not to compete at all during the sale event. Overall, the pricing actions of these retailers are in stark contrast to the highly conservative pricing strategies observed on Prime Day last year.
Our recent pricing analysis of the Home & Furniture category revealed more interesting insights and pricing dynamics over the past year.
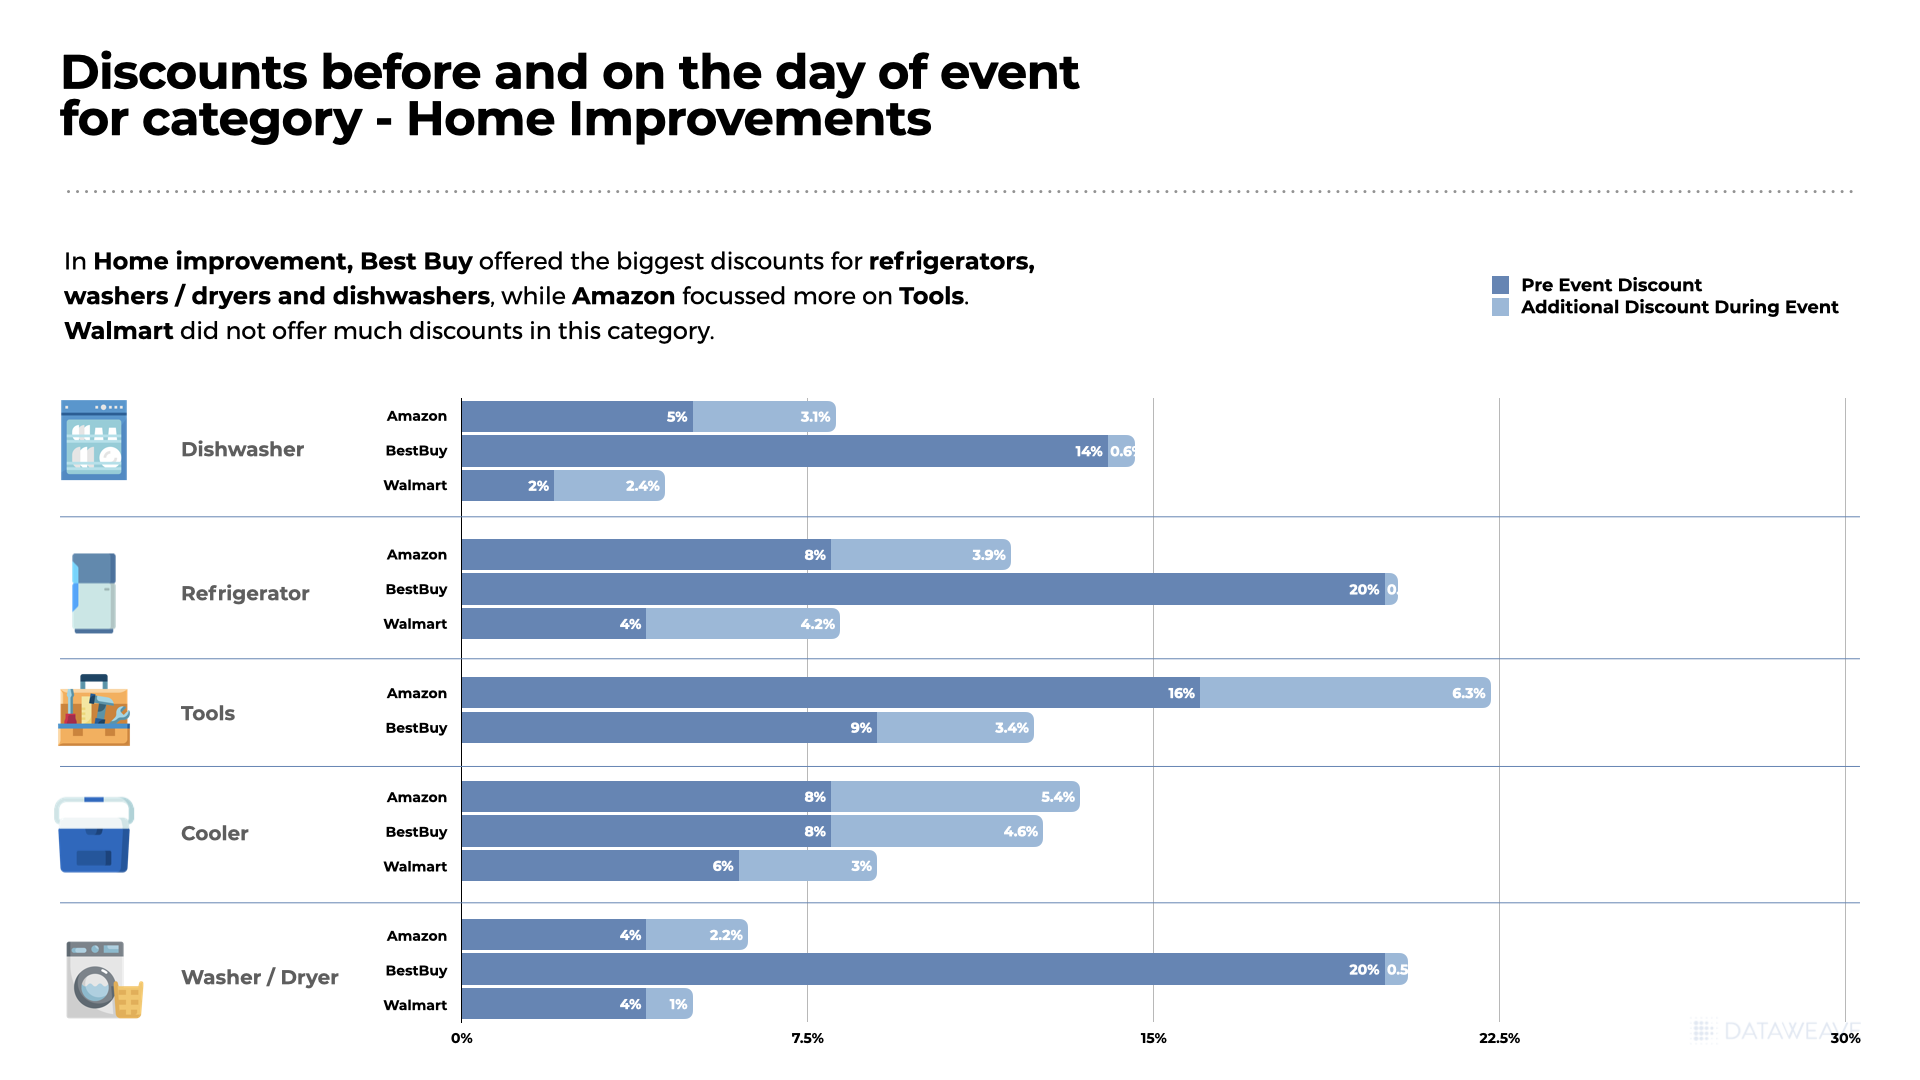
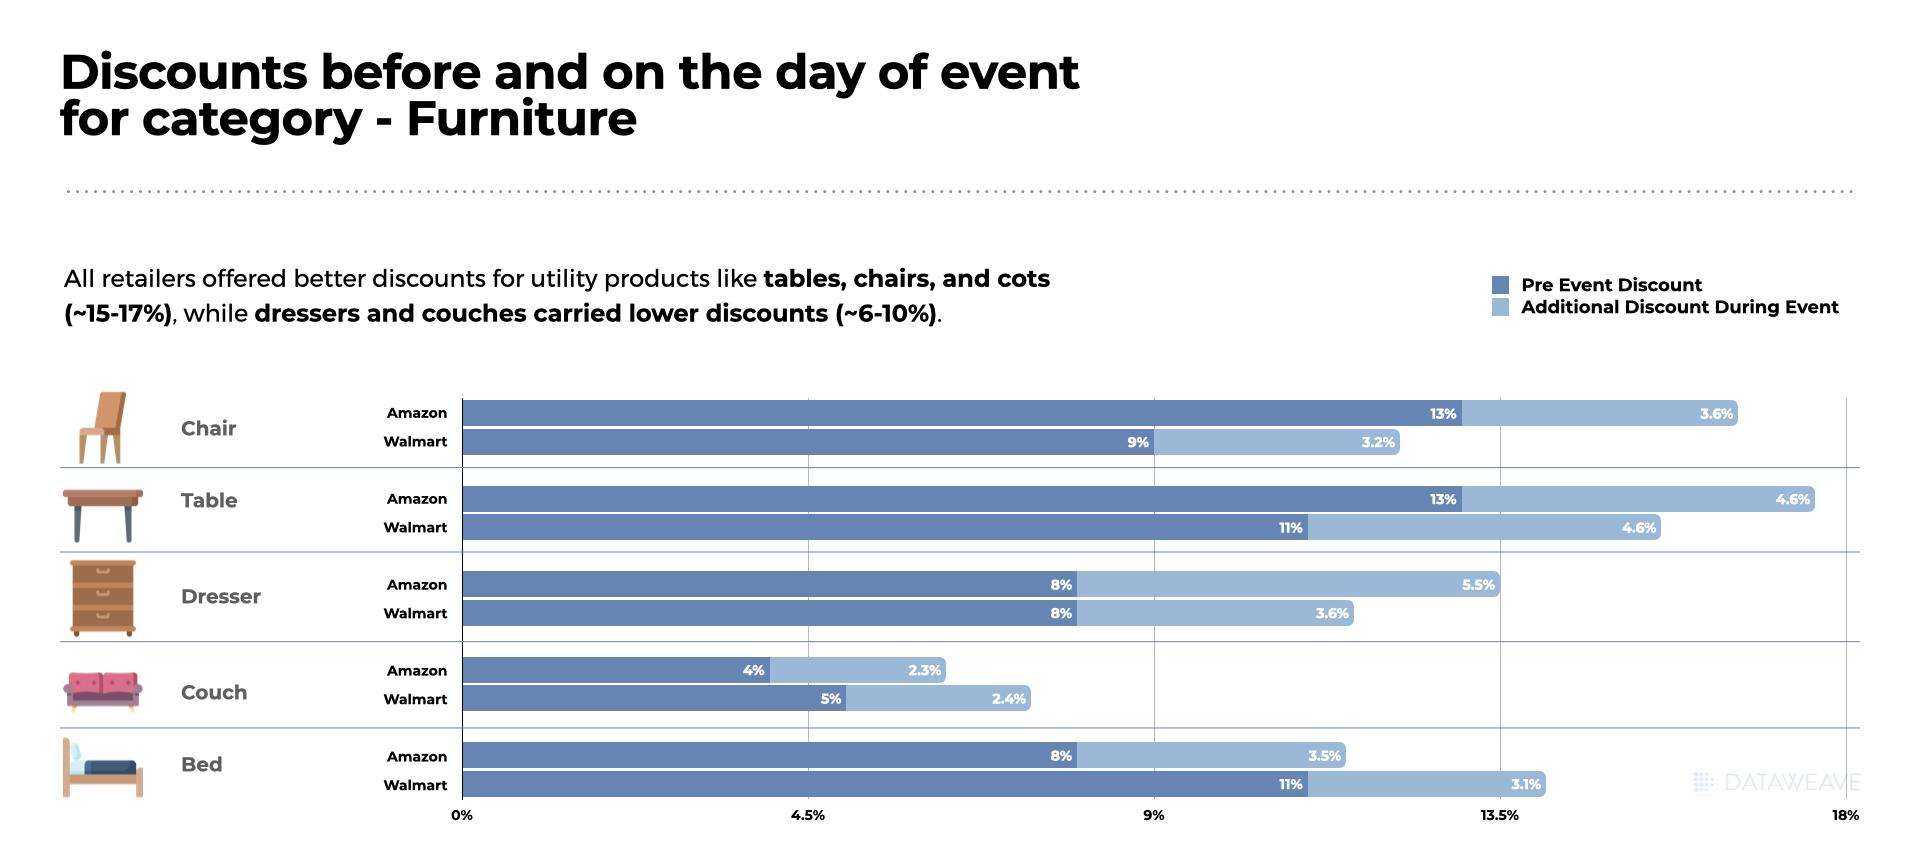
Across all the subcategories we analyzed, Bookcases (8.2%), Rugs (7.8%), Mattresses (6.5%), and Luggage (6.2%) were among the ones with high price reductions.
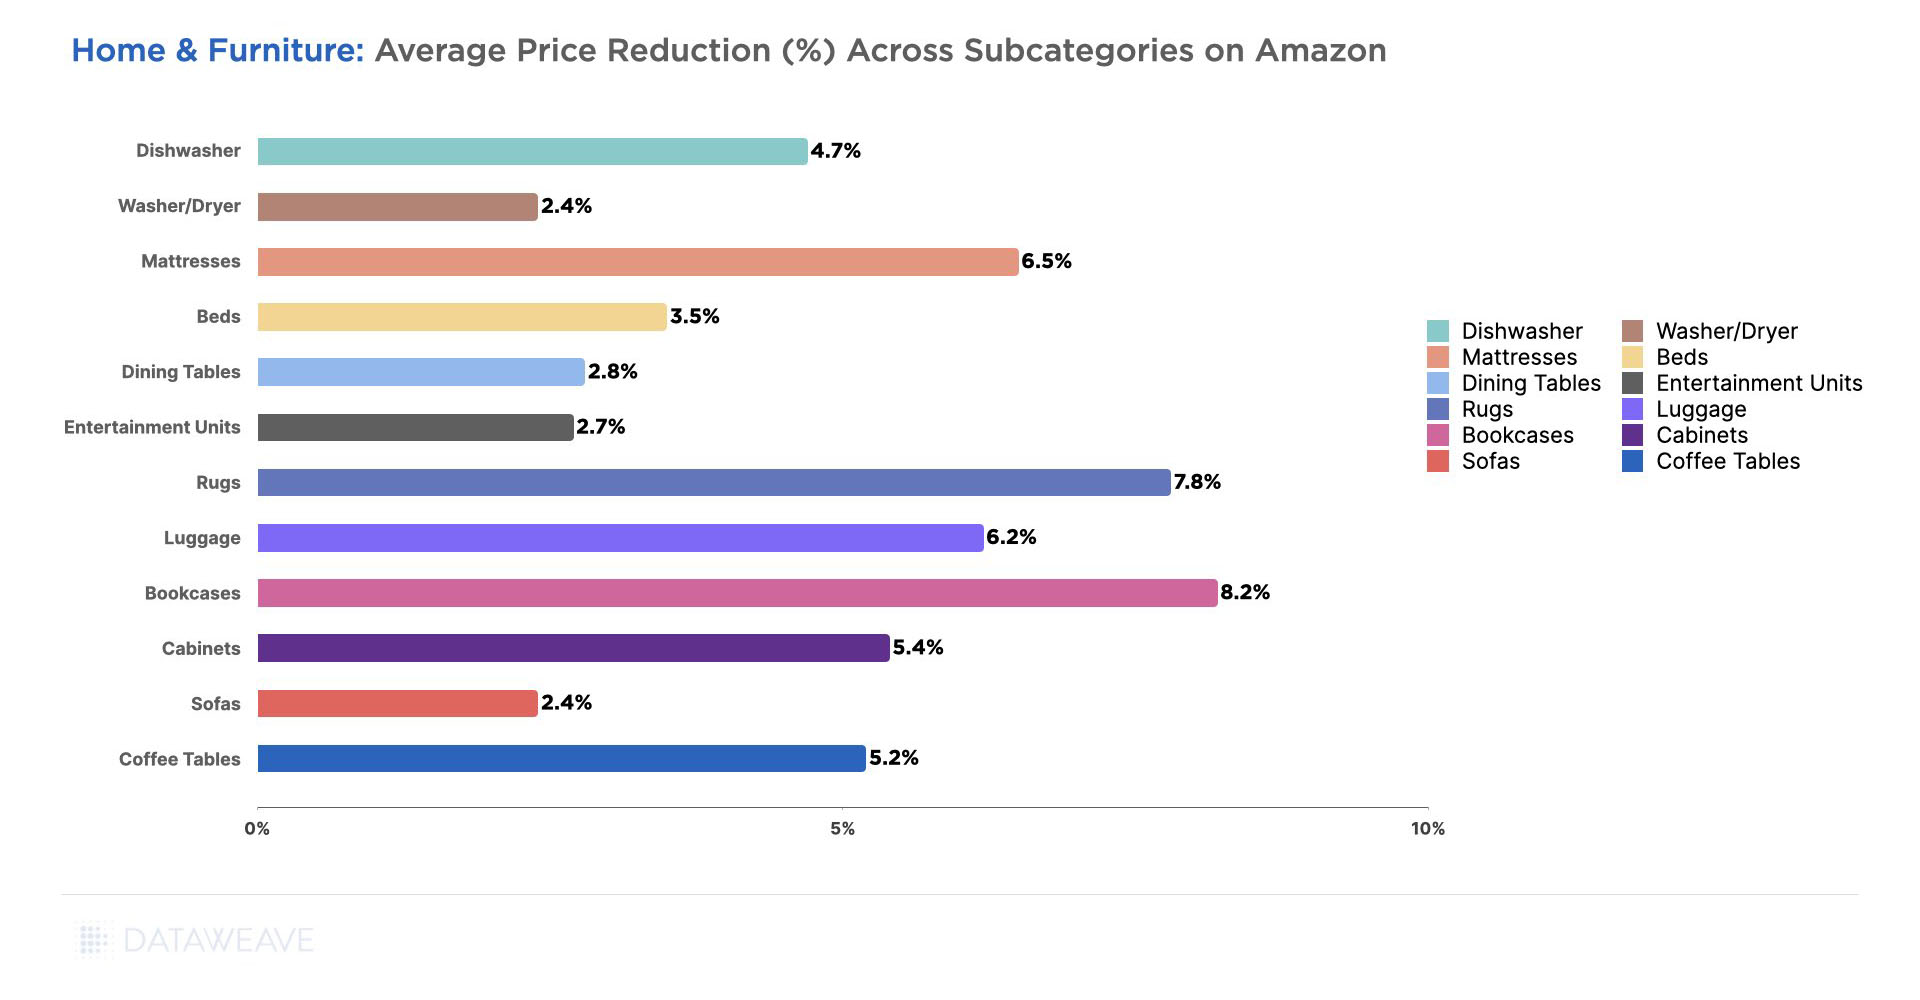
Meanwhile, Sofas (2.4%), Washer / Dryers (2.4%), and Entertainment Units (2.7%) had lower markdowns. These are large and substantial purchases, making retailers more cautious about deeply discounting them while still ensuring profitability.
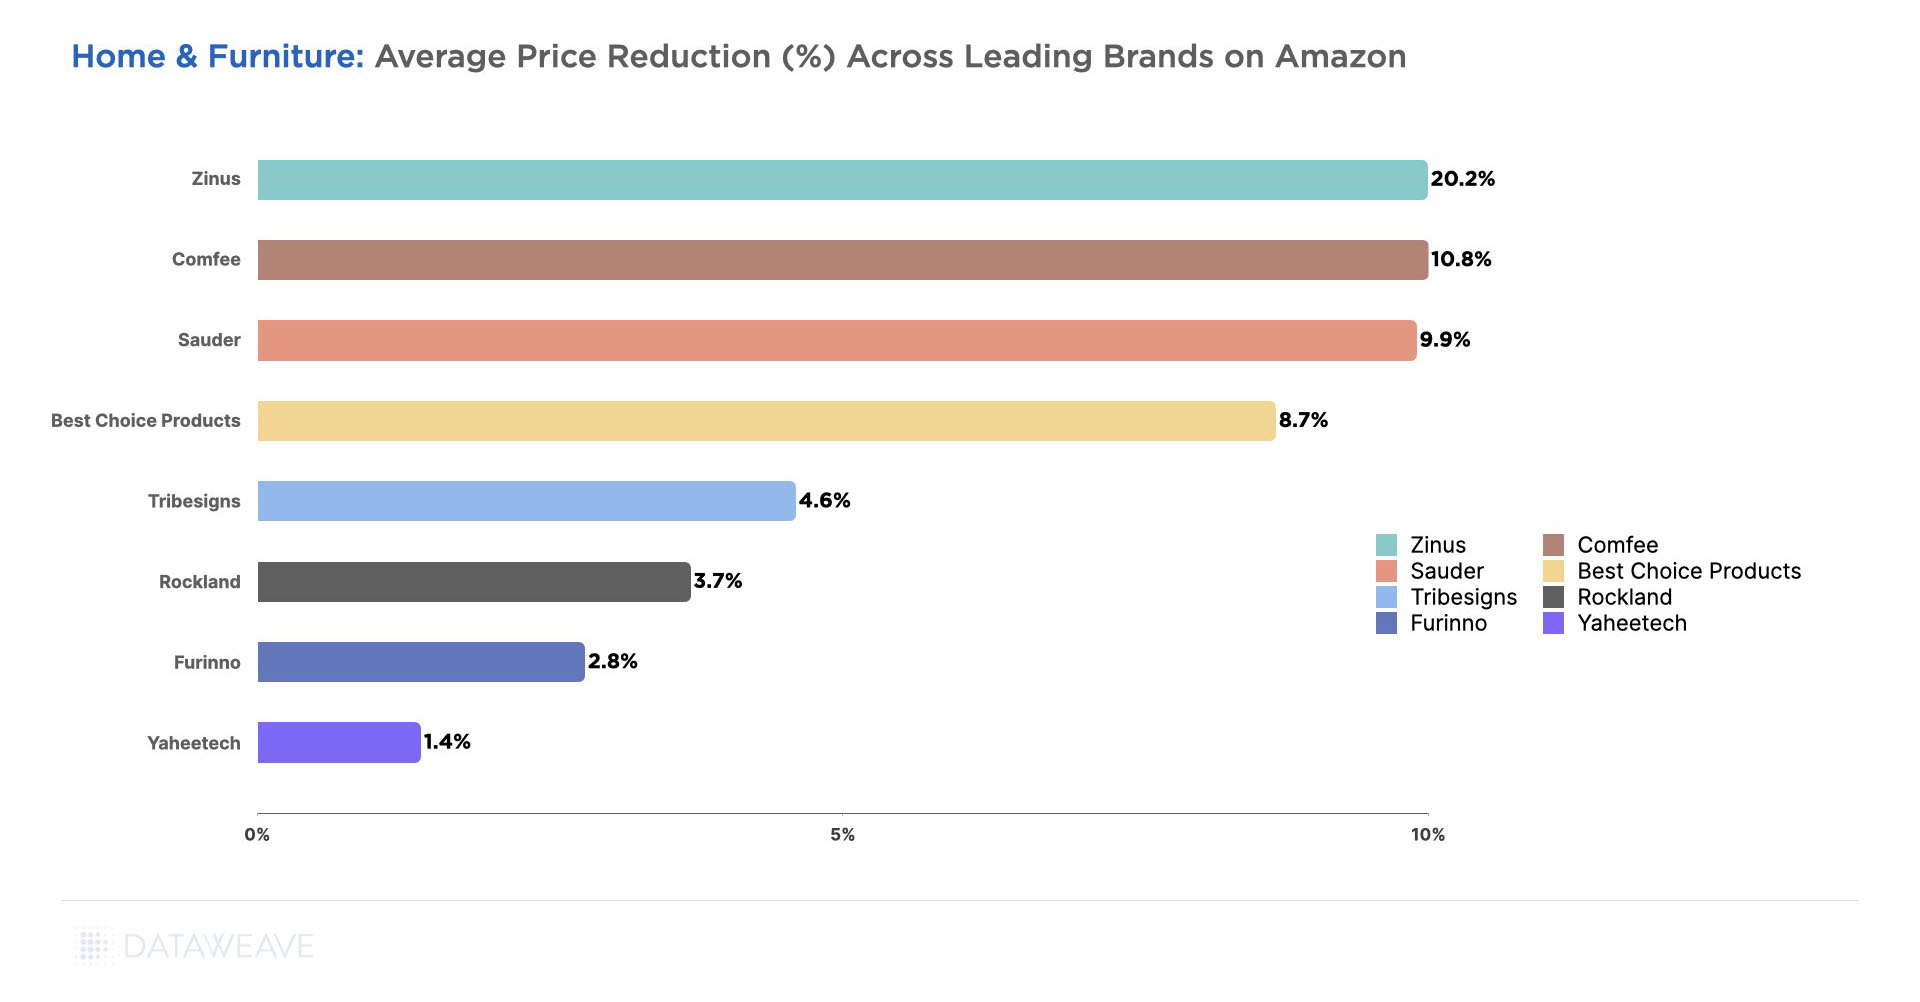
The brands that stepped up and offered the highest markdowns in this category include Zinus (20.2%), Comfee (10.8%), Sauder (9.9%), and Best Choice Products (8.7%).
In terms of Share of Search, Rockland in Luggage gained the highest (21%), followed by Farberware in Dishwasher, Olee Sleep in Mattresses, and Homeguave in Mattresses gained significant ground in their respective categories as shown in the image below.
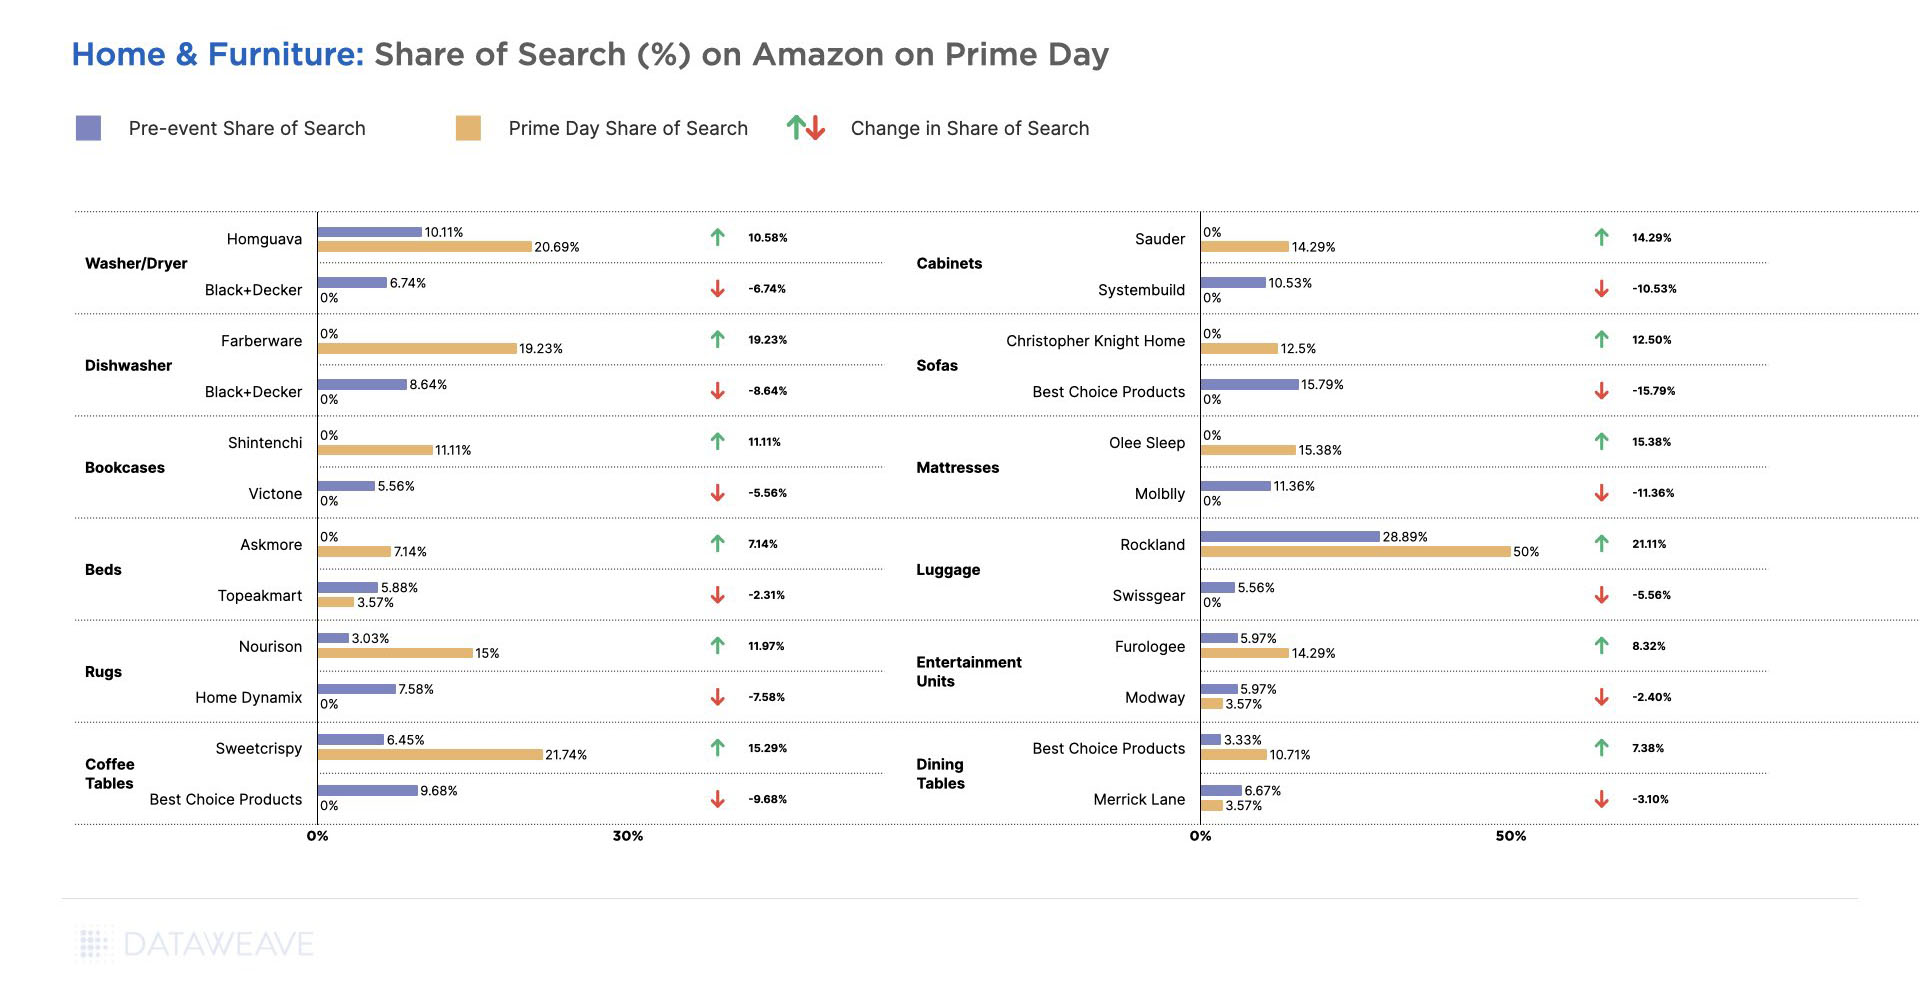
Brands like Best Choice Products in Coffee Tables, Molblly in Mattresses, and Black+Decker in Washer/Dryers and Dishwashers lost a good portion of their Share of Search during the event. Due to high competition for visibility during sale events, brands that fail to keep an eye on their Share of Search stand to take a hit in their sales, especially in categories like Home & Furniture that tend to have low brand loyalty.
Consumer Electronics
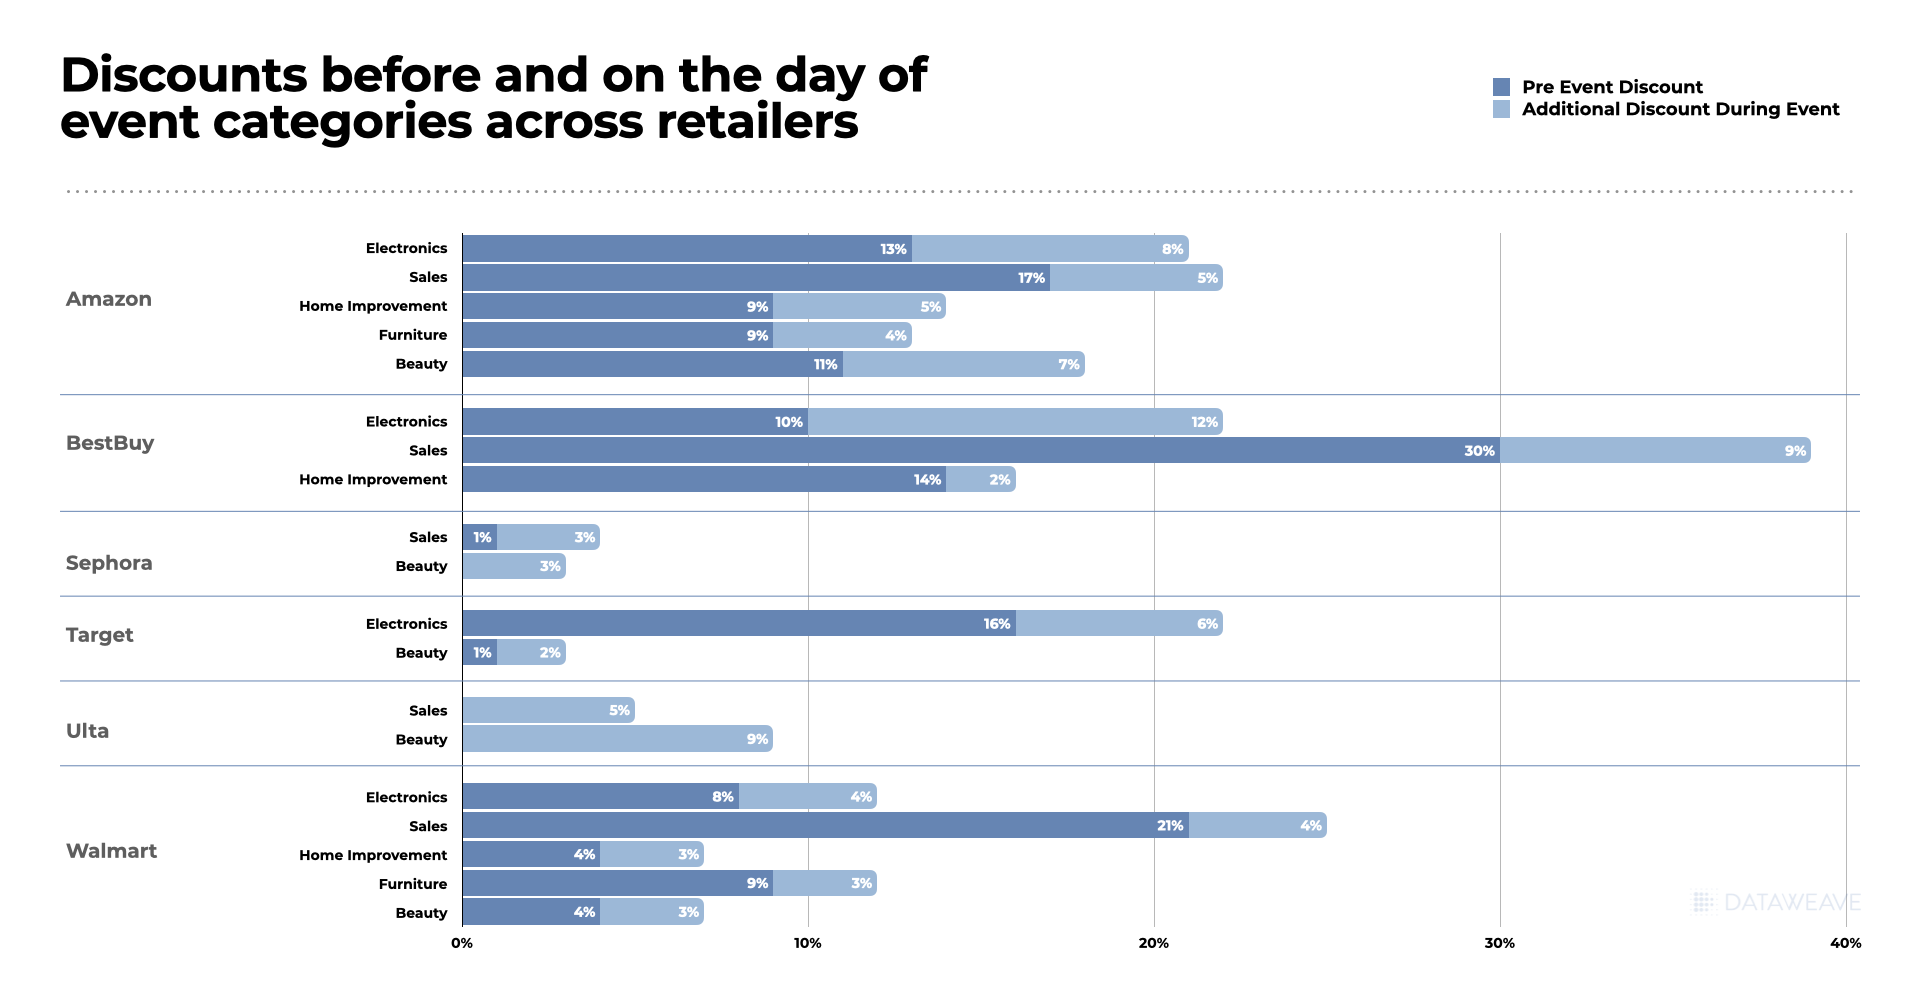
2023 was the year of consumer electronics on Amazon Prime Day. Amazon’s price reduction during the sale averaged 10.4% across 54.5% of its assortment in the category. Target and Walmart, on the other hand, offered significantly lower additional discounts of 1.9% and 2.7% on 10.4% and 19.1% of their assortment, respectively.
The consumer electronics category often witnesses aggressive price reductions during Prime Day and other sale events due to its popularity and high demand. In addition, since retailer margins are usually low in this category, shoppers often have to wait for sale events like Prime Day (when brands markdown their wholesale rates) to have several attractive deals to choose from.
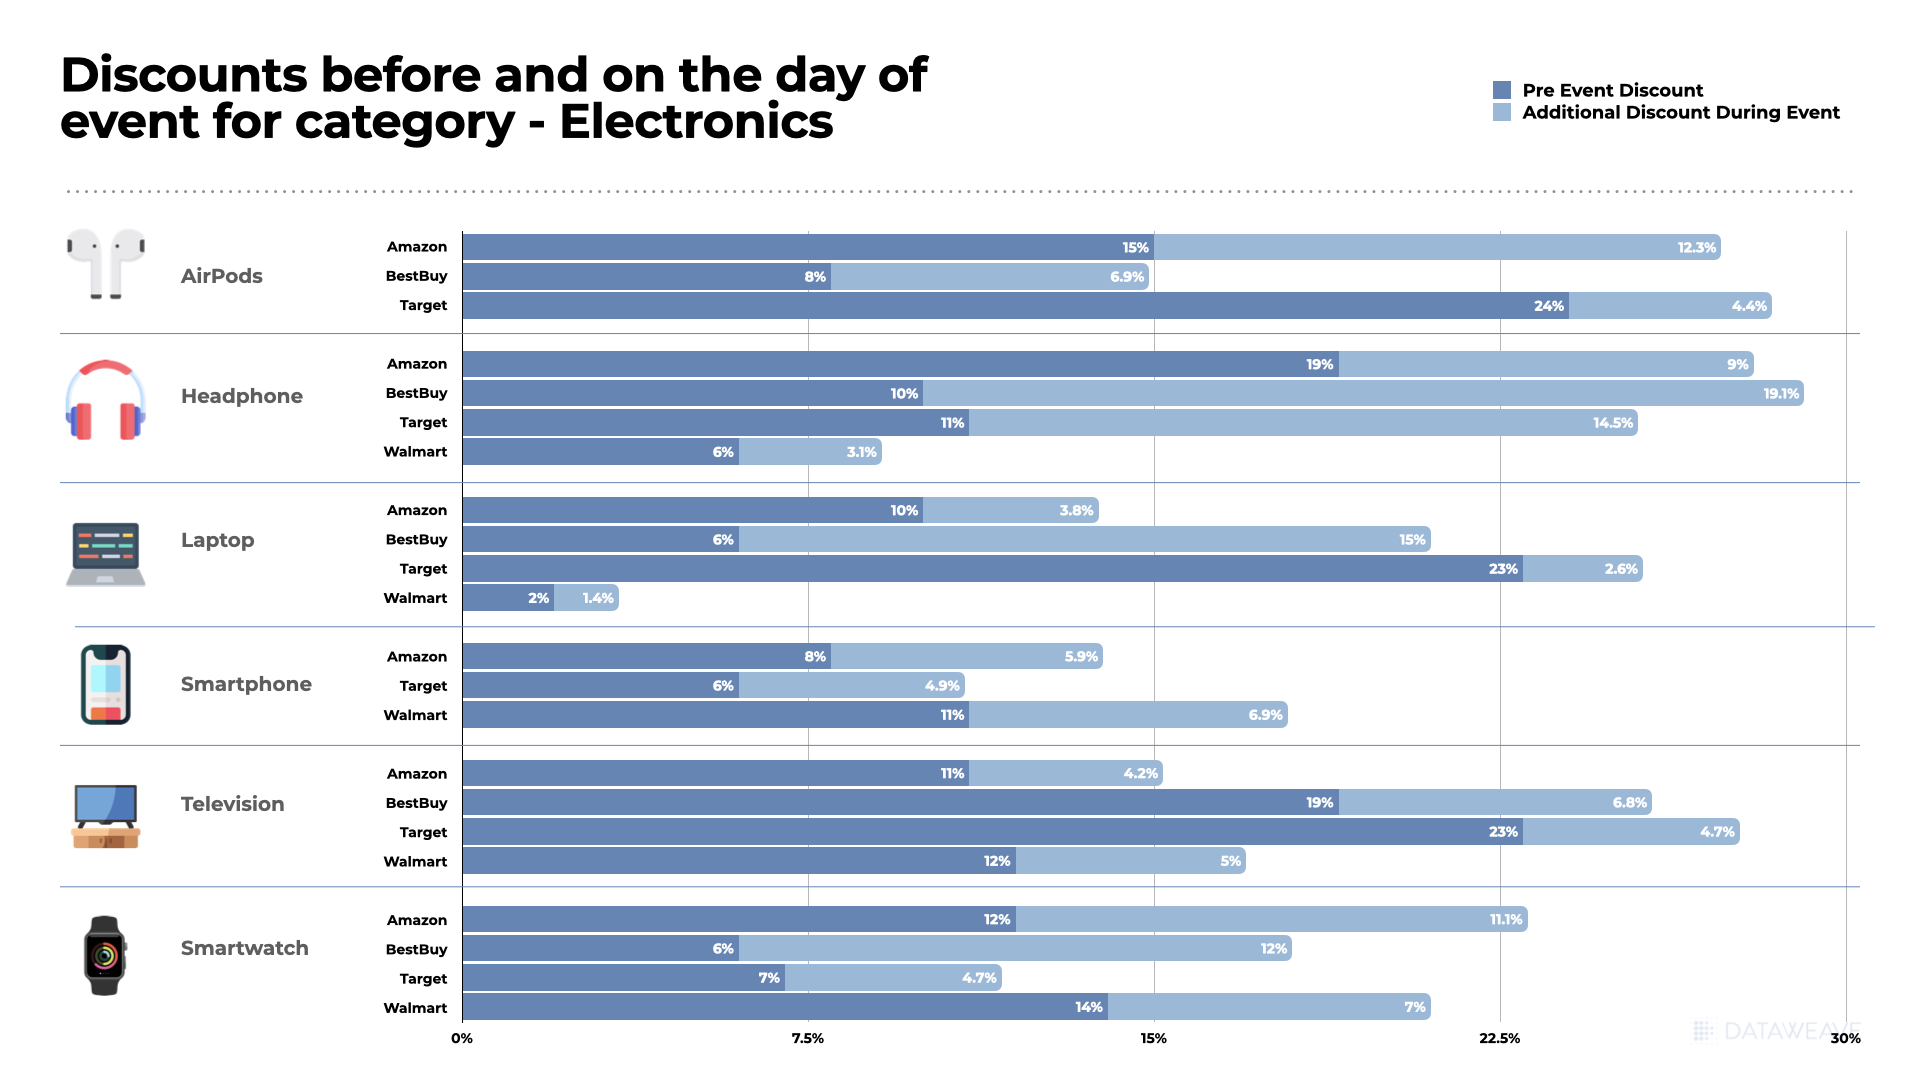
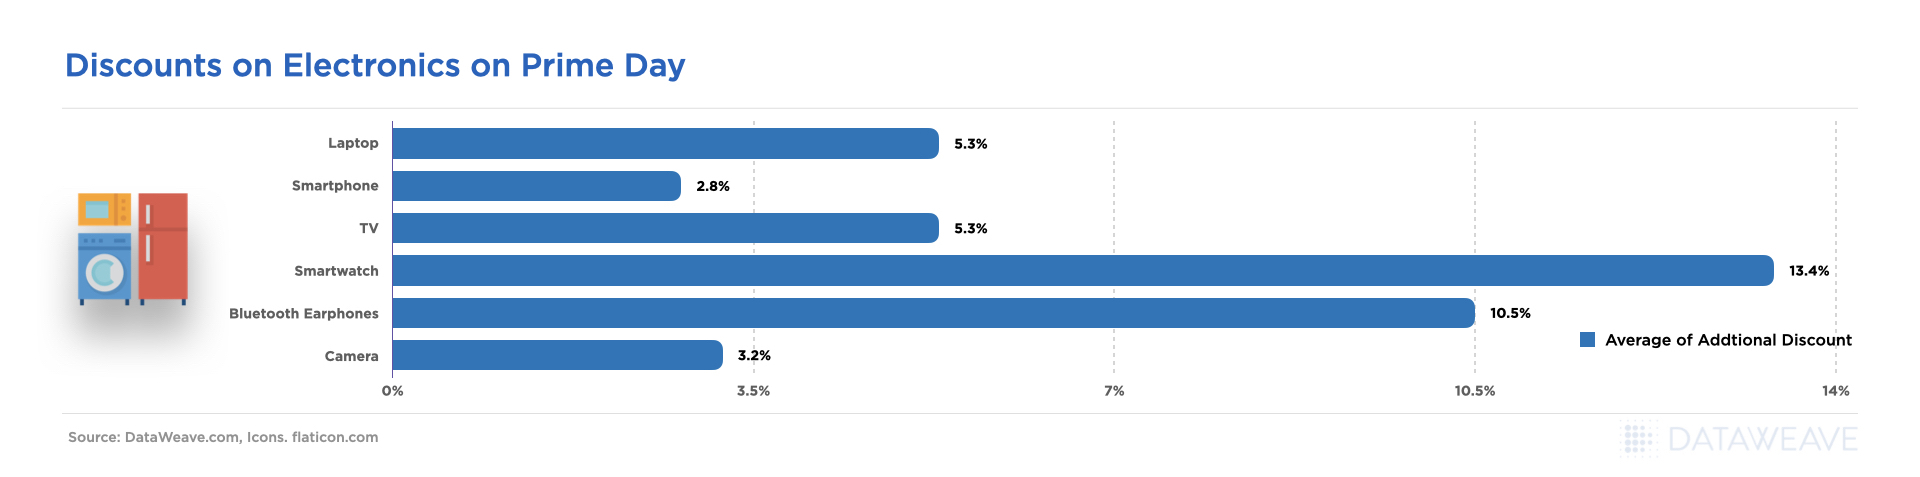
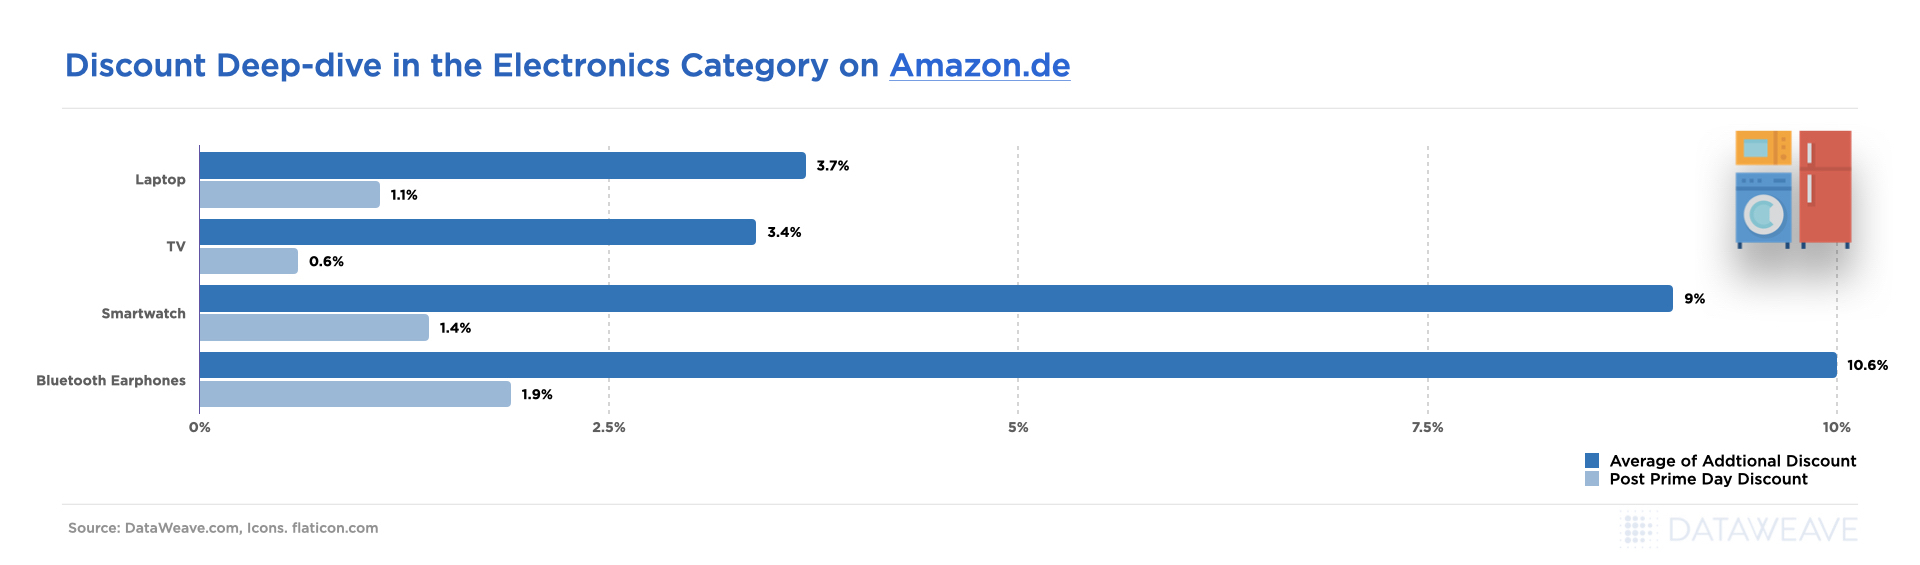
Across all the subcategories we analyzed, Smartwatches (15.4%), Wireless Headphones (15.4%), Earbuds (14.9%), Headphones (12.5%), and Tablets (12.0%), were among the ones with the highest price reductions. All of these subcategories are quite popular that tend to sell in large volumes during sale events.
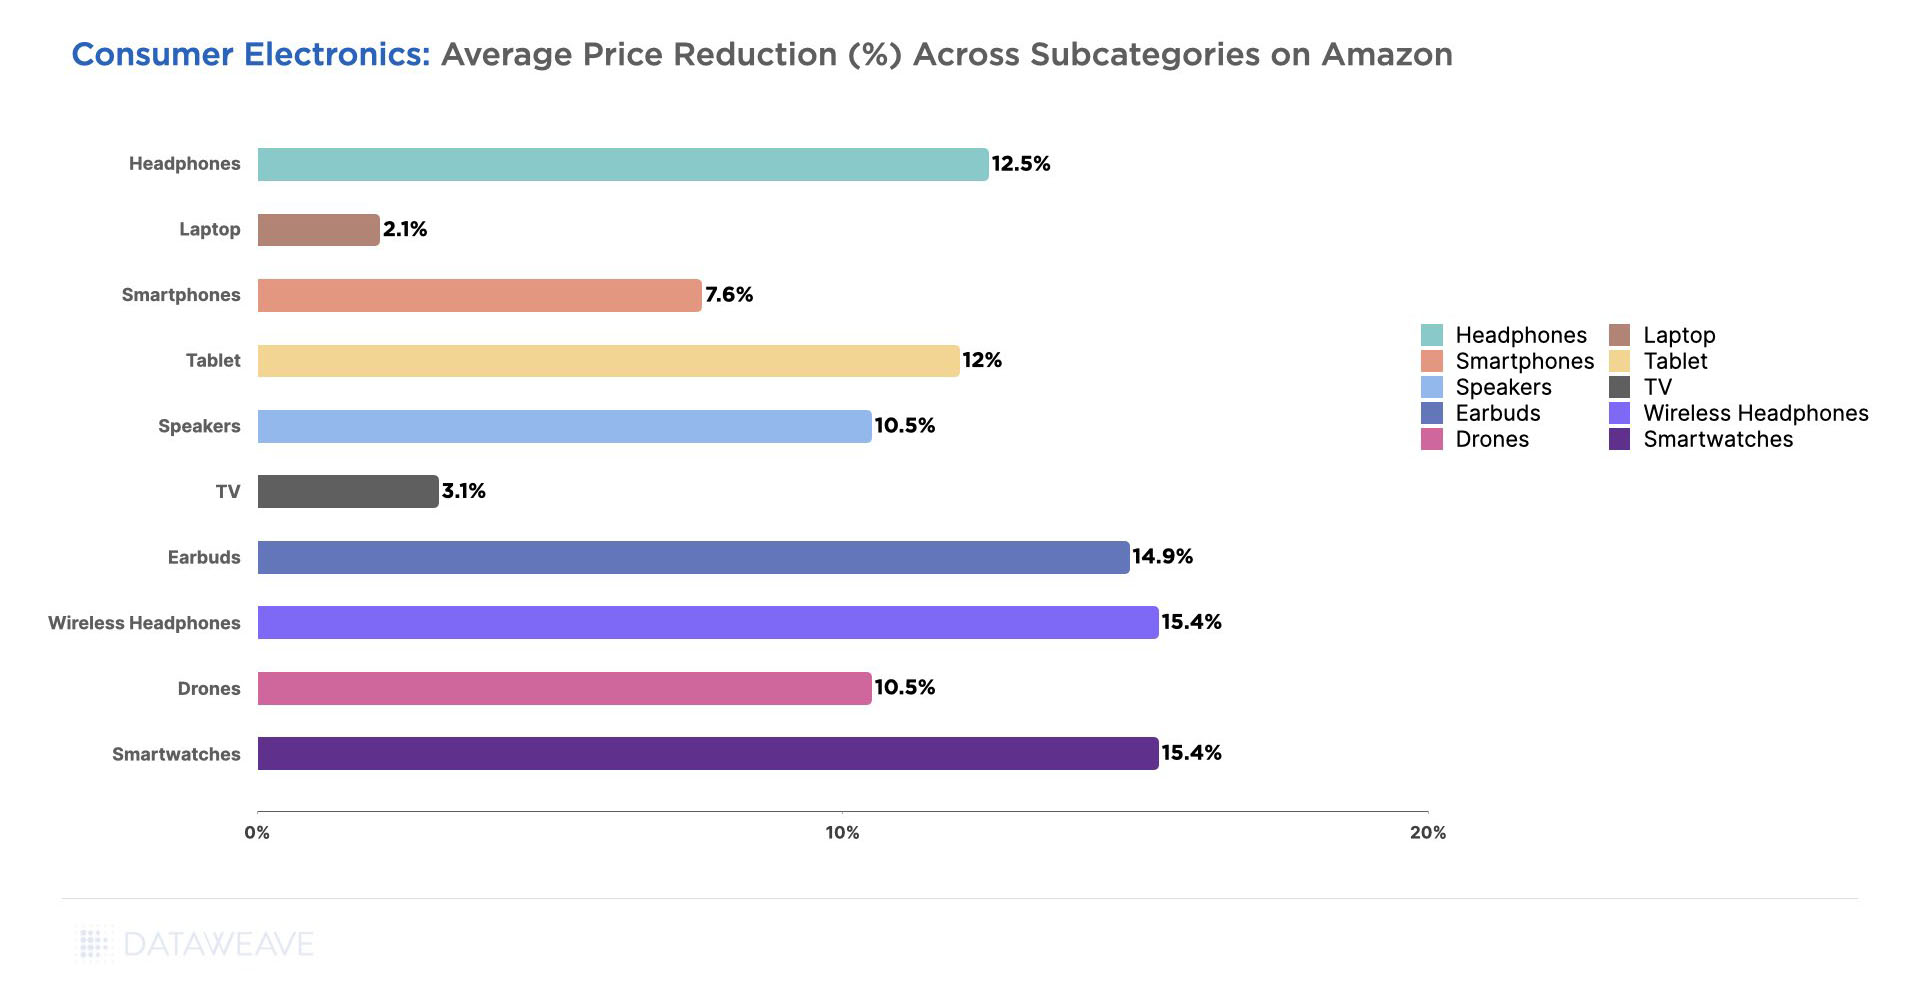
Meanwhile, Laptops (2.1%), TVs (3.1%), and Smartphones (7.6%) had lower markdowns. A lower markdown on smartphones may reflect steady demand throughout the year, reducing the urgency to offer significant discounts during the short Prime Day window.
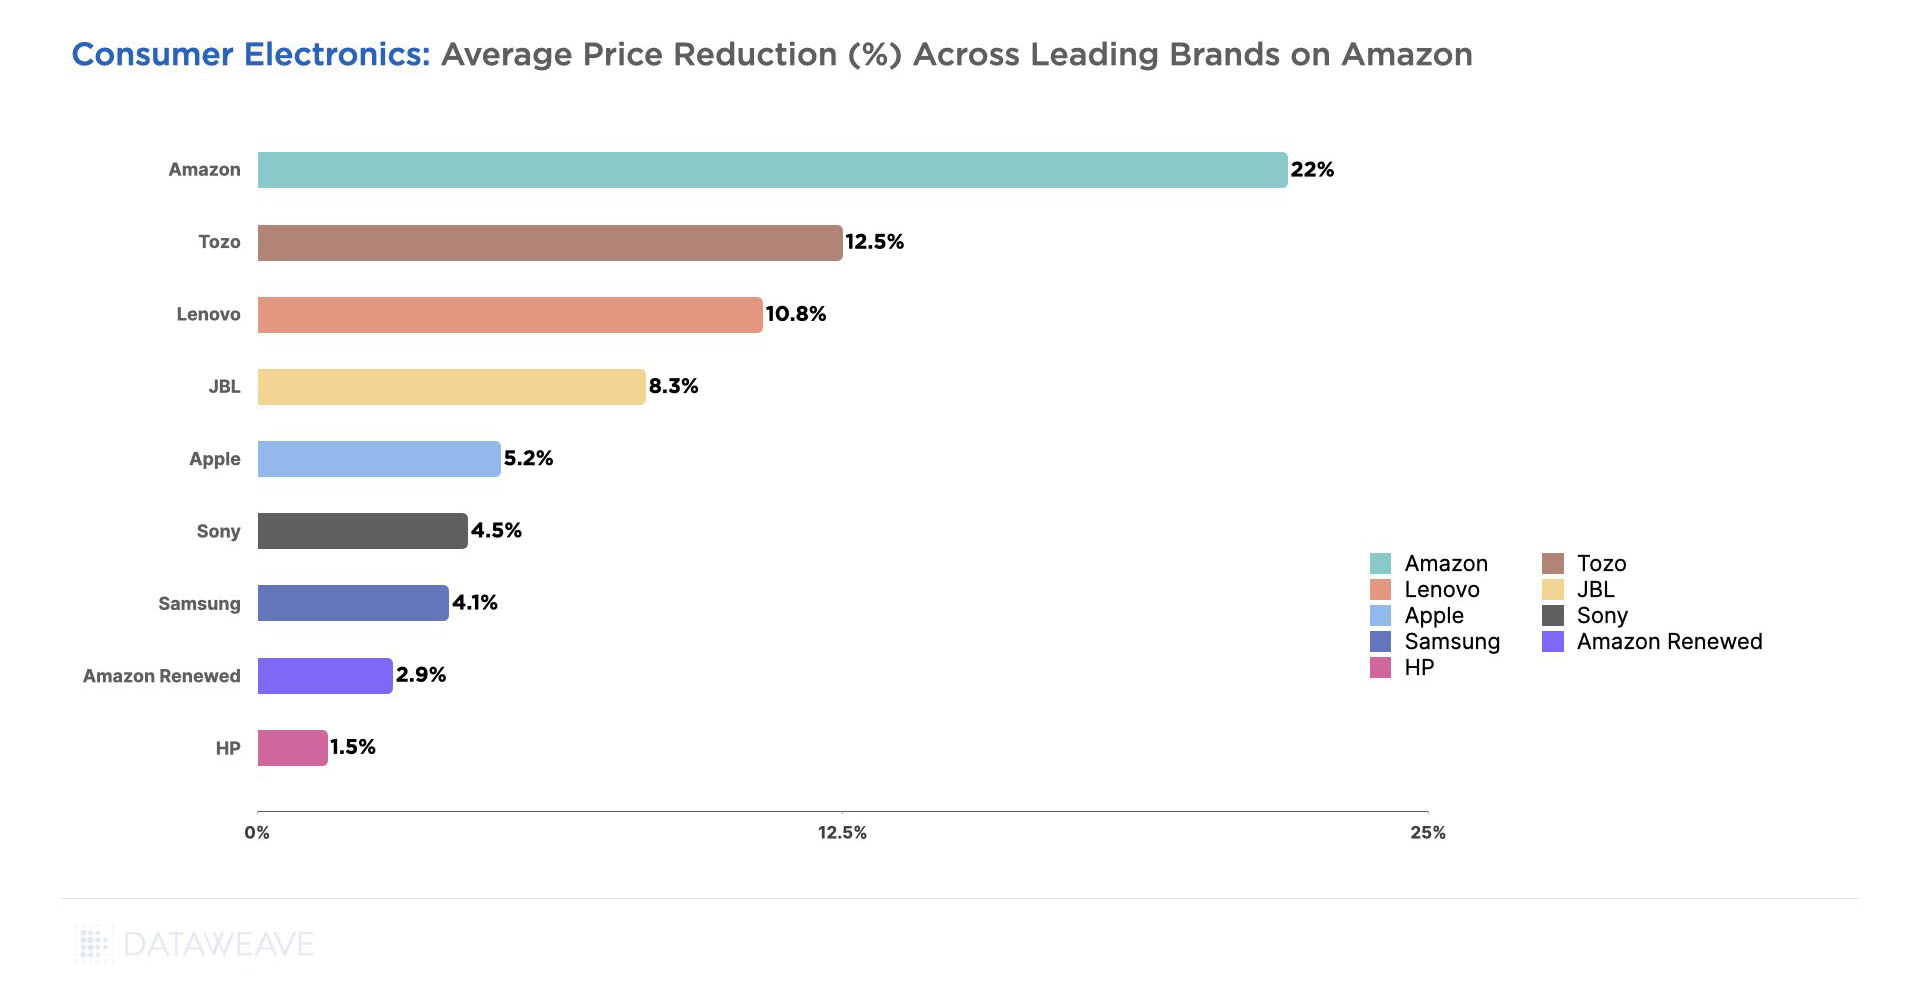
Amazon (22%), Tozo (12.5%), Lenovo (10.8%), JBL (8.3%), and Apple (5%) offered the highest price reductions in Consumer Electronics as a whole. Clearly, Amazon didn’t hold back on offering attractive deals on its own private label products in this category.
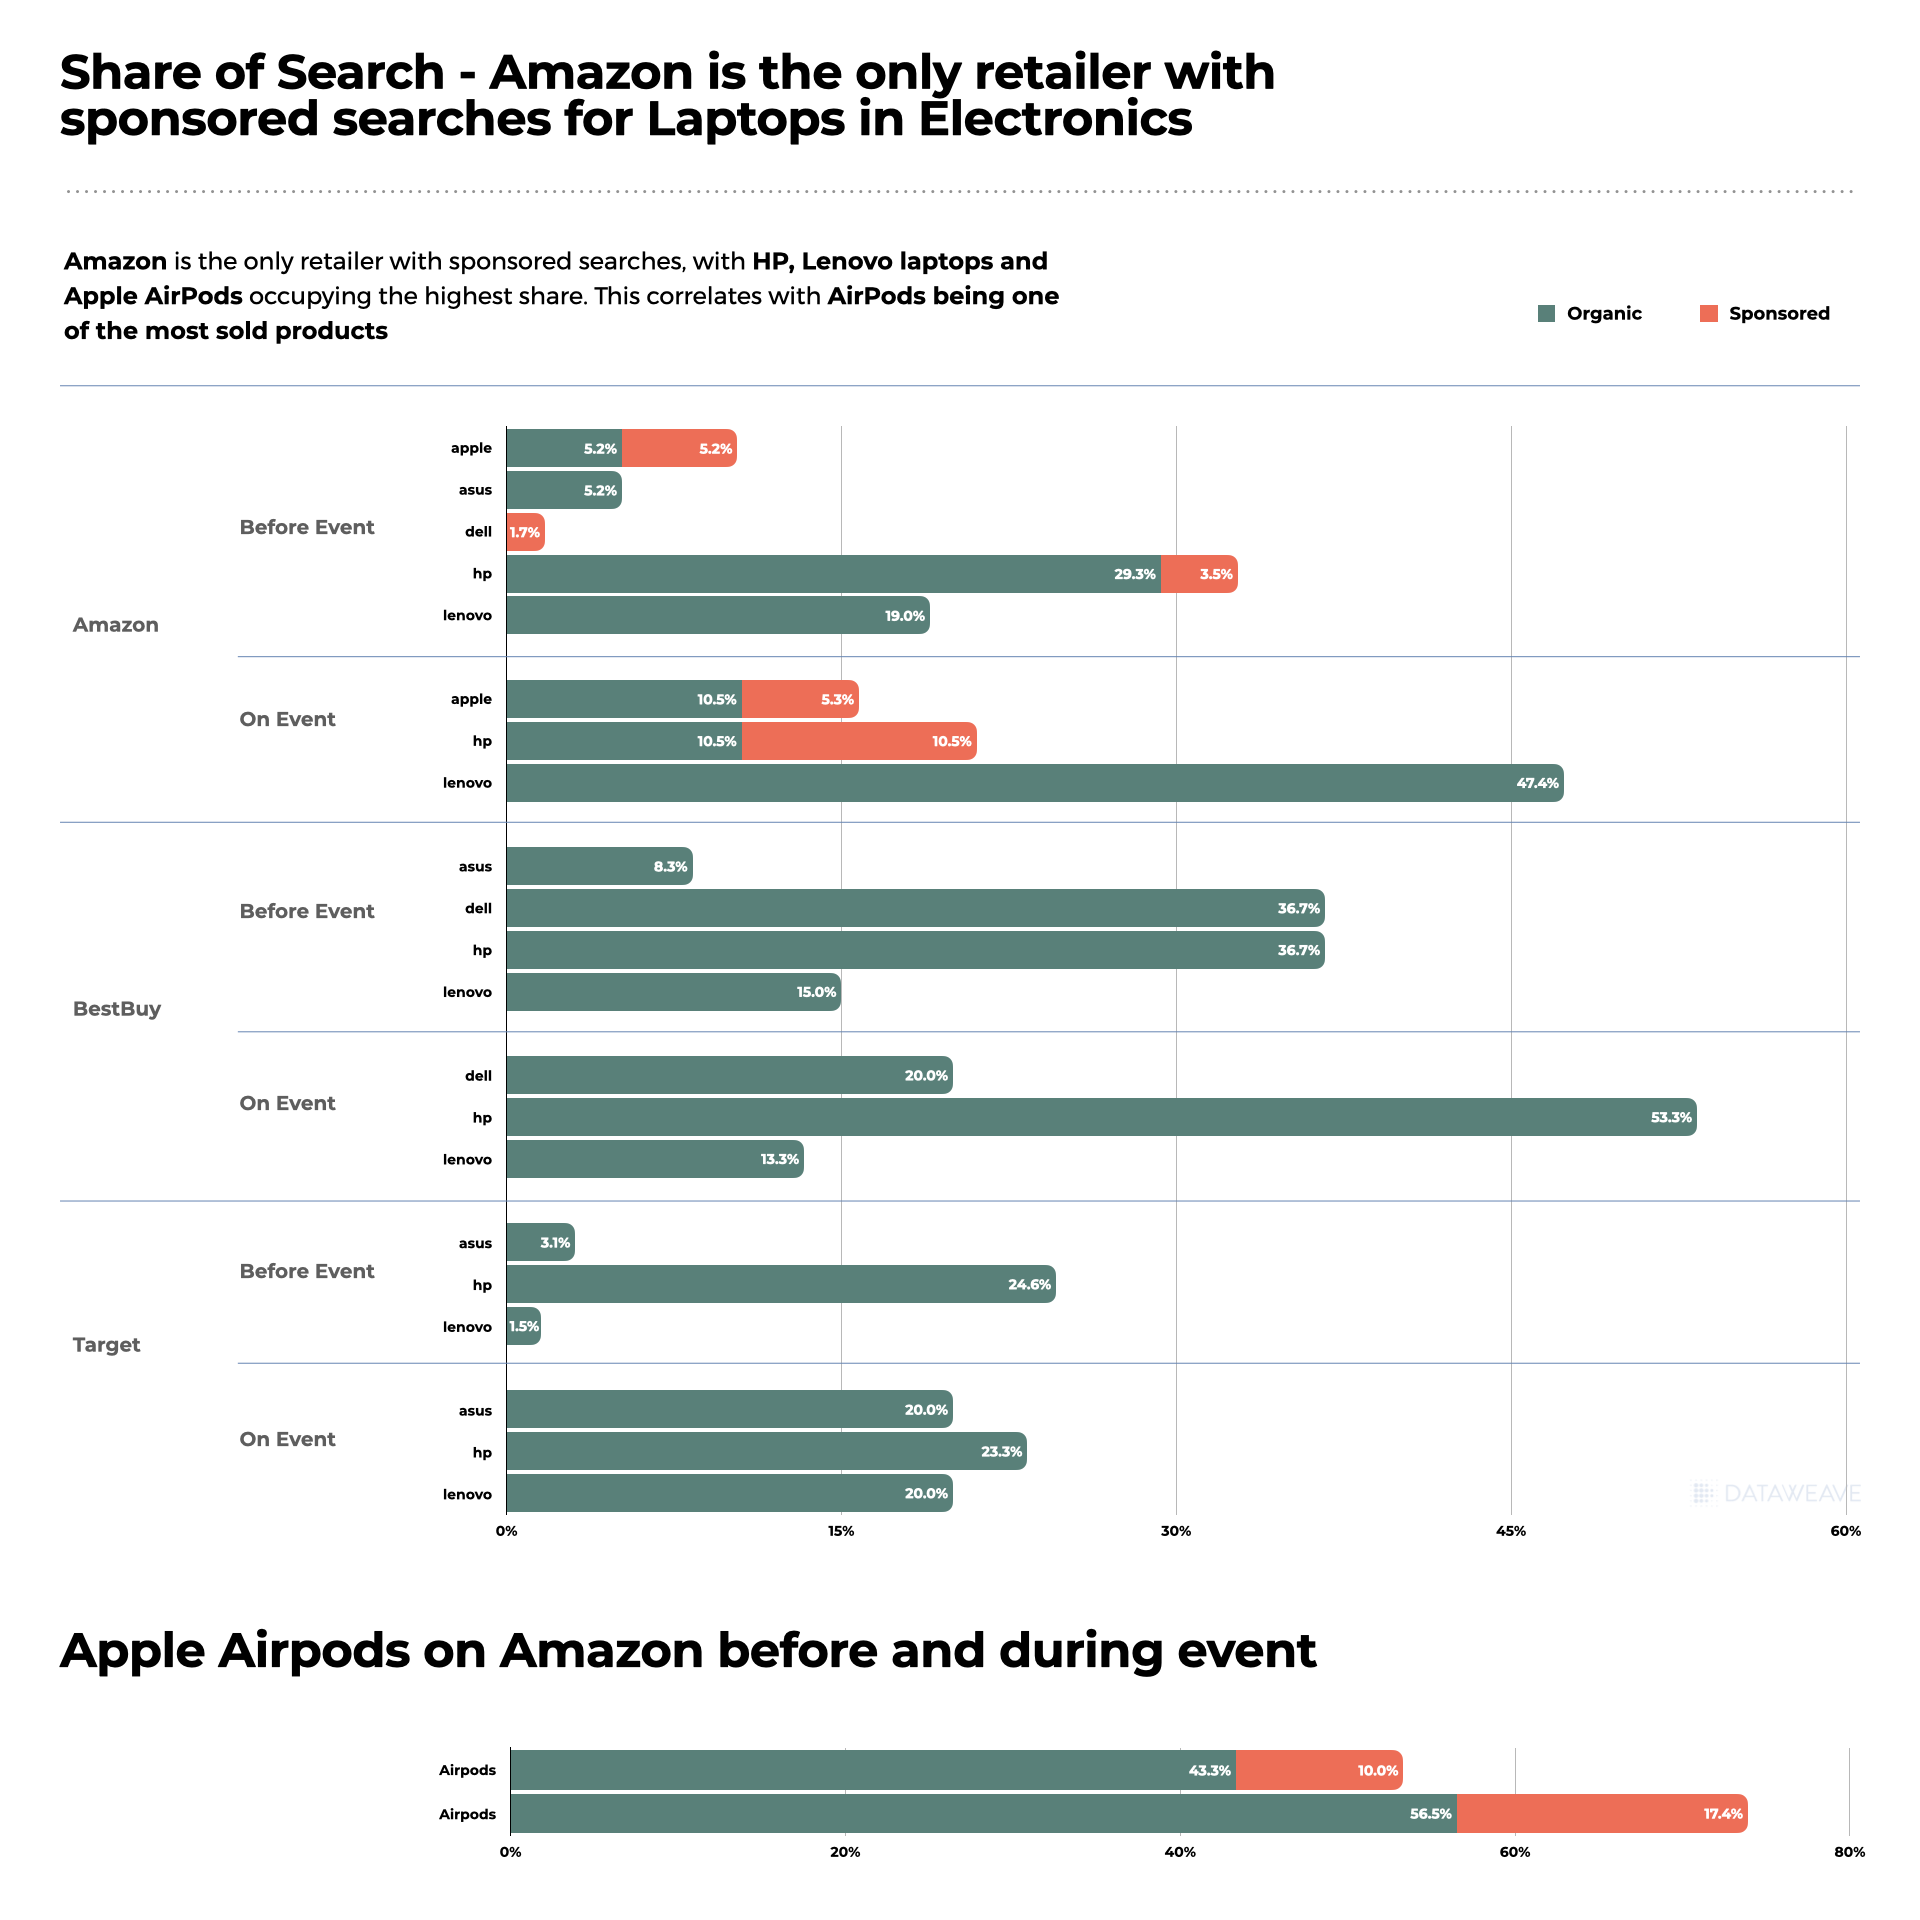
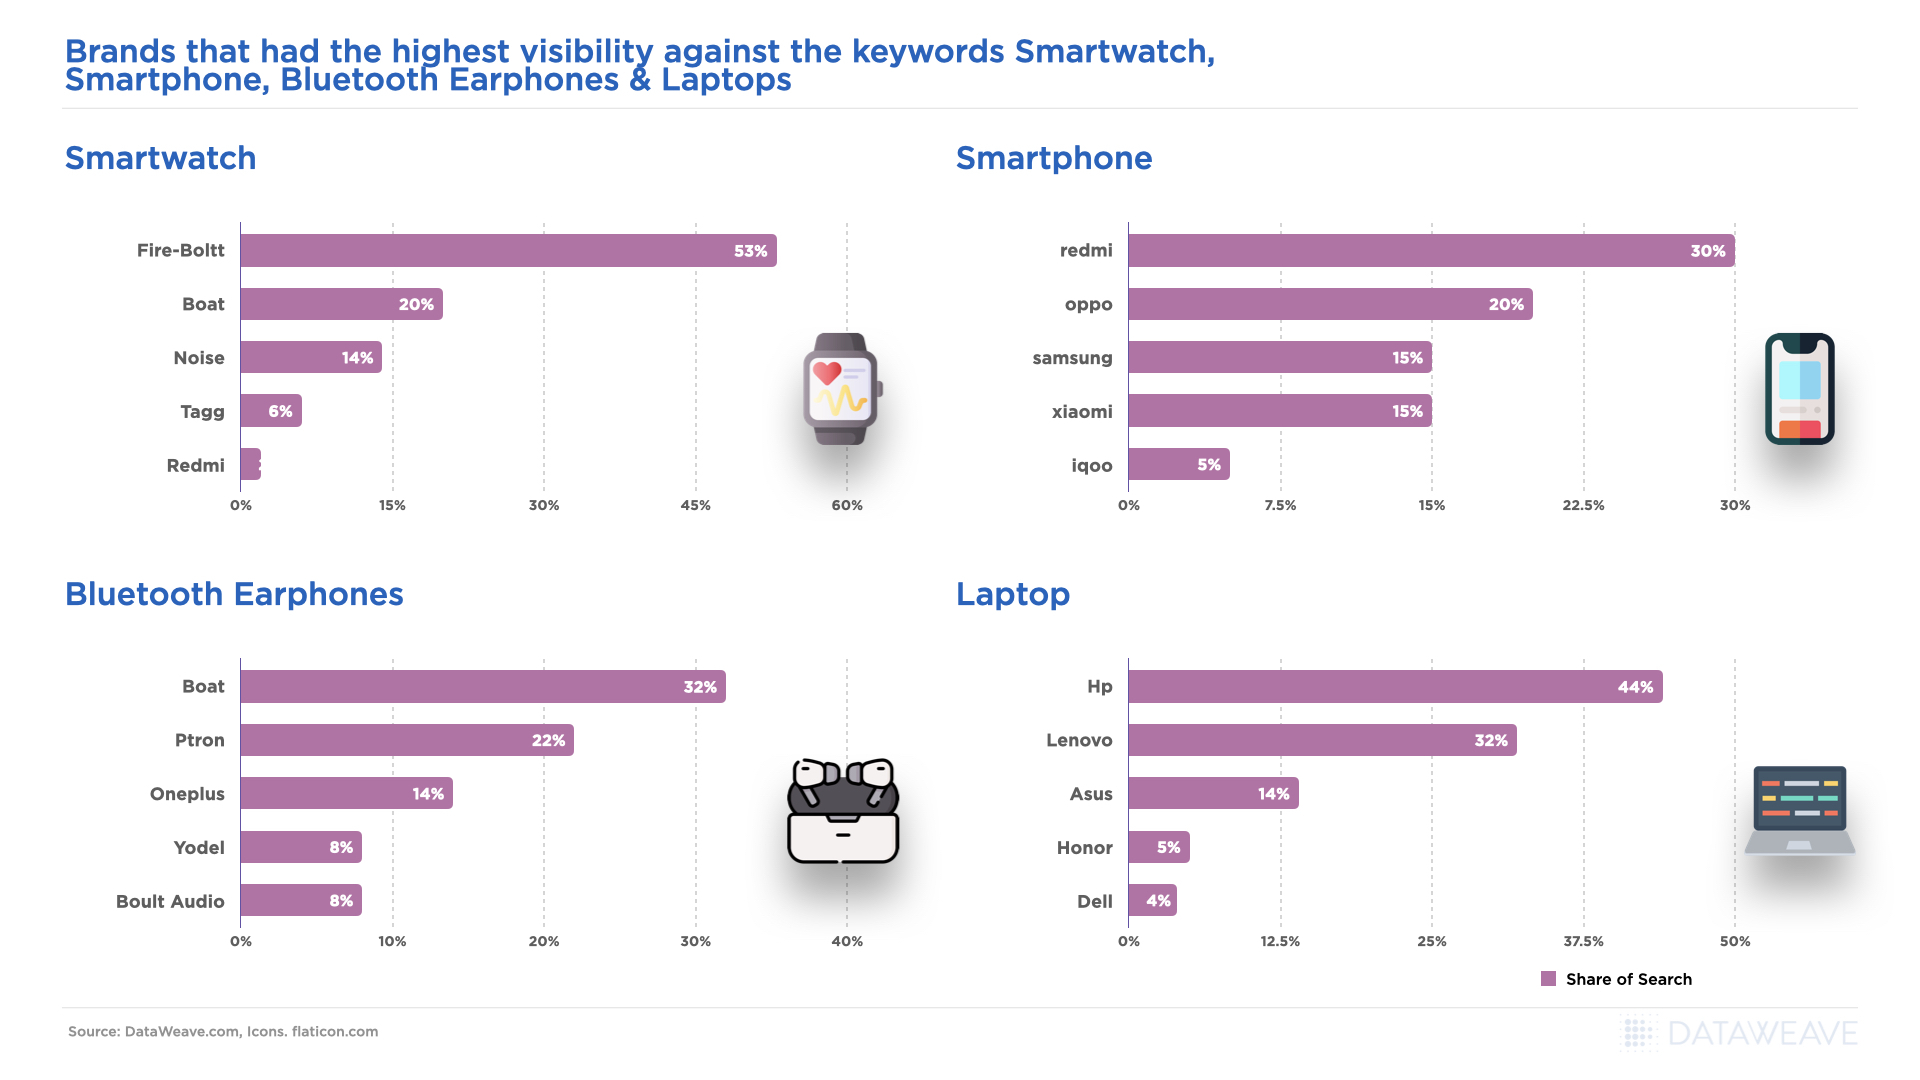
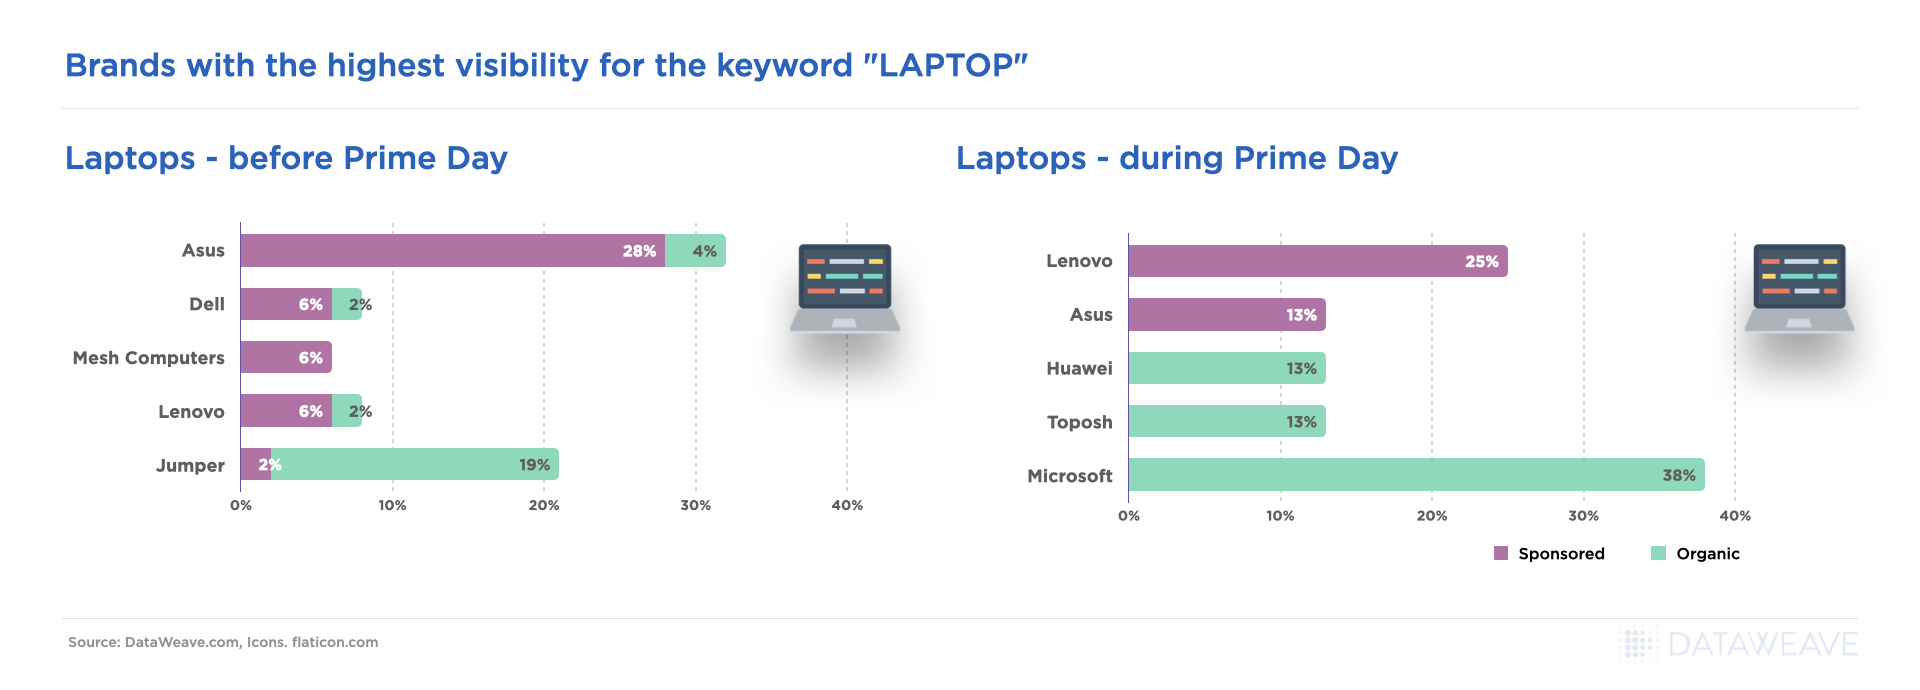
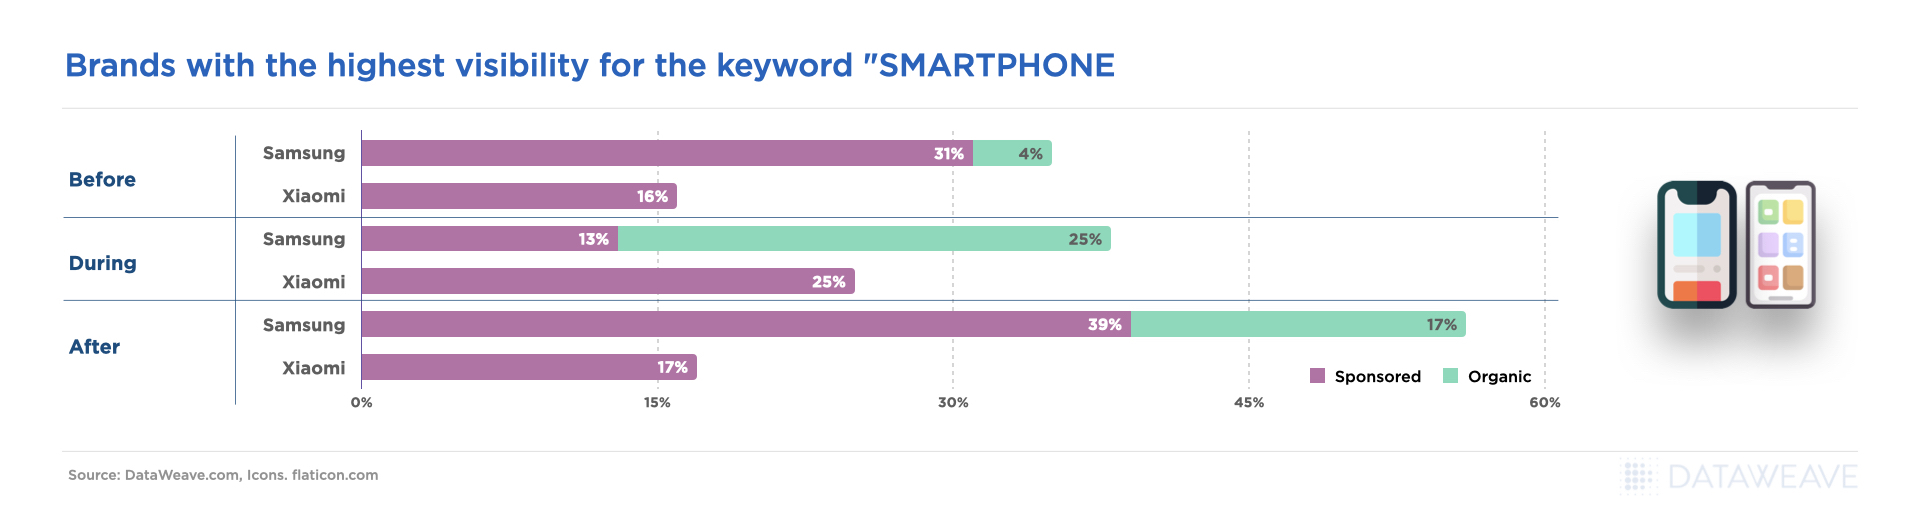
Consumer Electronics as a category tends to have a brand loyal shopper base. However, Share of Search generic search keywords are still very important for keywords like earbuds, headphones, and tablets that result in relatively lower priced products. HP in Laptops, Samsung in Tablets and TVs, and Oneplus in Smartphones all made strong strides in building their discoverability on Amazon during Prime Day. Beyond just driving more sales, this also has the intended effect of boosting brand awareness among high-intent shoppers.
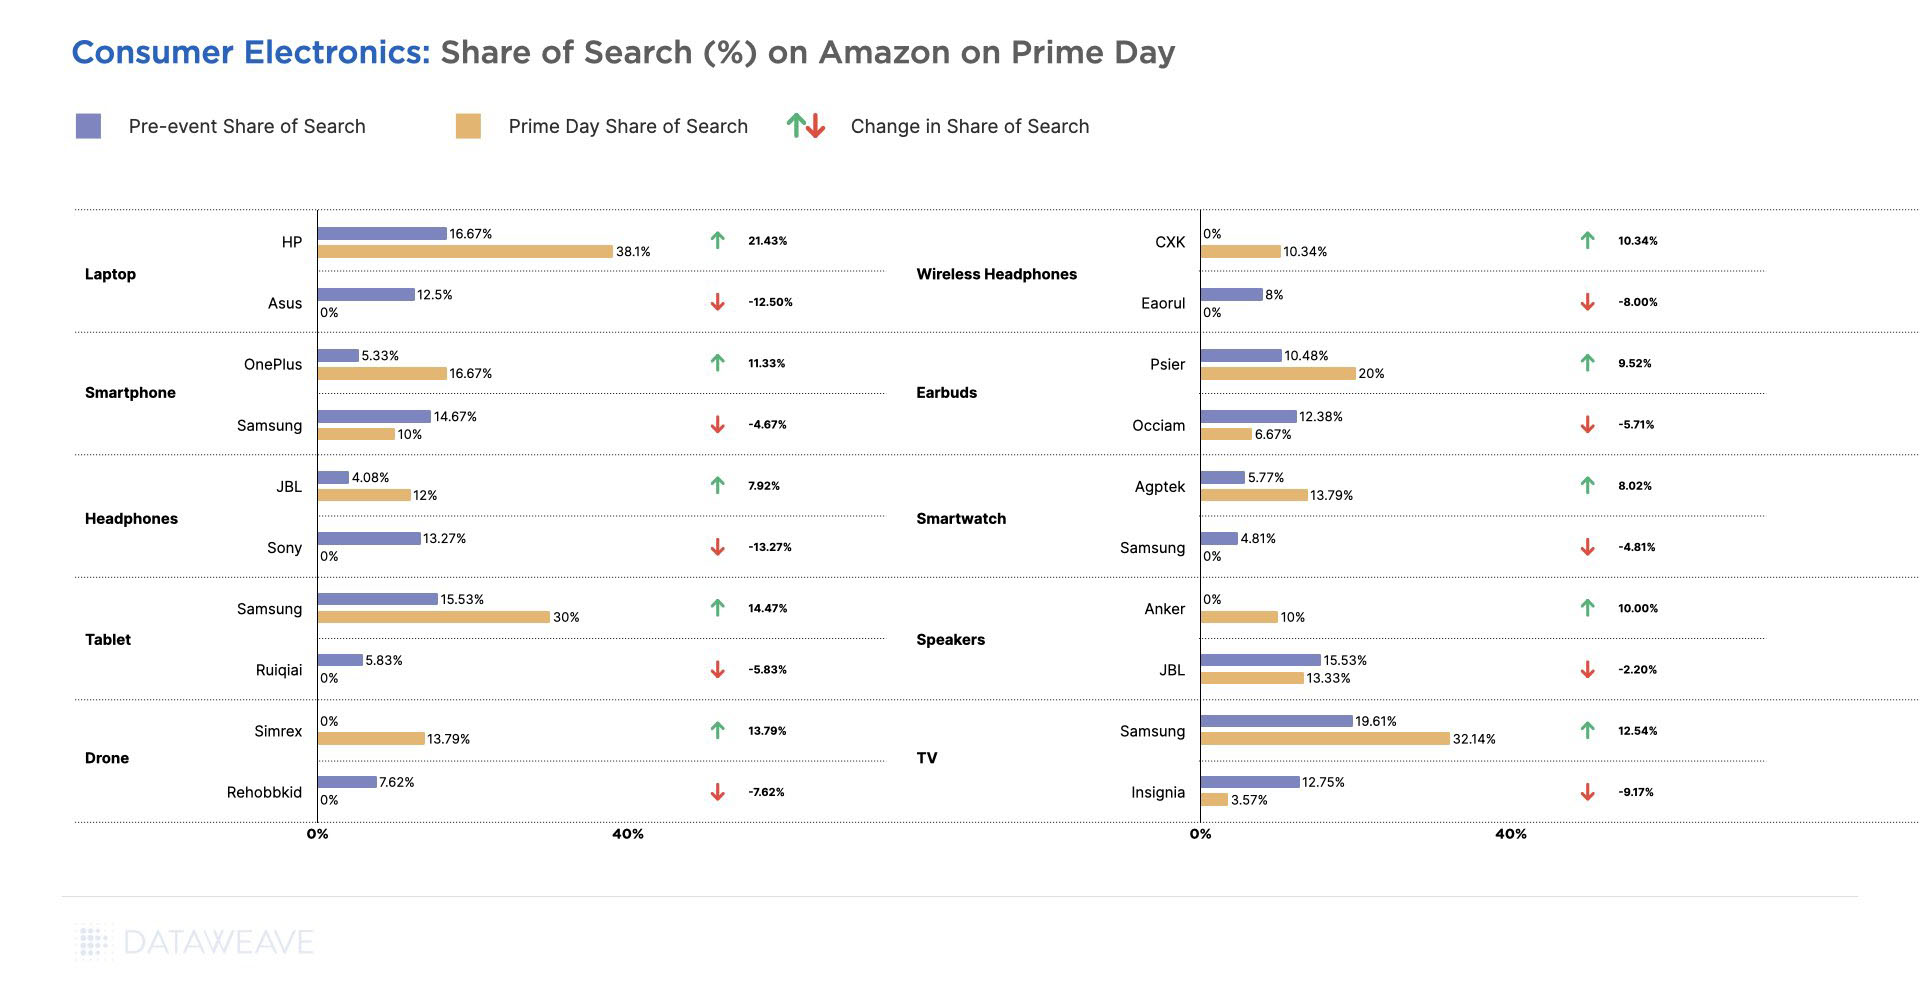
Sony in Headphones, Asus in Laptops, and Insignia in TVs lost out to other brands in terms of their discoverability during the sale. Sony and Asus, especially would be hurting as they are prominent brands in their respective categories.
Health & Beauty
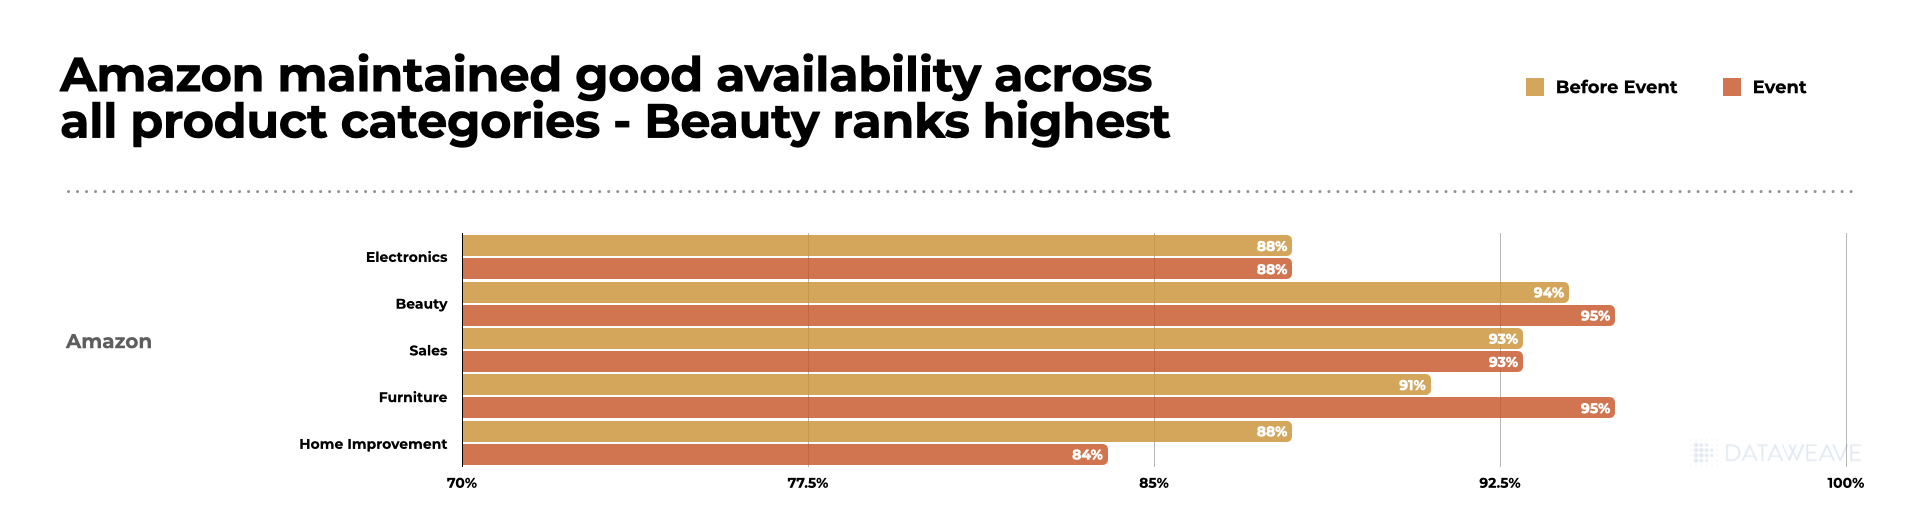
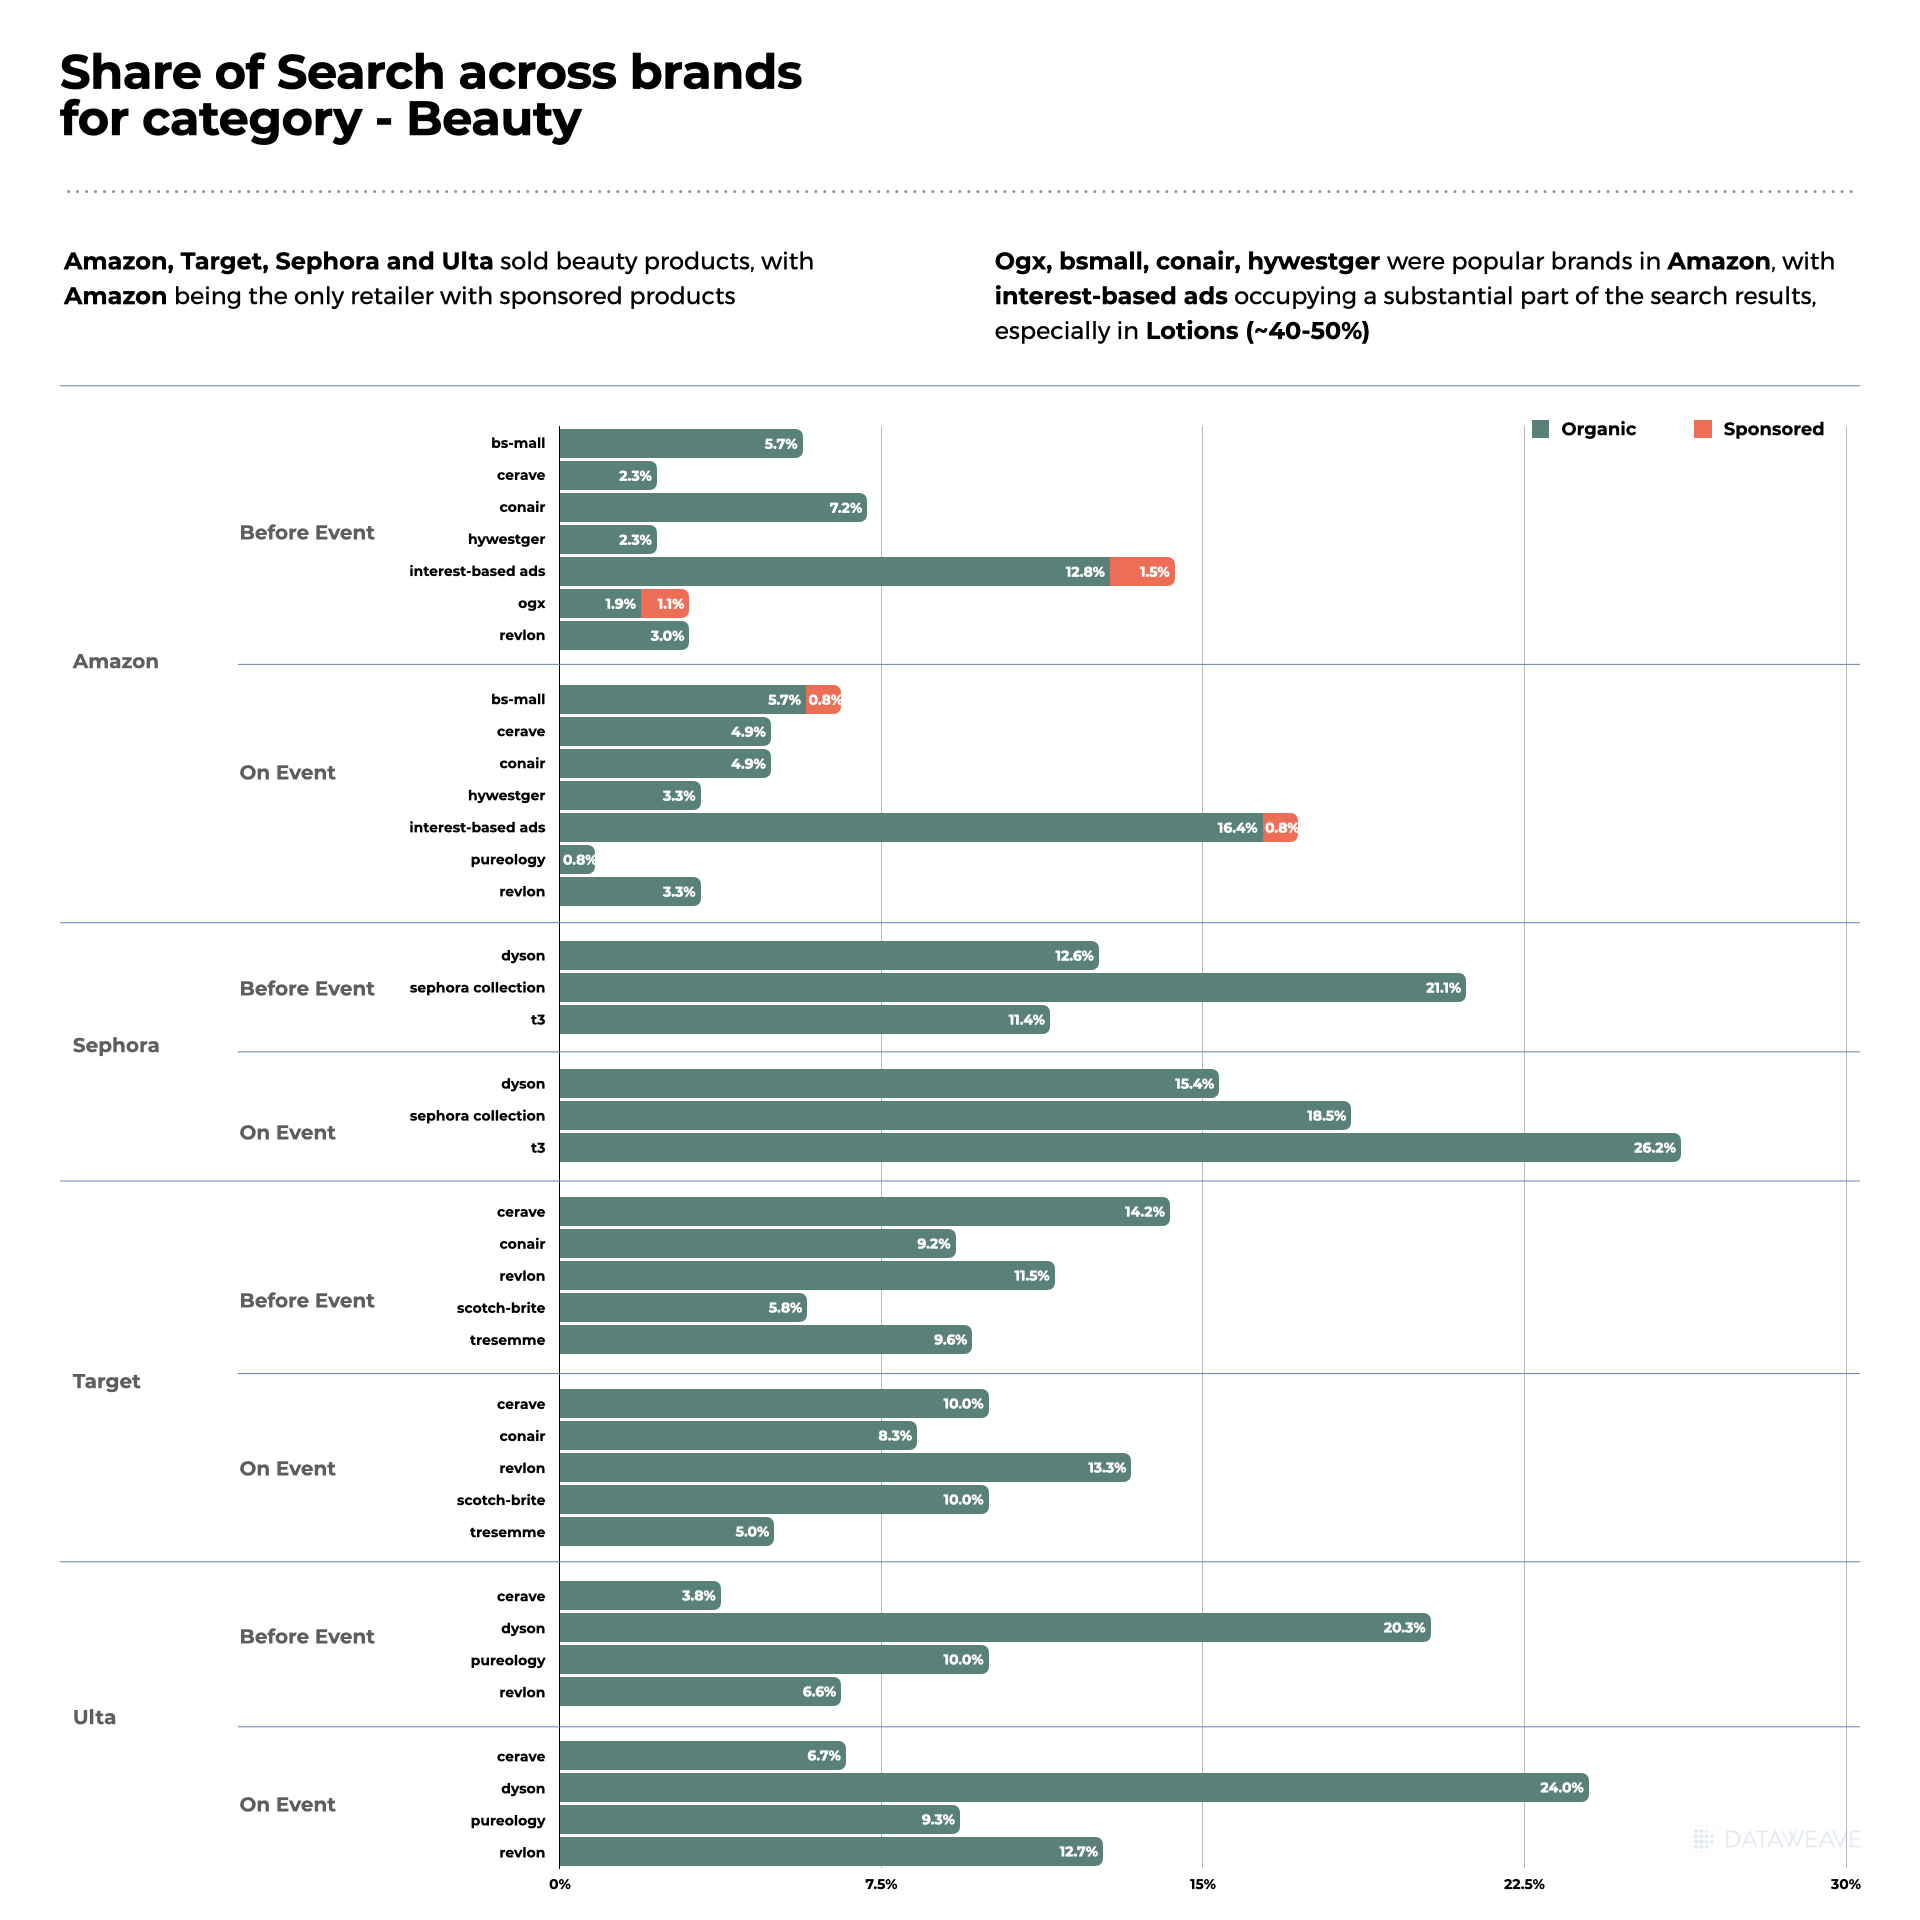
The Health & Beauty category is a favorite among consumers during Prime Day, as it encompasses a wide range of products like skincare, cosmetics, and grooming items. As shoppers often tend to stock up during the sale, brands and retailers are willing to offer competitive discounts and gain an edge over their competitors.
Our data reveals that the average additional discount on Amazon was 6.7%, offered on a little over a third of its assortment. Walmart reduced its prices sizably as well, by an average of 3.1% on 13.4% of its assortment.
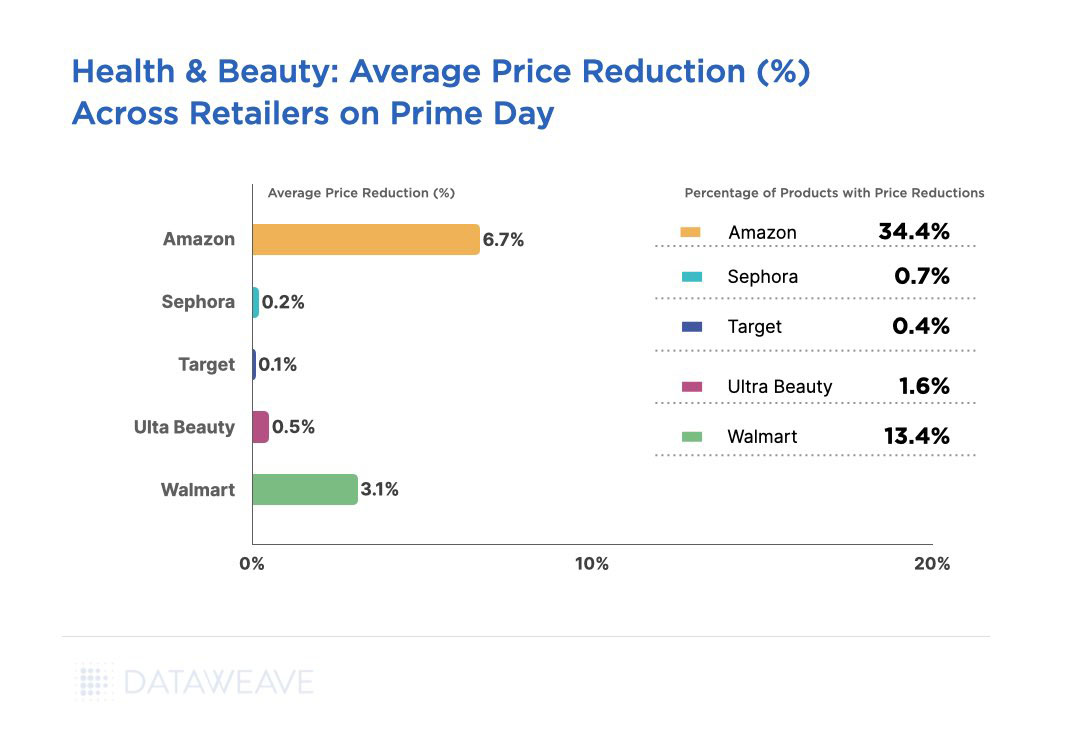
Interestingly, Sephora and Ulta Beauty, leading retailers in the Health & Beauty category did not compete on price at all this Prime Day. It is likely they are confident their loyal customer base will not be influenced by Amazon’s Prime Day deals and be driven away merely by lower prices. In addition, keeping their prices steady during Prime Day might have been a strategic choice to protect their brand reputation and premium positioning.
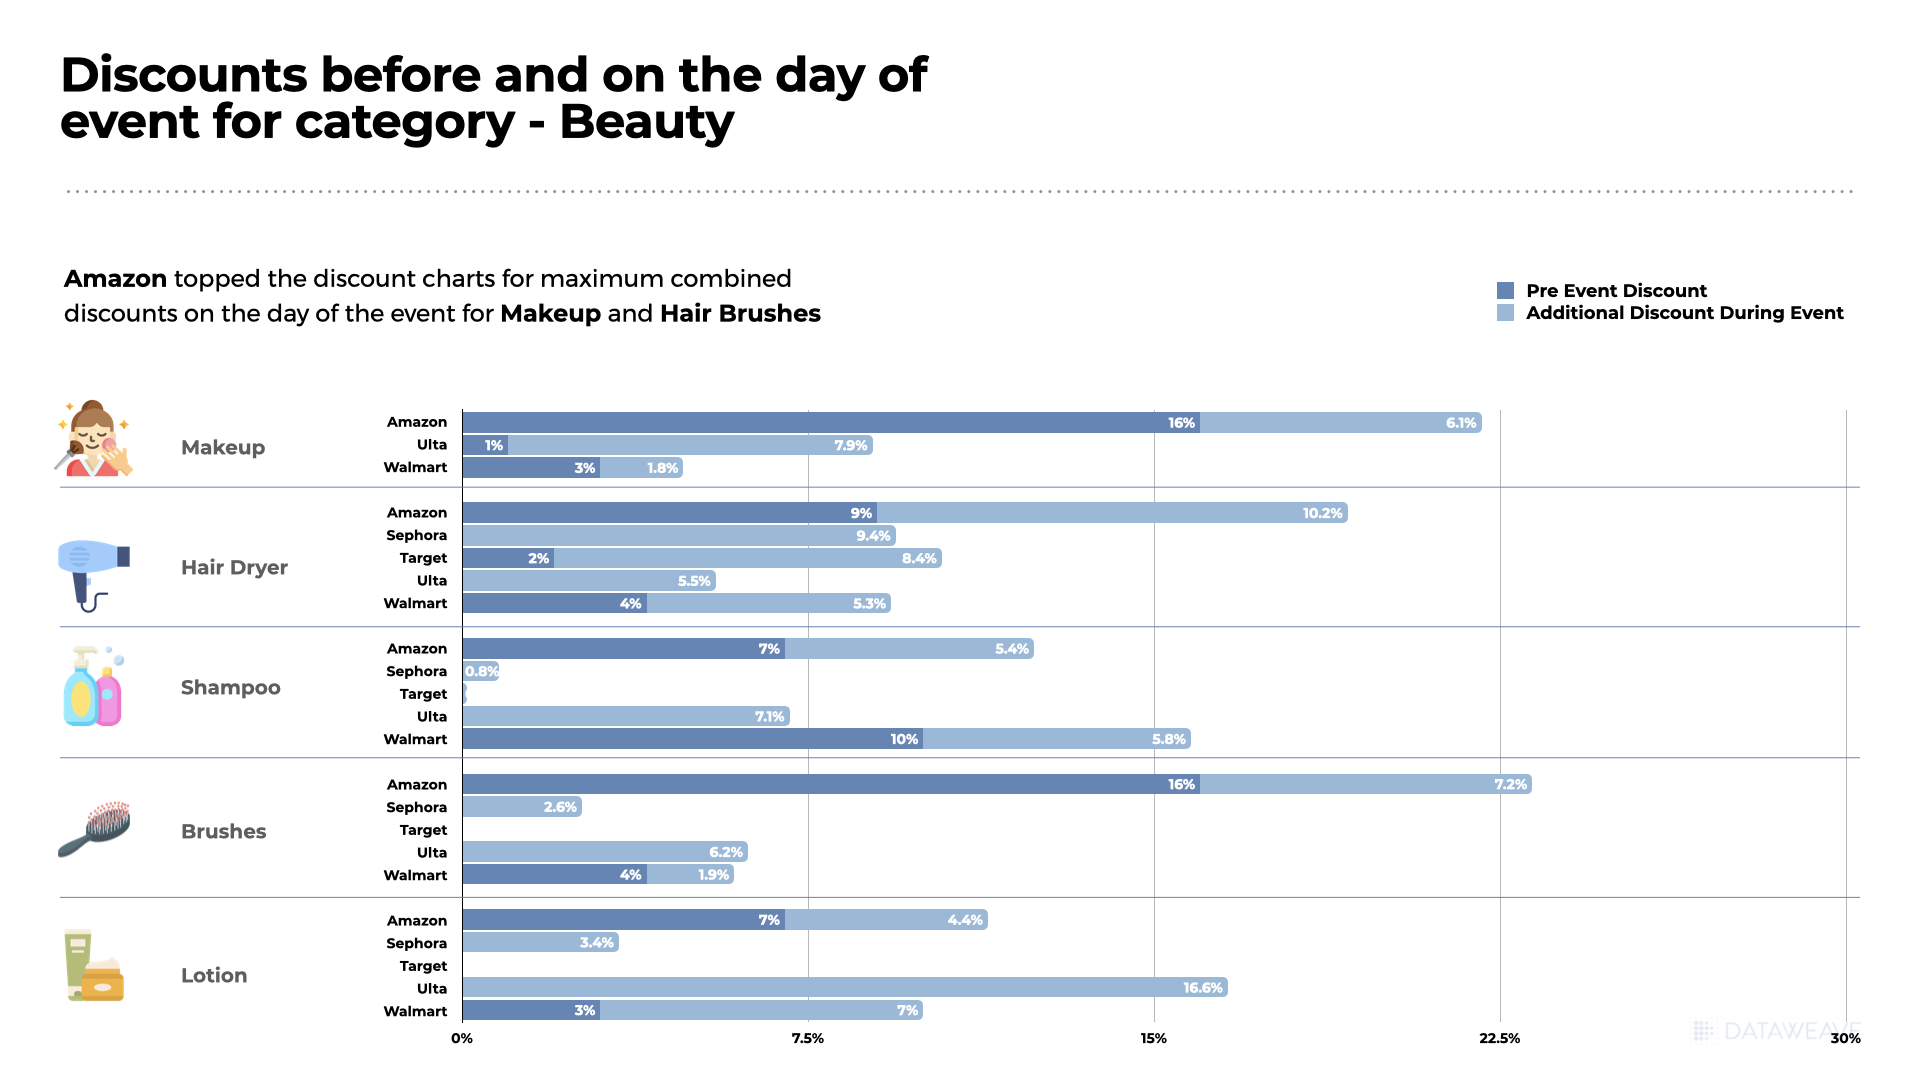
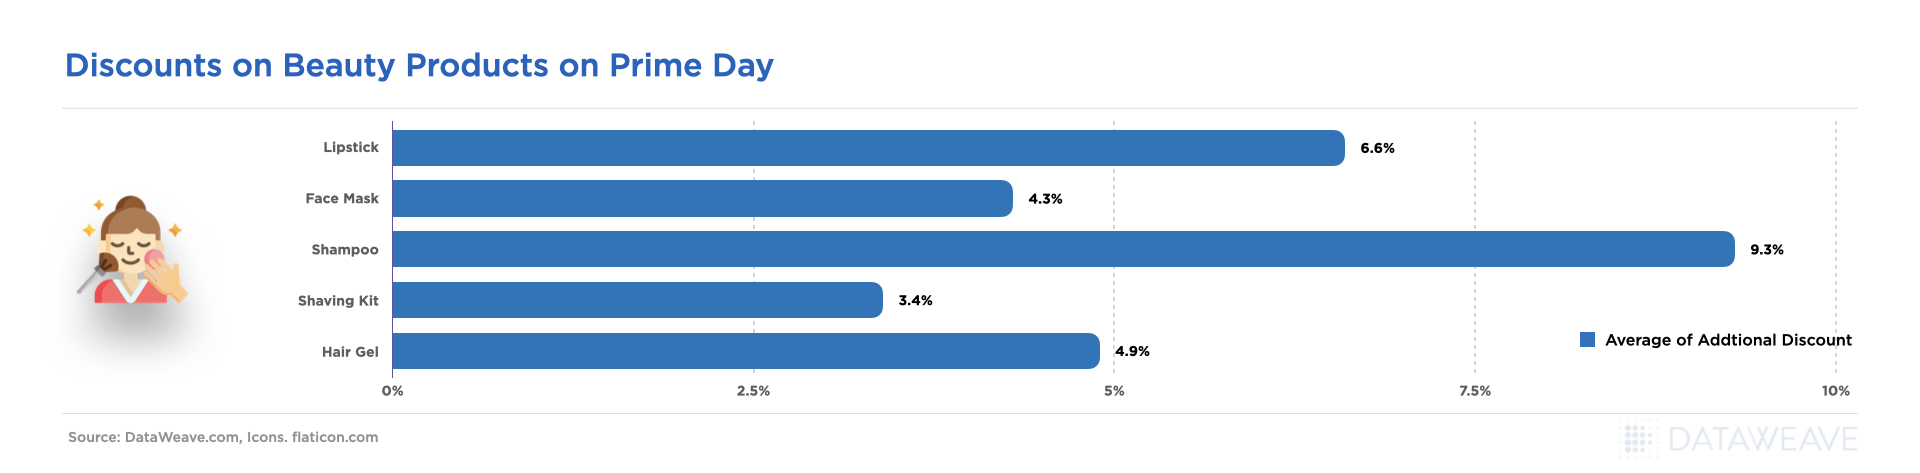
Relatively premium subcategories like Electric Toothbrushes (10%), Moisturizer (8.3%), Beardcare (7.3%), and Make Up (6.7%) saw the highest price reductions on Amazon.
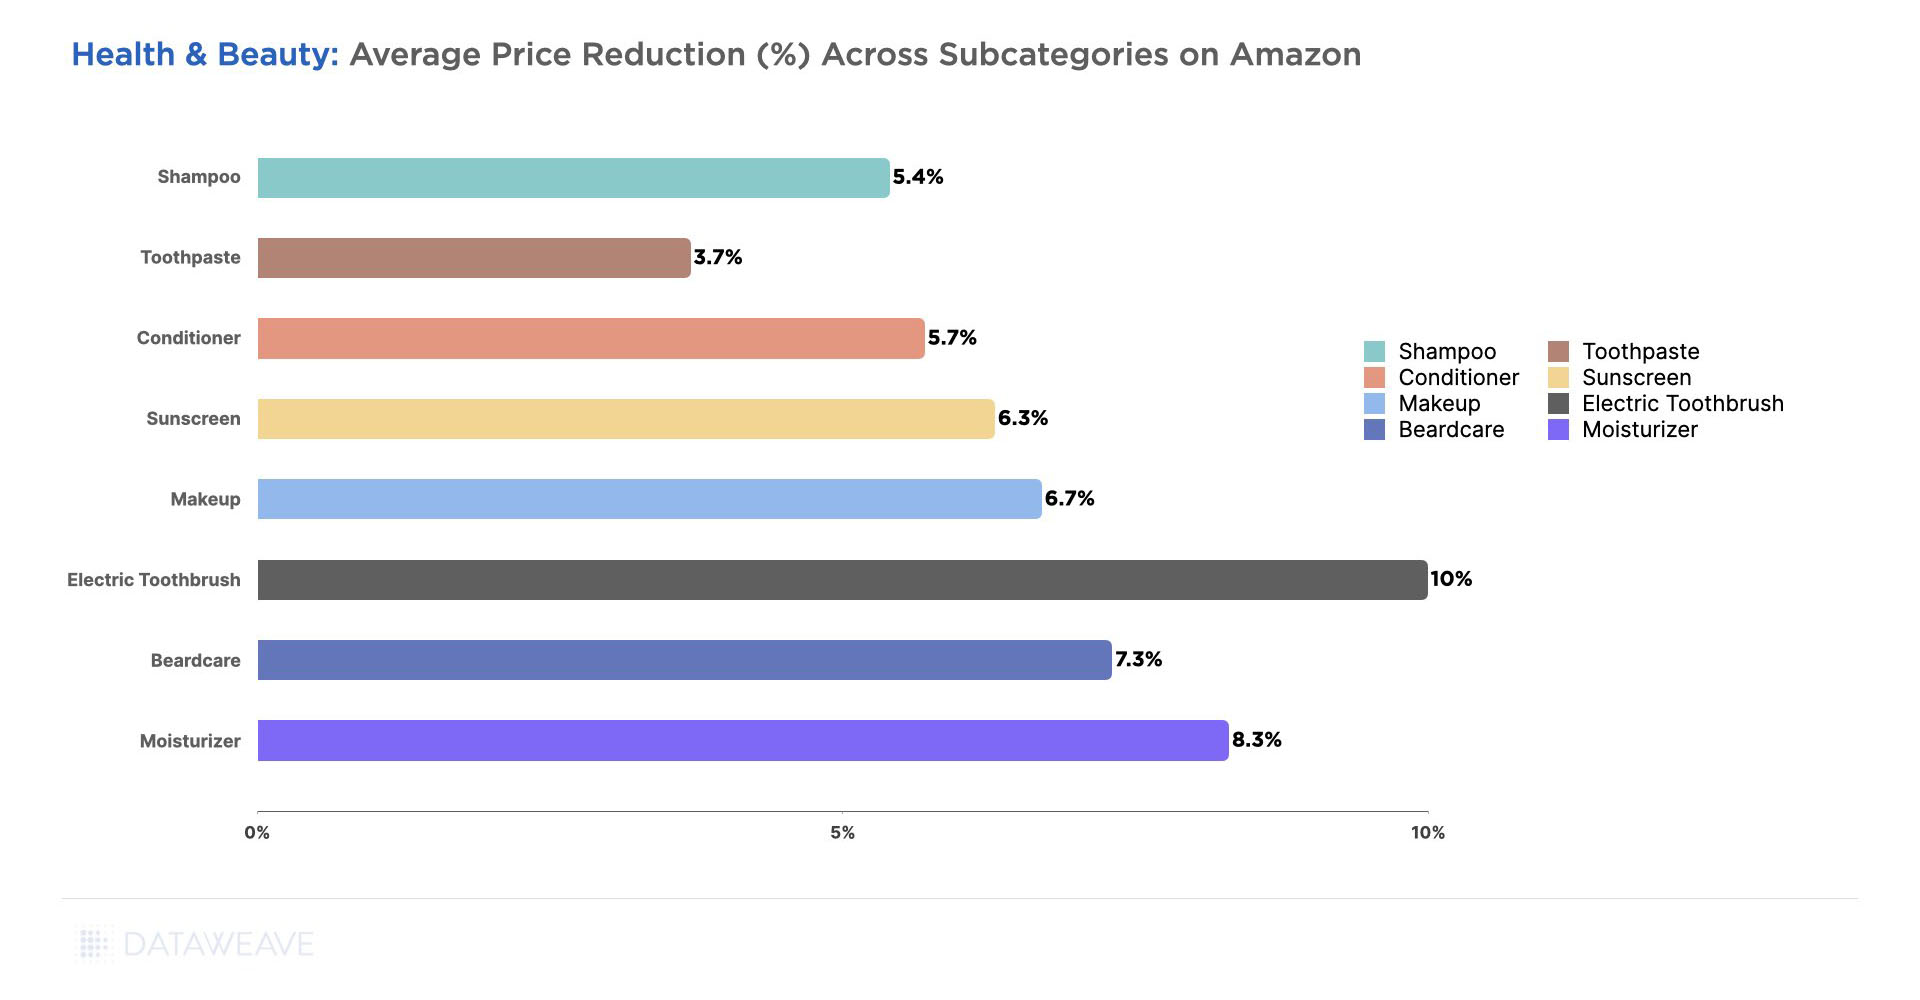
In contrast, staple items like Toothpaste (3.7%), Shampoos (5.4%), and Conditioners (5.7%) had lower markdowns.
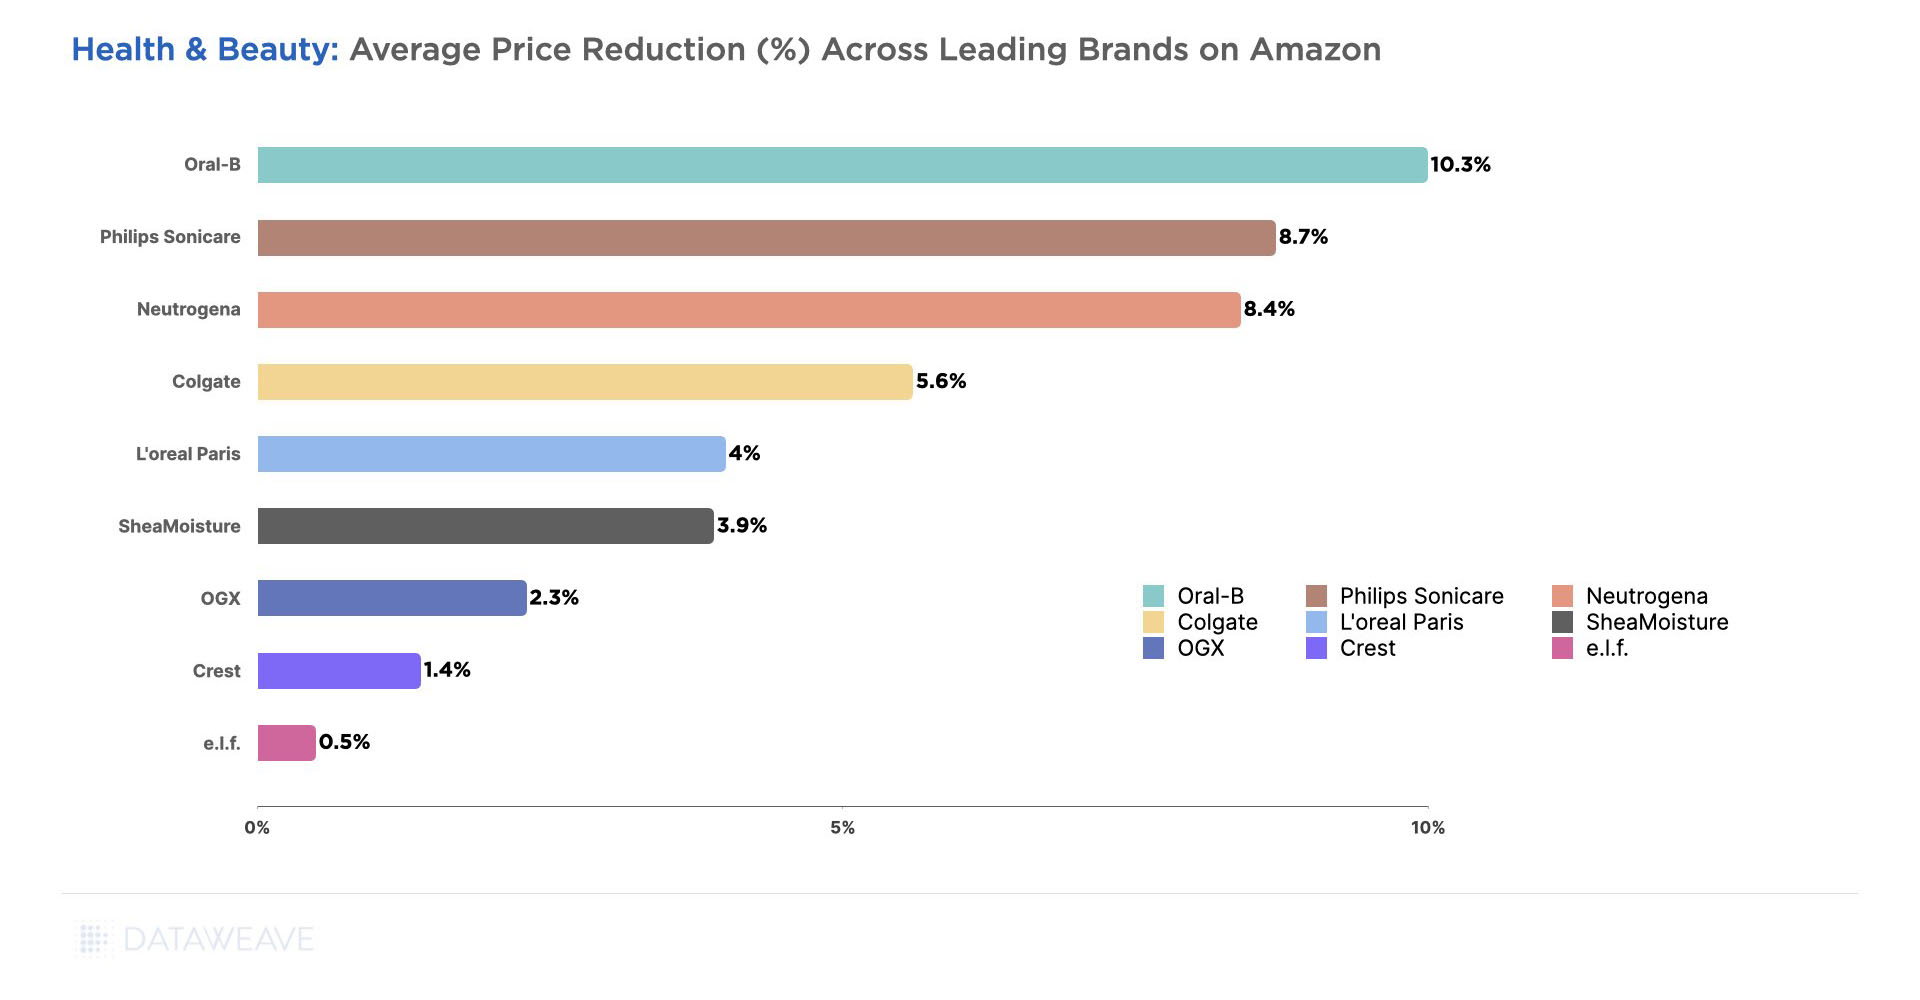
Among the leading brands in this category, Oral-B (10.3%), Philips Sonicare (8.7%), Neutrogena (8.4%), and Colgate (5.6%) offered the most attractive deals during the sale event.
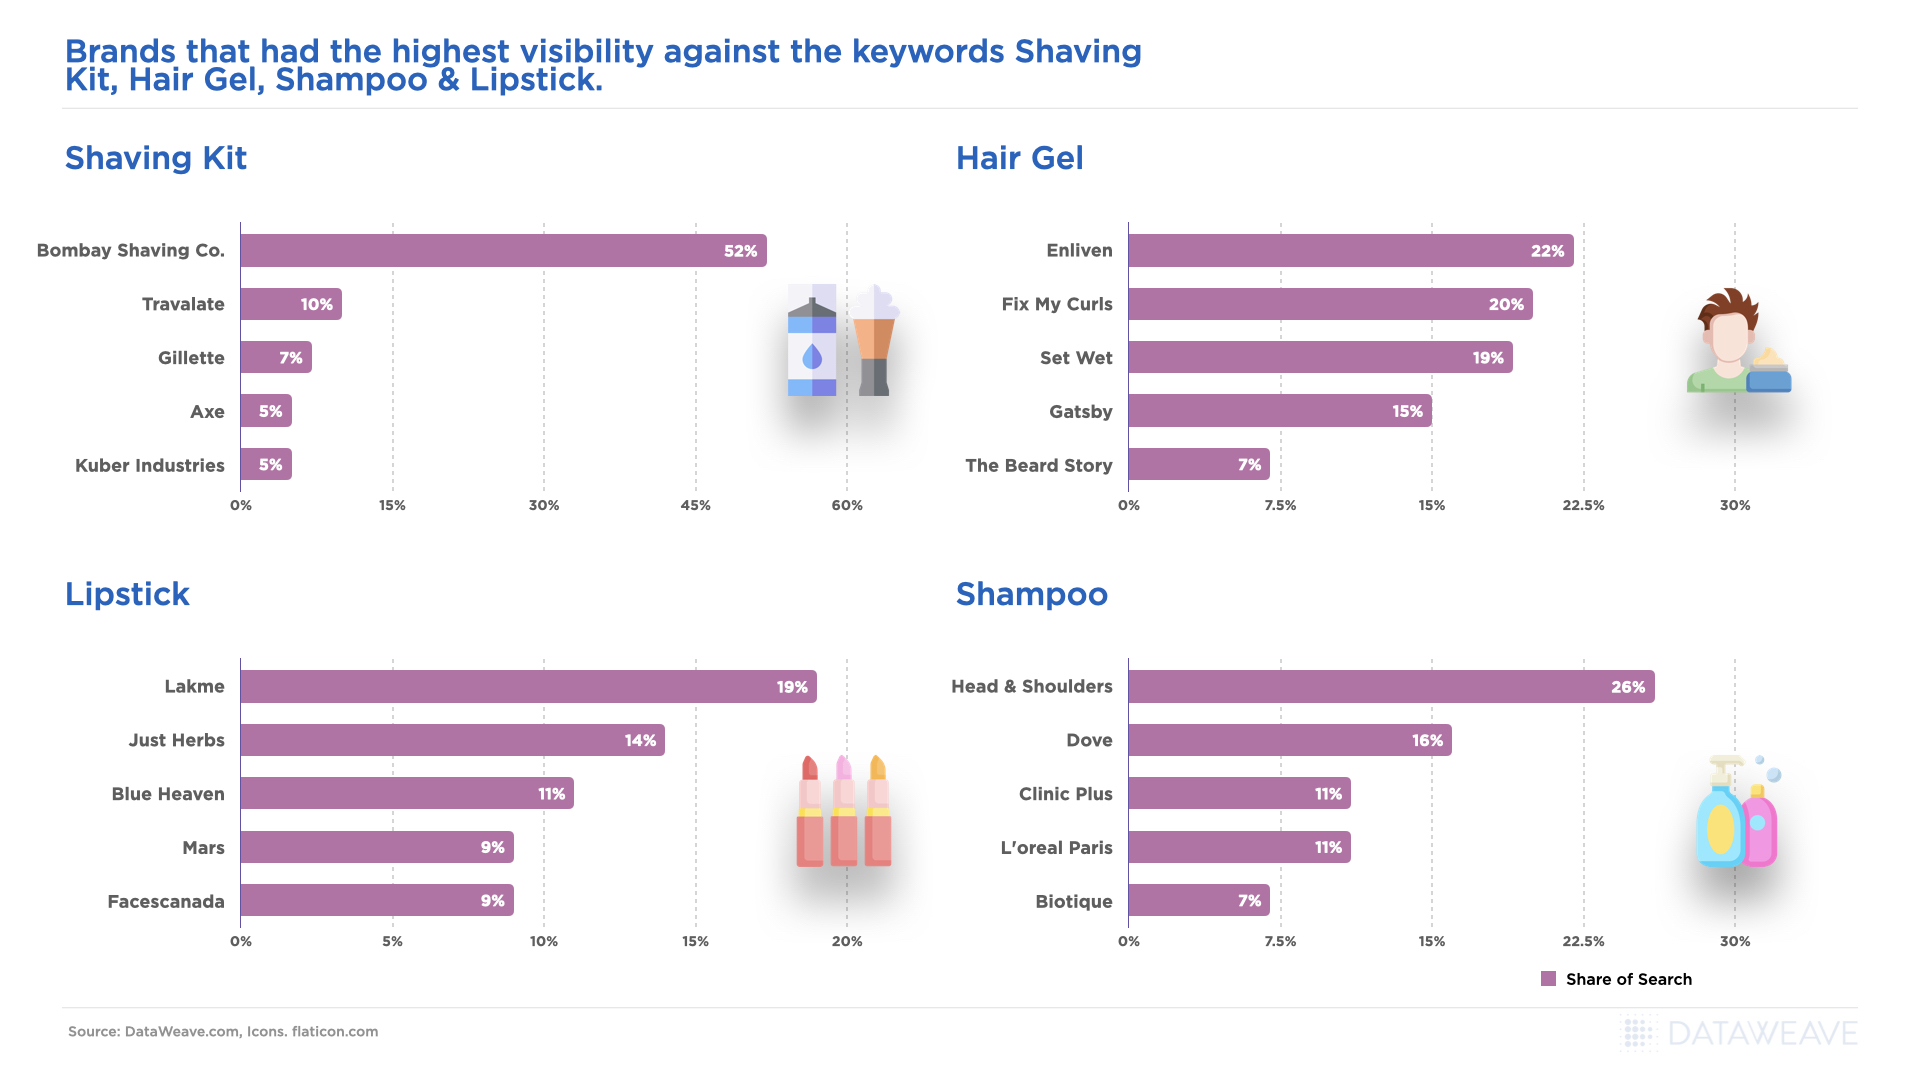
In terms of significant gains in Share of Search for brands, Oral-B in Electric Toothbrushes led the pack again. Neutrogena in Sunscreens and Somall in Toothpastes also gained more than 10% in their Share of Search during the sale event, followed by Tresemme in Shampoos and Airspun in Make-Up products.
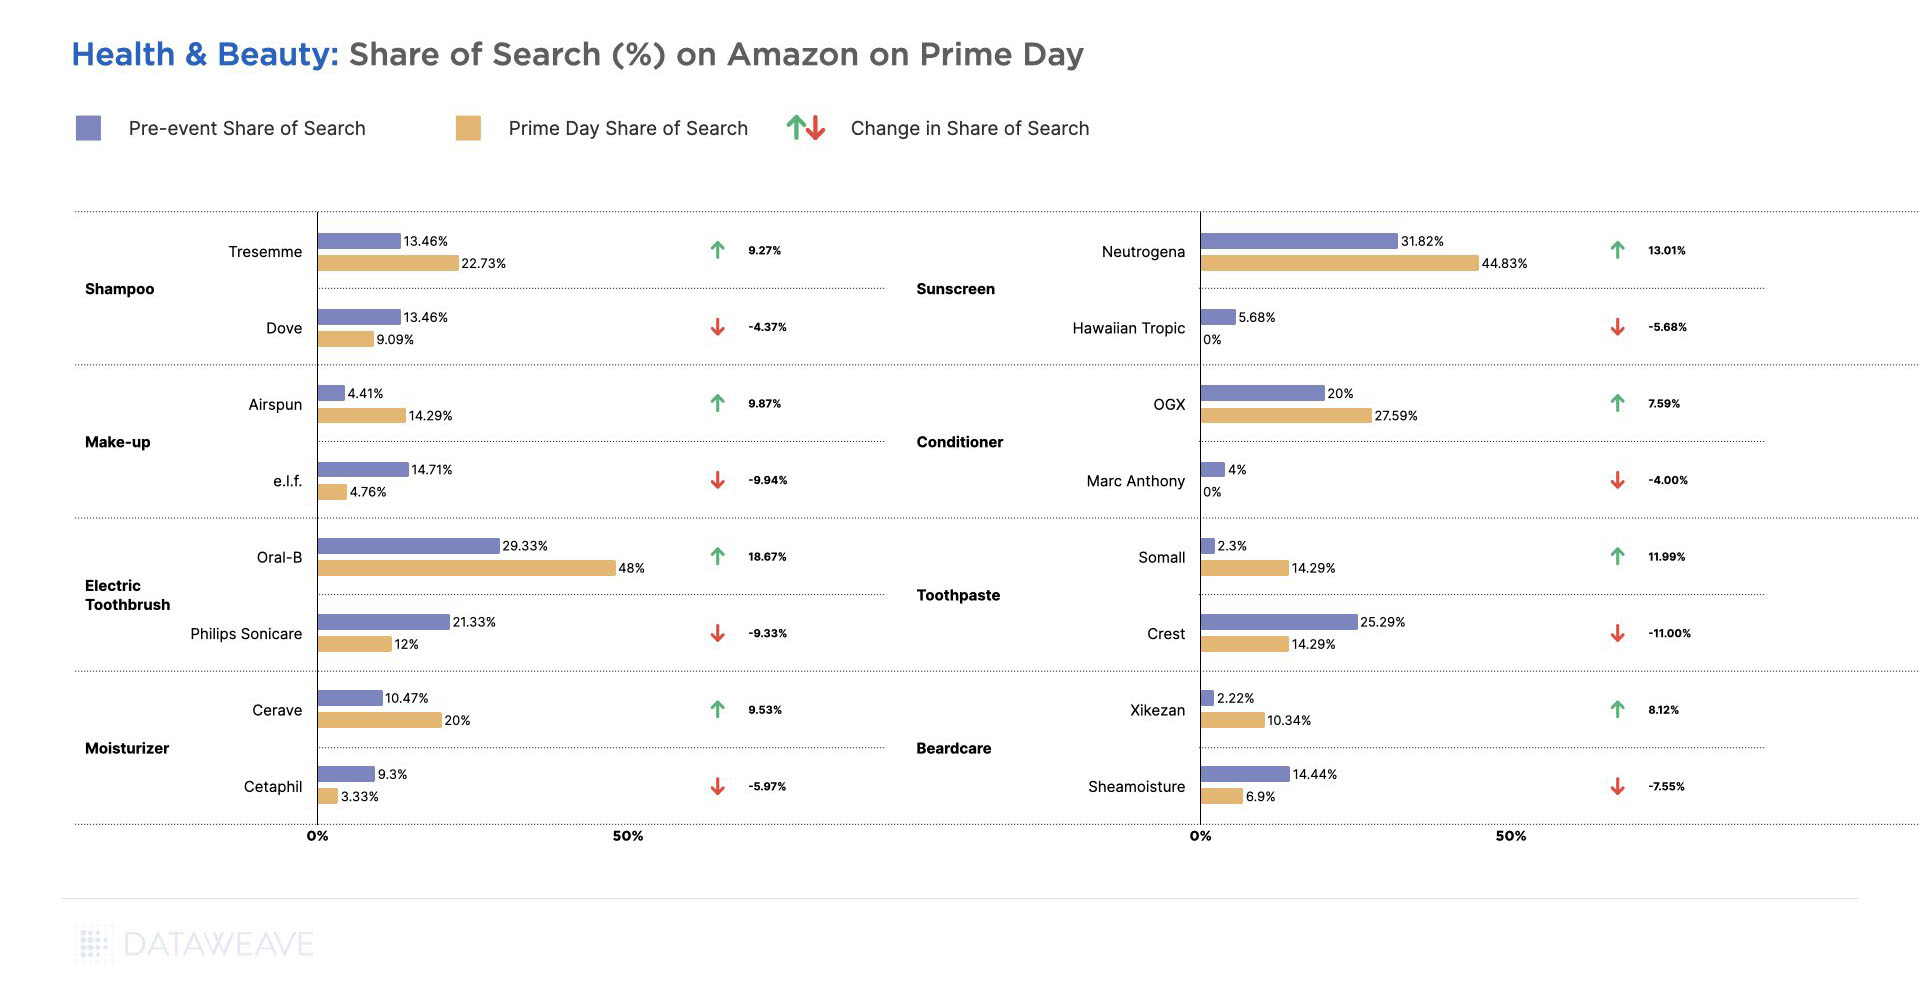
Other popular brands like Crest in Toothpastes, e.l.f in Make-Up, Philips Sonicare in Electric Toothbrushes, and Sheamoisture in Beradcare surprisingly had reduced visibility among the top search results for relevant subcategories.
Staying Ahead of the Curve During Sale Events
This Prime Day, Amazon leveraged its scale to offer aggressive discounts across key product categories, while several competing retailers chose to sit back and let the sale play out. Others chose a selective discounting strategy that focused their modest price reductions on a small set of items.
At DataWeave, we understand the pivotal role competitive pricing insights play in empowering retailers and brands to gain a competitive edge, especially during crucial events like Prime Day. For retailers, the ability to track competitor prices accurately, at scale, in a timely manner is essential to plotting and acting on impactful pricing strategies and staying ahead of the curve.
To learn more about how this can be done, reach out to us today!