Category: Product Assortment

  • eCommerce Performance Analytics for CPG Private Label

    eCommerce Performance Analytics for CPG Private Label

    The combination of economic uncertainty, inflation, and perceived affordability has increased consumer’s willingness to buy and try more private label products, challenging National brands to differentiate their eCommerce strategies, especially those related to price positioning, in other ways.

    Our previously released report, Inflation Accelerates Private Label Share and Penetration, confirmed 8 out of 10 brands with the highest SKU count carried across all grocery retailer websites to be private label, signaling the strength of their digital Share of Voice. Given the growing shift in consumer preference toward private label brands, we are providing access to the latest trends seen from September 2021 through March 2022. Below you will find a summary of what the data revealed about the growing presence of private label brands on the Digital Shelf.

    Private Label Account and Category Penetration

    We analyzed private label penetration at an account level to understand which private label brands have the greatest presence on retailer digital shelves, and to see which retailers may be leaving product assortment opportunities on the table.

    Private Label Penetration Across Retail Grocer Websites

    As a retailer, it is important to understand how your private label penetration stacks up against the industry average at a category level, especially given the performance tracked for retailers included within our analysis and the vast number of SKUs they offer online (over 20,000).

    Private Label Penetration by Category Across Retail Grocer Websites

    The Private Label and National Brand Price Gap Widens

    Private label brands tried out of necessity mid-pandemic increased in popularity as grocery prices continued to rise, providing an opportunity for retailers to increase brand affinity and loyalty for their online shoppers. Retailers alike were able to keep affordability at the forefront of their strategies and maintain a price gap of 23% or more, despite inflationary pressures to increase prices.

    Private Label / National Brand Price Gap by Retailer

    Looking at the results at a category level, we can see that Meat is the only category found within our analysis where private label brands are priced higher than National brands at an average of 8% greater. The Alcohol & Beverages category tends to always see the greatest price gap between private label and National brands given the price variances by unit (ranging from under $10 to over $100), in this case averaging a 148% price gap.

    Private Label & National Brand Price Gap by Category

    Private Label Total Basket Value Comparison Across Retailers

    While SKU-level pricing is extremely important to product strategy, for a retailer, it is equally as important to be as mindful of the total basket value even more so now as consumers further their private label loyalty across various categories. A few SKU-level missteps in pricing decisions can exacerbate cart abandonment and negatively impact shopper loyalty in a world where prices can be compared instantly in the palm of your hand.

    Based on our analysis, Walmart and H-E-B private label products offered the lowest priced total basket of goods at $42.90 and $45.06 respectively, whereas AmazonFresh and Safeway offered the highest total at $73.19 and $69.52 respectively.

    Private Label Item Level Price Comparison by Retailer

    Inflation-driven Price Changes are on the Rise with Room to Grow

    Based on the 20,000+ SKUs analyzed, we saw a continual price increase every month since September 2021 when comparing future monthly prices to those we tracked in September. The greatest price increase happened in March 2022 at 12.5% on average, however, there are still 48% of SKUs that have yet to see a price increase even as inflationary pressures rise.

    When viewing the split between National and private label brand price increases in March 2022 versus September 2021, we saw National brands increased prices on average by 13% where private label brand prices only increased an average of 7%.

    Private Label & National Brand Price Change
    Private Label & National Brand Price Change (%)

    Price decreases are still occurring across all categories, despite inflation, but to varying degrees ranging from 5% for Deli items to 17% for Dairy & Eggs. Within the Dairy & Eggs and Pantry categories, private label brands reduced prices for an additional 10% of total SKUs compared to National brands.

    The greatest category of opportunity for price increases within private label were found within Beauty & Personal Care with 67% of private label products yet to see a price change since September 2021.

    Price Change (%) by Category and Brand Type

    Private Label Price Change Correlation to Product Availability

    The category with the greatest magnitude of price increase seen within private label brands occurred within Baby at 16.3% followed by Home at 14.3% on average. Private label products within Home and Baby categories were also showing the lowest availability rates, 75.9% and 79.5% respectively, indicating a high demand for these items even as prices increased.

    The private label categories with the smallest price increase on average were Dairy & Eggs at 2.4% and Other Foods and Pantry at 3.4% and 3.6%, respectively.

    Private Label Price Change Magnitude & Availability
    Private Label Price Change Magnitude & Availability

    While in many accounts both private label and National brands struggled with stock availability in March 2022, National brand availability is much lower (around 10% on average) than private label availability.

    H-E-B had the lowest overall product availability at 76% across both private label and National brands on average. Only Walmart had lower availability for Private Label at 75% compared to 93% for National brands, but they also had the greatest price gap between private label and National brands.

    Private Label & National Brand Product Stock Availability

    The Future of eCommerce Growth for Private Label

    Our greatest learning from this analysis is that it’s time for retailers to start thinking and planning more like the National brands they carry when it comes to positioning their private label brands for success. Successful retailers are taking this time to reset their private-label strategies and transfer short-term switching behavior into long-term customer loyalty.

    Retailers playing catch up have the opportunity to address some of the gaps highlighted throughout this analysis, for example, relative to pricing and assortment changes. Below are some of the highlighted opportunities:

    • Though inflation is driving price hikes, more than 50% of products analyzed have yet to see a price increase indicating an opportunity to protect margin
    • Narrowing the price gap between a store’s brand and National brands should not be the only focus as competitive private label brands are becoming a greater threat at a category and basket level
    • Modifying and expanding assortments as demand increases for private label can improve customer retention and loyalty, especially for cross-shopping consumers

    According to The Food Industry Association (FMI), only 20% of food retailers currently promote private brands on their homepages, and only 48% include detailed product descriptions indicating even more opportunities left on the table for retailers to optimize private label digital performance.

    Many leading retailers are leveraging real-time digital marketplace insights and eCommerce analytics solutions like ours to further their online brand presence and optimize sales performance. This report highlights only a small sample of the types of near real-time insights we provide our clients to effectively build competing strategies, make smarter pricing and merchandising decisions, and accomplish eCommerce growth goals. Be sure to reach out to our Retail Analytics experts for access to more details regarding the above analysis.

    For access to a previously recorded webinar presented in partnership with the Private Label Manufacturers Association and conducted by DataWeave’s President and COO, Krish Thyagarajan, click here.

  • 9 Things to Build a Thriving Fashion eCommerce Brand

    9 Things to Build a Thriving Fashion eCommerce Brand

    According to the Statista Fashion eCommerce report 2021, the compound annual growth rate (CAGR) for online fashion is predicted to be 10.3% between 2018-2023. The widespread need for trendy fashion presents a challenge for fashion brands to succeed in a highly crowded and competitive space. With eCommerce shopping becoming more prevalent, fashion brands aren’t just competing for brick-and-mortar sales. Instead, they’re also competing for those late-night or impulse purchases from online customers.

    Looking to 2022 and beyond, this blog will highlight 9 things to build a thriving fashion eCommerce brand:

    1. Allow shopping on multiple channels

    Breakdown of Shopping journeys in Apparel
    Breakdown of Shopping journeys in Apparel

    Typically buyers from diverse age groups prefer different sales channels. Some prefer large retailers, and some choose web stores. If you know where your customers like to purchase your products, you can leverage the power of search engines and marketplaces to improve your sales. Multi-channel retailing helps fashion eCommerce brands to sell and promote products on a platform and device of the audience’s choice. 

    A brand should offer support and access to its products across all platforms, channels, and devices. It helps fashion brands to reach customers where they prefer to shop. If your customers prefer to shop on a computer or an app, your brand can offer a seamless customer experience. 

    2. Don’t sell on the Homepage

    Your online fashion store homepage is more about increasing credibility and trust among potential buyers. Your ideal home page shouldn’t display products or their prices. Instead, it would be best to integrate promotional and marketing strategies on the landing page to encourage visitors to explore your product categories and the rest of the website. You should have an intuitive interface that makes navigating the pages easier. You can also use the homepage to promote seasonal offers and new launches. Fashion brands can also display customer reviews, awards, brand achievements, and web security trust seals to increase the conversion rate.

    Don't sell on homepage
    Don’t sell on the homepage

    3. Product Descriptions with Unique Stories

    Product descriptions often get overlooked or underutilized even though they are important for eCommerce businesses. Your products won’t sell with spammy and same product descriptions. The modern product description is all about communicating a product’s worth and value with a story that captivates your buyer’s attention. Identify areas where your content & images don’t align with your product or represent it in the best light. Make sure to deliver an enhanced consistent brand experience across all online channels to improve your conversions.

    4. Focus on Review and Ratings

    Rating & Review of a fashion brand
    Rating & Review of a fashion brand

    Customer reviews have a huge influence on a buyer’s purchase decision, especially in the fashion industry. Encourage your consumers to leave reviews on your brand website. Reviews help fashion brands to build trust for their products and convert customers. Legitimate customer reviews help your shoppers to get crucial insights into what previous buyers liked or disliked about a particular product. 

    However, you should stay away from paid-for or false reviews usually encouraged by unscrupulous sellers as they are easy to spot and hurt your rankings. You must remember that receiving reviews also includes dealing with negative comments. They should be used to improve your upcoming product offerings. 

    5. Sell Looks

    Product can be combined with in the detail page
    The product can be combined with in the detail page

    Successful fashion brands don’t simply sell individual products. Instead, they sell complete looks that inspire shoppers to purchase the entire stylish look. As an online fashion brand, you’re not selling clothes; you’re selling an elegant collection of wearable art. When visitors reach your online store, you should appeal to their fantasies and sentiments through aesthetic look books that are both pleasing and congruent with your brand. Most successful online fashion shops are inspirational and visual. Look books help brands pair their previous season items or dead stock with new stock and increase sales. Brands can also share these look books on social media or in their monthly newsletters to increase reach. 

    6. Provide Promotions and Offers

    Fashion brands can take advantage of plenty of sales throughout the year, from New Year celebrations to Black Friday, Cyber Monday, and Christmas. Brands can leverage these high sales periods to sell looks and gift items to boost sales. Just make sure you’re measuring the effectiveness of your online promotions. Holiday and festive sales also offer an excellent opportunity to plan strategic discounts to get rid of old stock. Since trends in the fashion industry have been changing rapidly, you can use discounts to get rid of dead-stock or out-of-trend items each season. 

    7. Be active on social media

    Social media is a way to promote your brand, increase trust among your audience, and entertain your audience with exciting content. You can also engage the audience by providing gift coupons or giveaways. Brands can promote products while keeping their audience engaged with engaging content and promotional offers. 

    Social media is a great way to get influencer support, either organically or through a paid partnership. Brands have to focus on every element of social media marketing strategy, right from choosing a platform, creating Instagram/Facebook shops, jumping on trends/events, and tracking customer sentiment

    8. High-quality product photography

    Capture every detail of your product
    Capture every detail of your product

    Nothing is worse than ordering a piece of clothing online and not getting what you saw on the website. Not being able to accurately convey fashion products will hurt your bottom line. Fashion brands must use top-notch product photography that includes high-quality visuals, such as multiple angle views, 360-degree images of each product, accurate depictions of all color options, and the option to zoom in on product attributes.  

    High-quality product photography
    High-quality product photography

    A recent game-changer in the fashion industry has been including different sets of models to accurately feature clothes of various shapes, heights, and weights. Instead of displaying a dress in only one size, fashion brands can have multiple models wearing various sizes for the same article of clothing.  

    9. Stay up to date with new trends

    Fashion eCommerce brands have to be particularly careful of continuously updating their product offering with the latest fashion trends for each season. They can boost sales with an in-demand product assortment. Continuously updated fashion inventory signifies that the brand is up-to-date with the latest fashion trends in the market and has unique products to offer. You can always get creative with new styling, better looks, and personalized product recommendations. 

    Conclusion

    Fashion eCommerce is rapidly growing and transforming at a staggering rate as technologies continue to advance. Traditional fashion brands can now expand their reach from brick-and-mortar shops to digital and eCommerce platforms to reach shoppers across the globe. The new digital selling opportunities also come with considerable challenges – from staying up to date with ever-evolving trends to managing dead stock. 
    Are you a fashion brand that needs help monitoring your product content? Or measuring the effectiveness of your online promotions? Or decoding customer sentiment from reviews they’ve left for your products? Sign up for a demo with our team to know how DataWeave can help!

  • How Restaurants can use QSR Intelligence to Drive Sales

    How Restaurants can use QSR Intelligence to Drive Sales

    Quick service restaurants (QSR) are not only about delivering great food. They also have to overcome challenges like delivery, logistics, and affordable pricing, especially since covid-19 has staggered the entire industry. QSR intelligence helps restaurants get real-time insight into their performance across food delivery apps. With QSR intelligence, restaurants can identify the highest paying buyers across customer segments, demographics, and locations. Data-driven insights will help QSRs improve performance, decrease delivery time, optimize ad budget, and increase food quality – all with the goal to scale revenue and increase orders through food apps.

    The global fast food and quick service restaurant market are expected to grow at a CAGR of 5.1% from 2020 to 2027. The QSR industry is rapidly growing to encompass the changing needs of customers. 60% of U.S. consumers order delivery or takeout once a week and online ordering is growing 300% faster than in-house dining. With QSR intelligence, restaurants can get insights into metrics that will drive their profitability by helping them to fine-tune menus, enhance customer interaction, improve advertisements, and adjust inventory.

    Benefits of QSR Intelligence

    Continuous in-depth analysis of restaurant statistical data will help companies spot trends and devise strategies to improve sales via food apps. Here are a few benefits of QSR intelligence:

    a.    Improve estimates & minimize wait times

    QSR intelligence can help with accurate sales forecasting. With big data, restaurants can track their popular dishes or combos for various meal times to minimize wait times and increase delivery speed. It can also inform restaurants about upcoming trends, especially during holidays and festivals. Keeping an eye for trends will play a significant role in maximizing efficiency during food preparation and ensuring accurate food delivery ETAs.

    b.    Location-based promotions

    QSR intelligence allows restaurants to target customers based on their proximity to the restaurant. The food must be delivered at a particular time to the customers to enjoy the dish at the right temperature. QSRs can apply demographic intelligence to determine cancellation rates, delivery charges, and the proportion of demand and supply. These metrics will help QSRs to improve location-based promotions.

    c.    Increase ROI on deliveries

    To increase return on investment through food deliveries, QSRs can track metrics like location-based promotions, various payment options, ratings, etc. Tracking these metrics will help QSRs offer accurate ETAs, improve operational efficiency, and personalize services, which will increase revenue. Restaurants will also be able to understand where they can adjust their profit margins to increase revenue while maintaining a cumulative level of success.

    How to use QSR Intelligence

    a.    Assortment and availability

    The more restaurants can understand what and how their customers eat, the better they will be prepared to service those demands throughout the day. For example, QSRs can calibrate the menu, ingredients availability, and kitchen preparation time depending on their customers’ orders for lunch and dinner. This also helps optimize daily workflow, such as reorganizing staff to lower labor costs, optimizing the supply chain for ingredient delivery, and revamping the menu to offer better dishes. Another way to ensure your availability is to analyze your busiest hours and adjust the staff and delivery workforce accordingly. For example, if your customers tend to order more during breakfast, it’s worth considering opening your restaurant a bit earlier.

    QSR availability across 4 Food Delivery apps
    Availability across 4 QSR Food Delivery apps
    Availability trend during peak hours - Lunch & Dinner
    Availability trend during peak hours – Lunch & Dinner

    b.    Delivery time

    One of the most driving factors for the success of QSR is delivery time. Restaurants have to ensure the food is delivered as quickly as possible so customers can consume it at the right temperature. Data-driven insights can help restaurants track repeat addresses, find shortcuts or time-saving routes, and avoid unfamiliar or low delivery locations.

    QSRs have to analyze the entire delivery process from time taken to order on the app, how quickly kitchens can prepare orders, hand over to delivery partners, and get them to the customers. An essential part of QSRs is throughput, the speed at which they can process and deliver orders. During peak hours like lunch and dinner, faster service and quick ETAs ensure that customers do not choose other restaurants. If you have different menus for breakfast and other meals, ensure that your foodservice app can remove such menus when they are not available.

    Delivery Time Analysis
    Delivery Time Analysis
    Delivery Fee Analysis
    Delivery Fee Analysis

    c.    Pricing and Promotions

    QSRs have to understand customers’ price sensitivity while determining delivery costs and ensuring profitability for the business and delivery partners. Customers might look for free deliveries but not adding delivery charges might lead to loss. A deep dive into common transaction data across the locations will allow restaurants to understand the price sensitivity of all customer segments, helping them make intelligent pricing decisions.

    QSR intelligence can also help restaurants determine which delivery locations are most profitable. This helps to adjust the delivery radius, fee, and promotions. Restaurants can offer promo codes, coupons, referral codes, etc., to attract customers and encourage repeat purchases.

    d.    Discoverability

    Restaurants have to ensure that their dishes are on the first-page listing. With QSR intelligence on category analysis, keyword optimization, and competition analysis, restaurants can help their customers discover dishes. This also includes optimizing listings for pricing and rating and delivery fees and availability during peak times such as breakfast, lunch, and dinner.

    e.    Advertisement Optimizer

    QSRs can use data to optimize the advertisement budget and adequately improve return on investment. They can track the visibility of advertisement banners across locations and optimize them for different times of the day. Data analysis can also help restaurants understand which customer segments are more likely to convert to long-term loyalists. This data will help QSRs design personalized campaigns and align advertisement budgets while converting them to long-term customers, further improving the bottom line.

    Ad spends by identifying carousels with the highest visibility
    Ad spends by identifying carousels with the highest visibility
    Track QSRs performance across Carousels across multiple zip codes
    Track QSRs performance across Carousels across multiple zip codes

    f.     Growth & Expansion

    Upselling and cross-selling are two popular tactics that improve growth for quick-service restaurants. However, that requires a rich understanding of customers’ price sensitivity, preferences, and behavior. QSR intelligence can provide information about which upsell and cross-selling offers a customer segment is likely to value and which optimal channels for distributing the offer.

    Conclusion

    Quick service restaurants can track critical data points and use them to increase revenue and improve customer experience. Learning how to price, promote, and deliver food to customers during a pandemic can be challenging. QSR intelligence will help brands attract the right clientele, adjust inventory, reduce overall marketing costs, and increase order rates. This will also help increase customer loyalty across segments which can, in turn, increase the number of returning customers and profitability.

  • Valentine’s Day eCommerce Insights

    Valentine’s Day eCommerce Insights

    Access to these types of real-time digital marketplace insights can enable retailers and brands to make strategic decisions and help drive profitable growth in an intensifying competitive environment. Be sure to reach out to our Retail Analytics experts for access to more details regarding the above analysis.         

  • Quick Commerce in 2022: An Era of Hyperlocal Delivery

    Quick Commerce in 2022: An Era of Hyperlocal Delivery

    Busy lifestyles, urbanization, aging populations, and smaller households led to the preference for convenience and efficiency in eCommerce deliveries. However, the Covid-19 pandemic caused a massive shift in customer demand and buying decisions. The modern consumer journey moved from takeaway food to online shopping to quick or same-day deliveries. With evolving digital touchpoints, customers now favor fast deliveries and convenience. 

    According to a 2020 survey by KPMG in the UK, 43% of consumers chose next-day delivery, a 4% increase from last year. Interestingly, 17% of consumers abandoned a brand if they faced a longer delivery. Standard delivery time has shortened from 3 to 4 days and two-day shipping to next-day or same-day delivery. This increasing trend of quick delivery has led to the boom of quick commerce or Q-Commerce. Quick commerce or on-demand delivery refers to retailers that deliver goods in under an hour or as quickly as 10 minutes. The rise of Q-commerce is caused by changing consumer behavior and rising expectations since the pandemic. 

    In this blog, you’ll learn about quick commerce or Q-Commerce and its benefits. You’ll also read about factors to consider for quick commerce and tips to implement this business model. 

    1. What is Quick Commerce?

    on-demand delivery
    On-Demand Delivery

    Quick commerce or on-demand delivery is a set of sales and logistics processes that empowers eCommerce businesses, restaurants, grocery chains, and manufacturers to deliver products in less than 24-hours. A study shows that 41% of consumers are willing to pay for same-day delivery while 24% of customers will pay more to deliver their items within a one- or two-hour window.  

    Changing lifestyles and customer behavior directly impacted the rise of Q-Commerce. The takeaway food industry had used quick commerce for many years. But with Q-Commerce businesses consistently cutting delivery time, quick commerce for instant grocery delivery has become a new trend. For instance, India-based online grocery delivery firm Grofers rebranded to BlinkIt amid rising competition, promising 10-minute instant delivery. 

    2. How quick is Quick Commerce?

    The post-pandemic lifestyle & the rise in the number of small and single-person households has led to an increase in demand for products in small quantities that need to be delivered sooner than later. Sometimes in as little as 10 minutes! This trend is oriented towards specific products such as packed or fresh foods, Groceries, Food delivery, Gifts, Flowers, Medicines to name a few.

    quick delivery service
    Quick Commerce Categories

    Local shops that can reach more customers with less friction have swapped traditional brick-and-mortar warehouses to cater to an urban population. These online Q-Commerce stores can deliver goods from favorite stores and offer a vast choice of products that are available 24/7. However, it requires real-time inventory management, data-driven pricing management, innovative logistics technology, a fantastic rider community, and a proper assortment. 

    3. Factors to consider for Quick Commerce

    q commerce
    Competitive Assortment & Pricing

    a. Assortment

    With growing competition, getting product assortment right isn’t easy for quick commerce businesses, yet it’s critical to their success. To optimize assortment for quick commerce stores, they need to understand how demand differs between demographics and various stores. Since quick delivery involves packed and fresh products, it is even more essential to carry a unique assortment for each store. 

    Data analytics will help Q-Commerce businesses understand which products are repeatedly purchased in every store. It also helps identify high-demand gaps in your competitors’ platforms. Assortment analytics can help distinguish shifts in customer behavior across short- and long-term demands. The key to increasing sales is shaping inventory to match the overlap between market opportunity and consumer interest. With assortment analytics, they can determine the optimal mix of products for their daily inventory. 

    b. Pricing

    Pricing information is readily available on quick commerce businesses, allowing customers to compare prices before making purchase decisions. Before deciding on a product, shoppers actively track the best deals on platforms across various Q-Commerce delivery platforms. According to a survey, 31% of consumers rated price comparisons as the essential aspect of their shopping experience. Understanding price perception can help quick commerce companies to optimize their pricing strategy while remaining competitive. 

    A competitive pricing strategy does not imply that Q-Commerce businesses have to cut prices. Instead, it’s about adjusting prices relative to your competitors but not significantly impacting the bottom line. Competitive pricing provides real-time pricing updates, allowing quick commerce platforms to drive sales by nailing their pricing strategy. 

    c. Delivery Time

    delivery time
    Grocery Delivery Race In India

    Delivery time has become the game-changer in quick commerce, with platforms fighting over shorter delivery times. Unpredictable factors such as specific delivery windows, last-minute customer requests, and traffic congestion can wreak havoc in your planning. Optimizing your delivery time can improve operational efficiency through faster delivery, quick route planning, and driver monitoring. 

    Big eCommerce platforms like Amazon offer same-day or next-day delivery to prime members with no extra fee on minimum order criteria. The only demand of customers who do not worry about discounts or lower wholesale prices is quick delivery. The demand for quick delivery services has led to many global retailers offering same-day delivery to meet those expectations.

    d. Demand Forecasting

    Since quick commerce is a viable solution for certain products, businesses must determine what customers want and when they want it. Q-Commerce businesses can use historical data to predict future sales patterns with demand forecasting. It ensures that Q-Commerce businesses can limit wastages and their inventory can cater to a targeted market. Demand forecasting also helps to replenish stock based on real-time data. Furthermore, companies can identify bottlenecks and points of wastage in the supply chain with a demand-driven system in place.

    4. Benefits of Quick Commerce

    same day delivery
    Q-Commerce Benefits

    a. Competitive USP

    Q-Commerce businesses get new value propositions because customers that need immediate delivery are willing to try new brands and order from new stores. It also allows online Q-Commerce businesses to compete with global marketplaces and brick-and-mortar stores. 

    We at DataWeave have helped quick-service restaurants (QSRs) that are going the Q-Commerce route & selling via food aggregator apps to increase their revenue significantly. Our AI-Powered Food Analytic solutions have helped QSRs diagnose improvement areas, monitor key metrics, and drive 10-15% growth. Our data has helped them understand availability during peak times, monitor product visibility by region, track competitors, and choose suitable banners for promotion. Read more about that here.

    b. Increase margins

    A study from Deloitte suggests that 50% of online shoppers spend extra money to get convenient delivery of the products they need during the pandemic. These customers also paid extra for on-demand fulfillment and bought online pick-up in-store options. 

    Since the assortment of products in quick commerce is relatively small, Q-Commerce businesses can drive sales for their most profitable product lines. There is a potential for greater margins because wealthier demographics often require convenience. For instance, time-stranded professionals value convenience over discounts. 

    c. Customer experience is paramount

    With quick commerce, retailers can meet customer expectations and exceed them, fostering brand loyalty. Quick commerce addresses customer pain points such as running out of food before a small party or getting a birthday present for your friends. It can simply help people who cannot make it to the shop or stock up essentials.

    5. How to implement Quick Commerce

     quick delivery
    Implementation of Quick Commerce

    a. The need for local hubs

    To pack and deliver products in under an hour, businesses must be located close to the customers. Therefore, quick commerce relies on local warehouses that can serve customers in immediate proximity. Since the duration of two-wheelers is less likely to be impacted by heavy traffic or parking spaces, delivery services employ riders to deliver products.

    b. Ensure you have the right analytics in place

    Another essential part of running a quick commerce business is to have a web or phone application that can facilitate online ordering and offer accurate stock information to customers. Q-Commerce businesses also need a real-time inventory management tool that will provide insights into stock levels and allow for quick reordering and redistribution of products. This will also prevent deadstock and stockouts. 

    DataWeave’s Food Delivery Analytics product suite helps companies to increase order volumes, understand inventory, and optimize prices. It also provides access to discounts, offers, delivery charges, inventory, and final cart value across all your competitors. 

    c. It’s all about stock availability & assortment

    Q-Commerce in the Grocery Delivery space is excellent for specific product niches like packed or fresh foods and vegetables, drinks, gifts, cosmetics, and other CPG products that customers use every day.

    The stock assortment is as important in the Food Delivery space with restaurant chains like McDonald’s or Burger King that generate as much as 75% of their sales from online orders. These businesses have to make sure they’re carrying the most in-demand product assortment there is. 

    Conclusion

    same day delivery
    Same Day Delivery

    The rise of quick commerce represents the next big change in eCommerce, accompanied by a shift in consumer behavior towards online grocery shopping and food ordering. When positioned with proper assortment and pricing, instant delivery services can allow Q-Commerce businesses to capture the influx of consumers looking for speedy delivery. By tapping into big data from quick commerce markets, Q-Commerce businesses can gain insights into consumer demands. 

    If you’re a Q-Commerce business in the Food Delivery or Grocery Delivery space, reach out to our experts at DataWeave to learn how our solutions can help you understand the best Pricing Strategy, Delivery Time SLAs, Assortment Mix you need in order to successfully sell on Q-Commerce platforms. 

  • 2021 Cost-Push Inflationary Trends Ran Rampant, Impacting Holiday Discounts

    2021 Cost-Push Inflationary Trends Ran Rampant, Impacting Holiday Discounts

    Business has been anything but usual this holiday season, especially in the digital retail world. The holiday hustle and bustle historically seen in stores was once again occurring online, but not as anticipated given the current strength of consumer demand and the reemergence of COVID-19 limiting in-store traffic. While ‘Cyber Weekend’, Thanksgiving through Cyber Monday, continues to further its importance to retailers and brands, this year’s performance fell short of expectation due to product shortages and earlier promotions that pulled forward holiday demand.

    Holiday promotions were seen beginning as early as October in order to compete with 2020 Prime Day sales, but discounting, pricing and availability took an opposite direction from usual. This shift influenced our team to get a jump start on our 2021 digital holiday analysis to assess how drastic the changes were versus 2020 activity, and to understand how much of this change has been influenced by inflationary pressures and product scarcity.

    Scarcity Becomes a Reality

    Our initial analysis started by reviewing year-over-year product availability and pricing changes from January through September 2021, leading up to the holiday season, as detailed in our 2021 Cyber Weekend Preliminary Insights blog. We reviewed popular holiday categories like apparel, electronics, and toys, to have a broad sense of notable trends seen consistently throughout various, applicable marketplaces. What we found was a consistent decline in product availability over the last six months compared to last year, alongside an increase in prices.

    Although retailers significantly improved stock availability in November and early December 2021, even digital commerce giants like Amazon and Target were challenged to maintain consistent product availability on their website as seen below. While small in magnitude, there is also a declining trend occurring again closer toward the end of our analysis period, post Cyber Weekend, across all websites included in our analysis.

    Inventory Availability 2021 Holidays
    Source: Commerce Intelligence – Product Availability insights for Home & Garden, Jewelry & Watches, Clothing & Shoes, Bed N Bath, Lighting & Ceiling Fans categories

    Greater Discounts, Higher Prices?

    With inflation at a thirty-nine year high, retailers and manufacturers have realized they can command higher prices without impacting demand as consumers have shown their willingness to pay the price, especially when threatened by product scarcity. Our assessment is that while some products and categories have responded drastically, manufacturers’ suggested retail prices (MSRPs) have increased nearly seven percent on average from January to December 2021. MSRP adjustments are not taken lightly either, as this is an indication increased prices will be part of a longer-term shift in product strategy.

    2021 MoM Retail Inflation Tracker
    Source: Commerce Intelligence – Pricing Insights for Bed & Bath, Electronics, Furniture, Healthy & Beauty, and Fashion categories on Amazon.com & Target.com each month in 2021 comparing price increases from January 2021 base

    Our 2021 pre-Cyber Weekend analysis reviewed MSRP changes for select categories (Bed & Bath, Electronics, Furniture, Healthy & Beauty, and Fashion) on Amazon and Target.com, and found around forty-eight percent of products on Amazon and thirty-five percent of products on Target.com have increased their MSRPs year-over-year, but kept pre-holiday discount percentages the same.

    Looking more specifically as to what year-over-year changes occurred on Black Friday in 2021, we observed MSRPs increasing across the board for all categories at various magnitudes. This indicates why 2021 discounts appeared to be greater than or equivalent to 2020 for many categories, when in reality consumers paid a higher price than they would have in 2020 for the same items.

    2021 Black Friday MSRP Increases
    Source: Commerce Intelligence – MSRP Pricing Insights for Bed & Bath, Electronics, Furniture, Healthy & Beauty, and Fashion categories on Black Friday November 27th, 2021, versus average MSRP pricing for the same SKU count from November 20-26th 2021

    On Amazon.com, categories like health & beauty have already increase MSRPs by a much greater percentage and magnitude versus Target.com leading up to and during Black Friday 2021, while other categories like furniture have increased MSRPs evenly on average across both retail websites. The below chart cites a few specific examples of year-over-year SKU-level MSRP, promotional price, and discount changes within found within the electronics, furniture, fashion, and health & beauty categories.

    Black Friday 2021 vs. 2020 SKU-level Price Changes
    Source: Commerce Intelligence – MSRP Pricing Insights for Bed & Bath, Electronics, Furniture, Healthy & Beauty, and Fashion categories on Black Friday November 27th, 2021, versus average MSRP pricing for the same SKUs on Black Friday November 26th, 2020.

    Fewer, but Deeper Discounts

    From October through early November 2021, fewer products were discounted compared to this same period in 2020, and the few that were saw much deeper discounts apart from the home improvement category. The most extreme example we saw in discounts offered was within furniture where only three percent of SKUs were on discount in 2021 compared to twenty-six percent in 2020. Interestingly, the magnitude of discount was also higher pre-Cyber Weekend 2021 versus 2020, but this trend was not exclusive to furniture and was also seen within electronics, health & beauty, and home improvement.

    Pre-Black Friday 2021 and 2020 SKUs on Discount and Magnitude
    Source: Commerce Intelligence – Pricing Insights for Bed & Bath, Electronics, Furniture, Healthy & Beauty, and Fashion categories on Amazon.com & Target.com Pre-Black Friday average selling price during November 20-26th 2021 versus average selling price from November 13-19th 2021 compared to Pre-Black Friday average selling price during November 19-25th 2020 versus average selling price from November 12-18th, 2020.

    Within the furniture category, the subcategories offering the greatest number of SKUs with price decreases on Black Friday 2021 were rugs by a wide margin, followed by cabinets, bed and bath, and entertainment units, but the magnitude of discounts offered were all under twenty percent.

    2021 Black Friday Furniture Category Price Decreases
    Source: Commerce Intelligence – Pricing Insights for Bed & Bath, Electronics, Furniture, Healthy & Beauty, and Fashion categories on Amazon.com and Target.com on Black Friday November 27th, 2021, versus average pricing for the same SKUs from Pre-Black Friday November 20-26th 2021 and Black Friday November 26th, 2020, versus average pricing for the same SKUs from Pre-Black Friday November 19th-25th 2020

    Accounting for this phenomenon could have been retailers’ attempts to clear inventory for SKUs which hadn’t sold even during the period of severe supply chain shortages. With more products selling at higher prices this year, retailers were also able to use fewer SKUs with greater discounts to attract buyer in hopes of filling their digital baskets with more full-priced goods, helping to protect margins heading in to Cyber Weekend. Scarcity threats also encouraged consumers to buy early, even when not on promotion, to ensure they would have gifts in time for the holidays.

    The same trends seen pre-Cyber Weekend 2021 were also seen on Black Friday with a year-over-year decrease in the percentage of SKUs offered on discount versus 2020, and steeper price reductions for the discounted products which can also be attributed to the increase in MSRPs.

    Black Friday 2021 and 2020 SKUs on Discount and Magnitude
    Source: Commerce Intelligence – Pricing Insights for Bed & Bath, Electronics, Furniture, Healthy & Beauty, and Fashion categories on Amazon.com and Target.com on Black Friday November 27th, 2021, versus average pricing for the same SKUs from Pre-Black Friday November 20-26th 2021 and Black Friday November 26th, 2020, versus average pricing for the same SKUs from Pre-Black Friday November 19th-25th 2020

    2021 Black Friday Price Increases?

    We all know Black Friday is all about price reductions, discounts and deals and so it’s rare to see actual price increases, yet for Black Friday 2021, trends ran counter to this. We observed price increases across all categories for around thirteen to nineteen percent of SKUs, with an average price increase of around fifteen percent in 2021 versus an average of only two percent in 2020.

    SKUs with Price Increases Black Friday 2021 and 2020
    Source: Commerce Intelligence – Pricing Insights for Bed & Bath, Electronics, Furniture, Healthy & Beauty, and Fashion categories on Amazon.com and Target.com on Black Friday November 27th, 2021, versus pricing for the same SKUs from Pre-Black Friday November 20-26th 2021 and Black Friday November 26th, 2020, versus average pricing for the same SKUs from Pre-Black Friday November 19th-25th 2020

    At an account level, we noticed a few interesting differences happening on Black Friday 2021 versus 2020 regarding category price changes. On Target.com, almost ninety percent of the bed and bath SKUs analyzed had a price change on Black Friday in 2021 versus 2020 with eighty-two percent presenting a higher price year-over-year versus only around seven percent showing a decrease, where on Amazon nearly forty-four percent of bed and bath SKUs showed an increase in price and around thirty-eight percent showed a decrease. Except for the health and beauty category on Target.com, more than half of the SKUs in each category saw a price increase on Black Friday versus a price decrease.

    2021 YoY Price Changes on Black Friday
    Source: Commerce Intelligence – Pricing Insights for Bed & Bath, Electronics, Furniture, Healthy & Beauty, and Fashion categories on Amazon.com and Target.com on Black Friday November 27th, 2021, versus average pricing for the same SKUs on Black Friday November 26th, 2020.

    The magnitude of year-over-year price changes seen on Black Friday 2021 was significant across all categories, but the magnitude of price increases found on Amazon.com within the health and beauty category outpaced the rest by far. We reviewed three hundred and sixty-five SKUs on Amazon.com within the health & beauty category and saw almost eighty-three percent of them had a price change with around thirty-one percent decreasing prices and around fifty-two percent increasing prices. This means that within the health & beauty category on Amazon.com, more than fifty percent of the SKUs tracked were sold at a one hundred and seventy-six percent higher price on average during Black Friday 2021 versus 2020.

    Magnitude of Black Friday 2021 Price Increases
    Source: Commerce Intelligence – Pricing Insights for Bed & Bath, Electronics, Furniture, Healthy & Beauty, and Fashion categories on Amazon.com and Target.com on Black Friday November 27th, 2021, versus average pricing for the same SKUs on Black Friday November 26th, 2020.

    The subcategories offering the greatest number of SKUs with price increases on Black Friday 2021 were cameras, followed by men’s fragrances, laptops, and desktops & accessories, but the magnitude of discounts offered were all under ten percent.

    2021 Subcategories with Price Increases during Black Friday
    Source: Commerce Intelligence – Pricing Insights for Bed & Bath, Electronics, Furniture, Healthy & Beauty, and Fashion categories on Amazon.com and Target.com on Black Friday November 27th, 2021, versus pricing for the same SKUs from Pre-Black Friday November 20-26th 2021 and Black Friday November 26th, 2020, versus average pricing for the same SKUs from Pre-Black Friday November 19th-25th 2020

    The Aftermath Post-2021 Cyber Weekend

    Extending this analysis beyond the holiday weekend, we analyzed price change activity from December third through the ninth across the top US retailers (chart below) and found that price decreases have been very minimal, comparatively speaking. Though there was a spike in number of price decreases from December 8th to the 9th, the percentage of SKUs with price decreases was still very low (less than three percent). We anticipate this trend will continue into 2022.

    SKUs with Price Decrease Post Cyber Weekend 2021
    Source: Commerce Intelligence – Pricing insights for Home & Garden, Jewelry & Watches, Clothing & Shoes, Bed N Bath, Lighting & Ceiling Fans categories

    A Sign of Things to Come

    A confluence of inflationary trends, product shortages and consumer liquidity have driven many marketplace changes to occur simultaneously. Government programs in the form of stimulus checks, have put extra money in consumers’ hands, and so they’ve been more willing to spend. That, coupled with the shock in the supply chain, has motivated people to buy far ahead of the 2021 holiday season. Hence, retailers have needed to rely much less on across-the-board discounts. Promotions have been more strategic – we’ve seen deeper discounts over fewer products, likely used to draw consumers in to buy certain items, and once they’re there, customers are buying everything else at a non-discount level. When these factors once again normalize, we could see a return to the “race to the bottom” that has occurred since the financial crisis of 2008-2009, but for once, retailers may be able to maintain some pricing power as the 2021 holiday shopping season played out.

    Even though performance was not as anticipated and holiday sales did not grow as rapidly as they did in 2020, Cyber Monday was still the greatest online shopping day in 2021. Through it all, retailers managed to keep their digital shelves stocked and orders filled in time for the holidays for the most part, running the risk of housing aged inventory if goods didn’t arrive in time. Despite predictions for steep promotions in January 2022, with supply chains still challenged and inflationary pressures still full steam ahead, we don’t anticipate much in the way of enhanced discounts to continue beyond the holidays.

    Access to these types of real-time digital marketplace insights can enable retailers and brands to make strategic decisions like how and when to address inflationary pressures, while also supporting many other day-to-day operations and help drive profitable growth in an intensifying competitive environment. Continue to follow us in the coming weeks for a detailed 2021 year-end review across more retailers and categories. Be sure to reach out to our Retail Analytics experts for access to more details regarding the above analysis.         

  • 6 Promotional Strategies for the Holiday Season

    6 Promotional Strategies for the Holiday Season

    For eCommerce companies, holidays are the busiest season of the year. Whether creating brand awareness with your marketing campaigns or freshening up your landing pages or finding new ways to segment & understand your customers, the list of tasks seems endless. It’s the time of the year when most people look forward to shopping for friends and family. 

    The holiday shopping season begins with Black Friday and Cyber Monday and leads to the December holidays, including Christmas and New Year. Consequently, proper planning and marketing are essential for a successful holiday season. 

    In fact, holiday sales during November and December are forecasted to be between $843.4B – $859B, up 10.5% over 2020, according to the National Retail Federation (NRF). For online stores specifically, sales are predicted to increase between 11% – 15% to a total of between $218.3B and $226.2B driven by online purchases.

    This guide will share eight promotional strategies retailers can use during the holiday season. We will also discuss how data analytics can help retailers improve their promotional strategies. 

    Using data analytics to guide promotional strategies

    Promotional Strategies
    Promotional Strategies

    Data is the foundation of every successful marketing campaign. Data analysis helps companies understand which graphics worked well and campaigns that generated the most revenue. Gathering data and running analysis helps companies improve their next marketing campaign. Retailers can also get deeper insights into campaigns/channels with the highest conversion rate or average order value (AOV).

    With data analytics, retailers can prioritize campaigns and channels that resonate the most with their customers this holiday season. But, it would be best to try more than one promotional strategy to ensure you double down on what works without placing all of your eggs in one Christmas-themed basket. 

    Here are four ways that data analytics can help guide promotional strategies:

    a. Customized alerts for listing pages

    Data analysis helps retailers determine if certain products are out of stock on their rival’s website and adjust their own pricing accordingly. It allows retailers to grab market share for trending items. For example, if you get an out-of-stock alert for a particular product at competitors’ stores, you can invest more in advertising that product on your online store. In addition, customized alerts keep retailers informed about their inventory status, allowing them to plan promotions and ads. They can see which products are becoming commoditized due to intense competition and which ones offer better revenue opportunities. 

    Learn how DataWeave can help retailers track their competitor’s stock and inventory status.

    b. Maximize conversions by tracking product trends

    Assortment Analytics
    Assortment Analytics

    Customers are always looking for products that are currently trending. With assortment analytics, eCommerce companies can get insights into hot trends, allowing them to stock in-demand categories and products. Integrating assortment analytics with AI-powered image analytics can also provide insights into attributes that are popular among customers. By filling gaps in their current assortments, retailers can improve conversion rates and increase revenue. 

    Here’s a case study on how DataWeave helped Douglas, a luxury beauty retailer in Germany boost sales by building an in-demand product assortment 

    c. Monitor competitor promotions

    Promotional Insights
    Promotional Insights

    With increased competition and consumer demand for deals, it has become important for retailers to monitor their competitor’s promotions. Monitoring promotions helps retailers to optimize their ad spend accordingly. AI-powered image analysis tools can capture important information from competitors’ ad banners and deliver insights into metrics that are working to deliver sales. 

    Here’s how DataWeave can help retailers make their marketing magnetic with competitive promotional insights

    d. Optimize margins with a data-driven pricing strategy 

    Pricing Intelligence
    Pricing Intelligence

    It has become challenging to price products in recent years since digital tools enable price transparency across channels. Although this trend is excellent for consumers, it makes competition fierce for retailers. A data-driven pricing strategy incorporates a variety of factors, including industry needs, competitor analysis, consumer demand, production costs, and profit margins. 

    With data-driven competitive pricing, retailers can keep pace with the changing eCommerce environment with real-time pricing updates. It also helps them optimize margins and quickly respond to changes in prices on rival stores. 

    Promotional Strategies for the Holiday Season

    a. Virtual Webrooms

    When customers want to see a product in-person, they go to a store showroom. It helps them make a purchase decision. However, with the Internet, eCommerce companies can bring this tactic online. The only difference between showrooming and webrooming is that the former takes in-person, whereas the latter happens digitally. Webrooming grew in popularity during the COVID-19 pandemic. Instead of spending weekends browsing stores, consumers took to the Internet for most of their product research.

    A webroom allows customers to explore products from every angle, providing them with the complete in-person showroom experience online. Webrooming is a powerful holiday marketing strategy, especially regarding expensive purchases. Customers prefer to understand how the product will look. However, building a webroom is extensive and requires retailers to hire developers and professional photographers.

    Webrooms allow retailers to share their collections, schedule virtual appointments, share 3D product images, set up virtual fitting rooms for clothing products, and accept purchase orders. For example, in 2015, Tommy Hilfiger launched its first digital showroom in Amsterdam to improve sustainability and minimize its carbon footprint. Through remote wholesale selling and digital product creation, a digital showroom helped Tommy Hilfiger transform the buying journey and retail value chain.

    b. Loyalty-rewarding sales and perks

    Loyalty Rewarding
    Customer Loyalty

    Consider building customer loyalty during your holiday promotions. First, encourage your holiday shoppers to become loyal customers by offering bonus rewards, contests, or giveaways when they sign up for your loyalty program. You can encourage them to purchase right away by providing instant discount coupons or points for a reward to redeem on their next purchase. For maximum impact, you should run this promotion throughout the holiday season. 

    Second, you should attract your current loyalty program members with discount codes. Offer free shipping or provide a one-day-only discount code to ensure your customers choose you during their last-minute purchases. With these rewards, you’ll attract customers who are window shopping and simultaneously bring your loyal customers back throughout the holiday season.

    c. Charitable Tie-Ins

    AmazonSmile
    AmazonSmile

    Research shows that customers are four times more likely to purchase from brands with a strong sense of purpose. With the festive season being the time of giving, working with a charity and giving back to your community is a great way to reach out to customers. 

    After a tough one and half years because of the pandemic, people want to give back and help those in need this holiday season. You can partner with a non-profit and run campaigns that allow customers to give back. It’s also great for sharing your brand mission with your customers. For instance, Amazon allows customers to shop from AmazonSmile, which donates 0.5% of their eligible Charity List purchases to a selected charity, at no extra cost to the customers. 

    Consider partnering with an organization within your industry. For example, you can pair up with a non-profit that collects and gives clothes to the needy if you sell clothes. You can involve customers by asking them to exchange old dresses for coupons or cash discounts. 

    d. Omni-channel customer experience

    Omni-channel marketing provides customers with a seamless, consistent, and cohesive experience over multiple marketing channels. Omnichannel marketing aims to provide a meaningful and cohesive experience that inspires your customers to make a purchase. Unlike multichannel marketing, this strategy puts the customer at the center of marketing campaigns and elevates the cross-channel customer experience. 

    Omnichannel shoppers spend 10% more money and purchase 15% more items than the original shoppers. eCommerce companies can use historical data to analyze successful channels and create a more transparent marketing strategy for the holiday season. Omnichannel analytics will provide a holistic picture of customer data that will help retailers to better meet the customer’s requirements and predict inventory. 

    e. Buy now, pay later (BNPL)

    Buy Now Pay Later
    Buy Now Pay Later (BNPL)

    Technically, buy now, pay later isn’t a promotional idea since your customers will still be paying the full price. However, BNPL allows them to delay their payments and not pay in full right away at checkout. Buy now, pay later needs to be on every eCommerce company’s holiday promotions plans. Various retailers, including Walmart, offer affordable monthly payments at the pace of 3 to 24 months with Affirm. Target also has a similar scheme with Sezzle and Affirm. Whereas Sephora and Macy’s offer 4 interest-free payments with Klarna.

    BNPL is especially popular with millennials and Gen Z shoppers and will factor into their 2021 holiday shopping plans. Research showed 62% growth in the use of buy now, pay later service in consumers aged 18 to 24. Giving customers a means to manage their budgets during holidays while still taking home their purchases will attract more customers. While the customer doesn’t pay the full price right away for their purchase, businesses still get the total worth of the item. In the eCommerce industry—nearly 50% of BNPL users say they use it while shopping online, and among them, 45% use the service frequently.

    f. Buy One, Get One

    The last promotional idea is a classic buy one, get one offer. Everyone likes a good BOGO promotional offer. In fact, 66% of shoppers from a survey preferred BOGO over other promotions. It’s a win-win promotional strategy for retailers and customers. With this offer, people shop and stock up on gifts for their friends and family, while retailers make a more significant profit than 50% off sales. People prefer to get 100% off on a product over 50% on two items. 

    BOGO sales are best to move inventory by giving shoppers a deal they can’t pass up. If you have stocked up extra items during Black Friday, you can move those last-minute gifts as end-of-year BOGO sales, making room for new merchandise in January.

    Conclusion

    In this post, you saw that there’s more to holiday marketing than a few social media posts. eCommerce companies can use these holiday promotional ideas to offer Loyalty-rewarding sales and perks, buy now pay later service, and an omnichannel customer experience. Regardless of which strategies you’re using, remember that historical data analytics and early planning will play a significant role in increasing your sales and revenue. 

    Proper planning backed by insights into key metrics will help your team develop a one-of-a-kind holiday marketing strategy to drive your holiday sales upward. From sharing gratitude to offering personalized experiences, retailers have various options for promoting business this holiday season.

    Learn how DataWeave can help make sense of your and your competitor’s pricing, promotional, and assortment data this holiday season. Sign up for a demo with our team to know more.

  • Top 7 AI tools for your eCommerce business

    Top 7 AI tools for your eCommerce business

    The 2020 global health crisis sped up the adoption of omnichannel shopping and fulfillment. Consumers spent $791.70 billion online with U.S. merchants in 2020, a 32.4% rise compared to 2019. To keep up with this digital shift, offline businesses have substantially moved investments to online infrastructures for everything from e-commerce platforms, product recommendations, inventory management, and communications. AI tools for eCommerce have played a major role in helping businesses in the digital shift. 

    However, the benefits of setting up e-commerce stores are potentially outweighed by the increased costs. As markets transition to online retailers, they must learn to efficiently collect, secure, and analyze data coming in from multiple sources. Strategically approaching the data problem with artificial intelligence (AI) can help better serve customers, gain a competitive advantage, and drive loyalty.

    In this blog, you will learn about seven data and AI tools for eCommerce businesses:

    Seven data and AI tools for eCommerce businesses
    Seven Data and AI tools for eCommerce businesses

    1. Data Warehouse

    Data is the one advantage that eCommerce merchants and marketers have over brick and mortar retailers. When buyers are from the internet, eCommerce retailers can collect data and measure almost every aspect of their interactions. However, that advantage is worthless unless there is a system to make sense of the data they collect. Companies assume that they have a sound system in place. But, what they have is a network of silos. In such a system, data sticks to different platforms like Google Analytics, Shopify, or Klaviyo and can’t move to deliver valuable insights. Funneling all your data into a single location for your eCommerce stores is the right way to go. Data warehouses centralize and merge a plethora of data from various sources, helping organizations to derive valuable business insights and improve decision-making. 

    Data Warehouses support real-time analytics and ML operations quickly & are designed to enable and support business intelligence (BI) activities like performing queries and analysis on a colossal amount of data. Data could range from customer-related data, product or pricing data, or even competitor data. 

    However, the time needed to gather, clean, and upload the data to the warehouse is a time-consuming process. Here’s where DataWeave’s AI-Powered Data Aggregation & Analysis Platform can help! Get critical insights on your competitor’s pricing, assortment, and historical sale trends with a real-time dashboard. Build a winning eCommerce strategy with market intelligence without the need to store your data. 

    2. Data Lake

    Data Lake

    A data lake is a centralized repository that can store structured and unstructured data at any scale. Companies don’t have to provide a schema to the data before storing it, but they still can run different analytics and ML-related operations. However, it takes more time to refine the raw data and then analyze or create ML models for predictions. 

    An Aberdeen survey saw businesses implementing a Data Lake outperforming similar companies by 9% in organic revenue growth. The organizations that implemented Data Lake could perform various analytics over additional data from social media, click-streams, websites, etc. A Data Lake allows for the democratization of data and the versatility of storing multi-structured data from diverse sources, improving insights and business growth. 

    eCommerce businesses can collect competitors’ data in data lakes like their popular products, categories, landing pages, and ads. Analyzing competitors’ data helps retailers price their products correctly, helps with product matching, historical trend analysis, and much more. However, data lakes can also be used to store consumer data such as who they are, what they purchase, how much they spend on average, and how they interact with a company. Successful retailers leverage both competitor and consumer data to understand their consumers better, what brands to carry, how to price each product, and what categories to expand or contract. Retailers also store identity data such as a person’s name, contact information, gender, email address, and social media profiles. Other types of data stored are website visits, purchase patterns, email opens, usage rates, and behavioral data. 

    The major challenge with a data lake architecture is that it stores raw data with no oversight of the contents. Without elements like a defined mechanism to catalog and secure data, data cannot be found, or trusted resulting in a “data swamp.” Consequently, companies need teams of data engineers to clean data for data scientists or analysts to generate insights. This not only increases the turnaround time of gaining valuable information but also increases operational costs.

    However, you can rely on platforms like DataWeave that stores competitor pricing & assortment information at a centralized location. You can leverage intelligently designed dashboards to get real-time insights into the collected data and make data-driven decisions without the need for storing, cleaning, and transforming the data.

    3. Data Ingestion & ETL

    To churn out better insights, businesses need access to all data sources. An incomplete picture of data can cause spurious analytic conclusions, misleading reports and inhibit decision-making. As a result, to correlate data from multiple sources, data must be in a centralized location—a data warehouse or a data lake. However, extracting and storing information into these systems require data engineers who can implement techniques like data ingestion and ETL.

    While data ingestion focuses on getting data into data lakes, ETL focuses on transforming data into well-defined rigid structures optimized and storing it into a data warehouse for better analytics workflows. Both processes allow for the transportation of data from various sources to a storage medium that an organization can access, use, and analyze. The destination can be a data warehouse in the case of ETL and a data lake in case of data ingestion. Sources can be almost anything from in-house apps, websites, SaaS data, databases, spreadsheets, or anywhere on the internet.

    Data ingestion & ETL are the backbones of any analytics/AI architecture since these processes provide consistent and convenient data, respectively. 

    4. Programming languages

    Programming languages

    Programming languages are tools used by programmers to write instructions for computers to follow since they “think” in binary—strings of 1s and 0s. It serves as a bridge that allows humans to translate instructions into a language that computers can understand. Some common and highly used programming languages for building AI models are Python and R.  

    While Python is the most widely used language for training and testing models, R is mostly embraced for visualizations and statistical analysis. However, to productize the ML models, you would require Java programming language so that models can be integrated with your websites to provide recommendations.

    5. Libraries/AI frameworks

    An AI framework is a structure that acts as a starting point for companies or developers to add higher-level functionality and build advanced AI software. A framework serves as a foundation, ensuring that developers aren’t starting entirely from scratch.

    Using AI frameworks like TensorFlow, Theano, PyTorch, and more saves time and reduces the risk of errors while building complex deep learning models. Libraries and AI frameworks also assist in building a more secure and clean code. They future aid developers in simpler testing and debugging.

    Various open-source frameworks in the market also come with pre-trained models for specific use cases. Organizations can leverage off-the-shelf models and tweak with existing data to enhance the accuracy of the predictions.

    6. IDE & Notebooks tools

    IDE or Integrated Development Environment is a coding tool that allows developers to write and test their code more efficiently. However, notebooks are one of the most popular AI tools for organizations to execute analysis and other machine learning tasks. It offers more flexibility over IDEs in terms of exploratory analysis.

    All the features, including auto-complete, that IDEs or notebooks offer are beneficial for development as they make coding more comfortable. IDEs/Notebooks increase developers’ productivity by combining common software activities into a single application: building executables, editing code, and debugging.

    7. Analytics tools

    Competitive Pricing

    Data Analysis transforms raw data into valuable statistics, insights, and explanations to help companies make data-driven business decisions. Data analytics tools like PowerBI and Tableau have become the cornerstone of modern business for quickly analyzing structured and semi-structured data. 

    However, these platforms aren’t optimized specifically for the eCommerce industry. Consequently, you should embrace analytical tools particularly designed for eCommerce companies to make better decisions about product assortment, pricing, and promotions. With data analytics, companies can gain insights into the most popular and discoverable brands on their own and competitors’ platforms. Paired with attribute matching, competitive intelligence gives a deeper understanding of the latest trends and why certain products are popular with your customers. Some more meaningful metrics that retailers can track are discount gap, price gap, catalog strength, and product type gaps. 

    Competitive pricing is another benefit of data analytics with which retailers can identify gaps and keep up with actionable pricing insights. Retailers get to maximize profits and respond to demand by cashing in on insights into rivals’ pricing. With the right analytics tools, they can also track changes in pricing across crucial metrics such as matched products, recent price changes, highest price positions, stock status, and much more. 

    Analytics tools can also help eCommerce companies to capture information about competitors’ promotional banners through AI-powered image analysis. It can provide insights into how and where to spend promotional expenditure. 

    Conclusion

    This listicle discusses some of the AI and data tools commonly used by the eCommerce industry. Data analytics has become a popular method for retailers to understand their customers and boost productivity. Data analytics help companies improve customer experience, improve customer loyalty, generate insights, and advise on data-driven actions. Business intelligence tools can help companies monitor key performance indicators (KPIs), perform proper data analyses, and generate accurate reports. 

    Want to learn how DataWeave can help make sense of your and your competitor’s pricing, promotional, and assortment data? Sign up for a demo with our team to know more.

  • How Brands Can Outperform Rivals With Next-Gen Digital Shelf Analytics

    How Brands Can Outperform Rivals With Next-Gen Digital Shelf Analytics

    As eCommerce grows in complexity, brands need new ways to grow sales and market share. Right now, brands face urgent market pressures like out-of-stocks, an influx of new competition and rising inflation, all of which erode profitability. As online marketplaces mature, more brands need to make daily changes to their digital marketing strategies in response to these market pressures, shifts in demand, and competitive trends.

    eMarketer forecasts 2021 U.S. eCommerce will rise nearly 18% year-over-year (vs. 6.3% for brick-and-mortar), led by apparel and accessories, furniture, food and beverage, and health and personal care. The eCommerce industry is also undergoing fundamental changes with newer entities emerging and traditional business models evolving to adapt to the changed environment. For example, sales for delivery intermediaries such as Doordash, Instacart, Shipt, and Uber have gone from $8.8 billion in 2019 to an estimated $35.3 billion by the end of 2021. Similarly, many brands have established or are building out a Direct to Consumer (D2C) model so they can fully own and control their customer’s experiences.

    In response, DataWeave has launched the next generation of our Digital Shelf Analytics suite to help brands across retail categories directly address today’s costly market risks to drive eCommerce growth and gain a competitive advantage.

    Our new enhancements help brands improve online search rank visibility and quantify the impact of digital investments – especially in time for the busy holiday season.”  
    ~ Karthik Bettadapura, CEO and co-founder, DataWeave

    The latest product enhancements provide brands access to tailored dashboard views that track KPI achievements and trigger actionable alerts to improve online search rank visibility, protect product availability and optimize share of search 24/7. Dataweave’s Digital Shelf Analytics platform works seamlessly across all forms of eCommerce platforms and models – marketplaces, D2C websites and delivery intermediaries.

    Dashboard for Multiple Functions

    While all brands share a common objective of increasing sales and market share, their internal teams are often challenged to communicate and collaborate, given differing needs for competitive and performance data across varying job functions. As a result, teams face pressure to quickly grasp market trends and identify what’s holding their brands back.

    In response, DataWeave now offers executive-level and customized scorecard views, tailored to each user’s job function, with the ability to measure and assess marketplace changes across a growing list of online retail channels for metrics that matter most to each user. This enhancement enables data democratization and internal alignment to support goal achievement, such as boosting share of category and content effectiveness. The KPIs show aggregated trends, plus granular reasons that help to explain why and where brands can improve.

    Brands gain versatile insights serving users from executives to analysts and brand and customer managers.

    Prioritized, Actionable Insights

    As brands digitize more of their eCommerce and digital marketing processes, they accumulate an abundance of data to analyze to uncover actionable insights. This deluge of data makes it a challenge for brands to know exactly where to begin, create a strategy and determine the right KPIs to set to measure goal accomplishment.

    DataWeave’s Digital Shelf Analytics tool enables brands to effectively build a competitive online growth strategy. To boost online discoverability (Share of Search), brands can define their own product taxonomies across billions of data points aggregated across thousands of retailer websites. They can also create customized KPIs that track progress toward goal accomplishment, with the added capability of seeing recommended courses of action to take via email alerts when brands need to adjust their eCommerce plans for agility.

    “Brands need an integrated view of how to improve their discoverability
    and share of search by considering all touchpoints in the digital commerce ecosystem.”

    ~ Karthik Bettadapura, CEO and co-founder, DataWeave

    Of vital importance, amid today’s global supply chain challenges, brands gain detailed analysis on product inventory and availability, as well as specific insights and alerts that prompt them to solve out-of-stocks faster, which Deloitte reports is a growing concern of consumers (75% are worried about out-of-stocks) this holiday season.

    User and system generated alerts provide clarity to actionable steps to improving eCommerce effectiveness.
    You also have visibility to store-level product availability, and are alerted to recurring out-of-stock experiences.

    Scalable Insights – From Bird’s Eye to Granular Views

    DataWeave’s Digital Shelf Analytics allows brands to achieve data accuracy at scale, including reliable insights from a top-down and bottom-up perspective. For example, you can see a granular view of one SKUs product content alongside availability, or you can monitor a group of SKUs, say your best selling ones, at a higher level view with the ability to drill down into more detail.

    Brands can access flexible insights, ranging from strategic overviews to finer details explaining performance results.

    Many brands struggle with an inability to scale from a hyper-local eCommerce strategy to a global strategy. Most tools available on the market solve for one or the other, addressing opportunities at either a store-level basis or top-down basis – but not both.

    According to research by Boston Consulting Group and Google, advanced analytics and AI can drive more than 10% of sales growth for consumer packaged goods (CPG) companies, of which 5% comes directly from marketing. With DataWeave’s advanced analytics, AI and scalable insights, brands can set and follow global strategies while executing changes at a hyper-local level, using root-cause analysis to drill deeper into problems to find out why they are occurring.

    As more brands embrace eCommerce and many retailers localize their online assortment strategies, the need for analytical flexibility and granular visibility to insights becomes increasingly important. Google reports that search terms “near me” and “where to buy” have increased by more than 200% among mobile users in the last few years, as consumers seek to buy online locally.

    e-Retailers are now fine-tuning merchandising and promotional strategies at a hyper-local level based on differences seen in consumer’s localized search preferences, and DataWeave’s Digital Shelf Analytics solution provides brands visibility to retailer execution changes in near real-time.

    Competitive Benchmarking

    Brand leaders cannot make sound decisions without considering external factors in the competitive landscape, including rival brands’ pricing, promotion, content, availability, ratings and reviews, and retailer assortment. Dataweave’s Digital Shelf Analytics solution allows you to monitor share of search, search rankings and compare content (assessing attributes like number of images, presence of video, image resolution, etc.) across all competitors, which helps brands make more informed marketing decisions.

    Brands are also provided visibility into competitive insights at a granular level, allowing them to make actionable changes to their strategies to stay ahead of competitors’ moves. A new module called ‘Sales and Share’ now enables brands to benchmark sales performance alongside rivals’ and measure market share changes over time to evaluate and improve competitive positioning.

    Monitor competitive activity, spot emerging threats and immediately see how your performance compares to all rivals’, targeting ways to outmaneuver the competition.

    Sales & Market Share Estimates Correlated with Digital Shelf KPIs

    In a brick-and-mortar world, brands often use point of sale (POS) based measurement solutions from third party providers, such as Nielsen, to estimate market share. In the digital world, it is extremely difficult to get such estimates given the number of ways online orders are fulfilled by retailers and obtained by consumers. Dataweave’s Digital Shelf Analytics solution now provides sales and market share estimates via customer defined taxonomy, for large retailers like Amazon. Competitive sales and market share estimates can also be obtained at a SKU level so brands can easily benchmark their performance results.

    Additionally, sales and market share data can also be correlated with digital shelf KPIs. This gives an easy way for brands to check the effect of changes made to attributes, such as content and/or product availability, and how the changes impact sales and market share. Similarly, brands can see how modified search efforts, both organic and sponsored, correspond to changes in sales and market share estimates.

    Take Your Digital Shelf Growth to the Next Level

    The importance of accessing flexible, actionable insights and responding in real-time is growing exponentially as online is poised to account for an increasing proportion of brands’ total sales. With 24/7 digital shelf accessibility among consumers comes 24/7 visibility and the responsibility for brands to address sales and digital marketing opportunities in real-time to attract and serve online shoppers around the clock.

    Brands are turning to data analytics to address these new business opportunities, enhance customer satisfaction and loyalty, drive growth and gain a competitive advantage. Companies that adopt data-driven marketing strategies are six times more likely to be profitable year-over-year, and DataWeave is here to help your organization adopt these practices. To capitalize on the global online shopping boom, brands must invest in a digital shelf analytics solution now to effectively build their growth strategies and track measurable KPIs.

    DataWeave’s next-gen Digital Shelf Analytics enhancements now further a brand’s ability to monitor, analyze, and determine systems that enable faster and smarter decision-making and sales performance optimization. The results delight consumers by helping them find products they’re searching for, which boosts brand trust.

    Connect with us to learn how we can scale with your brand’s analytical needs. No project or region is too big or small, and we can start where you want and scale up to help you stay agile and competitive.

  • 2021 Cyber Weekend Preliminary Insights

    2021 Cyber Weekend Preliminary Insights

    The exponential growth of eCommerce has forever changed holiday shopping as we know it. What was once led by the launch of Cyber Monday in 2005, has since expanded to ‘Cyber Five’ in 2018, now spans beyond an eight-week period, and is collectively the busiest digital shopping period of the year. Most retail websites have launched a ‘Thanksgiving Comes Early’ sales event for a mosaic of products, causing one to wonder how this ‘early start’ to holiday shopping will impact the traditional promotional cadence consumers have grown to expect to see launch closer to the holidays. Given today’s environmental challenges, threats of scarcity are also encouraging consumers to buy early, which could also impact traffic on the shopping days that have traditionally seen the highest sales volume from digital shoppers.

    In the current environment, the onus will be on consumers to keep a watch for their categories of interest and buy them as and when they appear on sale in their favorite store, because there is no guarantee of sustained availability. Of course, they might return and buy at a different store if a better deal comes up, but there’s a time cost for the dollars saved. More broadly, there has been enough noise made about deals and discounts to keep consumer interest and curiosity going.

    The early promotional start and heightened demand has influenced our team to get a jump start on our 2021 Black Friday analysis to look deeper at trends seen pre-Black Friday 2021 versus 2020. With this assessment, we can track how promotional prices and product availability rates may have changed throughout the event leading in to 2021 Cyber Five, and compare it to last year’s activity to understand how 2021 holiday sales may be impacted.

    We reviewed popular holiday categories like apparel, electronics, and toys (for kids and pets), to have a broad sense of notable trends seen consistently throughout various, applicable marketplaces. What we found is a consistent decline in product availability over the last six months and as compared to last year, alongside an increase in prices.

    We first analyzed availability changes for popular categories on Amazon, noted in the chart below, to understand how inventory may have changed throughout the year, and also compared to 2020. With the exception of batteries and solar power goods and books and maps, there appears to be consistency in greater product availability in 2021 versus 2020, but a slow decline in availability throughout 2021, leading into the holiday season.

    Source: DataWeave Commerce Intelligence – Product Availability in-stock percentage from July 2020 through September 2021 for a sample size of 1000+ products on Amazon.com

    When it came to our pricing analysis, we reviewed select categories on Amazon and Target.com, and found around fifty percent of products on both websites to have seen a price increase year-over-year, while only thirty-seven percent and sixteen percent of products saw a price decrease on Amazon and Target.com, respectively. We also see an increase in the manufacturer’s retail price (MRP) in 2021 versus 2020 for a very high proportion of products (forty-eight percent of products on Amazon and thirty-five percent of products on Target.com), but the discount percentages have remained the same.

    Source: DataWeave Commerce Intelligence – Pricing Intelligence: MRP and promotional pricing for 1000+ products on Amazon and Target.com were analyzed from November 13th – 15th, 2021 versus Pre-Black Friday November 24th & 25th 2020

    *Please reach out to our Retail Analytics experts for access to sub-category details available within the above analysis conducted on Amazon and Target.com.

    This indicates 2021 discounts may appear to be greater than or equivalent to 2020, but in reality, consumers will end up paying higher prices than they would have for the same items in 2020. The remainder of this article highlights our key findings found within each key category reviewed – Electronics, Apparel and Toys.

    Electronics Category Analysis

    The television category showcases a great example of how pricing fluctuations impact holiday promotional cadences. Based on our analysis, we found the average television price to have increased around seven percent from April to October 2021, as seen below and as noted within our analysis conducted with NerdWallet.

    Source: DataWeave Commerce Intelligence – Pricing Intelligence: The change in average price captured for televisions sold on Amazon from May 2021 through October 2021.

    In fact, on Amazon and Target.com, we see around eighty-four percent of the SKUs listed show both an MRP and promotional price increase in 2021 versus 2020 during pre-Black Friday times. One specific example found on Amazon is noted below for Samsung TV model QN65LS03TAFXZA, a 65 inch QLED TV that was priced at $1697 during this analysis at a fifteen percent discount from MRP, but was priced last year at $1497 without a discount from MRP. In essence, even though the TV offers a greater discount this year, it is actually more expensive than it was in 2020 at this same time of year.

    Source: DataWeave Commerce Intelligence – Pricing Intelligence: MRP and promotional pricing analysis on Amazon.com comparing prices from November 13th – 15th, 2021 versus Pre-Black Friday November 24th & 25th 2020

    Unlike TVs, the price of laptops has experienced a decrease over time based on our analysis conducted during the same timeframe, indicating these are a great buy for consumers this holiday season versus promotional offers seen in 2020.

    Source: DataWeave Commerce Intelligence – Pricing Intelligence: The month-over-month change in average price captured for televisions sold on Amazon from April 2021 through September 2021.

    Overall, our prediction is that within the electronics category, promotions during Cyber Five may be equivalent to last year’s offers, however, supply will be limited and the total spend versus last year will be greater to the consumer outside of Doorbuster deals offered on select models.

    Apparel Category Analysis

    The Luxury market is seeing a Roaring 20s-like feeling this season given the Covid-induced changes in work and lifestyle and higher disposable income. Therefore, our prediction is that prices for these goods are likely to remain flat, or offer very little discounts this season both due to supply constraints as well as higher demand. For example, our analysis on shoe pricing changes shows relative stability from April to October 2021.

    Source: DataWeave Commerce Intelligence – Pricing Intelligence: The change in average price captured for shoes sold on Amazon from May 2021 through October 2021.

    Given heightened demand and the Global shipping crisis, we anticipate luxury apparel categories to face out-of-stock challenges this holiday season, and therefore we also anticipate seeing less promotional activity for these items as well during Cyber Five 2021. To dive deeper into the severity of the impact, we looked at availability for clothing, accessories, and footwear categories from August 2020 until present to verify our thesis.

    Focusing only on clothing, accessories, and footwear, these categories followed the same downward trending pattern regarding product availability decreases this year with a decline from June (seventy-six percent versus eighty-six percent in May 2021) to September 2021 (the lowest rate seen at sixty-eight percent availability), followed by a partial recovery in October and November (achieving seventy-seven percent availability).

    Source: DataWeave’s Commerce Intelligence – Product Availability: 10k SKUs tracked across 11 retailers US websites (Farfetch, Brownsfashion, NetAPorter, EndClothing, 24s, Selfridges, Ssense, Harrods, Luisaviaroma, MyTheresa, MrPorter) tracked daily stock status in apparel categories; Availability is calculated as percent of instances when product is in stock against all instances tracked.

    Not all recoveries were the same however, and given this, we predict accessories to have the lowest availability rate and greatest risk of facing out of stocks heading into Cyber Five. From May through November 2021, accessories availability continued to decline significantly from month to month, beginning at eighty-three percent in May and ending at seventy-four percent in November. Given this continued decline and with Black Friday right around the corner, we don’t anticipate inventory levels to increase enough to meet the increased holiday demand.

    Source: DataWeave’s Commerce Intelligence – Product Availability: 10k SKUs tracked across 11 retailers US websites (Farfetch, Brownsfashion, NetAPorter, EndClothing, 24s, Selfridges, Ssense, Harrods, Luisaviaroma, MyTheresa, MrPorter) tracked daily stock status in apparel categories; Availability is calculated as percent of instances when product is in stock against all instances tracked.

    Toys & Games Category Analysis

    As noted by DigitalCommerce360, we also anticipate toys to be one of the greatest impacted categories this holiday season given the continued decline in overall availability for these items on Amazon.com, as one great example. Within our category analysis, we saw a steady decline in availability from March 2021 through June (eighty percent to sixty-one percent), followed by a period of stability from June through August (approximately sixty percent), followed by another decline from September through October, finally reaching the lowest availability of fifty-six percent (down twenty-four percent from March 2021).

    Source: DataWeave’s Commerce Intelligence – Product Availability – hundreds of Toys & Games SKUs tracked on Amazon.com on a weekly basis from March 2021-October 2021

    The biggest sub-category within the toys department on Amazon, Sports and Outdoor Play, followed the same trend as Toys and Games overall through June 2021, also reaching its lowest availability of fifty-six percent. Instead of continuing along that pattern, Sports and Outdoor Play started on a recovery path, ending at a relatively high availability level of sixty-seven percent in October, which is only five percent lower than its highest availability (seventy-two percent in March 2021). Games and Accessories, the second largest sub-category in Toys and Games, had a continuous decline starting with eighty-nine percent in March 2021, reaching its lowest availability of fifty-four percent in October.

    Source: DataWeave’s Commerce Intelligence – Product Availability – hundreds of Toys & Games SKUs tracked on Amazon.com on a weekly basis from March 2021-October 2021

    The sub-category Tricycles, Scooters and Wagons interestingly had its highest availability from July to September 2021 (around eighty percent), unlike other sub-categories which as a whole, had their lowest availability during the same timeframe. From September through October, there was a significant decline (fourteen percent), reaching its lowest availability of sixty-seven percent. The sub-category Babies & Toddlers started on a continuous decline from its highest availability of eighty percent in April to its lowest availability of fifty-six percent in October.

    Source: DataWeave’s Commerce Intelligence – Product Availability – hundreds of Toys & Games SKUs tracked on Amazon.com on a weekly basis from March 2021-October 2021

    *Please reach out to our Retail Analytics experts for access to sub-category details available within the above analysis on the Toys and Games category on Amazon.com.

    Pet Toys Category Analysis

    When it comes to in demand holiday toys, you can’t forget about the needs for gifts for our furry friends and family. We also tracked sub-categories such as dog, cat, and bird toys, following the same methodology as tracked within Toys and Games to track pet toy availability changes.

    Source: DataWeave’s Commerce Intelligence – Product Availability – hundreds of Pet Toys SKUs tracked on Amazon.com on a weekly basis from March 2021-October 2021

    Dog toys, the biggest sub-category out of the three pet toys analyzed, had high availability – ninety percent in March 2021, but started to decline reaching a low of sixty-five percent in October. There was a period of stability from April to August (averaging seventy-seven percent), followed by a significant decline of over thirteen percent in from September to October. Cat toys, the second largest sub-category, also had its highest availability in March (eighty-nine percent) followed by a steady decline to sixty-six percent in June, a recovery from July to August (achieving seventy-three percent), followed by another decline during September and October, reaching its lowest availability of sixty-three percent (down twenty-six percent from eighty-one percent in March). Interestingly, dog toys which has a product count eight times greater than cat toys, had higher availability than cat toys during each of the months considered during the analysis.

    Source: DataWeave’s Commerce Intelligence – Product Availability – hundreds of Pet Toys SKUs tracked on Amazon.com on a weekly basis from March 2021-October 2021

    In Conclusion

    If we consider discounts and availability to be a good indicator of sales for the 2021 holiday season, with the Global shipping crisis looming over this year’s event, we expect retailers to have trouble keeping their inventory well stocked, which might affect growth rates. That being said, while discounts may be muted and popular items may come on very limited sales given constraints, we believe digital sales on Black Friday will see the highest year-over-year growth to date, given a number of supporting factors: scarcity threats increasing demand and the reason to buy, and consumers waiting to see if holiday offers surpass those see in the early start promotions, followed by the sudden rush to buy on Black Friday so as not to risk a given product being out of stock beyond this time period.

    We also anticipate seeing a continued decline in product availability day-to-day as we progress throughout Cyber Five 2021. Given the analysis conducted on 2020 trends, (we tracked nearly a one percent decline in availability on Black Friday 2020 vs. Thanksgiving Day, followed by a two percent decline on Cyber Monday), our data indicates products went out-of-stock at a faster rate then also.

    Ultimately only the digital-savvy retailers and brands will thrive during these opportune times, while others will continue to be in catch-up mode. Access to real-time marketplace insights can enable a first-to-market strategy, while having access to historical patterns can also help react faster to commonly seen future market factors, such as another pandemic or Global shipping crisis. These types of insights also support day-to-day operations, enabling retailers and brands to accelerate eCommerce growth, determine systems to distinguish their online strategies, discover efficiencies and drive profitable growth in an intensifying competitive environment.

    Continue to follow us in the coming weeks to see the insights we track through Cyber Five 2021, and be sure to reach out to our Retail Analytics experts for access to more details regarding the above analysis.

  • Top 10 Retail Analytics that You Must Know

    Top 10 Retail Analytics that You Must Know

    Customers expect personalization. Unless they have a seamless experience on your online channels, they’ll leave for a different retailer. Retail analytics can solve these problems for merchants looking to increase customer satisfaction and sales. It provides insights into inventory, sales, customers, and other essential aspects crucial for decision-making. Retail analytics also encompasses several granular fields to create a broad picture of a retail business’s health and sales, along with improvement areas.

    Big data analytics in the retail market
    Big data analytics in the retail market

    Big data analytics in the retail market is expected to reach USD 13.26 billion by the end of 2026, registering a CAGR of 21.20% during the forecast period (2021-2026). The growth of analytics in retail depicts how it can help companies run businesses more efficiently, make data-backed choices, and deliver improved customer service.

    In this blog, we’ll discuss the top 10 analytics that retailers are using to gain a competitive advantage in accurately evaluating business & market performance.

    Top 10 of Retail Analytics You Must Know
    Top 10 of Retail Analytics You Must Know

    1. Assortment

    Assortment planning allows retailers to choose the right breadth (product categories) and depth (product variation within each category) for their retail or online stores. Assortment management has grown beyond simple performance metrics like total sales or rotation numbers. Instead, retail analytics offers a comprehensive analysis of product merchandise and an estimated number of units at the push of a button. Retailers that effectively apply assortment analytics can enjoy increased gross margins and prevent significant losses from overstocks sold at discounted prices or out-of-stock inventory leading their customers to buy from competitors. 

    It also helps retailers gain insights into the trendy and discoverable brands and products on all e-commerce websites across the globe. They can boost sales by making sure they have an in-demand product assortment. They can also track pricing information and attributes common across popular products to drive their pricing and promotion strategies.

    2. Inventory Management

    An inadequately maintained inventory is every retailer’s worst nightmare. It represents a poor indicator of inadequate demand for a product and leads to a loss in sales. Data can help companies answer issues like what to store and what to discard. It’s beneficial to discard or increase offers on products that are not generating sales and keep replenished stocks of popular items. 

    Worldwide Inventory Distribution

    In 2020, the estimated value for out-of-stock items ($1.14 trillion) was double that of overstock items ($626 billion). A similar trend was especially prominent in grocery stores, where out-of-stock items were worth five times more than overstock items.

    Unavailability of high-selling products can lead to reduced sales, ultimately generating incorrect data for future forecasting and producing skewed demand and supply insights. Retailers can now use analytics to identify which products are in demand, which are moving slowly, and which ones contribute to dead stock. They can know in real-time if a high-demand product is unavailable at a specific location and take action to increase the stock. Retailers can use this historical data to predict what to stock, at what place, time, and cost to maintain and optimize revenue. It helps satisfy consumer needs, prevents loss of sales, reduces inventory cost, and streamlines the complete supply chain.

    3. Competitive Intelligence

    Market intelligence & Competitive Insights
    Market intelligence & Competitive Insights

    The ability to accurately predict trends after the global pandemic and with an unknown economic future is becoming the cornerstone for successful retailers. Smart retailers know how important it is to Pandemic-Proof their retail strategy with Market Intelligence & Competitive Insights 

    With 90% of Fortune 500 companies using competitive intelligence, it’s an essential tool to gain an advantage over industry competitors. Competitive Intelligence allows you to gather and analyze information about your competitors and understand the market–providing valuable insights that you can apply to your own business. A more strategic competitor analysis will explain brand affinities and provide insights on what to keep in stock and when to start promotions. Customer movement data will also give you access to where your customers are shopping.

    4. Fraud Detection

    Fraud Detection
    Fraud Detection

    Retailers have been in a constant struggle with fraud detection and prevention since time immemorial. Fraudulent products lead to substantial financial losses and damage the reputation of both brands and retailers. Every $1 of fraud now costs U.S. retail and eCommerce merchants $3.60, a 15% growth since the pre-Covid study in 2019, which was $3.13. Retail Analytics acts as a guardian against fraudsters by constantly monitoring, identifying, and flagging fraud products and sellers. 

    5. Campaign Management

    Some of the challenges of the retail industry are that it’s seasonal, promotion-based, highly competitive, and fast-moving. In today’s competitive marketplace, consumers compare prices and expect personalized shopping experiences. Campaign management allows marketing teams to plan, track, and analyze marketing strategies for promoting products and attracting audiences. Retail analytics can help businesses predict consumer behavior, improve decision-making across the company, and determine the ROI of their marketing efforts. 

    According to Invesp, 64% of marketing executives “strongly agree” that data-driven marketing is crucial in the economy. Retail analytics can help businesses analyze their data to learn about their customers with target precision. With predictive analysis, retailers can design campaigns that encourage consumers to interact with the brand, move down the sales funnel, and ultimately convert.

    6. Behavioral Analytics

    Retail firms often look to improve customer conversion rates, personalize marketing campaigns to increase revenue, predict and avoid customer churn, and lower customer acquisition costs. Data-driven insights on customer shopping behaviors can help companies tackle these challenges. However, several interaction points like social media, mobile, e-commerce sites, stores, and more, cause a substantial increase in the complexity and diversity of data to accumulate and analyze. 

    Insider Intelligence forecasts that m-eCommerce volume will rise at 25.5% (CAGR) until 2024, hitting $488 billion in sales, or 44% of all e-commerce transactions. 

    Data can provide valuable insights, for example, recognizing your high-value customers, their motives behind the purchase, their buying patterns, behaviors, and which are the best channels to market to them and when. Having these detailed insights increases the probability of customer acquisition and perhaps drives their loyalty towards you. 

    7. Pricing

    competitive pricing in retail
    Competitive pricing in retail

    Market trends fluctuate at an unprecedented pace, and pricing has become as competitive as it’s ever been. The only way to keep up with competitive pricing in retail is to use retail analytics that enables retailers to drive more revenue & margin by pricing products competitively

    A report from Inside Big Data found companies experience anywhere from 0.5% up to 17.1% in margin loss purely because of pricing errors. Pricing analytics provides companies with the tools and methods to perceive better, interpret and predict pricing that matches consumer behavior. Appropriate pricing power comes from understanding what your consumers want, which offers they respond to, how and where they shop, and how much they will pay for your products. 

    In 2021, the price optimization segment is anticipated to own the largest share of the overall retail analytics market. Retailers can identify gaps and set alerts to track changes across crucial SKUs or products with pricing analytics. Knowing your customer’s price perception will increase sales and also allow you to design promotions that’ll attract customers. Pricing analytics also accounts for factors like demographics, weather forecasting, inventory levels, real-time sales data, product movement, purchase history, and much more to arrive at an excellent price.  

    8. Sales and Demand Forecasting

    Sales and demand forecasting allow retailers to plan for levels of granularity—monthly, weekly, daily, or even hourly—and use the insights in their marketing campaigns and business decisions. The benefits of a granular forecast are apparent since retailers don’t have to bank on historical data of previous clients and customers to predict revenues. Retailers can plan their strategies and promotions that suit their customer’s demands. 

    With sales and demand forecasting, retailers can also consider the most recent, historical, and real-time data to predict potential future revenue. Sales and demand analytics can predict buying patterns and market trends based on socioeconomic and demographic conditions. 

    9. Customer Service and Experience

    With the development of eCommerce, more and more customers prefer to browse and interact with the product before purchasing online. They look for better deals and discounts across stores and platforms. 3 out of 5 consumers say retail’s investment in technology is improving their online and in-store shopping experiences. To enhance merchandising and marketing strategies, retailers can gather data on customer buying journeys to understand their in-store and online experiences. 

    Retailers can run test campaigns to know the impact on sales and use historical data to predict consumers’ needs based on their demographics, buying patterns, and interests. Retail analytics help retailers to bring more efficiency in promotions and drive impulsive purchases and cross-selling.

    10. Promotion

    Analyze competitors' promotions
    Analyze Competitors’ Promotions

    Promotions are potent sales drivers and need to be cleverly targeted towards specific customers with precise deals to generate outstanding sales. Retail analytics allows companies to study their customers and competitors to a vastly elevated level. 

    To be an industry leader, retail companies not only have to understand their customers, but they must also analyze competitors’ promotions to improve their marketing strategies. Analyzing your competitor’s promotional banners, ads, and marketing campaigns are no more associated with imitation. 

    With data analytics and AI, retailers can watch their competitors’ commercialization strategies. It can uncover vital information about their target audience, sales volume fluctuations, popular seasonal product types, product attributes of popular items, and significant industry trends.  Knowing exactly which products and brands are popular among your competitor’s campaigns can help retailers improve their promotional strategies. 

    Conclusion

    The benefits of retail analytics are spread across various verticals, from merchandising, assortment, inventory management, and marketing to reducing losses. The need for analytics has become even more apparent considering the growing eCommerce platforms, changing customer buying journeys, and the complexity of the industry. Understanding which products sell best among which customers will help retailers to deliver an optimized shopping experience.

    Want to drive profitable growth by making smarter pricing, promotions, and product merchandising decisions using real-time retail insights? DataWeave’s AI-powered Competitive Intelligence can help! Reach out to our Retail Analytics experts to know more.

  • How Essential Goods Have Shaped Retail Strategies

    How Essential Goods Have Shaped Retail Strategies

    The rapid evolution in essential goods is rattling retail. That’s because the COVID-19 pandemic has dramatically changed shopping habits and retail necessities, leading to unpredictable shifts in demand.

    Most notably, U.S. e-commerce has surged by an astonishing 45% year-over-year, as the pandemic accelerated online shopping by five years.[1] Since more consumers now work and learn from home, many pandemic-inspired habits will likely shape retail for years to come.[2]

    Now that the risk of the second wave lies ahead, it’s the ideal time for retailers to review pandemic bestsellers and patterns to adapt to shifts in shopping behavior.


    Pandemic’s bestsellers shape retail strategies

    2020’s unexpected consumption patterns give retailers a glimpse of how they can adapt and thrive. The best-selling essential goods during the pandemic have included:

    • Toilet paper: +734% year-over-year (YoY) growth in March[3]
    • Disposable gloves: +670% in March[4]
    • Fitness equipment: + 535% YoY in online sales for February to March[5]
    • Hand sanitizer: +470% YoY for the week ending March 7[6]
    • Yeast: +410% YoY for the four weeks ending April 11[7]
    • Puzzles: +370% YoY in the last two weeks of March
    • Pyjamas: + 143% in online sales between March and April[8]

    As such, retailers can ensure their assortments contain these types of popular cross-category items, which reflect overall themes of consumers’ needs for self-sufficiency, wellness and comfort.

    E-grocery is also soaring, as experts predict a 40% rise in U.S. online grocery sales in 2020 due to the pandemic.[9] Top categories bought by online grocery shoppers include:

    • Packaged non-fresh food (69%)
    • Toiletries, personal care and diapers (63%)
    • Household cleaning and paper products (61%)[10]

    In response to these trends, retailers can prioritize shelf-stable center store products and non-food consumer goods throughout the pandemic.

    How retailers boost agility, clarity and sales amid COVID-19 chaos

    Consumer panic led to pricing volatility for hard-to-find items like hand sanitizer, disinfectant wipes and masks.[11] To keep up with competitors’ online price fluctuations, more retailers use competitive analytics to adapt their own prices accordingly. Notably, McKinsey & Company cites data insights and price sensitivity as the top two disruptive trends the pandemic has turbocharged.[12]

    In March, shortages of toilet paper and flour led consumers to react with panic and hoarding that created urgent supply chain issues. To avoid out-of-stock items, more retailers now turn to data insights to identify potential disruptions. Up-to-date insights help retailers spot emerging market trends and adapt their assortment to stock in-demand items.

    Now that more consumers shop online, retailers are investing in digital promotions to boost sales. Data analytics help retailers quickly evaluate the effectiveness of their promotions, which can inspire consumers to fill their baskets. Nimbly adapting to competitors’ promotions is essential, as McKinsey cites rising competition for deals among the pandemic’s most disruptive retail trends.[13]

    Avoid empty shelves: The pandemic has motivated more retailers to rely on data insights to make fast, effective pricing and assortment decisions.

    As consumption habits evolve, high-level dashboards help retailers quickly spot inventory shortages to prevent out-of-stocks.

    To make their retail strategies pandemic-proof, leading retailers are collaborating with DataWeave to access accurate, actionable insights that boost online agility and sales. Applying DataWeave’s trusted data gives retailers clarity amid today’s chaotic market and shifting demand for essential goods, so they can make effective decisions fast. Insights also help retailers enhance the customer experience by supporting in-stock product assortments, competitive pricing and effective promotions that boost sales, trust and loyalty. To see how DataWeave helps retailers stay agile and competitive, visit dataweave.com.


    [1] Perez, Sarah. COVID-19 pandemic accelerated shift to e-commerce by 5 years, new report says. TechCrunch. August 24, 2020.

    [2] Gottlieb, David. 5 Strategic Imperatives for Retail’s New Normal. Total Retail. August 18, 2020.

    [3] Weiczner, Jen. The case of the missing toilet paper: How the coronavirus exposed U.S. supply chain flaws. Fortune. May 18, 2020.

    [4] Clement, J. COVID-19 impact on fastest growing e-commerce categories in the U.S. 2020. Statista. June 19, 2020.

    [5] Gibson, Kate. Coronavirus inspires fitness buying binge that tops New Year’s. CBS News. April 1, 2020.

    [6] Chasark, Krisann. Coronavirus impact: Hair dye becoming next high-demand item amid COVID-19 pandemic. ABC News. April 11, 2020.

    [7] Guynn, Jessica and Kelly Tyko. Dry yeast flew off shelves during coronavirus pantry stocking. Here’s when you can buy it again. USA Today. April 23, 2020

    [8] Thomas, Lauren. Comfort is en vogue during coronavirus: PJ sales surge 143%, pants sales fall 13%. CNBC. May 12, 2020.

    [9] Redman, Russell. Online grocery sales to grow 40% in 2020. Supermarket News. May 11, 2020.

    [10] Redman, Russell. Online grocery sales to grow 40% in 2020. Supermarket News. May 11, 2020.

    [11] Levenson, Michael. Price Gouging Complaints Surge Amid Coronavirus Pandemic. The New York Times. March 27, 2020.

    [12] Kopka, Udo, Eldon Little, Jessica Moulton, René Schmutzler, and Patrick Simon. What got us here won’t get us there: A new model for the consumer goods industry. McKinsey & Company. July 30, 2020.

    [13] Kopka, Udo, Eldon Little, Jessica Moulton, René Schmutzler, and Patrick Simon. What got us here won’t get us there: A new model for the consumer goods industry. McKinsey & Company. July 30, 2020.

  • JioMart Launches Online Grocery Store

    JioMart Launches Online Grocery Store

    JioMart, the online channel for Reliance Retail Limited, launched in December 2019 as a contender in the e-grocery segment. Currently in India, this segment is being dominated by bigbasket, Amazon, Flipkart Supermart, Grofers, etc. After less than a year and from their initial launch in Mumbai, they now have their presence in 205 cities across India.

    According to their recent press release, they claim to be clocking over 250,000 daily orders, compared to bigbasket’s 220,000 and Amazon’s 150,000. To get an understanding of this rapid penetration, we had a look at the PIN codes that JioMart serves, spanning the country.

    The map below represents the percentage of PIN codes that are being served by JioMart’s online grocery in each state:

    **Disclaimer -Map for representation purposes only

    While states like Chandigarh, Delhi and Punjab in the North are covered extensively, JioMart has a stronger distribution in the Southern states.

    The image below shows the top ten states in India where JioMart’s online grocery has the highest presence:

    They’re yet to launch in 14 more states but it’s interesting to note that in this limited time, they’ve managed to cover 14% of the PIN codes in the country and all this, in the midst of lockdowns.

    Assortment

    To get an idea of the assortment in their range, we analyzed select PIN codes across three tiers of cities in India. The parameters we looked at were categories, brands and discounts to get an understanding of how JioMart is stacking up against its competitors. The cities we examined were:

    • Tier 1 – Bangalore, Delhi, Kolkata, Mumbai
    • Tier 2 – Ahmedabad, Jaipur, Kochi, Visakhapatnam
    • Tier 3 – Mohali, Mysore, Nagpur, Siliguri

    In its range, they offer eight broad categories, of which, we focussed on the four that offer the highest selection of products: home care, personal care, snacks & branded food and staples.

    The table below represents the average selection of products offered across each tier.

    Overview of discounts offered and the private label split

    Out of the assortment we looked at in the three tiers, we noticed that an average of 18% of the products are JioMart’s private labels. What stood out further is that private labels accounted for 48% in the Staples category and 24% in Personal Care. We noticed this trend (increase in the private label) when we did an analysis of Amazon.

    When it comes to discounts, we noticed that a near-total 91% of the products listed are being sold at a discount. Out of this, the highest discounts were witnessed in the Home Care and Staples categories.

    The brands with the highest number of products listed were Good Life, Reliance, Amul, Gillette and items sold loosely. All these accounted for 14% of the assortment. Out of these, Good Life, Reliance and the loose items are JioMart’s private labels.

    Competitor analysis

    To get an idea of where JioMart stands with relation to its competitors, we focussed on food and essentials in the Tier 1 cities. The table below highlights the number of product offerings in each category:

    It’s clear that in these categories (food and essentials), JioMart has the least number of products on discount. There’s no doubt that bigbasket is miles ahead in its product range/ assortment.

    To get a better idea of the discounting patterns, we analyzed the same categories to get a count of the number of products being discounted, as well as the average discount being offered. 

    We noticed that JioMart bookended our analysis – the least average discount, across the most number of products. Grofers offered the highest average discount of 23% with Flipkart Supermart and bigbasket closely behind. Lastly, bigbasket had the least number of products on discount with a little over 53%.

    Conclusion

    JioMart launched during a tumultuous and unprecedented time; the COVID-19 pandemic and the subsequent nation-wide lockdowns. Given this trial by fire, they managed to make an impact in this highly competitive space. Their expansion plans of tying up with mom and pop stores to fortify their penetration, had to take a back seat due to the ongoing situation but is sure to resume once conditions improve. This set-back did not however deter JioMart from attracting strategic investments from Facebook, Google and 12 other investors  in a span of 3 months. 

    In a study by Goldman Sachs, it found that India’s e-commerce business is expected to grow at a compound annual growth rate of 27% by 2024, resulting in a $99 billion market share. What’s even more shocking is that 50% of this market will be captured by Reliance Industries. It, therefore, stands to reason that all we’ve seen and heard of so far, is merely the tip of the iceberg and there’s surely more to come in the near future.

  • Decoding Alibaba’s Singles Day Sales

    Decoding Alibaba’s Singles Day Sales

    An average of $11.7 million per second was the rate at which Alibaba clocked $1 billion in sales during the first 85 seconds of Singles’ Day. As Alibaba’s annual sale event continues to grow in scale, referring to it as a global retail phenomenon is an understatement. Alibaba closed the day having shipped 1.04 billion express packages based on sales of merchandize worth 213.5 billion yuan ($30.67 billion).

    This performance shredded any lingering concerns analysts may have harbored about the prospects of this year’s sale, given the international backdrop of the ongoing trade skirmish between the US and China.

    Along with attractive discounts across a range of product categories, Singles’ Day also promised an integrated experience fusing entertainment, digital and shopping, in stark contrast to other large global sale events like Black Friday, which focus predominantly on discounts.

    At DataWeave, we set out to investigate if all the hype resulted in actual price benefits to the shoppers and how the various categories and brands performed in terms of sales during the event. To do this, we leveraged our proprietary data aggregation and analysis platform to capture a range of diverse data points on Tmall Global, covering unit sales (reported by the website) and pricing associated with Tmall Global’s major categories over the Singles’ Day period.

    Our Methodology

    We captured 5 separate snapshots of data from Tmall.com during the period between October 25 and November 14, encompassing over 15,000 unique products each time, across 15 product categories.

    To calculate the average discount rate, we considered the percentage difference between the maximum retail price and the available price of each product. We also looked at the additional discount rate, for which we compared the available price during Singles’ Day to the available price from before the sale. This metric reflects the truest value to the shopper during Singles’ Day in terms of price.

    Our AI-powered technology platform is also capable of capturing prices embedded in an image. For example, the offer price of ¥4198 was extracted accurately from the accompanying image by our algorithms and attributed as the available price while ¥100 from the same image was ignored.

    This technology was employed across hundreds of products using DataWeave’s proprietary Computer Vision technology.

    Domestic Appliances and Digital/Computer Categories Powered Turnover

    The Domestic Appliances and Digital/Computer categories dominated the Singles Day Sale in terms of absolute sales turnover. This isn’t surprising, since the average order value for these categories are typically much higher compared to the other categories analyzed.

    What clearly stands out in the above infographic is that the two largest categories in terms of sales turnover had average additional discounts of only 2 per cent and 0 per cent — a rather surprising insight. In general, with the exceptions of Women’s skincare, Men’s skincare, and Women’s bags (11 per cent, 10 per cent, and 9 per cent respectively), all other categories saw low additional discounts during Singles’ Day.

    However, the absolute discounts across the board were consistently high, with only Luggage (6 per cent), Digital/Computer (9 per cent) and Women’s wear (12 per cent) staying significantly below the 20 per cent mark. In fact, eight categories enjoyed absolute discounts greater than 30 per cent.

    Among common categories between Men and Women, the Men clocked more sales in Men’s wear, shoes, and bags. Only skincare proved to be an exception, where Women’s skincare generated twice the turnover of their Men’s equivalent.

    The Infants category was another intriguing sector to emerge during the sale. Both Diapers (38 per cent) and Infant’s Formula (25 per cent) were substantially discounted, despite only receiving low additional discounts of 2 per cent and 0 per cent respectively – indicating aggressive pricing strategies in this category even during non-sale time periods.

    The biggest takeaway from our analysis is the lack of any correlation between sales turnover and additional discounts, or even the absolute discounts.

    International Brands Make Gains

    International brands continue to penetrate the Chinese market showing up amongst the Top 5 brands of 13 of the 16 categories on sale.

    In the Diaper category, Pampers delivered nearly twice the sales turnover of its next biggest competitor. As expected, Apple and Huawei battled it out for honors in the Digital/Computer category although Xiaomi enjoyed pleasing results, nearly matching Huawei’s sales to go with its sales leadership of the Domestic Appliances category. Local brands, though, swept the Domestic Appliances, Furniture and Women’s Wear categories.

    The challenge posed by Chinese brands was illustrated by Nike’s spot in the second place in the highly competitive Men’s Shoes category after Anta.

    International brands topped only five of the 16 categories and Top 3 positions in ten categories. Still, there’s a growing presence of international brands in China’s eCommerce.

    Gillette won handsomely over its competition in the Personal Care category while Skechers enjoyed a similar result in Women’s Shoes, racking up nearly twice the retail sales of its nearest competitor. Another category dominated by international brands was the Women’s Cosmetics category where international brands accounted for 4 of the Top 5 brands.

    Similarly, Samsonite’s acquisition of American Tourister gave it two top 5 brands in the Luggage category. Other global brands to make the cut during the Singles’ Day sale included L’Oréal, Canada’s Hershel, Playboy, South Korea’s Innisfree and Japan’s Uniqlo.

    It’s Not All About Price On Singles’ Day

    The dramatic rise in shopping during Singles’ Day is not driven solely by price reductions. Alibaba’s commitment to its “New Retail” strategic model has led the Chinese giant to channel its impressive resources to focus on bringing together the online elements of its business with the more traditional offline aspects of its retail distribution. This is combined with entertainment to create a larger story based around the shopper’s overall “experience” rather than just driving “attractive prices” as a short-term retail hook.

    Alibaba is betting big on erasing the line between online and offline and its futuristic vision of structuring retail around the way people actually want to shop. Based on the consistently impressive results of Singles’ Day year after year, “New Retail” has a promising future.

    If you wish to know more about how DataWeave aggregates data from online sources to provide actionable insights to retailers and consumer brands, check out our website!

  • Dataweave – Smartphones vs Tablets: Does size matter?

    Dataweave – Smartphones vs Tablets: Does size matter?

    Smartphones vs Tablets: Does size matter?

    We have seen a steady increase in the number of smartphones and tablets since the last five years. Looking at the number of smartphones, tablets and now wearables ( smart watches and fitbits ) that are being launched in the mobiles market, we can truly call this ‘The Mobile Age’.

    We, at DataWeave, deal with millions of data points related to products which vary from electronics to apparel. One of the main challenges we encounter while dealing with this data is the amount of noise and variation present for the same products across different stores.

    One particular problem we have been facing recently is detecting whether a particular product is a mobile phone (smartphone) or a tablet. If it is mentioned explicitly somewhere in the product information or metadata, we can sit back and let our backend engines do the necessary work of classification and clustering. Unfortunately, with the data we extract and aggregate from the Web, chances of finding this ontological information is quite slim.

    To address the above problem, we decided to take two approaches.

    • Try to extract this information from the product metadata
    • Try to get a list of smartphones and tablets from well known sites and use this information to augment the training of our backend engine

    Here we will talk mainly about the second approach since it is more challenging and engaging than the former. To start with, we needed some data specific to phone models, brands, sizes, dimensions, resolutions and everything else related to the device specifications. For this, we relied on a popular mobiles/tablets product information aggregation site. We crawled, extracted and aggregated this information and stored it as a JSON dump. Each device is represented as a JSON document like the sample shown below.

    { "Body": { "Dimensions": "200 x 114 x 8.7 mm", "Weight": "290 g (Wi-Fi), 299 g (LTE)" }, "Sound": { "3.5mm jack ": "Yes", "Alert types": "N/A", "Loudspeaker ": "Yes, with stereo speakers" }, "Tests": { "Audio quality": "Noise -92.2dB / Crosstalk -92.3dB" }, "Features": { "Java": "No", "OS": "Android OS, v4.3 (Jelly Bean), upgradable to v4.4.2 (KitKat)", "Chipset": "Qualcomm Snapdragon S4Pro", "Colors": "Black", "Radio": "No", "GPU": "Adreno 320", "Messaging": "Email, Push Email, IM, RSS", "Sensors": "Accelerometer, gyro, proximity, compass", "Browser": "HTML5", "Features_extra detail": "- Wireless charging- Google Wallet- SNS integration- MP4/H.264 player- MP3/WAV/eAAC+/WMA player- Organizer- Image/video editor- Document viewer- Google Search, Maps, Gmail,YouTube, Calendar, Google Talk, Picasa- Voice memo- Predictive text input (Swype)", "CPU": "Quad-core 1.5 GHz Krait", "GPS": "Yes, with A-GPS support" }, "title": "Google Nexus 7 (2013)", "brand": "Asus", "General": { "Status": "Available. Released 2013, July", "2G Network": "GSM 850 / 900 / 1800 / 1900 - all versions", "3G Network": "HSDPA 850 / 900 / 1700 / 1900 / 2100 ", "4G Network": "LTE 800 / 850 / 1700 / 1800 / 1900 / 2100 / 2600 ", "Announced": "2013, July", "General_extra detail": "LTE 700 / 750 / 850 / 1700 / 1800 / 1900 / 2100", "SIM": "Micro-SIM" }, "Battery": { "Talk time": "Up to 9 h (multimedia)", "Battery_extra detail": "Non-removable Li-Ion 3950 mAh battery" }, "Camera": { "Video": "Yes, 1080p@30fps", "Primary": "5 MP, 2592 x 1944 pixels, autofocus", "Features": "Geo-tagging, touch focus, face detection", "Secondary": "Yes, 1.2 MP" }, "Memory": { "Internal": "16/32 GB, 2 GB RAM", "Card slot": "No" }, "Data": { "GPRS": "Yes", "NFC": "Yes", "USB": "Yes, microUSB (SlimPort) v2.0", "Bluetooth": "Yes, v4.0 with A2DP, LE", "EDGE": "Yes", "WLAN": "Wi-Fi 802.11 a/b/g/n, dual-band", "Speed": "HSPA+, LTE" }, "Display": { "Multitouch": "Yes, up to 10 fingers", "Protection": "Corning Gorilla Glass", "Type": "LED-backlit IPS LCD capacitive touchscreen, 16M colors", "Size": "1200 x 1920 pixels, 7.0 inches (~323 ppi pixel density)" } }

    From the above document, it is clear that there are a lot of attributes that can be assigned to a mobile device. However, we would not need all of them for building our simple algorithm for labeling smartphones and tablets. I had decided to use the device screen size for separating out smartphones vs tablets, but I decided to take some suggestions from our team. After sitting down and taking a long, hard look at our dataset, Mandar had an idea of using the device dimensions also for achieving the same goal!

    Finally, the attributes that we decided to use were,

    • Size
    • Title
    • Brand
    • Device dimensions

    Screen sizeI wrote some regular expressions for extracting out the features related to the device screen size and resolution. Getting the resolution was easy, which was achieved with the following Python code snippet. There were a couple of NA values but we didn’t go out of our way to get the data by searching on the web because resolution varies a lot and is not a key attribute for determining if a device is a phone or a tablet.

    size_str = repr(doc["Display"]["Size"]) resolution_pattern = re.compile(r'(?:\S+\s)x\s(?:\S+\s)\s?pixels') if resolution_pattern.findall(size_str): resolution = ''.join([token.replace("'","") for token in resolution_pattern.findall(size_str)[0].split()[0:3]]) else: resolution = 'NA'

    But the real problems started when I wrote regular expressions for extracting the screen size. I started off with analyzing the dataset and it seemed that screen size was mentioned in inches so I wrote the following regular expression for getting screen size.

    size_str = repr(doc[“Display”][“Size”]) screen_size_pattern = re.compile(r'(?:\S+\s)\s?inches’) if screen_size_pattern.findall(size_str): screen_size = screen_size_pattern.findall(size_str)[0].split()[0] else: screen_size = ‘NA’

    However, I noticed that I was getting a lot of ‘NA’ values for many devices. On looking up the same devices online, I noticed there were three distinct patterns with regards to screen size. They are,

    • Screen size in ‘inches’
    • Screen size in ‘lines’
    • Screen size in ‘chars’ or ‘characters’

    Now, some of you might be wondering what on earth do ‘lines’ and ‘chars’ mean and how do they measure screen size. On digging it up, I found that basically both of them mean the same thing but in different formats. If we have ‘n lines’ as the screen size, it means, the screen can display at most ‘n’ lines of text at any instance of time. Likewise, if we have ‘n x m chars’ as the screen size, it means the device can diaplay ‘n’ lines of text at any instance of time with each line having a maximum of ‘m’ characters. The picture below will make things more clear. It represents a screen of 4 lines or 4 x 20 chars.

    Thus, the earlier logic for extracting screen size had to be modified and we used the following code snippet. We had to take care of multiple cases in our regexes, because the data did not have a consistent format.

    Thus, the earlier logic for extracting screen size had to be modified and we used the following code snippet. We had to take care of multiple cases in our regexes, because the data did not have a consistent format.

    size_str = repr(doc["Display"]["Size"]) screen_size_pattern = re.compile(r'(?:\S+\s)\s?inc[h|hes]') if screen_size_pattern.findall(size_str): screen_size = screen_size_pattern.findall(size_str)[0] .replace("'","").split()[0]+' inches' else: screen_size_pattern = re.compile(r'(?:\S+\s)\s?lines') if screen_size_pattern.findall(size_str): screen_size = screen_size_pattern.findall(size_str)[0] .replace("'","").split()[0]+' lines' else: screen_size_pattern = re.compile(r'(?:\S+\s)x\s(?:\S+\s)\s?char[s|acters]') if screen_size_pattern.findall(size_str): screen_size = screen_size_pattern.findall(size_str)[0] .replace("'","").split()[0]+' lines' else: screen_size = 'NA'

    Mandar helped me out with extracting the ‘dimensions’ attribute from the dataset and performing some transformations on it to get the total volume of the phone. It was achieved using the following code snippet.

    dimensions = doc['Body']['Dimensions'] dimensions = re.sub (r'[^\s*\w*.-]', '', dimensions.split ('(') [0].split (',') [0].split ('mm') [0]).strip ('-').strip ('x') if not dimensions: dimensions = 'NA' total_area = 'NA' else: if 'cc' in dimensions: total_area = dimensions.split ('cc') [0] else: total_area = reduce (operator.mul, [float (float (elem.split ('-') [0])/10) for elem in dimensions.split ('x')], 1) total_area = round(float(total_area),3)

    We used PrettyTable to output the results in a clear and concise format.

    Next, we stored the above data in a csv file and used PandasMatplotlib, Seaborn and IPython to do some quick exploratory data analysis and visualizations. The following depicts the top ten brands with the most number of mobile devices as per the dataset.

    Then, we looked at the device area frequency for each brand using boxplots as depicted below. Based on the plot, it is quite evident that almost all the plots are right skewed, with a majority of the distribution of device dimensions (total area) falling in the range [0,150]. There are some notable exceptions like ‘Apple’ where the skew is considerably less than the general trend. On slicing the data for the brand ‘Apple’, we noticed that this was because devices from ‘Apple’ have an almost equal distribution based on the number of smartphones and tablets, leading to the distribution being almost normal.

    Based on similar experiments, we noticed that tablets had larger dimensions as compared to mobile phones, and screen sizes followed that same trend. We made some quick plots with respect to the device areas as shown below.

    Now, take a look at the above plots again. The second plot shows the distribution of device areas in a kernel density plot. This distribution resembles a Gaussian distribution but with a right skew. [Mandar reckons that it actually resembles a Logistic distribution, but who’s splitting hairs, eh? ;)] The histogram plot depicts the same, except here we see the frequency of devices vs the device areas. Looking at it closely, Mandar said that the bell shaped curve had the maximum number of devices and those must be all the smartphones, while the long thin tail on the right side must indicate tablets. So we set a cutoff of 160 cubic centimeters for distinguishing between phones and tablets.

    We also decided to calculate the correlation between ‘Total Area’ and ‘Screen Size’ because as one might guess, devices with larger area have large screen sizes. So we transformed the screen sizes from textual to numeric format based on some processing, and calculated the correlation between them which came to be around 0.73 or 73%

    We did get a high correlation between Screen Size and Device Area. However, I still wanted to investigate why we didn’t get a score close to 90%. On doing some data digging, I noticed an interesting pattern.

    After looking at the above results, what came to our minds immediately was: why do phones with such small screen sizes have such big dimensions? We soon realized that these devices were either “feature phones” of yore or smartphones with a physical keypad!

    Thus, we used screen sizes in conjunction with dimensions for labeling our devices. After a long discussion, we decided to use the following logic for labeling smartphones and tablets.

    device_class = None if total_area >= 160.0: device_class = 'Tablet' elif total_area < 160.0: device_class = 'Phone' if 'lines' in screen_size: device_class = 'Phone' elif 'inches' in screen_size: if float(screen_size.split()[0]) < 6.0: device_class = 'Phone'

    After all this fun and frolic with data analysis, we were able to label handheld devices correctly, just like we wanted it!

    Originally published at blog.priceweave.com.

  • Benefits of Assortment Intelligence

    Benefits of Assortment Intelligence

    In retail, product assortment plays a critical role in selling effectively. It impacts the everyday decision making of category managers, brand managers, the merchandising, planning, and logistics teams. A good assortment mix helps achieve the following objectives:

    1. Reduce acquisition costs for new customers (as well as retain existing customers)
    2. Increase penetration by catering to a variety of customer segments
    3. Optimize planning and inventory management costs.

    Increasingly, retailers are moving away from a generic one-size-fits all assortment planning model, to a more dynamic and data driven approach. As a result, assortment benchmarking followed by assortment planning are activities that take place round the year. The breadth and depth of one’s assortment achieved through assortment benchmarking can define how and when products get bought.

    A number of factors are crucial for assortment planning: analytics over internal data, intuition, experience, and understanding gained through trends. In addition to these, tracking assortment changes on competitors’ websites helps retailers track and adjust their product mix by adjusting features such as brands, colors, variants, and pricing. The goal is to help users find exactly what they are looking for, the moment they are looking for it.

    Let’s see how we can achieve this through Assortment Intelligence tools in a moment. But first, some basics.

    What is Assortment Intelligence?

    Assortment intelligence refers to online retailers tracking, analysing a competitor’s assortment, and benchmarking it against one’s one assortment. Assortment intelligence tools make this process efficient. A good assortment intelligence tool such as PriceWeave gives you information the breadth and depth of your competitors’ assortment across categories and brands. It helps you analyze assortment through different lenses: colors, variants, sizes, shapes, and other technical specifications. With the help of an assortment intelligence tool, a retailer can get a good understanding about what products competitors have, how they perform and whether they should add these products to their existing catalog.

    Who uses Assortment Intelligence?

    Assortment tracking is used by retailers operating across categories as varied as footwear, electronics, jewelry, household goods,appliances, accessories, tools, handbags, furniture, clothing, baby products, and books among others.

    Some Uses of Assortment Intelligence

    Gaps in Catalog: Discover products/brands your competitors are offering that are not on your catalog, and add them.

    Unique Offerings: Find products/brands that only you are offering and decide whether you are pricing them right. May be you want to bump up their prices.

    Compare and analyze product assortment across dimensions: Benchmark your assortments across different dimensions and combinations thereof. Understand your as well as competitors’ focus areas. You can do this in aggregate as well as at the category/brand/feature level. Below we show a few examples.

    Effectively measure discount distributions across brands and/or sources. Understand your competitors’ “sweet spots” in terms of discounts.

    Understand assortment spread across price ranges. Are you focusing on all price ranges or only a few? Is that a decision you made consciously?

    Deep dive using smart filters — monitor specific competitors, brands and sets of products with filters such as colors, variants, sizes and other product features.

    Why do it?

    Assortment Intelligence not only increases sales and improves margins, but also helps reduce planning and inventory costs. It allows retailers to strike the right balance between assortment and inventory while maximizing sales. Retailers can take informed decisions by analyzing one’s own as well as competitors’ assortments. Businesses gain an edge by identifying opportunities around changes in product mix and make quick decisions. By identifying areas that need focus, and taking timely actions, an assortment intelligence tool will help improve the bottom line.

    What does PriceWeave bring in?

    With a feature-rich product such as PriceWeave, you can do all of the above and more everyday (or more frequently if you like). In addition, you can get all assortment related data as reports in case you want to do your own analysis. You can also set alerts on any changes that you want to track.

    PriceWeave lets you drill down as deep as you like. Assortments do not have to be based on high level dimensions or standard features like colors and sizes. You can analyze assortments based on technical specs of products (RAM size, cloth material, style, shape, etc.) or their combinations.

    Assortment Intelligence is an important part of the PriceWeave offering. If you’d like us to help you make smarter assortment intelligence decisions talk to us

    About Priceweave

    PriceWeave provides Competitive Intelligence for retailers, brands, and manufacturers. We’re built on top of huge amounts of products data to provide features such as: pricing opportunities (and changes), assortment intelligence, gaps in catalogs, reporting and analytics, and tracking promotions, and product launches. PriceWeave lets you track any number of products across any number of categories against your competitors. If you’d like to try us out request for a demo.

    Originally published at blog.priceweave.com.

  • Mining Twitter to Analyze Product Trends | DataWeave

    Mining Twitter to Analyze Product Trends | DataWeave

    Due to the massive growth of social media in the last decade, it has become a rage among data enthusiasts to tap into the vast pool of social data and gather interesting insights like trending items, reception of newly released products by society, popularity measures to name a few.

    We are continually evolving PriceWeave, which has the most extensive set of offerings when it comes to providing actionable insights to retail stores and brands. As part of the product development, we look at social data from a variety of channels to mine things like: trending products/brands; social engagement of stores/brands; what content “works” and what does not on social media, and so forth.

    We do a number of experiments with mining Twitter data, and this series of blog posts is one of the outputs from those efforts.

    In some of our recent blog posts, we have seen how to look at current trends and gather insights from YouTube the popular video sharing website. We have also talked about how to create a quick bare-bones web application to perform sentiment analysis of tweets from Twitter. Today I will be talking about mining data from Twitter and doing much more with it than just sentiment analysis. We will be analyzing Twitter data in depth and then we will try to get some interesting insights from it.

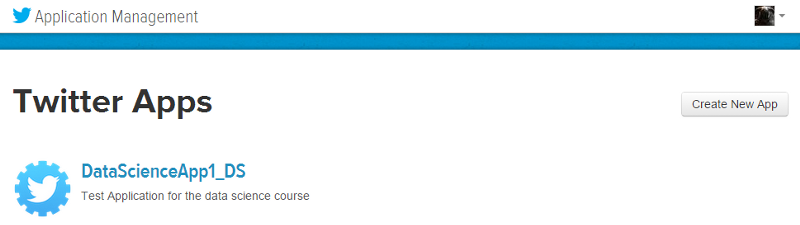
    To get data from twitter, first we need to create a new Twitter application to get OAuth credentials and access to their APIs. For doing this, head over to the Twitter Application Management page and sign in with your Twitter credentials. Once you are logged in, click on the Create New App button as you can see in the snapshot below. Once you create the application, you will be able to view it in your dashboard just like the application I created, named DataScienceApp1_DS shows up in my dashboard depicted below.

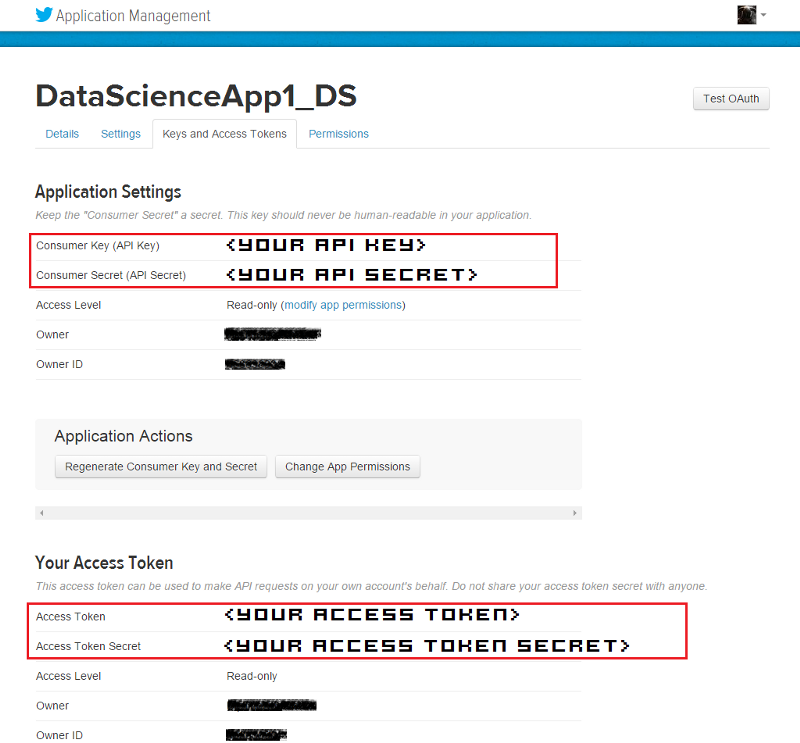
    On clicking the application, it will take you to your application management dashboard. Here, you will find the necessary keys you need in the Keys and Access Tokens section. The main tokens you need are highlighted in the snapshot below.

    I will be doing most of my analysis using the Python programming language. To be more specific, I will be using the IPython shell, but you are most welcome to use the language of your choice, provided you get the relevant API wrappers and necessary libraries.

    Installing necessary packages

    After obtaining the necessary tokens, we will be installing some necessary libraries and packages, namely twitter, prettytable and matplotlib. Fire up your terminal or command prompt and use the following commands to install the libraries if you don’t have them already.

    Creating a Twitter API Connection

    Once the packages are installed, you can start writing some code. For this, open up the IDE or text editor of your choice and use the following code segment to create an authenticated connection to Twitter’s API. The way the following code snippet works, is by using your OAuth credentials to create an object called auth that represents your OAuth authorization. This is then passed to a class called Twitter belonging to the twitter library and we create a resource object named twitter_api that is capable of issuing queries to Twitter’s API.

    If you do a print twitter_api and all your tokens are corrent, you should be getting something similar to the snapshot below. This indicates that we’ve successfully used OAuth credentials to gain authorization to query Twitter’s API.

    Exploring Trending Topics

    Now that we have a working Twitter resource object, we can start issuing requests to Twitter. Here, we will be looking at the topics which are currently trending worldwide using some specific API calls. The API can also be parameterized to constrain the topics to more specific locales and regions. Each query uses a unique identifier which follows the Yahoo! GeoPlanet’s Where On Earth (WOE) ID system, which is an API itself that aims to provide a way to map a unique identifier to any named place on Earth. The following code segment retrieves trending topics in the world, the US and in India.

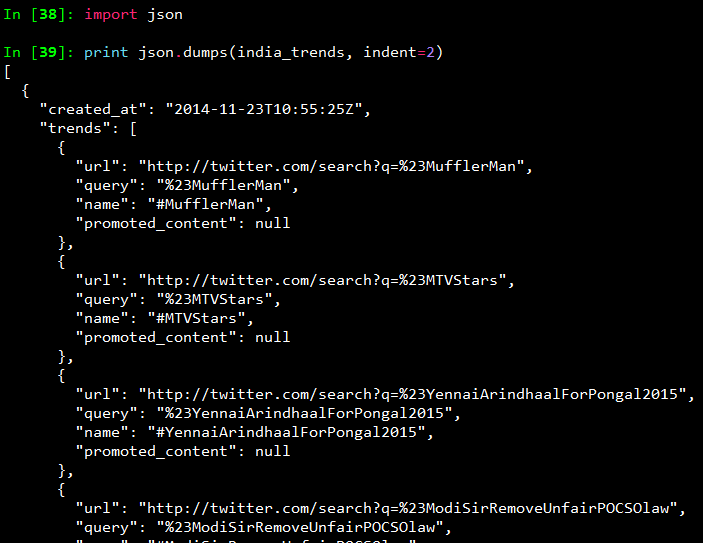
    Once you print the responses, you will see a bunch of outputs which look like JSON data. To view the output in a pretty format, use the following commands and you will get the output as a pretty printed JSON shown in the snapshot below.

    To view all the trending topics in a convenient way, we will be using list comprehensions to slice the data we need and print it using prettytable as shown below.

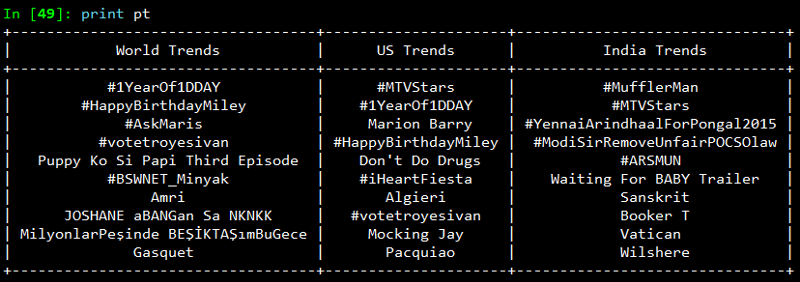
    On printing the result, you will get a neatly tabulated list of current trends which keep changing with time.

    Now, we will try to analyze and see if some of these trends are common. For that we use Python’s set data structure and compute intersections to get common trends as shown in the snapshot below.

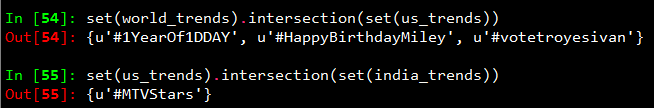
    Interestingly, some of the trending topics at this moment in the US are common with some of the trending topics in the world. The same holds good for US and India.

    Mining for Tweets

    In this section, we will be looking at ways to mine Twitter for retrieving tweets based on specific queries and extracting useful information from the query results. For this we will be using Twitter API’s GET search/tweets resource. Since the Google Nexus 6 phone was launched recently, I will be using that as my query string. You can use the following code segment to make a robust API request to Twitter to get a size-able number of tweets.

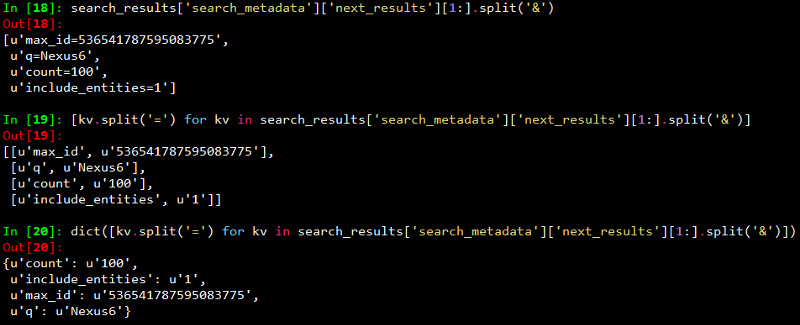
    The code snippet above, makes repeated requests to the Twitter Search API. Search results contain a special search_metadata node that embeds a next_results field with a query string that provides the basis of making a subsequent query. If we weren’t using a library like twitter to make the HTTP requests for us, this preconstructed query string would just be appended to the Search API URL, and we’d update it with additional parameters for handling OAuth. However, since we are not making our HTTP requests directly, we must parse the query string into its constituent key/value pairs and provide them as keyword arguments to the search/tweets API endpoint. I have provided a snapshot below, showing how this dictionary of key/value pairs are constructed which are passed as kwargs to the Twitter.search.tweets(..) method.

    Analyzing the structure of a Tweet

    In this section we will see what are the main features of a tweet and what insights can be obtained from them. For this we will be taking a sample tweet from our list of tweets and examining it closely. To get a detailed overview of tweets, you can refer to this excellent resource created by Twitter. I have extracted a sample tweet into the variable sample_tweet for ease of use. sample_tweet.keys() returns the top-level fields for the tweet.

    Typically, a tweet has some of the following data points which are of great interest.

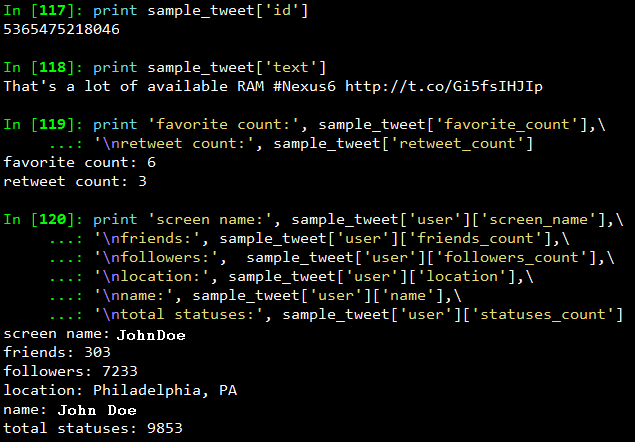
    The identifier of the tweet can be accessed through sample_tweet[‘id’]

    • The human-readable text of a tweet is available through sample_tweet[‘text’]
    • The entities in the text of a tweet are conveniently processed and available through sample_tweet[‘entities’]
    • The “interestingness” of a tweet is available through sample_tweet[‘favorite_count’] and sample_tweet[‘retweet_count’], which return the number of times it’s been bookmarked or retweeted, respectively
    • An important thing to note, is that, the retweet_count reflects the total number of times the original tweet has been retweeted and should reflect the same value in both the original tweet and all subsequent retweets. In other words, retweets aren’t retweeted
    • The user details can be accessed through sample_tweet[‘user’] which contains details like screen_name, friends_count, followers_count, name, location and so on

    Some of the above datapoints are depicted in the snapshot below for the sample_tweet. Note, that the names have been changed to protect the identity of the entity that created the status.

    Before we move on to the next section, my advice is that you should play around with the sample tweet and consult the documentation to clarify all your doubts. A good working knowledge of a tweet’s anatomy is critical to effectively mining Twitter data.

    Extracting Tweet Entities

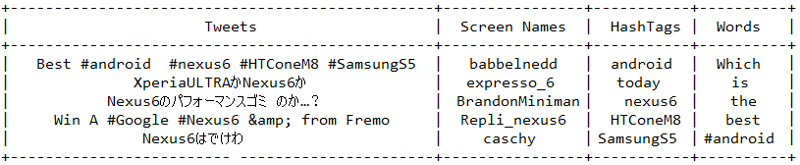
    In this section, we will be filtering out the text statuses of tweets and different entities of tweets like hashtags. For this, we will be using list comprehensions which are faster than normal looping constructs and yield substantial perfomance gains. Use the following code snippet to extract the texts, screen names and hashtags from the tweets. I have also displayed the first five samples from each list just for clarity.

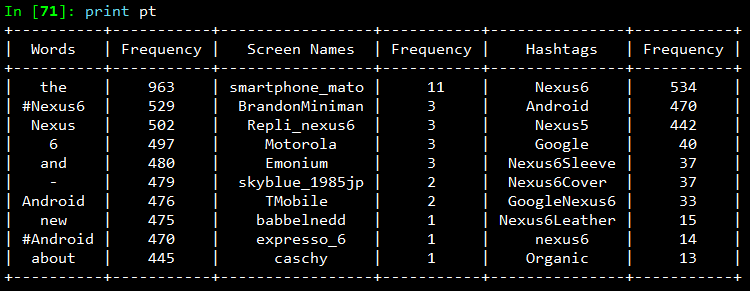
    Once you print the table, you should be getting a table of the sample data which should look something like the table below but with different content ofcourse!

    Frequency Analysis of Tweet and Tweet Entities

    Once we have all the required data in relevant data structures, we will do some analysis on it. The most common analysis would be a frequency analysis where we find out the most common terms occurring in different entities of the tweets. For this we will be making use of the collection module. The following code snippet ranks the top ten most occurring tweet entities and prints them as a table.

    The output I obtained is shown in the snapshot below. As you can see, there is a lot of noise in the tweets because of which several meaningless terms and symbols have crept into the top ten list. For this, we can use some pre-processing and data cleaning techniques.

    Analyzing the Lexical Diversity of Tweets

    A slightly more advanced measurement that involves calculating simple frequencies and can be applied to unstructured text is a metric called lexical diversity. Mathematically, lexical diversity can be defined as an expression of the number of unique tokens in the text divided by the total number of tokens in the text. Let us take an example to understand this better. Suppose you are listening to someone who repeatedly says “and stuff” to broadly generalize information as opposed to providing specific examples to reinforce points with more detail or clarity. Now, contrast that speaker to someone else who seldom uses the word “stuff” to generalize and instead reinforces points with concrete examples. The speaker who repeatedly says “and stuff” would have a lower lexical diversity than the speaker who uses a more diverse vocabulary.

    The following code snippet, computes the lexical diversity for status texts, screen names, and hashtags for our data set. We also measure the average number of words per tweet.

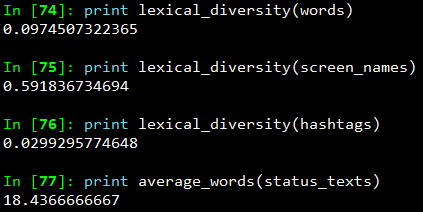
    The output which I obtained is depicted in the snapshot below.

    Now, I am sure you must be thinking, what on earth do the above numbers indicate? We can analyze the above results as follows.

    • The lexical diversity of the words in the text of the tweets is around 0.097. This can be interpreted as, each status update carries around 9.7% unique information. The reason for this is because, most of the tweets would contain terms like Android, Nexus 6, Google
    • The lexical diversity of the screen names, however, is even higher, with a value of 0.59 or 59%, which means that about 29 out of 49 screen names mentioned are unique. This is obviously higher because in the data set, different people will be posting about Nexus 6
    • The lexical diversity of the hashtags is extremely low at a value of around 0.029 or 2.9%, implying that very few values other than the #Nexus6hashtag appear multiple times in the results. This is relevant because tweets about Nexus 6 should contain this hashtag
    • The average number of words per tweet is around 18 words

    This gives us some interesting insights like people mostly talk about Nexus 6 when queried for that search keyword. Also, if we look at the top hashtags, we see that Nexus 5 co-occurs a lot with Nexus 6. This might be an indication that people are comparing these phones when they are tweeting.

    Examining Patterns in Retweets

    In this section, we will analyze our data to determine if there were any particular tweets that were highly retweeted. The approach we’ll take to find the most popular retweets, is to simply iterate over each status update and store out the retweet count, the originator of the retweet, and status text of the retweet, if the status update is a retweet. We will be using a list comprehension and sort by the retweet count to display the top few results in the following code snippet.

    The output I obtained is depicted in the following snapshot.

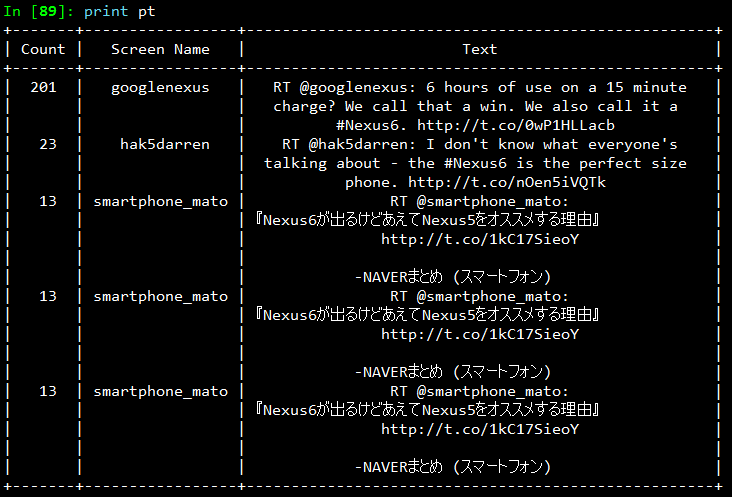
    From the results, we see that the top most retweet is from the official googlenexus channel on Twitter and the tweet speaks about the phone being used non-stop for 6 hours on only a 15 minute charge. Thus, you can see that this has definitely been received positively by the users based on its retweet count. You can detect similar interesting patterns in retweets based on the topics of your choice.

    Visualizing Frequency Data

    In this section, we will be creating some interesting visualizations from our data set. For plotting we will be using matplotlib, a popular Python plotting library which comes inbuilt with IPython. If you don’t have matplotlib loaded by default use the command import matplotlib.pyplot as plt in your code.

    Visualizing word frequencies

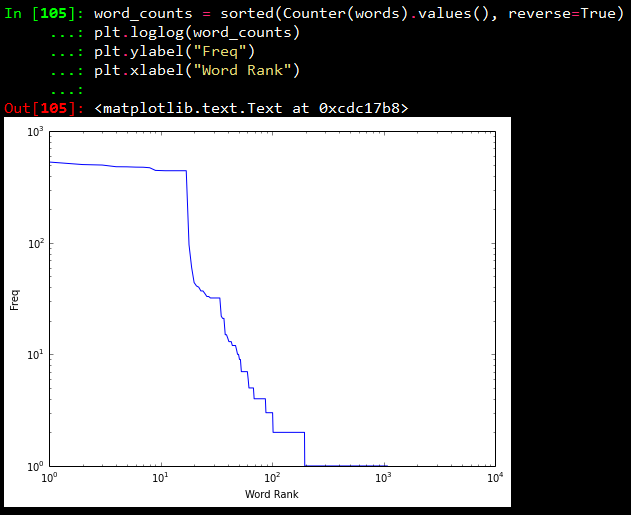
    In our first plot, we will be displayings the results from the words variable which contains different words from the tweet status texts. Using Counter from the collections package, we generate a sorted list of tuples, where each tuple is a (word, frequency) pair. The x-axis value will correspond to the index of the tuple, and the y-axis will correspond to the frequency for the word in that tuple. We transform both axes into a logarithmic scale because of the vast number of data points.

    Visualizing words, screen names, and hashtags

    A line chart of frequency values is decent enough. But what if we want to find out the number of words having a frequency between 1–5, 5–10, 10–15… and so on. For this purpose we will be using a histogram to depict the frequencies. The following code snippet achieves the same.

    What this essentially does is, it takes all the frequencies and groups them together and creates bins or ranges and plots the number of entities which fall in that bin or range. The plots I obtained are shown below.

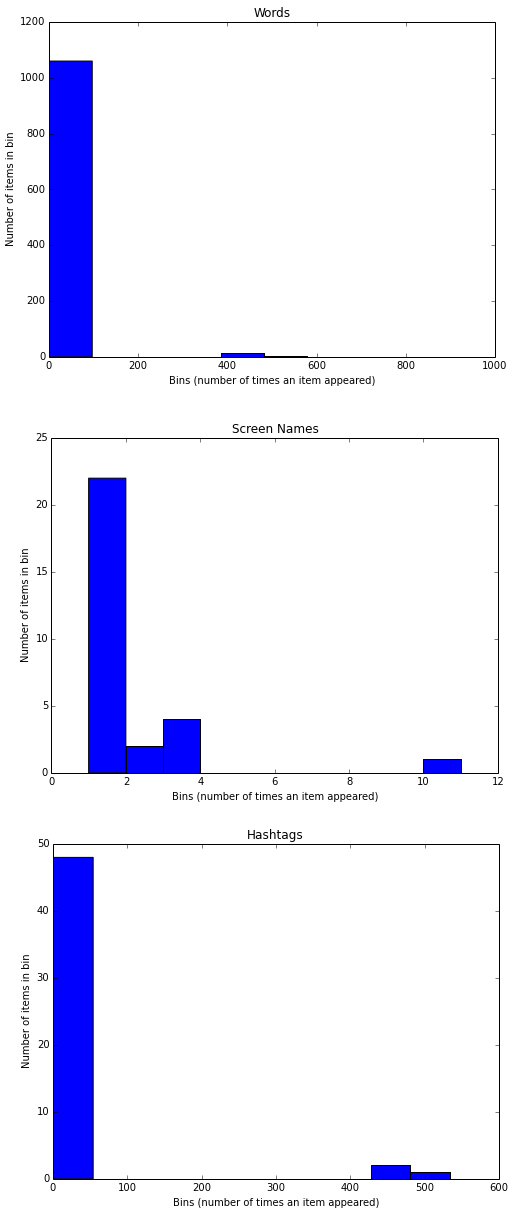
    From the above plots, we can observe that, all the three plots follow the “Pareto Principle” i.e, almost 80% of the words, screen names and hashtags have a frequency of only 20% in the whole data set and only 20% of the words, screen names and hashtags have a frequency of more than 80% in the data set. In short, if we consider hashtags, a lot of hashtags occur maybe only once or twice in the whole data set and very few hashtags like #Nexus6 occur in almost all the tweets in the data set leading to its high frequency value.

    Visualizing retweets

    In this visualization, we will be using a histogram to visualize retweet counts using the following code snippet.

    The plot which I obtained is shown below.

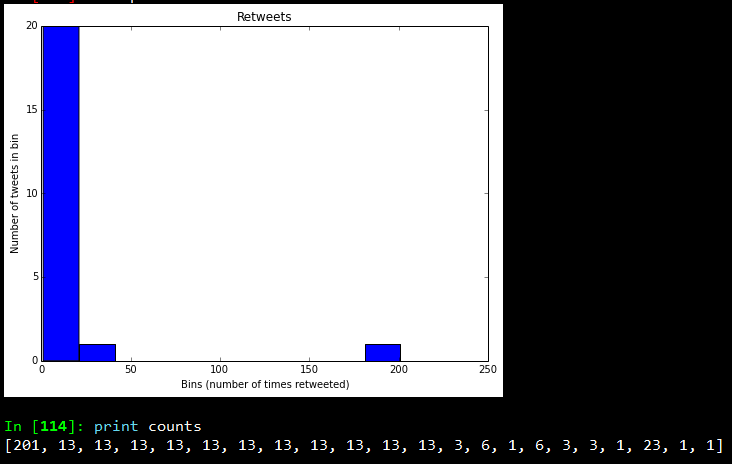
    Looking at the frequency counts, it is clear that very few retweets have a large count.

    I hope you have seen by now, how powerful Twitter APIs are and using simple Python libraries and modules, it is really easy to generate very powerful and interesting insights. That’s all for now folks! I will be talking more about Twitter Mining in another post sometime in the future. A ton of thanks goes out to Matthew A. Russell and his excellent book Mining the Social Web, without which this post would never have been possible. Cover image credit goes to Social Media.