Category: Pricing Strategies

  • Standard Reporting vs. Competitive Intelligence: What Retail Leaders Need to Know

    Standard Reporting vs. Competitive Intelligence: What Retail Leaders Need to Know

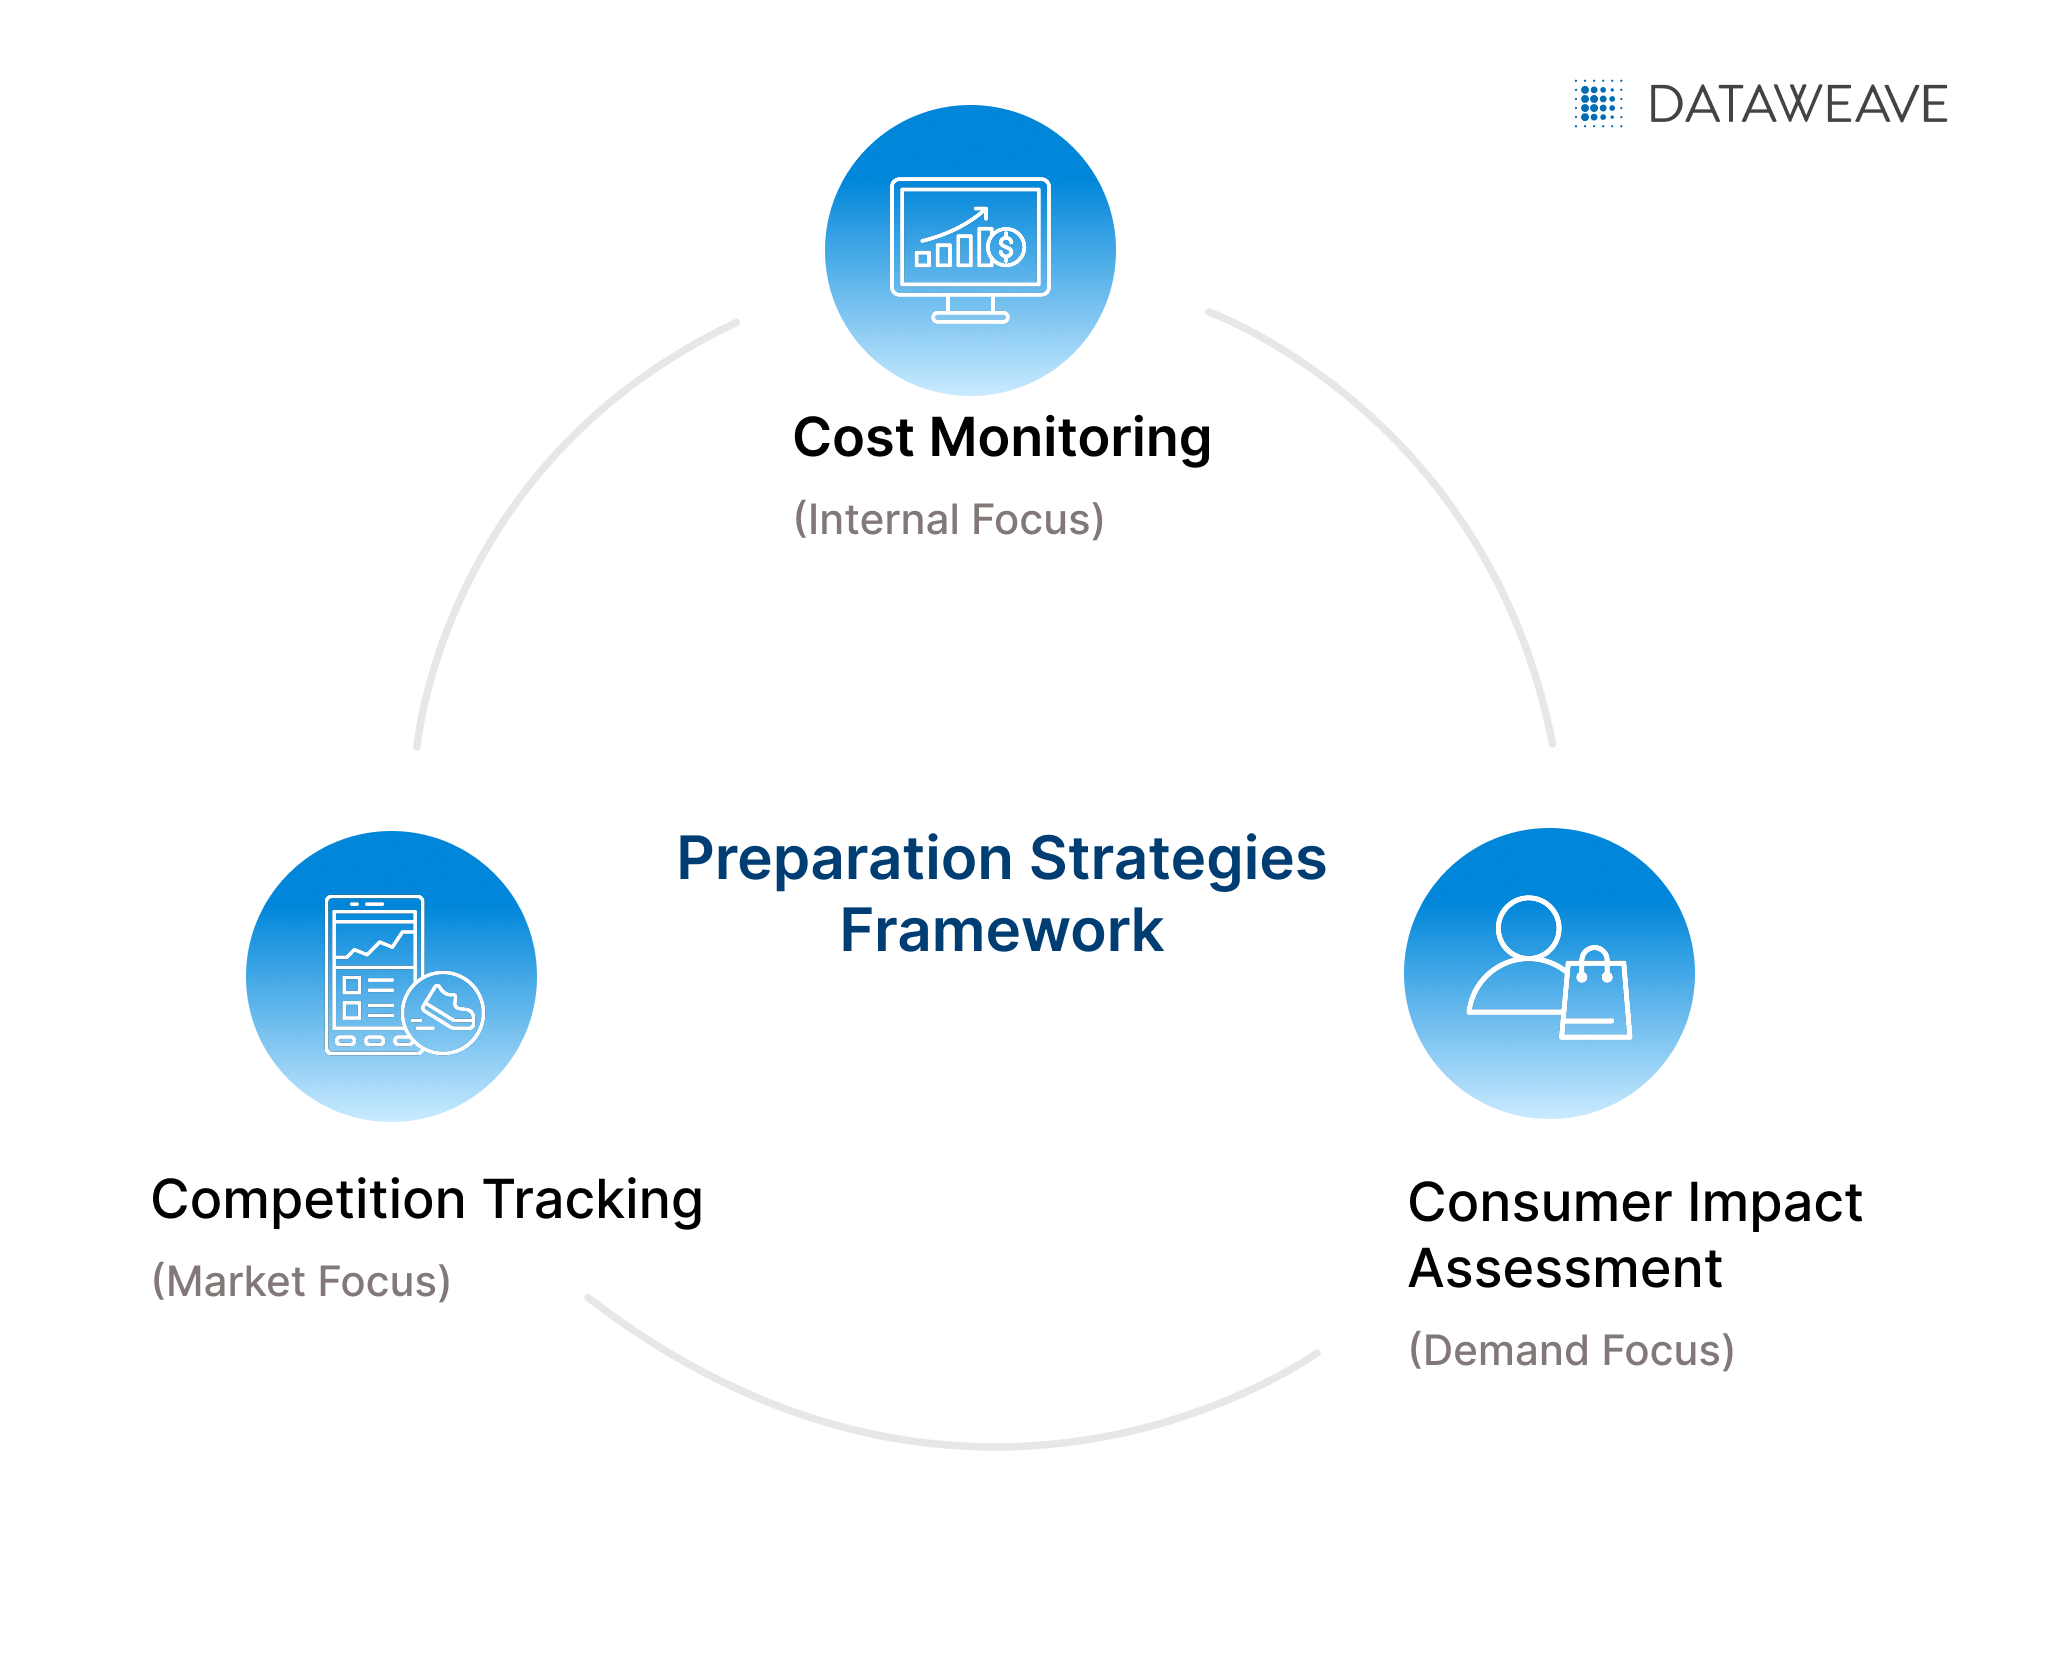
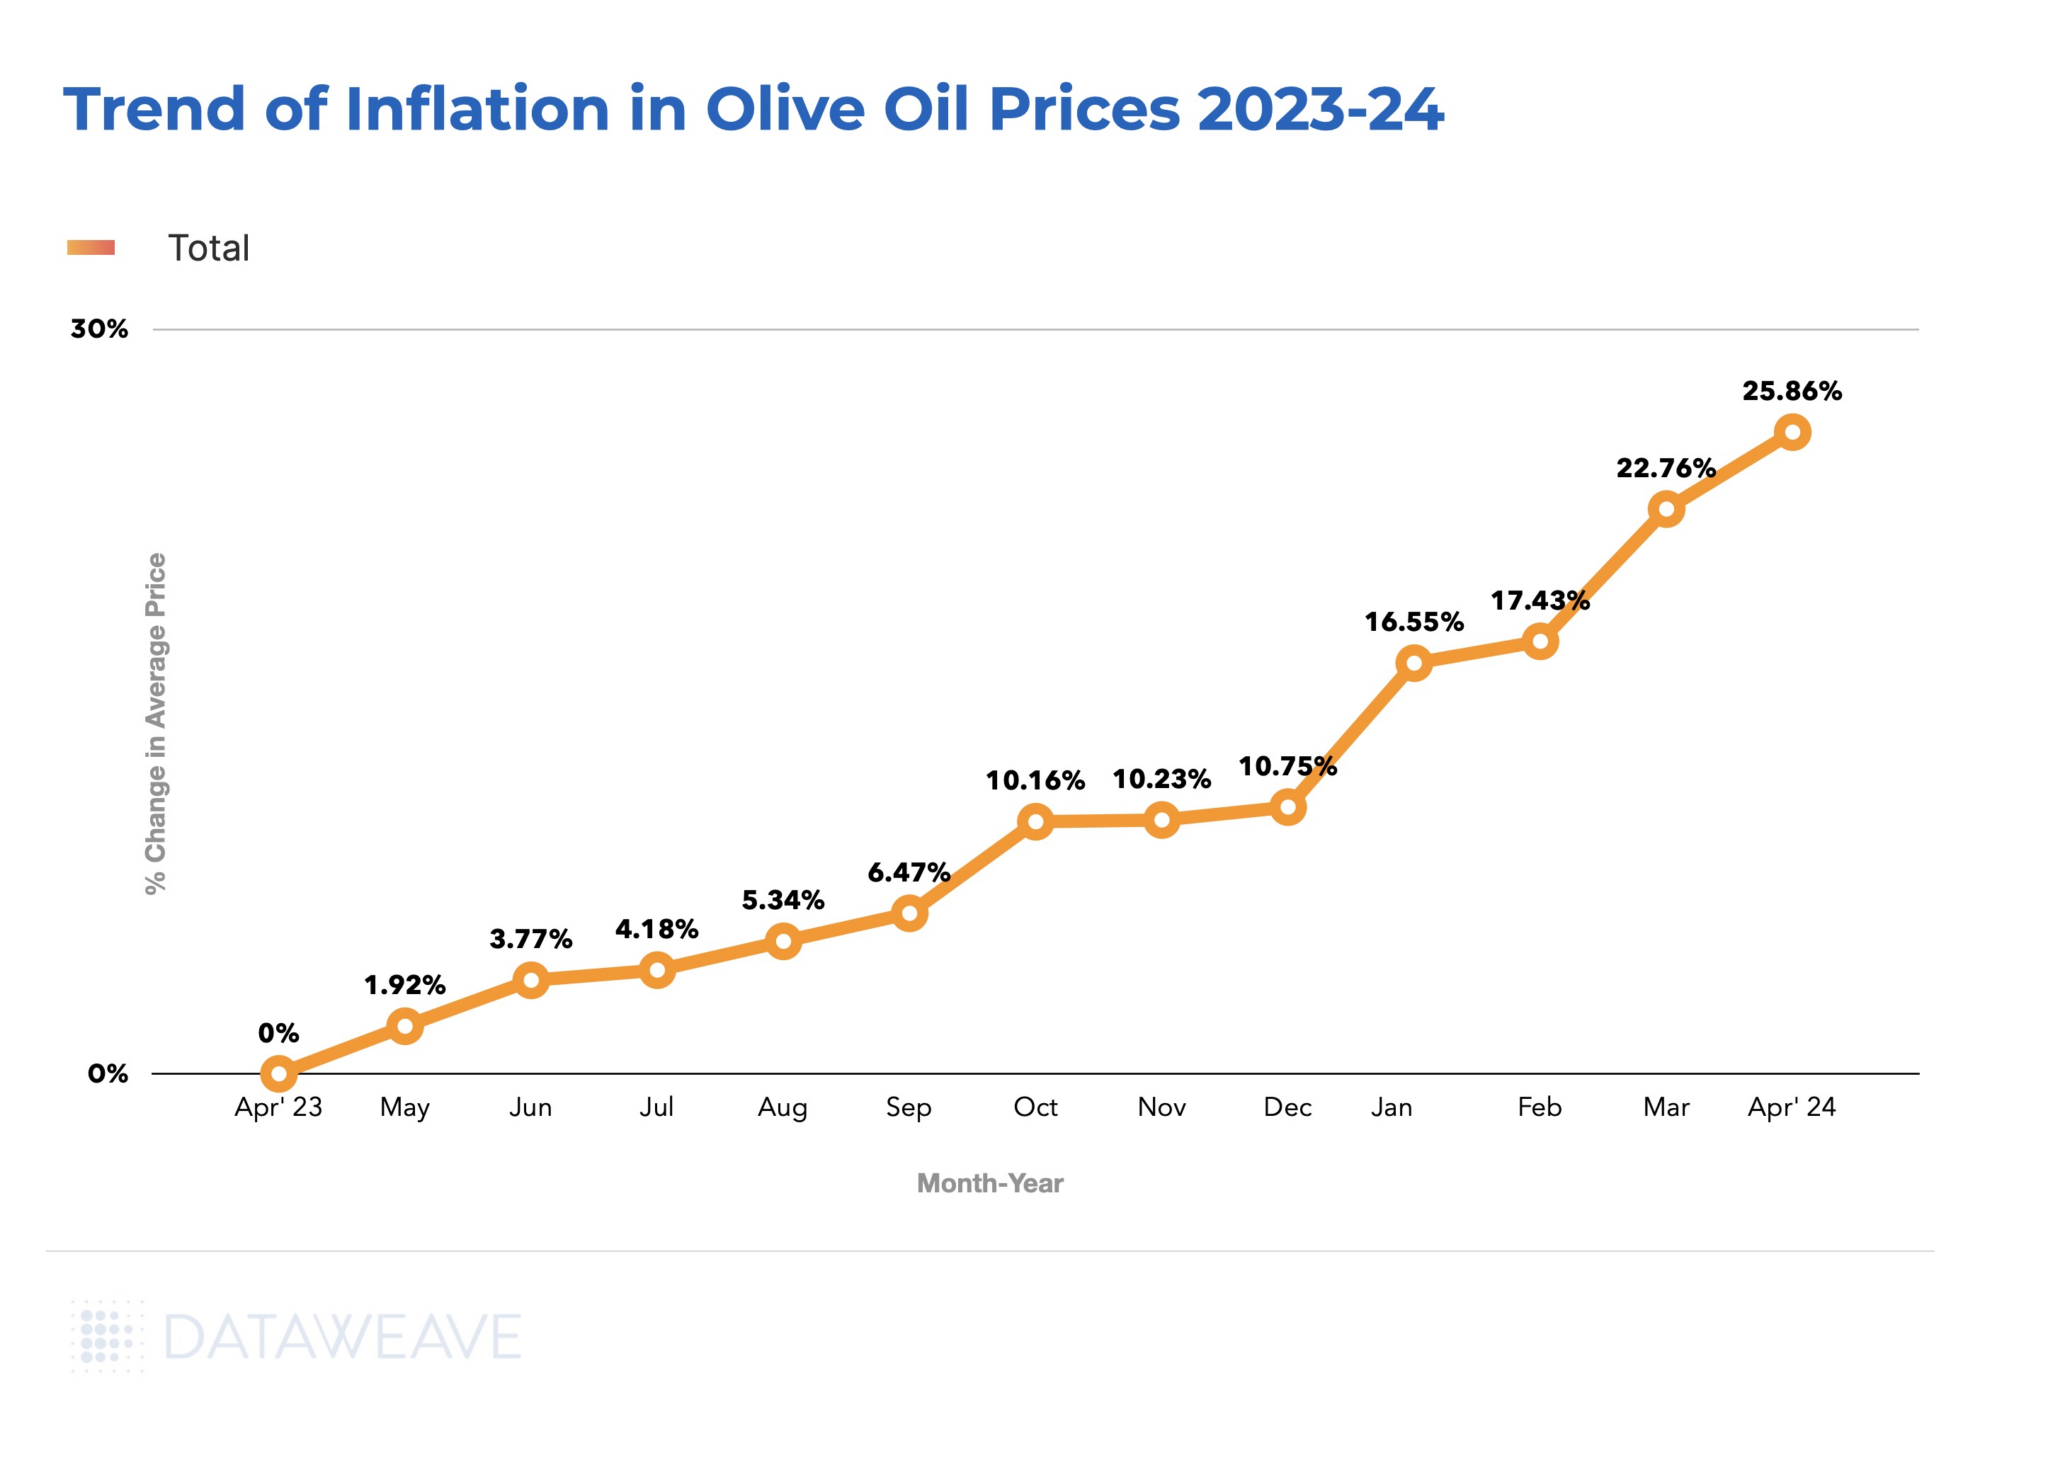
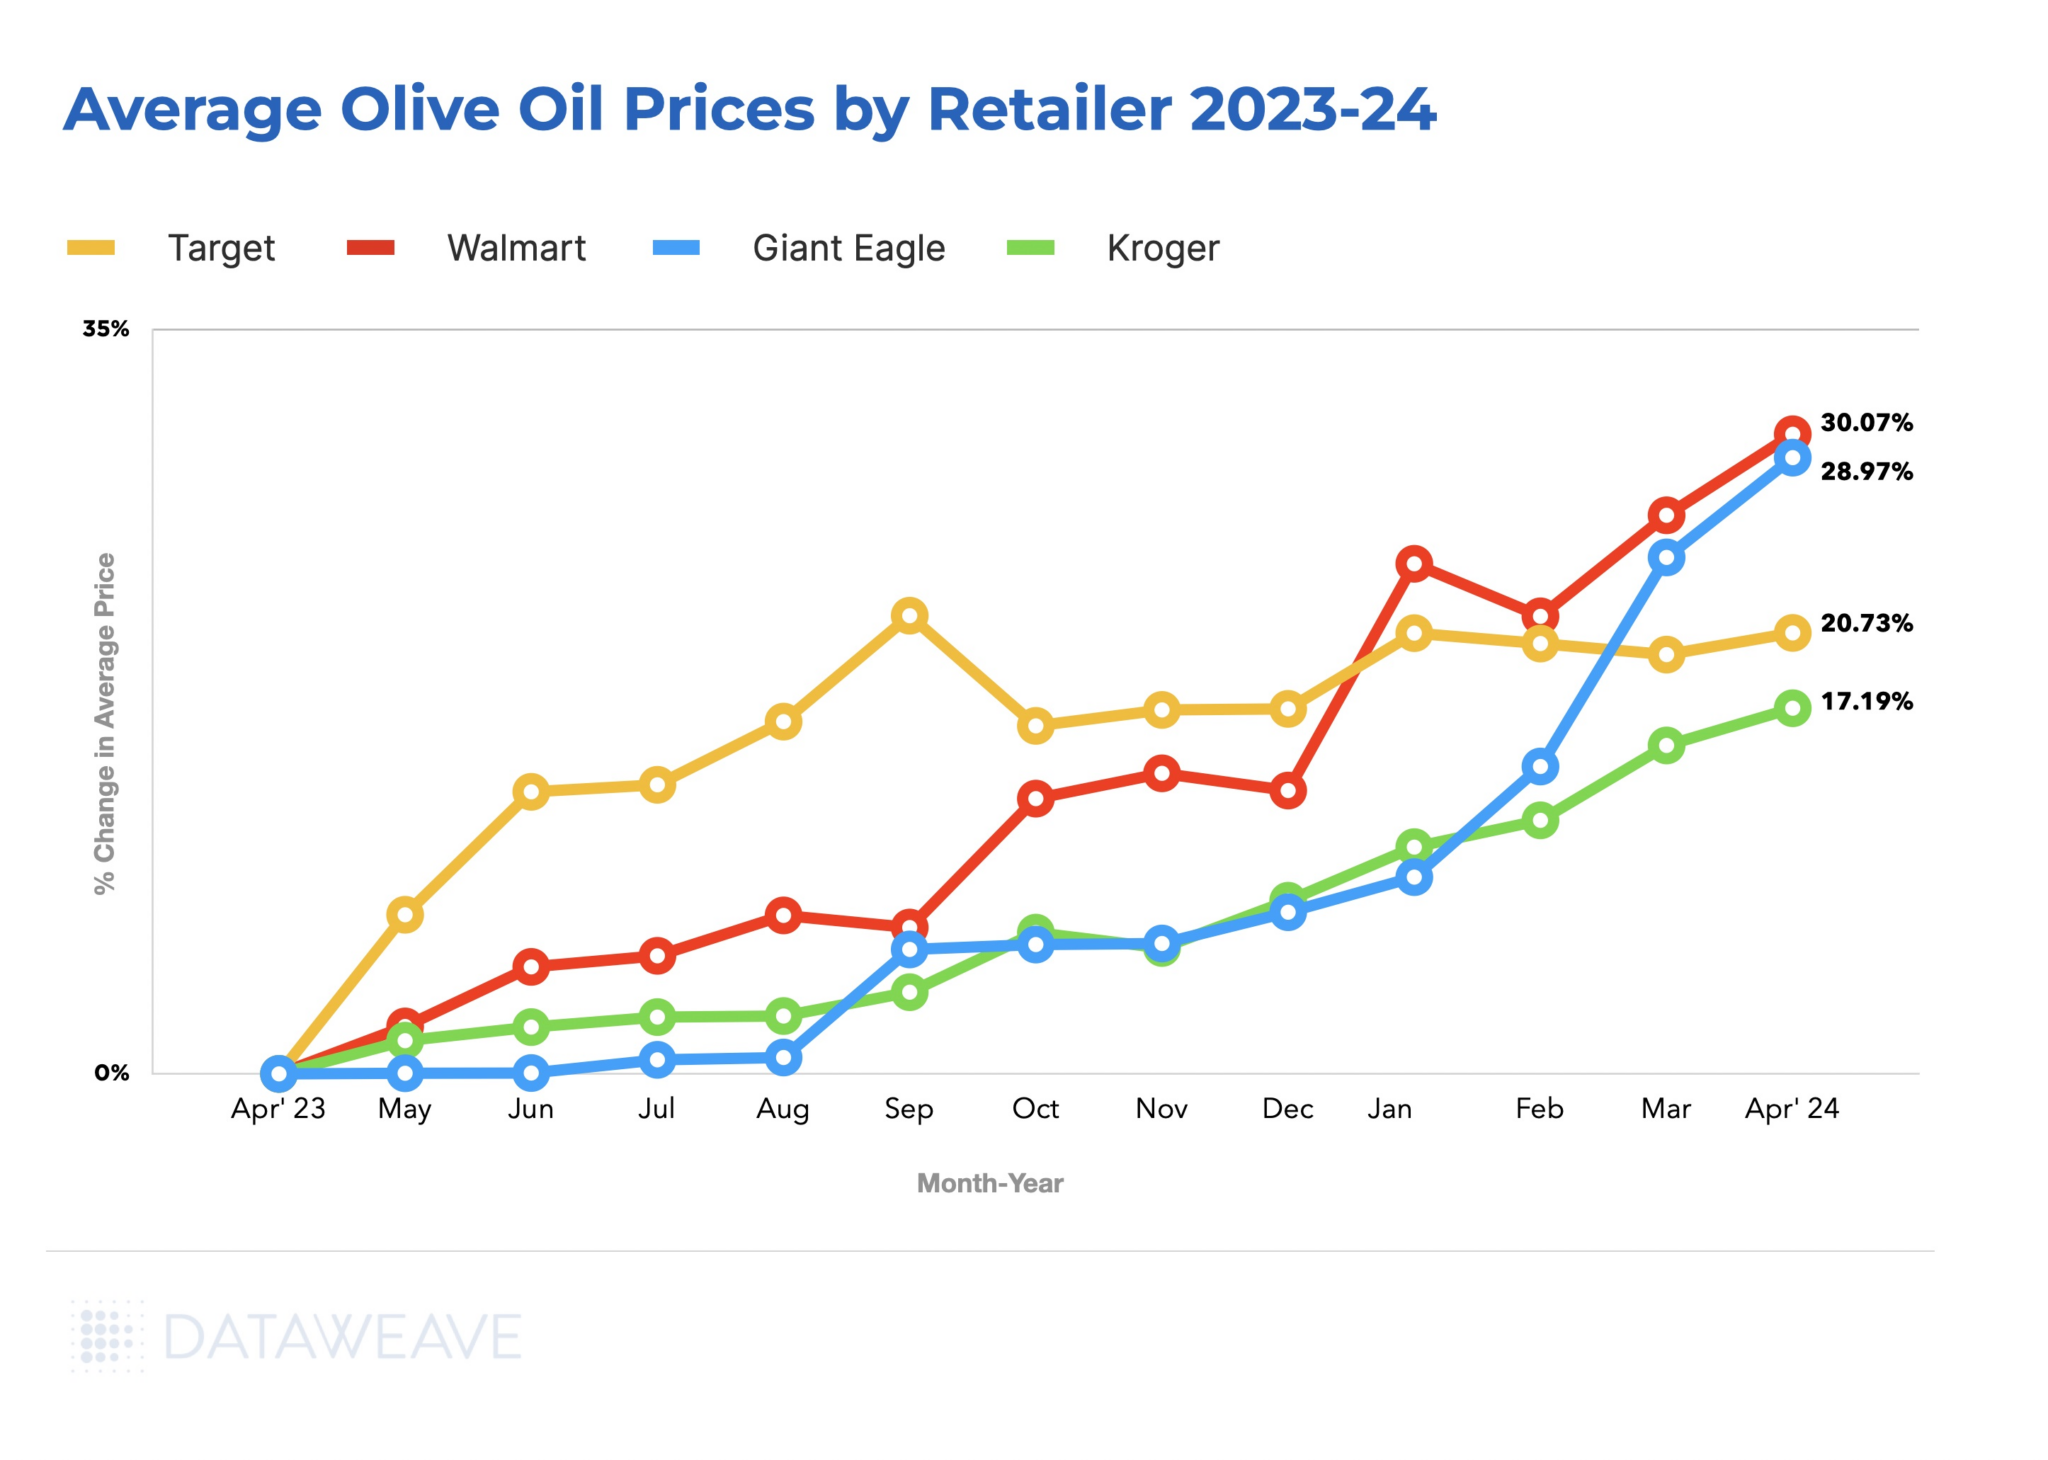
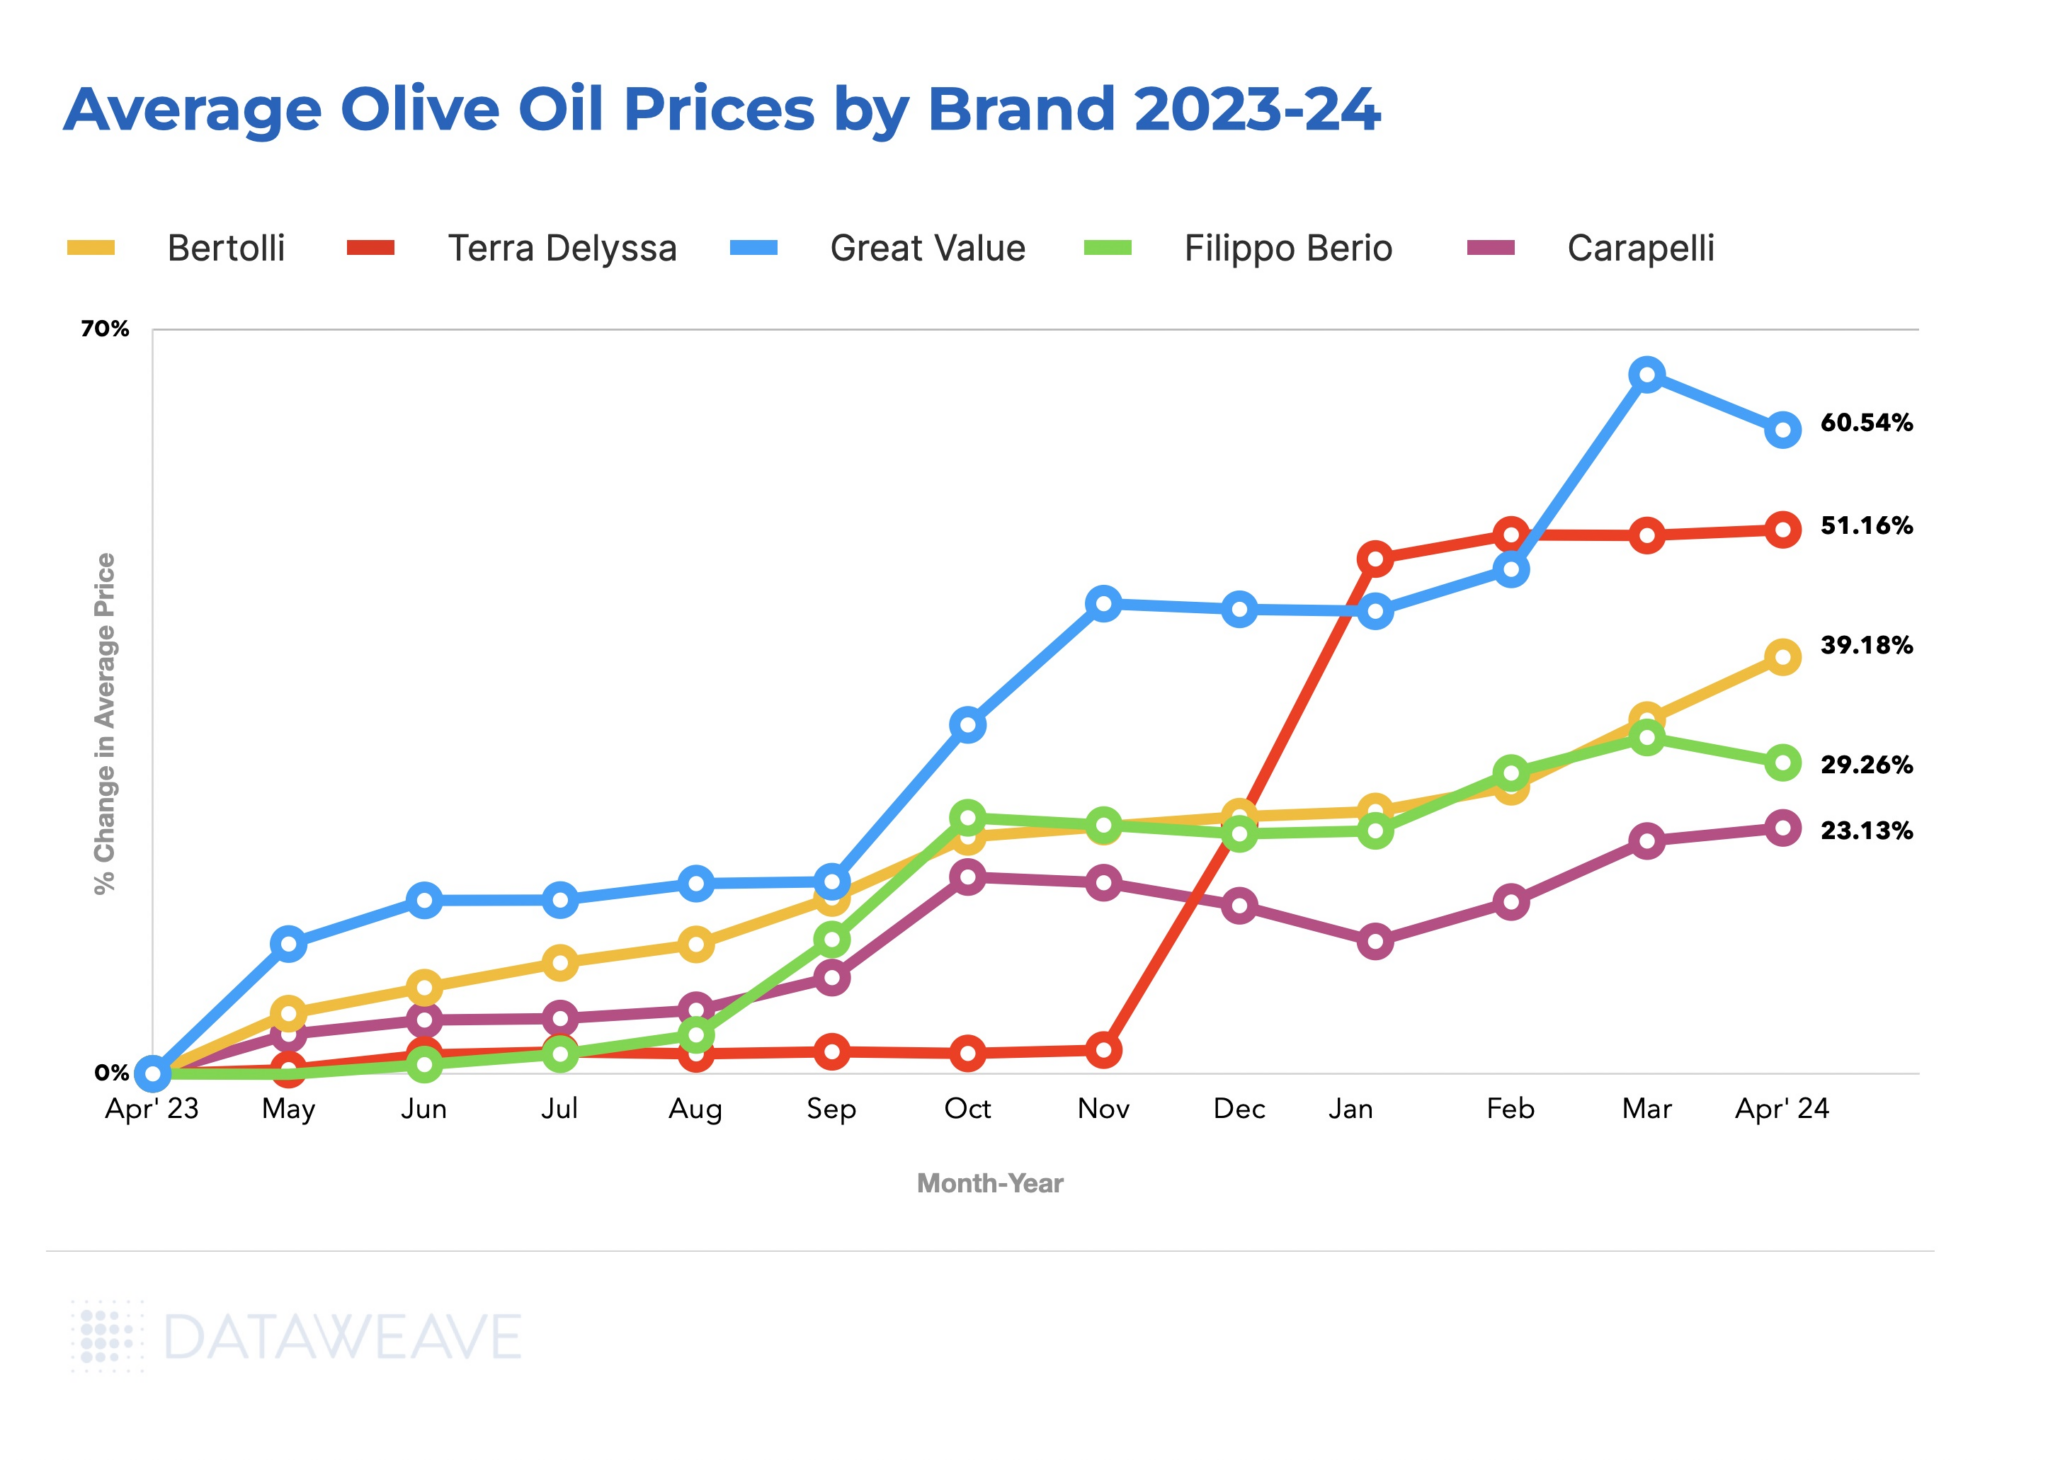
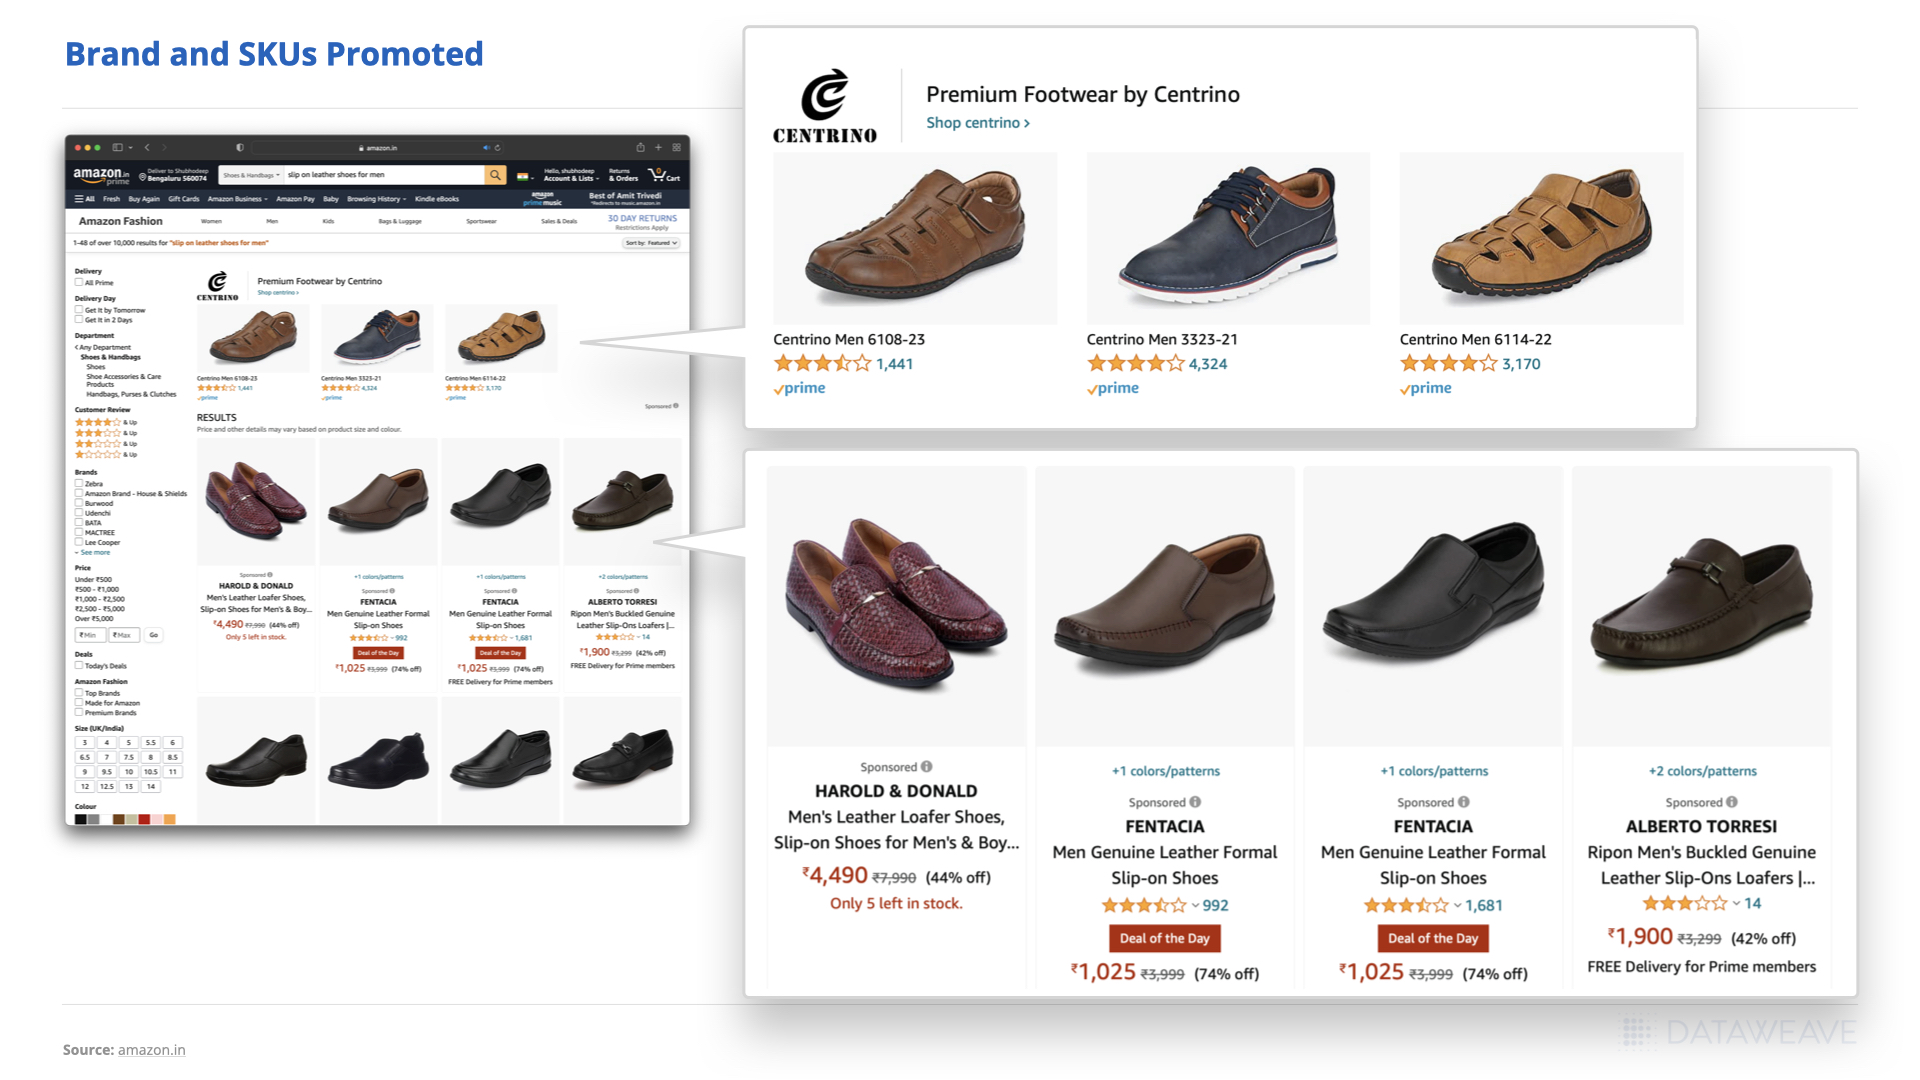
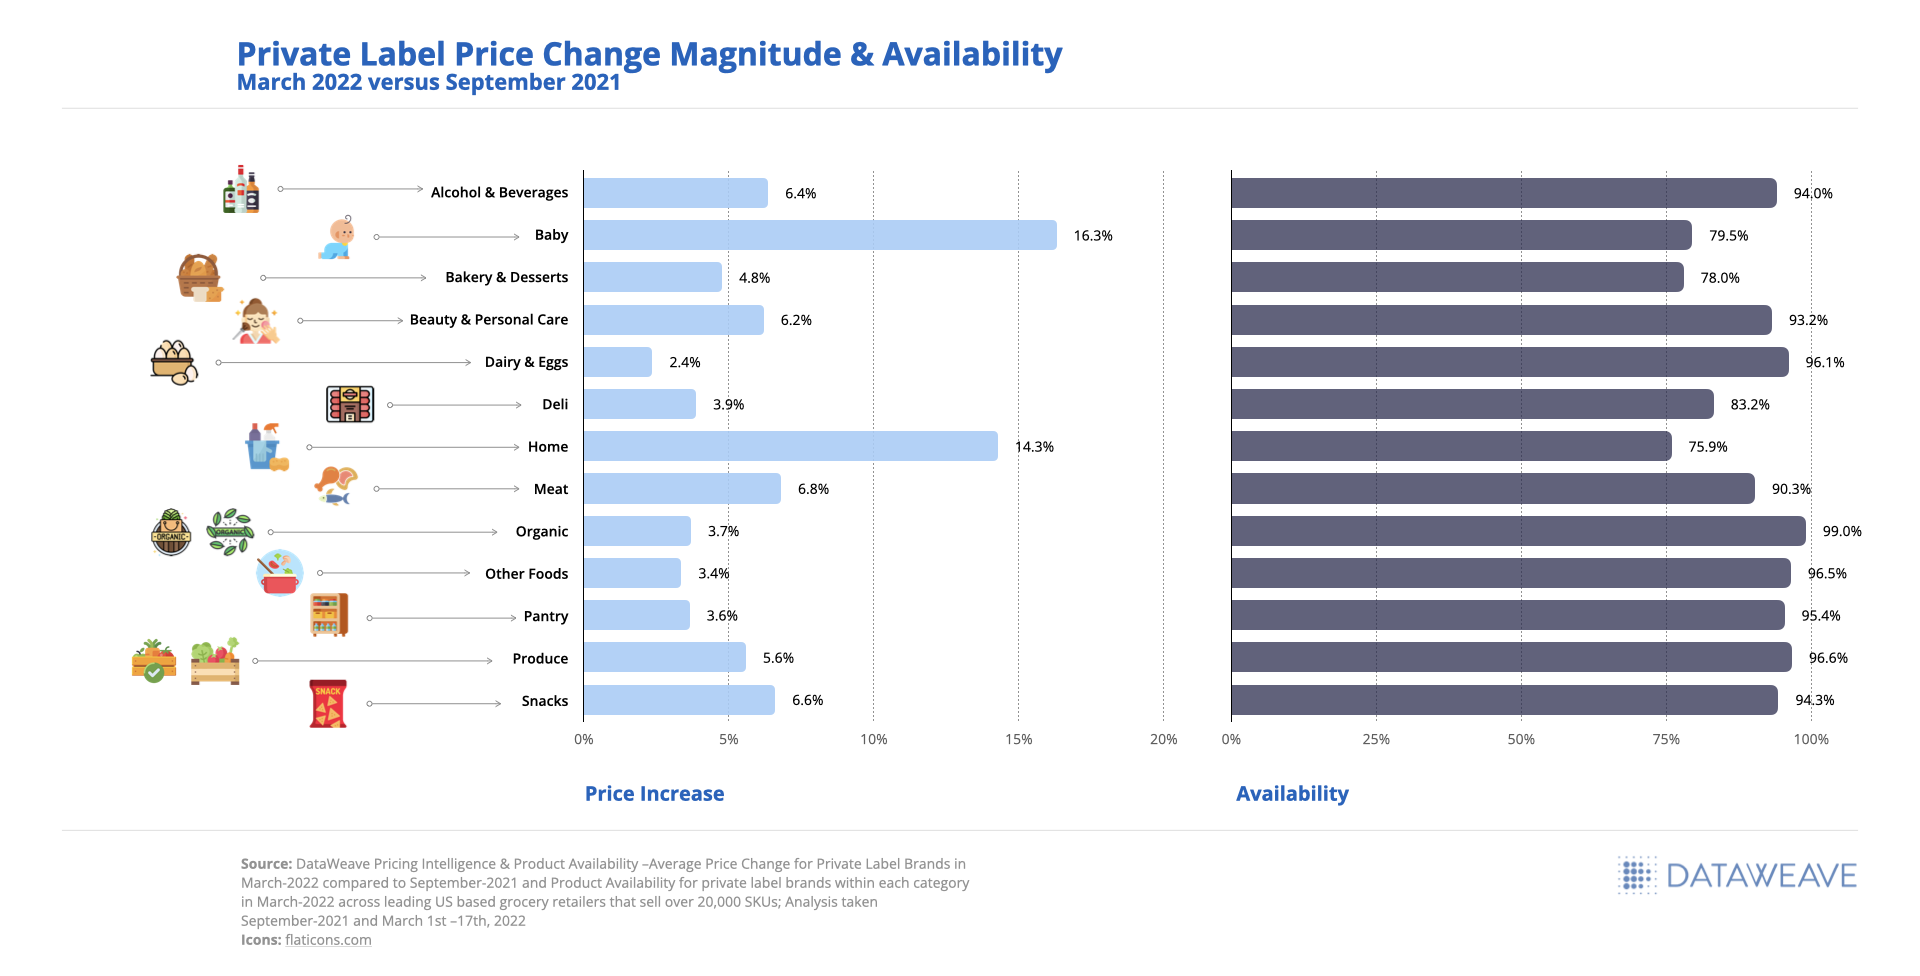
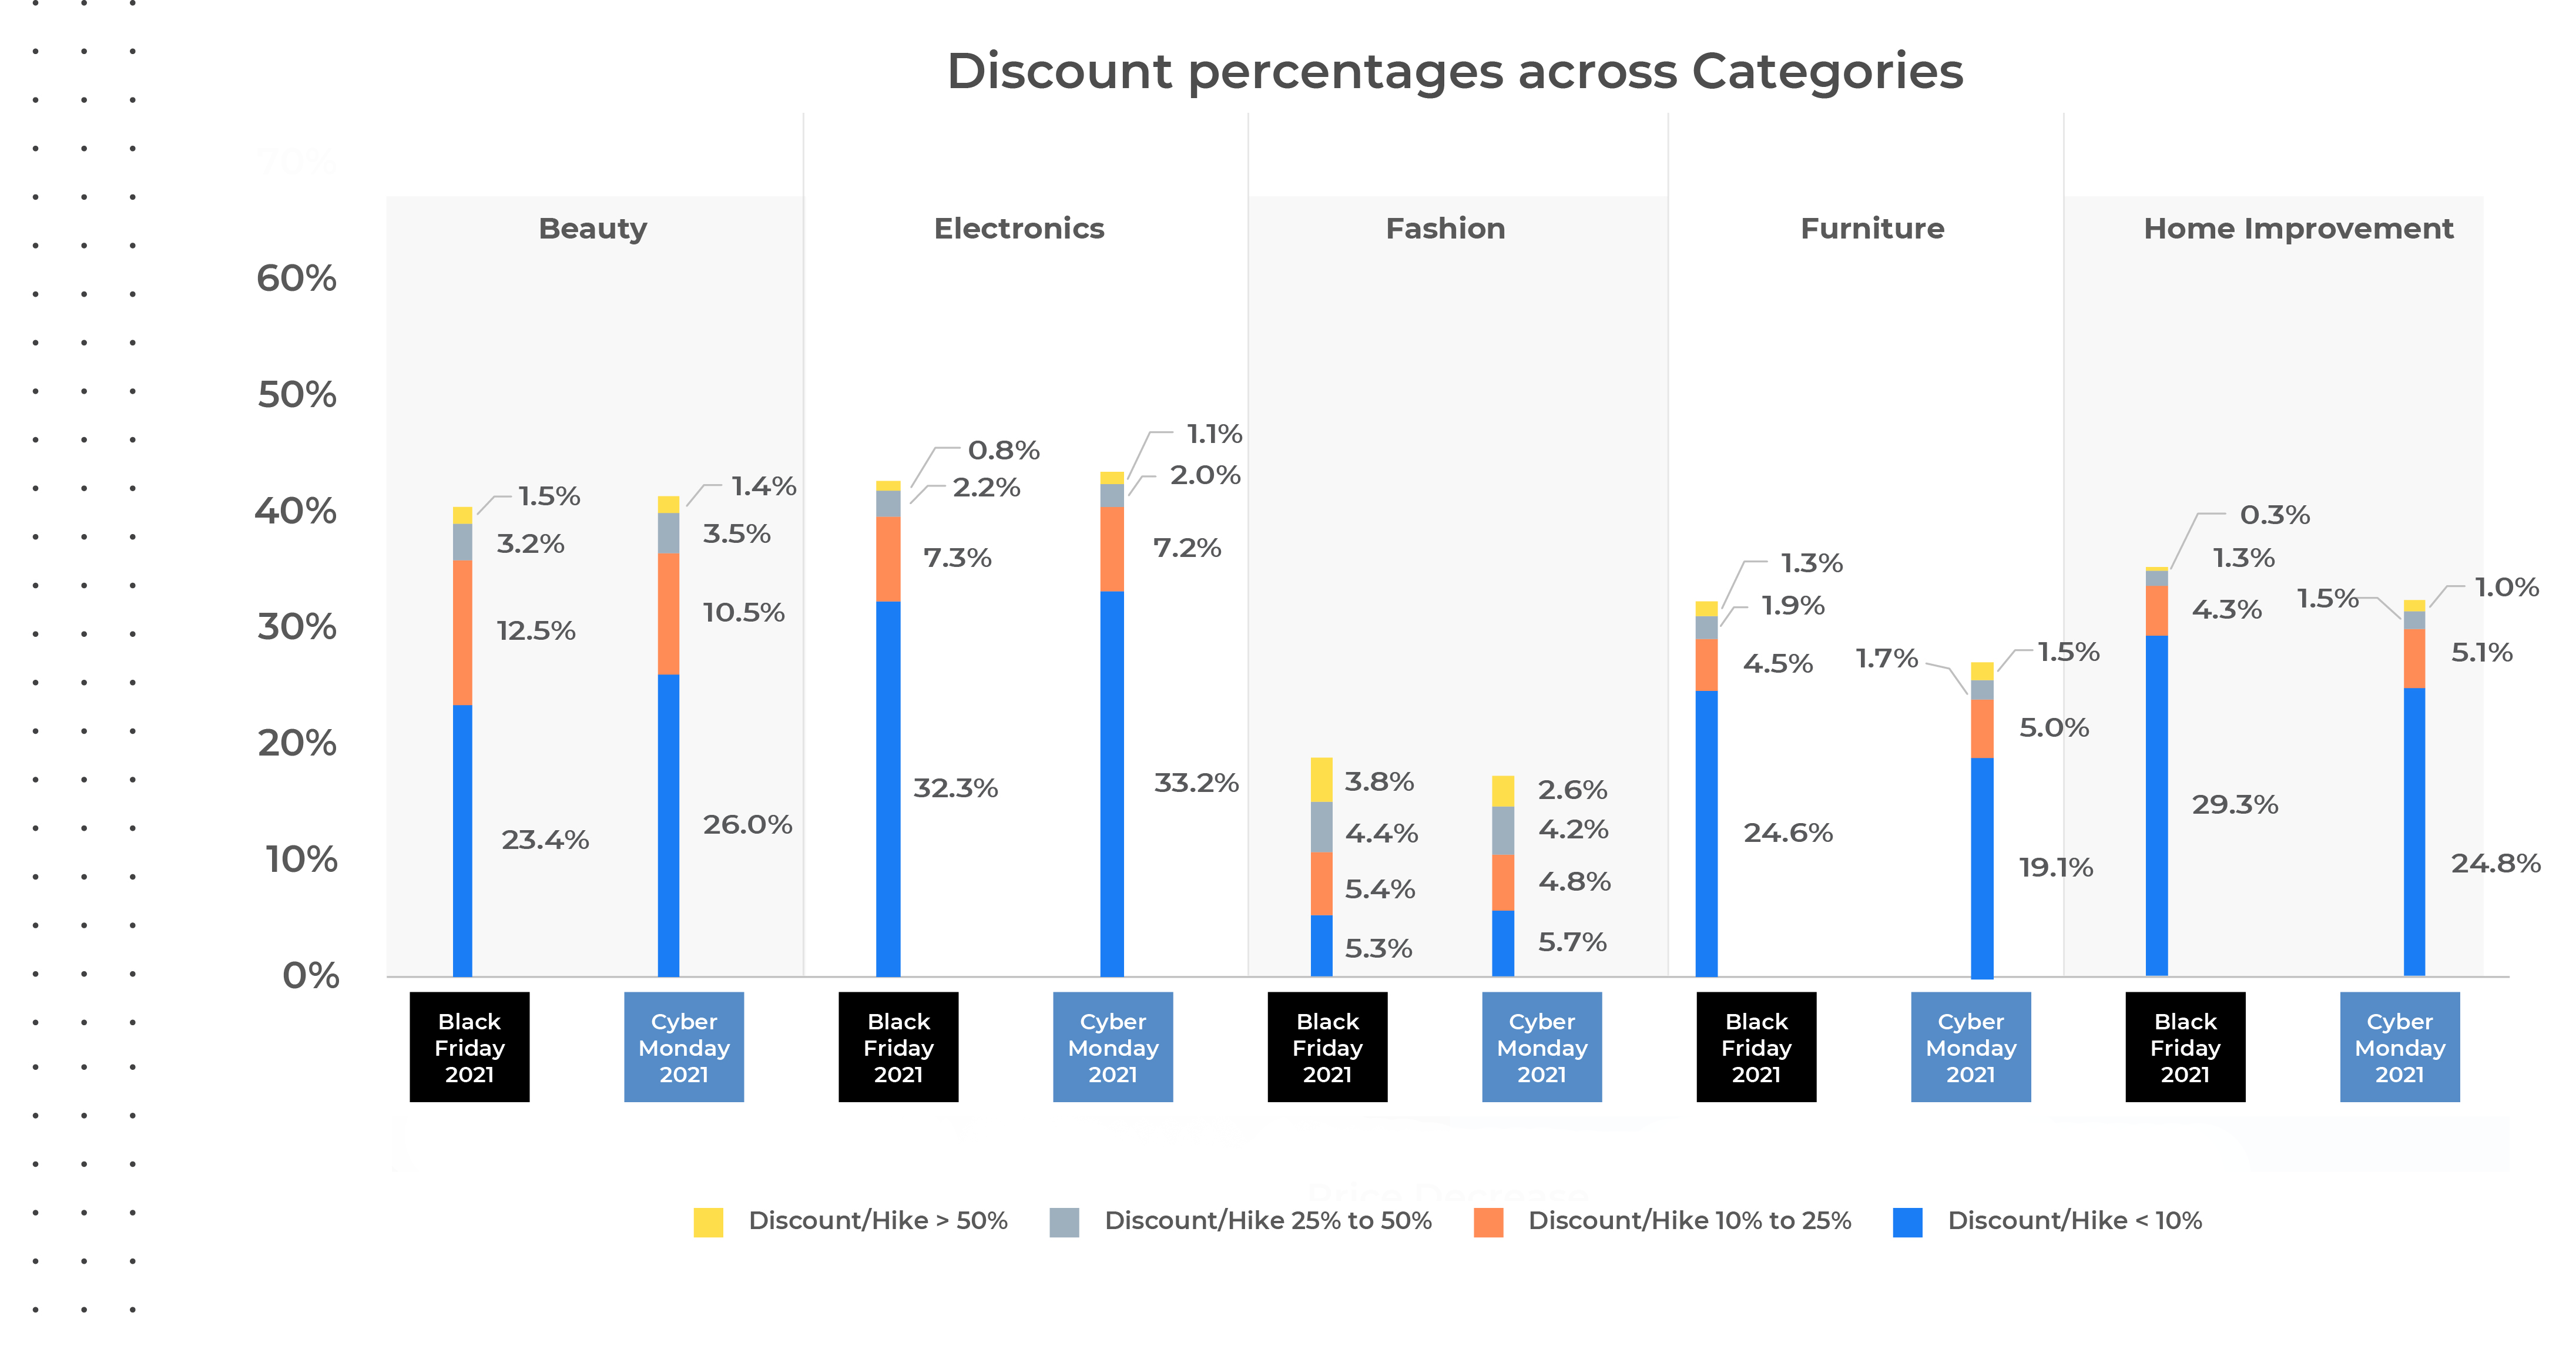
    Back in the day, pricing strategies were a lot easier. These days, not only do teams need to have robust standard price reporting workflows, but they also need to have the know-how and tools to gain and act on competitive intelligence. Retail leaders should prioritize automation and strategic thinking and ensure their teams have the tools, processes, and methodologies required to monitor the competition at scale and over the long term.

    Retail leaders who recognize the distinction between standard reporting and competitive intelligence are more likely to gain team buy-in, especially when developing pricing strategies that drive results. You can’t be everywhere at once, but you can optimize pricing strategies to stay ahead of the competition.

    This article has everything you need to know about the differences between standard reporting and competitive intelligence and how to use both to make your teams more effective than ever!

    Understanding the Distinction

    Standard price reporting is much like checking the weather to see if it’s stormy before grabbing a raincoat or sunhat. You need to do it to make essential, everyday choices, but it will not help you predict when the next storm is coming. Standard price reporting deals more with the short-term and immediate actions needed as opposed to long-term strategy.

    Don’t get us wrong, standard price reporting is still an essential responsibility of a pricing team’s function—but there’s more to it. It is also lower-tech than a competitive intelligence strategy and can rely on route heuristics.

    Think of it as data-in, data-out. It deals with pricing operations like:

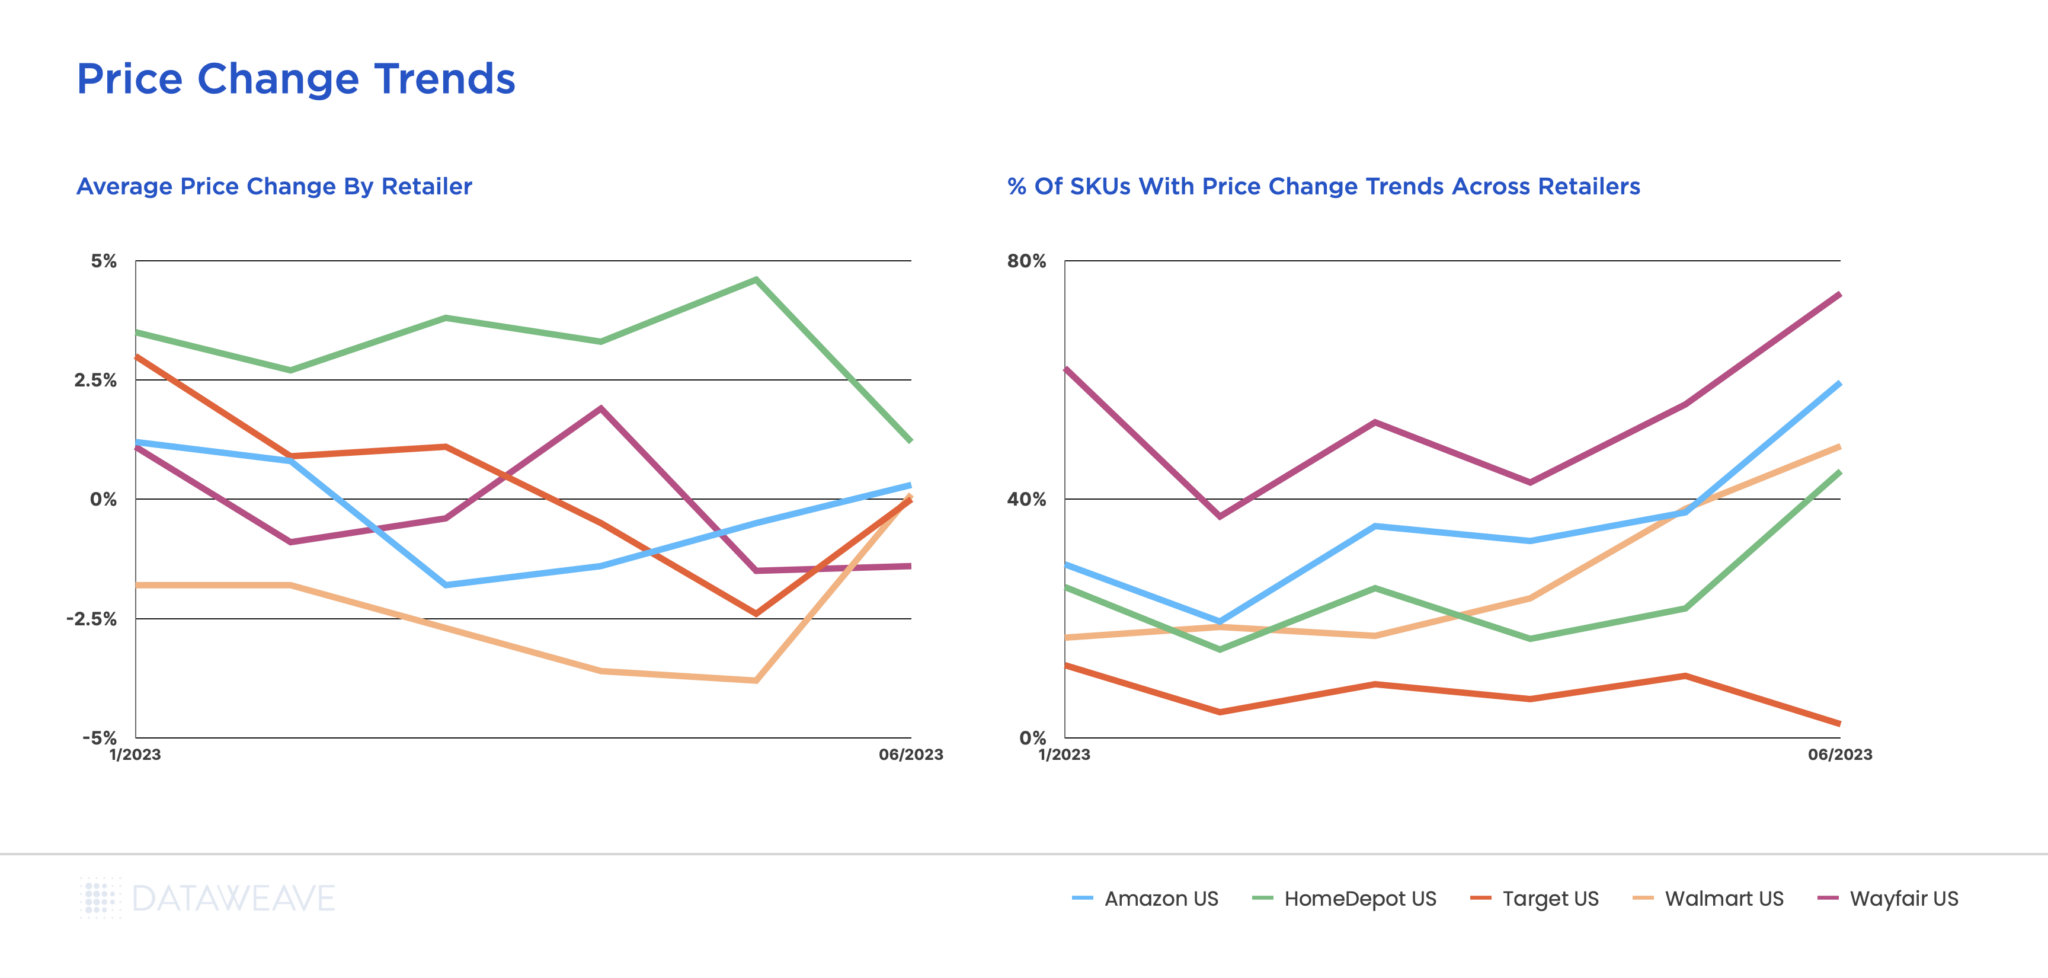
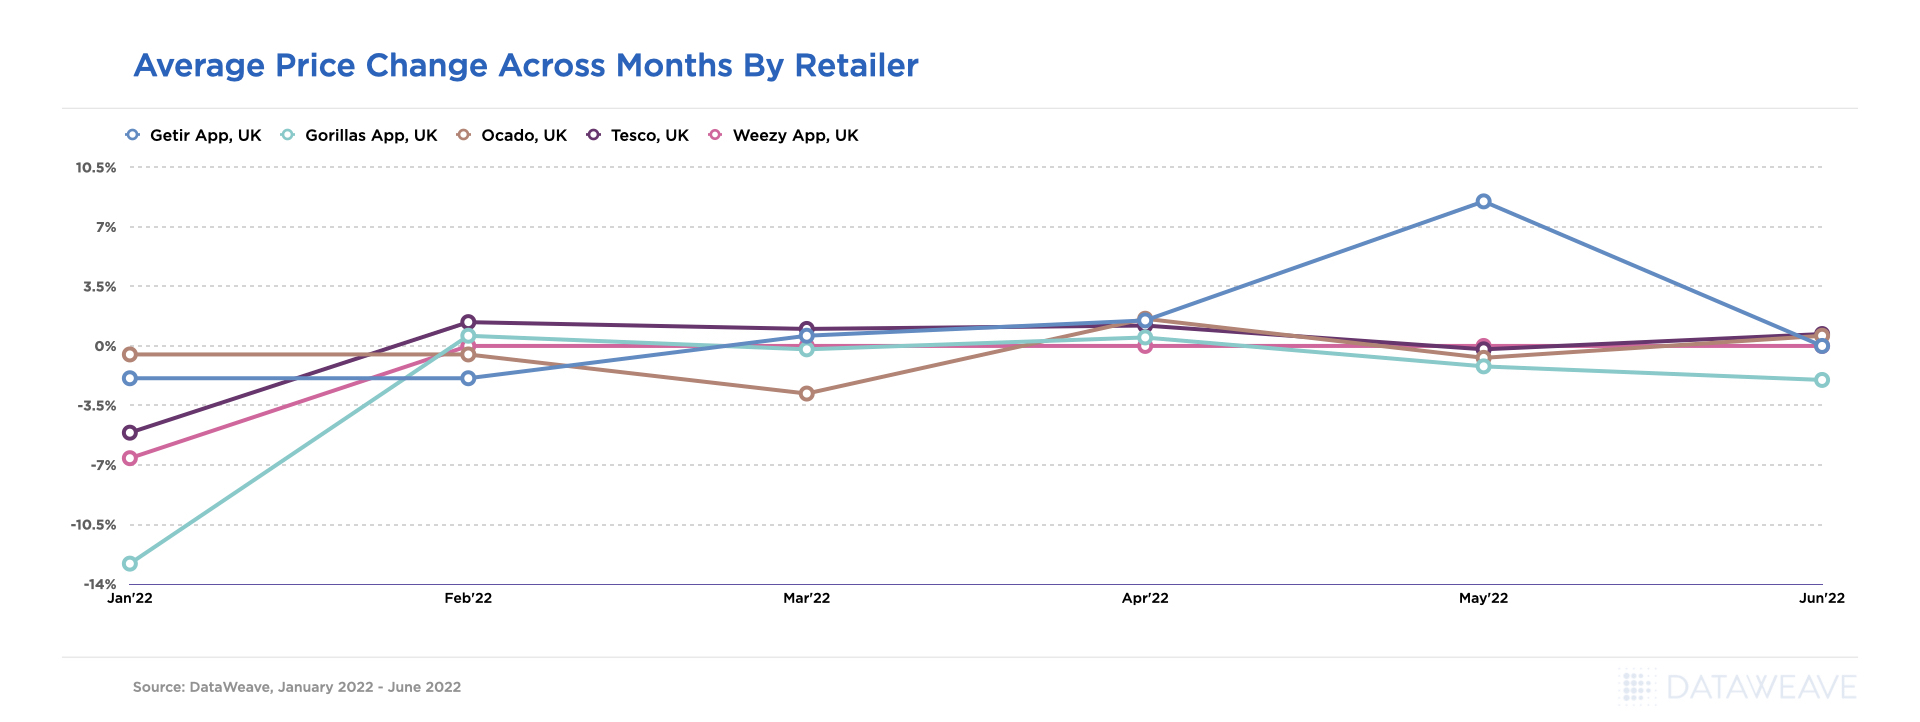
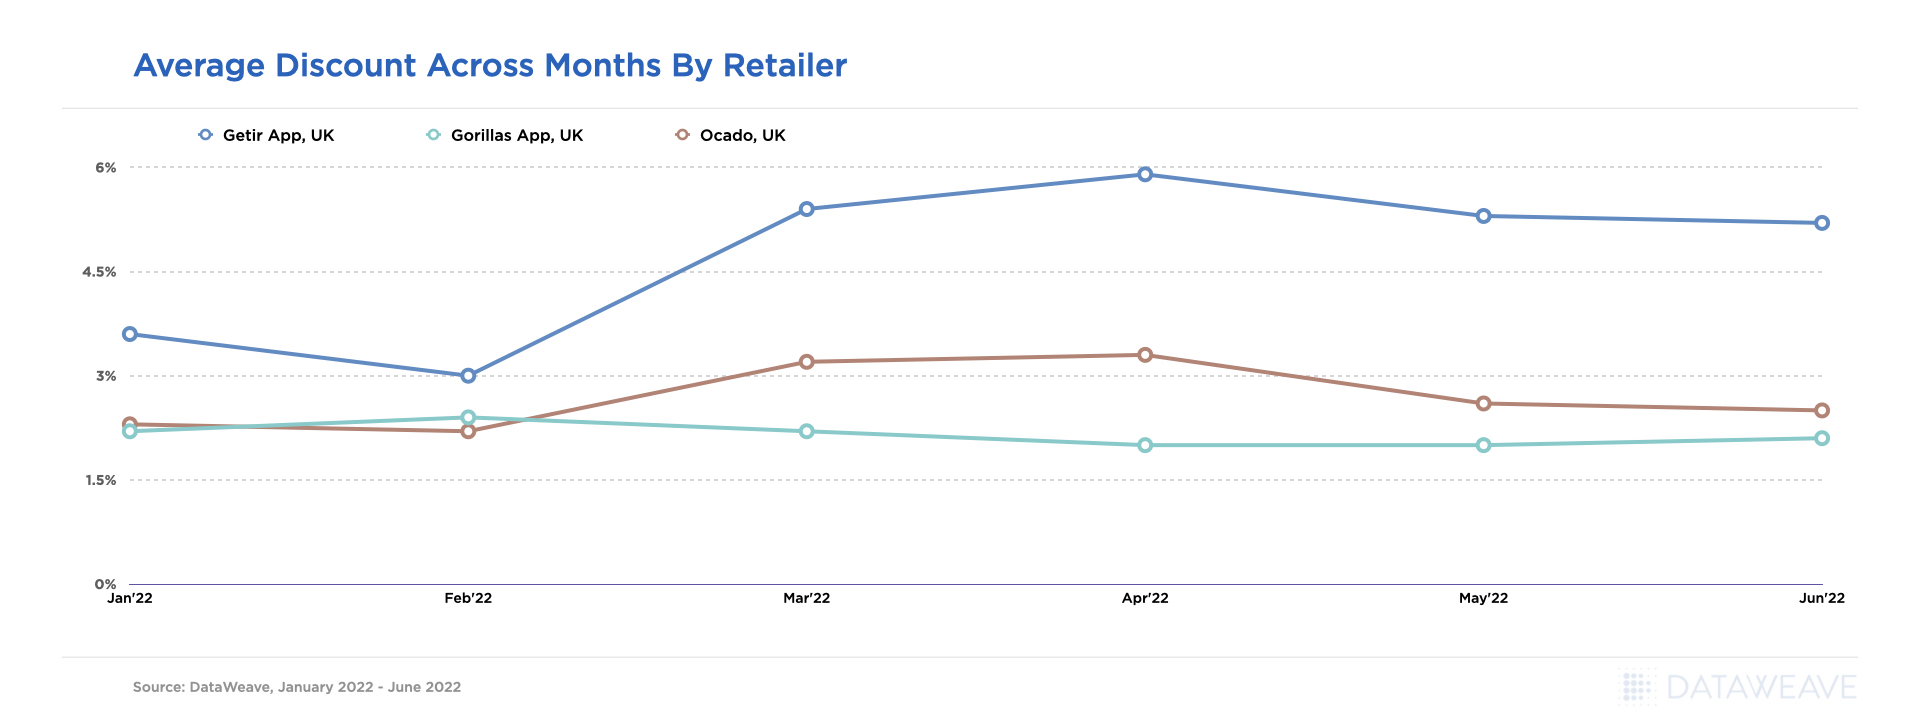
    • Weekly price movements: Seeing which competitors, product categories, and individual items had pricing shifts in the short-term
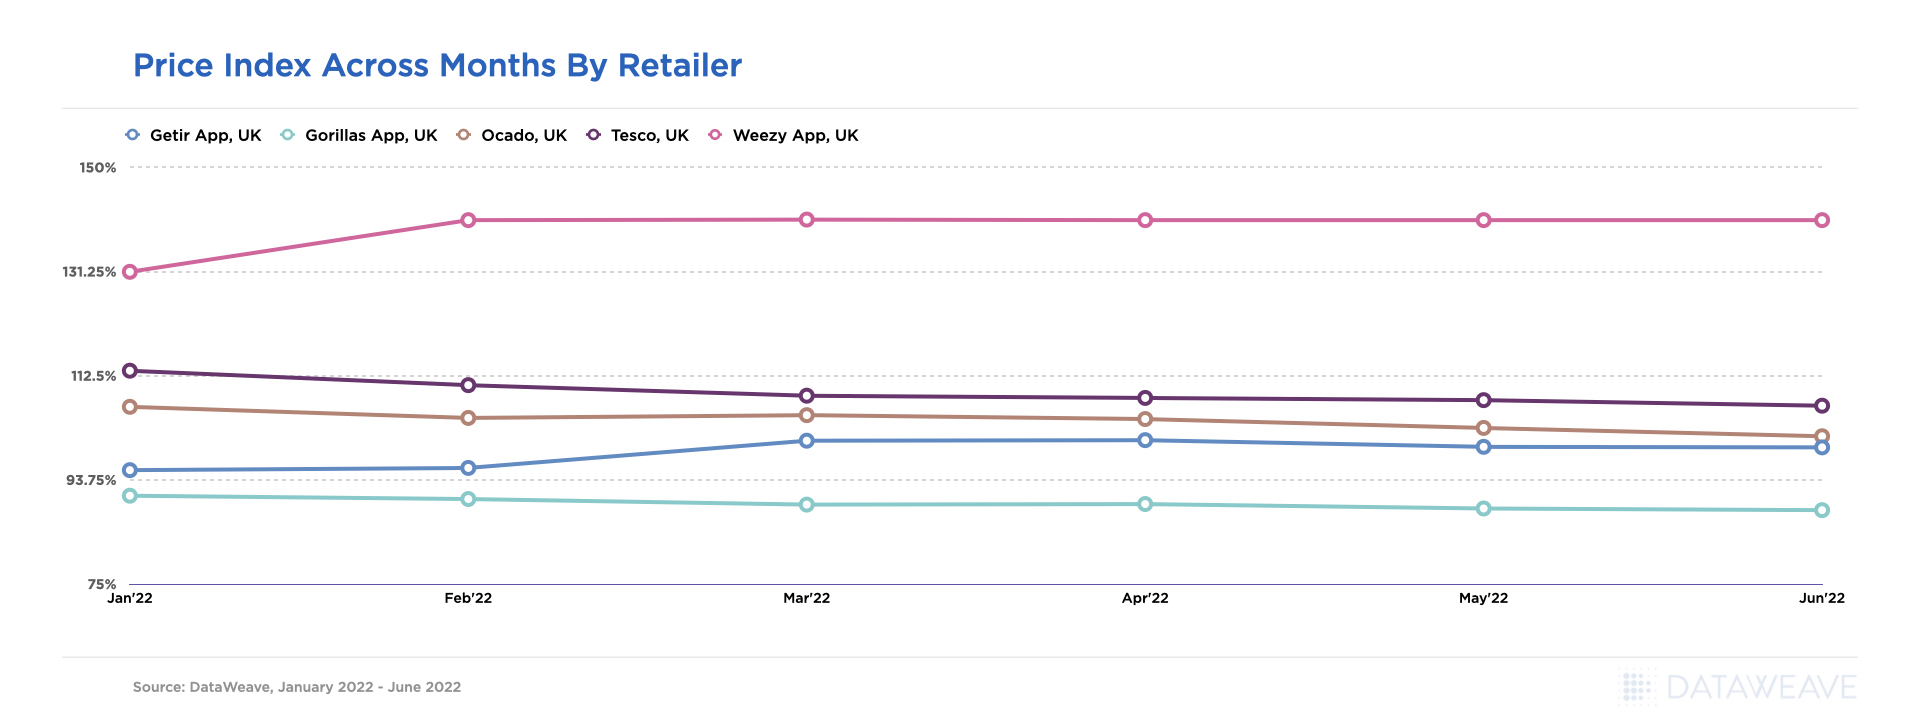
    • Basic price indices: Outlining benchmarks to watch how your own, and your competitors’, products are trending in the market
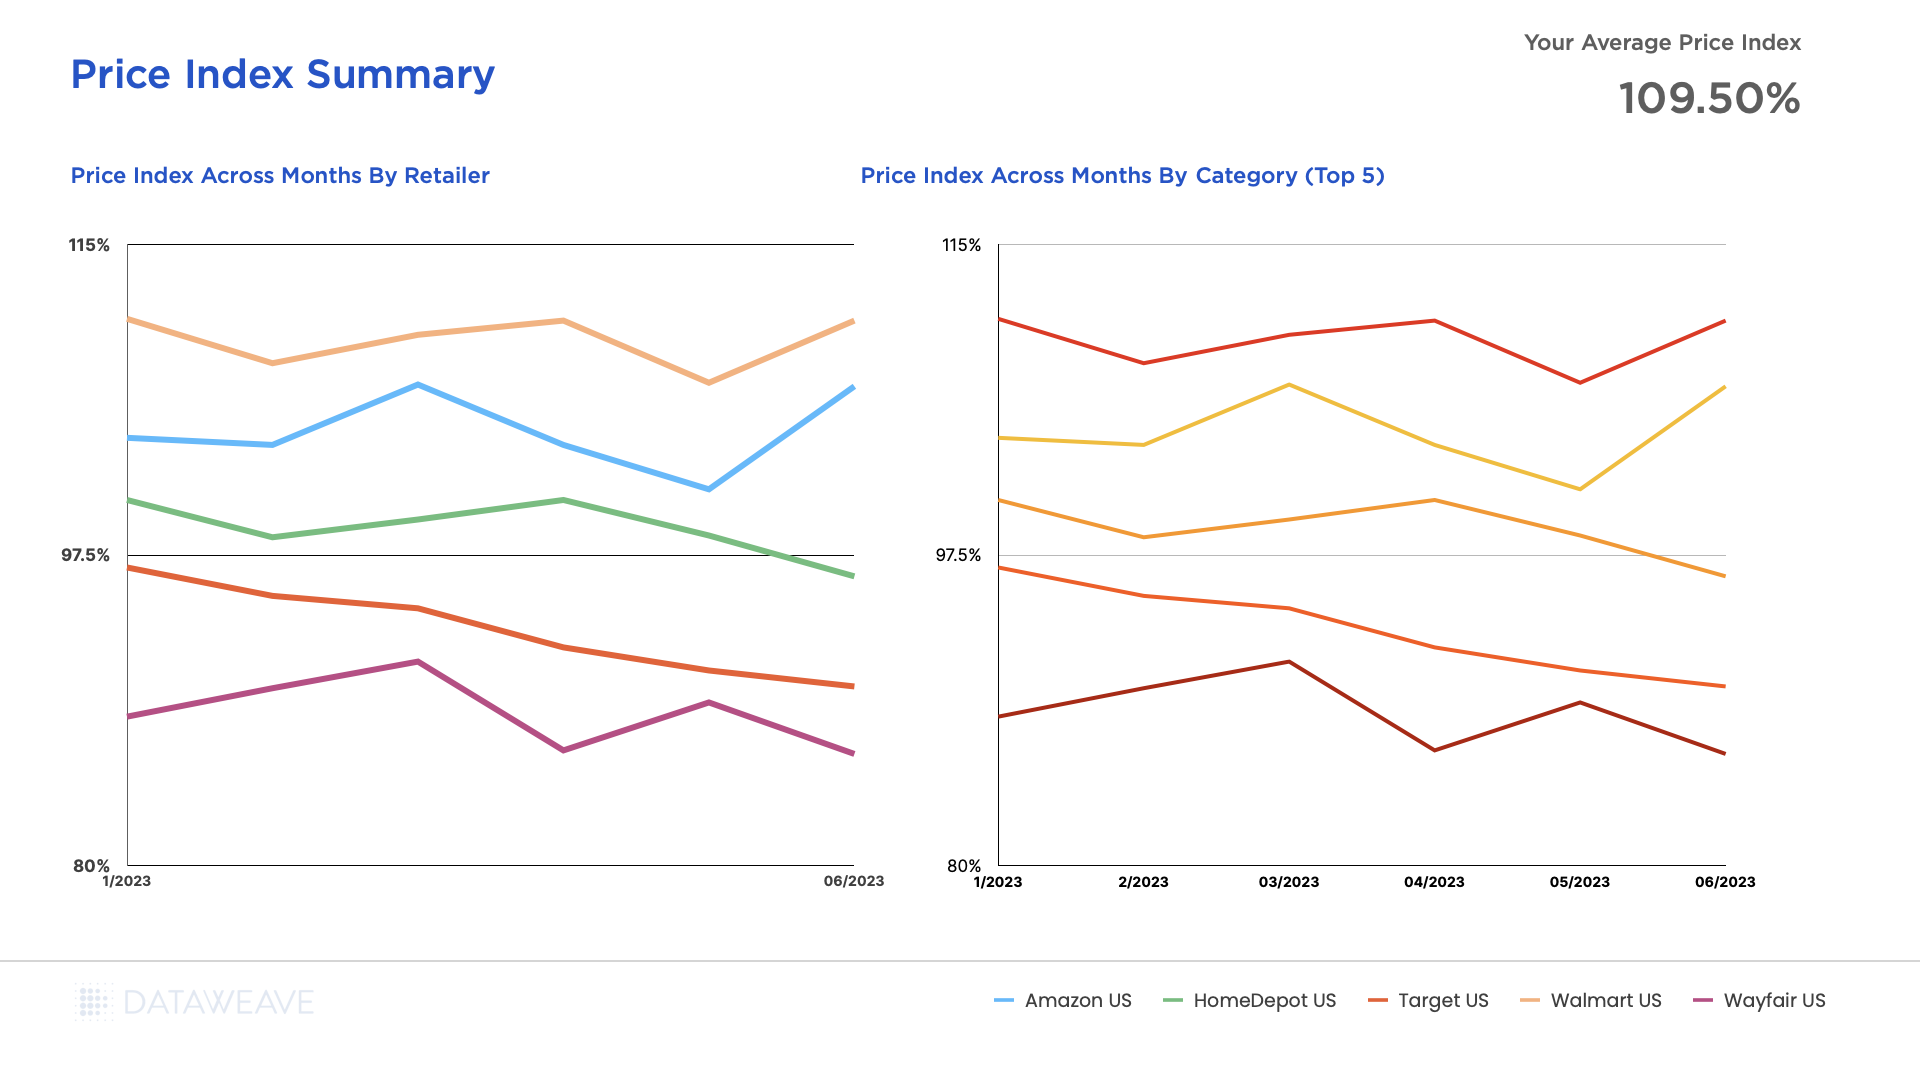
    • Price competitiveness metrics: Setting thresholds that show whether your products are priced below, above, or equal to your competition for general trend reporting

    Standard price reporting is fundamental for operational teams that manage price adjustments in the short term. It can also help teams remain agile and reactive to market condition changes.

    It’s likely that your team already has standard reporting strategies or tools to help them with tactical execution. But are they harnessing competitive intelligence correctly with your help?

    Characteristics of Competitive Intelligence

    While standard price reporting is like checking the weather, competitive intelligence is like being a meteorologist who measures atmospheric changes, predicts storms, and scientifically analyzes weather patterns to keep everyone informed and in the know.

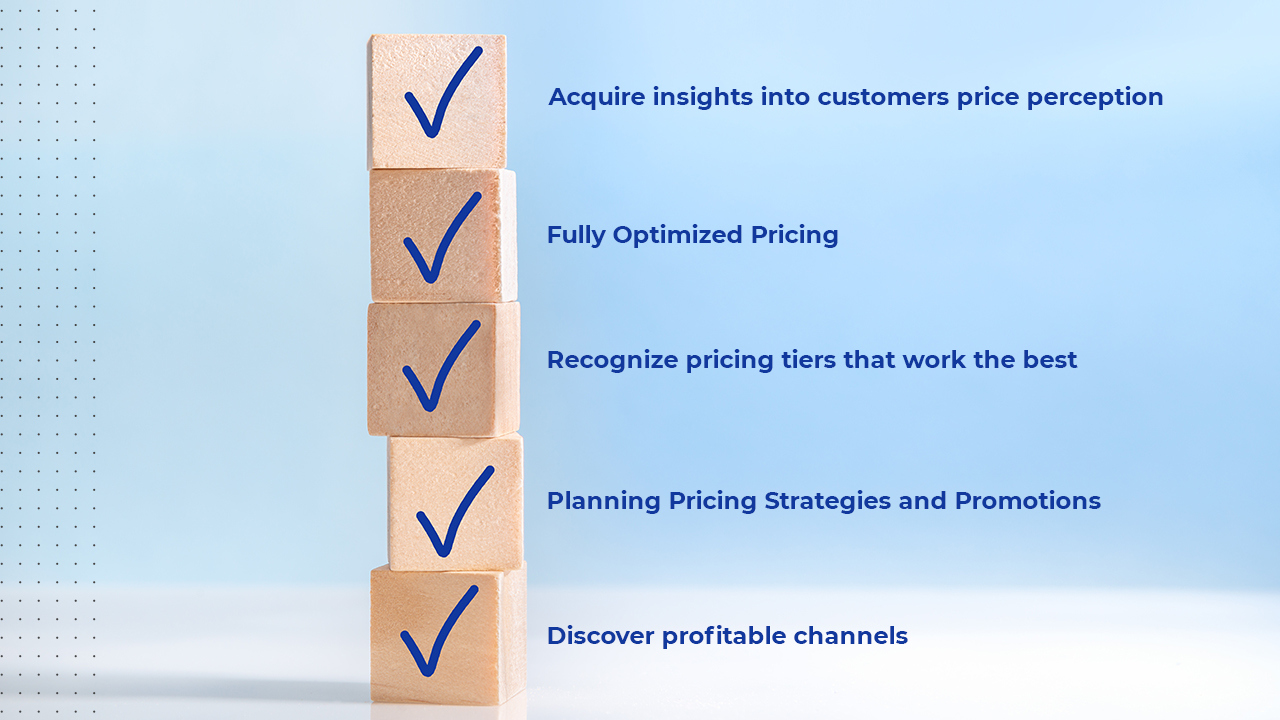
    Competitive intelligence goes well beyond simply tracking price movements and benchmarking them against a single set of standards. Competitive intelligence helps steer teams in a strategic direction based on insights from the market. It can drive long-term business success and is one of your best tools to ‘steer the ship’ as a retail leader.

    Here are some of the essential elements of competitive intelligence:

    • Strategic insights: Including but not limited to understanding your competitors’ pricing strategy, promotions, and product positioning
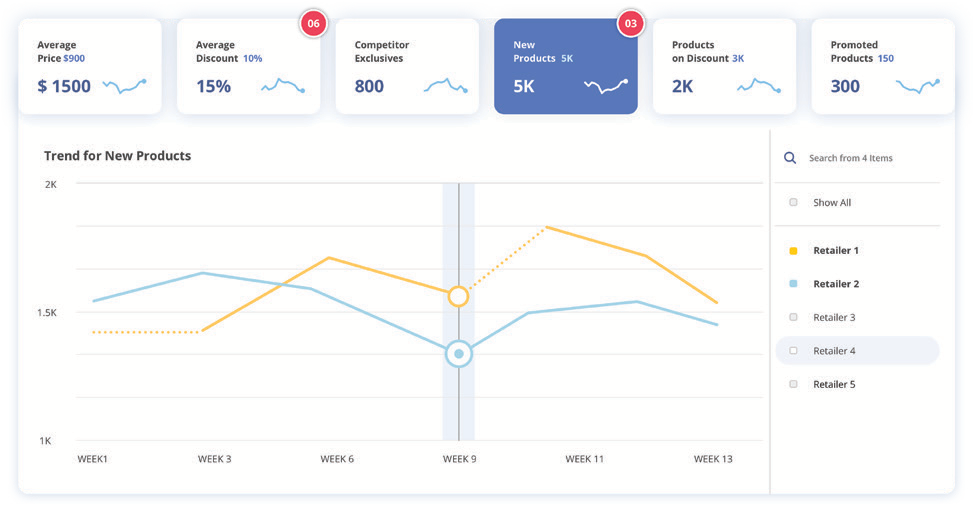
    • Market-wide patterns: Identifying trends based on geography, product category, or individual SKU across retailers to inform broader strategies
    • Long-term trends: Taking historical market and competitor data and combining it with real-time retail data to predict future price movements as shifts in consumer behavior to inform pricing strategies

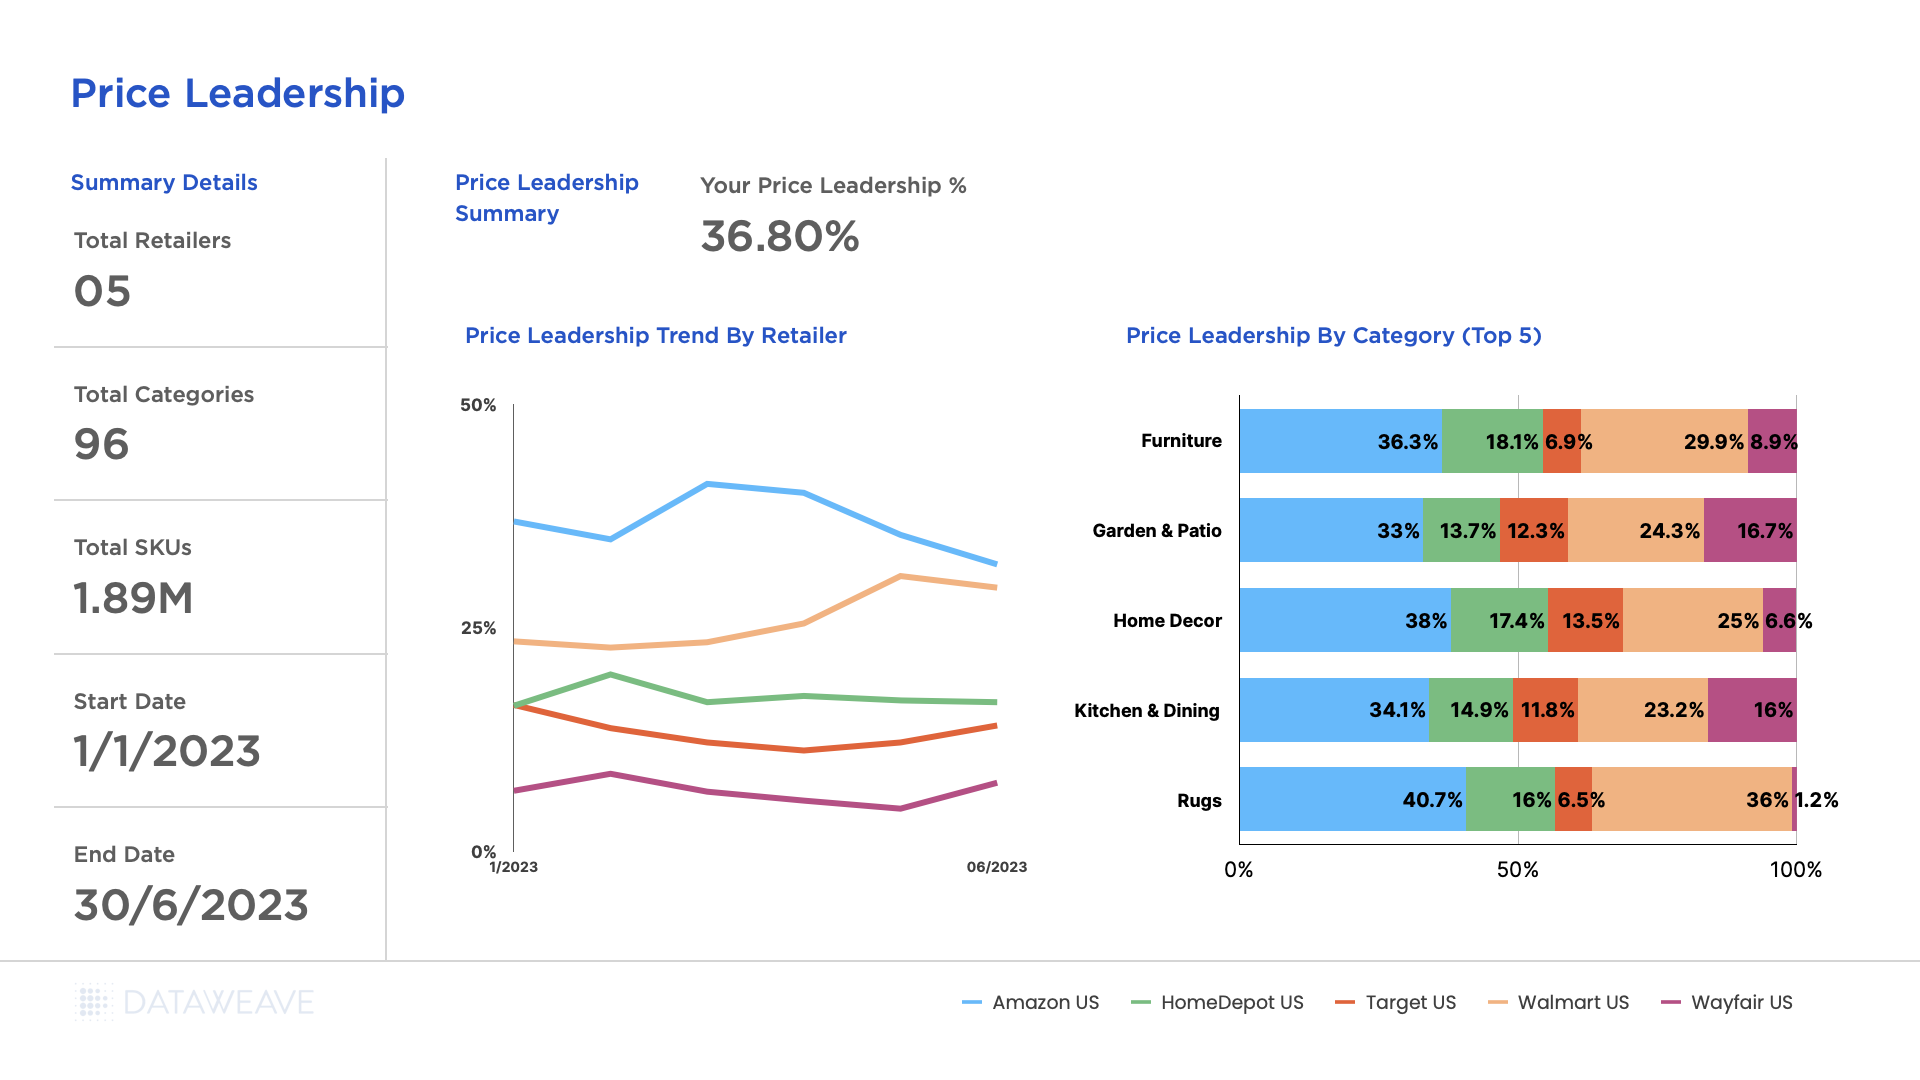
    The pricing team serves as a critical strategic partner to senior leadership, delivering the cross-functional insights and market analysis needed to inform C-suite decision-making. By equipping executives with a holistic view of the competitive landscape, pricing gaps, and emerging trends, the team empowers leadership to align pricing strategies with broader business objectives.

    This partnership enables senior leaders to guide day-to-day pricing operations with confidence—ensuring tactical execution aligns with corporate goals, monitoring strategy effectiveness, and maintaining competitive agility. Through ongoing market intelligence and scenario modeling, the pricing function helps leadership proactively position the brand, capitalize on untapped opportunities, and future-proof revenue streams.

    Different Audiences, Different Needs

    As mentioned, there is a place for both standard price reporting and competitive intelligence. They have different roles to play, and different teams find them valuable. Since standard reporting mainly focuses on day-to-day shifts and being able to react to real-time changes, operational teams find it most useful.

    On the other hand, competitive intelligence is a tool that leadership can use to shape overarching pricing strategies. The insights from competitive intelligence drive operational activities over months and quarters, whereas standard reporting drives actions daily.

    To succeed in pricing, you need to rely on a combination of tactical standard reporting and competitive intelligence for long-term planning. With both, you can successfully navigate the ever-fluctuating retail market.

    Price Reporting for Operational Teams

    Your operational team is responsible for making pricing adjustments that directly impact sales volume. Automated data aggregation and AI-powered analytics can make this process faster and more accurate by eliminating the need for manual intervention.

    Instead of spending hours identifying changes, standard reporting tools surface the most critical areas that need attention and recommend adjustments. This helps operational teams react fast to shifting market conditions.

    Key functions of standard price reporting include:

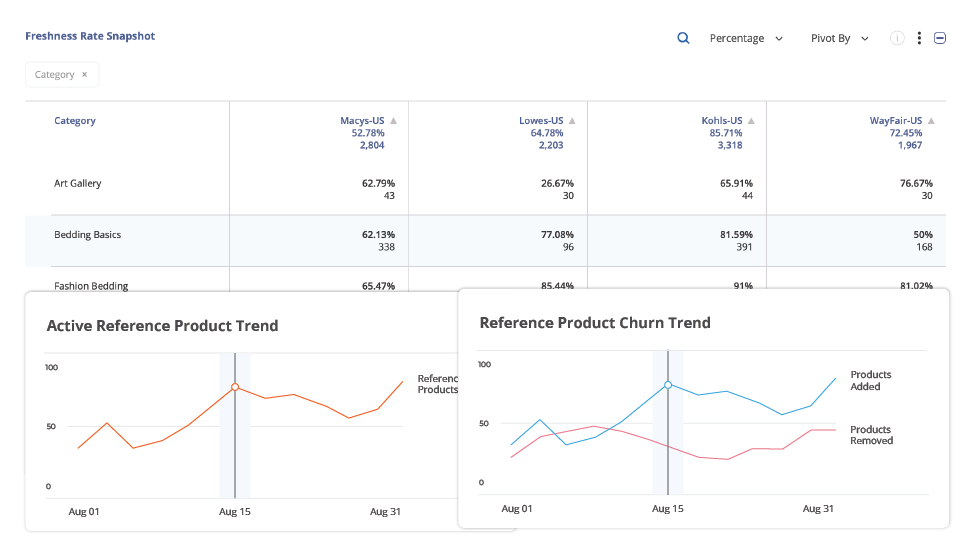
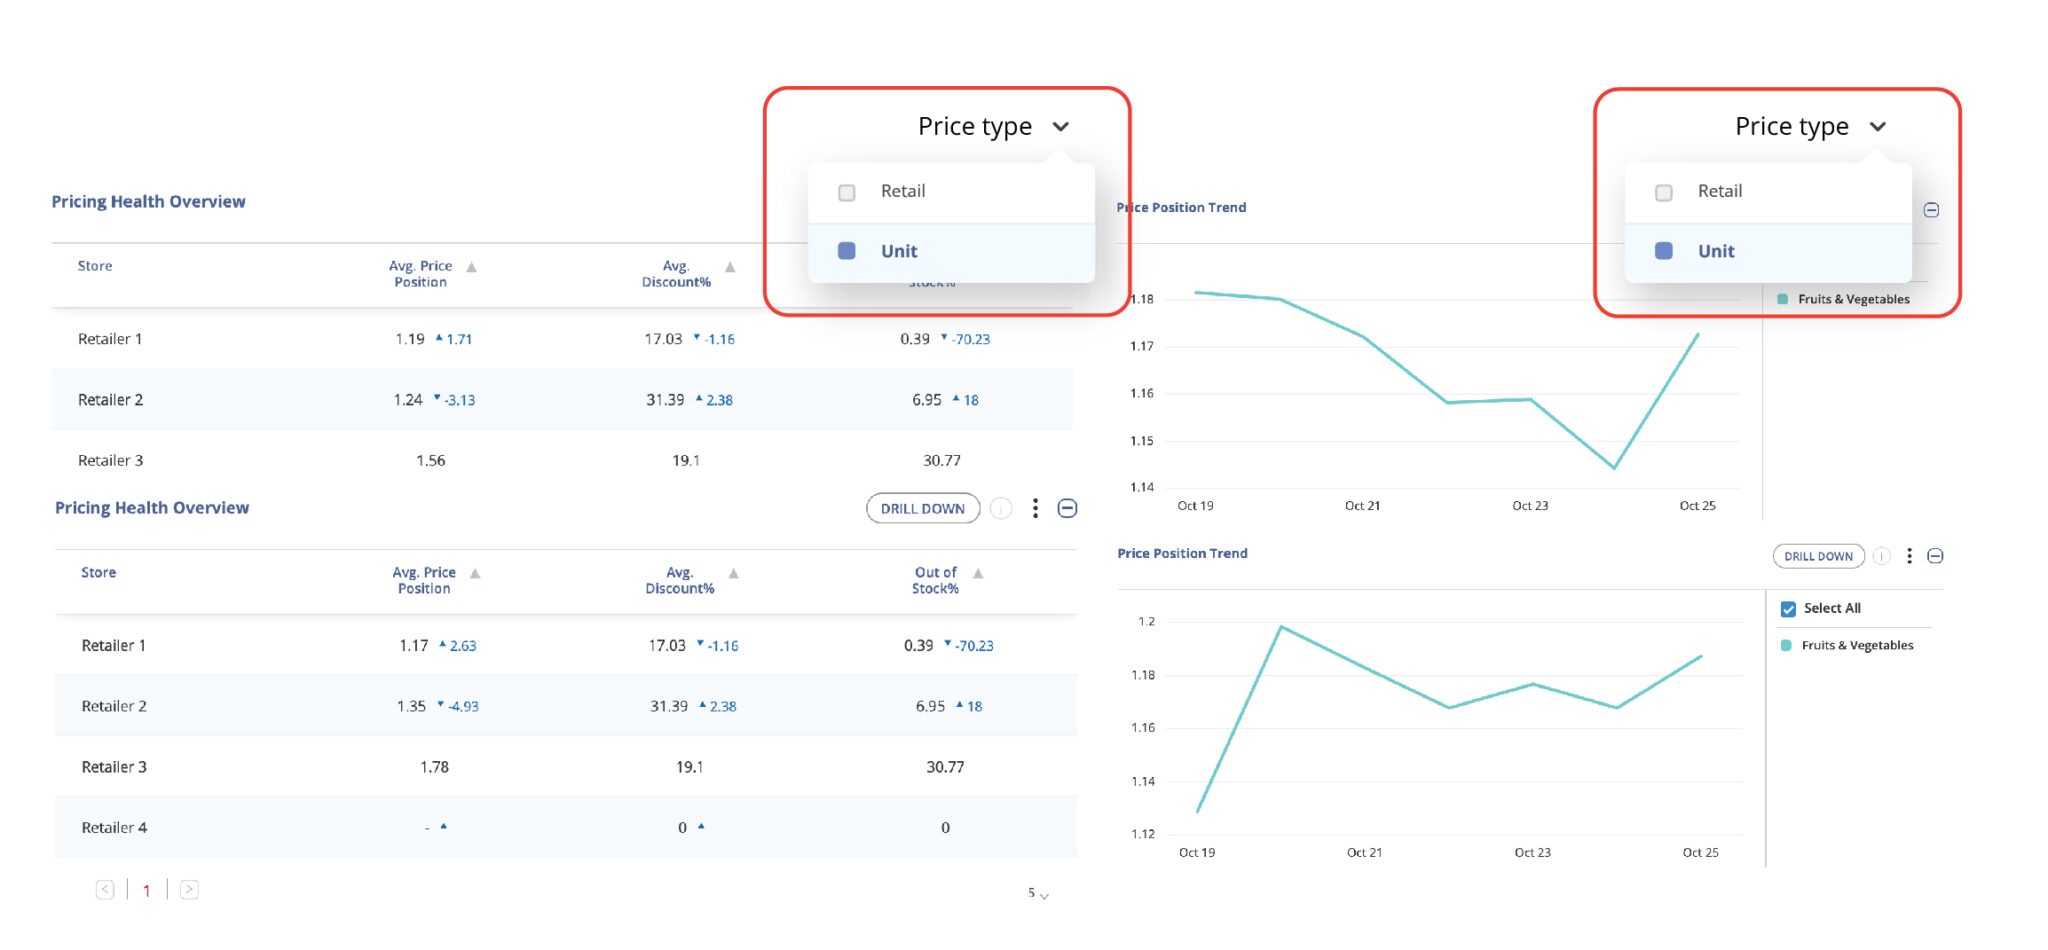
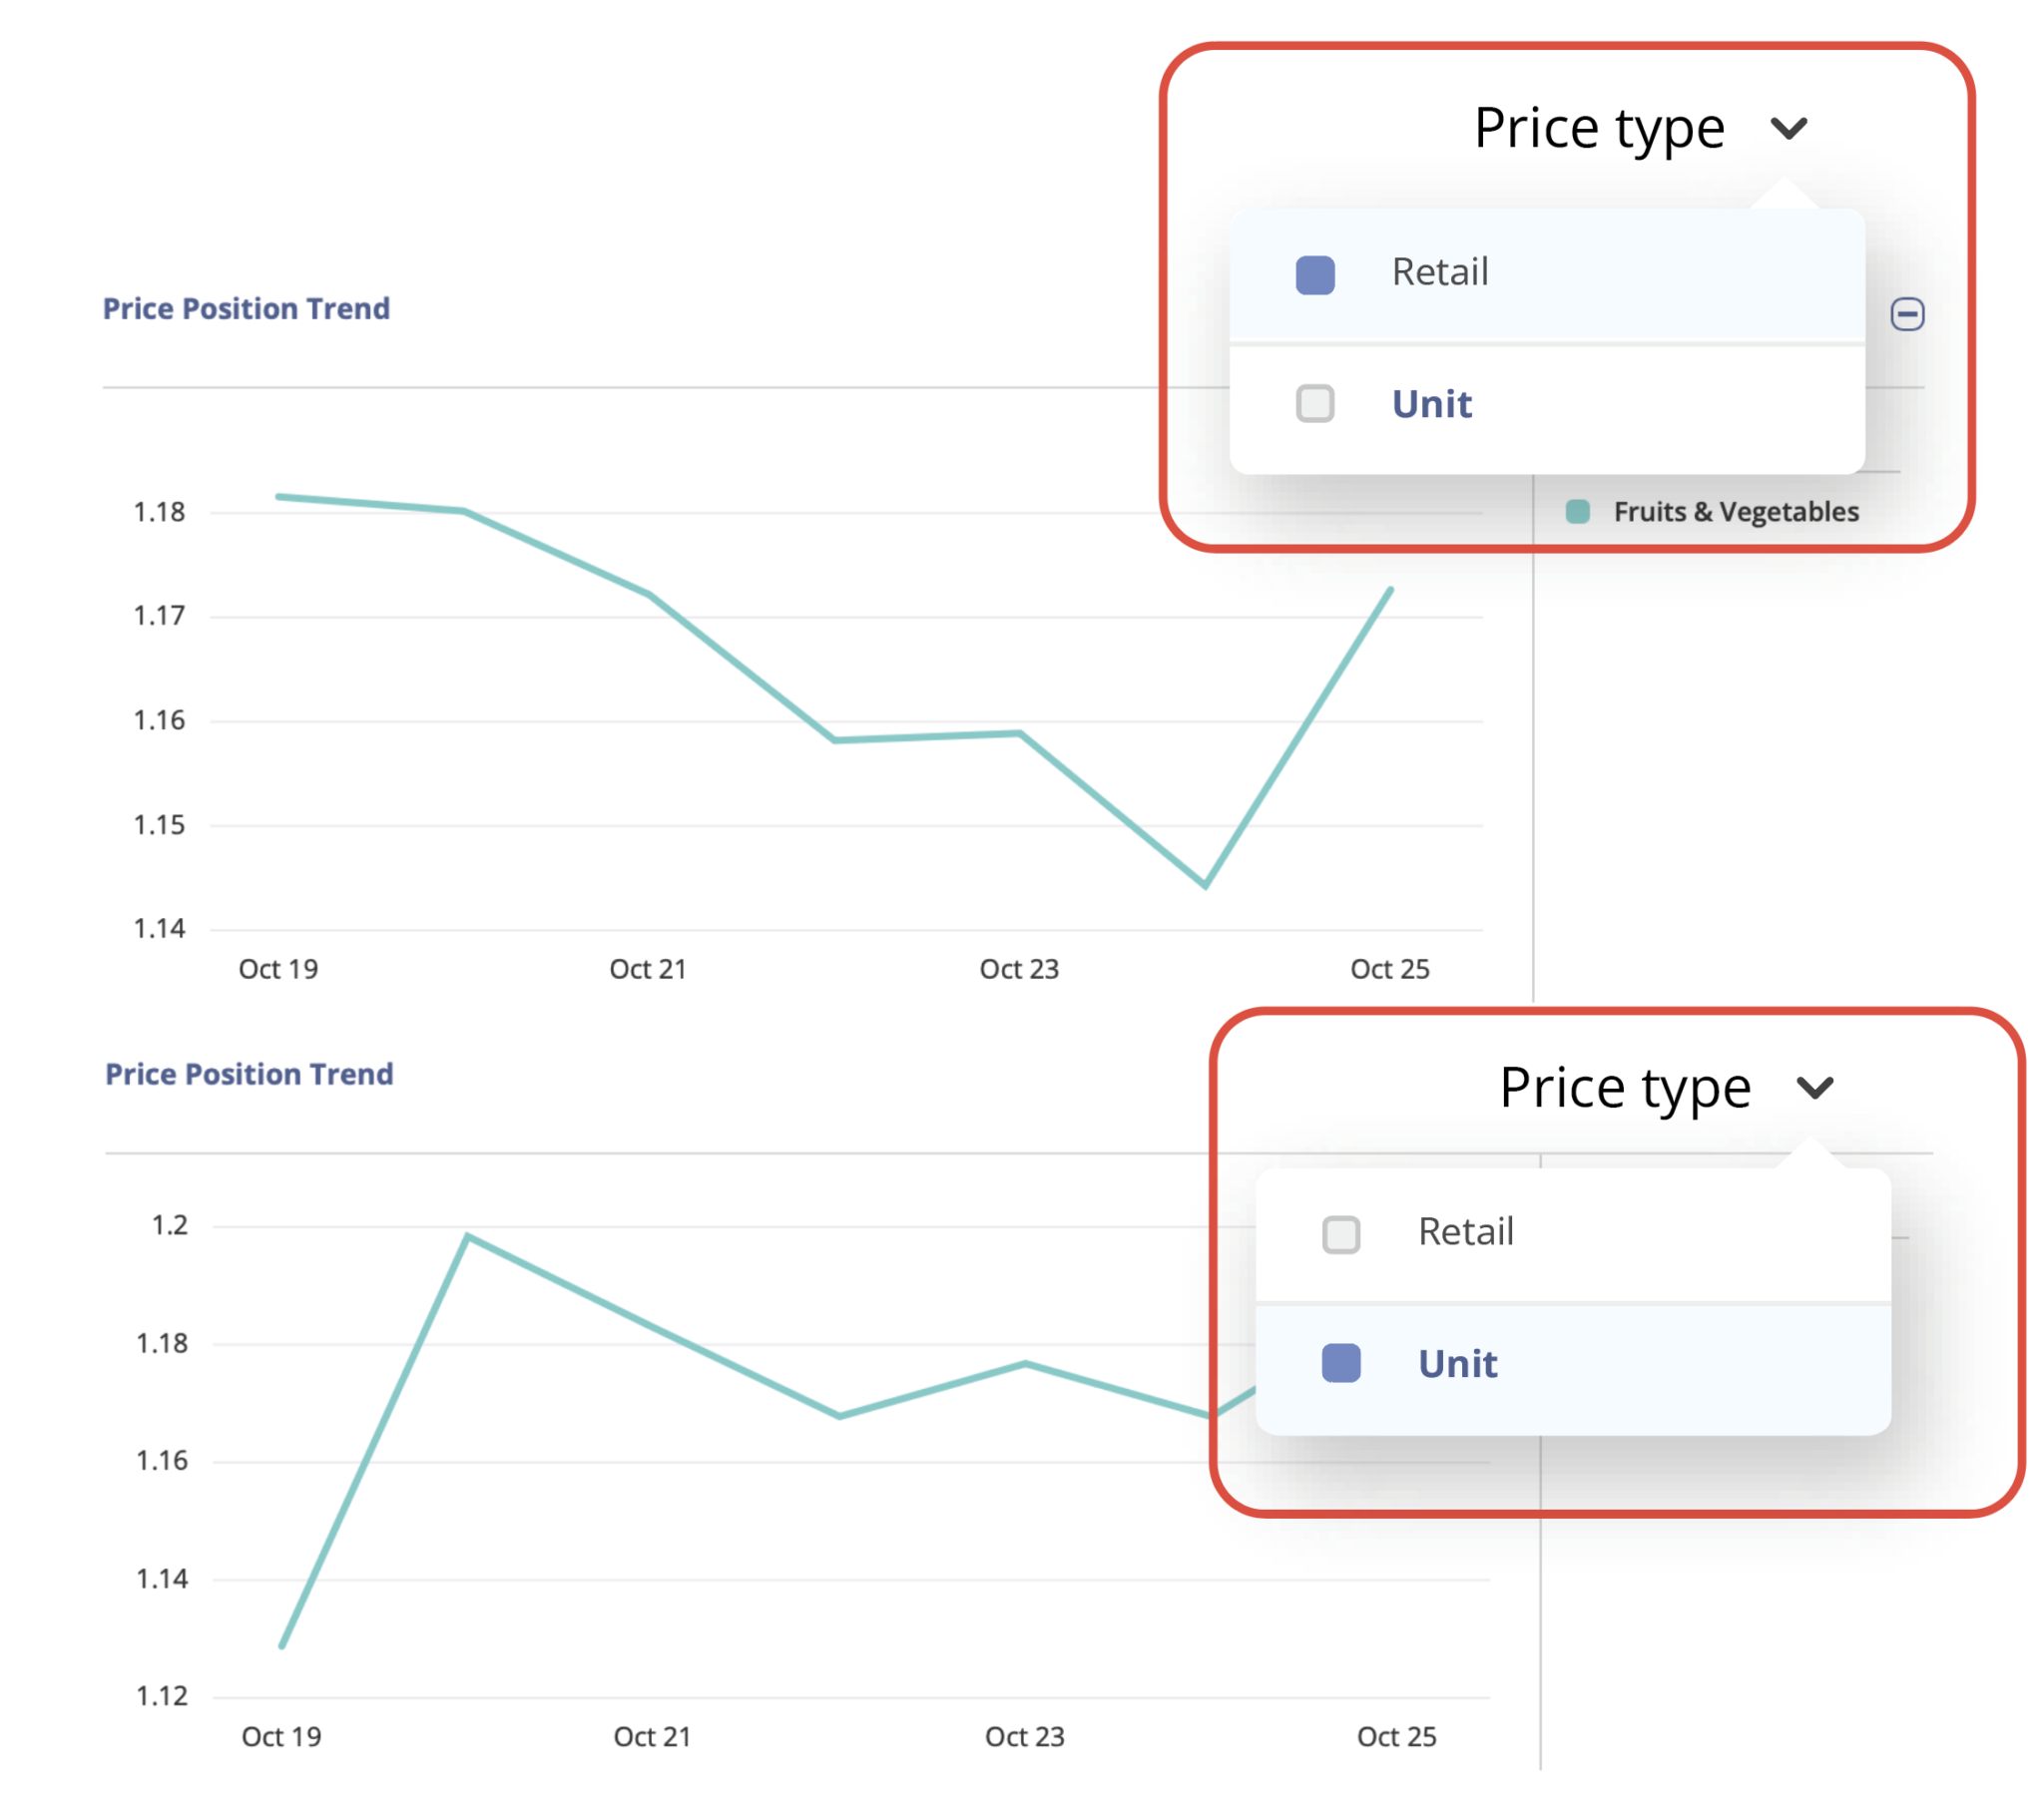
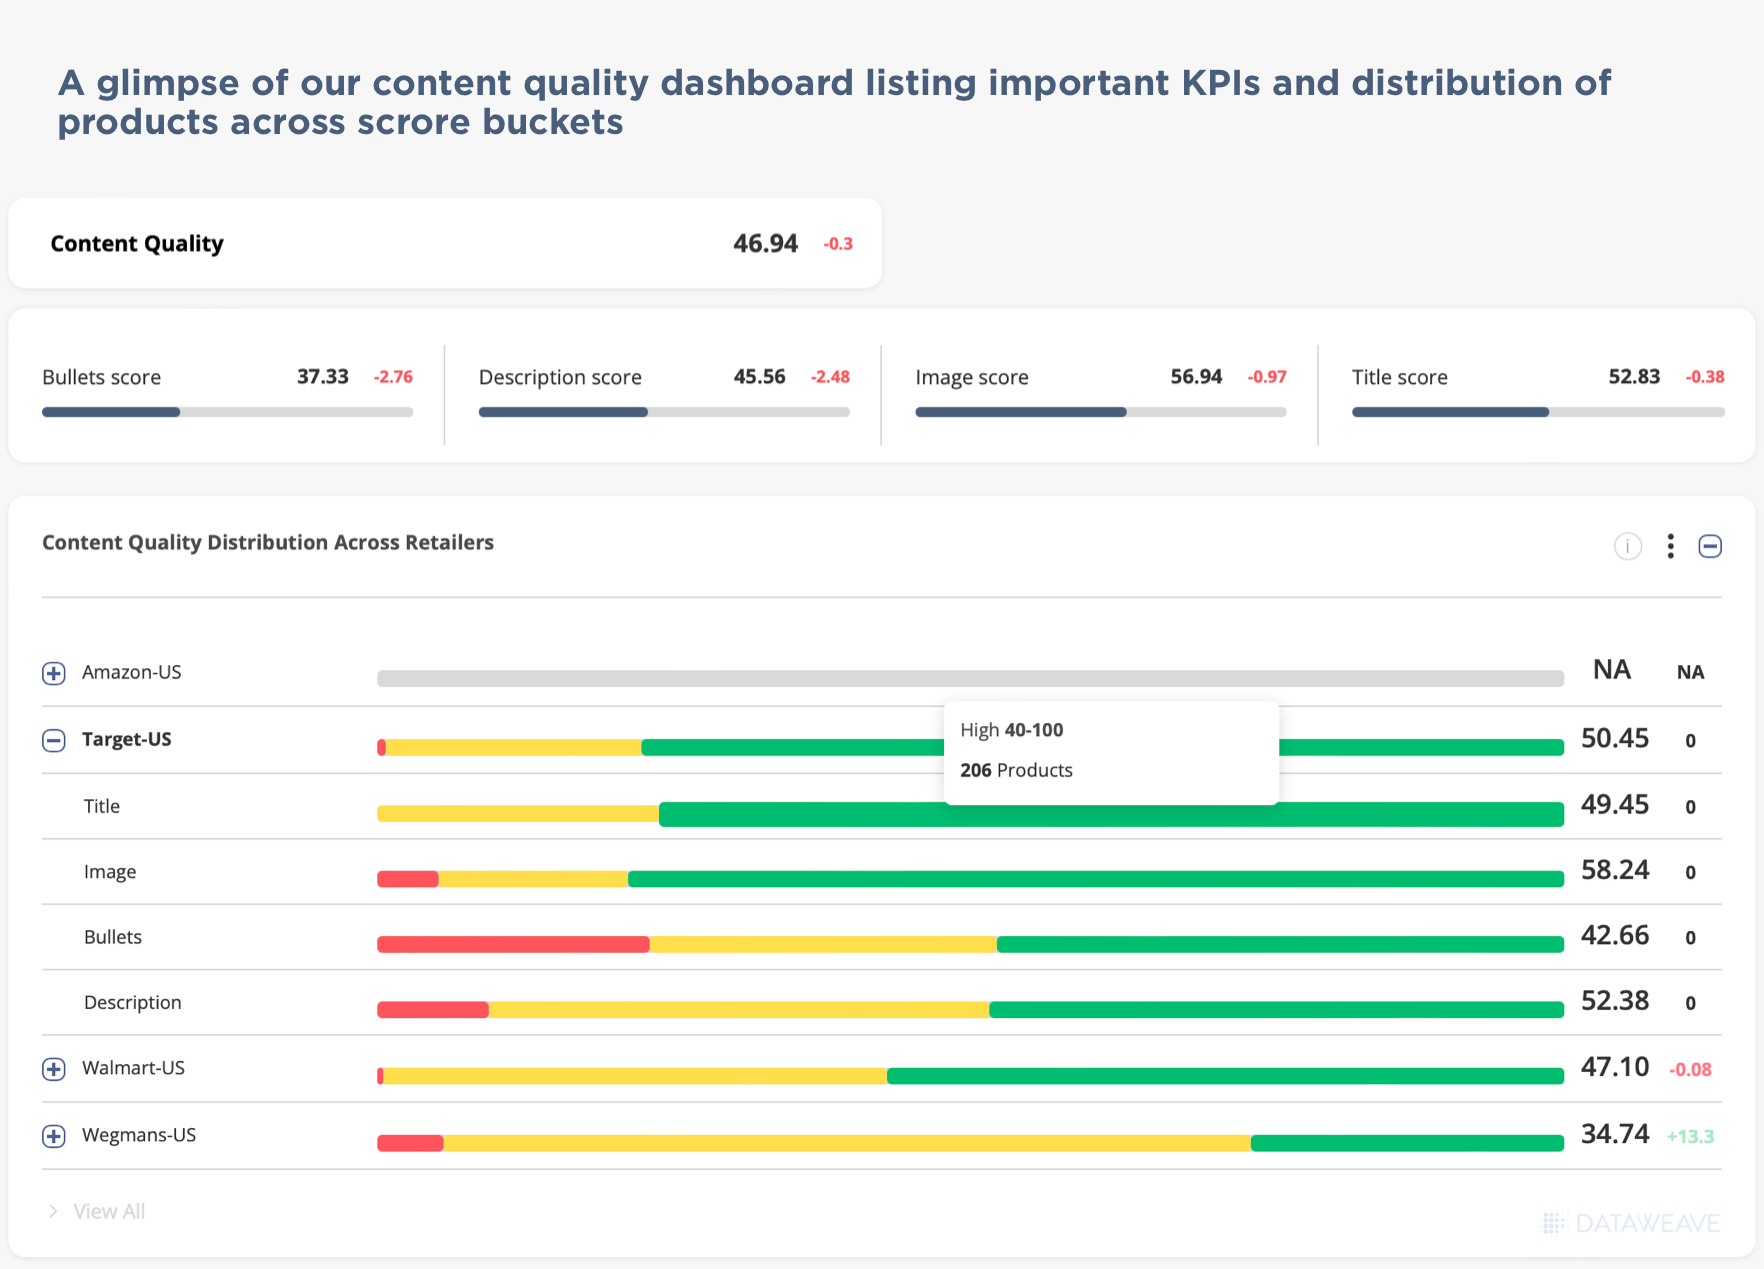
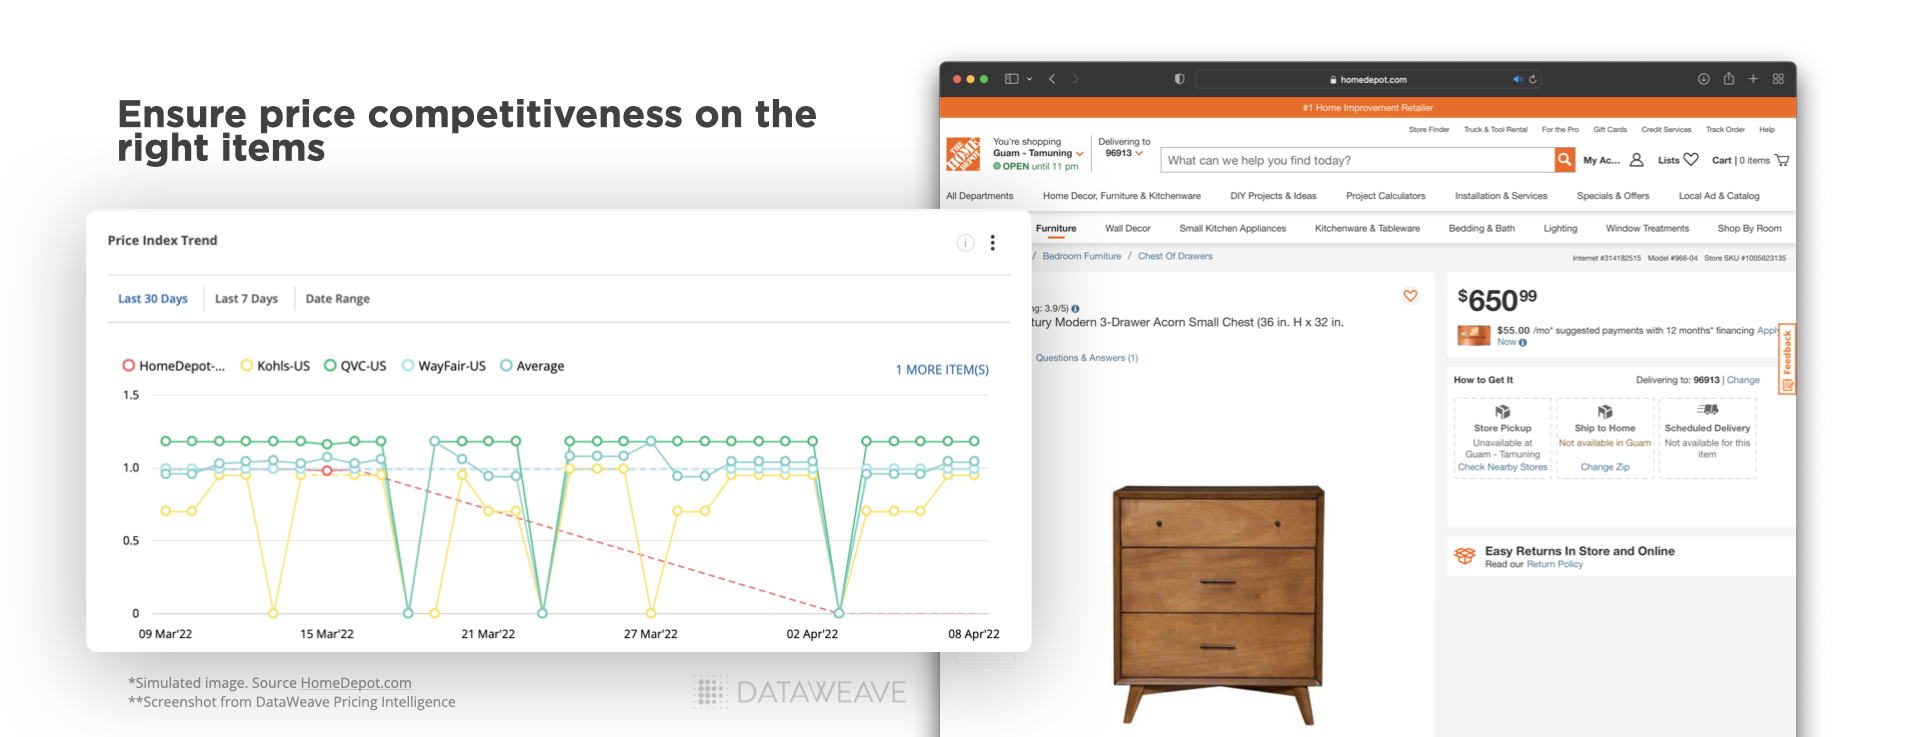
    • Daily/weekly pricing decisions: Frequent price adjustments based on market trends will help your company remain competitive across entire product categories. With automated, real-time dashboards, your pricing team can monitor broad category-level pricing shifts and make necessary adjustments accordingly.
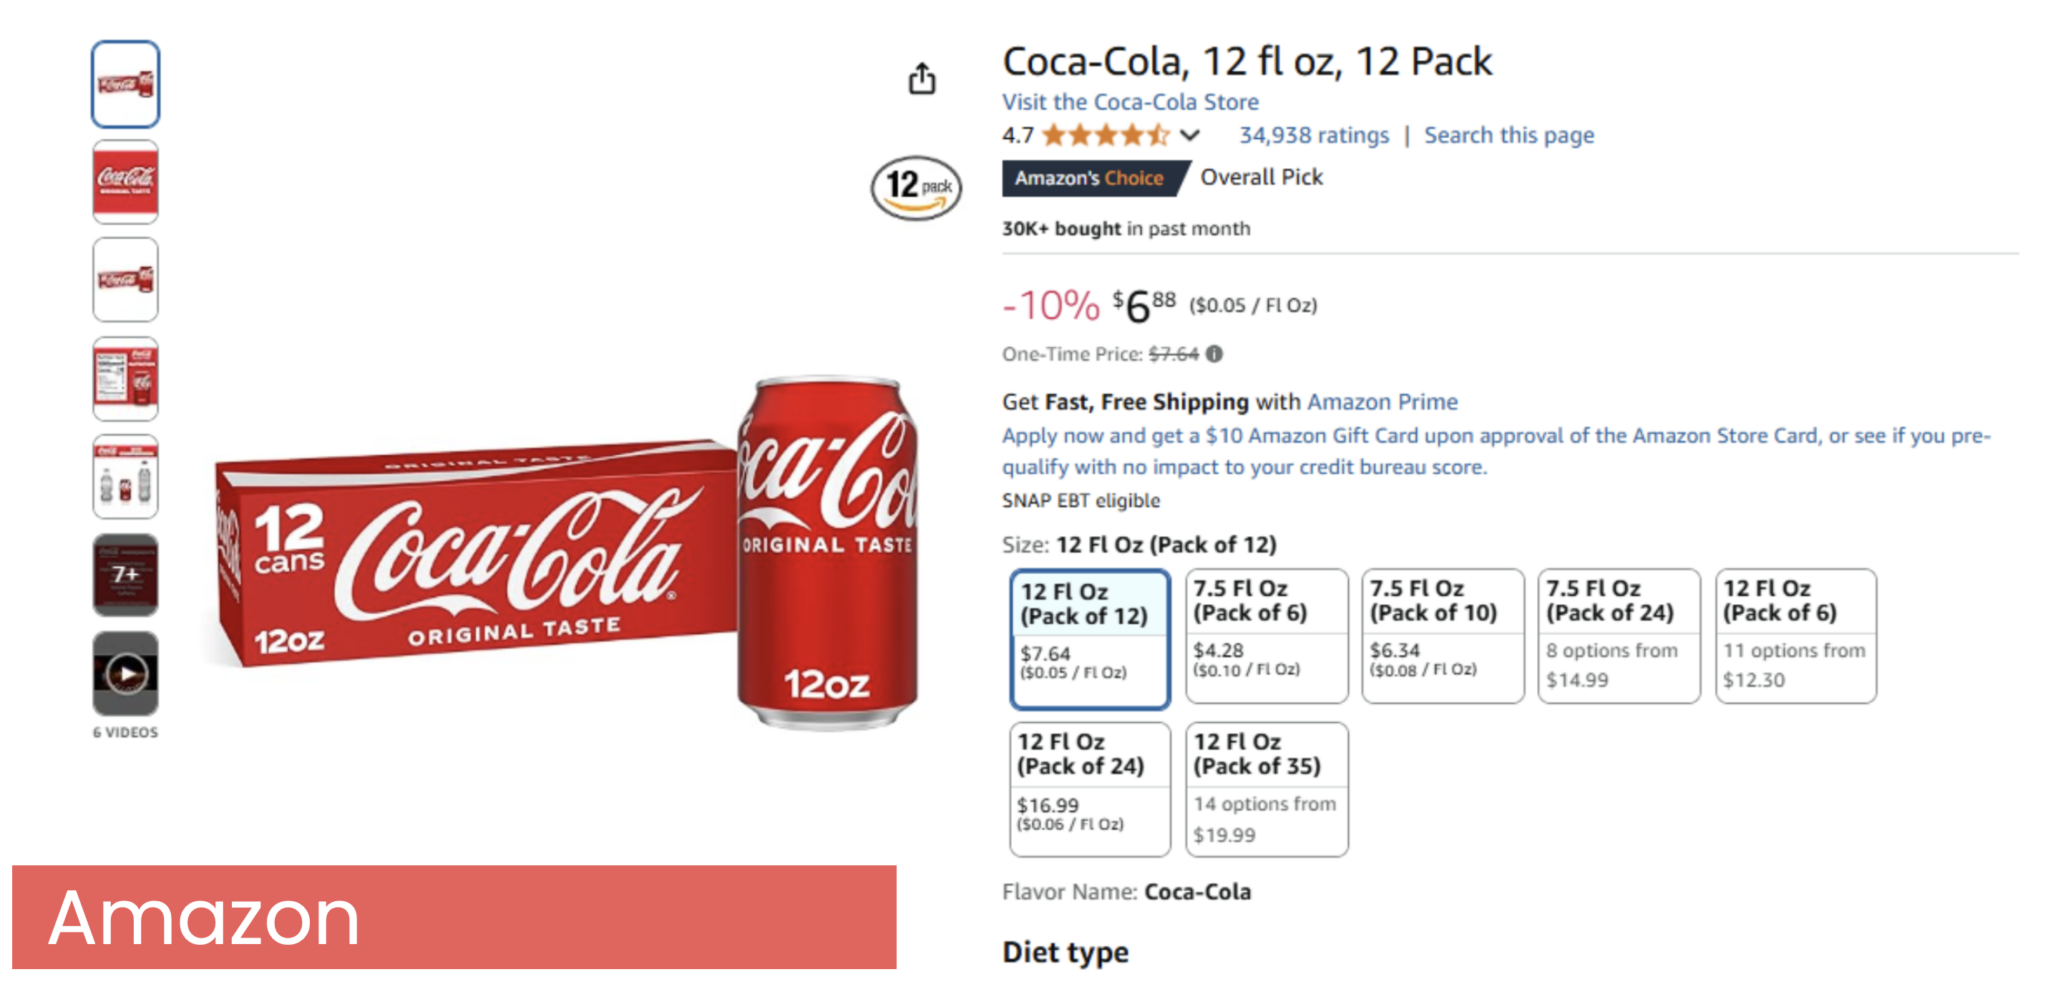
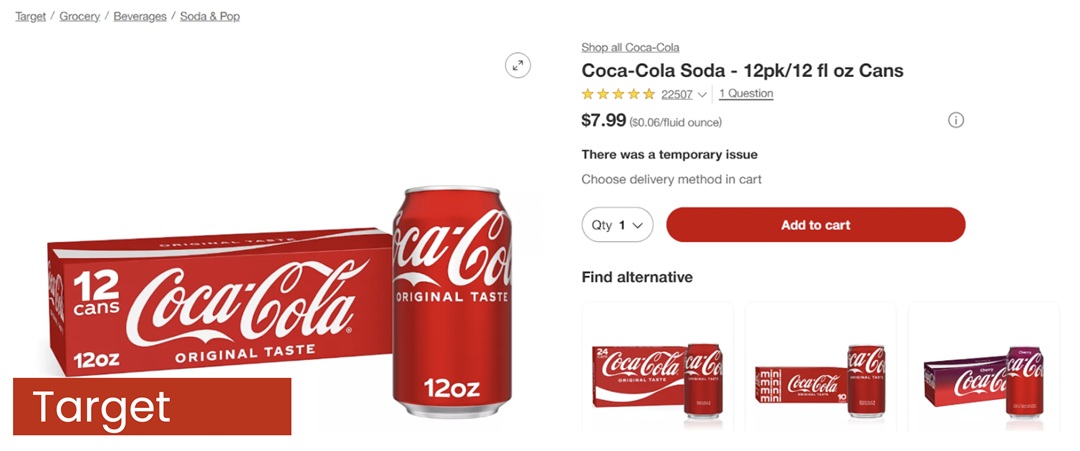
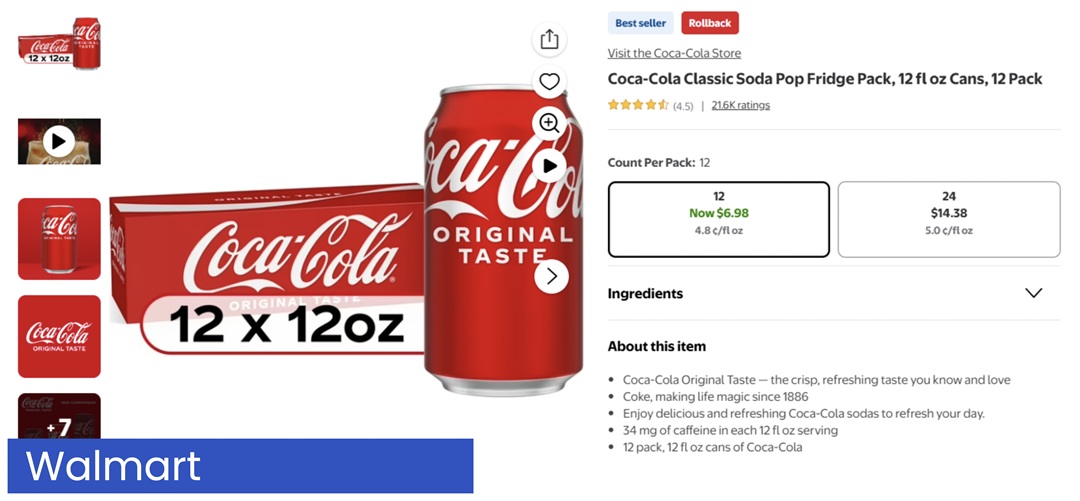
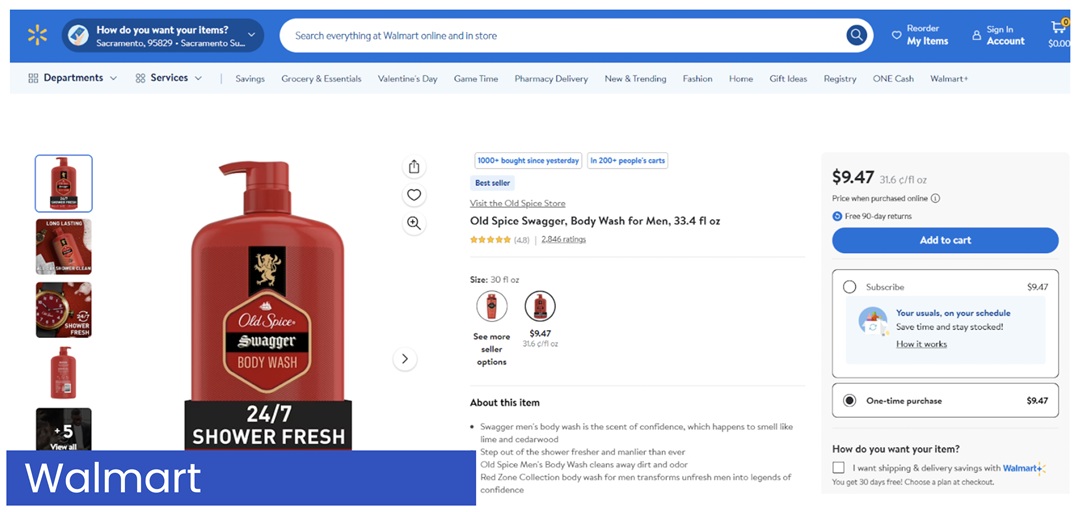
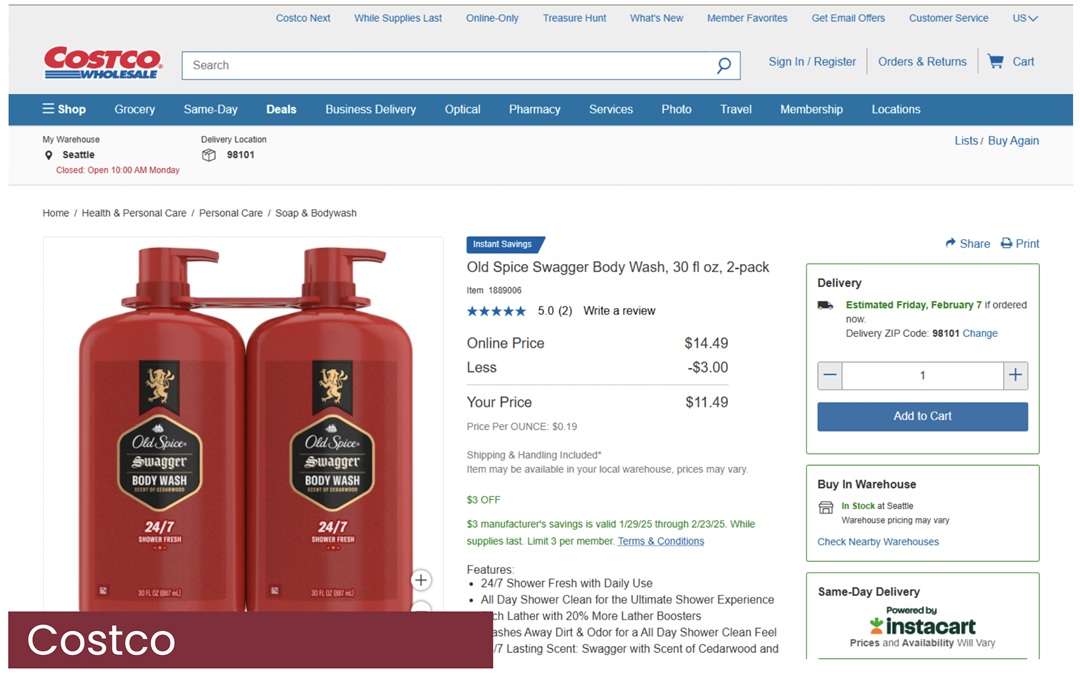
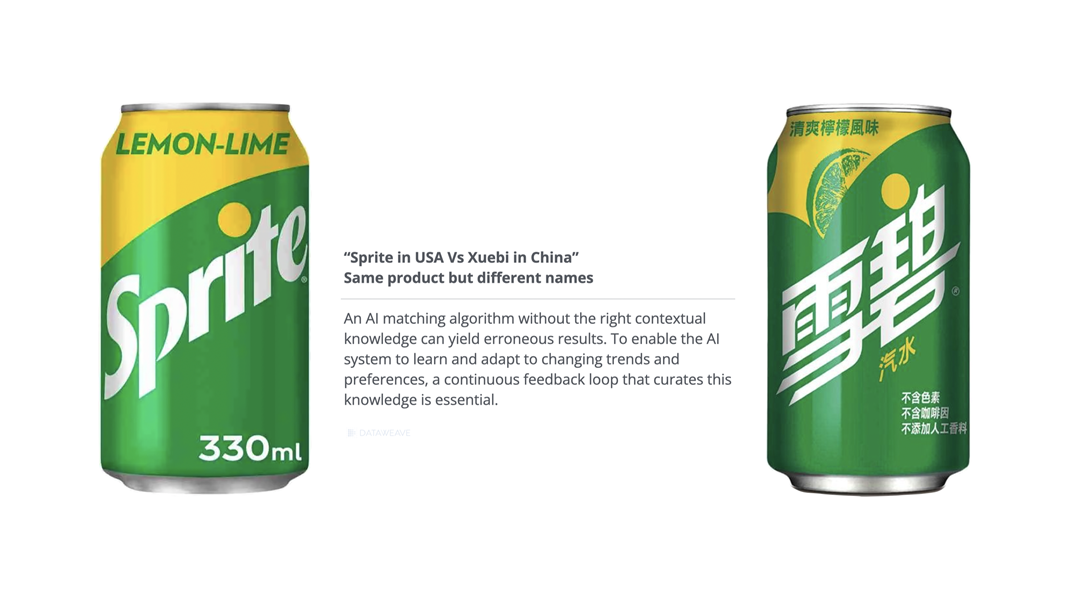
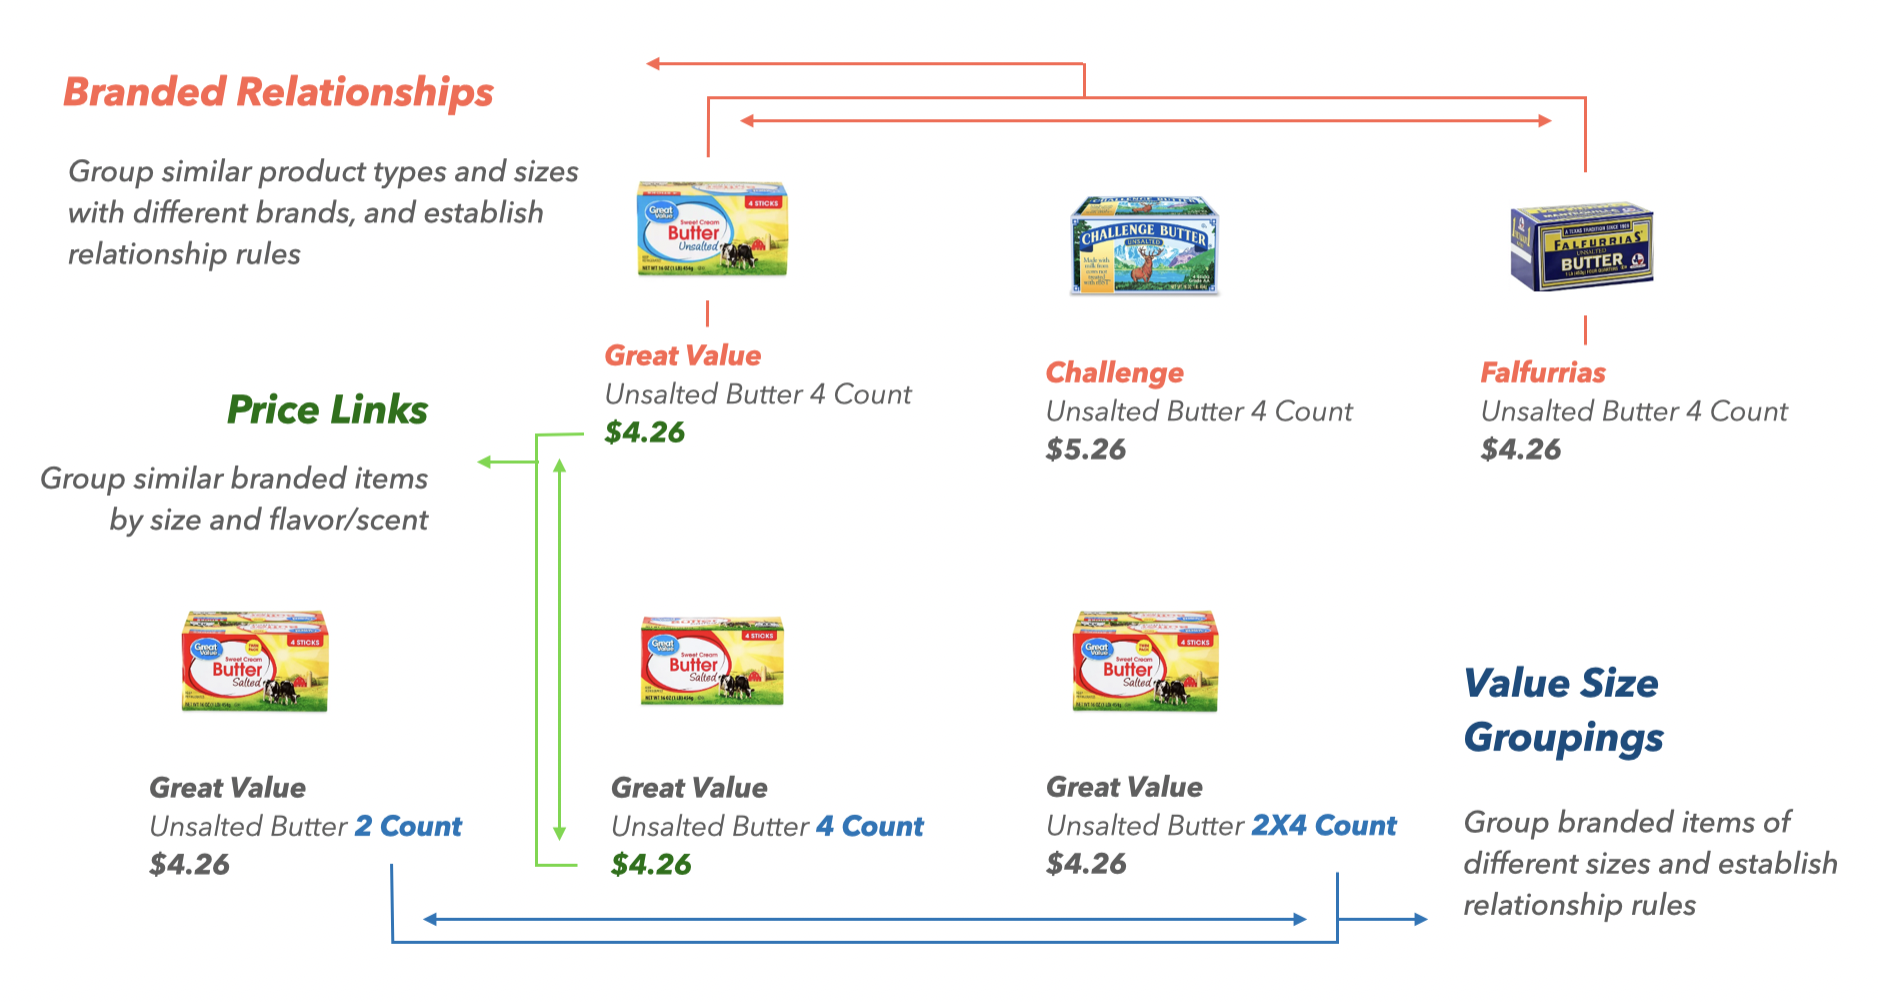
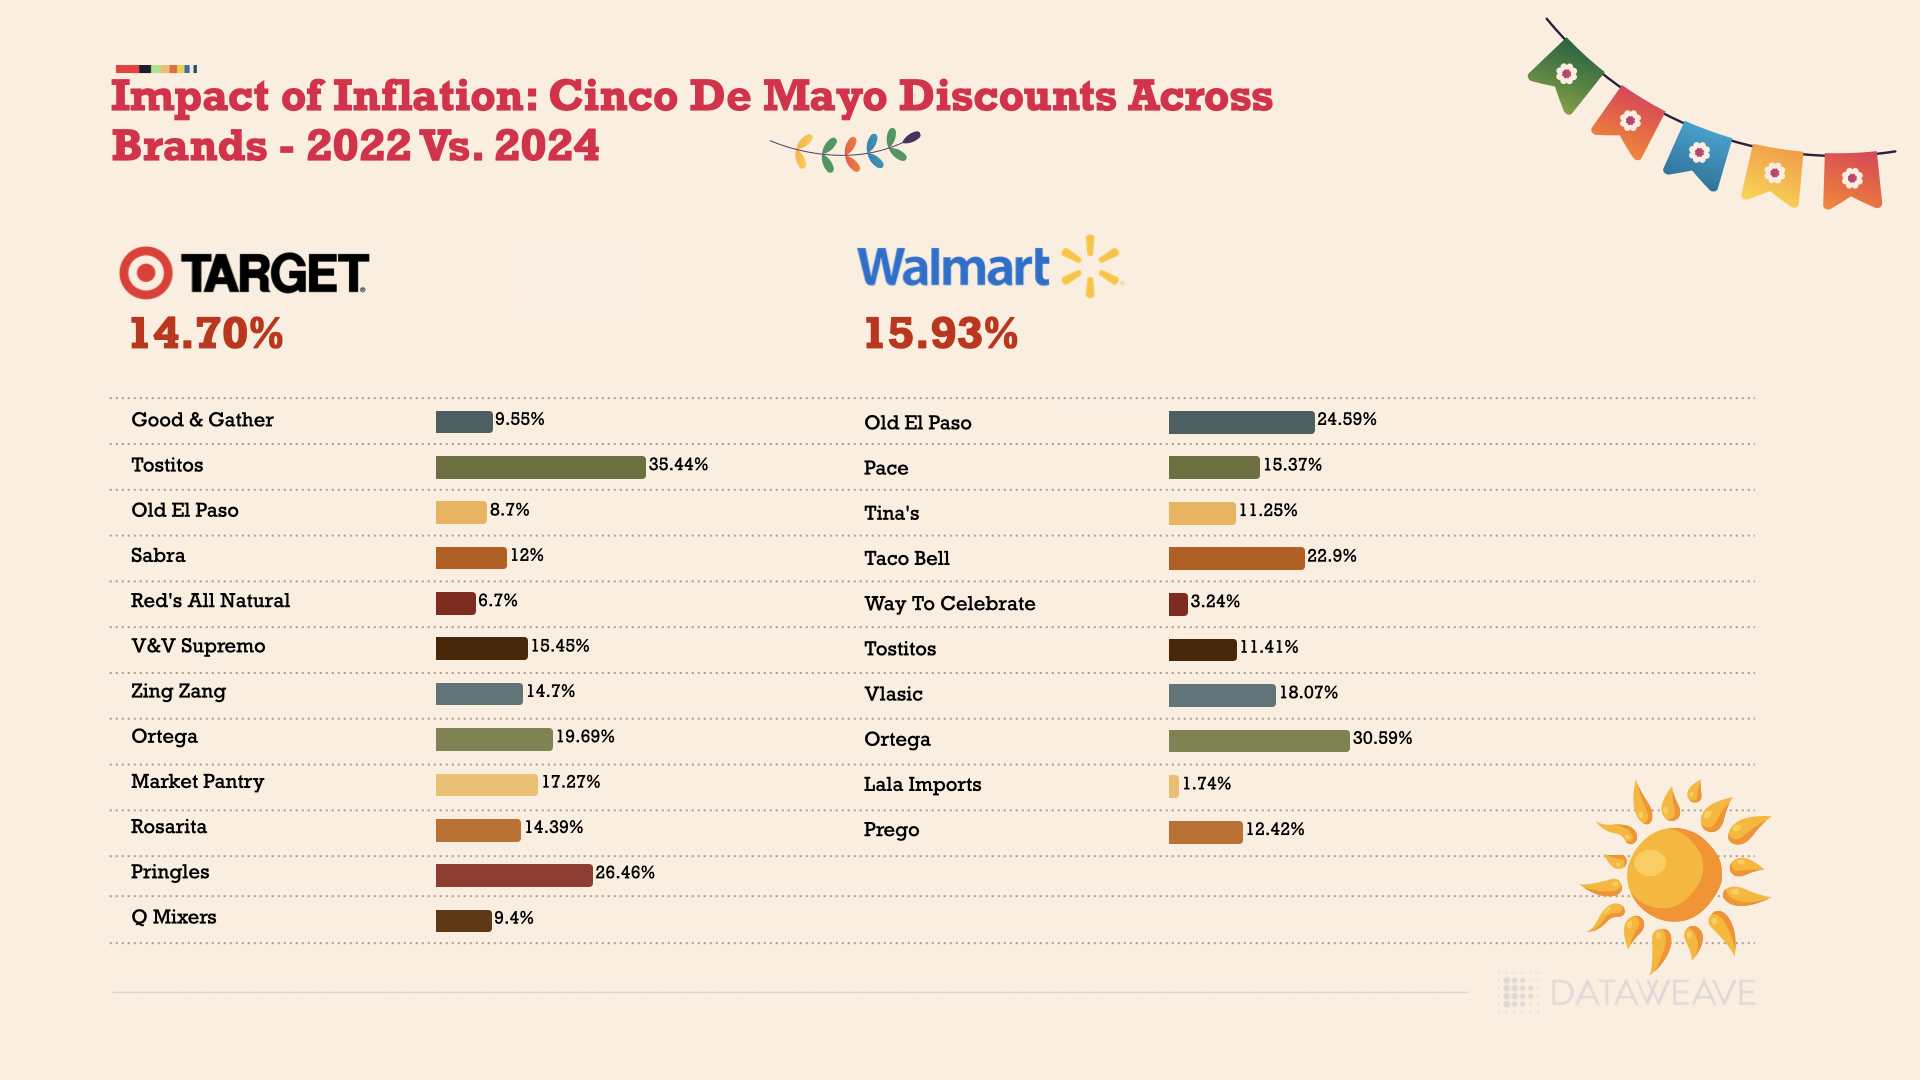
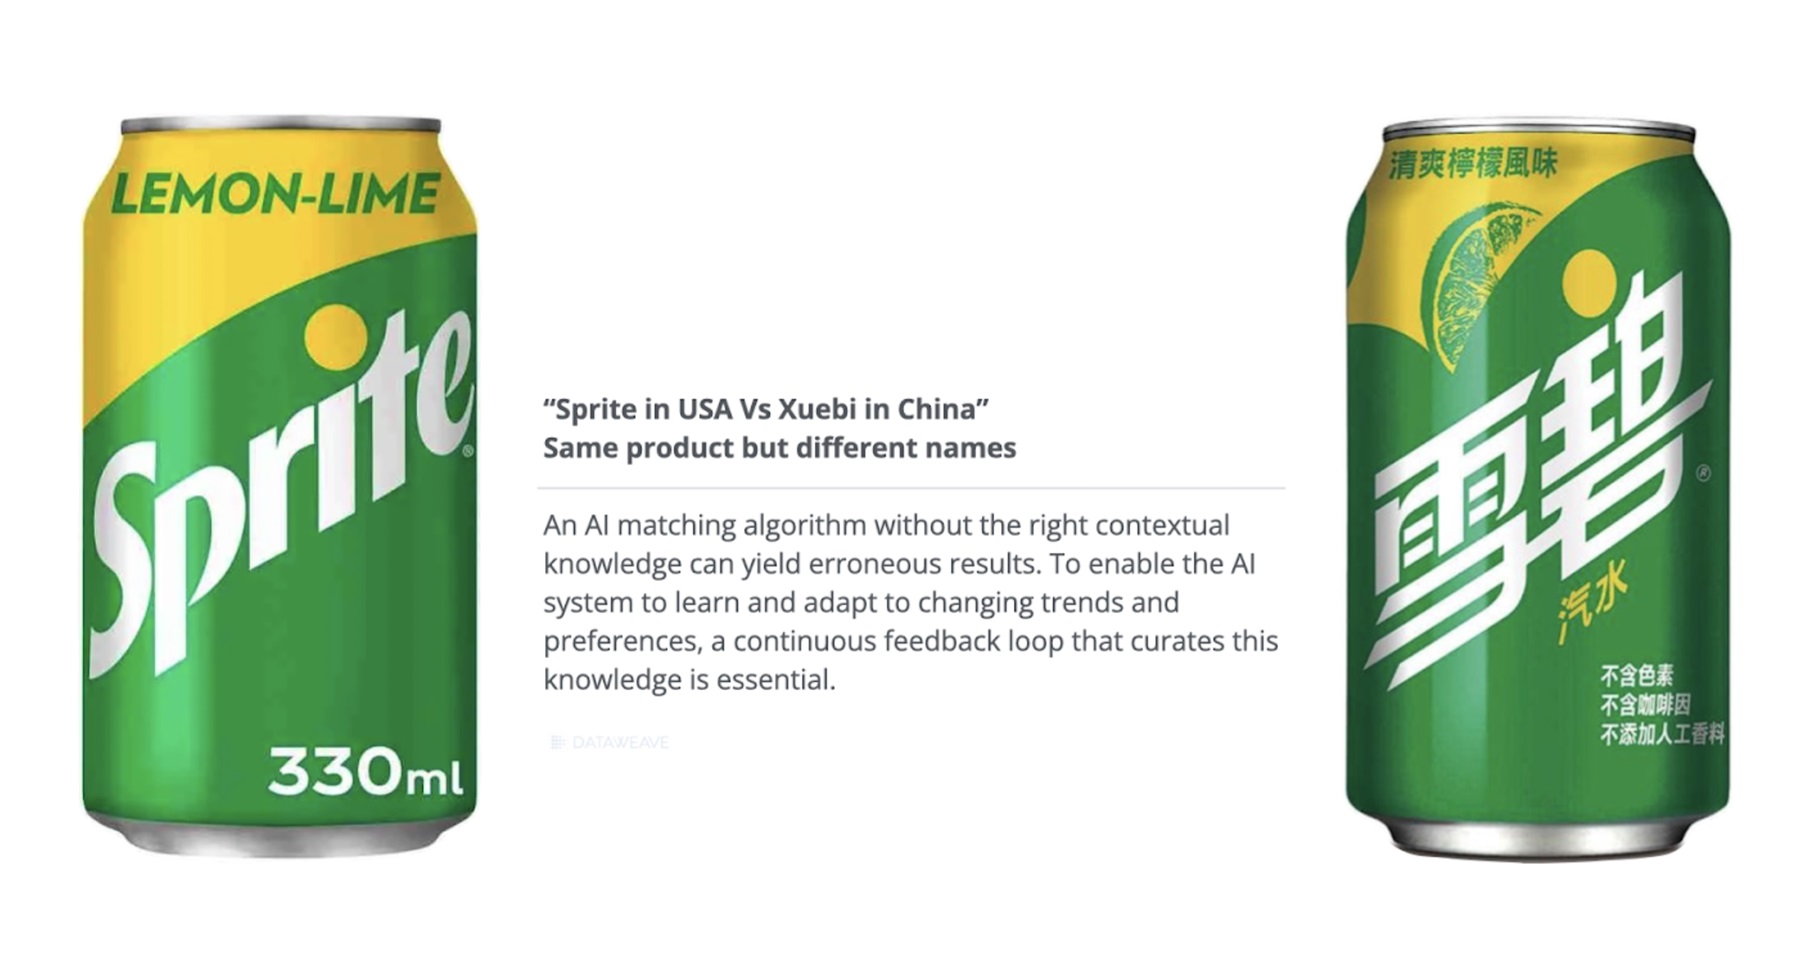
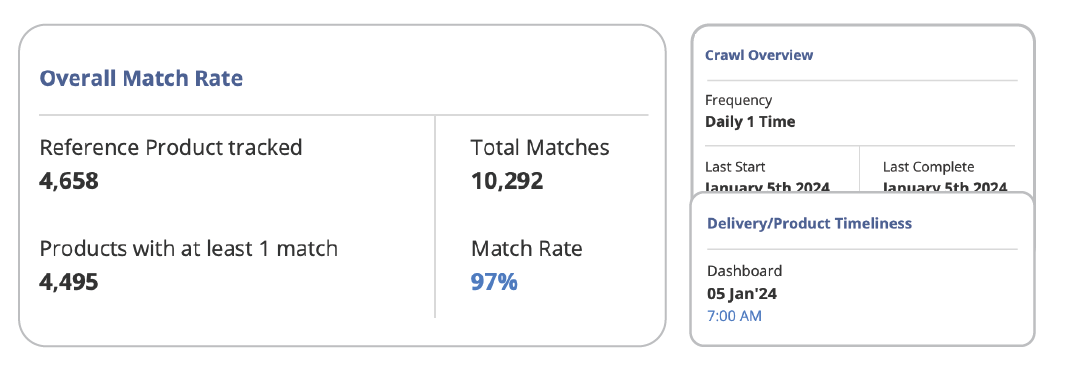
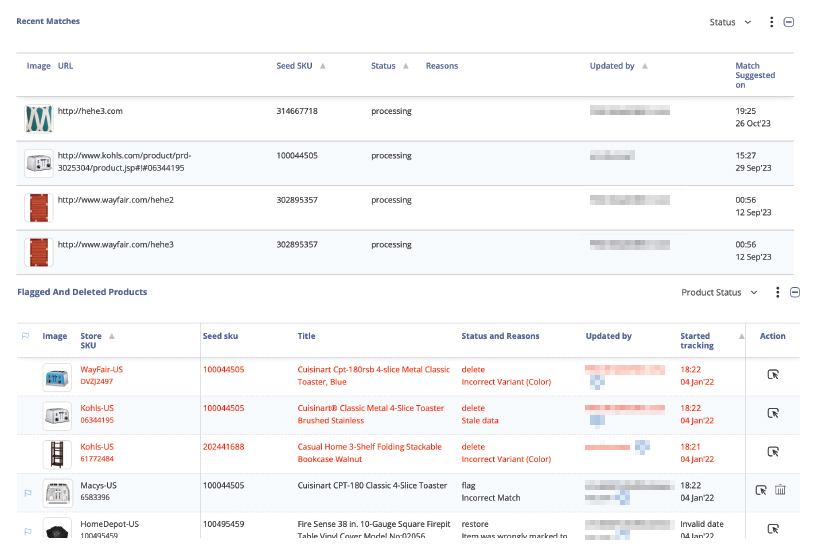
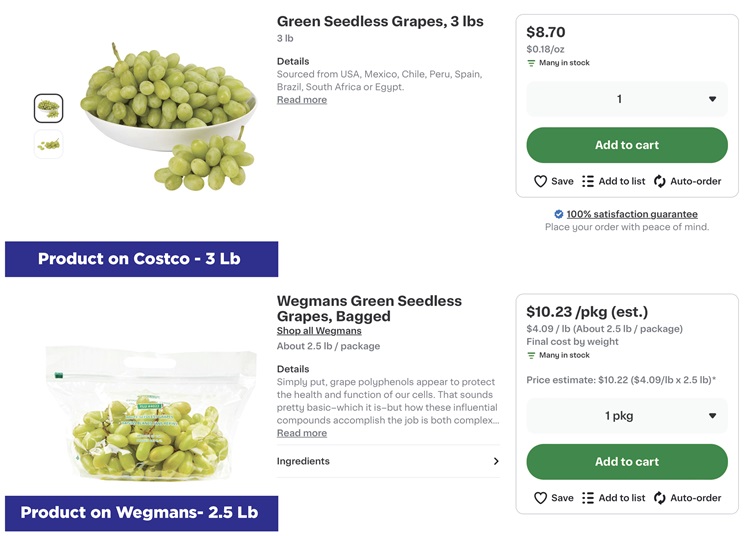
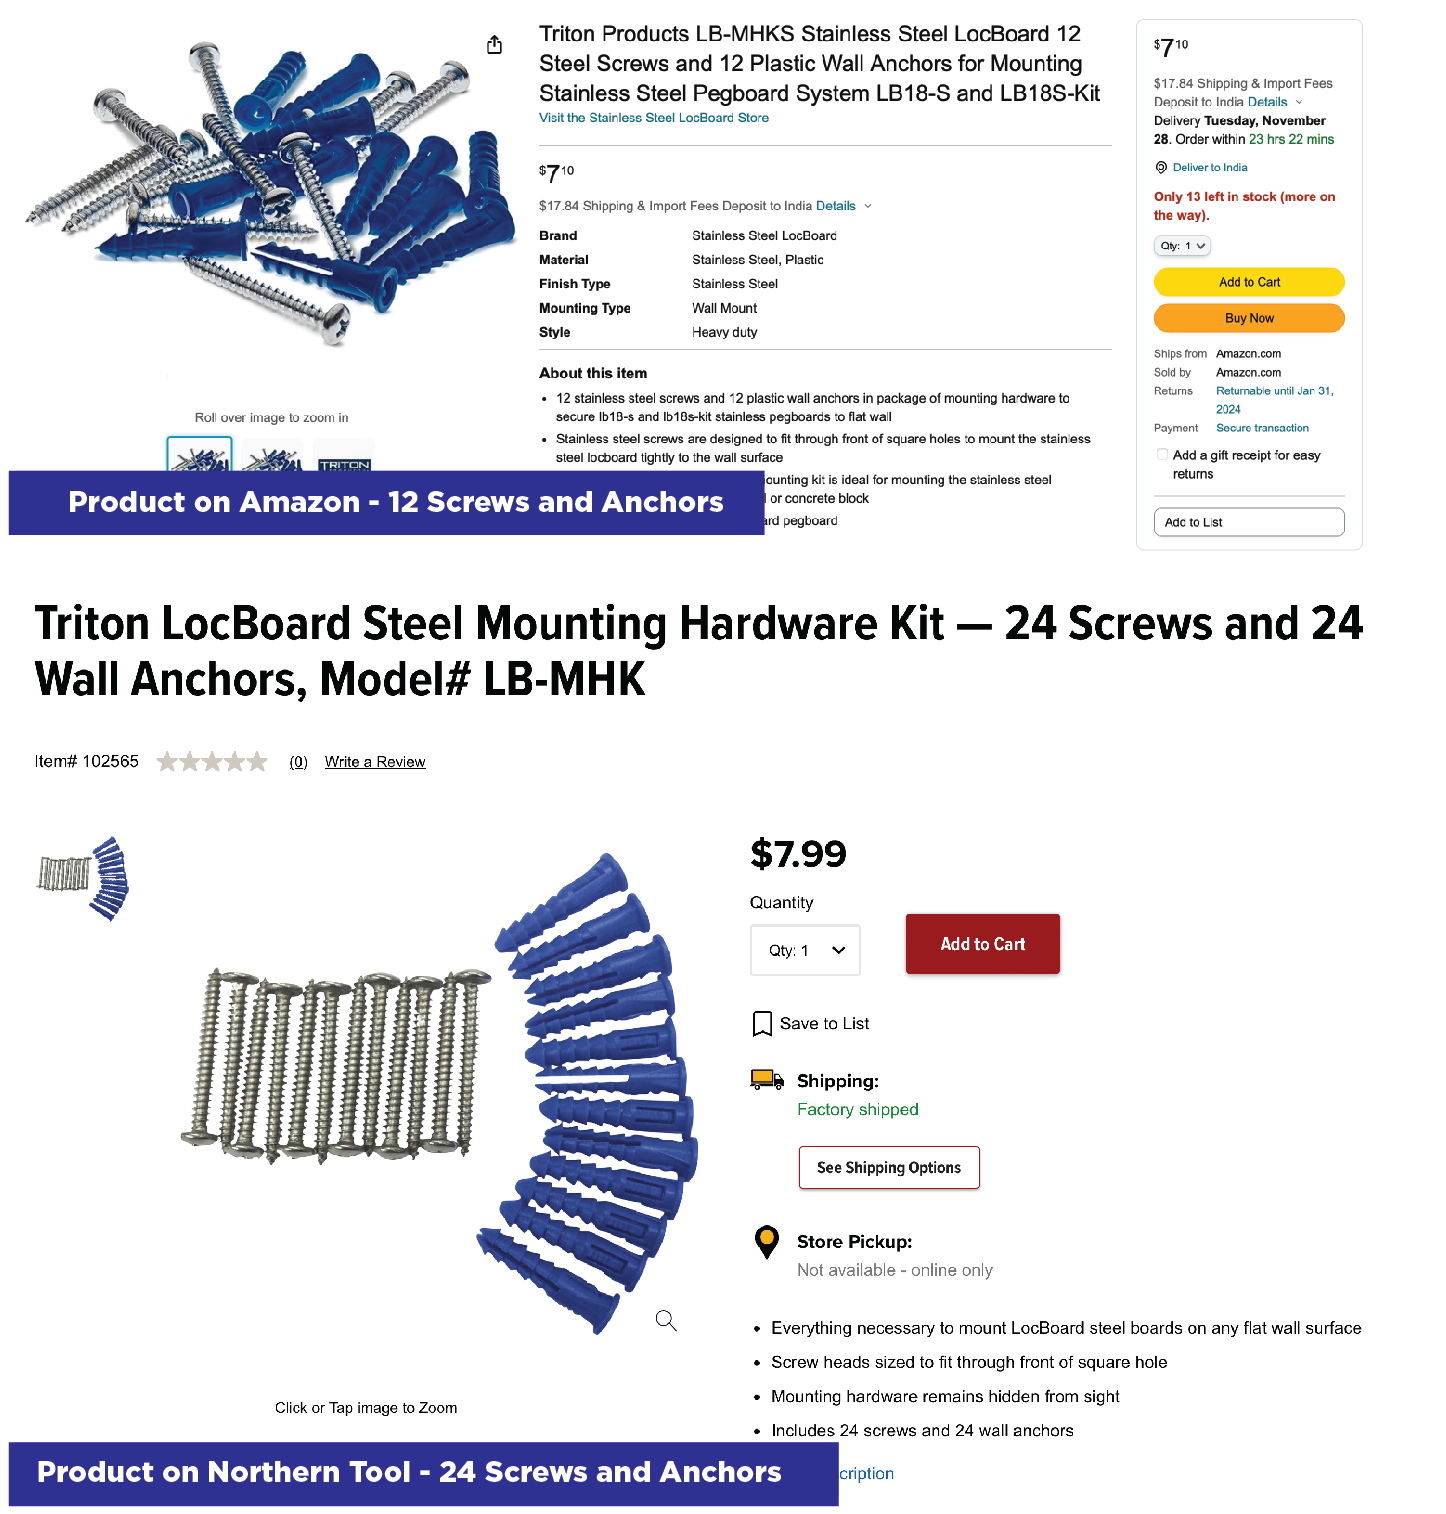
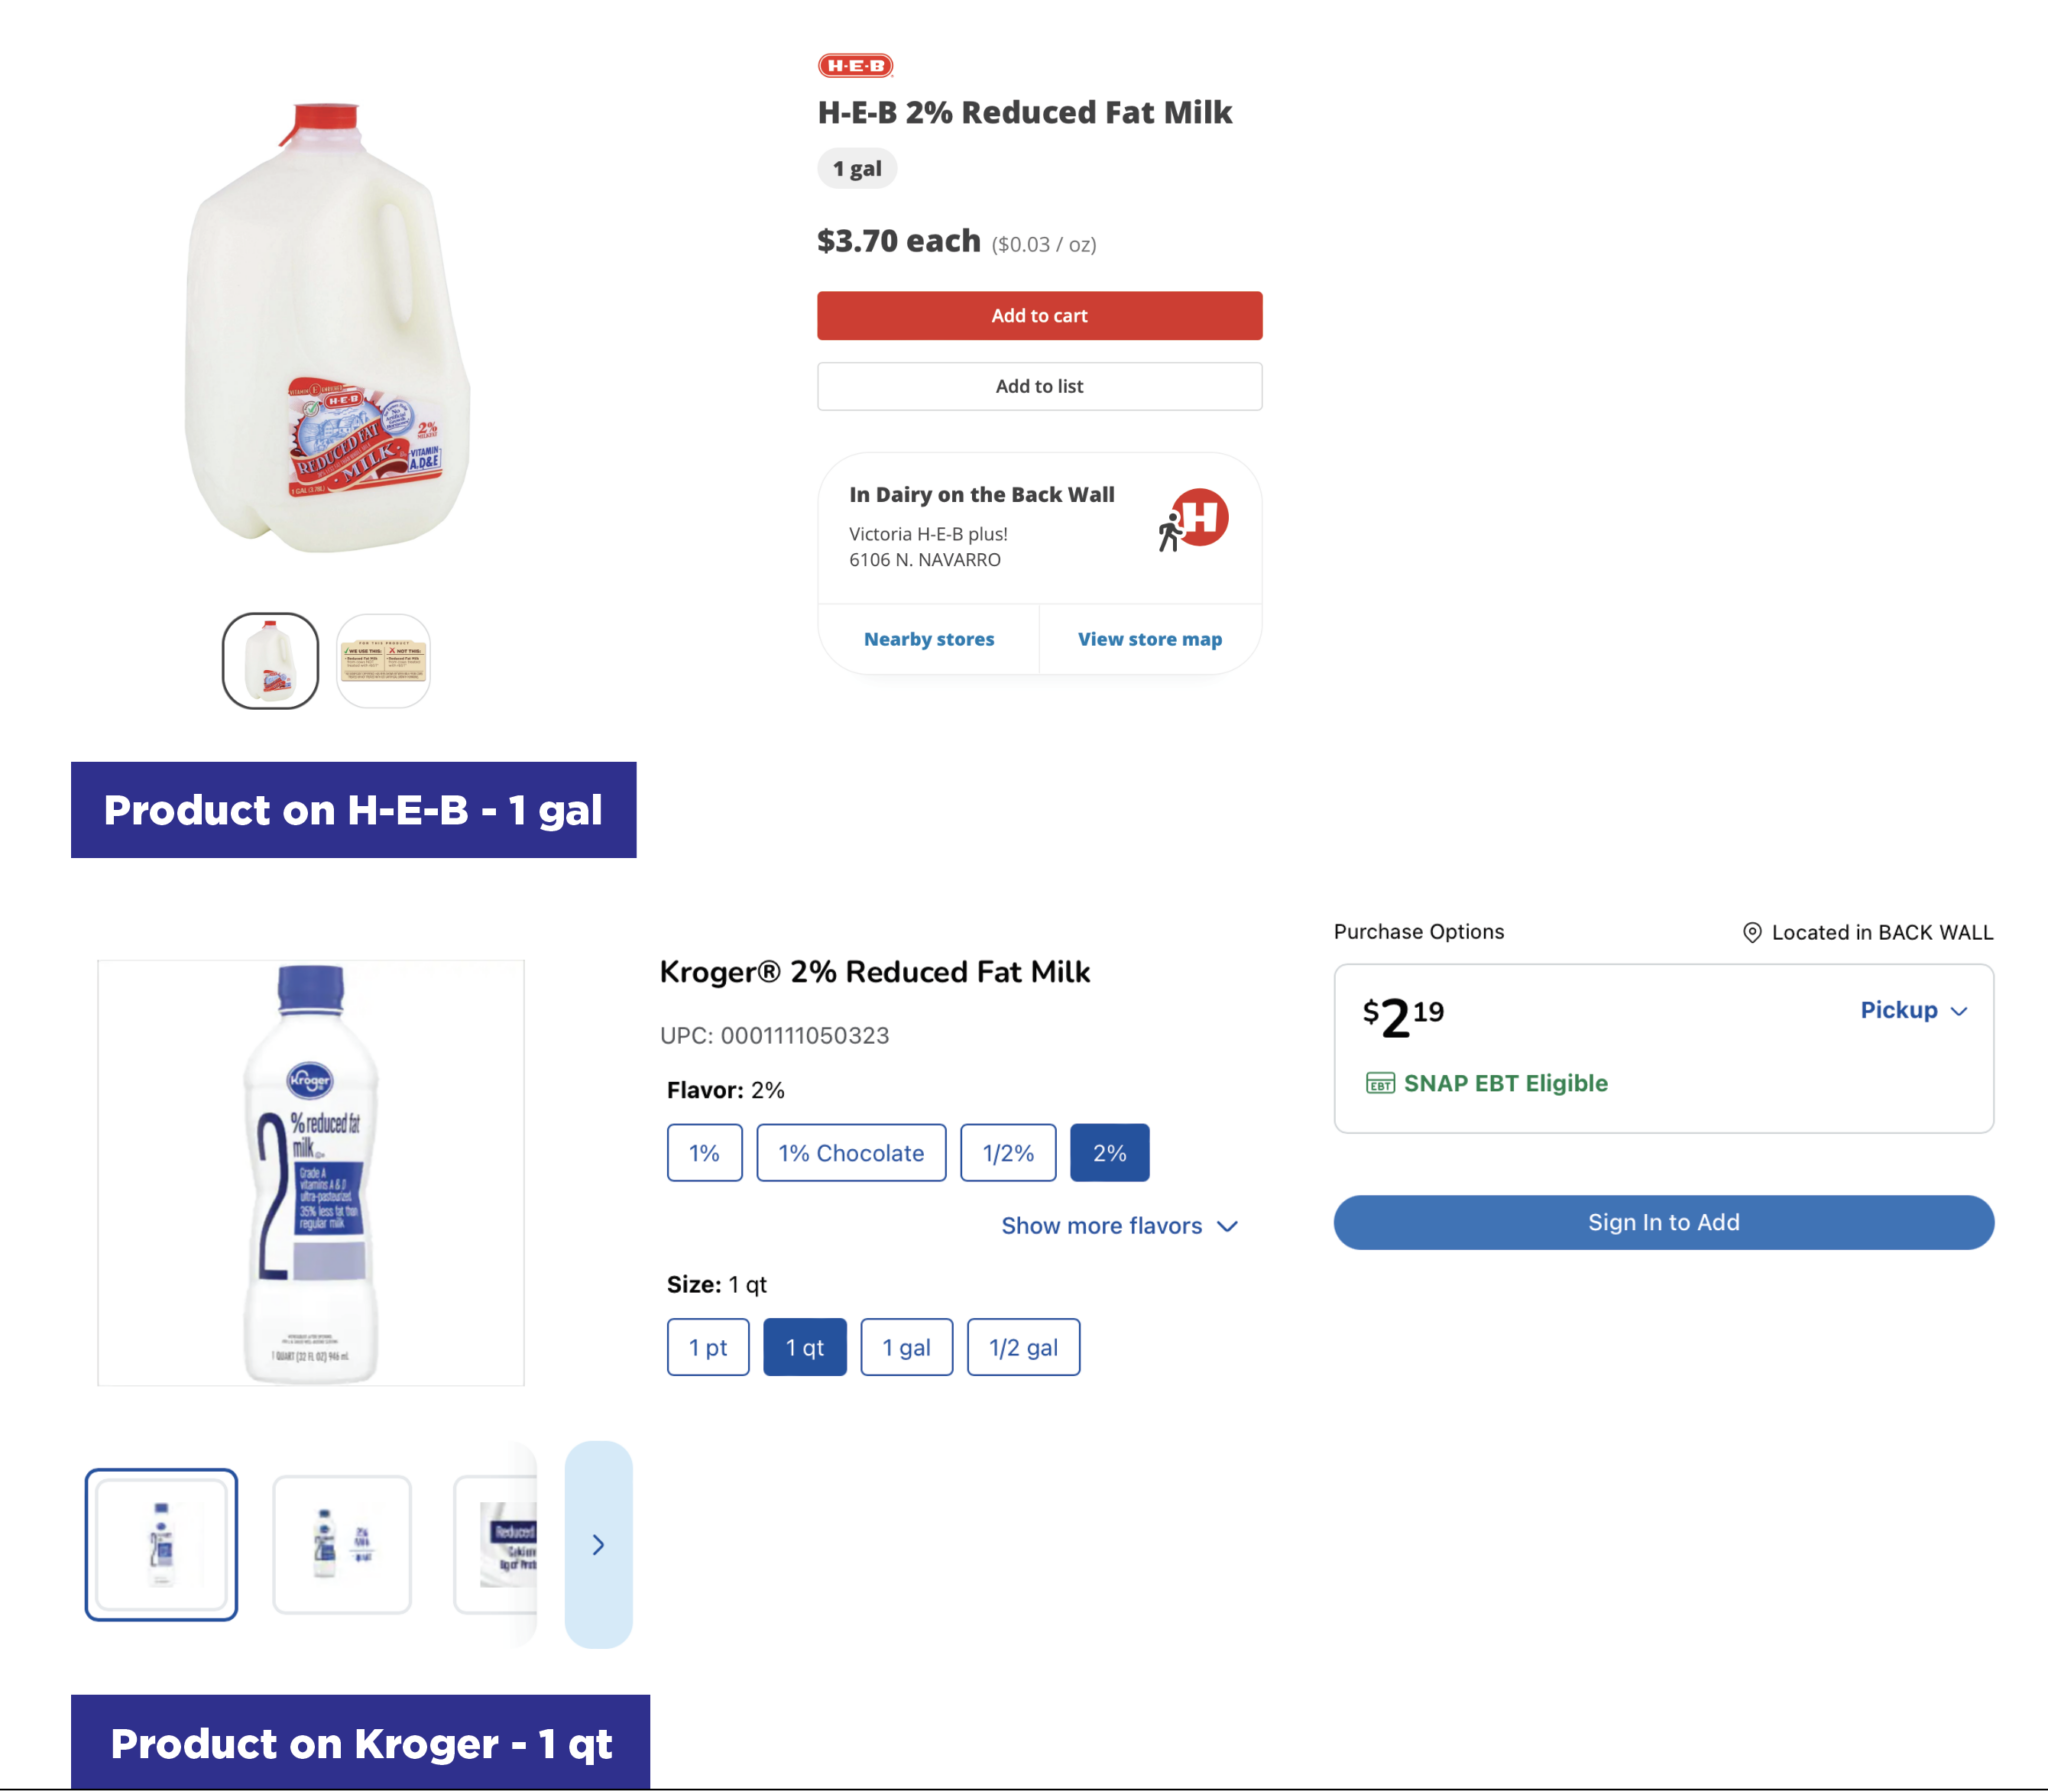
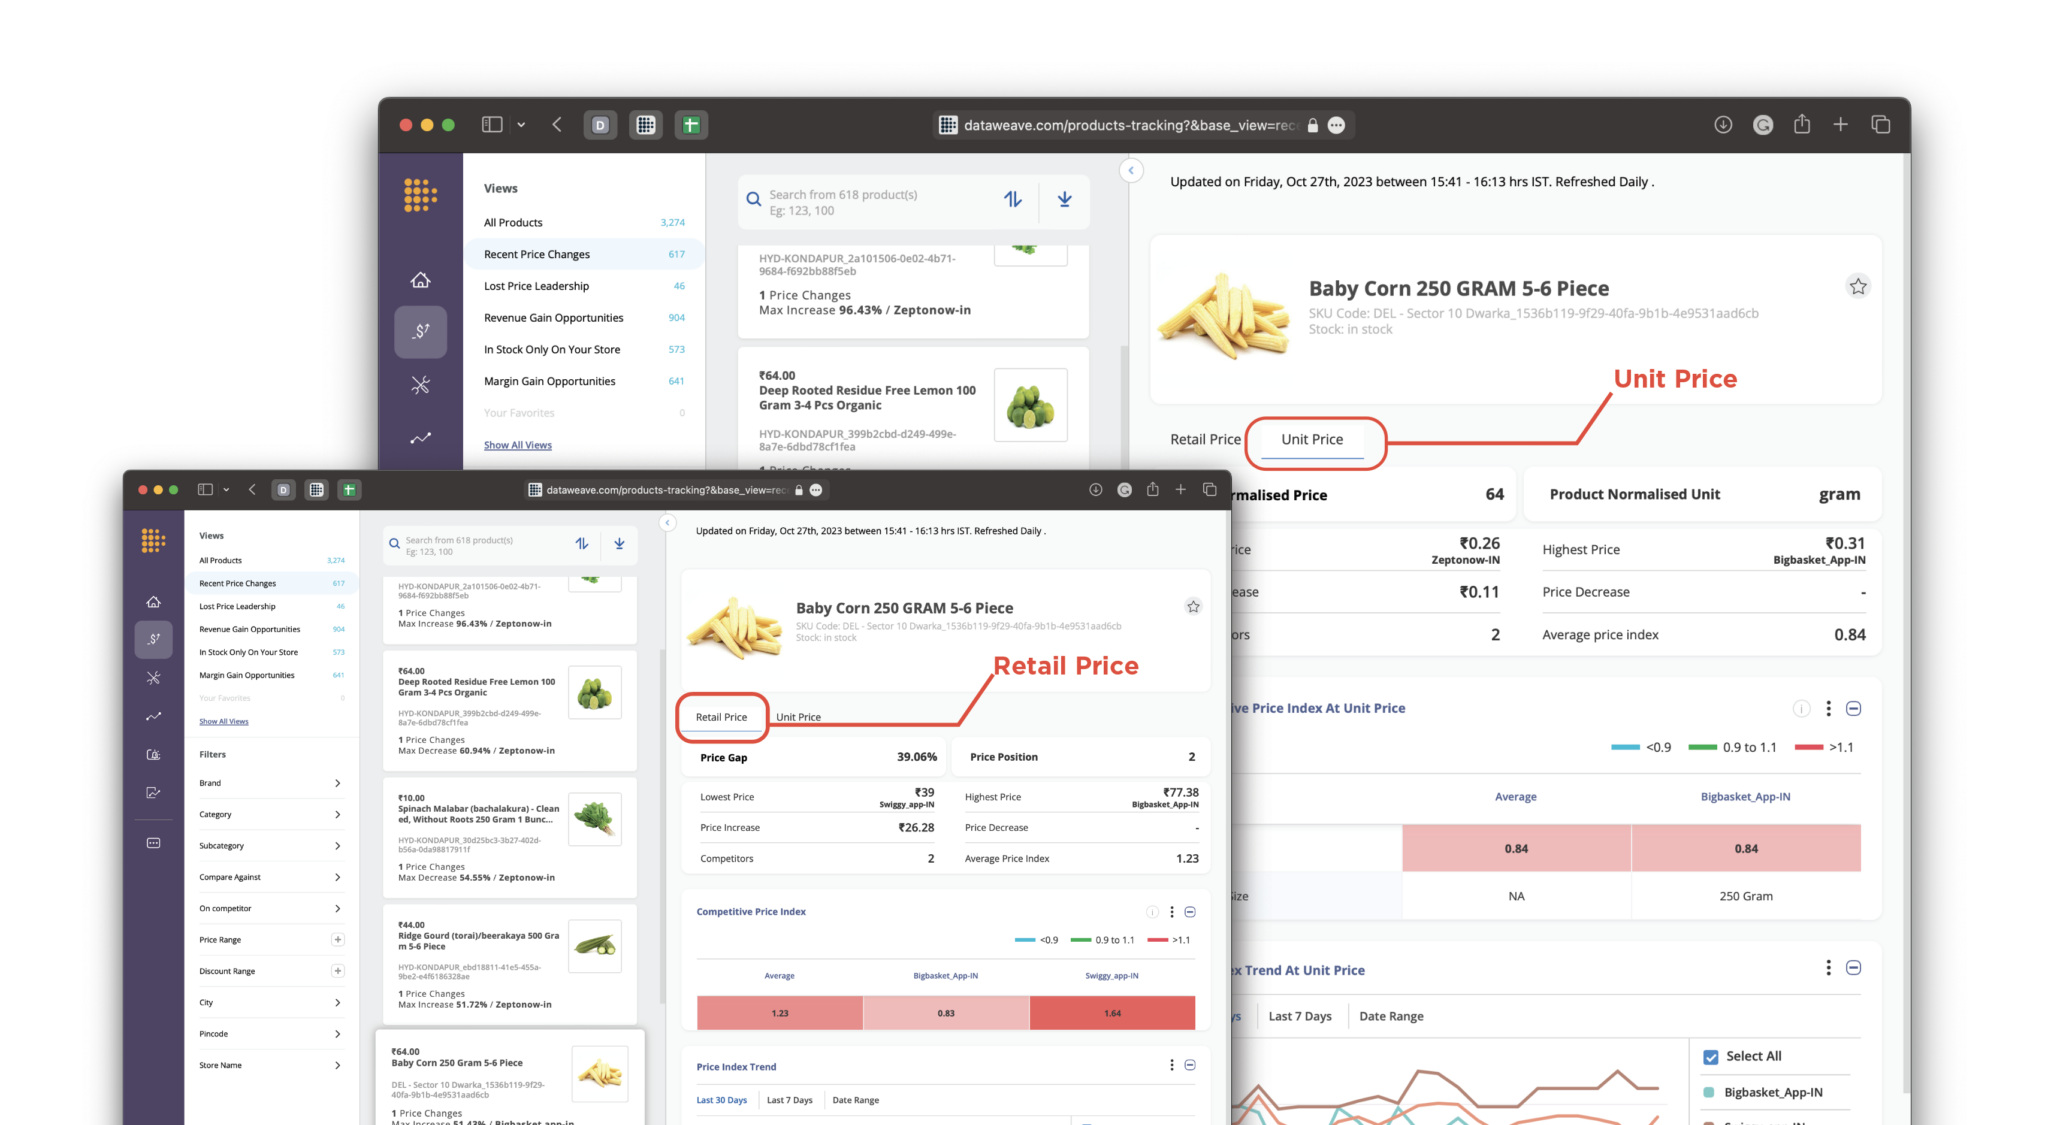
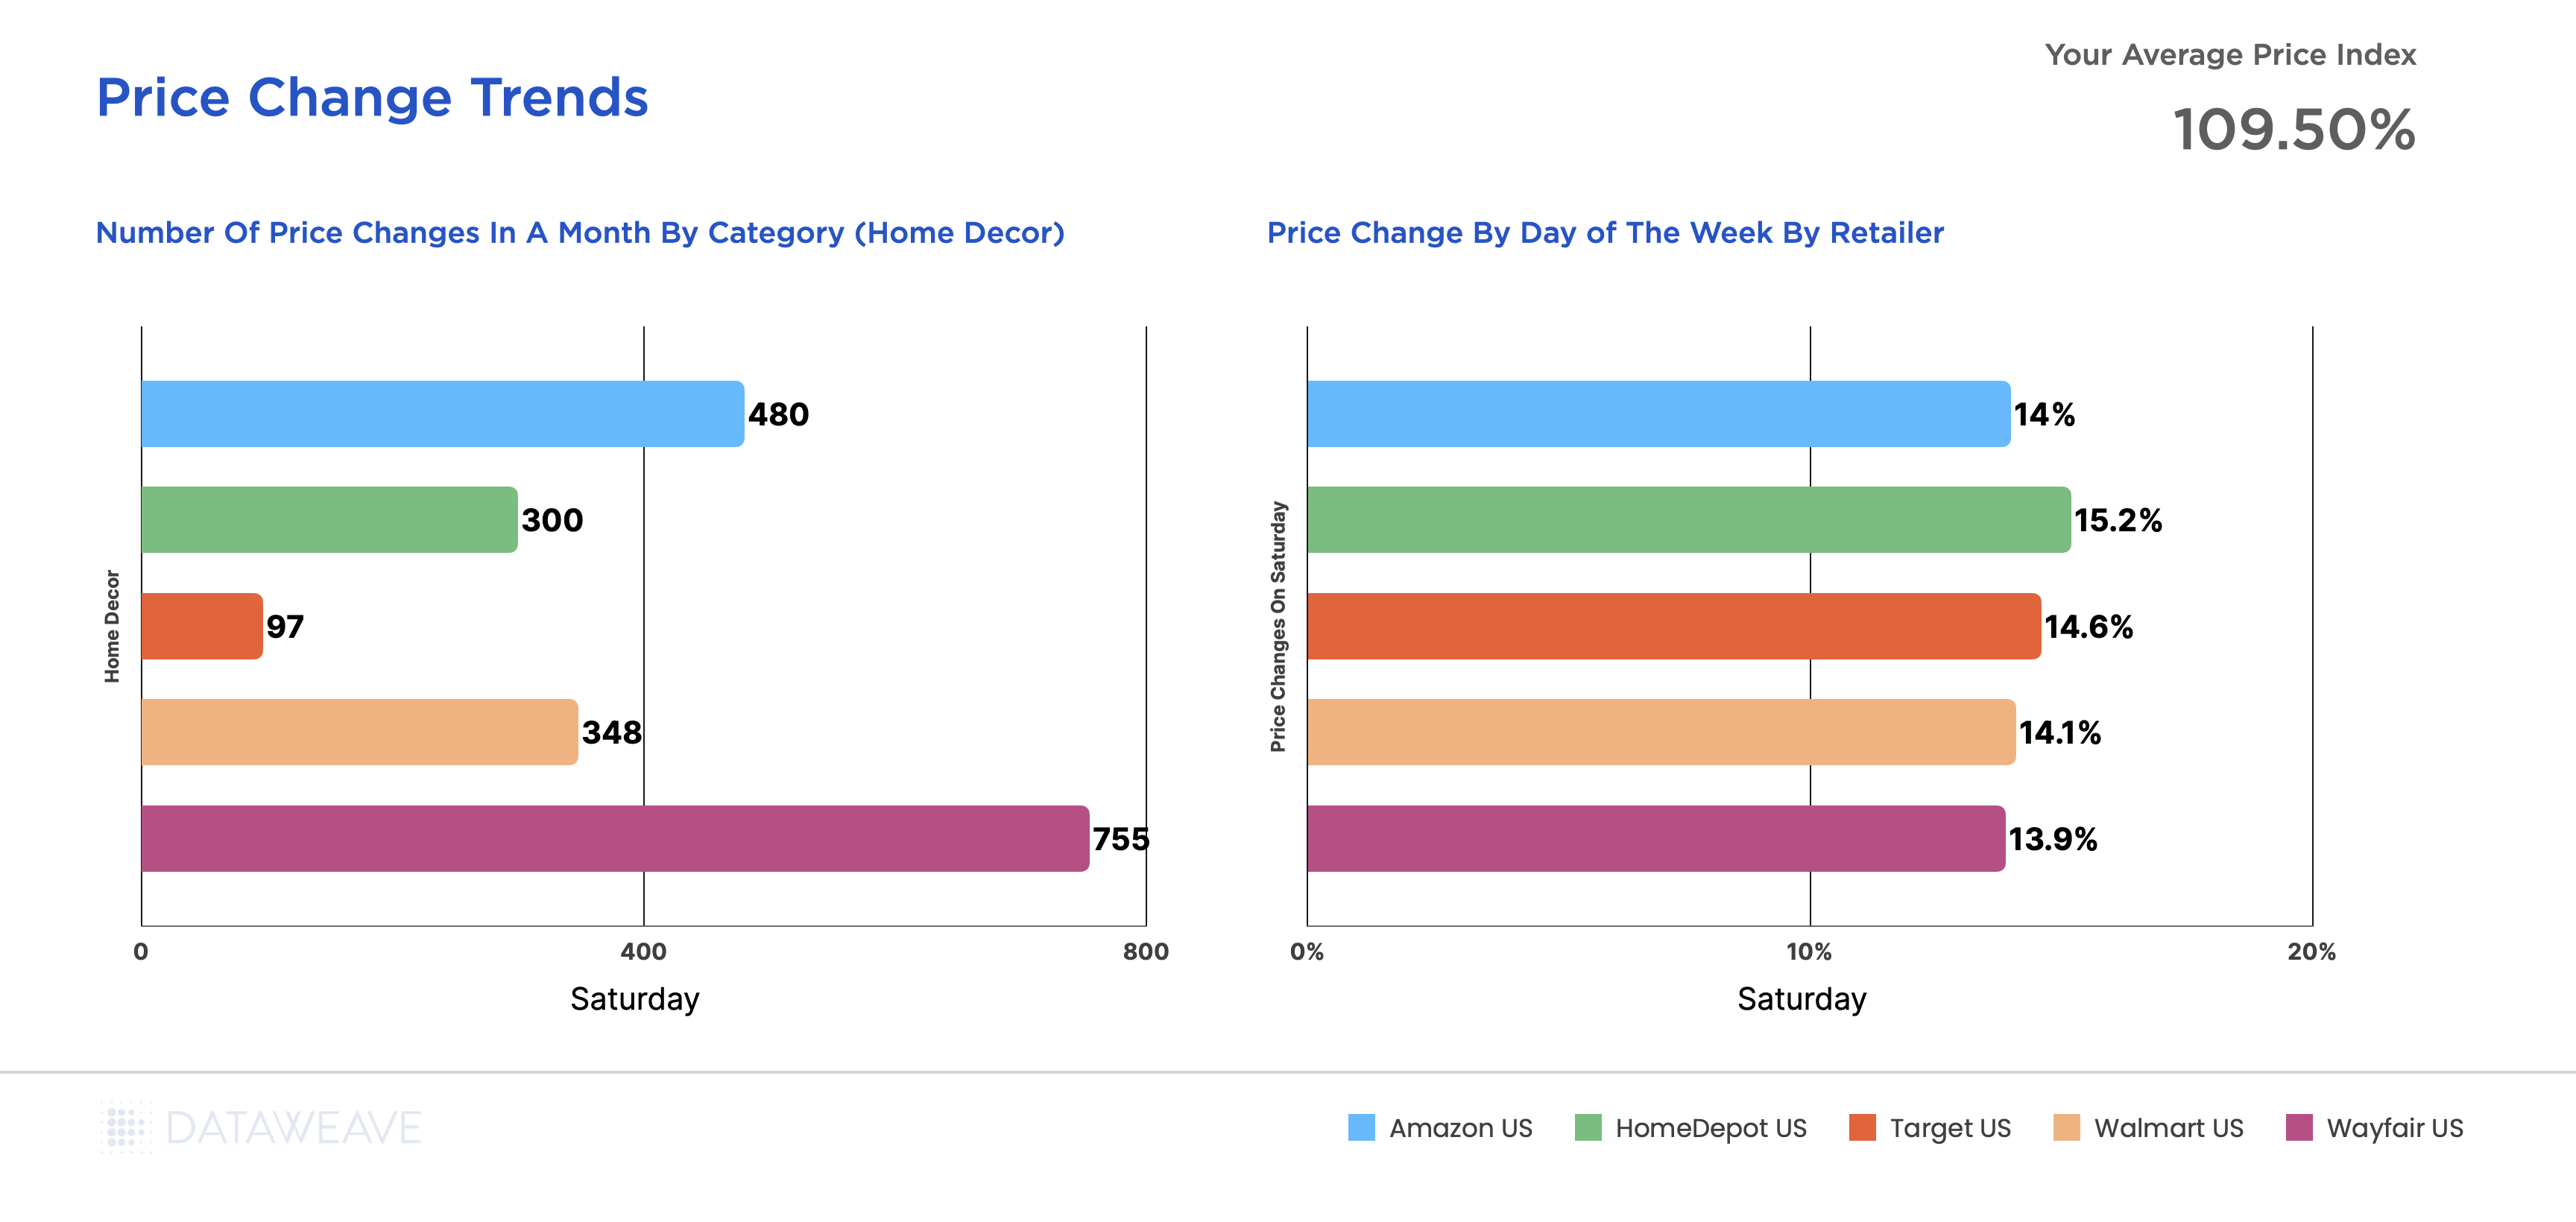
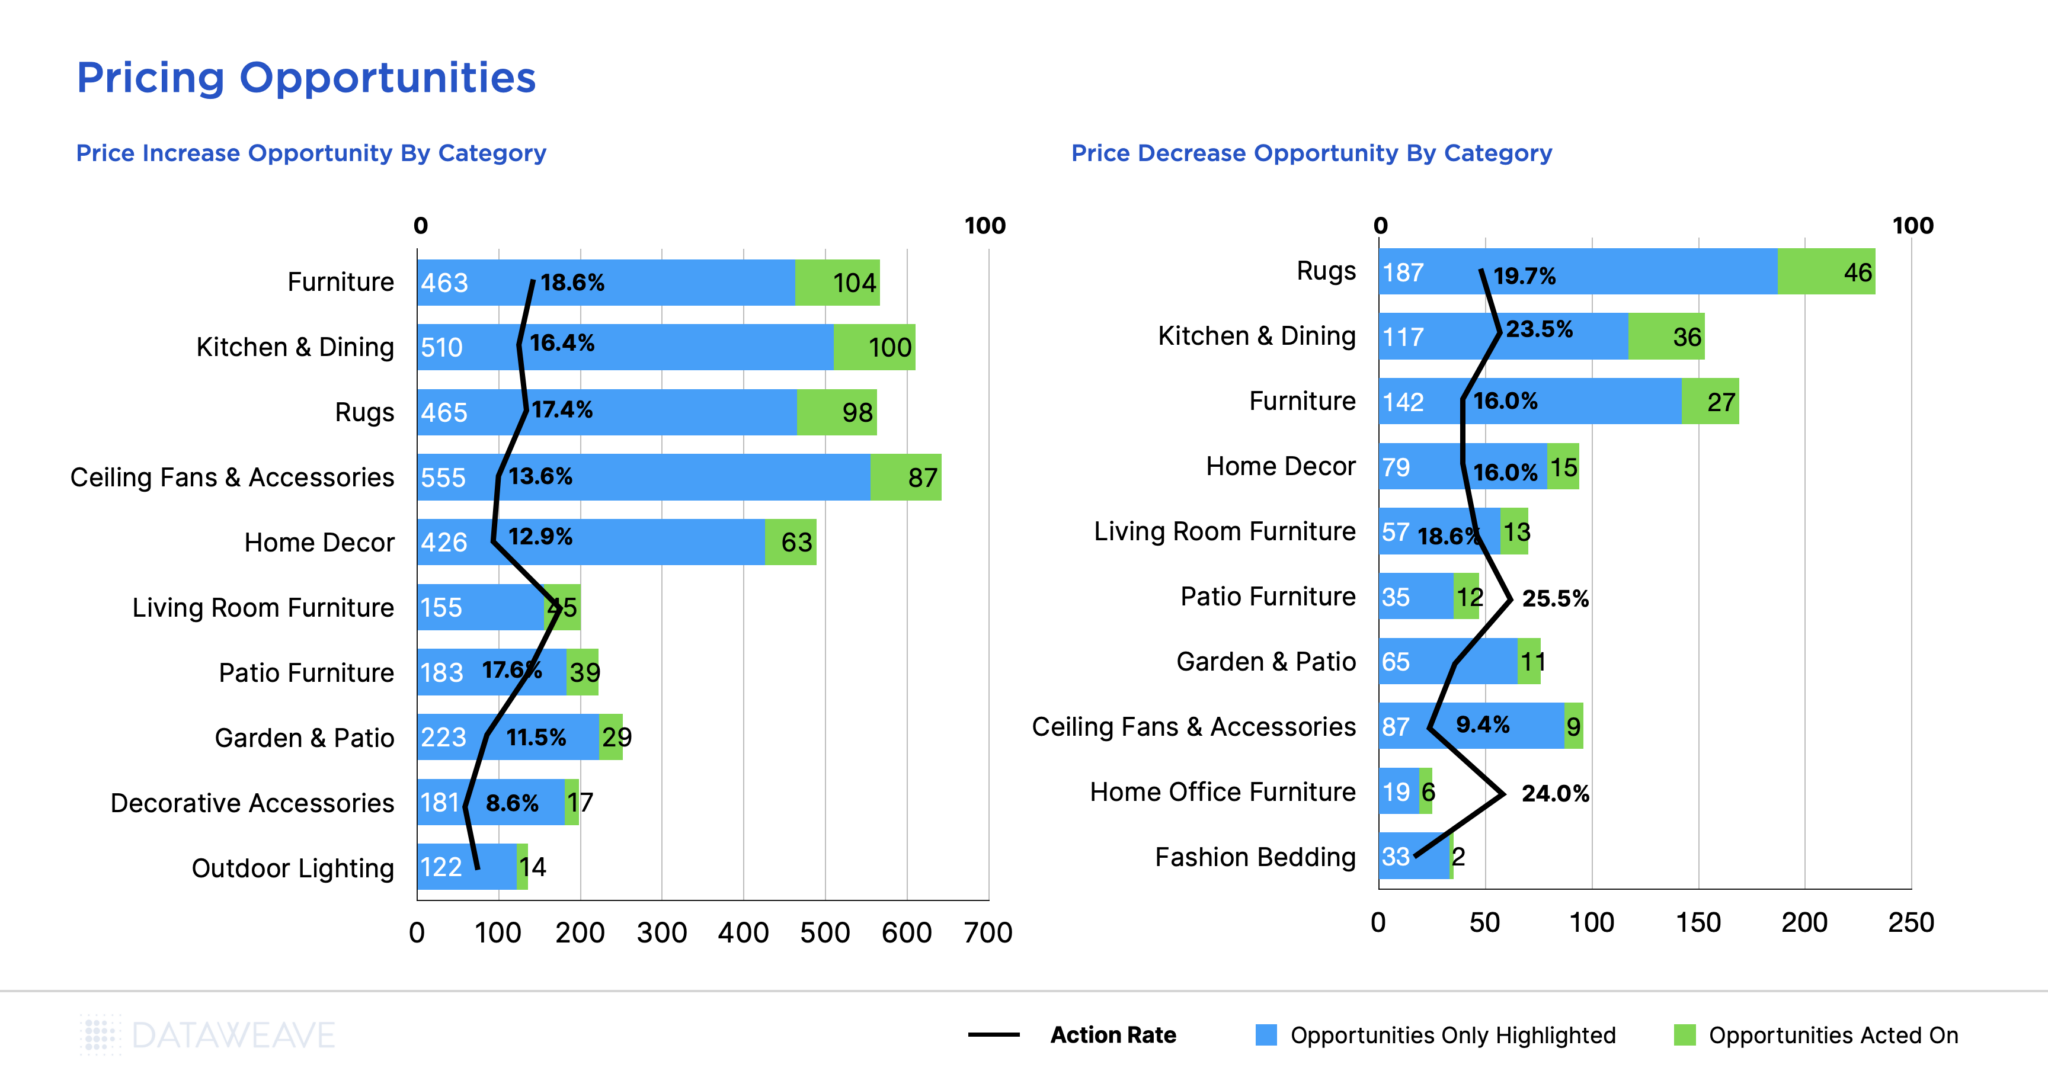
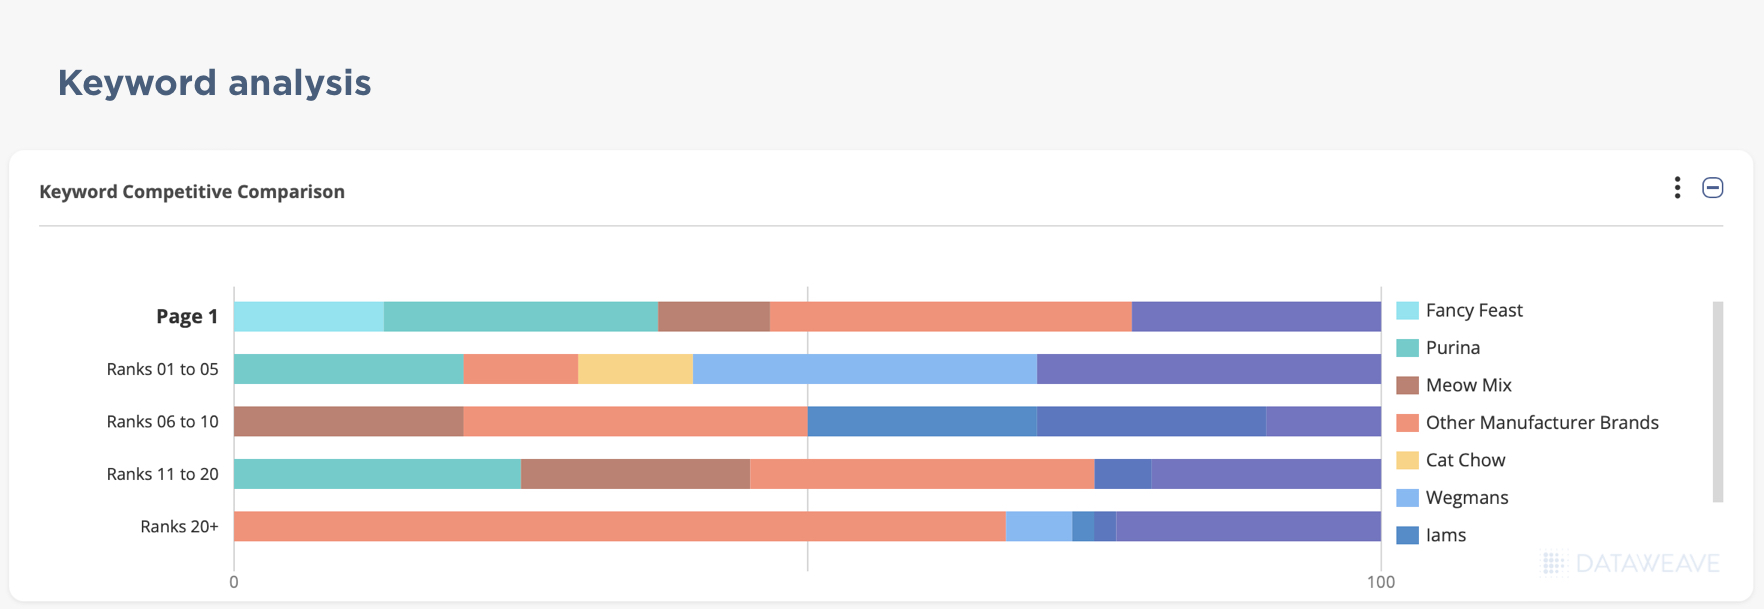
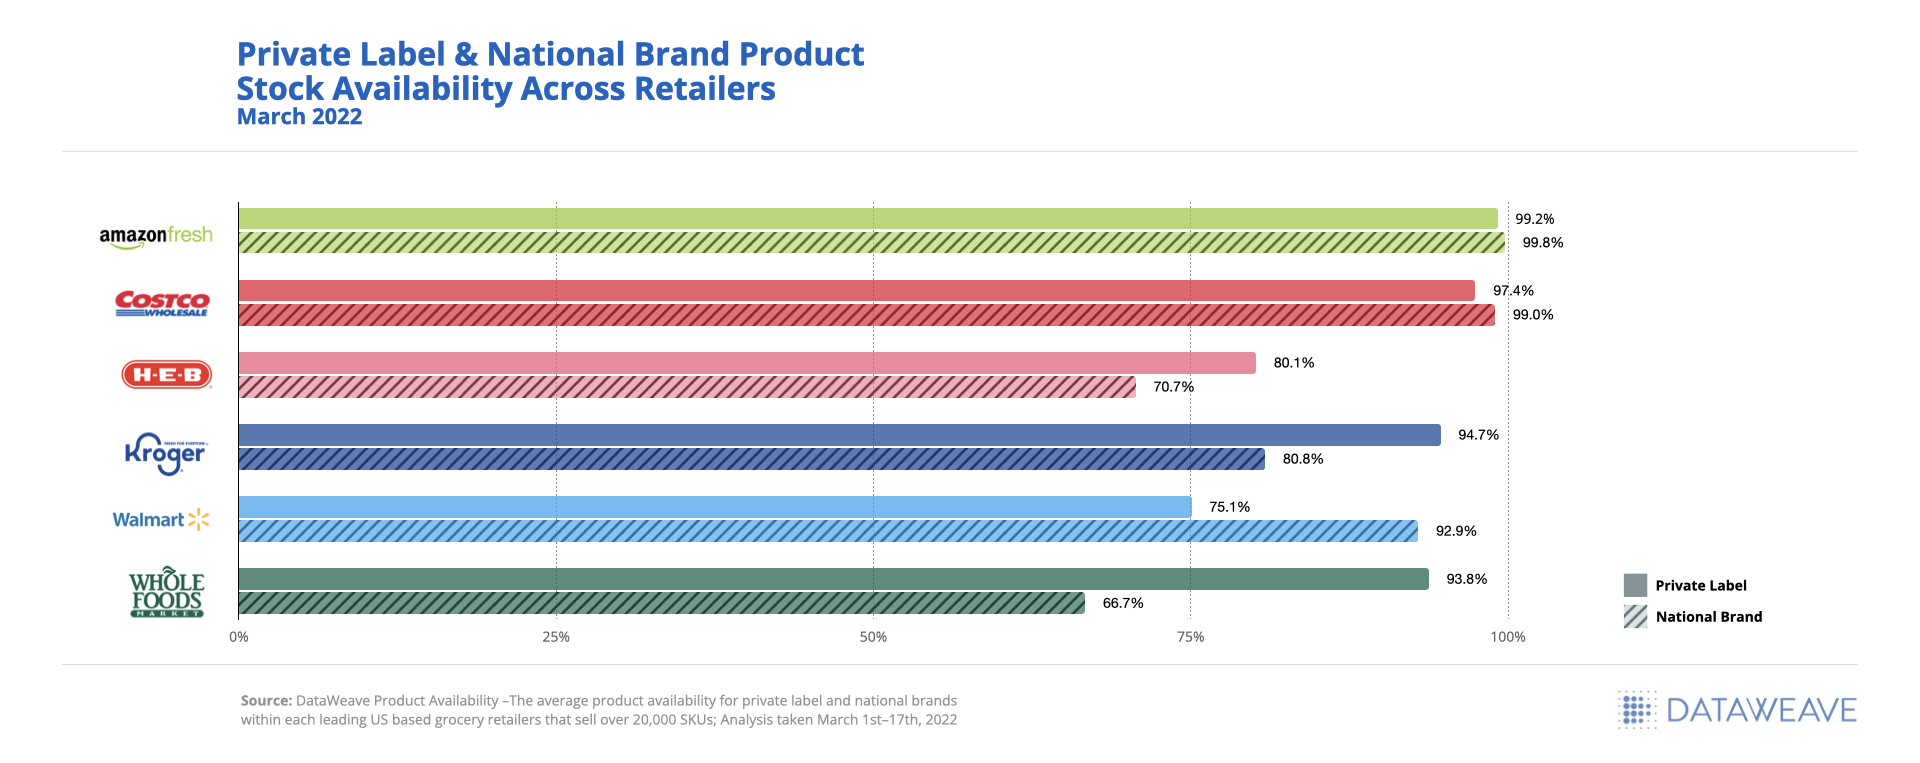
    • Individual SKU management: Not all pricing changes happen at the category level. Standard reporting also allows teams to view price and promotion changes on individual SKUs down to the zip code. It’s important to have targeted, granular insights when a change occurs even on a single SKU, especially because these individual changes are easy to miss. Advanced product matching algorithms can tie together exact products across retailers to monitor items conjointly. By incorporating similar product matching technologies beyond standard reporting, your teams can monitor individual price changes on comparable products.
    • Immediate action items: The best standard reporting tools alert pricing teams when there has been a change in competitor pricing and give them recommendations for what to change. If a competitor launches a flash sale or an aggressive discount program, your team should know as fast as possible which product to adjust. Without this functionality, teams can miss important changes or experience a delay in action that results in lost sales or customer perception.

    Competitive Intelligence for Leadership

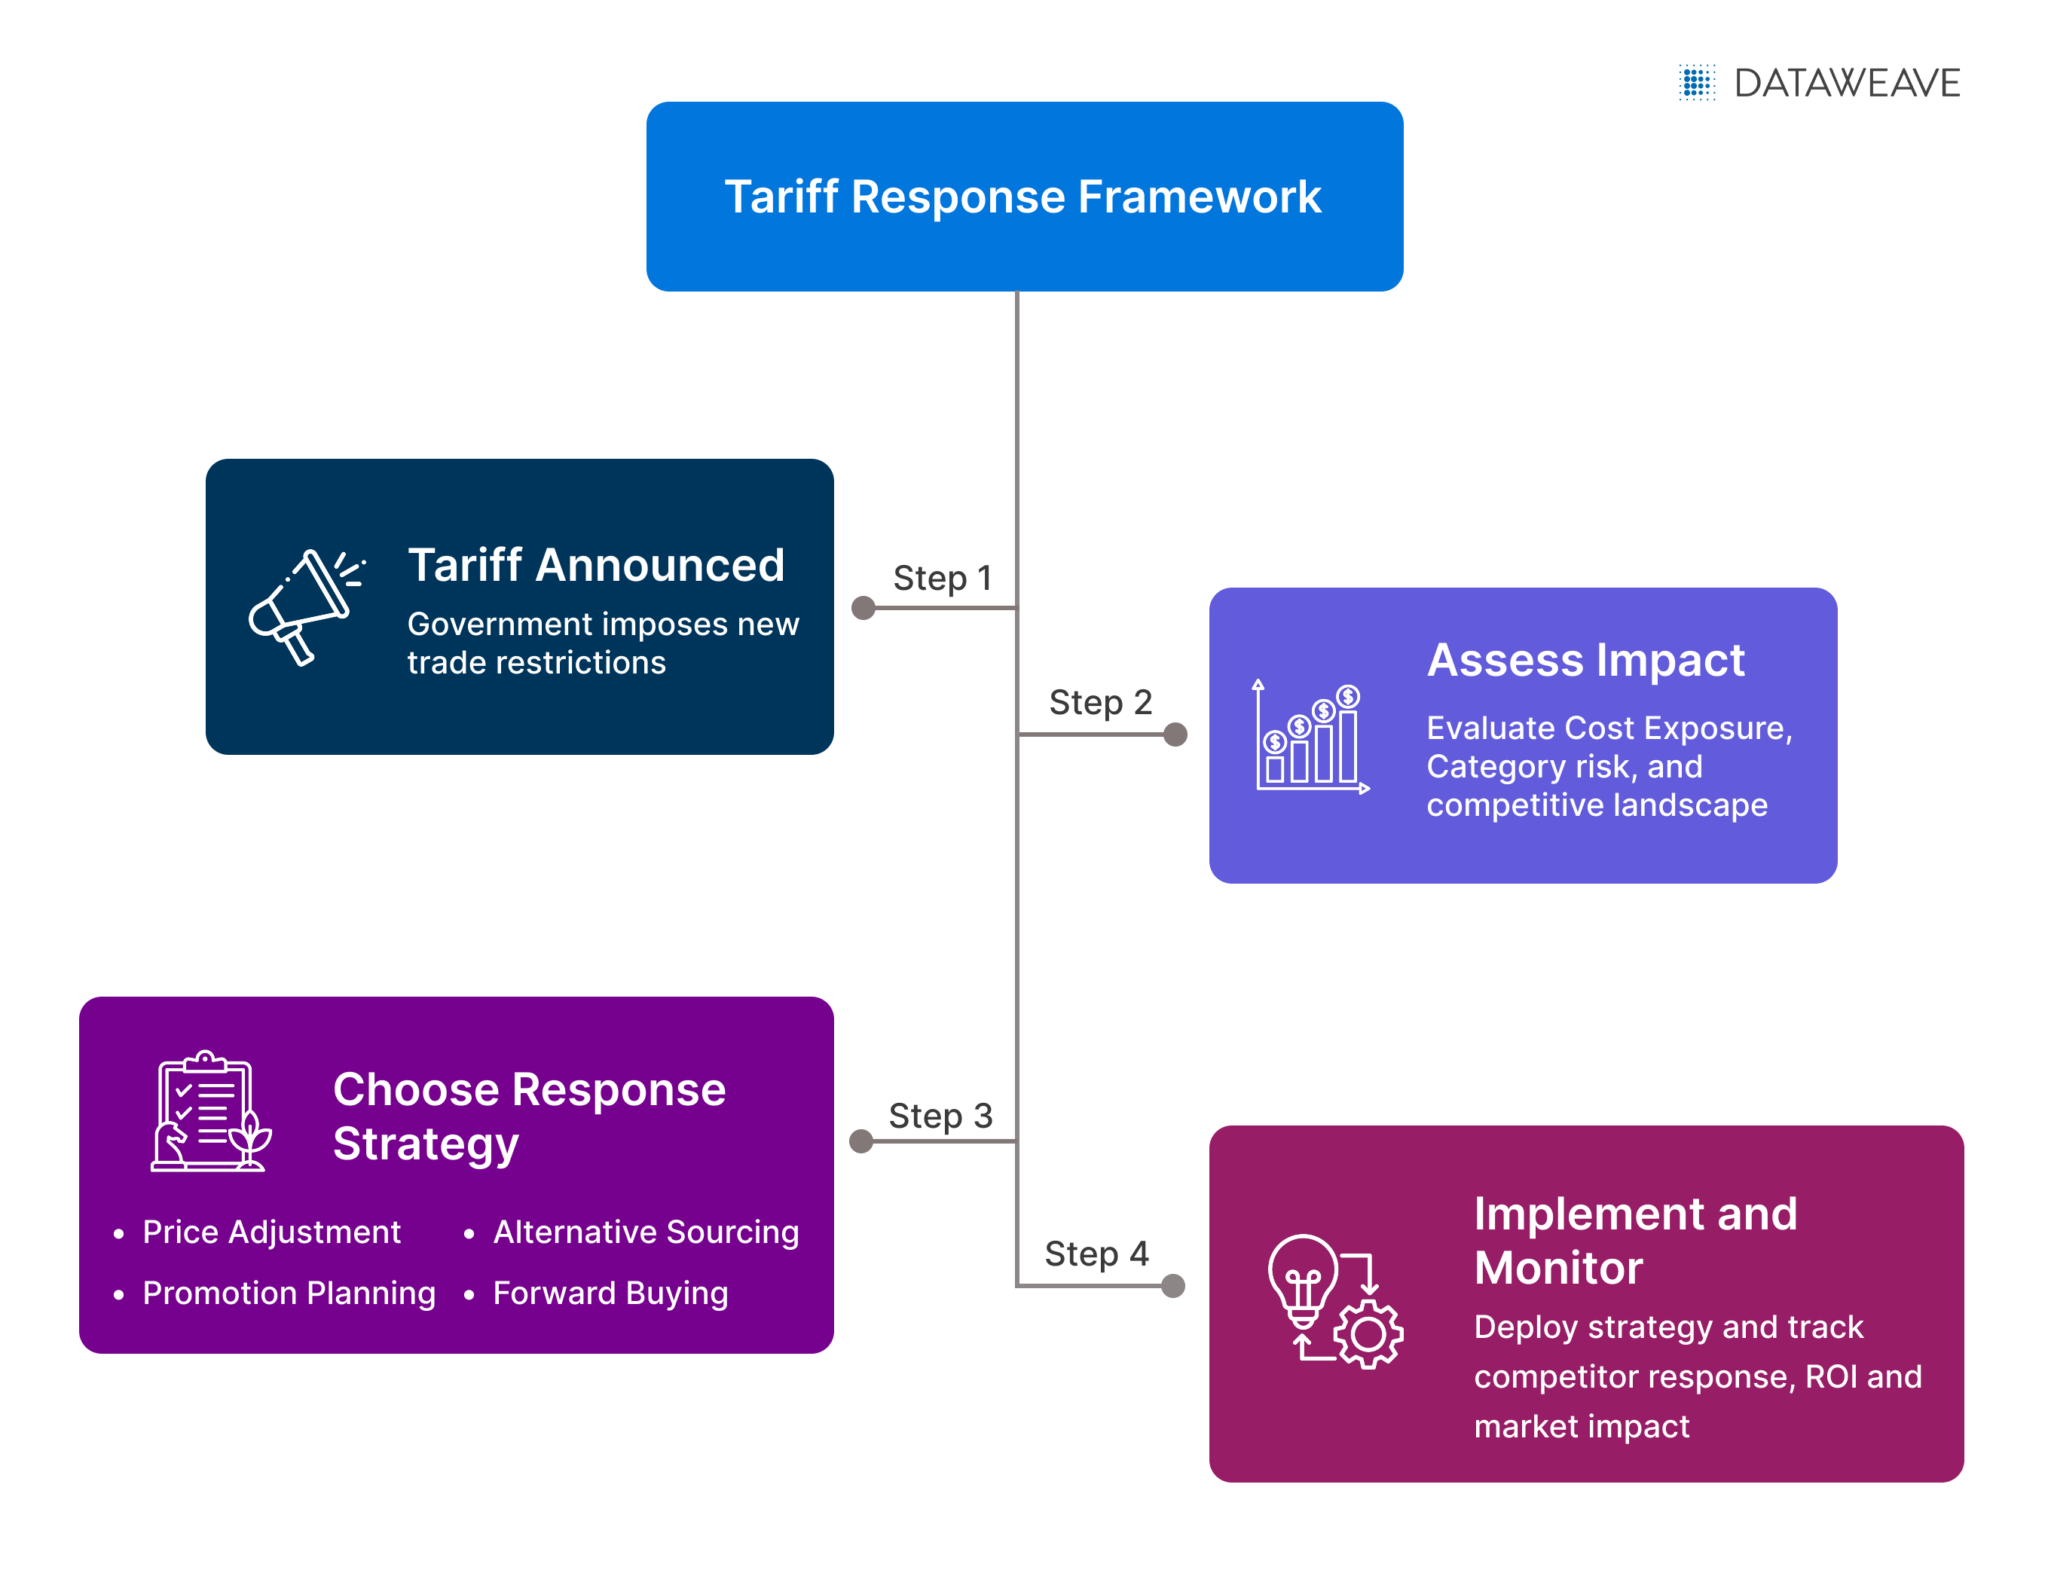
    For Senior Retail Executives, Category Directors, and Pricing Strategy Leaders, pricing cannot only be about reacting to individual competitor price changes. Instead, you must proactively think about your market positioning and brand perception. Doing this without a complete competitive intelligence strategy can feel like throwing darts while blindfolded. Sometimes, you’ll hit the target, but mostly, you’ll miss or only come close. Competitive intelligence tools can help you hit that target every time. They leverage big data, artificial intelligence (AI), and predictive modeling to help you derive holistic insights to understand your current positioning relative to the current and future pricing landscape.

    Core strategic functions of competitive intelligence include:

    • Strategic planning: Competitive intelligence tools can help you forecast competitor behavior, economic shifts, and category-specific patterns you’d otherwise overlook (ex, price drops before new releases, subscription or bundling trends, or seasonable price cycles). Instead of reacting to a change, your team can already have made changes or at least know what playbook to implement.
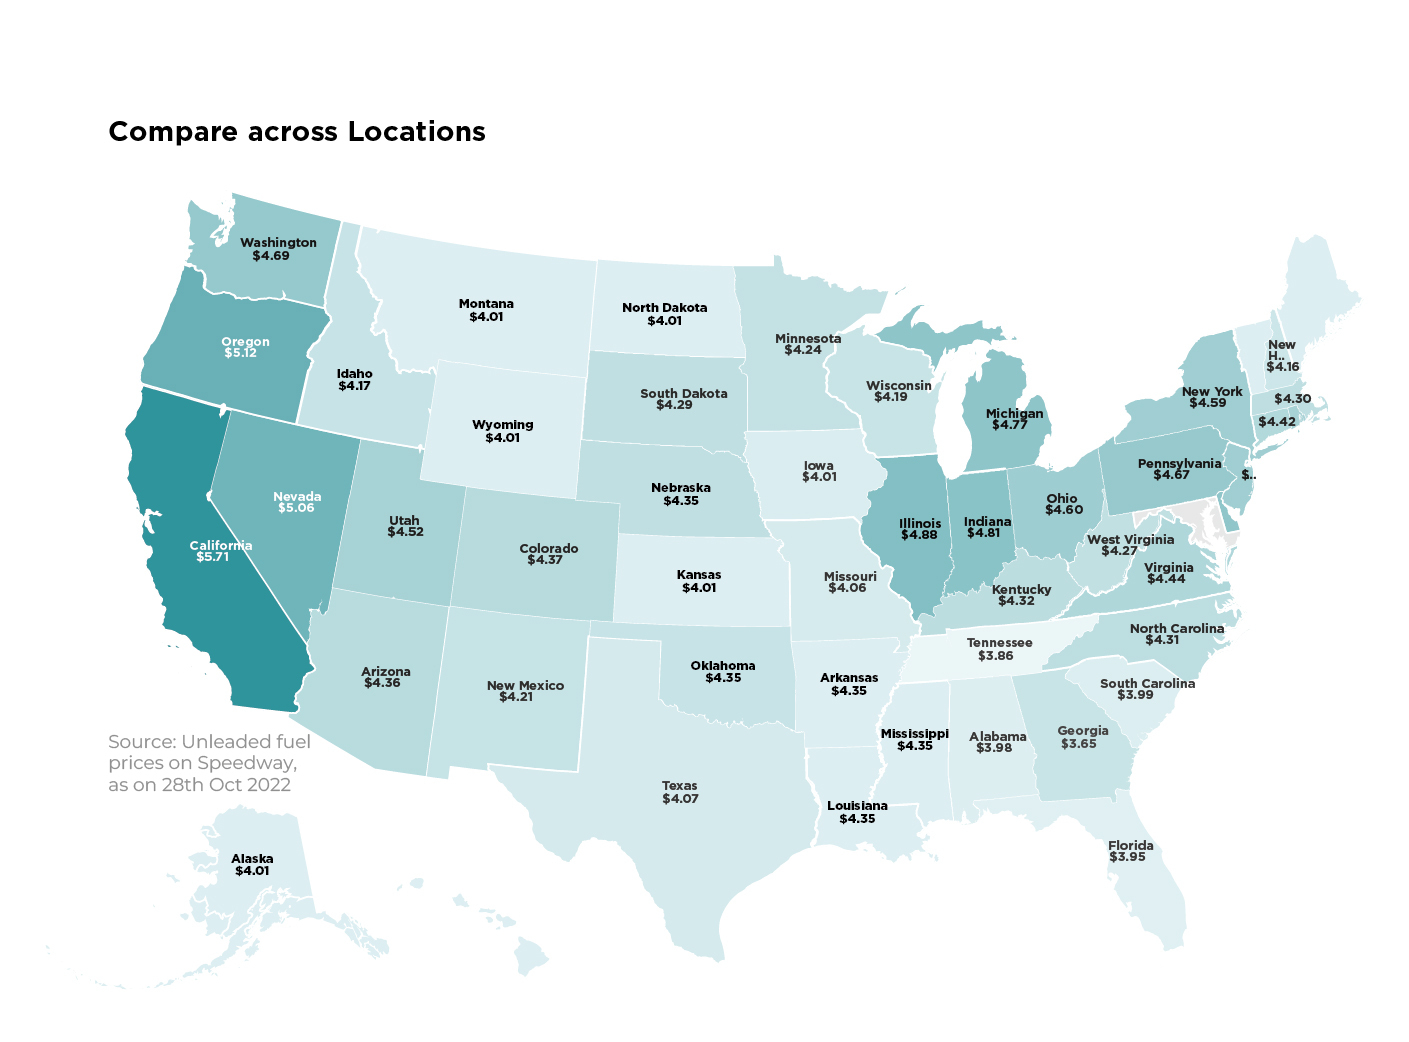
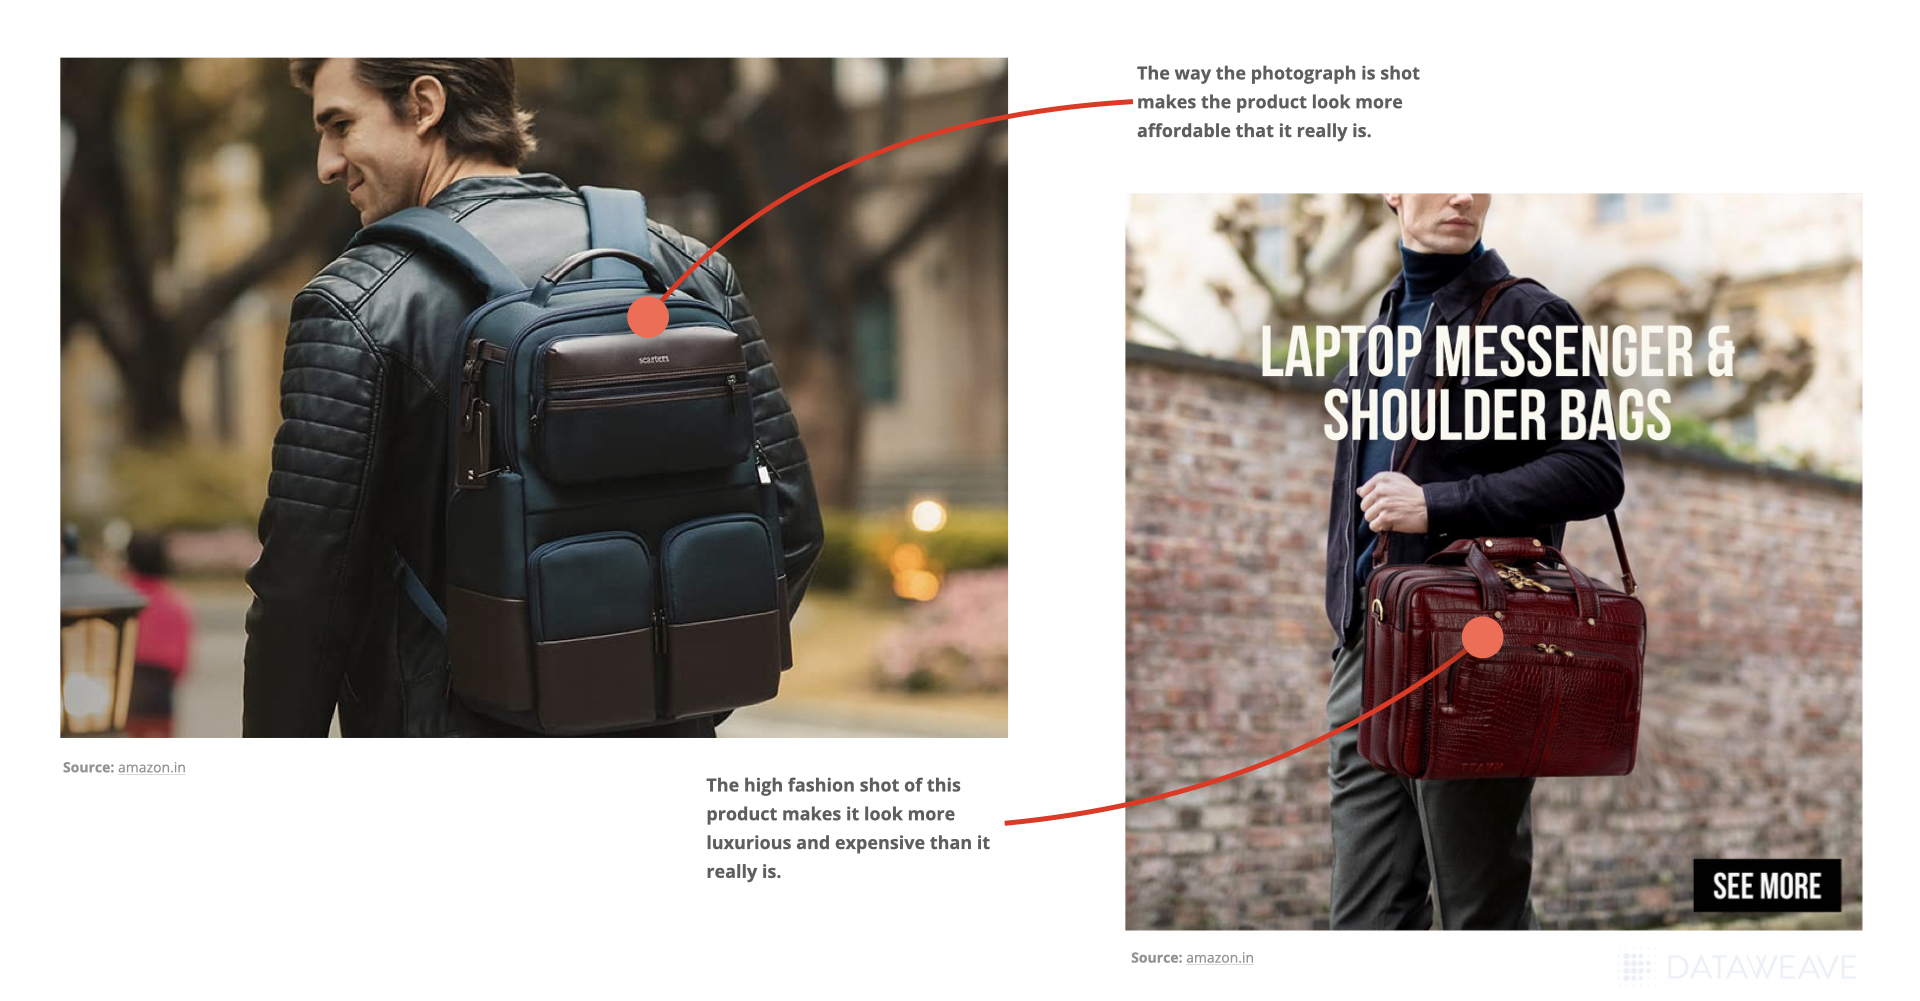
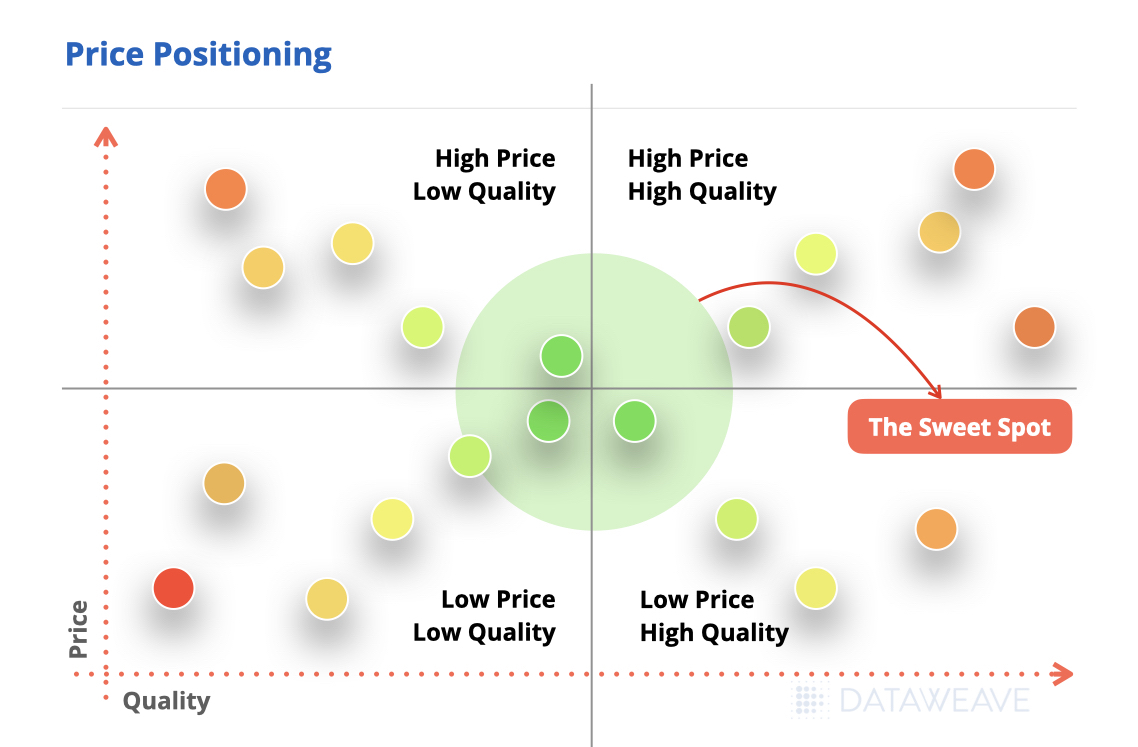
    • Market positioning: Geographic pricing intelligence built into competitive intelligence tools can help you understand variations across locations and optimize multiple channels simultaneously. This can be the foundation of regional pricing strategies that factor in local economies and consumer perception.
    • Long-term decision-making: You can use competitive intelligence technology to align your pricing strategy with upcoming seasonal trends isolated using historical data, predicted economic shifts, and changes in customer purchasing behavior. This aggregate view of the pricing landscape will help you step out of the weeds and make better company decisions.

    From Data to Strategy – Transforming Basic Price Data

    Shifting your focus from isolated, reactive data to broader market trends is the key to going from basic price reporting to real competitive intelligence. Never forget the importance of real-time data, but know it’s your responsibility as a leader to bring a broader viewpoint to operations.

    Transforming from basic price data to competitive intelligence involves:

    1. Harnessing the data
      • Pattern recognition: Your solution should help you identify repeat pricing behaviors and competitor strategies
    2. Figuring out what to do with the data
      • Strategic implications: It should help you understand how your pricing changes will affect customer perception of your brand
    3. Doing something with the insights from your data
      • Action planning: The solution should help you create proactive strategies that position you as a market leader, leaving your competition to try to keep up with you instead of vice versa

    Leveraging Technology for Competitive Intelligence

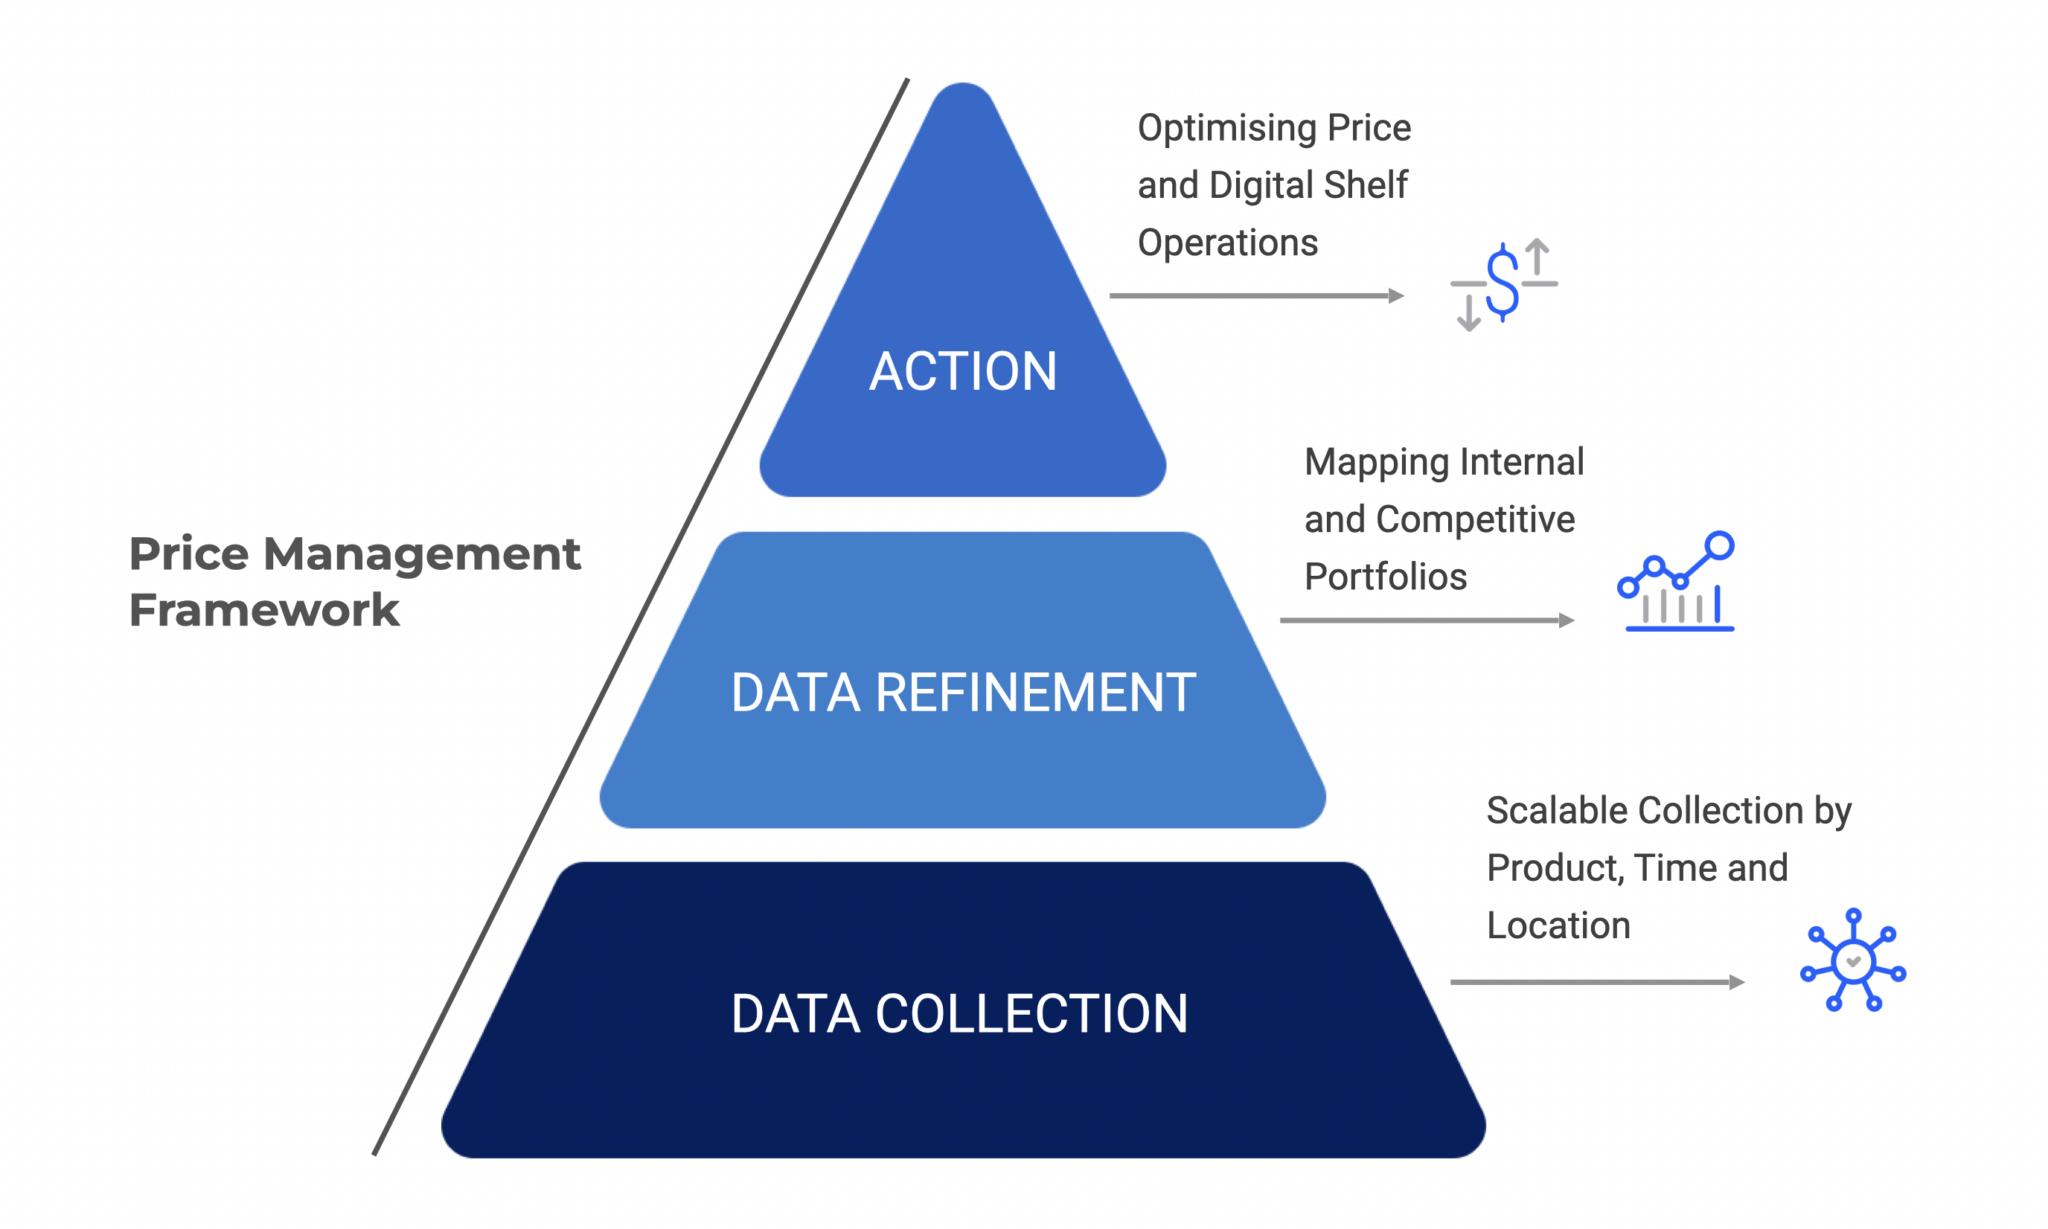
    Technology is at the heart of leveling up your standard price reporting game. If you want industry-leading competitive intelligence, you can leverage DataWeave’s comprehensive pricing intelligence solution with built-in competitive intelligence capabilities and features for your operational teams.

    You can also uncover gaps and stay competitive in the dynamic world of eCommerce. It provides brands with the competitive intelligence they need to promptly adapt to market demand and competitors’ pricing. Stay ahead of market shifts by configuring your own alerts for price fluctuations on important SKUs, categories, or brands, all time-stamped and down to the zip.

    And since our platform relies on human-backed AI technology, you can have complete confidence in your data’s accuracy at any scale. If you want to bring a new strategic mindset to your pricing team, consider adding competitive intelligence to your tech stack. If you want to learn more, connect with our team at DataWeave today.

  • Preparing for Tariff Impact: A Retailer’s Guide to Price Intelligence

    Preparing for Tariff Impact: A Retailer’s Guide to Price Intelligence

    The power to impose tariffs on foreign countries is one of the most impactful measures a government has at their disposal. The government can use this power for various reasons: to punish rivals, equalize trade, give domestic products a comparative advantage, or collect more funds for the federal government.

    Whatever the reason, tariffs have real-world impacts on brands and retailers selling in a global economy. They effectively make products more expensive for some and comparatively cheaper for others. Since tariffs can be added or removed at the drop of a hat, retail executives, category managers, and pricing teams trying to keep up have their work cut out for them.

    You’ve come to the right place if you’re wondering how to prepare for and respond to potential tariffs. The answer lies in technology that will make you flexible when you need to react to policy changes. Establishing workflows and processes embedded with pricing intelligence can help you stay competitive even when global politics intercepts your business.

    Understanding Tariff Impact

    Before diving into tariffs’ implications on pricing strategies, we need to understand how tariffs work and the current economic environment. Tariffs are a government’s tax on products a foreign country sells to domestic buyers. You might remember President Trump’s expanded tariff policy in September 2018. It placed a 10% tax on $200 billion worth of Chinese imports for three months before raising to a rate of 25% in January 2019. At that time, an American buyer would pay the original price of the goods plus the tax to the American government. Many additional tariffs and counter-tariffs by other countries were enacted during Trump’s first term in office, including the European Union, Canada, Mexico, Brazil, and Argentina, resulting in a trade war.

    Announcements of when, where, and on what new tariffs will be imposed are unpredictable. The only predictable thing is that this type of market volatility is here to stay. Pricing teams should adjust their mindsets to assume that volatility may always be on the horizon. This is because tariffs have many cost implications. Besides the flat rate imposed by the government on a certain product, tariffs have historically raised the price of all goods.

    In economic terms, tariffs create a multiplier effect. Consider a tariff placed on gasoline imported from Canada. This measure may encourage American drilling but will have immediate ripple effects throughout the economy. Everything that relies on ground transportation will increase in price, at least in the short term.

    This means that a fashion brand that sources and manufactures its entire line domestically will incur more costs since transportation will be more expensive. If fashion companies act like most companies, they will pass that added tax burden on to the consumer through higher prices. The company will make this decision based on how sensitive its consumers are to price increases, i.e., the elasticity of demand. These interwoven relationships extend across industries and products, affecting most retailers somehow.

    Of course, category exposure varies by industry and sector. Tariffs are known to impact specific industries more than others. For example, steel, electronics, and agriculture products are at risk of price fluctuations based on their reliance on imported components. These have high category exposure. Some industries reliant on domestic production with stable input costs are less prone to category exposure. These include domestic power grids, natural gas, real estate, and handmade goods. No matter which industry you’re in, however, expect some spill over.

    Preparation Strategies

    Strategies to battle disruption in retail

    Forward-thinking leaders can help position their teams for success in the face of pricing volatility brought on by tariffs. The key is to enable teams to sense disruptions quickly and provide a way to take corrective action that doesn’t diminish sales. Here are three strategies you can implement ahead of time that will help keep you competitive during tariff disruption.

    Cost Monitoring

    Start by getting a firm handle on internal and external costs. Understand and analyze fluctuations in the cost of raw materials, production, and supply chain for your business to operate. Make sure that your products are priced with pre-defined logic so changes in price on one SKU don’t create confusion with another. For example, faux leather costs rise while genuine leather stays the same. In that case, a leather version of a product should be raised to reflect the price increase in the pleather variation, not to devalue the perception of luxury.

    Next, you will want to understand historical pricing trends as well as pricing indexes across your categories. These insights can help your teams anticipate cost fluctuations before they even arise and mitigate the risk that economic shifts create, even unexpected tariffs.

    Competition Tracking

    Tracking your competition is likely already a strategy you have in mind. But how well are your teams executing this important task? If they’re trying to watch for market shifts and adjust pricing in real time without the help of technology, things are likely slipping through the cracks.

    Competitive intelligence solutions help retailers discover all competitive SKUs across the e-commerce market, monitor for real-time pricing shifts, and take action to mitigate risk. You need an “always-on” competitive pricing strategy now so that the second a tariff is announced, you can see how it’s affecting your market. This way, you can maintain price competitiveness and avoid margin erosion when competitors’ pricing changes in response to a tariff or other market shift.

    Consumer Impact Assessment

    The multiplier effect is felt throughout the supply chain when tariffs are implemented. The effect can affect consumers in a number of ways and cause them to become spending averse in certain areas. Often, during times of economic hardship, grocery items remain relatively inelastic. This is because consumers continue to purchase essentials regardless of price changes. Conversely, the price of eating out or home delivery becomes more elastic since consumers cut back on dining expenses when costs rise across their shopping basket.

    You need to establish clear visibility into the results of your pricing changes. The goal should be to monitor progress and measure the ROI on specific and broad pricing changes across your assortment. Conducting market share impact analysis will also help you determine if you are losing out on potential customers or whether a decline in sales is being felt across your competition. Impact analysis tools can help your company check actual deployed price changes in real time.

    Response Framework

    Tariff response action plan for retailers

    Once you’ve prepared your team with strategies and technologies to set them up for success, it’s time to think about what to do once a tariff is announced or implemented. Here are three real-time decision-making strategies you should consider before your feet are to the fire. Having these in your back pocket will help you avoid financial disruption.

    Price Adjustment Strategies

    Think about how you strategically adjust prices. These could include percentage increases, flat rate increases, or absorbed via other strategies like bundling. You should also determine a cost increase threshold that you’re willing to absorb before raising prices. Think about the importance of remaining price attractive to consumers and weigh the risk of increasing prices past consumers’ ability or willingness to pay.

    Promotion Planning

    Folding increased costs into value-added offerings for consumers can be a good way to retain customer sentiment and sales volume without negatively affecting profit margins. You can leverage discounts, promotions, or bundling options to sell more of an item to a customer at a lower per-unit cost.

    What you don’t want to do is panic-adjust prices in response to tariffs of competitor moves. Instead, you can use a tool competitor intelligence solutions to watch if your competition is holding prices steady or adjusting. With full information about pricing at your disposal, you can make better decisions on your promotional strategy and not undercut yourself or lose customer loyalty.

    Alternative Sourcing

    Let’s face it: putting all your eggs in one basket is bad for business. Instead of relying solely on a single supplier for production, you should have a diverse set of suppliers ready and able to shift production when tariffs are announced. If a tariff impacts Chinese exports, having a backup supplier in Vietnam can prevent added costs entirely. You can also consider strategies like bulk pricing, set pricing, or shifting entirely to domestic suppliers.

    Forward Buying

    Proactively stockpile inventory by purchasing large quantities of at-risk products before tariffs take effect. This strategy locks in lower costs and ensures supply continuity during disruptions. However, balance this with careful demand forecasting to avoid overstocking, which ties up cash flow and incurs storage costs. Use historical sales data and tariff implementation timelines to optimize order volumes—this is especially effective for products with stable demand or long shelf lives.

    Market Intelligence Requirements

    Preparing your pricing teams and giving them a framework upon which to act when tariffs are announced doesn’t have to be complicated. You can get access to the right data on costs, competitors, and consumer behavior with DataWeave’s pricing intelligence capability.

    We provide retailers with insights on pricing trends, category exposure, and competitor adjustments. Our AI-powered competitor intelligence solutions allow you to get timely alerts whenever a significant change happens. This can include changes to competitor pricing and category-level shifts that you’d otherwise react to when it’s too late.

    These automated insights can also help you track historical pricing trends, elasticity, and margin impact to construct a clear response framework in an emergency. Additionally, our analytics capabilities can help you identify patterns to power pre-emptive pricing and promotional strategies.

    Getting the right pricing intelligence strategy in place now can prevent disaster later. Think through your preparedness strategy and how you want your teams to respond in the event of a new tariff, and consider how much easier reacting accurately would be with all the data needed at your fingertips. Reach out to us to know more.

  • Portfolio Enhancement Through Price Relationship Management: Building Coherent Pricing Across Product Lines

    Portfolio Enhancement Through Price Relationship Management: Building Coherent Pricing Across Product Lines

    Do you remember when the movie Super Size Me came out? If you missed it, it was about the harmful effects of eating fast food too often. One aspect of the film that stands out is McDonald’s clever use of pricing to encourage consumers to buy bigger—and therefore more expensive—meals.

    Hungry patrons could upgrade their meal to a Super Size version for only a few cents more. In doing so, McDonald’s was able to capitalize on perceived value, i.e., getting more product for an apparent lower total price for the volume. It encouraged restaurant-goers to spend a little more while feeling like they got a great deal. It was a smart use of strategic pricing.

    There are hundreds of pricing relationship types like this one that pricing leaders need to be aware of and can use to their advantage when creating their team’s pricing strategy and workflows. You need to maintain profitable and logical price relationships across your entire product portfolio while keeping up with the competition. After all, the gimmick to Super Size would never have worked if the upgrade had been of less value than just buying another burger, for example.

    In this article, we’ll examine more real-world examples of pricing challenges so you can consider the best ways to manage complex price relationships. We’ll examine things like package sizes, brands, and product lines and how they’re intertwined in systematic price relationship management. Read on to learn how to prevent margin erosion, improve customer perception of your brand, and keep your pricing consistent and competitive.

    The Price Relationship Challenge

    Pricing is one of the most challenging aspects of managing a retail brand. This is especially true if you are dealing with a large assortment of products, including private label items, the same products of differing sizes, and hundreds, or even thousands, of competing products to link. Inconsistencies in your price relationship management can confuse customers, erode trust, and harm your bottom line.

    Let’s take a look at a few common pitfalls in portfolio pricing that you might run into in real life to better understand the impact on customer perception, trust, and sales.

    Pricing Relationship Challenges Retailers Need to Account For

    Private Label vs. Premium Product Pricing

    Let’s consider a nuanced scenario where price relationships between a retailer’s private label and premium branded products create an unexpected customer perception. Imagine you’re in a supermarket, comparing prices on peanut butter. You’ve always opted for the store’s private-label brand, “Best Choice,” because it’s typically the more affordable option. Here’s what you find:

    • Best Choice (Private Label) 16 oz – $3.50
    • Jif (National Brand) 16 oz – $3.25

    At first glance, this pricing feels off—shouldn’t the private label be the cheaper option? If a customer has been conditioned to expect savings with private-label products, seeing a national brand undercut that price could make them pause.
    This kind of pricing misalignment can erode trust in private-label value and even push customers toward the national brand. When price relationships don’t follow consumer expectations, they create friction in the shopping experience and may lead to lost sales for the retailer’s own brand.

    Value Size Relationships

    A strong value-size relationship ensures that customers receive logical pricing as they move between different sizes of the same product. When this relationship is misaligned, customers may feel confused or misled, which can lead to lost sales and eroded trust.

    Let’s look at a real-world example using a well-known branded product—salad dressing. Imagine you’re shopping for Hidden Valley Ranch (HVR) dressing and see the following pricing on the shelf:

    • HVR 16 oz – $3.99
    • HVR 24 oz – $6.49
    • HVR 36 oz – $8.99

    At first glance, you might assume that buying a larger size offers better value. However, a quick calculation shows that the price per ounce actually increases with size:

    • 16 oz = $0.25 per ounce
    • 24 oz = $0.27 per ounce
    • 36 oz = $0.25 per ounce

    Customers expecting a discount for buying in bulk may feel misled or frustrated when they realize the mid-size option (24 oz) is actually the most expensive per ounce. This mispricing could drive shoppers to purchase the smallest size instead of the intended larger, more profitable unit—or worse, lead them to a competitor with clearer pricing structures.

    Retailers must maintain logical price progression by ensuring that price per unit decreases as the product size increases. This not only improves customer trust but also encourages higher-volume purchases, driving profitability while maintaining a fair value perception.

    Price Link Relationships

    A well-structured price link relationship ensures customers can easily compare similar offerings of the same product and size. When the pricing across different versions or variations of the same item isn’t clear or consistent, it can confuse customers and damage trust, ultimately leading to missed sales and a negative brand perception.

    Let’s break this down with an example of a popular product—coffee. Imagine you’re shopping for a bag of Starbucks coffee and you see the following pricing on the shelf:

    • Starbucks Classic Coffee, 12 oz – $7.99
    • Starbucks Coffee, Mocha, 12 oz – $9.99
    • Starbucks Ground Coffee, Pumpkin Spice, 12 oz – $12.99

    At first glance, the product is the same size (12 oz) across all options, but the prices vary significantly. One might assume that the price difference is due to differences in quality or features, but what if there’s no clear indication of why the different flavors are priced higher than the standard?

    After investigating, you may realize that the only differences are related to different variants—like “Mocha” or “Pumpkin Spice” rather than any significant changes in the product’s core attributes. When customers realize they’re paying a premium for just different flavors, without any tangible difference in product quality, it can lead to feelings of confusion and frustration.

    Retailers must ensure that price links between similar offerings are justifiable by clearly communicating what differentiates each product. This avoids the perception that customers are being charged extra for little added value, building trust and encouraging repeat purchases. By maintaining transparent price link relationships, businesses can foster customer loyalty, increase sales, and drive better overall satisfaction.

    What is the Foundational Process to Tackle the Price Relationship Challenge?

    Now that we’ve reviewed several challenges brands face when pricing their products, what can be done about them?

    If you’re a pricing leader, you must create a robust pricing strategy that considers customer expectations, competitive data, sizing, and the overall value progressions of your product assortment. These are the three foundational steps to solve your price relationship challenges.

    1. First, you need to group products together accurately.
    2. Second, you need to establish price management rules around the group of related items.
    3. Third, you should set in place a process to review your assortment each week to see if anything is out of tolerance.

    This process is difficult, if not impossible, to manage manually. To effectively set up and execute these steps, you’ll need the help of an advanced pricing intelligence system.

    Implementation Strategy

    Want to know how to roll out a price relationship management strategy? Follow this implementation strategy for a practical way to get started.

    1. Set up price relationship rules: Determine which of your products go together, such as same products with different sizes or color options. Assign different product assortment groups and determine tolerances for scaling prices based on volume or unit counts.
    2. Monitoring and maintenance: Establish rules to alert the appropriate party when something is out of tolerance or a price change has been discovered with a competitive product.
    3. Exception management: Only spend time actioning the exceptions instead of pouring through clean data each week, looking for discrepancies. This will save your team time and help address the most significant opportunities first.
    4. Change management considerations: Think about the current processes you have in place. How will this affect the individuals on your team who have managed pricing operations? Establish a methodology for rolling this new strategy and technology out over select product assortments or brands one at a time to build trust with internal players.

    DataWeave offers features specifically built to help pricing teams manage pricing strategies. These applications can help you optimize profit margins and improve your overall market positioning for long-term success. A concerted effort to create brand hierarchies within your own product assortment from the get-go, followed by routine monitoring and real-time updates, can make all the difference in your pricing efforts.

    Within DataWeave, you can create price links between your products (value sizing) and those of the competition. These will alert you to exceptions when discrepancies are discovered outside your established tolerance levels. If a linked set of your products in different sizes shows inconsistent pricing based on scaled volumes, your team can quickly know how to make changes. If a competitor’s price drops significantly, you can react to that change before you lose sales.

    DataWeave even offers AI-driven similar product matching capabilities, which can help you manage pricing for private label products by finding and analyzing similar products across the market.

    If you want to learn more about price relationship management, connect with our team at DataWeave today.

  • Maximizing Competitive Match Rates: The Foundation of Effective Price Intelligence

    Maximizing Competitive Match Rates: The Foundation of Effective Price Intelligence

    Merchants make countless pricing decisions every day. Whether you’re a brand selling online, a traditional brick-and-mortar retailer, or another seller attempting to navigate the vast world of commerce, figuring out the most effective price intelligence strategy is essential. Having your plan in place will help you price your products in the sweet spot that enhances your price image and maximizes profits.

    For the best chance of success, your overall pricing strategy must include competitive intelligence.

    Many retailers focus their efforts on just collecting the data. But that’s only a portion of the puzzle. The real value lies in match accuracy and knowing exactly which competitor products to compare against. In this article, we will dive deeper into cutting-edge approaches that combine the traditional matching techniques you already leverage with AI to improve your match rates dramatically.

    If you’re a pricing director, category manager, commercial leader, or anyone else who deals with pricing intelligence, this article will help you understand why competitive match rates matter and how you can improve yours.

    Change your mindset from tactical to strategic and see the benefits in your bottom line.

    The Match Rate Challenge

    To the layman, tracking and comparing prices against the competition seems easy. Just match up two products and see which ones are the same! In reality, it’s much more challenging. There are thousands of products to discover, analyze, compare, and derive subjective comparisons from. Not only that, product catalogs across the market are constantly evolving and growing, so keeping up becomes a race of attrition with your competitors.

    Let’s put it into focus. Imagine you’re trying to price a 12-pack of Coca-Cola. This is a well-known product that, hypothetically, should be easy to identify across the web. However, every retailer uses their own description in their listing. Some examples include:

    How product names differ on websites - Amazon Example
    Why matching products is a challenge - Naming conventions on Target
    Match Rate Challenge - how product names differ on retailers - Wamlart
    • Retailer A lists it as “Coca-Cola 12 Fl. Oz 12 Pack”
    • Retailer B shows “Coca Cola Classic Soda Pop Fridge Pack, 12 Fl. Oz Cans, 12-Pack”
    • Retailer C has “Coca-Cola Soda – 12pk/12 fl oz Cans”

    While a human can easily deduce that these are the same product, the automated system you probably have in place right now is most likely struggling. It cannot tell the difference between the retailers’ unique naming conventions, including brand name, description, bundle, unit count, special characters, or sizing.

    This has real-world business impacts if your tools cannot accurately compare the price of a Coca-Cola 12-pack across the market.

    Why Match Rates Matter

    If your competitive match rates are poor, you aren’t seeing the whole picture and are either overcharging, undercharging, or reacting to market shifts too slowly.

    Overcharging can result in lost sales, while undercharging may result in out-of-stock due to spikes in demand you haven’t accounted for. Both are recipes to lose out on potential revenue, disappoint customers, and drive business to your competitors.

    What you need is a sophisticated matching capability that can handle the tracking of millions of competitive prices each week. It needs to be able to compare using hundreds of possible permutations, something that is impossible for pricing teams to do manually, especially at scale. With technology to make this connection, you aren’t missing out on essential competitive intelligence.

    The Business Impact

    Besides the bottom-line savings, accurately matching competitor products for pricing intelligence has other business impacts that can help your business. Adding technology to your workflow to improve match rates can help identify blind spots, improve decision quality, and improve operational efficiency.

    • Pricing Blind Spots
      • Missing competitor prices on key products
      • Inability to detect competitive threats
      • Delayed response to market changes
    • Decision Quality
      • Incomplete competitive coverage leads to suboptimal pricing
      • Risk of pricing decisions based on wrong product comparisons
    • Operational Efficiency
      • Manual verification costs
      • Time spent reconciling mismatched products
      • Resources needed to maintain price position

    Current Industry Challenges

    As mentioned, the #1 reason businesses like yours probably aren’t already finding the most accurate matches is that not all sites carry comparable product codes. If every listing had a consistent product code, it would be very easy to match that code to your code base. In fact, most retailers currently only achieve 60-70% match rates using their traditional methods.

    Different product naming conventions, constantly changing product catalogs, and regional product variations contribute to the industry challenges, not to mention the difficulty of finding brand equivalencies and private label comparisons across the competition. So, if you’re struggling, just know everyone else is as well. However, there is a significant opportunity to get ahead of your competition if you can improve your match rates with technology.

    The Matching Hierarchy

    • Direct Code Matching: There are a number of ways to start finding matches across the market. The base tier of the hierarchy of most accurate approaches is Direct Code matching. Most likely, your team already has a process in place that can compare UPC to UPC, for example. When no standard codes are listed, your team is left with a blind spot. This poses limitations in modern retail but is an essential first step to identifying the “low-hanging fruit” to start getting matches.
    • Non-Code-Based Matching: The next level of the hierarchy is implementing non-code-based matching strategies. This is when there are no UPCs, DPCIs, ASINs, or other known codes that make it easy to do one-to-one comparisons. These tools can analyze complex metrics like direct size comparisons, unique product descriptions, and features to find more accurate matches. They can look deep into the listing to extract data points beyond a code, even going as far as analyzing images and video content to help find matches. Advanced technologies for competitive matching can help pricing teams by adding different comparison metrics to their arsenal beyond code-based. 
    • Private Label Conversions: Up until this level of the hierarchy, comparisons relied on direct comparisons. Finding identical codes and features and naming similarities is excellent for figuring out one-to-one comparisons, but when there is no similar product to compare with for pricing intelligence, things get more complicated. This is the third tier of the matching hierarchy. It’s the ability to find similar product matches for ‘like’ products. This can be used for private label conversions and to create meaningful comparisons without direct matches.
    • Similar Size Mappings: This final rung on the matching hierarchy adds another layer of advanced calculations to the comparison capability. Often, retailers and merchants list a product with different sizing values. One may choose to bundle products, break apart packs to sell as single items or offer a special-sized product manufactured just for them. 
    Similar Size Mappings - product matching hierarchy - Walmart
    Similar Size Mappings - product matching hierarchy - Costco

    While at the end of the day, the actual product is the same, when there are unusual size permutations, it can be hard to identify the similarities. Technology can help with value size relationships, package variation handling, size equalization, and unit normalization.

    The AI Advantage

    AI is the natural solution for efficiently executing competitive product matching at scale. DataWeave offers solutions for pricing teams to help them reach over 95% product match accuracy. The tools leverage the most modern Natural Language Processing models for ingesting and analyzing product descriptions. Image recognition capabilities apply methods such as object detection, background removal, and image quality enhancement to focus on an individual product’s key features to improve match accuracy.

    Deep learning models have been trained on years of data to perform pattern recognition in product attributes and to learn from historical matches. All of these capabilities, and others, automate the attribute matching process, from code to image to feature description, to help pricing teams build the most accurate profile of products across the market for highly accurate pricing intelligence.

    Implementation Strategy

    We understand that moving away from manual product comparison methods can be challenging. Every organization is different, but some fundamental steps can be followed for success when leveling up your pricing teams’ workflow.

    1. First, conduct a baseline assessment. Figure out where you are on the Matching hierarchy. Are you still only doing direct code-based comparisons? Has your team branched out to compare other non-code-based identifiers?
    2. Next, establish clear match rate targets for yourself. If your current match rate is aligned with industry norms, strive to significantly improve it, aiming for a high alignment that supports maximizing the match rate. Break this down into achievable milestones across different stages of the implementation process.
    3. Work with your vendor on quality control processes. It may be worth running your current process in tandem to be able to calculate the improvements in real time. With a veteran technology provider like DataWeave, you can rely on the most cutting-edge technology combined with human-in-the-loop checks and balances and a team of knowledgeable support personnel. Additionally, for teams wanting direct control, DataWeave’s Approve/Disapprove Module lets your team review and validate match recommendations before they go live, maintaining full oversight of the matching process.
    4. The more data about your products it has, the better your match rates. DataWeave’s competitive intelligence tools also come with a built-in continuous improvement framework. Part of this is the human element that continually ensures high-quality matches, but another is the AI’s ‘learning’ capabilities. Every time the AI is exposed to a new scenario, it learns for the next time.
    5. The final step, ensure cross-functional alignment is achieved. Every one from the C-Suite down should be able to access the synthesized information useful for their role without complex data to sift through. Customized dashboards and reports can help with this process.

    Future-Proofing Match Rates

    The world of retail is constantly evolving. If you don’t keep up, you’re going to be left behind. There are emerging retail channels, like the TikTok shop, and new product identification methods to leverage, like image comparisons. As more products enter the market along with new retailers, figuring out how to scale needs to be taken into consideration. It’s impossible to keep up with manual processes. Instead, think about maximizing your match rates every week and not letting them degrade over time. A combination of scale, timely action, and highly accurate match rates will help you price your products the most competitively.

    Key Takeaways

    Match rates are the foundation of pricing intelligence. You can evaluate how advanced your match rate strategy is based on the matching hierarchy. If you’re still early in your journey, you’re likely still relying on code-to-code matches. However, using a mix of AI and traditional methods, you can achieve a 95% accuracy rate on product matching, leading to overall higher competitive match rates. As a result, with continuous improvement, you will stay ahead of the competition even as the goalposts change and new variables are introduced to the competitive landscape.

    Starting this process to add AI to your pricing strategy can be overwhelming. At DataWeave, we work with you to make the change easy. Talk to us today to know more.

  • Beyond Basic Price Monitoring: Advanced Applications of Competitive Intelligence

    Beyond Basic Price Monitoring: Advanced Applications of Competitive Intelligence

    It’s up to senior leadership, whether you’re a Chief Strategy Officer, Pricing Executive, or Commercial Director, to think big picture about your company’s competitive intelligence strategy. For more junior team members, it’s easy to get caught in the “this is how we’ve always done it” mindset and continue to go through the motions of price monitoring.

    You don’t have that luxury—it’s up to you to find and implement new ways to move beyond basic price monitoring and usher your company into an era of achieving actionable insights through competitive intelligence. There is much more to gain from competitive data than simple price monitoring.

    How can retailers leverage clean, competitive data to uncover strategic insights beyond basic price comparisons? This article will help you shift your mindset from tactical monitoring to strategic insight generation. We’ll see how sophisticated analysis of clean and refined competitive data can reveal competitor strategies, regional and geographic opportunities, and overall market trends.

    It’s time to shift away from standard reporting, which should be left for your pricing owners and end users, and towards gaining competitive intelligence to shape your holistic company pricing strategy. With the right tools, you can make this shift a reality.

    Regional Price Intelligence

    One significant opportunity you should take advantage of is a greater understanding of regional price intelligence. Understanding the nuances that shape how products, categories, and other retailers’ prices according to geographical differences can set your company up to win customer trust and dollars at checkout.

    Understanding geographic and regional pricing strategies

    Geographic price intelligence helps leaders leverage market opportunities based on where sales are happening. Variations in how products and categories are priced across regions often reflect competitor tactics, local demand, and cost structures.

    Let’s consider an example that impacts a broad geography, such as the entire continental United States – egg prices. Eggs are a staple grocery item and are frequently a loss leader in stores. This means they are products priced below their cost specifically to draw customers into stores.

    However, Avian Flu outbreaks affecting millions of birds have become more common recently. These outbreaks drive the cost of eggs higher as flocks must be culled to prevent the spread of the disease. This means that retailers must act to maintain acceptable margins or losses without frightening away customers or losing their trust.

    Avian Flu has been especially bad in Iowa and California. Retailers in these regions face tough decisions during outbreaks. They need to figure out how to balance the high prices required to cover the supply shortages with maintaining consumer trust that this staple product will not be perceived as ‘overpriced.’ Customers expect retailers to be fair even when supply chain issues make it challenging to keep prices stable.

    Another example impacting the broader USA is credit card defaults. Credit card defaults are reaching levels unseen since the financial crisis of 2008. $46 billion worth of credit card balances were written off in the first nine months of 2024 alone. This unprecedented figure highlights the fact that many Americans are struggling financially. Higher-income earners continue to do ok, but lower-income families are feeling the pressure more than ever.

    Understanding the differences between the geographies you sell in can help you construct your pricing strategies better. This is especially true as consumers brace themselves for more anticipated economic hardship.

    Retailers must set realistic financial targets without overpricing their catalogs. Otherwise, they risk losing customers who would otherwise have bought their products. Competitive intelligence can help retailers understand how economic disparities impact core consumer bases.

    Pricing leaders can leverage insights around geographic variations in supply, demand, and competitor pricing to help in situations like these. With how important eggs are, changes to their price can spill over into other categories. And with credit card defaults affecting hundreds of thousands of Americans, having a way to dive into these topics can help shape overarching strategies.

    Customer perception is a recurring theme in competitive intelligence. It’s not only about the actual value your brand offers but the perceived value based on historical context, current events, and competition.

    Leveraging Regional Price Differences for Strategic Advantage

    On the topic of customer perception, there are strategic ways to use customer perception to your advantage. One of these is detecting cross-market arbitrage opportunities using competitive intelligence and actioning them.

    But what is cross-market arbitrage? It’s the practice of exploiting the differences in price across different markets or regions. As a retailer, you can use cross-market arbitrage to your advantage by finding disparities in market conditions and strategically pricing your products to entice customers or offer more value. These opportunities can be in demand, supply, or competitive pricing. Acting quickly in markets where frequent disruptions happen can drive your business forward.

    DataWeave’s advanced competitive intelligence tools can analyze regional market trends to help you respond to real-time local demand fluctuations or cost pressures.

    Local Market Dynamics

    Pricing isn’t a one-size-fits-all operation. Where and what you’re pricing truly matters. Pricing teams should take price zones into account when constructing pricing strategies. This is because pricing isn’t equivalent across locations; it’s localized. Understanding this fact is critical for category-specific considerations at the macro and micro levels.

    This map shows a retailer’s regional price differentials on a breakfast basket. With the ability to access and refine your data, you can better construct maps like this one to track local market dynamics. Determine where you need to differentiate prices based on locality, understand the strategic stance of your competitors, and plan if you start to see changes in competitive price zones.

    Map shows a retailer's regional price differentials on a breakfast basket

    Competitor Strategy Detection

    As a retailer, you should continuously monitor your competitors, whether they’re succeeding or stagnating. One example of a major retailer that is seeing growth even during this challenging economic time is Costco. Costco is an interesting case because they do not have stores in every major city or even in every state.

    Costco has its brand strategy down, and it is tied to the pricing strategy. Costco has committed to its customers to provide quality items at competitive prices, and they’ve delivered even in a volatile economy. Costco has managed to maintain competitive prices on core merchandise and make strategic pricing adjustments on items that matter most to members. Their private label brand, Kirkland Signature, highlights their value-first approach. They continue to lead with price reductions like:

    • Organic Peanut Butter: $11.49 → $9.99
    • Chicken Stock: $9.99 → $8.99
    • Sauvignon Blanc: $7.49 → $6.99

    Costco has figured out how to balance premium offerings for cost-conscious consumers with standardly priced items filling the shopper’s basket. This demonstrates that they have a pricing strategy that relies on competitive intelligence and market trends.

    With the correct data and tools, any retailer can conduct research to discover more about their competitors and gain usable insights into their implemented pricing strategies. Once established, this can act as an early warning signal so you can take action.

    For example, understanding whether a retailer operates with a stable Everyday Low Price (EDLP) strategy or a more dynamic High/Low pricing approach is crucial when building and maintaining the integrity of your pricing strategy.

    Data should be able to show you things like:

    • When holiday price decreases start to accelerate
    • How quickly a retailer responds to cost increases (especially at the category or item level)
    • The cadence of seasonal campaigns and their impact on pricing behavior

    When we move beyond the numbers, these patterns tell a story about how to win in today’s competitive retail landscape. After all, pricing isn’t just a standard reporting tactic. In its truest form, it’s a strategy rooted in understanding the bigger picture of your consumers, competition, and the economy.

    Actionable Intelligence Framework

    With a practical system to turn insights into action, your company’s pricing strategy is much more likely to drive actual results. Merely collecting data and churning out out-of-date reports won’t cut it. Instead, begin to identify patterns and insights for accurate competitive intelligence. Use this simple framework to start setting up a comprehensive competitive intelligence process.

    • Setting up monitoring systems: Leverage technology to monitor and aggregate data on your competition, market trends, and consumer behavior. Ensure the system chosen can clean and refine the data along the way so it’s ready to be analyzed.
    • Creating action triggers: Define clear thresholds and triggers based on key insights. These can be things like price changes of a certain amount, competitor moves, assortment changes, or regional and geographic trends. These triggers should prompt specific, pre-planned actions for your team to capitalize on opportunities.
    • Response protocol development: Change management is easier with a plan. Work on building out and training your teams on protocols for specific triggers. When something arises, they know the protocol to take advantage of the opportunity or mitigate the challenge effectively.
    • Performance measurement: Measure the impact of your team’s protocol-based actions with the help of pre-determined KPIs and then hone your approach to competitive intelligence based on the results.

    Competitive Intelligence at Your Fingertips

    Shifting from a latent standard reporting and price monitoring mindset to a growth mindset centered around competitive intelligence doesn’t need to be a struggle. The key is to lean on the tools that will accelerate your company’s journey to finding the right insights and putting action behind them quickly.

    Start by conducting a competitive intelligence maturity assessment to evaluate your organization’s current state and identify areas for improvement. Then, create a capability development roadmap for your company to track efficacy and progress toward your goal.

    Want to talk to the experts in competitive pricing intelligence? Click here to speak with the DataWeave team!

  • From Raw Data to Retail Pricing Intelligence: Transforming Competitive Data into Strategic Assets

    From Raw Data to Retail Pricing Intelligence: Transforming Competitive Data into Strategic Assets

    Poor retail data is the bane of Chief Commercial Officers and VPs of Pricing. If you don’t have the correct inputs or enough of them in real time, you can’t make data-driven business decisions regarding pricing.

    Retail data isn’t limited to your product assortment. Price data from your competition is as important as understanding your brand hierarchies and value size progressions. However, the vast and expanding nature of e-commerce means new competitors are around every corner, creating more raw data for your teams.

    Think of competitive price data like crude oil. Crude or unrefined oil is an extremely valuable and sought-after commodity. But in its raw form, crude oil is relatively useless. Simply having it doesn’t benefit the owner. It must be transformed into refined oil before it can be used as fuel. This is the same for competitive data that hasn’t been transformed. Your competitive data needs to be refined into an accurate, consistent, and actionable form to power strategic insights.

    So, how can retailers transform vast amounts of competitive pricing data into actionable business intelligence? Read this article to find out.

    Poor Data Refinement vs. Good Refinement

    Let’s consider a new product launch as an example of poor price data refinement vs. good data refinement, which affects most sellers across industries.

    Retailer A

    Imagine you’re launching a limited-edition sneaker. Sneakerheads online have highly anticipated the launch, and you know your competitors are watching you closely as go-live looms.

    Now, imagine that your pricing data is outdated and unrefined when you go to price your new sneakers. You base your pricing assumptions on last year’s historical data and don’t have a way to account for real-time competitor movements. You price your new product the same as last year’s limited-edition sneaker.

    Your competitor, having learned from last year, anticipates your new product’s price and has a sale lined up to go live mid-launch that undercuts you. Your team discovers this a week later and reacts with a markdown on the new product, fearing demand will lessen without action.

    Customers who have already bought the much-anticipated sneakers feel like they’ve been overcharged now, and backlash on social media is swift. New buyers see the price reduction as proof that your sneakers aren’t popular, and demand decreases. This hurts your brand’s reputation, and the product launch is not deemed a success.

    Retailer B

    Imagine your company had refined competitive data to work with before launch. Your team can see trends in competitors’ promotional activity and can see that a line of sneakers at a major competitor is overdue for sale based on trends. Your team can anticipate that the competitor is planning to lower prices during your launch week in the hope of undercutting you.

    Instead of needing to react retroactively with a markdown, your team comes up with clever ways to bundle accessories with a ‘deal’ during launch week to create value beyond just the price. During launch week, your competitor’s sneakers look like the lesser option while your new sneakers look like the premium choice while still being a good value. Customer loyalty improves, and buzz on social media is positive.

    Here, we can see that refined data drives better decision-making and competitive advantage. It is the missing link in retail price intelligence and can set you ahead of the competition. However, turning raw competitive data into strategic insights is easier said than done. To achieve intelligence from truly refined competitive pricing data, pricing teams need to rely on technology.

    The Hidden Cost of Unrefined Data

    Technology is advancing rapidly, and more sellers are leveraging competitive pricing intelligence tools to make strategic pricing decisions. Retailers that continue to rely on old, manual pricing methods will soon be left behind.

    You might consider your competitive data process to be quite extensive. Perhaps you are successfully gathering vast data about your competitors. But simply having the raw data is just as ineffective as having access to crude oil and making no plan to refine it. Collection alone isn’t enough—you need to transform it into a usable state.

    Attempting to harmonize data using spreadsheets will waste time and give you only limited insights, which are often out of date by the time they’re discovered. Trying to crunch inflexible data will set your team up for failure and impact business decision quality.

    The Two Pillars of Data Refinement

    There are two foundational pillars in data refinement. Neither can truly be achieved manually, even with great effort.

    Competitive Matches

    There are always new sellers and new products being launched in the market. Competitive matching is the process of finding all these equivalent products across the web and tying them together with your products. It goes beyond matching UPCs to link identical products together. Instead, it involves matching products with similar features and characteristics, just as a shopper might decide to compare two similar products on the shelf. For instance private label brands are compared to legacy brands when consumers shop to discern value.

    A retailer using refined competitive matches can quickly and confidently adjust its prices during a promotional event, know where to increase prices in response to demand and availability and stay attractive to sensitive shoppers without undercutting margins.

    Internal Portfolio Matches

    Product matching is a combination of algorithmic and manual techniques that work to recognize and link identical products. This can even be done internally across your product portfolio. Retailers selling thousands or even hundreds of thousands of products know the challenge of consistently pricing items with varying levels of similarity or uniformity. If you must sell a 12oz bottle of shampoo for $3.00 based on its costs, then a 16oz bottle of the same product should not sell for $2.75, even if that aligns with the competition.

    Establishing a process for internal portfolio matching helps to eliminate inefficiencies caused by duplicated or misaligned product data. Instead of discovering discrepancies and having to fire-fight them one by one, an internal portfolio matching feature can help teams preempt this issue.

    Leveraging AI for Enhanced Match Rates

    As product SKUs proliferate and new sellers seem to enter the market at lightning speed, scaling is essential without hiring dozens more pricing experts. That’s where AI comes in. Not only can AI do the job of dozens of experts, but it also does it in a fraction of the time and at an improved match accuracy rate.

    DataWeave’s AI-powered pricing intelligence and price monitoring offerings help retailers uncover gaps and opportunities to stay competitive in the dynamic world of e-commerce. It can gather competitive data from across the market and accurately match competitor products with internal catalogs. It can also internally match your product portfolio, identifying product family trees and setting tolerances to avoid pricing mismatches. The AI synthesizes all this data and links products into a usable format. Teams can easily access reports and dashboards to get their questions answered without manually attempting to refine the data first.

    How AI helps convert raw data to pricing and assortment intelligence

    From Refinement to Business Value

    Refined competitive price data is your team’s foundation to execute these essential pricing functions: price management, price reporting, and competitive intelligence.

    Price Management

    Refined data is the core of accurate price management and product portfolio optimization. Imagine you’re an electronics seller offering a range of laptops and personal computing devices marketed toward college students. Without refined competitive data, you might fail to account for pricing differences based on regionality for similar products. Demand might be greater in one city than in another. By monitoring your competition, you can match your forecasted demand assumptions with competitor pricing trends to better manage your prices and even offer a greater assortment where there is more demand.

    Price Reporting

    Leadership is always looking for new and better market positioning opportunities. This often revolves around how products are priced, whether you’re making a profit, and where. To effectively communicate across departments and with leadership, pricing teams need a convenient way to report on pricing and make changes or updates as new ad hoc requests come through. Spending hours constructing a report on static data will feel like a waste when the C-Suite asks for it again next week but with current metrics. Refined, constantly updated price data nips this problem in the bud.

    Competitive Intelligence

    Unrefined data can’t be used to discover competitive intelligence accurately. You might miss a new player, fail to account for a new competitive product line, or be unable to extract insights quickly enough to be helpful. This can lead to missed opportunities and misinformed strategies. As a seller, your competitive intelligence should be able to fuel predictive scenario modeling. For example, you should be able to anticipate competitor price changes based on seasonal trends. Your outputs will be wrong without the correct inputs.

    Implementation Framework

    As a pricing leader, you can take these steps to begin evaluating your current process and improve your strategy.

    • Assess your current data quality: Determine whether your team is aggregating data across the entire competitive landscape. Ask yourself if all attributes, features, regionality, and other metrics are captured in a single usable format for your analysts to leverage.
    • Setting refinement objectives: If your competitive data isn’t refined, what are your objectives? Do you want to be able to match similar products or product families within your product portfolio?
    • Measuring success through KPIs: Establish a set of KPIs to keep you on track. Measure things like match rate accuracy, how quickly you can react to price changes, assortment overlaps, and price parity.
    • Building cross-functional alignment: Create dashboards and establish methods to build ad hoc reports for external departments. Start the conversation with data to build trust across teams and improve the business.

    What’s Next?

    The time is now to start evaluating your current data refinement process to improve your ability to capture and leverage competitive intelligence. Work with a specialized partner like DataWeave to refine your competitive pricing data using AI and dedicated human-in-the-loop support.

    Want help getting started refining your data fast? Talk to us to get a demo today!

  • Mastering Grocery Pricing Intelligence: A Strategic Approach for Modern Retailers

    Mastering Grocery Pricing Intelligence: A Strategic Approach for Modern Retailers

    When egg prices surged 70% during the 2023 avian flu outbreak, grocery retailers faced a critical dilemma: maintain margins and risk losing customers, or absorb costs and watch profits evaporate. Similarly, rising olive oil and chocolate prices also had domino effects, cascading down from retailers to consumers. In each of these scenarios, those with sophisticated pricing intelligence systems adapted swiftly, finding the sweet spot between competitiveness and profitability. Others weren’t so fortunate.

    This scenario continues to play out daily across thousands of products in the grocery sector. From breakfast cereals to fresh produce to bottled water, retailers must orchestrate pricing across a variety of categories – each with its own competitive dynamics, margin requirements, and price sensitivity patterns.

    The Evolution of Grocery Pricing Intelligence

    Imagine these scenarios in the grocery industry:

    • Milk prices spike during a supply shortage.
    • Your competitor drops egg prices by 20%.
    • Fresh produce costs fluctuate with an unseasonable frost.

    For grocery retailers, these aren’t occasional challenges—they’re Tuesday. Reacting to each pricing crisis as it comes isn’t just exhausting—it’s a recipe for shrinking margins and missed opportunities.

    Think of it this way: If you’re constantly playing defense with your pricing strategy, you’re already two steps behind. Commoditized items like milk and eggs face intense price competition, while seasonal products and fresh produce demand constant attention. Simply matching competitor prices or adjusting for cost changes isn’t enough anymore. What’s needed is a proactive approach that anticipates market shifts before they happen and turns pricing challenges into competitive advantages. This is where price management comes in.

    Price management has transformed from simple competitor checks into a strategic power play that can make or break a retailer’s market position. Weekly manual adjustments have given way to a long-term strategic view, driven by data analytics and market intelligence. Here are the basics of how price management in grocery retail works today.

    Three Pillars of Grocery Price Management

    1. Smart Data Collection: Building Your Foundation

    The journey begins with comprehensive data collection and storage across your entire product ecosystem. This means:

    • Complete Coverage Of All SKUs Across All Stores: Tracking prices for all SKUs across all stores, with particular attention to high-velocity items and volatile categories.
    • Dynamic Monitoring: Tracking prices across different time frequencies as grocery prices are highly volatile for different categories. So daily tracking for volatile items like dairy and produce, and weekly for more stable categories may be needed.
    • Competitive Intelligence: Gathering data not just on prices, but on promotions, pack sizes, and private label alternatives.
    • Infrastructure to Support Large Volumes of Data: Partnering with external data and analytics providers to bridge the gap when retailers struggle with the scale of digital infrastructure these data sets require.

    2. Intelligent Data Refinement: Making Sense of the Numbers

    Raw data alone isn’t enough—it needs context and structure to become actionable intelligence. This is called Data Refinement—the process of establishing meaningful relationships within the data to facilitate the extraction of valuable insights. This refinement stage is closely tied to the data collection strategy, as the quality and depth of the insights derived depend on the accuracy and coverage of the collected data.

    Data refinement includes several key processes:

    Advanced Product Matching

    Picture this: You’re tracking a competitor’s pricing on organic apples. Simple, right? Not quite. Yes, Universal Product Codes (UPCs) and Price Lookup Codes (PLUs) are present in Grocery to standardize product identification across different retailers—unlike the fashion industry’s endless style variations. Still, product matching isn’t as straightforward as scanning barcodes.

    Grocery Pricing Intelligence data faces a challenge when product names, weights, and details differ

    Here’s the catch: many retailer websites don’t display them. Then there’s the private label puzzle—your “Store’s Best” organic apples need to match against competitors’ house brands, each with their own unique UPC. Throw in different sizes (4 Apples vs. 1Kg of Apples), regional product names (fancy naming for plain old arugula), and international brand variations (like the name for Sprite in the USA and China), and you’ve got yourself a complex matching challenge that would make conventional pricing intelligence providers sweat.

    Grocery Pricing Intelligence data faces a challenge when different naming conventions and languages are used in different geographies

    Custom Product Relationships for Consistent Pricing and Competitive Positioning

    Think like a shopper browsing the dairy aisle. You regularly buy your family’s favorite organic yogurt, the 24oz tub. But today, you notice the larger 32oz size is on sale – except the 24oz isn’t. As you stand there, confused, you wonder: Is the sale only for the bigger size? Did I miss a promotion? Should I buy the 32oz even though it’s more than I need?

    For shoppers, this inconsistent pricing across product variations creates a frustrating experience. Establishing clear relationships between related items in your catalog is essential for maintaining consistent pricing and a coherent competitive strategy.

    Grocery Pricing Intelligence data refinement involves Custom Product Relationships for Consistent Pricing and Competitive Positioning

    Start by linking products based on attributes like size, brand, and packaging. That way, when you adjust the price of the 32oz yogurt, the 24oz version automatically updates too – no more scrambling to ensure uniform pricing across your assortment. Similarly, products of the same brand but with flavor variations should be connected to keep pricing consistent.

    Taking this one step further, mapping your competitors’ exact and similar products is crucial for comprehensive competitive intelligence. Distinguishing between premium and private label tiers, national brands, and regional players gives you a holistic view of the landscape. With this understanding, you can hone your pricing strategies to maintain a clear, compelling position across your entire category lineup.

    Consistent pricing, whether across your own product variations or against competitors, provides clarity and accuracy in your overall competitive positioning. By establishing these logical connections, you avoid the customer confusion of seemingly random, inconsistent discounts – and ensure your pricing strategies work in harmony, not disarray.

    The Role of AI and Data Sciences in Data Refinement

    On the surface, linking products based on attributes like size, brand, and packaging seems like a no-brainer. But developing and maintaining the systems to accurately and automatically identify these connections? That’s a whole different animal.

    Think about it – you’re not just dealing with text-based product titles and UPCs. There are images, videos, regional variations, private labels, and a whole host of other data types and industry nuances to account for.

    Luckily, DataWeave is one of the few companies that’s truly cracked the code. Our multimodal AI models are trained to process all those diverse data formats – from granular product specs to zany regional produce names. And it’s not just about technology; we also harness the power of human intelligence.

    See, in the grocery world, category managers are the real decision makers. They know their shelves inside and out and can spot those tricky connections in product matching, especially when they are not UPC-based. That’s why DataWeave built in a Human-in-the-Loop (HITL) process, where their AI systems continuously learn from expert feedback. It’s a feedback loop that allows our customers to pitch in and keep product relationships accurate, reliable, and always adapting to new market realities.

    So while product mapping may seem straightforward on the surface, the reality is it takes some serious horsepower to do it right. Thankfully, DataWeave has both the technical chops and the grocery industry know-how to make it happen. Because when it comes to pricing intelligence, getting those product connections right is half the battle.

    3. Strategic Implementation: Turning Insights into Action

    The true value of pricing intelligence (PI) is realized through its strategic application. Although many view PI as a technical function, its strategic significance is increasing, particularly in the context of recent economic pressures like inflation. Here’s why:

    Tactical vs Strategic Use of Data: From Standard Reporting to Competitive Analysis

    Pricing intelligence has come a long way from the days of simply reacting to daily price changes. These days, it’s not just about firefighting—it’s about driving long-term strategy.

    You can use pricing data to make quick, tactical adjustments, like matching a competitor’s sudden price drop on milk. Or, you can leverage that same data to predict market trends, optimize your product lineup, and shape your overall pricing strategy. Retailers who take that strategic view can get out ahead of the curve, anticipating shifts instead of just chasing them.

    DataWeave supports both of these approaches. Our Standard Reporting tools give pricing managers the nitty-gritty details they need—current practices, historical patterns, and operational KPIs. It’s all the insights you’d expect for making those tactical, day-to-day tweaks.

    In addition, DataWeave offers something more powerful: Competitive analysis. This is where pricing intelligence becomes a true strategic weapon. By providing a high-level view of market positioning, competitor moves, and untapped opportunities, competitive analysis empowers leadership to make proactive, big-picture decisions.

    Armed with this broader perspective, retailers can start taking a more surgical approach. Maybe you need to adjust pricing zones to better meet customer demands. Or rethink your overall strategies to stay ahead of the competition, not just keep pace. It’s the difference between constantly putting out fires and systematically fortifying your entire pricing fortress.

    Beyond Pricing: Comprehensive Data for Broader Insights

    Pricing intelligence is just the tip of the iceberg. When you really start to refine and harness your data, the possibilities for grocery retailers expand far beyond simple price comparisons. Think about it – all that information you’re collecting on products, markets, and consumer behavior? That’s a goldmine waiting to be tapped. Sure, you can use it to keep a pulse on competitor pricing. But why stop there?

    What if you could leverage that data to optimize your product assortment, making sure you’re stocking the right mix to meet customer demands? Or tap into predictive analytics to get a glimpse of future market shifts, so you can get out ahead of the curve? How about using it to streamline your supply chain, identify availability inefficiencies, and get products to shelves faster?

    Sure, pricing intelligence will always be mission-critical. But when you couple it with these other data-driven insights, that’s when grocery retailing gets really interesting. It’s about evolving from a price-matching robot to a true strategic visionary, armed with the intelligence to take your business to new heights.

    Looking Ahead: The Future of Grocery Pricing Intelligence

    The grocery pricing landscape continues to evolve, driven by:

    • Integration of AI and machine learning for predictive pricing
    • Enhanced focus on omnichannel pricing consistency
    • Growing importance of personalization in pricing strategies

    Pricing intelligence isn’t just about having data—it’s about having the right data and knowing how to use it strategically. Success requires a comprehensive approach that combines robust data collection, sophisticated analysis, and strategic implementation.

    By embracing modern pricing intelligence tools and strategies, grocery retailers can navigate market volatility, maintain competitive positioning, and drive sustainable growth. The key lies in building a pricing ecosystem that’s both sophisticated enough to handle complex data and flexible enough to adapt to changing market conditions.

    Ready to transform your pricing strategy? Check out our grocery price tracker to get month-on-month updates on grocery prices in the real world. Contact us to learn how our advanced pricing intelligence solutions can help your business stay ahead in the competitive grocery market.

  • The Complete Guide to Competitive Pricing Strategies in Retail and E-commerce

    The Complete Guide to Competitive Pricing Strategies in Retail and E-commerce

    Your budget-conscious customers are hunting for value and won’t hesitate to switch brands or shop at other retailers.

    In saturated and fiercely competitive markets, how can you retain customers? And better yet, how can you attract more customers and grow your market share? One thing you can do as a brand or retailer is to set the right prices for your products.

    Competitive or competition-based pricing can help you get there.

    So what exactly is competitive pricing? Let’s dive into this strategy, its advantages and disadvantages, and how it can be used to stay ahead of the competition.

    What is Competitive Pricing?

    Competitive or competition-based pricing is a strategy where brands and retailers set product prices based on what their competitors charge. This method focuses entirely on the market landscape and sets aside the cost of production or consumer demand.

    It is a good pricing model for businesses operating in saturated markets, such as consumer packaged goods (CPGs) or retail.

    Competitive Pricing Models

    Competitive pricing isn’t a one-size-fits-all strategy. The approach includes various pricing models that can be customized to fit your business goals and market positioning.

    Here’s a closer look at five of the most common competition-based pricing models:

    Price Skimming

    If you have a new product entering the market, you can initially set a high price. Price skimming allows you to maximize margins when competition is minimal.

    This strategy taps into early adopters’ willingness to pay a premium for new project categories. As competitors enter the market, you can gradually reduce the price to maintain competitiveness.

    Premium Pricing

    Premium pricing lets you position your product as high-quality or luxurious goods.

    When you charge more than your competitors, you’re not just selling a product—you’re selling status and an experience. This strategy is effective when your offering is of superior quality or has unique features that justify a higher price point.

    Price Matching

    Price matching—also known as parity pricing—is a defensive pricing tactic.

    By consistently matching your competitors’ prices, you can retain customers who might otherwise, be tempted to switch to an alternative.

    This approach signals your customers that they don’t need to look elsewhere for what they need and can feel comfortable remaining loyal to your brand.

    Penetration Pricing

    Penetration pricing is when you set a low price for a new product to gain market share quickly. The opposite of price skimming, this strategy can be particularly effective in price-sensitive or highly competitive industries.

    By attracting customers early, you can also deter some competitors from entering the market. This bold move can establish your product as a market leader from the get-go.

    Loss Leader Pricing

    Loss leader pricing is a strategic sacrifice that can lead to greater gains in the long run.

    By offering a product at a low price—sometimes even below cost—you can attract new customers to your brand and strengthen your current customers’ loyalty.

    Eventually, you can cross-sell other higher-margin products to your loyal customer base to cover the loss from your loss leader pricing and increase sales of other more profitable products.

    Key Advantages of Competitive Pricing

    Although it’s not the only pricing strategy available, competitive pricing has some significant advantages.

    It is Responsive

    Agility is synonymous with profit in industries where consumer preferences and market conditions shift rapidly.

    Competitive pricing allows you to adapt quickly—if a competitor lowers their prices, you can respond promptly to maintain your positioning.

    It is Simple to Execute and Manage

    Competitive pricing is straightforward, unlike cost-based pricing, which requires complex calculations and spans various factors and facets.

    By closely monitoring competitors’ prices and adjusting your prices accordingly, you can implement this pricing strategy with relative ease and speed.

    It Can Be Combined with Other Pricing Strategies

    Competitive pricing is not a standalone strategy—it’s a versatile approach that can easily be combined with other pricing strategies. For example, say you want to use competitive pricing without losing money on a product. In this case, you could use cost-plus pricing to determine a base price that you won’t go below, then use competitive pricing as long as the price stays above your base price.

    Key Disadvantages of Competitive Pricing

    While competition-based pricing has its advantages, it’s not without its pitfalls. Here are some potential disadvantages of competitive pricing.

    It De-emphasizes Consumer Demand

    If you focus solely on what competitors are charging, you could overlook consumer demand.

    For example, you could underprice items that consumers could be willing to purchase for more. Or, you might overprice items that consumers perceive as low-value, which can reduce sales.

    You Risk Price Wars

    If you and your competition undercut each other for customer acquisition and loyalty, you will eventually erode profit margins and harm the industry’s overall profitability. It’s a slippery slope where everyone loses in the end.

    There’s Potential for Complacency

    When you base your prices on beating those of competitors, you might neglect to differentiate your offerings through innovation and product improvements. Over time, this can weaken your brand’s position and lead to a loss of market share. Staying competitive means more than just matching prices—it means continuously evolving and adding value for the consumer.

    4 Tips for a Successful Competitive Pricing Strategy in Retail

    Here are four competition-based pricing tips for retailers:

    Retailer Tip #1. Know Where to Position Your Products in the Market

    For competitive pricing to work, you must understand your optimal product positioning in the overall market. To gain this understanding, you must regularly compare your offerings and prices with those of your key competitors, especially for high-demand products.

    Then, you can decide which competition-based pricing model is suitable for you.

    Retailer Tip #2. Price Dynamically

    Dynamic pricing is a tactic with which you automatically adjust prices on your chosen variables, such as market conditions, competitor actions, or consumer demand.

    When it comes to competitive pricing, a dynamic pricing system can track your competitors’ price changes and update yours in lockstep.

    Price-monitoring tools like DataWeave allow you to stay ahead of the game with seasonal and historical pricing trend data.

    Retailer Tip #3. Combine Competitive Pricing with Other Pricing Strategies

    Competitive pricing can be powerful, but it doesn’t have to stand alone. You can enhance its benefits with complementary marketing tactics.

    To illustrate, you can bundle products to offer greater value than what your competitors are offering. You can also leverage loyalty programs to offer exclusive discounts or rewards so customers keep returning, even when your competitors offer them lower prices.

    Retailer Tip #4. Stay in Tune with Consumer Demand

    Competition-based pricing aligns you with your competitor, but don’t lose sight of what your customers want. Routinely test your pricing strategy against consumer behavior to ensure that your prices reflect the actual value of your offerings.

    5 Tips for a Successful Competitive Pricing Strategy for Consumer Brands

    If you’re thinking about how to create a competitive pricing strategy for your brand, consider these five tips:

    Brand Tip #1. Identify Competing Products for Accurate Comparisons

    The first step in competitive pricing is to know the value of what you’re selling and how it compares to that of your competitors’ products. This extends to private-label products, similar but not identical products, and use-case products.

    Product matching ensures your pricing decisions are based on accurate like-for-like comparisons, allowing you to compete effectively.

    Brand Tip #2. Understand Your Product’s Relative Value

    Knowing how your product competes on value is key to setting the right price. If your product offers higher value, price it higher; if it offers less, price it accordingly. This ensures your pricing strategy reflects your product’s market placement.

    Brand Tip #3. Consider Brand Perception

    Even if your product is virtually the same as a competitor’s, your brand’s perceived value may be different, which plays a crucial role in pricing.

    If your brand is perceived as premium, you can justify higher prices. Conversely, if customers perceive you as a value brand, your pricing should reflect affordability.

    Brand Tip #4. Leverage Value-Based Differentiation

    When your prices are similar to competitors’, you must differentiate your products by expressing your product value through branding, packaging, quality, or something else entirely.

    This differentiation will compel consumers to choose your product over other similarly priced options.

    Brand Tip #5. Stay Vigilant with Price Monitoring

    Your competitors will update their pricing repeatedly, and you will, too.

    It can be difficult and time-consuming to monitor your competitive pricing, so you’ll need a system like DataWeave to monitor competitors’ pricing and manage dynamic pricing changes.

    This vigilance ensures your brand remains competitive and relevant in real time.

    4 Essential Capabilities You Need to Implement Successful Competition-Based Pricing

    You’ll need four key capabilities to implement a competitive pricing strategy effectively.

    AI-Driven Product Matching

    Product matching means you’ll compare many products (sometimes tens or hundreds) with varying details across multiple platforms. Accurate product matching at that scale requires AI.

    For instance, AI can identify similar smartphones to yours by analyzing features like screen size and processor type. DataWeave’s AI product matches start with 80–90% matching accuracy, and then human oversight can fine-tune the data for near-perfect matches.

    You can make informed pricing decisions once you know which competing products to base your prices on.

    Accurate and Comprehensive Data

    A successful competition-based pricing strategy depends on high-quality, comprehensive product and pricing data from many retailers and eCommerce marketplaces.

    By tracking prices on large online platforms and niche eCommerce sites across certain regions, you’ll gain a more comprehensive market view, which enables you to make quick and confident price changes.

    Normalized Measurement Units

    Accurate price comparisons are dependent on normalized unit measurements.

    For example, comparing laundry detergent sold in liters to laundry detergent sold in ounces requires converting either or both products to a common base like price-per-liter or price-per-ounce.

    This normalization ensures accurate pricing analysis.

    Timely Actionable Insights

    Timely and actionable pricing insights empower you to make informed pricing decisions.

    With top-tier competitive pricing intelligence systems, you get customized alerts, intuitive dashboards, and detailed reports to help your team quickly act on insights.

    In Conclusion

    Competitive pricing or competition-based pricing is a powerful strategy for businesses navigating crowded markets, but you must balance competitive pricing with your brand’s unique value proposition.

    Competitive pricing should complement innovation and customer-centric strategies, not replace them. To learn more, talk to us today!

  • Less is More in Holiday Pricing: The Case for a Simple, Stable Approach This Holiday Season

    Less is More in Holiday Pricing: The Case for a Simple, Stable Approach This Holiday Season

    With pricing making headlines more frequently than ever, now is the perfect moment for retailers to take a step back and rethink their holiday strategy. The heightened focus on pricing—driven by economic uncertainties, inflationary pressures, and fluctuating supply chain dynamics—presents a unique opportunity for retailers to not only meet customer expectations but to exceed them by rebuilding trust. In today’s climate, where consumer confidence is often fragile, the perception of fair pricing can be a significant differentiator. This is especially true during the holiday season when shoppers are more budget-conscious, and every dollar counts.

    Rather than focusing on the price of individual items, consumers are increasingly concerned with the total amount they spend at checkout. This means the overall basket cost, rather than the price tag on a single product, holds greater sway in determining whether a customer feels they’ve gotten a good deal. Retailers who can maintain steady, predictable basket pricing—despite external pressures such as supply chain disruptions or increased competition—will stand out as reliable and customer-centric.

    Pricing Strategy for the Holiday Season

    Your pricing strategy sets the tone for fostering and maintaining customer trust during the busy holiday season. From establishing initial prices to managing markdowns, having a stable, well-thought-out plan is crucial to balancing profitability with customer satisfaction. Below are several guiding principles to help you navigate this critical time frame:

    holiday-pricing-considerations

    Anchor Your Prices Early on Key Holiday Items

    Identify the products that are likely to drive traffic and sales during the holiday period and set your prices strategically early on. Use these prices as a ceiling that you won’t exceed, allowing customers to trust that they’re getting consistent value. By establishing this anchor price, you create a sense of stability in an otherwise fluctuating market, helping your customers feel confident that they won’t face price hikes on essential holiday items.

    Prepare for Competitive Moves

    The holiday season is notorious for aggressive pricing tactics by competitors, so you’ll need to remain agile. Be prepared to make strategic price reductions when necessary, but ensure you stay below your anchored price to avoid eroding trust. Monitoring competitors closely and adjusting your strategy without undermining your overall value proposition will be key to maintaining a competitive edge.

    To accomplish this, having reliable and timely competitor pricing data is essential. A sophisticated pricing intelligence platform like DataWeave’s can get the job done, which is equipped to handle the scale and speed demanded during the fast-paced holiday season.

    Collaborate with Vendors on Promotions

    Strong vendor relationships are crucial during the holiday season. By working closely with your suppliers, you can develop compelling promotions that not only attract customers but also ensure you have adequate inventory levels to support any reduced pricing strategies. Vendors may offer additional incentives or discounts during this period, and leveraging those to provide deeper savings can help retailers pass along better deals to customers without sacrificing margin.

    Pre-Holiday Markdowns

    Pre-holiday markdowns are an essential tool to clear out older inventory and make room for newer, more seasonal items. Get ahead of these markdowns by tracking trends and data from previous years. This will allow you to anticipate demand and address any overstocking issues early, ensuring that your shelves are stocked with the right products at the right time.

    Post-Holiday Markdowns

    Once the holiday rush subsides, differentiating between products is crucial. For “In and Out” items, which are seasonal or limited-time offers, your goal should be to clear through inventory as quickly as possible to free up valuable shelf space for upcoming product cycles. For products that are part of your regular planogram, the focus should shift to adjusting inventory levels back down to non-holiday norms, ensuring you’re not left with excess stock that could tie up cash flow in the slower months ahead.

    Manage Markdowns at the Store/Item Level

    Not all stores or products will move at the same pace, so it’s essential to manage markdowns on a granular level. Each store has different inventory turnover rates, and customer demand may vary from one location to another. Tailoring markdown strategies to the specific needs of individual stores and products allows for greater flexibility and ensures you’re maximizing sell-through while minimizing excess stock.

    Managing the Rest of the Assortment

    While holiday-specific items will undoubtedly capture much of the attention from customers due to the increased volume and seasonal demand, it’s essential to remember that the rest of the customer’s basket—comprised of non-holiday items—plays a pivotal role in their overall shopping experience. Retailers often focus heavily on optimizing prices for holiday items, but maintaining a consistent and customer-friendly pricing strategy across the entire assortment is equally important. Neglecting non-holiday items can erode trust and diminish the effectiveness of the overall holiday pricing strategy. Customers shop holistically, and their perception of your brand is shaped by the totality of their shopping experience, not just individual product categories.

    While holiday promotions may attract traffic, it’s the consistency and transparency of your broader pricing strategy that will strengthen trust and encourage repeat business. After all, the holiday season is not just about winning a single transaction—it’s about building relationships that extend well into the new year.

    A few critical factors to consider for your non-holiday assortment:

    Minimize Price Increases Unless Absolutely Necessary

    The holiday season is a delicate time when customers are highly sensitive to pricing. Sudden, unexpected price hikes, especially on everyday, non-seasonal items, can quickly erode the trust you’ve worked hard to build. Customers may forgive small fluctuations, but if they perceive a retailer is taking advantage of holiday demand or inflationary pressures to unnecessarily raise prices, that goodwill can evaporate. By maintaining steady pricing, you reinforce the idea that your brand prioritizes fairness over opportunism, especially in a period marked by heightened scrutiny around pricing practices.

    Evaluate Price Gaps Between Product Tiers

    A key element of pricing strategy that retailers should focus on is maintaining appropriate price gaps between product tiers, such as private label and national brands. Ensuring that the price difference between these tiers remains clear and consistent helps reinforce a value proposition for both types of customers: those who seek premium national brands and those who are value-oriented and gravitate toward private label options. If the price gap becomes too narrow, customers may be confused about the differentiation between products, leading to dissatisfaction or lost sales.

    Ensure Accurate Value Sizing

    One of the most effective ways to gain customer trust is through clear, transparent pricing, particularly when it comes to value sizing. Misleading unit pricing, whether intentional or accidental, can quickly frustrate customers, making them feel that they are being deceived. Ensure that unit pricing is visible, logical, and consistent across all product categories, allowing customers to make informed choices without feeling overwhelmed or misled. By offering transparency in this area, you can foster a sense of fairness and accountability, further building your reputation as a customer-first retailer.

    Maintain Price Links Across Your Assortments

    Consistency in pricing across various categories and product lines is crucial to managing customer expectations. Pricing disparities between similar products or across different stores in your chain can create confusion and frustration, leading to negative perceptions of your brand. Customers expect a seamless shopping experience, and this includes consistency in pricing, no matter what they buy or where they buy it. Establishing and maintaining price links within your assortment will ensure that your broader pricing strategy remains aligned with customer expectations, reinforcing reliability.

    Trust is Your Greatest Currency

    In a retail environment where customers are constantly bombarded with news about inflation, price hikes, and economic instability, trust is your greatest asset. Negative perceptions surrounding pricing, whether it’s from the media or personal experiences, can make customers wary and hesitant. By committing to a stable, transparent, and fair pricing strategy—not just for holiday items but across the entire assortment—you can differentiate yourself in the market and foster long-term loyalty. Stability and consistency in your pricing model allow customers to feel confident that they’re getting good value every time they shop with you, regardless of external economic pressures.

    It’s important to prioritize the customer relationship above all else, even if that means sacrificing some immediate short-term gains. Retailers who opt for quick wins through aggressive price changes may see a temporary boost in profits but risk damaging long-term customer loyalty. On the other hand, by focusing on providing a consistent and fair experience, you position your brand as a reliable choice, one that customers will return to not just during the holidays but throughout the entire year.

    In a season where every retailer is vying for the same holiday dollar, your approach to pricing must stand out by emphasizing trust, loyalty, and customer satisfaction. Pricing transparency and fairness are key differentiators, especially in an environment where many retailers will be tempted to capitalize on increased demand by raising prices or reducing promotions. Instead, leading with trust and focusing on stability will allow you to rise above the noise and deliver a superior customer experience.

    In Summary: Stability Wins

    This holiday season, the winning strategy isn’t about pushing for the highest possible margins or taking advantage of seasonal demand spikes. It’s about the bigger picture—building lasting customer relationships that extend well beyond the holidays. By prioritizing consistency in your pricing, maintaining transparency across your assortment, and leading with trust, you’ll not only achieve success during the holiday period but also set the stage for long-term customer loyalty.

    In short, stability wins. Prioritize the customer experience, remain consistent in your approach, and lead with trust. Doing so will ensure that your customers not only choose you during the holidays but continue to choose you long into the future.

    To learn more, reach out and chat with us today!

  • The Essential Price Management Framework for Retailers

    The Essential Price Management Framework for Retailers

    As a leader with over 20 years of experience leading pricing strategy at a major US grocery chain, I deeply understand the complexities pricing teams face when trying to derive, quantify, and execute corporate pricing initiatives.

    Providing insights into the competitive marketplace in order to ensure the overall success of directed pricing strategies is more than simple reporting.

    That’s what many teams get wrong.

    Reporting is a post-mortem, which is a valuable exercise, but not one that will help you achieve your pricing goals all by itself. After all, your pricing goals can change due to a number of reasons: macroeconomic challenges, regional competition, corporate objectives, along with several other factors.

    Pricing teams need a well-defined process to devise and implement their pricing strategies. This process needs to holistically examine your product base to provide robust price management. It also needs to be backed up by technology powered by the latest advancements because you can be sure your competition is already thinking that way.

    Let’s break down an effective and modern price management process for retailers.

    Data Collection

    The first aspect of any effective price management framework for retailers is a clearly defined product data collection. You need to understand your collection in terms of who to collect pricing data from, what data to collect, where to collect it from, and how often.

    • The who: Consists of both primary competition and others you’d like to keep tabs on
    • The what: Can range from targeted single items like Key Value Items (KVIs) or total portfolio
    • Where: Can range from targeted locations within your market or the total competitive network
    • How often: To be able to support your price management process and for reporting purposes, determining a cadence is essential.

    Data is power and the more data you can acquire, the more insights you’ll gain. Make sure that your collection data is well thought out ahead of time. Leaning on a price management framework built for retailers that can aggregate all your data into representative prices can help.

    For example, if you have multiple competitive stores in a single market, flattening pricing data into a defined representative price will help speed up your analysis. Don’t get confined to a single store when a comprehensive assortment view across your target markets will provide a more accurate understanding.

    Data Refinement

    Competitive Matched Items

    Next, you need to examine your competitive-matched items. These are the products that you want to be priced in direct response to your competitors’ pricing. The goal is to remain closely aligned with their prices so as not to lose market share while simultaneously achieving your corporate strategies.

    Your price management system needs to help you manage your overlapping items. Trying to do so manually will be inefficient and is almost impossible to execute across 100% of your product catalog. 

    The mapping needs to go beyond exact UPC / PLU matches to encompass other match criteria. It needs to be able to incorporate any number of derivatives, including competitor-specific item codes like Amazon’s ASINs or Target’s DPCIs. This will help you overcome the challenge of mapping exact items to a competitor when the competitor’s site doesn’t showcase a UPC. It will also help you map your own private-label items to your competitor’s private-label counterparts.

    A good price management framework will also help you match the same items but with dissimilar sizes (e.g., Cheerios 18 OZ vs. Cheerios 20 OZ), either by letting you match directly within acceptable tolerances or by enabling you to compare prices on a per-unit basis. 

    We need to leverage GenAI to help facilitate matches beyond UPC / PLU exact matches, such as Exact Item with no Competitor Code, Exact Item with Competitive Specific Codes, Similarity Matching on Private Label, Similarity Matching on Size all need to leverage it.

    If you’re playing in a vertical that doesn’t always have a unifying code (restaurants, apparel, etc.) you’ll need to leverage the latest GenAI tools to map items together for price management. The variables are simply too numerous and complex to do manually.

    Unmatched Items and Internal Portfolio

    Not every product will be included in your competitive-matched items collection. Competitive matches in your internal portfolio offer a proxy for building clear and concise price management strategies that are in line with your corporate initiatives.

    However, your unmatched items still need to be factored into your price strategy. If you only manage your competitively priced items, you won’t have a holistic viewpoint of your total product catalog and pricing. It’s critical to ensure that internal portfolio items are effectively mapped and grouped in order to extend overall price management.

    Here are three things you need to consider when managing the pricing of your internal product portfolio. A smart price management framework is your best bet for achieving these results:

    • Value Size Groupings
      Value size groupings allow for the same branded items of different sizes to be priced accordingly to ensure price parity. You don’t want to sell a private label gallon of milk for $4.00 while the half gallon is at $1.75, for example. You need certain mechanisms in place to alert you when price parity is off. This is especially true when some of your items are competitively matched, and others are not.
    • Relationships between Brands
      Relationships between brands are also critical to ensure price parity. There should be well-defined relationships between like-sized products that are from different brands. This will ensure that your private label program is priced ‘at a value’ compared with their national branded counterparts. You need to maintain the balance between different private label tiers along with different national brand tiers.
    • Price Links
      Price Links are also critical to keeping up to date from a consumer perspective. Your customers expect that certain items should be priced together and will be put off if they are not. For example, if you sell an item in different sizes or flavors and scents, their prices should be logically linked.

    For your internal portfolio, there may be items that don’t have a competitive match or simply don’t fall into one of your internal portfolio groupings. These are unique items to your banner and should be considered margin drivers for your brand.

    Leveraging Data for Action

    Now that you have a complete line of sight into both competitively matched items and internal mappings, you can move to fully leveraging your data. Figuring out how to utilize these competitive insights to understand where your price positioning is compared with your competition can be a challenge without a playbook. An effective price management framework will help guide you to the best insights and help you understand how it relates to your corporate strategy.

    If you don’t have a well-defined corporate pricing strategy (competitive or margin) or you need to update it to be more modern, the data sets provided by a price management framework can help you ascertain where you are in your pricing journey. They can also help you identify options for where you want to go.

    Here are some other ways a price management framework can help you improve your pricing strategy:

    • Utilize Competitive Data
      Get competitive insights, identify competitive price zones, and understand your competitors’ pricing philosophy. Figure out if they’re using strategies like:
      • High-Low
      • Everyday Low Price (EDLP)
      • Cost Plus
    • Unravel Competitor Strategy
      See if you can unlock what your competition has planned for pricing strategy and promotions. Try relating what you see in corporate filings and tie back to what you see in your competitive data sets.
    • Assortment Analysis
      Try looking at the data not only from a pricing perspective but also from a competitive assortment, promotion, and supply chain perspective.
    • Proactive Alerts
      Establish alerts for your internal portfolio to ensure that you don’t exceed your tolerance based on price moves.

    Leveraging a Price Management Framework Designed for Retailers

    A price management system designed specifically for you as a retailer is a game changer. An effective one can be configured specifically for the price owners, whether you have a dedicated team for this function or the price is owned by the category management team.

    For category managers, standard reporting offers a clear view of pricing performance and trends. Beyond that, competitive intelligence becomes crucial—using data from various sources like collected pricing data, market filings, social media insights, etc. to provide the senior leadership team with a deeper understanding of competitor strategies and actions. This empowers informed decision-making at the highest levels.

    With these price management insights, retailers can gain a holistic view of the competitive marketplace, uncover gaps and opportunities, and scale their business more effectively. As someone with experience on the retailer’s side of the market, I know first-hand how valuable these insights can be.

    We’d love to talk with you if you’re interested in learning more about DataWeave’s AI-powered price intelligence solution for retailers. Click here to schedule an introductory conversation.

  • Competitor Price Monitoring in E-commerce: Everything You Need to Know

    Competitor Price Monitoring in E-commerce: Everything You Need to Know

    Picture this: You wake up one morning to discover that your top competitor reduced their prices overnight. And now your shopper traffic has tanked and your sales have taken a hit.

    Unfortunately, this is a common scenario because your customers can compare prices online in seconds—and loyalty lies with the budget.

    So, how can you protect your business? Price monitoring.

    Price monitoring solutions can help you keep abreast of competitor price changes—which, of course, will help you improve your pricing strategies, retain your customers, and maximize your profits.

    How? In this article, we’ll explore:

    • What is price monitoring
    • The key benefits of price monitoring for retailers and brands
    • What a capable price monitoring solution can do

    What Is Price Monitoring?

    Price monitoring is the process of tracking and analyzing your competitor’s prices across various online and offline platforms. By monitoring competitors’ prices, you can understand market price trends and adjust your prices strategically—which, in turn, helps you remain competitive, increase margins, and improve customer retention.

    5 Benefits of Price Monitoring

    Competitor price monitoring can help you:

    1. Gain a competitive edge: Competitor price tracking allows you to adjust your prices to remain attractive to consumers.
    2. Maximize revenue: With timely pricing data, you’re empowered to identify optimum price points that strike a delicate balance between maximizing revenue and maintaining customer loyalty.
    3. Retain customers: Consumers are looking for the most value for their dollar, so maintaining consistently competitive pricing is crucial for retaining loyal customers.
    4. Understand promotional effectiveness: Price monitoring helps businesses evaluate the effectiveness of their promotions and discounts. By comparing the impact of different pricing strategies, businesses can refine their promotional tactics to maximize sales and customer engagement.
    5. Understand market movements: By analyzing historical pricing data, you’re better positioned to anticipate future pricing changes — and adjust your strategies accordingly.

    4 Essential Capabilities of Price Monitoring Software

    Here are four capabilities to look for when choosing a price monitoring system.

    1. AI-Driven Product Matching

    Product matching is the process of identifying identical or similar products across different platforms to ensure accurate price comparisons.

    If your price monitoring solution can’t reliably match your products with competitors’ across various sales channels at scale, you’ll end up with poor data. Inaccurate data will then lead you to make misinformed pricing decisions.

    Product matching needs to be accurate and comprehensive, covering a wide range of products and product variations—even for including private label products.

    For example, AI-driven product matching can recognize a specific brand and model of sneakers across multiple online stores—even if product descriptions and images differ. Here’s how it works in a nutshell:

    • Sophisticated algorithms and deep learning architecture enable AI to identify and match products that aren’t identical but share key characteristics and features.
    • Using unified systems for text and image recognition, the AI matches similar SKUs across hundreds of eCommerce stores and millions of products.
      The AI zeroes in on critical product elements in images, like a t-shirt’s shape, sleeve length, and color.
    • The AI also extracts unique signatures from photos for rapid, efficient identification and grouping across billions of indexed items.

    DataWeave’s AI algorithm can initially match products with 80–90% accuracy. Then, humans can bring contextual judgement and make nuanced decisions that the AI might miss to correct errors quickly and push for accuracy closer to 100%. By integrating AI automation with human validation, you can achieve accurate and reliable product-matching coverage at scale.

    2. Accurate and Comprehensive Data Collection and Aggregation

    The insights you derive are only as good as the data you collect. However, capturing comprehensive pricing data is tough when your competitors operate on multiple platforms.

    For truly effective price monitoring insights, you need consistent, comprehensive, and highly accurate data. This means your chosen price monitoring system should:

    • Scrape data from various sources, such as desktop and mobile sites and mobile applications.
    • Pull data from various online platforms like aggregators, omnichannel retailers, delivery intermediaries, online marketplaces, and more.
    • Handle data from different regions and languages.
    • Collect data at regular intervals to ensure timeliness.

    DataWeave’s online price monitoring software covers all of these bases and more with a fast, automated data source configuration system. It also allows you to painlessly add new data sources to scrape.

    Instead of incomplete or inaccurate data, you’ll have comprehensive and up-to-date data, allowing you to respond quickly to market changes with confidence.

    3. Seamless Normalization of Product Measurement Units

    You can’t compare apples to oranges—or price-per-kilogram to price-per-pound.

    For price monitoring to be accurate, there must be a way to normalize measurement units—so that we’re always comparing price-per-gram to price-per-gram. If we compare prices without taking into account measurement units, our data will be misleading at best.

    Let’s take a closer look. Say that your top competitor sells 12oz cans of beans for $3, and you sell 15oz cans for $3.20. At first glance, your larger cans of beans will appear more expensive—but that’s not true. If we normalize the measurement unit—in this example, an oz—the larger can of beans offers more value to customers.

    Unit of measure normalization facilitates sound price adjustments based on accurate and reliable data. For this reason, every business needs a price tracking tool that can guarantee accurate comparisons by normalizing unit measurements—including weight, volume, and quantity.

    4. Actionable Data and an Intuitive User Experience

    Knowledge is only powerful when applied—and price monitoring insights are only useful when they’re accessible and actionable.

    For this reason, the best price monitoring software doesn’t just provide insights based on accurate and comprehensive data, but it also provides several ways to understand and deploy those insights.

    Ideal price monitoring solutions provide customized pricing alerts, intuitive dashboards, detailed reports, and visuals that are easy to interpret—all tailored to each particular team or a team member’s needs. These features should make it easy for team members to compare prices against those of competitors in specific categories and product groupings.

    Your price tracking tool should also permit flexible API integrations and offer straightforward data export options. This way, you can integrate competitive pricing data with your pricing software, Business Intelligence (BI) tools, or Enterprise Resource Planning (ERP) system.

    4 Ways Retailers Can Leverage Price Monitoring

    Retailers can use price monitoring tools to remain competitive without compromising profitability—here’s how:

    1. Track Competitors’ Prices

    Competitor price monitoring helps you avoid being undercut—and, as a result, maintain market share. By tracking competitor prices in real-time, you can adjust prices to remain competitive, especially in dynamic markets. Ideally, you should monitor both direct competitors selling the same products and indirect competitors selling similar or alternative products. This way, you’ll have a complete picture of market prices and can make more informed pricing adjustments.

    2. Understand Historical and Seasonal Price Trends

    As a retailer, you may want to analyze historical data to identify price patterns and predict future price movements—especially in relation to holidays and seasonal products. Knowing what’s coming, you’re better positioned to plan for pricing changes and promotional campaigns.

    3. Implement Dynamic Pricing

    Dynamic pricing is the process of adjusting prices based on real-time market conditions, product demand, and competitors’ prices—allowing you to respond faster to market changes to maintain optimized prices.

    4. Optimize Promotional Strategies

    Price monitoring tools can track retail promotions across numerous online and offline sales avenues, providing insight into the nature and timing of competitors’ promotions. This data can help you determine which promotions are most effective—and which aren’t—allowing you to improve your own promotions and discounts, and allocate marketing resources where it matters most. This is especially beneficial during peak sales periods.

    3 Ways Brands Can Employ Price Monitoring

    Here are three ways brands can use price monitoring to remain profitable, protect brand equity, and gain a competitive edge.

    1. Maintain Consistent Retail Prices

    Minimum advertised price (MAP) policies are designed to prevent retailers from devaluing a brand while ensuring fair competition among retailers. Price monitoring applications allow your brand to track retailers’ prices to detect MAP policy violations. Data in hand, you can maintain consistent pricing across online sales channels, physical stores, and retail stores’ digital shelves — and, critically, protect your brand equity.

    2. Improve Product and Brand Positioning

    When you understand how your products’ prices compare to those of competitors, you can set prices to improve brand positioning. For example, if you want to position your brand as luxurious and high-quality, you need to set higher product prices than budget-friendly alternative products.

    3. Ensure Product Availability

    You can use a price monitoring solution to track product availability to ensure products are always in stock, even across different physical stores and online marketplaces. If a product is frequently sold out, you can adjust production levels or help retailers to improve their inventory management.

    Key Takeaways: E-commerce Price Monitoring

    Price monitoring software allows you to compare your products’ prices with competitors. This valuable data can help you:

    • Optimize revenue through timely price changes and dynamic pricing
      Avoid being undercut by competitors
    • Improve pricing strategies and promotions to increase sales and retain customers
    • Maintain consistent prices across sales channels

    To learn more, check out our article, What is Competitive Pricing Intelligence: The Ultimate Guide here or reach out and talk to us today!

  • Cracking the Code: How Retailers Can Adapt to Plummeting Egg Prices in 2024

    Cracking the Code: How Retailers Can Adapt to Plummeting Egg Prices in 2024

    Virtually every cuisine in the world uses eggs. They’re in your breakfast, lunch, dinner, and dessert — which is perhaps why the global egg market is expected to generate $130.70 billion in revenue in 2024 and is projected to grow to approximately $193.56 billion by 2029.

    More specifically, the United States is the fourth-largest egg producer worldwide. The country’s egg market is projected to generate $15.75 billion in 2024 and increase to $22.51 billion by 2029.

    This growth is driven by several factors, most notably:

    • Health-consciousness among consumers: Consumers value eggs for their essential nutrients and rich protein content.
    • Demand for convenience foods: Consumers’ preferences are shifting toward quick and easy foods, which drives demand for shell eggs and pre-packaged boiled or scrambled eggs.
    • Population Growth: A growing worldwide population increases the demand for eggs.
    • Affordability and accessibility: Eggs are an affordable and accessible nutrient-dense food source for many.

    Despite these factors contributing to the U.S. egg market’s growth, recent times have seen egg prices fall dramatically.

    Based on a sample of 450 SKUs, DataWeave discovered that egg prices in the U.S. fell by 6.7% between April 2023 and April 2024, dipping to its lowest (-12.6%) in December 2023.

    Egg Price Chart: Egg Prices USA Going Down 98.95% between April 2023 and April 2024

    So, what’s causing the decrease in egg prices?

    The Rise and Fall of Egg Prices: A Recent History

    In 2022, avian influenza severely impacted the United States. The disease affected wild birds in nearly every state and devastated commercial flocks in approximately half of the country.

    The 2022 incident was the first major outbreak since 2015 and led to the culling of more than 52.6 million birds, mainly poultry, to prevent the disease from spreading uncontrollably.

    With almost 12 million fewer egg-laying hens, the United States produced around 109.5 billion eggs in 2022 — a drop of nearly two billion from the previous year.

    Consequently, the cost of eggs soared, peaking at $4.82 a dozen — more than double the price of eggs in the previous year.

    The avian flu continues to affect egg-laying hens and other poultry birds across the United States. As of April 2024, farms have killed a total of 85 million poultry birds in an attempt to contain the disease.

    Despite the disease’s effects, production facilities have made significant efforts to repopulate flocks, leading to a steady increase in supply – and a much anticipated decrease in egg prices.

    According to the U.S. Bureau of Labor Statistics, there was an increase in producer egg prices in 2022, reaching a peak in November 2022, at which point they began to fall.

    Retailer’s egg prices followed suit. The egg price chart below depicts retailers’ declining egg prices over one year, from April 2023 to April 2024, with Giant Eagle showing the most significant price reductions and Walmart the least.

    Egg Price Chart Featuring Leading Retailers 2023-2024

    What Does the Future Hold for Egg Prices?

    The USDA reported recent severe avian flu outbreaks in June 2024. These outbreaks are estimated to have affected 6.23 million birds.

    With a reduction in egg-laying hens, egg prices are likely to increase — time will tell.

    Nonetheless, the annual per capita consumption of eggs in the U.S. is projected to reach 284.4 per person in 2024 from 281.3 per person in 2023. So for now, producers and retailers can rest assured of the growing demand for eggs.

    How Can Retailers Adapt to the Unpredictability of Egg Prices?

    Egg prices were down to $2.69 for a dozen in May 2024. However, they are still significantly higher than consumers were used to just a few years ago—eggs were, on average, $1.46 a dozen in early 2020.

    Additionally, while the avian flu puts pressure on producers, inflation and supply chain disruptions exert pressure on retailers.

    With such challenging egg market conditions, what can retailers do to maintain customer loyalty amid reduced consumer spending while maintaining profitability?

    1. Give the Customer What They Want: Increase Offerings of Organic, Cage-Free, and Free-Range Eggs

    As mentioned, Data Bridge Market Research’s trends and forecast report highlighted a significant increase in consumer health consciousness. Additionally, animal welfare increasingly influences consumers’ purchasing decisions when buying meat and dairy products.

    DataWeave data shows that the prices of organic, cage-free, and free-range eggs—such as those by brands like Happy Eggs and Marketside—have fallen less than those of non-organic, caged egg brands.

    Egg Price Chart Featuring Leading Egg Brand Prices 2023-2024

    2. Increase Private-Label Offerings

    Private labels typically offer retailers higher margins than national brands. These margins can shield consumers from sudden wholesale egg price swings, helping to preserve brand trust and consumer loyalty without sacrificing profitability.

    Moreover, eggs are particularly suited to private labeling, given their uniform appearance and taste and the lack of product innovation opportunities.

    Undoubtedly, this is why sales of private-label eggs dwarf sales of national egg brands in the United States. Statista reports that across three months in 2024, private label egg sales amounted to $1.55 billion U.S. dollars, while the combined sales of the top nine national egg brands totaled just $617.88 million U.S. dollars.

    3. Price Intelligently

    With the current and predicted fluctuations in egg prices over the foreseeable future, price competitiveness is paramount to margin management and customer loyalty.

    This is especially true when lower prices are the primary factor influencing the average consumer’s choice of supermarket for daily essentials purchases.

    AI-driven pricing intelligence tools like DataWeave give retailers valuable highly granular and reliable insights on competitor pricing and market dynamics. In today’s data-motivated environment, these insights are necessary for competitiveness and profitability.

    Final Thoughts

    Egg prices have fluctuated significantly due to the impact of avian flu. Despite recent price drops, future egg price increases are possible due to ongoing outbreaks. Retailers should adapt to unstable egg prices by increasing organic, free-range, cage-free, and private-label egg offerings while leveraging AI-driven pricing tools to maintain margins and customer loyalty.

    Speak to us today to learn more!

  • How Retailers and Brands Can Navigate Skyrocketing Olive Oil Prices in 2024

    How Retailers and Brands Can Navigate Skyrocketing Olive Oil Prices in 2024

    Olive oil, renowned for its complex flavor and myriad health benefits, holds a significant place in the global market, valued at $14.64 billion in 2023. It is anticipated to reach $19.77 billion by 2032, with a steady compound annual growth rate (CAGR) of 3.42%.

    This growth is fueled by:

    • Increased consumer demand for healthier oils.
    • Olive oil’s rising popularity in skincare products.
    • Greater retail availability.

    Interestingly, this market expansion occurs alongside rising olive oil prices, mainly due to a notable decrease in production. Eight European Union countries, which are the main producers, saw a dramatic drop in output from an average of 2.17 million tons to just 1.50 million tons in 2022—a 30.88% decline. Unfortunately, this drop in production comes as no surprise.

    Erratic weather patterns, rising temperatures, and exacerbating drought conditions in the Mediterranean basin have taken their toll. These climate changes disrupt the growing cycles of olive trees, leading to poorer crop yields and lower-quality olives.

    In the US, where olive oil constitutes 19% of all cooking oils sold and 40% of sales value due to its premium pricing, the market is expected to grow at an impressive CAGR of 11.31% between 2024 and 2032. This forecast is significant despite a recent dip in domestic consumption, which may further decline due to economic pressures. As a result, consumers must make difficult choices as they battle inflation, shrinkflation, and thin budgets.

    DataWeave’s Analysis of Rising Olive Oil Prices

    At DataWeave, we utilized our advanced AI-powered data aggregation and analysis platform to scrutinize the pricing trends of olive oils across key US retailers over the past year. Our analysis covered 130+ SKUs from major chains including Walmart, Kroger, Giant Eagle, and Target.

    The data revealed a notable escalation in olive oil prices, with consumers facing a sharp 25.8% increase from April 2023 to April 2024.

    This trend of rising costs was consistent across all analyzed retailers. Specifically, Walmart and Giant Eagle each reported a substantial 30% increase in their olive oil prices over the past year. In contrast, Target and Kroger experienced somewhat more modest hikes, at 20% and 15% respectively.

    Further investigation into individual brands within our sample highlighted that no brand is immune to the impacts of the ongoing supply shortages. Walmart’s own Great Value brand saw an exceptional 60% surge in prices. Other prominent olive oil brands such as Carapelli, Terra Delysia, and Bertolli also faced significant price increases, ranging from 20% to 50%.

    This across-the-board rise in prices underscores the widespread effect of supply constraints on the olive oil market, affecting both premium and private label brands alike.

    What Strategies Can Retailers and Brands Employ?

    In a market where consumer preferences and price sensitivities are rapidly evolving, retailers and brands must adopt versatile strategies without compromising on profit margins.

    Diversifying Brand Selection

    Retailers can enhance their appeal by offering a diverse range of olive oil brands, thereby stimulating competition among brands based on price, quality, innovation, and customer satisfaction. A well-curated selection that includes well-known brands like Filippo Berio and Bertolli, alongside emerging labels such as Terra Delyss, and premium options like Carapelli, allows retailers to meet a wide array of consumer preferences and budgets.

    For premium outlets, it might be beneficial to introduce more economical options than typically offered to attract budget-conscious consumers. Employing advanced assortment intelligence tools can provide retailers with crucial data, helping them make informed decisions about which brands to stock and promote, ensuring they meet consumer demand effectively while managing inventory costs.

    Data-driven Pricing

    With rising olive oil prices, competitive pricing is more crucial than ever. Retailers must strive to balance competitiveness with margin preservation. It’s essential for retailers to not just passively respond to market price increases but to actively ensure that their offerings are competitively priced relative to the market.

    This involves using sophisticated pricing intelligence tools, such as those provided by DataWeave, which track market trends and competitor pricing actions. These tools enable retailers to implement dynamic pricing strategies that respond promptly to market conditions and consumer demand shifts, helping to optimize sales and profitability.

    Diversifying Sourcing

    The traditional powerhouses of olive oil production, Spain and Italy, are now facing stiff competition from countries like Turkey and Tunisia. This shift is influenced by various factors, including currency fluctuations and changing trade policies, such as the imposition of tariffs on European olive oils by significant importers like the US. Retailers can take advantage of these changes by diversifying their sourcing strategies to include olive oil from non-traditional regions.

    The 2022/2023 season saw remarkable production levels from countries outside the Mediterranean basin, with Iran and China setting new production records. By broadening their supply chains to incorporate these emerging markets, retailers can benefit from lower production costs and introduce unique products to their consumers, enhancing both competitiveness and profit margins.

    Double Down on Private Labels

    Large retailers have successfully used their scale to develop strong private-label brands that can buffer consumers from price hikes in the olive oil market. By focusing on expanding and promoting their private-label offerings, retailers can provide cost-effective alternatives to national brands.

    Private labels generally have lower price points, making them particularly attractive during times of economic pressure and market volatility. Additionally, the development of private labels allows retailers to control more of their supply chain, from pricing to packaging, enabling them to offer high-quality products at competitive prices, thereby retaining customer loyalty and enhancing market share.

    Navigating Market Pressures

    High olive oil prices impact the entire supply chain, presenting varied challenges and opportunities:

    • Producers benefit from higher revenues but face increased pressure to maintain quality and yields in challenging climates. Adapting to these conditions with sustainable practices is crucial.
    • Exporters and Importers navigate tighter margins and greater risks due to tariffs and volume restrictions, requiring agility and strategic planning to adapt to market changes.
    • Retailers must carefully balance competitive pricing with rising procurement costs, affecting consumer affordability and potentially leading to shifts in buying patterns.
    • Consumers may seek cheaper alternatives or reduce their olive oil consumption, which influences overall market demand and pricing stability.

    These dynamics underscore the necessity for retailers and brands to adopt innovative and proactive strategies to navigate the volatile olive oil market effectively. By focusing on adaptive pricing, diversified sourcing, and customer engagement, businesses can enhance their resilience and secure long-term success in this competitive landscape.

    To learn more, talk to us today!

  • 5 Must-Have Capabilities of Your Ideal Competitive Pricing Intelligence Solution

    5 Must-Have Capabilities of Your Ideal Competitive Pricing Intelligence Solution

    In the cutthroat world of retail, where razor-thin margins and fierce competition reign supreme, pricing becomes your secret weapon to driving sales. The magic bullet unlocks sales, attracts customers, and ultimately fuels your bottom line. But with ever-changing market trends and competitor tactics shifting constantly, effective pricing strategies become even more crucial.

    A recent Bain & Company study highlights this very point. 78% of respondents acknowledged that their pricing decisions could be improved, leaving significant revenue untapped. John Furner, President and CEO of Kroger, echoes this sentiment. In a press release announcing a new pricing strategy, he emphasized their commitment to “providing our customers with predictable, affordable prices on the products they need most.” This focus on transparent and consistent pricing reflects the growing importance of building trust with customers, where value goes beyond just the lowest price tag.

    The right pricing strategy can unlock a treasure trove of benefits for retailers, including attracting new customers, boosting sales, and ultimately increasing their bottom line.

    But here’s the challenge: keeping pace with market trends and competitor strategies requires constant vigilance. This is where an advanced, user-centric pricing intelligence tool comes into play. Retailers need a platform specifically designed to address their unique challenges. It should empower them to protect margins, create a seamless pricing process, and attract and retain price-sensitive customers. To help you navigate this landscape, we’ve identified the must-have capabilities of a pricing intelligence solution that will transform your pricing strategy and propel your business toward long-term success.

    1. Reliable and Accurate Data Collection

    Retailers need a competitive intelligence solution that goes beyond merely capturing information en masse from competitor sites. An ideal solution ensures that data is consistent, extensive, and highly accurate, with an added level of granularity. This is achieved through statistical process control methods for data quality assurance, enabling highly accurate data capture and processing.

    Such a platform should be capable of scraping data from various sources, including desktop sites, mobile sites, and mobile applications, as well as a variety of online platforms: aggregators, omnichannel retailers, delivery intermediaries, quick commerce platforms, D2C sites, and more. This versatility ensures that data is captured across any global region and in dozens of languages, making the system geography and language agnostic.

    DataWeave’s solution includes a fast and automated data source configuration system, enabling a swift setup of new web sources for data capture. This capability ensures that retailers can stay ahead of the curve as the market landscape and competitor strategies evolve.

    An effective competitive pricing intelligence solution allows retailers to move away from working with incomplete or inaccurate data and instead leverage a comprehensive information stream to create strategic pricing decisions and optimize their overall business strategy. At the end of the day, the insights you base your decisions on are only as good as the data you aggregate. Even with the world’s best analytics engine, it’s always a case of “garbage in, garbage out.”

    2. Hyperlocal Insights From Store-Level Data

    Monitoring pricing and availability across specific stores is crucial for retailers to gain critical insights into a vast network of locations, enabling them to make strategic decisions that enhance pricing strategies and supply chain effectiveness, thereby minimizing stockouts or pricing inefficiencies in key markets. A platform like DataWeave provides retailers with a comprehensive view of store-level data across ZIP codes, maintaining a hyperlocal competitive strategy. It offers detailed visibility into product availability, highlighting out-of-stock scenarios across different competitors. This capability is invaluable, allowing quick identification of price improvement opportunities and providing retailers with a bird’s eye view of where products can be priced higher than usual to gain margins.

    The system operates at configurable intervals—daily, weekly, or monthly—enabling retailers to keep a vigilant eye on pricing, product availability, and delivery timelines based on the selected fulfillment option. Unlike many other providers who offer limited insights from a sample of stores, this solution delivers exhaustive analytics from every storefront. This comprehensive approach grants retailers (and brands) a strategic edge, facilitating efficient inventory tracking, precise pricing adjustments, and rapid responses to fluctuating market dynamics.

    3. Sophisticated, AI-Powered Product Matching

    A solution that matches products accurately at scale is essential for a robust and reliable competitive pricing strategy. Advanced platforms use unified systems for both text and image recognition to accurately match similar SKUs across thousands of eCommerce stores and millions of products. Deep learning architecture is employed to develop unique AI that matches text and images, grouping similar products based on their features, ensuring accurate matches even for private label products.

    This AI identifies critical elements of products in images, such as focusing on the top half of a model wearing a shirt, the sleeve length, the color of the product, etc.. Deep learning models, trained on extensive datasets of images, enhance these images by removing irrelevant background details and improving the quality of the core product image. Innovative AI then extracts unique signatures from the photos, allowing for quick and efficient identification and grouping of products across billions of indexed items.

    No matter how powerful the AI, combining it with human expertise is key to achieving true data veracity—ensuring accuracy, freshness, and comprehensive coverage required for reliable product matching. A human-in-the-loop approach elevates the AI-powered product matching process by addressing key challenges. AI algorithms may initially identify product matches with 80-90% accuracy, but human validation corrects errors, pushing accuracy closer to 100%. Humans apply contextual judgment for subjective criteria like aesthetics and design, making nuanced decisions that quantitative rules might miss. Continuous learning through an iterative feedback loop allows AI models to quickly adapt to changing trends and preferences as human experts provide context and re-label incorrect predictions. By integrating AI’s automation and scale with human validation, judgment, and knowledge curation, pricing intelligence solutions can achieve the accuracy and coverage necessary for actionable competitive pricing insights.

    This approach results in retailers being able to match products and compare prices between identical products, similar products, and private label brands.

    4. Unit of Measure Normalization

    Effective product matching and grouping are crucial for maintaining competitive pricing, but this requires a tech stack that can normalize units of measure across various sites. For example, a 10.75oz can of chicken noodle soup priced at $3 may seem cheaper than a 12.90oz can priced at $3.20, but this isn’t always the case. Initially, the larger package might appear more expensive, but when prices are compared based on the same unit amount, it often offers better value. Therefore, it is essential for retailers to standardize units to accurately compare prices. Advanced technology goes beyond simply matching products; it ensures accurate comparisons by normalizing unit measurements, including weight, quantity, and volume—crucial factors for establishing a clear pricing picture across competitors.

    Imagine comparing soup prices regardless of whether they are advertised in ounces, milliliters, or liters. By normalizing unit measurements, retailers can develop tailored pricing strategies on a level playing field, eliminating the risk of being misled by seemingly lower prices that conceal smaller quantities. Unit normalization allows retailers to uncover hidden value propositions by accurately determining the cost per unit, enabling them to set competitive prices, highlight the true value of their products, and make data-driven decisions.

    5. Ease of Actionability

    The most valuable insights are ineffective if they cannot be easily accessed and acted upon. Imagine a solution that not only provides industry insights but also customizes alerts and dashboards to show exactly how your prices compare to competitors in your specific categories and product groupings. An ideal solution would offer all this in one centralized platform, giving retailers easy access to data through intuitive dashboards, seamless data export options, and flexible API integrations. This enables a smooth, effortless process for adopting and utilizing the platform.

    Ease of use and actionable insights should be at the core of such a solution. A SaaS-based web portal can provide businesses with access to insights through user-friendly dashboards, detailed reports, and impactful visualizations. Customized insights tailored for each persona within the organization facilitate swift actions on relevant competitive intelligence. Whether it’s day-to-day tactical recommendations or inputs for long-term strategies, the platform should ensure that all insights are easily consumable and actionable.

    Moreover, the data should be accessible using plug-and-play APIs, enabling businesses to integrate external data with their internal pricing or ERP systems and BI tools. This integration generates predictive intelligence, enhances decision-making, and drives more robust business outcomes.

    Choosing the Right Pricing Intelligence Solution Will Determine Your Success

    Retailers need to leave behind generic pricing intelligence tools. For true success, retailers need a solution built to tackle their specific challenges. With capabilities like comprehensive data collection capturing granular details across regions and languages, local insights into store-level data for informed decision-making, accurate price comparisons with unit normalization, and access to actionable insights, retailers gain a complete and holistic picture of the pricing landscape, setting them up for success. Additionally, AI-powered and human-aided product matching ensures accurate competitor analysis

    These are just some of the essential capabilities DataWeave offers to retailers. By prioritizing these, retailers can transform their pricing strategy into a profit-generating machine, keeping them ahead of the curve and exceeding customer expectations in a competitive market to help them stay at the forefront of their categories.

    To learn more, talk to us today!

  • 6 Common Pricing Intelligence Challenges Retailers Face (And How to Overcome Them)

    6 Common Pricing Intelligence Challenges Retailers Face (And How to Overcome Them)

    When your product pricing is sub-optimal, you leave money on the table. This is especially significant for eCommerce retailers who must contend with their consumers ‘shopping around’ for the best price before making a purchase. All eCommerce retailers experience some amount of cart abandonment. In fact, the average cart abandonment rate is estimated at 70.19%, and the reason is often that customers find a better price elsewhere, whether at other online stores or in traditional brick-and-mortar ones.

    If you want to win the business of price-sensitive shoppers, you need a robust pricing strategy to keep up with changing competitor pricing. That’s one reason (among others) that retailers rely heavily on pricing intelligence solutions. With the right pricing intelligence solution, retailers can stay on top of market shifts, manage profit margins, maintain price perception, and of course, price their products competitively.

    Unfortunately, adding a new pricing intelligence solution to a retailer’s tech stack is not without its challenges. But the good news is there are ways to overcome them.

    In this post, we’ve rounded up six challenges most commonly cited by retailers and proposed strategies to overcome them. So if you’re considering a pricing intelligence solution that can get you closer to your business goals, read on to learn more.

    1. Scalability Constraints

    As access to the internet has expanded globally, the ratio of brick-and-mortar sales compared with eCommerce continues to narrow. A natural consequence of this is that more shoppers than ever before now browse and buy across diverse web environments, including mobile apps.

    This means that retailers need to track pricing across not just websites and physical stores, but also across mobile apps — a sales channel that was largely sidelined before.

    Modern pricing intelligence solutions need to consolidate data from:

    • Online storefronts
    • Mobile apps


    … and also from delivery channels, which often have different assortments and pricing:

    • Standard home delivery
    • Expedited, same-day home delivery
    • Buy online, pickup in-store (BOPIS)
    • Subscription
    • Curbside pickup


    In this context, imagine having to track the pricing of millions of SKUs compared against dozens of competitors each day. When new channels and devices are added, many pricing intelligence solutions in the market are unable to handle such data complexity and scale. They’re not built to continually grow and expand to meet changing needs. Even worse, some retailers opt for homegrown DIY systems, which struggle to keep the datasets updated, accurate, and current—activities that require significant cost and human effort.

    How DataWeave Bridges This Gap:

    What you need is a platform that can track millions of SKUs across dozens of competitors and geographies. No matter where the data is coming from or how vast the demand for the product is, an ideal solution should be able to synthesize huge amounts of complex data and generate meaningful insights.

    Your competitors are continually changing their eCommerce setup, whether through subtle changes to their product attribute listings or broader changes to domains or apps. With DataWeave’s pricing intelligence solution designed to scale up as required, you never need to worry about the backend flexing to accommodate changes.

    2. Inability to Match Products Without Clear UPC/EAN Identifiers

    Another problem with many pricing intelligence solutions is their inability to match products if a UPC/EAN identifier is missing. Often, a competitor will list an identical product on their storefront and omit any clear identifiers. On Amazon, an ASIN might be listed or you might be able to bring in a DPCI from Target.com. However, without clear identifiers across eCommerce platforms, retailers struggle to aggregate every instance of the products, and as a result, are unable to achieve accurate pricing comparisons. They often face this challenge when they work with commoditized web scraping service providers who have very limited expertise or experience in refining the data into meaningful insights.

    How DataWeave Bridges This Gap:

    If you can’t match UPC/EAN codes, you need a solution that leverages artificial intelligence to match products based on other variables, such as product titles, descriptions, and images. AI, in combination with human expertise, can take on the task at a speed and accuracy that would be unfeasible for humans alone.

    Artificial Intelligence is constantly learning and improving. At DataWeave, we accelerate this process by introducing new scenarios and datasets for the product to continually learn from. At the outset, our AI product matching is roughly 80-90% accurate every time. To improve this number to over 95%, we introduce human validation and nuanced judgments. Over the years, this feedback loop has continued to refine its algorithms, resulting in near-perfect data accuracy for retailers.

    Our solution uses AI built on more than ten years of data to perform robust product matching for retailers at a massive scale. Using a unified platform with text and image recognition, DataWeave matches products from among hundreds of eCommerce websites and across millions of products.

    3. Poor and Inconsistent Data

    Retailers often complain that the data within their pricing intelligence solution isn’t accurate, is inconsistent, and may even be comprised of statistical smoothing and gap-plugging smokescreens. The root of this problem often lies in the inability of these tools to consistently track prices across diverse web environments. Poorly designed web scraping infrastructure fail when eCommerce websites change their underlying configuration and structure (which happens periodically). As a result, they don’t have enough data to see the market as a whole, and end up viewing synthetic or small sample-set data.

    How DataWeave Bridges This Gap:

    At DataWeave, transparency drives our approach to delivering insights. We only present real-world data in our data feeds and dashboards to customers. This is possible only due to the supreme confidence we have in our ability to consistently capture and present accurate data. We achieve this by using a combination of AI and sophisticated web scraping infrastructure developed and enhanced over a decade.

    In fact, we are the first in the industry to launch a Data Statistics Dashboard that helps our customers scrutinize match rates, track data freshness, highlight any gaps in the data, and manage product matches independently.

    4. Limited Integration Options with Internal Systems

    Too often, a retailer will select a pricing intelligence solution that promises exceptional insights but then fails to offer a manageable workflow for day-to-day use. This usually happens because it doesn’t integrate with the retailer’s existing tech stack.

    Without a convenient process that connects internal systems, your pricing intelligence solution is just another piece of technology that your team does not use to its full potential. You may require your competitor pricing data to flow into price optimization tools, price management tools, BI tools, ERP systems, or revenue management systems. Without this capability, you’ll see limited ROI and underwhelming results because all the insights in the world are of little use if you can’t consume them easily and put them into action.

    How DataWeave Bridges This Gap:

    At DataWeave, we understand the importance of being able to integrate external data with your internal tech stack. Our data can be accessed and extracted using plug-and-play APIs, enabling businesses to combine their external and internal data to generate predictive intelligence.

    We also have other data feeds ready to be integrated, including FTP and Amazon S3. Our integration experts can work with you to create custom integrations to existing internal pricing platforms. Our ultimate goal here is to seamlessly elevate your pricing intelligence strategy with minimal change management.

    5. Limited Custom Analysis Capabilities

    Every retailer is unique. There are various geographies, languages, markets, product categories, and pricing strategies that differentiate one retailer from the next. Many retailers find it challenging to derive actionable insights from their pricing intelligence solution because the analysis and customization capabilities are too limited.

    For example, some retailers might want to evaluate their competitiveness after applying coupons and promos to selling prices. Others may want to perform a one-time pricing analysis of just list prices across competitors. Some may want to view insights that help them take tactical decisions day-to-day, while others would like a historical view across multiple dimensions to help make strategic long-term pricing decisions.

    Without the ability to customize their views or the underlying data, retailers could feel restricted in their ability to drive meaningful impact with their pricing intelligence.

    How DataWeave Bridges This Gap:

    What you need are foundational dashboards, reports, and visualizations in a web portal that can be tailored to your business needs. Then, you need the expertise and guidance of a team of business analysts who can help you configure custom reports and dashboards.

    At DataWeave, we offer bespoke insights for each persona, enabling swift actions on relevant competitive intelligence. These include day-to-day tactical recommendations or inputs for long-term strategies. And because all DataWeave customers get access to our team of expert analysts, it’s simple and straightforward to configure unique reports and dashboards to suit your business.

    6. Sloppy Support

    No solution, at least not one that undertakes complex work, works optimally with a ‘set it and forget it’ approach. From time-to-time, you need human intervention to ensure your pricing intelligence is working in the way that it needs to for you. Unfortunately, one of the most common challenges retailers face with their pricing intelligence tool is a lack of support.

    Unavailable or patchy customer support is a significant challenge that can result in low confidence, delayed resolutions, and even abandoned pricing actions.

    How DataWeave Bridges This Gap:

    Dataweave’s global team of pricing experts are available around the clock for support and guidance. Not only do we have tech experts and business analysts that you can consult at any point, we also have an exceptional team of customer success professionals to help you overcome any technical and strategic issue you might face.

    As one customer puts it, with DataWeave you gain access to: “Excellent customer service, super collaborative staff, user-friendly interface.”

    Another verified user from the consumer goods industry had this to say:

    “Great platform and customer service! Our client service team is very helpful and always responds to ad-hoc requests in a very timely matter!”

    Read more reviews from real DataWeave users on G2: https://www.g2.com/products/dataweave/reviews

    Finding The Right Pricing Intelligence Solution

    As the competition heats up, retailers need to unlock every available opportunity to gain an edge and capture market share. At DataWeave, our AI-powered pricing intelligence software helps you uncover gaps quickly and build a pricing strategy that is as attractive as it is effective. Our ability to scale, match your products across the entire ecosystem with consistent accuracy, and slide right into your current operations to provide advanced analytics, makes us the preferred choice for many of the world’s leading retailers.

    Want to start benefiting from actionable product matching and pricing intelligence? Request a demo today.

  • Cinco de Mayo 2024 Pricing Insights: An Analysis of Discounts Amid Inflation

    Cinco de Mayo 2024 Pricing Insights: An Analysis of Discounts Amid Inflation

    Cinco de Mayo is a vibrant celebration of Mexican-American and Hispanic heritage, marked by lively parades, festive tacos, and refreshing tequila across North America. For the service industry, brands, and retailers, this day offers a golden opportunity to roll out enticing promotions on beloved Mexican foods and beverages, drawing in large crowds and boosting sales.

    Americans love to indulge in Mexican cuisine during Cinco de Mayo. Take avocados, for example: despite inflation, avocado sales soared to 52.3 million units this year, marking a 25% increase from last year, according to the Hass Avocado Board’s 2023 Holiday Report. Such festive events see a significant sales spike, largely driven by appealing discounts and special offers.

    So, what discounts did retailers roll out this Cinco de Mayo?

    At DataWeave, our cutting-edge data aggregation and analysis platform tracked and analyzed the prices and deals on Mexican food and alcohol products offered by leading retailers. Our in-depth analysis sheds light on their pricing competitiveness during Cinco de Mayo, revealing how pricing strategies differed across various subcategories and brands.

    We conducted a similar analysis in 2022, allowing us to compare the prices of identical products this year versus last year. This comparison helps us understand the impact of inflation over the past two years on the prices offered today.

    Our Methodology

    For our analysis, we monitored the average discounts offered by major US retailers on over 2,000 food and beverage products during Cinco de Mayo, as well as in the days leading up to the event. Many retailers kick off their Cinco de Mayo promotions a week before, so we included the entire week leading up to May 5th in our analysis.

    Key Details:

    • Number of SKUs: 2000+
    • Retailers Analyzed: Target, Amazon Fresh, Safeway, Walmart, Total Wines & More, Sam’s Club, Meijer, Kroger
    • Categories: Food, Alcohol
    • Analysis Period: April 28 – May 5

    To truly demonstrate the value of Cinco de Mayo for shoppers, we concentrated on price reductions and additional discounts during the event. By comparing these with regular day discounts, we were able to highlight the genuine savings and benefits that Cinco de Mayo promotions offer to budget-conscious consumers.

    Our Findings

    Safeway led the pack with the highest average additional discount of 4.91%, covering 38.6% of their food inventory for Cinco de Mayo. Total Wine & More followed closely, offering an average discount of 3.46% across 70.8% of its tequila, whiskey, mezcal, and other spirit products during the Cinco de Mayo week.

    In contrast, Target provided minimal additional discounts, averaging just 0.8% over a small fraction (11.6%) of its SKUs. Similarly, Kroger’s additional discounts were also 0.8%, but they were spread across over 60% of its tracked products. Walmart (1.4%) and Amazon Fresh (1.2%) offered relatively conservative discounts during the sale period.

    During Cinco de Mayo, various brands rolled out attractive discounts to entice shoppers. Among beverage brands, The American Plains vodka led the way with the highest average discount of 20.80%. Coffee brands also joined the festivities with significant discounts: Death Wish Coffee at 14.30%, Dunkin’ at 11.10%, and Starbucks at 5.70%. Notably, Dunkin’ and Death Wish Coffee introduced complimentary beverages such as whiskey barrel-aged coffee and spiked coffee products to celebrate the event.

    In the wine category, Erath stood out with a 10% additional discount. However, brands like Jose Cuervo and Franzia offered more modest discounts of 0.70% and 1.80%, respectively.

    Food brands associated with traditional Mexican ingredients or products, such as tortillas, salsas, and spices, provided higher discounts compared to mainstream snack brands. For instance, McCormick (25%), El Monterey (13.3%), and La Tortilla Factory (16.7%)—known for ready-to-eat frozen foods, seasonings, and condiments—delivered the highest discounts. Other notable discounts included Jose Ole (12.5%), a frozen food brand, and Yucatan (8.3%), known for its guacamole.

    Safeway’s private label brand, Signature Select, offered a 5.20% discount. Additionally, Safeway provided deep discounts on brands like Pace, Herdez, and Taco Bell, indicating an aggressive discounting strategy. In contrast, brands closely associated with Mexican or Tex-Mex cuisine, such as Old El Paso, Mission, Rosarita, and La Banderita, offered relatively modest discounts ranging from 0.5% to 3.3%.

    The discount patterns varied between alcohol and food categories, with food brands generally offering higher discounts. This trend may be attributed to pricing being regulated in the alcohol industry. These differing discount levels highlight how brands navigated the balance between driving sales and maintaining profit margins during Cinco de Mayo, particularly in the context of inflation affecting costs.

    Impact of Inflation on Cinco de Mayo Prices (2024 vs 2022)

    To gauge the impact of inflation on popular Cinco de Mayo products, we analyzed the average prices at Walmart and Target between 2022 and 2024. These two retailers were chosen due to their prominence in the retail sector and the robustness of our sample data.

    At Walmart, the Tex Mex category saw the highest average price increase, rising by 22.51%. Other notable subcategories with significant price hikes include Condiments (23.21%), Vegetables/Packaged Vegetables (21.22%), and Lasagne (14.10%). Categories like Dips & Spreads (13.77%), Pantry Staples (14.92%), and Salsa & Dips (8.23%) experienced relatively lower increases.

    At Target, the Snacks subcategory had the steepest average price rise at 27.94%, followed by Meal Essentials (16.07%) and Deli Pre-Pack (8.82%). Categories such as Dairy (0.51%), Frozen Meals/Sides (7.11%), and Adult Beverages (7.41%) saw smaller price increases.

    Brands associated with traditional Mexican or Tex-Mex cuisine faced higher price hikes. Examples include Old El Paso (24.59% at Walmart, 8.70% at Target), Tostitos (35.44% at Walmart, 11.41% at Target), Ortega (30.59% at Walmart, 19.69% at Target), and Rosarita (14.39% at Walmart).

    In contrast, private label or store brands generally experienced lower price increases compared to national brands. For instance, Good & Gather (Target’s private label) saw a 9.55% increase, while Market Pantry (Walmart’s private label) had a 17.27% rise. This trend is understandable as retailers have more control over their costs with private label brands.

    The data clearly indicates that both Walmart and Target have significantly raised prices across various categories and brands, reflecting the broader inflationary environment where the cost of goods and services has been steadily climbing.

    Interestingly, we observed higher price increases at Walmart compared to Target. Although Walmart is renowned for its consumer-friendly pricing strategies, it too had to elevate grocery prices post-2022 to combat inflationary pressures. As consumers become more cost-conscious and reduce spending on discretionary items, Walmart and other retailers are now cutting prices across categories to align with shifting consumer behaviors.

    Mastering Pricing Strategies During Sale Events

    Our pricing analysis for Cinco de Mayo reveals compelling insights into the dynamics of retailer landscapes in the US. It highlights the enduring relevance of private label brands, even amidst fluctuating demand, showing the emergence of local, national, and small players vying for market share.

    As retailers navigate inflationary pressures and evolving consumer behaviors, understanding these pricing dynamics becomes crucial for optimizing strategies and bolstering market competitiveness. This analysis offers actionable intelligence for retailers seeking to navigate the intricate terrain of sale event promotions while addressing shifting consumer preferences and economic challenges.

    Access to reliable and timely pricing data equips retailers and brands with the tools needed to make informed decisions and drive profitable growth in an increasingly competitive environment. To learn more and gain guidance, reach out to us to speak to a DataWeave expert today!

  • Augmenting AI-powered Product Matching with Human Expertise to Achieve Unparalleled Accuracy

    Augmenting AI-powered Product Matching with Human Expertise to Achieve Unparalleled Accuracy

    In today’s expansive omnichannel commerce landscape, pricing intelligence has become indispensable for retailers seeking to stay competitive and refine their pricing strategies. The sheer magnitude of eCommerce, spanning thousands of websites, billions of SKUs, and various form factors, adds layers of complexity. Consequently, ensuring the accuracy and reliability of competitive insights presents a formidable challenge for retailers aiming to leverage pricing data effectively.

    At the core of any robust pricing intelligence system lies product matching. This process enables retailers to recognize identical or similar products across competitors. Once these matches are identified, tracking prices is a relatively more straightforward task, facilitating ongoing analysis and informed decision-making.

    Accurate matching is crucial for meaningful price comparisons and tailoring product assortments. The challenge is matching products is often complicated, especially for non-local brands, niche categories, or items lacking consistent global identifiers. It becomes even trickier when trying to match very similar but not identical products. A comprehensive approach that compares and analyzes multiple attributes like product titles, descriptions, images and more is essential.

    Artificial intelligence algorithms are commonly used to automate product matching, leveraging machine learning techniques to analyze patterns in images and text data. While AI can adapt and improve over time, the question remains: Can it fully address the complexities of product matching on its own?

    The reality is that many retailers still struggle with incomplete, inaccurate, or outdated product data, despite these AI-powered product matching solutions. This can lead to suboptimal pricing decisions, missed opportunities, and reduced competitiveness.

    Challenges in an ‘AI-only’ Approach to Product Matching

    While AI plays a vital role in automated product matching solutions, there are complexities that AI alone cannot fully address:

    Subjectivity in Matching Criteria

    Some product categories have subjective or hard-to-quantify criteria for determining similarity. AI learns from historical data, so it may struggle with nuanced aspects like:

    Aesthetics, style, and design: In the Fashion and Jewellery vertical, for example, products are matched according to attributes like style, aesthetics, design – all of which have some subjectivity involved.

    Quantity/packaging variations: In the grocery sector, variations in product packaging and quantities can introduce complexities that require subjective decision-making. For example, apples may be sold in different packaging like a 0.5 kg bag or a pack of 4 individual apples. Determining if these different packaging options should be considered equivalent often involves making a qualitative judgment call, rather than a clear-cut objective decision.

    Matching product sets: For categories like home furnishings, the focus is often on matching coordinated sets rather than individual items. For example, in the bedroom category, matching may involve grouping together an entire set of complementary furniture like a bed frame, dresser, and wardrobe based on their cohesive design and style. This goes beyond simply making one-to-one product associations, requiring more nuanced judgments about aesthetic coordination.

    Contextual Factor

    Products can have regional preferences, cultural differences, or evolving trends that impact how they are matched. AI may miss important context like Local/regional product names or distinct brand names across countries.

    For instance, in the image we see Sprite (in the US) is branded Xubei in China. Continuous human curation is needed to help AI adapt to this context.

    High Accuracy & Coverage Expectations

    Retailers rely on AI powered and automated pricing adjustments based on product matching for insight. To ensure that pricing recommendations and updates are accurate, accurate product matching is crucial. For this, simply identifying similar top results is not enough – the process must comprehensively capture all relevant matches. While AI excels at finding the top groupings with around 80% accuracy, even small matching errors can have significant consequences.

    As AI matching improves, customer expectations may rise even higher. If AI achieves 90% accuracy, for instance, SLAs may demand over 95%. Reaching such a high level of accuracy is very challenging for AI alone, especially when faced with incomplete data, contextual nuances, evolving trends, and subjective matching criteria across products and categories.

    The solution is to combine the power of AI with human expertise. This is the key to achieving true data veracity – the accuracy, freshness, and comprehensive coverage required for precise and reliable product matching.

    Human-in-the-Loop Approach for Elevated Product Matching

    Human intelligence and quality testing can elevate the AI powered product matching process by addressing key challenges:

    • Matching Validation: AI algorithms may identify product matches with 80-90% accuracy initially. Having humans validate these AI-suggested matches allows for correcting errors and pushing the accuracy close to 100%. As humans flag issues, provide context, and re-label incorrect predictions, it allows the AI model to learn and enhance its reliability for complex, high-stakes decisions.
    • Applying Contextual Judgment: For subjective matching criteria like aesthetics, design, and categorizing product sets, human discernment is needed. Humans can make nuanced judgments beyond just quantitative rules, ensuring meaningful apples-to-apples product comparisons. Their contextual understanding augments AI’s capabilities.
    • Continuous Learning Via Feedback Loop: Product experts possess rich category knowledge across markets. Integrating this human insight through an iterative feedback loop helps AI models quickly learn and adapt to changing trends, preferences, and context. As humans explain their match assessments, the AI continuously enhances its precision over time.

    By combining AI’s automation and scale with human validation, judgment, and knowledge curation, pricing intelligence solutions can achieve the accuracy and coverage demanded for actionable competitive pricing insights.

    DataWeave’s Data Veracity Framework: A Scalable Workflow Combining AI and Human Expertise

    Given the vast number of products, retailers, and brands that exist today, any product matching solution must be highly scalable. At DataWeave, we bring you such a scalable workflow to address these complexities by integrating human expertise with AI-driven automation. The image below outlines our approach for combining AI with human intelligence in a seamless, scalable workflow for accurate product matching:

    Retailers and brands can benefit in several ways with this workflow, as listed below.

    Several Rounds of Data Verification Due to Hierarchical Validation Teams

    The workflow employs a hierarchical validation team of Leads and Executives to efficiently integrate human expertise without creating bottlenecks. Verification Leads play a pivotal role in managing the distribution of product matches identified by DataWeave’s AI model to the Verification Executives.

    The Executives then meticulously validate these AI-suggested matches, adding any missing product associations and removing inaccurate matches. After validation, the matched product groups are sent back to the Leads, who perform random sampling checks to ensure quality.

    Throughout this entire workflow, feedback and suggestions are continuously gathered from both the Executives and Leads. This curated input is then incorporated back into DataWeave’s AI model, allowing it to learn and improve its matching accuracy on an ongoing basis.

    This hierarchical structure ensures that human validation seamlessly scales alongside the AI’s matching capabilities. Leveraging the respective strengths of AI automation and human expertise in an iterative feedback loop prevents operational bottlenecks while steadily elevating overall accuracy.

    Confidence-based Distribution of Matched Articles for Validation

    The AI model assigns confidence scores, differentiating high-confidence (>95%) and low-confidence matches. For high-confidence groups, executives simply remove incorrect matches – a quicker process. Low-confidence matches require more human effort in adding/removing matches.

    As the AI model improves over time with feedback, the share of high-confidence matches increases, making validation more efficient and swift.

    Automated, Standardized Process with Iterative Feedback Loop

    The entire workflow is standardized and automated, with verification metrics seamlessly tracked. At each step, feedback captured from both leads and executives flows back into the AI, enhancing its matching accuracy and coverage iteratively.

    DataWeave’s closed-loop system of AI automation with hierarchical human validation allows product matching to achieve comprehensive accuracy at a vast scale.

    Unleash the Power Accurate and Comprehensive Product Matching

    In summary, combining AI and human expertise in product matching is crucial for retailers navigating the complexities of omnichannel retail. While AI algorithms excel in automation, they often struggle with subjective criteria and contextual nuances. DataWeave’s approach integrates AI-driven automation with human validation, delivering the industry’s most accurate product matching capabilities, enabling actionable competitive pricing insights.

    To learn more, reach out to us today!

  • How DataWeave Enhances Transparency in Competitive Pricing Intelligence for Retailers

    How DataWeave Enhances Transparency in Competitive Pricing Intelligence for Retailers

    Retailers heavily depend on pricing intelligence solutions to consistently achieve and uphold their desired competitive pricing positions in the market. The effectiveness of these solutions, however, hinges on the quality of the underlying data, along with the coverage of product matches across websites.

    As a retailer, gaining complete confidence in your pricing intelligence system requires a focus on the trinity of data quality:

    • Accuracy: Accurate product matching ensures that the right set of competitor product(s) are correctly grouped together along with yours. It ensures that decisions taken by pricing managers to drive competitive pricing and the desired price image are based on reliable apples-to-apples product comparisons.
    • Freshness: Timely data is paramount in navigating the dynamic market landscape. Up-to-date SKU data from competitors enables retailers to promptly adjust pricing strategies in response to market shifts, competitor promotions, or changes in customer demand.
    • Product matching coverage: Comprehensive product matching coverage ensures that products are thoroughly matched with similar or identical competitor products. This involves accurately matching variations in size, weight, color, and other attributes. A higher coverage ensures that retailers seize all available opportunities for price improvement at any given time, directly impacting revenues and margins.

    However, the reality is that untimely data and incomplete product matches have been persistent challenges for pricing teams, compromising their pricing actions. Inaccurate or incomplete data can lead to suboptimal decisions, missed opportunities, and reduced competitiveness in the market.

    What’s worse than poor-quality data? Poor-quality data masquerading as accurate data.

    In many instances, retailers face a significant challenge in obtaining comprehensive visibility into crucial data quality parameters. If they suspect the data quality of their provider is not up to the mark, they are often compelled to manually request reports from their provider to investigate further. This lack of transparency not only hampers their pricing operations but also impedes the troubleshooting process and decision-making, slowing down crucial aspects of their business.

    We’ve heard about this problem from dozens of our retail customers for a while. Now, we’ve solved it.

    DataWeave’s Data Statistics and SKU Management Capability Enhances Data Transparency

    DataWeave’s Data Statistics Dashboard, offered as part of our Pricing Intelligence solution, enables pricing teams to gain unparalleled visibility into their product matches, SKU data freshness, and accuracy.

    It enables retailers to autonomously assess and manage SKU data quality and product matches independently—a crucial aspect of ensuring the best outcomes in the dynamic landscape of eCommerce.

    Beyond providing transparency and visibility into data quality and product matches, the dashboard facilitates proactive data quality management. Users can flag incorrect matches and address various data quality issues, ensuring a proactive approach to maintaining the highest standards.

    Retailers can benefit in several ways with this dashboard, as listed below.

    View Product Match Rates Across Websites

    The dashboard helps retailers track match rates to gauge their health. High product match rates signify that pricing teams can move forward in their pricing actions with confidence. Low match rates would be a cause for further investigation, to better understand the underlying challenges, perhaps within a specific category or competitor website.

    Our dashboard presents both summary statistics on matches and data crawls as well as detailed snapshots and trend charts, providing users with a holistic and detailed perspective of their product matches.

    Additionally, the dashboard provides category-wise snapshots of reference products and their matching counterparts across various retailers, allowing users to focus on areas with lower match rates, investigate underlying reasons, and develop strategies for speedy resolution.

    Track Data Freshness Easily

    The dashboard enables pricing teams to monitor the timeliness of pricing data and assess its recency. In the dynamic realm of eCommerce, having up-to-date data is essential for making impactful pricing decisions. The dashboard’s presentation of freshness rates ensures that pricing teams are armed with the latest product details and pricing information across competitors.

    Within the dashboard, users can readily observe the count of products updated with the most recent pricing data. This feature provides insights into any temporary data capture failures that may have led to a decrease in data freshness. Armed with this information, users can adapt their pricing decisions accordingly, taking into consideration these temporary gaps in fresh data. This proactive approach ensures that pricing strategies remain agile and responsive to fluctuations in data quality.

    Proactively Manage Product Matches

    The dashboard provides users with proactive control over managing product matches within their current bundles via the ‘Data Management’ panel. This functionality empowers users to verify, add, flag, or delete product matches, offering a hands-on approach to refining the matching process. Despite the deployment of robust matching algorithms that achieve industry-leading match rates, occasional instances may arise where specific matches are overlooked or misclassified. In such cases, users play a pivotal role in fine-tuning the matching process to ensure accuracy.

    The interface’s flexibility extends to accommodating product variants and enables users to manage product matches based on store location. Additionally, the platform facilitates bulk match uploads, streamlining the process for users to efficiently handle large volumes of matching data. This versatility ensures that users have the tools they need to navigate and customize the matching process according to the nuances of their specific product landscape.

    Gain Unparalleled Visibility into your Data Quality

    With DataWeave’s Pricing Intelligence, users gain the capability to delve deep into their product data, scrutinize match rates, assess data freshness, and independently manage their product matches. This approach is instrumental in fostering informed and effective decisions, optimizing inventory management, and securing a competitive edge in the dynamic world of online retail.

    To learn more, reach out to us today!

  • Black Friday Cyber Monday 2023: Unveiling Health & Beauty Pricing and Discount Trends

    Black Friday Cyber Monday 2023: Unveiling Health & Beauty Pricing and Discount Trends

    On Black Friday this year, Health & Beauty brands saw a significant increase with a 13% jump in foot traffic, according to a report by RetailNext. Despite caution from various sources, higher prices for everyday goods, and high interest rates, consumers chose to spend big this cyber week.

    So what kind of deals did top retailers and brands offer in the Health & Beauty category this BFCM? At DataWeave, we harnessed the power of our proprietary data aggregation and analysis platform to track and analyze the prices and deals of Health & Beauty products across prominent retailers to uncover unique insights into their price competitiveness this BFCM, as well as understand how pricing strategies varied across diverse subcategories and brands.

    Also check out our insights on discounts and pricing for Consumer Electronics, Apparel, and Home & Furniture categories this Black Friday and Cyber Monday.

    Our Methodology

    For this analysis, we tracked the average discounts among leading US retailers in the Health & Beauty category during the Thanksgiving weekend sale, including Black Friday and Cyber Monday. We noticed prices and discounts didn’t change significantly over the course of the weekend, and hence the average prices of products between the 24th and 27th of November are being reported. Our sample was chosen to encompass the top 500 ranked products in each product subcategory across leading retailers during the sale.

    • Sample size: 15,253 SKUs
    • Retailers tracked: Amazon, Walmart, Target, Sephora, Ulta Beauty
    • Subcategories reported on: Shampoo, Toothpaste, Conditioner, Sunscreen, Makeup, Electric Toothbrush, Beard Care, Moisturizer
    • Timeline of analysis: 24 to 27 November 2023

    Our Key Findings

    Average Discounts Across Retailers

    Amazon leads the pack with a huge margin, offering an average discount of 31.9%, covering 62% of its products analyzed. Target follows an 18.8% average discount across only 5% of its analyzed assortment. The other retailers aren’t even close.

    Ulta Beauty was the next in line, providing a 9.2% average discount followed by Walmart with a 6.8% average discount. Sephora, known for its premium beauty offerings, adopted a more conservative approach with a 3.5% average discount, targeting only 9% of its top products

    Across retailers, it is clear that Amazon led the charge by far this cyber week, with the other retailers choosing to markdown prices conservatively in the Health & Beauty category.

    Average Discounts: Subcategories

    Amazon offered high discounts on lower priced subcategories like Toothpaste (49.4%), Sunscreen (46.3%), Moisturizers (38.5%), and Conditioners (37.5%), highlighting its focus on products with high demand that consumers would look to stock up on. Ulta Beauty also focused its discounts on Toothpaste (15.6%), Moisturizers (14.9%), and Conditioners (12.6%), targeting skincare and grooming.

    Sephora, meanwhile, offered the most attractive deals on the Makeup subcategory at 5.3% across 12.67% of its analyzed assortment, banking on the demand generated due to the brand’s popularity in this subcategory.

    Target prioritized discounts on Toothpaste (22.5%), Shampoo (21.6%), and Moisturizers (18.9%). Walmart too offered significant discounts on Shampoo (21.6%) and Toothpaste (22.5%).

    Retailers prioritized staple subcategories like Toothpaste and Moisturizer with substantial discounts during this Black Friday Cyber Monday, ensuring a broad consumer appeal. In contrast, discretionary items like Makeup may be less motivated by discounts alone, and hence saw lower discounts during the sale.

    Average Discounts: Brands

    Brands offered the most attractive deals on Amazon, with OGX leading the pack at 58.4% average discount. Neutrogena and Colgate followed with an average discount of 50.4% and 44%. This mirror’s Amazon’s subcategory focus on shampoos, conditioners, and toothpastes.

    Other instances of brands offering attractive deals across retailers include Belif (27.9%) and Anastasia Beverly Hills (17.6%) on Sephora, Johnson’s (20%) and Philips Sonicare (18.8%) on Target, and Olay (12.2%) and Colgate (10.6%) on Walmart.

    Ulta Beauty hosted several attractive deals by specific brands, including Moon (30.7%), Joico (24%), and Clinique (22.3%).

    Share of Search For Health & Beauty Brands Across Subcategories

    Our Share of Search analysis illuminates the strategic moves made by brands to enhance their visibility, playing a crucial role in influencing consumer choices during Black Friday and Cyber Monday.

    Among some of the leading brands, Head & Shoulders and Oral-B increased their Share of Search by 2.3% and 1% respectively, reflecting a successful strategy to boost brand visibility during the Black Friday and Cyber Monday shopping events. On the other hand, L’Oreal Paris, Colgate, and Neutrogena faced marginal decreases in Share of Search.

    Overall, since the difference in Share of Search values did not change dramatically, the visibility levels of leading brands across key subcategories remained consistent during the Thanksgiving weekend.

    For deeper insights on pricing and discounting trends across a diverse range of shopping categories during Black Friday and Cyber Monday, check out our blog!

    To learn more about our AI-powered Pricing Intelligence and Digital Shelf Analytics platform, contact us today!

  • Black Friday Cyber Monday 2023: Insights on Pricing and Discounts in Home & Furniture

    Black Friday Cyber Monday 2023: Insights on Pricing and Discounts in Home & Furniture

    Insider Intelligence‘s forecast of a 4.5% growth in US Holiday Sales this year has been validated by the sustained robust spending observed during Black Friday and Cyber Monday. Despite multiple challenges impacting consumer spending, such as escalating prices of everyday products and elevated interest rates, shoppers continued to spend significantly, aligning with these earlier predictions.

    However, in response to these projections, retailers strategically adjusted their approach. Our analysis indicates substantial discounts prevalent in the Consumer Electronics and Home & Furniture segments during Cyber Week. Prominent retailers specializing in Home & Furniture, such as Wayfair, Overstock, and Home Depot, notably led the charge in offering attractive discounts.

    At DataWeave, we harnessed the power of our proprietary data aggregation and analysis platform to track and analyze the prices and deals of home & furniture products across prominent retailers to uncover unique insights into their price competitiveness this BFCM, as well as understand how pricing strategies varied across diverse subcategories and brands.

    We’ve also recently published our analysis of the Consumer Electronics and Apparel categories this Black Friday and Cyber Monday.

    Our Methodology

    For this analysis, we tracked the discounts offered by leading US retailers in the Home & Furniture category during the Thanksgiving weekend sale, including Black Friday and Cyber Monday. We noticed prices and discounts didn’t change significantly over the course of the weekend, and hence the average prices of products between the 24th and 27th of November are being reported. Our sample was chosen to encompass the top 500 ranked products in each product subcategory across leading retailers during the sale.

    • Sample size: 44,716 SKUs
    • Retailers tracked: Amazon, Walmart, Target, Best Buy, Overstock, Wayfair, Home Depot
    • Subcategories reported on: Dishwasher, Washer/Dryer, Mattresses, Beds, Dining Tables, Entertainment Units, Rugs, Luggage, Bookcases, Cabinets, Sofas, Coffee Tables
    • Timeline of analysis: 24 to 27 November 2023

    Our Key Findings

    Discounts Across Retailers

    Wayfair led the pack with the highest average discount of 27.5%, covering an impressive 88% of its Home & Furniture inventory. This bold strategy positions Wayfair as a go-to destination for consumers seeking substantial savings on high-quality Home & Furniture items during Black Friday and Cyber Monday.

    Home Depot offered an average discount of 17.5%, covering a substantial 69% of the products analyzed, choosing to cash in on the Cyber Week madness. Overstock followed next with an average discount of 16.6%.

    Interestingly, Home & Furniture happens to be one of the few categories in which Amazon did not offer the highest discount among the analyzed retailers, choosing a moderate average discount of 13.8%.

    Best Buy also maintained a competitive stance in the category, providing an average discount of 12.8% across 58% of their assortment. Target adopted a conservative markdown strategy, offering a relatively low average discount of 6.5%.

    In summary, the Home & Furniture category exhibited a diverse range of discounting strategies among retailers, reflecting a balance between competitiveness and profit margins. Consumers could have chosen from a spectrum of discounts based on their preferences and budget considerations during Black Friday and Cyber Monday.

    Average Discounts: Subcategories

    Among subcategories, Amazon offered a moderate 8.3% average discount on 32.9% of its products in this Dishwasher category, while Best Buy took a more aggressive stance with a 14.7% average discount covering 55.9% of its products.

    Home Depot emerged as a standout player in the Washer/Dryer category, providing a substantial 21.3% discount on 78.4% of its analyzed inventory. Best Buy closely followed with a 15.1% average discount targeting 67.6% of its products.

    Wayfair grabbed attention with a generous 36.9% average discount on Mattresses, covering almost all (99%) of its analyzed products. In addition, Wafair led the discount war in Beds, Dining Tables, Cabinets, Sofas, Coffee Tables, and Entertainment Units. Overstock took an aggressive pricing stance on Rugs, offering a substantial 52.3% average discount, covering 100% of its Rugs inventory.

    Average Discounts: Brands

    Among brands, Signature Design by Ashley maintained a consistent presence with substantial discounts on both Best Buy (25.24%) and Overstock (16.19%). This could be indicative of the brand’s commitment to appealing to a diverse customer base through varied retail channels. Costway emerges as a standout brand offering exceptionally high discounts at both Target (61.6%) and Walmart (51.7%).

    Home Decorators Collection, Home Depot’s in-house brand, offered a significant 30.9% discount at Home Depot. High-margin private label brands like these afford retailers the opportunity to offer markdowns while retaining significant margins.

    Strategic positioning on specific platforms, as seen with Alwyn Home on Wayfair and Noble House at Home Depot, suggests brands tailor their approach to the strengths and customer demographics of each retailer. The data suggests a nuanced interplay between brand positioning, discount strategies, and the perceived value offered.

    Share of Search For Home & Furniture Brands

    The Share of Search data for the Home & Furniture category unveils intriguing insights into brand visibility and performance during the Black Friday and Cyber Monday events. In this competitive landscape, where consumer decisions are influenced not only by discounts but also by brand visibility, the dynamics of Share of Search become pivotal.

    Samsung strategically increased its Share of Search during the sale, showcasing a 1.2% improvement. This suggests a deliberate effort to reinforce brand visibility and capture the attention of potential buyers actively searching for Home & Furniture products, in this case, Washer/Dryers and Dishwashers.

    Bosch too experienced a notable surge in Share of Search by 1.1%. LG, meanwhile, maintained a consistent Share of Search, with a marginal decrease of 0.1%. American Tourister experienced a modest increase in Share of Search by 0.4%.

    Like in the other categories analyzed, the dynamics of Share of Search in the Home & Furniture category reflect brand strategies aimed at not only offering discounts but also ensuring heightened visibility during the critical Black Friday and Cyber Monday shopping events. Positive shifts indicate effective marketing efforts, while stable performers demonstrate a resilient brand presence in a competitive online marketplace.


    To explore how our insights can help retailers and brands boost their pricing strategies during sale events, reach out to us today!

    For more in-depth analyses and trends across various shopping categories, stay tuned to our blog.

  • Black Friday Cyber Monday 2023 Insights: A Report on Pricing and Discounts in Apparel

    Black Friday Cyber Monday 2023 Insights: A Report on Pricing and Discounts in Apparel

    As the highly anticipated shopping season approached, industry analysts, including Deloitte, had forewarned consumer spending caution owing to persistent inflationary pressures tightening budgets. Despite these concerns, the holiday spirit was buoyed by sensational deals that delighted bargain-hunting shoppers.

    According to the National Retail Federation (NRF), over 200 million consumers participated in both in-store and online shopping activities over the Thanksgiving weekend. This marked an almost 2% uptick from the previous year, surpassing the NRF’s initial estimates of 182 million and showcasing a robust start to the holiday shopping season.

    So what was all the hype about this Black Friday and Cyber Monday? How did top retailers react to reports of possibly decreased consumer spending? At DataWeave, we harnessed the power of our proprietary data aggregation and analysis platform to track and analyze the prices and deals of products across prominent retailers and categories to uncover unique insights into their price competitiveness this BFCM, as well as understand how pricing strategies varied across diverse subcategories and brands.

    In this article, we focus on the pricing and discounting strategies of Amazon, Walmart, and Target in the Apparel category.

    (Read Also: Black Friday Cyber Monday 2023: Insights on Pricing and Discounts in Consumer Electronics)

    Stay tuned to our blog for insights on other shopping categories like Home & Furniture, and Health & Beauty!

    Our Methodology

    For this analysis, we tracked the average discounts of apparel products among leading US retailers during the Thanksgiving weekend sale, including Black Friday and Cyber Monday. We noticed prices and discounts didn’t change significantly over the course of the weekend, and hence the average prices of products between the 24th and 27th of November are being reported. Our sample was chosen to encompass the top 500 ranked products in each product subcategory across during the sale.

    • Sample size: 17,981 SKUs
    • Retailers tracked: Amazon, Walmart, Target
    • Subcategories reported on: Women’s Tops, Men’s Swimwear, Men’s Innerwear, Women’s Innerwear, Women’s Athleisure, Women’s Dresses, Men’s Athleisure, Men’s Shirts, Women’s Shoes, Men’s Shoes, Women’s Swimwear
    • Timeline of analysis: 24 to 27 November 2023

    Our Key Findings

    Average Discounts Across Retailers

    Amazon offered the most attractive deals, showcasing an average discount of 19.5%, applying to a substantial 61% of their apparel inventory.

    Trailing closely behind was Target, offering an average discount of 14.8% across 52% of the products analyzed. Walmart, however, took a more conservative approach, providing an average discount of 8.5%, applicable to 29% of its products.

    The contrast in discounting strategies highlights the diverse tactics employed by retailers to entice Black Friday and Cyber Monday shoppers within the Apparel category. Amazon remains the forerunner, balancing competitive discounts with a significant coverage of discounted items.

    Target follows suit with a competitive stance, while Walmart opts for a more reserved markdown approach, given that the retailer tends to carry a large number of products in the affordable price ranges.

    Average Discounts: Subcategories

    Examining the Black Friday and Cyber Monday discount landscape within the Apparel category reveals intriguing patterns among major retailers. Amazon led the charge, boasting an impressive 24.9% average discount on Women’s Tops, covering a substantial 76.5% of its products. In the same subcategory, Target competed fiercely with a 25.1% average discount, covering 87.5% of its products. Walmart, taking a measured approach, presented a 14.6% average discount across 45.1% of its Women’s Tops inventory.

    Notably, Men’s Swimwear at Target has no discounts. Meanwhile, Amazon remained aggressive across various subcategories, particularly in Women’s Shoes and Women’s Tops, aiming to capture a significant market share through both competitive pricing and a broad coverage of discounted items.

    Average Discounts: Brands

    Across brands, Tommy Hilfiger and Jockey took the lead on Amazon with an enticing average discount of 28.3% and 24.6% respectively, appealing to savvy shoppers. Calvin Klein followed closely with a 17.3% discount, offering a balance of style and affordability.

    In Walmart, Crocs stood out with a 39.9% average discount, followed by Reebok (15.7%) and Hanes (14.9%) Xhilaration, Target’s in-house brand, stole the spotlight on the retailer platform with an impressive 50% average discount. Reebok (32.3%) and Levi’s (22.9%) maintained competitive discounts, appealing to diverse tastes.

    Our analysis sheds light on the dynamic landscape of apparel discounts, showcasing how brands adopt varying pricing strategies to position themselves competitively for Black Friday and Cyber Monday shoppers.

    Share of Search For Apparel Brands Across Subcategories

    The dynamics of Black Friday and Cyber Monday extend beyond price reductions, with brands strategically vying for increased visibility through Share of Search metrics. This metric signifies a brand’s prominence among the top 20 ranked products in a given subcategory, offering valuable insights into their online marketplace visibility.

    Among the standout performers in the Apparel category, Jockey experienced a significant surge in Share of Search, leaping from 1.70% before the event to an impressive 13.30% during the Black Friday and Cyber Monday sales. Speedo, in the Women’s Swimwear subcategory, demonstrated a substantial increase from 4.40% to 13.30%, solidifying its presence and gaining an 8.90% boost in Share of Search.

    Tommy Hilfiger and Adidas also exhibited notable gains in Share of Search, increasing by 5.30% and 5.60%, respectively. However, some brands experienced a slight dip, with Speedo in the Men’s Swimwear subcategory seeing a 2.50% dip in their search visibility, and Reebok in Men’s Shoes witnessing a 3.3% decrease.

    These fluctuations highlight the dynamic nature of brand strategies during Black Friday and Cyber Monday in the Apparel category, where gaining visibility also proves to be crucial alongside offering competitive discounts.

    For a deeper dive into the world of competitive pricing intelligence and to explore how our solutions can benefit apparel retailers and brands, reach out to us today!

    Stay tuned to our blog for forthcoming analyses on pricing and discounting trends across a spectrum of shopping categories, as we continue to unravel the intricacies of consumer behavior and market dynamics.

  • Black Friday Cyber Monday 2023: Insights on Pricing and Discounts in Consumer Electronics

    Black Friday Cyber Monday 2023: Insights on Pricing and Discounts in Consumer Electronics

    As Black Friday and Cyber Monday unfolded across the globe, there was a noticeable subdued atmosphere compared to previous years. TD Cowen brokerage adjusted its forecast for US holiday spending, revising it down from an initial 4-5% growth to a more conservative estimate of 2-3%.

    Compounded by persistent inflation and elevated interest rates, many consumers find themselves financially strained, leading to the projection of the slowest growth in US holiday spending in five years.

    In this context, it would be relevant to investigate whether this restrained reaction from consumers had an influence on the extent of attractive deals and discounts provided by top retailers and brands during the sale event.

    At DataWeave, we harnessed the power of our proprietary data aggregation and analysis platform to track and analyze the prices and deals of consumer electronics products across prominent retailers to uncover unique insights into their price competitiveness this BFCM, as well as understand how pricing strategies varied across diverse subcategories and brands.

    Keep an eye on our blog for insights on other shopping categories like Apparel, Home & Furniture, and Health & Beauty!

    Our Methodology

    For this analysis, we tracked the average discounts among leading US electronics retailers during the Thanksgiving weekend sale, including Black Friday and Cyber Monday. We noticed prices and discounts didn’t change significantly over the course of the weekend, and hence the average prices of products between the 24th and 27th of November are being reported. Our sample was chosen to encompass the top 500 ranked products in each product subcategory across leading retailers during the sale.

    • Sample size: 23,505 SKUs
    • Retailers tracked: Amazon, Walmart, Target, Best Buy
    • Subcategories reported on: Headphones, Laptops, Smartphones, Tablets, Speakers, TVs, Earbuds, Wireless Headphones, Drones, Smartwatches
    • Timeline of analysis: 24 to 27 November 2023

    Our Key Findings

    Average Discounts Across Retailers

    The observed Black Friday and Cyber Monday discount strategies reveal a distinct competitive landscape among major retailers. Amazon emerged as the frontrunner, offering the highest average discounts at 23.30%, spanning a significant 74% of their consumer electronics inventory. Best Buy closely followed, with an average discount of 19.40% across 76% of their products.

    On the other hand, Target and Walmart adopted a more conservative stance, providing lower average discounts at 14.8% and 12%, respectively, with Target discounting 51% of its products and Walmart discounting 41%. This variation in discounting strategies highlights the diverse approaches retailers take to attract and retain Black Friday and Cyber Monday shoppers, balancing competitiveness with profit margins.

    Average Discounts: Subcategories

    In the Headphones subcategory, Amazon stands out with a substantial 31.40% average discount, targeting 84.69% of SKUs, showcasing an aggressive discounting strategy. Best Buy follows closely, demonstrating competitive pricing with a 21.80% average discount on 67.03% of products.

    Meanwhile, in TVs, Best Buy offered a significant 17.9% average discount across 89% of its products, signaling a targeted effort to capture a broad market share in this subcategory.

    In the Laptop subcategory, Target was highly conservative, with only a 4.1% average discount covering 14.3% of its products, while Walmart positioned itself with a moderate 9.5% average discount, targeting 39.8% of its inventory.

    Among Smartphones, Amazon (14.7%) was third to Best Buy and Target, which offered average discounts of 20.5% and 18.1%, respectively. Walmart, with an average discount of only 9.9% in the subcategory opted for a relatively muted approach.

    Average Discounts: Brands

    The discount strategies across top electronics brands during Black Friday unveil distinct approaches. Samsung emerges as a focal point across Amazon, Best Buy, Walmart, and Target. The brand was most attractively priced on Best Buy, with an average discount of 25.3%, followed by Target (18.3%) and Amazon (17.9%).

    Apple’s discounts were quite consistent across Amazon (17.6%), Best Buy (16.1%), and Target (17.8%), with the exception of Walmart (8.1%). JBL, interestingly, opted to discount very heavily on Best Buy, at an average of 38.8%, resulting in several attractive deals for shoppers on the website. Sony, too, offered impressive discounts at over 23% on Amazon and Best Buy, followed by 16% on Walmart. On Amazon, Amazon Renewed (13.9%) was among the most aggressively discounted products, highlighting an effort to further appeal to cost-conscious consumers.

    Overall, our analysis throws light on the nuanced strategies employed by leading brands on Amazon, Best Buy, Walmart, and Target, reflecting a delicate interplay between brand positioning, pricing competitiveness, and customer appeal.

    Share of Search For Consumer Electronics Brands Across Subcategories

    The Share of Search data reflects intriguing shifts in brand strategies during the Black Friday and Cyber Monday events. During sale events, brands looking to entice shoppers don’t rely only on price but also on search visibility to help drive awareness and conversion. Share of Search is defined as the share of a brand’s products among the top 20 ranked products in a subcategory, thereby providing insight into a brand’s visibility on online marketplaces.

    Some of the brands that improved their Share of Search the most include LG, Skullcandy, Asus, JBL, and Samsung. On the other hand, prominent brands like Sony and Apple actually lost ground on this metric by 0.4% and 2% respectively.

    At DataWeave, our commitment to empowering retailers and brands with actionable competitive and digital shelf insights remains unwavering. Our AI-powered platform provides a comprehensive view of market dynamics for our customers, enabling informed decision-making. As a partner in your journey, we offer tailored solutions to enhance your competitive edge, drive sales, and elevate your brand presence. To find out more about our solution, reach out to us today!

    To learn more about pricing and discounting trends during Black Friday and Cyber Monday across various other shopping categories, stay tuned to our blog!

  • Which Amazon Sale Offered Better Deals: Prime Day in July or Big Deal Days in October?

    Which Amazon Sale Offered Better Deals: Prime Day in July or Big Deal Days in October?

    Amazon reported a record-breaking Prime Day this July, marking it as the biggest sales event in the company’s history. So when the eCommerce giant announced the Prime Big Deal Days this fall, we were curious to find out how big a deal it really is.

    The Prime Big Deal Days, similar in magnitude to the Summer Prime Day, promised to present substantial savings across a diverse range of categories, including electronics, toys, home, fashion, beauty, and Amazon products.

    However, for a shopper, an important question is: Does the Prime Big Deal Days in October offer lower prices than Amazon’s mega Prime Day event in July?

    To answer this question, we turned our data aggregation and analysis platform to focus on these two sale events and analyzed which event offered better deals across key categories and brands.

    TL;DR: Surprisingly, the Prime Big Deal Days in October offered, on average, 2.02% higher discounts than its counterpart event in July.

    Read on for details on how we went about our analysis and how discounts vary across categories, sub-categories, and brands.

    Our Methodology

    We tracked the prices and discounts of a large sample of products during both Prime Day events. The following are some relevant details about our sample:

    • Number of products analyzed: 1500+
    • Categories: Apparel, Consumer Electronics, Home & Furniture, Health & Beauty
    • Prime Day Sale Analysis: 11-12 July 2023
    • Prime Big Deal Days Analysis: 10-11 Oct 2023
    • Website: Amazon.com

    Our analysis focused on the differences in the prices and discount levels of products between the two sale events.

    Our Key Findings

    The average discount during the Prime Big Deal Days in October was 29.44%, which was 2.02% higher than the average discount during the Prime Day sale in July (27.42%). Interestingly, the October event offered better deals across each product category analyzed, albeit at slightly varying levels.

    By offering deeper discounts in October, Amazon may have aimed to encourage early holiday shopping, thereby capturing a larger share of the consumer wallet before competitors intensify their promotional activities closer to the festive season.

    As other retailers and online marketplaces gear up for their own holiday promotional events, Amazon’s decision to provide heightened discounts in October could serve as a preemptive move to secure customer loyalty and drive sales momentum before the onset of the peak shopping period.

    Additionally, Amazon’s strategic push to amplify the visibility of its diverse product offerings, including exclusive launches and partnerships during the October event might have contributed to the higher discounts.

    Next, let’s take a closer look at each product category.

    Apparel

    During October’s Prime Big Deal Days, the Apparel category experienced a notable uptick, boasting a 2.29% increase in discounts compared to the earlier Prime Day event in July.

    In the detailed assessment of Apparel sub-categories, Men’s and Women’s Swimwear, alongside Men’s Shoes, Innerwear, and Athleisure, emerged as the segments showcasing the most substantial average discounts during October. Fall also brought about more affordable prices for Women’s Innerwear and Men’s Shirts. However, Women’s Athleisure, Dresses, and Tops displayed diminished average discounts during this Prime Big Deal Days event.

    Delving into brand-specific analyses revealed intriguing trends. Athleisure brands such as Ibkul, Esprlia, and Ryka notably escalated their discounts in October after minimal markdowns during the Summer Prime Day sale.

    Steve Madden, witnessing heightened discounts in October, hinted at a growing demand for boots and footwear in the Autumn and Winter seasons. For instance, the Steve Madden Men’s Fenta Fashion Sneaker was priced at $46 during the Summer Prime Day, and only at $35 during the Prime Big Deal Days in October.

    Conversely, brands like PGA Tour, Land’s End, Roxy, and Anrabess offered more substantial discounts during the Summer compared to the October event.

    Consumer Electronics

    The Consumer Electronics segment during October’s Prime Big Deal Days showcased an average price decrease of 1.98% compared to the Prime Day event in July.

    Nearly all scrutinized subcategories experienced heightened discounts during the Fall Prime Big Deal Days in October. Tablets, Speakers, Drones, and Smartwatches notably presented higher discounts of 4.06%, 3.51%, 2.99%, and 2.69%, respectively, in October. However, more enticing deals were found on Earbuds and TVs during July’s event.

    Examining consumer electronics brands, Google stood out by offering the most compelling deals in October, boasting an average discount of 23.35%, marking an 8.94% increase from the Summer Prime Days’ 14.41%. Psier, Sony, and OnePlus also featured significantly reduced prices during the Fall. For example, the OnePlus 10 Pro | 8GB+128GB was $500 during the sale in July and only $440 during the Prime Big Deal Days in October.

    Conversely, prominent brands such as Bose, Sennheiser, Samsung, LG, and Asus opted to offer heavier discounts in July. Notably, the Samsung All-in-One Soundbar w/Dolby 5.1 was priced at $218 in October but only $168 in July.

    Home & Furniture

    During October’s Prime Big Deal Days, the Home & Furniture category experienced a notable 1.59% increase in average discounts compared to the Prime Day event held in July.

    Notably, Entertainment Units, Rugs, and Coffee Tables emerged as standout sub-categories that were more attractively priced in October, exhibiting price differences of 7.73%, 5.33%, and 4.80%, respectively.

    Interestingly, among the scrutinized sub-categories, only Luggage showed a lower price during the Prime Day sale in July compared to the October event. This shift likely reflects evolving consumer demand as the holiday season approaches, with items like rugs and entertainment units becoming increasingly sought-after categories for purchase.

    If you’re keen to explore how these trends vary across brands within this category, reach out to us for more insights.

    Health & Beauty

    During October’s Prime Big Deal Days, the Health & Beauty category showcased products at an average of 1.99% lower prices compared to the Prime Day event held in July.

    Our analysis of Health & Beauty reveals that a majority of the subcategories presented higher discounts during the October Big Deal Days event. Essential items such as Toothpaste, Sunscreen, and Electric Toothbrushes notably stood out as significantly more affordable during the Fall event, reflecting not only consistent demand but also a seasonal emphasis on these products. For instance, the Oral B iO Series 3 Limited Edition Electric Toothbrush, priced at $140 during the summer Prime Days, was further discounted to $120 in the fall event.

    Interestingly, Beard Care emerged as an exception, displaying higher discounts during the Prime Day sale in Summer compared to Fall’s Prime Big Deal Days.

    Examining brands within the category, Babyganics, Thinkbaby, and Vaseline showcased substantial increases in average additional discounts during October’s Prime Big Deal Days.

    Conversely, prominent brands like Maybelline, Neutrogena, and Cetaphil offered lower discounts during the fall event.

    Competitive Insights to Drive Optimized Sale Event Pricing

    At DataWeave, we understand the pivotal role of competitive pricing insights in empowering retailers and brands to gain a competitive edge, especially during significant events like Prime Day. Our commitment lies in providing retailers with precise and extensive competitor price tracking on a large scale. This empowers them to devise impactful pricing strategies and consistently uphold a competitive stance in the market. To learn more about how this can be done, talk to us today!

  • Why Unit of Measure Normalization is Critical For Accurate and Actionable Competitive Pricing Intelligence

    Why Unit of Measure Normalization is Critical For Accurate and Actionable Competitive Pricing Intelligence

    Competitive pricing intelligence is pivotal for retailers seeking to analyze their product pricing in relation to competitors. This practice is essential for ensuring that their product range maintains a competitive edge, meeting both customer expectations and market demands consistently.

    Product matching serves as a foundational element within any competitive pricing intelligence solution. Products are frequently presented in varying formats across different websites, featuring distinct titles, images, and descriptions. Undertaking this process at a significant scale is highly intricate due to numerous factors. One such complication arises from the fact that products are often displayed with differing units of measurement on various websites.

    The Challenge of Varying Units

    In certain product categories, retailers often offer the same item in varying volumes, quantities, or weights. For instance, a clothing item might be available as a single piece or in packs of 2 or 3, while grocery brands commonly sell eggs in counts of 6, 12, or 24.

    Consider this example: a quick glance might suggest that an 850g pack of Kellogg’s Corn Flakes priced at $5 is a better deal than a 980g pack of Nestle Cornflakes priced at $5.2. However, this assumption can be deceptive. In reality, the latter offers better value for your money, a fact that only becomes evident through price comparisons after standardizing the units.

    This issue is particularly relevant due to the prevalence of “shrinkflation,” where brands adjust packaging sizes or quantities to offset inflation while keeping prices seemingly low. When quantities, pack sizes, weight, etc. reduce instead of prices increasing, it’s important that this change is considered while analyzing competitive pricing.

    Normalizing Units of Measure

    In order to effectively compare prices among different competitors, retailers must standardize the diverse units of measurement they encounter. This standardization (or normalization) is crucial because price comparisons should extend beyond individual product SKUs to accommodate variations in package sizes and quantities. It’s essential to normalize units, ranging from “each” (ea) for individual items to “dozen” (dz) for sets, and from “pounds” (lb), “kilograms” (kg), “liters” (ltr), to “gallons” (gal) for various product types.

    For example, a predetermined base unit of measure, such as 100 grams for a specific product like cornflakes, serves as the reference point. The unit-normalized price for any cornflake product would then be the price per 100 grams. In the example provided, this reveals that Kellogg’s is priced at $0.59 per 100 grams, while Nestle is priced at $0.53 per 100 grams.

    Various Categories of Unit Normalization

    1. Weight Normalization

    Retailers frequently feature products with weight measurements expressed in grams (g), kilograms (kg), pounds (lbs), or ounces (oz).

    2. Quantity or Pack Size Normalization

    Products are also often featured with varying pick sizes or quantities in each SKU.

    mounting hardware kit

    3. Volume or Capacity Normalization

    Products can also vary in volumes or capacities with units like liters (L) or fluid ounces (fl oz).

    DataWeave’s Unit Normalized Pricing Intelligence Solution

    DataWeave’s highly sophisticated product matching engine can match the same or similar products and normalize their units of measurement, leading to highly accurate and actionable competitive pricing insights. It standardizes different units of measurement, like weight, quantity, and volume, ensuring fair comparisons across similar and exact matched products.

    Retailers have the flexibility to view pricing insights either with retailer units or normalized units. This capability empowers retailers and analysts to perform accurate, in-depth analyses of pricing information at a product level.

    In some scenarios, analyzing unit normalized pricing reflects pricing trends and competitiveness more accurately than retail price alone. This is particularly true for categories like CPG, where products are sold in diverse units of measure. For instance, in the example shown here, we can view a comparison of price position trends for the category of Fruits and Vegetables based on both retail price and unit price.

    The difference is striking: the original retail price based analysis shows a stagnation in price position, whereas unit normalized pricing analysis reflects a more dynamic pricing scenario.

    With DataWeave, retailers can specify which units to compare, ensuring that comparisons are made accurately. For example, a retailer can specify that unit price comparisons apply only to 8, 12, or 16-ounce packs, as well as 1 or 3-pound packs, but not to 10 and 25-pound bags. This precision ensures that products are matched correctly, and prices are represented for appropriately normalized units, leading to more accurate pricing insights.

    To learn more about this capability, write to us at contact@dataweave.com or visit our website today!

  • Revolutionizing Fuel Pricing: How Fuel Retailers and Convenience Stores Can Gain a Winning Edge with DataWeave

    Revolutionizing Fuel Pricing: How Fuel Retailers and Convenience Stores Can Gain a Winning Edge with DataWeave

    Consider this scenario: A retailer establishes its fuel prices using pricing data that’s a few days old, only to subsequently discover that a nearby competitor is offering substantially lower prices. The result? Lost customers, decreased foot traffic, and diminished sales. This serves as a stark reality that retailers must confront and address today.

    In the fiercely competitive realm of retail, where every decision holds weight, maintaining a competitive edge is paramount. The fuel category, frequently underestimated, has the potential to significantly impact a retailer’s revenue stream. This challenge is not unique; retailers worldwide, particularly in North America, grapple with a common hurdle: mastering the intricate art of real-time fuel pricing.

    The Quest For Reliable, Real-Time Fuel Pricing Data

    For retailers, traditional methods for procuring and analyzing fuel price data have proven to be both expensive and error-prone, often relying on manual data collection or third-party data providers. These outdated approaches yield frustrating delays, inaccuracies, and missed opportunities. When it comes to obtaining timely fuel pricing intelligence, the majority of fuel retailers grapple with three central challenges:

    • Low Accuracy: Ensuring that fuel pricing information remains up-to-date, dependable, and actionable, even when sourced from complex web-based platforms.
    • Less Coverage: Acquiring comprehensive data that encompasses all of North America, spanning across retailers, convenience stores, fuel stations, and beyond.
    • High Cost: Effectively managing the substantial costs associated with acquiring and processing this vital information.

    DataWeave’s Fuel Pricing Intelligence Solution

    Comprehensive, accurate, and real-time fuel pricing intelligence can play a huge role in the profitability of retailers throughout North America. DataWeave takes the forefront in delivering this transformative Data-as-a-Service (DaaS) solution to some of the most prominent retailers in the region, including the top 20 fuel retail behemoths.

    With a rich and extensive history spanning over a decade in the realm of competitive intelligence, DataWeave boasts an impressive track record of empowering well-informed decision-making in retail. We leverage state-of-the-art technology to bring an unparalleled level of accuracy, timeliness, and coverage to fuel pricing intelligence.

    The following are some compelling advantages offered by our solution:

    Accurate and Real-Time First Party Data

    We deliver retailers an unparalleled advantage through real-time, first-party fuel price data. Our data originates directly from the retailer’s own channels, encompassing websites and mobile apps, rendering it the industry’s foremost and most reliable source.

    Imagine having access to fuel pricing information that updates as frequently as every 30 minutes. This rapid update cadence guarantees that you, as a retailer, constantly possess the latest pricing insights at your fingertips, empowering you to respond swiftly to market fluctuations and competitor manoeuvres. Our comprehensive data spans a wide spectrum of fuel types, including:

    • Gasoline: Be it regular, mid-grade, super, premium, ethanol-free, ethanol blends, methanol blends, or reformulated gasoline, we have got you covered.
    • Diesel: Our data encompasses biodiesel, biodiesel off-road, biodiesel blends, biodiesel ultra-low sulfur (ULS), diesel ultra-low sulfur (ULS), diesel off-road, standard diesel, and premium diesel.

    Armed with our real-time, first-party data, you can make pricing decisions with unwavering confidence, secure in the knowledge that you possess access to the most current, authoritative, and extensive fuel pricing intelligence in North America.

    The data points we capture directly from relevant web sources include: gas station postal code, store name and code, location, city, state, ZIP code, fuel type, competitor name, regular price, member price (if available), time and date of data capture, and more.

    Click here if you wish to access a sample report of our fuel pricing data.

    Unrivaled Geographical Coverage

    Our extensive coverage of fuel data spans over 30,000 ZIP codes and encompasses the top 100 retailers across the western, mid-western, and eastern regions of the United States.

    Retailers benefit from the flexibility to configure and tailor the solution to their precise needs, whether it involves adding more locations or selectively acquiring specific segments of the data. This far-reaching coverage guarantees that retailers, whether situated in bustling urban centers or remote areas, can readily access the essential data required to maintain their competitive edge.

    Moreover, if you currently source your fuel pricing data from alternative providers, our solution seamlessly integrates, amplifies, and complements your existing array of data sources, ensuring a harmonious and unified approach to data acquisition.

    Optimization of Dynamic Pricing Strategies

    In the world of retail, the importance of timing cannot be overstated. Even a mere difference of a few cents can translate into millions of dollars in revenue impact. With DataWeave, retailers gain the capability to make data-driven decisions that provide them with a competitive edge around the clock, every single day.

    Our platform empowers you to unearth margin gaps by pinpointing opportunities to raise prices while maintaining your competitive pricing position. It also identifies instances where you may be substantially overpriced, prompting necessary price adjustments to ensure competitiveness within the market. All these valuable insights are available at a hyperlocal level, facilitating pricing efficiency and optimization across your various regions of coverage. Equipped with this real-time data, you can swiftly adapt to ever-changing market conditions.

    Furthermore, our comprehensive competitive data seamlessly integrates into your existing pricing systems through APIs, facilitating quick and informed pricing actions based on robust data.

    Reliable and Customer-First Tech Platform

    Our platform boasts a remarkable level of sophistication when it comes to data aggregation, normalization, visualization, and integration capabilities. It stands as a massively scalable system with the capacity to aggregate billions of data points daily, spanning thousands of web sources. This includes the intricate handling of sources like mobile apps and websites known for frequently altering their site structures, among others.

    What truly sets us apart is our proficiency in addressing these challenges through a blend of human expertise and large-scale machine learning. Additionally, our commitment to delivering unmatched service extends to round-the-clock, 24/7 support. This comprehensive approach makes our fuel pricing intelligence solution not only effective but also cost-efficient in meeting your fuel data requirements.

    We also provide a variety of options for you to consume our data, which includes receiving our reports via email, SFTP, S3 buckets, data lakes like Snowflake, and APIs.

    Enhance your Fuel Pricing Strategies with DataWeave

    In the ever-competitive world of retail, staying ahead is not just a goal; it’s a necessity. The fuel pricing landscape, often overlooked, holds immense power to impact a retailer’s profitability. DataWeave’s real-time, comprehensive, and accurate fuel pricing intelligence solution is the key to securing this advantage. Retailers and convenience stores now have a powerful platform at their disposal, offering unparalleled precision, comprehensive coverage, and the agility needed to navigate this landscape.

    Join the ranks of industry leaders who have already harnessed the potential of DataWeave. Reach out to us today to redefine your approach to fuel pricing and propel your business to new heights!

  • DataWeave Launches PricingPulse: Empowering Retail Leaders With Comprehensive and Strategic Pricing Insights

    DataWeave Launches PricingPulse: Empowering Retail Leaders With Comprehensive and Strategic Pricing Insights

    In the evolving retail landscape, success often hinges on a singular focal point: pricing. A recent Statista survey revealed that 70% of US online users prioritize competitive pricing in their digital shopping choices. In this cutthroat arena, where surpassing rivals is paramount, a deep comprehension of pricing nuances is no longer just an edge, but a necessity.

    Retailers are increasingly adopting pricing intelligence solutions that meticulously dissect competitor pricing data in comparison to their own, down to the SKU level. This analysis empowers their pricing teams with the insights they need to price their products competitively on a day-to-day basis.

    However, in a landscape where a staggering 50 million price changes occur daily, reliance on a reactive pricing intelligence solution, though effective in many ways, often falls short. To develop a strategic and predictive pricing engine, retailers also need the ability to track historical pricing relative to market conditions, competitor actions, seasonality, promptness of competitor pricing actions, and more. This would be particularly useful for senior retail pricing and business unit leaders as they look to gain a strategic perspective on their competitive pricing health. However, even today’s leading providers of retail pricing intelligence solutions lack in this area. This results in a relatively myopic view of competitive pricing even in large retail organizations.

    Introducing DataWeave’s PricingPulse

    DataWeave’s PricingPulse helps retail leaders better understand their competitive pricing strategies in comparison to relevant market dynamics over time. The capability bridges the gap between day-to-day competitive pricing operations and long-term strategic pricing analysis and actions, enabling senior retail pricing leaders to untangle the complexities of their pricing strategies. Delivered as a dashboard, the view offers an elevated vantage point for industry-wide pricing dynamics, empowering retailers with the foresight needed to navigate market shifts, predict vulnerabilities, and capitalize on new opportunities.

    PricingPulse is provided to all DataWeave retail customers as an add-on to our Pricing Intelligence solution.

    The insights offered by PricingPulse enable retailers to answer pivotal questions about competitor pricing behaviors, price leadership across categories, timing of price changes, and the effectiveness of capitalizing on price improvement opportunities. Some of the questions that PricingPulse offers answers to include:

    • How frequently are my competitors changing prices and for which products?
    • How does my price leadership vary across key product categories?
    • Which day of the week or month do my competitors change their pricing most and least frequently?
    • How well do I seize on price improvement opportunities over time?

    Strategic Pricing Views Via PricingPulse

    In the following section, we share a few views available to retail leaders via our PricingPulse dashboard. For a complete list of insights available on the dashboard, request a demo today.

    Competitive Price Leadership Across Retailers and Categories

    This view provides retailers with an overview of the price leaders across various product categories and how it changes with time. More often than not, retailers would aim to gain price leadership in certain categories, while maintaining healthy margins in others.

    Retailers can also gauge their consistency and effectiveness in maintaining a competitive edge for key categories over time. They can fortify areas of strength and identify opportunity areas to optimize their pricing.

    In addition, the dashboard tracks a retailer’s price index across categories, a measure that determines its price competitiveness.

    The price index is determined by dividing the retailer’s price by the lowest price offered by any of its competitors. A ratio lesser than 1 indicates that the retailer is the lowest priced in the market. This measure is also presented for competitors, providing insights into competitors that are most attractively priced in the market. A timeline trend of this metric helps track how price leadership among retailers changes over time.

    Price Change Trends

    This view provides a summary of the level of price changes by a retailer and its competitors over a period of time, which includes the average magnitude of price changes as well as the proportion of the retailer’s assortment that underwent these price changes.

    In addition, the number of price changes each month are provided for each retailer. This is further broken down into the total number of price changes during each day of the week.

    These insights help retailers determine which competitors are most and least active in their pricing activities, how aggressive the pricing actions are, and if there are any specific price change patterns followed in terms of the days of the week or month.

    Price Improvement Opportunities and Actions

    The dashboard actively reports on price improvement opportunities, which could include either a price increase opportunity or a price decrease opportunity, for a retailer and its competitors across categories over time. A price increase opportunity occurs when a product is significantly under priced (by more than 2%) and a price decrease opportunity occurs when a product is significantly overpriced (by more than 2%).

    Further, the retailer gains insight into how many price improvement opportunities were actually acted on within 15 days of the opportunity presenting itself. This “action rate” helps retailers quantify how well they seize on price improvement opportunities, which eventually result in higher sales and margins. The dashboard also reports on the average number of days it took for a retailer to act on a price improvement opportunity, thereby quantifying the responsiveness and agility of pricing teams.

    This is especially useful for pricing leaders to “audit” or evaluate the performance of their pricing teams. When similar insights are viewed for a set of competitors as well, retailers can better understand the level of sophistication of their competitors’ pricing operations.

    Ready to Elevate Your Pricing Game?

    The launch of DataWeave’s PricingPulse marks a significant advancement in the realm of pricing solutions for retail leaders. As the retail landscape undergoes continuous transformation, the significance of precise pricing strategies cannot be overstated. PricingPulse is the first and only pricing view in the industry to bridge the gap between tactical pricing decisions and comprehensive strategic analysis.

    In a world where agility and foresight are crucial, PricingPulse equips retail leaders with the ability to predict competitor actions, optimize pricing strategies, and stay ahead of the competition.

    If you are a senior pricing leader or retail business unit head, reach out to us today to either sign up or learn more!

  • Amazon US Prime Day 2023: Insights on Pricing and Discounts Across Popular Categories and Brands

    Amazon US Prime Day 2023: Insights on Pricing and Discounts Across Popular Categories and Brands

    Amazon’s Prime Day this year proved to be a record-breaking success, becoming the largest Prime Day event in the company’s history. Over the two-day extravaganza, shoppers in the US spent a staggering $12.7 billion, a 6.1% increase from the previous year. Amid inflationary pressures and supply chain disruptions, Amazon adopted a bold discounting strategy, offering steeper discounts compared to Prime Day 2022.

    An interesting aspect of Amazon’s approach is their loyalty based offerings. In the weeks leading to Prime Day on July 11-12, members of the loyalty program were given access to “invite-only deals” where shoppers could request invites to specific products that they were looking to purchase on deals. Overall, Amazon’s pricing and discount strategies during Prime Day were carefully designed to create a buzz among shoppers, generate increased sales, and maintain a competitive advantage in the market.

    While Prime Day is Amazon’s showstopper, it’s interesting to also see how other leading retailers respond to such a massive sale by their biggest competitor. Do they also lower their prices during the event, or are they happy to take a backseat? To answer these questions, we leveraged our proprietary data aggregation and analysis platform to analyze the prices and discounts of Amazon and its leading competitors across key product categories – Apparel, Home & Furniture, Consumer Electronics, and Health & Beauty – during Prime Day.

    Since products on Amazon and other eCommerce websites are often sold at discounts even on normal days not linked to a sale event, we delved into the real value that Prime Day offers to shoppers by focusing on price reductions or additional discounts during the sale compared to the week before. As a result, our approach highlights the genuine benefits of the event for shoppers who count on lower prices during the sale.

    Research & Methodology

    For our analysis, we tracked the prices of a large number of products across several leading retailers during Prime Day as well as the week prior to the event. The details of our sample are mentioned below:

    • Number of SKUs: 110,000+
    • Websites: Amazon, Walmart, Target, Overstock, The Home Depot, Wayfair, Ulta Beauty, Sephora
    • Categories: Apparel, Home & Furniture, Electronics, Health & Beauty
    • Pre-event Analysis: 4-10 July 2023
    • Prime Day Analysis: 11-12 July 2023

    Our Key Findings

    Our data reveals that Amazon’s price reductions were most aggressive in the Consumer Electronics category, with an average price reduction of 10.4% on Prime Day, due to the category’s popularity and high demand.

    The Health & Beauty (6.7%), Apparel (5.9%), and Home & Furniture (4.8%) categories offered relatively modest deals during the sale event.

    The Health & Beauty (6.7%), Apparel (5.9%), and Home & Furniture (4.8%) categories offered relatively modest deals during the sale event.

    Below, we delve deeper into our analysis of each category to better understand how price reductions were distributed across key subcategories on Amazon as well as the discounting strategies of Amazon’s leading competitors.

    Apparel

    As Amazon grappled with surplus inventory, heightened storage costs, and reduced profit margins in apparel (like most other retailers), its average discount before Prime Day was already as high as 13.3%. Then, on Prime Day, Amazon’s apparel deals were tempered at around 5.9% across an impressive 33.1% of its assortment, while Target and Walmart chose not to compete in a meaningful way.

    Unlike Prime Day 2022, when Target competed with Amazon with high discounts, the retailer offered only 0.8% additional discount across 4.4% of its assortment in this category. Walmart, too, reduced its prices by only 1.4% on 8.5% of its assortment during Prime Day.

    Check out our latest analysis on fashion pricing trends across 2022-23 to better understand the pricing dynamics in this category in greater detail.

    Across all the apparel subcategories we analyzed, Women’s Athleisure (8.7%), Men’s Swimwear (8%), and Women’s Tops (7.6%) were among the ones with the highest price reductions. On the other hand, Men’s Athleisure (2.5%), Women’s Shoes (3.5%), and Men’s Innerwear (4.1%) had conservative markdowns.

    Pricing decisions across the various subcategories are likely to have been influenced by several factors like inventory levels, demand patterns, and the need to balance competitive offers with maintaining reasonable profit margins, as Amazon tried to cater to a more price-sensitive consumer.

    Across all apparel subcategories, leading brands that offered the highest markdowns were Tommy Hilfiger (11.5%), Amazon Essentials (9.4%), Adidas (8.6%), and Calvin Klein (8.6%).

    For brands, however, lowering prices is only one lever to attract and convert shoppers. They also need to ensure they’re highly visible and discoverable on Amazon’s search listings. This exponentially improves their chances of driving more clicks and conversions. In our analysis, we tracked the Share of Search of brands across several popular search keywords. Share of Search for a brand is defined as the proportion of the brand’s products in the top 20 search results for a search query.

    Our data indicates that several brands gained impressive ground in their discoverability during Prime Day, while others fell behind. Gildan in Men’s Innerwear, Adidas in Men’s and Women’s Shoes, Anrabess in Women’s Athleisure, and Lululemon in Men’s Athleisure, among others, improved their Share of Search by significant levels during Prime Day.

    On the other hand, brands like Hanes in Men’s and Women’s Innerwear, Kanu Surf in Men’s Swimwear, Cupshe in Women’s Swimwear, and others lost around 10% in their Share of Search during the event. This is likely to have impacted their sales volumes adversely.

    Home & Furniture

    The Home & Furniture industry has been challenged with reduced demand due to inflationary pressures over the past year or so. Leading retailers in the category overestimated the demand, leading to overstocking of inventory. As a result, Home & Furniture is one of the few categories that saw Amazon’s competitors participate at a significant level on Prime Day in order to ensure they don’t fall behind on liquidating their stock.

    Amazon’s additional discounts averaged 4.8% across 30.2% of its assortment. Wayfair and Overstock too reduced their prices by 4.8% and 4.3% on around 44% of their respective assortments. Wayfair’s move is likely a part of their strategy to attract new customers and expand their market share, in response to a decline in their consumer base. Last year, Wayfair experienced a loss of 5 million out of its 1.3 billion consumers due to weakening demand.

    Target and Walmart did offer additional discounts, but they were not at a competitive level. The Home Depot effectively opted not to compete at all during the sale event. Overall, the pricing actions of these retailers are in stark contrast to the highly conservative pricing strategies observed on Prime Day last year.

    Our recent pricing analysis of the Home & Furniture category revealed more interesting insights and pricing dynamics over the past year.

    Across all the subcategories we analyzed, Bookcases (8.2%), Rugs (7.8%), Mattresses (6.5%), and Luggage (6.2%) were among the ones with high price reductions.

    Meanwhile, Sofas (2.4%), Washer / Dryers (2.4%), and Entertainment Units (2.7%) had lower markdowns. These are large and substantial purchases, making retailers more cautious about deeply discounting them while still ensuring profitability.

    The brands that stepped up and offered the highest markdowns in this category include Zinus (20.2%), Comfee (10.8%), Sauder (9.9%), and Best Choice Products (8.7%).

    In terms of Share of Search, Rockland in Luggage gained the highest (21%), followed by Farberware in Dishwasher, Olee Sleep in Mattresses, and Homeguave in Mattresses gained significant ground in their respective categories as shown in the image below.

    Brands like Best Choice Products in Coffee Tables, Molblly in Mattresses, and Black+Decker in Washer/Dryers and Dishwashers lost a good portion of their Share of Search during the event. Due to high competition for visibility during sale events, brands that fail to keep an eye on their Share of Search stand to take a hit in their sales, especially in categories like Home & Furniture that tend to have low brand loyalty.

    Consumer Electronics

    2023 was the year of consumer electronics on Amazon Prime Day. Amazon’s price reduction during the sale averaged 10.4% across 54.5% of its assortment in the category. Target and Walmart, on the other hand, offered significantly lower additional discounts of 1.9% and 2.7% on 10.4% and 19.1% of their assortment, respectively.

    The consumer electronics category often witnesses aggressive price reductions during Prime Day and other sale events due to its popularity and high demand. In addition, since retailer margins are usually low in this category, shoppers often have to wait for sale events like Prime Day (when brands markdown their wholesale rates) to have several attractive deals to choose from.

    Across all the subcategories we analyzed, Smartwatches (15.4%), Wireless Headphones (15.4%), Earbuds (14.9%), Headphones (12.5%), and Tablets (12.0%), were among the ones with the highest price reductions. All of these subcategories are quite popular that tend to sell in large volumes during sale events.

    Meanwhile, Laptops (2.1%), TVs (3.1%), and Smartphones (7.6%) had lower markdowns. A lower markdown on smartphones may reflect steady demand throughout the year, reducing the urgency to offer significant discounts during the short Prime Day window.

    Amazon (22%), Tozo (12.5%), Lenovo (10.8%), JBL (8.3%), and Apple (5%) offered the highest price reductions in Consumer Electronics as a whole. Clearly, Amazon didn’t hold back on offering attractive deals on its own private label products in this category.

    Consumer Electronics as a category tends to have a brand loyal shopper base. However, Share of Search generic search keywords are still very important for keywords like earbuds, headphones, and tablets that result in relatively lower priced products. HP in Laptops, Samsung in Tablets and TVs, and Oneplus in Smartphones all made strong strides in building their discoverability on Amazon during Prime Day. Beyond just driving more sales, this also has the intended effect of boosting brand awareness among high-intent shoppers.

    Sony in Headphones, Asus in Laptops, and Insignia in TVs lost out to other brands in terms of their discoverability during the sale. Sony and Asus, especially would be hurting as they are prominent brands in their respective categories.

    Health & Beauty

    The Health & Beauty category is a favorite among consumers during Prime Day, as it encompasses a wide range of products like skincare, cosmetics, and grooming items. As shoppers often tend to stock up during the sale, brands and retailers are willing to offer competitive discounts and gain an edge over their competitors.

    Our data reveals that the average additional discount on Amazon was 6.7%, offered on a little over a third of its assortment. Walmart reduced its prices sizably as well, by an average of 3.1% on 13.4% of its assortment.

    Interestingly, Sephora and Ulta Beauty, leading retailers in the Health & Beauty category did not compete on price at all this Prime Day. It is likely they are confident their loyal customer base will not be influenced by Amazon’s Prime Day deals and be driven away merely by lower prices. In addition, keeping their prices steady during Prime Day might have been a strategic choice to protect their brand reputation and premium positioning.

    Relatively premium subcategories like Electric Toothbrushes (10%), Moisturizer (8.3%), Beardcare (7.3%), and Make Up (6.7%) saw the highest price reductions on Amazon.

    In contrast, staple items like Toothpaste (3.7%), Shampoos (5.4%), and Conditioners (5.7%) had lower markdowns.

    Among the leading brands in this category, Oral-B (10.3%), Philips Sonicare (8.7%), Neutrogena (8.4%), and Colgate (5.6%) offered the most attractive deals during the sale event.

    In terms of significant gains in Share of Search for brands, Oral-B in Electric Toothbrushes led the pack again. Neutrogena in Sunscreens and Somall in Toothpastes also gained more than 10% in their Share of Search during the sale event, followed by Tresemme in Shampoos and Airspun in Make-Up products.

    Other popular brands like Crest in Toothpastes, e.l.f in Make-Up, Philips Sonicare in Electric Toothbrushes, and Sheamoisture in Beradcare surprisingly had reduced visibility among the top search results for relevant subcategories.

    Staying Ahead of the Curve During Sale Events

    This Prime Day, Amazon leveraged its scale to offer aggressive discounts across key product categories, while several competing retailers chose to sit back and let the sale play out. Others chose a selective discounting strategy that focused their modest price reductions on a small set of items.

    At DataWeave, we understand the pivotal role competitive pricing insights play in empowering retailers and brands to gain a competitive edge, especially during crucial events like Prime Day. For retailers, the ability to track competitor prices accurately, at scale, in a timely manner is essential to plotting and acting on impactful pricing strategies and staying ahead of the curve.

    To learn more about how this can be done, reach out to us today!

  • Fashion eCommerce 2023: Leveraging Pricing Intelligence to Stay Competitive Despite Reduced Demand

    Fashion eCommerce 2023: Leveraging Pricing Intelligence to Stay Competitive Despite Reduced Demand

    The fashion industry is currently undergoing a period of stabilization after facing significant disruptions in recent years. Fashion retailers find themselves navigating not only changing consumer preferences but also the challenges brought about by inflation and supply chain issues that are remnants of the COVID-19 era.

    The effects of inflation have raised concerns regarding overabundance, rise of sustainable and pre-used fashion and declining sales, creating a mismatch between supply and demand within the market. As consumers scale back on spending due to rising prices, fashion retailers are left grappling with surplus inventory, heightened storage costs, and reduced profit margins.

    Consequently, these market dynamics have significantly impacted the pricing strategies employed by fashion retailers, resulting in dynamic shifts in pricing and competitiveness across different time periods, subcategories, and individual retailers.

    Counteracting this impact requires fashion retailers to adopt a data-driven approach that leverages competitive and market insights. They must adopt agile and versatile pricing strategies that enable advanced pricing and assortment management. By understanding their market position and the competitive landscape, retailers can effectively react to reduced demand and inflationary pressures without compromising heavily on their top line and profitability.

    At DataWeave, we harnessed the power of our proprietary data aggregation and analysis platform to track and analyze the prices of prominent fashion retailers to uncover unique insights into their price competitiveness over the past year, as well as understand how pricing strategies varied across diverse subcategories.

    Our Methodology

    For this analysis, we tracked the average price changes among leading US fashion retailers over 12 months to understand how their pricing across several fashion subcategories altered in response to supply chain inefficiencies, inflationary pressures, seasonal effects, and changing consumer preferences.

    • Sample: 88,000+ SKUs matched across 5 leading retailers
    • Retailers tracked: Amazon, Walmart, Target, Macy’s, Zappos
    • Key subcategories reported on: Boots, Bottoms, Coats, Denims, Flats, Heels, Jackets, Kids
    • Timeline of analysis: April 2022 to April 2023

    Our Analysis

    While prices have generally been rising in several industry segments, such as groceries, due to inflation, the fashion sector has experienced relatively stable prices, with even a few periods of price drops. In fact, average prices in April 2023 are 1.2% lower than those in April 2022. The main reason for this trend is that consumers have become cautious about discretionary spending on fashion in order to prioritize other necessities, resulting in lower demand and overstocking by retailers.

    In the first quarter of 2022, clothing accounted for only 3.9% of total expenditure by US consumers, down from 4.3% in 2019 before the pandemic. Additionally, in March 2023, 60% of fashion retailers in the US still had surplus goods, accounting for almost 20% of their entire stock. As demand decreased, fashion retailers started offering freebies with purchases, bundling products, giving away unwanted items, and notably, slashing prices.

    Subcategory level analysis of Average Price Change Month-on-Month between April 2022 – April 2023

    Our analysis at a subcategory level reveals that in winter 2022, seasonal demand led to the largest price increases of 6-11% in coats, boots, and jackets. However, these prices quickly declined afterward. In 2023, stabilization of raw material costs and a continuing decline in demand for non-essential apparel and fashion accessories are factors contributing to a significant drop in prices.

    Some of these trends vary among retailers as each faces different challenges and responds in distinct ways. Our data indicates that some retailers have chosen to increase their prices from Q3 2022 due to mounting pressure on profit margins, while others have further lowered prices due to increasing inventory levels.

    Average Price Change Month-on-Month Across Amazon, Macy’s, Walmart, Target, and Zappos between April 2022 – April 2023

    _____________

    Capability Spotlight

    Matching products across competitor websites is an essential part of tracking competitive prices and analyzing price leadership. In fashion, matching exact products is no mean feat. Websites often host a slew of variants in terms of size, color, material, etc. without any form of standardization in the way the products are represented. So fashion retailers often struggle with simply unusable pricing insights resulting from inaccurate and incomplete product matching. 

    DataWeave’s industry-leading product matching algorithm recognizes and leverages dozens of product attributes extracted from product titles, descriptions, and images to match products at very high levels of accuracy and coverage. What’s more, our platform can also match similar products based on a large variety of parameters, so our customers can benefit from a comprehensive competitive perspective.

    _____________

    For example, in August, Target reported a 90% plunge in profits during the second quarter of 2022, as shoppers concerned about inflation reduced spending on nonessential items. The company stated that its price cuts did not have the desired impact, resulting in a 1.5% increase in inventory compared to three months prior. As a result, we can see that Target’s average fashion prices spiked in August 2022 and have remained steady since then. Walmart also faced similar challenges and increased its prices in October 2022.

    However, during the same period in August 2022, Macy’s announced increased discounts to clear out excess inventory in preparation for the holiday shopping season. In the same announcement, Macy’s highlighted how the rising cost of groceries, which had experienced a double-digit increase, was impacting consumers’ budgets, changing their behaviors, and increasing the need for discounts. Our data reflects this, showing a significant drop in prices from October 2022 to January 2023.

    However, in January 2023, Macy’s successfully managed its inventory levels, reducing them from $6.4 billion in October 2022 to $4.3 billion in January 2023. As a result, average prices at Macy’s have started to rise.

    _____________

    For today’s fashion retailers, achieving a balance between expansion goals and profitability is crucial. It requires a meticulous examination of competitive and market insights on a regular basis to mitigate competitive pressures and navigate through these challenging times successfully.

    DataWeave’s platform offers retailers the insights they need to gain a competitive advantage. With access to accurate, timely, and actionable pricing and assortment insights, retailers can make informed decisions and stay ahead of the competition. To learn more, reach out to us today!

  • 5 Ways DataWeave Helps Brands Drive Growth With Amazon Ads

    5 Ways DataWeave Helps Brands Drive Growth With Amazon Ads

    Consumers are discovering and trialing new eCommerce marketplaces, brands and products at a faster rate than ever before, given the vast amount of choices encountered browsing for products online. A recent analysis shows how events like Amazon Prime Day, Black Friday, and Cyber Monday are especially fruitful for new-to-brand customer advertising, encouraging B2C marketers to increase their digital advertising spend to fuel product discovery, sales and market share for their brands.

    Amazon advertisers grow market share and brand loyalty with ecommerce intelligence
    DataWeave joins Amazon Advertising partner network

    The majority of eCommerce consumers are discovering products via relevant keywords attributable to their needs, with most clicks happening on page one results for the first few products listed. Simplifying the digital shopping experience is critical for brands to be in the consideration set for the majority of consumers who won’t venture past page one results. 

    An internal analysis conducted shows getting a product to page one on retailer websites can improve sales by as much as 50 percent, but figuring out the right levers to pull to get there organically—without paid advertising—is a real challenge, especially given fast-changing algorithms. While more than half of all retail related online browsing sessions are “organic”, sometimes brands need to boost their product visibility by investing in sponsored (paid) opportunities to improve a product’s rank.

    Data analytics can equip brands with intelligence to help them decide when, where, and how to make digital advertising investments profitably, while simultaneously acting on insights that help drive organic growth. Considering a majority of U.S. consumers begin their product discovery on marketplaces like Amazon, it makes sense for brands to prioritize digital advertising opportunities with Amazon.

    Maximize Return on Ad Spend (ROAS) with Amazon Ads

    Brands use Amazon Ads to drive brand awareness, acquire new customers, drive sales and gain market share, with the goal of furthering their marketing return on investment. Top performing advertisers average 40 percent greater year-on-year (YoY) sales growth, 50 percent greater YoY growth in customer product page viewership on Amazon, and 30 percent higher returns on ad spend (ROAS) with Amazon Ads, according to a recent analysis. Sponsored Products, Sponsored Brands, Amazon DSP and Sponsored Display are among the types of Amazon Ads options cited that produce maximum return.

    Ensuring your product listings appear at the top of page one results on Amazon for the most relevant discovery keywords is therefore the most important determinant for maximizing ROAS. DataWeave has become a vetted partner and measurement provider in the Amazon Advertising Partner Network, with the goal of supporting brands to optimize digital advertising campaigns by providing visibility to Digital Shelf Analytics (DSA) key performance indicators (KPIs), like Share of Search, Pricing and Product Availability, Content Audits, Ratings and Reviews, and Sales Performance and Market Share.

    Below is a summary of how our Digital Shelf solutions, in partnership with Amazon Ads, can improve the performance of your Amazon Ads campaigns

    1. Keyword Recommendations Improve Share of Search

    With the DataWeave Share of Search solution, brands can monitor their placement of both organic and paid discovery keywords relative to their competition. Once your keywords are determined, you are also provided a weighted Share of Search score that helps measure how well each keyword performs relative to product discoverability. Below is an example of insights you’d gain.

    Share of Keyword Search

    Brands can provide their own list of keywords to monitor, or through our Amazon Ads collaborative solution, learn which keywords are the “best” for them to measure in the realm of Amazon. Performance results are based on data that shows which keywords consumers are actually using when browsing online alongside other keywords brands request to measure. Users are able to see exactly which keywords are most popular, competitive (and even unexpected), and relevant at an Amazon Standard Identification Number (ASIN) level of granularity. 

    We can also estimate the degree of relevance and estimated traffic for the recommended keywords. Brands can then use these insights to adjust campaign strategies based on these parameters, which can boost product discoverability and rank visibility. A brand could assume people find its products by brand name, yet traffic insights may reveal a majority of people look for a generic product type before they end up buying that particular brand. 

    2. Content Audits Increase Discovery Relevancy Scores

    Strong product content is critical to succeeding on Amazon. Thorough, accurate, and descriptive content leads to better click through rates (CTR), conversion rates, more positive reviews, and fewer returns, which results in increased discoverability. DataWeave’s Content Audit solution reviews existing copy and images on a per-attribute basis to highlight any gaps essential to improving visibility, as seen in the example below.

    Content Analysis

    To further growth, it is equally as important that your product content aligns with your advertising strategy. With Amazon Ads partner add-on, our solution can also audit your content to measure how effectively you are incorporating Amazon Ads keywords into your product content to enhance discovery relevancy.

    3. Discover More Opportunities with Pricing and Product Availability Insights

    Quality content and keyword updates will only get you so far if your products are not consistently available and priced competitively. With DataWeave’s Pricing and Promotions and Product Availability modules, advertisers can monitor their selling prices and availability trends alongside their competitors to uncover more opportunities to incorporate into advertising campaigns, as seen in the Pricing and Promotions dashboard example below.

    Promotion Analysis

    Additionally, product targeting recommendations can be utilized to target a competitor’s ASIN that may be overpriced or that is having issues staying in stock. Alternatively, broaden your strategy to target specific brands, complementary products, or category listing pages.

    You can also create alerts on your own products to monitor when items are low on inventory or out of stock to ensure key products are consistently available when customers are shopping.

    4. Leverage Ratings and Reviews to Increase Conversion

    Product ratings and reviews are also a critical component to running a successful Amazon Ads campaign. A large number of reviews and a positive star rating will provide customers with the confidence to purchase, resulting in higher conversion rates. Conversely, negative feedback can have a detrimental impact, resulting in lost sales and wasted ad spend. DataWeave’s Ratings and Reviews module can help you monitor your reviews and extract attribute-level insights on your products. This information can then be utilized to further optimize your advertising strategy.

    If you see consistent feedback in your reviews on aspects of a product not meeting customer expectations, address them in your product content to prevent potential misplaced expectations. Alternatively, if customer reviews are raving about certain product features, ensure these are promoted and relevant keywords are populated throughout your descriptions and feature bullets. Below is an example of insights seen within the DSA Ratings & Reviews dashboard.

    Ratings and Reviews

    5. Correlate Digital Shelf KPIs to Sales Performance and Market Share

    The newest DSA module, Sales Performance and Market Share, provides SKU, sub-category, and brand-level sales and market share estimates on Amazon for brands and their competitors, via customer defined taxonomies, to easily benchmark performance results.

    This data can also be correlated with other Digital Shelf KPIs, like Content Audit and Product Availability, giving brands an easy way to check the effect of attribute changes and how they impact sales and market share. Similarly, brands can see how search rank, both organic and sponsored, affects sales and market share estimates.

    Understanding the correlation between your advertising campaigns and your Digital Shelf brand visibility will help you identify which areas to prioritize to drive sales and win more market share.

    Digital Shelf Insights Help Brands Win with Amazon Ads

    The need for access to flexible, actionable eCommerce insights is growing exponentially as a way to help brands drive growth, increase their Share of Voice, and to gain a competitive edge. As a result, more global brands are seeking Digital Shelf Analytics for access to near real-time marketplace changes and to develop data-driven growth strategies that leverage pricing, merchandising, and competitive insights at scale.

    By monitoring, measuring and analyzing key performance indicators (KPIs) like Sales Performance and Market Share, Share of Search, Content Audits, Product Availability, Pricing and Promotions and Ratings and Reviews alongside competitors, brands will know what actions to take to boost brand visibility, customer satisfaction, and online sales. 

    DataWeave’s acceptance into the Amazon Advertising Partner Network enables Amazon advertisers to effectively build their Amazon growth strategies and determine systems that enable faster and smarter advertising and marketing decision-making to optimize product discoverability and overall results.

    Connect with us now to learn how we can scale with your brand’s analytical needs, or for access to more details regarding our Amazon Ads Partnership or Digital Shelf solutions.

    UPDATED: Read the full press release here

  • Prime Day Germany 2022 – highlights from the 2 day annual shopping festival!

    Prime Day Germany 2022 – highlights from the 2 day annual shopping festival!

    In 2022, Amazon sold 300 million products during Prime Day – selling roughly 100,000 items per minute. Since Amazon started Prime Day in 2015 to celebrate its 20th birthday, the shopping festival has grown into a holiday and rivals Black Friday and Cyber Monday in the U.S. and Singles’ Day in China. 

    According to RetailDetail, the leading B2B retail community in Benelux, Amazon is planning a 2nd Prime Day shopping festival in the autumn, just a few months after its annual Prime Day event. The retailer has asked its sales partners to prepare for a promotional event in the autumn where they have until the beginning of September to propose attractive discounts, with at least 20% discounts. This year’s second Prime Day may occur in October, with or without the same name. 

    But before that, let’s examine what happened in Germany this year on Prime Day 2022.

    Methodology

    • We tracked Amazon.de both before & on 12 & 13th July 2022, on Prime Day.
    • Categories Tracked – Electronics, Wine & Spirits, Grocery, Furniture, Fashion, and Beauty. 
    • We looked at Additional Discounts offered on Prime Day: Additional Discount is the extra discount on an item during Prime Day when compared to the Pre-Prime day price.
    • We also looked at Post Prime Day Discounts, which were the discounts offered after the 2-day event ended.

    What kind of Discounts did Amazon.de offer?

    Amazon Prime Day will be significant, especially for customers hoping to get discounts amid soaring inflation. Both Amazon as well as other sources reported that electrical and electronic items were the most popular purchases, followed by general retail products. Electrical and electronics saw the value of transactions soar 90% on the first day. Mobile phones and accessories were the most popular, with transaction values almost doubling to 96% on day one.

    Discounts across Categories on Amazon.de
    Discounts across Categories on Amazon.de
    • Based on trends from past events, Amazon likely knew electronic items were going to be best sellers. Keeping this in mind, they made sure to offer high discounts in the electronics category. They offered a 6.5% additional discount on electronics on Prime Day. And once the sale ended, they continued to discount electronics by 1.3%.
    • The Fashion category also had a fair bit of discounts and came in at a close second at 5.9%
    • Looks like Amazon discounted everyday use items minimally. Groceries had an additional discount of just 1.8% on Prime Day, and wine and spirits had 2% extra discount.  
    Discounts on Electronics Category on Amazon.de
    Discounts on Electronics Category on Amazon.de
    • Within Electronics, in the four categories we tracked, we saw the highest additional discounts were offered on Bluetooth earphones (10.6%) and Smartwatches (9%)
    Discounts on Fashion Category on Amazon.de
    Discounts on Fashion Category on Amazon.de
    • Jeans and Sunglasses had the highest discounts at 8.6% & 7.6% respectively.
    • Sneakers & Watches too had additional discounts of 6.6% on Prime Day.
    • Post the Prime Day event, Amazon retained an average of 1.5% discount across all products in the fashion category instead of pricing them at the original price. 
    • However, in the case of women’s T-Shirts, they increased the price by 1.7% from the pre-event price.

    Discounts across Price Tiers

    Retailers must consider several factors when making strategic discounting decisions, including customer buying behavior, the type of discount offered & the volume of discount offered. The best discounting approach will vary depending on the product and other factors like the original selling price of the product.

    Now let’s compare the discounting strategy Amazon used in the Electronics v/s Fashion category on Prime Day.

    Discounts across Price Ranges
    Discounts across Price Ranges
    • Interestingly, in both the Electronics and Fashion categories, Amazon increased prices for the lowest-end products between the €0-10 range by 3.6% and 13.2%, respectively, during the sale instead of discounting them! Maybe this was a strategy to drive consumers to higher-value products with greater discounts? 
    • Another similarity in strategy was that most of the mid-priced items had maximum discounts. In electronics & fashion both, the maximum discounts were given to products between the € 30-100 range. 
    • Here’s a difference that stood out – for Electronics in the higher price range between €100 – 500, the volume of discounts dropped a bit which meant Amazon gave moderate discounts on high-end electronics. But the trend flipped for Fashion as luxury fashion items were made to look more attractive with higher discounts.

    Monitoring stock availability during key sales days is critical

    Brands need to have the right stock availability, especially during sale events, because more customers shop online during sales. What’s worse, non-availability of products may drive customers to competitors that are stocking the same product.  Out-of-stock situations lead to missed opportunities & lost sales! Let’s take a look at our data and see how Amazon planned product availability across categories on Prime Day. 

    Availability Analysis across Categories on Prime Day
    Availability Analysis across Categories on Prime Day
    • Amazon was betting big on 2 categories – Electronics & Home. This meant they needed to keep a keen eye on availability in these categories, especially since they forecasted the highest sales to be generated here.
      … it was no surprise that the Furniture category had almost 100% availability during Prime Day! Electronics too had a high availability at 94% during the event.
    • Generally, our data showed that availability across multiple categories we tracked seemed robust and above 80% in more cases. Only Beauty & Grocery had 79% availability.

    Conclusion

    Prime Day sales reached an estimated 12 billion U.S. dollars worldwide, 9.8% higher than last year, making it the most successful shopping event in Amazon’s history. If you’re a brand selling on Amazon or a retailer trying to compete with Amazon, reach out to us at DataWeave to know how we can help!

  • Prime Day UK 2022 – highlights from the 2 day annual shopping festival!

    Prime Day UK 2022 – highlights from the 2 day annual shopping festival!

    Prime Day launched in 2015 as a celebration of the 20th anniversary of Amazon’s founding & has quickly become the biggest shopping event of the year for Amazon. Prime Day is a great opportunity for customers to snag fantastic deals on products they might not otherwise consider buying. Last year, Amazon Prime Day was a tremendous success, with Prime members spending billions of dollars on discounted items. In 2022 alone, global sales during the event reached a new record high of $12 Bn.

    18 countries participated in Prime Day this year, including the US. We did a deep dive into what happened in the UK – the discounts Amazon offered and categories with the highest discounts as well as checked to see if other retailers tweaked their pricing strategy to compete with Amazon on Prime Day.

    Methodology

    • In addition to Amazon UK, we tracked some key retailers on 12 & 13th July 2022, on Prime Day.
      Retailers tracked – eBay UK, OnBuy, Selfridges, ASOS.com, Net-A-Porter 
    • Categories tracked – Electronics, Wine & Spirits, Grocery, Furniture, Fashion, Beauty. 
    • We looked at Additional Discounts offered on Prime Day: Additional Discount is the extra discount on an item during Prime Day when compared to the Pre-Prime day price. 
    • We also looked at Post Prime Day Discounts, which were the discounts offered after the 2-day event ended.

    Did other retailers compete with Amazon on Prime Day?

    Traditionally, as Amazon’s Prime Day sale approaches, other retailers adjust their prices by offering summer deals or getting creative with offers. However, we did not see aggressive strategies from other retailers this year. In the US, Walmart always has a sale during Amazon’s Prime Day. The Wall Street Journal reported that Walmart announced there wouldn’t be an annual promotional event on Prime Day 2022 this year.

    Another report published by Forrester stated that major retailers scaled back their promotions, and overall offers from other retailers were less than impressive. We took a look at the data we gathered in the UK to see if this trend aligned. 

    Discounts offered on Prime Day on Amazon v/s other retailers
    Discounts offered on Prime Day on Amazon v/s other retailers
    • Our data showed that most retailers we tracked offered negligible discounts (in the range of 0.1 – 1.5%) and did not really try and compete or match the discounts Amazon was offering. 
    • However, ASOS was the one retailer that competed heavily with Amazon in the Fashion & Beauty category. While Amazon offered an average additional discount of 7.7% in the Fashion category, ASOS offered 13.2%. And in the beauty category, Amazon offered 6.7%, while ASOS offered 15.2%.
    • When we looked at post-prime day discounts, we saw that as soon as Prime Day ended, ASOS went back to the original price and stopped offering a discount which clearly shows they were keeping an active eye on out their competitors pricing. In fact, ASOS was offering up to 80% off almost everything on the site until Prime Day.

    Which were the popular categories that offered the most discounts?

    During Prime Day, shoppers saw tons of deals on essential gadgets. Tech deals were a massive hit and saw big discounts on everything from TVs, laptops, smartwatches, phones, and tablets. We look at the data we collected to see if we saw a similar trend. 

    Discounts on Amazon UK across categories
    Discounts on Amazon UK across categories
    • Amazon offered discounts across categories and reported that some of the best-selling categories were Consumer Electronics & Home. 
    • Our data too showed that the highest additional discounts were offered in electronics – Bluetooth Earphones at 18.4%, followed by Smartwatches at 14.9% and Laptops as well as Cameras, both at 12%.
    • Low discounts were offered on Alcohol, with Beer at 0.9% and Wine at 1.3%, respectively.
    • Relatively attractive discounts were seen in the Fashion & Beauty category – Sunglasses (9.1%), Shampoo (9.7%), & Watches (9.4%)
    Discounts on Amazon UK in the Electronics category
    Discounts on Amazon UK in the Electronics category

    Electronics being the hot favorite – we wanted to deep dive into the data and get more insights on Amazon’s pricing & discounting strategy here. Discounts can entice customers to buy more, encourage customer loyalty, or clear out old inventory. However, businesses must be careful since too much discounting can eat into profits. They also have to be mindful of which products should be discounted and by how much. 

    • Our data showed that the highest discounts (between 13 – 18%) were given on electronics priced between the £ 20-100 price range.
    • Electronics priced higher, between the £ 100 – 500 pound price range, were discounted less than 10%
    • However, high-value premium electronics over £ 500 were discounted slightly above 10%

    How did Amazon manage stock availability during Prime Day?

    Keeping track of inventory is especially important during big sales like Prime Day when thousands of customers are actively looking for deals.  There’s nothing worse than them finding the item they wanted is out of stock (OOS). OOS leads to lost sales, a situation that must be avoided at all costs. Read about how a small short term stock out on Amazon led to long term negative impacts for one of our customers. And let’s also look at the data and see what product availability looked like on Prime Day.

    • Overall, Amazon maintained robust availability across categories, and re-stocking was constant both before, during & after the event. 
    • Furniture, Fashion & Electronics had the highest availability. No surprise there since Amazon estimated that Home/ Furniture would be one of the best-selling categories.
    • Grocery saw average availability – perhaps cause some of these products are perishables, so it’s best to be mindful about overstocking.

    Which Brands Won on Prime Day?

    If there is one thing to remember about improving your product visibility on Amazon, it’s that it all boils down to the usage of the right keywords. Using relevant keywords makes your product appear higher up in search when customers are running searches on Amazon for those products. And the higher up a product appears in search, the higher the chances of a sale! 

    Let’s take a look at some popular categories and which brands had the highest Share of Search (SoS) during Prime Day.

    • Corona, San Miguel, and Becks were the top 3 brands optimized for the keyword Beer. However, what’s really important to note is both Corona & Becks had 20% SoS that was completely organic. San Miguel had a 20% SoS too, but it was sponsored ads that gave them this artificial boost. 
    • While a whole bunch of other brands had a 10% SoS most of them achieved this via Sponsored Ads. Youngever was the only brand that achieved this completely organically. They must have made sure they optimized key KPIs like content, ratings & reviews & product availability to achieve this result.
    • There were deep discounts on a wide range of Lenovo laptops. For example, the Lenovo IdeaPad duet Chromebook and Lenovo IdeaPad Flex 3 Chromebook were available at £100 off. Our data, too saw Lenovo & Asus fight for the top spot.
    • Asus sponsored 28% of products before Prime Day, hoping to capitalize on the pre-sale frenzy. During the event, they sponsored only 13% of products, bringing down their total SoS from 31% before the event to 13% during the event. 
    • Lenovo followed the opposite strategy; they sponsored just 6% of products before the event and during the event sponsored a whopping 25% which made them “almost” dominate the Laptop category during Prime Day.
    • Then there was Microsoft, with the highest SoS at 38%, of which all of it was organic!
    • The Smartphone SoS battle was clearly between Samsung & Xiaomi. Samsung was a consistent #1 at all 3 time periods (Before, During & After Prime Day) with the highest total SoS. Xiaomi came in at a close second. 
    • Samsung had an exciting strategy – they went heavy on sponsorships before and after the event. Their sponsored SoS was 31% & 39% respectively. And SoS of 13% during the event. 
    • Xiaomi’s strategy was just the opposite. Their sponsored SoS was 16% before the event. And 17% after the event, which was moderate compared to their Sponsored SoS during the event at 25%, which was much higher than Samsung’s 13%
    • Critical to note, Xiaomi’s organic search visibility before, during, and after the event was 0%. It definitely should be a concern area for any brand.
    Share of search
    Share of search
    • Both before & after the event, Cadbury had the highest visibility for the keyword Chocolate. During the event, they were not in the top 5 brands.
    • During Prime Day, Nestle won the top spot and had a 29% SoS. However, before the event, they were at #3 and after at #2. Artificially boosting visibility might’ve had something to do with this.

    Conclusion

    Prime Day sales reached an estimated 12 billion U.S. dollars worldwide, 9.8% higher than last year, making it the most successful shopping event in Amazon’s history. If you’re a brand selling on Amazon or a retailer trying to compete with Amazon, reach out to us at DataWeave to know how we can help!

  • UK Grocery Pricing Wars in 2022! A quick look at Pricing Data we gathered from 5 Grocery retailers in the UK

    UK Grocery Pricing Wars in 2022! A quick look at Pricing Data we gathered from 5 Grocery retailers in the UK

    Grocery sales in the UK are dominated by the “big four” – Tesco, Asda, Sainsbury’s, and Morrisons. A Statista report on these Grocery Giants as of May 2022 indicates that Tesco, Sainsbury’s, and Asda own approximately 27%, 15%, and 13% market share of grocery stores in the UK. Whereas Ocado and Symbols & Independent have the lowest market share, 1.8% each.

    However, the grocery delivery market is seeing a major shift because of new-age Quick Commerce companies that have swooped into the already crowded grocery space offering super-speedy home delivery! These new entrants added to the already competitive Grocery market & price wars intensified. Customers today rely on ultra-fast delivery services for their grocery requirements. For example, Berlin-based Gorillas charges £1.80 to deliver anything from a £7 pizza to a 30p apple — with no minimum order value. 

    Investors funded over £5B in grocery delivery apps such as Getir, Gorillas, Zapp, Fancy, Dija, Weezy, Jiffy, and Beelivery, in the UK. These rapid grocery delivery apps offer shorter delivery times, as low as 10 minutes, along with deep discounts to attract customers. For example, Gorillas, Weezy, and Getir all claim a 10-minute delivery time and offer promotional codes for the first couple of orders. Customers also get discounts for inviting friends and family.  

    To get more insight into the Grocery space in the UK, we tracked 5 Grocery retailers & Q-Commerce companies to try and understand trends wrt pricing in this competitive environment. Let’s take a look at what our data found & which retailer won the competitive pricing tug of war. 

    Methodology

    • Data Scrape time period: January 2022 – June 2022
    • Grocery Retailers tracked: Tesco & Ocado
    • Grocery Apps tracked: Gorillas, Weezy & Getir
    • Categories tracked: Alcohol, Drinks & Beverages, Fresh & Frozen, Grocery, Health & Wellness, Home Care, Packed Food & Snacks, and Smoke shop.

    Grocery Giants v/s Grocery Delivery apps – who was the Price Leader?

    Price leadership by category
    Price leadership by category
    Price leadership across months by Retailer
    Price leadership across months by Retailer

    We wanted to track and see which retailer was the Price Leader – i.e., had the most number of lower-priced items in a particular category. Our data clearly showed that the Grocery Giants Ocado & Tesco won hands down! Interestingly, Ocado launched a new Ad Campaign earlier in Jan this year about bringing value to the table for customers with quality products at affordable prices – seems like they’re taking this new promise very seriously! 

    • Tesco and Ocado were price leaders in maximum categories when compared to Gorillas, Weezy, and Getir. 
    • Between Tesco & Ocado, Ocado enjoyed price leadership across all these categories for 4 out of the 6 months we tracked pricing for. Tesco occupied the top slot for just the balance 2 months. 
    • Tesco was the price leader in the Alcohol category, with close to 40% of products priced the lowest compared to other retailers. They were also price leaders in the Smoke Shop category.
    • Ocado won price leadership for the remaining 6 categories, with a marginal gap between both retailers. 

    Watching Price Index Trends as inflation soars!

    Price index across monthsby Retailer
    Price index across months by Retailer

    The Guardian reports that Grocery inflation has hit a 13-year high in the UK, and food price rises could hit 15% by this summer – the highest level in more than 20 years. Meats, cereals, dairy, fruit & vegetables are likely to be the worst affected. Keeping this in mind, we tracked the Price Index (PI) across these 5 retailers to measure how prices changed over a 6 month period from Jan – June 2022. 

    Note: Retailers selling at the 100% mark were selling at an optimal price & did not undercut the market. The pricing sweet spot is 95% – 105%. Anything lower would compromise margins, and higher would mean the retailer was not competitive. 

    • Getir & Ocado had a Price Index that was the most optimal, sitting in the 95% – 105% range.
    • Gorillas had the lowest Price Index, between 88% – 90%.
    • Weezy has the highest Price Index – they were selling at a minimum 30% – 40% premium over other retailers! Perhaps it’s their quick delivery service that justified these super high prices? Unlike other apps with a lower delivery fee but longer delivery times, Weezy offers a 15-minute delivery service & customers seem to be willing to pay for convenience! Wheezy also has a delivery fee of £2.95, which is at least £1 more than other platforms.
      Supermarkets like Ocado are now playing catch up to compete with Q-Commerce and quick delivery services. Ocado has launched a new “Zoom” service promising delivery in 60 minutes, and Amazon is now delivering “same day” groceries (but both have a minimum spend of £15)

    Which Retailers were the quickest to make price changes?

    Average price change across months by Retailer
    Average price change across months by Retailer

    Competitive pricing is critical to winning the eCommerce race. Competitive pricing involves tracking your competitor’s pricing & strategically tweaking your own prices without hurting margins. We tracked the month-wise average Price change from Jan – June across all 5 retailers to see which retailer was making price changes and at what frequency. 

    • The main observation was – across all 6 months, all retailers were likely tracking each other’s prices and making minor price changes accordingly – the need of the hour in this hyper-competitive environment. 
    • Gorillas made significant changes to prices between Jan & Feb. And Getir in the May/ June time period. 

    Discounts & Promos in a turbulent UK Grocery Market

    Average discount across months by Retailer

    Although customer acquisition starts with building awareness, discounts are a proven way to attract customers quickly. When approached with the right strategy, promotional discounts can promote long-term customer loyalty, drive customer acquisition, and improve customer lifetime value. However, deep discounting can risk margins and create more problems than benefits. We wanted an insight into discounting trends in the Grocery space, so we looked at our data. Here’s what we saw:

    • Getir offered by far the highest discounts compared to Ocado & Gorillas. In fact, in most cases, they offered discounts close to 2-3% higher than the retailer with the 2nd highest discounts! 
    • Our data showed that Gorillas offered the lowest discounts. As reported in The Sun & other sources, newer Q-Commerce players like Gorillas have been showering users with discount codes, and that is why this data surprised us! 

    We went & looked back at the Price Index earlier in this blog, we noticed that Gorillas had a low price index overall, with most products priced at a 90%, way below other retailers. Perhaps this already lower price is why they’re offered very few discounts?

    Conclusion

    The UK grocery delivery market saw a huge rise in new retailers who are currently fighting for better discounts, competitive prices, and quick delivery. Although Tesco and Ocado were the price leaders in our findings, new players like Gorillas, Weezy, and Getir are attracting customers with quicker delivery times and low delivery costs. 

  • The Role of eCommerce in Sustainable Fashion

    The Role of eCommerce in Sustainable Fashion

    Today, environmental damage is rapidly occurring on a global scale. And there are many reasons and causes for this. Global warming is one, deforestation, over population are some others. The list is long. In a small way, the retail & clothing industry contributes to environmental damage too. The good news is that sustainable fashion addresses this issue. Sustainable clothing is designed using sustainable fabrics like organic cotton, hemp, and Pima cotton that have less of a negative impact on the planet. 

    sustainable clothing and its benefits
    Sustainable clothing and its benefits

    In this blog, we will discuss the rise of sustainable clothing and its benefits. We will also discuss marketplaces for sustainable fashion.

    Benefits of Sustainable Fashion

    a. Reduces carbon footprint

    The fashion industry emits numerous greenhouse gases annually. Most clothes are made from fossil fuels and require significantly more energy in production. Sustainable brands often use natural or recycled fabrics that require less chemical treatment, water, and energy. Organic fabrics such as linen, hemp, and organic cotton are biodegradable and environmentally sound.

    b. Saves animal lives

    Leather isn’t a by-product of the meat industry, and it’s estimated that it alone is slaughtering and killing over 430 million animals annually. Sustainable fashion brands are increasingly embracing the use of cruelty-free alternatives. Various alternatives include polyester made with ocean trash, plant-based compostable sneakers, bags from recycled seatbelts, silk created from yeast, and bio-fabricated vegan wool. Another interesting leather alternative comes from pineapples, where the fabric is produced using the leaves of pineapples.

    c. Requires less water

    Water is used in the dyeing and finishing process for nearly all items in the fashion industry. It takes 2,700 liters of water to produce a single T-shirt. Cotton is highly dependent on water but is usually grown in hot and dry areas. Linen, hemp, Refibra, and recycled fibers are some other sustainable fabrics that require little to no water during production.

    d. Supports safer working conditions

    Endless working hours, unacceptable health & safety conditions, and minimum wages, are the reality for most garment workers in the fast fashion sector. A few informative documentaries like “The True Cost” or “Fashion Factories Undercover” document the social injustices of the fast fashion industry. Eco-ethical brands advocate for sustainable fashion, health care, humane working conditions, and fair wages for their workers. 

    e. Healthy for people and the environment

    Fast fashion products often undergo an intense chemical process where 8,000 types of chemicals are used to bleach, dye, and wet process garments. Those chemicals often lead to diseases or fatal accidents for workers and inflict serious congenital disabilities on their children. These chemicals harm our health, as our skin absorbs anything we put on it.

    5 Sustainable & Ethical Online Marketplaces

    Here is a list of five earth-minded and socially responsible marketplaces that have sustainable and fair trade brands for the discerning and mindful shopper:

    1. thegreenlabels

    Netherlands-based webshop thegreenlabels is a sustainable fashion retailer that sells sneakers, womenswear, and accessories from various “green labels” brands. Founded in 2018, this is a marketplace where people can buy products from brands that care about a positive impact on the environment. All brands featured here guarantee fair working conditions and represent at least one of these 4 values – “CLEAN PROCESS” environmentally friendly production, clothes that support “LOCAL” communities, “VEGAN” brands to assure no animals were harmed and “WASTE REDUCTION”

    2. LVRSustainable

    LVRSustainable
    LVRSustainable

    Luisa Via Roma started as a family-owned boutique in the early 1900s. They have grown into a luxury e-retailer and created an LVRSustainable section for people trying to insert sustainability into their wardrobes. They have brands rated ‘Good’ or ‘Great.’ The site offers a wide range of products like bags, accessories, sports, shoes, lingerie, and much more for men, women, and kids. You can find organic, vegan, eco-friendly, ethical, and recycled & upcycled items here.

    3. Brothers We Stand

    Brothers We Stand
    Brothers We Stand

    Brothers We Stand is a retailer set up in solidarity with the people who make our clothes. This retailer conducts rigorous research to ensure that every product in their collection meets the following three standards: designed to please, ethical production, and created to last. It’s a great platform to shop for ethical and sustainable menswear. They also have their private clothing line along with other brands.

    4. Labell-D 

    Labell-D was launched with a clear mission to reduce the negative impact of fast fashion on the planet. This retailer wants to make Responsible Fashion the new norm. They intend to make sustainable clothing and fashion easy for both brands and consumers. Labell-D has a transparent accreditation process where they evaluate the brand’s carbon footprint and environmental impact. Their verification assessment includes animal welfare, emissions, materials, production processes, chemical usage, waste management, and traceability.

    5. Cerqular

    Cerqular wants to make sustainable shopping affordable and accessible for all. The retailer promises that every product and seller is verified as organic, recycled, sustainable, carbon-neutral, eco-friendly, vegan, or circular. They have a wide range of sellers and do not limit products only from luxury brands, so sustainable shopping is no longer expensive or inconvenient.

    Conclusion

    The fashion industry is a contributor to worldwide carbon emissions. Sustainable fashion is the new big thing giving rise to more and more sustainable brands and marketplaces. 

    To stand out and shine in the crowded eCommerce space is not easy. Having a robust Digital Shelf becomes critical for brands. A brand’s Digital Shelf is all of the ways their customers digitally interact with the brand, not only on marketplaces but on the brand’s DTC website & shoppable social media. This is why brands need to closely track & optimize their Digital Shelf KPIs like assortment, availability, pricing, ratings & reviews, product discoverability & product content to increase their online sales.

    Want to learn how DataWeave can help you win the Digital Shelf? Sign up for a demo with our team to know more.

  • U.S. Prime Day Deals 2022: Promotion Intelligence First Look

    U.S. Prime Day Deals 2022: Promotion Intelligence First Look

    As inflation hits another 40-year high at 9.1 percent, U.S. consumers geared up for their first sign of hope and relief in the form of anticipated discount buys – 2022 Amazon Prime Days, or so we thought. While Prime Days have grown to become a promotional period almost as important as Black Friday to digital shoppers, the combination of economic uncertainty, inflationary pressures, and supply chain challenges seemed to alter the discount strategy expected given activity seen during 2021 Prime Days.

    Our analyst team has been hard at work aiming to provide a ‘first look’ at 2022 Prime Day Promotional Insights, tracking discounts offered across 46,000+ SKUs within key categories like Electronics, Clothing, Health & Beauty and Home, on seven major retailer websites – Amazon, Target, Best Buy, Sephora, Ulta, Lowe’s and Home Depot. Our analysis compares prices seen during Amazon Prime Day 2022 on July 12th, to pre-Prime Day maximum value prices seen in the ten days leading up to Prime Days, to determine the average change in discounts offered during the promotional period. Below is a summary of our findings.

    Competitive Promotions Give Amazon a Run for their Money

    Amazon offered the greatest average discount enhancements for Electronics at 5.6 percent followed by Health & Beauty items at 5.1 percent, and Home products at 4.2 percent versus pre-Prime Day discounts seen across the categories considered within our analysis. The only category reviewed where average discounts were greater on a competitor’s website was on Target.com within the Clothing category. As seen below, Clothing on Target.com average discounts were 6.8 percent greater than pre-Prime Day offers, which was 2.6 percent higher than the average discounts offered for Clothing on Amazon.

    Target Capitalizes on Growth Opportunity in Clothing Category

    Diving deeper into the details of where Target won within the Clothing category, you can see a majority of their promotional activity took place within Women’s Accessories where discounts offered were 18.5 percent greater than those seen pre-Prime Day 2022, which was almost 15 percent greater than the discount enhancements seen on Amazon for Women’s Accessories. In fact, Women’s Shoes and Sneakers were the only two categories where the average discounts offered were greater on Amazon than on Target.com.

    Overall, the discounts offered on Target.com within the Clothing category were primarily concentrated within items priced $40 and lower, but what was most interesting is that within the $10 and under price bucket, Target offered average discounts of over 11 percent whereas Amazon increased prices for these items on average by over 9 percent.

    While most of the Clothing available on both Amazon and Target.com during Prime Days 2022 were offered without a price change, the greatest discount percentages tracked were within the range of 10-25 percent off on Amazon whereas Target chose to offer the bulk of their promotions at 25 percent off an up.

    Strategic Promotional Strategies Defined at the Electronics Subcategory Level

    When it comes to the Electronics category on Prime Day, the big question is always who will win the battle of the brands. Below shows the difference in average pricing and promotions discounts offered between products manufactured by Samsung versus Apple across each retailer platform, noting discounts were almost 3 percent greater on average for Apple versus Samsung products on Amazon, and Apple discounts were almost 5 percent greater on Amazon versus than those seen on Target.com.

    Amazon wasn’t going all in on Apple however, as we saw ‘Alexa’ devices (Amazon products) available on Best Buy and Target websites also, but the discounts were almost 4 percent greater on Amazon versus Target and over 7 percent greater than the discounts seen on BestBuy.com.

    While the average discounts offered within the Electronics category were greatest on Amazon (5.6 percent) versus Best Buy (3.9 percent) and Target (3.4 percent) as noted within the first chart of this blog and across brands and technologies considered above, the discounts offered on Amazon were strategically focused between 10-25 percent as seen below.

    Amazon’s Electronics promotions were also targeted at smaller price points, items priced between $20-500, whereas Best Buy and Target offered greater promotions for electronics priced $500 and up than Amazon.

    Below is a snapshot of price buckets tracked for Electronics available on BestBuy.com, highlighting where most of the promotional activity was targeted at products priced $50 and up during Prime Days 2022, with discounts ranging from 10 percent up to greater than 25 percent greater than pre-Prime day prices.

    The standout categories were TVs on Target.com with discounts averaging nearly 12 percent greater than those seen pre-Prime day, and smartphones on BestBuy.com with discounts averaging just over 11 percent greater than those seen pre-Prime Day. The category with the greatest average discount enhancements seen on Amazon during Prime Days 2022 was for Wireless Headphones with an average discount of 8.7 percent.

    Home is Where Amazon’s Heart Was on Prime Day

    Amazon dominated offers within the Home categories, especially for products within mid ($40-100) and higher price ranges (items priced $200-500), with the bulk of the discounts offered between 10-25 percent. There was little to no promotional activity seen across all price points on Lowe’s or Home Depot’s websites within the categories we tracked, and most other competitive offers on Home products were seen on BestBuy.com for products priced from $50-500. Even a subcategory like Tools offered deeper average discounts on Amazon (4.7 percent) than discounts seen on HomeDepot.com (1.1 percent) or Lowes.com (0 percent).

    For Large Appliances, Amazon was the only retailer to off any significant discount across each major subcategory with the greatest average discount being on Ovens at 6 percent, followed by Refrigerators at 4 percent. One caveat with this category, when we reviewed Large Appliance prices two weeks prior to Prime Days, we saw average price increases around 16.7 percent occurring on Amazon.

    During Prime Days 2022 however, Amazon also offered top average discounts for small appliances, except for on Instant Pots which appeared to have greater average discounts on Target.com (5.9 percent versus 4.2 percent on Amazon), and Vacuum Cleaners which appeared to have the best promotion of appliances small and large at 13.8 percent average discount on BestBuy.com. Another subcategory deeply discounted on BestBuy.com was weighted blankets, which averaged discounts around 18.5 percent versus Amazon’s average discount at only 6.2 percent.

    Health & Beauty Retailer Pricing Strategies Revealed

    Given the importance Health & Beauty Brands placed on Prime Day sales last year, we had anticipated to see more offers, especially within pure-play beauty retail channels, than we did for this booming category.

    Amazon drove most of the Health & Beauty offers seen averaging 5.1% discounts versus other retailers only offering less than 1% on average, but discounts were aimed at a targeted group of SKUs on Amazon, bringing the average discount lower overall. Most of the promotions offered on Amazon fell within mid-range price points ($20-50) and were discounted between 10-25 percent versus pre-Prime Day prices.

    Target.com offered the most comparable discounts to Amazon for Health & Beauty products on average, but their strategy primarily focused on items within the $20 and lower price range with discounts ranging primarily between 10-25 percent.

    More 2022 Prime Day Insights Coming Soon

    We know the significance visibility to critical pricing and promotional insights play in enabling retailers and brands to offer the right discounts to stay competitive, especially during promotional periods like Prime Days. While this blog is intended to provide a ‘sneak peek’ into 2022 Prime Day insights for the U.S. market, we will be providing more extensive, global coverage and will proactively share new insights with the marketplace as they become available throughout the month of July.

    Be sure to also check out our Press page for access to the latest media coverage on Prime Day insights and more. Don’t hesitate to reach out to our team if there is any particular category you are interested in seeing in more detail, or for access to more information on our Commerce Intelligence and Digital Shelf solutions.

  • The challenges in scaling a ‘House of Brands’

    The challenges in scaling a ‘House of Brands’

    Let’s start with the basics – what is a ‘House of Brands.’

    House of Brands is a portfolio management strategy that defines how a family of brands owned by one parent company, each independent of one another and each with its own audience, marketing, look & feel operate in harmony with each other. 

    Advantages of a House of Brands Strategy

    • The Profit Playbook: The playbook generated by the success of one brand can be leveraged to scale other brands.
    • Economies of Scale: Cost across Marketing, Supply chain, Advertising, and Operations gets shared across multiple brands helping optimize costs.
    • Market Coverage: Multiple products enable brands to cover multiple market niches and audiences while maintaining unique messaging for each niche. 
    • Future-Proofing: By hedging bets across multiple brands, it cushions the parent company against changes in customer preferences and trends. 

    … for these reasons and more, it’s no surprise that every digital-first consumer brand today aspires to leverage a portfolio strategy to become a House of Brands.

    More and more companies are slowly adopting this strategy

    • In the US the brands like P&G, Newell, and Unilever which found early success in the online space are quickly acquiring more brands and betting on the “House of Brands” strategy to scale.
    • In India, Unicorn D2C start-ups like MamaEarth, Good Glamm Group, Sugar Cosmetics, Rebel, Boat, and Lenskart to name a few, are already knee-deep into this strategy as their brand portfolio keeps growing.
    • And then there are brand roll-ups like Thrasio, Perch, HeyDay in the USA, Branded, Hero in the UK and Mensa, and GlobalBees in India which started as a House of Brands from the get-go.

    More Brands. More Data. More need for Monitoring!

    You cannot improve what you cannot measure! In order to scale these brands, the first thing needed is DATA. Data across all digital platforms – data on social media performance, customer engagement, eCommerce sales, product stock availability, pricing, reviews, and customer sentiment to name a few. This data will unlock huge value for brands and it gives them a sense of what’s working and what needs to be improved in order to increase sales & scale. 

    All brands need to track this information – but here’s a challenge unique to a House of Brands – it is the sheer volume & scale of data needed across multiple brands across multiple digital platforms! For example, a House of Brands with let’s say 10+ brands, each brand with 50 SKUs, selling on 10 eCommerce platforms is the equivalent of managing 10 retail shops with 500 SKUs! 

    Let’s look at some of the questions the analytics, marketing, and brand management teams at House Of Brands would ask. And the data they would need almost on a daily basis for every single brand. 

    • What is the search ranking for all of our SKUs across each and every single eCommerce store it is available on? How does this benchmark to the closest competitor? And are competitors using aggressive advertising strategies to outperform & overshadow our SKUs?
    • Are competitors offering discounts? Are those discounts higher than what we’re offering leading customers to purchase their products instead of ours?
    • Are my products & SKUs available and not out of stock across every single marketplace and online store?
    • Are positive ratings & reviews driving my customers to purchase my product? Or do our competitors have a better customer perception than my brand does?
    • Are Amazon and other marketplaces displaying my product content correctly so customers have enough information to make an informed purchase decision?

    … if the sheer scale across multiple brands was not a big enough challenge when this data needs to be tracked hyper-locally for each brand, it becomes anyone’s worst data nightmare!

    Need Data? Lots of it? No problem!

    To get ample data, across key KPIs brands need to invest in a Digital Shelf Solution. However, traditional Digital Shelf Solutions were built for brands that got a majority of their revenue from in-store sales and only a part of their revenue was being generated online. 

    That’s where DataWeave is different. DataWeave’s AI-Powered Digital Shelf Solutions was built with Digital Native brands in mind. 

    What KPIs do we help House of Brands track?

    • Keyword Search Ranking: Track & improve your search rankings for priority keywords. Boost product visibility and sales
    Keyword Analysis
    Keyword Analysis
    • Content: Optimize your brand’s product content to drive up conversions
    Content Quality Analysis
    Content Quality Analysis
    Availability Analysis
    Availability Analysis

    The following metrics are available to view in one single dashboard, across multiple online stores and multiple geographies making it so easy to get a consolidated view of the health of the entire portfolio of products! What’s more, we’ve created a dashboard with multiple views – brand-wise, function-wise & even hierarchy-wise. This means a brand manager can see all KPIs specific for only the brand they manage, while the marketing team can look at keyword search rankings across all brands and the leadership team can see a brand-level daily scorecard for a quick health check. And that’s not all! Our dashboard highlights insights that can be “actioned asap” to make it easier to understand what critical tweaks and changes can help improve sales. Lastly, as a House of Brands adds more Brands & SKUs to its portfolio, our solution has the full flexibility to add and delete SKUs on the go!

    If you are a House of Brand and wish to explore how some of the problems you face daily can be solved – please email: contact@dataweave.com.

    Brand Roll-Ups and House of Brands are always scouting for new brands to acquire. DataWeave has a unique product to help you track a category daily, highlighting brands that show exceptional KPIs across – Ranking, Reviews, Ratings, Bestseller ranks, Sales Estimates, etc. Read more about how VC’s & Brand Rolls up are using Data for faster Acquisitions

  • 7 Key Metrics that QSRs want (but may not get) from Food Delivery Apps

    7 Key Metrics that QSRs want (but may not get) from Food Delivery Apps

    The Quick Service Restaurant market is projected to be valued at $691 billion by 2022. As the QSR industry grows and the market becomes even more competitive, restaurant chains continuously seek ways to increase sales via food aggregators to market their business. To improve ROI and sales, having data and insights into key metrics could help QSRs to boost their success rate.

    QSRs would like to know how they stack up against their competition regarding discoverability on cluttered food aggregator apps. Restaurants want to know the gaps in their product assortment to understand what drives customers to their competitors. Getting insights into delivery time and competitors’ delivery fees will help QSR improve delivery ETAs and optimize fees. They can also set competitive pricing with insights into their competitors’ pricing. In addition, they can use data to optimize their ad spending on food apps and improve marketing ROI.

    In this blog, we will discuss the relationship between QSRs and food aggregators and how getting data about key metrics from these food delivery platforms can help QSRs scale their revenue. 

    Data: The Key Ingredient to increasing sales

    According to Statista, online food ordering revenue is expected to grow at a robust CAGR of 10.39% between 2021 and 2025. Food Aggregators apps like Uber Eats, DoorDash, and GrubHub offer convenient meal delivery options from various QSRs within a single app. Food aggregators provide a multitude of benefits for QSRs. They give access to a huge customer base, quick delivery, and an easy entry into quick commerce, helping QSRs increase visibility. Although QSRs rely on food aggregator platforms for hassle-free ordering, tracking, and delivery, they can’t always rely on them to share critical data that could help them optimize their operations & increase sales. 

    Online food ordering revenue
    Online food ordering revenue

    1. Data on Product Assortment

    QSRs need assortment insights to understand their competitor’s menu assortment. Assortment analytics plays a crucial role in ensuring that QSRs aren’t losing sales because their competitors are offering cuisines and dishes that they aren’t. Understanding gaps in menus helps QSRs to better plan their menu. However, food aggregator apps can’t share competitors’ assortment data with QSRs for a multitude of reasons, guidelines, and privacy laws. Thankfully, at DataWeave, our QSR intelligence solution can! We help restaurants improve their assortment by sharing insights into the dishes and cuisines their competitors’ have on display.

    Menu Assortment
    Menu Assortment

    2. Data on QSR Discoverability

    QSRs would love to know how to increase discoverability on food aggregators, as it will help them to appear ahead in search results and beat the competition. Improving visibility on these apps directly impacts sales and drives more orders for restaurants. Some aggregators offer discoverability information but give it on demand, usually after 20-30 days, making it irrelevant due to the enormous time gap. They also don’t provide information about the change in the discoverability of your competition. All these data points are so critical, and understandably so, Food Apps can’t share this level of information with restaurants. However, DataWeave’s QSR Intelligence solution can! It provides real-time discoverability insights into your restaurant and competitor’s visibility so that the data is actionable, and QSRs can use insights to improve visibility

    Read how DataWeave’s QSR Intelligence helped an American QSR Chain and how their ranking on search results page on Ube rEats, DoorDash & Grubhub impacted outlet discoverability & sales!

    3. Data on Pricing & Promotions

    Pricing a QSR’s menu is tricky. If you price too high, you’ll turn off new customers. If you price too low, you’ll cut margins & may even come off as low-qualify. Customer Price Perception is greatly influenced by the Price-Quality relationship. To add to this, restaurants are often up against stiff competition from restaurants with similar cuisine offerings so it’s critical that prices are competitive. Understanding competitor pricing doesn’t imply that you have to beat their prices. You can compensate for any price differences by offering higher quality cuisines, better customer service, and quicker delivery. Once again, food apps can’t share competitors’ pricing data with QSRs. But DataWeave’s QSR & Pricing Intelligence solution can! QSRs can use these insights to drive more revenue & margins by pricing their menu right.

    4. Data on Delivery Time

    QSRs must be able to deliver hot meals, in a timely manner to customers because customers want to quickly dig into the delicious food they ordered. Quicker deliveries within the ETA will also help earn the trust and loyalty of customers. However, food aggregators don’t share information on the delivery times with restaurants – not their own delivery time or their competitors. DataWeave can help QSRs to understand their peak hours and optimize their service to ensure quick ETAs. They can also get detailed insights into competitors’ delivery times to make sure they’re competitive. This is important because customers will often pick restaurants with quicker ETAs.


    Read how DataWeave’s QSR Intelligence helped an American QSR Chain understand the correlation between delivery time & sales volumes

    Delivery time trend by urbanity
    Delivery time trend by urbanity

    5. Data on Delivery Fee

    As a thumb rule, customers will always compare delivery fees across apps. They’re conscious of delivery dollars included in their bill and often choose a restaurant with lesser delivery fees. This makes it even more critical for restaurants to understand how they stack up against their competitors. Understanding competitors’ delivery fees could potentially help QSRs to optimize their rates. And once again, food aggregators can’t share information on competitors’ delivery fees with restaurants. However, DataWeave’s QSR Intelligence can provide all delivery-related insights – be it Delivery etas or fees. 

    Delivery fee trend by urbanity
    Delivery fee trend by urbanity

    6. Data on Ad Performance & ROI

    Getting ad analytics will help QSRs better manage their budgets & increase the ROI on their Ad spends. For example, wouldn’t it be great if QSRs were able to understand which ad formats or promotions led to the most sales? Or which carousal ads had the most visibility in key zip codes where your QSR is expected to do maximum business? Or even insights into a competitor’s ads and promotions on food apps. Knowing this information will help restaurants spend sensibly when buying media on Food Apps & get the most bang for their advertising buck. Food apps do provide standard ad analytics – a number of clicks, CTR, and so on, but for more complex, insightful & actionable insights, there’s DataWeave’s QSR Intelligence

    Read how DataWeave’s QSR Intelligence helped an American QSR Chain understand the ROI delivered on ad spends across Food Delivery apps.

    Insightful & actionable insights for QSR Chains
    Insightful & actionable insights for QSR Chains
    Insightful & actionable insights for QSR Chains
    Insightful & actionable insights for QSR Chains

    7. Data on Outlet Availability / Availability Audit

    To avoid lost sales, being available & “open for business” on Food Apps during peak lunch & dinner hours is critical. Also on weekends, when order volumes are usually high. Sometimes because of technical glitches, QSR outlets appear unavailable on Food Apps. A glitch like that can lead to lost business, and the longer the glitch stays undiscovered, the greater the impact on revenue. While Food Aggregators do their best to make sure all QSRs are up and running on their app, using DataWeave’s QSR Intelligence, restaurants can now do an outlet audit to make sure that’s the case. With just a mere 2.8% unavailability, we saw a 28% drop in the sales for one of our QSR customers! That’s how critical Availability insights are. 

    Conclusion

    Analyzing and optimizing sales, delivery, discoverability, availability & customer data is one of the fastest ways to help grow your QSRs revenue. However, the biggest challenge QSRs face is that it isn’t always easy to get this information. With DataWeave’s QSR Intelligence now some of that data is a little more accessible as we discussed in this blog. And additionally, here are the 7 Tricks we recommend QSRs to use to win on Food Apps

  • eCommerce in South Africa: Data-Driven approach to getting ahead

    eCommerce in South Africa: Data-Driven approach to getting ahead

    What an exciting month we’ve had at DataWeave! Our team flew down to gorgeous Cape Town, South Africa to attend the 8th edition of #EcomAfrica! After months of Zoom calls and virtual events, it was a refreshing change to see our customers in person and meet some of the movers and shakers in eCommerce and some of the top South African brands. 

    Top eCommerce Companies in South Africa
    Top eCommerce Companies in South Africa

    My last visit to South Africa was before the pandemic. Things have changed since then, & the difference was stark! The eCommerce landscape had a paradigm shift during Covid-19 and grew exponentially. My customers spoke to me about the new opportunities, growth potential as well as challenges that came in because of this boom. For one, eCommerce in South Africa has become more competitive than ever – from online retail to grocery and food delivery to even alcohol delivery! All retail businesses seem to have jumped onto the eCommerce bandwagon.

    A recent Deloitte report found that over 70% of South Africans shop online at least once a month & 2 out of 3 respondents said they plan to increase their frequency of online shopping. 65% said they know what they want, search online & check all stores that stock the product to compare prices. Price is one of the key factors that influence consumer purchase decisions. Other critical factors include delivery fee, delivery time, promotions & discounts & product assortment to name a few. In order to stay ahead in this highly competitive arena, both retailers and brands need to make data-driven decisions about critical KPIs like pricing to stay ahead of the competition.

    Increased Online Shopping & Online Shopping Frequency
    Increased Online Shopping & Online Shopping Frequency

    We’ve been working with customers in South Africa for over 4 years now, even before the pandemic. So on Day 2 of the event – S.Krishnan Thyagarajan “Krish”, President & COO, Dataweave had a chance to share our learnings and experience from all these years and how user data is critical to getting ahead & winning the eCommerce race in South Africa.

    For the purpose of Krish’s keynote address, we tracked pricing insights for a finite set of categories across key South African retailers like Checkers, Pick n Pay, EveryShop, Incredible, Makro, Waltons, Shoprite & Dis-Chem to name a few over a period of 16 months from Dec 2020 to April 2022. We highlighted price increase and decrease opportunities and how each retailer reacted in order to stay competitive, increase sales and protect margins. 

    BATTLE of the eCommerce GIANTS!

    Key Highlights from the Keynote

    • Increasing prices where an opportunity exists helps retailers increase their margins exponentially. Pick n Pay had the highest action rate (73%) when it came to capitalizing on price increase opportunities v/s Dis-Chem at 11%. 
    • When it came to price decrease opportunities (in order to stay competitive with rival brands) Takealot was the most responsive retailer – they capitalized on 30% of the opportunities, followed by Pick n Pay at a close second (28%) and Shoprite & Dis-Chem at just 4%.
    • Most retailers took between 1 – 5 days maximum to make price changes which means responsiveness to the market among all retailers is high making it more important for online retailers to always be on their toes.  
    • The 2 categories where most retailers capitalized on Price Increase Opportunities were Sauces & Condiments and Crackers & Biscuits.

    Want to watch the Keynote video on Demand? Click here to register & watch.

    Price Increase & Decrease Opportunities
    Price Increase & Decrease Opportunities

    Bonus video content! 

    • Watch the Impact of price increase & decrease opportunities on Private Label brands! 
    • See how product stock availability impacts price changes over a 16-month period. 
    • Find out which brands are in the lead in the Skin Care, Pet, Baby, Laundry & Cleaning Aid categories 

    If you’re an online retailer in South Africa & need insights on staying competitive with the right pricing, product assortment, delivery time, delivery rates, and the other key influencers that affect customers’ choice of online retailers, sign up for a demo with our team at DataWeave to know how we can help!  

  • How Inflation has hit the Retail Industry

    How Inflation has hit the Retail Industry

    Inflation has resurfaced after a decade of tranquil price increases. The persistent COVID-related supply chain disruptions have been a driving factor in increasing consumer costs since some commodities are harder to come by. While inflation is a normal economic phenomenon, the current 3.81% inflation rate has increased the cost of living for families across the globe.

    Global Inflation Rate
    Global Inflation Rate. Source: Statista

    Worldwide inflation is expected to remain near 5.0% in early 2022 before gradually easing in response to industrial and agricultural commodity price declines. Additionally, the global consumer price inflation peaked from 2.2% in 2020 to 3.8% in 2021 and will average 4.1% in 2022 before subsiding to 2.8% in 2023.

    In this blog, you’ll learn about the impact of inflation on the Retail Industry. 

    What is Inflation?

    Inflation is an economic term that describes an overall increase in the price of goods and services in an economy, and a by-product of inflation is the devaluation of the currency used within that economy. For example, a clothing retailer that used to pay $8 for a t-shirt two years ago will now have to pay $10 for that exact product. The t-shirt hasn’t changed at all. However, it has become 25% more expensive. Inflation and the devaluation of currency are part of the reasons why they’d now pay $2 more for that same T-shirt.

    Also Read: Top 7 strategies to sell effectively on Amazon

    Impact of inflation on Retail

    FMCG

    The Fast-moving consumer goods (FMCG) sector will continue to grow because there is growth in household goods spending despite the Russia-Ukrainian crisis, global interest rate, and rising fuel prices. In fact, the demand for consumer packaged goods rose sharply in countries heavily affected by the pandemic. However, the FMCG sector will see a rise in prices of commodities because crucial resources such as cooking oil, tea, cocoa, etc., become scarce. The persistent shock to the supply chain has forced various FMCG companies to increase their prices. For instance, Mondelez, a Fortune 500–listed snack and beverage company, announced a 6-7% price increase. 

    Inflation for Fashion & Pharma Industry
    Inflation for Fashion & Pharma Industry

    Fashion

    The global fashion industry posted a 20% decline in revenues in 2019–20. Inflation in fashion is caused by transportation bottlenecks, material shortages, rising shipping costs, and straining supply and demand. The global fashion industry will see complete recovery in 2022. COVID-caused supply and demand constraints have eased, but shoppers will have to reconcile to price jumps in everything from bags to shoes.

    Pharma

    Pharmaceuticals are recognized as an essential commodity and therefore have a massive impact on the household budget. Vizient has projected a 3.09% increase in the inflation rate in drug prices from July 1, 2022 – June 30, 2023. It shows how inflation has a direct impact on prescription drug costs. Notably, retail prices for some of the most widely used prescription drugs are expected to increase 2x as much as inflation. The demand for pharmaceutical drugs has been higher post-pandemic, ensuring that consumers’ total demand and spending in this vertical will remain unchanged. 

    Comparison of New, Used & Electric cars
    Comparison of New, Used & Electric cars
    Highest & Lowest Inflation in Beauty category. Source: nielseniq.com

    Automotive

    The rise of both new and used cars has been steeply increasing partly because of the shortage of semiconductors and the backlog from the closure of factories during COVID-19. According to the Bureau of Labor Statistics, there has been a 24.4% inflation in the used car purchase prices and an 8.8% increase in the new car purchase price. Rising oil prices across the globe and the historical oil crisis fuelled by the Ukraine-Russia war have strained many people’s budgets. However, the automobile market is seeing an uptake in demand for electrical vehicles (EVs). EVs represented 14% of car sales between January and June 2021. 

    Beauty

    COVID-19 brought new challenges to the cosmetics industry, chief among this being face-covering required by law. In light of social distancing and lockdowns across the globe, consumers were buying less makeup. The rising cost of labor, energy, and raw materials used in beauty products have resulted in a “once-in-two-decade” backdrop for price hikes. The cost of palm oil, a common material in beauty products, has soared 82% in two years due to Indonesian labor shortages. Nevertheless, consumers will spend more time outside the house. Beauty price per unit changes shot up 17% in-store and online in 2021.

    5 Things that will help retailers during inflationary times

    1. Observe Competition

    Retailers should follow their competitors closely—when they start to raise/lower prices, consider following suit. Using competitive data to gauge price changes will help in managing price parity. However, excessive discounts and lower prices to gain an advantage over your competitor could backfire in various ways. For example, low pricing may convey that your products aren’t as good as your competitors’, impacting your long-term brand image. Moreover, lowering prices to sell more doesn’t necessarily mean higher profits, especially during high inflation. To leverage this strategy effectively, retailers must first identify SKUs that have the highest impact on their pricing.

    2. Build a structured and targeted pricing strategy

    An effective pricing strategy that leverages differences in product, channels, and customers will help retailers to maintain long-term value for their business and customers. However, customers might react differently to a steep price increase. Broad price increases will demonstrate insensitivity and erode customer trust. Instead, retailers can thoughtfully tailor their inflationary price increases for each customer and product segment with a competitive pricing strategy. With a competitive and historical pricing strategy, brands can examine their customers’ end-to-end profitability and willingness to pay relative to a comparable peer set. 

    Price  Competitiveness for the right items
    Price Competitiveness for the right items

    3. Rethink commercial positioning

    The pandemic and rise of inflation during 2020–2021 have profoundly impacted how consumers live and what they value. Understanding how your consumer’s needs have shifted and used a promotion strategy to manage today’s inflationary pressures is crucial. As new behaviors emerge post-pandemic, retailers must prepare for the potential top-line impact of demand shifts. Rethink commercial positioning and review marketing and packaging strategies, including the potential use of nonuniform and, in some cases, nonprice mechanisms.

    4. Ensure price competitiveness on the right items

    The Key-Value Item (KVIs) list should be reviewed again, considering changing shopper needs and habits during the pandemic, plus the supply and demand shock that the industry is currently experiencing. Price-sensitive and vulnerable shoppers are finding this inflationary period particularly tough, so brands might require an even deeper investment in KVI pricing. Reinvest base prices on essential products to drive volume for your best price-sensitive (PS) customers. Compete only where you need to be without overspending. Online channels should continue to reflect in-store prices and diverge during this time. Pricing Optimisation software enables best practices to simultaneously manage a high number of price increase requests.

    5. Revisit promotions to conserve costs and preserve stock availability

    Increasing the number of promoted products is a reflexive response to inflation, but it’s not the right response for building sustainable sales or longer-term loyalty. Inflationary times offer an excellent opportunity to reset promotional strategies to save money and margin. Retailers can increase sales and seize opportunities with a promotional pricing strategy. Increased promotional activity has a knock-on effect vs pricing position in high-low strategies and erodes overall value perception, creating a vicious circle of more promotions equals poorer value.

    Conclusion

    Today’s economic climate and associated pricing pressures are challenging for retailers and customers. Some companies have responded by announcing an increase in prices across product categories. Companies can manage pricing margins responsibly and profitably during inflation. Determining how and where new opportunities exist can help companies control inflation, drive growth, and remain profitable.

    Need help to arrive at the right pricing & discounting strategies to counter inflation? Sign up for a demo with our team to know how we can help!  

  • What is Customer Price Perception  and why it is important

    What is Customer Price Perception and why it is important

    Finding the right price often requires a trade-off between margin and price perception. Brands may want to defeat competitors’ prices on all their products, but that can often lead to losses because sales directly link to price perception. Instead of trying to stay competitive across the board on all products, brands must identify key value categories (KVCs) and key-value items (KPIs) whose prices buyers tend to remember and price those products competitively. In this scenario, they can make up for lowered prices on key products by fixing higher prices on other products. 

    Consumers’ perception of price fairness largely determines their experience with a brand. Brands selling online can often have a disconnect between their prices and what customers expect their prices to be. However, that does not mean spiraling downwards by getting trapped in discounting cycles and heavy promotions that can harm your bottom line. Instead, brands require real-time monitoring across thousands of stock-keeping units (SKUs) to identify key categories and items they need to price with care. In this blog, you’ll learn about price perception and the factors that influence it. 

    What is Price Perception?

    Price perception is the perceived worth of a product or service in the consumer’s mind. It is one of the leading variables in the consumer’s buying process. Buyers are unaware of the true cost of production for the products they buy. Instead, they make buying decisions based on an internal feeling about how much certain products are worth and which brand offers them the best value. To offer competitive prices and yet obtain a higher price for products, brands often pursue marketing strategies to improve the price perception of their brand and products.

    Price Perception
    Price Perception

    However, brands should not fall into the trap of assuming that price perception is a competitor’s price index. It’s not about offering the lowest price on certain SKUs. Not every brand strives to offer the lowest prices. Some brands take a slightly different approach to ensure the right value for their products. For example, take a look at Trader Joe’s, a grocery chain that has never claimed low costs. They’ve always taken a holistic approach to their pricing and customers to build a loyal following. And it worked well for them. Trader Joe’s can boast one of a high-value perception score, despite not having rock-bottom prices. 

    Marketplaces such as Walmart and Amazon may not have the best prices on every item. Still, customer perception is that they will have the lowest prices and will often shift the share of sales towards such platforms over businesses that offer the same or even lower prices. 

    Some things to consider:

    • What do your customers think of your brand?
    • What are the key factors that are driving your customers’ price perceptions?
    • Is your product mix properly aligned with your brand perception?
    • Are you communicating the most important and relevant information to your customers?
    • Is your message being received and understood?
    • Who do your customers see as your competitors, and why?

    Also Read: 11 Reasons why your eCommerce Business is fail 

    What is Price Positioning?

    Price positioning is pricing products or services within a certain price range. It indicates where certain services or products lie in relation to competitors’ pricing and in the mind of different customers. A brand’s price positioning has a huge impact on whether the products are seen as priced low or not. The following is a great way to understand the price-value matrix:

    Price Positioning
    Price Positioning

    Your brand’s position in this matrix will depend on your pricing objectives, competition, and customer loyalty. Price positioning helps the marketing and operating teams understand customers’ perceptions of your brand and convince customers to buy your products. Brands need a holistic approach toward setting prices for their products in order to drive conversions through intelligent pricing and competitive insights. 

    Factors that influence Price Perception

    Price-Quality Relationship

    Price is often an indicator of product quality. The general rule is that the higher-priced products are perceived to have better quality, implying that brands should consider a rational quality-price relationship in their pricing or promo strategy. For example, it might not be best practice to have similar prices for both good and low-quality products because customers will perceive low-quality products as overpriced and might not purchase from you.

    Price-Consciousness

    Customers aren’t price conscious about every product. Instead, they are only price conscious about certain products under the best price guarantee or BGP. For instance, if buyers find your BGP products more expensive than your competitors, the cheaper products in your assortment will still be perceived as expensive. 

    Value-Consciousness

    During markdown periods, ensure that you are not undermining the efforts to shape and maintain price perception by offering extreme or complex discounts. In an attempt to clear stocks, promotions simply confuse the shopping experience for customers and further deteriorate trust in your brand. Your promotional offers should keep price perception during the holiday season or clearance sales by offering a simplified promotional program. Start by understanding which price mechanics and SKUs work best for your target customer segment. You should also reduce over-communication on hero deals else buyers will assume that you incorrectly price products during new seasonal launches. 

    Prestige Sensitivity

    Gerald Zaltman, a Harvard professor, argues that 95% of all purchasing decisions are subconscious. Luxury brands are a great example of how psychology directly links to price perception. Customers buy premium or luxury products to demonstrate their social status. In this scenario, buyers don’t hesitate to buy expensive products from certain brands even if they are explicitly overpriced. Thus, brands selling premium products will have to ensure pricing is coherent with buyers’ expectations. 

    Every customer wants to know they’re getting the best value. They use the highest and lowest prices in a range to understand how expensive a product or brand is. So, by removing high price point lines with low volume, customers will see more minor price points around the store. Brands must merchandise entry price points to help customers identify the lowest prices and improve the perception of their product ranges. 

    Product Range
    Product Range

    How to adjust Price Perception

    Here are three ways for brands to improve price parity:

    • Marketing to influence Price Perception

    An efficient pricing management strategy will focus on competitiveness and establishing the right price perception among your customers. You can influence customers’ price perception by improving the look and feel of your online stores since simpler designs are often reflections of lower prices. Another great way to influence price perception is to offer loyalty and reward programs that also improve brand loyalty and reinforces the vision of an economy store irrespective of the prices of your products.

    • Competitive Analysis

    Brands can understand price differences after a competitive analysis. Customers often search for similar products across brands to find the best deals, and you will be able to understand customer opinion through competitor analysis.

    • Price Management Automation

    A price monitoring platform can help brands to stay on top of promotions and discounts offered by their competitors. A price intelligence software will help brands associate products by similarity criteria and compare the pricing of their products with those of competitors. It offers a detailed view of the market and ensures that brands take care of their bottom line.

    Conclusion

    When a consumer comes across a similar low-priced product or service from a different brand, they may see it as a good deal or might perceive it not worthy of their time or money. What consumers think about your brand’s price is just as important as the actual price of that product. A buyer may sense a company as “upscale” and assume that they have high prices, or they may see a brand as a discount retailer whose prices are too high for its reputation. At times, consumers might also see cheaper alternatives as inferior. It’s not easy for a brand to understand its customers’ perception of price vs. value it offers. Brands need a long-term, dynamic pricing strategy that matches the demands and trends of a global, competitive market. And in order to drive sustainable growth, they need to make smarter pricing and promotion decisions with insights into competitive pricing. 

    Learn how DataWeave can help make sense of your and your competitor’s pricing & promotional strategies and help your brand build the right Price Perception. Sign up for a demo with our team to know more.

  • Top 7 strategies to sell effectively on Amazon

    Top 7 strategies to sell effectively on Amazon

    According to MarketingCharts, 63% of online shoppers start their buying journey on Amazon. This shows that customers believe they will find the products they are looking for with competitive prices and excellent customer service on Amazon. Amazon is one of the most dominant eCommerce marketplaces with 197 million users and 112 million Amazon Prime members. Brands can sell on Amazon to capitalize on this vast customer base by showcasing and promoting their products properly. 

    In this article, we’re going to take a look at the top 7 strategies to sell effectively on Amazon:

    1. Boost Product Discoverability using Ads

    Amazon Advertising helps sellers, brands, and agencies to drive profitability by making sure product discoverability is high & shoppers are able to find their brand with ease. The ads on Amazon fuel product discovery and improve conversion rate. The advertising options on Amazon are designed to help brands increase exposure, generate incremental sales, boost organic rankings, and drive growth.

    Amazon has three PPC programs: sponsored product ads, sponsored brands ads, and sponsored display ads. Brands can increase visibility on Amazon with these three paid campaigns. You can sponsor products or your brand for related searches on Amazon. Businesses only pay for clicks received. 

    Sponsored products are for individual product listings that appear on shopping results pages and product detail pages. Sponsored brands are for showcasing brand portfolios such as logo, custom headline, and a selection of products on the shopping results page. The last is sponsored display, a self-service advertising solution for displaying ads on and off Amazon. 

    Promotions for Brand and SKU's
    Promotions for Brand and SKU’s

    2. Improve your Amazon SEO using effective Product Descriptions

    To effectively sell on Amazon, businesses first have to understand the A9 algorithm. Amazon uses A9 Algorithm to decide which products are ranked in search results, emphasizing sales conversions. This algorithm helps Amazon promote listings that are more likely to result in sales. 

    Keywords in product descriptions are one of the main driving factors that the Amazon A9 algorithm looks for in determining relevance to search queries and setting rankings on its results pages. Therefore, brands must integrate high volume and significantly relevant keywords as part of their listings. Crafting product descriptions with the right keywords will provide compelling reasons for buyers to purchase the product and for the A9 algorithm to better rank the brands. Brands can analyze and optimize their content to improve discoverability across Amazon. Accurate product descriptions help users make informed decisions and allow brands to deliver a consistent customer experience.

    Detailed Descriptions and Highlights
    Detailed Descriptions and Highlights

    3. Improve your Product Visuals

    Avoid using standard visuals when displaying your products in Amazon’s image gallery. Product images are the hook that encourages visitors to click on your products. However, Amazon has specific image requirements that you’ll need to adhere to while presenting products. When shopping on Amazon, potential buyers are looking for high-definition and clearly visible photos. Thus, you will need diversity in images if you want your product and photos to stand out.

    In addition to images, brands can make their product descriptions better through video content. Videos help your brand to stand out, build a more personal relationship with customers, and lead to increased sales. One study on eCommerce sellers found that using product videos increases sales for online stores by 144%.

    Product Images
    Product Images

    4. Switch to Intelligent Pricing & Win the Buy Box

    Intelligent and competitive pricing is the most essential lever for revenue growth. With advanced technology like AI and analytics, brands can get insights into competitive pricing and develop an intelligent pricing strategy to calculate real-time changes in pricing optimally

    Amazon wants to give the consumer the best value for their money and thus has a Buy Box option. The white box on the right side of the Amazon product detail page is called the Buy Box, and customers can directly add items for purchase to their cart. However, not all sellers are eligible to win the Buy Box. 

    Thanks to Amazon’s customer-obsessed approach and high competition, only businesses with excellent seller metrics have a chance to win a share of Buy Box. Amazon weighs low prices with high seller metrics. If your brand has near-perfect performance metrics, having higher prices can still get you a share of the Buy Box. In contrast, brands with mid-range metrics will probably need to focus on offering the most competitive price.

    But, why is the Buy Box important? According to BigCommerce, 82% of sales on Amazon go through the Buy Box, and the rate is even higher for mobile purchases. Getting insights into your competitor’s pricing with our Digital Shelf Solution will help you improve seller metrics and find the right pricing strategy for your products.

    5. Provide Plenty of Social Proof

    Testimonials can increase sales page conversions by 34%. Social proof has emerged to be of great importance in the eCommerce world, and it isn’t limited to recommendations from people customers know in the “real world.” A survey conducted by BrightLocal revealed that 31% of consumers reported that they read more online reviews in 2020 than ever due to Covid-19. 

    Product ratings and reviews on Amazon are at the center of the recommended products section, product listing page, and search results. Interestingly, customer feedback also has a huge impact on a brand’s ODR or Order Defect Rate. It is one of the most critical measurements tracked by Amazon. ODR is a measure of customers who have had a negative experience with you as a seller. Amazon uses it to assess a brand’s health as a seller. The ODR indicator is driven by customer feedback, so review management is the primary step for brands to avoid an Amazon ODR warning and improve their order defect. 

    6. Go Global

    The Amazon marketplace is available in countries and markets worldwide, allowing brands to explore new territories and sell their products globally. Each foreign territory has a unique Amazon site that resonates with its culture and audience, making it easy for global sellers to compete with other brands. If your eCommerce brand has the operation capacity to expand globally, Amazon offers state-of-the-art international logistic capabilities. 

    Brands can expand in European countries like France, Italy, Netherlands, Germany, Spain, etc., and Asia Pacific locations like India, Japan, and Australia. Amazon is also available in emerging eCommerce locations like the Middle East, Brazil, Turkey, and Singapore. 

    7. Build a Branded Store

    One of the best strategies to stand out on Amazon is to feature your products on a branded Store. Amazon has free tools that allow grants to build an online store where brands and sellers can showcase products and connect with customers. These stores look different from the typical Amazon listing layout and also have the option to create detailed pages with A+ content. 

    Build your Brand Page
    Build your Brand Page

    For instance, Netgear, a company that offers technology-related products has an excellent branded store on Amazon. The brand has embedded images and videos that address buyers’ needs and how users’ lives are affected by using their products. The most attractive feature about this store is that they have integrated the value offered by their products into new use cases because of the current pandemic. For example, they’ve used phrases like “Make Online Learning fast and fun” and “Work from office at office speed.” Additionally, the categories and search tab help buyers search for specific products easily.

    Creating branded stores allows you to build a beautiful brand experience for customers and offers a multi-page, immersive shopping experience. Brands can pick unique designs, integrate promotions, and use rich media to create a custom curation of handpicked products. 

    Conclusion

    Amazon has 9.7 million sellers worldwide, of which 1.9 million are actively selling on the marketplace. The competition on Amazon is fierce, and it’s continuously increasing. Despite a large number of active sellers on Amazon, only a tiny fraction generates a significant portion of its total sales. Fewer than one in ten active Amazon sellers generated over $100,000 in annual sales, and only one percent of them hit the $1 million sales mark. Use these strategies to develop a comprehensive understanding of the Amazon platform and how to sell effectively on the platform while maximizing your presence amid rising competition. 

  • eCommerce Performance Analytics for CPG Private Label

    eCommerce Performance Analytics for CPG Private Label

    The combination of economic uncertainty, inflation, and perceived affordability has increased consumer’s willingness to buy and try more private label products, challenging National brands to differentiate their eCommerce strategies, especially those related to price positioning, in other ways.

    Our previously released report, Inflation Accelerates Private Label Share and Penetration, confirmed 8 out of 10 brands with the highest SKU count carried across all grocery retailer websites to be private label, signaling the strength of their digital Share of Voice. Given the growing shift in consumer preference toward private label brands, we are providing access to the latest trends seen from September 2021 through March 2022. Below you will find a summary of what the data revealed about the growing presence of private label brands on the Digital Shelf.

    Private Label Account and Category Penetration

    We analyzed private label penetration at an account level to understand which private label brands have the greatest presence on retailer digital shelves, and to see which retailers may be leaving product assortment opportunities on the table.

    Private Label Penetration Across Retail Grocer Websites

    As a retailer, it is important to understand how your private label penetration stacks up against the industry average at a category level, especially given the performance tracked for retailers included within our analysis and the vast number of SKUs they offer online (over 20,000).

    Private Label Penetration by Category Across Retail Grocer Websites

    The Private Label and National Brand Price Gap Widens

    Private label brands tried out of necessity mid-pandemic increased in popularity as grocery prices continued to rise, providing an opportunity for retailers to increase brand affinity and loyalty for their online shoppers. Retailers alike were able to keep affordability at the forefront of their strategies and maintain a price gap of 23% or more, despite inflationary pressures to increase prices.

    Private Label / National Brand Price Gap by Retailer

    Looking at the results at a category level, we can see that Meat is the only category found within our analysis where private label brands are priced higher than National brands at an average of 8% greater. The Alcohol & Beverages category tends to always see the greatest price gap between private label and National brands given the price variances by unit (ranging from under $10 to over $100), in this case averaging a 148% price gap.

    Private Label & National Brand Price Gap by Category

    Private Label Total Basket Value Comparison Across Retailers

    While SKU-level pricing is extremely important to product strategy, for a retailer, it is equally as important to be as mindful of the total basket value even more so now as consumers further their private label loyalty across various categories. A few SKU-level missteps in pricing decisions can exacerbate cart abandonment and negatively impact shopper loyalty in a world where prices can be compared instantly in the palm of your hand.

    Based on our analysis, Walmart and H-E-B private label products offered the lowest priced total basket of goods at $42.90 and $45.06 respectively, whereas AmazonFresh and Safeway offered the highest total at $73.19 and $69.52 respectively.

    Private Label Item Level Price Comparison by Retailer

    Inflation-driven Price Changes are on the Rise with Room to Grow

    Based on the 20,000+ SKUs analyzed, we saw a continual price increase every month since September 2021 when comparing future monthly prices to those we tracked in September. The greatest price increase happened in March 2022 at 12.5% on average, however, there are still 48% of SKUs that have yet to see a price increase even as inflationary pressures rise.

    When viewing the split between National and private label brand price increases in March 2022 versus September 2021, we saw National brands increased prices on average by 13% where private label brand prices only increased an average of 7%.

    Private Label & National Brand Price Change
    Private Label & National Brand Price Change (%)

    Price decreases are still occurring across all categories, despite inflation, but to varying degrees ranging from 5% for Deli items to 17% for Dairy & Eggs. Within the Dairy & Eggs and Pantry categories, private label brands reduced prices for an additional 10% of total SKUs compared to National brands.

    The greatest category of opportunity for price increases within private label were found within Beauty & Personal Care with 67% of private label products yet to see a price change since September 2021.

    Price Change (%) by Category and Brand Type

    Private Label Price Change Correlation to Product Availability

    The category with the greatest magnitude of price increase seen within private label brands occurred within Baby at 16.3% followed by Home at 14.3% on average. Private label products within Home and Baby categories were also showing the lowest availability rates, 75.9% and 79.5% respectively, indicating a high demand for these items even as prices increased.

    The private label categories with the smallest price increase on average were Dairy & Eggs at 2.4% and Other Foods and Pantry at 3.4% and 3.6%, respectively.

    Private Label Price Change Magnitude & Availability
    Private Label Price Change Magnitude & Availability

    While in many accounts both private label and National brands struggled with stock availability in March 2022, National brand availability is much lower (around 10% on average) than private label availability.

    H-E-B had the lowest overall product availability at 76% across both private label and National brands on average. Only Walmart had lower availability for Private Label at 75% compared to 93% for National brands, but they also had the greatest price gap between private label and National brands.

    Private Label & National Brand Product Stock Availability

    The Future of eCommerce Growth for Private Label

    Our greatest learning from this analysis is that it’s time for retailers to start thinking and planning more like the National brands they carry when it comes to positioning their private label brands for success. Successful retailers are taking this time to reset their private-label strategies and transfer short-term switching behavior into long-term customer loyalty.

    Retailers playing catch up have the opportunity to address some of the gaps highlighted throughout this analysis, for example, relative to pricing and assortment changes. Below are some of the highlighted opportunities:

    • Though inflation is driving price hikes, more than 50% of products analyzed have yet to see a price increase indicating an opportunity to protect margin
    • Narrowing the price gap between a store’s brand and National brands should not be the only focus as competitive private label brands are becoming a greater threat at a category and basket level
    • Modifying and expanding assortments as demand increases for private label can improve customer retention and loyalty, especially for cross-shopping consumers

    According to The Food Industry Association (FMI), only 20% of food retailers currently promote private brands on their homepages, and only 48% include detailed product descriptions indicating even more opportunities left on the table for retailers to optimize private label digital performance.

    Many leading retailers are leveraging real-time digital marketplace insights and eCommerce analytics solutions like ours to further their online brand presence and optimize sales performance. This report highlights only a small sample of the types of near real-time insights we provide our clients to effectively build competing strategies, make smarter pricing and merchandising decisions, and accomplish eCommerce growth goals. Be sure to reach out to our Retail Analytics experts for access to more details regarding the above analysis.

    For access to a previously recorded webinar presented in partnership with the Private Label Manufacturers Association and conducted by DataWeave’s President and COO, Krish Thyagarajan, click here.

  • UK’s Biggest Sale Days: What we saw in 2021 and trends for 2022

    UK’s Biggest Sale Days: What we saw in 2021 and trends for 2022

    Customers love discounts, and promotions are the most effective tool to attract shoppers and increase sales during the holiday season and clearance sales. According to a survey, 76% of UK customers look for discounts before purchasing a product. Promotional discounts encourage customers to try new brands. And this is why brands often have a special coupon for first-time users. 

    According to Software Advice, discounting tops the pricing strategy for retailers across all industries. It is preferred by 97% of survey respondents over other promotional strategies

    Share of Respondents
    Share of Respondents

    Retail Trends in the UK for 2022

    The arrival of the Omicron variant in December 2021 slashed the shopping mood of UK customers and led to a 3.7% monthly drop in retail sales, but sales were still higher than February 2020 levels when Covid-19 first hit worldwide. Sales during the holiday season in 2021 took a hit due to a consistent decline in product availability and an increase in prices.  Inflation too started to rise in 2021 and is expected to increase by 7% by spring 2022. However, despite inflation, retail sales jumped back in January 2022. In fact, it is predicted that inflation will be a key driver of sales growth, with underlying demand across categories being uneven. Keeping that in mind, let’s look at sales growth across categories in 2021 and projected growth in 2022.

    Category Breakdown: Sales growth 2021/22
    Category Breakdown: Sales growth 2021/22

    Discounting Trends we saw in the UK in 2021

    Methodology

    • We tracked prices on the three biggest Sales Days in the UK
      – Amazon Prime Day, June 21st & 22nd 2021
      – Black Friday, Nov 26th, 2021
      – Cyber Monday, Nov 29th, 2021
    • Categories tracked: Beauty, Fashion, Electronics, Home Improvement, Furniture 
    • Websites tracked: Amazon UK, OnBuy, eBay UK, Etsy, Wayfair, Selfridges, John Lewis

    Prime Day, Black Friday, and Cyber Monday are three of the biggest sales days with comparable discounts. However, according to new research, in 54% of cases, it depends on the category of product you’re after that determines the volume of discount you get. For example, tech items such as smartphones, laptops, games consoles, smartwatches, and wireless speakers were cheaper on Black Friday but may not necessarily have been cheaper on the other sale days. 

    We wanted to see which sale period had the most number of products on discount during the three big sale events. We also wanted to see which of those three sales would’ve been the best for consumers to get a higher section of products at a discount. 

    How Big were the Discounts?

    Discount across 3 key Sale Days
    Discount across 3 key Sale Days

    32% of products went on discount during Black Friday, 35% on Cyber Monday, and only 6.6% on Prime Day. One factor contributing to the low Prime Day percentage is the fact that not all retailers participate in discounting wars during Prime Day since it’s an exclusive Amazon-only sale. Customers looking for the best deals would’ve gotten them during the holiday season with a combination of the Black Friday & Cyber Monday sales. 

    Another interesting thing to note is the percentage discount – on Prime Day, only 0.2% of products had a discount of over 50% of all the discounted products. While on Black Friday & Cyber Monday that number was 1.7% & 1.3% respectively. 

    In conclusion, more products were offered at a discount on Black Friday & Cyber Monday; and the total percentage discount on those products was also higher.

    Which Categories had the Maximum Discount?

    Discounts by category
    Discounts by category

    On Black Friday, an estimated 47% of consumers in the UK planned to shop for electronics, whereas 40% of customers planned to shop for clothing and footwear during Black Friday to Cyber Monday.  The top-selling categories across the 48 hours of Amazon UK’s Black Friday 2021 sale included Home, Toys, Beauty, Books, and Health & Personal Care.

    Our data shows that Categories with the highest discounts were Beauty and Electronics with the highest discount on all 3 sale events. These 2 categories had discounts on over 40% products on Black Friday & Cyber Monday while categories like Home Improvement were in the 30 – 35% range, Furniture in the 27 – 32% range and Fashion has the least products on discounts at a little over 15%

    In the fashion category in the UK, Amazon UK offered the highest percentage of items with a price decrease (31.6%), whereas eBay offered the most significant magnitude of price decrease (14.3%). 

    Which UK Retailers gave the most discounts?

    OnBuy is an emerging marketplace in the UK that offers impressive discounted prices and is taking on top UK marketplaces like Amazon. It’s ranked Britain’s fastest-growing eCommerce platform in 2020 and also the fastest grower by traffic. The low listing fees starting at 5% allow sellers to competitively price their products, making them more accessible to a greater number of buyers with huge discounts. The most prominent deals and discounts are highlighted on the landing page and featured across OnBuy’s social pages to grab the audience’s attention. 

    Discounts by Retailer
    Discounts by Retailer

    This was clearly reflective in the data we gathered from the 3 big sales in 2021. Most retailers in the UK, including Amazon offered at best 20% of their products, in the categories we tracked, at discount. The only outlier was OnBuy – OnBuy offered close to 90% of their products at discount! 

    OnBuy was able to offer a comparatively high number of discounted products than their competition because the magnitude of the discount was much much lower. The platform offered minimal discounts; out of the 90% of discounted products, 80% of those products had discounts that were less than 10%. As opposed to other retailers who had under 7% of their products on discounts of less than 10%.

    OnBuy’s discounting strategy built a perception that they were the biggest discounters, even when the discounts were not as deep.

    Black Friday v/s Cyber Monday – which one was better for holiday shoppers?

    Discount by category- Black Friday VS Cyber Monday
    Discount by category- Black Friday VS Cyber Monday

    Black Friday kicks off the holiday shopping season and is synonymous with some of the most significant sales after Thanksgiving. But until recently, Cyber Monday has become a great way for eCommerce retailers to capitalize on holiday discounts and expand their most beneficial sales events of the year.

    In 2021, retailers pulled in $8.9 billion in Black Friday online sales and a total sales of $10.7 billion on Cyber Monday. In the YOY review, Black Friday saw a decline of 1.3% from 2020’s record of $9.03 billion, and Cyber Monday saw a drop of 1.4%, only $100 million shy of $10.8 billion in 2020. 

    Across Beauty, Home Improvement, Electronics & Furniture categories, we saw that more products were on discount on Cyber Monday v/s Black Friday. However, the opposite was true for the Fashion Category. In the Fashion Category, we saw a marginally higher number of products on Discount during Black Friday than Cyber Monday.

    Discount percentages across categories
    Discount percentages across categories

    Across both sales, the Electronics category offered the highest discounts at over 40% of products discounted compared to other categories on both Black Friday & Cyber Monday. However, a very small fraction of the products had a discount of over 50%, indicating the lack of ‘BIG blockbuster deals’ in this category. At the same time, the Fashion category offered the least number of deals with less than 20% products on discount, but the highest magnitude of discount across the board! On Black Friday, 3.8% of products had discounts higher than 50%, and 2.6% of products on Cyber Monday. In most other categories, between 1 – 1.5% of products had over 50% discount. However, Fashion brands offered more than 50% discount on 2x the average number of products on both sale days.

    Why did the Fashion Category offer such high discounts? Brands are now capitalizing on customers’ need for instant gratification in the age of see-now, buy-now fashion trends by offering their products at high discounts. It also allows them to quickly eliminate overstock. However, this has given rise to fast fashion, a trend that focuses on rapidly producing low-quality clothes in huge volume. Fast fashion focuses on replicating trendy pieces like streetwear and fashion week designs, not four times a year but every week, if not daily. Fast fashion promotes brands to manufacture and sell low-quality merchandise that goes out of trend as soon as buyers wear it once. There is little to no time for quality control, and pieces are thrown away after a few wears. In the UK alone, 300,000 tonnes of used clothes are buried or burned in landfills each year. However, every element of fast fashion from rapid production, competitive pricing, to trend replication has a detrimental impact on the planet.

    Conclusion  

    The effects of COVID-19 can be seen far and wide in the UK retail industry, especially with a steep rise in inflation. Fortunately, even though retail sales in the UK declined during the 2021 holiday season due to the Omicron variant, they increased during Black Friday and Cyber Monday. Sales also jumped back in January 2022 and are further projected to grow by 5% in 2022. Additionally, brands can sustain the impact of disruptive factors throughout 2022 by ensuring their Digital Shelf is updated and flexible enough to react swiftly to both threats and opportunities in order to maximize the chances of success. 

    Reach out to the team at DataWeave if you’d like to make smarter pricing & discounting decisions with up-to-date competitive insights. 

  • Valentine’s Day eCommerce Insights

    Valentine’s Day eCommerce Insights

    Access to these types of real-time digital marketplace insights can enable retailers and brands to make strategic decisions and help drive profitable growth in an intensifying competitive environment. Be sure to reach out to our Retail Analytics experts for access to more details regarding the above analysis.         

  • What Historical Pricing Data can tell you & how to use it

    What Historical Pricing Data can tell you & how to use it

    For many brands, pricing strategy boils down to guesswork — shooting in the dark and hoping consumers are willing and happy to pay. However, the ‘throw it at the wall, and see what sticks’ pricing strategy leads to big pricing mistakes. Pinning down an optimal price for products requires a clear picture of ideal customers, understanding each customer segment’s behavior, a solid grasp of your product’s value, and an analysis of competitors. Pricing analytics can help brands track a wide range of pricing metrics with cutting-edge analytical tools and use insights to get ahead of their competition. This analysis uses historical data to understand how previous pricing and promotion activities affect brand, sales, and customer price perception. It often involves identifying opportunities and weaknesses in competitors’ pricing strategies and exploiting them to improve sales and revenue. 

    Pricing analytics helps brands understand how product pricing and promotions affect profitability and the steps they can take to optimize their pricing structures. Brands can leverage their pricing and consumer data to design appropriate pricing models for achieving their sales goals.

    Here is a brief overview of pricing analytics, its benefits, and ways to improve sales with historical pricing analytics.

    What is historical pricing data analytics?

    historical pricing data analytics
    Historical Pricing Data Analytics

    Pricing analytics uses historical pricing and demand data to understand how pricing activities have affected profitability and overall brand. It also helps to optimize a brands’ pricing strategy for maximum revenue. Manual tracking of pricing for brands with numerous product lines, multiple selling points, different customer tiers, and complex product bundles is a huge challenge. Brands from every sector and industry vertical, manufacturing and distribution to retail and eCommerce, can benefit from pricing analytics.

    There are three types of pricing analysis:

    Descriptive

    Descriptive pricing analytics involves analyzing historical data to evaluate how customers have perceived and reacted to pricing fluctuations in the past. It analyzes metrics such as month-on-month sales growth, average revenue per customer, year-on-year pricing changes, or changes to the number of registrations to a particular service over a specific period. 

    Predictive

    Although brands can’t accurately predict how pricing changes will reflect sales, they can use predictive pricing analytics to get insights into the best possible chance of doing so. Predictive pricing analyzes historical data with statistical algorithms and machine learning to predict the price and trends of products in the future. It also helps brands to optimize their prices with future goals.

    Prescriptive

    Prescriptive pricing analytics is the opposite of descriptive analytics. Unlike descriptive analytics that helps brands explore their historical data to understand customer response after an event, prescriptive analytics help brands design better and more informed strategies. With prescriptive analytics, brands can shape their growth strategies to achieve more sustainable results over the long term.

    Benefits of historical pricing data analytics

    Benefits of historical pricing data analytics
    Benefits of Historical Pricing Data Analytics

    Acquire insights into customers price perception

    While analyzing the metrics to understand pricing optimization, brands can also gather valuable insights into their customer’s price perception. Pricing analytics helps brands understand which customer segments are the most (and least) profitable and how each segment responds to specific pricing strategies. With historical pricing data analytics, brands can also intelligently link pricing and promotions by first determining customer price sensitivity then gauging the effectiveness of promotions

    Fully Optimized Pricing

    Historical pricing analytics means eliminating guesswork from deciding the optimal pricing for a given product. By analyzing historical pricing data, brands can discover how their past pricing and promotional decisions impact profitability. Based on this historical data, they can also test various pricing strategies like value-based and dynamic pricing. It also allows brands to learn which customer segments are most likely to respond positively to price change. These insights from pricing analytics will drive more effective (and profitable) pricing decisions.

    Recognize pricing tiers that work the best

    Many brands have gaps in their pricing strategy — underpriced or overpriced tiers, pricing leaks, markup errors, or neglected upsell opportunities. Tiered pricing models are prevalent in subscription-based brands where brands offer tiers to meet the needs of diverse customer segments. With historical pricing analytics, brands can improve their pricing tiers and get insight into the right number of tiers and optimal prices for each. Pricing analytics will comb a brand’s historical data to find tier pricing mistakes to improve sales and revenue.

    Planning Pricing Strategies and Promotions

    Promotional pricing decisions are critical for any brand, as pricing perception is directly linked to consumer demand and profits. Brands have to carefully plan promotions that include variables such as list prices, special offers, advertisements, and discounts while ensuring profit margins. With predictive analytics, brands can determine optimal discount levels, keep a close eye on the competition, and announce promotional offers when customers are likely to purchase. Historical pricing analysis also helps predict revenue and determine optimal locations and platforms for promotional ads.

    Discover profitable channels

    Not all sales channels bring equal revenue to your brand. Historical pricing analysis can help you determine the most effective quality, volume, and revenue channels. Brands must understand which marketing and sales channels bring quality leads that convert to paying customers. It also helps to determine which eCommerce channels are most profitable so you can optimize your budget and identify channels you should be investing in as a part of future customer acquisition strategies. 

    Metrics to track

    Metrics to track
    Metrics to Track

    Here are a few pricing analytics metrics that can help brands to understand customer behavior towards pricing:

    Willingness to Pay (WTP)

    WTP, also known as price sensitivity, is the maximum price your potential customers are willing to pay for your service or product. It is an essential part of pricing strategy since you have no other way of understanding whether your product can yield an augmented product value. Numerous factors are responsible for a customer’s willingness to pay, and it’s not static. Brands must track willingness to pay for all customer segments to ensure that the product is priced competitively and drives maximum profit while staying in line with current market conditions. 

    Feature Value Analysis

    Feature value analysis, also known as relative reference analysis, measures the most important features to customers in relation to other features of a product or service. Analyzing critical features to customer segments will help brands price products based on basic or premium components. It can also help to better bundle your services or products so you can drive the most revenue. 

    Average Revenue per User (ARPU)

    The average revenue per user is the revenue generated from the sum of active users divided by the total number of users in a monthly time frame. Delving deeper into ARPU can help brands compare numbers with rivals and check how all products or customer segments perform. 

    Lifetime Value (LTV)

    Lifetime Value offers a complete picture of a user’s journey and the average revenue that the user will generate throughout their engagement as a customer with your brand. It helps brands determine various economic decisions such as marketing budgets, profitability, forecasting, and resource allocation. 

    Customer Acquisition Cost (CAC)

    A successful and profitable brand needs to balance its customer acquisition cost or CAC. It is about spending the right amount of resources and time to drive new customers without jeopardizing their lifetime value and revenue. Correct calculation of CAC helps brands to quantify their sales funnel and determine the efficiency and profitability of their strategies.

    Conclusion

    Historical pricing analytics is a powerful tool, and it can make a huge difference to a brand’s potential by increasing sales and unlocking incredible profitability in a relatively short time. Historical analysis of pricing and promotions data will help brands get better marketing returns than relying on traditional pricing approaches. 

    Leveraging pricing analytics will prevent brands from blindly reacting to competitor price changes and support solutions for scaling up price transformation efforts. By using historical pricing data, brands can more effectively segment their customers for marketing and promotion strategies. Properly utilizing predictive analytics and past sales data can help cut costs and keep profit margins high by adjusting production and prices according to market trends.
    Need help tracking your competitor prices? Or want historic pricing insights for your own brand? Or need to track the efficacy of your online promotions?
    Sign up for a demo
    with our team to know how DataWeave can help!