As the baby formula shortage continues, retailers and brands are working quickly to meet evolving consumer demand, considering supply chain driven headwinds, a baby formula recall, and inflationary-driven impacts. The DataWeave analytics team has actively tracked marketplace changes, alongside reports from the FDA, for the baby formula category at a state-level, and has shared the latest snapshot of product availability through June 7th, 2022, below.
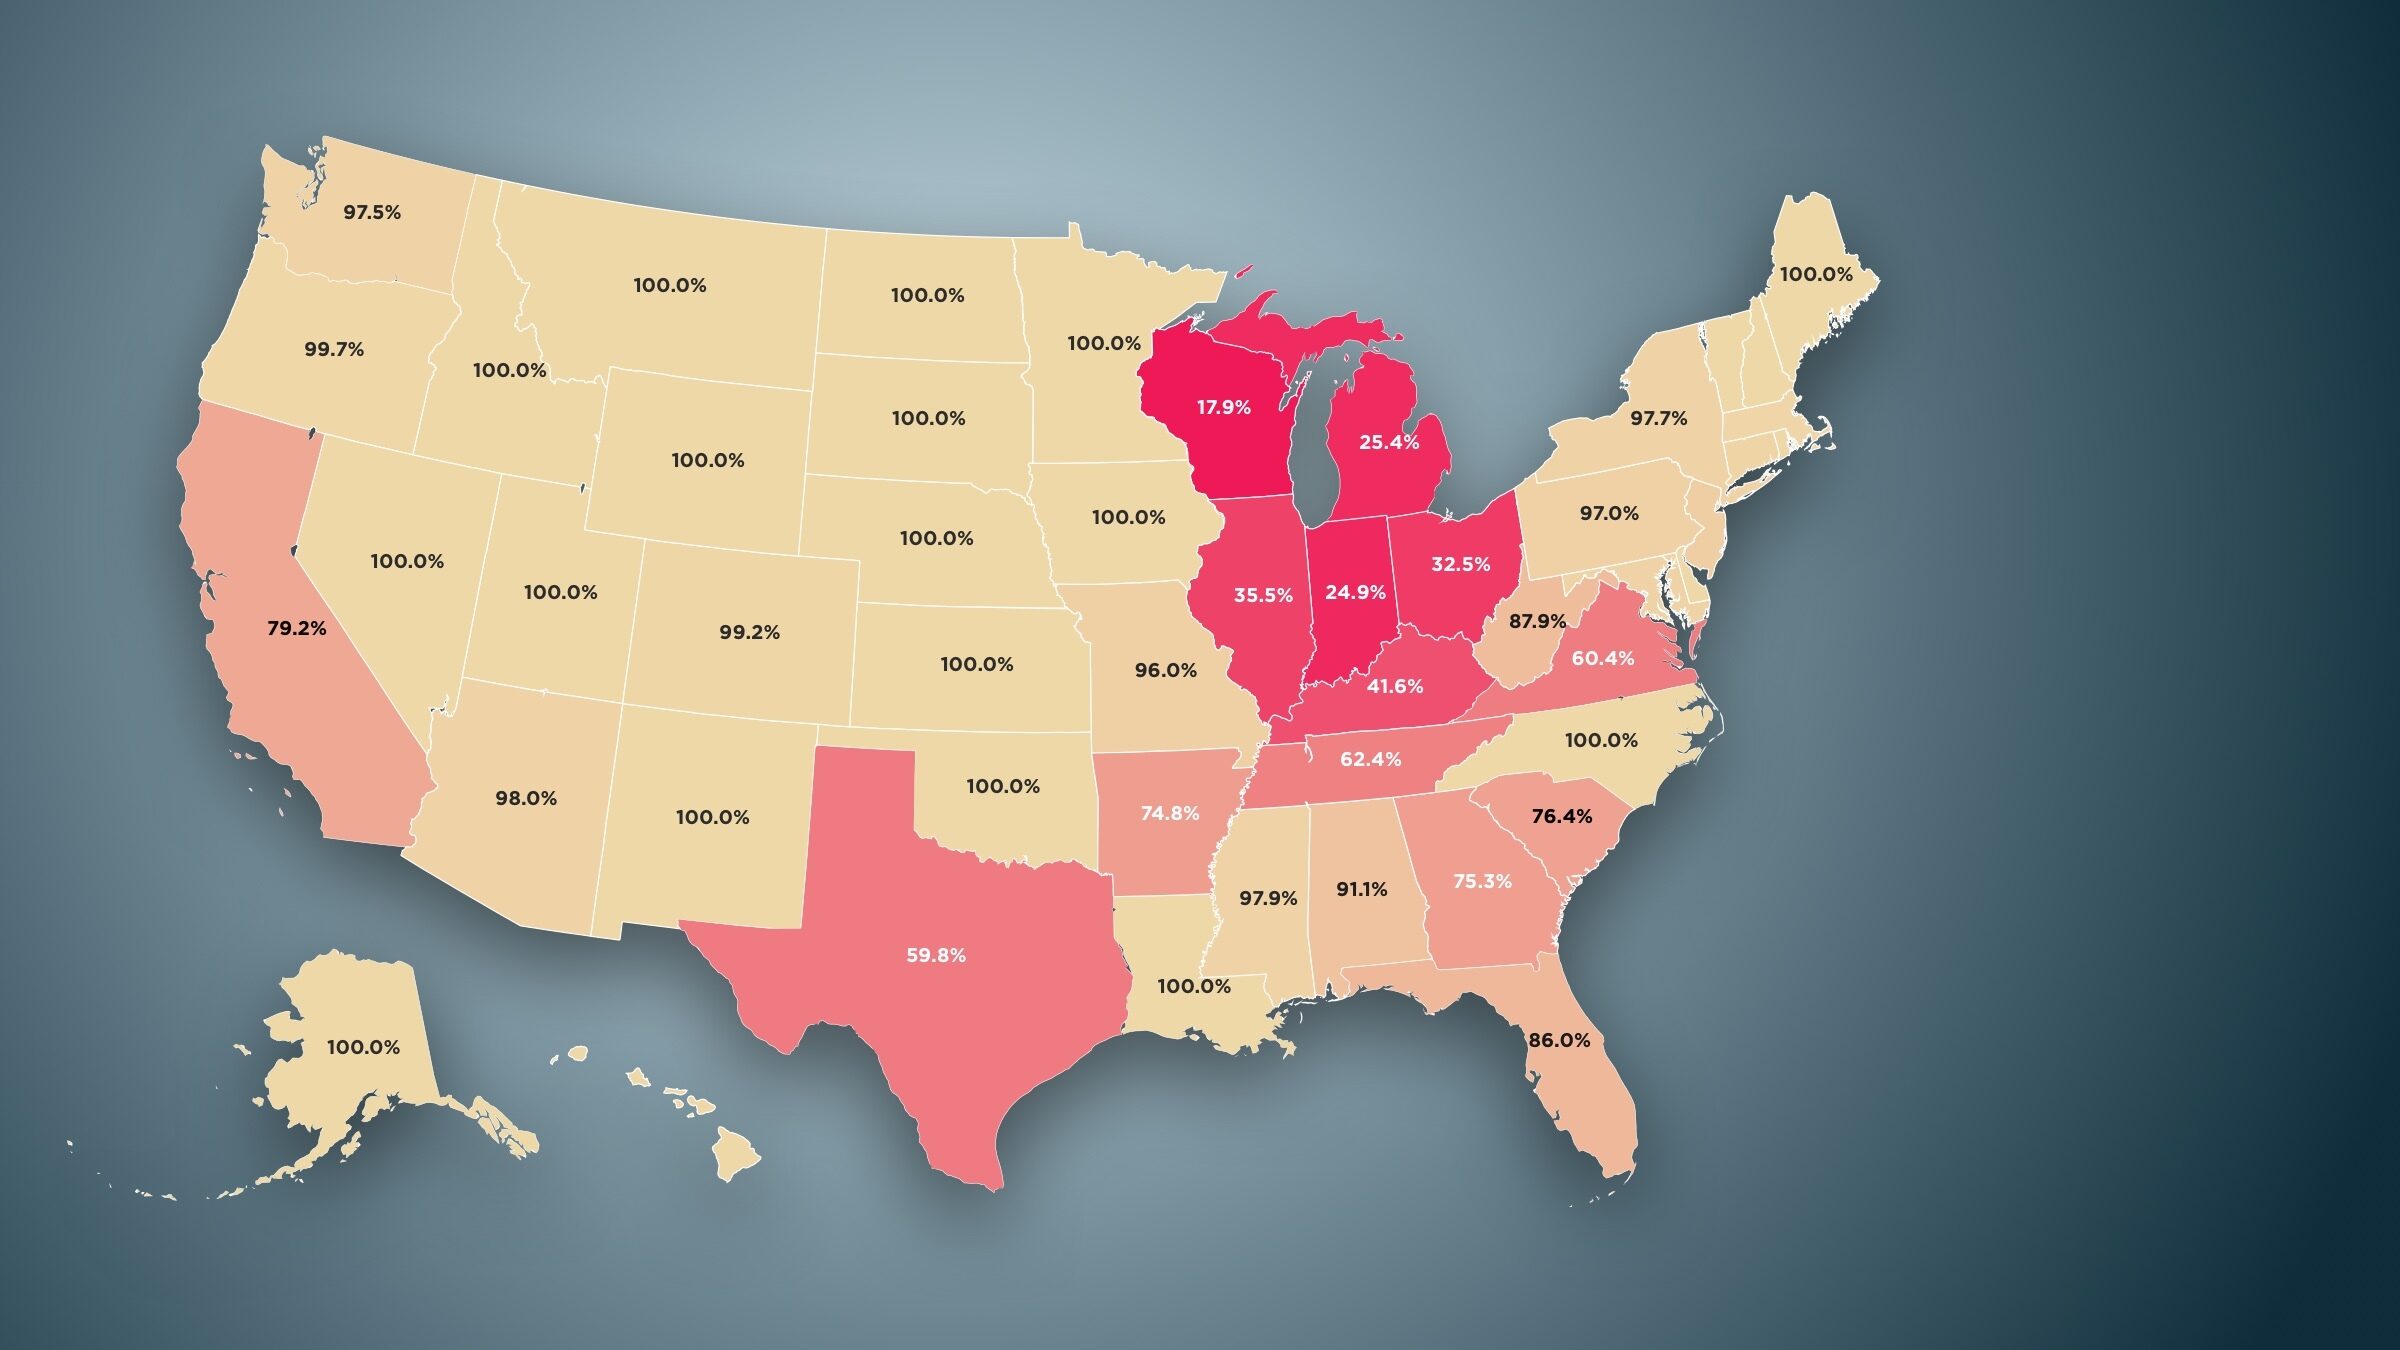
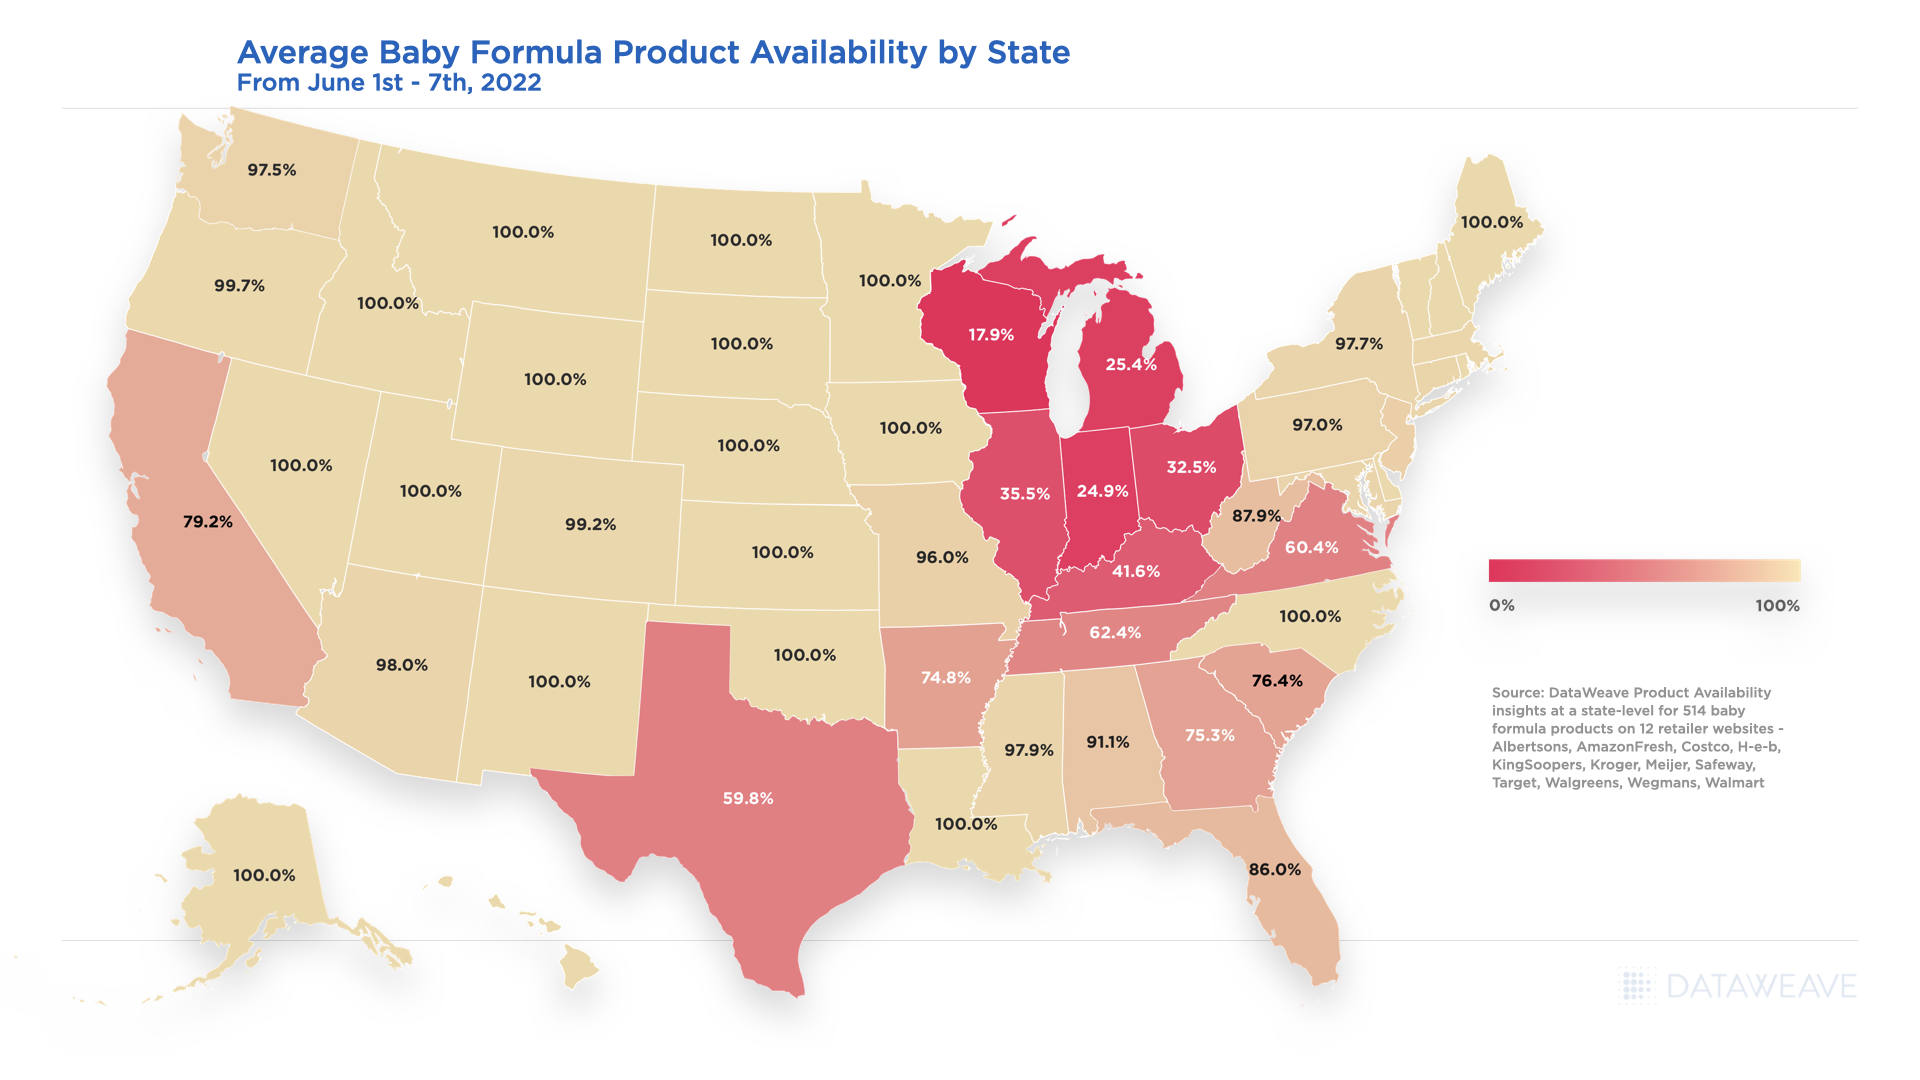
Average Baby Formula Product Availability by State – June 2022
While the U.S. has reached an average of 84% baby formula availability the first week of June 2022, given recent news headlines related to the baby formula shortage, and tracking out of stock encounters by state, we see a continued decline in availability throughout the Midwest versus product availability levels seen in May 2022.
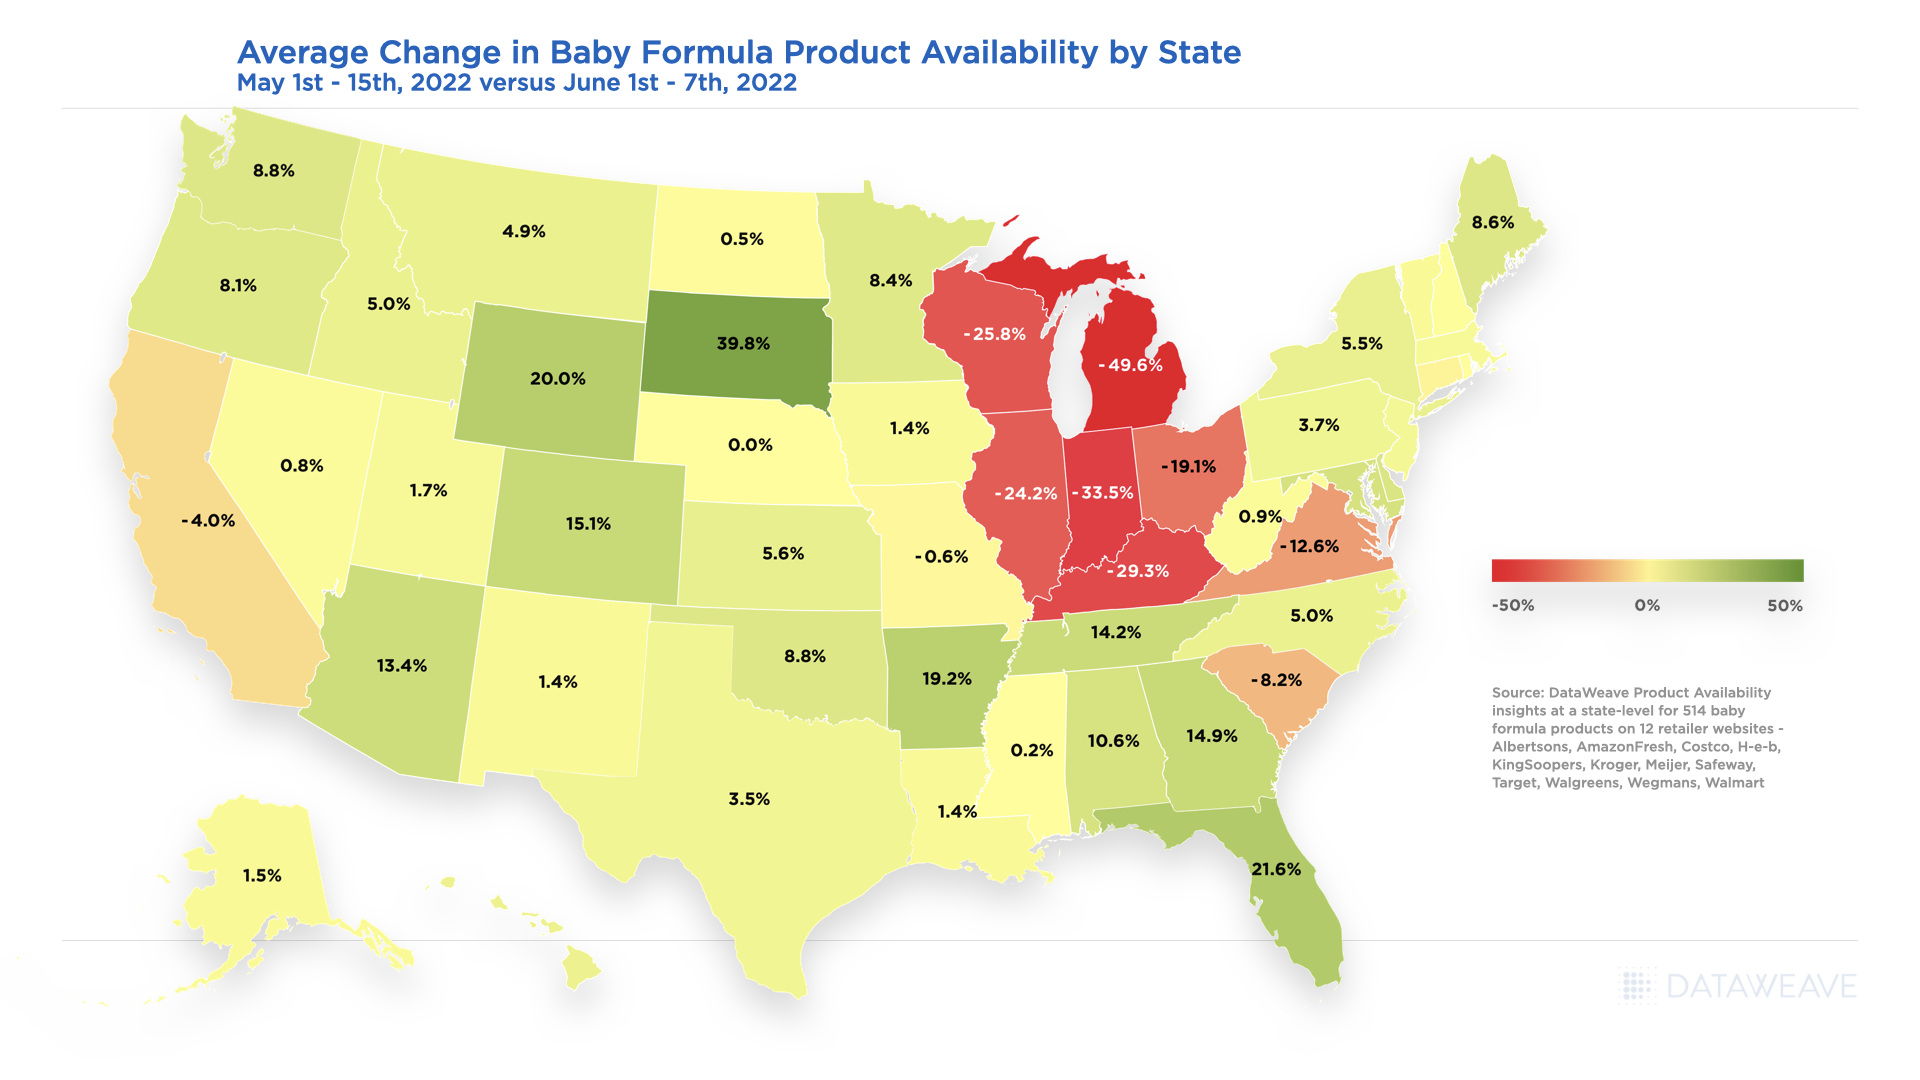
Wisconsin, Michigan, Illinois, Indiana, Ohio, and Kentucky all show average availability for baby formula to be less than 50%, with Wisconsin being impacted the most at less than 18% average availability. While Texas shows an average availability improvement of 3.5% from the first two weeks of May 2022 to the first week of June 2022 as noted in the below chart, availability is also very low overall at less than 60%.
Average Change in Baby Formula Product Availability by State – May 2022 to June 2022
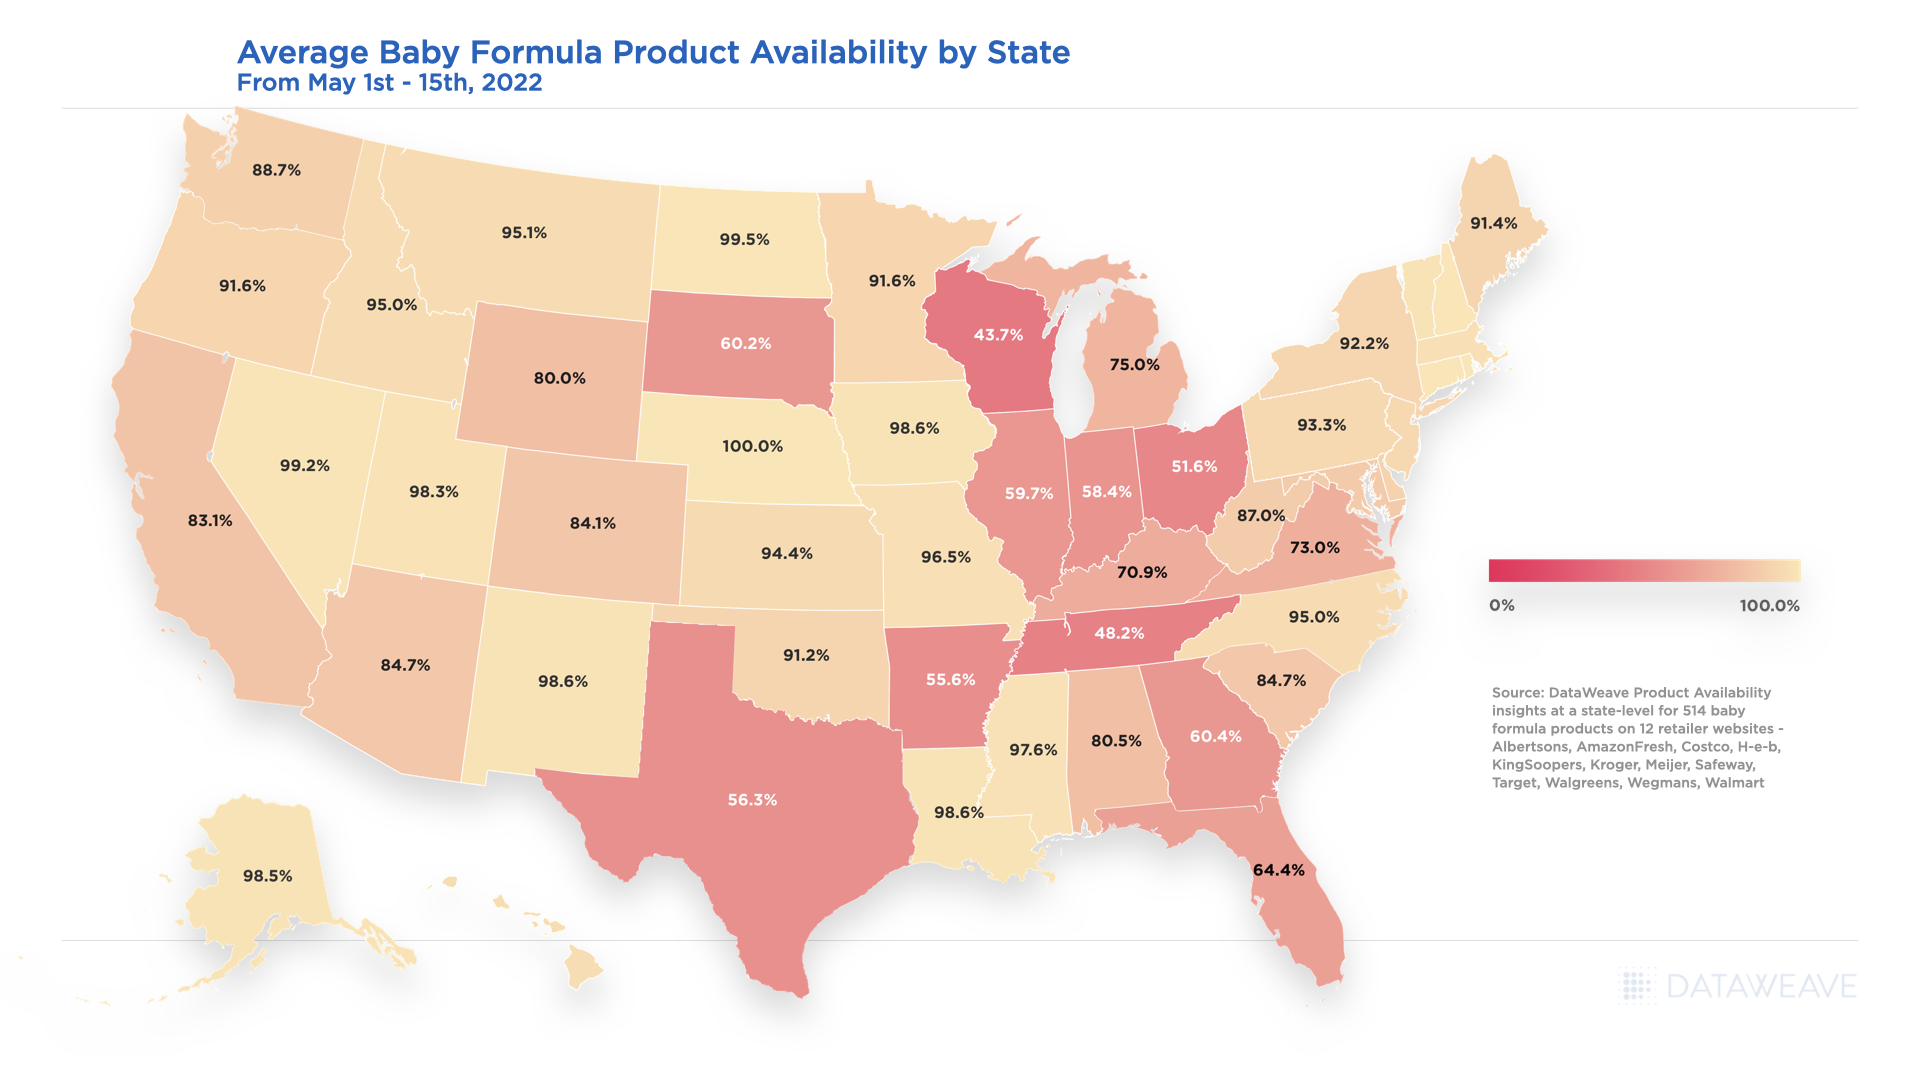
Outside of the Midwest and Texas, the other states for consumers to be cautious in are California, Virginia, and South Carolina as their month-over-month average change in availability also declined 4%, 12.6% and 8.2% respectively. Below is a snapshot of where the baby formula availability average started as of May 1st through the 15th, 2022.
Average Baby Formula Product Availability by State – May 2022
Baby Formula Product Availability Changes – March 2021 through May 2022
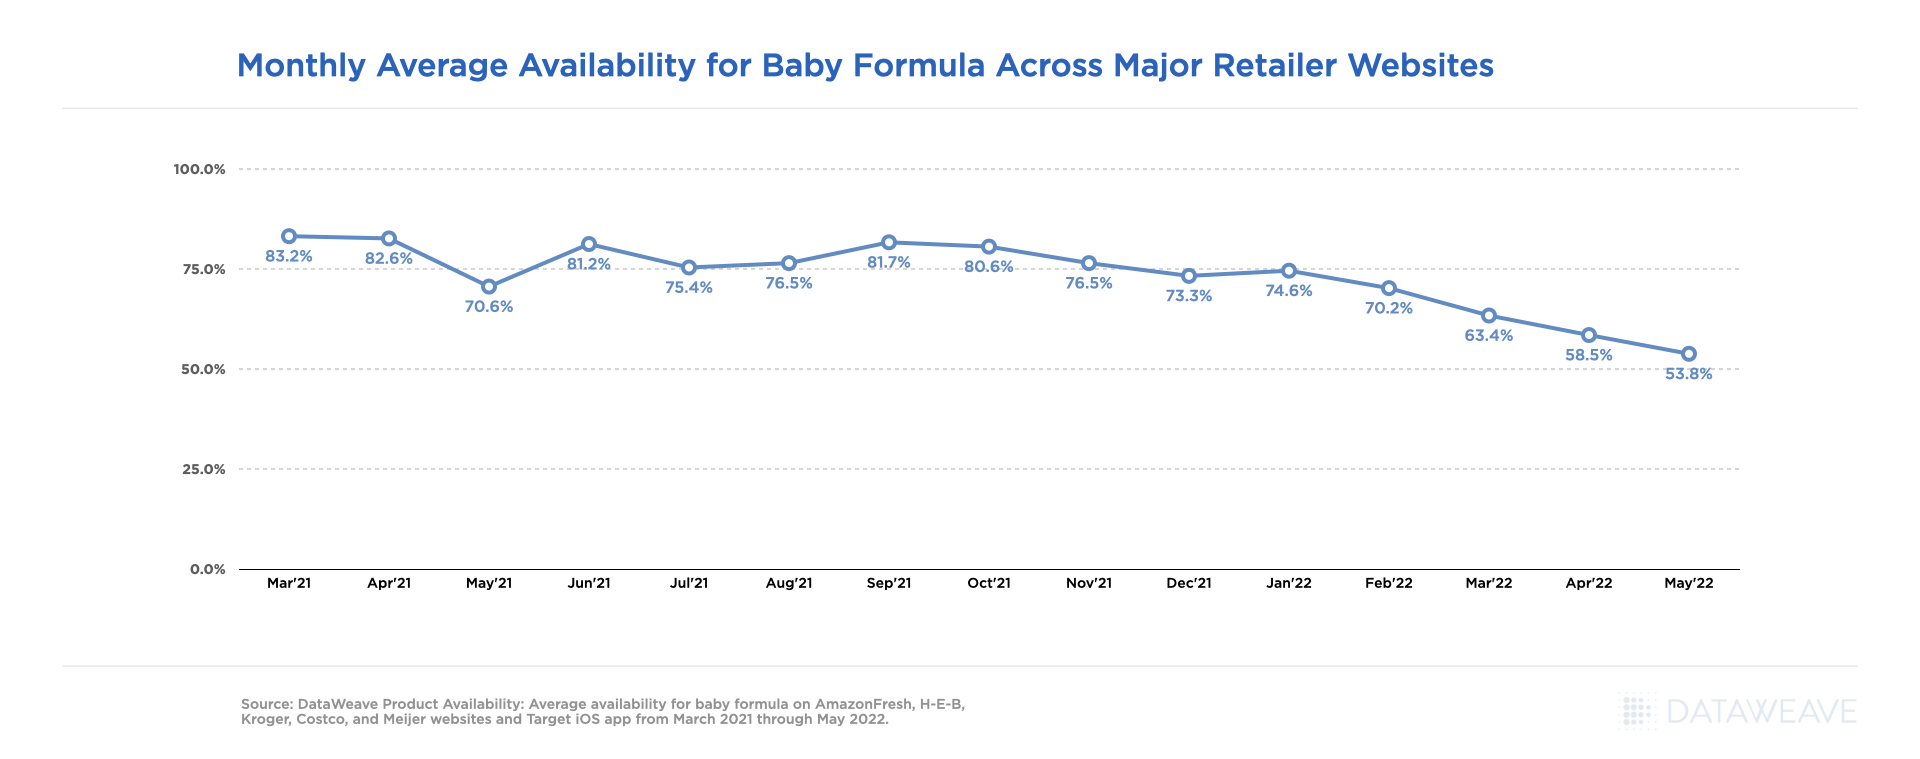
At an aggregated level overall, the availability for baby formula was relatively stable across all retailers considered within our analysis from March 2021 through September 2021, but has been on a steady decline ever since, starting at 81.7% availability in September and ending at 53.8% availability in May 2022 as noted in the below chart.
Monthly Average Availability for Baby Formula Across Major Retailer Websites
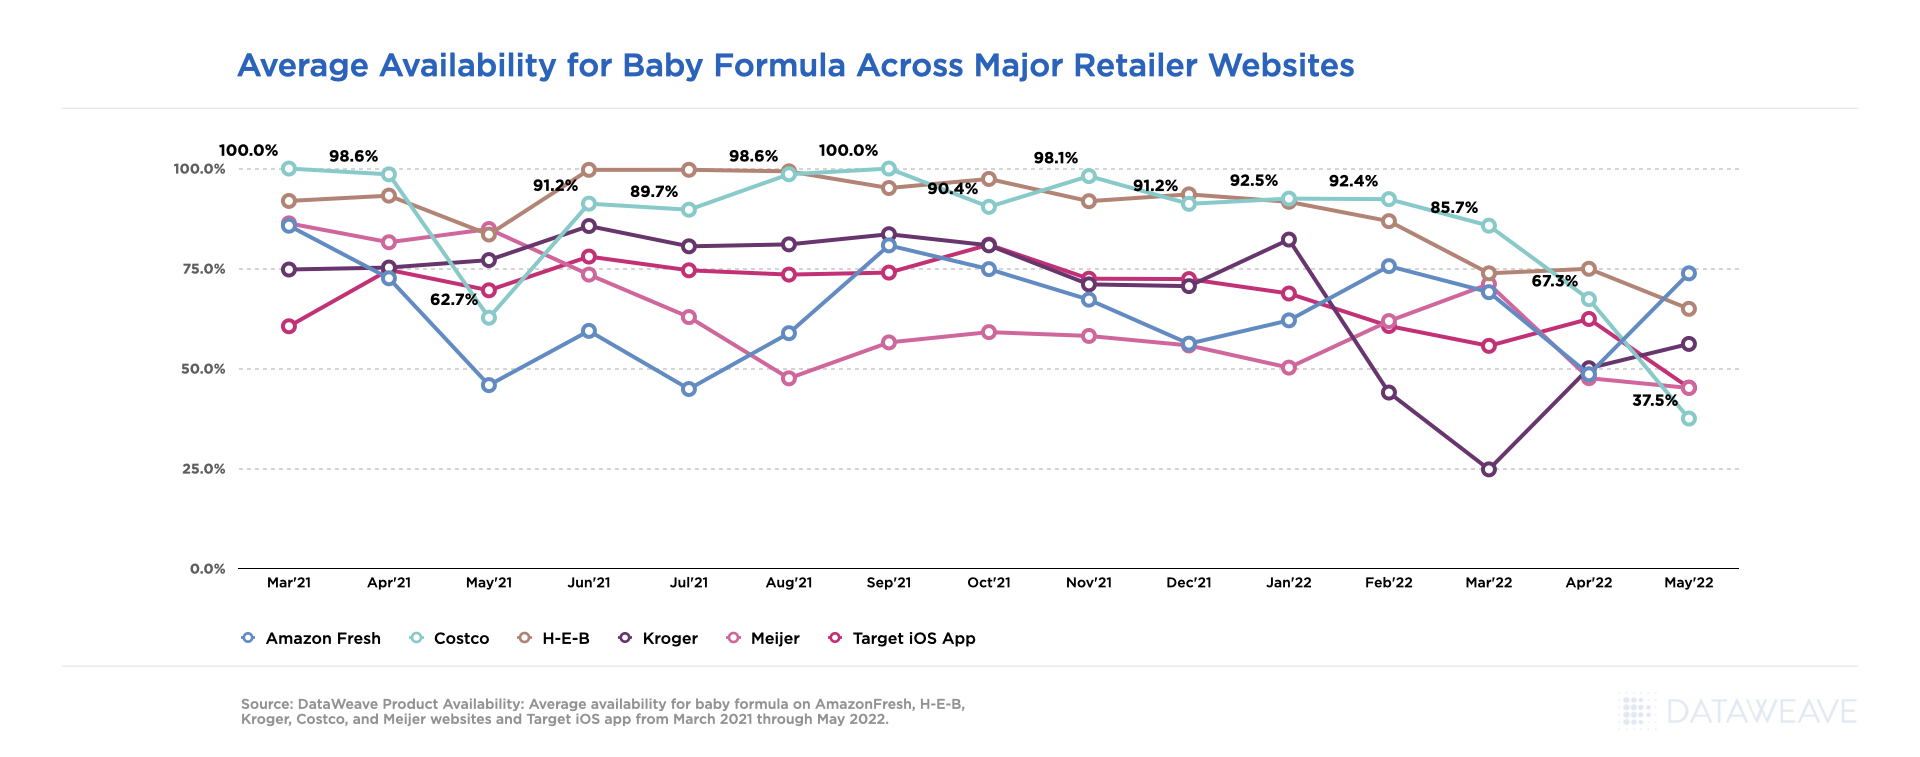
Looking at baby formula availability at a retail level, we saw yet again not all availability challenges were alike, by month or retailer. Costco.com lead the other retailers within our analysis for greatest average availability from March 2021 through May 2022, but had one of the lowest availability percentages at 62.7% in May 2021, and dropped to the lowest availability of the group in May 2022 at 37.5%.
Average Availability for Baby Formula Across Major Retailer Websites
Baby Formula Prices Increase as Availability Changes
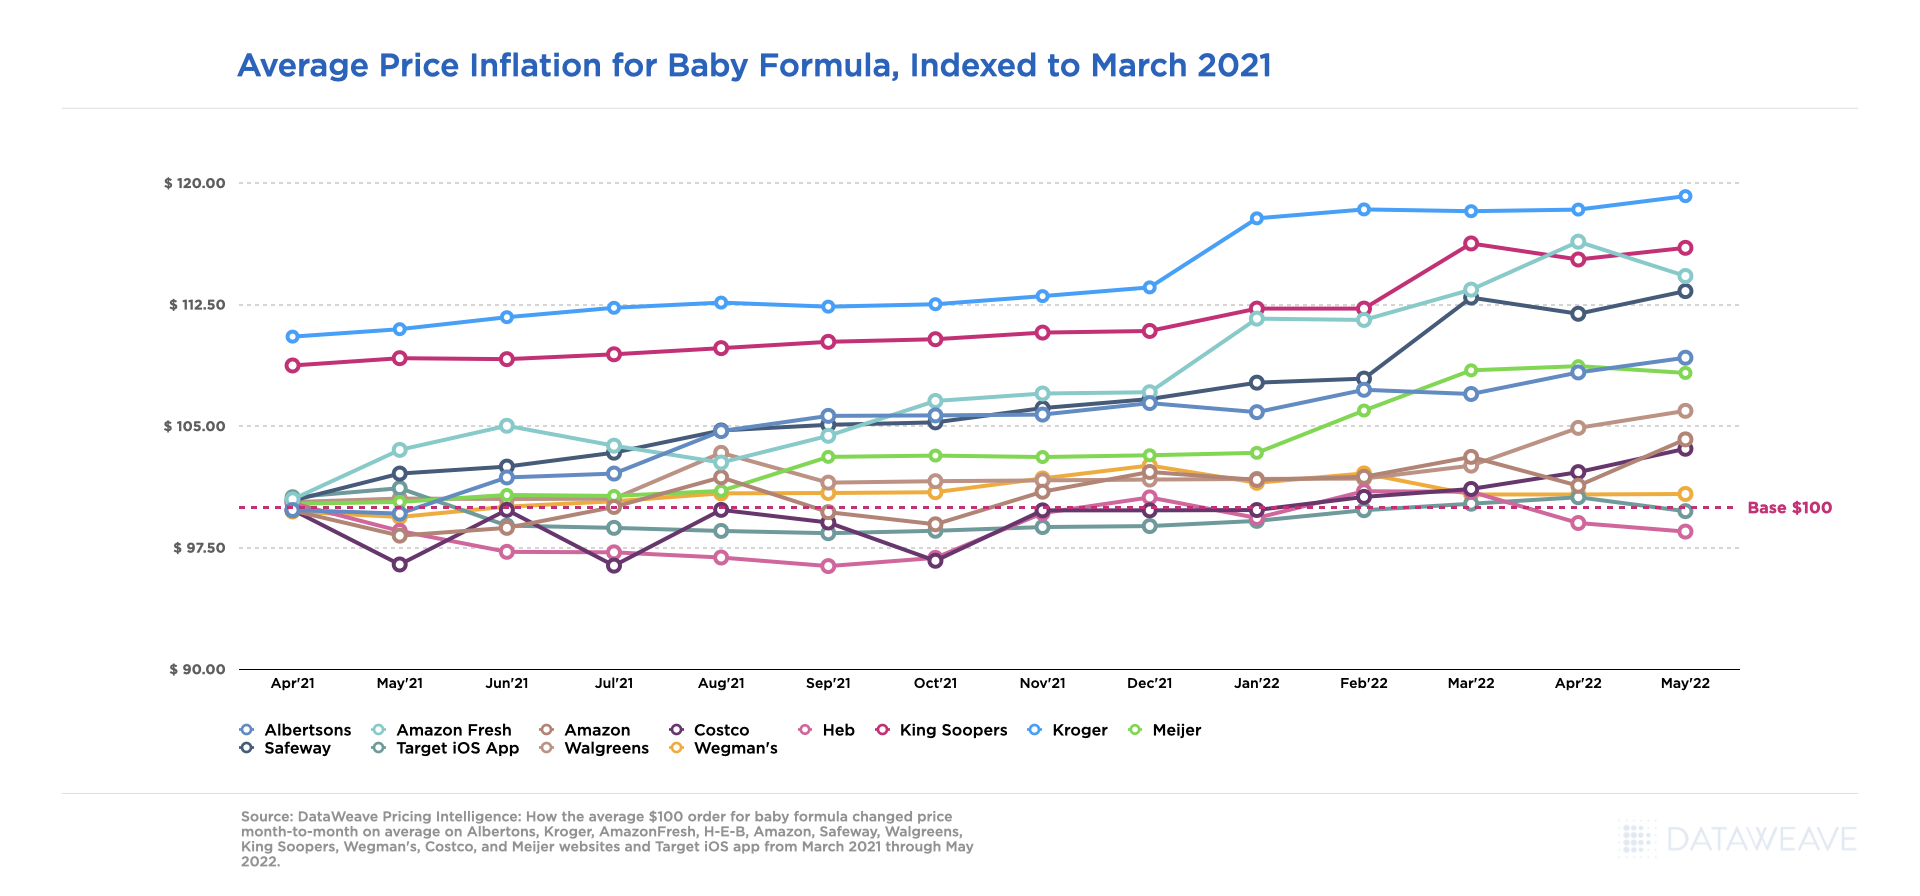
While unnecessary price gouging is prohibited, price increases are still happening at a slow and steady rate across all the accounts included within our Pricing Intelligence analysis given external market factors outside of baby formula recall related stockout scenarios.
Kroger.com experienced the greatest average price increases overall, with the peak being in May 2022 at a 19% increase, 8% higher than other retailers on average, versus prices seen in March 2021 for the same baby formula products. The most significant price hike occurred on Kroger.com from December 2021 to January 2022. Other retailers like H-E-B, Target and Wegman’s have had minimal price changes from March 2021 through May 2022.
Average Price Inflation for Baby Formula, Indexed to March 2021
Address the Baby Formula Shortage With eCommerce Intelligence
As the market continues to evolve and baby formula supply works its way to catching back up to demand, our team will continue providing critical pricing, merchandising, and competitive insights at scale, to enable retailers and brands to develop data-driven growth strategies that directly influence their eCommerce performance, accelerate revenue growth and drive profitability.
Be sure to reach out to our Retail Analytics experts for access to more details regarding the above analysis, or for more information on our Commerce Intelligence and Digital Shelf solutions, and let us know what other category insights you’d be interested in seeing this year.
What an exciting month we’ve had at DataWeave! Our team flew down to gorgeous Cape Town, South Africa to attend the 8th edition of #EcomAfrica! After months of Zoom calls and virtual events, it was a refreshing change to see our customers in person and meet some of the movers and shakers in eCommerce and some of the top South African brands.
Top eCommerce Companies in South Africa
My last visit to South Africa was before the pandemic. Things have changed since then, & the difference was stark! The eCommerce landscape had a paradigm shift during Covid-19 and grew exponentially. My customers spoke to me about the new opportunities, growth potential as well as challenges that came in because of this boom. For one, eCommerce in South Africa has become more competitive than ever – from online retail to grocery and food delivery to even alcohol delivery! All retail businesses seem to have jumped onto the eCommerce bandwagon.
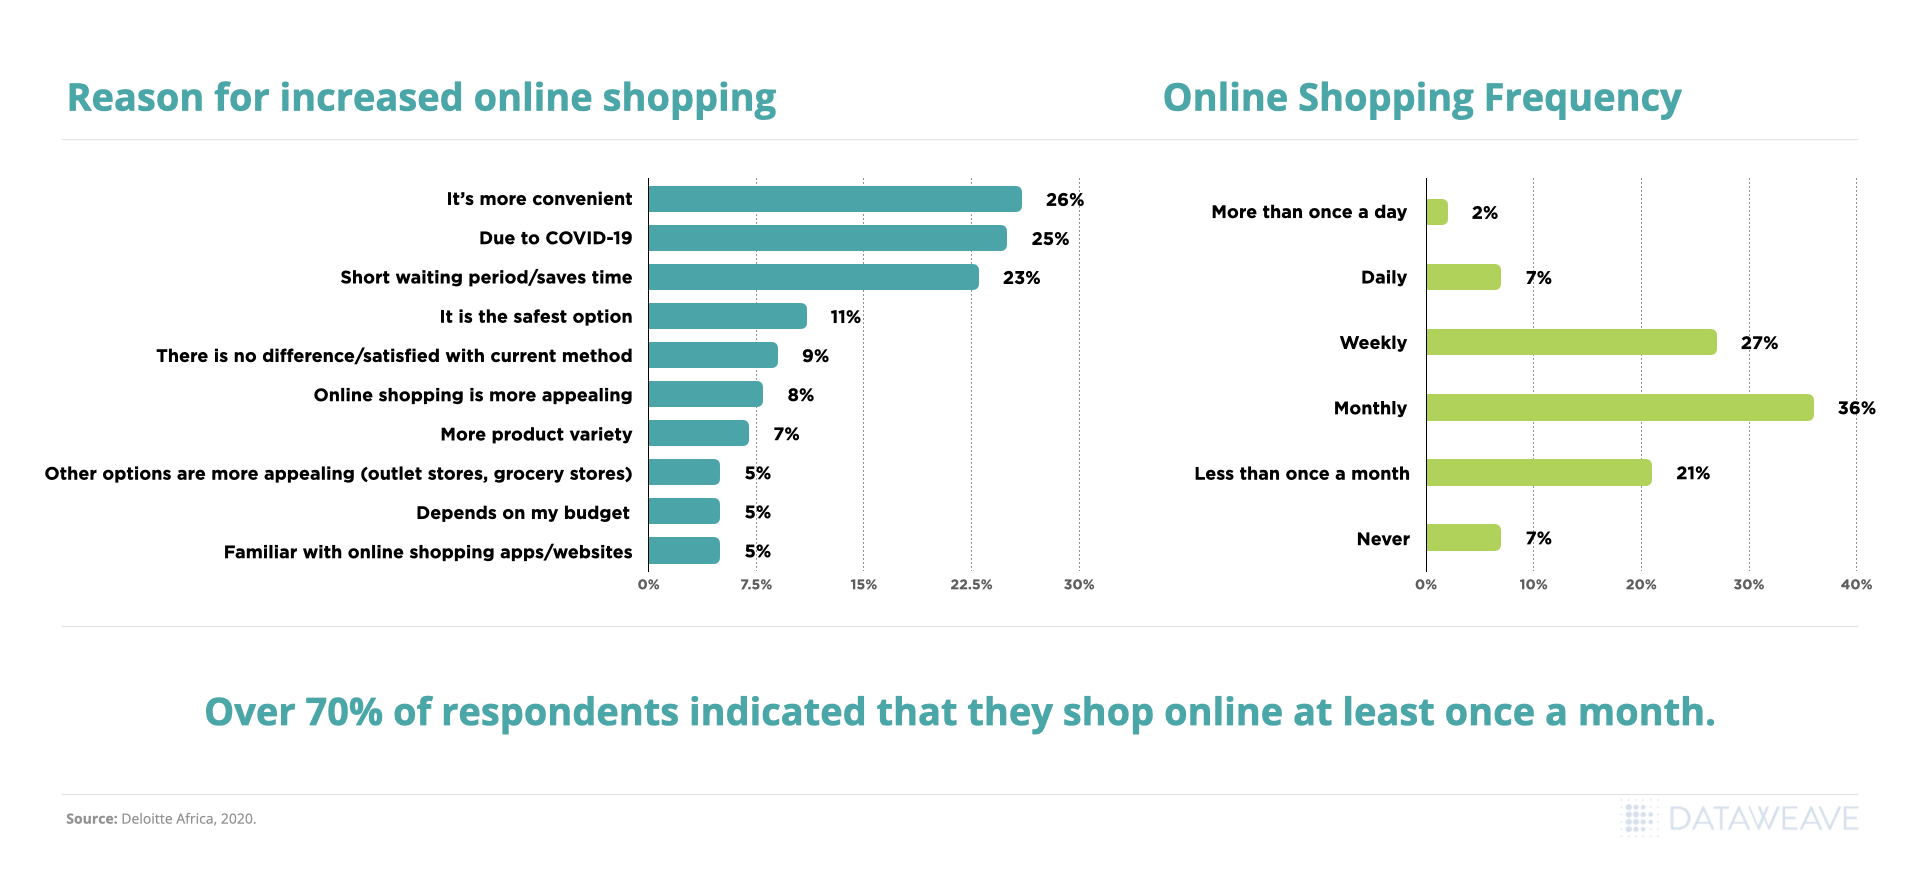
A recent Deloitte report found that over 70% of South Africans shop online at least once a month & 2 out of 3 respondents said they plan to increase their frequency of online shopping. 65% said they know what they want, search online & check all stores that stock the product to compare prices. Price is one of the key factors that influence consumer purchase decisions. Other critical factors include delivery fee, delivery time, promotions & discounts & product assortmentto name a few. In order to stay ahead in this highly competitive arena, both retailers and brands need to make data-driven decisions about critical KPIs like pricing to stay ahead of the competition.
Increased Online Shopping & Online Shopping Frequency
We’ve been working with customers in South Africa for over 4 years now, even before the pandemic. So on Day 2 of the event – S.Krishnan Thyagarajan “Krish”, President & COO, Dataweave had a chance to share our learnings and experience from all these years and how user data is critical to getting ahead & winning the eCommerce race in South Africa.
For the purpose of Krish’s keynote address, we tracked pricing insights for a finite set of categories across key South African retailers like Checkers, Pick n Pay, EveryShop, Incredible, Makro, Waltons, Shoprite & Dis-Chem to name a few over a period of 16 months from Dec 2020 to April 2022. We highlighted price increase and decrease opportunities and how each retailer reacted in order to stay competitive, increase sales and protect margins.
BATTLE of the eCommerce GIANTS!
Key Highlights from the Keynote
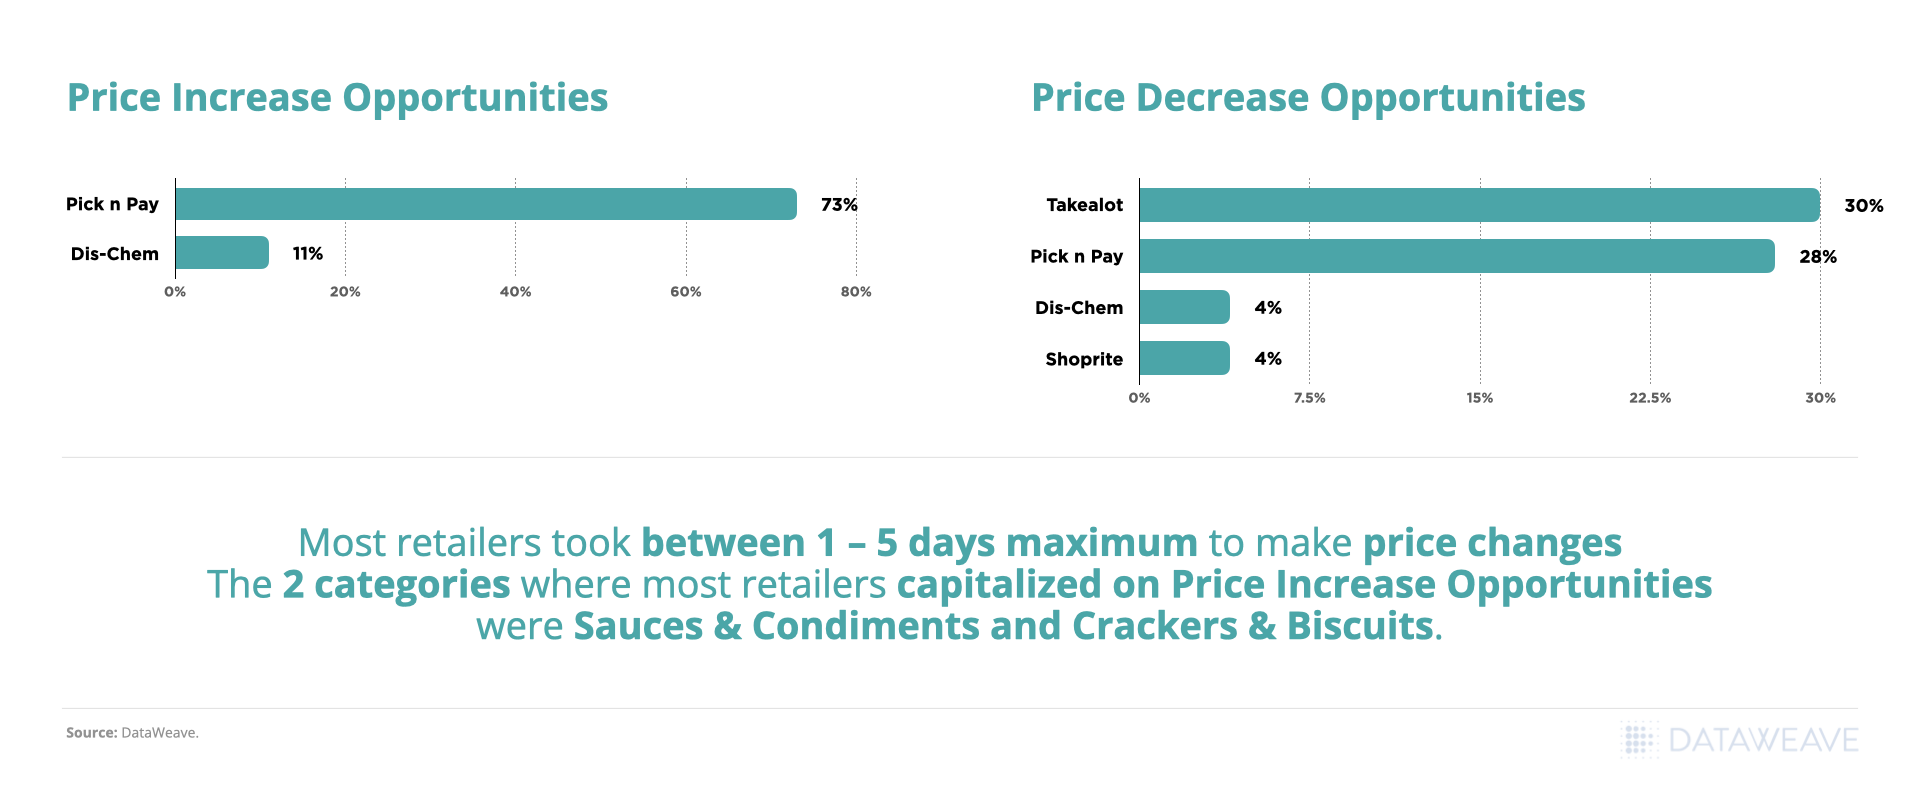
Increasing prices where an opportunity exists helps retailers increase their margins exponentially. Pick n Pay had the highest action rate (73%) when it came to capitalizing on price increase opportunities v/s Dis-Chem at 11%.
When it came to price decrease opportunities (in order to stay competitive with rival brands) Takealot was the most responsive retailer – they capitalized on 30% of the opportunities, followed by Pick n Pay at a close second (28%) and Shoprite & Dis-Chem at just 4%.
Most retailers took between 1 – 5 days maximum to make price changes which means responsiveness to the market among all retailers is high making it more important for online retailers to always be on their toes.
The 2 categories where most retailers capitalized on Price Increase Opportunities were Sauces & Condiments and Crackers & Biscuits.
Watch the Impact of price increase & decrease opportunities on Private Label brands!
See how product stock availability impacts price changes over a 16-month period.
Find out which brands are in the lead in the Skin Care, Pet, Baby, Laundry & Cleaning Aid categories
If you’re an online retailer in South Africa & need insights on staying competitive with the right pricing, product assortment, delivery time, delivery rates, and the other key influencers that affect customers’ choice of online retailers, sign up for a demo with our team at DataWeave to know how we can help!
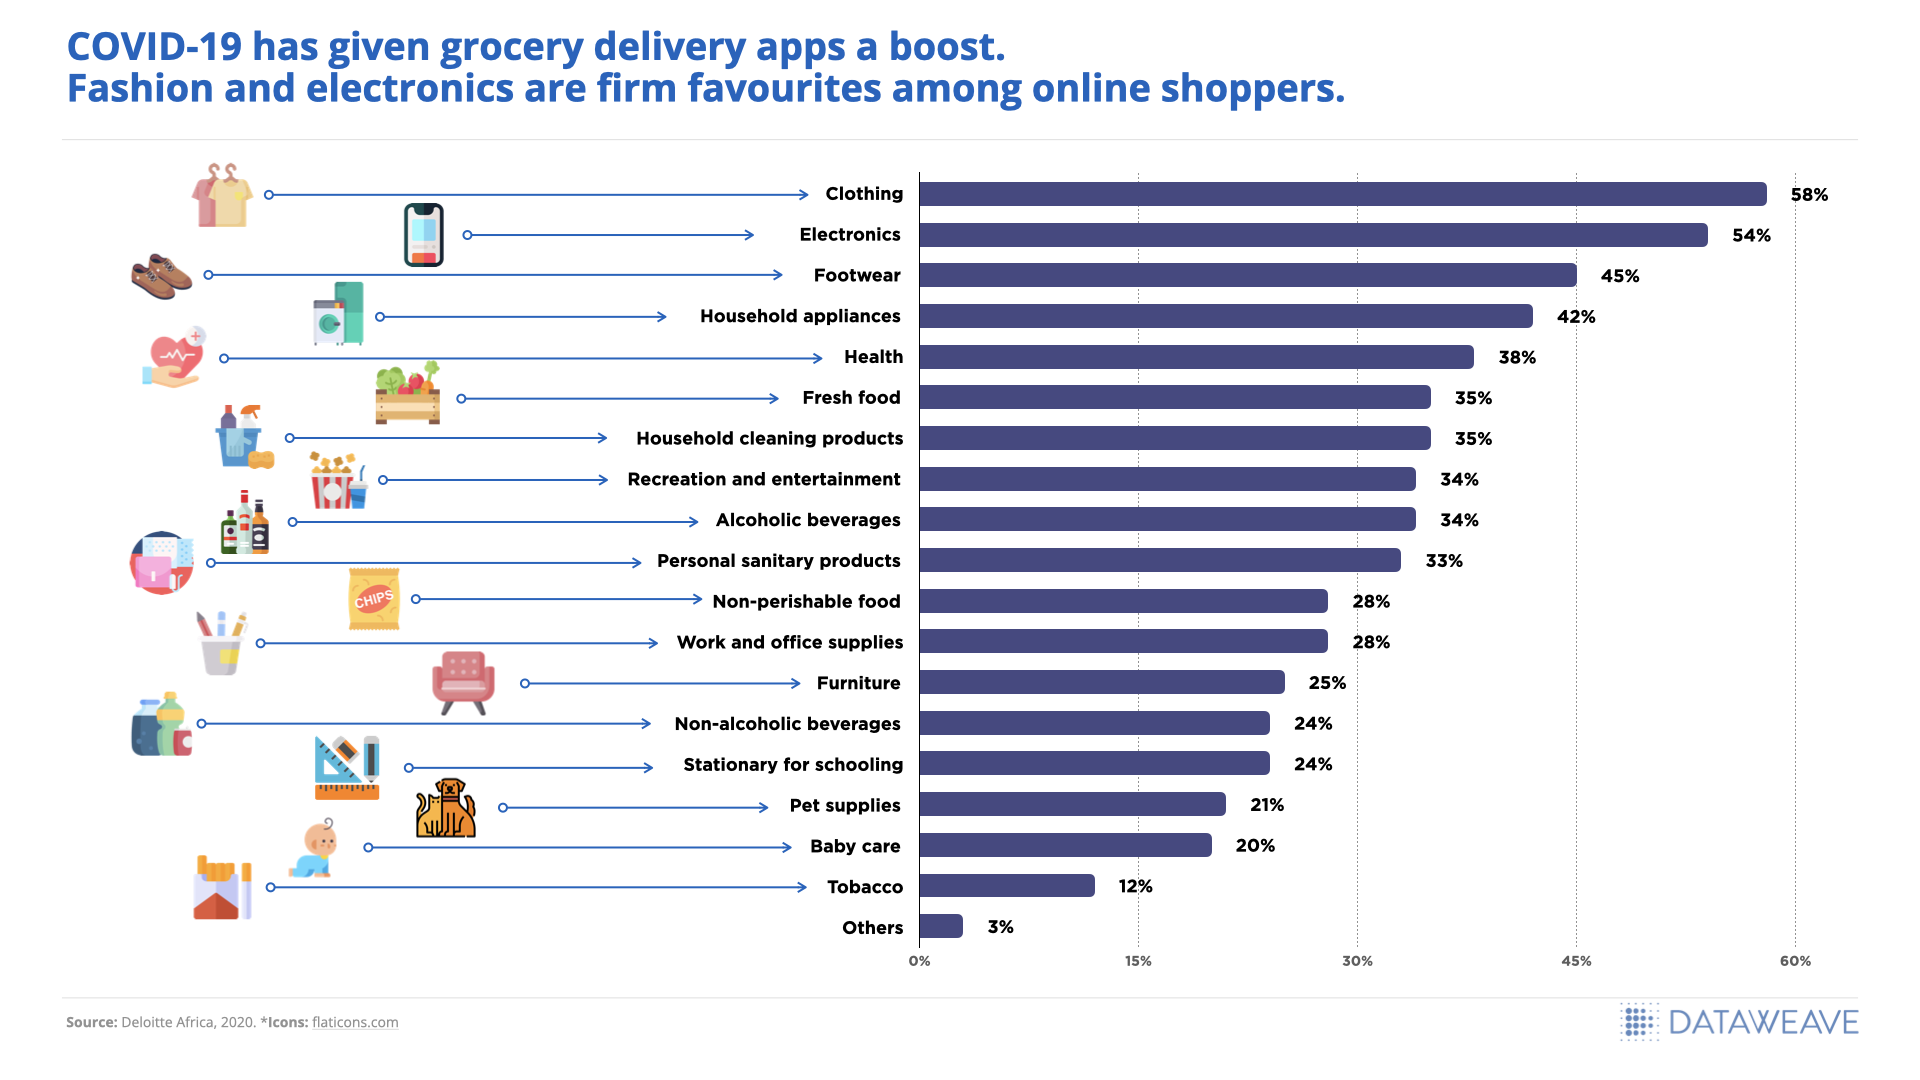
2020 onwards, the South African economy was crippled due to the pandemic and lockdowns. However, according to StatsSA, South Africa’s online retail market share grew to 2.8% in 2020, double that in 2018. After the pandemic, South Africa’s eCommerce industry grew by 66% in 2020 compared to the year before. This increase was primarily because of restrictions on traditional stores that led to a 30% reduction in in-store purchases. According to a Deloitte study, over 70% of South Africans shop online at least once a month because of convenience. Household appliances, footwear, clothing, electronics, and health products are the most popular categories among South African online customers.
Top Categories
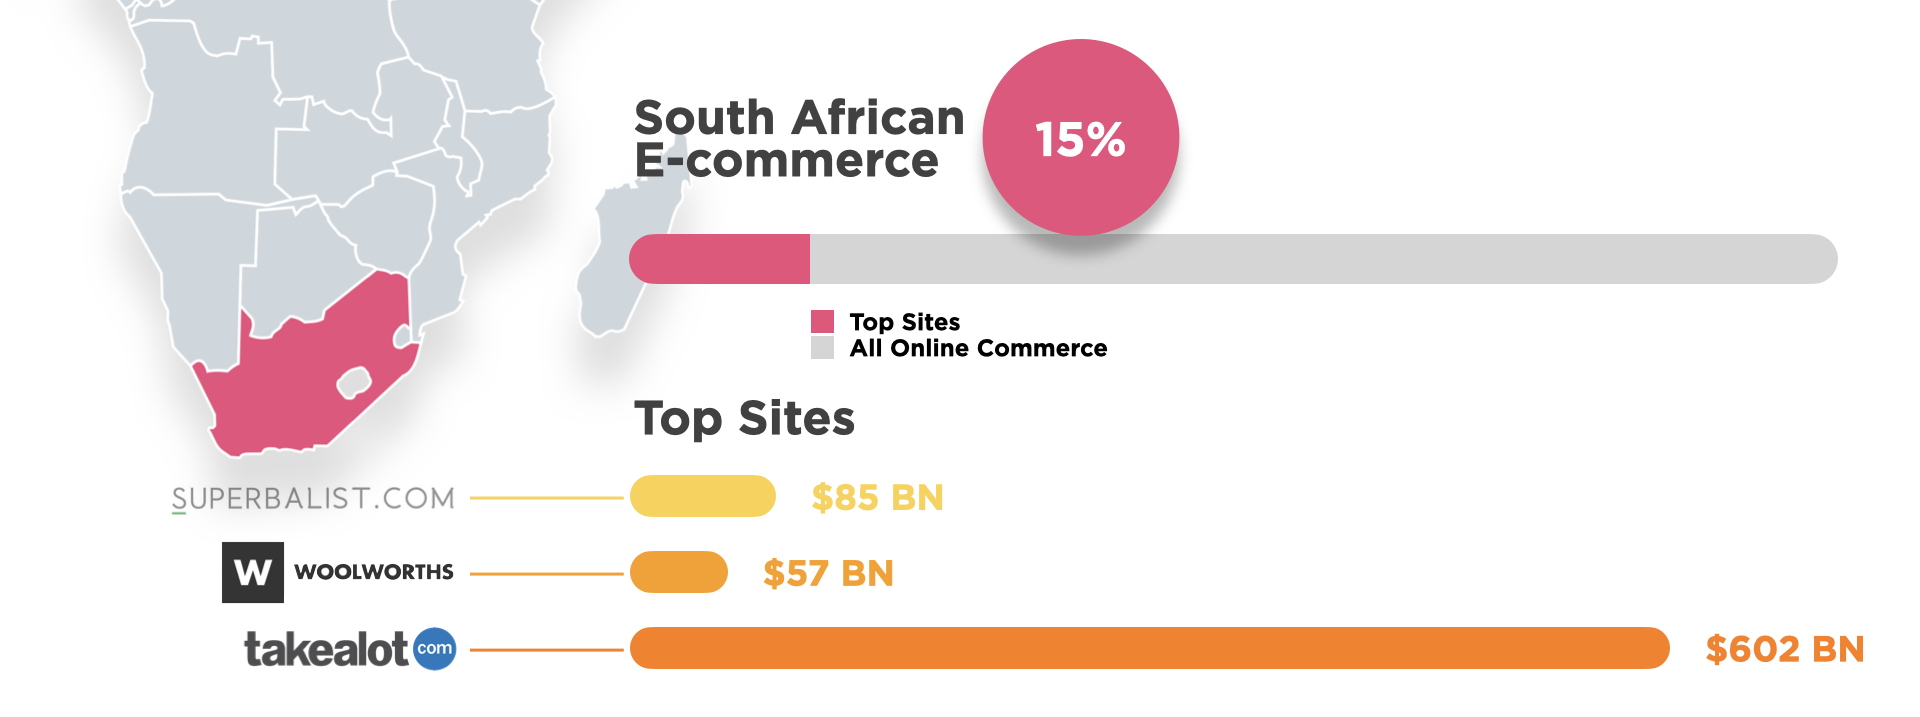
South African Ecommerce
These eCommerce stores account for 15% of online revenue in South Africa
Takealot.com: Revenue US$602 million
Superbalist.com: Revenue US$85 million
Woolworths.co.za: Revenye US$57 million
In this blog, we will discuss emerging eCommerce trends in South Africa and their impact on the various retail segments.
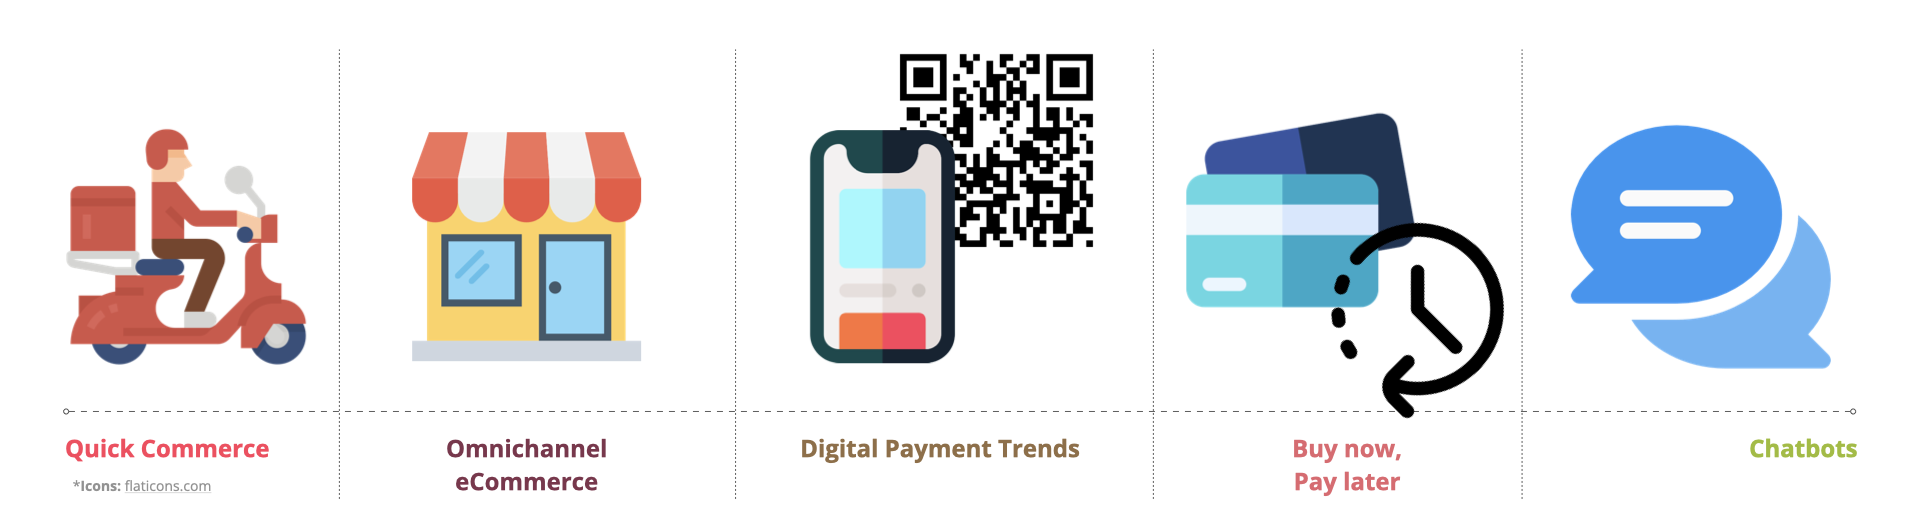
Trends to watch in 2022
Trends to watch
1. Quick commerce
Quick delivery, especially when it comes to groceries, medicines, and food has become a customer expectation now. Q-commerce, a trend that capitalizes on optimizing delivery time, has become common in food tech companies and is now gaining traction in grocery delivery too, especially after the pandemic. UberEats, Checkers, Pick ‘n Pay, and Jumia is some of the country’s biggest Q-commerce players.
2. Omnichannel eCommerce
Omnichannel experience has taken center stage for retailers in South Africa after the pandemic. According to Nielseniq’s study, 30% of South African consumers indicated they had shifted their shopping habits to online shopping from in-person grocery store visits between March 2021 and 2022.
3. Digital Payment Trends
The digital payment ecosystem in South Africa has seen a massive growth trajectory after the pandemic. Customers seamlessly use digital payments across shopping, entertainment, groceries, food, health, and wellness – a trend we suspect is here to stay.
4. Buy Now Pay Later
Buy now pay later is an interest-free mode of payment that is popular worldwide for helping customers who cannot make high-value purchases. Consumers don’t have to pay any price upfront and pay off the amount in interest-free installments over a predefined period. The BNPL is forecasted to account for 13.6% of global eCommerce payments by 2024.
5. Chatbots
Quick response to customer queries and problems is instrumental in increasing conversion rate and sales. However, it can be difficult to respond to emails and instant chat 24/7 for small businesses. This is where automated chatbots are helping South African retailers answer customer questions promptly and correctly.
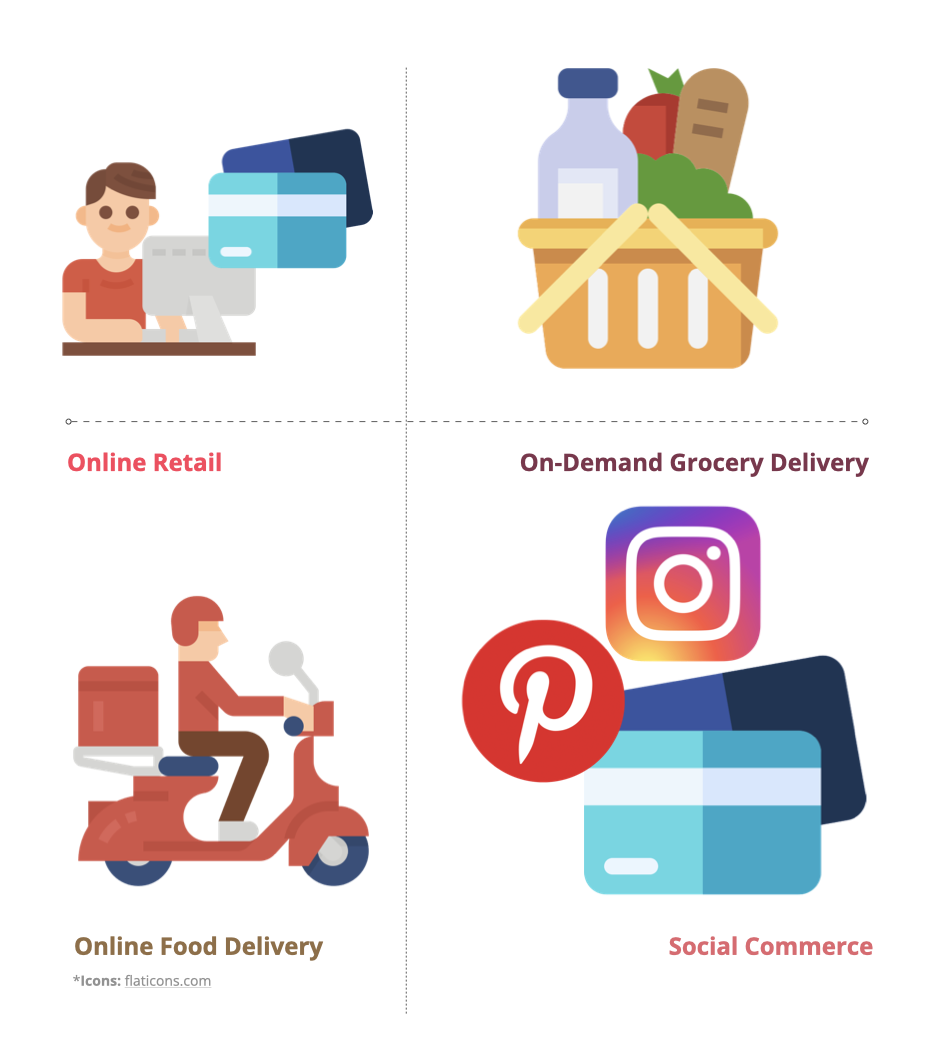
The 4 Fastest-Growing Retail Segments
4 Fastest-Growing Retail Segments
1. Online Retail
eCommerce & online retail grew 20% YOY after the pandemic. Retailers saw a huge increase in the adoption of online shopping by consumers. Traditional brick-and-mortar stores looked for omnichannel opportunities to keep up with online retailers. Mr. Price, a clothing retailer in South Africa, saw a surge in online sales by a massive 90% between April and June 2020. There is a similar success story where OneDayOnly, another South African online retailer, saw 40% growth during the same period.
… but this growth surge brought in some challenges for retailers too. With more and more customers shopping online, competition increased. Price-sensitive customers would constantly compare prices across online retailers before making a purchase. It became critical for retailers to price their products right to beat the competition & win the sale, without hurting their margins!
South African eCommerce companies offer a wide range of on-demand services, from taxi rides and grocery orders to liquor delivery. Retailers fulfill orders from stores to offer affordable rates and quick delivery across South Africa. It replicates the instant gratification of purchasing products from brick and mortar stores and the added benefits of the hyper convenience of shopping from a mobile or a computer.
According to Statista, revenue in the online food delivery segment in South Africa is projected to reach US$0.87bn in 2022. As competition heats up and more and more players enter the market, staying competitive is becoming increasingly challenging for food delivery businesses.
Bolt Foods SA said they grew 50% month on month in mid-2021 and said they had to bet on making sure they were offering competitive prices in order to get ahead. Additionally, in their quest to have a stronger competitive advantage, Bolt Food says it is also offering customers a very low delivery fee, lower than Uber Eats & Mr. D since delivery costs are a major consideration for customers when using food delivery apps.
With approximately 41.19 million South African customers engaging in online activity, there is a huge shift in user behavior as customers get comfortable purchasing directly via social platforms instead of online retailers or physical stores. Social commerce uses networking websites such as Facebook, Instagram, and Twitter as vehicles to promote and sell products and services.
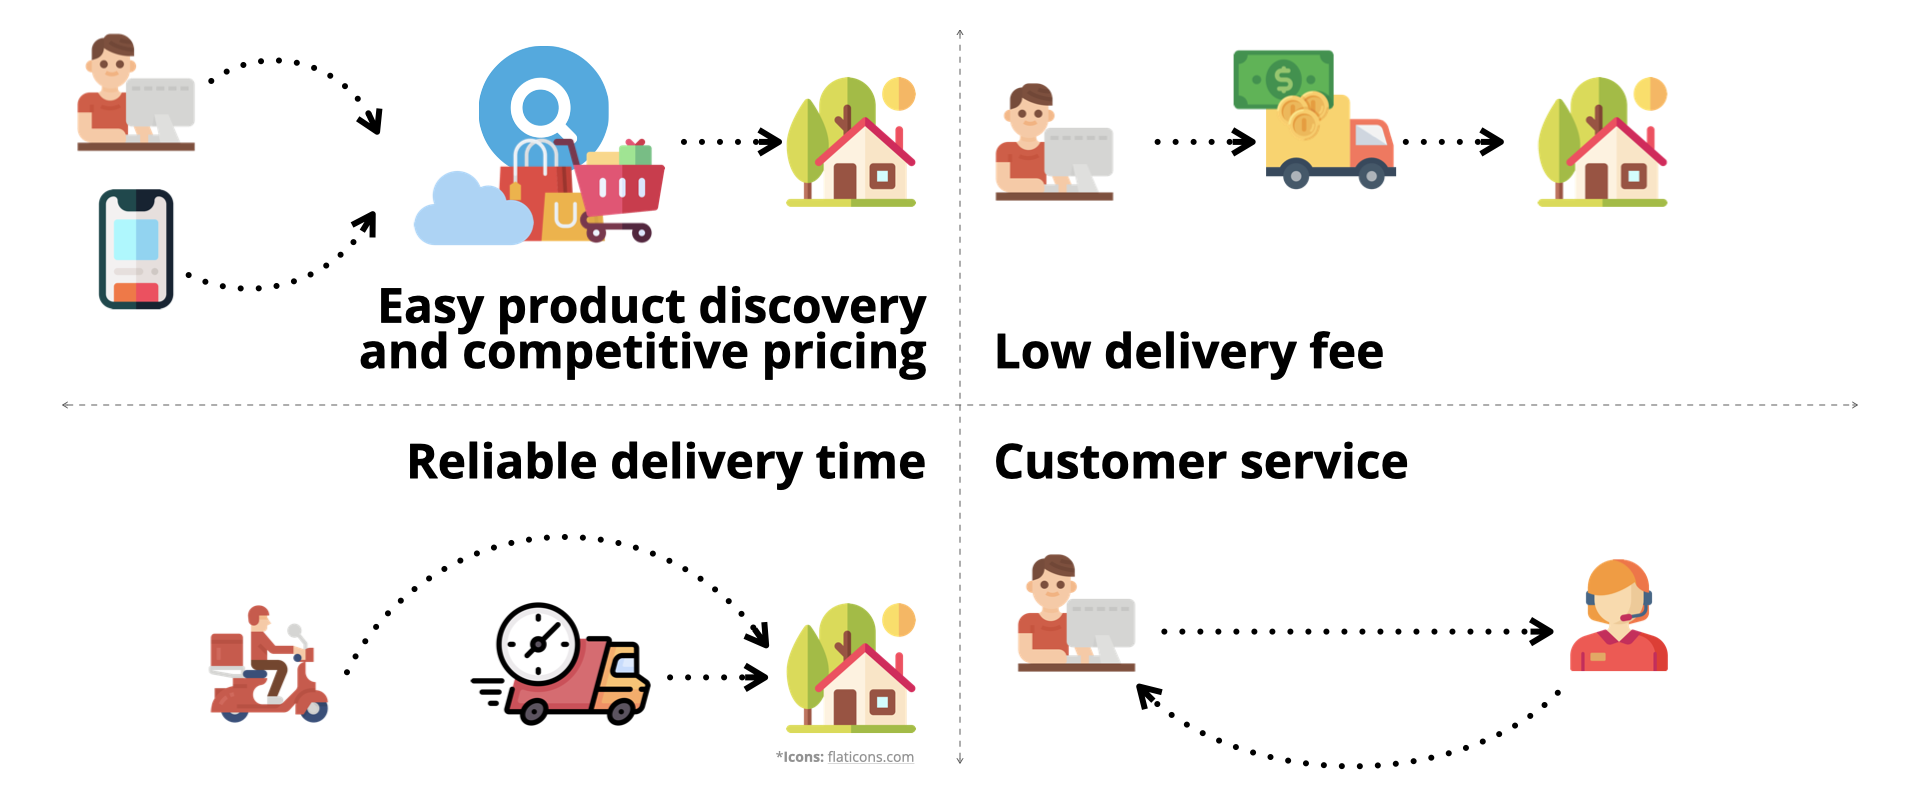
What matters to South African online shoppers?
Between June and November 2020, South African consumers mostly used online retailers monthly (42%), food delivery services weekly (36%), and online classifieds less than once a month (34%).
Here is a summary of things that matter to South African shoppers when they shop online:
1. Easy product discovery and competitive pricing
Most customers start their online shopping with a product in mind and look for discounts and sales across retailers. More than 67% of respondents of a survey have said that they go to a specific online store and search for the product they want. Almost the same share of consumers said they compare online stores to find offers for products they want. Price plays an important part in product selection.
In order to offer the most competitive pricing, retailers in South Africa need to keep a keen eye on competitor pricing. They need to identify gaps and opportunities to make price changes to not only offer the most attractive price to customers but also drive more revenue and margins by pricing products right.
2. Reliable Delivery time
81% of South African consumers say that unreliable delivery time is one of the reasons that affect their choice of an online store. Quick delivery time has become a differentiator in the eCommerce space, where ‘next day delivery or even ‘same-day delivery’ have become the norm. South African online shoppers want reliable delivery times that suit their busy schedules.
Your company’s customer service should be responsive, smooth, omnichannel, and hassle-free. 78% of South African customers are frustrated with delays in customer support from online retailers. Slow response times and lack of communication in case of delays, delivery, and refunds hamper the customer experience drastically.
Customer Service
Conclusion
eCommerce in South Africa is growing at unprecedented rates. There has been a surge in the appetite of South Africans for online shopping and online retailers across the board are gearing up to meet this demand.
If you’re an online retailer in South Africa & need insights on staying competitive with the right pricing, product assortment, delivery time, delivery rates, and the other key influencers that affect customers’ choice of online retailers, sign up for a demo with our team at DataWeave to know how can help!
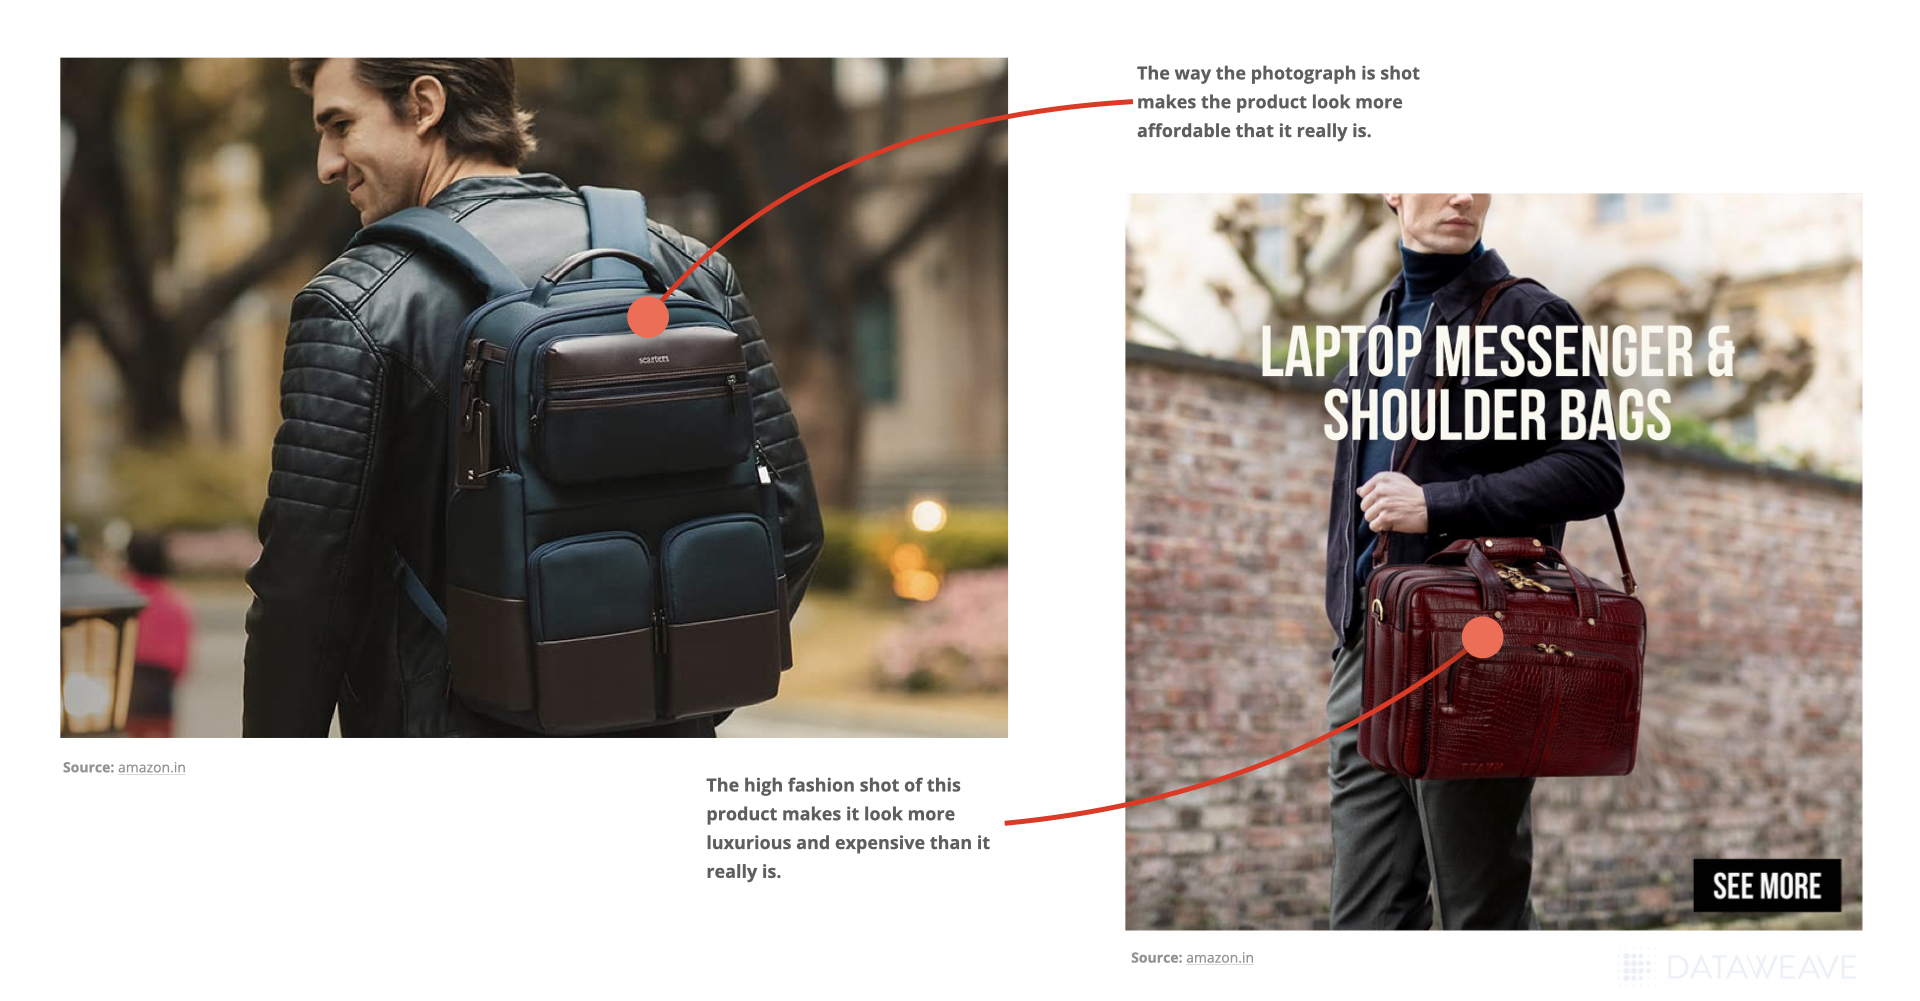
Finding the right price often requires a trade-off between margin and price perception. Brands may want to defeat competitors’ prices on all their products, but that can often lead to losses because sales directly link to price perception. Instead of trying to stay competitive across the board on all products, brands must identify key value categories (KVCs) and key-value items (KPIs) whose prices buyers tend to remember and price those products competitively. In this scenario, they can make up for lowered prices on key products by fixing higher prices on other products.
Consumers’ perception of price fairness largely determines their experience with a brand. Brands selling online can often have a disconnect between their prices and what customers expect their prices to be. However, that does not mean spiraling downwards by getting trapped in discounting cycles and heavy promotions that can harm your bottom line. Instead, brands require real-time monitoring across thousands of stock-keeping units (SKUs) to identify key categories and items they need to price with care. In this blog, you’ll learn about price perception and the factors that influence it.
What is Price Perception?
Price perception is the perceived worth of a product or service in the consumer’s mind. It is one of the leading variables in the consumer’s buying process. Buyers are unaware of the true cost of production for the products they buy. Instead, they make buying decisions based on an internal feeling about how much certain products are worth and which brand offers them the best value. To offer competitive prices and yet obtain a higher price for products, brands often pursue marketing strategies to improve the price perception of their brand and products.
Price Perception
However, brands should not fall into the trap of assuming that price perception is a competitor’s price index. It’s not about offering the lowest price on certain SKUs. Not every brand strives to offer the lowest prices. Some brands take a slightly different approach to ensure the right value for their products. For example, take a look at Trader Joe’s, a grocery chain that has never claimed low costs. They’ve always taken a holistic approach to their pricing and customers to build a loyal following. And it worked well for them. Trader Joe’s can boast one of a high-value perception score, despite not having rock-bottom prices.
Marketplaces such as Walmart and Amazon may not have the best prices on every item. Still, customer perception is that they will have the lowest prices and will often shift the share of sales towards such platforms over businesses that offer the same or even lower prices.
Some things to consider:
What do your customers think of your brand?
What are the key factors that are driving your customers’ price perceptions?
Is your product mix properly aligned with your brand perception?
Are you communicating the most important and relevant information to your customers?
Is your message being received and understood?
Who do your customers see as your competitors, and why?
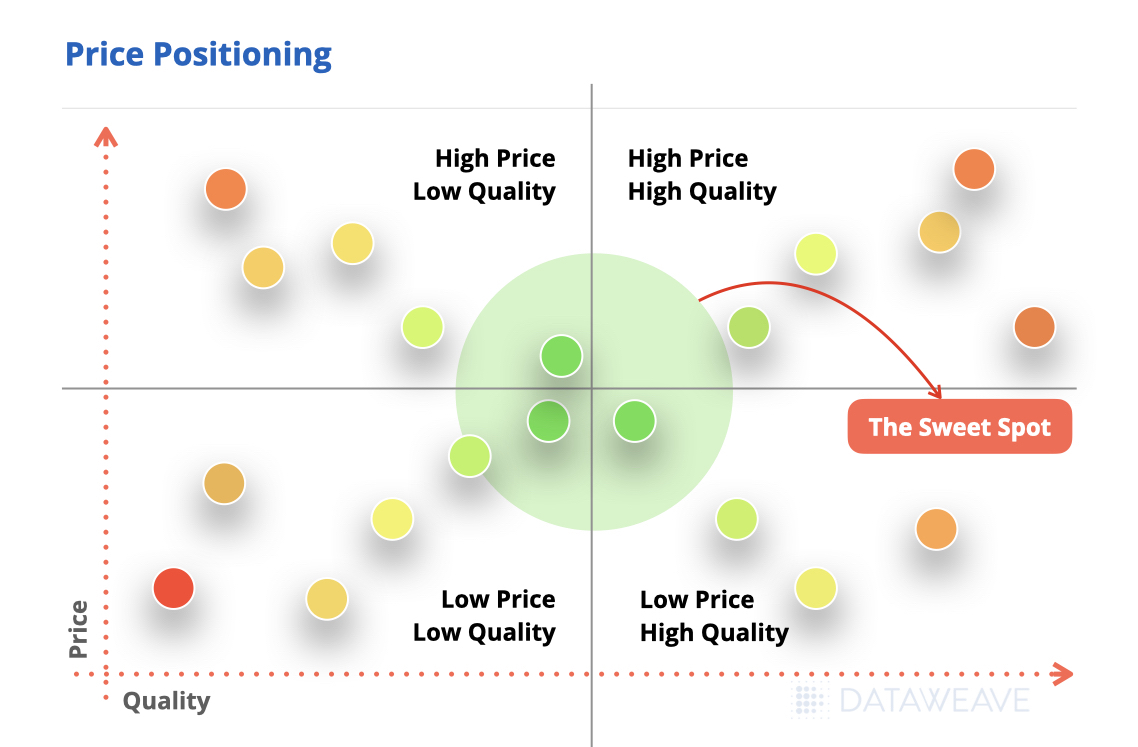
Price positioning is pricing products or services within a certain price range. It indicates where certain services or products lie in relation to competitors’ pricing and in the mind of different customers. A brand’s price positioning has a huge impact on whether the products are seen as priced low or not. The following is a great way to understand the price-value matrix:
Price Positioning
Your brand’s position in this matrix will depend on your pricing objectives, competition, and customer loyalty. Price positioning helps the marketing and operating teams understand customers’ perceptions of your brand and convince customers to buy your products. Brands need a holistic approach toward setting prices for their products in order to drive conversions through intelligent pricing and competitive insights.
Factors that influence Price Perception
Price-Quality Relationship
Price is often an indicator of product quality. The general rule is that the higher-priced products are perceived to have better quality, implying that brands should consider a rational quality-price relationship in their pricing or promo strategy. For example, it might not be best practice to have similar prices for both good and low-quality products because customers will perceive low-quality products as overpriced and might not purchase from you.
Price-Consciousness
Customers aren’t price conscious about every product. Instead, they are only price conscious about certain products under the best price guarantee or BGP. For instance, if buyers find your BGP products more expensive than your competitors, the cheaper products in your assortment will still be perceived as expensive.
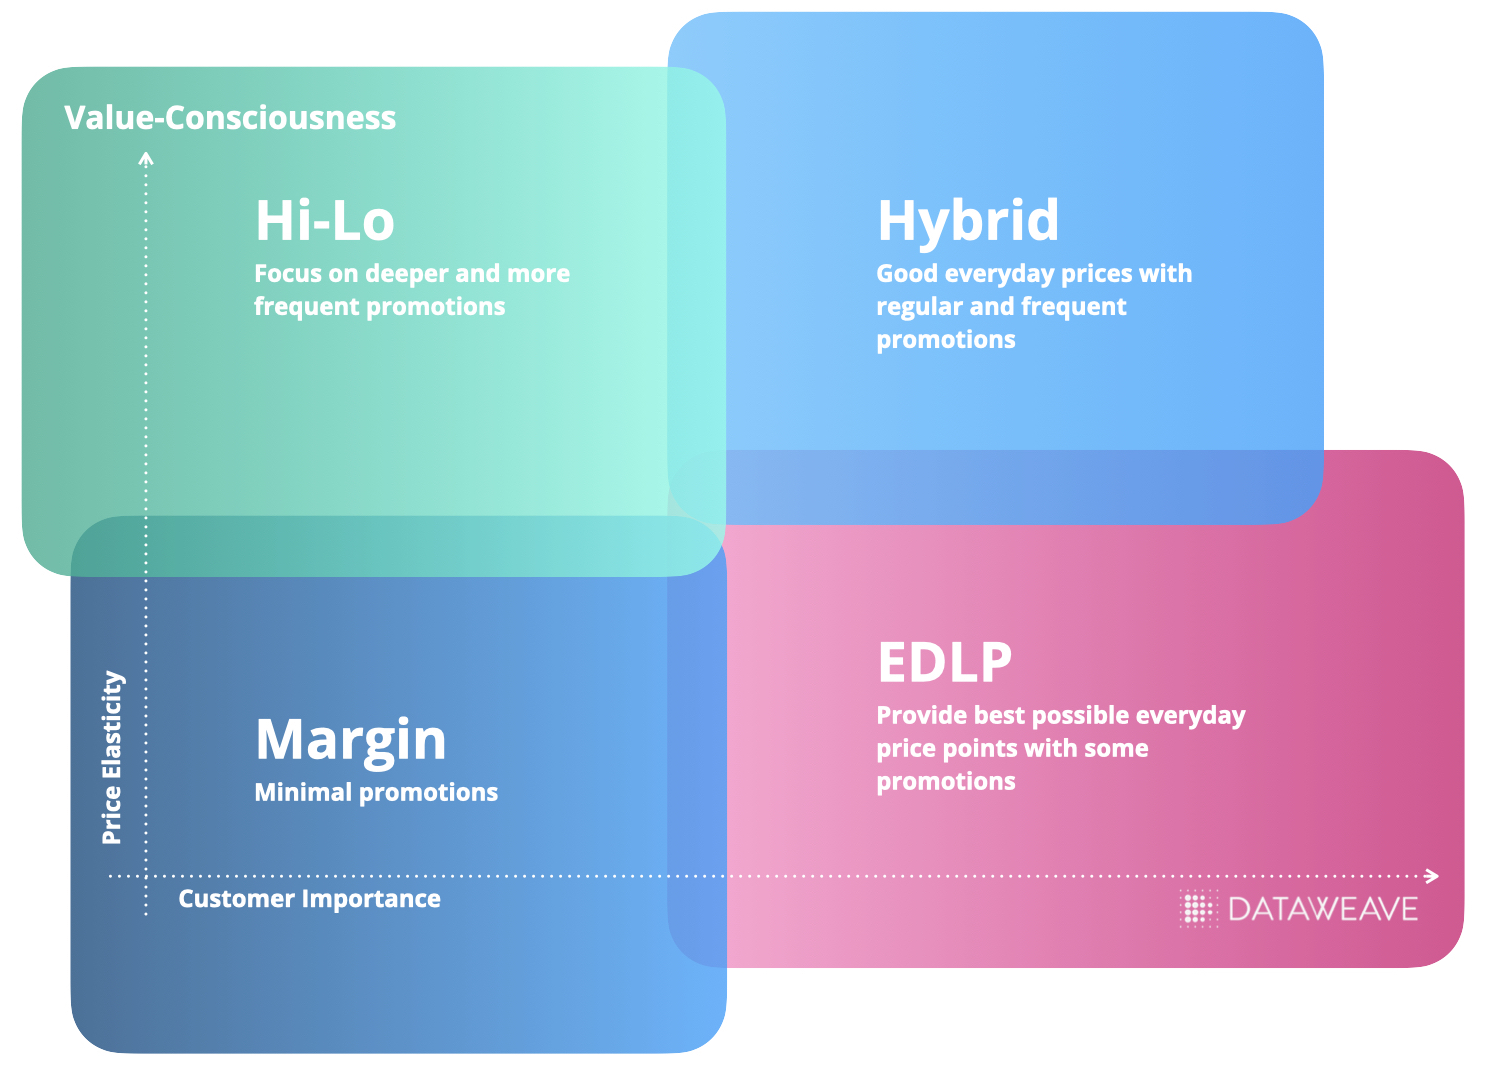
Value-Consciousness
During markdown periods, ensure that you are not undermining the efforts to shape and maintain price perception by offering extreme or complex discounts. In an attempt to clear stocks, promotions simply confuse the shopping experience for customers and further deteriorate trust in your brand. Your promotional offers should keep price perception during the holiday season or clearance sales by offering a simplified promotional program. Start by understanding which price mechanics and SKUs work best for your target customer segment. You should also reduce over-communication on hero deals else buyers will assume that you incorrectly price products during new seasonal launches.
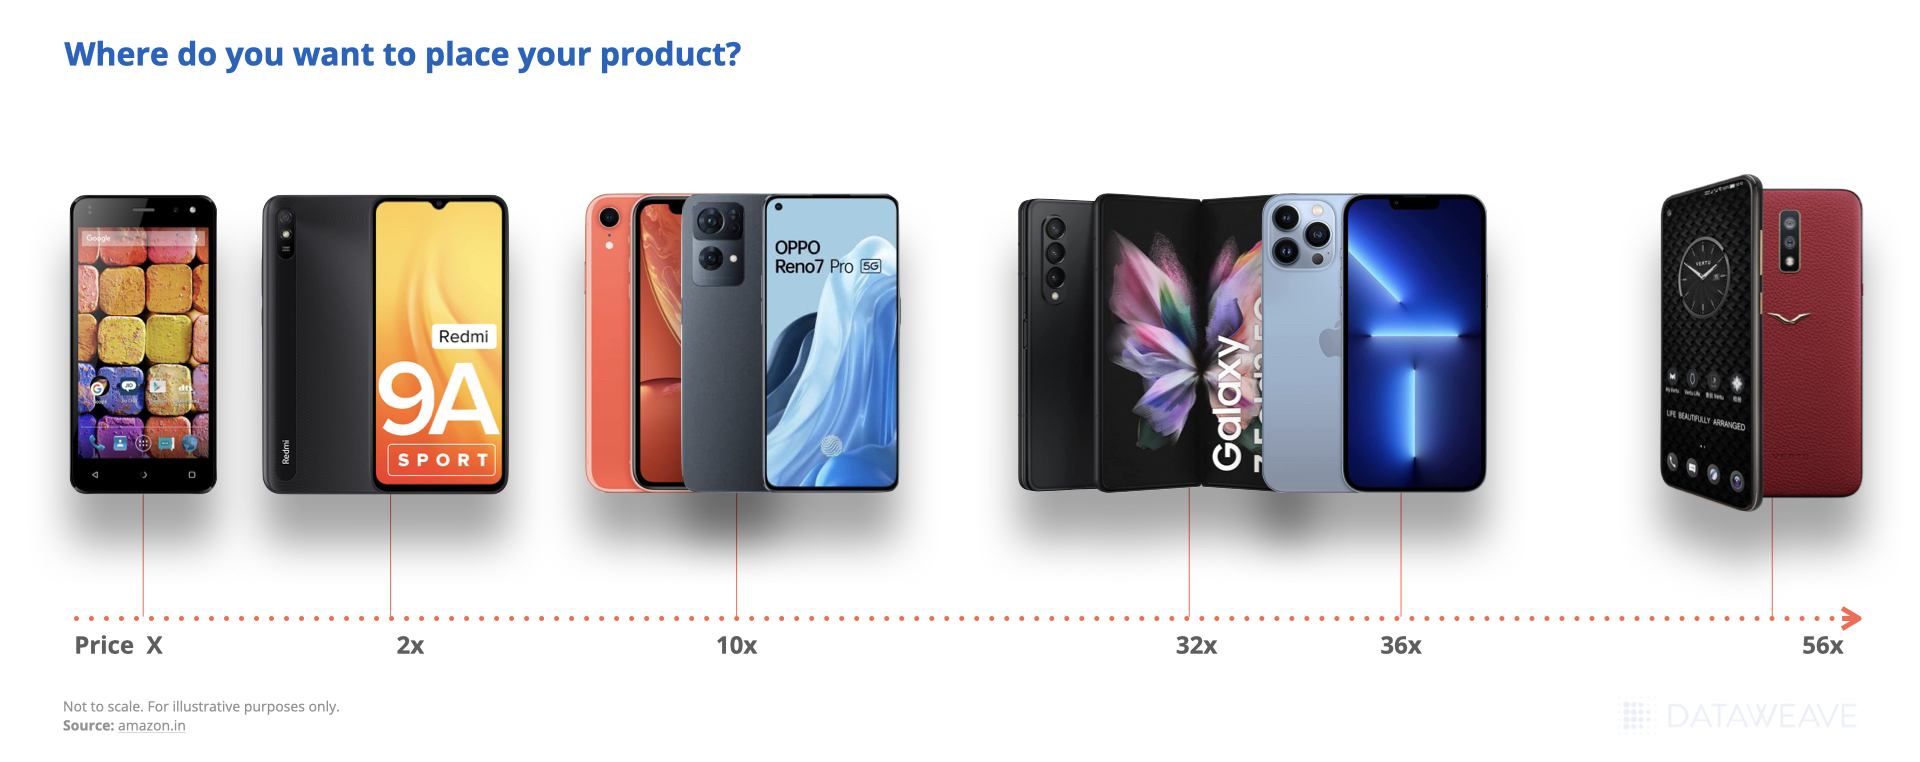
Prestige Sensitivity
Gerald Zaltman, a Harvard professor, argues that 95% of all purchasing decisions are subconscious. Luxury brands are a great example of how psychology directly links to price perception. Customers buy premium or luxury products to demonstrate their social status. In this scenario, buyers don’t hesitate to buy expensive products from certain brands even if they are explicitly overpriced. Thus, brands selling premium products will have to ensure pricing is coherent with buyers’ expectations.
Every customer wants to know they’re getting the best value. They use the highest and lowest prices in a range to understand how expensive a product or brand is. So, by removing high price point lines with low volume, customers will see more minor price points around the store. Brands must merchandise entry price points to help customers identify the lowest prices and improve the perception of their product ranges.
Product Range
How to adjust Price Perception
Here are three ways for brands to improve price parity:
Marketing to influence Price Perception
An efficient pricing management strategy will focus on competitiveness and establishing the right price perception among your customers. You can influence customers’ price perception by improving the look and feel of your online stores since simpler designs are often reflections of lower prices. Another great way to influence price perception is to offer loyalty and reward programs that also improve brand loyalty and reinforces the vision of an economy store irrespective of the prices of your products.
Competitive Analysis
Brands can understand price differences after a competitive analysis. Customers often search for similar products across brands to find the best deals, and you will be able to understand customer opinion through competitor analysis.
Price Management Automation
A price monitoring platform can help brands to stay on top of promotions and discounts offered by their competitors. A price intelligence software will help brands associate products by similarity criteria and compare the pricing of their products with those of competitors. It offers a detailed view of the market and ensures that brands take care of their bottom line.
Conclusion
When a consumer comes across a similar low-priced product or service from a different brand, they may see it as a good deal or might perceive it not worthy of their time or money. What consumers think about your brand’s price is just as important as the actual price of that product. A buyer may sense a company as “upscale” and assume that they have high prices, or they may see a brand as a discount retailer whose prices are too high for its reputation. At times, consumers might also see cheaper alternatives as inferior. It’s not easy for a brand to understand its customers’ perception of price vs. value it offers. Brands need a long-term, dynamic pricing strategy that matches the demands and trends of a global, competitive market. And in order to drive sustainable growth, they need to make smarter pricing and promotion decisions with insights into competitive pricing.
Learn how DataWeave can help make sense of your and your competitor’s pricing & promotional strategies and help your brand build the right Price Perception. Sign up for a demo with our team to know more.
According to MarketingCharts, 63% of online shoppers start their buying journey on Amazon. This shows that customers believe they will find the products they are looking for with competitive prices and excellent customer service on Amazon. Amazon is one of the most dominant eCommerce marketplaces with 197 million users and 112 million Amazon Prime members. Brands can sell on Amazon to capitalize on this vast customer base by showcasing and promoting their products properly.
In this article, we’re going to take a look at the top 7 strategies to sell effectively on Amazon:
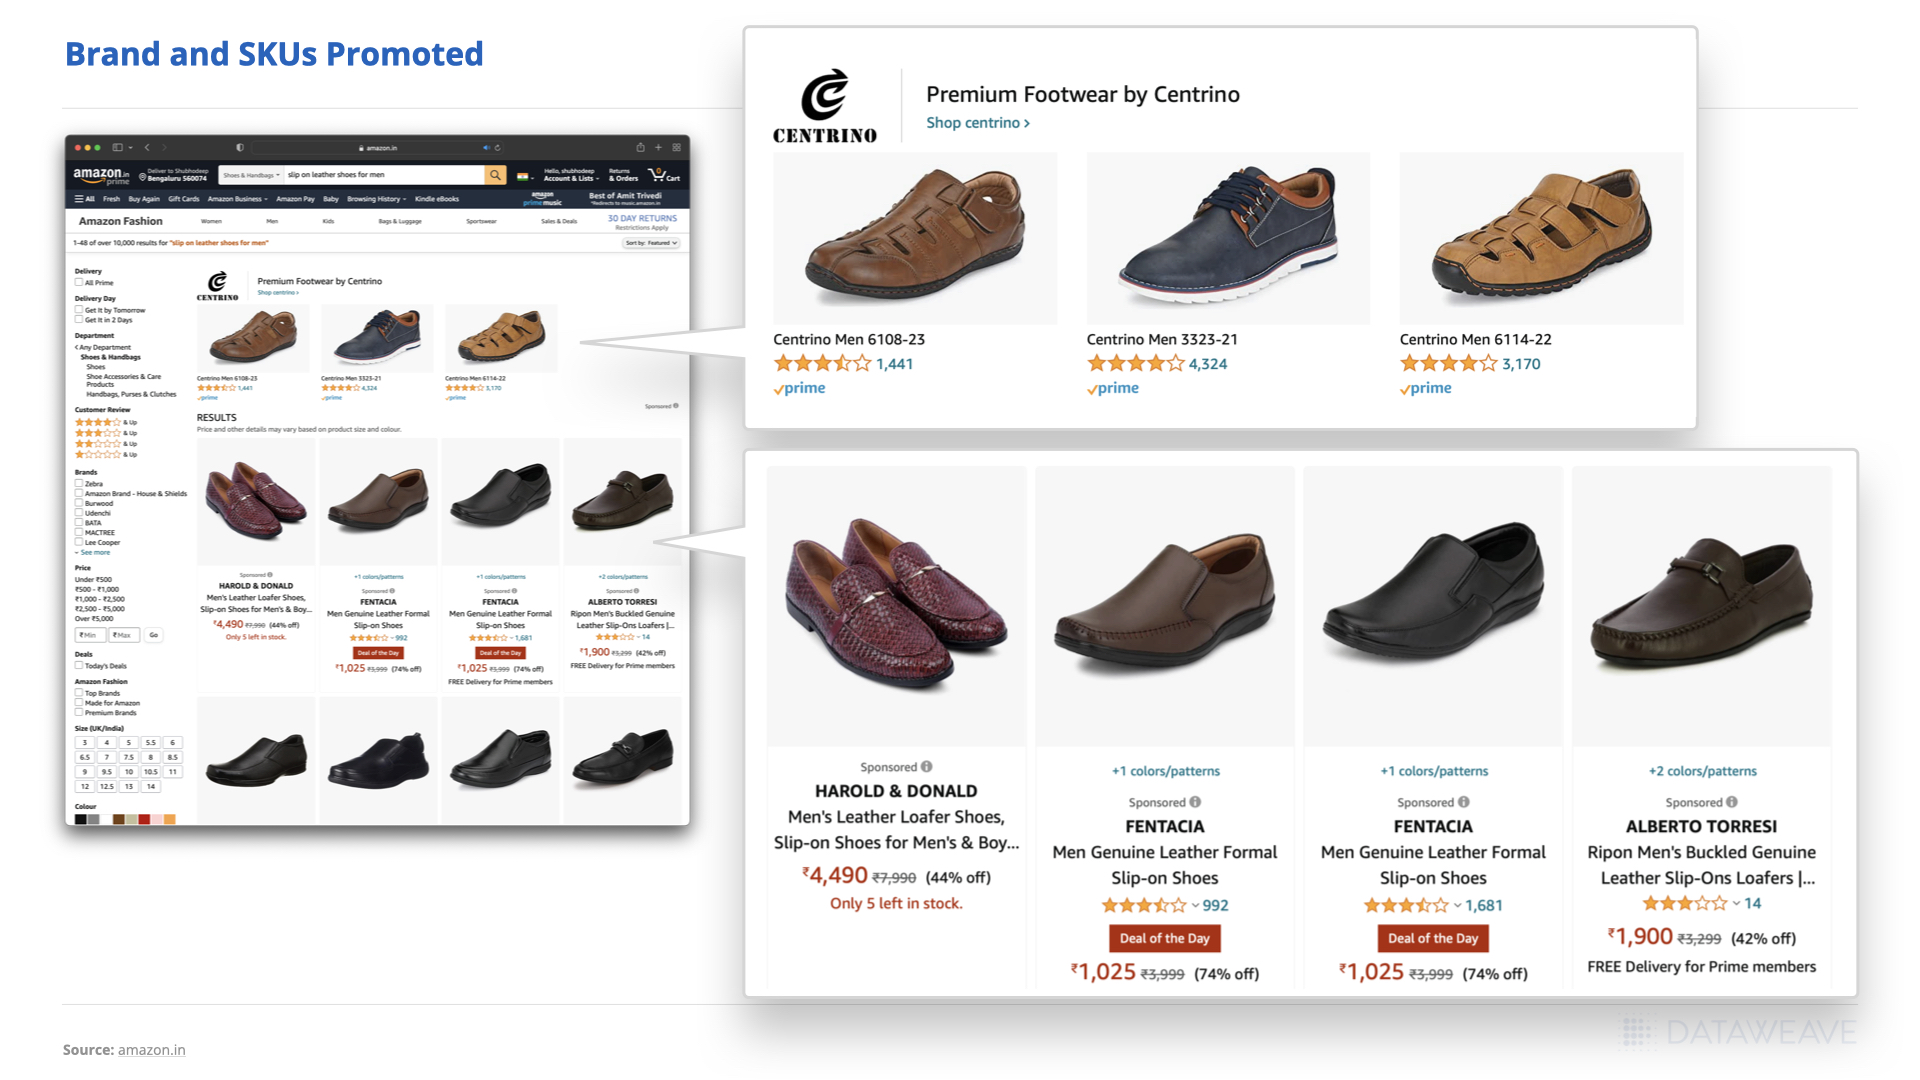
1. Boost Product Discoverability using Ads
Amazon Advertising helps sellers, brands, and agencies to drive profitability by making sure product discoverability is high & shoppers are able to find their brand with ease. The ads on Amazon fuel product discovery and improve conversion rate. The advertising options on Amazon are designed to help brands increase exposure, generate incremental sales, boost organic rankings, and drive growth.
Amazon has three PPC programs: sponsored product ads, sponsored brands ads, and sponsored display ads. Brands can increase visibility on Amazon with these three paid campaigns. You can sponsor products or your brand for related searches on Amazon. Businesses only pay for clicks received.
Sponsored products are for individual product listings that appear on shopping results pages and product detail pages. Sponsored brands are for showcasing brand portfolios such as logo, custom headline, and a selection of products on the shopping results page. The last is sponsored display, a self-service advertising solution for displaying ads on and off Amazon.
Promotions for Brand and SKU’s
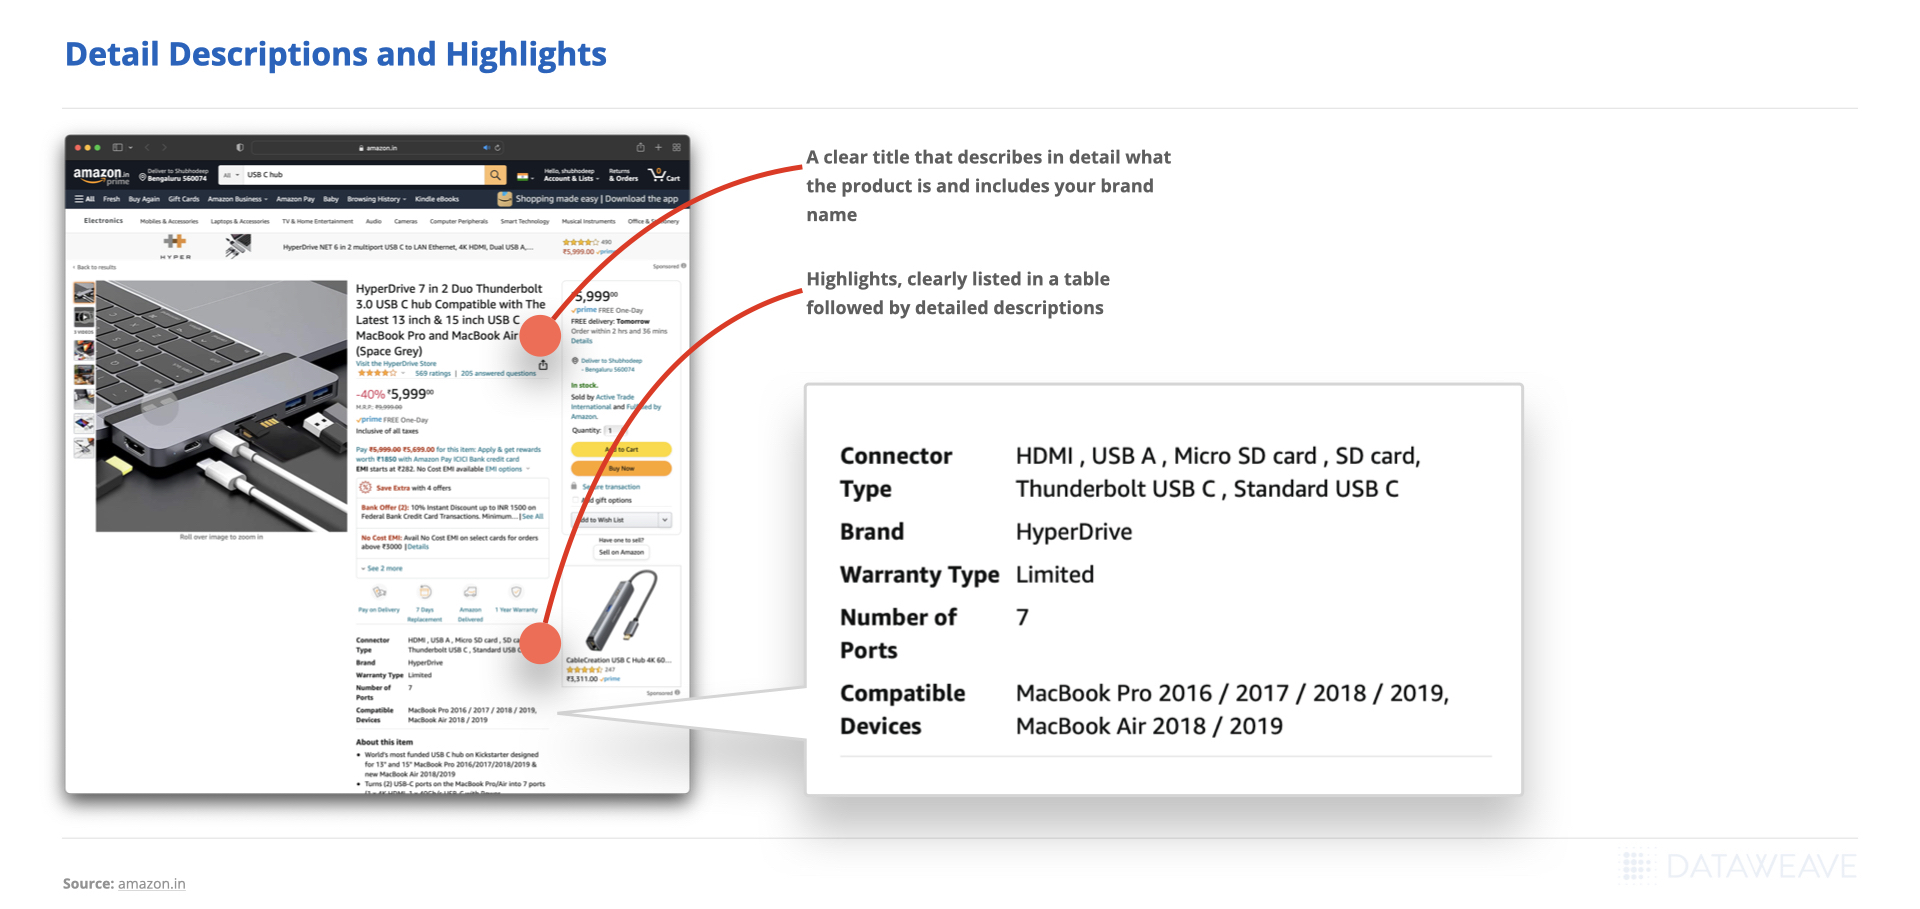
2. Improve your Amazon SEO using effective Product Descriptions
To effectively sell on Amazon, businesses first have to understand the A9 algorithm. Amazon uses A9 Algorithm to decide which products are ranked in search results, emphasizing sales conversions. This algorithm helps Amazon promote listings that are more likely to result in sales.
Keywords in product descriptions are one of the main driving factors that the Amazon A9 algorithm looks for in determining relevance to search queries and setting rankings on its results pages. Therefore, brands must integrate high volume and significantly relevant keywords as part of their listings. Crafting product descriptions with the right keywords will provide compelling reasons for buyers to purchase the product and for the A9 algorithm to better rank the brands. Brands can analyze and optimize their content to improve discoverability across Amazon. Accurate product descriptions help users make informed decisions and allow brands to deliver a consistent customer experience.
Detailed Descriptions and Highlights
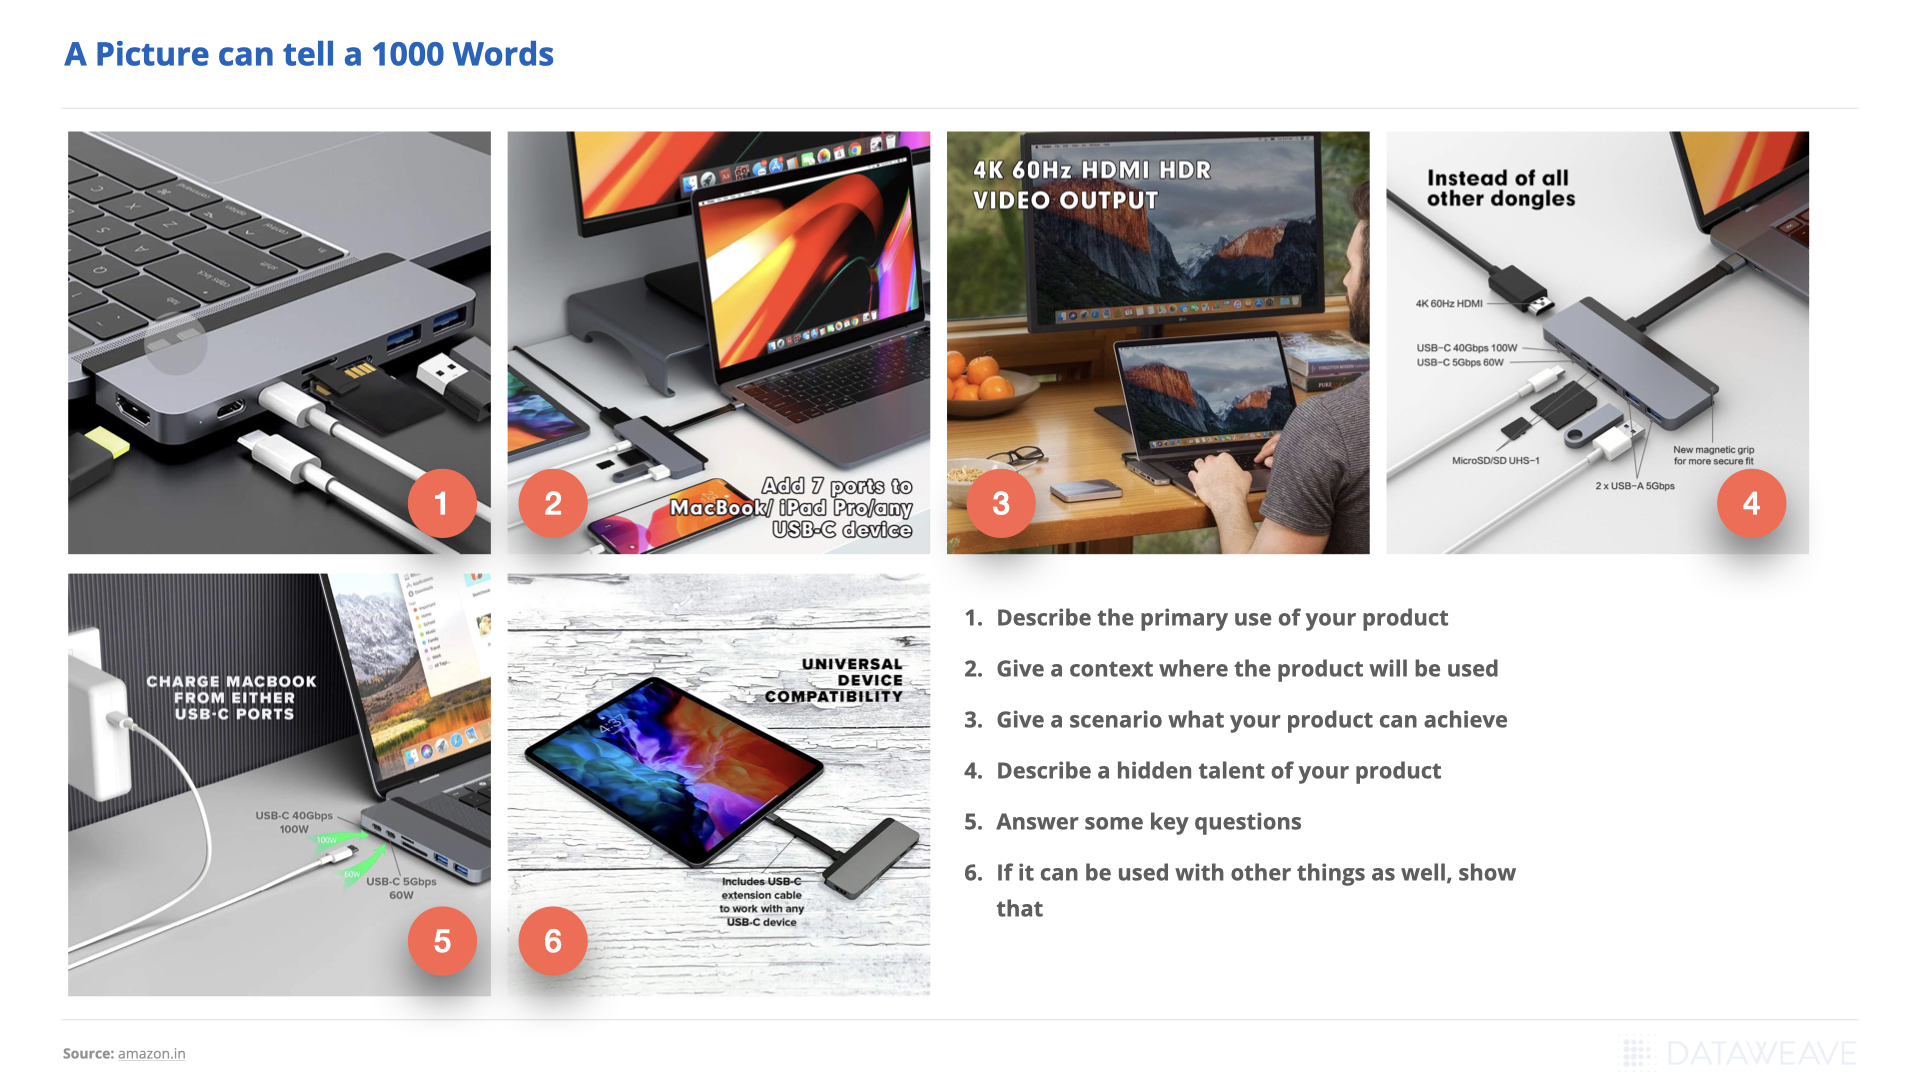
3. Improve your Product Visuals
Avoid using standard visuals when displaying your products in Amazon’s image gallery. Product images are the hook that encourages visitors to click on your products. However, Amazon has specific image requirements that you’ll need to adhere to while presenting products. When shopping on Amazon, potential buyers are looking for high-definition and clearly visible photos. Thus, you will need diversity in images if you want your product and photos to stand out.
In addition to images, brands can make their product descriptions better through video content. Videos help your brand to stand out, build a more personal relationship with customers, and lead to increased sales. One study on eCommerce sellers found that using product videos increases sales for online stores by 144%.
Product Images
4. Switch to Intelligent Pricing & Win the Buy Box
Intelligent and competitive pricing is the most essential lever for revenue growth. With advanced technology like AI and analytics, brands can get insights into competitive pricing and develop an intelligent pricing strategy to calculate real-time changes in pricing optimally.
Amazon wants to give the consumer the best value for their money and thus has a Buy Box option. The white box on the right side of the Amazon product detail page is called the Buy Box, and customers can directly add items for purchase to their cart. However, not all sellers are eligible to win the Buy Box.
Thanks to Amazon’s customer-obsessed approach and high competition, only businesses with excellent seller metrics have a chance to win a share of Buy Box. Amazon weighs low prices with high seller metrics. If your brand has near-perfect performance metrics, having higher prices can still get you a share of the Buy Box. In contrast, brands with mid-range metrics will probably need to focus on offering the most competitive price.
But, why is the Buy Box important? According to BigCommerce, 82% of sales on Amazon go through the Buy Box, and the rate is even higher for mobile purchases. Getting insights into your competitor’s pricing with our Digital Shelf Solution will help you improve seller metrics and find the right pricing strategy for your products.
5. Provide Plenty of Social Proof
Testimonials can increase sales page conversions by 34%. Social proof has emerged to be of great importance in the eCommerce world, and it isn’t limited to recommendations from people customers know in the “real world.” A survey conducted by BrightLocal revealed that 31% of consumers reported that they read more online reviews in 2020 than ever due to Covid-19.
Product ratings and reviews on Amazon are at the center of the recommended products section, product listing page, and search results. Interestingly, customer feedback also has a huge impact on a brand’s ODR or Order Defect Rate. It is one of the most critical measurements tracked by Amazon. ODR is a measure of customers who have had a negative experience with you as a seller. Amazon uses it to assess a brand’s health as a seller. The ODR indicator is driven by customer feedback, so review management is the primary step for brands to avoid an Amazon ODR warning and improve their order defect.
6. Go Global
The Amazon marketplace is available in countries and markets worldwide, allowing brands to explore new territories and sell their products globally. Each foreign territory has a unique Amazon site that resonates with its culture and audience, making it easy for global sellers to compete with other brands. If your eCommerce brand has the operation capacity to expand globally, Amazon offers state-of-the-art international logistic capabilities.
Brands can expand in European countries like France, Italy, Netherlands, Germany, Spain, etc., and Asia Pacific locations like India, Japan, and Australia. Amazon is also available in emerging eCommerce locations like the Middle East, Brazil, Turkey, and Singapore.
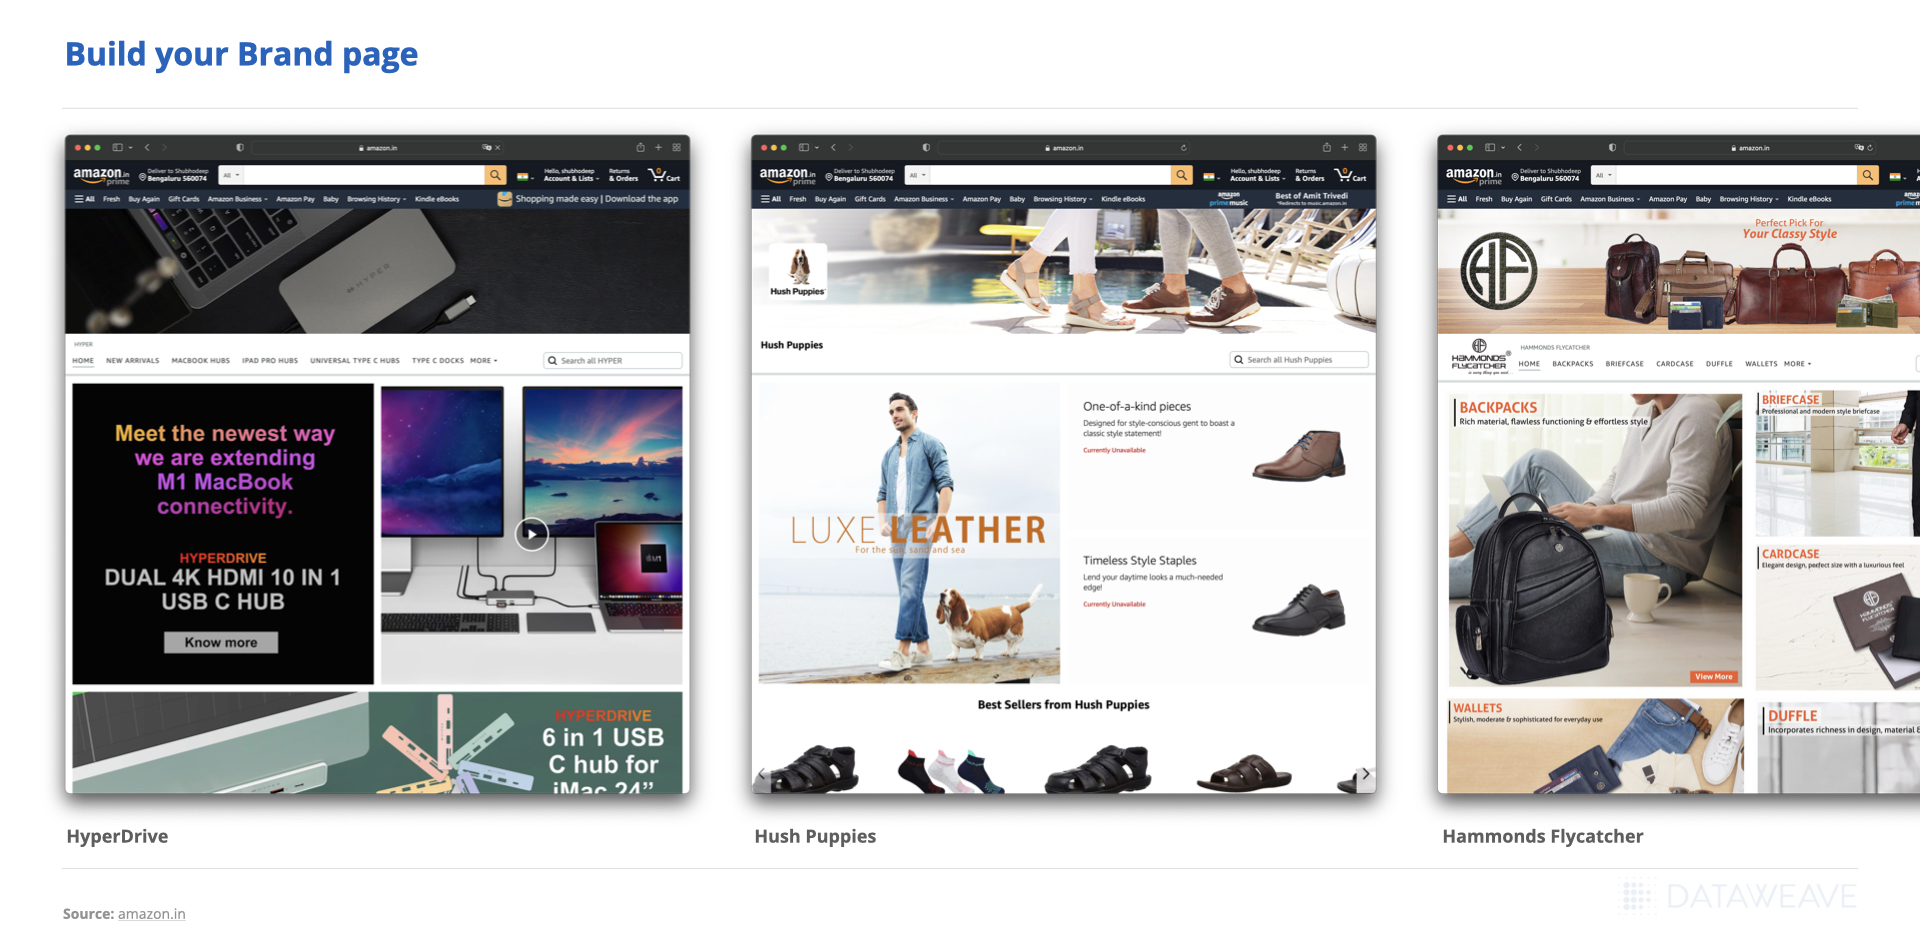
7. Build a Branded Store
One of the best strategies to stand out on Amazon is to feature your products on a branded Store. Amazon has free tools that allow grants to build an online store where brands and sellers can showcase products and connect with customers. These stores look different from the typical Amazon listing layout and also have the option to create detailed pages with A+ content.
Build your Brand Page
For instance, Netgear, a company that offers technology-related products has an excellent branded store on Amazon. The brand has embedded images and videos that address buyers’ needs and how users’ lives are affected by using their products. The most attractive feature about this store is that they have integrated the value offered by their products into new use cases because of the current pandemic. For example, they’ve used phrases like “Make Online Learning fast and fun” and “Work from office at office speed.” Additionally, the categories and search tab help buyers search for specific products easily.
Creating branded stores allows you to build a beautiful brand experience for customers and offers a multi-page, immersive shopping experience. Brands can pick unique designs, integrate promotions, and use rich media to create a custom curation of handpicked products.
Conclusion
Amazon has 9.7 million sellers worldwide, of which 1.9 million are actively selling on the marketplace. The competition on Amazon is fierce, and it’s continuously increasing. Despite a large number of active sellers on Amazon, only a tiny fraction generates a significant portion of its total sales. Fewer than one in ten active Amazon sellers generated over $100,000 in annual sales, and only one percent of them hit the $1 million sales mark. Use these strategies to develop a comprehensive understanding of the Amazon platform and how to sell effectively on the platform while maximizing your presence amid rising competition.
The combination of economic uncertainty, inflation, and perceived affordability has increased consumer’s willingness to buy and try more private label products, challenging National brands to differentiate their eCommerce strategies, especially those related to price positioning, in other ways.
Our previously released report, Inflation Accelerates Private Label Share and Penetration, confirmed 8 out of 10 brands with the highest SKU count carried across all grocery retailer websites to be private label, signaling the strength of their digital Share of Voice. Given the growing shift in consumer preference toward private label brands, we are providing access to the latest trends seen from September 2021 through March 2022. Below you will find a summary of what the data revealed about the growing presence of private label brands on the Digital Shelf.
Private Label Account and Category Penetration
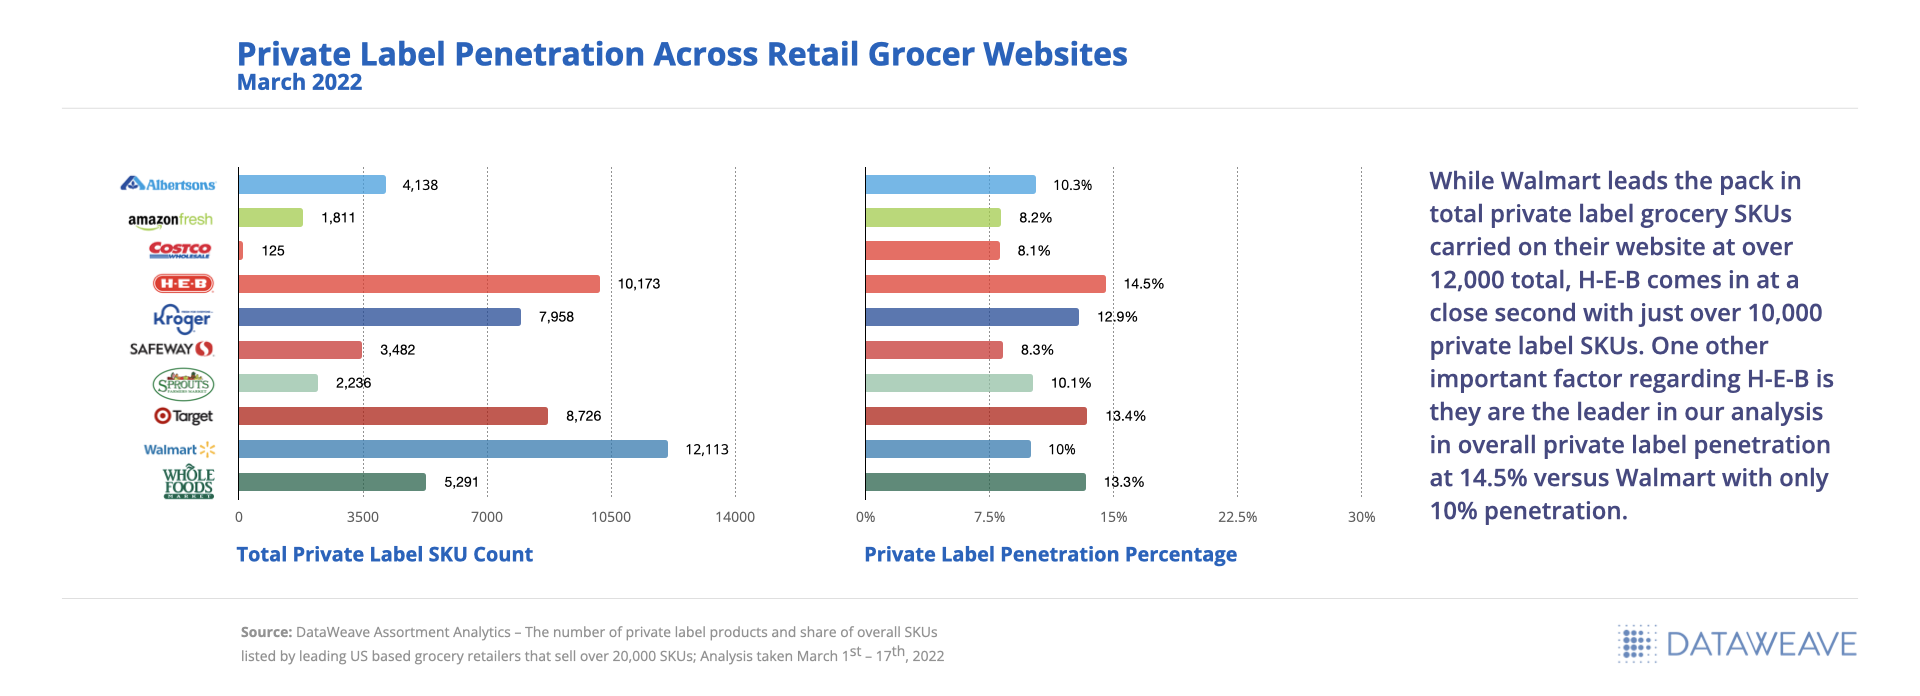
We analyzed private label penetration at an account level to understand which private label brands have the greatest presence on retailer digital shelves, and to see which retailers may be leaving product assortment opportunities on the table.
Private Label Penetration Across Retail Grocer Websites
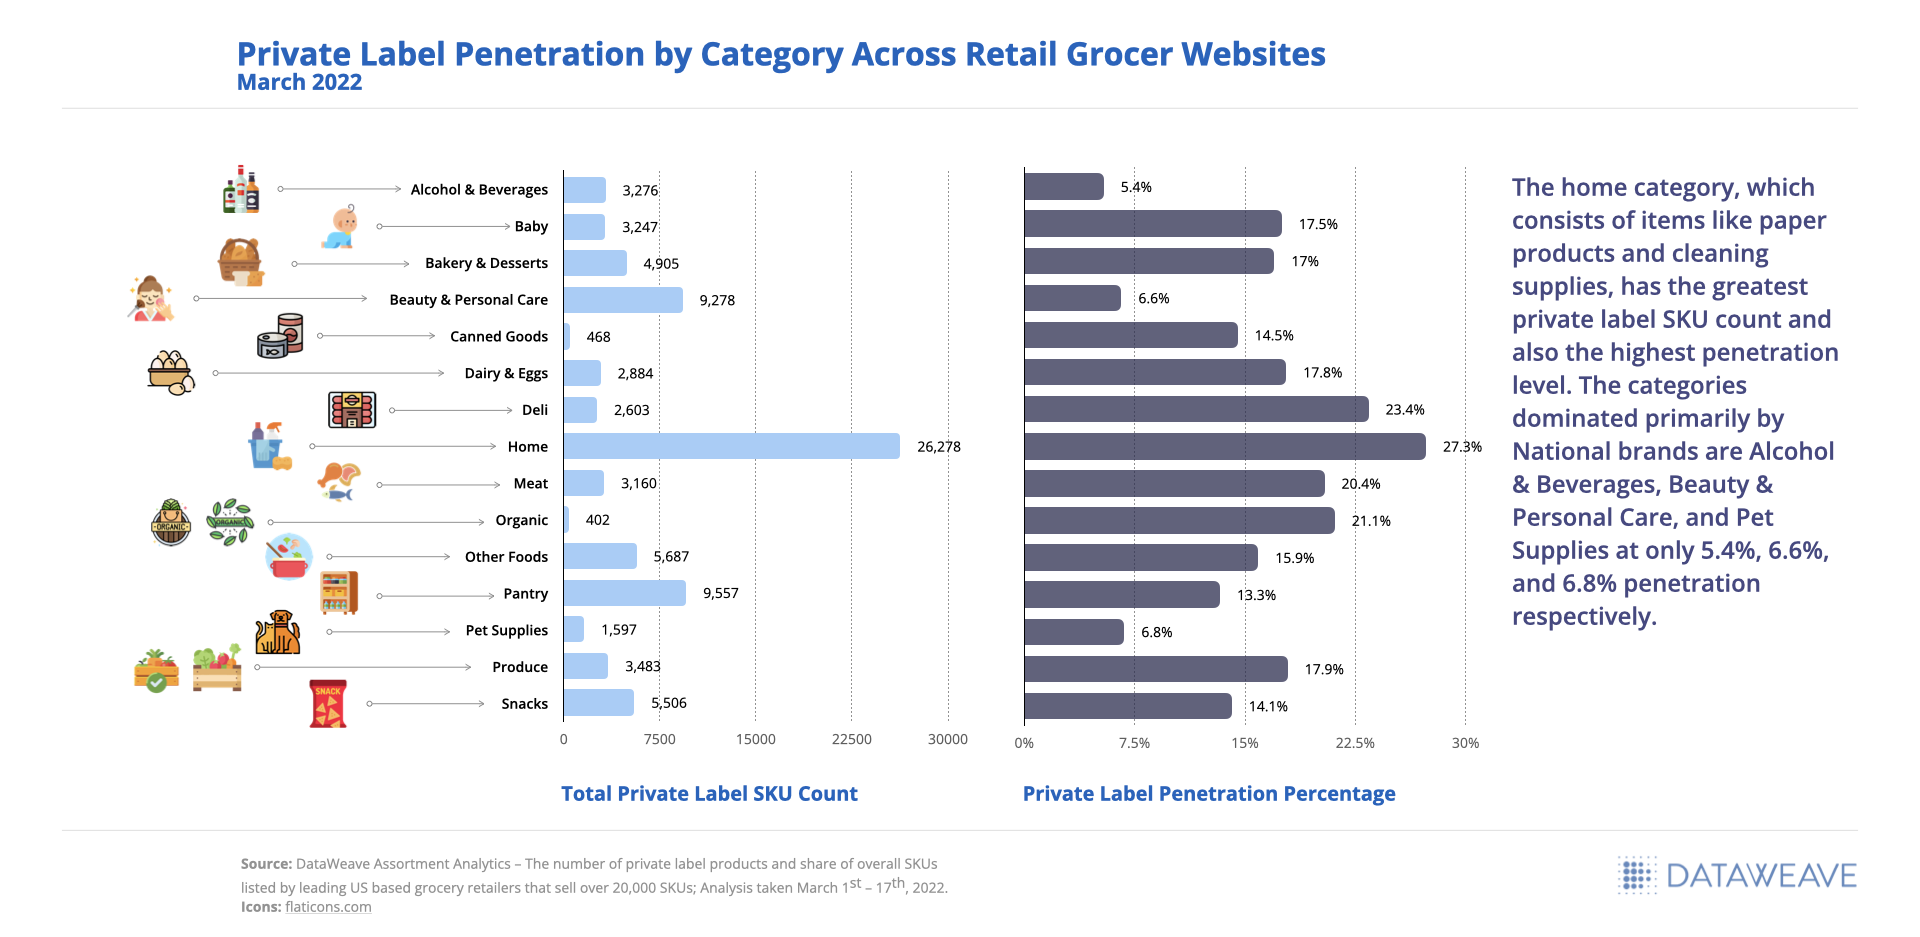
As a retailer, it is important to understand how your private label penetration stacks up against the industry average at a category level, especially given the performance tracked for retailers included within our analysis and the vast number of SKUs they offer online (over 20,000).
Private Label Penetration by Category Across Retail Grocer Websites
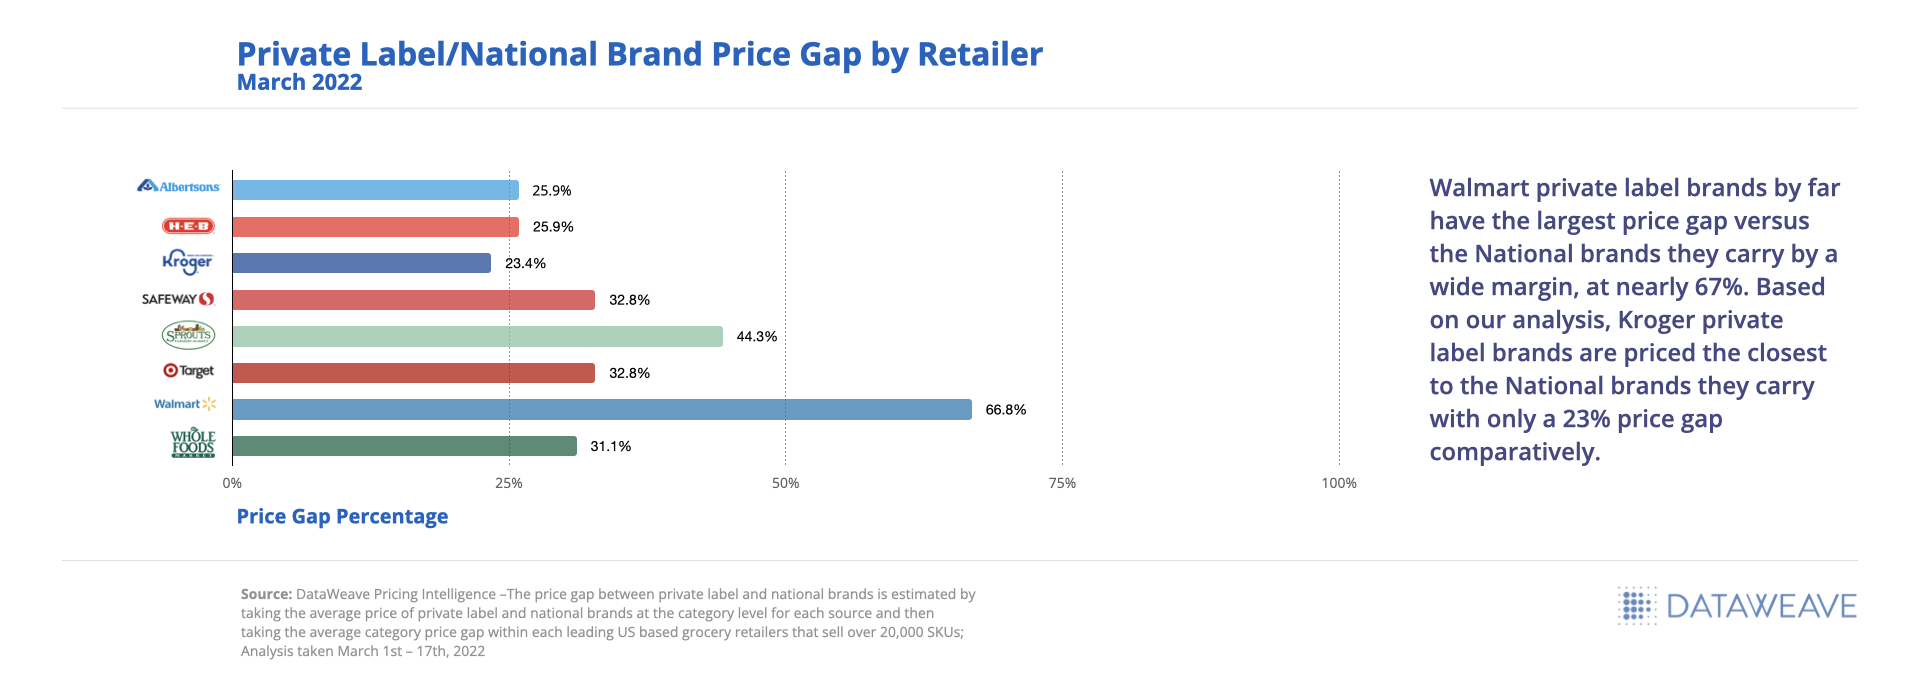
The Private Label and National Brand Price Gap Widens
Private label brands tried out of necessity mid-pandemic increased in popularity as grocery prices continued to rise, providing an opportunity for retailers to increase brand affinity and loyalty for their online shoppers. Retailers alike were able to keep affordability at the forefront of their strategies and maintain a price gap of 23% or more, despite inflationary pressures to increase prices.
Private Label / National Brand Price Gap by Retailer
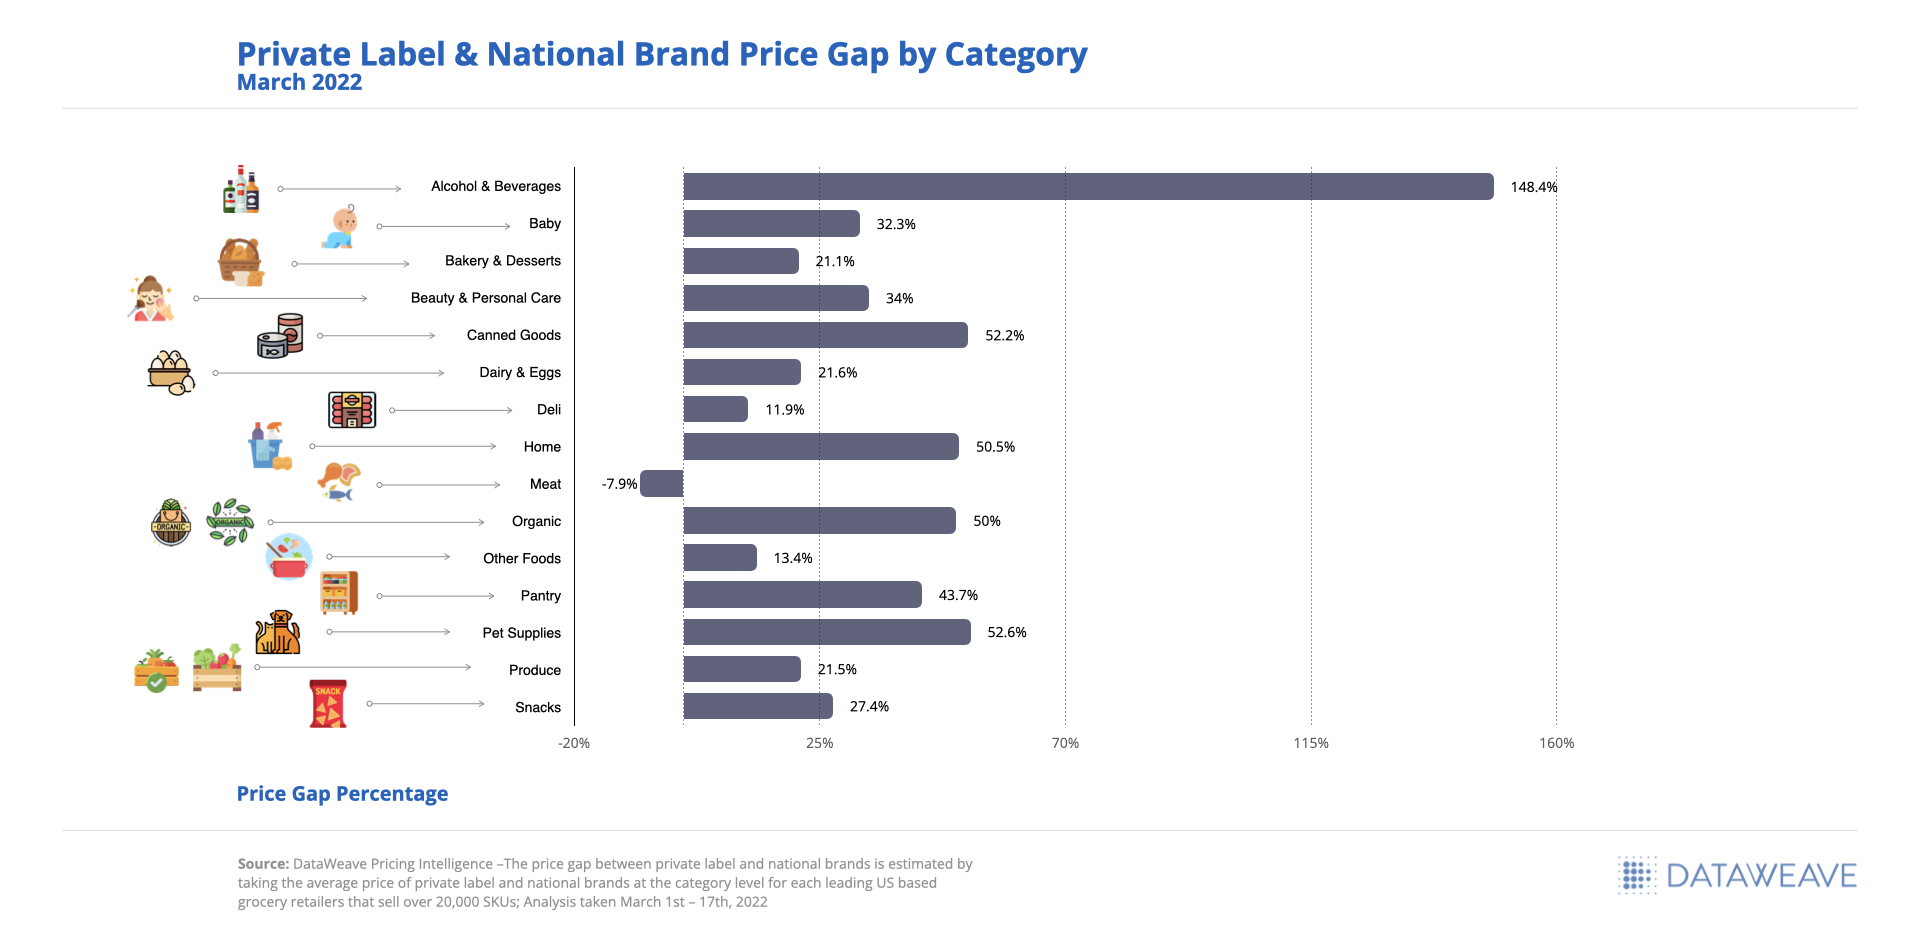
Looking at the results at a category level, we can see that Meat is the only category found within our analysis where private label brands are priced higher than National brands at an average of 8% greater. The Alcohol & Beverages category tends to always see the greatest price gap between private label and National brands given the price variances by unit (ranging from under $10 to over $100), in this case averaging a 148% price gap.
Private Label & National Brand Price Gap by Category
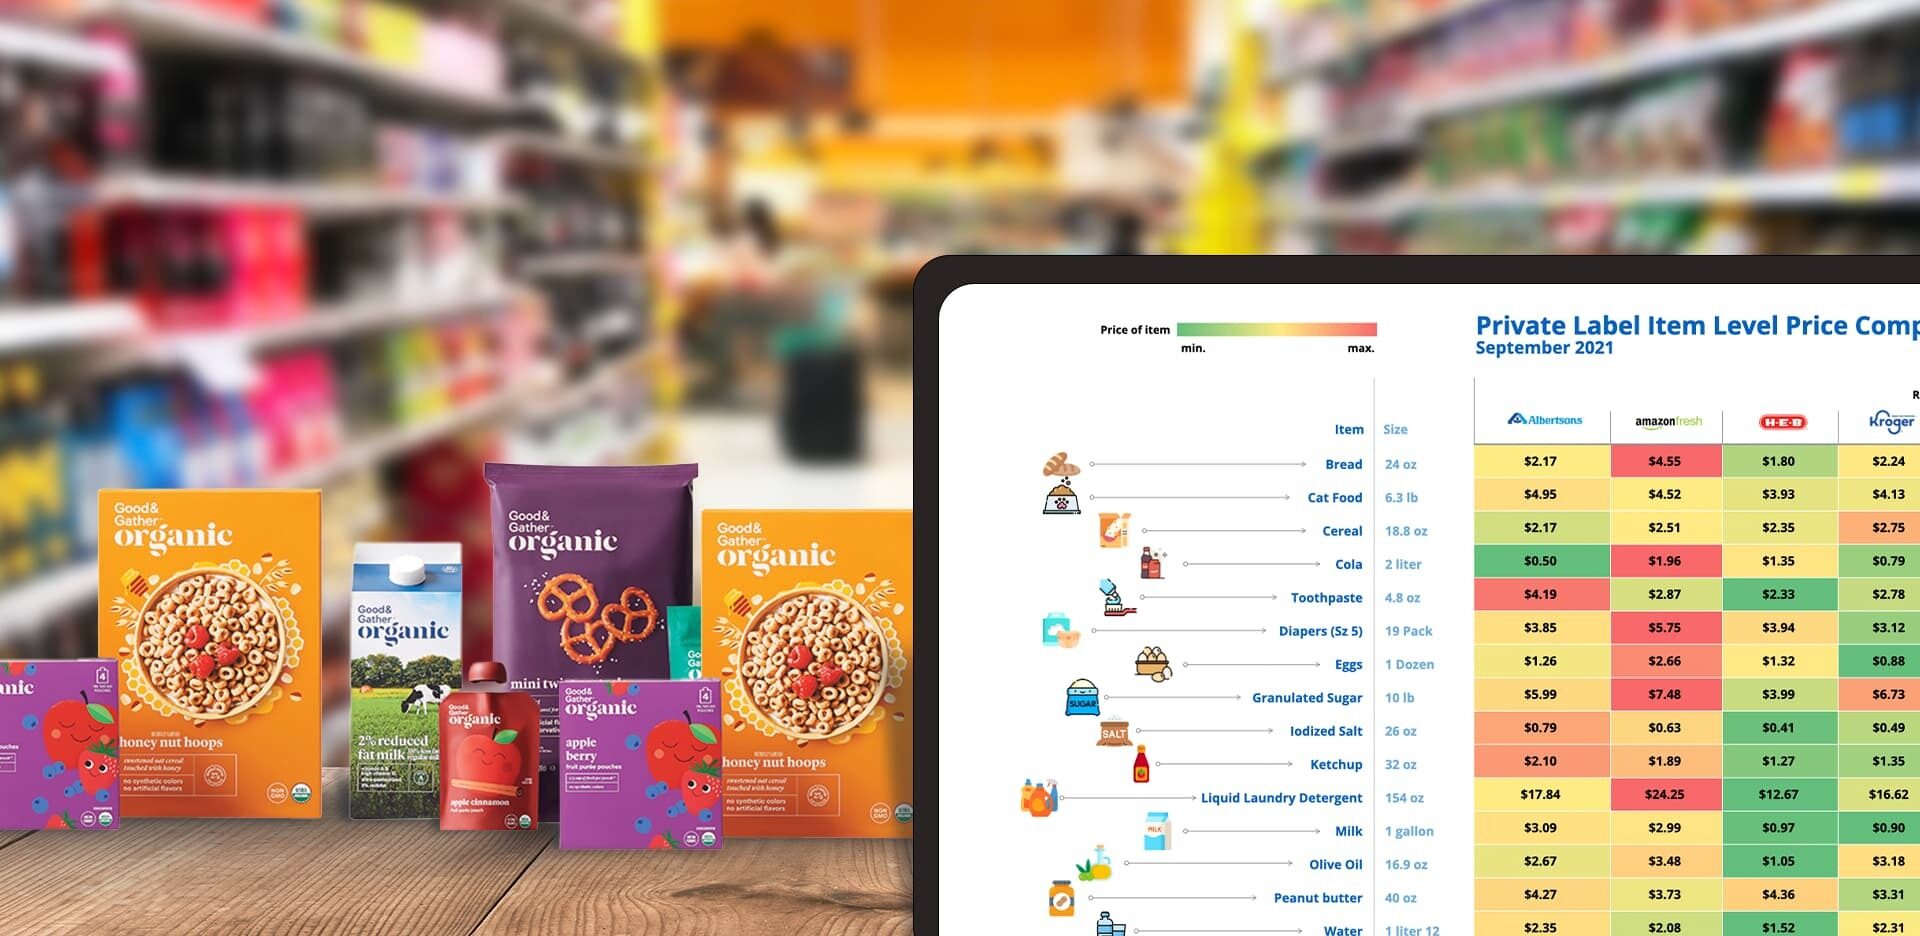
Private Label Total Basket Value Comparison Across Retailers
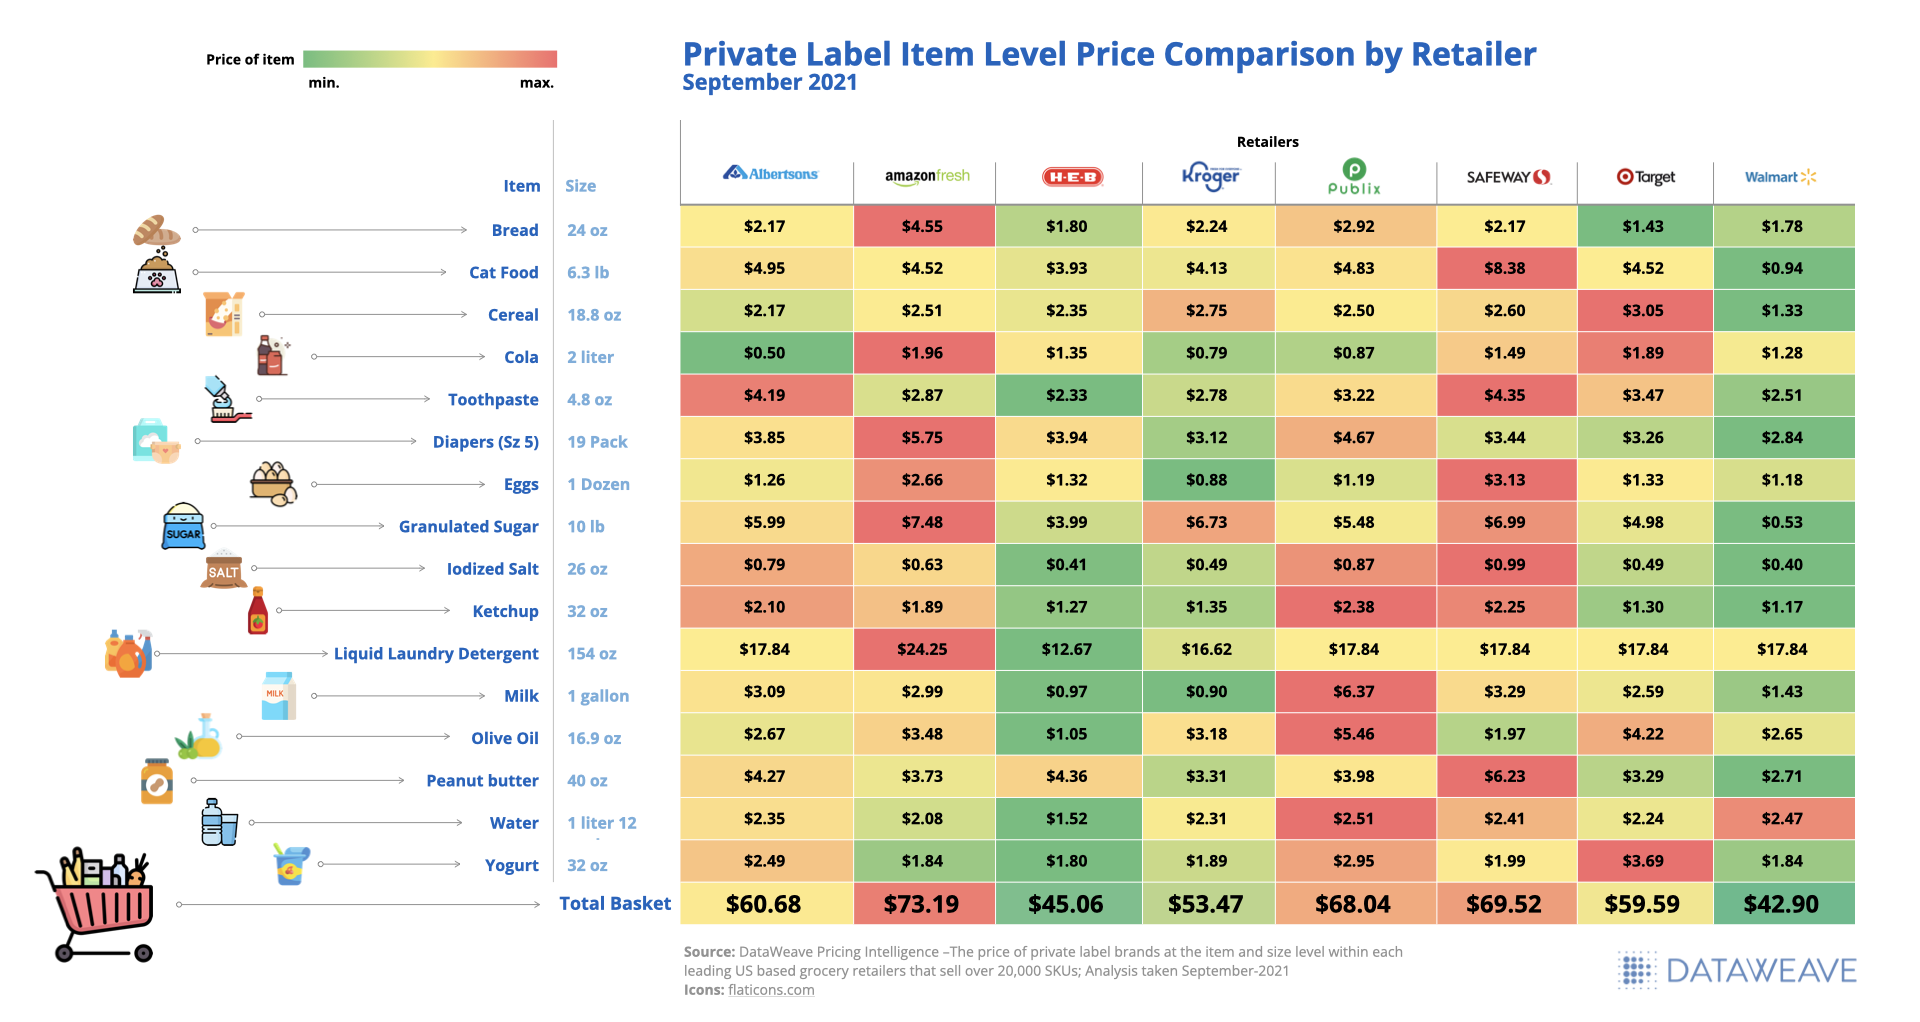
While SKU-level pricing is extremely important to product strategy, for a retailer, it is equally as important to be as mindful of the total basket value even more so now as consumers further their private label loyalty across various categories. A few SKU-level missteps in pricing decisions can exacerbate cart abandonment and negatively impact shopper loyalty in a world where prices can be compared instantly in the palm of your hand.
Based on our analysis, Walmart and H-E-B private label products offered the lowest priced total basket of goods at $42.90 and $45.06 respectively, whereas AmazonFresh and Safeway offered the highest total at $73.19 and $69.52 respectively.
Private Label Item Level Price Comparison by Retailer
Inflation-driven Price Changes are on the Rise with Room to Grow
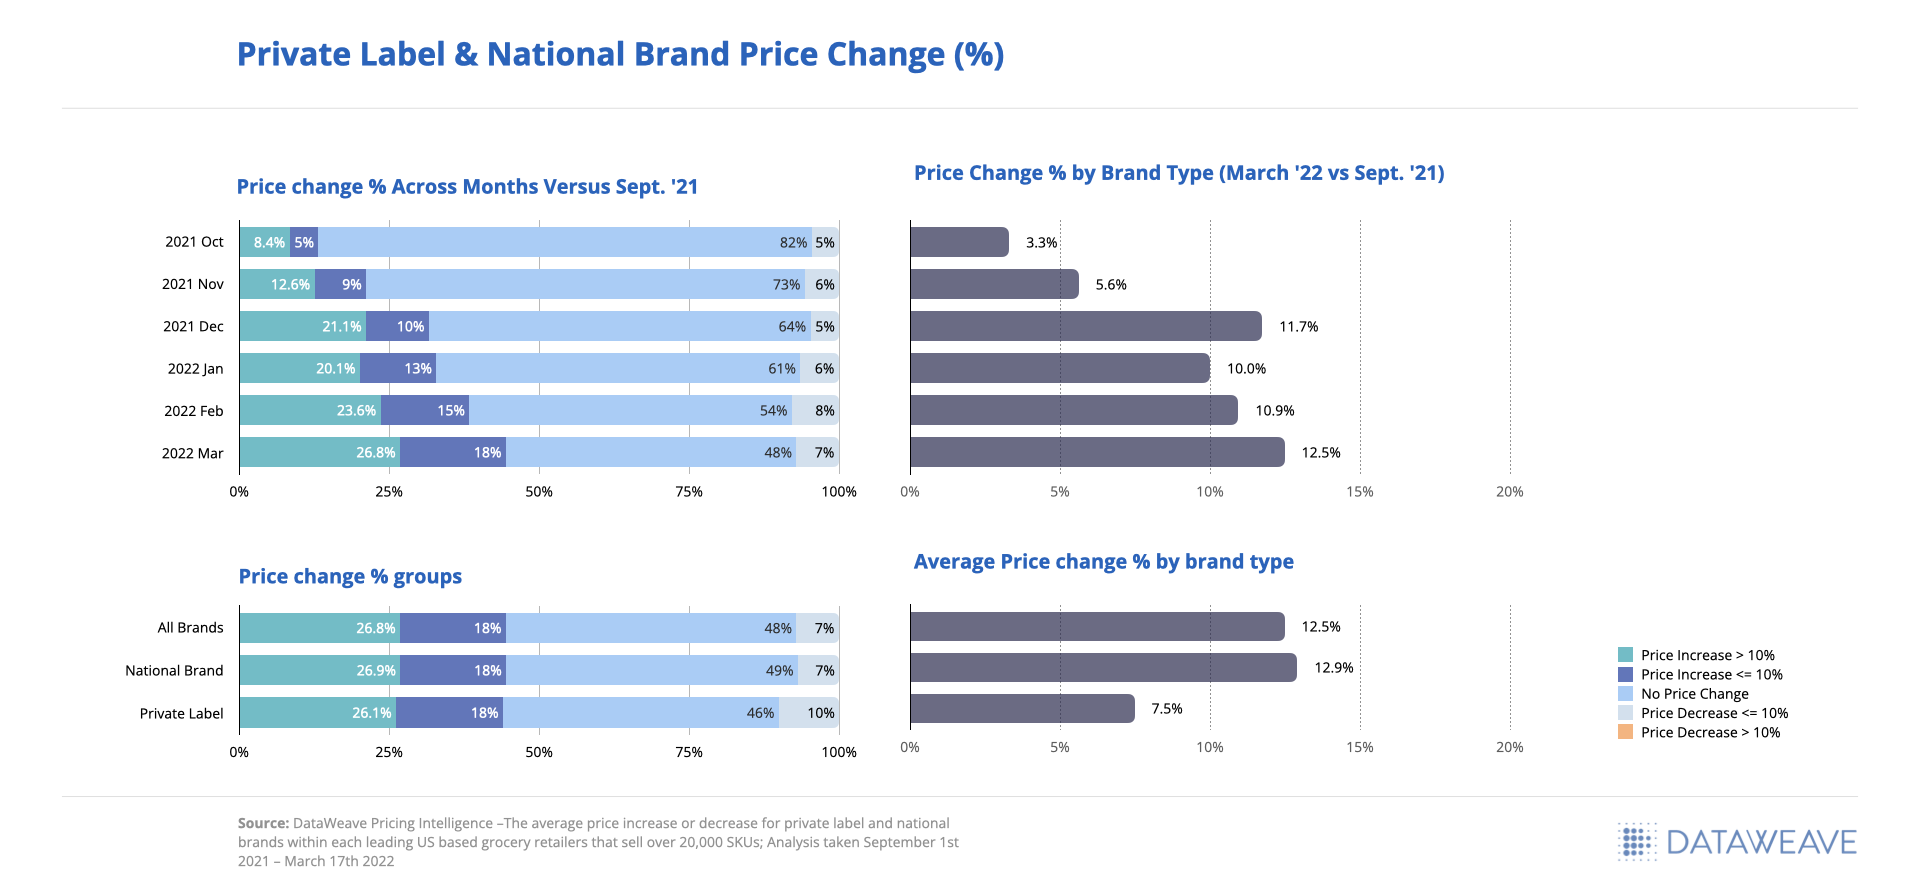
Based on the 20,000+ SKUs analyzed, we saw a continual price increase every month since September 2021 when comparing future monthly prices to those we tracked in September. The greatest price increase happened in March 2022 at 12.5% on average, however, there are still 48% of SKUs that have yet to see a price increase even as inflationary pressures rise.
When viewing the split between National and private label brand price increases in March 2022 versus September 2021, we saw National brands increased prices on average by 13% where private label brand prices only increased an average of 7%.
Private Label & National Brand Price Change (%)
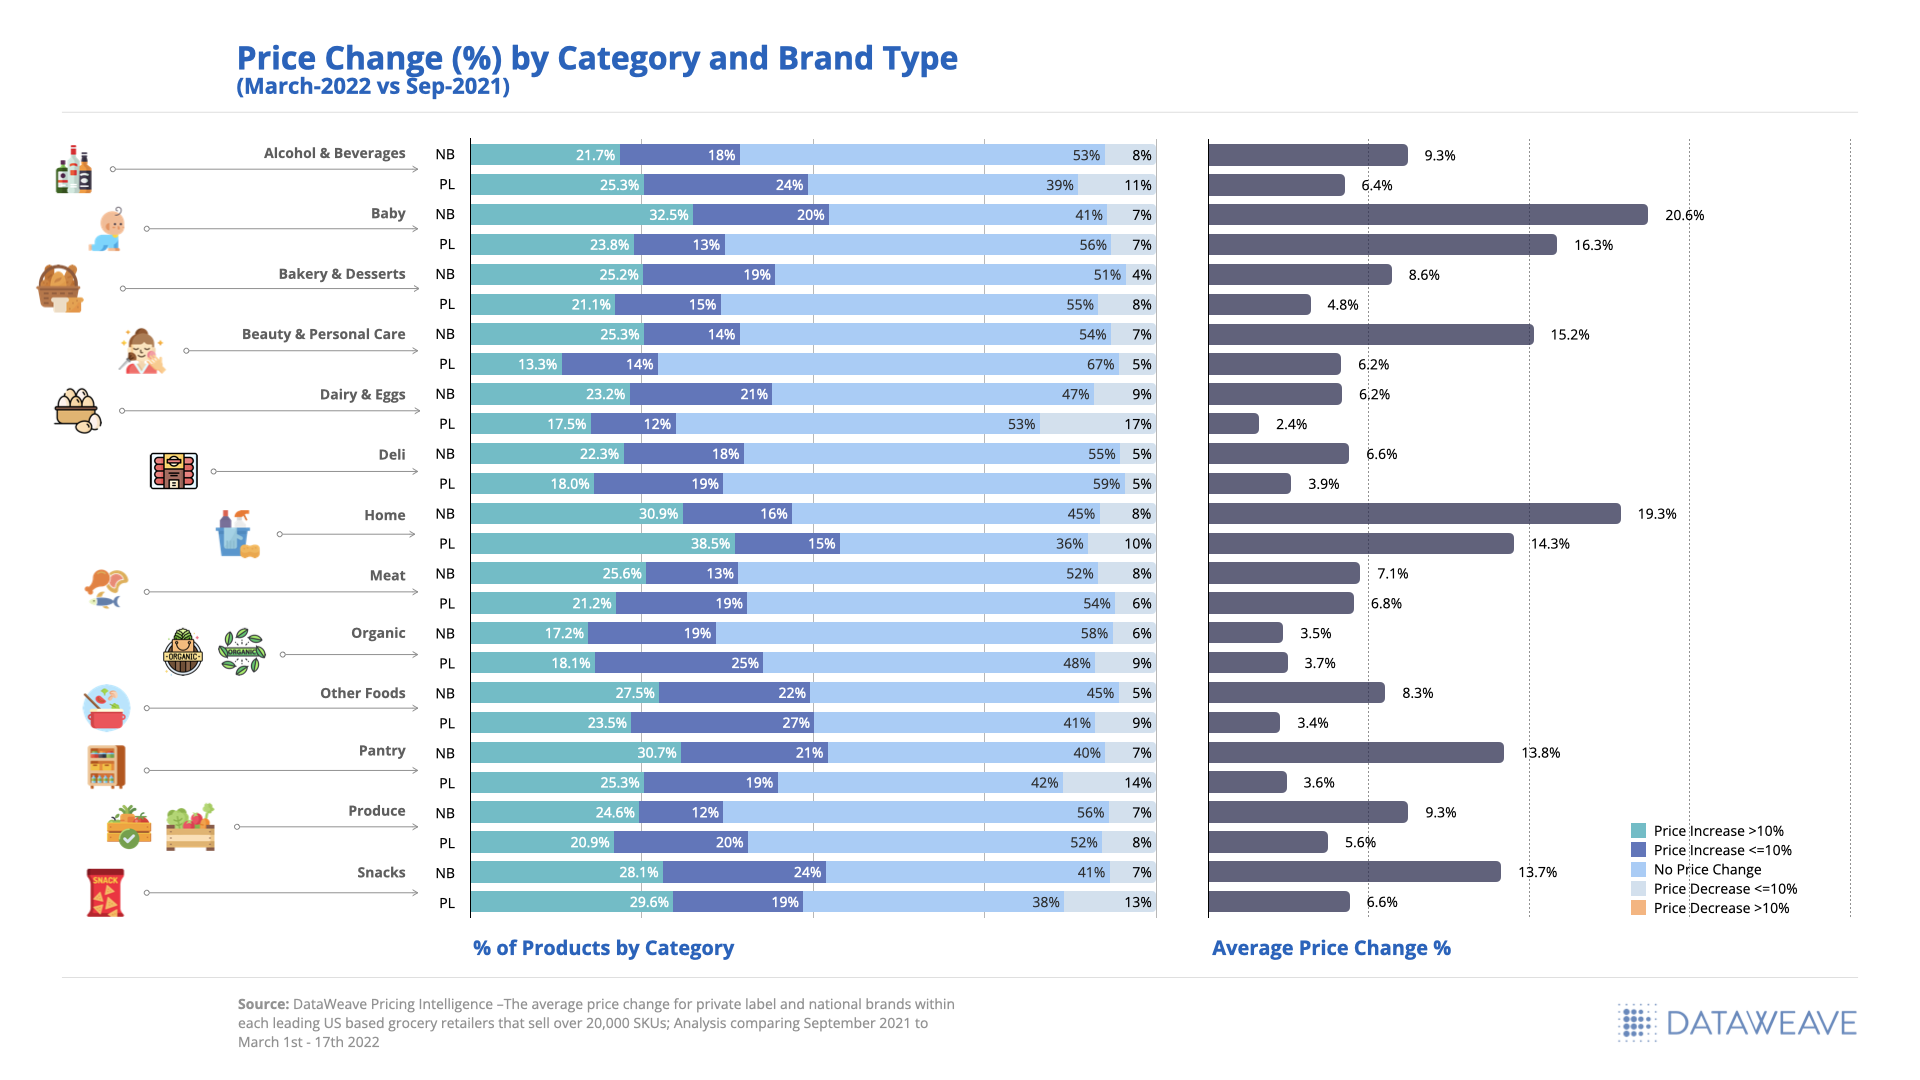
Price decreases are still occurring across all categories, despite inflation, but to varying degrees ranging from 5% for Deli items to 17% for Dairy & Eggs. Within the Dairy & Eggs and Pantry categories, private label brands reduced prices for an additional 10% of total SKUs compared to National brands.
The greatest category of opportunity for price increases within private label were found within Beauty & Personal Care with 67% of private label products yet to see a price change since September 2021.
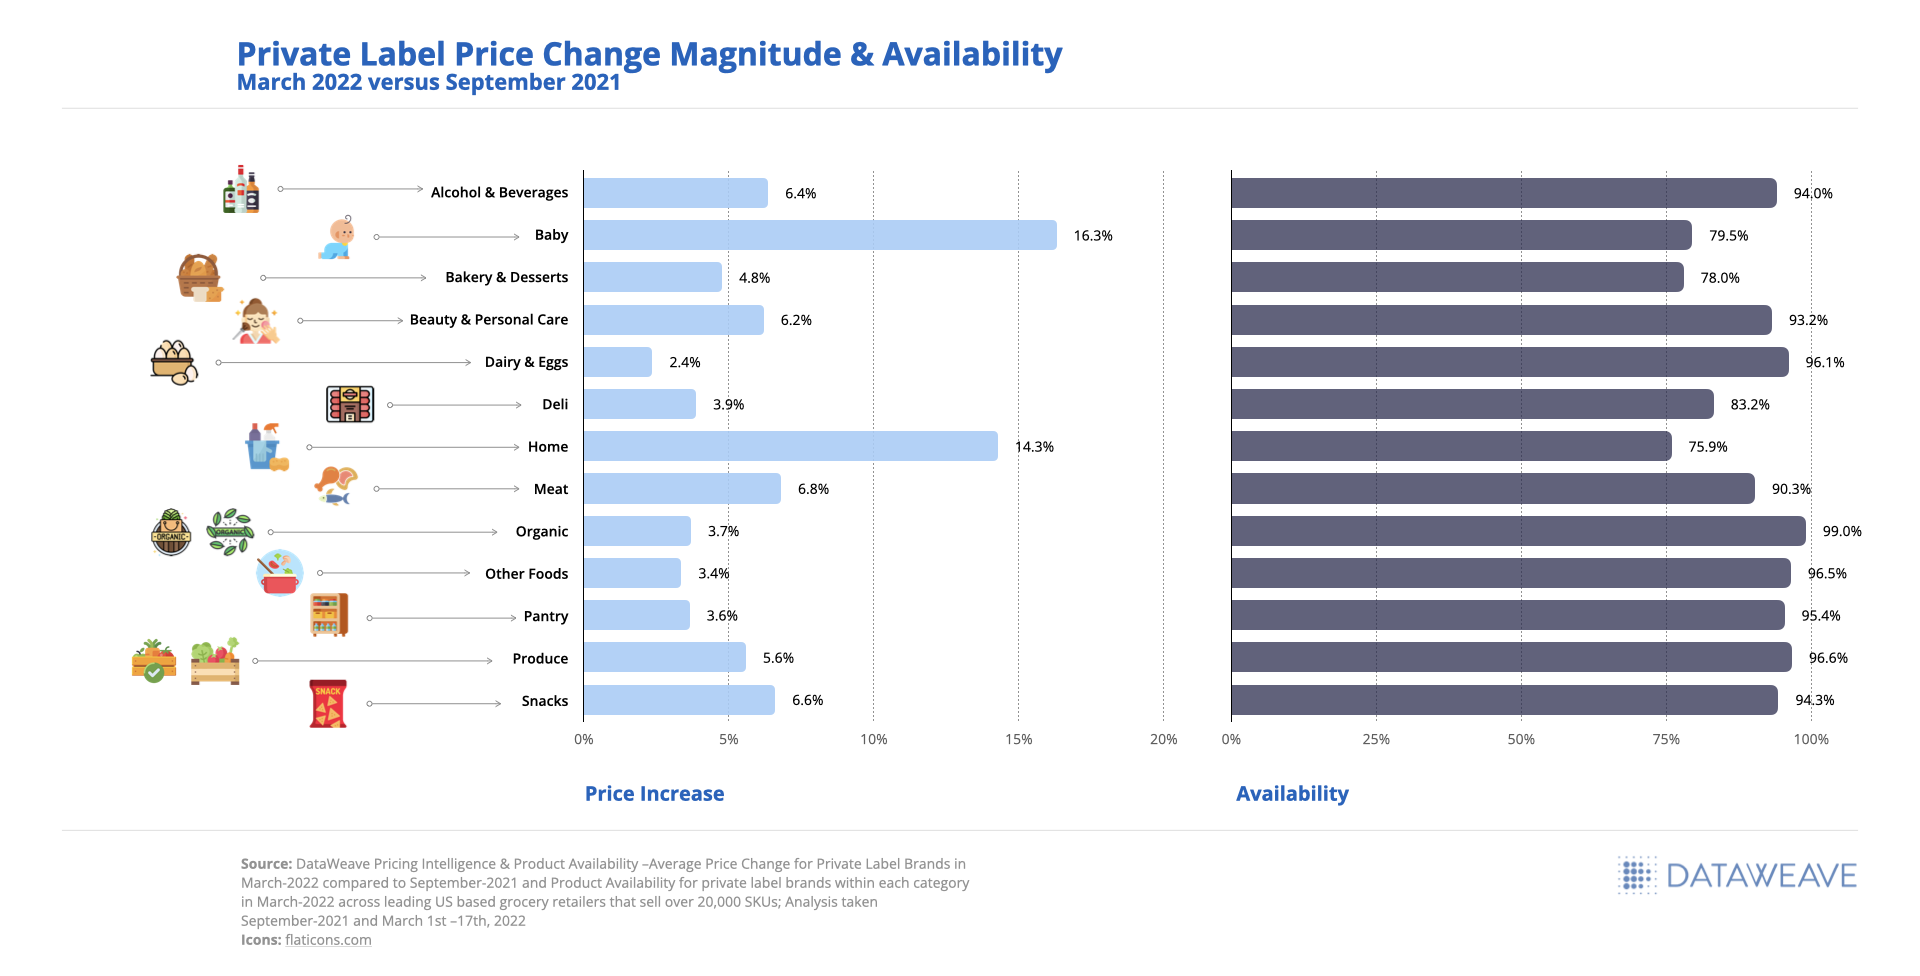
Price Change (%) by Category and Brand Type
Private Label Price Change Correlation to Product Availability
The category with the greatest magnitude of price increase seen within private label brands occurred within Baby at 16.3% followed by Home at 14.3% on average. Private label products within Home and Baby categories were also showing the lowest availability rates, 75.9% and 79.5% respectively, indicating a high demand for these items even as prices increased.
The private label categories with the smallest price increase on average were Dairy & Eggs at 2.4% and Other Foods and Pantry at 3.4% and 3.6%, respectively.
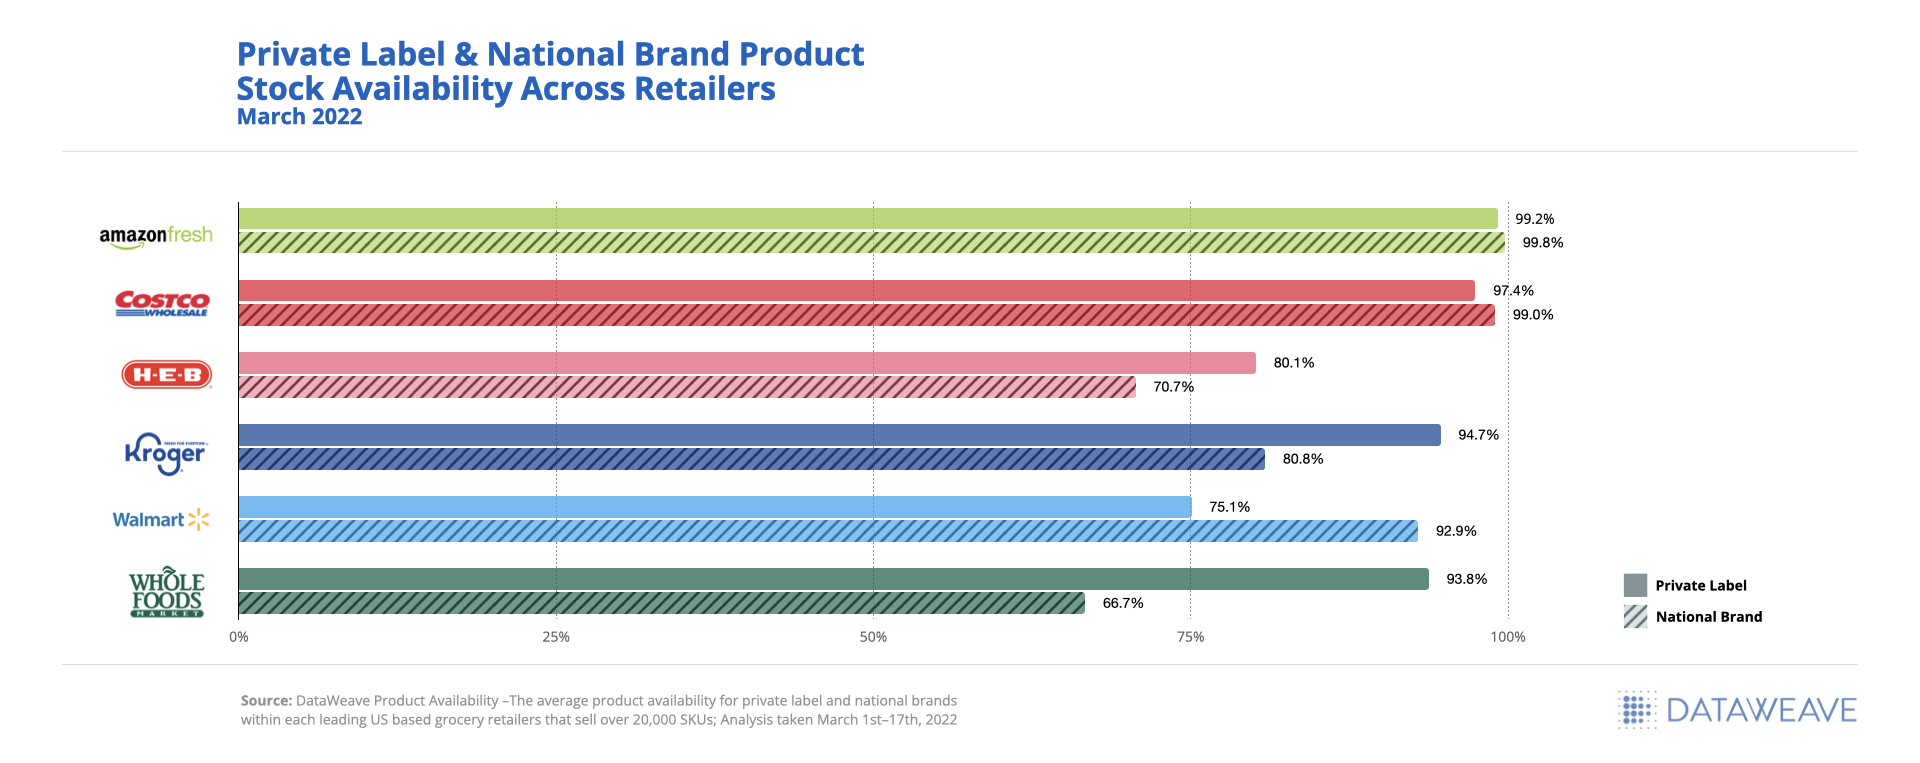
While in many accounts both private label and National brands struggled with stock availability in March 2022, National brand availability is much lower (around 10% on average) than private label availability.
H-E-B had the lowest overall product availability at 76% across both private label and National brands on average. Only Walmart had lower availability for Private Label at 75% compared to 93% for National brands, but they also had the greatest price gap between private label and National brands.
Private Label & National Brand Product Stock Availability
The Future of eCommerce Growth for Private Label
Our greatest learning from this analysis is that it’s time for retailers to start thinking and planning more like the National brands they carry when it comes to positioning their private label brands for success. Successful retailers are taking this time to reset their private-label strategies and transfer short-term switching behavior into long-term customer loyalty.
Retailers playing catch up have the opportunity to address some of the gaps highlighted throughout this analysis, for example, relative to pricing and assortment changes. Below are some of the highlighted opportunities:
Though inflation is driving price hikes, more than 50% of products analyzed have yet to see a price increase indicating an opportunity to protect margin
Narrowing the price gap between a store’s brand and National brands should not be the only focus as competitive private label brands are becoming a greater threat at a category and basket level
Modifying and expanding assortments as demand increases for private label can improve customer retention and loyalty, especially for cross-shopping consumers
According to The Food Industry Association (FMI), only 20% of food retailers currently promote private brands on their homepages, and only 48% include detailed product descriptions indicating even more opportunities left on the table for retailers to optimize private label digital performance.
Many leading retailers are leveraging real-time digital marketplace insights and eCommerce analytics solutions like ours to further their online brand presence and optimize sales performance. This report highlights only a small sample of the types of near real-time insights we provide our clients to effectively build competing strategies, make smarter pricing and merchandising decisions, and accomplish eCommerce growth goals. Be sure to reach out to our Retail Analytics experts for access to more details regarding the above analysis.
For access to a previously recorded webinar presented in partnership with the Private Label Manufacturers Association and conducted by DataWeave’s President and COO, Krish Thyagarajan, click here.
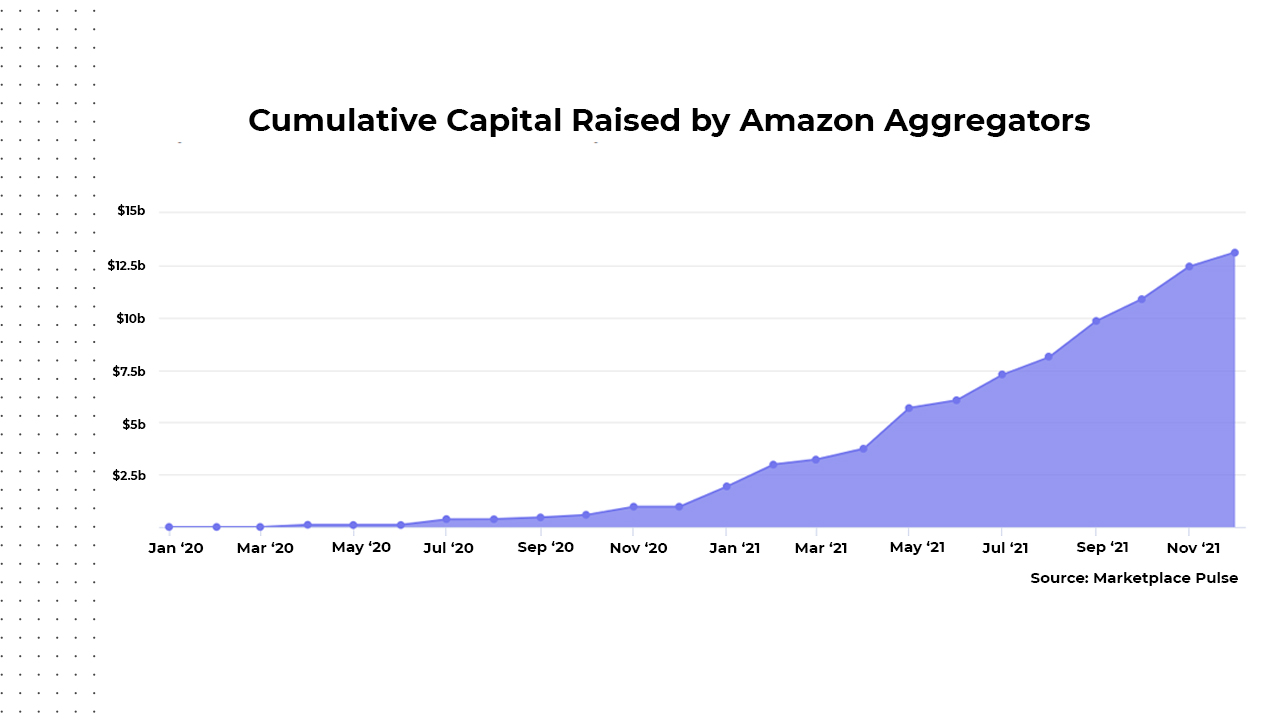
When it comes to brands – the biggest story of 2021 was the astronomical growth of Brand Roll-ups. For the uninitiated, Brand Roll-ups are companies that acquire multiple digital consumer brands and then scale these brands 100x by leveraging their own operational expertise across eCommerce platforms, Supply Chain, Warehousing, Marketing, and so on.
Thrasio is the poster boy for the Brand roll-ups and is valued at over 10 Bn USD.
Brand rollups have raised over $12 billion in 2021 and the trend only seems to be accelerating in 2022. Not only Brand Roll ups, but VCs too have been pouring money into digital brands. In India, 77+ brands have raised more than 2B USD in 2021. In the US this number is estimated to be north of $10 billion.
Cumulative capital raised by Amazon Aggregators
Scaling fast doesn’t come easy. It comes with its own set of challenges. So even with ample experience in running and scaling brands, Brand roll-ups are posed with unique challenges.
Challenge of Scouting the right brand
There are 1000s of online consumer brands and new ones are launching every day. Every Brand roll-up wants to be the first one to scout a brand – but this is not easy.
The challenge here is to identify & pick the right brands without having access to any sales or financial data. Every Brand Rollup has a wishlist with regards to the number of SKUs, price points, reviews, and ratings as well – but don’t have tools in place to scout brands with these criteria in mind. And across multiple platforms and categories, the problem gets more complicated.
This is an ongoing problem since a brand that was not selling well yesterday may start hitting higher sales numbers a week down the line – and that is why Brand scouting has to be a continuous process.
One way these aggregators have solved this challenge is by offering mouth-watering referral fees for referring a brand. But this is not a sustainable long-term solution.
Data Comes to the Rescue
What Brand Roll-ups need is a continuous and automated data first Brand Scouting solution to enable them to scout the right brands.
What are all the brands in a category of interest?
Which of these brands is within the filters of Number of SKUs, Price Range, etc.?
Which brands have shown an exceptional rise in search rankings?
Which brands have shown the most increase in the number of ratings and reviews?
Which brands have the highest gain in the customer ratings?
What are the estimated sales and market share of the brands?
DataWeave’s Brand Scouting Solution is a comprehensive solution to help Brand Rollups and VCs scout for the ideal brand that fits their acquisition profile. We leverage public data collected from multiple eCommerce platforms to get them the desired information on brands they’re looking for.
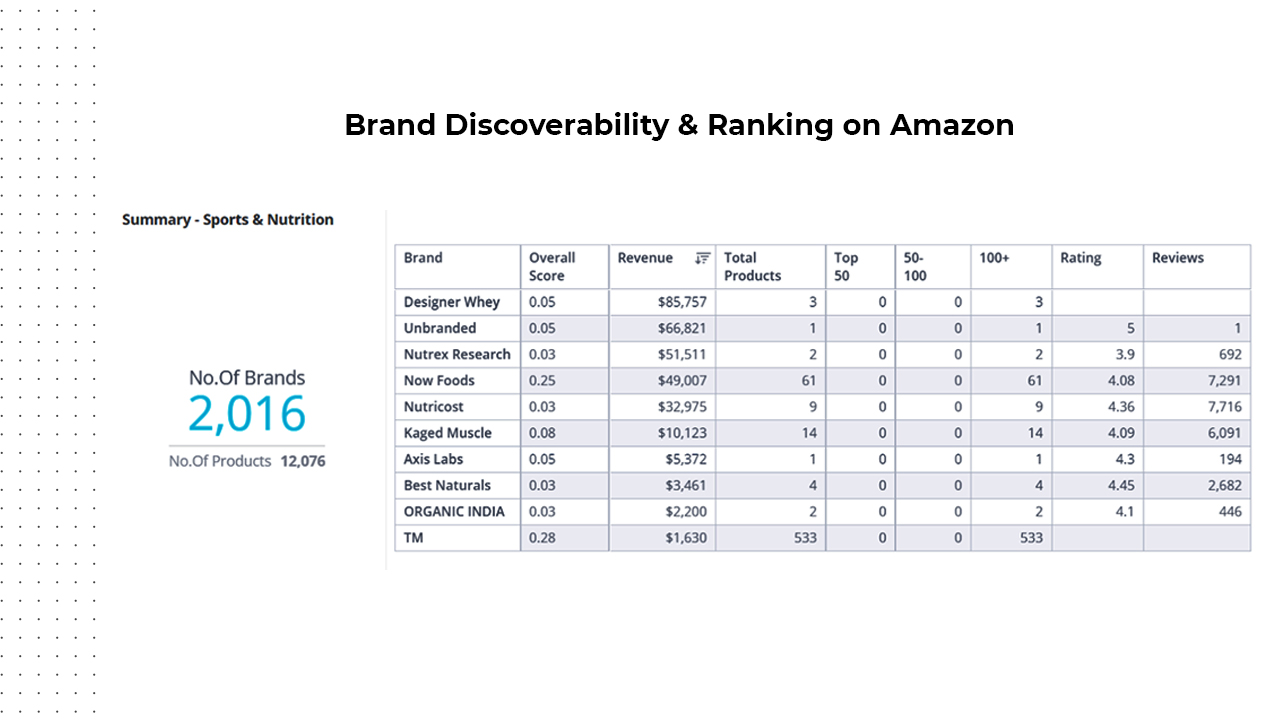
For all the focused categories (Typically 30-40) – we collect data of all the SKUs (Typically 15,000-20,000) and aggregate that at a Brand level:
Ranking – Usually Brand Rollups are not interested in the Brands which are on the first page. But, they are interested in the brands which might be b/w 500 to 10,000 ranks but are showing an exceptional gain in ranking week on week.
Brand Discoverability & Ranking on Amazon
Ratings – It’s important to look at brands that are showing high improvement in ratings or have consistently shown high ratings. The proportion of 5 stars vs. 1 star is an important metric here.
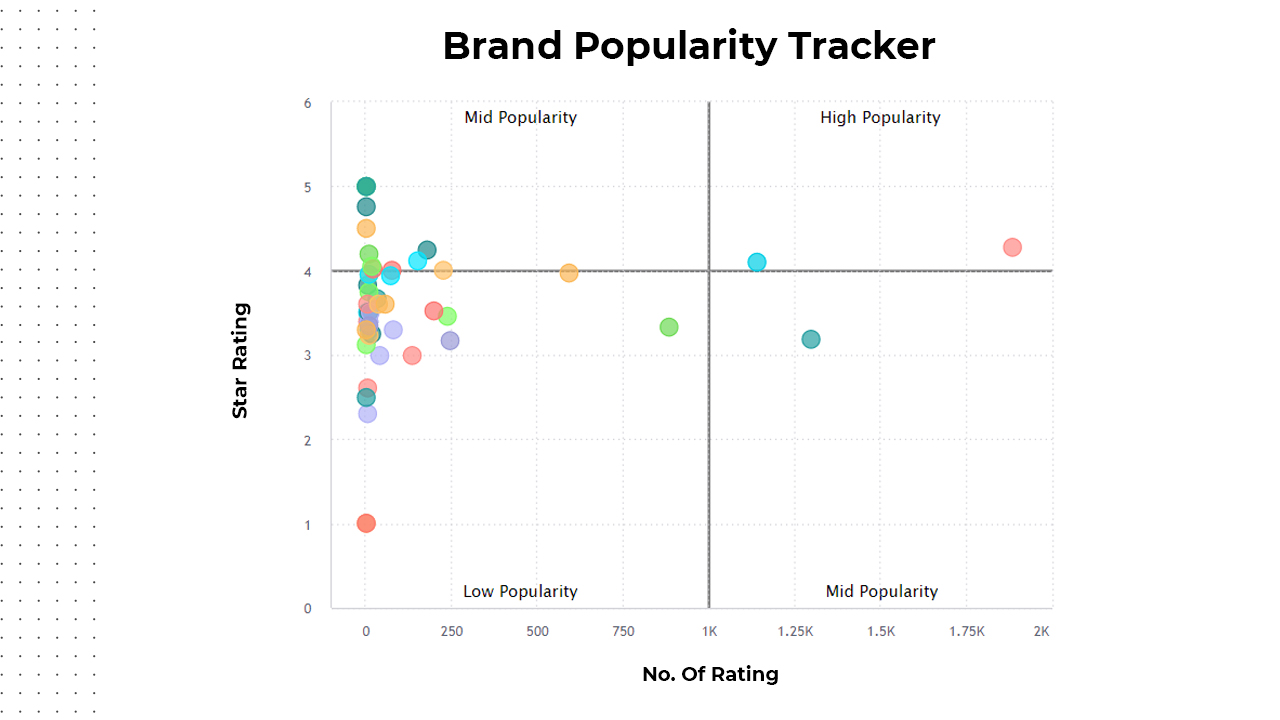
Number of Reviews and Ratings – We enable you to find brands that have both high ratings as well as a high number of reviews. This is a very good metric to find the brands in a category that are getting exceptional customer love.
Brand Popularity Tracker
Filters – We enable filtering in terms of – No. of SKUs, Price Range, Rating and Reviews and even can eliminate established brands so that you only see the brands which qualify your criteria. We also enable you to separately analyze brands that are buying sponsored ads in a category, so you have a clear distinction between organic and sponsored growth of these brands.
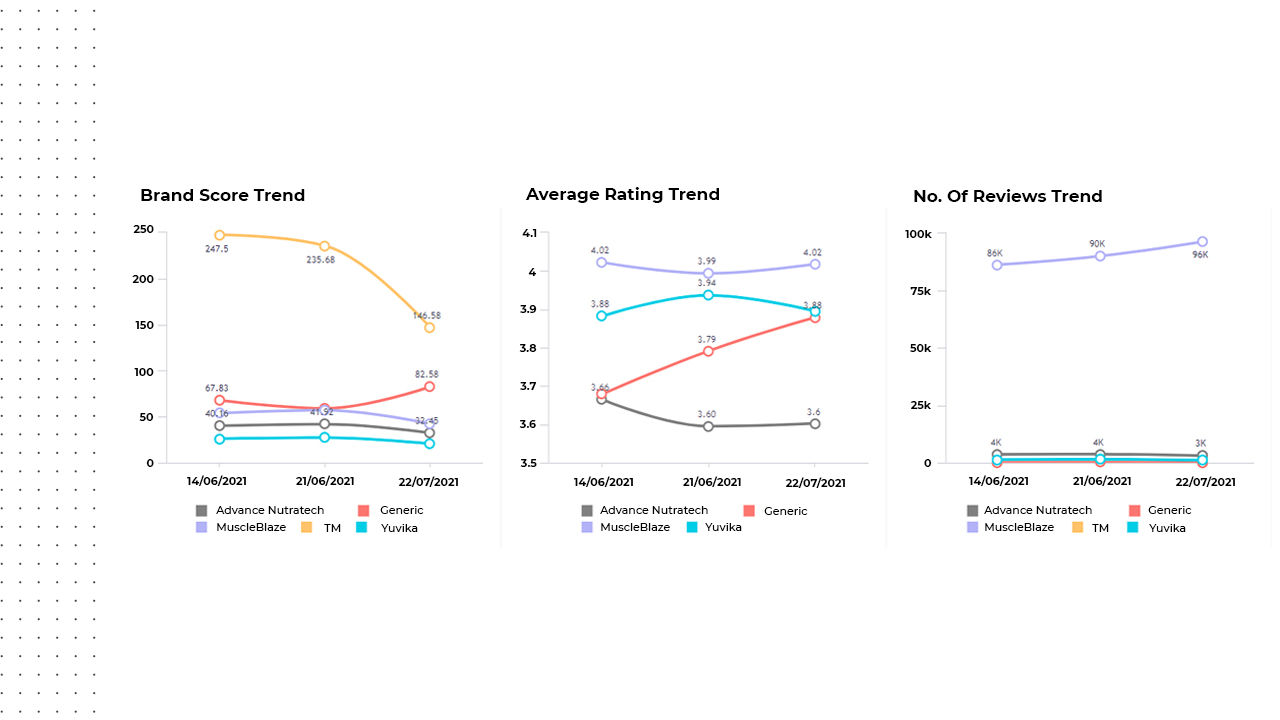
Trends – What is important is not just the static performance on the day of analysis – but a trend analysis over a period of time to find the brands which are growing exceptionally.
Brand Score Trend, Average Rating trend & No of Reviews Trend
… but, wait there’s more.
We compliment Brand Scouting with three more solutions to provide the right context and further analysis needed to provide comprehensive insights into the category and platforms where you are scouting for brands:
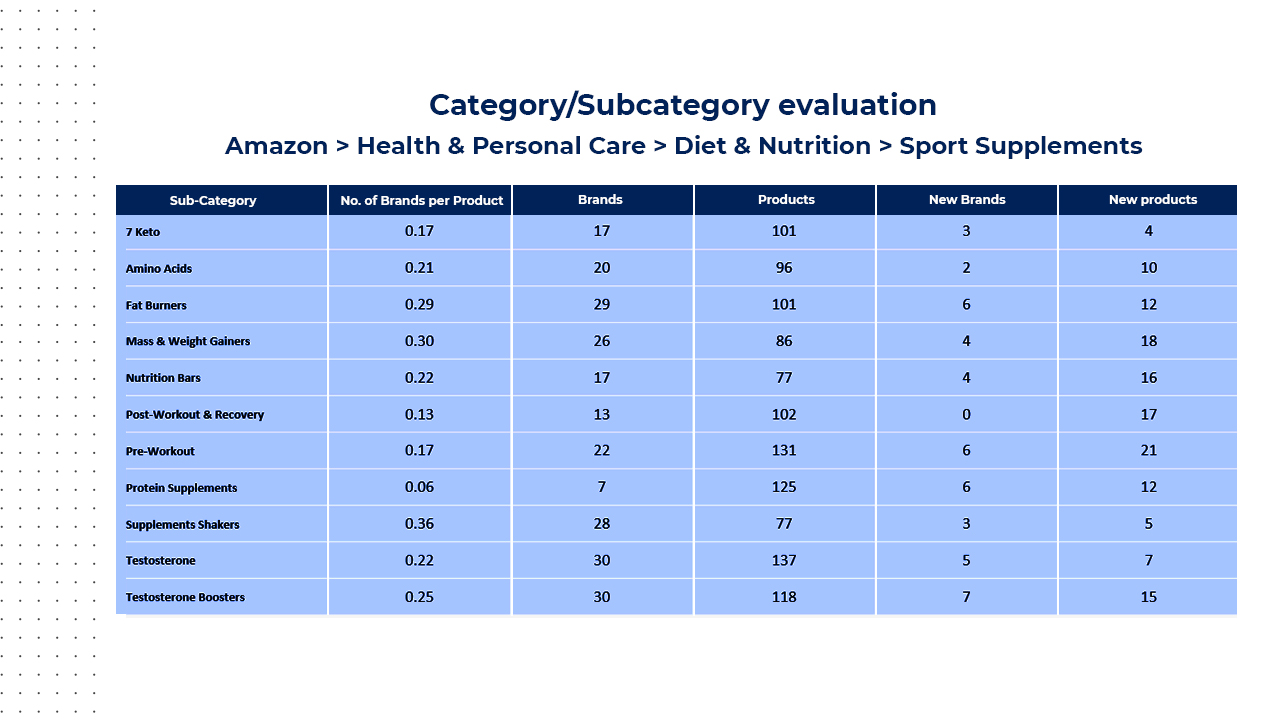
Category Analytics: When you are looking at a category and the brands in that category, it is often important to understand how dynamic that category is. We can help analyze:
If the category is crowded with more brands per product.
Does it have space for new brands?
What is the number of new brands entering that category?
We can also help with benchmarking the category – to help understand how the brand that you are scouting is doing when compared to its category peers.
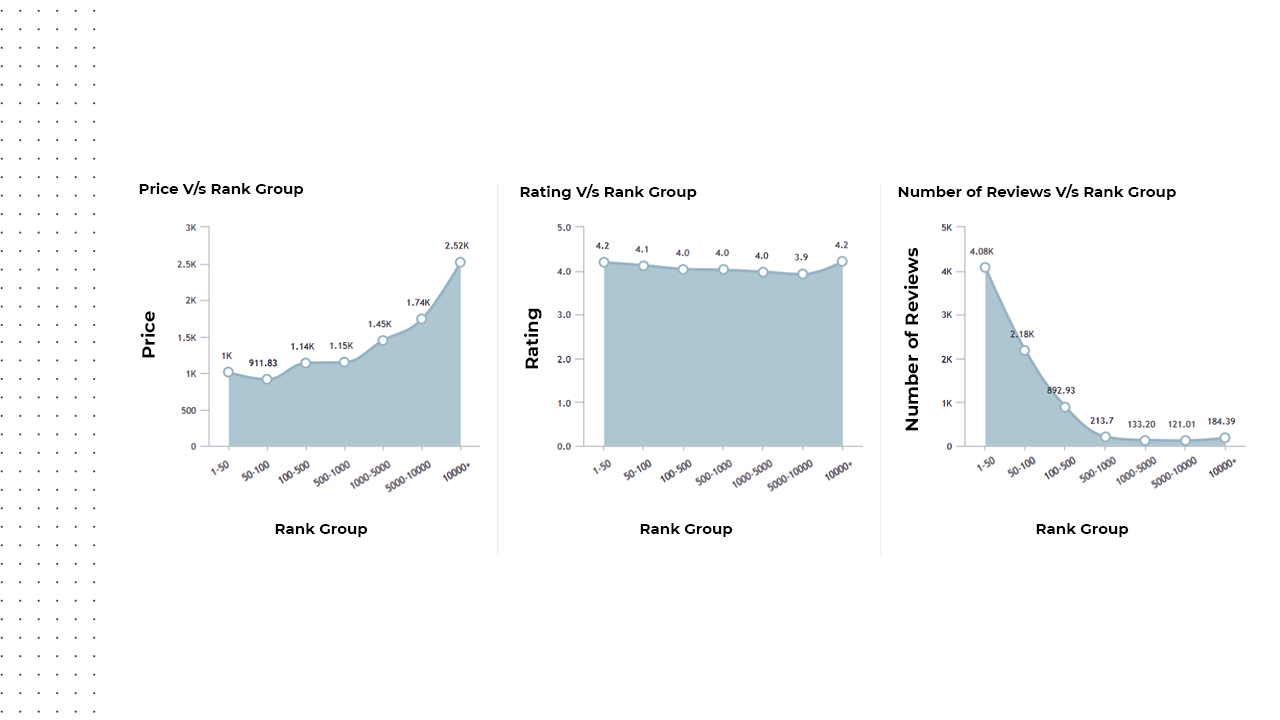
Rank Group versus Price, Rating & No of Reviews
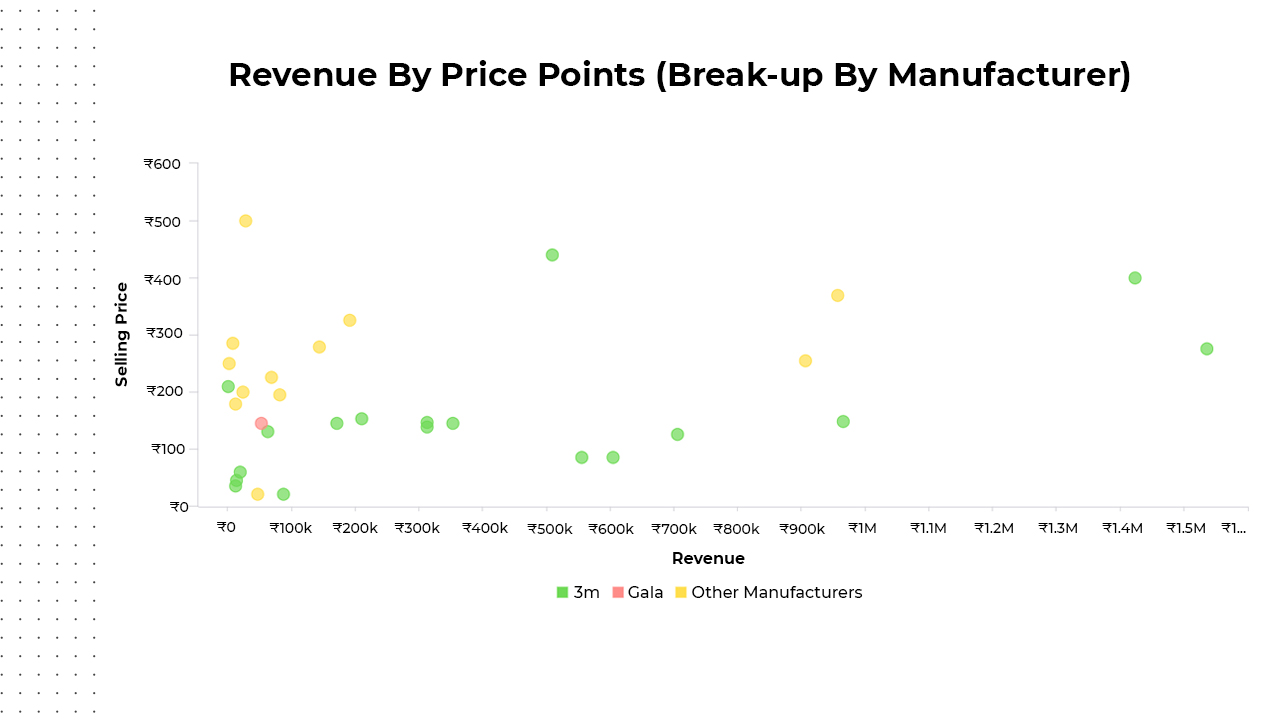
Sales & Share: We can also provide a good directional estimate of the sales and market share of all the SKUs in the category wherein you are scouting for brands. These are estimates powered by our proprietary machine learning algorithms and can help you solidify your hypothesis around a blog or a category.
Revenue by Price Points
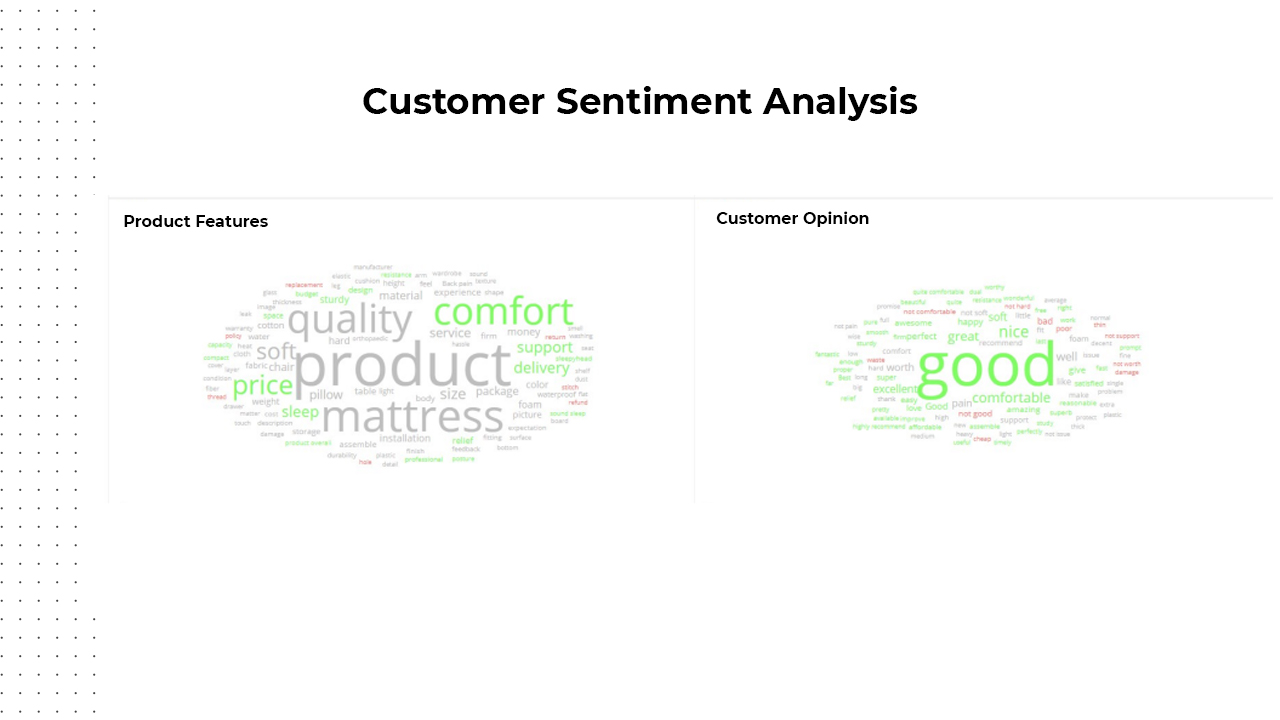
Sentiment Analysis of Reviews: Customer reviews tell more about the qualitative aspects of the SKU and the brand itself. Our algorithms can help understand what features of a brand or a product do customers really care about. We can answer questions such as:
Which features are mentioned most commonly?
Which features are mentioned positively or negatively?
What adjective is used to describe that particular feature?
Customer Sentiment Analysis
The suite of Brand Scouting and complementary solutions is evolving rapidly as the space is evolving rapidly. We are supporting several VCs and Brand Roll-ups globally to scout for brands.
The best aspect about DataWeave is our ability to scout brands across 2,000+ eCommerce platforms globally across geographies. We are super stoked to be playing an enabler in the Brand Rollup revolution.
The challenge for Brand roll-ups is not over by just scouting and acquiring a brand. The journey is just about starting – the next challenge that the Brand Rollup faces now is to scale up these brands.
The challenge the Brand Rollup face is unique and very different from a single brand operator or even traditional CPG conglomerates.
DataWeave’s flexible product philosophy enables Brand Roll-ups to diagnose and measure the performance of multiple brands across multiple platforms in one dashboard.
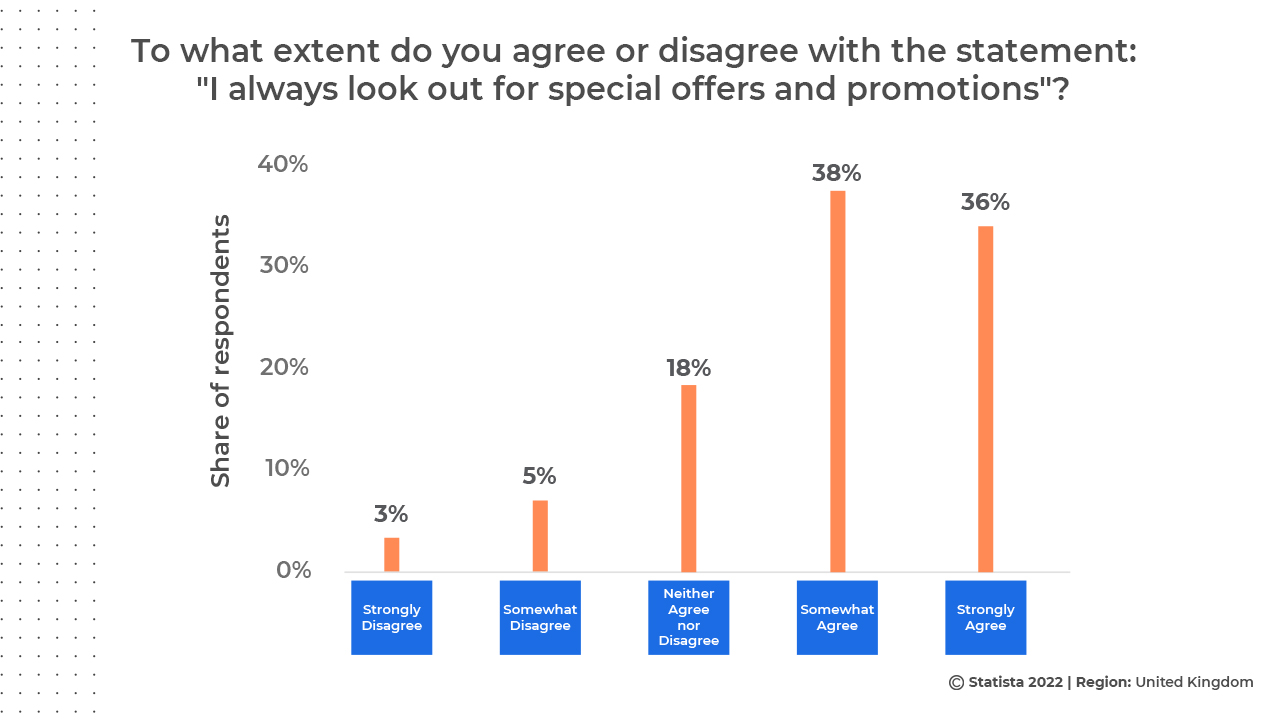
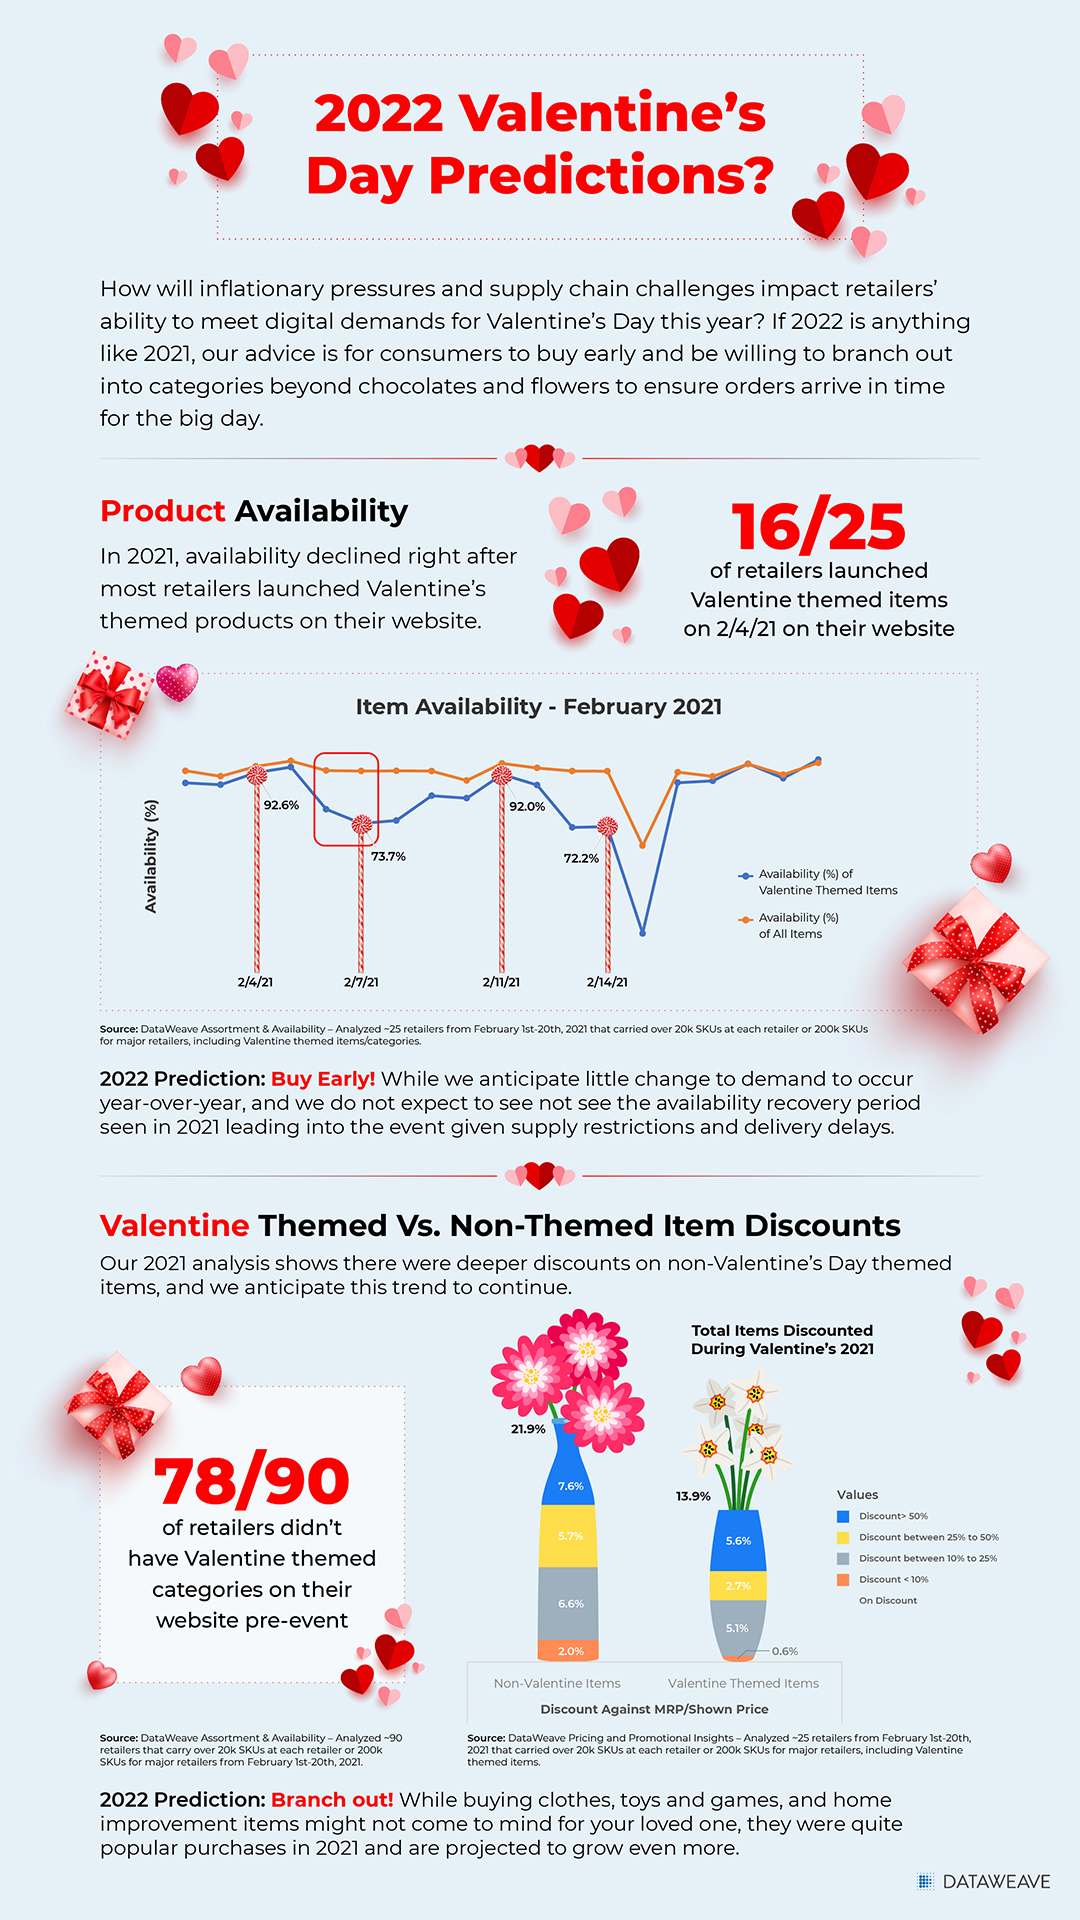
Customers love discounts, and promotions are the most effective tool to attract shoppers and increase sales during the holiday season and clearance sales. According to a survey, 76% of UK customers look for discounts before purchasing a product. Promotional discounts encourage customers to try new brands. And this is why brands often have a special coupon for first-time users.
According to Software Advice, discounting tops the pricing strategy for retailers across all industries. It is preferred by 97% of survey respondents over other promotional strategies.
Share of Respondents
Retail Trends in the UK for 2022
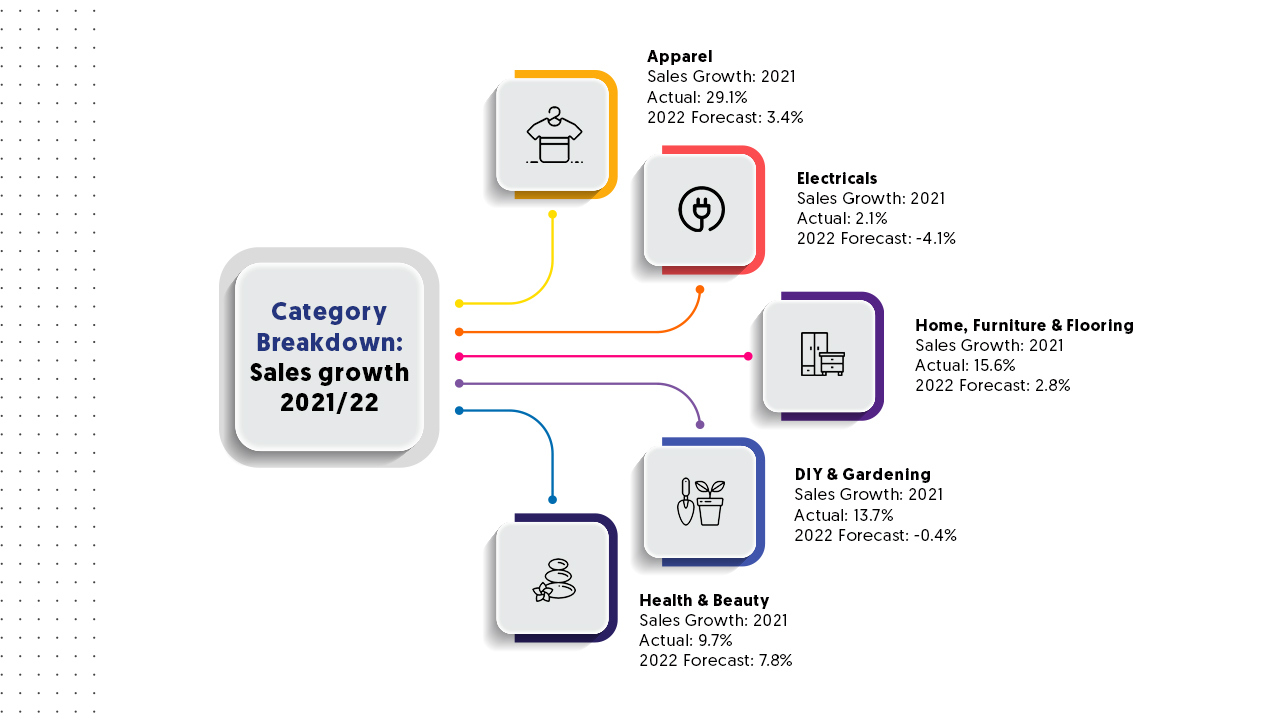
The arrival of the Omicron variant in December 2021 slashed the shopping mood of UK customers and led to a 3.7% monthly drop in retail sales, but sales were still higher than February 2020 levels when Covid-19 first hit worldwide. Sales during the holiday season in 2021 took a hit due to a consistent decline in product availability and an increase in prices. Inflation too started to rise in 2021 and is expected to increase by 7% by spring 2022. However, despite inflation, retail sales jumped back in January 2022. In fact, it is predicted that inflation will be a key driver of sales growth, with underlying demand across categories being uneven. Keeping that in mind, let’s look at sales growth across categories in 2021 and projected growth in 2022.
Category Breakdown: Sales growth 2021/22
Discounting Trends we saw in the UK in 2021
Methodology
We tracked prices on the three biggest Sales Days in the UK – Amazon Prime Day, June 21st & 22nd 2021 – Black Friday, Nov 26th, 2021 – Cyber Monday, Nov 29th, 2021
Categories tracked: Beauty, Fashion, Electronics, Home Improvement, Furniture
Websites tracked: Amazon UK, OnBuy, eBay UK, Etsy, Wayfair, Selfridges, John Lewis
Prime Day, Black Friday, and Cyber Monday are three of the biggest sales days with comparable discounts. However, according to new research, in 54% of cases, it depends on the category of product you’re after that determines the volume of discount you get. For example, tech items such as smartphones, laptops, games consoles, smartwatches, and wireless speakers were cheaper on Black Friday but may not necessarily have been cheaper on the other sale days.
We wanted to see which sale period had the most number of products on discount during the three big sale events. We also wanted to see which of those three sales would’ve been the best for consumers to get a higher section of products at a discount.
How Big were the Discounts?
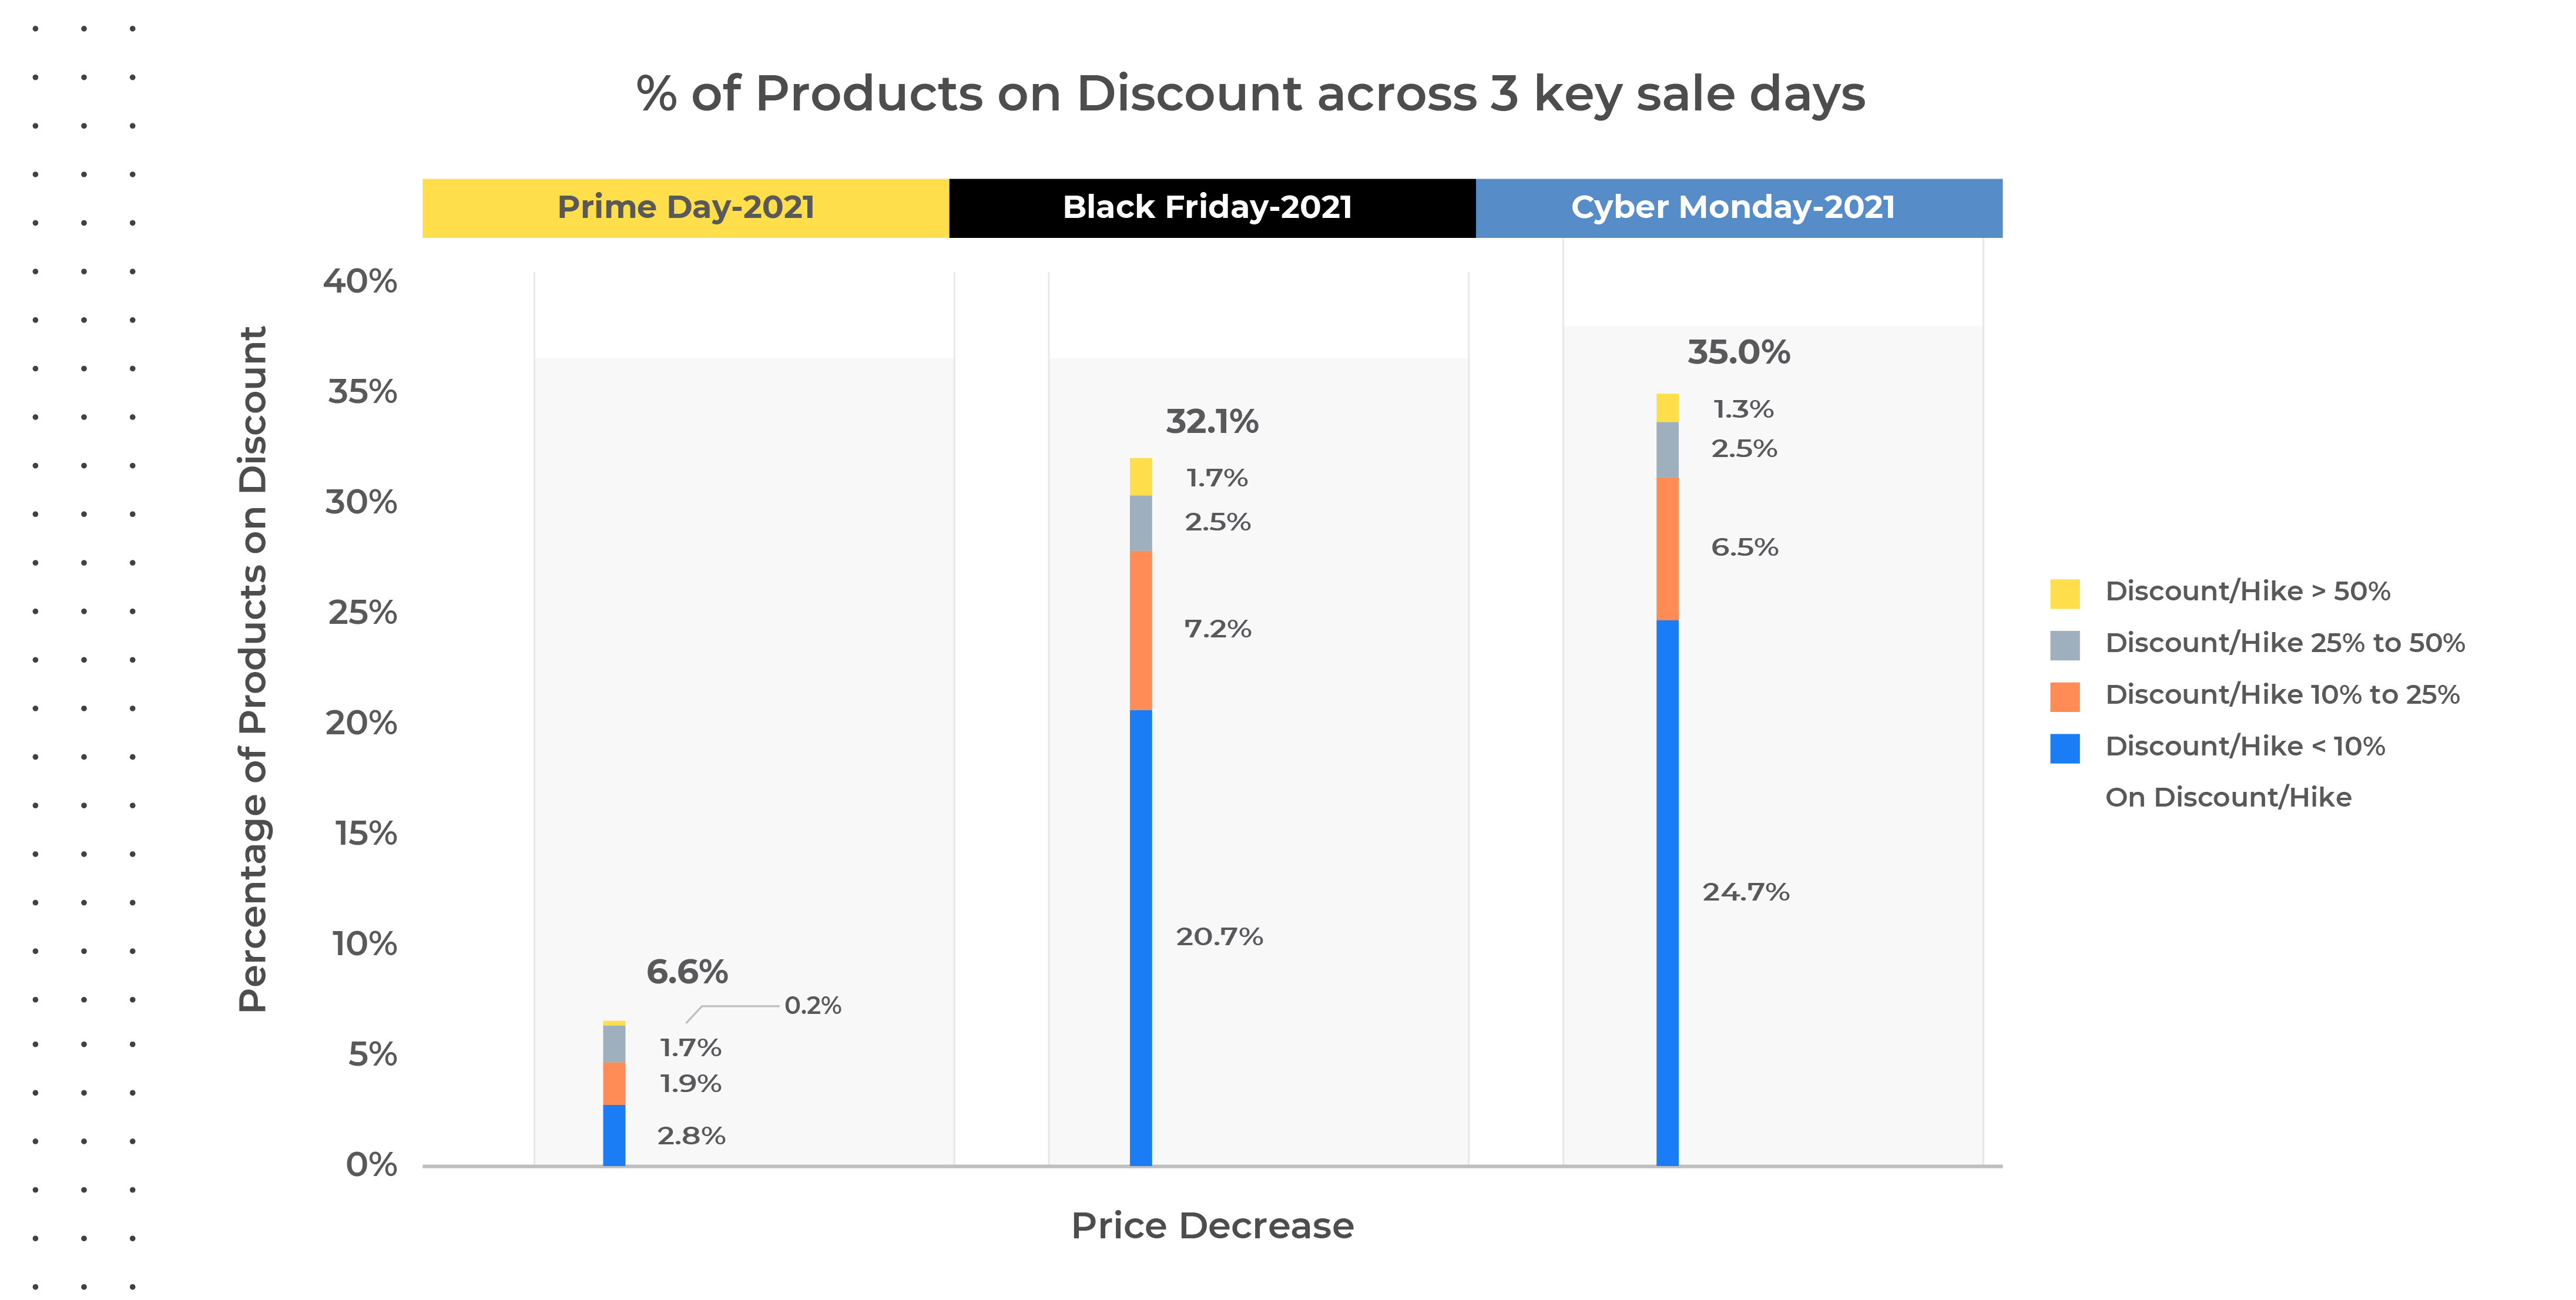
Discount across 3 key Sale Days
32% of products went on discount during Black Friday, 35% on Cyber Monday, and only 6.6% on Prime Day. One factor contributing to the low Prime Day percentage is the fact that not all retailers participate in discounting wars during Prime Day since it’s an exclusive Amazon-only sale. Customers looking for the best deals would’ve gotten them during the holiday season with a combination of the Black Friday & Cyber Monday sales.
Another interesting thing to note is the percentage discount – on Prime Day, only 0.2% of products had a discount of over 50% of all the discounted products. While on Black Friday & Cyber Monday that number was 1.7% & 1.3% respectively.
In conclusion, more products were offered at a discount on Black Friday & Cyber Monday; and the total percentage discount on those products was also higher.
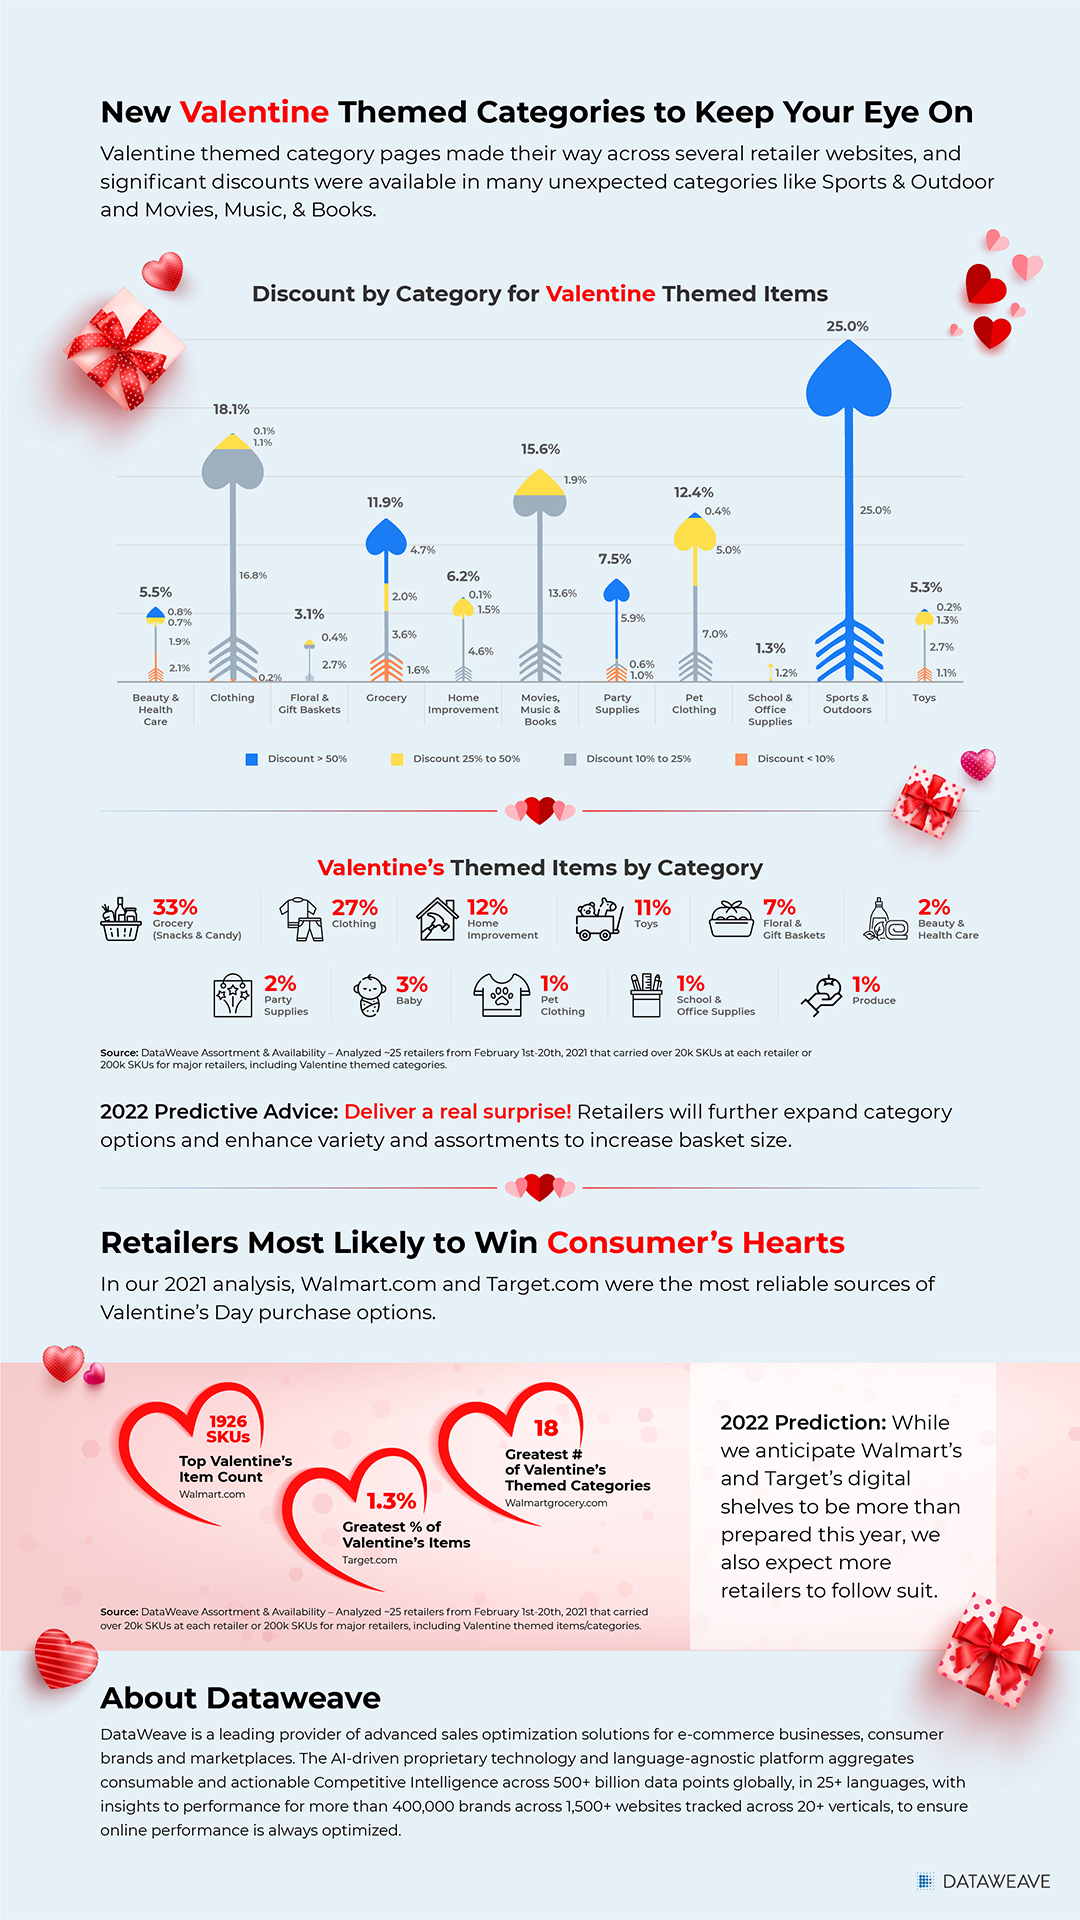
Which Categories had the Maximum Discount?
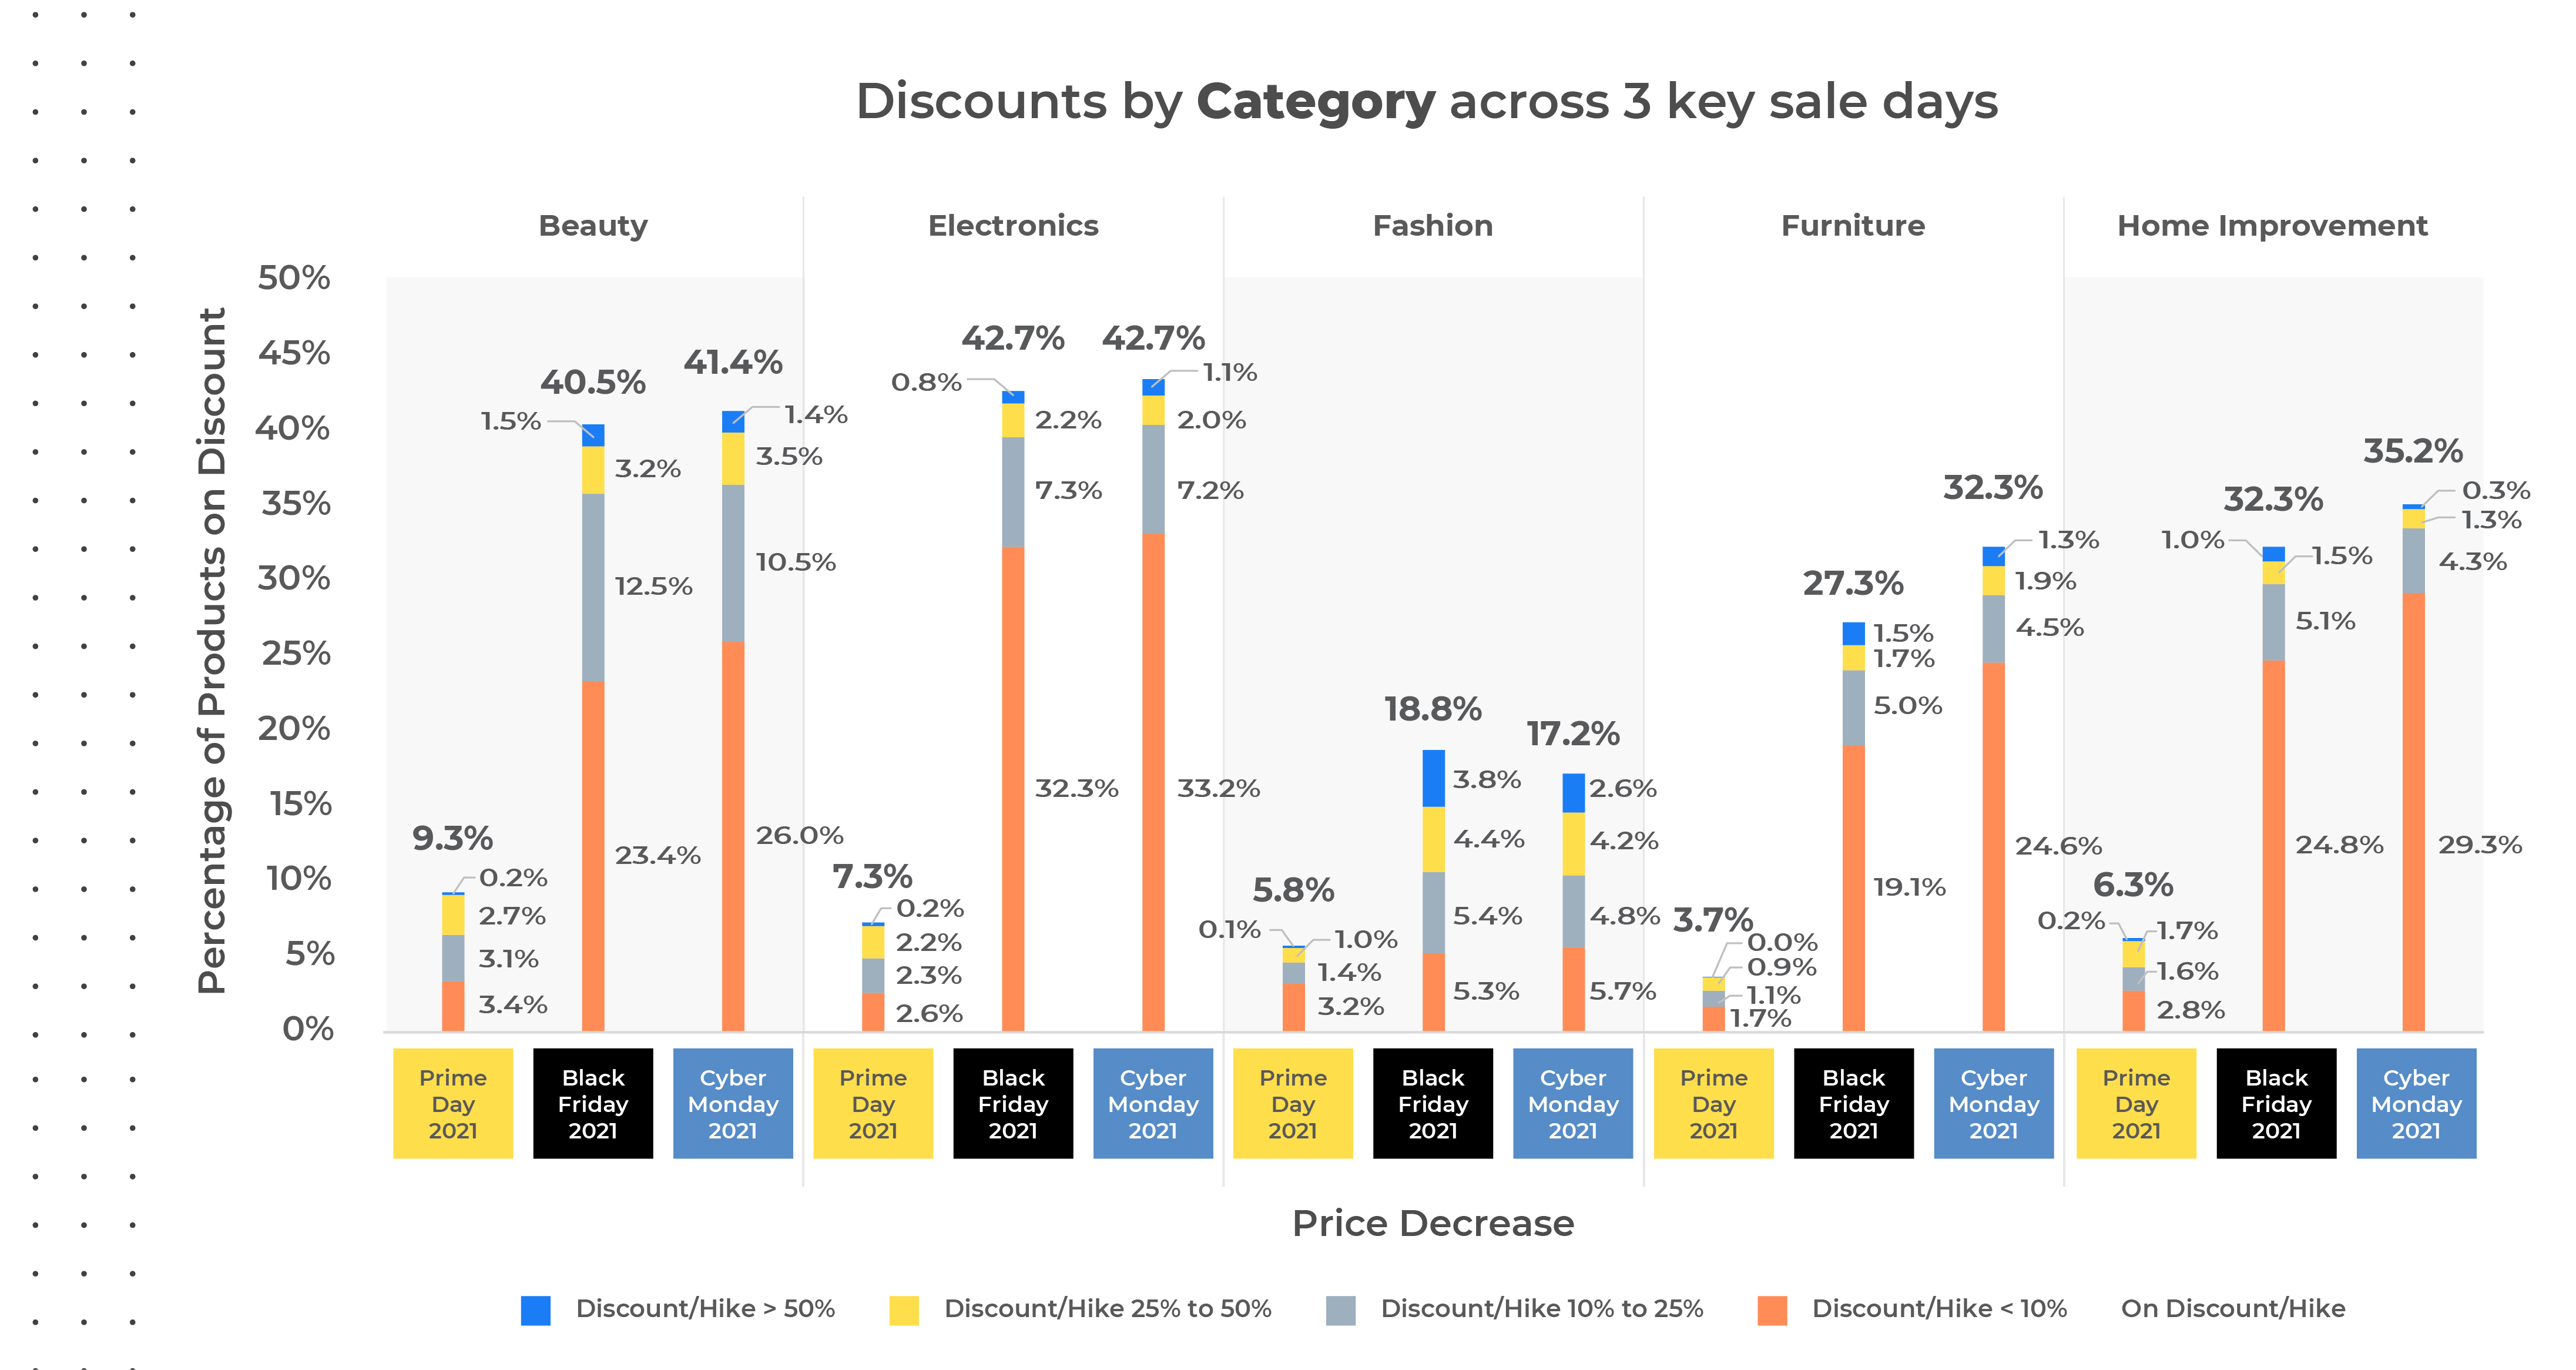
Discounts by category
On Black Friday, an estimated 47% of consumers in the UK planned to shop for electronics, whereas 40% of customers planned to shop for clothing and footwear during Black Friday to Cyber Monday. The top-selling categories across the 48 hours of Amazon UK’s Black Friday 2021 sale included Home, Toys, Beauty, Books, and Health & Personal Care.
Our data shows that Categories with the highest discounts were Beauty and Electronics with the highest discount on all 3 sale events. These 2 categories had discounts on over 40% products on Black Friday & Cyber Monday while categories like Home Improvement were in the 30 – 35% range, Furniture in the 27 – 32% range and Fashion has the least products on discounts at a little over 15%
In the fashion category in the UK, Amazon UK offered the highest percentage of items with a price decrease (31.6%), whereas eBay offered the most significant magnitude of price decrease (14.3%).
Which UK Retailers gave the most discounts?
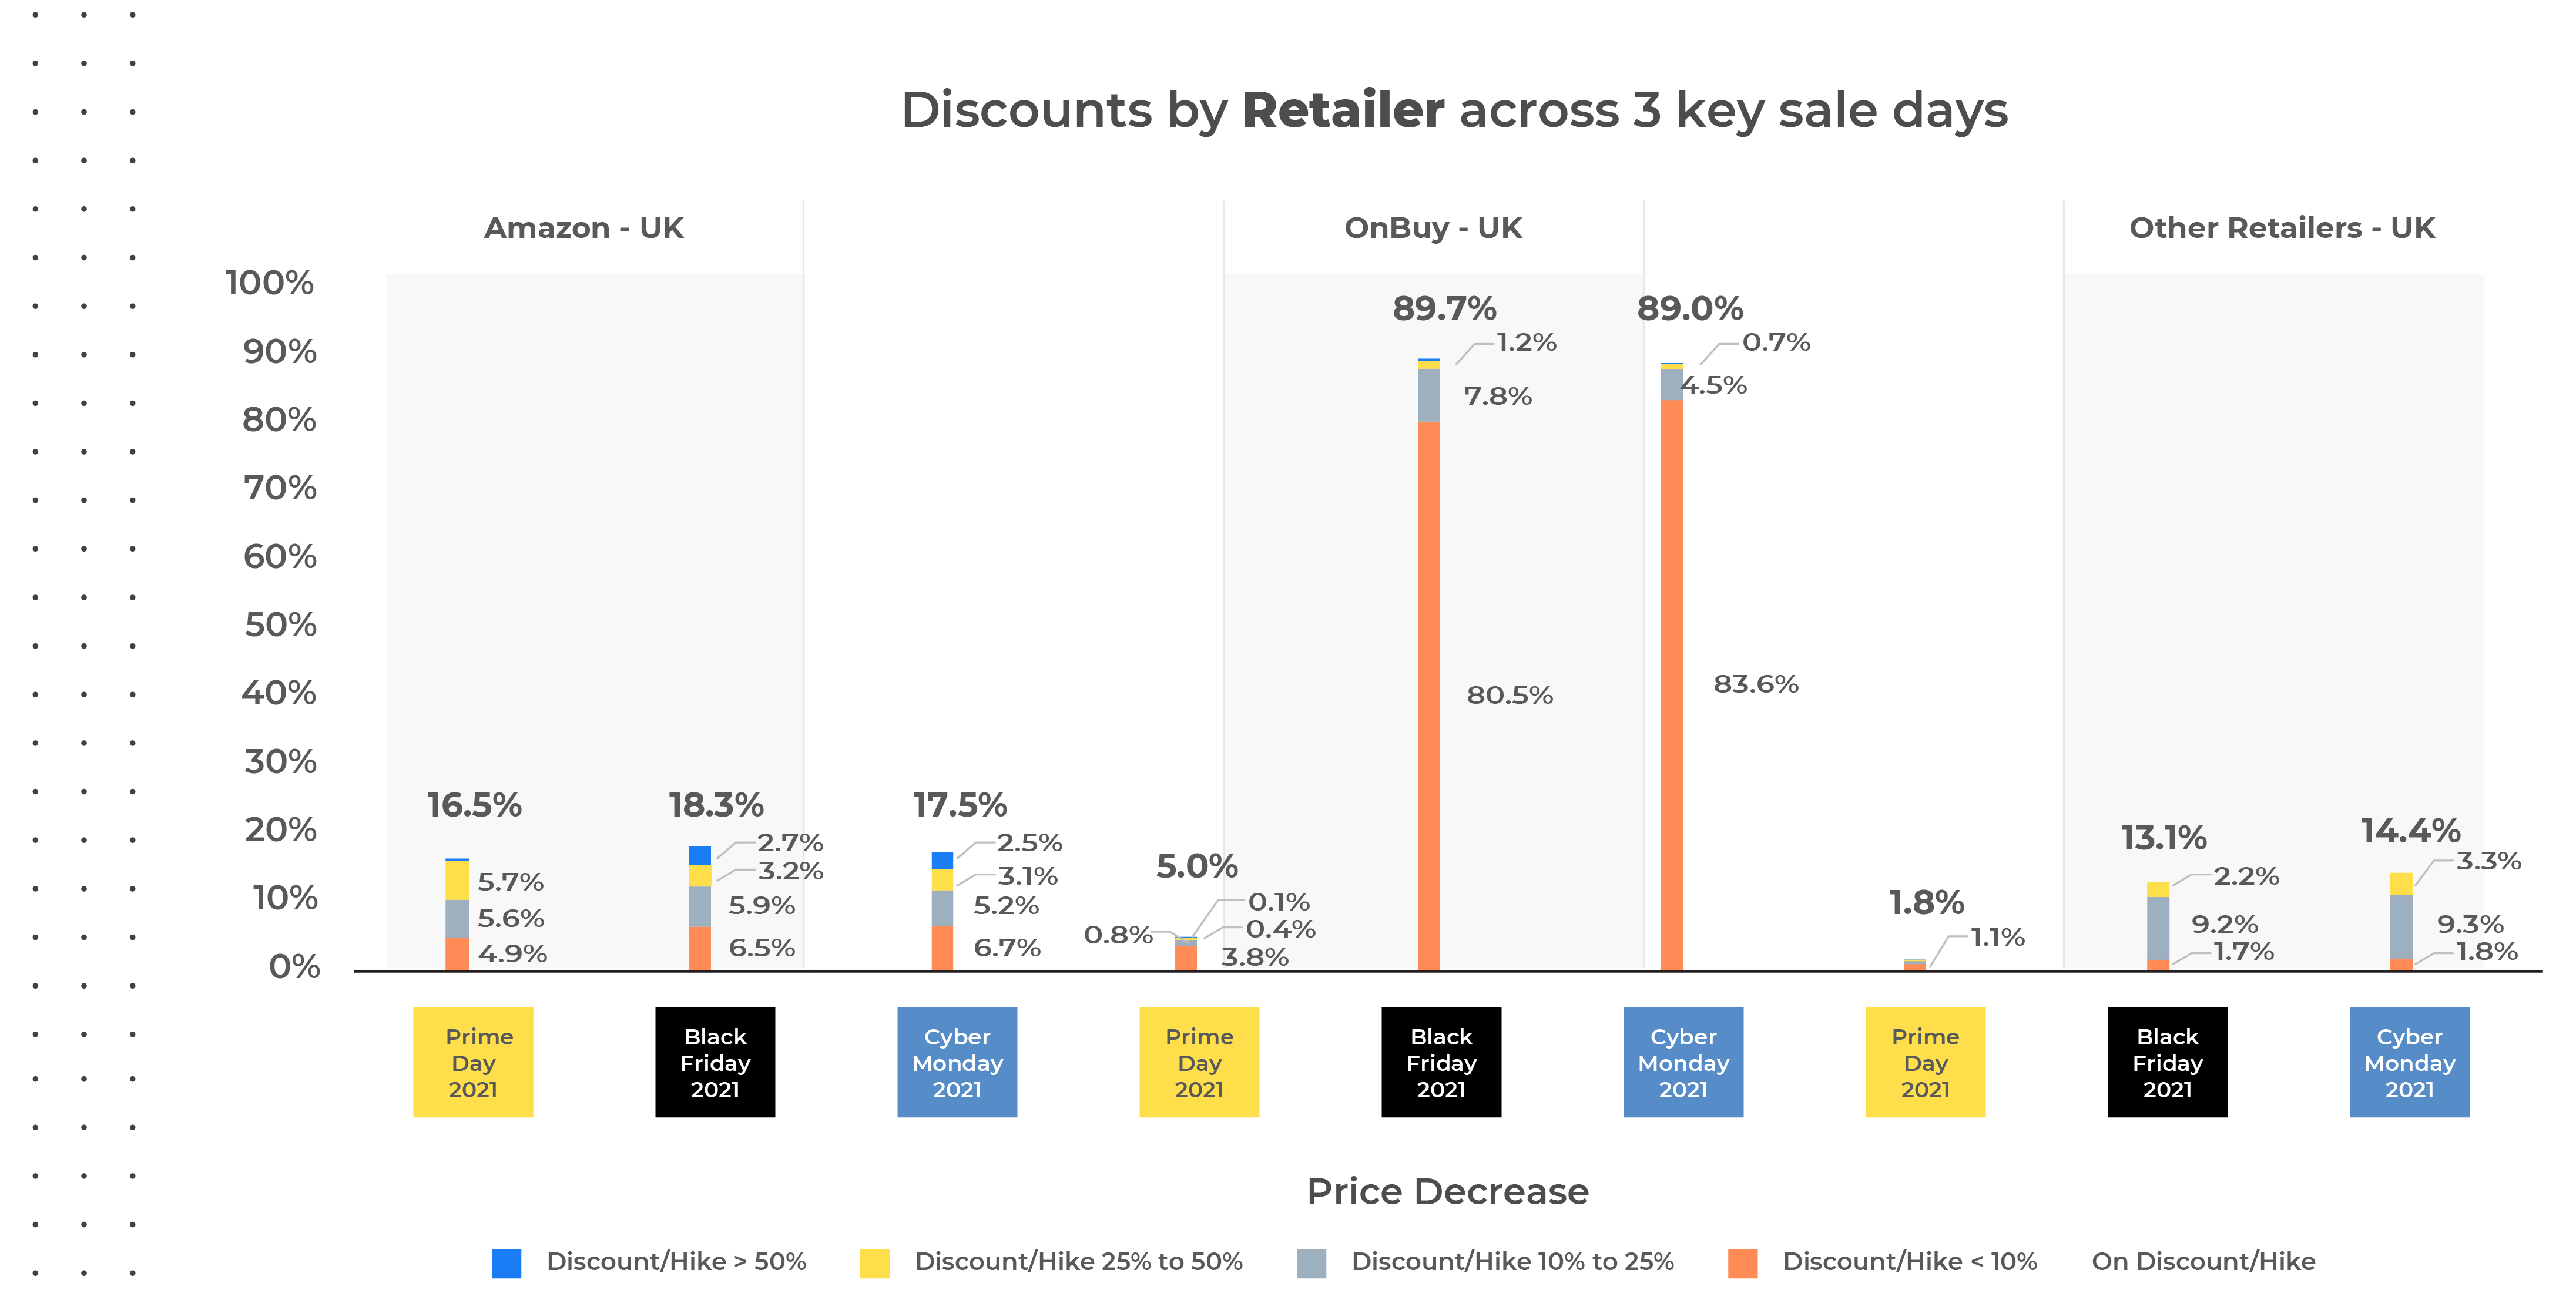
OnBuy is an emerging marketplace in the UK that offers impressive discounted prices and is taking on top UK marketplaces like Amazon. It’s ranked Britain’s fastest-growing eCommerce platform in 2020 and also the fastest grower by traffic. The low listing fees starting at 5% allow sellers to competitively price their products, making them more accessible to a greater number of buyers with huge discounts. The most prominent deals and discounts are highlighted on the landing page and featured across OnBuy’s social pages to grab the audience’s attention.
Discounts by Retailer
This was clearly reflective in the data we gathered from the 3 big sales in 2021. Most retailers in the UK, including Amazon offered at best 20% of their products, in the categories we tracked, at discount. The only outlier was OnBuy – OnBuy offered close to 90% of their products at discount!
OnBuy was able to offer a comparatively high number of discounted products than their competition because the magnitude of the discount was much much lower. The platform offered minimal discounts; out of the 90% of discounted products, 80% of those products had discounts that were less than 10%. As opposed to other retailers who had under 7% of their products on discounts of less than 10%.
OnBuy’s discounting strategy built a perception that they were the biggest discounters, even when the discounts were not as deep.
Black Friday v/s Cyber Monday – which one was better for holiday shoppers?
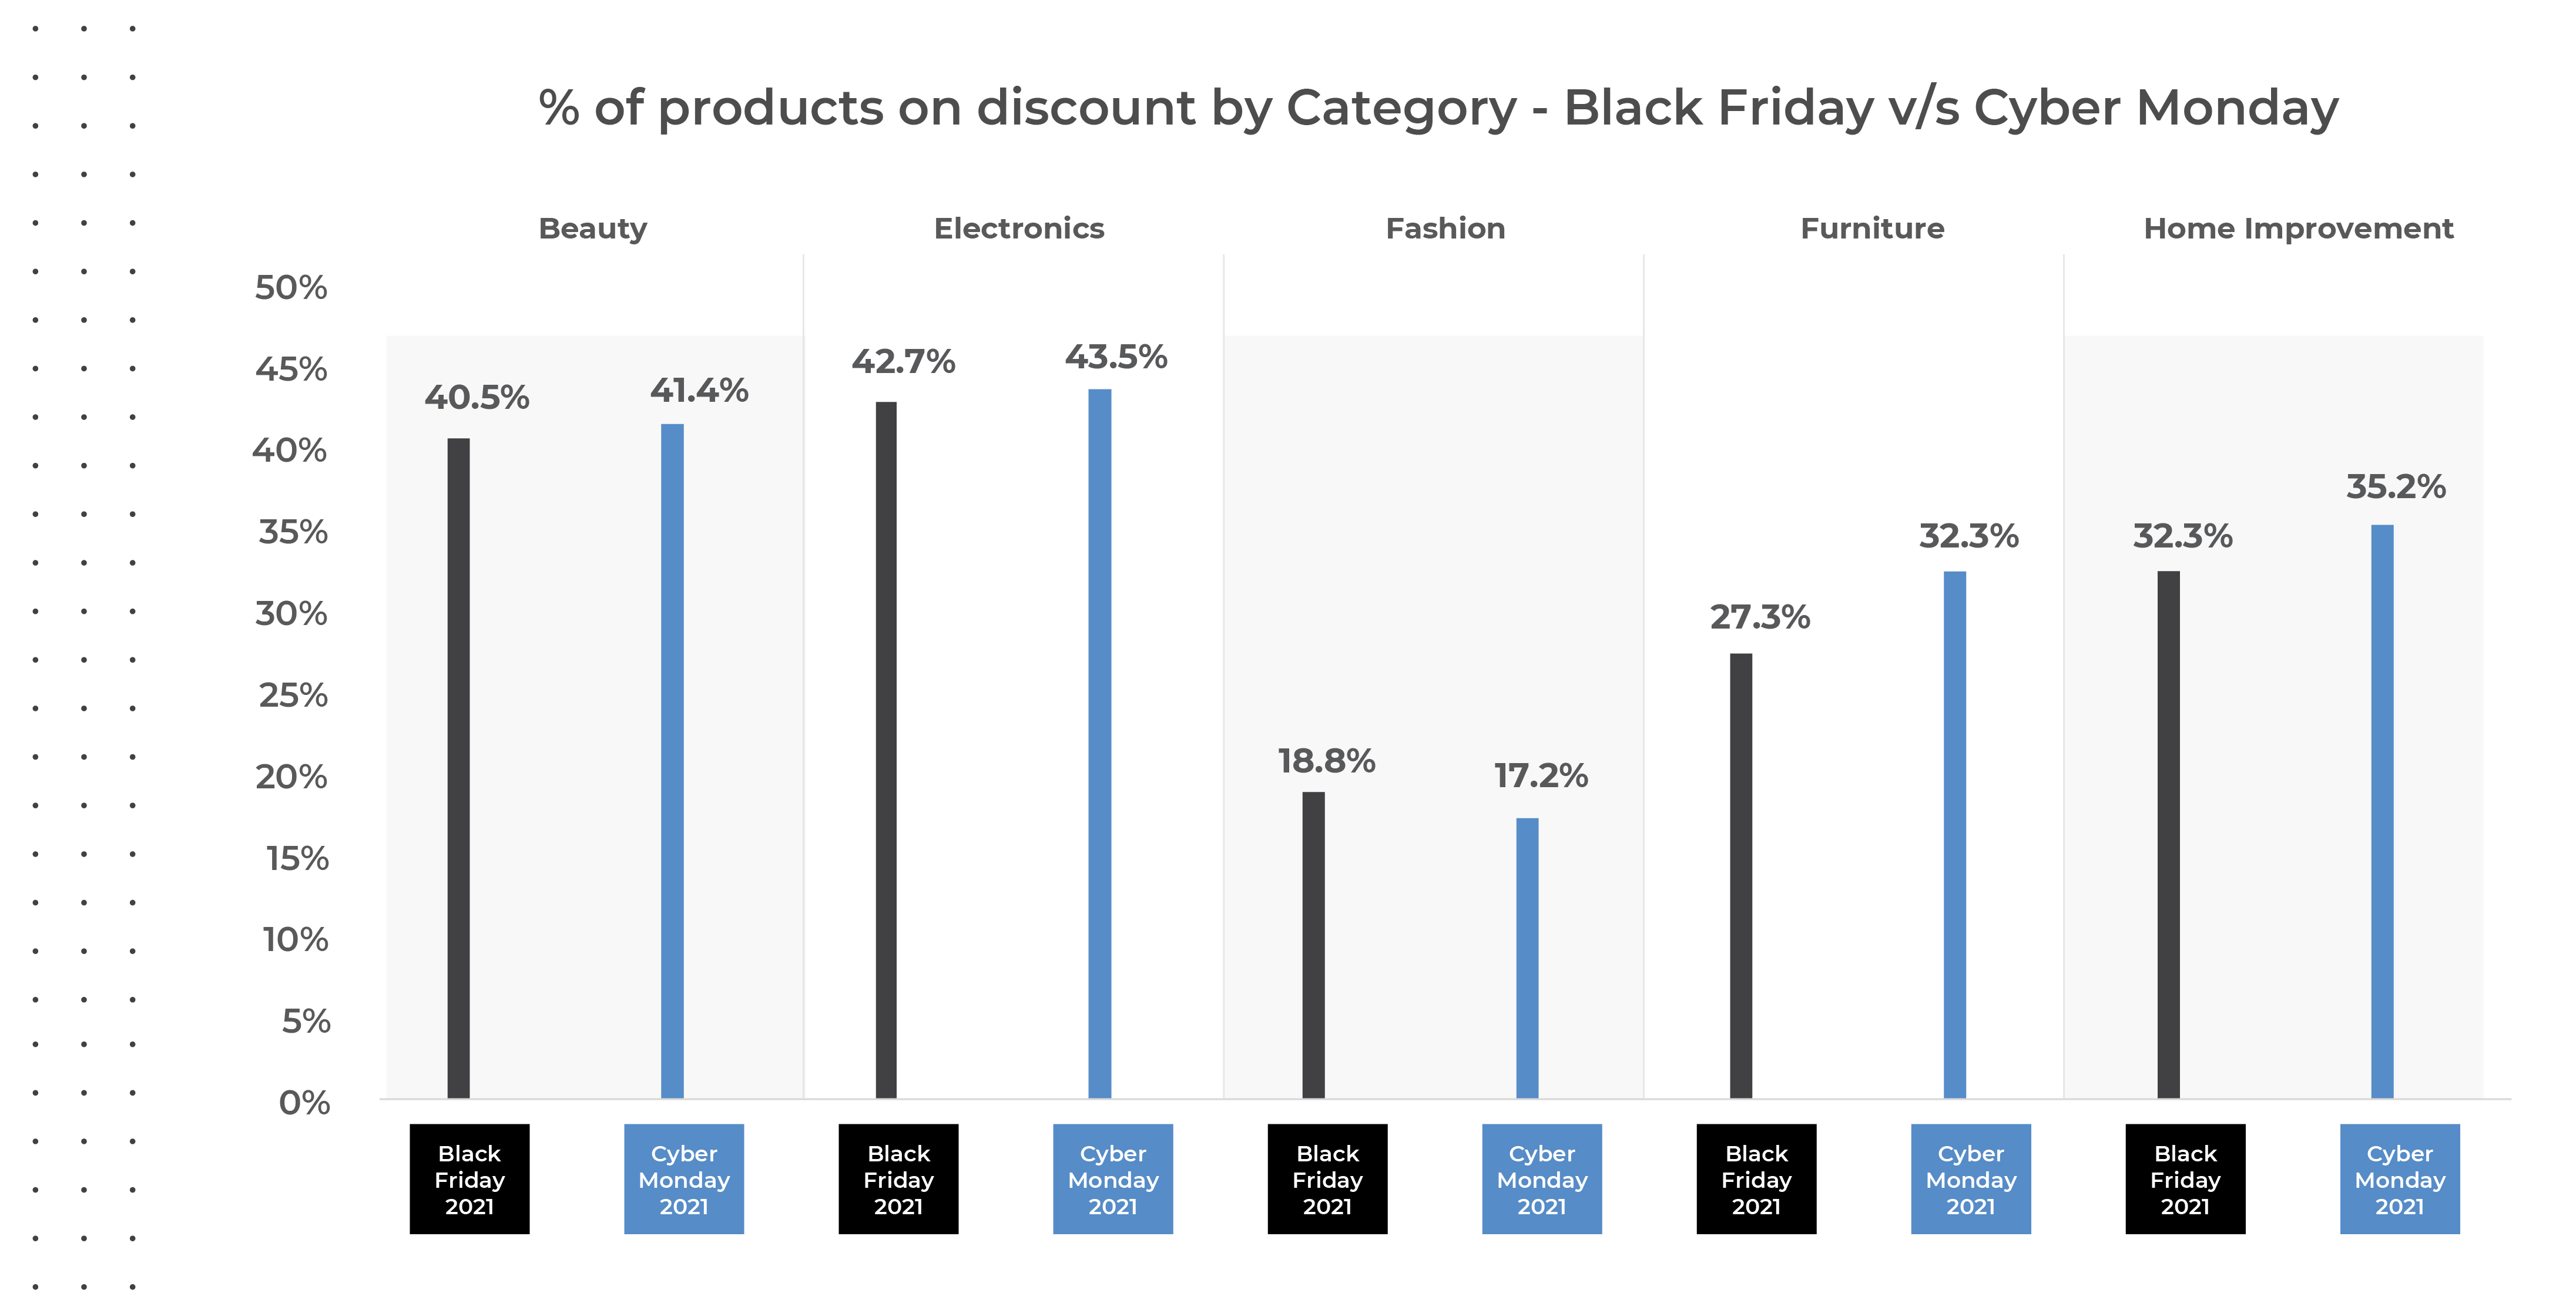
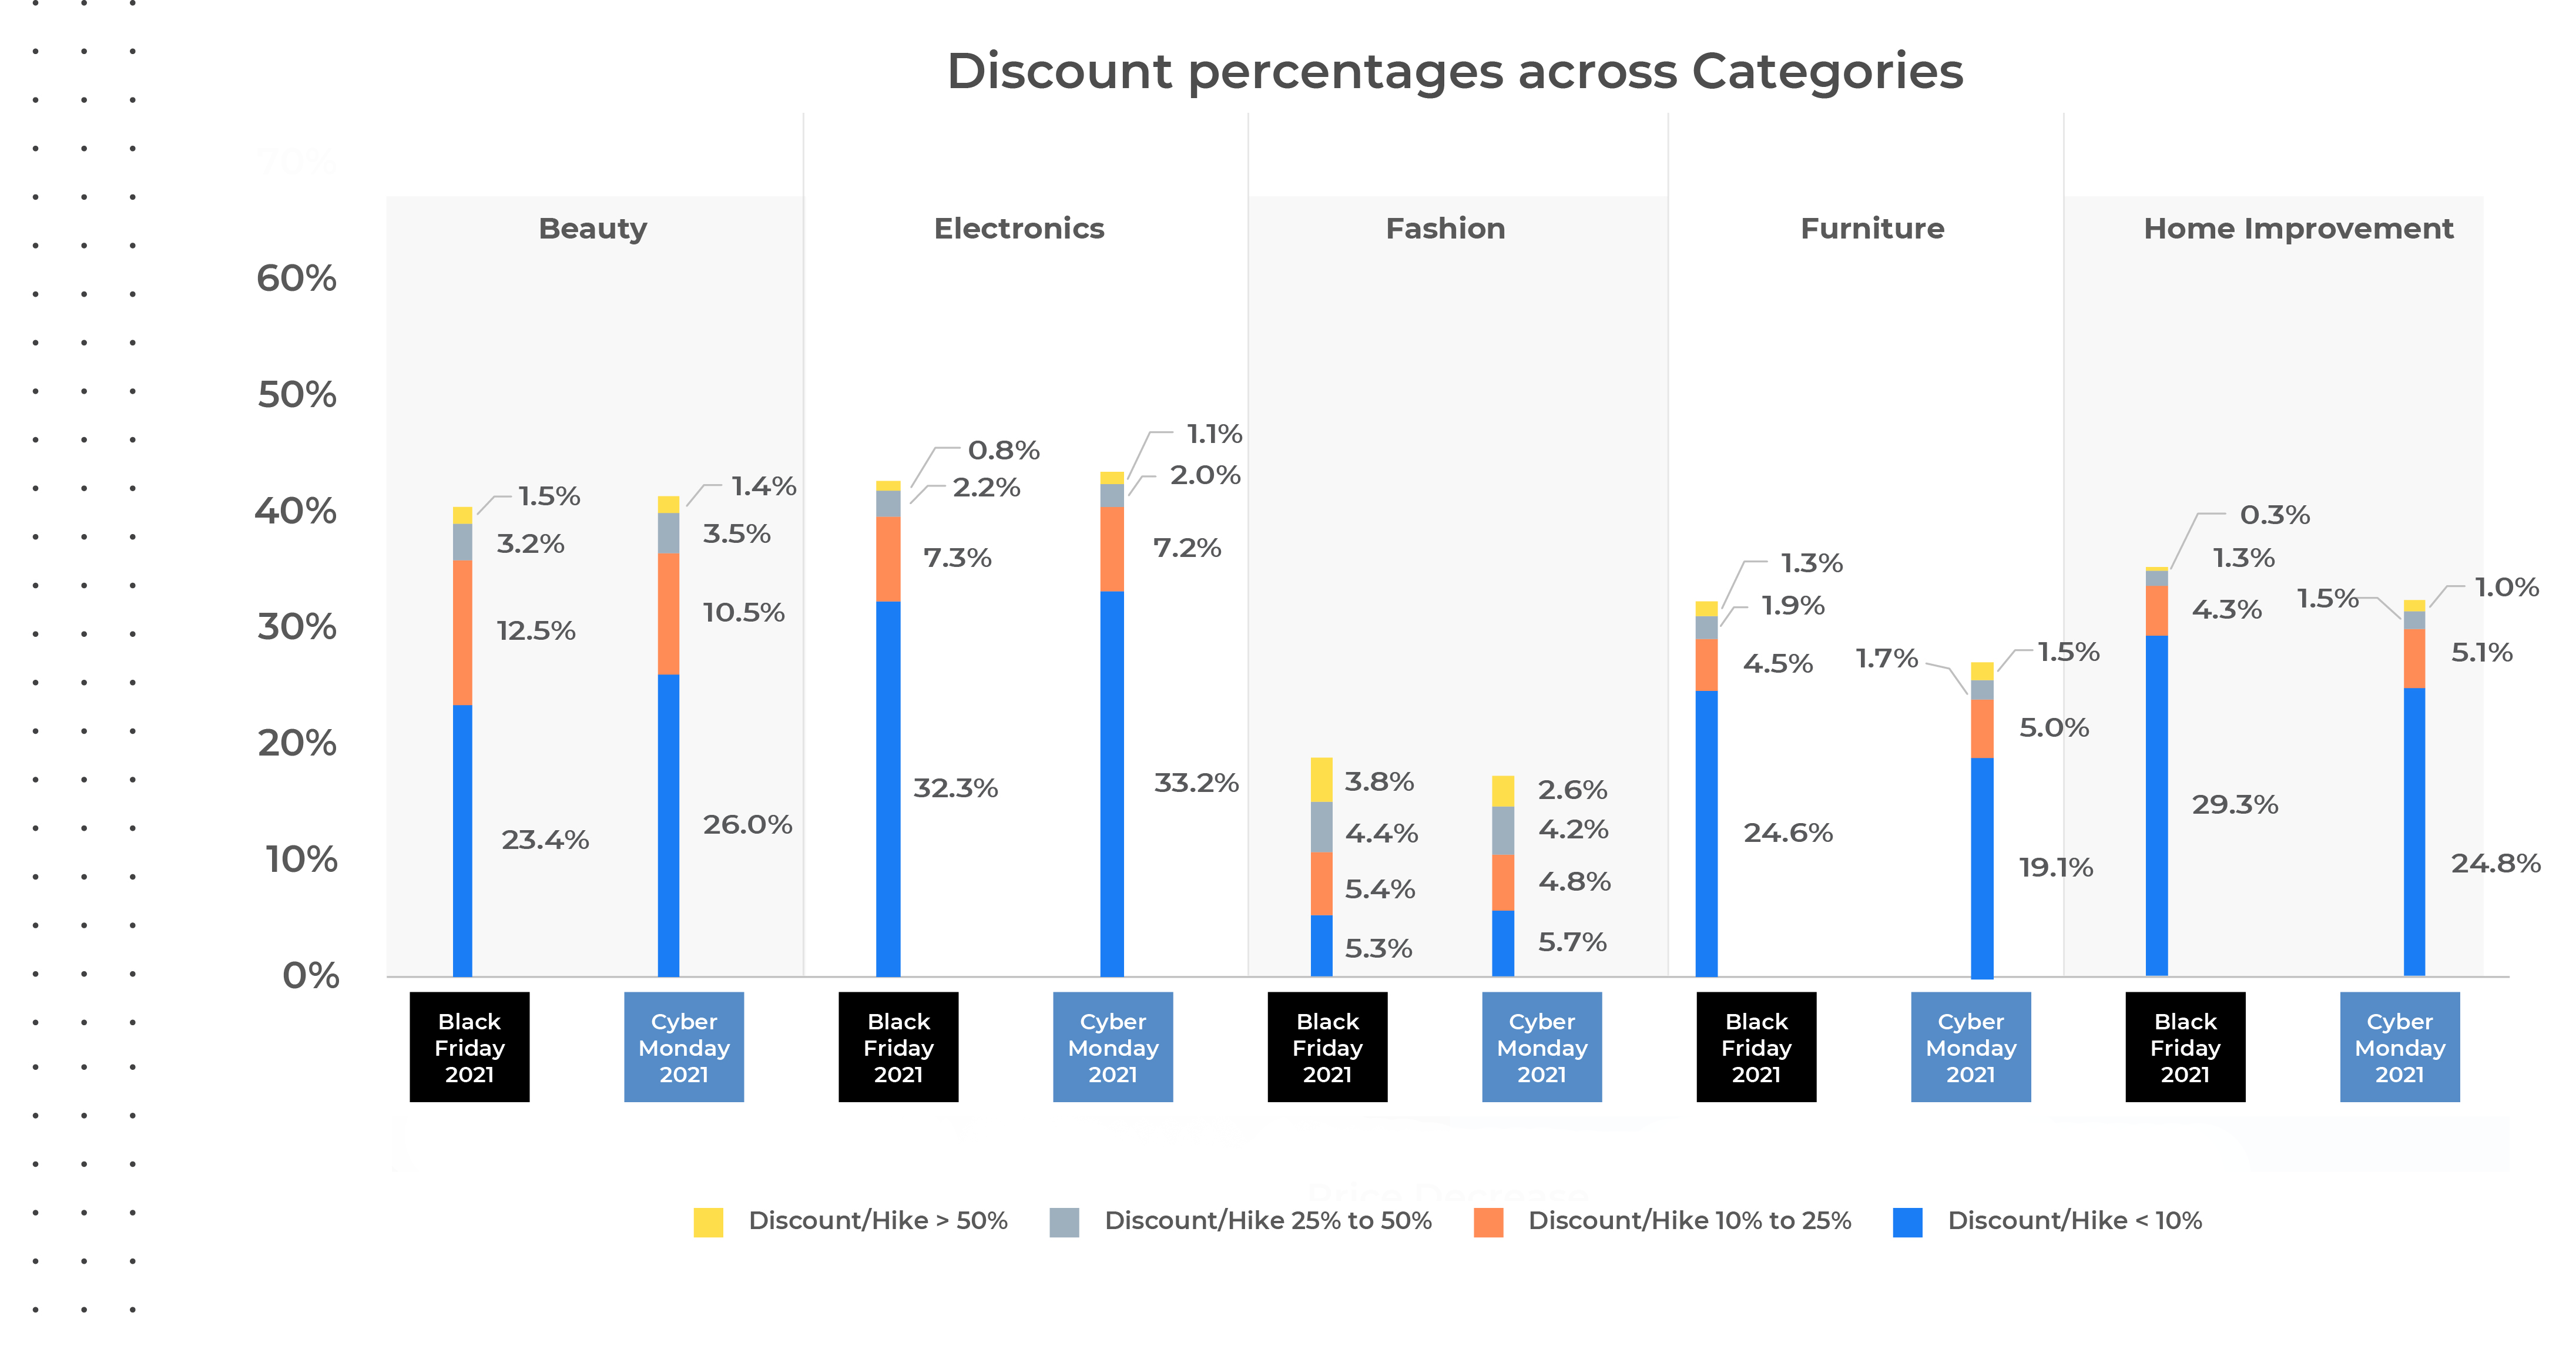
Discount by category- Black Friday VS Cyber Monday
Black Friday kicks off the holiday shopping season and is synonymous with some of the most significant sales after Thanksgiving. But until recently, Cyber Monday has become a great way for eCommerce retailers to capitalize on holiday discounts and expand their most beneficial sales events of the year.
In 2021, retailers pulled in $8.9 billion in Black Friday online sales and a total sales of $10.7 billion on Cyber Monday. In the YOY review, Black Friday saw a decline of 1.3% from 2020’s record of $9.03 billion, and Cyber Monday saw a drop of 1.4%, only $100 million shy of $10.8 billion in 2020.
Across Beauty, Home Improvement, Electronics & Furniture categories, we saw that more products were on discount on Cyber Monday v/s Black Friday. However, the opposite was true for the Fashion Category. In the Fashion Category, we saw a marginally higher number of products on Discount during Black Friday than Cyber Monday.
Discount percentages across categories
Across both sales, the Electronics category offered the highest discounts at over 40% of products discounted compared to other categories on both Black Friday & Cyber Monday. However, a very small fraction of the products had a discount of over 50%, indicating the lack of ‘BIG blockbuster deals’ in this category. At the same time, the Fashion category offered the least number of deals with less than 20% products on discount, but the highest magnitude of discount across the board! On Black Friday, 3.8% of products had discounts higher than 50%, and 2.6% of products on Cyber Monday. In most other categories, between 1 – 1.5% of products had over 50% discount. However, Fashion brands offered more than 50% discount on 2x the average number of products on both sale days.
Why did the Fashion Category offer such high discounts? Brands are now capitalizing on customers’ need for instant gratification in the age of see-now, buy-now fashion trends by offering their products at high discounts. It also allows them to quickly eliminate overstock. However, this has given rise to fast fashion, a trend that focuses on rapidly producing low-quality clothes in huge volume. Fast fashion focuses on replicating trendy pieces like streetwear and fashion week designs, not four times a year but every week, if not daily. Fast fashion promotes brands to manufacture and sell low-quality merchandise that goes out of trend as soon as buyers wear it once. There is little to no time for quality control, and pieces are thrown away after a few wears. In the UK alone, 300,000 tonnes of used clothes are buried or burned in landfills each year. However, every element of fast fashion from rapid production, competitive pricing, to trend replication has a detrimental impact on the planet.
Conclusion
The effects of COVID-19 can be seen far and wide in the UK retail industry, especially with a steep rise in inflation. Fortunately, even though retail sales in the UK declined during the 2021 holiday season due to the Omicron variant, they increased during Black Friday and Cyber Monday. Sales also jumped back in January 2022 and are further projected to grow by 5% in 2022. Additionally, brands can sustain the impact of disruptive factors throughout 2022 by ensuring their Digital Shelf is updated and flexible enough to react swiftly to both threats and opportunities in order to maximize the chances of success.
For many brands, pricing strategy boils down to guesswork — shooting in the dark and hoping consumers are willing and happy to pay. However, the ‘throw it at the wall, and see what sticks’ pricing strategy leads to big pricing mistakes. Pinning down an optimal price for products requires a clear picture of ideal customers, understanding each customer segment’s behavior, a solid grasp of your product’s value, and an analysis of competitors. Pricing analytics can help brands track a wide range of pricing metrics with cutting-edge analytical tools and use insights to get ahead of their competition. This analysis uses historical data to understand how previous pricing and promotion activities affect brand, sales, and customer price perception. It often involves identifying opportunities and weaknesses in competitors’ pricing strategies and exploiting them to improve sales and revenue.
Pricing analytics helps brands understand how product pricing and promotions affect profitability and the steps they can take to optimize their pricing structures. Brands can leverage their pricing and consumer data to design appropriate pricing models for achieving their sales goals.
Here is a brief overview of pricing analytics, its benefits, and ways to improve sales with historical pricing analytics.
What is historical pricing data analytics?
Historical Pricing Data Analytics
Pricing analytics uses historical pricing and demand data to understand how pricing activities have affected profitability and overall brand. It also helps to optimize a brands’ pricing strategy for maximum revenue. Manual tracking of pricing for brands with numerous product lines, multiple selling points, different customer tiers, and complex product bundles is a huge challenge. Brands from every sector and industry vertical, manufacturing and distribution to retail and eCommerce, can benefit from pricing analytics.
There are three types of pricing analysis:
Descriptive
Descriptive pricing analytics involves analyzing historical data to evaluate how customers have perceived and reacted to pricing fluctuations in the past. It analyzes metrics such as month-on-month sales growth, average revenue per customer, year-on-year pricing changes, or changes to the number of registrations to a particular service over a specific period.
Predictive
Although brands can’t accurately predict how pricing changes will reflect sales, they can use predictive pricing analytics to get insights into the best possible chance of doing so. Predictive pricing analyzes historical data with statistical algorithms and machine learning to predict the price and trends of products in the future. It also helps brands to optimize their prices with future goals.
Prescriptive
Prescriptive pricing analytics is the opposite of descriptive analytics. Unlike descriptive analytics that helps brands explore their historical data to understand customer response after an event, prescriptive analytics help brands design better and more informed strategies. With prescriptive analytics, brands can shape their growth strategies to achieve more sustainable results over the long term.
Benefits of historical pricing data analytics
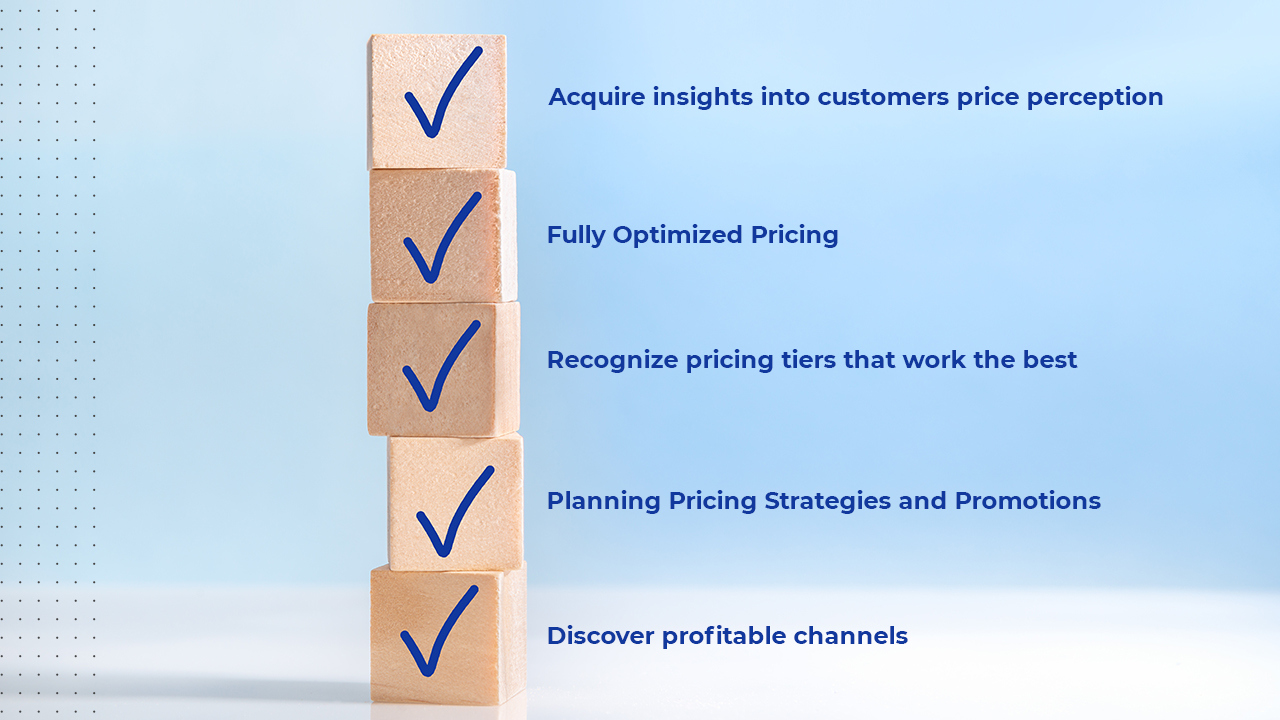
Benefits of Historical Pricing Data Analytics
Acquire insights into customers price perception
While analyzing the metrics to understand pricing optimization, brands can also gather valuable insights into their customer’s price perception. Pricing analytics helps brands understand which customer segments are the most (and least) profitable and how each segment responds to specific pricing strategies. With historical pricing data analytics, brands can also intelligently link pricing and promotions by first determining customer price sensitivity then gauging the effectiveness of promotions.
Fully Optimized Pricing
Historical pricing analytics means eliminating guesswork from deciding the optimal pricing for a given product. By analyzing historical pricing data, brands can discover how their past pricing and promotional decisions impact profitability. Based on this historical data, they can also test various pricing strategies like value-based and dynamic pricing. It also allows brands to learn which customer segments are most likely to respond positively to price change. These insights from pricing analytics will drive more effective (and profitable) pricing decisions.
Recognize pricing tiers that work the best
Many brands have gaps in their pricing strategy — underpriced or overpriced tiers, pricing leaks, markup errors, or neglected upsell opportunities. Tiered pricing models are prevalent in subscription-based brands where brands offer tiers to meet the needs of diverse customer segments. With historical pricing analytics, brands can improve their pricing tiers and get insight into the right number of tiers and optimal prices for each. Pricing analytics will comb a brand’s historical data to find tier pricing mistakes to improve sales and revenue.
Planning Pricing Strategies and Promotions
Promotional pricing decisions are critical for any brand, as pricing perception is directly linked to consumer demand and profits. Brands have to carefully plan promotions that include variables such as list prices, special offers, advertisements, and discounts while ensuring profit margins. With predictive analytics, brands can determine optimal discount levels, keep a close eye on the competition, and announce promotional offers when customers are likely to purchase. Historical pricing analysis also helps predict revenue and determine optimal locations and platforms for promotional ads.
Discover profitable channels
Not all sales channels bring equal revenue to your brand. Historical pricing analysis can help you determine the most effective quality, volume, and revenue channels. Brands must understand which marketing and sales channels bring quality leads that convert to paying customers. It also helps to determine which eCommerce channels are most profitable so you can optimize your budget and identify channels you should be investing in as a part of future customer acquisition strategies.
Metrics to track
Metrics to Track
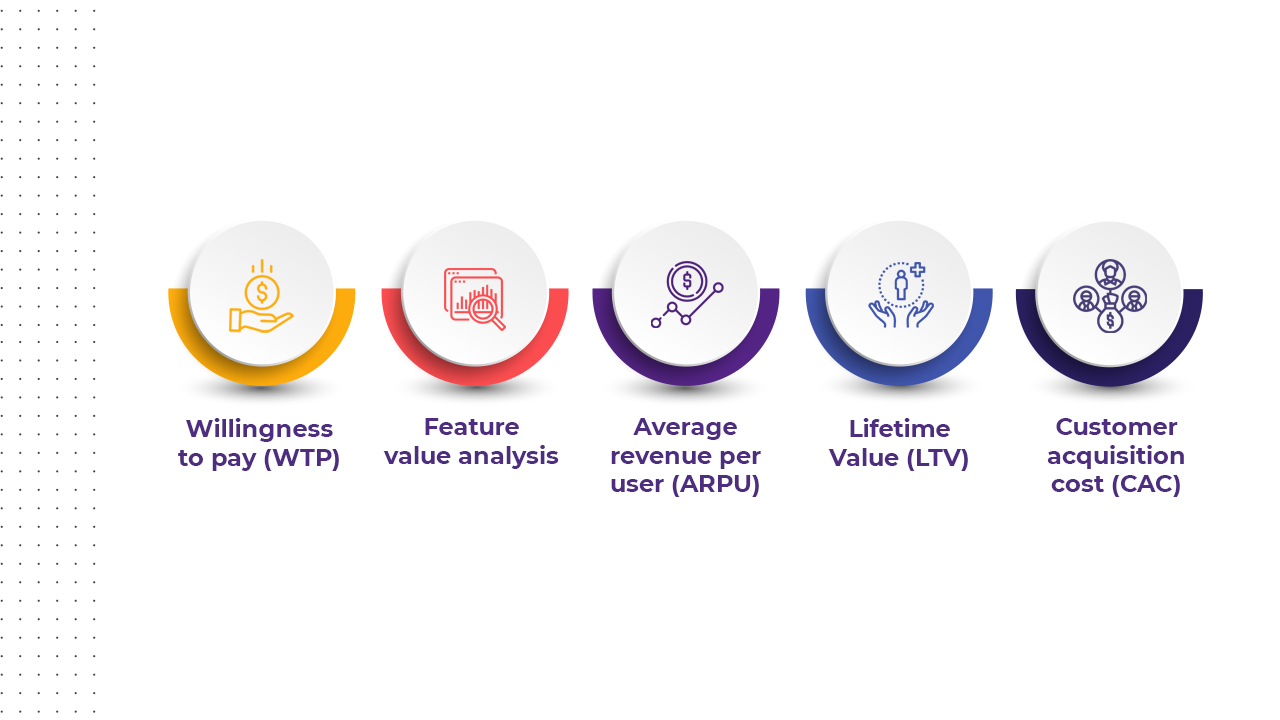
Here are a few pricing analytics metrics that can help brands to understand customer behavior towards pricing:
Willingness to Pay (WTP)
WTP, also known as price sensitivity, is the maximum price your potential customers are willing to pay for your service or product. It is an essential part of pricing strategy since you have no other way of understanding whether your product can yield an augmented product value. Numerous factors are responsible for a customer’s willingness to pay, and it’s not static. Brands must track willingness to pay for all customer segments to ensure that the product is priced competitively and drives maximum profit while staying in line with current market conditions.
Feature Value Analysis
Feature value analysis, also known as relative reference analysis, measures the most important features to customers in relation to other features of a product or service. Analyzing critical features to customer segments will help brands price products based on basic or premium components. It can also help to better bundle your services or products so you can drive the most revenue.
Average Revenue per User (ARPU)
The average revenue per user is the revenue generated from the sum of active users divided by the total number of users in a monthly time frame. Delving deeper into ARPU can help brands compare numbers with rivals and check how all products or customer segments perform.
Lifetime Value (LTV)
Lifetime Value offers a complete picture of a user’s journey and the average revenue that the user will generate throughout their engagement as a customer with your brand. It helps brands determine various economic decisions such as marketing budgets, profitability, forecasting, and resource allocation.
Customer Acquisition Cost (CAC)
A successful and profitable brand needs to balance its customer acquisition cost or CAC. It is about spending the right amount of resources and time to drive new customers without jeopardizing their lifetime value and revenue. Correct calculation of CAC helps brands to quantify their sales funnel and determine the efficiency and profitability of their strategies.
Conclusion
Historical pricing analytics is a powerful tool, and it can make a huge difference to a brand’s potential by increasing sales and unlocking incredible profitability in a relatively short time. Historical analysis of pricing and promotions data will help brands get better marketing returns than relying on traditional pricing approaches.
Leveraging pricing analytics will prevent brands from blindly reacting to competitor price changes and support solutions for scaling up price transformation efforts. By using historical pricing data, brands can more effectively segment their customers for marketing and promotion strategies. Properly utilizing predictive analytics and past sales data can help cut costs and keep profit margins high by adjusting production and prices according to market trends. Need help tracking your competitor prices? Or want historic pricing insights for your own brand? Or need to track the efficacy of your online promotions? Sign up for a demo with our team to know how DataWeave can help!