Amazon reported a record-breaking Prime Day this July, marking it as the biggest sales event in the company’s history. So when the eCommerce giant announced the Prime Big Deal Days this fall, we were curious to find out how big a deal it really is.
The Prime Big Deal Days, similar in magnitude to the Summer Prime Day, promised to present substantial savings across a diverse range of categories, including electronics, toys, home, fashion, beauty, and Amazon products.
However, for a shopper, an important question is: Does the Prime Big Deal Days in October offer lower prices than Amazon’s mega Prime Day event in July?
To answer this question, we turned our data aggregation and analysis platform to focus on these two sale events and analyzed which event offered better deals across key categories and brands.
TL;DR: Surprisingly, the Prime Big Deal Days in October offered, on average, 2.02% higher discounts than its counterpart event in July.
Read on for details on how we went about our analysis and how discounts vary across categories, sub-categories, and brands.
Our Methodology
We tracked the prices and discounts of a large sample of products during both Prime Day events. The following are some relevant details about our sample:
- Number of products analyzed: 1500+
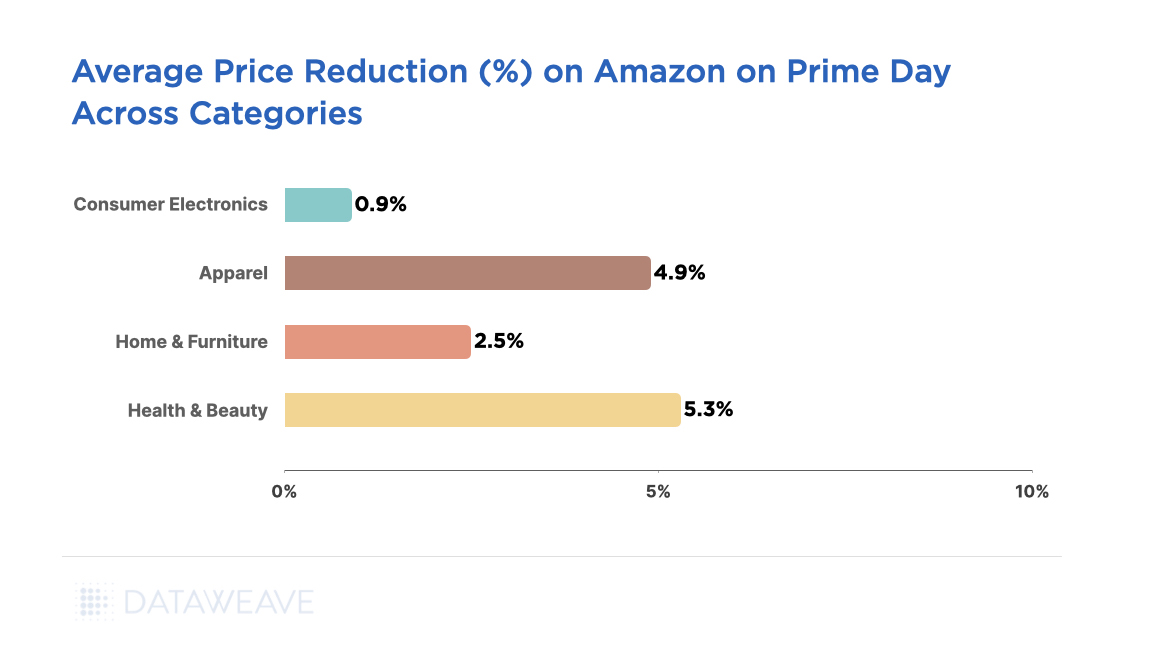
- Categories: Apparel, Consumer Electronics, Home & Furniture, Health & Beauty
- Prime Day Sale Analysis: 11-12 July 2023
- Prime Big Deal Days Analysis: 10-11 Oct 2023
- Website: Amazon.com
Our analysis focused on the differences in the prices and discount levels of products between the two sale events.
Our Key Findings
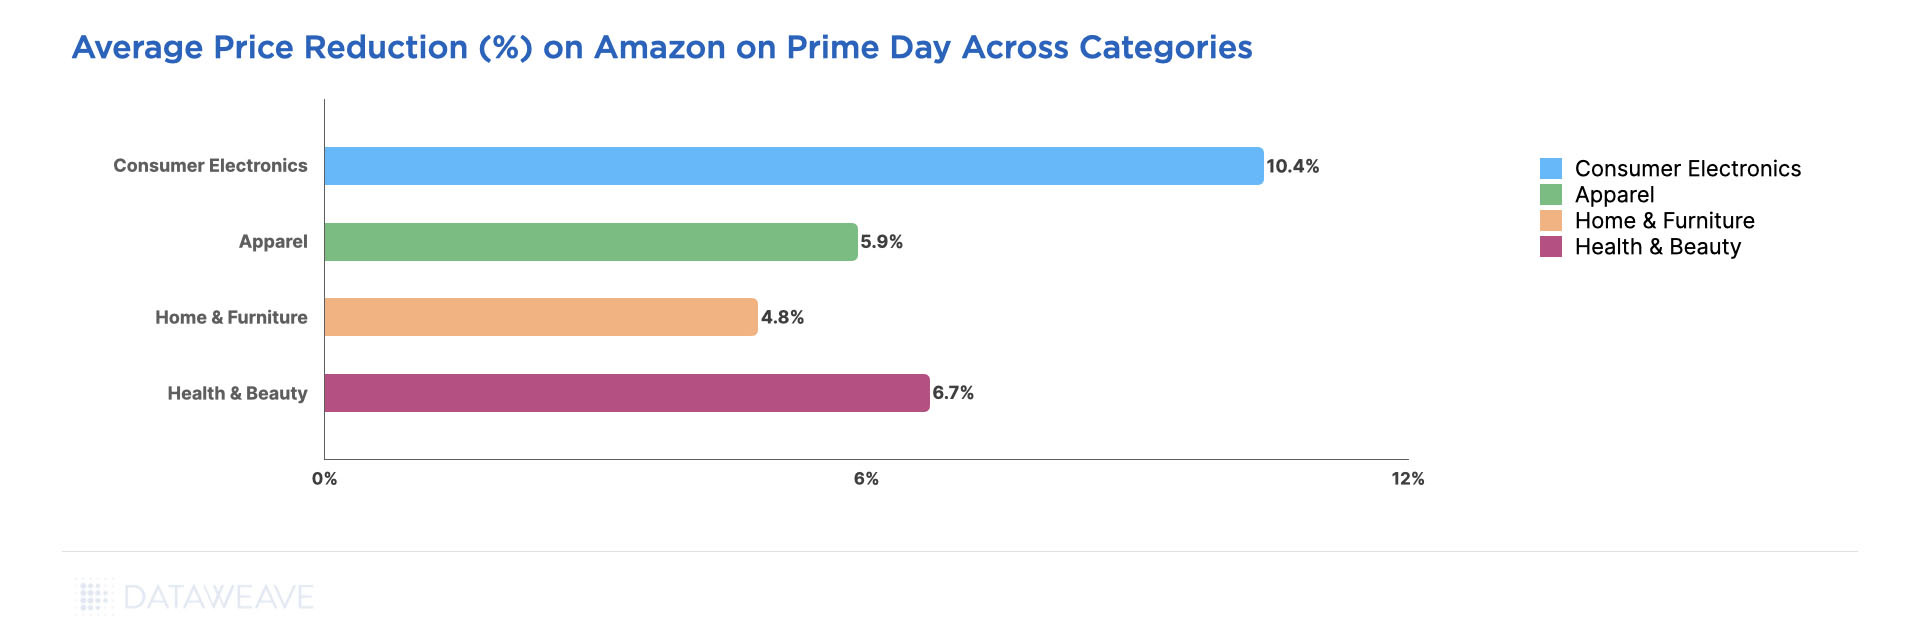
The average discount during the Prime Big Deal Days in October was 29.44%, which was 2.02% higher than the average discount during the Prime Day sale in July (27.42%). Interestingly, the October event offered better deals across each product category analyzed, albeit at slightly varying levels.

By offering deeper discounts in October, Amazon may have aimed to encourage early holiday shopping, thereby capturing a larger share of the consumer wallet before competitors intensify their promotional activities closer to the festive season.
As other retailers and online marketplaces gear up for their own holiday promotional events, Amazon’s decision to provide heightened discounts in October could serve as a preemptive move to secure customer loyalty and drive sales momentum before the onset of the peak shopping period.
Additionally, Amazon’s strategic push to amplify the visibility of its diverse product offerings, including exclusive launches and partnerships during the October event might have contributed to the higher discounts.
Next, let’s take a closer look at each product category.
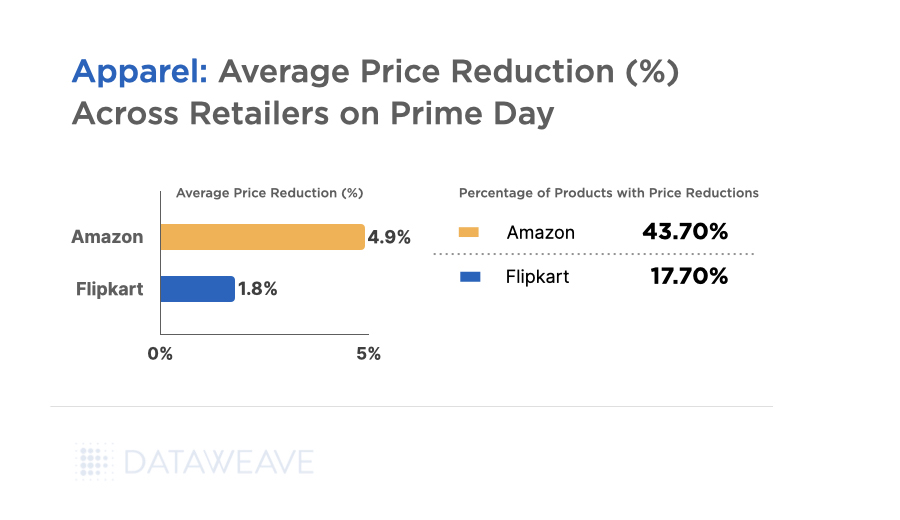
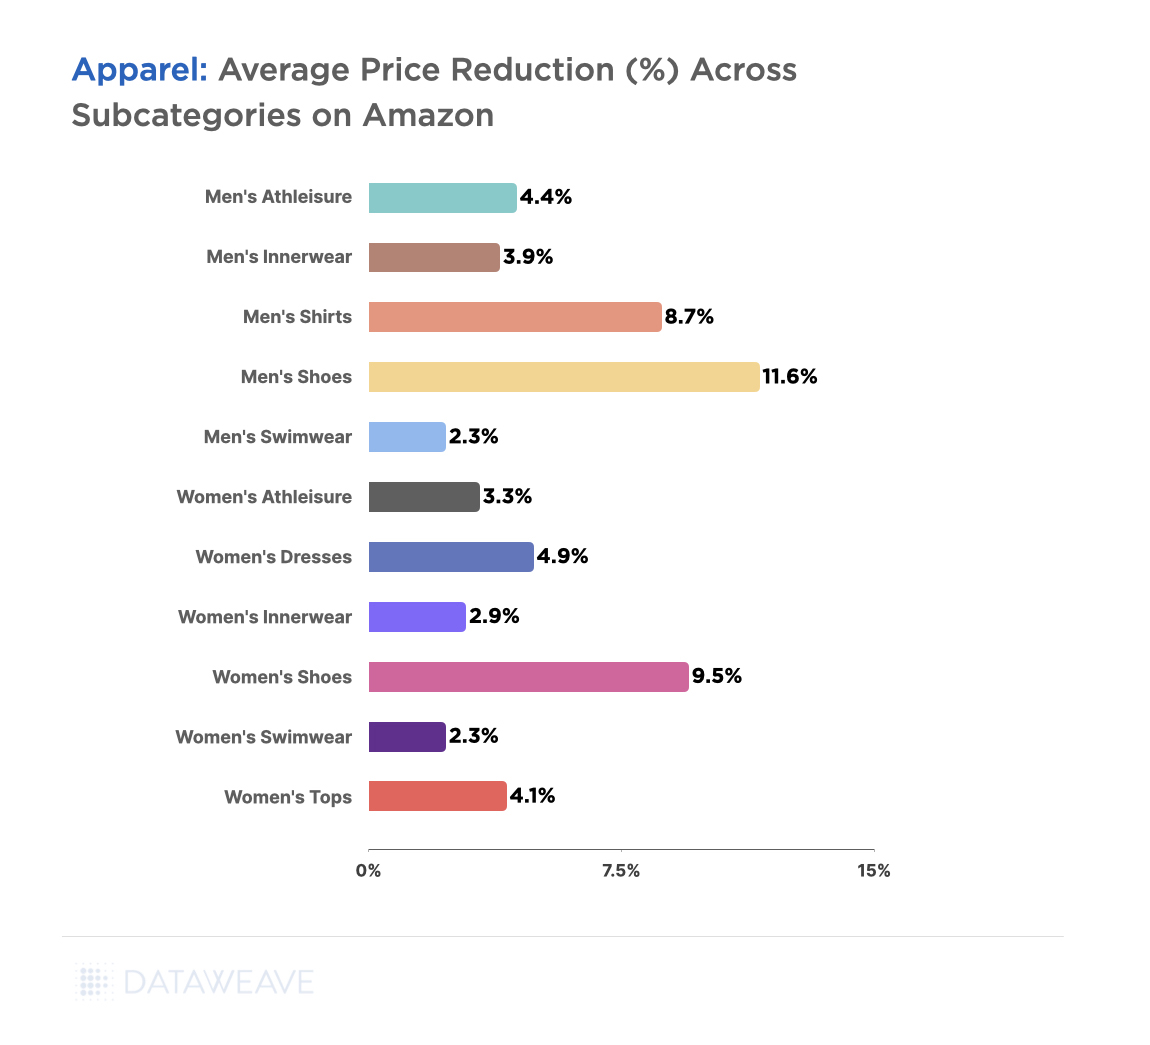
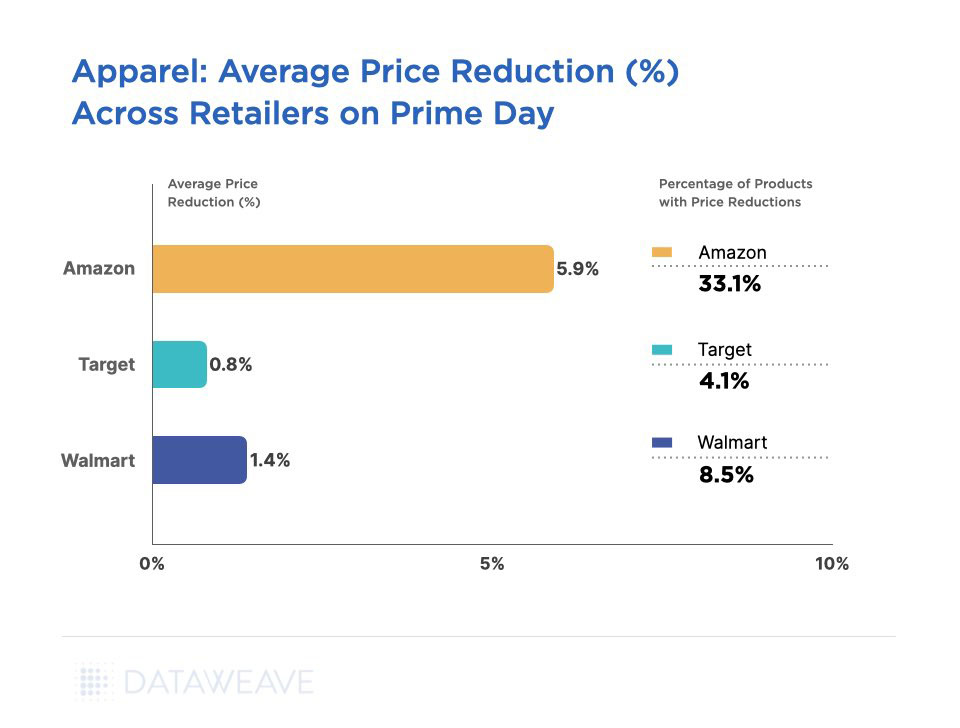
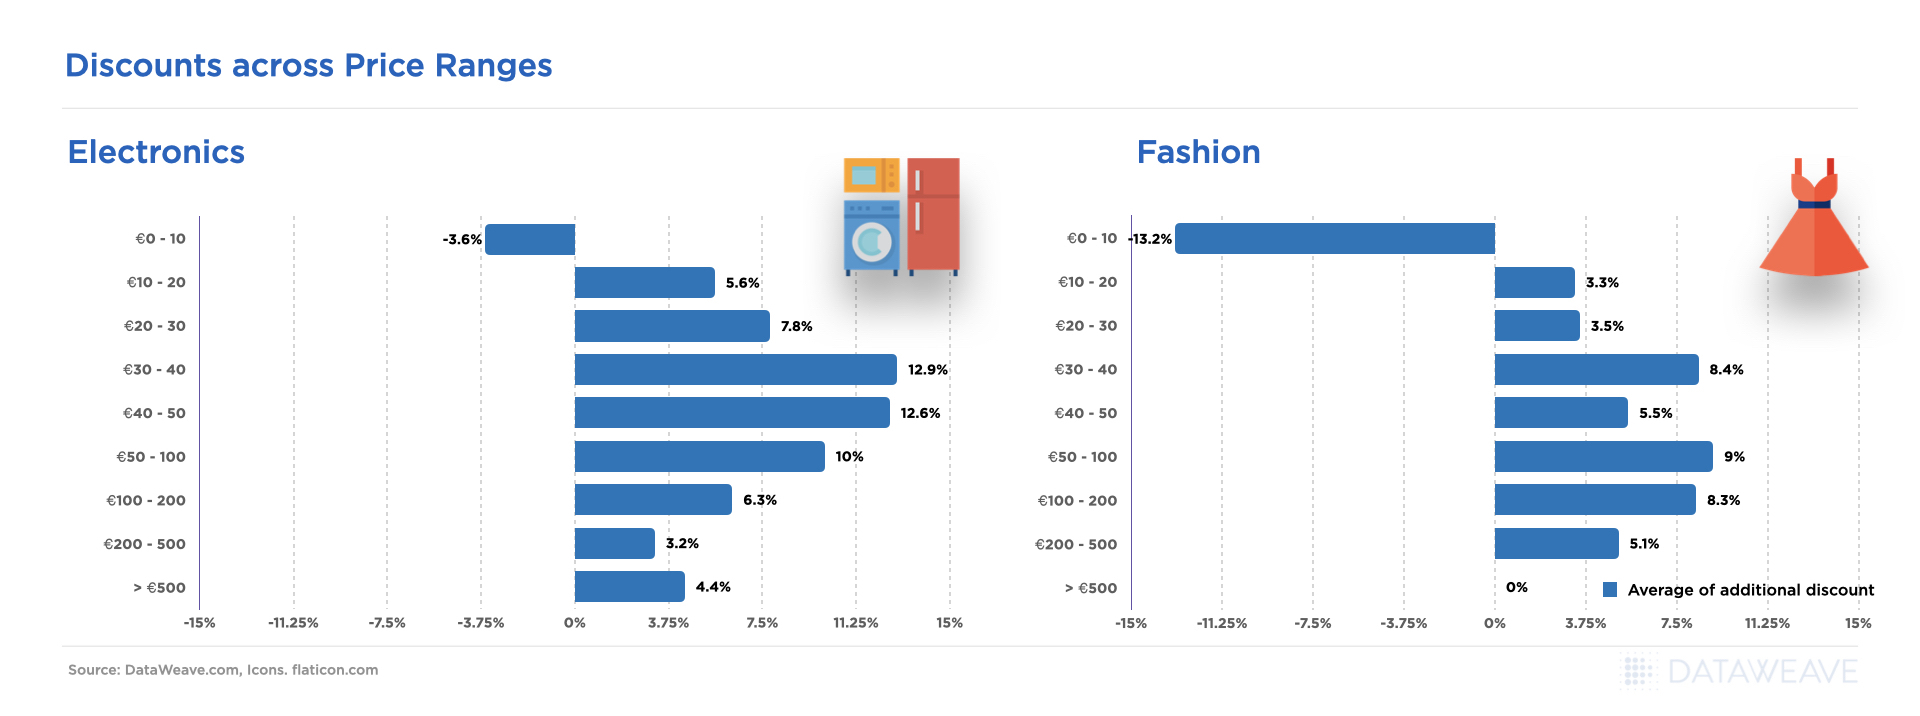
Apparel
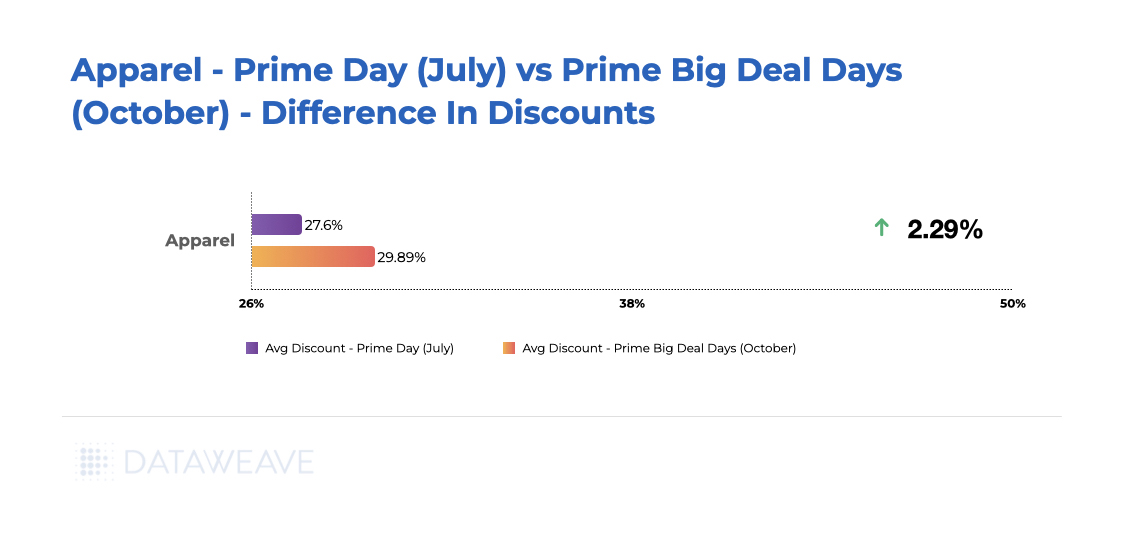
During October’s Prime Big Deal Days, the Apparel category experienced a notable uptick, boasting a 2.29% increase in discounts compared to the earlier Prime Day event in July.
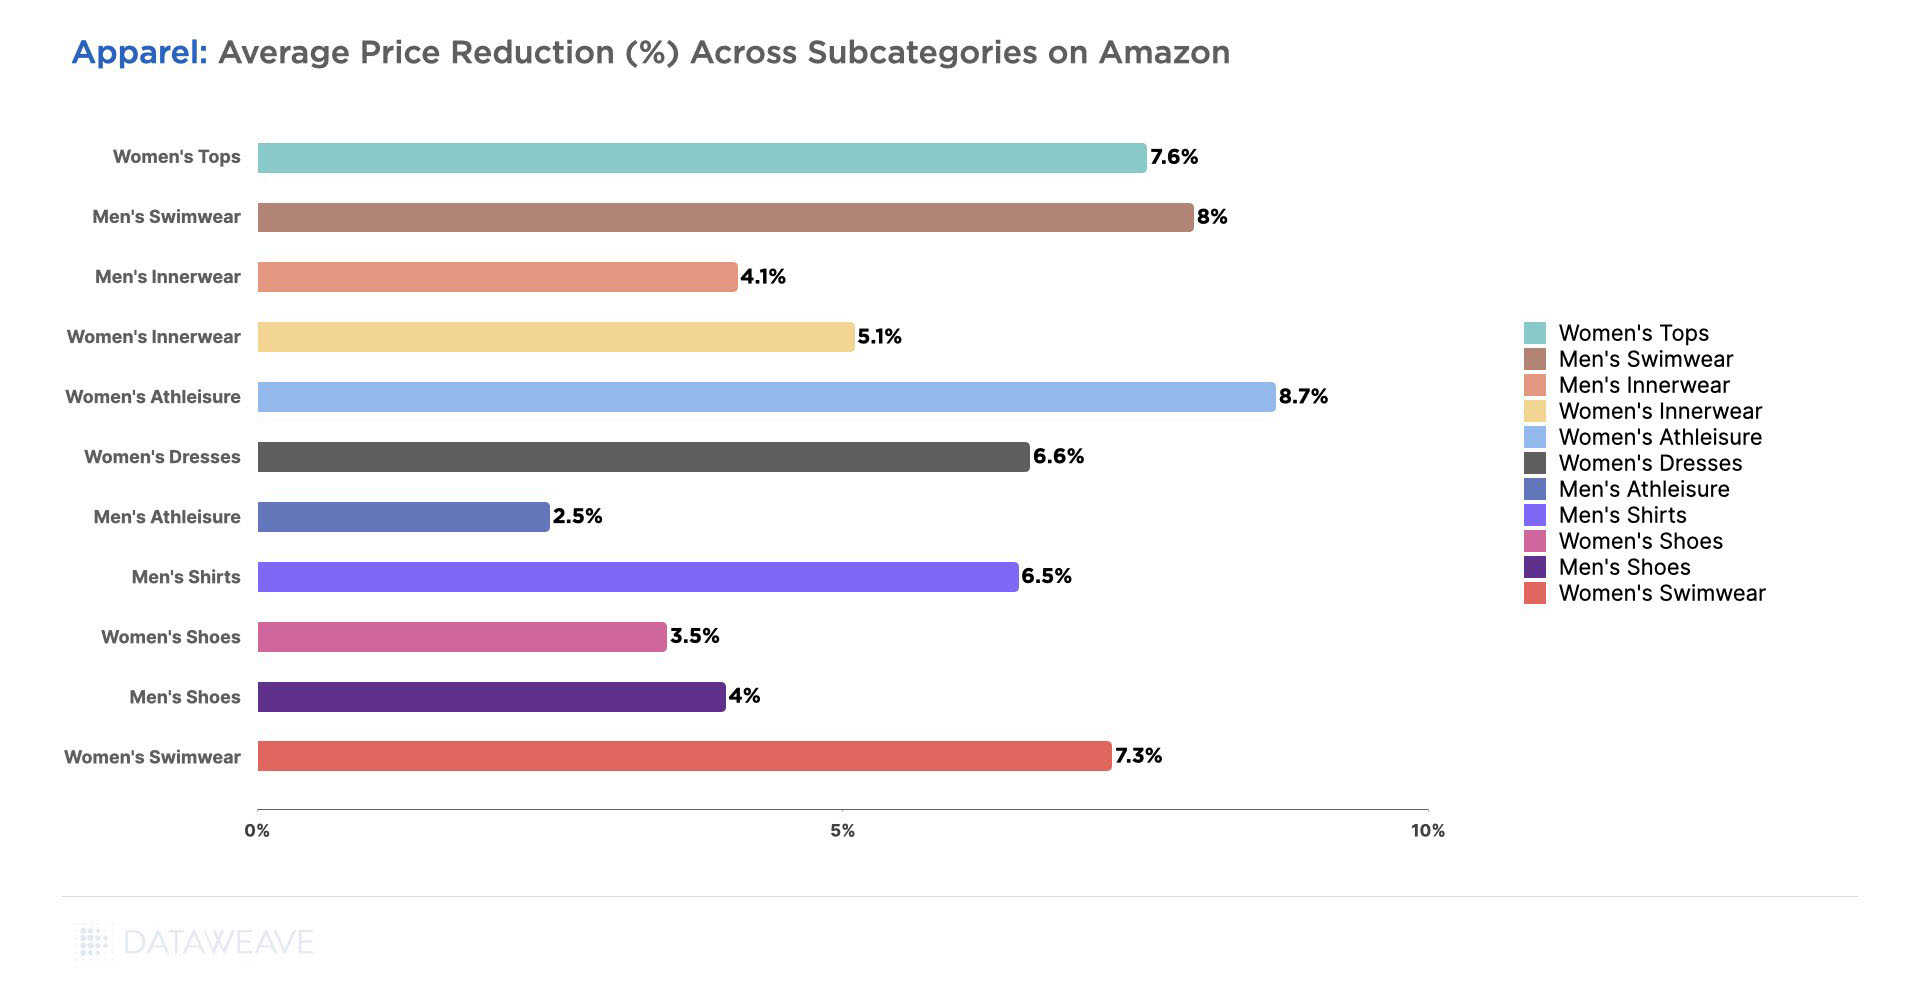
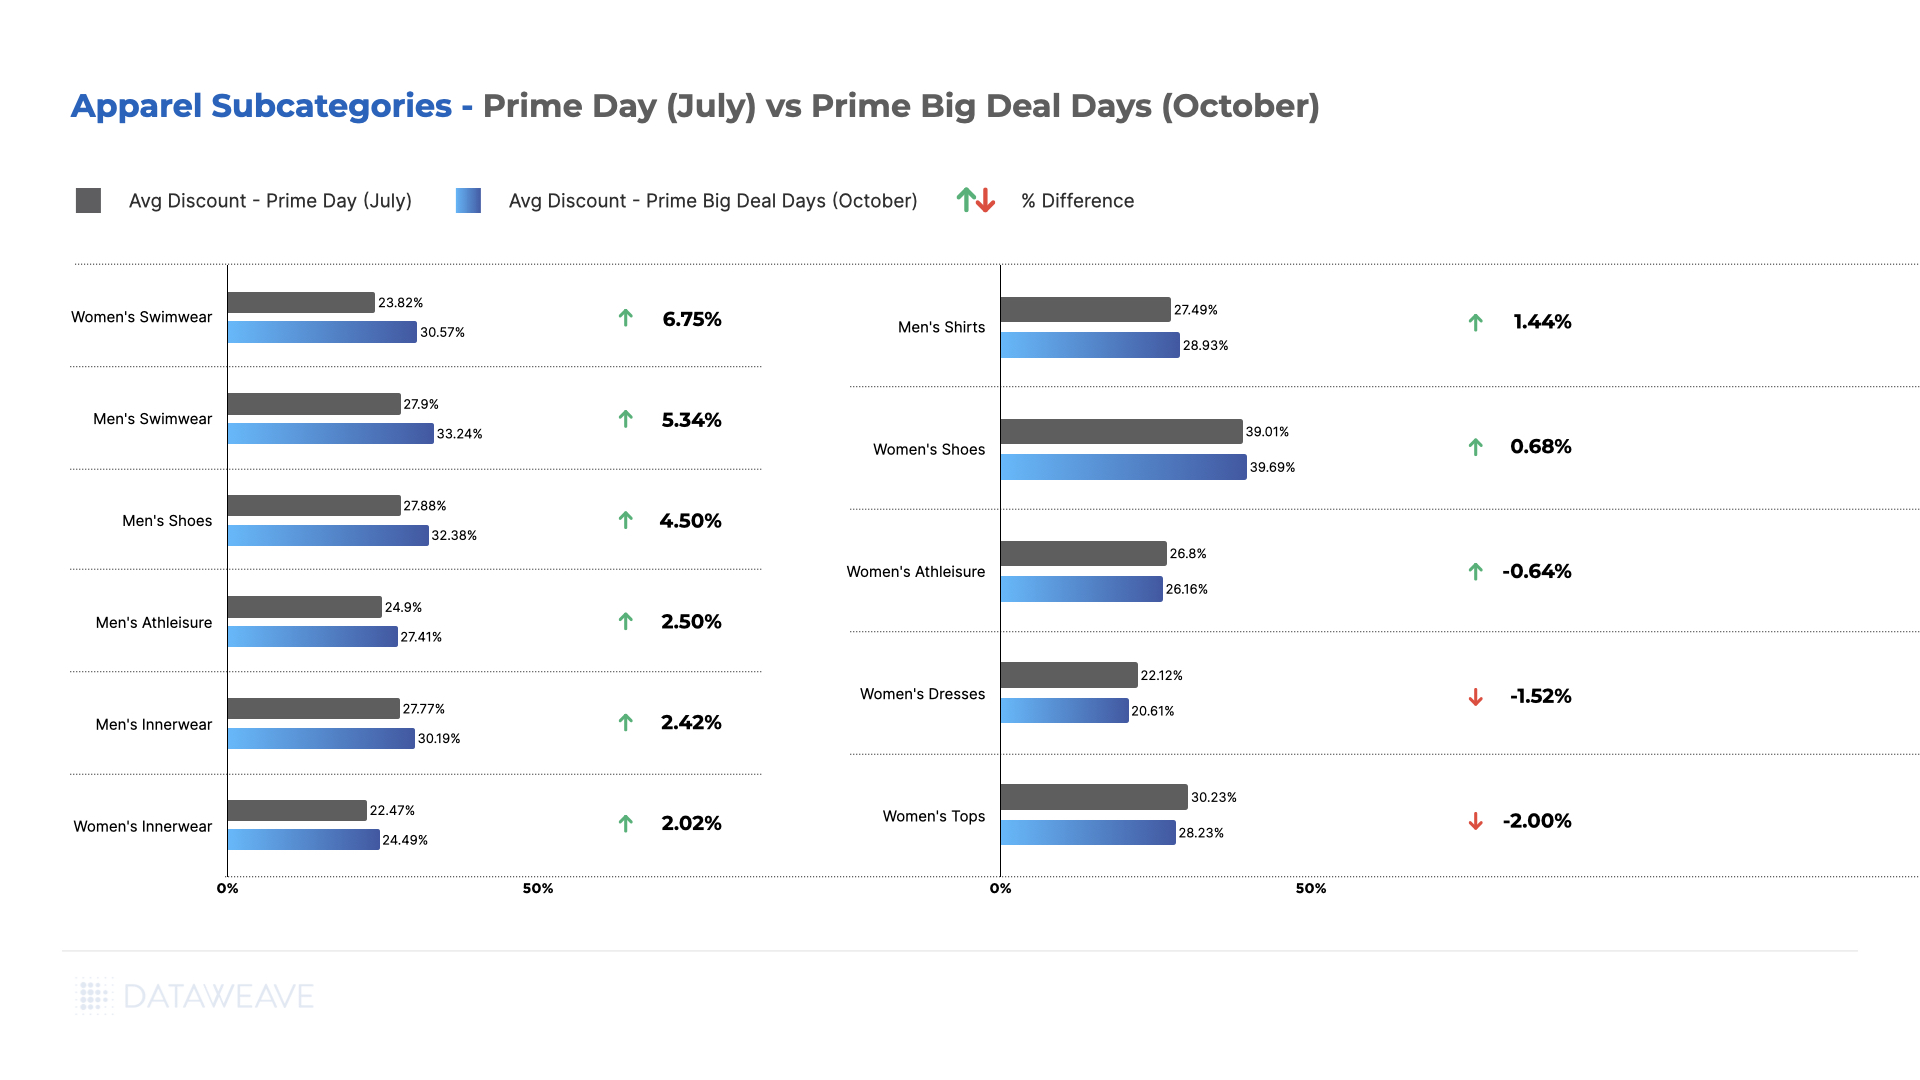
In the detailed assessment of Apparel sub-categories, Men’s and Women’s Swimwear, alongside Men’s Shoes, Innerwear, and Athleisure, emerged as the segments showcasing the most substantial average discounts during October. Fall also brought about more affordable prices for Women’s Innerwear and Men’s Shirts. However, Women’s Athleisure, Dresses, and Tops displayed diminished average discounts during this Prime Big Deal Days event.
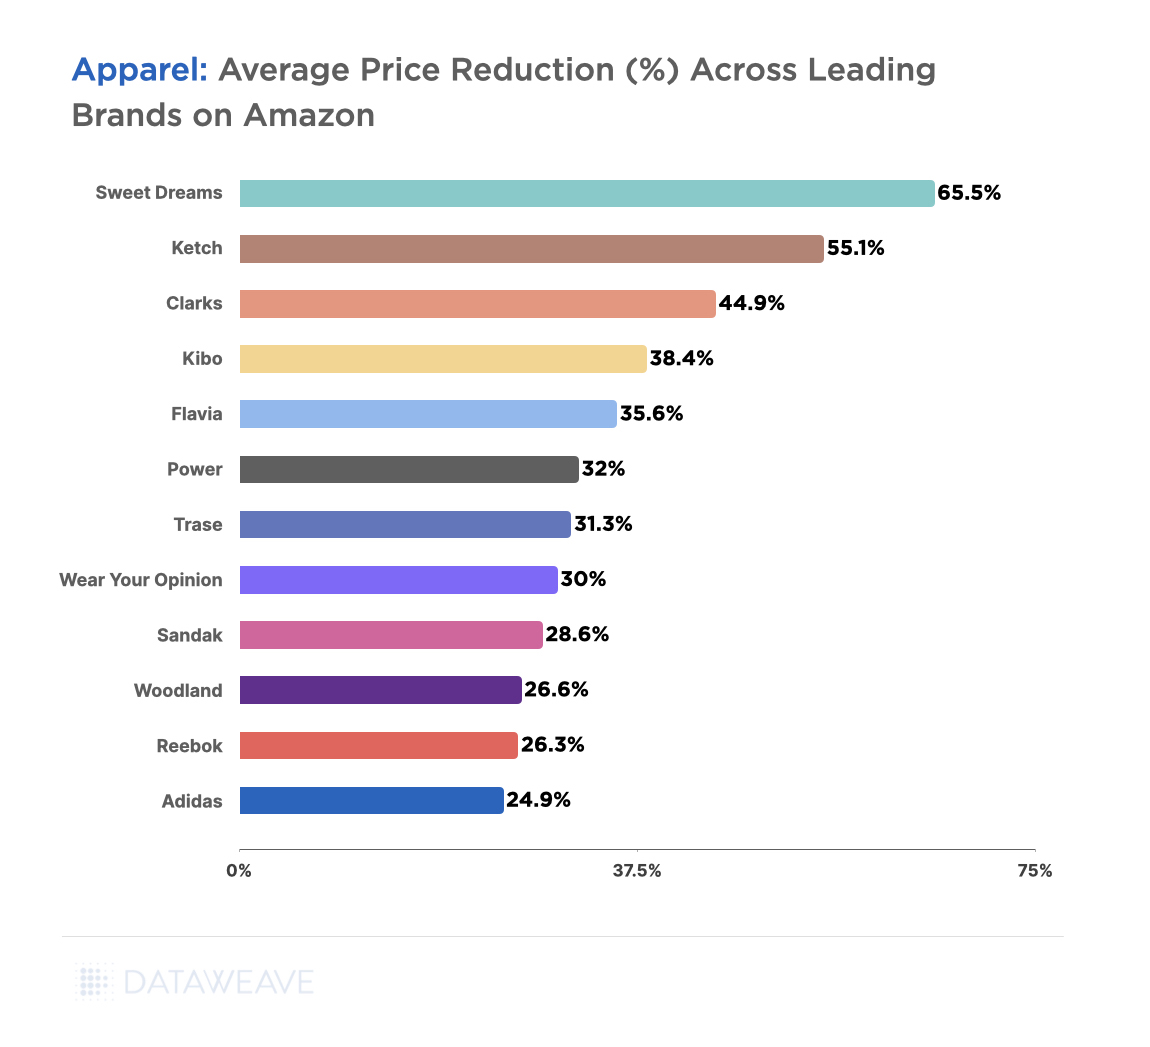
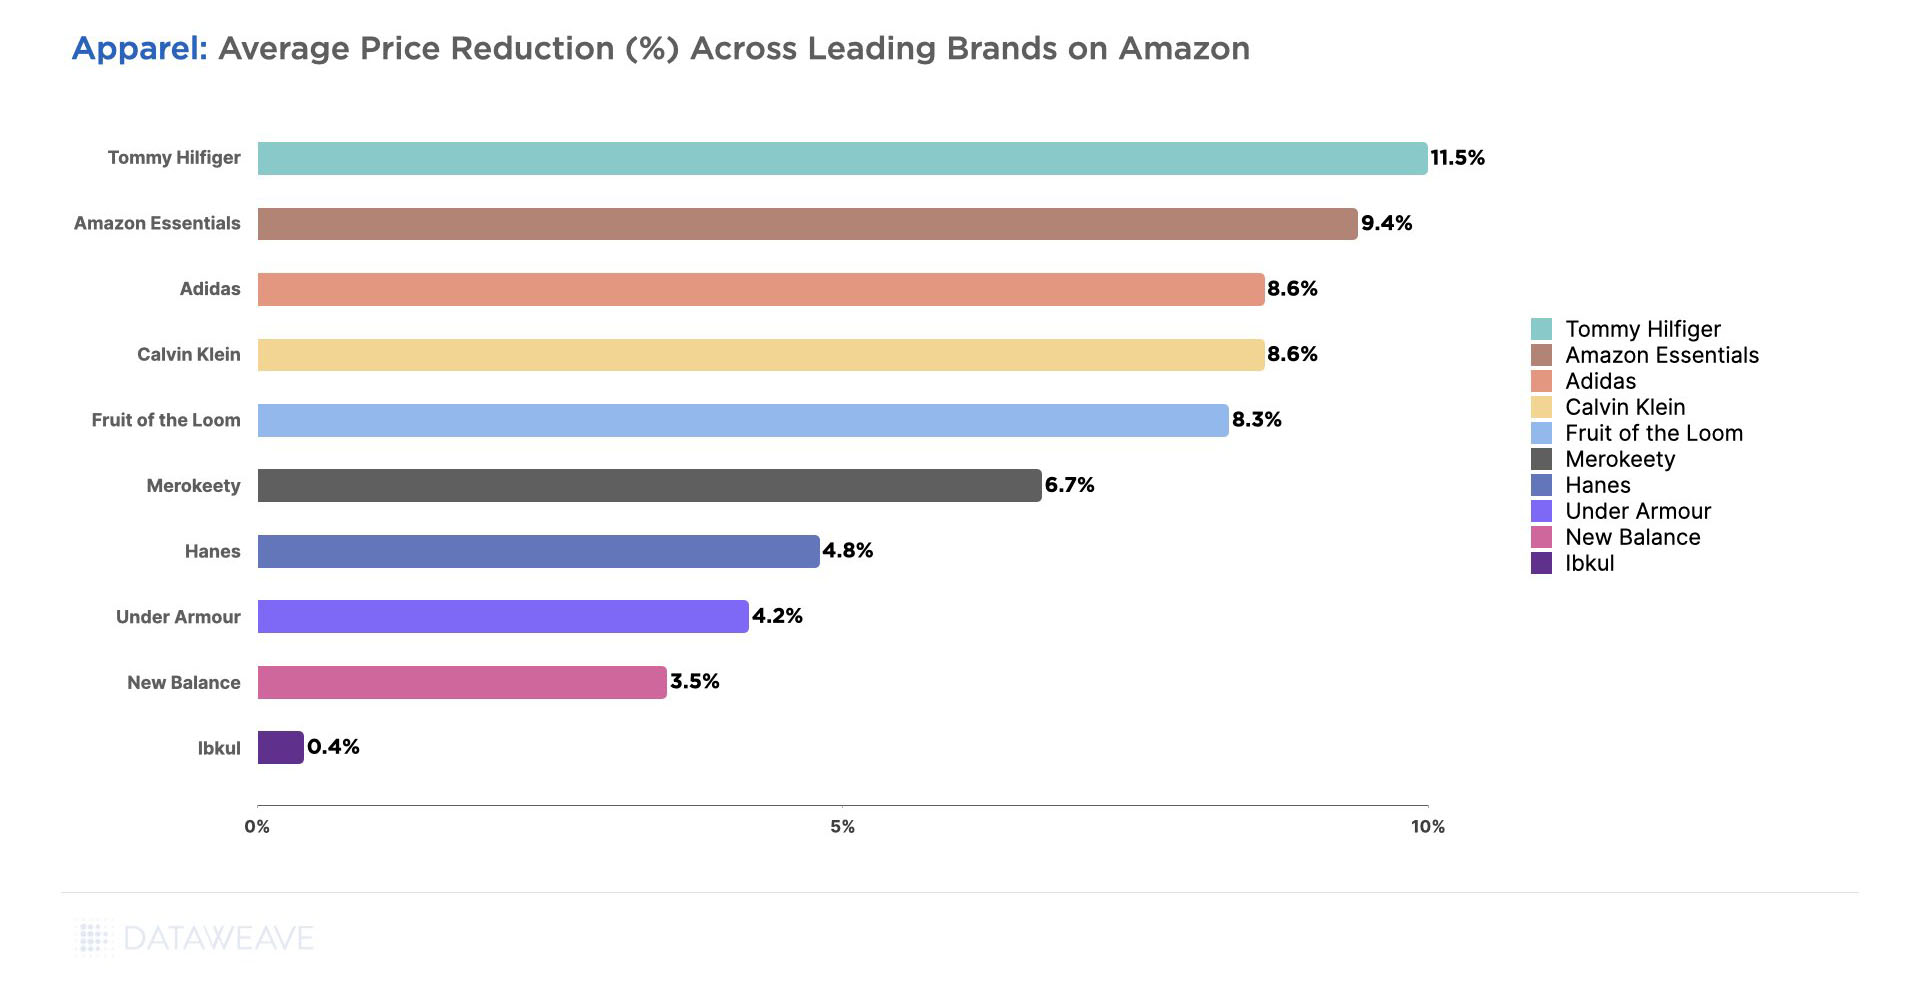
Delving into brand-specific analyses revealed intriguing trends. Athleisure brands such as Ibkul, Esprlia, and Ryka notably escalated their discounts in October after minimal markdowns during the Summer Prime Day sale.
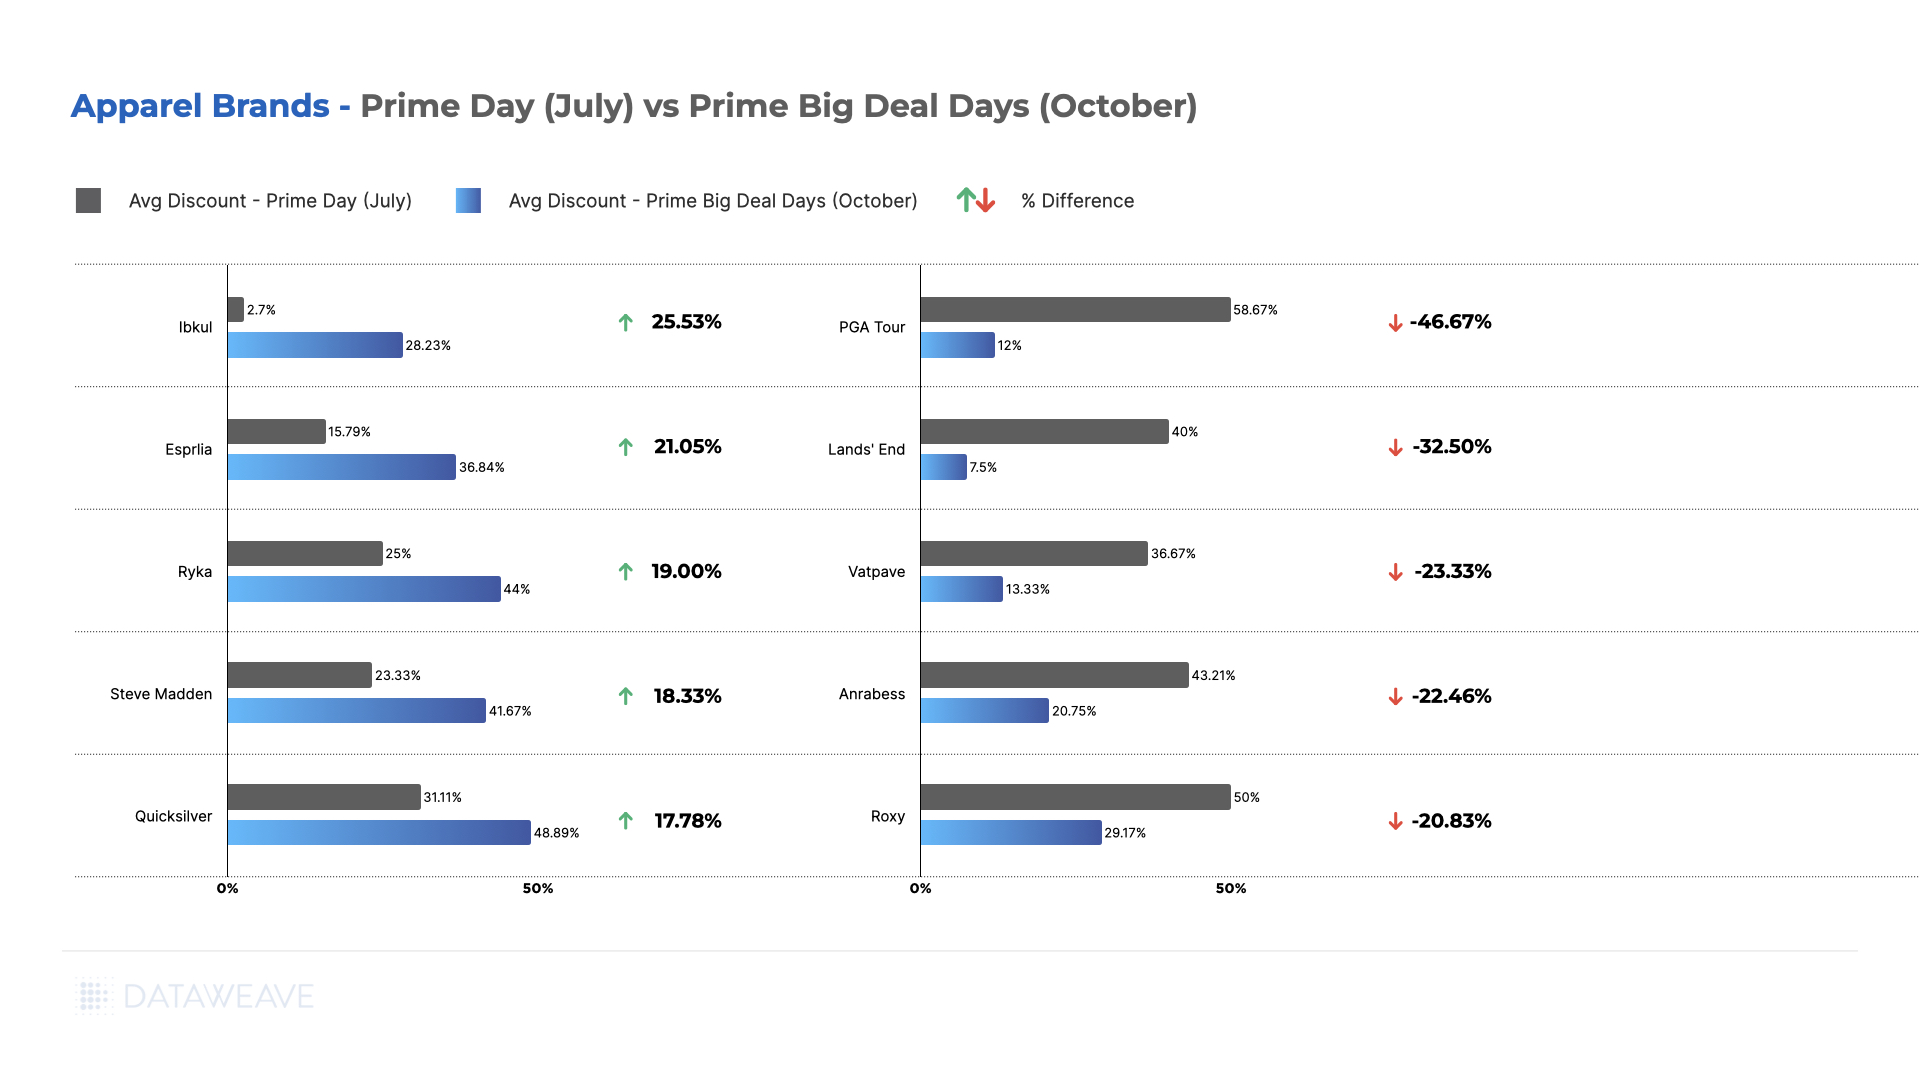
Steve Madden, witnessing heightened discounts in October, hinted at a growing demand for boots and footwear in the Autumn and Winter seasons. For instance, the Steve Madden Men’s Fenta Fashion Sneaker was priced at $46 during the Summer Prime Day, and only at $35 during the Prime Big Deal Days in October.
Conversely, brands like PGA Tour, Land’s End, Roxy, and Anrabess offered more substantial discounts during the Summer compared to the October event.
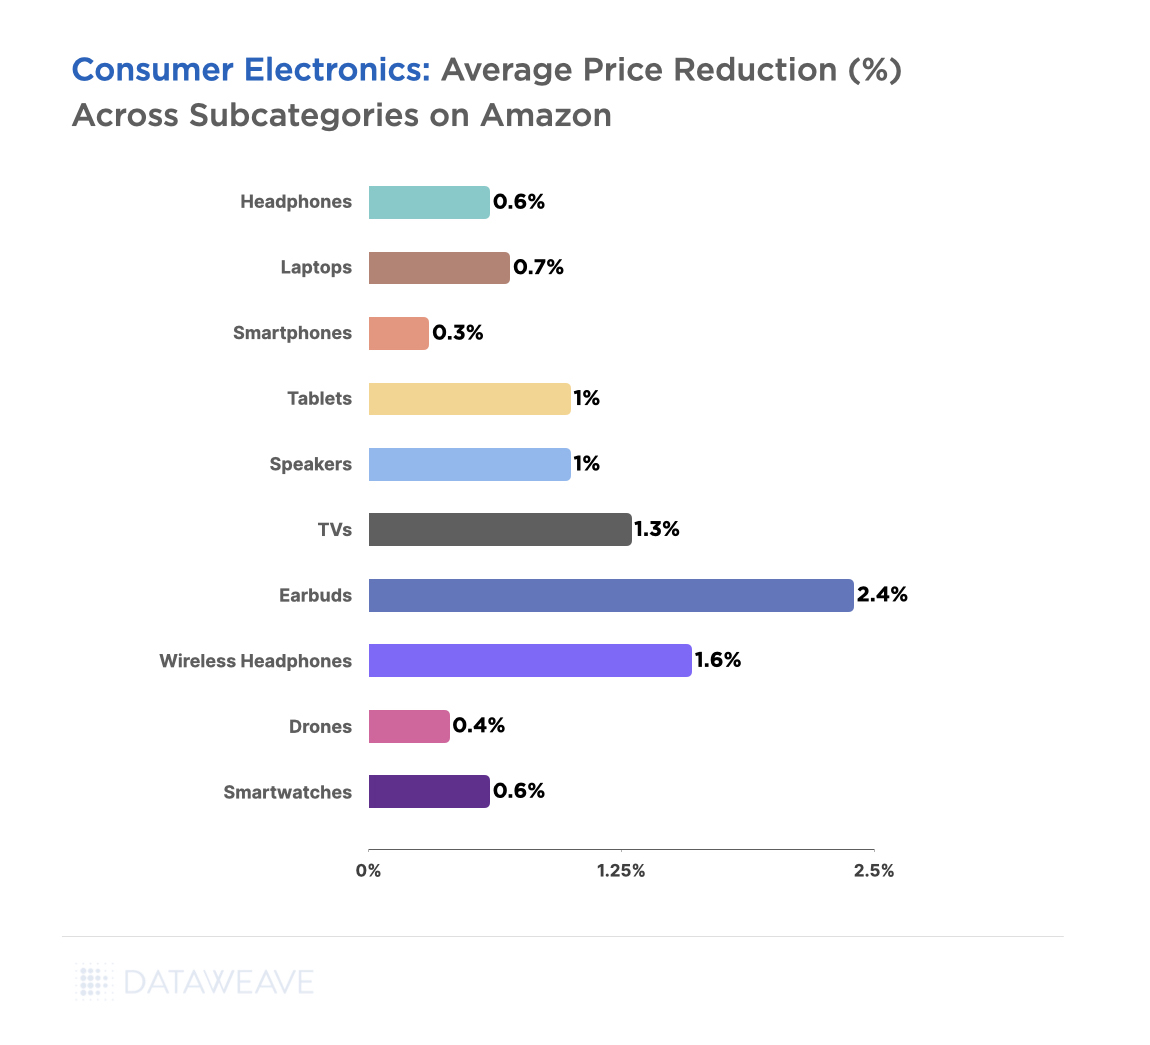
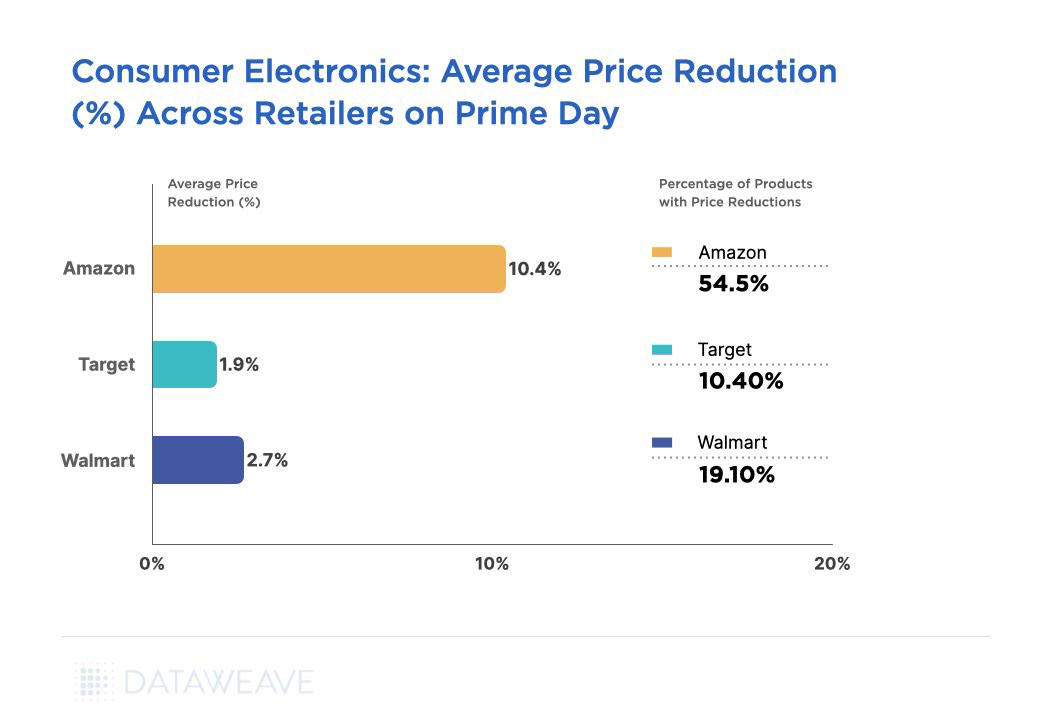
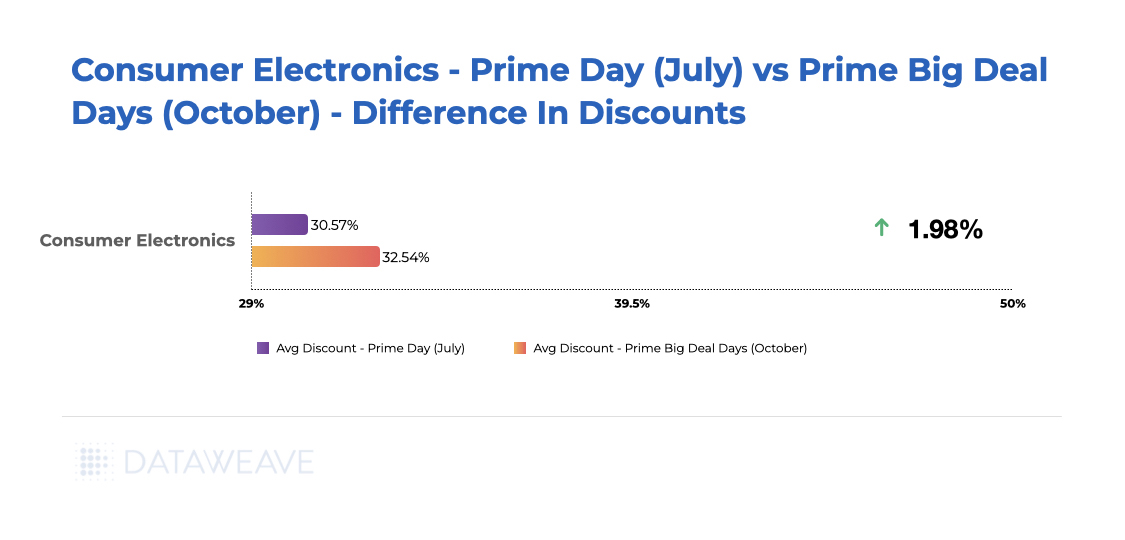
Consumer Electronics
The Consumer Electronics segment during October’s Prime Big Deal Days showcased an average price decrease of 1.98% compared to the Prime Day event in July.
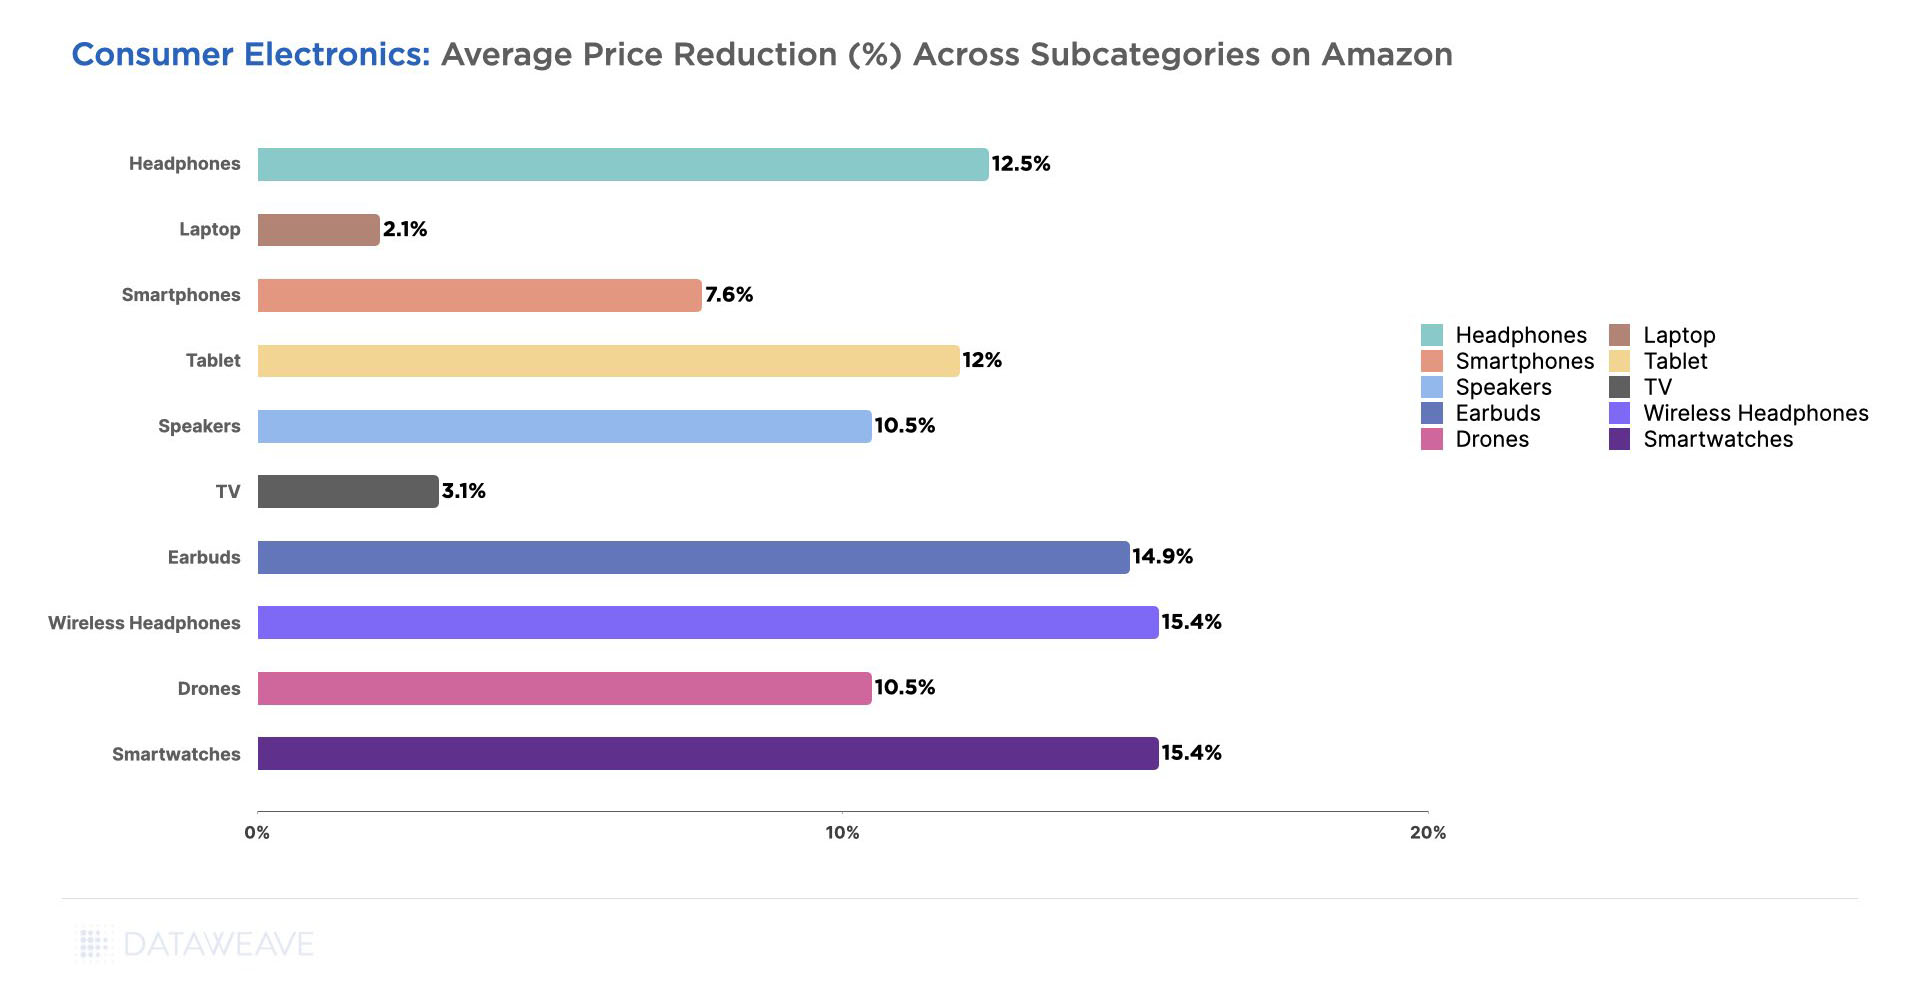
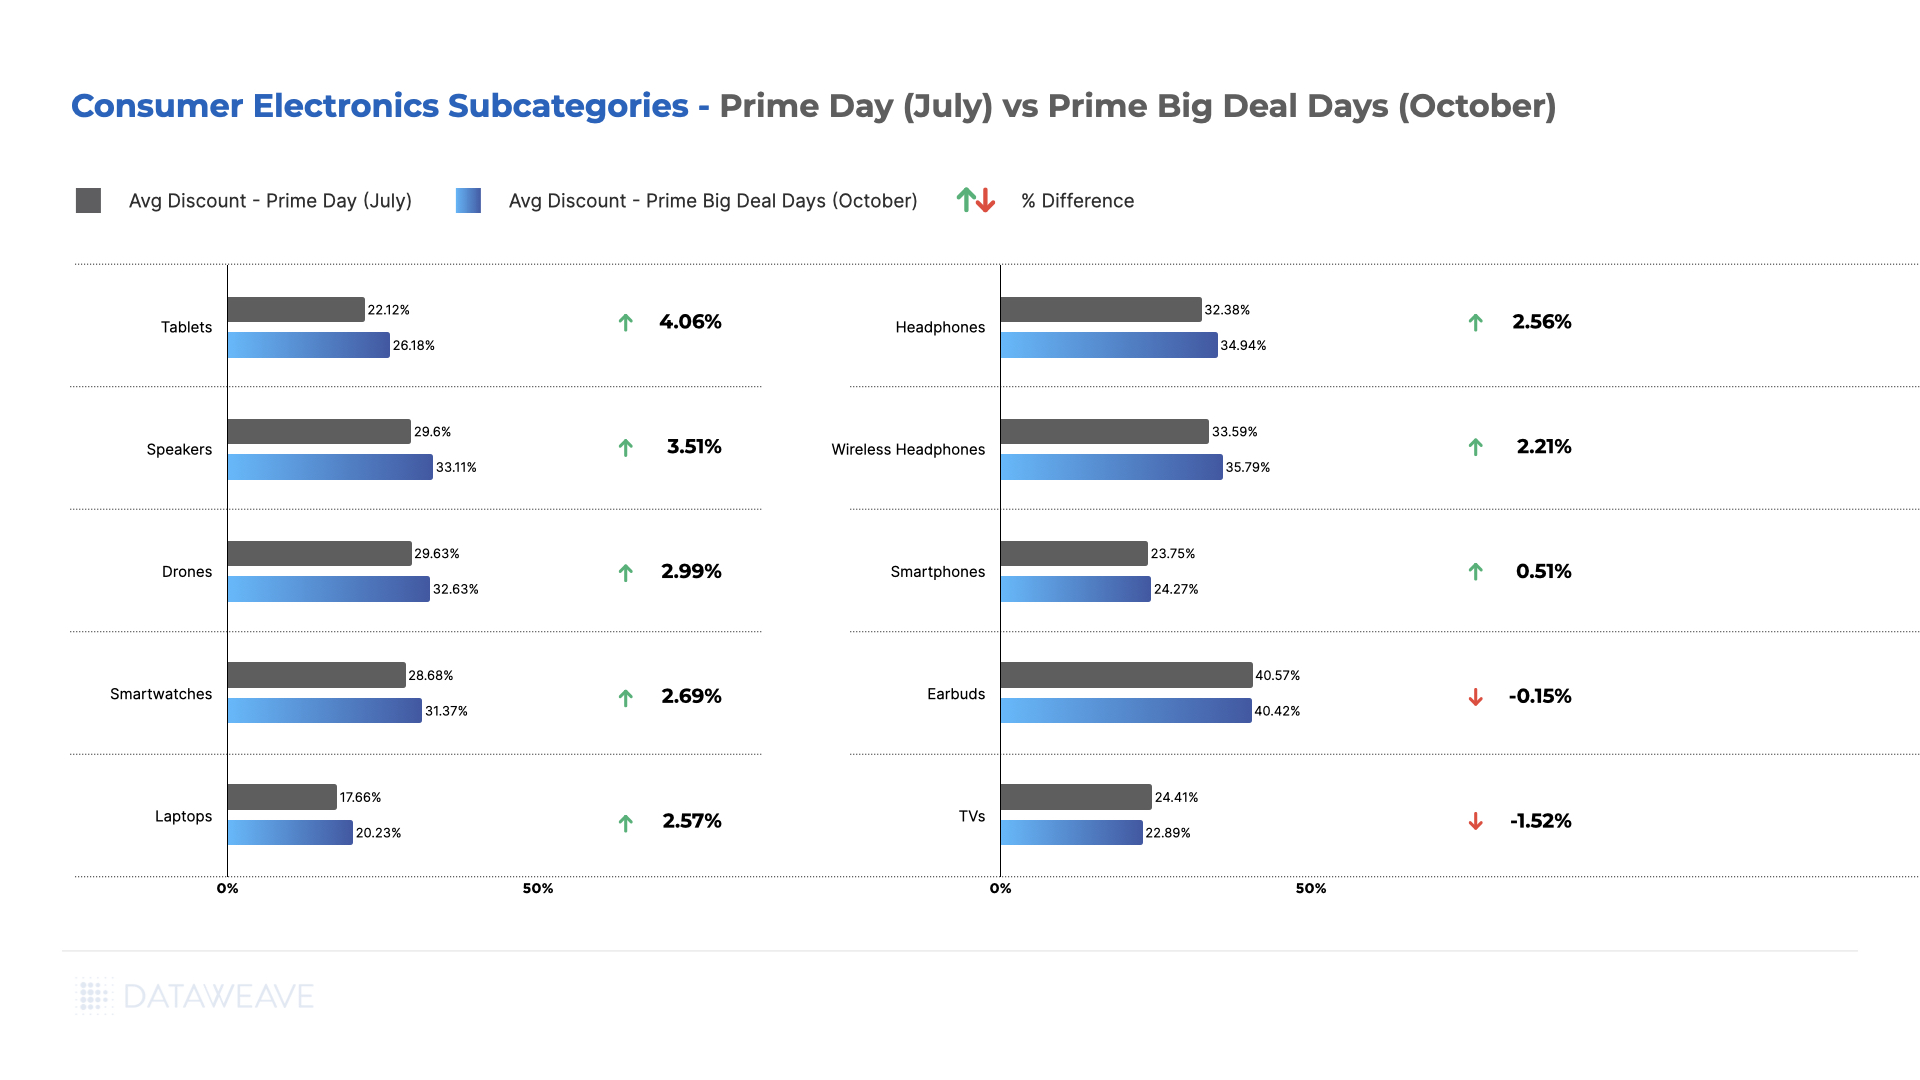
Nearly all scrutinized subcategories experienced heightened discounts during the Fall Prime Big Deal Days in October. Tablets, Speakers, Drones, and Smartwatches notably presented higher discounts of 4.06%, 3.51%, 2.99%, and 2.69%, respectively, in October. However, more enticing deals were found on Earbuds and TVs during July’s event.
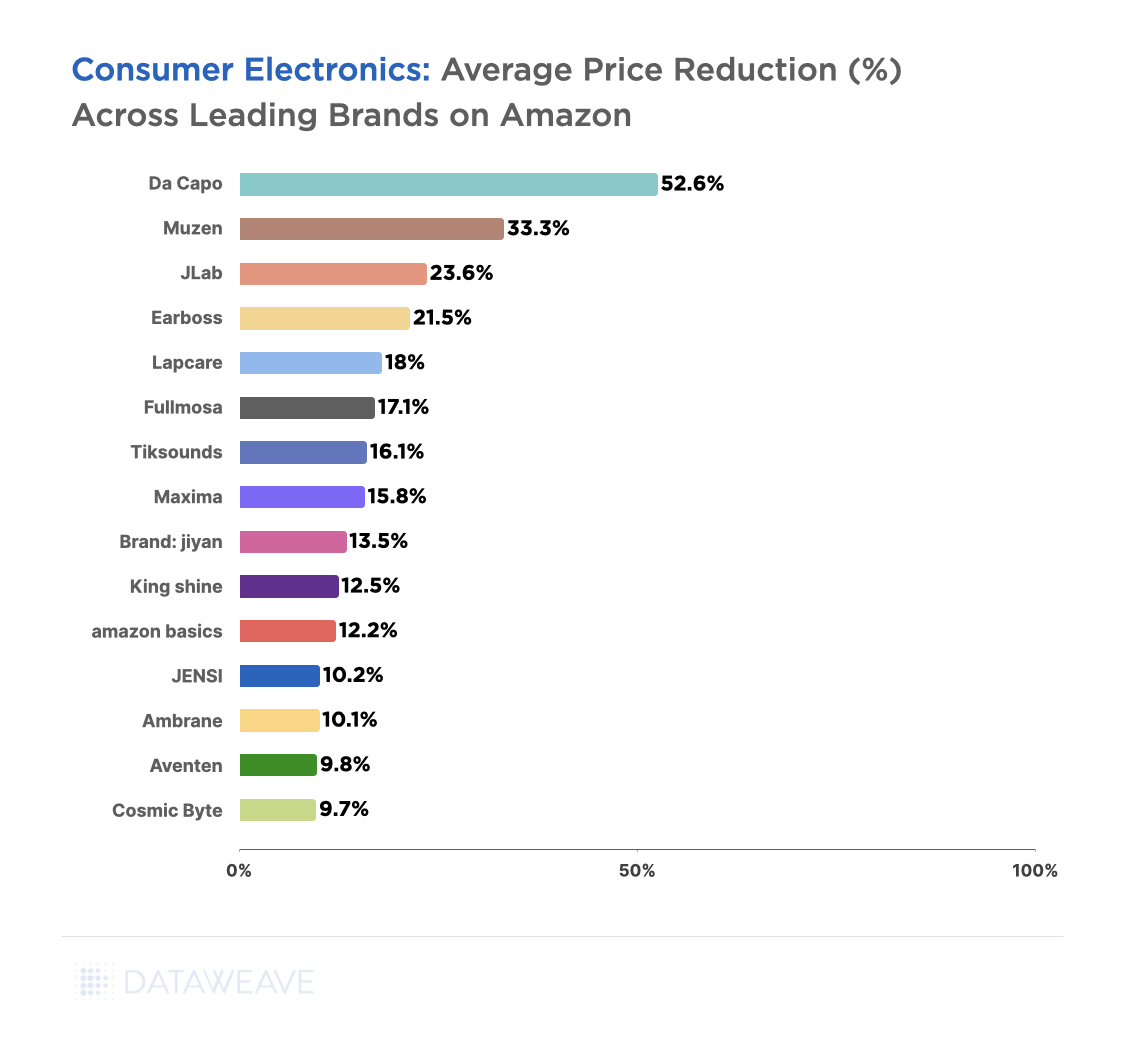
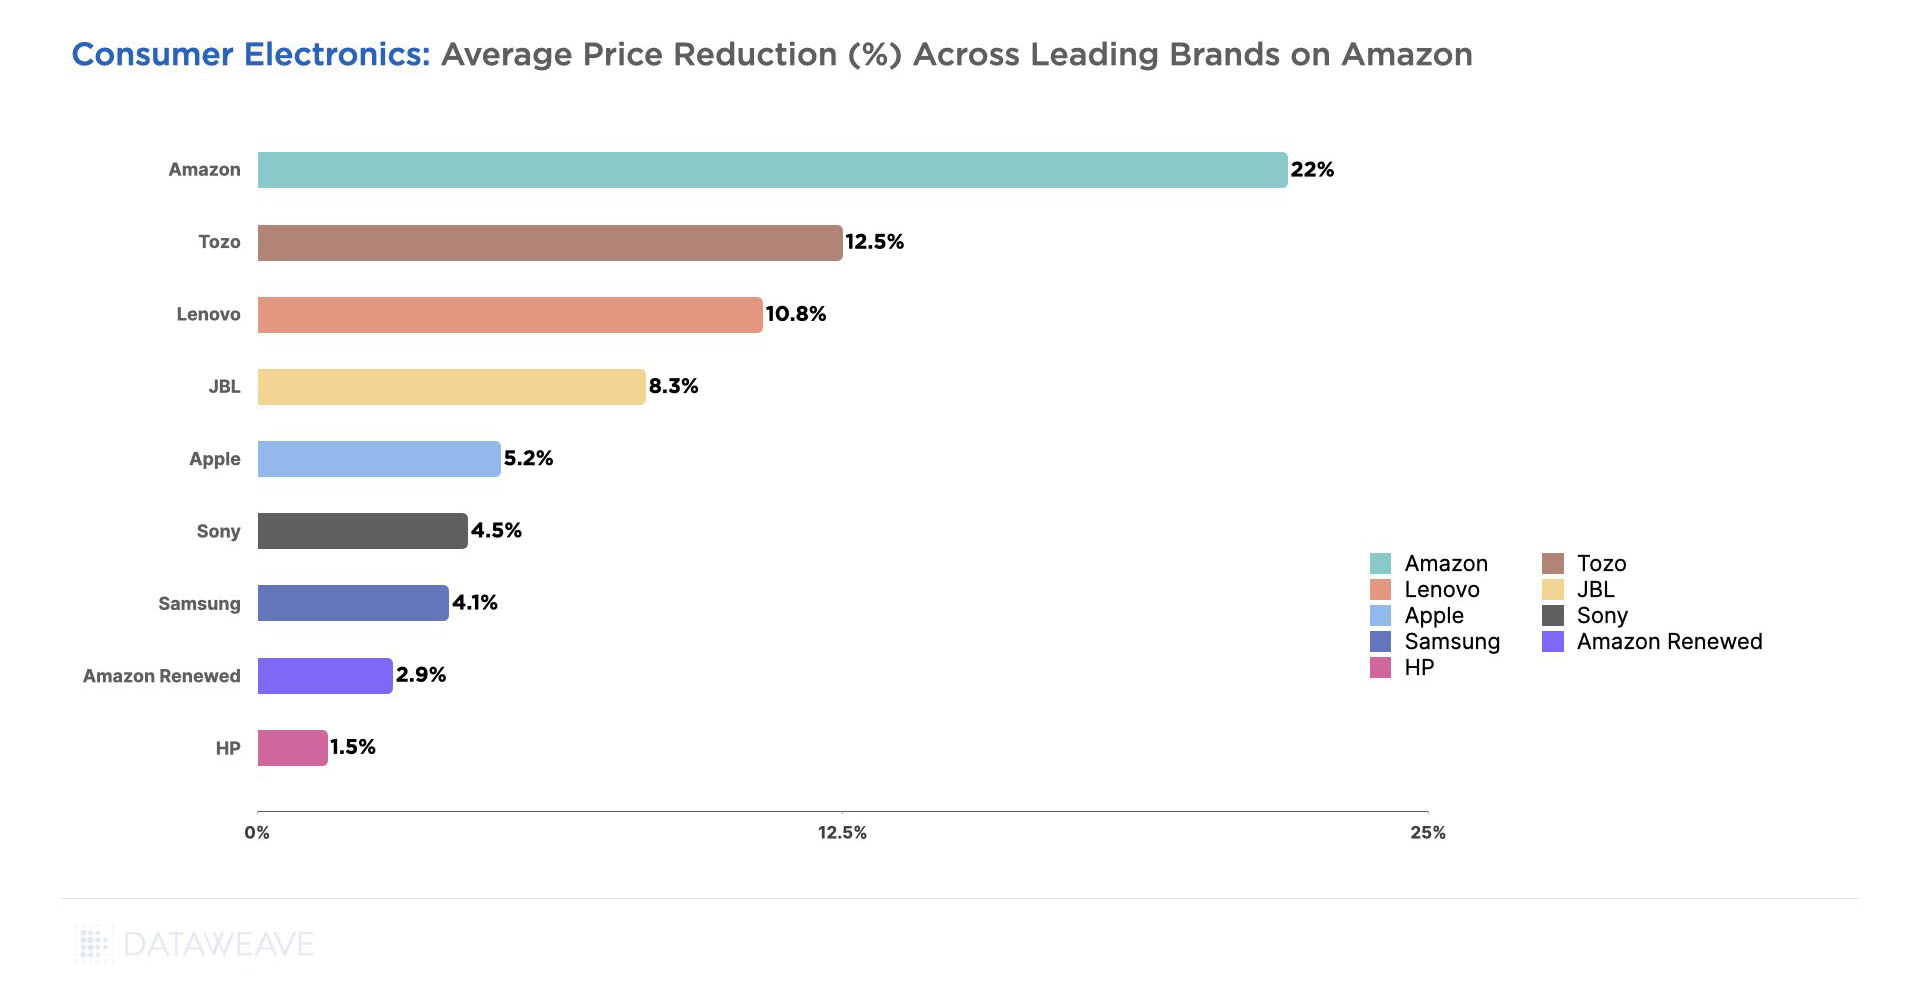
Examining consumer electronics brands, Google stood out by offering the most compelling deals in October, boasting an average discount of 23.35%, marking an 8.94% increase from the Summer Prime Days’ 14.41%. Psier, Sony, and OnePlus also featured significantly reduced prices during the Fall. For example, the OnePlus 10 Pro | 8GB+128GB was $500 during the sale in July and only $440 during the Prime Big Deal Days in October.
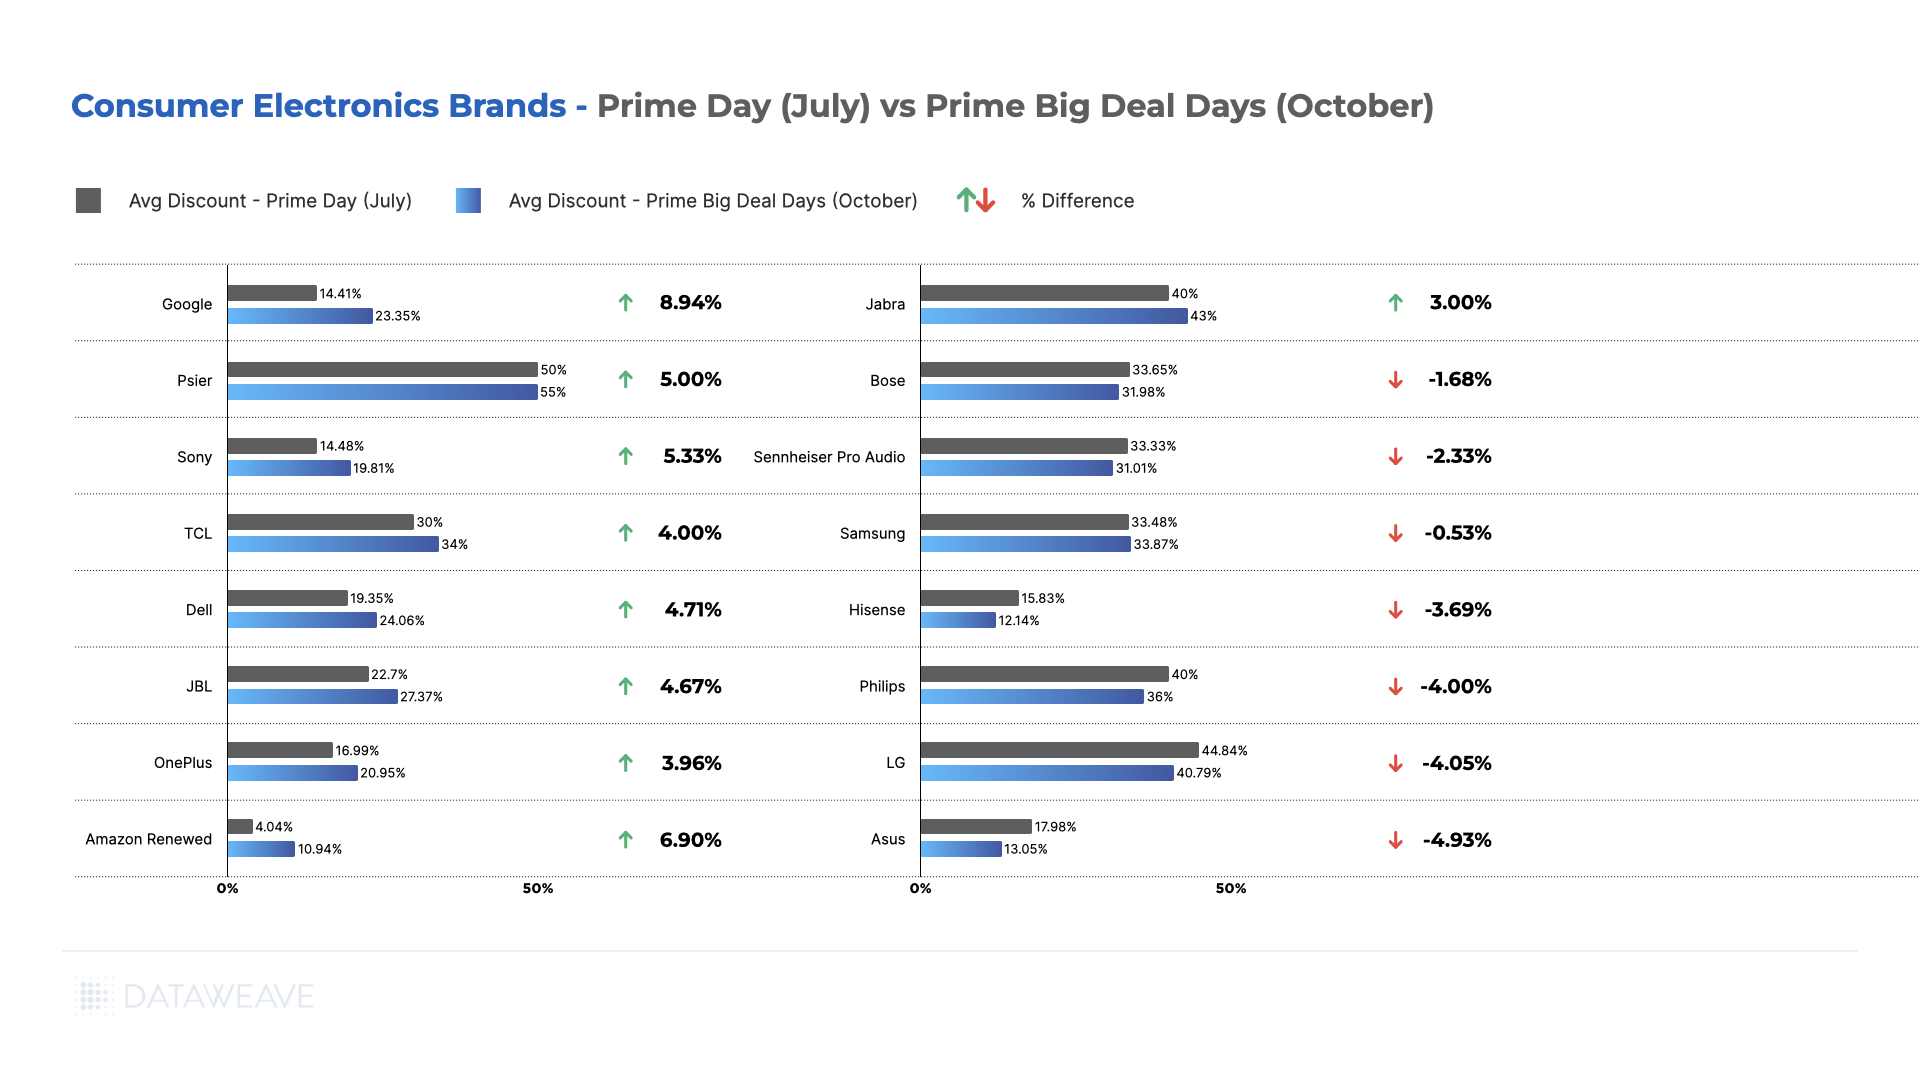
Conversely, prominent brands such as Bose, Sennheiser, Samsung, LG, and Asus opted to offer heavier discounts in July. Notably, the Samsung All-in-One Soundbar w/Dolby 5.1 was priced at $218 in October but only $168 in July.
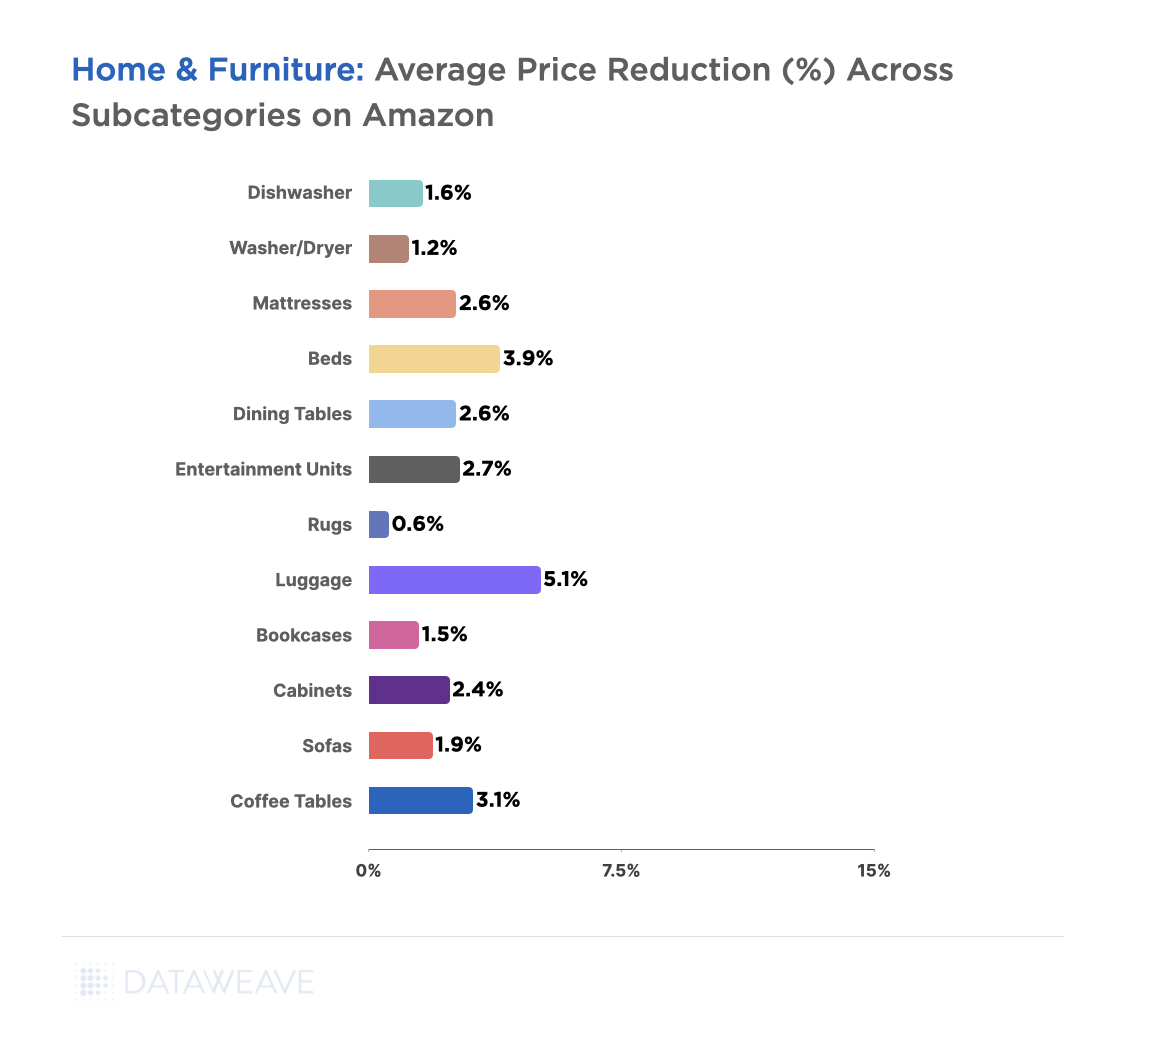
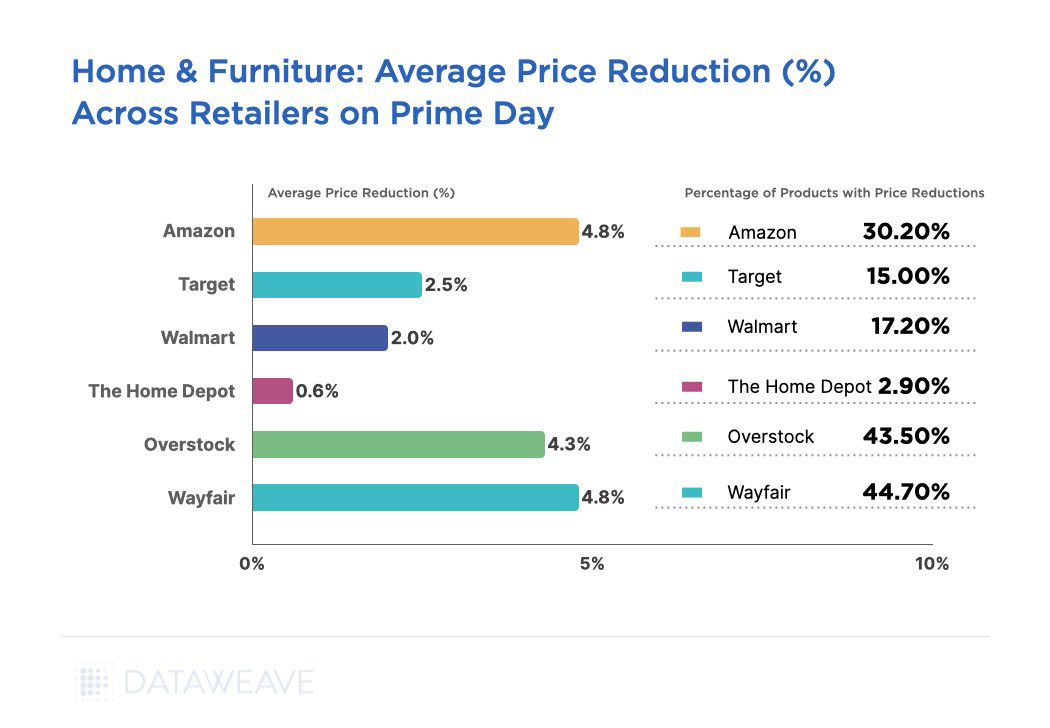
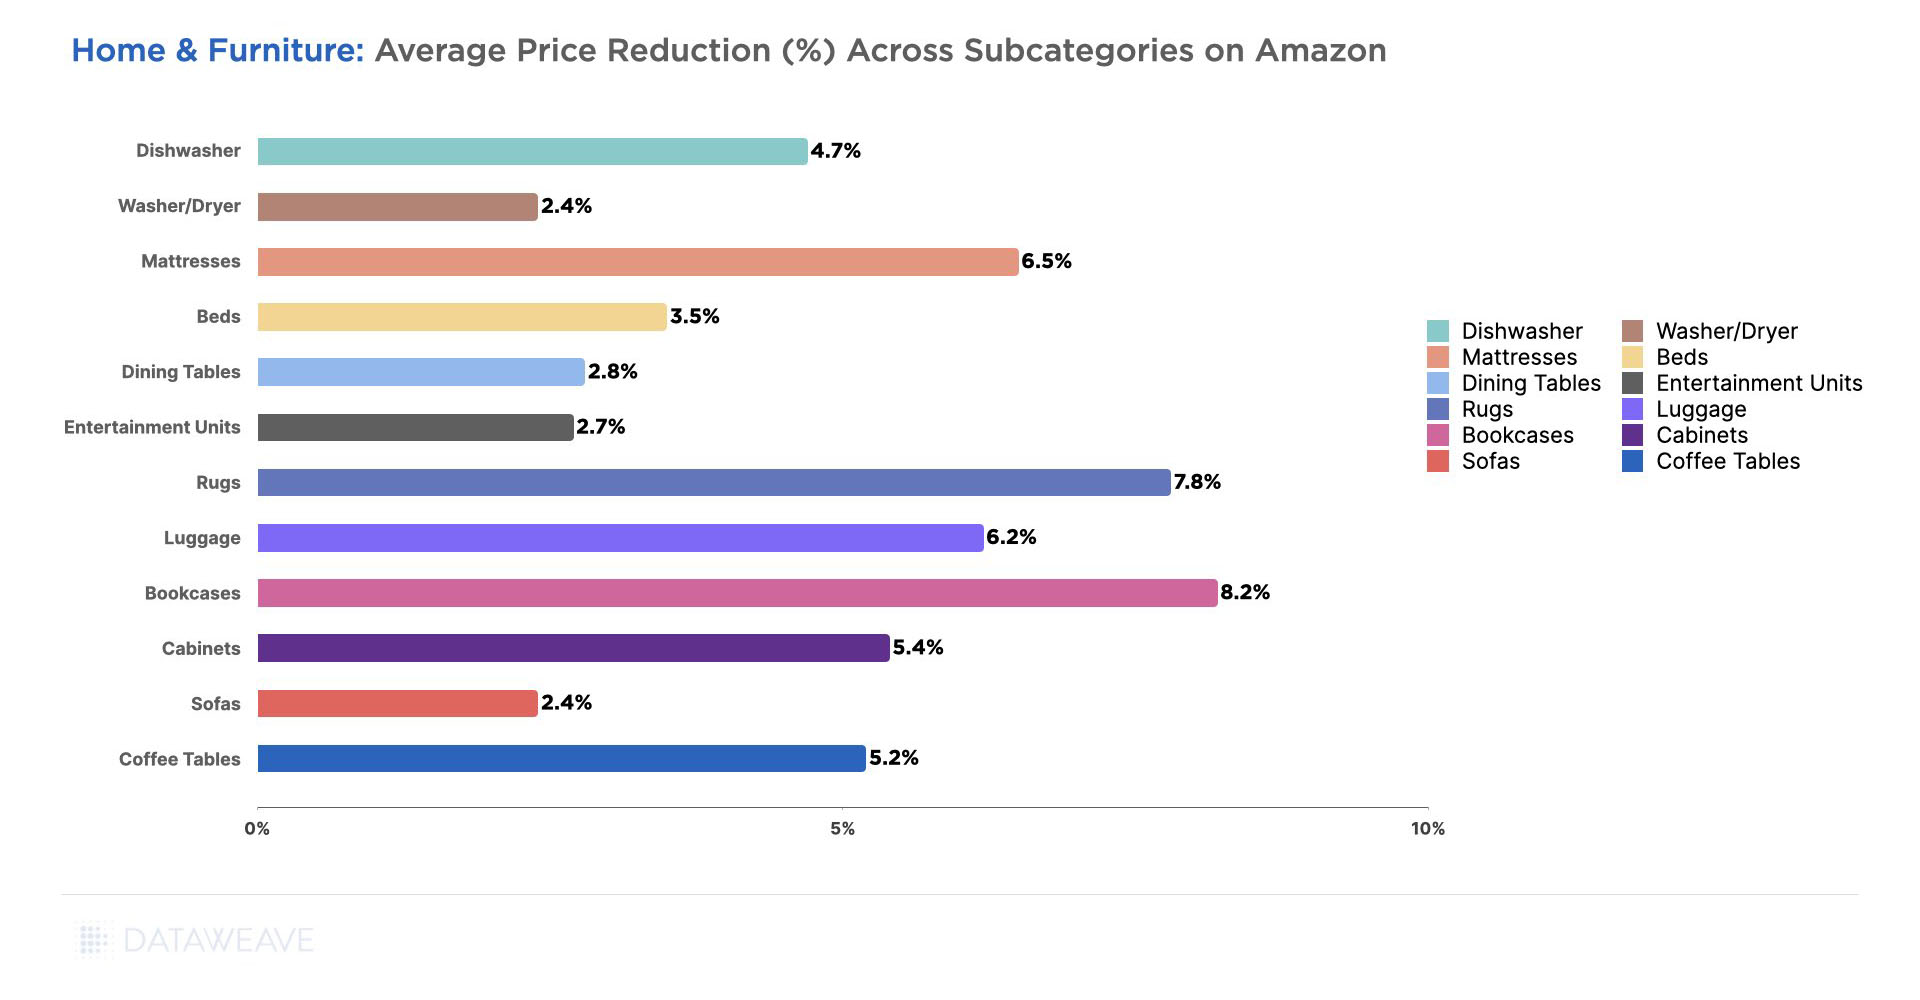
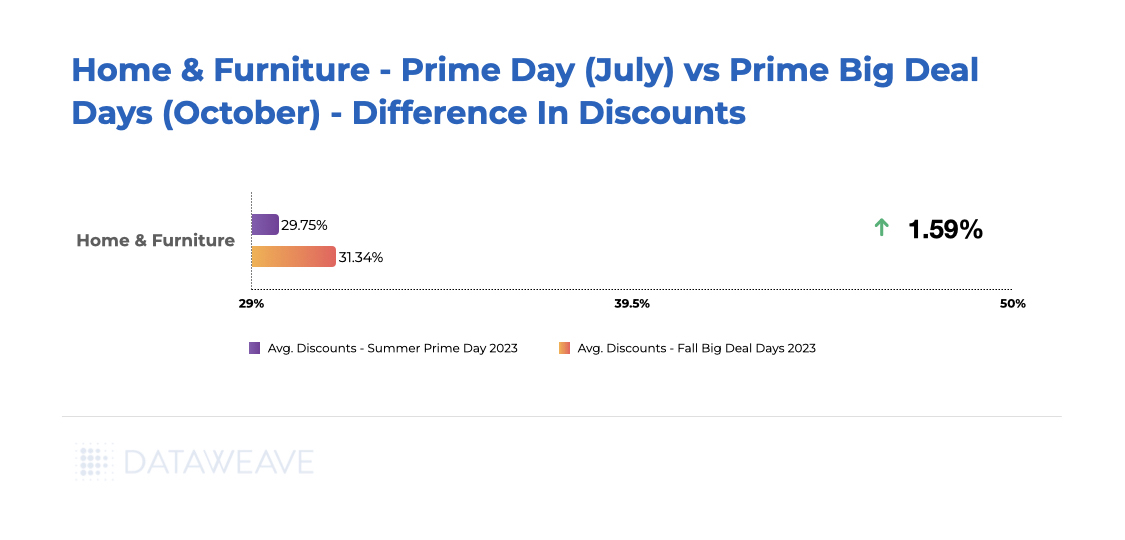
Home & Furniture
During October’s Prime Big Deal Days, the Home & Furniture category experienced a notable 1.59% increase in average discounts compared to the Prime Day event held in July.
Notably, Entertainment Units, Rugs, and Coffee Tables emerged as standout sub-categories that were more attractively priced in October, exhibiting price differences of 7.73%, 5.33%, and 4.80%, respectively.
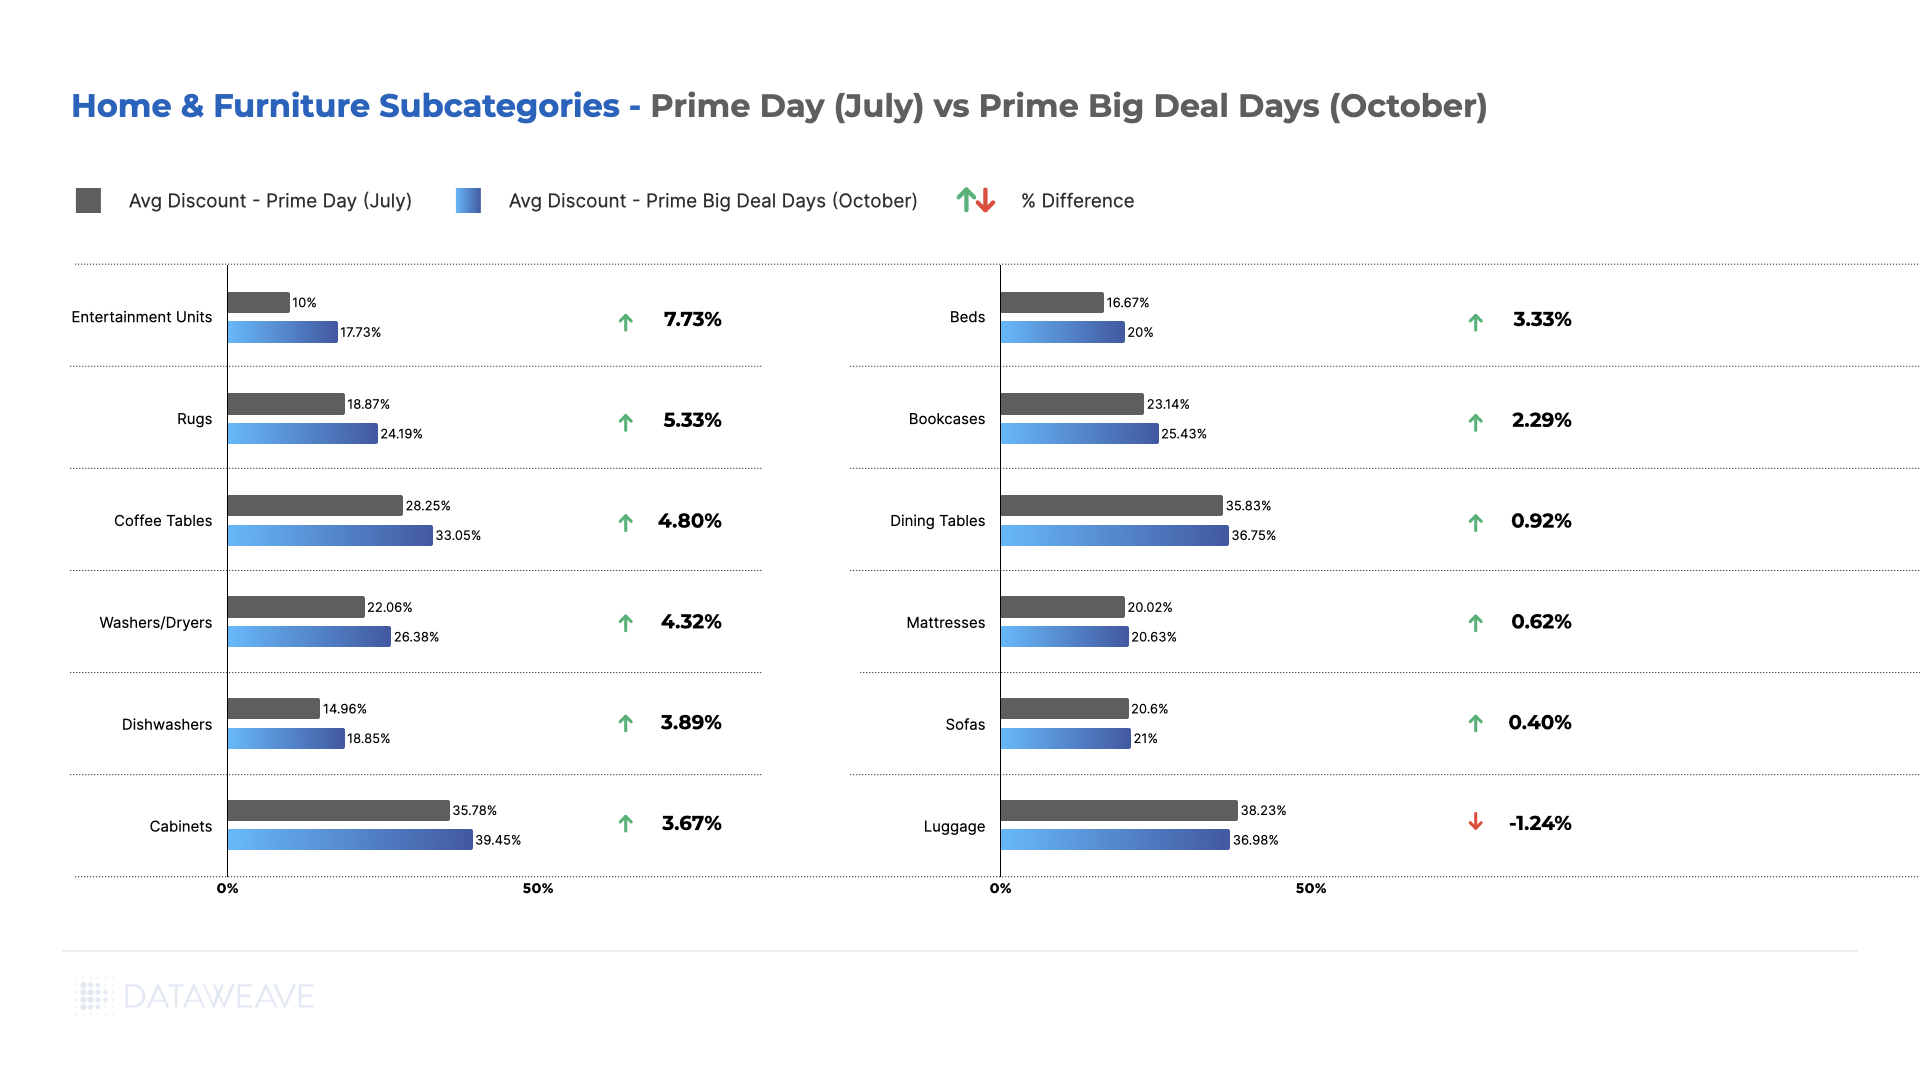
Interestingly, among the scrutinized sub-categories, only Luggage showed a lower price during the Prime Day sale in July compared to the October event. This shift likely reflects evolving consumer demand as the holiday season approaches, with items like rugs and entertainment units becoming increasingly sought-after categories for purchase.
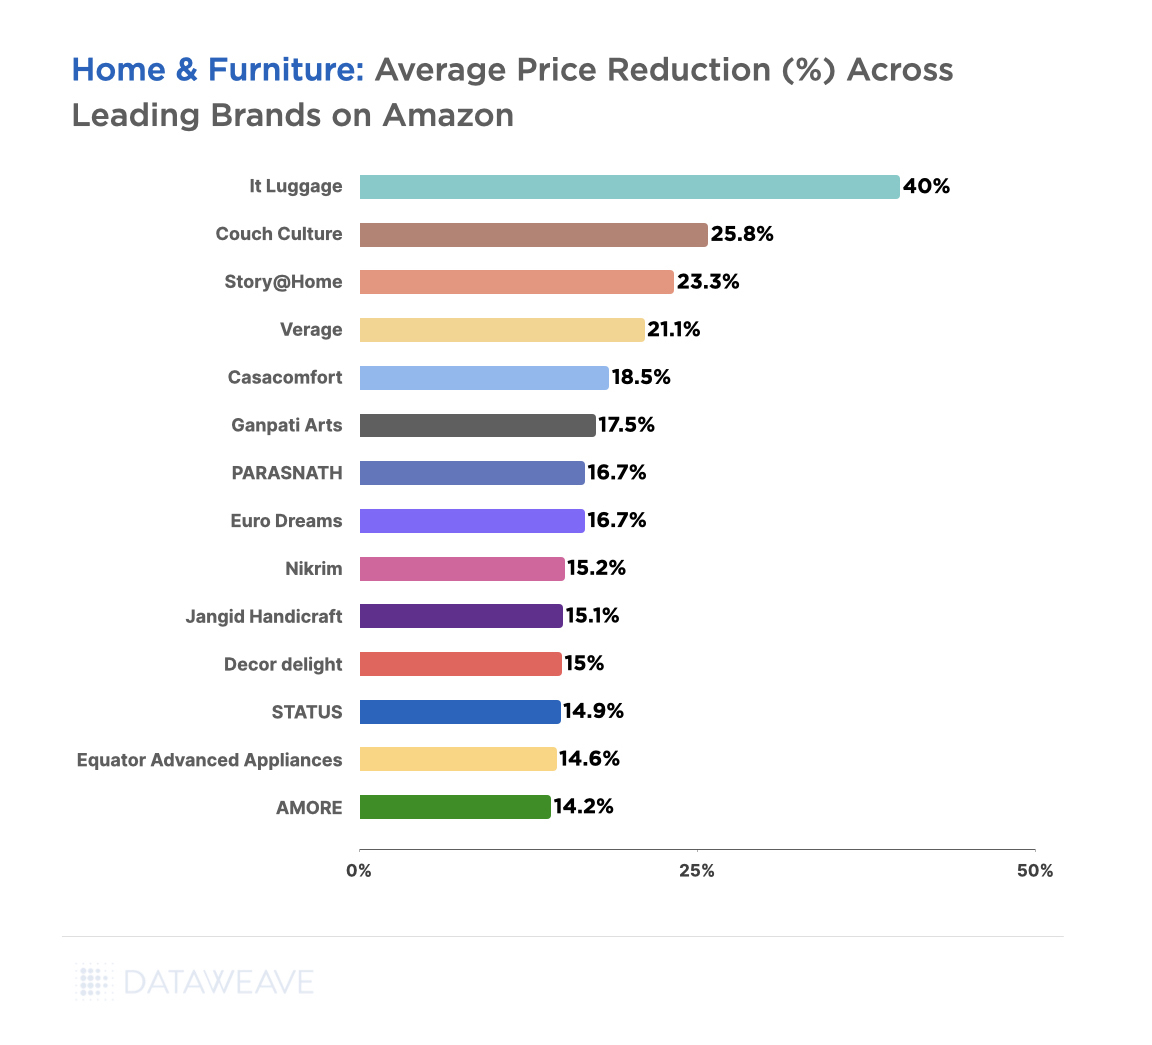
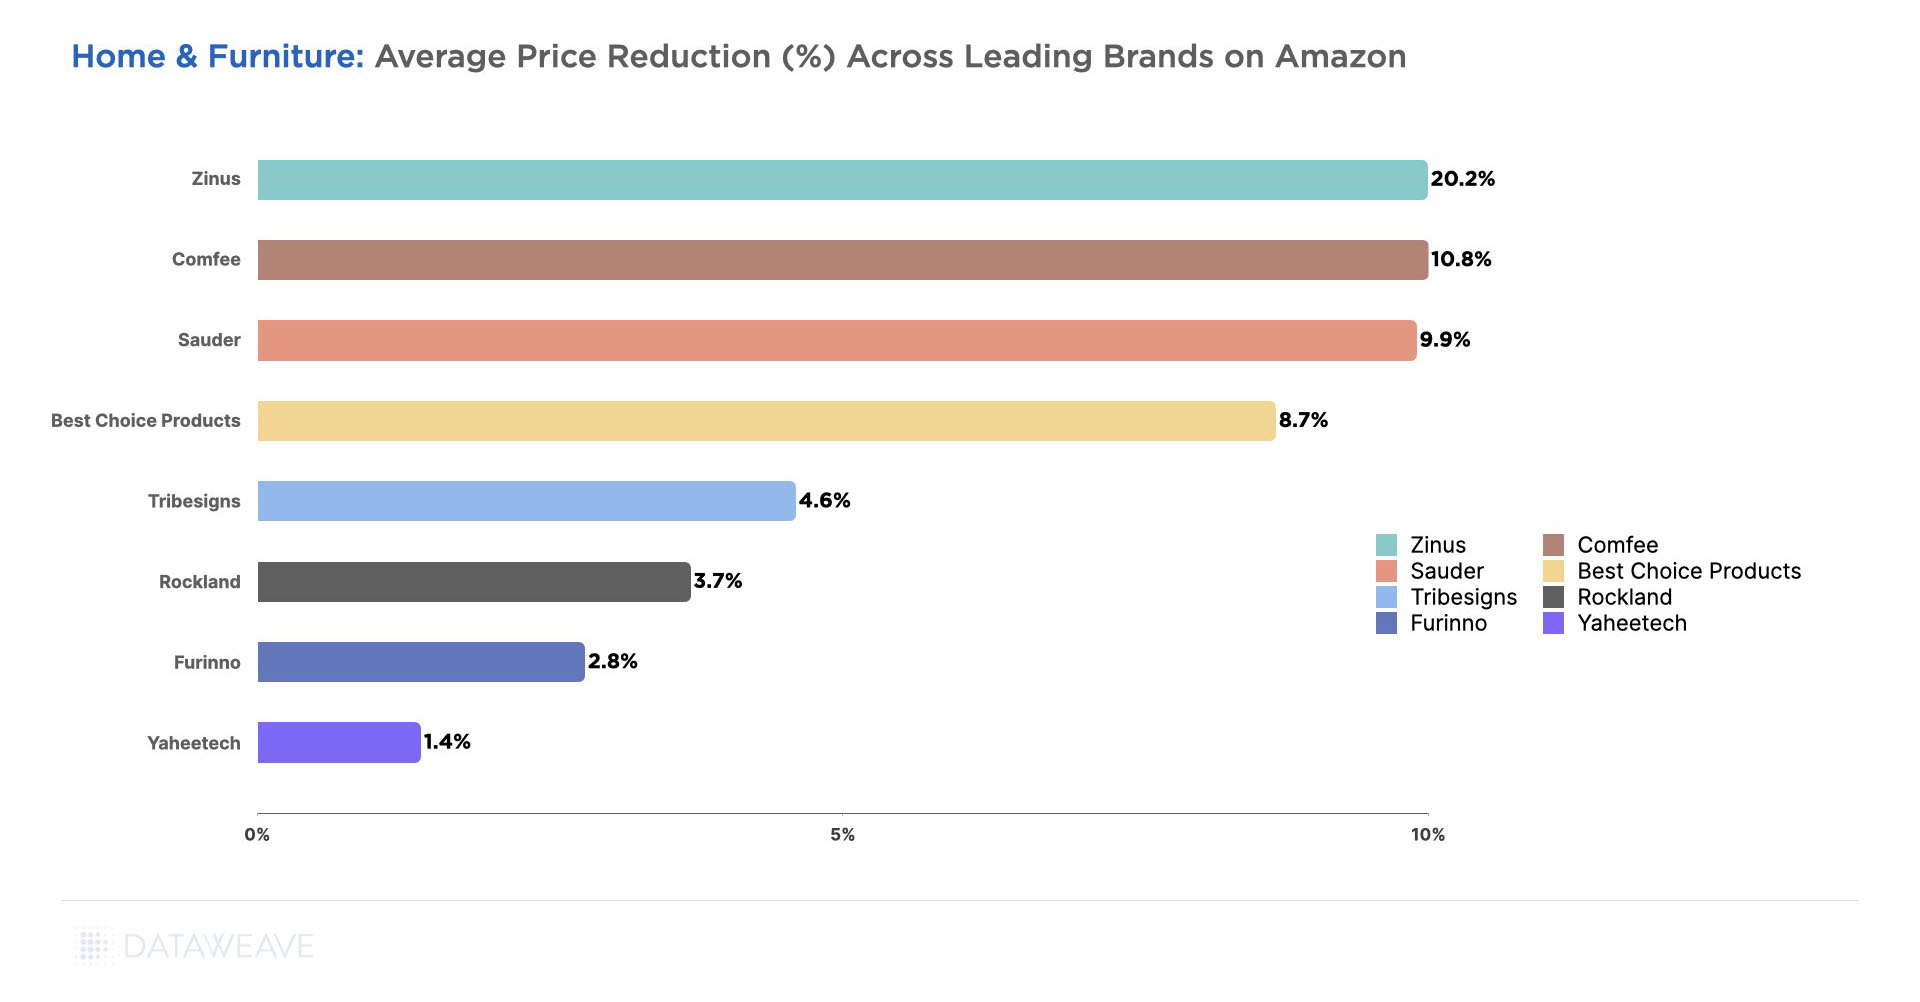
If you’re keen to explore how these trends vary across brands within this category, reach out to us for more insights.
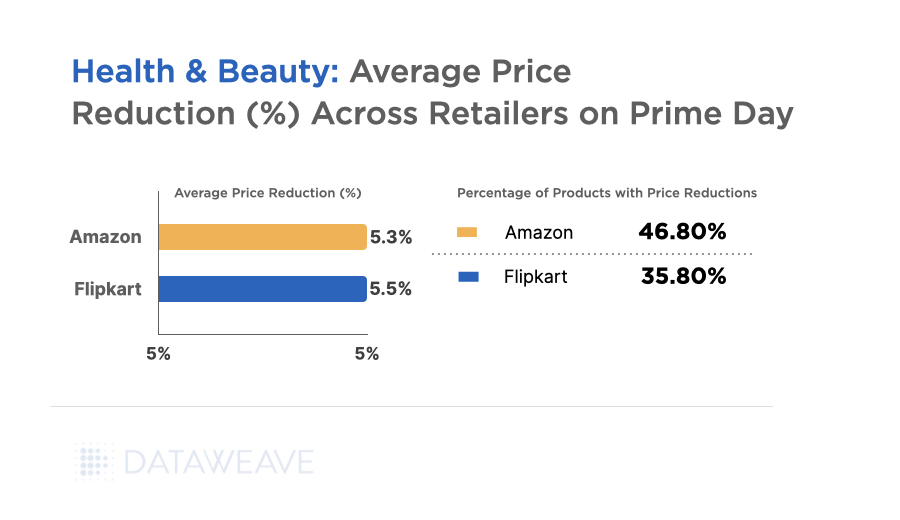
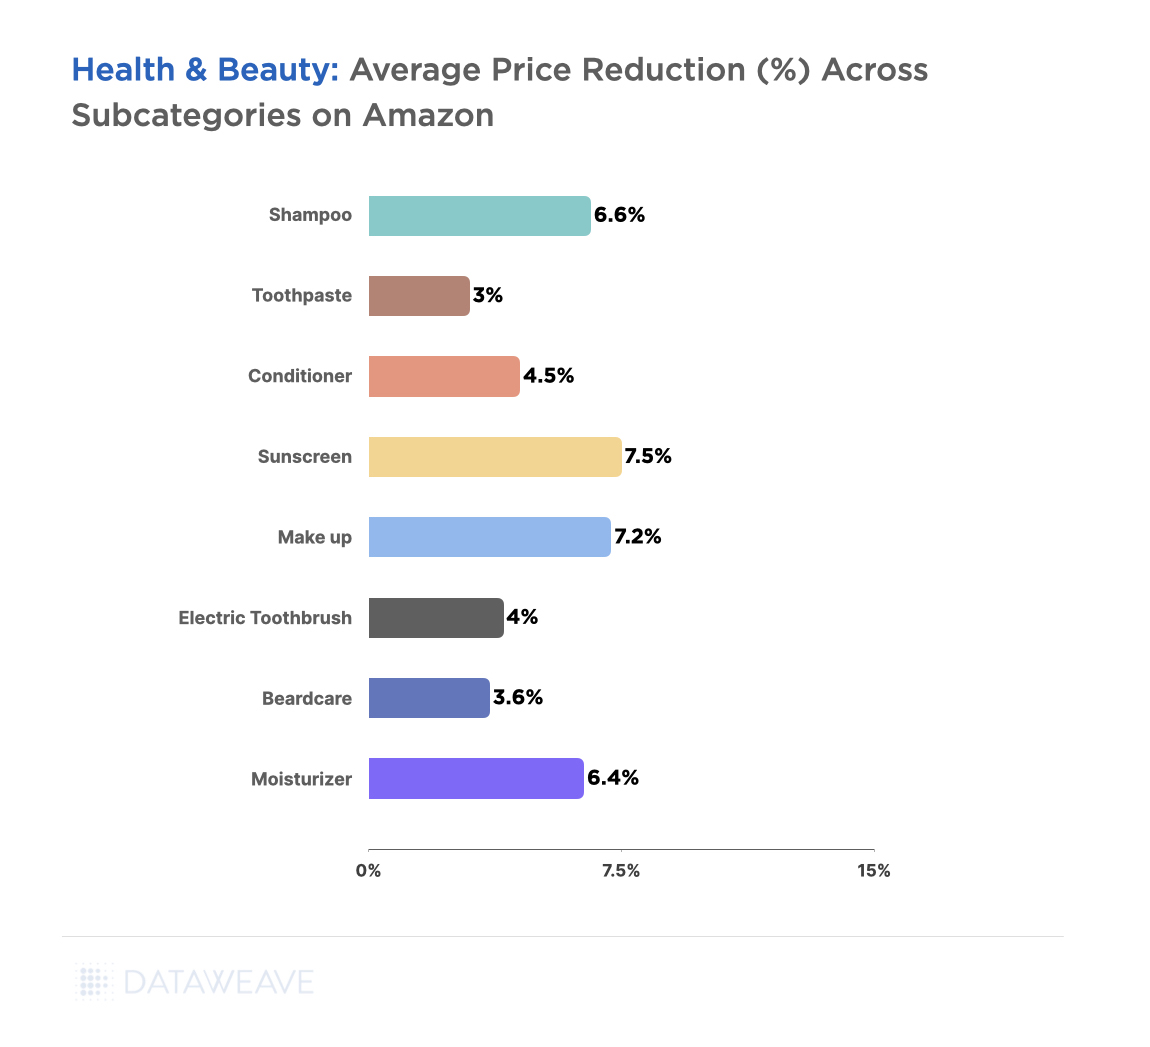
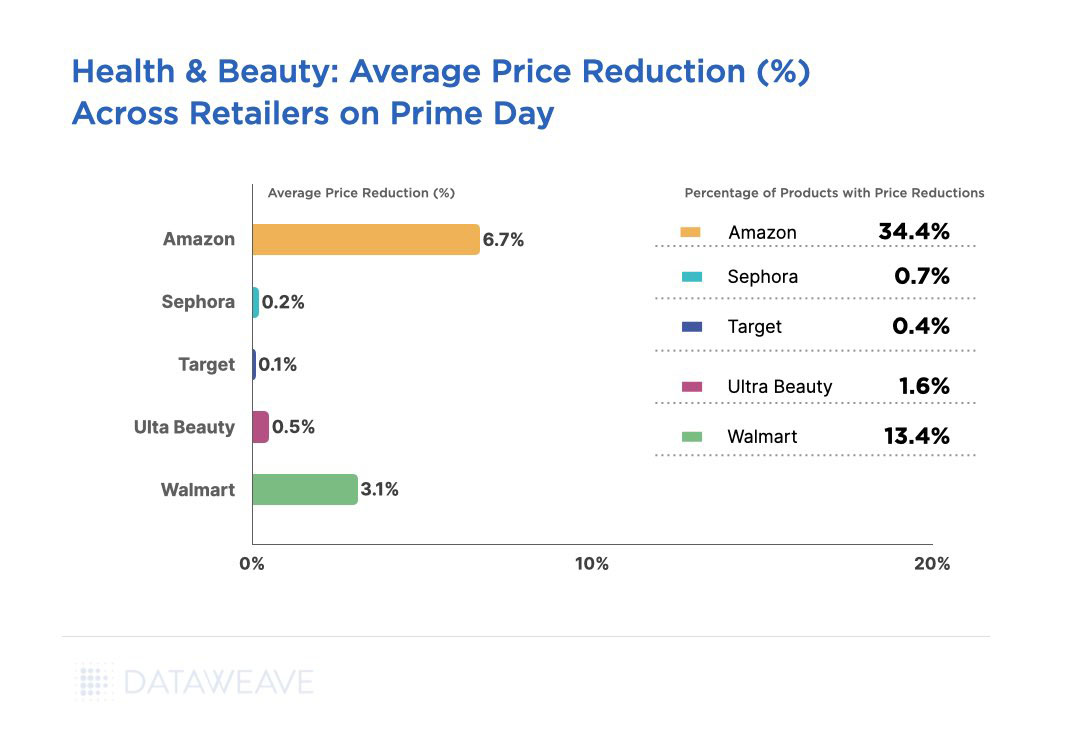
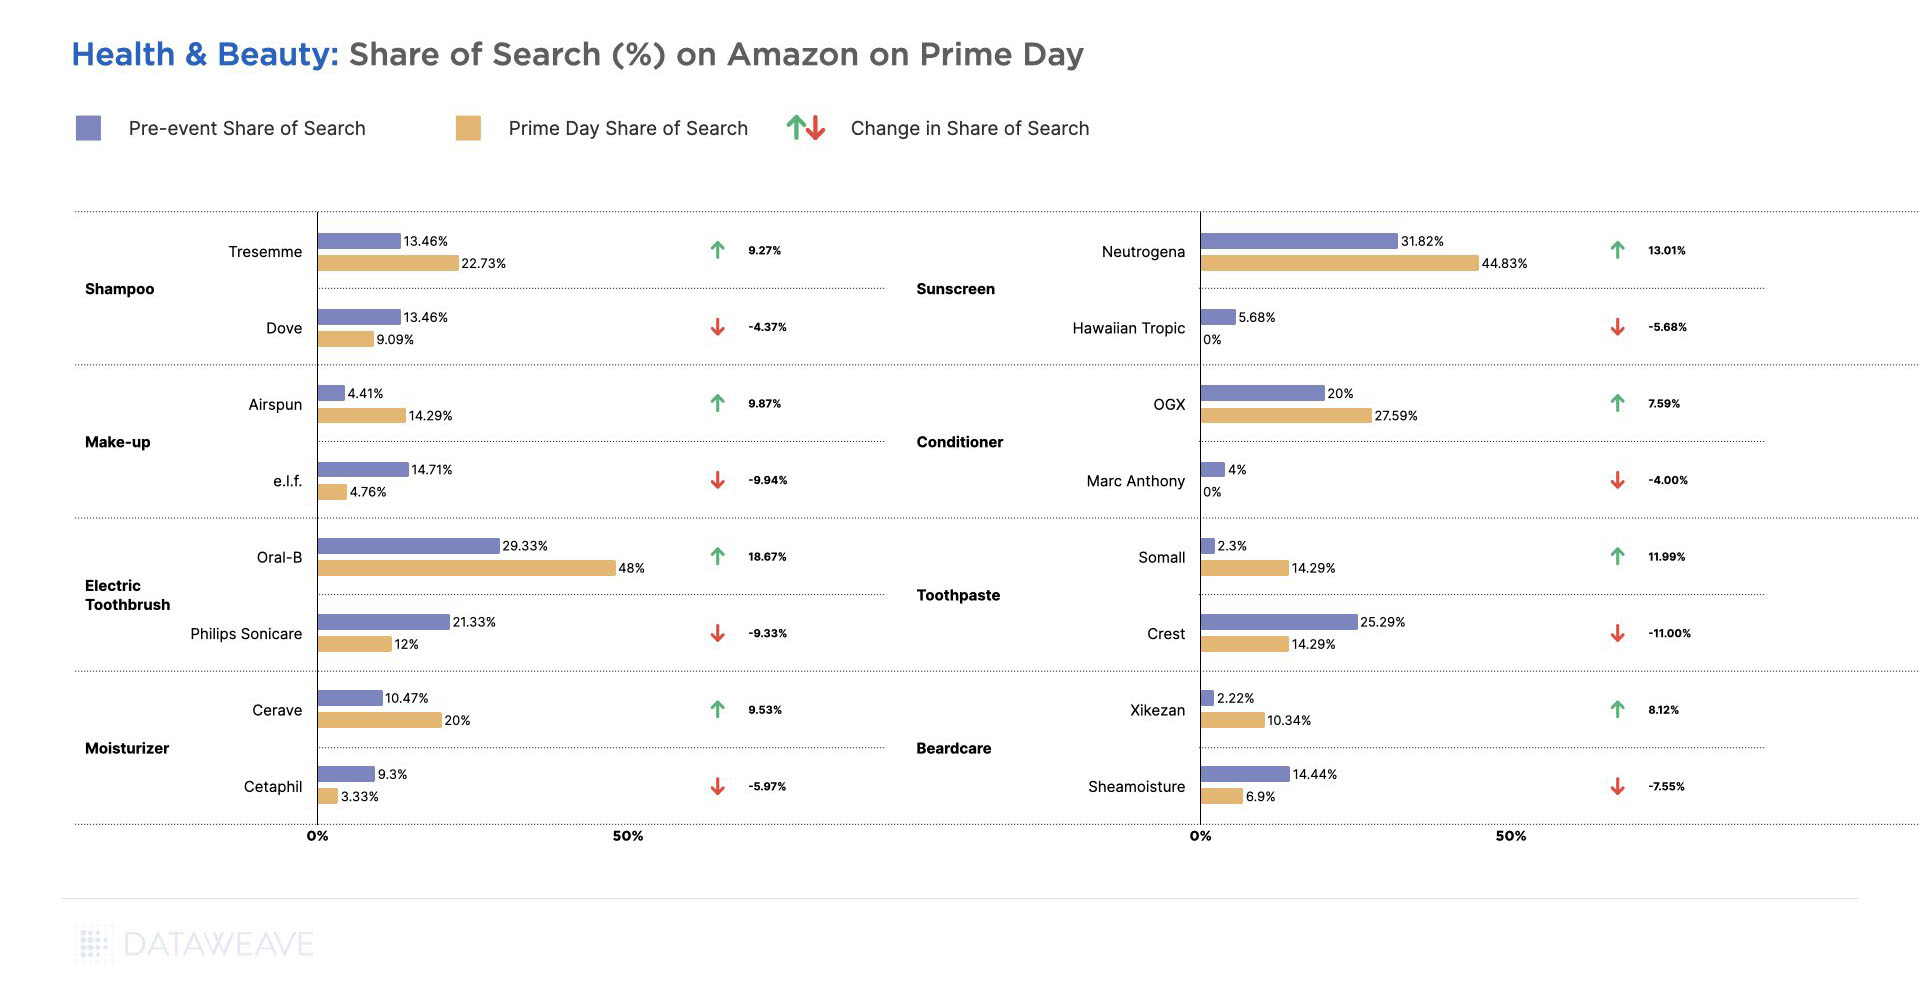
Health & Beauty
During October’s Prime Big Deal Days, the Health & Beauty category showcased products at an average of 1.99% lower prices compared to the Prime Day event held in July.

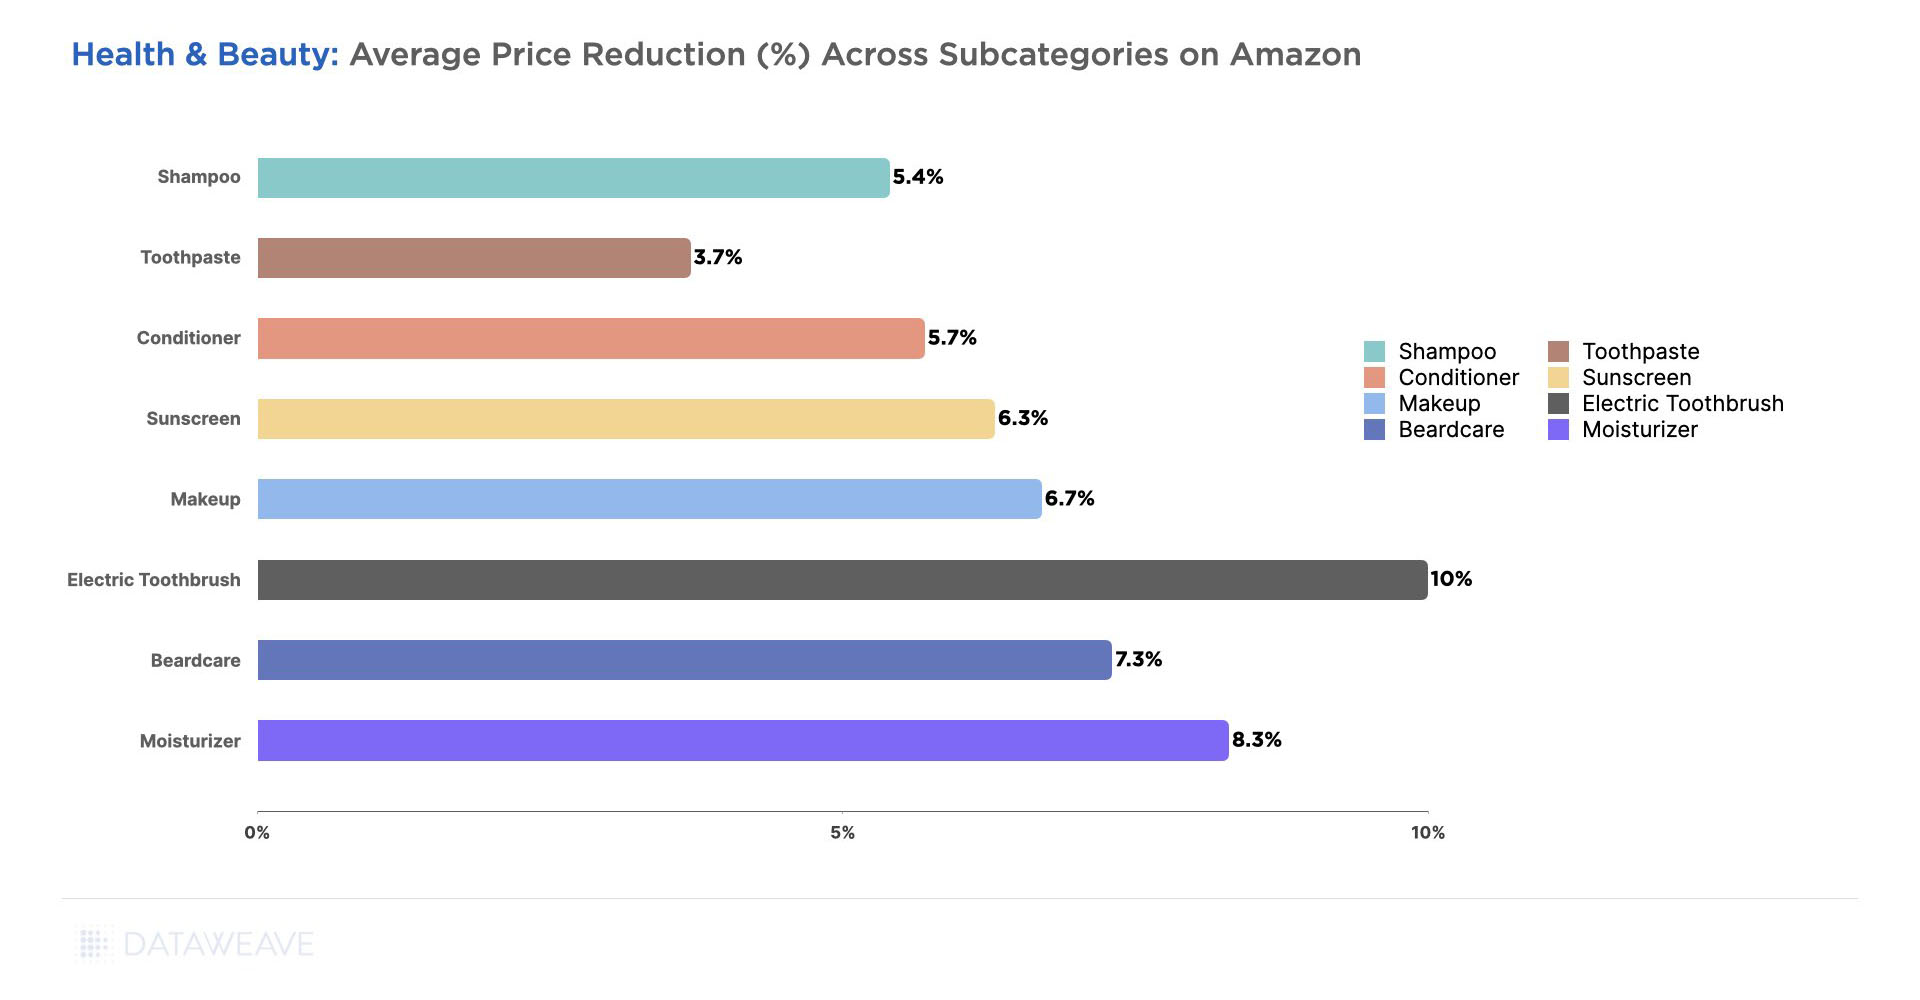
Our analysis of Health & Beauty reveals that a majority of the subcategories presented higher discounts during the October Big Deal Days event. Essential items such as Toothpaste, Sunscreen, and Electric Toothbrushes notably stood out as significantly more affordable during the Fall event, reflecting not only consistent demand but also a seasonal emphasis on these products. For instance, the Oral B iO Series 3 Limited Edition Electric Toothbrush, priced at $140 during the summer Prime Days, was further discounted to $120 in the fall event.
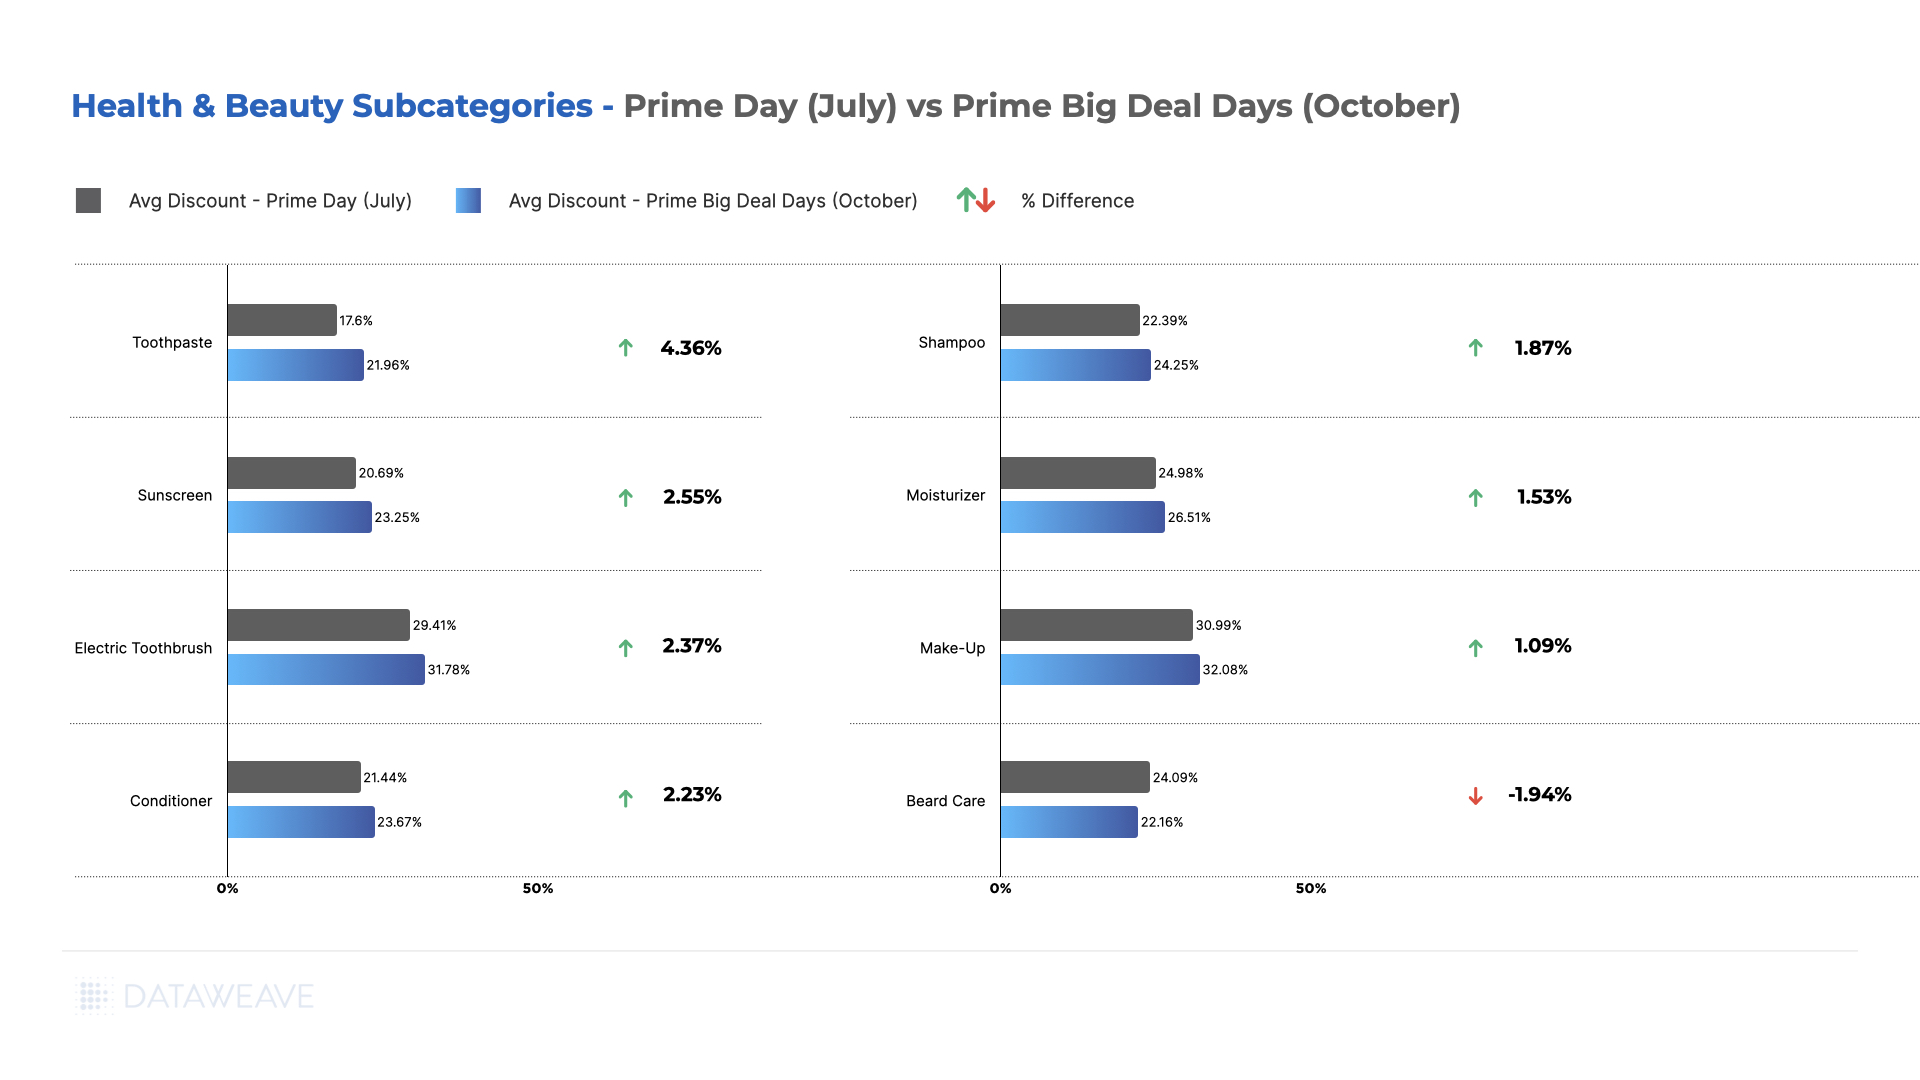
Interestingly, Beard Care emerged as an exception, displaying higher discounts during the Prime Day sale in Summer compared to Fall’s Prime Big Deal Days.
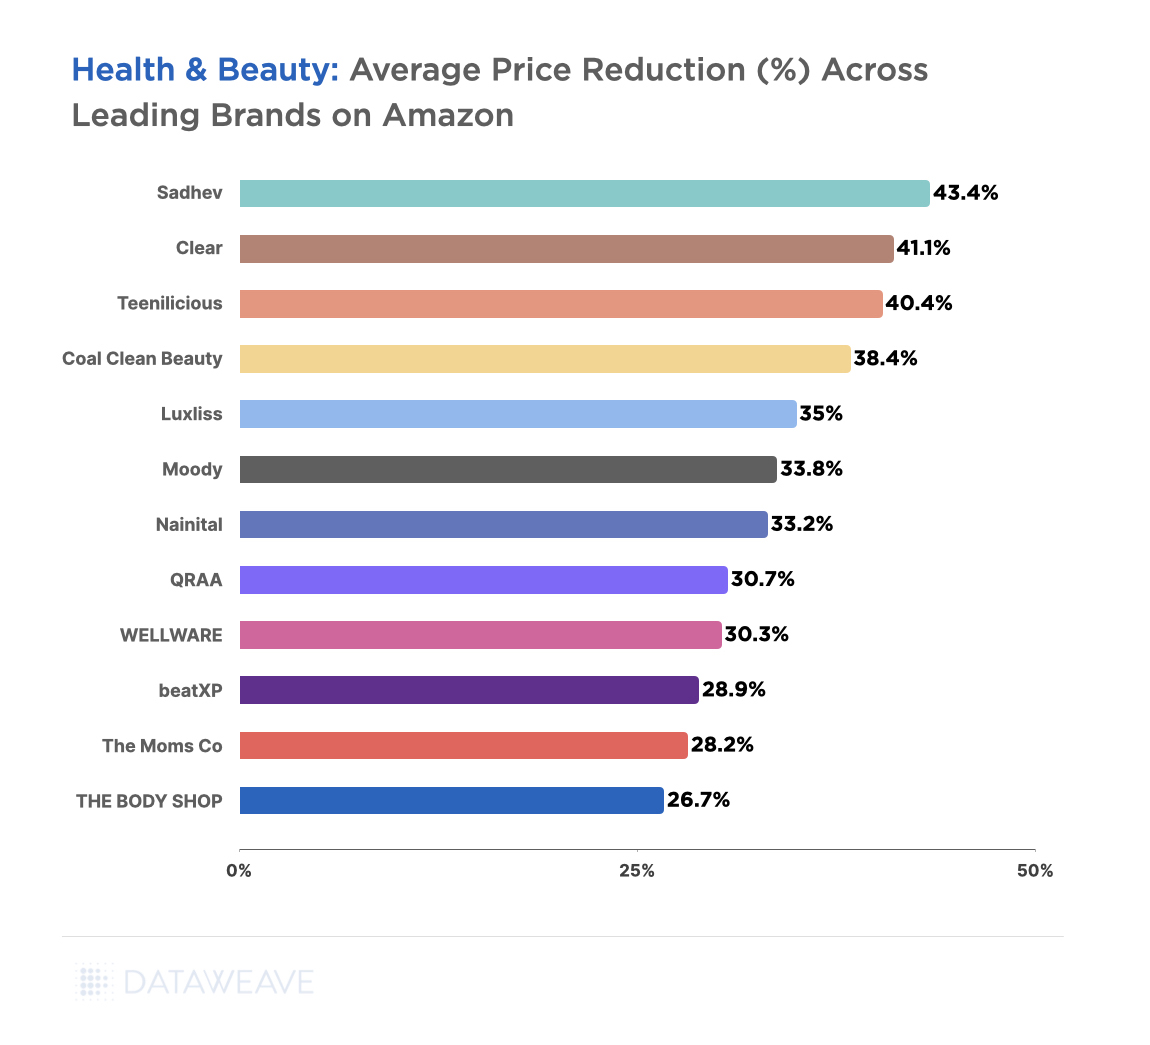
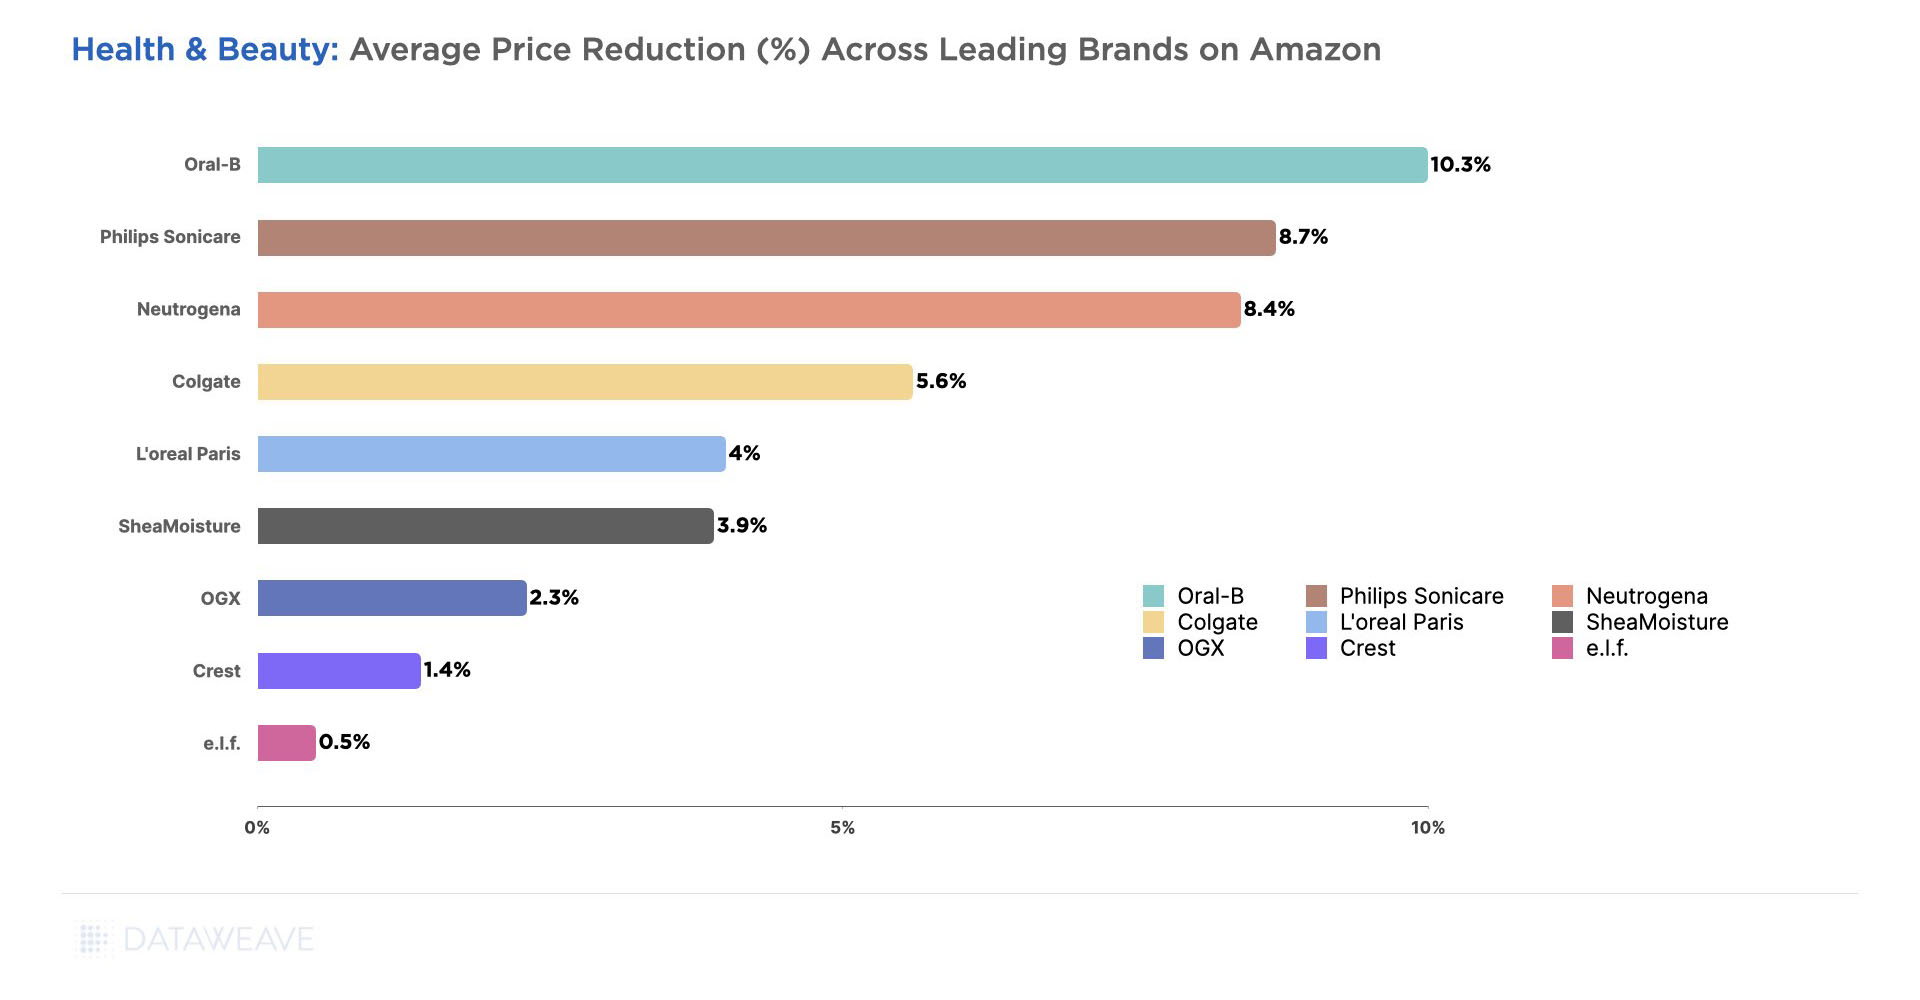
Examining brands within the category, Babyganics, Thinkbaby, and Vaseline showcased substantial increases in average additional discounts during October’s Prime Big Deal Days.
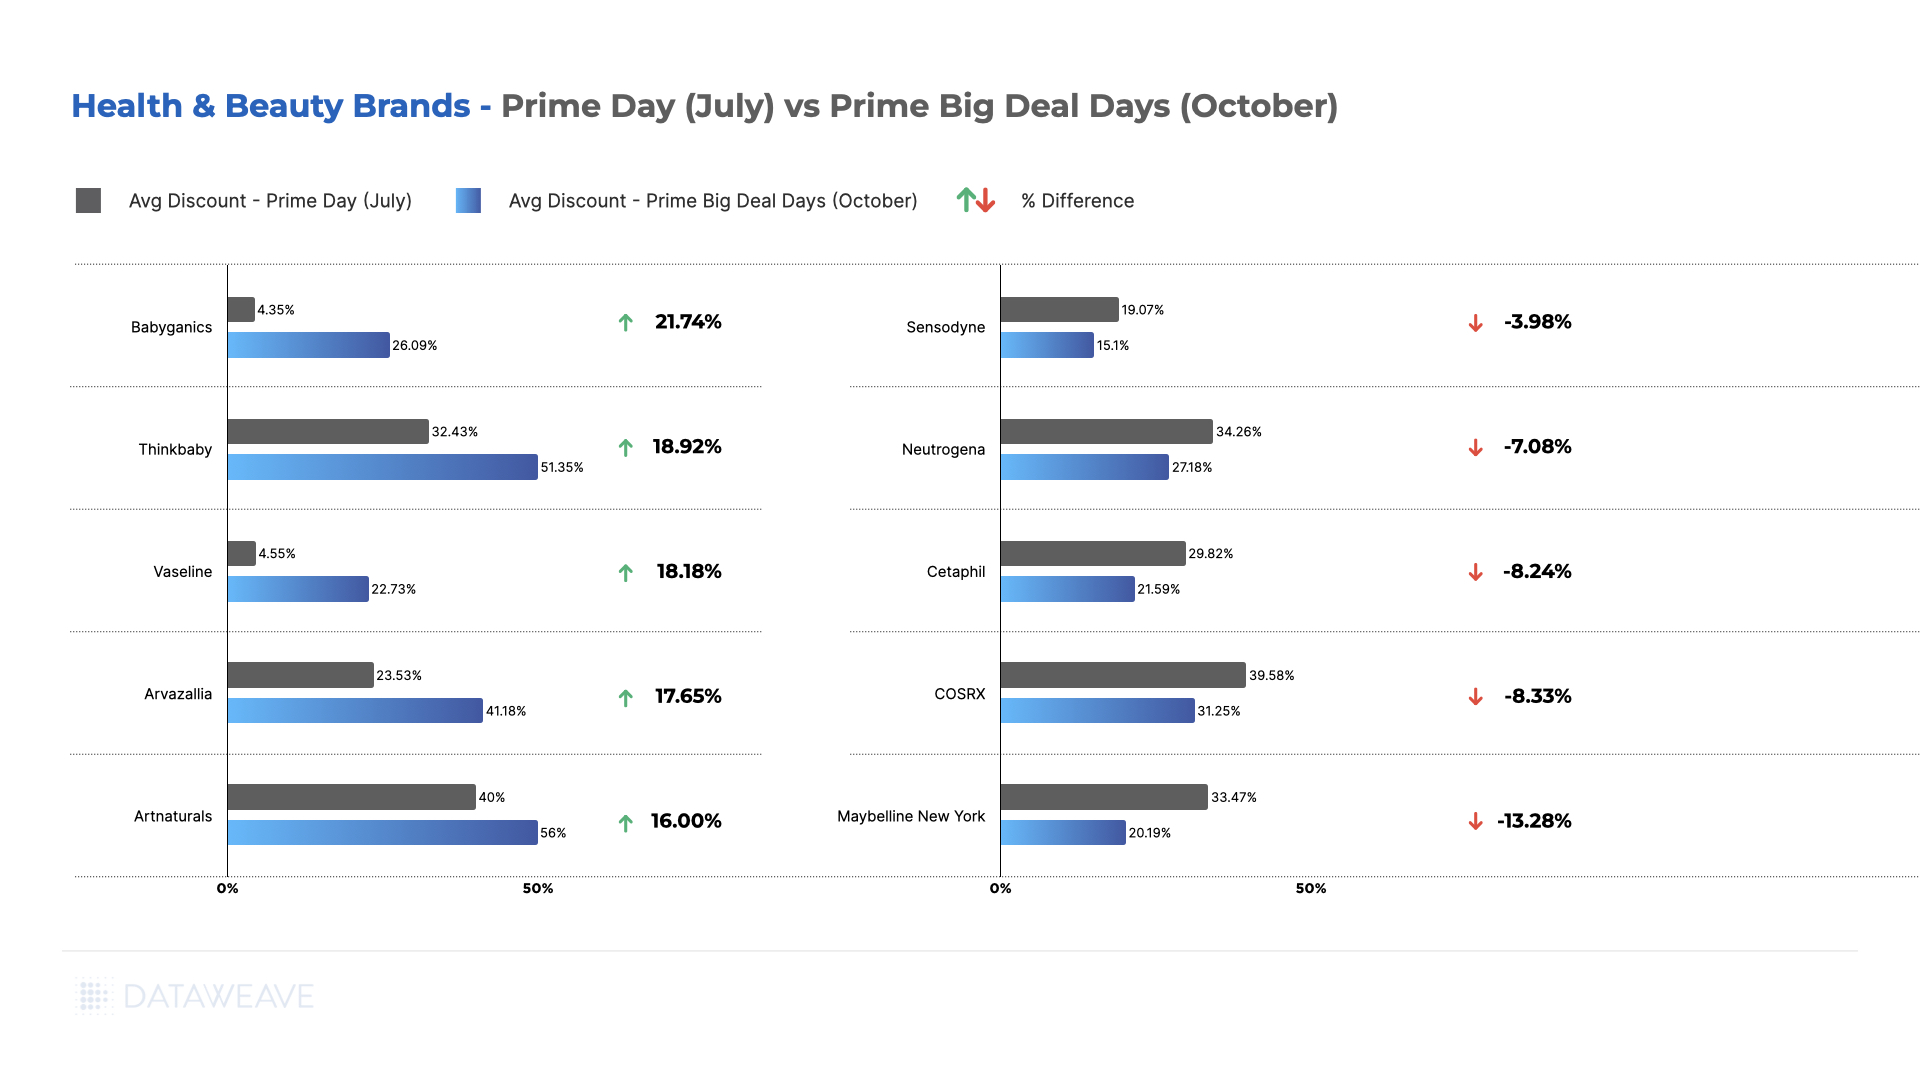
Conversely, prominent brands like Maybelline, Neutrogena, and Cetaphil offered lower discounts during the fall event.
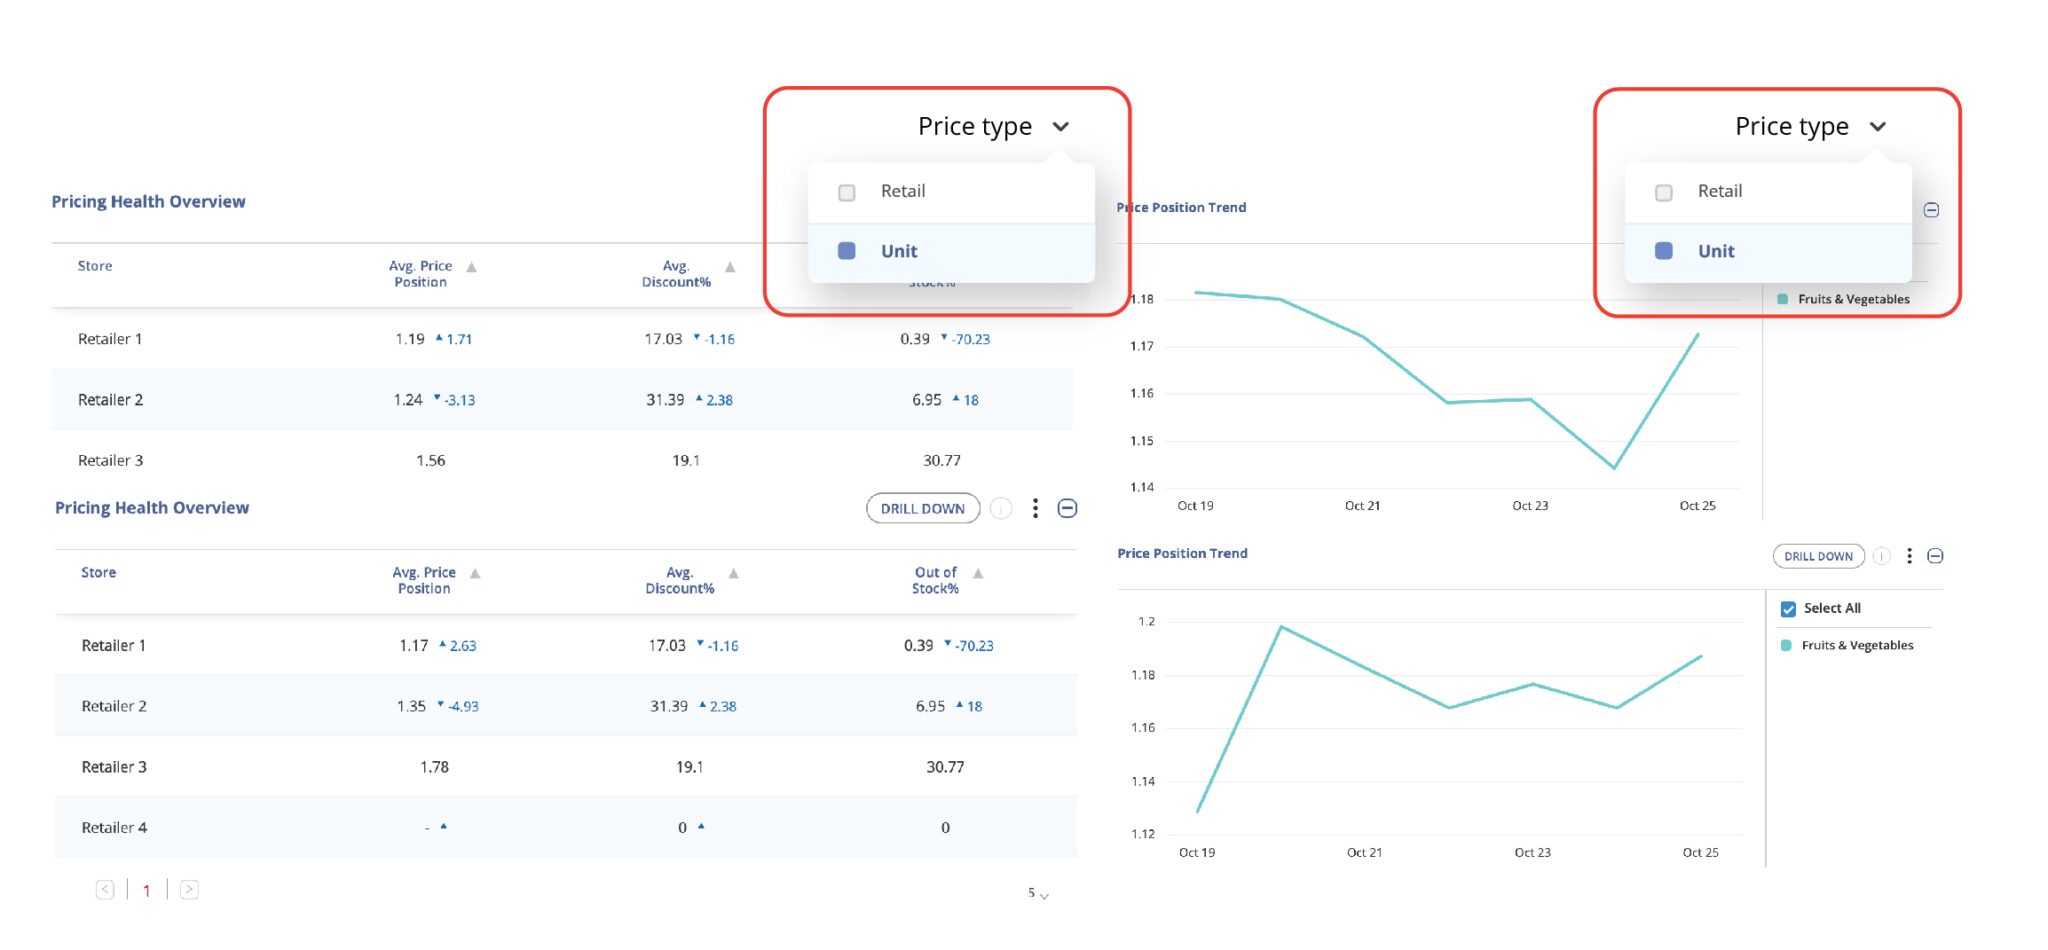
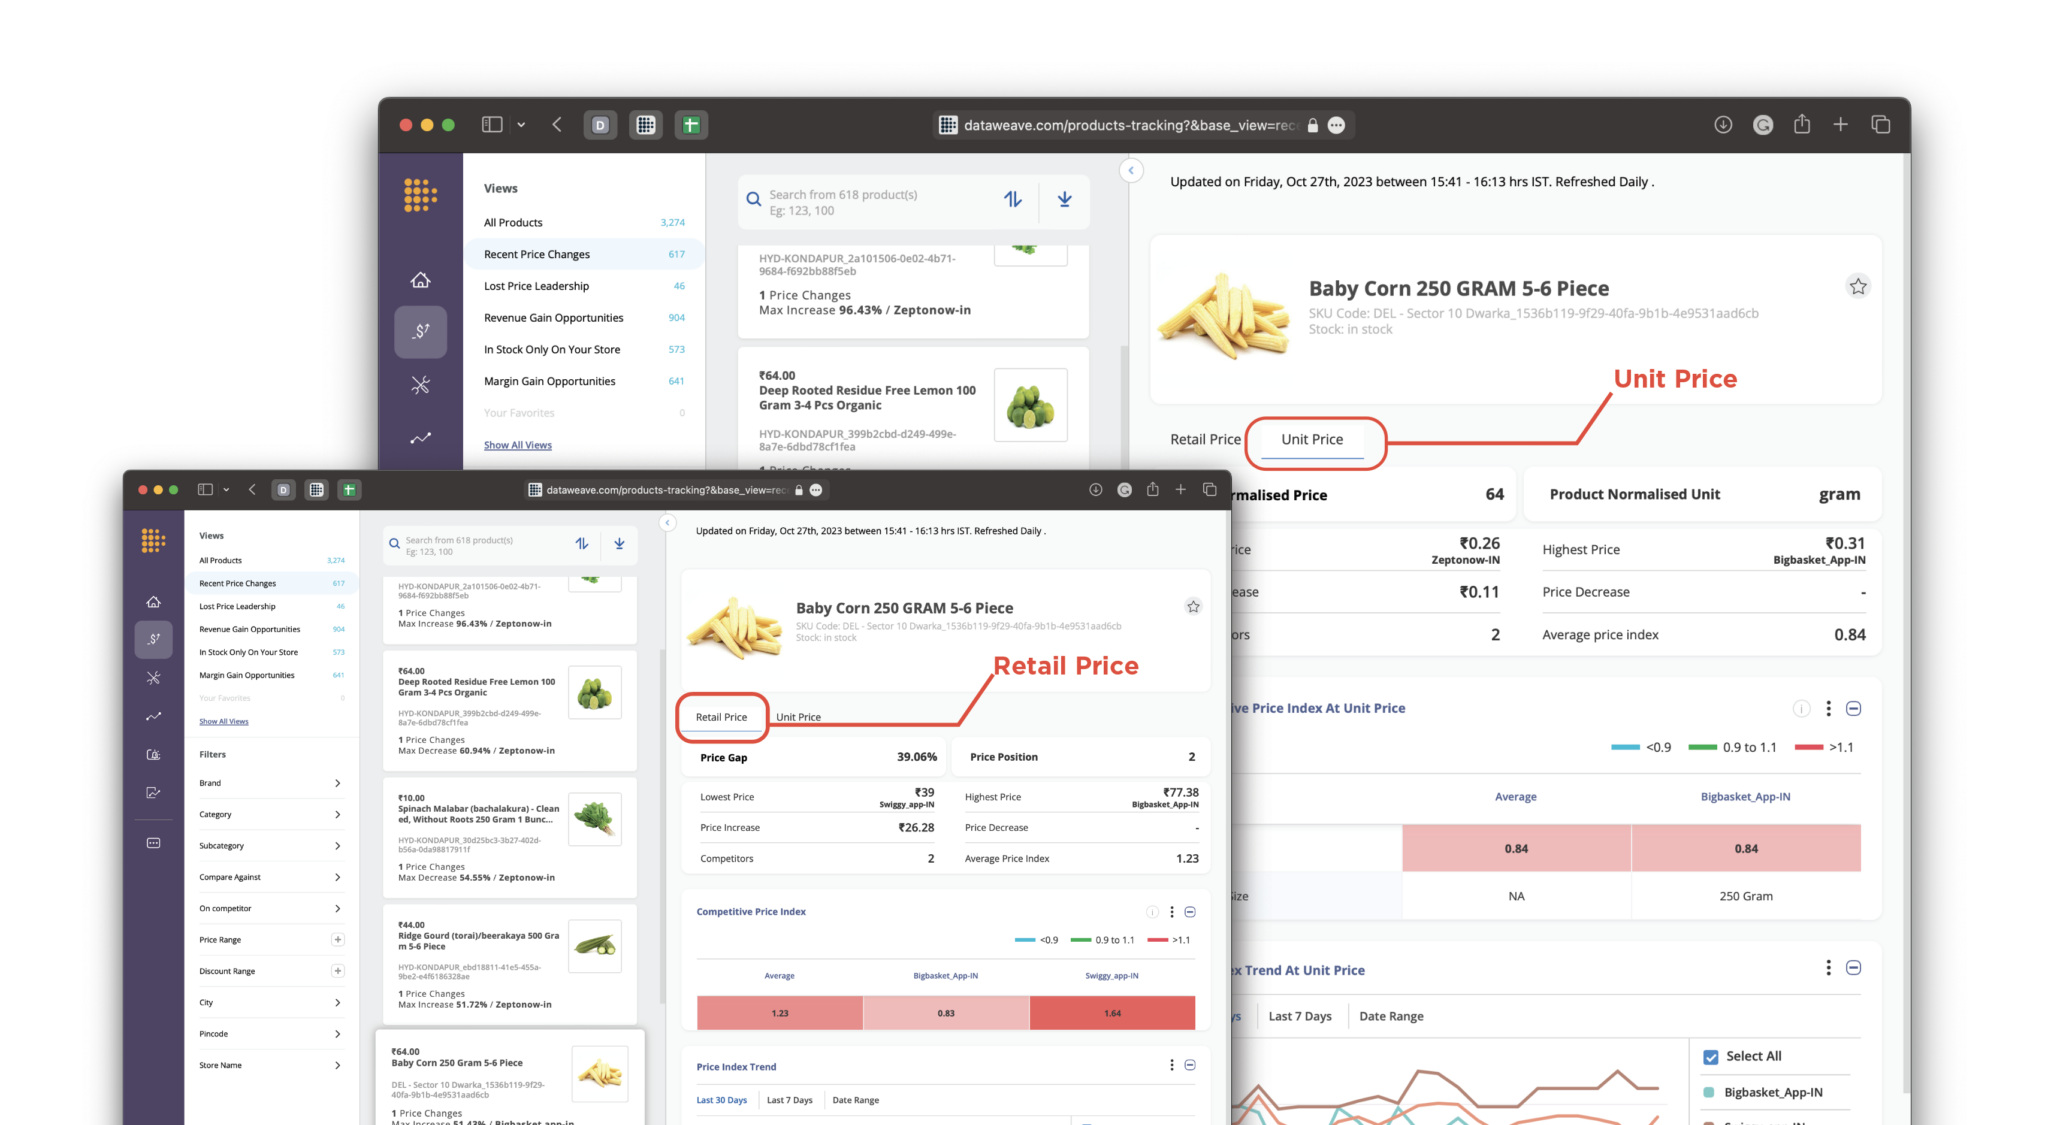
Competitive Insights to Drive Optimized Sale Event Pricing
At DataWeave, we understand the pivotal role of competitive pricing insights in empowering retailers and brands to gain a competitive edge, especially during significant events like Prime Day. Our commitment lies in providing retailers with precise and extensive competitor price tracking on a large scale. This empowers them to devise impactful pricing strategies and consistently uphold a competitive stance in the market. To learn more about how this can be done, talk to us today!