As the highly anticipated shopping season approached, industry analysts, including Deloitte, had forewarned consumer spending caution owing to persistent inflationary pressures tightening budgets. Despite these concerns, the holiday spirit was buoyed by sensational deals that delighted bargain-hunting shoppers.
According to the National Retail Federation (NRF), over 200 million consumers participated in both in-store and online shopping activities over the Thanksgiving weekend. This marked an almost 2% uptick from the previous year, surpassing the NRF’s initial estimates of 182 million and showcasing a robust start to the holiday shopping season.
So what was all the hype about this Black Friday and Cyber Monday? How did top retailers react to reports of possibly decreased consumer spending? At DataWeave, we harnessed the power of our proprietary data aggregation and analysis platform to track and analyze the prices and deals of products across prominent retailers and categories to uncover unique insights into their price competitiveness this BFCM, as well as understand how pricing strategies varied across diverse subcategories and brands.
In this article, we focus on the pricing and discounting strategies of Amazon, Walmart, and Target in the Apparel category.
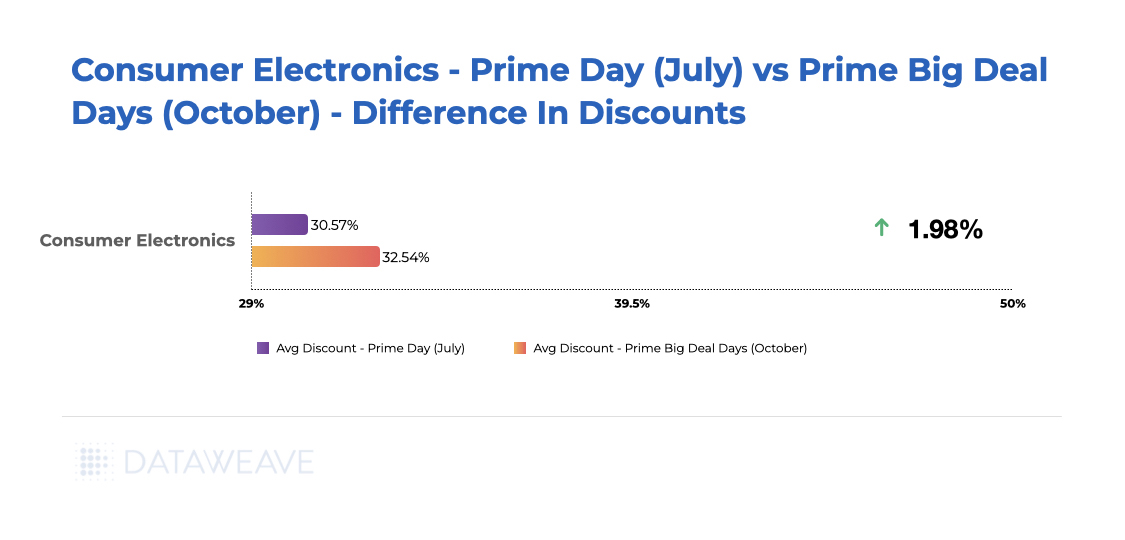
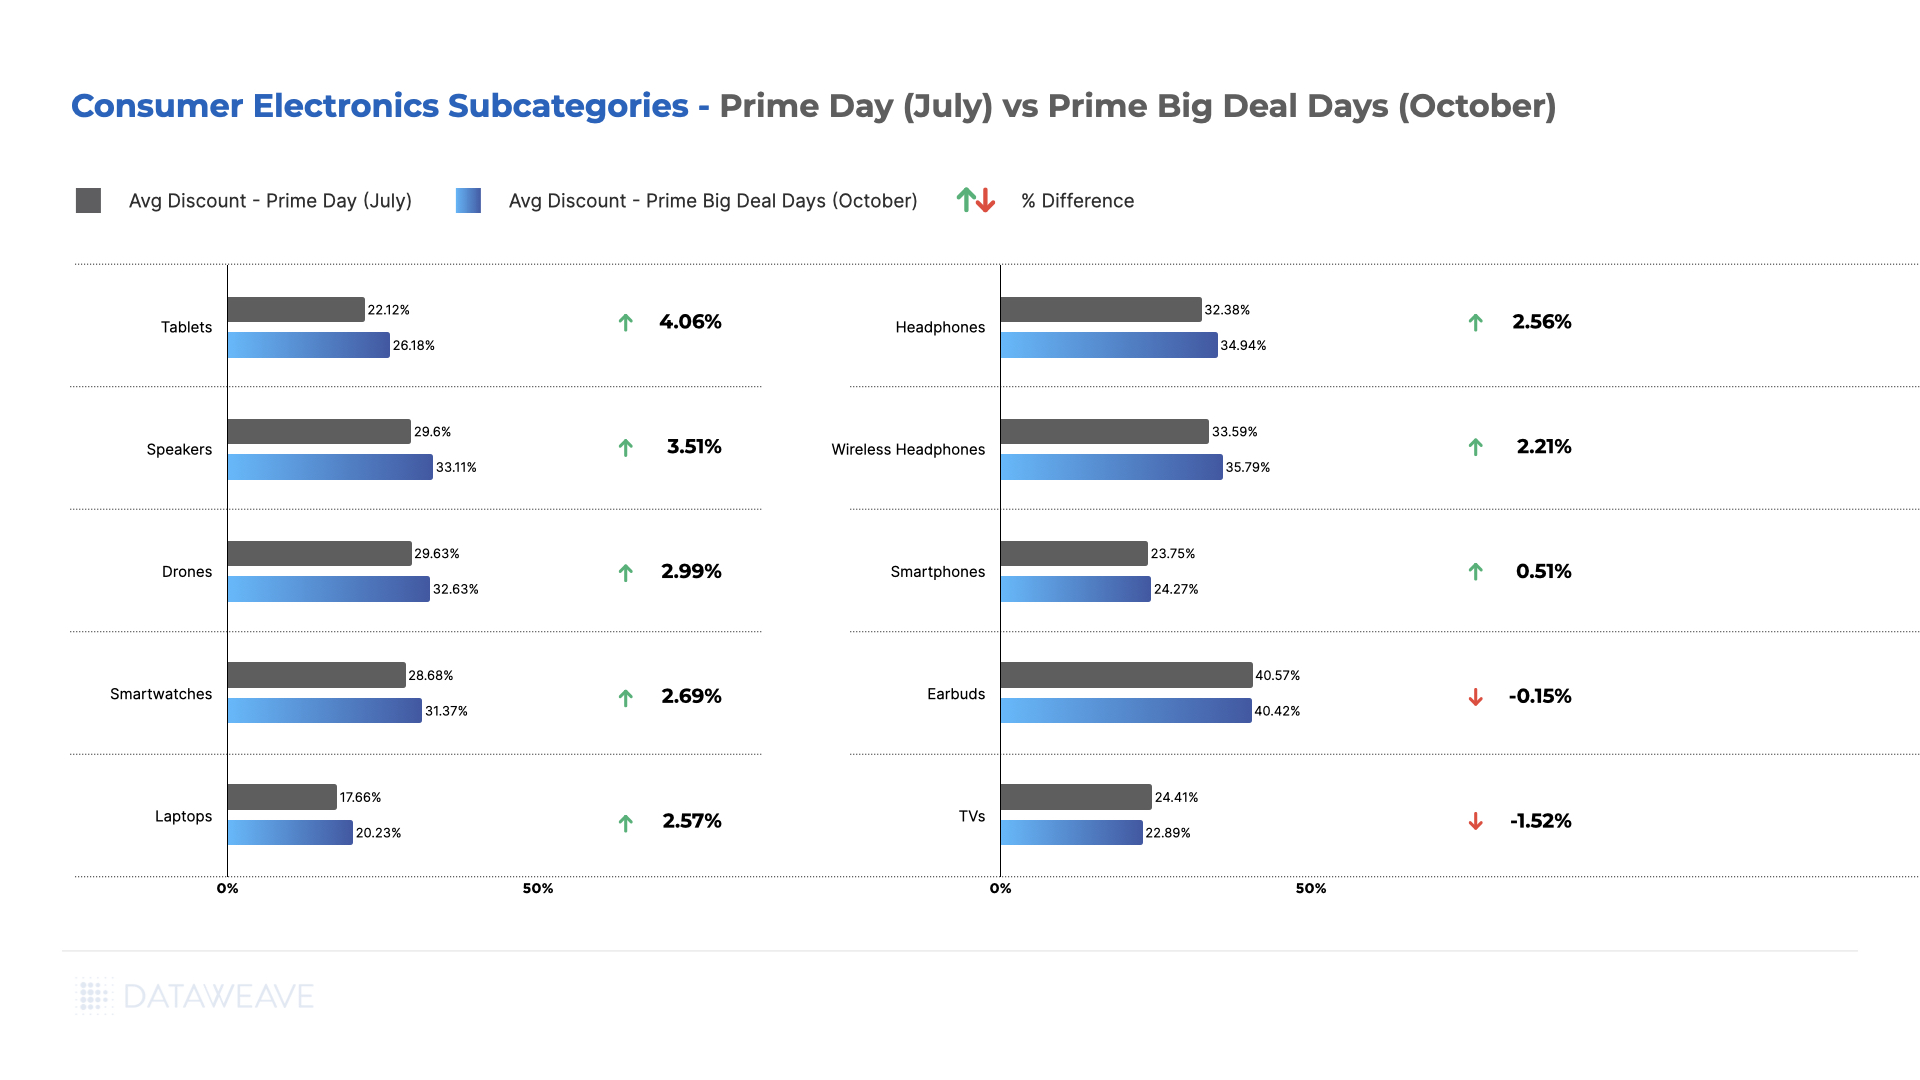
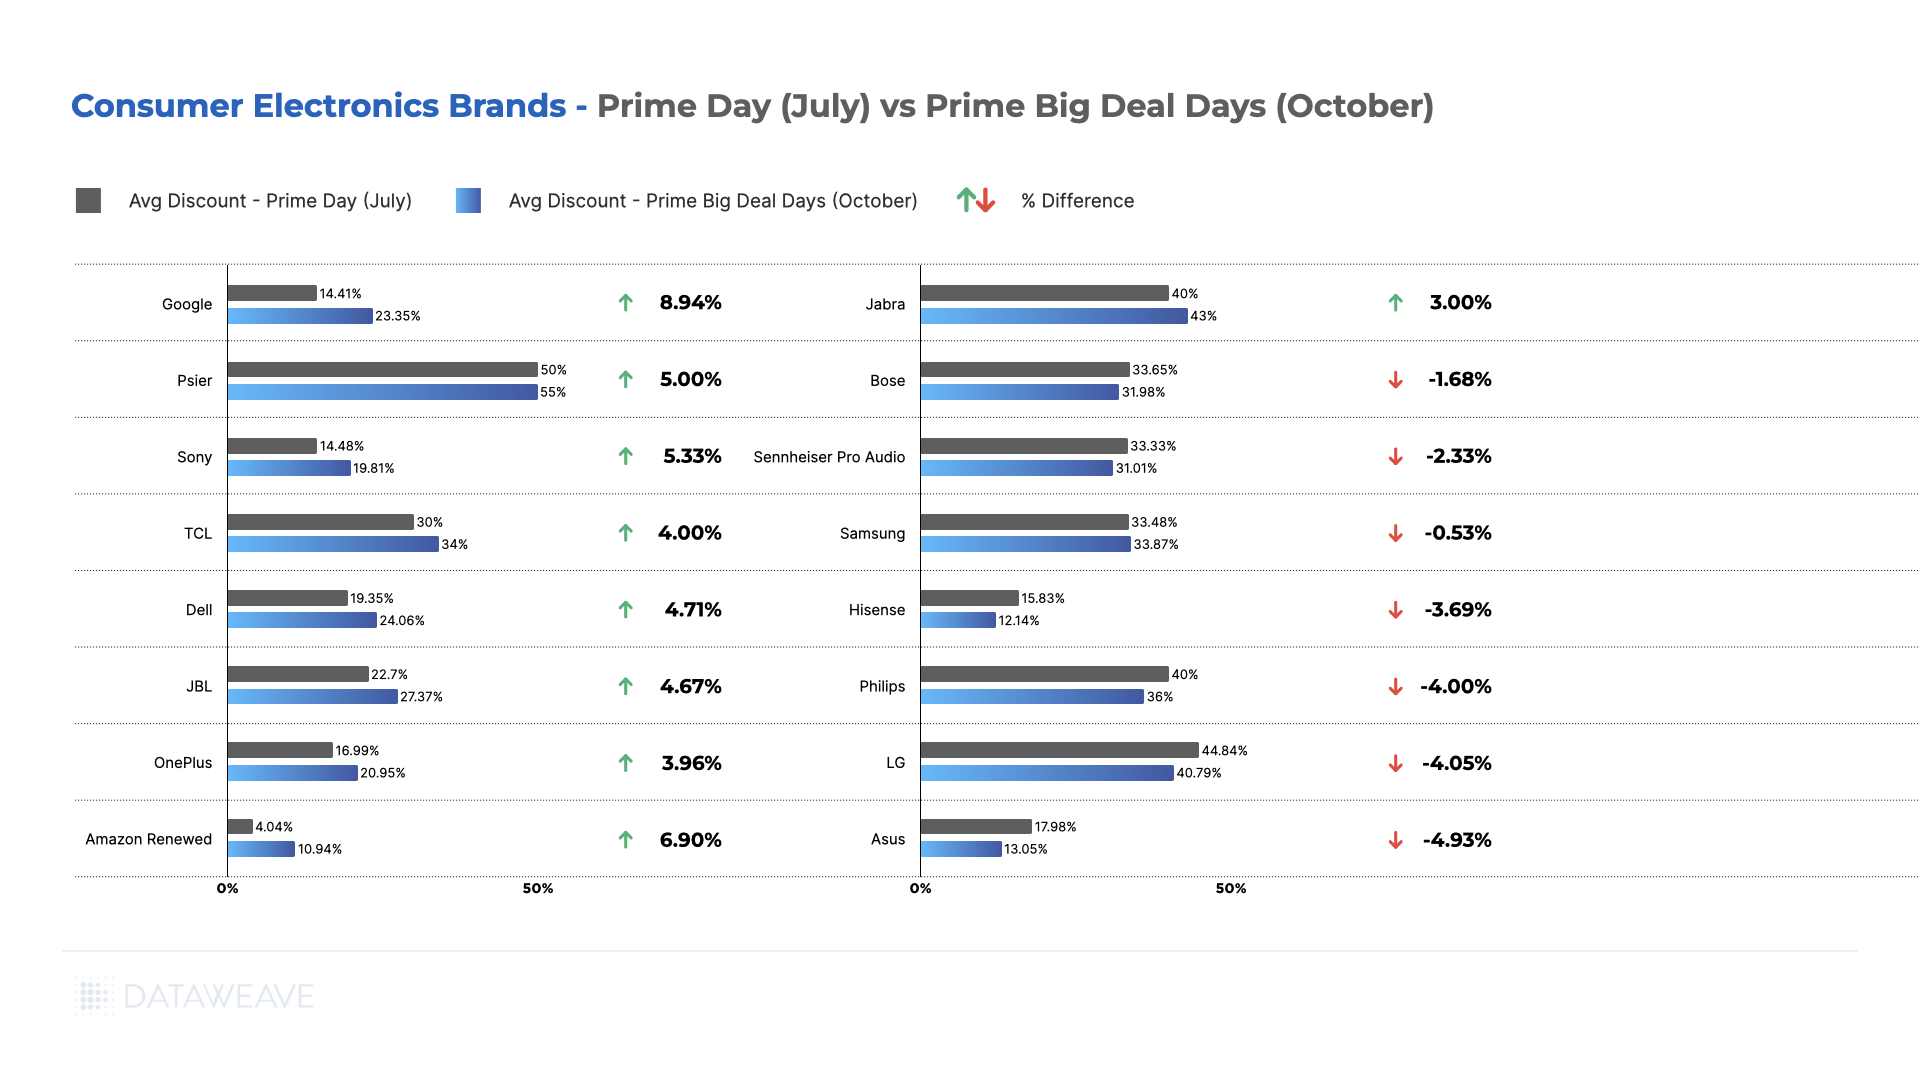
(Read Also: Black Friday Cyber Monday 2023: Insights on Pricing and Discounts in Consumer Electronics)
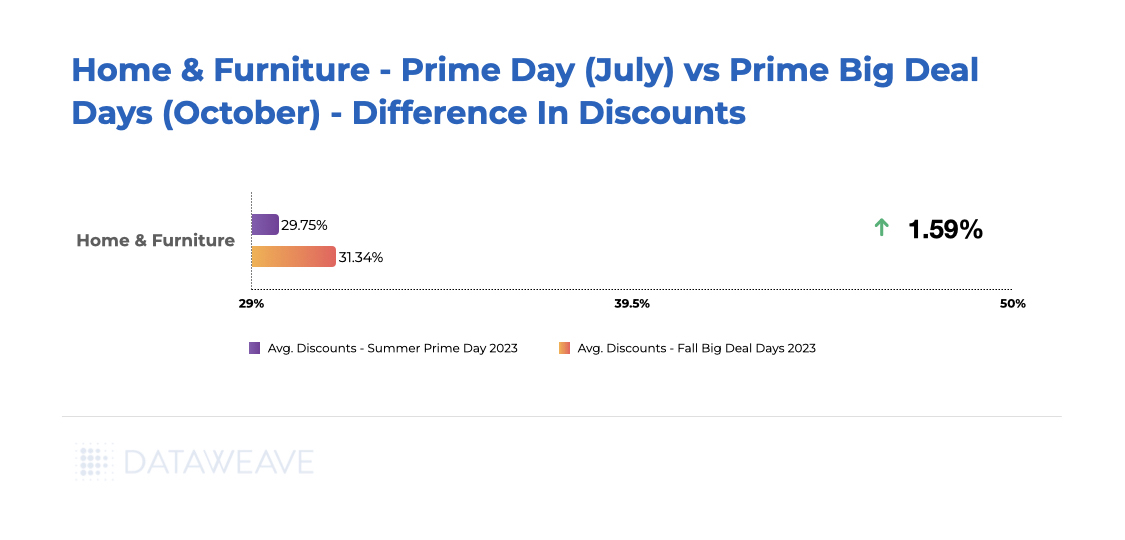
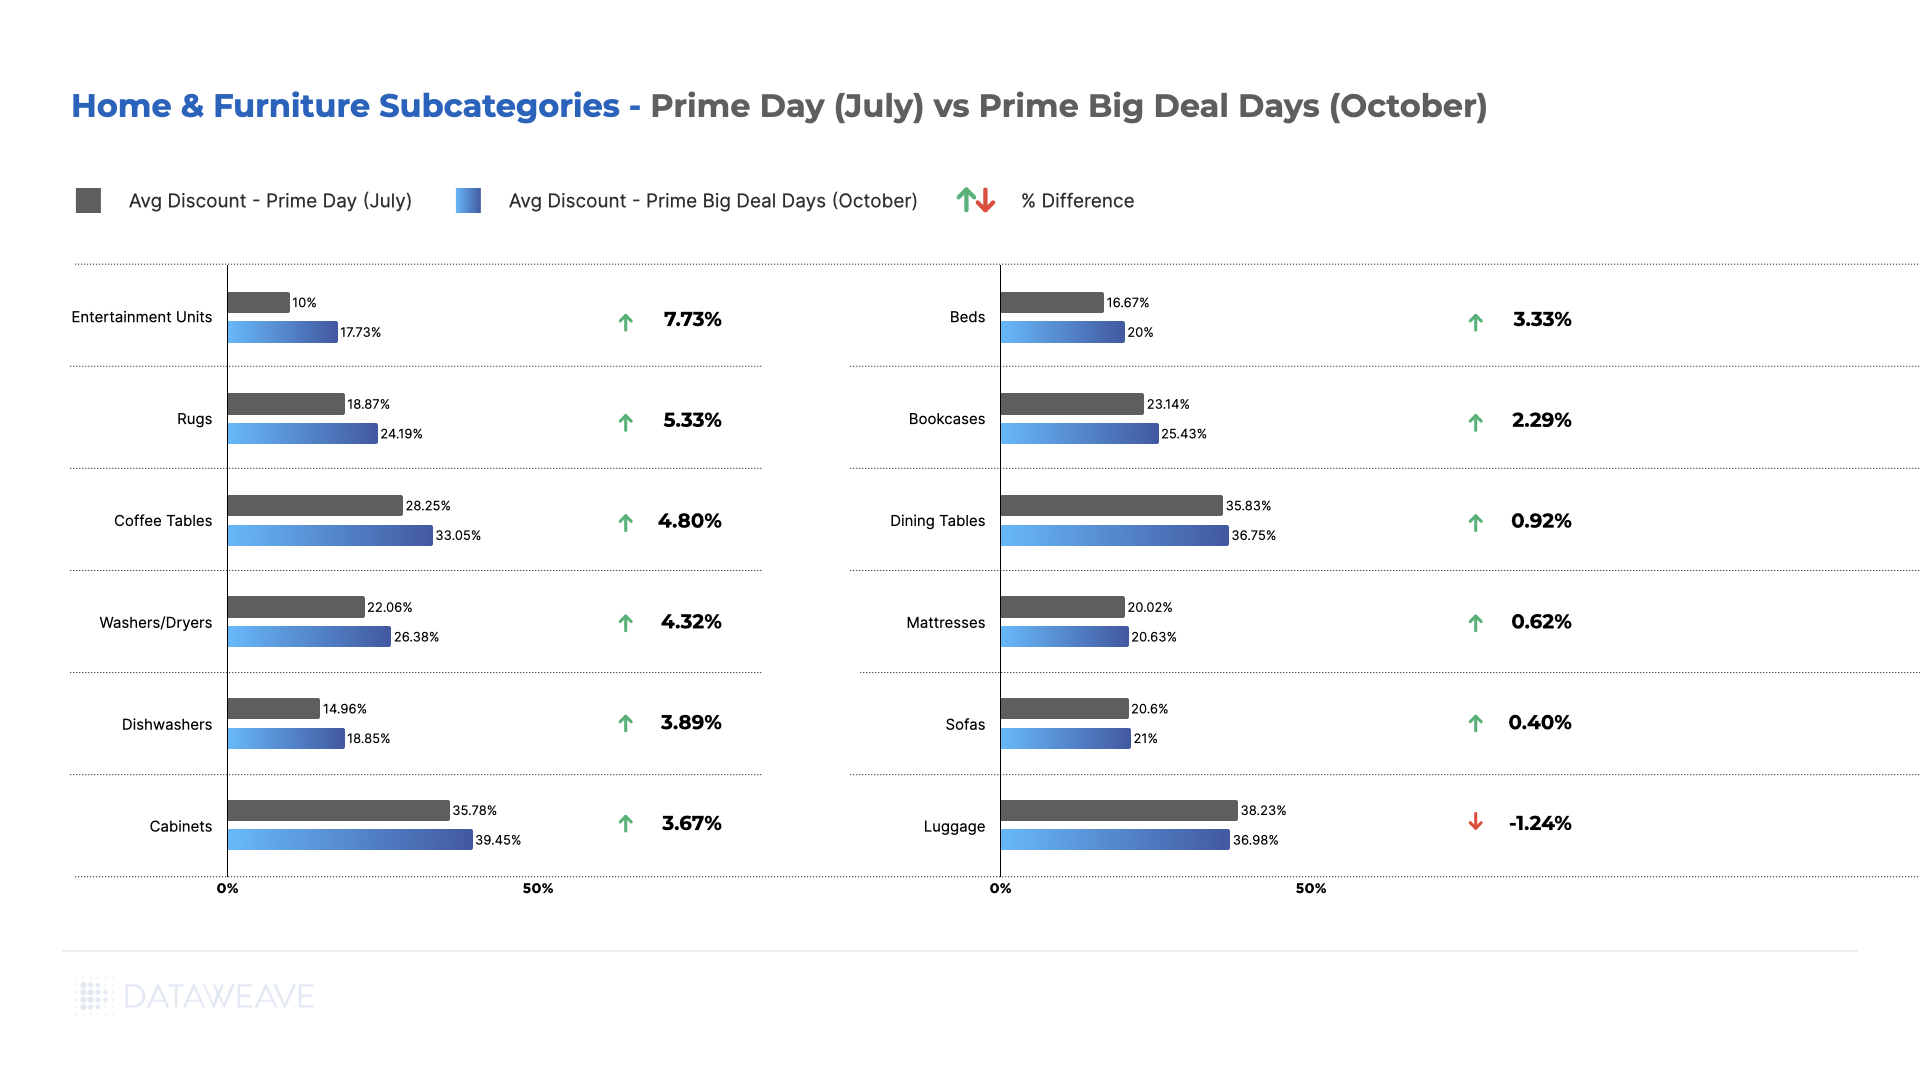
Stay tuned to our blog for insights on other shopping categories like Home & Furniture, and Health & Beauty!
Our Methodology
For this analysis, we tracked the average discounts of apparel products among leading US retailers during the Thanksgiving weekend sale, including Black Friday and Cyber Monday. We noticed prices and discounts didn’t change significantly over the course of the weekend, and hence the average prices of products between the 24th and 27th of November are being reported. Our sample was chosen to encompass the top 500 ranked products in each product subcategory across during the sale.
- Sample size: 17,981 SKUs
- Retailers tracked: Amazon, Walmart, Target
- Subcategories reported on: Women’s Tops, Men’s Swimwear, Men’s Innerwear, Women’s Innerwear, Women’s Athleisure, Women’s Dresses, Men’s Athleisure, Men’s Shirts, Women’s Shoes, Men’s Shoes, Women’s Swimwear
- Timeline of analysis: 24 to 27 November 2023
Our Key Findings
Average Discounts Across Retailers
Amazon offered the most attractive deals, showcasing an average discount of 19.5%, applying to a substantial 61% of their apparel inventory.
Trailing closely behind was Target, offering an average discount of 14.8% across 52% of the products analyzed. Walmart, however, took a more conservative approach, providing an average discount of 8.5%, applicable to 29% of its products.

The contrast in discounting strategies highlights the diverse tactics employed by retailers to entice Black Friday and Cyber Monday shoppers within the Apparel category. Amazon remains the forerunner, balancing competitive discounts with a significant coverage of discounted items.
Target follows suit with a competitive stance, while Walmart opts for a more reserved markdown approach, given that the retailer tends to carry a large number of products in the affordable price ranges.
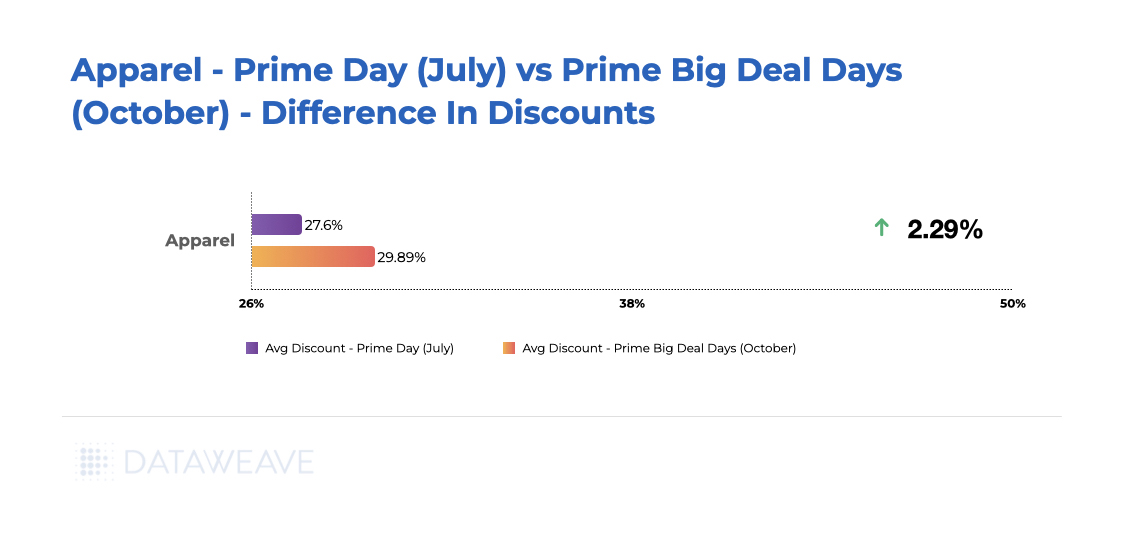
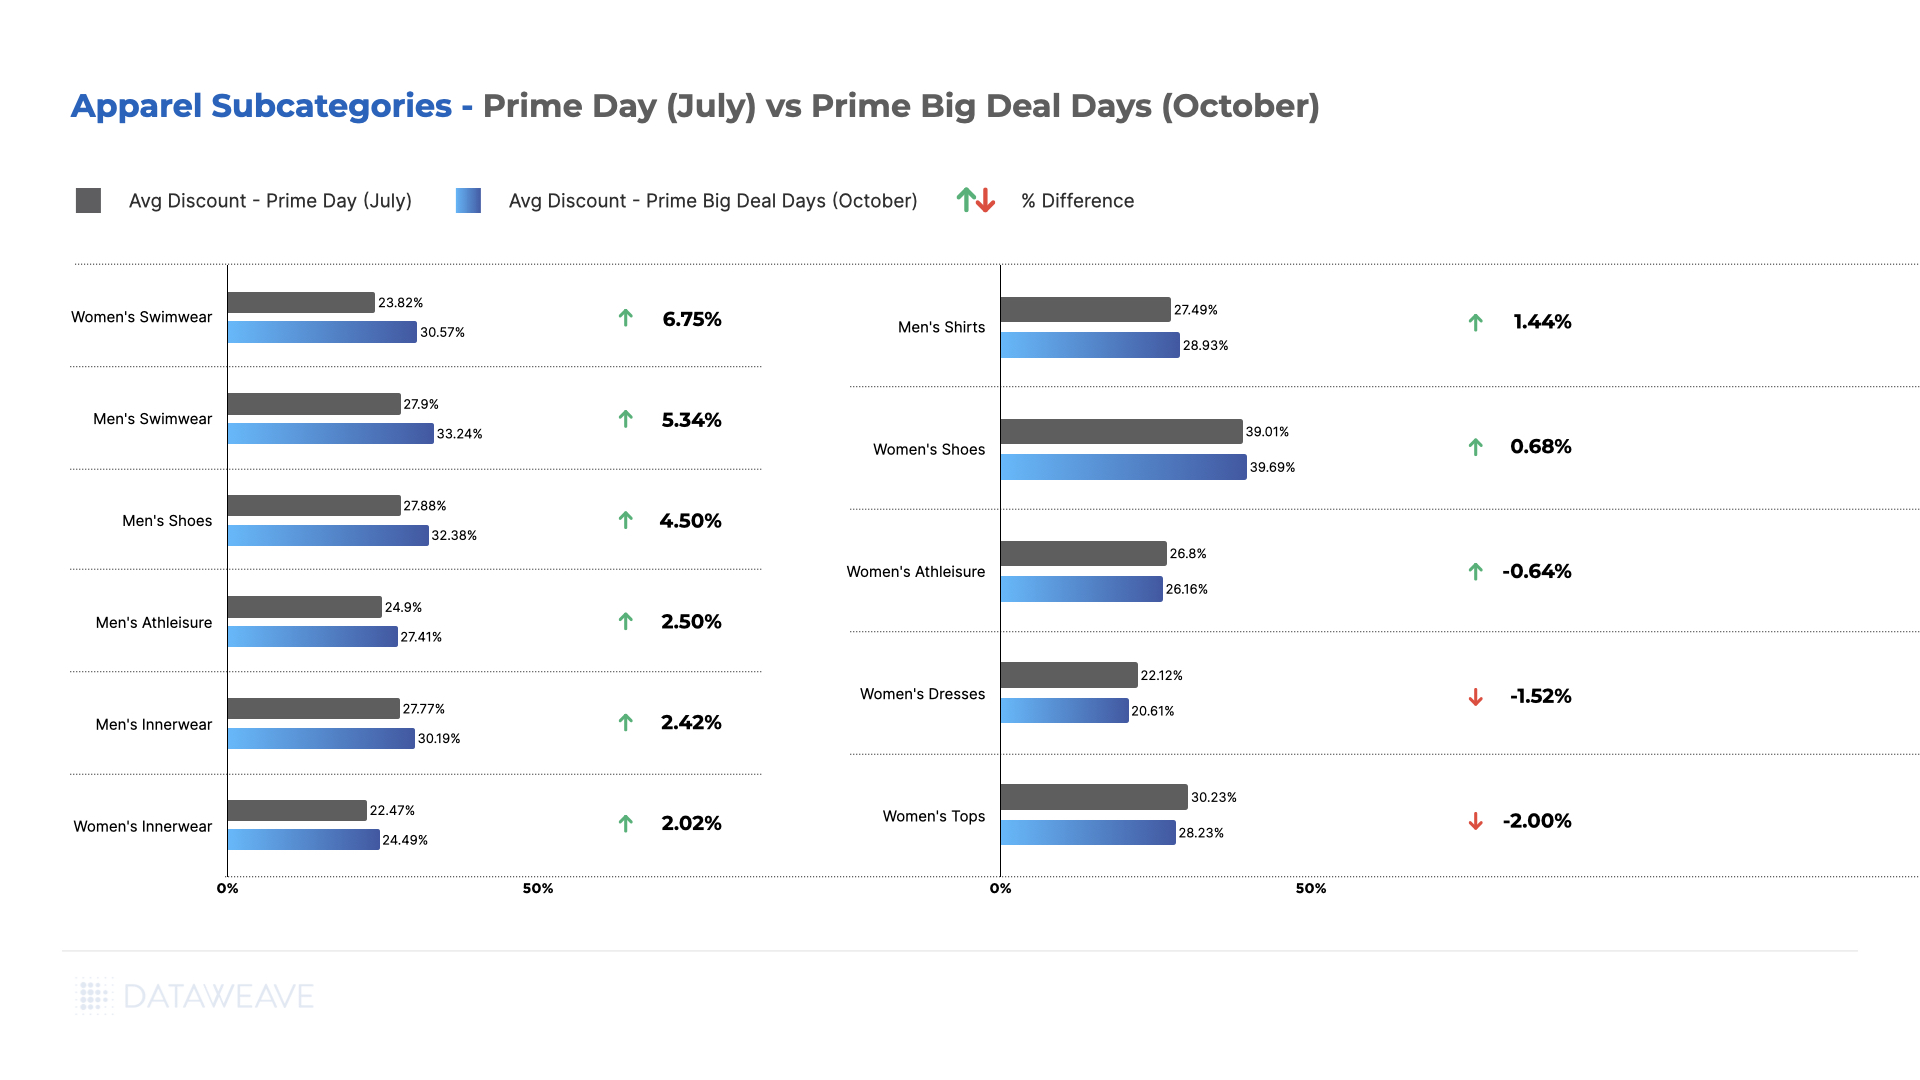
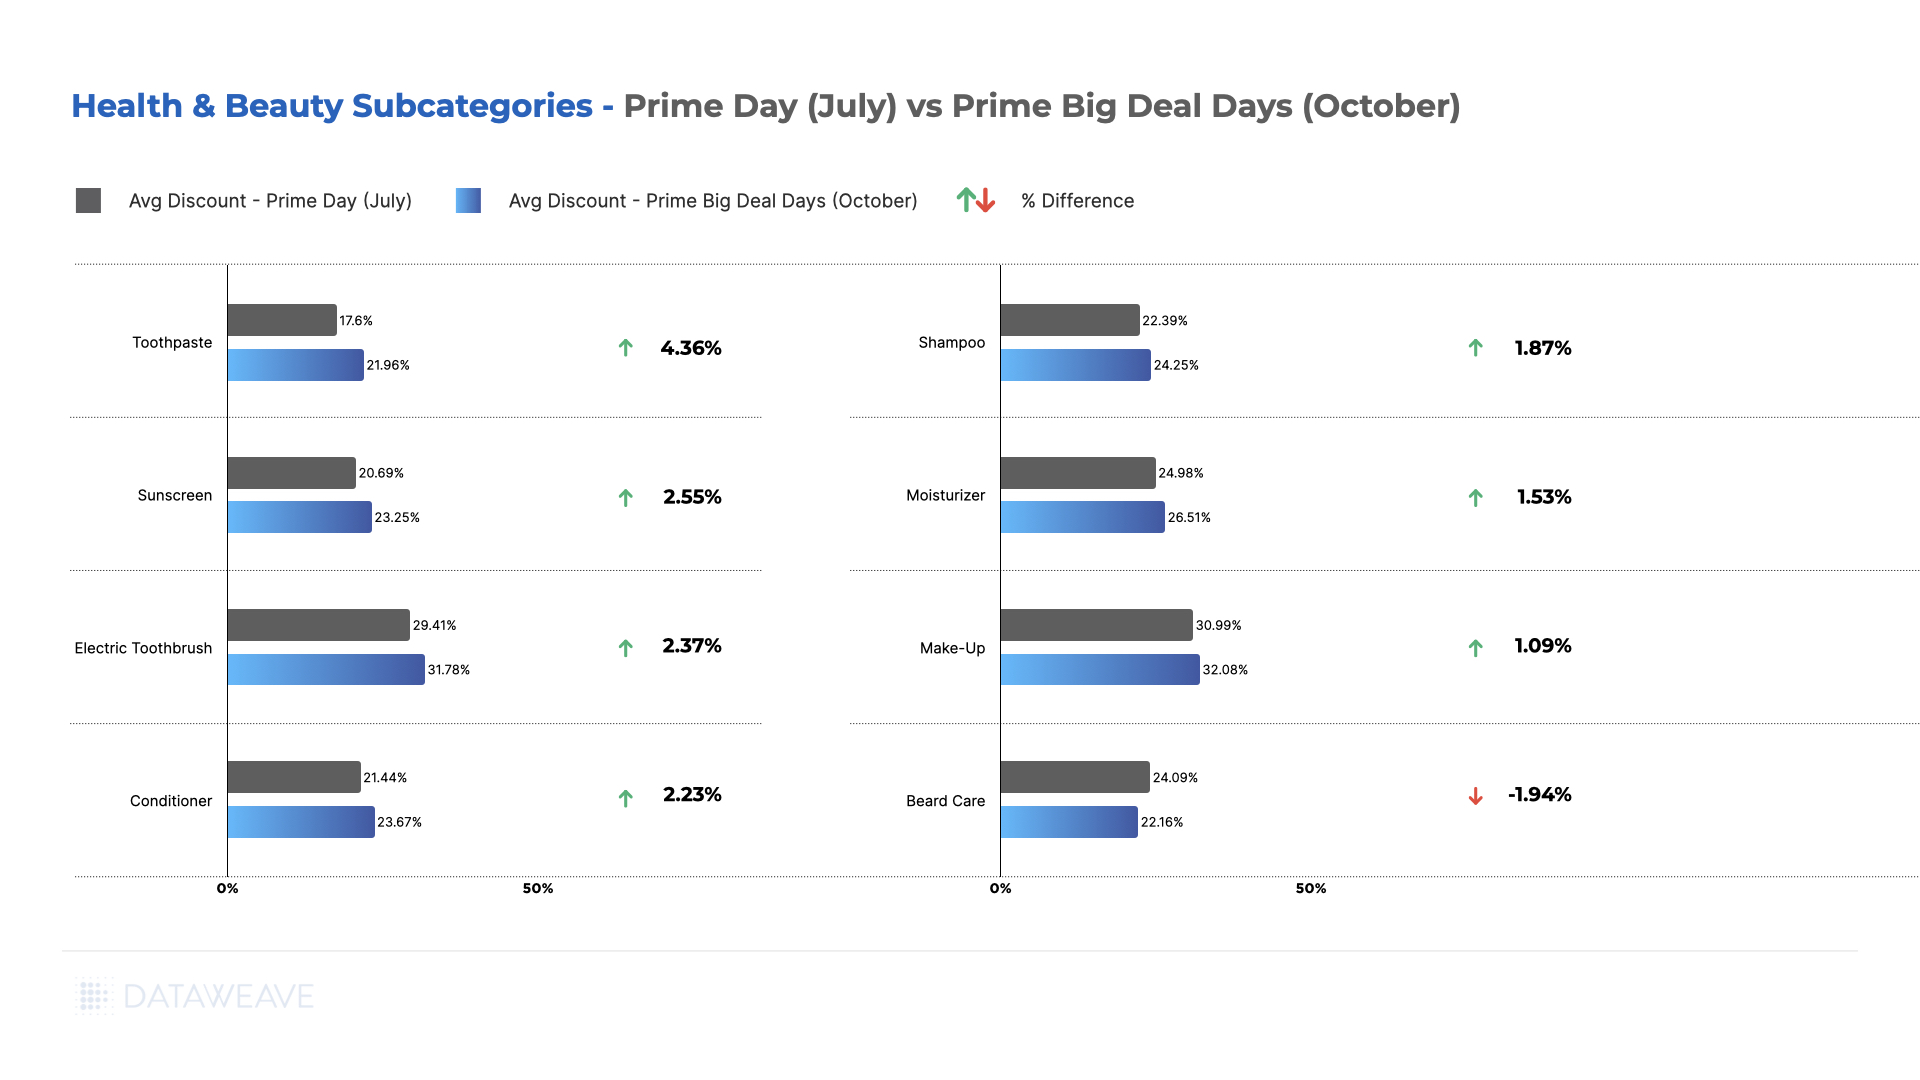
Average Discounts: Subcategories
Examining the Black Friday and Cyber Monday discount landscape within the Apparel category reveals intriguing patterns among major retailers. Amazon led the charge, boasting an impressive 24.9% average discount on Women’s Tops, covering a substantial 76.5% of its products. In the same subcategory, Target competed fiercely with a 25.1% average discount, covering 87.5% of its products. Walmart, taking a measured approach, presented a 14.6% average discount across 45.1% of its Women’s Tops inventory.

Notably, Men’s Swimwear at Target has no discounts. Meanwhile, Amazon remained aggressive across various subcategories, particularly in Women’s Shoes and Women’s Tops, aiming to capture a significant market share through both competitive pricing and a broad coverage of discounted items.
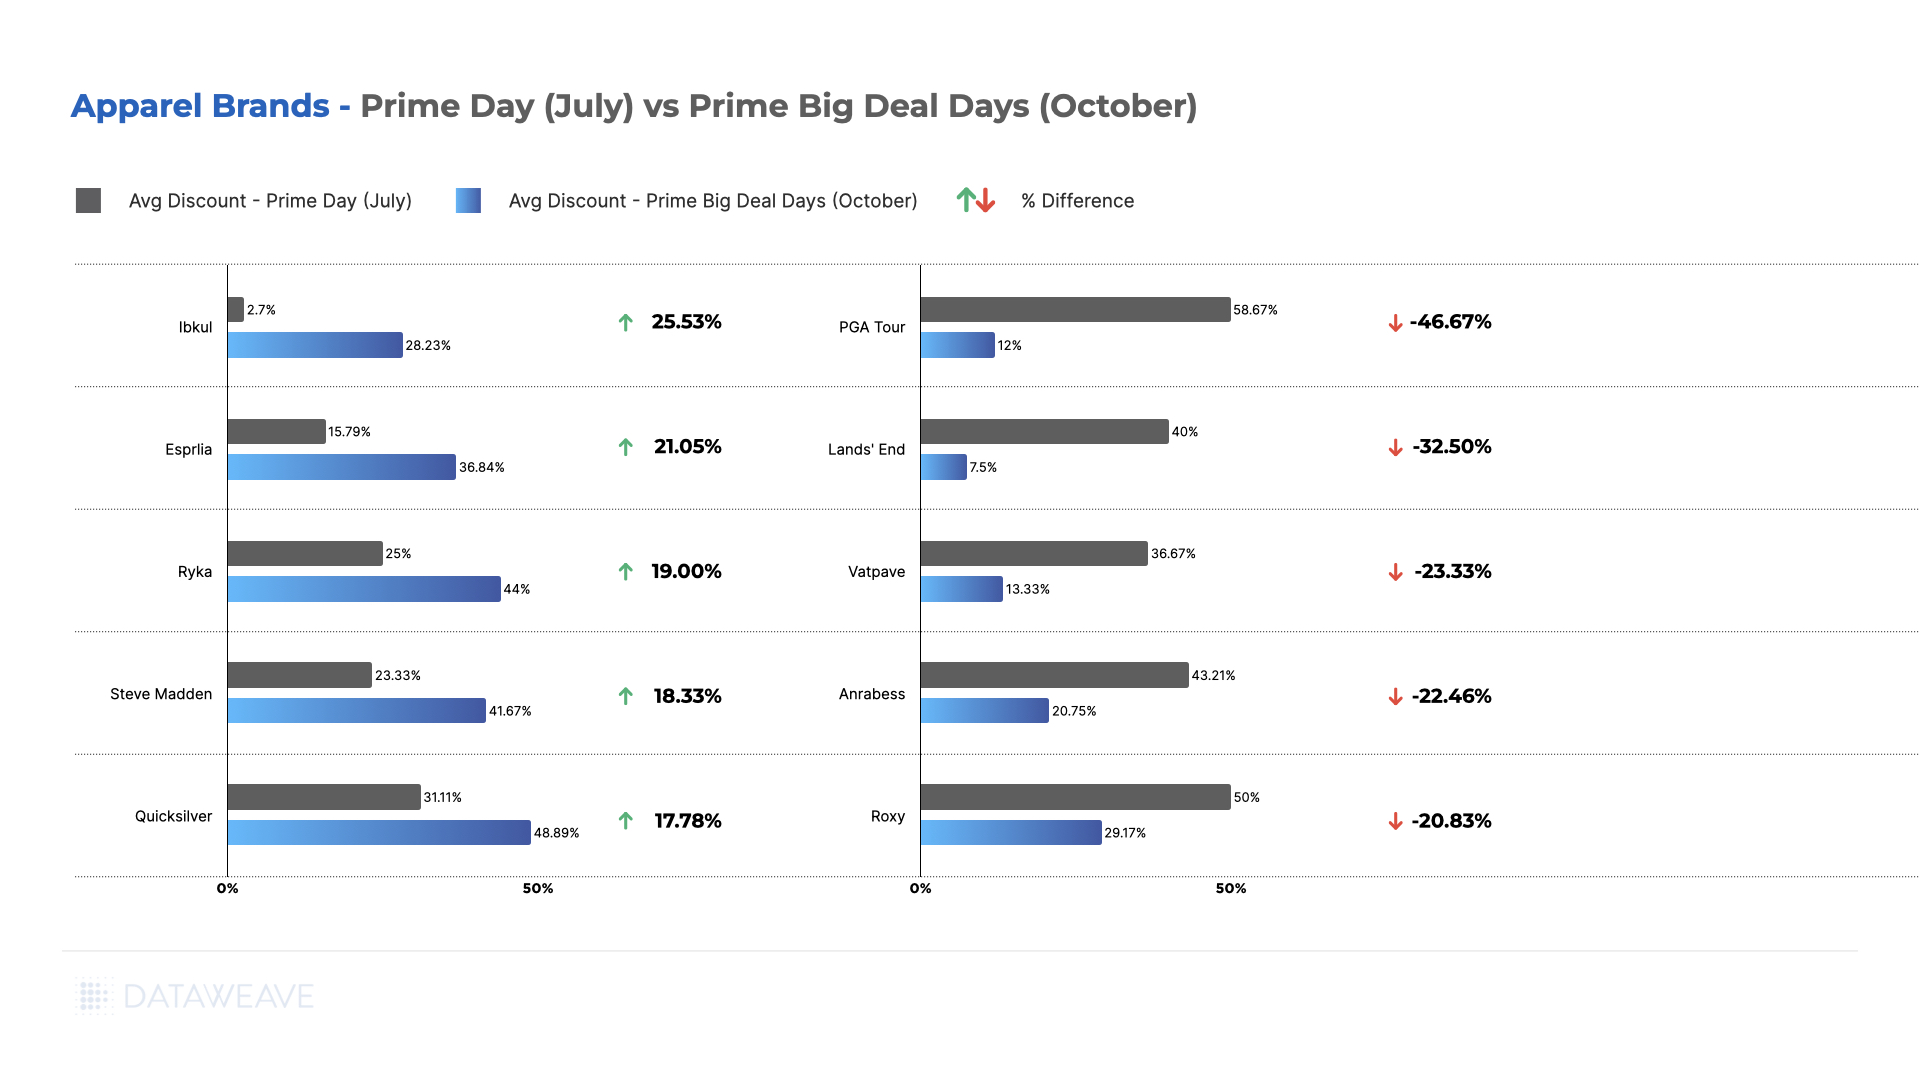
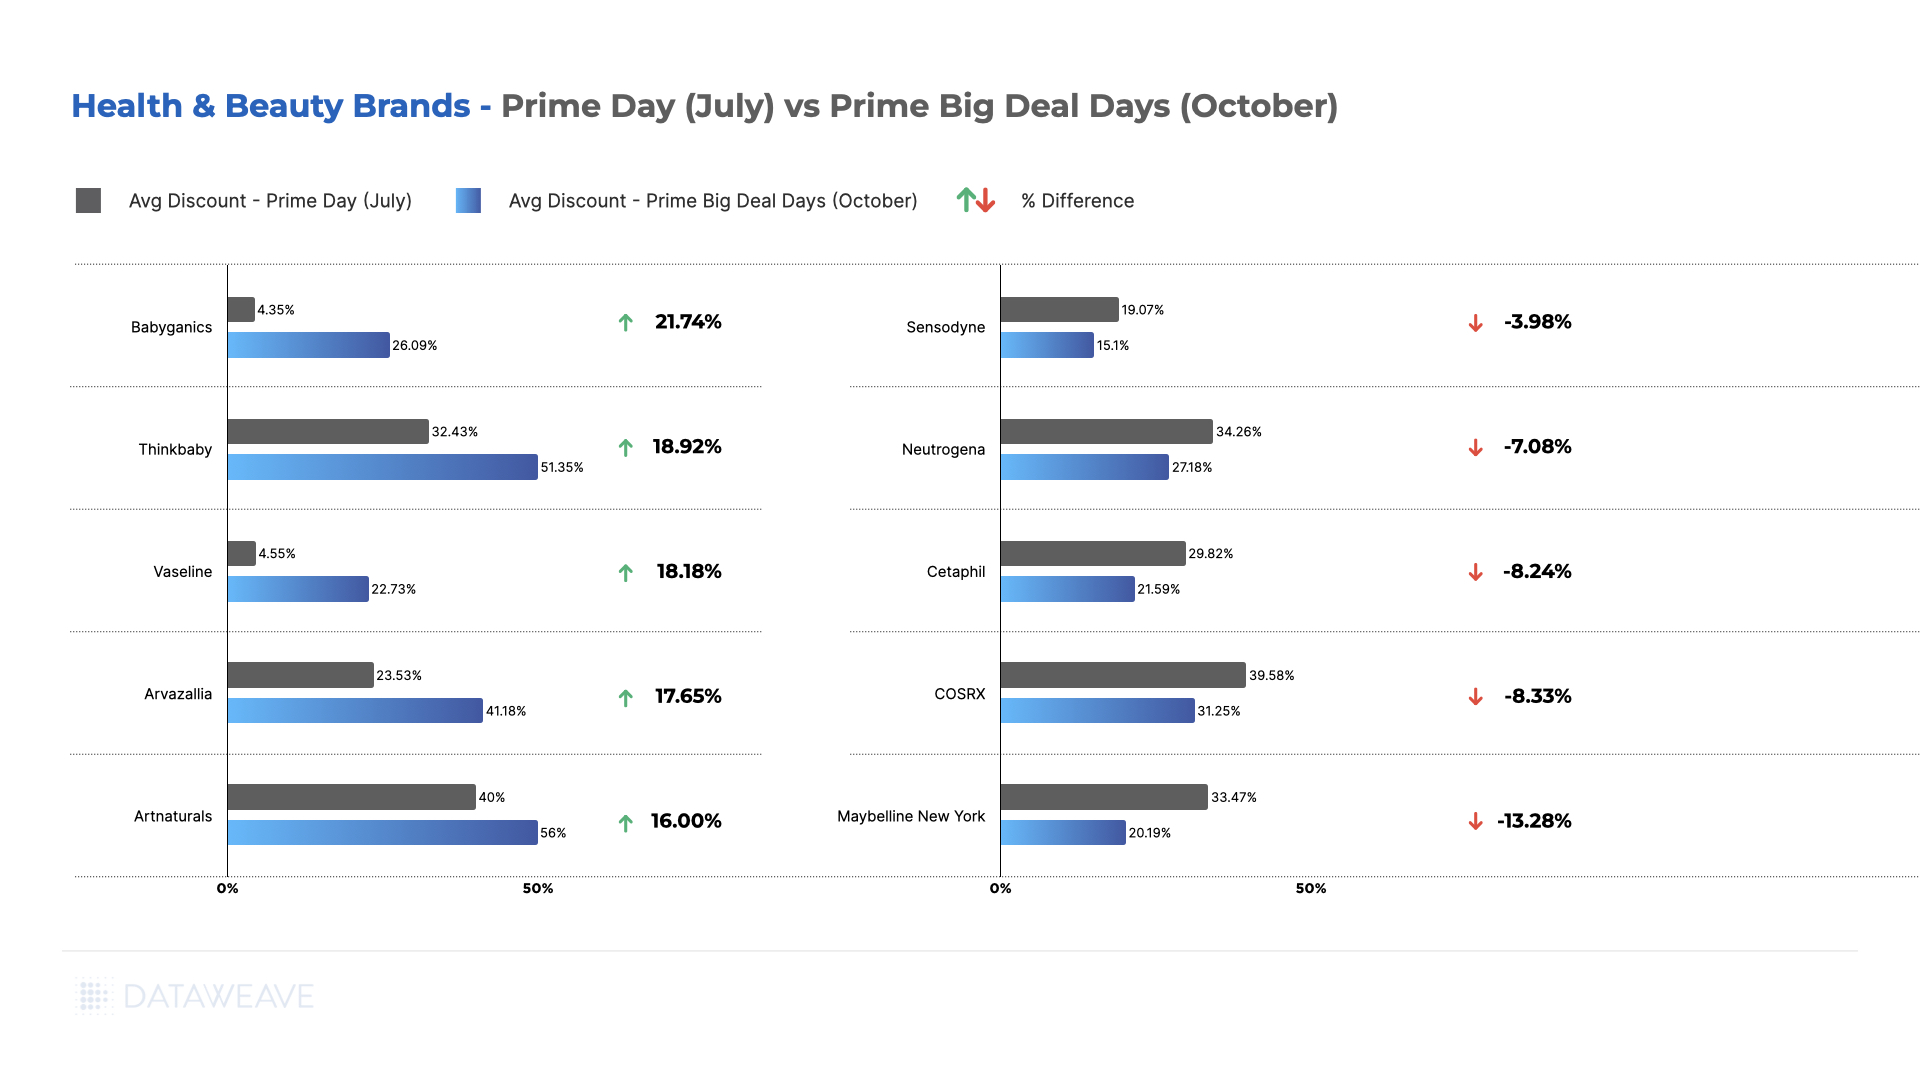
Average Discounts: Brands
Across brands, Tommy Hilfiger and Jockey took the lead on Amazon with an enticing average discount of 28.3% and 24.6% respectively, appealing to savvy shoppers. Calvin Klein followed closely with a 17.3% discount, offering a balance of style and affordability.

In Walmart, Crocs stood out with a 39.9% average discount, followed by Reebok (15.7%) and Hanes (14.9%) Xhilaration, Target’s in-house brand, stole the spotlight on the retailer platform with an impressive 50% average discount. Reebok (32.3%) and Levi’s (22.9%) maintained competitive discounts, appealing to diverse tastes.
Our analysis sheds light on the dynamic landscape of apparel discounts, showcasing how brands adopt varying pricing strategies to position themselves competitively for Black Friday and Cyber Monday shoppers.
Share of Search For Apparel Brands Across Subcategories
The dynamics of Black Friday and Cyber Monday extend beyond price reductions, with brands strategically vying for increased visibility through Share of Search metrics. This metric signifies a brand’s prominence among the top 20 ranked products in a given subcategory, offering valuable insights into their online marketplace visibility.
Among the standout performers in the Apparel category, Jockey experienced a significant surge in Share of Search, leaping from 1.70% before the event to an impressive 13.30% during the Black Friday and Cyber Monday sales. Speedo, in the Women’s Swimwear subcategory, demonstrated a substantial increase from 4.40% to 13.30%, solidifying its presence and gaining an 8.90% boost in Share of Search.

Tommy Hilfiger and Adidas also exhibited notable gains in Share of Search, increasing by 5.30% and 5.60%, respectively. However, some brands experienced a slight dip, with Speedo in the Men’s Swimwear subcategory seeing a 2.50% dip in their search visibility, and Reebok in Men’s Shoes witnessing a 3.3% decrease.
These fluctuations highlight the dynamic nature of brand strategies during Black Friday and Cyber Monday in the Apparel category, where gaining visibility also proves to be crucial alongside offering competitive discounts.
—
For a deeper dive into the world of competitive pricing intelligence and to explore how our solutions can benefit apparel retailers and brands, reach out to us today!
Stay tuned to our blog for forthcoming analyses on pricing and discounting trends across a spectrum of shopping categories, as we continue to unravel the intricacies of consumer behavior and market dynamics.