Category: price perception

  • Mastering Fuel Price Competitiveness: How First-Party Data Outperforms Third-Party in Pricing Accuracy

    Mastering Fuel Price Competitiveness: How First-Party Data Outperforms Third-Party in Pricing Accuracy

    Fuel retailers today operate in a highly competitive and volatile market. Consumer behavior is increasingly driven by price sensitivity, particularly in industries like fuel where small changes in price can significantly influence where consumers choose to fill up. The stakes are even higher when you consider the razor-thin margins many fuel retailers work with, making every cent count.

    For years, retailers have relied on third-party apps and services to provide them with location-based competitive fuel price data. These services collect pricing data based on customer transactions. While these platforms offer a convenient way for consumers to find cheaper fuel prices, their value to retailers is limited. The data they provide is often riddled with inaccuracies, lags, and incomplete coverage, leaving retailers vulnerable to missed pricing opportunities.

    In this rapidly shifting landscape, retailers need data that is not only accurate but also real-time. Solving this involves directly tapping into retailers’ own data sources (first-party or 1P data) —such as websites and apps. This is believed to be the most comprehensive and reliable source of fuel price data in the market.

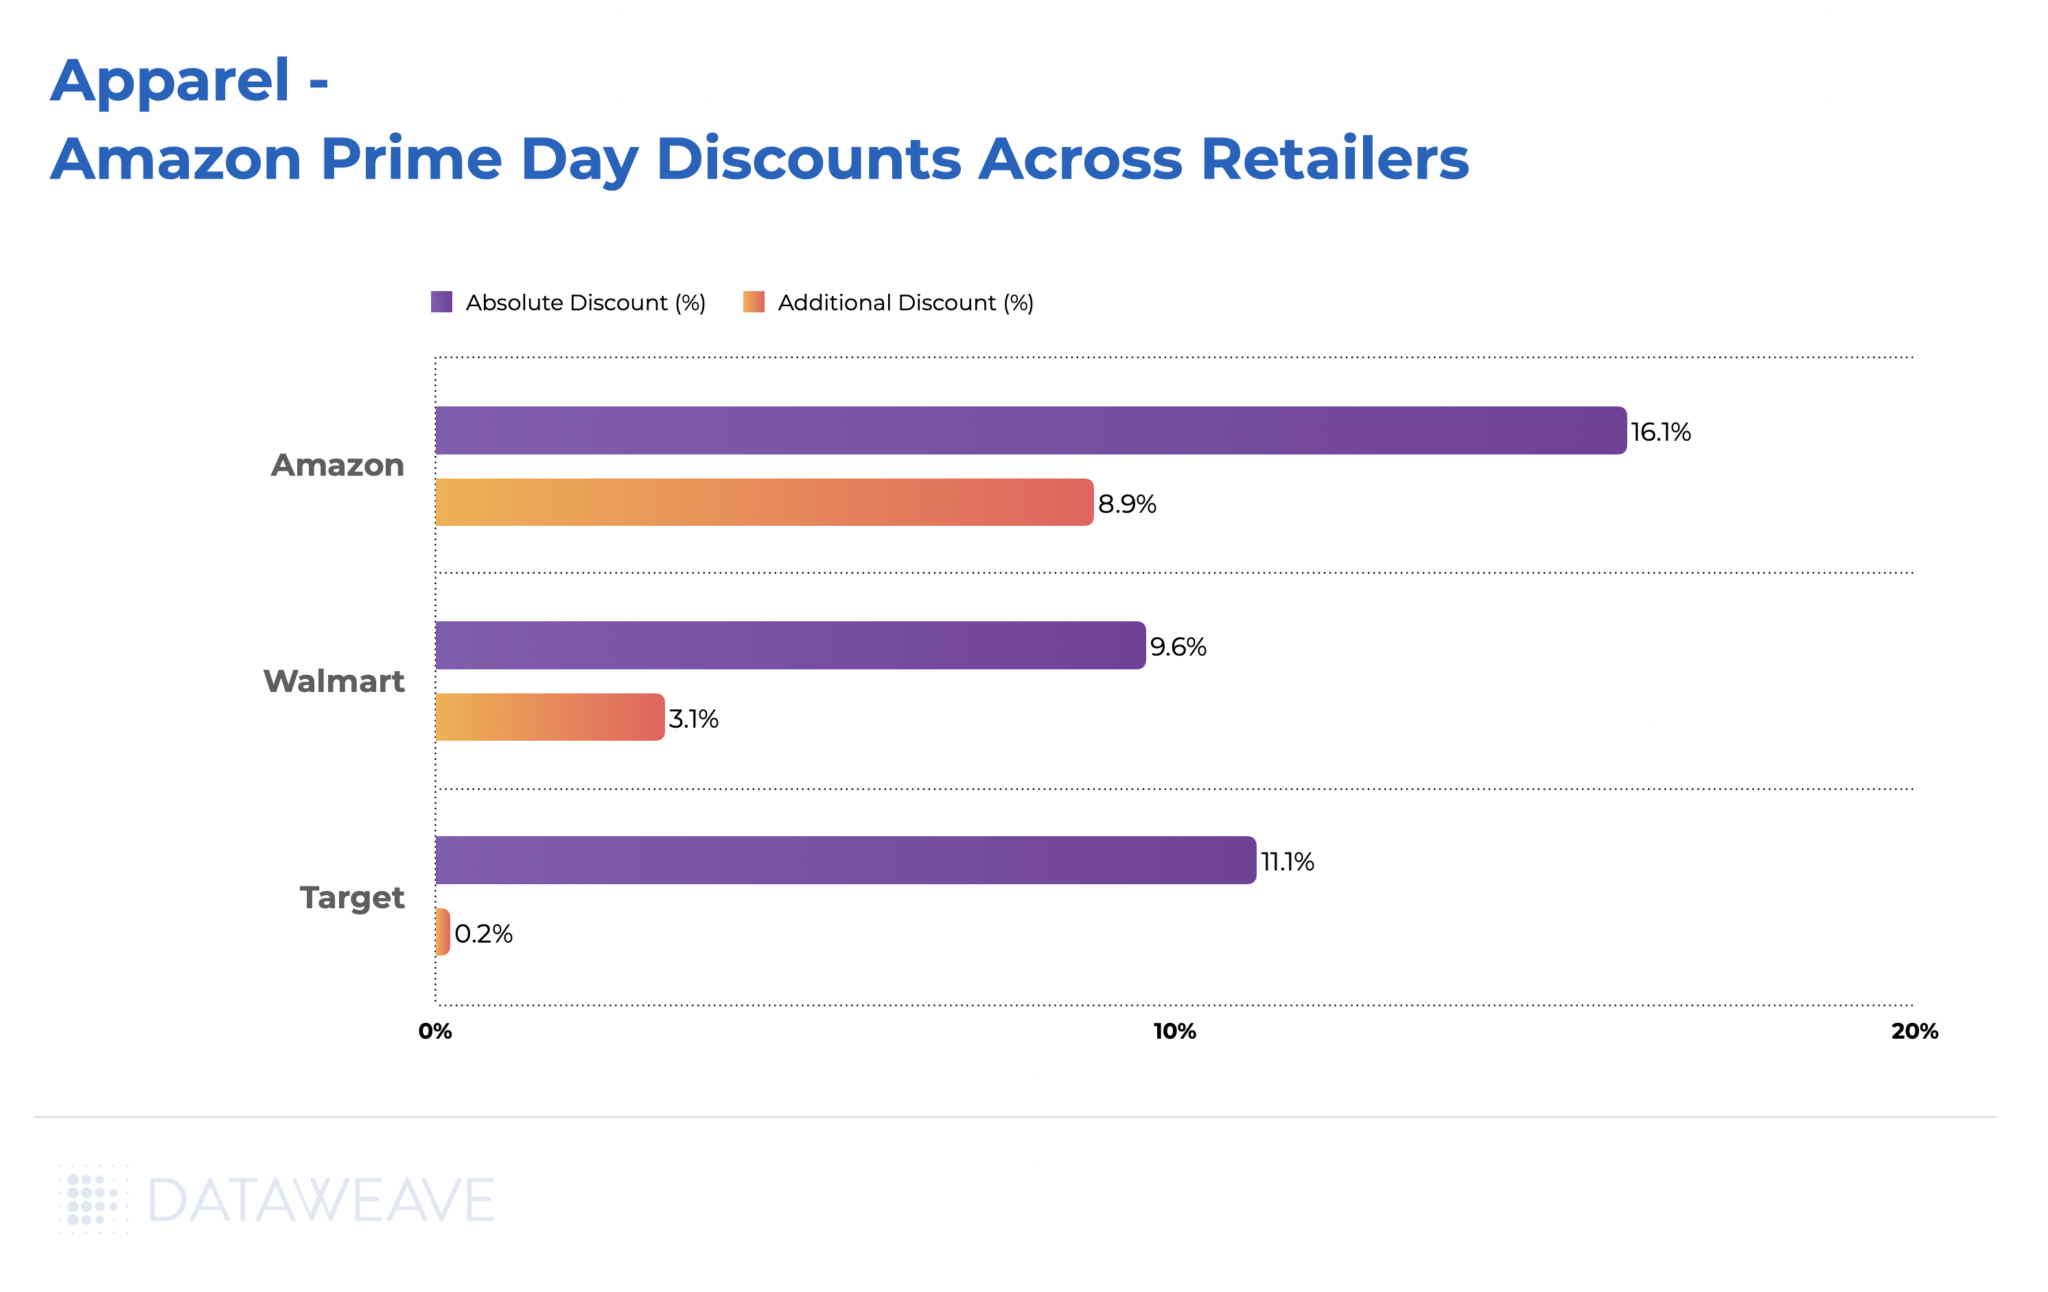
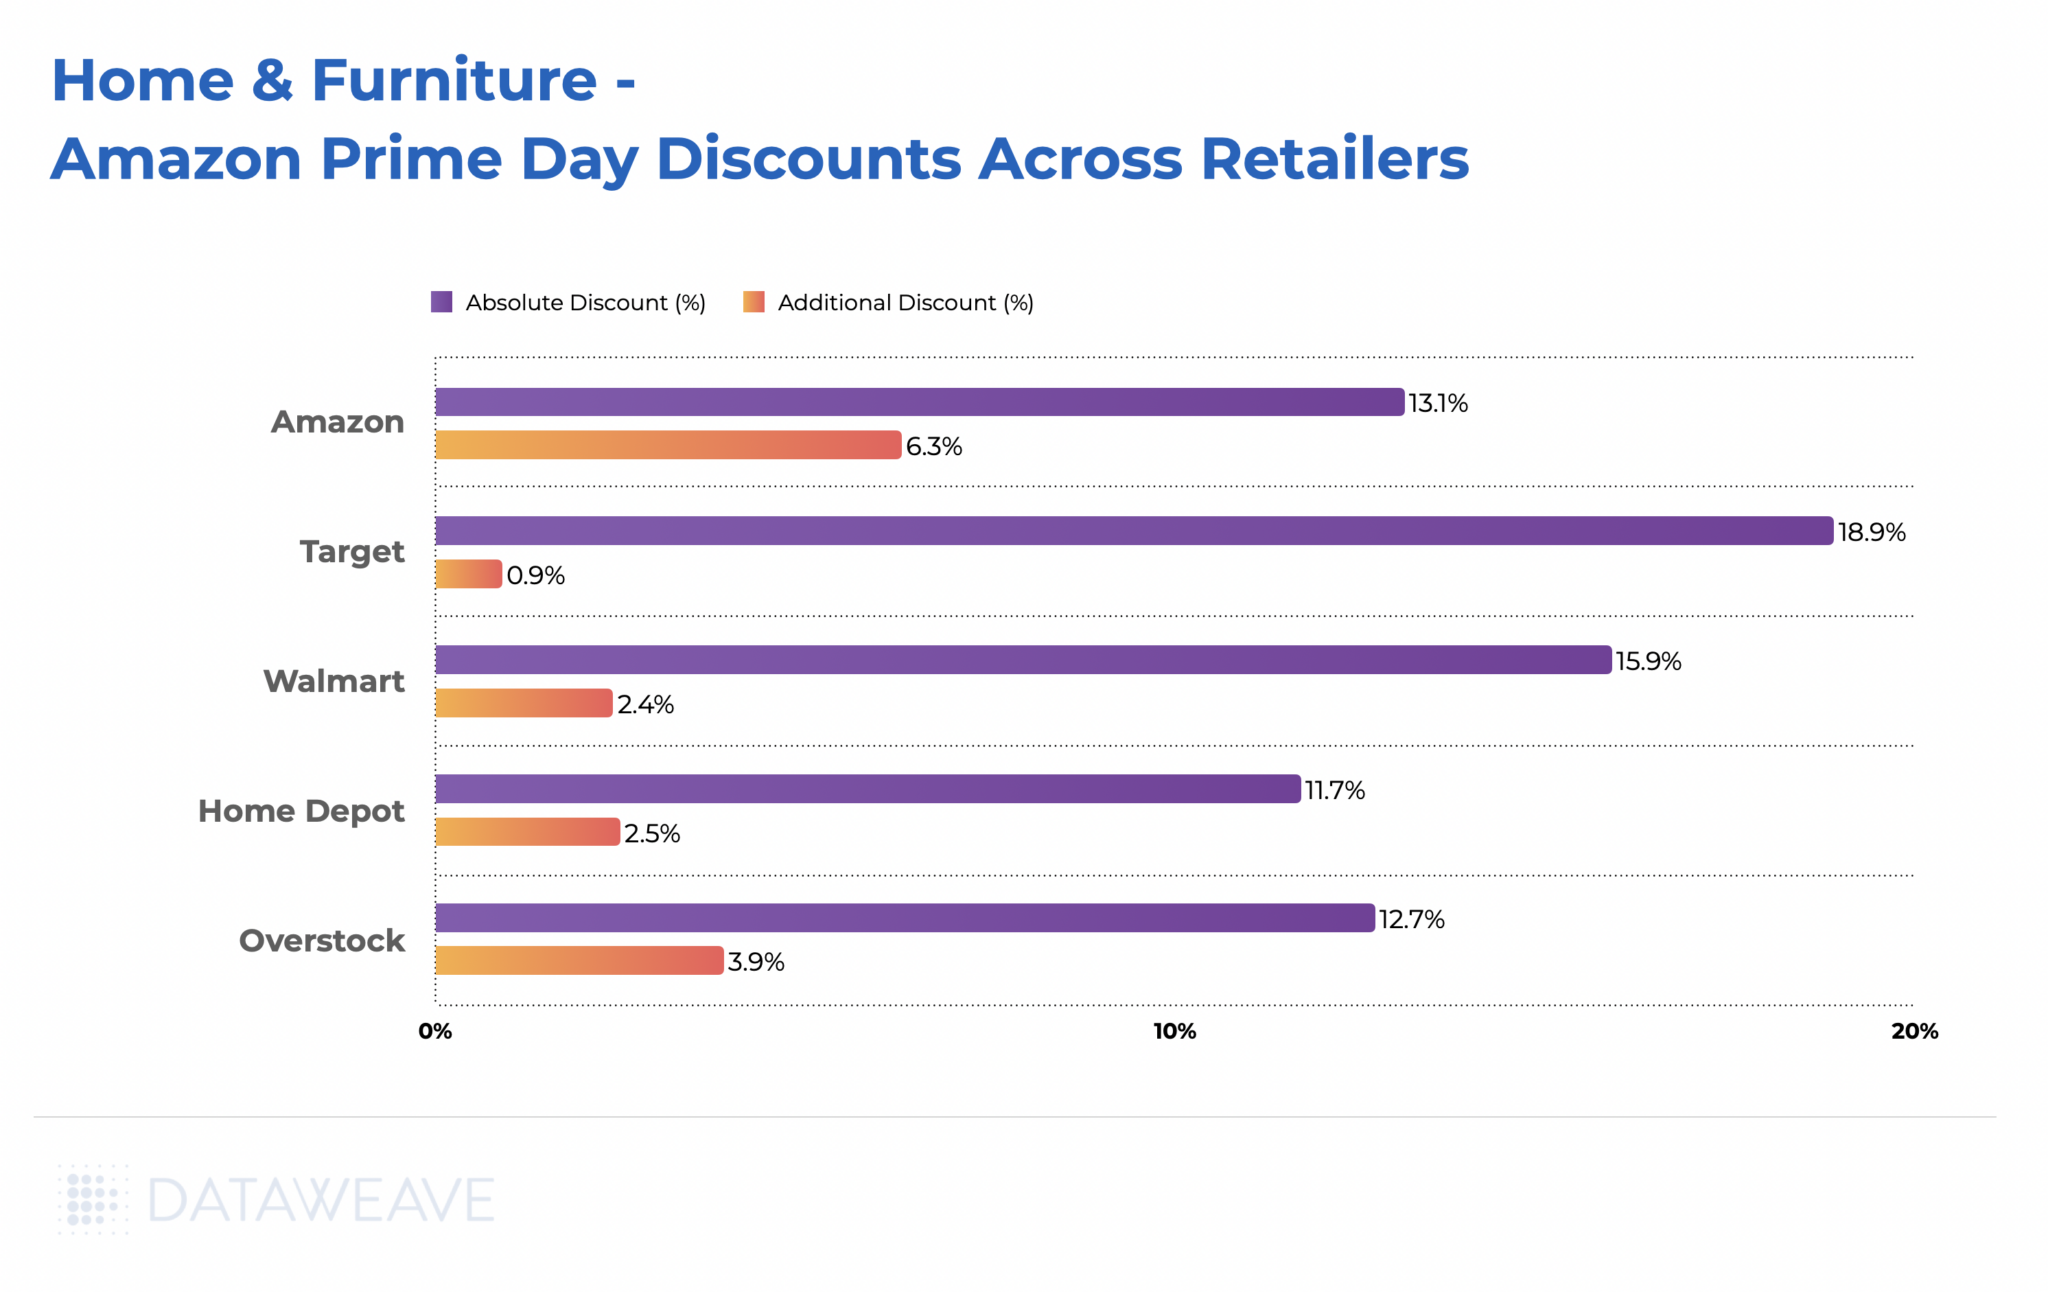
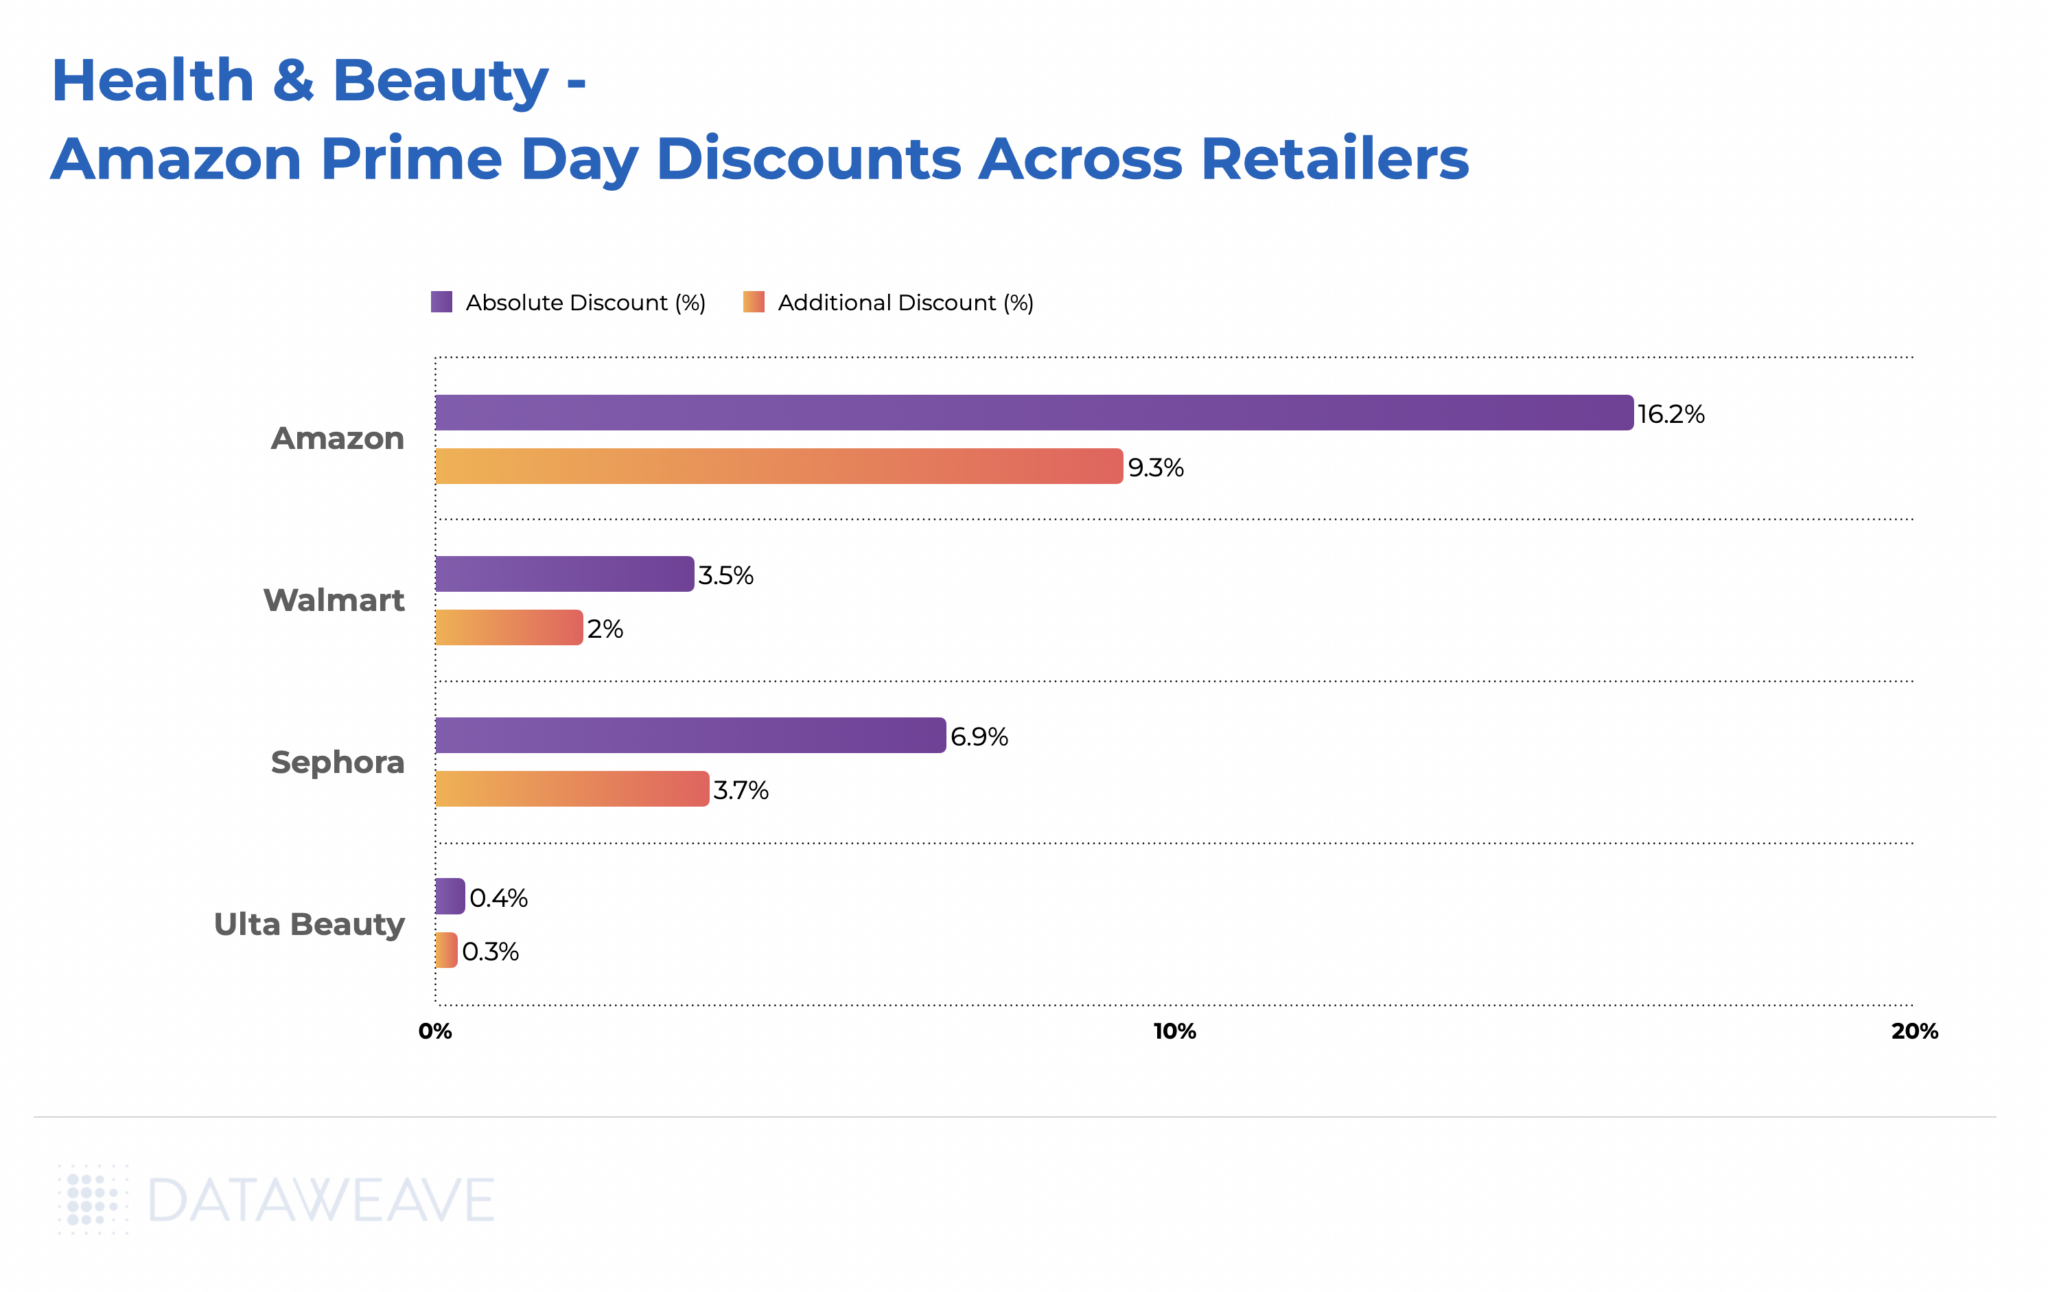
    To validate this hypothesis, we conducted a comprehensive analysis comparing first-party and third-party (3P) fuel price data. Our analysis compared pricing (at the same time of the day) across more than 40 gas stations—including major players like Circle K, Costco, Speedway, and Wawa. The data was captured several times a day for over a week.

    Accurate Pricing Matters More Than Ever

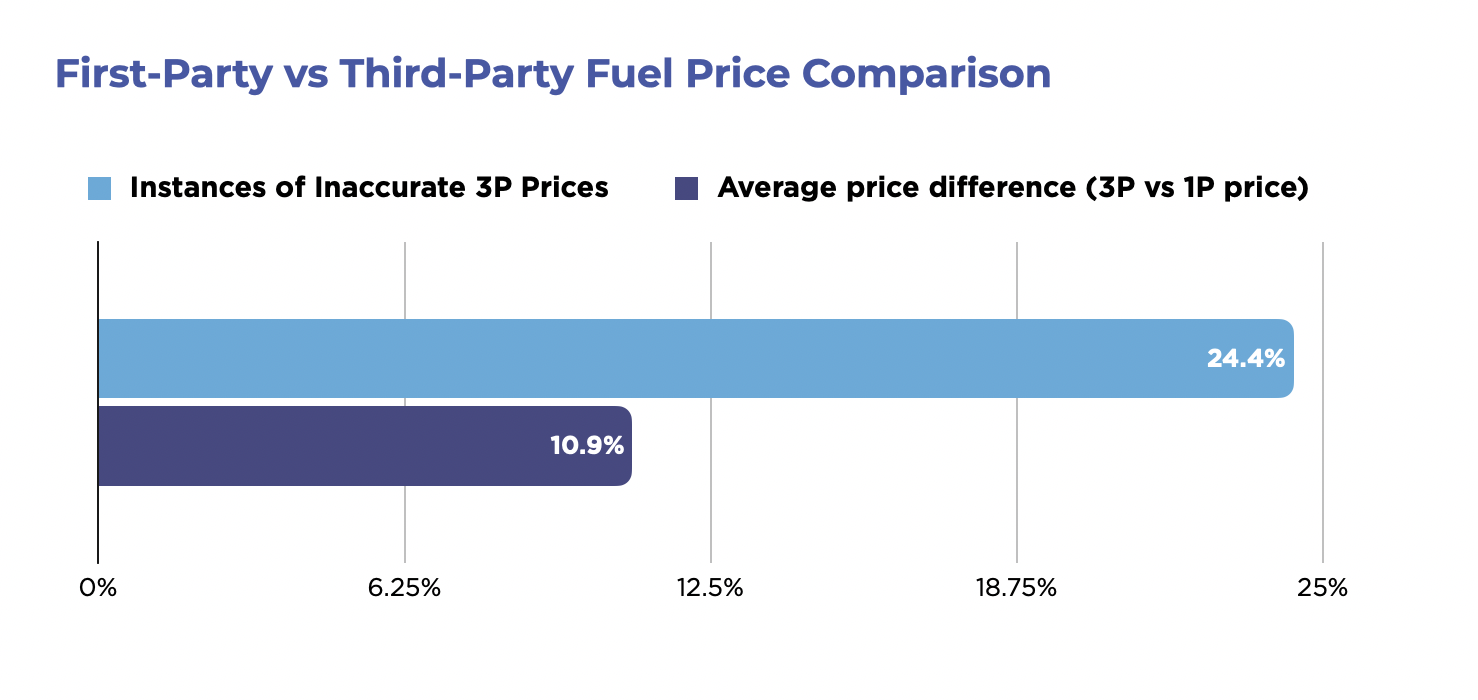
    Our analysis revealed that nearly a quarter (24.4%) of the fuel pricing data provided by third-party sources was inaccurate when compared to first-party data. On average, these inaccuracies amounted to a price difference of 10.9%.

    Such discrepancies, though seemingly minor, can significantly affect consumer behavior. Inaccurate prices could drive customers to competitors who are listed with lower prices—even if the real difference is negligible. For fuel retailers, this leads to lost revenue, missed opportunities, and reduced market share.

    First-party vs Third-party Fuel Price Comparison

    The implications are clear: relying on third-party competitive data alone puts retailers at risk. With inaccurate data, retailers may fail to adjust their prices in time to respond to market changes, losing customers to competitors.

    The Core Challenges of Third-Party Data

    Third-party data comes with inherent limitations. The way this data is collected presents significant challenges for fuel retailers looking to optimize pricing strategies. Here are the main issues:

    • Inconsistent Data Frequency: Third-party pricing data is often gathered through customer card transactions. As a result, pricing data updates only when and where transactions occur. This can lead to irregular data availability, particularly in stations with lower transaction volumes. For instance, in rural areas or during off-peak hours, fewer transactions lead to fewer updates. Retailers are left with outdated data, making it difficult to keep pace with real-time price fluctuations.
    • Limited Geographic Coverage: Regions with lower transaction volumes are particularly affected by data gaps. While urban centers may enjoy more frequent updates, rural and less-frequented stations often suffer from a lack of data. This limited geographic coverage creates blind spots, making it impossible for retailers in these regions to stay competitive.
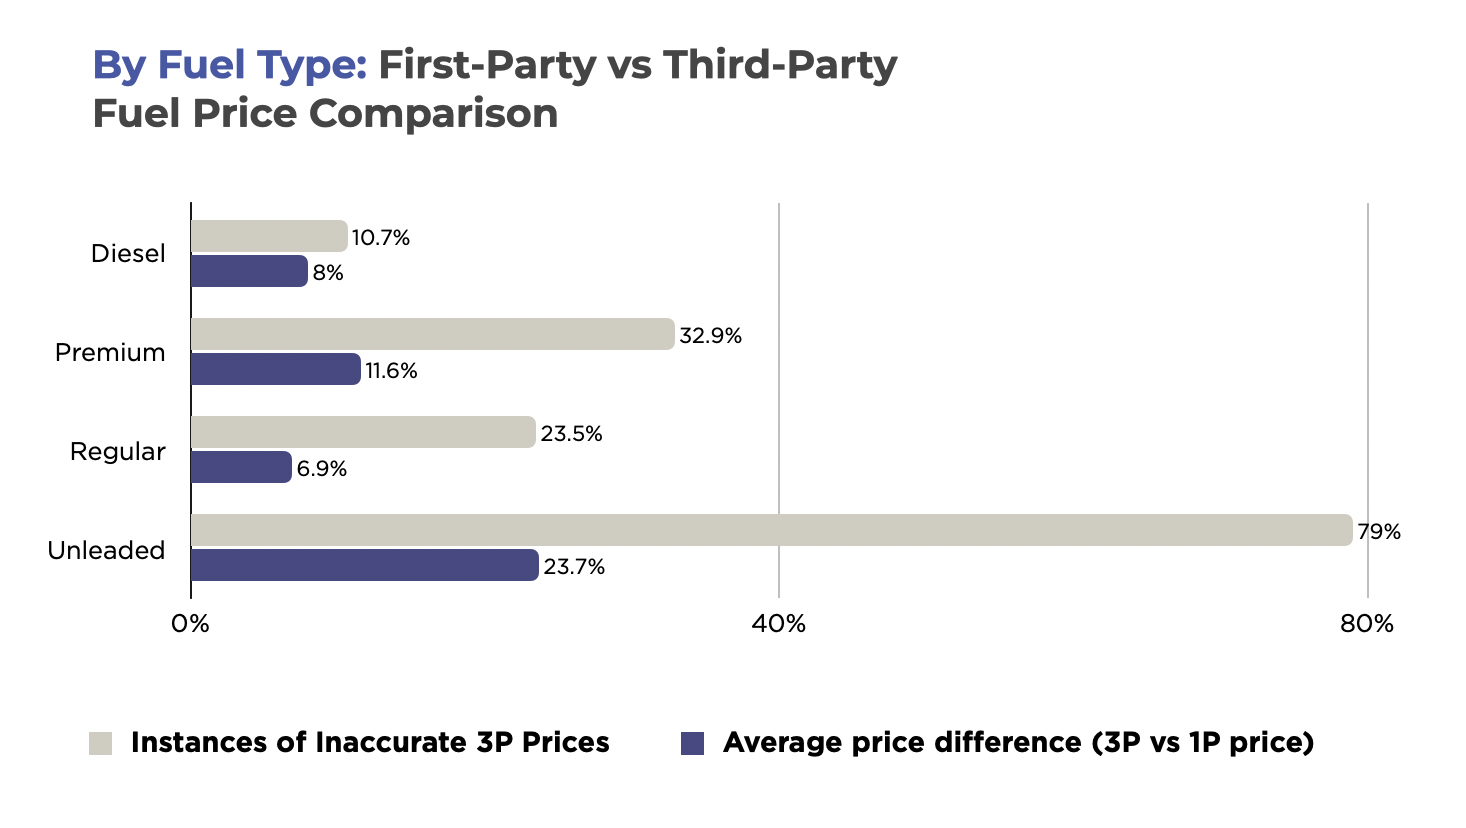
    • Potential Data Inaccuracies Across Fuel Types: Our analysis showed that inaccuracies in third-party pricing data were most pronounced for Unleaded fuel, with errors occurring nearly 80% of the time. While Diesel prices fared slightly better, inaccuracies were still frequent. This inconsistency across fuel types further complicates the challenge for retailers relying on third-party data.
    First-party vs Third-party Fuel Price Comparison by Fuel Type

    Leveraging First-Party Data

    At DataWeave, our Fuel Pricing Intelligence solution leverages real-time 1P data directly from fuel retailers’ websites and mobile apps, ensuring that retailers always have access to the most up-to-the-minute and accurate pricing information.

    Here’s why first-party data stands out:

    • Real-Time Updates: Our solution provides near-instantaneous updates across more than 30,000 ZIP codes, ensuring that retailers always have the most up-to-date pricing information. This real-time accuracy is essential for making dynamic pricing adjustments in a highly competitive market.
    • Wide Geographic Coverage: DataWeave’s first-party solution captures data across a broad geographic range, ensuring no blind spots in coverage. Retailers in rural or less-frequented areas benefit from the same level of insight as their urban counterparts, giving them the ability to optimize pricing in real-time.
    • Complementary to Existing Solutions: For retailers already using third-party data, DataWeave’s first-party solution can complement and enhance their current systems. By filling in data gaps and providing more frequent updates, our solution ensures that retailers are never left in the dark when it comes to competitive pricing.

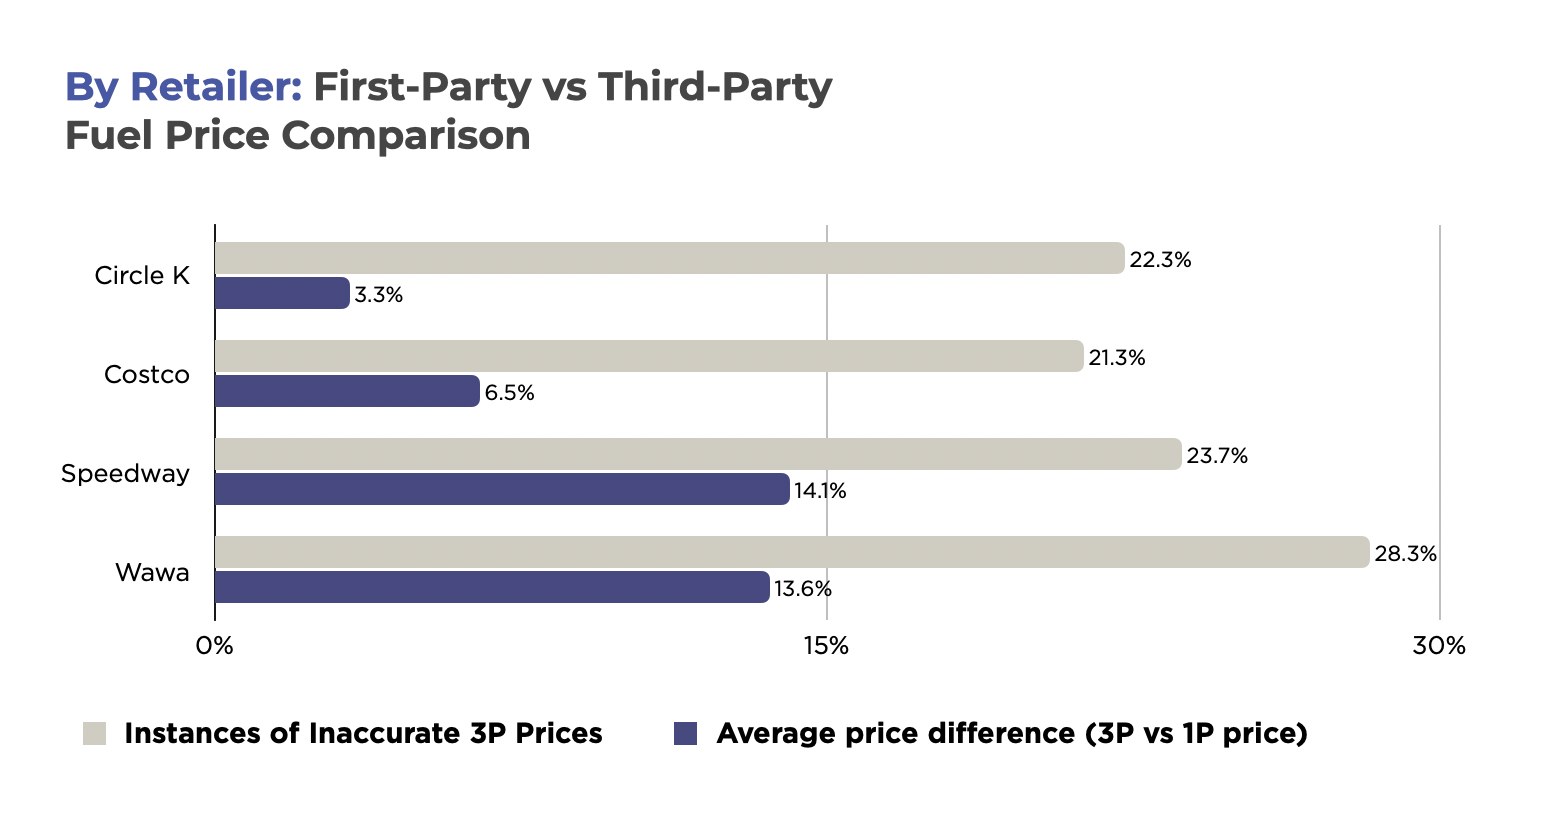
    Retailer-Wise Variances

    Among the retailers analyzed, we found that some were more affected by third-party data inaccuracies than others. Speedway and Wawa, for instance, experienced inaccuracies in up to 28% of third-party price data. In contrast, Circle K exhibited fewer discrepancies, but even they were not immune to the challenges posed by third-party data.

    For their competition, relying on third-party data alone presents a significant risk. By switching to first-party data sources, or complementing their existing third-party data with DataWeave’s first-party solution, retailers can ensure they stay competitive in the eyes of price-sensitive consumers.

    First-party vs Third-party Fuel Price Comparison by Retailer

    In an industry as price-sensitive as fuel retail, accurate data is a strategic asset. Leveraging first-party data allows fuel retailers to:

    • Maximize Revenue: By using real-time, accurate data, retailers can avoid under- or over-pricing their fuel, ensuring they capitalize on high-demand periods while minimizing losses during low-demand times.
    • Enhance Margins: First-party data provides the precision needed to fine-tune margins, ensuring profitability even in fiercely competitive markets.
    • Boost Customer Retention: Competitive pricing fosters customer loyalty. With better data, retailers can maintain customer trust and retention, even during volatile market shifts.

    Shift into High Gear with DataWeave

    As the fuel retail industry becomes increasingly competitive, the need for accurate, real-time pricing data has never been more important. DataWeave’s Fuel Pricing Intelligence solution empowers retailers with the insights they need to stay ahead of the competition, optimize pricing strategies, and boost profitability.


    With first-party data, fuel retailers can eliminate the blind spots and inaccuracies associated with third-party sources. This shift toward data-driven pricing strategies ensures that every price adjustment is backed by real-time insights, giving retailers the edge they need to succeed.

    To learn more, talk to us today!

  • The Complete Guide to Competitive Pricing Strategies in Retail and E-commerce

    The Complete Guide to Competitive Pricing Strategies in Retail and E-commerce

    Your budget-conscious customers are hunting for value and won’t hesitate to switch brands or shop at other retailers.

    In saturated and fiercely competitive markets, how can you retain customers? And better yet, how can you attract more customers and grow your market share? One thing you can do as a brand or retailer is to set the right prices for your products.

    Competitive or competition-based pricing can help you get there.

    So what exactly is competitive pricing? Let’s dive into this strategy, its advantages and disadvantages, and how it can be used to stay ahead of the competition.

    What is Competitive Pricing?

    Competitive or competition-based pricing is a strategy where brands and retailers set product prices based on what their competitors charge. This method focuses entirely on the market landscape and sets aside the cost of production or consumer demand.

    It is a good pricing model for businesses operating in saturated markets, such as consumer packaged goods (CPGs) or retail.

    Competitive Pricing Models

    Competitive pricing isn’t a one-size-fits-all strategy. The approach includes various pricing models that can be customized to fit your business goals and market positioning.

    Here’s a closer look at five of the most common competition-based pricing models:

    Price Skimming

    If you have a new product entering the market, you can initially set a high price. Price skimming allows you to maximize margins when competition is minimal.

    This strategy taps into early adopters’ willingness to pay a premium for new project categories. As competitors enter the market, you can gradually reduce the price to maintain competitiveness.

    Premium Pricing

    Premium pricing lets you position your product as high-quality or luxurious goods.

    When you charge more than your competitors, you’re not just selling a product—you’re selling status and an experience. This strategy is effective when your offering is of superior quality or has unique features that justify a higher price point.

    Price Matching

    Price matching—also known as parity pricing—is a defensive pricing tactic.

    By consistently matching your competitors’ prices, you can retain customers who might otherwise, be tempted to switch to an alternative.

    This approach signals your customers that they don’t need to look elsewhere for what they need and can feel comfortable remaining loyal to your brand.

    Penetration Pricing

    Penetration pricing is when you set a low price for a new product to gain market share quickly. The opposite of price skimming, this strategy can be particularly effective in price-sensitive or highly competitive industries.

    By attracting customers early, you can also deter some competitors from entering the market. This bold move can establish your product as a market leader from the get-go.

    Loss Leader Pricing

    Loss leader pricing is a strategic sacrifice that can lead to greater gains in the long run.

    By offering a product at a low price—sometimes even below cost—you can attract new customers to your brand and strengthen your current customers’ loyalty.

    Eventually, you can cross-sell other higher-margin products to your loyal customer base to cover the loss from your loss leader pricing and increase sales of other more profitable products.

    Key Advantages of Competitive Pricing

    Although it’s not the only pricing strategy available, competitive pricing has some significant advantages.

    It is Responsive

    Agility is synonymous with profit in industries where consumer preferences and market conditions shift rapidly.

    Competitive pricing allows you to adapt quickly—if a competitor lowers their prices, you can respond promptly to maintain your positioning.

    It is Simple to Execute and Manage

    Competitive pricing is straightforward, unlike cost-based pricing, which requires complex calculations and spans various factors and facets.

    By closely monitoring competitors’ prices and adjusting your prices accordingly, you can implement this pricing strategy with relative ease and speed.

    It Can Be Combined with Other Pricing Strategies

    Competitive pricing is not a standalone strategy—it’s a versatile approach that can easily be combined with other pricing strategies. For example, say you want to use competitive pricing without losing money on a product. In this case, you could use cost-plus pricing to determine a base price that you won’t go below, then use competitive pricing as long as the price stays above your base price.

    Key Disadvantages of Competitive Pricing

    While competition-based pricing has its advantages, it’s not without its pitfalls. Here are some potential disadvantages of competitive pricing.

    It De-emphasizes Consumer Demand

    If you focus solely on what competitors are charging, you could overlook consumer demand.

    For example, you could underprice items that consumers could be willing to purchase for more. Or, you might overprice items that consumers perceive as low-value, which can reduce sales.

    You Risk Price Wars

    If you and your competition undercut each other for customer acquisition and loyalty, you will eventually erode profit margins and harm the industry’s overall profitability. It’s a slippery slope where everyone loses in the end.

    There’s Potential for Complacency

    When you base your prices on beating those of competitors, you might neglect to differentiate your offerings through innovation and product improvements. Over time, this can weaken your brand’s position and lead to a loss of market share. Staying competitive means more than just matching prices—it means continuously evolving and adding value for the consumer.

    4 Tips for a Successful Competitive Pricing Strategy in Retail

    Here are four competition-based pricing tips for retailers:

    Retailer Tip #1. Know Where to Position Your Products in the Market

    For competitive pricing to work, you must understand your optimal product positioning in the overall market. To gain this understanding, you must regularly compare your offerings and prices with those of your key competitors, especially for high-demand products.

    Then, you can decide which competition-based pricing model is suitable for you.

    Retailer Tip #2. Price Dynamically

    Dynamic pricing is a tactic with which you automatically adjust prices on your chosen variables, such as market conditions, competitor actions, or consumer demand.

    When it comes to competitive pricing, a dynamic pricing system can track your competitors’ price changes and update yours in lockstep.

    Price-monitoring tools like DataWeave allow you to stay ahead of the game with seasonal and historical pricing trend data.

    Retailer Tip #3. Combine Competitive Pricing with Other Pricing Strategies

    Competitive pricing can be powerful, but it doesn’t have to stand alone. You can enhance its benefits with complementary marketing tactics.

    To illustrate, you can bundle products to offer greater value than what your competitors are offering. You can also leverage loyalty programs to offer exclusive discounts or rewards so customers keep returning, even when your competitors offer them lower prices.

    Retailer Tip #4. Stay in Tune with Consumer Demand

    Competition-based pricing aligns you with your competitor, but don’t lose sight of what your customers want. Routinely test your pricing strategy against consumer behavior to ensure that your prices reflect the actual value of your offerings.

    5 Tips for a Successful Competitive Pricing Strategy for Consumer Brands

    If you’re thinking about how to create a competitive pricing strategy for your brand, consider these five tips:

    Brand Tip #1. Identify Competing Products for Accurate Comparisons

    The first step in competitive pricing is to know the value of what you’re selling and how it compares to that of your competitors’ products. This extends to private-label products, similar but not identical products, and use-case products.

    Product matching ensures your pricing decisions are based on accurate like-for-like comparisons, allowing you to compete effectively.

    Brand Tip #2. Understand Your Product’s Relative Value

    Knowing how your product competes on value is key to setting the right price. If your product offers higher value, price it higher; if it offers less, price it accordingly. This ensures your pricing strategy reflects your product’s market placement.

    Brand Tip #3. Consider Brand Perception

    Even if your product is virtually the same as a competitor’s, your brand’s perceived value may be different, which plays a crucial role in pricing.

    If your brand is perceived as premium, you can justify higher prices. Conversely, if customers perceive you as a value brand, your pricing should reflect affordability.

    Brand Tip #4. Leverage Value-Based Differentiation

    When your prices are similar to competitors’, you must differentiate your products by expressing your product value through branding, packaging, quality, or something else entirely.

    This differentiation will compel consumers to choose your product over other similarly priced options.

    Brand Tip #5. Stay Vigilant with Price Monitoring

    Your competitors will update their pricing repeatedly, and you will, too.

    It can be difficult and time-consuming to monitor your competitive pricing, so you’ll need a system like DataWeave to monitor competitors’ pricing and manage dynamic pricing changes.

    This vigilance ensures your brand remains competitive and relevant in real time.

    4 Essential Capabilities You Need to Implement Successful Competition-Based Pricing

    You’ll need four key capabilities to implement a competitive pricing strategy effectively.

    AI-Driven Product Matching

    Product matching means you’ll compare many products (sometimes tens or hundreds) with varying details across multiple platforms. Accurate product matching at that scale requires AI.

    For instance, AI can identify similar smartphones to yours by analyzing features like screen size and processor type. DataWeave’s AI product matches start with 80–90% matching accuracy, and then human oversight can fine-tune the data for near-perfect matches.

    You can make informed pricing decisions once you know which competing products to base your prices on.

    Accurate and Comprehensive Data

    A successful competition-based pricing strategy depends on high-quality, comprehensive product and pricing data from many retailers and eCommerce marketplaces.

    By tracking prices on large online platforms and niche eCommerce sites across certain regions, you’ll gain a more comprehensive market view, which enables you to make quick and confident price changes.

    Normalized Measurement Units

    Accurate price comparisons are dependent on normalized unit measurements.

    For example, comparing laundry detergent sold in liters to laundry detergent sold in ounces requires converting either or both products to a common base like price-per-liter or price-per-ounce.

    This normalization ensures accurate pricing analysis.

    Timely Actionable Insights

    Timely and actionable pricing insights empower you to make informed pricing decisions.

    With top-tier competitive pricing intelligence systems, you get customized alerts, intuitive dashboards, and detailed reports to help your team quickly act on insights.

    In Conclusion

    Competitive pricing or competition-based pricing is a powerful strategy for businesses navigating crowded markets, but you must balance competitive pricing with your brand’s unique value proposition.

    Competitive pricing should complement innovation and customer-centric strategies, not replace them. To learn more, talk to us today!

  • Back-to-School 2024 Pricing Strategies: What Retailers and Brands Need to Know

    Back-to-School 2024 Pricing Strategies: What Retailers and Brands Need to Know

    As summer winds down, families across the US have been gearing up for the annual back-to-school shopping season. The back-to-school season has always been a significant event in the retail calendar, but its importance has grown in recent years. With inflation still impacting many households, parents and guardians are more discerning than ever about their purchases, seeking the best value for their money.

    The National Retail Federation has forecasted that this season could see one of the highest levels of spending in recent years, reaching up to $86.6 billion. As shoppers eagerly stock up on back-to-school and back-to-college essentials, it’s crucial for retailers and brands to refine their pricing strategies in order to capture a larger share of the market.

    To understand how retailers are responding to the back-to-school rush this season, our proprietary analysis delves into pricing trends, discount strategies, and brand visibility across major US retailers, including Amazon, Walmart, Kroger, and Target. By examining 1000 exactly matching products in popular back-to-school categories, our analysis provides valuable insights into the pricing strategies adopted by leading retailers and brands this year.

    Price Changes: A Tale of Moderation

    The most notable trend in our analysis is the much smaller annual price increases this year, in contrast to last year’s sharp price hikes. This shift is a reaction to growing consumer frustration about rising prices. After enduring persistent inflation and steep price growth, which peaked last year, consumers have become increasingly frustrated. As a result, retailers have had to scale back and implement more moderate price increases this year.

    Average Price Increases Across Retailers: Back-to-School 2022-24

    Kroger led the pack with the highest price increases, showing a 5.3% increase this year, which follows a staggering 19.9% rise last year. Walmart’s dramatic price increase of 14.9% is now followed by a muted 3.1% hike. Amazon and Target demonstrated a similar pattern of slowing price hikes, with increases of 2.3% and 2.7% respectively in the latest period. This trend indicates that retailers are still adjusting to increased costs but are also mindful of maintaining customer loyalty in a competitive market.

    Average Price Increases Across Categories 2022-24: Back-to-School USA

    When examining specific product categories, we observe diverse pricing trends. Electronics and apparel saw the largest price increases between 2022 and 2023, likely due to supply chain disruptions and volatile demand. However, the pace of these increases slowed in 2024, indicating a gradual return to more stable market conditions. Notably, backpacks remain an outlier, with prices continuing to rise sharply by 22%.

    Interestingly, some categories, such as office organization and planners, experienced a price decline in 2024. This could signal an oversupply or shifting consumer preferences, presenting potential opportunities for both retailers and shoppers.

    Brand Visibility: The Search for Prominence

    In the digital age, a brand’s visibility in online searches can significantly impact its success during the back-to-school season. Our analysis of the share of search across major retailers provides valuable insights into brand prominence and marketing effectiveness.

    Share of Search of Leading Brands Across Retailers During Back-to-School USA 2024

    Sharpie and Crayola emerged as the strongest performers overall, with particularly high visibility on Target. This suggests strong consumer recognition and demand for these traditional school supply brands. BIC showed strength on Amazon and Target but lagged on Kroger, while Pilot maintained a more balanced presence across most retailers.

    The variation in brand visibility across retailers also hints at potential partnerships or targeted marketing strategies. For instance, Sharpie’s notably high visibility on Target (5.16% share of search) could indicate a specific partnership.

    Talk to us to get more insights on the most prominent brands broken down by specific product categories.

    Navigating the 2024 Back-to-School Landscape

    As we look ahead to the 2024 back-to-school shopping season, several key takeaways emerge for retailers and brands:

    1. Price sensitivity remains high, but the rate of increase is moderating. Retailers should carefully balance the need to cover costs with maintaining competitive pricing.
    2. Strategic discounting can be a powerful tool, especially for lesser-known brands looking to gain market share. However, established brands would need to rely more on quality, visibility, and brand loyalty.
    3. Online visibility is crucial. Brands should invest in strong SEO and retail media strategies, tailored to different retail platforms.
    4. Category-specific strategies are essential. What works for backpacks may not work for writing instruments, so a nuanced approach is key.
    5. Retailers and brands should be prepared for potential shifts in consumer behavior, such as increased demand for value-priced items or changes in category preferences.

    By staying attuned to these trends and remaining flexible in their strategies, businesses can position themselves for success in the competitive back-to-school retail landscape of 2024. As always, the key lies in understanding and responding to consumer needs while maintaining a keen eye on market dynamics.

    Stay tuned to our blog to know more about how retailers can stay aware of changing pricing trends. Reach out to us today to learn more.

  • Do Amazon’s Competitors Lower Prices During Prime Day?

    Do Amazon’s Competitors Lower Prices During Prime Day?

    As the retail landscape continues to evolve, events like Amazon Prime Day have become more than just shopping extravaganzas—they’ve transformed into strategic battlegrounds where retailers assert their market positions and brand identities. Prime Day 2024 was no exception, serving as a crucial moment for retailers to showcase their pricing prowess, customer loyalty programs, and category expertise.

    In an era where consumer expectations for deals are at an all-time high, the impact of Prime Day extends far beyond Amazon’s ecosystem. Retailers like Walmart, known for its “everyday low prices,” Target with its emphasis on style and value, and Best Buy, the electronics specialist, have all adapted their strategies to compete. These companies didn’t just react to Prime Day; they proactively launched their own pre-emptive sales events, with Target Circle Week, Walmart July Deals and more, effectively extending the shopping bonanza and challenging Amazon’s dominance.

    For Prime Day, we analyzed over 47,000 SKUs across major retailers and product categories to publish insights on Amazon’s pricing strategies as well as the performance of leading consumer brands. Here, we go further to delve into the discounts offered (or not offered) by Amazon’s competitors during Prime Day. Our analysis reveals that some retailers chose to compete on price during the sale for certain categories, while others did not.

    Below, we highlight our findings for each product category. The Absolute Discount is the total discount offered by each retailer during Prime Day compared to the MSRP. These are the discounts consumers are familiar with, displayed on retail websites prominently during sale events. The Additional Discount, on the other hand, is the reduction in price during Prime Day compared to the week prior to the sale, revealing the level of price markdowns by the retailer specific to a sale event.

    Consumer Electronics

    In the Consumer Electronics category, Best Buy stood out as a strong competitor, offering an Additional Discount of 5.9%—the highest among all competitors analyzed. This is unsurprising, as Best Buy is well-known for its focus on consumer electronics and is likely aiming to reinforce its reputation for offering attractive deals in order to maintain its strong consumer perception in the category.

    Discounts offered on the Consumer Electronics category across retailers during Amazon Prime Day USA 2024

    Walmart was a close second with a 4.3% Additional Discount while Target reduced its prices by only 2% during the sale.

    Apparel

    In the Apparel category, Walmart’s Additional Discount was 3.1%, demonstrating its willingness to be priced competitively on a small portion of its assortment during the sale, without compromising much on margins.

    Discounts offered on the Apparel category across retailers during Amazon Prime Day USA 2024

    Target, on the other hand, opted out of competing with Amazon on price during the sale, choosing instead to maintain its Absolute Discount level of around 11%.

    Home & Furniture

    The Home & Furniture category showcased diverse strategies from retailers. Specialty furniture retailers such as Overstock and Home Depot provided Additional Discounts of 3.9% and 2.5%, respectively, compared to Amazon’s 6.9%. This indicates a clear intent to maintain market share and remain top-of-mind for consumers despite Amazon’s competitive pricing.

    Discounts offered on the Home & Furniture Category Across Retailers during Amazon Prime Day USA 2024

    Although Target didn’t significantly lower its prices during the sale, its Absolute Discount remains substantial at 18.9%. This suggests that Target’s markdowns were already steep before the event, which could explain the lack of further reductions during the sale.

    Health & Beauty

    The Health & Beauty category saw minimal participation from Amazon’s competitors, with the exception of Sephora, which reduced prices by 3.7% during Prime Day.

    Discounts offered on the Health & Beauty Category Across Retailers during Amazon Prime Day USA 2024

    Ulta Beauty chose not to adjust its prices, likely reflecting its strategy to uphold a premium brand image. Walmart, on the other hand, offered a modest Additional Discount of 2% on select items. Given Walmart’s generally affordable product range, its total discount remained relatively low, around 3.5%.

    In Conclusion

    During Prime Day, Walmart was the only major retailer that made an effort to compete, albeit modestly. Target, on the other hand, largely chose not to offer any additional markdowns. However, several category-specific retailers, such as Best Buy in Consumer Electronics, Overstock and Home Depot in Furniture, and Sephora in Health & Beauty, aimed to retain market share by providing notable discounts.

    What this means for consumers is that even on Amazon’s Prime Day, it’s not a bad idea to compshop to identify the best deal.

    For retailers, the key takeaway is the importance of quickly analyzing competitor pricing and making agile, data-driven decisions to improve both revenues and margins. By utilizing advanced pricing intelligence solutions like DataWeave, retailers can optimize their discount strategies, better navigate pricing complexities, and drive revenue growth — all while staying prepared for major shopping events and beyond.

    Reach out to us today to learn more!

  • How Digital Shelf Analytics Can Fix Common Revenue Growth Management Challenges for Consumer Brands

    How Digital Shelf Analytics Can Fix Common Revenue Growth Management Challenges for Consumer Brands

    As consumer goods brands increasingly turn to eCommerce marketplaces as a source of profitable growth, it becomes harder for teams to grapple with the complexity of revenue growth management.

    This complexity emerges from multiple fonts: there are hundreds, and even thousands, of competitors to consider when formulating strategies for managing pricing, promotion, and assortment changes. The world is currently experiencing a period of unprecedented supply chain instability, shifting more consumers away from traditional retail and into eCommerce shopping. And finally, consumer buying patterns, preferences, and trends are constantly shifting.

    Revenue growth management (RGM) and net revenue management (NRM) were once less complex processes; but that is no longer the case. Now, some 80% of consumer brand CEOs report that they “aren’t satisfied with their RGM results.”

    Gathering data, analyzing it, and acting on it quickly stand out as major challenges that businesses must overcome to grow their market share, earn more profits, and capitalize on market shifts in real time. In this article, we’ll dive into RGM and NRM, the obstacles business teams face, and explore how using technology for digital shelf analytics can help bridge the gap.

    What is Net Revenue Management (NRM) or Revenue Growth Management (RGM)?

    Every consumer goods company aims to increase profits and grow market share. This requires a concerted effort in RGM and net revenue management (NRM) strategy. Whether a company has a specific team dedicated to this task or relies on the abilities of business analysts or merchandisers, this function is crucial.

    It’s worth mentioning that though the terms NRM and RGM are often used interchangeably, there are subtle differences. While both net revenue management and revenue growth management focus on maximizing overall revenue for the brand, NRM typically has a narrower focus and is specific to optimizing profitability through product pricing, promotion, product mix, and cost management. RGM strategies are a bit broader and tend to look at the top line to grow market share and expand the customer base.

    The Challenges Revenue Teams Face

    Differentiating between ‘good growth’ and ‘bad growth’ is central to NRM and RGM. Net revenue management and revenue growth management teams need the data and tools in place to determine if growth in one area is coming at the expense of another so as not to cannibalize business. Tracking and analyzing extensive data to successfully take action on opportunities and determine whether strategies are working as intended consumes a tremendous amount of mental bandwidth. The fact that these decisions are incredibly time-sensitive only compounds the issue.

    To cope, many teams in charge of NRM or RGM employ digital shelf analytics strategies to help speed up data aggregation and analysis to make sure they’re capitalizing on potential opportunities.

    eCommerce has added a whole new layer of complexity to consumer goods sales. Instead of a few relatively stable prices at big-box stores, a single item for sale may experience high price volatility, with dozens of minute pricing changes occurring online each day. In some cases, consumers become blind to price volatility, letting brands increase prices, but consumer sentiment, the overall price elasticity of the product, and dozens of other factors go into determining the final price of an online product. Net revenue teams need to modernize and adapt to changing eCommerce environments to competitively price, promote, and grow their revenue.

    Here are the top three challenges standing in the way of net revenue management and revenue growth management teams and solutions to address these issues.

    Challenge 1: Incomplete or Inaccurate Data

    Incomplete and inaccurate data are critical for Net Revenue Management and Revenue Growth Management teams to get under control when attempting to modernize in a digital-centric selling environment. As more competitors enter the market, many brands find it hard to make strategic decisions without the complete picture.

    Data may be incomplete or inaccurate because a brand is analyzing only part of the market, such as Amazon or another enterprise-scale eCommerce marketplace. Additionally, they might not be analyzing all types of online media, such as branded ads, sponsored search listings, or sponsored category listings.

    Most importantly, another pitfall is the lack of hyperlocal data. Generalized data across regions, states, ZIPs, and stores can skew the decision-making process and result in poor outcomes.

    Overcoming Incomplete or Inaccurate Data

    In order to get the full picture, consumer brands need to ensure they have a view of the entire competitive landscape across their channels. This includes gathering data down to the case pack, the unique product identifier, and the geography, including ZIP and store. They also need the respective MSRP by SKU, the unit normalized price, and the selling price at a specific moment in time. This is done by aggregating brick-and-mortar store information available online, such as when stores list curbside pickup SKUs and pricing online.

    Individual teams cannot manually gather all this detailed data. The growth in eCommerce means there is simply too much data to find and aggregate. Instead, they can employ digital shelf technology to get more data from more sites. Teams can leverage AI to better match product listings, ads, and even visuals to avoid missing data on listings that lack common attributes, such as UPCs for normalization.

    To add to this, advanced pricing intelligence systems can cache URLs to help teams audit and verify their data, avoiding delays and confusion when ad hoc requests arise.

    Challenge 2: Difficulty in Making Sense of the Competitive Landscape

    Once net revenue management and revenue growth management teams have gathered all of the available data, it’s time to make sense of it. This is a monumental challenge, and ends up being the stage where most NRM and RGM teams flounder. Disparate marketplaces include different product attributes and images. This makes it extremely complicated to sync competitors’ data to ready it for analysis, especially if this analysis is carried out manually in Excel. These are some of the attributes that teams need to harmonize in order to make sense of the competitive landscape:

    • Product identifiers (UPC, SKU, Internal Code)
    • Size, case, pack, volume, bundled offerings
    • Language
    • Currency
    • Stock Status (Whether the product is available or not)
    • Platform-specific attributes such as ‘Amazon’s Choice,’ ‘Best Seller,’ etc.

    Teams also need to group and classify various categories of promotions. These can include sponsored listings, banner ads, coupons, bank offers, and others. Each of these categories needs to be tracked separately. This vast array of data points across hundreds of sites creates a big data problem for teams.

    Making Sense of the Competitive Landscape

    The best way to overcome this challenge is to task a digital shelf analytics system with gathering and harmonizing data automatically across the consumer goods competitive landscape. Competitive and market intelligence tools can help break down an overwhelming amount of data, matching similar products across competing brands and analyzing their various strengths and weaknesses. Once the technology matches complex product attributes and identifiers, it becomes easier for teams to gain insights and exploit findings. In a sense, the data needs to be cleaned before analysis can occur.

    Technology can gather data in multiple ways, and the best systems employ several methods to get the best matches. Data consumption modes include API integrations, CSV and Excel file uploads, and proprietary scrapers that view websites independently of direct inputs. Having all the data in a single place helps net revenue management and revenue growth management teams gain indicative insights on product popularity, pricing, and sales, on their own and competitor products.

    Challenge 3: Lack of Timely Visibility

    The final challenge that many net revenue management and revenue growth management teams face is something of a ‘silent killer’ — timeliness. Even if they successfully gather data across the entire competitive landscape and harmonize that data into a format for easy analysis, a lack of timeliness can render even the best actions irrelevant.

    Speed is of the utmost importance when there are market changes. If a product goes viral and competitors raise prices in response to increased demand, without timely visibility, the trend may be over before a consumer goods brand can successfully increase its prices for the duration of the trend. This can mean lost margins.

    Another example is analyzing data and incorporating lagging promotional and sales data into analyses. This can skew pricing strategies because timely data is not accessible to inform decision-making. Many teams waste time firefighting due to a lack of timely pricing and promotional intelligence data.

    Get Near Real-Time Insights for Faster Decision Making

    Using technology that allows for net revenue management and revenue growth management teams at consumer goods brands to establish update frequencies can be a game changer. Teams can set update frequencies based on their need. They can set up the system to check a fast-moving product daily, while a slow-moving item might only need to be checked weekly, monthly, or even quarterly. This allows teams to focus on the highest-impact products first and address the largest exceptions before they lose out on an opportunity. Managing exceptions with a digital shelf analytics platform saves teams significant time instead of poring over low-impact changes in the data.

    Digital Shelf Analytics for Net Revenue Management

    Modernizing a consumer goods brand’s net revenue management or revenue growth management processes requires advanced digital shelf analytics. DataWeave provides consumer goods companies with the technology they need for quick and accurate pricing, promotional, and assortment intelligence. By tracking over 200 million products each day, users can be sure they get the widest and most timely view of the competitive landscape. DataWeave’s deep industry knowledge is baked into every aspect of its platform.

    Learn more by requesting a demo today!

  • Competitor Price Monitoring in E-commerce: Everything You Need to Know

    Competitor Price Monitoring in E-commerce: Everything You Need to Know

    Picture this: You wake up one morning to discover that your top competitor reduced their prices overnight. And now your shopper traffic has tanked and your sales have taken a hit.

    Unfortunately, this is a common scenario because your customers can compare prices online in seconds—and loyalty lies with the budget.

    So, how can you protect your business? Price monitoring.

    Price monitoring solutions can help you keep abreast of competitor price changes—which, of course, will help you improve your pricing strategies, retain your customers, and maximize your profits.

    How? In this article, we’ll explore:

    • What is price monitoring
    • The key benefits of price monitoring for retailers and brands
    • What a capable price monitoring solution can do

    What Is Price Monitoring?

    Price monitoring is the process of tracking and analyzing your competitor’s prices across various online and offline platforms. By monitoring competitors’ prices, you can understand market price trends and adjust your prices strategically—which, in turn, helps you remain competitive, increase margins, and improve customer retention.

    5 Benefits of Price Monitoring

    Competitor price monitoring can help you:

    1. Gain a competitive edge: Competitor price tracking allows you to adjust your prices to remain attractive to consumers.
    2. Maximize revenue: With timely pricing data, you’re empowered to identify optimum price points that strike a delicate balance between maximizing revenue and maintaining customer loyalty.
    3. Retain customers: Consumers are looking for the most value for their dollar, so maintaining consistently competitive pricing is crucial for retaining loyal customers.
    4. Understand promotional effectiveness: Price monitoring helps businesses evaluate the effectiveness of their promotions and discounts. By comparing the impact of different pricing strategies, businesses can refine their promotional tactics to maximize sales and customer engagement.
    5. Understand market movements: By analyzing historical pricing data, you’re better positioned to anticipate future pricing changes — and adjust your strategies accordingly.

    4 Essential Capabilities of Price Monitoring Software

    Here are four capabilities to look for when choosing a price monitoring system.

    1. AI-Driven Product Matching

    Product matching is the process of identifying identical or similar products across different platforms to ensure accurate price comparisons.

    If your price monitoring solution can’t reliably match your products with competitors’ across various sales channels at scale, you’ll end up with poor data. Inaccurate data will then lead you to make misinformed pricing decisions.

    Product matching needs to be accurate and comprehensive, covering a wide range of products and product variations—even for including private label products.

    For example, AI-driven product matching can recognize a specific brand and model of sneakers across multiple online stores—even if product descriptions and images differ. Here’s how it works in a nutshell:

    • Sophisticated algorithms and deep learning architecture enable AI to identify and match products that aren’t identical but share key characteristics and features.
    • Using unified systems for text and image recognition, the AI matches similar SKUs across hundreds of eCommerce stores and millions of products.
      The AI zeroes in on critical product elements in images, like a t-shirt’s shape, sleeve length, and color.
    • The AI also extracts unique signatures from photos for rapid, efficient identification and grouping across billions of indexed items.

    DataWeave’s AI algorithm can initially match products with 80–90% accuracy. Then, humans can bring contextual judgement and make nuanced decisions that the AI might miss to correct errors quickly and push for accuracy closer to 100%. By integrating AI automation with human validation, you can achieve accurate and reliable product-matching coverage at scale.

    2. Accurate and Comprehensive Data Collection and Aggregation

    The insights you derive are only as good as the data you collect. However, capturing comprehensive pricing data is tough when your competitors operate on multiple platforms.

    For truly effective price monitoring insights, you need consistent, comprehensive, and highly accurate data. This means your chosen price monitoring system should:

    • Scrape data from various sources, such as desktop and mobile sites and mobile applications.
    • Pull data from various online platforms like aggregators, omnichannel retailers, delivery intermediaries, online marketplaces, and more.
    • Handle data from different regions and languages.
    • Collect data at regular intervals to ensure timeliness.

    DataWeave’s online price monitoring software covers all of these bases and more with a fast, automated data source configuration system. It also allows you to painlessly add new data sources to scrape.

    Instead of incomplete or inaccurate data, you’ll have comprehensive and up-to-date data, allowing you to respond quickly to market changes with confidence.

    3. Seamless Normalization of Product Measurement Units

    You can’t compare apples to oranges—or price-per-kilogram to price-per-pound.

    For price monitoring to be accurate, there must be a way to normalize measurement units—so that we’re always comparing price-per-gram to price-per-gram. If we compare prices without taking into account measurement units, our data will be misleading at best.

    Let’s take a closer look. Say that your top competitor sells 12oz cans of beans for $3, and you sell 15oz cans for $3.20. At first glance, your larger cans of beans will appear more expensive—but that’s not true. If we normalize the measurement unit—in this example, an oz—the larger can of beans offers more value to customers.

    Unit of measure normalization facilitates sound price adjustments based on accurate and reliable data. For this reason, every business needs a price tracking tool that can guarantee accurate comparisons by normalizing unit measurements—including weight, volume, and quantity.

    4. Actionable Data and an Intuitive User Experience

    Knowledge is only powerful when applied—and price monitoring insights are only useful when they’re accessible and actionable.

    For this reason, the best price monitoring software doesn’t just provide insights based on accurate and comprehensive data, but it also provides several ways to understand and deploy those insights.

    Ideal price monitoring solutions provide customized pricing alerts, intuitive dashboards, detailed reports, and visuals that are easy to interpret—all tailored to each particular team or a team member’s needs. These features should make it easy for team members to compare prices against those of competitors in specific categories and product groupings.

    Your price tracking tool should also permit flexible API integrations and offer straightforward data export options. This way, you can integrate competitive pricing data with your pricing software, Business Intelligence (BI) tools, or Enterprise Resource Planning (ERP) system.

    4 Ways Retailers Can Leverage Price Monitoring

    Retailers can use price monitoring tools to remain competitive without compromising profitability—here’s how:

    1. Track Competitors’ Prices

    Competitor price monitoring helps you avoid being undercut—and, as a result, maintain market share. By tracking competitor prices in real-time, you can adjust prices to remain competitive, especially in dynamic markets. Ideally, you should monitor both direct competitors selling the same products and indirect competitors selling similar or alternative products. This way, you’ll have a complete picture of market prices and can make more informed pricing adjustments.

    2. Understand Historical and Seasonal Price Trends

    As a retailer, you may want to analyze historical data to identify price patterns and predict future price movements—especially in relation to holidays and seasonal products. Knowing what’s coming, you’re better positioned to plan for pricing changes and promotional campaigns.

    3. Implement Dynamic Pricing

    Dynamic pricing is the process of adjusting prices based on real-time market conditions, product demand, and competitors’ prices—allowing you to respond faster to market changes to maintain optimized prices.

    4. Optimize Promotional Strategies

    Price monitoring tools can track retail promotions across numerous online and offline sales avenues, providing insight into the nature and timing of competitors’ promotions. This data can help you determine which promotions are most effective—and which aren’t—allowing you to improve your own promotions and discounts, and allocate marketing resources where it matters most. This is especially beneficial during peak sales periods.

    3 Ways Brands Can Employ Price Monitoring

    Here are three ways brands can use price monitoring to remain profitable, protect brand equity, and gain a competitive edge.

    1. Maintain Consistent Retail Prices

    Minimum advertised price (MAP) policies are designed to prevent retailers from devaluing a brand while ensuring fair competition among retailers. Price monitoring applications allow your brand to track retailers’ prices to detect MAP policy violations. Data in hand, you can maintain consistent pricing across online sales channels, physical stores, and retail stores’ digital shelves — and, critically, protect your brand equity.

    2. Improve Product and Brand Positioning

    When you understand how your products’ prices compare to those of competitors, you can set prices to improve brand positioning. For example, if you want to position your brand as luxurious and high-quality, you need to set higher product prices than budget-friendly alternative products.

    3. Ensure Product Availability

    You can use a price monitoring solution to track product availability to ensure products are always in stock, even across different physical stores and online marketplaces. If a product is frequently sold out, you can adjust production levels or help retailers to improve their inventory management.

    Key Takeaways: E-commerce Price Monitoring

    Price monitoring software allows you to compare your products’ prices with competitors. This valuable data can help you:

    • Optimize revenue through timely price changes and dynamic pricing
      Avoid being undercut by competitors
    • Improve pricing strategies and promotions to increase sales and retain customers
    • Maintain consistent prices across sales channels

    To learn more, check out our article, What is Competitive Pricing Intelligence: The Ultimate Guide here or reach out and talk to us today!

  • How Retailers and Brands Can Navigate Skyrocketing Olive Oil Prices in 2024

    How Retailers and Brands Can Navigate Skyrocketing Olive Oil Prices in 2024

    Olive oil, renowned for its complex flavor and myriad health benefits, holds a significant place in the global market, valued at $14.64 billion in 2023. It is anticipated to reach $19.77 billion by 2032, with a steady compound annual growth rate (CAGR) of 3.42%.

    This growth is fueled by:

    • Increased consumer demand for healthier oils.
    • Olive oil’s rising popularity in skincare products.
    • Greater retail availability.

    Interestingly, this market expansion occurs alongside rising olive oil prices, mainly due to a notable decrease in production. Eight European Union countries, which are the main producers, saw a dramatic drop in output from an average of 2.17 million tons to just 1.50 million tons in 2022—a 30.88% decline. Unfortunately, this drop in production comes as no surprise.

    Erratic weather patterns, rising temperatures, and exacerbating drought conditions in the Mediterranean basin have taken their toll. These climate changes disrupt the growing cycles of olive trees, leading to poorer crop yields and lower-quality olives.

    In the US, where olive oil constitutes 19% of all cooking oils sold and 40% of sales value due to its premium pricing, the market is expected to grow at an impressive CAGR of 11.31% between 2024 and 2032. This forecast is significant despite a recent dip in domestic consumption, which may further decline due to economic pressures. As a result, consumers must make difficult choices as they battle inflation, shrinkflation, and thin budgets.

    DataWeave’s Analysis of Rising Olive Oil Prices

    At DataWeave, we utilized our advanced AI-powered data aggregation and analysis platform to scrutinize the pricing trends of olive oils across key US retailers over the past year. Our analysis covered 130+ SKUs from major chains including Walmart, Kroger, Giant Eagle, and Target.

    The data revealed a notable escalation in olive oil prices, with consumers facing a sharp 25.8% increase from April 2023 to April 2024.

    This trend of rising costs was consistent across all analyzed retailers. Specifically, Walmart and Giant Eagle each reported a substantial 30% increase in their olive oil prices over the past year. In contrast, Target and Kroger experienced somewhat more modest hikes, at 20% and 15% respectively.

    Further investigation into individual brands within our sample highlighted that no brand is immune to the impacts of the ongoing supply shortages. Walmart’s own Great Value brand saw an exceptional 60% surge in prices. Other prominent olive oil brands such as Carapelli, Terra Delysia, and Bertolli also faced significant price increases, ranging from 20% to 50%.

    This across-the-board rise in prices underscores the widespread effect of supply constraints on the olive oil market, affecting both premium and private label brands alike.

    What Strategies Can Retailers and Brands Employ?

    In a market where consumer preferences and price sensitivities are rapidly evolving, retailers and brands must adopt versatile strategies without compromising on profit margins.

    Diversifying Brand Selection

    Retailers can enhance their appeal by offering a diverse range of olive oil brands, thereby stimulating competition among brands based on price, quality, innovation, and customer satisfaction. A well-curated selection that includes well-known brands like Filippo Berio and Bertolli, alongside emerging labels such as Terra Delyss, and premium options like Carapelli, allows retailers to meet a wide array of consumer preferences and budgets.

    For premium outlets, it might be beneficial to introduce more economical options than typically offered to attract budget-conscious consumers. Employing advanced assortment intelligence tools can provide retailers with crucial data, helping them make informed decisions about which brands to stock and promote, ensuring they meet consumer demand effectively while managing inventory costs.

    Data-driven Pricing

    With rising olive oil prices, competitive pricing is more crucial than ever. Retailers must strive to balance competitiveness with margin preservation. It’s essential for retailers to not just passively respond to market price increases but to actively ensure that their offerings are competitively priced relative to the market.

    This involves using sophisticated pricing intelligence tools, such as those provided by DataWeave, which track market trends and competitor pricing actions. These tools enable retailers to implement dynamic pricing strategies that respond promptly to market conditions and consumer demand shifts, helping to optimize sales and profitability.

    Diversifying Sourcing

    The traditional powerhouses of olive oil production, Spain and Italy, are now facing stiff competition from countries like Turkey and Tunisia. This shift is influenced by various factors, including currency fluctuations and changing trade policies, such as the imposition of tariffs on European olive oils by significant importers like the US. Retailers can take advantage of these changes by diversifying their sourcing strategies to include olive oil from non-traditional regions.

    The 2022/2023 season saw remarkable production levels from countries outside the Mediterranean basin, with Iran and China setting new production records. By broadening their supply chains to incorporate these emerging markets, retailers can benefit from lower production costs and introduce unique products to their consumers, enhancing both competitiveness and profit margins.

    Double Down on Private Labels

    Large retailers have successfully used their scale to develop strong private-label brands that can buffer consumers from price hikes in the olive oil market. By focusing on expanding and promoting their private-label offerings, retailers can provide cost-effective alternatives to national brands.

    Private labels generally have lower price points, making them particularly attractive during times of economic pressure and market volatility. Additionally, the development of private labels allows retailers to control more of their supply chain, from pricing to packaging, enabling them to offer high-quality products at competitive prices, thereby retaining customer loyalty and enhancing market share.

    Navigating Market Pressures

    High olive oil prices impact the entire supply chain, presenting varied challenges and opportunities:

    • Producers benefit from higher revenues but face increased pressure to maintain quality and yields in challenging climates. Adapting to these conditions with sustainable practices is crucial.
    • Exporters and Importers navigate tighter margins and greater risks due to tariffs and volume restrictions, requiring agility and strategic planning to adapt to market changes.
    • Retailers must carefully balance competitive pricing with rising procurement costs, affecting consumer affordability and potentially leading to shifts in buying patterns.
    • Consumers may seek cheaper alternatives or reduce their olive oil consumption, which influences overall market demand and pricing stability.

    These dynamics underscore the necessity for retailers and brands to adopt innovative and proactive strategies to navigate the volatile olive oil market effectively. By focusing on adaptive pricing, diversified sourcing, and customer engagement, businesses can enhance their resilience and secure long-term success in this competitive landscape.

    To learn more, talk to us today!

  • How Monitoring and Analyzing  End-User Prices can Help Retailers and Brands Gain a Competitive Edge

    How Monitoring and Analyzing  End-User Prices can Help Retailers and Brands Gain a Competitive Edge

    Retailers and brands are constantly engaged in a fierce battle over prices and discounts. Whether it’s major events like Amazon Prime Day, brand-led sales, or everyday price wars, they depend on pricing intelligence and digital shelf analytics to fine-tune their strategies. With a variety of offers such as sales, promotions, and bundles, determining the actual cost to the customer becomes a complex task. The price set by the brand, the retailer’s offer, and the final amount paid by the customer often vary significantly.

    In their analysis, retailers and brands frequently focus on the listed price or the final sale price, overlooking a critical factor: the “end-user price.” This includes all discounts, taxes, and shipping costs, providing a more accurate picture of what customers are truly willing to pay at checkout.

    Grasping this end-user price is vital for both retailers and brands. For retailers, it helps them stay competitive and refine their promotional strategies. For brands, it offers insights into competitive positioning, net revenue management, and shaping customer price perception.

    However, emphasizing the end-user price is challenging, as it involves comprehending all the intricate elements of pricing.

    How end-user pricing is calculated

    The list price, also known as the manufacturer’s recommended retail price (MSRP), is the initial price set by the brand. This may not always be displayed on marketplaces, especially in categories like grocery. The selling price, on the other hand, is the amount at which a retailer offers the product, often reduced from the list price. The end-user price is the actual amount the customer pays at checkout, which includes taxes, promotions, and other factors that affect the final cost.

    The process involves 3 key stages:

    Step 1: Identifying and categorizing promotional offers

    The first critical step in calculating end-user pricing is to identify and categorize the various promotional offers available for a given product that can reduce the final amount paid by the consumer. These promotions span a wide range of types:

    • Bank Offers: Involving discounts or cash back incentives when paying with specific bank credit or debit cards. For instance, a customer may receive 10% cashback on their purchase by using a specific bank’s card.
    • Bundled Deals: Combining multiple products or services at a discounted bundle price. A common example is a smartphone bundle including the phone itself, a protective case, and earphones at a reduced total cost.
    • Promo Codes/Coupons: Customers can enter promo codes or coupons during checkout to unlock special discounted prices or percentage-off offers, like 20% off a hotel booking, or even a special brand discount personalized for their needs (think loyalty offers and in-app promotions).
    • Shipping Offers: These include free shipping or reduced shipping fees for certain products or orders, such as free delivery on orders above a set amount.
    • TPRs (Temporary Price Reductions): TPRs play a significant role in the strategies of most retailers. Brands and retailers use them to encourage shoppers to purchase more of a product or to try a new product they wouldn’t usually buy. A TPR involves reducing the price of a product by more than 5% from its regular shelf price.

    By accurately identifying and classifying each type of promotion available, brands can then calculate the potential end-user pricing points.

    Step 2: Accounting for location and fulfilment nuances (delivery, in-store pickup) that impact final pricing

    Product pricing and promotional offers can vary based on the consumer’s location or ZIP code. Additionally, customers may opt for different fulfilment modes like delivery, shipping, or in-store pickup, which can further impact the final cost. Accurately calculating the end-user price necessitates considering these location-based pricing nuances as well as the chosen fulfilment method.

    In the example below, the selling price is $4.32 for one retailer (on the left in the image) after a discount for online purchase. In another case with Meijer, the item total shows $17.91, but the consumer ends up paying $15.74 after taxes and fees are applied (on the right in the image).

    Step 3: Applying each eligible promotion or offer to the selling price to determine potential end-user price points

    With the various promotional offers and discounts categorized in the previous steps, retailers and brands can now apply each eligible promotion to the product’s selling price. This involves deducting percentages for bank cashback, implementing bundled pricing, applying coupon code discounts, and incorporating shipping promotions.

    For retailers, this step allows them to calculate their true effective selling price to customers after all discounts and promotions. They can then compare this end-user price against competitors to ensure they remain competitively priced.

    For brands, by systematically layering every applicable offer onto the baseline selling price, they can accurately calculate the multiple potential end-user price points a customer may pay at checkout for their products across different retailers and regions.

    Why the end-user price matters

    Optimizing pricing strategies using the end-user price can benefit retailers and brands in several ways:

    • Price Competitiveness: By monitoring end-user pricing, retailers can adjust for discounts and promotional offers to attract customers, while brands can refine their pricing models to stay ahead in the market.
    • Customer Acquisition and Loyalty: Offers, promotions, and discounts directly impact the final price paid by customers, playing a crucial role in attracting new customers and retaining existing ones. For example, Walmart’s competitive pricing in groceries boosts customer loyalty and repeat purchases.
    • Consumer Perception: End-user pricing significantly shapes how consumers perceive both retailers and brands. Competitive pricing and promotional transparency enhance reputation and conversion rates. Amazon, for instance, is known for its competitive pricing and fast deliveries, which strengthen its consumer perception and satisfaction.
    • Sales Volumes: The final checkout price influences affordability and perceived value, directly affecting sales volumes. Both retailers and brands benefit from understanding this, as it guides consumer purchasing decisions and drives revenue streams.
    • Brand Perception: Consistent and transparent pricing enhances the perception of both the retailer and the brand. This not only strengthens the value proposition but also builds consumer trust and fosters long-term loyalty.

    While the listed and selling prices are readily available, calculating the true end-user price is quite complex. It involves meticulous tracking and application of various types of promotions, offers, location-based pricing nuances, and fulfillment costs – an uphill task without robust technological solutions.

    Track and Analyze end-user prices with DataWeave

    DataWeave’s end-user price tracking capability empowers retailers and brands with the insights and tools necessary to comprehend the complexities of pricing dynamics. For retailers, it offers the ability to monitor end-user pricing across various products and categories compared to competitors, ensuring competitiveness after all discounts and enabling optimization of promotional strategies. Brands benefit from informed pricing decisions, optimized strategies across retail channels, and a strengthened position within their industries.

    Our intuitive dashboard presents classified promotions and corresponding end-user prices across retailers, providing both retailers and brands with a transparent, comprehensive view of the end-user pricing landscape.

    Within the detailed product view of DataWeave’s dashboard, the Price and Promotions panel showcases diverse promotions available across different retailers for each product, along with the potential end-user price post-promotions.

    Harness the power of DataWeave’s sophisticated Pricing Intelligence and Digital Shelf Analytics to gain an accurate, real-time understanding of your end-user pricing dynamics. Make data-driven pricing decisions that resonate with customers and propel your brand toward sustained success.

    Find out how DataWeave can empower your eCommerce pricing strategy – get in touch with us today or write to us at contact@dataweave.com!

  • Augmenting AI-powered Product Matching with Human Expertise to Achieve Unparalleled Accuracy

    Augmenting AI-powered Product Matching with Human Expertise to Achieve Unparalleled Accuracy

    In today’s expansive omnichannel commerce landscape, pricing intelligence has become indispensable for retailers seeking to stay competitive and refine their pricing strategies. The sheer magnitude of eCommerce, spanning thousands of websites, billions of SKUs, and various form factors, adds layers of complexity. Consequently, ensuring the accuracy and reliability of competitive insights presents a formidable challenge for retailers aiming to leverage pricing data effectively.

    At the core of any robust pricing intelligence system lies product matching. This process enables retailers to recognize identical or similar products across competitors. Once these matches are identified, tracking prices is a relatively more straightforward task, facilitating ongoing analysis and informed decision-making.

    Accurate matching is crucial for meaningful price comparisons and tailoring product assortments. The challenge is matching products is often complicated, especially for non-local brands, niche categories, or items lacking consistent global identifiers. It becomes even trickier when trying to match very similar but not identical products. A comprehensive approach that compares and analyzes multiple attributes like product titles, descriptions, images and more is essential.

    Artificial intelligence algorithms are commonly used to automate product matching, leveraging machine learning techniques to analyze patterns in images and text data. While AI can adapt and improve over time, the question remains: Can it fully address the complexities of product matching on its own?

    The reality is that many retailers still struggle with incomplete, inaccurate, or outdated product data, despite these AI-powered product matching solutions. This can lead to suboptimal pricing decisions, missed opportunities, and reduced competitiveness.

    Challenges in an ‘AI-only’ Approach to Product Matching

    While AI plays a vital role in automated product matching solutions, there are complexities that AI alone cannot fully address:

    Subjectivity in Matching Criteria

    Some product categories have subjective or hard-to-quantify criteria for determining similarity. AI learns from historical data, so it may struggle with nuanced aspects like:

    Aesthetics, style, and design: In the Fashion and Jewellery vertical, for example, products are matched according to attributes like style, aesthetics, design – all of which have some subjectivity involved.

    Quantity/packaging variations: In the grocery sector, variations in product packaging and quantities can introduce complexities that require subjective decision-making. For example, apples may be sold in different packaging like a 0.5 kg bag or a pack of 4 individual apples. Determining if these different packaging options should be considered equivalent often involves making a qualitative judgment call, rather than a clear-cut objective decision.

    Matching product sets: For categories like home furnishings, the focus is often on matching coordinated sets rather than individual items. For example, in the bedroom category, matching may involve grouping together an entire set of complementary furniture like a bed frame, dresser, and wardrobe based on their cohesive design and style. This goes beyond simply making one-to-one product associations, requiring more nuanced judgments about aesthetic coordination.

    Contextual Factor

    Products can have regional preferences, cultural differences, or evolving trends that impact how they are matched. AI may miss important context like Local/regional product names or distinct brand names across countries.

    For instance, in the image we see Sprite (in the US) is branded Xubei in China. Continuous human curation is needed to help AI adapt to this context.

    High Accuracy & Coverage Expectations

    Retailers rely on AI powered and automated pricing adjustments based on product matching for insight. To ensure that pricing recommendations and updates are accurate, accurate product matching is crucial. For this, simply identifying similar top results is not enough – the process must comprehensively capture all relevant matches. While AI excels at finding the top groupings with around 80% accuracy, even small matching errors can have significant consequences.

    As AI matching improves, customer expectations may rise even higher. If AI achieves 90% accuracy, for instance, SLAs may demand over 95%. Reaching such a high level of accuracy is very challenging for AI alone, especially when faced with incomplete data, contextual nuances, evolving trends, and subjective matching criteria across products and categories.

    The solution is to combine the power of AI with human expertise. This is the key to achieving true data veracity – the accuracy, freshness, and comprehensive coverage required for precise and reliable product matching.

    Human-in-the-Loop Approach for Elevated Product Matching

    Human intelligence and quality testing can elevate the AI powered product matching process by addressing key challenges:

    • Matching Validation: AI algorithms may identify product matches with 80-90% accuracy initially. Having humans validate these AI-suggested matches allows for correcting errors and pushing the accuracy close to 100%. As humans flag issues, provide context, and re-label incorrect predictions, it allows the AI model to learn and enhance its reliability for complex, high-stakes decisions.
    • Applying Contextual Judgment: For subjective matching criteria like aesthetics, design, and categorizing product sets, human discernment is needed. Humans can make nuanced judgments beyond just quantitative rules, ensuring meaningful apples-to-apples product comparisons. Their contextual understanding augments AI’s capabilities.
    • Continuous Learning Via Feedback Loop: Product experts possess rich category knowledge across markets. Integrating this human insight through an iterative feedback loop helps AI models quickly learn and adapt to changing trends, preferences, and context. As humans explain their match assessments, the AI continuously enhances its precision over time.

    By combining AI’s automation and scale with human validation, judgment, and knowledge curation, pricing intelligence solutions can achieve the accuracy and coverage demanded for actionable competitive pricing insights.

    DataWeave’s Data Veracity Framework: A Scalable Workflow Combining AI and Human Expertise

    Given the vast number of products, retailers, and brands that exist today, any product matching solution must be highly scalable. At DataWeave, we bring you such a scalable workflow to address these complexities by integrating human expertise with AI-driven automation. The image below outlines our approach for combining AI with human intelligence in a seamless, scalable workflow for accurate product matching:

    Retailers and brands can benefit in several ways with this workflow, as listed below.

    Several Rounds of Data Verification Due to Hierarchical Validation Teams

    The workflow employs a hierarchical validation team of Leads and Executives to efficiently integrate human expertise without creating bottlenecks. Verification Leads play a pivotal role in managing the distribution of product matches identified by DataWeave’s AI model to the Verification Executives.

    The Executives then meticulously validate these AI-suggested matches, adding any missing product associations and removing inaccurate matches. After validation, the matched product groups are sent back to the Leads, who perform random sampling checks to ensure quality.

    Throughout this entire workflow, feedback and suggestions are continuously gathered from both the Executives and Leads. This curated input is then incorporated back into DataWeave’s AI model, allowing it to learn and improve its matching accuracy on an ongoing basis.

    This hierarchical structure ensures that human validation seamlessly scales alongside the AI’s matching capabilities. Leveraging the respective strengths of AI automation and human expertise in an iterative feedback loop prevents operational bottlenecks while steadily elevating overall accuracy.

    Confidence-based Distribution of Matched Articles for Validation

    The AI model assigns confidence scores, differentiating high-confidence (>95%) and low-confidence matches. For high-confidence groups, executives simply remove incorrect matches – a quicker process. Low-confidence matches require more human effort in adding/removing matches.

    As the AI model improves over time with feedback, the share of high-confidence matches increases, making validation more efficient and swift.

    Automated, Standardized Process with Iterative Feedback Loop

    The entire workflow is standardized and automated, with verification metrics seamlessly tracked. At each step, feedback captured from both leads and executives flows back into the AI, enhancing its matching accuracy and coverage iteratively.

    DataWeave’s closed-loop system of AI automation with hierarchical human validation allows product matching to achieve comprehensive accuracy at a vast scale.

    Unleash the Power Accurate and Comprehensive Product Matching

    In summary, combining AI and human expertise in product matching is crucial for retailers navigating the complexities of omnichannel retail. While AI algorithms excel in automation, they often struggle with subjective criteria and contextual nuances. DataWeave’s approach integrates AI-driven automation with human validation, delivering the industry’s most accurate product matching capabilities, enabling actionable competitive pricing insights.

    To learn more, reach out to us today!

  • Why Localized, Store-Specific Pricing and Availability Insights is Critical for Consumer Brands

    Why Localized, Store-Specific Pricing and Availability Insights is Critical for Consumer Brands

    Brands are becoming increasingly proficient in monitoring and refining their presence on online marketplaces, utilizing Digital Shelf Analytics to gather and analyze data on their online performance. These tools offer invaluable insights into enhancing visibility, adjusting pricing strategies, and improving content quality on eCommerce sites.

    Yet, as the retail landscape shifts towards a more integrated omnichannel approach, it’s crucial for brands, particularly those in CPG, to apply similar strategies to their offline channels. For brands that count physical stores among their primary sales channels, gaining localized insights is key to boosting in-store sales performance.

    Collecting shelf data from offline channels presents more challenges than online. Traditional methods, such as physical store visits, often fall short in reliability, timeliness, scale, and level of coverage.

    However, the world of eCommerce provides a solution. As part of the effort to facilitate options like buy-online-pickup-in-store (BOPIS) for shoppers, major retailers make store-specific product details available online. Consumers often go online and select their nearest store to make purchases digitally before choosing a fulfillment option like picking up at the store or direct delivery. Aggregating this store-level information offers brands critical insights into pricing and inventory across a vast network of stores, enabling them to make informed decisions that improve pricing strategies and supply chain efficiency, thus minimizing stockouts in crucial markets.

    Further, as consumers increasingly seek flexibility in how they receive their purchases—be it through in-store pickup, delivery, or shipping—brands need to adeptly monitor pricing and availability for these different fulfilment options. Such granular insight empowers brands to adapt swiftly and maintain a competitive edge in today’s dynamic retail environment.

    Why does monitoring pricing and availability data across stores matter to brands?

    • Hyperlocal Competitive Strategy: This allows brands to adjust their pricing strategies based on regional competition. By understanding the local market, brands can decide whether to position themselves as cost leaders or premium offerings. In particular, this is indispensable for Net Revenue Management (NRM) teams.
    • Targeted Marketing Initiatives: Understanding regional price and availability enables brands to customize their marketing efforts for specific markets. By aligning their strategies with local demand trends and inventory levels, brands can more effectively engage their target audiences.
    • Efficient Inventory Management: By keeping a close eye on store-level data, brands can better manage their stock, ensuring high-demand products are readily available while minimizing the risk of overstocking or running out of stock.
    • Minimum Advertised Price (MAP) Monitoring: While brands cannot directly control retail pricing, staying updated on pricing trends helps them adjust their MAP to reflect the competitive landscape, consumer expectations, cost considerations, and regional differences. A strategic approach to MAP management supports brand competitiveness and profitability in a fluctuating market.

    DataWeave’s Digital Shelf Analytics solutions equip brands with the necessary data and insights to do all of the above.

    DataWeave’s Digital Shelf Analytics is location-aware

    DataWeave’s Digital Shelf Analytics platform stands out with its sophisticated location-aware capabilities, enabling the aggregation and analysis of localized pricing, promotions, and availability data. Our platform defines locations using a range of identifiers, including latitudes and longitudes, ZIP codes, or specific stores, and can aggregate this data for particular states or regions.

    The strength of the platform lies in its robust data collection and processing framework, which operates seamlessly across thousands of stores and regions. This system is designed to operate at configurable intervals—daily, weekly, or monthly—allowing brands to keep a vigilant eye on product availability, pricing strategies, and delivery timelines based on the selected fulfillment option.

    Unlike many other providers, who may provide limited insights from a sample of stores, our solution delivers exhaustive analytics from every storefront. This comprehensive approach grants brands a strategic edge, facilitating efficient inventory tracking, precise pricing adjustments, and rapid responses to fluctuating market dynamics. It cultivates brand consistency and loyalty by enabling brands to adapt proactively to the changing landscape.

    Aggregated store-level digital shelf insights via DataWeave

    In the summarized view shown above, a brand can track how its various products are positioned across stores and retailers like Walmart, Amazon, Meijer, and others in the US.

    Using DataWeave, brands can easily see important metrics like availability levels, prices, and other metrics across these stores gaining immediate visibility without having to physically audit them. the brand can track the same metrics for products across competitor brands and inform its own pricing, stock, and assortment decisions.

    Store-level availability insights

    We provide a comprehensive view of product availability, highlighting the distribution of out-of-stock (OOS) scenarios across various retailers and pinpointing the availability status throughout a brand’s network of stores. This capability enables swift identification of widespread availability issues, offering a bird’s-eye view of where shortages are most pronounced. By simply hovering over a specific location, detailed information about stock status and pricing for individual stores becomes accessible.

    Such insights are crucial for brands to adapt their strategies, mitigate risks, and ensure they meet consumer needs despite the ever-changing retail ecosystem.

    Store-level pricing insights

    Retailers often adopt different pricing strategies to deal with margin pressure, local competition, and surplus stock. Grasping these pricing dynamics at a hyperlocal level enables brands to tailor their strategies effectively to maintain a competitive edge.

    Our platform offers an in-depth look at how prices vary among retailers, across different stores, and throughout various regions. This analysis reveals the nuanced pricing tactics employed by retailers on a regional scale.

    For example, brands might see that some retailers, like Kroger and Walmart in the chart below, maintain consistent pricing across their outlets, demonstrating a uniform pricing strategy. In contrast, others, such as Meijer and Shoprite, might adjust their prices to match local market conditions, indicating a more localized approach to pricing.

    With DataWeave, brands can dive deeper into the pricing landscape of a specific retailer, examining a price map that provides detailed information on pricing at the store level upon hovering over a given location.

    By presenting a historical analysis of average selling prices across different retailers, we equip brands with the insights needed to understand past pricing strategies and anticipate future trends, helping them to strategize more effectively in an ever-evolving market.

    Digital Shelf Analytics that work for both eCommerce and brick-and-mortar store data

    While established brands have made strides in gathering online pricing and availability data through Digital Shelf Analytics solutions, integrating comprehensive insights from both brick-and-mortar and eCommerce channels often remains a challenge.

    DataWeave stands out for its capacity to collect data across diverse digital platforms, including desktop sites, mobile sites, and mobile applications. This capability ensures that omnichannel brands can have a holistic view of their pricing, promotional, and inventory strategies across all locations and digital landscapes.

    Leveraging localized Digital Shelf Analytics to understand the intricacies of pricing and availability at the store level allows brands to fine-tune their approaches, swiftly adapt to local market shifts, and uphold a unified brand presence across the digital and offline spheres. This strategic agility places them in a favorable competitive position, enhancing customer satisfaction and trust, which are crucial for sustained success.

    Know more about DataWeave’s Digital Shelf Analytics here.

    Schedule a call with a specialist to see how it can work for your brand.

  • How DataWeave Enhances Transparency in Competitive Pricing Intelligence for Retailers

    How DataWeave Enhances Transparency in Competitive Pricing Intelligence for Retailers

    Retailers heavily depend on pricing intelligence solutions to consistently achieve and uphold their desired competitive pricing positions in the market. The effectiveness of these solutions, however, hinges on the quality of the underlying data, along with the coverage of product matches across websites.

    As a retailer, gaining complete confidence in your pricing intelligence system requires a focus on the trinity of data quality:

    • Accuracy: Accurate product matching ensures that the right set of competitor product(s) are correctly grouped together along with yours. It ensures that decisions taken by pricing managers to drive competitive pricing and the desired price image are based on reliable apples-to-apples product comparisons.
    • Freshness: Timely data is paramount in navigating the dynamic market landscape. Up-to-date SKU data from competitors enables retailers to promptly adjust pricing strategies in response to market shifts, competitor promotions, or changes in customer demand.
    • Product matching coverage: Comprehensive product matching coverage ensures that products are thoroughly matched with similar or identical competitor products. This involves accurately matching variations in size, weight, color, and other attributes. A higher coverage ensures that retailers seize all available opportunities for price improvement at any given time, directly impacting revenues and margins.

    However, the reality is that untimely data and incomplete product matches have been persistent challenges for pricing teams, compromising their pricing actions. Inaccurate or incomplete data can lead to suboptimal decisions, missed opportunities, and reduced competitiveness in the market.

    What’s worse than poor-quality data? Poor-quality data masquerading as accurate data.

    In many instances, retailers face a significant challenge in obtaining comprehensive visibility into crucial data quality parameters. If they suspect the data quality of their provider is not up to the mark, they are often compelled to manually request reports from their provider to investigate further. This lack of transparency not only hampers their pricing operations but also impedes the troubleshooting process and decision-making, slowing down crucial aspects of their business.

    We’ve heard about this problem from dozens of our retail customers for a while. Now, we’ve solved it.

    DataWeave’s Data Statistics and SKU Management Capability Enhances Data Transparency

    DataWeave’s Data Statistics Dashboard, offered as part of our Pricing Intelligence solution, enables pricing teams to gain unparalleled visibility into their product matches, SKU data freshness, and accuracy.

    It enables retailers to autonomously assess and manage SKU data quality and product matches independently—a crucial aspect of ensuring the best outcomes in the dynamic landscape of eCommerce.

    Beyond providing transparency and visibility into data quality and product matches, the dashboard facilitates proactive data quality management. Users can flag incorrect matches and address various data quality issues, ensuring a proactive approach to maintaining the highest standards.

    Retailers can benefit in several ways with this dashboard, as listed below.

    View Product Match Rates Across Websites

    The dashboard helps retailers track match rates to gauge their health. High product match rates signify that pricing teams can move forward in their pricing actions with confidence. Low match rates would be a cause for further investigation, to better understand the underlying challenges, perhaps within a specific category or competitor website.

    Our dashboard presents both summary statistics on matches and data crawls as well as detailed snapshots and trend charts, providing users with a holistic and detailed perspective of their product matches.

    Additionally, the dashboard provides category-wise snapshots of reference products and their matching counterparts across various retailers, allowing users to focus on areas with lower match rates, investigate underlying reasons, and develop strategies for speedy resolution.

    Track Data Freshness Easily

    The dashboard enables pricing teams to monitor the timeliness of pricing data and assess its recency. In the dynamic realm of eCommerce, having up-to-date data is essential for making impactful pricing decisions. The dashboard’s presentation of freshness rates ensures that pricing teams are armed with the latest product details and pricing information across competitors.

    Within the dashboard, users can readily observe the count of products updated with the most recent pricing data. This feature provides insights into any temporary data capture failures that may have led to a decrease in data freshness. Armed with this information, users can adapt their pricing decisions accordingly, taking into consideration these temporary gaps in fresh data. This proactive approach ensures that pricing strategies remain agile and responsive to fluctuations in data quality.

    Proactively Manage Product Matches

    The dashboard provides users with proactive control over managing product matches within their current bundles via the ‘Data Management’ panel. This functionality empowers users to verify, add, flag, or delete product matches, offering a hands-on approach to refining the matching process. Despite the deployment of robust matching algorithms that achieve industry-leading match rates, occasional instances may arise where specific matches are overlooked or misclassified. In such cases, users play a pivotal role in fine-tuning the matching process to ensure accuracy.

    The interface’s flexibility extends to accommodating product variants and enables users to manage product matches based on store location. Additionally, the platform facilitates bulk match uploads, streamlining the process for users to efficiently handle large volumes of matching data. This versatility ensures that users have the tools they need to navigate and customize the matching process according to the nuances of their specific product landscape.

    Gain Unparalleled Visibility into your Data Quality

    With DataWeave’s Pricing Intelligence, users gain the capability to delve deep into their product data, scrutinize match rates, assess data freshness, and independently manage their product matches. This approach is instrumental in fostering informed and effective decisions, optimizing inventory management, and securing a competitive edge in the dynamic world of online retail.

    To learn more, reach out to us today!

  • The Indian E-Commerce Showdown: Unveiling the Price War Between Flipkart’s Big Billion Days and Amazon’s Great Indian Festival

    The Indian E-Commerce Showdown: Unveiling the Price War Between Flipkart’s Big Billion Days and Amazon’s Great Indian Festival

    India’s homegrown eCommerce giant Flipkart, now backed by Walmart, reported a record 1.4 Billion customer visits during the early access phase and throughout the seven days of its premier shopping event, the Big Billion Days, launched on 8th October 2023. Competing with Flipkart, Amazon’s Great Indian Festival sale event started on October 8th as well and saw a whopping 95 Million customer visits to the website within the first 48 hours of the event.

    For consumers, the most pressing question was, “Who offered more attractive deals and lower prices during these sale events?”

    To answer this question, we leveraged our proprietary data aggregation and analysis platform and analyzed the prices and discounts on Amazon and Flipkart across key product categories..

    The details of our sample are mentioned below:

    • Number of SKUs Analyzed: 30,000+
    • Websites: Amazon.com and Flipkart.com
    • Categories: Apparel, Home & Furniture, Electronics, Health & Beauty
    • Dates: 7th Oct 2023 to 22nd Oct 2023

    Key Findings

    Based on our analysis, the Big Billion Days by Flipkart showcased relatively higher price reductions across categories compared to the Great Indian Festival sale by Amazon. The Apparel category on Flipkart saw the highest average discount at 50.6%. The Health & Beauty category had the lowest discount across Flipkart at 39.4% and Amazon at 33%.

    Overall, Flipkart offered higher discounts in each product category. It is clear that the retailer invested heavily in leveraging its supplier partnerships with key brands or sellers to enable them to offer higher discounts, thereby attracting more customers.

    Next, let’s take a closer look at each product category.

    Apparel

    While a majority of retailers expected demand for apparel and clothing to dip this festive season in India, eCommerce giants like Amazon and Flipkart are likely to recognize the strong consumer inclination towards apparel during this period.

    In the detailed assessment of Apparel sub-categories, Women’s Dresses, Women’s Tops, Men’s Shirts, Men’s Shoes, and Women’s Innerwear emerged as the segments showcasing the most substantial discounts during the sale events. While Flipkart offered higher average discounts across all sub-categories, Amazon offered competitive discounts as well.

    We observed significant differences in the average discounts across brands between Flipkart’s Big Billion Days and Amazon’s Great Indian Festival. Reinforcing the significant discounts on the Shoes subcategory, brands like Red Tape, Arrow, Adidas, Reebok, Nike, and more offered extensive discounts on both Flipkart and Amazon. Notably, Adidas and Reebok offered better deals on Amazon’s Great Indian Festival as compared to Flipkart.

    One8 by Virat Kohli had a significantly lower discount on Amazon compared to Flipkart, indicating an exclusive partnership.

    For brands, however, reducing prices is just one approach to entice shoppers. They must also guarantee their prominent presence and easy discoverability within Amazon and Flipkart search results. To gain insight into this, we monitored brands’ Share of Search across various frequently used search terms in addition to the discounts they provided. The Share of Search denotes the portion of a brand’s products within the top 20 search results for a specific search query.

    Our data indicates that Jockey and Speedo gained in Share of Search on Flipkart, but reduced discoverability on Amazon. Van Heusen fell behind in search results on Flipkart but showed a higher Share of Search on Amazon.

    Home & Furniture

    With demand for home and furniture products picking up in October, right before the festive season, Amazon and Flipkart offered significant discounts in this category.

    Discounts on both Amazon and Flipkart hovered around 50%. Across a few subcategories, Flipkart offered slightly lower discounts compared to Amazon. Only Luggage, Rugs, Sofas, and Entertainment Units saw lower markdowns on Flipkart during the Big Billion Days. 

    Dishwashers and Washer/ Dryers saw higher discounts on Amazon compared to Flipkart. The significant discounts on these products on Amazon possibly point to changing consumer preferences, as demand for these products is traditionally low in India, but seems to be growing.

    When it comes to Home & Furniture brands, Nasher Miles, Safari, Aristocrat, VIP, and American Tourister, luggage brands mostly, offered higher discounts on Flipkart, followed closely by Amazon.

    In terms of Share of Search, Skybags had high discoverability on both Flipkart and Amazon. The brand leveraged a strategy of offering big discounts this festive season as well as ensuring prominent placement in search results. Wildcraft lost out on its discoverability on Flipkart in contrast to its prominence on Amazon. Duroflex saw lower searchability on Amazon compared to Flipkart’s Big Billion Days.

    Consumer Electronics

    The Consumer Electronics and Appliances Manufacturers Association (CEAMA) expected an uptick in sales of consumer electronics products this festive season in India. With more consumers buying premium products using credit cards and EMIs, demand for expensive, high-end electronics was expected to increase.

    Again, average discounts in this category hovered around 50% on Flipkart and Amazon.

    Across electronics subcategories, Smartwatches, Earbuds, and Drones had the highest markdowns with Flipkart leading the pack during the Big Billion Days. Amazon offered relatively higher discounts at 44.9% on the TV subcategory, compared to Flipkart’s 40.6%.

    Speakers, Laptops, Smartphones, and Tablets also saw lower markdowns on Amazon compared to Flipkart. Amazon was the official partner for the launch of many high-level smartphones and products in September-October, contributing to the higher markdowns in the subcategory.

    Across brands, Lenovo’s discounts were the most differentiated between the two sites, with the brand offering higher discounts on Amazon (45.4%) compared to Flipkart (24.7%). Noise offered the highest discounts at 72.5% on Amazon and 52.8% on Flipkart. Brands like Boat and Zebronics, also saw lower discounts on Flipkart.

    Mi and JBL offered deeper discounts on Flipkart’s Big Billion Days. Apple meanwhile stands out with only 11.83% discounts on Amazon, but the brand offered impressive 31.4% discounts on Flipkart.

    Samsung dominated the Share of Search on Amazon at 15.7%, compared to only 2.6% on Flipkart. Apple and Lenovo also saw higher discoverability on Amazon. On Flipkart, JBL and Skullcandy stand out as brands with high search visibility.

    Health & Beauty

    The Health & Beauty category saw the lowest markdowns with only 39.4% discounts on Flipkart and 33% on Amazon.

    In the subcategories analyzed, Electric Toothbrushes had relatively high markdowns across both sites. Staple and lower priced subcategories like Toothpaste had the lowest markdowns across both sale events, with Amazon offering only 17.4% average discounts.

    Across brands, Beardo, a leading beard care brand, offered significantly higher discounts on Amazon compared to Flipkart. Most other well-known brands, including Nivea and Vaseline, saw higher discounts on Amazon compared to Flipkart. Only Tresmme and Dove were exceptions with higher discounts on Flipkart.

    In terms of Share of Search, once again, Beardo was the most discoverable brand in this category. Brands like Dove, Pond’s, Swiss Beauty, and Tresemme saw a lower Share of Search on Flipkart compared to Amazon.

    Navigating the Competitive Landscape: How To Thrive During Sale Events

    Amazon and Flipkart’s strategic pricing during the Big Billion Days and the Great Indian Festival Sale reflects a balance of profitability, inventory, and competition. Competitive pricing insights empower retailers to make informed decisions, optimize strategies, and thrive during high-stakes sale events with timely and relevant insights at a massive scale.

    To learn more about how you can leverage competitive pricing insights to stay ahead of the game during sale events, reach out to us today!

  • Why Unit of Measure Normalization is Critical For Accurate and Actionable Competitive Pricing Intelligence

    Why Unit of Measure Normalization is Critical For Accurate and Actionable Competitive Pricing Intelligence

    Competitive pricing intelligence is pivotal for retailers seeking to analyze their product pricing in relation to competitors. This practice is essential for ensuring that their product range maintains a competitive edge, meeting both customer expectations and market demands consistently.

    Product matching serves as a foundational element within any competitive pricing intelligence solution. Products are frequently presented in varying formats across different websites, featuring distinct titles, images, and descriptions. Undertaking this process at a significant scale is highly intricate due to numerous factors. One such complication arises from the fact that products are often displayed with differing units of measurement on various websites.

    The Challenge of Varying Units

    In certain product categories, retailers often offer the same item in varying volumes, quantities, or weights. For instance, a clothing item might be available as a single piece or in packs of 2 or 3, while grocery brands commonly sell eggs in counts of 6, 12, or 24.

    Consider this example: a quick glance might suggest that an 850g pack of Kellogg’s Corn Flakes priced at $5 is a better deal than a 980g pack of Nestle Cornflakes priced at $5.2. However, this assumption can be deceptive. In reality, the latter offers better value for your money, a fact that only becomes evident through price comparisons after standardizing the units.

    This issue is particularly relevant due to the prevalence of “shrinkflation,” where brands adjust packaging sizes or quantities to offset inflation while keeping prices seemingly low. When quantities, pack sizes, weight, etc. reduce instead of prices increasing, it’s important that this change is considered while analyzing competitive pricing.

    Normalizing Units of Measure

    In order to effectively compare prices among different competitors, retailers must standardize the diverse units of measurement they encounter. This standardization (or normalization) is crucial because price comparisons should extend beyond individual product SKUs to accommodate variations in package sizes and quantities. It’s essential to normalize units, ranging from “each” (ea) for individual items to “dozen” (dz) for sets, and from “pounds” (lb), “kilograms” (kg), “liters” (ltr), to “gallons” (gal) for various product types.

    For example, a predetermined base unit of measure, such as 100 grams for a specific product like cornflakes, serves as the reference point. The unit-normalized price for any cornflake product would then be the price per 100 grams. In the example provided, this reveals that Kellogg’s is priced at $0.59 per 100 grams, while Nestle is priced at $0.53 per 100 grams.

    Various Categories of Unit Normalization

    1. Weight Normalization

    Retailers frequently feature products with weight measurements expressed in grams (g), kilograms (kg), pounds (lbs), or ounces (oz).

    2. Quantity or Pack Size Normalization

    Products are also often featured with varying pick sizes or quantities in each SKU.

    mounting hardware kit

    3. Volume or Capacity Normalization

    Products can also vary in volumes or capacities with units like liters (L) or fluid ounces (fl oz).

    DataWeave’s Unit Normalized Pricing Intelligence Solution

    DataWeave’s highly sophisticated product matching engine can match the same or similar products and normalize their units of measurement, leading to highly accurate and actionable competitive pricing insights. It standardizes different units of measurement, like weight, quantity, and volume, ensuring fair comparisons across similar and exact matched products.

    Retailers have the flexibility to view pricing insights either with retailer units or normalized units. This capability empowers retailers and analysts to perform accurate, in-depth analyses of pricing information at a product level.

    In some scenarios, analyzing unit normalized pricing reflects pricing trends and competitiveness more accurately than retail price alone. This is particularly true for categories like CPG, where products are sold in diverse units of measure. For instance, in the example shown here, we can view a comparison of price position trends for the category of Fruits and Vegetables based on both retail price and unit price.

    The difference is striking: the original retail price based analysis shows a stagnation in price position, whereas unit normalized pricing analysis reflects a more dynamic pricing scenario.

    With DataWeave, retailers can specify which units to compare, ensuring that comparisons are made accurately. For example, a retailer can specify that unit price comparisons apply only to 8, 12, or 16-ounce packs, as well as 1 or 3-pound packs, but not to 10 and 25-pound bags. This precision ensures that products are matched correctly, and prices are represented for appropriately normalized units, leading to more accurate pricing insights.

    To learn more about this capability, write to us at contact@dataweave.com or visit our website today!

  • DataWeave Launches PricingPulse: Empowering Retail Leaders With Comprehensive and Strategic Pricing Insights

    DataWeave Launches PricingPulse: Empowering Retail Leaders With Comprehensive and Strategic Pricing Insights

    In the evolving retail landscape, success often hinges on a singular focal point: pricing. A recent Statista survey revealed that 70% of US online users prioritize competitive pricing in their digital shopping choices. In this cutthroat arena, where surpassing rivals is paramount, a deep comprehension of pricing nuances is no longer just an edge, but a necessity.

    Retailers are increasingly adopting pricing intelligence solutions that meticulously dissect competitor pricing data in comparison to their own, down to the SKU level. This analysis empowers their pricing teams with the insights they need to price their products competitively on a day-to-day basis.

    However, in a landscape where a staggering 50 million price changes occur daily, reliance on a reactive pricing intelligence solution, though effective in many ways, often falls short. To develop a strategic and predictive pricing engine, retailers also need the ability to track historical pricing relative to market conditions, competitor actions, seasonality, promptness of competitor pricing actions, and more. This would be particularly useful for senior retail pricing and business unit leaders as they look to gain a strategic perspective on their competitive pricing health. However, even today’s leading providers of retail pricing intelligence solutions lack in this area. This results in a relatively myopic view of competitive pricing even in large retail organizations.

    Introducing DataWeave’s PricingPulse

    DataWeave’s PricingPulse helps retail leaders better understand their competitive pricing strategies in comparison to relevant market dynamics over time. The capability bridges the gap between day-to-day competitive pricing operations and long-term strategic pricing analysis and actions, enabling senior retail pricing leaders to untangle the complexities of their pricing strategies. Delivered as a dashboard, the view offers an elevated vantage point for industry-wide pricing dynamics, empowering retailers with the foresight needed to navigate market shifts, predict vulnerabilities, and capitalize on new opportunities.

    PricingPulse is provided to all DataWeave retail customers as an add-on to our Pricing Intelligence solution.

    The insights offered by PricingPulse enable retailers to answer pivotal questions about competitor pricing behaviors, price leadership across categories, timing of price changes, and the effectiveness of capitalizing on price improvement opportunities. Some of the questions that PricingPulse offers answers to include:

    • How frequently are my competitors changing prices and for which products?
    • How does my price leadership vary across key product categories?
    • Which day of the week or month do my competitors change their pricing most and least frequently?
    • How well do I seize on price improvement opportunities over time?

    Strategic Pricing Views Via PricingPulse

    In the following section, we share a few views available to retail leaders via our PricingPulse dashboard. For a complete list of insights available on the dashboard, request a demo today.

    Competitive Price Leadership Across Retailers and Categories

    This view provides retailers with an overview of the price leaders across various product categories and how it changes with time. More often than not, retailers would aim to gain price leadership in certain categories, while maintaining healthy margins in others.

    Retailers can also gauge their consistency and effectiveness in maintaining a competitive edge for key categories over time. They can fortify areas of strength and identify opportunity areas to optimize their pricing.

    In addition, the dashboard tracks a retailer’s price index across categories, a measure that determines its price competitiveness.

    The price index is determined by dividing the retailer’s price by the lowest price offered by any of its competitors. A ratio lesser than 1 indicates that the retailer is the lowest priced in the market. This measure is also presented for competitors, providing insights into competitors that are most attractively priced in the market. A timeline trend of this metric helps track how price leadership among retailers changes over time.

    Price Change Trends

    This view provides a summary of the level of price changes by a retailer and its competitors over a period of time, which includes the average magnitude of price changes as well as the proportion of the retailer’s assortment that underwent these price changes.

    In addition, the number of price changes each month are provided for each retailer. This is further broken down into the total number of price changes during each day of the week.

    These insights help retailers determine which competitors are most and least active in their pricing activities, how aggressive the pricing actions are, and if there are any specific price change patterns followed in terms of the days of the week or month.

    Price Improvement Opportunities and Actions

    The dashboard actively reports on price improvement opportunities, which could include either a price increase opportunity or a price decrease opportunity, for a retailer and its competitors across categories over time. A price increase opportunity occurs when a product is significantly under priced (by more than 2%) and a price decrease opportunity occurs when a product is significantly overpriced (by more than 2%).

    Further, the retailer gains insight into how many price improvement opportunities were actually acted on within 15 days of the opportunity presenting itself. This “action rate” helps retailers quantify how well they seize on price improvement opportunities, which eventually result in higher sales and margins. The dashboard also reports on the average number of days it took for a retailer to act on a price improvement opportunity, thereby quantifying the responsiveness and agility of pricing teams.

    This is especially useful for pricing leaders to “audit” or evaluate the performance of their pricing teams. When similar insights are viewed for a set of competitors as well, retailers can better understand the level of sophistication of their competitors’ pricing operations.

    Ready to Elevate Your Pricing Game?

    The launch of DataWeave’s PricingPulse marks a significant advancement in the realm of pricing solutions for retail leaders. As the retail landscape undergoes continuous transformation, the significance of precise pricing strategies cannot be overstated. PricingPulse is the first and only pricing view in the industry to bridge the gap between tactical pricing decisions and comprehensive strategic analysis.

    In a world where agility and foresight are crucial, PricingPulse equips retail leaders with the ability to predict competitor actions, optimize pricing strategies, and stay ahead of the competition.

    If you are a senior pricing leader or retail business unit head, reach out to us today to either sign up or learn more!

  • Navigating the Turbulent Home and Furniture eCommerce Market in 2023 with the Power of Competitive Intelligence

    Navigating the Turbulent Home and Furniture eCommerce Market in 2023 with the Power of Competitive Intelligence

    The home and furniture retail industry is going through a turbulent time. As inflation reared its head mid-2022, leading retailers in the category have been grappling with the higher costs associated with producing and distributing their products, as well as reduced shopper demand. The rising costs of raw materials, transportation, and labor have had a direct impact on the pricing dynamics within the industry. For example, reports indicate container rates soared to nearly 10 times pre-pandemic levels towards the end of 2021.

    Furthermore, shoppers’ spending power has been constrained, while higher interest rates have suppressed demand. Retailers have had to adapt their assortment and pricing strategies to cater to a wider range of shopper preferences driven by changing lifestyles and a growing emphasis on sustainability. Post-pandemic, demand has been primarily driven by affluent shoppers.

    Towards the end of 2021, due to supply delays and disruptions, retailers heavily stocked up on available products. However, when demand subsequently decreased in 2022, they were left with a significant amount of unsold stock that was purchased at high rates. This put them in a difficult situation, as they had an excess of products but were unable to sell them even at reduced prices without impacting their profit margins. Additionally, staying competitive in a rapidly changing market environment was equally important.

    Given this context, it is crucial for home and furniture retailers to adopt a data-driven approach that utilizes competitive and market insights to consistently maintain or increase their online sell-through rates. DataWeave’s Commerce Intelligence solution offers exactly that, empowering retailers across various industry segments to stay updated on evolving consumer trends and competitor actions.

    To gain a better understanding of the pricing strategies employed by leading home and furniture retailers throughout the past year, we leveraged our proprietary data aggregation and analysis platform to track and analyze the pricing of a wide range of products across multiple retailers and subcategories within the industry.

    Our Research Methodology

    • Number of SKUs: 400,000+
    • Key retailers tracked: Amazon, Wayfair, Home Depot, Overstock, Target, Walmart
    • Key categories reported: Home and Office, Bed and Bath, Bathroom, Bedroom, Decorative, Dining Room, Kitchen, Garden & Patio, Hardware
    • Timeline of analysis: April 2022 to April 2023

    Our Findings

    Interestingly, our analysis indicates that average prices in the home and furniture category rose by around 5% between March 2022 and April 2023. However, there have been seasonal fluctuations in the prices over the course of the year.

    Among the various subcategories, the most substantial price surge was observed in home office equipment, with an uptick of 9.3% in January 2023 when compared to March 2022. The surge in demand for home office furniture, fueled by the widespread adoption of work from home arrangements, played a pivotal role in depleting inventories and consequently driving up prices. Additionally, the shift towards collaborative workspaces and the gradual expansion of office environments have contributed to the sustained demand for office furniture.

    Avg. price changes MoM across home and furniture subcategories from April 2022-23.

    While prices for several subcategories rose significantly, others experienced subdued growth, such as bed and bath. The subcategory experienced the lowest price increment, registering a modest 2.8% increase annually. This can be attributed to the impact of a subdued housing market and a decrease in first-time buyers, which may partly be due to the global recession and inflationary pressures.

    Moreover, retailers overestimated the demand for home furniture during the holiday season, leading to an overstocking of inventory. Consequently, prices experienced a dip from October to December 2022. In fact, this was a common trend across all home and furniture subcategories. As retailers emerged from the holiday season, prices rose to their highest level in January 2023, and have stayed relatively stable since.

    Some of these trends vary among retailers as each faces different challenges and responds in distinct ways.

    Wayfair, for example, shows a significant dip in pricing after October 2022, with prices stabilizing in 2023. This could be in response to the retailer’s shrinking consumer count, losing 5 million of its 1.3 billion consumers in 2022 due to declining demand.

    Avg. price change MoM within the home and furniture sector across retailers from April 2022-23.

    In fact, online furniture retailers like Wayfair and Overstock reported declines in annual revenue in 2022, as the furniture sector continued to normalize from the high spending seen during COVID-era lockdowns. Wayfair reported that its 2022 net revenue was $12.2 billion, down almost 11% from the year prior. The company also laid off 10% of its workforce in August 2022. Overstock’s reported annual net revenue in 2022 was $1.9 billion, a 30% decrease year-over-year.

    Interestingly, both companies took contrasting approaches in response to this situation. Wayfair opted for aggressive cost-cutting measures, including layoffs and a reduced marketing budget. On the other hand, Overstock focused on attracting new customers through influencer marketing and improving their app, aiming to expand their customer base. With a strategy geared towards younger buyers, Overstock allocated a larger marketing budget than ever before. Our data supports the fact that Overstock did not rely on price reductions to entice shoppers.

    Target has consistently maintained lower price increases compared to Walmart, defying the common perception of Walmart being more conservative in its pricing. Notably, Amazon also stood out minimal price increases throughout the year, being surpassed only by Wayfair since November 2022.

    As price sensitive shoppers increasingly compare prices before making a purchase decision, retailers need to ensure they are priced competitively in the market on a consistent basis to liquidate stock and gain market share without compromising significantly on margins.

    A Sophisticated and Versatile Product Matching Solution is Essential to Achieving Price Leadership

    Product matching plays a vital role in monitoring competitive prices and analyzing price leadership. Within the home and furniture category, there is often a multitude of representations for the same product across various online platforms. Furthermore, eCommerce websites offer a wide array of options, including variations in size, color, material, and similar products. Without an accurate and comprehensive method of matching these products, it becomes impossible to track and compare prices effectively, especially on a large scale. Thus, a versatile product matching engine tailored to the unique requirements of the home and furniture sector becomes essential.

    DataWeave offers an industry-leading product matching platform that harnesses advanced AI models specifically trained to identify and leverage multiple product attributes extracted from titles, descriptions, and images to accurately match products across websites. Additionally, our platform intelligently matches similar products based on a diverse range of extracted attributes. This empowers our retail partners to gain competitive pricing intelligence not only on exact product matches but also on similar and substitute products, as well as their respective variants.

    With our competitive pricing intelligence solution, retailers in the home and furniture industry can confidently analyze and track prices, ensuring they stay at the forefront of price leadership in their market.

    To learn more, reach out to us today!

  • The Rapid Rise of Alcohol eCommerce in the UK

    The Rapid Rise of Alcohol eCommerce in the UK

    Alcohol eCommerce has been rapidly growing over the years, and like a lot of other industries, the pandemic accelerated its growth. Convenience, safety & home delivery became important criteria for customers in the post pandemic era and so the sale of alcohol via eCommerce went up. Kantar reported that UK booze sales were up £261m & online and convenience stores were the biggest winners. The latest IWSR Drinks Market Analysis Report 2022 reported on another interesting trend – when ordering alcohol online, consumers prefer using websites v/s apps in most parts of the world except China and Brazil. In the UK the largest chunk of online alcohol purchases happens on a retailer website instead of an app. 

    Platform used for last online alcohol purchase. Source

    To get a better understanding of this, we tracked 2 grocery retailers and 3 grocery Q-Commerce apps in the UK to get insights into Alcohol sales, pricing, trends & more! 

    Methodology

    • Data Scrape time period: Feb 2022 – June 2022
    • Grocery Retailers tracked: Tesco & Ocado
    • Grocery Apps trackedGorillasWeezy & Getir
    • Category tracked: Alcohol

    Which retailer was the Price Leader in the alcohol category? 

    Before the pandemic Tesco was the only Big 4 retailer to increase their alcohol market share & Waitrose was the biggest loser, with its share of booze sales falling from 5.4% to 4.7%. Maintaining Price Leadership is a critical element and plays a big role in increasing sales & market share because consumers will buy the most competitively priced product. We wanted to track and see which retailer was the Price Leader in the alcohol category – i.e., had the most number of lower-priced items in the alcohol category. We also wanted to see if & how Tesco’s position had changed post pandemic. 

    Price Leadership
    • Tesco enjoyed price leadership in the Alcohol category from Feb – June 2022 with 38.9% products priced the lowest. This, followed by Ocado at 33.8%. Gorillas had price leadership for the least amount of products in the alcohol category at 5.6%. Tesco was the clear winner! 
    • Tesco’s Price Leadership kept declining through the months though – at the beginning of the year in Feb, Tesco had 44% products priced the lowest but by June, that number fell to a little over 36%. Ocado showed a reverse trend – in Feb they had price leadership on 32% items and by June that number rose to 35.3%.
    • One player Tesco could’ve potentially lost price leadership to was Getir. In Feb, Getir had price leadership on only 8.2% products but that increased gradually over the months to land on 14.5% in June. 

    Which retailers focused on Discounts to perk up alcohol sales? 

    Discounts are a great way to draw in inflation-hit shoppers. Loyalty card discounts, reward vouchers, and other promotional strategies retailers offer help make their products more competitive & attractive to customers. To stay competitive, retailers need to be aware of the discounts their competition is offering. They also need to understand the risk of deep discounting and the impact on margins. We wanted an insight into alcohol related discounts in the UK so we dug into our data. Here’s what we saw. 

    Average discounts across months by retailers
    • A host of European and UK based startups like Jiffy, Dija, Weezy, Zapp, Getir & Gorillas launched with the promise of delivering groceries the fastest & cheapest
    • Our data showed that Gorillas offered discounts in line with the competition, however, Getir likely went the deep discounting route. 
    • Getir offered the highest discounts across all months. And in the month of April they offered almost 9% more discount than Ocado – the retailer with the 2nd highest discounts. 
      Like we discussed above, Getir gained price Leadership from Feb to June. Deep discounting could have potentially played a role. 
    • Gorillas on the other hand had the lowest, almost non-existent discounts.

    Let’s look at Price Index trends across 5 months 

    We tracked the Price Index (PI) across these 5 retailers to measure how alcohol prices changed over a 5 month period from Feb – June 2022. 

    Note: Retailers selling at the 100% mark were selling at an optimal price & did not undercut the market. The pricing sweet spot is 95% – 105%. Anything lower would compromise margins, and higher would mean the retailer was not competitive. 

    Price Index across months by retailers
    • Weezy had a Price Index that was the most optimal, sitting in the 100% – 102% range.
    • Gorillas had the lowest Price Index, between 89% – 91%.
    • Getir had a low price index in Feb (96.1%) but slowly kept increasing to cross 110% in April, May & June.
    • What was interesting to see was the competition between the 2 retail giants Ocado & Tesco. Ocado had a lower price index at the start of the year at 105.1%, while Tesco was at 109.8%. In the subsequent months, Ocado kept increasing prices to be competitive with Tesco and Tesco decreased prices to likely match Ocado’s pricing. By June BOTH Tesco & Ocado had the exactly the same price index – 108.7%

    Which retailers were the quickest to make price changes?

    Competitive pricing is critical to eCommerce success. Competitive pricing involves tracking your competitor’s pricing & strategically tweaking your own prices without hurting margins. We tracked the month-wise average Price change from Feb – June across all 5 retailers to see which retailer was making price changes and at what frequency. 

    Average price change across months by retailers
    • Most retailers did not make massive prices changes, they were ballpark competitive with each other from a pricing standpoint. 
    • However, Gorillas made significant changes in the month of March when they dropped prices by 3.8% and in May when they increased prices by 5.5%!
    • In May, the same month Gorillas made a big price hike, Weezy dropped their prices significantly by 10% widening the gap between the 2 retailers. 

    Which retailers avoided lost sales by maintaining stock availability?

    Having a near real time view on stock availability is crucial to driving sales. Customers can buy products only when they’re available! So, we went ahead, looked into our data to see how each of these retailers managed stock availability from Feb to June.

    Average availability across months by retailers
    • Our data showed varying availability levels across retailers with Ocado having the highest availability across all 5 months. They had a robust stock at the beginning of the year at 100% but kept dwindling through the months to land at 95.8% by June. 
    • Tesco had a sharp drop in availability in May & June – from 97% at the beginning of the year to the 92-93% range.
    • Gorillas had the lowest availability across months between 90 & 94%.
    • Weezy consistently maintained availability at 95% across all 5 months.

    Conclusion

    For the most part, the UK market has a positive outlook towards buying alcohol online thanks to changes to shopper behavior arising from the pandemic. As per the IWSR Drinks Market Analysis Report 2022 in website-led markets, such as the UK, breadth of product range is important to customers along with price. These 2 play a key factor in purchase decisions. By contrast, consumers in app-driven markets have different preferences. While price matters, it is less important than convenience and speed. 

    As an alcohol retailer, if you need help tracking your competitor prices, discounts and product assortment, reach out to the team at DataWeave to learn how we can help!

  • Prime Day India 2022 – highlights from the 2 day annual shopping festival!

    Prime Day India 2022 – highlights from the 2 day annual shopping festival!

    Amazon India’s much-awaited annual two-day shopping event, Prime Day, kicked off with a bang on July 23rd & 24th this year & was one of the most successful Prime Day events yet! Amazon reported that more than 32,000 sellers saw their highest ever sales day during the event. Interestingly 70% of these sellers who received orders during Prime Day were based in Tier 2 cities in India, further validating how the post-pandemic eCommerce boom has spread across the country. Also, Indian exporters saw 50% business growth on Amazon on Prime Day as customers across markets like North America, Europe, Australia, and Japan continued to purchase Made In India products.
    It was a great 2 days for Indian sellers, but what about customers who were waiting in anticipation for the great deals typically offered on Prime Day? We dug into our data to take a look at the deals, discounts, and brands that shone bright on Prime Day in India.

    Methodology

    • In addition to Amazon IN, we also tracked Flipkart on 23 & 24th July 2022, on Prime Day.
    • Categories tracked – Electronics, Grocery, Fashion & Beauty.
    • We looked at Additional Discounts offered on Prime Day: Additional Discount is the extra discount on an item during Prime Day when compared to the Pre-Prime Day price. 
    • We also looked at Post Prime Day Discounts, which were the discounts offered after the 2-day event ended.

    Amazon v/s Flipkart – who offered better discounts?

    Prime Day discounts are legendary. And across the globe, during Prime Day retailers try and compete to see if they can offer better deals than Amazon. Forbes even published an article on the 36 Prime Day competitor sales that were way more enticing than what Amazon had to offer. In India, we wanted to see if Amazon’s homegrown rival Flipkart might give it a tough fight, so we tracked the volume of discounts across categories on both retailers. 

    Discounts on Amazon & Flipkart across categories
    Discounts on Amazon & Flipkart across categories
    • Out of the 4 categories we tracked, in spite of Prime Day, Amazon offered discounts higher than Flipkart in only 2 categories – Electronics & Beauty. 
    • … while Flipkart offered higher discounts than Amazon in the Grocery & Fashion category. For groceries, Flipkart offered a 3.2% additional discount v/s 2.2% on Amazon. However, in the Fashion category, the difference was marginal – 8.1% on Amazon v/s 8.6% on Flipkart
    • Post-event, both Amazon & Flipkart went back to the original pre-event prices. This made it clear that Flipkart was tracking and making price changes based on their closest competitor. It’s what smart eCommerce businesses do to stay ahead in the race. 
    • Interestingly, post-event, in the fashion category, not only did Amazon revert to the original pre-event price, they even increased prices by close to 2%.

    Let’s take a look at discounts across 4 categories & the Brands that WON in each category.

    From Electronics to Fashion, Beauty & Groceries, let’s deep dive into the data to see which products were highly discounted within each category and brands that sprinted ahead to win the race on Amazon on Prime Day 2022.

    ELECTRONICS

    Tech publication Gadgets360 reported on the biggest Smartphone deals right from Brands like Samsung, Redmi, Oppo, and more. There were some fab deals on earphones too with Boat taking the lead. We wanted to take a look at electronics on Amazon and see which products had the heaviest discounts & if discounts were more lucrative than Prime Day 2021

    Discounts on Electronics on Prime Day
    Discounts on Electronics on Prime Day
    • Amazon India released highlights from Prime Day and reported that Smartphones & Electronics were among the categories that saw the most success in terms of units sold.
    • From the 6 product categories we tracked within electronics, we saw the highest additional discounts on Smartwatches (13.4%), followed by Bluetooth headphones (10.5%)
    • TV, Smartphones, cameras, and laptops had an additional discount of between 3 – 5.5%

    ELECTRONICS Brands that had the highest Share of Search on Amazon during Prime Day

    Research shows that on Amazon, the first 3 products garner 64% of business generated. This is why it is critical for brands to appear in the top few listings when consumers are searching for products. Being on top helps shoppers find your brand with ease & increases the chances of a sale. 

    On Prime Day 2022, Amazon India reported that the top-selling consumer electronics brands were HP, Lenovo, Asus, and Boat to name a few. Our assumption is, these brands must’ve had a high Share of Search (SoS), which played a massive role in increasing sales, so we looked into our data to see which brands had the highest SoS against specific keywords related to electronics. 

    Brand Visibility against the Keywords
    Brand Visibility against the Keywords
    • Our data aligned with what Amazon reported. HP had high sales, perhaps because they occupied the premium #1 spot in the laptop category with a 44% SoS! Simply put, this means of the 100 laptops that appeared on a page, against a search for the keyword laptop, 44 products were listed by HP! Consumers always gravitate towards buying products they can find with ease
    • Lenovo had a 32% SoS for Laptops. Asus at 14% 
    • The top selling smartphone brands reported by Amazon included OnePlus, Redmi, Samsung, Realme & iQOO – our data showed that 3 out of these 5 brands were in the top 5 listings on Prime Day! Redmi had a whopping 30% SoS against the keyword smartphone, Samsung at 15%, and iQOO at 5% – clear validation that a high SoS can positively impact sales.

    BEAUTY & GROOMING

    Now let’s look at discounts in the beauty & grooming category. 

    Discounts on Beauty Products on Prime Day
    Discounts on Beauty Products on Prime Day
    • The highest additional discounts were given on shampoos (9.3%), followed by Lipsticks (6.6%)
    • Shaving kits for men were at an additional discount of 3.4%. Hair gel at 4.9% & Face Masks at 4.3%

    BEAUTY Brands that had the highest Share of Search on Amazon during Prime Day

    Brand Visibility against the Keywords
    Brand Visibility against the Keywords

    In the beauty category, Amazon India reported that top-selling brands included Head & Shoulders, Dove, Biotique, L’Oreal, Sugar Cosmetics, and Mamaearth to name a few. Once again, we looked into our data to see the sort of brand visibility & SoS each of these brands had.

    • All the top-selling brand’s Amazon reported on we noticed appeared in the top 5 search results. 
    • Head & Shoulders & Dove were the top 2 listings against the keyword Shampoo at 26% & 16% SoS respectively. Biotique came in at #5 with a 7% SoS
    • Bombay Shaving Company, Gillette, and Axe were the top grooming brands for men in the Shaving Kit category. 
    • Lakme made a clean sweep with a 19% SoS against the keyword lipstick, which speaks volumes, considering the aggressive competition from D2C beauty brands in India today.

    GROCERY

    According to the New eCommerce in India report by consulting firm Redseer, grocery has been a major contributor to the growth of ecommerce in India & Amazon Fresh used Prime Day to grab a larger piece of that pie! As part of the Prime Day sale, Amazon Fresh also pushed discounts on groceries, as well as fruits and vegetables. We tracked products that fell into the “snack” category, and here’s what we saw.

    Discounts on Snacks on Prime Day
    Discounts on Snacks on Prime Day
    • Given changing lifestyles & healthy food fads, it was no surprise that we saw the highest additional discounts were given on Healthy Snacks (3.2%) & Diet Food (2.7%)
    • Chocolates and chips saw much lower additional discounts at 1.2% each.
    • Drinks were additionally discounted by 2.5% during Prime Day.

    SNACK Brands that had the highest Share of Search on Amazon during Prime Day

    Brand Visibility against the Keywords
    Brand Visibility against the Keywords
    • Cadbury had a 69% share of search against the keyword Chocolate, leaving some of its key competitors way behind. Amul had a 20% SoS, while Hershey’s was at just 4%. 
    • According to an article in the Economic times, YogaBar tripled sales in FY22, which is why we were not surprised to see the brand at #1 when users were searching for “Healthy Snacks” during Prime Day. YogaBar products typically enjoy high visibility year-round, which clearly helped with brand awareness on Amazon & sales.

    FASHION

    Amazon reported that Men’s t-shirts and polos, denims, Kurtis, tops, and dresses for women, designer wear, and clothing for kids were some of the most-loved fashion categories on Prime Day. We looked into our data to see the trends that emerged.

    Discounts on Fashion on Prime Day
    Discounts on Fashion on Prime Day
    • From the categories we tracked, women’s handbags had the highest additional discount (11.8%), followed by watches (9.1%)
    • Sneakers & jeans had additional discounts in the ballpark of 7% and sunglasses at 4.4%

    FASHION Brands that had the highest Share of Search on Amazon during Prime Day

    Brand Visibility against the Keywords
    Brand Visibility against the Keywords
    • Some of the usual suspects made it to the top 5, but what really stood out for us were brands that popped up against the keyword Jeans. While Levi’s came in at #2 with an 11% SoS, 2 Private Label Amazon brands featured in the top 5! Symbol at 27% SoS and Inkast Denim at 9%
    • Against the keyword Handbag, Lavie had a massive lead at 38% v/s the #2 brand – Caprese, at 13%
    • Boat found a #2 spot against the keyword watches, racing way ahead of the age-old popular brand Fastrack at #5 with a 4% SoS.

    Conclusion

    Amazon Prime Day 2022 in India came to a successful close as shoppers across India discovered the joy of the 2 day celebration with the best deals, savings, new launches, and more. Prime members from 95% of pin codes in India made purchases, there were 1000’s of deals and 500+ new product launches from brand partners & sellers. Nearly 18% more sellers grossed sales over INR 1 crore, and close to 38% more sellers grossed sales of over 1 lakh vs Prime Day 2021. Local neighborhood shops that sell on Amazon witnessed 4x sales growth. And start-ups and brands under the Amazon Launchpad program witnessed a growth of 3x. All in all, a successful event for everyone involved! 

  • Prime Day Germany 2022 – highlights from the 2 day annual shopping festival!

    Prime Day Germany 2022 – highlights from the 2 day annual shopping festival!

    In 2022, Amazon sold 300 million products during Prime Day – selling roughly 100,000 items per minute. Since Amazon started Prime Day in 2015 to celebrate its 20th birthday, the shopping festival has grown into a holiday and rivals Black Friday and Cyber Monday in the U.S. and Singles’ Day in China. 

    According to RetailDetail, the leading B2B retail community in Benelux, Amazon is planning a 2nd Prime Day shopping festival in the autumn, just a few months after its annual Prime Day event. The retailer has asked its sales partners to prepare for a promotional event in the autumn where they have until the beginning of September to propose attractive discounts, with at least 20% discounts. This year’s second Prime Day may occur in October, with or without the same name. 

    But before that, let’s examine what happened in Germany this year on Prime Day 2022.

    Methodology

    • We tracked Amazon.de both before & on 12 & 13th July 2022, on Prime Day.
    • Categories Tracked – Electronics, Wine & Spirits, Grocery, Furniture, Fashion, and Beauty. 
    • We looked at Additional Discounts offered on Prime Day: Additional Discount is the extra discount on an item during Prime Day when compared to the Pre-Prime day price.
    • We also looked at Post Prime Day Discounts, which were the discounts offered after the 2-day event ended.

    What kind of Discounts did Amazon.de offer?

    Amazon Prime Day will be significant, especially for customers hoping to get discounts amid soaring inflation. Both Amazon as well as other sources reported that electrical and electronic items were the most popular purchases, followed by general retail products. Electrical and electronics saw the value of transactions soar 90% on the first day. Mobile phones and accessories were the most popular, with transaction values almost doubling to 96% on day one.

    Discounts across Categories on Amazon.de
    Discounts across Categories on Amazon.de
    • Based on trends from past events, Amazon likely knew electronic items were going to be best sellers. Keeping this in mind, they made sure to offer high discounts in the electronics category. They offered a 6.5% additional discount on electronics on Prime Day. And once the sale ended, they continued to discount electronics by 1.3%.
    • The Fashion category also had a fair bit of discounts and came in at a close second at 5.9%
    • Looks like Amazon discounted everyday use items minimally. Groceries had an additional discount of just 1.8% on Prime Day, and wine and spirits had 2% extra discount.  
    Discounts on Electronics Category on Amazon.de
    Discounts on Electronics Category on Amazon.de
    • Within Electronics, in the four categories we tracked, we saw the highest additional discounts were offered on Bluetooth earphones (10.6%) and Smartwatches (9%)
    Discounts on Fashion Category on Amazon.de
    Discounts on Fashion Category on Amazon.de
    • Jeans and Sunglasses had the highest discounts at 8.6% & 7.6% respectively.
    • Sneakers & Watches too had additional discounts of 6.6% on Prime Day.
    • Post the Prime Day event, Amazon retained an average of 1.5% discount across all products in the fashion category instead of pricing them at the original price. 
    • However, in the case of women’s T-Shirts, they increased the price by 1.7% from the pre-event price.

    Discounts across Price Tiers

    Retailers must consider several factors when making strategic discounting decisions, including customer buying behavior, the type of discount offered & the volume of discount offered. The best discounting approach will vary depending on the product and other factors like the original selling price of the product.

    Now let’s compare the discounting strategy Amazon used in the Electronics v/s Fashion category on Prime Day.

    Discounts across Price Ranges
    Discounts across Price Ranges
    • Interestingly, in both the Electronics and Fashion categories, Amazon increased prices for the lowest-end products between the €0-10 range by 3.6% and 13.2%, respectively, during the sale instead of discounting them! Maybe this was a strategy to drive consumers to higher-value products with greater discounts? 
    • Another similarity in strategy was that most of the mid-priced items had maximum discounts. In electronics & fashion both, the maximum discounts were given to products between the € 30-100 range. 
    • Here’s a difference that stood out – for Electronics in the higher price range between €100 – 500, the volume of discounts dropped a bit which meant Amazon gave moderate discounts on high-end electronics. But the trend flipped for Fashion as luxury fashion items were made to look more attractive with higher discounts.

    Monitoring stock availability during key sales days is critical

    Brands need to have the right stock availability, especially during sale events, because more customers shop online during sales. What’s worse, non-availability of products may drive customers to competitors that are stocking the same product.  Out-of-stock situations lead to missed opportunities & lost sales! Let’s take a look at our data and see how Amazon planned product availability across categories on Prime Day. 

    Availability Analysis across Categories on Prime Day
    Availability Analysis across Categories on Prime Day
    • Amazon was betting big on 2 categories – Electronics & Home. This meant they needed to keep a keen eye on availability in these categories, especially since they forecasted the highest sales to be generated here.
      … it was no surprise that the Furniture category had almost 100% availability during Prime Day! Electronics too had a high availability at 94% during the event.
    • Generally, our data showed that availability across multiple categories we tracked seemed robust and above 80% in more cases. Only Beauty & Grocery had 79% availability.

    Conclusion

    Prime Day sales reached an estimated 12 billion U.S. dollars worldwide, 9.8% higher than last year, making it the most successful shopping event in Amazon’s history. If you’re a brand selling on Amazon or a retailer trying to compete with Amazon, reach out to us at DataWeave to know how we can help!

  • Prime Day UK 2022 – highlights from the 2 day annual shopping festival!

    Prime Day UK 2022 – highlights from the 2 day annual shopping festival!

    Prime Day launched in 2015 as a celebration of the 20th anniversary of Amazon’s founding & has quickly become the biggest shopping event of the year for Amazon. Prime Day is a great opportunity for customers to snag fantastic deals on products they might not otherwise consider buying. Last year, Amazon Prime Day was a tremendous success, with Prime members spending billions of dollars on discounted items. In 2022 alone, global sales during the event reached a new record high of $12 Bn.

    18 countries participated in Prime Day this year, including the US. We did a deep dive into what happened in the UK – the discounts Amazon offered and categories with the highest discounts as well as checked to see if other retailers tweaked their pricing strategy to compete with Amazon on Prime Day.

    Methodology

    • In addition to Amazon UK, we tracked some key retailers on 12 & 13th July 2022, on Prime Day.
      Retailers tracked – eBay UK, OnBuy, Selfridges, ASOS.com, Net-A-Porter 
    • Categories tracked – Electronics, Wine & Spirits, Grocery, Furniture, Fashion, Beauty. 
    • We looked at Additional Discounts offered on Prime Day: Additional Discount is the extra discount on an item during Prime Day when compared to the Pre-Prime day price. 
    • We also looked at Post Prime Day Discounts, which were the discounts offered after the 2-day event ended.

    Did other retailers compete with Amazon on Prime Day?

    Traditionally, as Amazon’s Prime Day sale approaches, other retailers adjust their prices by offering summer deals or getting creative with offers. However, we did not see aggressive strategies from other retailers this year. In the US, Walmart always has a sale during Amazon’s Prime Day. The Wall Street Journal reported that Walmart announced there wouldn’t be an annual promotional event on Prime Day 2022 this year.

    Another report published by Forrester stated that major retailers scaled back their promotions, and overall offers from other retailers were less than impressive. We took a look at the data we gathered in the UK to see if this trend aligned. 

    Discounts offered on Prime Day on Amazon v/s other retailers
    Discounts offered on Prime Day on Amazon v/s other retailers
    • Our data showed that most retailers we tracked offered negligible discounts (in the range of 0.1 – 1.5%) and did not really try and compete or match the discounts Amazon was offering. 
    • However, ASOS was the one retailer that competed heavily with Amazon in the Fashion & Beauty category. While Amazon offered an average additional discount of 7.7% in the Fashion category, ASOS offered 13.2%. And in the beauty category, Amazon offered 6.7%, while ASOS offered 15.2%.
    • When we looked at post-prime day discounts, we saw that as soon as Prime Day ended, ASOS went back to the original price and stopped offering a discount which clearly shows they were keeping an active eye on out their competitors pricing. In fact, ASOS was offering up to 80% off almost everything on the site until Prime Day.

    Which were the popular categories that offered the most discounts?

    During Prime Day, shoppers saw tons of deals on essential gadgets. Tech deals were a massive hit and saw big discounts on everything from TVs, laptops, smartwatches, phones, and tablets. We look at the data we collected to see if we saw a similar trend. 

    Discounts on Amazon UK across categories
    Discounts on Amazon UK across categories
    • Amazon offered discounts across categories and reported that some of the best-selling categories were Consumer Electronics & Home. 
    • Our data too showed that the highest additional discounts were offered in electronics – Bluetooth Earphones at 18.4%, followed by Smartwatches at 14.9% and Laptops as well as Cameras, both at 12%.
    • Low discounts were offered on Alcohol, with Beer at 0.9% and Wine at 1.3%, respectively.
    • Relatively attractive discounts were seen in the Fashion & Beauty category – Sunglasses (9.1%), Shampoo (9.7%), & Watches (9.4%)
    Discounts on Amazon UK in the Electronics category
    Discounts on Amazon UK in the Electronics category

    Electronics being the hot favorite – we wanted to deep dive into the data and get more insights on Amazon’s pricing & discounting strategy here. Discounts can entice customers to buy more, encourage customer loyalty, or clear out old inventory. However, businesses must be careful since too much discounting can eat into profits. They also have to be mindful of which products should be discounted and by how much. 

    • Our data showed that the highest discounts (between 13 – 18%) were given on electronics priced between the £ 20-100 price range.
    • Electronics priced higher, between the £ 100 – 500 pound price range, were discounted less than 10%
    • However, high-value premium electronics over £ 500 were discounted slightly above 10%

    How did Amazon manage stock availability during Prime Day?

    Keeping track of inventory is especially important during big sales like Prime Day when thousands of customers are actively looking for deals.  There’s nothing worse than them finding the item they wanted is out of stock (OOS). OOS leads to lost sales, a situation that must be avoided at all costs. Read about how a small short term stock out on Amazon led to long term negative impacts for one of our customers. And let’s also look at the data and see what product availability looked like on Prime Day.

    • Overall, Amazon maintained robust availability across categories, and re-stocking was constant both before, during & after the event. 
    • Furniture, Fashion & Electronics had the highest availability. No surprise there since Amazon estimated that Home/ Furniture would be one of the best-selling categories.
    • Grocery saw average availability – perhaps cause some of these products are perishables, so it’s best to be mindful about overstocking.

    Which Brands Won on Prime Day?

    If there is one thing to remember about improving your product visibility on Amazon, it’s that it all boils down to the usage of the right keywords. Using relevant keywords makes your product appear higher up in search when customers are running searches on Amazon for those products. And the higher up a product appears in search, the higher the chances of a sale! 

    Let’s take a look at some popular categories and which brands had the highest Share of Search (SoS) during Prime Day.

    • Corona, San Miguel, and Becks were the top 3 brands optimized for the keyword Beer. However, what’s really important to note is both Corona & Becks had 20% SoS that was completely organic. San Miguel had a 20% SoS too, but it was sponsored ads that gave them this artificial boost. 
    • While a whole bunch of other brands had a 10% SoS most of them achieved this via Sponsored Ads. Youngever was the only brand that achieved this completely organically. They must have made sure they optimized key KPIs like content, ratings & reviews & product availability to achieve this result.
    • There were deep discounts on a wide range of Lenovo laptops. For example, the Lenovo IdeaPad duet Chromebook and Lenovo IdeaPad Flex 3 Chromebook were available at £100 off. Our data, too saw Lenovo & Asus fight for the top spot.
    • Asus sponsored 28% of products before Prime Day, hoping to capitalize on the pre-sale frenzy. During the event, they sponsored only 13% of products, bringing down their total SoS from 31% before the event to 13% during the event. 
    • Lenovo followed the opposite strategy; they sponsored just 6% of products before the event and during the event sponsored a whopping 25% which made them “almost” dominate the Laptop category during Prime Day.
    • Then there was Microsoft, with the highest SoS at 38%, of which all of it was organic!
    • The Smartphone SoS battle was clearly between Samsung & Xiaomi. Samsung was a consistent #1 at all 3 time periods (Before, During & After Prime Day) with the highest total SoS. Xiaomi came in at a close second. 
    • Samsung had an exciting strategy – they went heavy on sponsorships before and after the event. Their sponsored SoS was 31% & 39% respectively. And SoS of 13% during the event. 
    • Xiaomi’s strategy was just the opposite. Their sponsored SoS was 16% before the event. And 17% after the event, which was moderate compared to their Sponsored SoS during the event at 25%, which was much higher than Samsung’s 13%
    • Critical to note, Xiaomi’s organic search visibility before, during, and after the event was 0%. It definitely should be a concern area for any brand.
    Share of search
    Share of search
    • Both before & after the event, Cadbury had the highest visibility for the keyword Chocolate. During the event, they were not in the top 5 brands.
    • During Prime Day, Nestle won the top spot and had a 29% SoS. However, before the event, they were at #3 and after at #2. Artificially boosting visibility might’ve had something to do with this.

    Conclusion

    Prime Day sales reached an estimated 12 billion U.S. dollars worldwide, 9.8% higher than last year, making it the most successful shopping event in Amazon’s history. If you’re a brand selling on Amazon or a retailer trying to compete with Amazon, reach out to us at DataWeave to know how we can help!