As the dust settles on Amazon’s 8th Prime Day extravaganza in India, held on July 20-21, 2024, the eCommerce giant has once again shattered records. This year’s event saw unprecedented engagement, with 24% more Prime members participating compared to 2023, marking the highest-ever Prime member involvement in the sale’s history.
At DataWeave, we’ve conducted an extensive analysis of this landmark event, examining over 47,000 SKUs across major categories for Flipkart and Amazon to uncover compelling insights into pricing strategies, competitive positioning, and emerging trends in the Indian eCommerce space. This follows our comprehensive analysis of Prime Day in the USA across categories and brands, which readers can explore for a global perspective on Amazon’s strategies.
Key Highlights:
- Tier-2 Cities Drive Growth: This year’s exponential growth was notably fueled by orders from tier-2 cities, highlighting the expanding reach of eCommerce in India.
- Swift Deliveries: Most Prime members’ orders from metros were delivered the same day or the next, while tier-2 cities saw deliveries in less than 2 days, highlighting the importance of delivery time when it comes to purchase decisions.
- Brand Participation: Over 450 top Indian and global brands participated, including Intel, Samsung, OnePlus, and Puma, alongside 3,200 new product launches from small and medium Indian businesses. This highlights Amazon’s policy to promote small, local businesses globally in 2024.
- Premium Products in Demand: Despite modest discounts across electronics and similar offerings, consumers chose to purchase premium products during Prime Day. With financial flexibility and no-cost EMI options, Indian consumers, especially Gen Z and millennials, are now ready to invest in premium products and experiences.
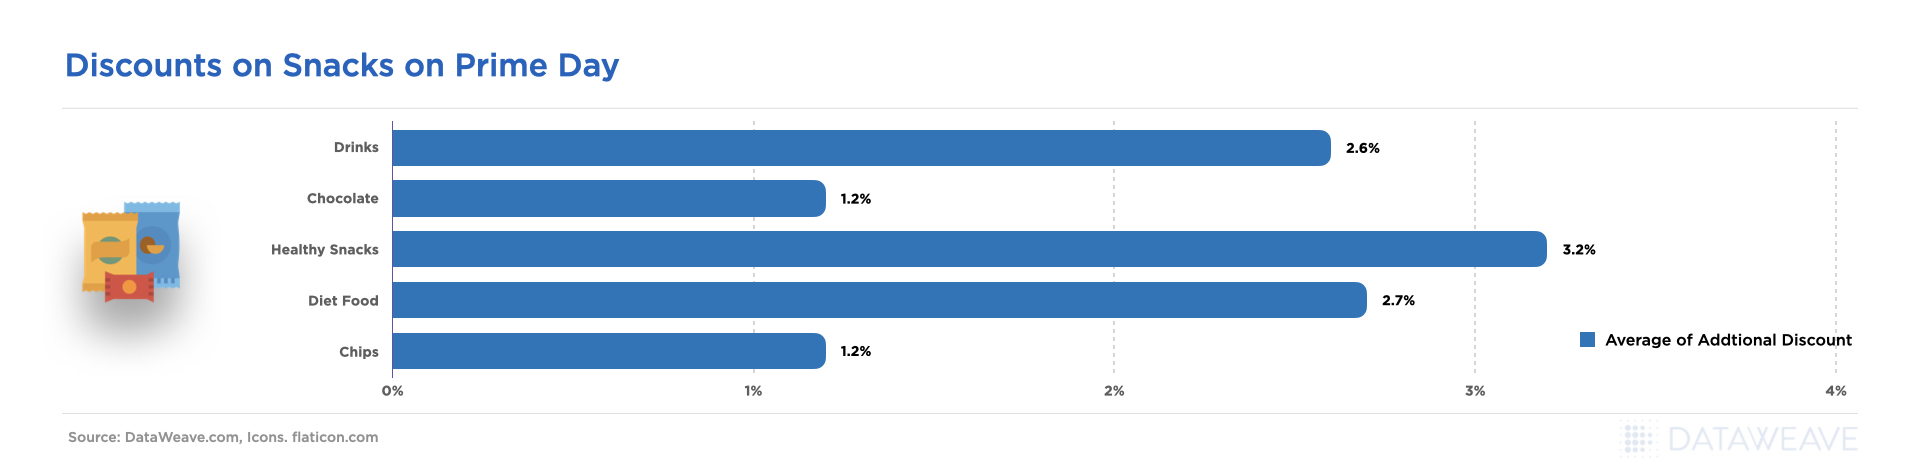
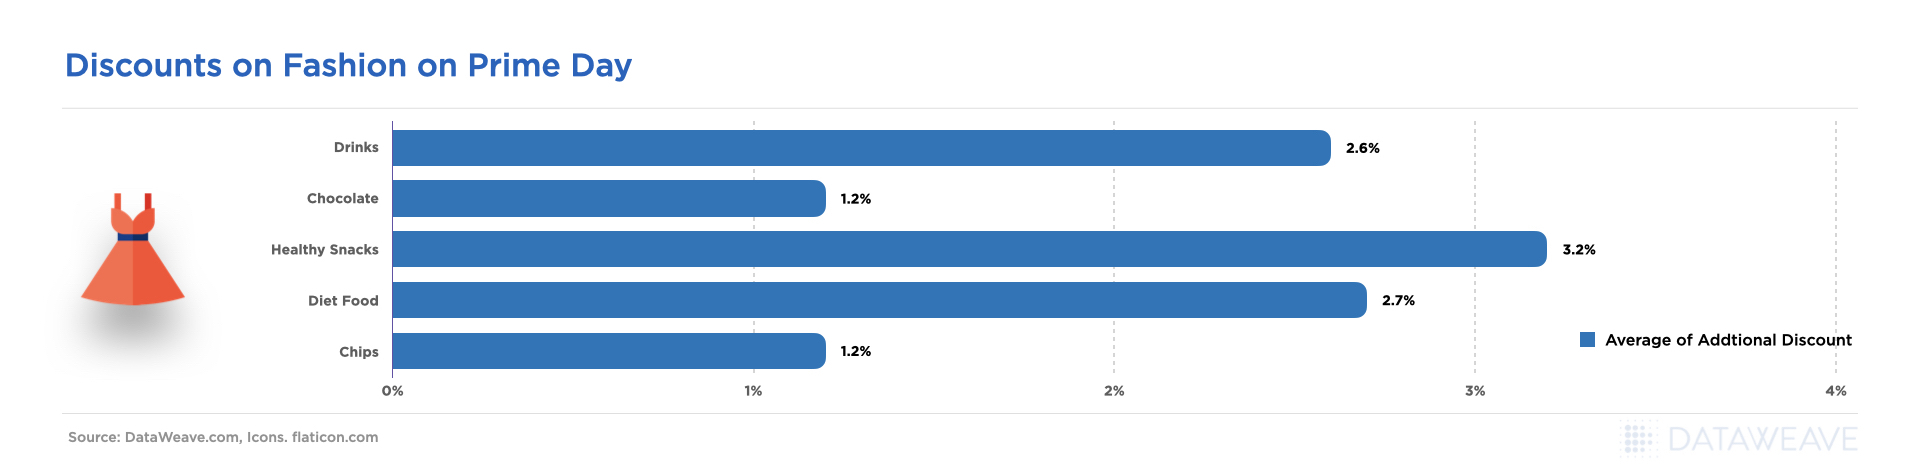
Our analysis focused on both the Additional Discounts offered during Prime Day (calculated relative to prices the week prior to the event), highlighting the event’s genuine benefits, and the Absolute Discounts offered during Prime Day, representing the total markdown relative to the MRP.
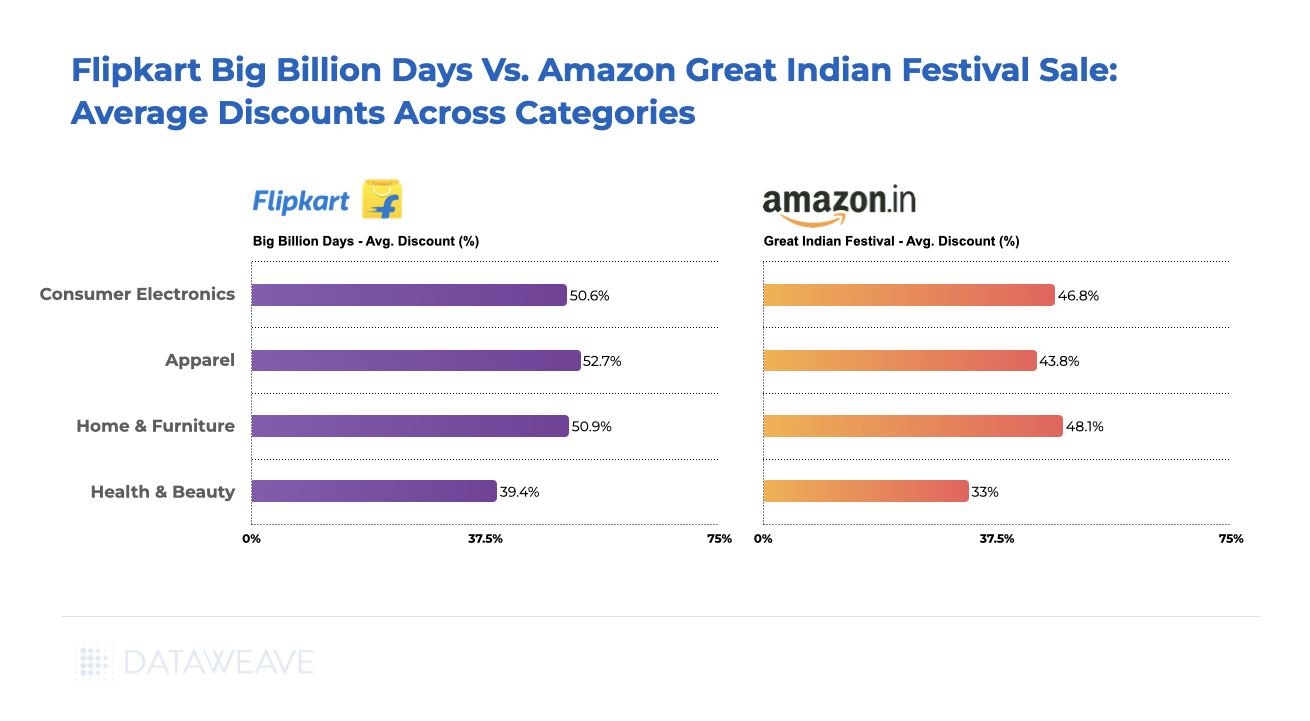
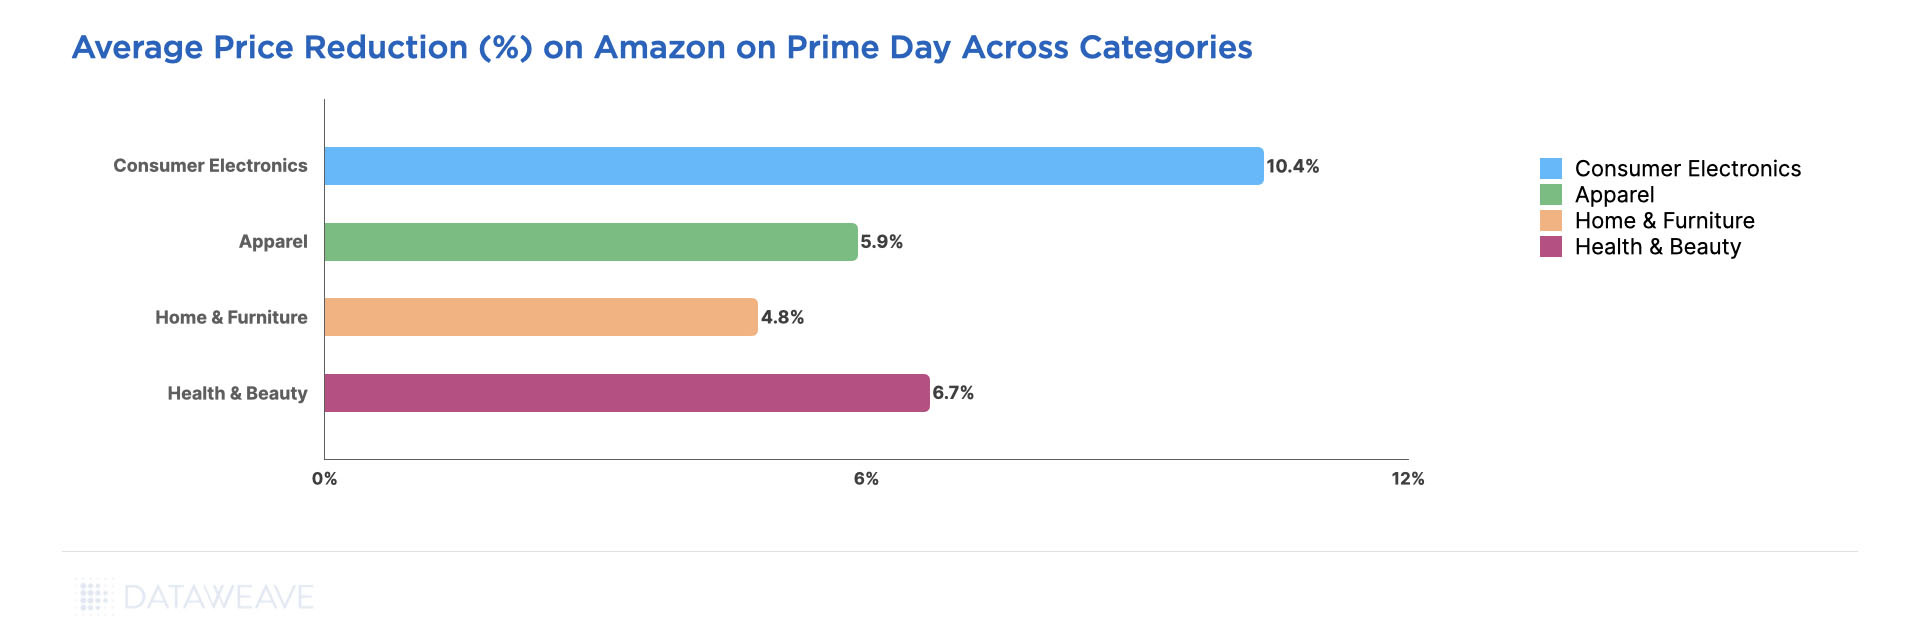
Cross-Category Discount Strategy
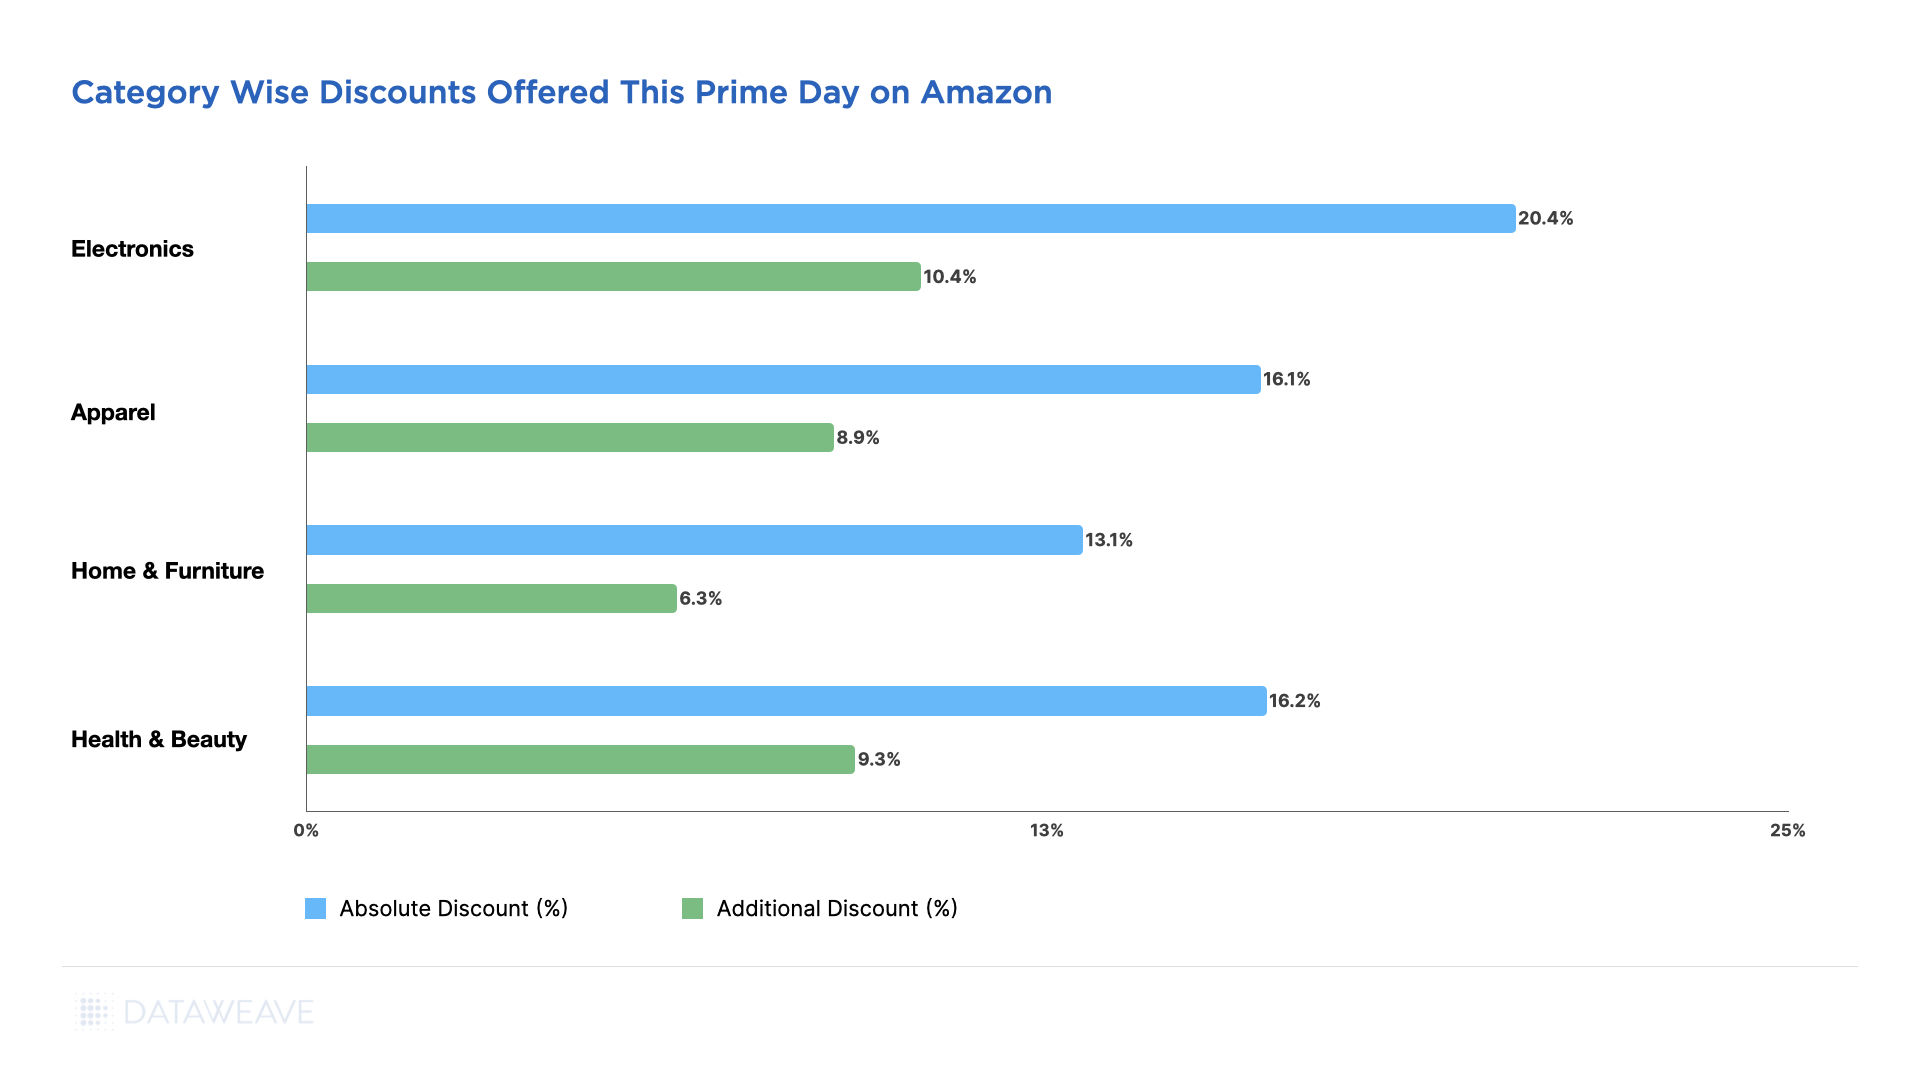
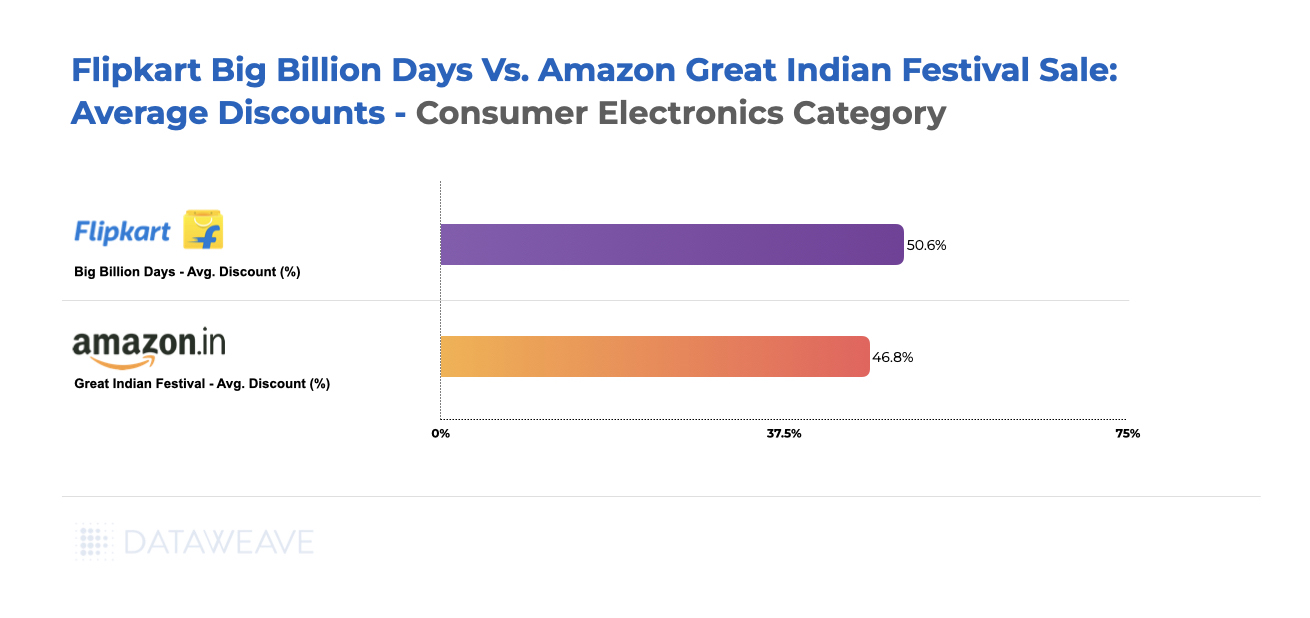
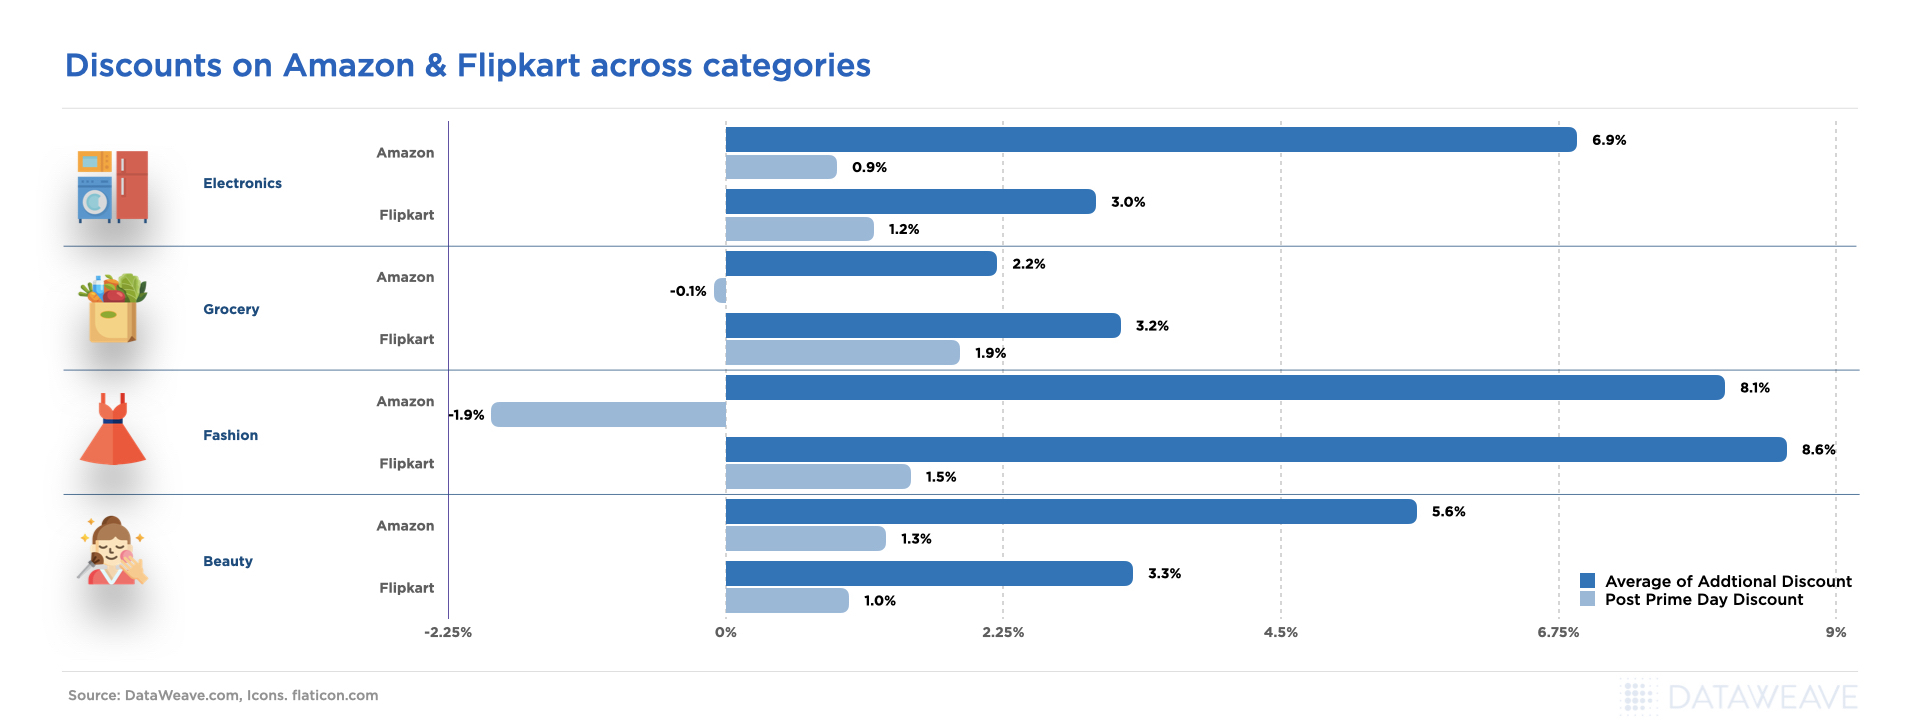
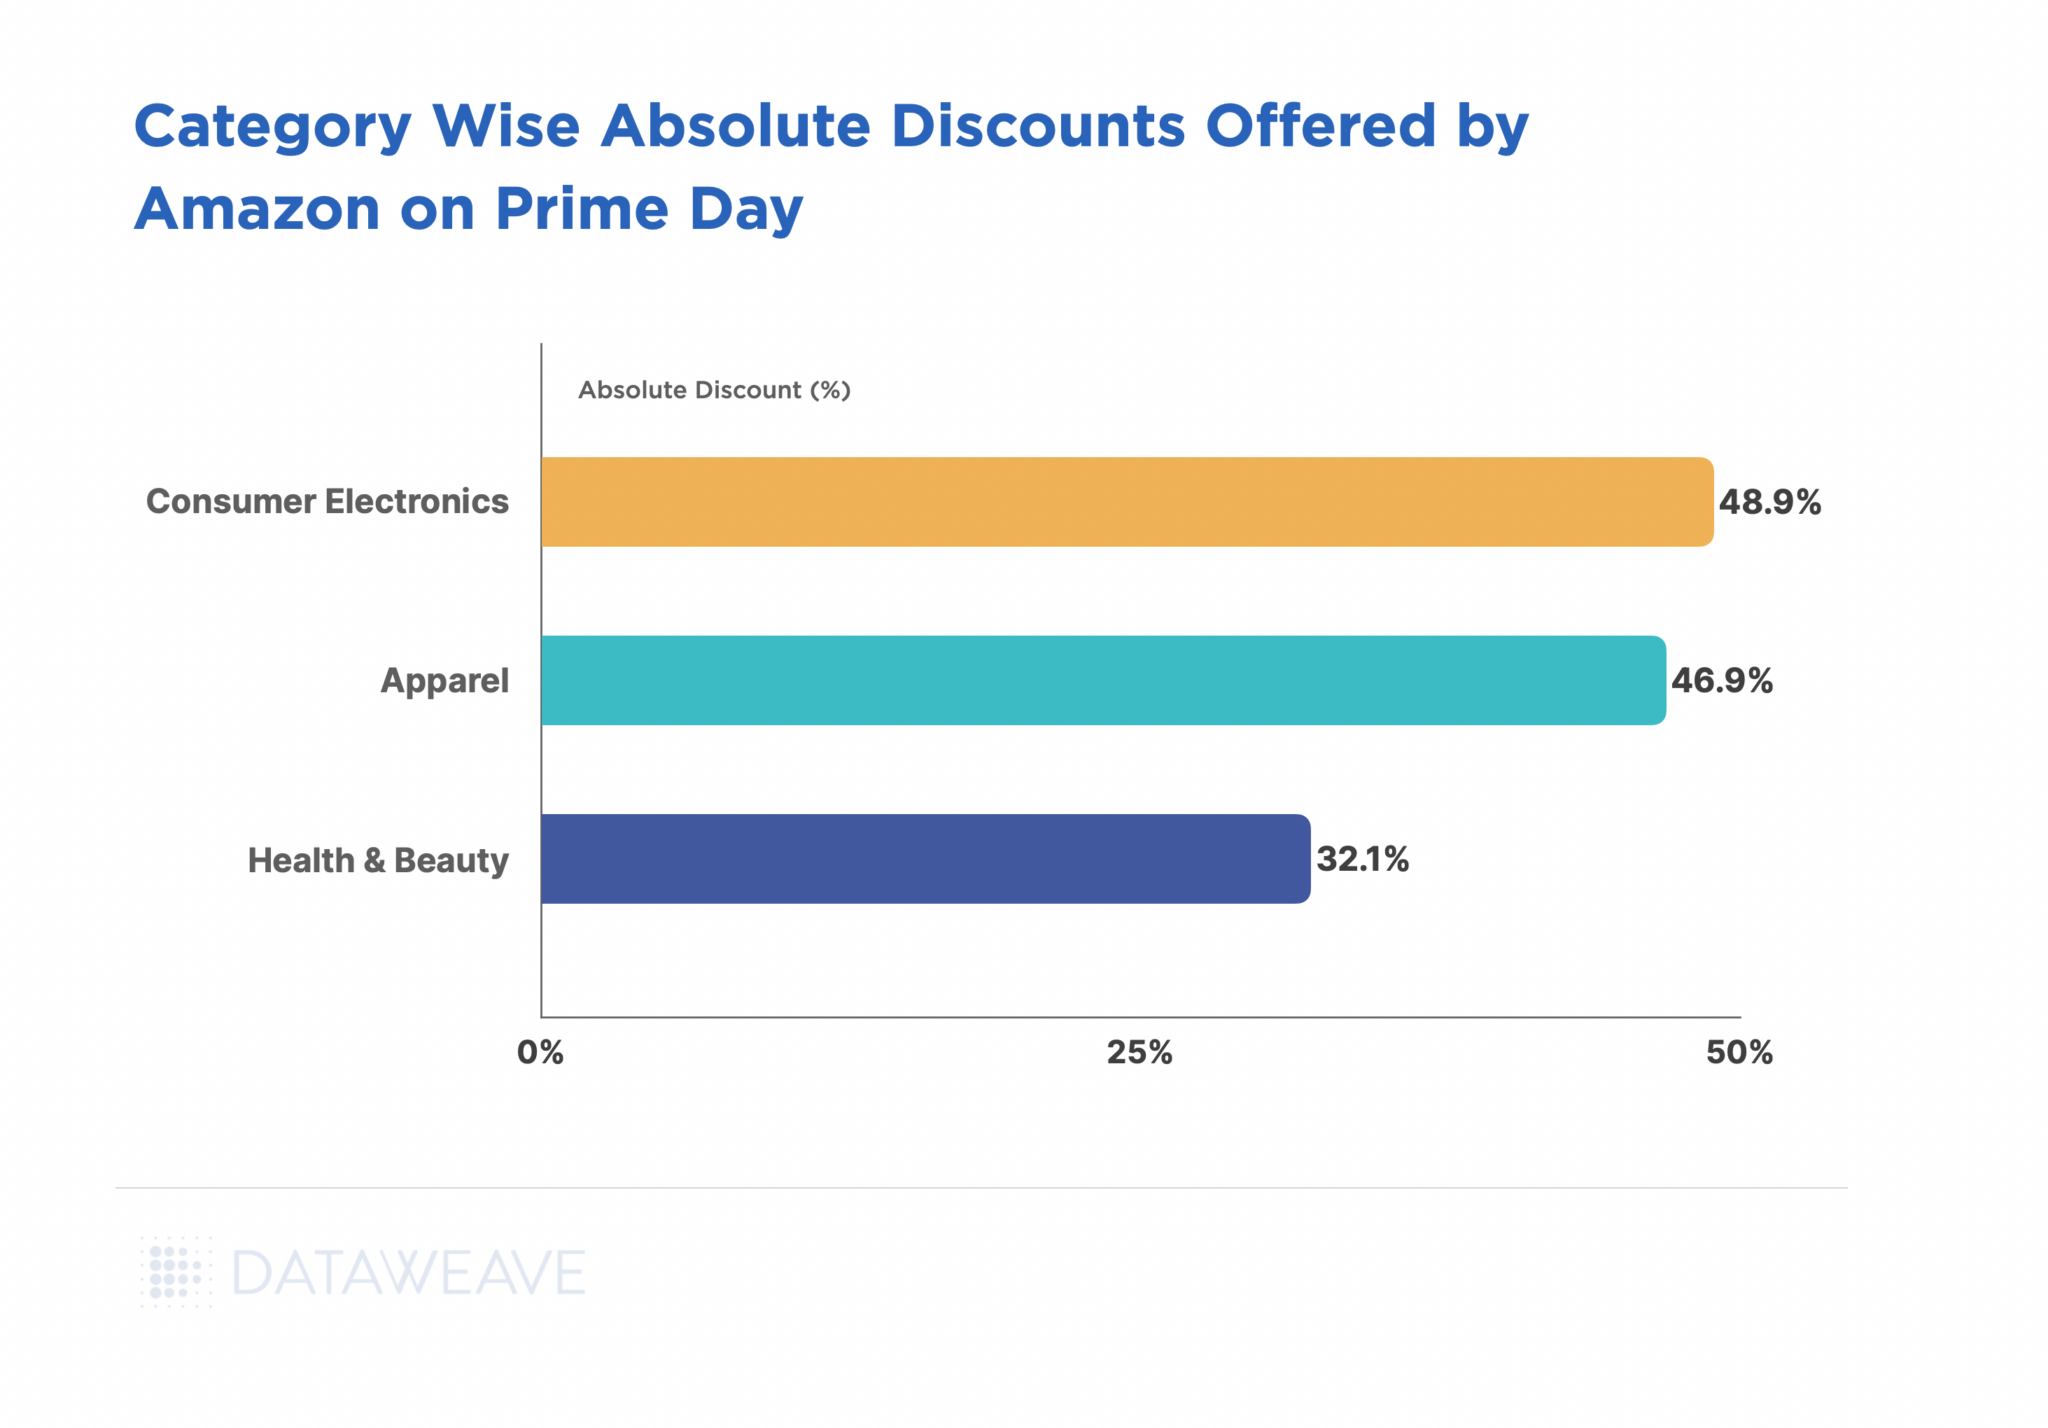
Our analysis this year reveals that the Consumer Electronics category saw the highest Absolute Discounts with an average of 48.9%, closely followed by Apparel at 46.9%. The Health & Beauty category had the lowest Absolute Discount at 32.1%.
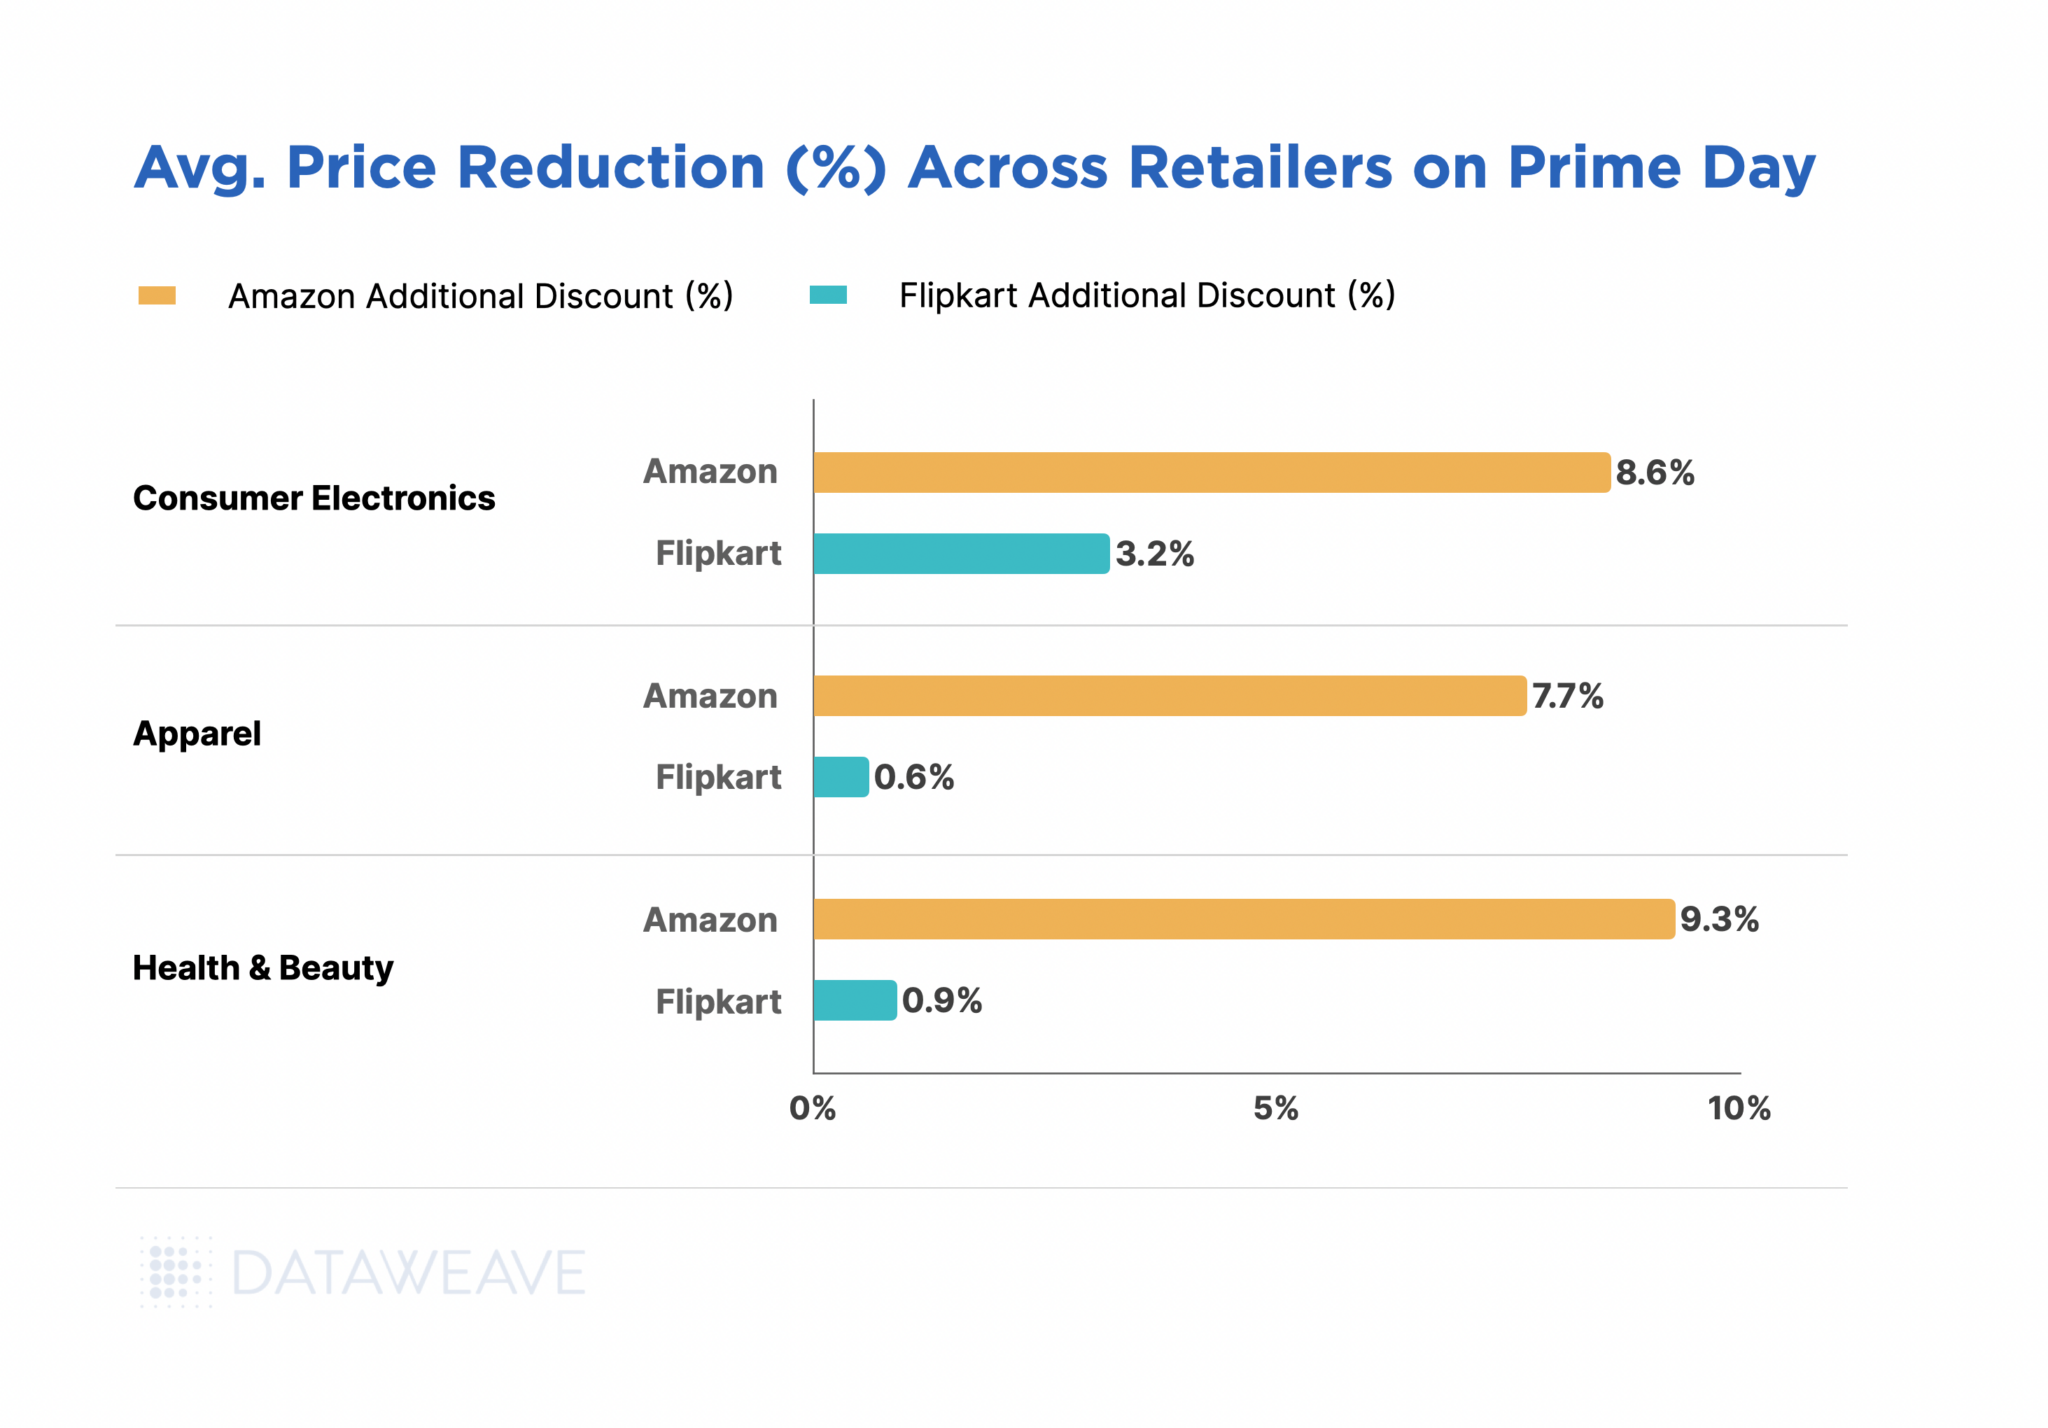
However, Amazon offered the highest Additional Discount in Health & Beauty at 9.3%. Electronics and Apparel had additional discounts of 8.6% and 7.7% respectively.
Overall, Flipkart chose to not compete aggressively with Amazon during Prime Day this year. Only in Electronics did Flipkart offer an additional discount of 3.2% during the sale. Price changes in Apparel and Health & Beauty were negligible.
Category Deep Dive
Consumer Electronics
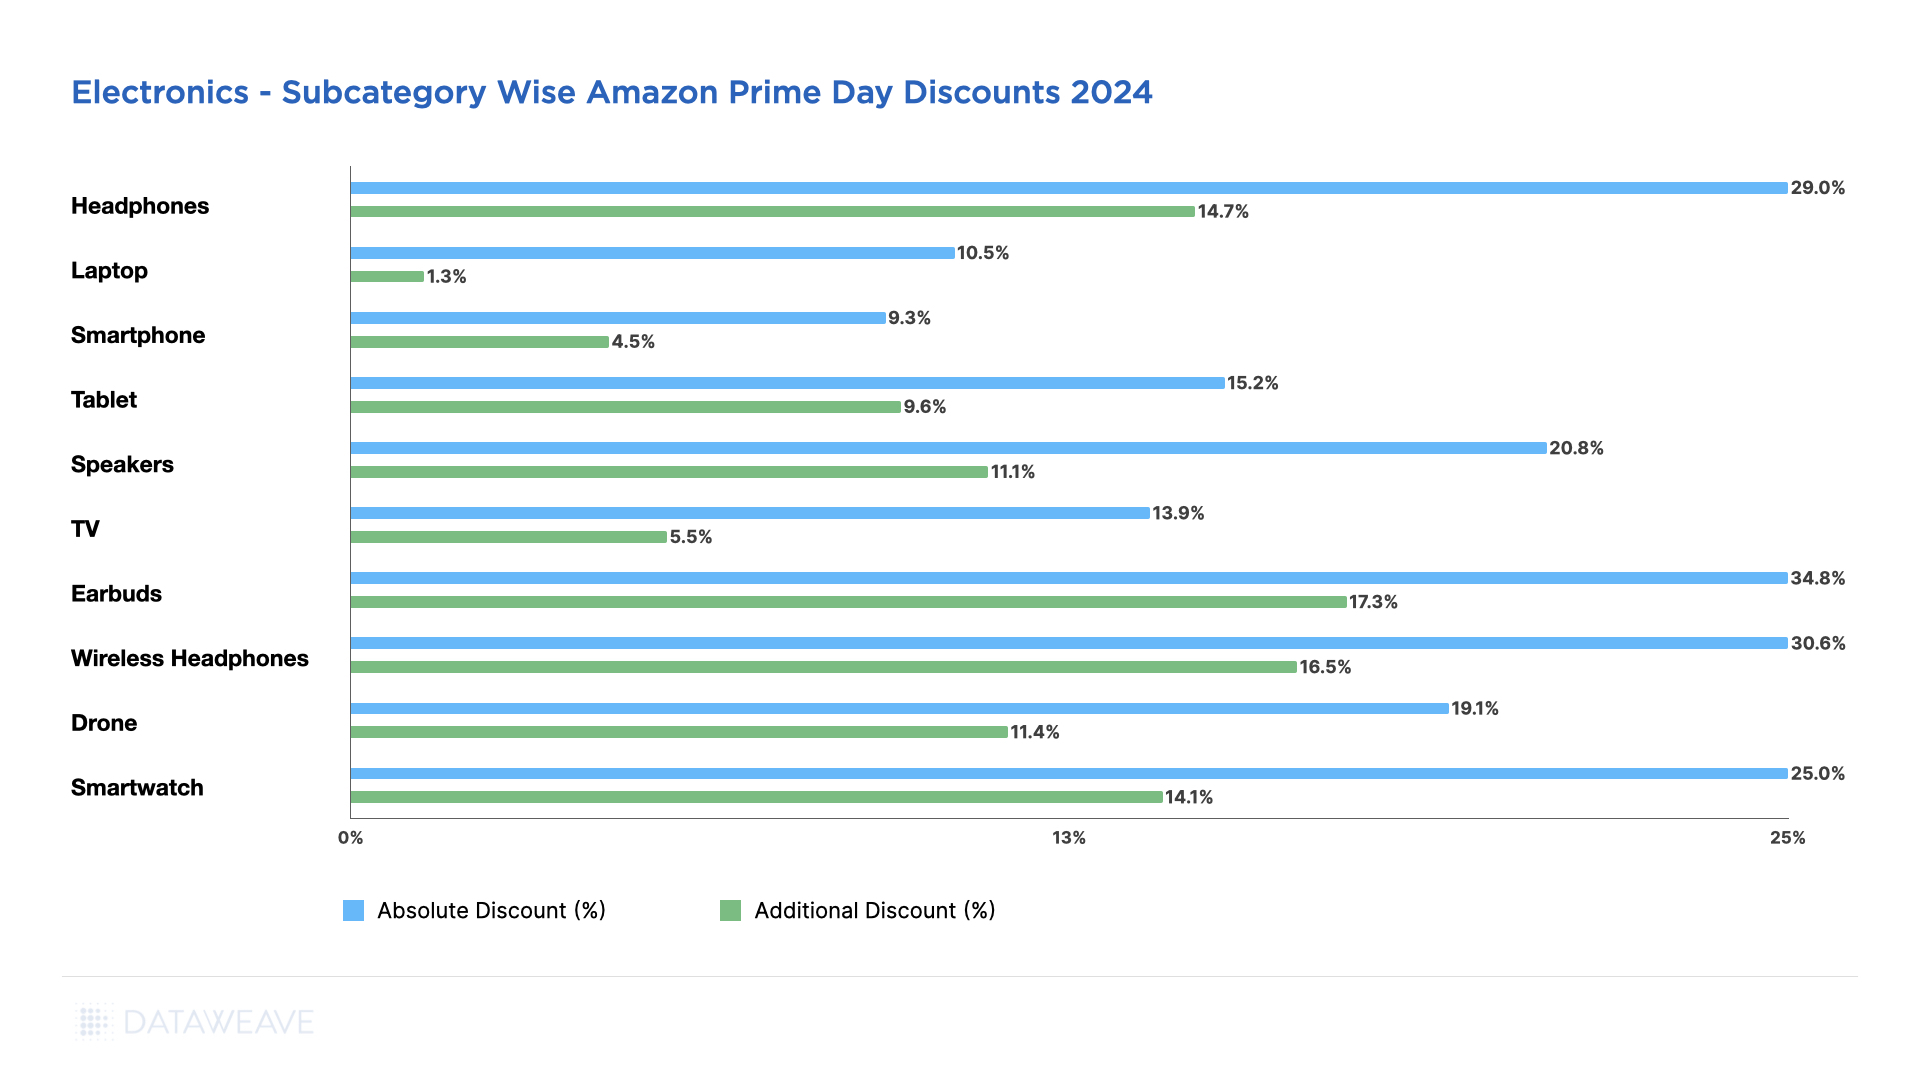
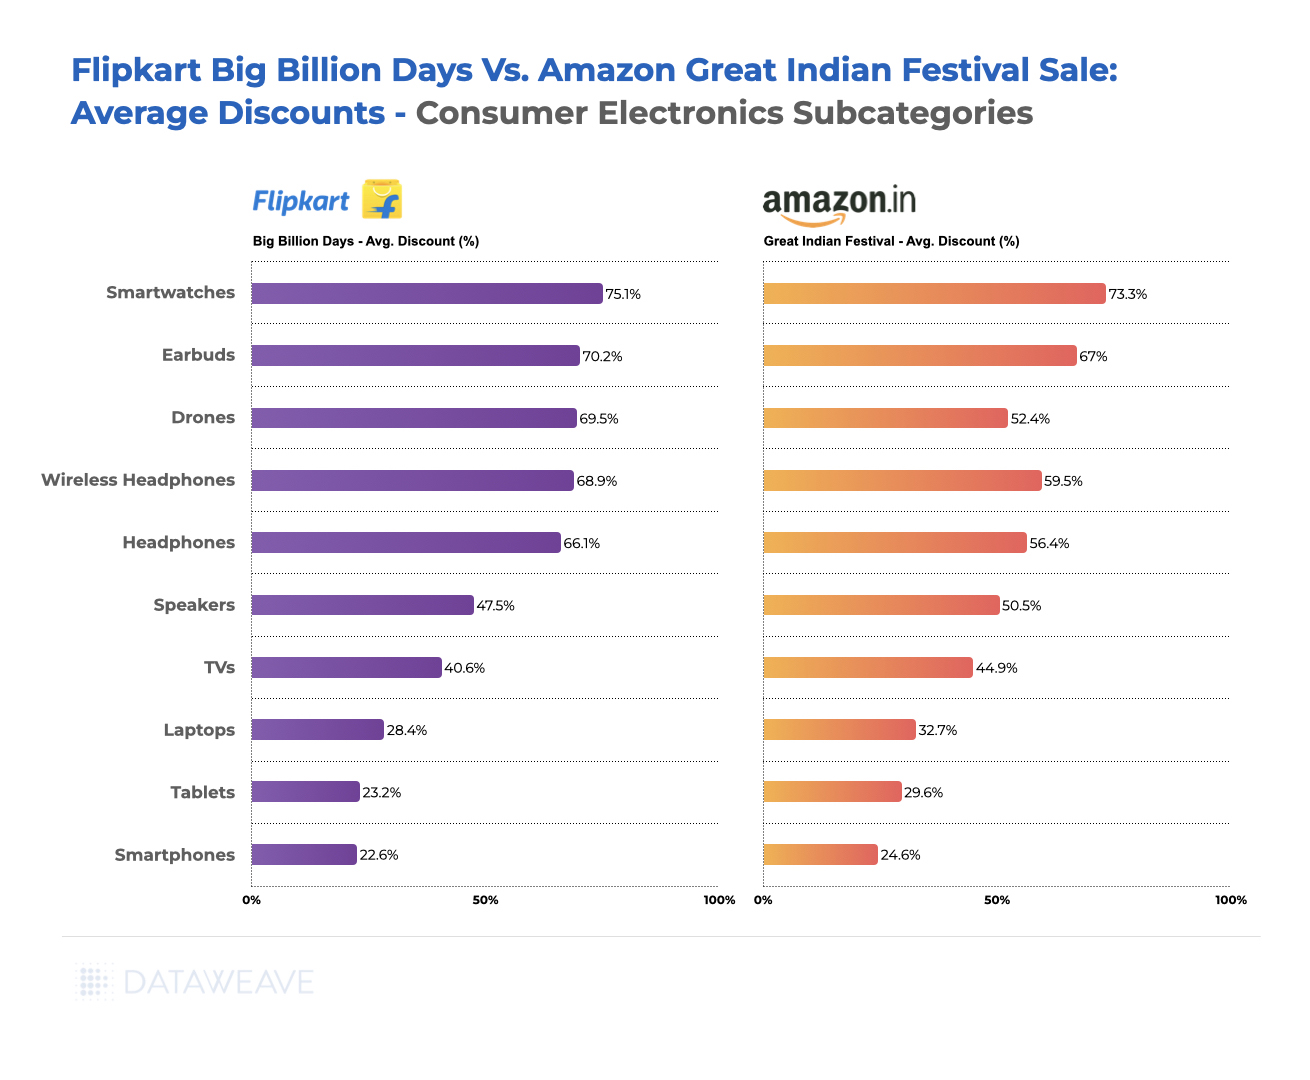
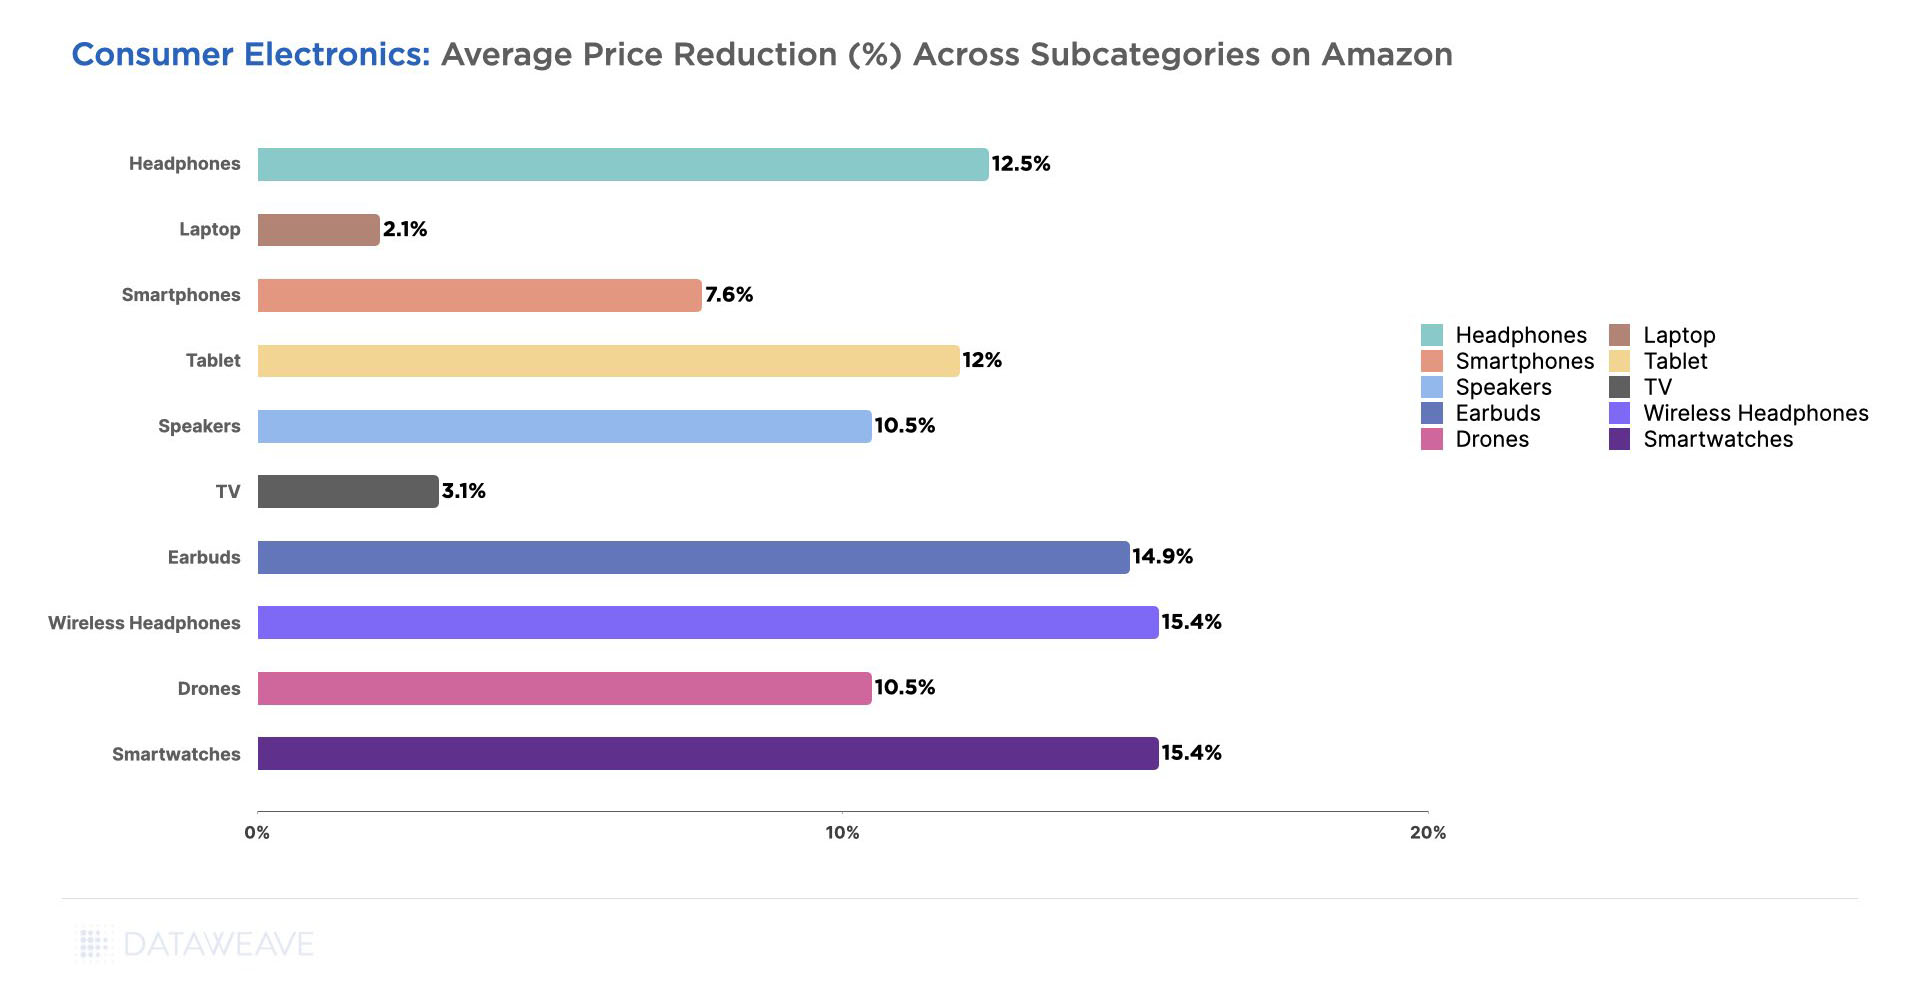
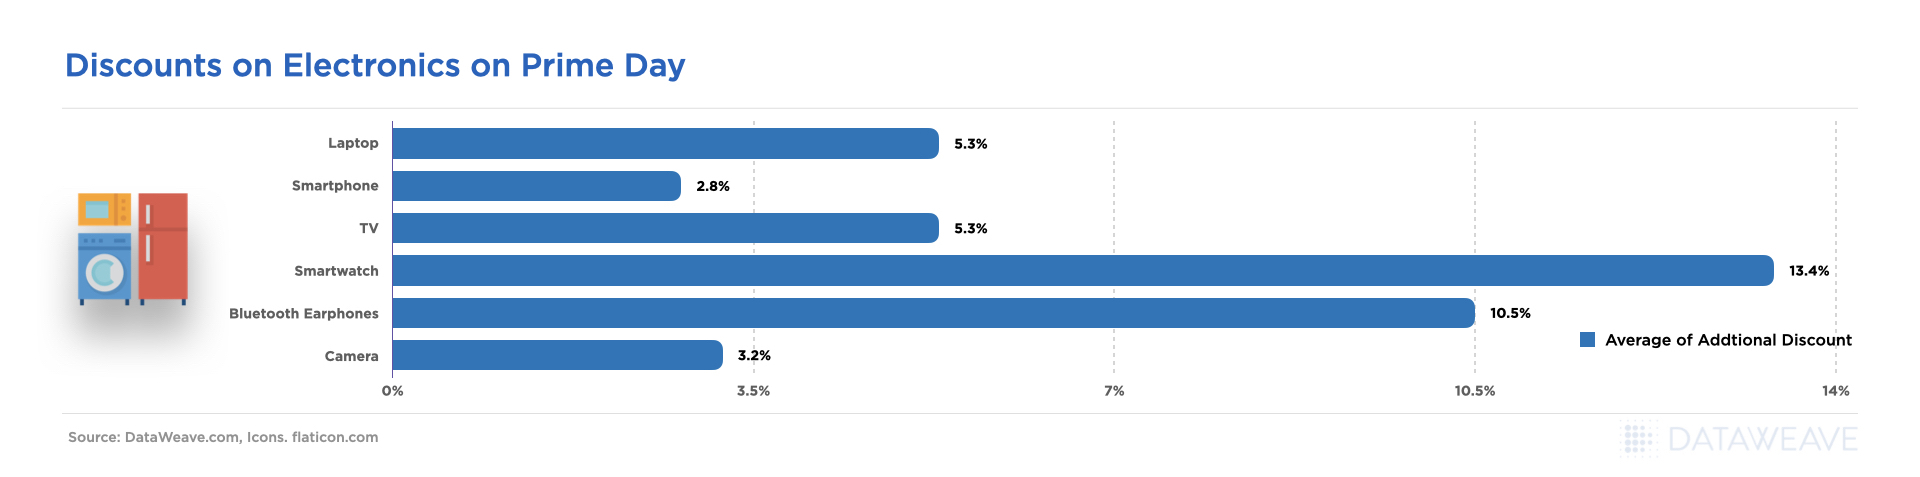
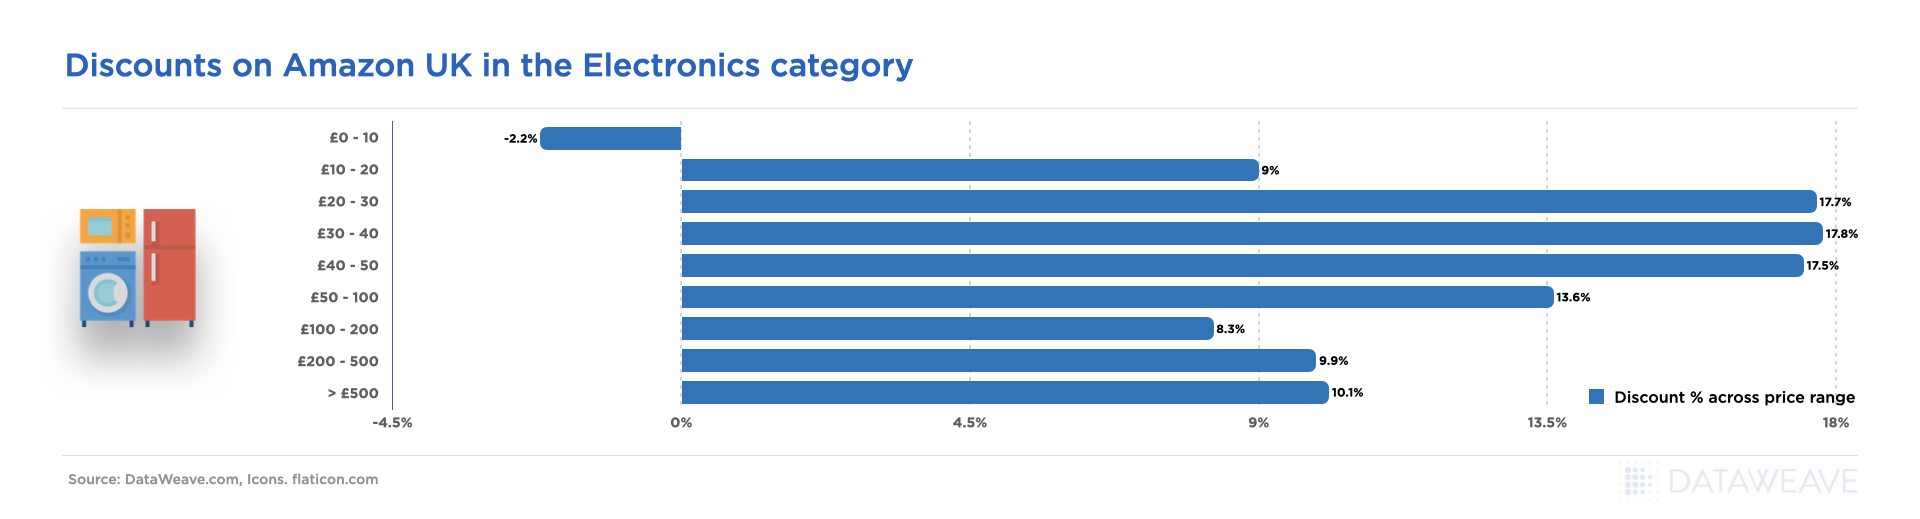
In Electronics, Earbuds (14.7%) and Wireless Headphones (12.5%) saw the highest Additional Discounts on Amazon, likely due to high demand for personal audio devices. Smartwatches followed closely at 12.5%, indicating a strong push in the wearable technology sector.
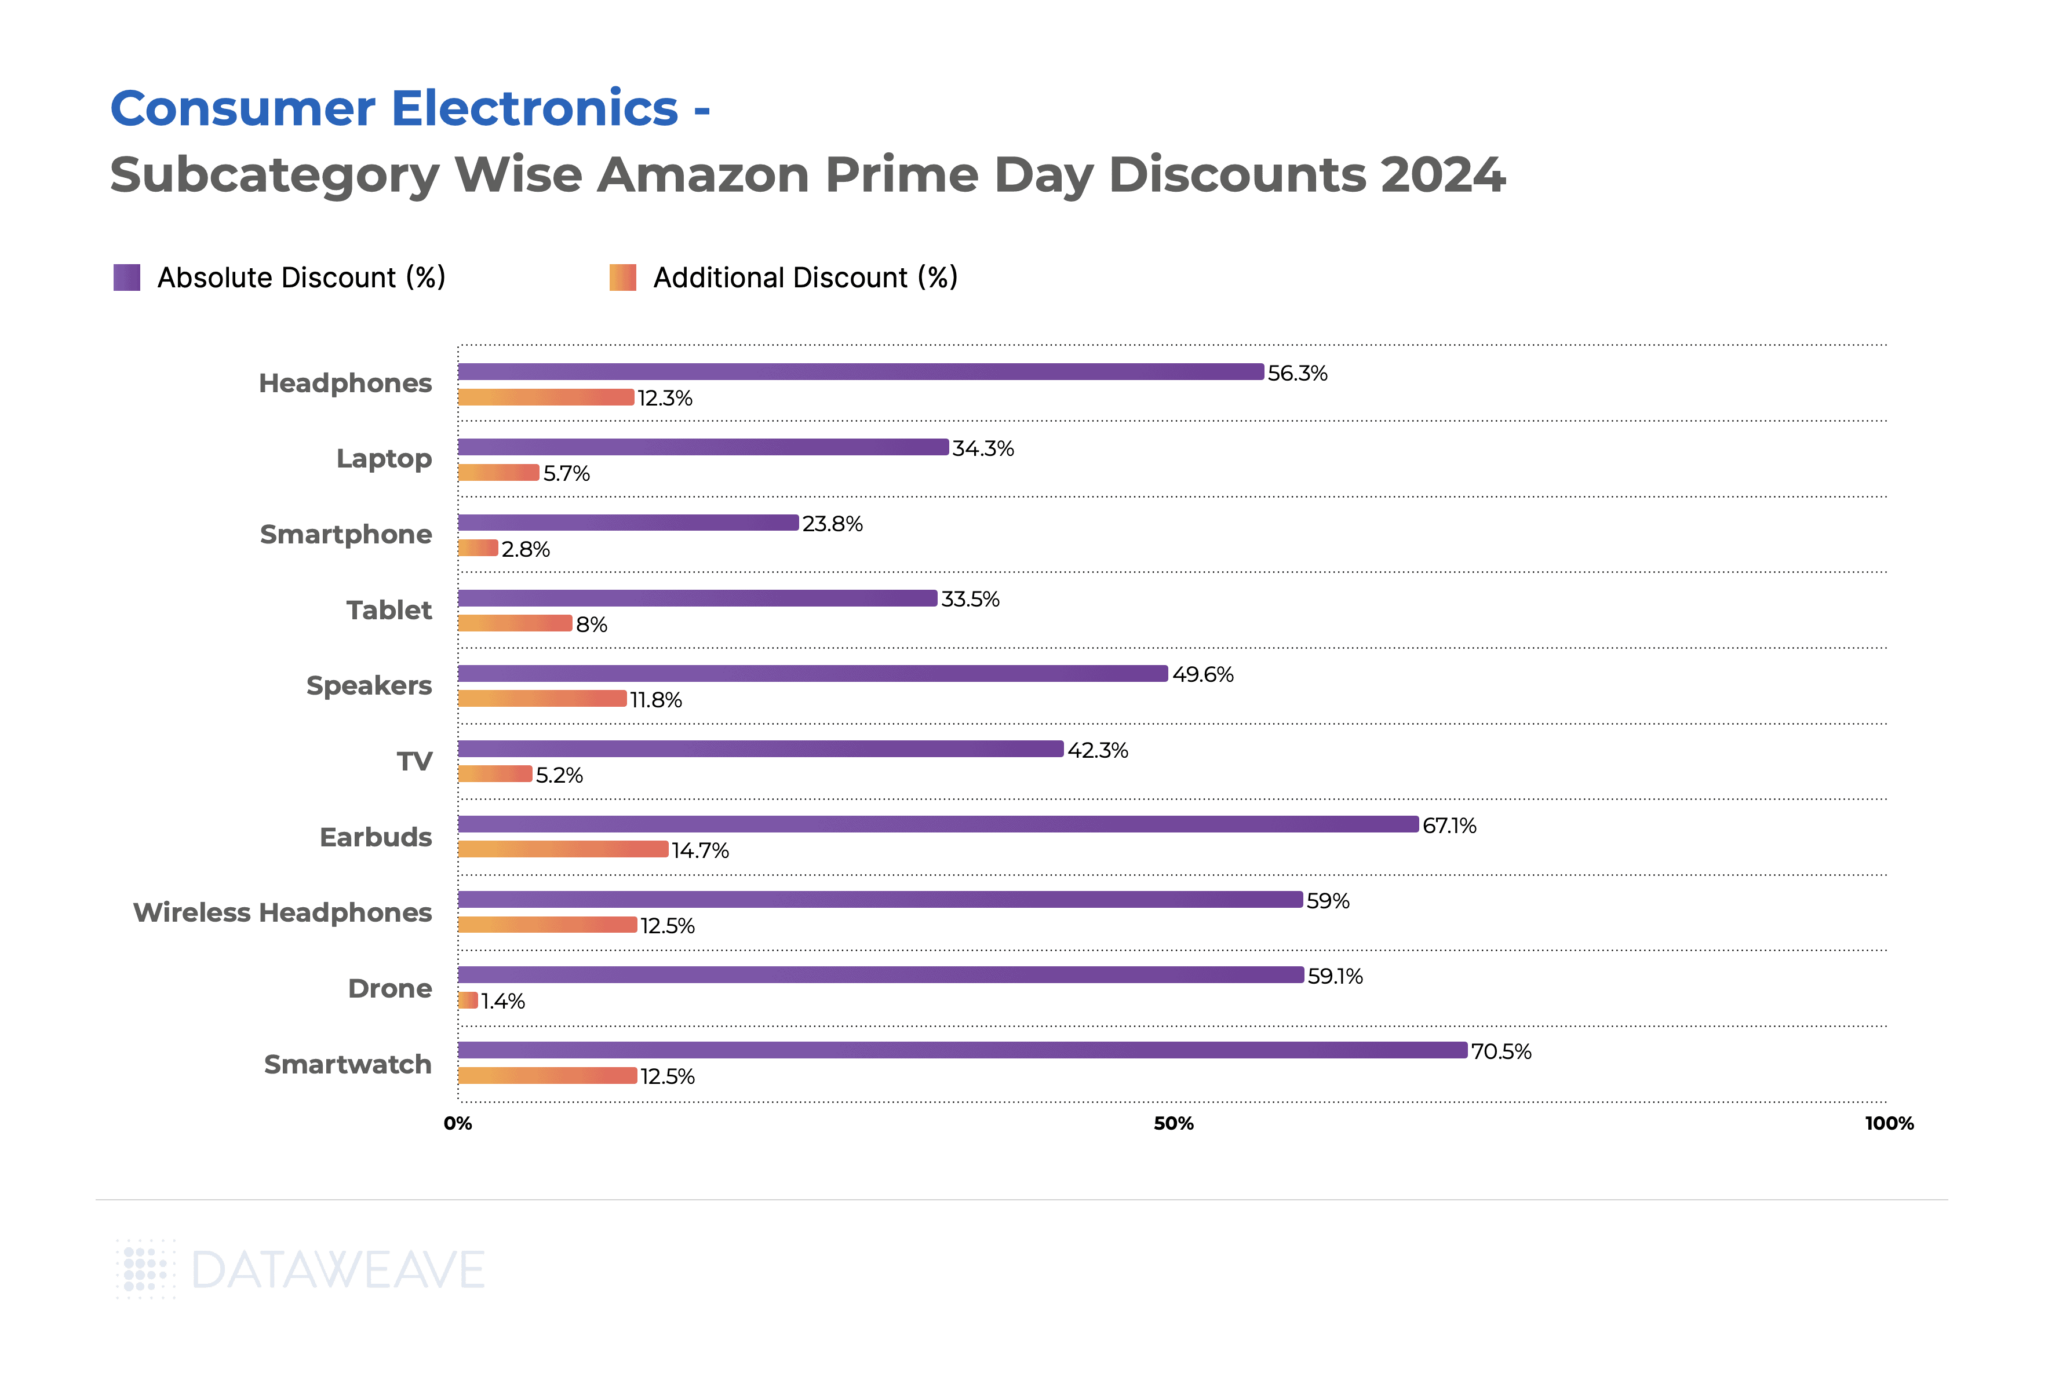
Larger electronic appliances like TVs saw more modest Additional Discounts (5.2%), despite a significant Absolute Discount (42.3%).
Smartphones, interestingly, had the lowest Additional Discount (2.8%) among the subcategories, potentially due to their already competitive pricing or brand-specific strategies.
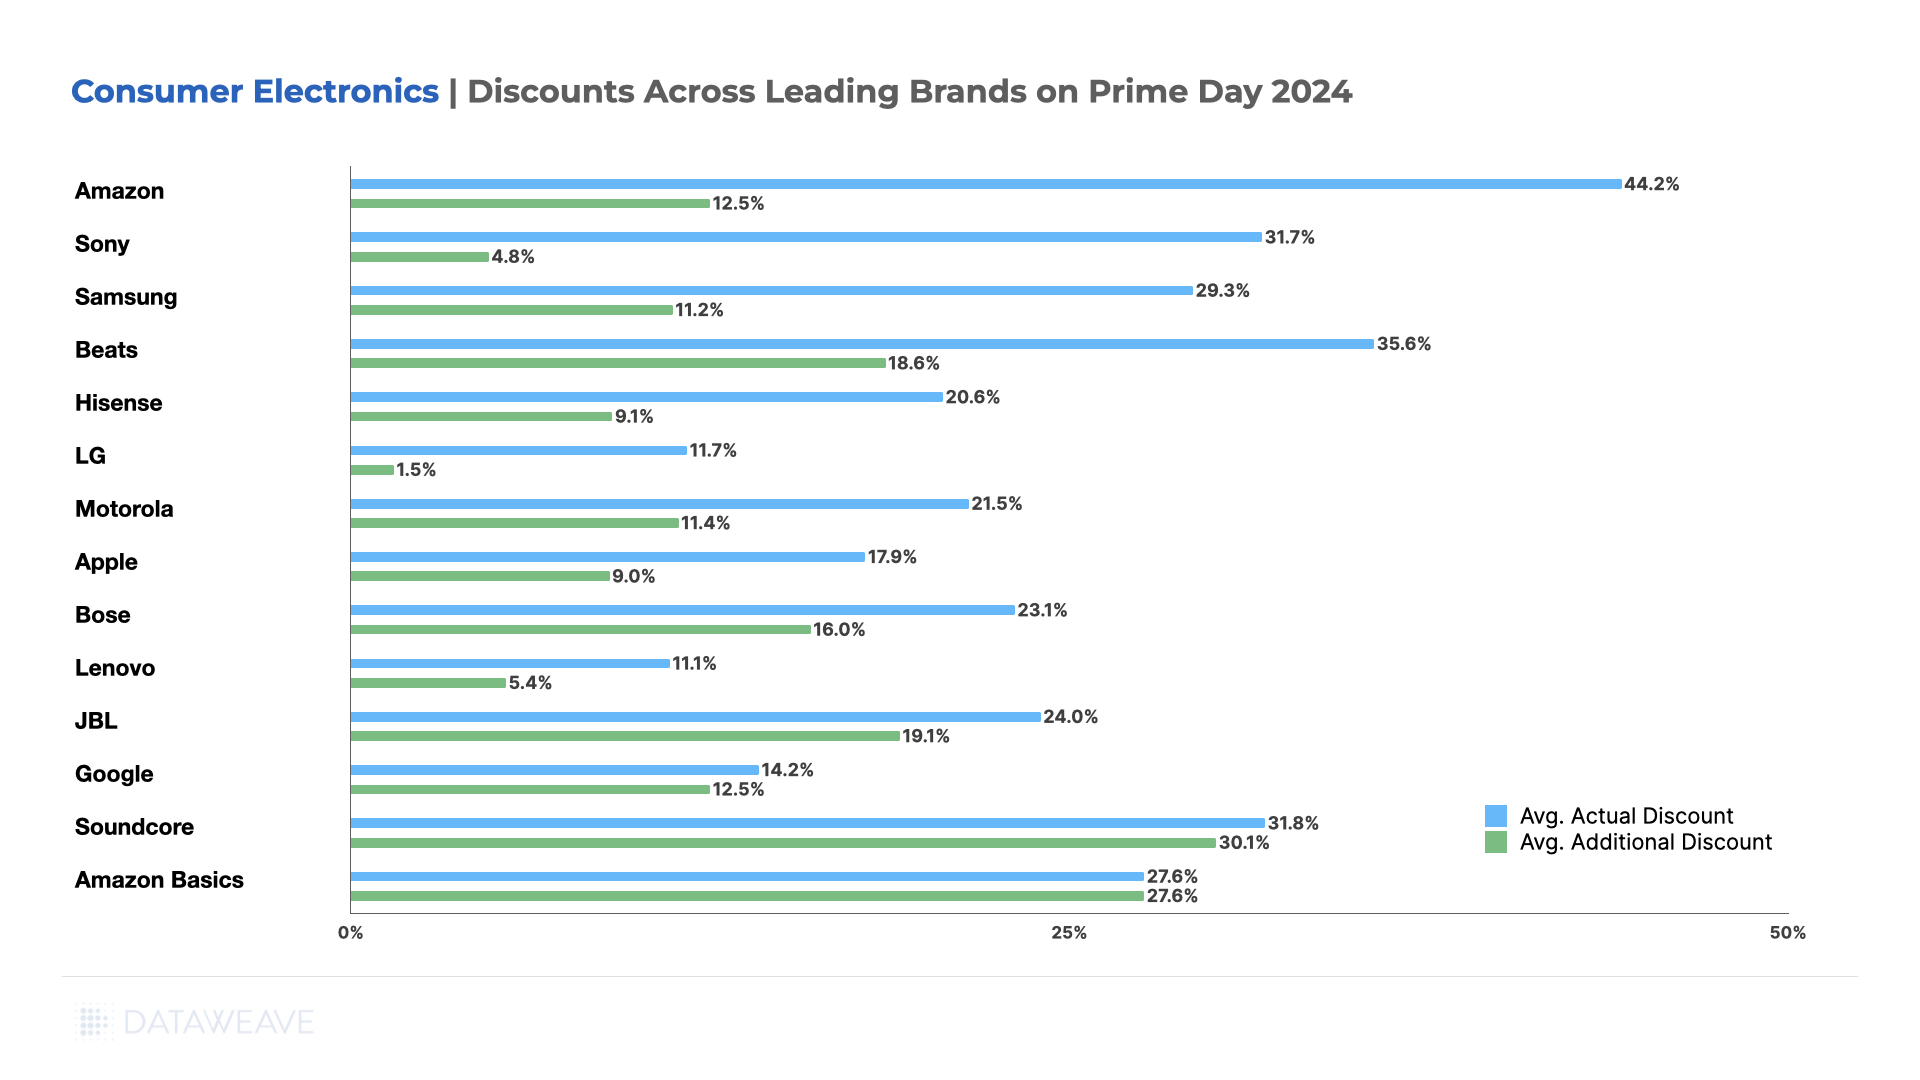
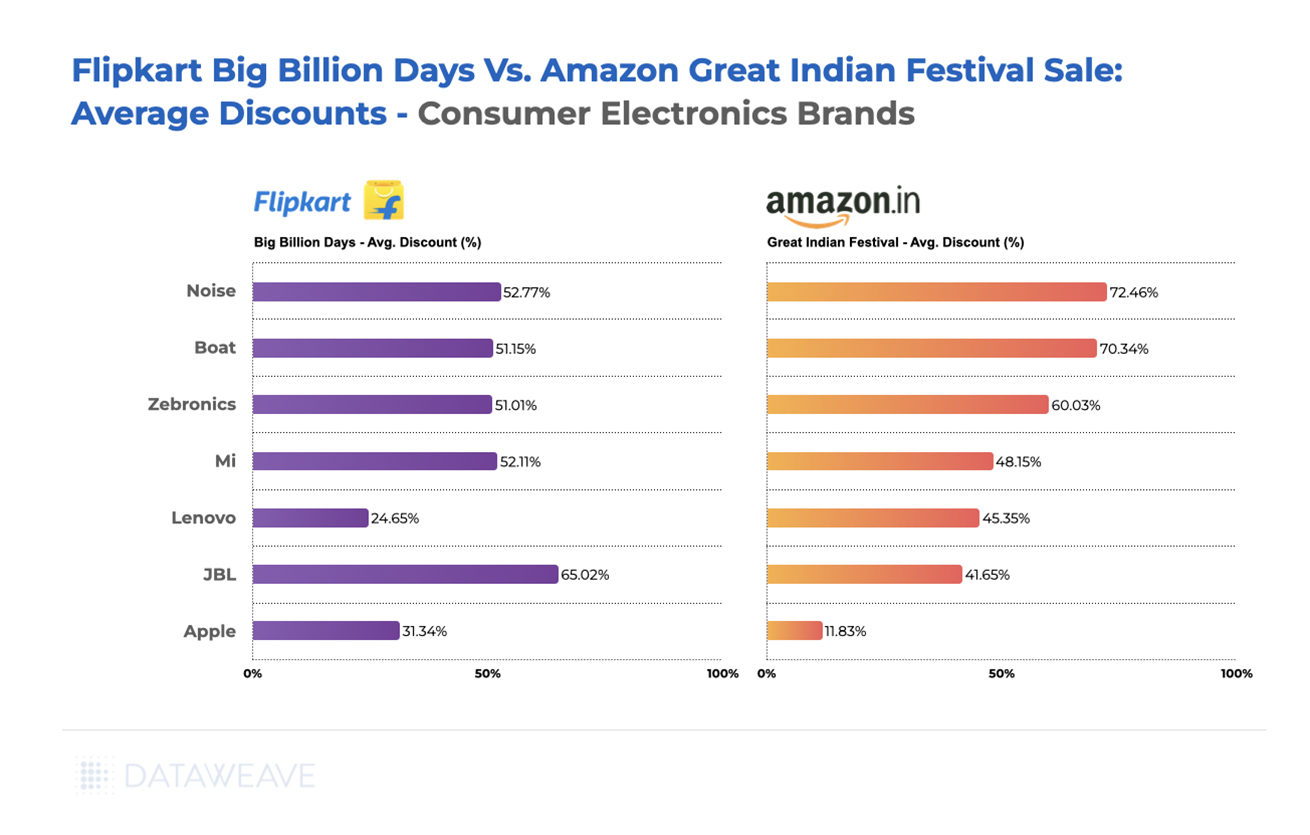
Brand-level Insights in Consumer Electronics
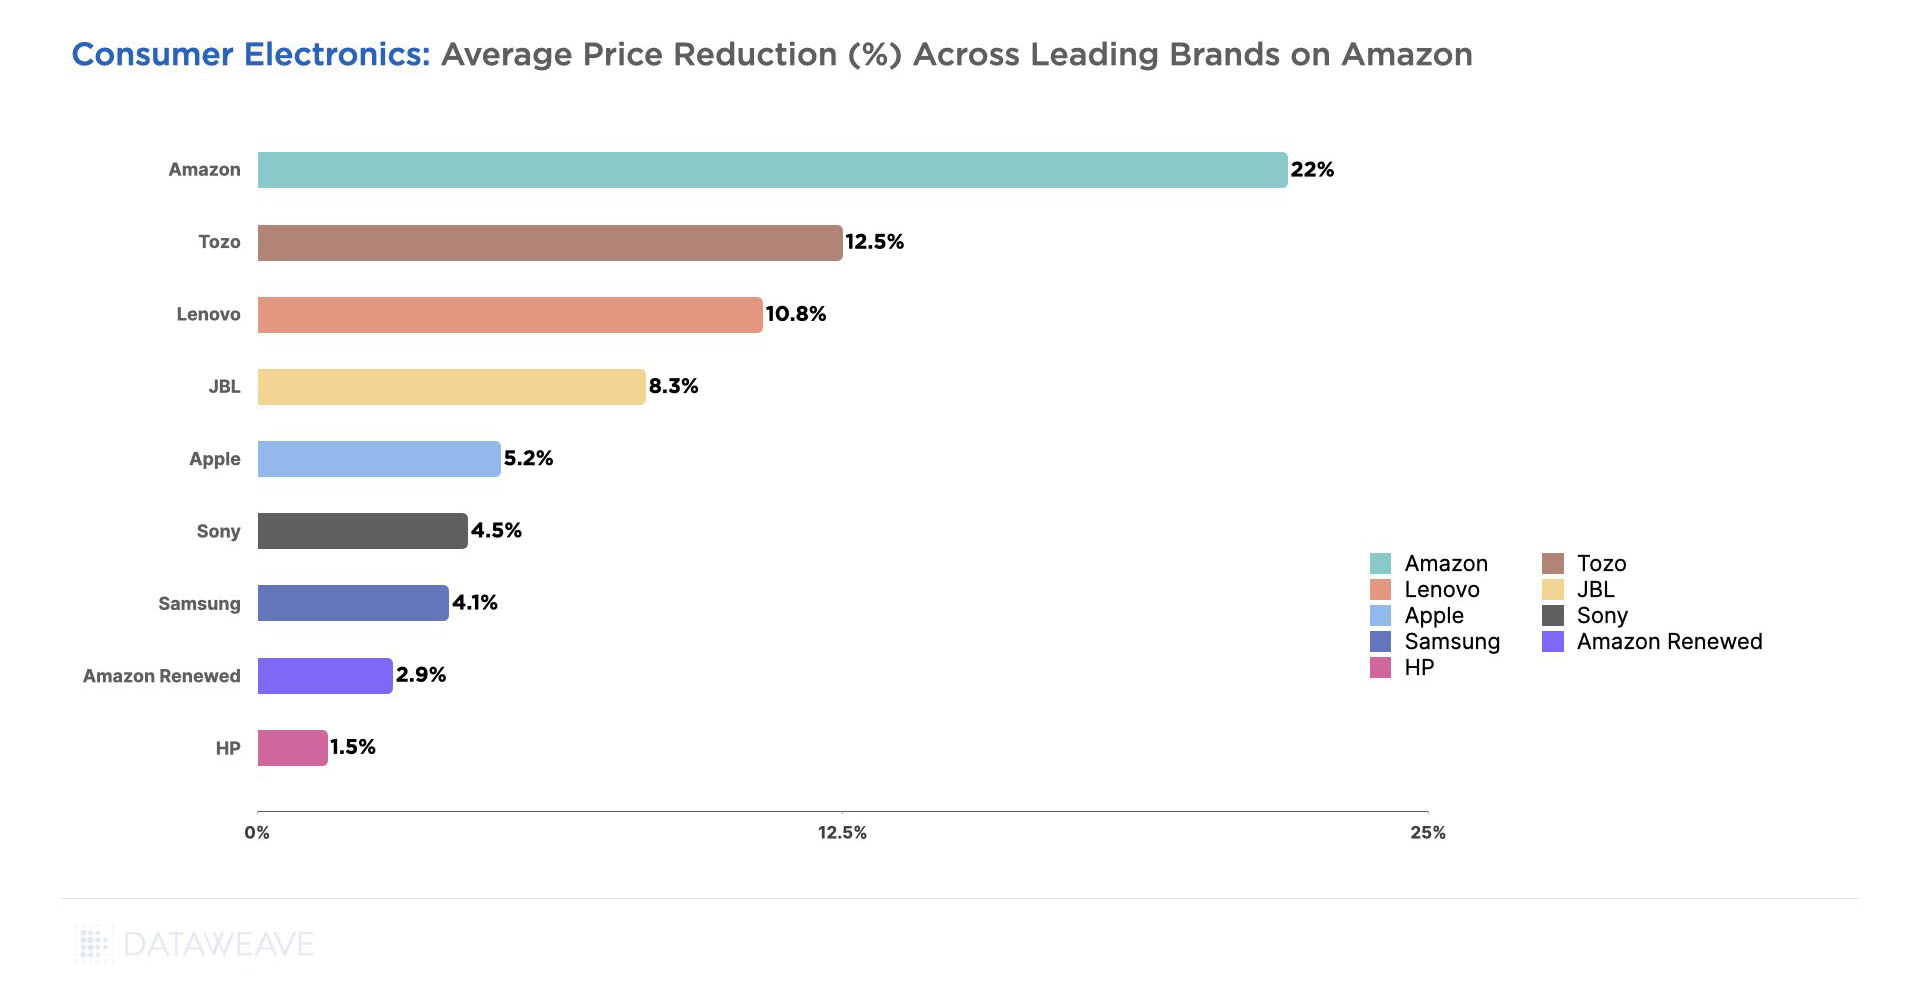
During the sale event, Soundcore (headphone and earphone brand from Anker) led with the highest Additional Discount of 10.3%, followed closely by OnePlus at 9.3%. These brands clearly leveraged Prime Day to drive sales and potentially gain market share.
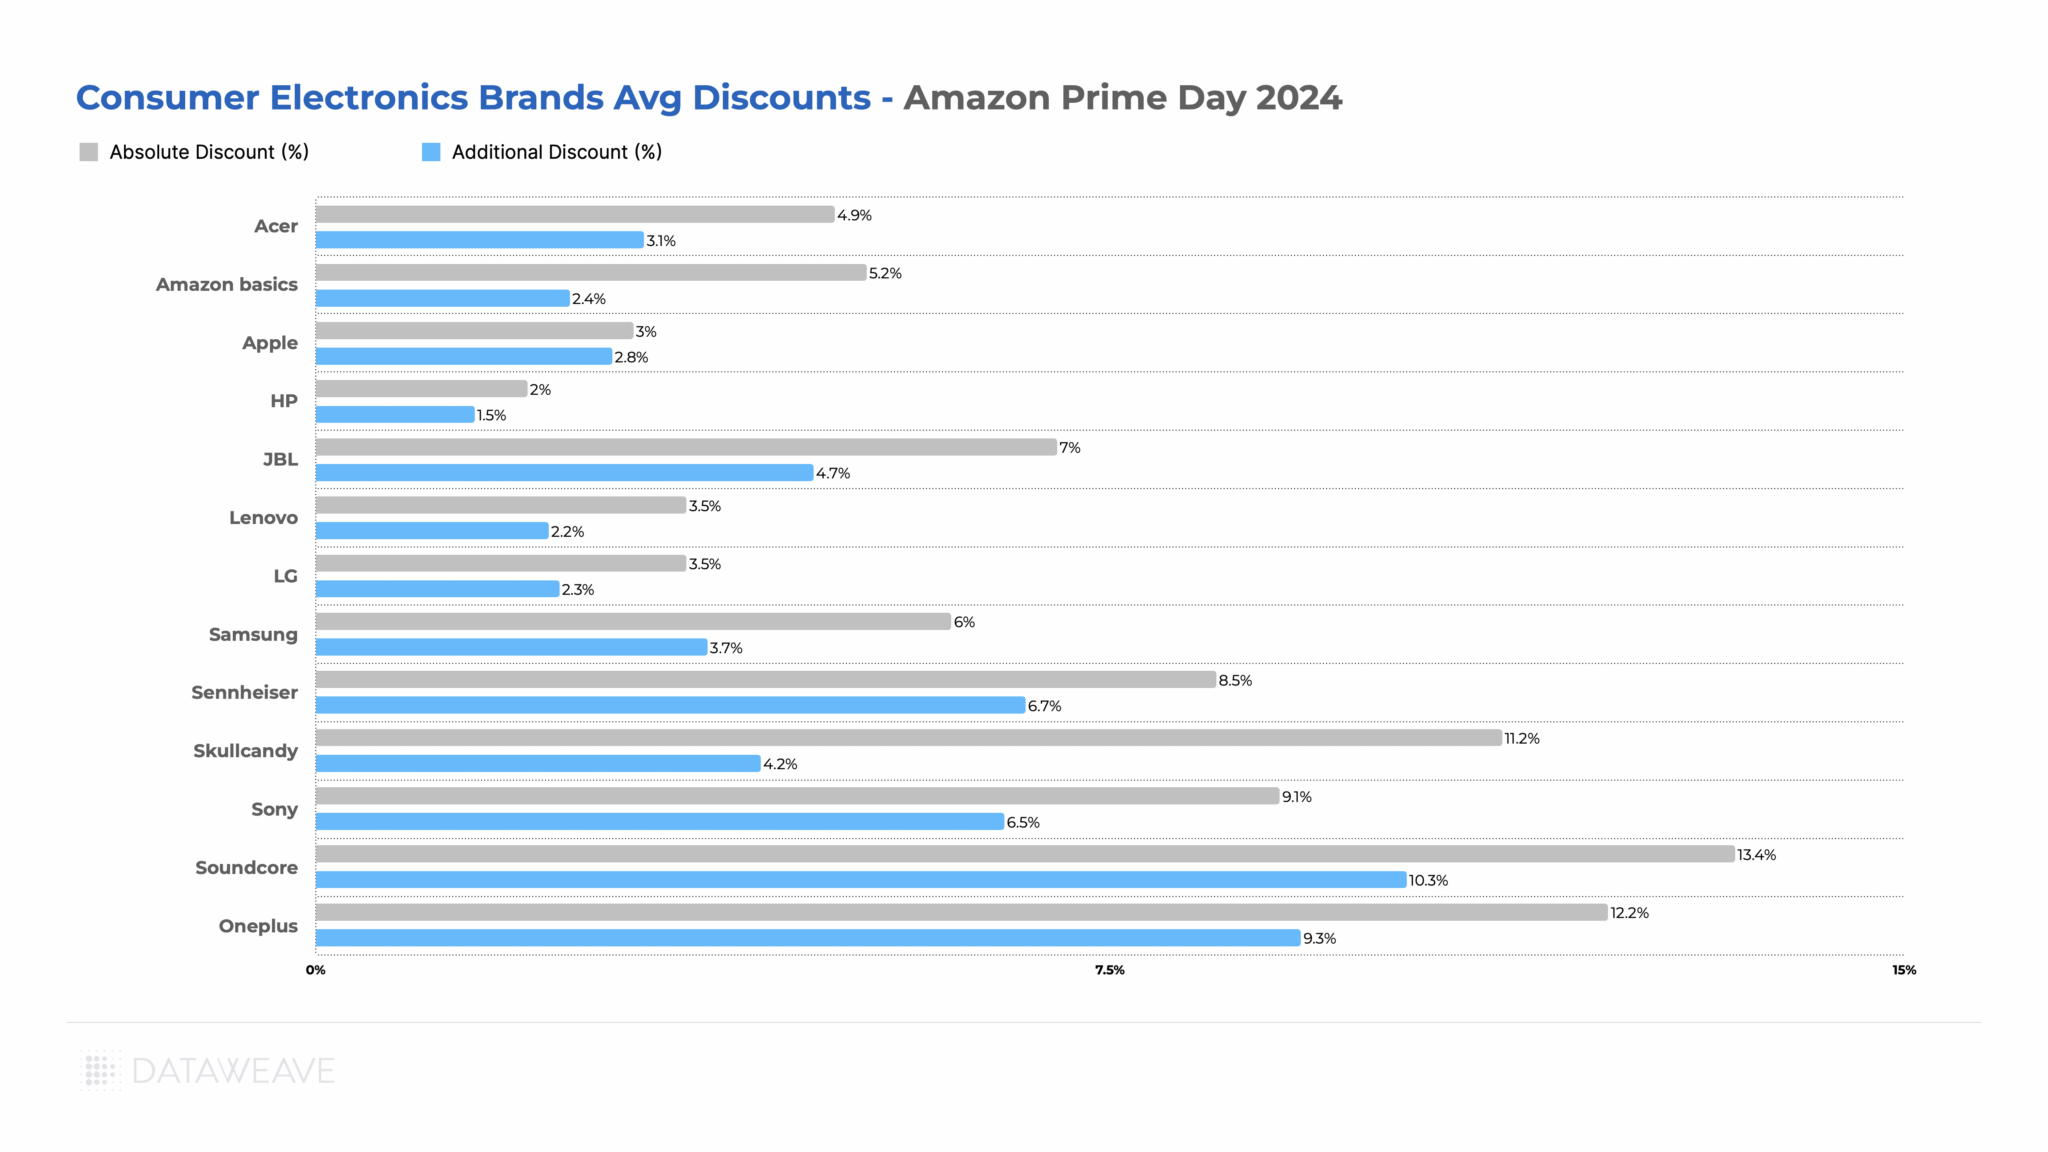
Sennheiser and Sony also offered significant additional discounts, indicating aggressive promotional strategies during the event.
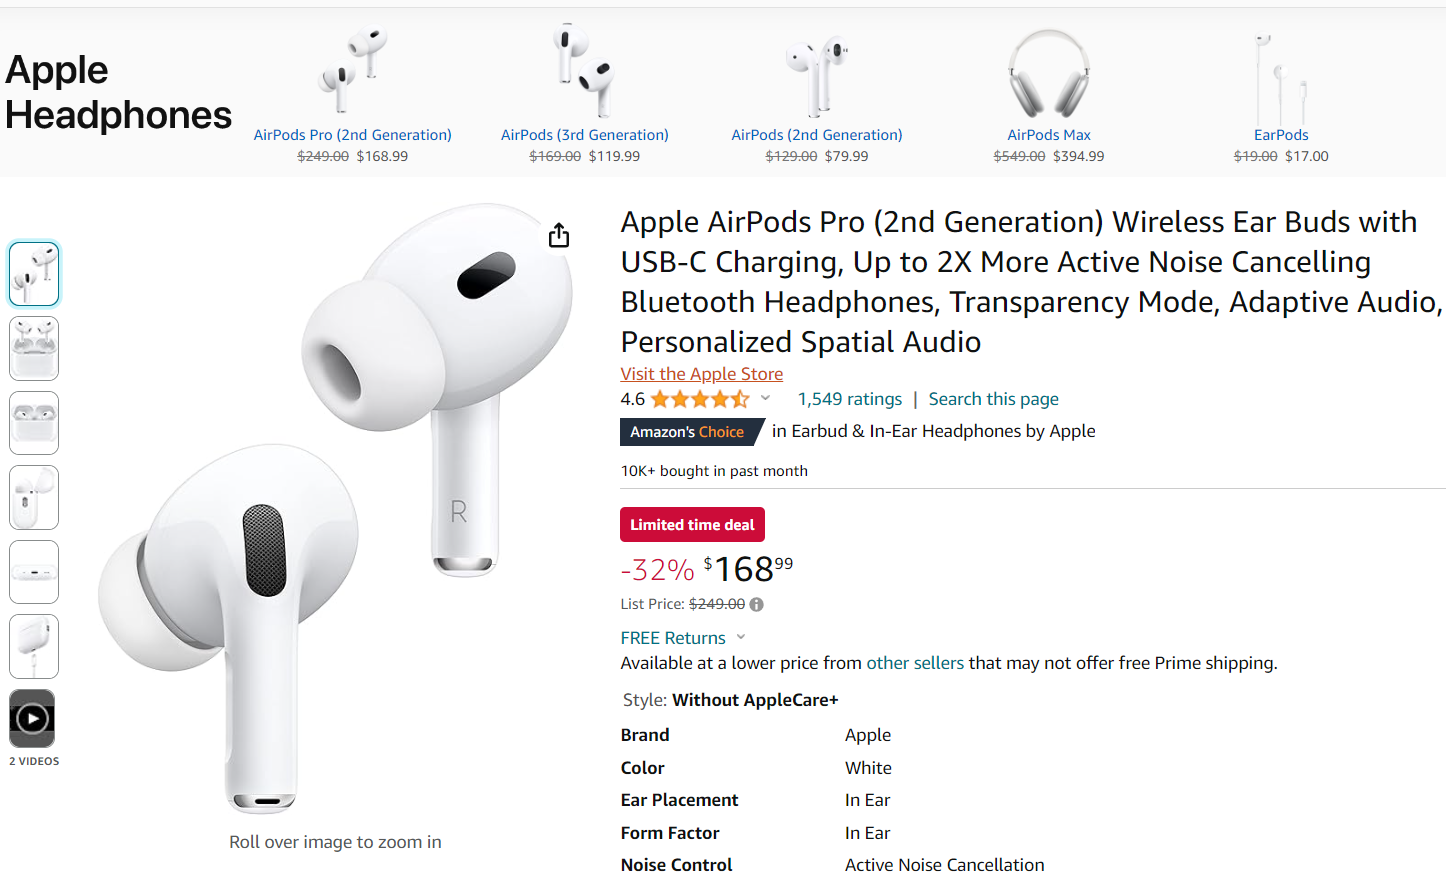
Notably, some well-known brands like Apple and HP offered more conservative discounts, possibly due to their established market positions or differing promotional strategies.
Despite modest discounts though, Amazon revealed that the iPhone 13 and OnePlus 12R were among the top premium smartphones customers bought this Prime Day. Prime members shopped from top brands such as LG, IFB, Bosch, and Haier and upgraded to premium appliances through affordability options of no cost EMI, Bank discounts and exchange offers, claims Amazon.
These learnings offer valuable insight into the mindset of the modern Indian consumer, who is ready to purchase premium products. Brands can leverage more detailed market intelligence to drive their positioning in India.
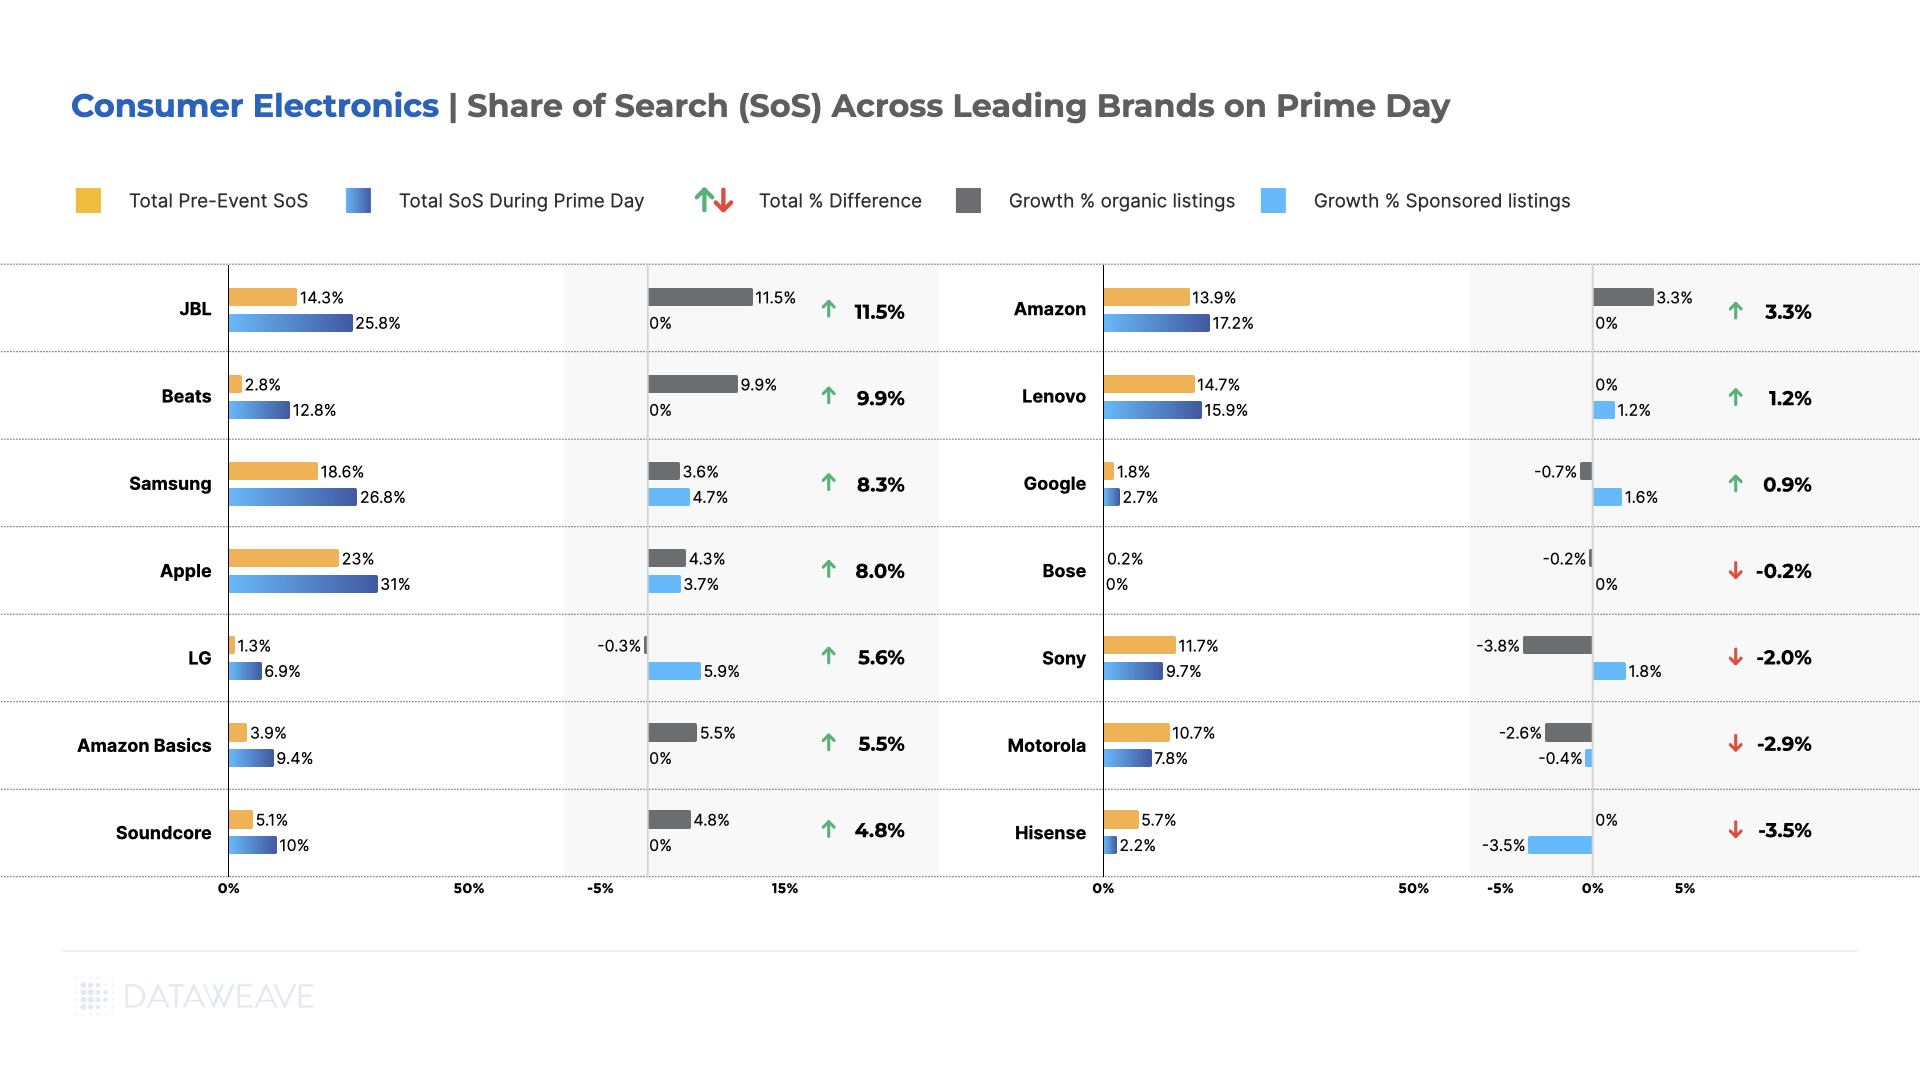
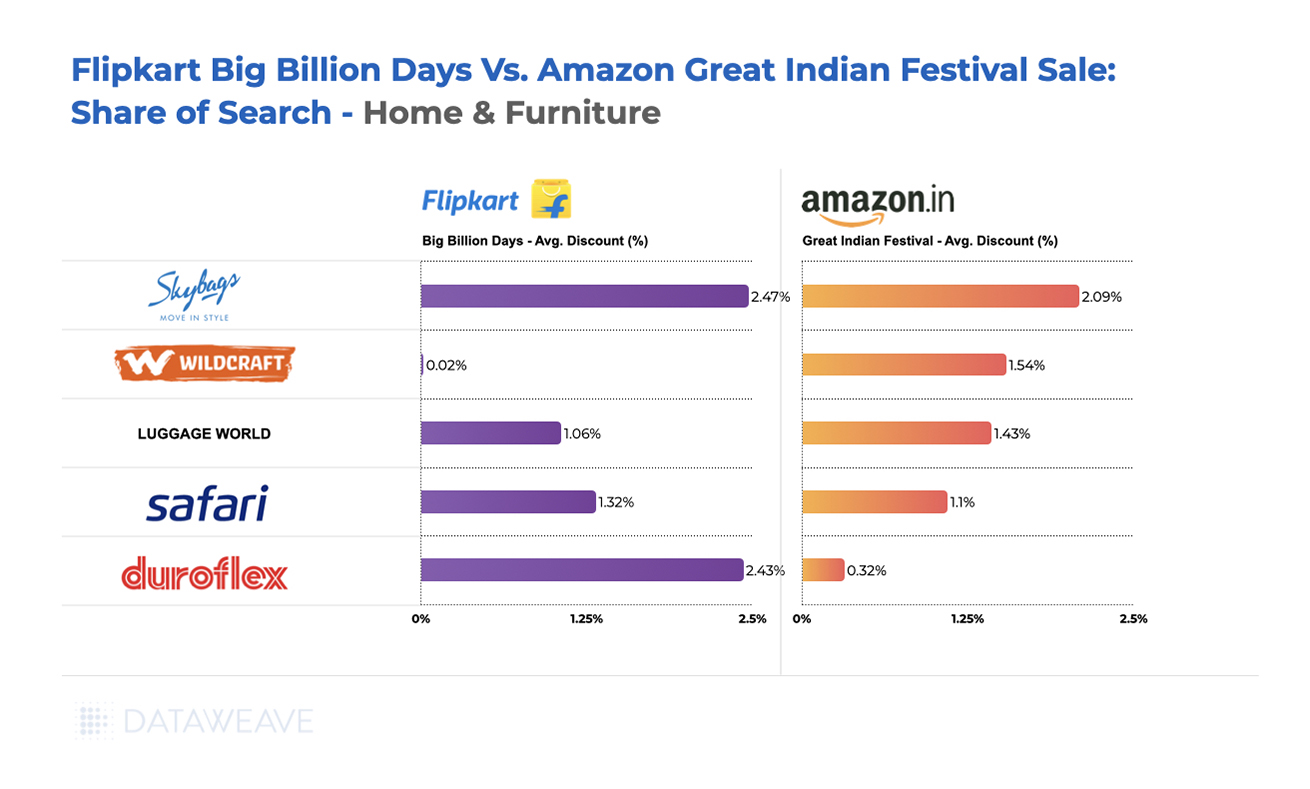
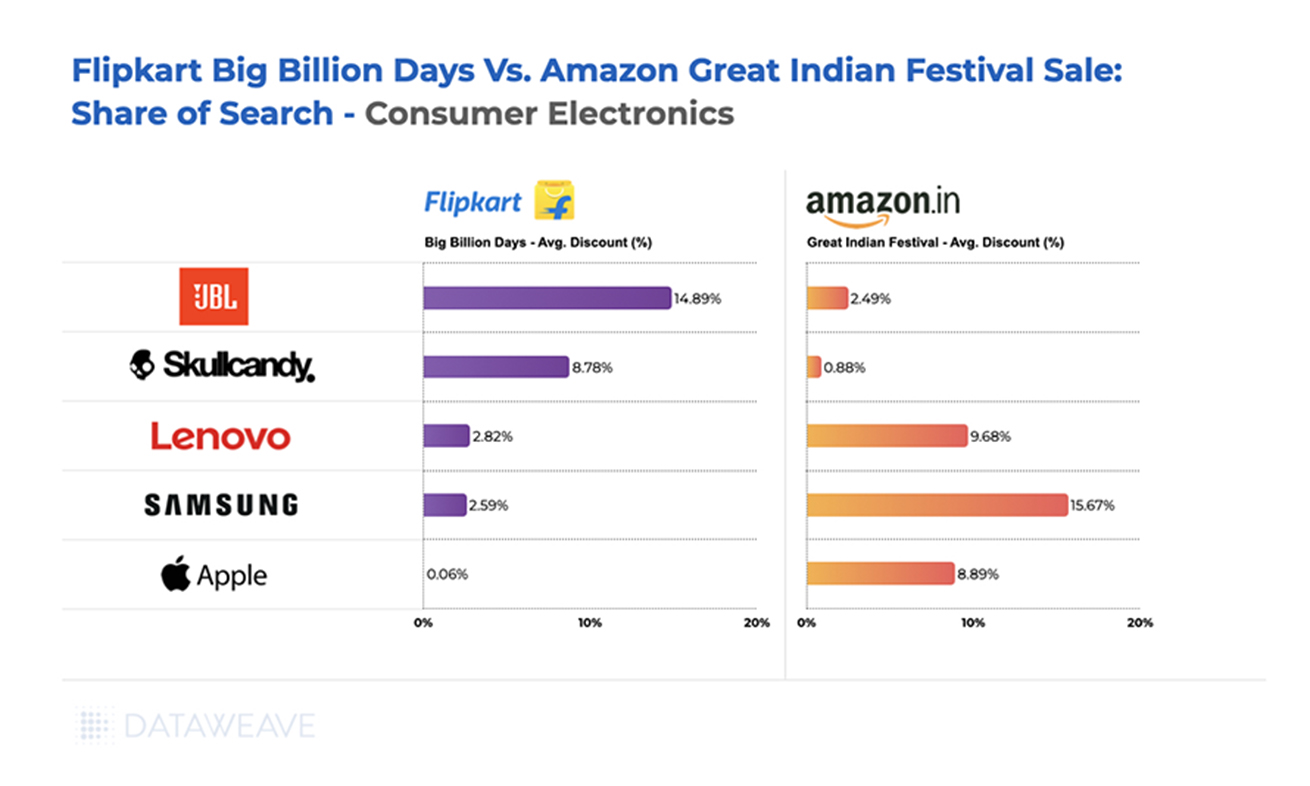
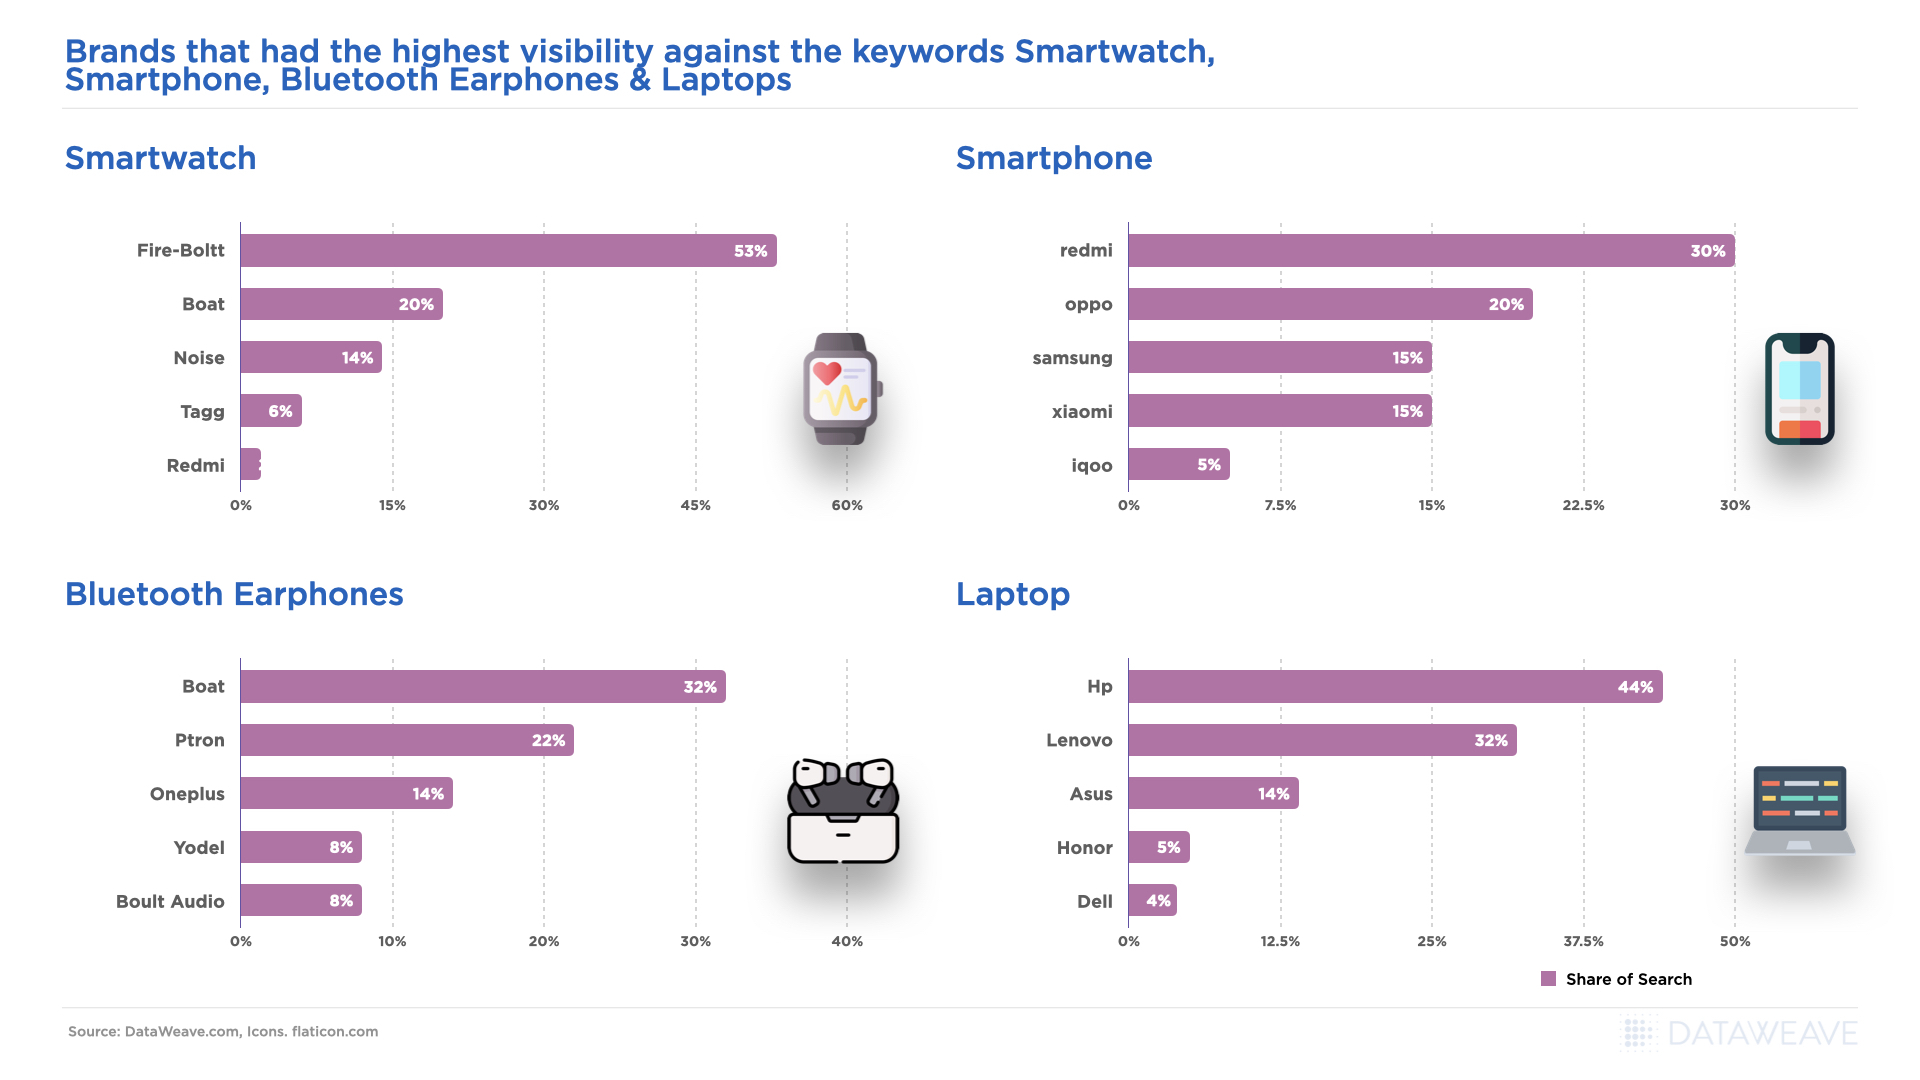
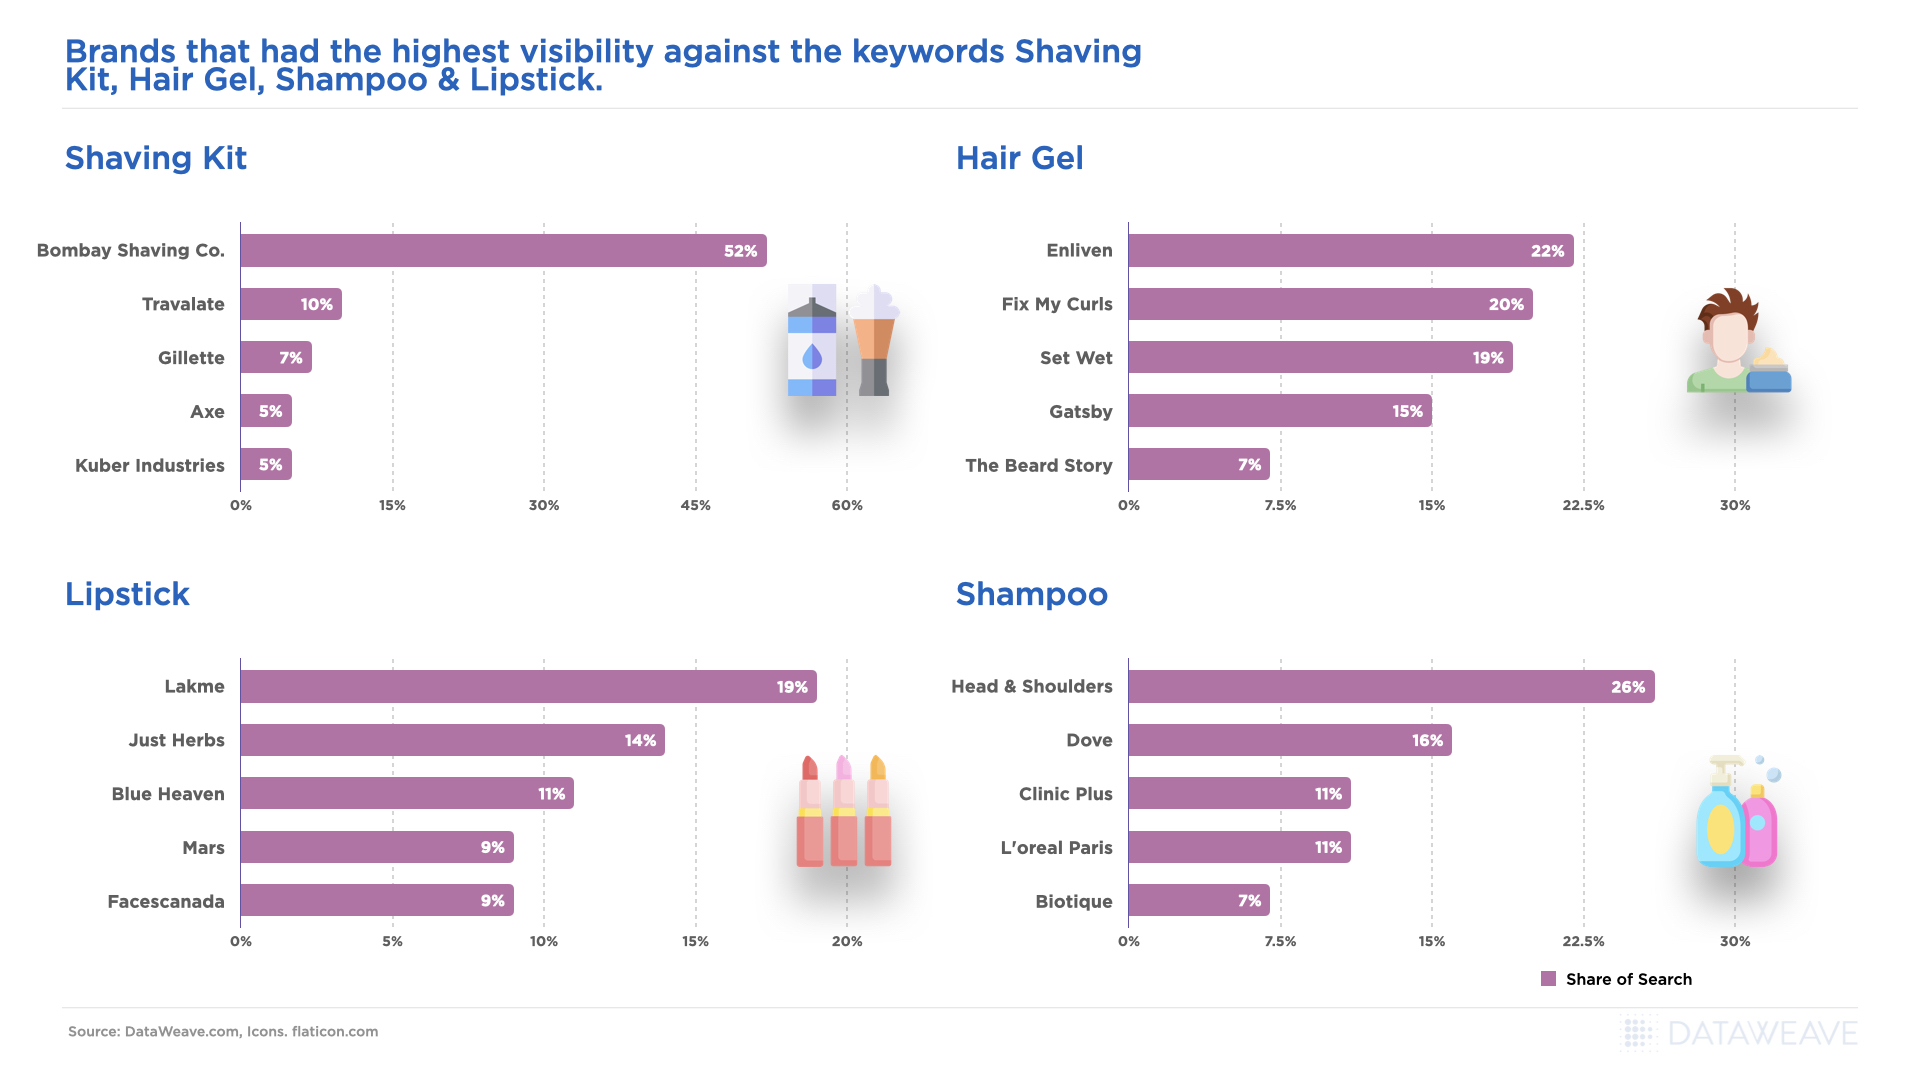
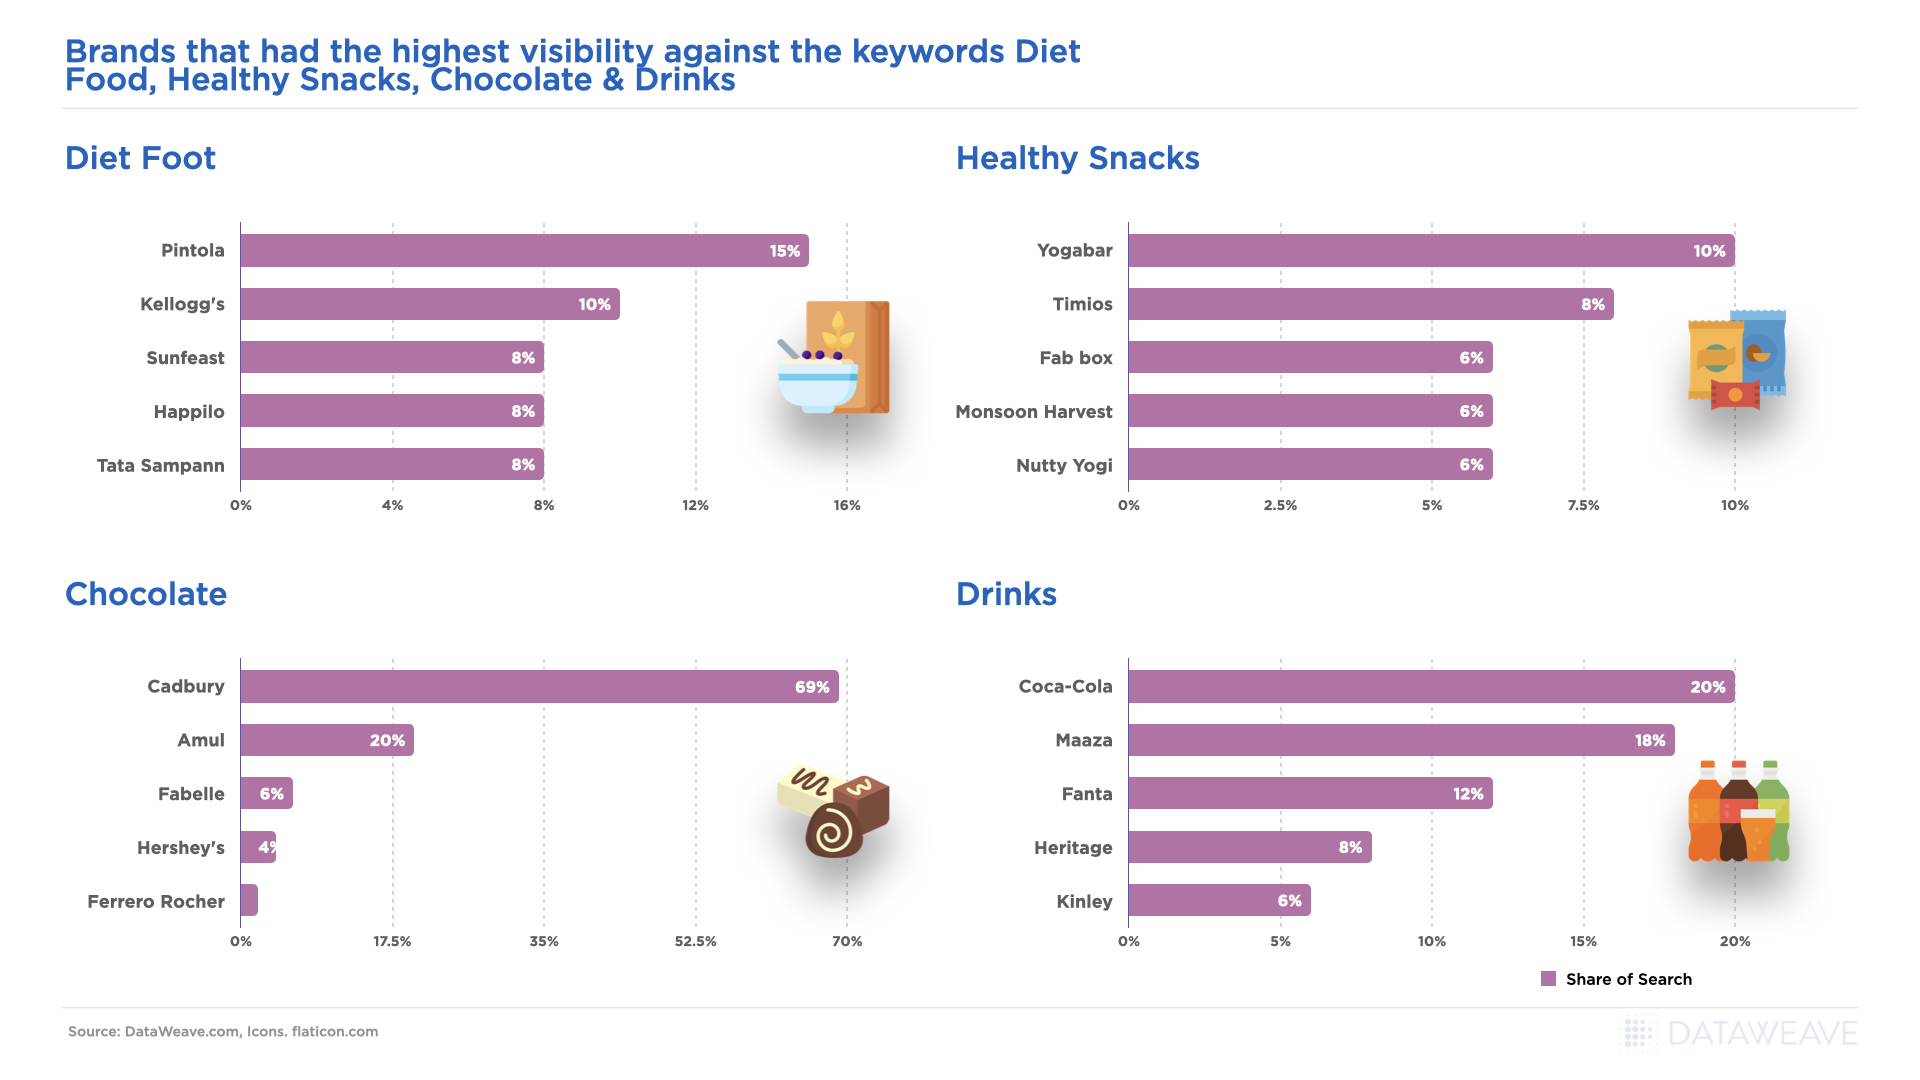
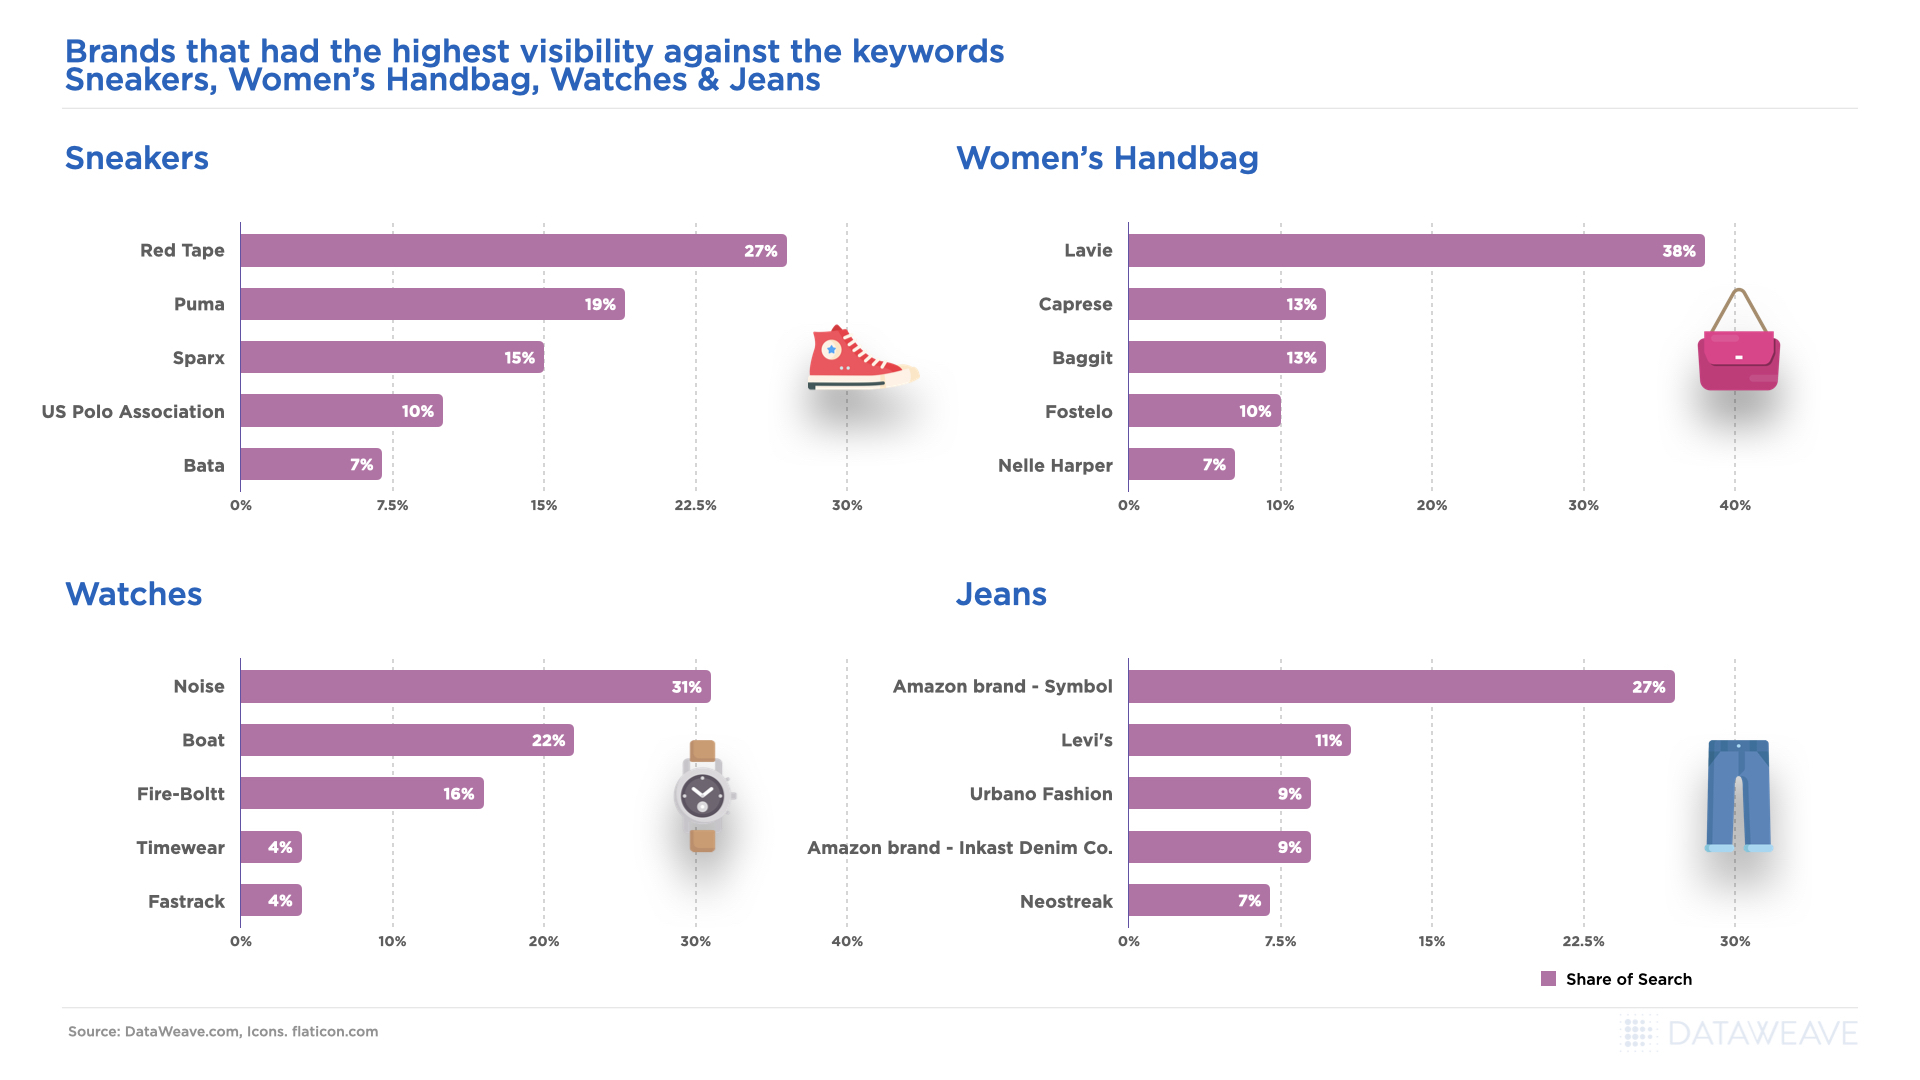
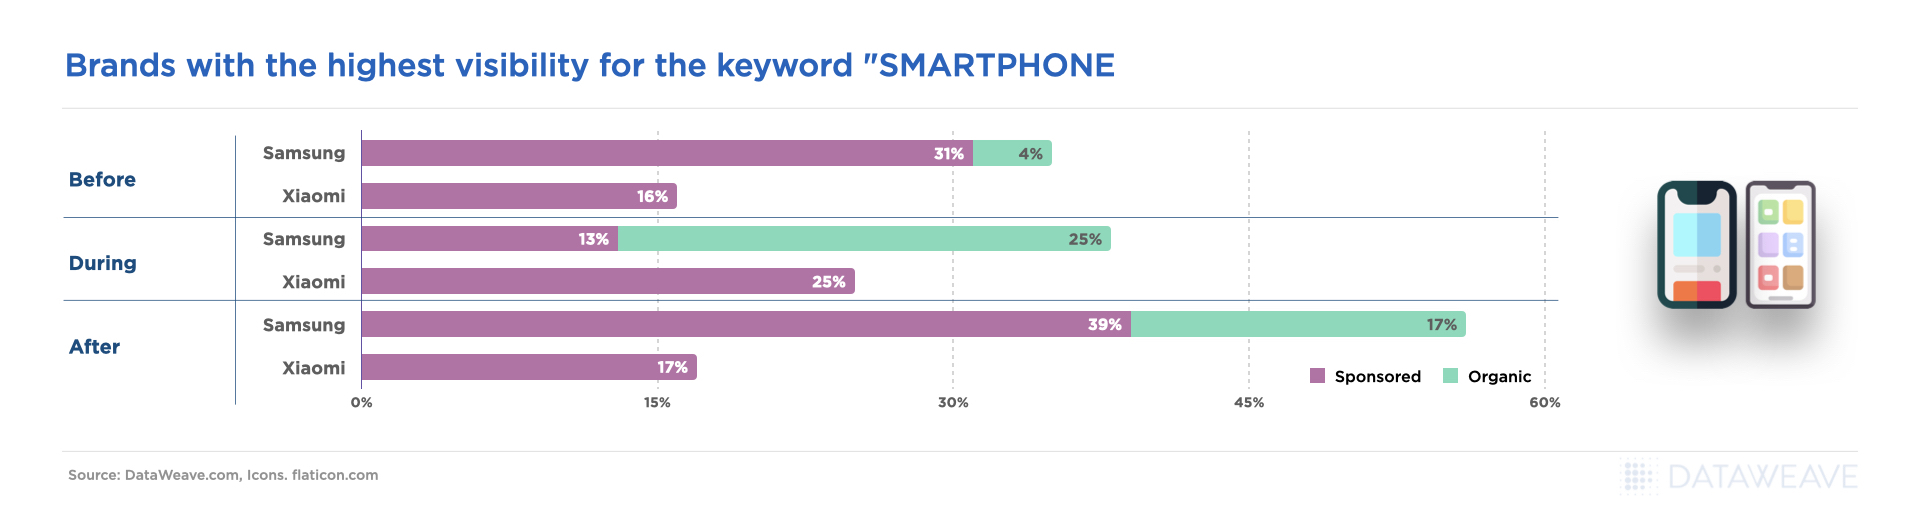
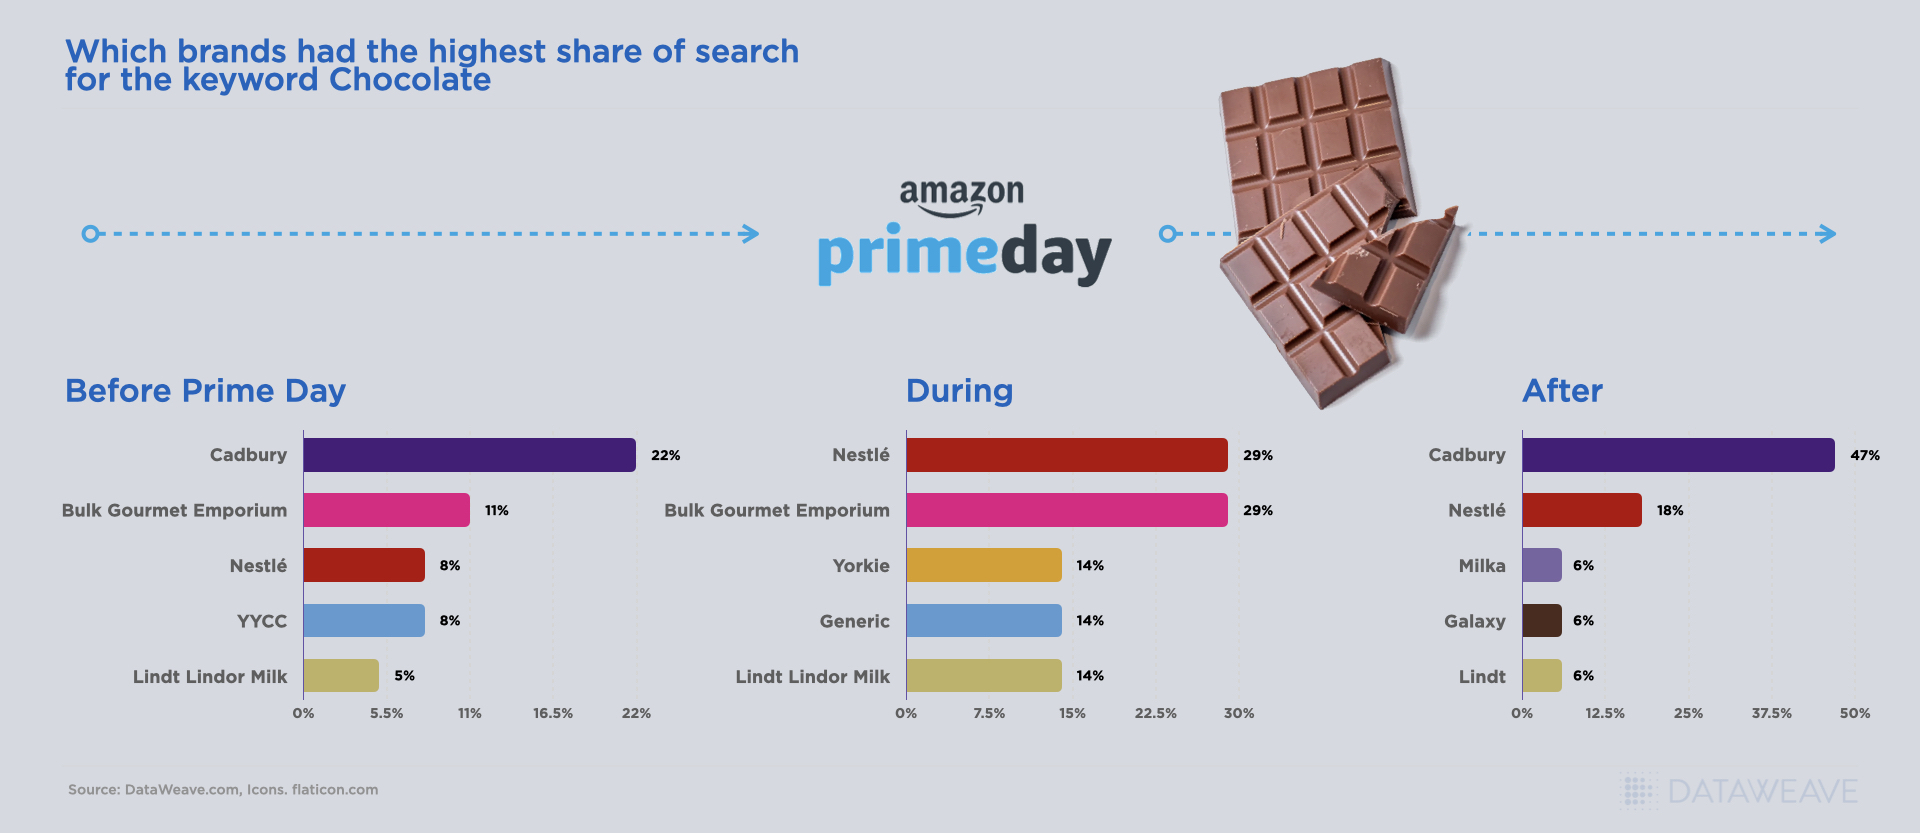
Share of Search Analysis
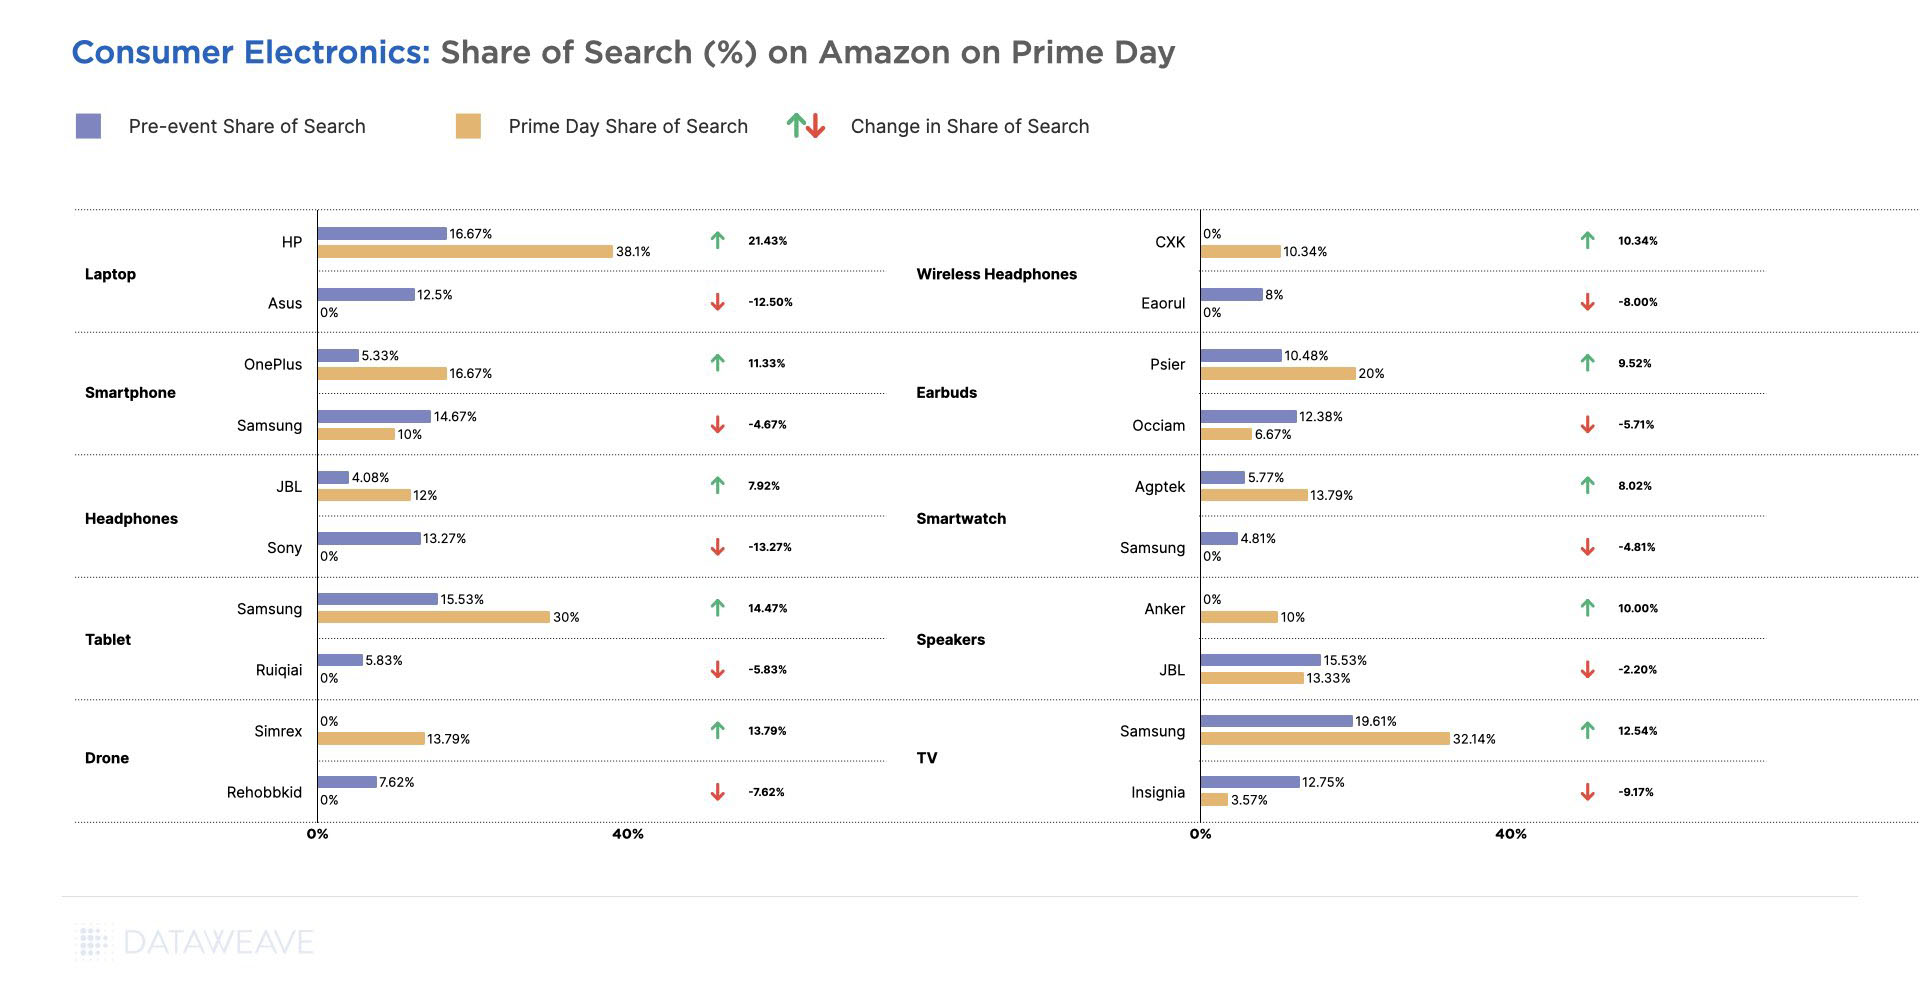
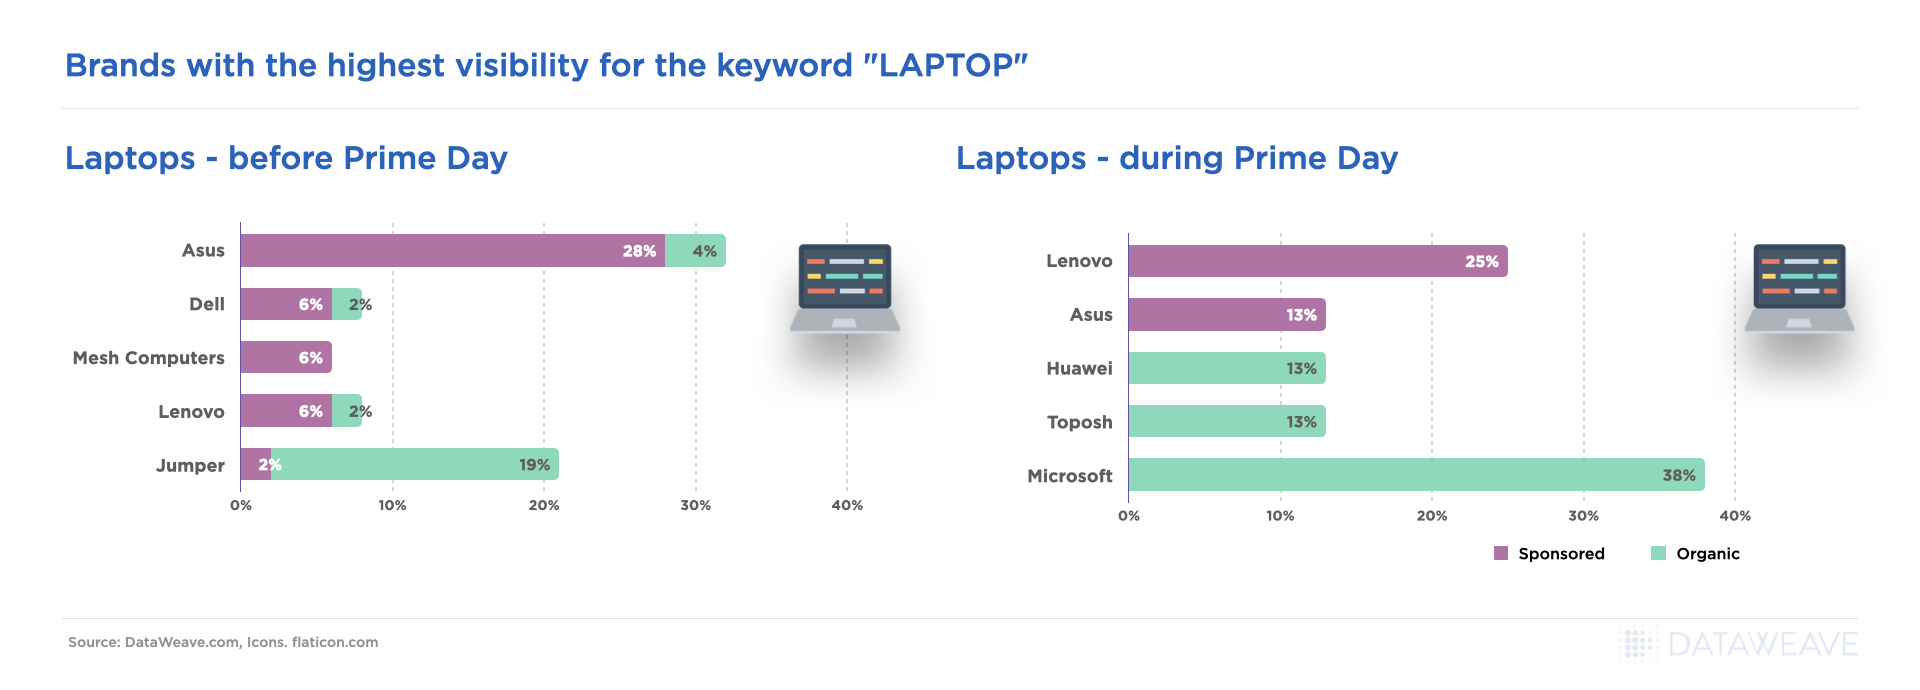
The Share of Search (SoS) for a brand represents the number of its products in the top 20 search results for relevant search keywords on Amazon, relative to that of its competitors. It provides insights into a brand’s visibility during the sale event.
HP saw the most significant improvement in its Share of Search during Prime Day, gaining 9.2%, with strong growth in both organic (7.5%) and sponsored (1.7%) listings. LG also made substantial gains of 8.2% and 5.3% respectively. Both brands offered significant markdowns on laptops and accessories.
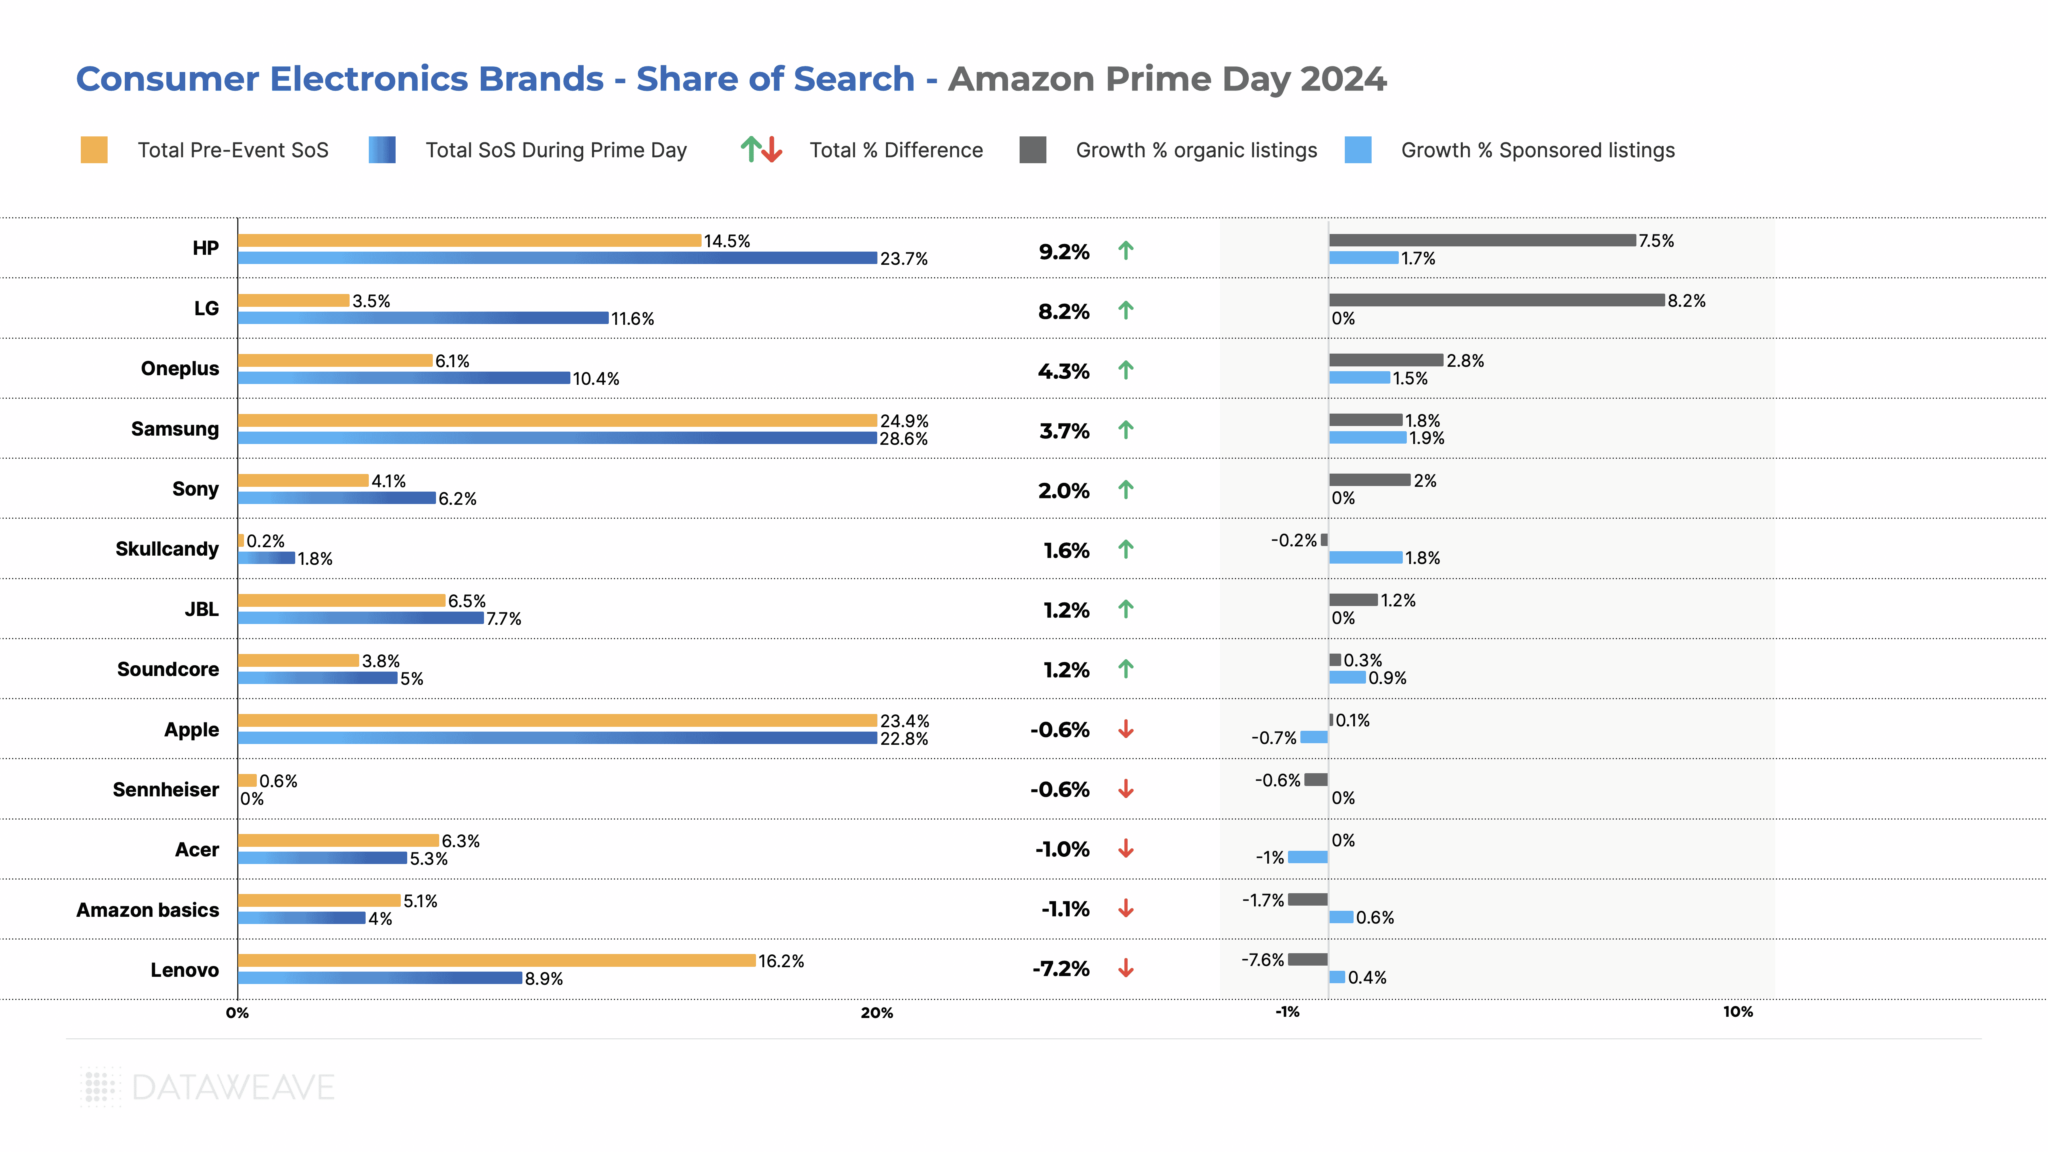
Surprisingly, some popular brands like Apple (-0.6%) and Acer (-1.0%) experienced slight decreases in their SoS. Lenovo notably lost 7.2% of its visibility share, with a significant decline in organic listings (-7.6%). Samsung maintained its strong position with an increase in SoS (3.7%).
Key Takeaways:
While some brands like Soundcore and OnePlus used aggressive discounting to drive sales, others like HP and LG focused on improving their search visibility. The data suggests that a combination of attractive discounts and improved search visibility was key to success during the event. Brands that managed to balance these factors effectively, like HP and Samsung, seemed to perform particularly well. Interestingly, some brands with lower discounts (like HP) still managed to significantly increase their SoS, indicating that factors beyond pricing played a role in visibility during the event.
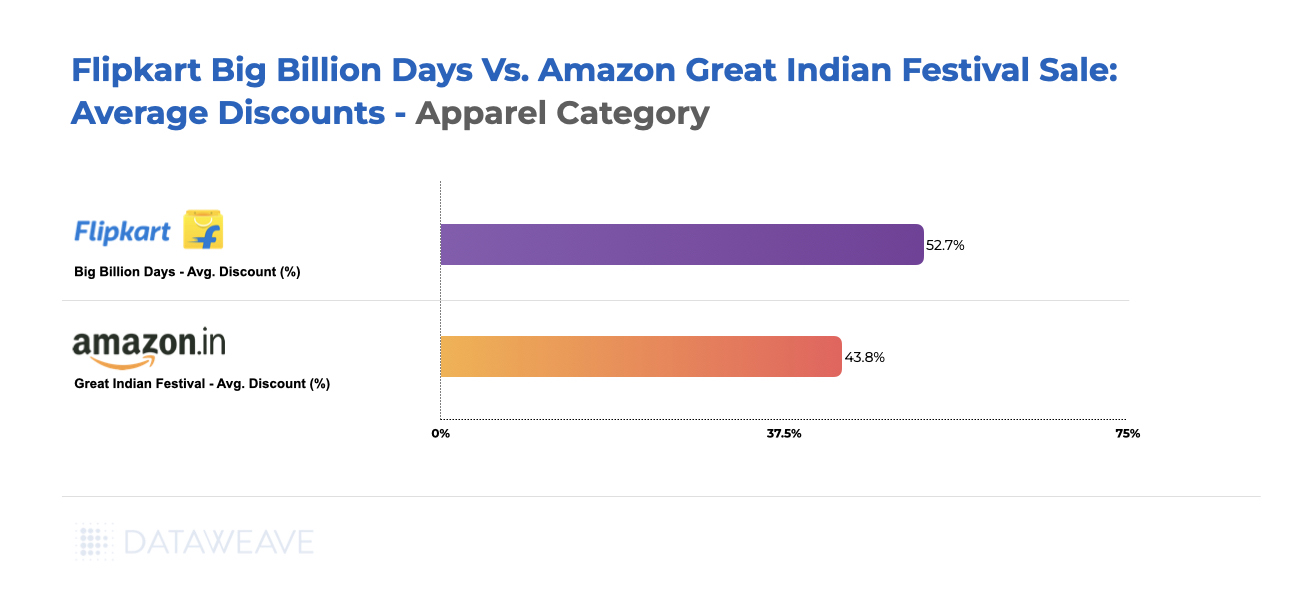
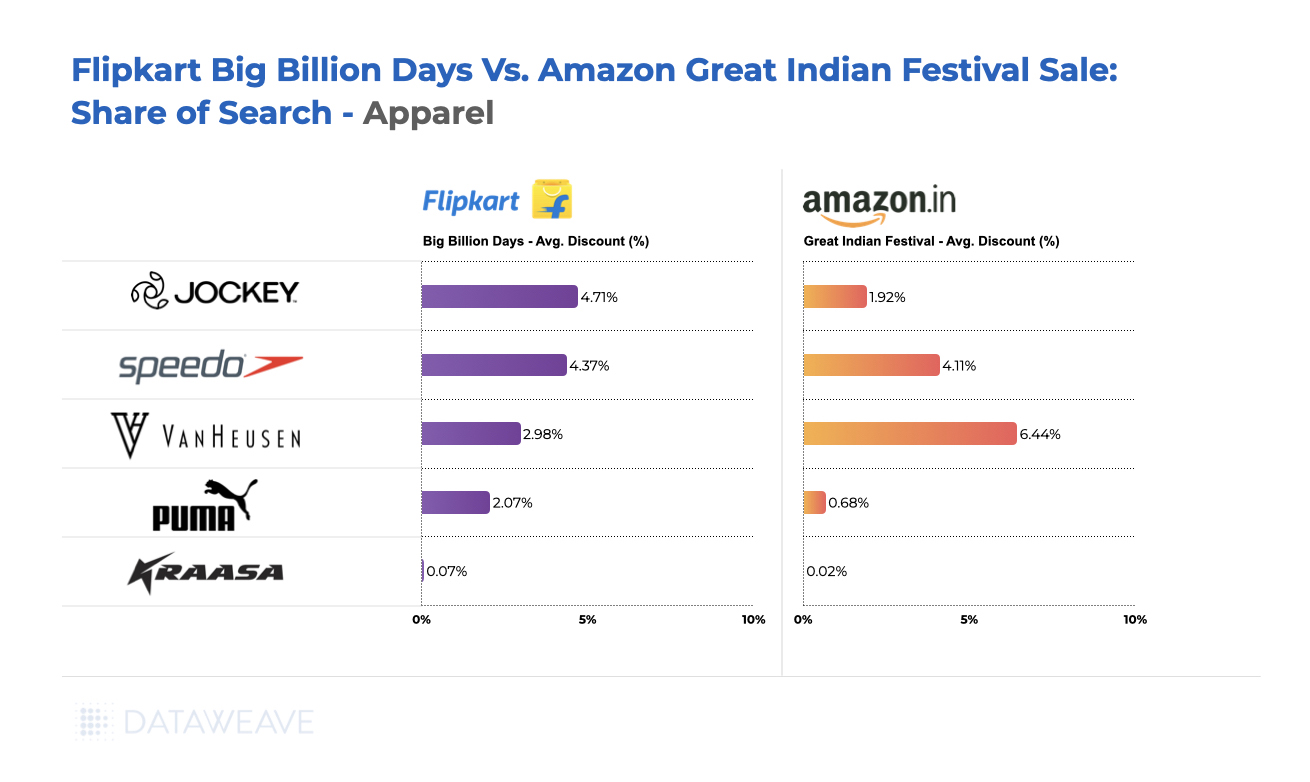
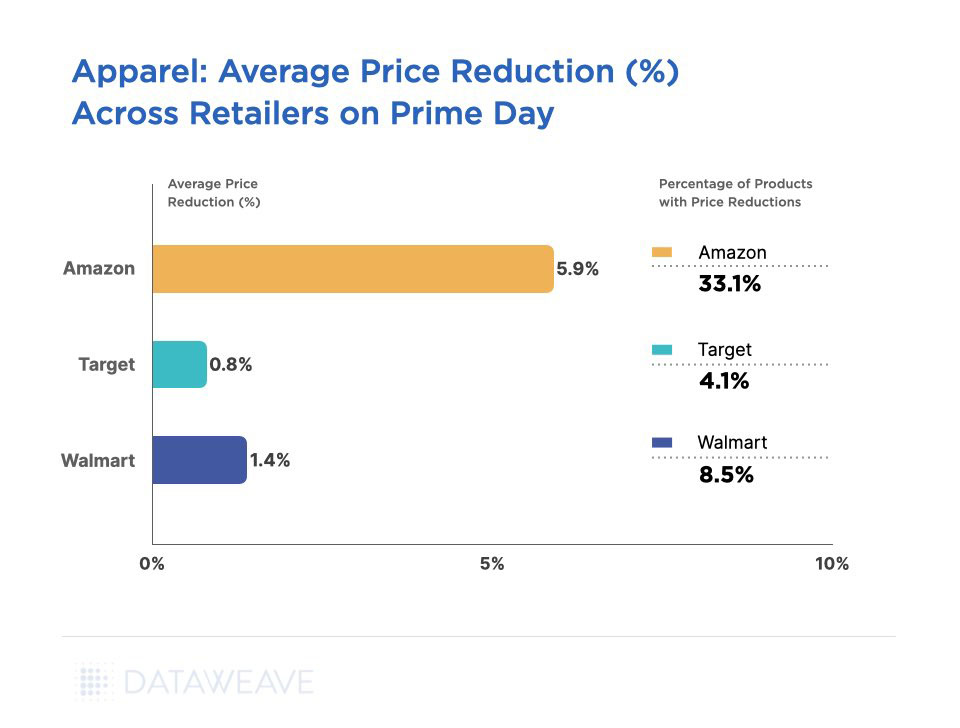
Apparel
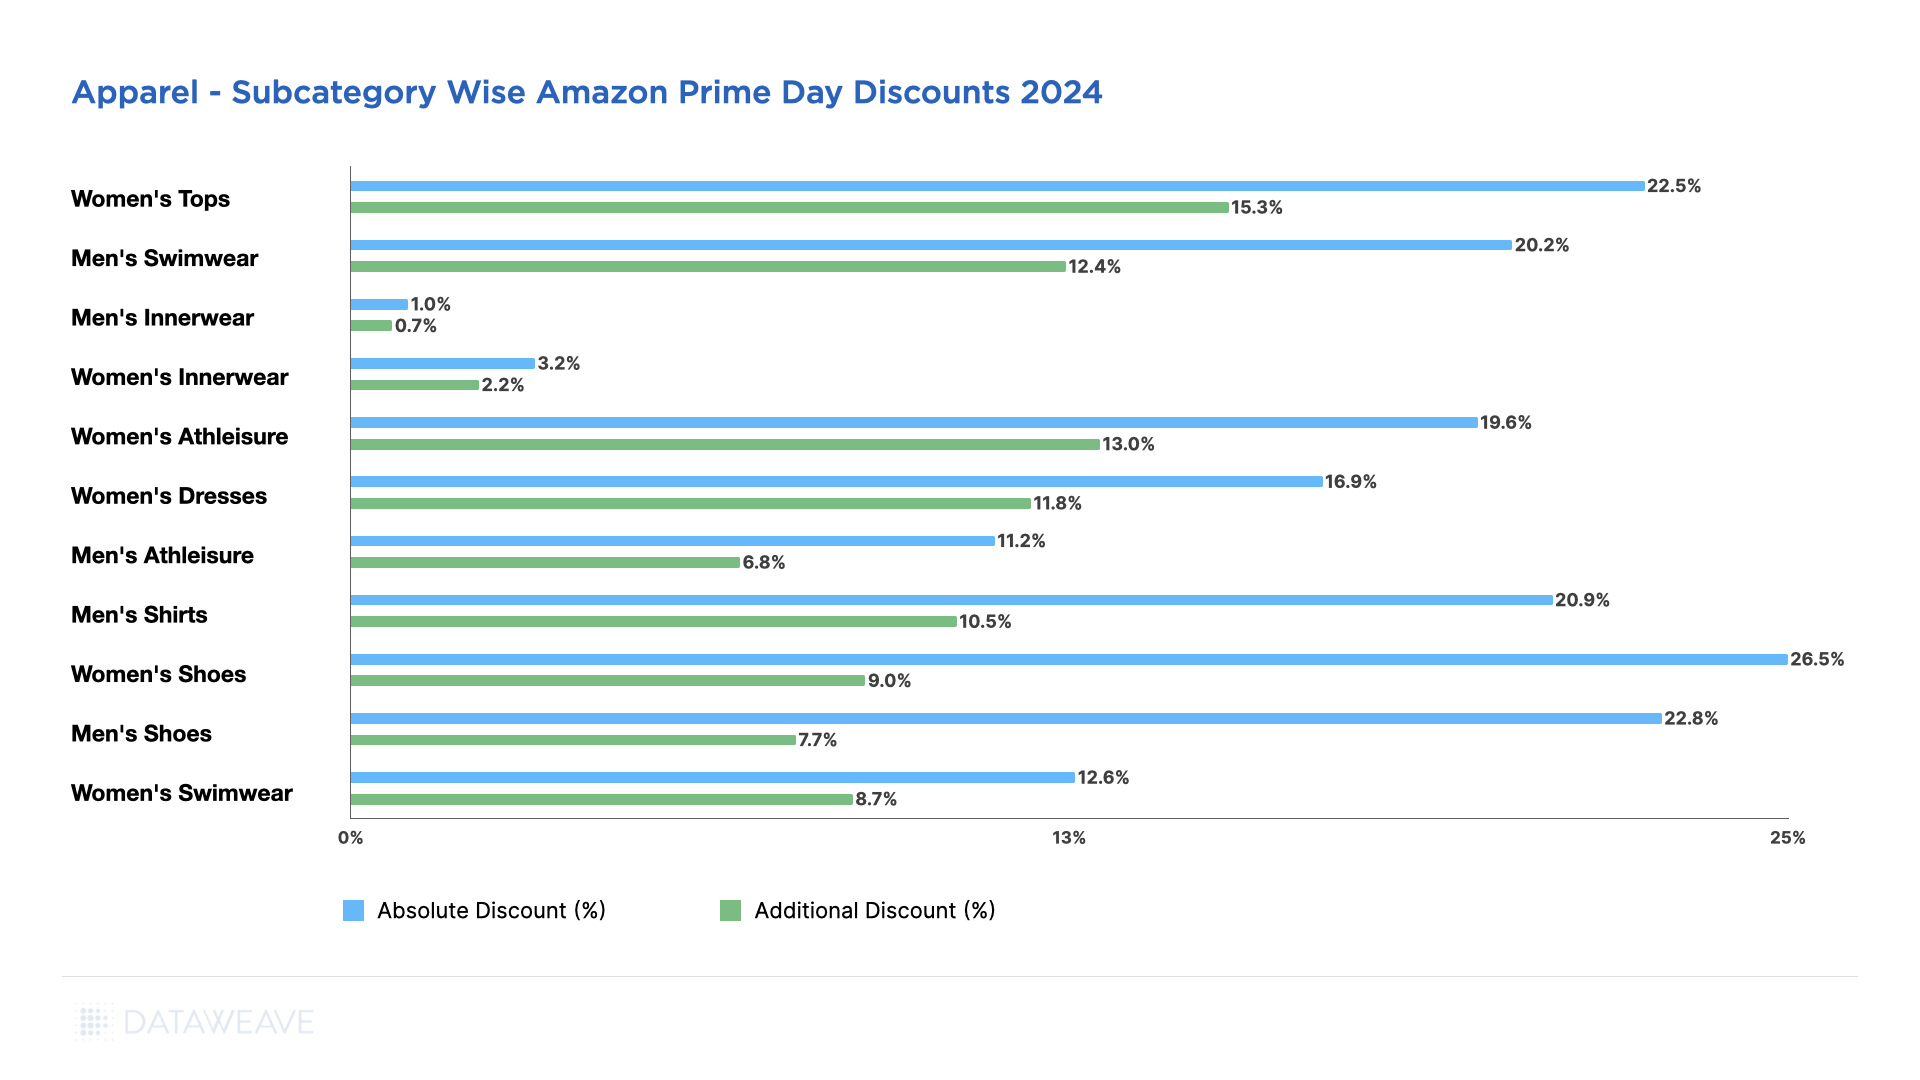
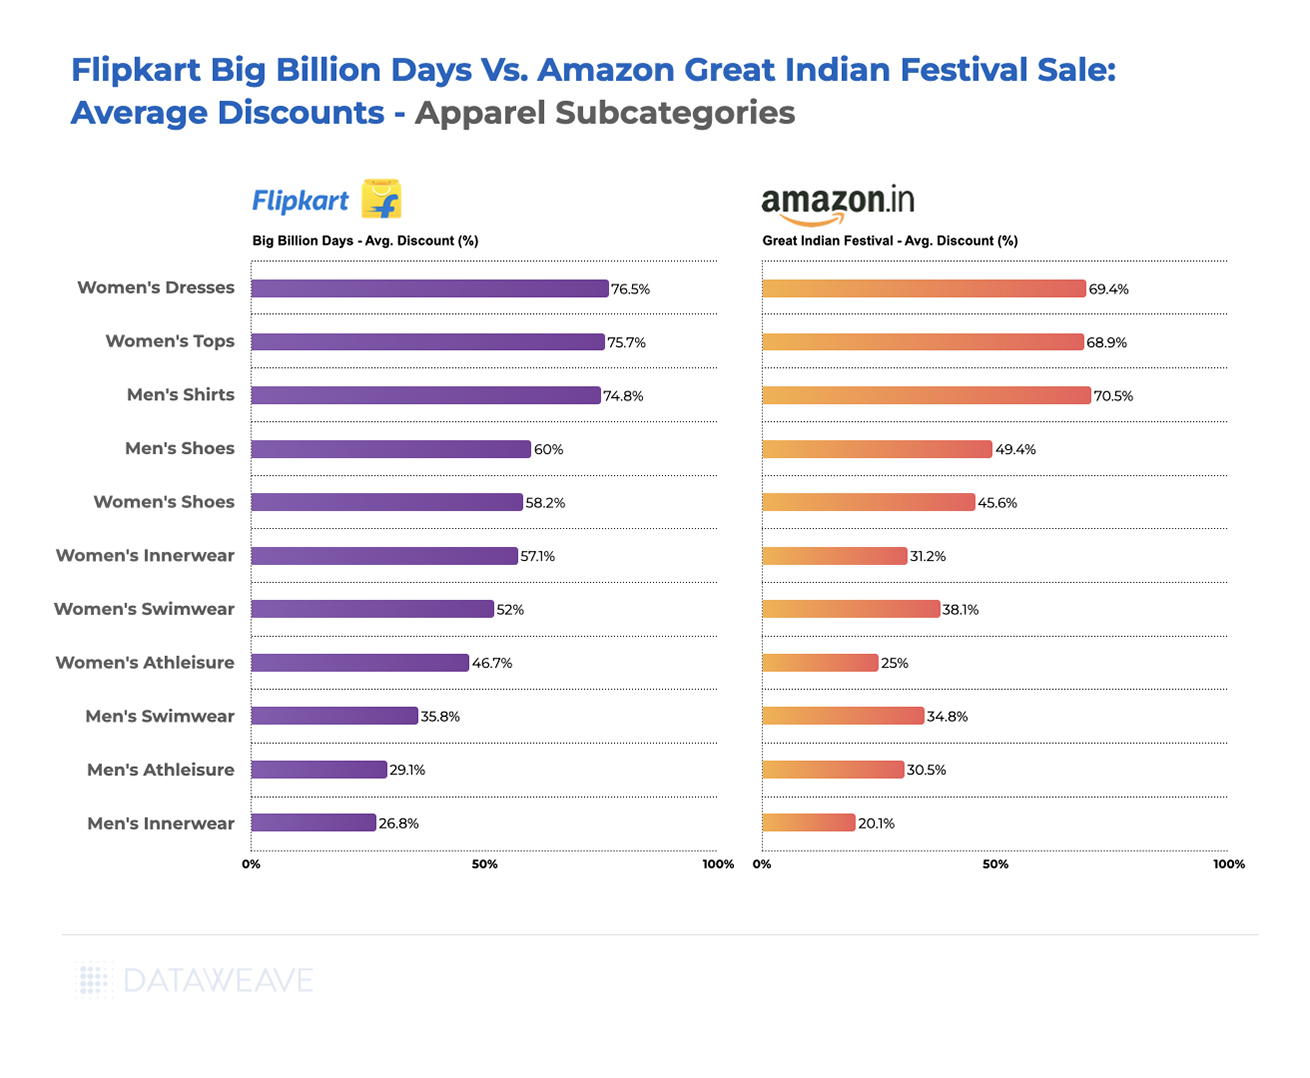
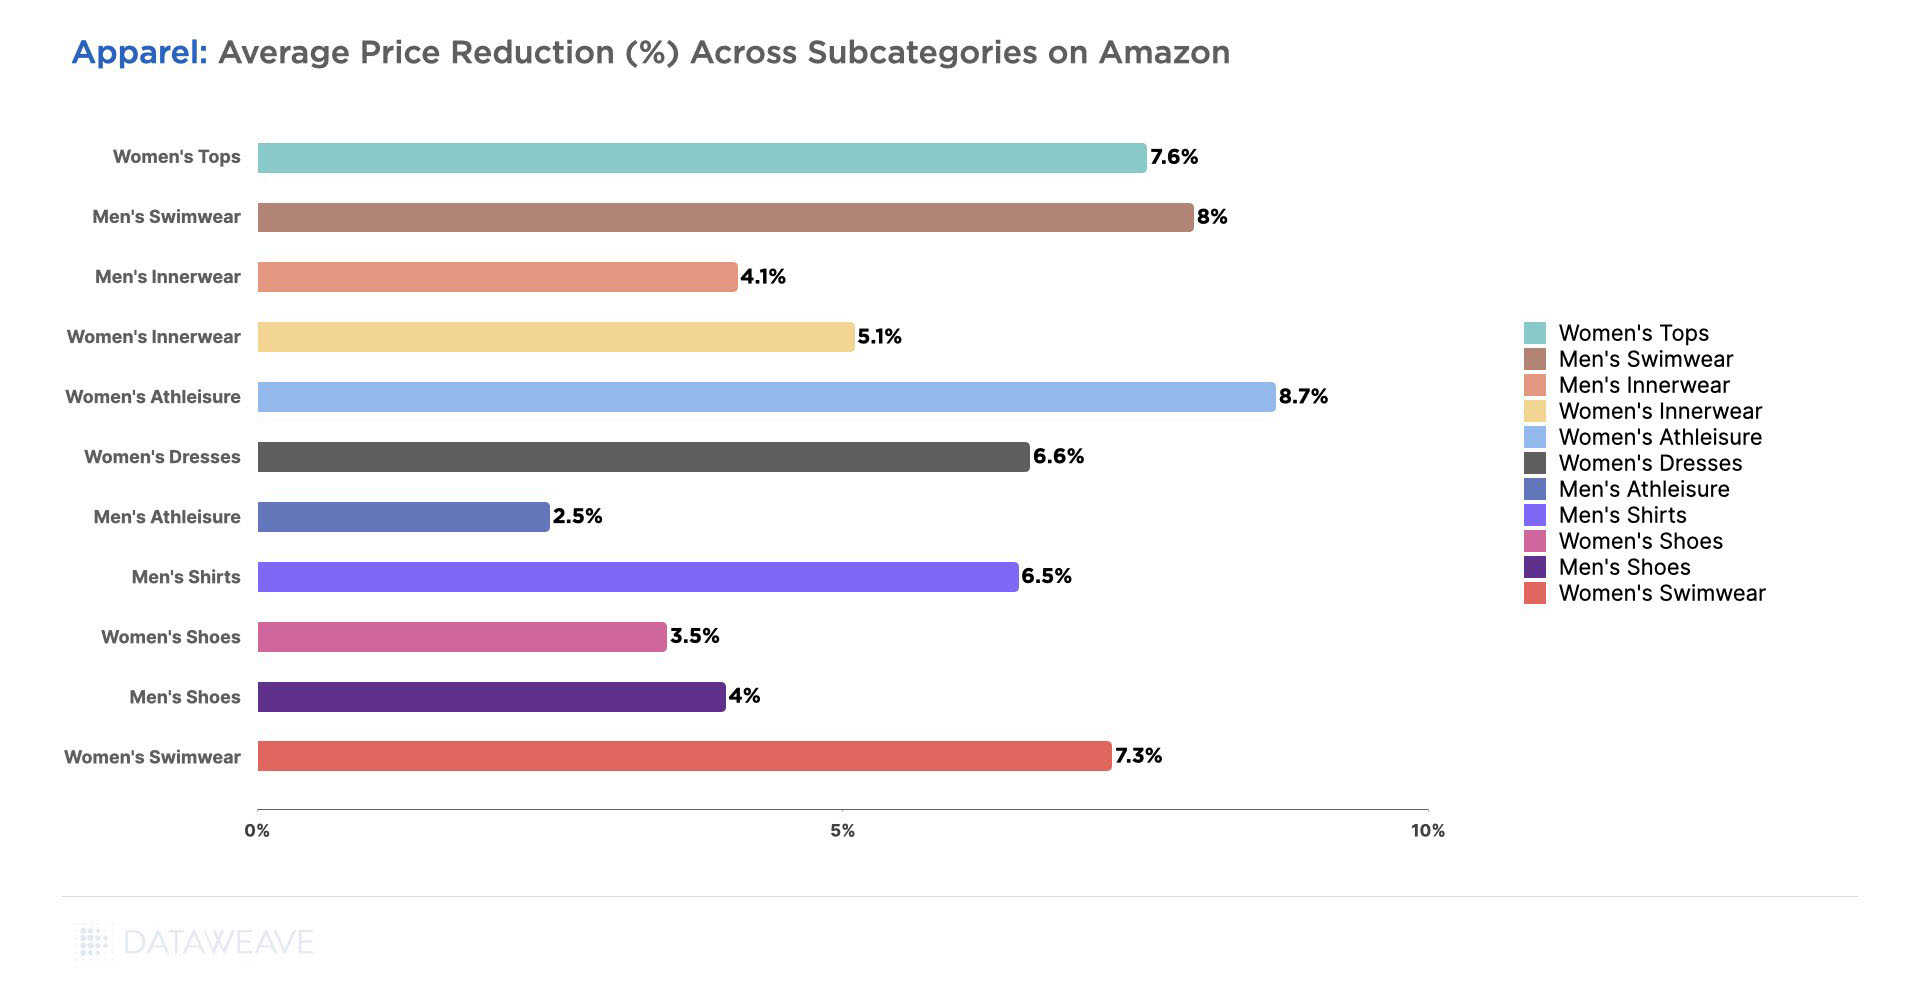
Within the subcategories analyzed, Women’s Shoes (13.4%) and Men’s Shoes (11.6%) saw the highest Additional Discounts on Amazon, indicating a strong focus on footwear during the event. Men’s Shirts followed closely at 11.1%
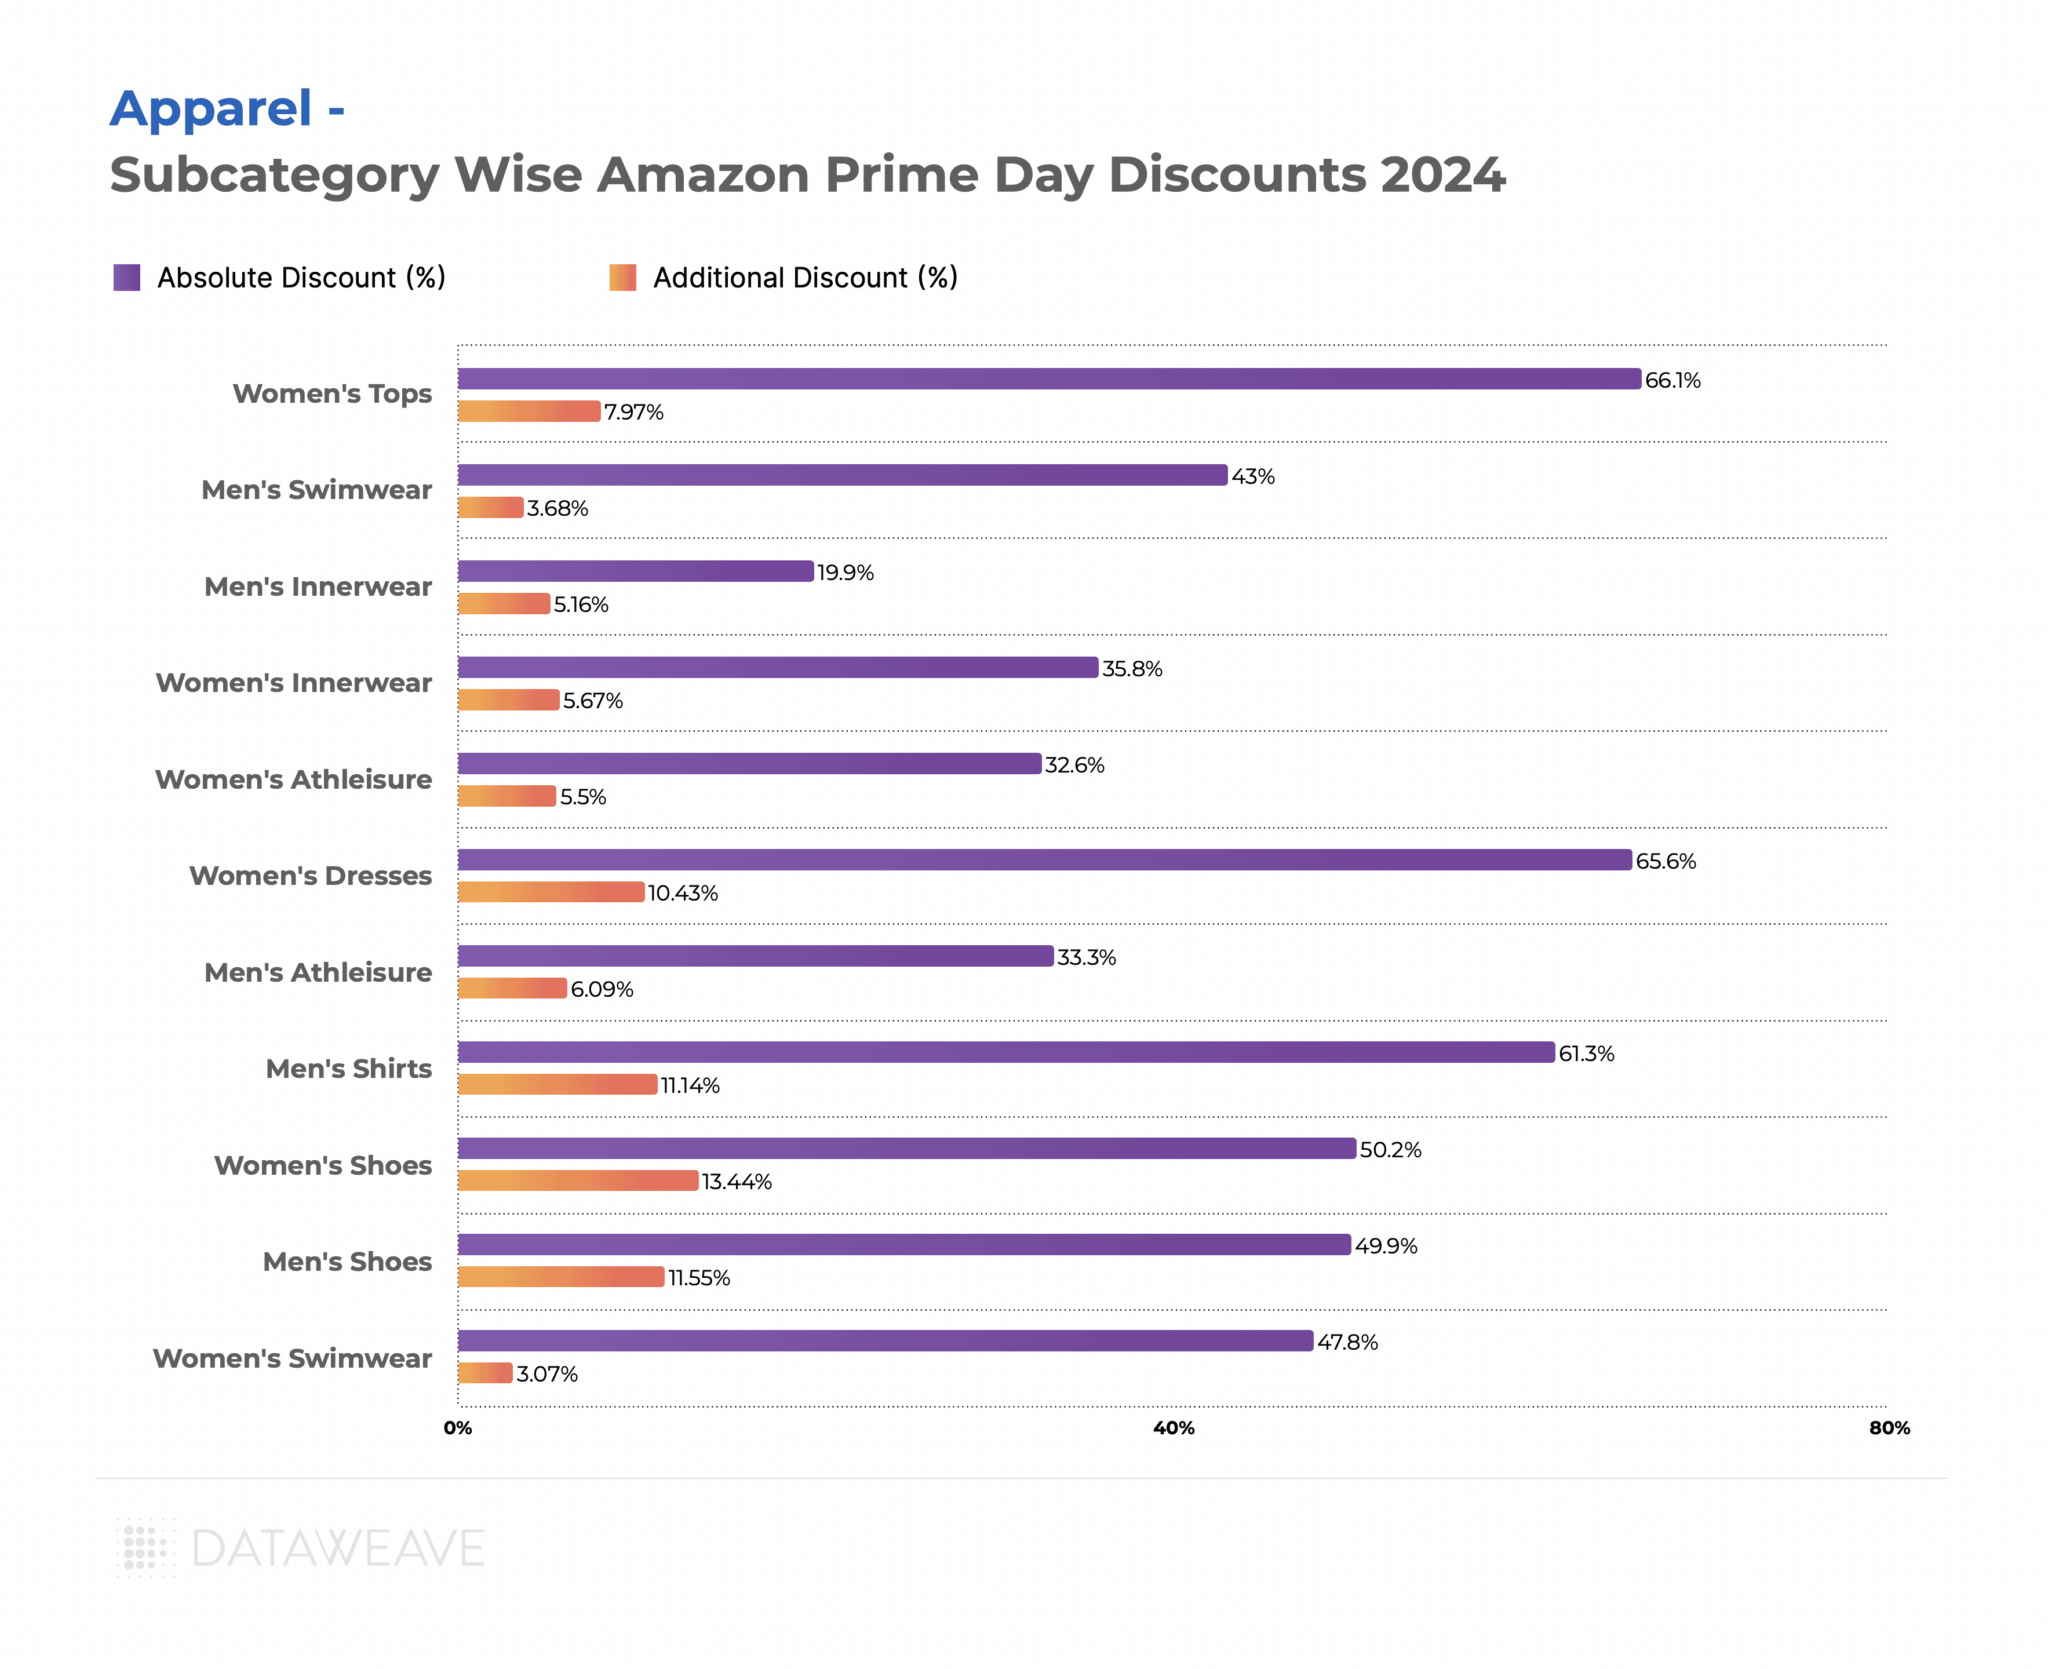
Women’s Tops had a more modest Additional Discount of 7.9% despite a high Absolute Discount before the event. Similarly, Women’s Dresses showed substantial Additional Discounts (10.4%).
Swimwear for both men and women saw low Additional Discounts (3.7% and 3.0% respectively). Innerwear categories for both men and women had more conservative discounts, with Men’s Innerwear showing the lowest Absolute Discount (19.9%) among all subcategories.
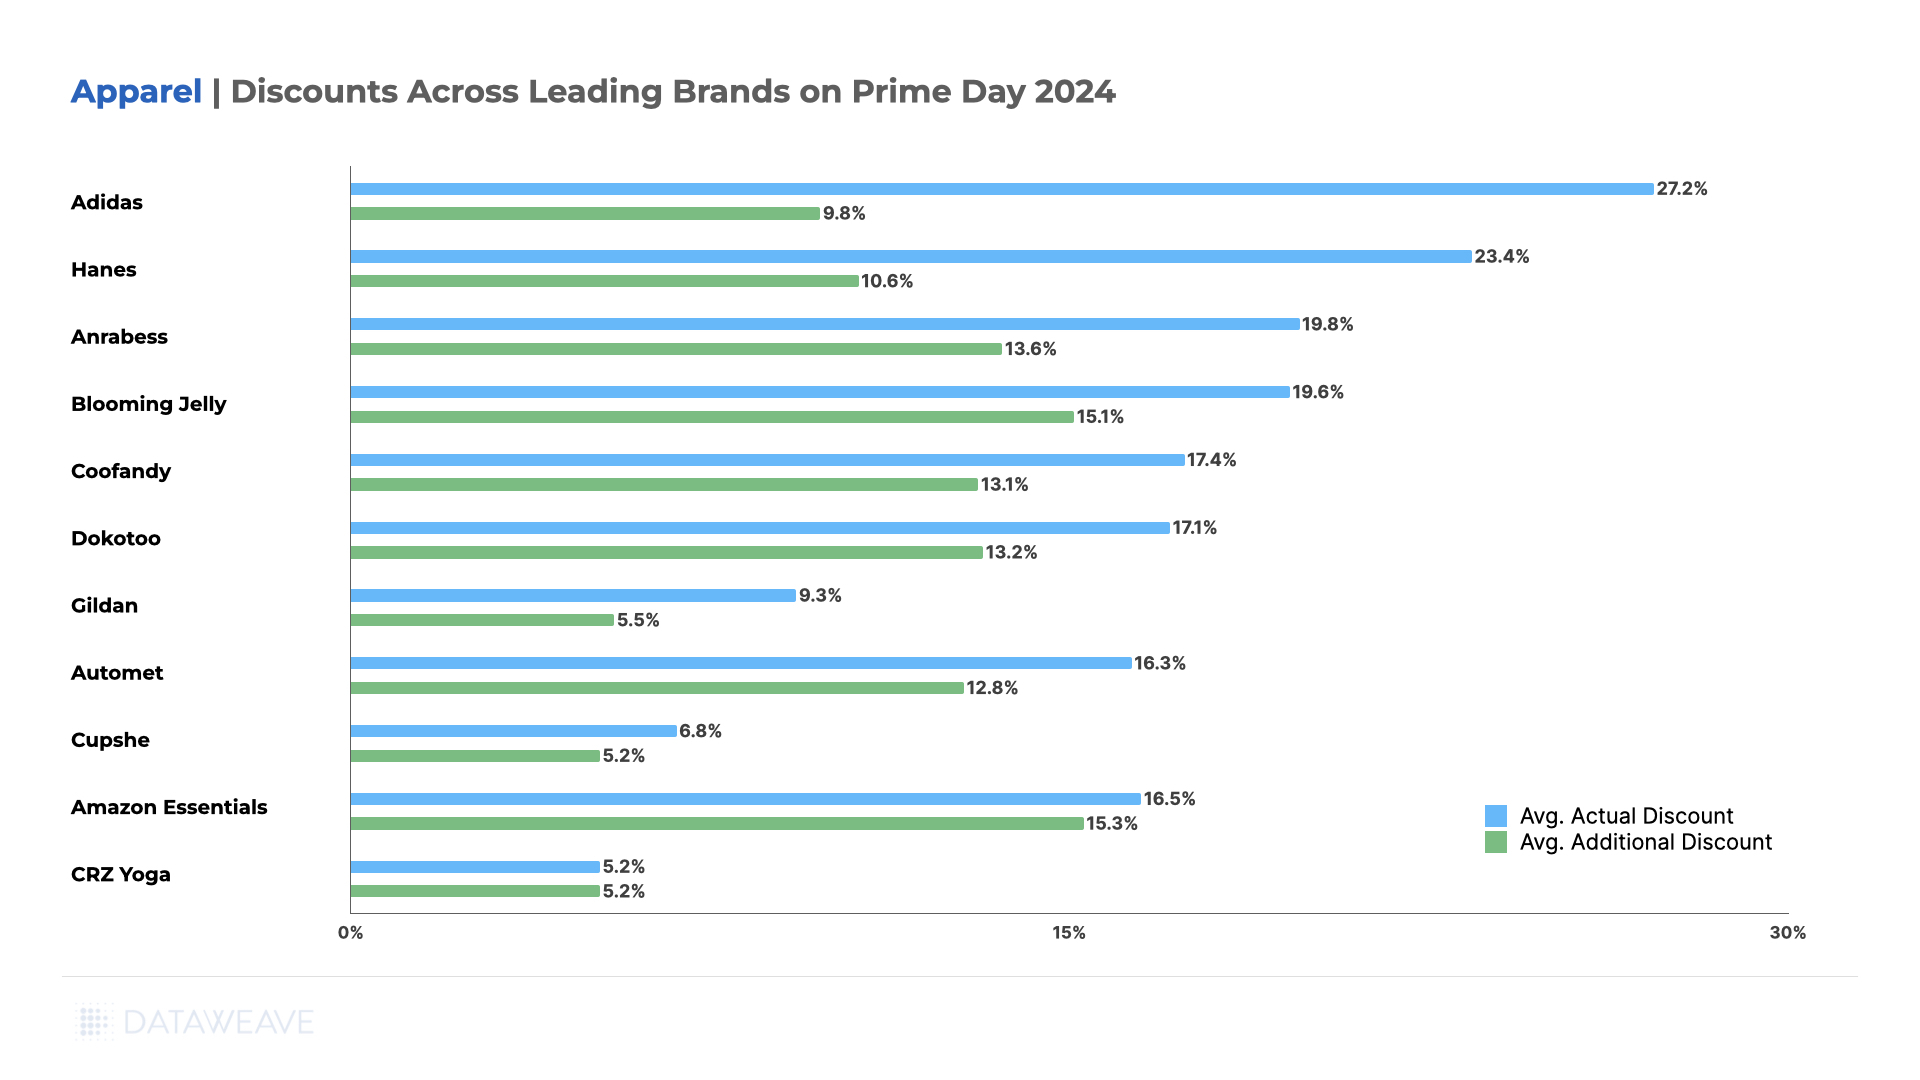
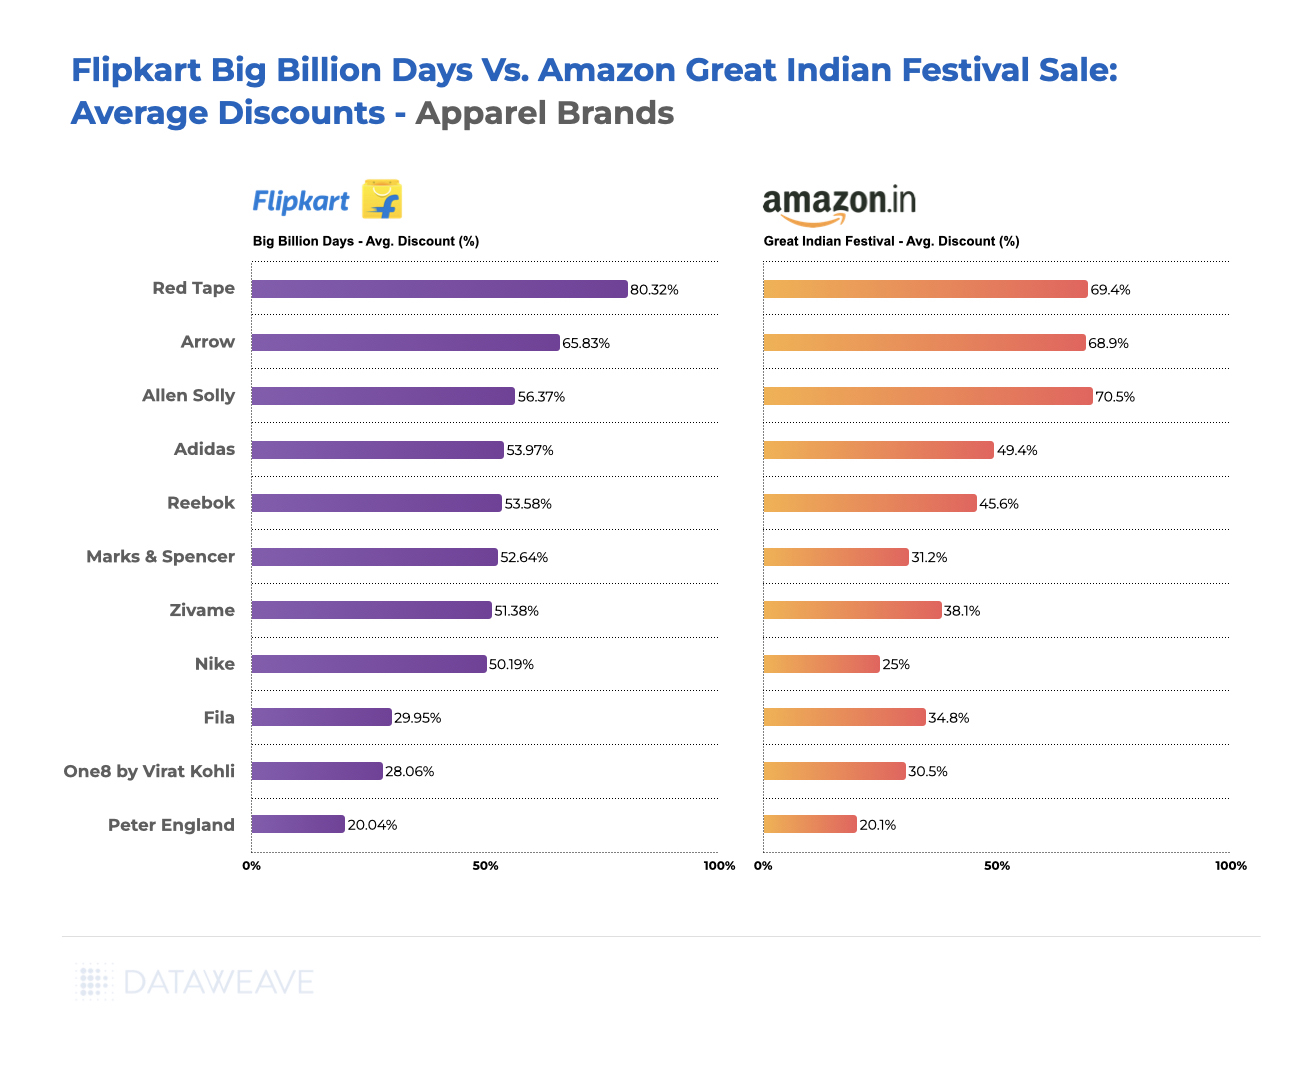
Brand-level Insights in Apparel
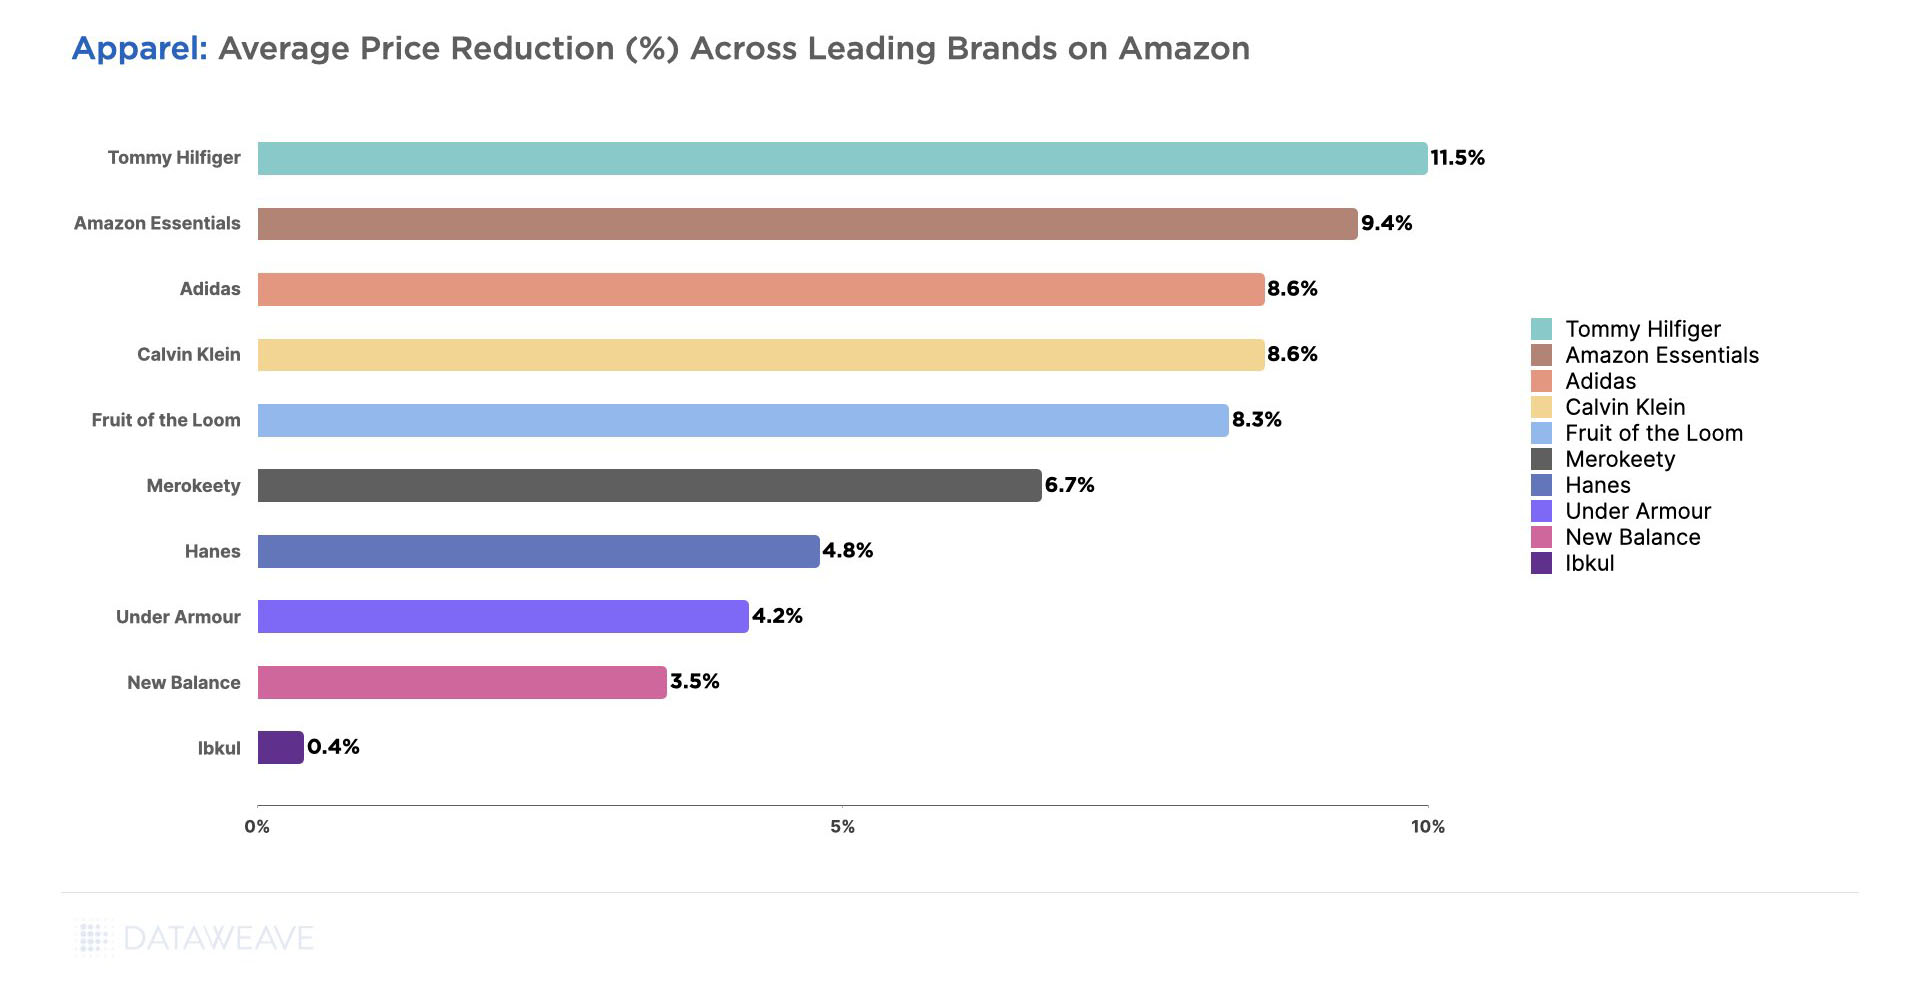
During the sale event, Sangani (innerwear brand) led with the highest Additional Discount of 41%, followed by Louis Philippe at 25%. These brands clearly leveraged Prime Day to drive sales and gain market share.
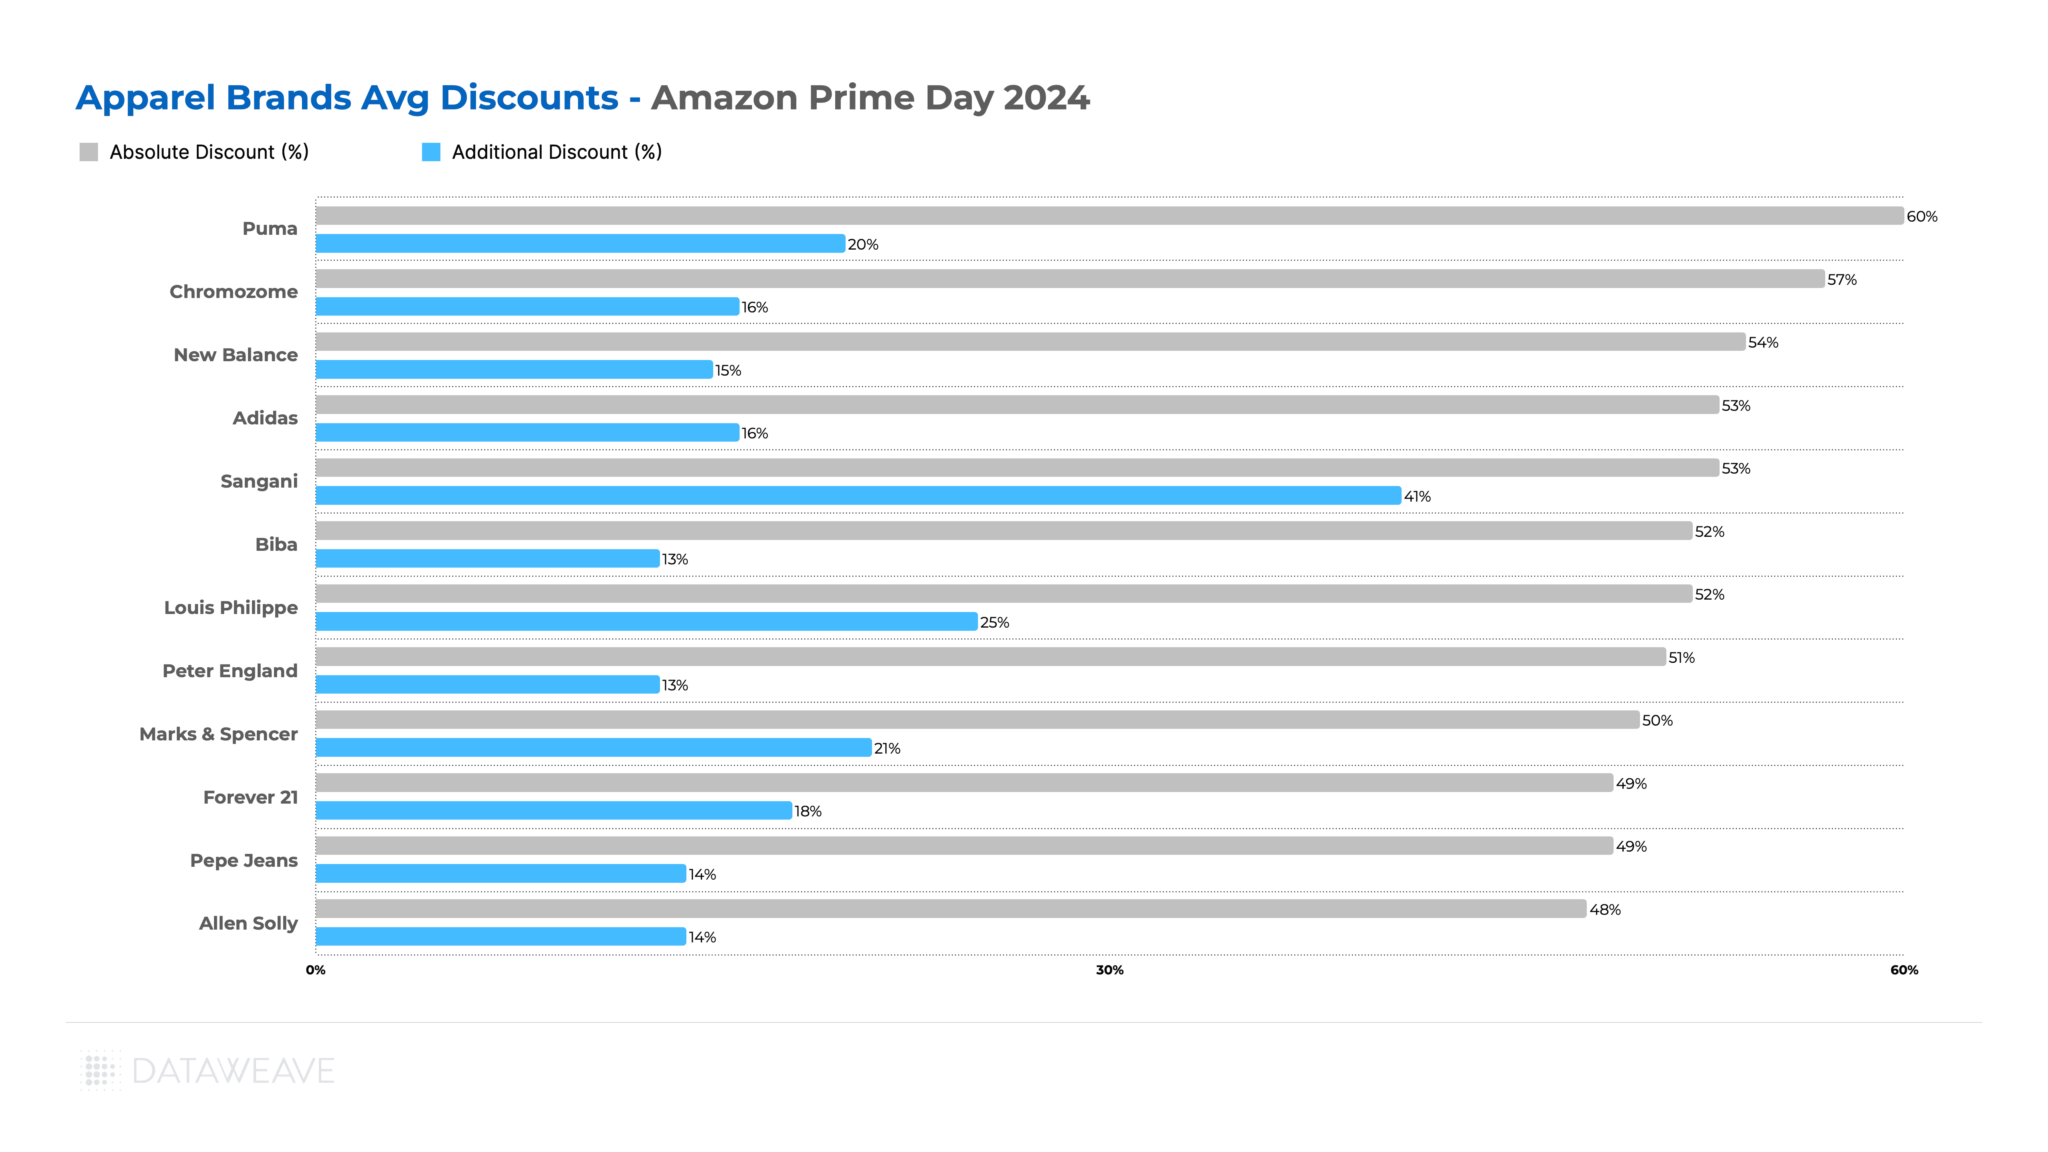
Puma offered the highest Absolute Discount at 60% with a significant Additional Discount of 20%, indicating a consistently aggressive promotional strategy. Chromozome (men’s innerwear brand) and Bacca Bucci (homegrown shoe brand of Shark Tank India fame) also offered substantial Absolute Discounts (57% and 56% respectively), but their Additional Discounts varied significantly (16% and 6% respectively).
Again, some well-known brands like Adidas, and Pepe Jeans offered more moderate Additional Discounts, possibly due to their established market positions.
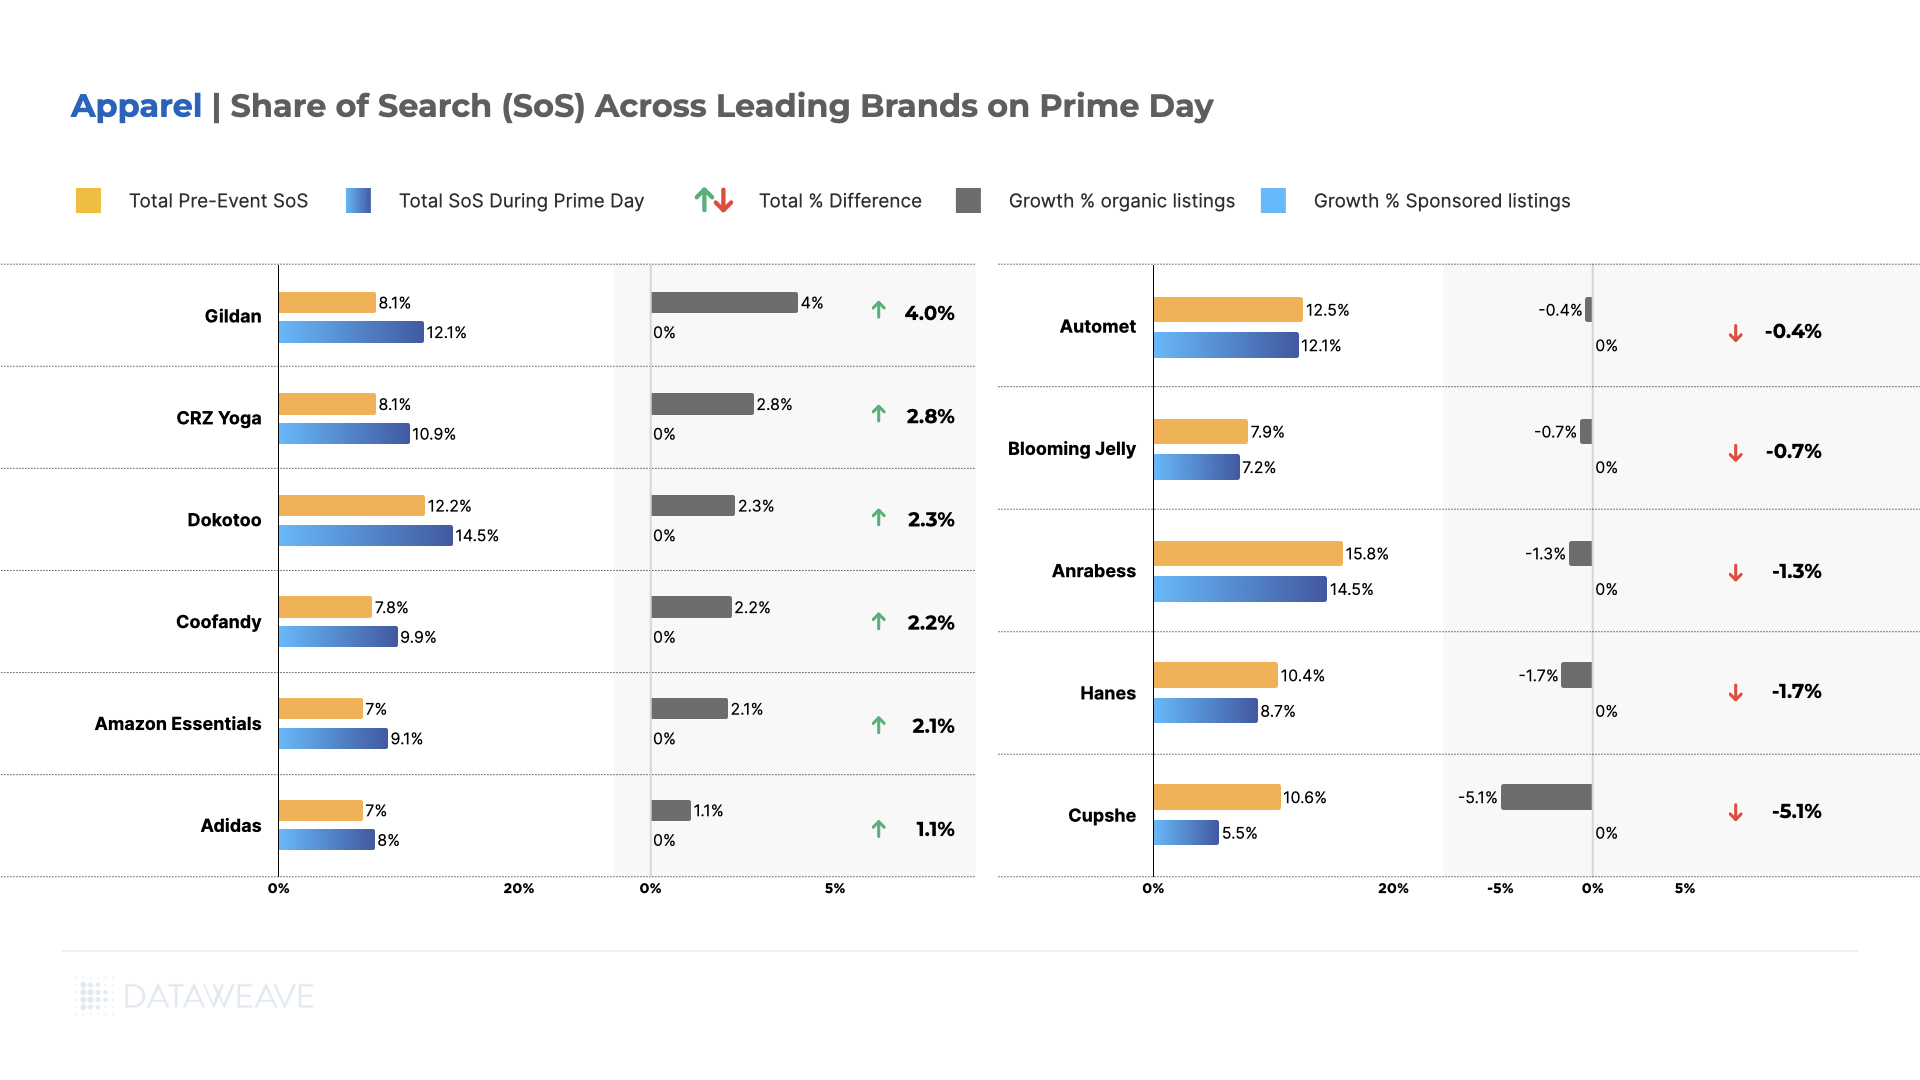
Share of Search Analysis
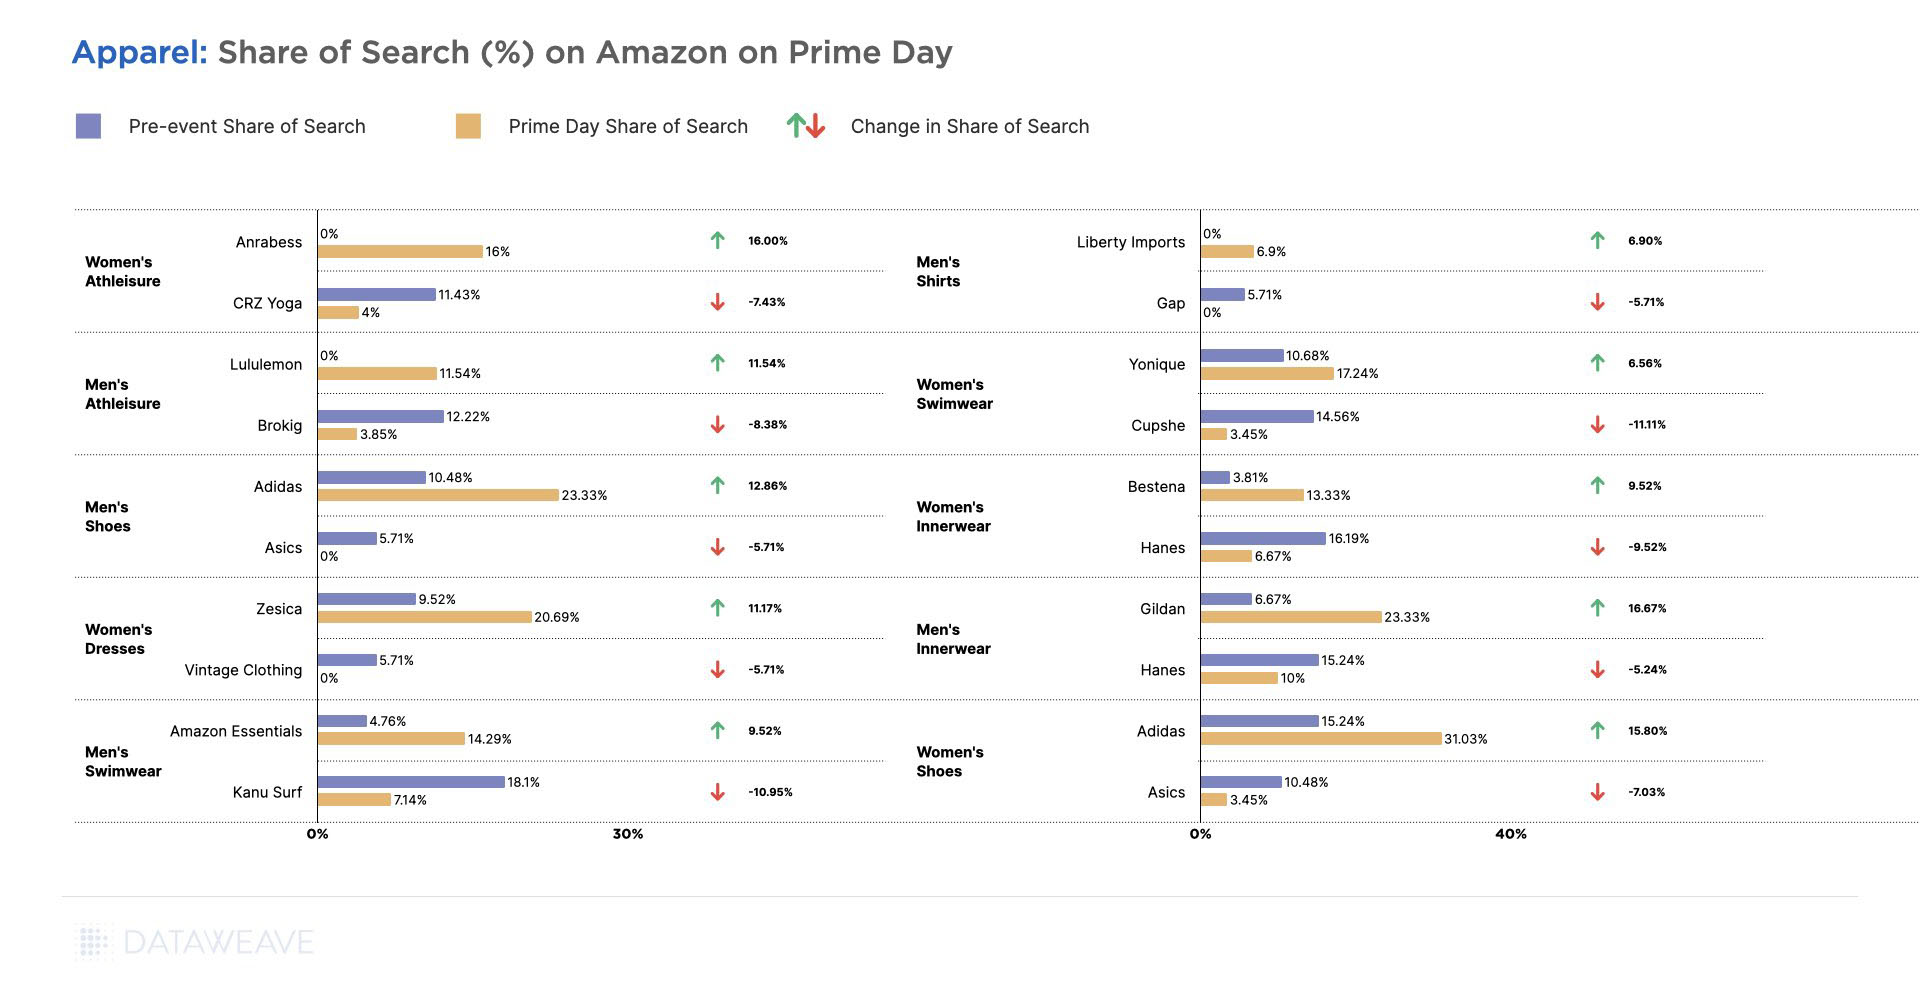
Biba (women’s ethnic wear brand) saw the most significant improvement in its SoS, gaining 3.60%, entirely through investments in sponsored listings. Allen Solly and New Balance (shoe brand) also made substantial gains of 3.3% and 3.2% respectively.
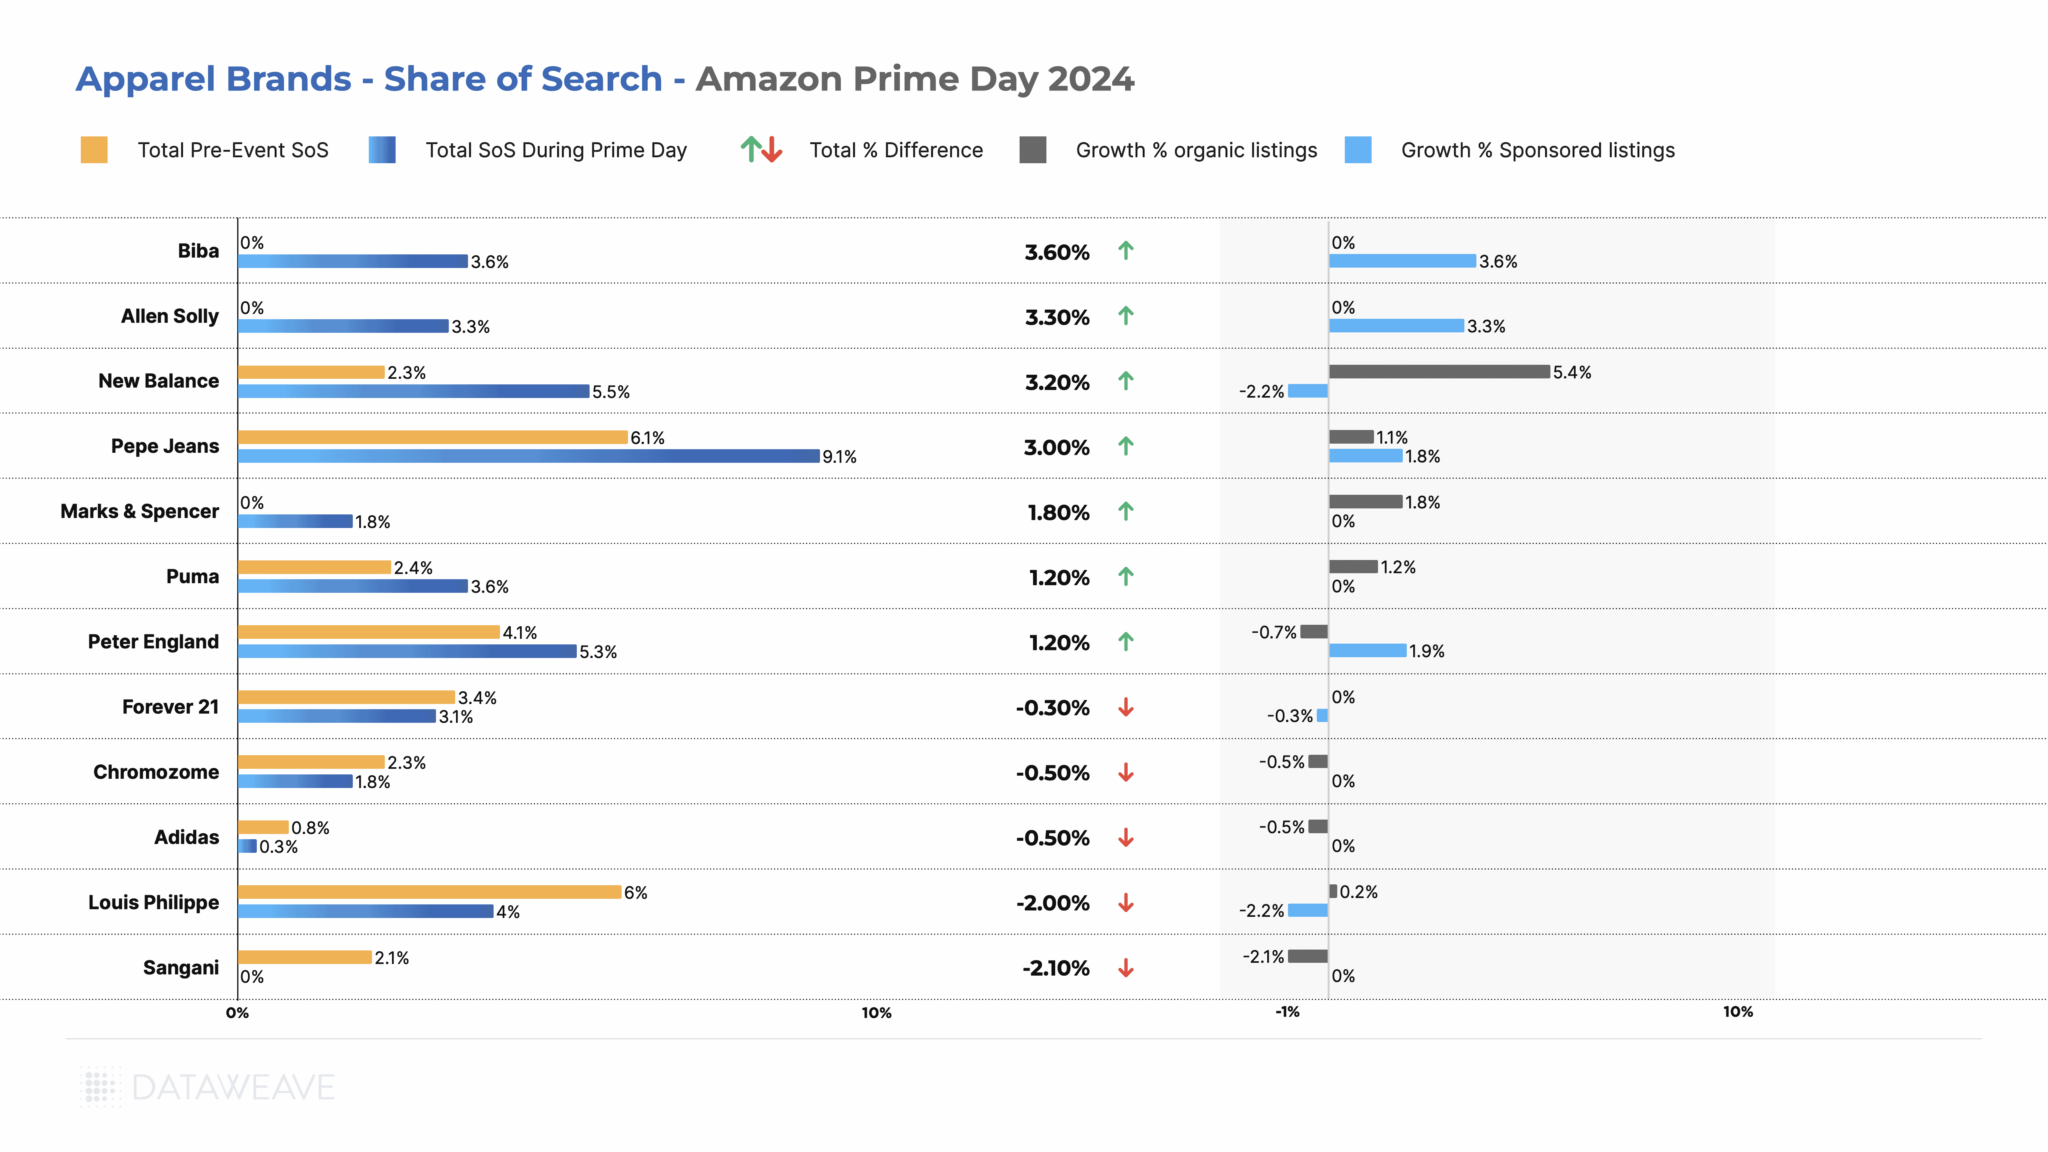
Surprisingly, some popular brands like Louis Philippe (-2.00%) and Sangani (-2.10%) experienced decreases in their SoS. Louis Philippe lost its share due to a roll back of its sponsored listings, while Sangini lost ground organically.
Key Takeaways:
While some brands like Sangani and Louis Philippe used aggressive discounting to drive sales, others like Biba and Allen Solly focused on improving their search visibility through sponsored listings.
Some brands with high discounts (like Sangani) saw a decrease in SoS, while others with more modest discounts (like Biba) significantly increased their visibility. This indicates that factors beyond pricing played a crucial role in brand performance during the event.
The significant use of sponsored listings by some brands highlights the importance of paid advertising in gaining visibility during competitive events like Prime Day.
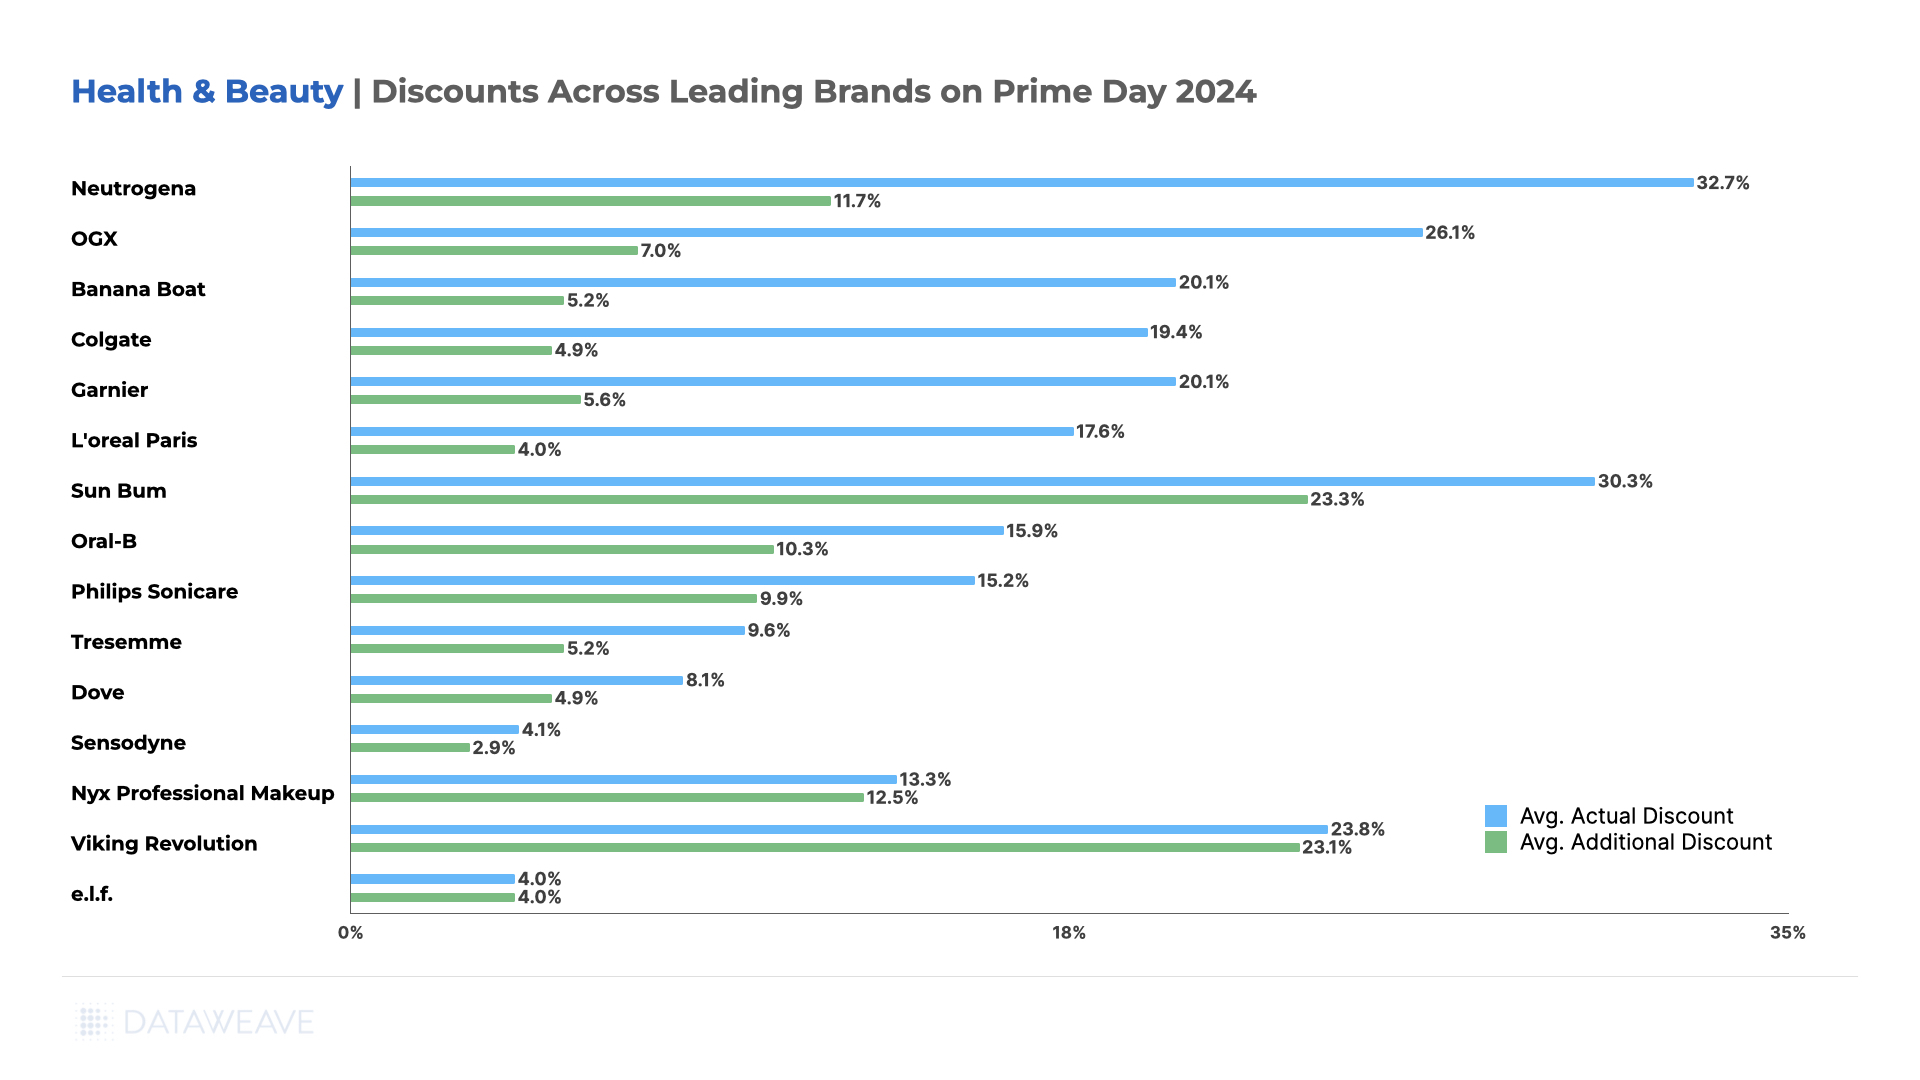
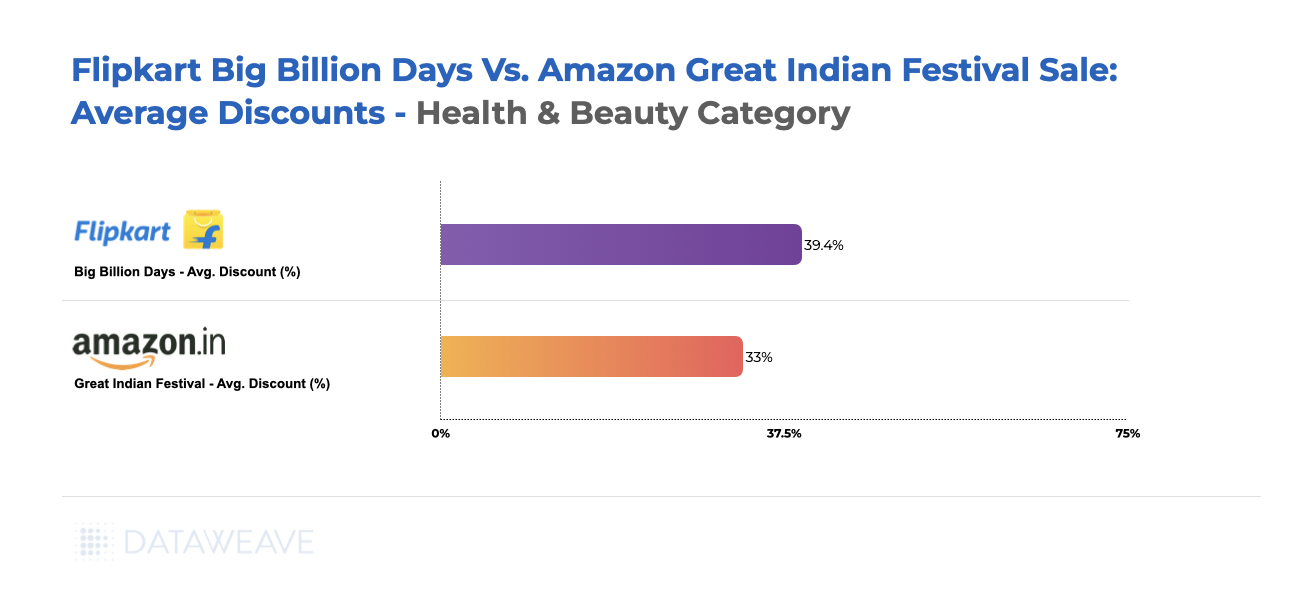
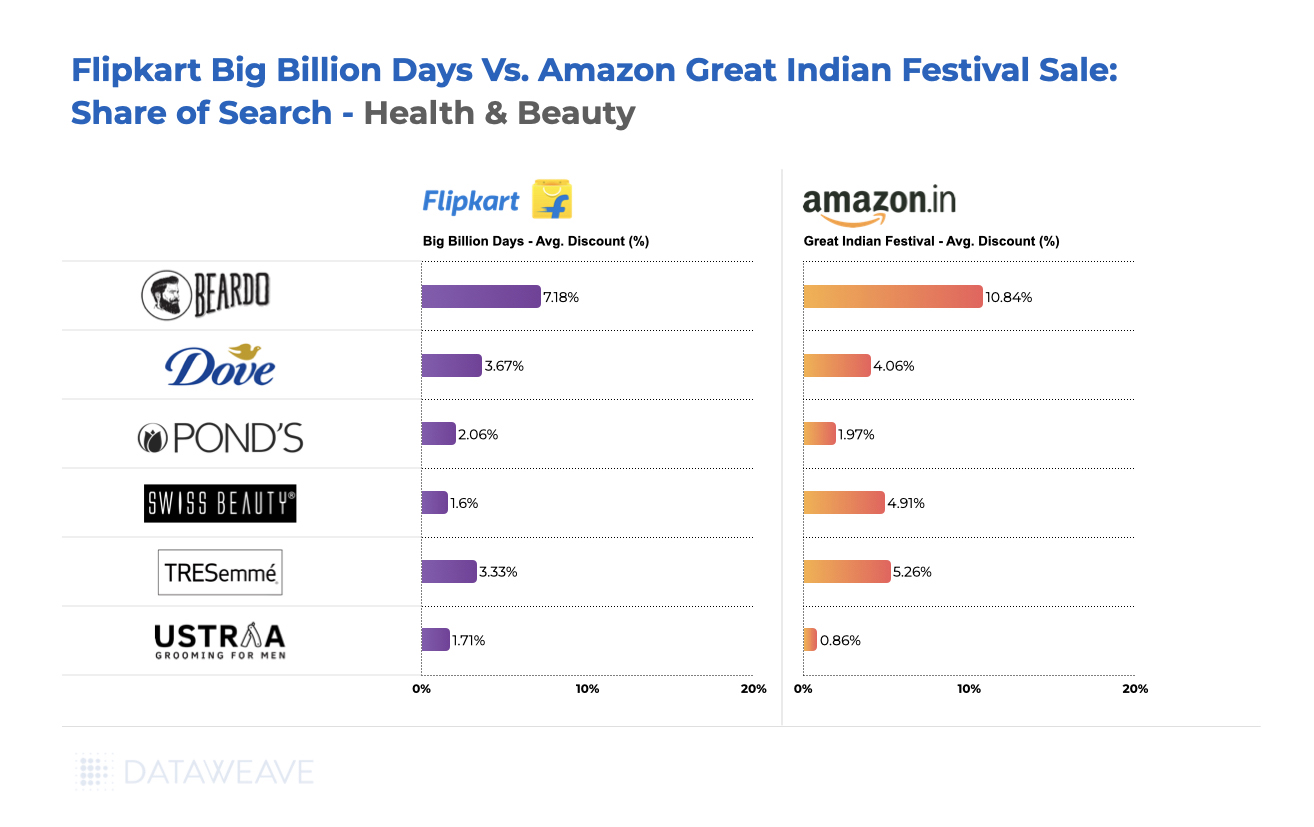
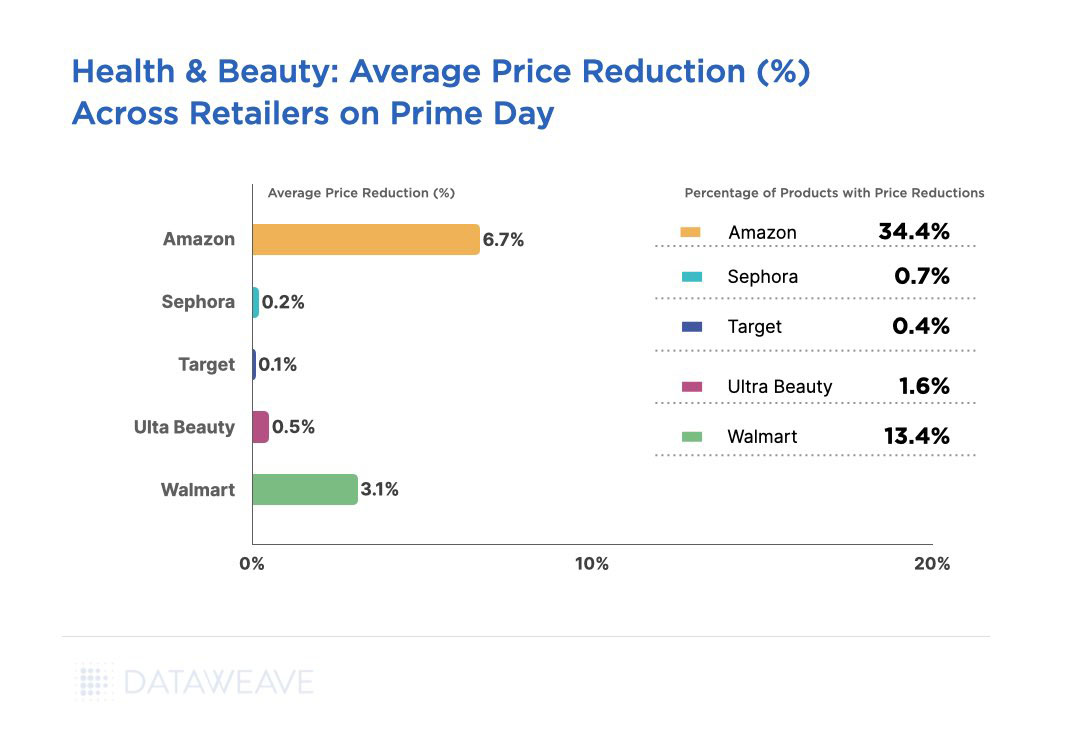
Health & Beauty
Health & Beauty emerged as a standout category during Amazon Prime Day India 2024, with significant discounts and competitive strategies at play.
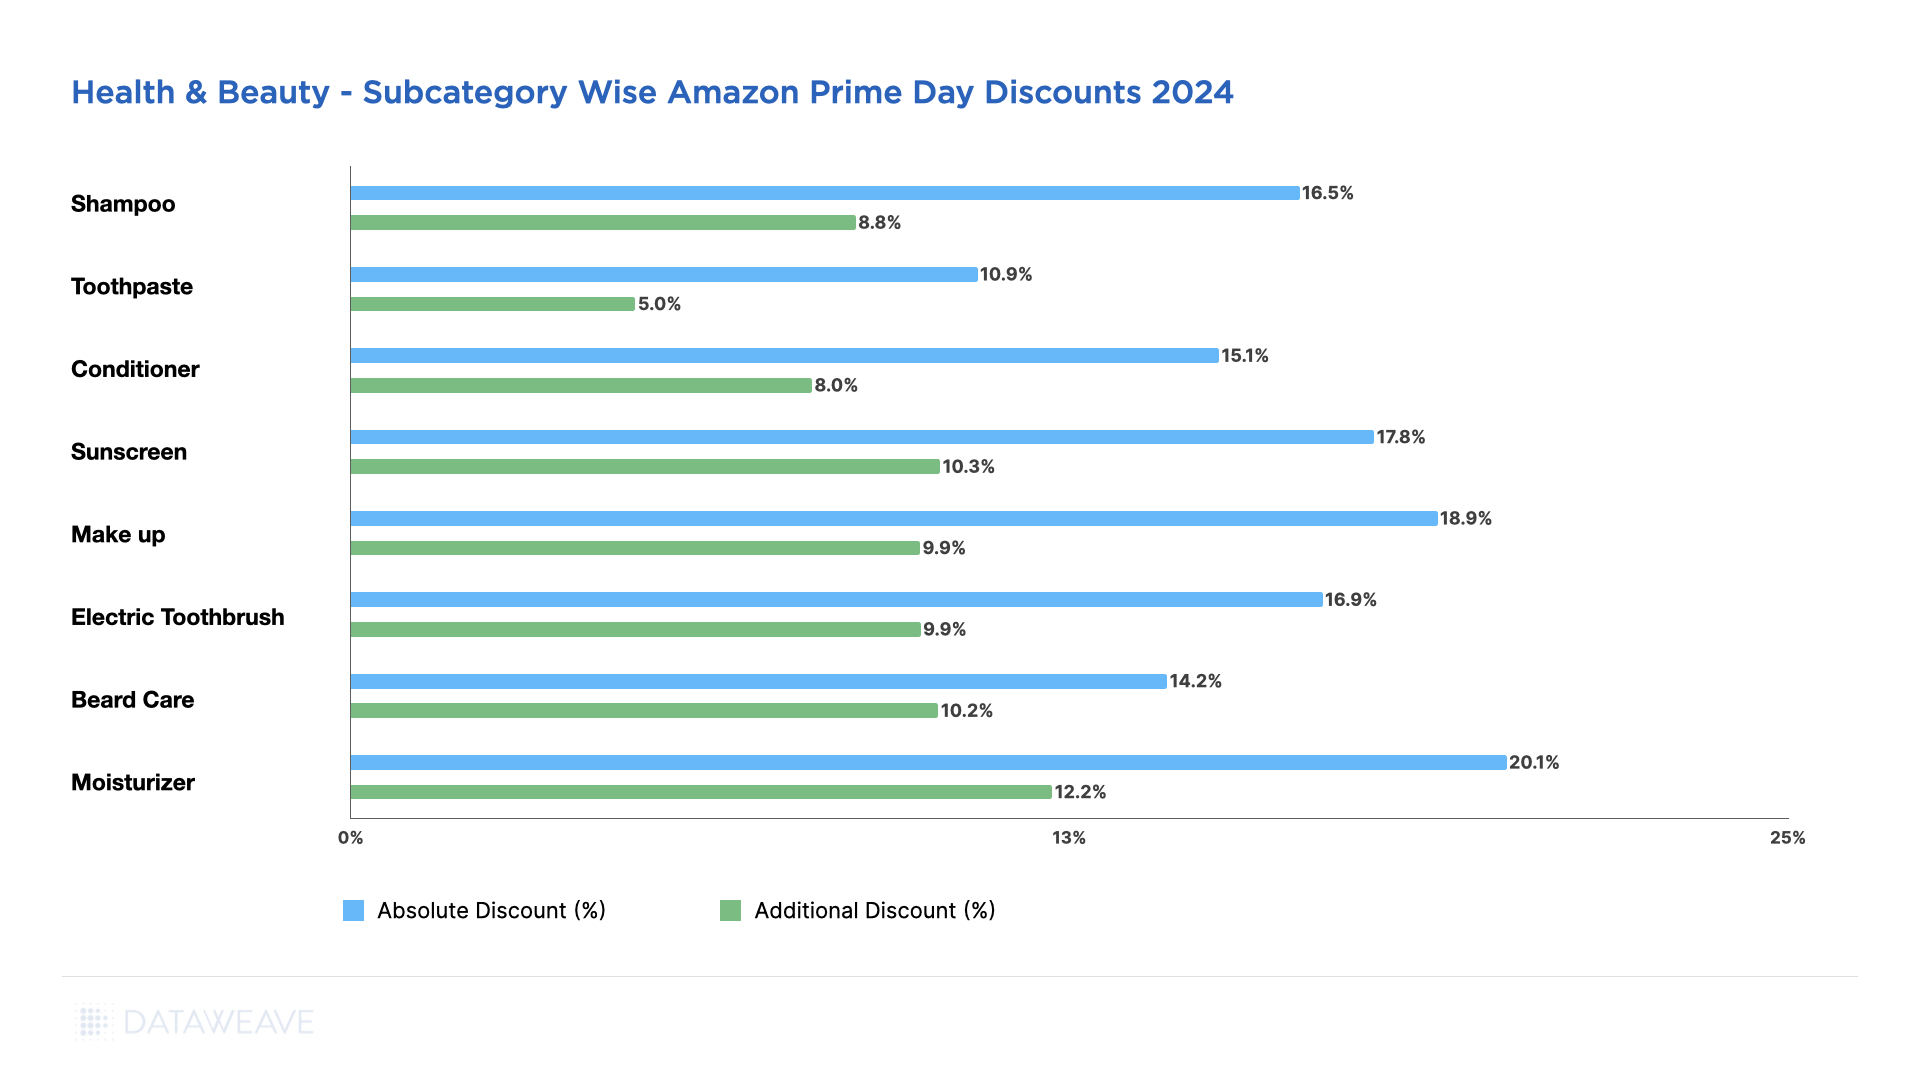
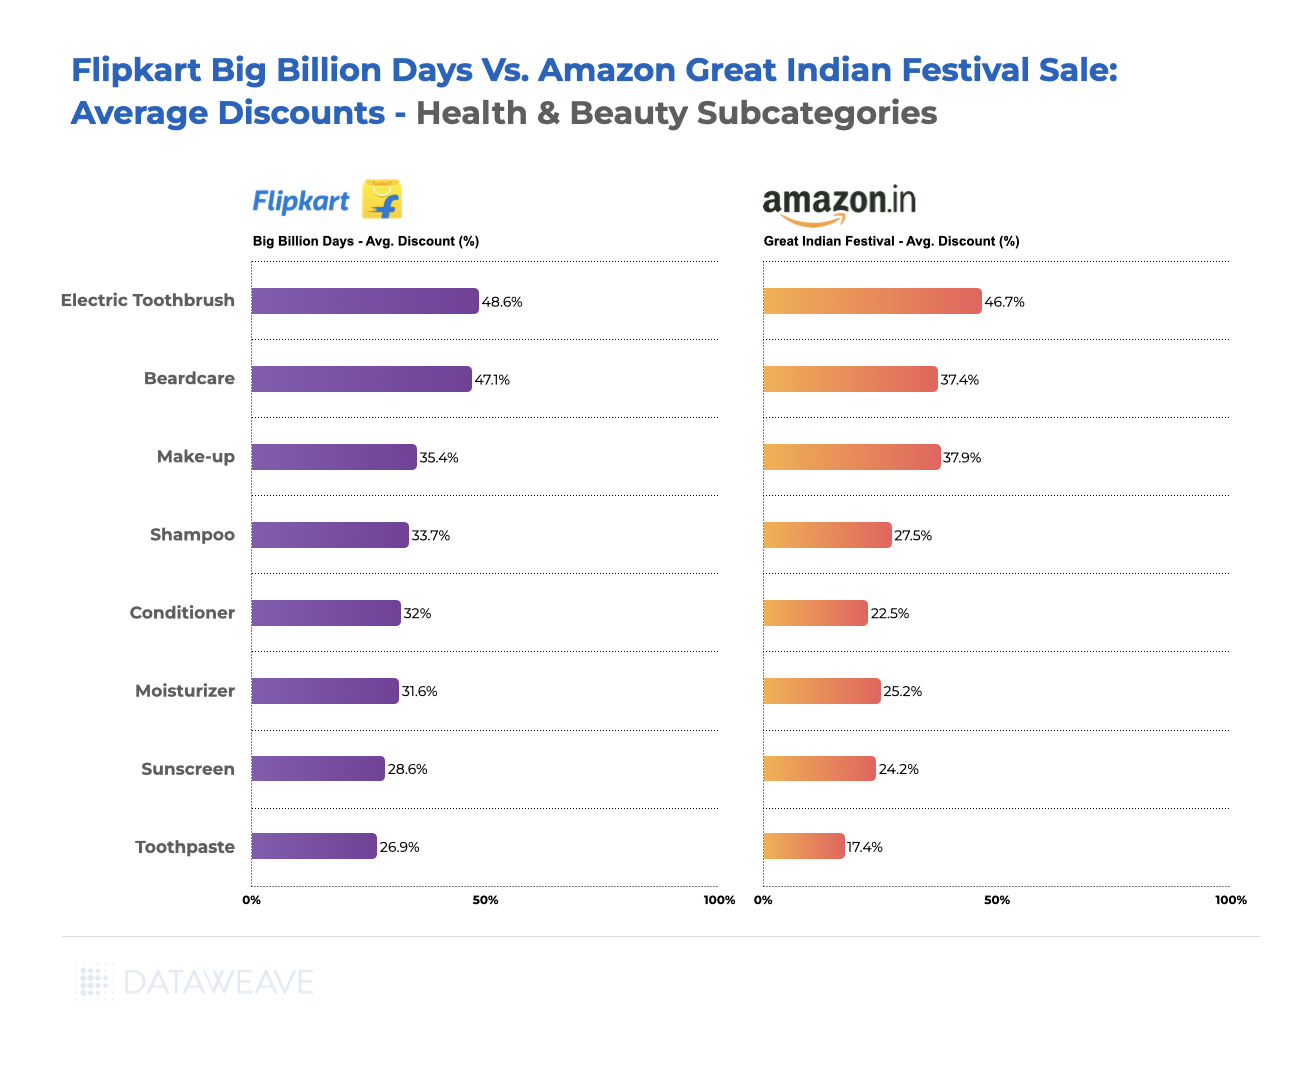
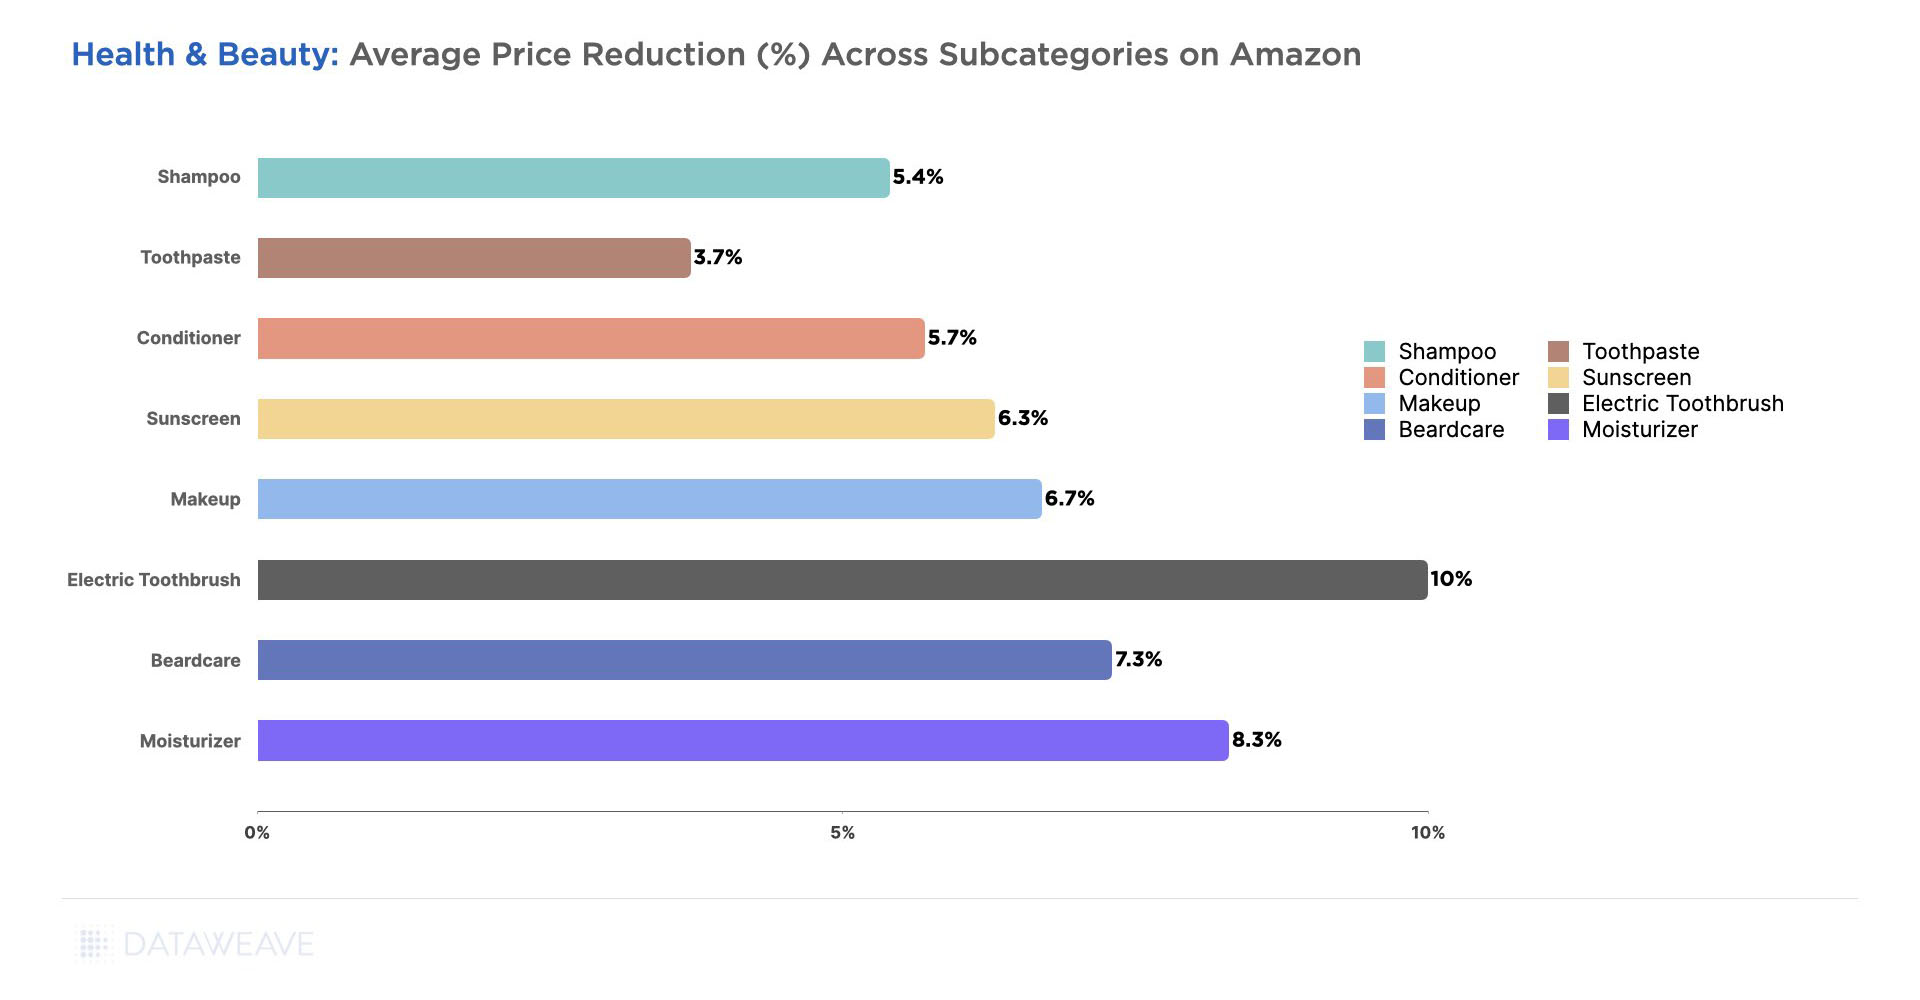
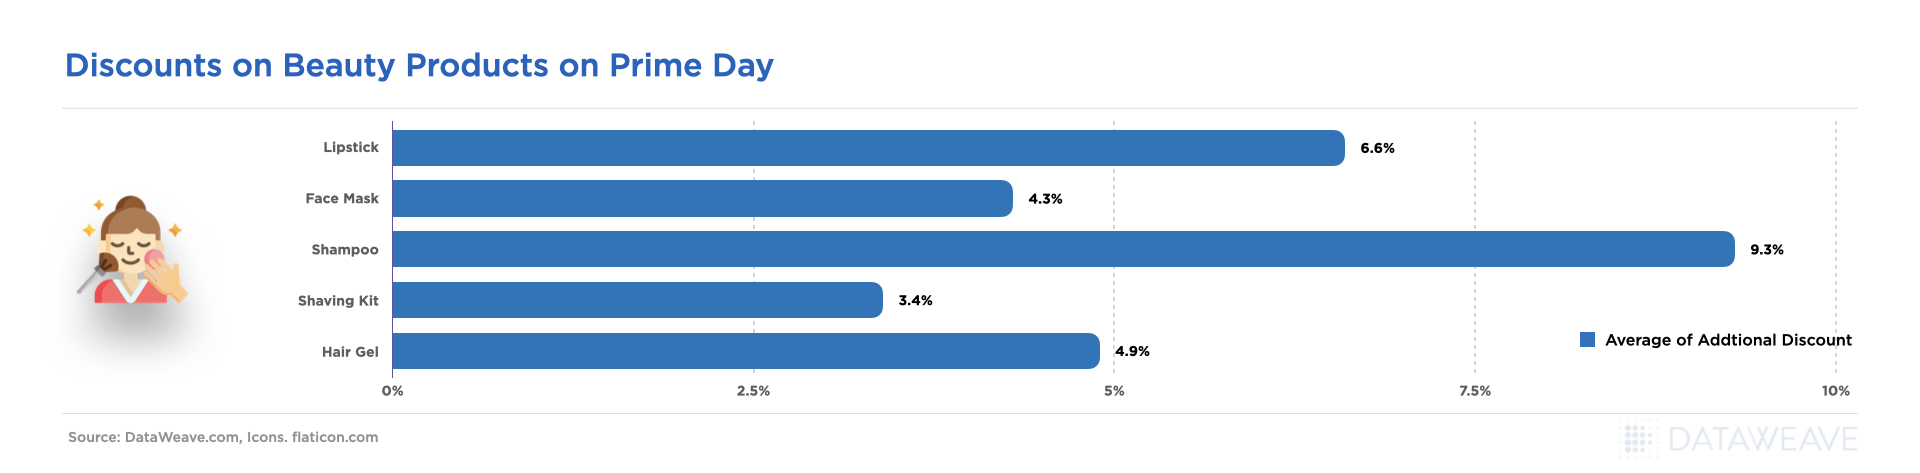
Within the subcategories we analyzed, Moisturizer (11.9%) and Sunscreen (11.8%) saw the highest additional price reductions on Amazon, likely due to seasonal demand during Prime Days. Make-up followed closely at 10.6%.
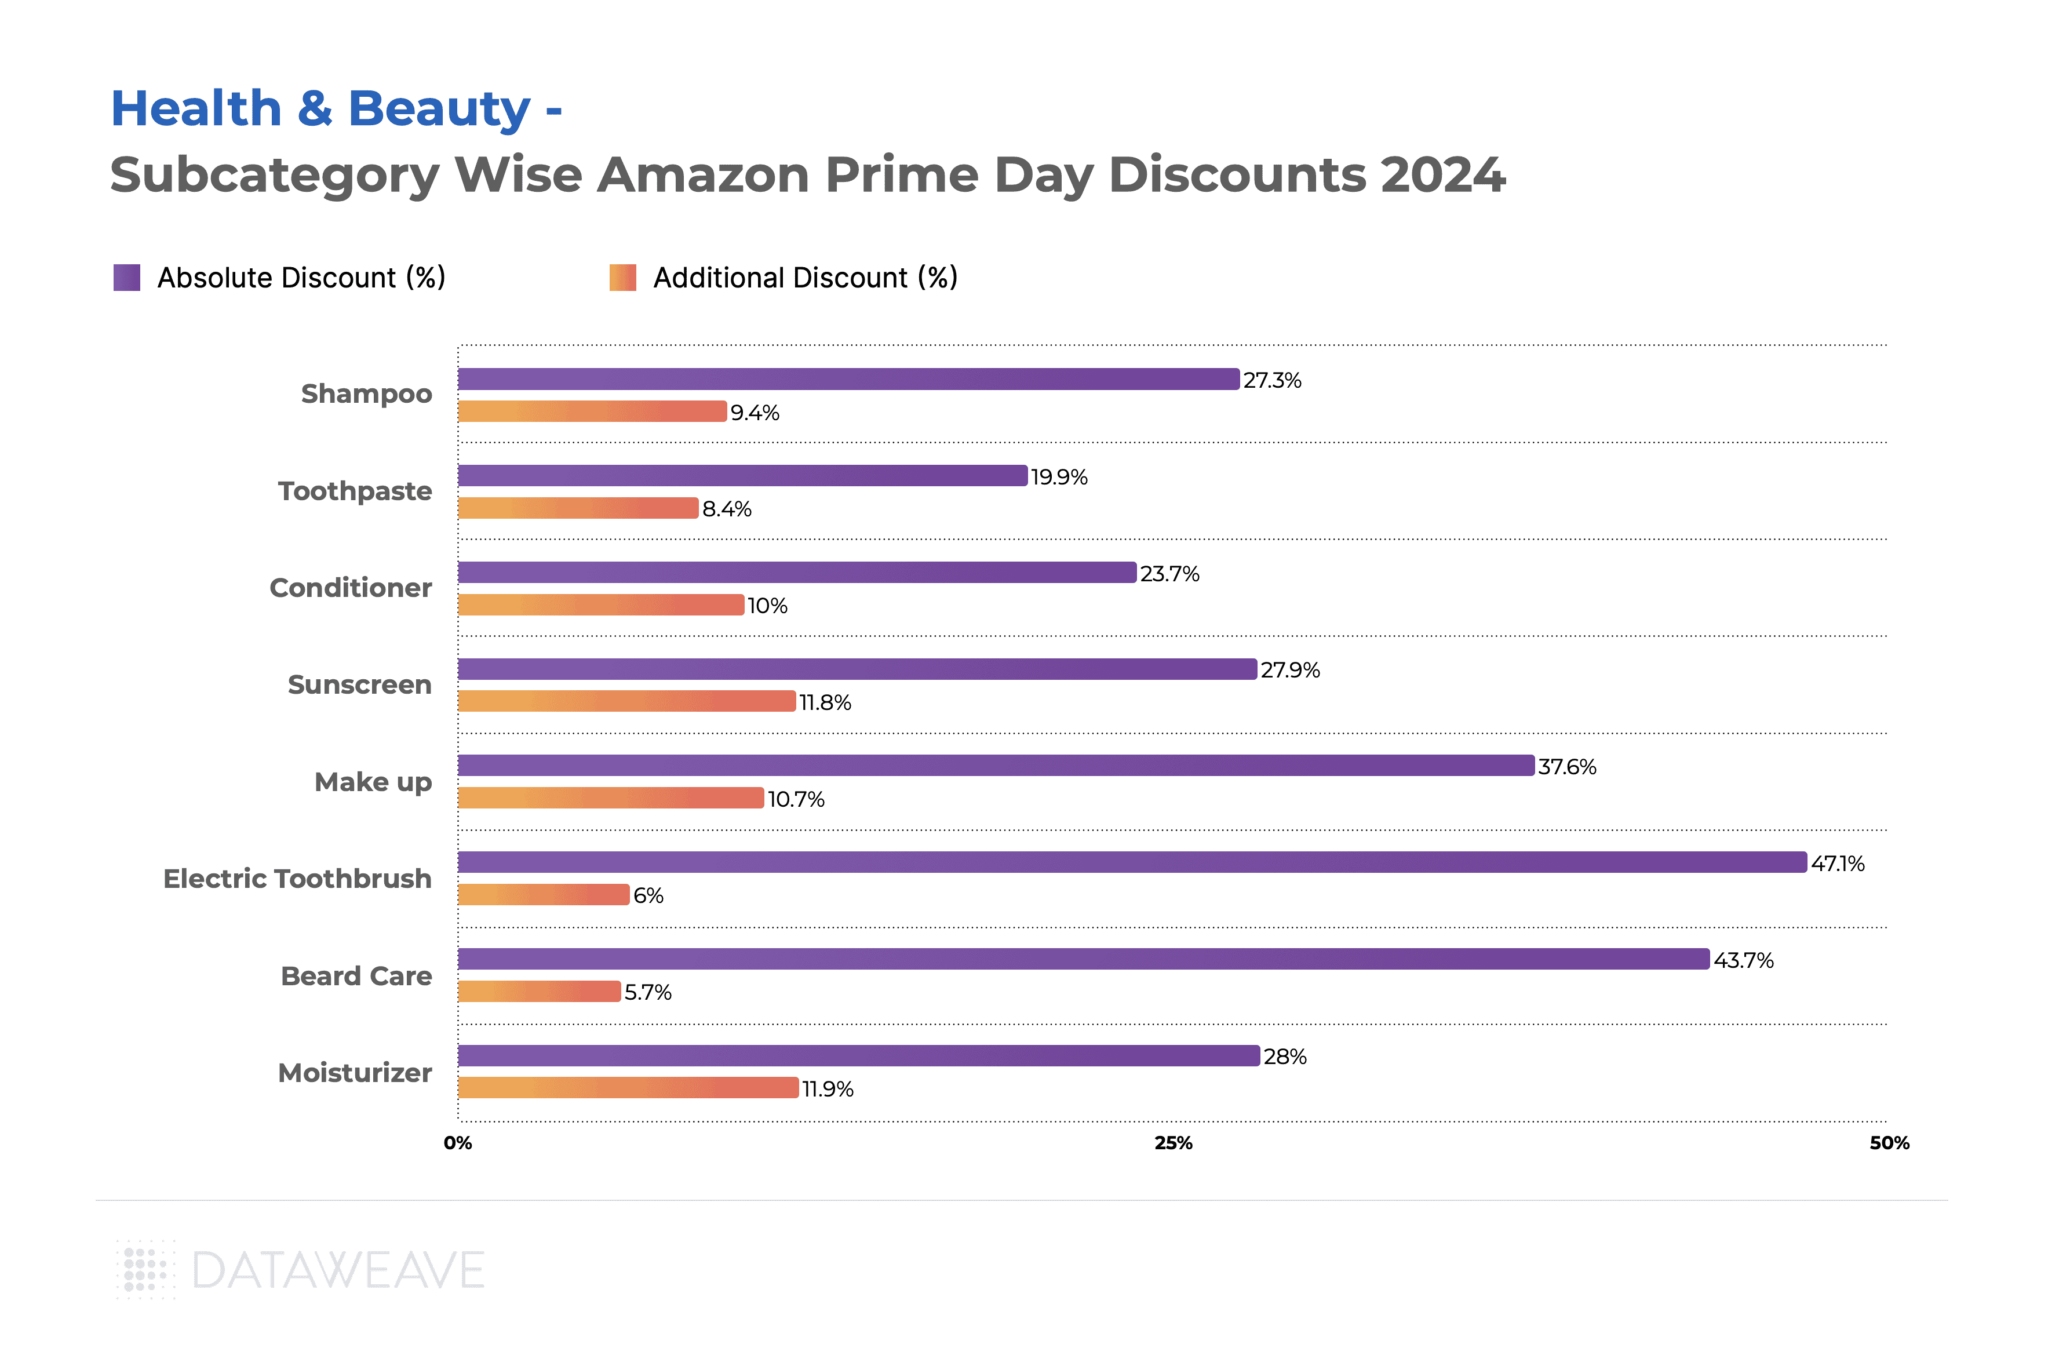
Electric Toothbrushes had the highest Absolute Discount at 47.1%, but a lower Additional Discount of 6.0%, highlighting that these products were already significantly discounted before the event. Similarly, Beard Care products showed high Absolute Discounts (43.7%) but lower Additional Discounts (5.7%) during Prime Day.
Everyday essentials like Toothpaste saw more modest discounts (19.9% Absolute, 8.4% Additional), reflecting steady demand for these products.
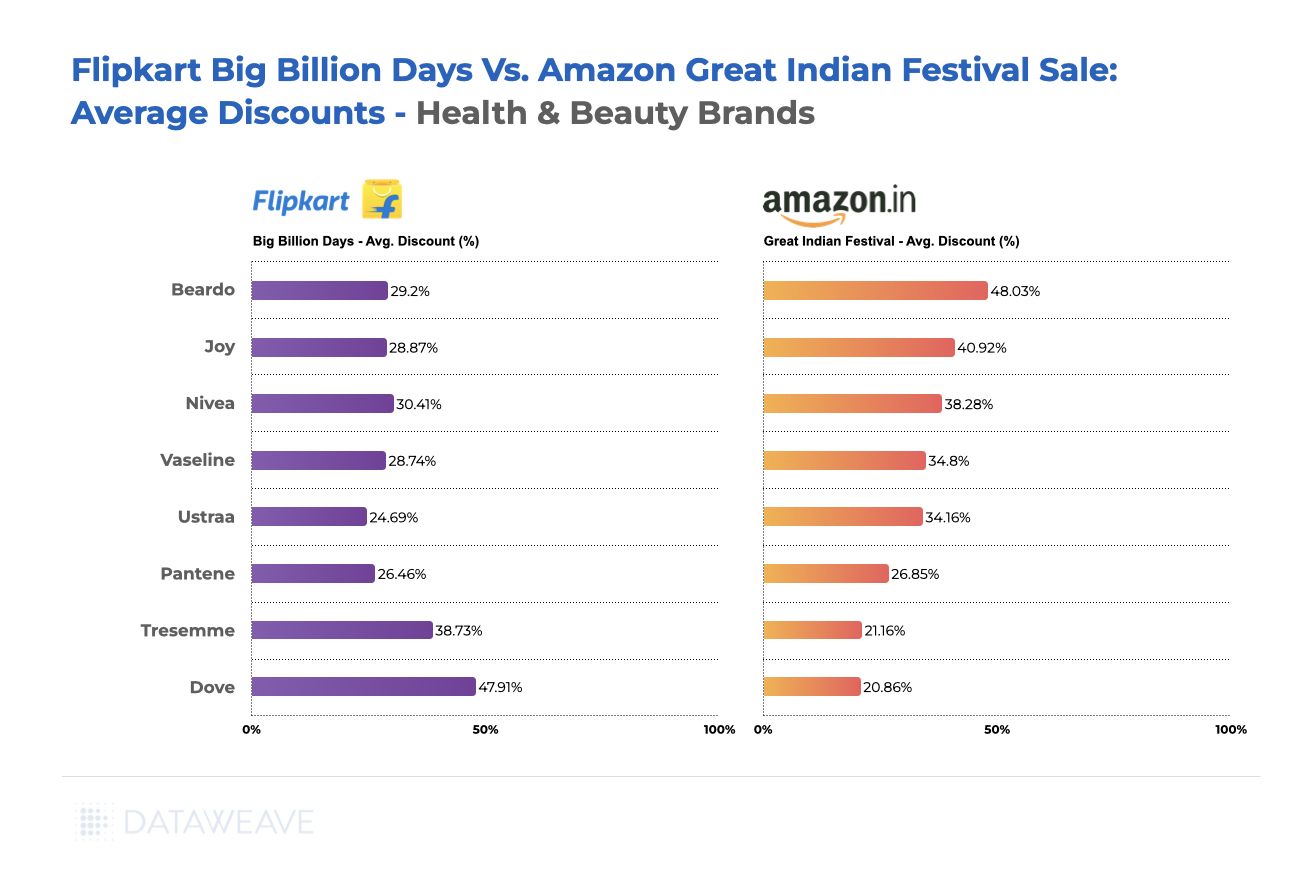
Brand-level Insights in Health & Beauty
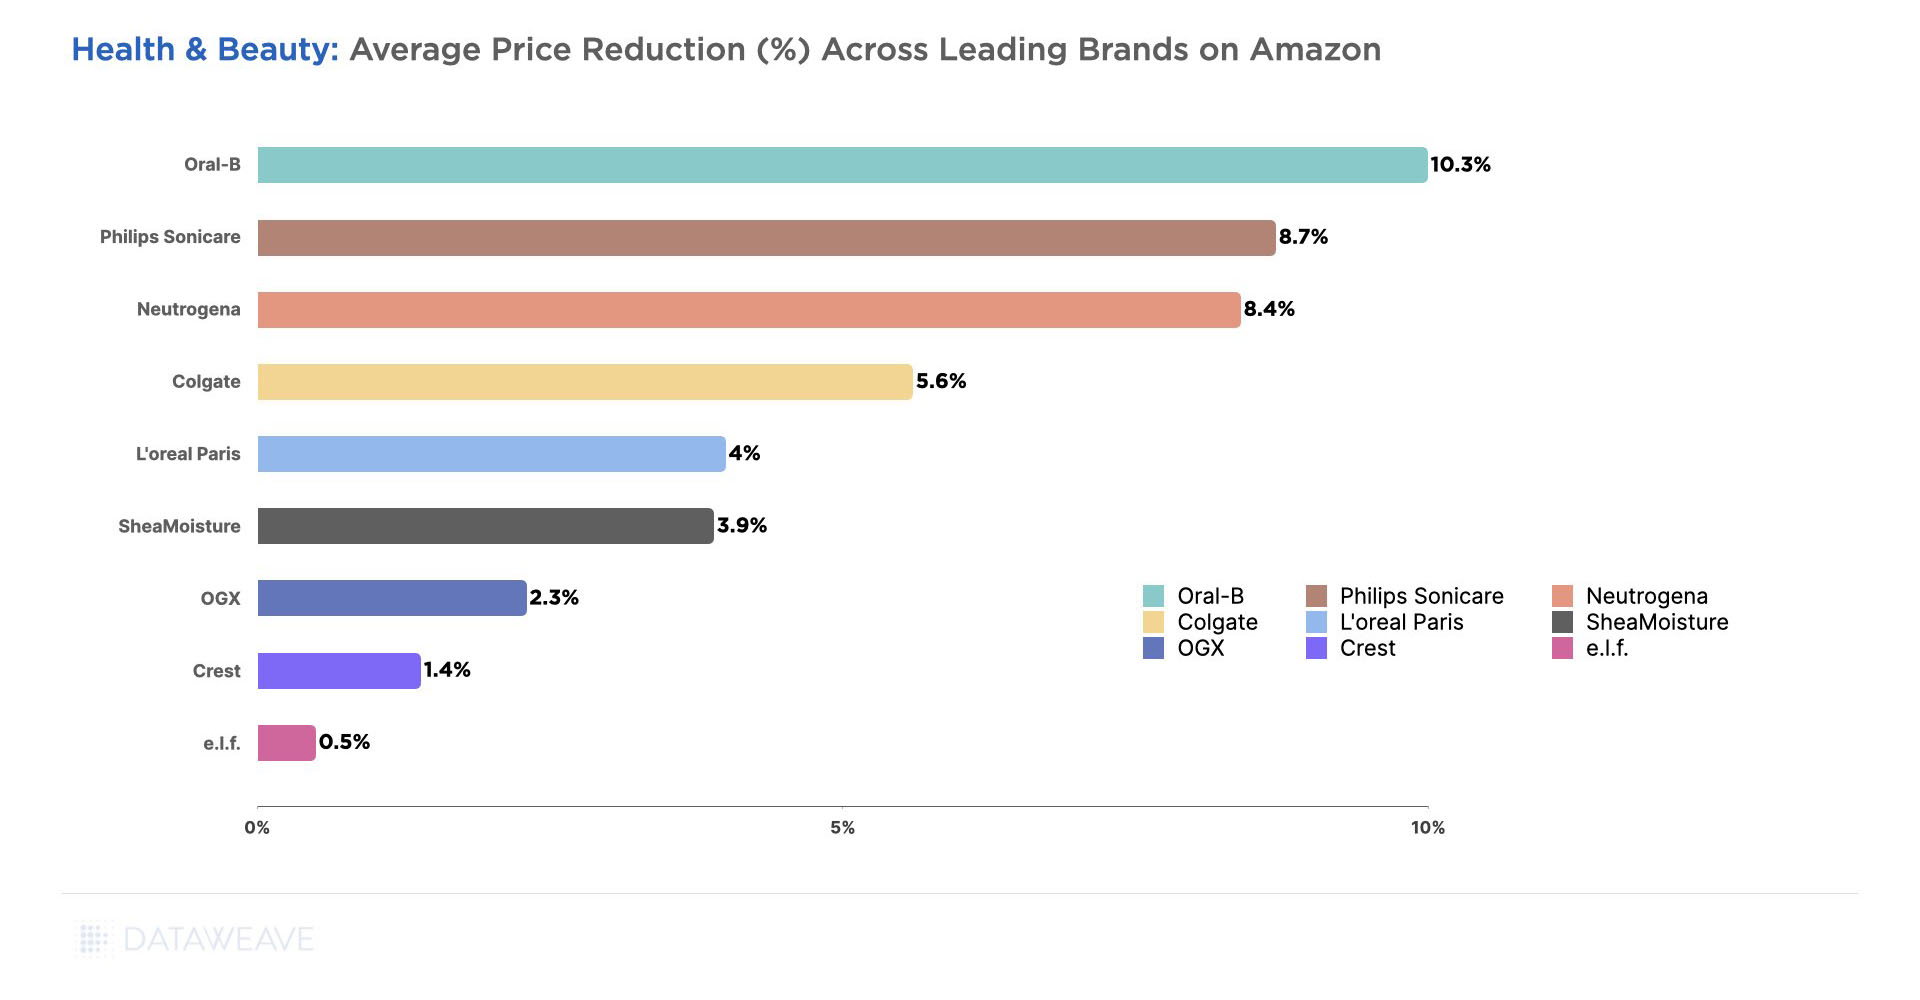
Vaseline led with the highest Additional Discount of 13.1%, followed by Maybelline at 9.5%. These brands clearly leveraged Prime Day to drive sales and potentially gain market share.
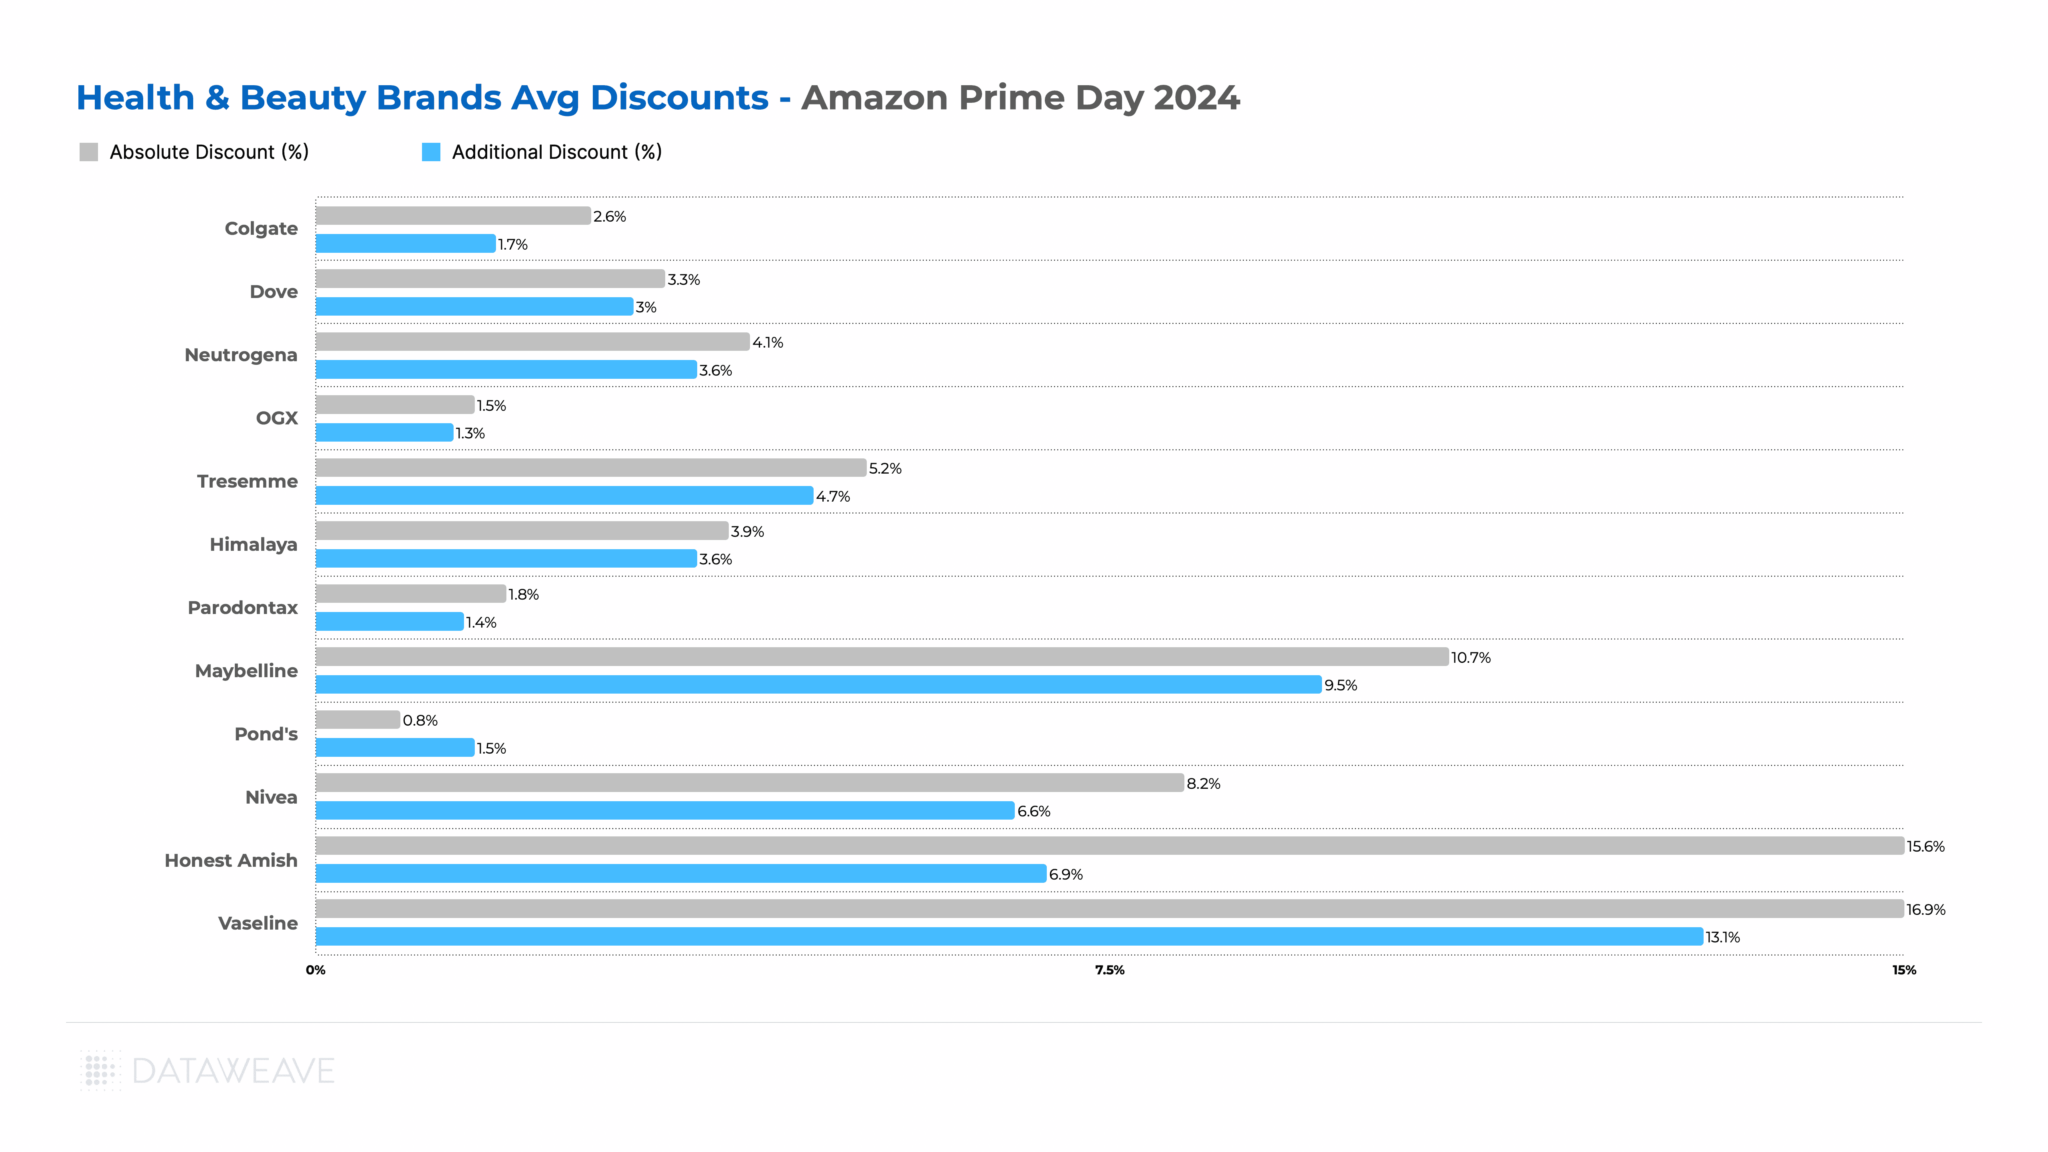
Honest Amish (beard care brand) and Nivea also offered substantial Absolute Discounts (15.6% and 8.2% respectively), but their Additional Discounts were lower, indicating pre-existing promotional strategies.
Once again, some well-known brands like Colgate, Dove, and Neutrogena offered more conservative discounts, possibly due to their established market positions or differing promotional strategies.
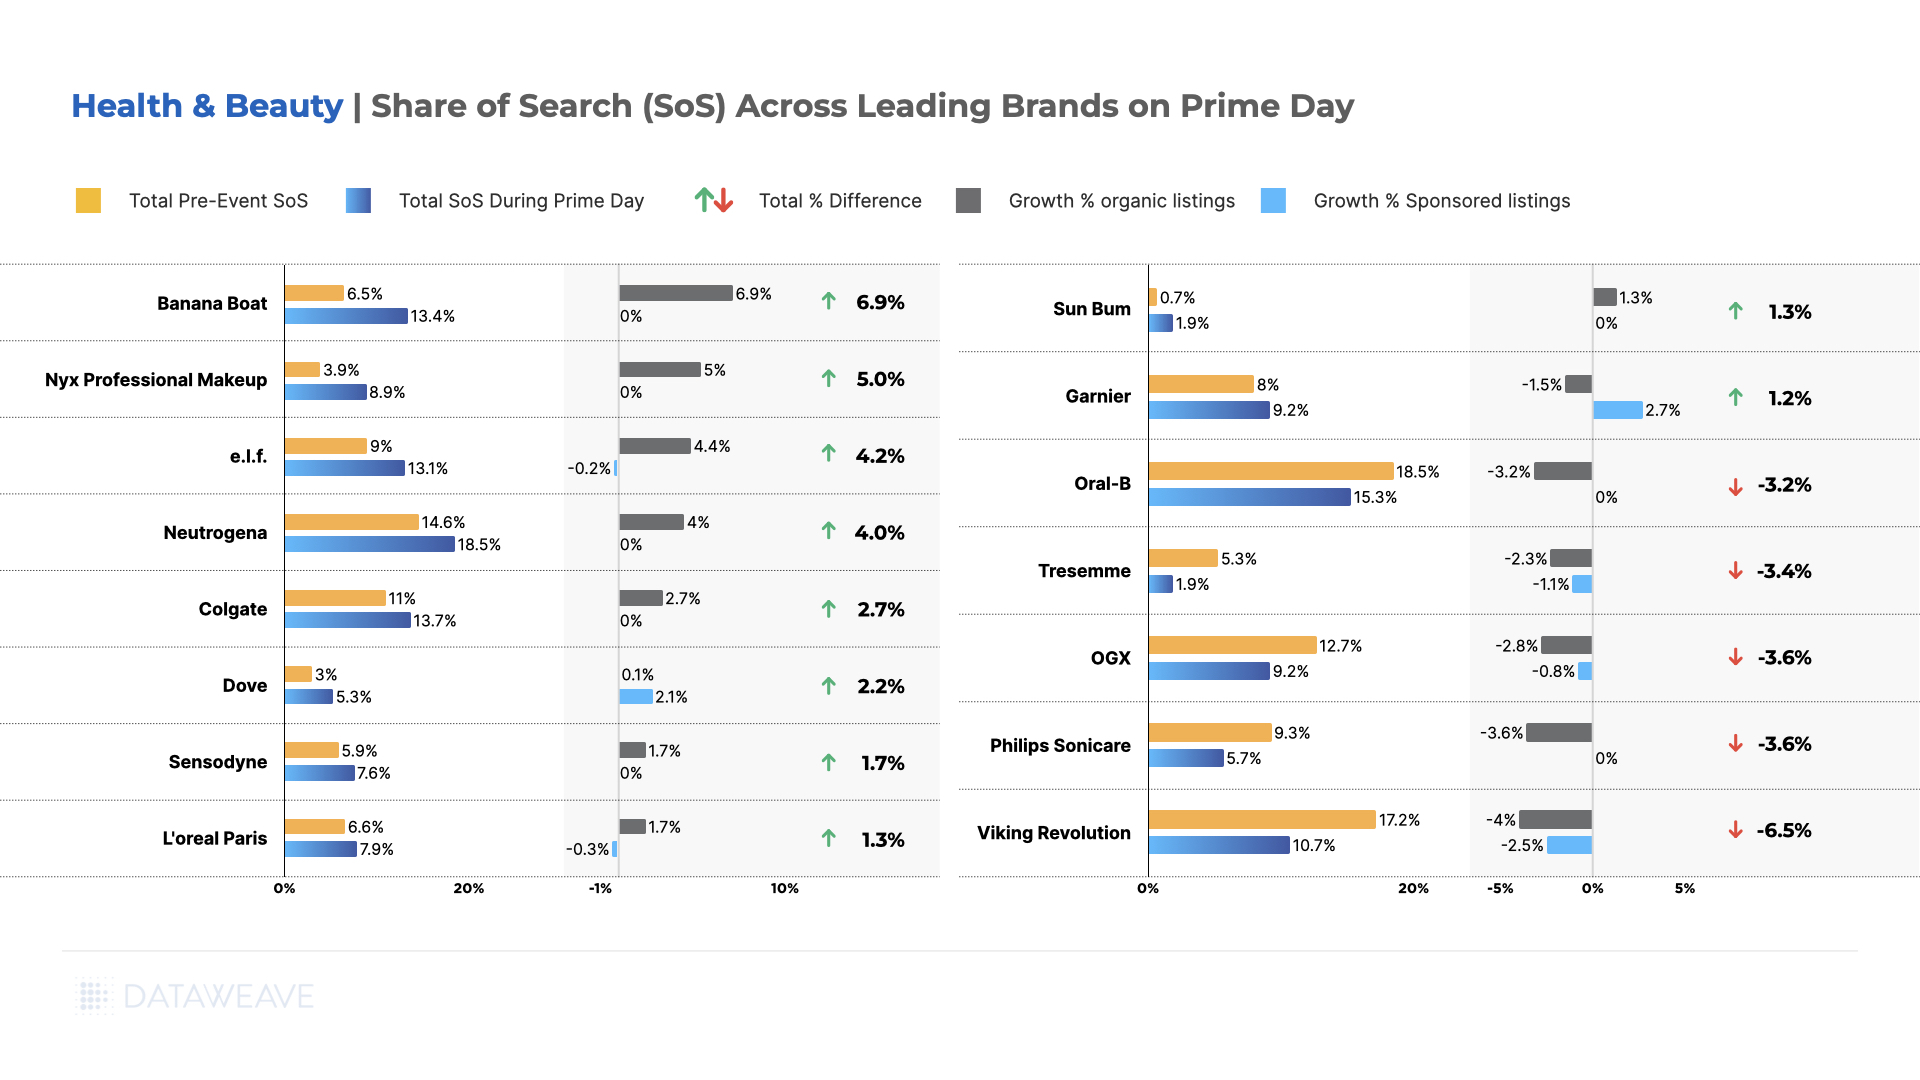
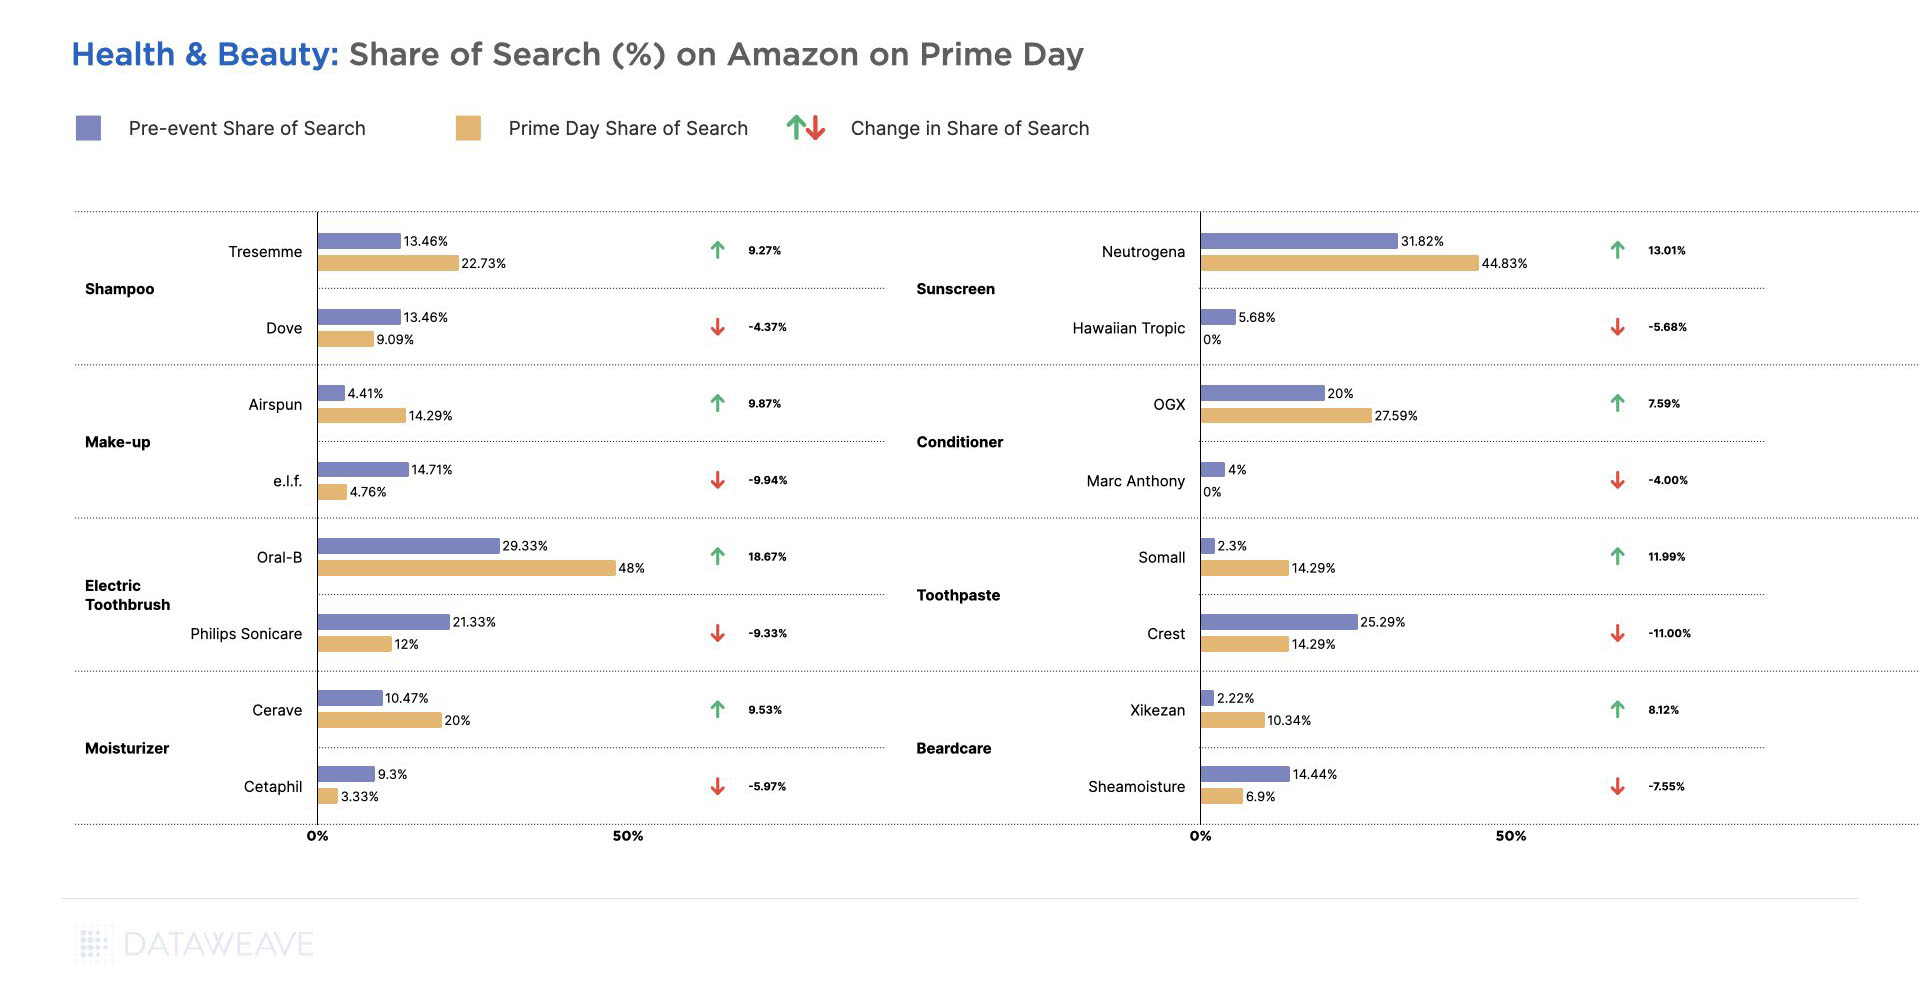
Share of Search Analysis
Maybelline saw the most significant improvement, gaining 5.6% in SoS, all through organic listings. The brand has been aggressively increasing market share with several new product launches and influencer campaigns. Nivea and Vaseline also made substantial gains of 5.2% and 3.8% respectively.
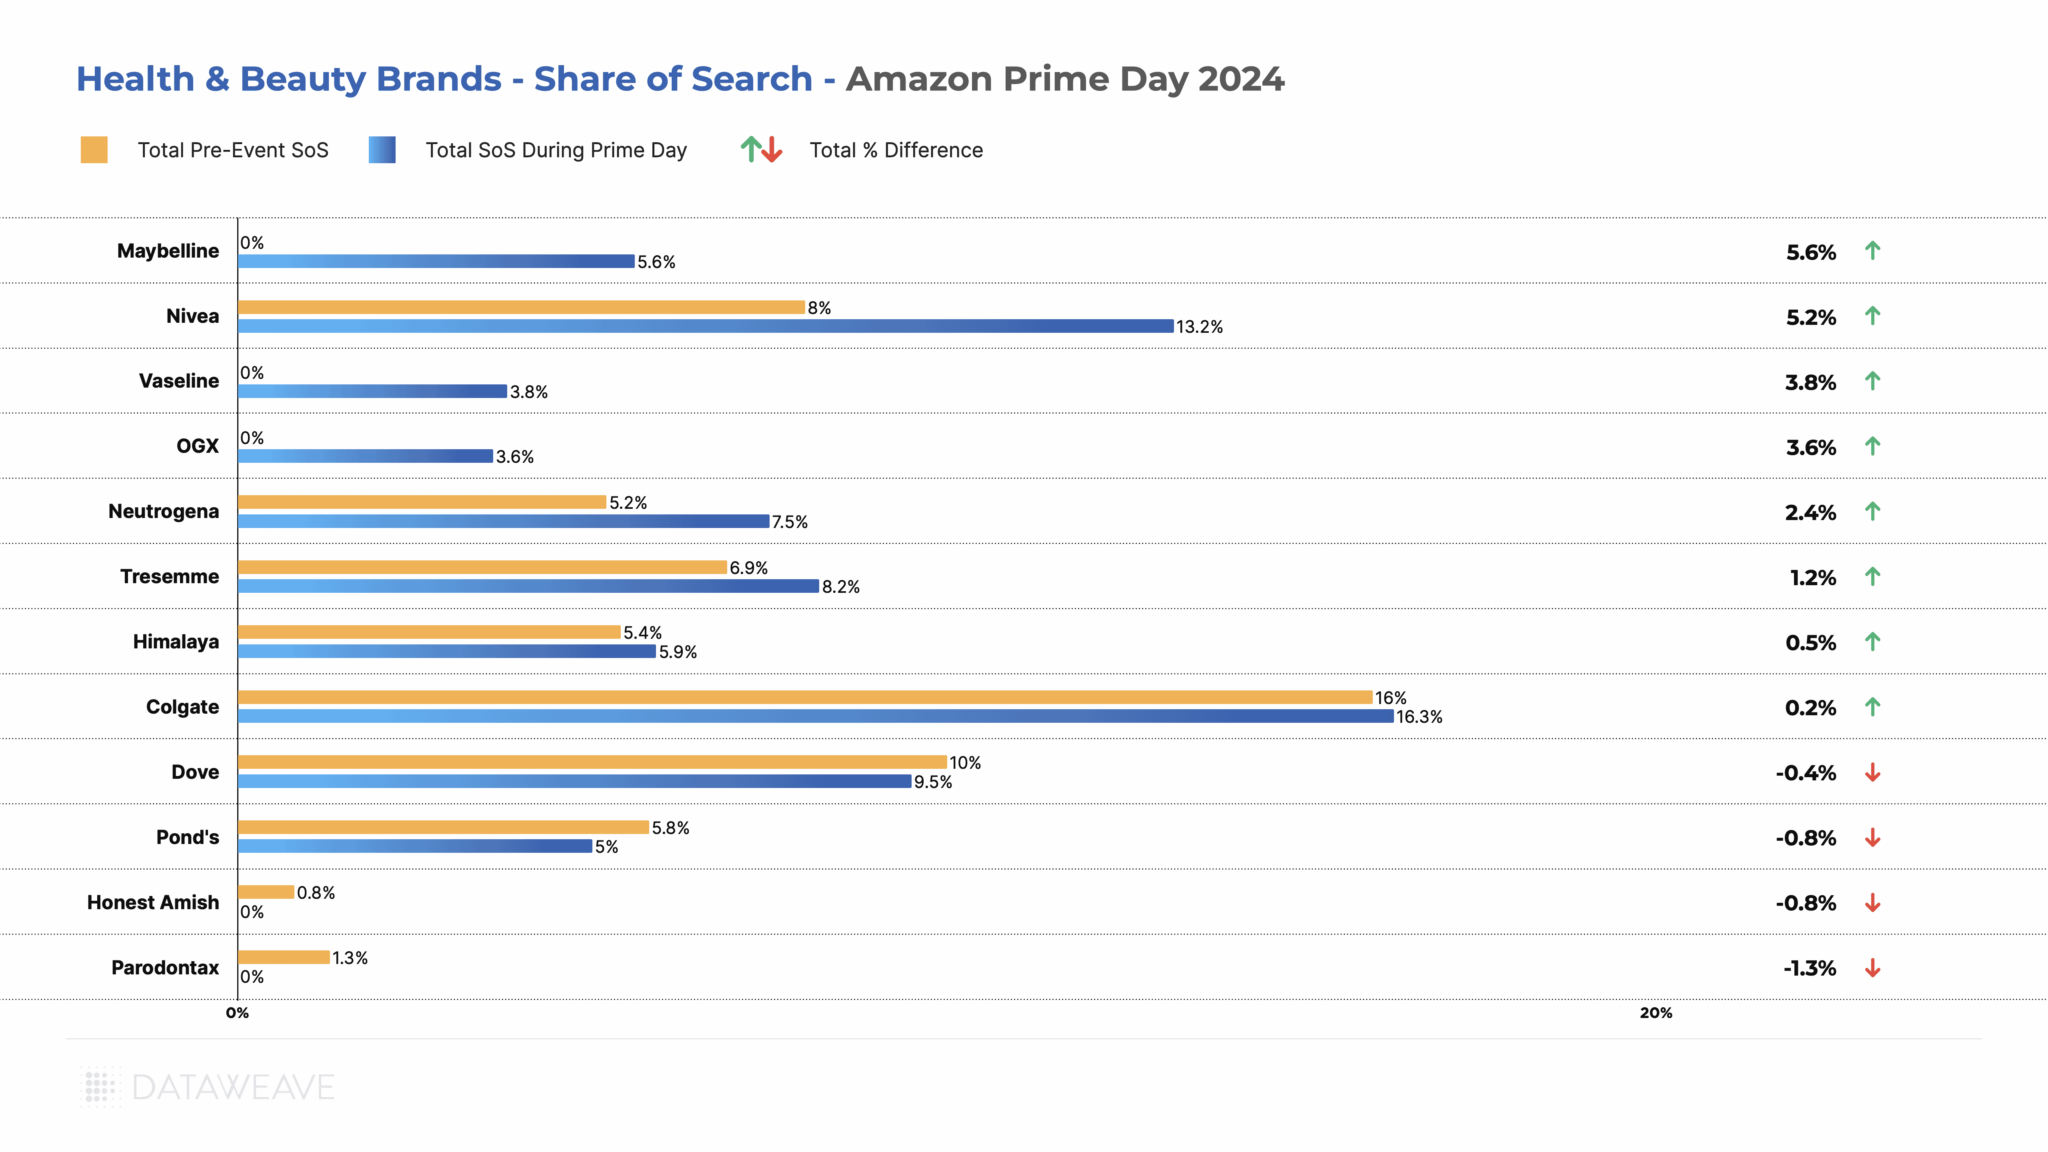
In this category as well, some popular brands like Dove (-0.4%), Pond’s (-0.8%), and Honest Amish (-0.8%) experienced slight decreases in their SoS. Parodontax (toothpaste brand) notably lost 1.3% SoS, with most of the decline in sponsored listings. Colgate maintained its strong position with a slight increase in SoS (0.2%), reflecting its dominant market presence.
Key Takeaways:
While some brands like Vaseline and Maybelline used aggressive discounting and improved visibility to drive sales, others like Colgate and Dove relied more on their established market positions.
None of the brands made any significant strides in sponsored listings, revealing that brands in this category are not yet fully leveraging retail media to help manage and boost their visibility on online marketplaces.
Final Thoughts
Amazon Prime Day 2024 has redefined the eCommerce landscape in India, yet again, showcasing diverse strategies employed by brands to maximize their impact. By understanding and leveraging these insights, brands and retailers can better navigate future sales events, optimizing their eCommerce strategies to achieve sustained growth and success.
Stay tuned to our blog for more in-depth analyses of brand and retailer performance across various retail events.
Reach out to us today to learn how you can leverage data-driven insights to optimize your eCommerce strategy.