Amazon Prime Day 2024 has once again shattered records, with more items sold during the two-day event than any previous Prime Day. Prime members worldwide saved billions across all categories, while independent sellers moved an impressive 200 million items.
At DataWeave, we conducted an extensive analysis of the discounts offered by Amazon across major categories. By examining over 47,000 SKUs, we’ve uncovered compelling insights into pricing strategies, competitive positioning, and emerging trends in the eCommerce space.
Since products on Amazon and other eCommerce websites are often sold at discounts even on normal days not linked to a sale event, we delved into the real value that Prime Day offers to shoppers by focusing on price reductions or the Additional Discount during the sale compared to the week before. As a result, our approach highlights the genuine benefits of the event for shoppers who count on lower prices during the sale. At the same time, our report also includes the Absolute Discounts offered during Prime Day, which represents the total markdown relative to the MSRP.
Amazon’s Cross-Category Discount Strategy
Our analysis reveals that the Electronics category saw the highest discounts with an average absolute discount of 20.4% and additional discounts on Prime Day amounting to 10.4%. Meanwhile the Home & Furniture had the lowest discount at 13.1%.
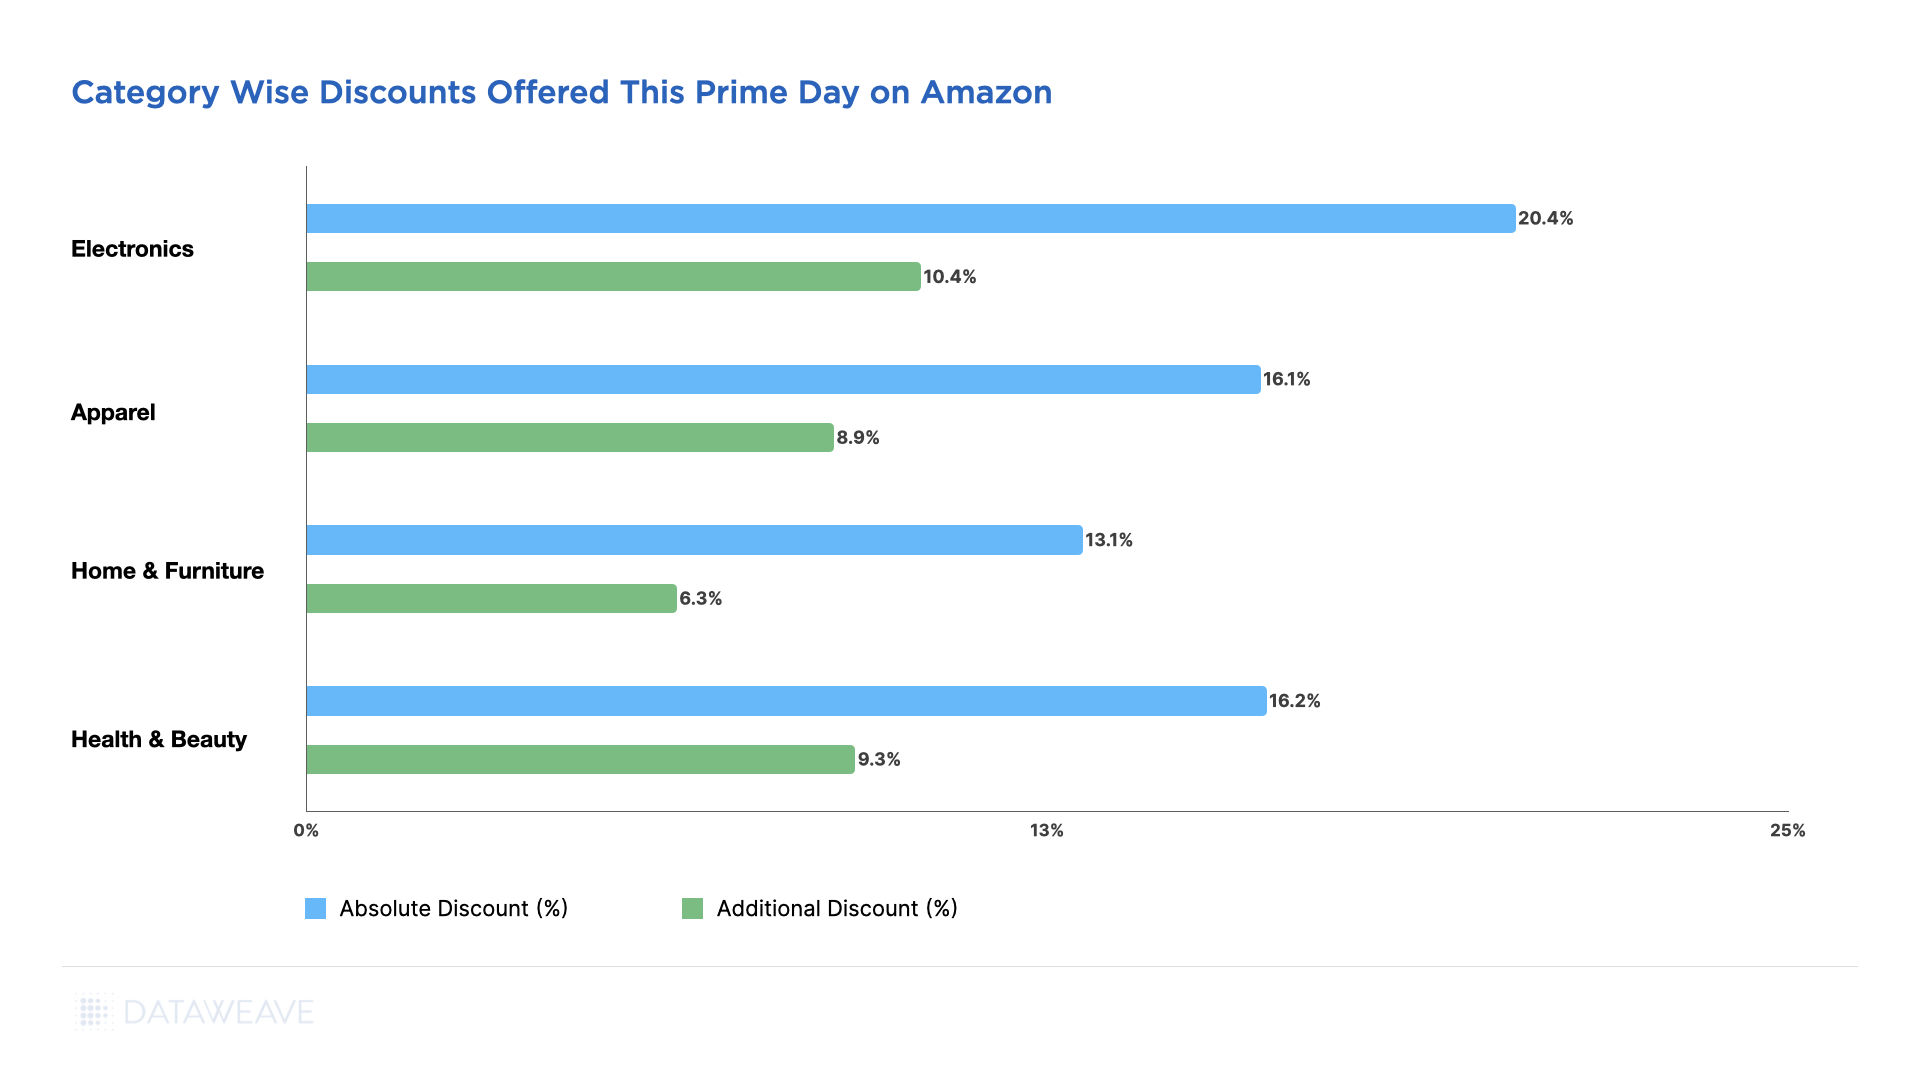
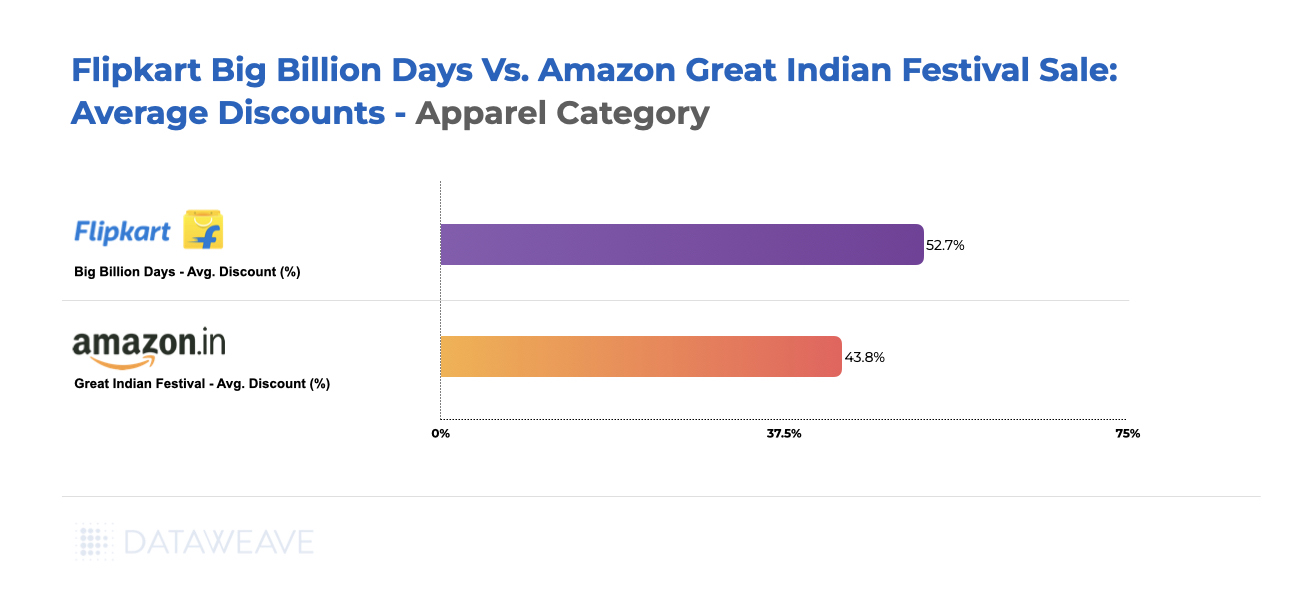
The Health & Beauty category saw significant additional discounts during Prime Day, at 9.26%. The Apparel category offered attractive absolute (16.10%) and additional (8.90%) discounts.
Category Deep Dive
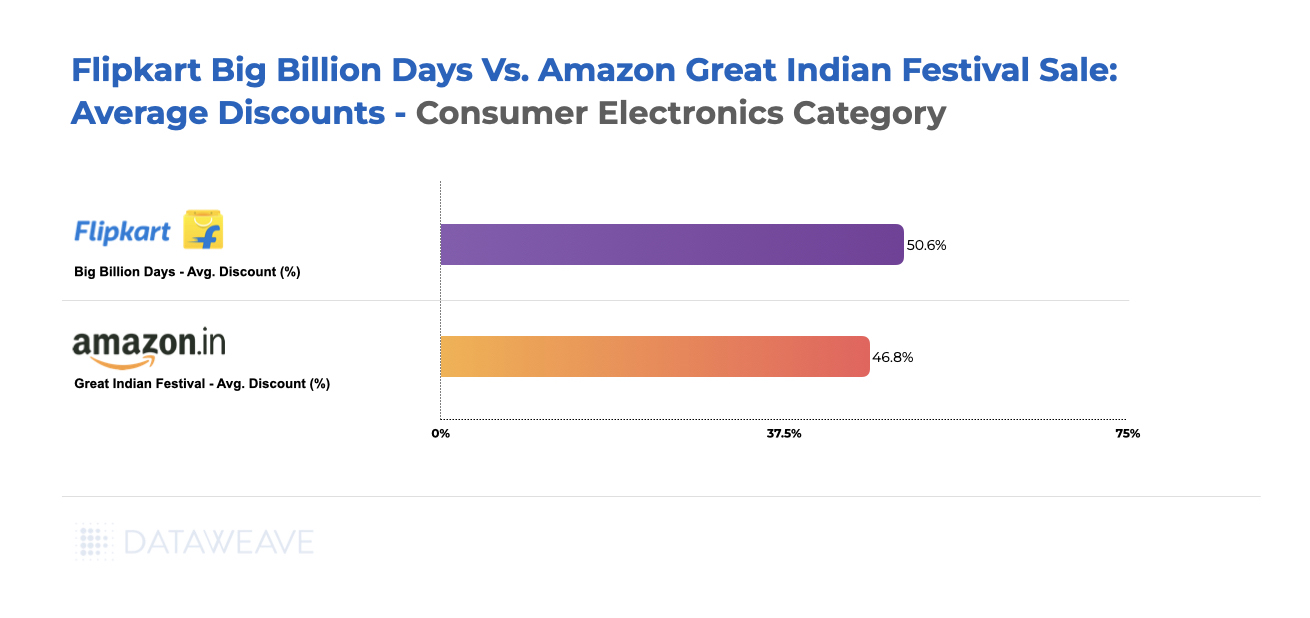
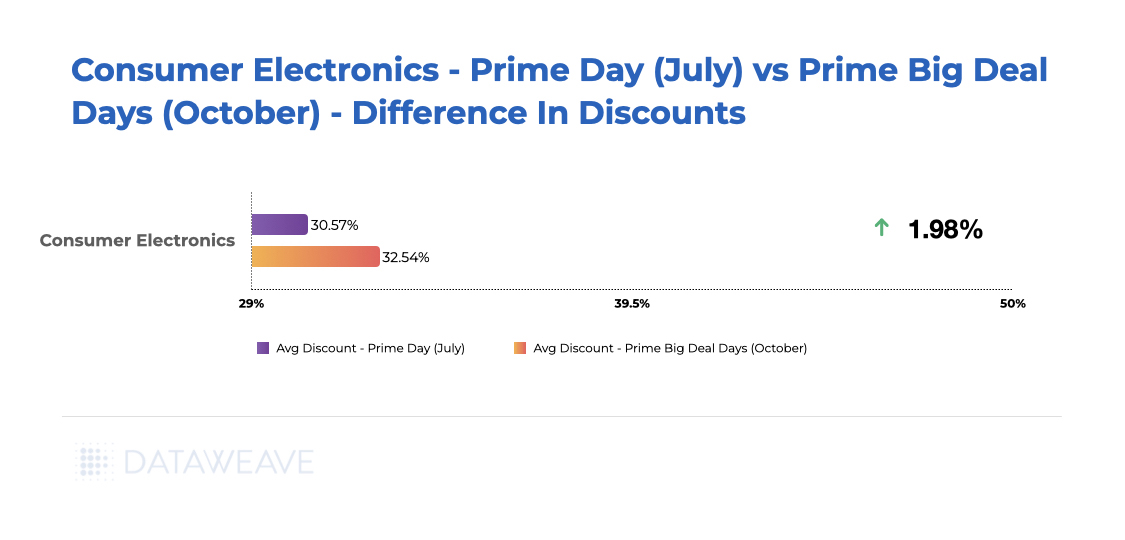
Consumer Electronics
Still the star of the show, the electronics category saw the highest markdowns this Prime Day with absolute discounts at 20.40% and across 14.61% of their inventory.
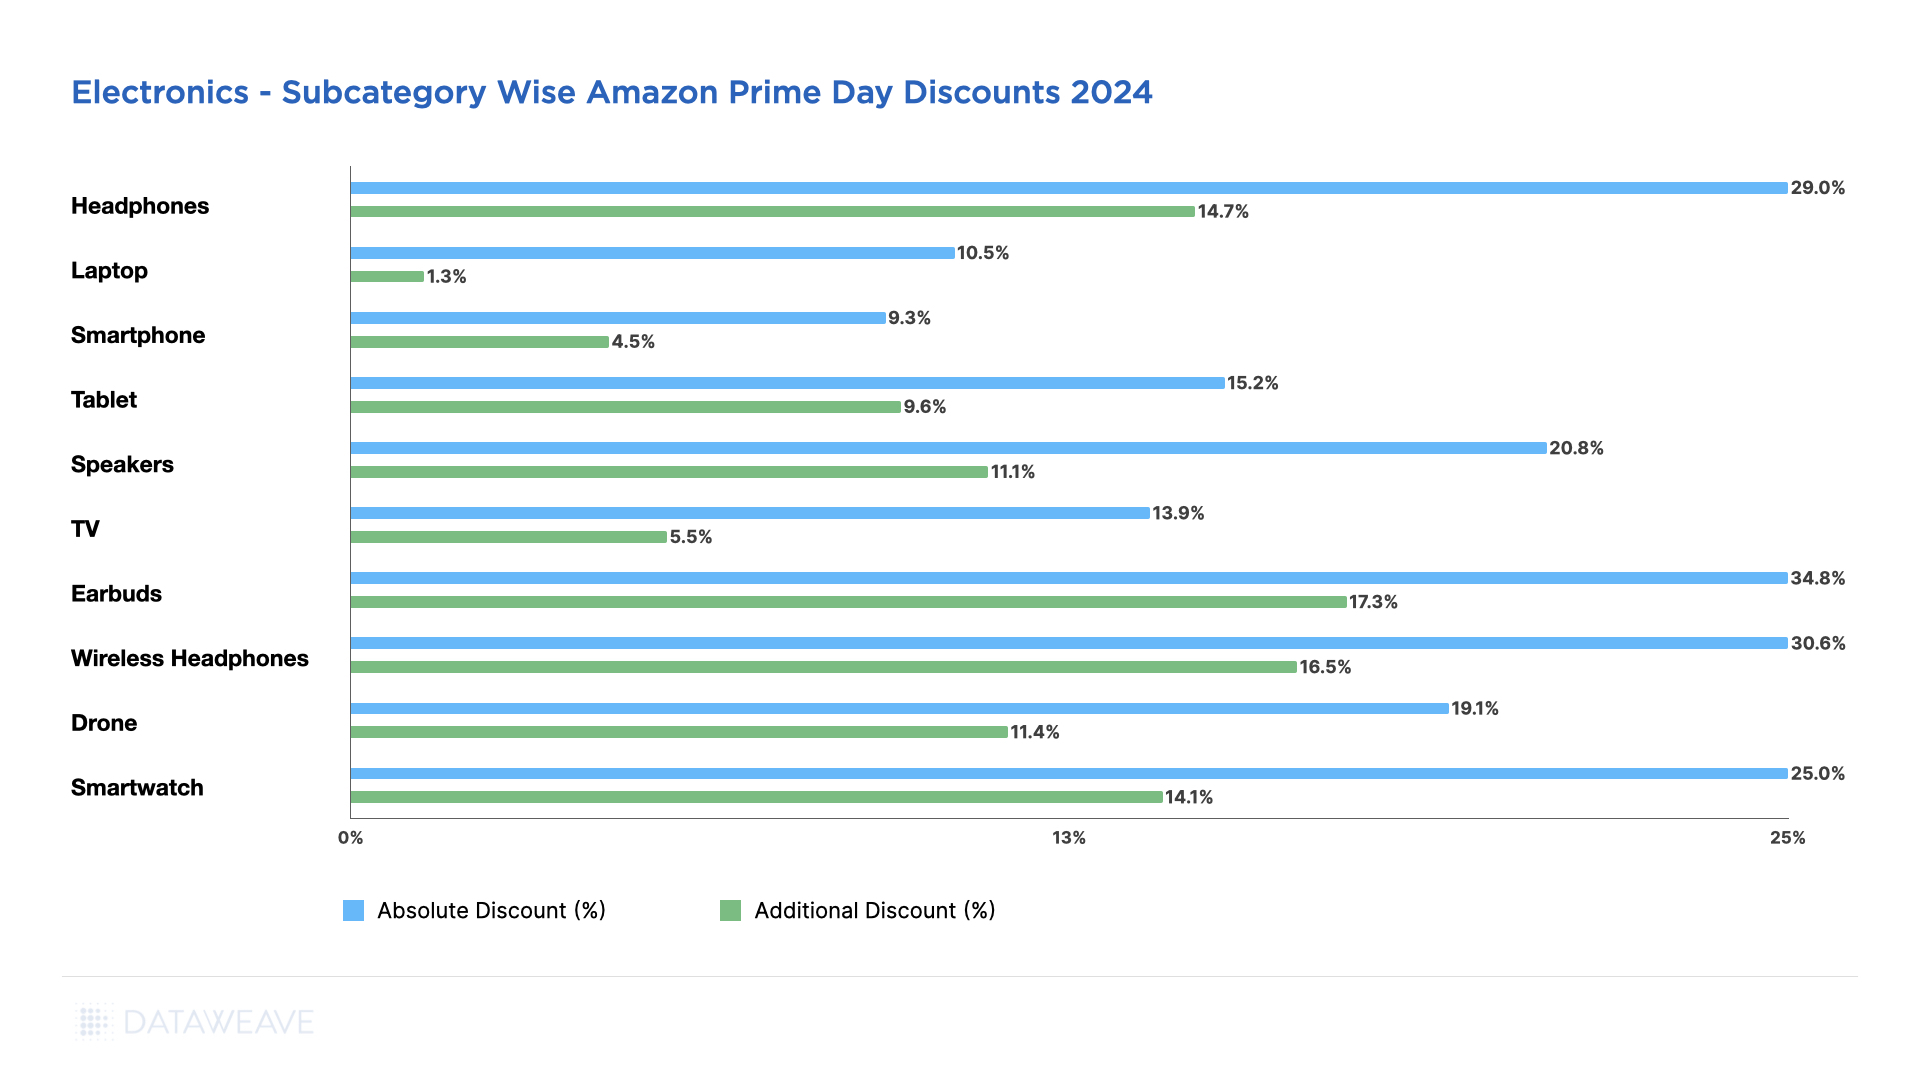
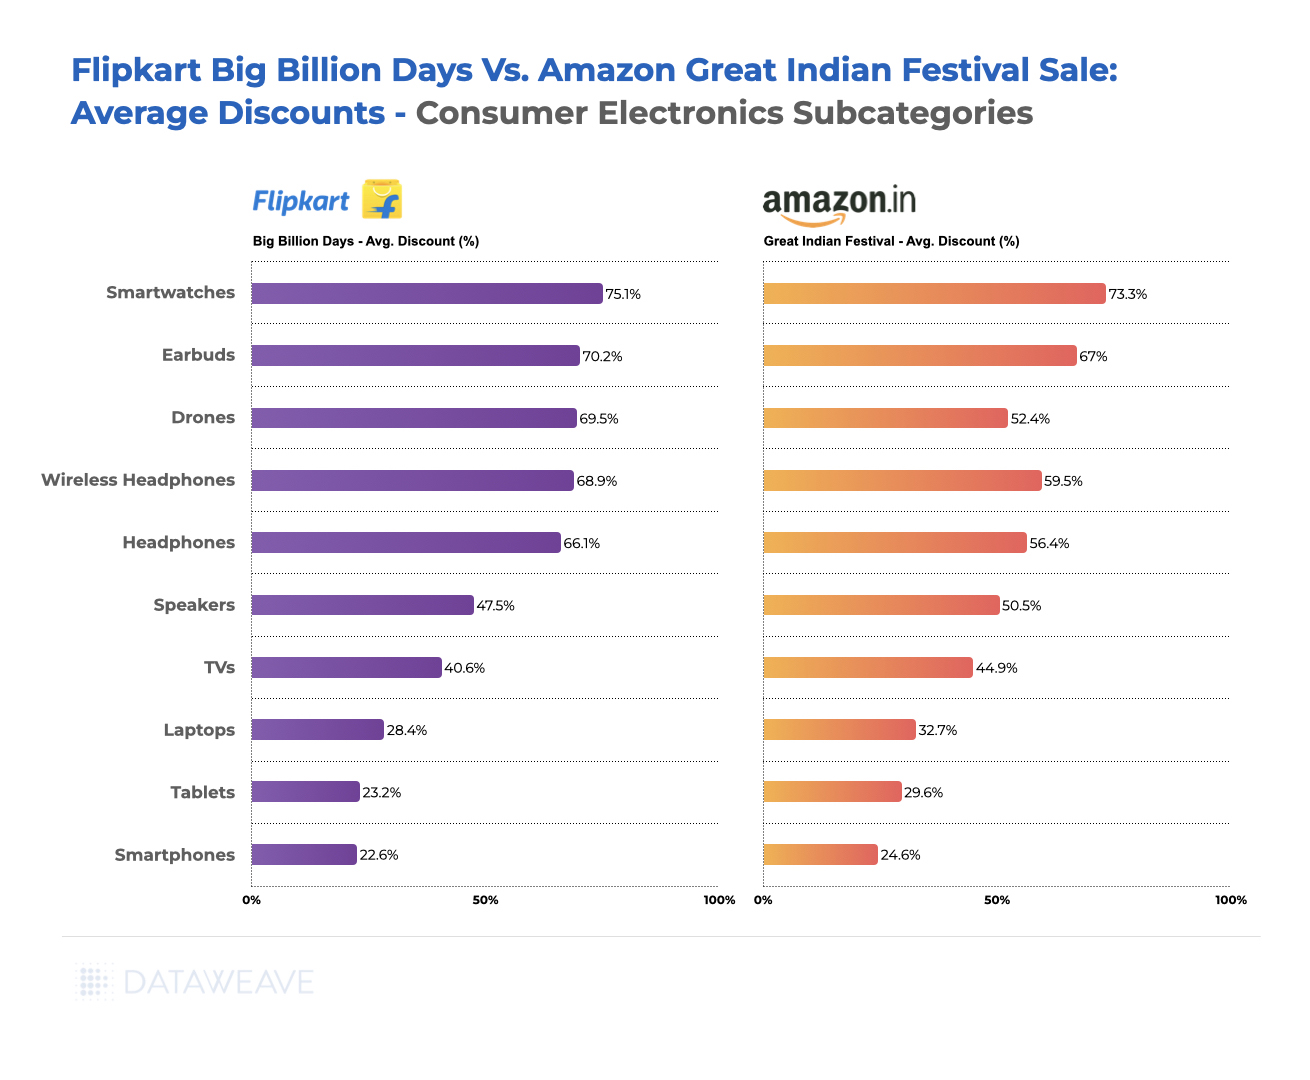
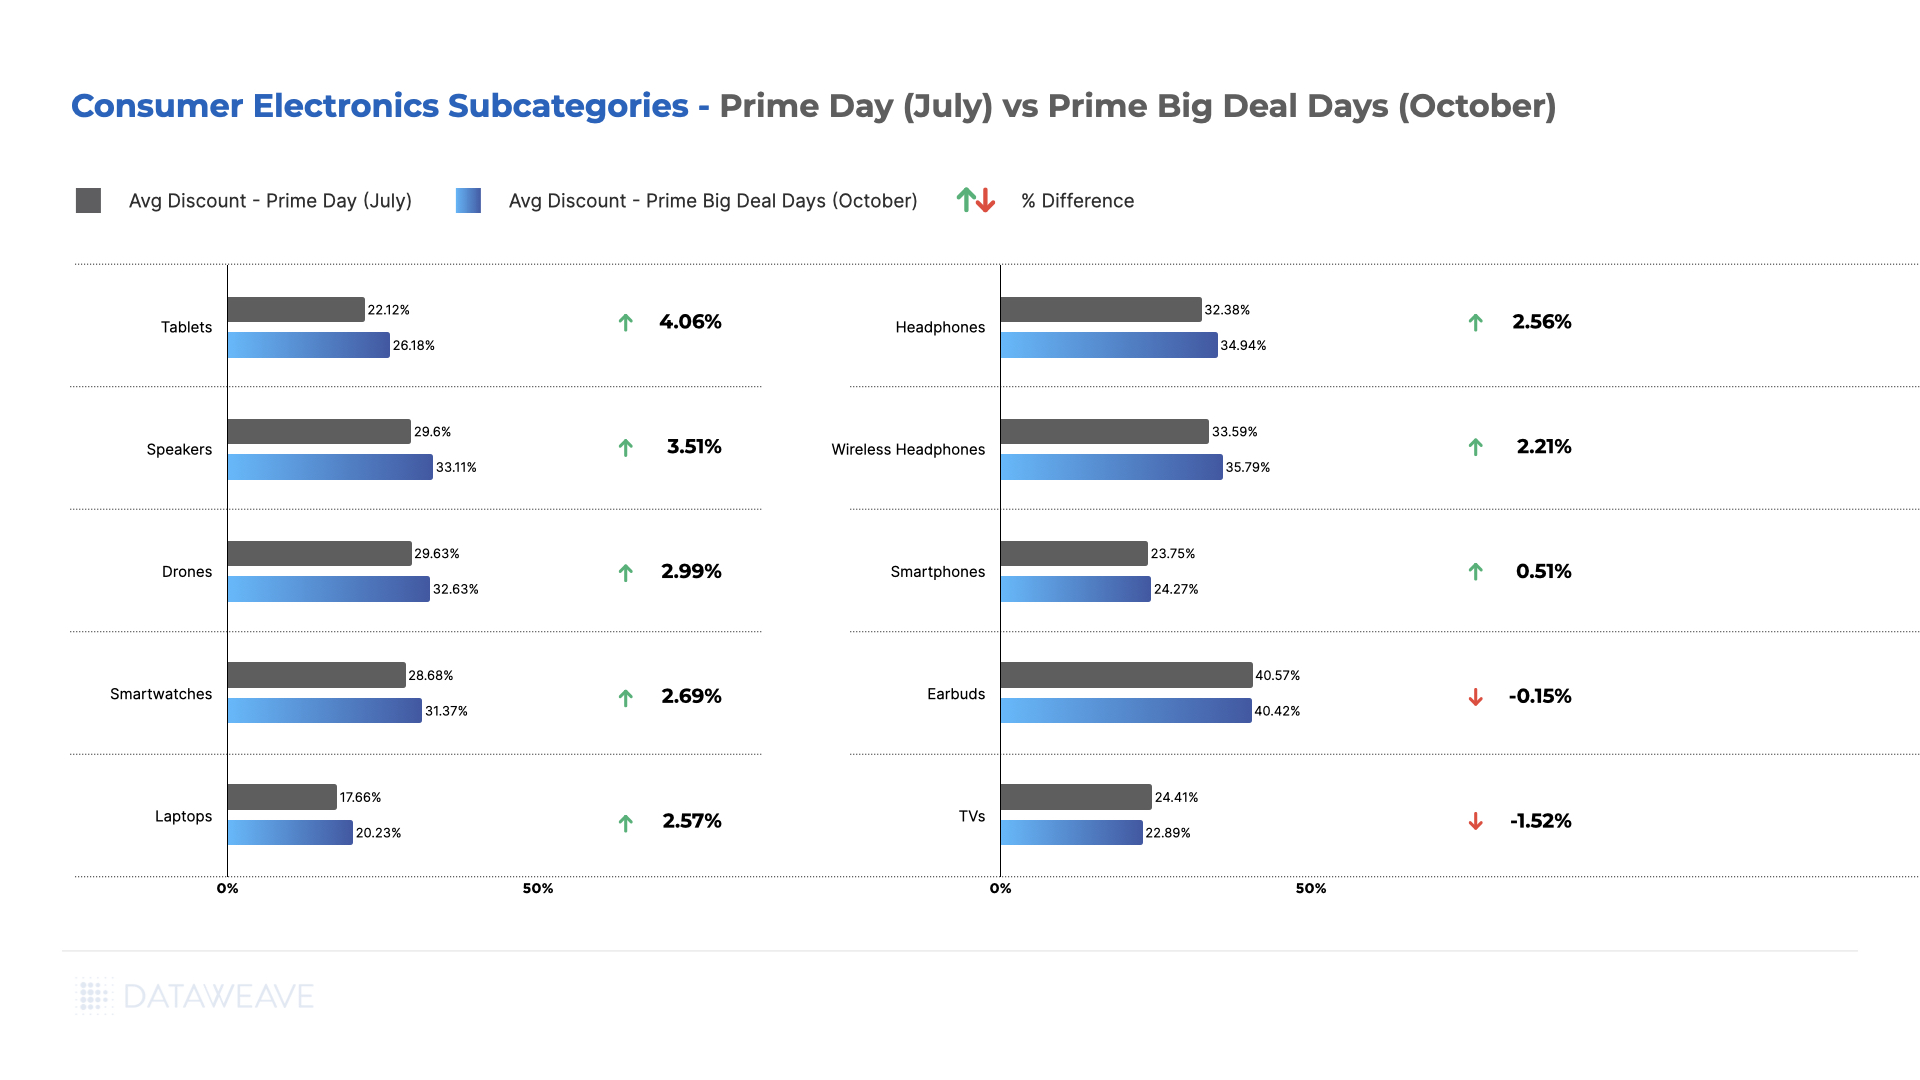
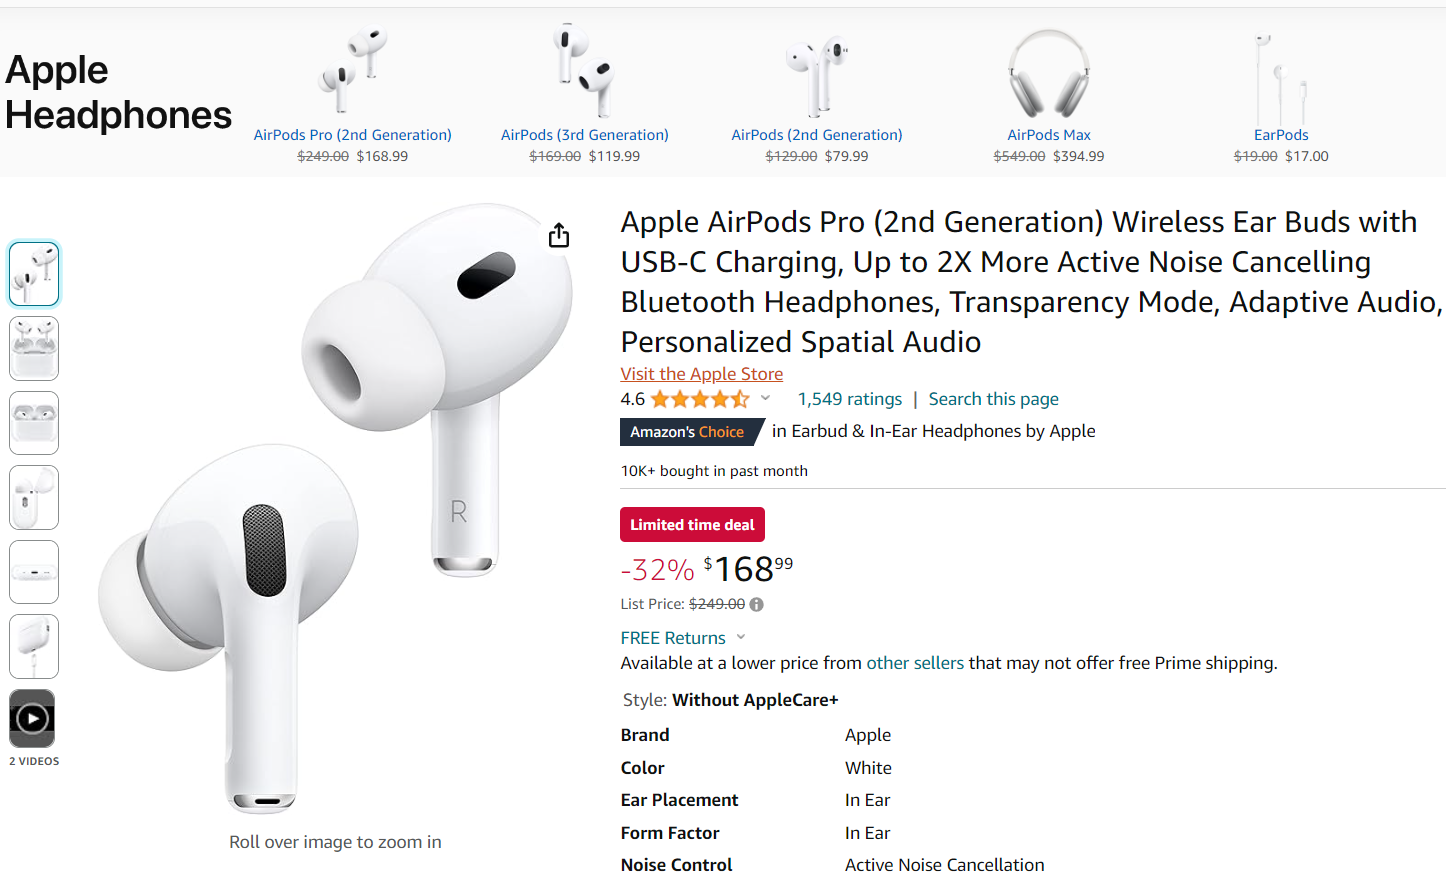
Across Electronics subcategories, Earbuds had the highest markdowns at 34.80%, followed closely by Wireless Headphones at 30.60% and Headphones at 29.00%, with steep additional discounts during Prime Day as well. Apple AirPods Pro, for example, retailed at $168 (down from $249) at a 32% discount.
Meanwhile, smartphones had the lowest markdowns at 9.30%, followed by Laptops at 10.50%. Laptops also had the lowest additional discount during Prime Day at just 1.28%, significantly lower than other subcategories. Speakers (20.80%), Drones (19.10%), and Smartwatches (25.00%) offered moderate to high markdowns.
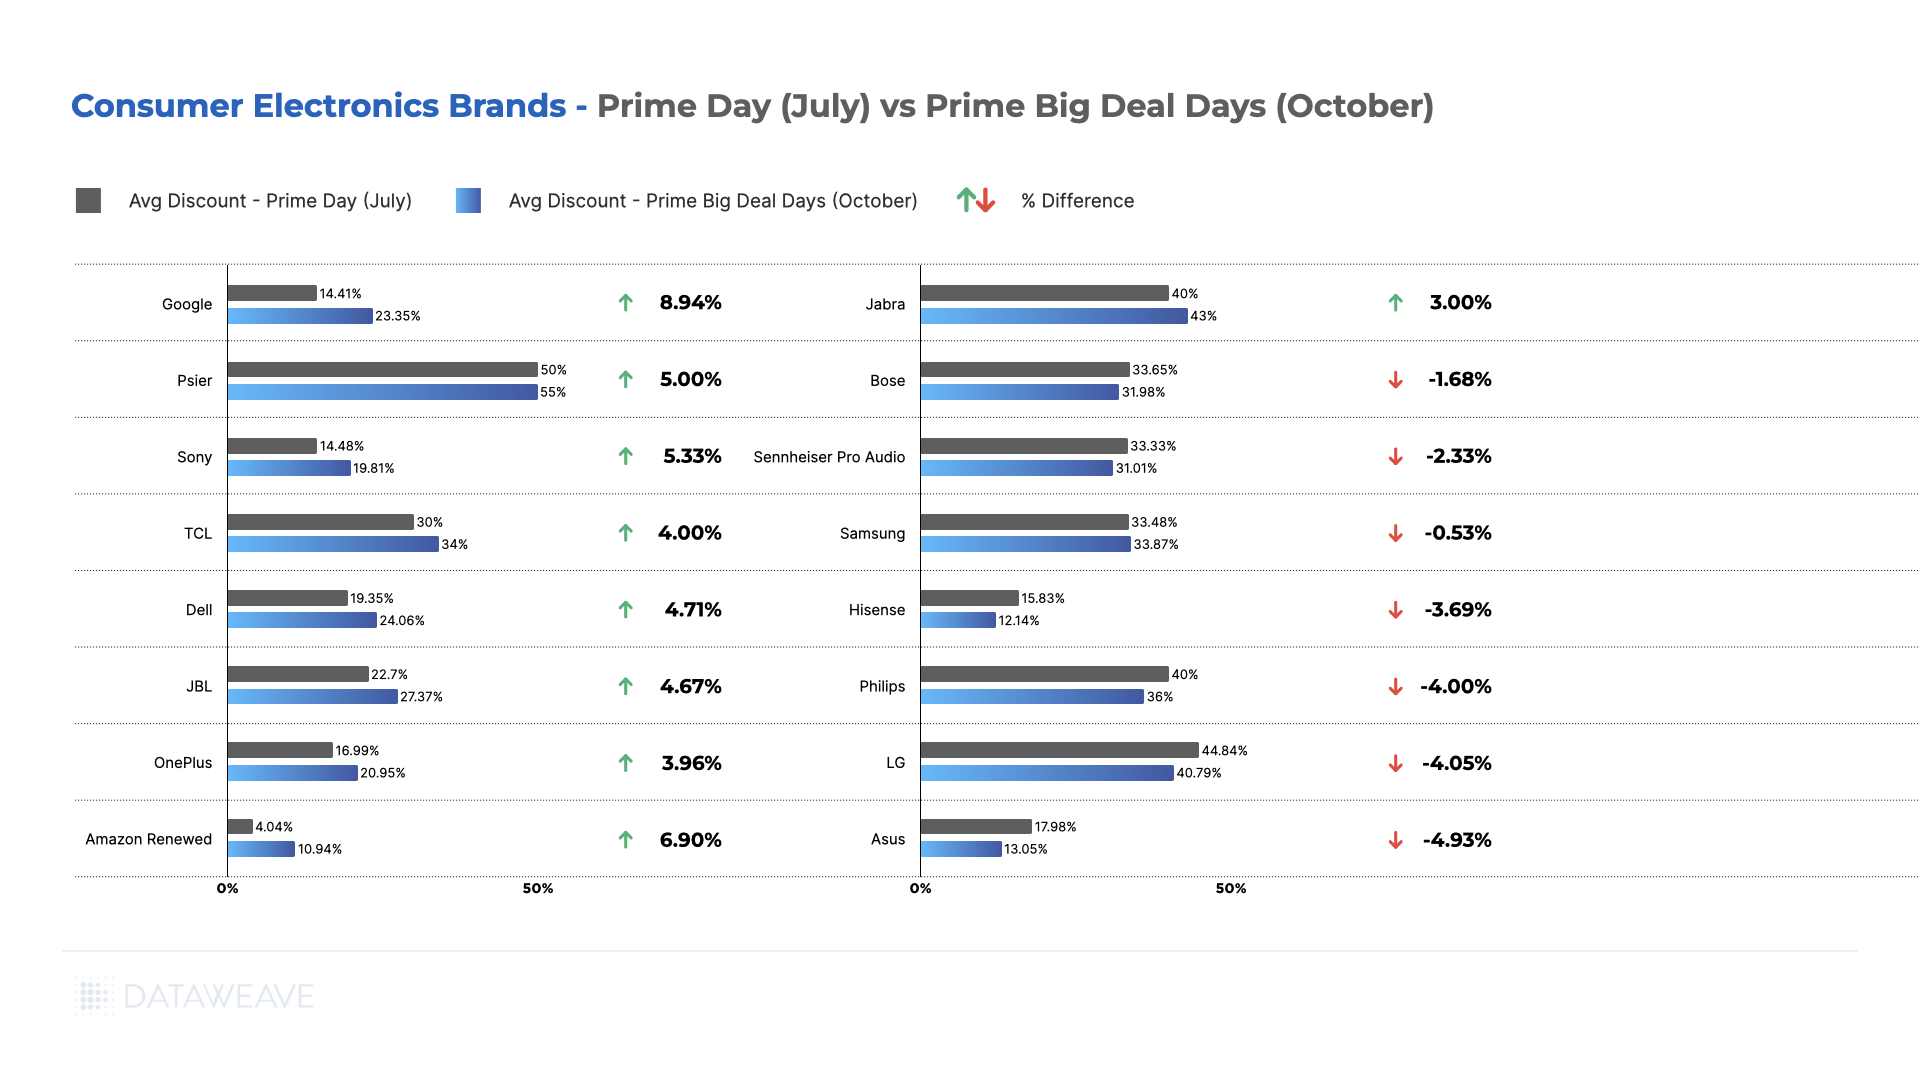
Notably, all Amazon products including Kindle, Echo, Echo Earbuds, Alexa, Fire TV, Fire TV Stick, and Fire Tablets, were aggressively discounted upwards of 30% this Prime Day. These products also came with the label “Climate Pledge Friendly.”

These aspects indicate Amazon’s push to promote its own ecosystem of products to the top, as well as cater to changing consumer preferences.
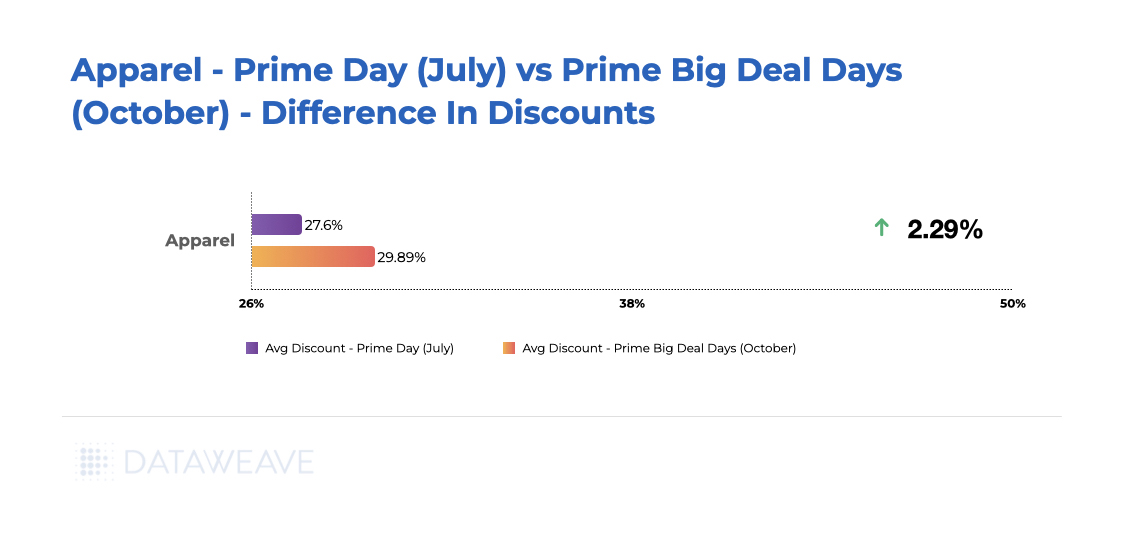
Apparel
Discounts offered this Prime Day increased from 13.2% in 2023 to 16.1% in 2024.
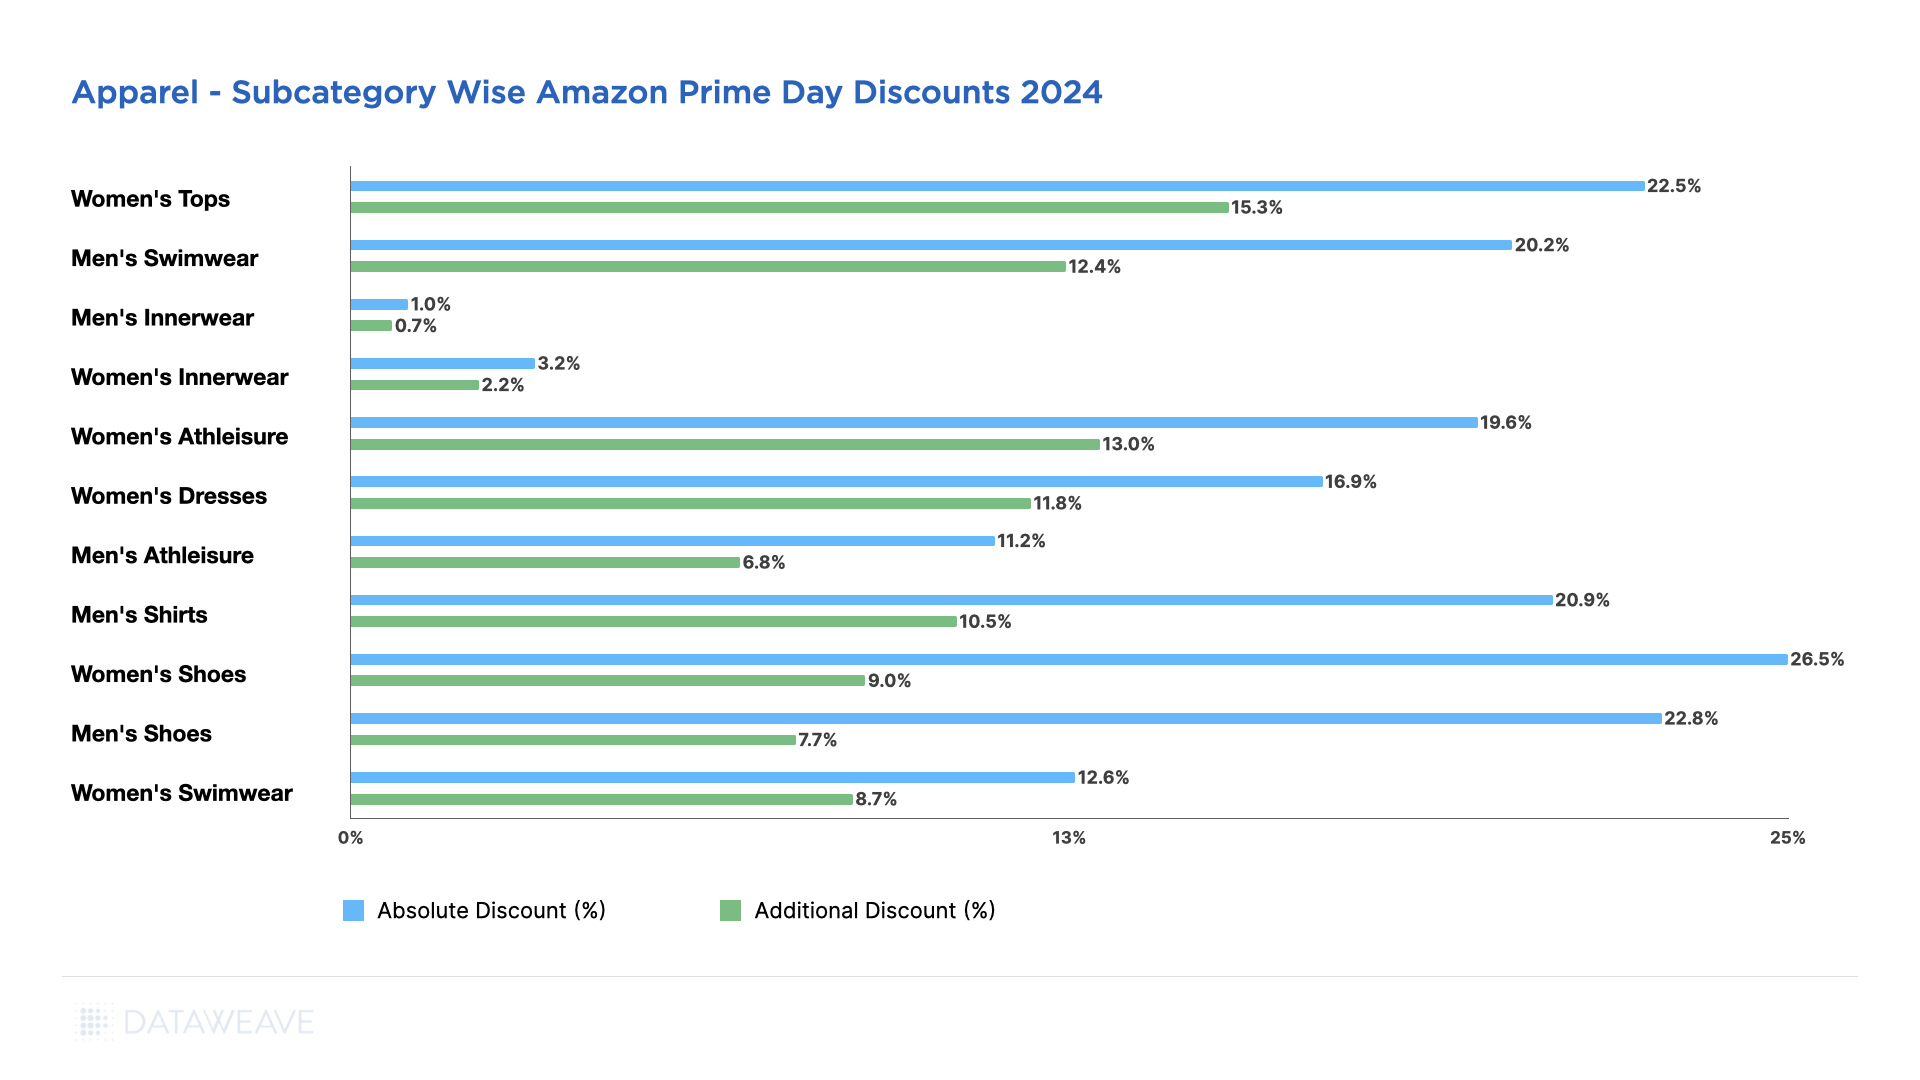
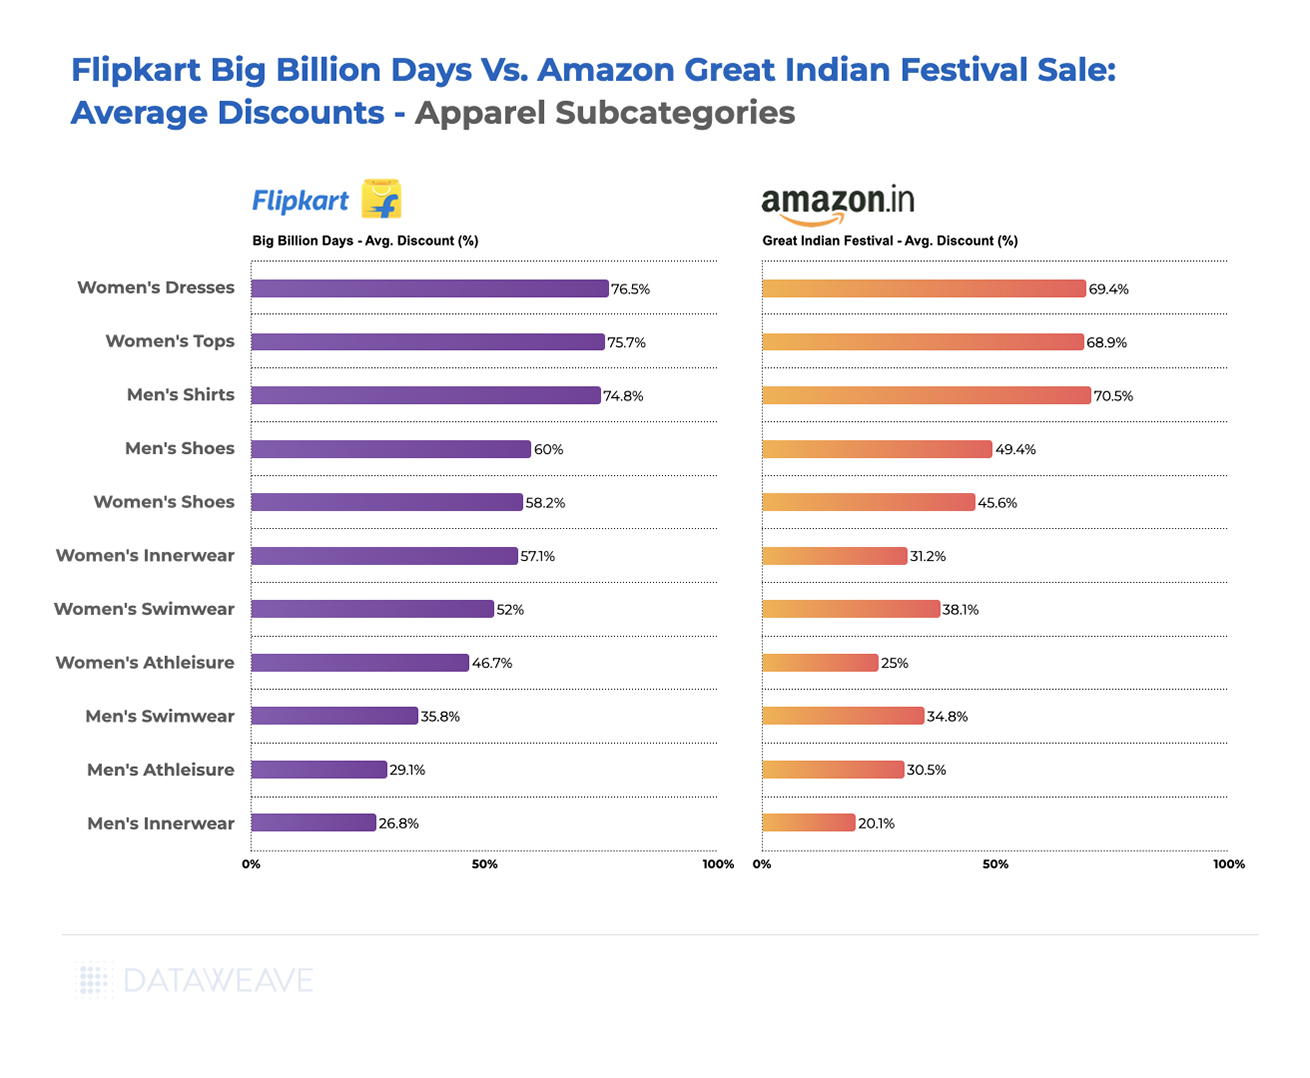
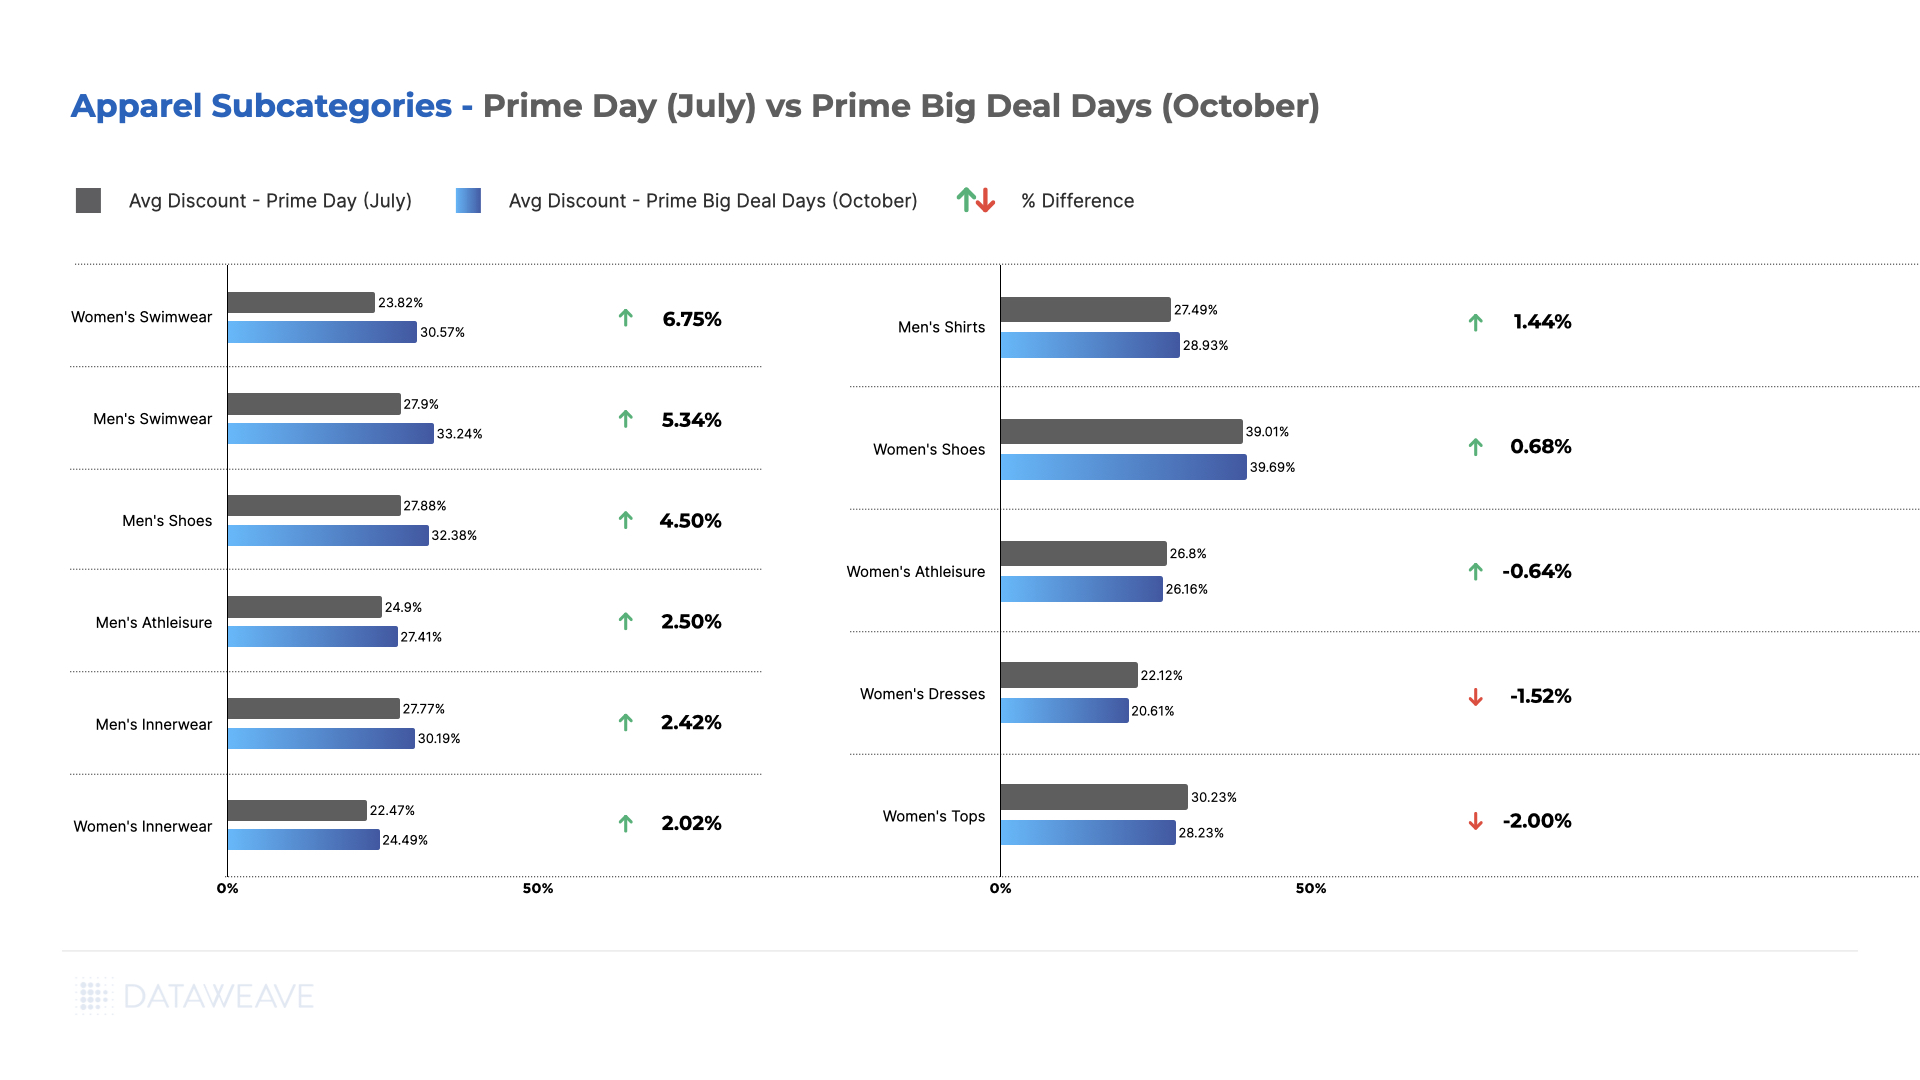
Amid apparel subcategories, Amazon appears to be pushing Women’s apparel categories more aggressively, particularly in Tops, Shoes, and Athleisure.
Women’s Shoes lead with the highest discounts at 26.50%, followed by Women’s Tops at 22.50% and Men’s Shoes at 22.80%. Women’s Tops also maintained the highest additional discount at 15.27%, followed by Women’s Athleisure at 13.03% and Men’s Swimwear at 12.44%.
Similar to 2023, Men’s Innerwear offered significantly lower discounts, with only 1% absolute discount and 0.72% additional discount. Women’s Innerwear also shows low discounts at 3.20% absolute and 2.23% additional.
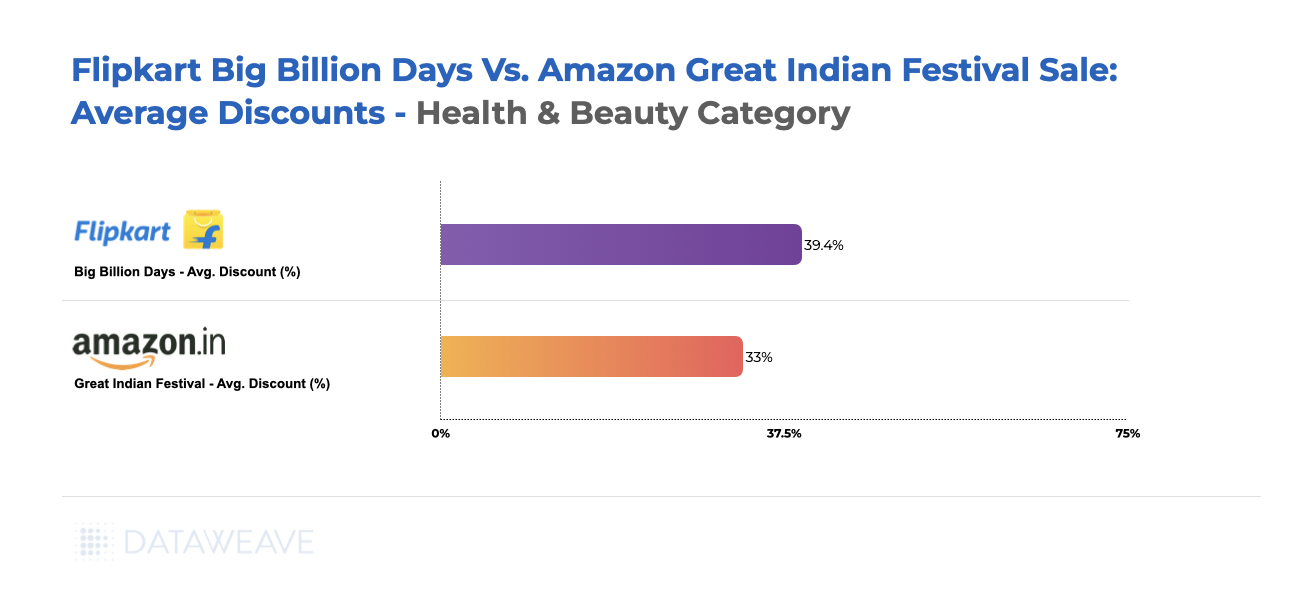
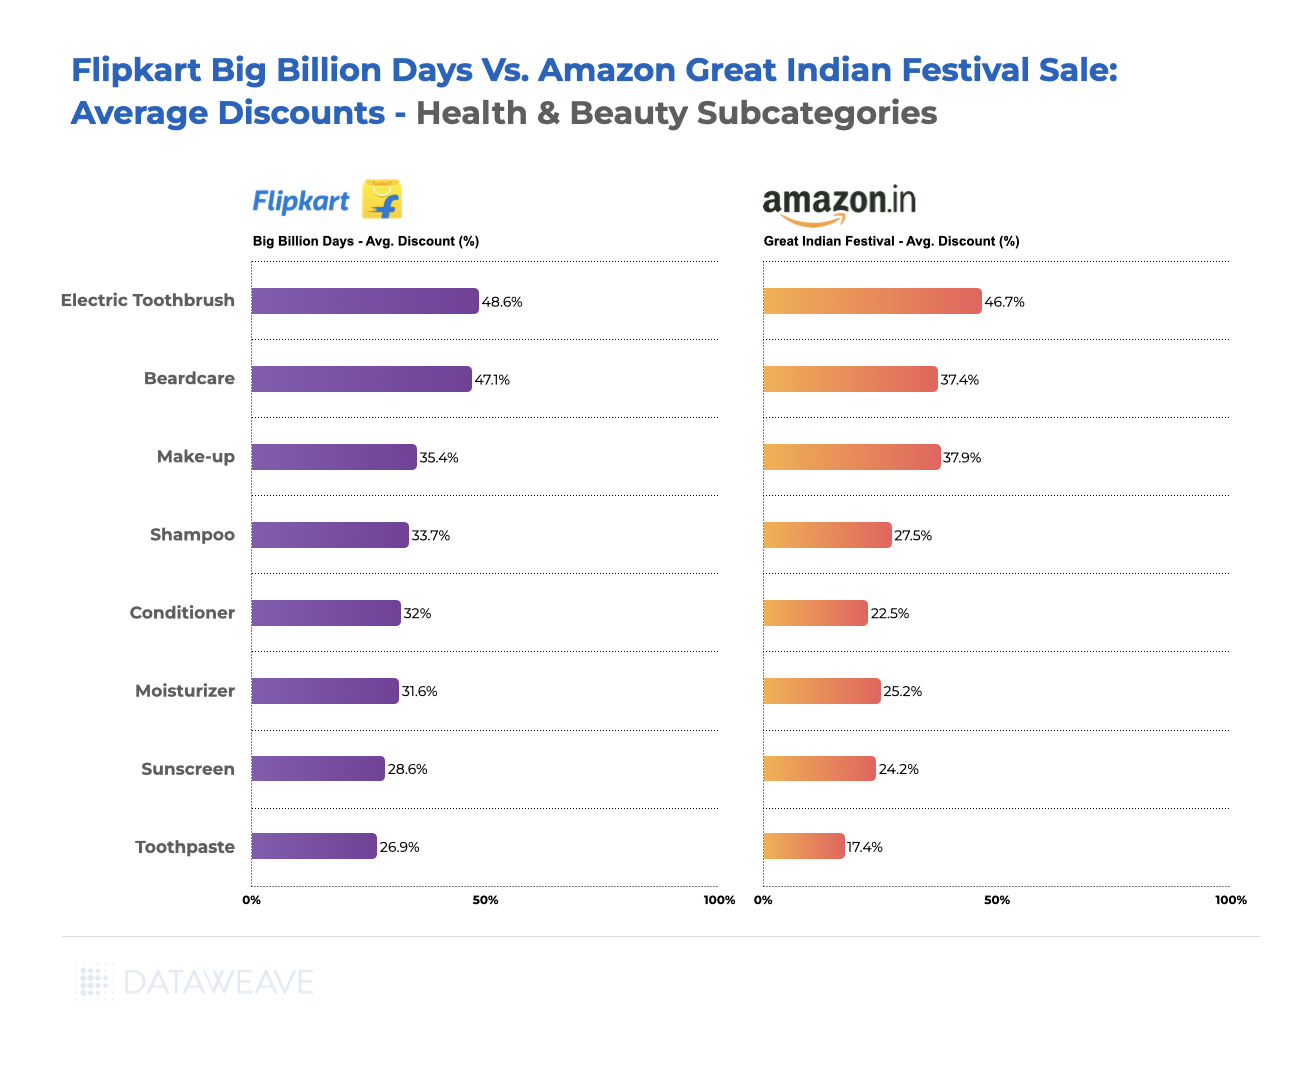
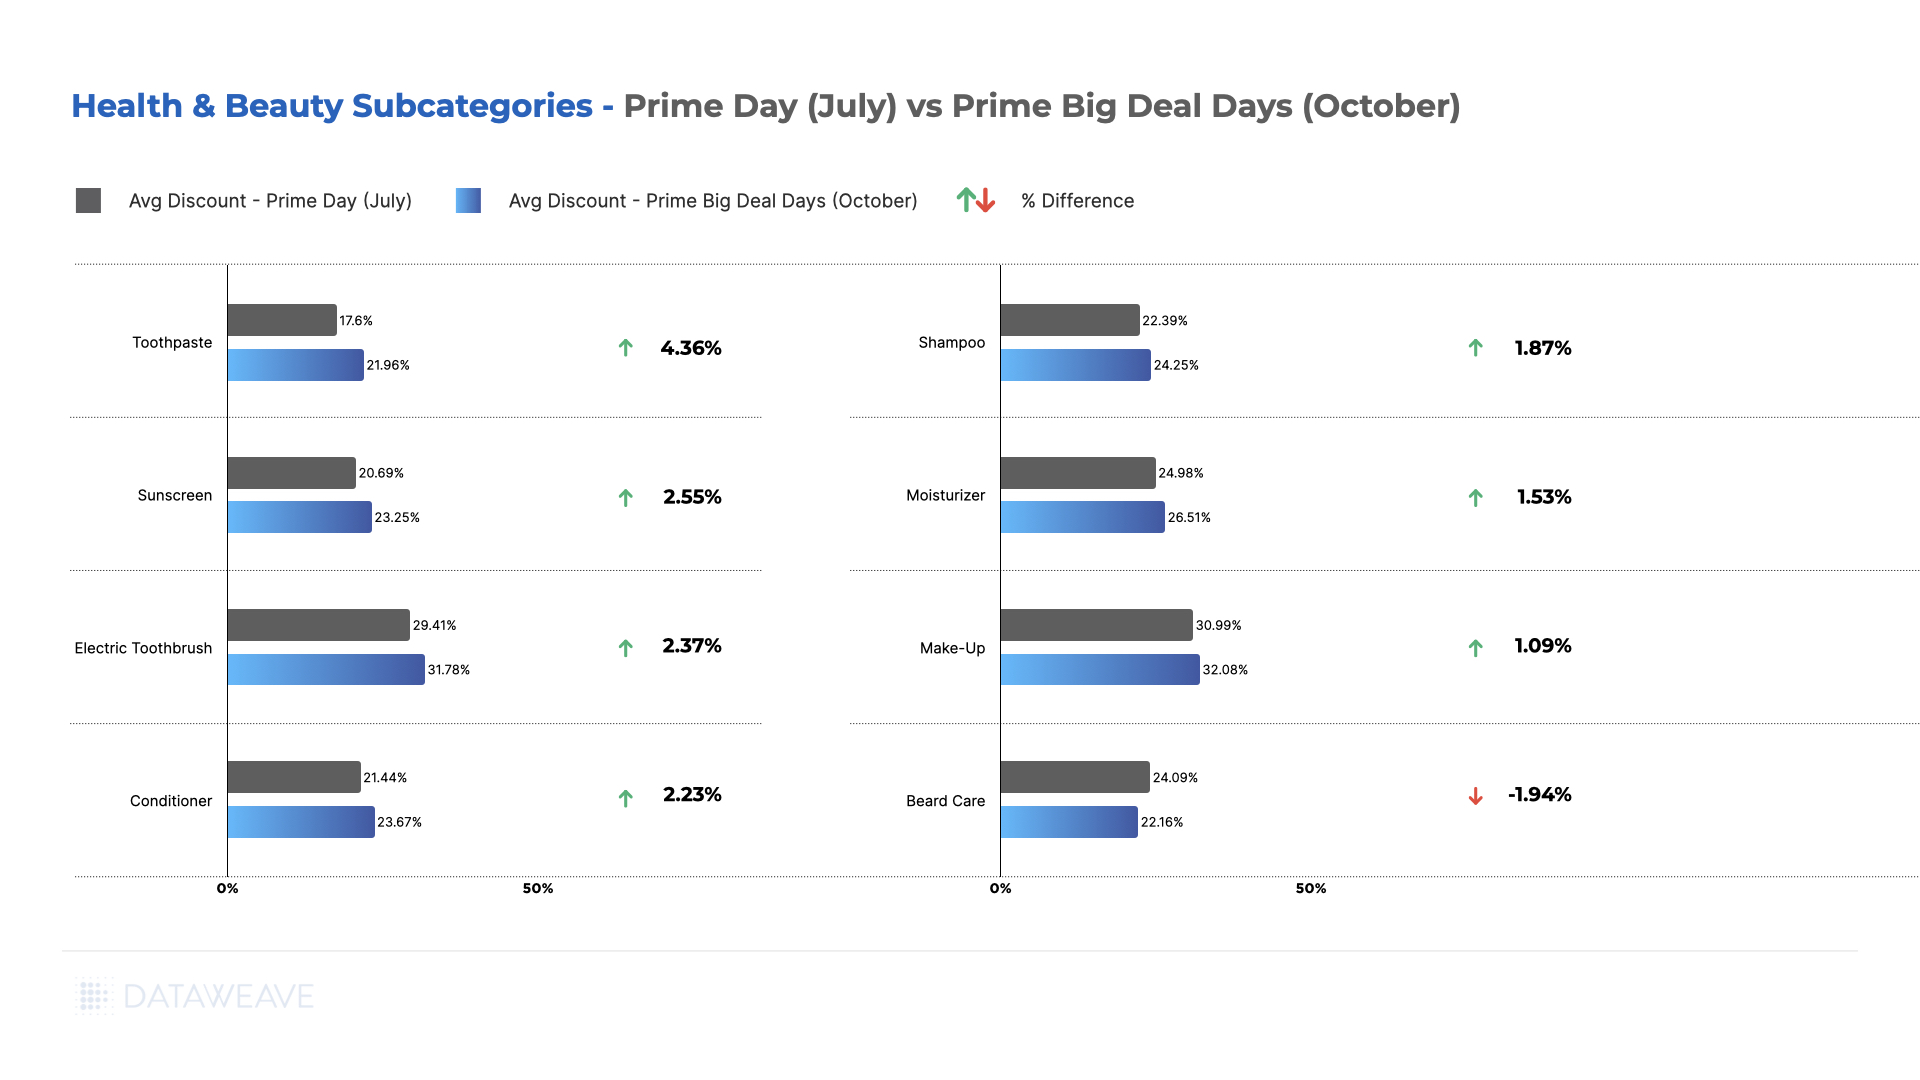
Health & Beauty
Amid health & beauty subcategories, Moisturizes witnessed the highest markdowns at 20.10%, followed by Make Up at 18.90%. The Moisturizer subcategory also offers highest additional discounts at 12.20%, followed closely by Sunscreen at 10.25% and Beard Care at 10.22%.
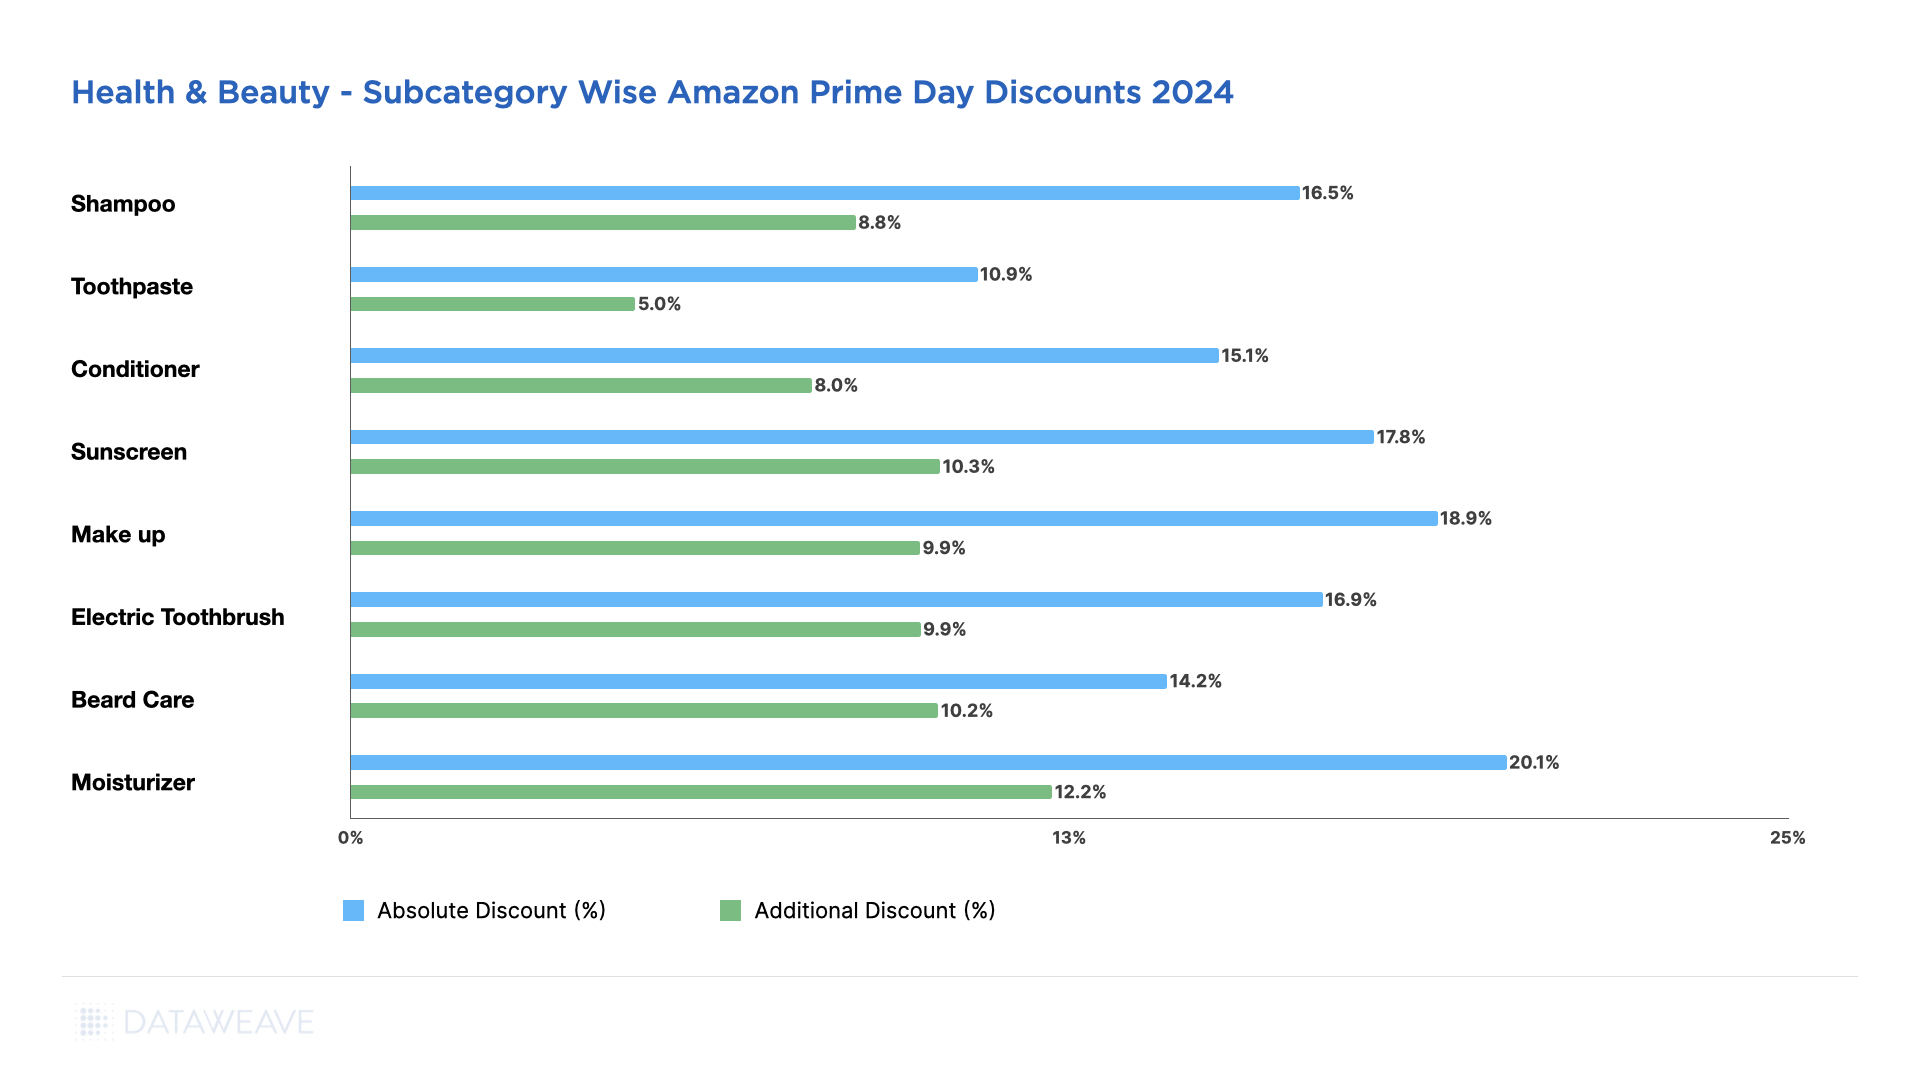
The Toothpaste subcategory has the lowest discounts, at 10.90%. The lower discounts on everyday essentials like this might indicate a steady demand or an attempt to maintain margins on frequently purchased items.
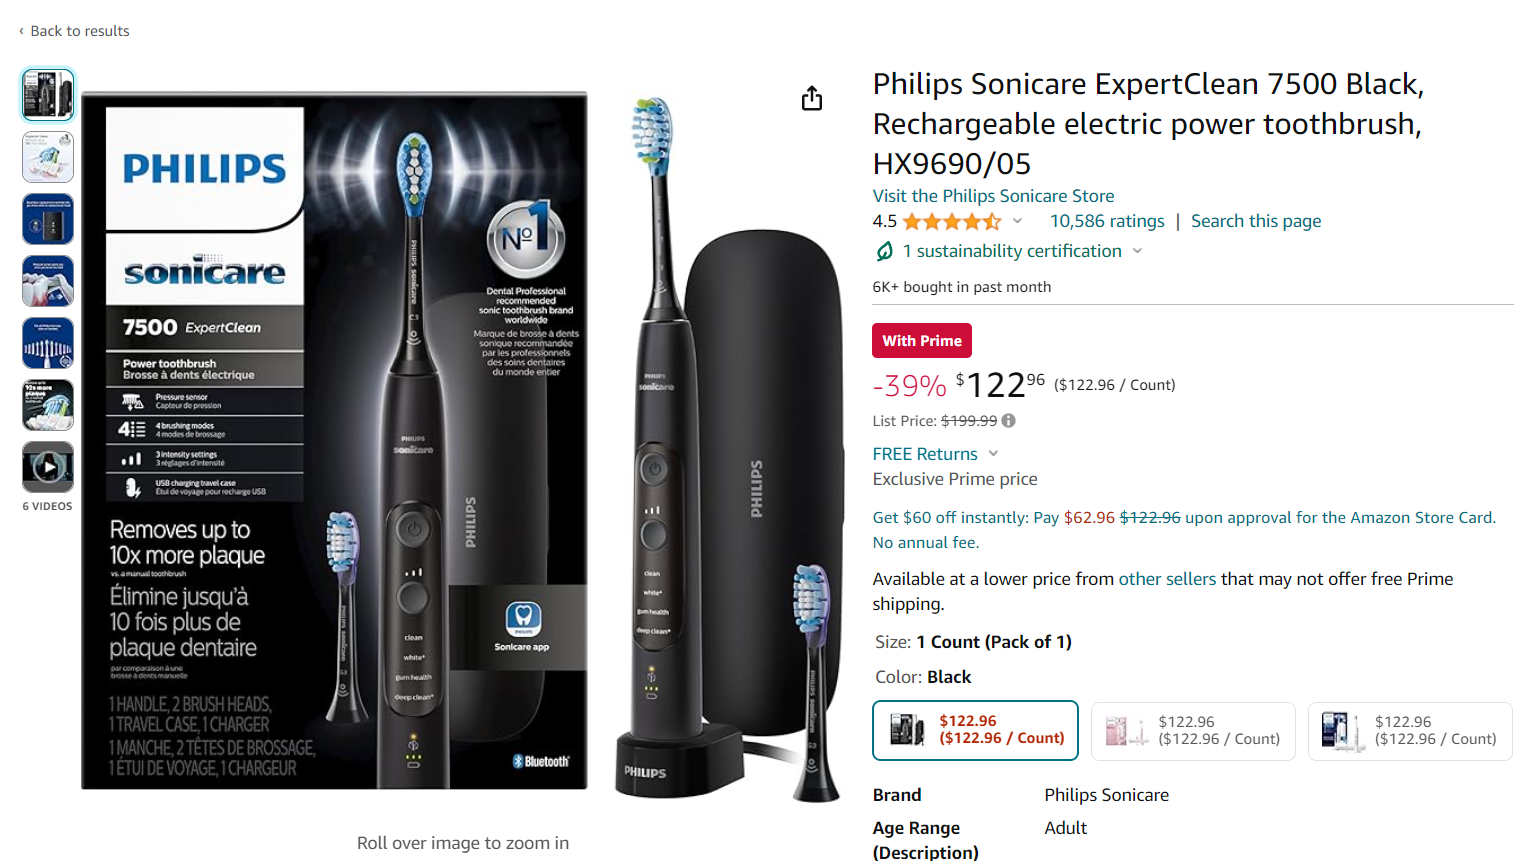
Most Health & Beauty subcategories fall in the 15-18% range for actual discounts and 8-10% range for additional discounts. Electric Toothbrush (16.90% actual, 9.91% additional) and Shampoo (16.50% actual, 8.78% additional) represent the middle of the pack. There were a few highly attractive deals though, such as the Philips Sonicare toothbrush retailing at $122.96 (down from $199.99), with a 39% discount.
Amazon also offered significant discounts on Open Box products (products that are returned, but unused, out of mint condition boxes) to Prime members.
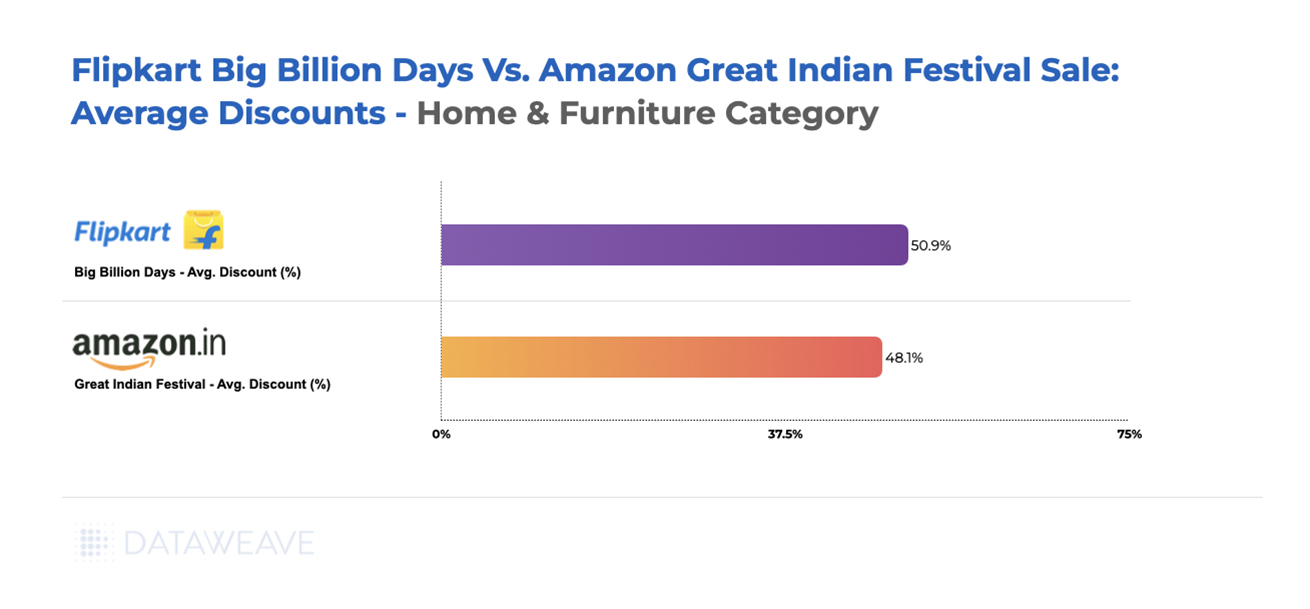
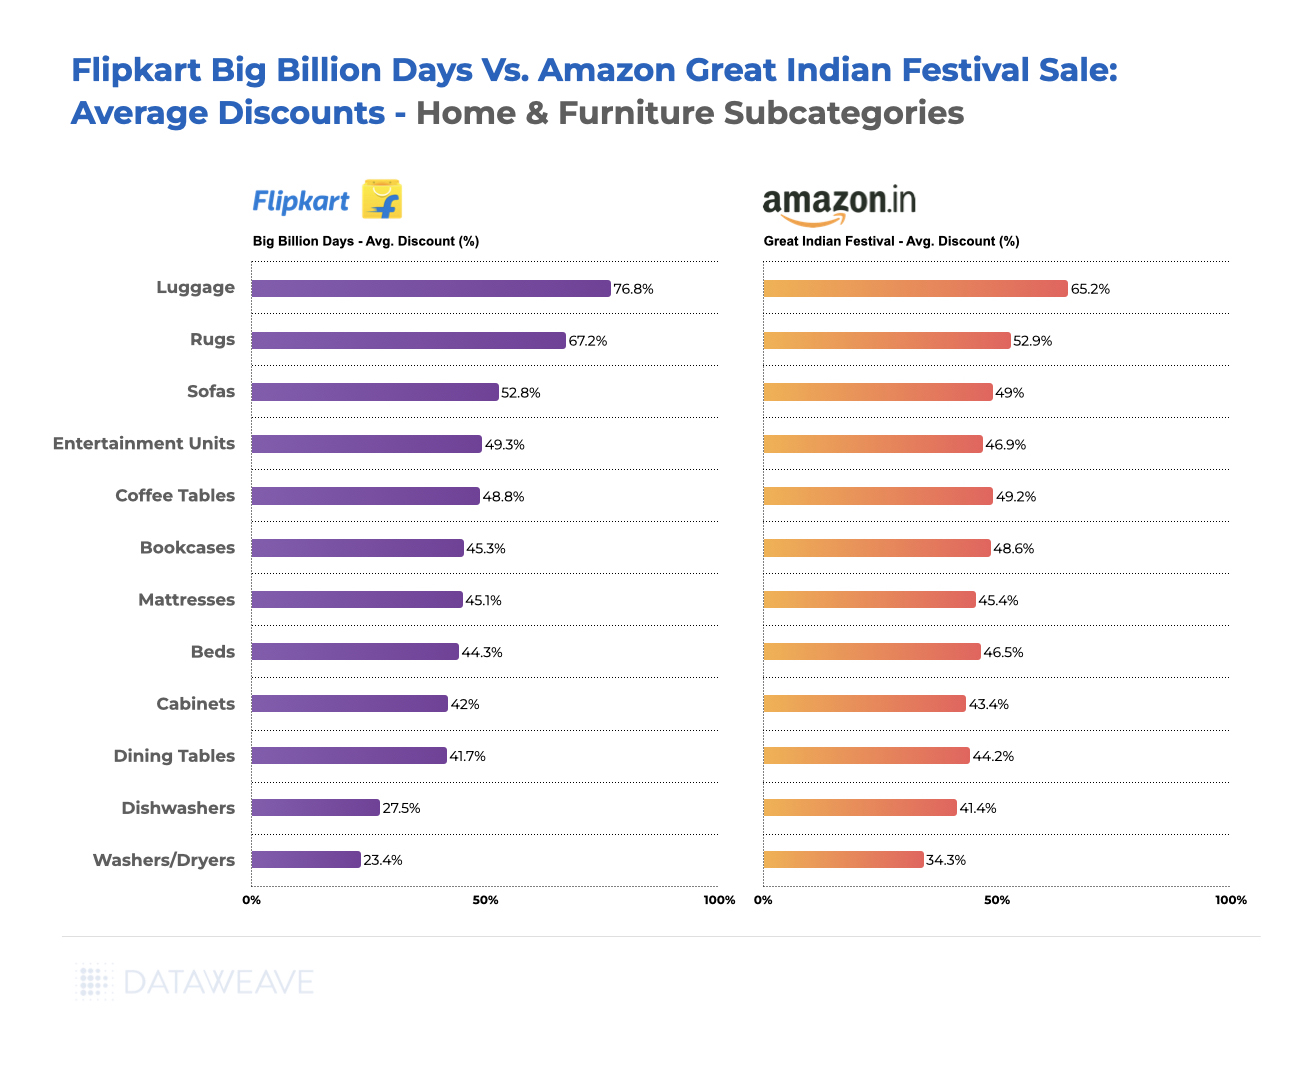
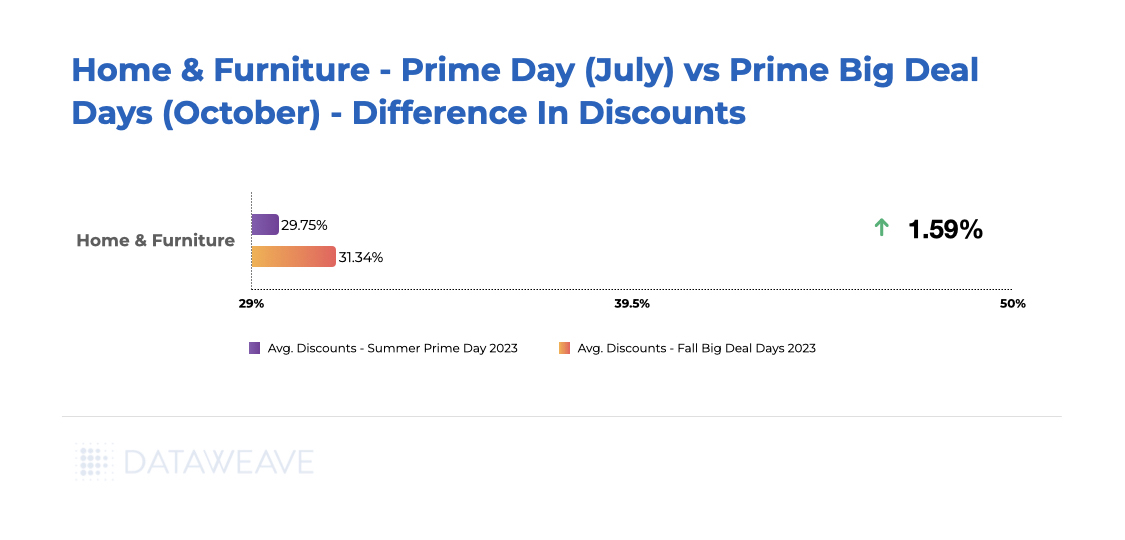
Home & Furniture
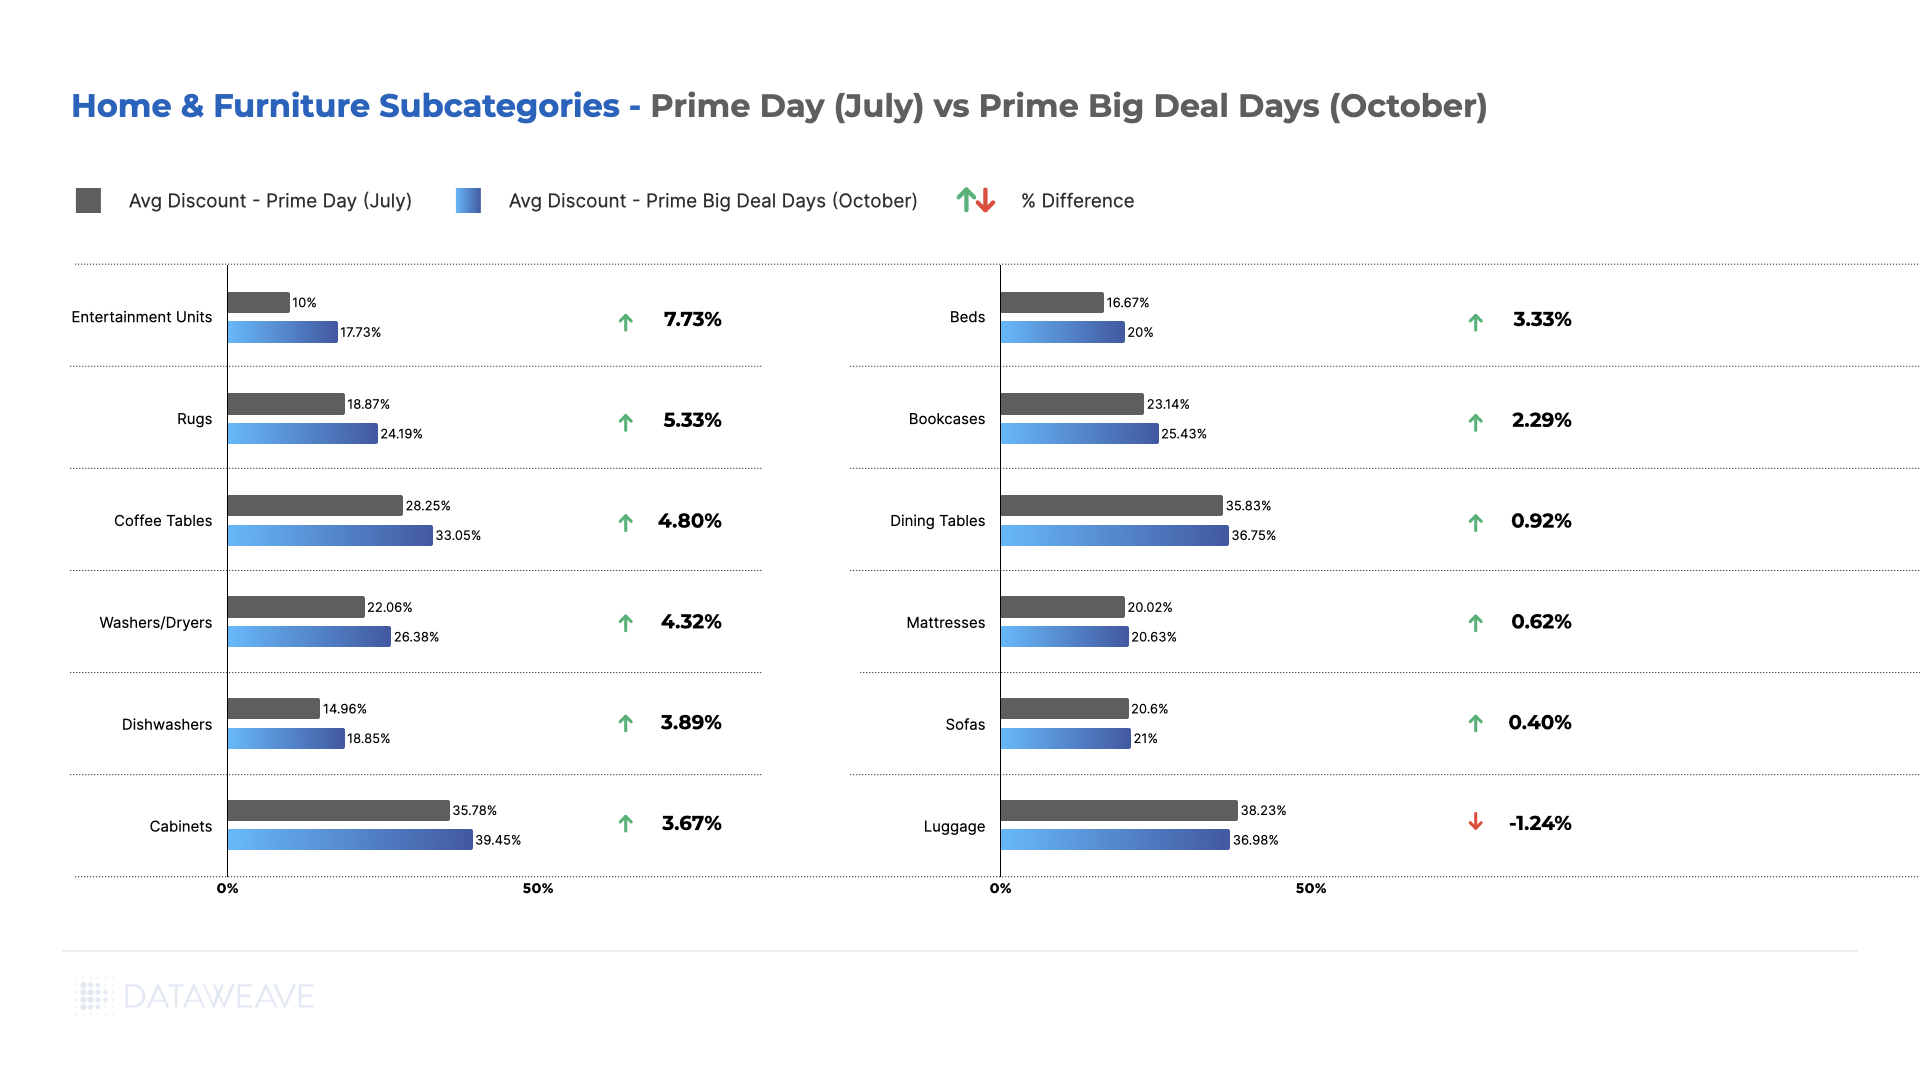
This category saw the lowest discounts for this Prime Day event at 13.1%. Across subcategories, Rugs lead with the highest average discount at 21.50%, closely followed by Luggage at 20.90%. Amazon seems to be pushing decorative and organizational items (Rugs, Bookcases) more aggressively, possibly due to higher margins. Rugs also stood out as the subcategory with the highest additional discount of 11.54%.
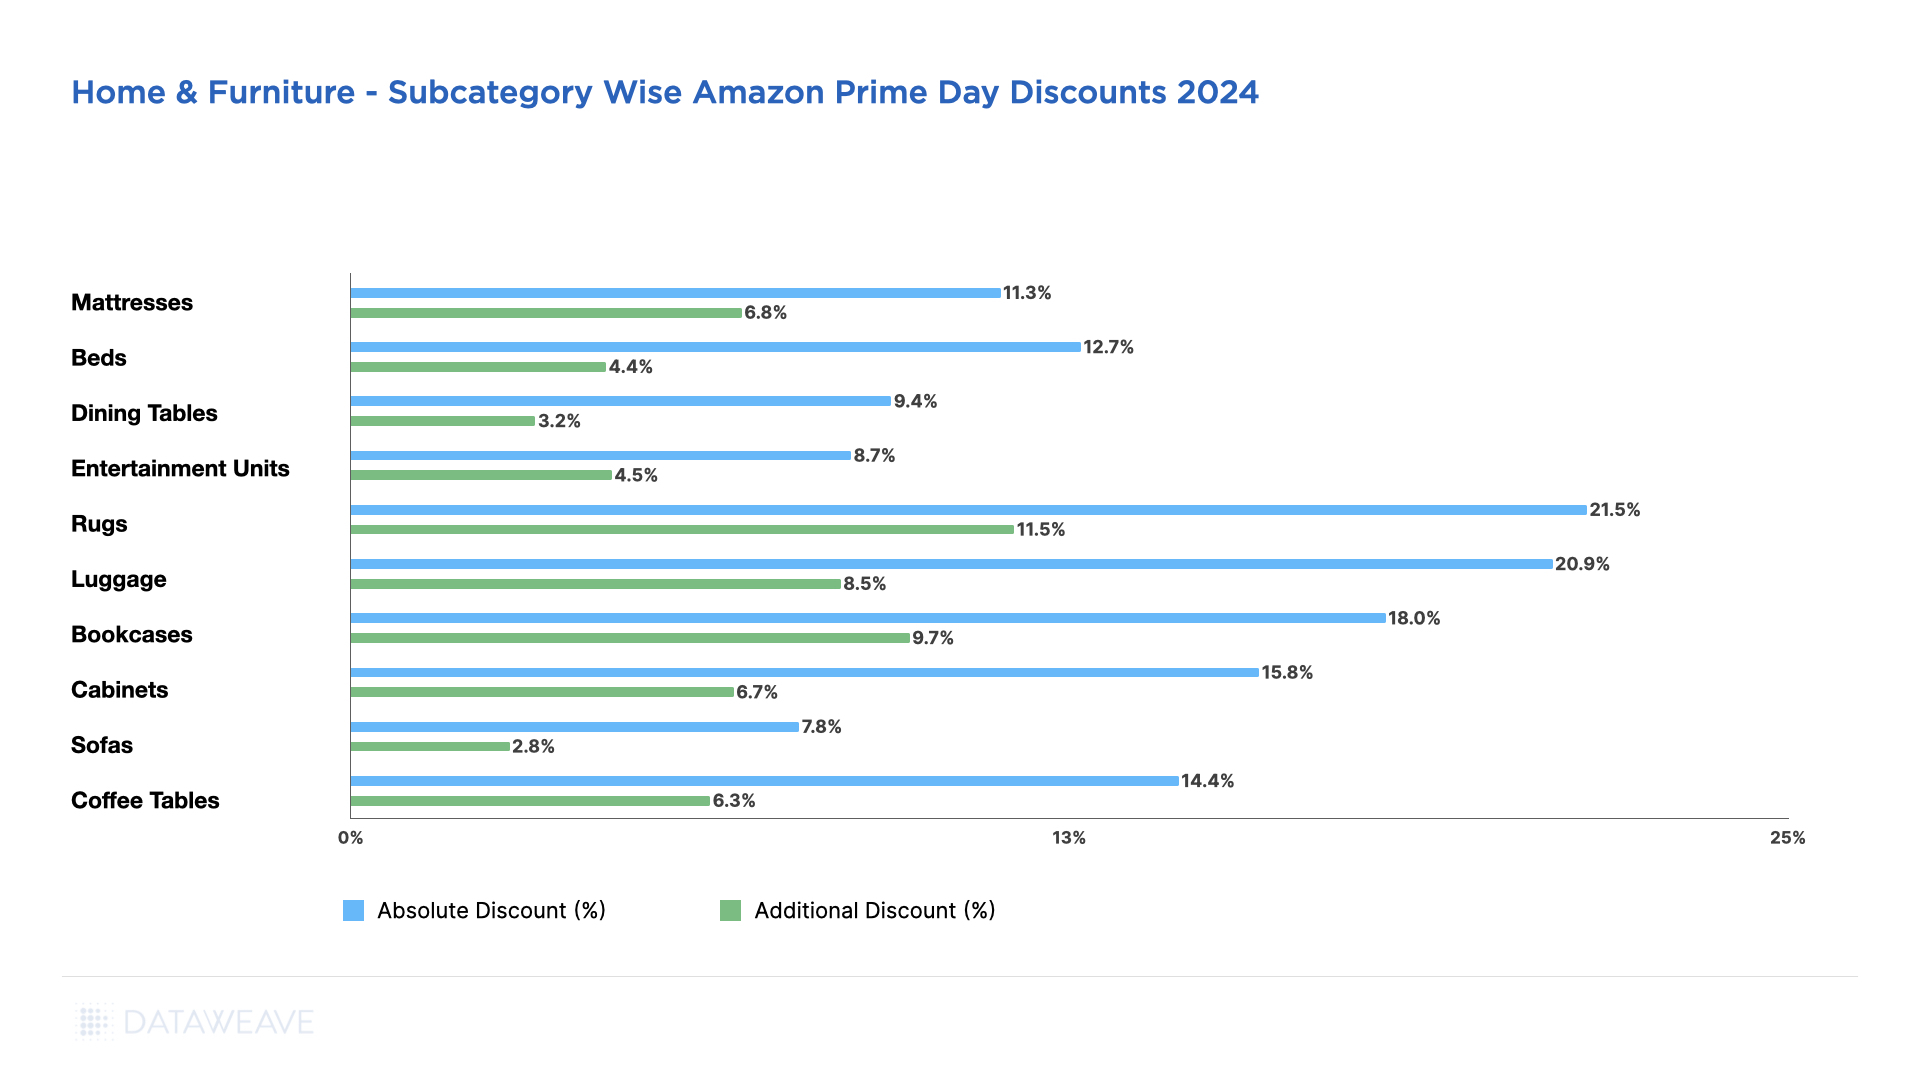
Sofas have the lowest additional discount at 2.76%, followed by Dining Tables at 3.21%. Items like Cabinets (15.80% absolute, 6.66% additional) and Coffee Tables (14.40% absolute, 6.25% additional) represent the middle range of discounts.
Watch Out For More
As the holiday season approaches, it’s clear that the retail landscape continues to evolve. While Amazon remains a formidable force, there are opportunities for savvy competitors to carve out their niches and attract deal-hungry shoppers. By analyzing these trends and adjusting strategies accordingly, retailers can position themselves for success in the high-stakes world of summer sales events.
Stay tuned to our blog for more insights on how Amazon’s competitors reacted to Prime Day, and how leading brands across categories fared in terms of their pricing and their visibility during the sale event. Reach out to us today to learn more.