Black Friday has evolved from a purely Western retail phenomenon into a global shopping event. India is no exception. While the country celebrates its own mega sale events like the Great Indian Festival and Big Billion Days, Black Friday has carved out its own space in the Indian retail calendar. E-commerce in India is expected to reach $325 billion by 2030, with festive shopping seasons driving significant portions of that growth.
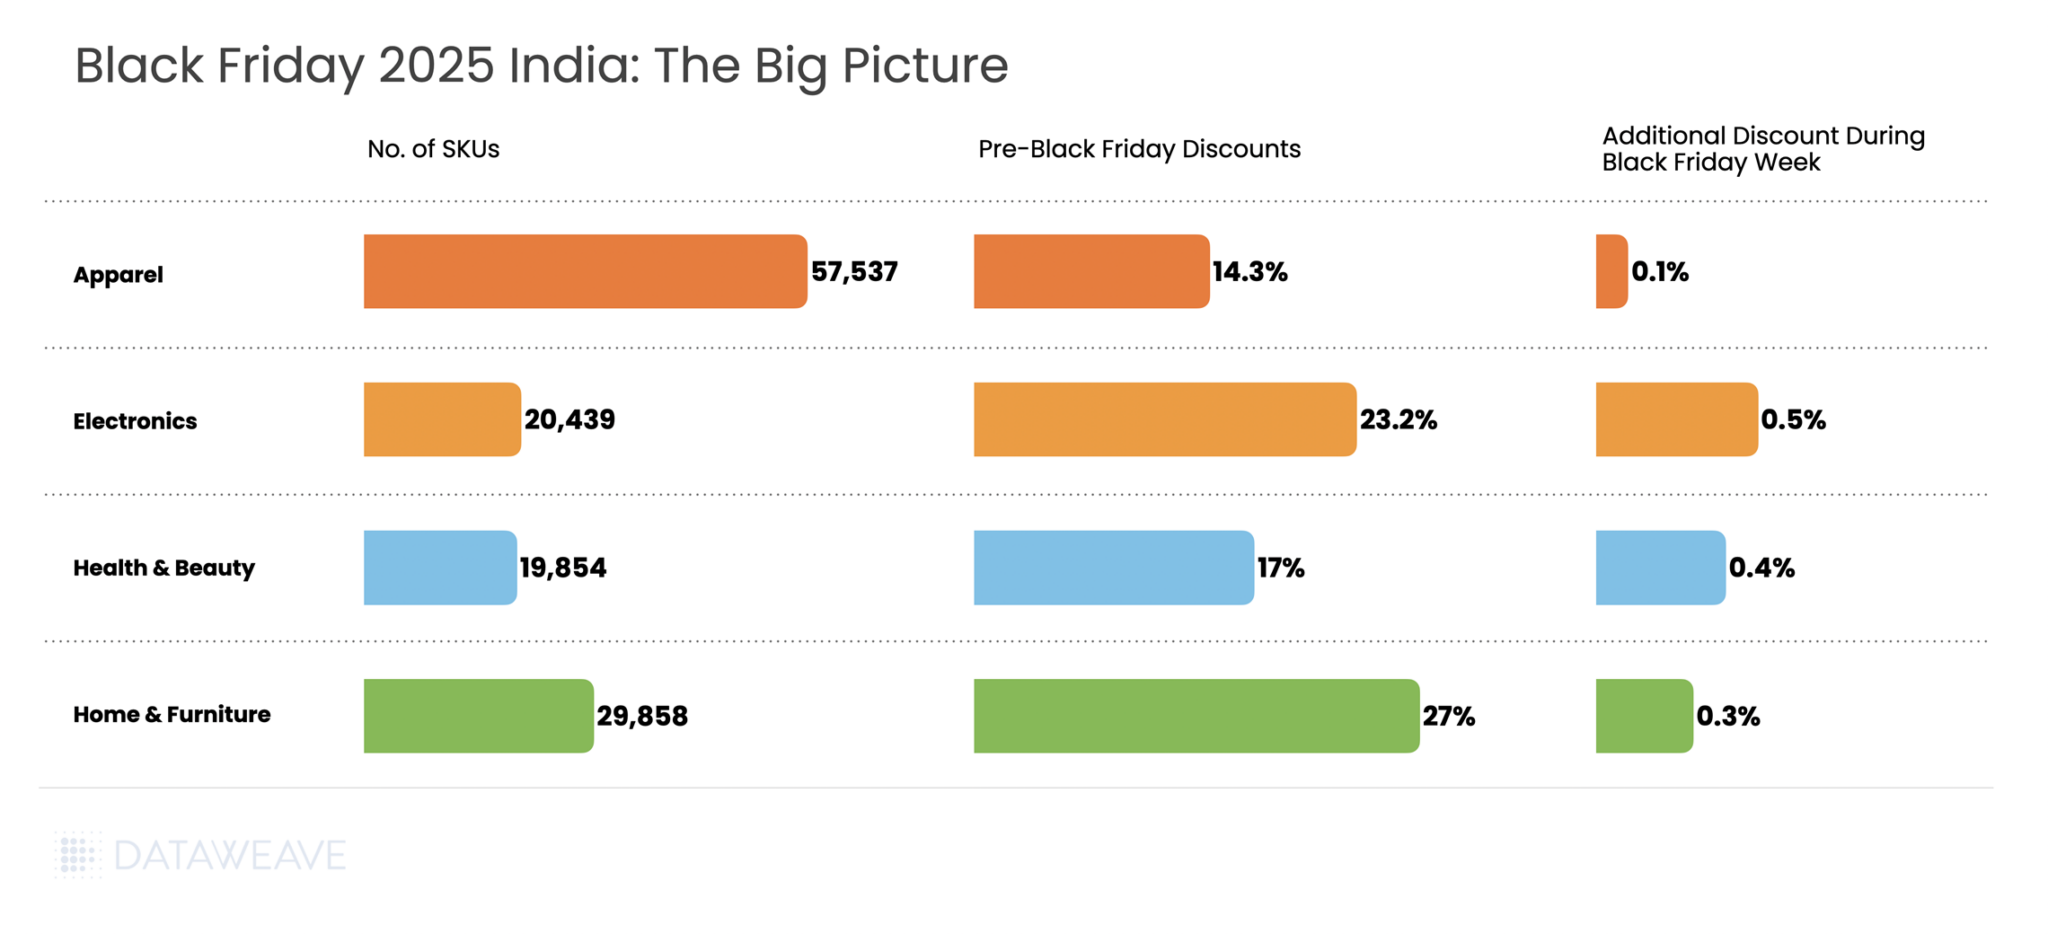
So how did Indian retailers and brands navigate Black Friday 2025? At DataWeave, we analyzed pricing trends across four major categories: Consumer Electronics, Home & Furniture, Health & Beauty, and Apparel. Our AI-powered retail intelligence platform tracked nearly 128,000 SKUs across leading platforms including Amazon India, Flipkart, Myntra, and others, revealing how the Indian market approached discounting and brand visibility during this high-stakes shopping period.
Our Methodology
DataWeave monitored average discount percentages across major Indian e-commerce platforms during two distinct periods:
Pre-Black Friday: Up to November 23, 2025 – capturing early promotional activity and baseline pricing
Black Friday Week: November 24 – December 1,2025 – spanning Thanksgiving week through Black Friday (November 28) and Cyber Monday (December 1)
We analyzed top-ranked products across subcategories on major retail sites, alongside Share of Search data, a metric that measures brand visibility by tracking which brand names appear in the top 20 search results for high-intent keywords.
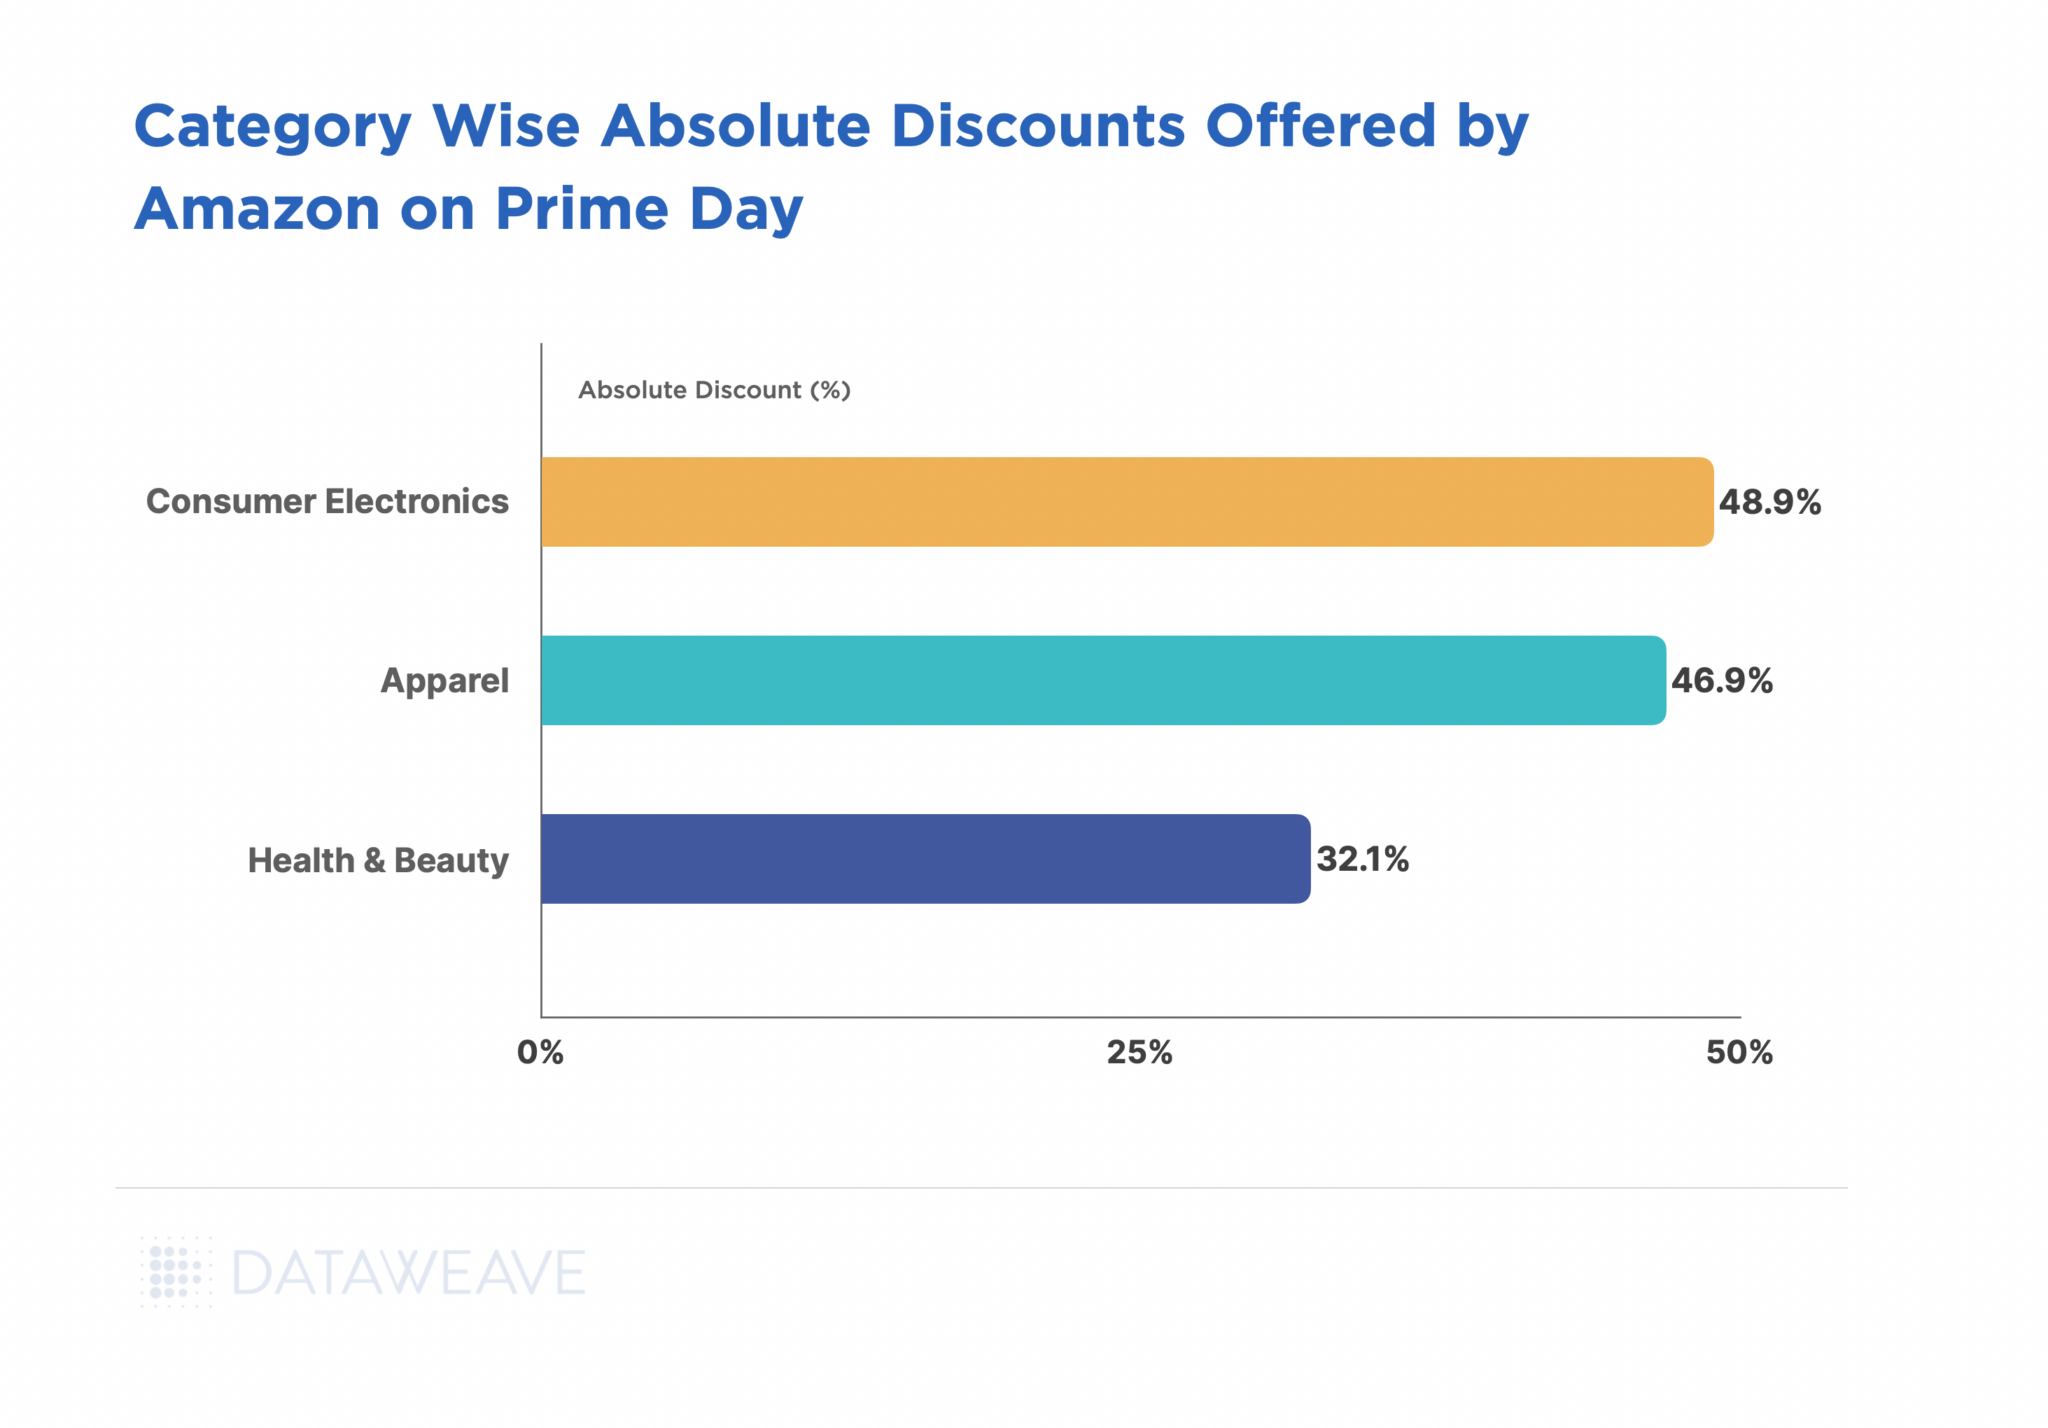
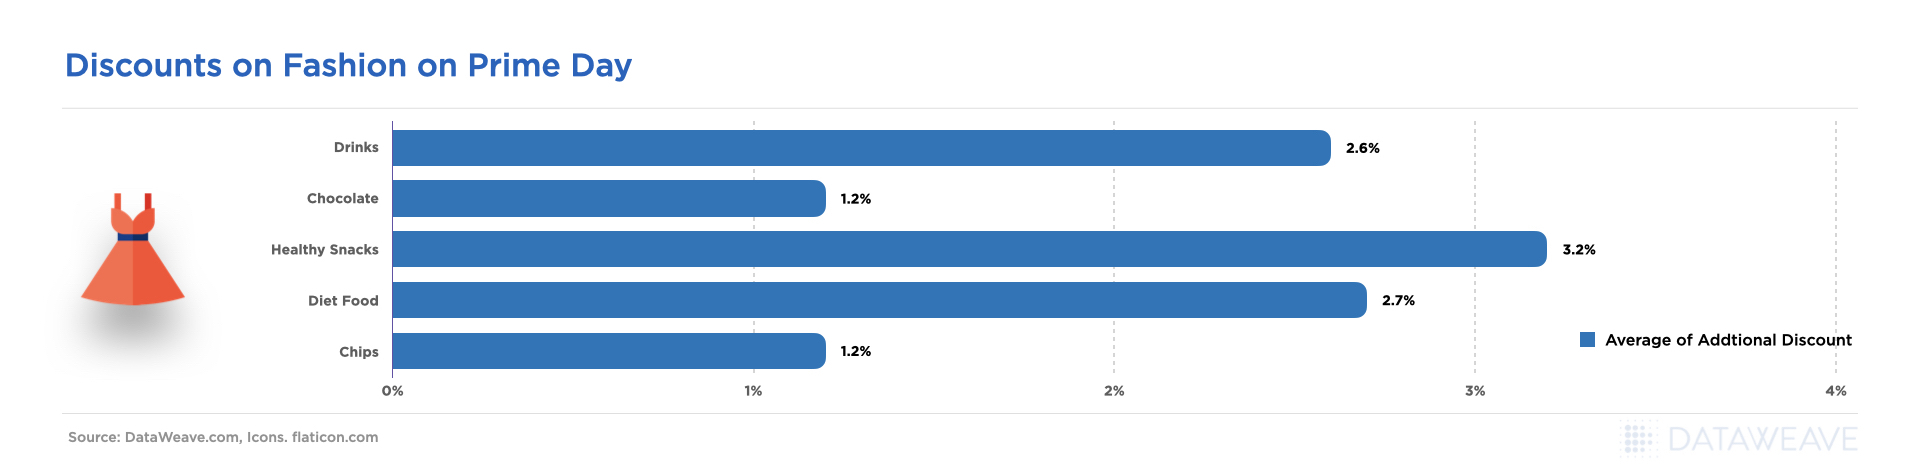
Here’s a quick look at the overall discounts this Black Friday in India:
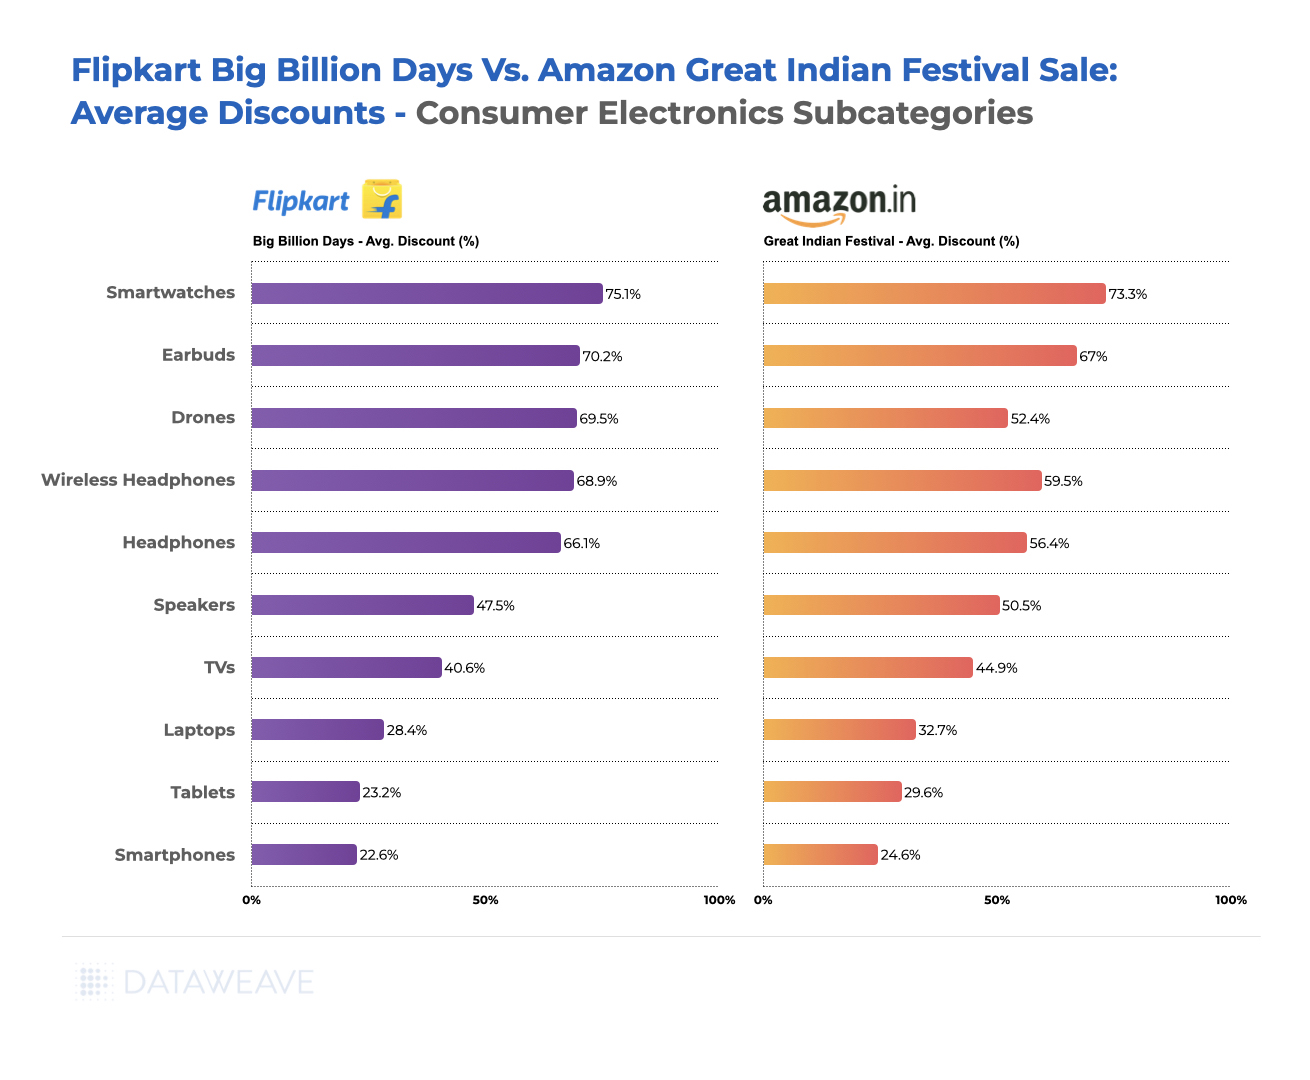
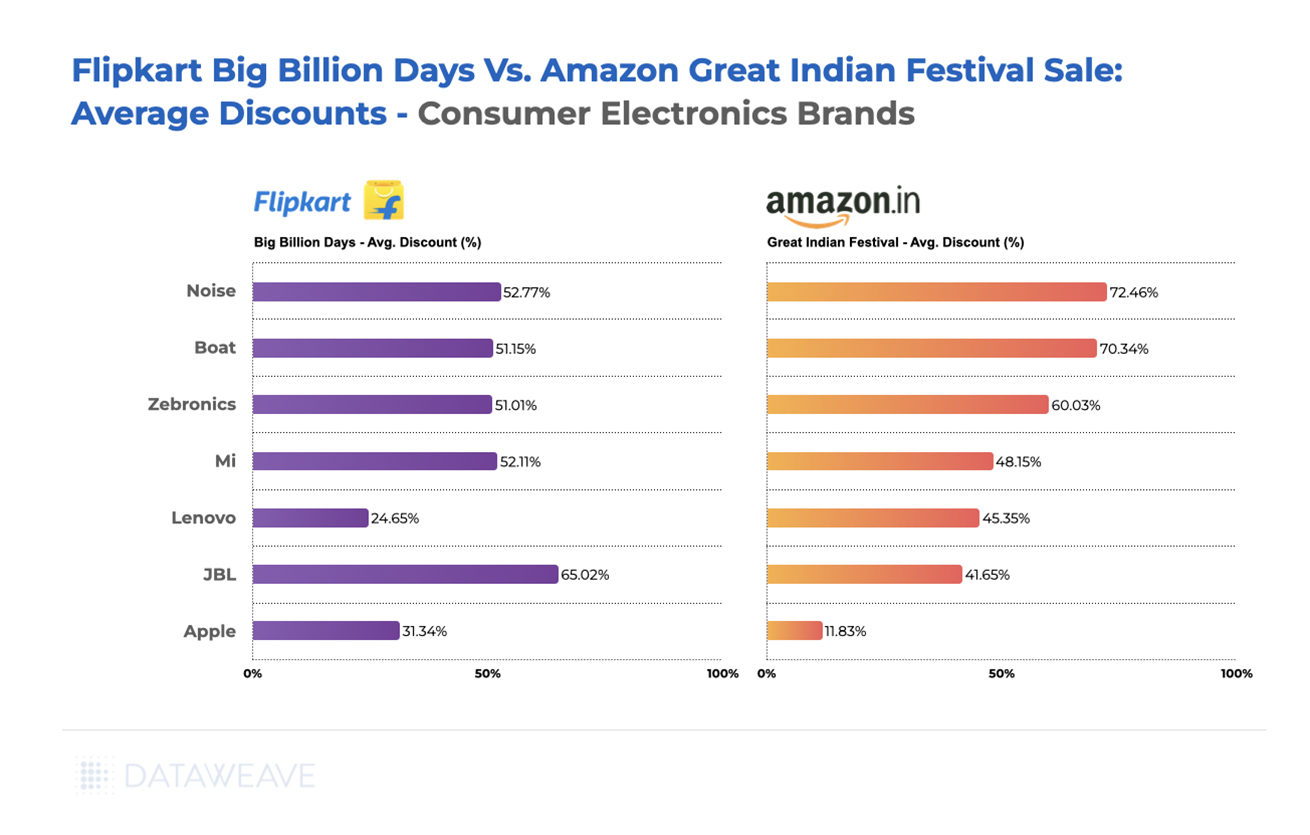
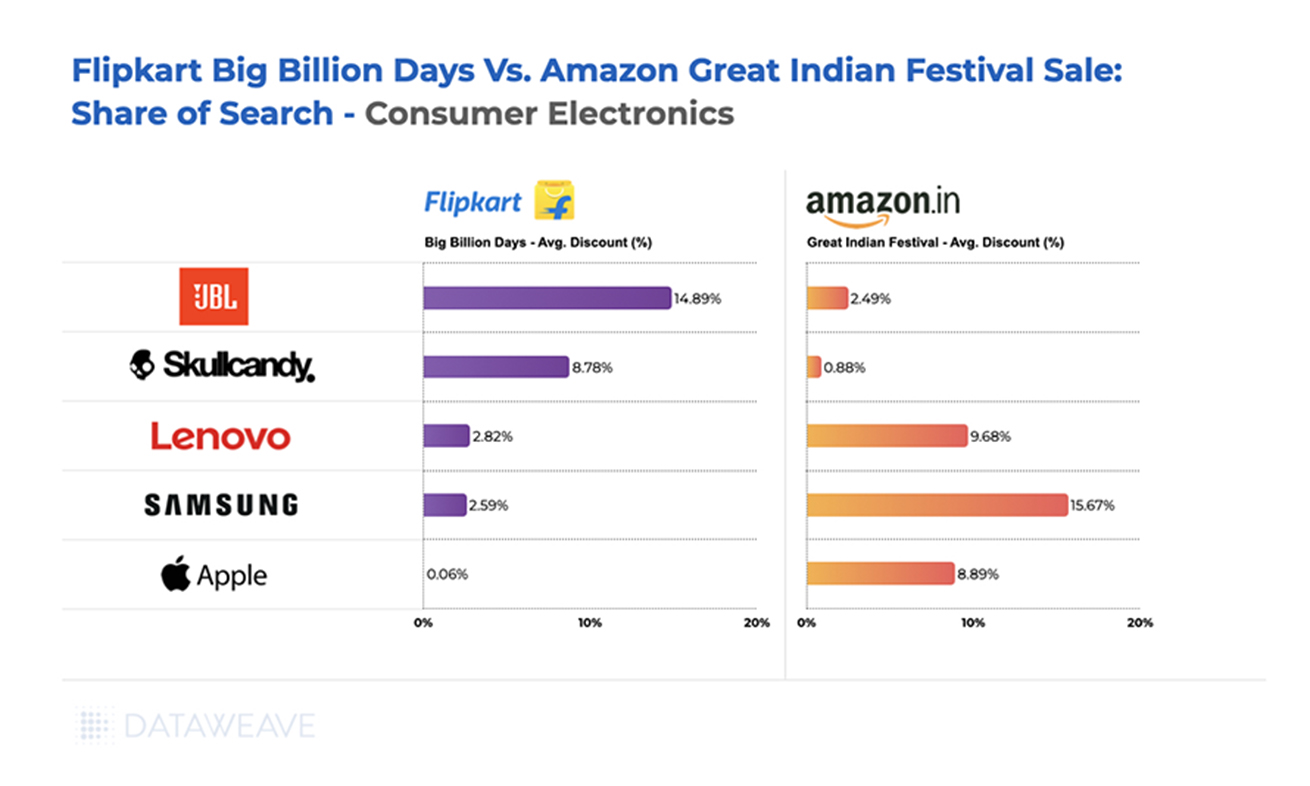
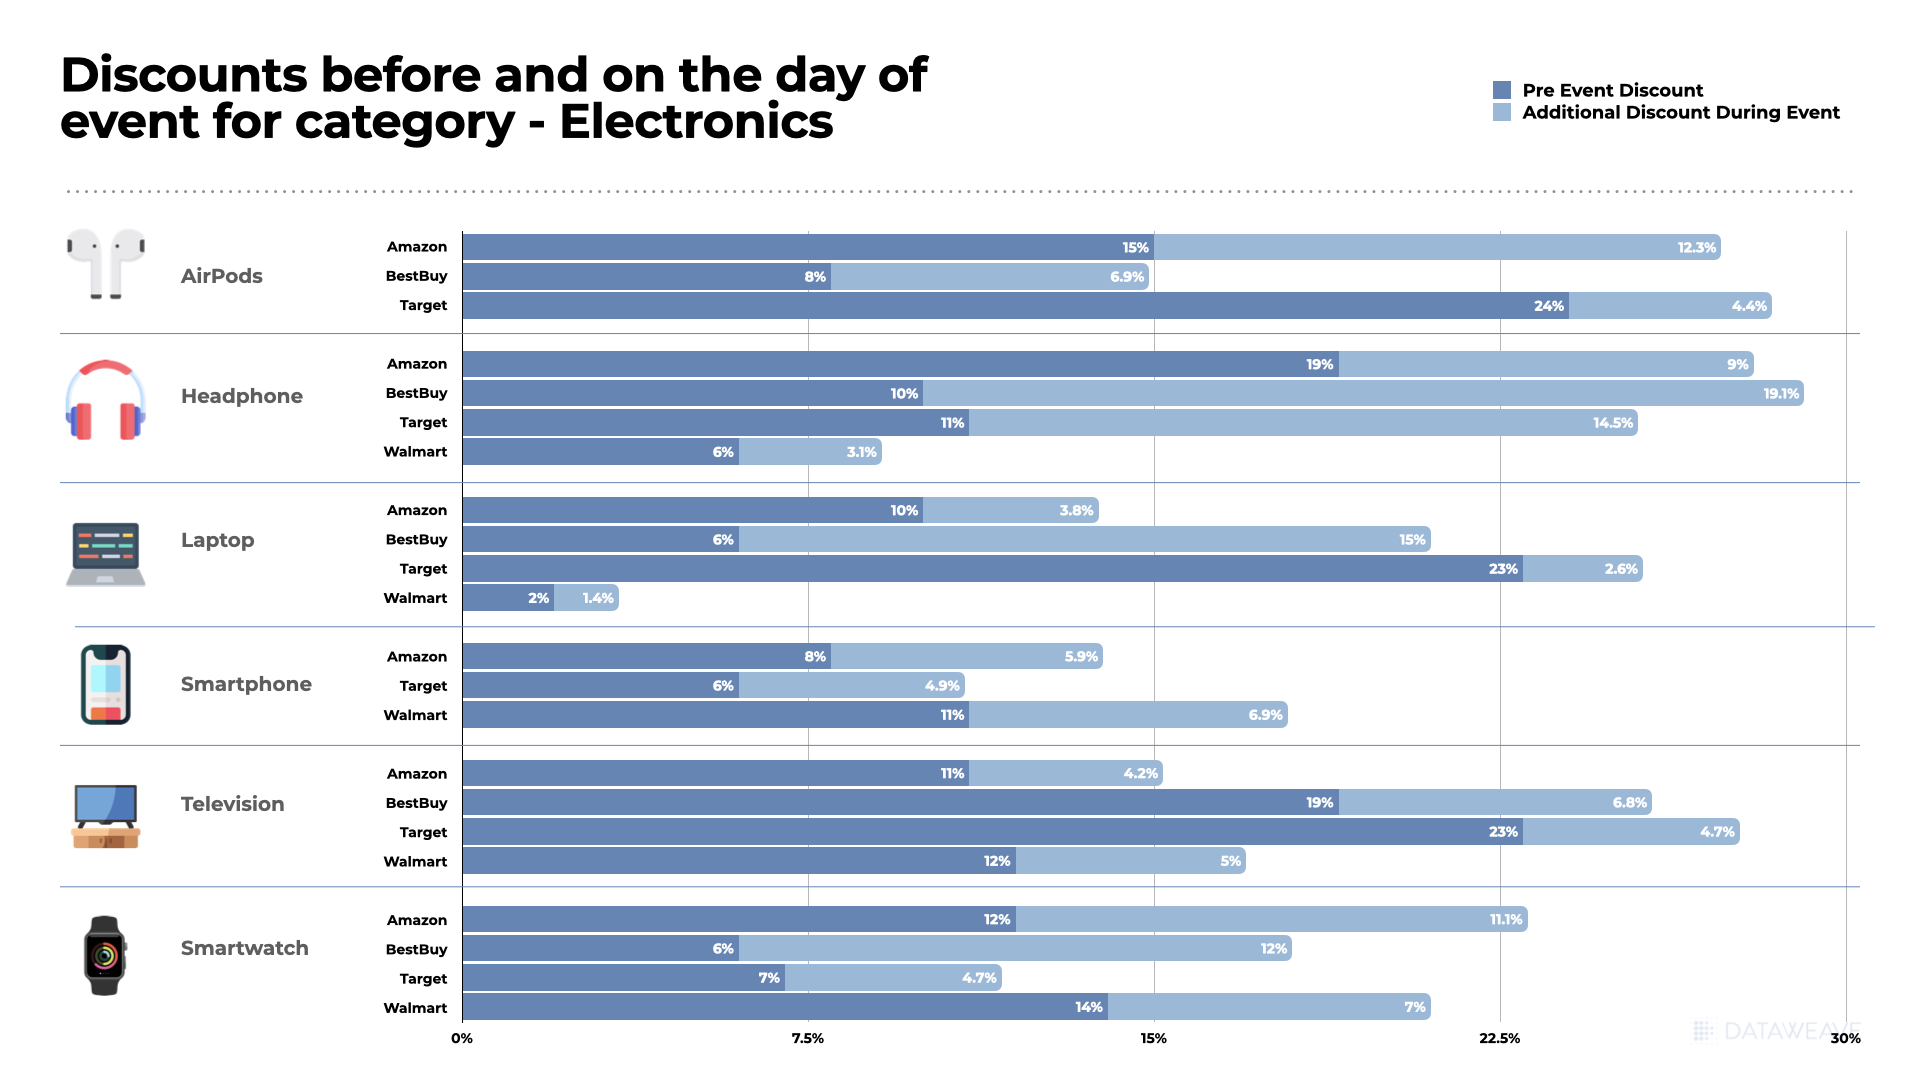
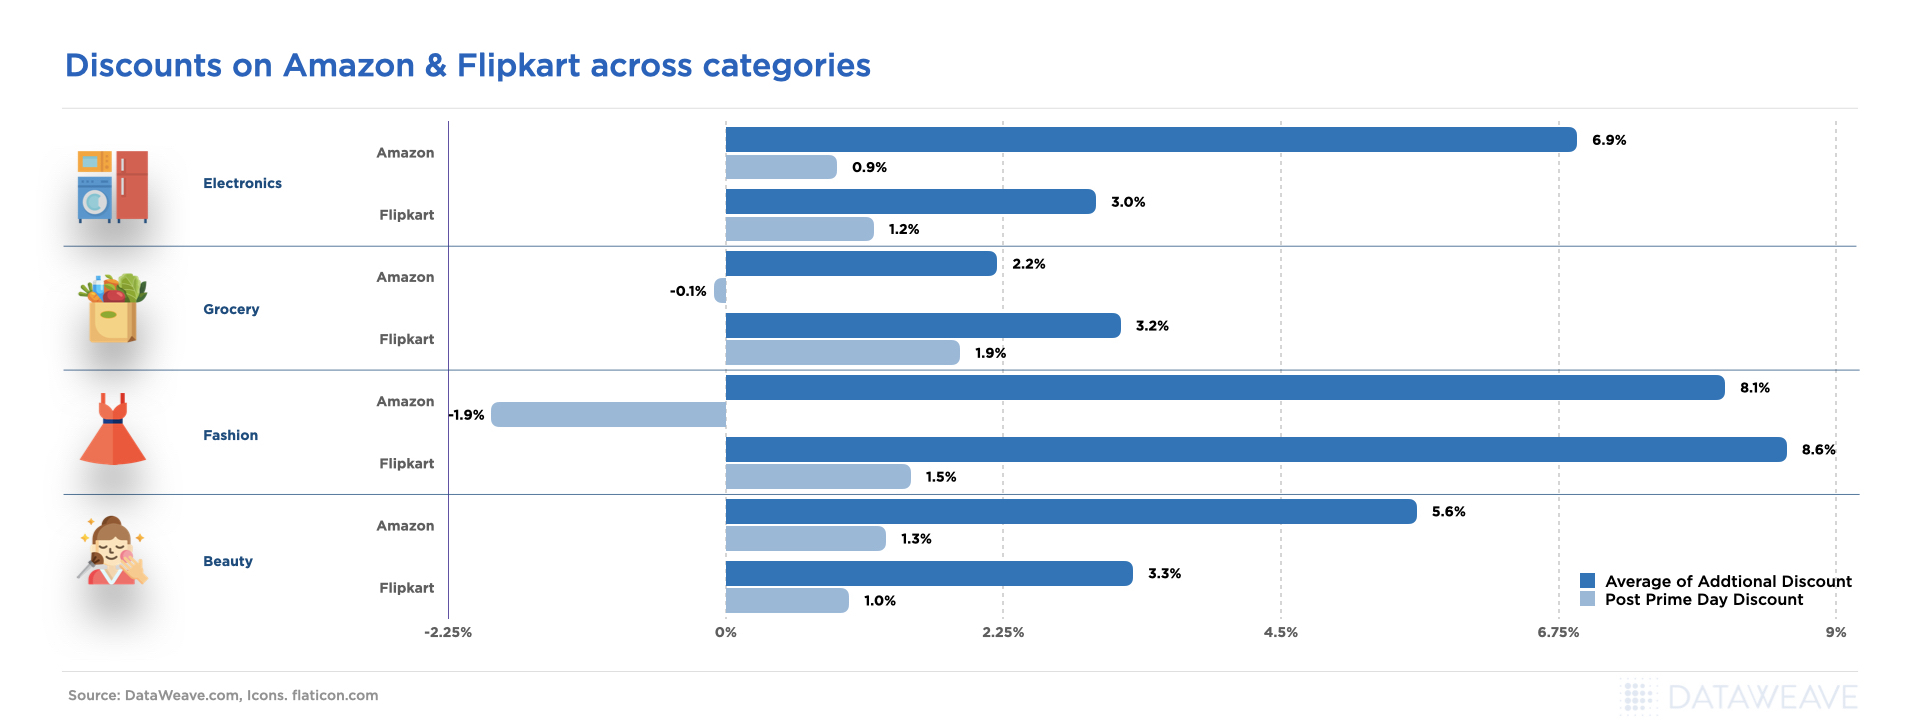
Consumer Electronics
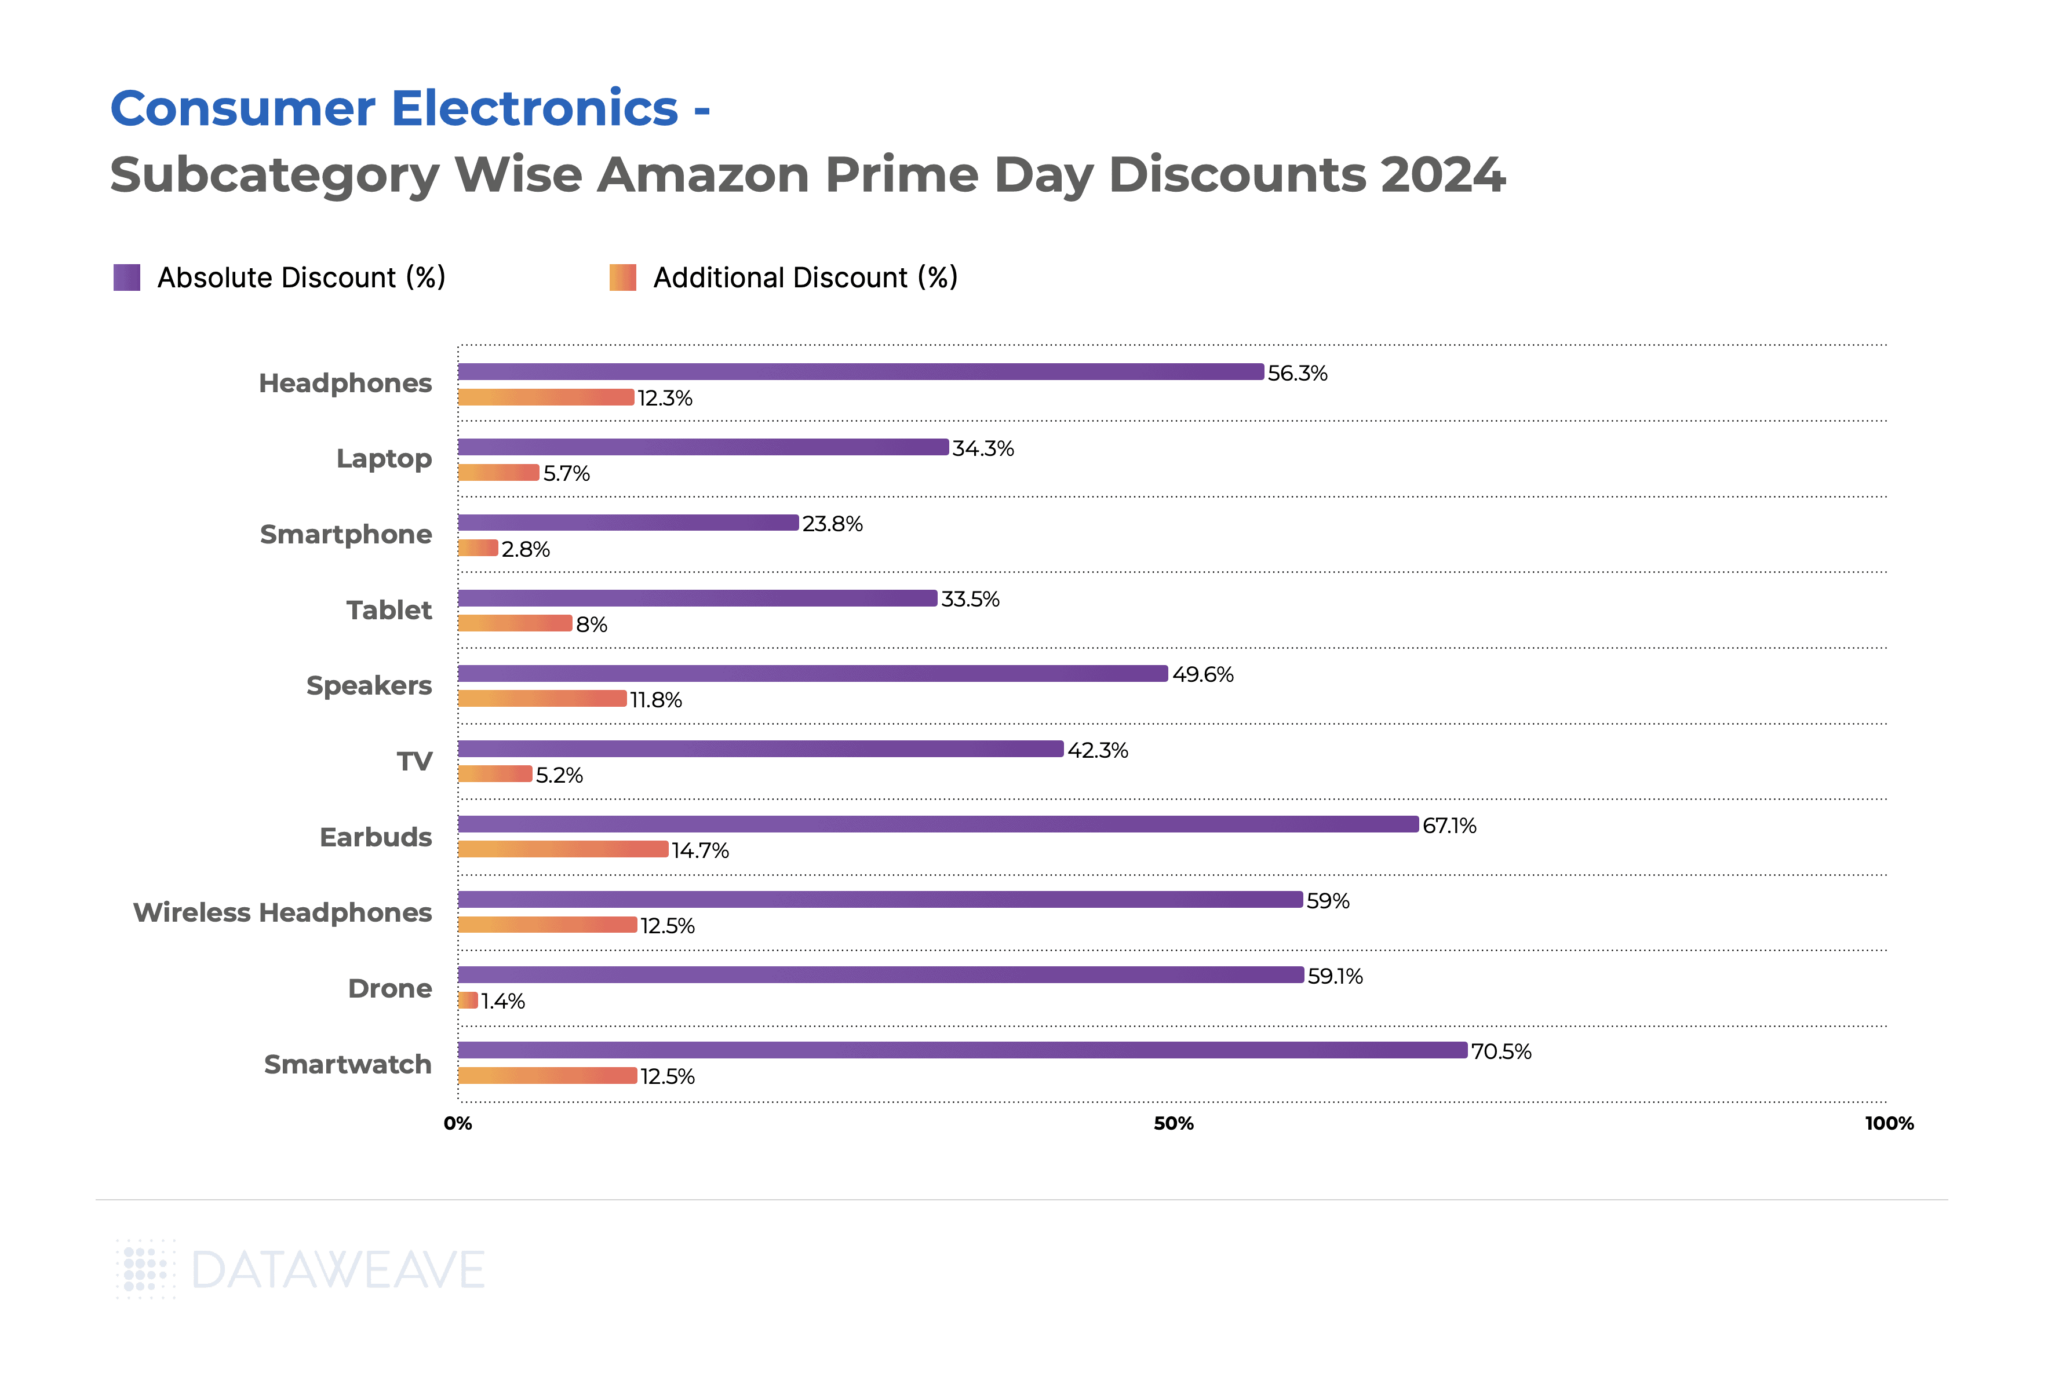
Consumer electronics remain a cornerstone of Black Friday shopping in India, with smartphones and laptops driving significant online sales. Our analysis of 20,439 SKUs reveals distinctive discount patterns across subcategories.
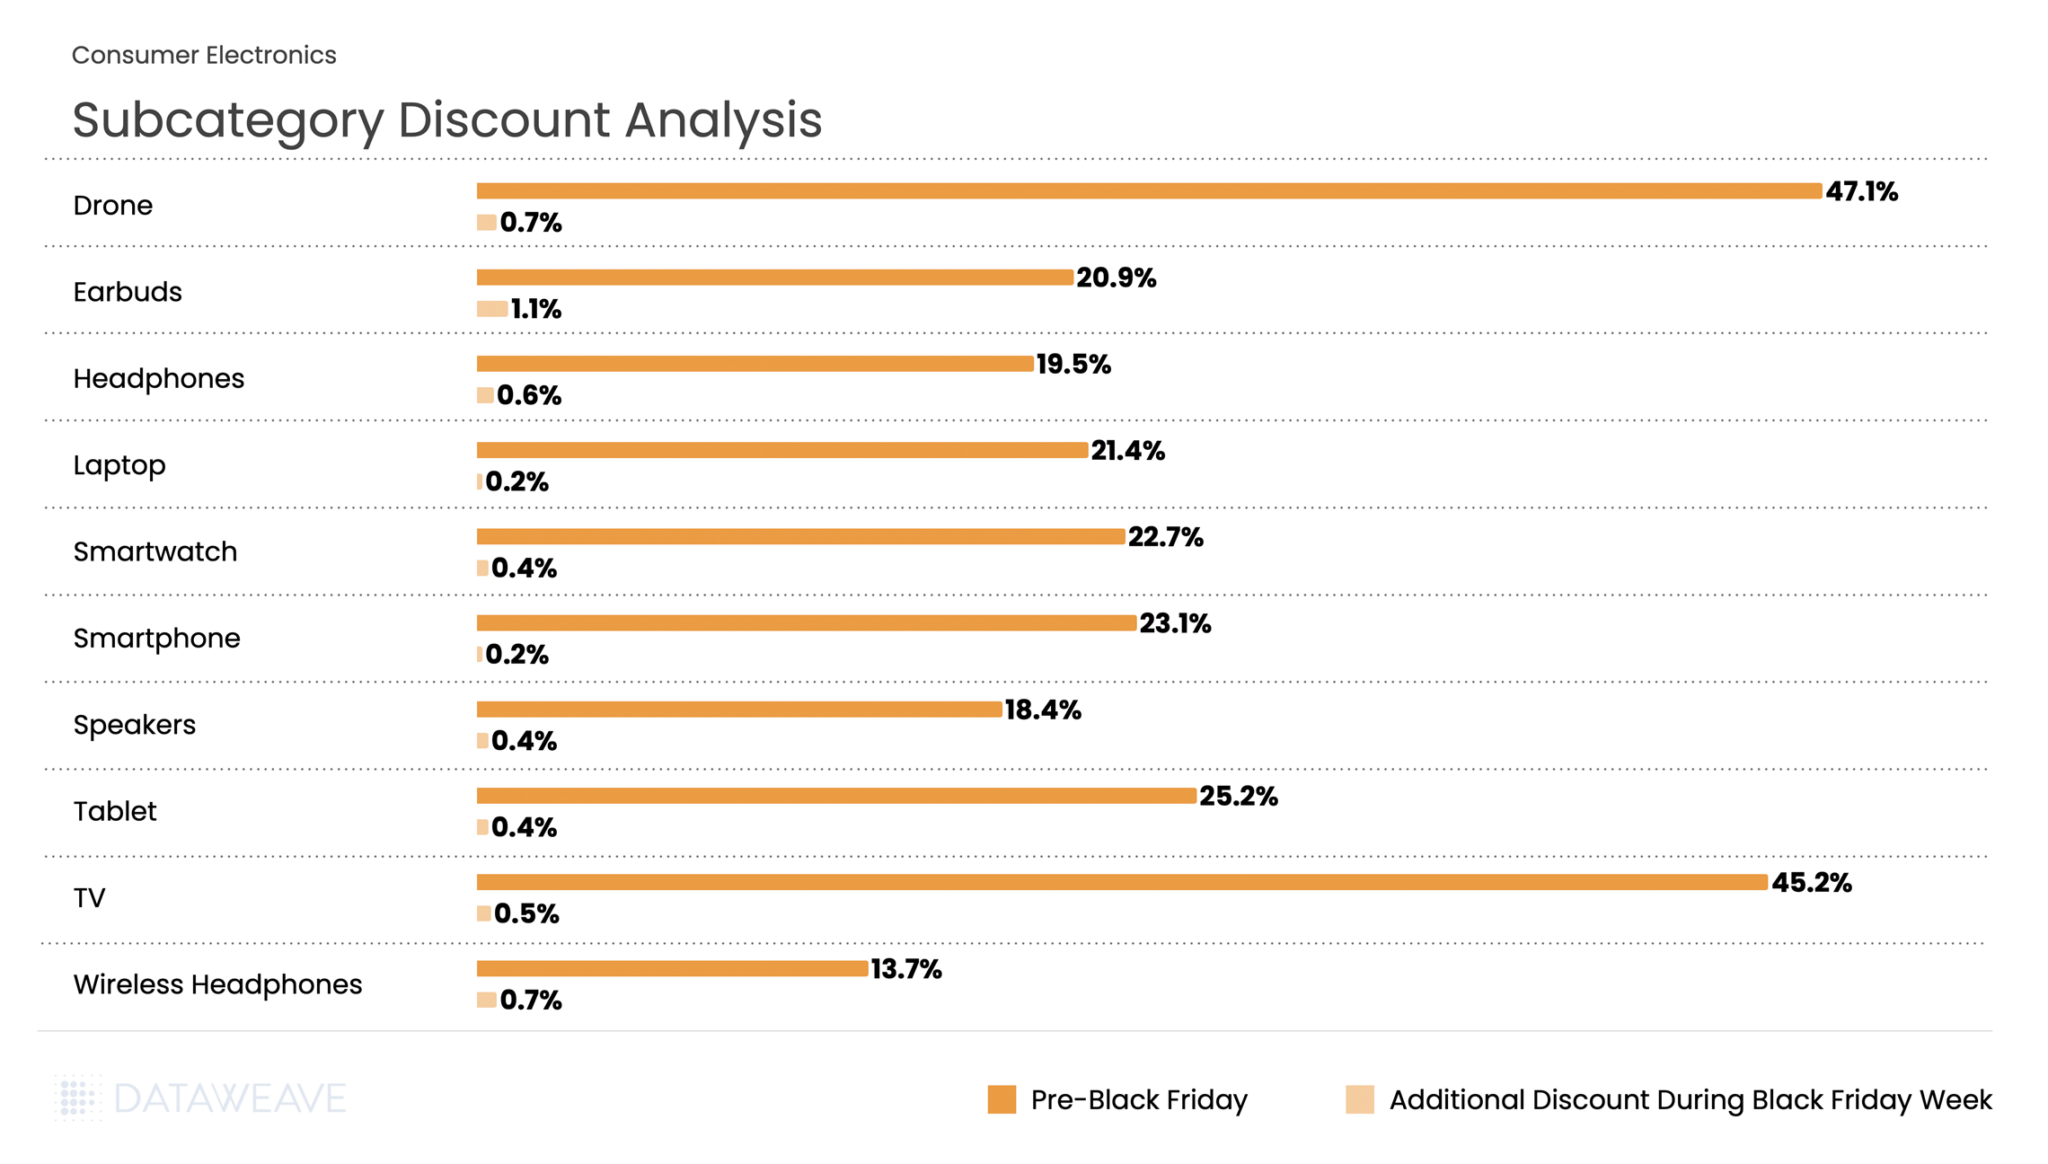
Subcategory Discount Analysis
The category averaged 23.2% pre-Black Friday discounts with an additional 0.5% during Black Friday Week. Drones and TVs led pre-sale discounting at 47.1% and 45.2% respectively, suggesting retailers wanted to clear high-ticket inventory ahead of the main event. Tablets (25.2%) also saw aggressive pre-sale pricing. During Black Friday Week, Earbuds saw the most substantial additional discounts at 1.1%, while categories like Laptops and Smartphones, already heavily discounted, had minimal incremental price cuts at 0.2%.
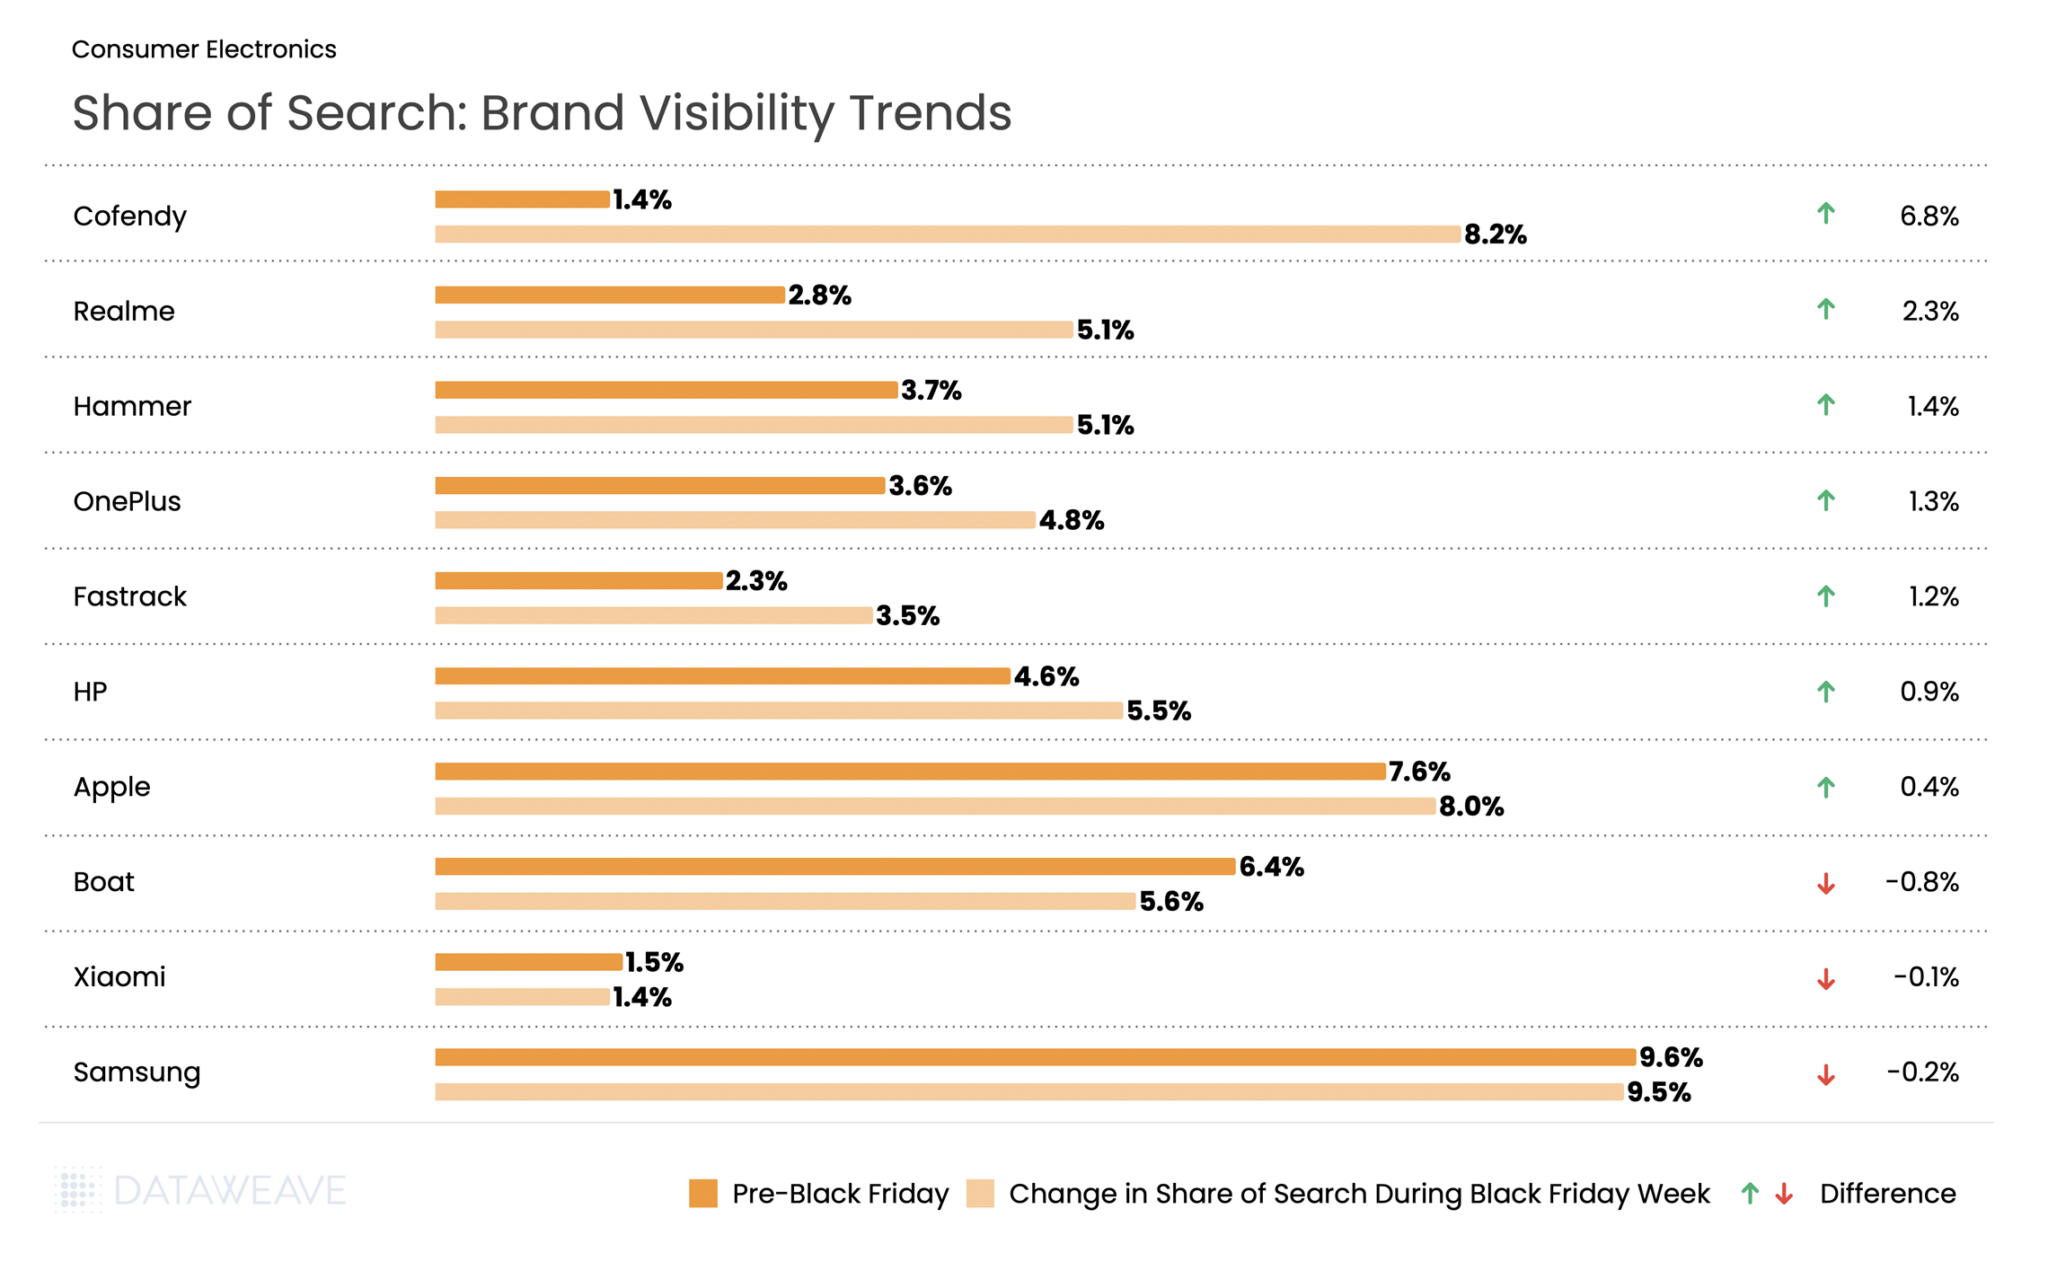
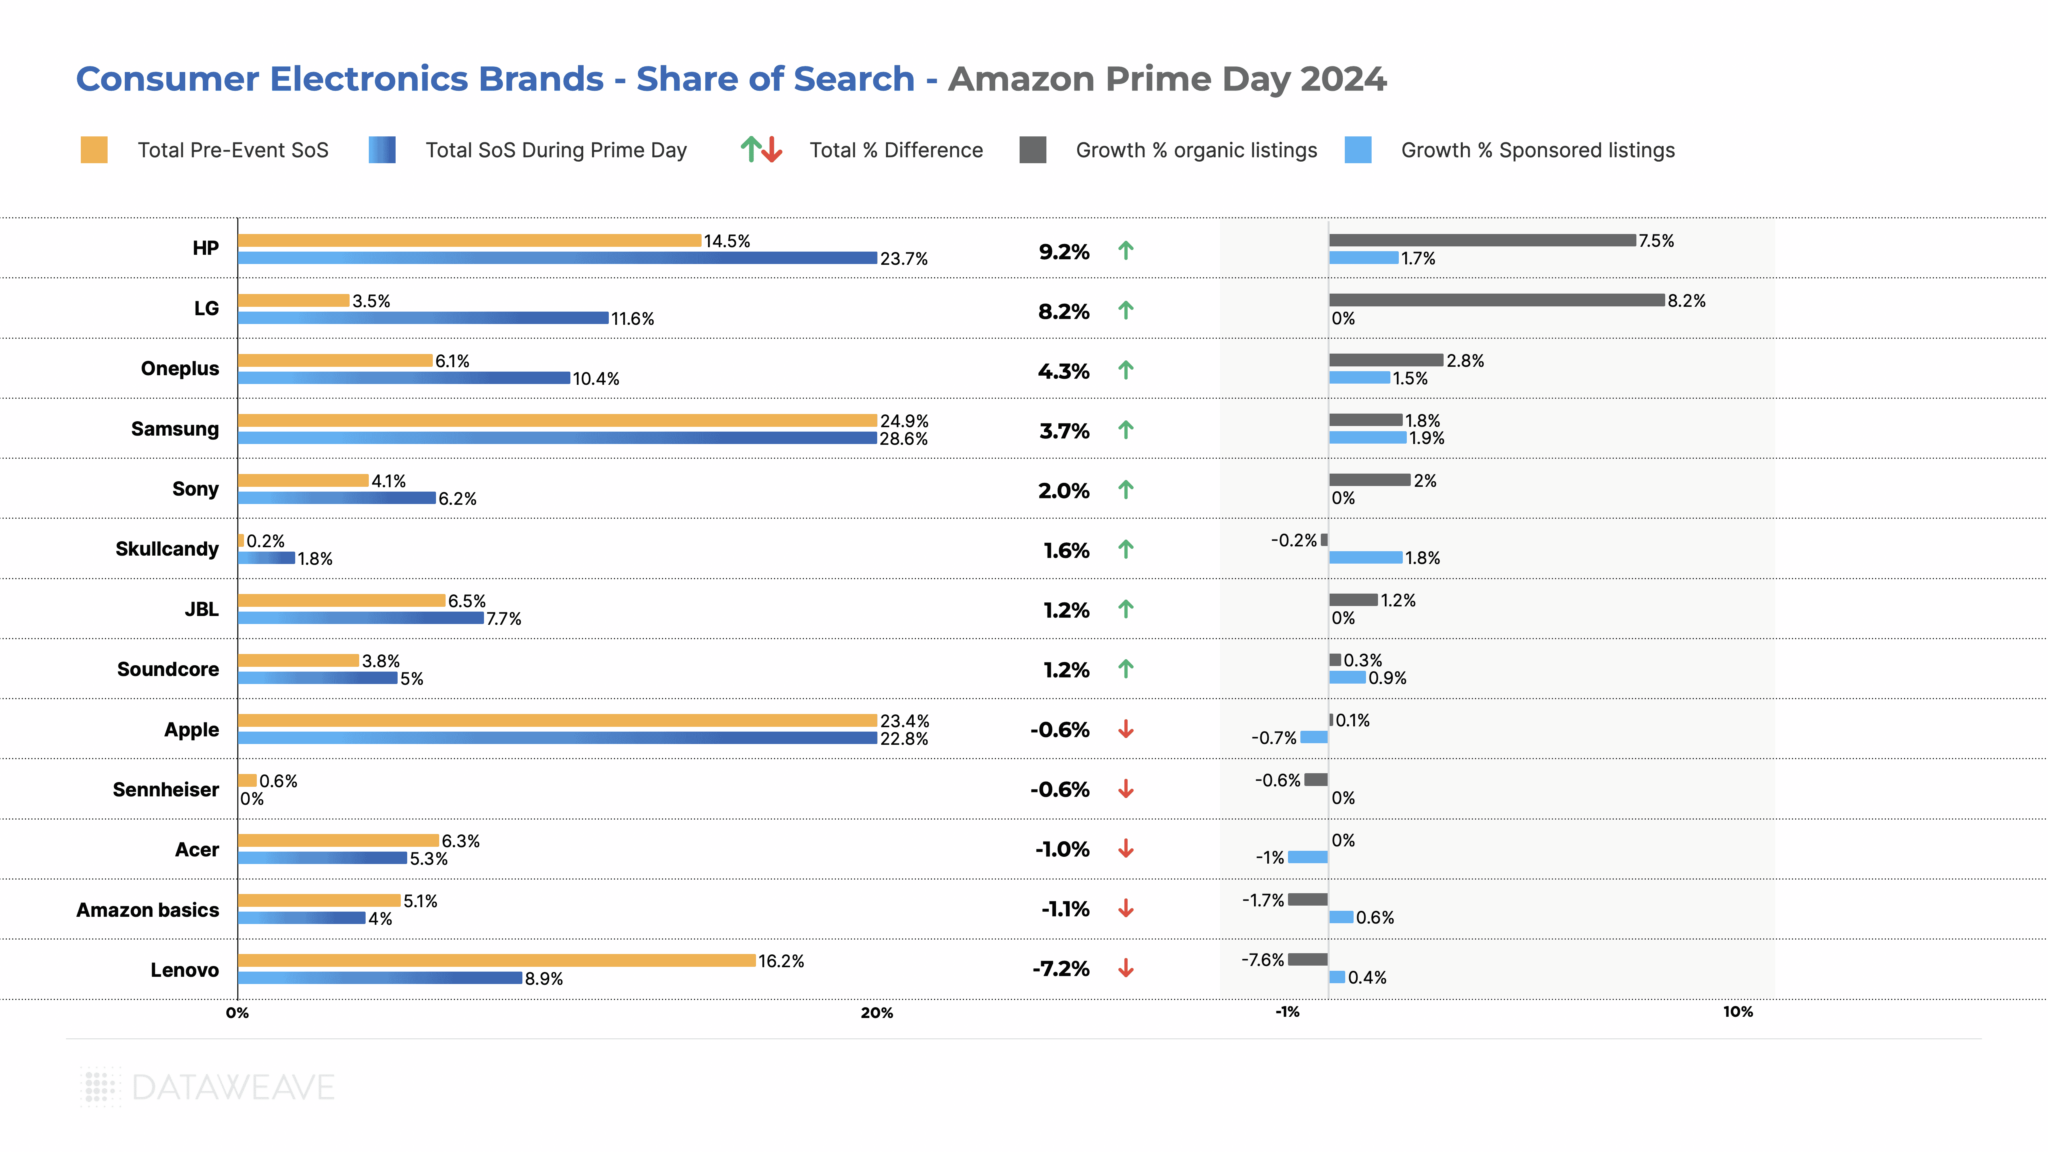
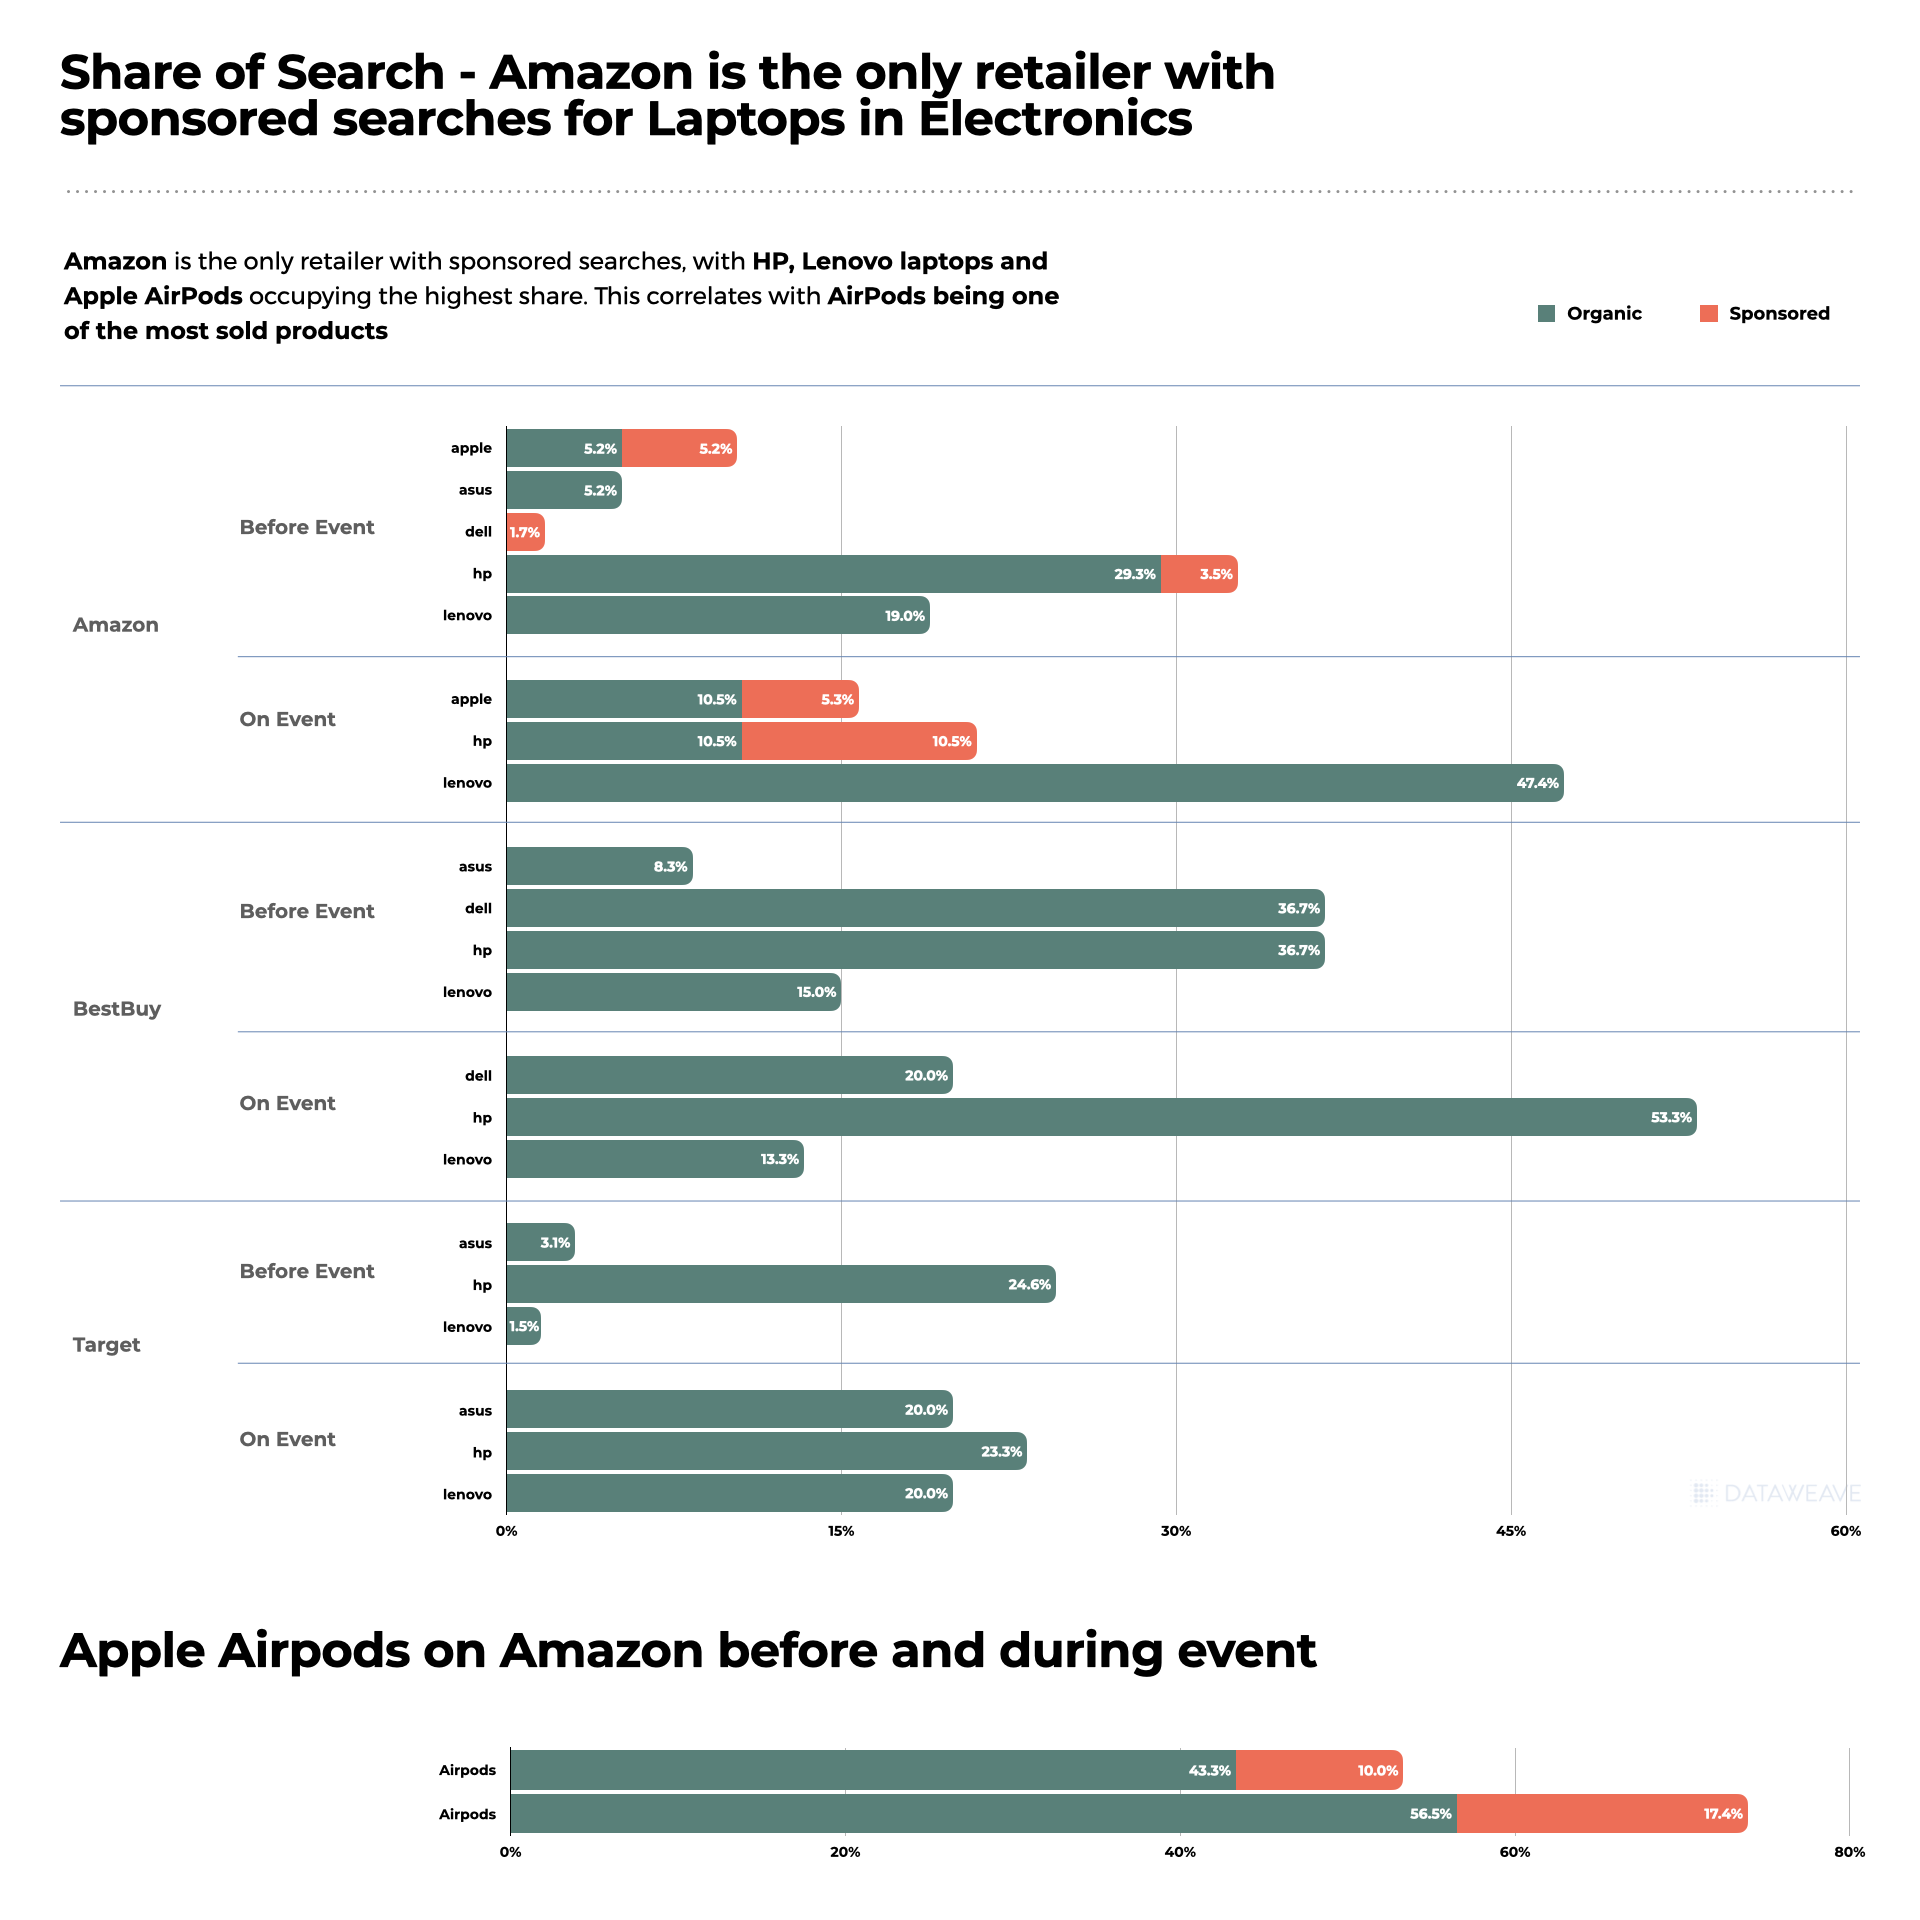
Share of Search: Brand Visibility Trends
The most notable is Cofendy, electronics accessories and speaker brand, that saw the share of search rise from 1.4% pre Black Friday to 8.2% during the event. Realme followed with a solid 2.3% gain, reinforcing its position as a rising smartphone brand. Smart gadget brand Hammer also saw visibility increase by 1.4% at par with OnePlus, Fastrack, HP and Asus.
Samsung saw the highest brand visibility with share of search at 9.6% pre-event and 9.5% during Black Friday week, despite seeing a small drop in visibility. Audio brand Boat saw a visibility drop by 0.8%, while Xiaomi saw the share of search drop by 0.1%. This shift suggests that Indian consumers were drawn to newer brands and compelling deals across computing and mobile devices during the sale period.
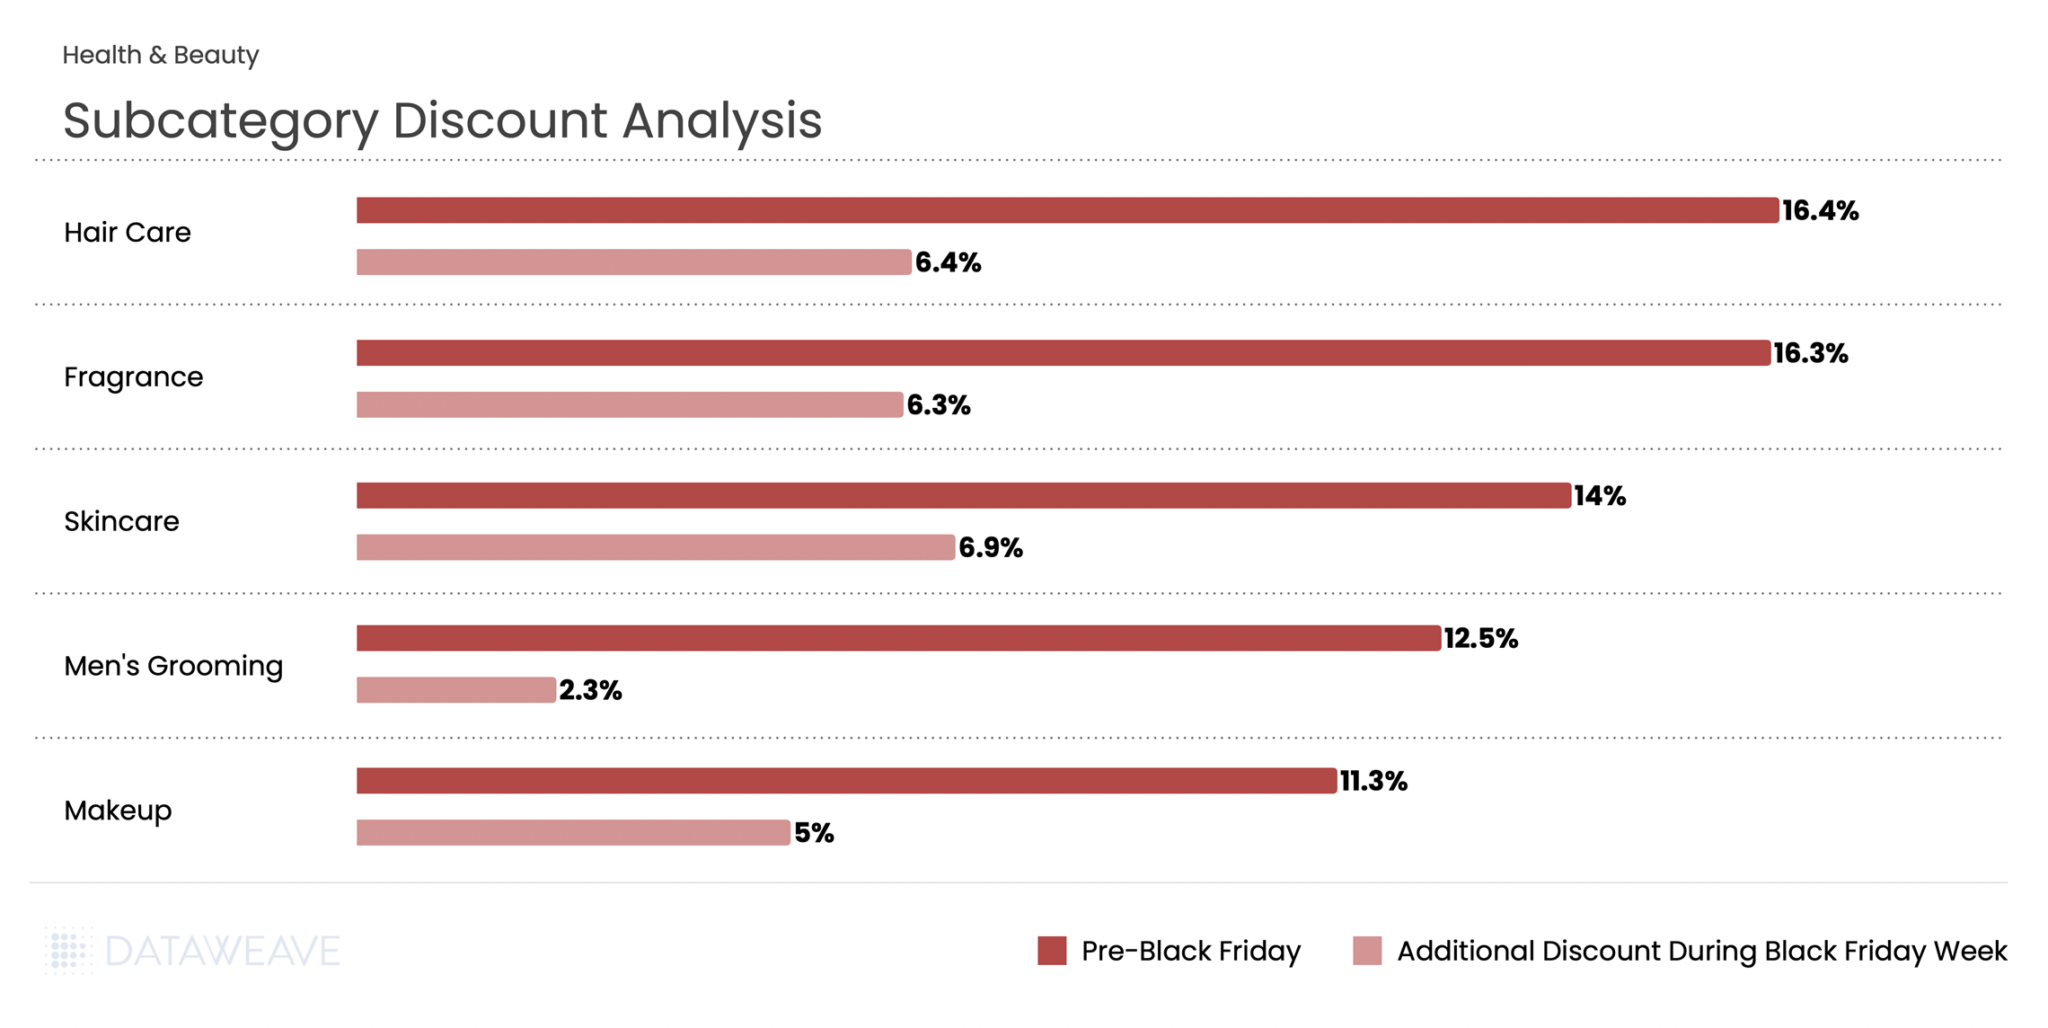
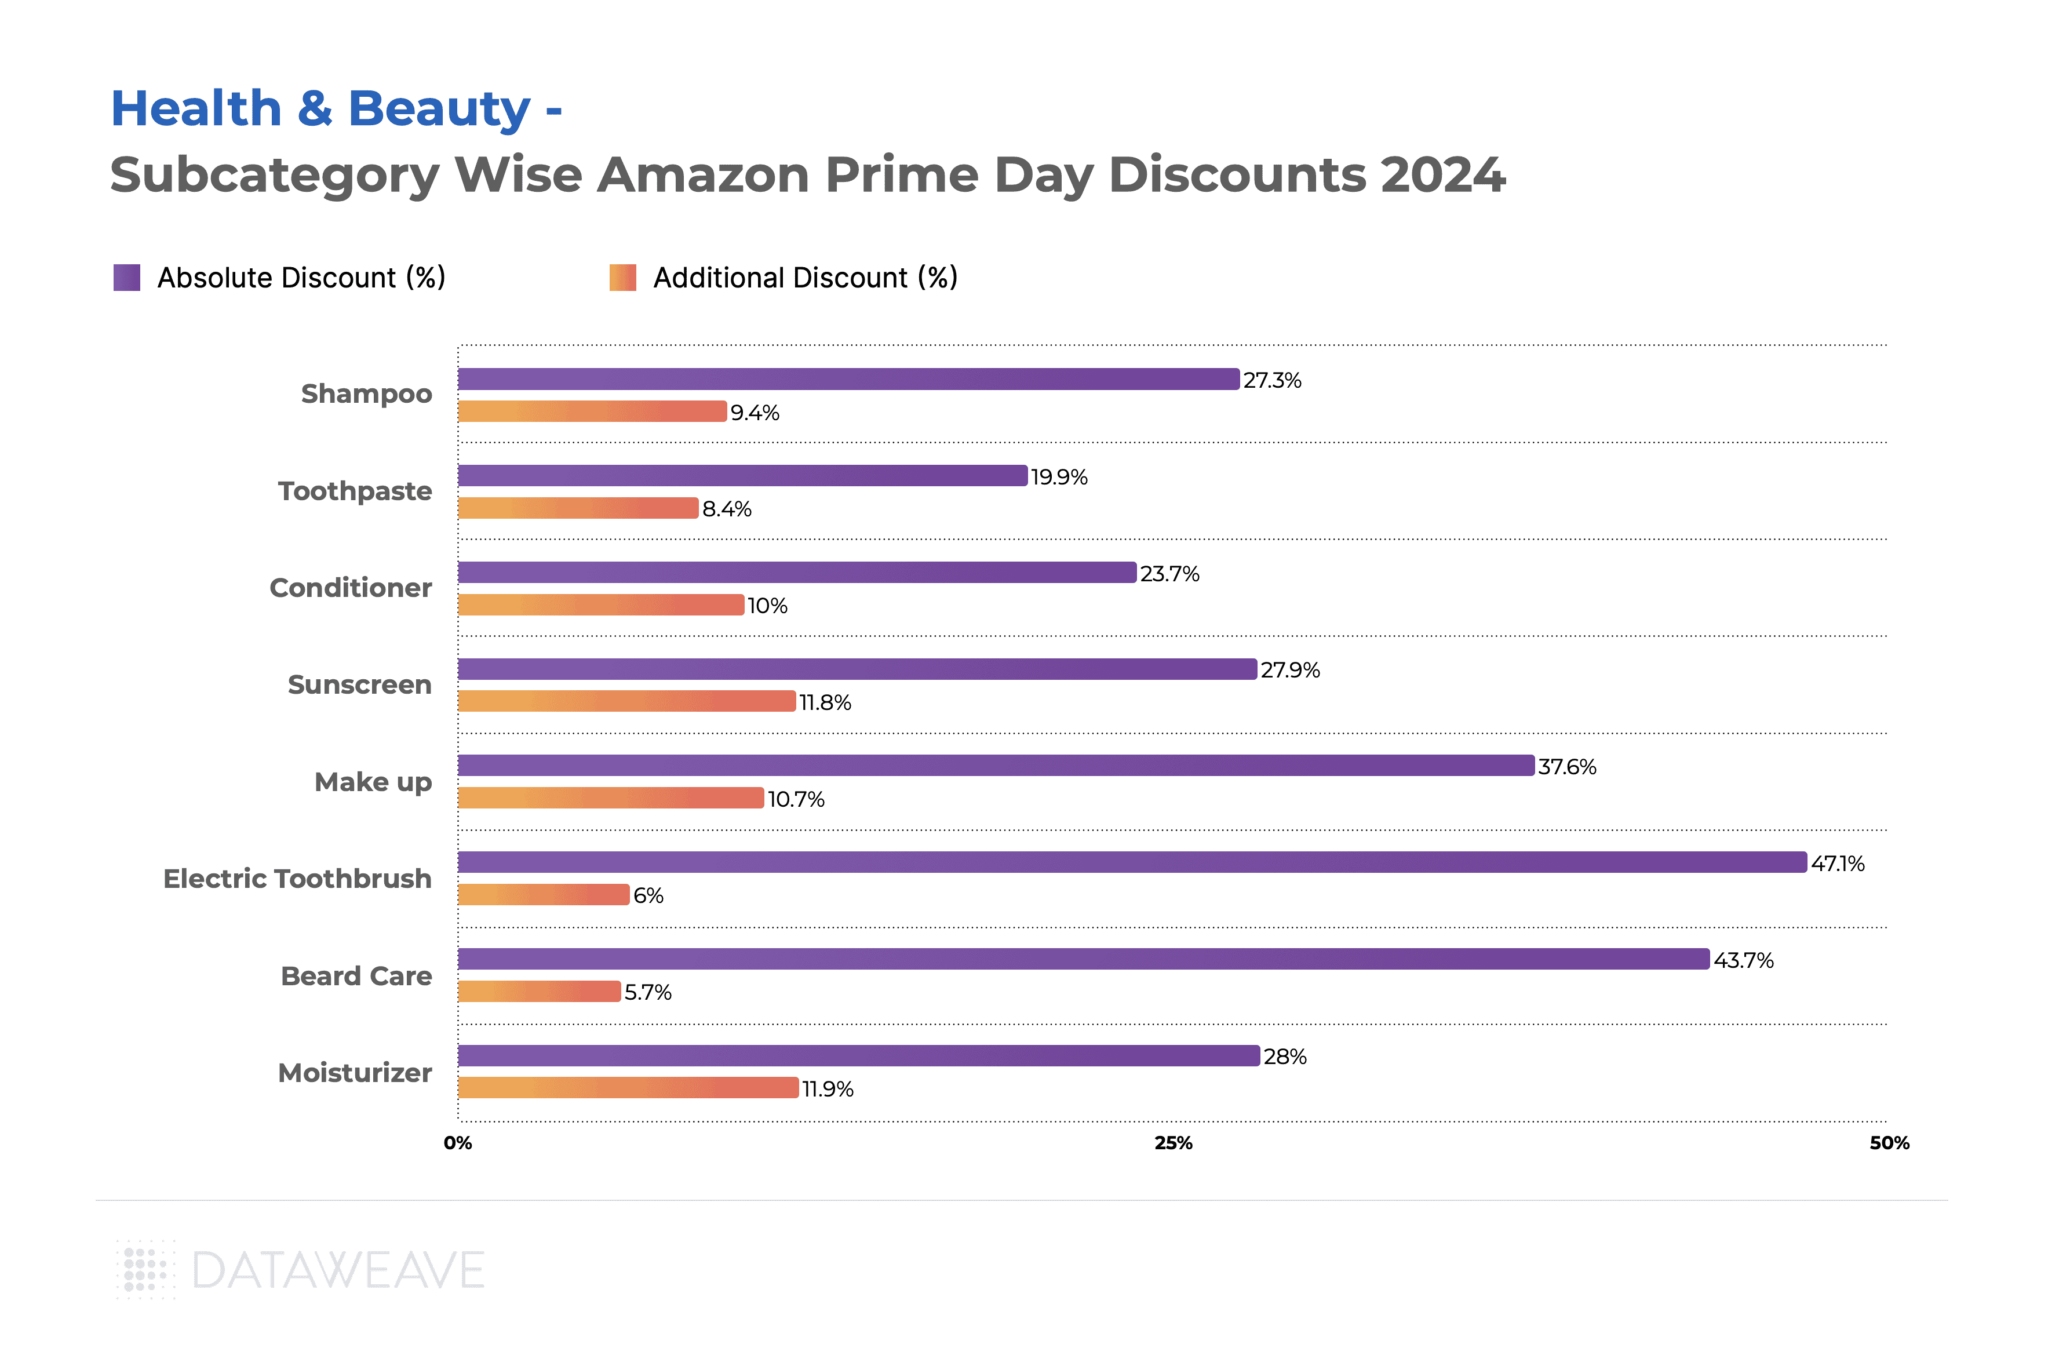
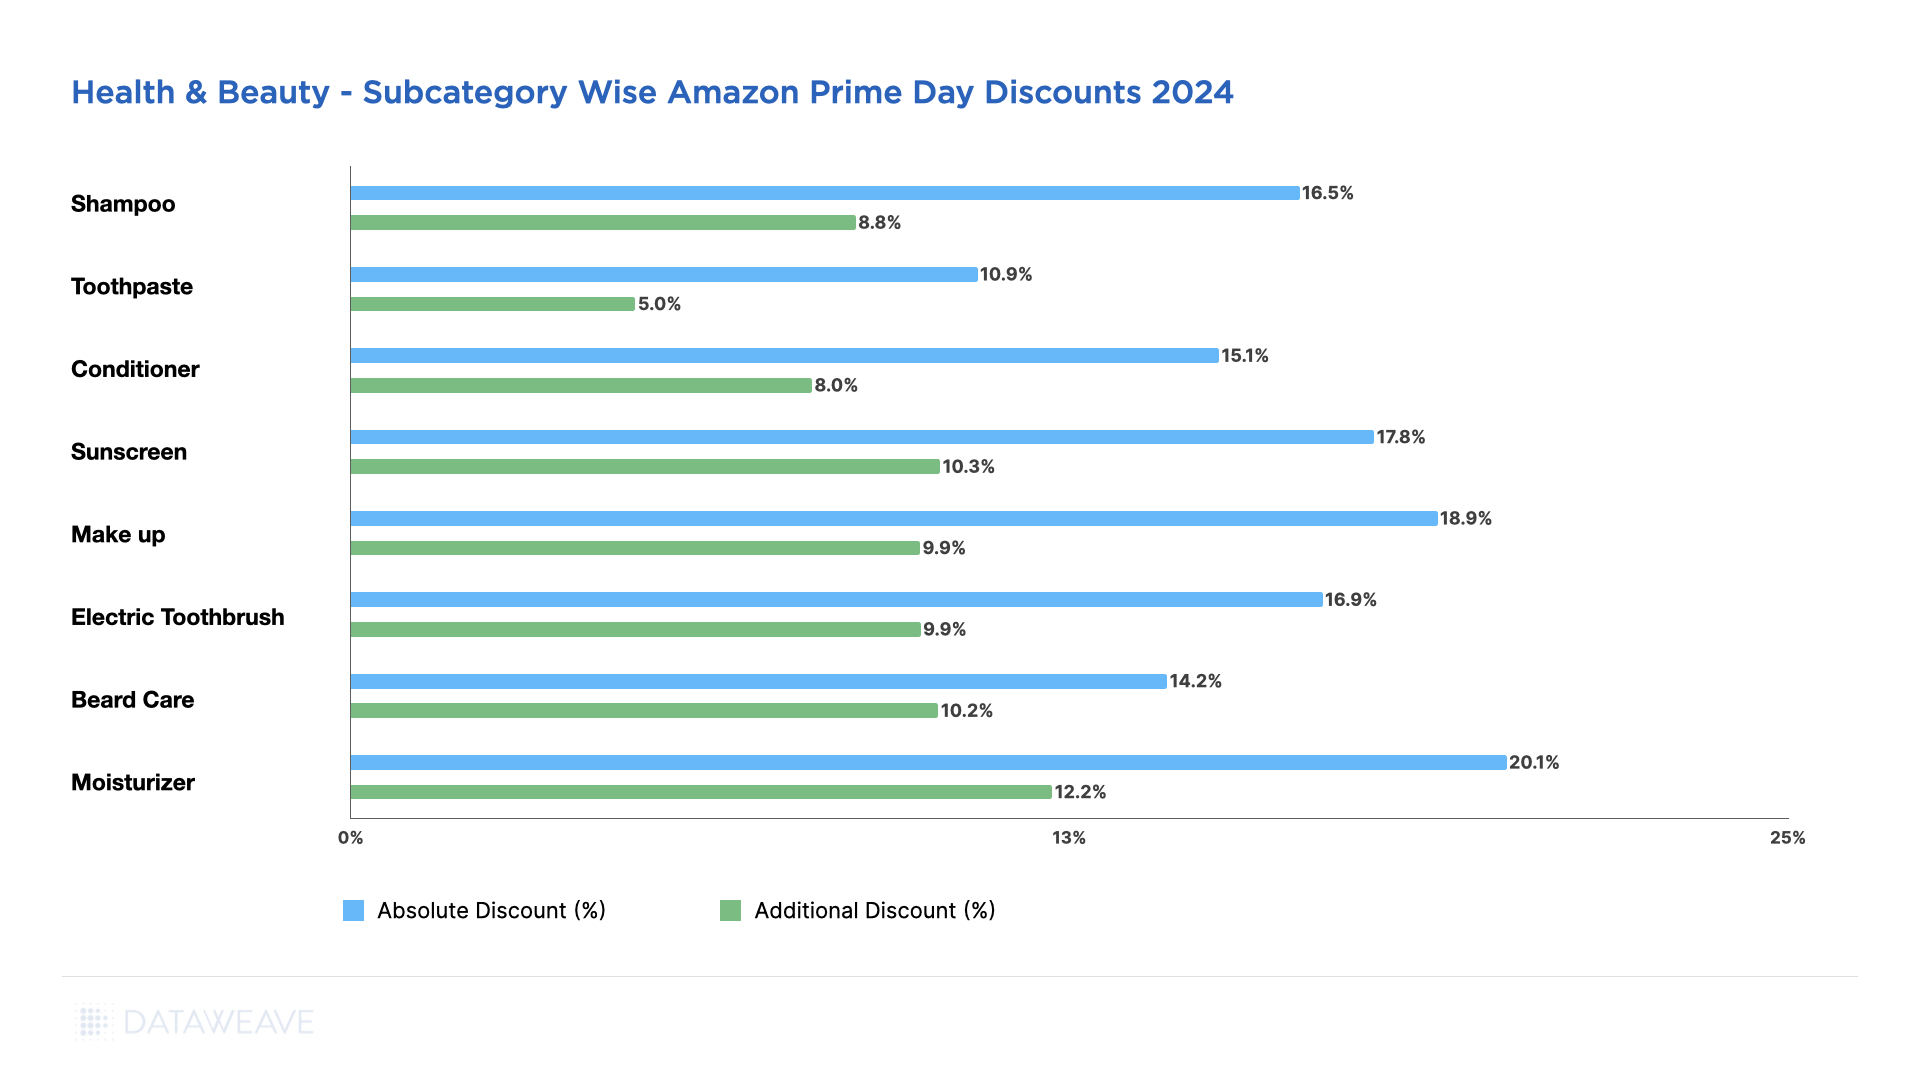
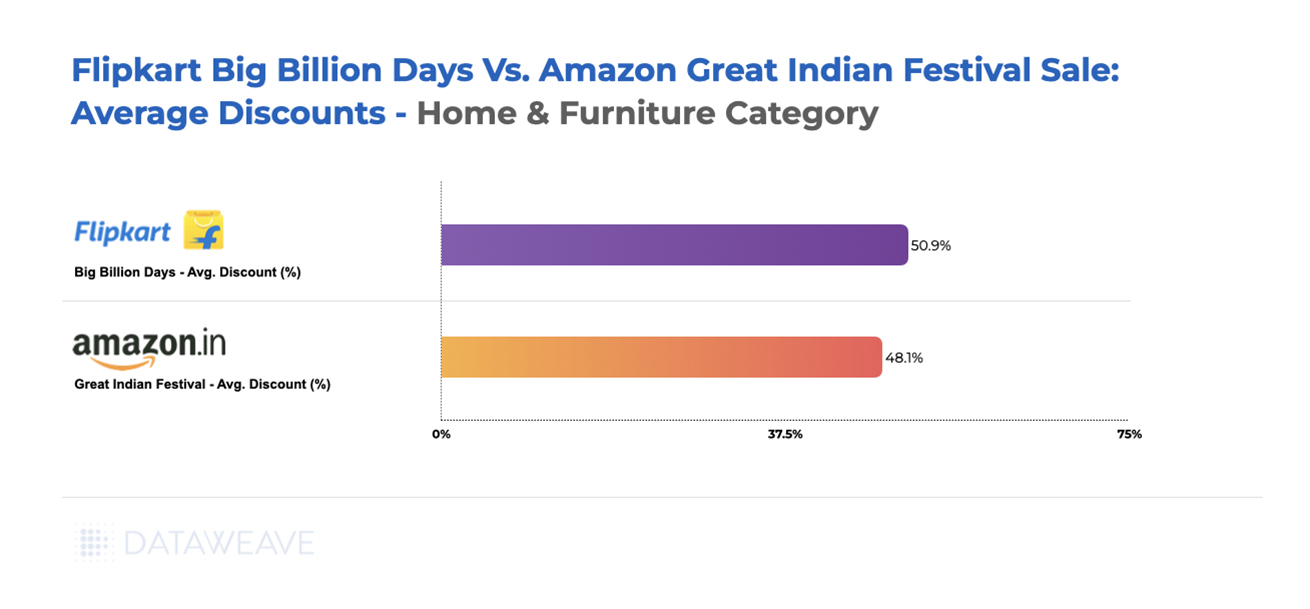
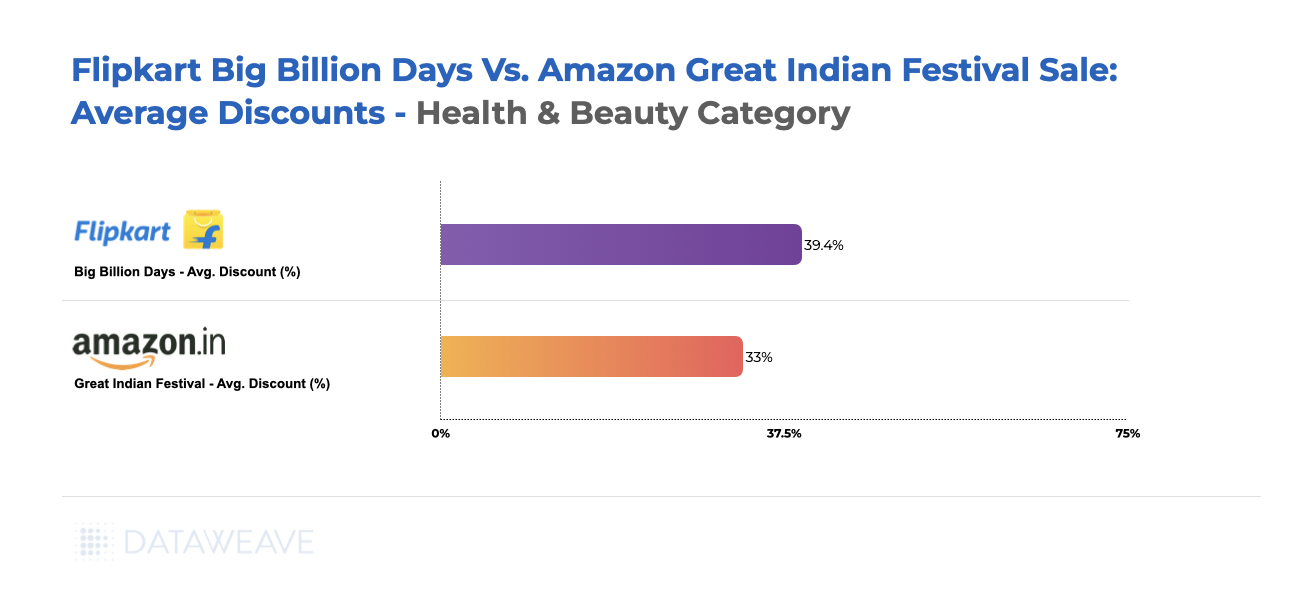
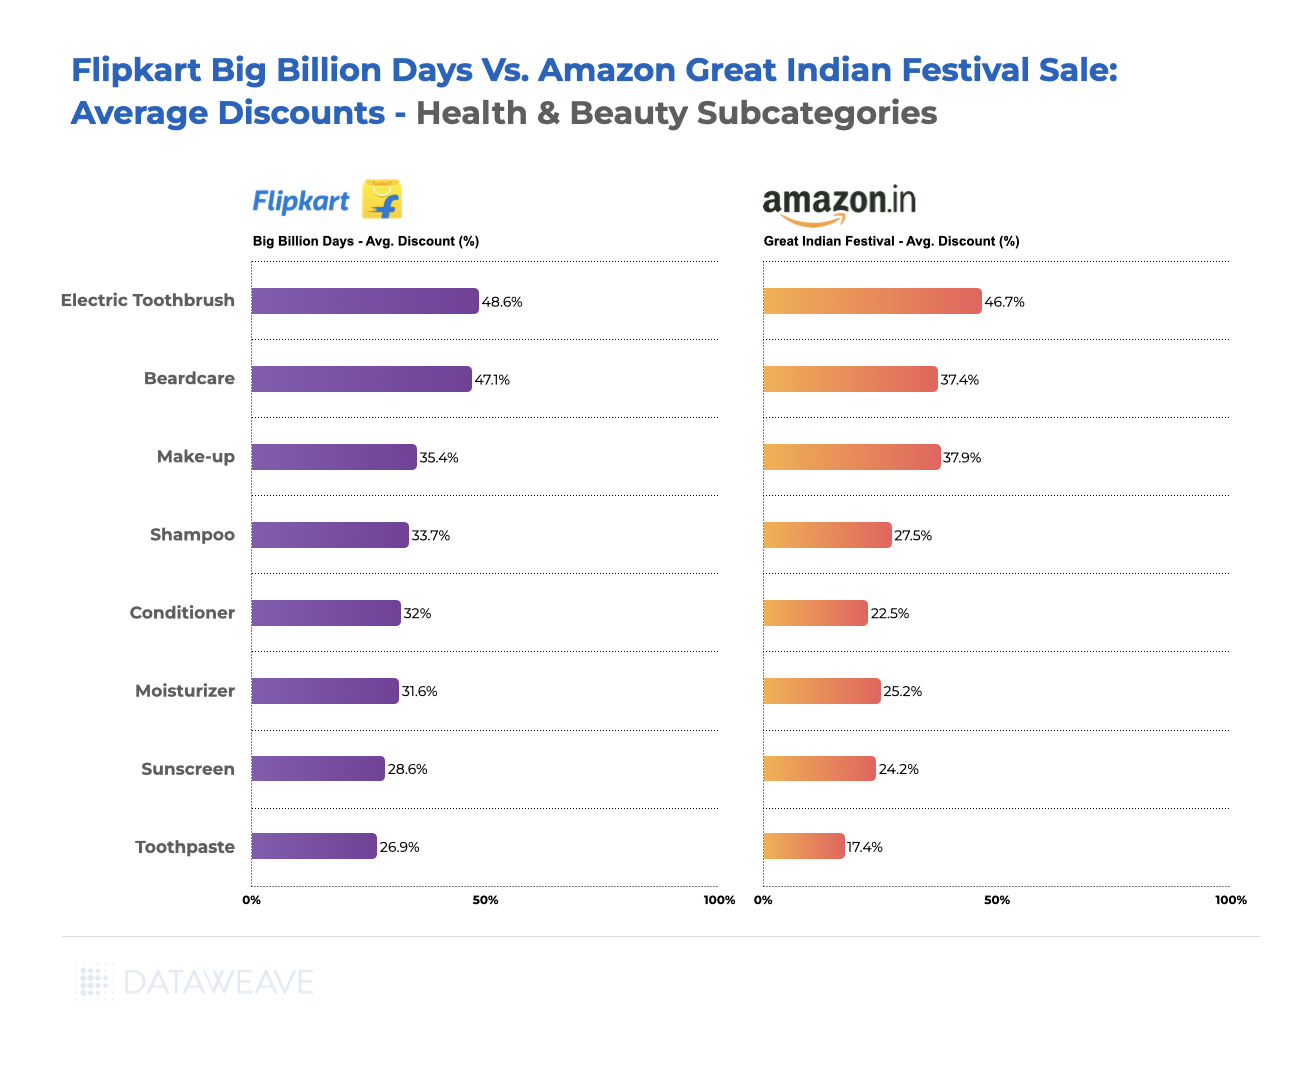
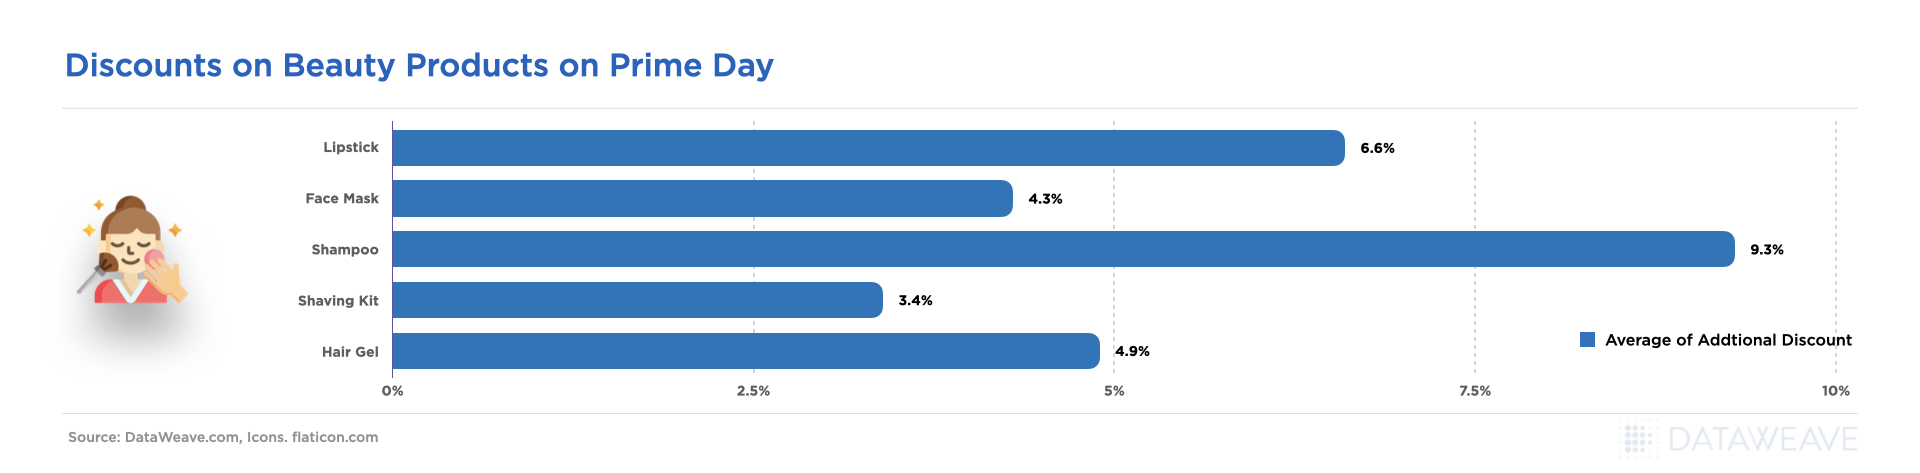
Health & Beauty
The Indian beauty and personal care market is experiencing rapid growth, expected to reach $30 billion by 2027. Black Friday has become an important sales window for beauty brands and retailers. Our analysis of 19,854 SKUs reveals distinct patterns.
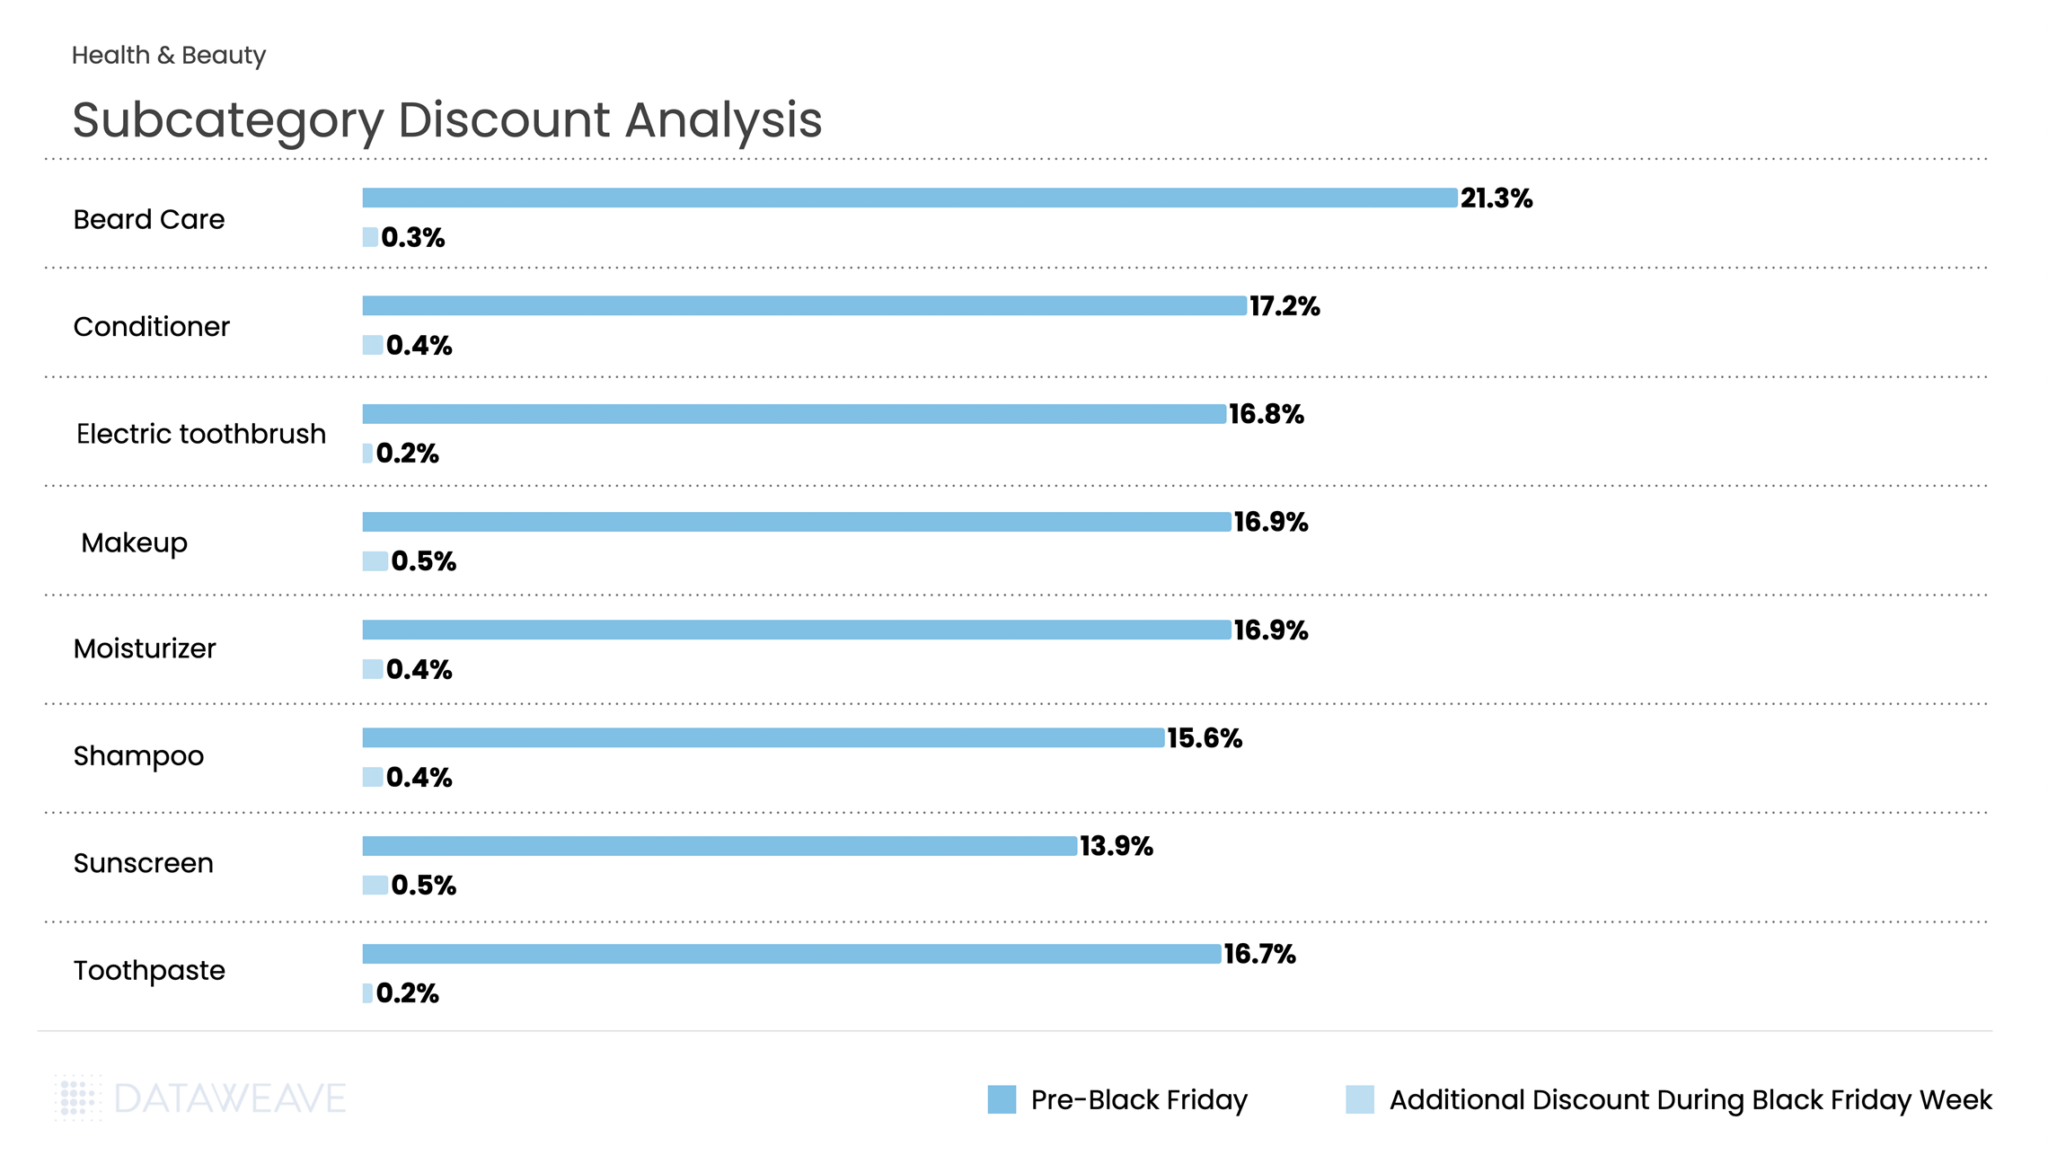
Subcategory Discount Analysis
The category averaged 17% pre-Black Friday discounts with an additional 0.4% during Black Friday Week. Beard Care led early discounting at 21.3%, reflecting strong pre-sale positioning in men’s grooming. Conditioner (17.2%), Makeup (16.9%), and Moisturizer (16.9%) also saw solid baseline promotions. During Black Friday Week, Makeup and Sunscreen saw the highest additional discounts at 0.5% each, while Electric Toothbrush and Toothpaste maintained modest incremental discounts at 0.2%.
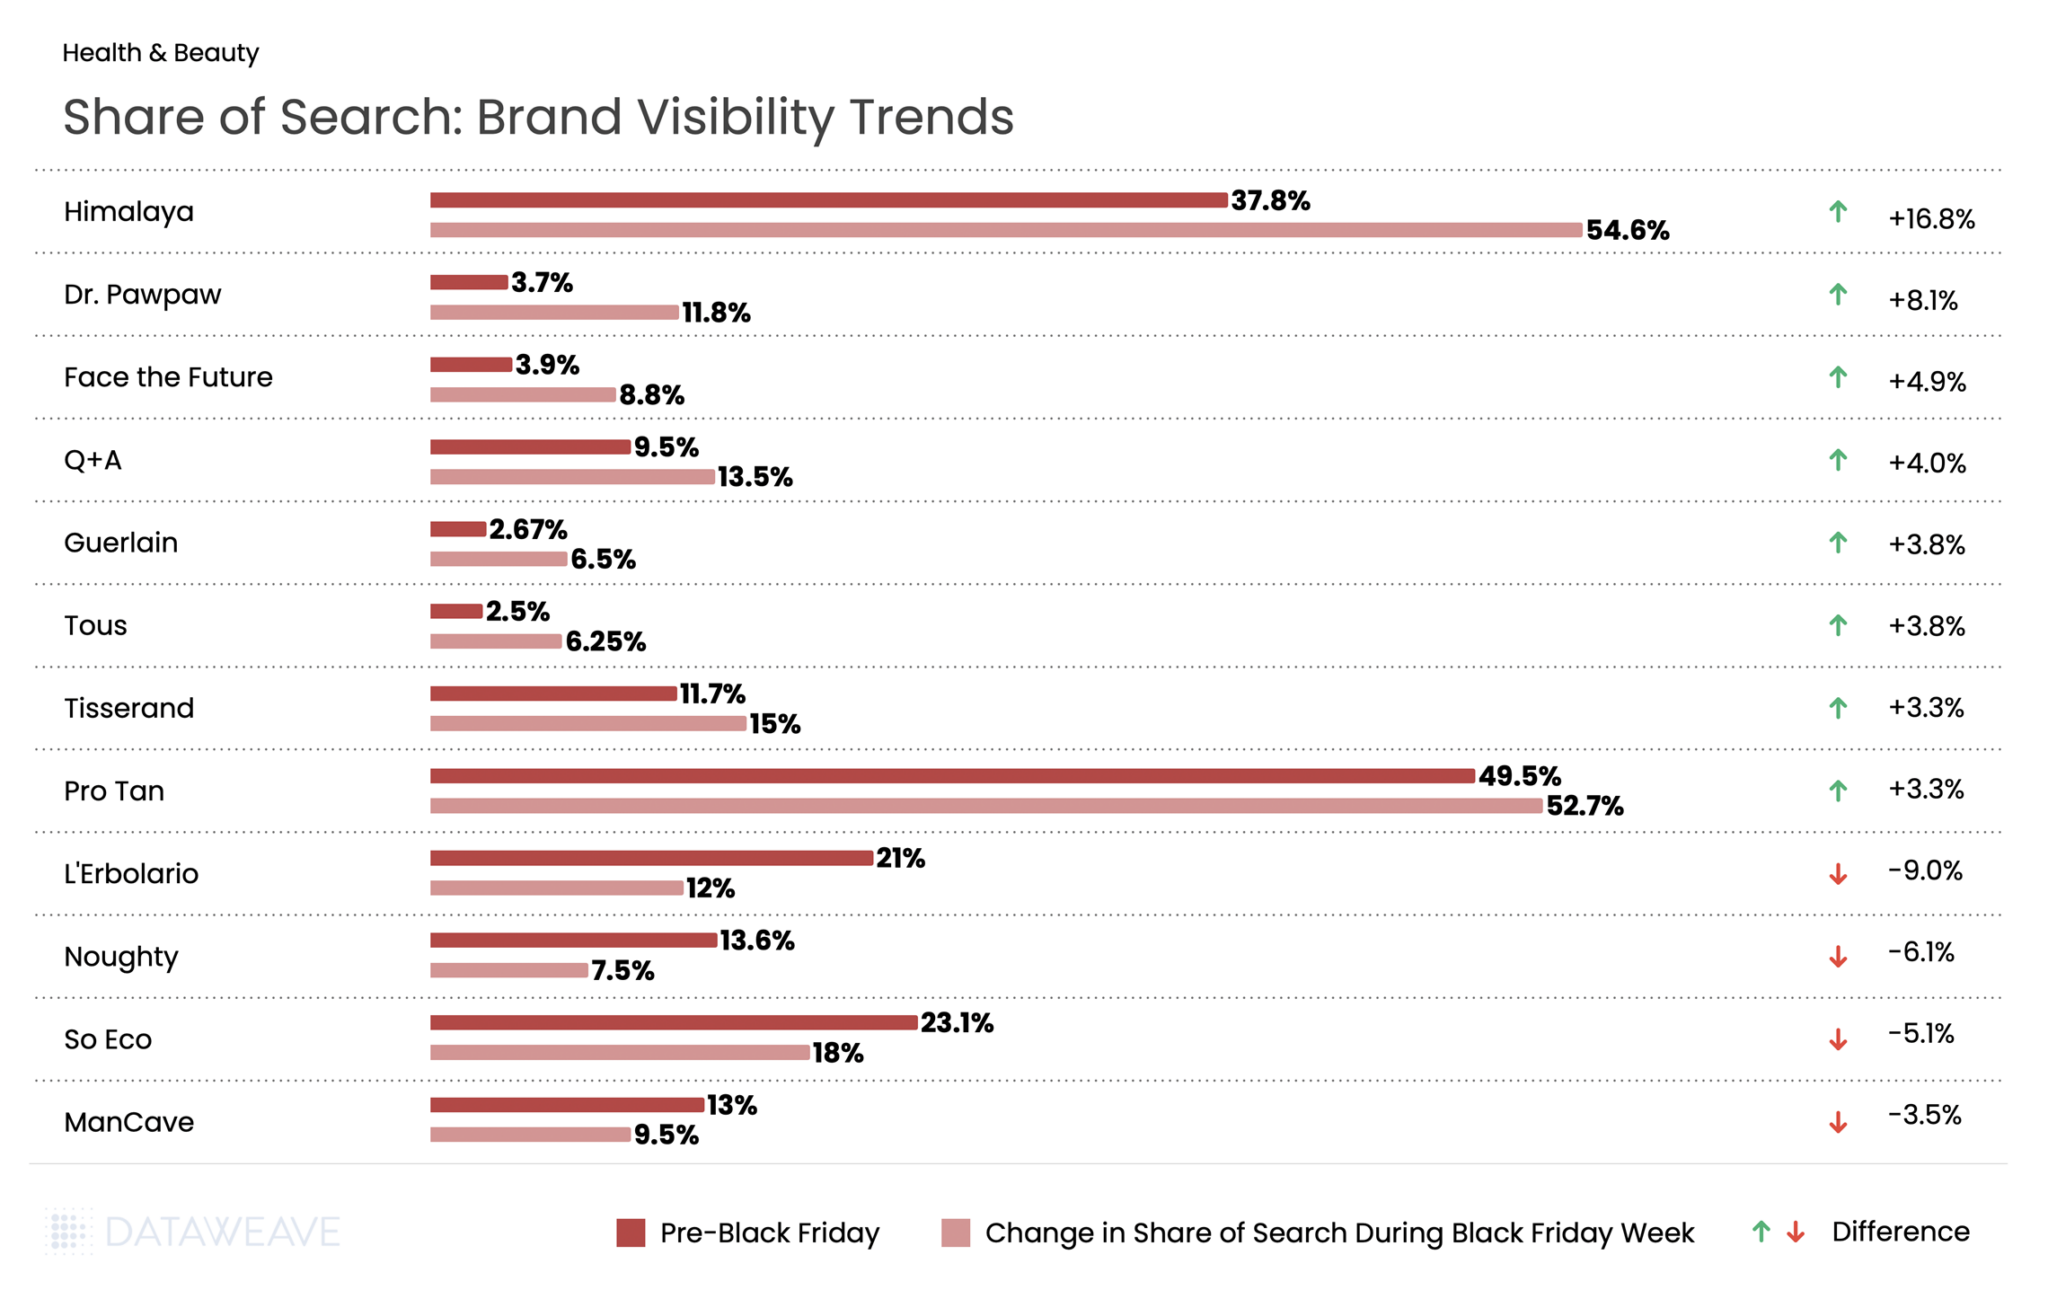
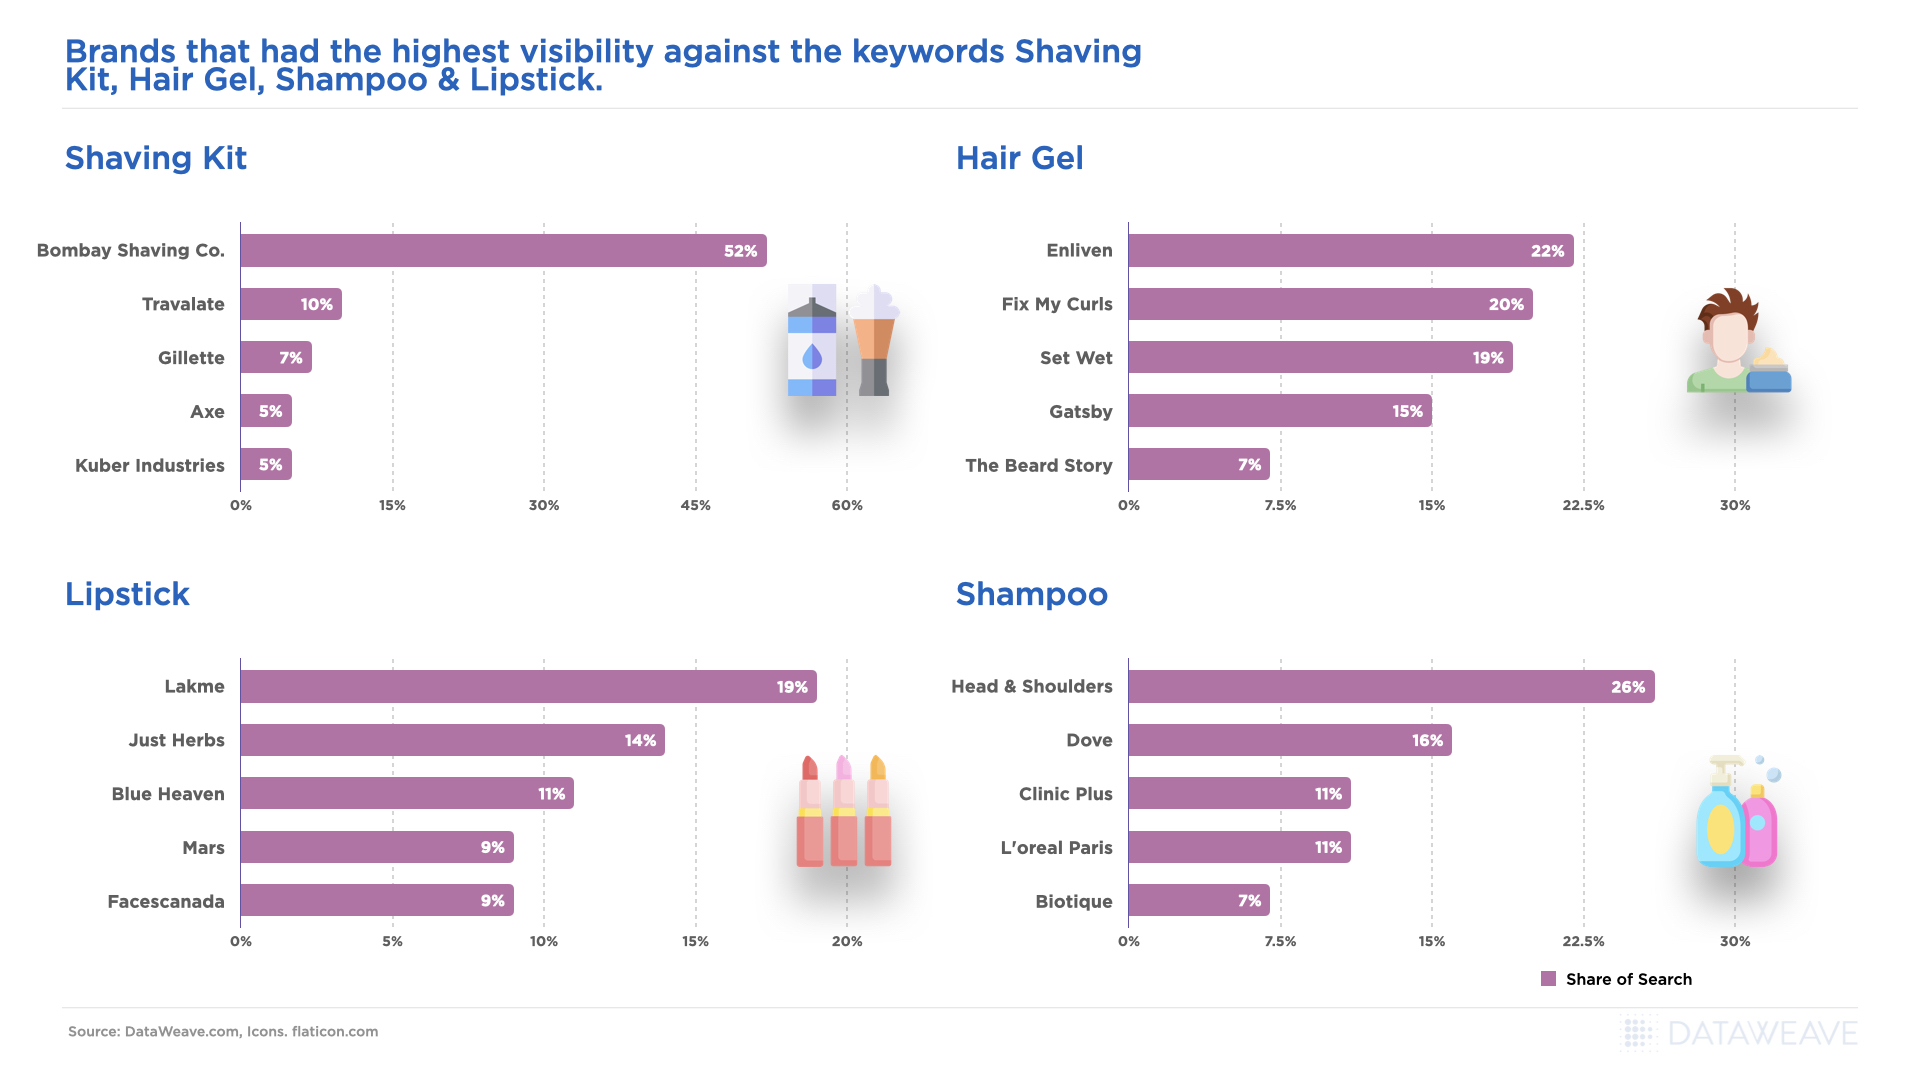
Share of Search: Brand Visibility Trends
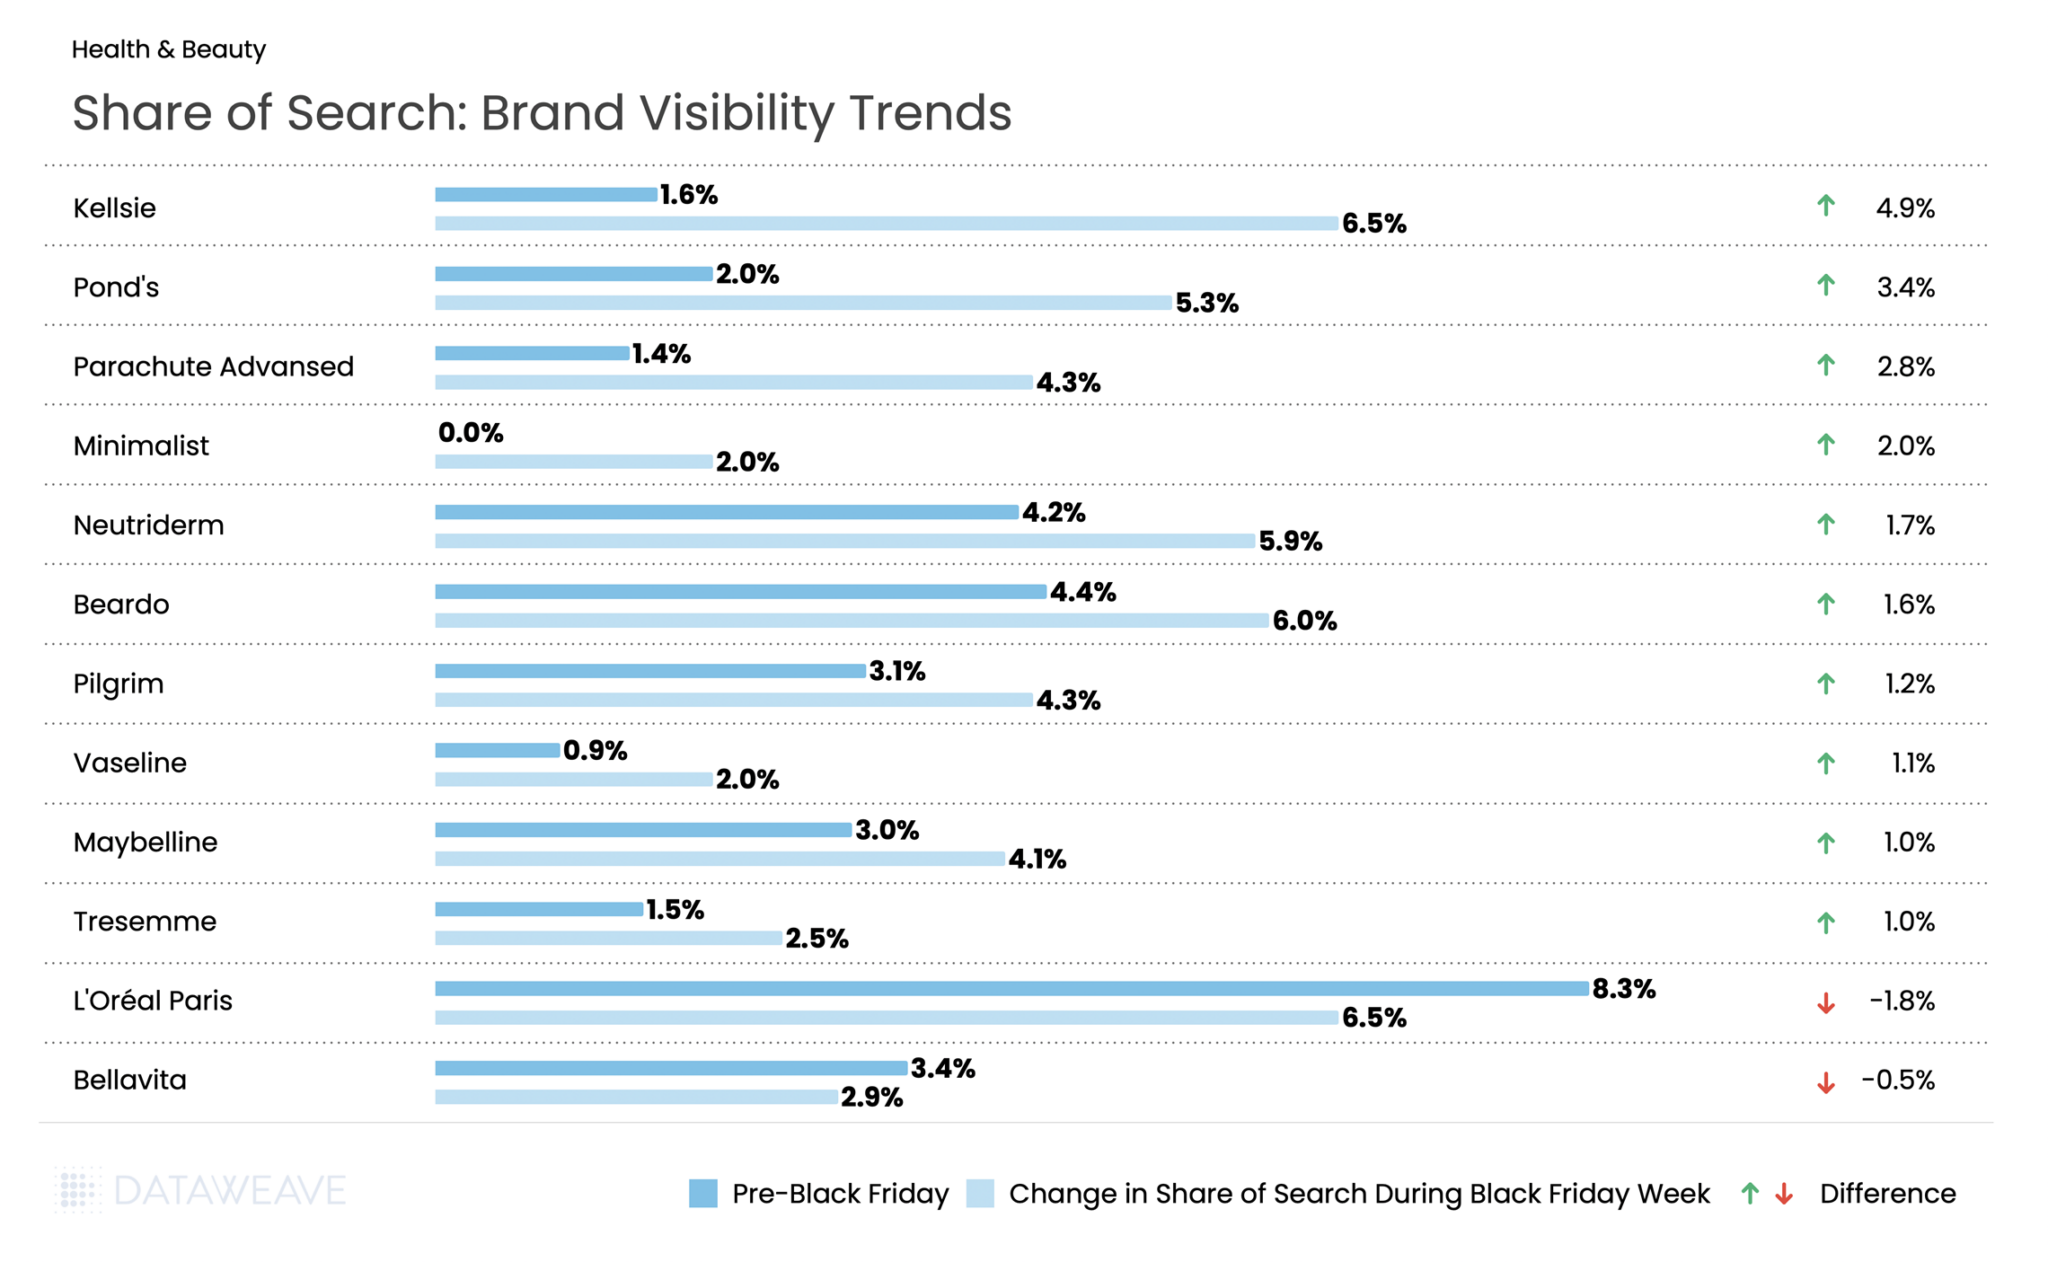
Affordable and emerging beauty brands dominated during Black Friday in India. Kellsie (beauty tools brand) surged from 1.6% to 6.5%. Classic mass-market brands like Pond’s (+3.4%) and Parachute Advanced (+2.8%) also performed strongly, alongside men’s grooming favorite Beardo (+1.6%). Other popular brands like Maybelline, Tresemme, Vaseline, all saw share of search and visibility increase during Black Friday.
Skincare brand Minimalist made a notable entry, jumping from 0% to 2.0% visibility. The flip side? Premium international brand L’Oréal Paris dropped from 8.3% to 6.5%, losing visibility during Black Friday.
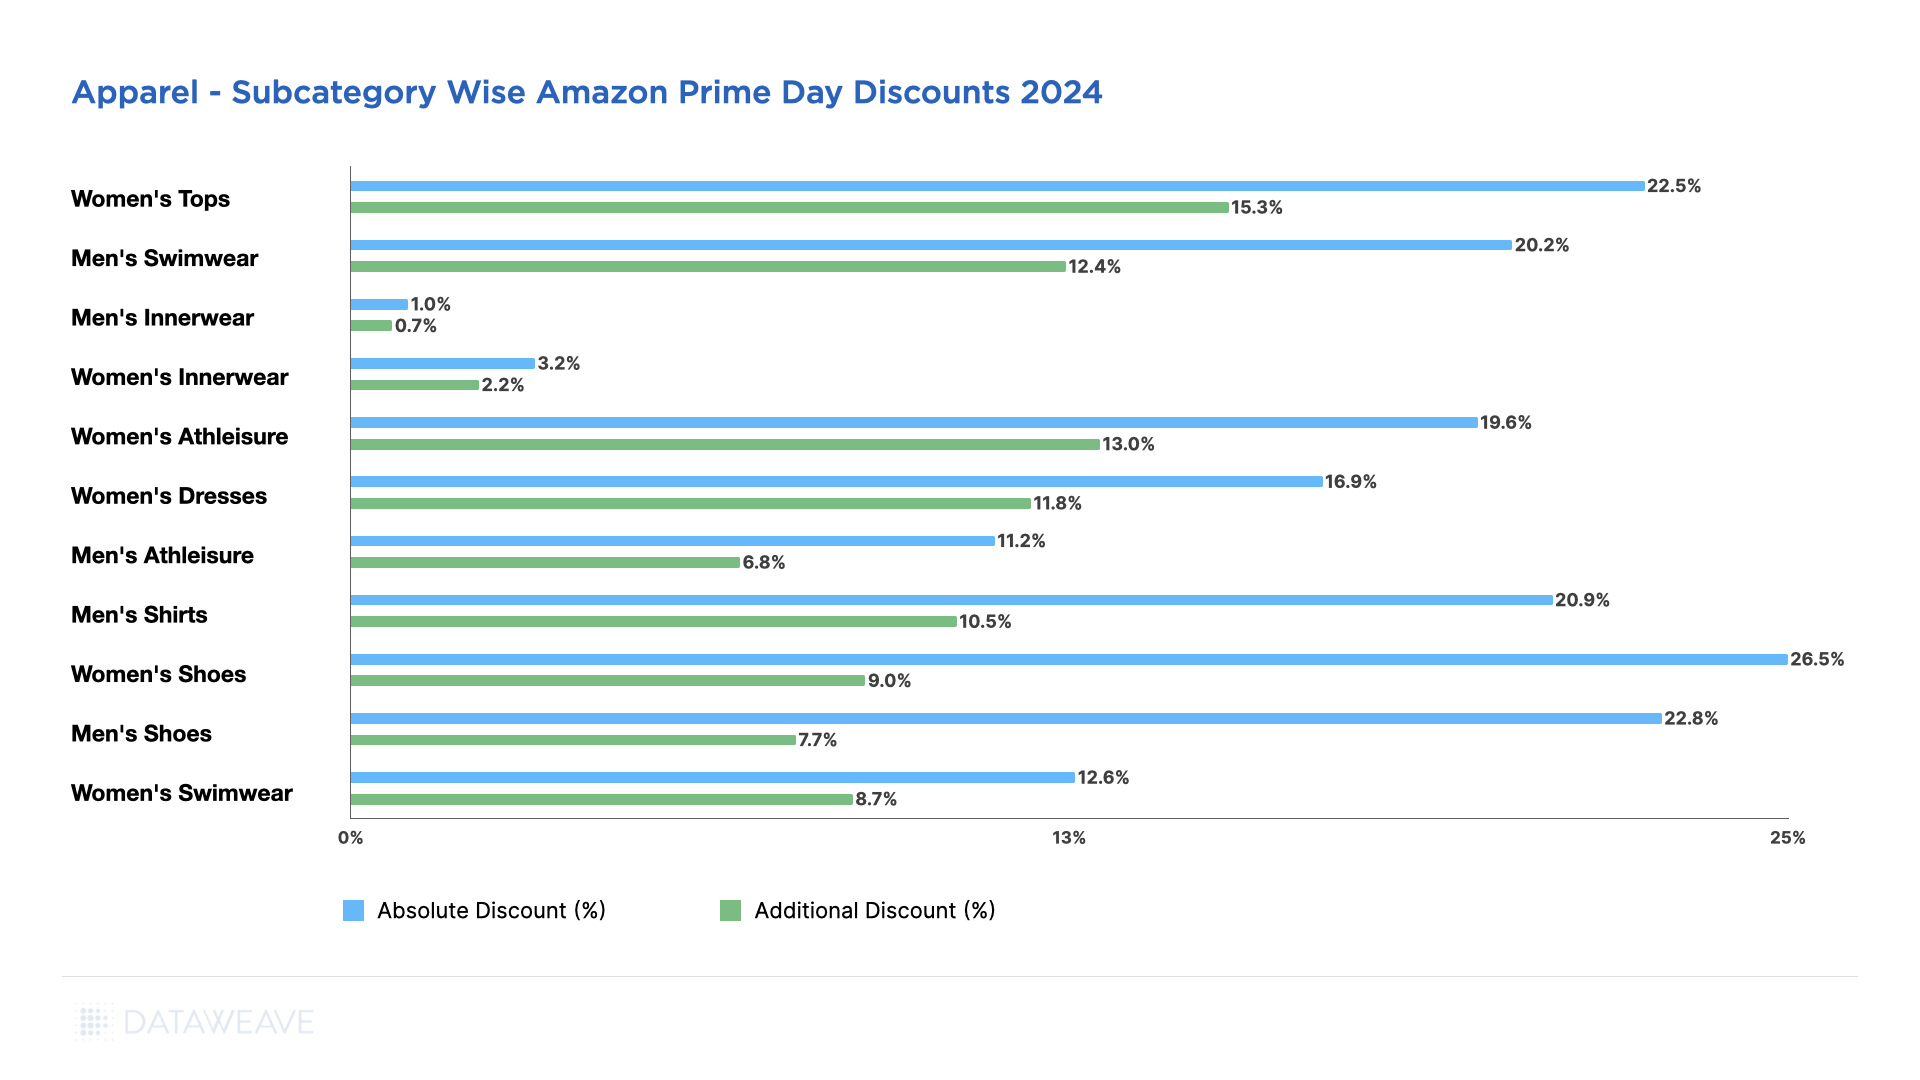
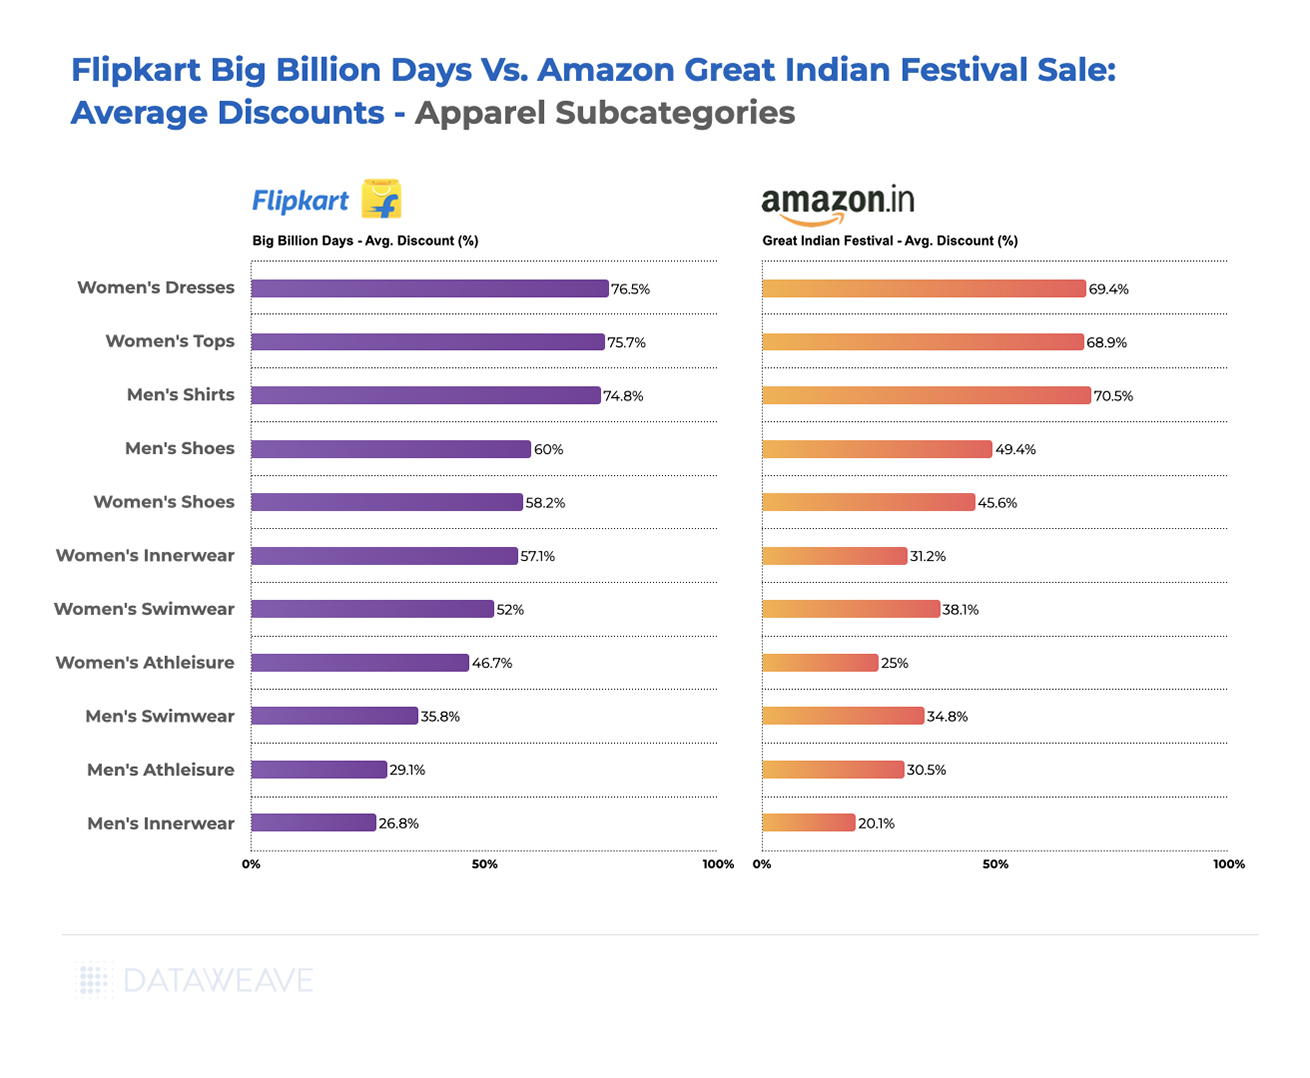
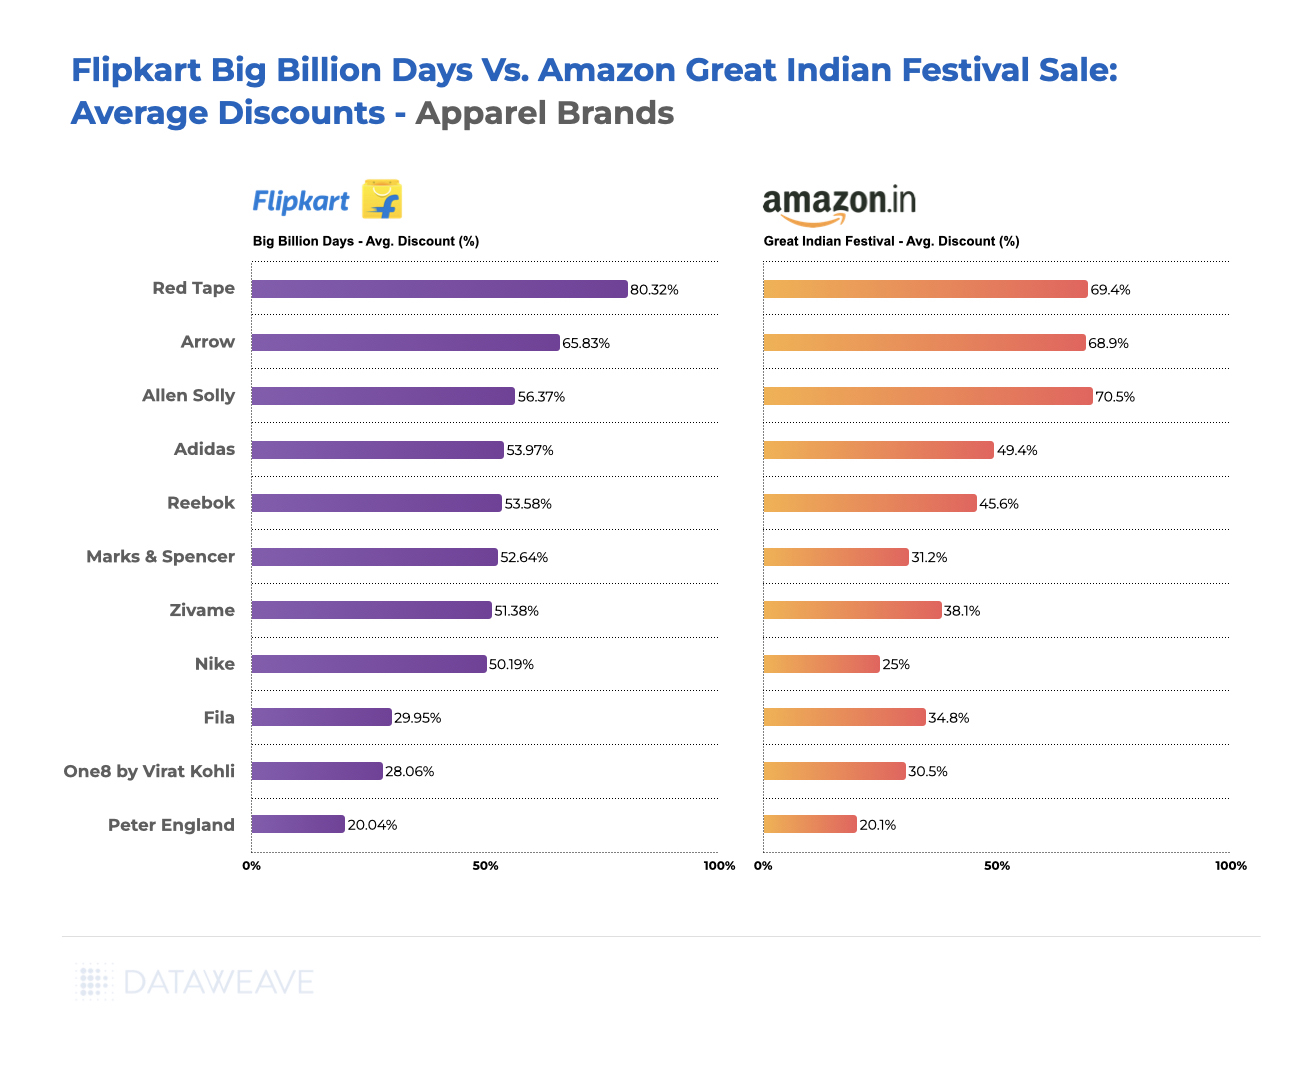
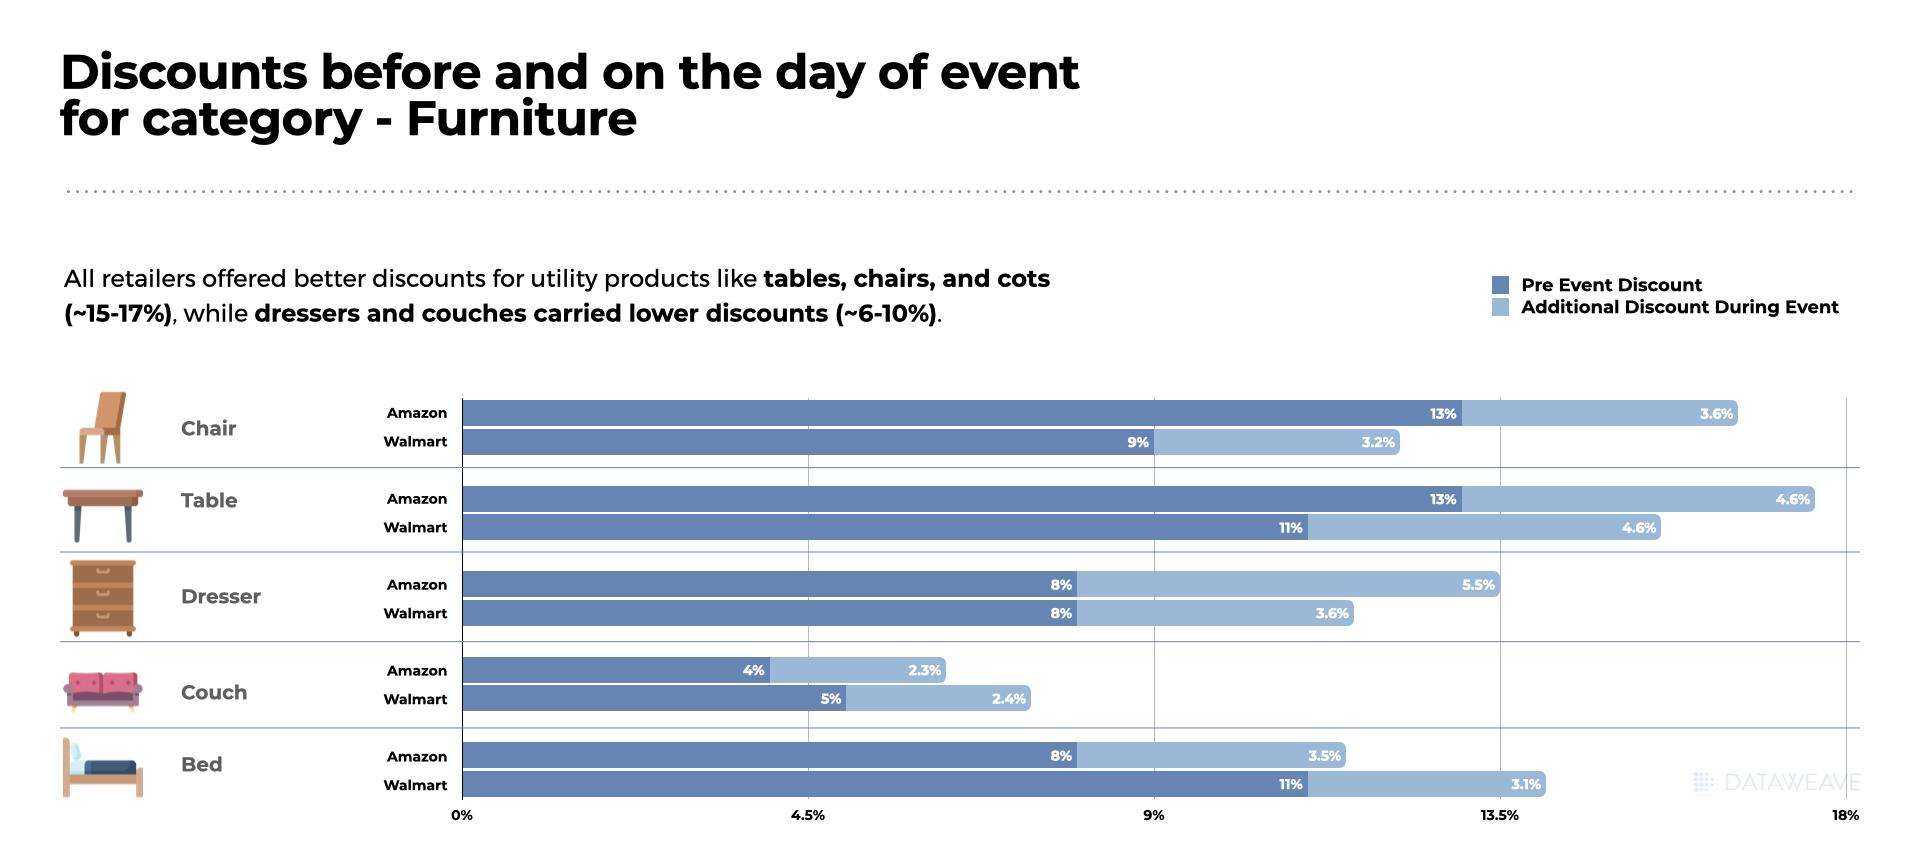
Apparel
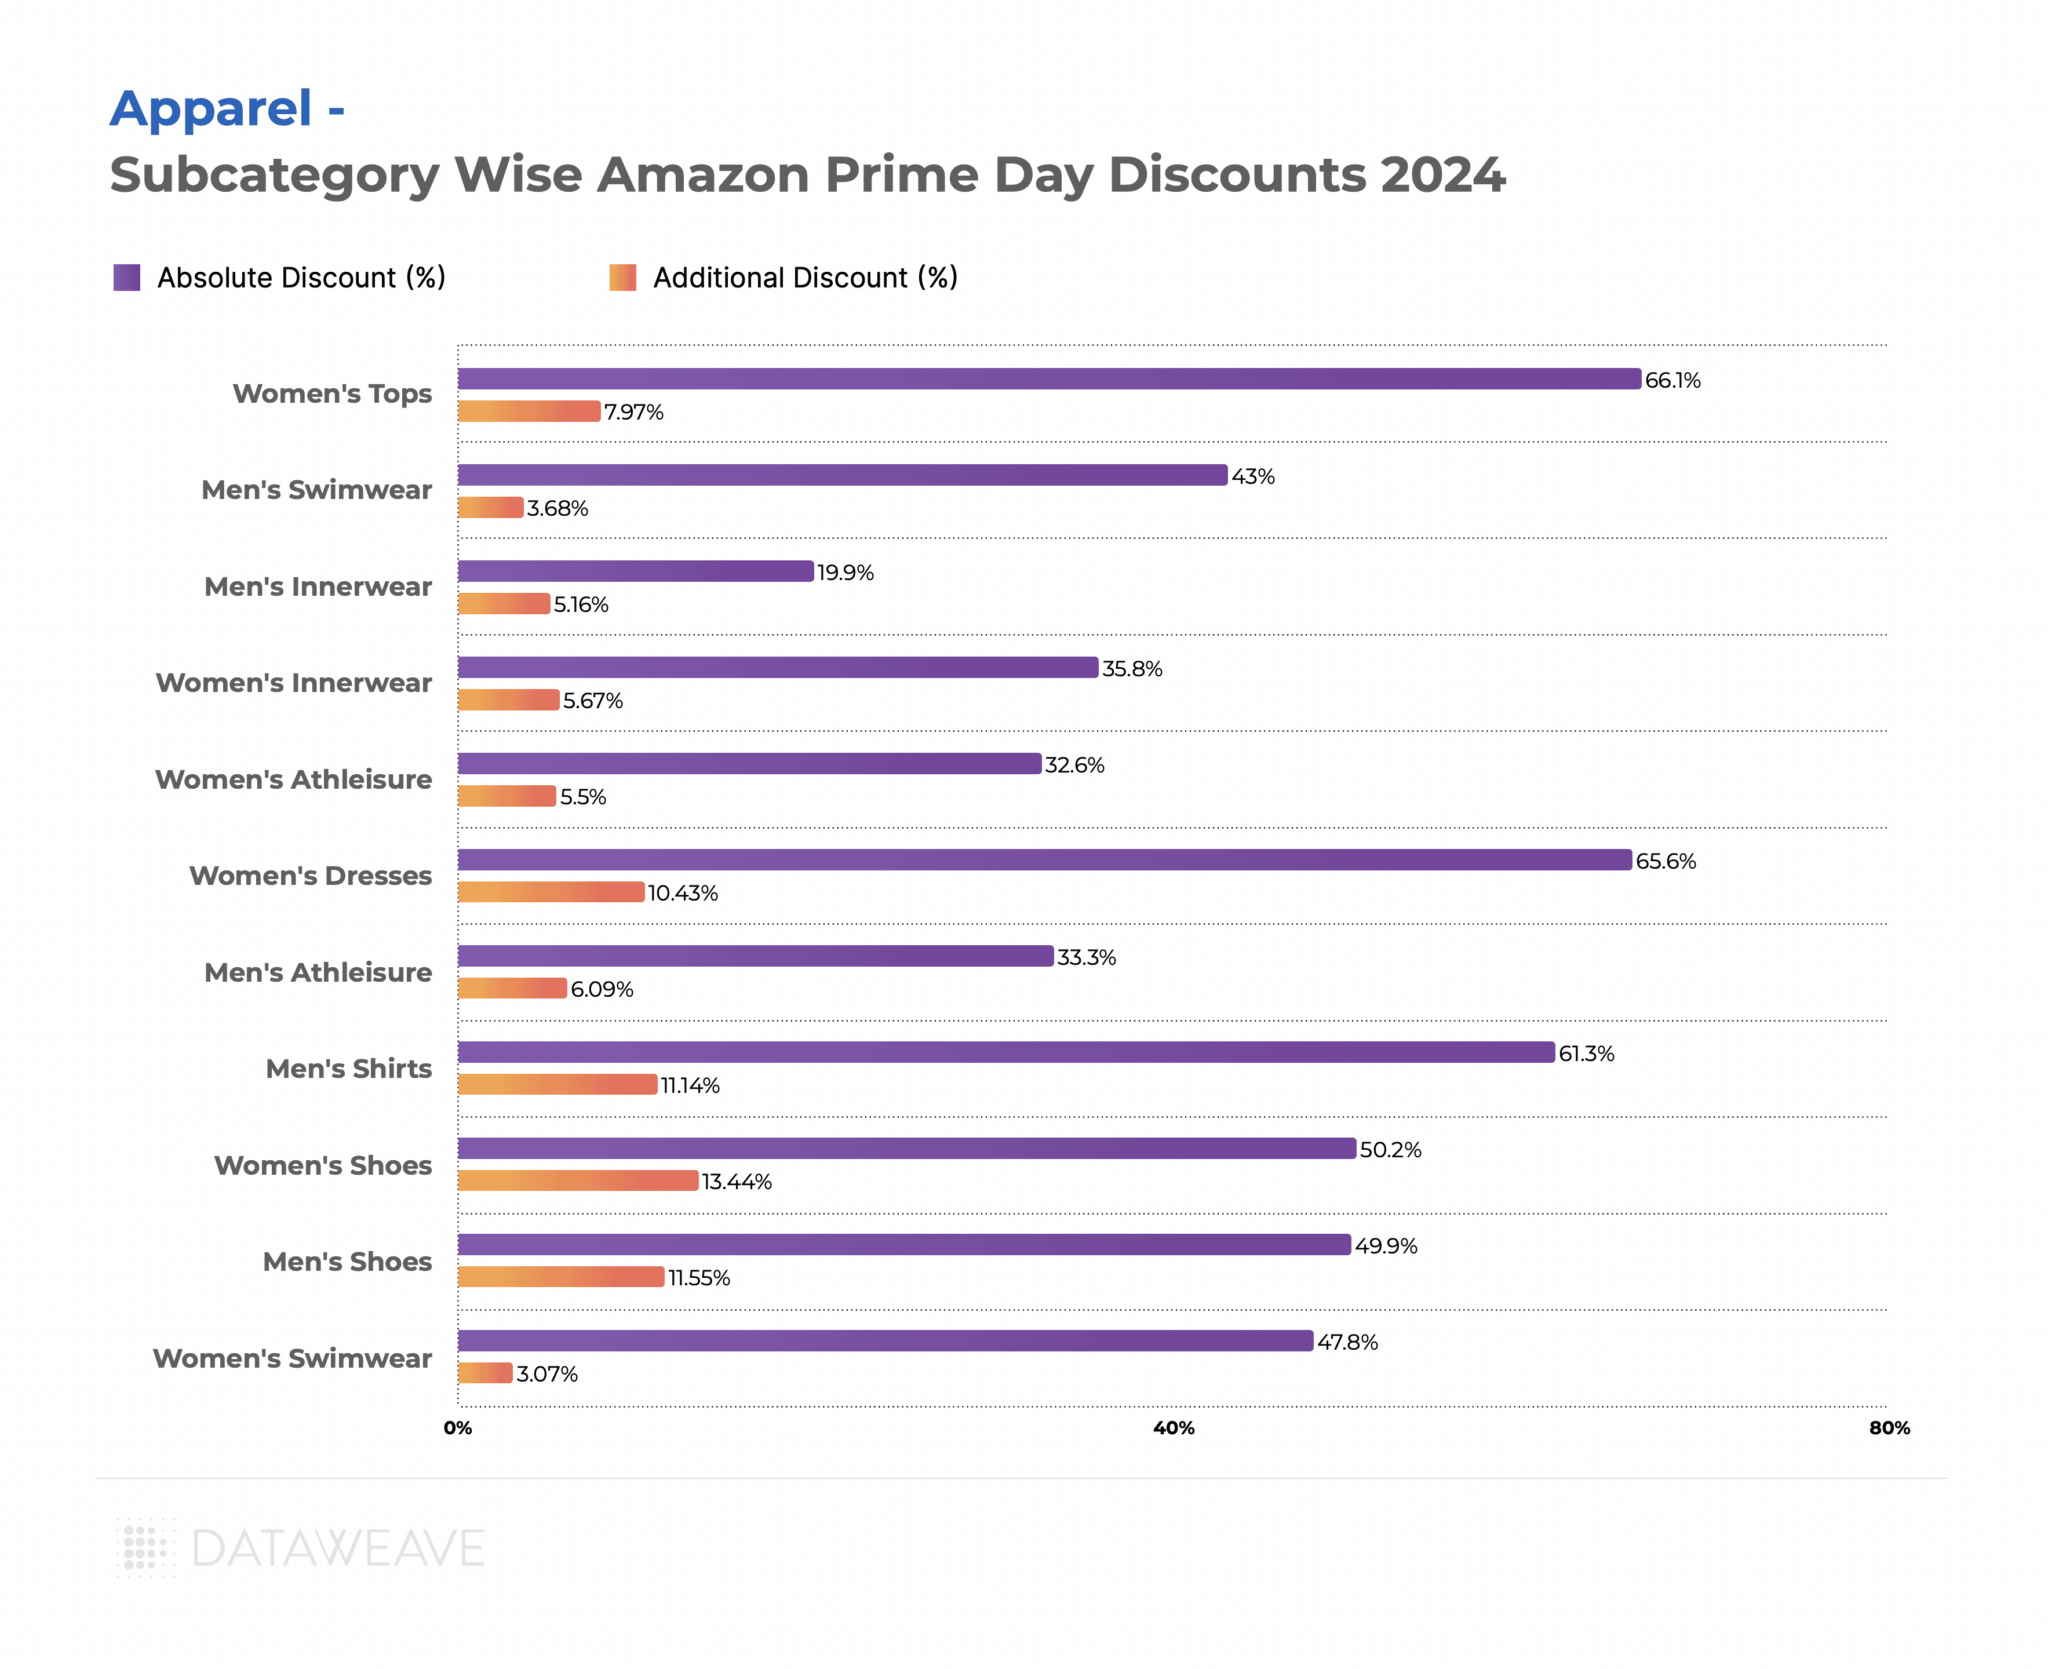
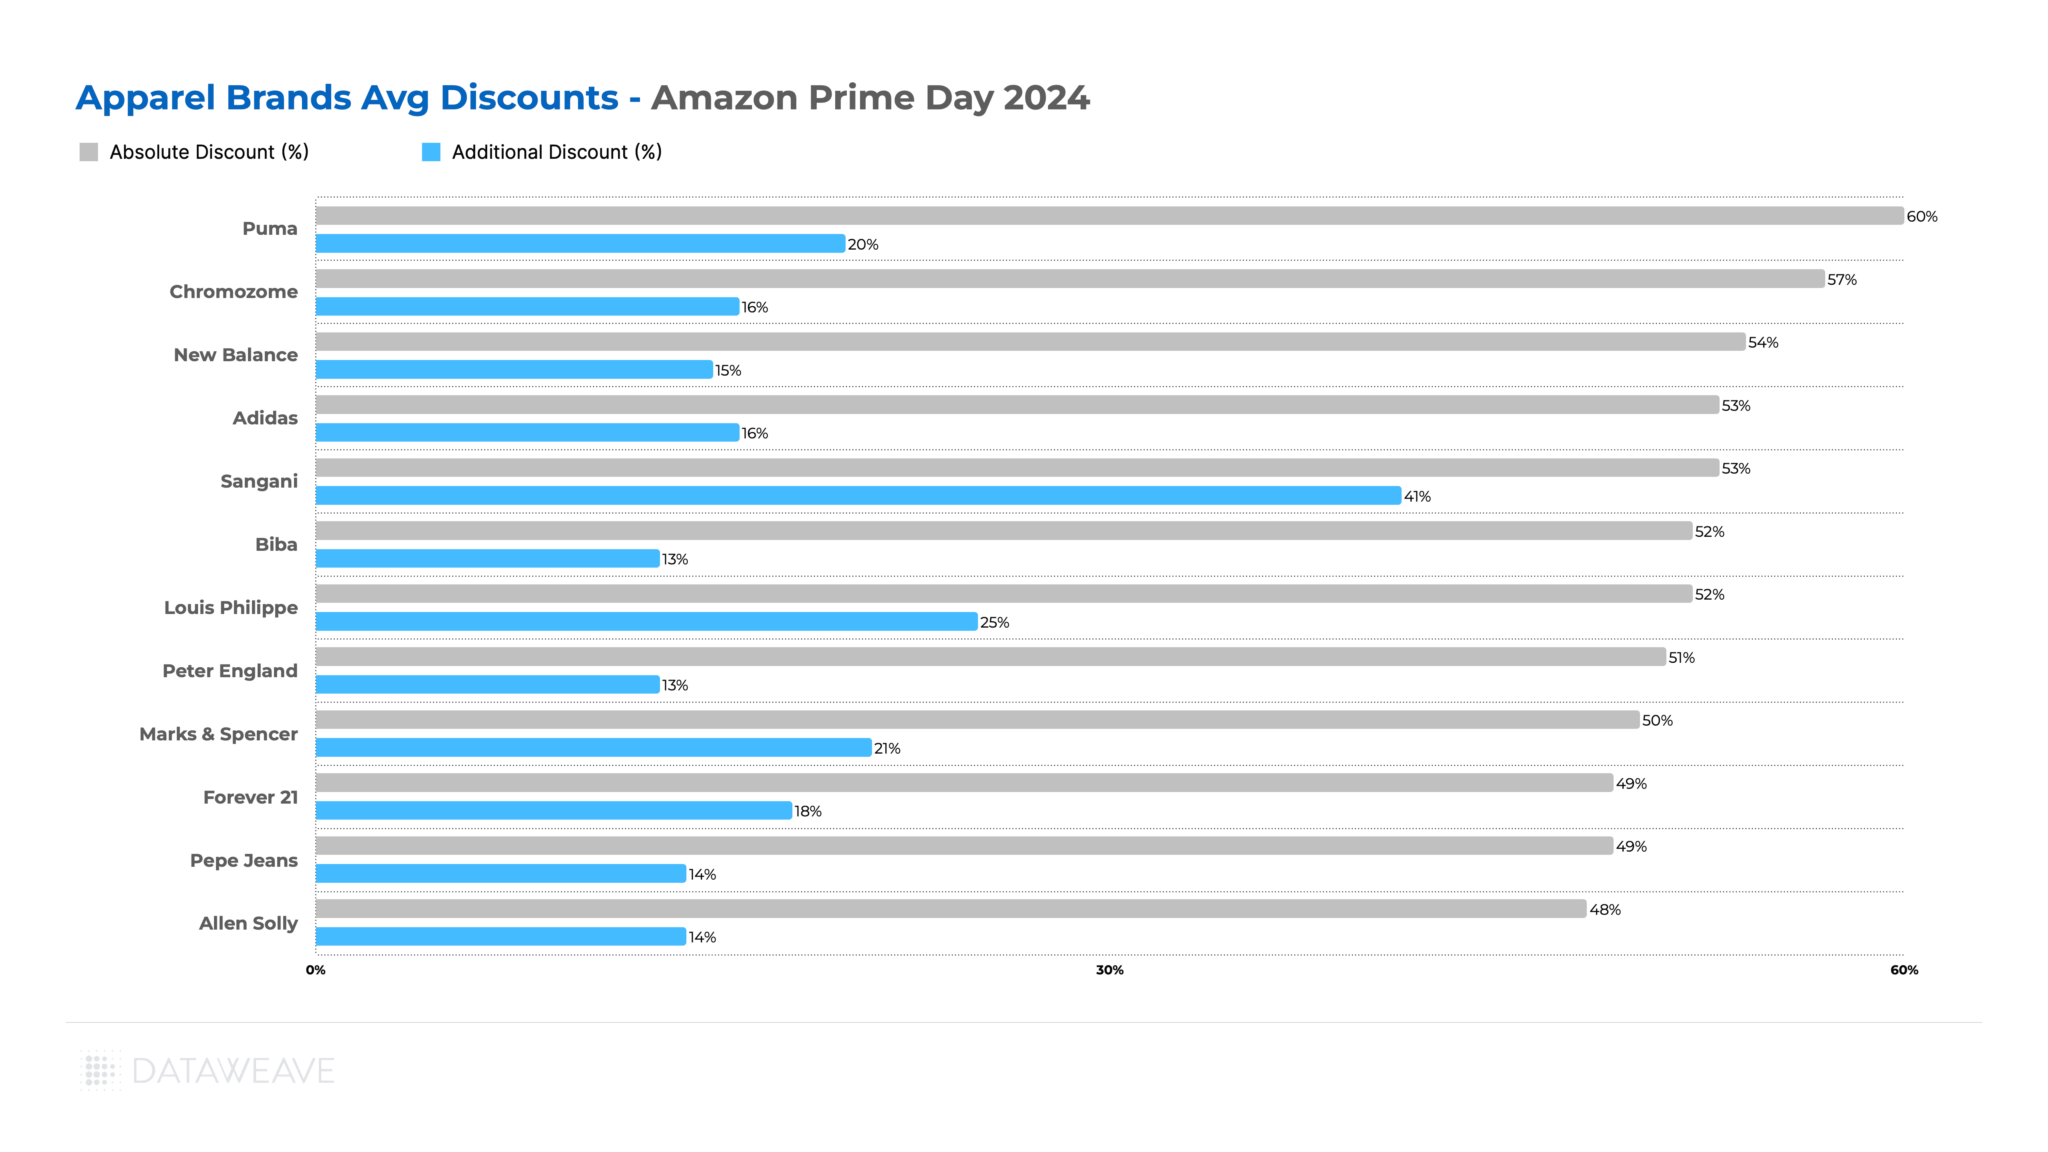
Our analysis of 57,537 SKUs reveals interesting discount dynamics.
Subcategory Discount Analysis
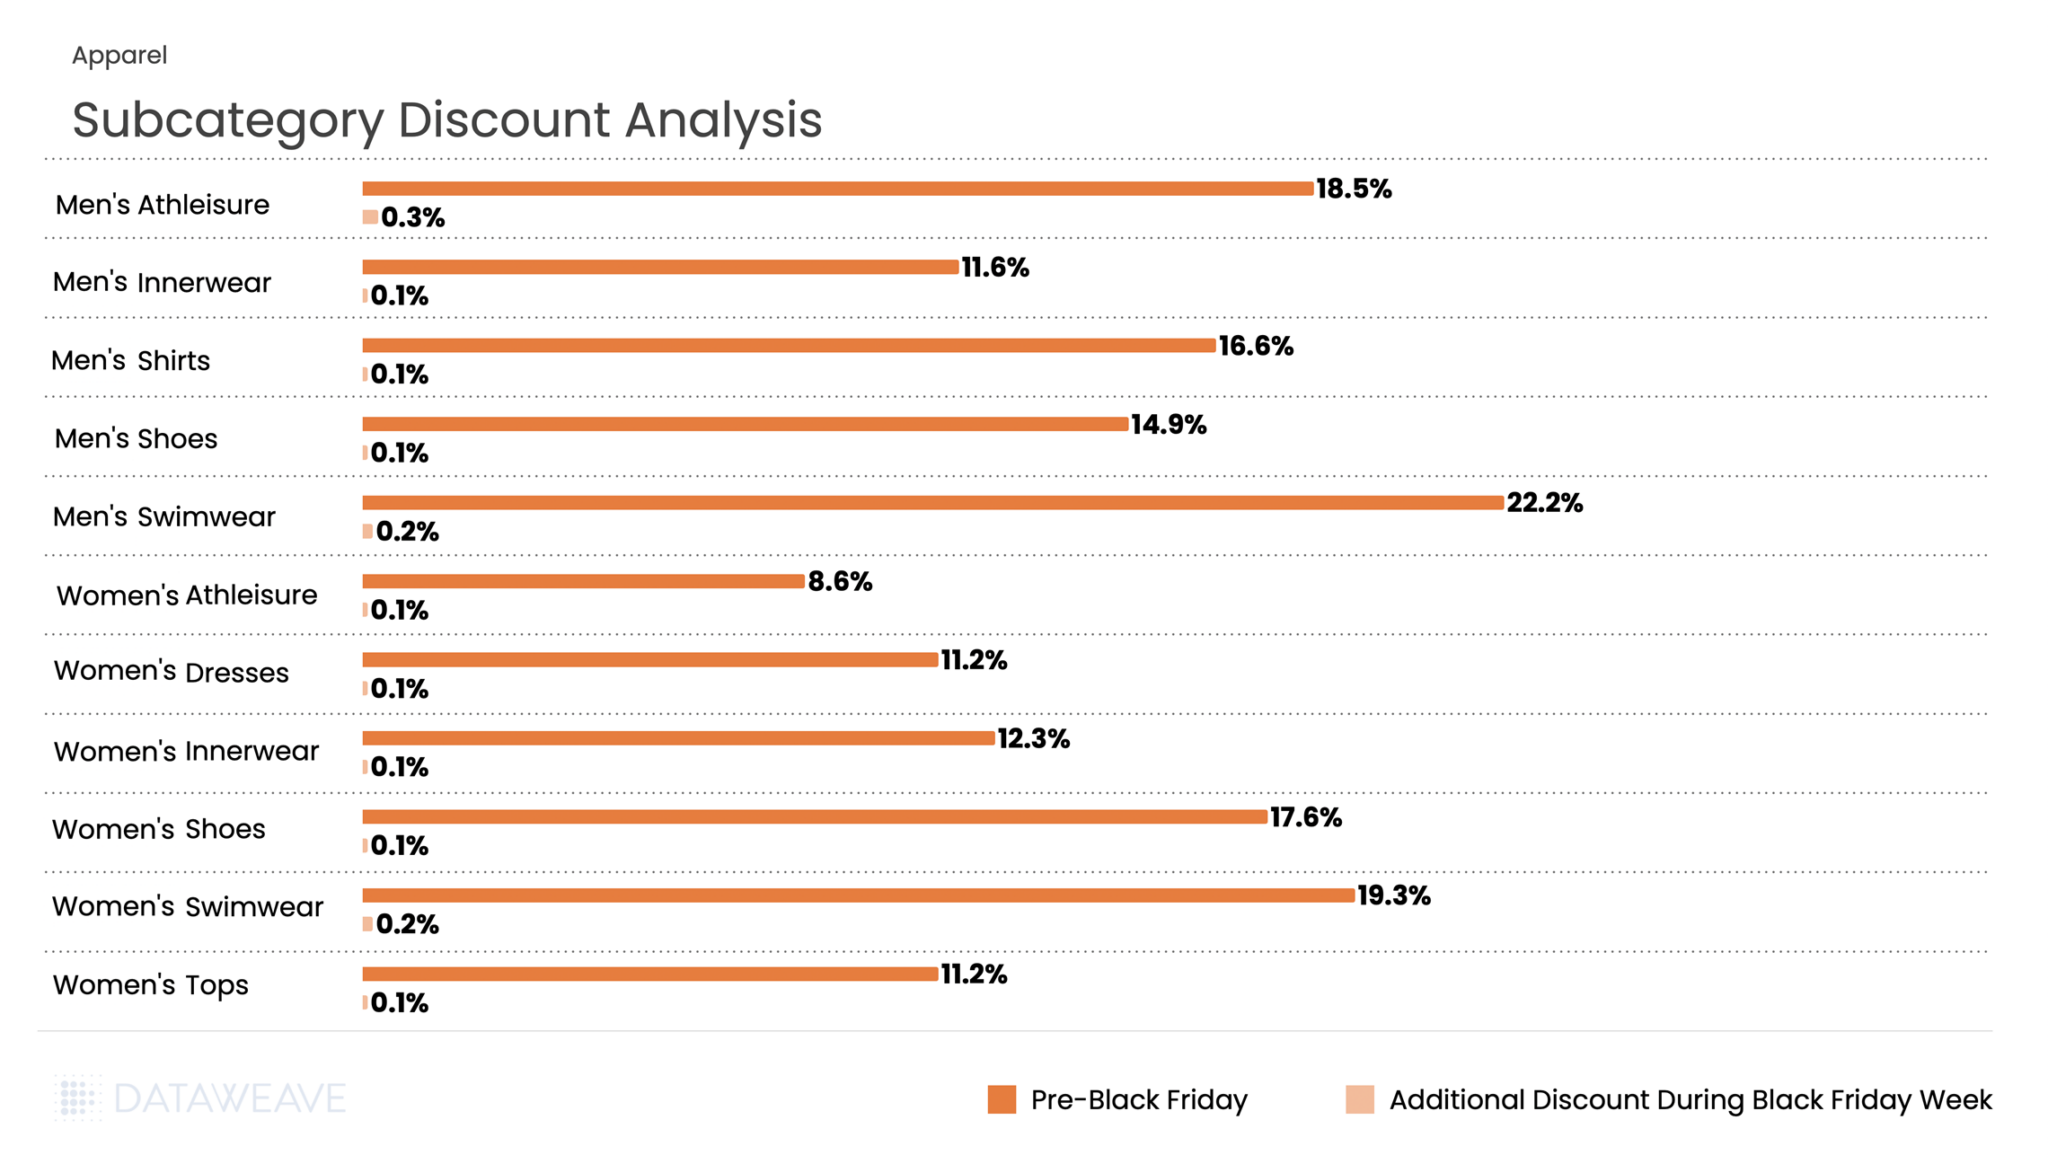
The category averaged 14.3% pre-Black Friday discounts with an additional 0.1% during Black Friday Week. Men’s Swimwear and Men’s Athleisure led pre-sale promotions at 22.2% and 18.5% respectively, while Women’s Swimwear and Women’s Shoes also saw strong pre event discounts at 19.3% and 17.6%.
Black Friday Week saw minimal incremental discounting across all subcategories, with most adding just 0.1-0.3%. The relatively subdued incremental discounting indicates that early birds captured the best deals, or that margins were already stretched from pre-sale promotions.
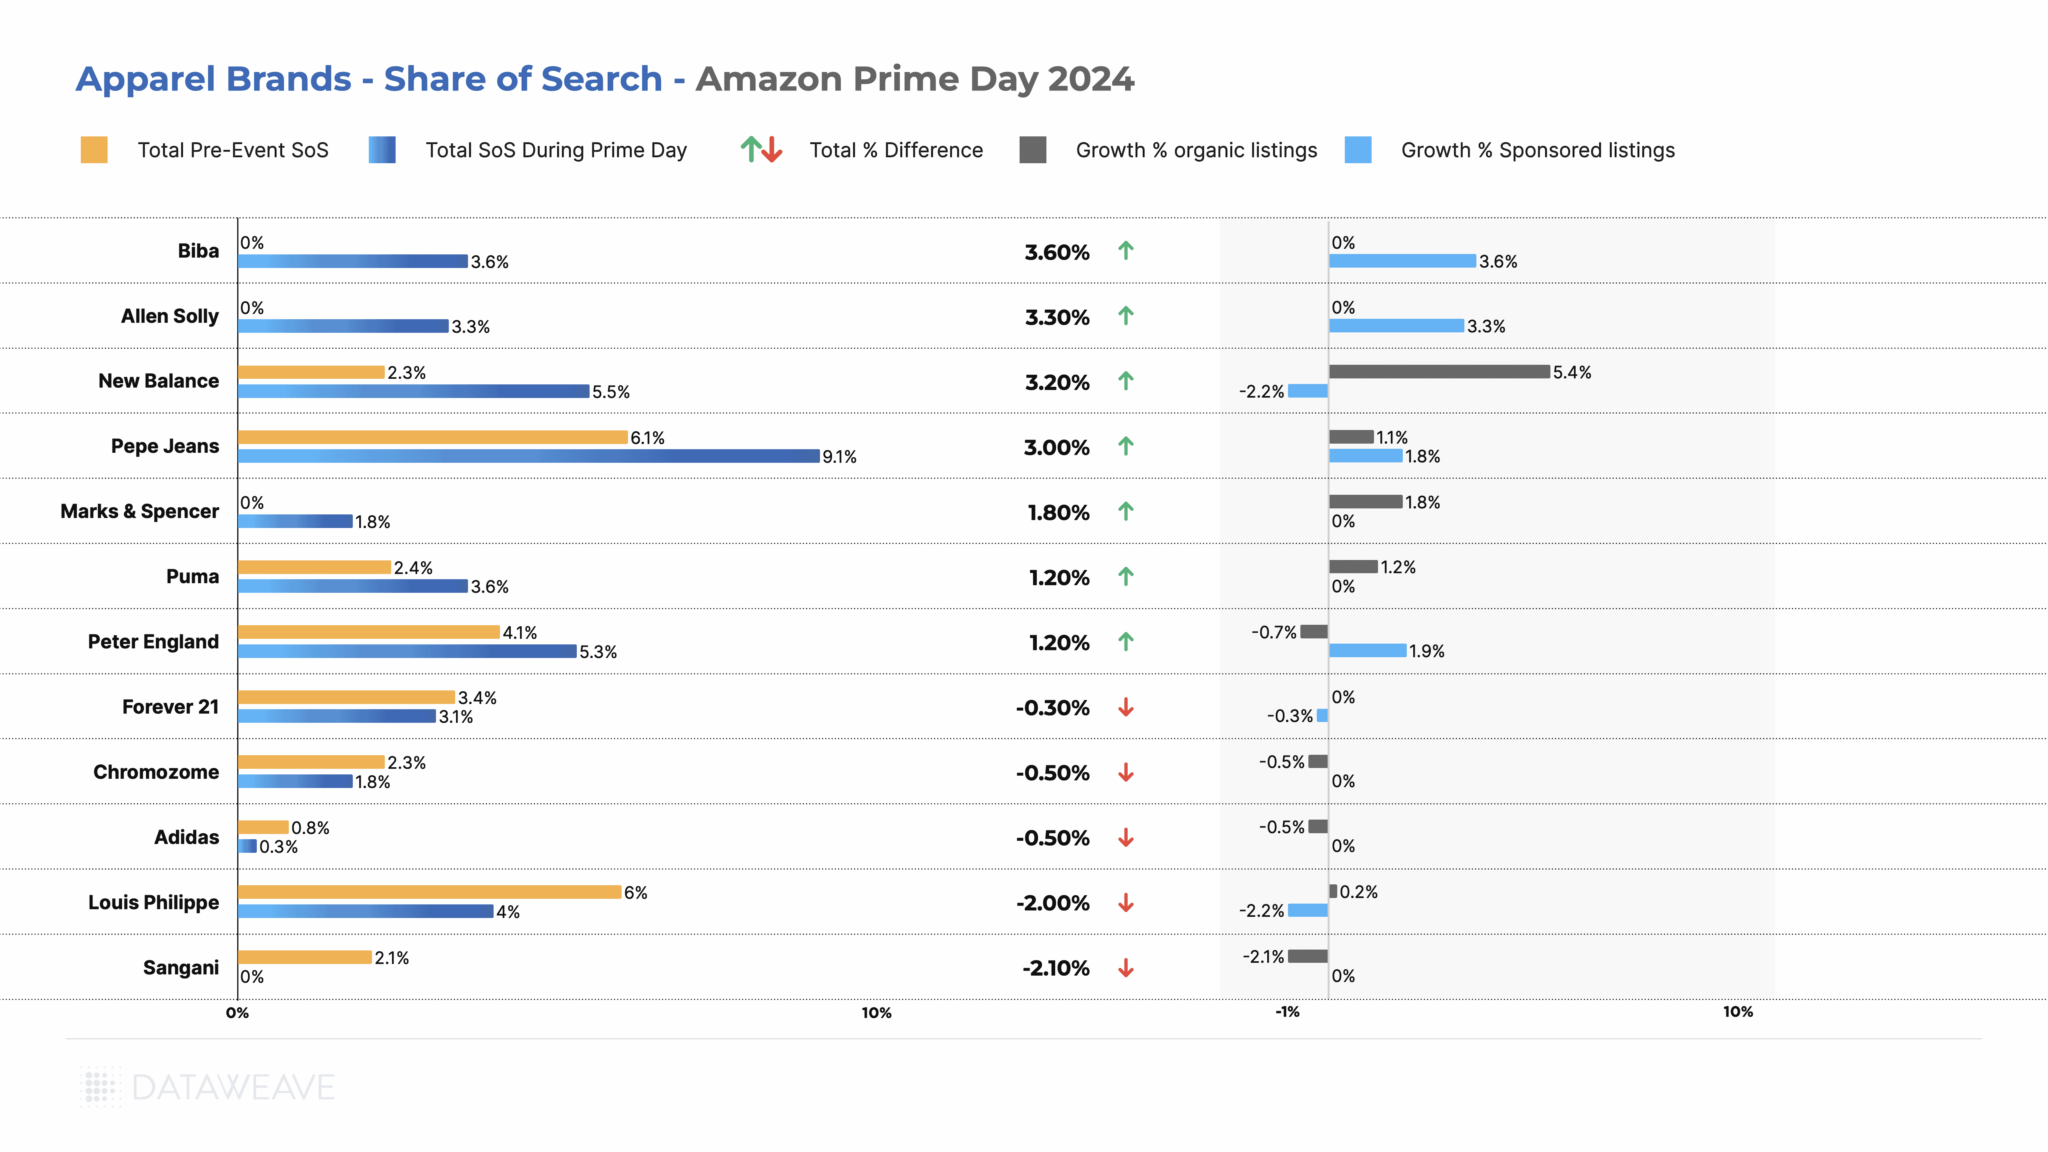
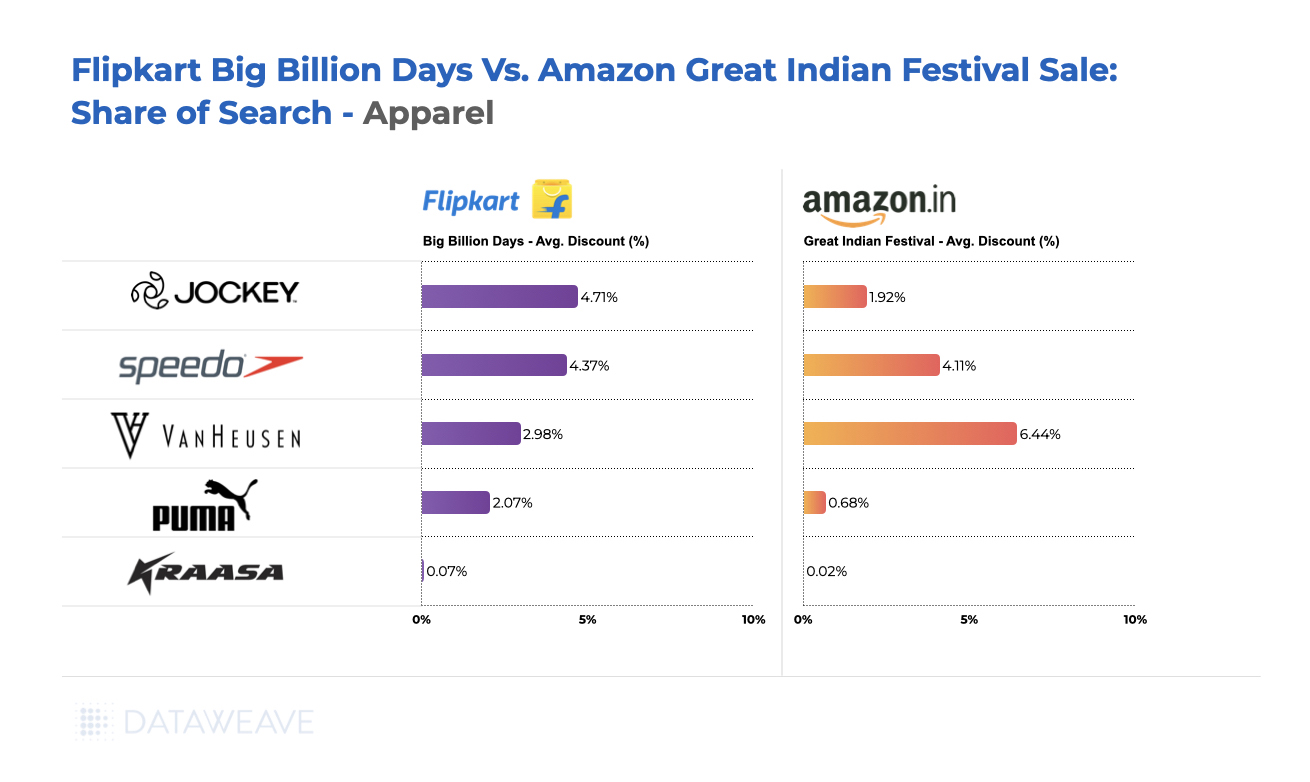
Share of Search: Brand Visibility Trends
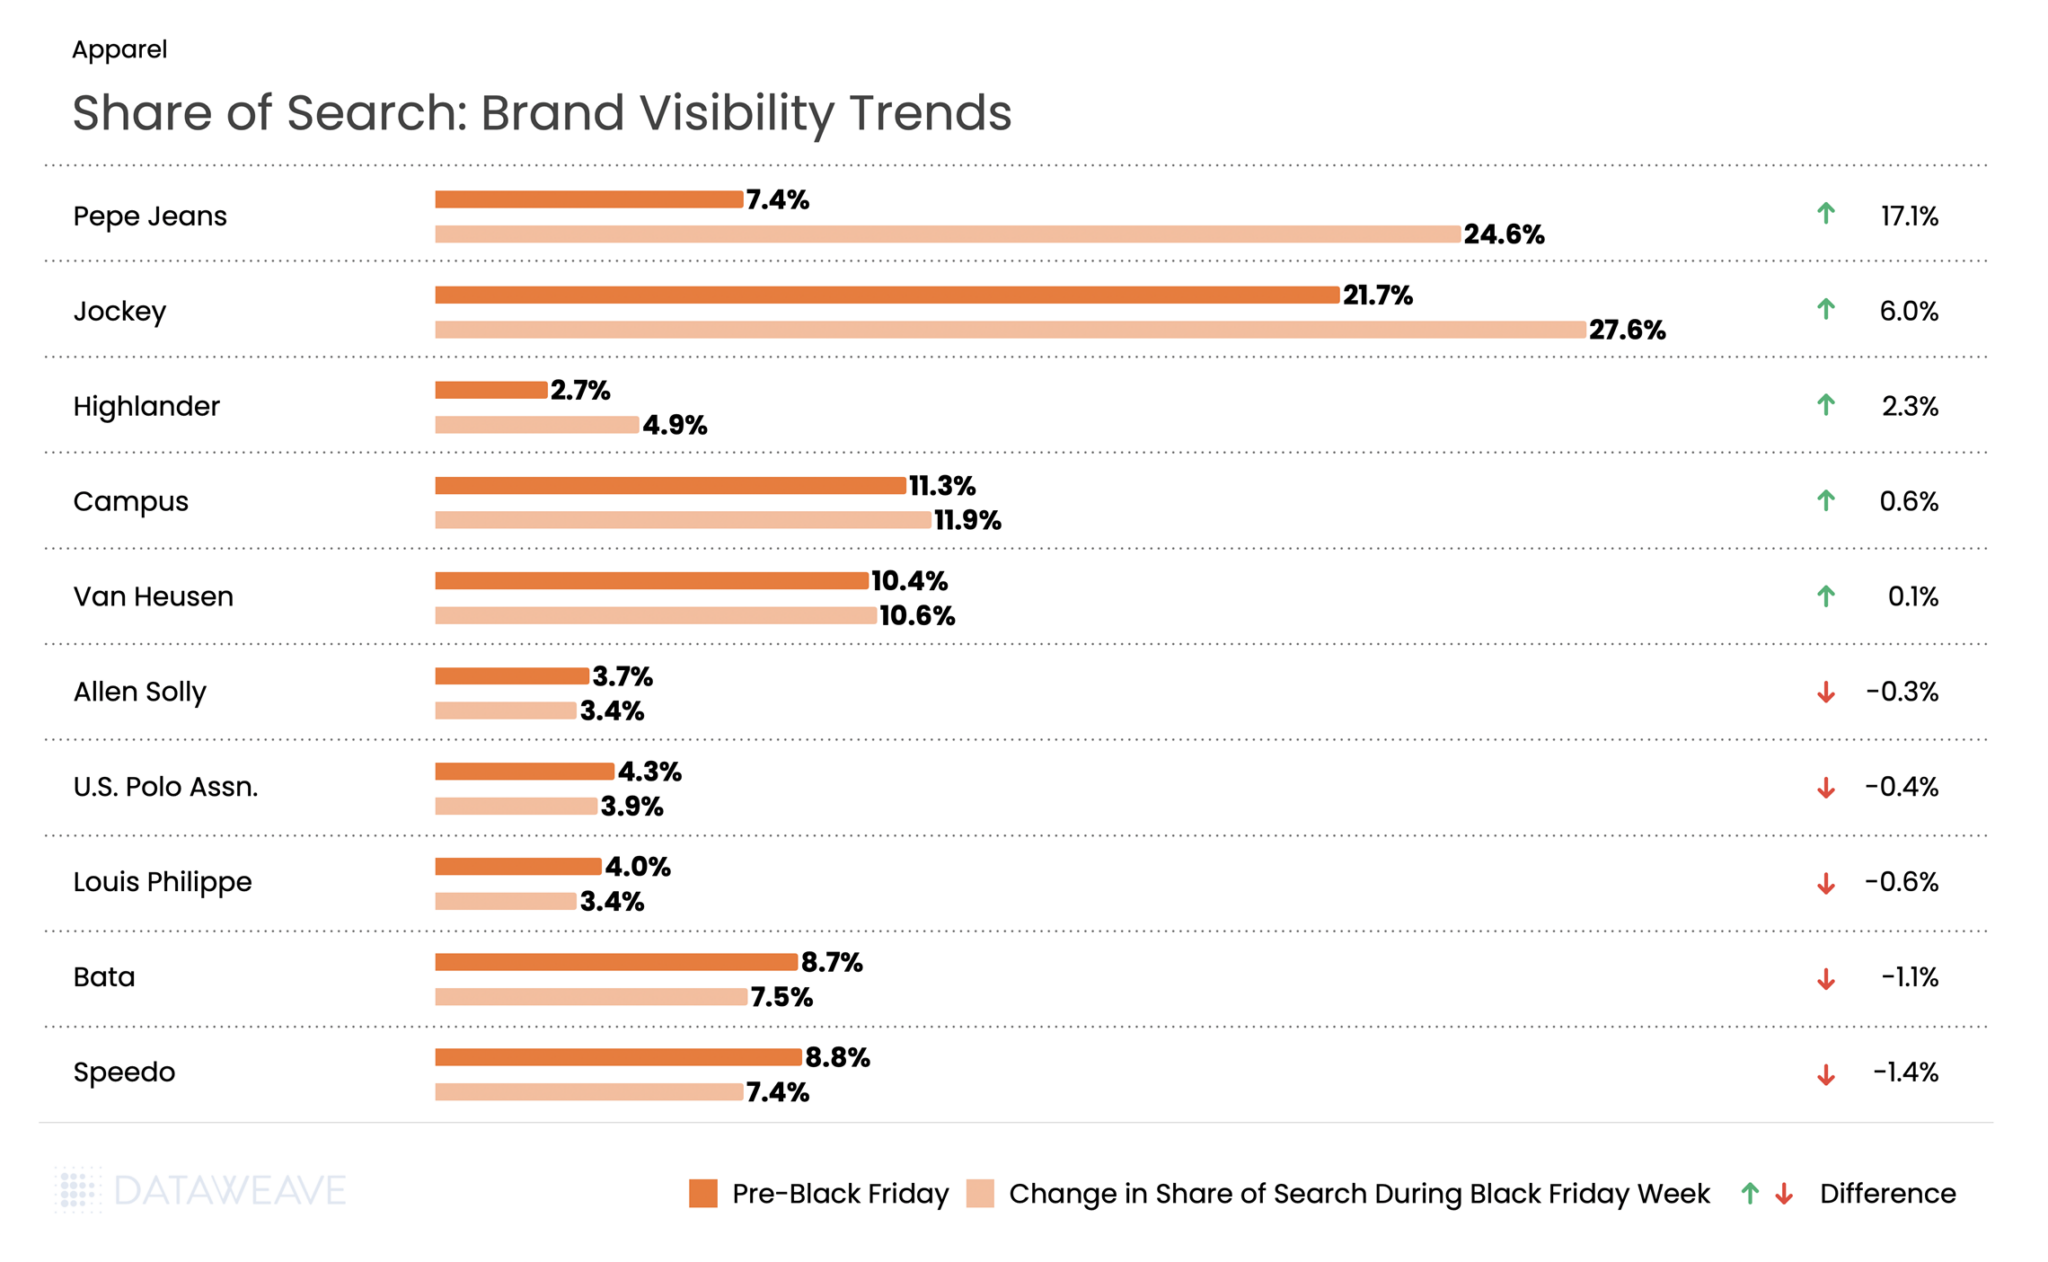
Pepe Jeans dominated visibility, surging from 7.4% to 24.6%, a staggering gain that represents the largest visibility increase across all categories. Jockey also performed strongly with a 6% gain, solidifying its position in innerwear.
On the flip side, athletic and footwear stalwarts faced headwinds: Speedo dropped 1.4% and Bata fell 1.1%. This data suggests that during Black Friday 2025 in India, denim and lifestyle fashion brands invested heavily in promotional visibility, capturing massive mindshare at the expense of traditional athletic and footwear brands.
For brands and retailers navigating India’s increasingly competitive e-commerce landscape, the 2025 Black Friday data reveals a critical insight: pre-sale positioning matters more than Black Friday Week discounting. Early promotional investment and visibility campaigns delivered far greater returns than late-stage price drops, fundamentally reshaping how brands should approach this shopping event.
Want to understand how DataWeave’s retail intelligence platform can help your business make data-driven decisions during peak sales events? Contact us to learn more about competitive insights, price intelligence, assortment analytics, content analytics, and digital shelf analytics.
Check out our analysis on Black Friday 2025 Pricing and Discount trends in the USA, Canada, UK, and Germany. Follow our blog for more insights on retail pricing trends, brand visibility analysis, and data-driven commerce intelligence.
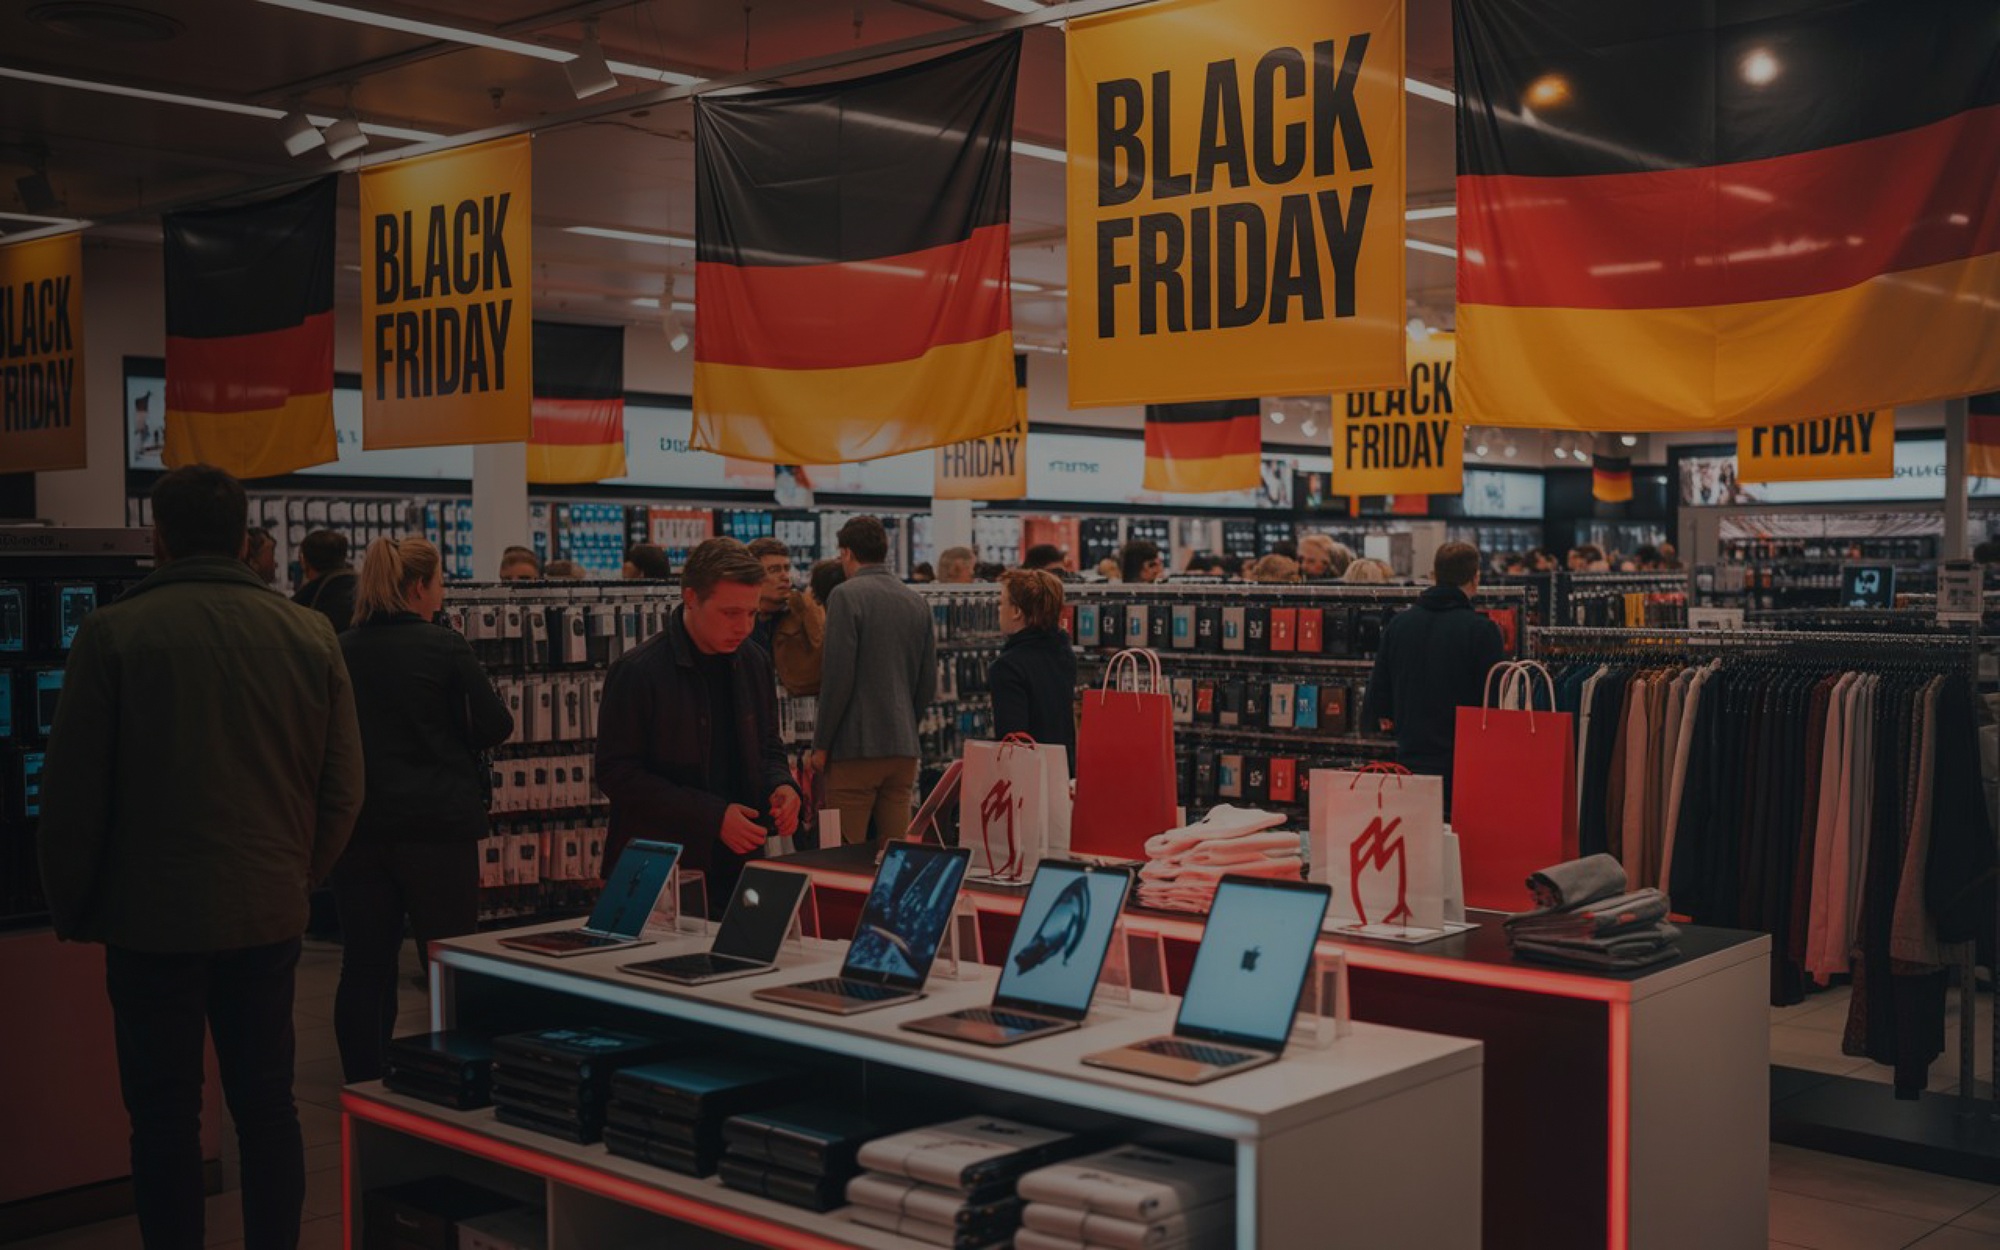
Black Friday 2025 solidified its position as a major retail event in the German market. German consumers demonstrated an average Black Friday budget of €317, the highest among select European countries.
The German market, however, exhibited unique consumer behavior patterns during Black Friday 2025. Rather than meticulous planning, 59% of German shoppers allowed deals to inspire their purchases, compared to just 32% who shopped with predetermined lists and budgets. This spontaneous yet budget-conscious approach distinguishes German consumers from other markets, where FOMO-driven purchasing tends to dominate.
Against this backdrop of rational deal-seeking and regional diversity, how did retailers and brands perform across key categories this Black Friday?
At DataWeave, we conducted a comprehensive analysis of Black Friday 2025 discounting trends across five major categories in the German market: Consumer Electronics, Home & Furniture, Health & Beauty, Grocery, and Apparel. Our AI-powered pricing intelligence platform monitored over 16,000+ SKUs across leading German retailers like Amazon, Aldi, Douglas, Nutritienda, Carethy, Bofrost, and more, revealing fascinating patterns in how retailers and brands approached this year’s sale season.
Our Methodology
For this analysis, DataWeave monitored average discounts across leading German retailers during two distinct periods:
Pre-Black Friday: November 6 – November 23, 2025 – capturing early holiday deals and baseline pricing
Additional Discounts During Black Friday Week: November 24 – December 1, 2025 – covering Thanksgiving week through Black Friday (November 28) and Cyber Monday (December 1)
Our sample encompassed the top-ranked products across subcategories on major retail sites. We also analyzed Share of Search data, which measures brand visibility by monitoring which brand names appear in the top 20 search results for critical keywords.
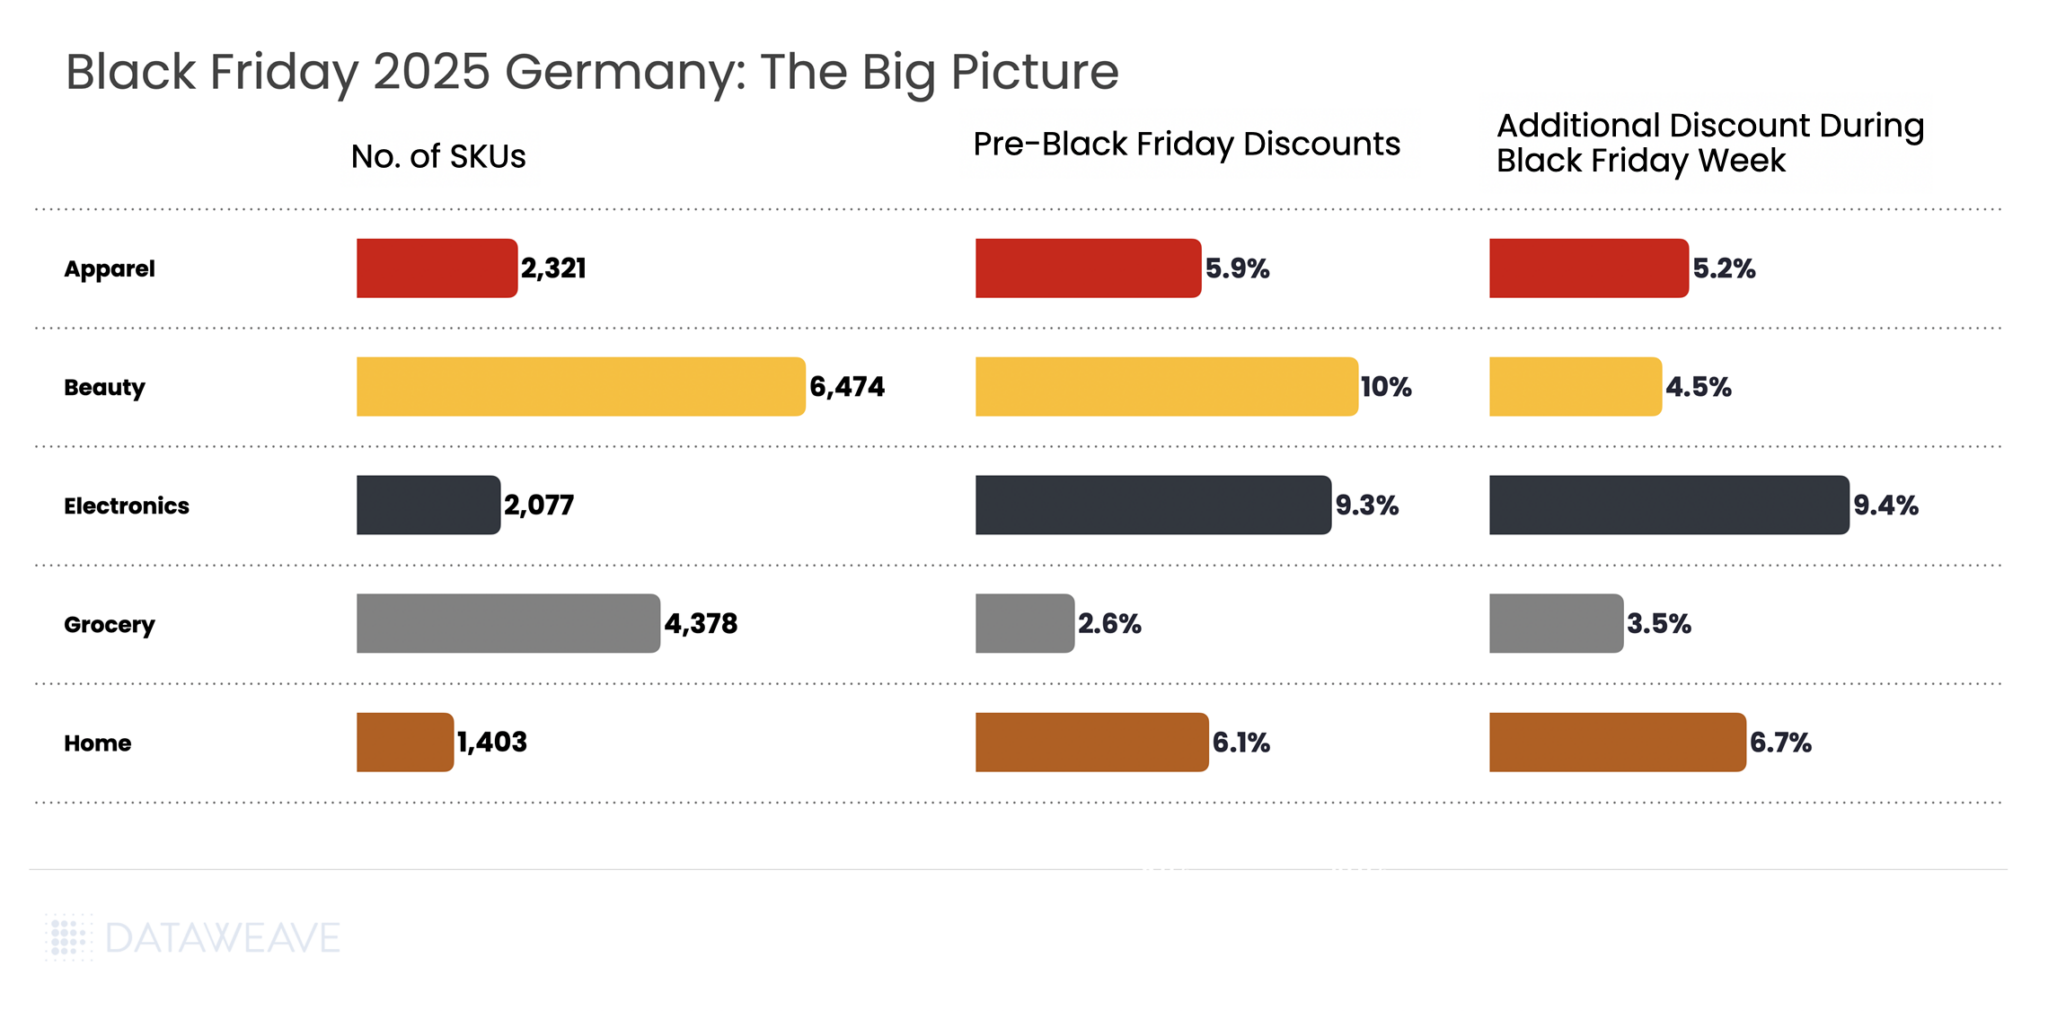
Black Friday 2025 Germany: The Big Picture
Our analysis covered 16,653 SKUs across five major categories. Here’s the snapshot of average discounts during the Pre-Black Friday period compared to Black Friday Week:
Key Insight: The German market presented a notably different discounting pattern compared to other markets. Pre-Black Friday discounts averaged 7% across all categories, with Black Friday Week adding 5.1% on average. Unlike the UK and US markets where retailers front-loaded promotions heavily, German retailers took a more balanced approach, with several categories actually seeing higher discounts during the main Black Friday Week.
Beauty led pre-sale discounts at 10%, followed by Electronics at 9.3%. Consumer electronics stood out with the highest Black Friday Week discounts at 9.4%, slightly exceeding even the pre-sale period at 9.3%.
Shopping Behavior Patterns: The relatively modest discount levels reflect the rational, value-oriented approach of German consumers. With the majority of shoppers setting budgets between €100-€299 and prioritizing wish fulfillment over impulse purchases, German retailers focused on strategic discounting rather than aggressive margin erosion.
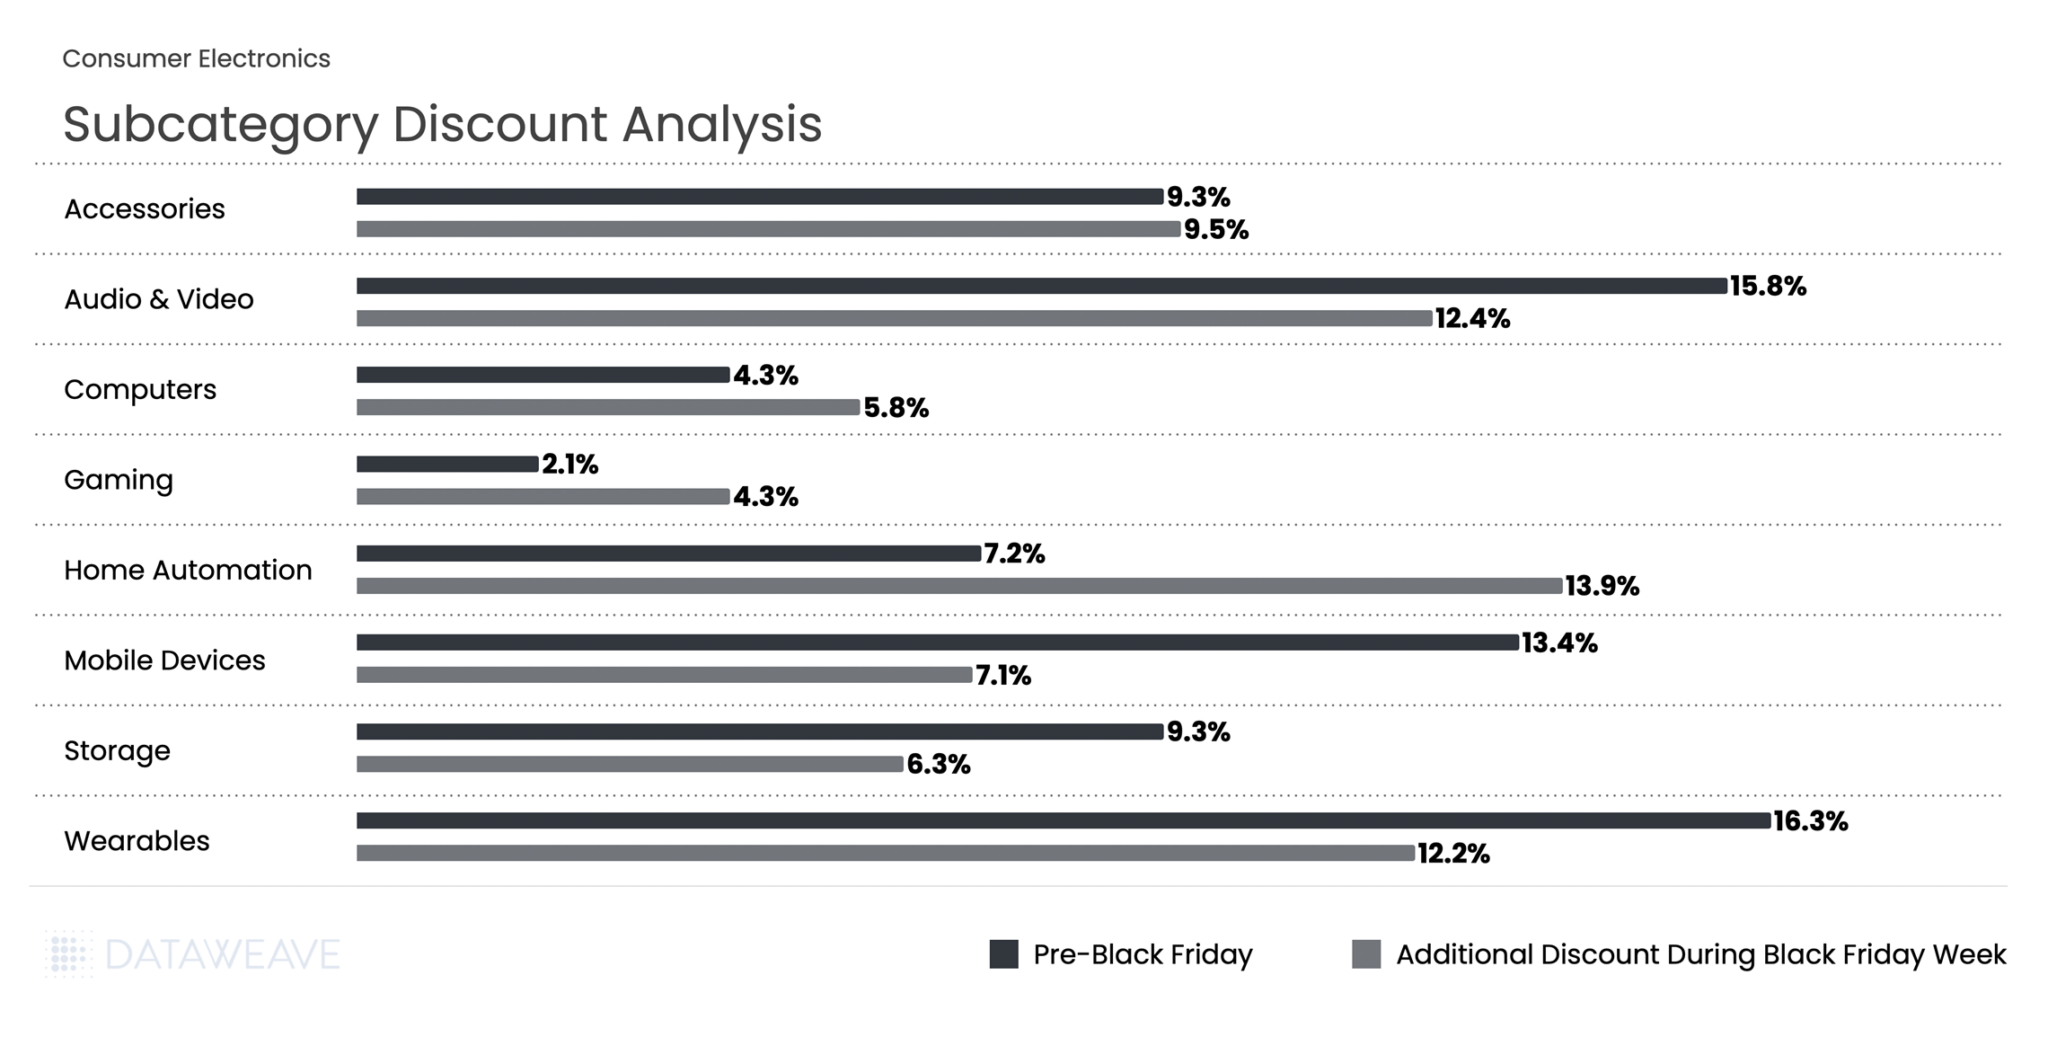
Consumer Electronics
Consumer electronics dominated German Black Friday interest, with 77% of German shoppers most interested in electronics deals, making it the most anticipated category during the sales period. Our analysis of 2,077 SKUs reveals how discounts varied across subcategories and which brands dominated search visibility in this highly competitive category.
Subcategory Discount Analysis
This was one of the few categories where Black Friday Week discounts matched or exceeded pre-sale levels. Wearables led pre-sale discounting at 16.3%, followed closely by Audio & Video at 15.8%. During Black Friday Week, these categories saw additional discounts of 12.2% and 12.4% respectively.
The standout performer was Home Automation, which nearly doubled its additional discount from 7.2% to 13.9% during Black Friday Week. Mobile Devices saw additional discounts dropping from 13.4% pre-sale to 7.1% during Black Friday Week. Meanwhile Gaming doubled additional discounting from 2.1% to 4.3%.
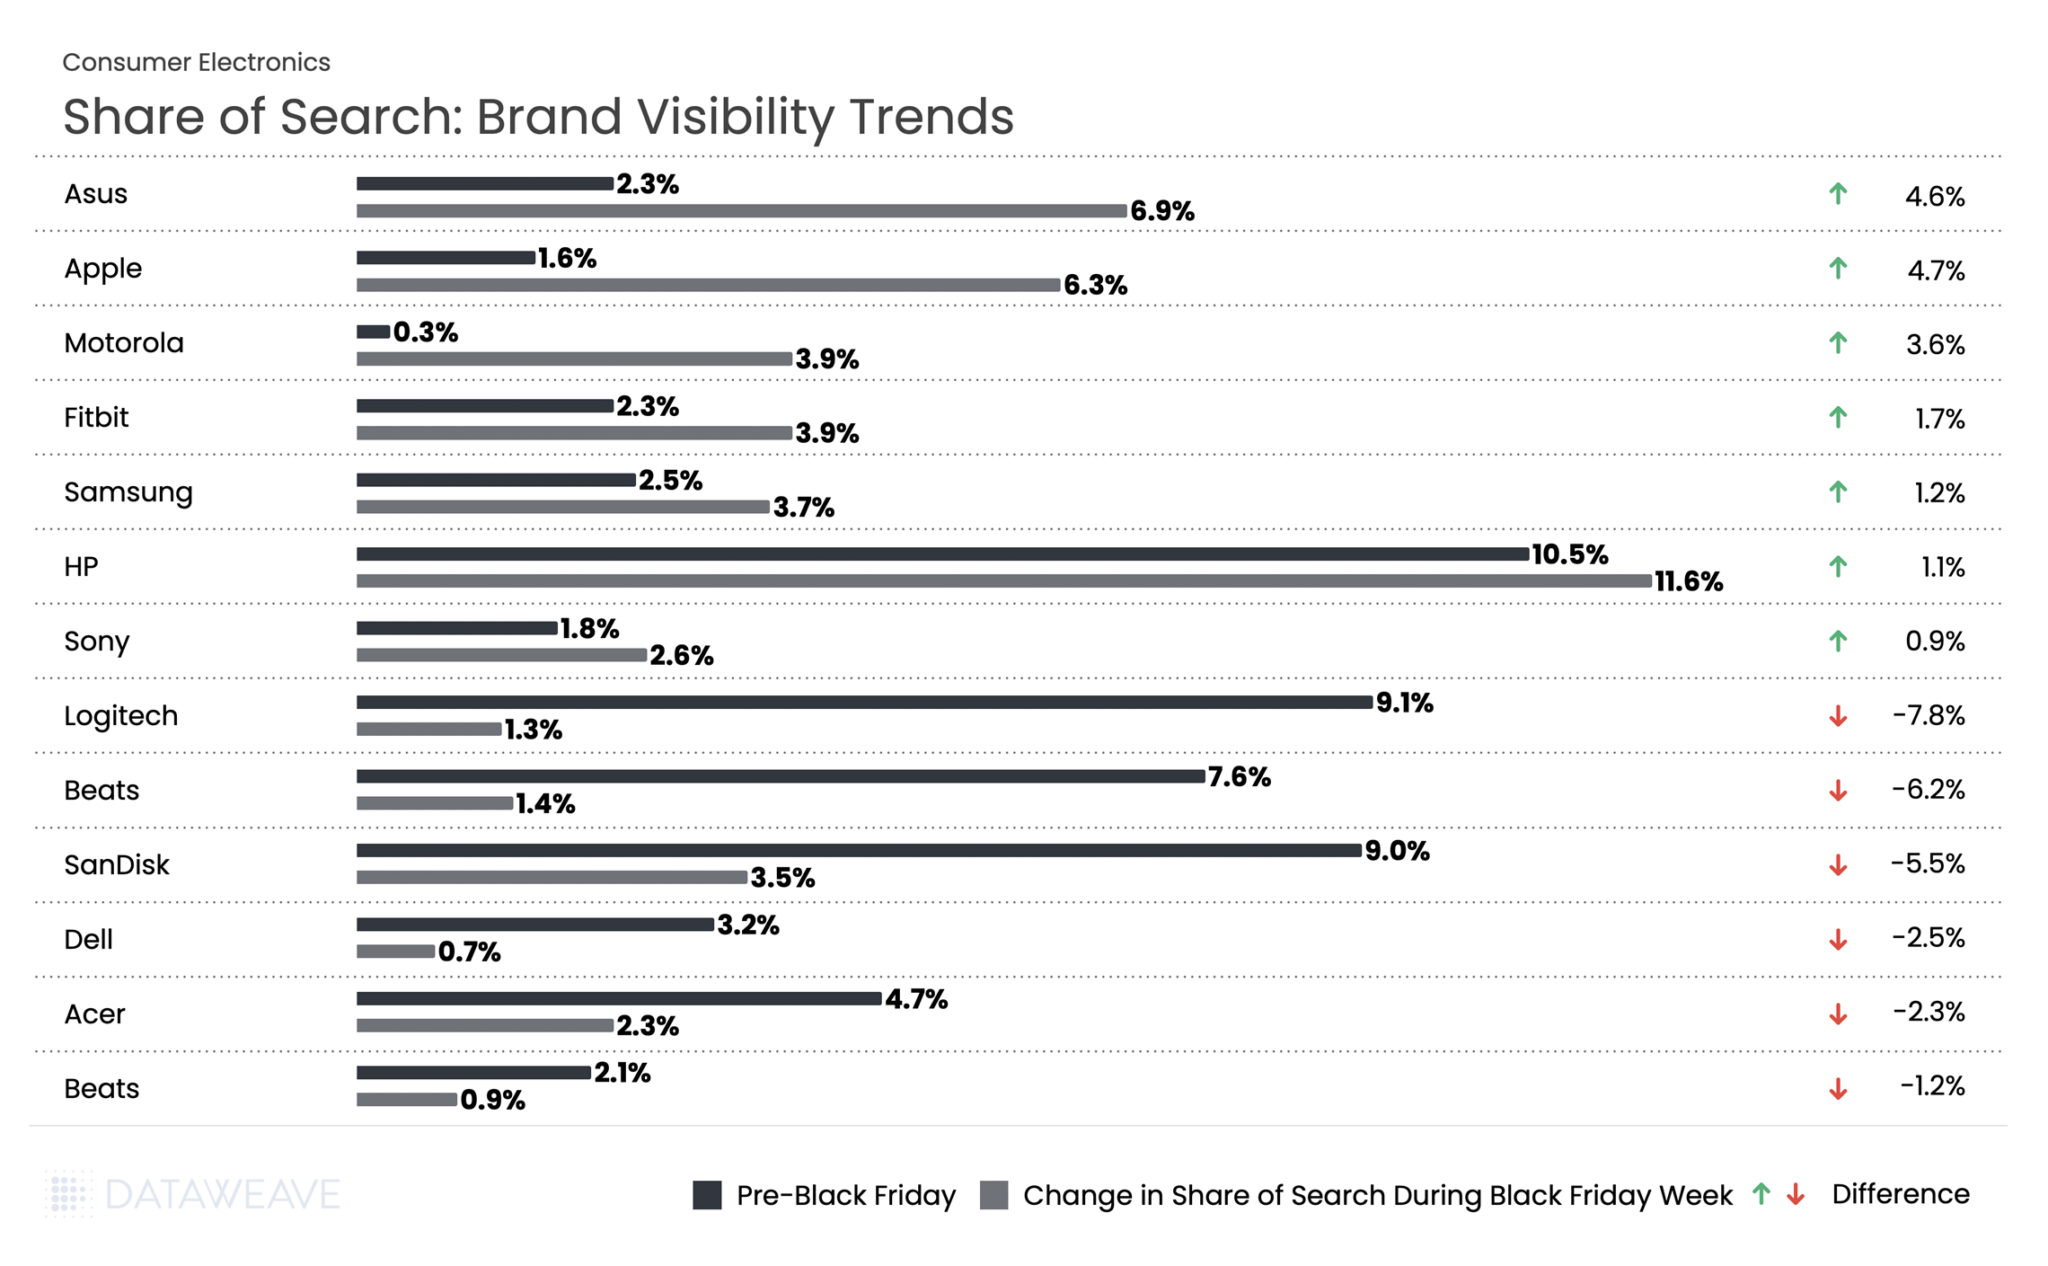
Share of Search: Brand Visibility Trends
Our Share of Search analysis reveals significant shifts in brand visibility during Black Friday Week:
HP saw the highest share of search across Black Friday at 10.5% pre event and 11.6% during the event. Apple led with a 4.7% increase in visibility, jumping from 1.6% to 6.3%. Asus followed at 4.6%. Motorola surged 3.6 %, while wearables brand Fitbit gained 1.7%.
In stark contrast, Logitech dropped by 7.8 %, Beats fell 6.2 %, and SanDisk declined 5.5 %. Computer manufacturers Dell and Acer also struggled, falling 2.5 and 2.3 % respectively.
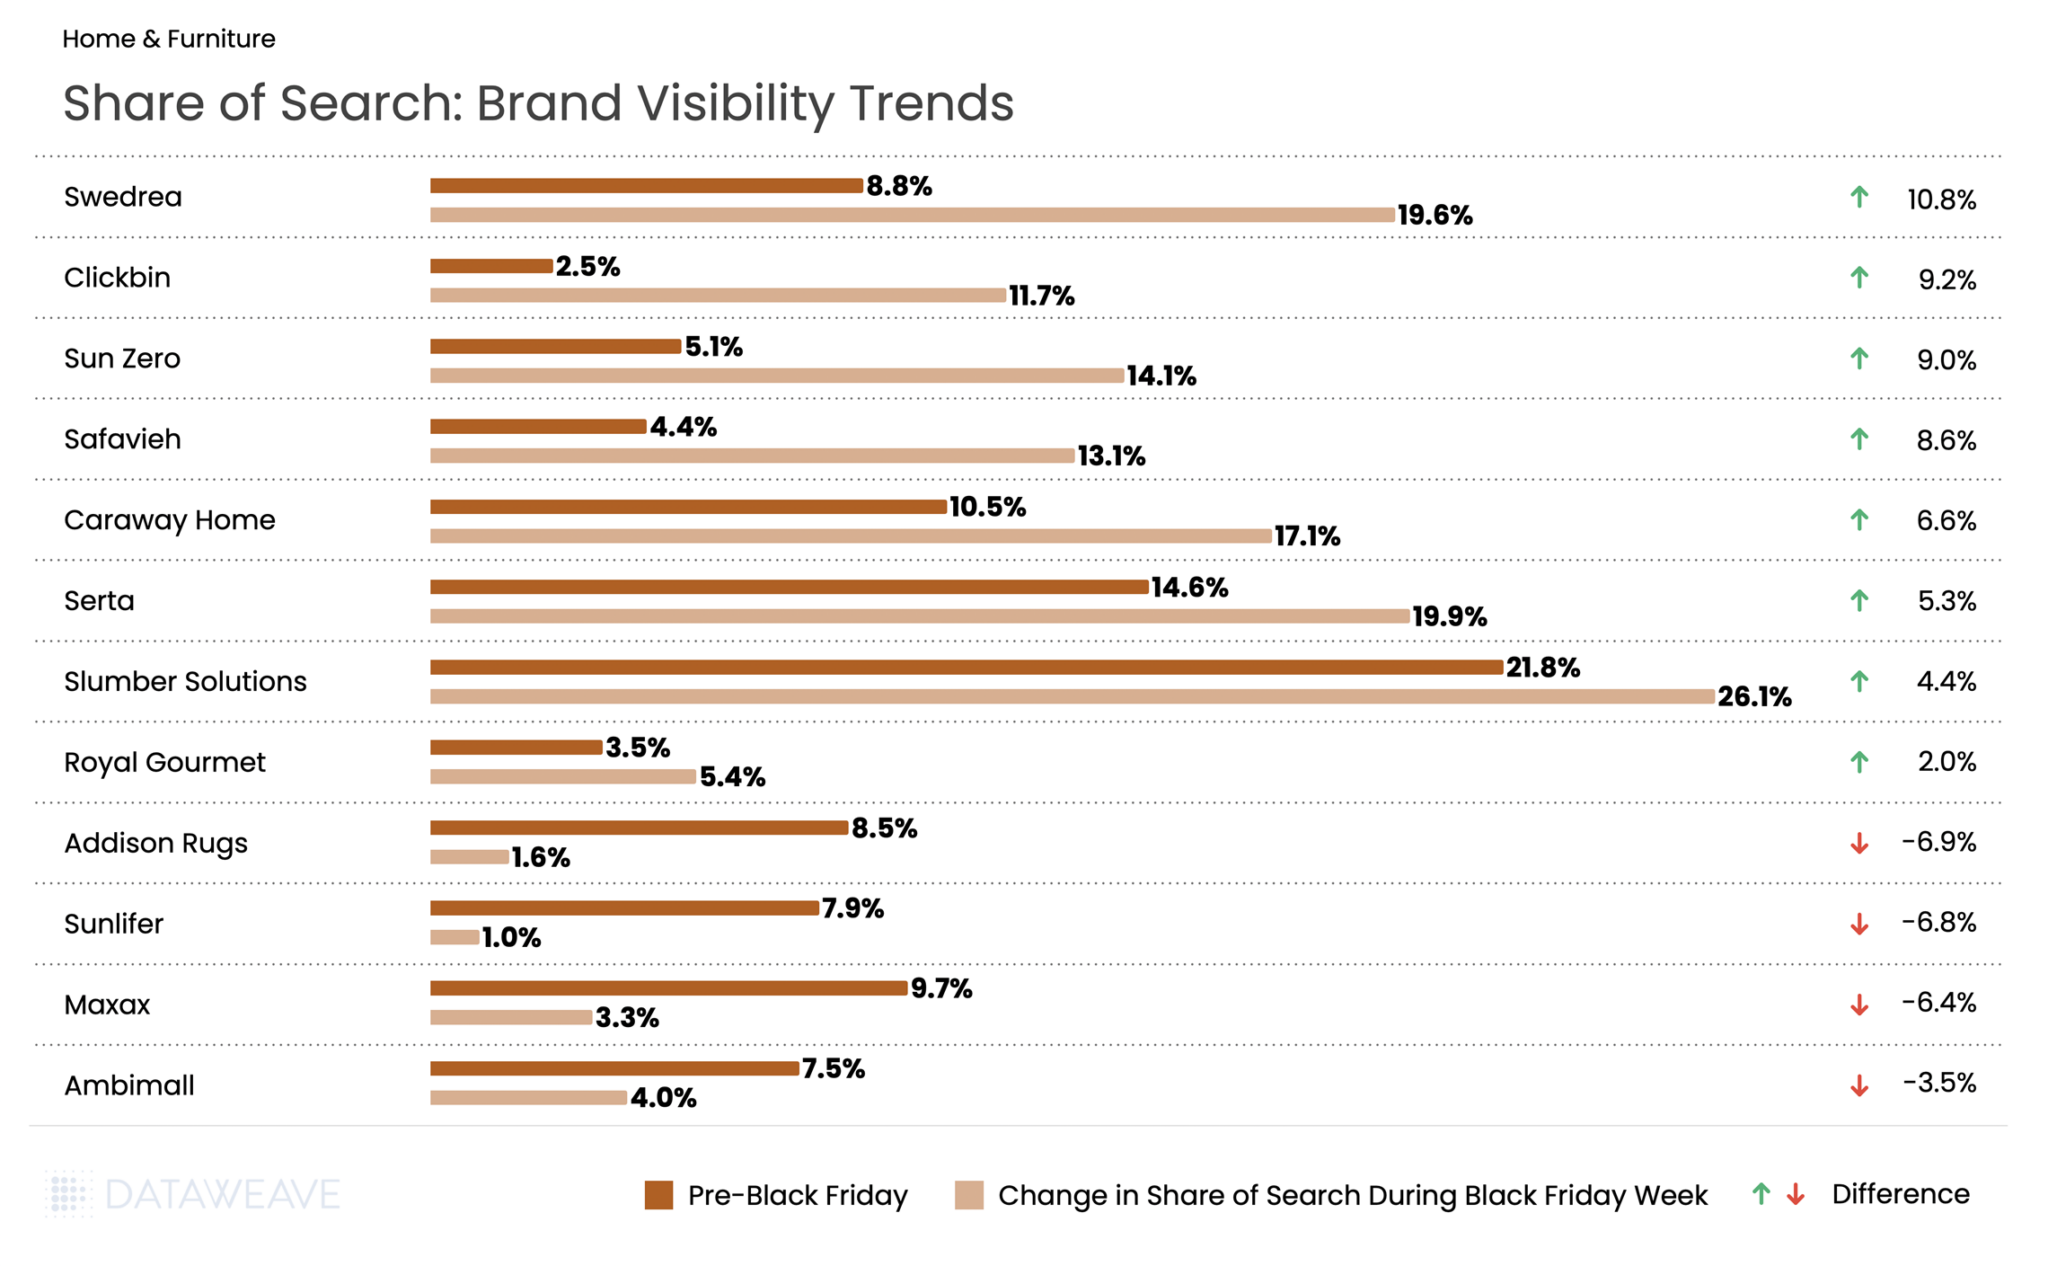
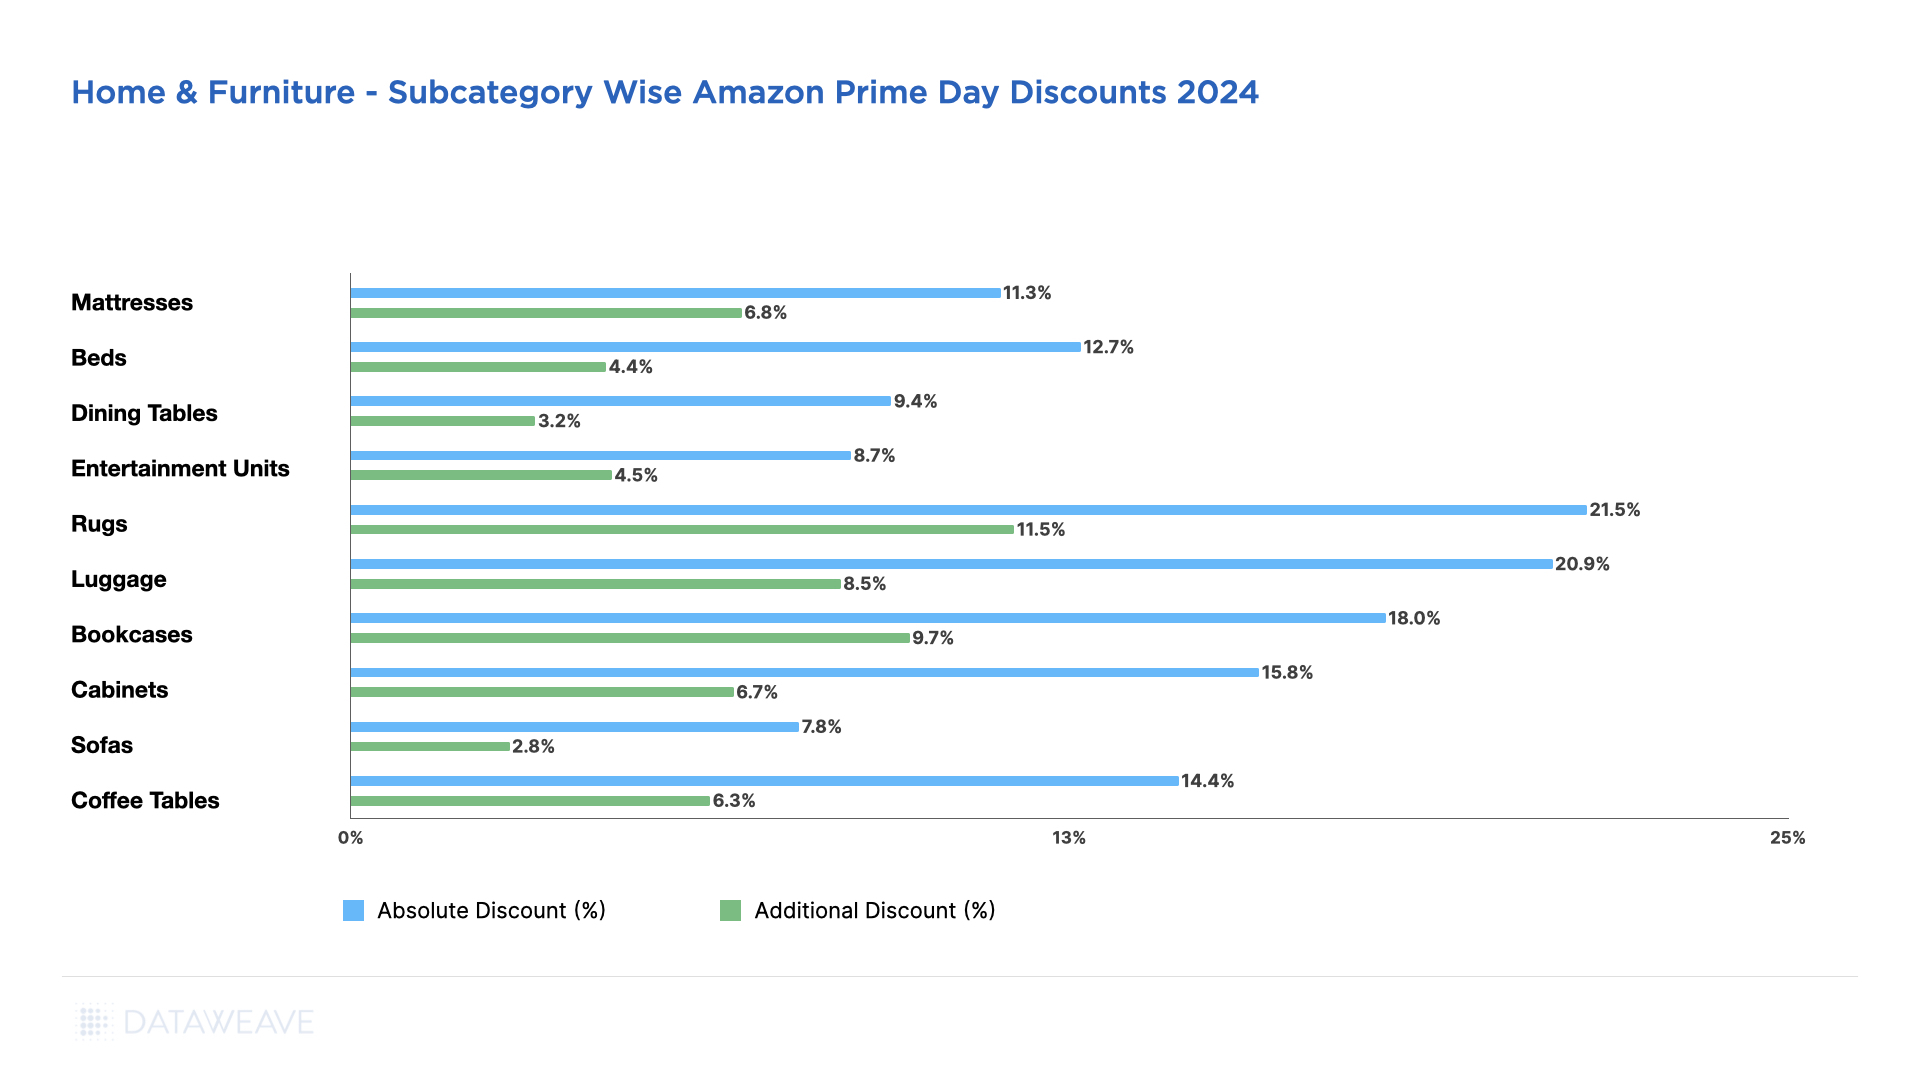
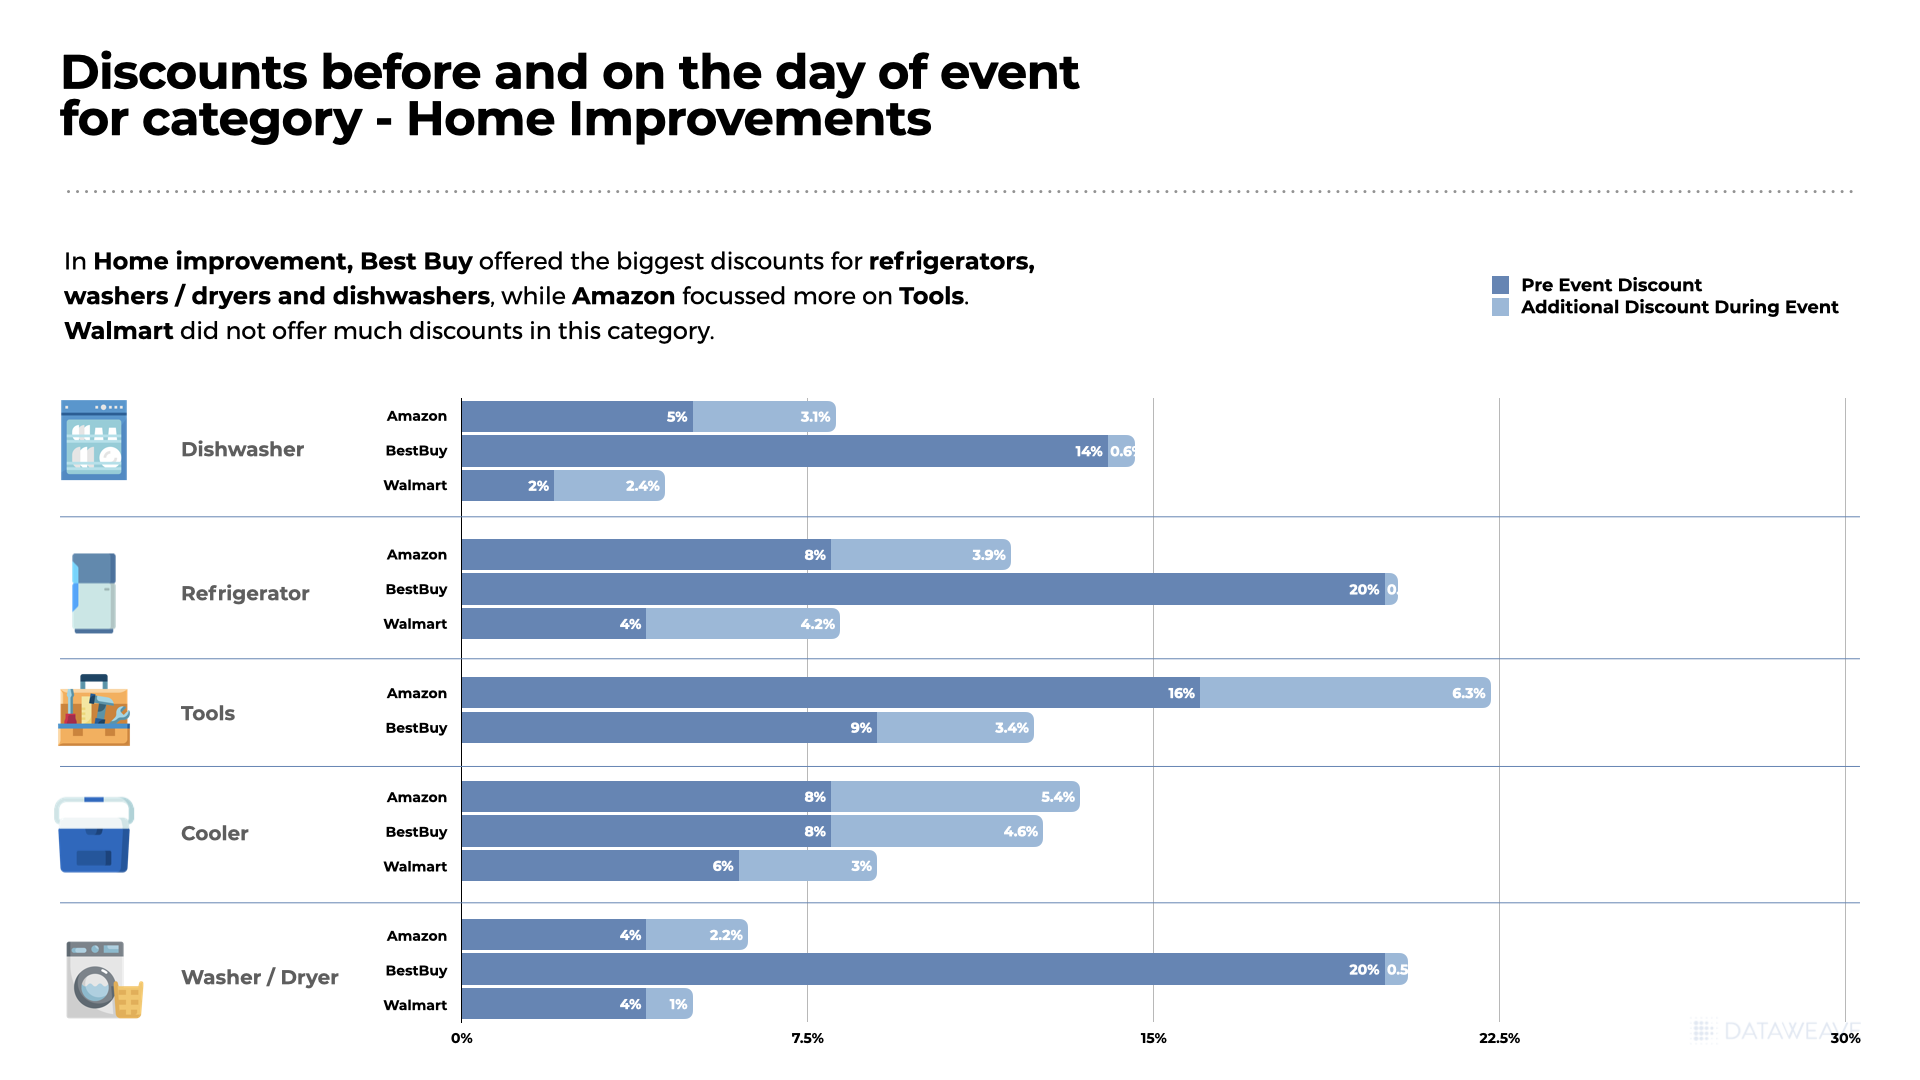
Home & Furniture
The Home & Furniture category in Germany showed unique discounting behavior compared to other markets, with additional Black Friday Week discounts (6.7%) actually exceeding Pre-Black Friday levels (6.1%). Our analysis of 1,403 SKUs shows how discounts were distributed across subcategories.
Subcategory Discount Analysis
Kitchenware led pre-sale discounts at 8.7%. Decor surged from 5% to 7.5%, lighting jumped from 5% to 6.9%, and bedding more than doubled from 3.2% to 6.6%. These substantial increases suggest strategic timing to capture consumer attention during peak shopping days.
Share of Search: Brand Visibility Trends
Mattress brand Slumber Solutions saw the highest share of search at 21.8% pre event and 26.1% during Black Friday week. Meanwhile, another mattress brand Swedrea led all brands with a remarkable 10.8% surge in visibility, jumping from 8.8% to 19.6%. Budget-friendly furniture brand Clickbin gained 9.2%, while window treatment brand Sun Zero increased 9% and home textiles brand Safavieh surged 8.6%.
Premium and established brands also performed well: Caraway Home (cookware) rose 6.6%, mattress brand Serta gained 5.3%, and Slumber Solutions added 4.4%. Royal Gourmet, specializing in outdoor cooking equipment, gained 2.0%.
However, several mid-tier brands faced steep declines. Addison Rugs dropped 6.9% from 8.5% to just 1.6%, while Sunlifer fell 6.8 % and Maxax declined 6.4 %.
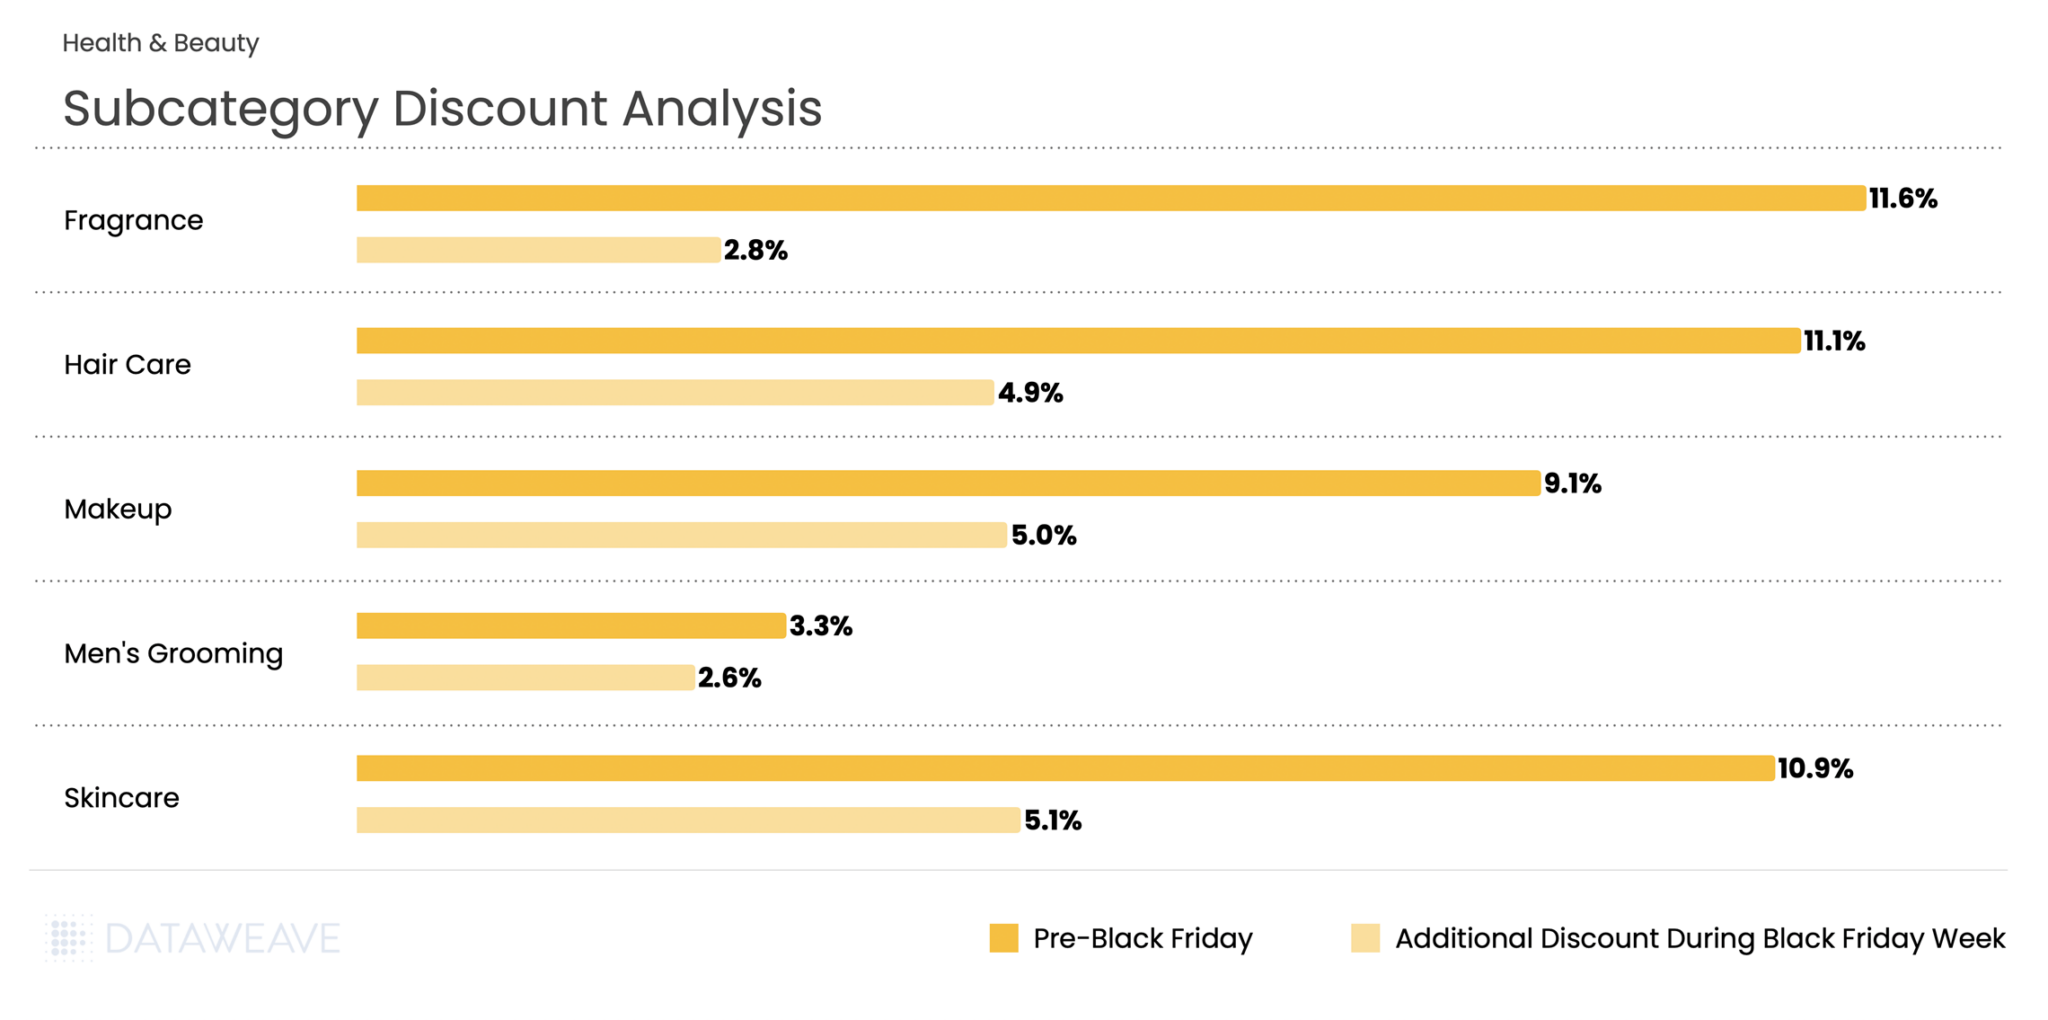
Health & Beauty
Our analysis of 6,474 SKUs reveals subcategory-level insights and dramatic brand visibility shifts that highlight the evolving German beauty landscape.
Subcategory Discount Analysis
Pre-Black Friday discounts averaged 10%, with Black Friday Week adding 4.5% on average. Fragrance led pre-sale discounting at 11.6%, positioning perfumes and colognes as attractive early holiday purchases. However, Fragrance saw the smallest Black Friday Week addition at just 2.8%.
Hair Care and Skincare both showed strong performance across both periods, with Hair Care at 11.1% pre-sale and 4.9% during Black Friday Week, while Skincare registered 10.9% and 5.1% respectively. Skincare’s 5.1% Black Friday Week discount was the highest in the category.
Men’s Grooming stood apart with notably lower discounts at 3.3% pre-sale and 2.6% during Black Friday Week, suggesting either tighter margins in this subcategory or strategic positioning at different price points.
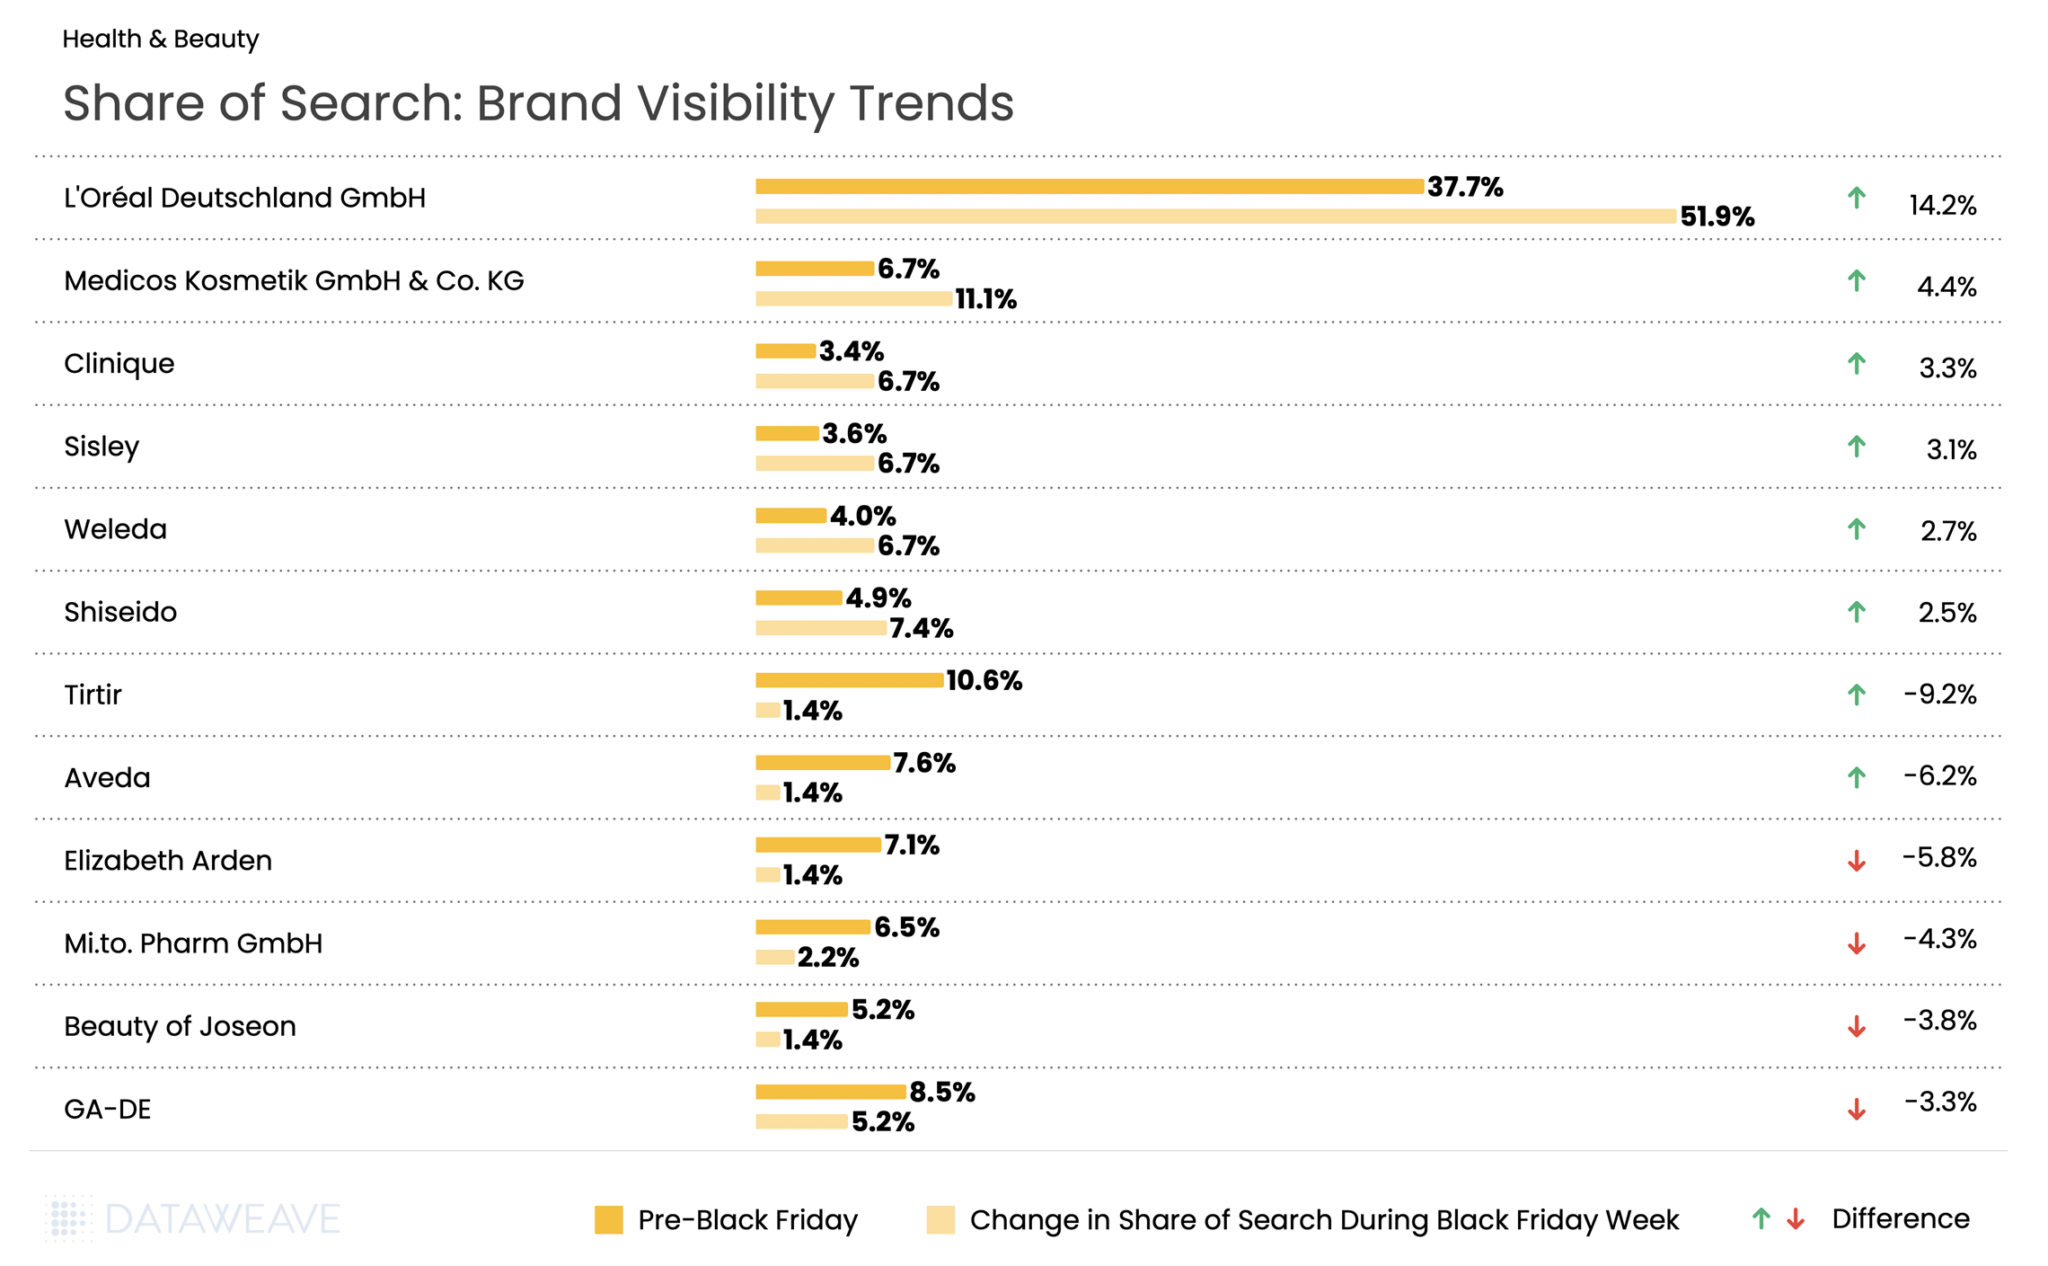
Share of Search: Brand Visibility Trends
L’Oréal Deutschland GmbH emerged as the most visible brand, surging from 37.7% to 51.9%, (+14.2). German pharmaceutical cosmetics company Medicos Kosmetik GmbH & Co. KG gained 4.4 %. Clinique gained 3.3 %, and French luxury brand Sisley added 3.1 %, German natural cosmetics brand Weleda rose 2.7 %, and Japanese prestige brand Shiseido gained 2.5 %.
The flip side? K-beauty brands and some international names faced significant challenges. Viral make-up brand Tirtir experienced the steepest decline visibility, dropping by 9.2 %. Aveda fell 6.2 %, Elizabeth Arden dropped 5.8 %, and Beauty of Joseon declined 3.8 %. German pharmacy brand Mi.to. Pharm GmbH lost 4.3 %, while Israeli makeup brand GA-DE fell 3.3 %.
The data reveals a clear German preference for European beauty heritage, pharmaceutical-grade cosmetics, and established prestige brands during Black Friday, rather than trendy K-beauty products or mid-tier international brands.
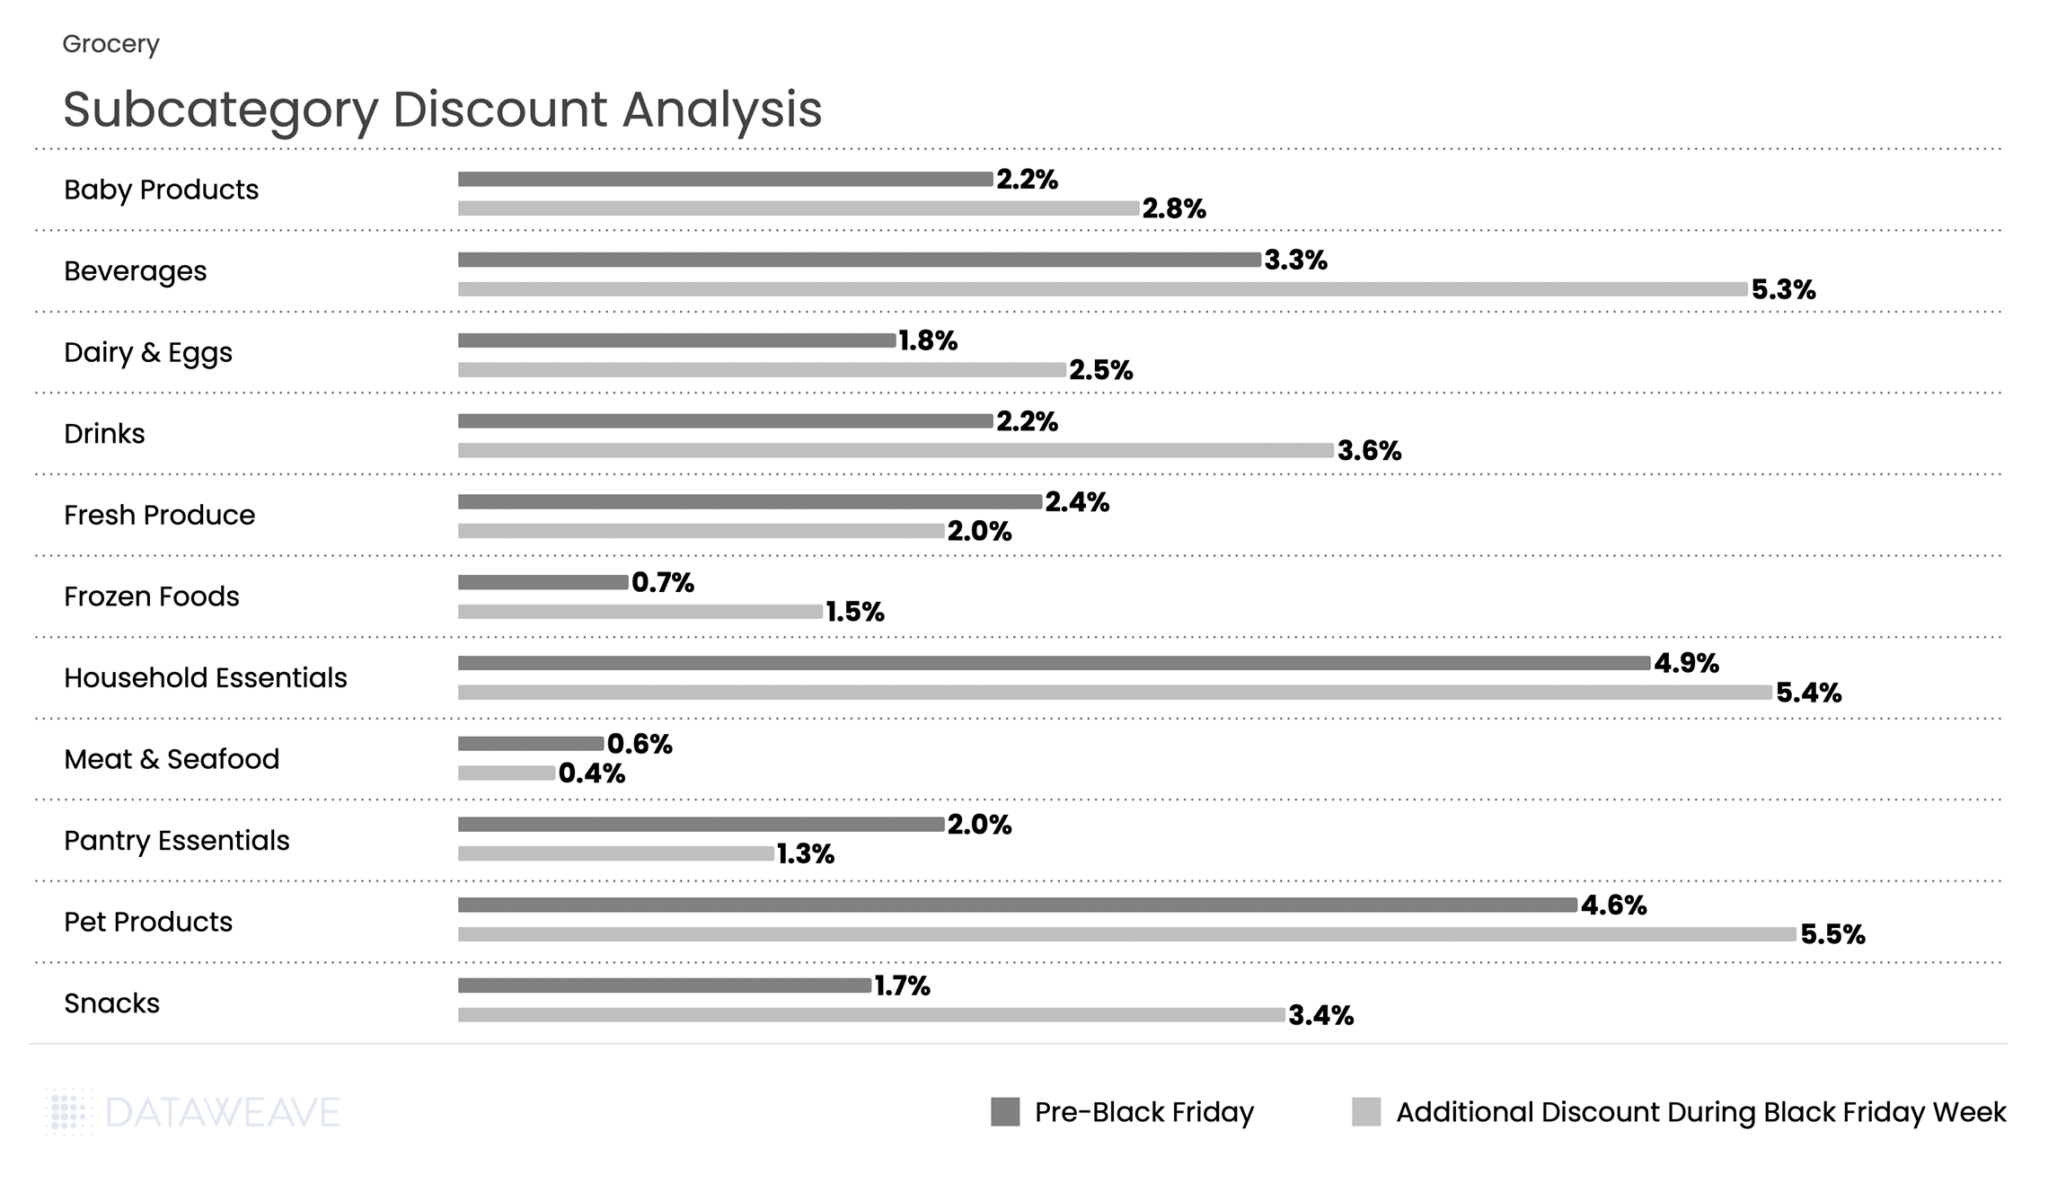
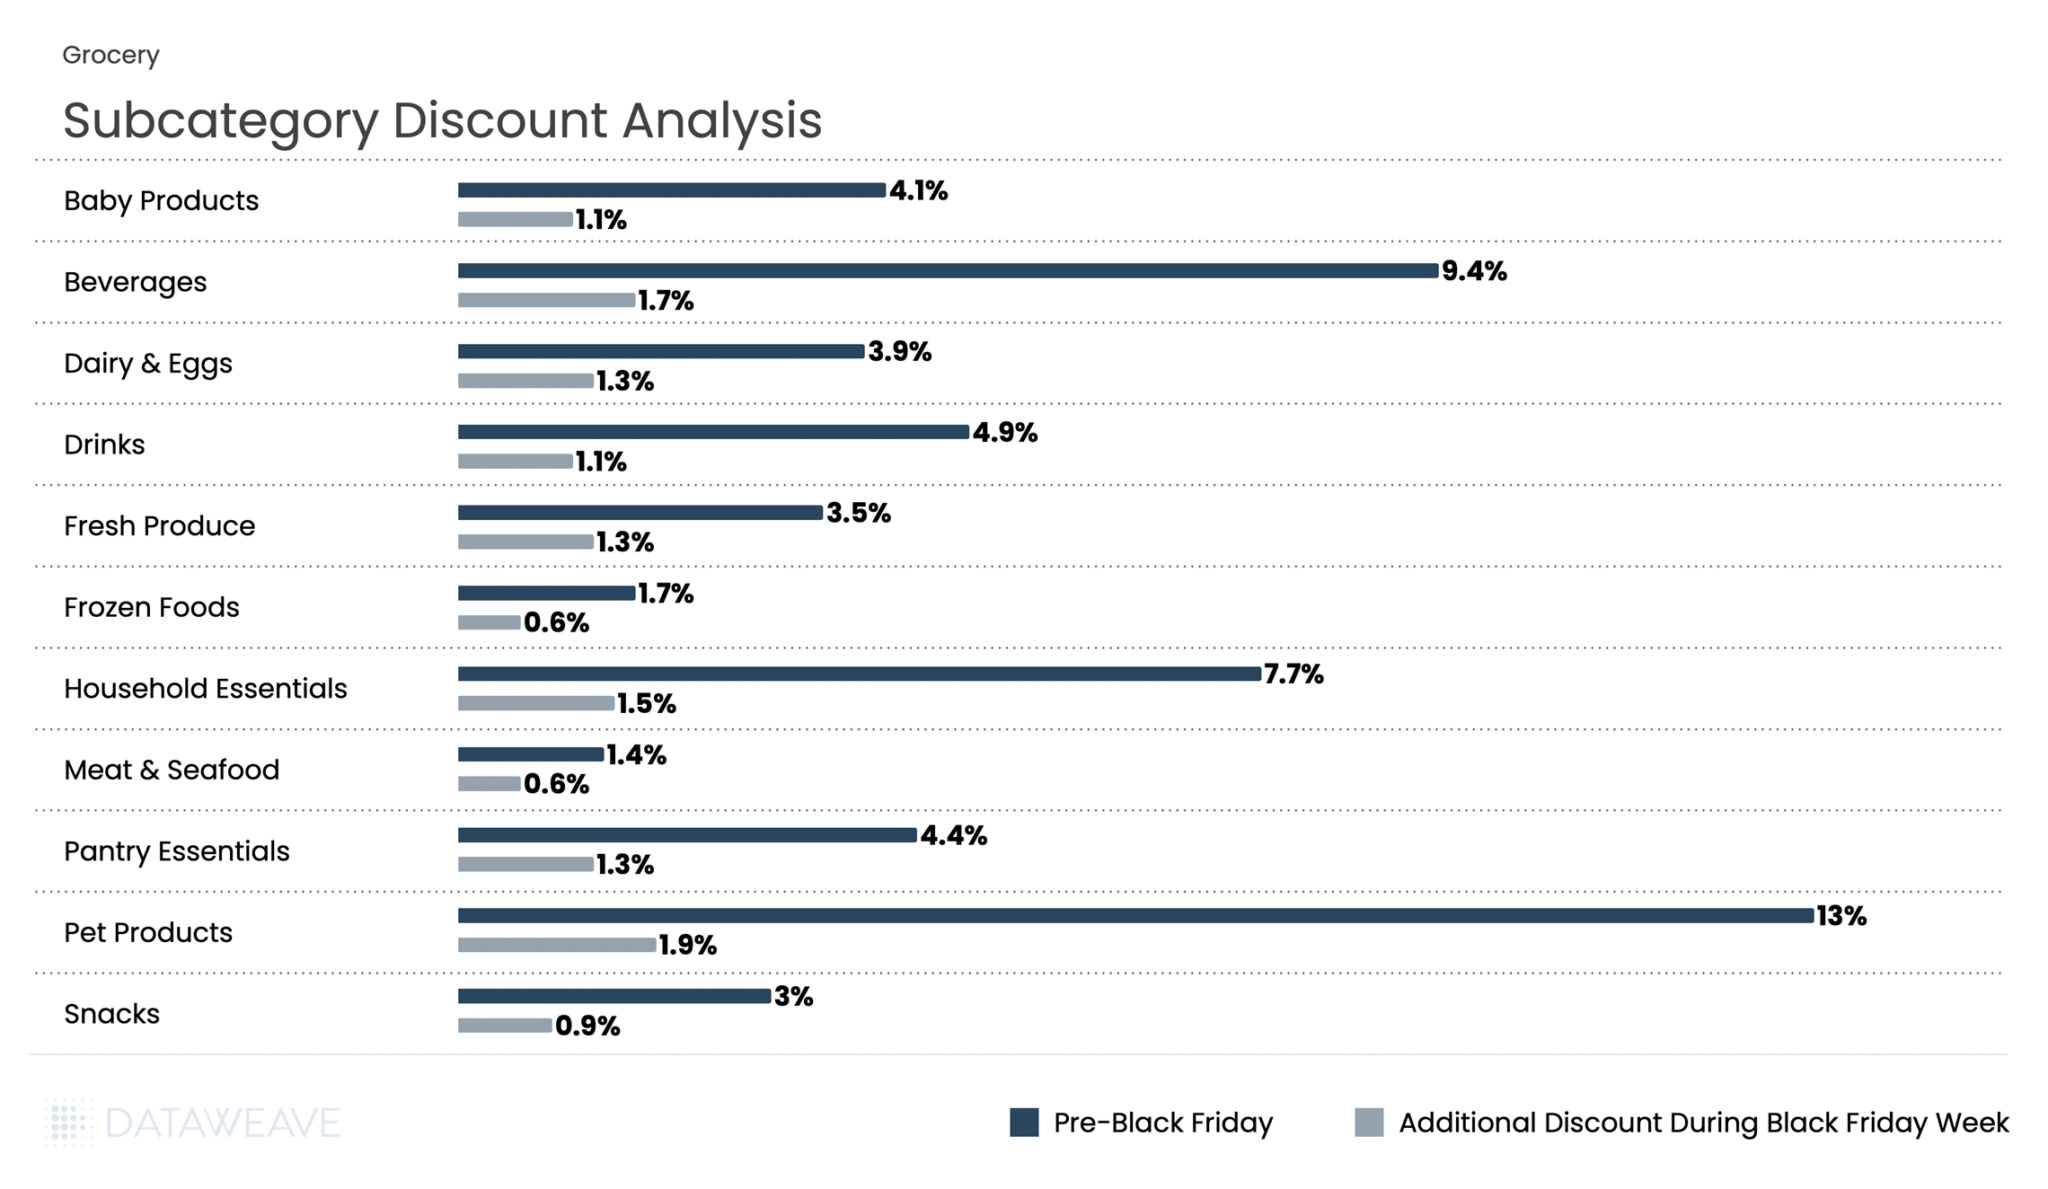
Grocery
While Grocery typically sees more modest discounts compared to discretionary categories, the German market showed interesting patterns with Black Friday Week discounts (3.5%) actually exceeding Pre-Black Friday levels (2.6%). Our analysis of 4,378 SKUs shows how German retailers approached promotions across essential and indulgent subcategories.
Subcategory Discount Analysis
Pre-Black Friday discounts averaged just 2.6% in grocery. But Black Friday Week saw this surging to 3.5%, an increase that represents the highest proportional jump among all categories.
Pet Products and Household Essentials led discounting, with Pet Products at 4.6% pre-sale and an additional 5.5% during Black Friday Week. Meanwhile Household Essentials registered 4.9% and 5.4% respectively.
Beverages showed particularly strong Black Friday Week performance, jumping from 3.3% to 5.3%, while snacks doubled from 1.7% to 3.4%. Fresh categories maintained minimal promotional activity consistent with perishable inventory constraints: Meat & Seafood saw negligible discounts (0.6% pre-sale, 0.4% Black Friday Week), while Fresh Produce actually decreased from 2.4% to 2% during the main event.
Share of Search: Brand Visibility Trends
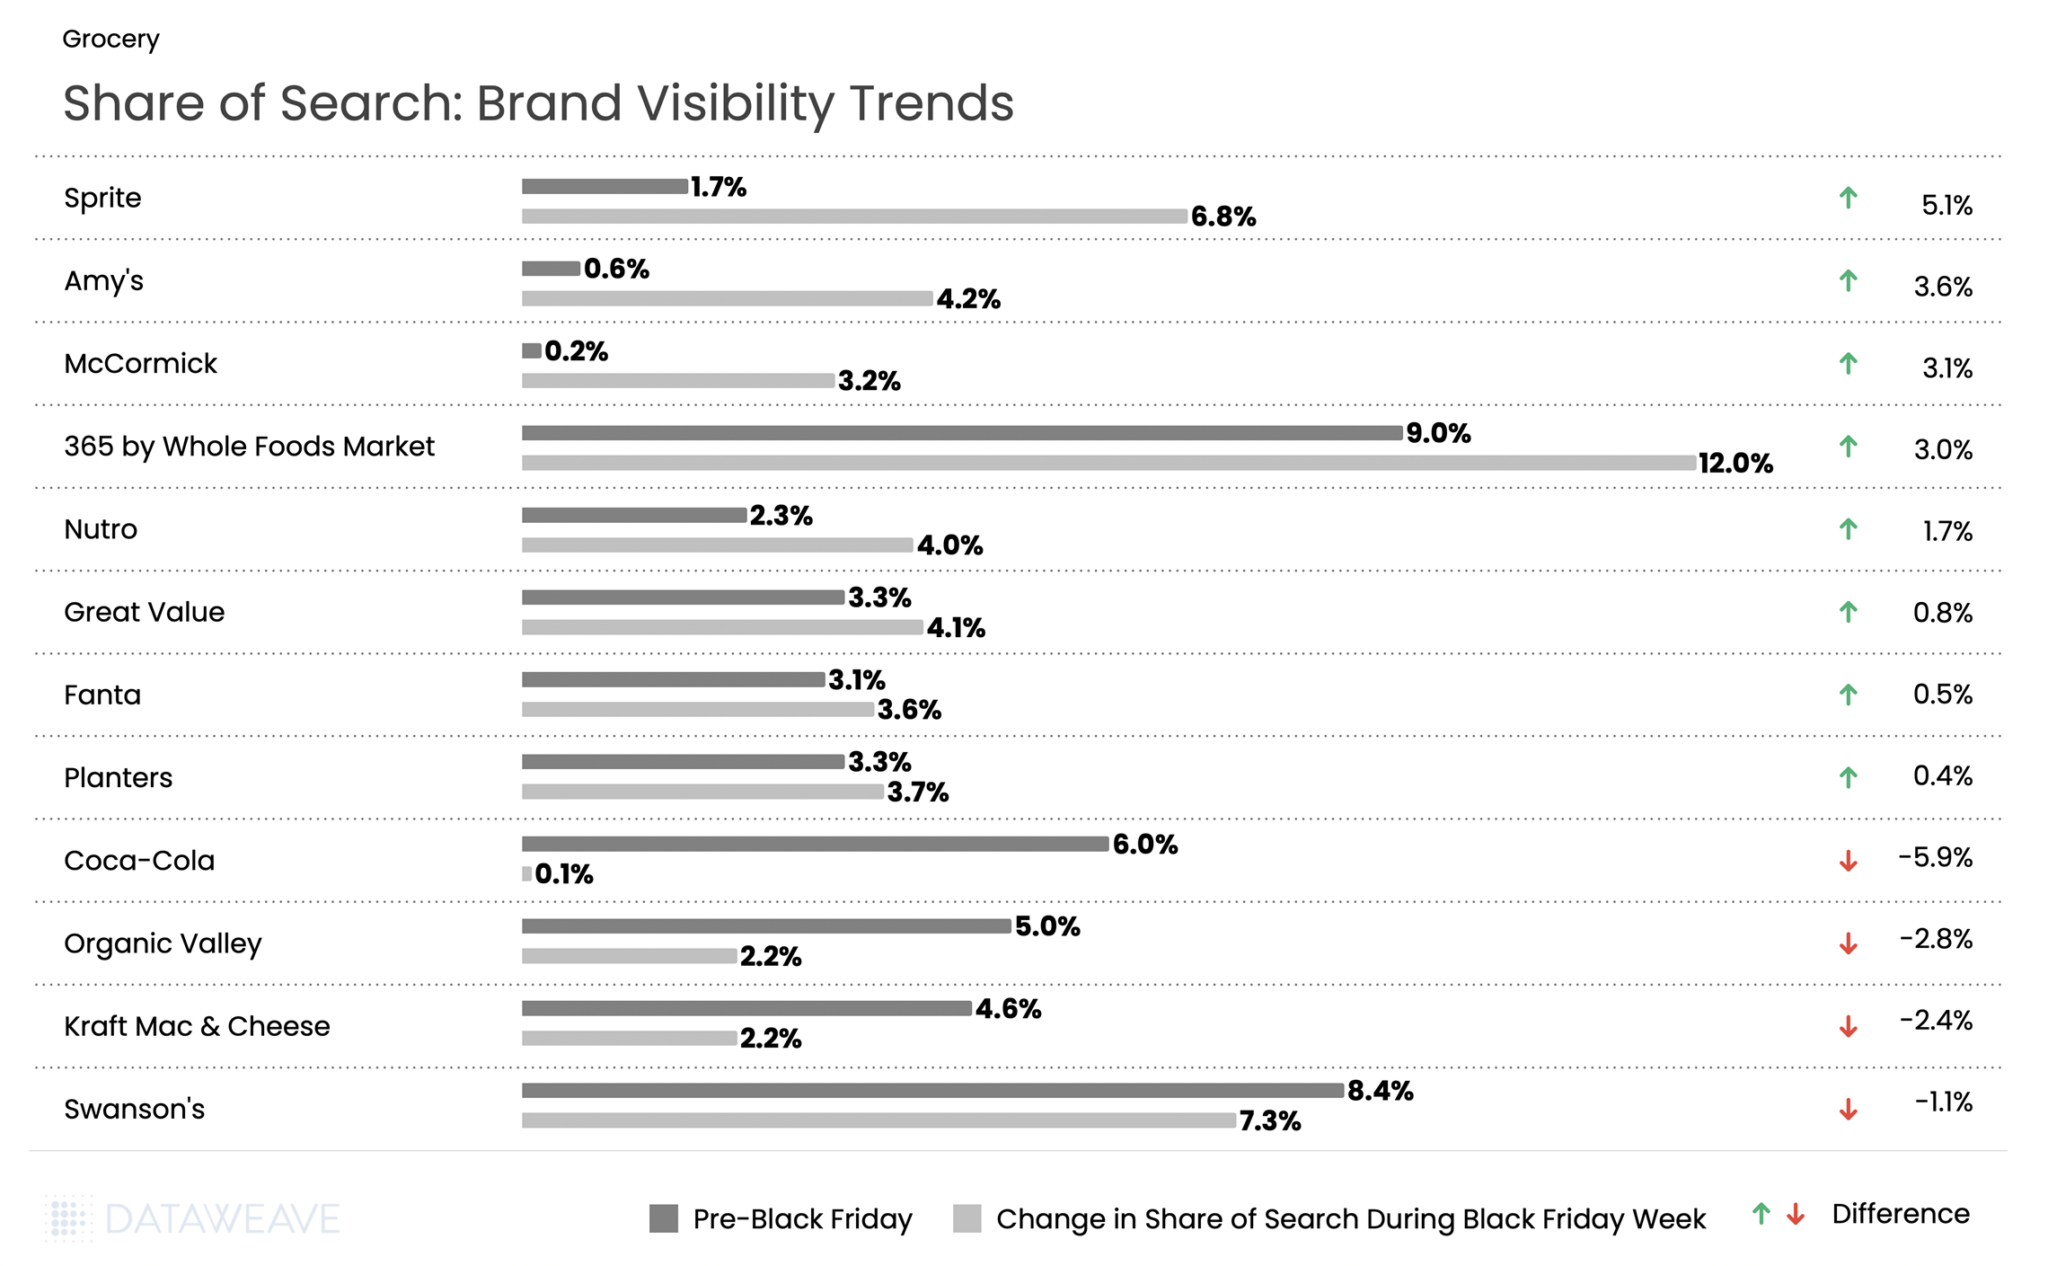
365 by Whole Foods saw the highest share of search at 9% pre event and 12% during Black Friday week. But Sprite led all brands with a 5.1% surge in share of search. Meanwhile, sister brand Coca-Cola experienced one of the steepest declines in our analysis, with visibility plummeting from 6.0% to just 0.1%. Fanta maintained modest search growth at 0.5 %. This stark divergence between two brands from the same parent company suggests vastly different promotional strategies during Black Friday Week.
Specialty and organic food brands performed well: Amy’s (organic/natural foods) gained 3.6 %, while spice brand McCormick surged 3.1 %. Pet food brand Nutro gained 1.7 %, while value-oriented Great Value added 0.8 %.
Snack brand Planters gained 0.4 %. On the decline side, Organic Valley dropped 2.8 %, Kraft Mac & Cheese fell 2.4 %, and Swanson’s declined 1.1 %.
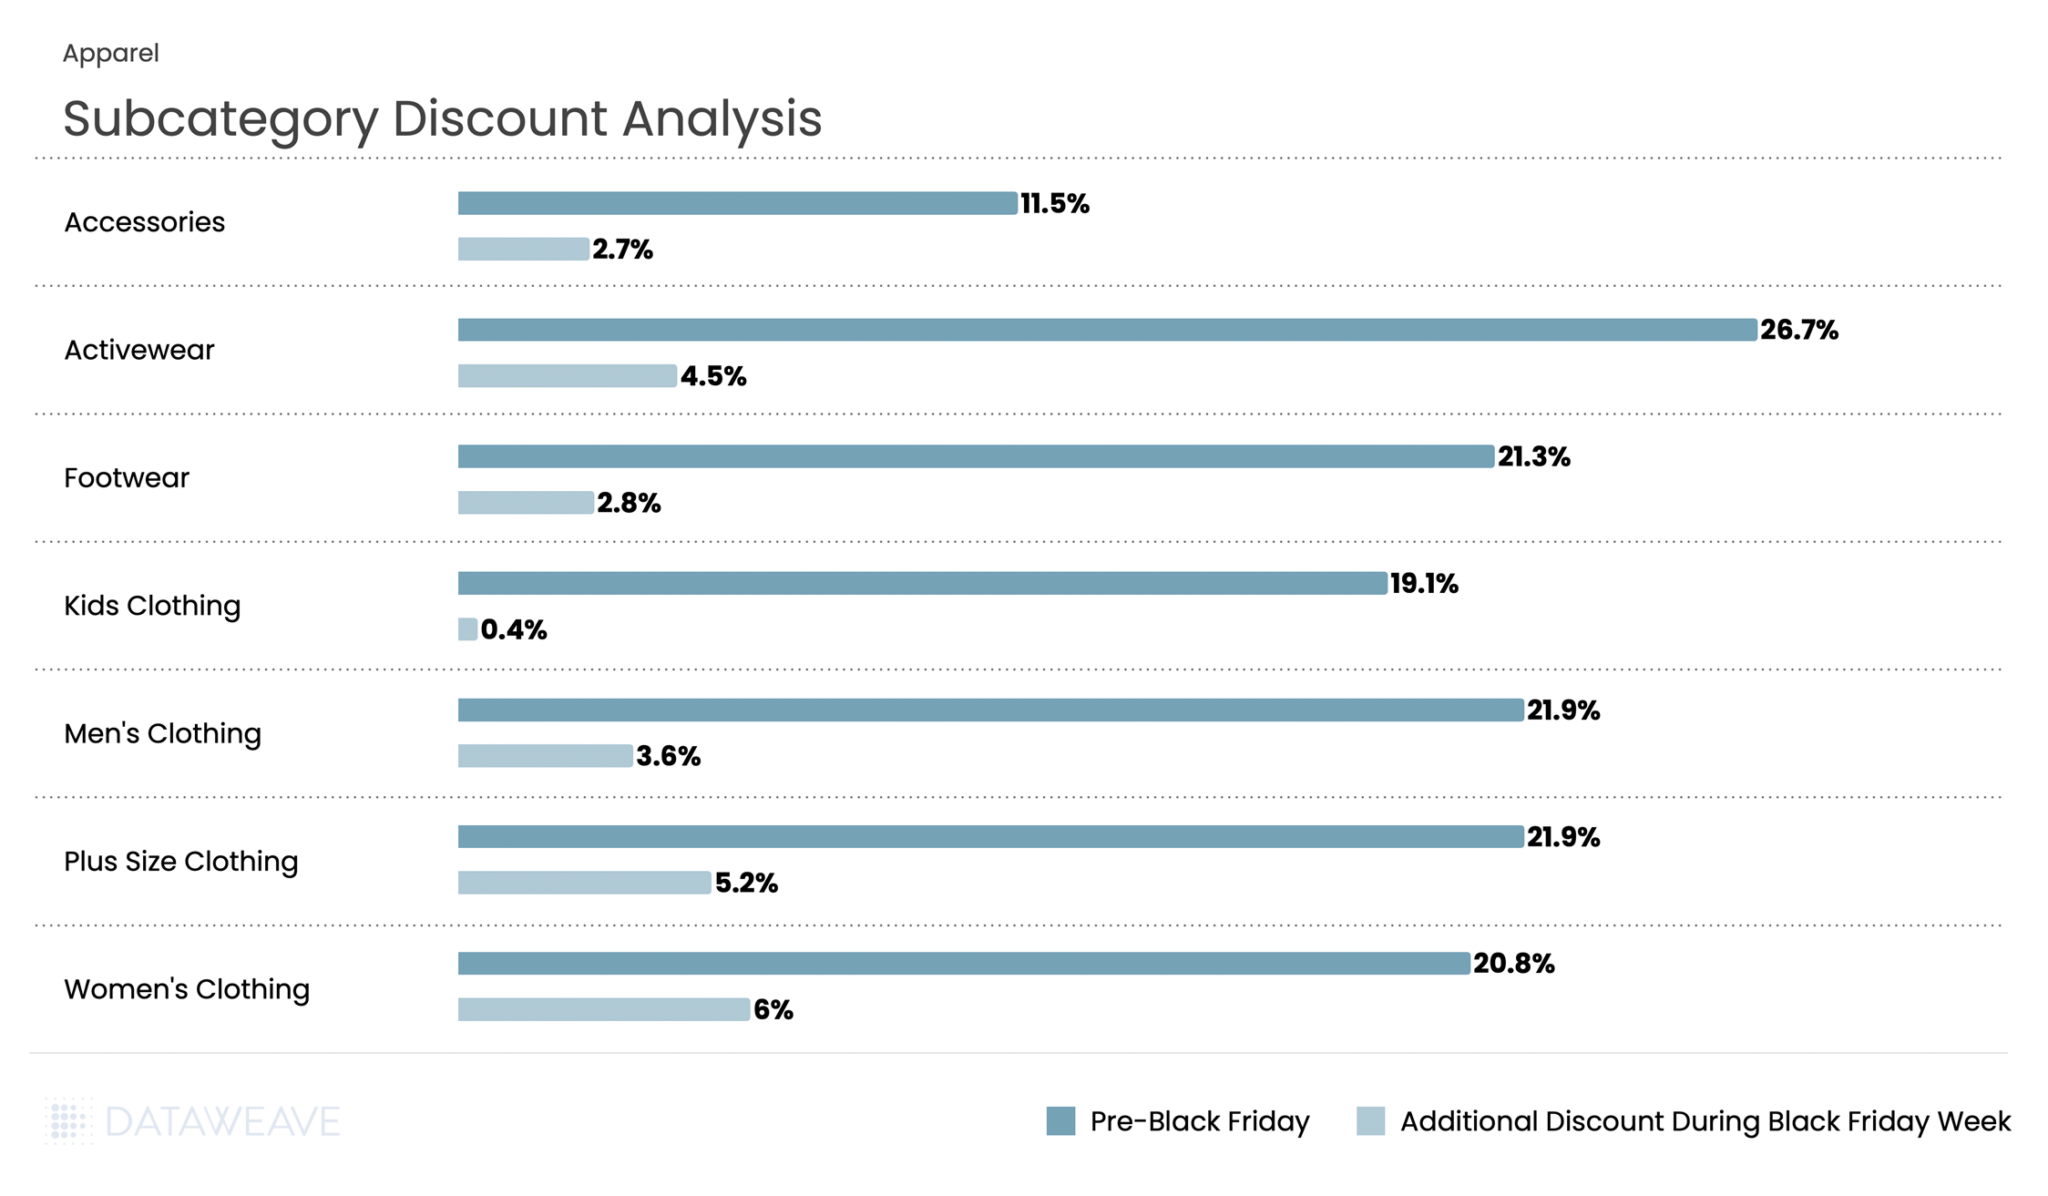
Apparel
Apparel in the German market showed modest promotional activity compared to other markets, with Pre-Black Friday discounts averaging 5.9% and Black Friday Week at 5.2%. Our analysis of 2,321 SKUs reveals interesting patterns across fashion segments in the German market.
Subcategory Discount Analysis
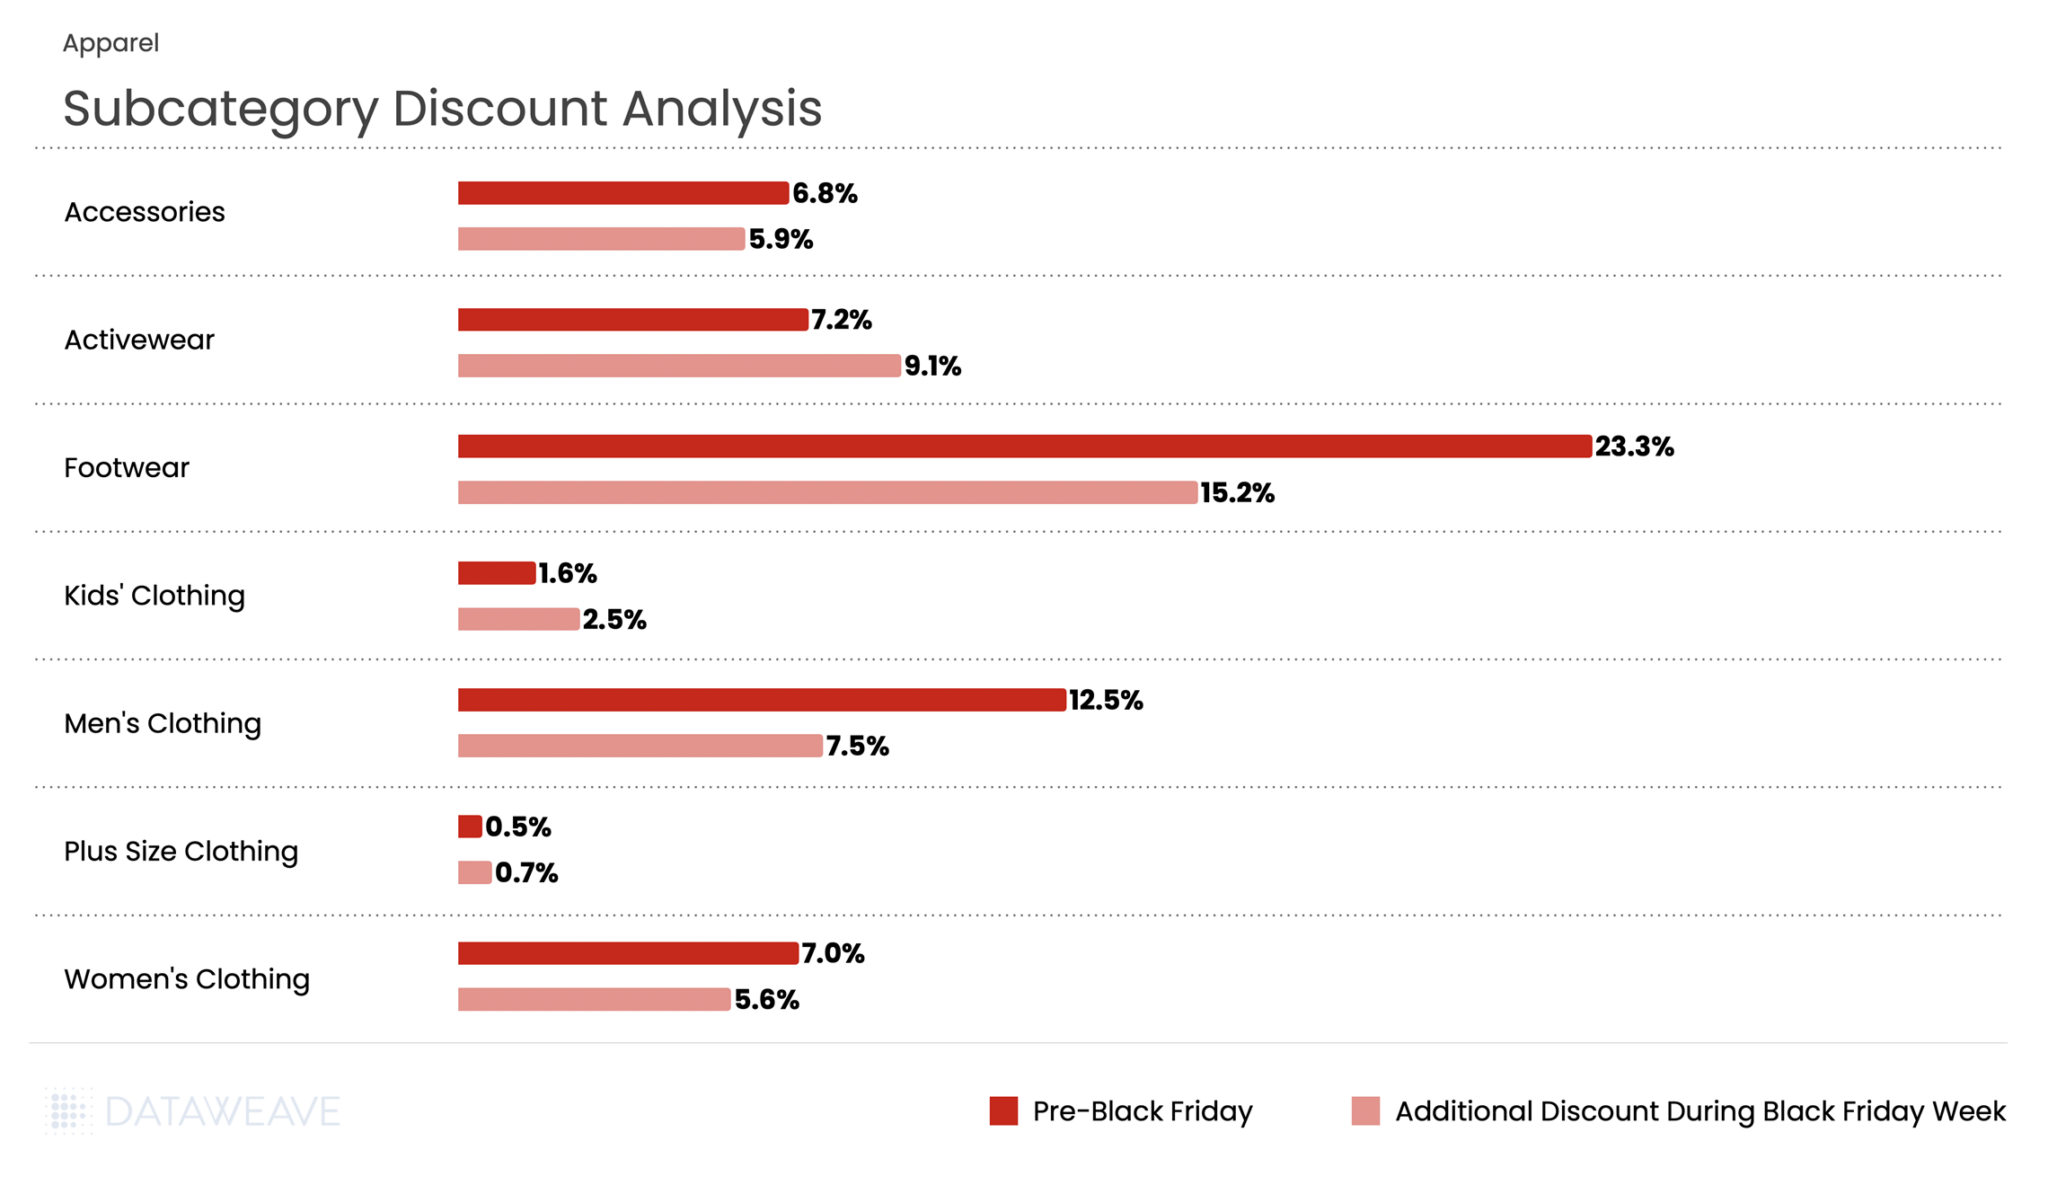
Footwear dominated discounting in both periods, with an impressive 23.3% pre-sale discount, and 15% additional discount during Black Friday Week. Men’s Clothing followed at 12.5% pre-sale, with additional 7.5% during Black Friday Week.
Activewear presented a unique pattern, with discounts increasing from 7.2% pre-event to additional 9.1% during Black Friday Week: one of the few subcategories to show higher discounts during the main event. Plus Size Clothing saw minimal promotional activity at 0.5% pre-sale and 0.7% during Black Friday Week, the lowest discounts in the entire category.
Share of Search: Brand Visibility Trends
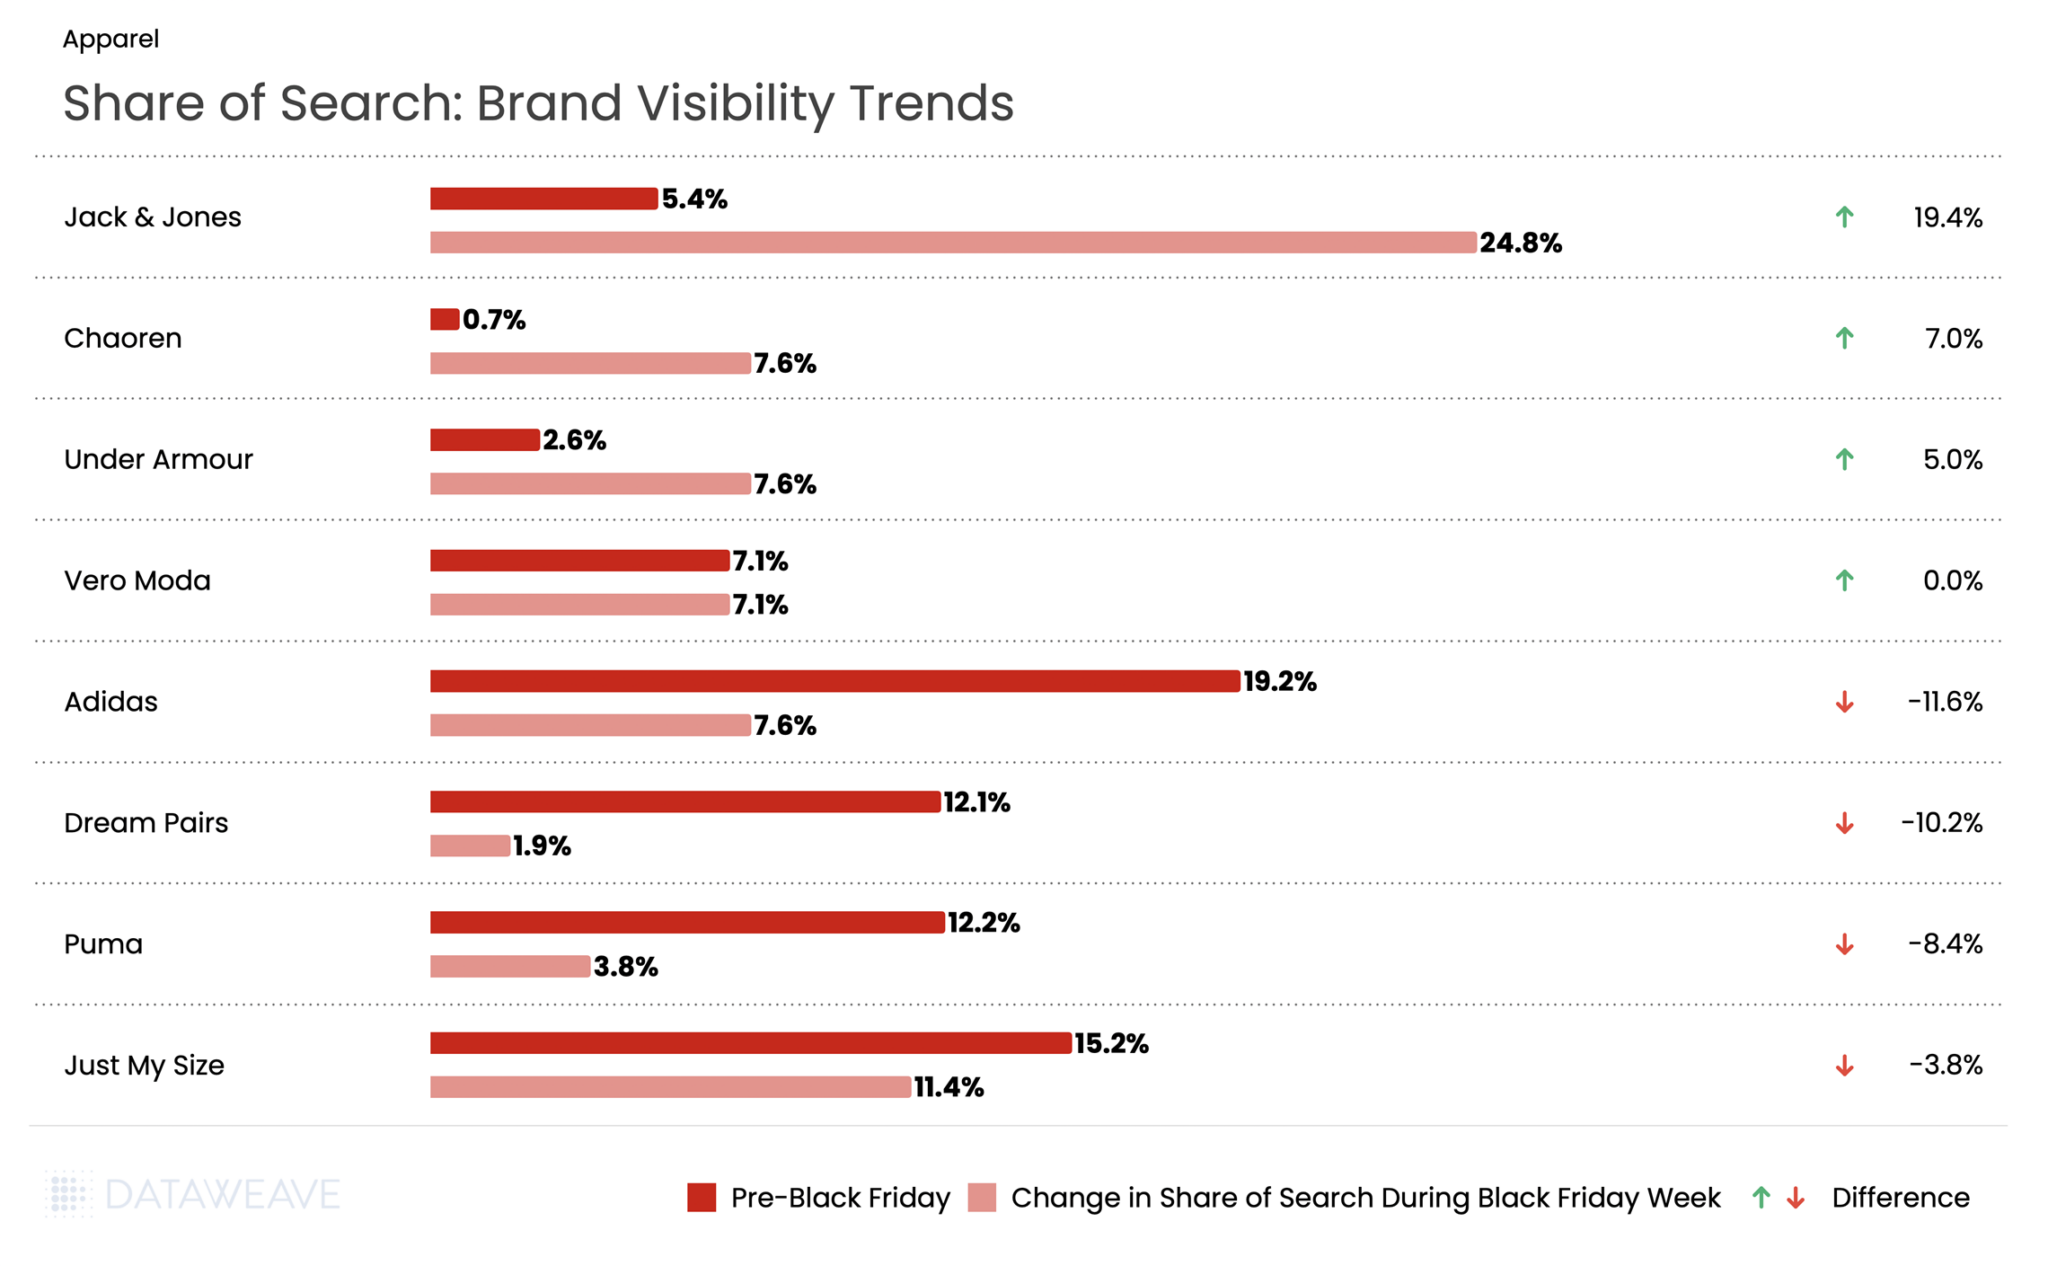
Danish fashion brand Jack & Jones experienced an unprecedented surge with a staggering 19.4% gain in visibility. Sister brand Vero Moda (also owned by Jack & Jones’ parent company Bestseller) maintained flat visibility at 7.1%. Footwear brand Chaoren gained 7%. Meanwhile activewear giant Under Armour rose by 5%.
However, established sportswear giants suffered dramatic visibility losses. Adidas experienced an 11.6% decline in share of search. Dream Pairs saw visibility drop by 10.2%, Puma fell 8.4%, and plus-size brand Just My Size declined by 3.8 %.
Want to understand how DataWeave’s pricing intelligence platform can help your business make data-driven decisions during peak sales events? Contact us to learn more about competitive insights, price intelligence, assortment analytics, content analytics, and digital shelf analytics.
Check out our analysis on Black Friday Pricing and Discount trends in the USA and UK. Follow our blog for more insights on retail pricing trends, brand visibility analysis, and data-driven commerce intelligence.
Black Friday 2025 saw British shoppers spend an average of £430 each this year representing a £91 increase from last year and totaling over £10.2 billion across the sales period.
The 2025 sales event arrived at a pivotal moment for UK retail. Retail sales fell 1.1% in October 2025 as consumers held back spending in anticipation of Black Friday promotions, according to the Office for National Statistics. Over 2 in 5 UK adults participated in Black Friday shopping, with 45% planning to pick up Christmas gifts at a discount, according to a Barclays study.
Against this backdrop of cautious optimism and strategic consumer behavior, how did retailers and brands perform across key categories this Black Friday? At DataWeave, we conducted a comprehensive analysis of Black Friday 2025 discounting trends across five major categories in the UK market: Consumer Electronics, Home & Furniture, Health & Beauty, Grocery, and Apparel. Our AI-powered pricing intelligence platform monitored over 71K SKUs across leading UK retailers like Costco, Selfridges, Boots, Debenham’s, Carethy, Argos, John Lewis, Amazon, and more, revealing fascinating patterns in how retailers and brands approached this year’s sale season.
Our Methodology
For this analysis, DataWeave monitored average discounts across leading UK retailers during two distinct periods:
Pre-Black Friday: November 6 – November 23, 2025 – capturing early holiday deals and baseline pricing
Additional Discounts During Black Friday Week: November 24 – December 1, 2025 – covering Thanksgiving week through Black Friday (November 28) and Cyber Monday (December 1)
Our sample encompassed the top-ranked products across subcategories on major retail sites. We also analyzed Share of Search data, which measures brand visibility by monitoring which brand names appear in the top 20 search results for critical keywords.
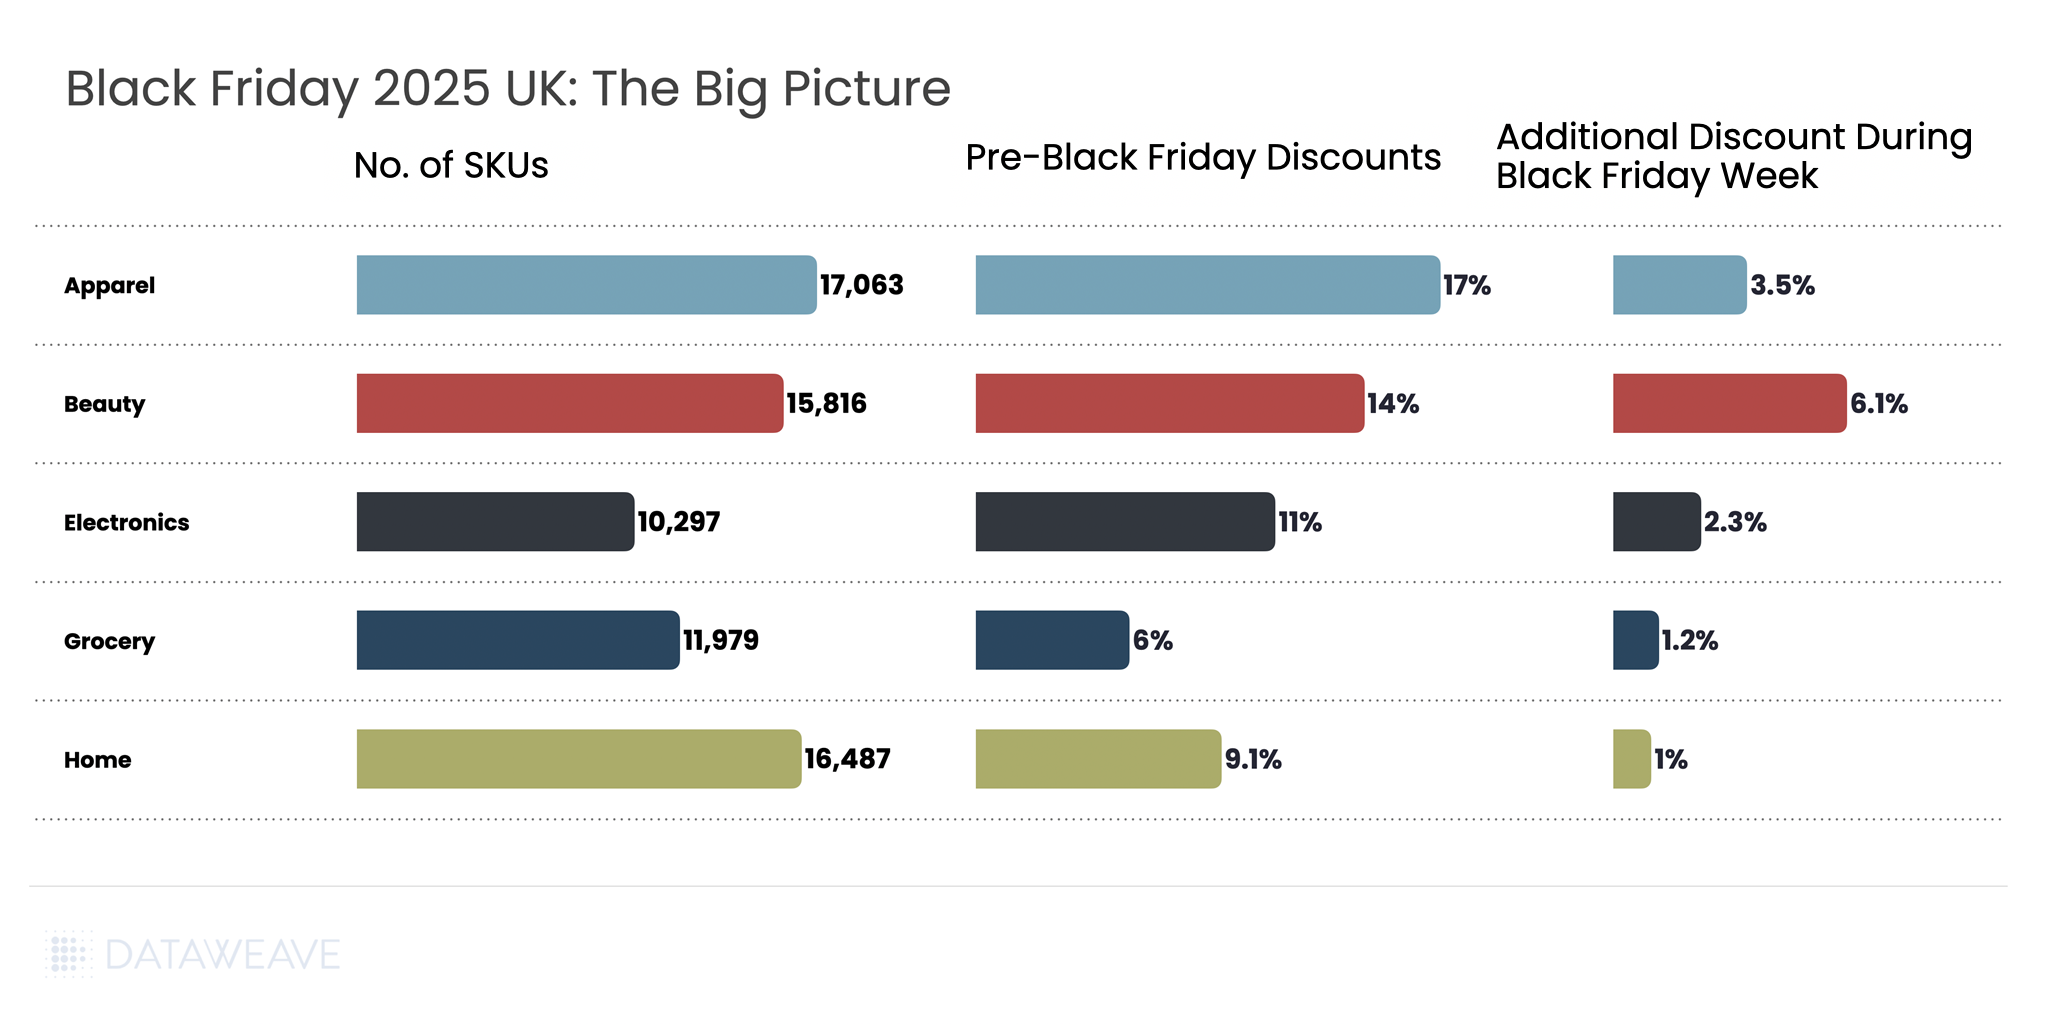
Black Friday 2025 UK: The Big Picture
Our analysis covered 71,642 SKUs across five major categories. Here’s the snapshot of average discounts during the Pre-Black Friday period compared to Black Friday Week:
Key Insight: Pre-Black Friday discounts were substantial across all categories. This suggests UK retailers front-loaded their promotions to capture early holiday shoppers, with additional discounts during Black Friday Week adding to the baseline discounts already in place. The extended promotional period transformed Black Friday from a single-day event into a month-long campaign, with 60% of UK shoppers beginning their deal searches as early as October.
Consumer Electronics
Consumer electronics remains a cornerstone of Black Friday shopping in the UK, with technology accounting for 48% of planned consumer spending during the sales period, according to PwC.
AI is transforming how consumers shop for electronics, with AI-driven traffic to retail sites expected to rise 410% year-on-year during the 2025 holiday season. Younger shoppers particularly embraced AI tools, with 17% of Gen Z consumers using AI platforms like Chat GPT and Gemini to source and compare deals. Our analysis of 10,297 SKUs reveals how discounts varied across subcategories and which brands dominated search visibility.
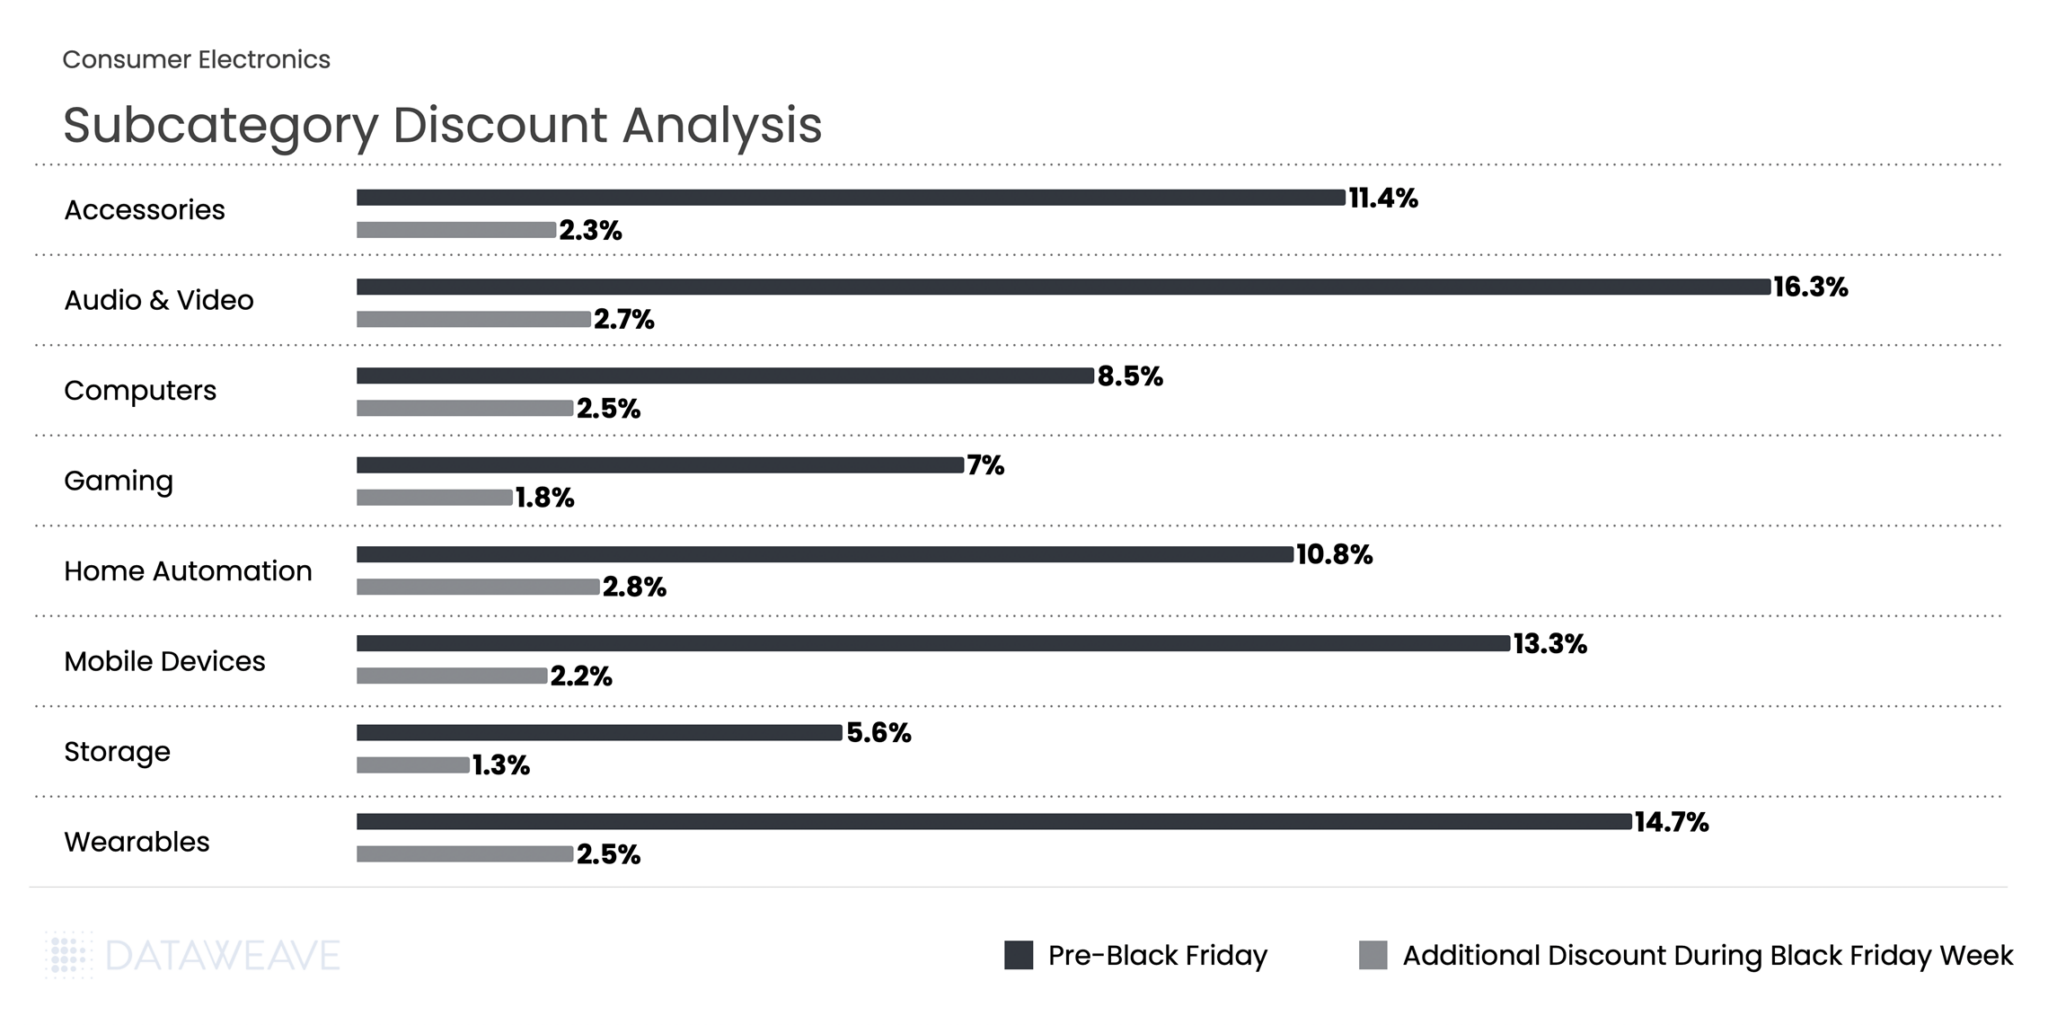
Subcategory Discount Analysis
Pre-Black Friday discounts averaged 11.1% across subcategories, while Black Friday Week saw an additional 2.3% discount on average. Audio & Video products led the pre-sale discounting at 16.3%, indicating retailers were eager to move inventory early in the season.
During Black Friday Week, Home Automation saw the highest additional discount at 2.8%. Wearables and Computers both saw solid 2.5% additional discounts, making them attractive categories during the peak shopping period.
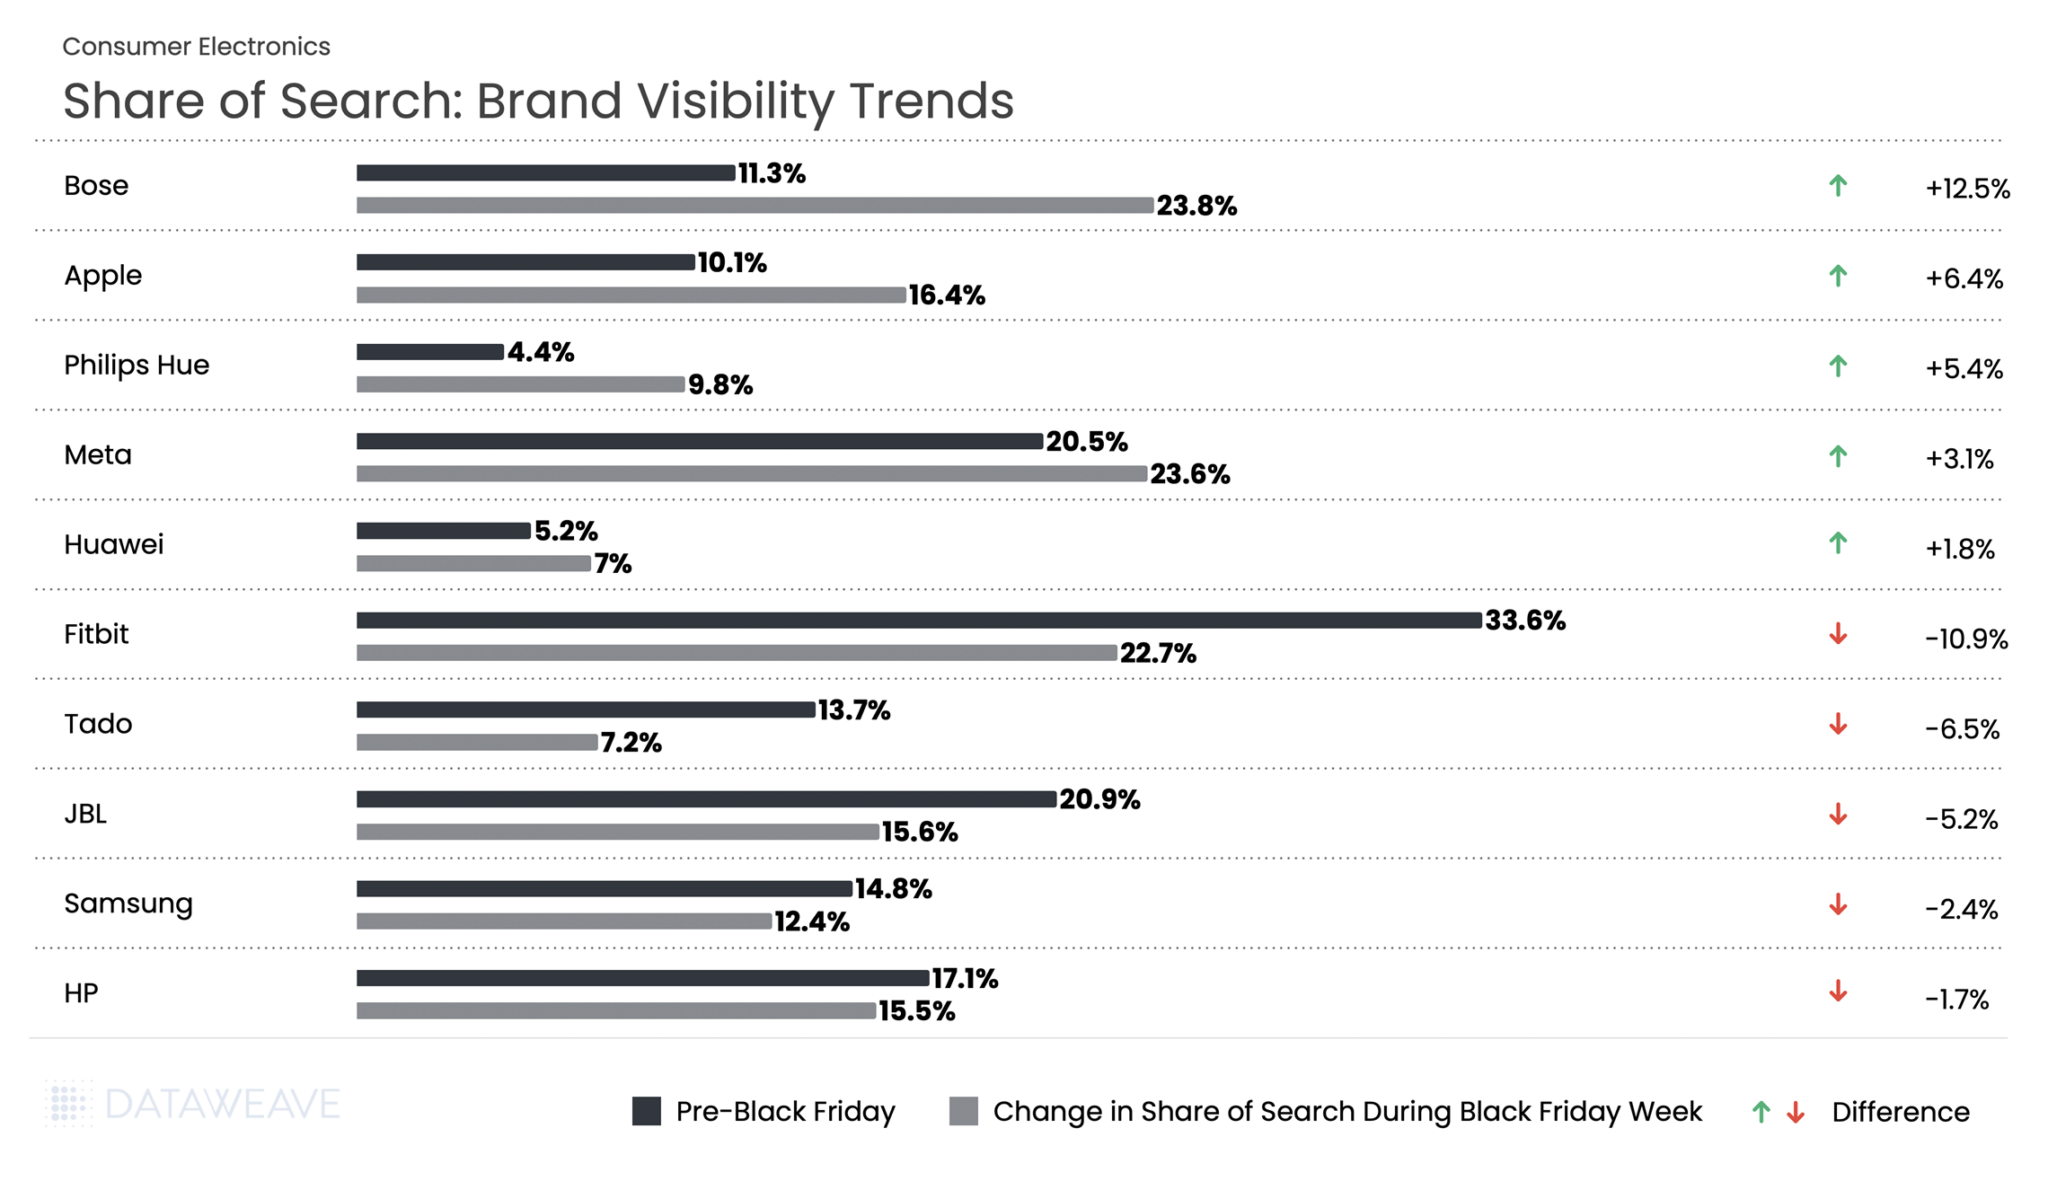
Share of Search: Brand Visibility Trends
Our Share of Search analysis reveals significant shifts in brand visibility during Black Friday Week:
Bose dominated with its Share of Search more than doubling from 11.3% to 23.8%, a remarkable +12.5% gain. Lighting brand Philips Hue followed, gaining by +5.4% in share of search during Black Friday week. Notably, Meta, with it’s range of wearables, stands out for a +3.1% increase in visibility.
Apple’s Share of Search jumped from 10.1% to 16.4%, a gain of 6.4%. At the same time, Fitbit’s share dropped nearly 11%, the steepest decline in the entire electronics category. Meanwhile, Samsung and HP also lost on visibility this Black Friday in the UK.
Home & Furniture
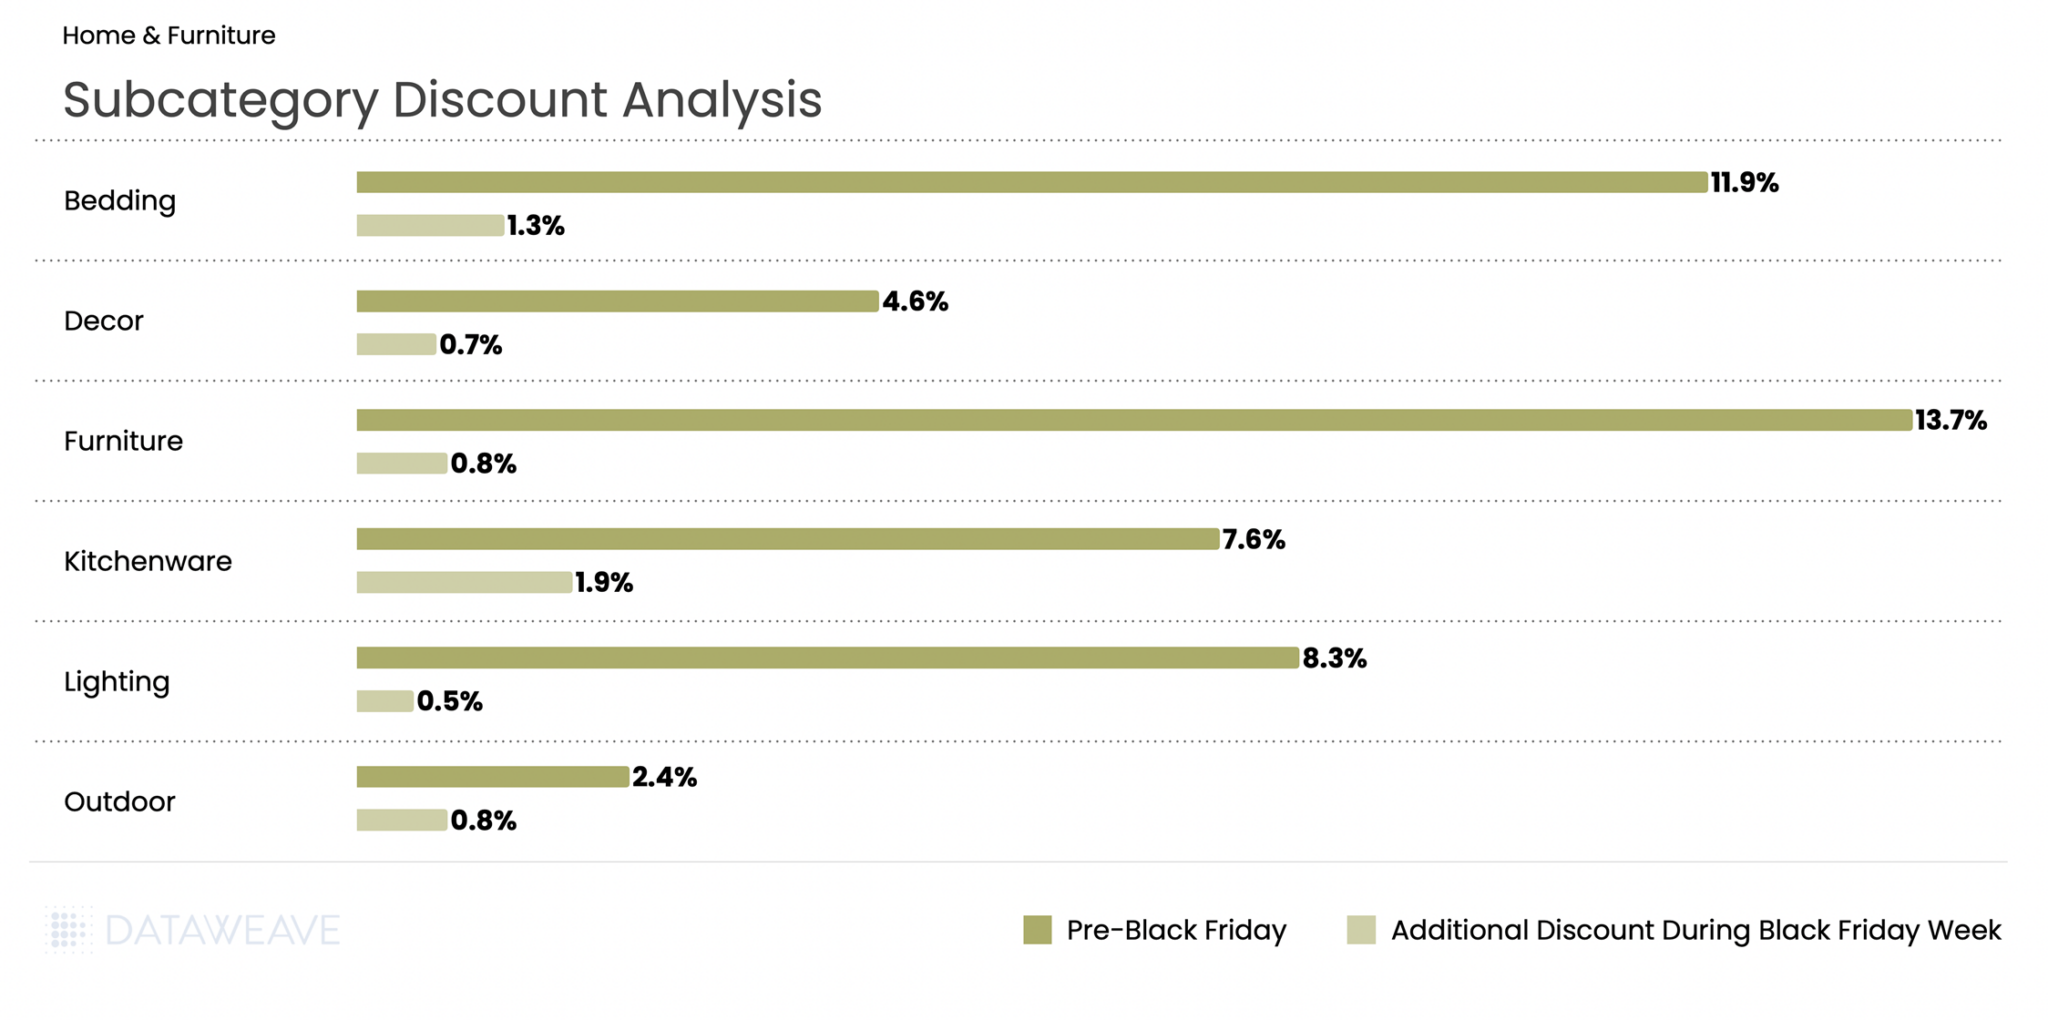
The Home & Furniture category continues to attract UK consumers during Black Friday, though with a more measured discounting approach compared to other categories. Our analysis of 16,487 SKUs shows how discounts were distributed across subcategories.
Subcategory Discount Analysis
Home & Furniture saw Pre-Black Friday discounts averaging 9.1%, with Black Friday Week adding just 1% on average, the lowest additional discount among all categories. Furniture led pre-sale discounts at 13.7%, followed by Bedding at 11.9%. This suggests retailers aggressively promoted larger home goods early in the season to capture deal-seekers.
During Black Friday Week, Kitchenware saw the highest additional discount at 1.9%, making it attractive for holiday cooking and gifting needs. Conversely, Lighting saw minimal additional promotion at just 0.5%.
Share of Search: Brand Visibility Trends
Made.com, the contemporary furniture brand, saw visibility surge during Black Friday with an impressive 8.9% increase. Similarly, emerging mattress brand Vesgantti gained 5.4%. Rug specialist Gooch Oriental also made significant gains with a 4.9% increase.
On the flip side, British heritage brands faced challenges. Both Laura Ashley and Julian Bowen saw share of search drop 2.2%. Premium mattress maker Vispring also declined 2.1%, while French cookware brand Le Creuset fell 1.9%.
Health & Beauty
Health & Beauty has emerged as a growth engine during Black Friday in the UK. The beauty industry is projected to grow 5% annually through 2030 according to a McKinsey survey. The category continues to demonstrate resilience even as consumers show caution in other discretionary categories. Our analysis of 15,816 SKUs reveals fascinating subcategory-level insights and dramatic brand visibility shifts that highlight evolving consumer preferences in the beauty space.
Subcategory Discount Analysis
Health & Beauty presented a unique discounting pattern compared to other categories. Pre-Black Friday discounts averaged 14.4%, the second-highest among all categories. But Black Friday Week discounts were also robust at 6.1%, the highest additional discount increase.
Hair Care led both periods with 16.4% pre-sale discounts and an additional 6.4% during Black Friday Week. Skincare saw the highest Black Friday Week discount at 6.9%, suggesting retailers strategically saved their best skincare promotions for the main event when consumers are actively seeking holiday gift sets. Men’s Grooming stood apart with strong pre-sale discounts of 12.5% but more modest Black Friday Week additions of just 2.3%.
Share of Search: Brand Visibility Trends
The UK Beauty category saw some of the most dramatic Share of Search swings in our analysis.
Himalaya, the Ayurvedic skincare brand, dominated the category with a stunning 16.8% gain. British cult favorite Dr. Pawpaw exploded from 3.7% to 11.8%, a gain that reflects the brand’s growing mainstream appeal. Face the Future, the skincare specialist, also gained significant ground with a 4.9% increase.
Budget-friendly British brand Q+A continued its momentum, rising 4%, while prestige names like Guerlain and Tous each gained 3.8%.
Italian natural beauty brand L’Erbolario saw the steepest decline, with visibility dropping by 9%. Haircare brand Noughty fell 6.1%, and eco-beauty brand So Eco declined by 5.1%.
Grocery
While Grocery typically sees more modest discounts compared to discretionary categories, the sector remains a critical part of Black Friday shopping in the UK, particularly as consumers prepare for holiday entertaining and gifting. Our analysis of 11,979 SKUs shows how UK retailers approached promotions across essential and indulgent subcategories.
Subcategory Discount Analysis
Grocery had the lowest discounts across all categories, reflecting the already-thin margins in food retail. Pre-Black Friday discounts averaged just 5.7%, with Black Friday Week adding only 1.2%. Pet Products led pre-sale discounts at an impressive 13%, significantly outpacing other grocery subcategories.
Beverages and Household Essentials followed with 9.4% and 7.7% pre-sale discounts respectively, and maintained their lead during Black Friday Week with 1.7% and 1.5% additional discounts each. Fresh categories like Meat & Seafood (1.4% pre-sale, 0.6% Black Friday Week) and Frozen Foods (1.7% pre sale, 0.6% additional discounts during Black Friday week) saw minimal promotional activity, consistent with perishable inventory constraints and tight margins.
Share of Search: Brand Visibility Trends
Doritos led with a 7.3% surge in visibility. Pepsi delivered an equally impressive performance, rising from 3.6% pre Black Friday to 10.7% during Black Friday week. Fanta too saw 5.2% gain in share of search.
Conversely, Coca-Cola gained more modestly at 1.6%, while its Sprite brand actually declined 0.9%.
Apparel
Apparel remains a Black Friday staple in the UK and is projected to deliver the strongest year-on-year growth of any UK retail segment this festive season. With clothing accounting for 39% of planned Black Friday purchases, the category represents one of the most hotly contested battlegrounds during the sales period.
Our analysis of 17,063 SKUs, the largest category in our study, reveals interesting patterns across fashion segments that demonstrate both the opportunities and competitive intensity in UK apparel retail.
Subcategory Discount Analysis
Apparel showed the strongest discounting activity throughout the BFCM period among all categories. Pre-Black Friday discounts averaged 17.2%, with Black Friday Week adding 3.5%, making it one of the most heavily promoted categories.
Activewear led pre-sale discounts at an impressive 26.7%, with an additional 4.5% discount during Black Friday week. Plus Size Clothing and Men’s Clothing tied for second place in pre-sale discounts at 21.9% each. Notably, Plus Size Clothing saw the highest Black Friday Week discount at 5.4%.
Women’s Clothing saw robust discounts throughout, with 20.8% pre-sale and an additional 6% during Black Friday Week (the highest additional discount in the category).
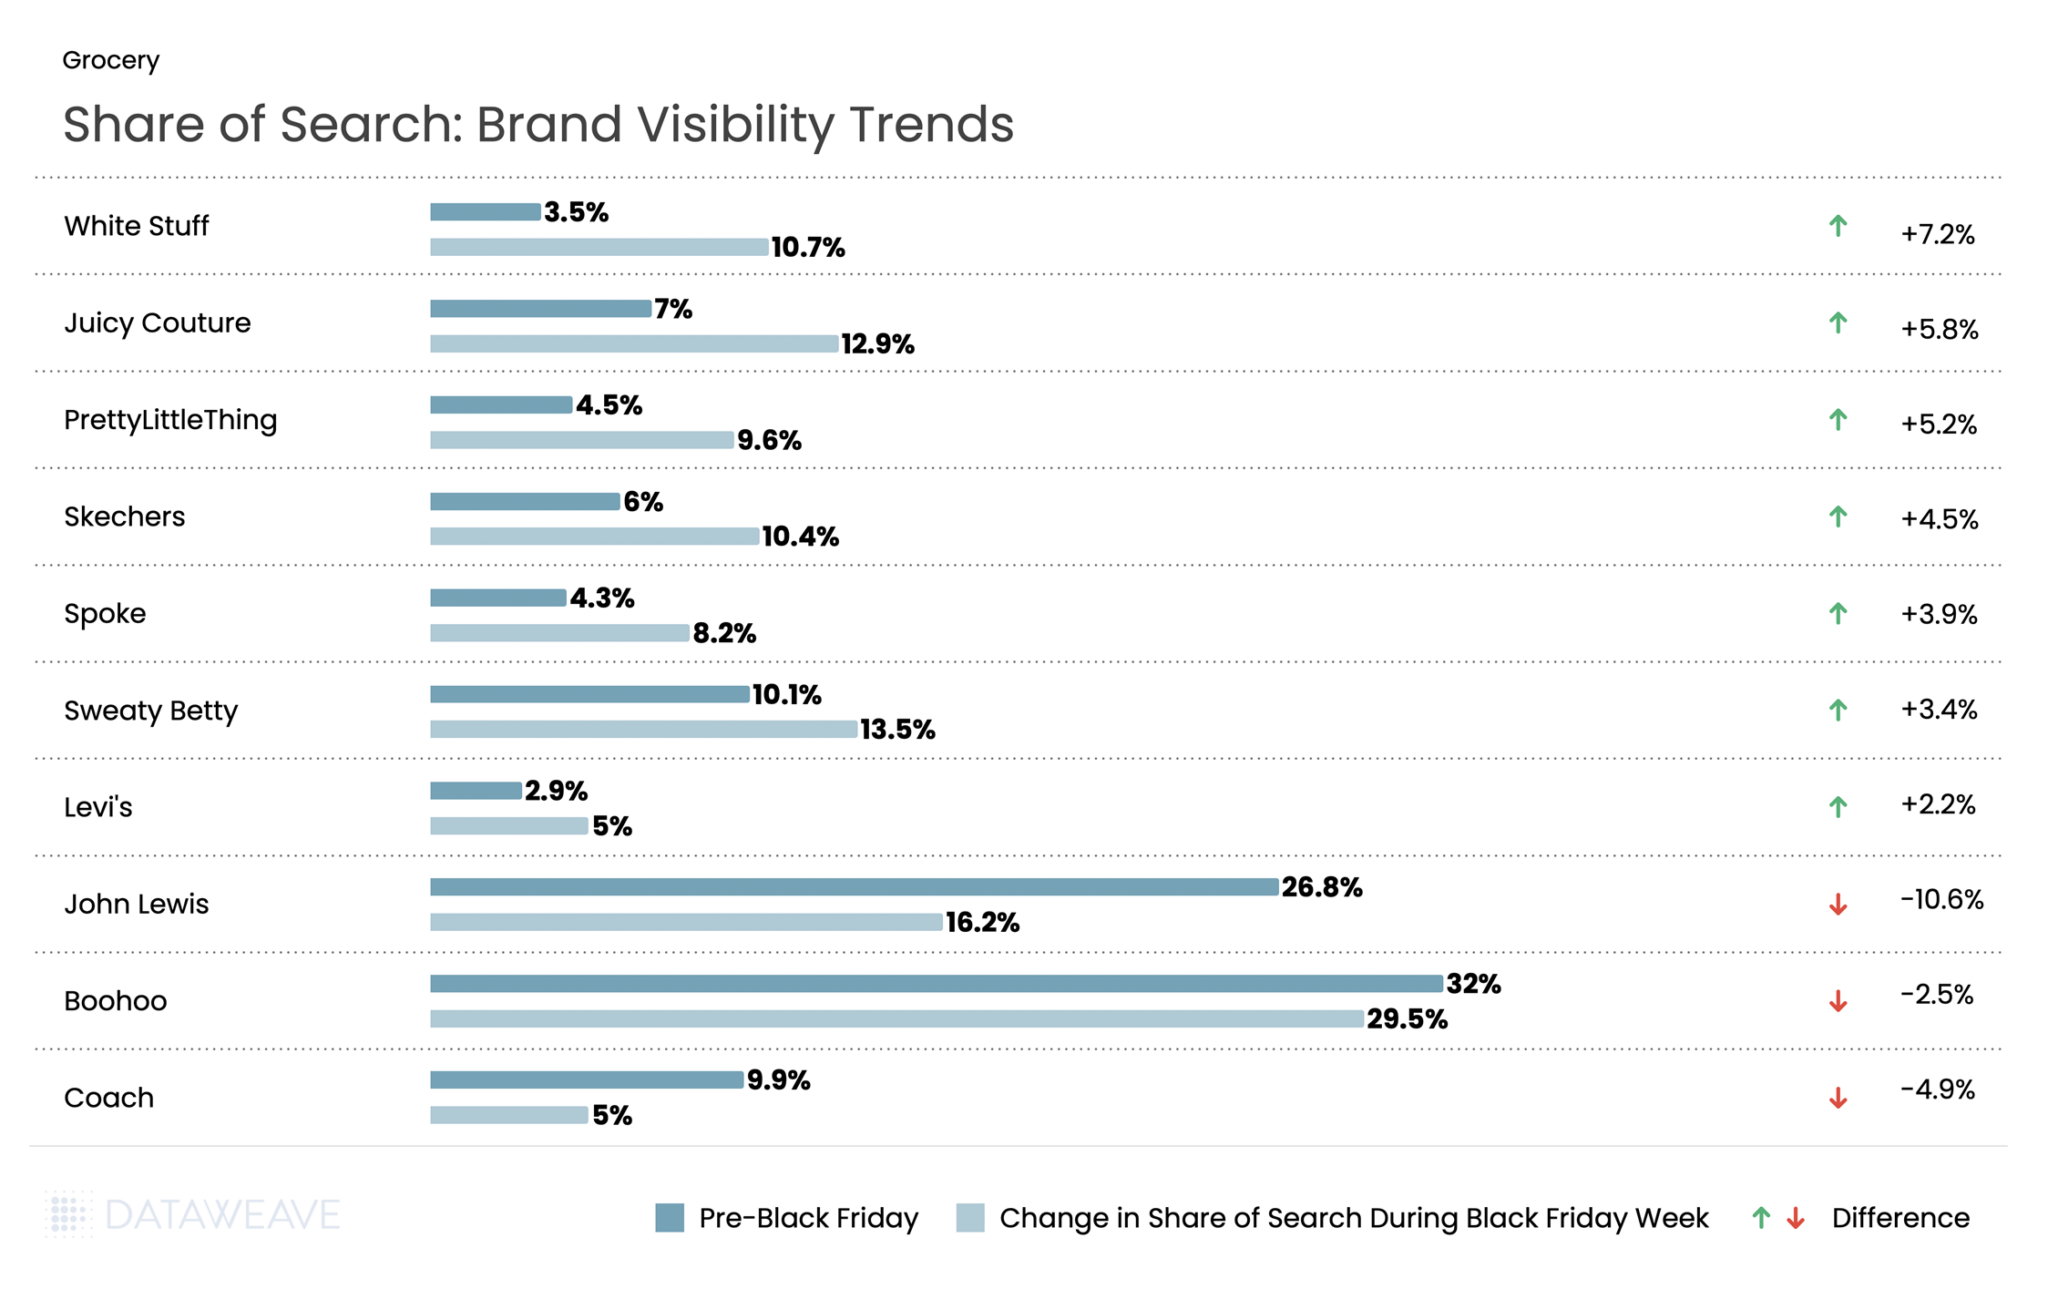
Share of Search: Brand Visibility Trends
White Stuff, the British lifestyle brand, saw a 7.2% surge in visibility during Black Friday. Y2K fashion made a statement as Juicy Couture jumped 5.8 %. Fast fashion player Pretty Little Thing gained in visibility by 5.2%. Comfort brands performed strongly, with Skechers gaining 4.5% and activewear specialist Sweaty Betty rising 3.4%. Even premium denim brand Levi’s gained ground, increasing share of search by 2.2%.
However, retail giants faced significant visibility challenges. John Lewis saw the steepest decline in the Apparel category, with share of search dropping by 10.6% during Black Friday week. Fast fashion giant Boohoo declined 2.5%. Premium accessory brand Coach’s share fell 4.9%.
The data suggests UK consumers gravitated toward distinctive brands with clear identities during Black Friday, whether heritage British labels, Y2K nostalgia, or comfort-focused specialists, rather than generalist retailers or fast fashion platforms.
Want to understand how DataWeave’s pricing intelligence platform can help your business make data-driven decisions during peak sales events? Contact us to learn more about competitive insights, price intelligence, assortment analytics, content analytics, and digital shelf analytics.
Amazon Prime Day 2025 generated a record-breaking $24.1 billion in US online sales during its extended four-day run (July 8–11, 2025). While the expanded format helped broaden participation, it also diluted the urgency and daily peaks that typically define Prime Day.
Beneath this record-setting performance lies a more complex reality. Persistent inflation, shifting consumer behavior, and rising pricing pressures created a retail environment very different from previous years, one where higher baseline prices often replaced the deep discounts shoppers expected.
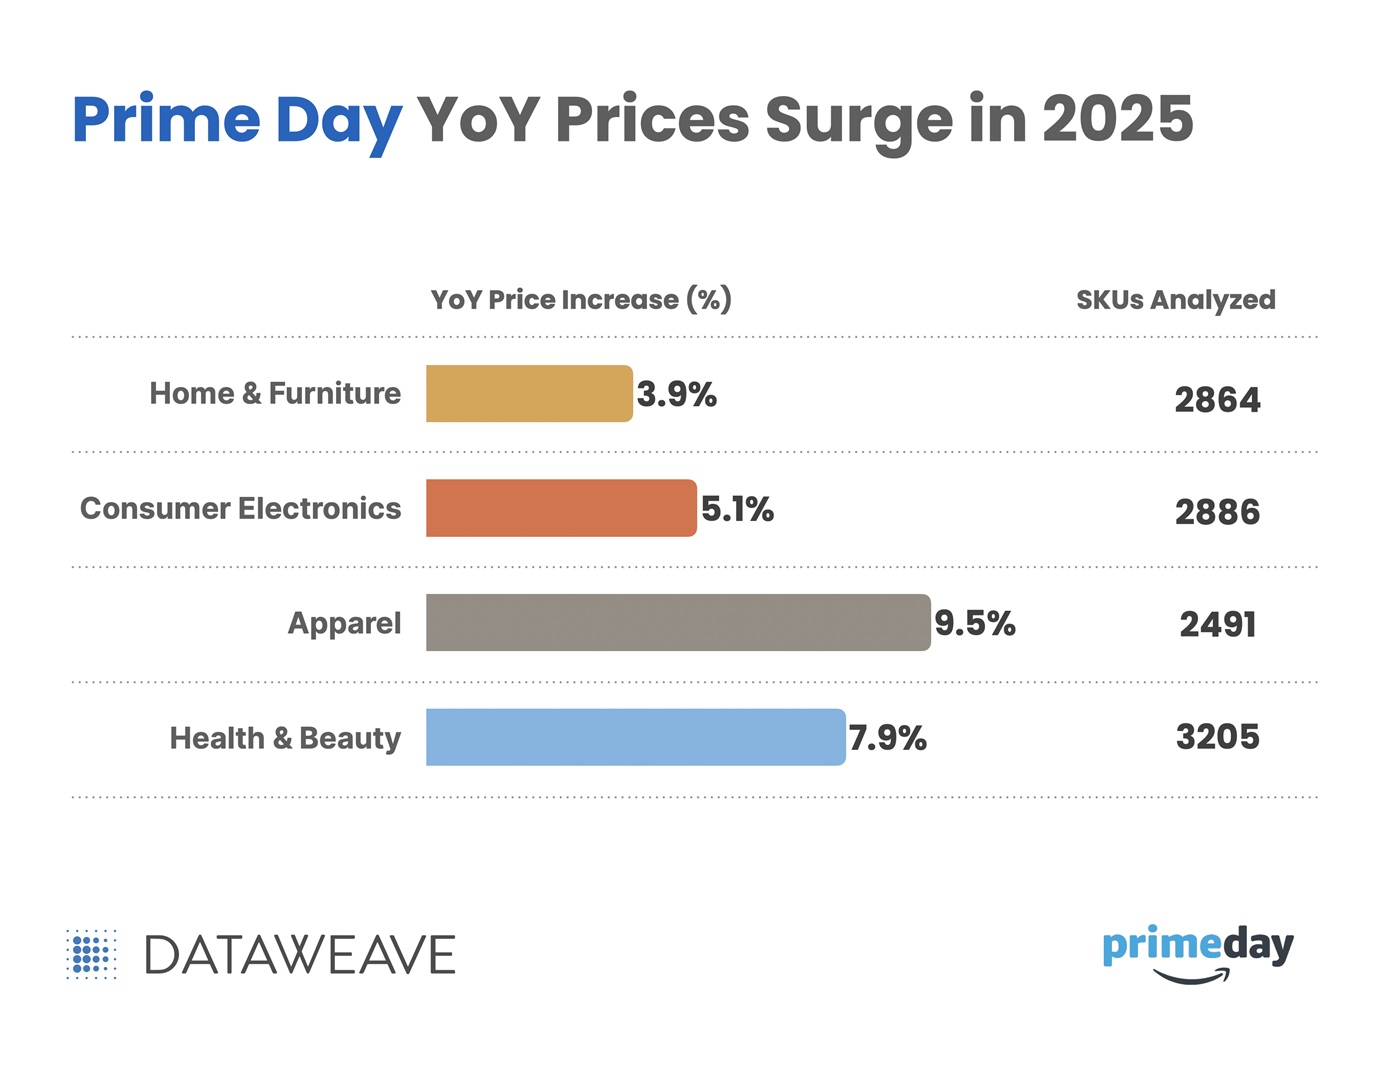
To understand these dynamics, DataWeave analyzed pricing and visibility trends across 11,495 products using our proprietary AI platform. The study focused on four major categories – Consumer Electronics, Apparel, Home & Furniture, and Health & Beauty – comparing identical SKUs from Prime Day 2024 and 2025, and tracking changes in both organic and sponsored share of search for leading brands.
The results reveal clear year-over-year price increases: Apparel led with a 9.5% rise, followed by Health & Beauty (7.9%), Consumer Electronics (5.1%), and Home & Furniture (3.9%). In total, 47% of tracked products saw higher prices, indicating that this year’s record sales were achieved in an environment of elevated base pricing rather than deeper discounts.
Multiple converging forces shaped the retail landscape leading into Prime Day 2025, pushing baseline prices higher even before promotions began.
Supply Chain Pressures: Ongoing disruptions and elevated shipping and production costs continue to shape the cost structure across categories.
Trade Policy Factors: Recent tariff measures and trade regulations may be contributing to upward pricing trends in certain categories, particularly those with high import dependence such as electronics and home goods.
Labor and Operating Costs: Rising wages, transportation expenses, and general operating overhead are placing additional pressure on retailer margins and influencing pricing decisions.
Currency Fluctuations: Shifts in exchange rates continue to add variability to the cost of imported goods, especially in globally sourced categories like electronics and apparel.
These combined pressures created a pricing environment where brands had less room for deep discounting, shaping not just how products were priced, but also how aggressively they were promoted.
To better understand the impact, we compared Prime Day 2025 prices to those from Prime Day 2024 for the same SKUs across major categories. This year-over-year view highlights how elevated baseline prices, driven by the factors outlined above, shaped the shopping experience and promotional strategies.
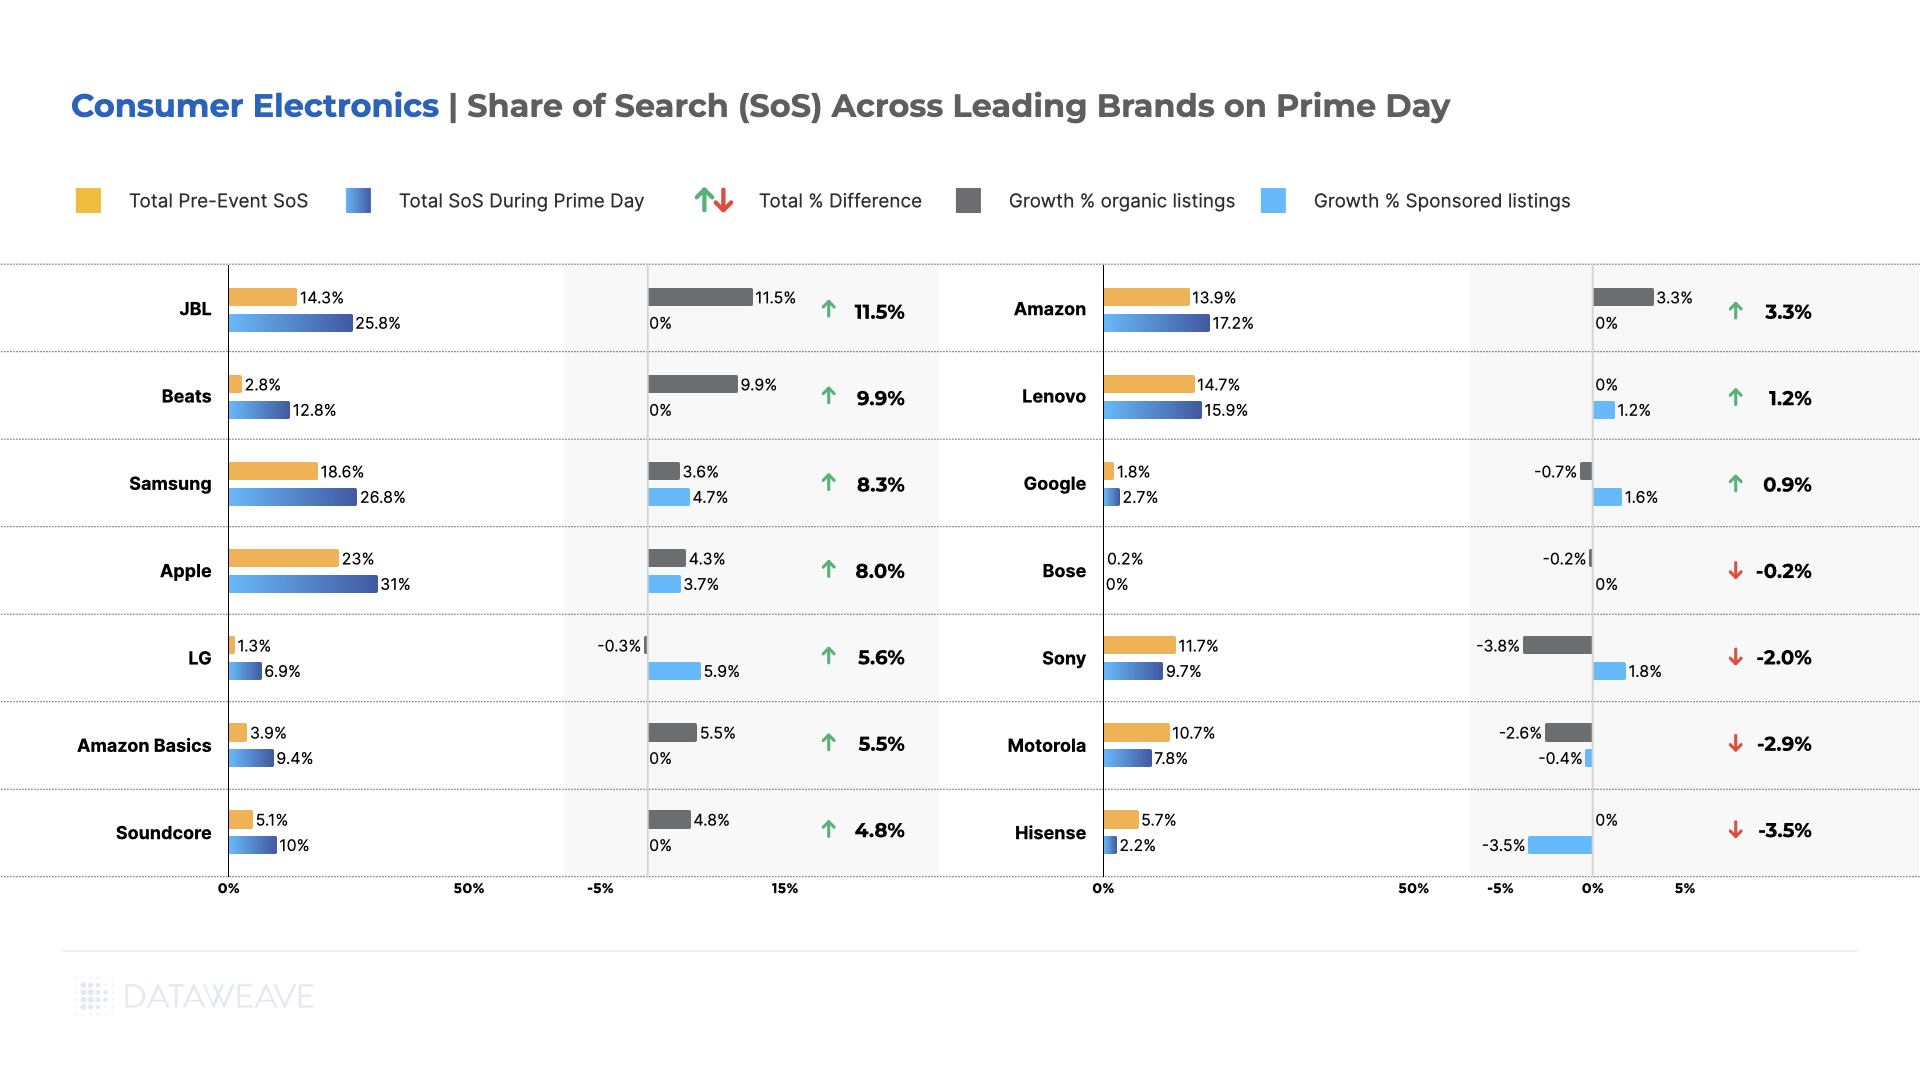
Consumer Electronics
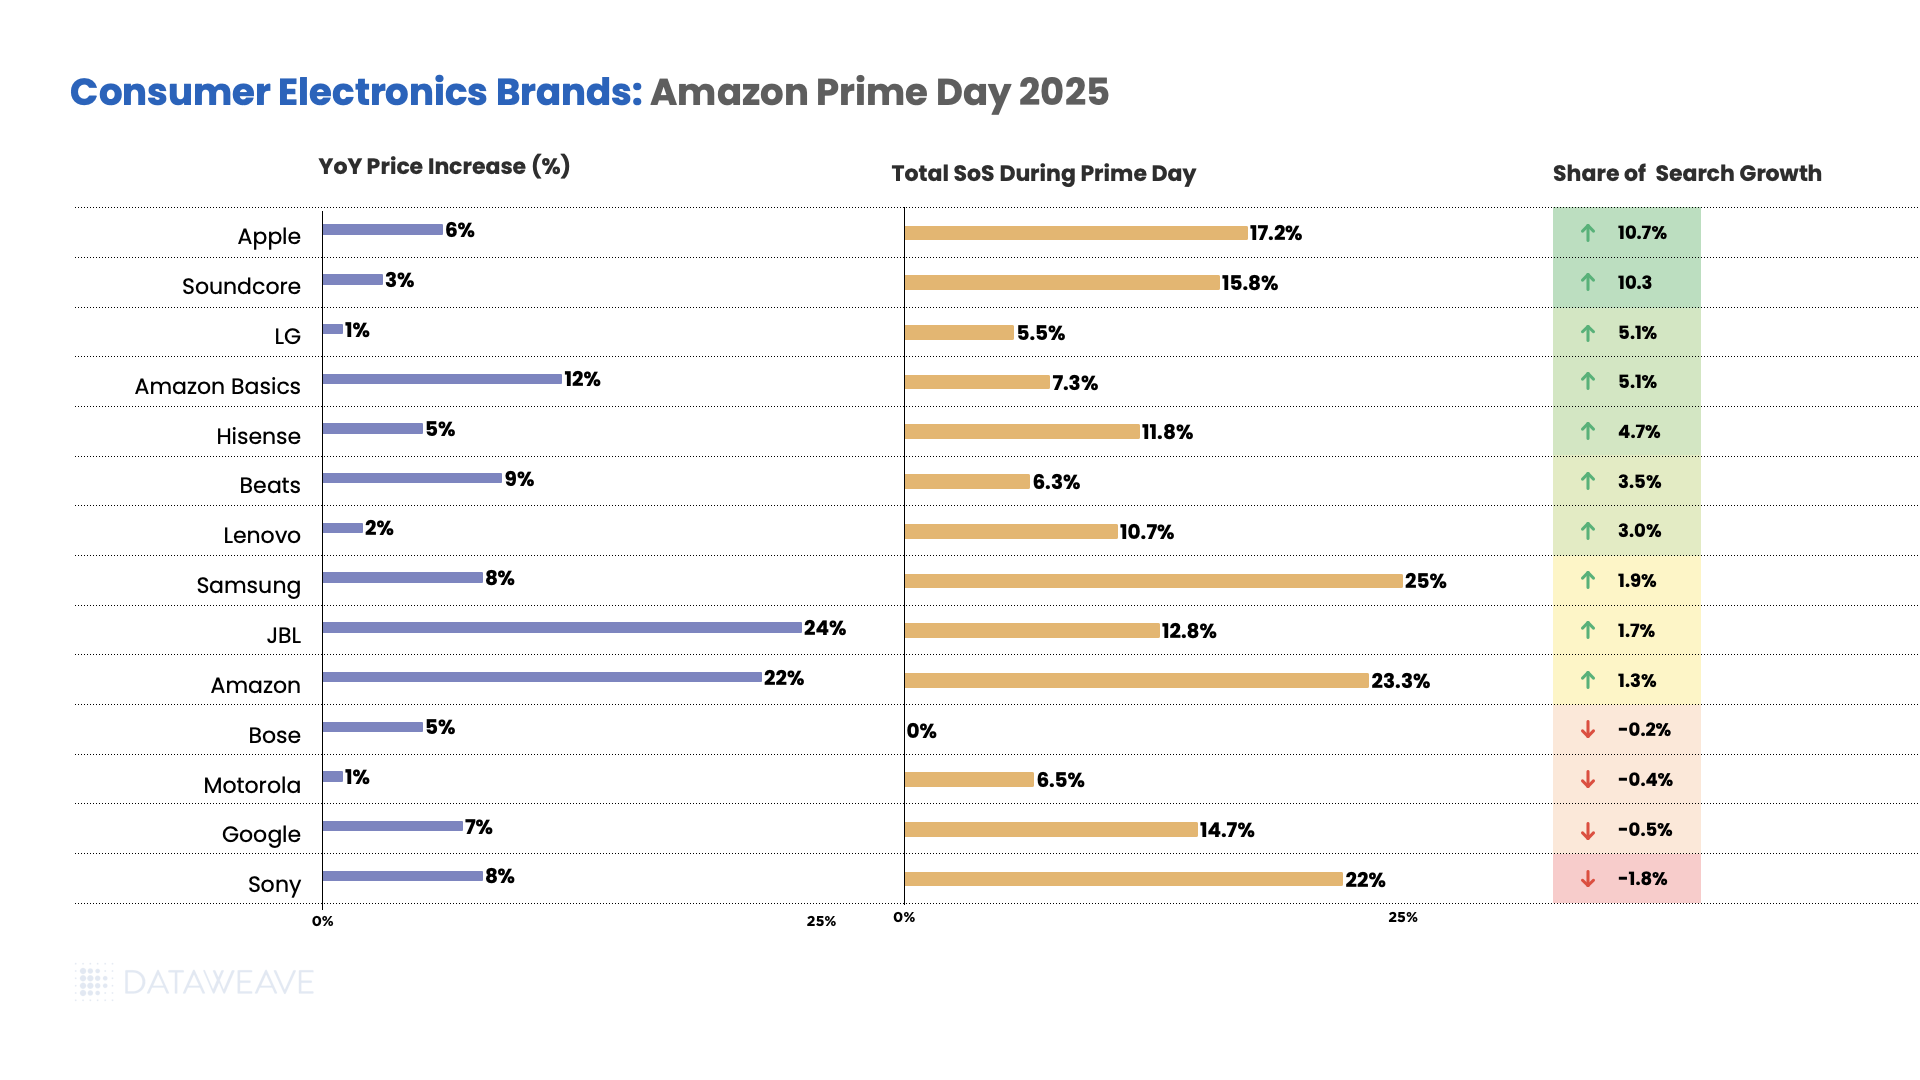
JBL prices increased 24% year-over-year, the highest among major electronics brands.
Amazon’s own brand saw prices increase by 22%.
Beats saw a significant 9% increase, while Sony and Samsung both experienced 8% price increases. Apple prices went up by 6%, and Google saw a 7% increase.
Meanwhile, other established brands like LG and Motorola maintained minimal increases at 1%, Lenovo at 2%, Soundcore at 3%, and Bose and Hisense both at 5%.
Apple dominated visibility gains, jumping to 17.2% share of search during Prime Day with a 10.7% growth, likely driven by promotional focus on premium devices. Soundcore also saw significant gains of 10.3%, reaching 15.8% share of search.
LG and Amazon Basics both achieved strong 5.1% growth. Hisense gained 4.7% share with 5% price increases. Samsung and Amazon maintained strong positions with modest gains of 1.9% and 1.3% respectively.
However, several brands lost ground, with Sony declining most significantly by 1.8% share despite its strong market position, followed by Google (-0.5%) and Motorola (-0.4%).
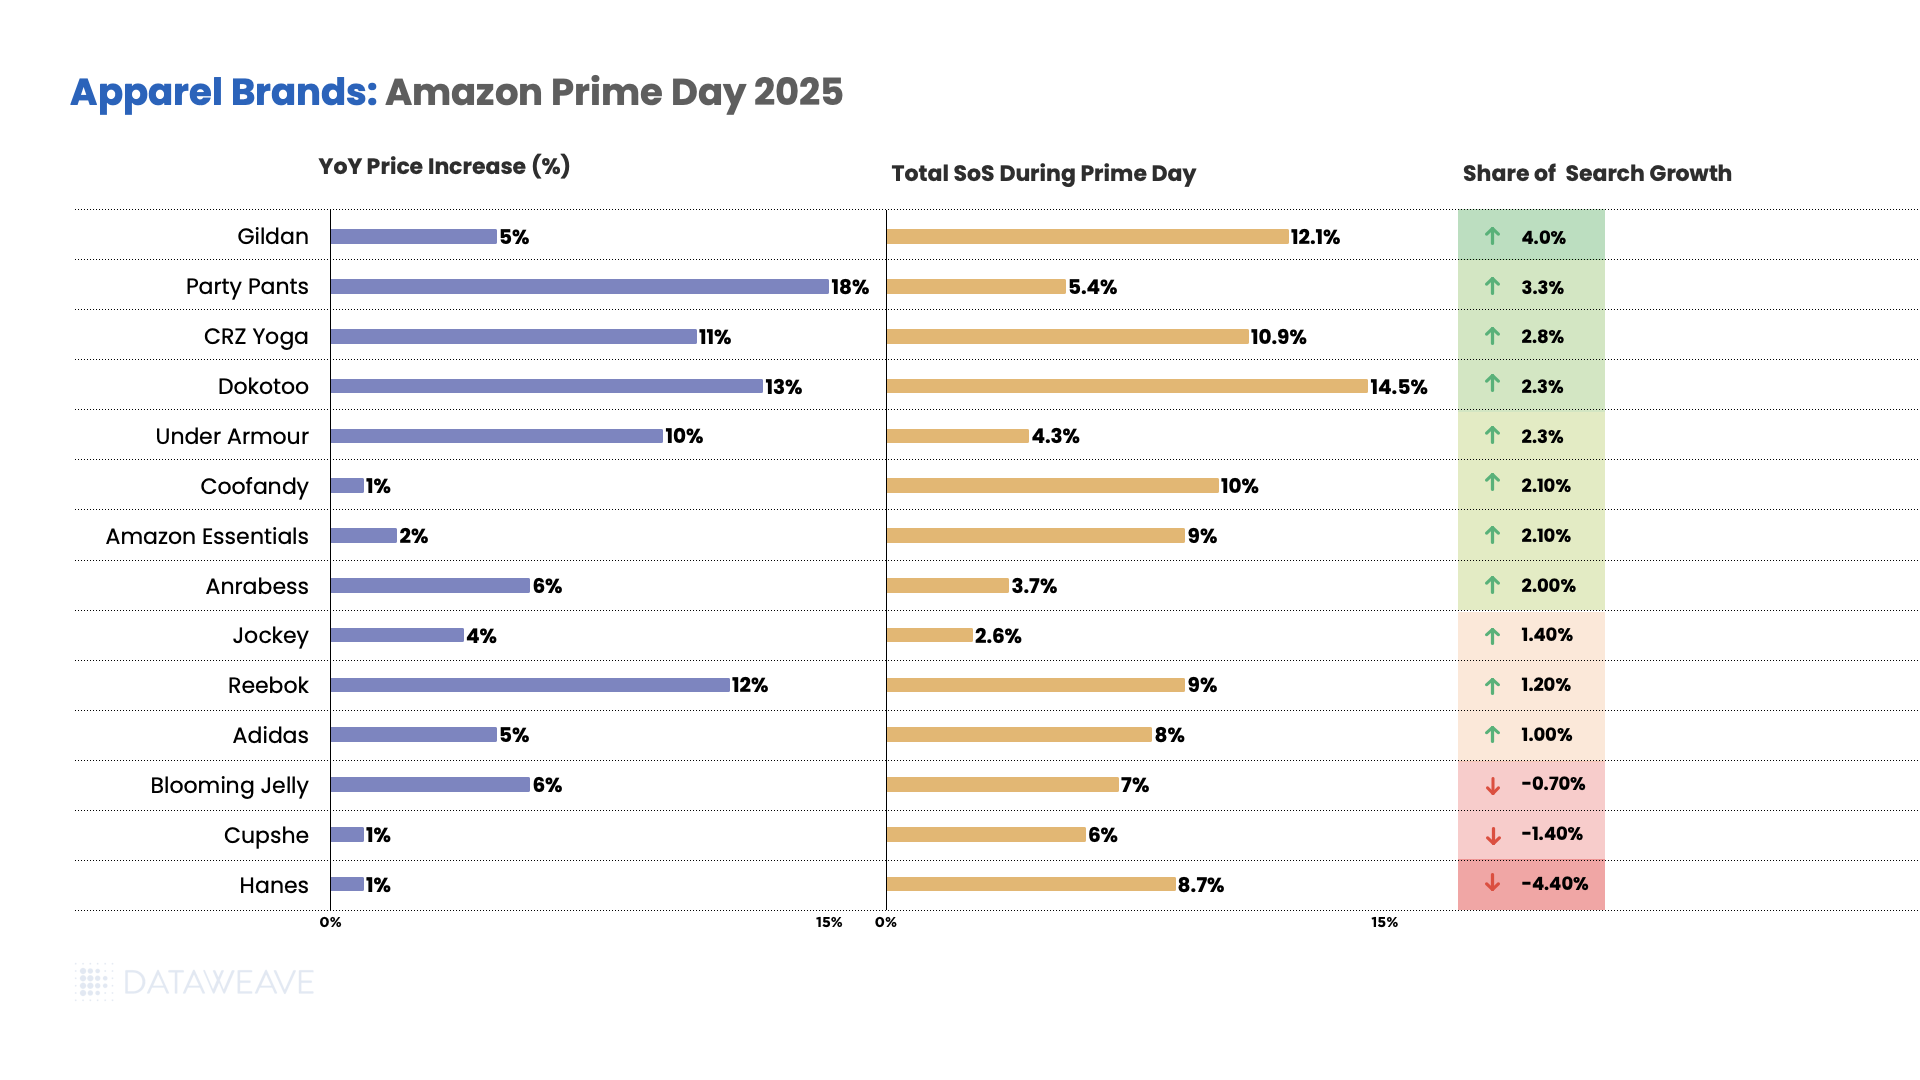
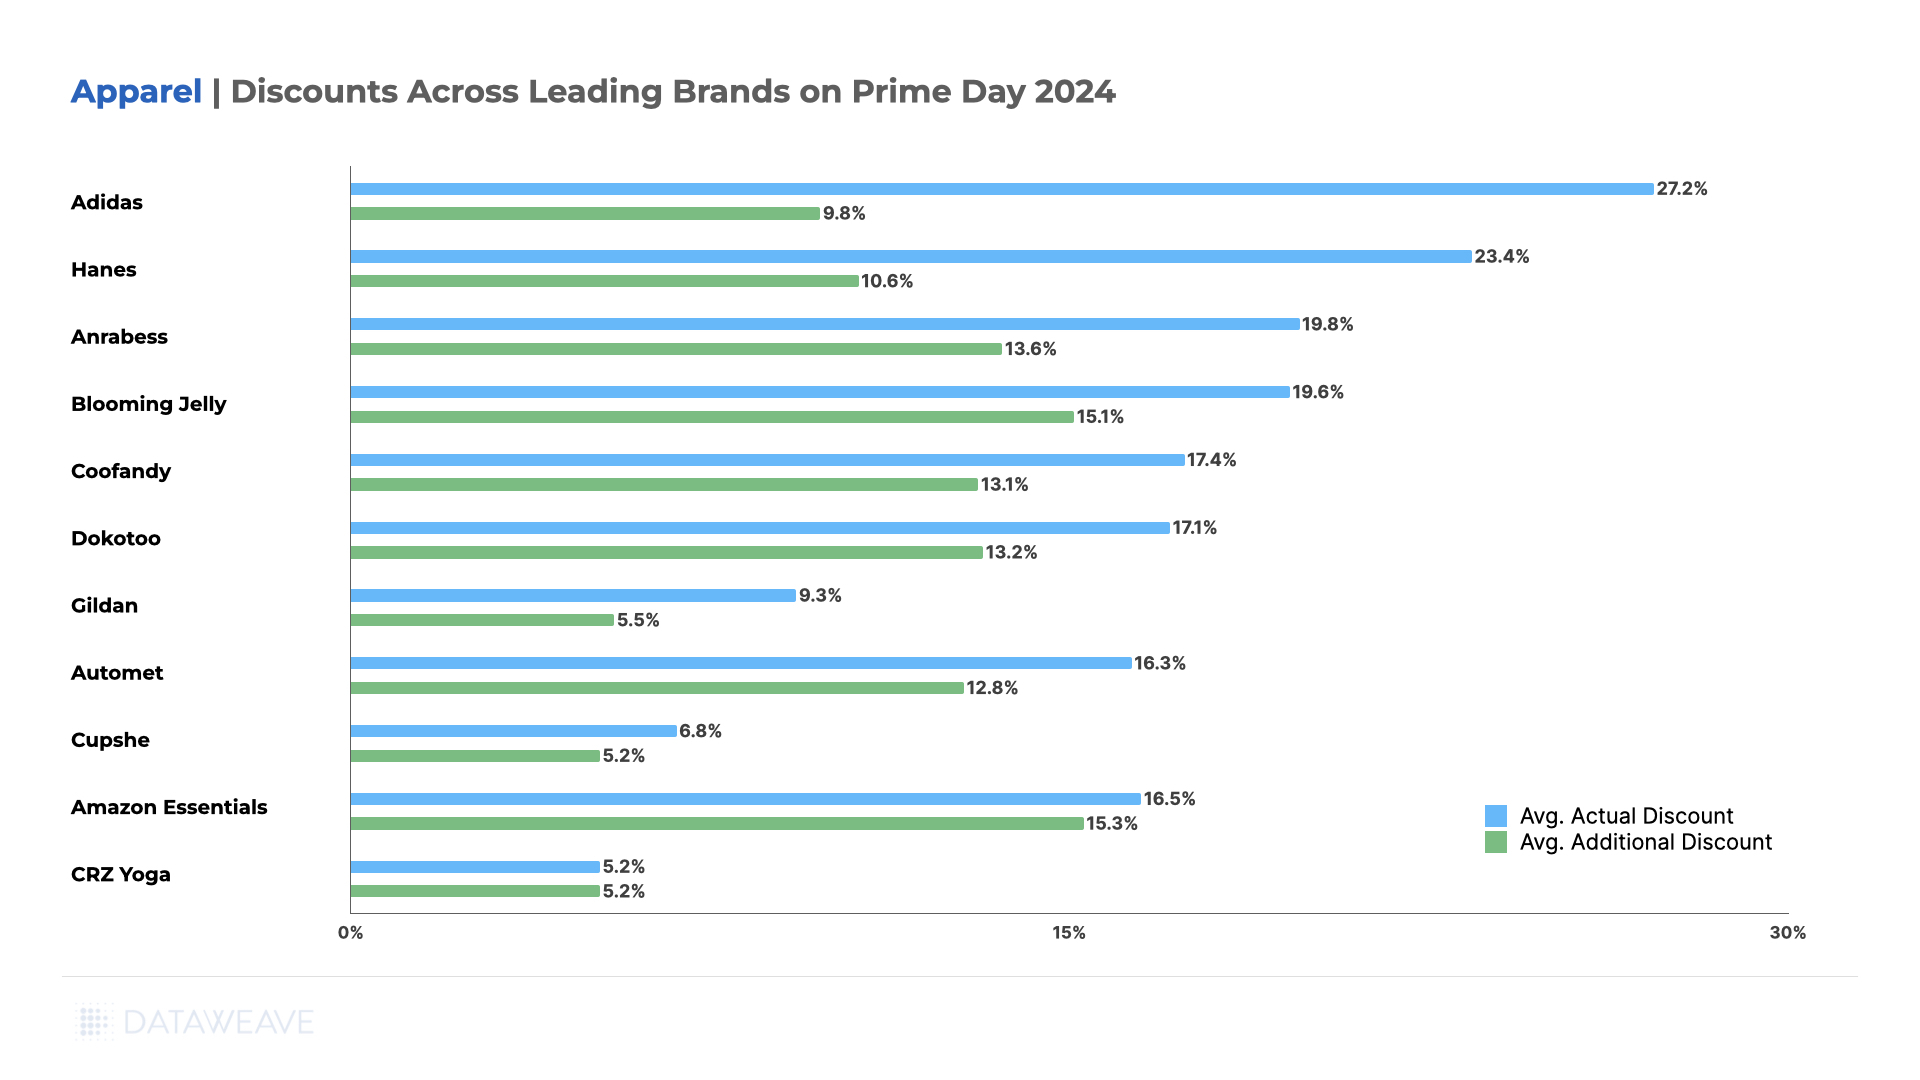
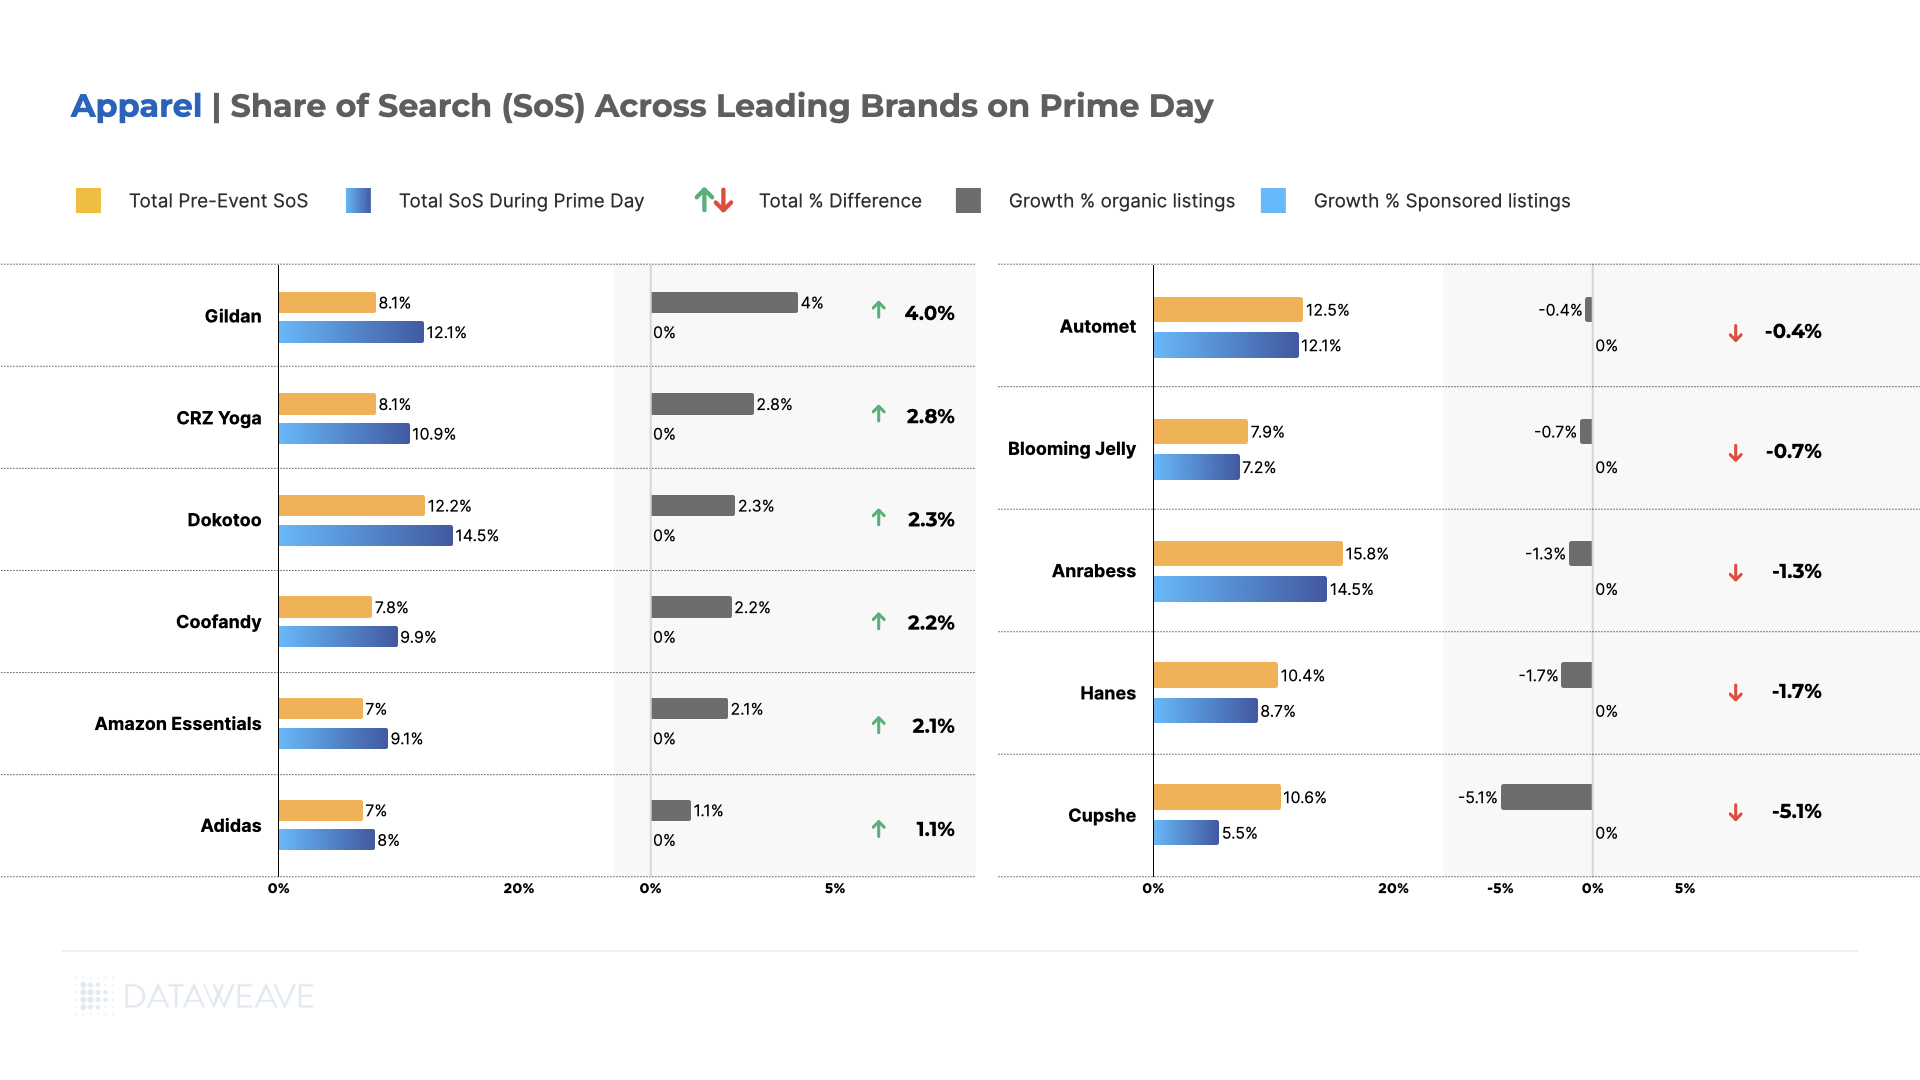
Apparel
Party Pants showed the highest price increases at 18% year-over-year, followed by casual wear brand Dokotoo at 13%.
Athleisure brand CRZ Yoga saw prices increasing by 11%, while Under Armour saw prices rise by 10%.
While Reebok experienced a significant 12% increase, Adidas saw 5% price increase.
Meanwhile, innerwear brands like Hanes and Cupshe saw minimal price increases at 1%, while Coofandy also saw minimal increases of 1%.
Amazon’s own Amazon Essentials maintained minimal price increases of 2%, and Jockey saw modest increases of 4%.
T-shirt brand Gildan led share of search gains with 4.0% growth along with a 5% price increase. Party Pants achieved 3.3% growth with 18% price increases, while CRZ Yoga gained 2.8% share and 11% price increases.
Amazon Essentials and Mens’ apparel brand Coofandy both improved share by 2.1%, with Amazon Essentials keeping price increases to just 2% and Coofandy at 1%. Under Armour gained 2.3% share with 10% price increase.
However, several brands lost ground, with Hanes declining significantly by 4.4% while keeping price increases to just 1%, followed by Cupshe (-1.4%) and Blooming Jelly (-0.7%).
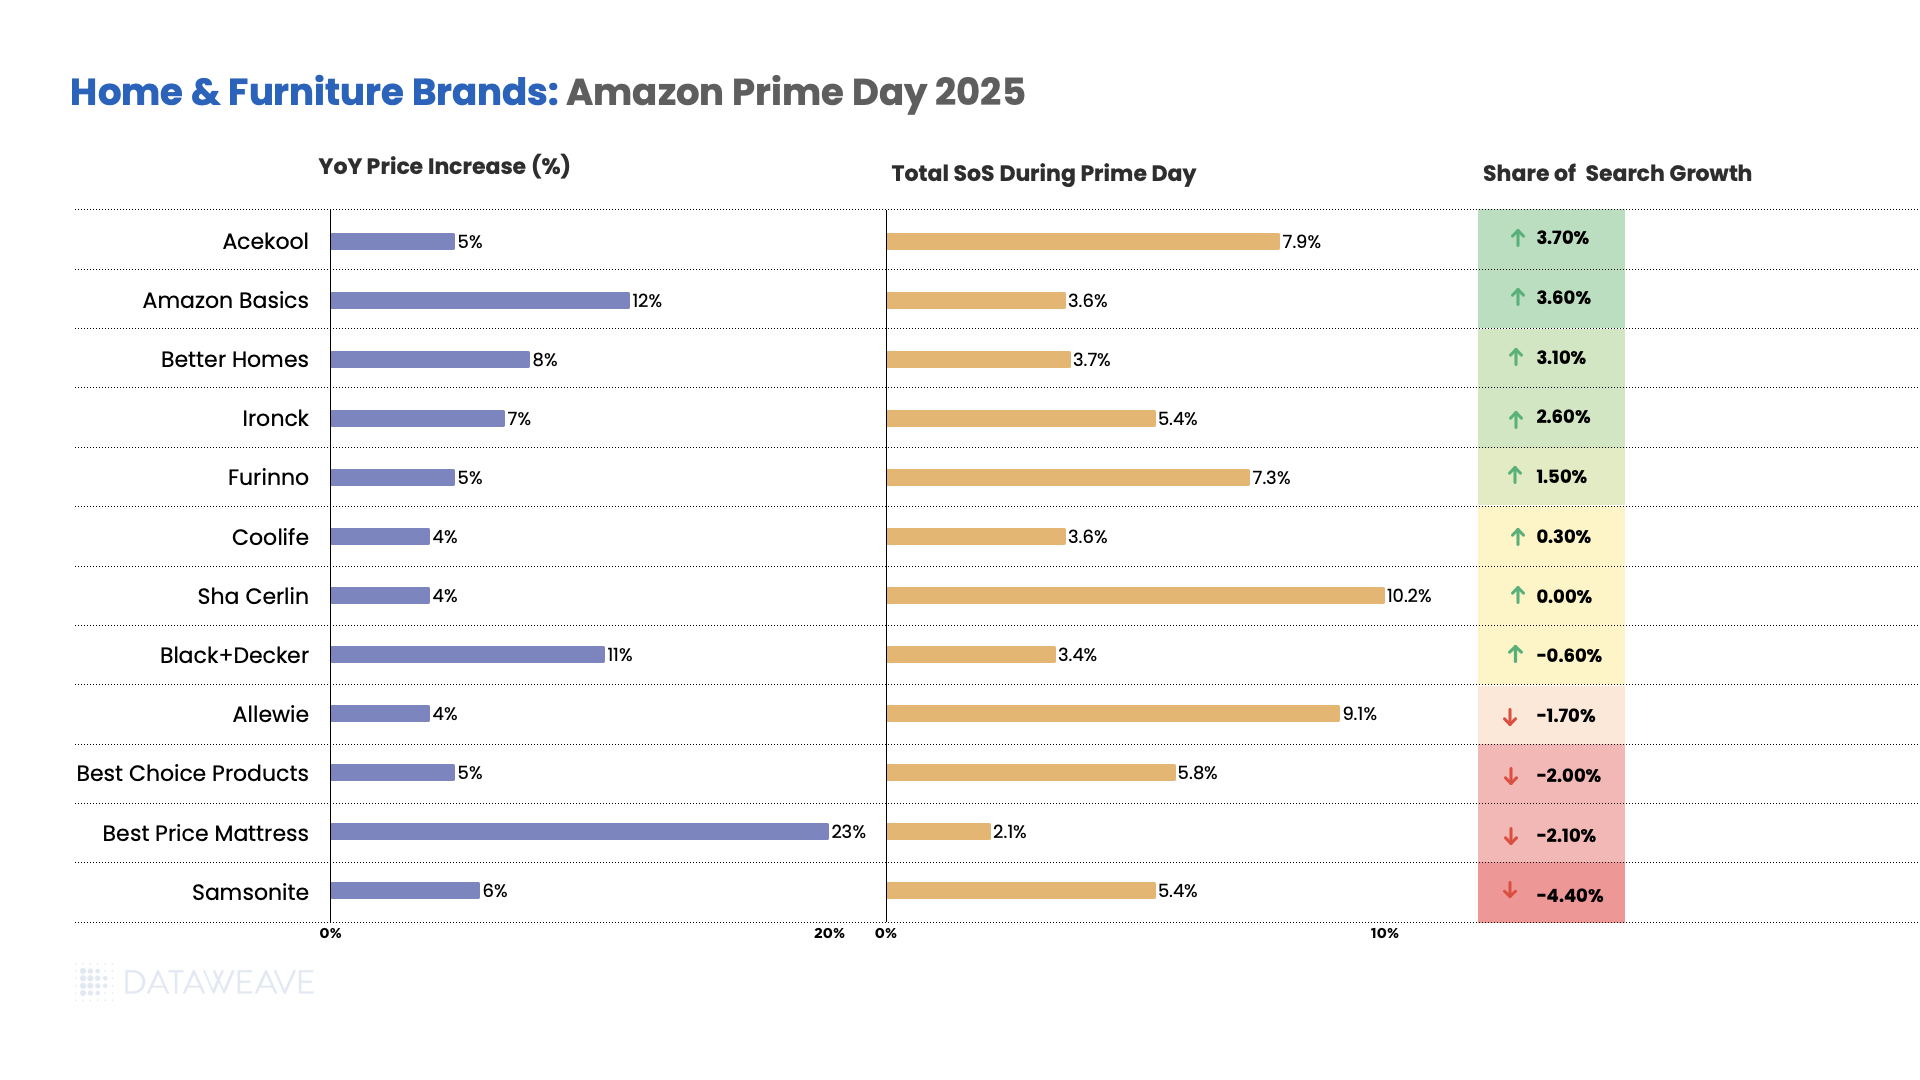
Home & Furniture
Mattress brand Best Price Mattress increased prices 23% year-over-year, the highest in the category.
Home Improvement and Appliances brand Black+Decker saw a pricing increase of 11%.
Better Homes saw an 8% increase, while most other brands saw price increases between 4-7%.
Appliance brand Acekool led visibility gains with 3.7% growth along with a 5% price increase. Amazon Basics improved significantly with a 3.6% share growth alongside its 12% price increases. Better Homes achieved 3.1% gains with 8% price increases.
Ironck gained 2.6% share with 7% price increases, and furniture brand Furinno improved by 1.5% with 5% price increases. However, several brands lost ground, with Samsonite declining most significantly by 4.4%, Best Price Mattress lost 2.1% share with its massive 23% price increase, and Allewie declined by 1.7% with 4% price increases.
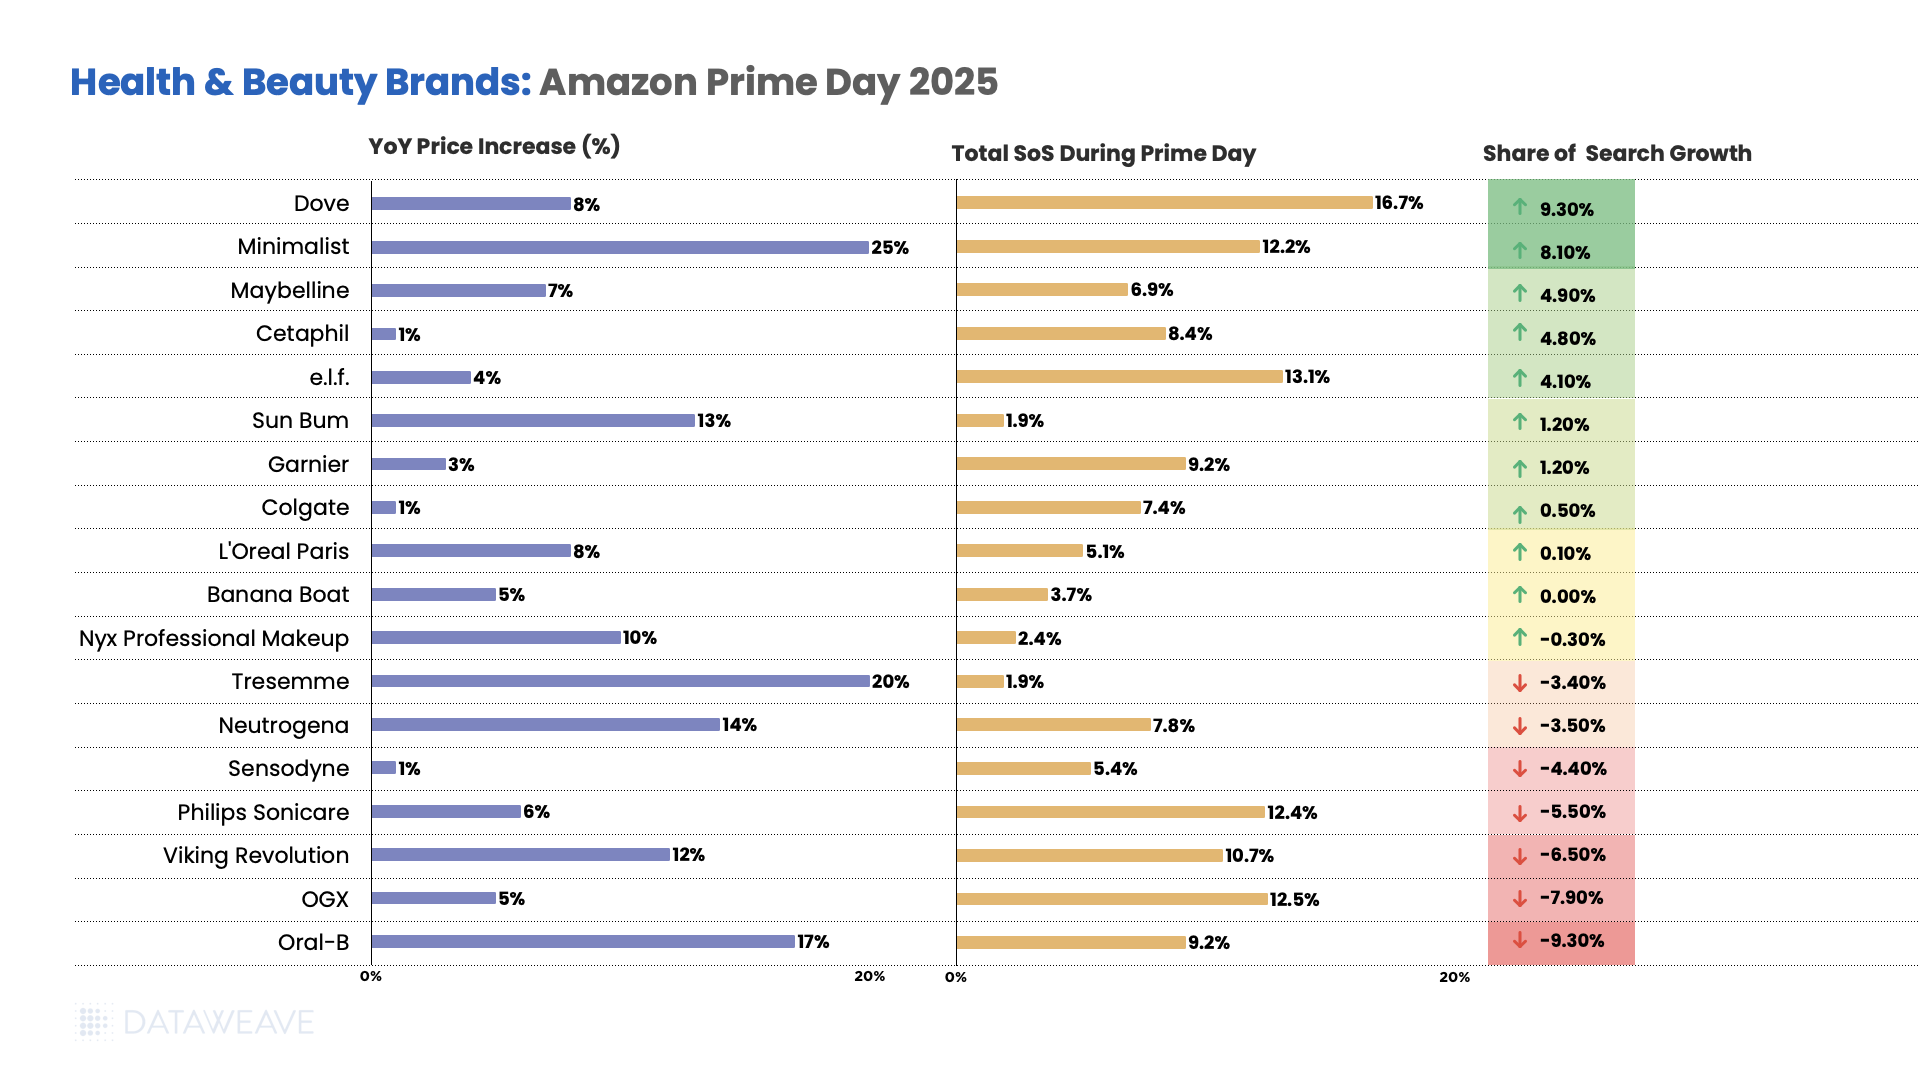
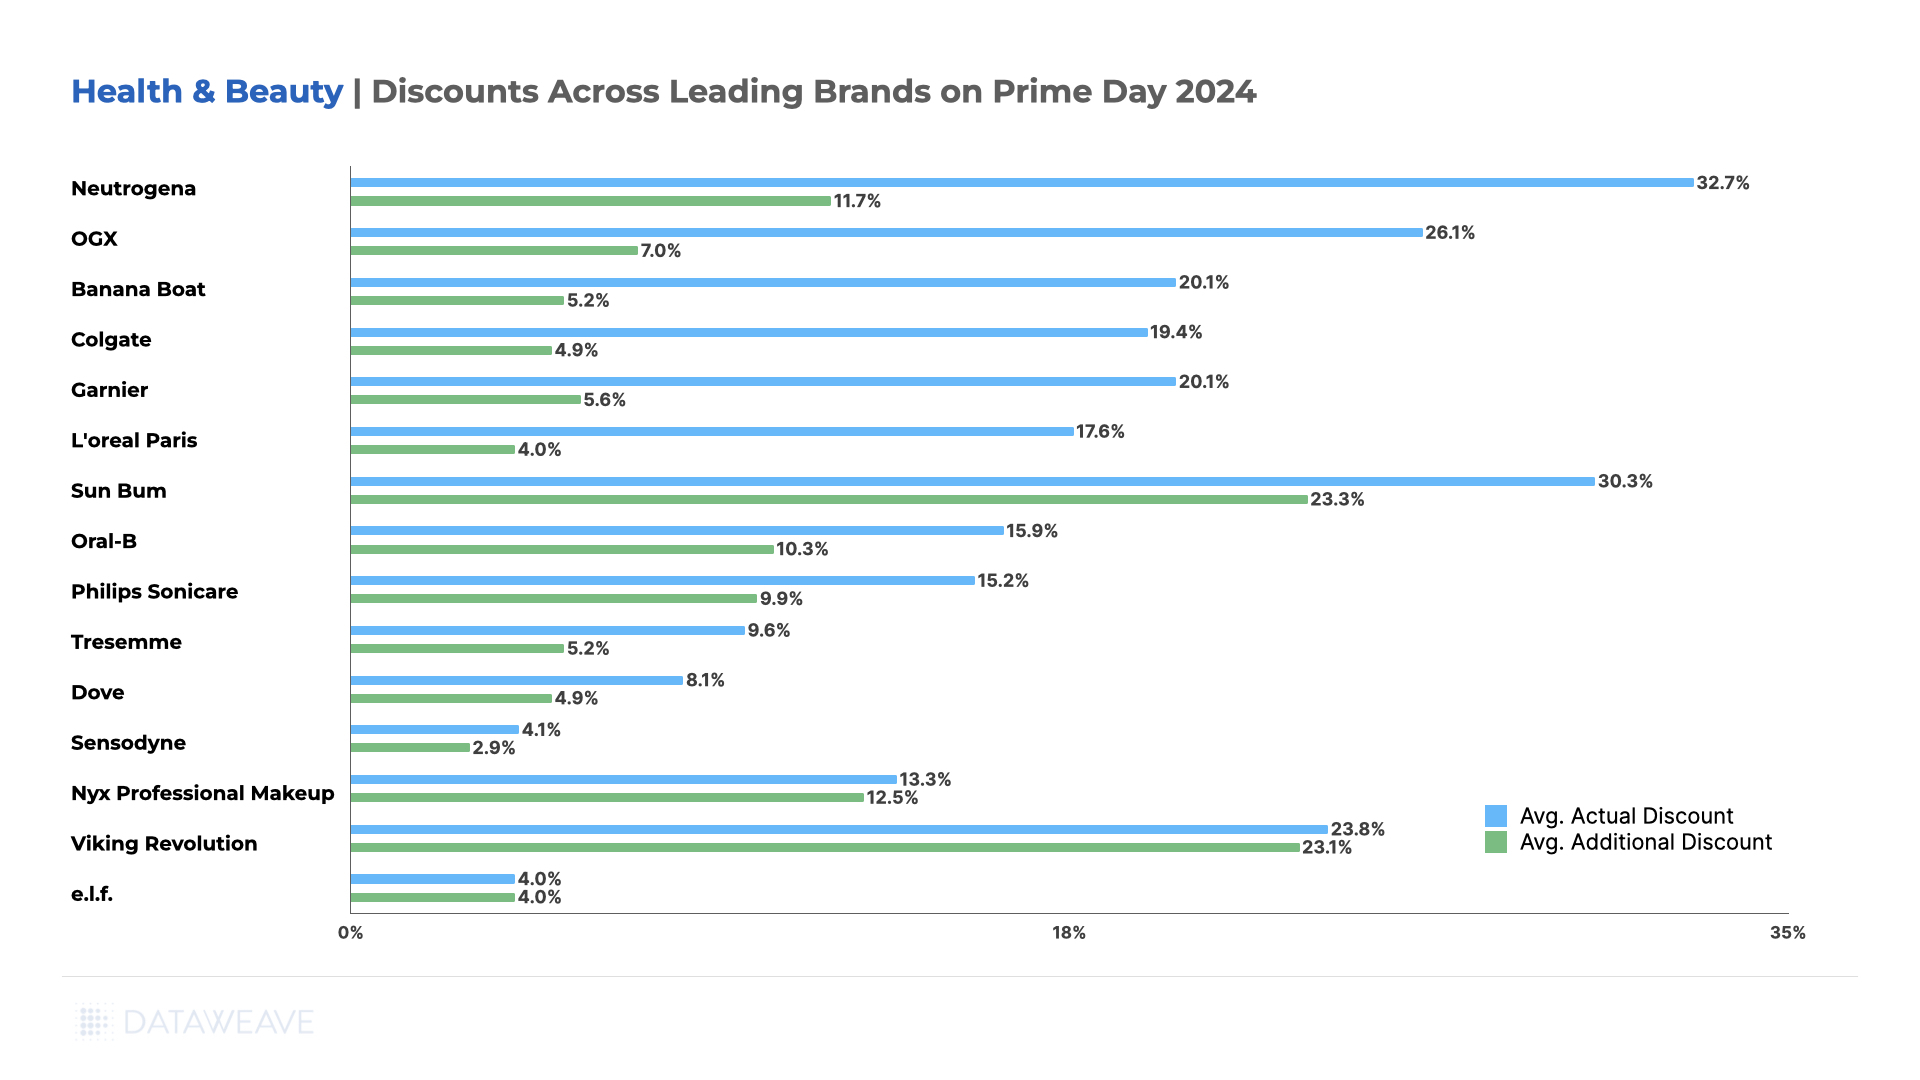
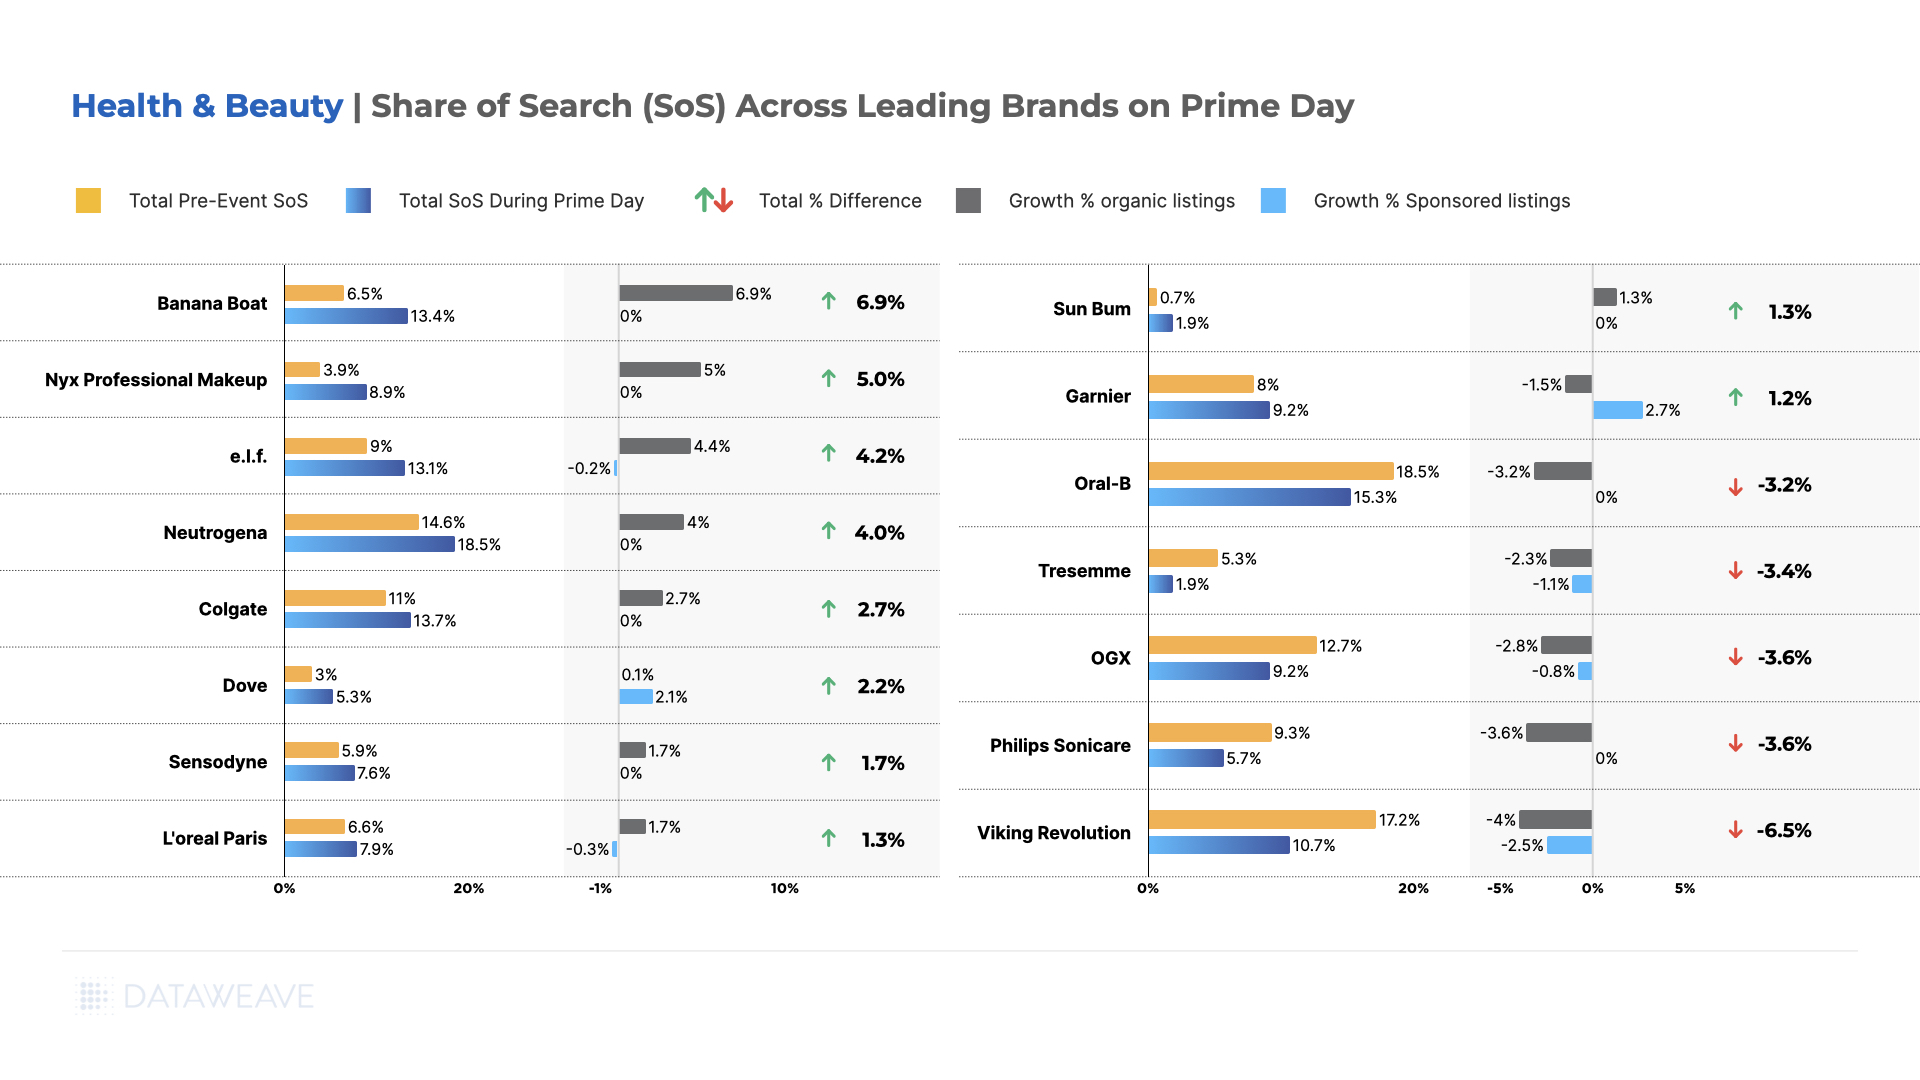
Minimalist saw prices increase 25% year-over-year, the highest in the category, followed by Tresemme at 20% and Oral-B at 17%.
Neutrogena increased pricing by 14%, while Sun Bum rose 13% and Viking Revolution 12%.
Nyx Professional Makeup saw price increases of 10%, Dove and L’Oréal Paris both at 8%, and Maybelline at 7%.
Value-positioned brands saw modest price increases, with Philips Sonicare (6%), OGX and Banana Boat (both 5%), e.l.f. (4%), and Garnier (3%).
Notably, Cetaphil, Colgate, and Sensodyne all kept increases to just 1%.
Dove led visibility gains with 9.3% growth along with 8% price increases. Minimalist achieved remarkable 8.1% growth even with the category’s highest 25% price increases, and Maybelline gained 4.9% share with 7% price increases.
Cetaphil improved by 4.8% with minimal 1% price increases, while e.l.f. gained 4.1% share with 4% price increases. However, several established brands lost share, with Oral-B declining most significantly by 9.3% along with 17% price increases, followed by OGX (-7.9%) with 5% price increases, Viking Revolution (-6.5%) with 12% increases, and Philips Sonicare (-5.5%) with 6% price increases.
In Conclusion
Prime Day 2025 underscores the shifting realities of retail, where persistent pricing pressures, evolving consumer behavior, and complex market forces are redefining how promotions are planned and executed. In this environment, success hinges on having the right intelligence at the right time, empowering brands to target promotions strategically, protect margins, and maintain visibility in a crowded marketplace.
As competition intensifies, the ability to anticipate trends and respond with precision will separate market leaders from the rest. At DataWeave, we equip retailers and brands with the insights needed to navigate these changes and make data-backed decisions that drive sustainable growth.
Stay connected to our blog for ongoing analysis of pricing, promotion, and visibility trends or reach out to us today to learn more.
When it comes to shopping events, Black Friday stands out as one of the most anticipated dates for scoring deals. Typically occurring the day after Thanksgiving, the weekend kicks off the holiday shopping season with a frenzy of discounts. But Boxing Day, celebrated on December 26, is also well-known for its post-Christmas clearance sales.
This Black Friday, US eCommerce sales increased by a hefty 14.6% in 2024, according to Mastercard SpendingPulse. While Black Friday leads in overall revenue generation for retailers, Boxing Day presents unique opportunities for clearing post-holiday inventory.
For a consumer, which sale event is likely to offer the most attractive deals?
At DataWeave, we analyzed discounts across retailers and categories to uncover the answer.
Our Methodology
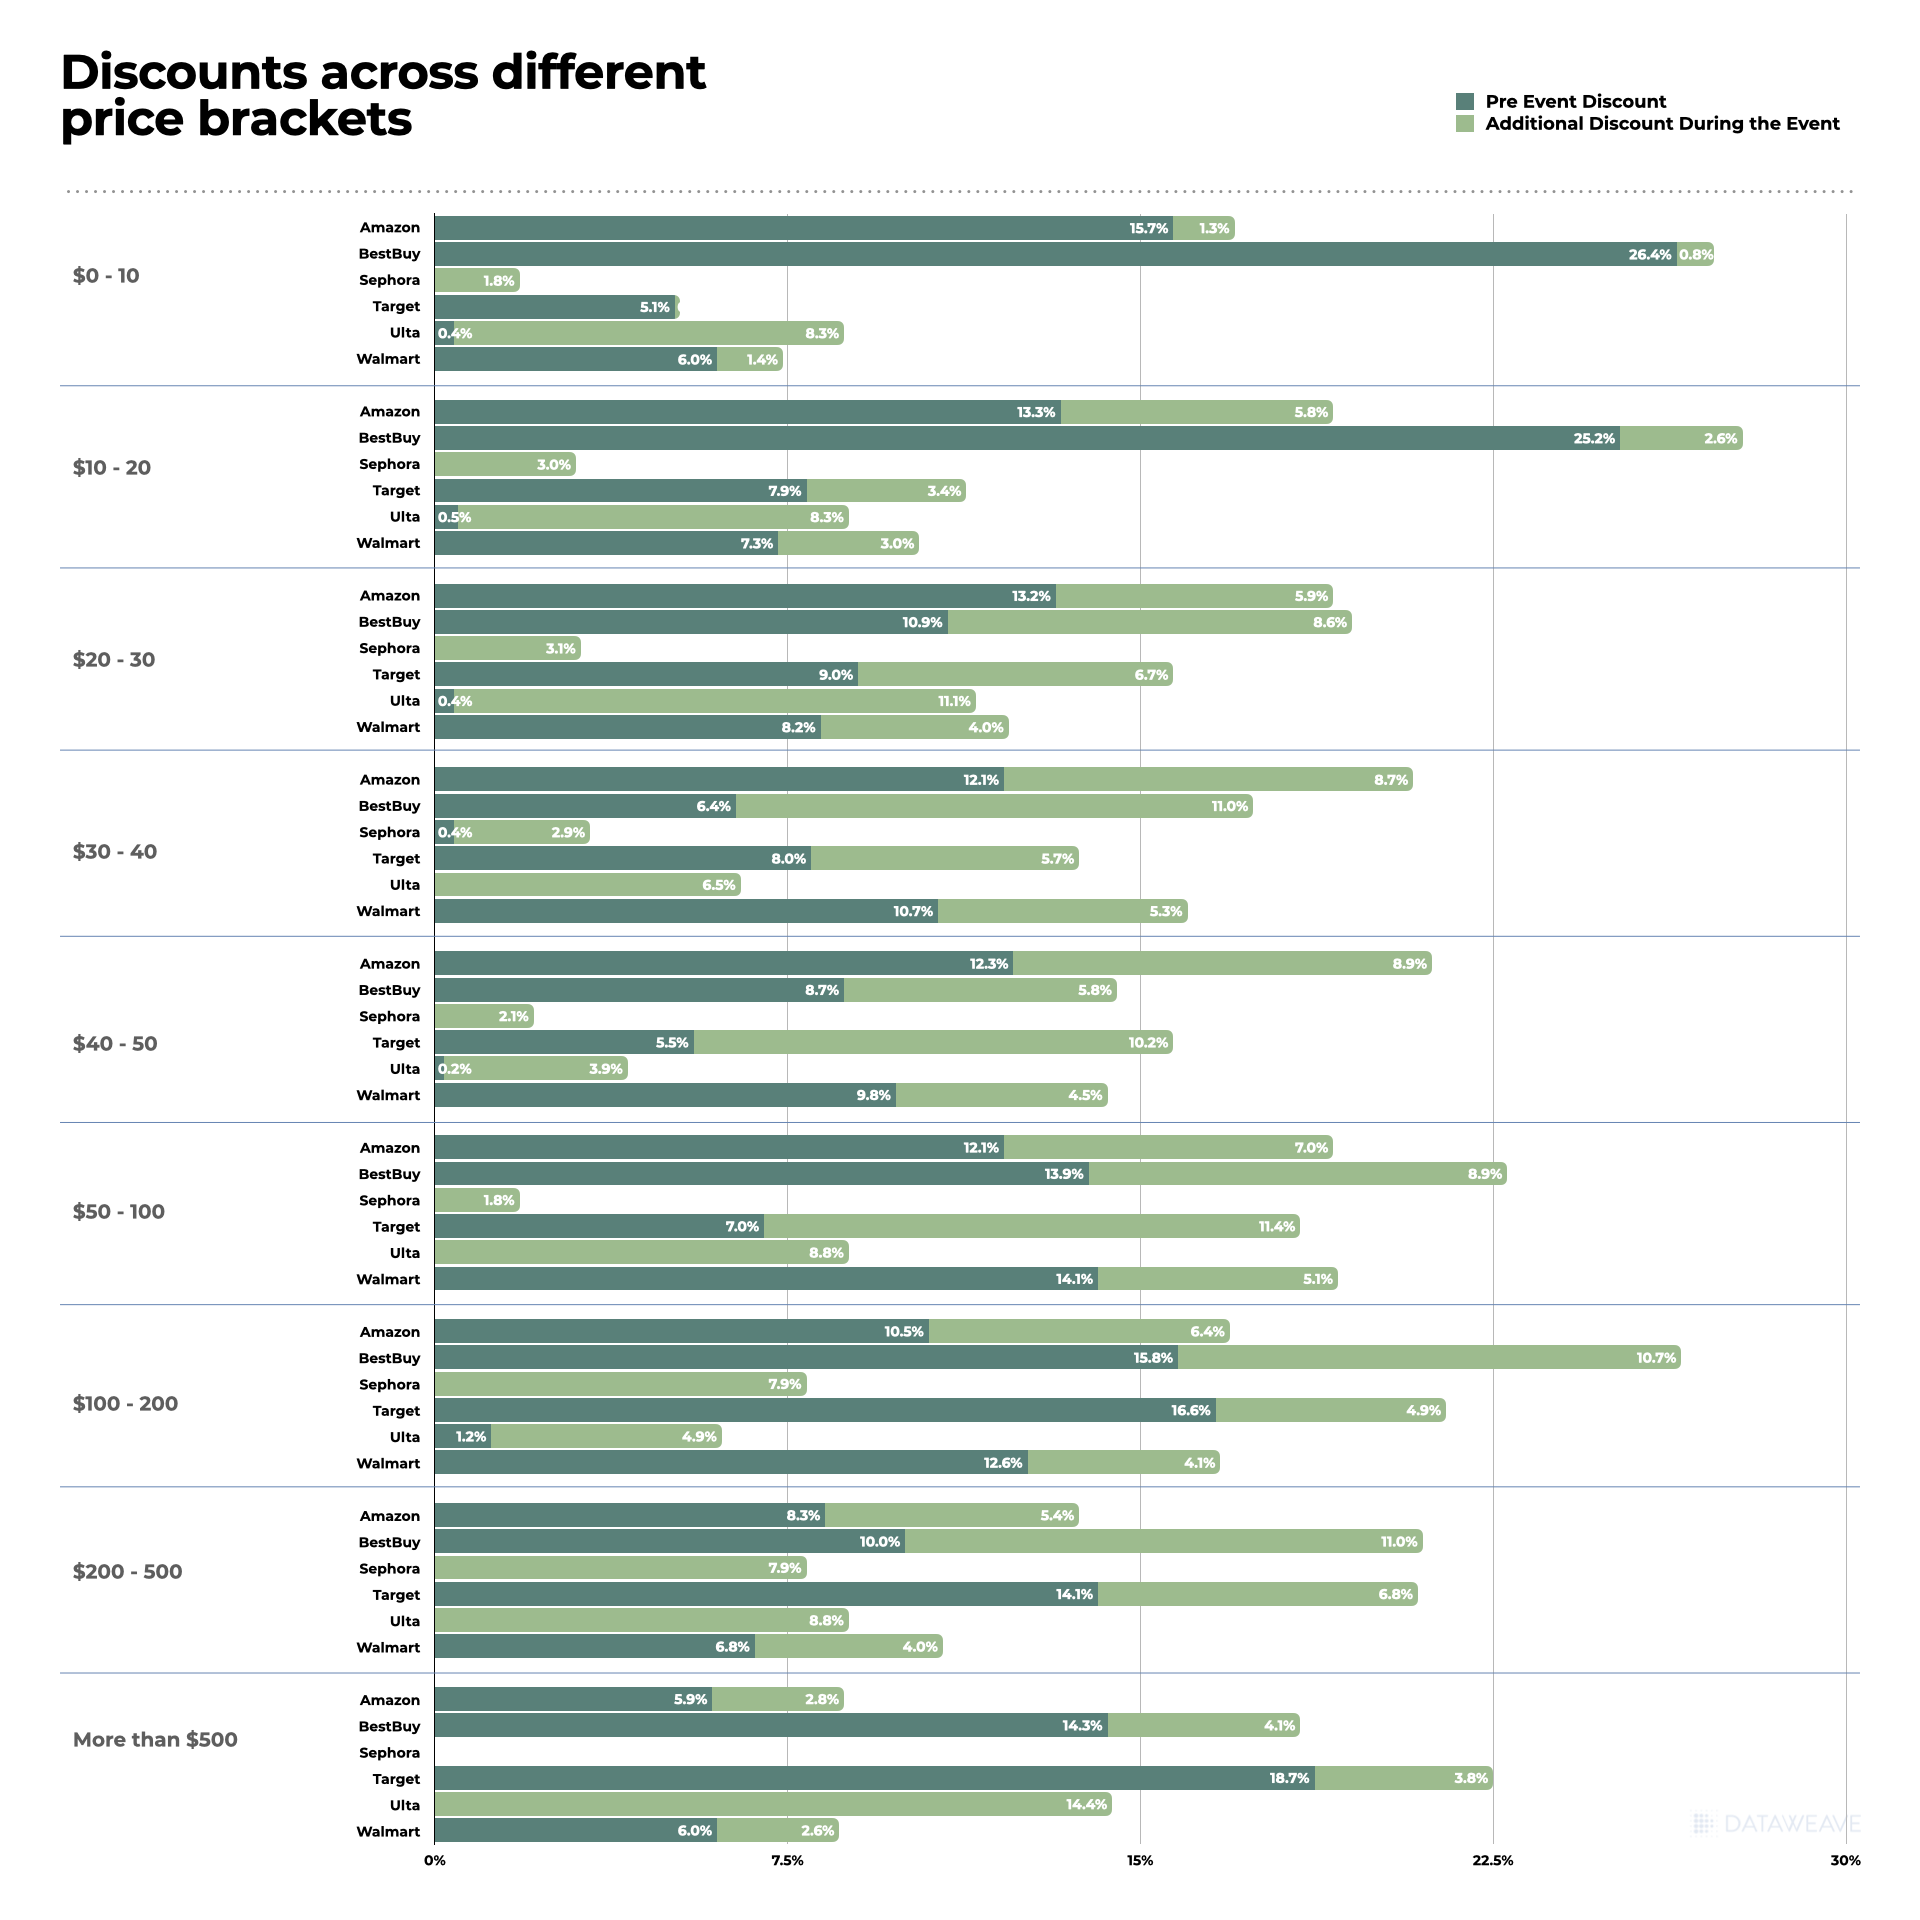
For this analysis, we tracked pricing data across major retailers for Black Friday and Boxing Day. To provide a comprehensive analysis of Black Friday pricing strategies, we explored a matched products dataset, comparing identical 14,000+ SKUs across retailers within key categories.
Categories included: Consumer Electronics, Home & Furniture, Apparel, Health & Beauty, Grocery
Retailers included: Amazon, Target, Walmart, Sephora, Ulta Beauty, Overstock, Home Depot, Best Buy, Saks Fifth Ave, Nordstrom, Macy’s, Bloomingdale’s, Neiman Marcus
Timeline: November 26 (Black Friday), December 26 (Boxing Day)
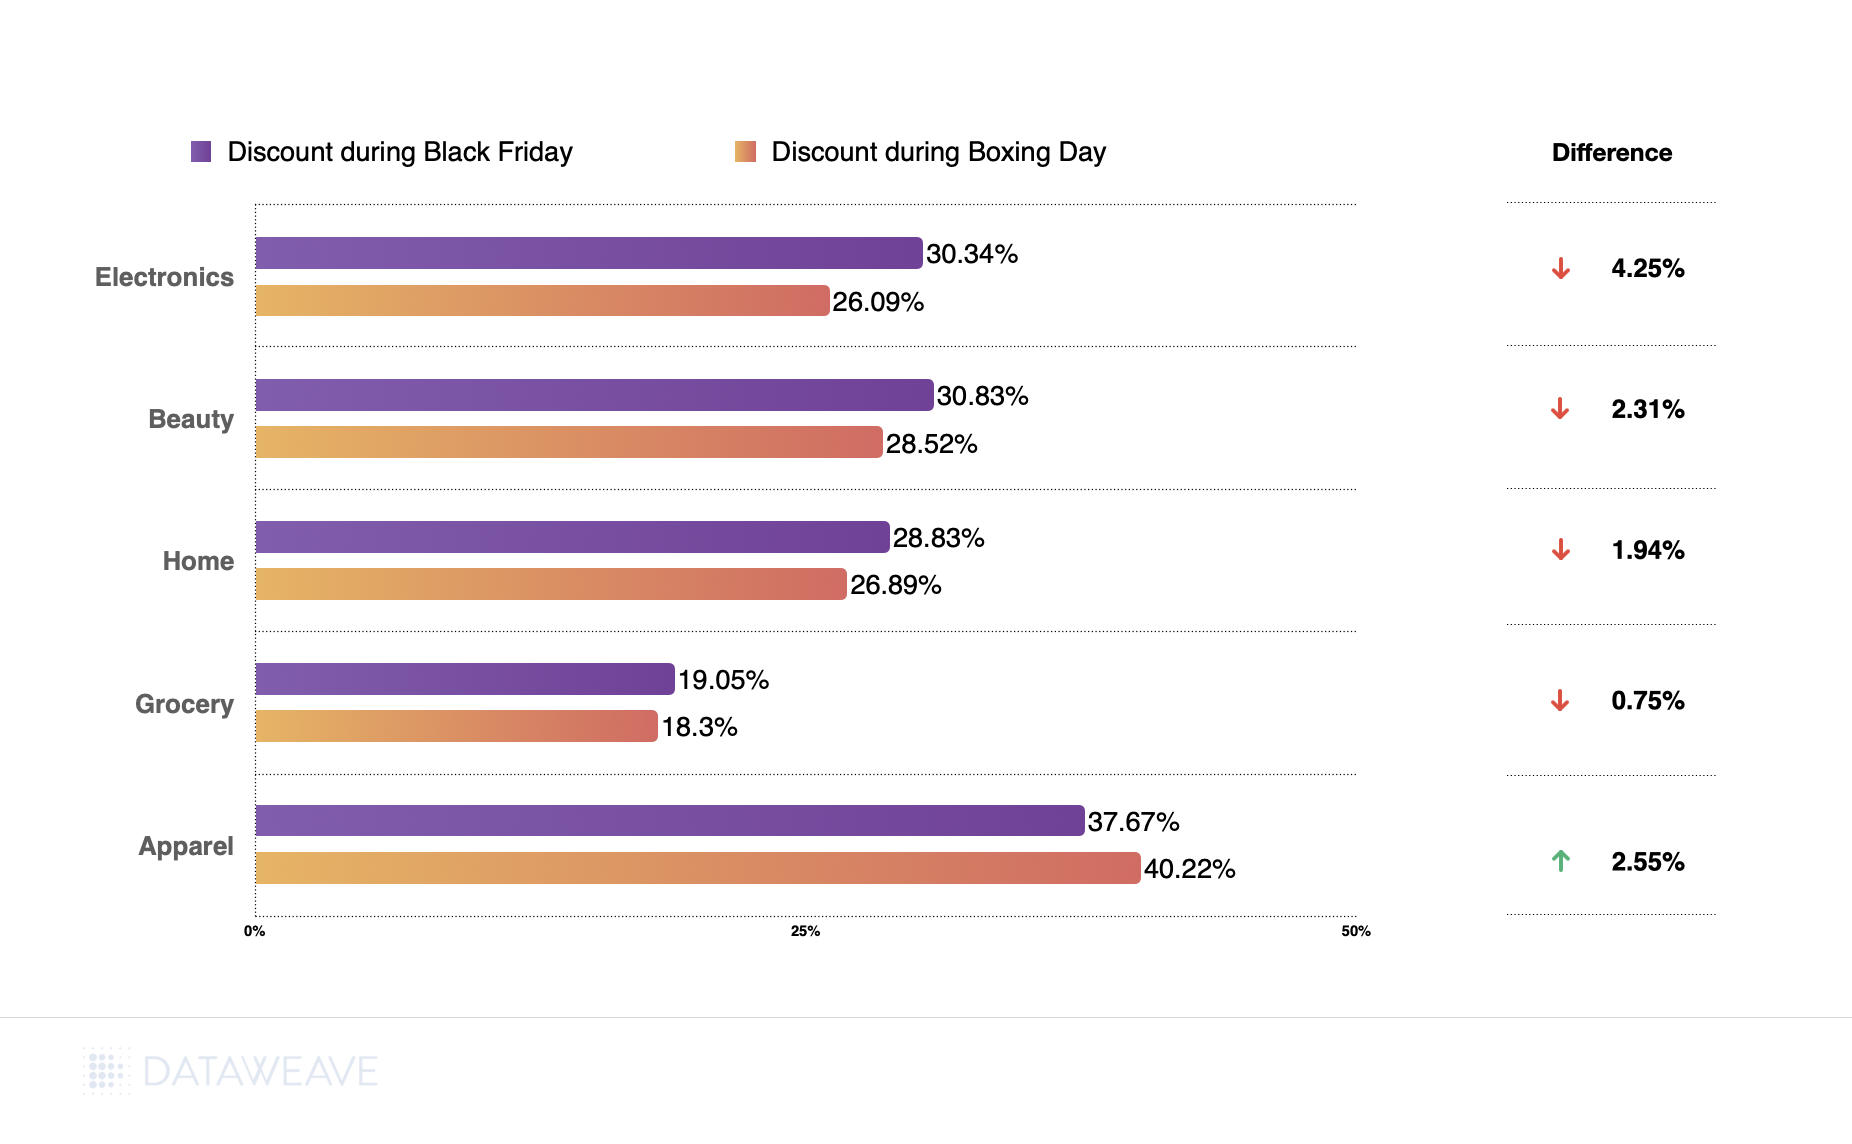
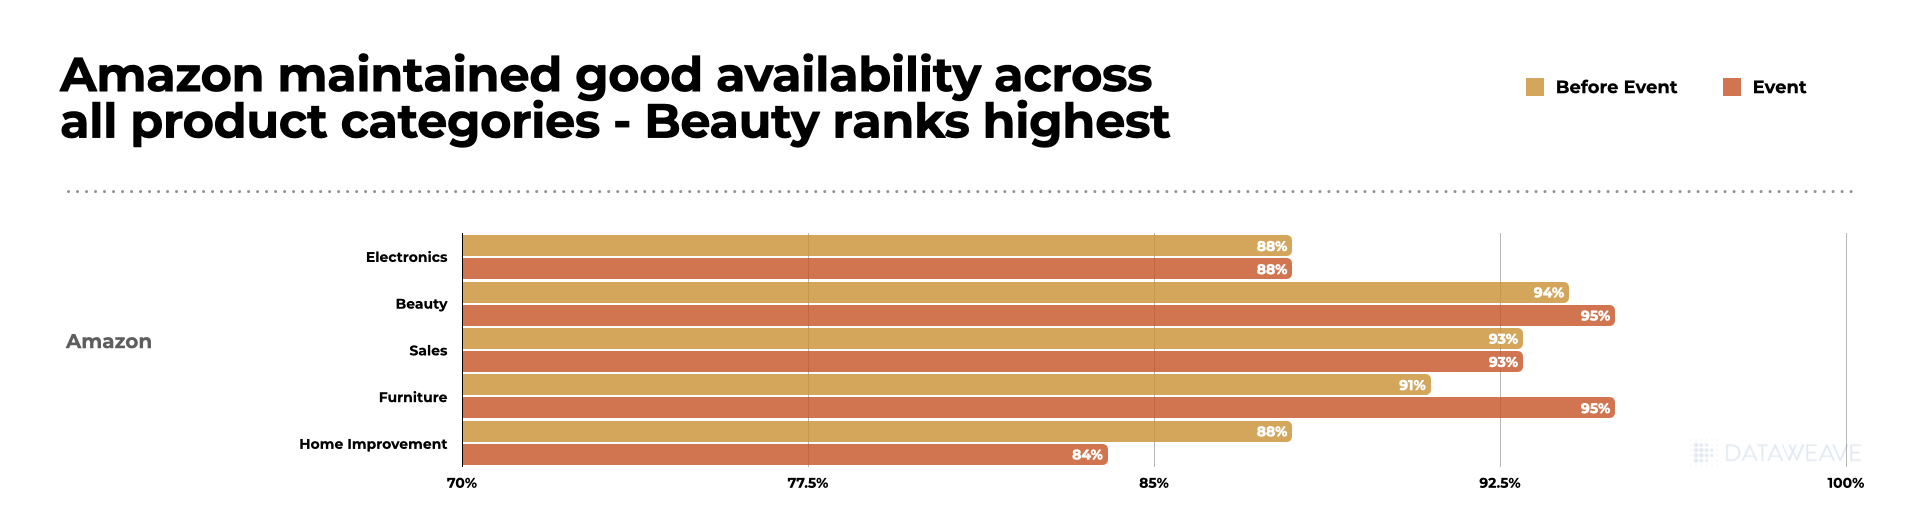
Average Discounts: Black Friday vs Boxing Day
Our analysis reveals that Black Friday generally offered steeper discounts across most categories, although Boxing Day wasn’t far behind. Here’s a breakdown:
While Black Friday led in most categories, Apparel saw a slight edge on Boxing Day, with discounts averaging 40.22% compared to 37.67% on Black Friday. Electronics, Beauty, and Home, however, remained more lucrative during Black Friday.
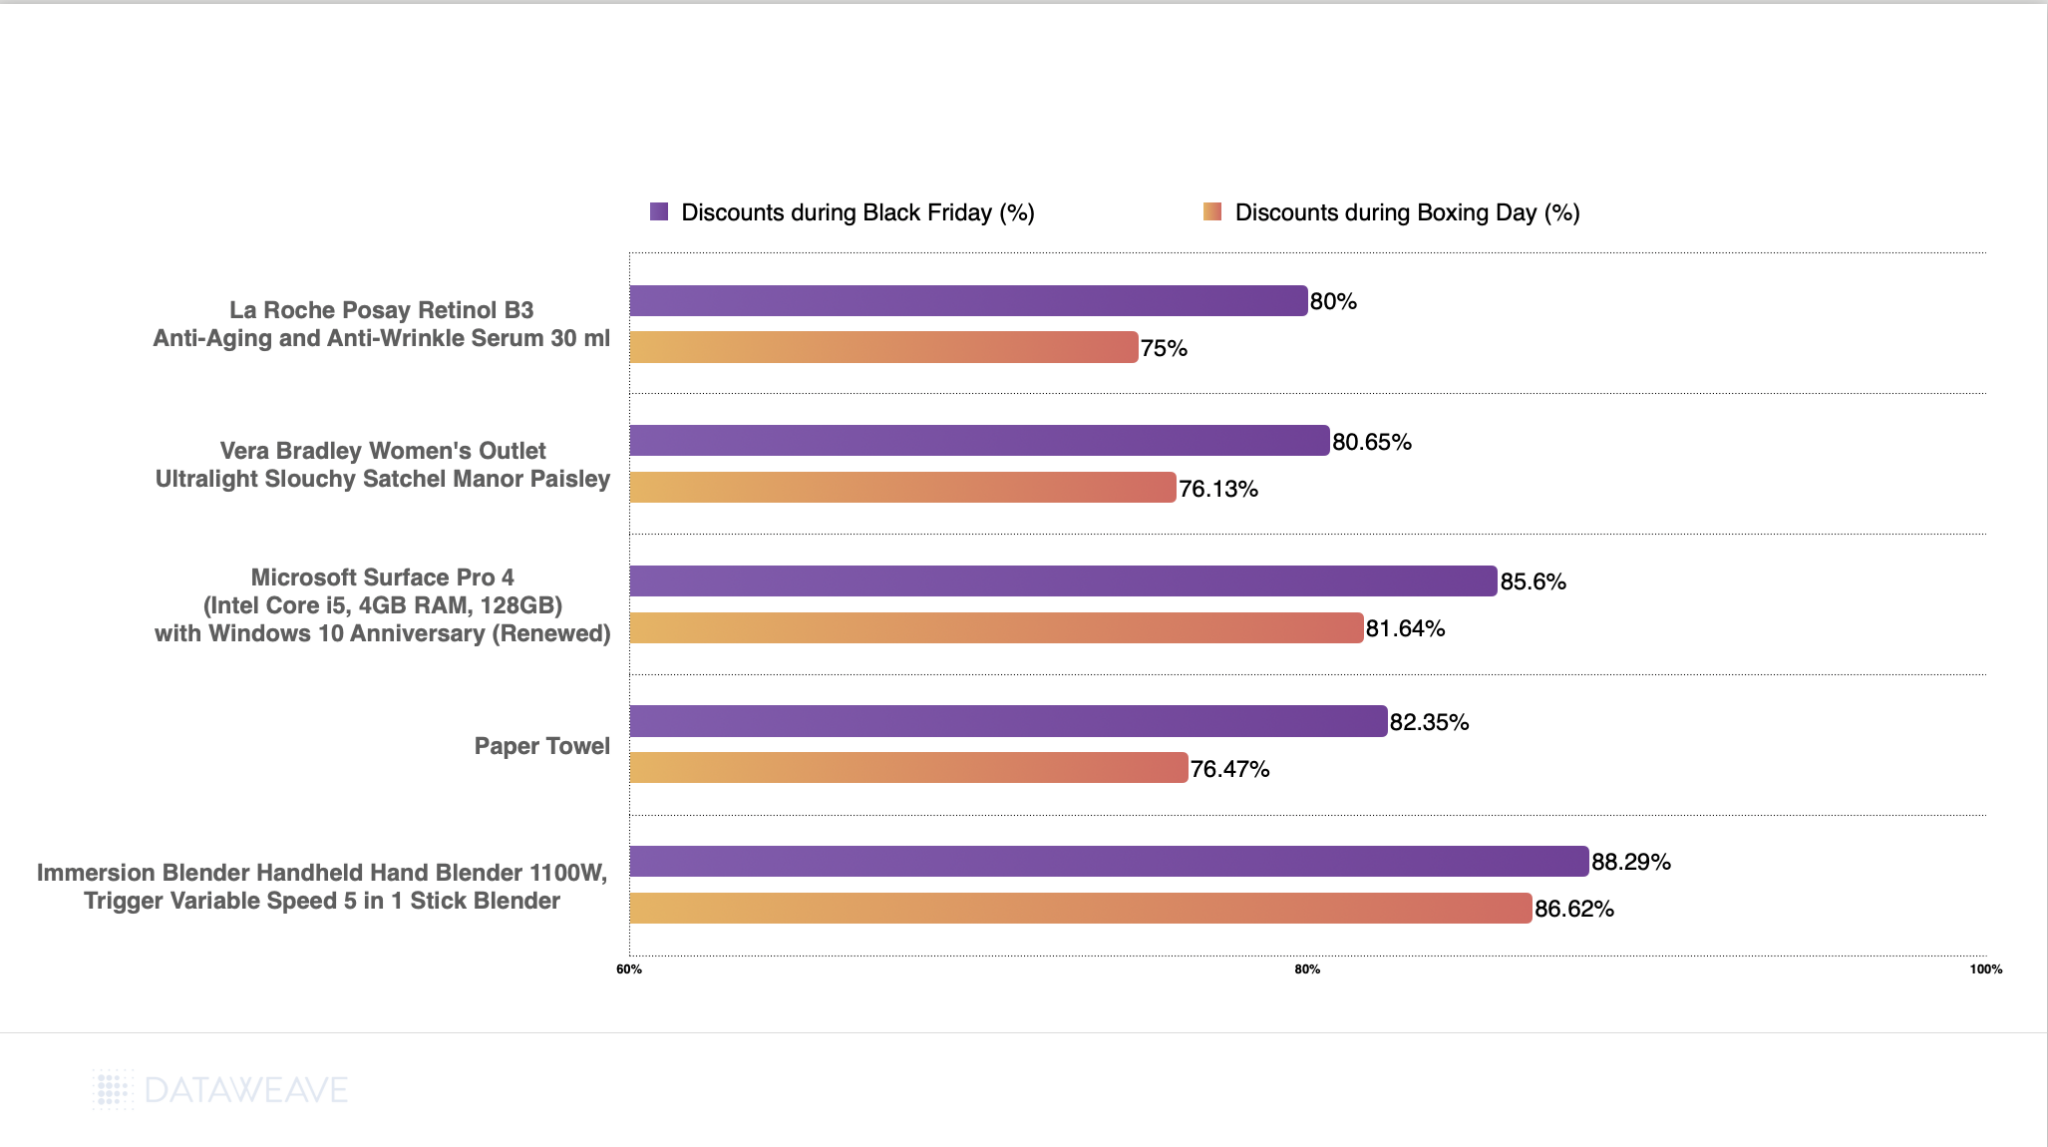
Top 5 Products Higher Discounts on Black Friday
Diving deeper into specific products, here are our top 5 picks offering better discounts during Black Friday.
Appliances like an Immersion blender set offering a discount of 88.29%, significantly higher than its Boxing Day offer of 86.62%.
High-end electronics like the Microsoft Surface Pro 4 also saw substantial markdowns at 84.60%.
In beauty and fashion, both La Roche Posay’s retinol serum and Vera Bradley’s satchel offered discounts above 80%.
Even everyday essentials like paper towels enjoyed generous discounts, with markdowns reaching 82.35% during Black Friday compared to 76.47% on Boxing Day.
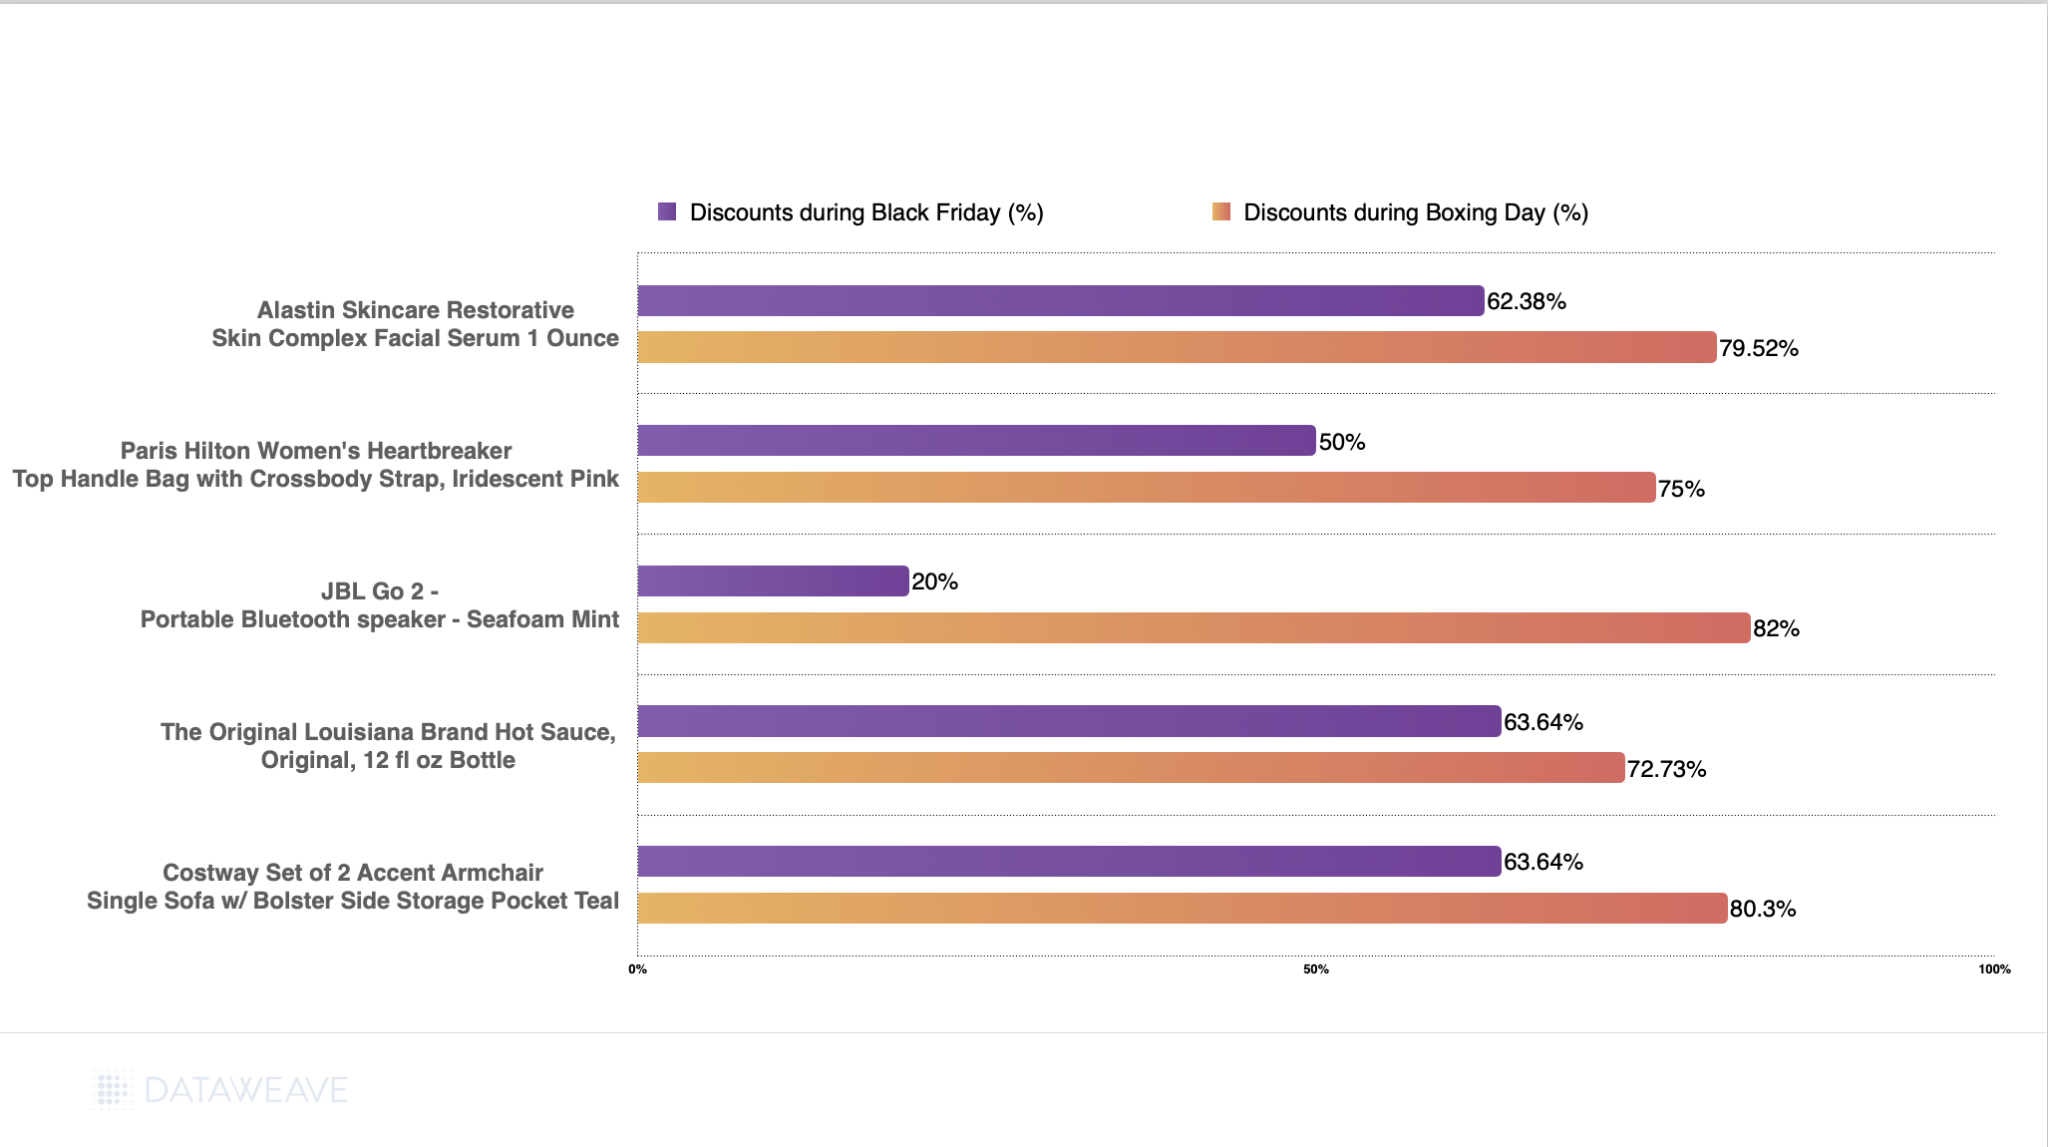
Top 5 Products With Higher Discounts on Boxing Day
Boxing Day revealed some remarkable deals across diverse categories, with certain products offering significantly better value than their Black Friday counterparts.
The JBL Go 2 portable speaker emerged as the standout, with an extraordinary 82% Boxing Day discount compared to just 20% on Black Friday—a dramatic 62% difference.
Home furnishings showed strong Boxing Day performance, with the Costway accent armchair set reaching 80.30% off.
In Conclusion
Black Friday reigns supreme in driving early holiday sales, offering deeper discounts and drawing larger crowds. However, Boxing Day remains critical for retailers to offload surplus inventory and attract post-holiday shoppers.
By combining insights from both events, retailers can refine their strategies to maximize revenue and enhance customer satisfaction. For shoppers, the decision comes down to timing—shop early for better deals or wait to capitalize on clearance markdowns. The products and categories with more attractive offers tend to vary between these two sale events. Hence, as a shopper, it’s a good idea to keep track of prices all through the holiday season to take advantage of the best deals.
For a deeper dive into the world of competitive pricing intelligence and to explore how our solutions can benefit apparel retailers and brands, reach out to us today!
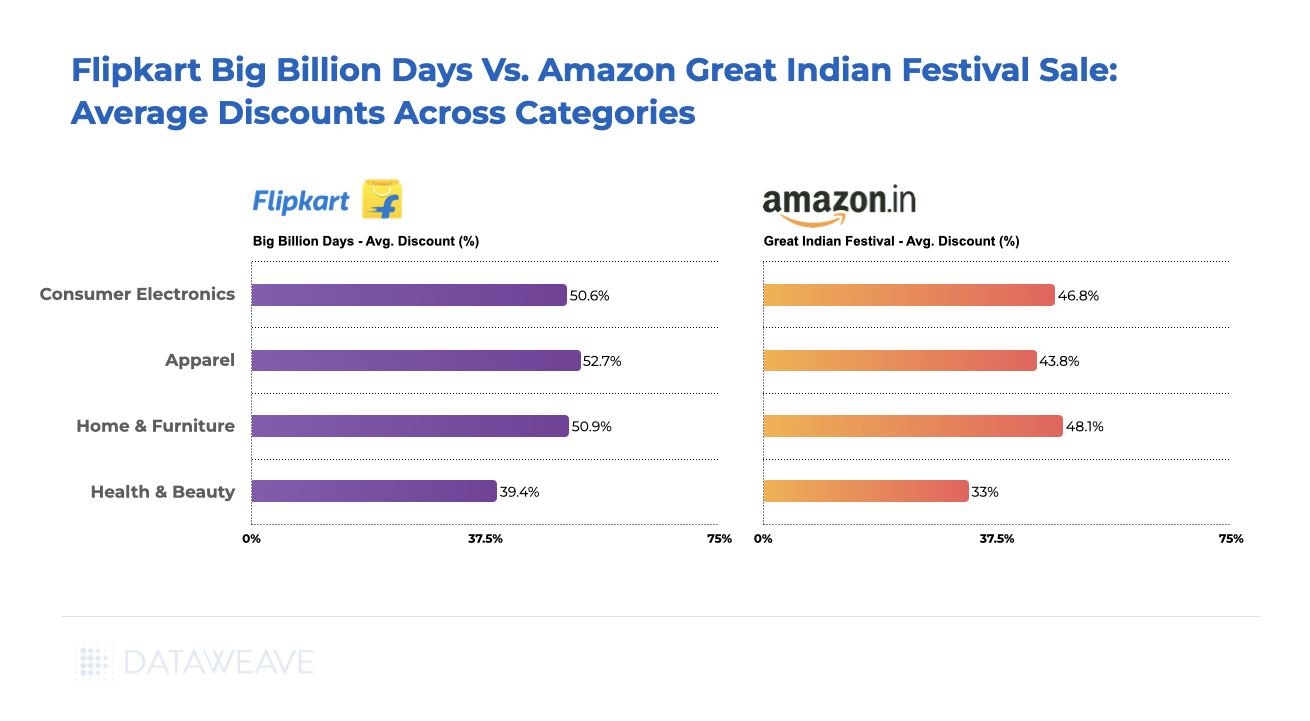
As the holiday shopping season kicked off, savvy shoppers embraced the spirit of the season, drawn by enticing deals. The apparel category is forecasted as the second highest earning category (Source: Statista), expected to generate revenues up to $43.9 billion, closely following consumer electronics. To understand the pricing strategies of top retailers amidst the sale season, DataWeave analyzed the pricing trends for the Apparel category this Black Friday.
We leveraged our AI-powered data platform to analyze the discounting across key retailers. Our analysis focused on the Apparel category, examining how Amazon, Walmart, Target, Saks Fifth Avenue, Nordstrom, Bloomingdales, Neiman Marcus and Macy’s differentiated themselves through their discounts.
For this analysis, we tracked the average discounts of apparel products among leading US retailers during the Thanksgiving weekend sale, including Black Friday. Our sample was chosen to encompass the top 500 ranked products in each product subcategory across during the sale.
Subcategories reported on: Footwear, Kid’s Clothing, Men’s Clothing, Women’s Clothing, Activewear, Plus Size Clothing, Accessories
Timeline of analysis: 10 to 29 November 2024
We focused on the top 500 products ranked for each search keyword on each retail site, using targeted terms aligned with categories like “athleisure” and “plus size clothing”. Our methodology distinguished between standard discounts and Black Friday-specific ‘additional discounts’ or price reductions during the sale compared to the week before, to reveal true consumer value.
Key Findings
This year’s fashion discounts were unprecedented. Let’s take a look.
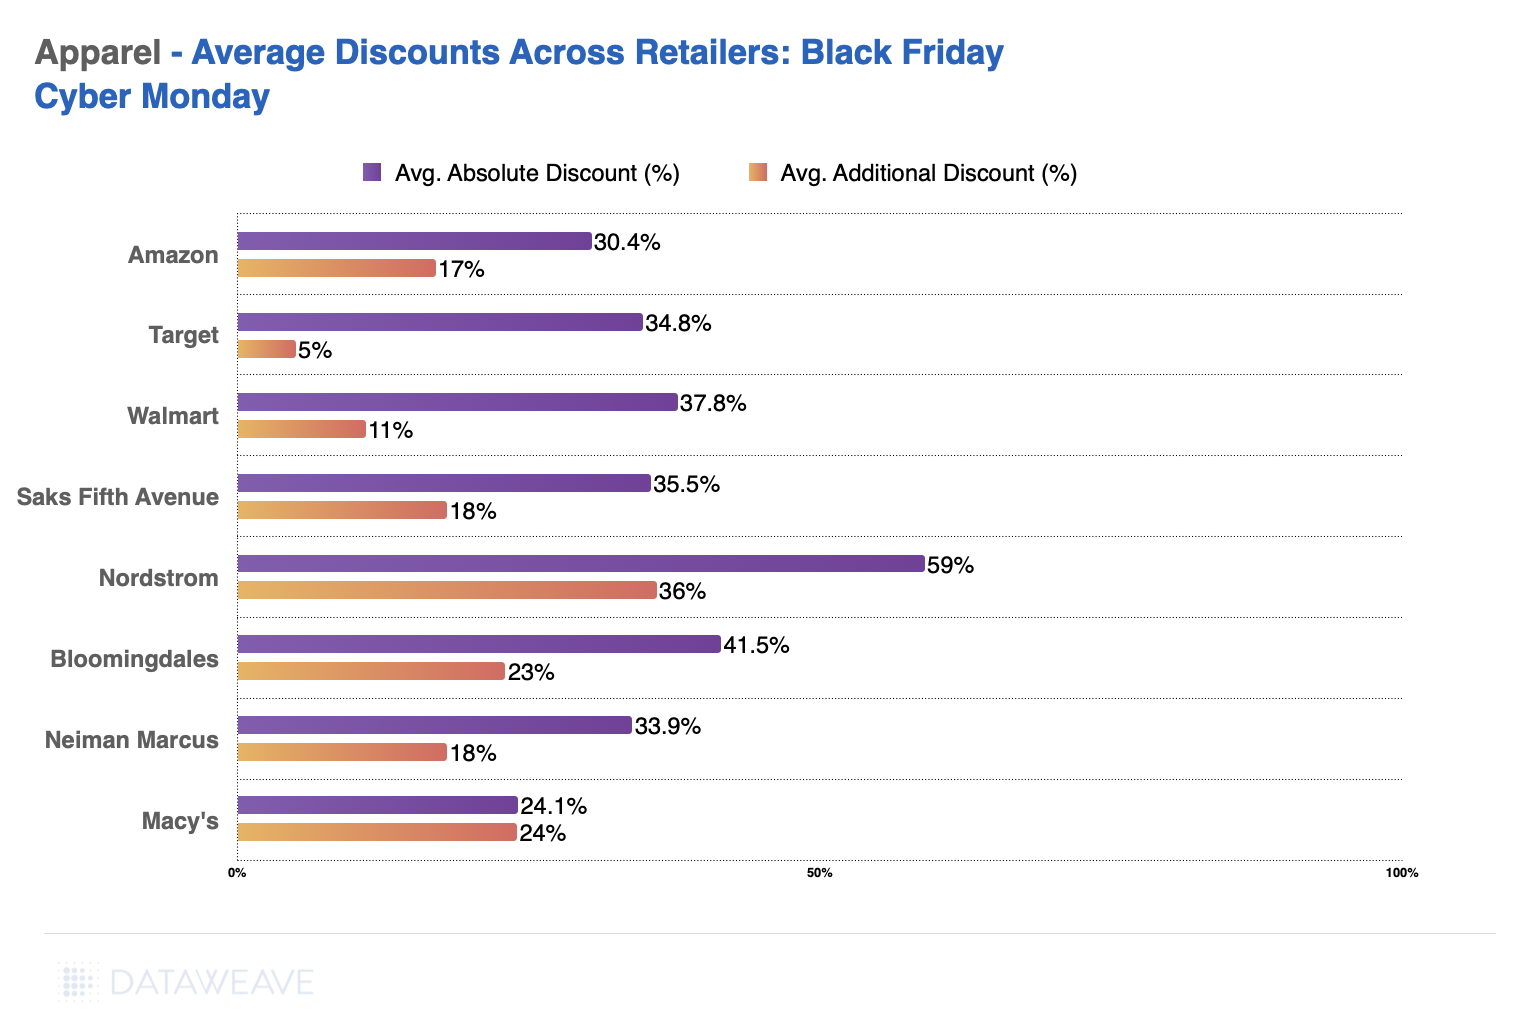
Retailer Level Insights
Nordstrom leads with the highest average absolute discount at 59%, followed by Saks Fifth Avenue at 35.5% and Bloomingdale’s at 41.5%. Macy’s shows the lowest average discount at 24.1%, while Amazon has an average discount of 30.4%.
Amazon ranks lower in both average absolute and additional discounts compared to competitors, indicating a more conservative discounting strategy.
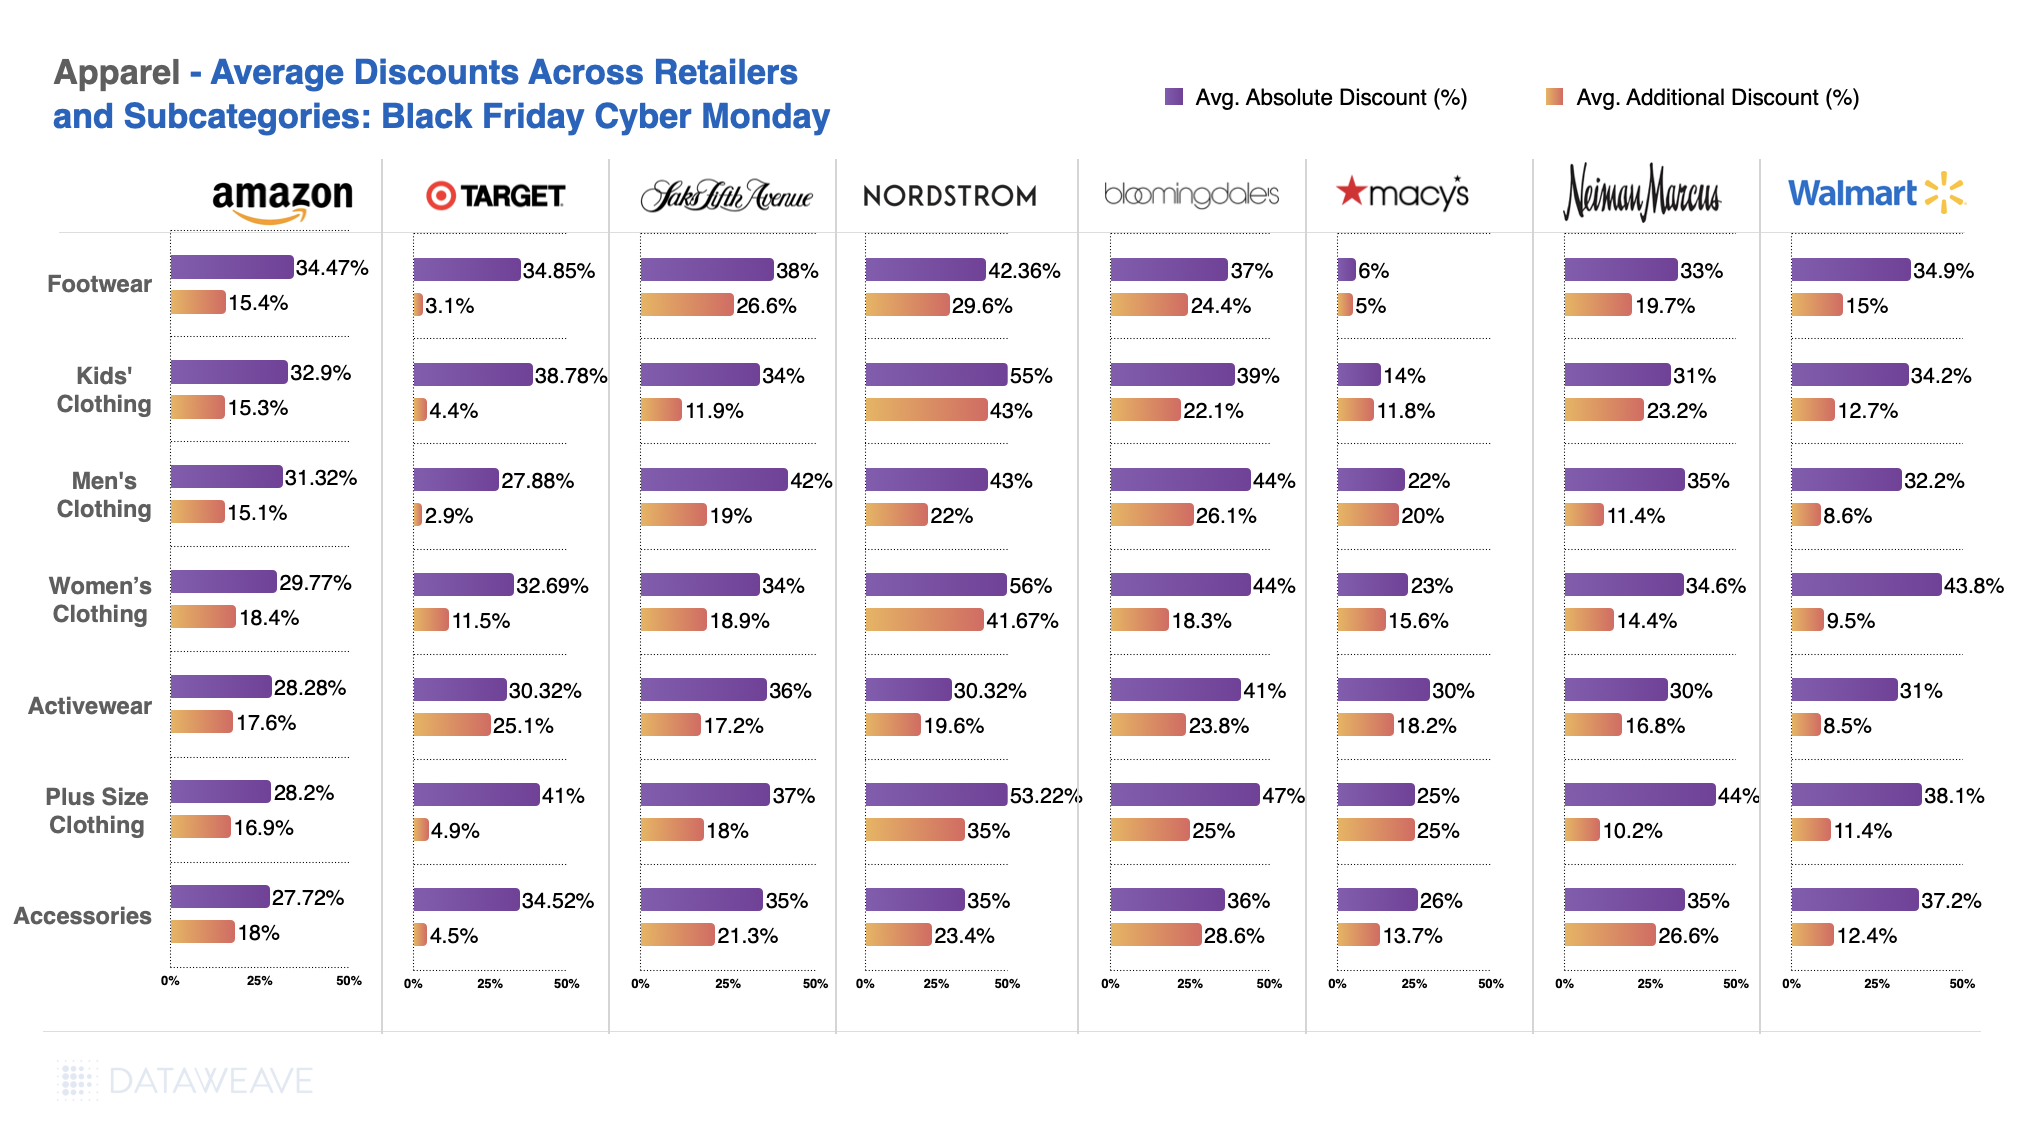
Subcategory Analysis
Kids’ Clothing saw the deep discounts (up to 55% at Nordstrom), reflecting growing pressure on family budgets and heightened competition to attract budget-conscious parents.
Plus-Size Clothing emerged as a major focus, with Nordstrom leading at 53.22% average absolute discounts, signaling that retailers are increasingly prioritizing size inclusivity and appealing to a broader consumer base.
Footwear experienced robust discounting, particularly at Bloomingdale’s with 37% average absolute discounts, showing a competitive approach to attract customers looking for seasonal footwear deals.
Activewear displayed substantial discounts, with Walmart offering up to 41% on average, aligning with the trend of consumers looking for practical and comfortable attire during the winter season.
Brand Level Insights
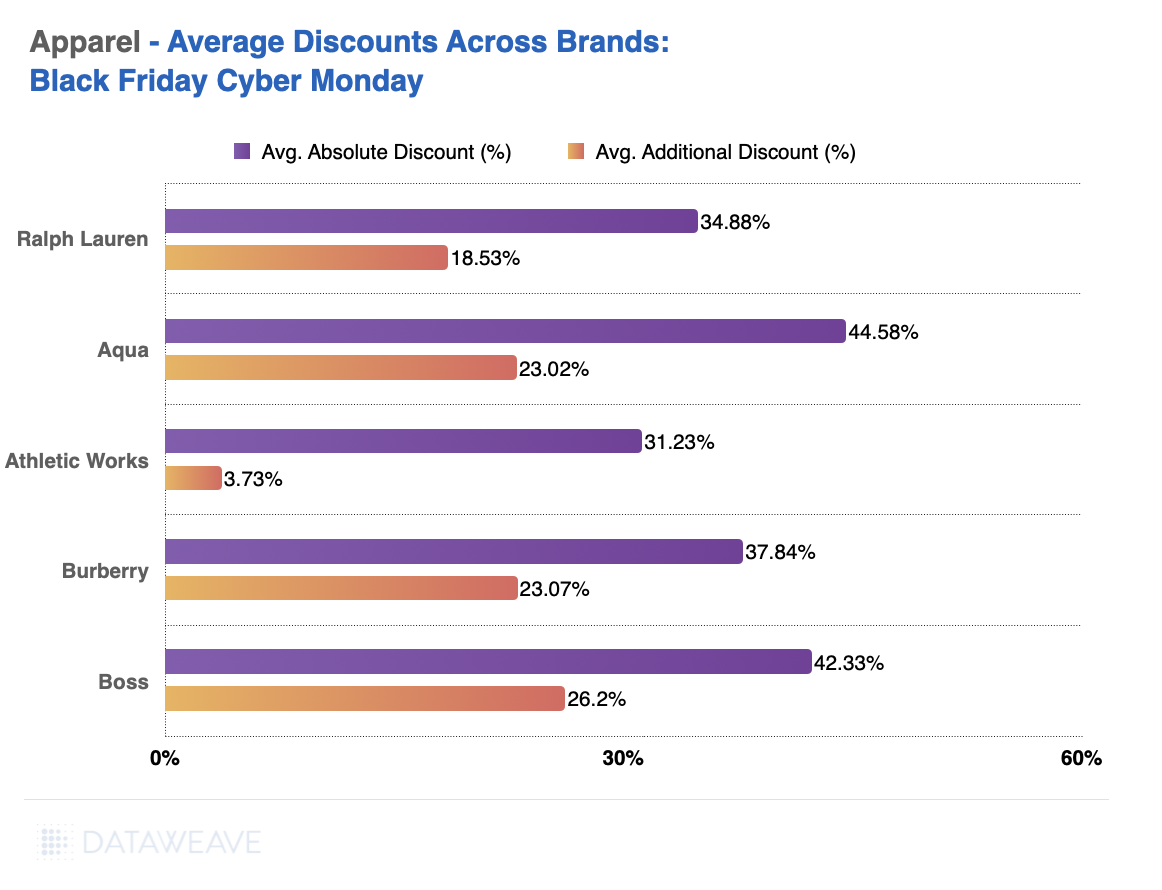
Apparel brands, meanwhile, also offer telling insights.
Top Discounting Brands: Aqua leads with an average absolute discount of 44.58%, followed by Boss at 42.33% and Burberry at 37.84%.
Lowest Discounts: Athletic Works shows the lowest average absolute discount at 31.23%, with a minimal additional discount of 3.73%.
Competitive Advantage: Brands like Ralph Lauren and Boss show strong discounts, indicating aggressive marketing during the sale.
Share of Search Insights
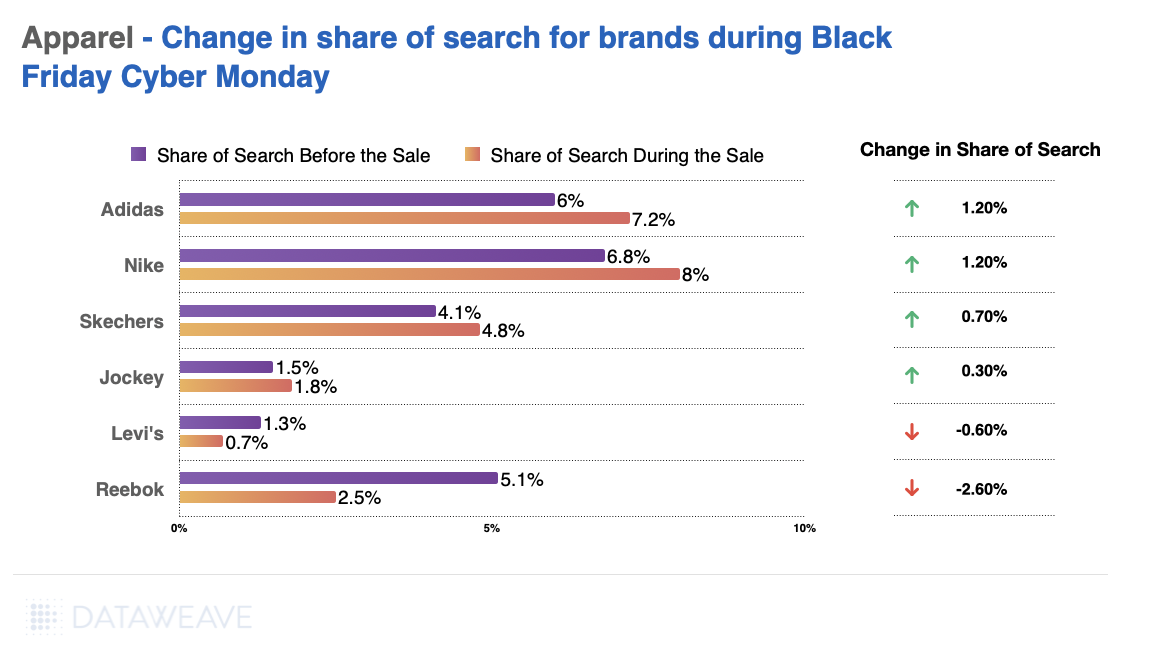
Top Gainers: Adidas and Nike each saw an increase of 1.20% in their share of search during Black Friday/Cyber Monday, highlighting their strong brand presence and consumer interest.
Top Losers: Reebok experienced a sharp decline, losing 2.60% in its share of search, while Levi’s also dropped by 0.60%.
Search Trends: The data suggests a strong consumer preference for activewear brands like Nike and Adidas and a decline in interest for traditional apparel brands like Levi’s.
Who Offered Most Value This Black Friday
In the previous analysis, we focused on the top 500 products within each subcategory for each retailer, showcasing the discount strategies for their highlighted or featured items. However, to identify which retailer offered the lowest or highest prices for the same set of products, it’s necessary to match items across retailers. For this, we analyzed a separate dataset of 418 matched products across Apparel specific retailers to compare their pricing during Black Friday. This approach provides a clearer picture of price leadership and competitiveness across categories.
Here are the key takeaways from this analysis.
Category-Level Analysis
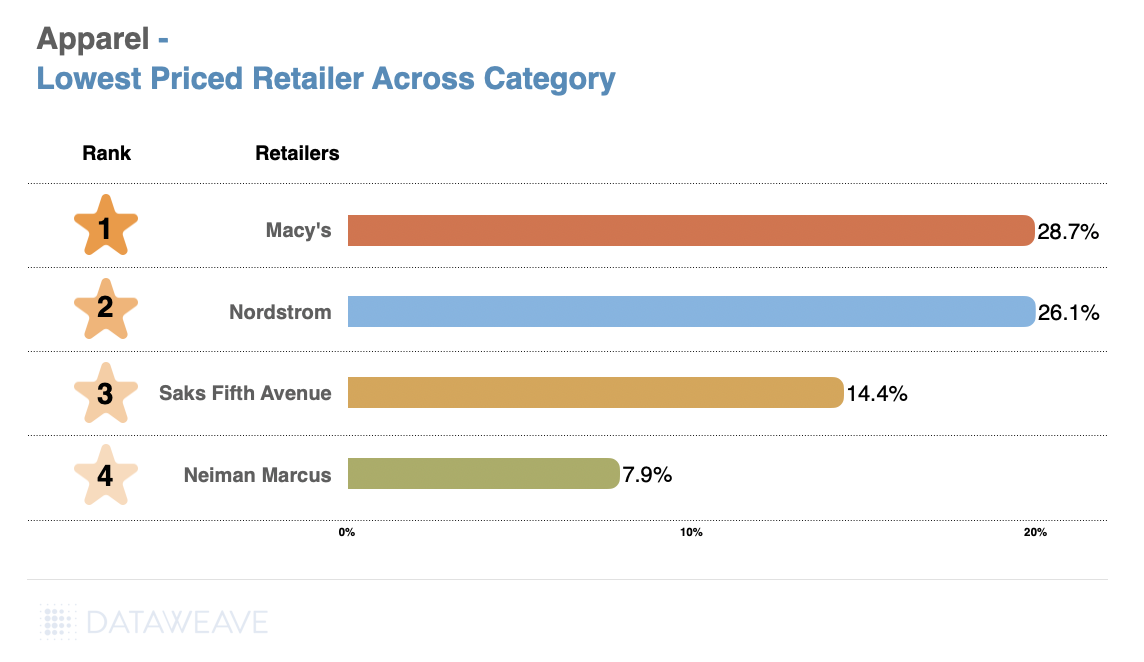
At the overall category level, Macy’s emerged as the lowest-priced retailer, offering the highest average discount of 28.72%, followed closely by Nordstrom (26.06%). The steep decline in average discounts from Saks Fifth Avenue (14.42%) and Neiman Marcus (7.93%) highlights a clear gap in discounting strategies.
Macy’s and Nordstrom are aggressively competitive on pricing in the overall apparel category, likely capturing consumer attention with substantial discounts.
Saks Fifth Avenue and Neiman Marcus may rely more on brand perception and luxury positioning rather than heavy discounting.
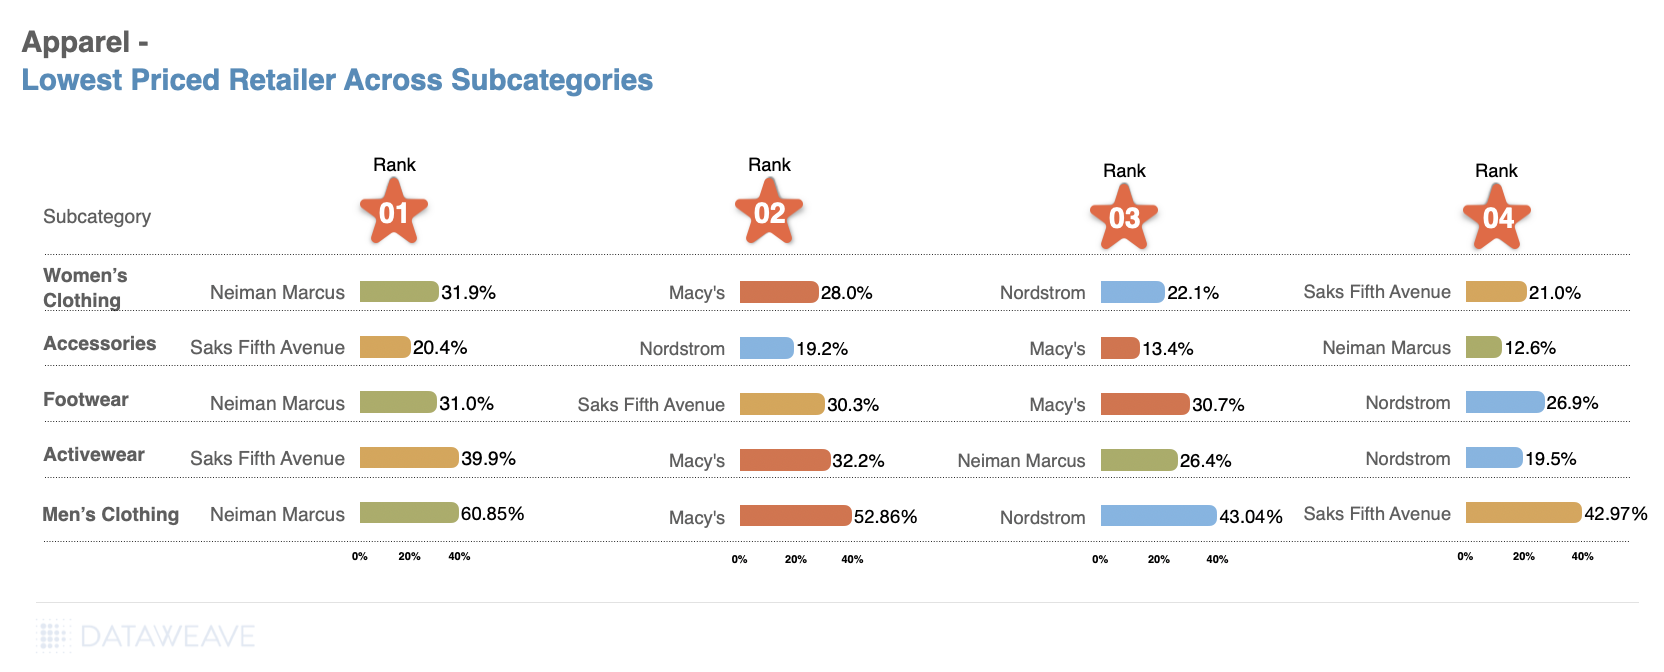
Subcategory-Level Analysis
Neiman Marcus tops the ranking with an impressive 60.85% average discount, outperforming Macy’s (52.86%) and Nordstrom (43.04%) for Men’s Clothing. We see a similar trend with Neiman Marcus offering more value across Women’s Clothing as well, compared to other retailers.
The competition in footwear was intense, with Neiman Marcus narrowly securing the top spot at 31.03%, slightly ahead of Saks Fifth Avenue (30.28%) and Macy’s (30.07%).
Saks Fifth Avenue led by a significant margin in the Activewear category, offering 39.89% average discounts, indicating a strong push in this growing segment.
Macy’s followed at 32.16% in Activewear, while Neiman Marcus and Nordstrom had comparatively lower discounts of 26.40% and 19.52%, respectively.
Brand-Level Analysis
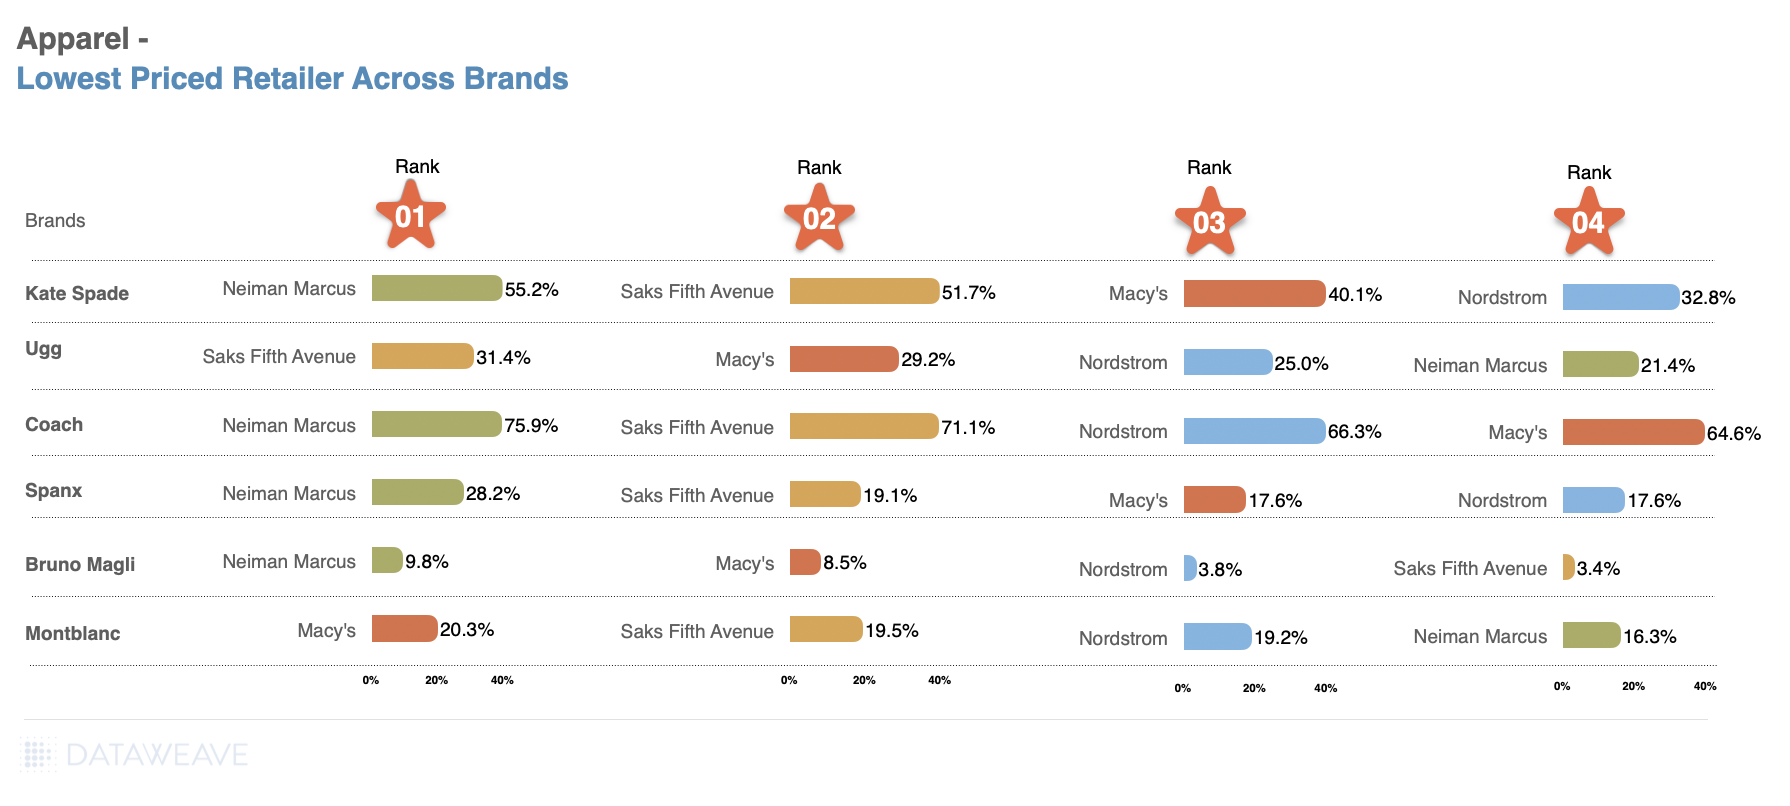
Kate Spade New York: Neiman Marcus leads with the highest discount of 55.23%, reflecting strong price leadership in premium fashion, closely followed by Saks Fifth Avenue at 51.66%.
Coach: Neiman Marcus dominates with a significant 75.85% discount, showcasing an aggressive promotional strategy for this luxury brand.
Spanx: While Neiman Marcus leads with 28.22%, discounts across other retailers like Saks Fifth Avenue, Macy’s, and Nordstrom are clustered within a competitive range of 17–19%.
Montblanc: Macy’s takes the lead with 20.32%, signaling its competitiveness even in high-end accessories, with Saks Fifth Avenue and Nordstrom closely behind.
Ugg: Saks Fifth Avenue leads with 31.42%, focusing on maintaining price leadership for this popular brand, while other retailers remain competitive with discounts around 25–30%.
What’s Next
To win over price-conscious shoppers, retailers need to stay competitive and consistently offer the lowest prices.
For a deeper dive into the world of competitive pricing intelligence and to explore how our solutions can benefit apparel retailers and brands, reach out to us today!
Stay tuned to our blog for more insights on different categories this Black Friday and Cyber Monday.
Black Friday, once confined to a single weekend, has evolved into a shopping season that now stretches well before Thanksgiving. With inflation hovering around 3% and consumer confidence showing signs of recovery, retailers are adapting their promotional calendars to capture early-bird shoppers and maintain a competitive edge.
Major retailers, including Amazon, Walmart, Target, and Best Buy, have capitalized on this trend by launching promotions weeks in advance, signaling the traditional holiday rush is now a month-long event. At DataWeave, we put these deals under a microscope.
Our Methodology
Using DataWeave’s advanced, AI-powered pricing intelligence platform, we tracked early Black Friday deals across Consumer Electronics, Home & Furniture, Health & Beauty, and Apparel categories. We monitored dedicated Black Friday deal pages on Amazon, Walmart, Target, Best Buy, Nordstrom, Neiman Marcus, and Sephora to gather and analyze discount data a week prior to Black Friday weekend.
Who’s Offering the Best Deals Across Categories?
Our pre- Black Friday analysis reveals a clear pattern of premium brands offering deeper discounts across categories ahead of the holiday. Here are some key findings around retail players:
Walmart emerges as the most aggressive discounter across categories, leading in Health & Beauty (57.07%), Apparel (48.97%), and Consumer Electronics (43.35%).
Amazon maintains consistent but lower discounts (28-29%) across categories, suggesting potential deeper cuts ahead.
Best Buy and Sephora, both category specialists, play it conservative compared to mass retail players.
Let’s look at each category more closely to get a detailed snapshot of the deals this Thanksgiving week:
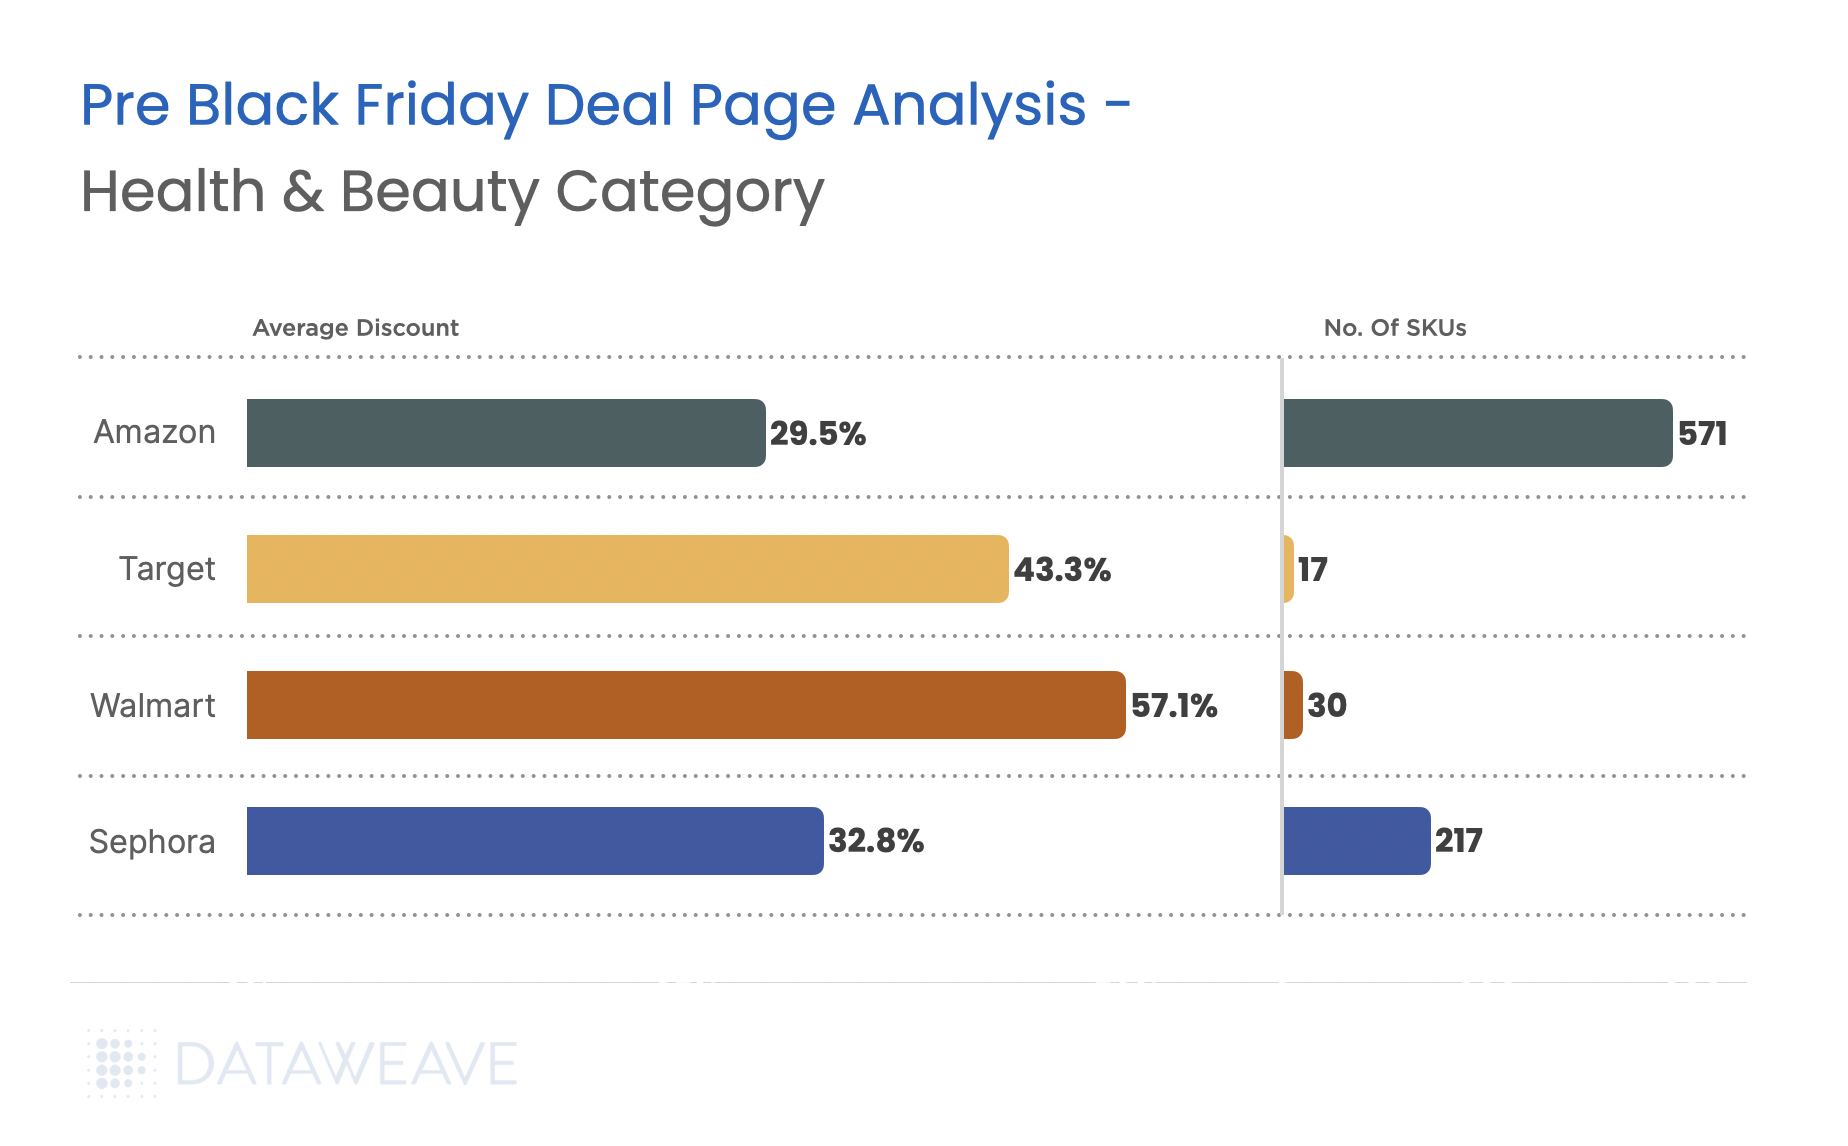
Health & Beauty
Our analysis reveals that it’s not electronics, but the health & beauty category that leads with the widest discount range pre Black Friday, making it the category to watch out for.
Walmart takes the lead with an aggressive 57.1% average discount in this category, capitalizing on its value-oriented reputation.
Beauty specialist Sephora holds modest beauty discounts (32.81%) compared to other retailers.
Amazon offers the broadest range of SKUs (571) in the category.
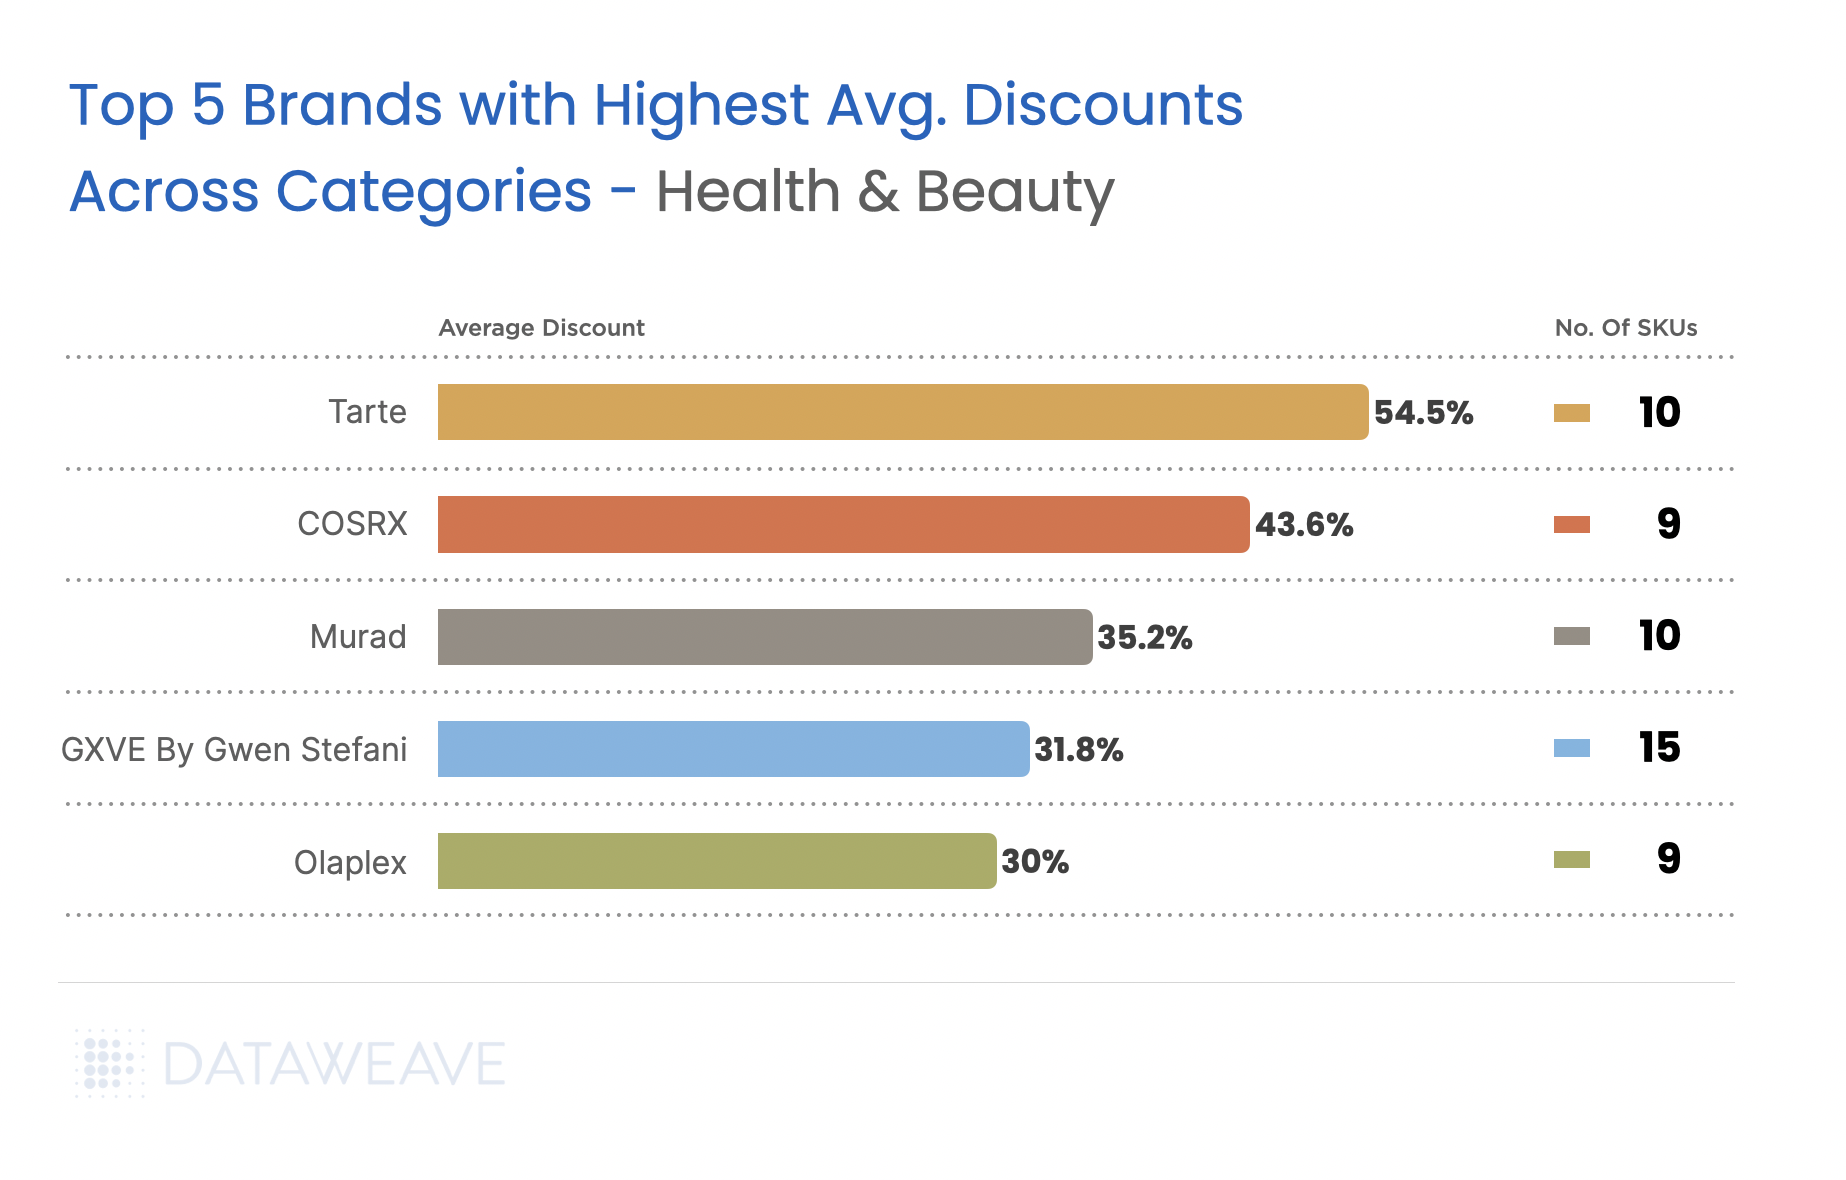
Among the health & beauty brands we analyzed, cosmetics brand Tarte and viral K-Beauty skincare brand COSRX stand out with discounts above 40%, appealing to cost-conscious beauty enthusiasts.
Consumer Electronics
Our pre- Black Friday analysis reveals interesting insights about consumer electronics deals this season.
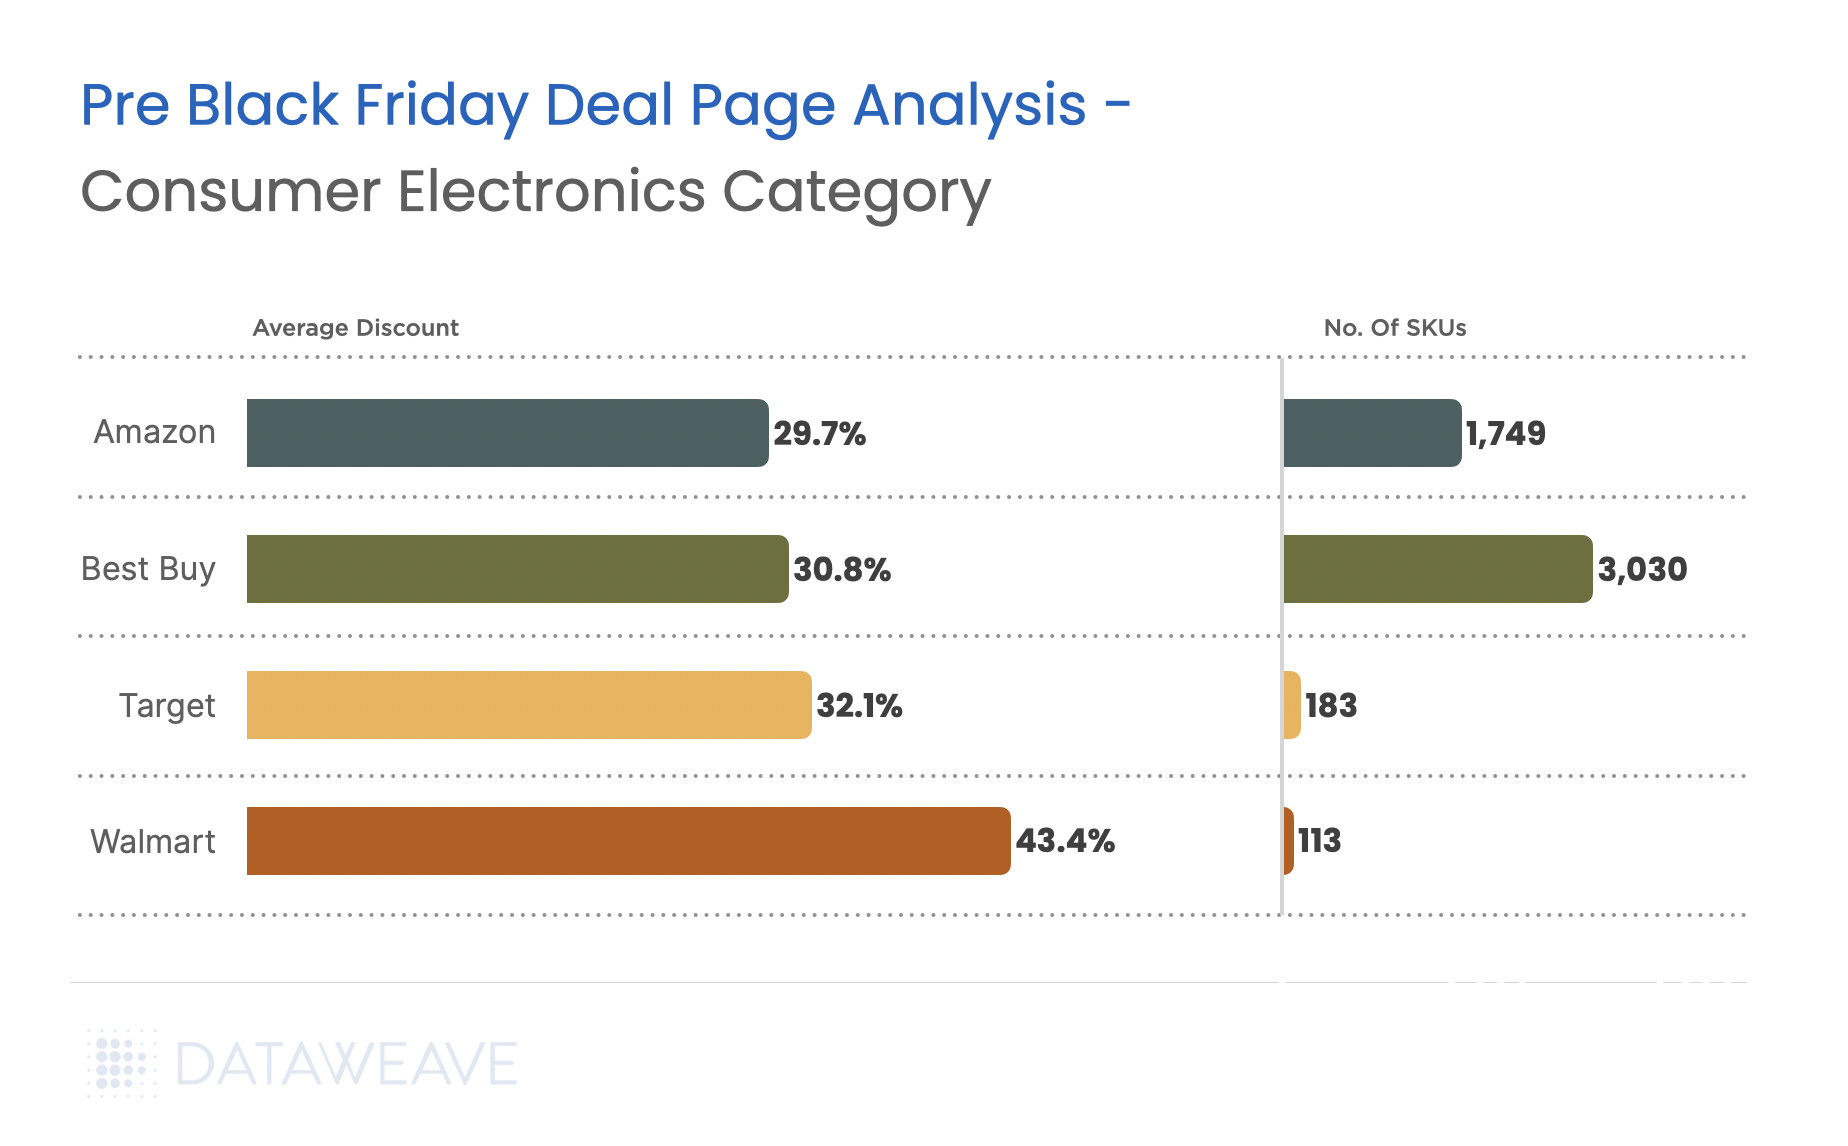
Walmart, once again, emerges as the frontrunner in the category with 43.4% average discounts.
Best Buy plays it conservative in electronics (30.75%), despite being a category specialist, but offers the most extensive SKU coverage (3030).
Amazon’s consistent 29.7% discount across 1,749 SKUs suggests they’re probably holding back their best deals for Prime members during Black Friday.
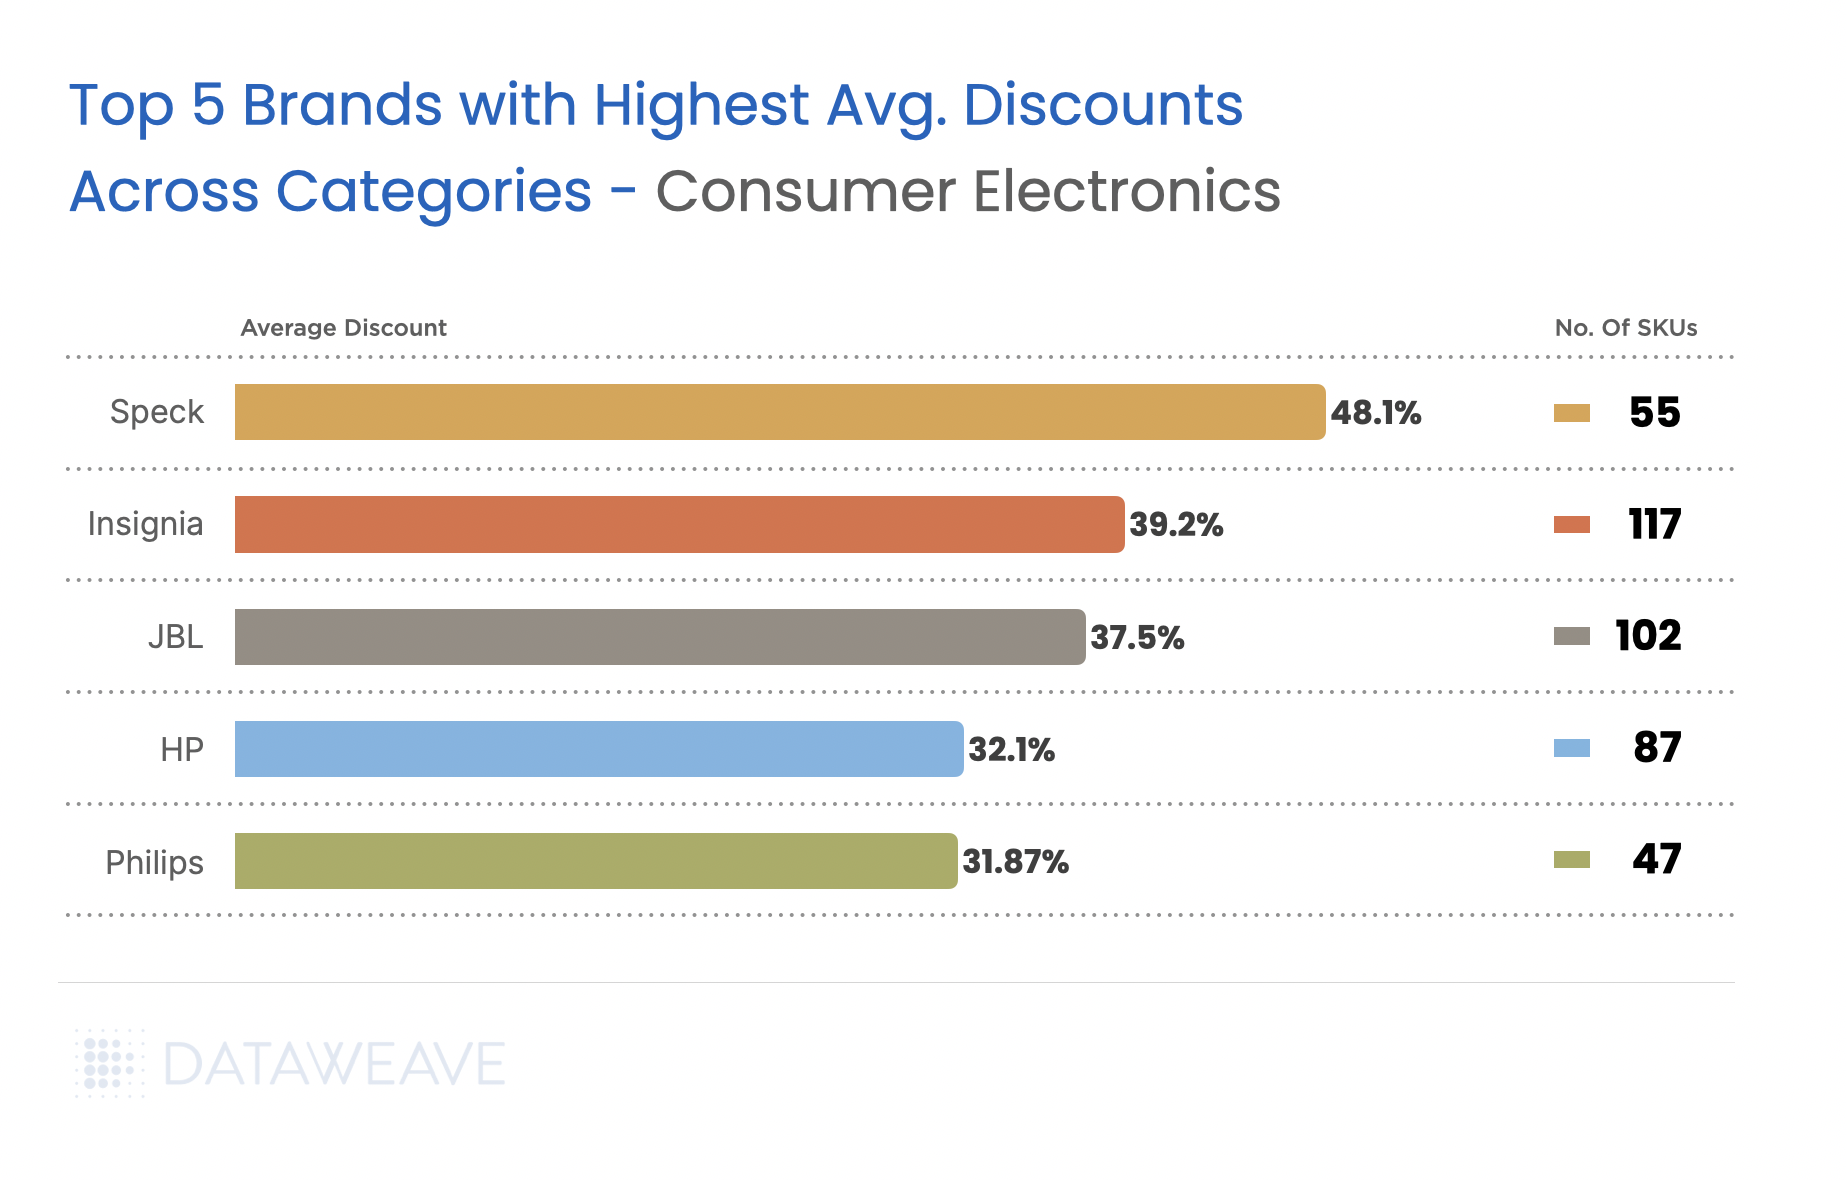
Brand-specific data for the category reveals significant deals on Speck (48.07%) and smart TV brand Insignia (39.22%), making accessories and mid-tier electronics attractive for early shoppers. Core computing (HP at 32.14%) and electronics brands maintain more conservative discounts. It remains to be seen if this changes on Black Friday or Cyber Monday.
Apparel
Our analysis of the apparel category reveals several highlights:
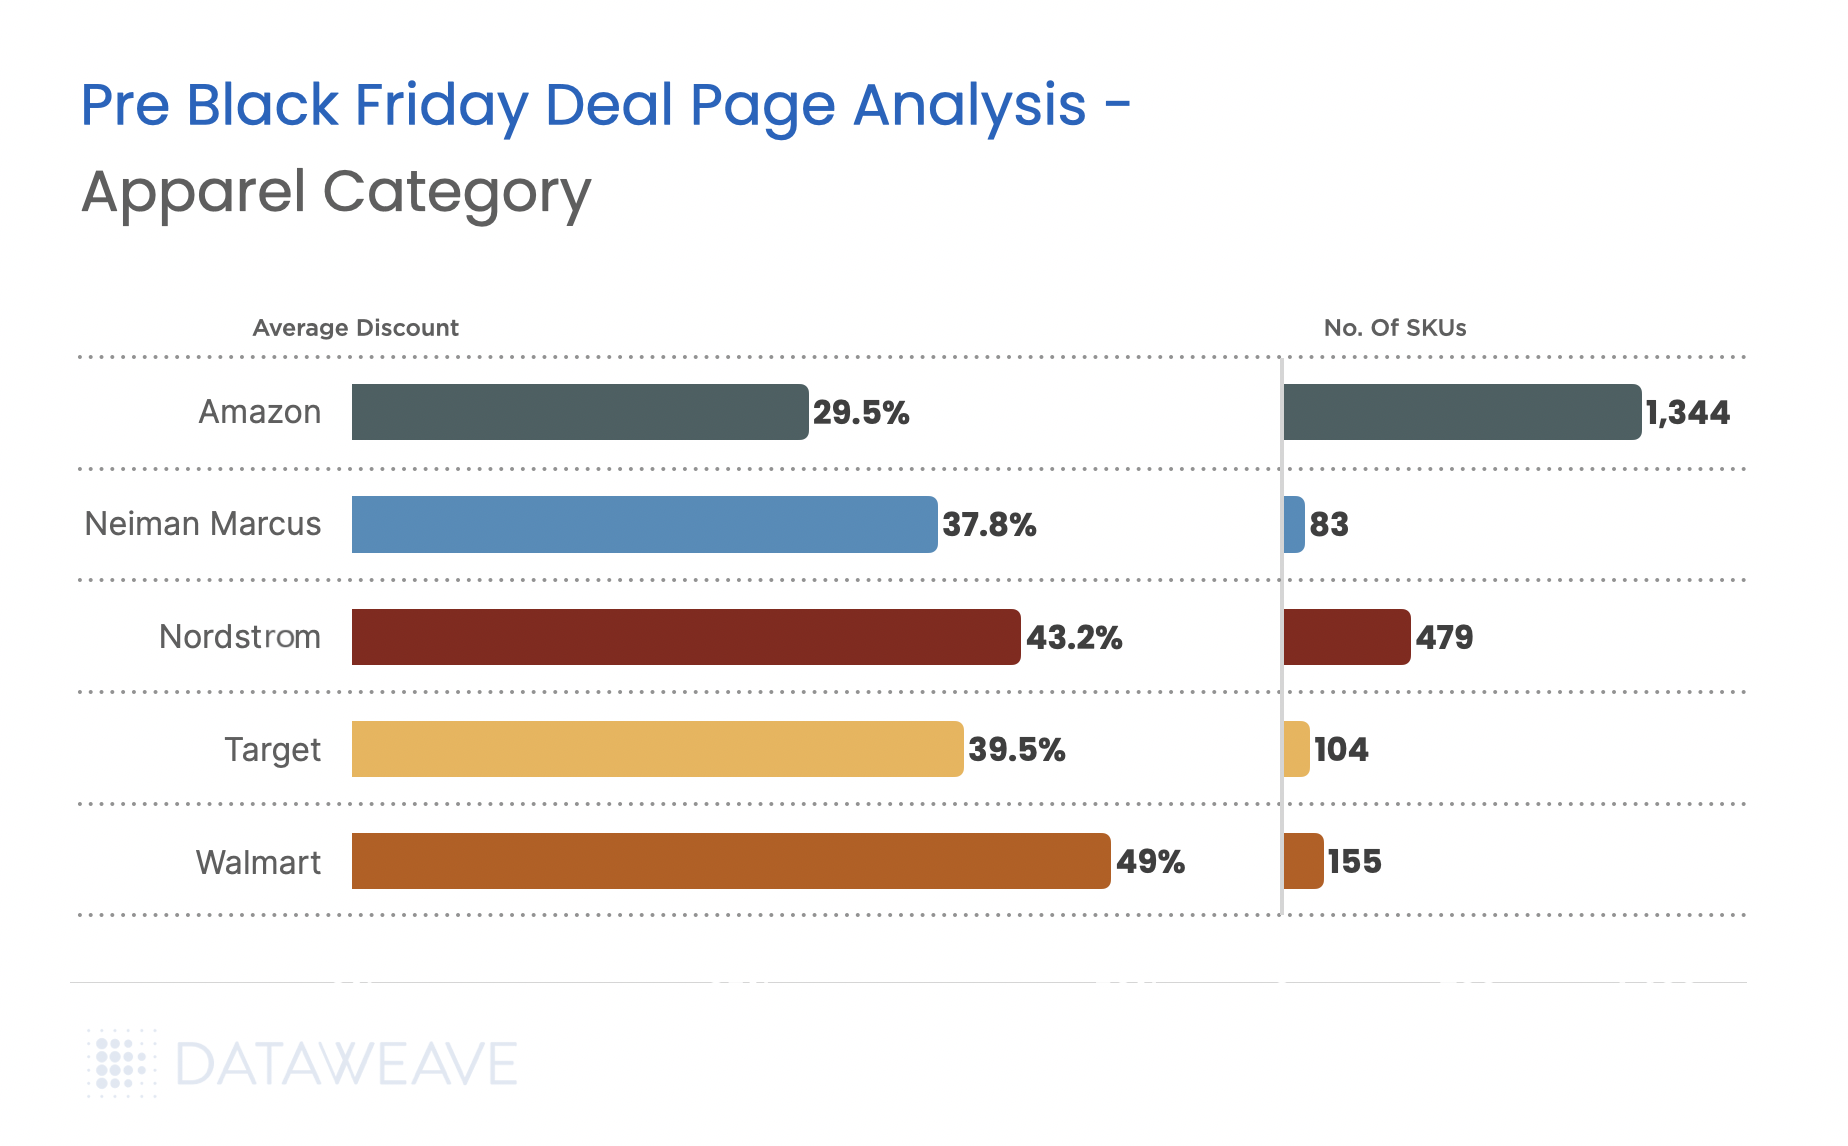
In the apparel category too, Walmart dominates with an impressive 49% average discount, effectively targeting price-sensitive shoppers in the fashion segment.
Nordstrom and Neiman Marcus, both known for apparel, offer significant discounts at 43.2% and 37.8% respectively.
Amazon’s expansive SKU coverage (1344) is countered by a modest 29.5% discount, showing its focus on variety over depth of discounts.
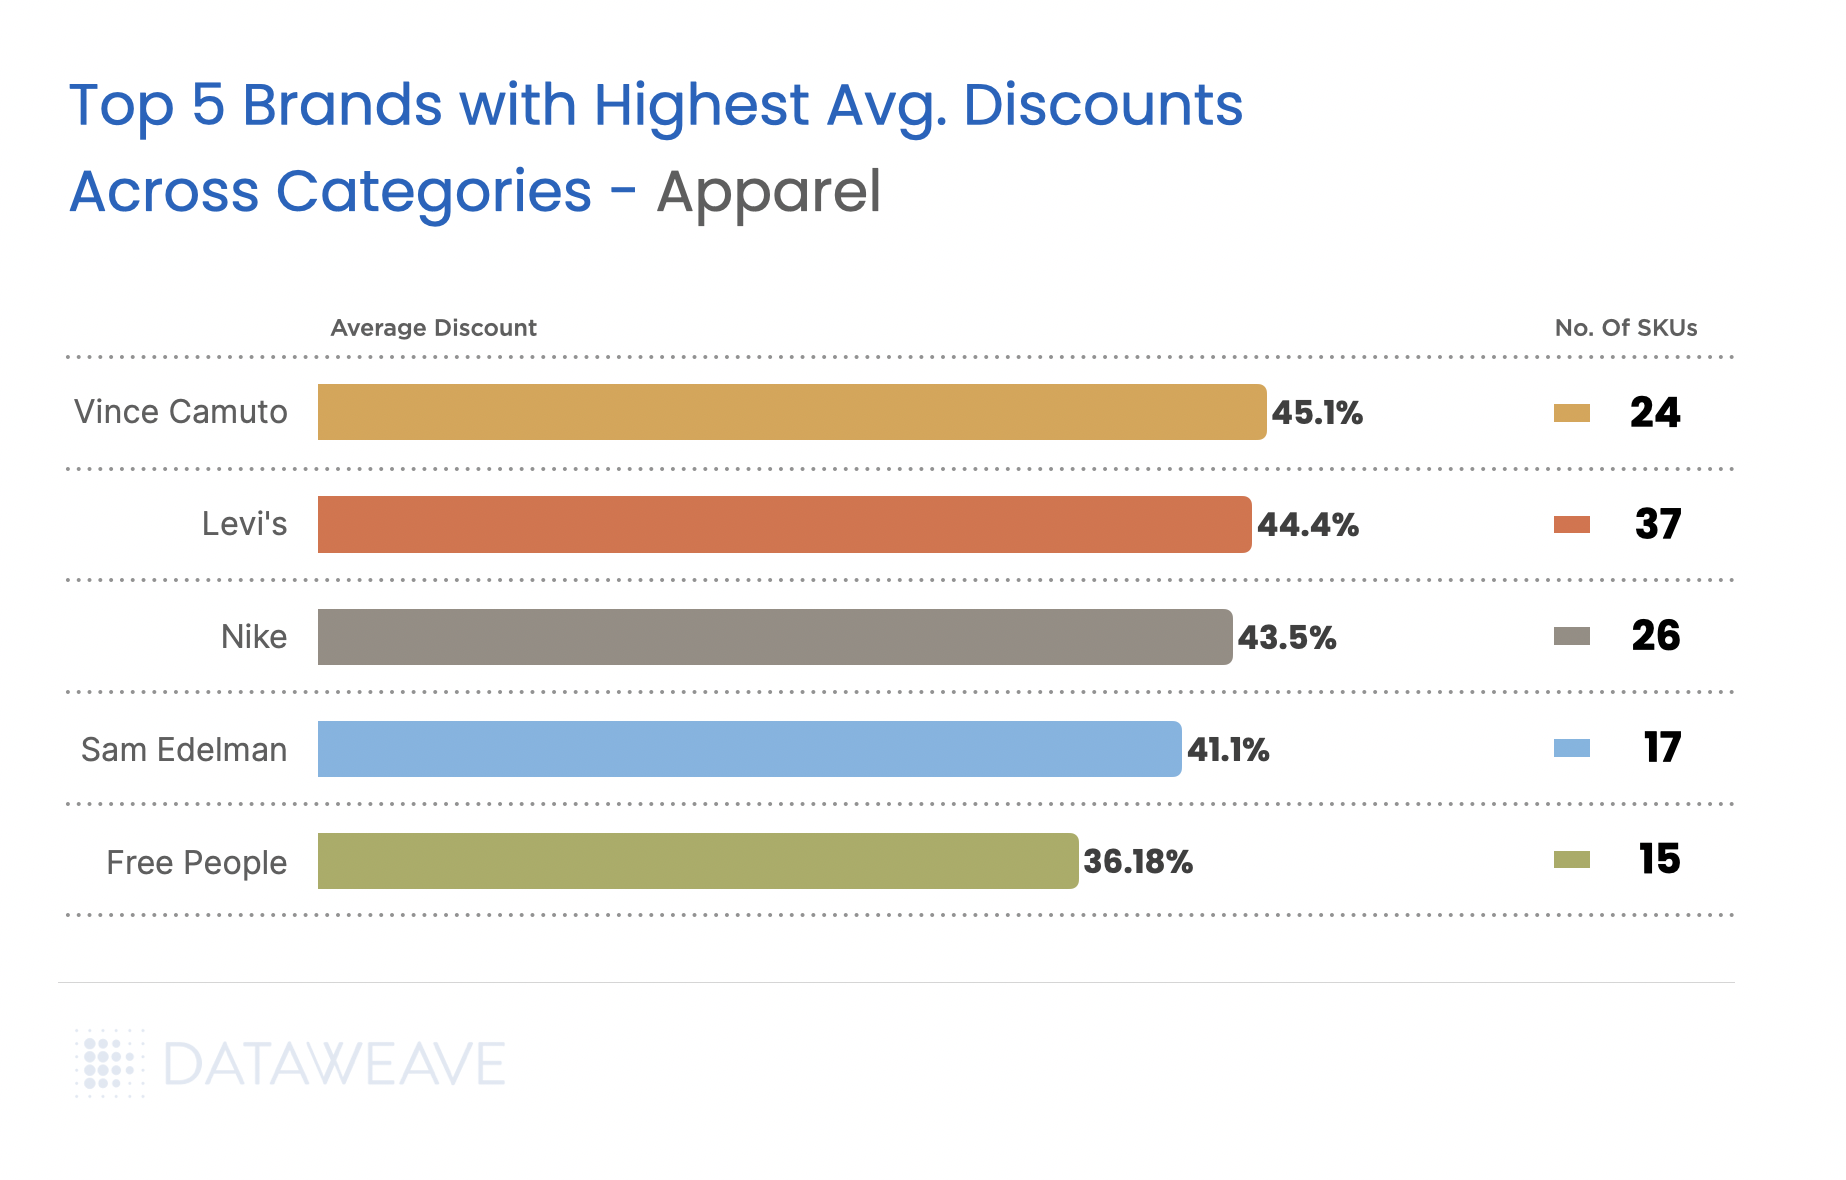
Premium fashion brands dominate the highest discounts this Black Friday in the apparel category. Vince Camuto leads with over 45.1% average discount. Notably, Levi and Nike’s aggressive 44.43% and 43.50% discounts suggests significant inventory positions or intent to capture market share.
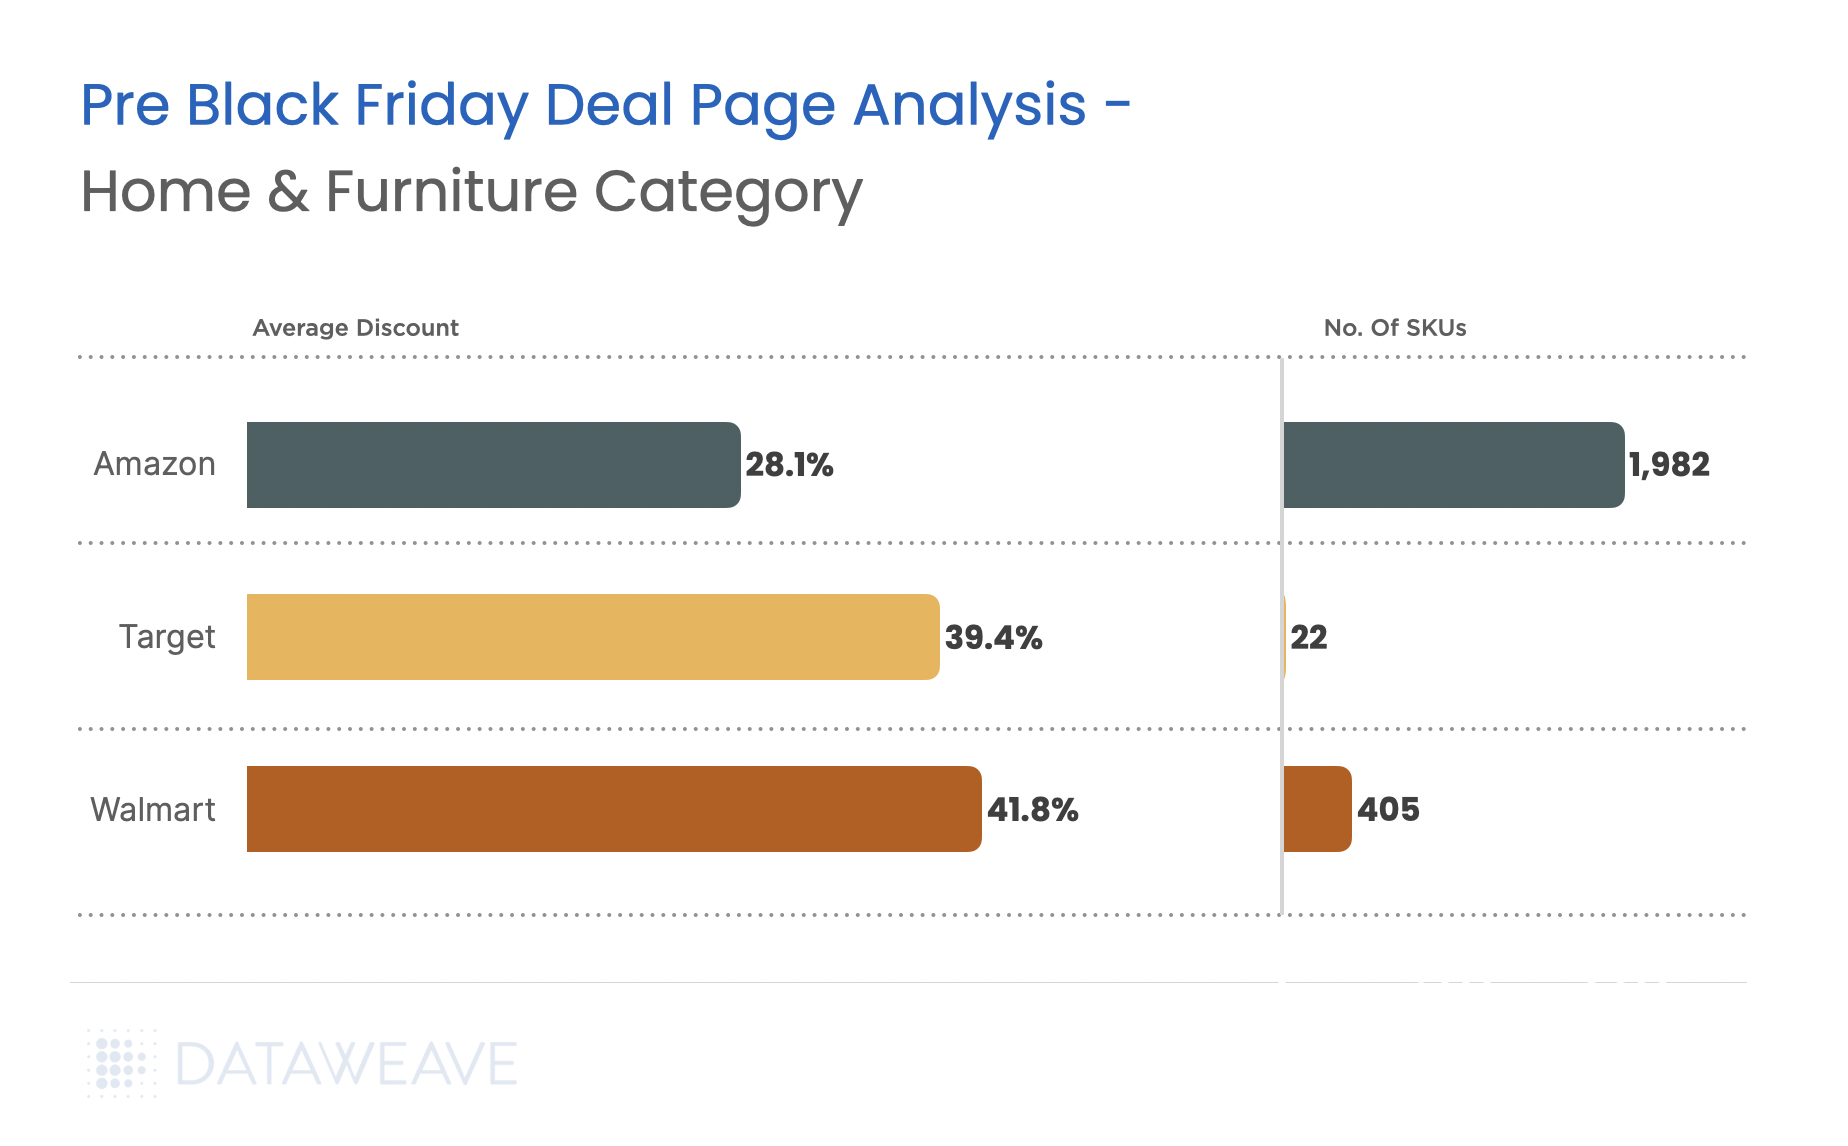
Home & Furniture
Our analysis reveals an interesting trend across the category.
In the home & furniture category too, Walmart leads at 41.8% average discounts. Target follows closely, but with significantly lesser SKUs on offer.
Amazon’s 28.1% discount, though the lowest among major players, spans a substantial 1,982 SKUs, reinforcing its position as a marketplace for diverse needs.
Top 3 Products With the Highest Discounts Across Retailers
To provide a clearer picture of the early Black Friday landscape, we analyzed the top 3 products with the most substantial discounts in consumer electronics and health & beauty categories. These insights highlight how retailers are leveraging strategic discounts on high-value items to attract early shoppers.
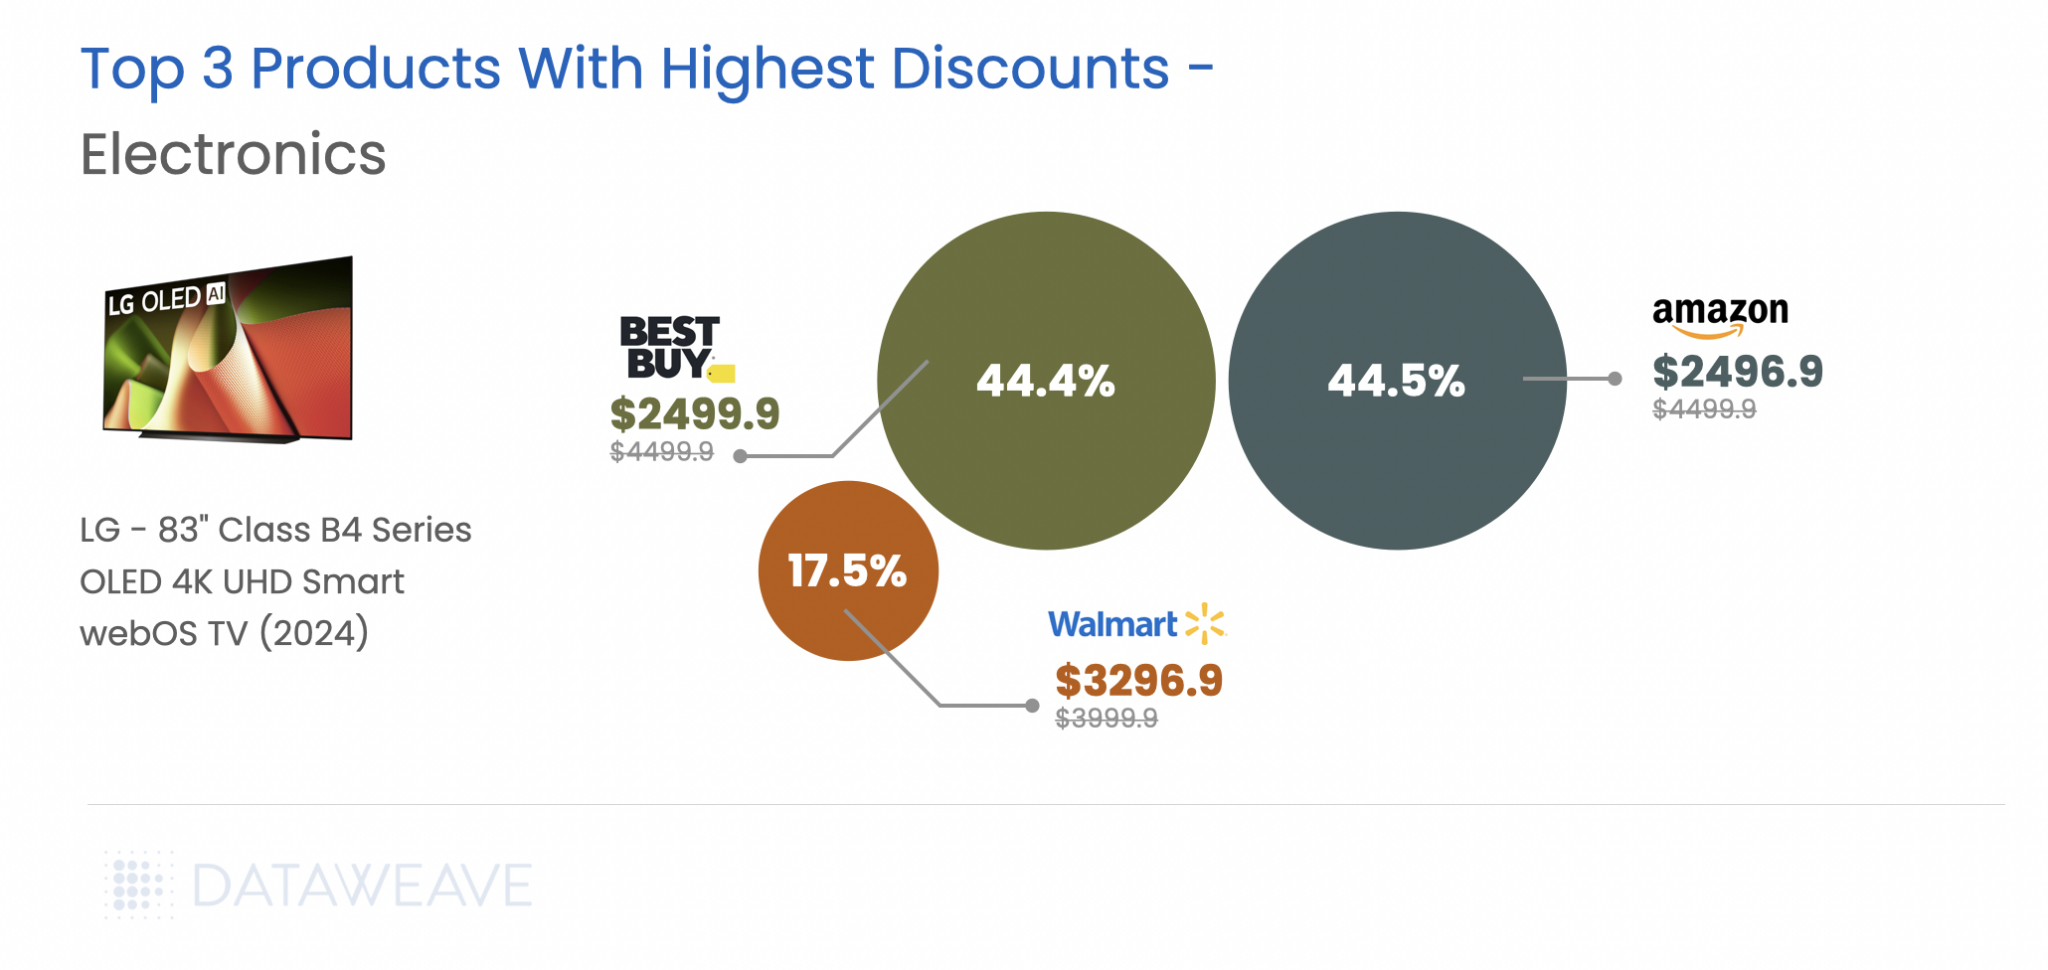
Top Discounted Products in Consumer Electronics
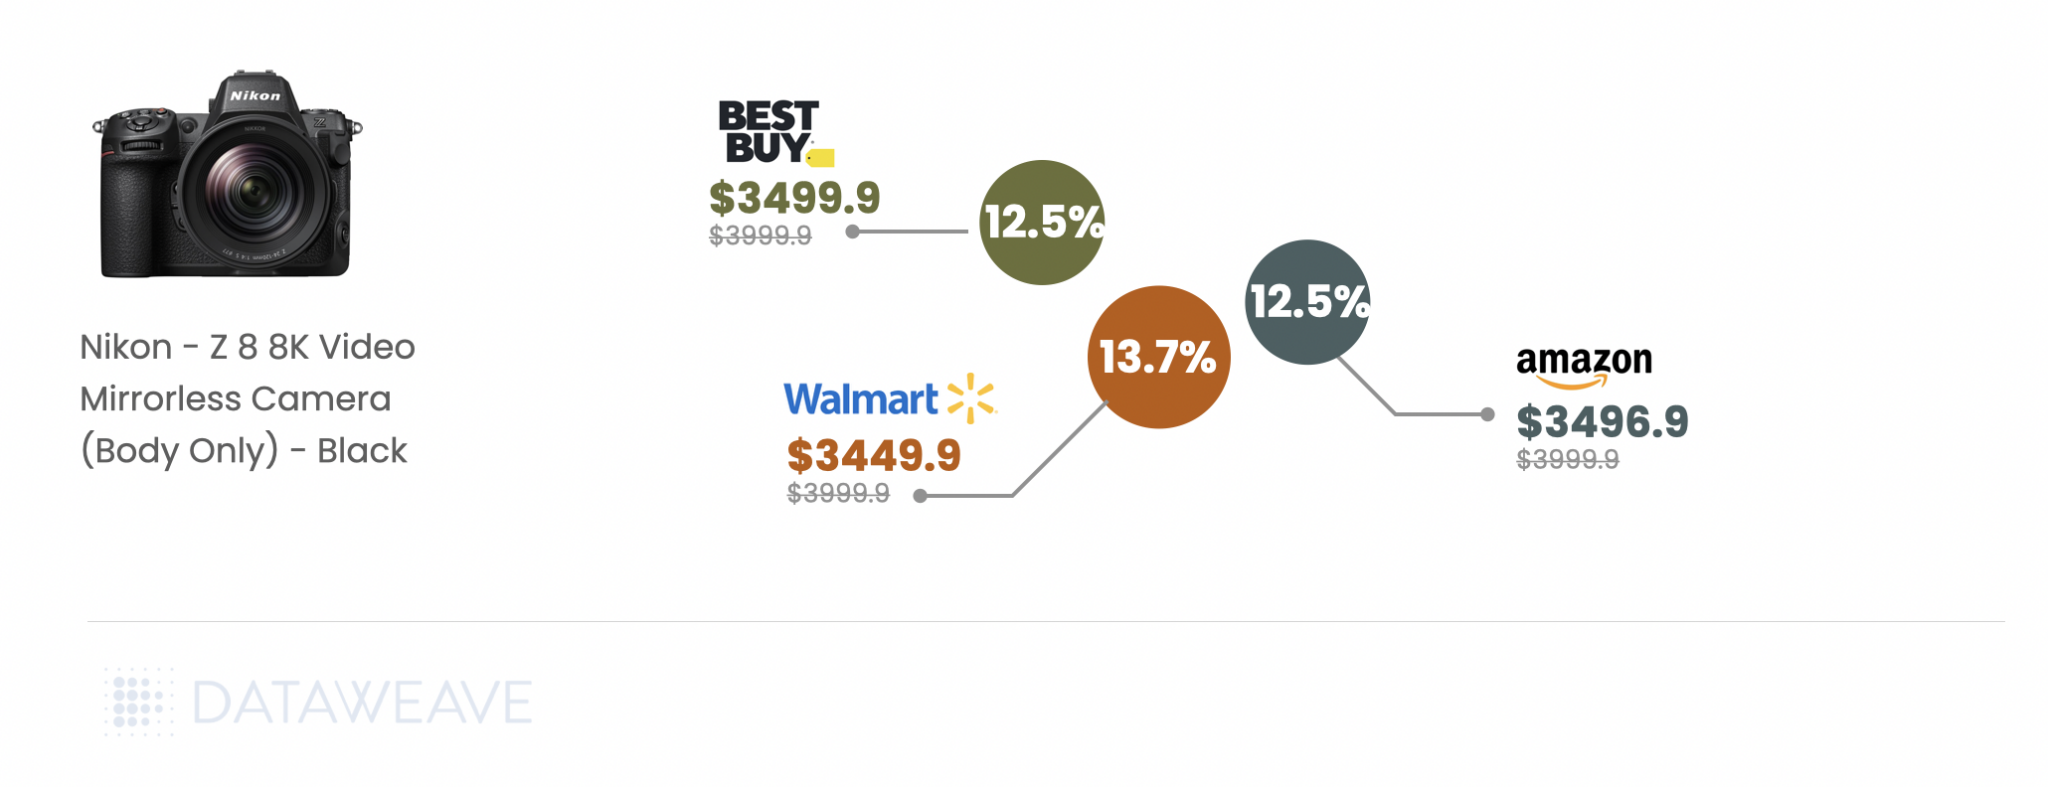
Premium TVs dominate the discount scene, with LG’s 83″ OLED offering up to 44.5% off on Amazon, closely followed by a 44.4% discount on Best Buy, showcasing aggressive competition. The same product has much lower discounting on Walmart, but notably, the product is retailed at $3999.9, at least $1000 less than other retailers, highlighting Walmart’s commitment to offering lowest prices.
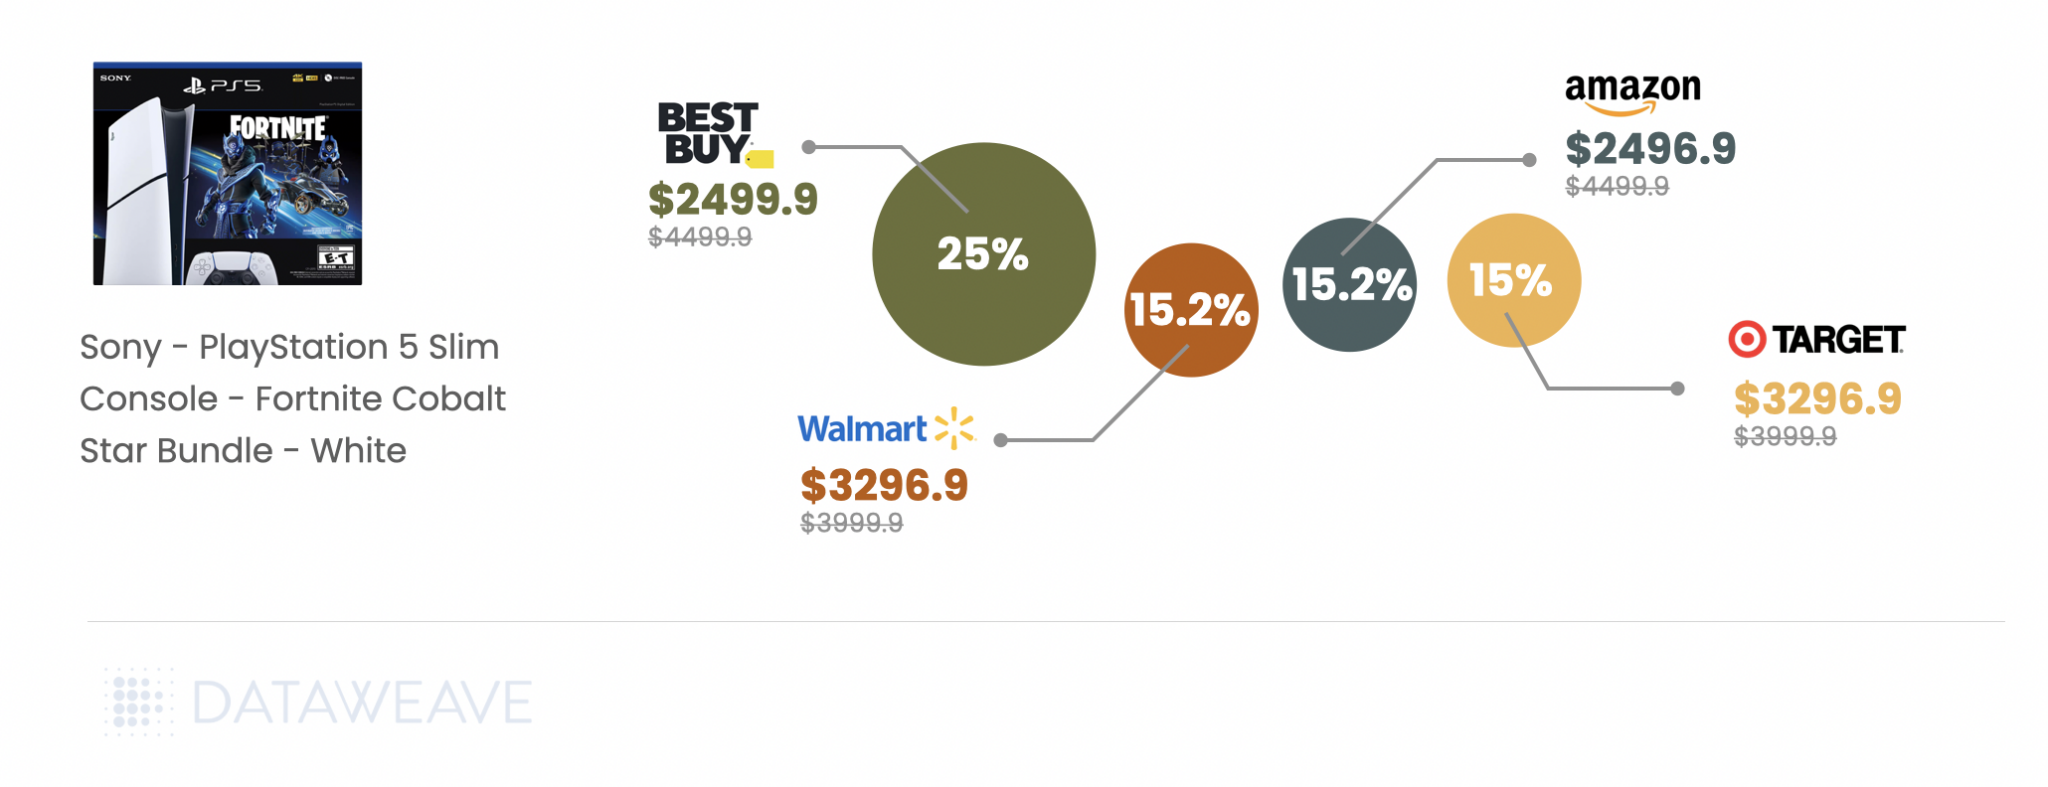
Gaming consoles, like the PlayStation 5 Slim Bundle, show moderate discounts (ranging from 15% on Walmart and Target to 25% at Best Buy), appealing to tech-savvy shoppers.
Notable competition is evident in price matching across major retailers, particularly in TVs and high-value electronics like the Nikon Z 8 camera, where Walmart offers the deepest discount at 13.75%, edging past Amazon and Best Buy.
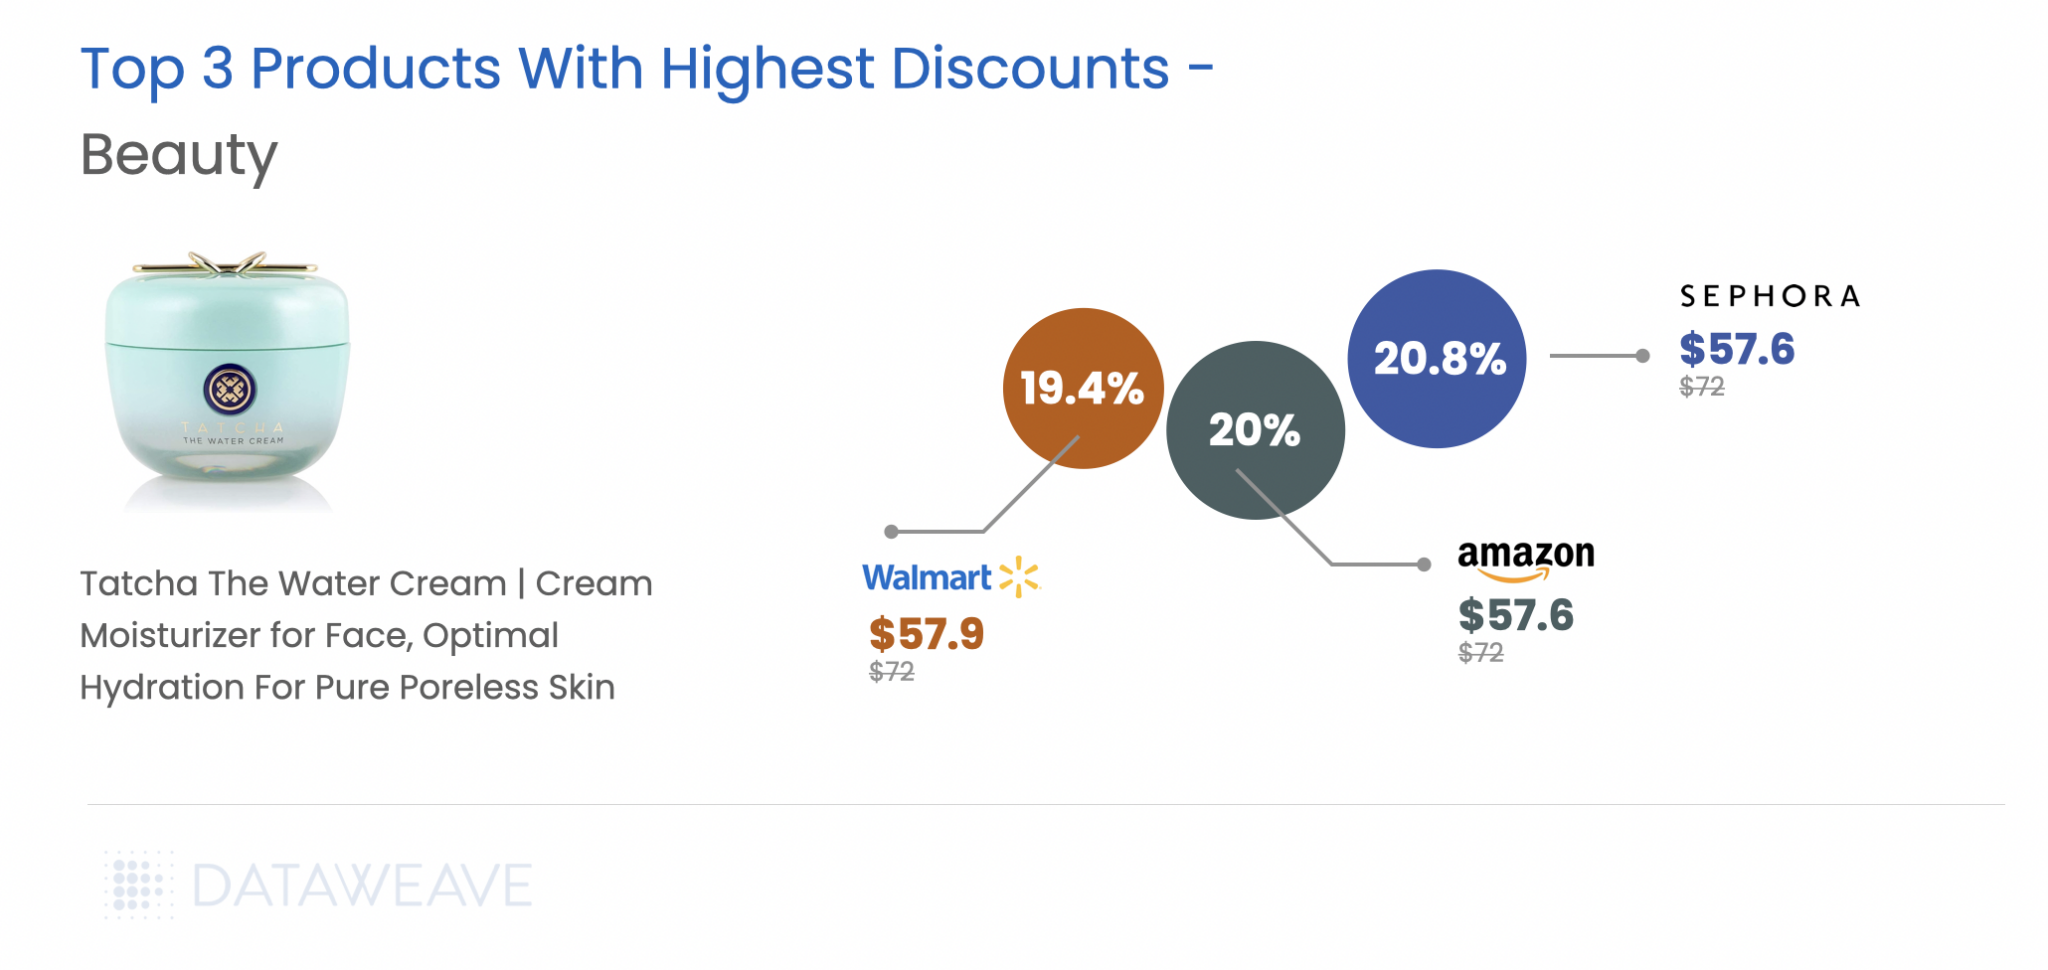
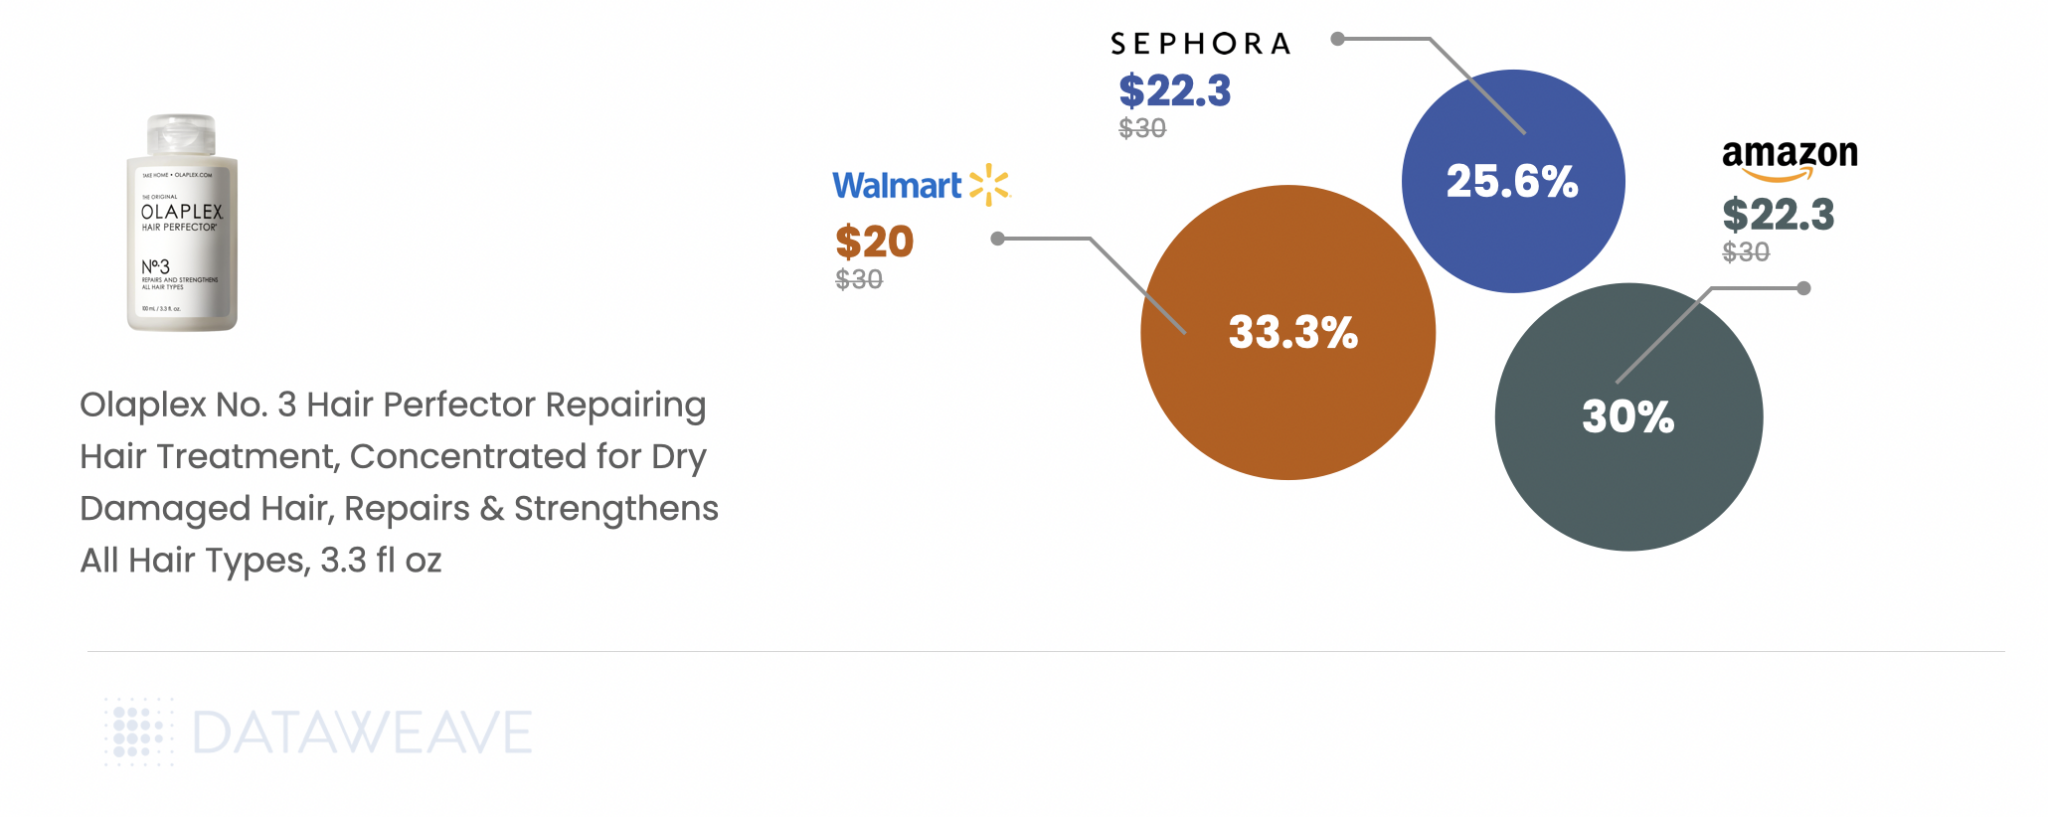
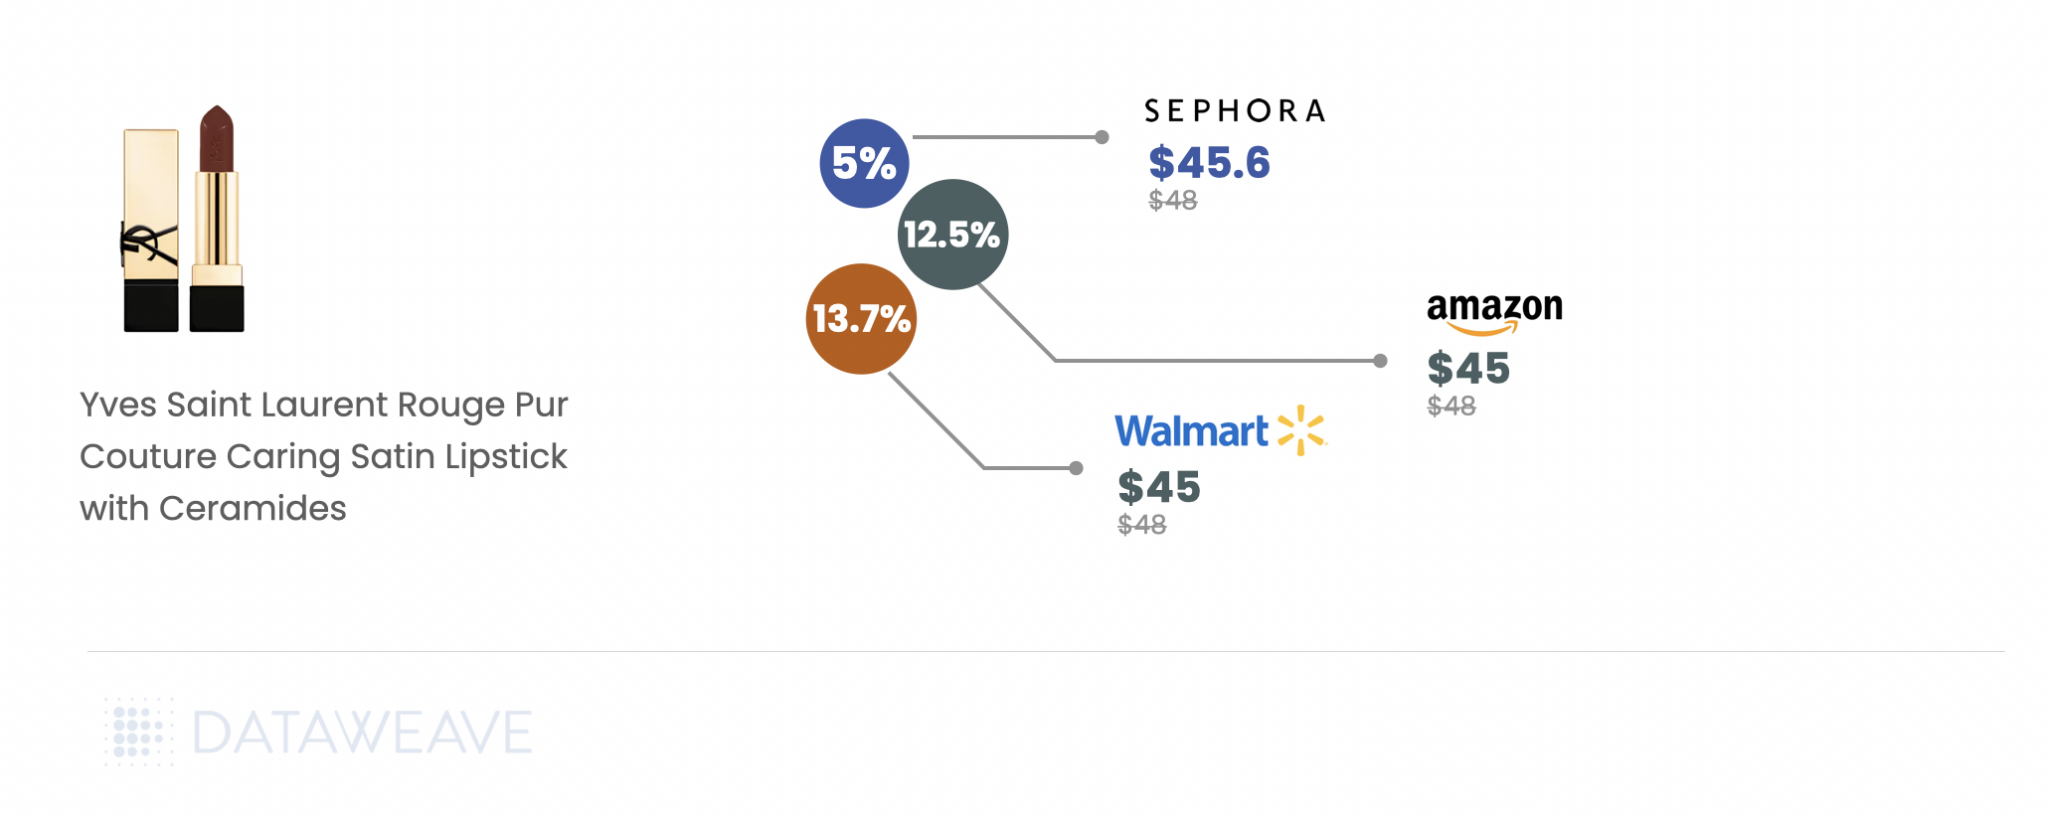
Top Discounted Products in Health & Beauty
Viral skincare staples like Tatcha’s Water Cream show tight discounting consistency, with Walmart offering 19.47% off compared to Amazon’s 20% and Sephora’s 20.83%.
Trending haircare brand Olaplex displays greater disparity, with Walmart leading with a 33.33% discount, surpassing Amazon and Sephora. Luxury brand, Yves Saint Laurent’s Satin Lipstick is one of the highest discounted items across retailers.
Looking Ahead
Our analysis suggests that while some early deals offer genuine value, particularly in premium beauty and high-end electronics, many retailers might be holding their best discounts for Black Friday.
For shoppers, the key is being selective: jump on premium brand discounts now (since they’re likely to remain the same though the weekend), but wait on mid-range electronics and home goods where better deals are likely to emerge on Black Friday or Cyber Monday.
For retailers, the imperative is clear: dynamic pricing intelligence is crucial for maintaining a competitive edge while protecting margins. Competitive insights will be critical as the holiday season progresses to balance market share against profitability.
Stay tuned for our Black Friday Cyber Monday analysis next week, where we’ll track how these early discounts compare to the main event’s deals!
In online retail, success hinges on more than just offering quality products at competitive prices. As eCommerce catalogs expand and consumer expectations soar, businesses face an increasingly complex challenge: How do you effectively organize, categorize, and present your vast product assortments in a way that enhances discoverability and drives sales?
Having complete and correct product catalog data is key. Effective product attribute tagging—a crucial yet frequently undervalued capability—helps in achieving this accuracy and completeness in product catalog data. While traditional methods of tagging product attributes have long struggled with issues of scalability, consistency, accuracy, and speed, a new thinking and fundamentally new ways of addressing these challenges are getting established. These follow from the revolution brought in Large Language Models but they fashion themselves as Small Language Models (SLM) or more precisely as Domain Specific Language Models. These can be potentially considered foundational models as they solve a wide variety of downstream tasks albeit within specific domains. They are a lot more efficient and do a much better job in those tasks compared to an LLM. .
Retail Domain Language Models (RLMs) have the potential to transform the eCommerce customer journey. As always, it’s never a binary choice. In fact, LLMs can be a great starting point since they provide an enhanced semantic understanding of the world at large: they can be used to mine structured information (e.g., product attributes and values) out of unstructured data (e.g., product descriptions), create baseline domain knowledge (e.g, manufacturer-brand mappings), augment information (e.g., image to prompt), and create first cut training datasets.
Powered by cutting-edge Generative AI and RLMs, next-generation attribute tagging solutions are transforming how online retailers manage their product catalog data, optimize their assortment, and deliver superior shopping experiences. As a new paradigm in search emerges – based more on intent and outcome, powered by natural language queries and GenAI based Search Agents – the capability to create complete catalog information and rich semantics becomes increasingly critical.
In this post, we’ll explore the crucial role of attribute tagging in eCommerce, delve into the limitations of conventional tagging methods, and unveil how DataWeave’s innovative AI-driven approach is helping businesses stay ahead in the competitive digital marketplace.
Why Product Attribute Tagging is Important in eCommerce
As the eCommerce landscape continues to evolve, the importance of attribute tagging will only grow, making it a pertinent focus for forward-thinking online retailers. By investing in robust attribute tagging systems, businesses can gain a competitive edge through improved product comparisons, more accurate matching, understanding intent, and enhanced customer search experiences.
Taxonomy Comparison and Assortment Gap Analysis
Products are categorized and organized differently on different retail websites. Comparing taxonomies helps in understanding focus categories and potential gaps in assortment breadth in relation to one’s competitors: missing product categories, sizes, variants or brands. It also gives insights into the navigation patterns and information architecture of one’s competitors. This can help in making search and navigation experience more efficient by fine tuning product descriptions to include more attributes and/or adding additional relevant filters to category listing pages.
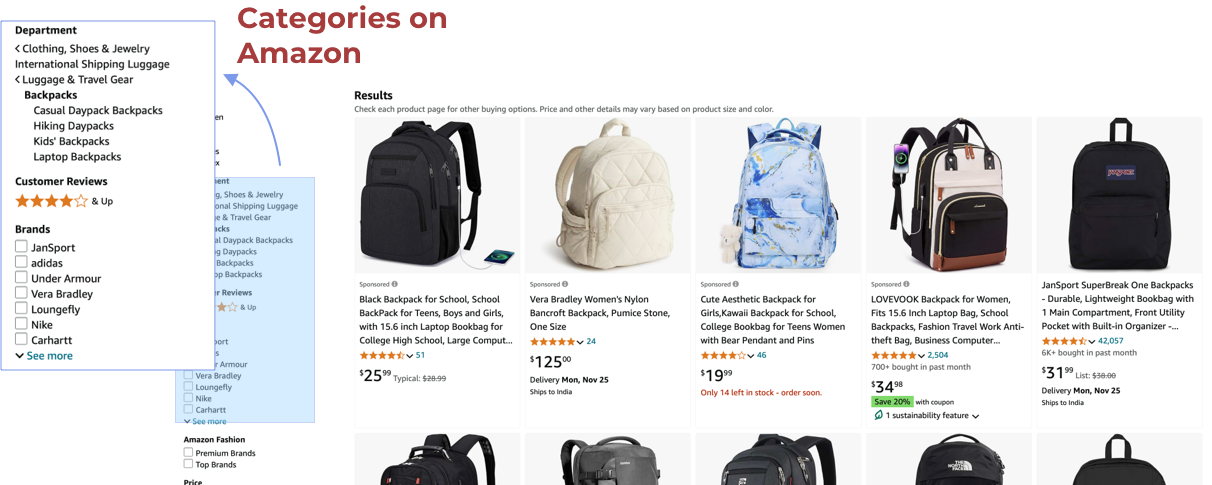
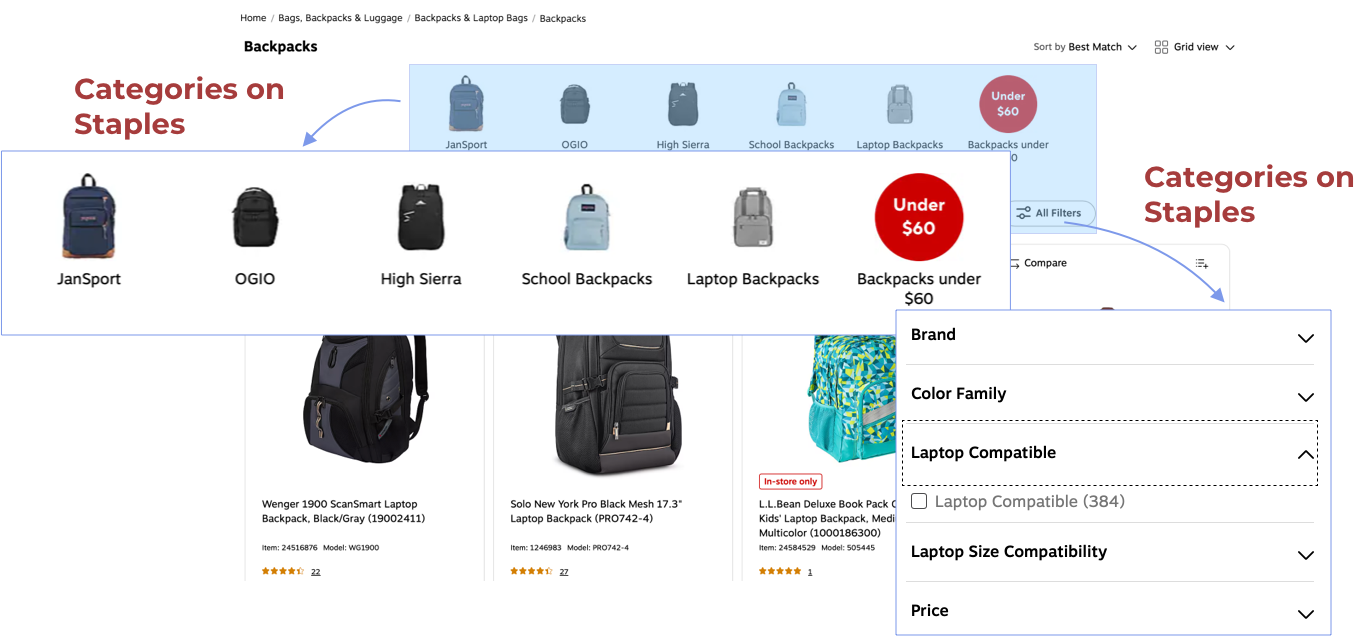
For instance, check out the different Backpack categories on Amazon and Staples in the images below.
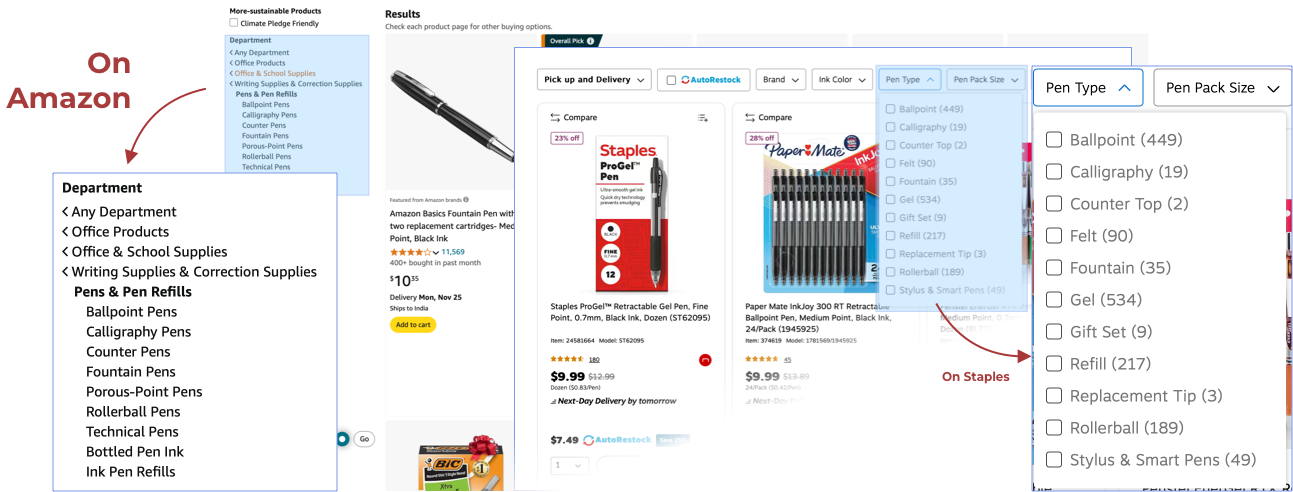
Or look at the nomenclature of categories for “Pens” on Amazon (left side of the image) and Staples (right side of the image) in the image below.
Assortment Depth Analysis
Another big challenge in eCommerce is the lack of standardization in retailer taxonomy. This inconsistency makes it difficult to compare the depth of product assortments across different platforms effectively. For instance, to categorize smartphones,
Retailer A might organize it under “Electronics > Mobile Phones > Smartphones”
Retailer B could use “Technology > Phones & Accessories > Cell Phones”
Retailer C might opt for “Consumer Electronics > Smartphones & Tablets”
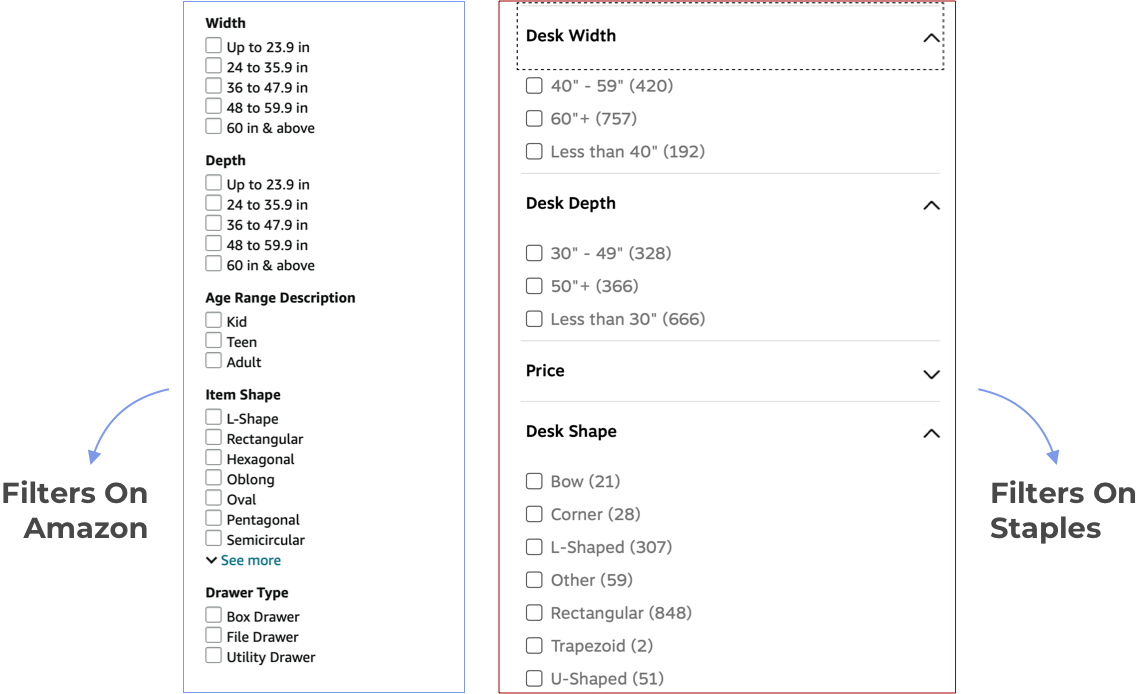
Inconsistent nomenclature and grouping create a significant hurdle for businesses trying to gain a competitive edge through assortment analysis. The challenge is exacerbated if you want to do an in-depth assortment depth analysis for one or more product attributes. For instance, look at the image below to get an idea of the several attribute variations for “Desks” on Amazon and Staples.
Custom categorization through attribute tagging is essential for conducting granular assortment comparisons, allowing companies to accurately assess their product offerings against those of competitors.
Enhancing Product Matching Capabilities
Accurate product matching across different websites is fundamental for competitive pricing intelligence, especially when matching similar and substitute products. Attribute tagging and extraction play a crucial role in this process by narrowing down potential matches more effectively, enabling matching for both exact and similar products, and tagging attributes such as brand, model, color, size, and technical specifications.
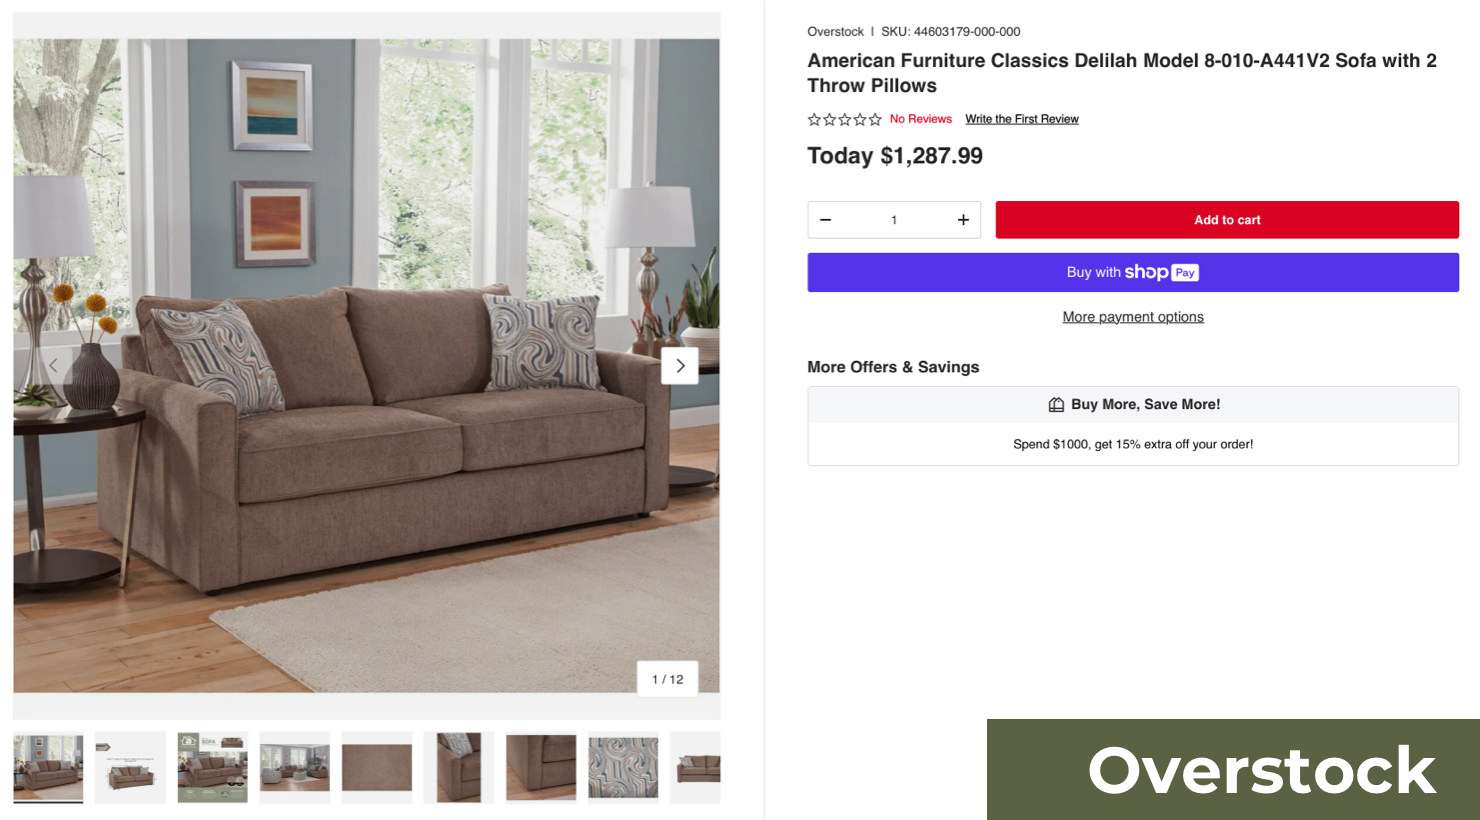
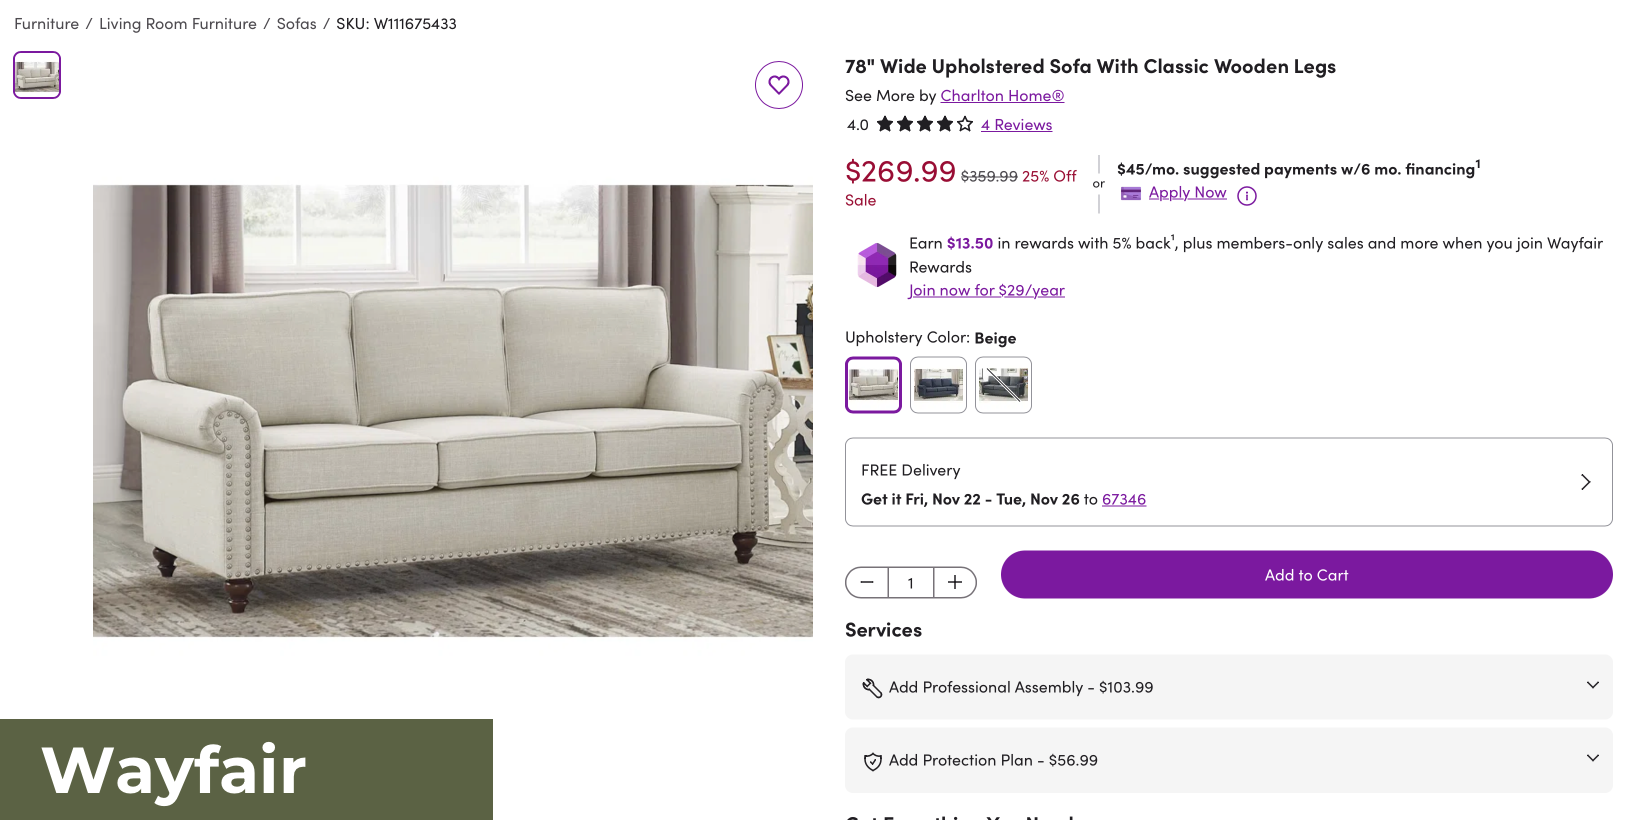
For instance, when choosing to match similar products in the Sofa category for 2-3 seater sofas from Wayfair and Overstock, tagging attributes like brand, color, size, and more is a must for accurate comparisons.
Taking a granular approach not only improves pricing strategies but also helps identify gaps in product offerings and opportunities for expansion.
Fix Content Gaps and improve Product Detail Page (PDP) Content
Attribute tagging plays a vital role in enhancing PDP content by ensuring adherence to brand integrity standards and content compliance guidelines across retail platforms. Tagging attributes allows for benchmarking against competitor content, identifying catalog gaps, and enriching listings with precise details.
This strategic tagging process can highlight missing or incomplete information, enabling targeted optimizations or even complete rewrites of PDP content to improve discoverability and drive conversions. With accurate attribute tagging, businesses can ensure each product page is fully optimized to capture consumer attention and meet retail standards.
Elevating the Search Experience
In today’s online retail marketplace, a superior search experience can be the difference between a sale and a lost customer. Through in-depth attribute tagging, vendors can enable more accurate filtering to improve search result relevance and facilitate easier product discovery for consumers.
By integrating rich product attributes extracted by AI into an in-house search platform, retailers can empower customers with refined and user-friendly search functionality. Enhanced search capabilities not only boost customer satisfaction but also increase the likelihood of conversions by helping shoppers find exactly what they’re looking for more quickly and with minimal effort.
Pitfalls of Conventional Product Tagging Methods
Traditional methods of attribute tagging, such as manual and rule-based systems, have been significantly enhanced by the advent of machine learning. While these approaches may have sufficed in the past, they are increasingly proving inadequate in the face of today’s dynamic and expansive online marketplaces.
Scalability
As eCommerce catalogs expand to include thousands or even millions of products, the limitations of machine learning and rule-based tagging become glaringly apparent. As new product categories emerge, these systems struggle to keep pace, often requiring extensive revisions to existing tagging structures.
Inconsistencies and Errors
Not only is reliance on an entirely human-driven tagging process expensive, but it also introduces a significant margin for error. While machine learning can automate the tagging process, it’s not without its limitations. Errors can occur, particularly when dealing with large and diverse product catalogs.
As inventories grow more complex to handle diverse product ranges, the likelihood of conflicting or erroneous rules increases. These inconsistencies can result in poor search functionality, inaccurate product matching, and ultimately, a frustrating experience for customers, drawing away the benefits of tagging in the first place.
Speed
When product information changes or new attributes need to be added, manually updating tags across a large catalog is a time-consuming process. Slow tagging processes make it difficult for businesses to quickly adapt to emerging market trends causing significant delays in listing new products, potentially missing crucial market opportunities.
How DataWeave’s Advanced AI Capabilities Revolutionize Product Tagging
Advanced solutions leveraging RLMs and Generative AI offer promising alternatives capable of overcoming these challenges and unlocking new levels of efficiency and accuracy in product tagging.
DataWeave automates product tagging to address many of the pitfalls of other conventional methods. We offer a powerful suite of capabilities that empower businesses to take their product tagging to new heights of accuracy and scalability with our unparalleled expertise.
Our sophisticated AI system brings an advanced level of intelligence to the tagging process.
RLMs for Enhanced Semantic Understanding
Semantic Understanding of Product Descriptions
RLMs analyze the meaning and context of product descriptions rather than relying on keyword matching. Example: “Smartphone with a 6.5-inch display” and “Phone with a 6.5-inch screen” are semantically similar, though phrased differently.
Attribute Extraction
RLMs can identify important product attributes (e.g., brand, size, color, model) even from noisy or unstructured data. Example: Extracting “Apple” as a brand, “128GB” as storage, and “Pink” as the color from a mixed description.
Identifying Implicit Relationships
RLMs find implicit relationships between products that traditional rule-based systems miss. Example: Recognizing that “iPhone 12 Pro” and “Apple iPhone 12” are part of the same product family.
Synonym Recognition in Product Descriptions
Synonym Matching with Context
RLMs identify when different words or phrases describe the same product. Examples: “Sneakers” = “Running Shoes”, “Memory” = “RAM” (in electronics) Even subtle differences in wording, like “rose gold” vs “pink” are interpreted correctly.
Overcoming Brand-Specific Terminology
Some brands use their own terminologies (e.g., “Retina Display” for Apple). RLMs can map proprietary terms to more generic ones (e.g., Retina Display = High-Resolution Display).
Dealing with Ambiguities
RLMs analyze surrounding text to resolve ambiguities in product descriptions. Example: Resolving “charger” to mean a “phone charger” when matched with mobile phones.
Contextual Understanding for Improved Accuracy and Precision
By leveraging advanced natural language processing (NLP), DataWeave’s AI can process and understand the context of lengthy product descriptions and customer reviews, minimizing errors that often arise at human touch points. The solution processes and interprets information to extract key information to dramatically improve the overall accuracy of product tags.
It excels at grasping the subtle differences between similar products, sizes, colors and identifying and tagging minute differences between items, ensuring that each product is uniquely and accurately represented in a retailer’s catalog.
This has a major impact on product and similarity-based matching that can even help optimize similar and substitute product matching to enhance consumer search. At the same time, our AI can understand that the same term might have different meanings in various product categories, adapting its tagging approach based on the specific context of each item.
This deep comprehension ensures that even nuanced product attributes are accurately captured and tagged for easy discoverability by consumers.
Case Study: Niche Jewelry Attributes
DataWeave’s advanced AI can assist in labeling the subtle attributes of jewelry by analyzing product images and generating prompts to describe the image. In this example, our AI identifies the unique shapes and materials of each item in the prompts.
The RLM can then extract key attributes from the prompt to generate tags. This assists in accurate product matching for searches as well as enhanced product recommendations based on similarities.
This multi-model approach provides the flexibility to adapt as product catalogs expand while remaining consistent with tagging to yield more robust results for consumers.
Unparalleled Scalability
DataWeave can rapidly scale tagging for new categories. The solution is built to handle the demands of even the largest eCommerce catalogs enabling:
Effortless management of extensive product catalogs: We can process and tag millions of products without compromising on speed or accuracy, allowing businesses to scale without limitations.
Automated bulk tagging: New product lines or entire categories can be tagged automatically, significantly reducing the time and resources required for catalog expansion.
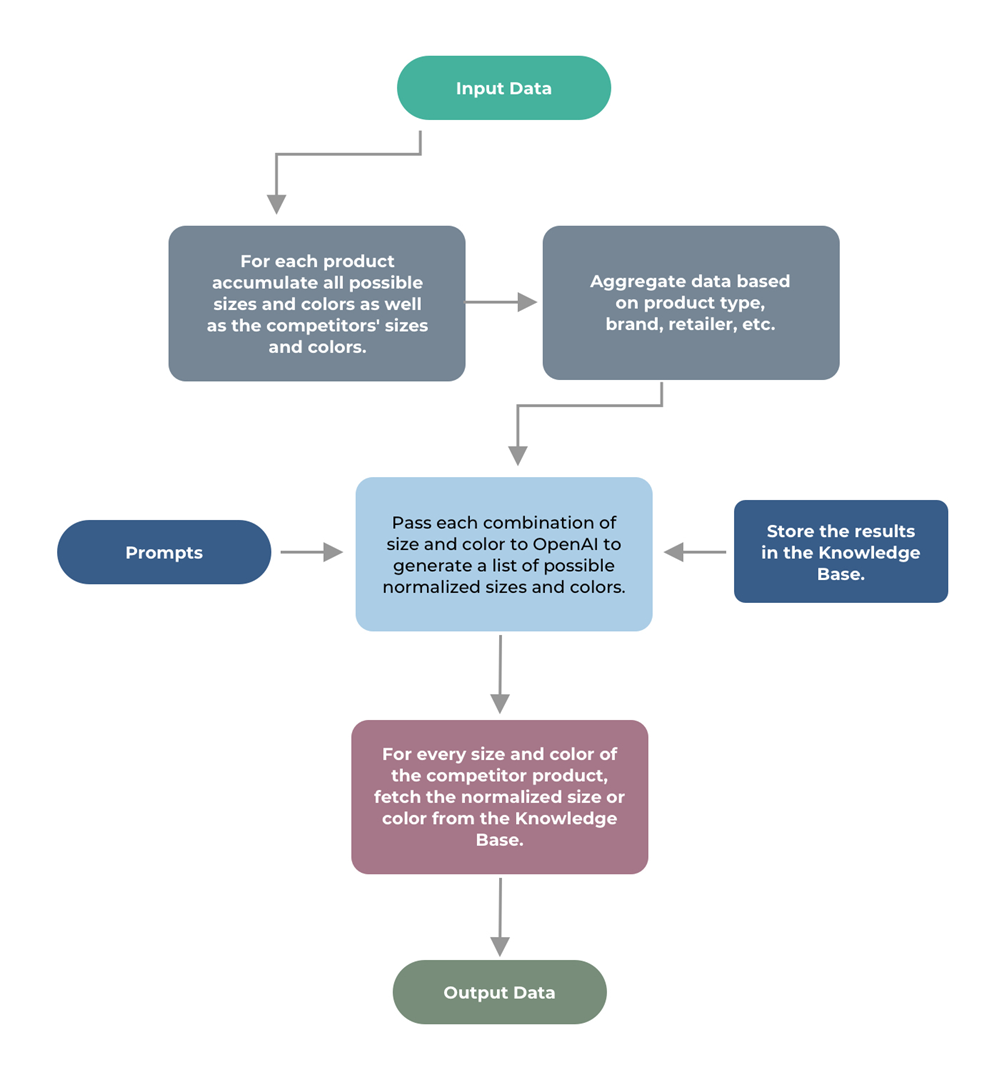
Normalizing Size and Color in Fashion
Style, color, and size are the core attributes in the fashion and apparel categories. Style attributes, which include design, appearance, and overall aesthetics, can be highly specific to individual product categories.
Our product matching engine can easily handle color and sizing complexity via our AI-driven approach combined with human verification. By leveraging advanced technology to identify and normalize identical and similar products from competitors, you can optimize your pricing strategy and product assortment to remain competitive. Using Generative AI in normalizing color and size in fashion is key to powering competitive pricing intelligence at DataWeave.
Continuous Adaptation and Learning
Our solution evolves with your business, improving continuously through feedback and customization for retailers’ specific product categories. The system can be fine-tuned to understand and apply specialized tagging for niche or industry-specific product categories. This ensures that tags remain relevant and accurate across diverse catalogs and as trends emerge.
The AI in our platform also continuously learns from user interactions and feedback, refining its tagging algorithms to improve accuracy over time.
Stay Ahead of the Competition With Accurate Attribute Tagging
In the current landscape, the ability to accurately and consistently tag product attributes is no longer a luxury—it’s essential for staying competitive. With advancements in Generative AI, companies like DataWeave are revolutionizing the way product tagging is handled, ensuring that every item in a retailer’s catalog is presented with precision and depth. As shoppers demand a more intuitive, seamless experience, next-generation tagging solutions are empowering businesses to meet these expectations head-on.
DataWeave’s innovative approach to attribute tagging is more than just a technical improvement; it’s a strategic advantage in an increasingly competitive market. By leveraging AI to scale and automate tagging processes, online retailers can keep pace with expansive product assortments, manage content more effectively, and adapt swiftly to changes in consumer behavior. In doing so, they can maintain a competitive edge.
Fashion is as dynamic a market as any—and more competitive than most others. Consumer trends and customer needs are always evolving, making it challenging for fashion and apparel brands to keep up.
Despite the inherent difficulties fashion and apparel sellers face, this industry is one of the largest grossing markets in the world, estimated at $1.79 trillion in 2024. Global revenue for apparel is expected to grow at an annual rate of about 3.3% over the next four years. That means companies in this space stand to make significant revenue if they can competitively price their products, keep up with the competition, and win customer loyalty with consistent product availability.
There are three main categories in fashion and apparel. These include:
Apparel and clothing (i.e., shirts, pants, dresses, and other apparel)
Footwear (i.e., sneakers, sandals, heels, and other products)
Accessories (i.e., bags, belts, watches, and so on)
If you look at all of these product types across all sorts of retailers, there is a massive amount of overlapping data based on product attributes like style and size that are difficult to normalize.
Fashion Attributes
Style, color, and size are the main attribute categories in fashion and apparel. Style attributes include things like design, look, and overall aesthetics of the product. They’re very dependent on the actual product category of fashion as well. A shirt might have a slim fit attribute associated with it, whereas a belt might have a length. All these different attributes are usually labeled within a product listing and affect the consumer’s decision-making process:
Color (red, blue, sea green, etc.)
Pattern (solid, striped, checked, floral, etc.)
Material (cotton, polyester, leather, denim, silk, etc.)
Fit (regular, slim, relaxed, oversized, tailored, etc.)
Type (casual, formal, sporty, vintage, streetwear)
Color Complexity in Fashion
Color is perhaps the most visually distinctive attribute in fashion, yet it presents unique challenges for retailers. This is because color naming can vary across retailers and marketplaces. There are several major differences in color convention:
A single color can be labeled differently across brands (e.g., “navy,” “midnight blue,” “deep blue”)
Seasonal color names (e.g., “summer sage” vs. “forest green”)
Marketing-driven names (e.g., “sunset coral” vs. “pale orange”)
Size: The Other Critical Dimension
Size in fashion refers to the dimensions or measurements that determine how fashion products fit. Depending on whether the product is a clothing item, shoes, or a hat, there will be different sizing options. Types of sizes include:
Standard sizes (XS, S, M, L, XL, XXL, XXL)
Custom sizes (based on brand, retailer, country, etc.)
A single type of product may have different sizing labels. For instance, one pants listing may use traditional S, M, L, XL sizing, while another pants listing may use 24, 25, or 26, to refer to the waist measurement.
Size is a dynamic attribute that changes based on current trends. For example, there has recently been a significant shift towards inclusive sizing. Size inclusivity refers to the practice of selling apparel in a wide range of sizes to accommodate people of all body types. Consumers are more aware of this trend and are demanding a broader range of sizing offerings from the brands they shop from.
In the US market, in particular, some 67% of American women wear a size 14 or above and may be interested in purchasing plus-size clothing. There is a growing demand in the plus-size market for more options and a wider selection. Many brands are considering expanding their sizes to accommodate more shoppers and tap into this growing revenue channel.
Pricing Based on Size and Color
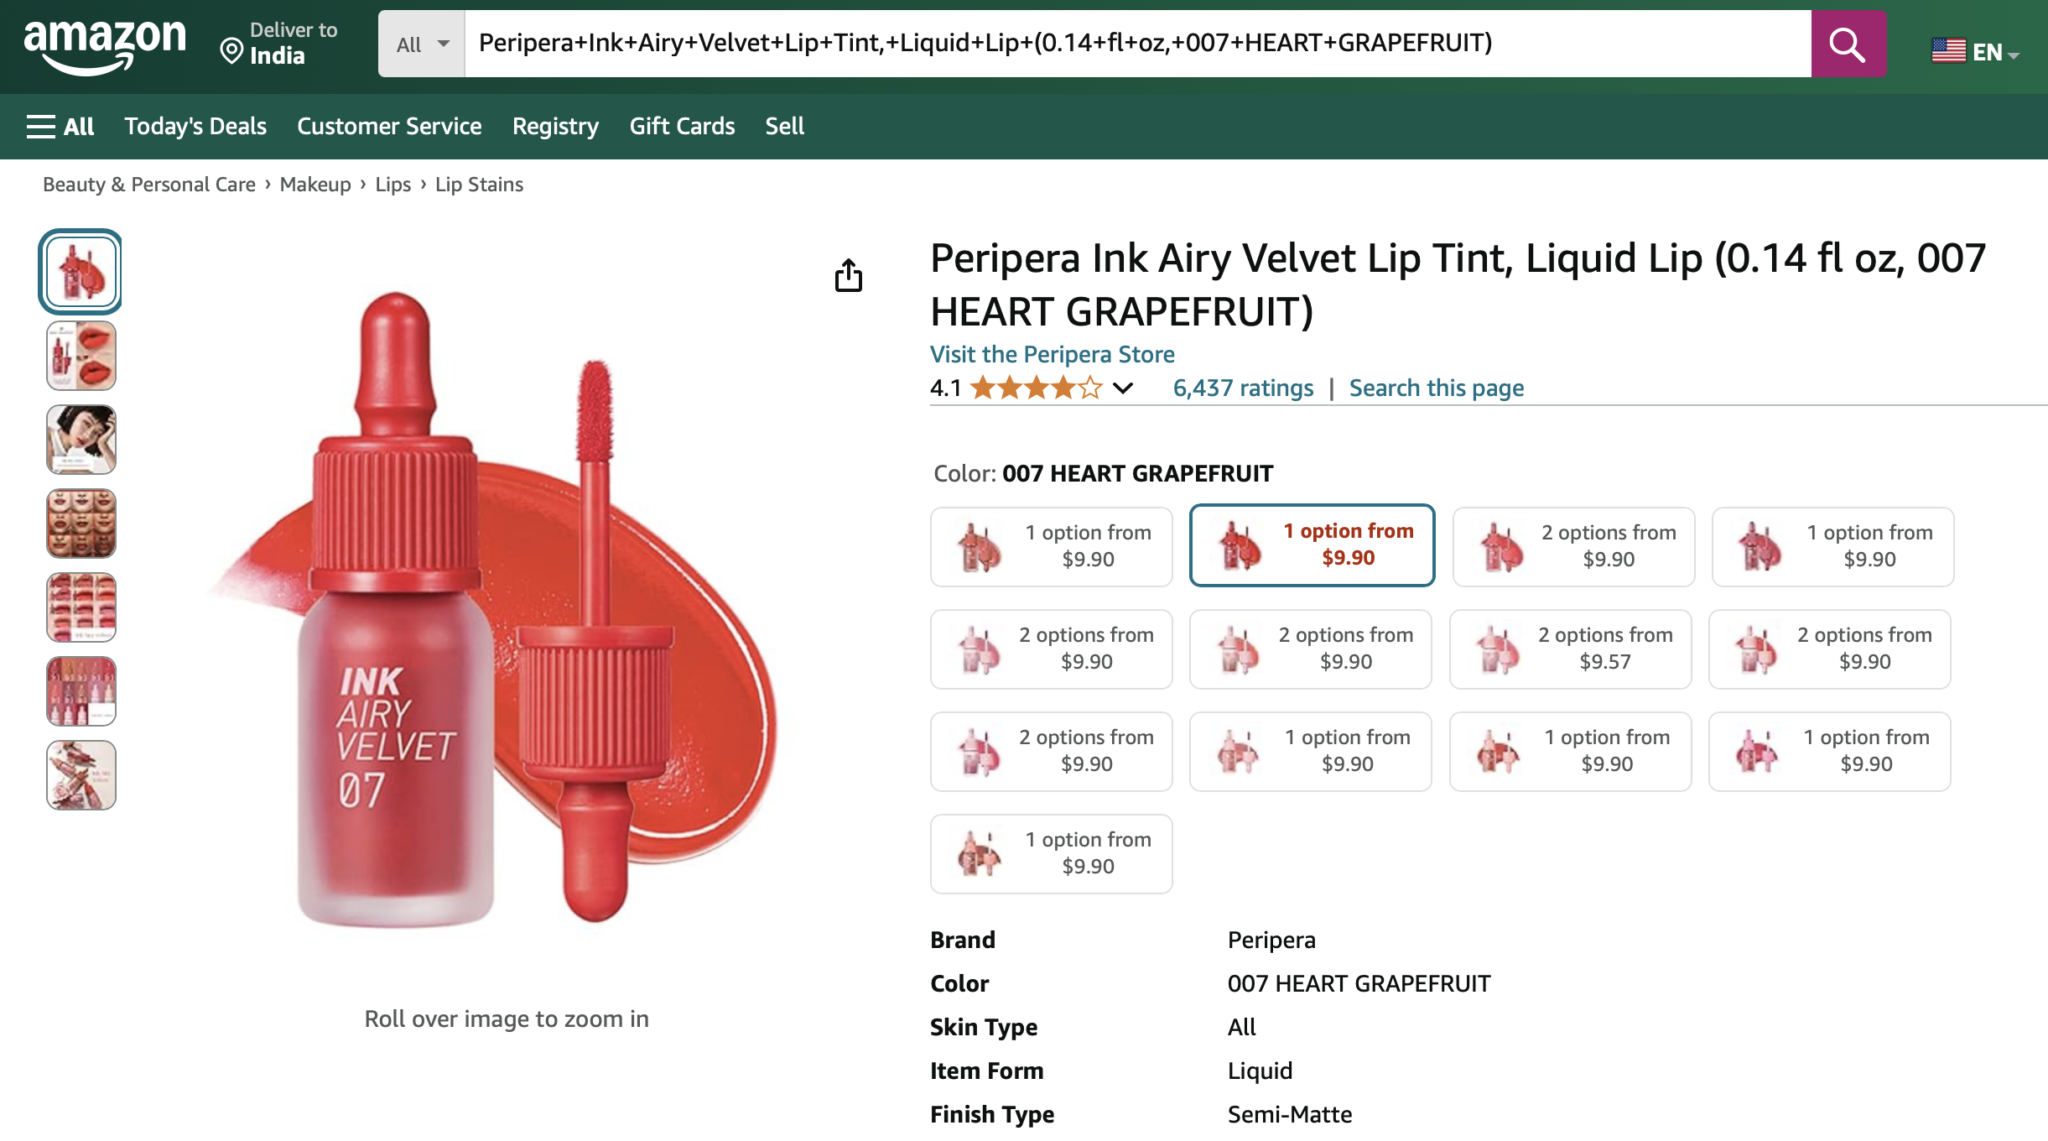
Many fashion products are priced differently based on size and color. Let’s take a look at an example of what this can look like.
A popular beauty brand (see image) is known for its viral lip tint. While most of the color variants are priced at $9.90 on Amazon, a specific colorway option, featuring less pigmented options, is priced at $9.57. This price differential is driven by both material costs and market demand.
Different colorways (any of a range of combinations of colors in which a style or design is available) of the same product often command different prices also. This is based on:
Dye costs (some colors require more expensive processes)
Seasonal demand (traditional colors vs. trend colors)
Exclusivity (limited edition colors)
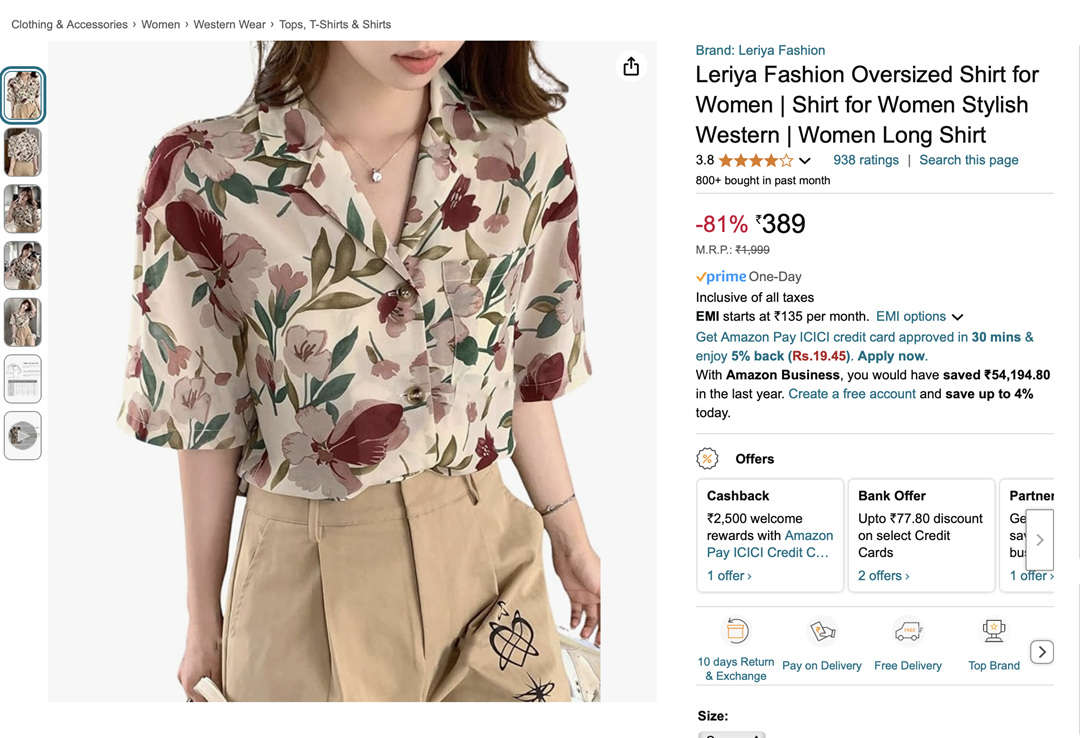
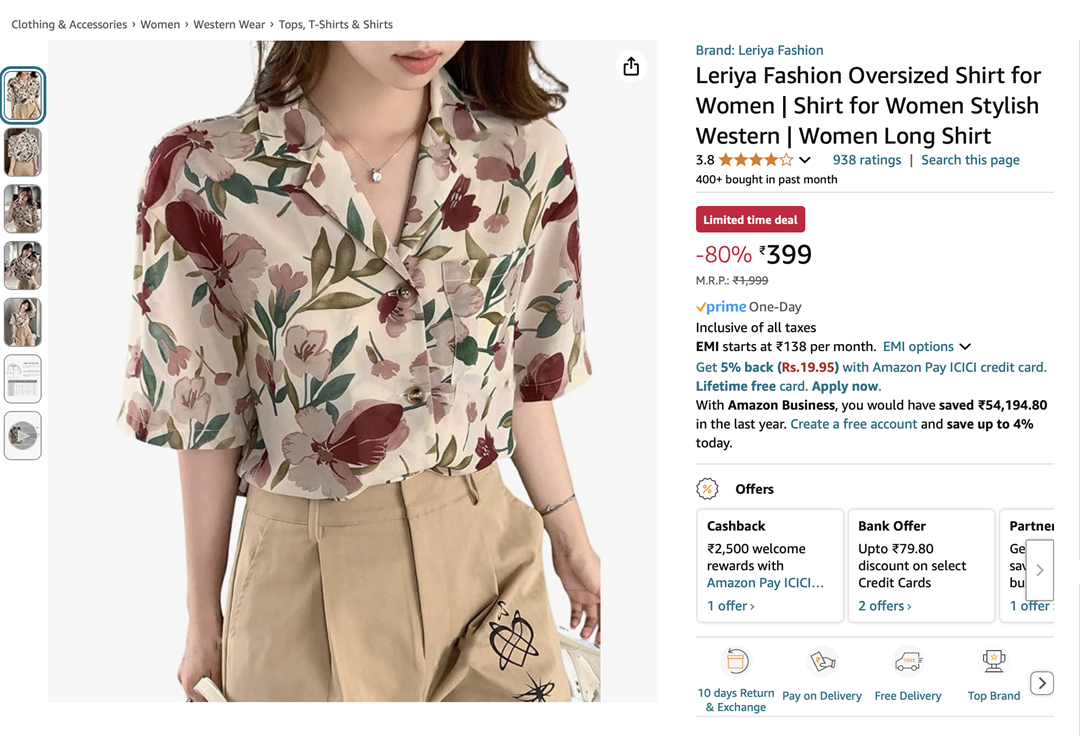
An example of price variations by size is a women’s shirt that is being sold on Amazon as shown below. For this product, there are no style attributes to choose from. The only parameter the shopper has to select is the size they’d like to purchase. They can choose from S to XL. On the top, we can see that the product in size S is ₹389. Below, the size XL version of this same shirt is ₹399. This price increase is correlated to the change in size.
So why are these same products priced differently? In an analysis of One Six, a plus-size clothing brand, several reasons for this difference in plus-size clothing were determined.
Extra material is needed, hence an increase in production costs
Extra stitching costs, hence an increase in production costs
Production of plus-size clothing often means acquiring specialized machinery
Smaller scale production runs for plus-size clothing means these initiatives often don’t benefit from cost savings
Some sizes are sold more than others, meaning that in-demand sizes for certain apparel can affect pricing as well. Brands want to be able to charge as much as possible for their listing without risking losing a sale to a competitor.
The Competitive Pricing Challenge: Normalizing Product Attributes Across Competitors in Apparel and Fashion
There are hundreds of possible attribute permutations for every single apparel product. Some retailers may only sell core sizes and basic colors; some may sell a mix of sizes for multiple style types. Most retailers also sell multiple color variants for all styles they have on catalog. Other retailers may only sell a single, in-demand size of the product. Also, when other retailers are selling the product, it’s unlikely that their naming conventions, color options, style options, and sizing match yours one-for-one.
In one analysis, it was found that there were 800+ unique values for heel sizes and 1000+ unique values for shirts and tops at a single retailer! If you’re looking to compare prices, the effort involved in setting up and managing lookup tables to identify discrepancies when one retailer uses European sizes and another uses USA sizes, for example, is simply too onerous to contemplate doing. Colors only add to the complexity – as similar colors may have new names in different regions and locations as well!
Even if you managed to find all the discrepancies between product attributes, you would still need to update them any time a competitor changed a convention.
Still, monitoring your competitors and strategically pricing your listings is essential to maintain and grow market share. So what do you do? You can’t simply eyeball your competitor’s website to check their pricing and naming conventions. Instead, you need advanced algorithms to scan the entire marketplace, identify individual products being sold, and normalize their data and attributes for analysis.
Getting Color and Size Level Pricing Intelligence
With DataWeave, size and color are just two of several dimensions of a product instead of an impossible big data problem for teams. Our product matching engine can easily handle color and sizing complexity via our AI-driven approach combined with human verification.
This works by using AI built on more than 10 years of product catalog data across thousands of retail websites. It matches common identifiers, like UPC, SKU code, and other attributes for harmonization before employing a large language model (LLM) prompts to normalize color variations and sizing to a single standard.
For example, if a competitor has the smallest size listed as Sm but has your smallest listing identified as S, DataWeave can match those two attributes using AI. Similar classification can be performed on color as well.
Complex LLM prompts are pre-established so that this process is fast and efficient, taking minutes rather than weeks of manual effort.
Harmonizing products along with their color and sizing data across different retailers for further analysis has several benefits. Most importantly, product matching helps teams conduct better competitive analysis, allowing them to stay informed about market trends, competitors’ offerings, and how those competitors are pricing various permutations of the same product. It helps ensure that you’re offering the most competitive assortment of sizing in several colors to win more market share as well. Overall, it’s easier for teams to gain insights and exploit their findings when all the data is clean and available at their fingertips.
Product Matching Size and Color in Apparel and Fashion
Color and size are crucial attributes for retailers and brands in the apparel and fashion industry. It adds a level of complexity that can’t be overstated. While it’s a necessity to win consumers (more colors and sizes will mean a wider potential reach), the more permutations you add to your listing, the more complicated it will be to track it against your competition. However, This challenge is worth undertaking as long as you have the right solutions at your disposal.
With a strategy backed by advanced technology to discover identical and similar products across the competitive landscape and normalize their color and sizing attributes, you can ensure that you are competitively pricing your products and offering the best assortment possible. Employing DataWeave’s AI technology to find competitor listings, match products across variants, and track pricing regularly is the way to go.
Interested in learning more about DataWeave? Click here to get in touch!
As the dust settles on Amazon’s 8th Prime Day extravaganza in India, held on July 20-21, 2024, the eCommerce giant has once again shattered records. This year’s event saw unprecedented engagement, with 24% more Prime members participating compared to 2023, marking the highest-ever Prime member involvement in the sale’s history.
At DataWeave, we’ve conducted an extensive analysis of this landmark event, examining over 47,000 SKUs across major categories for Flipkart and Amazon to uncover compelling insights into pricing strategies, competitive positioning, and emerging trends in the Indian eCommerce space. This follows our comprehensive analysis of Prime Day in the USA across categories and brands, which readers can explore for a global perspective on Amazon’s strategies.
Key Highlights:
Tier-2 Cities Drive Growth: This year’s exponential growth was notably fueled by orders from tier-2 cities, highlighting the expanding reach of eCommerce in India.
Swift Deliveries: Most Prime members’ orders from metros were delivered the same day or the next, while tier-2 cities saw deliveries in less than 2 days, highlighting the importance of delivery time when it comes to purchase decisions.
Brand Participation: Over 450 top Indian and global brands participated, including Intel, Samsung, OnePlus, and Puma, alongside 3,200 new product launches from small and medium Indian businesses. This highlights Amazon’s policy to promote small, local businesses globally in 2024.
Premium Products in Demand: Despite modest discounts across electronics and similar offerings, consumers chose to purchase premium products during Prime Day. With financial flexibility and no-cost EMI options, Indian consumers, especially Gen Z and millennials, are now ready to invest in premium products and experiences.
Our analysis focused on both the Additional Discounts offered during Prime Day (calculated relative to prices the week prior to the event), highlighting the event’s genuine benefits, and the Absolute Discounts offered during Prime Day, representing the total markdown relative to the MRP.
Cross-Category Discount Strategy
Our analysis this year reveals that the Consumer Electronics category saw the highest Absolute Discounts with an average of 48.9%, closely followed by Apparel at 46.9%. The Health & Beauty category had the lowest Absolute Discount at 32.1%.
However, Amazon offered the highest Additional Discount in Health & Beauty at 9.3%. Electronics and Apparel had additional discounts of 8.6% and 7.7% respectively.
Overall, Flipkart chose to not compete aggressively with Amazon during Prime Day this year. Only in Electronics did Flipkart offer an additional discount of 3.2% during the sale. Price changes in Apparel and Health & Beauty were negligible.
Category Deep Dive
Consumer Electronics
In Electronics, Earbuds (14.7%) and Wireless Headphones (12.5%) saw the highest Additional Discounts on Amazon, likely due to high demand for personal audio devices. Smartwatches followed closely at 12.5%, indicating a strong push in the wearable technology sector.
Larger electronic appliances like TVs saw more modest Additional Discounts (5.2%), despite a significant Absolute Discount (42.3%).
Smartphones, interestingly, had the lowest Additional Discount (2.8%) among the subcategories, potentially due to their already competitive pricing or brand-specific strategies.
Brand-level Insights in Consumer Electronics
During the sale event, Soundcore (headphone and earphone brand from Anker) led with the highest Additional Discount of 10.3%, followed closely by OnePlus at 9.3%. These brands clearly leveraged Prime Day to drive sales and potentially gain market share.
Sennheiser and Sony also offered significant additional discounts, indicating aggressive promotional strategies during the event.
Notably, some well-known brands like Apple and HP offered more conservative discounts, possibly due to their established market positions or differing promotional strategies.
Despite modest discounts though, Amazon revealed that the iPhone 13 and OnePlus 12R were among the top premium smartphones customers bought this Prime Day. Prime members shopped from top brands such as LG, IFB, Bosch, and Haier and upgraded to premium appliances through affordability options of no cost EMI, Bank discounts and exchange offers, claims Amazon.
These learnings offer valuable insight into the mindset of the modern Indian consumer, who is ready to purchase premium products. Brands can leverage more detailed market intelligence to drive their positioning in India.
Share of Search Analysis
The Share of Search (SoS) for a brand represents the number of its products in the top 20 search results for relevant search keywords on Amazon, relative to that of its competitors. It provides insights into a brand’s visibility during the sale event.
HP saw the most significant improvement in its Share of Search during Prime Day, gaining 9.2%, with strong growth in both organic (7.5%) and sponsored (1.7%) listings. LG also made substantial gains of 8.2% and 5.3% respectively. Both brands offered significant markdowns on laptops and accessories.
Surprisingly, some popular brands like Apple (-0.6%) and Acer (-1.0%) experienced slight decreases in their SoS. Lenovo notably lost 7.2% of its visibility share, with a significant decline in organic listings (-7.6%). Samsung maintained its strong position with an increase in SoS (3.7%).
Key Takeaways:
While some brands like Soundcore and OnePlus used aggressive discounting to drive sales, others like HP and LG focused on improving their search visibility. The data suggests that a combination of attractive discounts and improved search visibility was key to success during the event. Brands that managed to balance these factors effectively, like HP and Samsung, seemed to perform particularly well. Interestingly, some brands with lower discounts (like HP) still managed to significantly increase their SoS, indicating that factors beyond pricing played a role in visibility during the event.
Apparel
Within the subcategories analyzed, Women’s Shoes (13.4%) and Men’s Shoes (11.6%) saw the highest Additional Discounts on Amazon, indicating a strong focus on footwear during the event. Men’s Shirts followed closely at 11.1%
Women’s Tops had a more modest Additional Discount of 7.9% despite a high Absolute Discount before the event. Similarly, Women’s Dresses showed substantial Additional Discounts (10.4%).
Swimwear for both men and women saw low Additional Discounts (3.7% and 3.0% respectively). Innerwear categories for both men and women had more conservative discounts, with Men’s Innerwear showing the lowest Absolute Discount (19.9%) among all subcategories.
Brand-level Insights in Apparel
During the sale event, Sangani (innerwear brand) led with the highest Additional Discount of 41%, followed by Louis Philippe at 25%. These brands clearly leveraged Prime Day to drive sales and gain market share.
Puma offered the highest Absolute Discount at 60% with a significant Additional Discount of 20%, indicating a consistently aggressive promotional strategy. Chromozome (men’s innerwear brand) and Bacca Bucci (homegrown shoe brand of Shark Tank India fame) also offered substantial Absolute Discounts (57% and 56% respectively), but their Additional Discounts varied significantly (16% and 6% respectively).
Again, some well-known brands like Adidas, and Pepe Jeans offered more moderate Additional Discounts, possibly due to their established market positions.
Share of Search Analysis
Biba (women’s ethnic wear brand) saw the most significant improvement in its SoS, gaining 3.60%, entirely through investments in sponsored listings. Allen Solly and New Balance (shoe brand) also made substantial gains of 3.3% and 3.2% respectively.
Surprisingly, some popular brands like Louis Philippe (-2.00%) and Sangani (-2.10%) experienced decreases in their SoS. Louis Philippe lost its share due to a roll back of its sponsored listings, while Sangini lost ground organically.
Key Takeaways:
While some brands like Sangani and Louis Philippe used aggressive discounting to drive sales, others like Biba and Allen Solly focused on improving their search visibility through sponsored listings.
Some brands with high discounts (like Sangani) saw a decrease in SoS, while others with more modest discounts (like Biba) significantly increased their visibility. This indicates that factors beyond pricing played a crucial role in brand performance during the event.
The significant use of sponsored listings by some brands highlights the importance of paid advertising in gaining visibility during competitive events like Prime Day.
Health & Beauty
Health & Beauty emerged as a standout category during Amazon Prime Day India 2024, with significant discounts and competitive strategies at play.
Within the subcategories we analyzed, Moisturizer (11.9%) and Sunscreen (11.8%) saw the highest additional price reductions on Amazon, likely due to seasonal demand during Prime Days. Make-up followed closely at 10.6%.
Electric Toothbrushes had the highest Absolute Discount at 47.1%, but a lower Additional Discount of 6.0%, highlighting that these products were already significantly discounted before the event. Similarly, Beard Care products showed high Absolute Discounts (43.7%) but lower Additional Discounts (5.7%) during Prime Day.
Everyday essentials like Toothpaste saw more modest discounts (19.9% Absolute, 8.4% Additional), reflecting steady demand for these products.
Brand-level Insights in Health & Beauty
Vaseline led with the highest Additional Discount of 13.1%, followed by Maybelline at 9.5%. These brands clearly leveraged Prime Day to drive sales and potentially gain market share.
Honest Amish (beard care brand) and Nivea also offered substantial Absolute Discounts (15.6% and 8.2% respectively), but their Additional Discounts were lower, indicating pre-existing promotional strategies.
Once again, some well-known brands like Colgate, Dove, and Neutrogena offered more conservative discounts, possibly due to their established market positions or differing promotional strategies.
Share of Search Analysis
Maybelline saw the most significant improvement, gaining 5.6% in SoS, all through organic listings. The brand has been aggressively increasing market share with several new product launches and influencer campaigns. Nivea and Vaseline also made substantial gains of 5.2% and 3.8% respectively.
In this category as well, some popular brands like Dove (-0.4%), Pond’s (-0.8%), and Honest Amish (-0.8%) experienced slight decreases in their SoS. Parodontax (toothpaste brand) notably lost 1.3% SoS, with most of the decline in sponsored listings. Colgate maintained its strong position with a slight increase in SoS (0.2%), reflecting its dominant market presence.
Key Takeaways:
While some brands like Vaseline and Maybelline used aggressive discounting and improved visibility to drive sales, others like Colgate and Dove relied more on their established market positions.
None of the brands made any significant strides in sponsored listings, revealing that brands in this category are not yet fully leveraging retail media to help manage and boost their visibility on online marketplaces.
Final Thoughts
Amazon Prime Day 2024 has redefined the eCommerce landscape in India, yet again, showcasing diverse strategies employed by brands to maximize their impact. By understanding and leveraging these insights, brands and retailers can better navigate future sales events, optimizing their eCommerce strategies to achieve sustained growth and success.
Stay tuned to our blog for more in-depth analyses of brand and retailer performance across various retail events.
Reach out to us today to learn how you can leverage data-driven insights to optimize your eCommerce strategy.
Amazon Prime Day 2024 saw U.S. shoppers spending a staggering $14.2 billion online during the two-day event—an 11% increase from last year. This surge in spending reflects a significant shift in consumer behavior and presents a wealth of insights for brands and retailers alike.
Unlike last year’s focus on essentials, Prime Day 2024 saw Americans enthusiastically embracing both necessities and discretionary purchases. The Consumer Electronics and Health & Beauty categories, for example, experienced a notable uptick in interest, driven by major retailers slashing prices across CPG and Grocery segments, amid other reasons. Check out our first article in the Prime Day series 2024, analyzing retail insights across categories during the event.
This year, small businesses gained unprecedented visibility on Amazon, pushing relatively new brands into visibility.
At DataWeave, we recognize the critical importance of understanding these market dynamics for brands navigating the competitive eCommerce landscape. To provide actionable insights, we conducted an extensive analysis of over 47,000 SKUs across key categories before and during Amazon during Prime Day 2024. Our study delves into:
Pricing strategies: How did brands adjust their discounts to capitalize on the Prime Day frenzy?
Share of Search: Which brands achieved the highest visibility for major search keywords?
Dive into these insights below to uncover how brands performed during Amazon Prime Day 2024, and learn how you can leverage these findings to enhance your brand’s digital shelf performance.
Our Findings
Most brands offered substantial discounts before Prime Day, then added smaller discounts during the event. This strategy creates a perception of value while still allowing room for Prime Day-specific deals. To understand the real value offered by brands, we conducted an extensive analysis of brand performance, examining both pricing strategies and visibility on the platform. Our approach focuses on two key metrics:
Discounts: We analyzed both the Absolute Discount (total markdown relative to MSRP a week before Prime Day) and the Additional Discount (the price reduction during Prime Day compared to the week before).
Share of Search (SoS): We examined the visibility of brands in the top 20 search results. We also separately tracked this metric for organic and sponsored search results.
Let’s dive into the category and brand specific insights:
Consumer Electronics
Once again, in 2024, the Consumer Electronics category dominated discounts. Amazon’s own brands lead with the highest average Absolute Discount (44.2%) and a significant Additional Discount (12.5%), showcasing its aggressive push for Prime Day.
In a surprising twist, Amazon’s homepage wasn’t dominated by its own brands. Instead, tech giants like Apple and Samsung took centre stage. Despite this, Amazon’s own brands offered significant discounts across electronics products, including Amazon Kindle, Fire TVs, Fire TV Sticks, Echo Dot, and more, aiming to capture market share via markdowns.
Soundcore (earphone audio products brand) offered the highest discount during Prime Day, at 30.10%. Other headphone, earbuds, and wireless headphone brands including Sony, Beats, JBL, and more also offered significant discounts.
Premium brands like Apple (17.90% Absolute, 9.00% Additional) and Bose (23.10% Absolute, 16.00% Additional) offered relatively modest discounts, aligning with their brand positioning, but also taking advantage of the Prime Day frenzy.
Share of Search Insights in Consumer Electronics
JBL emerged as the standout performer, with the most significant increase in SoS, jumping from 14.3% pre-event to 25.8% during Prime Day, driven entirely by organic growth. Beats also saw a remarkable rise, increasing from 2.8% to 12.8%, again through organic listings only. Samsung maintained its strong presence, growing from 18.6% to 26.8%, with most of its growth influenced by increased ad spend.
Apple, despite already having a high pre-event SoS, managed to increase its share further from 23.0% to 31.0%, with some contribution via sponsored ads. LG saw a substantial increase from 1.3% to 6.9%, primarily through sponsored listings, opting for an inorganic approach to drive visibility during the sale.
Amazon and its AmazonBasics brand both saw notable increases in SoS, relying solely on organic growth. This is, of course, not surprising since Amazon controls its organic ranking algorithm.
Interestingly, some brands experienced decreases in SoS. Sony, Motorola, and Hisense all saw reductions in their share, with Hisense’s decline coming entirely from a reduction in sponsored listings.
Key Takeaway: Prime Day 2024 saw a significant reshuffling of brand visibility in the Consumer Electronics category. While some established brands like JBL, Beats, Samsung, and Apple strengthened their positions through a mix of organic and sponsored growth, others faced increased competition for consumer attention. The event highlighted the importance of a balanced approach to visibility, with successful brands leveraging both organic search optimization and strategic use of sponsored listings to maximize their presence during this high-traffic period.
Apparel
In the Apparel category, Adidas led with the highest Absolute Discount (27.2%) and a significant Additional Discount (9.8%). Value brands like Hanes (innerwear brand) and Anrabess offered substantial discounts, while Amazon Essentials maintained high discounts across the board (16.5% Absolute, 15.3% Additional).
Some brands like Cupshe (swimwear and vacation apparel brand) offered relatively lower additional markdowns. Meanwhile CRZ Yoga (athleisure brand) did not offer additional markdowns on Prime Day.
Share of Search Insights in Apparel
Gildan (activewear brand) emerged as the top performer in terms of SoS growth, increasing from 8.1% pre-event to 12.1% during Prime Day, driven entirely by organic growth. CRZ Yoga (an athleisure apparel brand) and Dokotoo (women’s casualwear brand) also saw significant increases in their SoS, rising by 2.8 and 2.3 percentage points respectively, again through organic listings only.
Amazon Essentials continued to perform well, increasing its visibility from 7.0% to 9.1%, aligning with its competitive pricing strategy. Coofandy also saw a notable increase, growing from 7.8% to 9.9%.
Interestingly, some brands that were previously highlighted for growth actually experienced decreases in SoS. Automet (clothing & accessories brand) saw a slight decline from 12.5% to 12.1%, while Anrabess (women’s fashion brand) dropped from 15.8% to 14.5%. Cupshe (swimwear brand) experienced the most significant decrease, falling from 10.6% to 5.5%.
Adidas, despite leading in discounts, saw only a modest increase in SoS from 7.0% to 8.0%. Notably, none of the brands visible in the top search results utilized sponsored listings, with all changes in SoS coming from organic growth or decline. This indicates a lack of maturity in this category in leveraging retail media.
Key Takeaway: Prime Day 2024 in the apparel category showcased the importance of organic search optimization. While some brands like Gildan and CRZ Yoga significantly improved their visibility, others faced challenges in maintaining their pre-event positions. The absence of sponsored listings across all brands highlights a unique dynamic in the apparel category, where organic search performance appears to be the primary driver of visibility during high-traffic events like Prime Day.
This suggests that Apparel brands may need to focus more on SEO strategies and organic content optimization to maximize their presence during major shopping events, rather than relying on paid promotions. On the other hand, smartly leveraging retail media to boost visibility can give apparel brands a competitive edge.
Health & Beauty
The Health & Beauty category this year got a push thanks to Amazon’s subscription offering. Prime members who subscribed for regular usage products like toothpaste and health aids or medicines availed higher discounts.
Amid Health & Beauty brands, Neutrogena led with the highest Absolute Discount (32.7%) and a significant Additional Discount (11.7%). Sun Bum moisturizers & sunscreen (23.3%) and Viking Revolution (23.1%) offered the highest Additional Discounts, indicating a strong Prime Day focus.
Premium brands like L’Oreal Paris and Philips Sonicare offered moderate discounts, balancing promotions with their intended brand image.
Share of Search Insights in Health & Beauty
Banana Boat (sunscreen brand) emerged as the standout performer, seeing the largest increase in SoS from 6.5% to 13.4%, achieved entirely through organic growth. Nyx Professional Makeup also saw a significant jump, rising from 3.9% to 8.9%, again solely through organic listings.
Contrary to previous analysis, e.l.f. actually experienced substantial growth, increasing from 9.0% to 13.1% SoS, with a strong focus on organic growth (4.4%) slightly offset by a minor decrease in sponsored listings (-0.2%).
Neutrogena maintained its strong performance, aligning with its aggressive discounting strategy, as its SoS increased from 14.6% to 18.5% through organic growth. Colgate also saw a notable increase from 11.0% to 13.7% SoS.
Interestingly, some brands employed a mixed strategy. Dove and Garnier saw overall increases in SoS, but achieved this through different means. Dove relied heavily on sponsored growth, while Garnier offset a decrease in organic listings with strong sponsored content growth.
Contrary to previous observations, Oral-B experienced a decrease in SoS from 18.5% to 15.3%, entirely in organic listings. Without any additional spend on sponsored listings to compensate, it lost significant ground in its visibility. Other brands facing significant declines include Tresemme, OGX, Philips Sonicare, and most notably, Viking Revolution, which dropped from 17.2% to 10.7% in its SoS.
Key Takeaway: The Health & Beauty category during Prime Day 2024 showcased a diverse range of strategies and outcomes. While some brands like Banana Boat and Nyx Professional Makeup achieved significant visibility gains through organic growth, others like Dove and Garnier relied more on sponsored content.
The success of e.l.f. and Neutrogena in aligning discounting strategies with increased visibility stands in contrast to the challenges faced by previously strong performers like Oral-B and Viking Revolution. This varied landscape shows the fierce competition in the category and the need for brands to employ multi-faceted strategies that balance organic optimization, sponsored content, and competitive pricing to succeed in high-stakes events like Prime Day.
Brand Strategies and Future Implications
Our analysis reveals several key trends:
Brand Positioning Matters: Premium brands like Apple and Bose maintained their positioning with modest discounts, while value-oriented brands like Soundcore and Hanes offered deeper cuts to attract price-sensitive shoppers.
Visibility vs. Discounting: Some brands, particularly in the Consumer Electronics category, prioritized increasing their visibility (Share of Search) over offering steep discounts. This strategy suggests a focus on long-term visibility and brand perception rather than short-term sales boosts.
Category-Specific Approaches: Apparel brands uniquely relied on organic search visibility, eschewing sponsored listings entirely. In contrast, several Health & Beauty brands leveraged sponsored content significantly to boost their presence.
Emerging Brand Opportunities: Lesser-known brands, especially in the Apparel and Health & Beauty categories, used Prime Day as a launchpad to increase their visibility, often outpacing established names in Share of Search growth.
Amazon’s Dual Strategy: As both a platform and a brand, Amazon showcased its ability to offer deep discounts on its own products while also providing a stage for other brands to shine.
Stay tuned to our blog for more in-depth analyses of brand and retailer performance and strategies across various retail events. Reach out to us today to learn how you can leverage data-driven insights to optimize your brand’s eCommerce strategy and performance.
Amazon Prime Day 2024 has once again shattered records, with more items sold during the two-day event than any previous Prime Day. Prime members worldwide saved billions across all categories, while independent sellers moved an impressive 200 million items.
At DataWeave, we conducted an extensive analysis of the discounts offered by Amazon across major categories. By examining over 47,000 SKUs, we’ve uncovered compelling insights into pricing strategies, competitive positioning, and emerging trends in the eCommerce space.
Since products on Amazon and other eCommerce websites are often sold at discounts even on normal days not linked to a sale event, we delved into the real value that Prime Day offers to shoppers by focusing on price reductions or the Additional Discount during the sale compared to the week before. As a result, our approach highlights the genuine benefits of the event for shoppers who count on lower prices during the sale. At the same time, our report also includes the Absolute Discounts offered during Prime Day, which represents the total markdown relative to the MSRP.
Amazon’s Cross-Category Discount Strategy
Our analysis reveals that the Electronics category saw the highest discounts with an average absolute discount of 20.4% and additional discounts on Prime Day amounting to 10.4%. Meanwhile the Home & Furniture had the lowest discount at 13.1%.
The Health & Beauty category saw significant additional discounts during Prime Day, at 9.26%. The Apparel category offered attractive absolute (16.10%) and additional (8.90%) discounts.
Category Deep Dive
Consumer Electronics
Still the star of the show, the electronics category saw the highest markdowns this Prime Day with absolute discounts at 20.40% and across 14.61% of their inventory.
Across Electronics subcategories, Earbuds had the highest markdowns at 34.80%, followed closely by Wireless Headphones at 30.60% and Headphones at 29.00%, with steep additional discounts during Prime Day as well. Apple AirPods Pro, for example, retailed at $168 (down from $249) at a 32% discount.
Meanwhile, smartphones had the lowest markdowns at 9.30%, followed by Laptops at 10.50%. Laptops also had the lowest additional discount during Prime Day at just 1.28%, significantly lower than other subcategories. Speakers (20.80%), Drones (19.10%), and Smartwatches (25.00%) offered moderate to high markdowns.
Notably, all Amazon products including Kindle, Echo, Echo Earbuds, Alexa, Fire TV, Fire TV Stick, and Fire Tablets, were aggressively discounted upwards of 30% this Prime Day. These products also came with the label “Climate Pledge Friendly.”
These aspects indicate Amazon’s push to promote its own ecosystem of products to the top, as well as cater to changing consumer preferences.
Apparel
Discounts offered this Prime Day increased from 13.2% in 2023 to 16.1% in 2024.
Amid apparel subcategories, Amazon appears to be pushing Women’s apparel categories more aggressively, particularly in Tops, Shoes, and Athleisure.
Women’s Shoes lead with the highest discounts at 26.50%, followed by Women’s Tops at 22.50% and Men’s Shoes at 22.80%. Women’s Tops also maintained the highest additional discount at 15.27%, followed by Women’s Athleisure at 13.03% and Men’s Swimwear at 12.44%.
Similar to 2023, Men’s Innerwear offered significantly lower discounts, with only 1% absolute discount and 0.72% additional discount. Women’s Innerwear also shows low discounts at 3.20% absolute and 2.23% additional.
Health & Beauty
Amid health & beauty subcategories, Moisturizes witnessed the highest markdowns at 20.10%, followed by Make Up at 18.90%. The Moisturizer subcategory also offers highest additional discounts at 12.20%, followed closely by Sunscreen at 10.25% and Beard Care at 10.22%.
The Toothpaste subcategory has the lowest discounts, at 10.90%. The lower discounts on everyday essentials like this might indicate a steady demand or an attempt to maintain margins on frequently purchased items.
Most Health & Beauty subcategories fall in the 15-18% range for actual discounts and 8-10% range for additional discounts. Electric Toothbrush (16.90% actual, 9.91% additional) and Shampoo (16.50% actual, 8.78% additional) represent the middle of the pack. There were a few highly attractive deals though, such as the Philips Sonicare toothbrush retailing at $122.96 (down from $199.99), with a 39% discount.
Amazon also offered significant discounts on Open Box products (products that are returned, but unused, out of mint condition boxes) to Prime members.
Home & Furniture
This category saw the lowest discounts for this Prime Day event at 13.1%. Across subcategories, Rugs lead with the highest average discount at 21.50%, closely followed by Luggage at 20.90%. Amazon seems to be pushing decorative and organizational items (Rugs, Bookcases) more aggressively, possibly due to higher margins. Rugs also stood out as the subcategory with the highest additional discount of 11.54%.
Sofas have the lowest additional discount at 2.76%, followed by Dining Tables at 3.21%. Items like Cabinets (15.80% absolute, 6.66% additional) and Coffee Tables (14.40% absolute, 6.25% additional) represent the middle range of discounts.
Watch Out For More
As the holiday season approaches, it’s clear that the retail landscape continues to evolve. While Amazon remains a formidable force, there are opportunities for savvy competitors to carve out their niches and attract deal-hungry shoppers. By analyzing these trends and adjusting strategies accordingly, retailers can position themselves for success in the high-stakes world of summer sales events.
Stay tuned to our blog for more insights on how Amazon’s competitors reacted to Prime Day, and how leading brands across categories fared in terms of their pricing and their visibility during the sale event. Reach out to us today to learn more.
India’s homegrown eCommerce giant Flipkart, now backed by Walmart, reported a record 1.4 Billion customer visits during the early access phase and throughout the seven days of its premier shopping event, the Big Billion Days, launched on 8th October 2023. Competing with Flipkart, Amazon’s Great Indian Festival sale event started on October 8th as well and saw a whopping 95 Million customer visits to the website within the first 48 hours of the event.
For consumers, the most pressing question was, “Who offered more attractive deals and lower prices during these sale events?”
To answer this question, we leveraged our proprietary data aggregation and analysis platform and analyzed the prices and discounts on Amazon and Flipkart across key product categories..
The details of our sample are mentioned below:
Number of SKUs Analyzed: 30,000+
Websites: Amazon.com and Flipkart.com
Categories: Apparel, Home & Furniture, Electronics, Health & Beauty
Dates: 7th Oct 2023 to 22nd Oct 2023
Key Findings
Based on our analysis, the Big Billion Days by Flipkart showcased relatively higher price reductions across categories compared to the Great Indian Festival sale by Amazon. The Apparel category on Flipkart saw the highest average discount at 50.6%. The Health & Beauty category had the lowest discount across Flipkart at 39.4% and Amazon at 33%.
Overall, Flipkart offered higher discounts in each product category. It is clear that the retailer invested heavily in leveraging its supplier partnerships with key brands or sellers to enable them to offer higher discounts, thereby attracting more customers.
Next, let’s take a closer look at each product category.
Apparel
While a majority of retailers expected demand for apparel and clothing to dip this festive season in India, eCommerce giants like Amazon and Flipkart are likely to recognize the strong consumer inclination towards apparel during this period.
In the detailed assessment of Apparel sub-categories, Women’s Dresses, Women’s Tops, Men’s Shirts, Men’s Shoes, and Women’s Innerwear emerged as the segments showcasing the most substantial discounts during the sale events. While Flipkart offered higher average discounts across all sub-categories, Amazon offered competitive discounts as well.
We observed significant differences in the average discounts across brands between Flipkart’s Big Billion Days and Amazon’s Great Indian Festival. Reinforcing the significant discounts on the Shoes subcategory, brands like Red Tape, Arrow, Adidas, Reebok, Nike, and more offered extensive discounts on both Flipkart and Amazon. Notably, Adidas and Reebok offered better deals on Amazon’s Great Indian Festival as compared to Flipkart.
One8 by Virat Kohli had a significantly lower discount on Amazon compared to Flipkart, indicating an exclusive partnership.
For brands, however, reducing prices is just one approach to entice shoppers. They must also guarantee their prominent presence and easy discoverability within Amazon and Flipkart search results. To gain insight into this, we monitored brands’ Share of Search across various frequently used search terms in addition to the discounts they provided. The Share of Search denotes the portion of a brand’s products within the top 20 search results for a specific search query.
Our data indicates that Jockey and Speedo gained in Share of Search on Flipkart, but reduced discoverability on Amazon. Van Heusen fell behind in search results on Flipkart but showed a higher Share of Search on Amazon.
Discounts on both Amazon and Flipkart hovered around 50%. Across a few subcategories, Flipkart offered slightly lower discounts compared to Amazon. Only Luggage, Rugs, Sofas, and Entertainment Units saw lower markdowns on Flipkart during the Big Billion Days.
Dishwashers and Washer/ Dryers saw higher discounts on Amazon compared to Flipkart. The significant discounts on these products on Amazon possibly point to changing consumer preferences, as demand for these products is traditionally low in India, but seems to be growing.
When it comes to Home & Furniture brands, Nasher Miles, Safari, Aristocrat, VIP, and American Tourister, luggage brands mostly, offered higher discounts on Flipkart, followed closely by Amazon.
In terms of Share of Search, Skybags had high discoverability on both Flipkart and Amazon. The brand leveraged a strategy of offering big discounts this festive season as well as ensuring prominent placement in search results. Wildcraft lost out on its discoverability on Flipkart in contrast to its prominence on Amazon. Duroflex saw lower searchability on Amazon compared to Flipkart’s Big Billion Days.
Consumer Electronics
The Consumer Electronics and Appliances Manufacturers Association (CEAMA) expected an uptick in sales of consumer electronics products this festive season in India. With more consumers buying premium products using credit cards and EMIs, demand for expensive, high-end electronics was expected to increase.
Again, average discounts in this category hovered around 50% on Flipkart and Amazon.
Across electronics subcategories, Smartwatches, Earbuds, and Drones had the highest markdowns with Flipkart leading the pack during the Big Billion Days. Amazon offered relatively higher discounts at 44.9% on the TV subcategory, compared to Flipkart’s 40.6%.
Speakers, Laptops, Smartphones, and Tablets also saw lower markdowns on Amazon compared to Flipkart. Amazon was the official partner for the launch of many high-level smartphones and products in September-October, contributing to the higher markdowns in the subcategory.
Across brands, Lenovo’s discounts were the most differentiated between the two sites, with the brand offering higher discounts on Amazon (45.4%) compared to Flipkart (24.7%). Noise offered the highest discounts at 72.5% on Amazon and 52.8% on Flipkart. Brands like Boat and Zebronics, also saw lower discounts on Flipkart.
Mi and JBL offered deeper discounts on Flipkart’s Big Billion Days. Apple meanwhile stands out with only 11.83% discounts on Amazon, but the brand offered impressive 31.4% discounts on Flipkart.
Samsung dominated the Share of Search on Amazon at 15.7%, compared to only 2.6% on Flipkart. Apple and Lenovo also saw higher discoverability on Amazon. On Flipkart, JBL and Skullcandy stand out as brands with high search visibility.
Health & Beauty
The Health & Beauty category saw the lowest markdowns with only 39.4% discounts on Flipkart and 33% on Amazon.
In the subcategories analyzed, Electric Toothbrushes had relatively high markdowns across both sites. Staple and lower priced subcategories like Toothpaste had the lowest markdowns across both sale events, with Amazon offering only 17.4% average discounts.
Across brands, Beardo, a leading beard care brand, offered significantly higher discounts on Amazon compared to Flipkart. Most other well-known brands, including Nivea and Vaseline, saw higher discounts on Amazon compared to Flipkart. Only Tresmme and Dove were exceptions with higher discounts on Flipkart.
In terms of Share of Search, once again, Beardo was the most discoverable brand in this category. Brands like Dove, Pond’s, Swiss Beauty, and Tresemme saw a lower Share of Search on Flipkart compared to Amazon.
Navigating the Competitive Landscape: How To Thrive During Sale Events
Amazon and Flipkart’s strategic pricing during the Big Billion Days and the Great Indian Festival Sale reflects a balance of profitability, inventory, and competition. Competitive pricing insights empower retailers to make informed decisions, optimize strategies, and thrive during high-stakes sale events with timely and relevant insights at a massive scale.
To learn more about how you can leverage competitive pricing insights to stay ahead of the game during sale events, reach out to us today!
As the highly anticipated shopping season approached, industry analysts, including Deloitte, had forewarned consumer spending caution owing to persistent inflationary pressures tightening budgets. Despite these concerns, the holiday spirit was buoyed by sensational deals that delighted bargain-hunting shoppers.
According to the National Retail Federation (NRF), over 200 million consumers participated in both in-store and online shopping activities over the Thanksgiving weekend. This marked an almost 2% uptick from the previous year, surpassing the NRF’s initial estimates of 182 million and showcasing a robust start to the holiday shopping season.
So what was all the hype about this Black Friday and Cyber Monday? How did top retailers react to reports of possibly decreased consumer spending? At DataWeave, we harnessed the power of our proprietary data aggregation and analysis platform to track and analyze the prices and deals of products across prominent retailers and categories to uncover unique insights into their price competitiveness this BFCM, as well as understand how pricing strategies varied across diverse subcategories and brands.
In this article, we focus on the pricing and discounting strategies of Amazon, Walmart, and Target in the Apparel category.
Stay tuned to our blog for insights on other shopping categories like Home & Furniture, and Health & Beauty!
Our Methodology
For this analysis, we tracked the average discounts of apparel products among leading US retailers during the Thanksgiving weekend sale, including Black Friday and Cyber Monday. We noticed prices and discounts didn’t change significantly over the course of the weekend, and hence the average prices of products between the 24th and 27th of November are being reported. Our sample was chosen to encompass the top 500 ranked products in each product subcategory across during the sale.
Amazon offered the most attractive deals, showcasing an average discount of 19.5%, applying to a substantial 61% of their apparel inventory.
Trailing closely behind was Target, offering an average discount of 14.8% across 52% of the products analyzed. Walmart, however, took a more conservative approach, providing an average discount of 8.5%, applicable to 29% of its products.
The contrast in discounting strategies highlights the diverse tactics employed by retailers to entice Black Friday and Cyber Monday shoppers within the Apparel category. Amazon remains the forerunner, balancing competitive discounts with a significant coverage of discounted items.
Target follows suit with a competitive stance, while Walmart opts for a more reserved markdown approach, given that the retailer tends to carry a large number of products in the affordable price ranges.
Average Discounts: Subcategories
Examining the Black Friday and Cyber Monday discount landscape within the Apparel category reveals intriguing patterns among major retailers. Amazon led the charge, boasting an impressive 24.9% average discount on Women’s Tops, covering a substantial 76.5% of its products. In the same subcategory, Target competed fiercely with a 25.1% average discount, covering 87.5% of its products. Walmart, taking a measured approach, presented a 14.6% average discount across 45.1% of its Women’s Tops inventory.
Notably, Men’s Swimwear at Target has no discounts. Meanwhile, Amazon remained aggressive across various subcategories, particularly in Women’s Shoes and Women’s Tops, aiming to capture a significant market share through both competitive pricing and a broad coverage of discounted items.
Average Discounts: Brands
Across brands, Tommy Hilfiger and Jockey took the lead on Amazon with an enticing average discount of 28.3% and 24.6% respectively, appealing to savvy shoppers. Calvin Klein followed closely with a 17.3% discount, offering a balance of style and affordability.
In Walmart, Crocs stood out with a 39.9% average discount, followed by Reebok (15.7%) and Hanes (14.9%) Xhilaration, Target’s in-house brand, stole the spotlight on the retailer platform with an impressive 50% average discount. Reebok (32.3%) and Levi’s (22.9%) maintained competitive discounts, appealing to diverse tastes.
Our analysis sheds light on the dynamic landscape of apparel discounts, showcasing how brands adopt varying pricing strategies to position themselves competitively for Black Friday and Cyber Monday shoppers.
Share of Search For Apparel Brands Across Subcategories
The dynamics of Black Friday and Cyber Monday extend beyond price reductions, with brands strategically vying for increased visibility through Share of Search metrics. This metric signifies a brand’s prominence among the top 20 ranked products in a given subcategory, offering valuable insights into their online marketplace visibility.
Among the standout performers in the Apparel category, Jockey experienced a significant surge in Share of Search, leaping from 1.70% before the event to an impressive 13.30% during the Black Friday and Cyber Monday sales. Speedo, in the Women’s Swimwear subcategory, demonstrated a substantial increase from 4.40% to 13.30%, solidifying its presence and gaining an 8.90% boost in Share of Search.
Tommy Hilfiger and Adidas also exhibited notable gains in Share of Search, increasing by 5.30% and 5.60%, respectively. However, some brands experienced a slight dip, with Speedo in the Men’s Swimwear subcategory seeing a 2.50% dip in their search visibility, and Reebok in Men’s Shoes witnessing a 3.3% decrease.
These fluctuations highlight the dynamic nature of brand strategies during Black Friday and Cyber Monday in the Apparel category, where gaining visibility also proves to be crucial alongside offering competitive discounts.
—
For a deeper dive into the world of competitive pricing intelligence and to explore how our solutions can benefit apparel retailers and brands, reach out to us today!
Stay tuned to our blog for forthcoming analyses on pricing and discounting trends across a spectrum of shopping categories, as we continue to unravel the intricacies of consumer behavior and market dynamics.
As Black Friday and Cyber Monday unfolded across the globe, there was a noticeable subdued atmosphere compared to previous years. TD Cowen brokerage adjusted its forecast for US holiday spending, revising it down from an initial 4-5% growth to a more conservative estimate of 2-3%.
Compounded by persistent inflation and elevated interest rates, many consumers find themselves financially strained, leading to the projection of the slowest growth in US holiday spending in five years.
In this context, it would be relevant to investigate whether this restrained reaction from consumers had an influence on the extent of attractive deals and discounts provided by top retailers and brands during the sale event.
At DataWeave, we harnessed the power of our proprietary data aggregation and analysis platform to track and analyze the prices and deals of consumer electronics products across prominent retailers to uncover unique insights into their price competitiveness this BFCM, as well as understand how pricing strategies varied across diverse subcategories and brands.
Keep an eye on our blog for insights on other shopping categories like Apparel, Home & Furniture, and Health & Beauty!
Our Methodology
For this analysis, we tracked the average discounts among leading US electronics retailers during the Thanksgiving weekend sale, including Black Friday and Cyber Monday. We noticed prices and discounts didn’t change significantly over the course of the weekend, and hence the average prices of products between the 24th and 27th of November are being reported. Our sample was chosen to encompass the top 500 ranked products in each product subcategory across leading retailers during the sale.
Sample size: 23,505 SKUs
Retailers tracked: Amazon, Walmart, Target, Best Buy
The observed Black Friday and Cyber Monday discount strategies reveal a distinct competitive landscape among major retailers. Amazon emerged as the frontrunner, offering the highest average discounts at 23.30%, spanning a significant 74% of their consumer electronics inventory. Best Buy closely followed, with an average discount of 19.40% across 76% of their products.
On the other hand, Target and Walmart adopted a more conservative stance, providing lower average discounts at 14.8% and 12%, respectively, with Target discounting 51% of its products and Walmart discounting 41%. This variation in discounting strategies highlights the diverse approaches retailers take to attract and retain Black Friday and Cyber Monday shoppers, balancing competitiveness with profit margins.
Average Discounts: Subcategories
In the Headphones subcategory, Amazon stands out with a substantial 31.40% average discount, targeting 84.69% of SKUs, showcasing an aggressive discounting strategy. Best Buy follows closely, demonstrating competitive pricing with a 21.80% average discount on 67.03% of products.
Meanwhile, in TVs, Best Buy offered a significant 17.9% average discount across 89% of its products, signaling a targeted effort to capture a broad market share in this subcategory.
In the Laptop subcategory, Target was highly conservative, with only a 4.1% average discount covering 14.3% of its products, while Walmart positioned itself with a moderate 9.5% average discount, targeting 39.8% of its inventory.
Among Smartphones, Amazon (14.7%) was third to Best Buy and Target, which offered average discounts of 20.5% and 18.1%, respectively. Walmart, with an average discount of only 9.9% in the subcategory opted for a relatively muted approach.
Average Discounts: Brands
The discount strategies across top electronics brands during Black Friday unveil distinct approaches. Samsung emerges as a focal point across Amazon, Best Buy, Walmart, and Target. The brand was most attractively priced on Best Buy, with an average discount of 25.3%, followed by Target (18.3%) and Amazon (17.9%).
Apple’s discounts were quite consistent across Amazon (17.6%), Best Buy (16.1%), and Target (17.8%), with the exception of Walmart (8.1%). JBL, interestingly, opted to discount very heavily on Best Buy, at an average of 38.8%, resulting in several attractive deals for shoppers on the website. Sony, too, offered impressive discounts at over 23% on Amazon and Best Buy, followed by 16% on Walmart. On Amazon, Amazon Renewed (13.9%) was among the most aggressively discounted products, highlighting an effort to further appeal to cost-conscious consumers.
Overall, our analysis throws light on the nuanced strategies employed by leading brands on Amazon, Best Buy, Walmart, and Target, reflecting a delicate interplay between brand positioning, pricing competitiveness, and customer appeal.
Share of Search For Consumer Electronics Brands Across Subcategories
The Share of Search data reflects intriguing shifts in brand strategies during the Black Friday and Cyber Monday events. During sale events, brands looking to entice shoppers don’t rely only on price but also on search visibility to help drive awareness and conversion. Share of Search is defined as the share of a brand’s products among the top 20 ranked products in a subcategory, thereby providing insight into a brand’s visibility on online marketplaces.
Some of the brands that improved their Share of Search the most include LG, Skullcandy, Asus, JBL, and Samsung. On the other hand, prominent brands like Sony and Apple actually lost ground on this metric by 0.4% and 2% respectively.
At DataWeave, our commitment to empowering retailers and brands with actionable competitive and digital shelf insights remains unwavering. Our AI-powered platform provides a comprehensive view of market dynamics for our customers, enabling informed decision-making. As a partner in your journey, we offer tailored solutions to enhance your competitive edge, drive sales, and elevate your brand presence. To find out more about our solution, reach out to us today!
To learn more about pricing and discounting trends during Black Friday and Cyber Monday across various other shopping categories, stay tuned to our blog!
Contrary to popular speculation of lukewarm online sales owing to the weak economy, high inflation, and stretched wallets, Black Friday this year recorded a whopping $9 billion in e-commerce sales. Despite the lull in online shopping across many retailers in the months preceding Thanksgiving and weakened consumer sentiment, US online merchants saw a sizable boost in sales during and after Thanksgiving, albeit at a slower growth of 2.3%, as reported by Adobe Analytics.
This article looks closely at the Black Friday data to understand which brands, retailers, and product categories were key players. Through DataWeave’s innovative Digital Shelf Analytics product, we deep dive into the availability, discount, and share-of-search data to deduce why some product categories and retailers fared better than others.
Who: Retailers and Brands that had the Highest Presence
Black Friday sales this year were driven by consumers grabbing the biggest and best deals to make the most of their already stretched wallets. Many shoppers opted for flexible payment schemes, and Buy Now Pay Later (BPNL) payments rose by 78% compared to the week before Thanksgiving. Surprisingly, Amazon, which was the most searched retailer during Black Friday last year, came only fourth this year, as reported by the Search Intelligence company, Captify.
According to Captify, Walmart was the most searched retailer for Black Friday deals, followed by Target, Kohls, and Amazon in that order. Amazon, however, has reported its biggest Thanksgiving sale this year, with independent retailers selling through Amazon seeing a total sales of $1 billion. With the economic slowdown and thin wallets looming large, discount rates greatly influenced consumer spending. Mobile shopping accounted for 55% of digital sales, 8.5% more than the previous year.
As told by Adobe, Electronics were the significant sales driver, reporting 221% higher sales than in October this year, with smart home items and audio equipment playing an important role with 271% and 230% higher sales. Toys ( popular purchases were Fortnite, Roblox, Bluey, Funko Pop!, and Disney Encanto) and exercise equipment also registered a substantial growth of 285% and 218%, respectively.
Other top-selling items included gaming consoles (Xbox Series X and PlayStation 5 devices, games including FIFA 23, NBA 2k23, and Pokemon Scarlet & Violet), drones, Apple MacBooks, and Dyson products (airwrap and vacuum). Amazon’s most popular items were reported to be Apple Airpods, Nintendo Switches, Echo Dot smart speakers, and Fire TV sticks.
What: Top Selling Product Categories
Electronics, closely followed by home appliances (robotic vacuum cleaners), toys, and exercise equipment, were popular product categories in demand during Black Friday this year. Several retailers, including Amazon, Walmart, Target, Kohls, BestBuy, and Home Depot, offered lucrative pre-Black Friday discounts to trigger early sales kick-off.
Amazon carried an early discount of 50% on its Echo smart speaker, Target offered 30% off on Dyson vacuum cleaners, Walmart offered 25-35% off on Apple ipads and watches, and Kohls offered 51% off on the iRobot Roomba.
Amazon’s top ten best-selling products ranged from Amazon devices like Echo Dot speakers, Fire TV sticks, and Echo Show to Apple AirPods, Nintendo Switches, New Balance sneakers, Champion Apparel, and Burt’s Bees Lotions. The popular product categories were home, fashion, toys, beauty & health, and Amazon devices. Consumers heavily supported small businesses, contributing to $1 billion in sales. Top sellers from small businesses included card and board games.
Briefly correlating the discounts offered with the best-selling product categories, one can notice that the deals have largely influenced Black Friday sales this year. Popular categories are those that have had deep discounts, reflecting the consumer’s tendency to wait and grab the best deals.
How: Role of Digital Shelf Analytics – Key Performance Indicators
DataWeave’s Analysis Methodology
We have seen a summary of the Black Friday 2022 statistics – sales recorded, top-selling products, product categories, and retailers. Using DataWeave’s e-commerce analytics product, we track and study the variations in digital shelf KPIs across retailers before Thanksgiving and during Thanksgiving to understand how these influence sales.
Availability scores, discount rates, and share of search data are analyzed for top retailers in the US for key product categories. Data is tracked and analyzed across two time periods – before Thanksgiving (Nov 10 – Nov 21) and during Thanksgiving (Nov 21 – Nov 25).
Methodology
Retailers tracked: Amazon, Best Buy, Sephora, Target, Ulta, Walmart
Product Categories tracked: Electronics, Home Improvement, Beauty, Furniture
Digital Shelf KPIs tracked: Availability, Discount rates, Share of Search
Location: USA
Amazon maintained good availability across all product categories – Beauty ranks the highest.
Salient Insights
Amazon maintained good overall availability – an improvement of 3% over Prime day.
Beauty had the highest availability of 95%, with none and Lotion & Brushes reporting 97% and 95% availability, respectively. Shampoo reported the lowest availability at 92%
Home Improvement had the least availability at 87%, with dishwashers (68%) and washers and dryers (78%) having the lowest availability.
Unlike Furniture and Home Improvement, most categories maintained similar availability scores before and during Black Friday.
Furniture improved its availability during Black Friday by 4%, while Home Improvement reported a decrease in availability during Black Friday by 4%.
Electronics, which was a major sales driver, had an availability of > 90% across all sub-categories except for Television, which had a low availability of 70%
Tables and chairs registered 99% availability under Furniture
The above data indicates that Amazon ensured the high availability of utility products that consumers would buy even during a slow economy. Other retailers showed similar availability trends, with scores being similar prior to and during the event.
Discounts Drove Sales – Best Buy offered the Highest Discounts
Highlights
Best Buy offered the highest early Black Friday discount of 30%, followed by an additional 9% discount around Black Friday. Walmart followed next with 21% early discounts and an extra 4.5% discount during the event. Amazon came next with 17% early discounts and a 5% discount during Black Friday. Discount rates seem to strongly correlate with online searches, with Walmart beating Amazon this year as the most searched retailer for Black Friday deals.
Electronics was the most discounted category across Amazon, Best Buy, and Target, with an average discount of 21%. Walmart gave lower deals on electronics (12%). Electronics also had heavy early discounts of 12%, with most retailers giving an additional discount of 7-8% closer to Thanksgiving.
Best Buy offered early discounts of 10% and further upped their discounts by another 12% closer to Thanksgiving. Being the most discounted category, electronics was also a significant sales driver this Black Friday.
Amazon offered the highest discounts for Beauty products (18%), followed by Ulta at 10% and Walmart at 8%. Sephora and Target gave minimal discounts on beauty products (3%)
Best Buy gave the maximum discounts on Home Improvement products (16%), followed by Amazon at 14%. Walmart gave much lower discounts of 7% on Home Improvement products.
Furniture is another category with 12-13% discounts at both Amazon and Walmart.
Best Buy’s strategy this year has been to offer heavily discounted early deals to boost their sales.
Airpods and headphones were the most discounted item under Electronics, with Amazon and Target offering a whopping 27-29% discount. This clearly resulted in heavy sales of AirPods this Thanksgiving.
Best Buy and Target had good discounts on all electronic items, while Amazon gave heavier discounts on AirPods, headphones, and smartwatches.
Walmart did not offer hefty discounts on laptops and headphones, instead focused on Smartwatches, smartphones, and television.
In Home improvement, Best Buy offered the biggest discounts for refrigerators, washers and dryers, and dishwashers, while Amazon focussed more on Tools.
Walmart did not offer many discounts in this category.
Amazon topped the discount charts for maximum combined discounts for makeup and hair brushes on the day of the event.
All retailers offered better discounts for utility products like tables, chairs, and cots (~15-17%), while dressers and couches carried lower discounts (~6-10%).
Highlights
Different companies had different discount strategies based on price buckets.
Amazon gave heavier discounts in the lower price buckets (< 200$) and lower discounts for products priced higher than 200$.
Best Buy offered the heaviest early discounts of >25% on products priced under 20$ but provided a few additional discounts during the event. For products priced higher than 20$, Best Buy uniformly offered substantial early discounts as well as further discounts during the event.
On the other hand, Target focussed on mid and high-priced items, offering heavy early discounts of 16-18% on products priced higher than 100$ and early discounts of ~7% for middle and lower-priced items. For middle-priced products (40-100$), it offered heavier discounts of 10-12% during the event.
Walmart focussed on mid-priced products, offering the highest discounts (both early (~12%) and additional discounts (5%)). It offered the least discounts (~8-9%) on products priced higher than 200$.
Share of Search – Amazon is the only retailer with sponsored searches; Apple AirPods rule the roost.
Salient Insights
Amazon is the only retailer with sponsored searches, with HP, Lenovo laptops, and Apple AirPods occupying the highest share. This correlates with AirPods being one of the most sold products.
HP laptops had the highest share on Amazon pre-Event but gave the spot to Lenovo during Thanksgiving.
Tracphone and Motorola smartphones, Insignia Televisions, and JBL headphones had a good SoS on Amazon.
On Best Buy, HP and Dell laptops featured most in searches, with HP ruling the roost during the event. Lenovo had a small presence.
Samsung smartwatches, televisions, and Apple AirPods have a big chunk of the search at Best Buy.
On Target, pop sockets, smartphones, Apple smartwatches, headphones, and AirPods have the most prominent presence. Apple was the most featured brand in this segment.
Note: The share of search percentage reported here is the average score across all subcategories (makeup, lotion, shampoo, hair dryers and hair brushes) of Beauty.
Salient Insights
Amazon, Target, Sephora, and Ulta sold beauty products, with Amazon being the only retailer with sponsored products.
Ogx, bs-mall, conair, hywestger were popular brands on Amazon, with interest-based ads occupying a substantial part of the search results, especially in Lotions (~40-50%)
Tresemme, Scotch Brite, Revlon and Cerave were popular brands in Target
Dyson products (brushes and hair dryers) are featured at Ulta’s top of the search, followed by Pureology shampoos.
Sephora’s own collection of brushes featured prominently on their website both before and during the event, followed by Dyson and T3 brushes and hair dryers.
Note: The share of search percentage reported here is the average score across all subcategories (refrigerator, washers/dryers, dishwashers, tools and coolers) of Home Improvements.
Salient Insights
In Amazon, Frigidaire and RCA had the highest SoS amongst Refrigerators, and LG occupied the highest share among washers and dryers, Coleman in Coolers, Dewalt in Tools, and Comfee in Dishwashers, both before and during Black Friday.
In contrast, on Best Buy, Samsung had the highest share of SoS amongst Refrigerators, package deals were most prominent in washers and dryers, LG among dishwashers, ifixit in Tools, and Corsair in Coolers.
Note: The share of search percentage reported here is the average score across all subcategories (bed, chair, couch, dresser, and table) of Furniture.
Salient Insights
Interest-based ads occupied the highest SoS on Amazon for Beds.
Urban shop and Amazon basics were popular in Chairs, Lifestyle in Couches, WLive in Dressers both before and during the event.
Vasagle was more popular during the event than Furrion in Tables, though the reverse was true prior to the event.
Summary & Key Takeaways
Black Friday this year was a pleasant surprise to Brands and Retailers, reporting much larger sales than predicted. After experiencing a slump in sales in the months leading up to Thanksgiving, e-commerce vendors have a reason to be optimistic about their holiday season sales forecasts.
A record-breaking $9.2 Billion in online sales was reported by Adobe Analytics, a growth of 2.3 % compared to the previous year.
Mobile shopping accounted for 55% of digital sales, a rise of 8.5% compared to last year.
Retailers wooed customers through deep discounts (~30%) prior to Thanksgiving and around Black Friday. Heavily discounted items like Apple AirPods were the most popular.
Thanks to inflation and stretched wallets, consumers were willing to spend but waited to grab the best and biggest deals. Utility products had better sales.
With tough competition between retailers on who offers the best discounts, Amazon slid down to the fourth position, and Walmart was the most searched retailer.
DataWeave, through its Digital Shelf Analytics and Commerce Intelligence solutions, gleans useful insights from e-commerce data and breaks down trends during global shopping events like Prime Day, Black Friday, and Cyber Monday. If you are a brand or a retailer who would like to know more about our products and solutions, contact us at contact@dataweave.com.
Amazon India’s much-awaited annual two-day shopping event, Prime Day, kicked off with a bang on July 23rd & 24th this year & was one of the most successful Prime Day events yet! Amazon reported that more than 32,000 sellers saw their highest ever sales day during the event. Interestingly 70% of these sellers who received orders during Prime Day were based in Tier 2 cities in India, further validating how the post-pandemic eCommerce boom has spread across the country. Also, Indian exporters saw 50% business growth on Amazon on Prime Day as customers across markets like North America, Europe, Australia, and Japan continued to purchase Made In India products. It was a great 2 days for Indian sellers, but what about customers who were waiting in anticipation for the great deals typically offered on Prime Day? We dug into our data to take a look at the deals, discounts, and brands that shone bright on Prime Day in India.
Methodology
In addition to Amazon IN, we also tracked Flipkart on 23 & 24th July 2022, on Prime Day.
We looked at Additional Discounts offered on Prime Day: Additional Discount is the extra discount on an item during Prime Day when compared to the Pre-Prime Day price.
We also looked at Post Prime Day Discounts, which were the discounts offered after the 2-day event ended.
Amazon v/s Flipkart – who offered better discounts?
Prime Day discounts are legendary. And across the globe, during Prime Day retailers try and compete to see if they can offer better deals than Amazon. Forbes even published an article on the 36 Prime Day competitor sales that were way more enticing than what Amazon had to offer. In India, we wanted to see if Amazon’s homegrown rival Flipkart might give it a tough fight, so we tracked the volume of discounts across categories on both retailers.
Discounts on Amazon & Flipkart across categories
Out of the 4 categories we tracked, in spite of Prime Day, Amazon offered discounts higher than Flipkart in only 2 categories – Electronics & Beauty.
… while Flipkart offered higher discounts than Amazon in the Grocery & Fashion category. For groceries, Flipkart offered a 3.2% additional discount v/s 2.2% on Amazon. However, in the Fashion category, the difference was marginal – 8.1% on Amazon v/s 8.6% on Flipkart
Post-event, both Amazon & Flipkart went back to the original pre-event prices. This made it clear that Flipkart was tracking and making price changes based on their closest competitor. It’s what smart eCommerce businesses do to stay ahead in the race.
Interestingly, post-event, in the fashion category, not only did Amazon revert to the original pre-event price, they even increased prices by close to 2%.
Let’s take a look at discounts across 4 categories & the Brands that WON in each category.
From Electronics to Fashion, Beauty & Groceries, let’s deep dive into the data to see which products were highly discounted within each category and brands that sprinted ahead to win the race on Amazon on Prime Day 2022.
Amazon India released highlights from Prime Day and reported that Smartphones & Electronics were among the categories that saw the most success in terms of units sold.
From the 6 product categories we tracked within electronics, we saw the highest additional discounts on Smartwatches (13.4%), followed by Bluetooth headphones (10.5%)
TV, Smartphones, cameras, and laptops had an additional discount of between 3 – 5.5%
On Prime Day 2022, Amazon India reported that the top-selling consumer electronics brands were HP, Lenovo, Asus, and Boat to name a few. Our assumption is, these brands must’ve had a high Share of Search (SoS), which played a massive role in increasing sales, so we looked into our data to see which brands had the highest SoS against specific keywords related to electronics.
Brand Visibility against the Keywords
Our data aligned with what Amazon reported. HP had high sales, perhaps because they occupied the premium #1 spot in the laptop category with a 44% SoS! Simply put, this means of the 100 laptops that appeared on a page, against a search for the keyword laptop, 44 products were listed by HP! Consumers always gravitate towards buying products they can find with ease.
Lenovo had a 32% SoS for Laptops. Asus at 14%
The top selling smartphone brands reported by Amazon included OnePlus, Redmi, Samsung, Realme & iQOO – our data showed that 3 out of these 5 brands were in the top 5 listings on Prime Day! Redmi had a whopping 30% SoS against the keyword smartphone, Samsung at 15%, and iQOO at 5% – clear validation that a high SoS can positively impact sales.
BEAUTY & GROOMING
Now let’s look at discounts in the beauty & grooming category.
Discounts on Beauty Products on Prime Day
The highest additional discounts were given on shampoos (9.3%), followed by Lipsticks (6.6%)
Shaving kits for men were at an additional discount of 3.4%. Hair gel at 4.9% & Face Masks at 4.3%
In the beauty category, Amazon India reported that top-selling brands included Head & Shoulders, Dove, Biotique, L’Oreal, Sugar Cosmetics, and Mamaearth to name a few. Once again, we looked into our data to see the sort of brand visibility & SoS each of these brands had.
All the top-selling brand’s Amazon reported on we noticed appeared in the top 5 search results.
Head & Shoulders & Dove were the top 2 listings against the keyword Shampoo at 26% & 16% SoS respectively. Biotique came in at #5 with a 7% SoS
Bombay Shaving Company, Gillette, and Axe were the top grooming brands for men in the Shaving Kit category.
Lakme made a clean sweep with a 19% SoS against the keyword lipstick, which speaks volumes, considering the aggressive competition from D2C beauty brands in India today.
GROCERY
According to the New eCommerce in India report by consulting firm Redseer, grocery has been a major contributor to the growth of ecommerce in India & Amazon Fresh used Prime Day to grab a larger piece of that pie! As part of the Prime Day sale, Amazon Fresh also pushed discounts on groceries, as well as fruits and vegetables. We tracked products that fell into the “snack” category, and here’s what we saw.
Discounts on Snacks on Prime Day
Given changing lifestyles & healthy food fads, it was no surprise that we saw the highest additional discounts were given on Healthy Snacks (3.2%) & Diet Food (2.7%)
Chocolates and chips saw much lower additional discounts at 1.2% each.
Drinks were additionally discounted by 2.5% during Prime Day.
Cadbury had a 69% share of search against the keyword Chocolate, leaving some of its key competitors way behind. Amul had a 20% SoS, while Hershey’s was at just 4%.
According to an article in the Economic times, YogaBar tripled sales in FY22, which is why we were not surprised to see the brand at #1 when users were searching for “Healthy Snacks” during Prime Day. YogaBar products typically enjoy high visibility year-round, which clearly helped with brand awareness on Amazon & sales.
FASHION
Amazon reported that Men’s t-shirts and polos, denims, Kurtis, tops, and dresses for women, designer wear, and clothing for kids were some of the most-loved fashion categories on Prime Day. We looked into our data to see the trends that emerged.
Discounts on Fashion on Prime Day
From the categories we tracked, women’s handbags had the highest additional discount (11.8%), followed by watches (9.1%)
Sneakers & jeans had additional discounts in the ballpark of 7% and sunglasses at 4.4%
Some of the usual suspects made it to the top 5, but what really stood out for us were brands that popped up against the keyword Jeans. While Levi’s came in at #2 with an 11% SoS, 2 Private Label Amazon brands featured in the top 5! Symbol at 27% SoS and Inkast Denim at 9%
Against the keyword Handbag, Lavie had a massive lead at 38% v/s the #2 brand – Caprese, at 13%
Boat found a #2 spot against the keyword watches, racing way ahead of the age-old popular brand Fastrack at #5 with a 4% SoS.
Conclusion
Amazon Prime Day 2022 in India came to a successful close as shoppers across India discovered the joy of the 2 day celebration with the best deals, savings, new launches, and more. Prime members from 95% of pin codes in India made purchases, there were 1000’s of deals and 500+ new product launches from brand partners & sellers. Nearly 18% more sellers grossed sales over INR 1 crore, and close to 38% more sellers grossed sales of over 1 lakh vs Prime Day 2021. Local neighborhood shops that sell on Amazon witnessed 4x sales growth. And start-ups and brands under the Amazon Launchpad program witnessed a growth of 3x. All in all, a successful event for everyone involved!
Today, environmental damage is rapidly occurring on a global scale. And there are many reasons and causes for this. Global warming is one, deforestation, over population are some others. The list is long. In a small way, the retail & clothing industry contributes to environmental damage too. The good news is that sustainable fashion addresses this issue. Sustainable clothing is designed using sustainable fabrics like organic cotton, hemp, and Pima cotton that have less of a negative impact on the planet.
Sustainable clothing and its benefits
In this blog, we will discuss the rise of sustainable clothing and its benefits. We will also discuss marketplaces for sustainable fashion.
Benefits of Sustainable Fashion
a. Reduces carbon footprint
The fashion industry emits numerous greenhouse gases annually. Most clothes are made from fossil fuels and require significantly more energy in production. Sustainable brands often use natural or recycled fabrics that require less chemical treatment, water, and energy. Organic fabrics such as linen, hemp, and organic cotton are biodegradable and environmentally sound.
b. Saves animal lives
Leather isn’t a by-product of the meat industry, and it’s estimated that it alone is slaughtering and killing over 430 million animals annually. Sustainable fashion brands are increasingly embracing the use of cruelty-free alternatives. Various alternatives include polyester made with ocean trash, plant-based compostable sneakers, bags from recycled seatbelts, silk created from yeast, and bio-fabricated vegan wool. Another interesting leather alternative comes from pineapples, where the fabric is produced using the leaves of pineapples.
c. Requires less water
Water is used in the dyeing and finishing process for nearly all items in the fashion industry. It takes 2,700 liters of water to produce a single T-shirt. Cotton is highly dependent on water but is usually grown in hot and dry areas. Linen, hemp, Refibra, and recycled fibers are some other sustainable fabrics that require little to no water during production.
d. Supports safer working conditions
Endless working hours, unacceptable health & safety conditions, and minimum wages, are the reality for most garment workers in the fast fashion sector. A few informative documentaries like “The True Cost” or “Fashion Factories Undercover” document the social injustices of the fast fashion industry. Eco-ethical brands advocate for sustainable fashion, health care, humane working conditions, and fair wages for their workers.
e. Healthy for people and the environment
Fast fashion products often undergo an intense chemical process where 8,000 types of chemicals are used to bleach, dye, and wet process garments. Those chemicals often lead to diseases or fatal accidents for workers and inflict serious congenital disabilities on their children. These chemicals harm our health, as our skin absorbs anything we put on it.
5 Sustainable & Ethical Online Marketplaces
Here is a list of five earth-minded and socially responsible marketplaces that have sustainable and fair trade brands for the discerning and mindful shopper:
1. thegreenlabels
Netherlands-based webshop thegreenlabels is a sustainable fashion retailer that sells sneakers, womenswear, and accessories from various “green labels” brands. Founded in 2018, this is a marketplace where people can buy products from brands that care about a positive impact on the environment. All brands featured here guarantee fair working conditions and represent at least one of these 4 values – “CLEAN PROCESS” environmentally friendly production, clothes that support “LOCAL” communities, “VEGAN” brands to assure no animals were harmed and “WASTE REDUCTION”
2. LVRSustainable
LVRSustainable
Luisa Via Roma started as a family-owned boutique in the early 1900s. They have grown into a luxury e-retailer and created an LVRSustainable section for people trying to insert sustainability into their wardrobes. They have brands rated ‘Good’ or ‘Great.’ The site offers a wide range of products like bags, accessories, sports, shoes, lingerie, and much more for men, women, and kids. You can find organic, vegan, eco-friendly, ethical, and recycled & upcycled items here.
3. Brothers We Stand
Brothers We Stand
Brothers We Stand is a retailer set up in solidarity with the people who make our clothes. This retailer conducts rigorous research to ensure that every product in their collection meets the following three standards: designed to please, ethical production, and created to last. It’s a great platform to shop for ethical and sustainable menswear. They also have their private clothing line along with other brands.
4. Labell-D
Labell-D was launched with a clear mission to reduce the negative impact of fast fashion on the planet. This retailer wants to make Responsible Fashion the new norm. They intend to make sustainable clothing and fashion easy for both brands and consumers. Labell-D has a transparent accreditation process where they evaluate the brand’s carbon footprint and environmental impact. Their verification assessment includes animal welfare, emissions, materials, production processes, chemical usage, waste management, and traceability.
5. Cerqular
Cerqular wants to make sustainable shopping affordable and accessible for all. The retailer promises that every product and seller is verified as organic, recycled, sustainable, carbon-neutral, eco-friendly, vegan, or circular. They have a wide range of sellers and do not limit products only from luxury brands, so sustainable shopping is no longer expensive or inconvenient.
Conclusion
The fashion industry is a contributor to worldwide carbon emissions. Sustainable fashion is the new big thing giving rise to more and more sustainable brands and marketplaces.
To stand out and shine in the crowded eCommerce space is not easy. Having a robust Digital Shelf becomes critical for brands. A brand’s Digital Shelf is all of the ways their customers digitally interact with the brand, not only on marketplaces but on the brand’s DTC website & shoppable social media. This is why brands need to closely track & optimize their Digital Shelf KPIs like assortment, availability, pricing, ratings & reviews, product discoverability & product content to increase their online sales.
Want to learn how DataWeave can help you win the Digital Shelf? Sign up for a demo with our team to know more.
Inflation has resurfaced after a decade of tranquil price increases. The persistent COVID-related supply chain disruptions have been a driving factor in increasing consumer costs since some commodities are harder to come by. While inflation is a normal economic phenomenon, the current 3.81% inflation rate has increased the cost of living for families across the globe.
Global Inflation Rate. Source: Statista
Worldwide inflation is expected to remain near 5.0% in early 2022 before gradually easing in response to industrial and agricultural commodity price declines. Additionally, the global consumer price inflation peaked from 2.2% in 2020 to 3.8% in 2021 and will average 4.1% in 2022 before subsiding to 2.8% in 2023.
In this blog, you’ll learn about the impact of inflation on the Retail Industry.
What is Inflation?
Inflation is an economic term that describes an overall increase in the price of goods and services in an economy, and a by-product of inflation is the devaluation of the currency used within that economy. For example, a clothing retailer that used to pay $8 for a t-shirt two years ago will now have to pay $10 for that exact product. The t-shirt hasn’t changed at all. However, it has become 25% more expensive. Inflation and the devaluation of currency are part of the reasons why they’d now pay $2 more for that same T-shirt.
The Fast-moving consumer goods (FMCG) sector will continue to grow because there is growth in household goods spending despite the Russia-Ukrainian crisis, global interest rate, and rising fuel prices. In fact, the demand for consumer packaged goods rose sharply in countries heavily affected by the pandemic. However, the FMCG sector will see a rise in prices of commodities because crucial resources such as cooking oil, tea, cocoa, etc., become scarce. The persistent shock to the supply chain has forced various FMCG companies to increase their prices. For instance, Mondelez, a Fortune 500–listed snack and beverage company, announced a 6-7% price increase.
Inflation for Fashion & Pharma Industry
Fashion
The global fashion industry posted a 20% decline in revenues in 2019–20. Inflation in fashion is caused by transportation bottlenecks, material shortages, rising shipping costs, and straining supply and demand. The global fashion industry will see complete recovery in 2022. COVID-caused supply and demand constraints have eased, but shoppers will have to reconcile to price jumps in everything from bags to shoes.
Pharma
Pharmaceuticals are recognized as an essential commodity and therefore have a massive impact on the household budget. Vizient has projected a 3.09% increase in the inflation rate in drug prices from July 1, 2022 – June 30, 2023. It shows how inflation has a direct impact on prescription drug costs. Notably, retail prices for some of the most widely used prescription drugs are expected to increase 2x as much as inflation. The demand for pharmaceutical drugs has been higher post-pandemic, ensuring that consumers’ total demand and spending in this vertical will remain unchanged.
Comparison of New, Used & Electric cars
Highest & Lowest Inflation in Beauty category. Source: nielseniq.com
Automotive
The rise of both new and used cars has been steeply increasing partly because of the shortage of semiconductors and the backlog from the closure of factories during COVID-19. According to the Bureau of Labor Statistics, there has been a 24.4% inflation in the used car purchase prices and an 8.8% increase in the new car purchase price. Rising oil prices across the globe and the historical oil crisis fuelled by the Ukraine-Russia war have strained many people’s budgets. However, the automobile market is seeing an uptake in demand for electrical vehicles (EVs). EVs represented 14% of car sales between January and June 2021.
Beauty
COVID-19 brought new challenges to the cosmetics industry, chief among this being face-covering required by law. In light of social distancing and lockdowns across the globe, consumers were buying less makeup. The rising cost of labor, energy, and raw materials used in beauty products have resulted in a “once-in-two-decade” backdrop for price hikes. The cost of palm oil, a common material in beauty products, has soared 82% in two years due to Indonesian labor shortages. Nevertheless, consumers will spend more time outside the house. Beauty price per unit changes shot up 17% in-store and online in 2021.
5 Things that will help retailers during inflationary times
1. Observe Competition
Retailers should follow their competitors closely—when they start to raise/lower prices, consider following suit. Using competitive data to gauge price changes will help in managing price parity. However, excessive discounts and lower prices to gain an advantage over your competitor could backfire in various ways. For example, low pricing may convey that your products aren’t as good as your competitors’, impacting your long-term brand image. Moreover, lowering prices to sell more doesn’t necessarily mean higher profits, especially during high inflation. To leverage this strategy effectively, retailers must first identify SKUs that have the highest impact on their pricing.
2. Build a structured and targeted pricing strategy
An effective pricing strategy that leverages differences in product, channels, and customers will help retailers to maintain long-term value for their business and customers. However, customers might react differently to a steep price increase. Broad price increases will demonstrate insensitivity and erode customer trust. Instead, retailers can thoughtfully tailor their inflationary price increases for each customer and product segment with a competitive pricing strategy. With a competitive and historical pricing strategy, brands can examine their customers’ end-to-end profitability and willingness to pay relative to a comparable peer set.
Price Competitiveness for the right items
3. Rethink commercial positioning
The pandemic and rise of inflation during 2020–2021 have profoundly impacted how consumers live and what they value. Understanding how your consumer’s needs have shifted and used a promotion strategy to manage today’s inflationary pressures is crucial. As new behaviors emerge post-pandemic, retailers must prepare for the potential top-line impact of demand shifts. Rethink commercial positioning and review marketing and packaging strategies, including the potential use of nonuniform and, in some cases, nonprice mechanisms.
4. Ensure price competitiveness on the right items
The Key-Value Item (KVIs) list should be reviewed again, considering changing shopper needs and habits during the pandemic, plus the supply and demand shock that the industry is currently experiencing. Price-sensitive and vulnerable shoppers are finding this inflationary period particularly tough, so brands might require an even deeper investment in KVI pricing. Reinvest base prices on essential products to drive volume for your best price-sensitive (PS) customers. Compete only where you need to be without overspending. Online channels should continue to reflect in-store prices and diverge during this time. Pricing Optimisation software enables best practices to simultaneously manage a high number of price increase requests.
Increasing the number of promoted products is a reflexive response to inflation, but it’s not the right response for building sustainable sales or longer-term loyalty. Inflationary times offer an excellent opportunity to reset promotional strategies to save money and margin. Retailers can increase sales and seize opportunities with a promotional pricing strategy. Increased promotional activity has a knock-on effect vs pricing position in high-low strategies and erodes overall value perception, creating a vicious circle of more promotions equals poorer value.
Conclusion
Today’s economic climate and associated pricing pressures are challenging for retailers and customers. Some companies have responded by announcing an increase in prices across product categories. Companies can manage pricing margins responsibly and profitably during inflation. Determining how and where new opportunities exist can help companies control inflation, drive growth, and remain profitable.
Need help to arrive at the right pricing & discounting strategies to counter inflation? Sign up for a demo with our team to know how we can help!
According to the Statista Fashion eCommerce report 2021, the compound annual growth rate (CAGR) for online fashion is predicted to be 10.3% between 2018-2023. The widespread need for trendy fashion presents a challenge for fashion brands to succeed in a highly crowded and competitive space. With eCommerce shopping becoming more prevalent, fashion brands aren’t just competing for brick-and-mortar sales. Instead, they’re also competing for those late-night or impulse purchases from online customers.
Looking to 2022 and beyond, this blog will highlight 9 things to build a thriving fashion eCommerce brand:
1. Allow shopping on multiple channels
Breakdown of Shopping journeys in Apparel
Typically buyers from diverse age groups prefer different sales channels. Some prefer large retailers, and some choose web stores. If you know where your customers like to purchase your products, you can leverage the power of search engines and marketplaces to improve your sales. Multi-channel retailing helps fashion eCommerce brands to sell and promote products on a platform and device of the audience’s choice.
A brand should offer support and access to its products across all platforms, channels, and devices. It helps fashion brands to reach customers where they prefer to shop. If your customers prefer to shop on a computer or an app, your brand can offer a seamless customer experience.
2. Don’t sell on the Homepage
Your online fashion store homepage is more about increasing credibility and trust among potential buyers. Your ideal home page shouldn’t display products or their prices. Instead, it would be best to integrate promotional and marketing strategies on the landing page to encourage visitors to explore your product categories and the rest of the website. You should have an intuitive interface that makes navigating the pages easier. You can also use the homepage to promote seasonal offers and new launches. Fashion brands can also display customer reviews, awards, brand achievements, and web security trust seals to increase the conversion rate.
Don’t sell on the homepage
3. Product Descriptions with Unique Stories
Product descriptions often get overlooked or underutilized even though they are important for eCommerce businesses. Your products won’t sell with spammy and same product descriptions. The modern product description is all about communicating a product’s worth and value with a story that captivates your buyer’s attention. Identify areas where your content & images don’t align with your product or represent it in the best light. Make sure to deliver an enhanced consistent brand experience across all online channels to improve your conversions.
4. Focus on Review and Ratings
Rating & Review of a fashion brand
Customer reviews have a huge influence on a buyer’s purchase decision, especially in the fashion industry. Encourage your consumers to leave reviews on your brand website. Reviews help fashion brands to build trust for their products and convert customers. Legitimate customer reviews help your shoppers to get crucial insights into what previous buyers liked or disliked about a particular product.
However, you should stay away from paid-for or false reviews usually encouraged by unscrupulous sellers as they are easy to spot and hurt your rankings. You must remember that receiving reviews also includes dealing with negative comments. They should be used to improve your upcoming product offerings.
5. Sell Looks
The product can be combined with in the detail page
Successful fashion brands don’t simply sell individual products. Instead, they sell complete looks that inspire shoppers to purchase the entire stylish look. As an online fashion brand, you’re not selling clothes; you’re selling an elegant collection of wearable art. When visitors reach your online store, you should appeal to their fantasies and sentiments through aesthetic look books that are both pleasing and congruent with your brand. Most successful online fashion shops are inspirational and visual. Look books help brands pair their previous season items or dead stock with new stock and increase sales. Brands can also share these look books on social media or in their monthly newsletters to increase reach.
6. Provide Promotions and Offers
Fashion brands can take advantage of plenty of sales throughout the year, from New Year celebrations to Black Friday, Cyber Monday, and Christmas. Brands can leverage these high sales periods to sell looks and gift items to boost sales. Just make sure you’re measuring the effectiveness of your online promotions. Holiday and festive sales also offer an excellent opportunity to plan strategic discounts to get rid of old stock. Since trends in the fashion industry have been changing rapidly, you can use discounts to get rid of dead-stock or out-of-trend items each season.
7. Be active on social media
Social media is a way to promote your brand, increase trust among your audience, and entertain your audience with exciting content. You can also engage the audience by providing gift coupons or giveaways. Brands can promote products while keeping their audience engaged with engaging content and promotional offers.
Social media is a great way to get influencer support, either organically or through a paid partnership. Brands have to focus on every element of social media marketing strategy, right from choosing a platform, creating Instagram/Facebook shops, jumping on trends/events, and tracking customer sentiment.
8. High-quality product photography
Capture every detail of your product
Nothing is worse than ordering a piece of clothing online and not getting what you saw on the website. Not being able to accurately convey fashion products will hurt your bottom line. Fashion brands must use top-notch product photography that includes high-quality visuals, such as multiple angle views, 360-degree images of each product, accurate depictions of all color options, and the option to zoom in on product attributes.
High-quality product photography
A recent game-changer in the fashion industry has been including different sets of models to accurately feature clothes of various shapes, heights, and weights. Instead of displaying a dress in only one size, fashion brands can have multiple models wearing various sizes for the same article of clothing.
9. Stay up to date with new trends
Fashion eCommerce brands have to be particularly careful of continuously updating their product offering with the latest fashion trends for each season. They can boost sales with an in-demand product assortment. Continuously updated fashion inventory signifies that the brand is up-to-date with the latest fashion trends in the market and has unique products to offer. You can always get creative with new styling, better looks, and personalized product recommendations.
Conclusion
Fashion eCommerce is rapidly growing and transforming at a staggering rate as technologies continue to advance. Traditional fashion brands can now expand their reach from brick-and-mortar shops to digital and eCommerce platforms to reach shoppers across the globe. The new digital selling opportunities also come with considerable challenges – from staying up to date with ever-evolving trends to managing dead stock. Are you a fashion brand that needs help monitoring your product content? Or measuring the effectiveness of your online promotions? Or decoding customer sentiment from reviews they’ve left for your products? Sign up for a demo with our team to know how DataWeave can help!