By 2028, Fortune Business Insights projects that the global bakery products market will reach USD 590 billion. The CAGR (Compounded annual growth rate) for 2021-28 is estimated at 5.12%. Products in this segment include bread, buns, cookies, tortillas, salted snacks, English muffins, bagels, confectionery food, hot dogs, cakes, popcorn, and so on.
Due to disruptions in the global supply chain caused by lockdowns and border closures, the pandemic has had a negative impact on the demand for bakery products and snacks worldwide. However, the market is not only changing, but consumer demand is increasing. Post-pandemic, health, food, and safety have gained renewed attention.
People across the world are making healthier choices with a focus on wellness.
A growing number of people are interested in plant-based foods and beverages, reducing sugar consumption, and understanding the link between lifestyle and health, including obesity and diabetes. As a result of these trends, food producers are reshaping their product strategies to meet new consumer demands.
In this article, we take a look at the ways companies can leverage data to inform their e-commerce strategy.
What’s driving up the demand for bakery products?
More people are choosing easy-to-use bakery products and snacks over other foods due to urbanization, convenience, western diets, and women’s participation in the workforce. Additionally, innovations in baking systems, food technologies, ingredients, formulations, and product ideas are providing customers with a greater level of choice, flexibility, and freedom.
How is e-commerce changing the game for bakery product companies?
To optimize their supply chains, bakery food and snack companies must better understand e-commerce metrics given the wide variety of products available and eventually convert sales. There are several measures that companies need to pay attention to.
Stock availability metrics, discounts across locations, and share of search results – are all critical metrics companies need to track. In addition to providing manufacturers and retailers with an insight into the trends, DataWeave’s tools also allow them to make better business decisions and ultimately improve their bottom line.
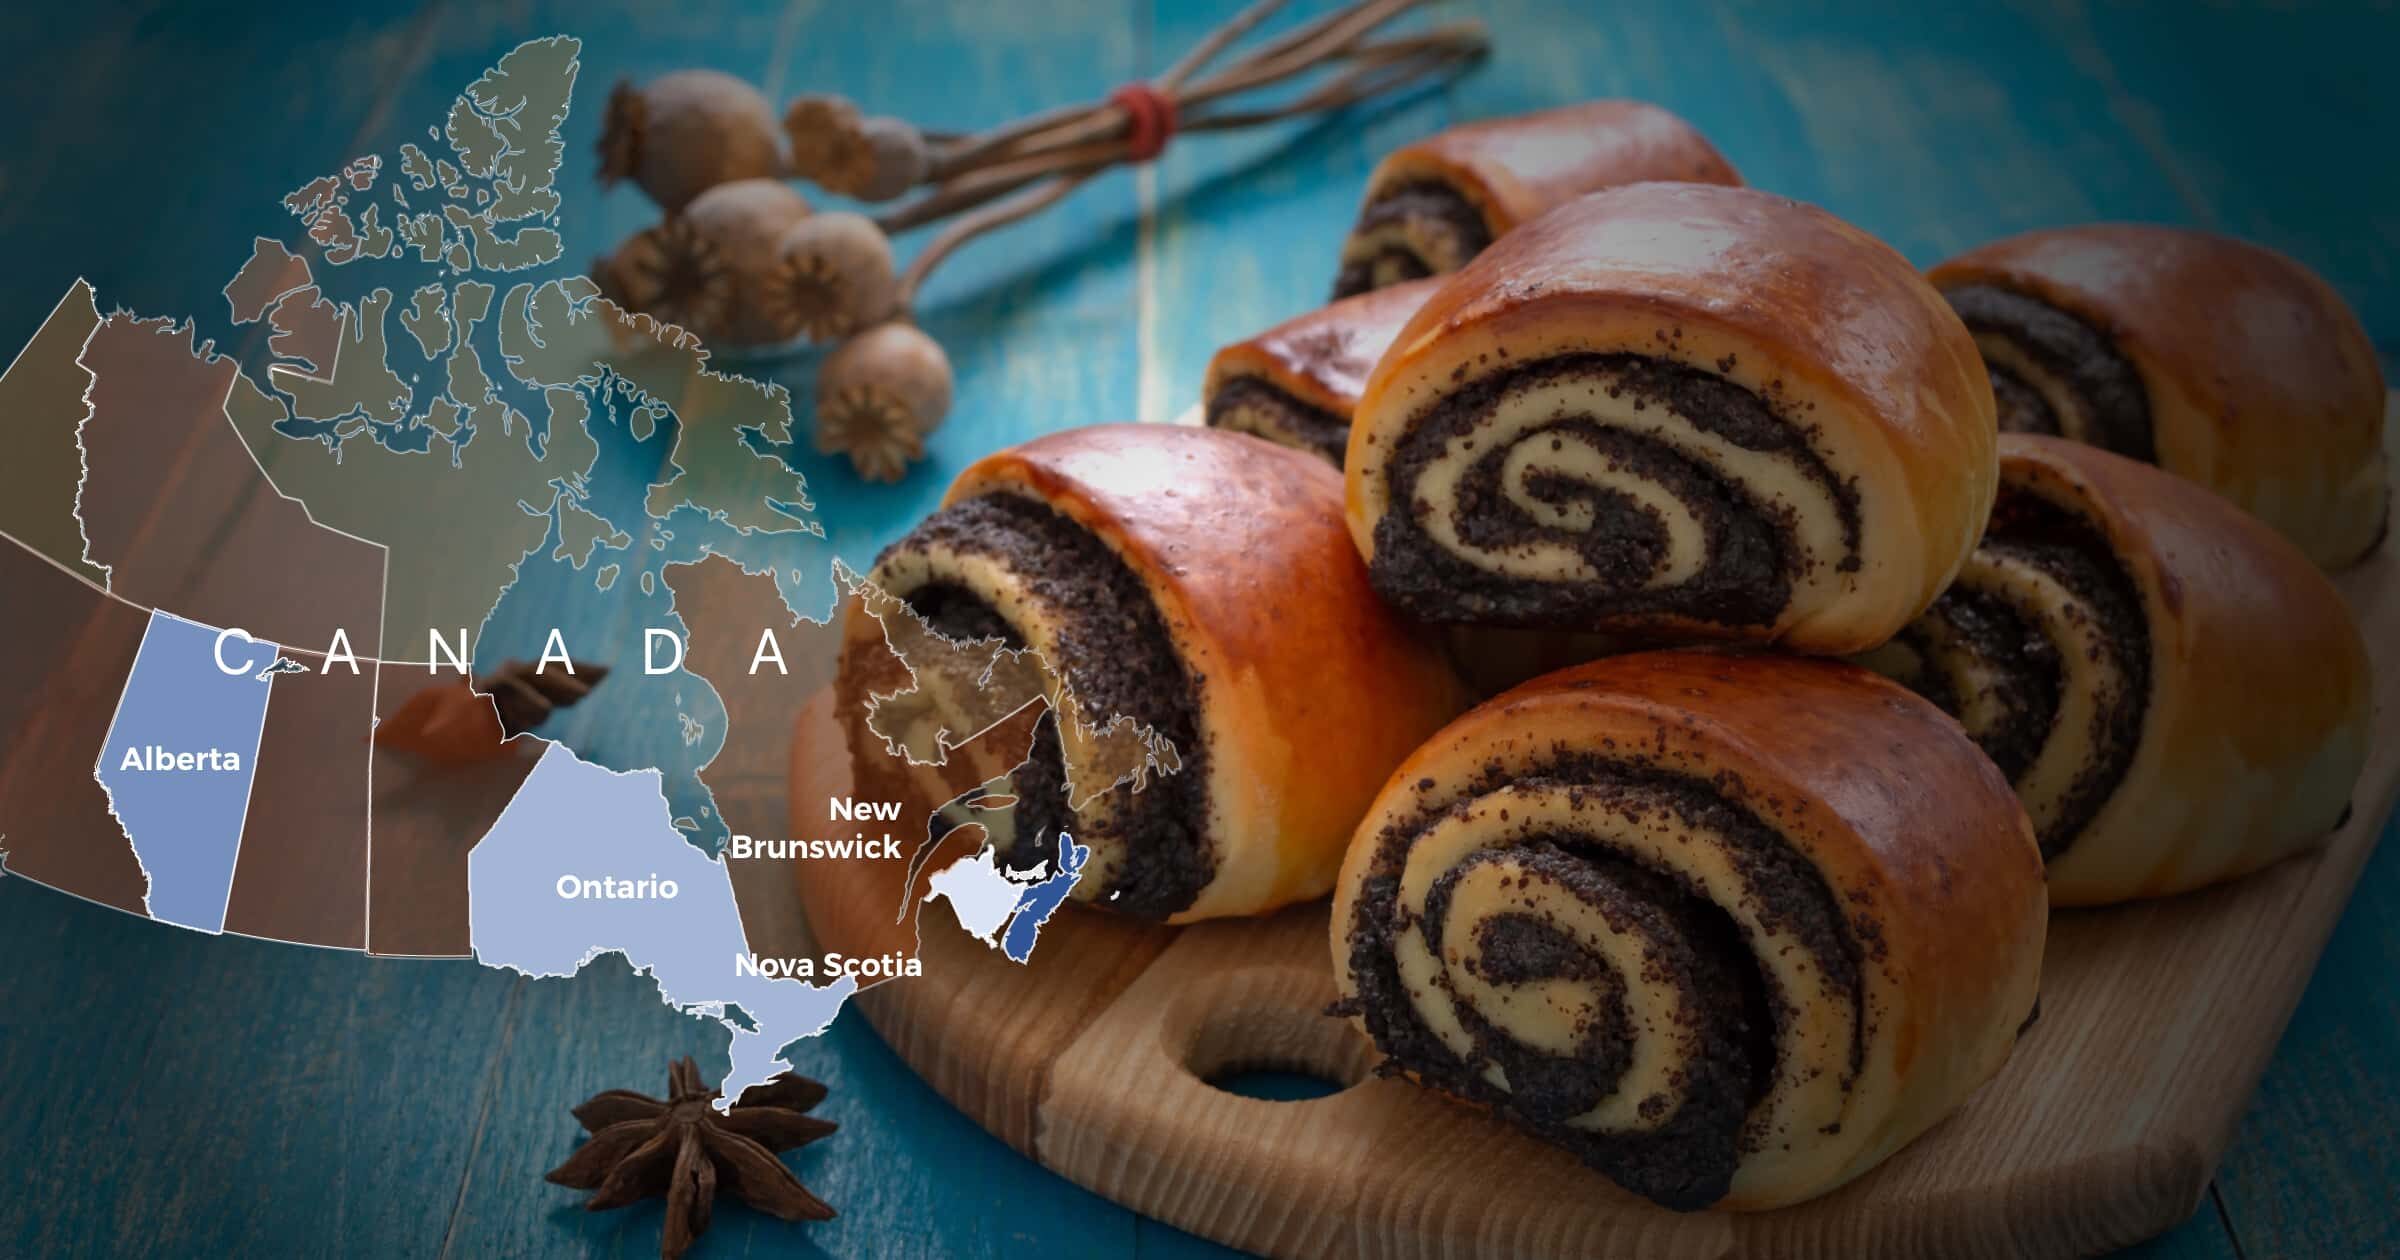
Grocery Retailers and Bakery Brands tracked
Methodology
Data Scrape period: February 2022 to September 2022
Category tracked: Bread and Bakery, Chips, Crackers, Deserts, Snacks.
Share of Search Analysis
Which brands feature the most on e-commerce portals?
When listing items on e-commerce platforms, share of search is crucial. The highest share of the top ten or top twenty items available on these platforms is correlated with how many times the item may be viewed. As a result, it would have a greater chance of being selected by the customer.
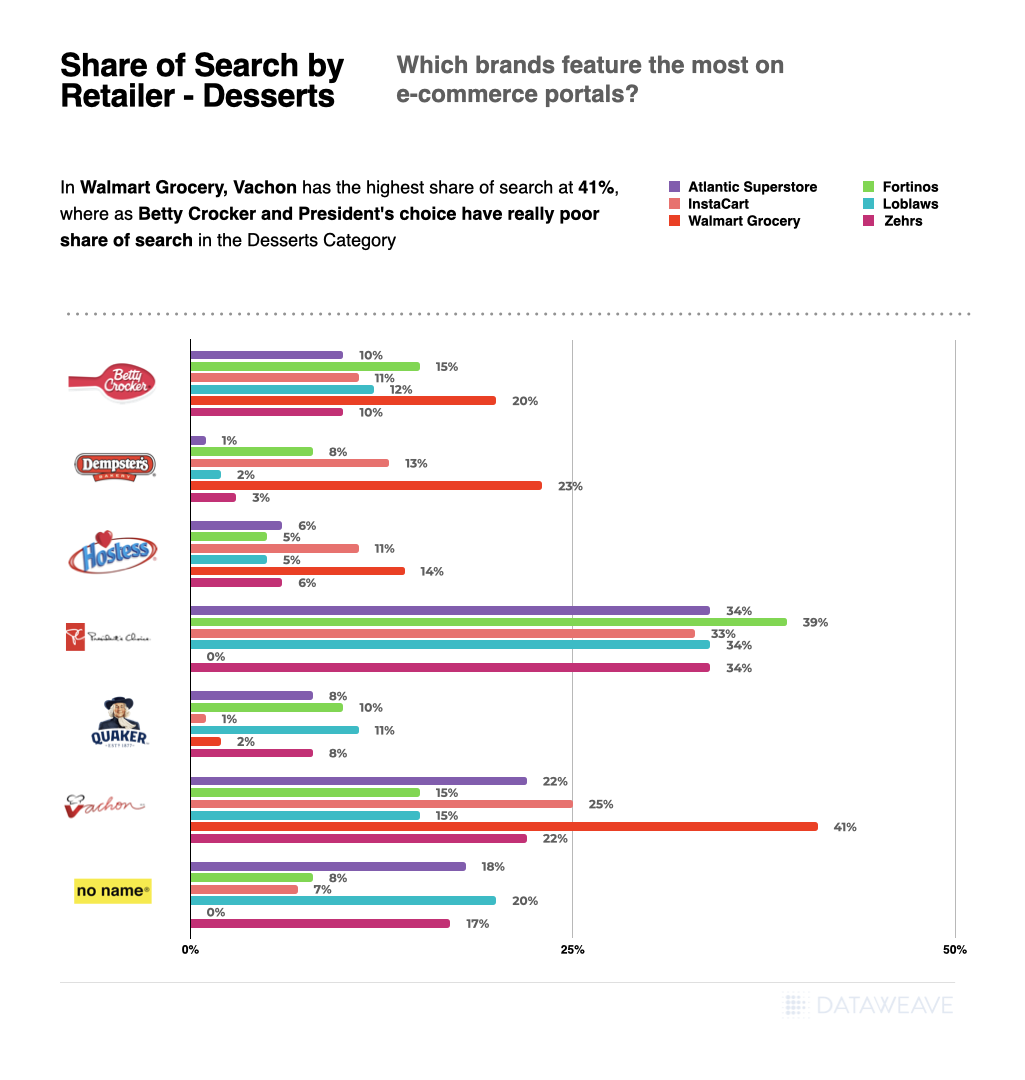
By Retailer for Category “Desserts”
Share of Search for Brands in each retailer
In Walmart Grocery, Vachon has the highest share of search at 41%, whereas Betty Crocker, Presidents Choice and No Name had the lowest share of search at 0%, in the Desserts Category.
In Loblaws, Presidents Choice had the highest share of search of 34%, whereas Dempsters had the lowest share of search of 2% in the Desserts Category.
The brand Presidents Choice consistently ranks high in the share of search results for Desserts across multiple retailers, including Atlantic Superstore, Fortinos, Instacart, Loblaws, and Zehrs – except at two retailers, Voila and Watlmart Grocery, where its share is zero.
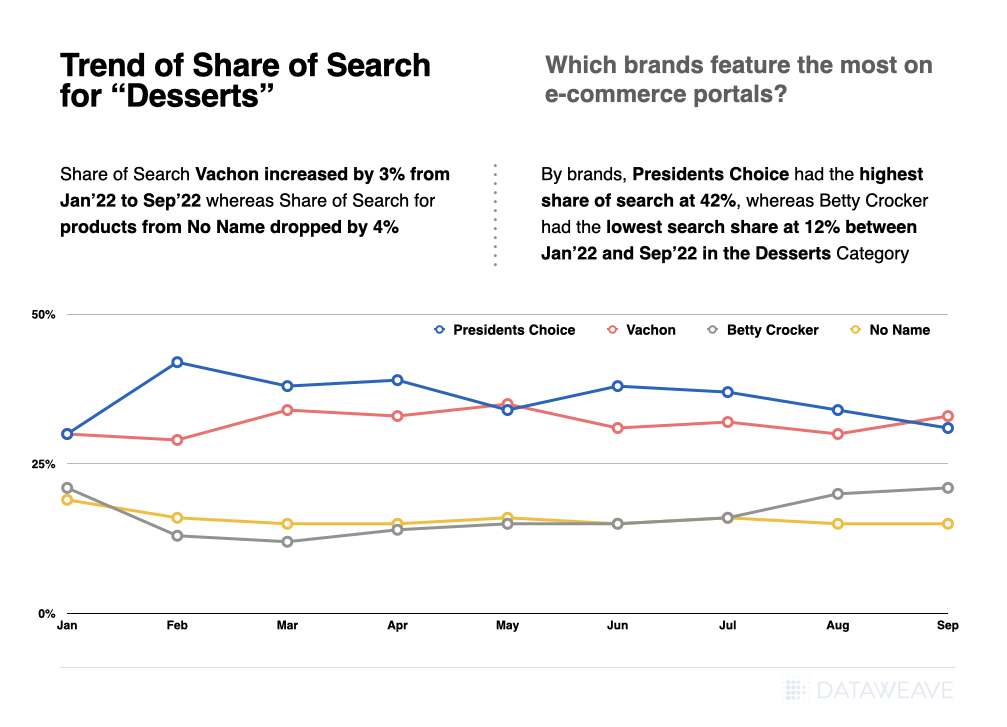
Trend of Share of Search for “Desserts”
Share of Search analysis by Brands over Time in category “Desserts”
Share of search had dropped by around 4% for No Name, whereas for Vachon, it increased by 3% from Jan’-22 to Sep’ 22
By brands, Presidents Choice had the highest share of search at 42%, whereas Betty Crocker had the lowest share of search at 12% between Jan’ 22 and Sep’ 22 in the Desserts Category.
Availability Analysis
Which products are widely available across e-commerce portals?
The availability of the product on the e-commerce portal is one of the key indicators of meeting customer demand. Brands can use insights from DataWeave to strategize how to restock their inventory and ease customer demand. Based on data analysis, brands can also determine which products to prioritize on which platforms.
By Category
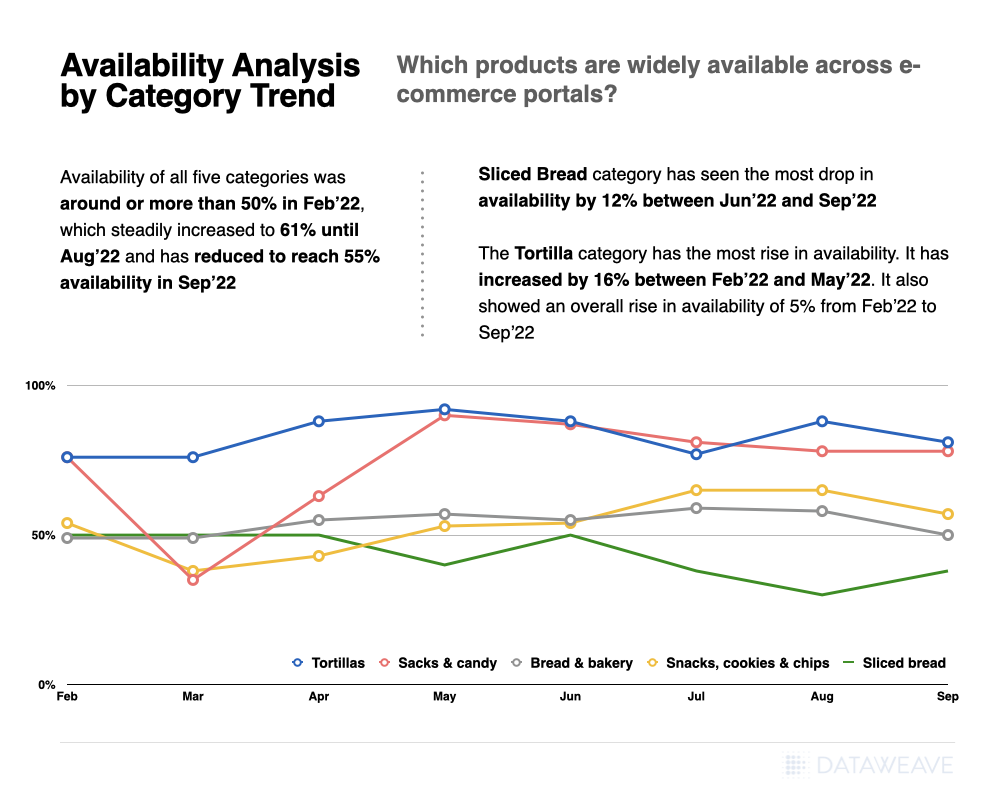
Availability analysis by Category over Time
Availability of all five categories was around 52% in Feb’ 22, which steadily increased to 61% until Aug’ 22 and has reduced to reach 55% availability in Sep’ 22
Sliced Bread category has seen the most drop in availability by 12% between Jun’ 22 and Sep’ 22
The tortilla category has the most rise in availability. It has increased by 16% between Feb-22 and May-22. It also showed an overall rise in availability of 5% from Feb-22 to Sep-22
By Location
Availability analysis by Location and Category
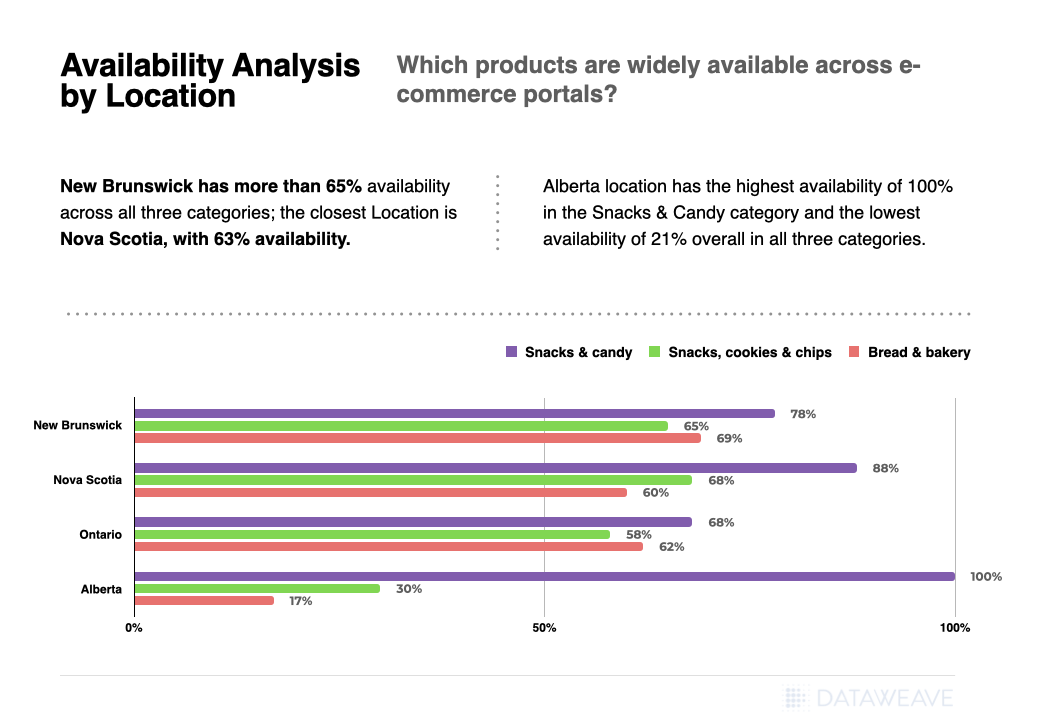
Across categories, Snacks & Candy had better availability at 73% than Bread & Bakery, with 56% availability.
By Location, New Brunswick had more than 65% availability across all three categories; the closest Location is Nova Scotia, with 63% availability.
Alberta had the highest availability of 100% in the Snacks & Candy category and the lowest availability of 21% overall in all three categories (weighted aggregate)
Discounts Analysis
Several discount-based insights can be studied on e-commerce platforms. From location-based trends, retailer-based trends, and manufacturer-based insights. These insights can help companies make the most of the revenue opportunity while creating an attractive value proposition for the retail consumer.
By Category
Discount analysis by Category
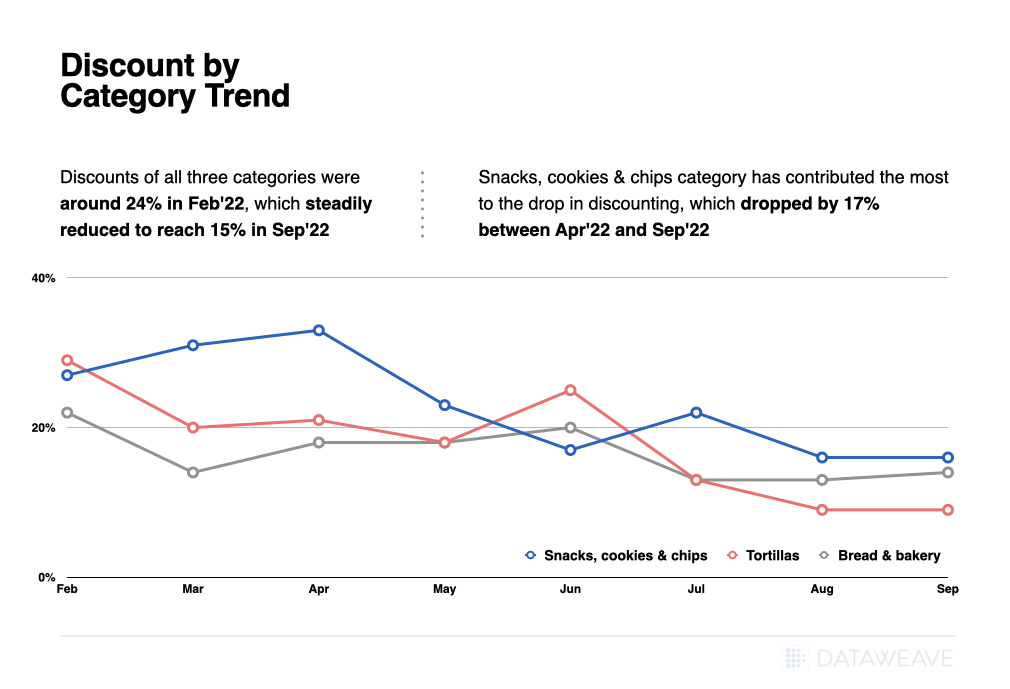
Discounts of all three categories were around 24% in Feb’ 22, which steadily reduced to reach 15% in Sep’ 22
Snacks, cookies & chips category has contributed the most to the drop in discounting, which dropped by 17% between Apr’ 22 and Sep’ 22
The Tortilla Category does not have any discount in the month of Jul’ 22
By Retailer
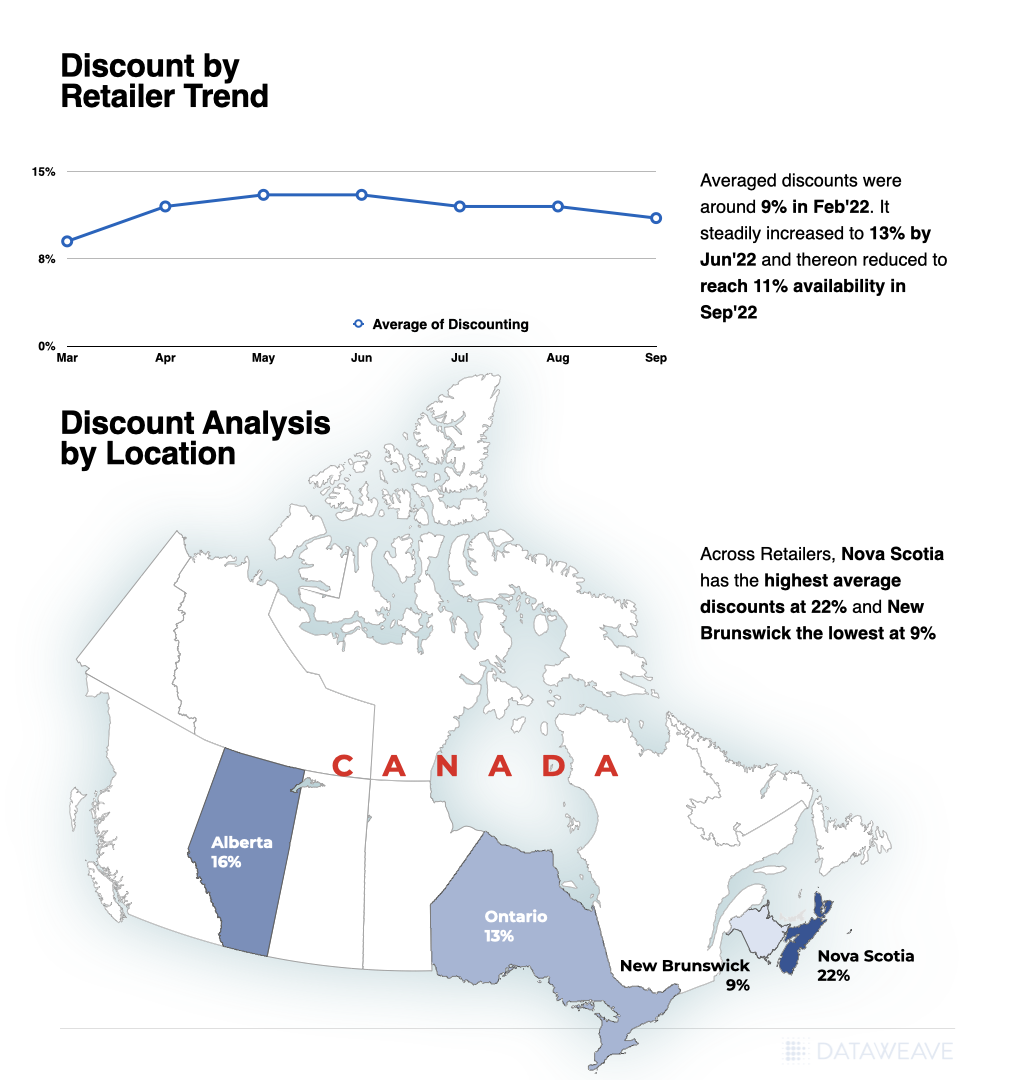
Discount on Bread & Bakery category in Walmart Grocery was around 9% in Feb’ 22. It steadily increased to 13% by Jun’ 22 and thereon reduced to reach 11% availability in Sep’ 22.
By Location
Across Retailers, Nova Scotia had the highest availability of discounts at 22%, whereas New Brunswick had the lowest with discounts at 9% in Bread & Bakery category.
Discount analysis by Retailers and Locations – Alberta, Ontario, New Brunswick, Nova Scotia Note: Analysis does not cover all locations
Bakery and snack product manufacturers on e-commerce platforms have access to a rich trove of insights they can leverage to benchmark their strategies. They can better understand customer demands, align their supply chain and critically understand the trends impacting their bottom line. Engaging with a third-party platform like DataWeave’s Digital Shelf Analytics can help brands unlock tremendous value.
As inflation hits another 40-year high at 9.1 percent, U.S. consumers geared up for their first sign of hope and relief in the form of anticipated discount buys – 2022 Amazon Prime Days, or so we thought. While Prime Days have grown to become a promotional period almost as important as Black Friday to digital shoppers, the combination of economic uncertainty, inflationary pressures, and supply chain challenges seemed to alter the discount strategy expected given activity seen during 2021 Prime Days.
Our analyst team has been hard at work aiming to provide a ‘first look’ at 2022 Prime Day Promotional Insights, tracking discounts offered across 46,000+ SKUs within key categories like Electronics, Clothing, Health & Beauty and Home, on seven major retailer websites – Amazon, Target, Best Buy, Sephora, Ulta, Lowe’s and Home Depot. Our analysis compares prices seen during Amazon Prime Day 2022 on July 12th, to pre-Prime Day maximum value prices seen in the ten days leading up to Prime Days, to determine the average change in discounts offered during the promotional period. Below is a summary of our findings.
Competitive Promotions Give Amazon a Run for their Money
Amazon offered the greatest average discount enhancements for Electronics at 5.6 percent followed by Health & Beauty items at 5.1 percent, and Home products at 4.2 percent versus pre-Prime Day discounts seen across the categories considered within our analysis. The only category reviewed where average discounts were greater on a competitor’s website was on Target.com within the Clothing category. As seen below, Clothing on Target.com average discounts were 6.8 percent greater than pre-Prime Day offers, which was 2.6 percent higher than the average discounts offered for Clothing on Amazon.
Target Capitalizes on Growth Opportunity in Clothing Category
Diving deeper into the details of where Target won within the Clothing category, you can see a majority of their promotional activity took place within Women’s Accessories where discounts offered were 18.5 percent greater than those seen pre-Prime Day 2022, which was almost 15 percent greater than the discount enhancements seen on Amazon for Women’s Accessories. In fact, Women’s Shoes and Sneakers were the only two categories where the average discounts offered were greater on Amazon than on Target.com.
Overall, the discounts offered on Target.com within the Clothing category were primarily concentrated within items priced $40 and lower, but what was most interesting is that within the $10 and under price bucket, Target offered average discounts of over 11 percent whereas Amazon increased prices for these items on average by over 9 percent.
While most of the Clothing available on both Amazon and Target.com during Prime Days 2022 were offered without a price change, the greatest discount percentages tracked were within the range of 10-25 percent off on Amazon whereas Target chose to offer the bulk of their promotions at 25 percent off an up.
Strategic Promotional Strategies Defined at the Electronics Subcategory Level
When it comes to the Electronics category on Prime Day, the big question is always who will win the battle of the brands. Below shows the difference in average pricing and promotions discounts offered between products manufactured by Samsung versus Apple across each retailer platform, noting discounts were almost 3 percent greater on average for Apple versus Samsung products on Amazon, and Apple discounts were almost 5 percent greater on Amazon versus than those seen on Target.com.
Amazon wasn’t going all in on Apple however, as we saw ‘Alexa’ devices (Amazon products) available on Best Buy and Target websites also, but the discounts were almost 4 percent greater on Amazon versus Target and over 7 percent greater than the discounts seen on BestBuy.com.
While the average discounts offered within the Electronics category were greatest on Amazon (5.6 percent) versus Best Buy (3.9 percent) and Target (3.4 percent) as noted within the first chart of this blog and across brands and technologies considered above, the discounts offered on Amazon were strategically focused between 10-25 percent as seen below.
Amazon’s Electronics promotions were also targeted at smaller price points, items priced between $20-500, whereas Best Buy and Target offered greater promotions for electronics priced $500 and up than Amazon.
Below is a snapshot of price buckets tracked for Electronics available on BestBuy.com, highlighting where most of the promotional activity was targeted at products priced $50 and up during Prime Days 2022, with discounts ranging from 10 percent up to greater than 25 percent greater than pre-Prime day prices.
The standout categories were TVs on Target.com with discounts averaging nearly 12 percent greater than those seen pre-Prime day, and smartphones on BestBuy.com with discounts averaging just over 11 percent greater than those seen pre-Prime Day. The category with the greatest average discount enhancements seen on Amazon during Prime Days 2022 was for Wireless Headphones with an average discount of 8.7 percent.
Home is Where Amazon’s Heart Was on Prime Day
Amazon dominated offers within the Home categories, especially for products within mid ($40-100) and higher price ranges (items priced $200-500), with the bulk of the discounts offered between 10-25 percent. There was little to no promotional activity seen across all price points on Lowe’s or Home Depot’s websites within the categories we tracked, and most other competitive offers on Home products were seen on BestBuy.com for products priced from $50-500. Even a subcategory like Tools offered deeper average discounts on Amazon (4.7 percent) than discounts seen on HomeDepot.com (1.1 percent) or Lowes.com (0 percent).
For Large Appliances, Amazon was the only retailer to off any significant discount across each major subcategory with the greatest average discount being on Ovens at 6 percent, followed by Refrigerators at 4 percent. One caveat with this category, when we reviewed Large Appliance prices two weeks prior to Prime Days, we saw average price increases around 16.7 percent occurring on Amazon.
During Prime Days 2022 however, Amazon also offered top average discounts for small appliances, except for on Instant Pots which appeared to have greater average discounts on Target.com (5.9 percent versus 4.2 percent on Amazon), and Vacuum Cleaners which appeared to have the best promotion of appliances small and large at 13.8 percent average discount on BestBuy.com. Another subcategory deeply discounted on BestBuy.com was weighted blankets, which averaged discounts around 18.5 percent versus Amazon’s average discount at only 6.2 percent.
Health & Beauty Retailer Pricing Strategies Revealed
Given the importance Health & Beauty Brands placed on Prime Day sales last year, we had anticipated to see more offers, especially within pure-play beauty retail channels, than we did for this booming category.
Amazon drove most of the Health & Beauty offers seen averaging 5.1% discounts versus other retailers only offering less than 1% on average, but discounts were aimed at a targeted group of SKUs on Amazon, bringing the average discount lower overall. Most of the promotions offered on Amazon fell within mid-range price points ($20-50) and were discounted between 10-25 percent versus pre-Prime Day prices.
Target.com offered the most comparable discounts to Amazon for Health & Beauty products on average, but their strategy primarily focused on items within the $20 and lower price range with discounts ranging primarily between 10-25 percent.
More 2022 Prime Day Insights Coming Soon
We know the significance visibility to critical pricing and promotional insights play in enabling retailers and brands to offer the right discounts to stay competitive, especially during promotional periods like Prime Days. While this blog is intended to provide a ‘sneak peek’ into 2022 Prime Day insights for the U.S. market, we will be providing more extensive, global coverage and will proactively share new insights with the marketplace as they become available throughout the month of July.
Be sure to also check out our Press page for access to the latest media coverage on Prime Day insights and more. Don’t hesitate to reach out to our team if there is any particular category you are interested in seeing in more detail, or for access to more information on our Commerce Intelligence and Digital Shelf solutions.
Last week the DataWeave analytics team identified the states most impacted by the baby formula shortage, only to see feminine hygiene products following similar trends with price increases occurring alongside a supply chain shortage. In this analysis, the team has identified over four hundred feminine hygiene products made available across eighteen retailer and delivery intermediary websites from August 2021 through June 2022, to see how product availability and price changes correlated.
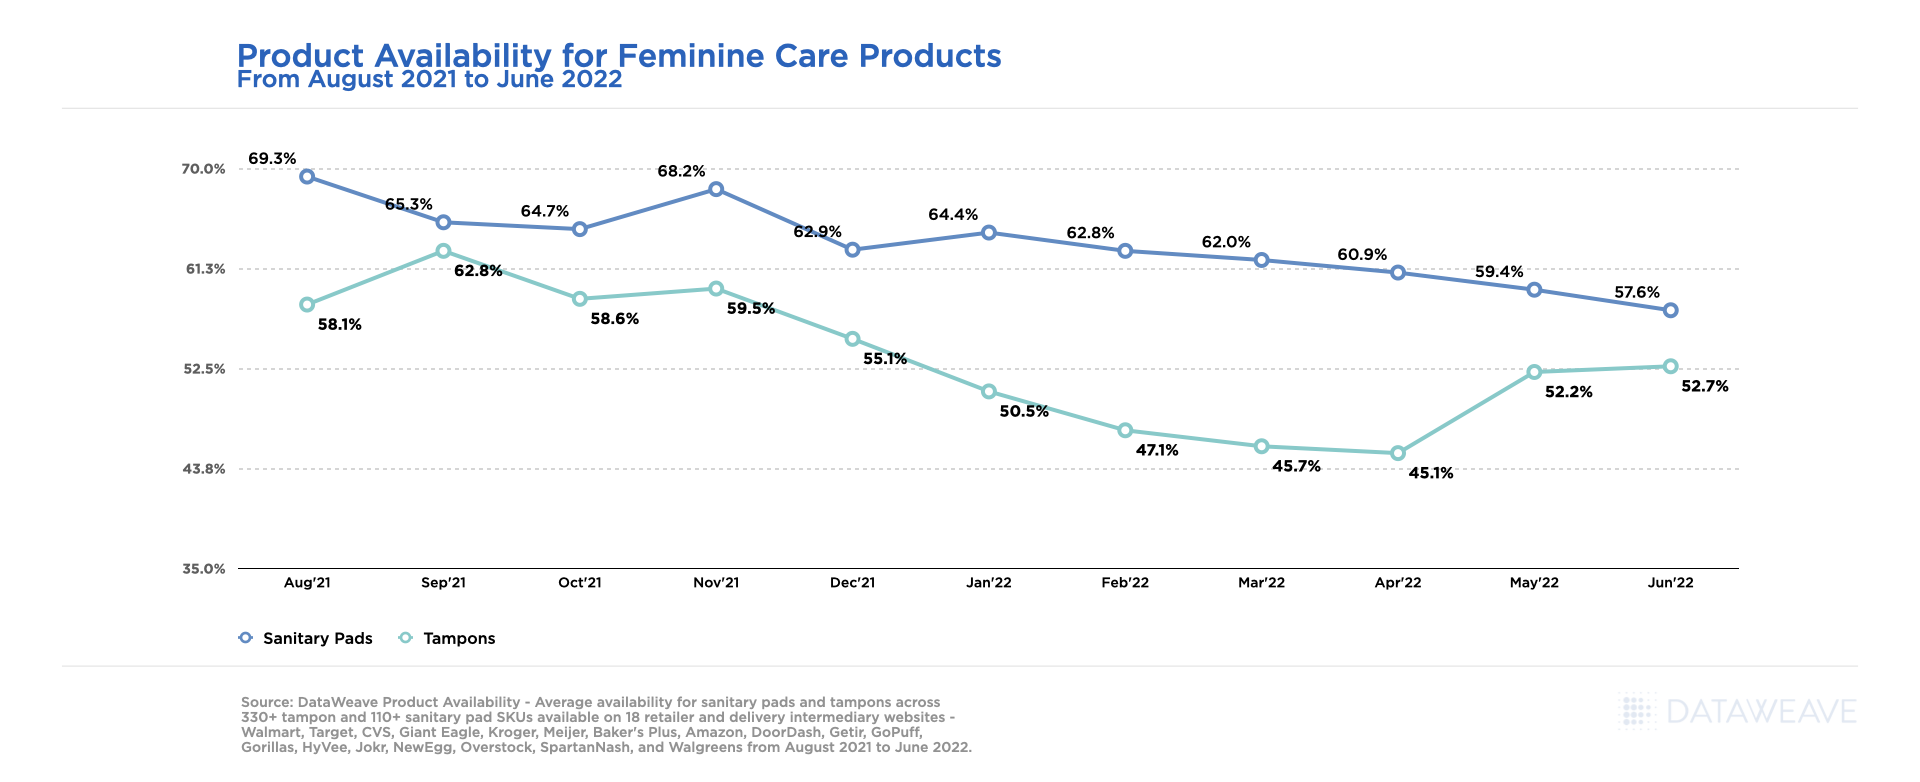
Within the feminine care products analyzed, both tampons and sanitary pads show to have under 58% availability as of June 2022. For sanitary pads, June 2022 shows the lowest level of product availability at around 58%, which has steadily declined each month from August 2021 where product availability started around 69%. Tampons however, reached their lowest level of availability in April 2022 at 45%, and appear to be slowly recovering each month, now reaching around 53% availability in June 2022.
Product Availability for Feminine Care Products – June 2022
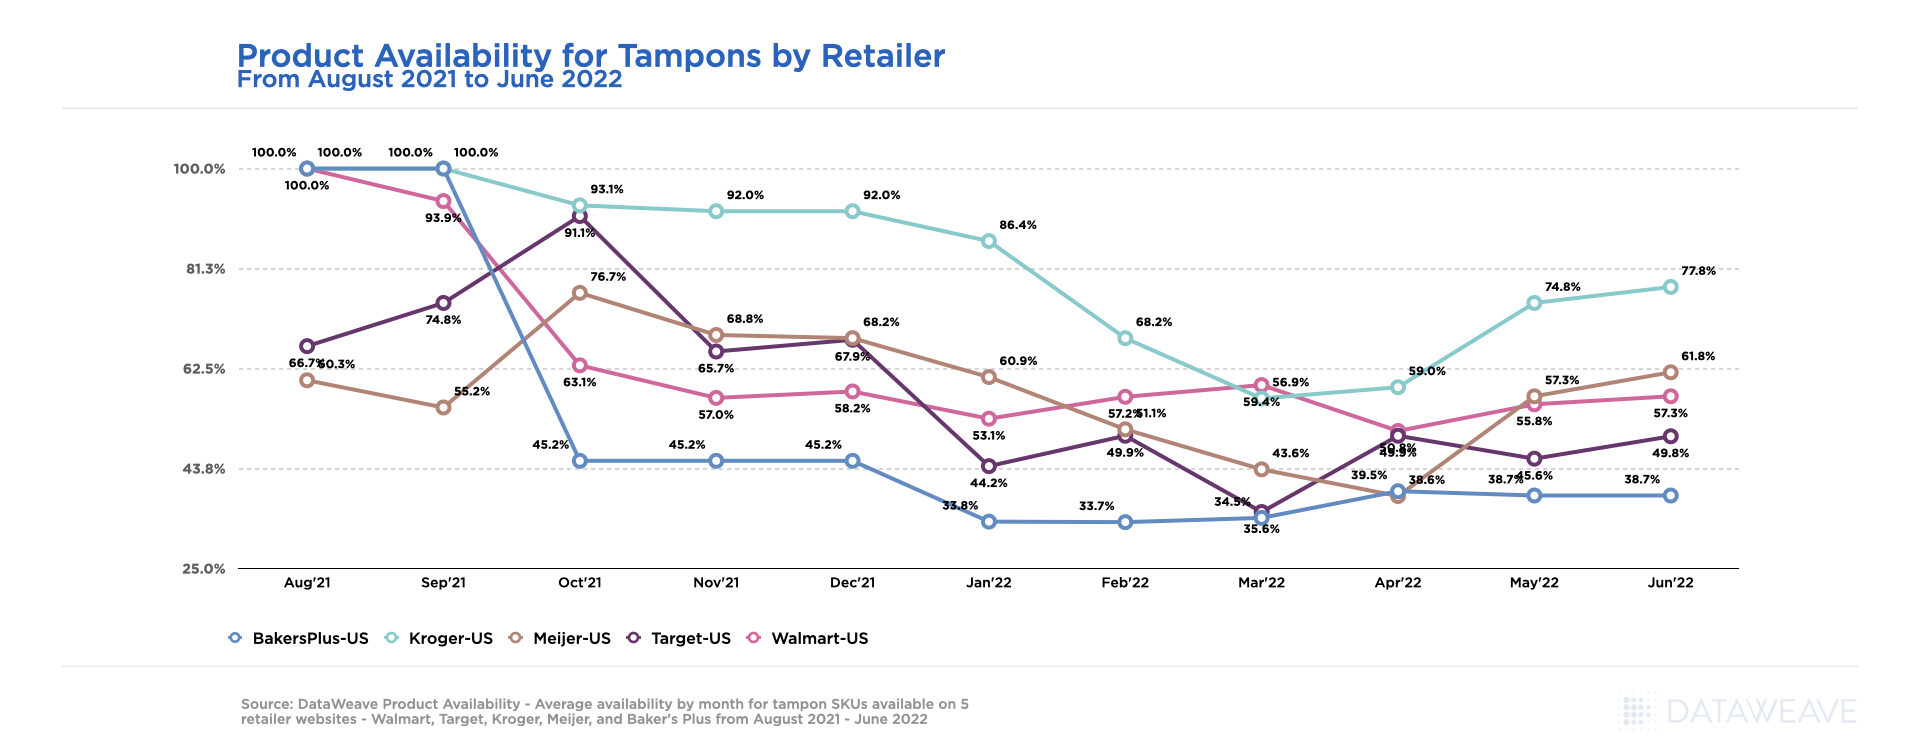
The Evolution of the Tampon Shortage by Retailer
Looking at tampons in more detail and at a retail level, we can see how much and how often product availability fluctuated from August 2021 through June 2022 across Kroger, Meijer, Baker’s Plus, Target and Walmart websites. Baker’s Plus, for example, shows the lowest product availability, maintaining an average of around 39% from October 2021 through June 2022. Kroger appears to be a notable exception only facing stock availability issues in March and April 2022, achieving nearly 78% availability in June 2022, which is 16% greater than the other retailers analyzed.
Product Availability for Tampons by Retailer – June 2022
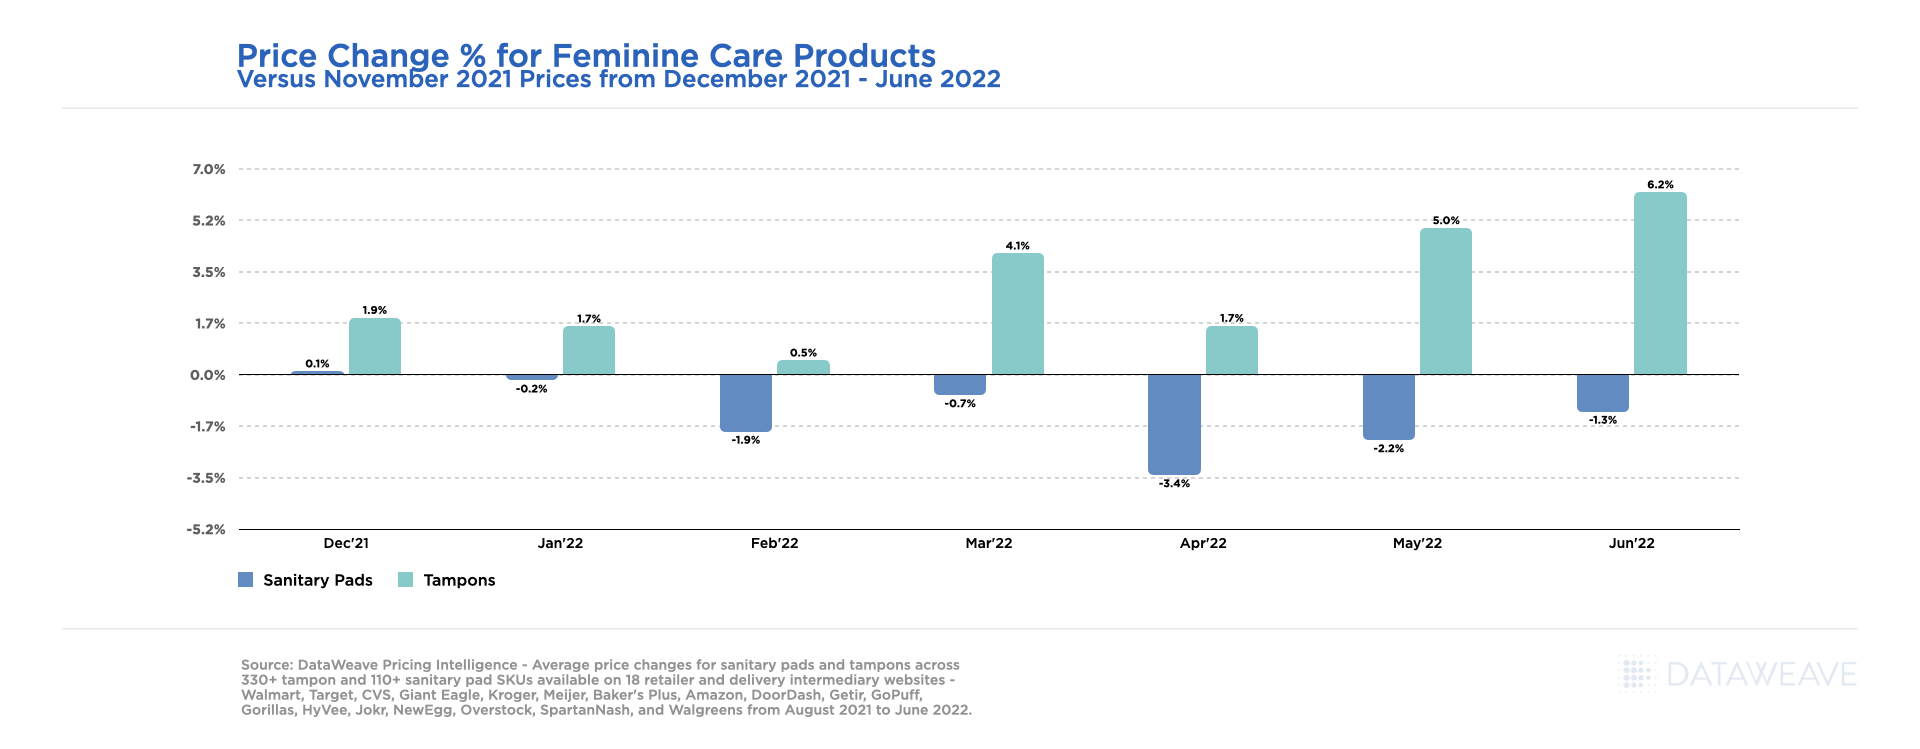
Feminine Care Product Price Changes Over Time
When looking at Pricing Intelligence insights and average price changes occurring alongside declining product availability for tampons and sanitary pads combined, we see a very different story. Tampons have seen steep price hikes from December 2021 onward, increasing the most in June 2022, up 6% compared to prices seen in November 2021. This steep price increase could be attributed to consistently low availability for tampons that has been seen in recent months.
To the contrary, sanitary pads have seen a price reduction of around 1.25% as of June 2022 compared to average prices seen in November 2021. While prices are lower in June 2022 for sanitary pads, the percentage by which they are lower is shrinking in recent months, potentially for the same reasons related to decreasing product availability.
Price Change for Feminine Care Products – June 2022
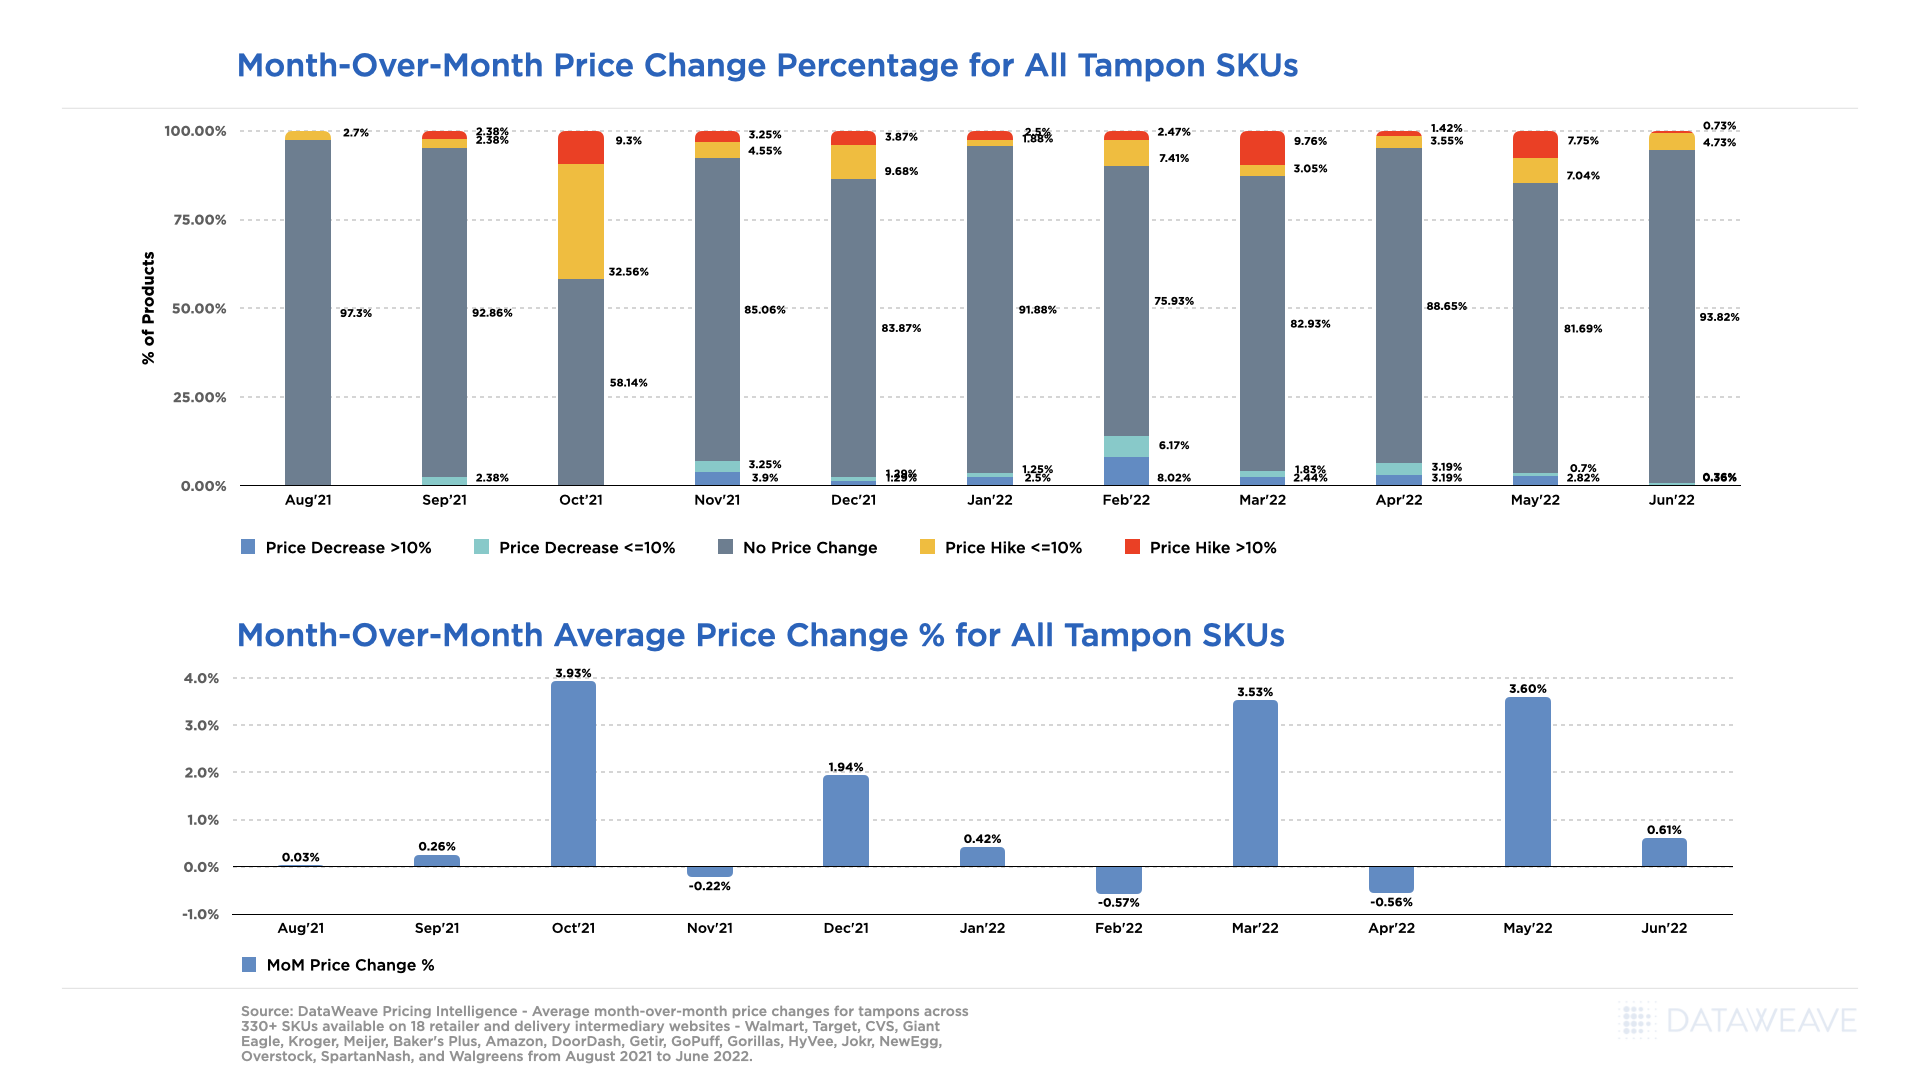
When looking at month-over-month average price changes for tampons only, we can clearly identify which months had the biggest price changes, noting price hikes that lead to the currently high prices seen in June 2022. In March and May 2022, over 10% of tampons offered had seen a price increase, and around 8% had seen significant price increases of more than 10%.
Month-Over-Month Price Changes for Tampons – June 2022
eCommerce Intelligence Provides Early Visibility to Evolving Trends
Price increases don’t seem to be stopping anytime soon given there was a 3.6% price hike seen on average in May 2022 versus April, with June seeing yet another .6% increase from May’s prices. That being said, as the market evolves and feminine hygiene products stabilize, our team will continue to provide visibility to critical pricing and product availability changes to enable our clients to stay ahead of the curve.
From a baby formula shortage to a tampon shortage, what category will be next to follow the supply chain shortage trend? Follow our blog for access to the latest insights and be sure to reach out to our team if there is any particular category you are interested in tracking next, or for access to more information on our Commerce Intelligence and Digital Shelf solutions.
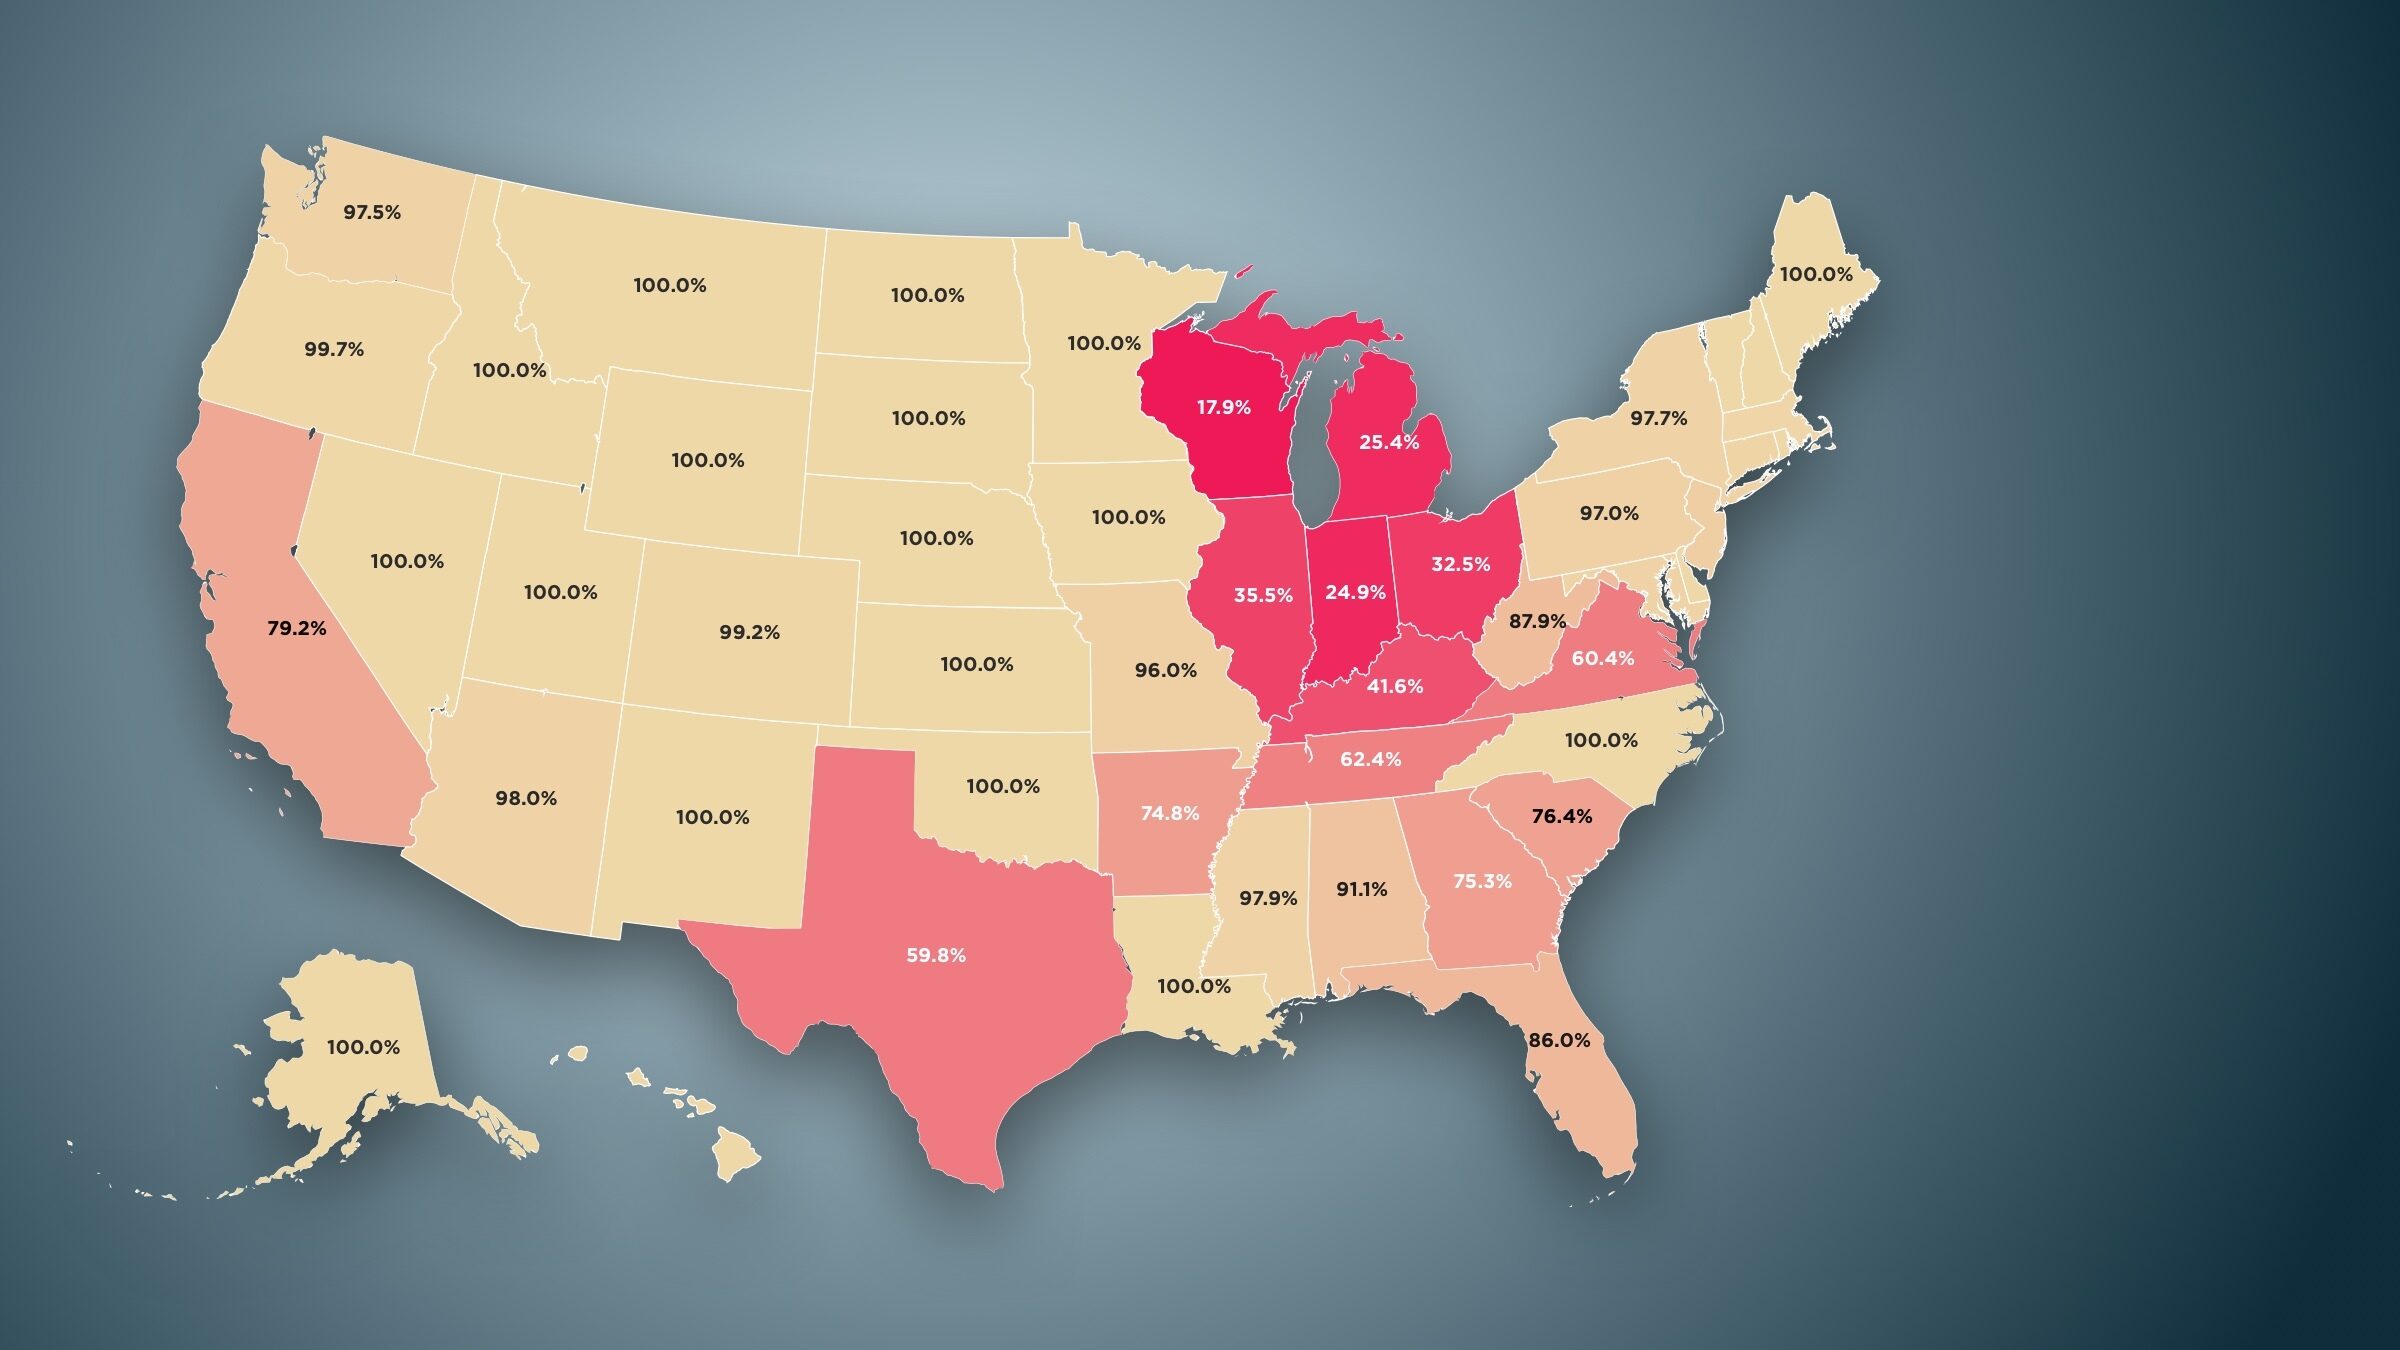
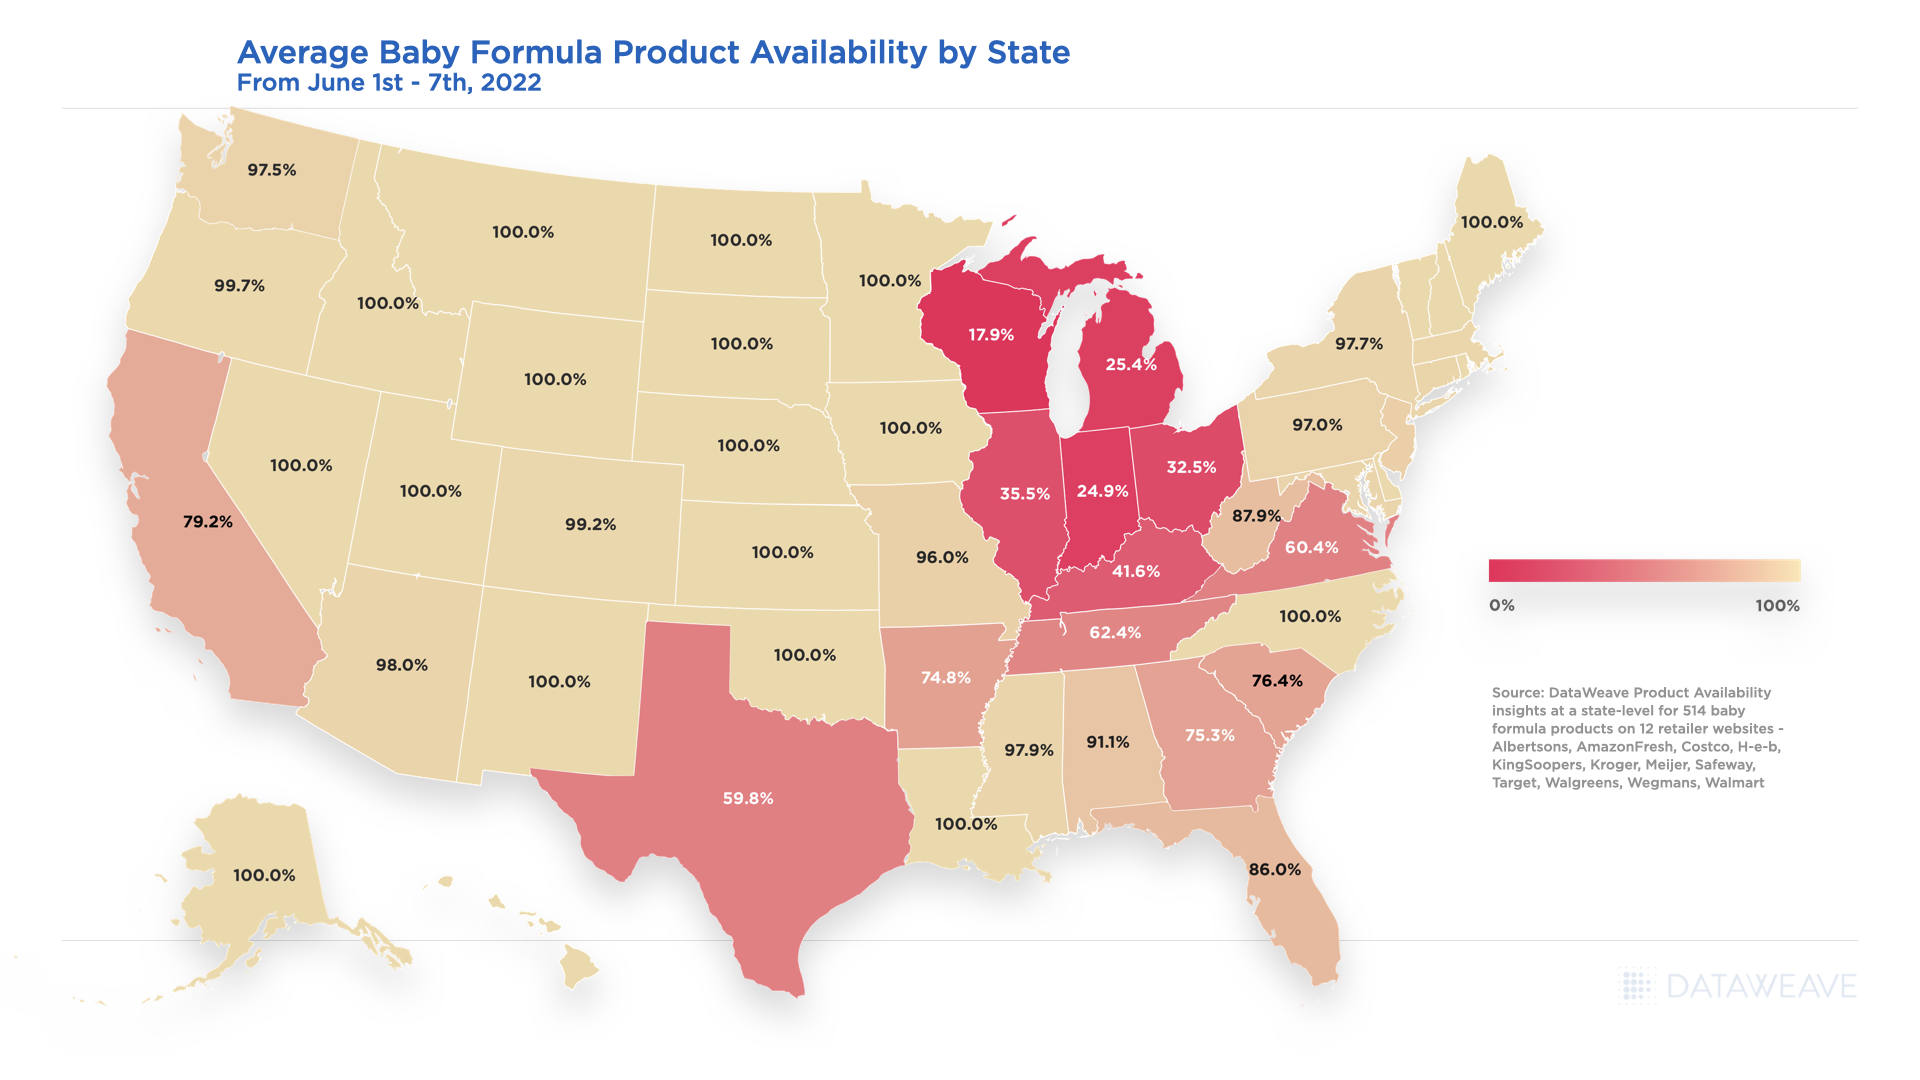
As the baby formula shortage continues, retailers and brands are working quickly to meet evolving consumer demand, considering supply chain driven headwinds, a baby formula recall, and inflationary-driven impacts. The DataWeave analytics team has actively tracked marketplace changes, alongside reports from the FDA, for the baby formula category at a state-level, and has shared the latest snapshot of product availability through June 7th, 2022, below.
Average Baby Formula Product Availability by State – June 2022
While the U.S. has reached an average of 84% baby formula availability the first week of June 2022, given recent news headlines related to the baby formula shortage, and tracking out of stock encounters by state, we see a continued decline in availability throughout the Midwest versus product availability levels seen in May 2022.
Wisconsin, Michigan, Illinois, Indiana, Ohio, and Kentucky all show average availability for baby formula to be less than 50%, with Wisconsin being impacted the most at less than 18% average availability. While Texas shows an average availability improvement of 3.5% from the first two weeks of May 2022 to the first week of June 2022 as noted in the below chart, availability is also very low overall at less than 60%.
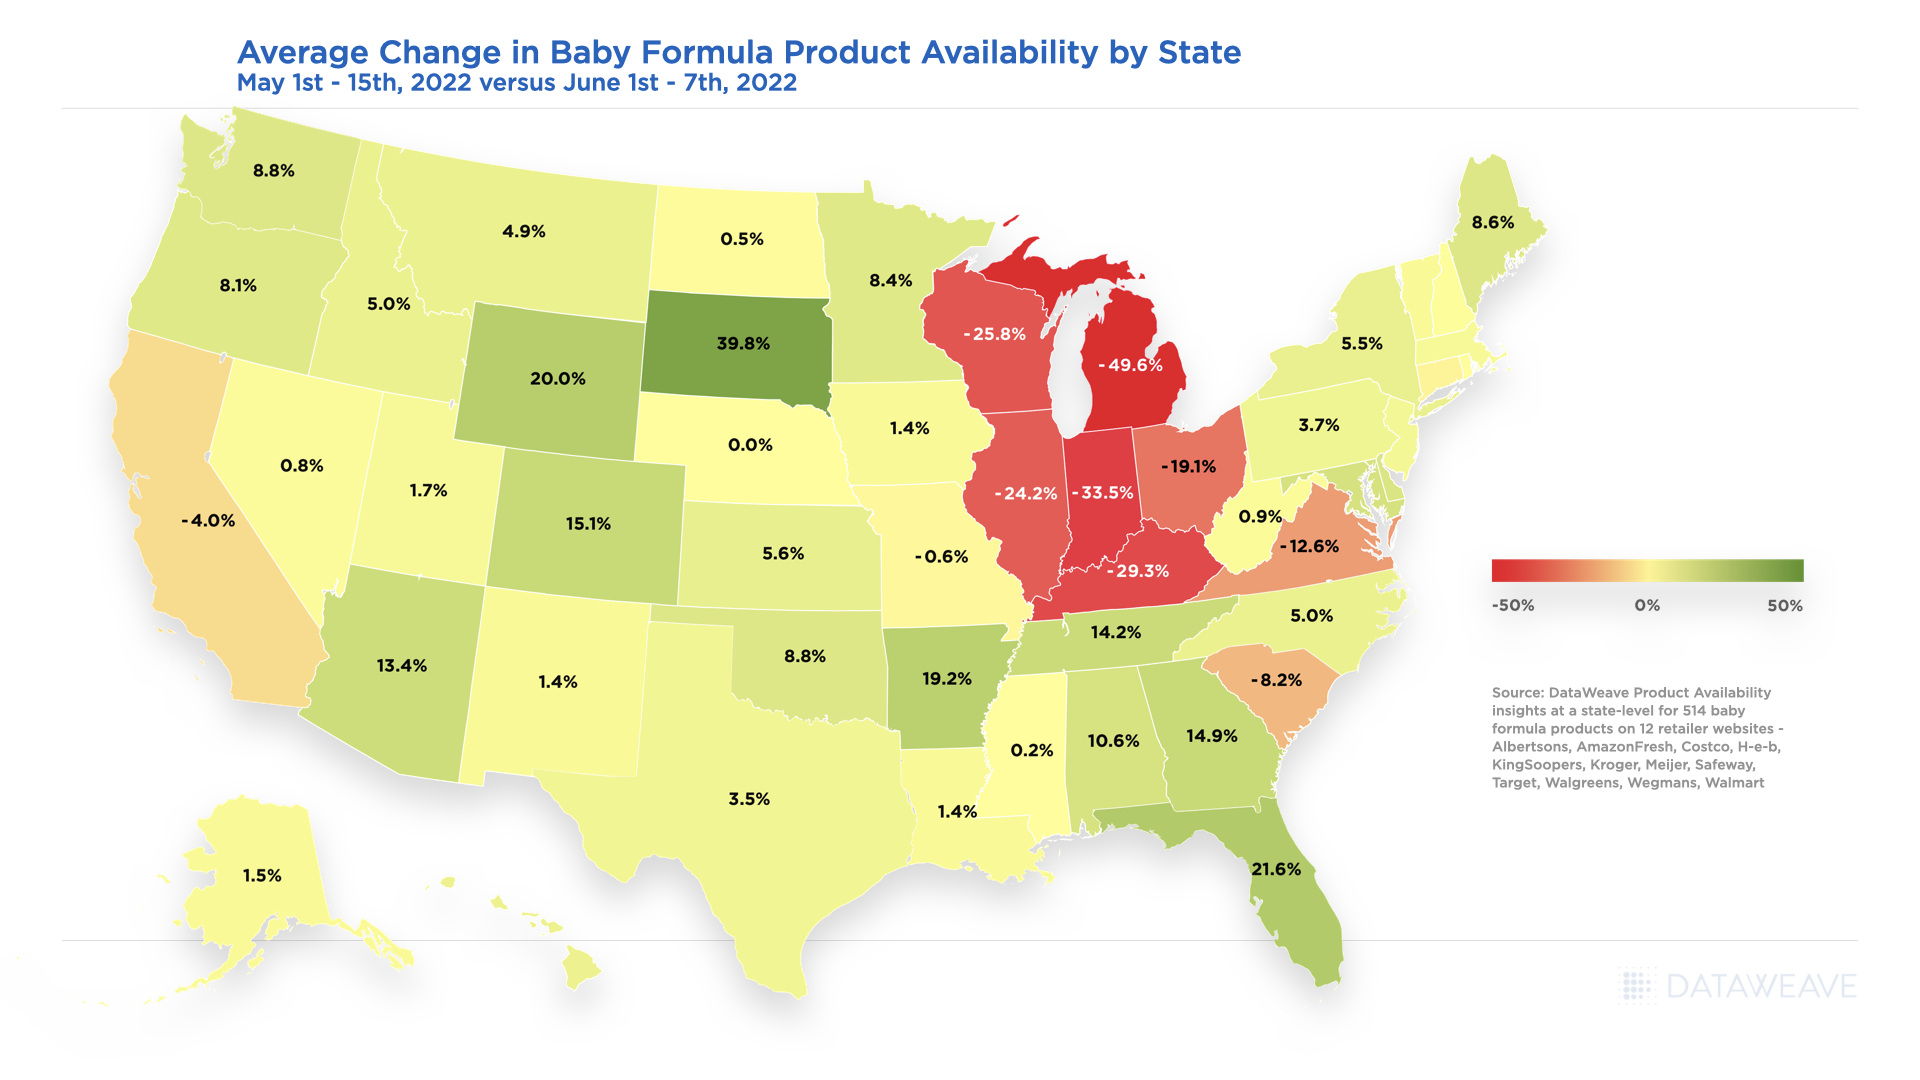
Average Change in Baby Formula Product Availability by State – May 2022 to June 2022
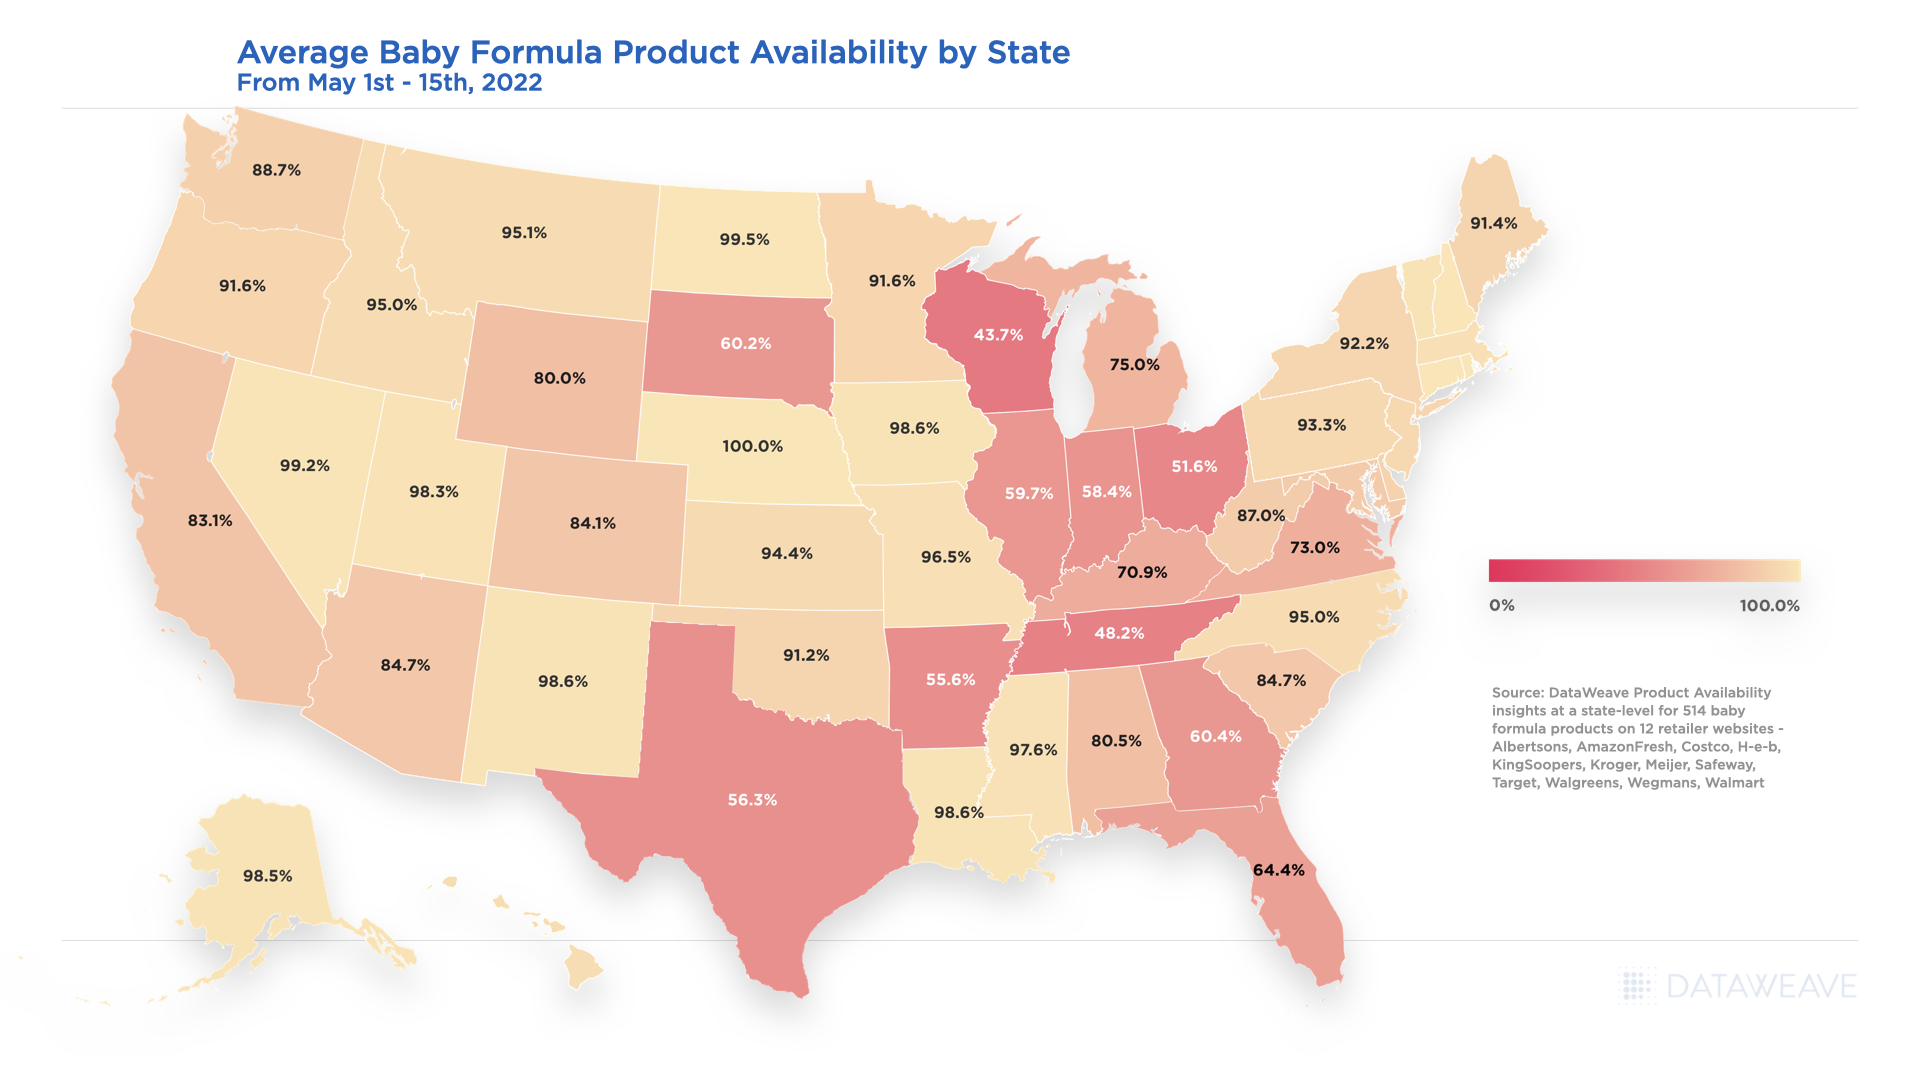
Outside of the Midwest and Texas, the other states for consumers to be cautious in are California, Virginia, and South Carolina as their month-over-month average change in availability also declined 4%, 12.6% and 8.2% respectively. Below is a snapshot of where the baby formula availability average started as of May 1st through the 15th, 2022.
Average Baby Formula Product Availability by State – May 2022
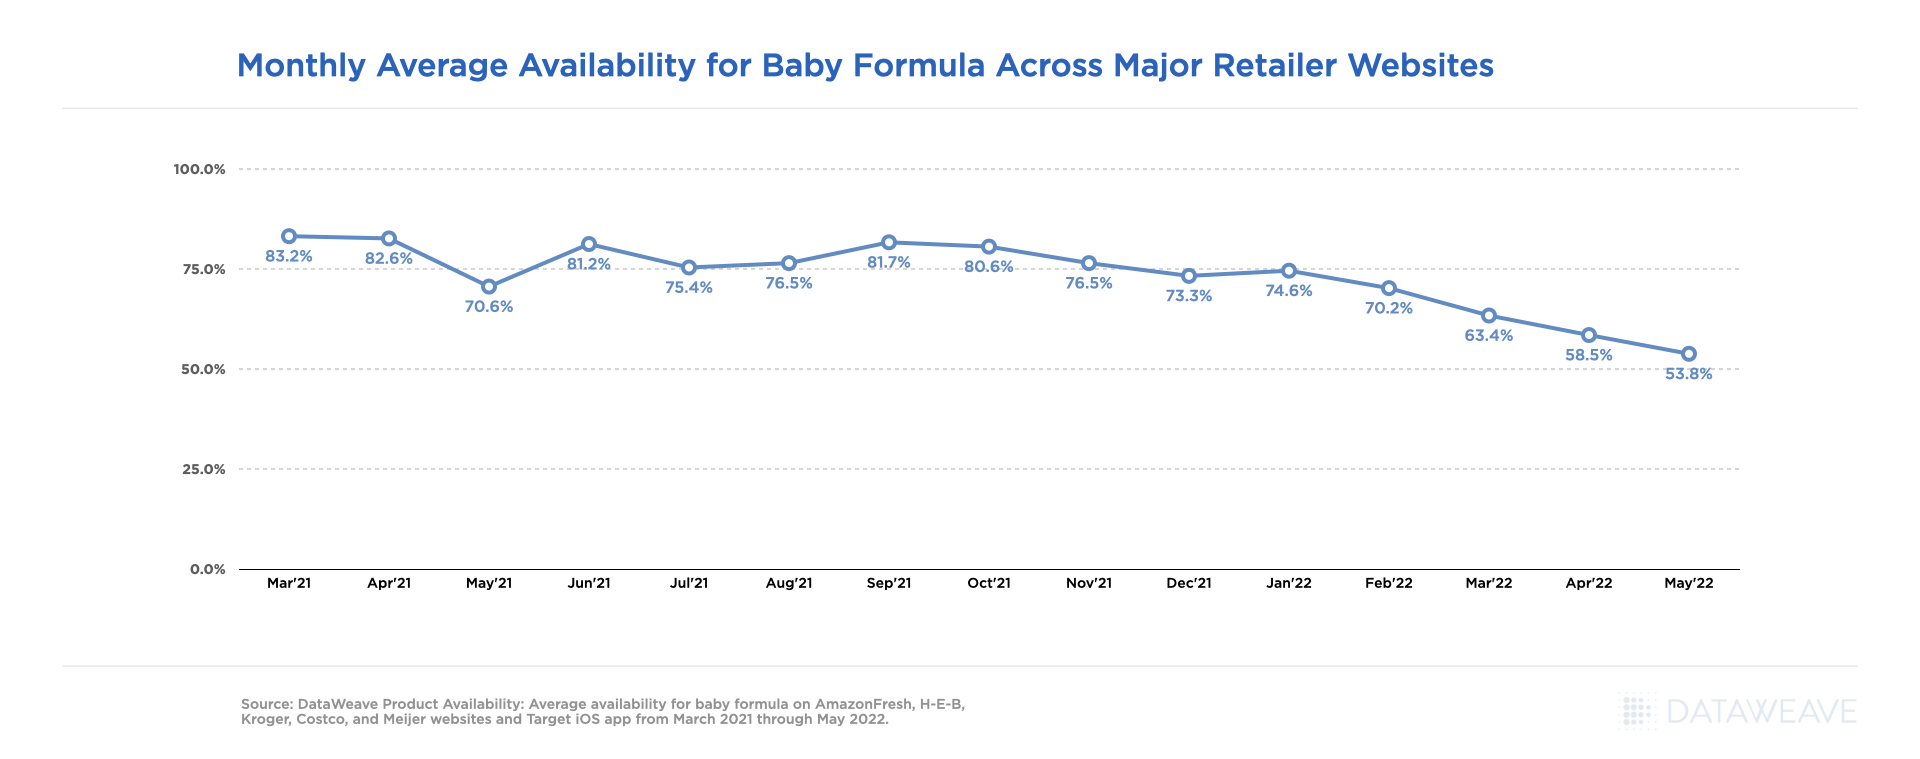
Baby Formula Product Availability Changes – March 2021 through May 2022
At an aggregated level overall, the availability for baby formula was relatively stable across all retailers considered within our analysis from March 2021 through September 2021, but has been on a steady decline ever since, starting at 81.7% availability in September and ending at 53.8% availability in May 2022 as noted in the below chart.
Monthly Average Availability for Baby Formula Across Major Retailer Websites
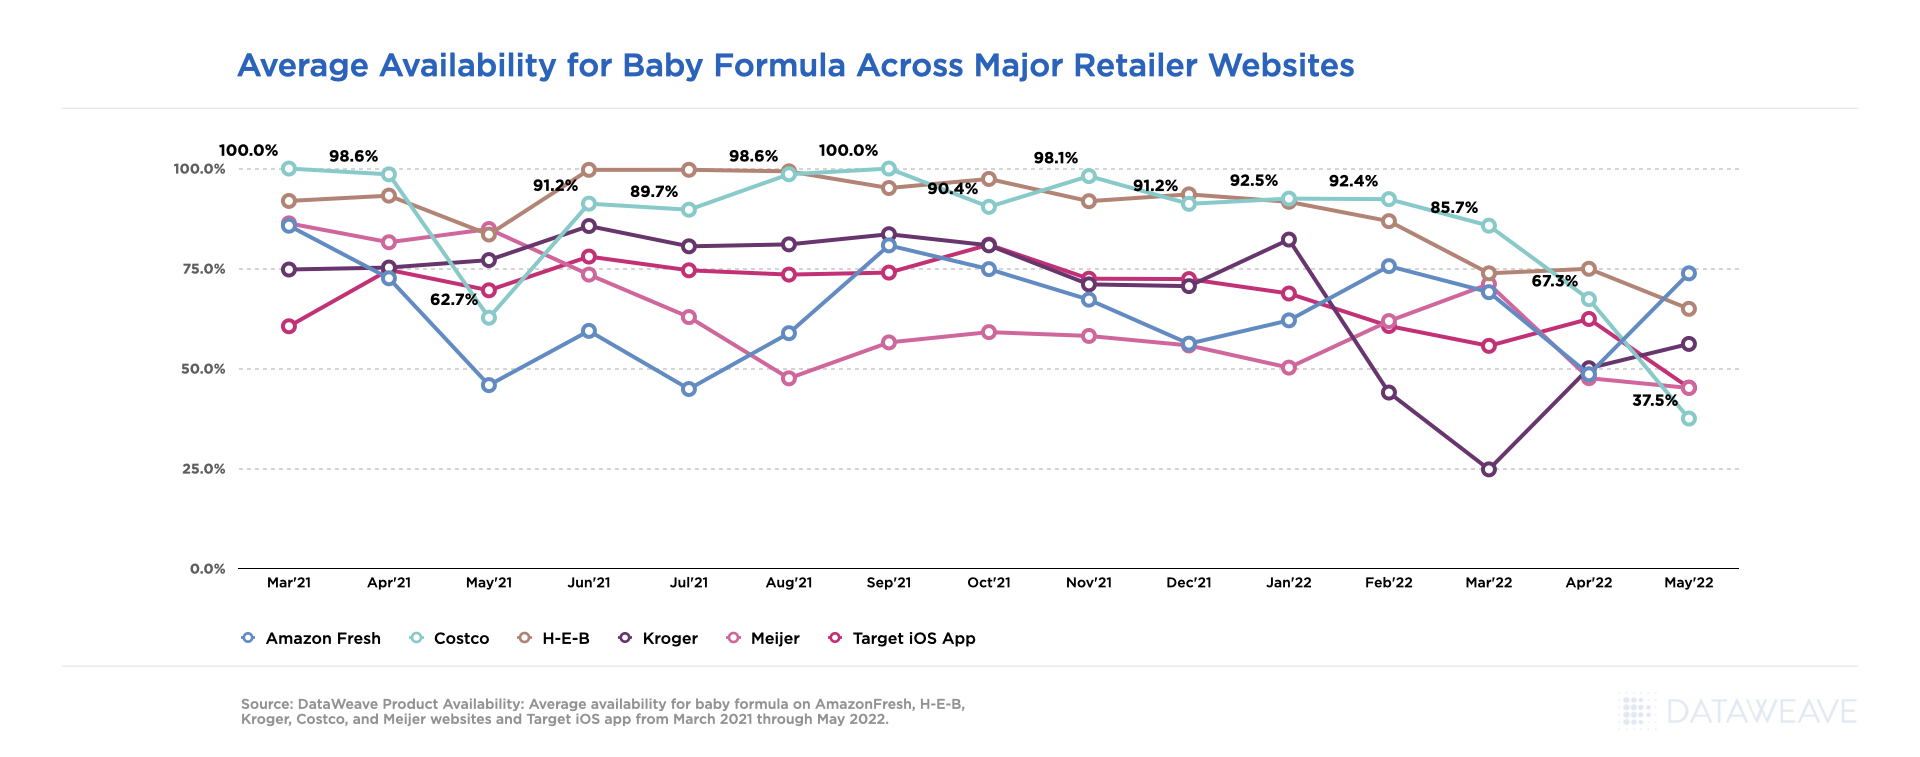
Looking at baby formula availability at a retail level, we saw yet again not all availability challenges were alike, by month or retailer. Costco.com lead the other retailers within our analysis for greatest average availability from March 2021 through May 2022, but had one of the lowest availability percentages at 62.7% in May 2021, and dropped to the lowest availability of the group in May 2022 at 37.5%.
Average Availability for Baby Formula Across Major Retailer Websites
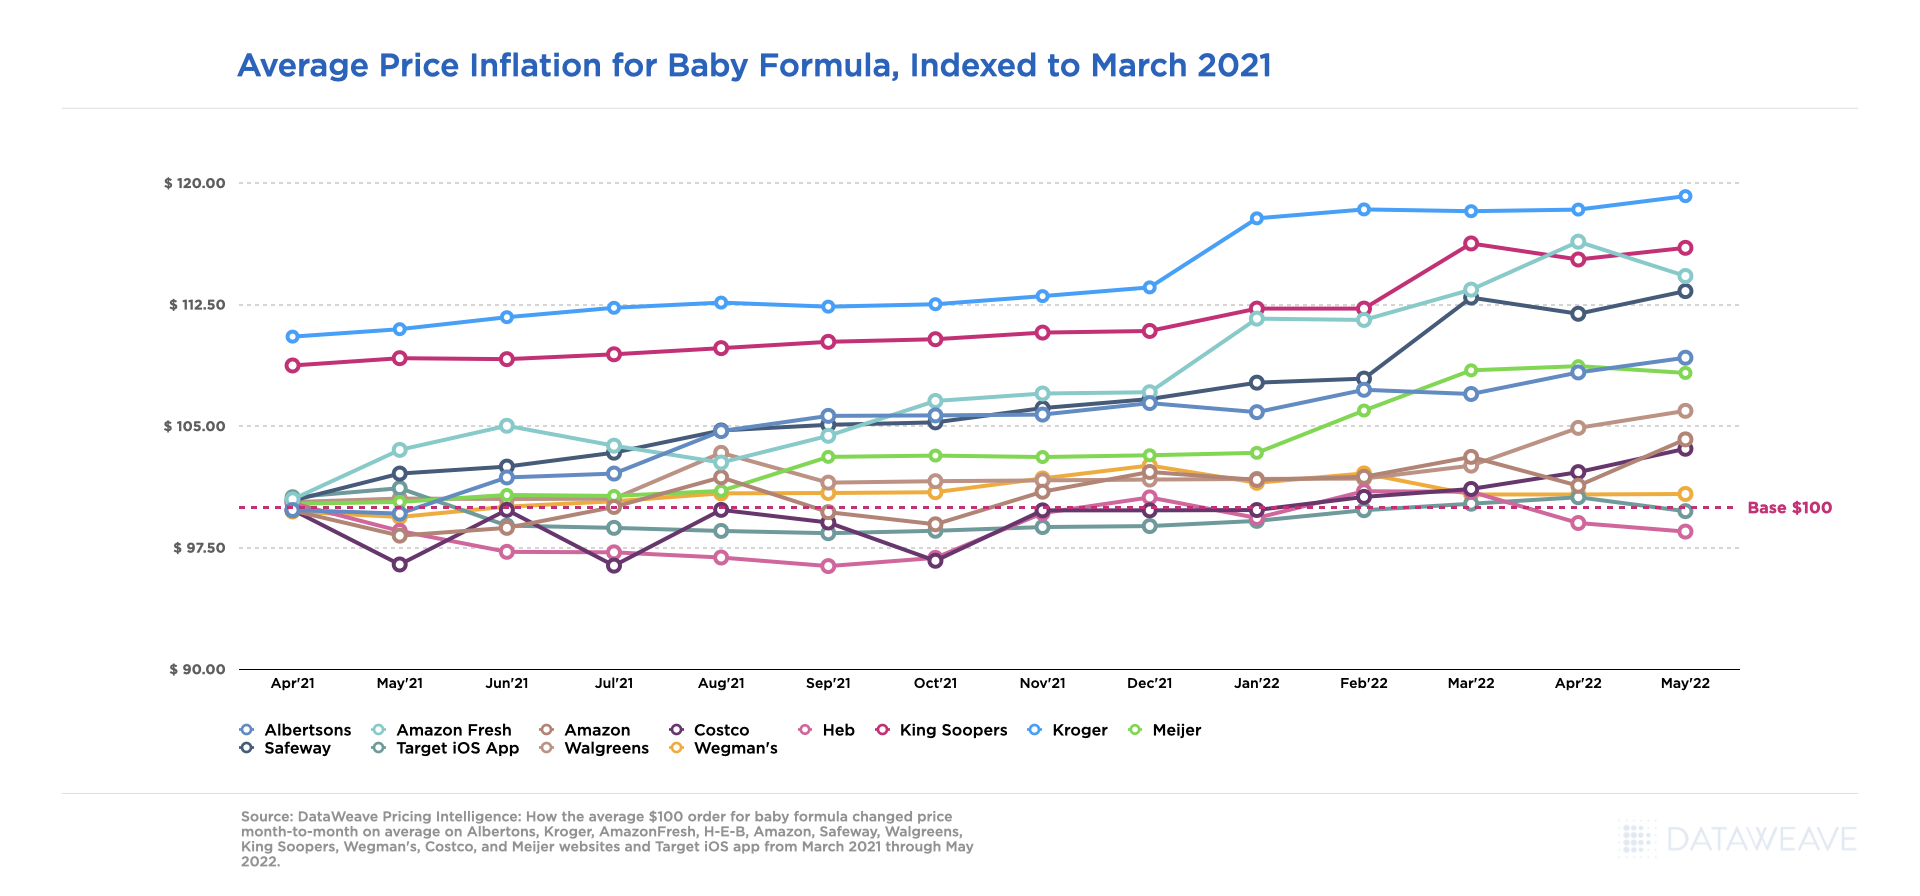
Baby Formula Prices Increase as Availability Changes
While unnecessary price gouging is prohibited, price increases are still happening at a slow and steady rate across all the accounts included within our Pricing Intelligence analysis given external market factors outside of baby formula recall related stockout scenarios.
Kroger.com experienced the greatest average price increases overall, with the peak being in May 2022 at a 19% increase, 8% higher than other retailers on average, versus prices seen in March 2021 for the same baby formula products. The most significant price hike occurred on Kroger.com from December 2021 to January 2022. Other retailers like H-E-B, Target and Wegman’s have had minimal price changes from March 2021 through May 2022.
Average Price Inflation for Baby Formula, Indexed to March 2021
Address the Baby Formula Shortage With eCommerce Intelligence
As the market continues to evolve and baby formula supply works its way to catching back up to demand, our team will continue providing critical pricing, merchandising, and competitive insights at scale, to enable retailers and brands to develop data-driven growth strategies that directly influence their eCommerce performance, accelerate revenue growth and drive profitability.
Be sure to reach out to our Retail Analytics experts for access to more details regarding the above analysis, or for more information on our Commerce Intelligence and Digital Shelf solutions, and let us know what other category insights you’d be interested in seeing this year.
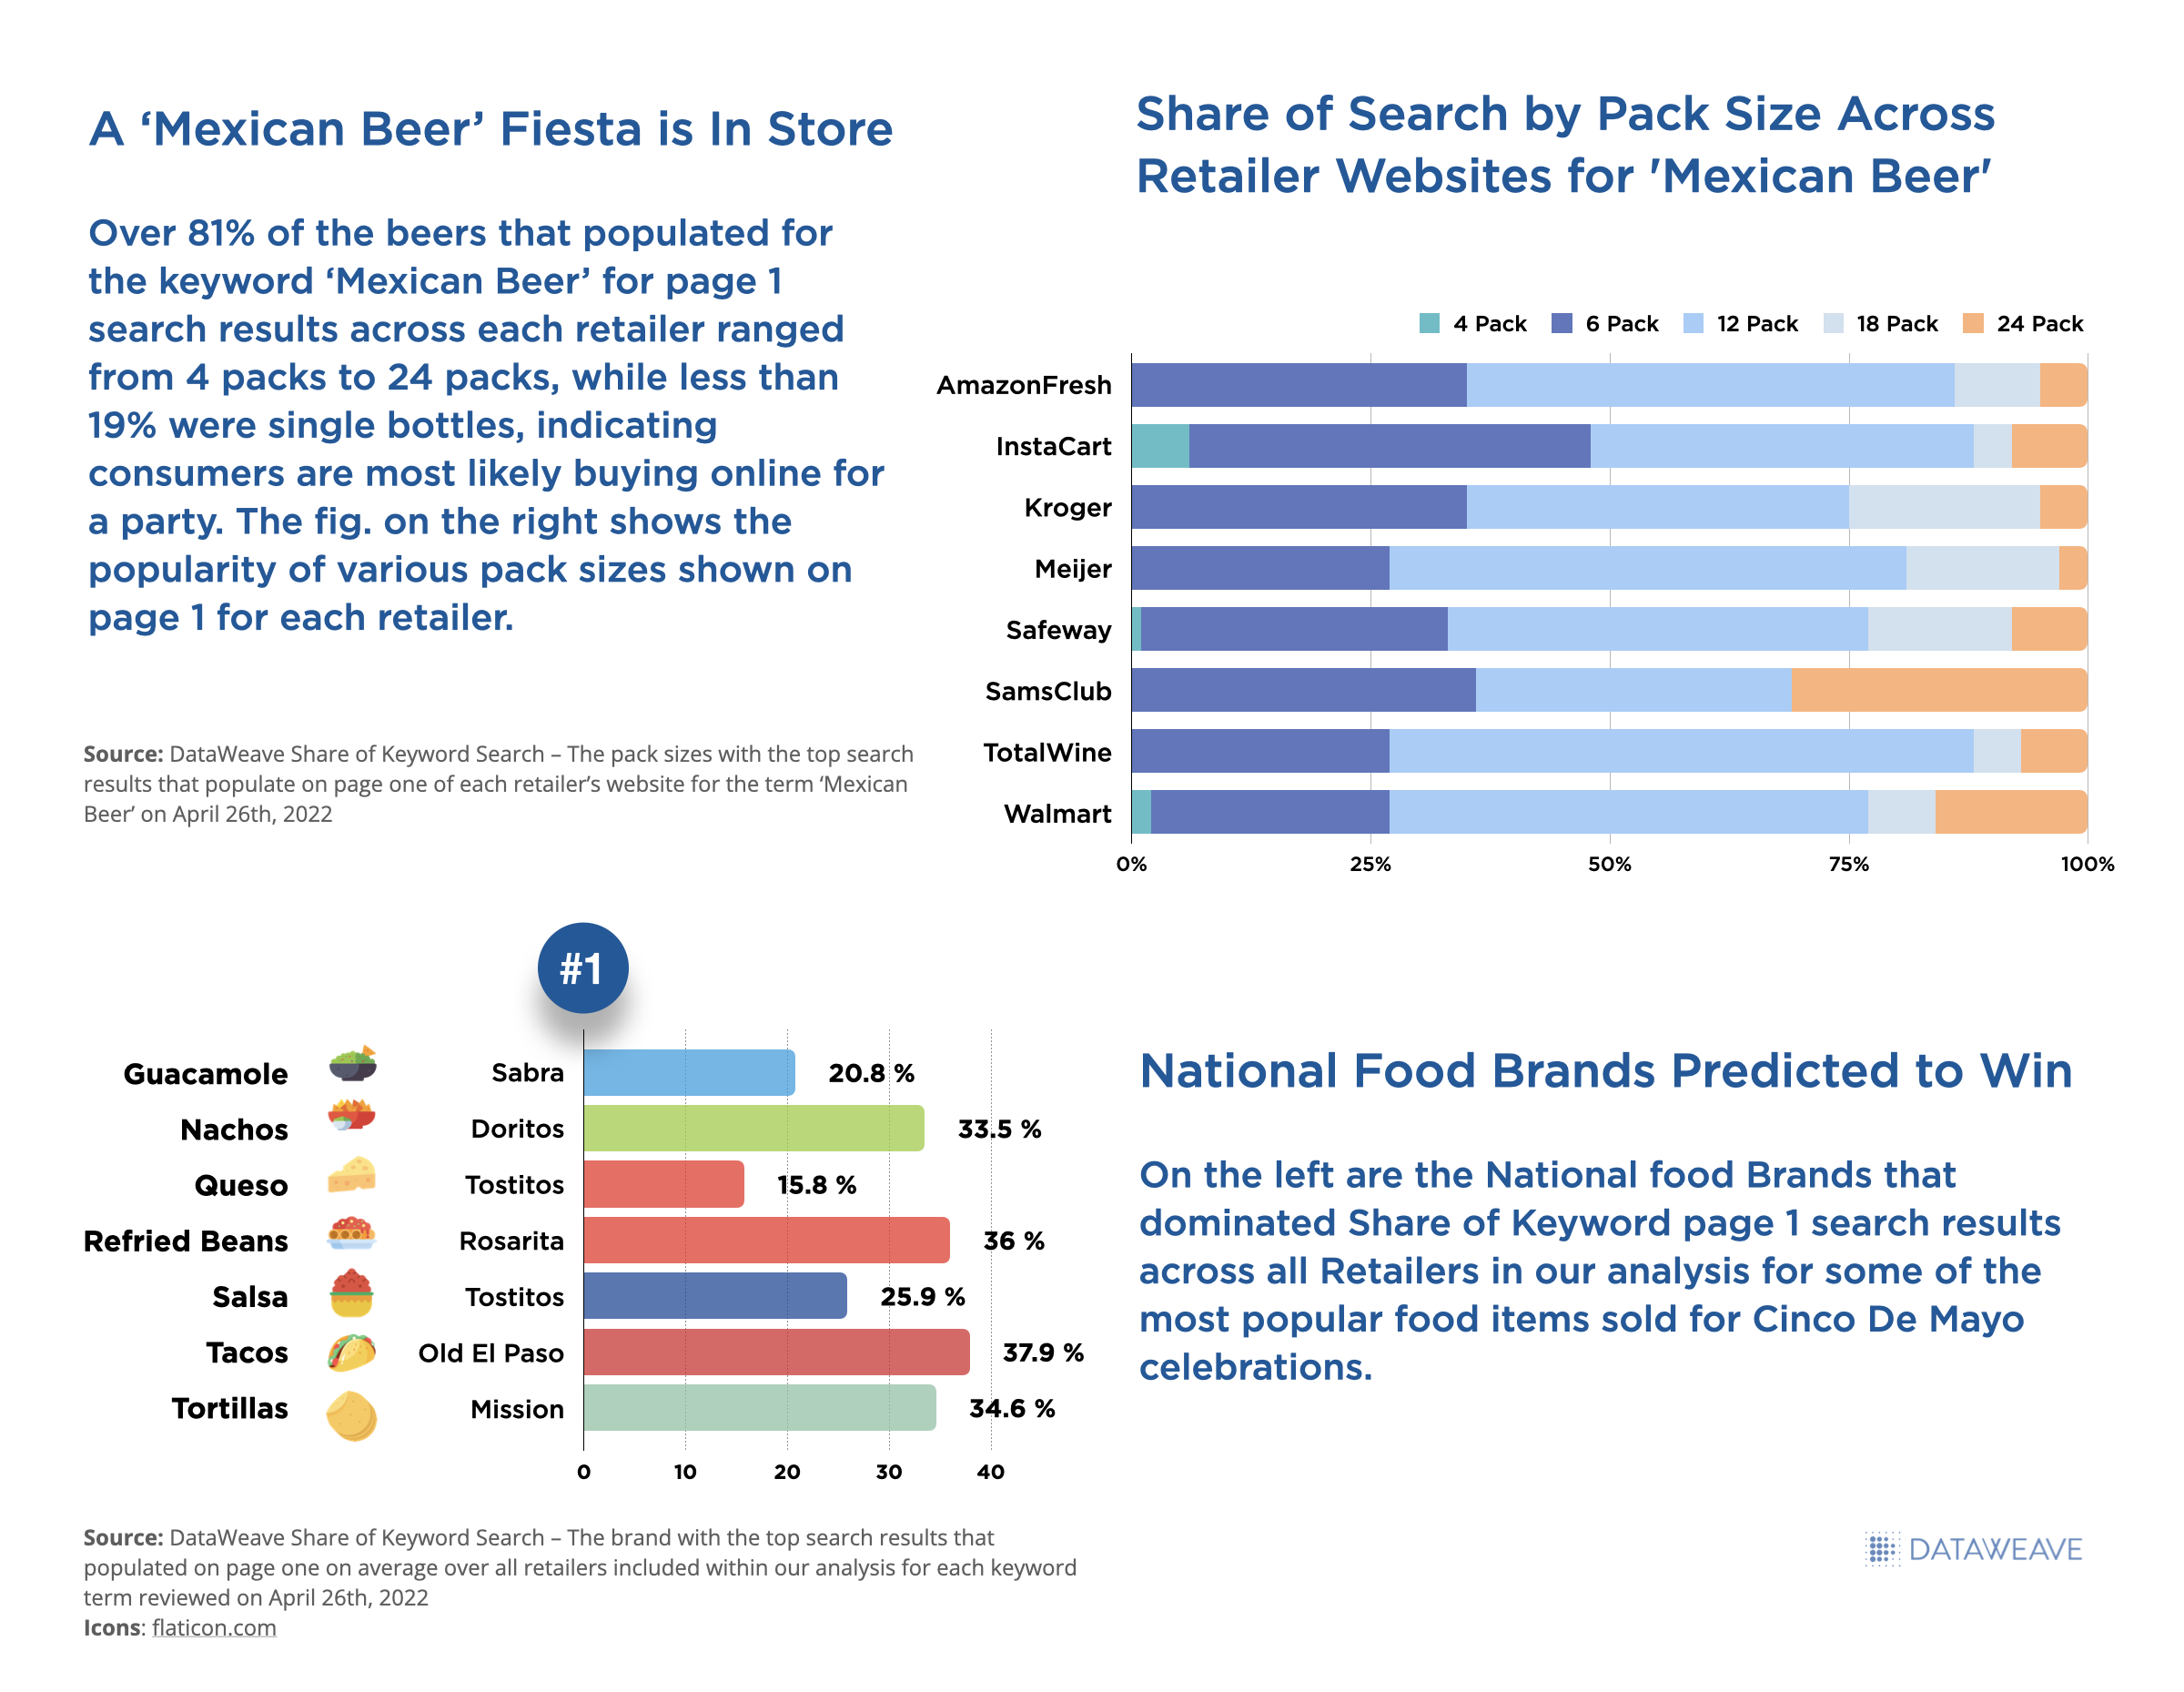
As inflation continues to hike costs for consumers and supply chains challenge them to maintain loyalty, there is still an active audience willing to pay the ultimate price for the convenience of food and alcohol delivery. That being said, we analyzed 8 popular Retail and Delivery Intermediary websites and 11 popular ‘Cinco de Mayo’ keywords to see which Brands are predicted to win the battle of Digital Shelf Share of Search this holiday.
2022 Cinco de Mayo Share of Search Insights – Top Brands for ‘Cinco de Mayo’
Opportunities for Food & Bev on Cinco de Mayo
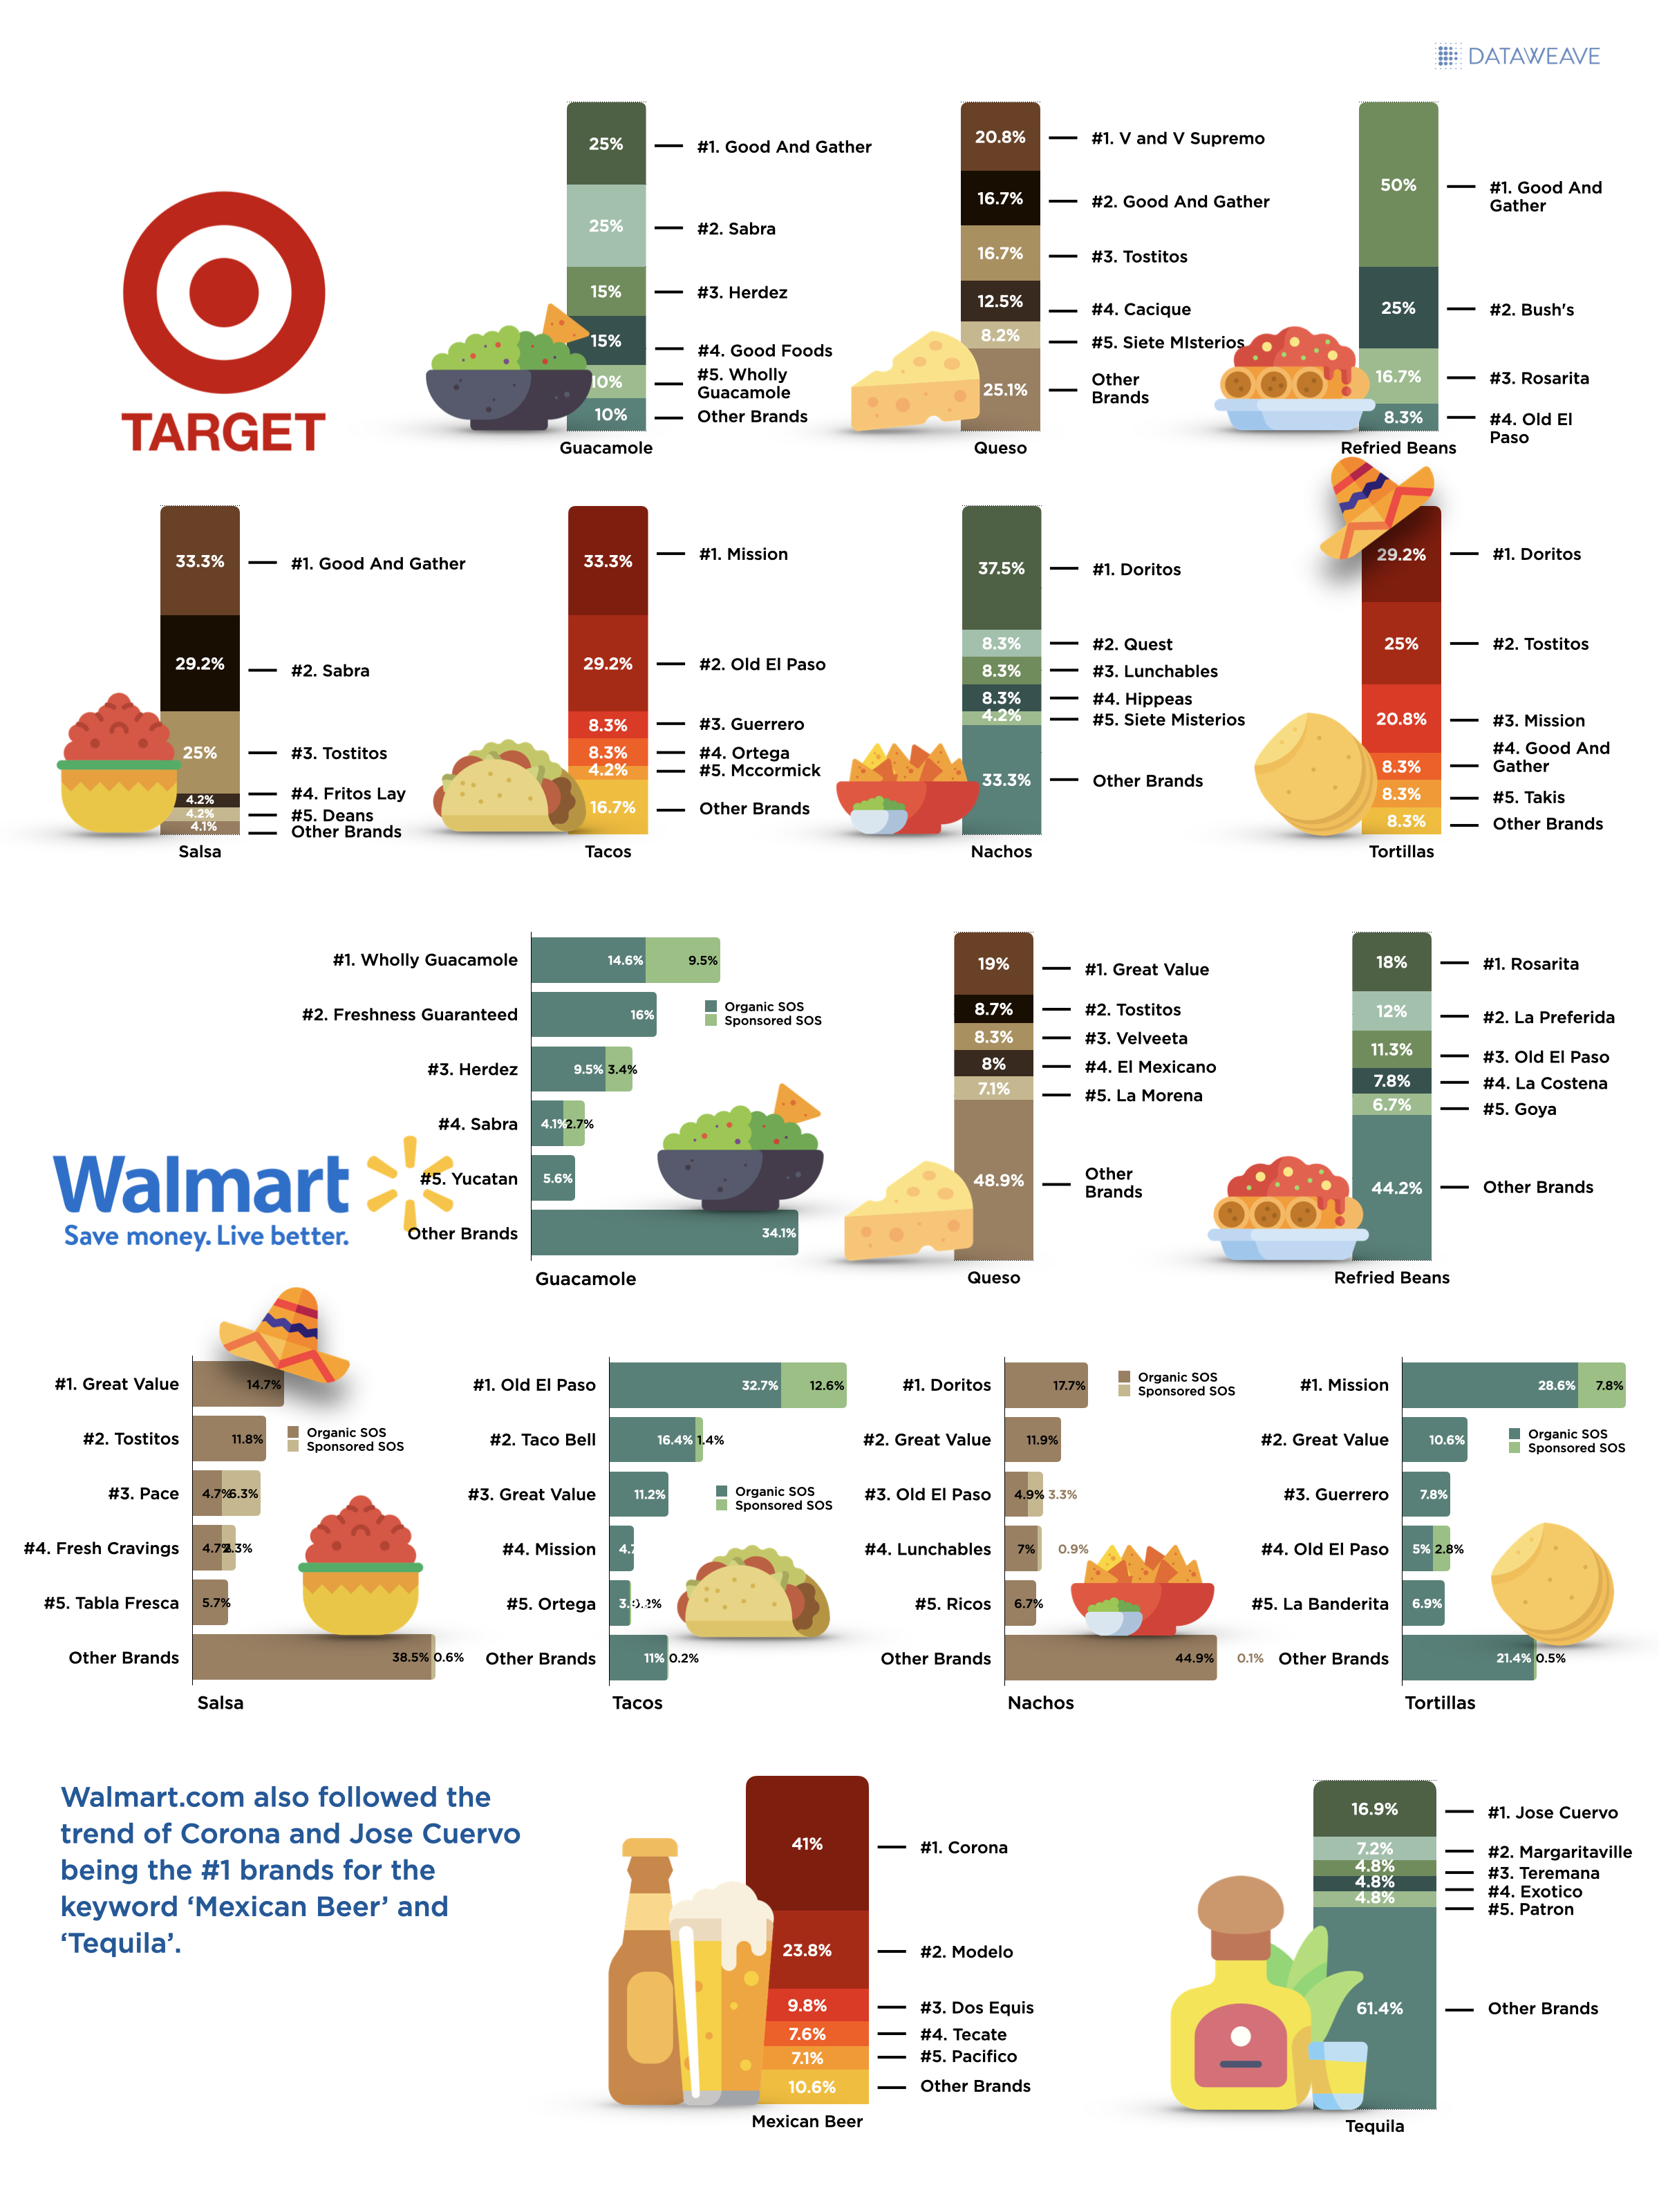
While most of our analysis focused on popular Cinco de Mayo food and beverage products, none of these brands populated on either Target (pictured on left below) or Walmart (pictured on right below) page 1 search results for the term ‘Cinco de Mayo’. Keyword search results for this term are dominated primarily by décor brands as indicated below.
Brands Achieving Top Share of Search for Food and Beverage Categories on Cinco de Mayo 2022
Share of Keyword Search Results – Alcohol Category
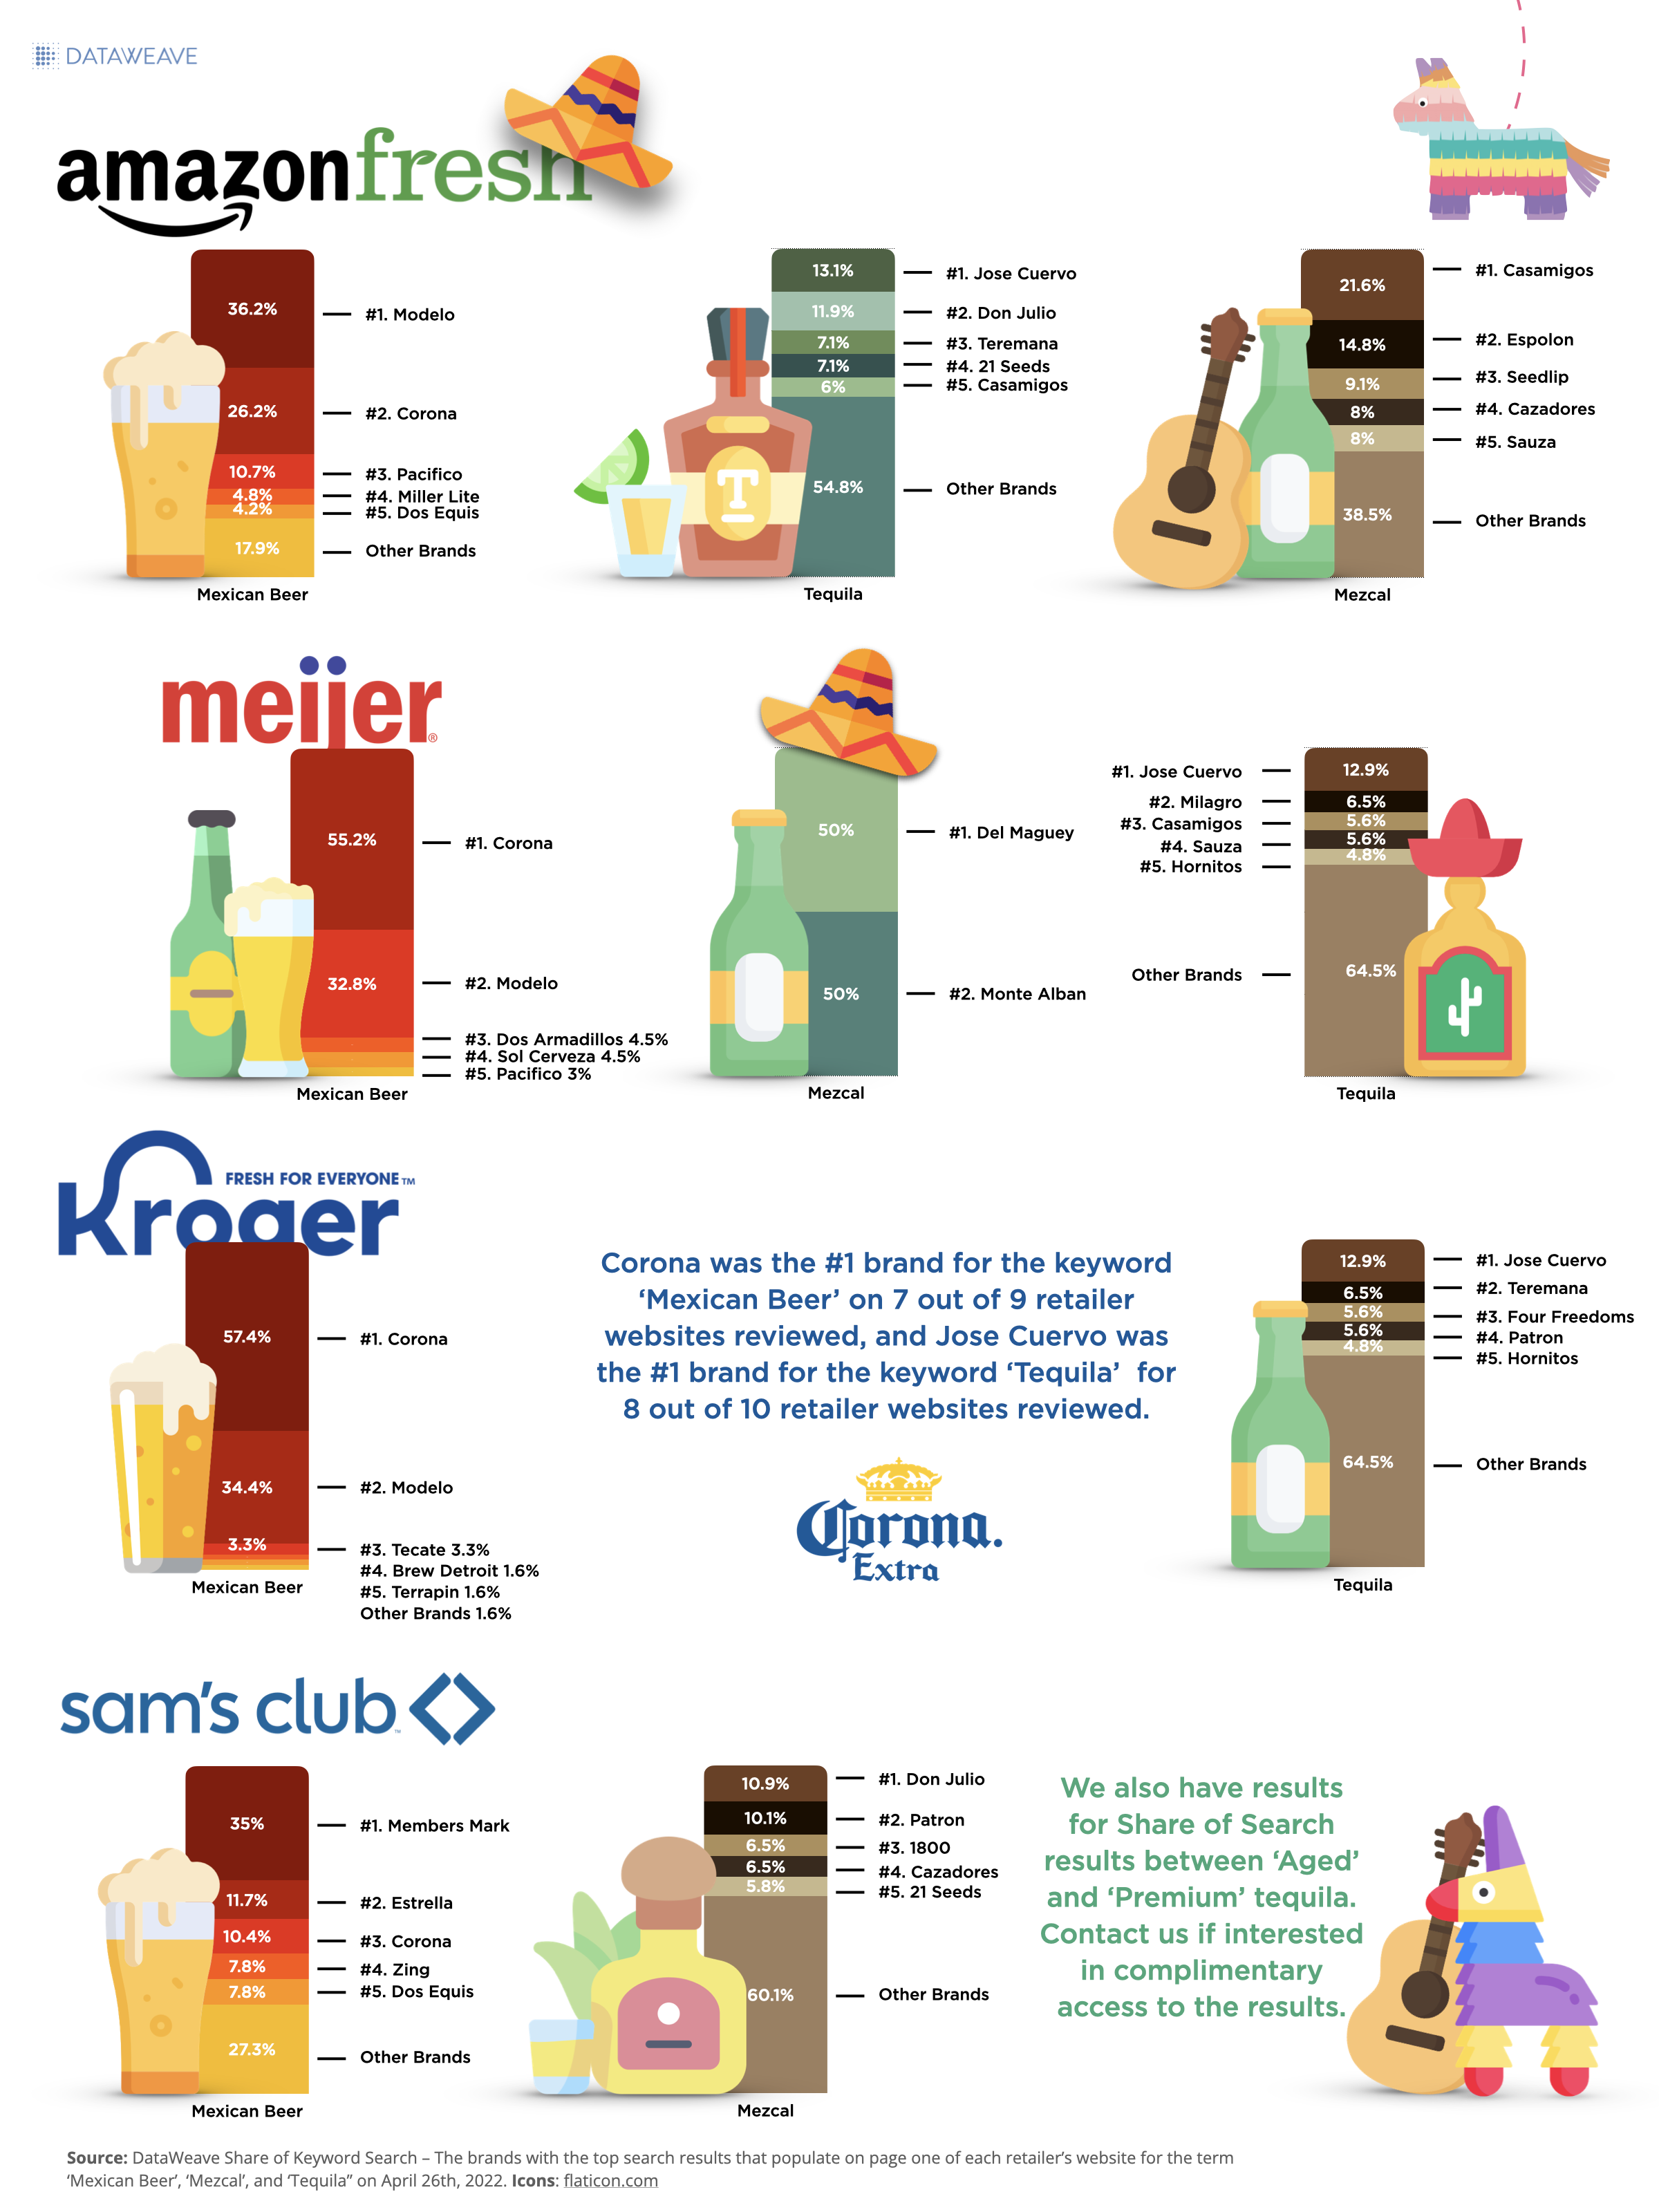
Three of the most popular alcohol types sought out during Cinco de Mayo are ‘Mexican Beer’, ‘Mezcal’, and ‘Tequila’. Below are the brands dominating Share of Keyword Search results on each of the major retail websites we researched.
AmazonFresh, Meijer, Kroger, and Sam’s Club Share of Search – Beer, Mezcal, and Tequila Keywords on Cinco de Mayo 2022
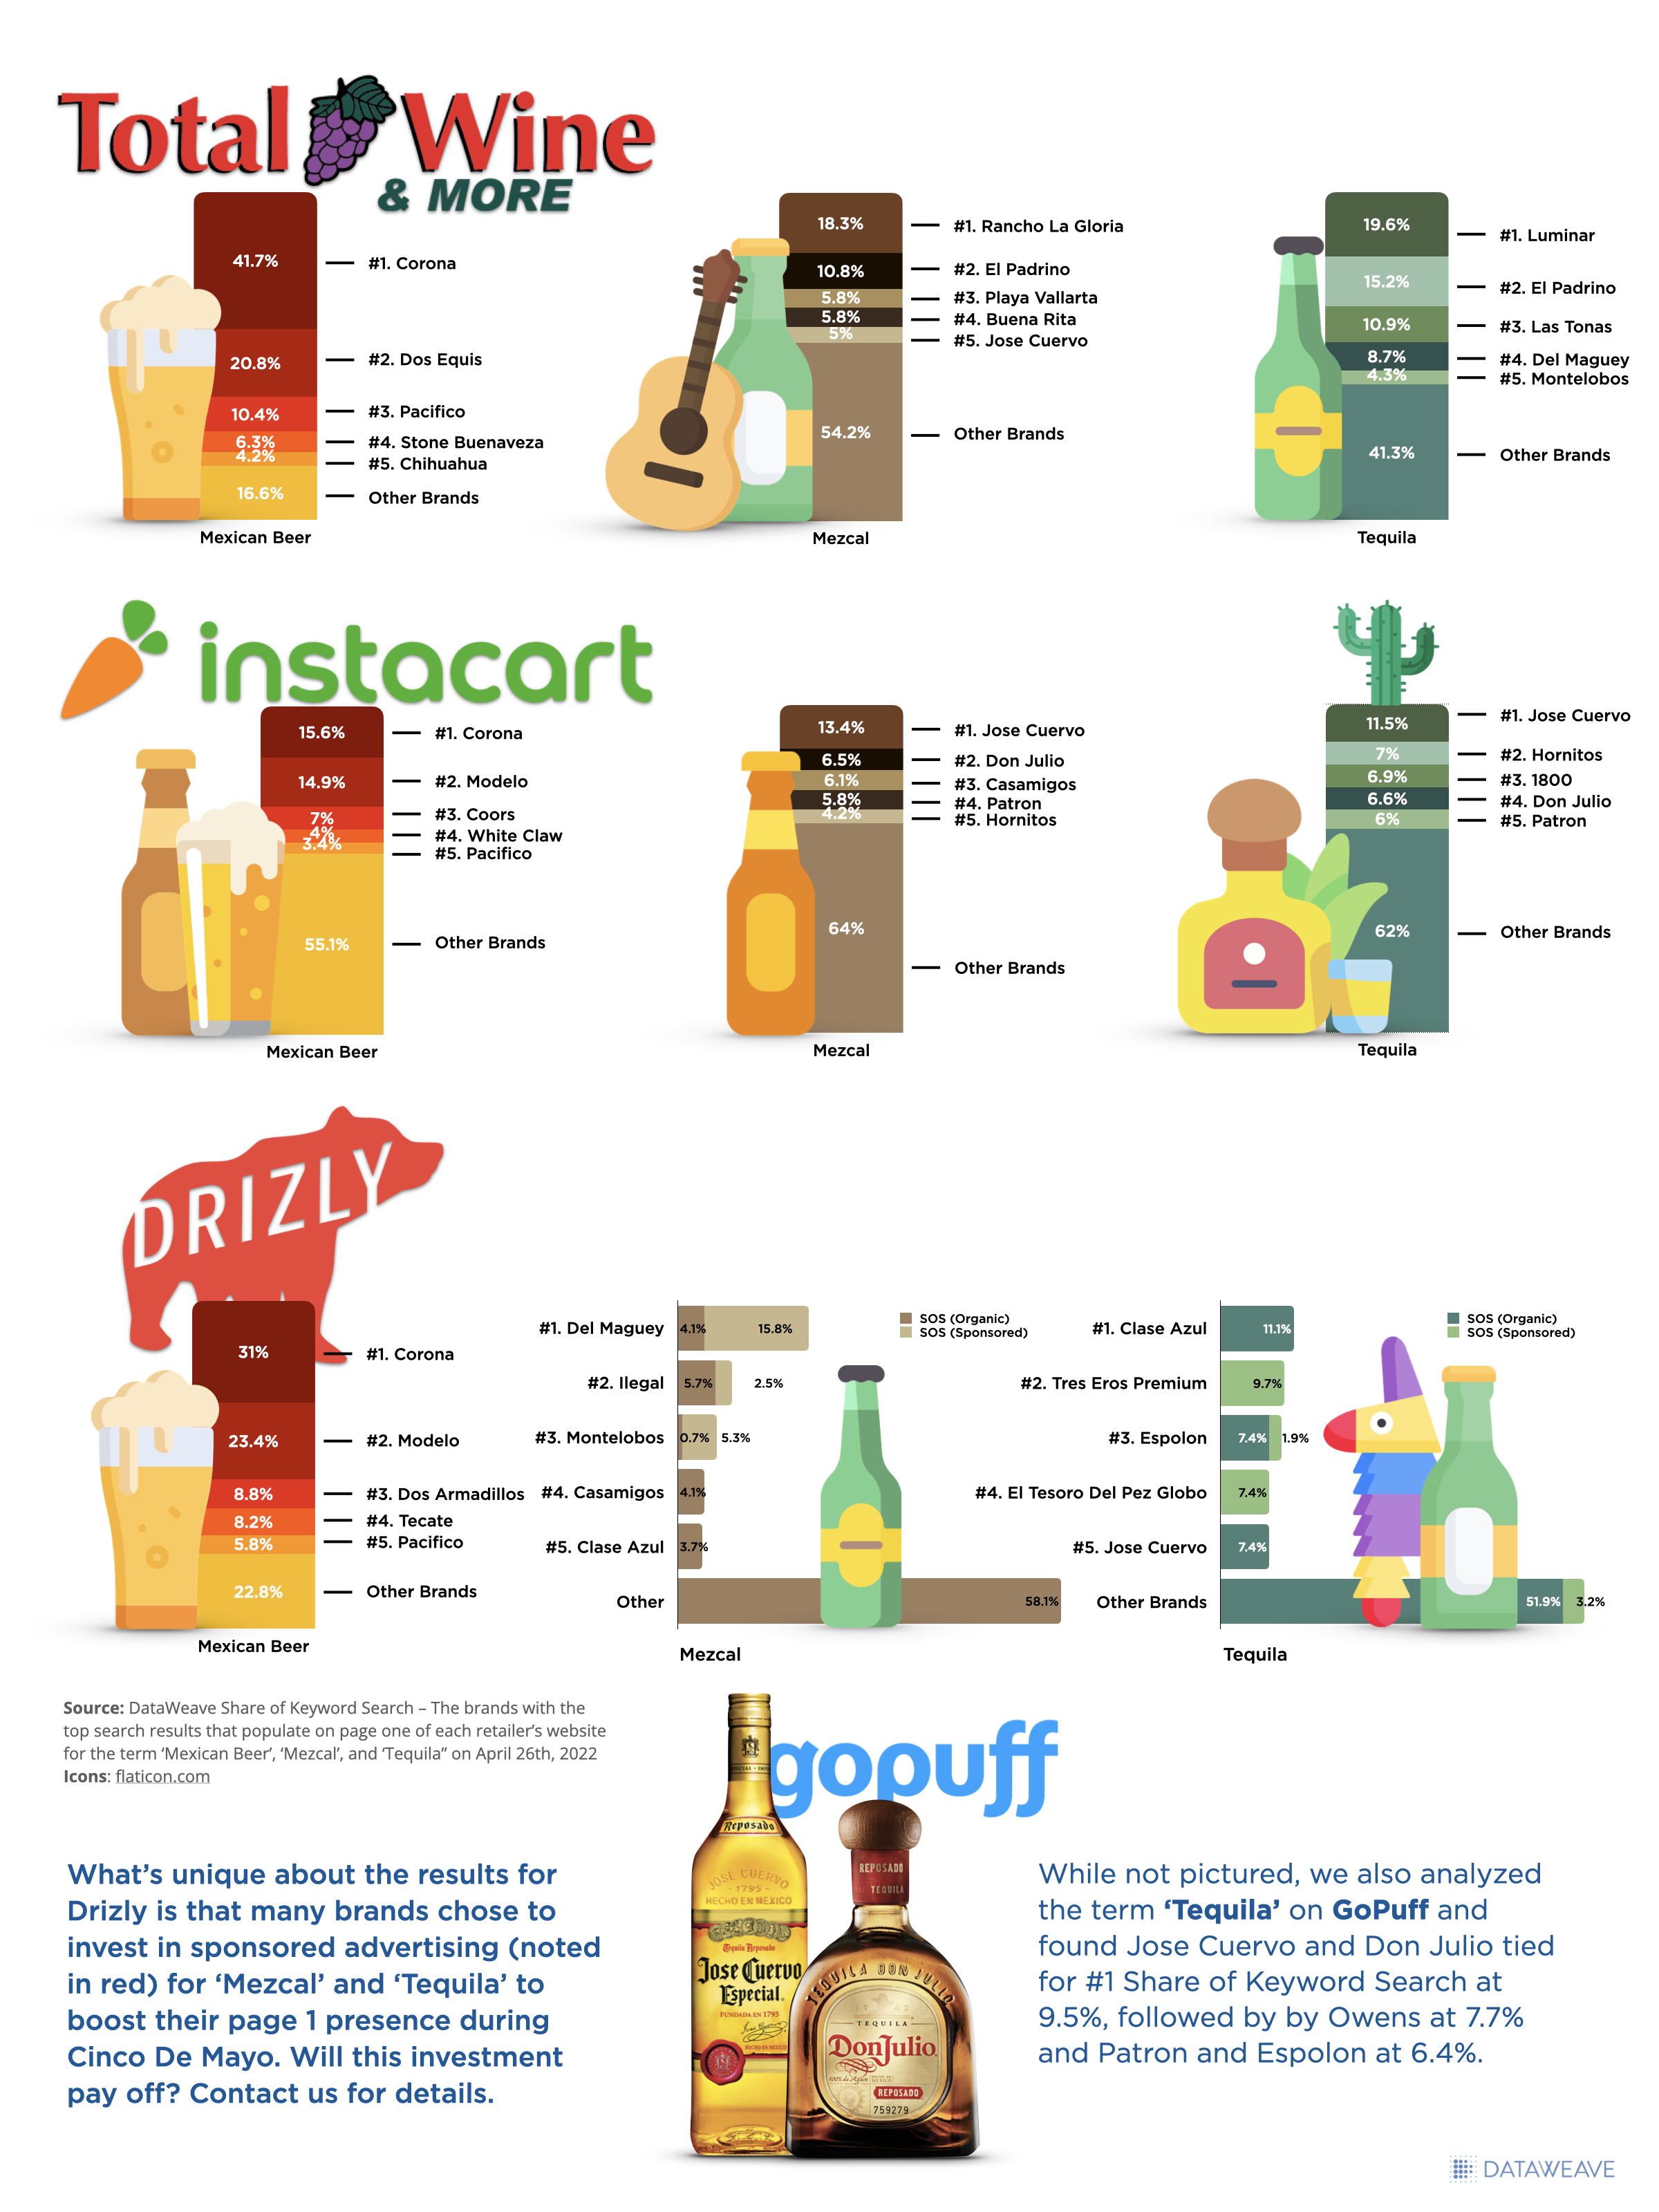
We also reviewed the same keyword performance across popular delivery intermediaries to see how Share of Keyword Search altered for ‘Mexican Beer’, ‘Mezcal’, and ‘Tequila’. The results are below for TotalWine, Instacart, Drizly and GoPuff:
TotalWine, Instacart, Drizly, and GoPuff of Search – Beer, Mezcal, and Tequila Keywords on Cinco de Mayo 2022
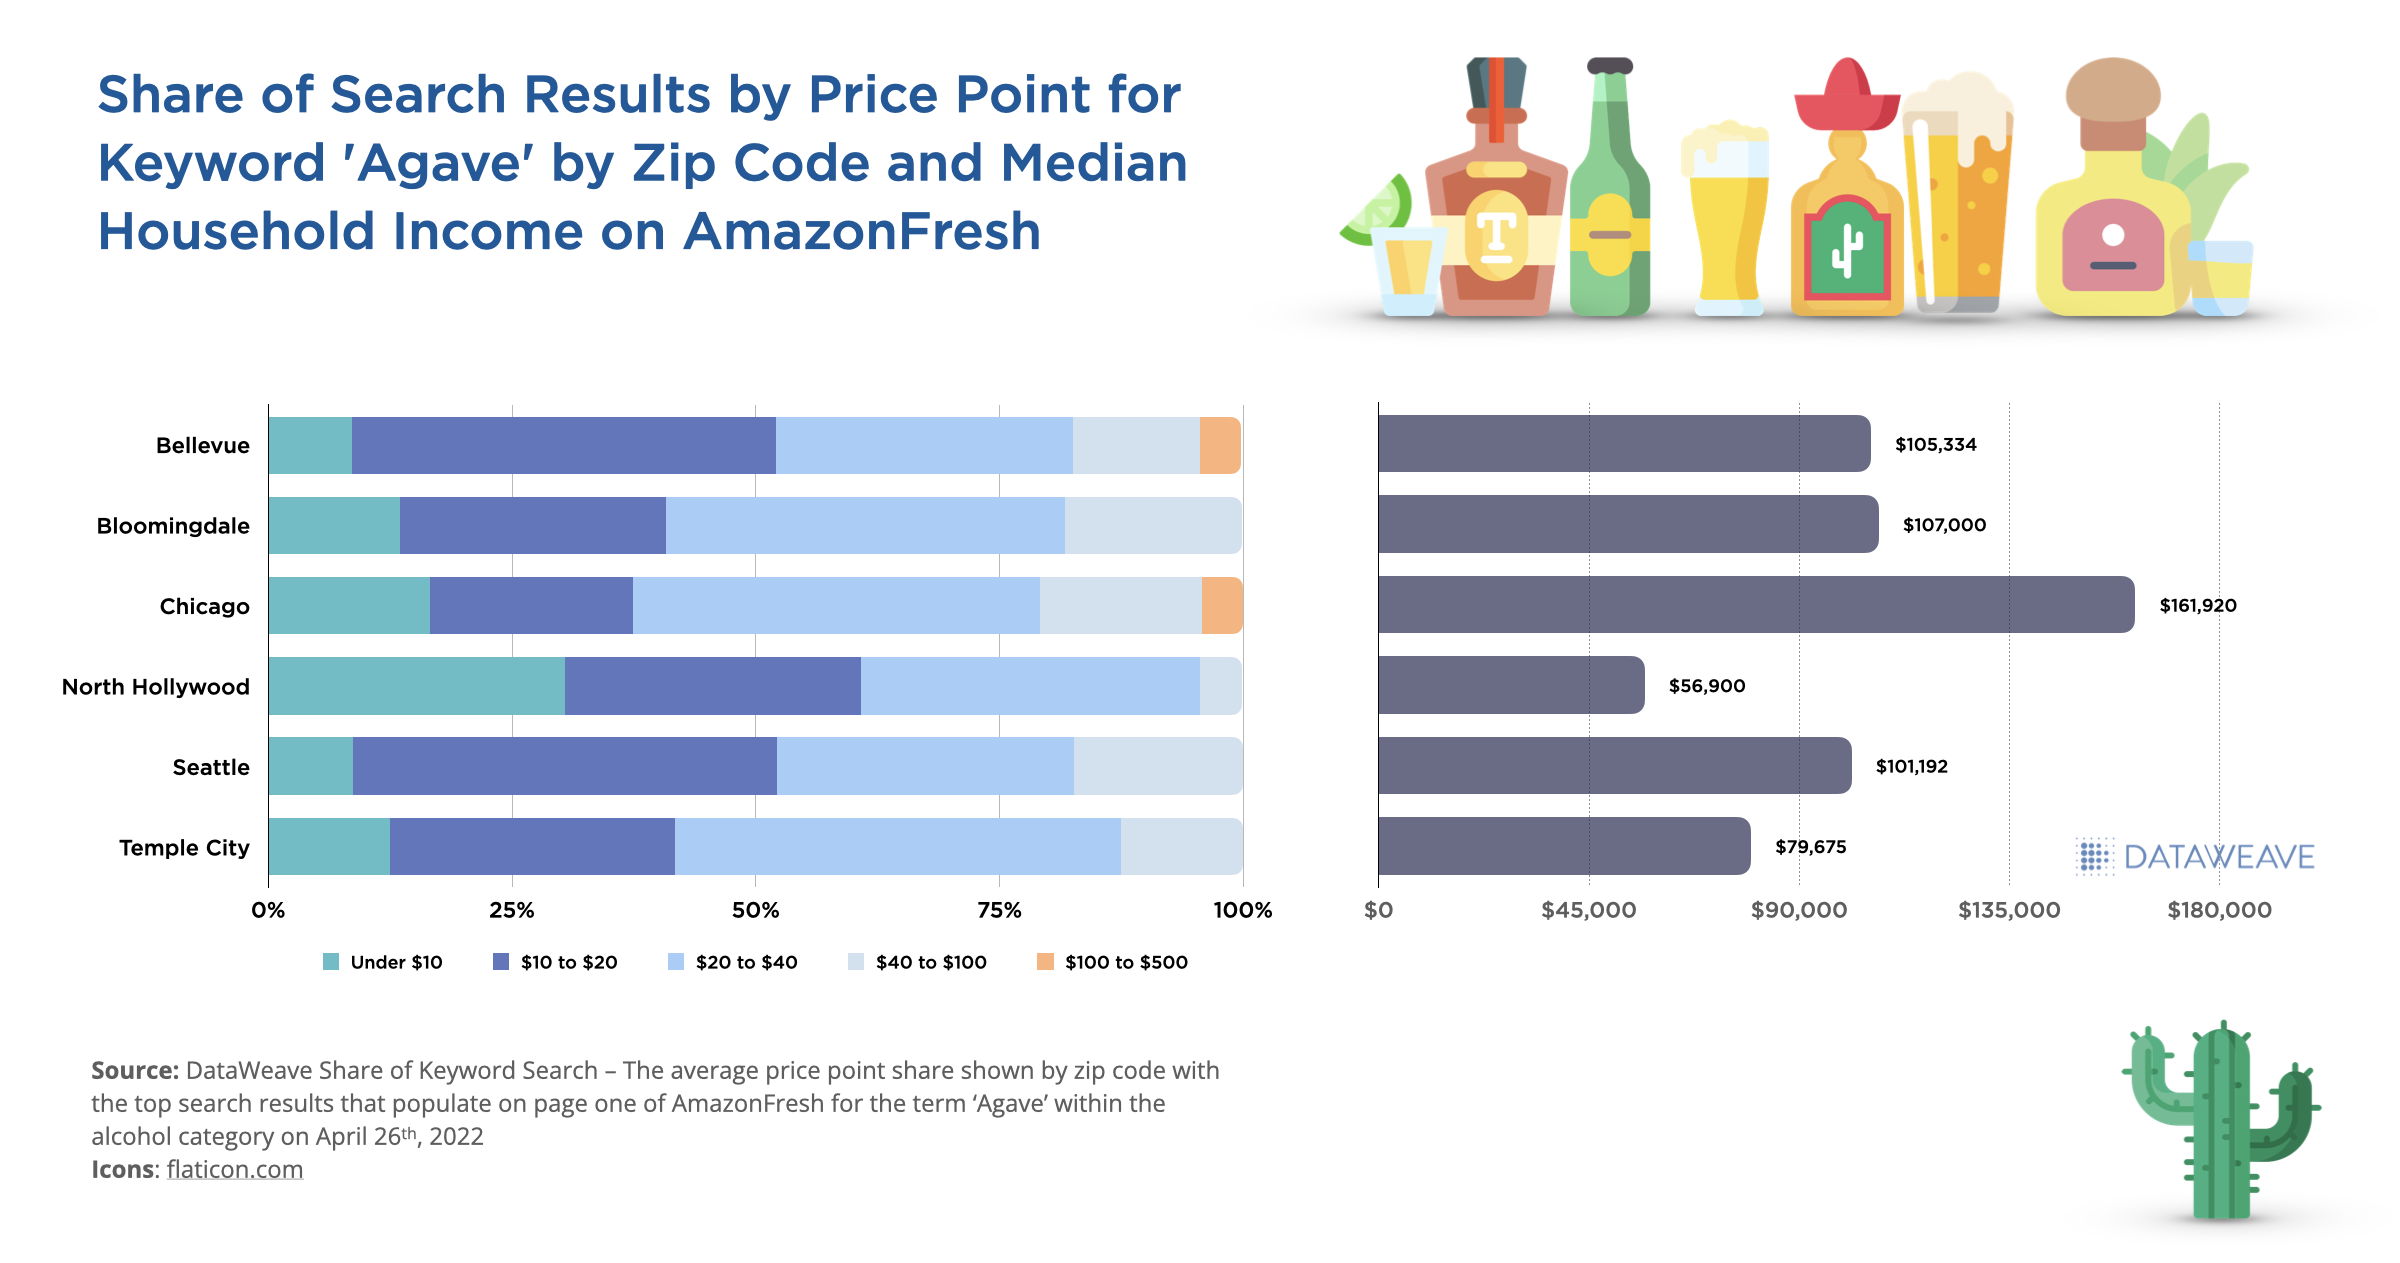
The keyword ‘Agave’ is also a popular search term within the alcohol category during the time leading up to Cinco de Mayo. We reviewed keyword search performance at various zip codes to see how price points that populated on page 1 search results varied given the change in median income. Below are the results:
Share of Search for Alcohol by Price Point and Zip Code on AmazonFresh
Share of Keyword Search Results – Grocery Categories
We also reviewed some of the most popular grocery items purchased during Cinco de Mayo by Keyword Share of Search results to see which brands are primed to win the Digital Shelf this year. Below are the results for Target.com and Walmart.com.
Walmart and Target Share of Search – Food and Beverage Keywords on Cinco de Mayo 2022
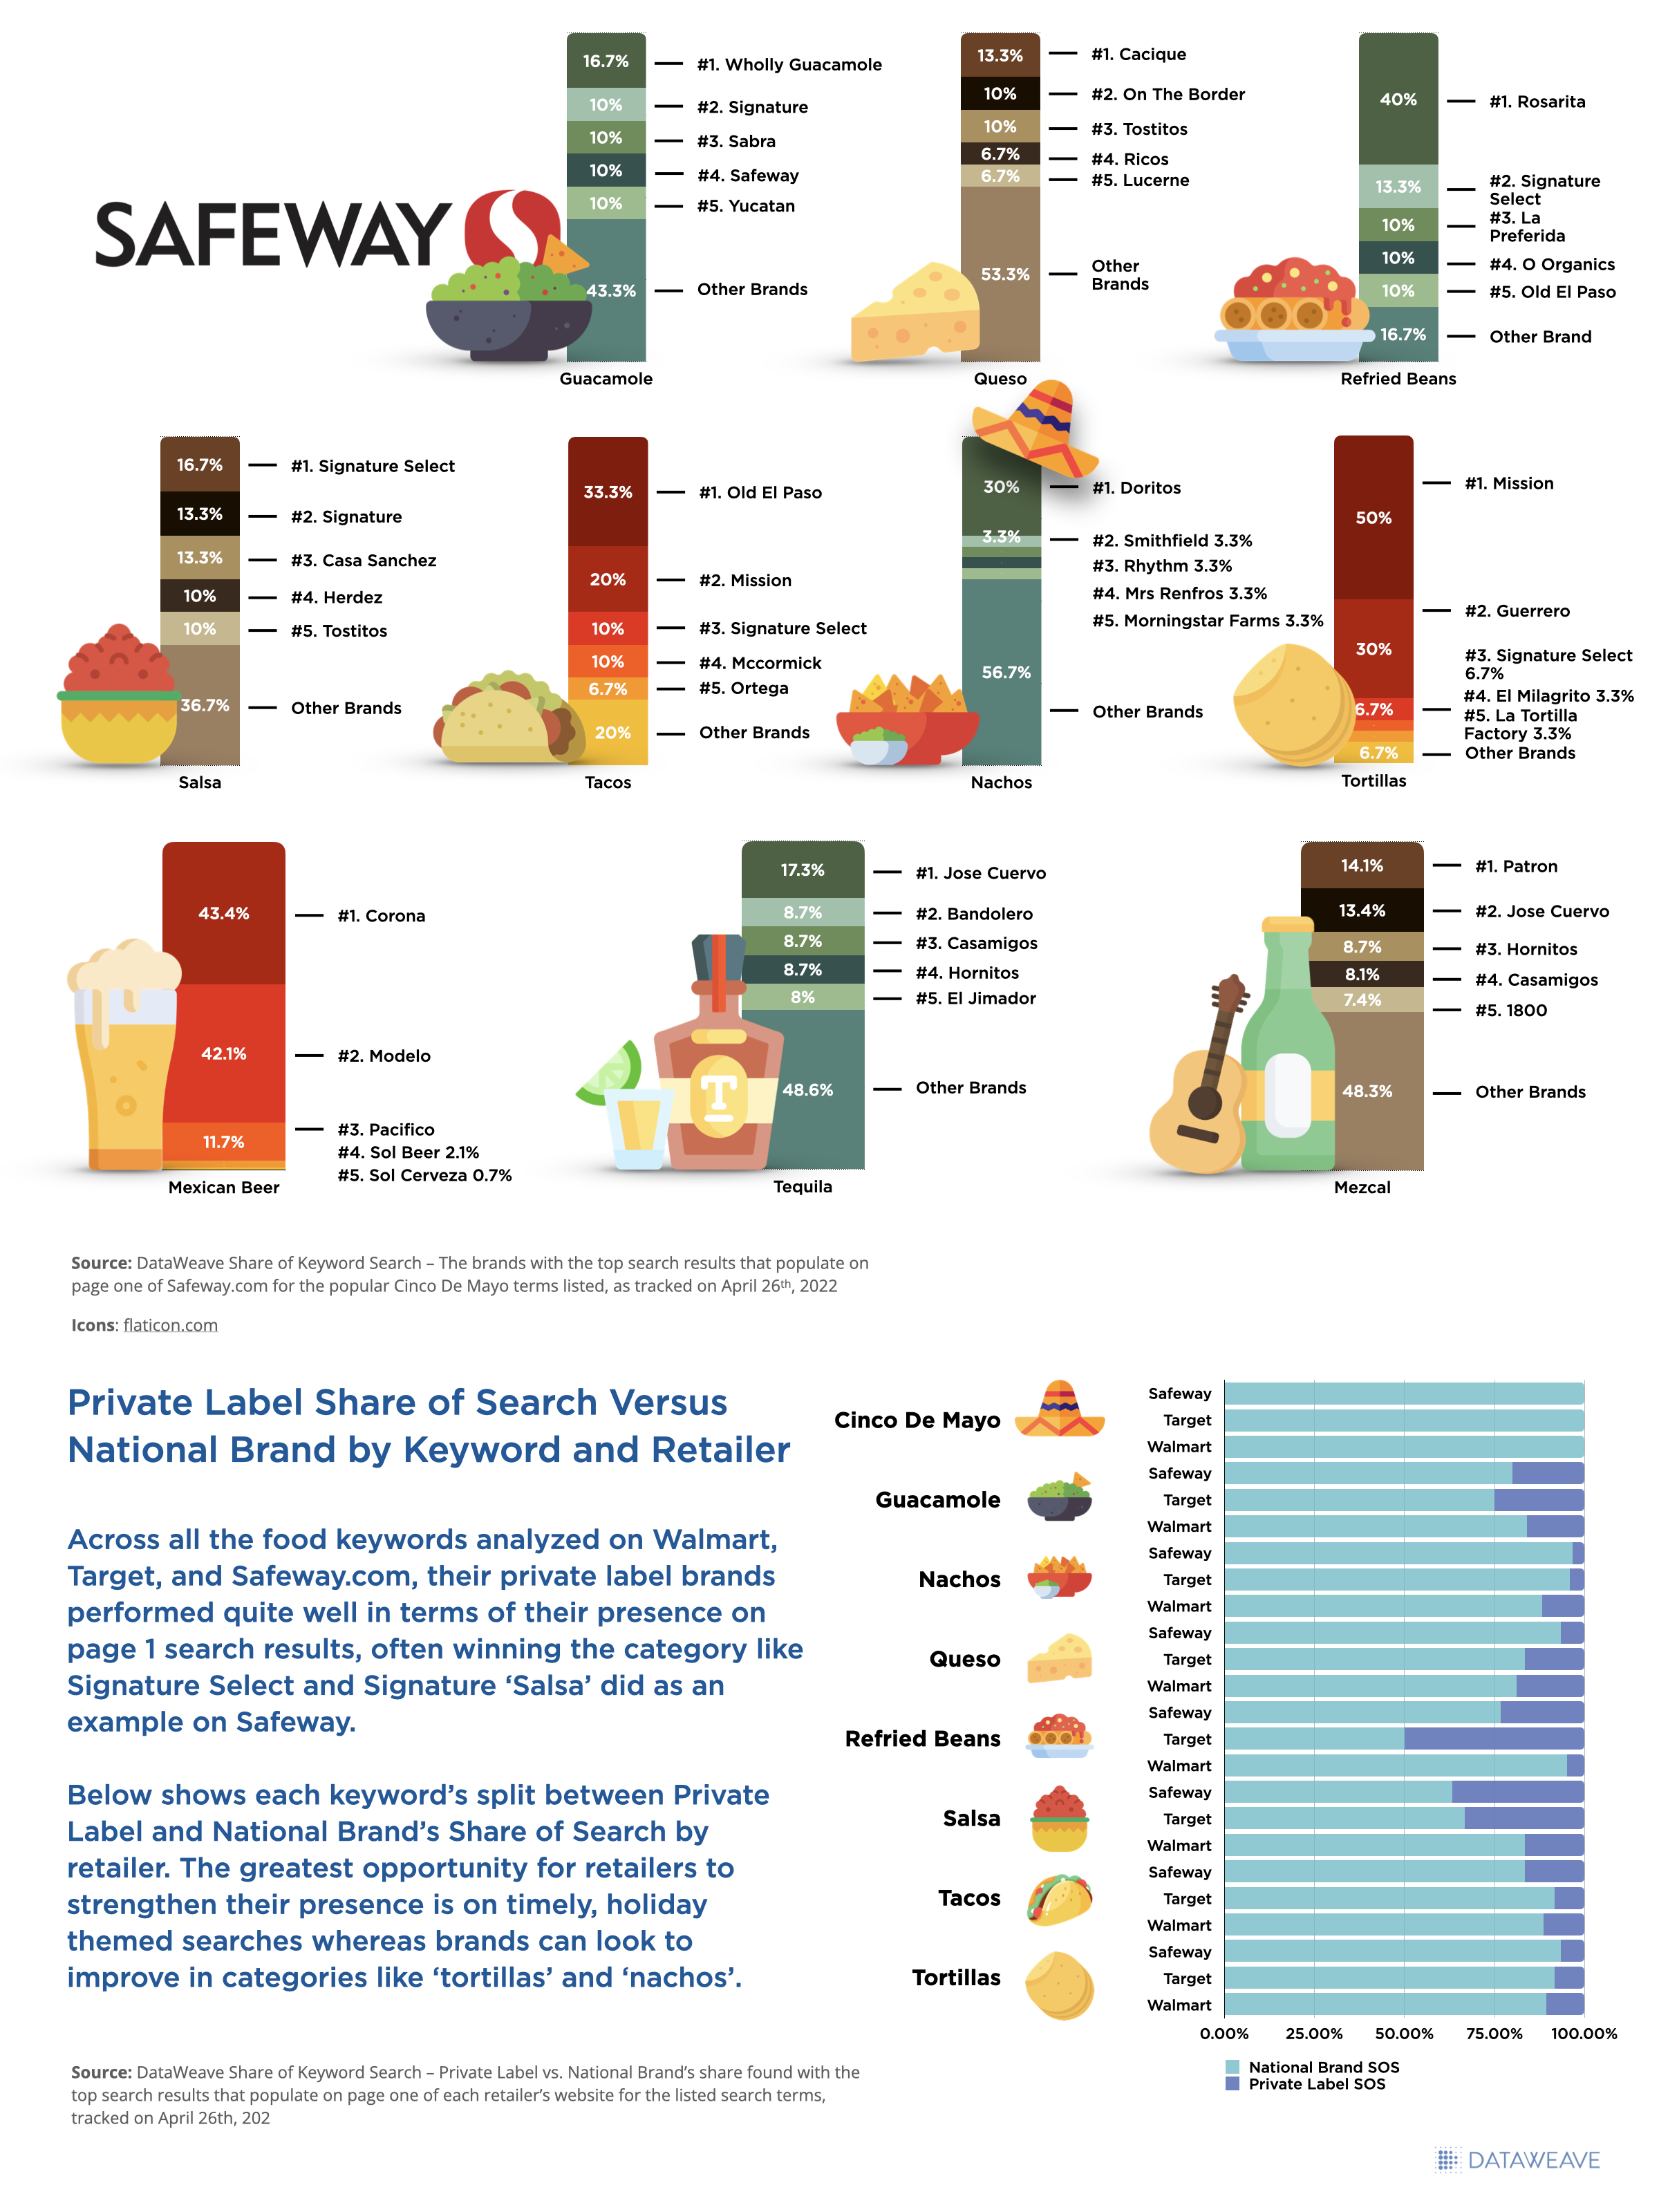
Below are the results for the same popular grocery items and alcohol keywords related to Cinco de Mayo and the page 1 results seen for Brand Share of Search on Safeway.com.
Safeway Share of Search – Food and Beverage Keywords on Cinco de Mayo 2022
Access to these types of real-time digital marketplace insights can enable retailers and brands to make strategic decisions and help drive profitable growth in an intensifying competitive environment. Be sure to reach out to our Retail Analytics experts for access to more details regarding the above analysis, and let us know what other holiday insights you’d be interested in seeing this year. Happy Cinco de Mayo!
Business has been anything but usual this holiday season, especially in the digital retail world. The holiday hustle and bustle historically seen in stores was once again occurring online, but not as anticipated given the current strength of consumer demand and the reemergence of COVID-19 limiting in-store traffic. While ‘Cyber Weekend’, Thanksgiving through Cyber Monday, continues to further its importance to retailers and brands, this year’s performance fell short of expectation due to product shortages and earlier promotions that pulled forward holiday demand.
Holiday promotions were seen beginning as early as October in order to compete with 2020 Prime Day sales, but discounting, pricing and availability took an opposite direction from usual. This shift influenced our team to get a jump start on our 2021 digital holiday analysis to assess how drastic the changes were versus 2020 activity, and to understand how much of this change has been influenced by inflationary pressures and product scarcity.
Scarcity Becomes a Reality
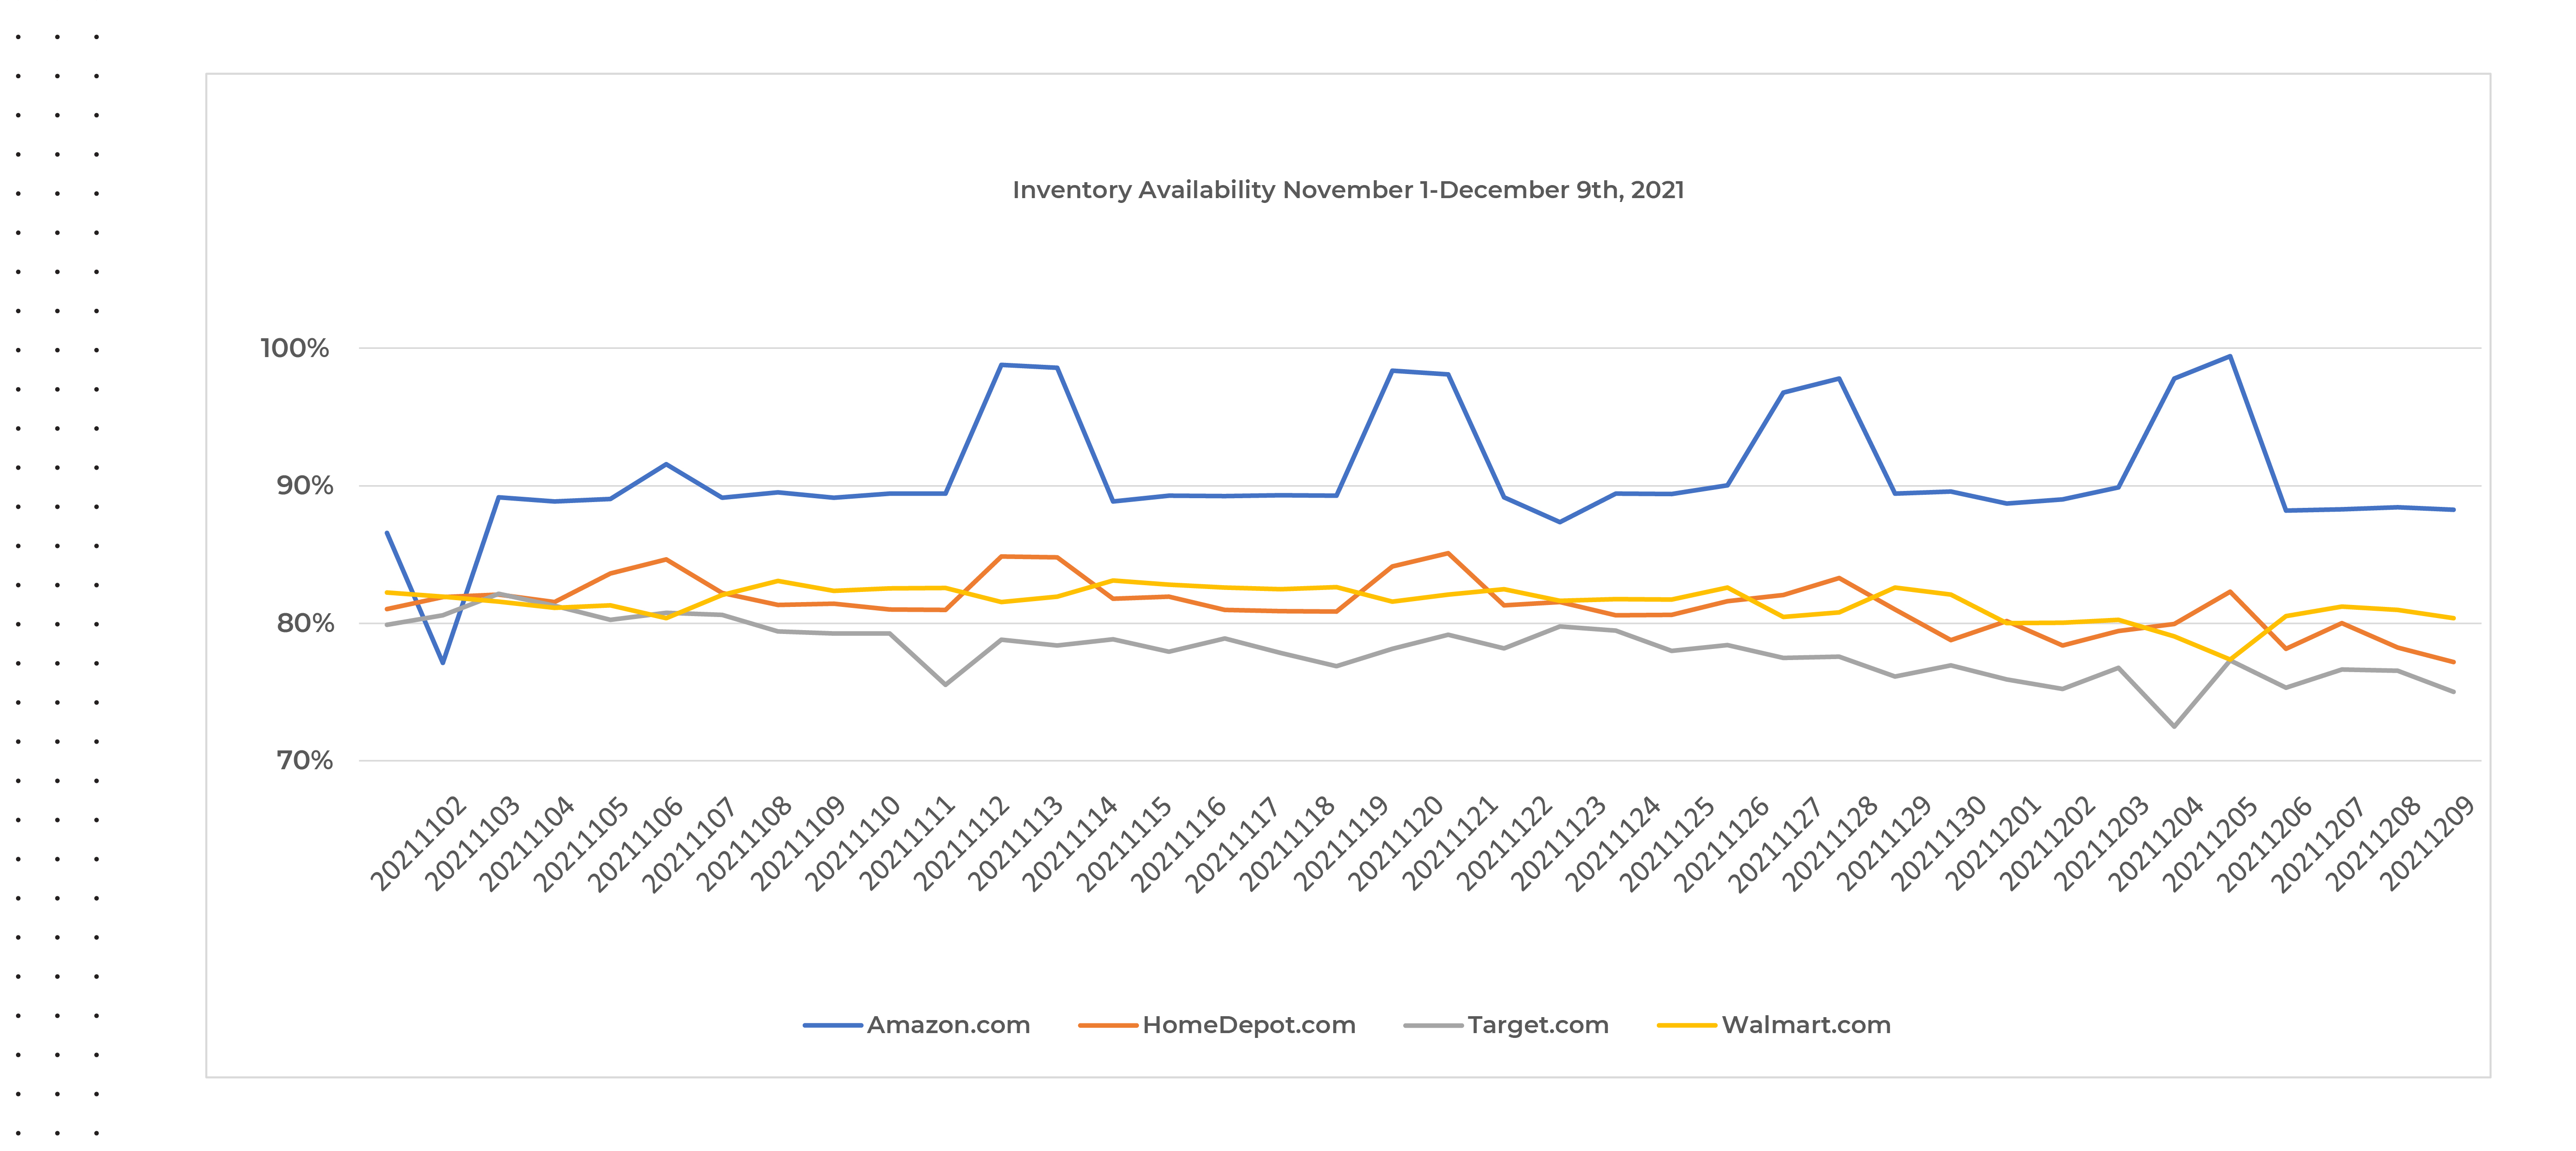
Our initial analysis started by reviewing year-over-year product availability and pricing changes from January through September 2021, leading up to the holiday season, as detailed in our 2021 Cyber Weekend Preliminary Insights blog. We reviewed popular holiday categories like apparel, electronics, and toys, to have a broad sense of notable trends seen consistently throughout various, applicable marketplaces. What we found was a consistent decline in product availability over the last six months compared to last year, alongside an increase in prices.
Although retailers significantly improved stock availability in November and early December 2021, even digital commerce giants like Amazon and Target were challenged to maintain consistent product availability on their website as seen below. While small in magnitude, there is also a declining trend occurring again closer toward the end of our analysis period, post Cyber Weekend, across all websites included in our analysis.
Source: Commerce Intelligence – Product Availability insights for Home & Garden, Jewelry & Watches, Clothing & Shoes, Bed N Bath, Lighting & Ceiling Fans categories
Greater Discounts, Higher Prices?
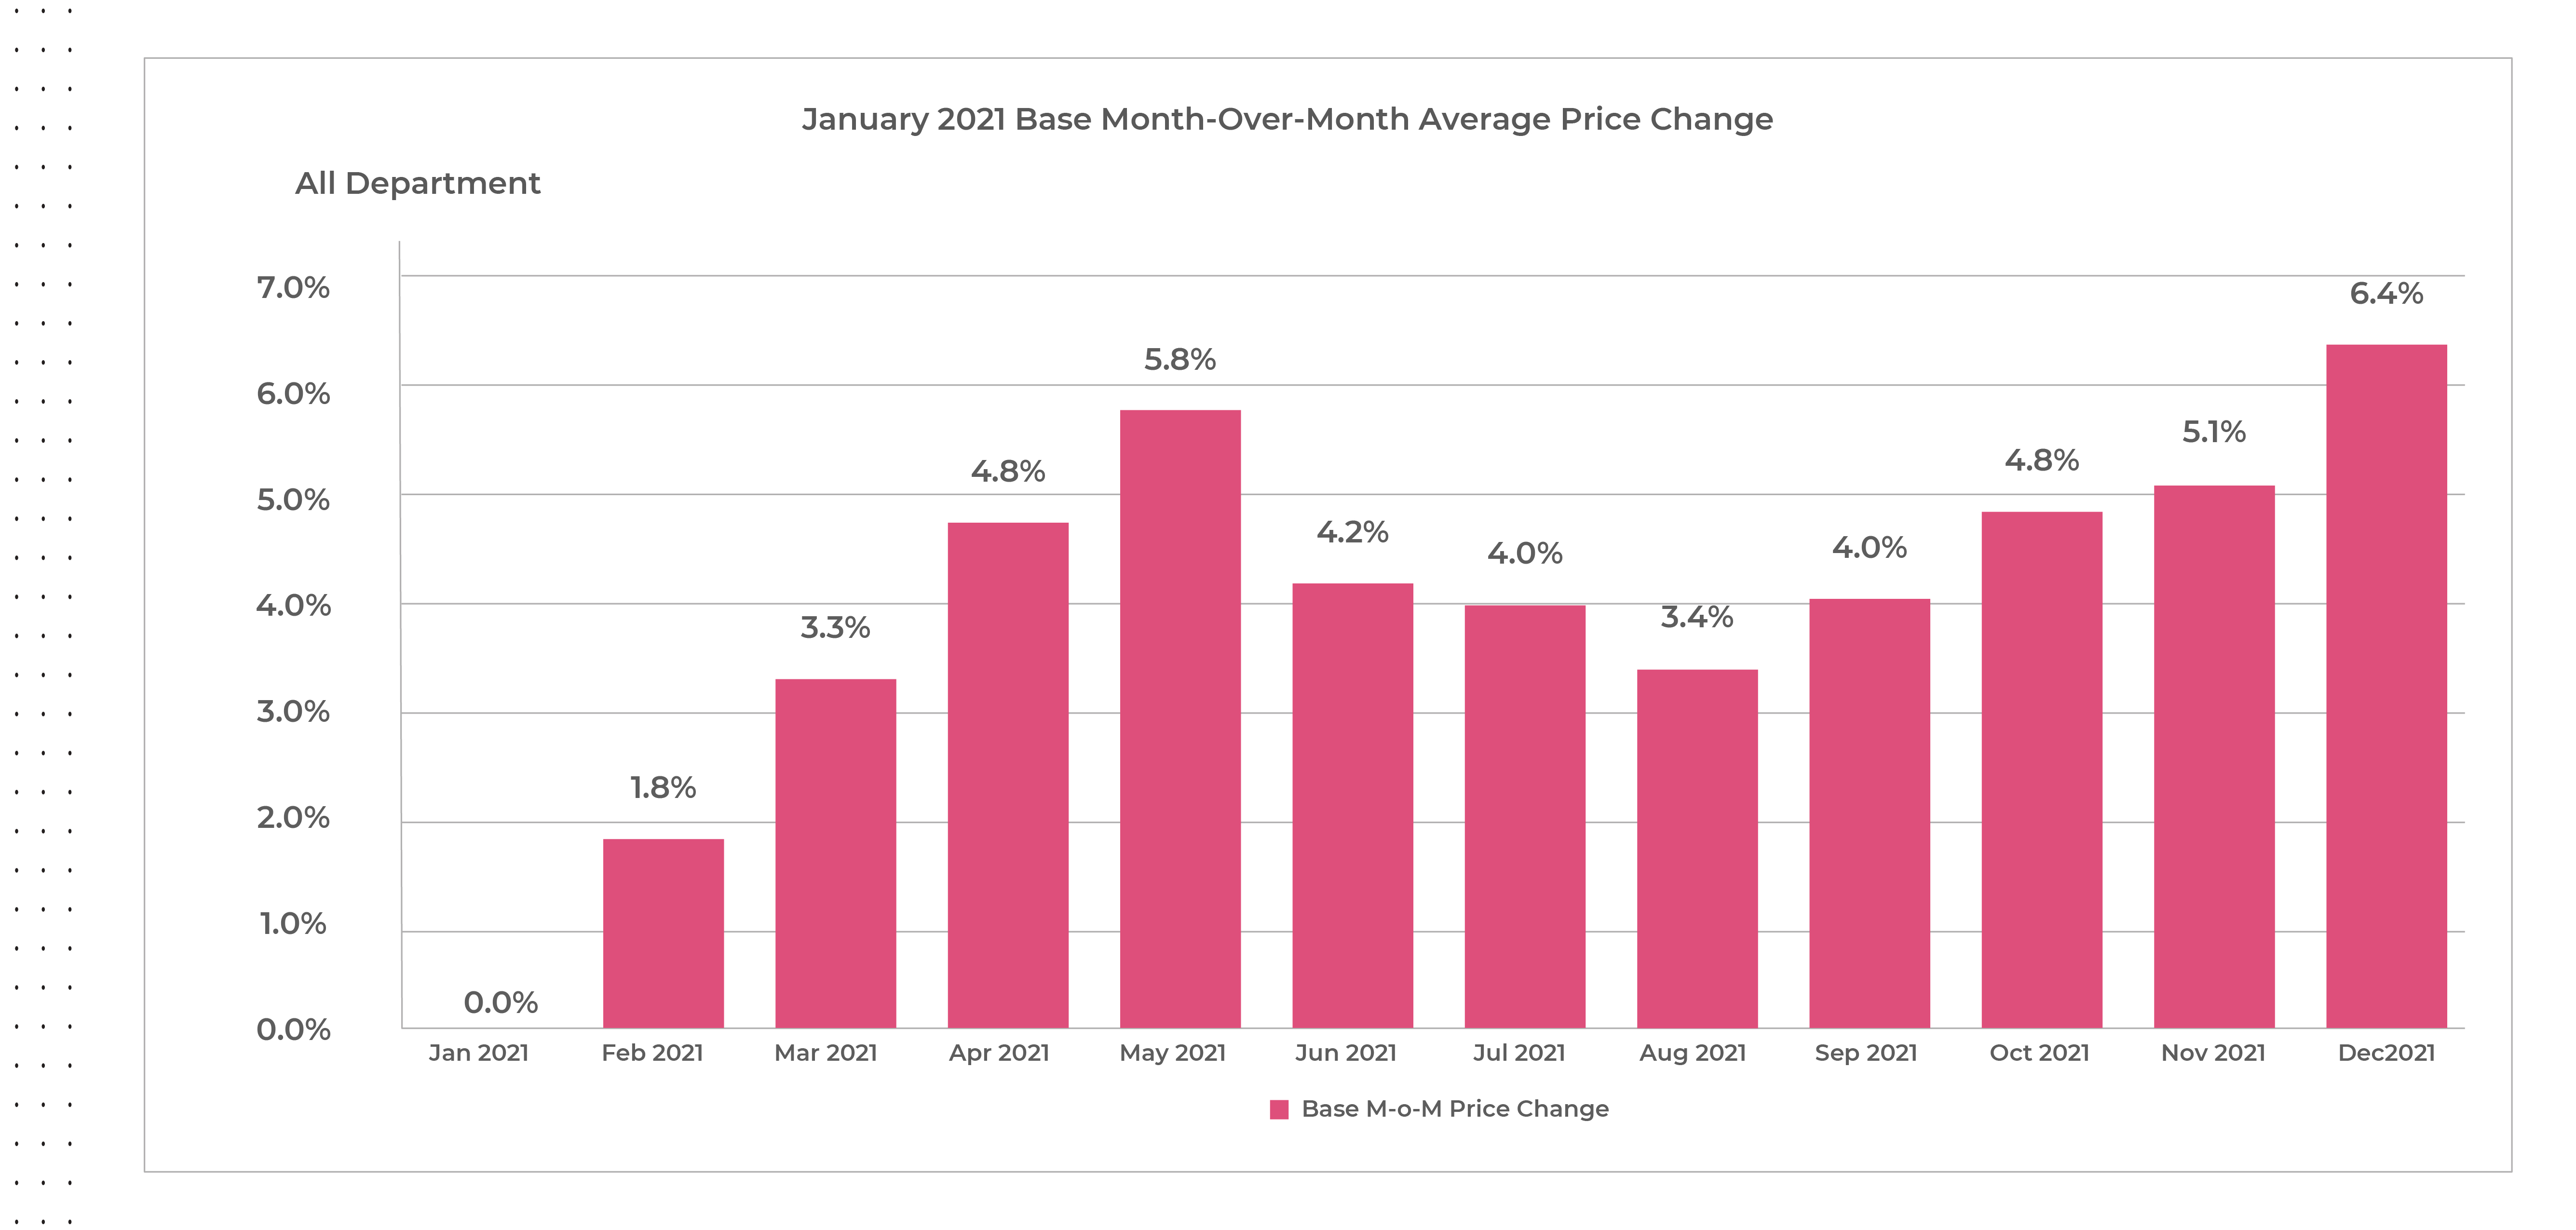
With inflation at a thirty-nine year high, retailers and manufacturers have realized they can command higher prices without impacting demand as consumers have shown their willingness to pay the price, especially when threatened by product scarcity. Our assessment is that while some products and categories have responded drastically, manufacturers’ suggested retail prices (MSRPs) have increased nearly seven percent on average from January to December 2021. MSRP adjustments are not taken lightly either, as this is an indication increased prices will be part of a longer-term shift in product strategy.
Source: Commerce Intelligence – Pricing Insights for Bed & Bath, Electronics, Furniture, Healthy & Beauty, and Fashion categories on Amazon.com & Target.com each month in 2021 comparing price increases from January 2021 base
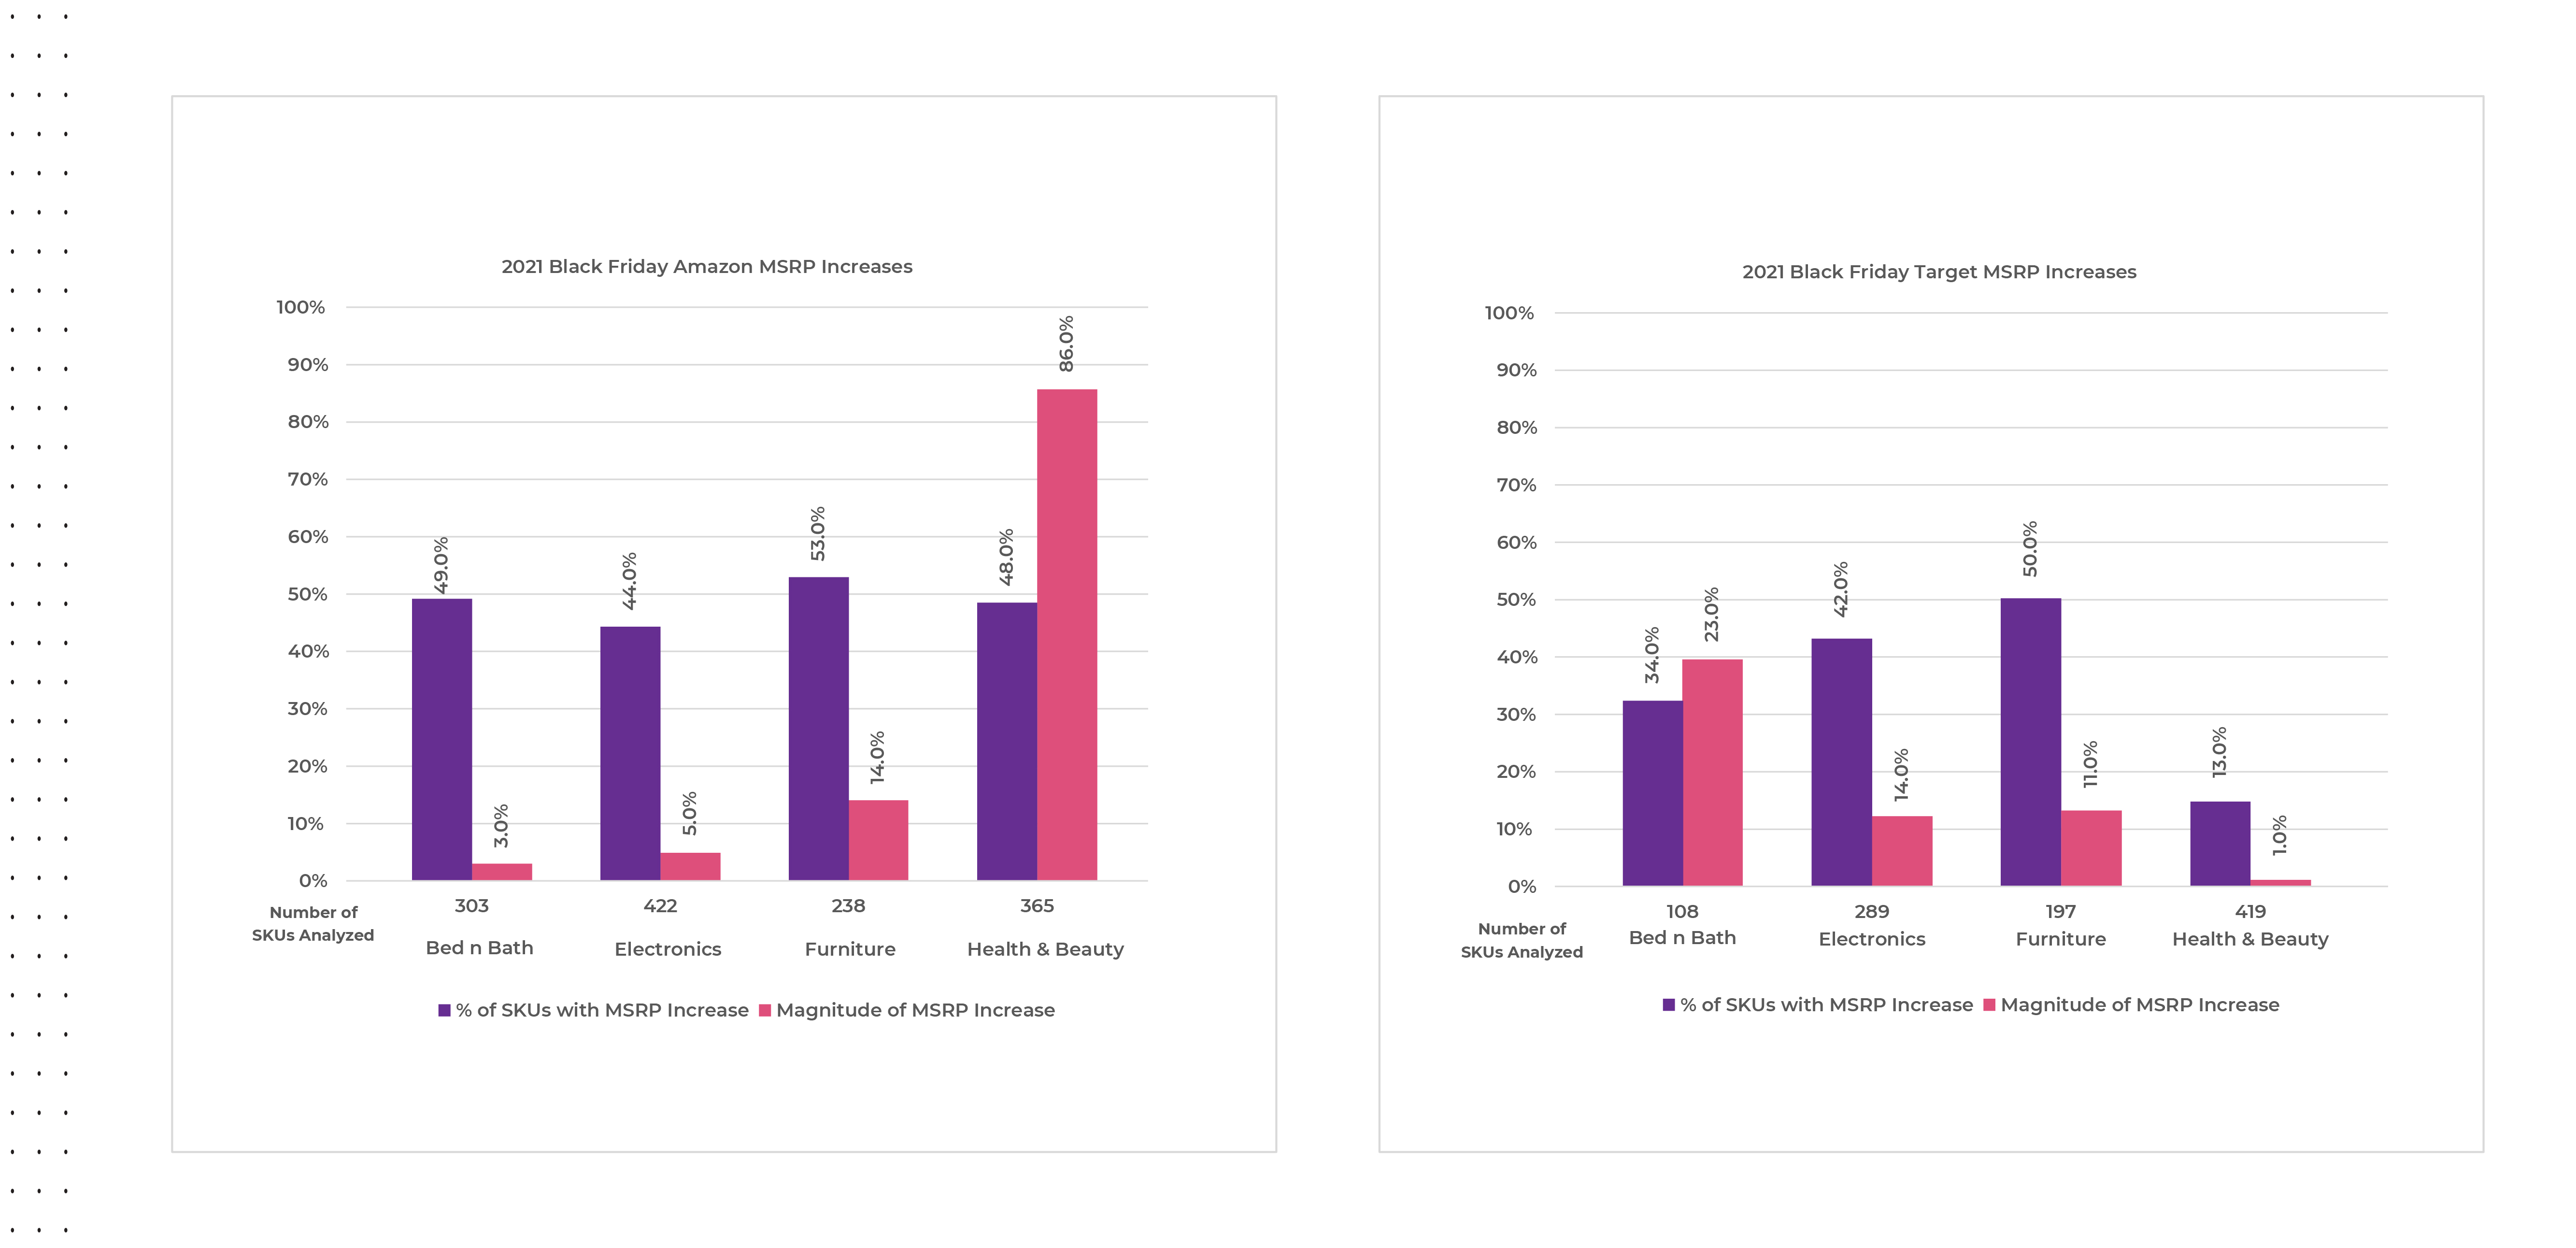
Our 2021 pre-Cyber Weekend analysis reviewed MSRP changes for select categories (Bed & Bath, Electronics, Furniture, Healthy & Beauty, and Fashion) on Amazon and Target.com, and found around forty-eight percent of products on Amazon and thirty-five percent of products on Target.com have increased their MSRPs year-over-year, but kept pre-holiday discount percentages the same.
Looking more specifically as to what year-over-year changes occurred on Black Friday in 2021, we observed MSRPs increasing across the board for all categories at various magnitudes. This indicates why 2021 discounts appeared to be greater than or equivalent to 2020 for many categories, when in reality consumers paid a higher price than they would have in 2020 for the same items.
Source: Commerce Intelligence – MSRP Pricing Insights for Bed & Bath, Electronics, Furniture, Healthy & Beauty, and Fashion categories on Black Friday November 27th, 2021, versus average MSRP pricing for the same SKU count from November 20-26th 2021
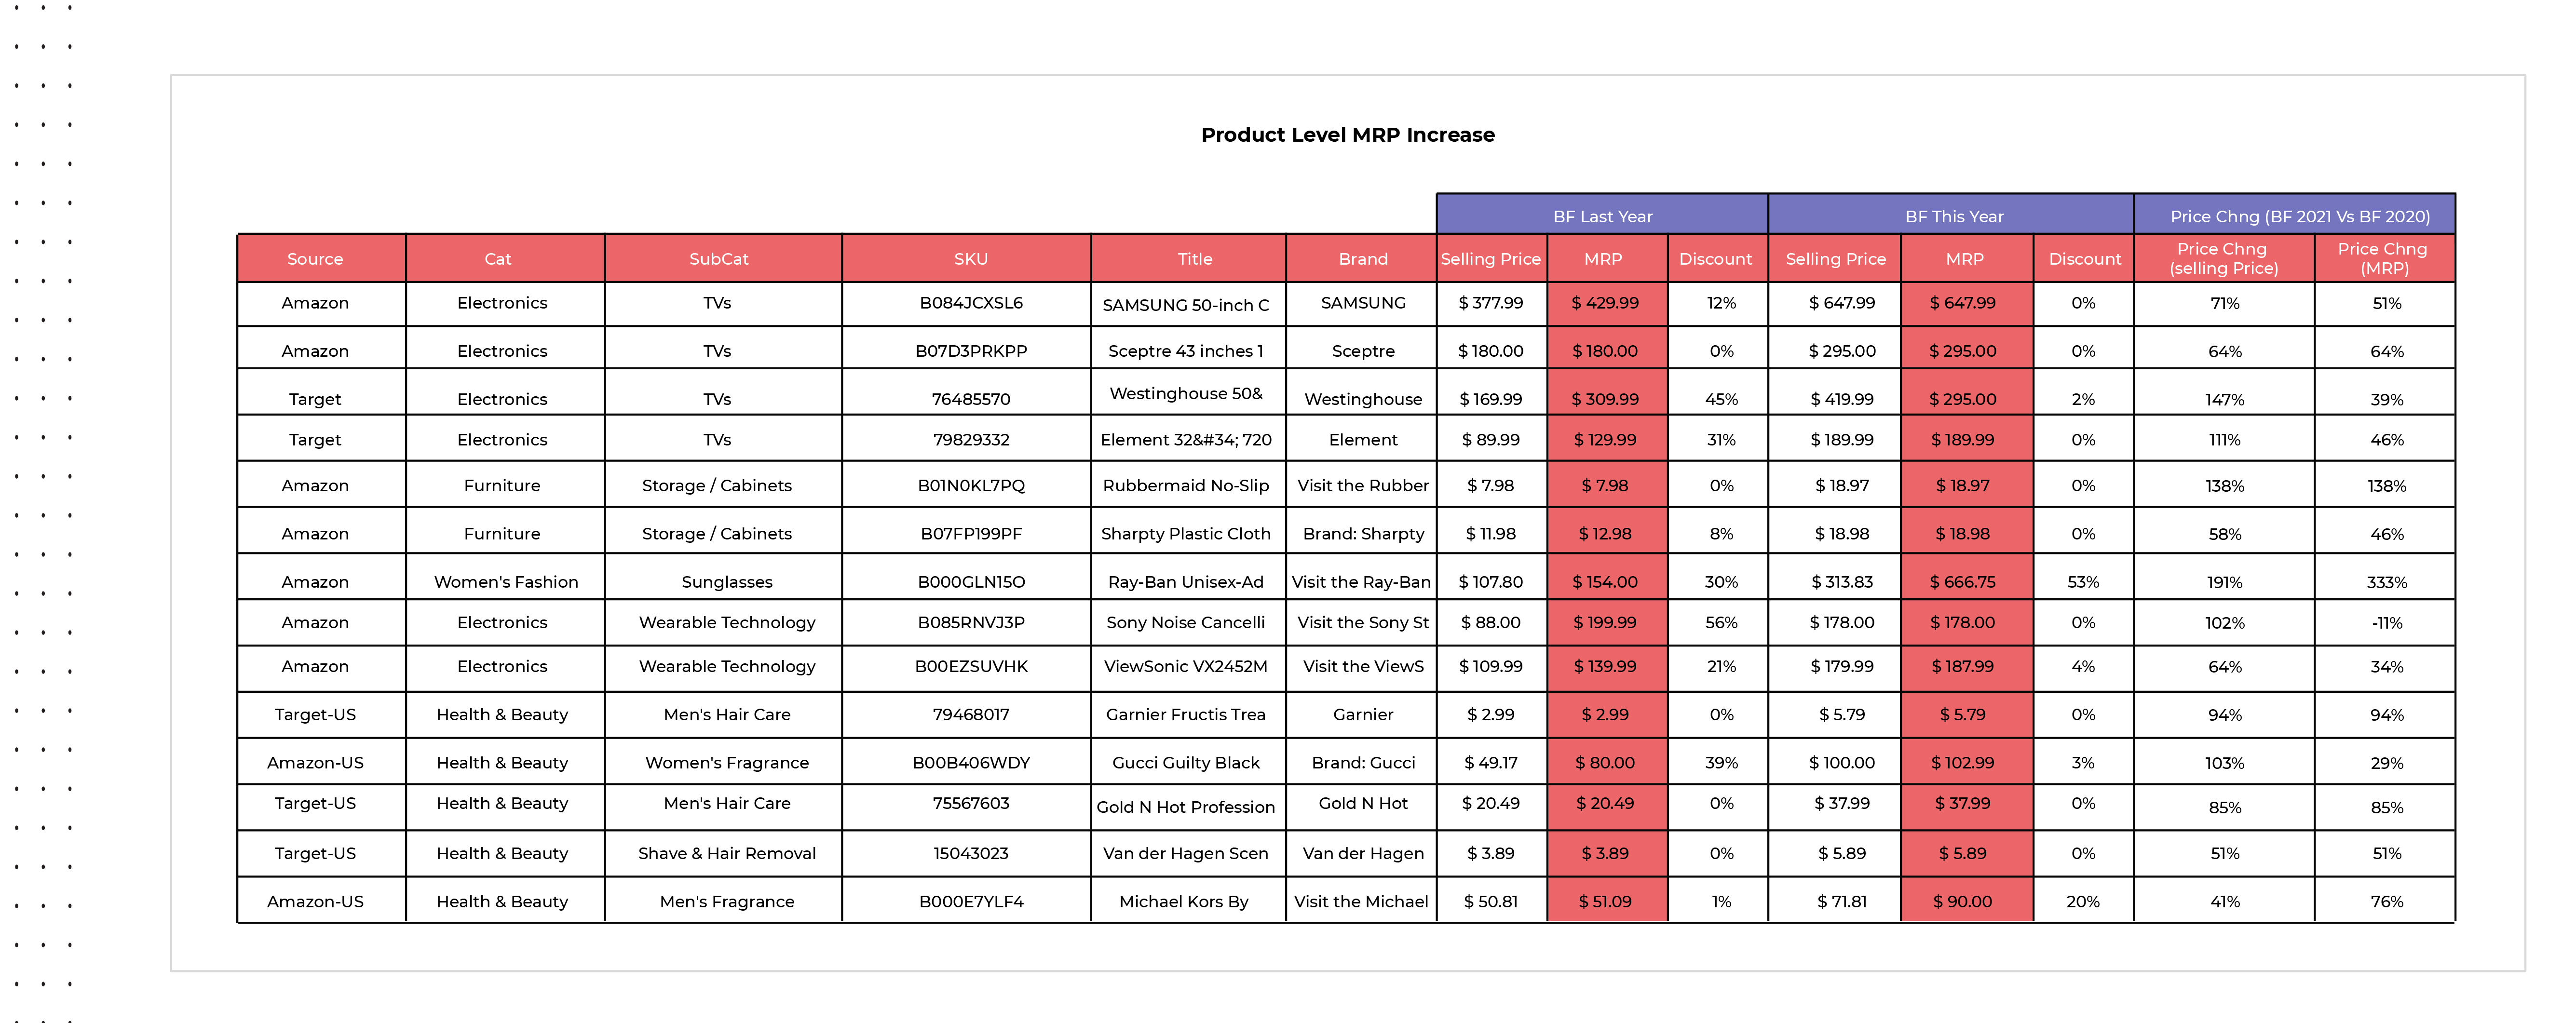
On Amazon.com, categories like health & beauty have already increase MSRPs by a much greater percentage and magnitude versus Target.com leading up to and during Black Friday 2021, while other categories like furniture have increased MSRPs evenly on average across both retail websites. The below chart cites a few specific examples of year-over-year SKU-level MSRP, promotional price, and discount changes within found within the electronics, furniture, fashion, and health & beauty categories.
Source: Commerce Intelligence – MSRP Pricing Insights for Bed & Bath, Electronics, Furniture, Healthy & Beauty, and Fashion categories on Black Friday November 27th, 2021, versus average MSRP pricing for the same SKUs on Black Friday November 26th, 2020.
Fewer, but Deeper Discounts
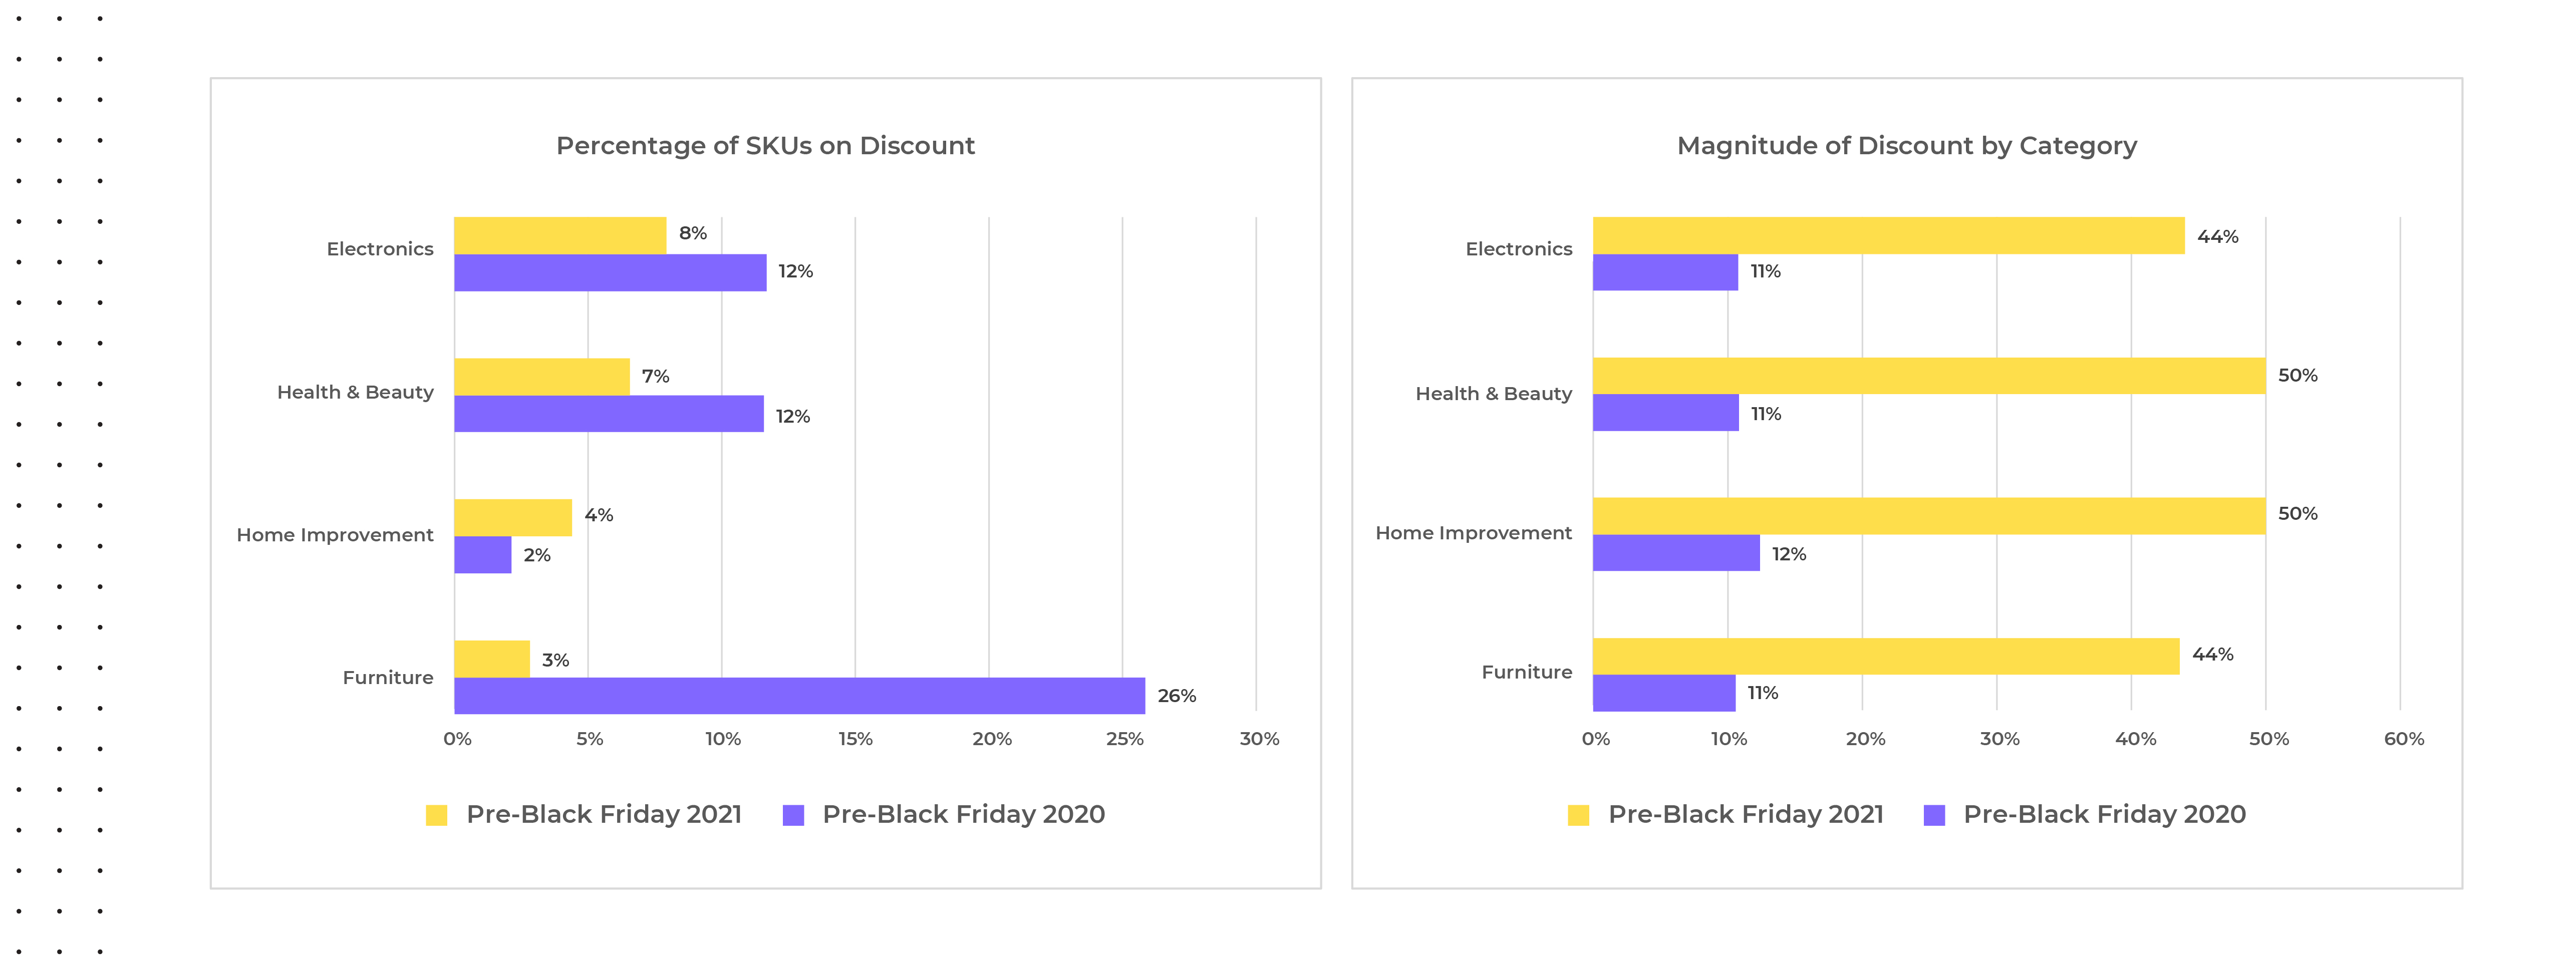
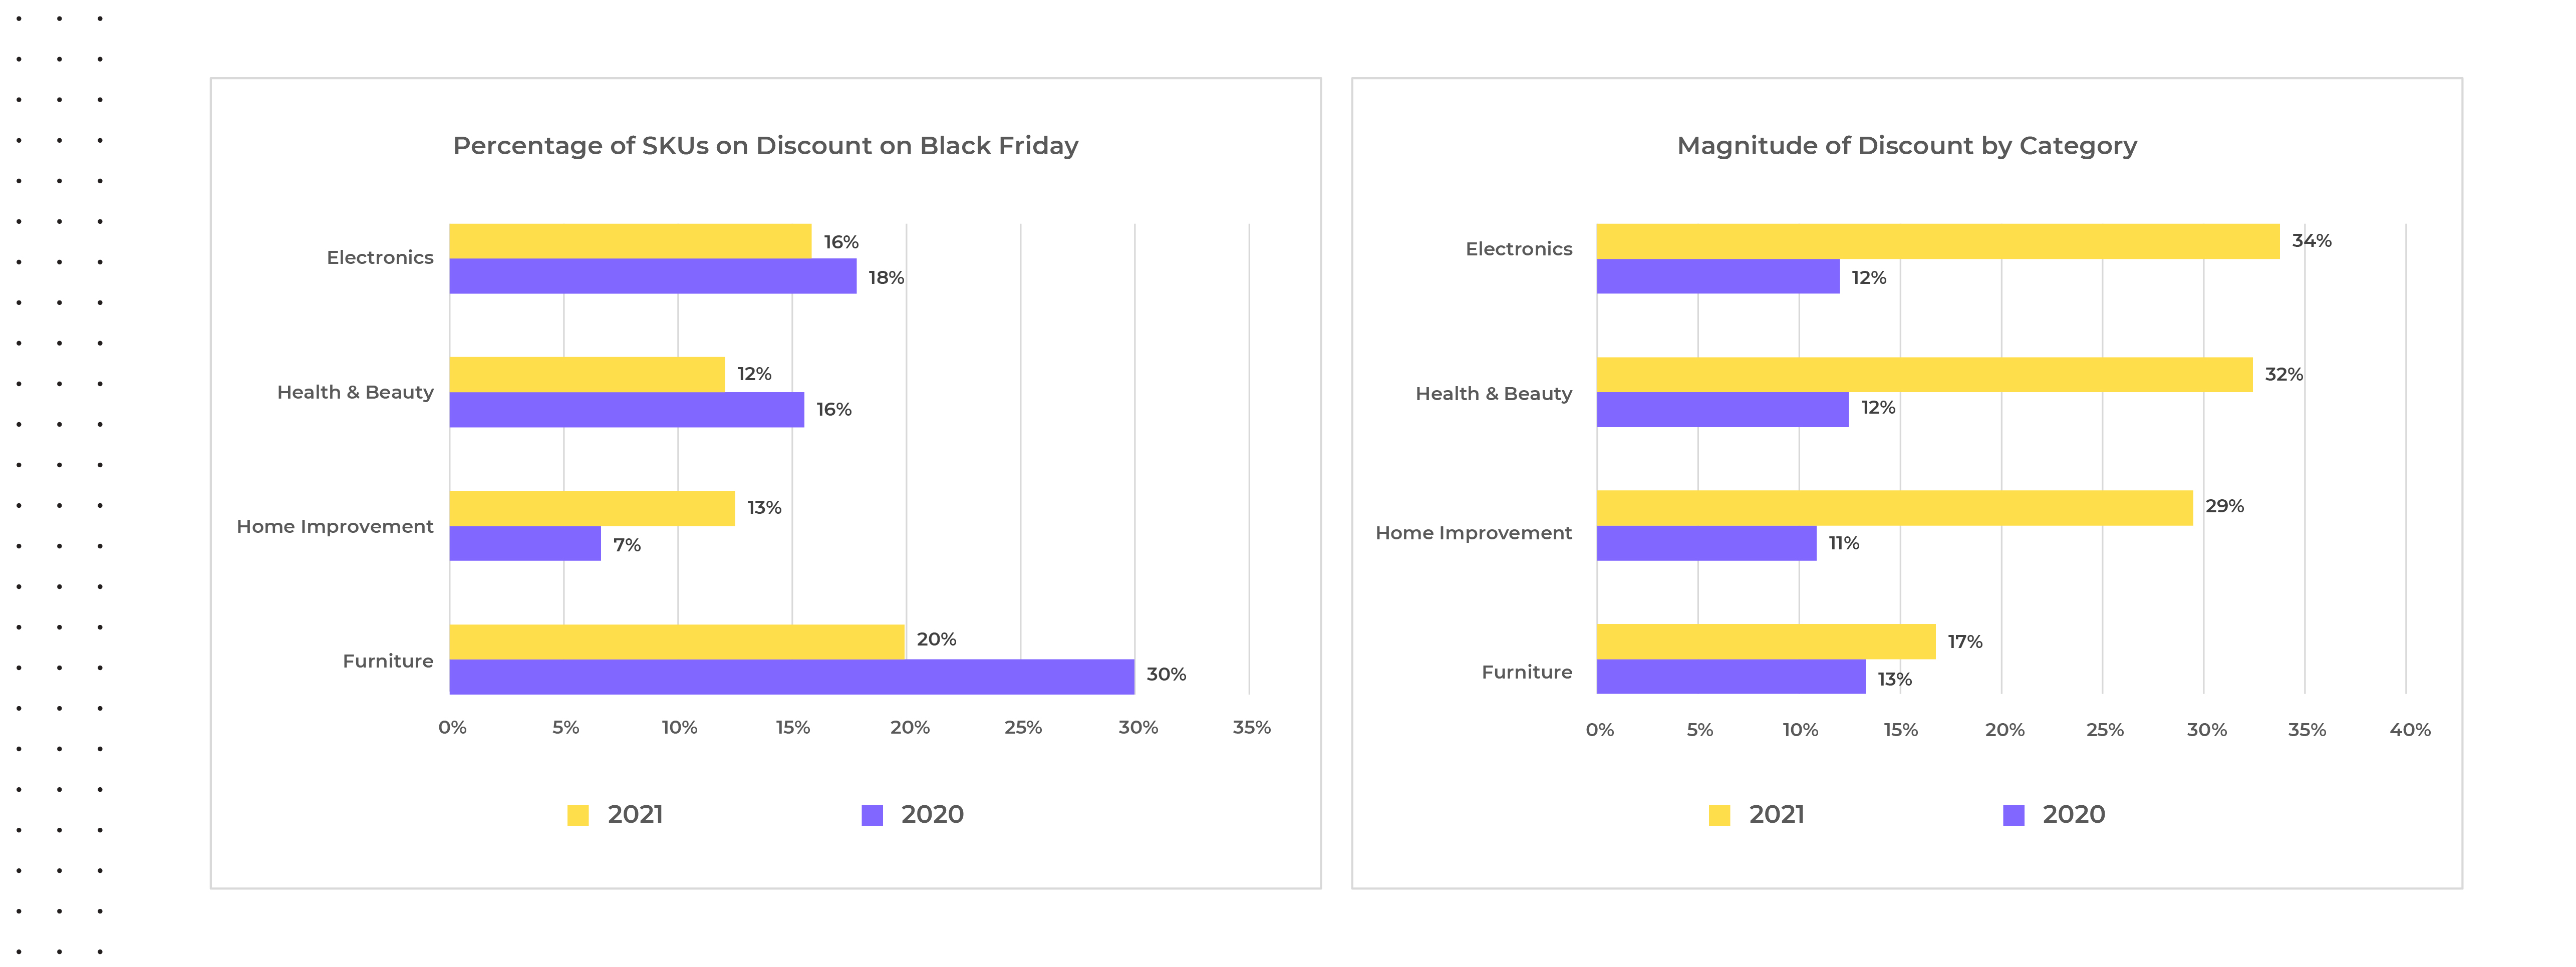
From October through early November 2021, fewer products were discounted compared to this same period in 2020, and the few that were saw much deeper discounts apart from the home improvement category. The most extreme example we saw in discounts offered was within furniture where only three percent of SKUs were on discount in 2021 compared to twenty-six percent in 2020. Interestingly, the magnitude of discount was also higher pre-Cyber Weekend 2021 versus 2020, but this trend was not exclusive to furniture and was also seen within electronics, health & beauty, and home improvement.
Source: Commerce Intelligence – Pricing Insights for Bed & Bath, Electronics, Furniture, Healthy & Beauty, and Fashion categories on Amazon.com & Target.com Pre-Black Friday average selling price during November 20-26th 2021 versus average selling price from November 13-19th 2021 compared to Pre-Black Friday average selling price during November 19-25th 2020 versus average selling price from November 12-18th, 2020.
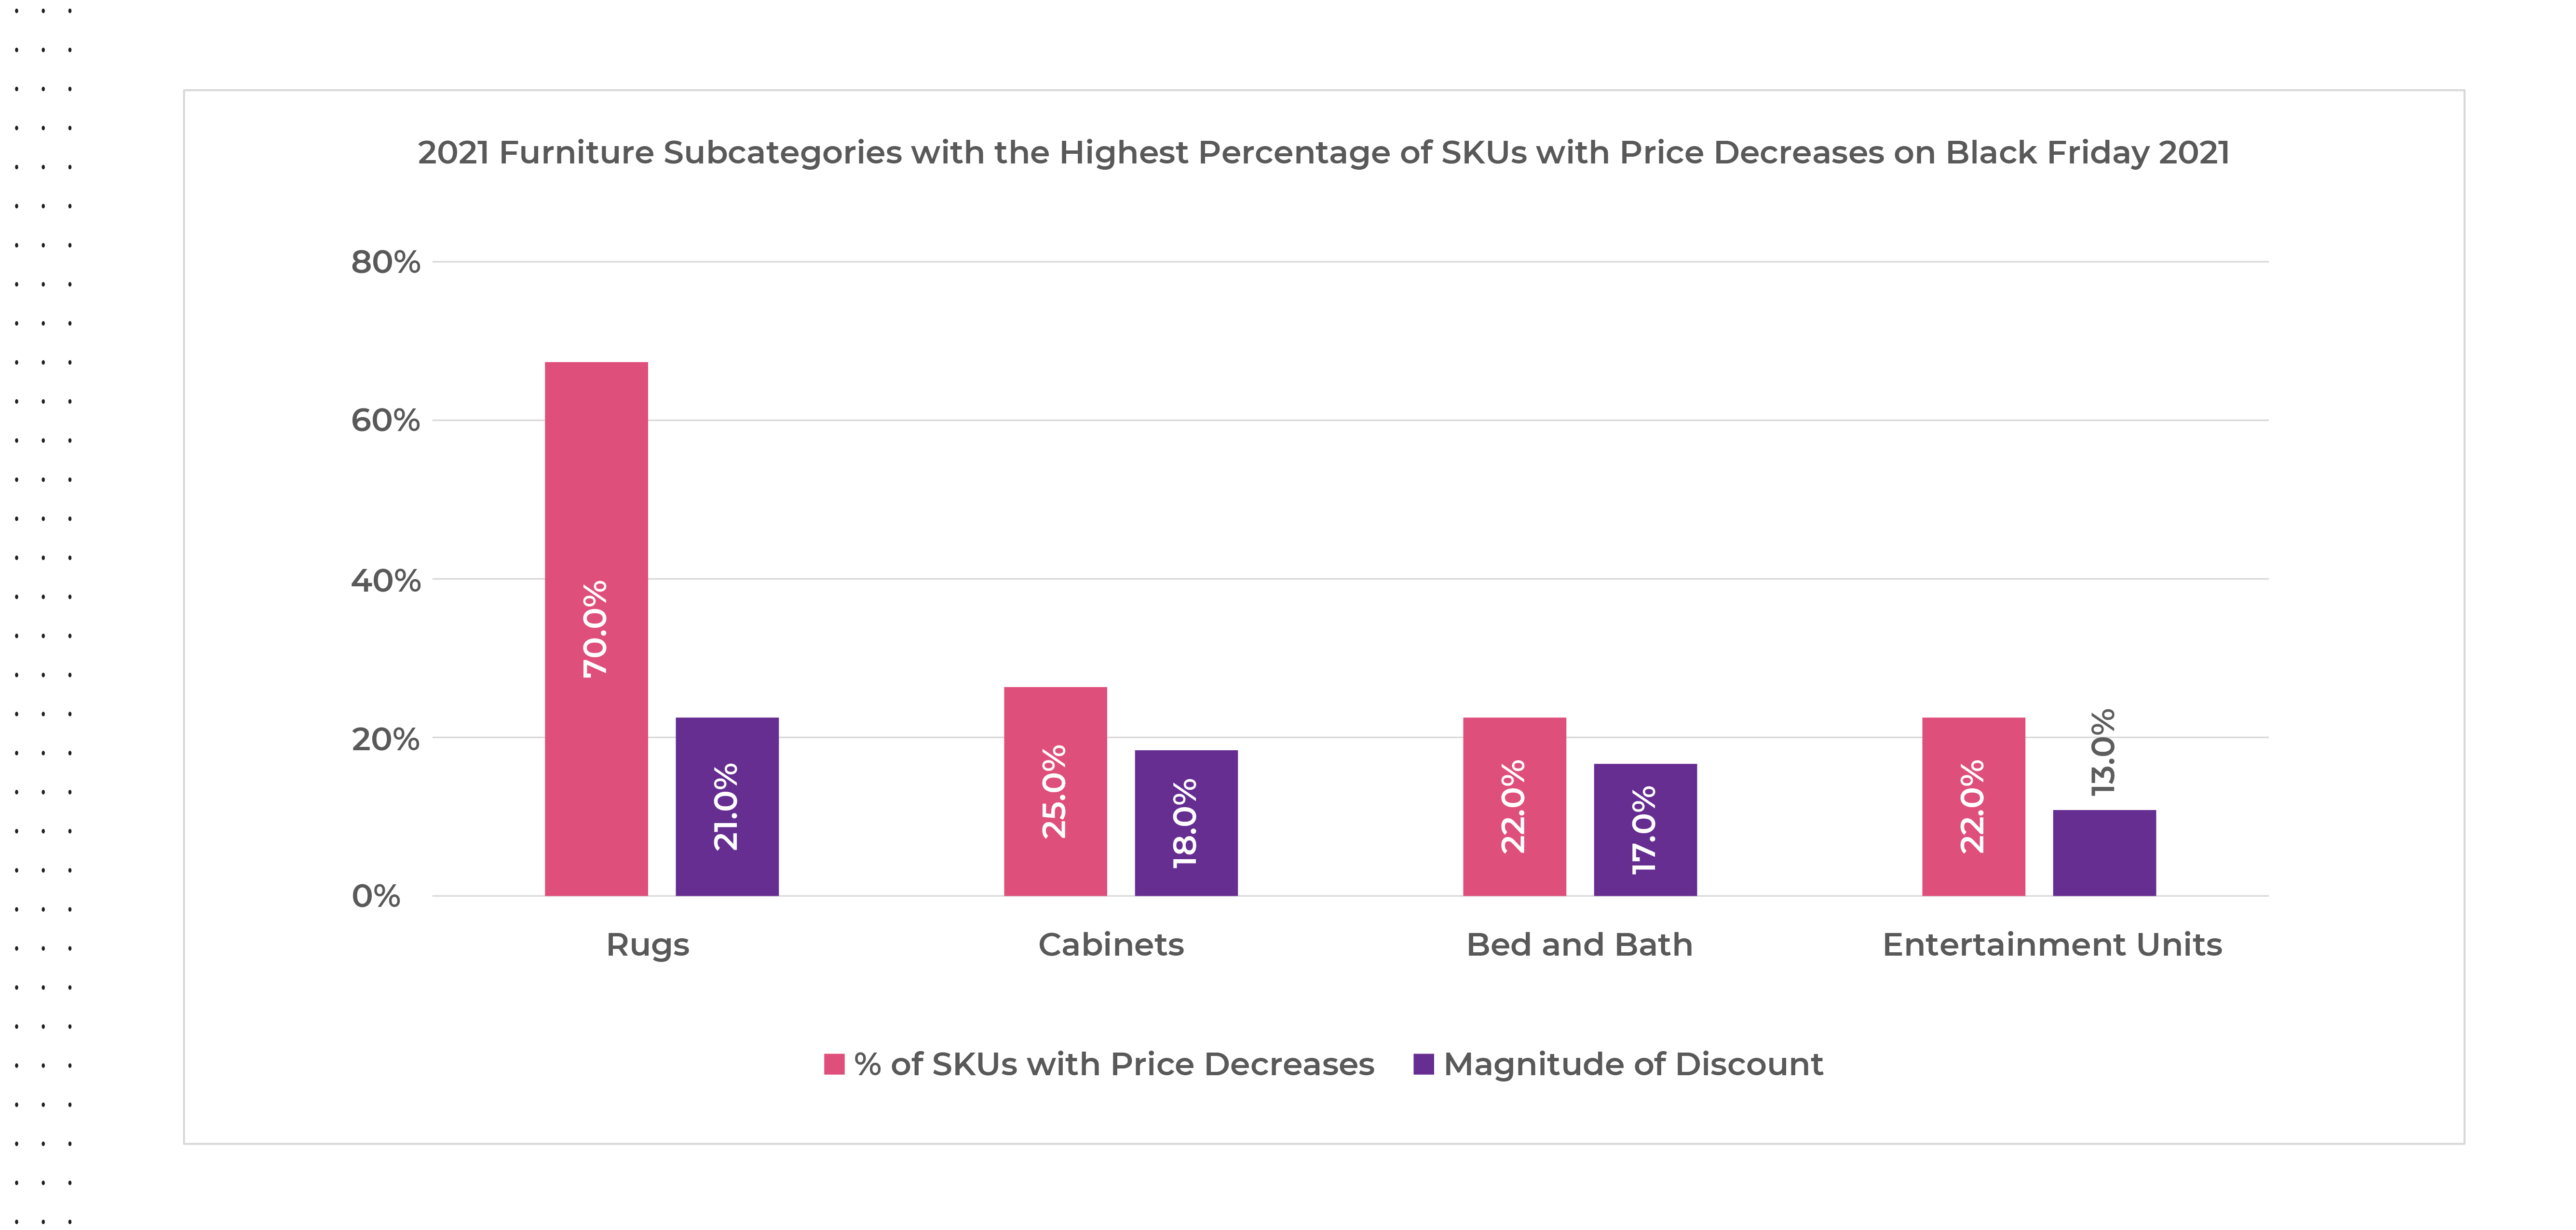
Within the furniture category, the subcategories offering the greatest number of SKUs with price decreases on Black Friday 2021 were rugs by a wide margin, followed by cabinets, bed and bath, and entertainment units, but the magnitude of discounts offered were all under twenty percent.
Source: Commerce Intelligence – Pricing Insights for Bed & Bath, Electronics, Furniture, Healthy & Beauty, and Fashion categories on Amazon.com and Target.com on Black Friday November 27th, 2021, versus average pricing for the same SKUs from Pre-Black Friday November 20-26th 2021 and Black Friday November 26th, 2020, versus average pricing for the same SKUs from Pre-Black Friday November 19th-25th 2020
Accounting for this phenomenon could have been retailers’ attempts to clear inventory for SKUs which hadn’t sold even during the period of severe supply chain shortages. With more products selling at higher prices this year, retailers were also able to use fewer SKUs with greater discounts to attract buyer in hopes of filling their digital baskets with more full-priced goods, helping to protect margins heading in to Cyber Weekend. Scarcity threats also encouraged consumers to buy early, even when not on promotion, to ensure they would have gifts in time for the holidays.
The same trends seen pre-Cyber Weekend 2021 were also seen on Black Friday with a year-over-year decrease in the percentage of SKUs offered on discount versus 2020, and steeper price reductions for the discounted products which can also be attributed to the increase in MSRPs.
Source: Commerce Intelligence – Pricing Insights for Bed & Bath, Electronics, Furniture, Healthy & Beauty, and Fashion categories on Amazon.com and Target.com on Black Friday November 27th, 2021, versus average pricing for the same SKUs from Pre-Black Friday November 20-26th 2021 and Black Friday November 26th, 2020, versus average pricing for the same SKUs from Pre-Black Friday November 19th-25th 2020
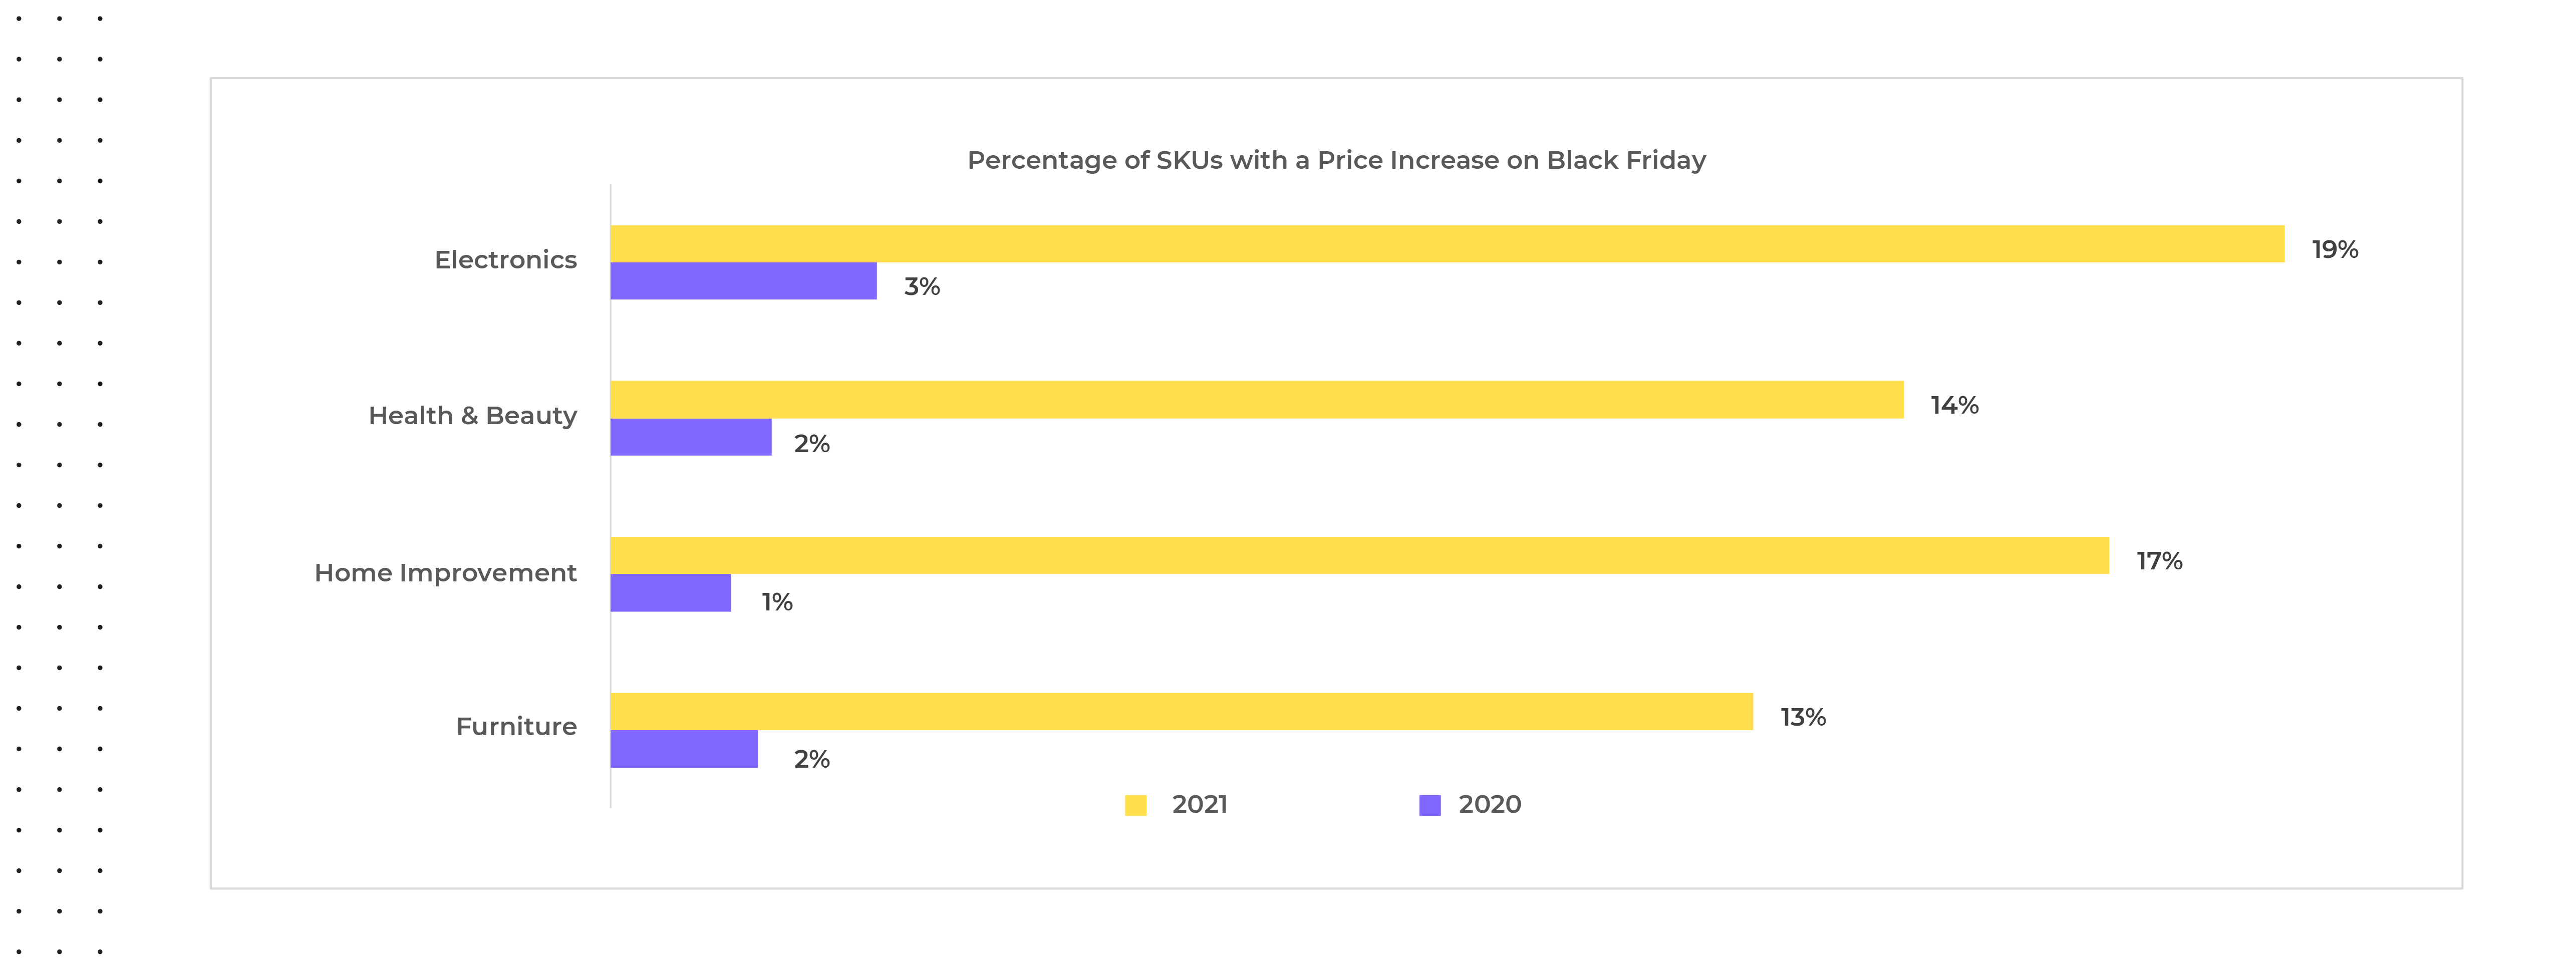
2021 Black Friday Price Increases?
We all know Black Friday is all about price reductions, discounts and deals and so it’s rare to see actual price increases, yet for Black Friday 2021, trends ran counter to this. We observed price increases across all categories for around thirteen to nineteen percent of SKUs, with an average price increase of around fifteen percent in 2021 versus an average of only two percent in 2020.
Source: Commerce Intelligence – Pricing Insights for Bed & Bath, Electronics, Furniture, Healthy & Beauty, and Fashion categories on Amazon.com and Target.com on Black Friday November 27th, 2021, versus pricing for the same SKUs from Pre-Black Friday November 20-26th 2021 and Black Friday November 26th, 2020, versus average pricing for the same SKUs from Pre-Black Friday November 19th-25th 2020
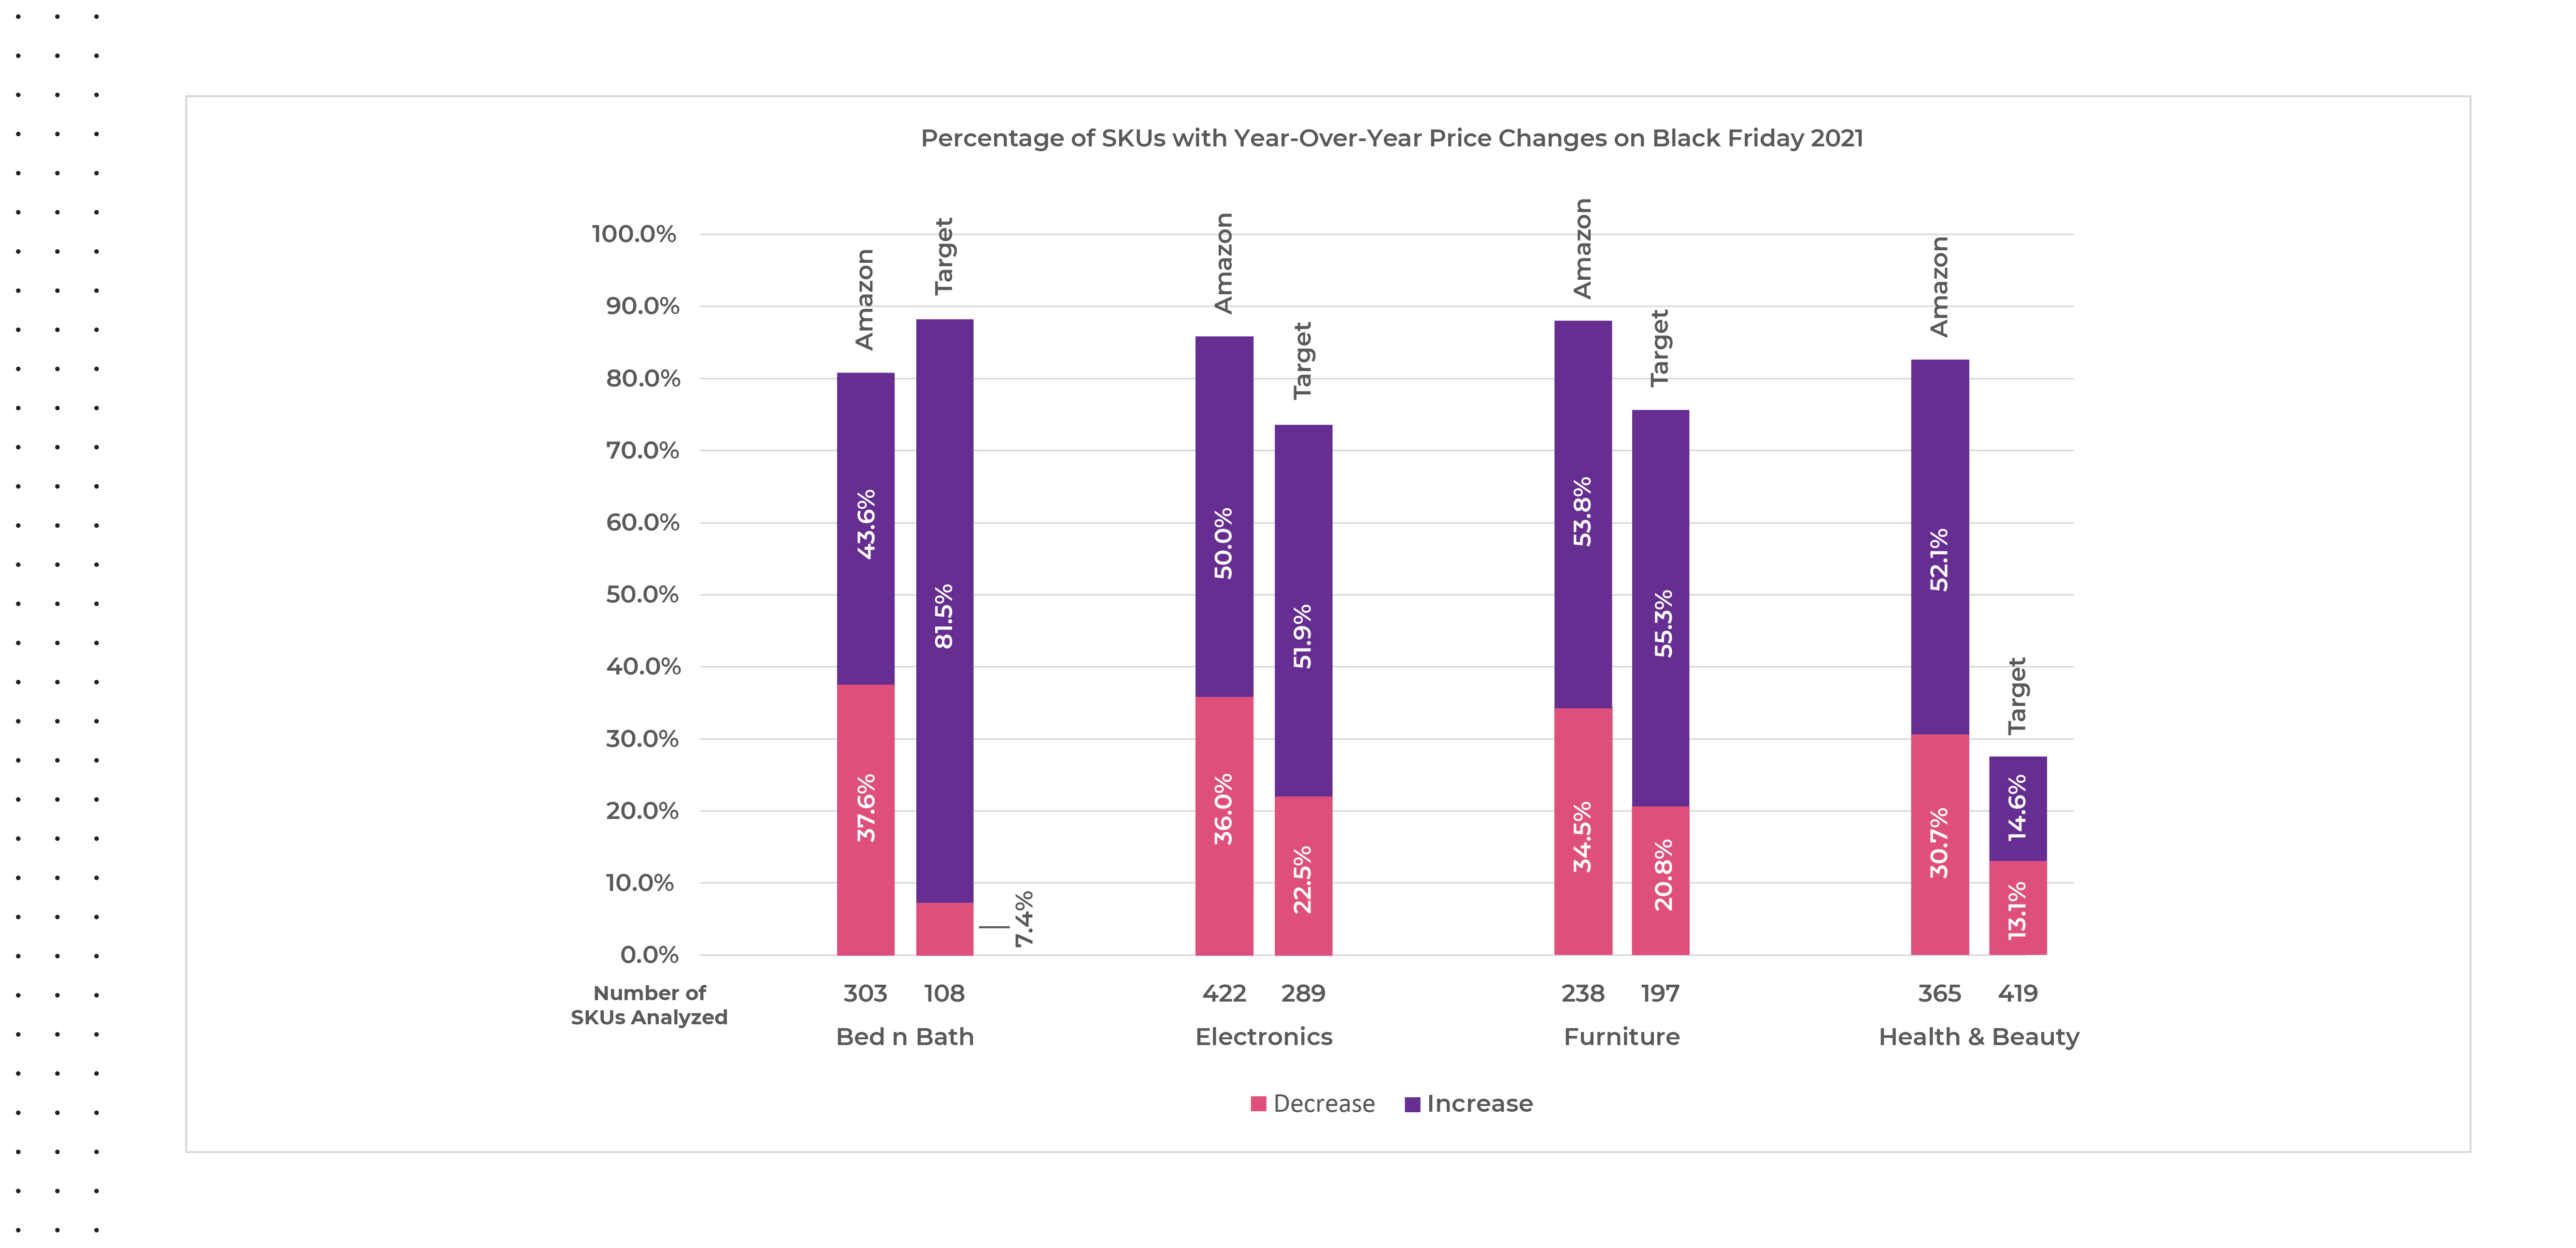
At an account level, we noticed a few interesting differences happening on Black Friday 2021 versus 2020 regarding category price changes. On Target.com, almost ninety percent of the bed and bath SKUs analyzed had a price change on Black Friday in 2021 versus 2020 with eighty-two percent presenting a higher price year-over-year versus only around seven percent showing a decrease, where on Amazon nearly forty-four percent of bed and bath SKUs showed an increase in price and around thirty-eight percent showed a decrease. Except for the health and beauty category on Target.com, more than half of the SKUs in each category saw a price increase on Black Friday versus a price decrease.
Source: Commerce Intelligence – Pricing Insights for Bed & Bath, Electronics, Furniture, Healthy & Beauty, and Fashion categories on Amazon.com and Target.com on Black Friday November 27th, 2021, versus average pricing for the same SKUs on Black Friday November 26th, 2020.
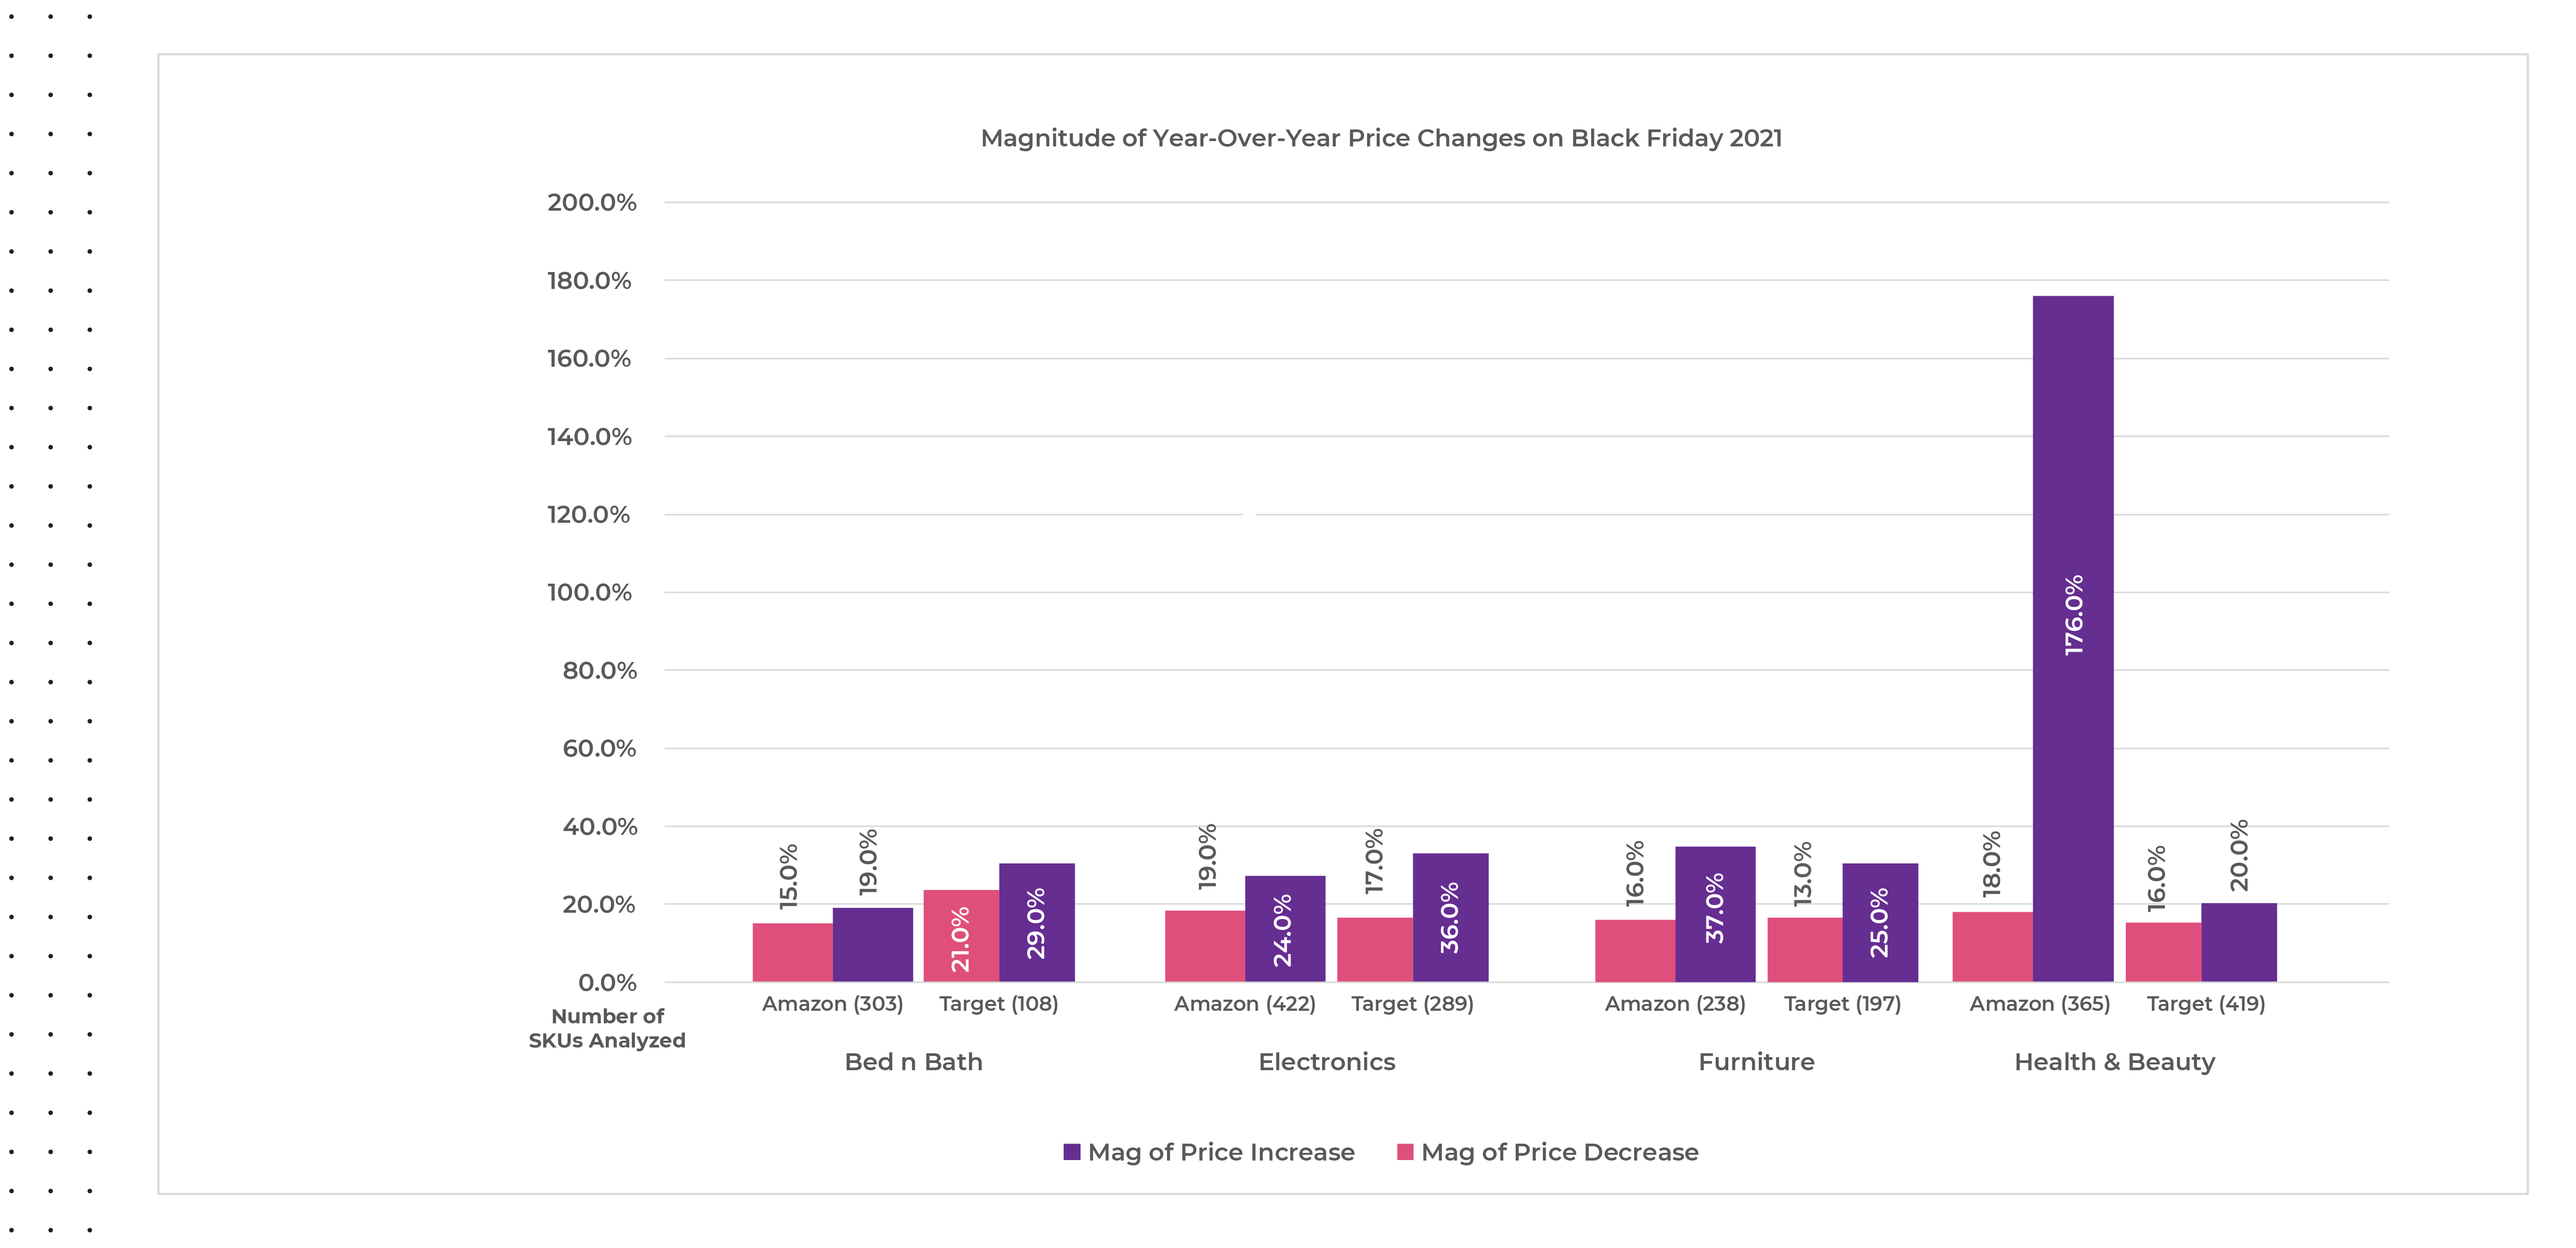
The magnitude of year-over-year price changes seen on Black Friday 2021 was significant across all categories, but the magnitude of price increases found on Amazon.com within the health and beauty category outpaced the rest by far. We reviewed three hundred and sixty-five SKUs on Amazon.com within the health & beauty category and saw almost eighty-three percent of them had a price change with around thirty-one percent decreasing prices and around fifty-two percent increasing prices. This means that within the health & beauty category on Amazon.com, more than fifty percent of the SKUs tracked were sold at a one hundred and seventy-six percent higher price on average during Black Friday 2021 versus 2020.
Source: Commerce Intelligence – Pricing Insights for Bed & Bath, Electronics, Furniture, Healthy & Beauty, and Fashion categories on Amazon.com and Target.com on Black Friday November 27th, 2021, versus average pricing for the same SKUs on Black Friday November 26th, 2020.
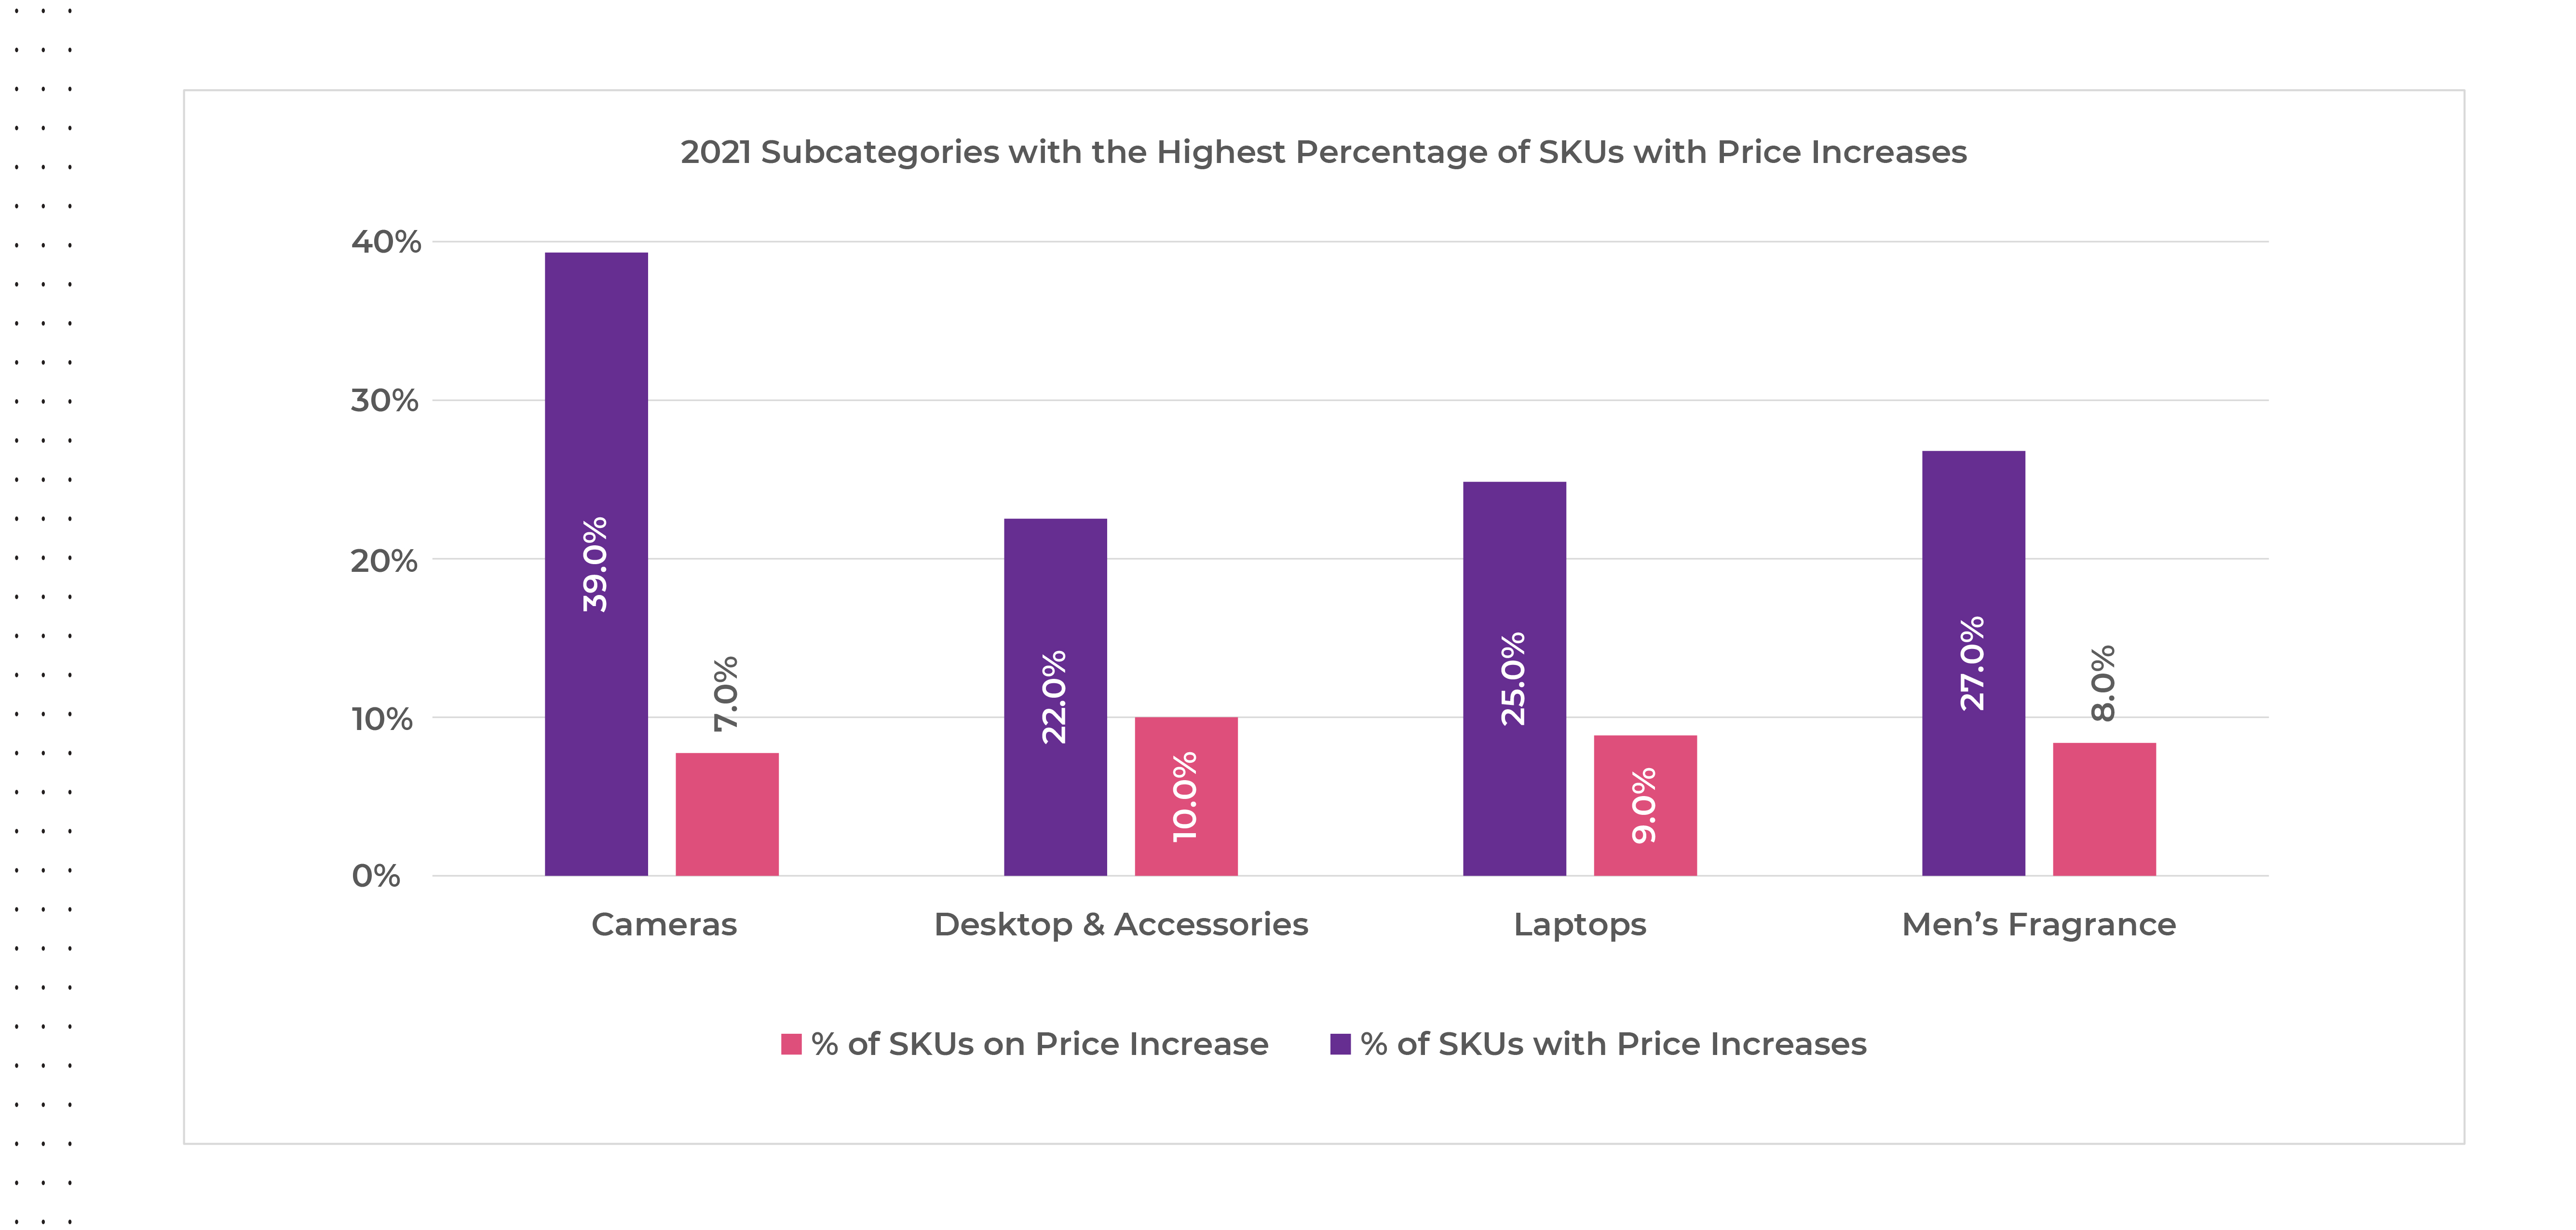
The subcategories offering the greatest number of SKUs with price increases on Black Friday 2021 were cameras, followed by men’s fragrances, laptops, and desktops & accessories, but the magnitude of discounts offered were all under ten percent.
Source: Commerce Intelligence – Pricing Insights for Bed & Bath, Electronics, Furniture, Healthy & Beauty, and Fashion categories on Amazon.com and Target.com on Black Friday November 27th, 2021, versus pricing for the same SKUs from Pre-Black Friday November 20-26th 2021 and Black Friday November 26th, 2020, versus average pricing for the same SKUs from Pre-Black Friday November 19th-25th 2020
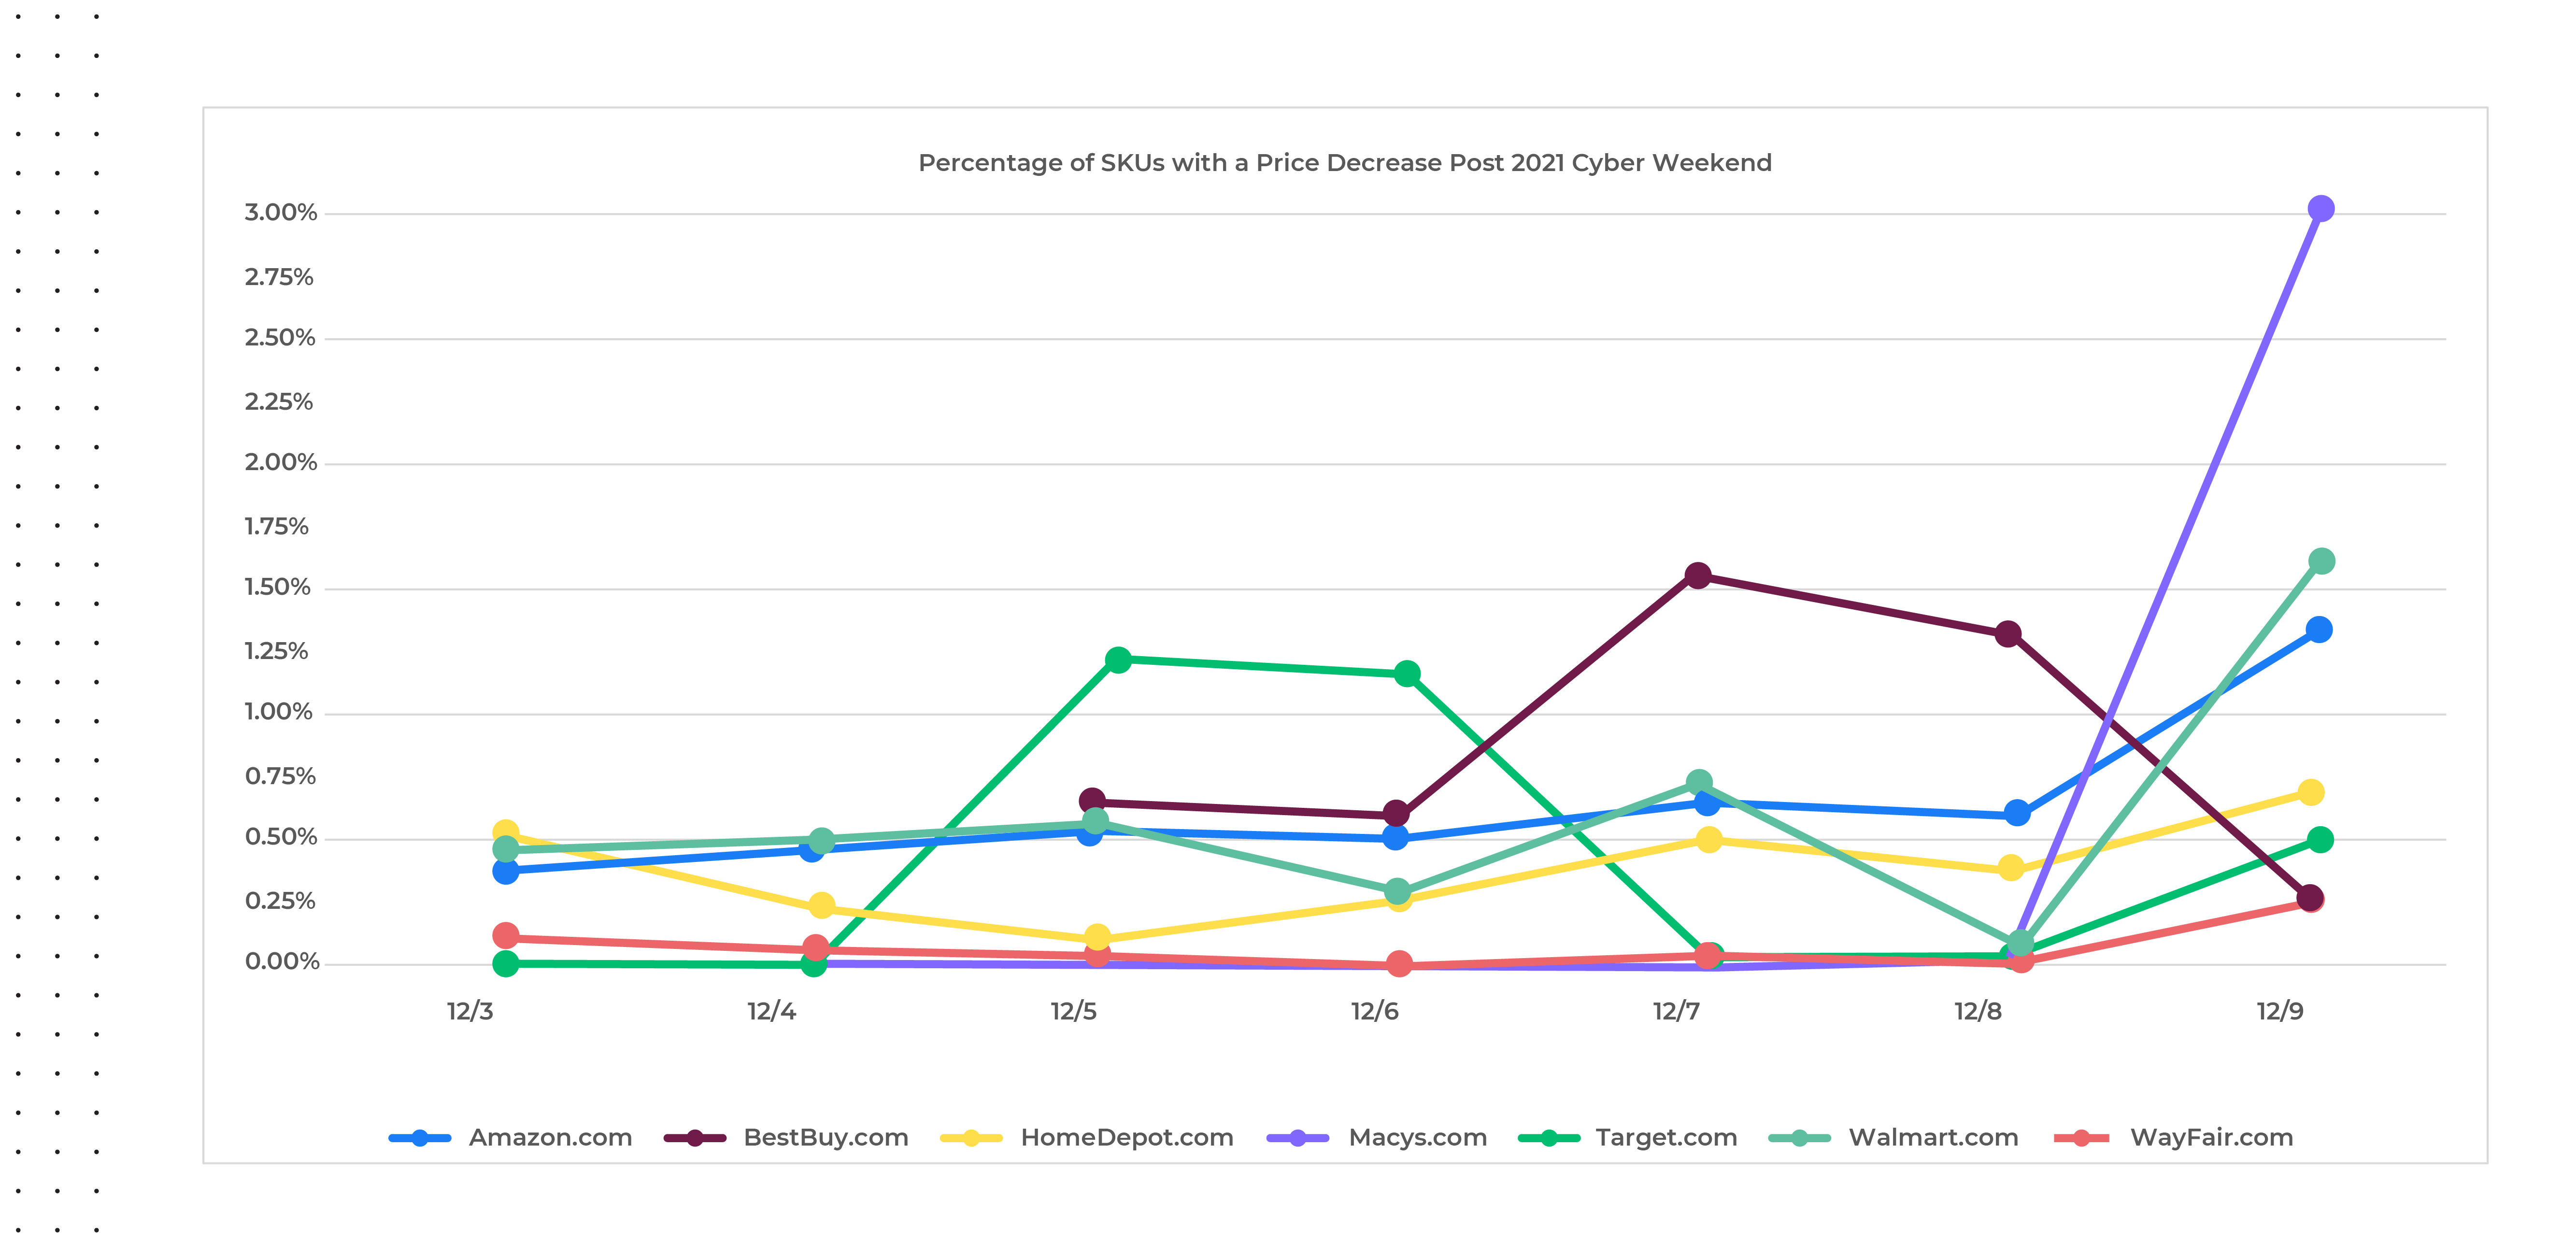
The Aftermath Post-2021 Cyber Weekend
Extending this analysis beyond the holiday weekend, we analyzed price change activity from December third through the ninth across the top US retailers (chart below) and found that price decreases have been very minimal, comparatively speaking. Though there was a spike in number of price decreases from December 8th to the 9th, the percentage of SKUs with price decreases was still very low (less than three percent). We anticipate this trend will continue into 2022.
Source: Commerce Intelligence – Pricing insights for Home & Garden, Jewelry & Watches, Clothing & Shoes, Bed N Bath, Lighting & Ceiling Fans categories
A Sign of Things to Come
A confluence of inflationary trends, product shortages and consumer liquidity have driven many marketplace changes to occur simultaneously. Government programs in the form of stimulus checks, have put extra money in consumers’ hands, and so they’ve been more willing to spend. That, coupled with the shock in the supply chain, has motivated people to buy far ahead of the 2021 holiday season. Hence, retailers have needed to rely much less on across-the-board discounts. Promotions have been more strategic – we’ve seen deeper discounts over fewer products, likely used to draw consumers in to buy certain items, and once they’re there, customers are buying everything else at a non-discount level. When these factors once again normalize, we could see a return to the “race to the bottom” that has occurred since the financial crisis of 2008-2009, but for once, retailers may be able to maintain some pricing power as the 2021 holiday shopping season played out.
Even though performance was not as anticipated and holiday sales did not grow as rapidly as they did in 2020, Cyber Monday was still the greatest online shopping day in 2021. Through it all, retailers managed to keep their digital shelves stocked and orders filled in time for the holidays for the most part, running the risk of housing aged inventory if goods didn’t arrive in time. Despite predictions for steep promotions in January 2022, with supply chains still challenged and inflationary pressures still full steam ahead, we don’t anticipate much in the way of enhanced discounts to continue beyond the holidays.
Access to these types of real-time digital marketplace insights can enable retailers and brands to make strategic decisions like how and when to address inflationary pressures, while also supporting many other day-to-day operations and help drive profitable growth in an intensifying competitive environment. Continue to follow us in the coming weeks for a detailed 2021 year-end review across more retailers and categories. Be sure to reach out to our Retail Analytics experts for access to more details regarding the above analysis.
Lessons from Kroger, Albertson’s, and Safeway’s Optimized Online Positioning
As consumers continue their migration to online shopping through and after the pandemic, Halloween shopping is no exception.
If that’s the new paradigm, what clues should retailers and brands be looking for to enhance their sales? With Halloween around the corner, the analyst team at DataWeave wanted to see how successfully grocers are partnering with brands to prepare for the influx of online Halloween shoppers. We tracked insights from September 14 to 24, 2021, using data from Kroger, Albertson’s, and Safeway websites to understand the preparedness of each retailer, their partnered brands, and how their online strategies compare with one another.
There are hundreds of ways for a consumer to search for a brand’s products online and of critical importance, almost 50 percent of traffic across the top 1000 retailers come through search. At the same time, consumers are becoming less brand conscious. This is a significant development, and there are significant ramifications to consumers searching for products using generic category specific keywords without including brand names in the search. Consequently, we can’t sufficiently stress how understanding online channel experiences is critical to successful outcomes. Retailers and brands alike need an integrated view of how to improve their discoverability and share of search by considering all touchpoints in the digital commerce ecosystem.
The Importance of Product Descriptions, Assortment, Sizes, Price Points
With 75 percent of people never scrolling past the first page of a website when searching for the goods they desire, getting products to page one is imperative to a brand’s success. While in-store, festive displays will help drive traffic and availability awareness, the ‘digital shelf’ is a totally different locus of opportunity. Here, brands rely on proper product descriptions, the right assortment, sizes, and competitive price points to stand out among the crowd and modify their positioning, given each retailer’s consumer base and assorted competitive brands.
Optimizing the Digital Shelf and leading Share of Search for page one across all retail websites isn’t achievable overnight, but it is never too early or too late to start, given the 24/7 visibility your products have online. When it comes to Halloween candies, confectionery brands must consider many factors when differentiating their online positioning, such as finding the ‘sweet spot’ for pricing, size, and variety within each product offered, and knowing the right and wrong times to drive promotions. Additional elements to consider when introducing seasonal candies include cannibalization of non-holiday inventory, which can increase spoilage for aged inventory, or if holiday items are successful, could cause an abundance of markdown items to be sold before replacement inventory can be ordered.
To better understand what retailers are doing—or should be doing—to optimize their Halloween holiday sales, we turned to our DataWeave Digital Shelf Analytics data to answer these questions:
Which brands and products are dominating “Share of Search” page one results across all three retailer websites?
How do discounts and promotions vary among candy brands and retailers?
How does each retailer use Halloween-specific and ‘variety’ labeling within the product descriptor to differentiate their holiday season assortment?
What sizes of candy packages is each retailer offering, and how does this play out in online positioning?
Winning Candy Brands
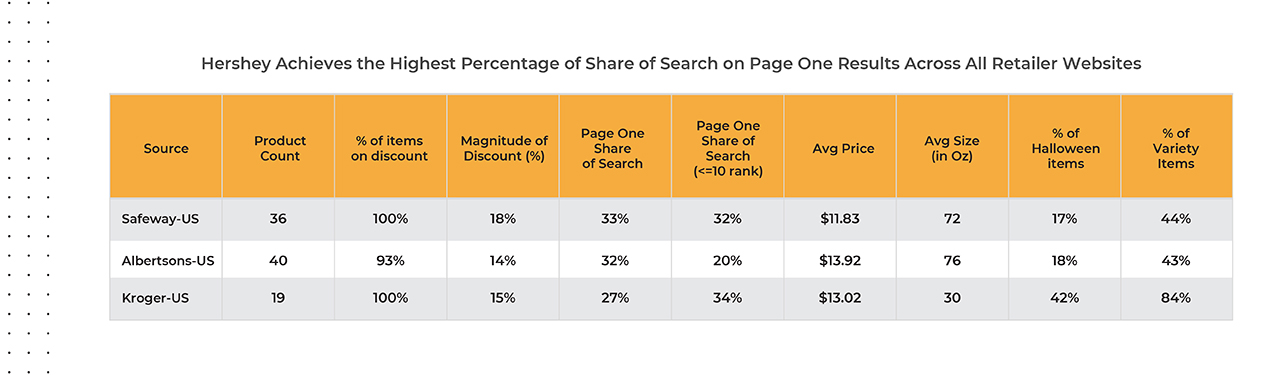
Which Halloween candies are people searching for—and presumably buying? Our data shows that Hershey’s branded candies achieved the greatest page one ‘Share of Search’ results across all three retailers’ websites—Albertson’s, Kroger and Safeway. This was unsurprising, given their total SKU count as well as the brand loyalty Hershey’s steadily maintains throughout the year. There is a high likelihood of consumers buying what they see on page one, so in our analysis, Hershey’s has the best chance of ‘winning’ this holiday season within all three of these retail channels.
That said, looking more specifically at how candy items are labeled and bundled adds another layer of insight to how candy brands are performing at each of these retailers.
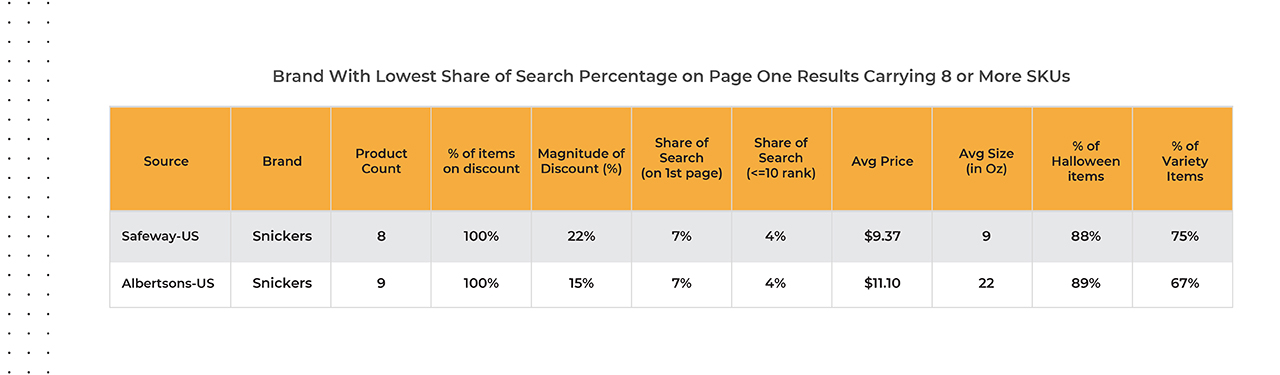
Historically speaking, Snickers is almost always within the top five confectionery brands sold during the Halloween season, but with the migration of more consumers shopping online, Mars may be leaving opportunity on the table this year. Our data shows that Snickers had the lowest Share of Search percentage on page one results on Safeway.com and Albertson’s.com for brands carrying 8 or more SKUs each, indicating they will most likely not make the first page results—and therefore may end up as a clearance item after Halloween if relying on online promotional efforts to achieve sales goals.
Source: DataWeave’s Digital Shelf Analytics Solution: Data aggregated from 9/14/21-9/24/21 for Albertson’s.com and Kroger.com, and 9/17-9/24 for Safeway.com; Analysis was conducted reviewing product information for items falling within the ‘Halloween Candy’ listing category
What Size Candy Packages Are Retailers Carrying/Betting On?
For example, Albertsons.com and Safeway.com’s assortment includes 124 SKUs and 108 SKUs respectively with most of those items falling within the 5 to 16-ounce (averaging 25 percent) and 32 to 64-ounce (averaging 29 percent) sizes, Kroger.com is betting on a ‘smaller is better’ strategy, with a majority (63 percent) of their candies sold in the 5 to 16-ounce package size.
The average Hershey candies available through all three retailers happen to be much greater in size and price point, on average, than other top ranked items, and while these larger items appear to mostly be variety packs, a majority are not labeled as ‘Halloween’ candy.
Source: DataWeave’s Digital Shelf Analytics Solution: Data aggregated from 9/14/21-9/24/21 for Albertson’s.com and Kroger.com, and 9/17-9/24 for Safeway.com; Analysis was conducted reviewing product information for items falling within the ‘Halloween Candy’ listing category
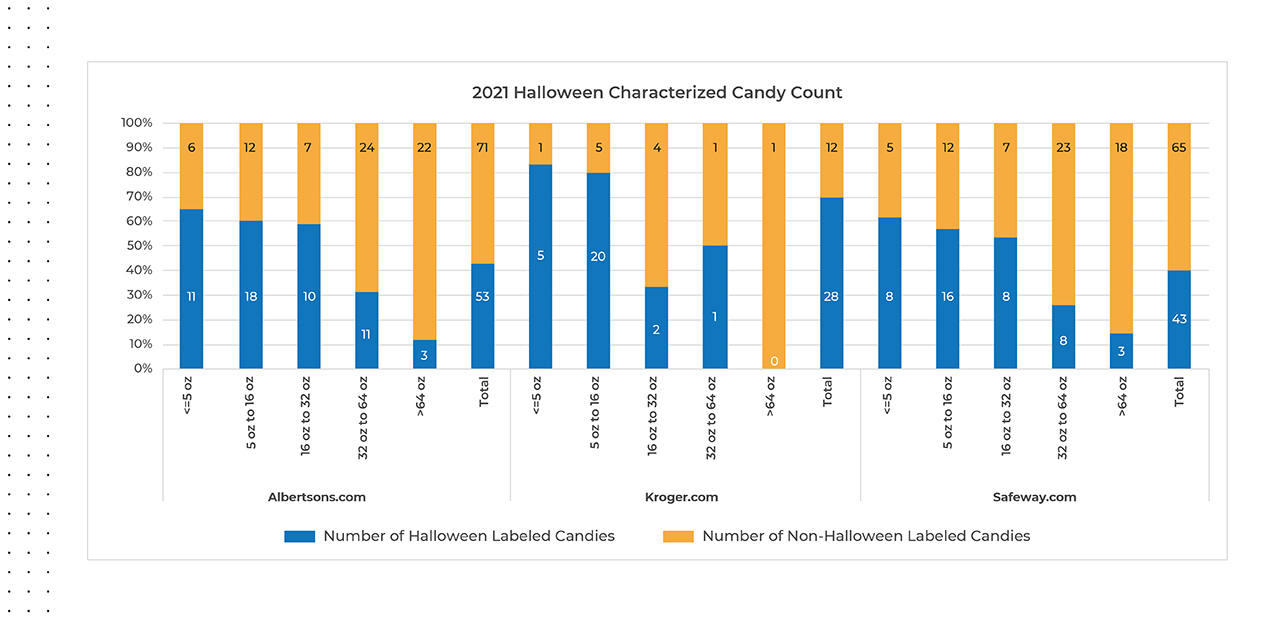
How Important Is Halloween-Specific Branding?
Our data shows that Kroger.com included the name ‘Halloween’ within the product description for most (around 80 percent) of the candies sized 16 ounces or smaller, and overall have labeled more than two-thirds of their total candy items sold as ‘Halloween.’ This indicates they are staged well for the peak of the seasonal demand and anticipate their shoppers to buy smaller unit sizes, comparatively speaking.
Source: DataWeave’s Digital Shelf Analytics Solution: Data aggregated from 9/14/21-9/24/21 for Albertson’s.com and Kroger.com, and 9/17-9/24 for Safeway.com; Analysis was conducted reviewing product information for items falling within the ‘Halloween Candy’ listing category
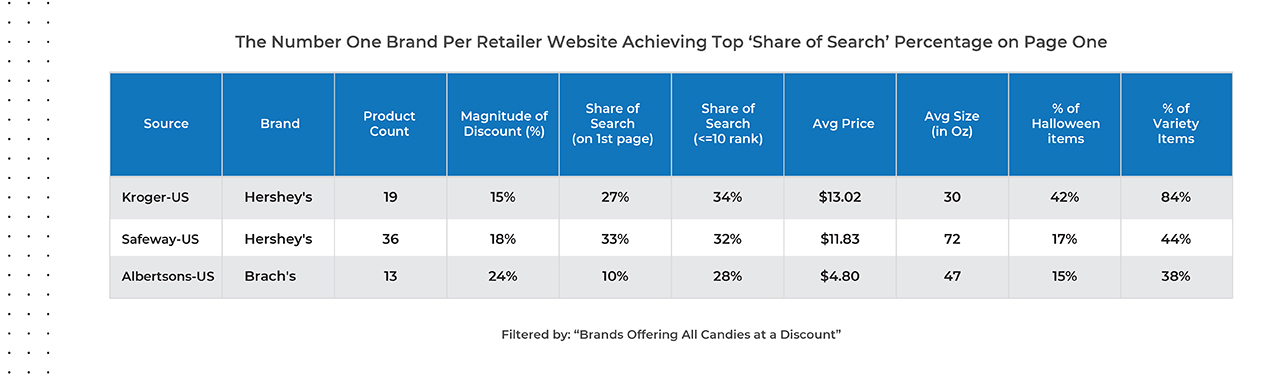
Taking a closer look at all items positioned as ‘Halloween’ across the three retailer websites, Hershey’s brand Reese’s is set for success at Kroger.com for total Share of Search percentage, considering they carry eight Reese’s, non-variety SKUs. Competing in the audience of others leading with variety packs indicates the weight the Reese’s brand carries and also indicates they will also have a great likelihood of success for increased sales this Halloween season.
Mars M&M’s brand came out on top at Safeway.com and Albertsons.com within the ‘Halloween’ labeled SKUs, but a majority (around 70 percent) of these are variety packs that leads with the M&M’s brand versus an M&M’s only bag.
Source: DataWeave’s Digital Shelf Analytics Solution: Data aggregated from 9/14/21-9/24/21 for Albertson’s.com and Kroger.com, and 9/17-9/24 for Safeway.com; Analysis was conducted reviewing product information for items falling within the ‘Halloween Candy’ listing category
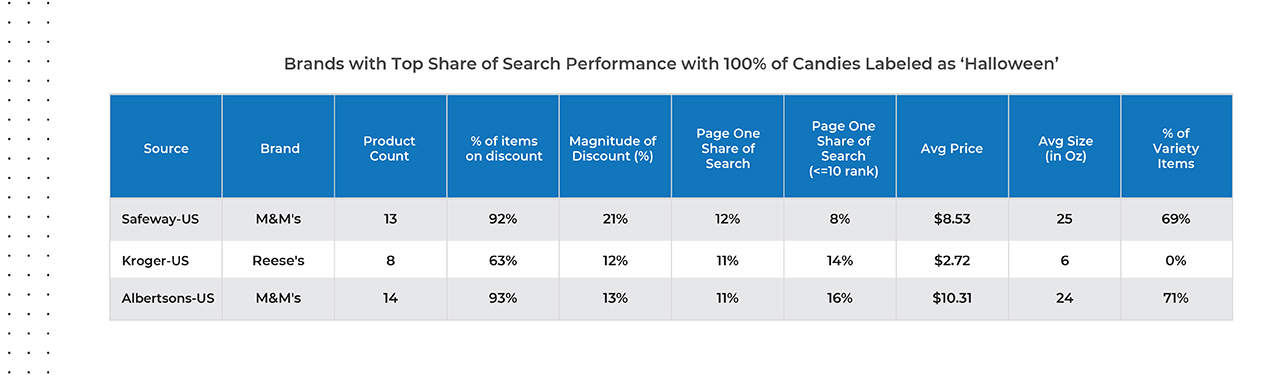
How Much (Less) Are People Paying for Halloween Candy?
To determine whether candy promotions are increasing Share of Search, DataWeave measured the average promotional discount these retailers and top candy brands are offering online. When looking only at brands offering discounts on 100% of the SKUs they carry within each retailer, Brach’s brand is performing best on Albertson’s.com, and Hershey products are positioned at the top for Kroger.com and Safeway.com.
Source: DataWeave’s Digital Shelf Analytics Solution: Data aggregated from 9/14/21-9/24/21 for Albertson’s.com and Kroger.com, and 9/17-9/24 for Safeway.com; Analysis was conducted reviewing product information for items falling within the ‘Halloween Candy’ listing category
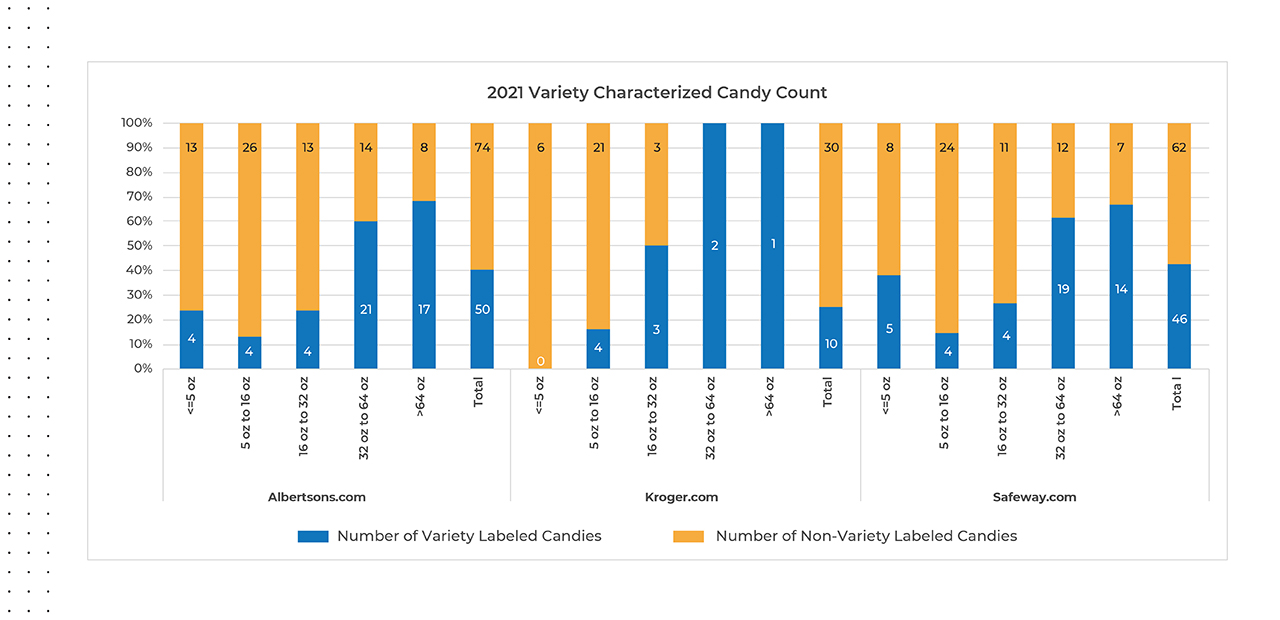
Do Consumers Search For ‘Variety’ Candy Bags, or One-Product-Only Bags?
DataWeave tagged the word ‘variety’ and found that across all three retailers’ websites, non-variety candy bags take up a greater overall Share of Search than ‘variety’ bags. Either this isn’t an important search word or retailers could try adding ‘variety’ to product descriptions to increase Share of Search.
Source: DataWeave’s Digital Shelf Analytics Solution: Data aggregated from 9/14/21-9/24/21 for Albertson’s.com and Kroger.com, and 9/17-9/24 for Safeway.com; Analysis was conducted reviewing product information for items falling within the ‘Halloween Candy’ listing category
Time to Make a Change
Getting products to page one on retailers’ websites can improve sales by as much as 50 percent, but determining the right levers to pull to get there is no easy feat. Based on our preliminary analysis of Halloween insights, our advice to confectionery brands this Halloween season is to invest now to increase visibility to the fast-changing market, to get orders right and on time, establish effective pricing and promotional plans, and get the right candies in stock, to the right locations. Retailers able to get an end-to-end view of the online competitive landscape will be able to make calculated marketing decisions that stand to help generate growth and profitability.
We are now within the prime Halloween shopping season, given that 55 percent of candy sales usually happen in the last two weeks of October (According to Timothy LeBel, President of U.S. Sales for Mars Wrigley). With online sales still growing as consumers have shifted their comfort level in buying more online, retailers should be looking for ways to optimize their product positioning, increase their Share of Search, to improve the likelihood of consumers ordering their brand’s candy to ply those Trick-or-Treaters knocking on their doors.
About DataWeave
DataWeave is a leading provider of advanced sales optimization solutions for e-commerce businesses, consumer brands and marketplaces. The AI-driven proprietary technology and language-agnostic platform aggregates consumable and actionable Competitive Intelligence across 500+ billion data points globally, in 25+ languages, with insights to performance for more than 400,000 brands across 1,500+ websites tracked across 20+ verticals, to ensure online performance is always optimized.