Black Friday 2025 saw British shoppers spend an average of £430 each this year representing a £91 increase from last year and totaling over £10.2 billion across the sales period.
The 2025 sales event arrived at a pivotal moment for UK retail. Retail sales fell 1.1% in October 2025 as consumers held back spending in anticipation of Black Friday promotions, according to the Office for National Statistics. Over 2 in 5 UK adults participated in Black Friday shopping, with 45% planning to pick up Christmas gifts at a discount, according to a Barclays study.
Against this backdrop of cautious optimism and strategic consumer behavior, how did retailers and brands perform across key categories this Black Friday? At DataWeave, we conducted a comprehensive analysis of Black Friday 2025 discounting trends across five major categories in the UK market: Consumer Electronics, Home & Furniture, Health & Beauty, Grocery, and Apparel. Our AI-powered pricing intelligence platform monitored over 71K SKUs across leading UK retailers like Costco, Selfridges, Boots, Debenham’s, Carethy, Argos, John Lewis, Amazon, and more, revealing fascinating patterns in how retailers and brands approached this year’s sale season.
Our Methodology
For this analysis, DataWeave monitored average discounts across leading UK retailers during two distinct periods:
- Pre-Black Friday: November 6 – November 23, 2025 – capturing early holiday deals and baseline pricing
- Additional Discounts During Black Friday Week: November 24 – December 1, 2025 – covering Thanksgiving week through Black Friday (November 28) and Cyber Monday (December 1)
Our sample encompassed the top-ranked products across subcategories on major retail sites. We also analyzed Share of Search data, which measures brand visibility by monitoring which brand names appear in the top 20 search results for critical keywords.
Black Friday 2025 UK: The Big Picture
Our analysis covered 71,642 SKUs across five major categories. Here’s the snapshot of average discounts during the Pre-Black Friday period compared to Black Friday Week:
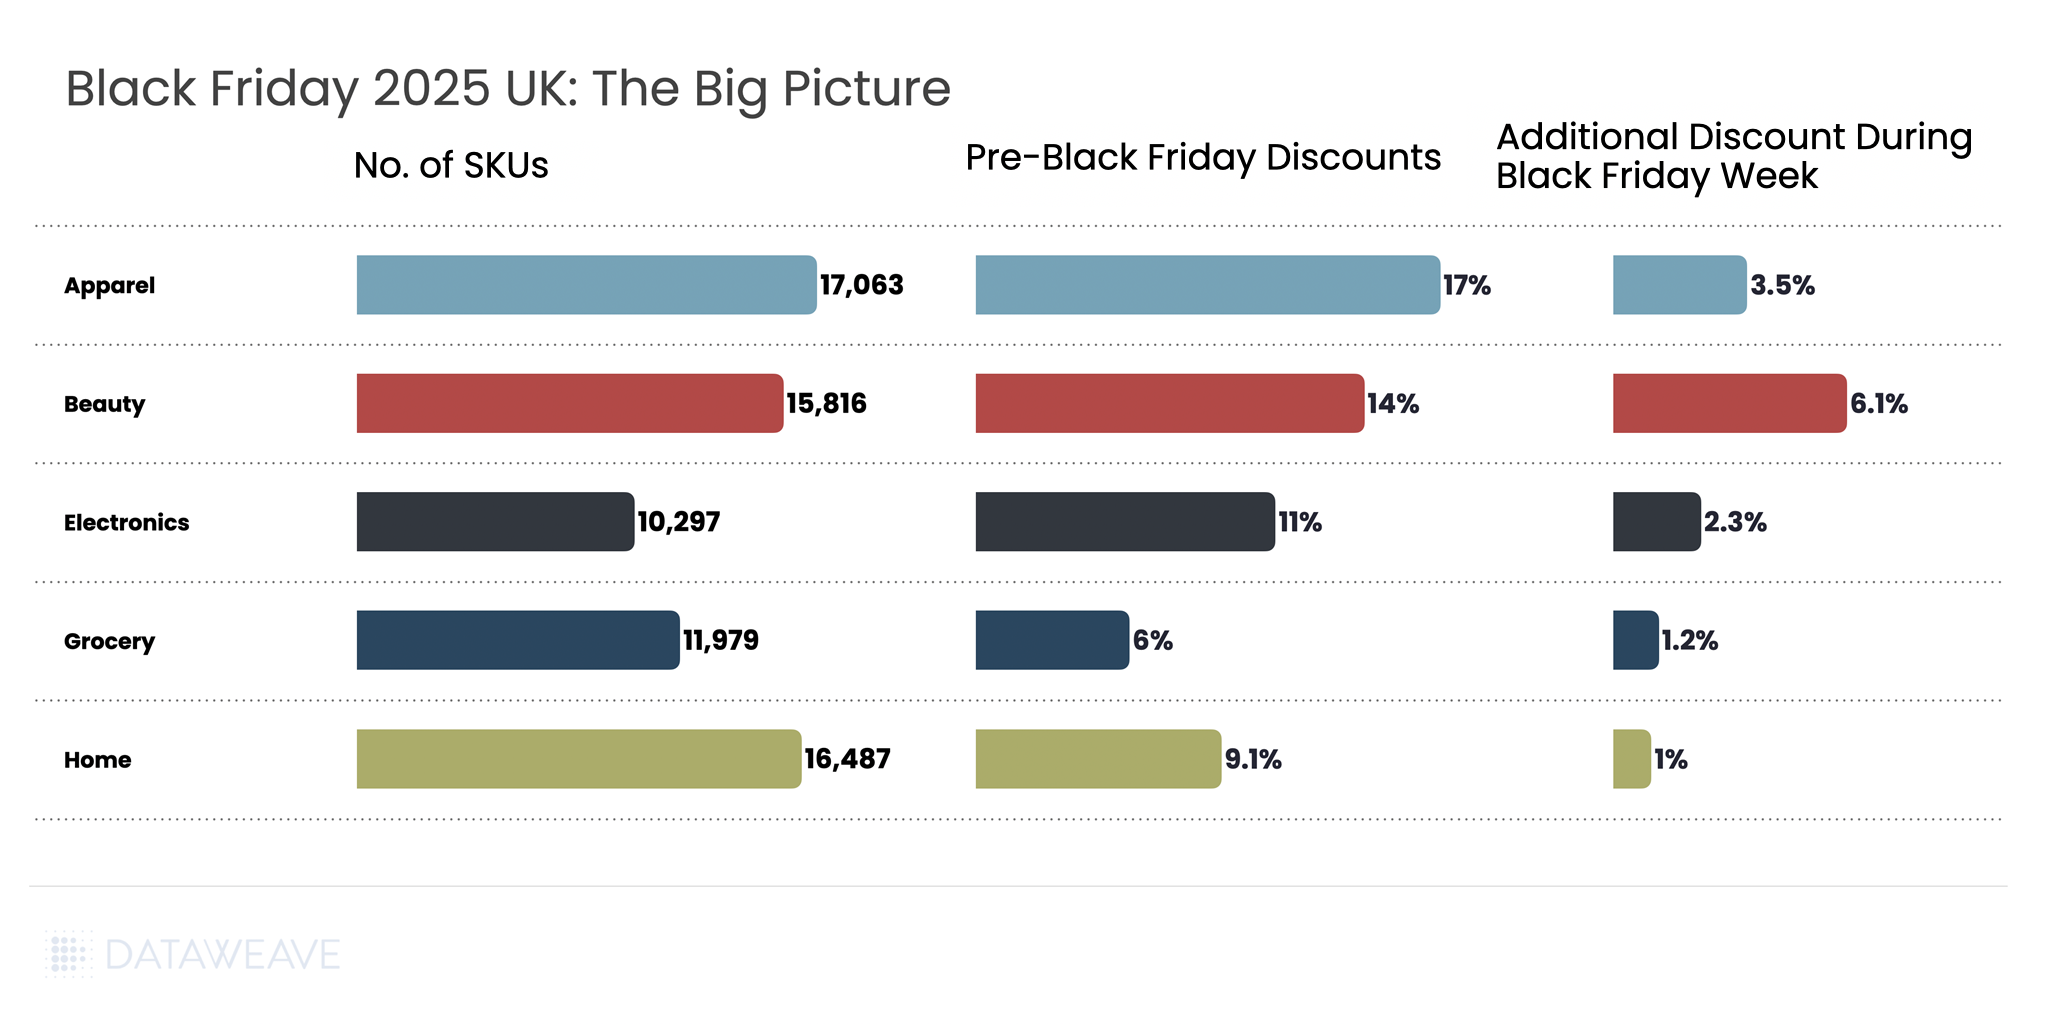
Key Insight: Pre-Black Friday discounts were substantial across all categories. This suggests UK retailers front-loaded their promotions to capture early holiday shoppers, with additional discounts during Black Friday Week adding to the baseline discounts already in place. The extended promotional period transformed Black Friday from a single-day event into a month-long campaign, with 60% of UK shoppers beginning their deal searches as early as October.
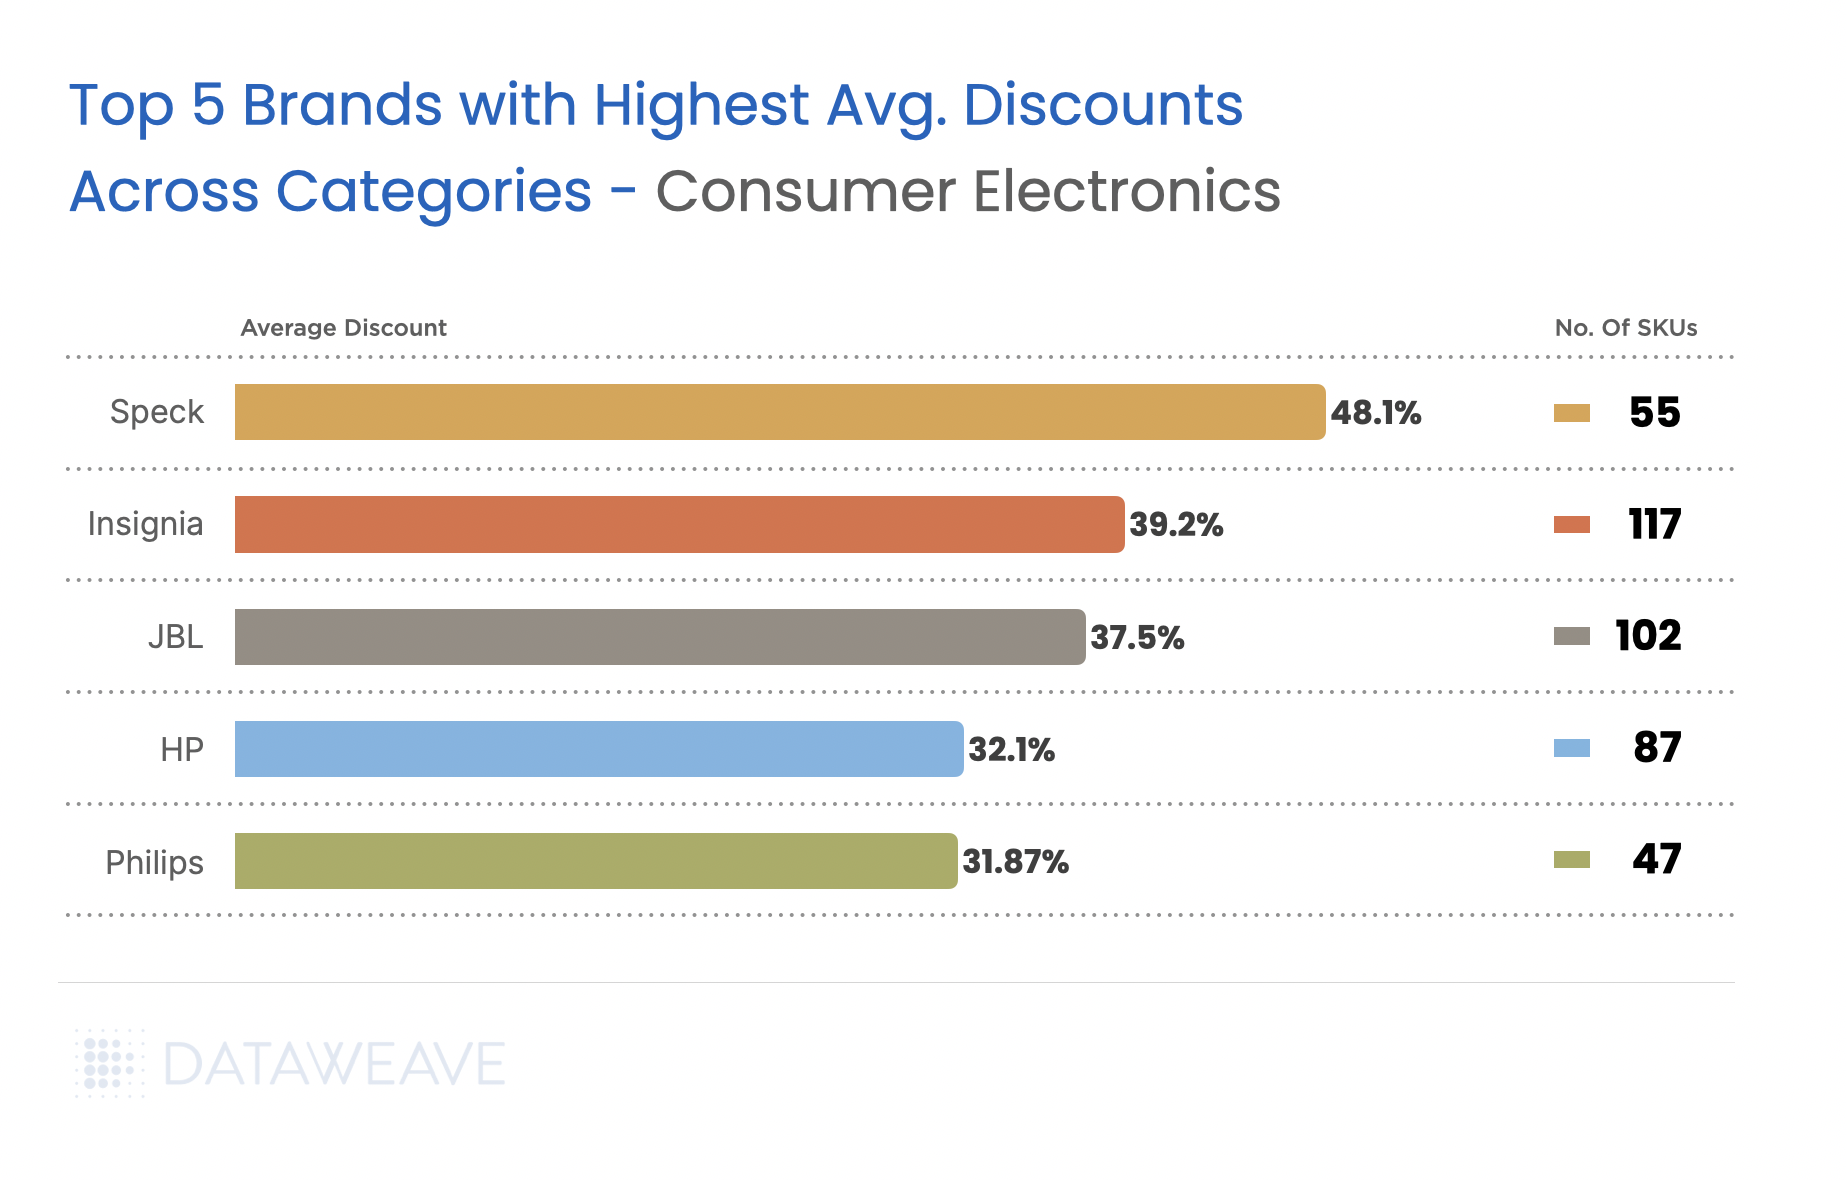
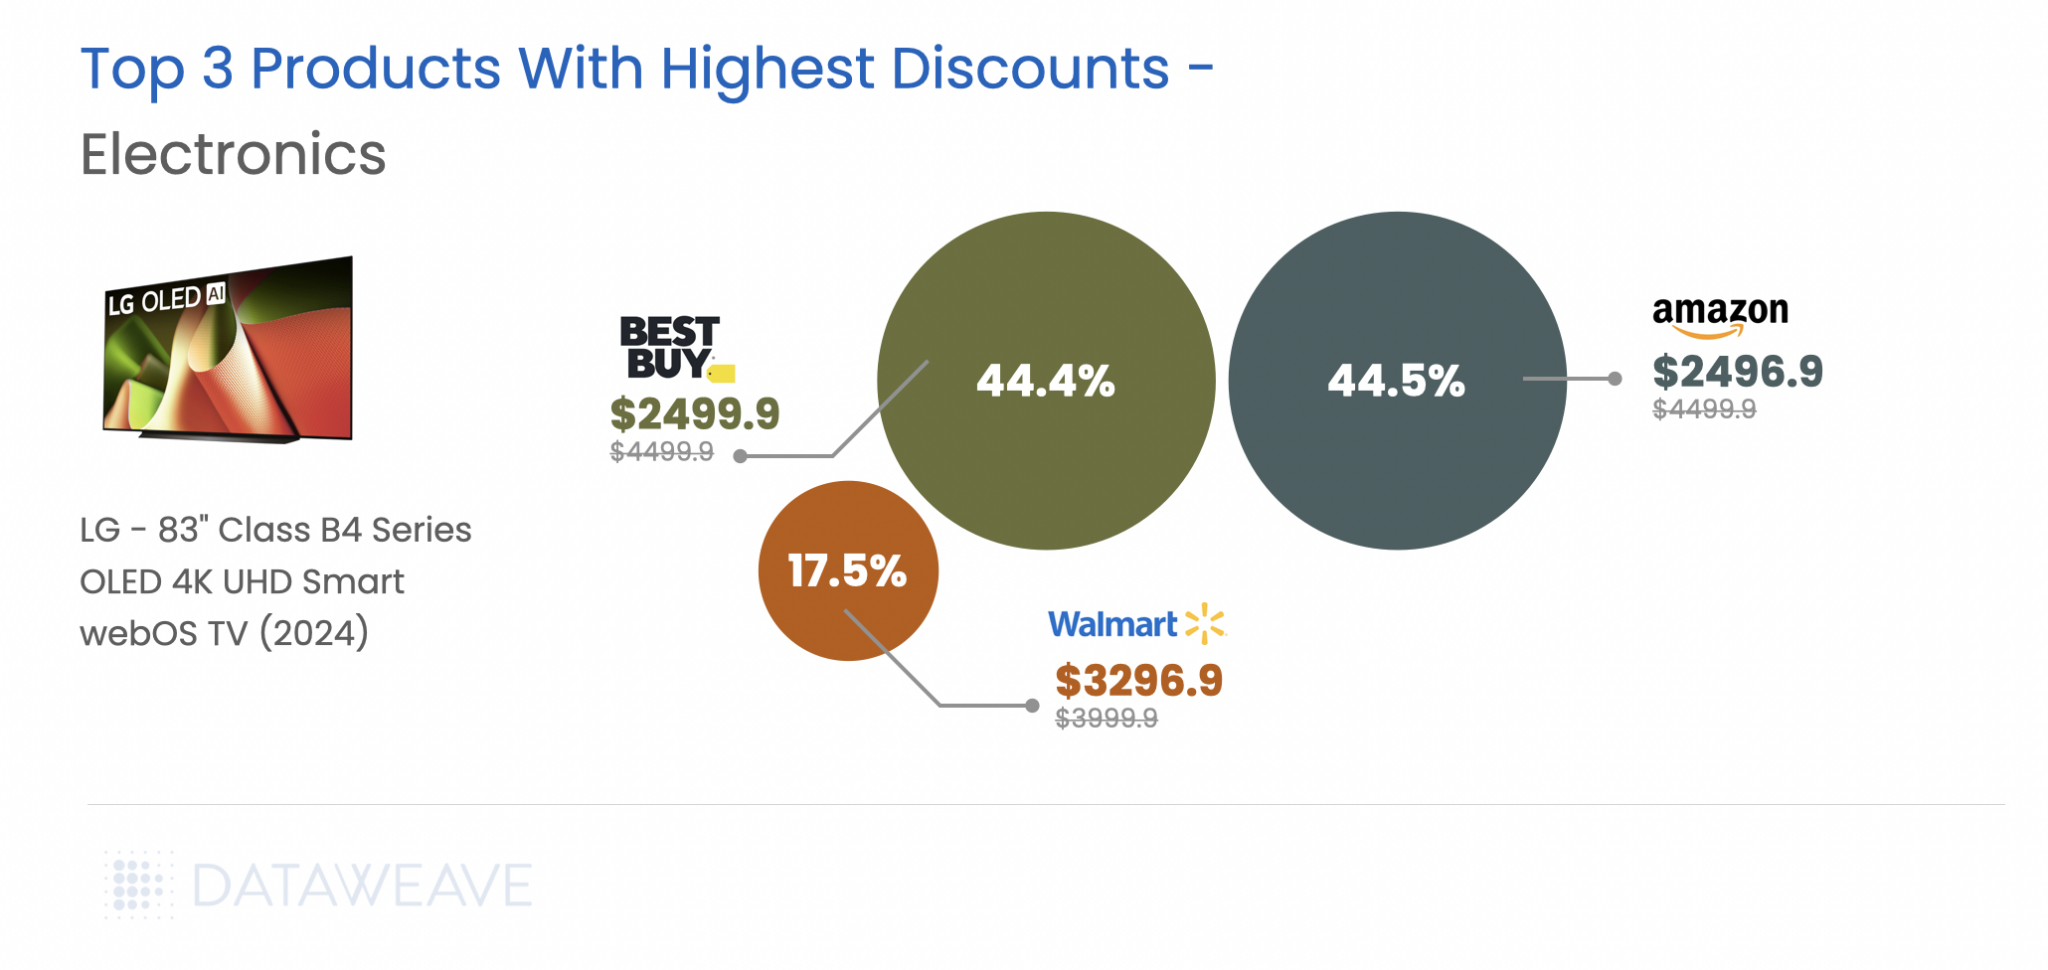
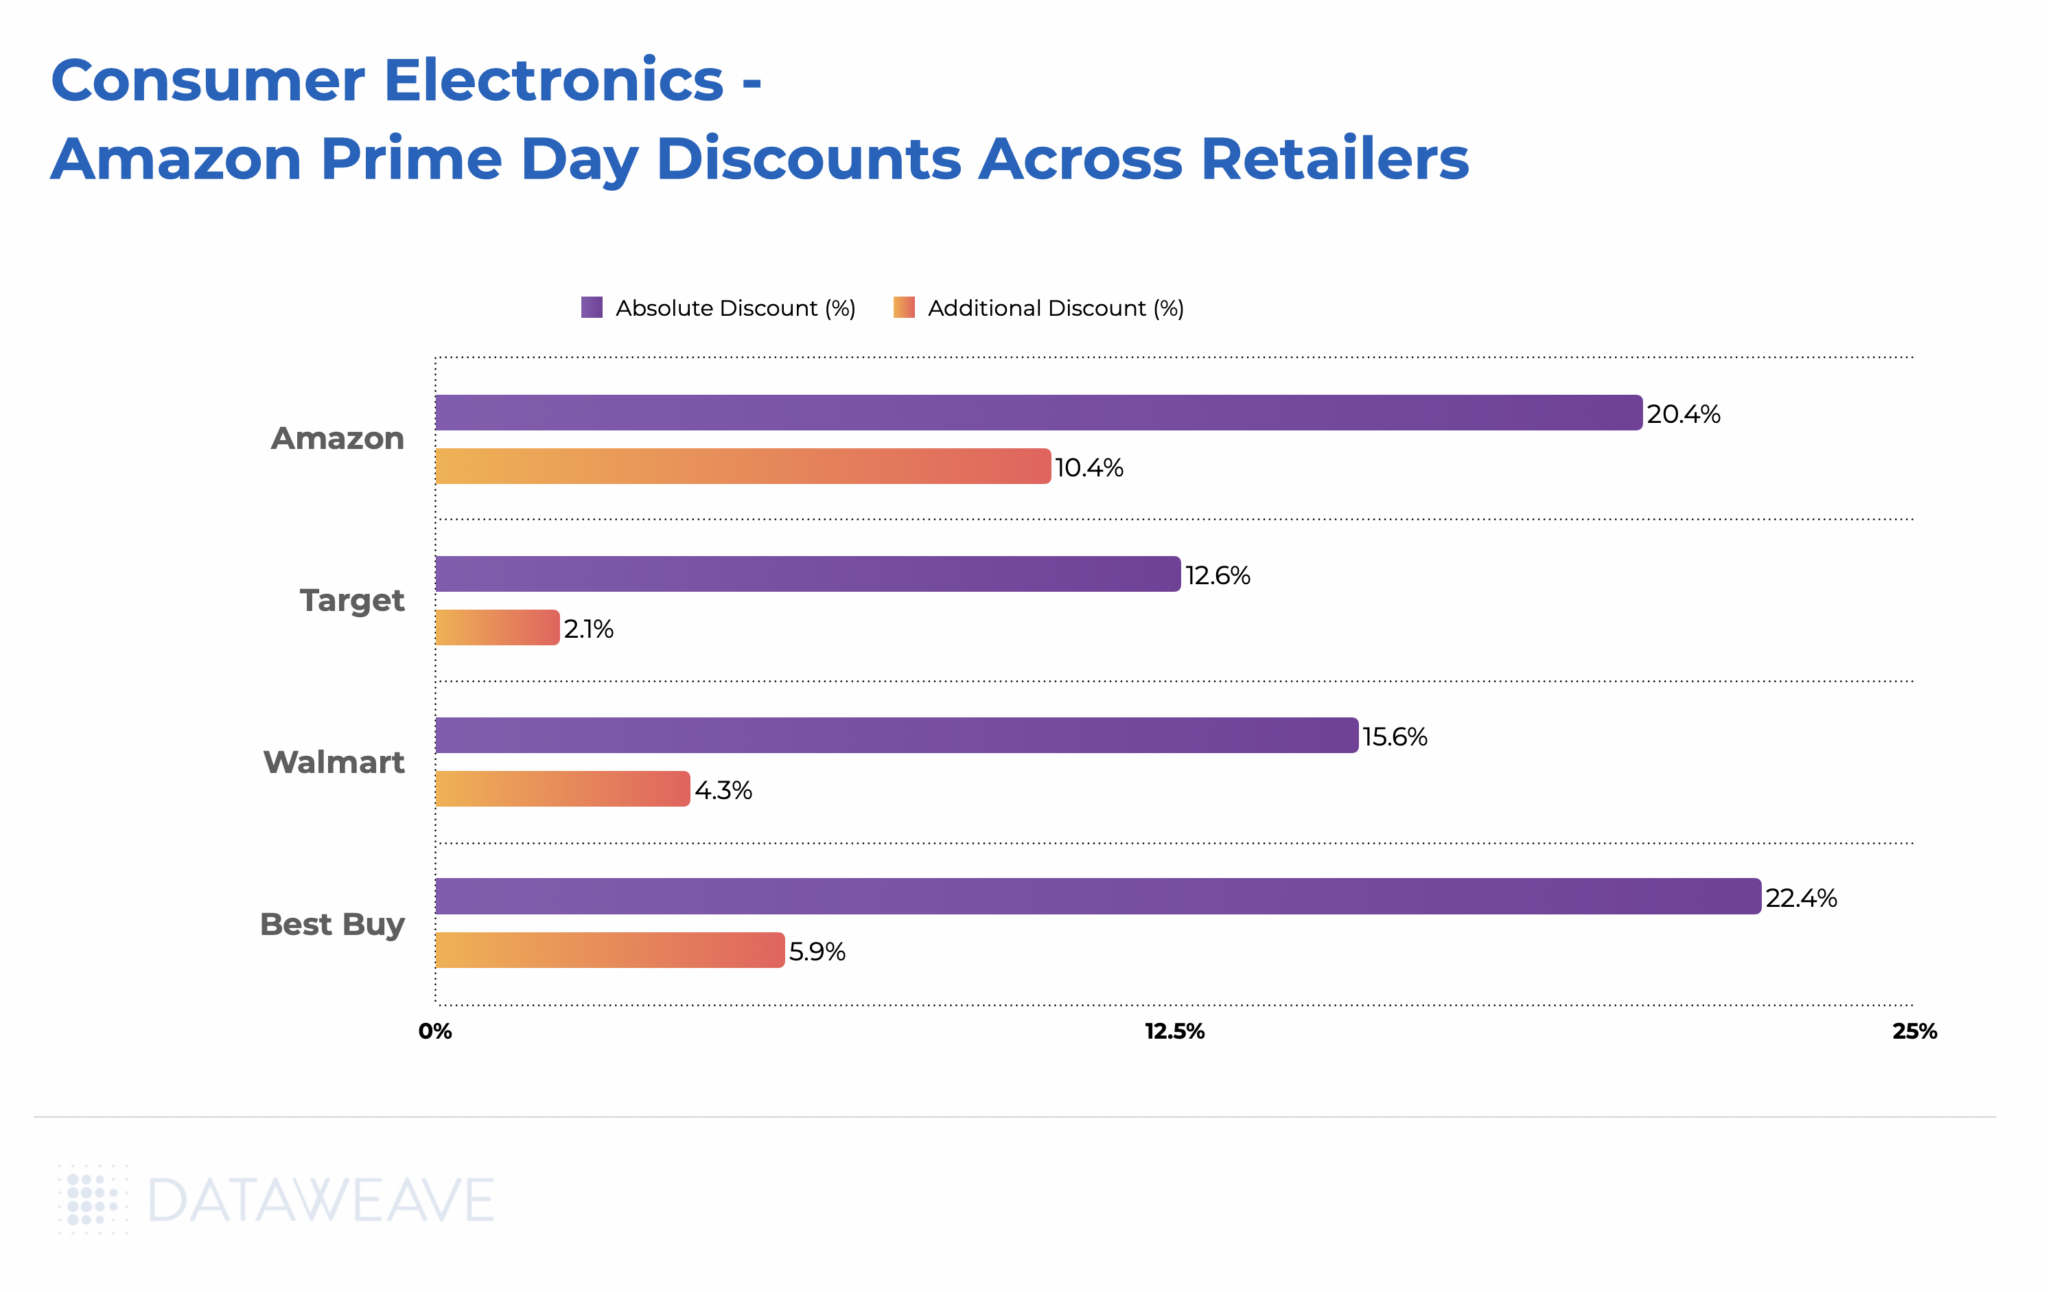
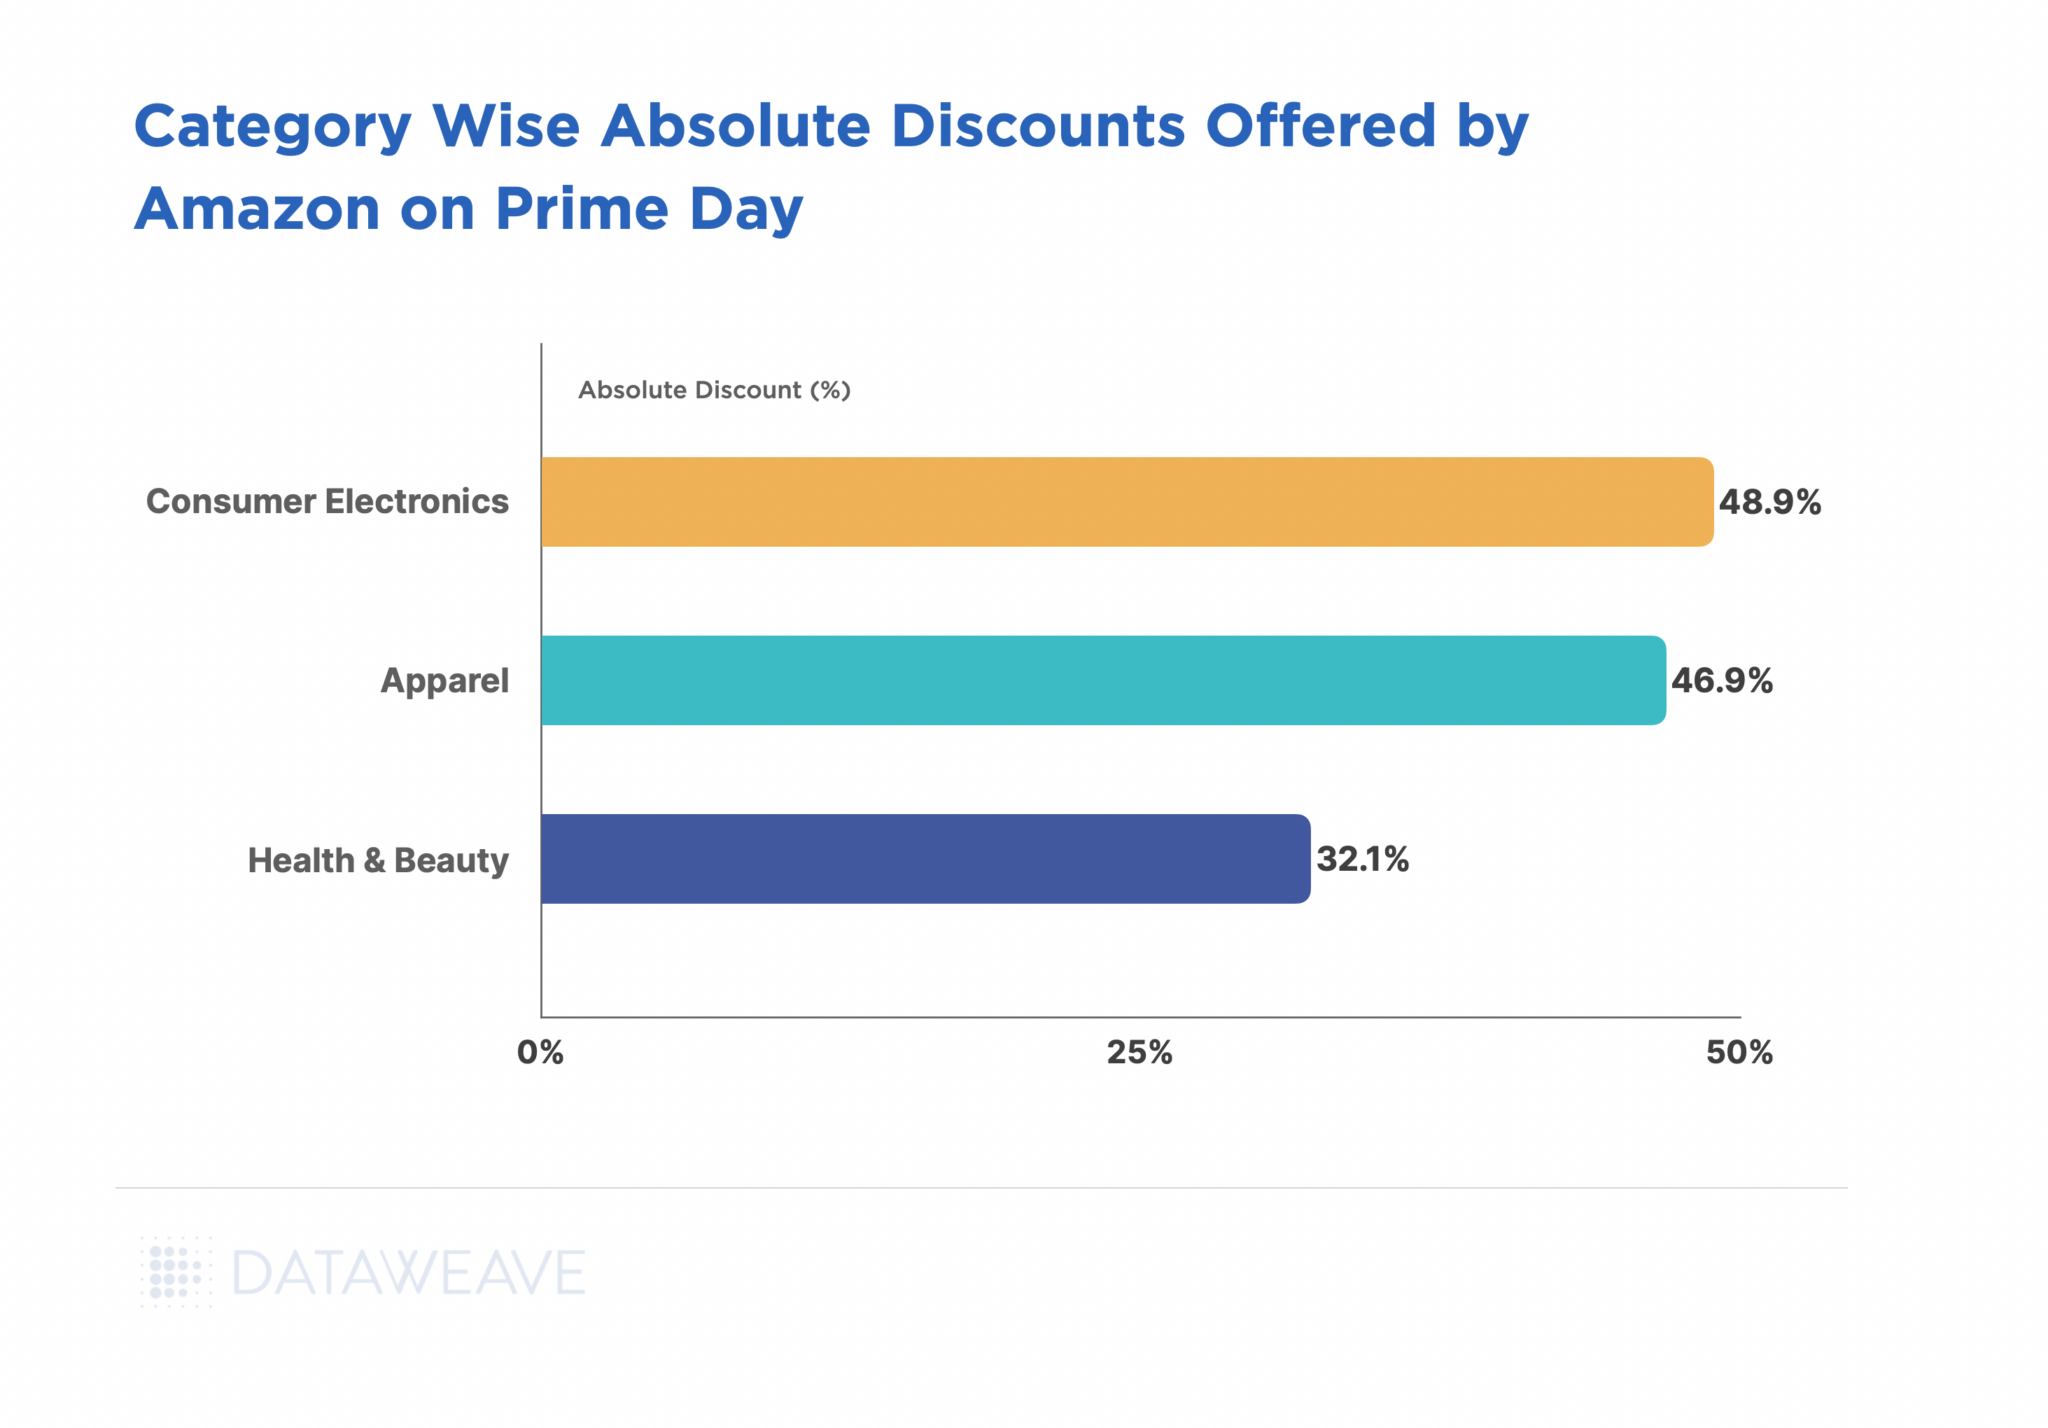
Consumer Electronics
Consumer electronics remains a cornerstone of Black Friday shopping in the UK, with technology accounting for 48% of planned consumer spending during the sales period, according to PwC.
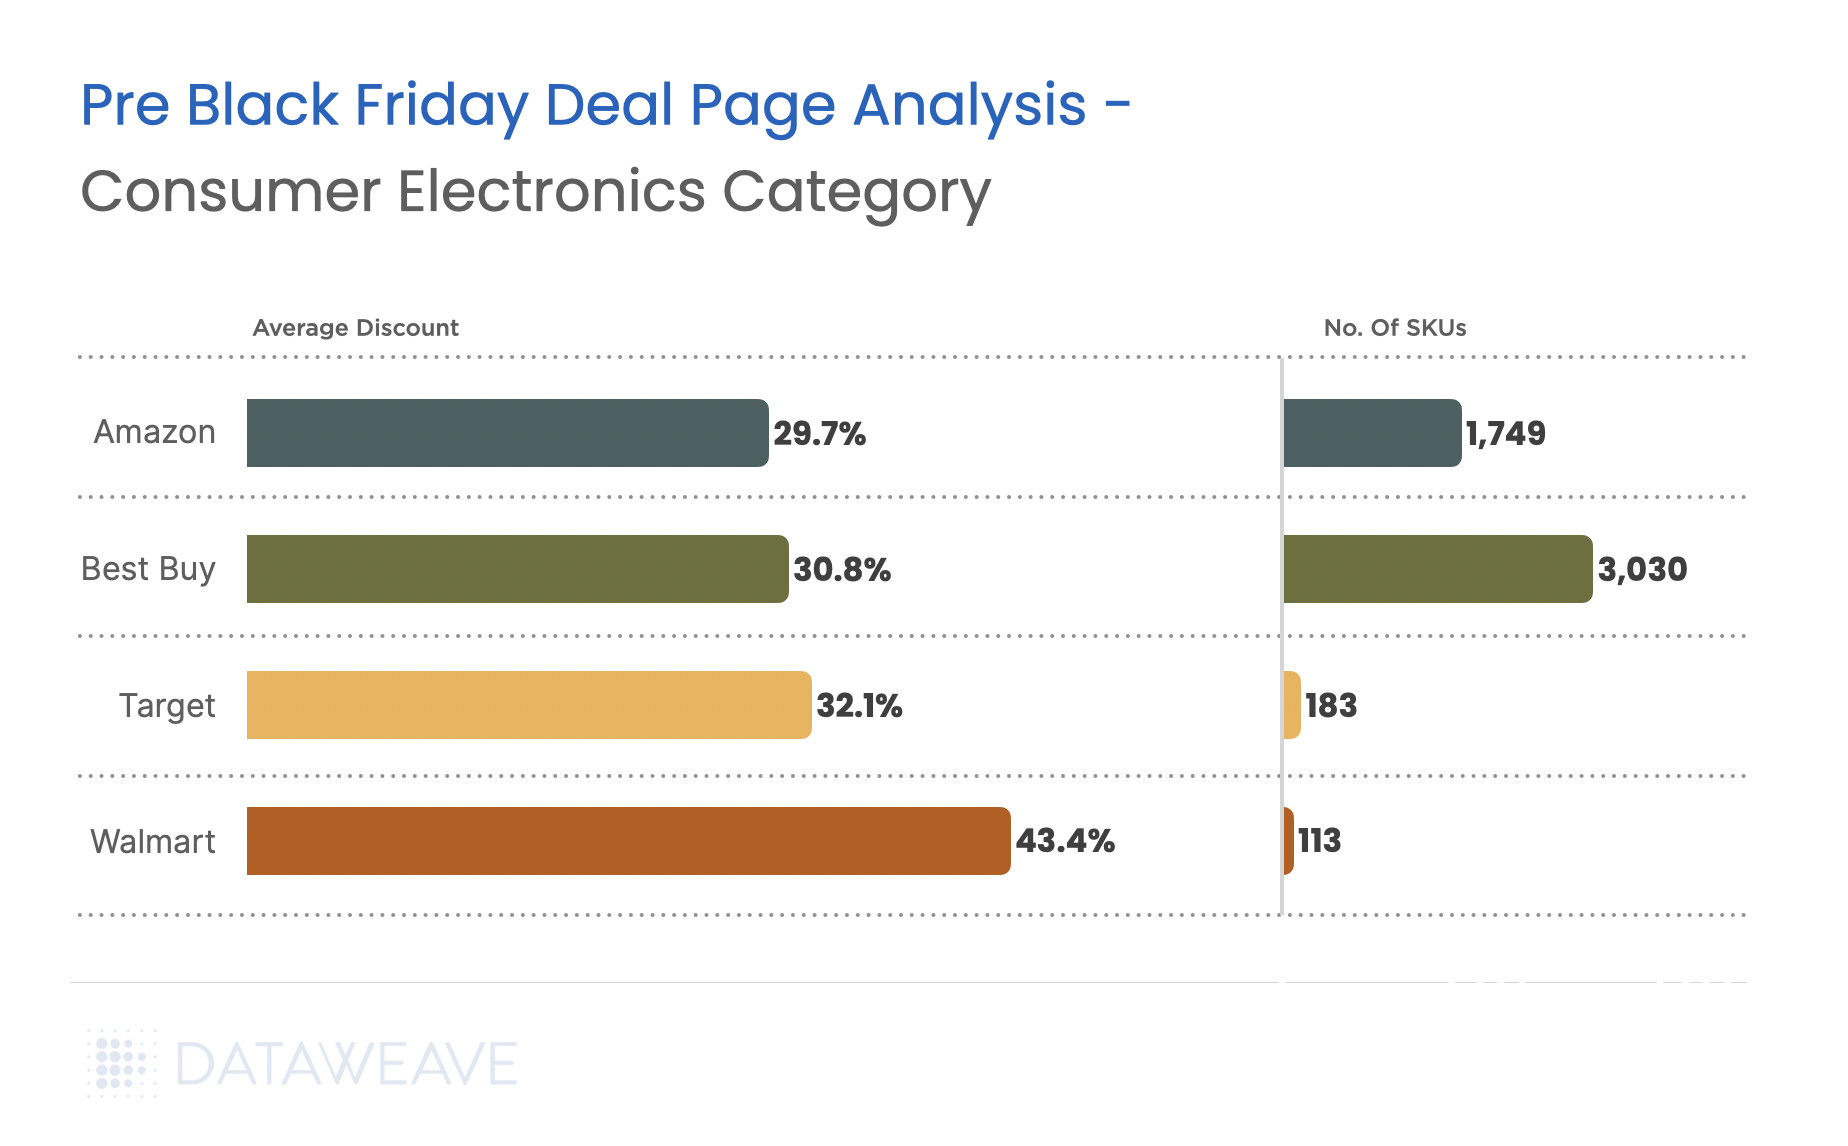
AI is transforming how consumers shop for electronics, with AI-driven traffic to retail sites expected to rise 410% year-on-year during the 2025 holiday season. Younger shoppers particularly embraced AI tools, with 17% of Gen Z consumers using AI platforms like Chat GPT and Gemini to source and compare deals. Our analysis of 10,297 SKUs reveals how discounts varied across subcategories and which brands dominated search visibility.
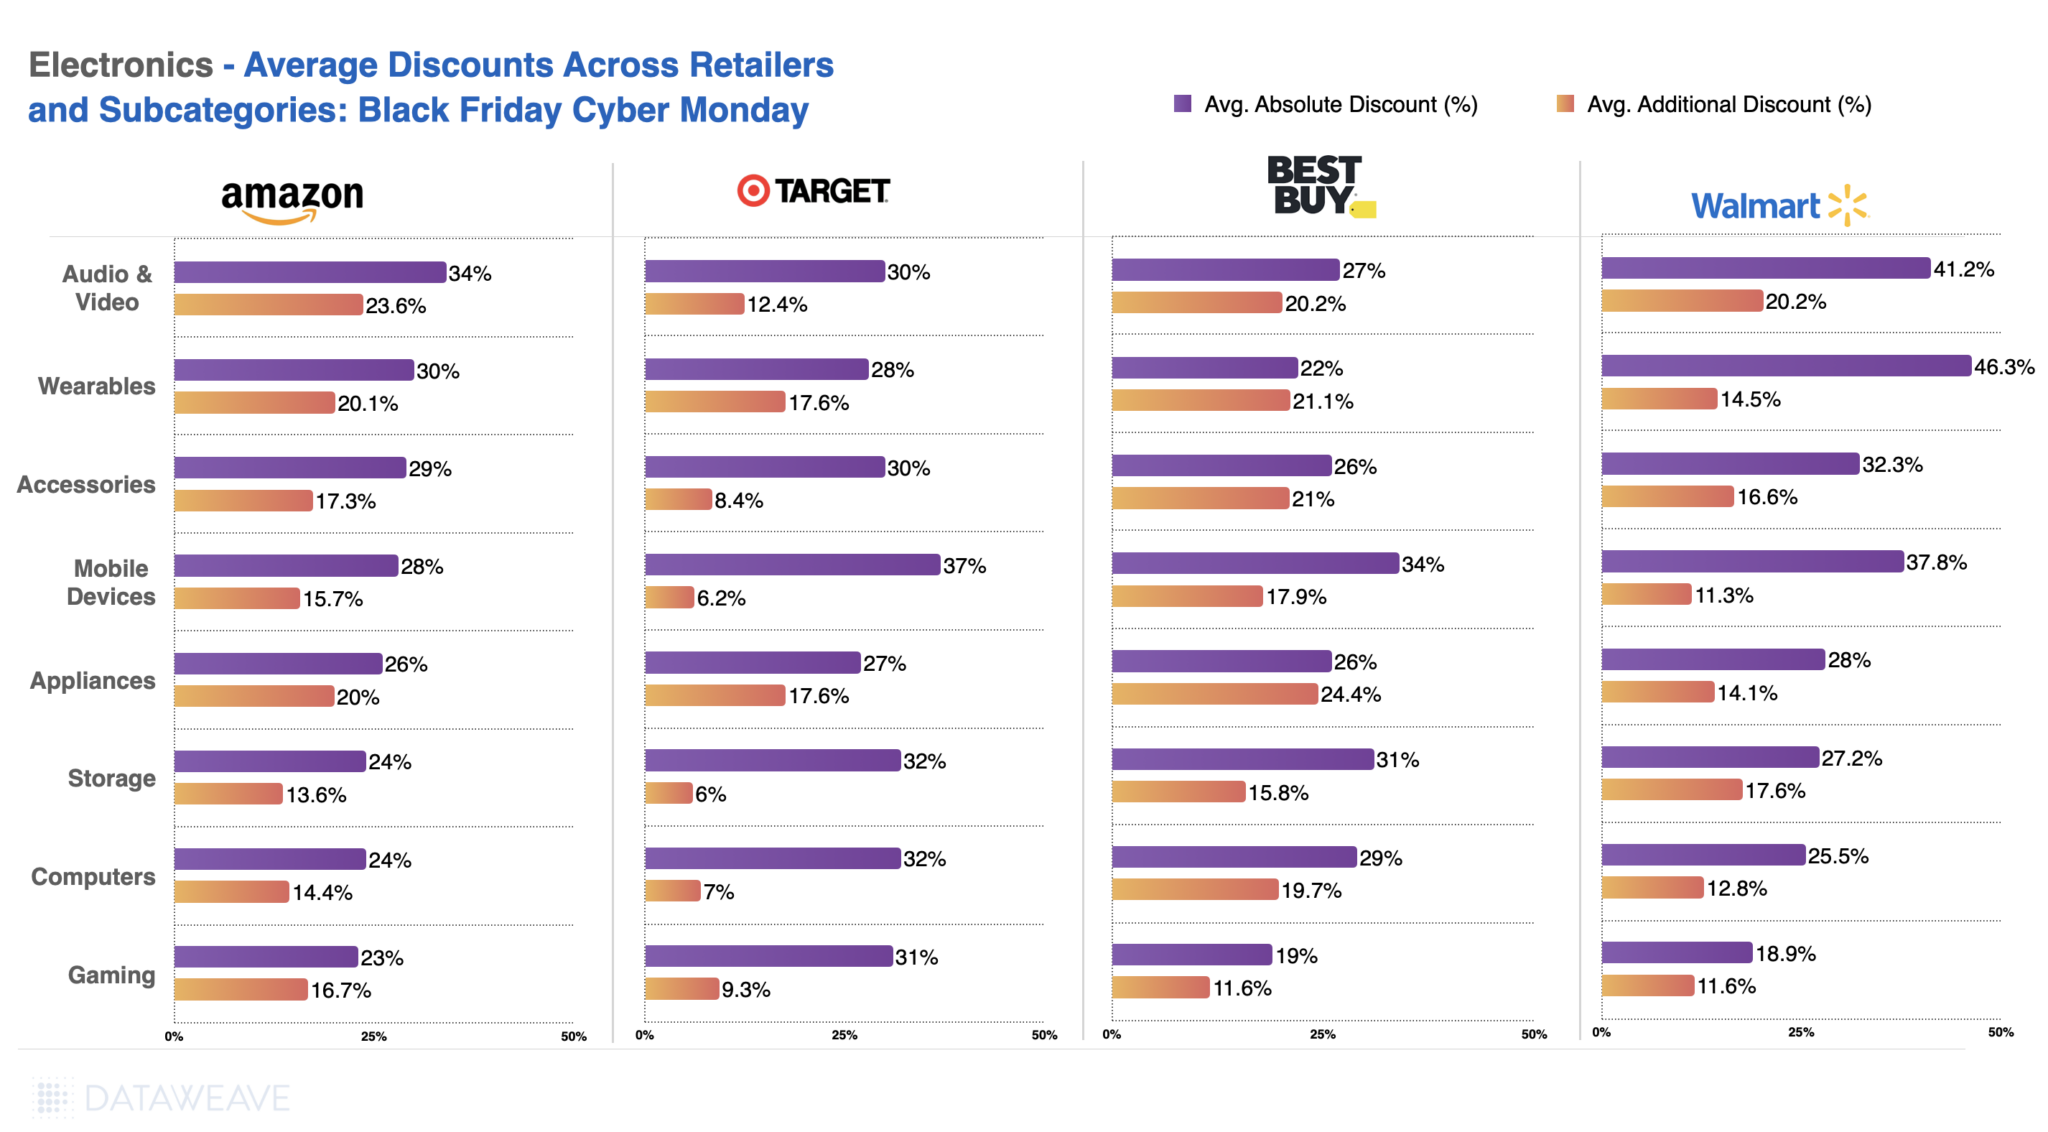
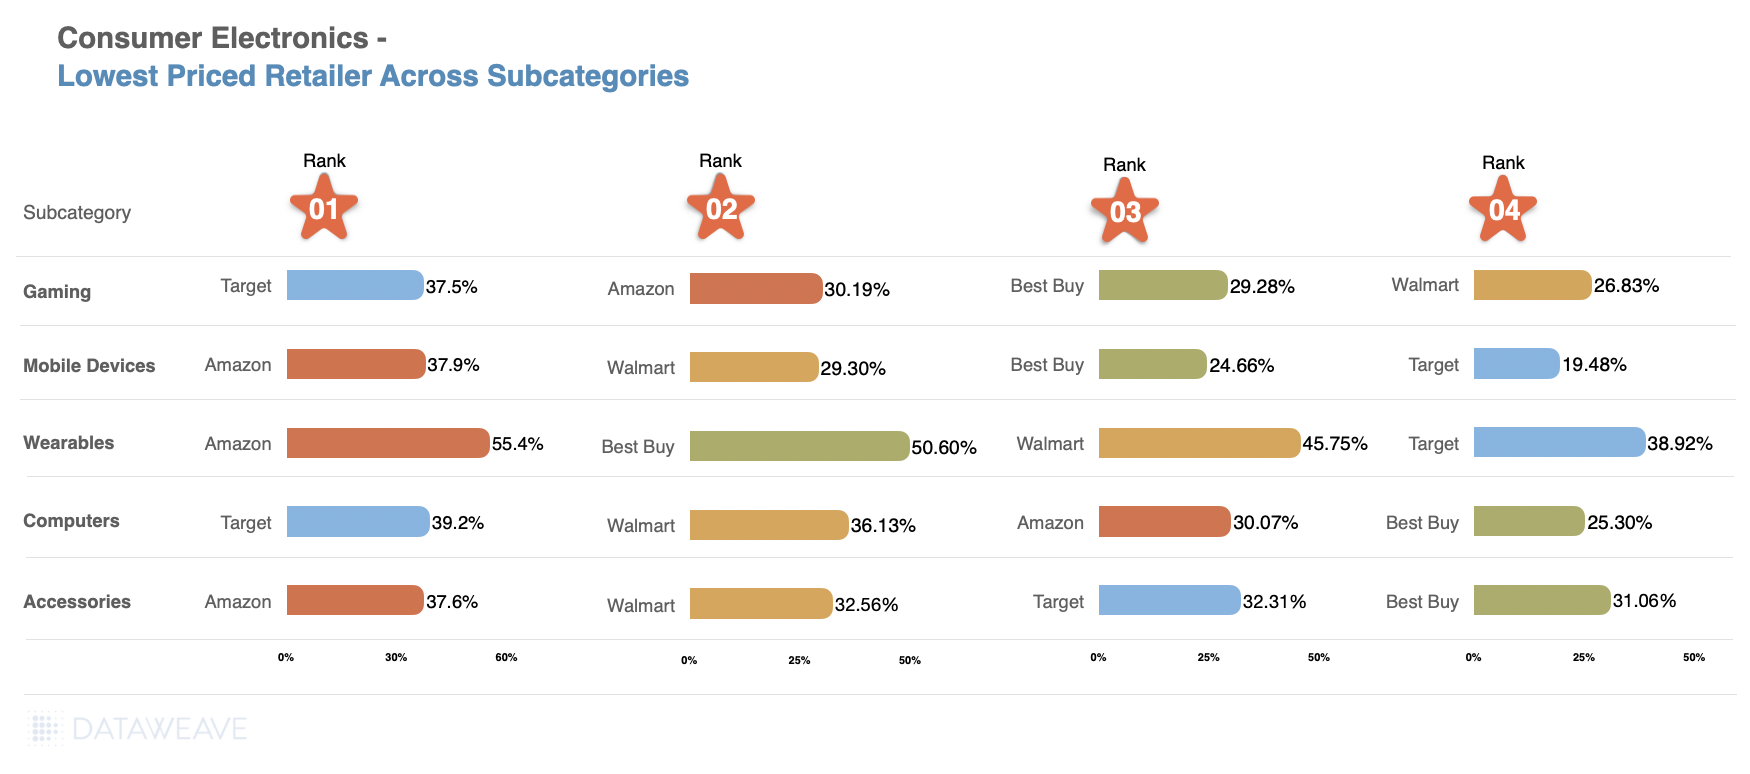
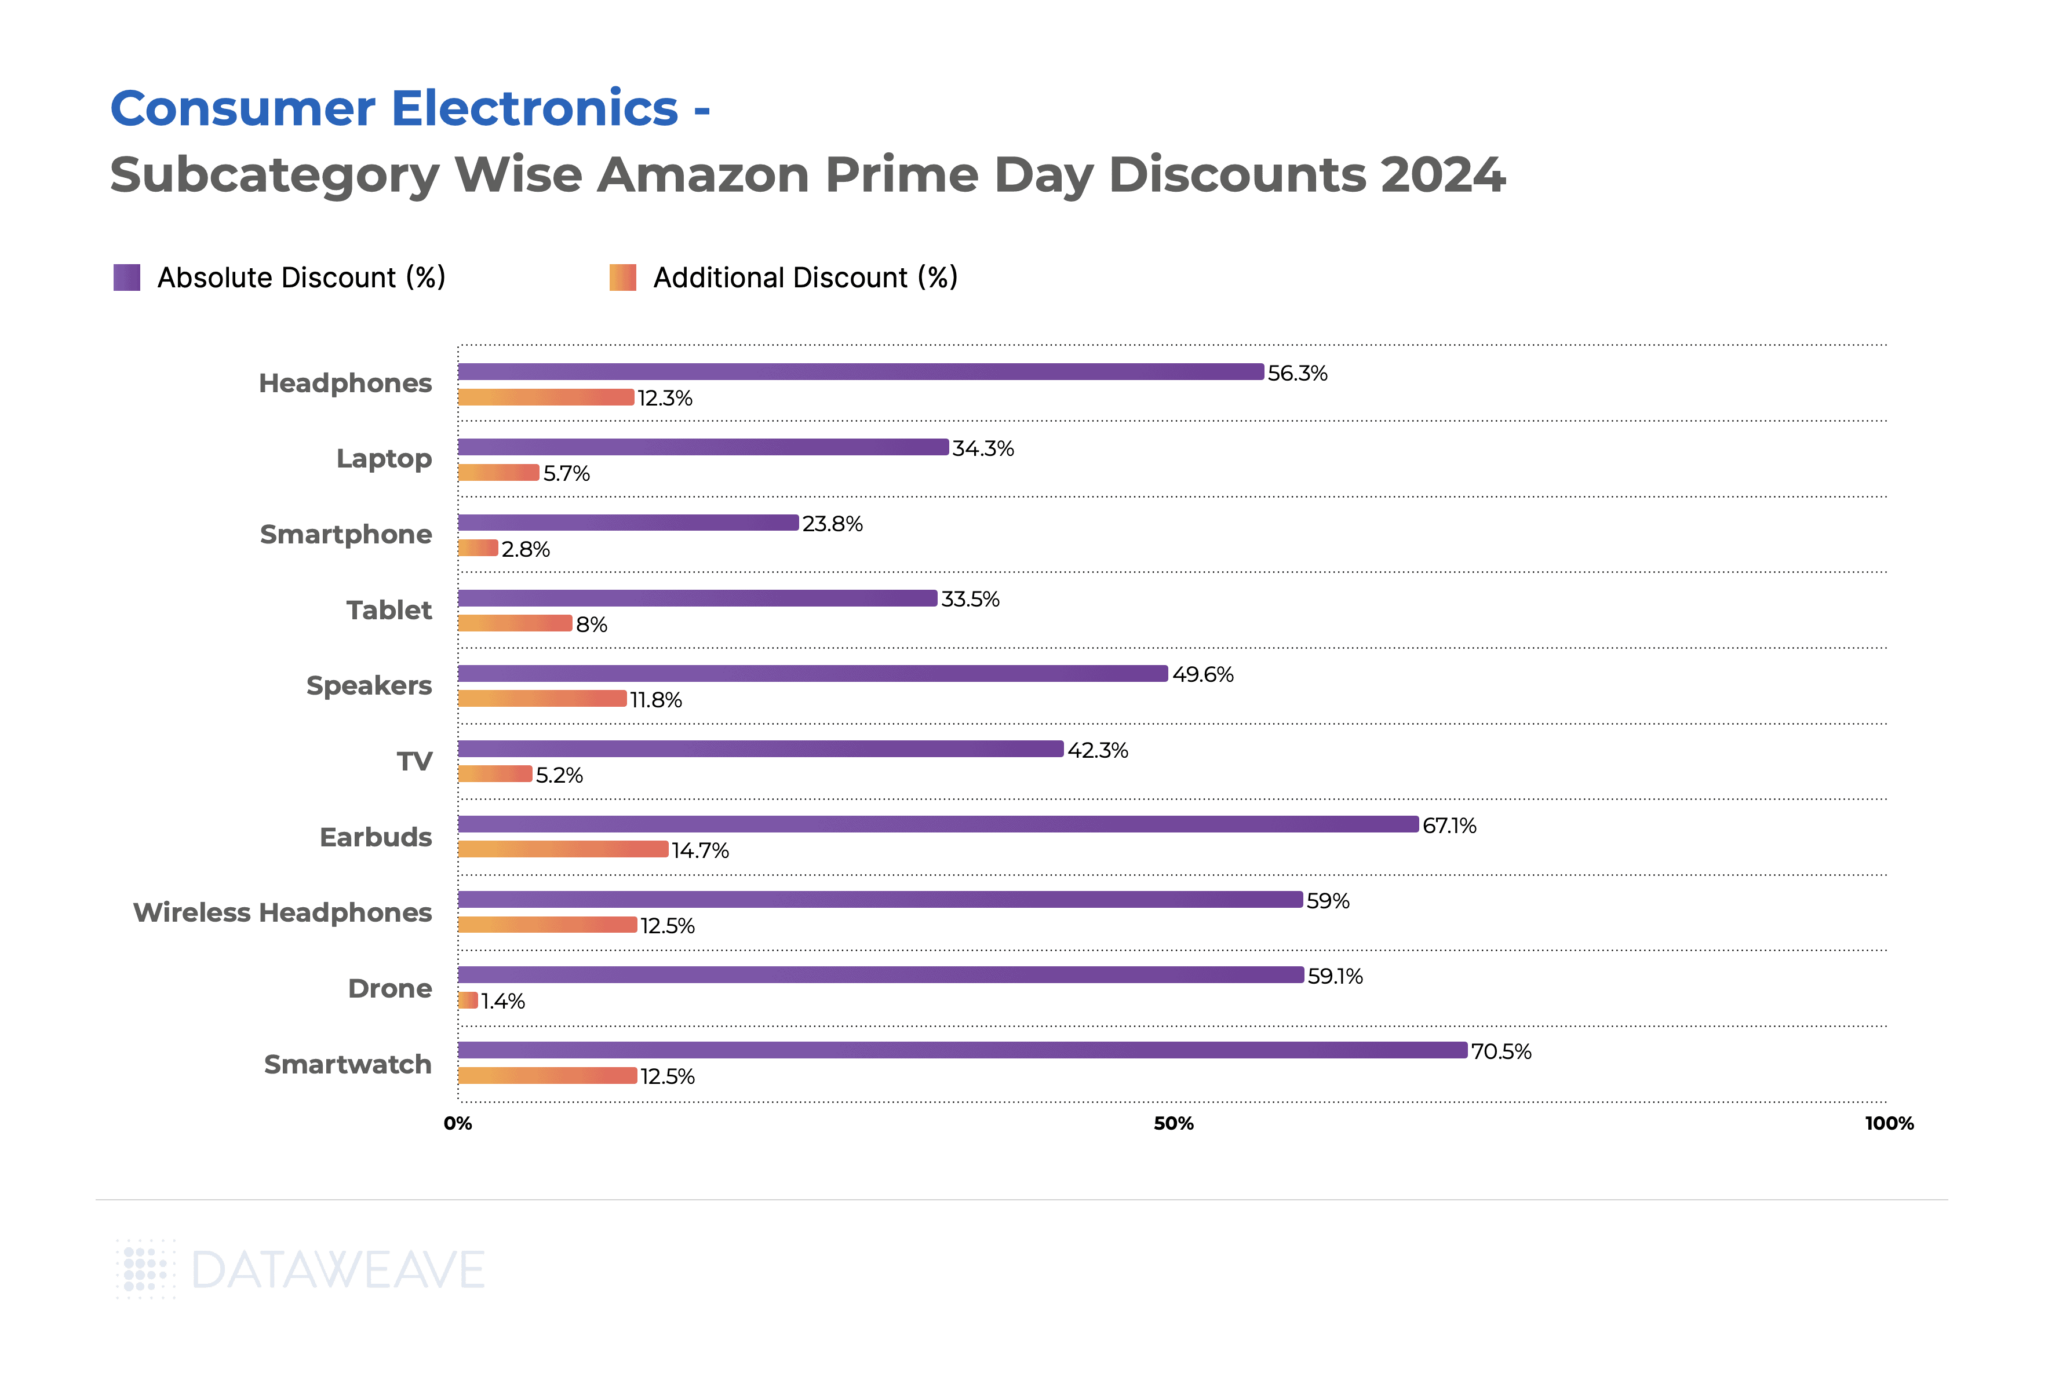
Subcategory Discount Analysis
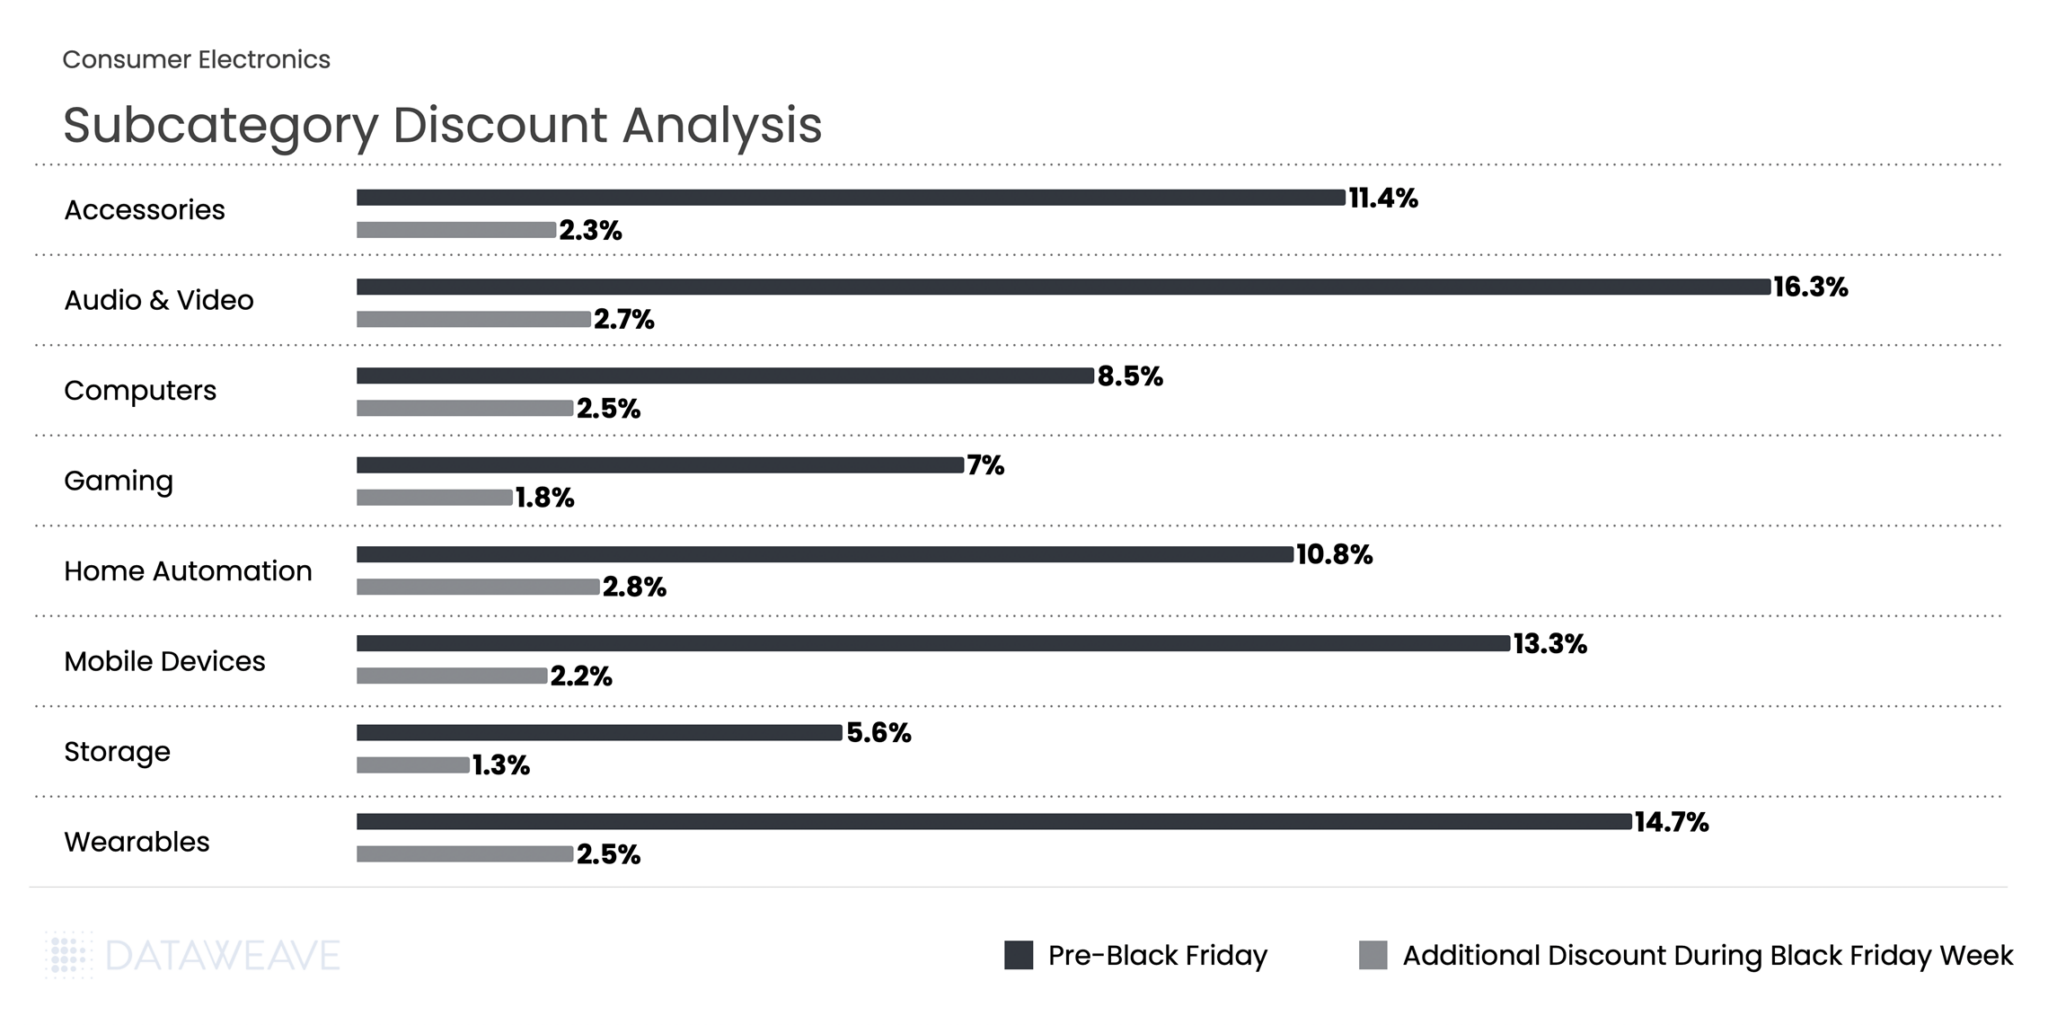
Pre-Black Friday discounts averaged 11.1% across subcategories, while Black Friday Week saw an additional 2.3% discount on average. Audio & Video products led the pre-sale discounting at 16.3%, indicating retailers were eager to move inventory early in the season.
During Black Friday Week, Home Automation saw the highest additional discount at 2.8%. Wearables and Computers both saw solid 2.5% additional discounts, making them attractive categories during the peak shopping period.
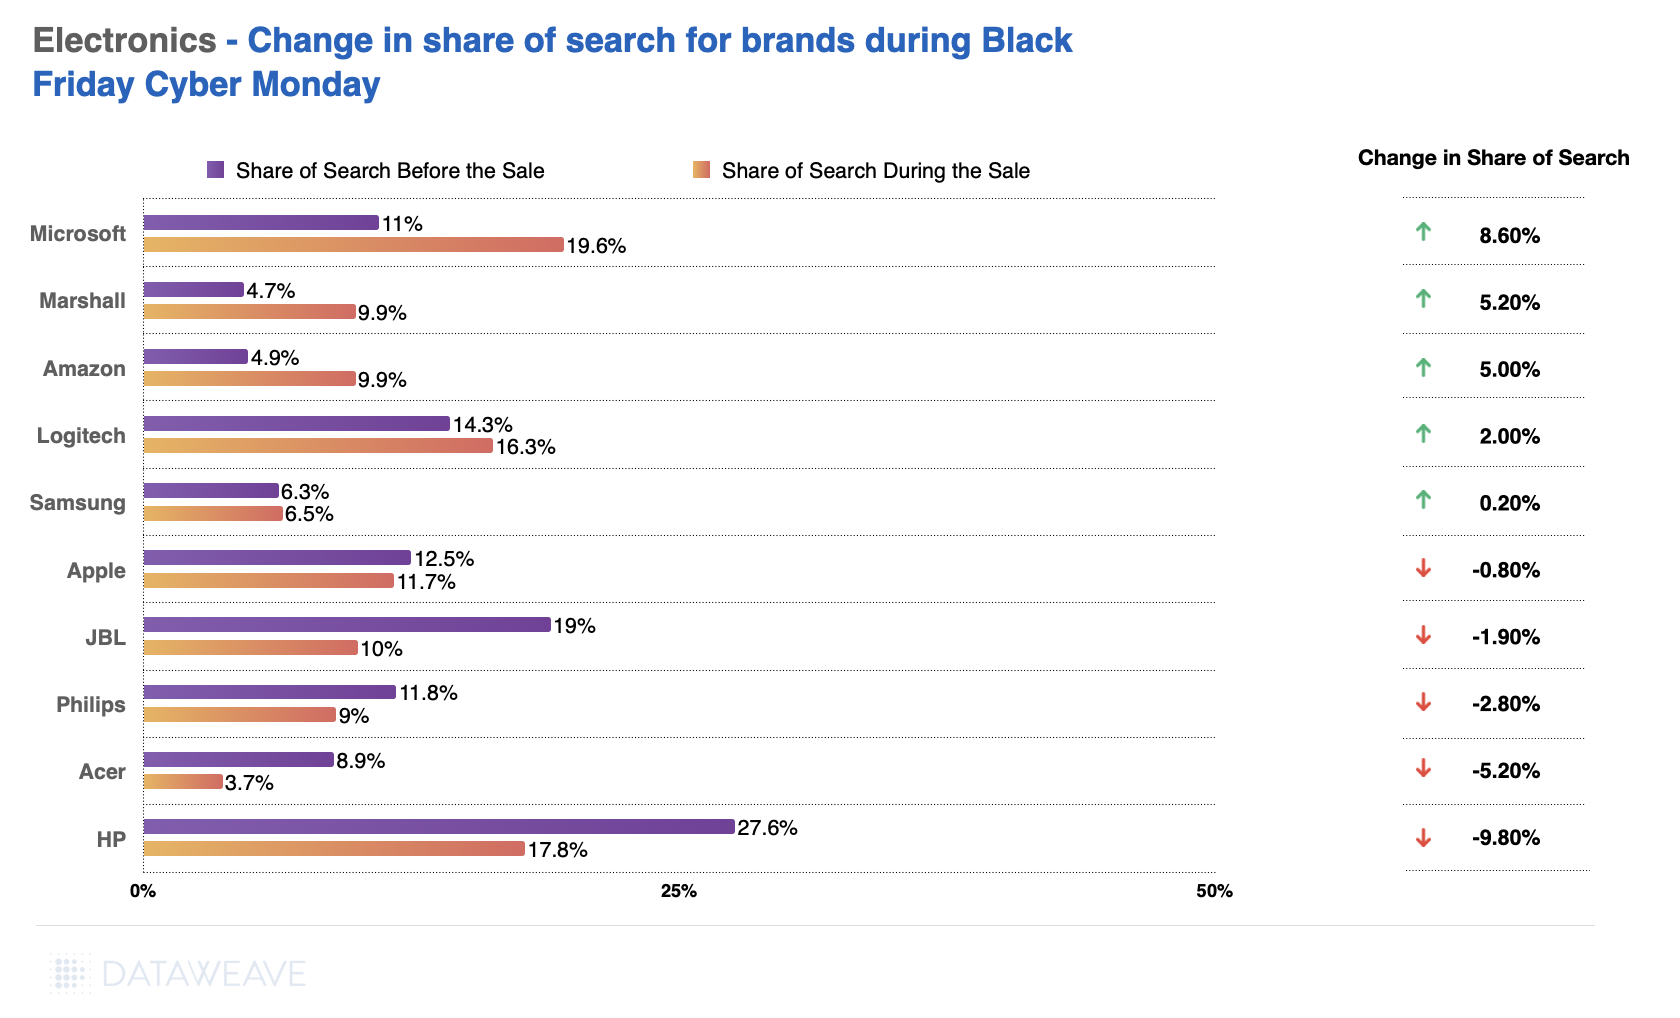
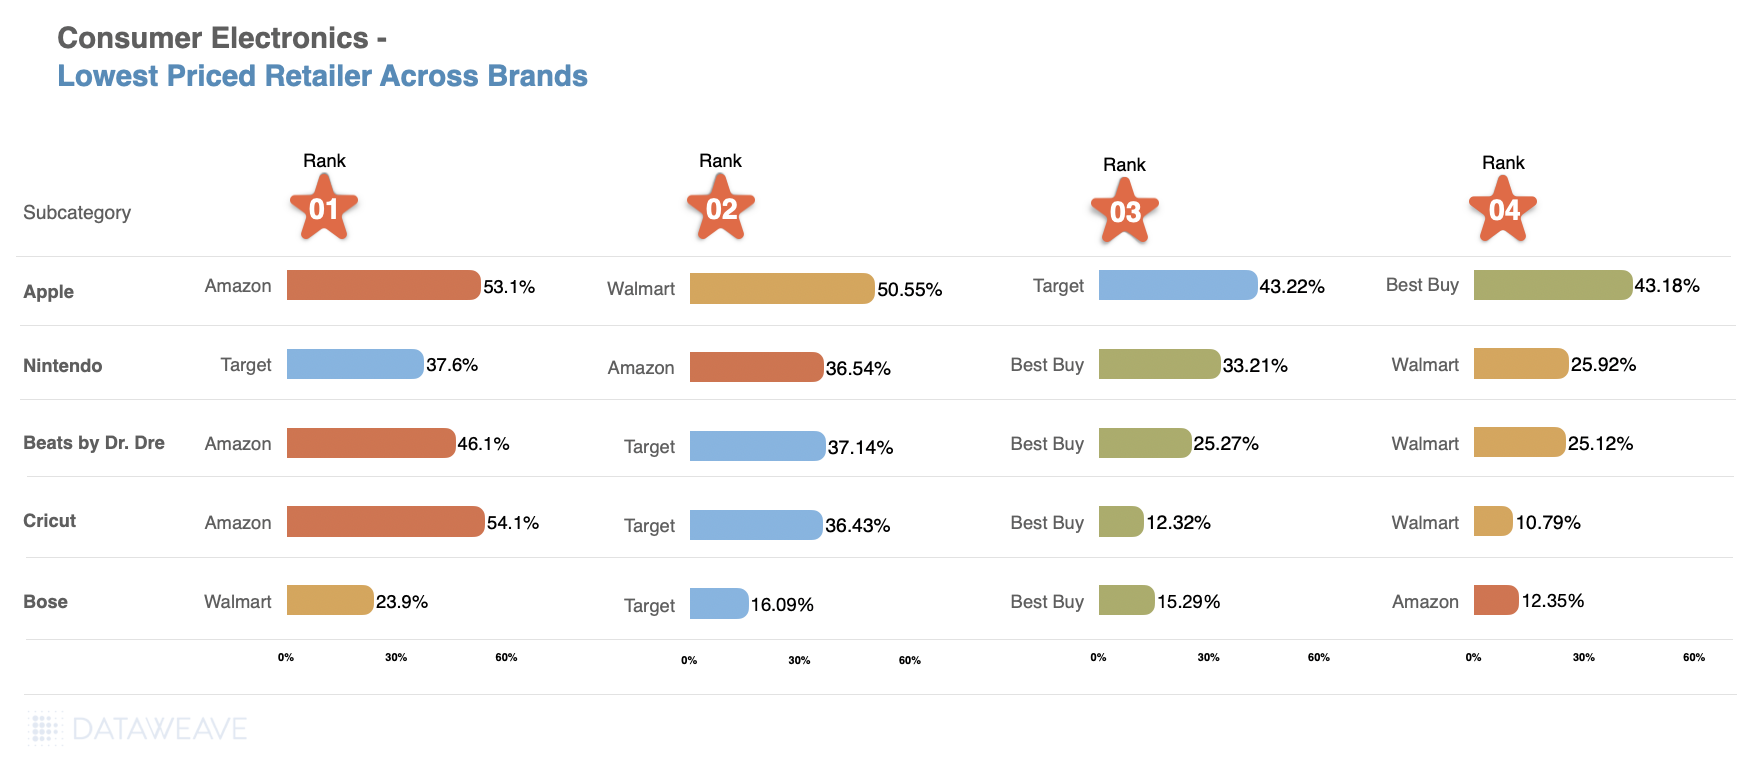
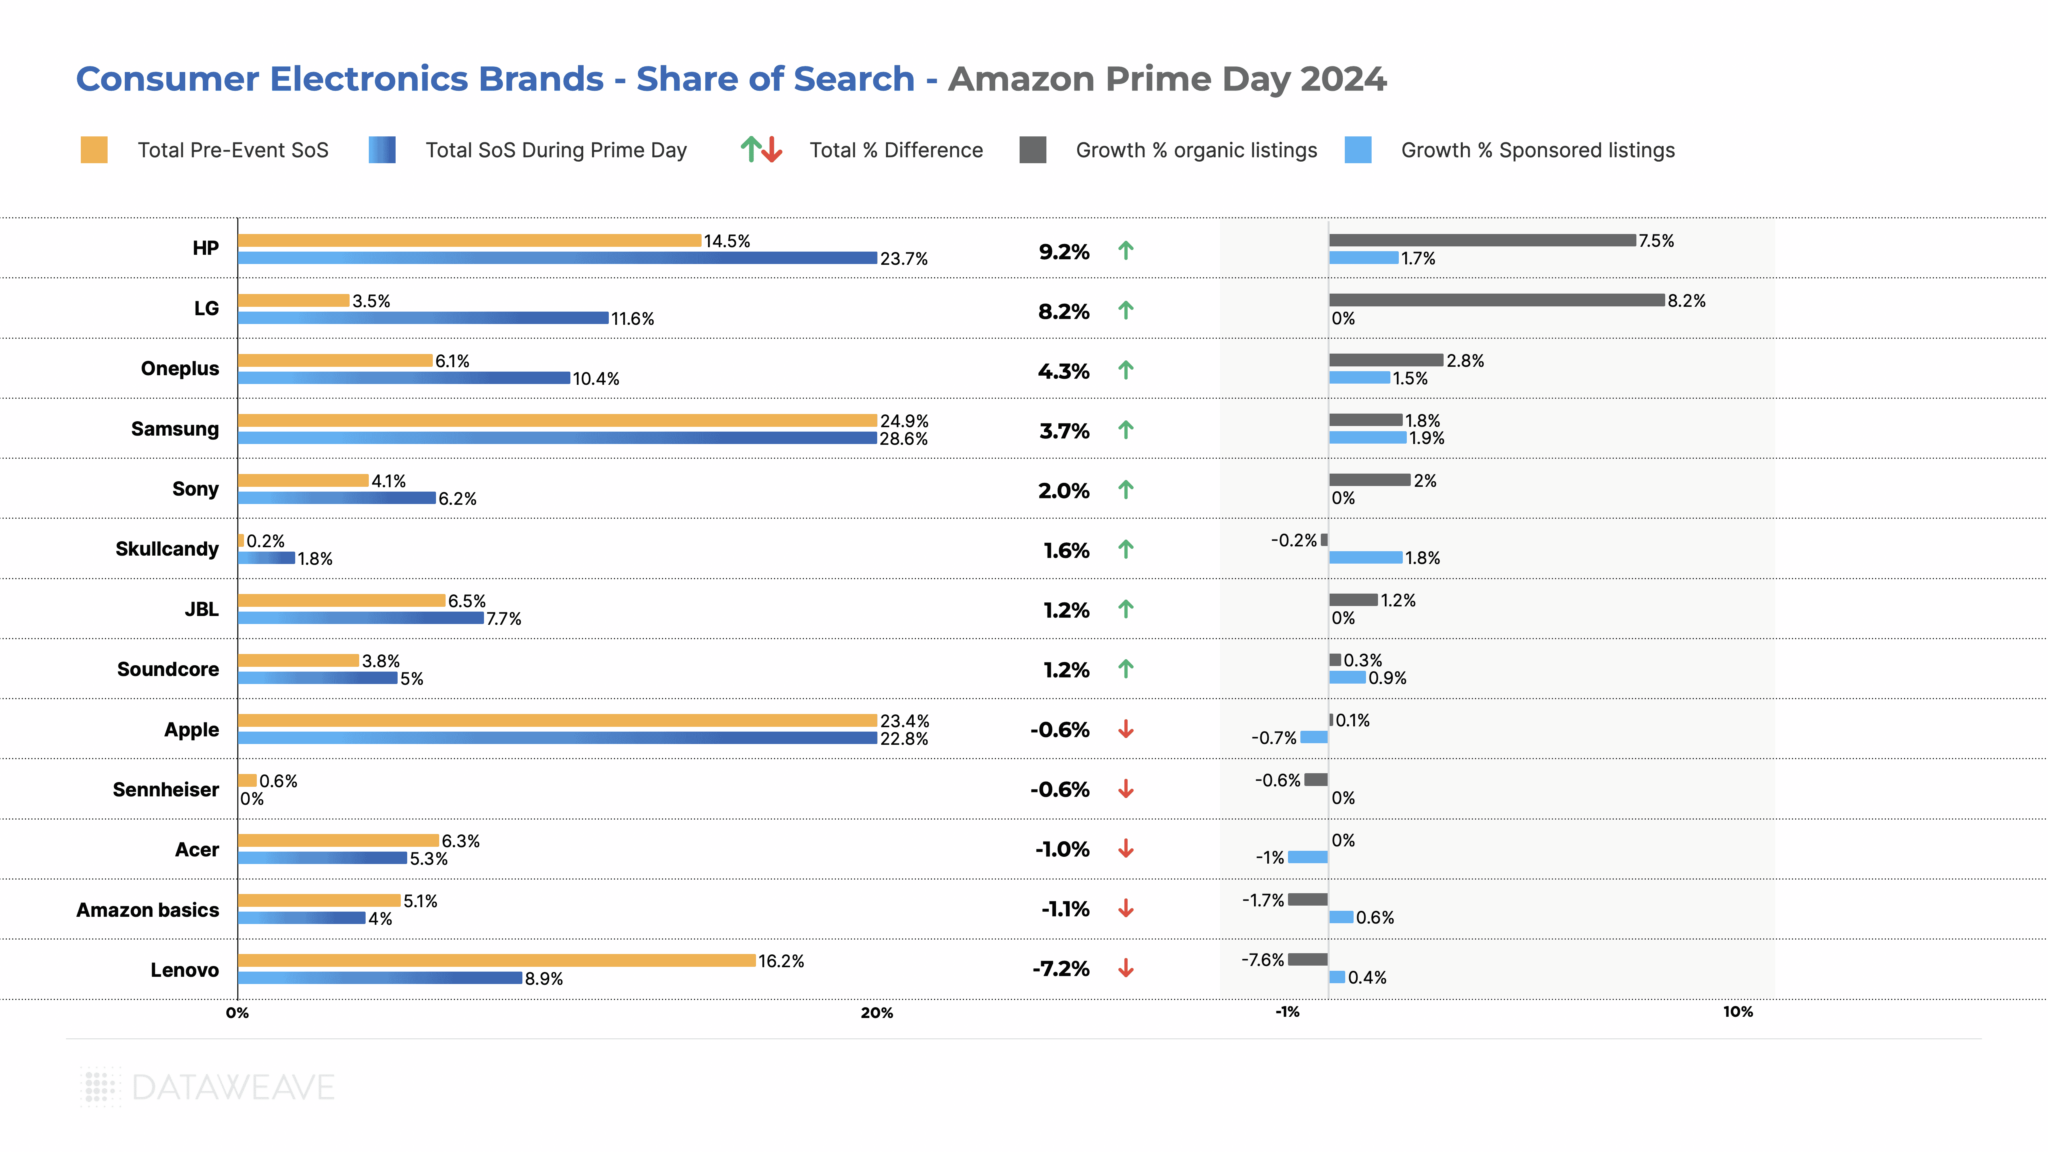
Share of Search: Brand Visibility Trends
Our Share of Search analysis reveals significant shifts in brand visibility during Black Friday Week:
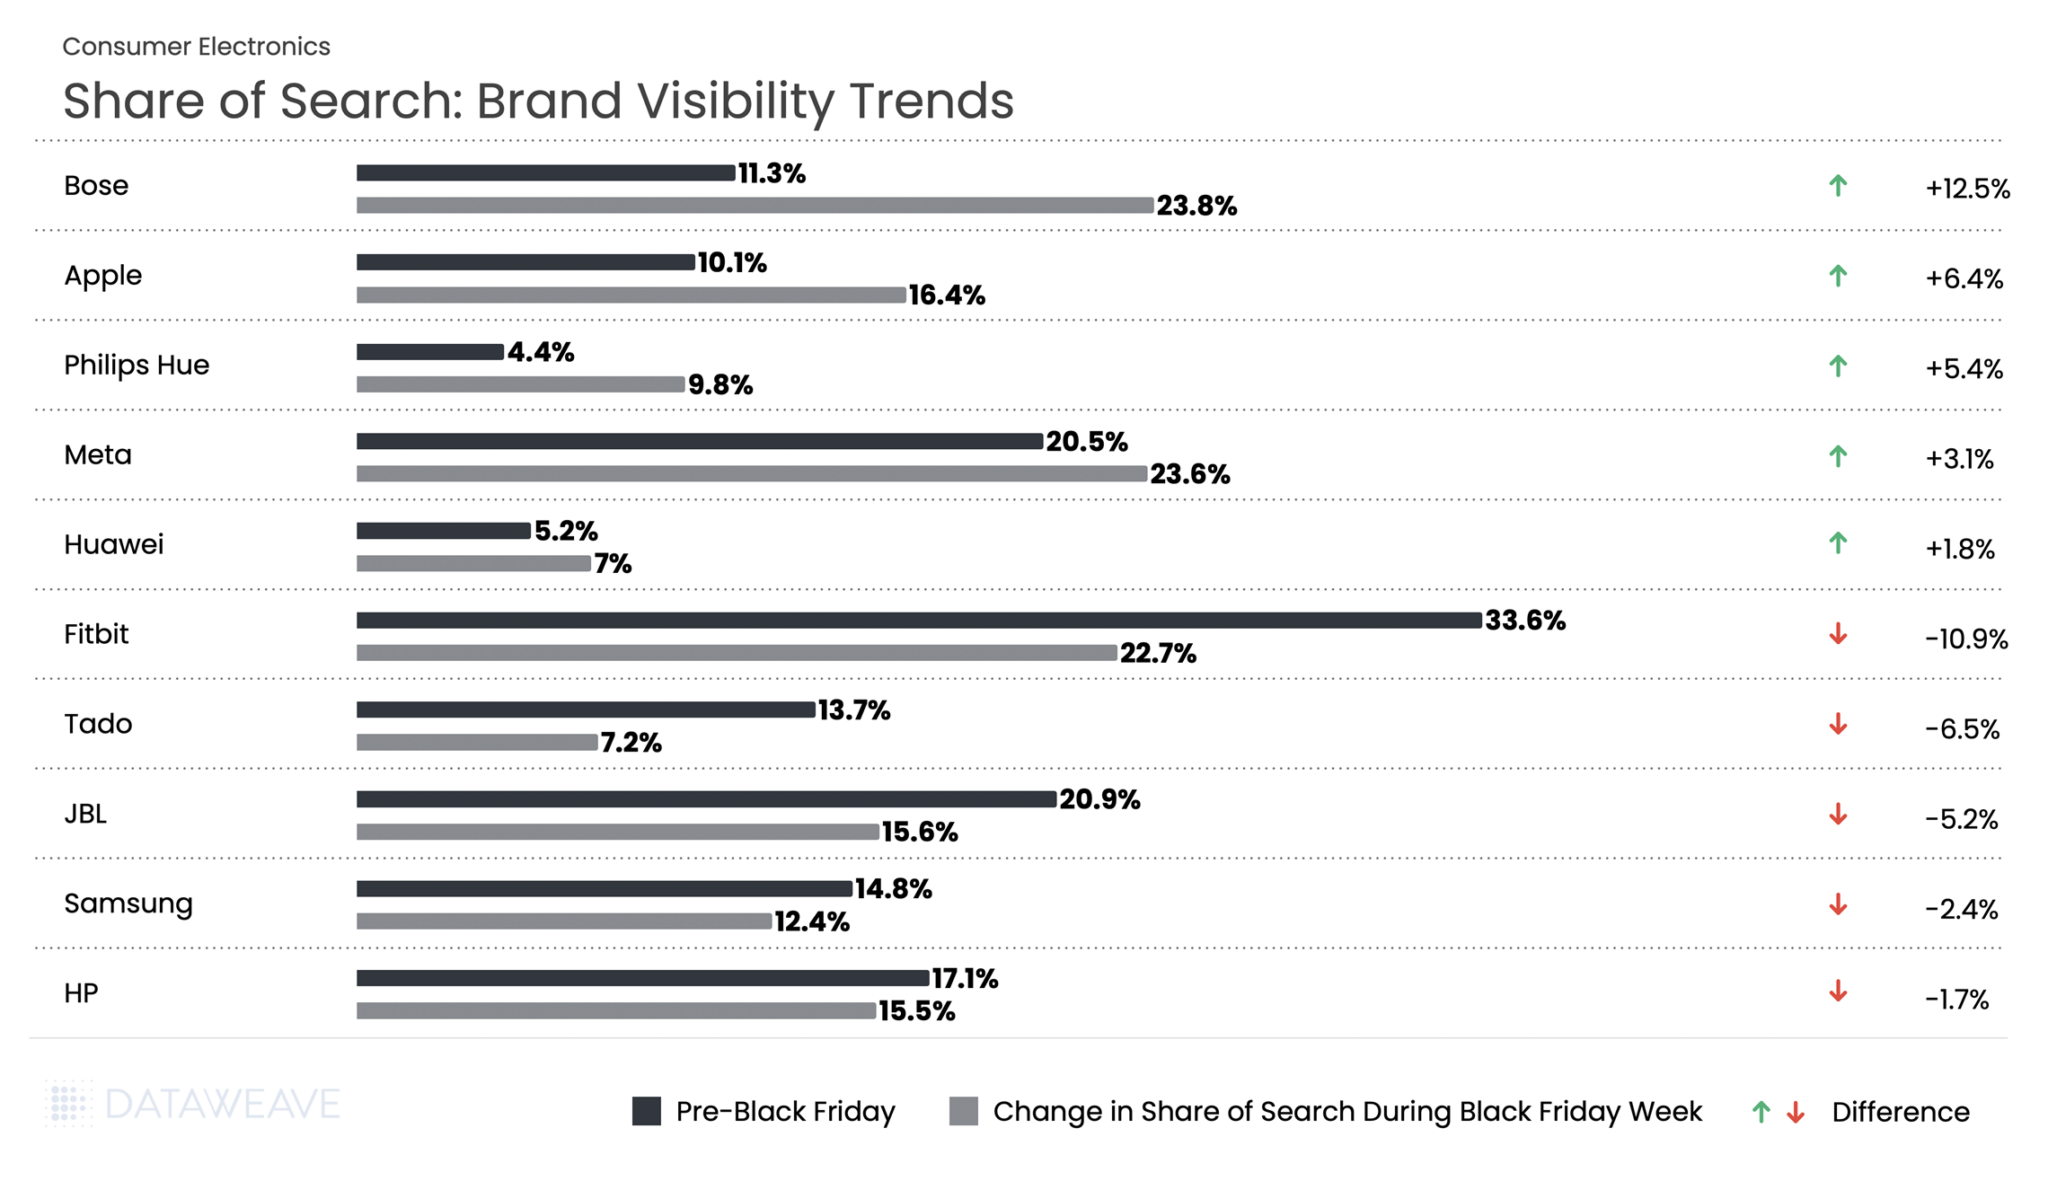
Bose dominated with its Share of Search more than doubling from 11.3% to 23.8%, a remarkable +12.5% gain. Lighting brand Philips Hue followed, gaining by +5.4% in share of search during Black Friday week. Notably, Meta, with it’s range of wearables, stands out for a +3.1% increase in visibility.
Apple’s Share of Search jumped from 10.1% to 16.4%, a gain of 6.4%. At the same time, Fitbit’s share dropped nearly 11%, the steepest decline in the entire electronics category. Meanwhile, Samsung and HP also lost on visibility this Black Friday in the UK.
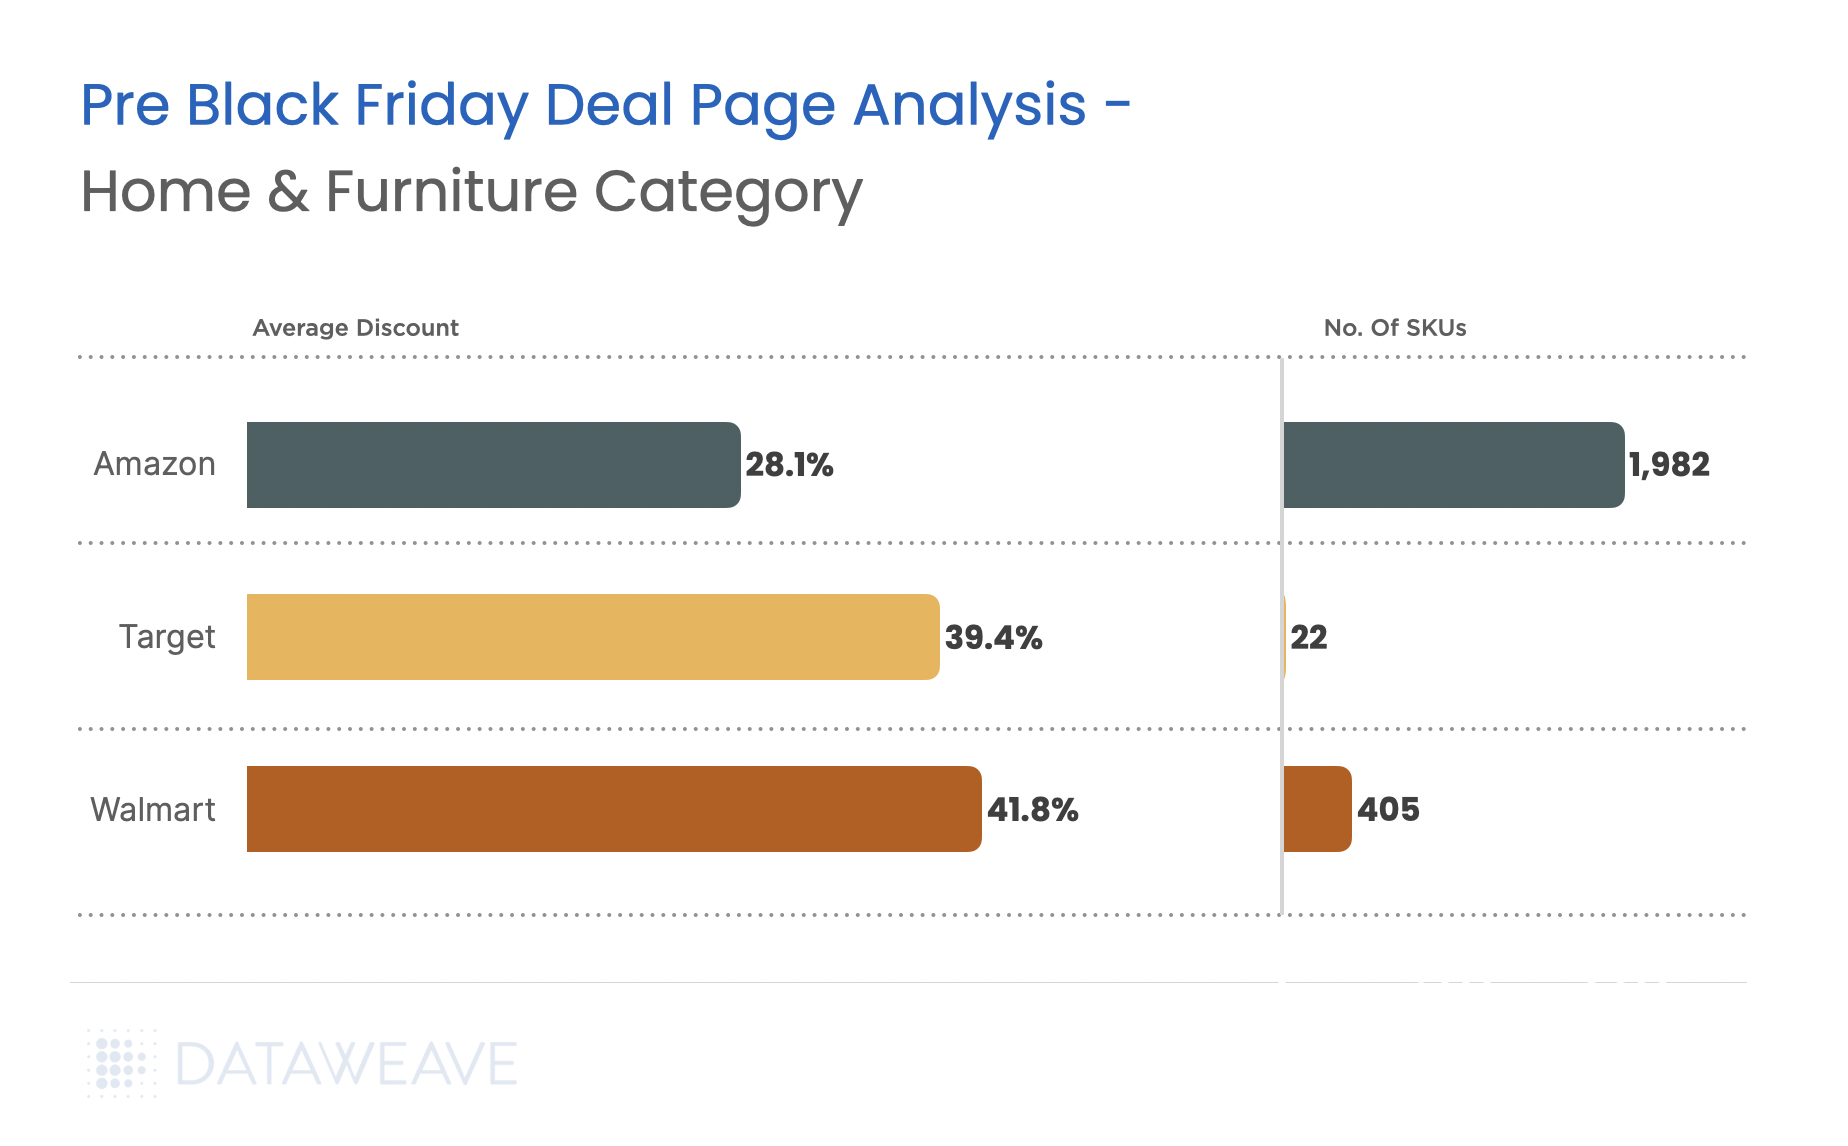
Home & Furniture
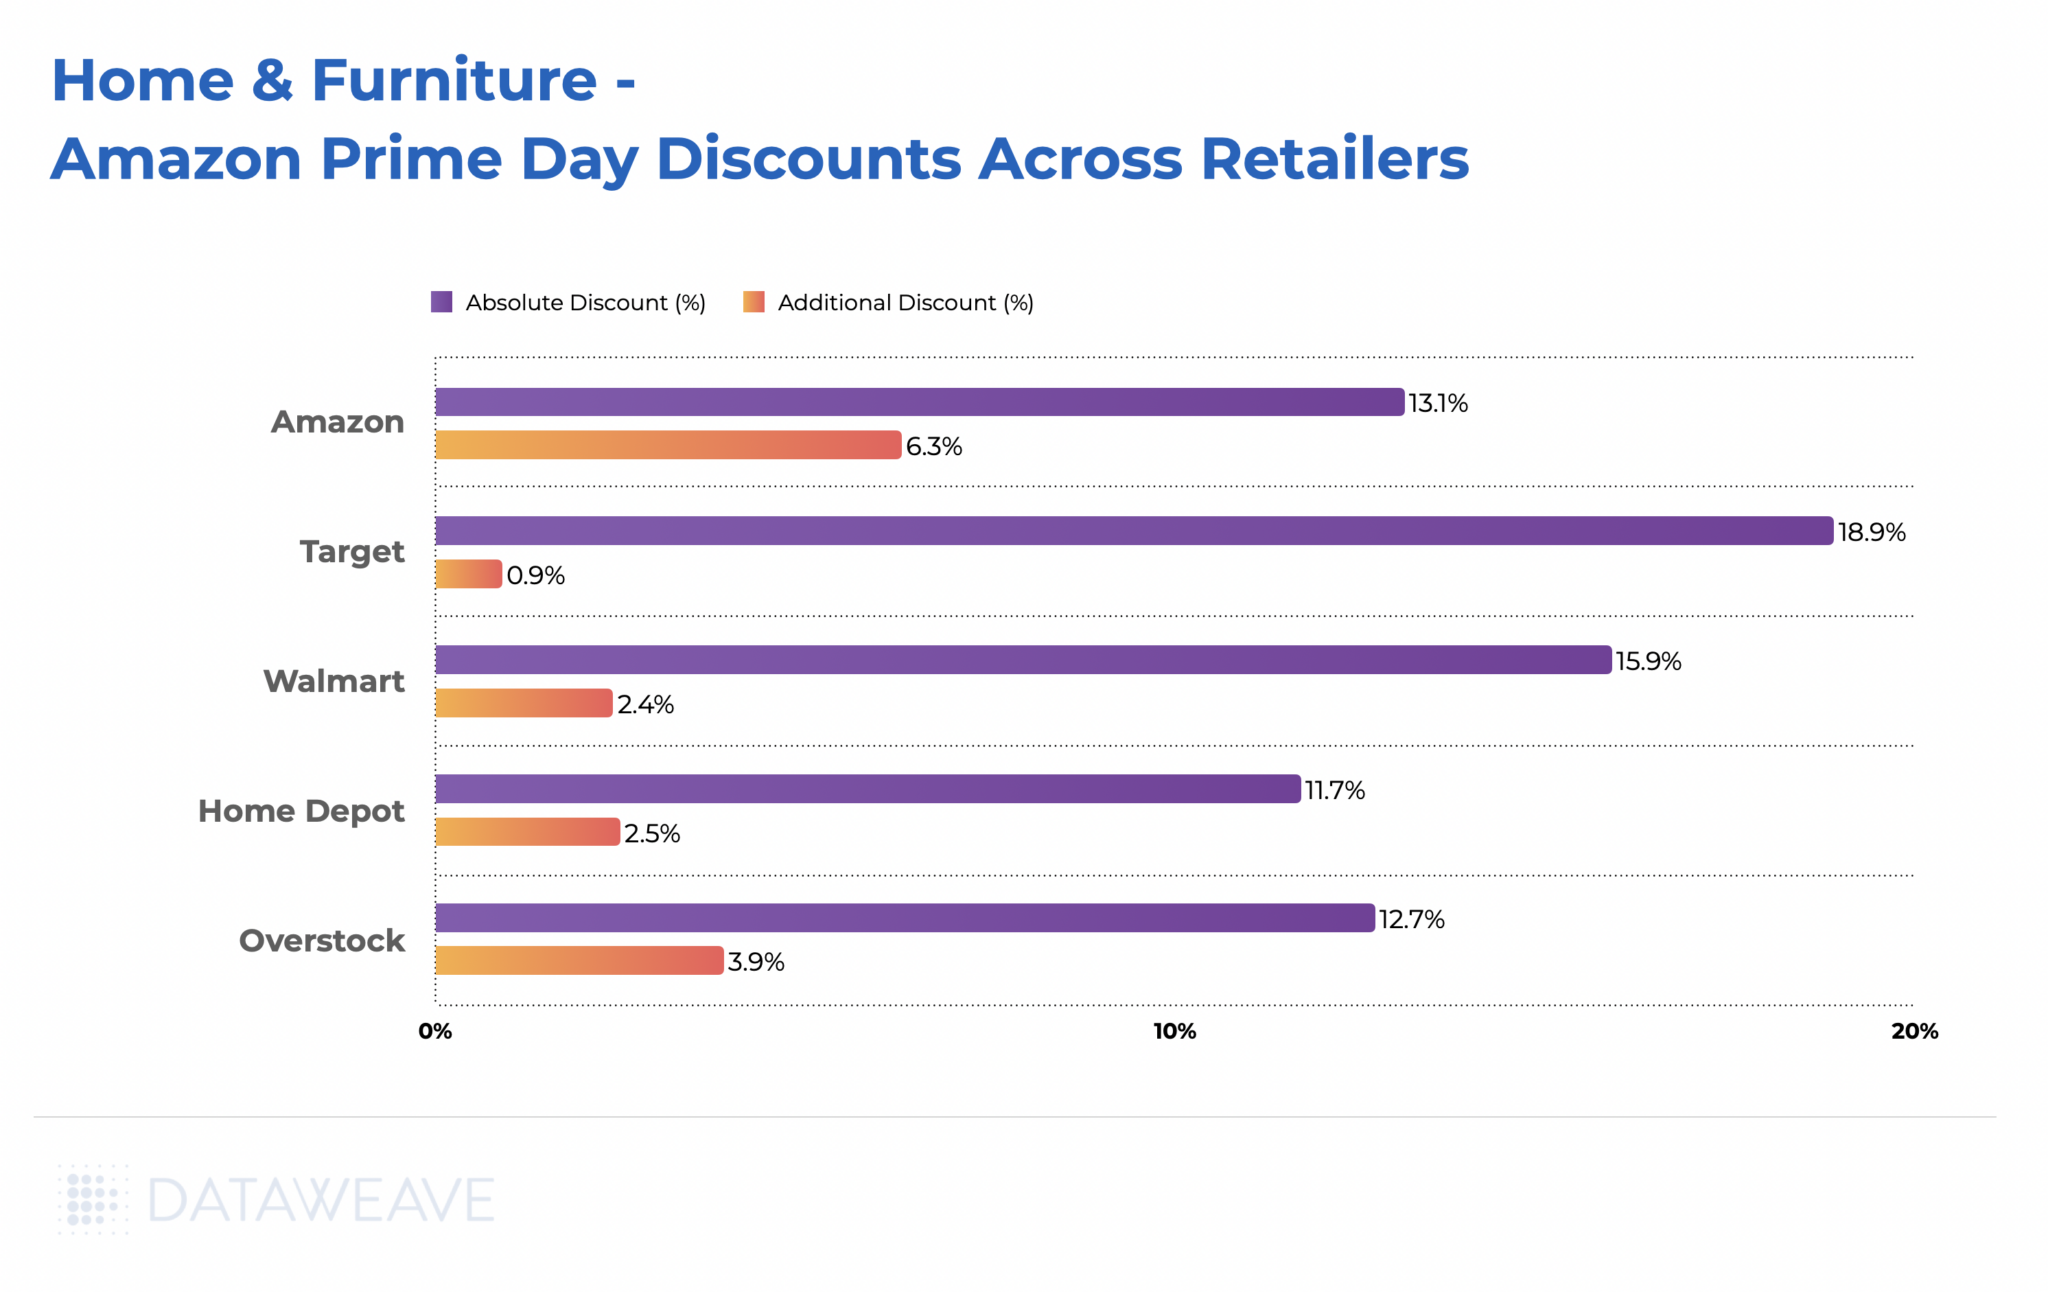
The Home & Furniture category continues to attract UK consumers during Black Friday, though with a more measured discounting approach compared to other categories. Our analysis of 16,487 SKUs shows how discounts were distributed across subcategories.
Subcategory Discount Analysis
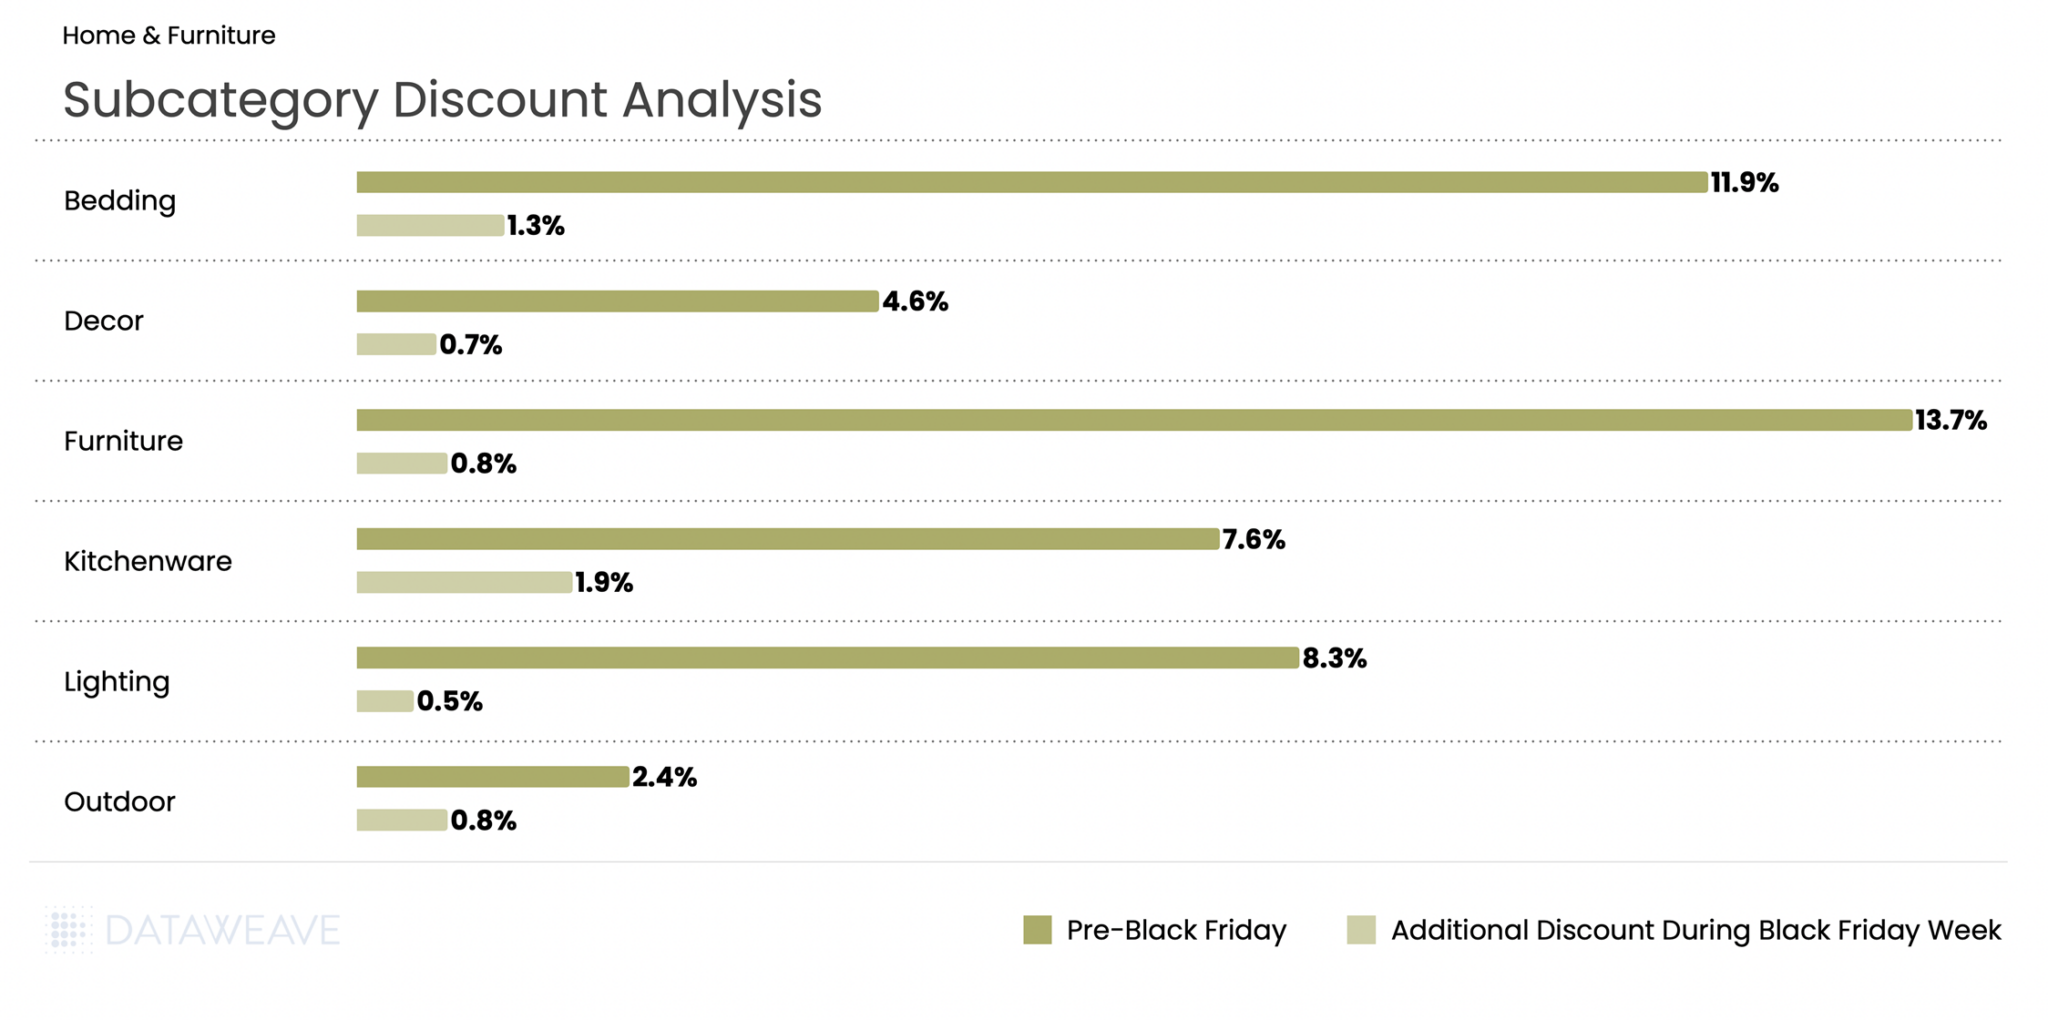
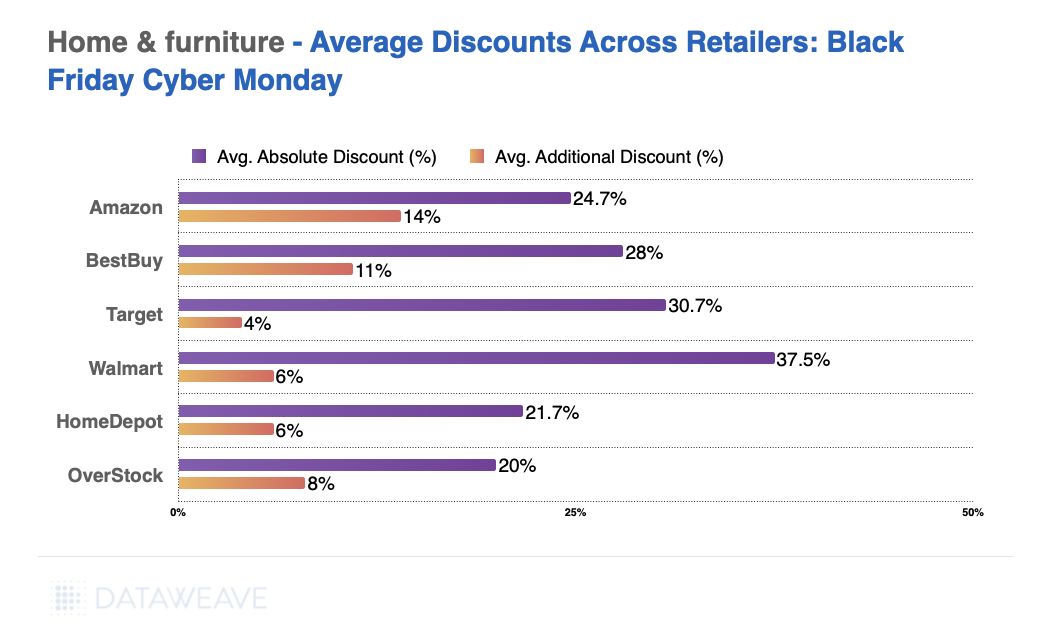
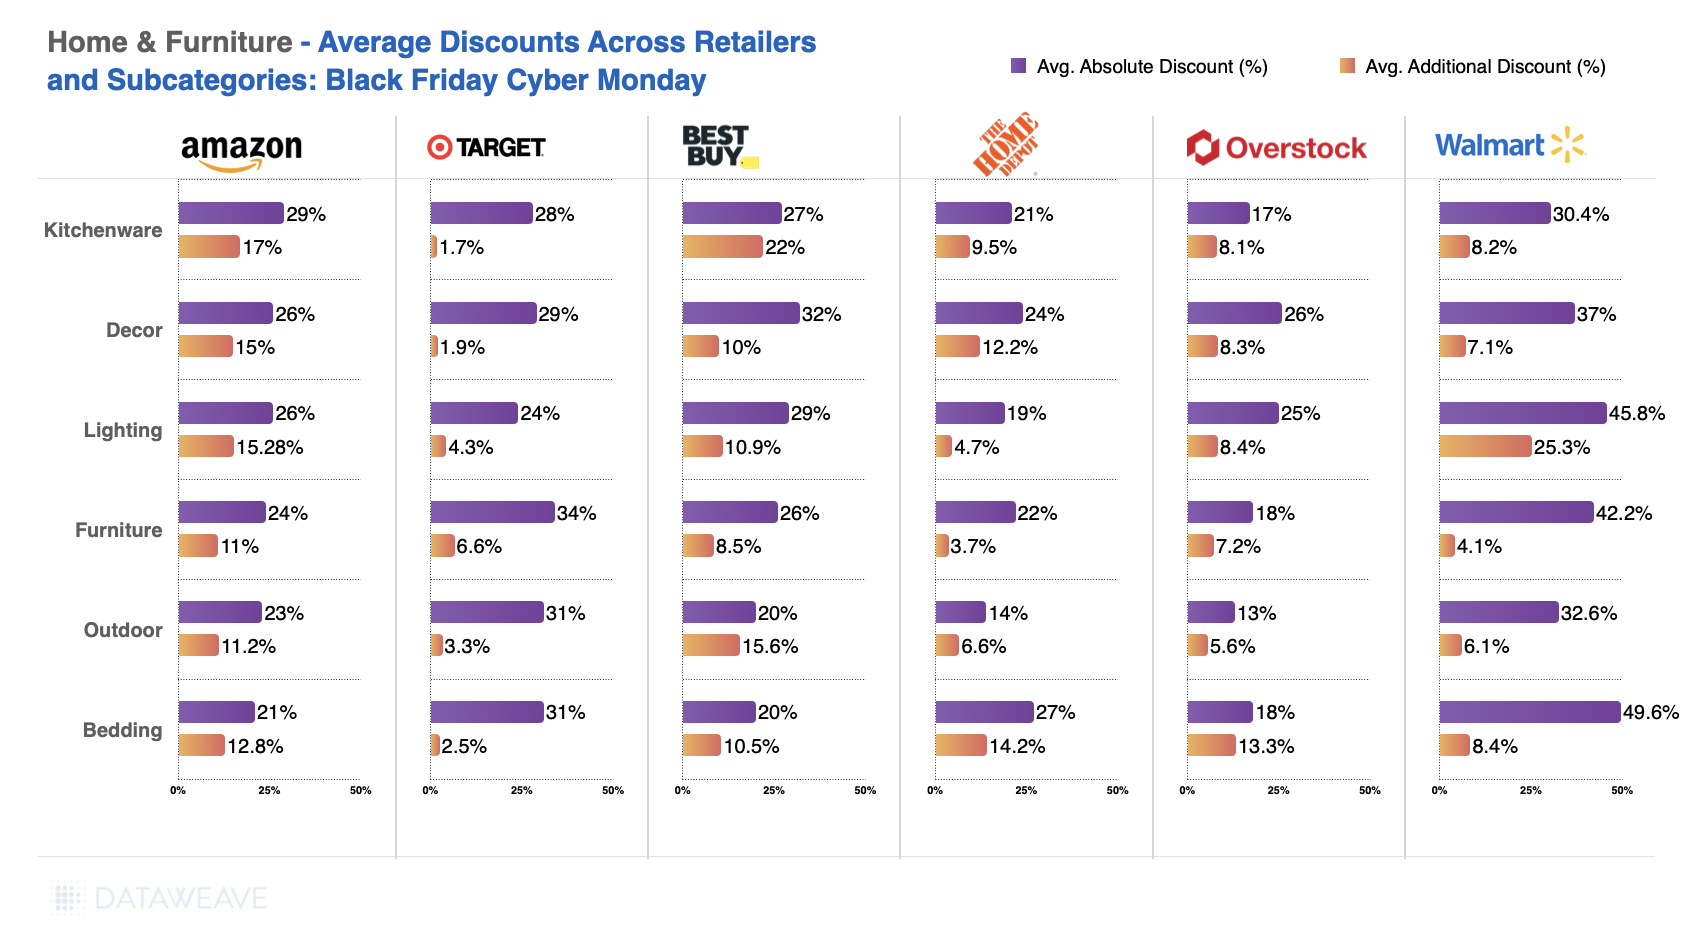
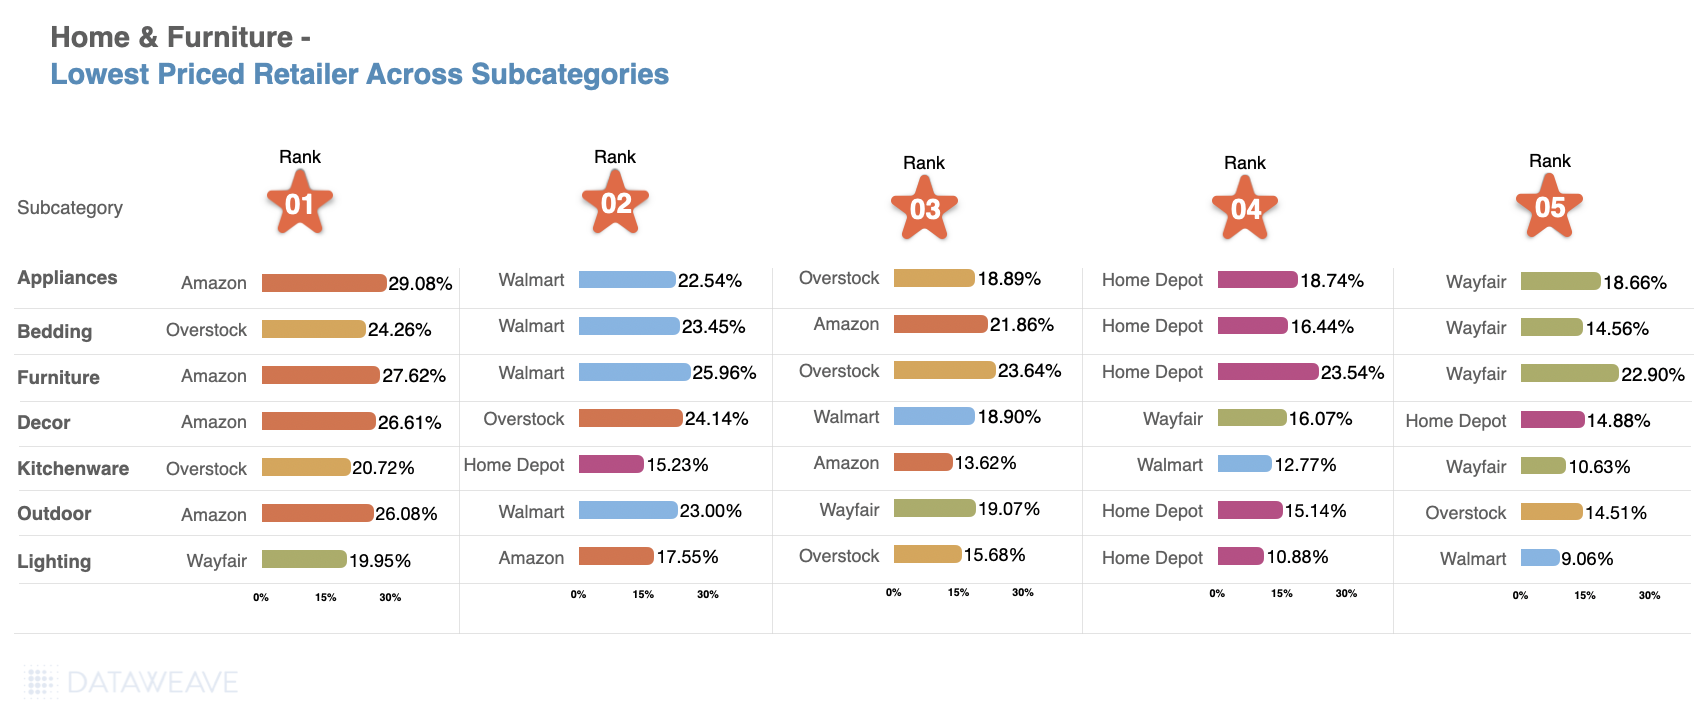
Home & Furniture saw Pre-Black Friday discounts averaging 9.1%, with Black Friday Week adding just 1% on average, the lowest additional discount among all categories. Furniture led pre-sale discounts at 13.7%, followed by Bedding at 11.9%. This suggests retailers aggressively promoted larger home goods early in the season to capture deal-seekers.
During Black Friday Week, Kitchenware saw the highest additional discount at 1.9%, making it attractive for holiday cooking and gifting needs. Conversely, Lighting saw minimal additional promotion at just 0.5%.
Share of Search: Brand Visibility Trends

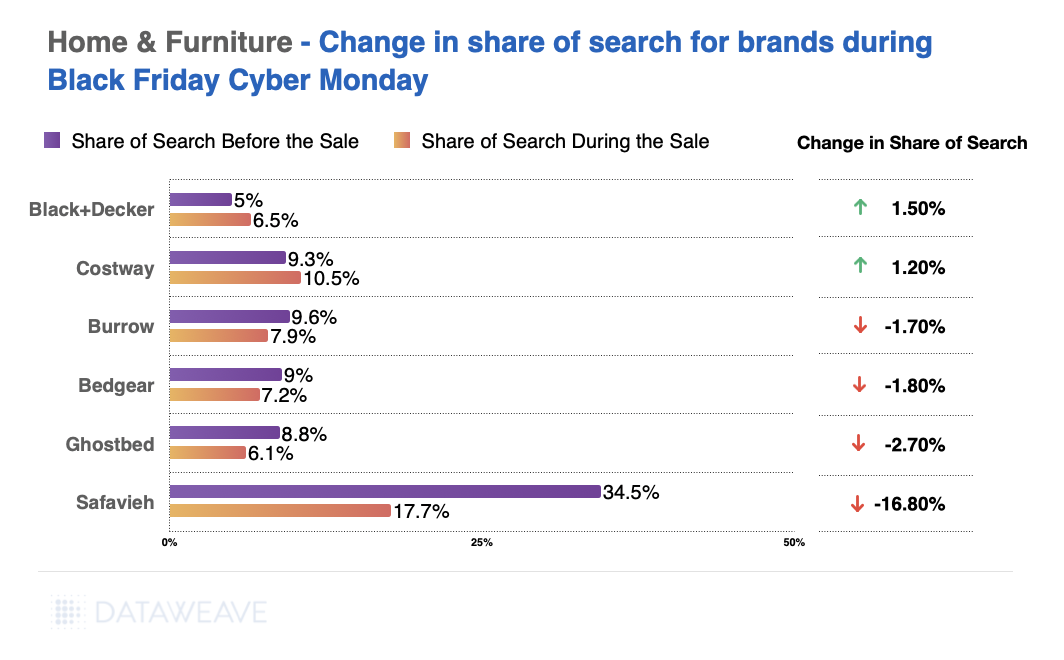
Made.com, the contemporary furniture brand, saw visibility surge during Black Friday with an impressive 8.9% increase. Similarly, emerging mattress brand Vesgantti gained 5.4%. Rug specialist Gooch Oriental also made significant gains with a 4.9% increase.
On the flip side, British heritage brands faced challenges. Both Laura Ashley and Julian Bowen saw share of search drop 2.2%. Premium mattress maker Vispring also declined 2.1%, while French cookware brand Le Creuset fell 1.9%.
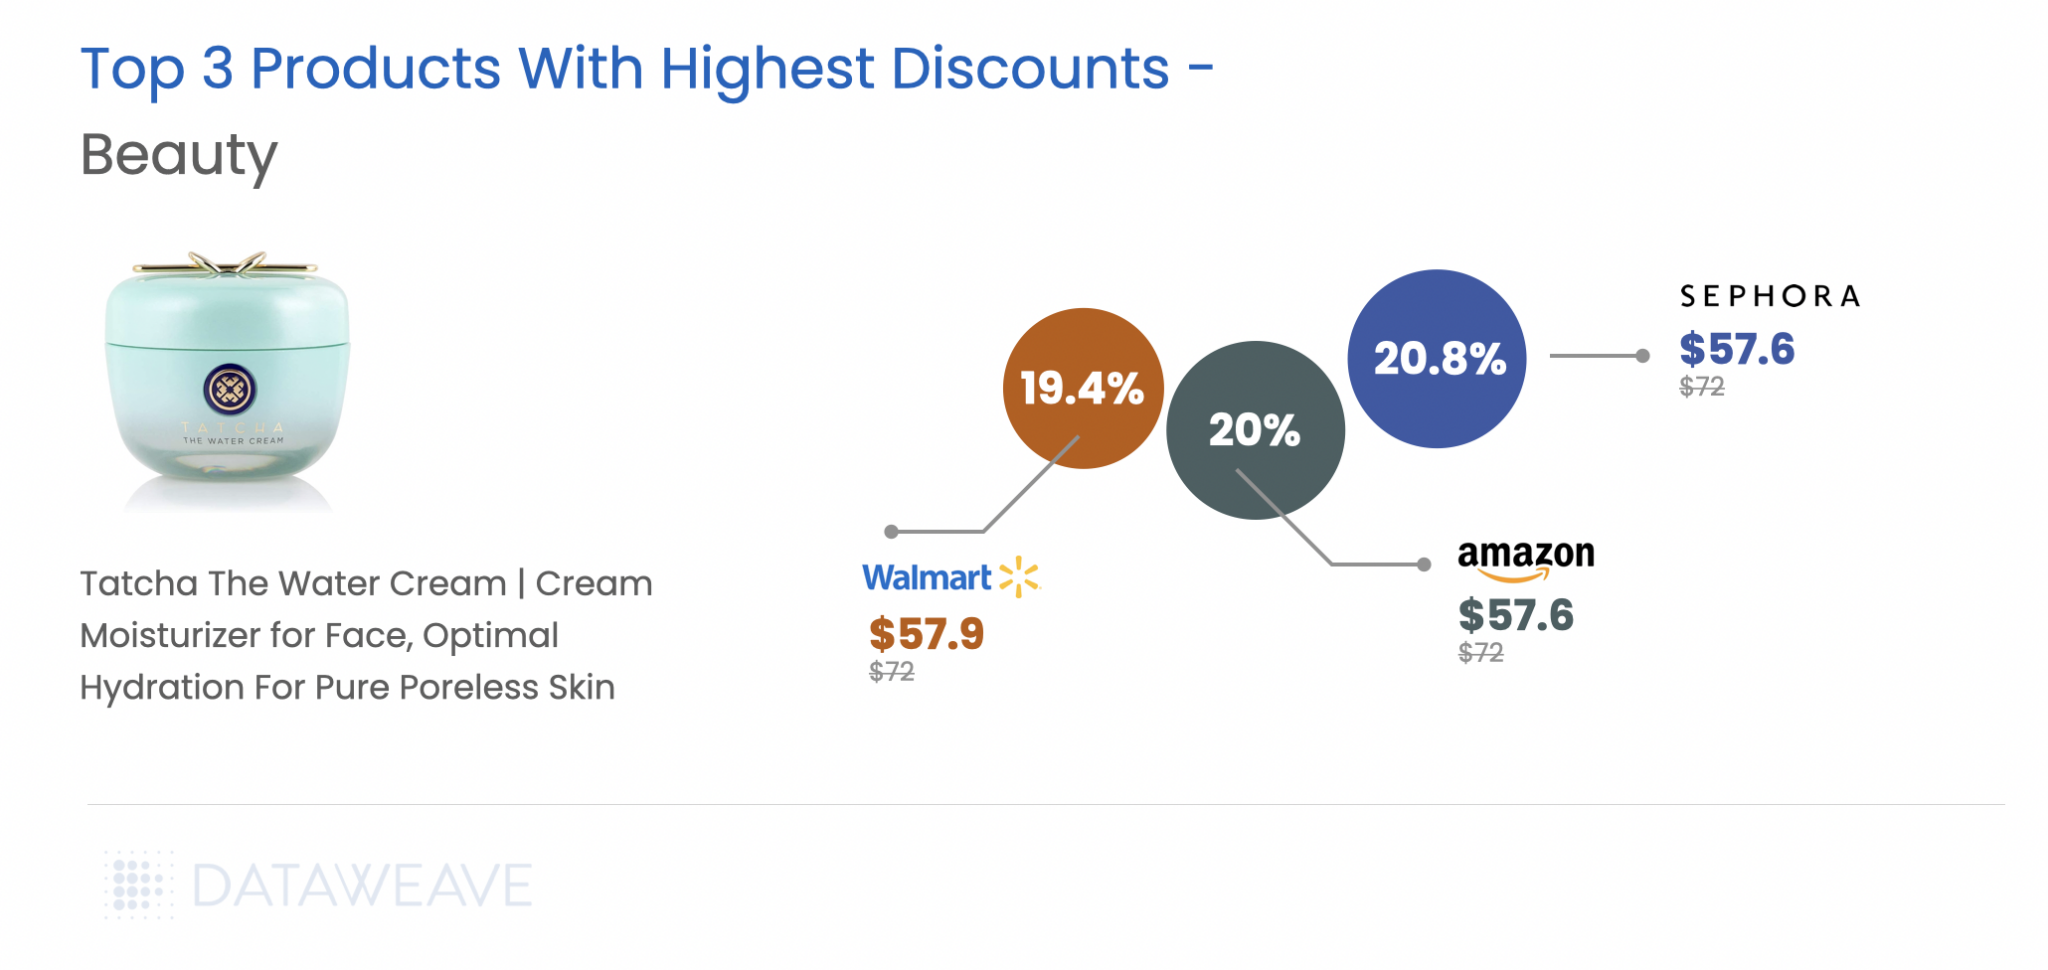
Health & Beauty
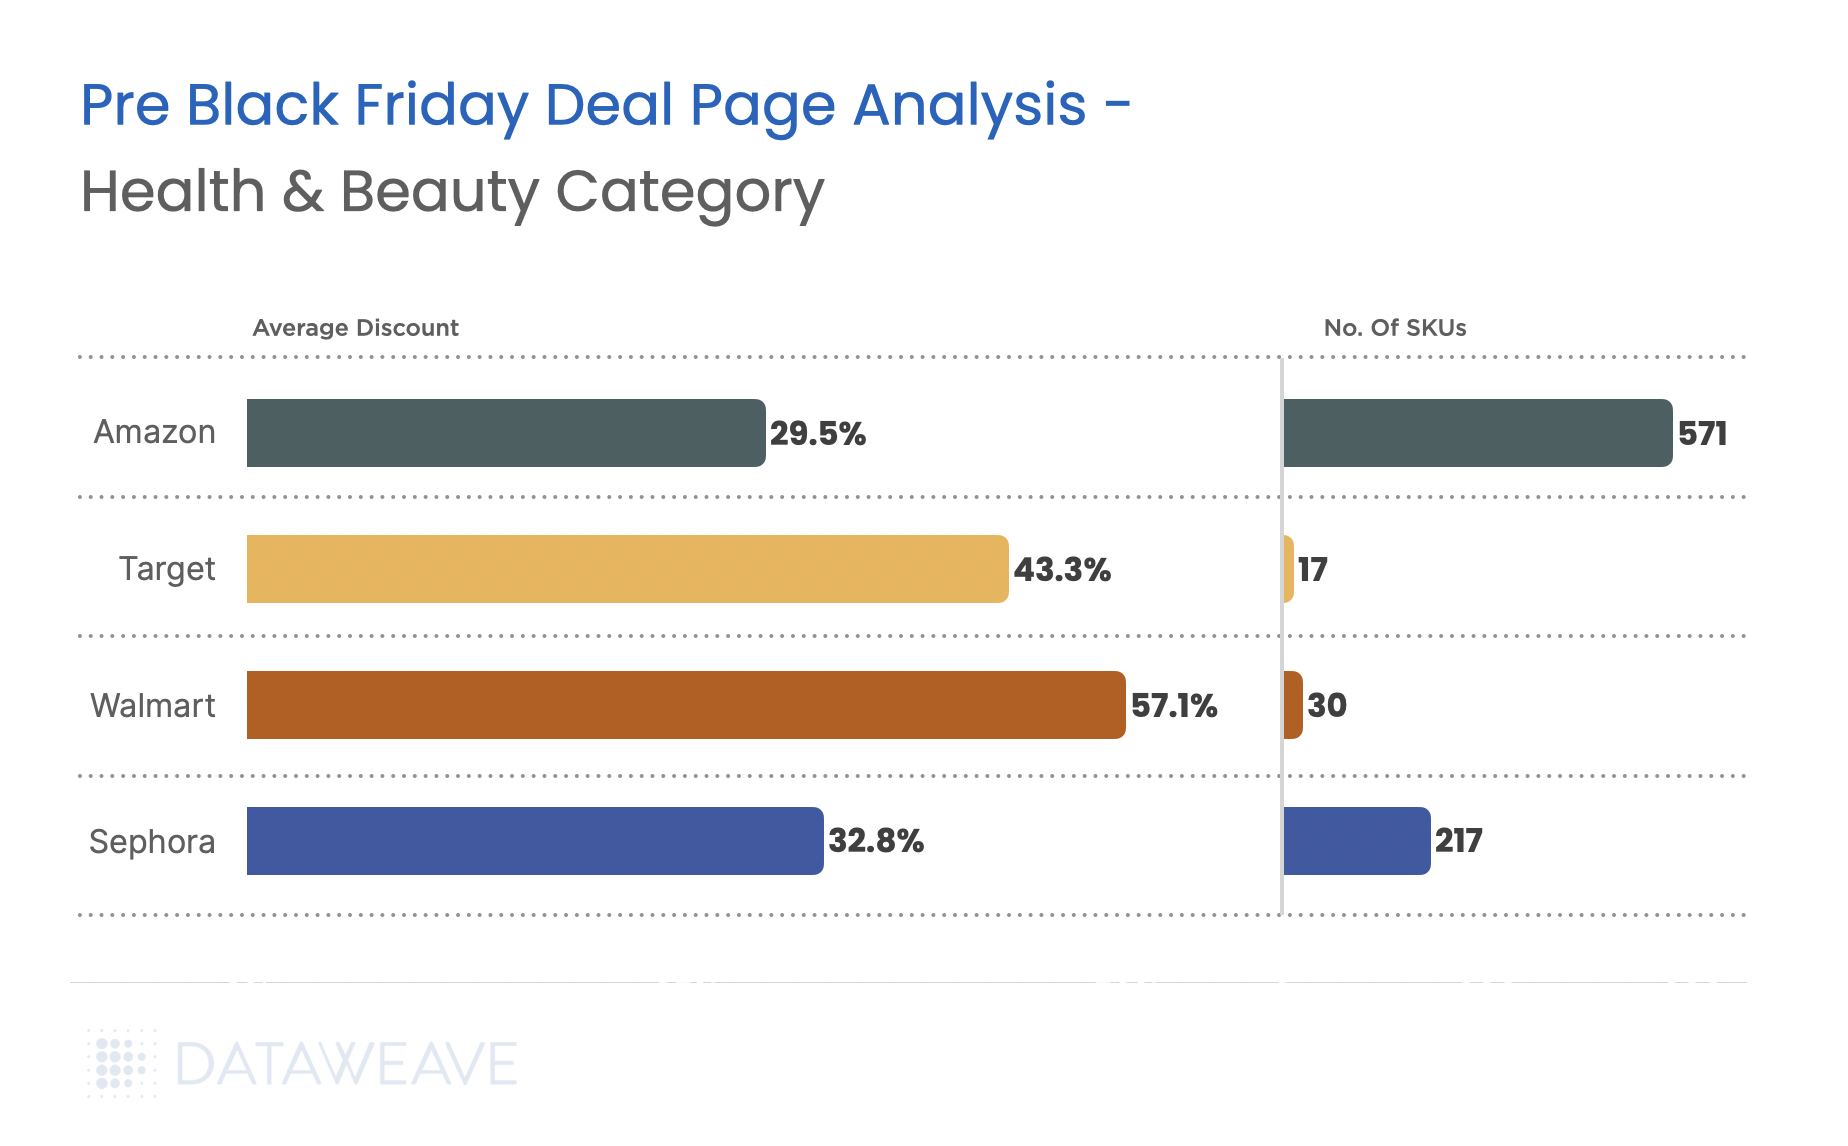
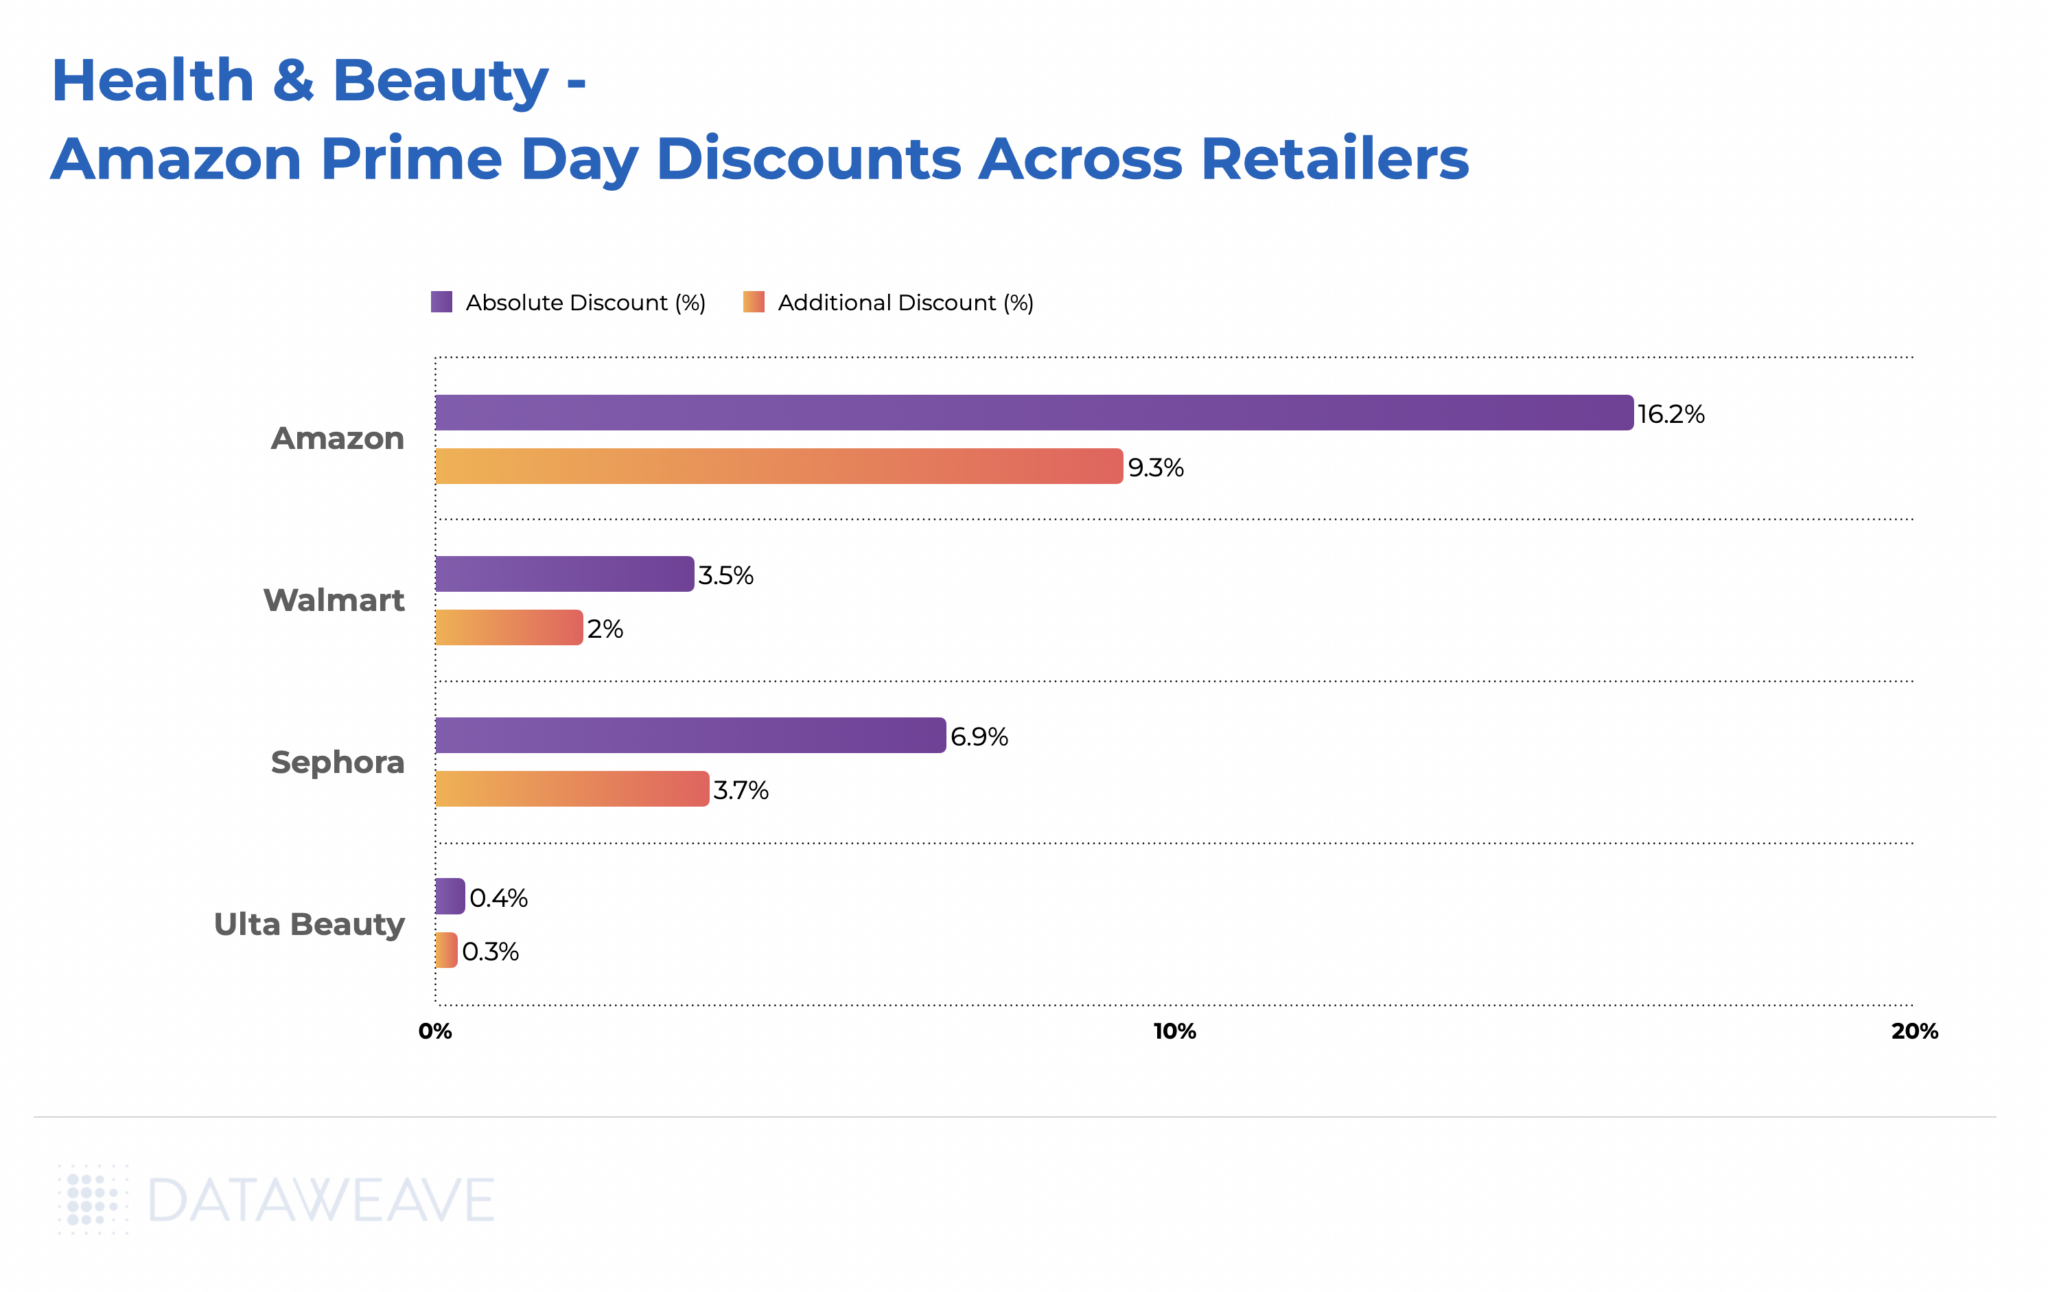
Health & Beauty has emerged as a growth engine during Black Friday in the UK. The beauty industry is projected to grow 5% annually through 2030 according to a McKinsey survey. The category continues to demonstrate resilience even as consumers show caution in other discretionary categories. Our analysis of 15,816 SKUs reveals fascinating subcategory-level insights and dramatic brand visibility shifts that highlight evolving consumer preferences in the beauty space.
Subcategory Discount Analysis
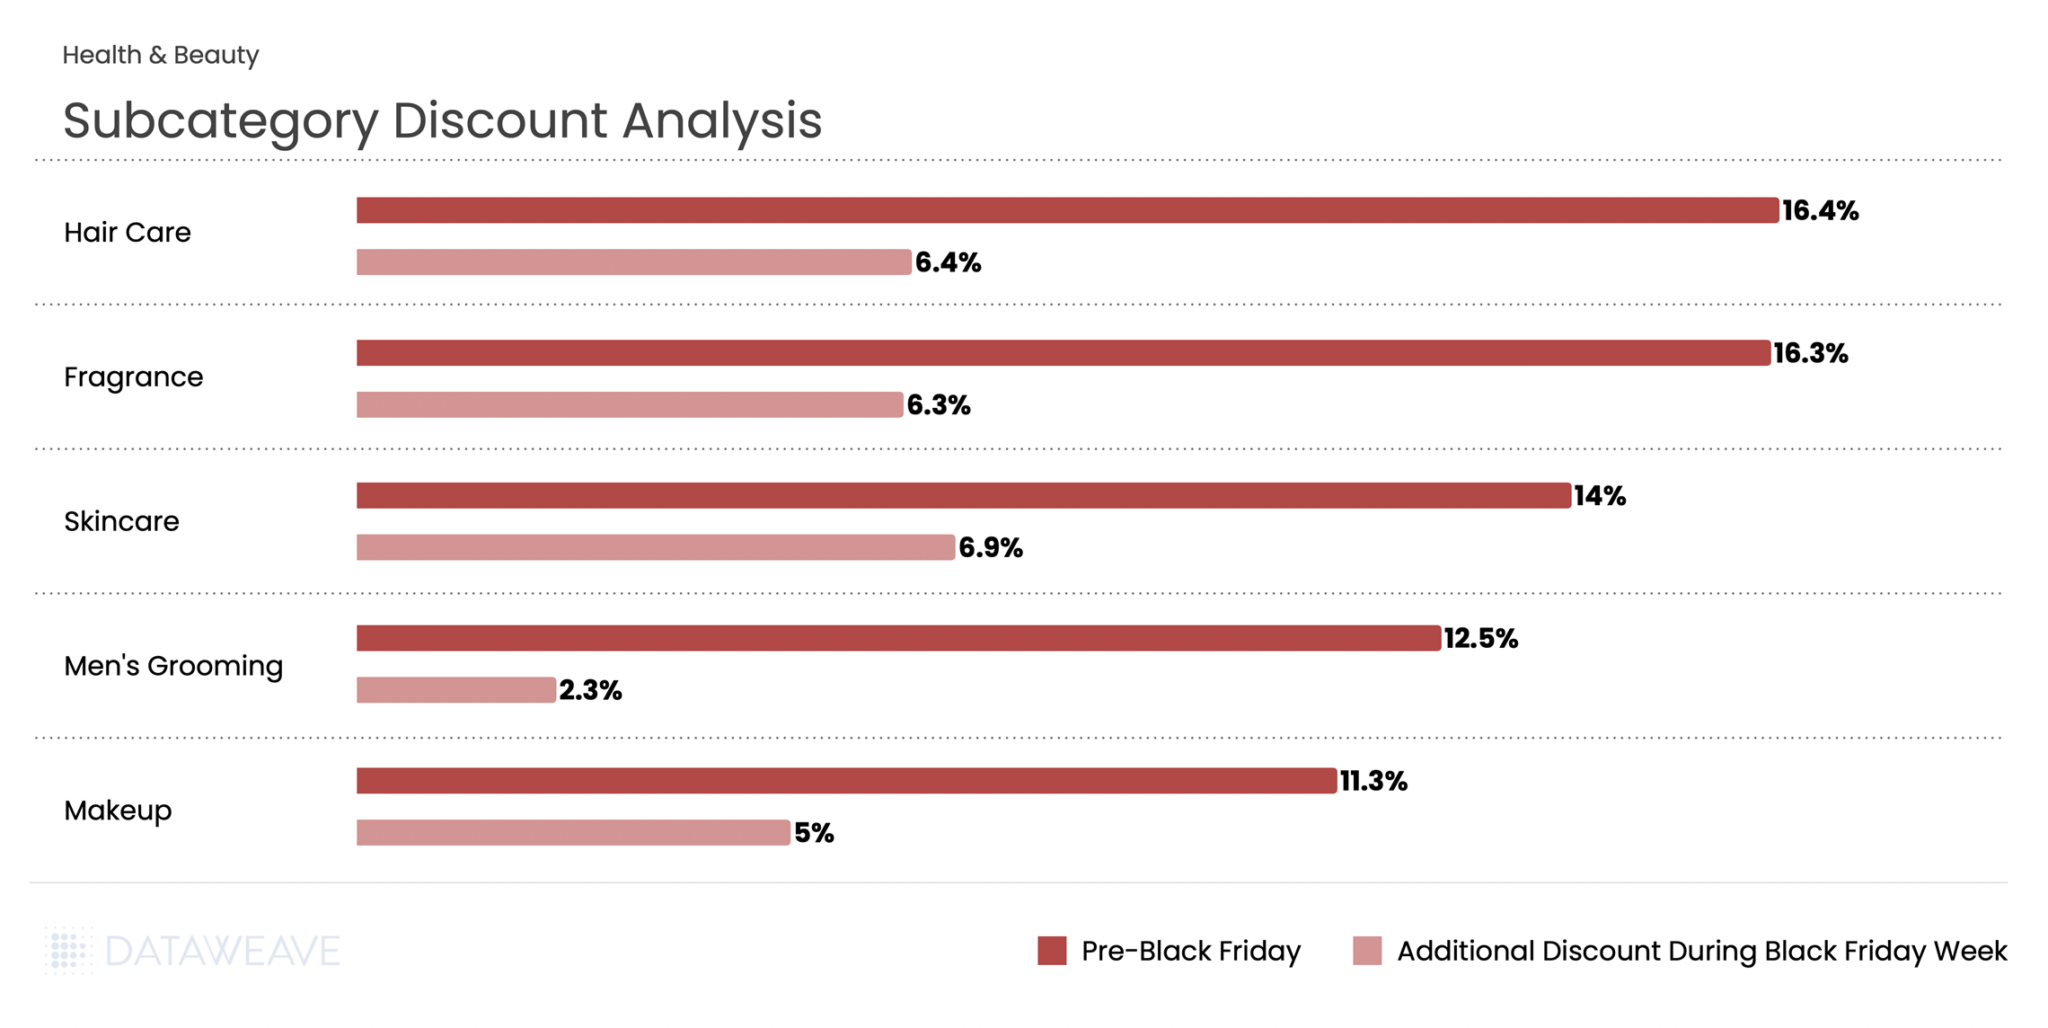
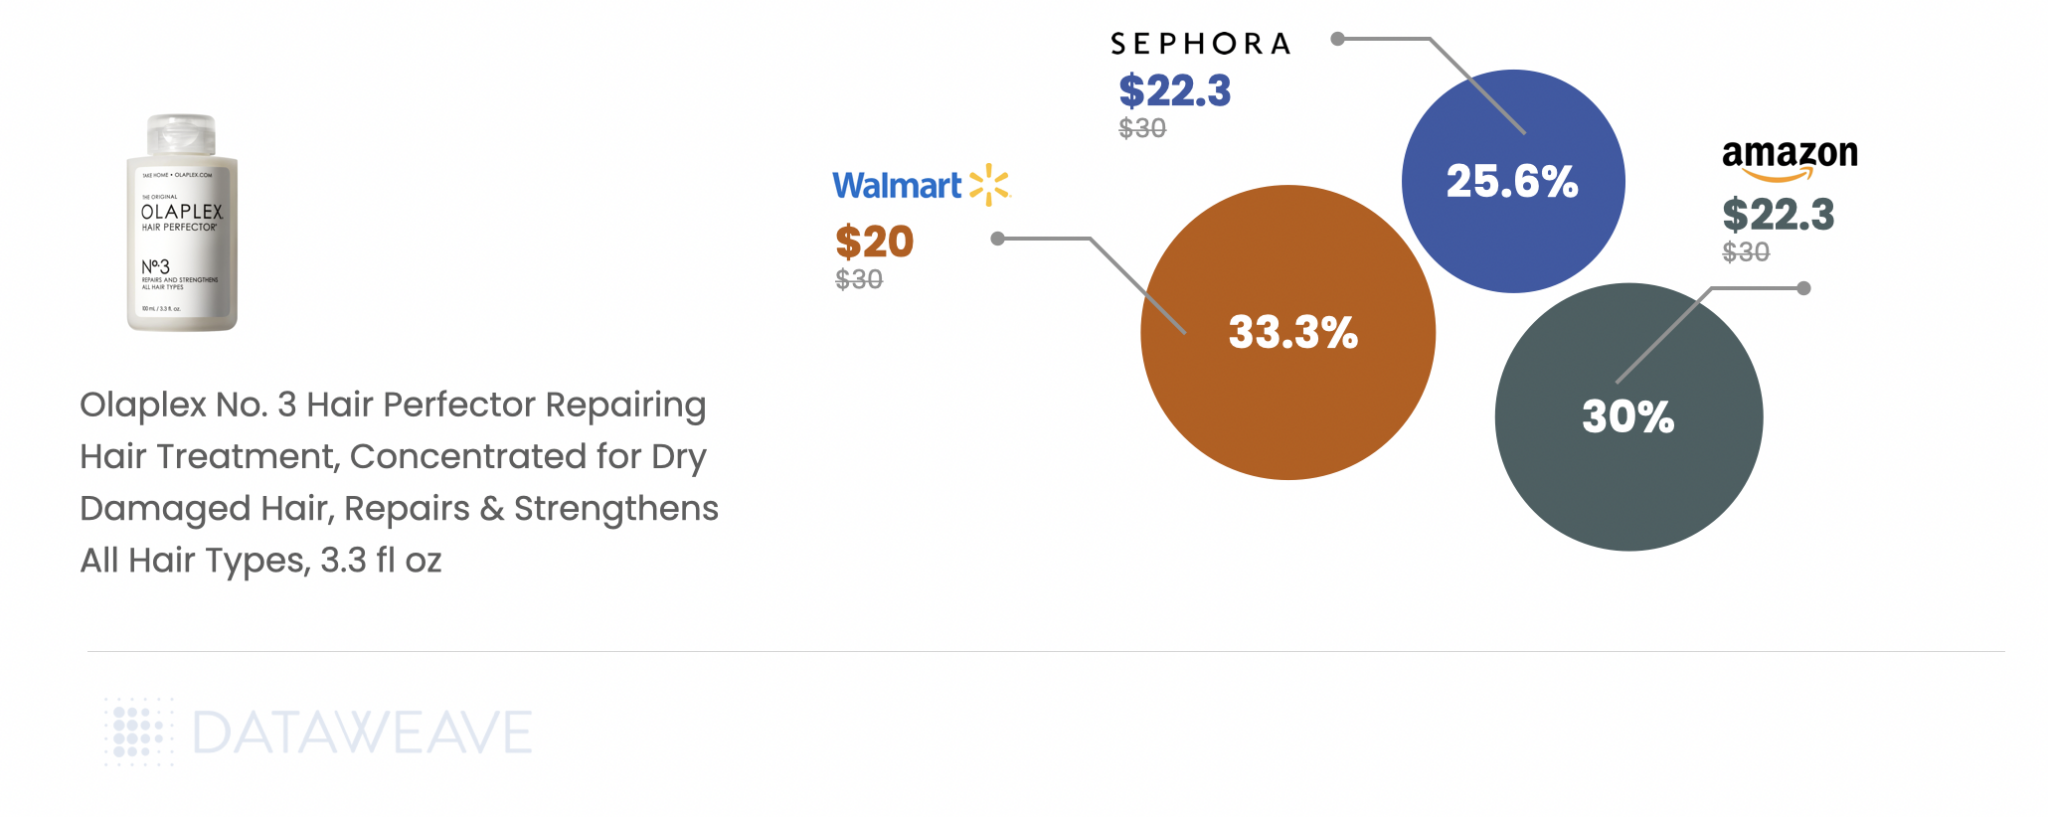
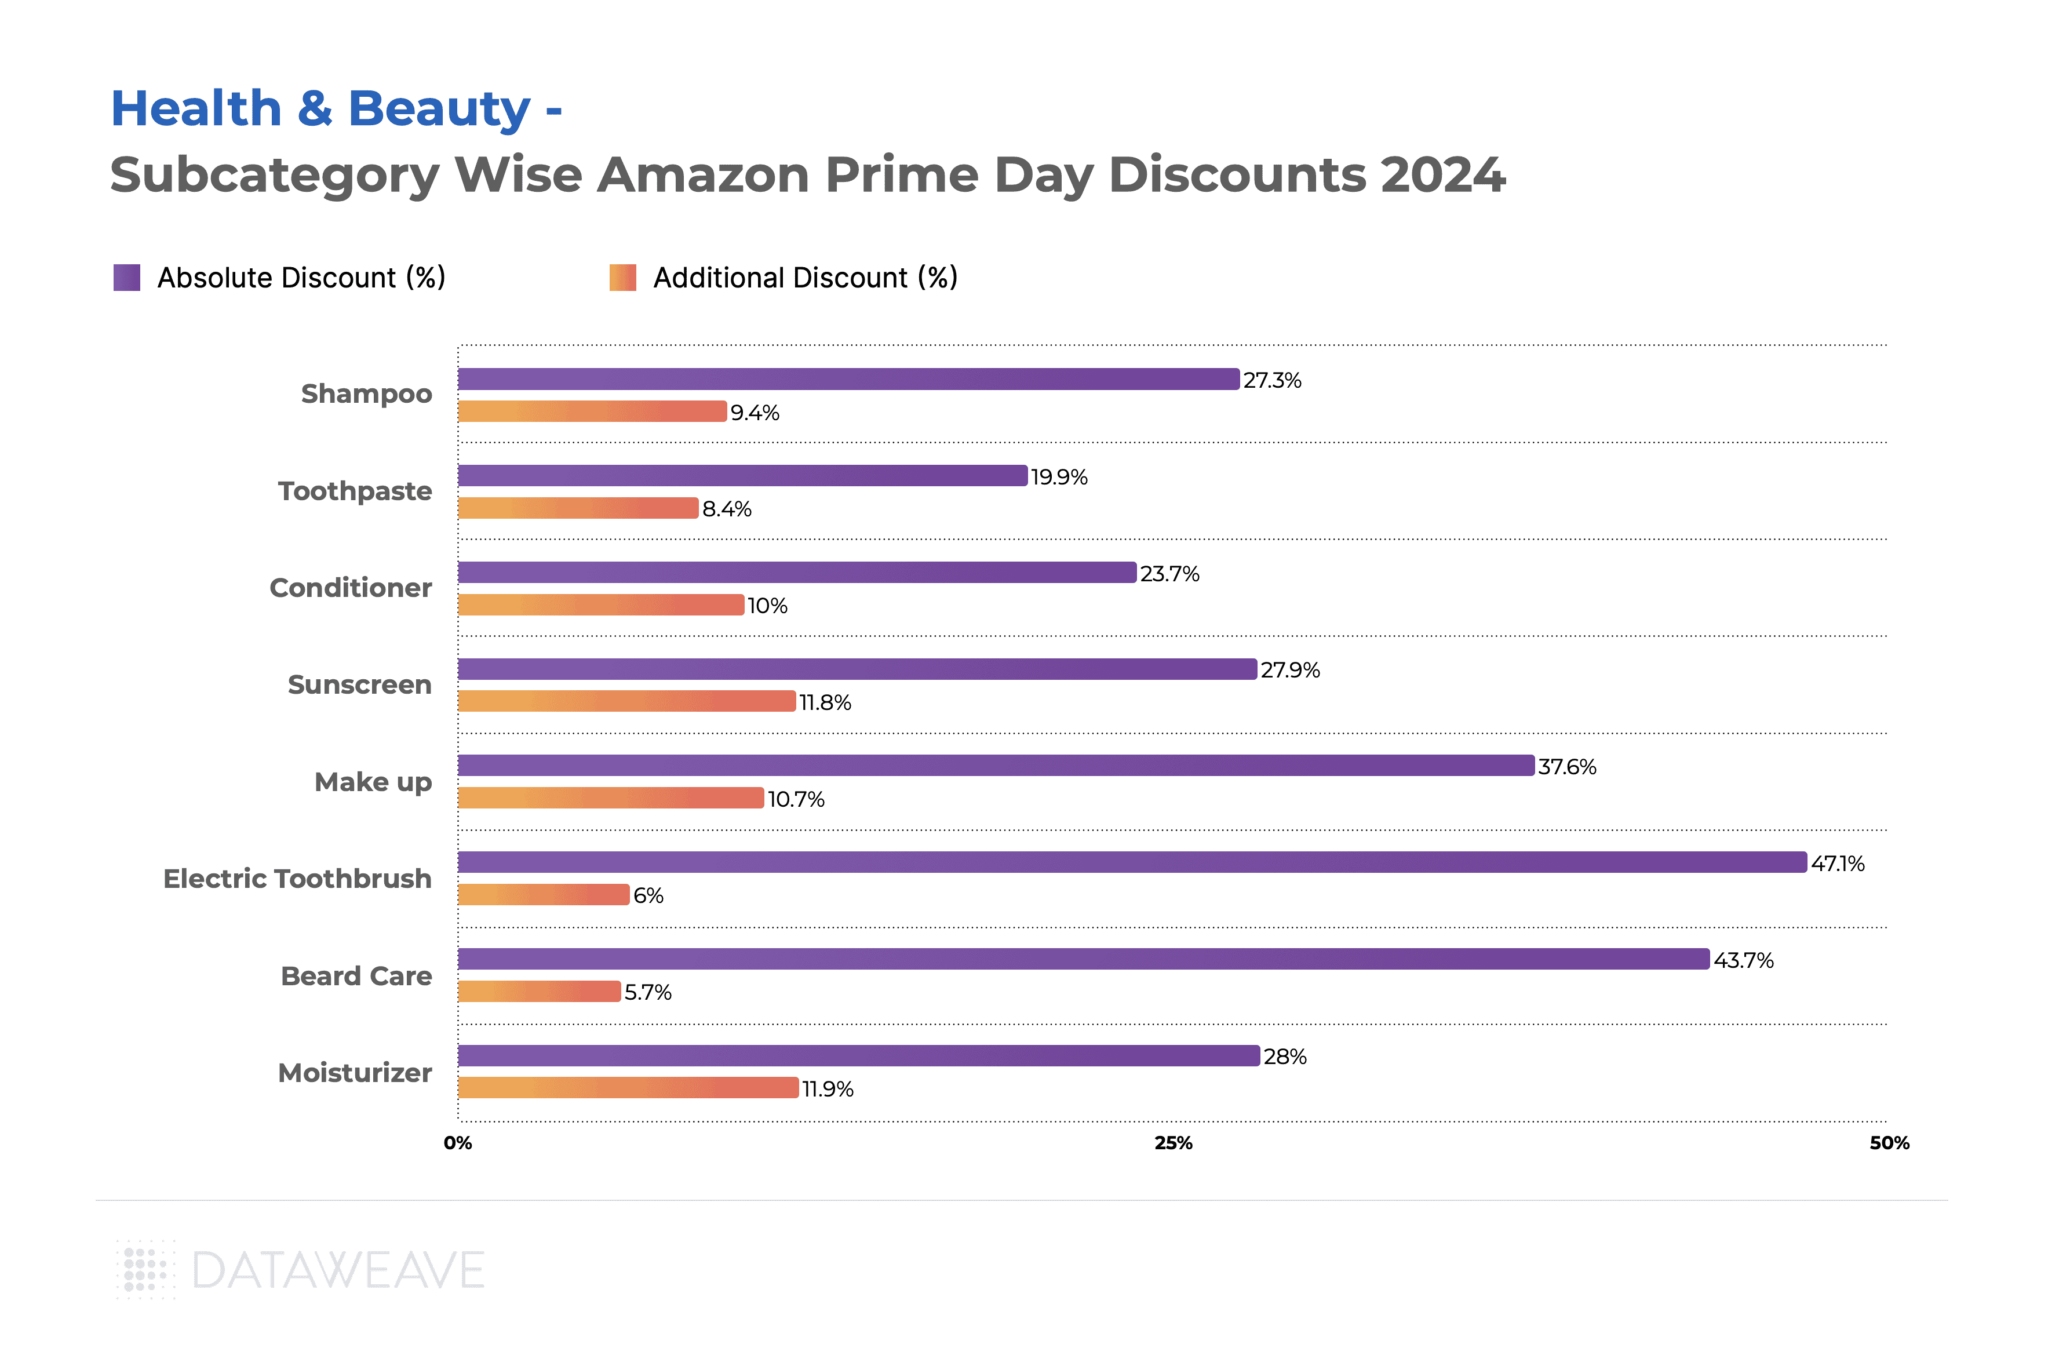
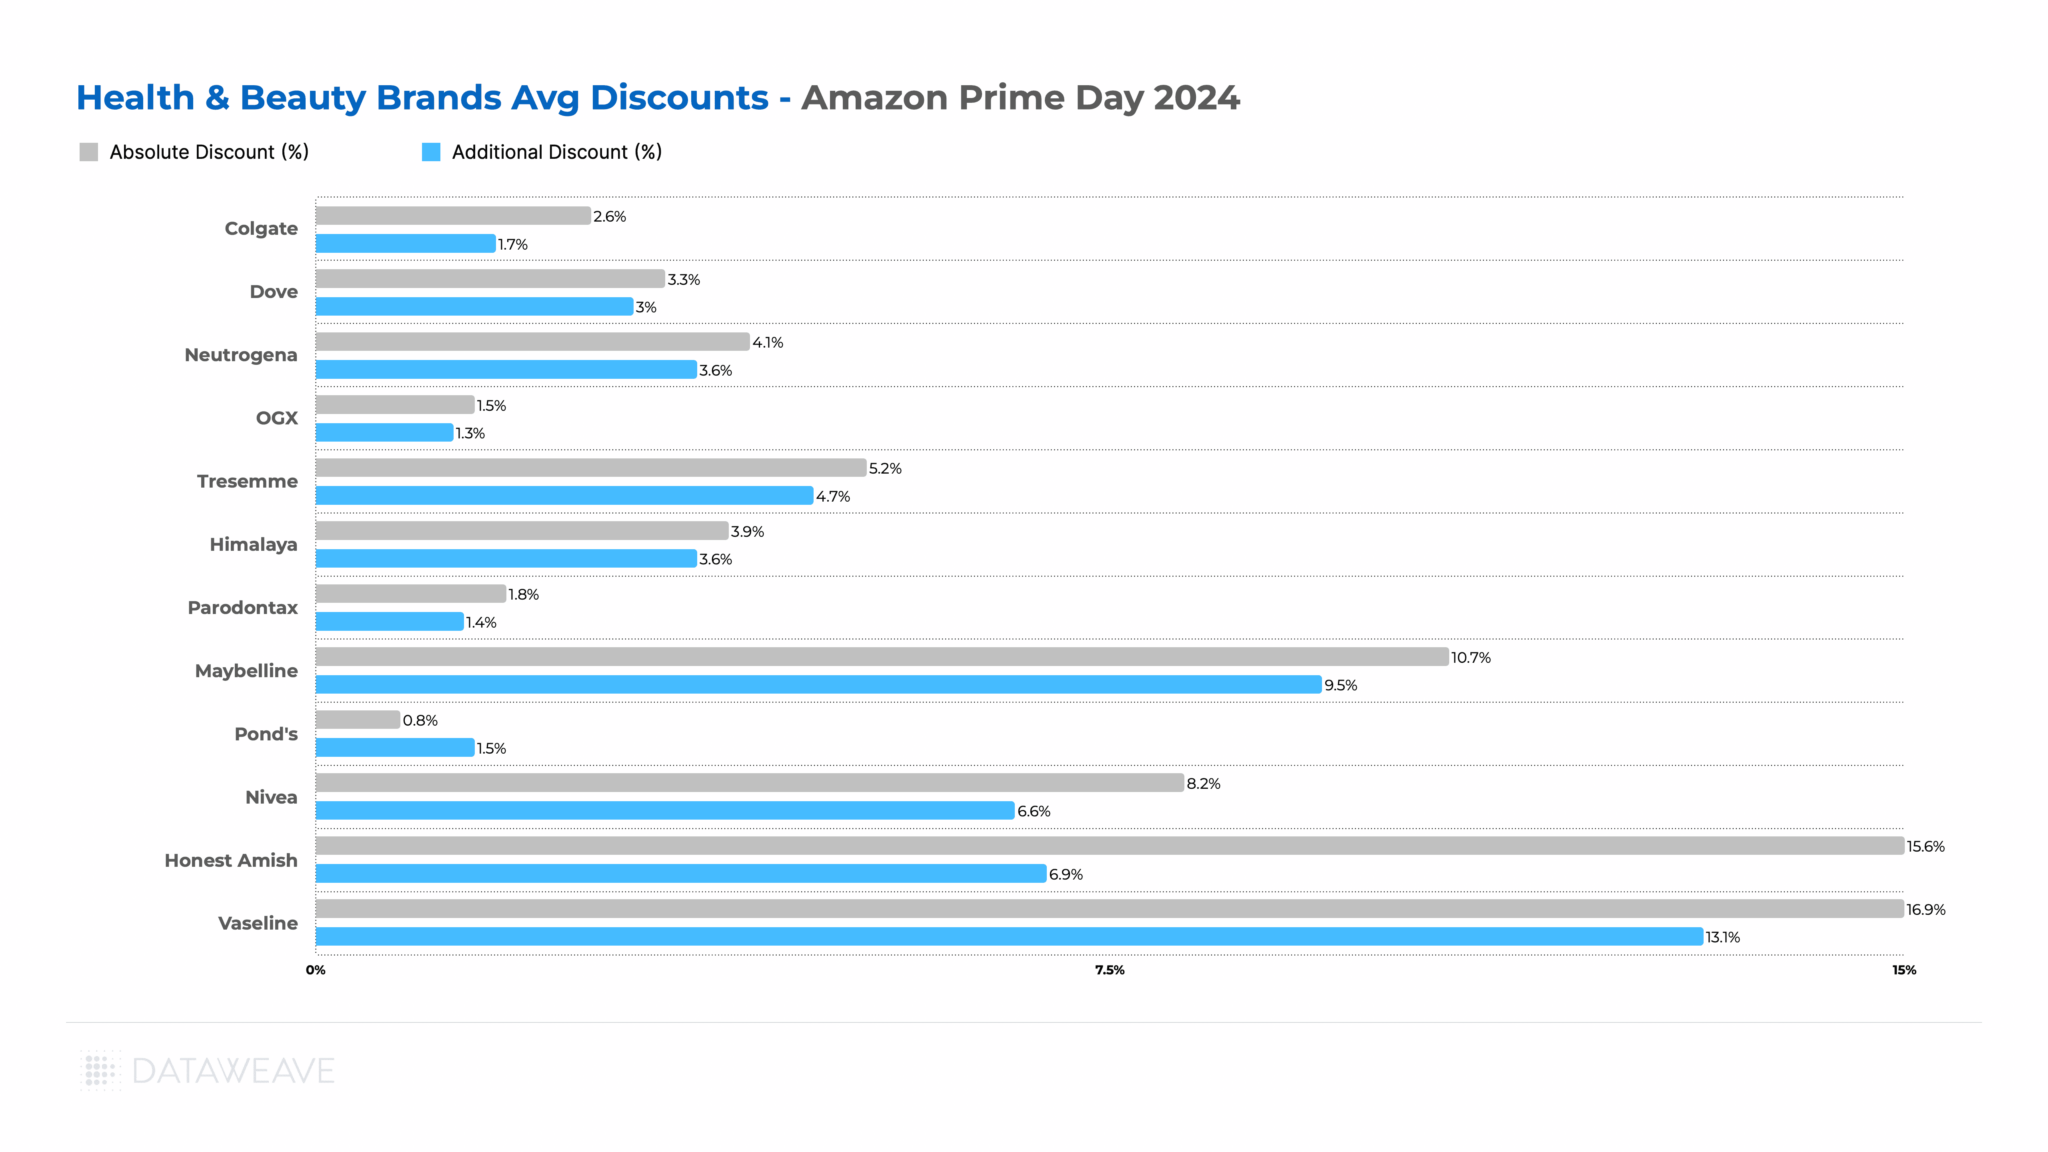
Health & Beauty presented a unique discounting pattern compared to other categories. Pre-Black Friday discounts averaged 14.4%, the second-highest among all categories. But Black Friday Week discounts were also robust at 6.1%, the highest additional discount increase.
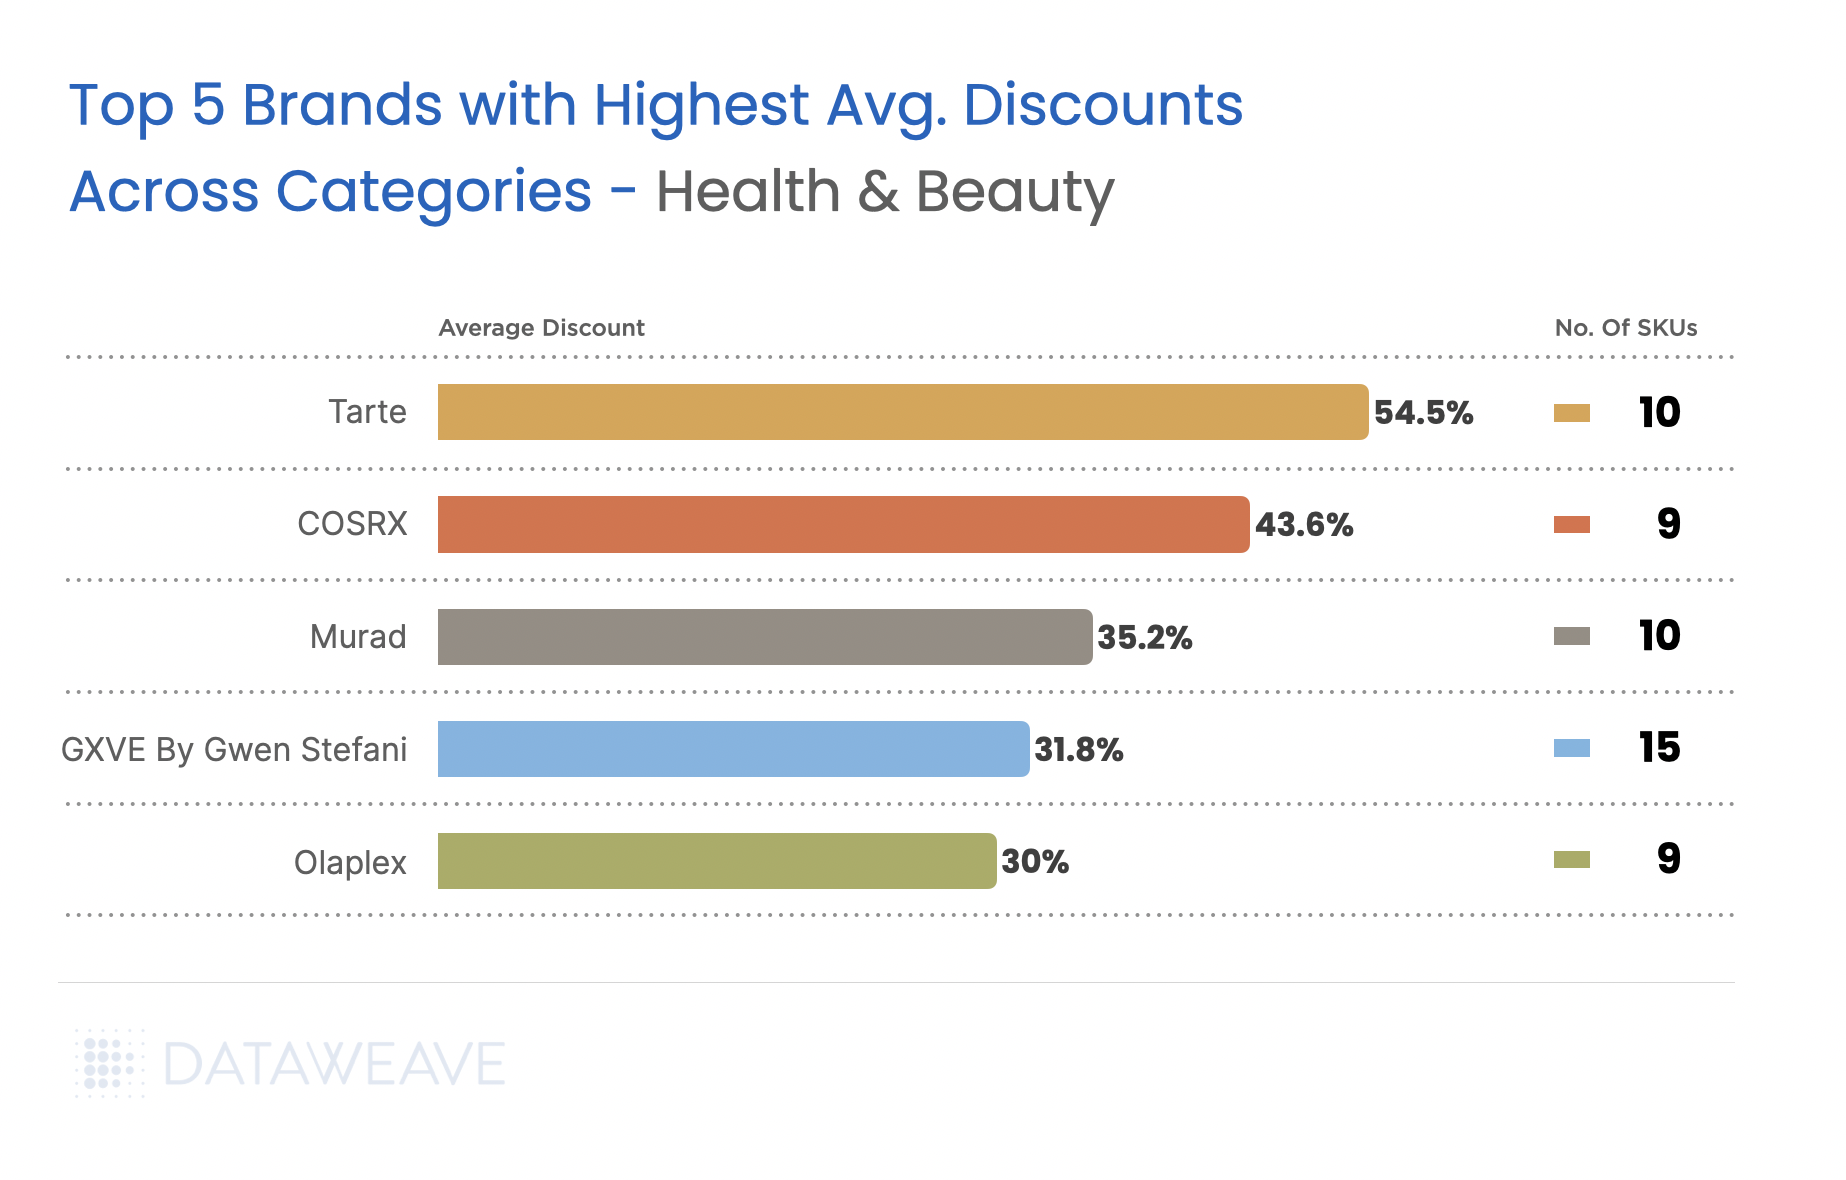
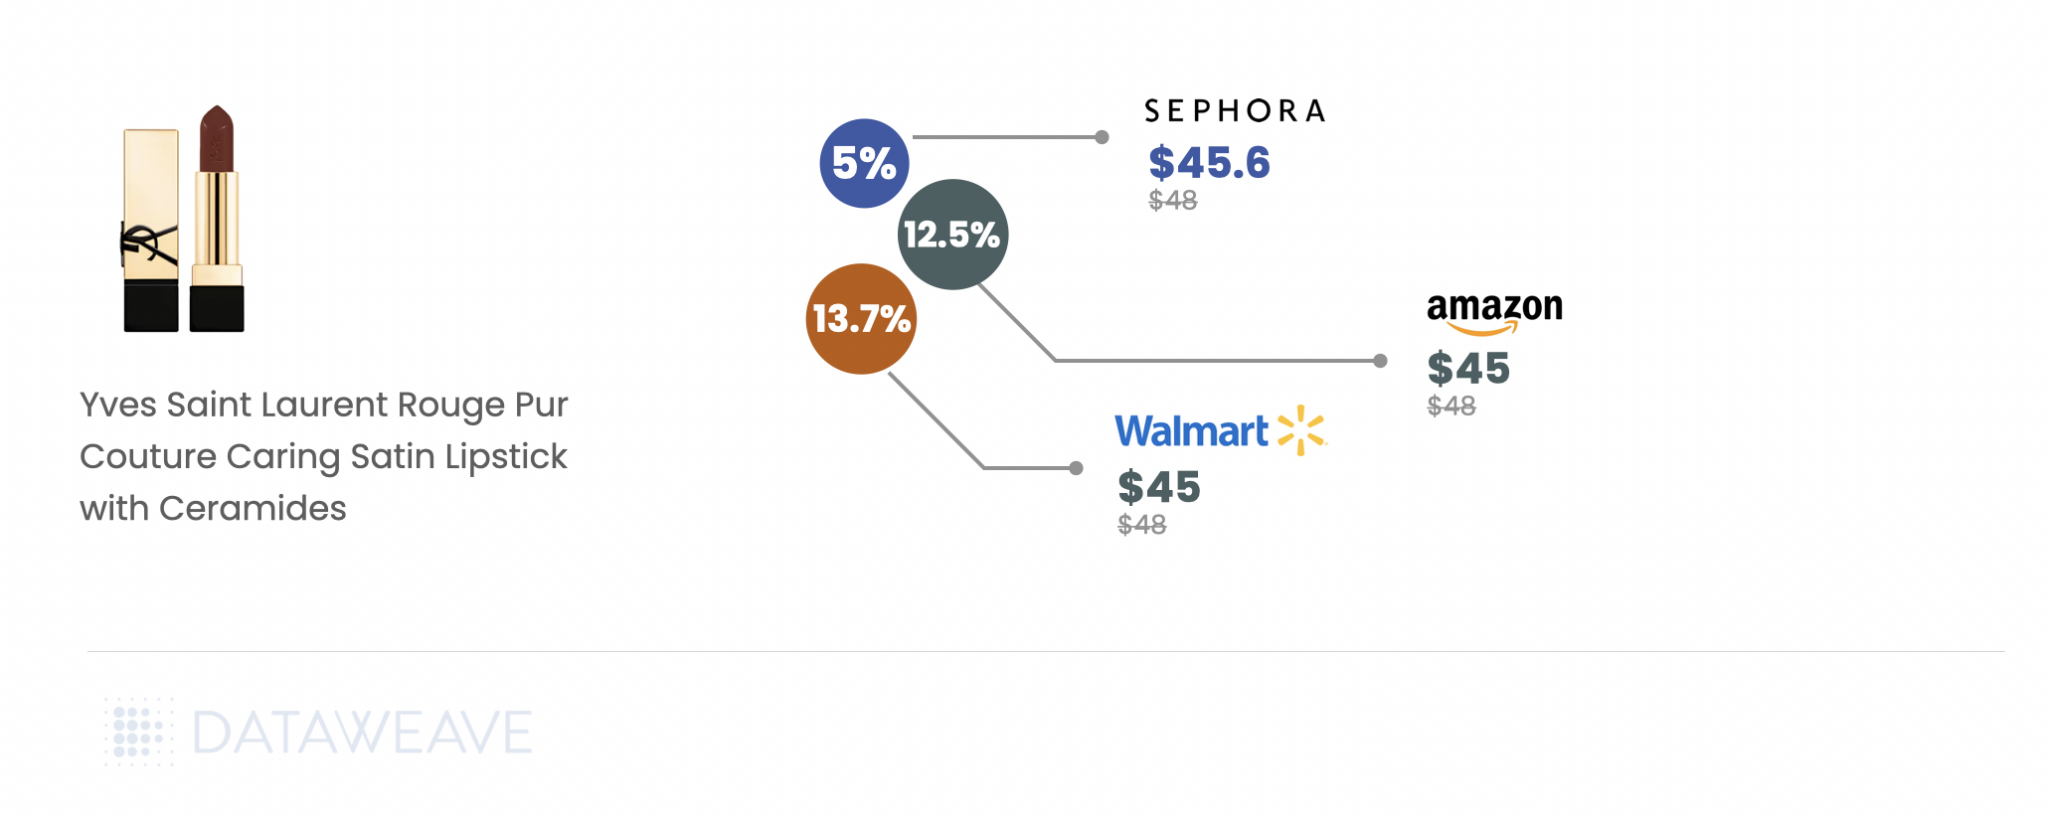
Hair Care led both periods with 16.4% pre-sale discounts and an additional 6.4% during Black Friday Week. Skincare saw the highest Black Friday Week discount at 6.9%, suggesting retailers strategically saved their best skincare promotions for the main event when consumers are actively seeking holiday gift sets. Men’s Grooming stood apart with strong pre-sale discounts of 12.5% but more modest Black Friday Week additions of just 2.3%.
Share of Search: Brand Visibility Trends
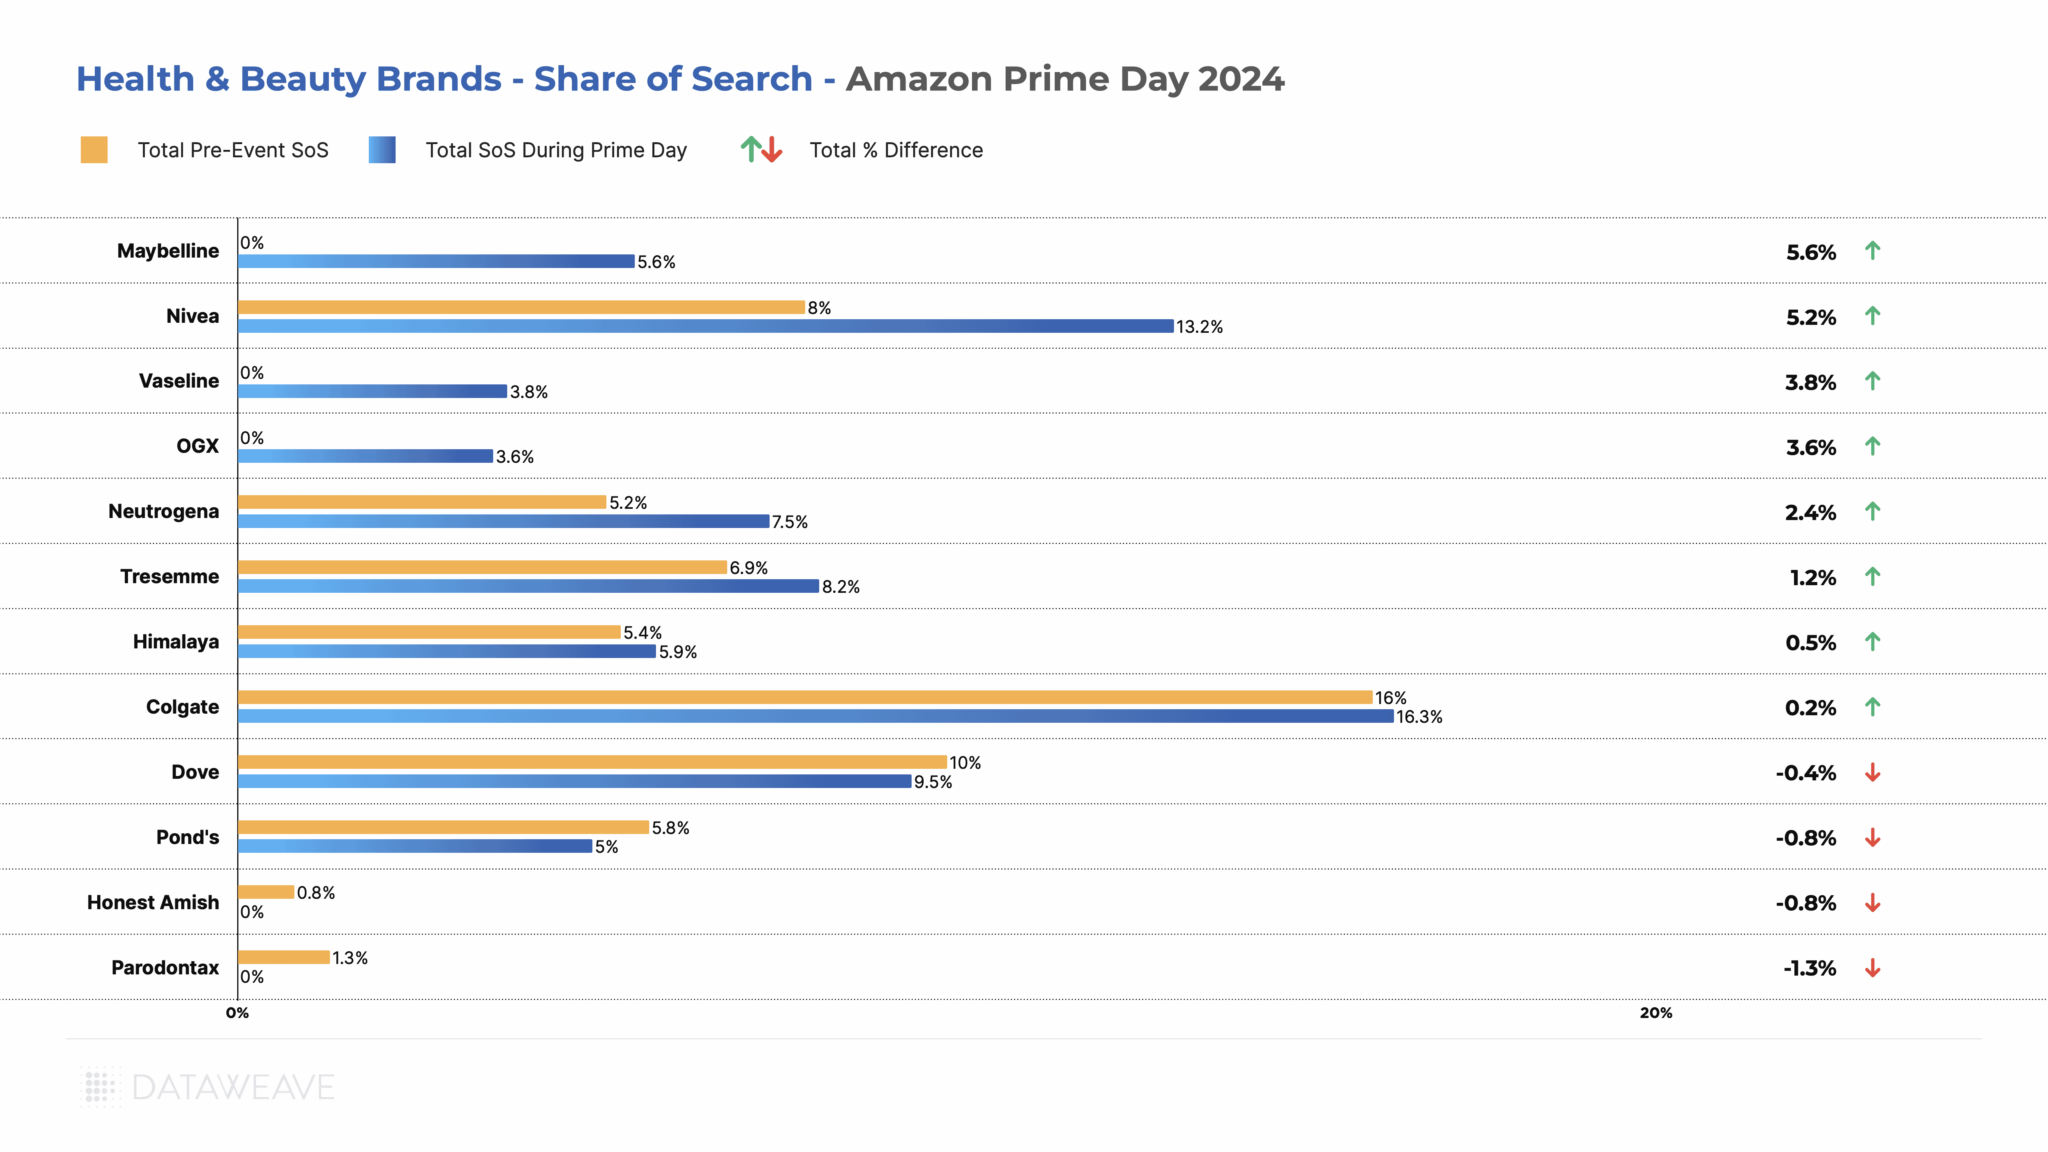
The UK Beauty category saw some of the most dramatic Share of Search swings in our analysis.
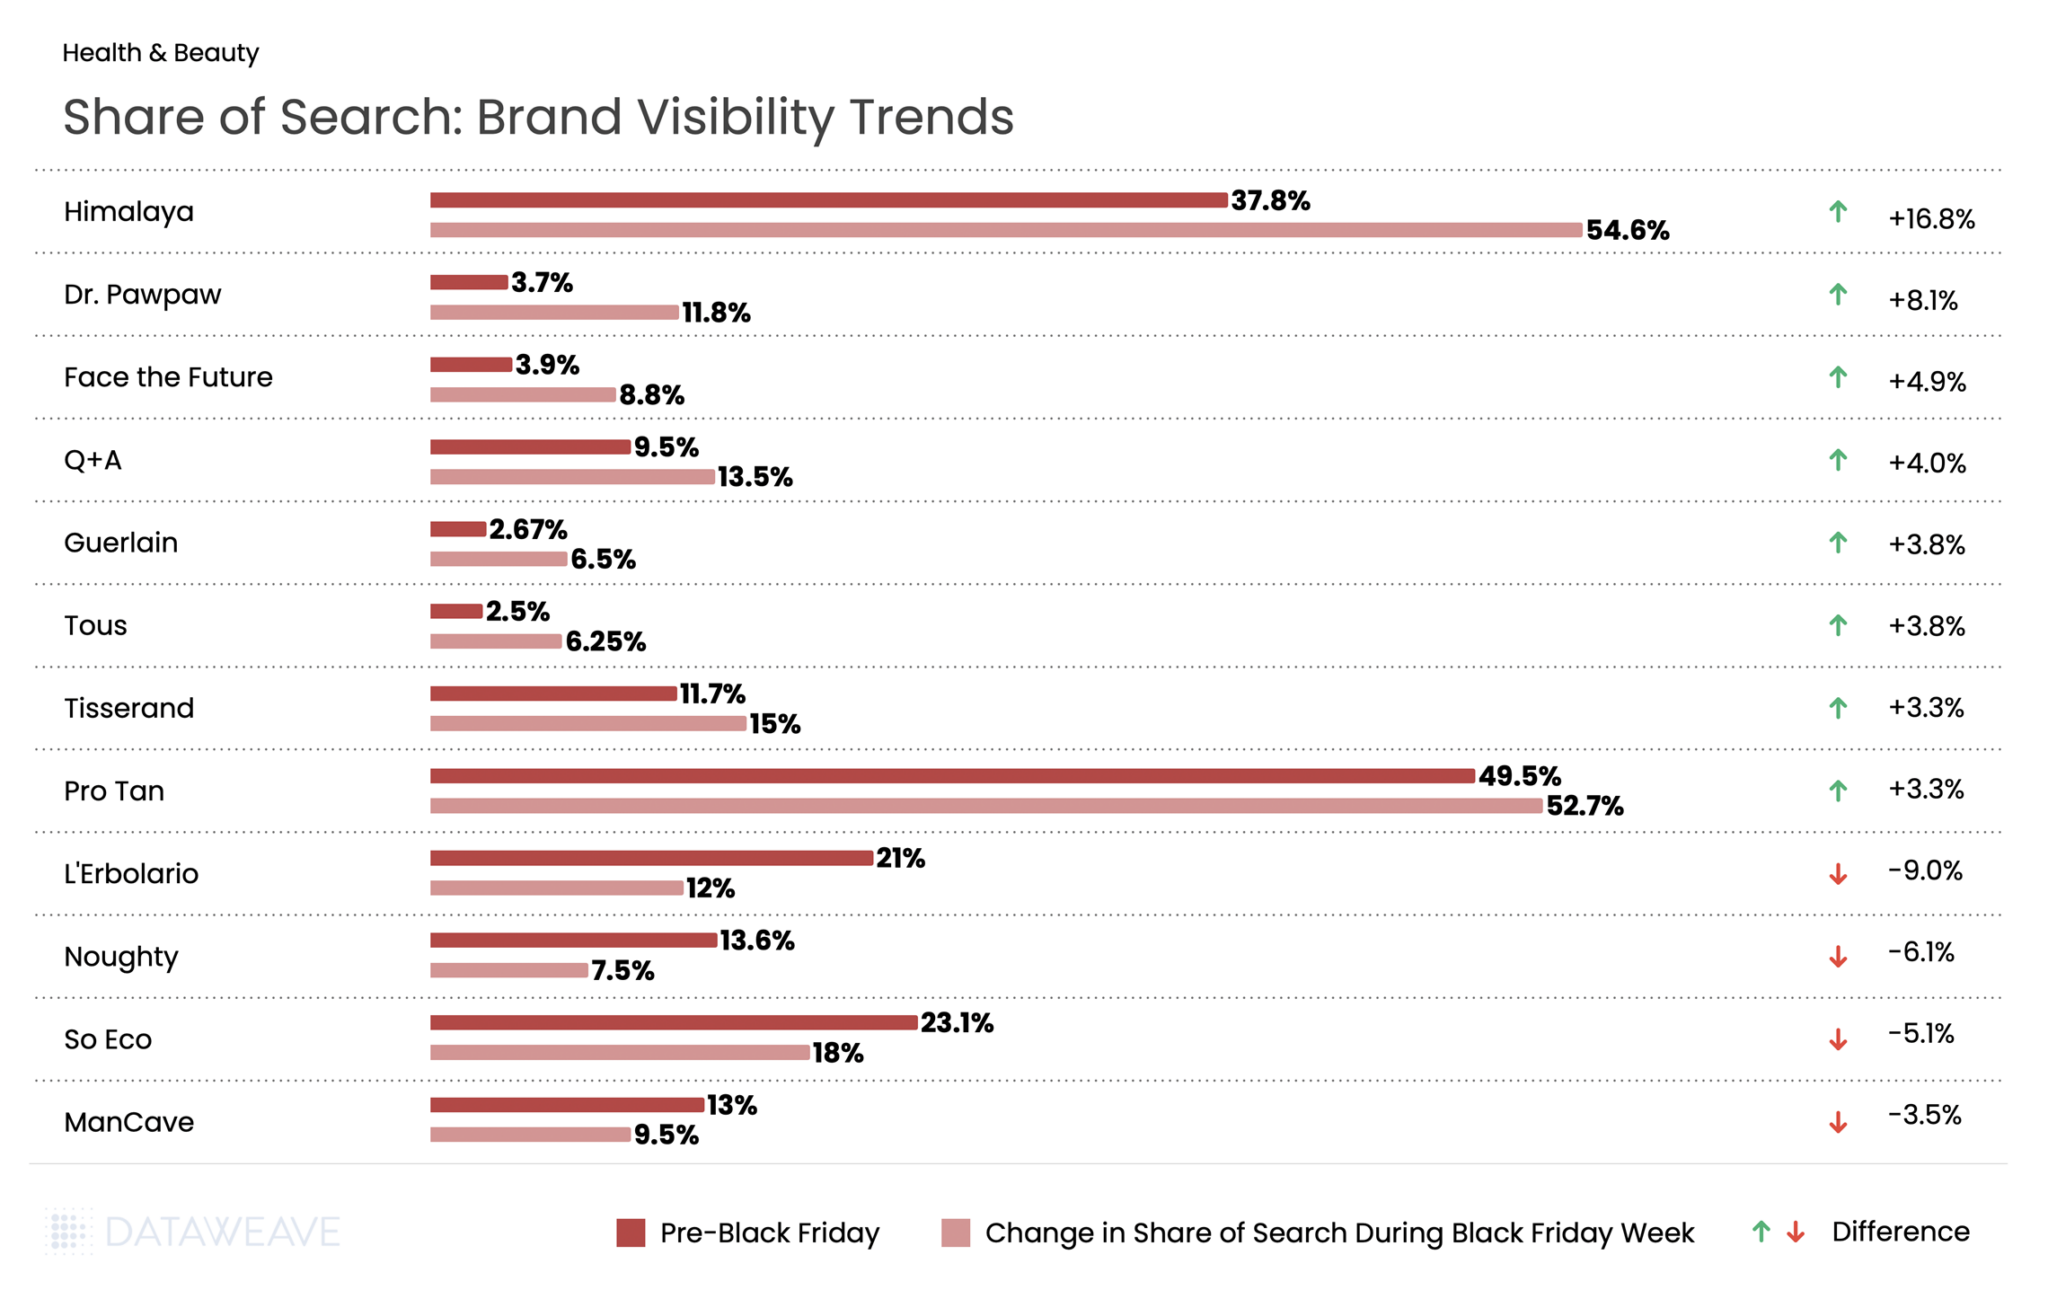
Himalaya, the Ayurvedic skincare brand, dominated the category with a stunning 16.8% gain. British cult favorite Dr. Pawpaw exploded from 3.7% to 11.8%, a gain that reflects the brand’s growing mainstream appeal. Face the Future, the skincare specialist, also gained significant ground with a 4.9% increase.
Budget-friendly British brand Q+A continued its momentum, rising 4%, while prestige names like Guerlain and Tous each gained 3.8%.
Italian natural beauty brand L’Erbolario saw the steepest decline, with visibility dropping by 9%. Haircare brand Noughty fell 6.1%, and eco-beauty brand So Eco declined by 5.1%.
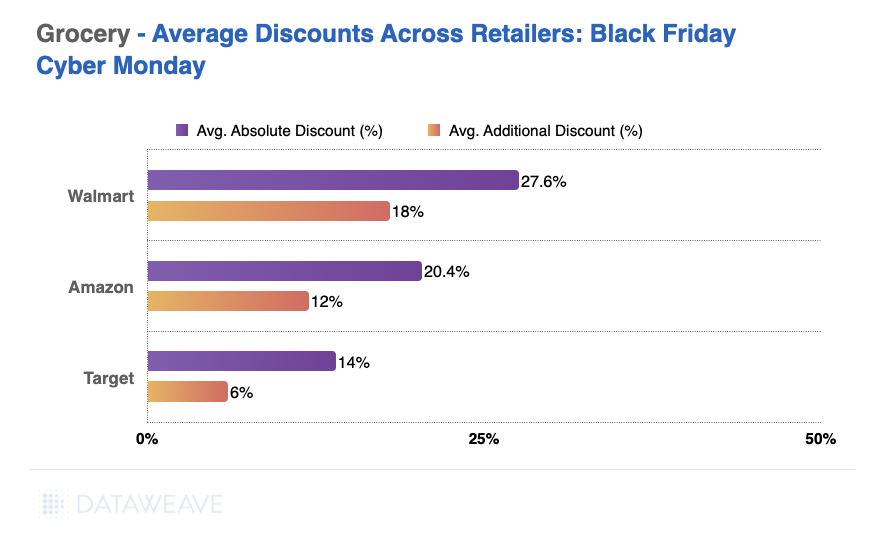
Grocery
While Grocery typically sees more modest discounts compared to discretionary categories, the sector remains a critical part of Black Friday shopping in the UK, particularly as consumers prepare for holiday entertaining and gifting. Our analysis of 11,979 SKUs shows how UK retailers approached promotions across essential and indulgent subcategories.
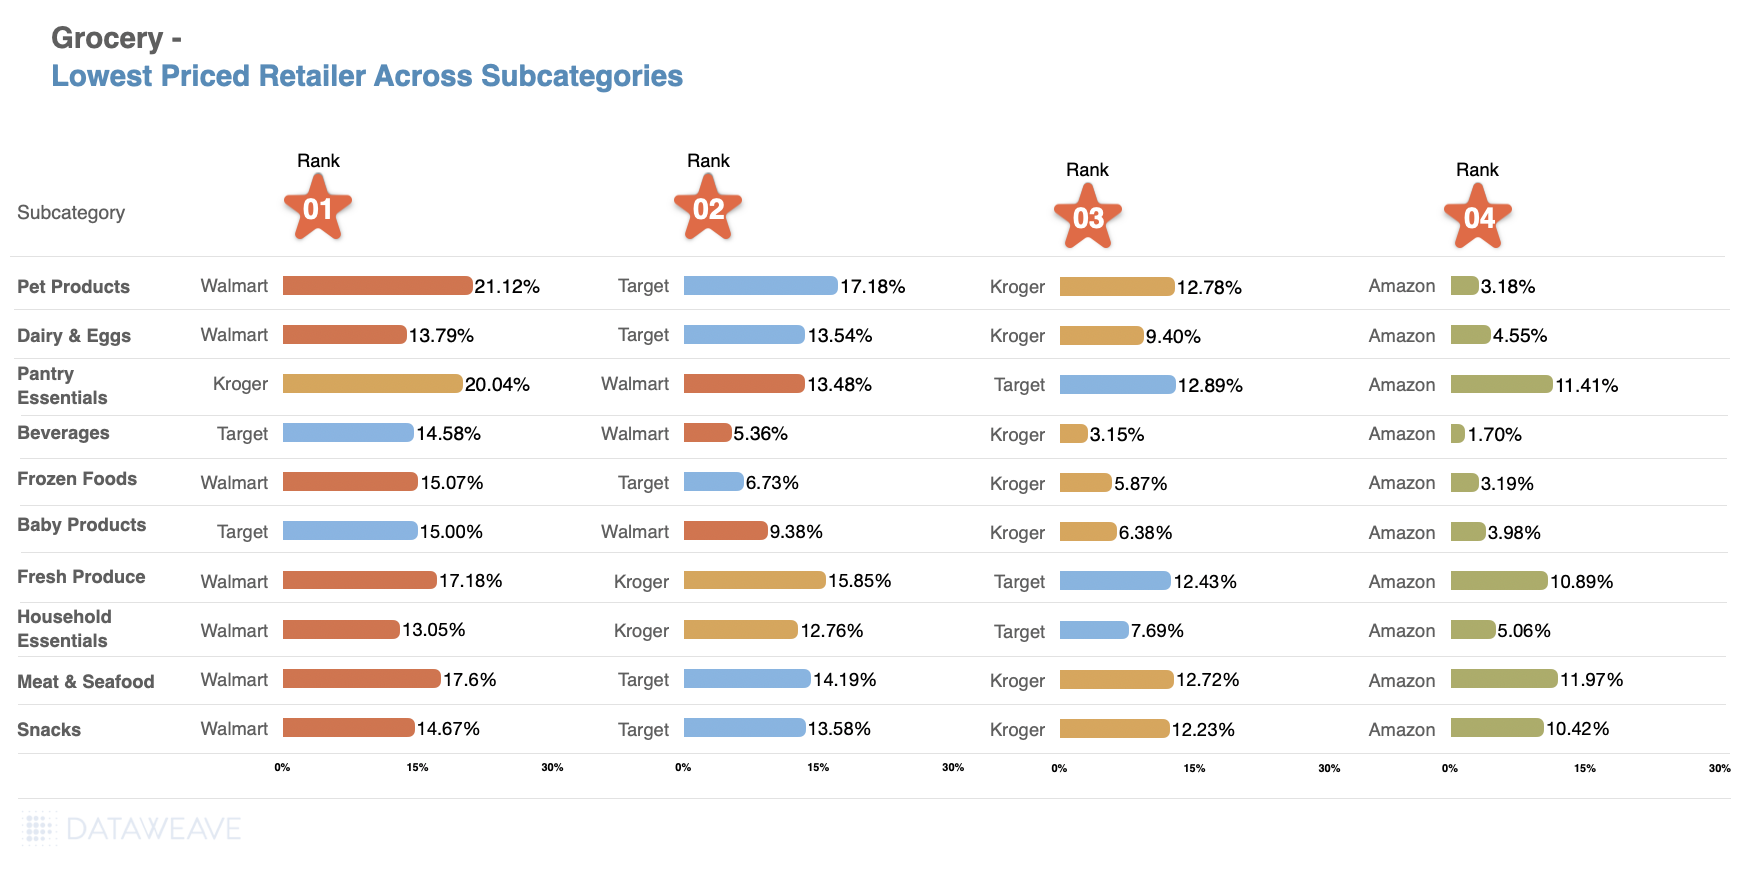
Subcategory Discount Analysis
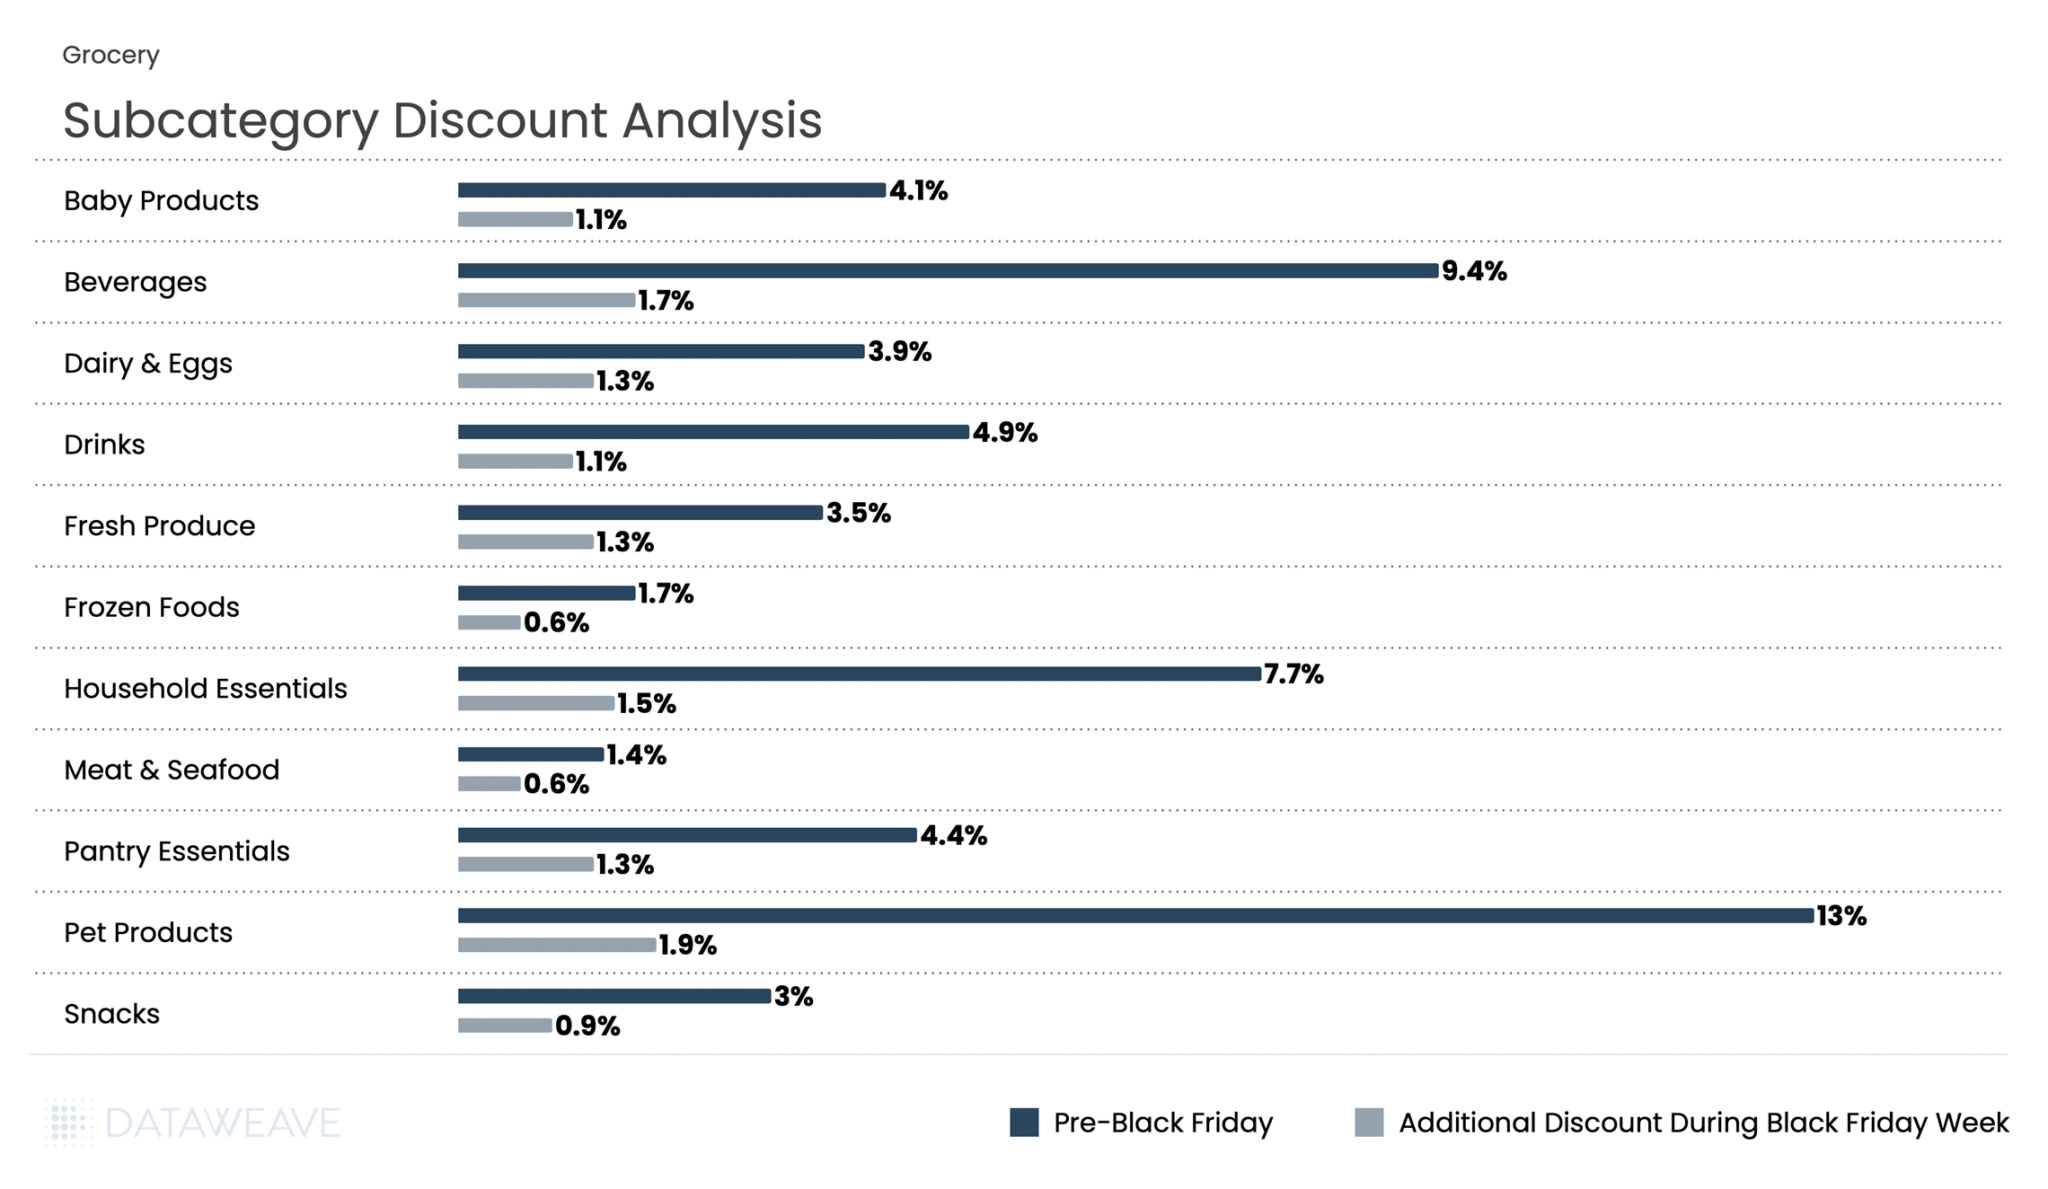
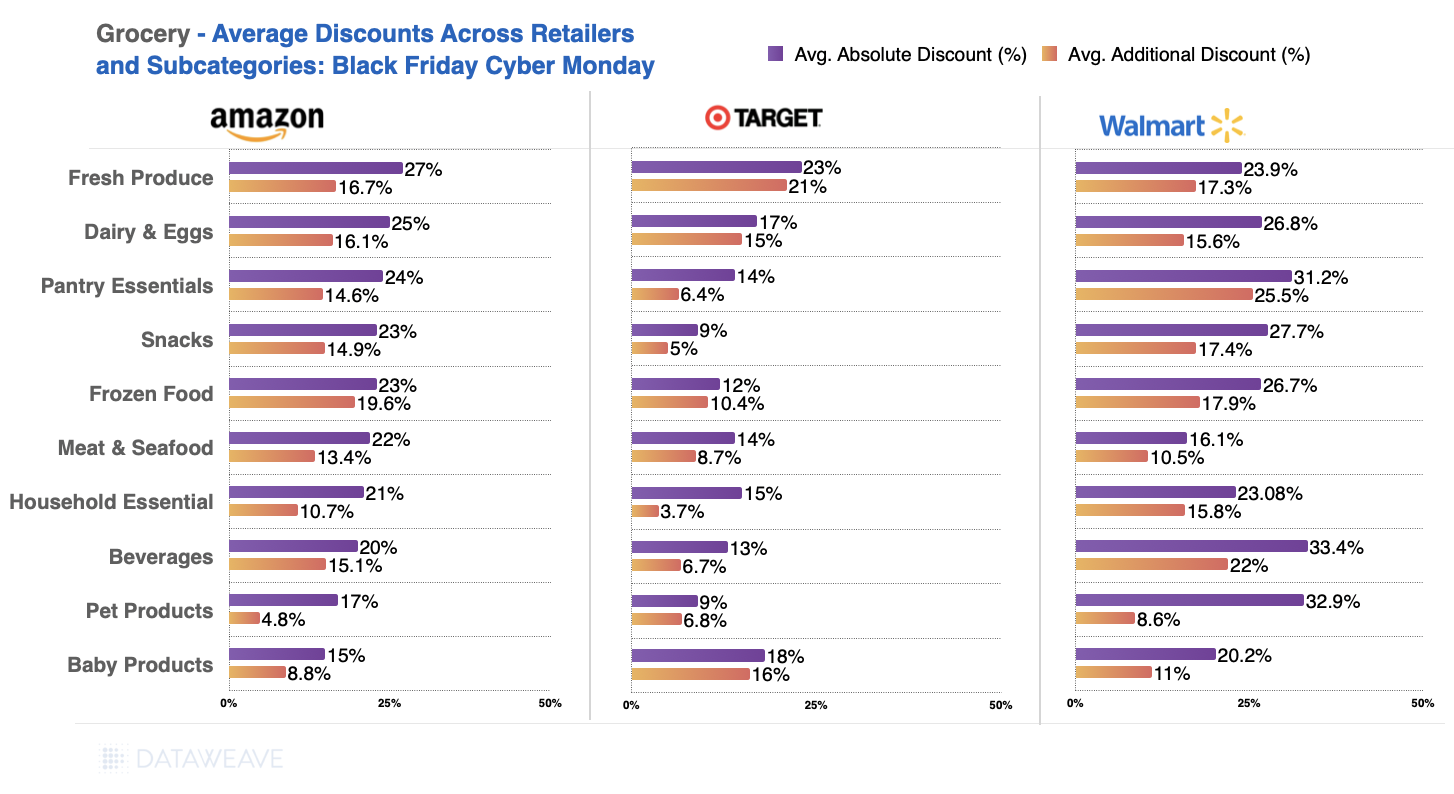
Grocery had the lowest discounts across all categories, reflecting the already-thin margins in food retail. Pre-Black Friday discounts averaged just 5.7%, with Black Friday Week adding only 1.2%. Pet Products led pre-sale discounts at an impressive 13%, significantly outpacing other grocery subcategories.
Beverages and Household Essentials followed with 9.4% and 7.7% pre-sale discounts respectively, and maintained their lead during Black Friday Week with 1.7% and 1.5% additional discounts each. Fresh categories like Meat & Seafood (1.4% pre-sale, 0.6% Black Friday Week) and Frozen Foods (1.7% pre sale, 0.6% additional discounts during Black Friday week) saw minimal promotional activity, consistent with perishable inventory constraints and tight margins.
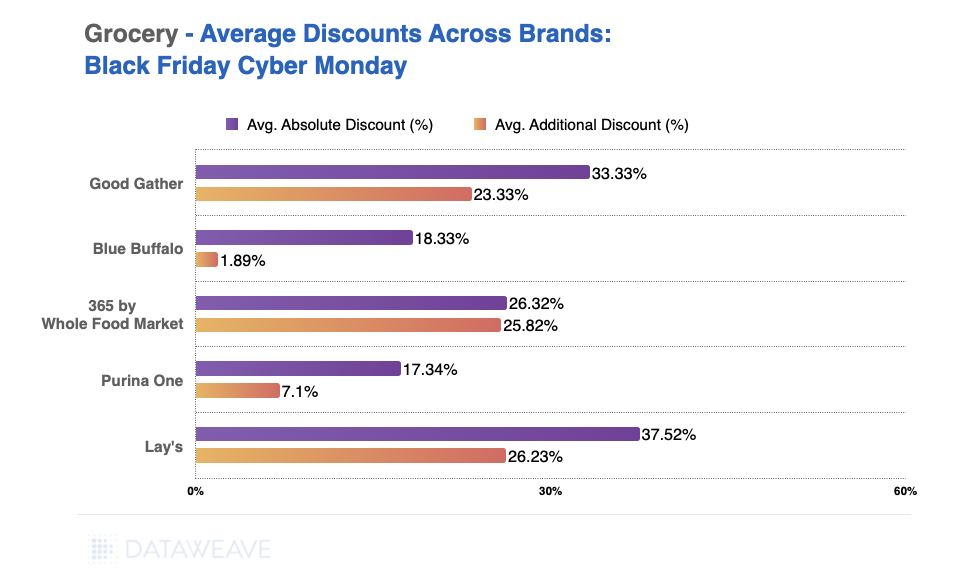
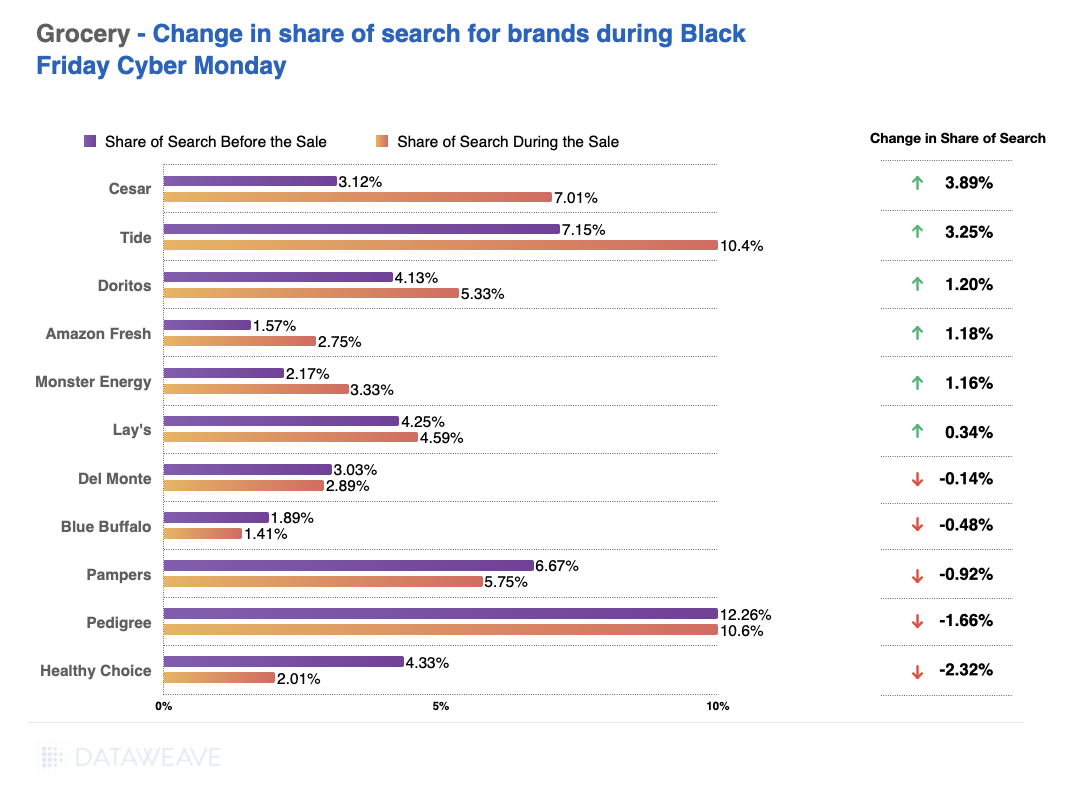
Share of Search: Brand Visibility Trends

Doritos led with a 7.3% surge in visibility. Pepsi delivered an equally impressive performance, rising from 3.6% pre Black Friday to 10.7% during Black Friday week. Fanta too saw 5.2% gain in share of search.
Conversely, Coca-Cola gained more modestly at 1.6%, while its Sprite brand actually declined 0.9%.
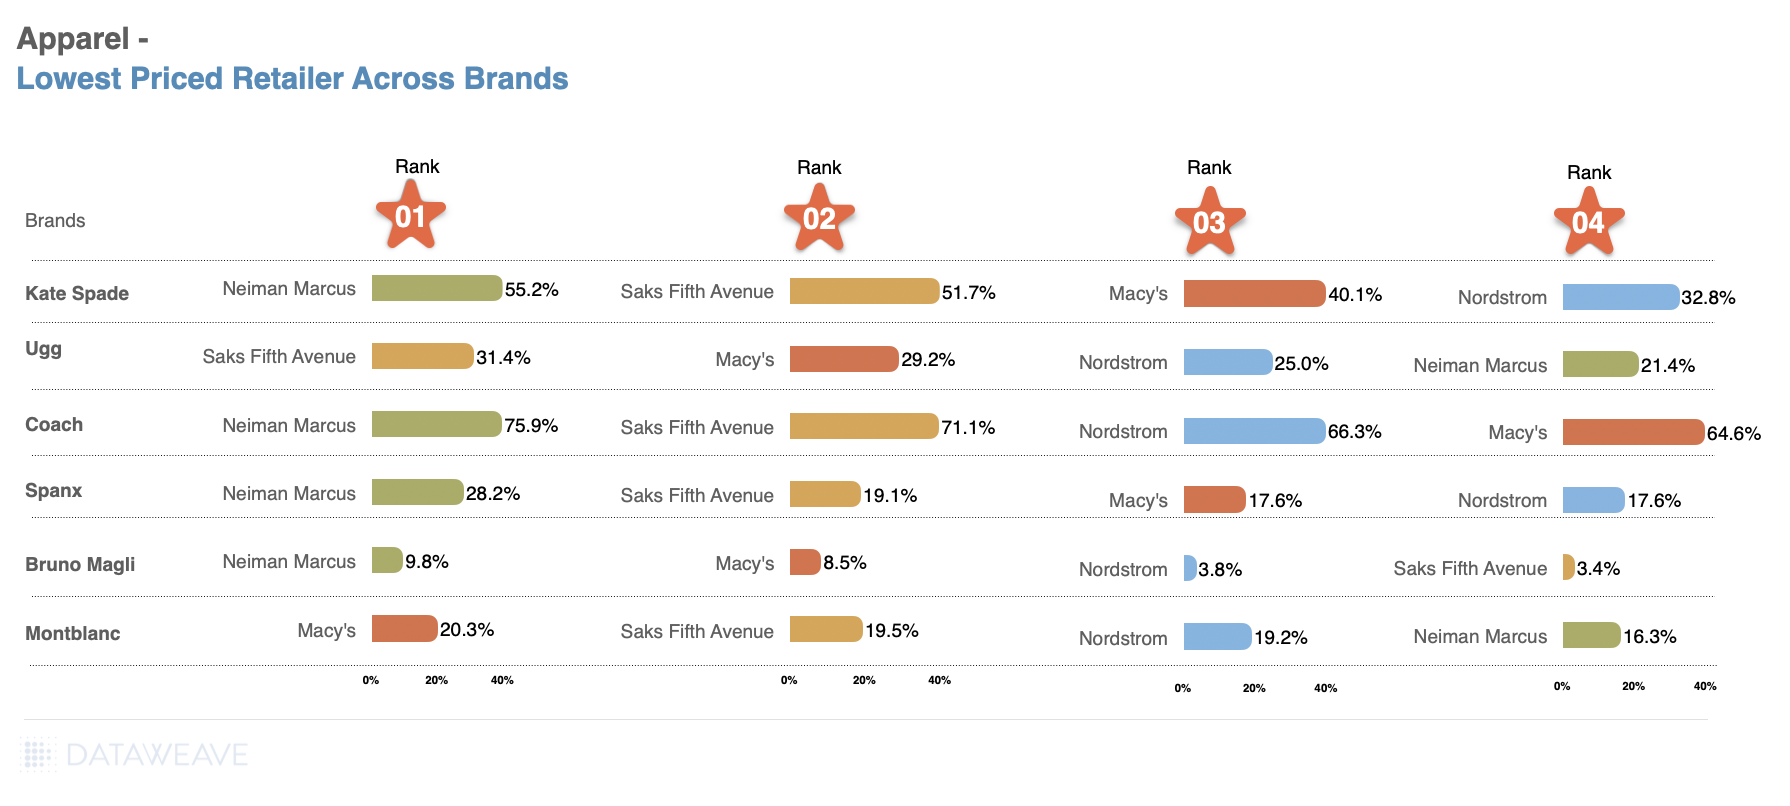
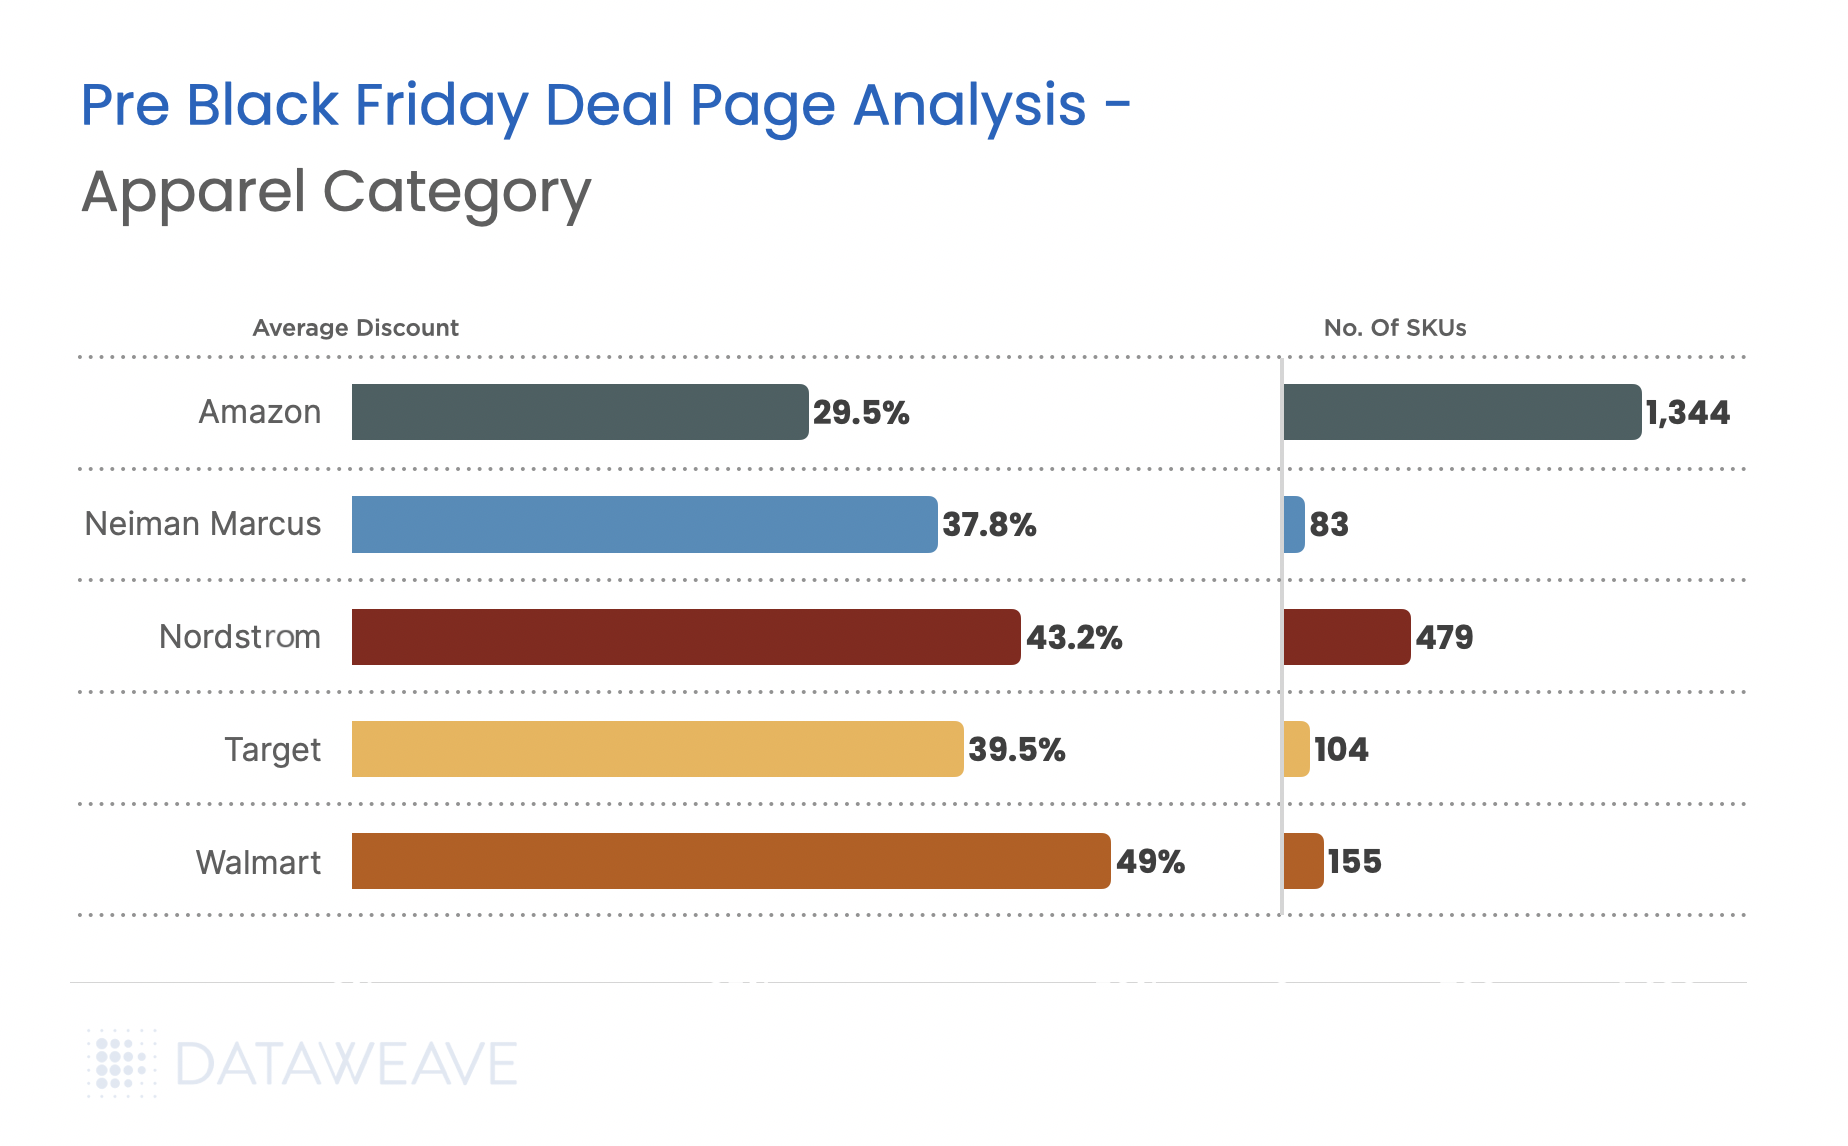
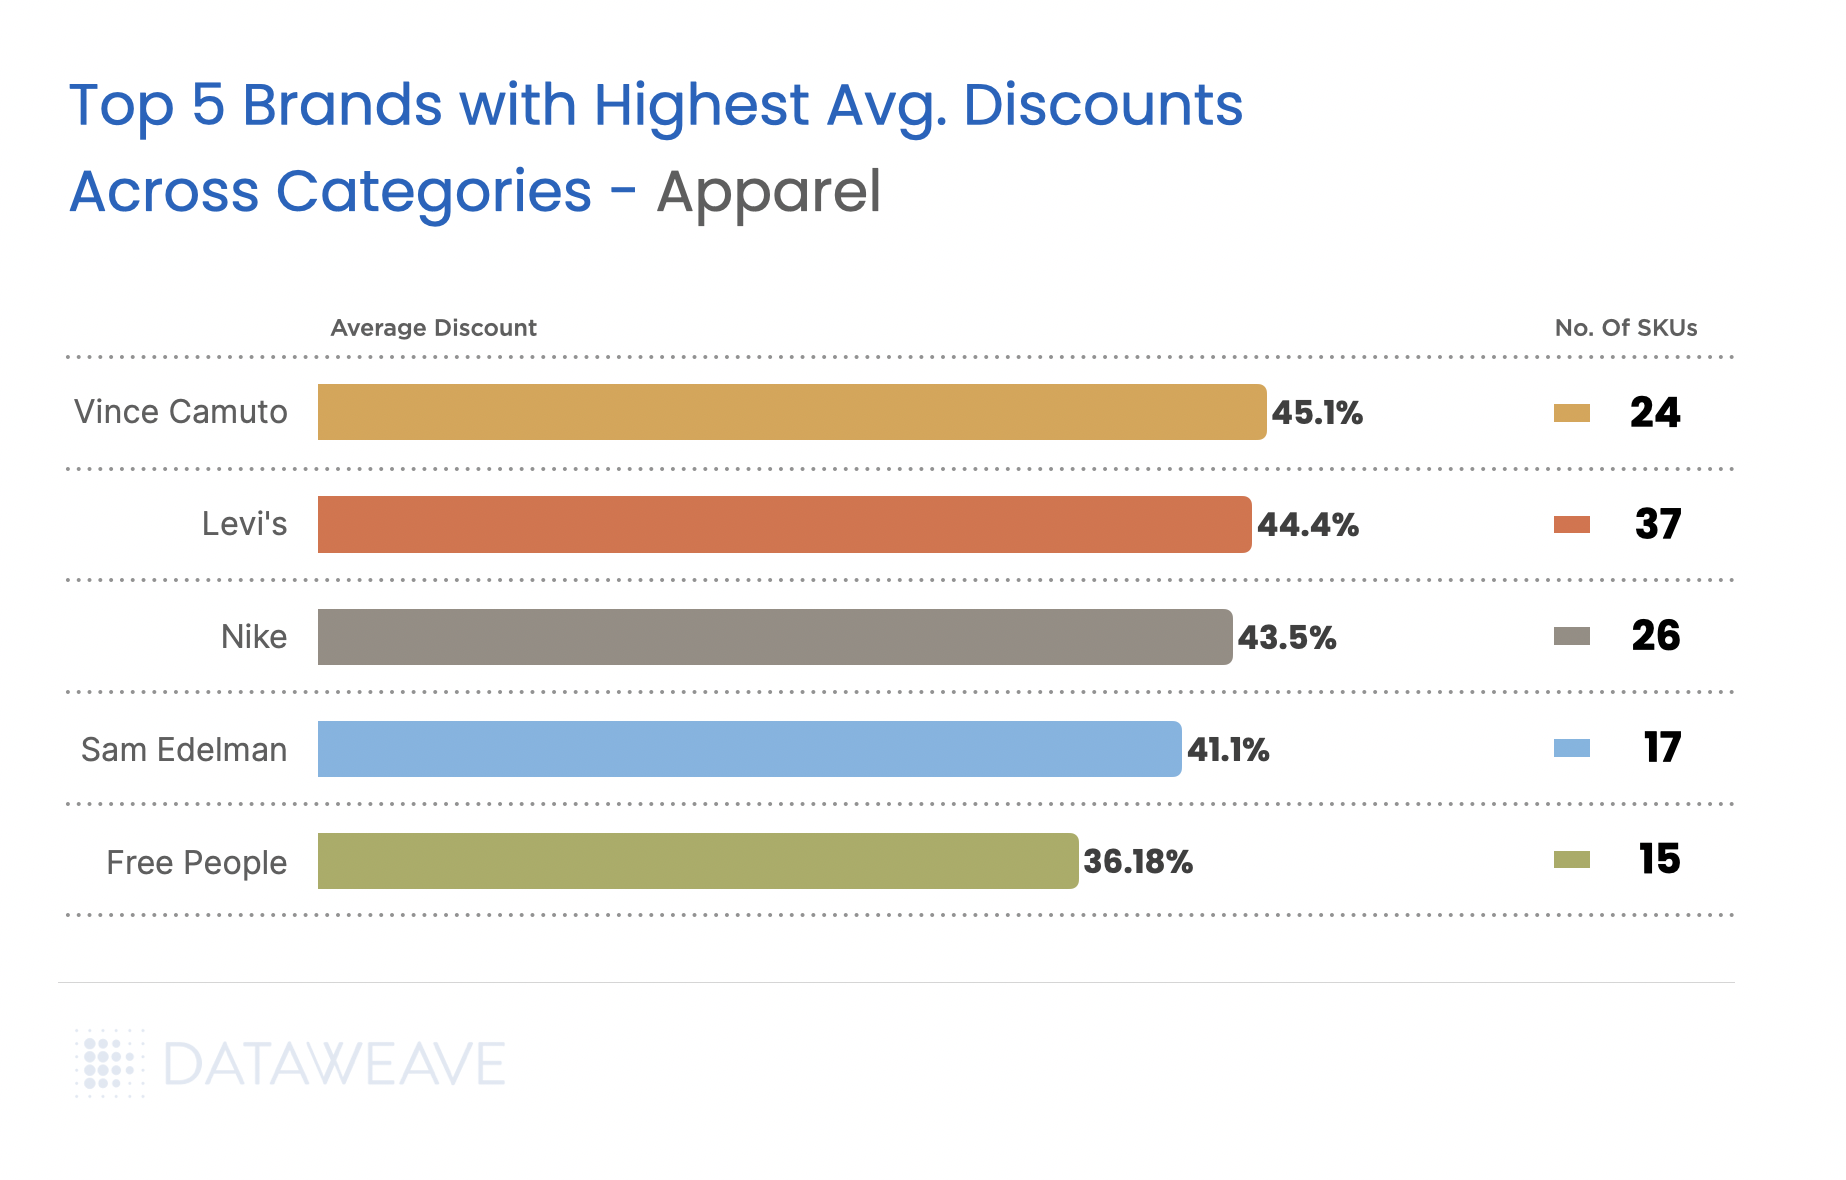
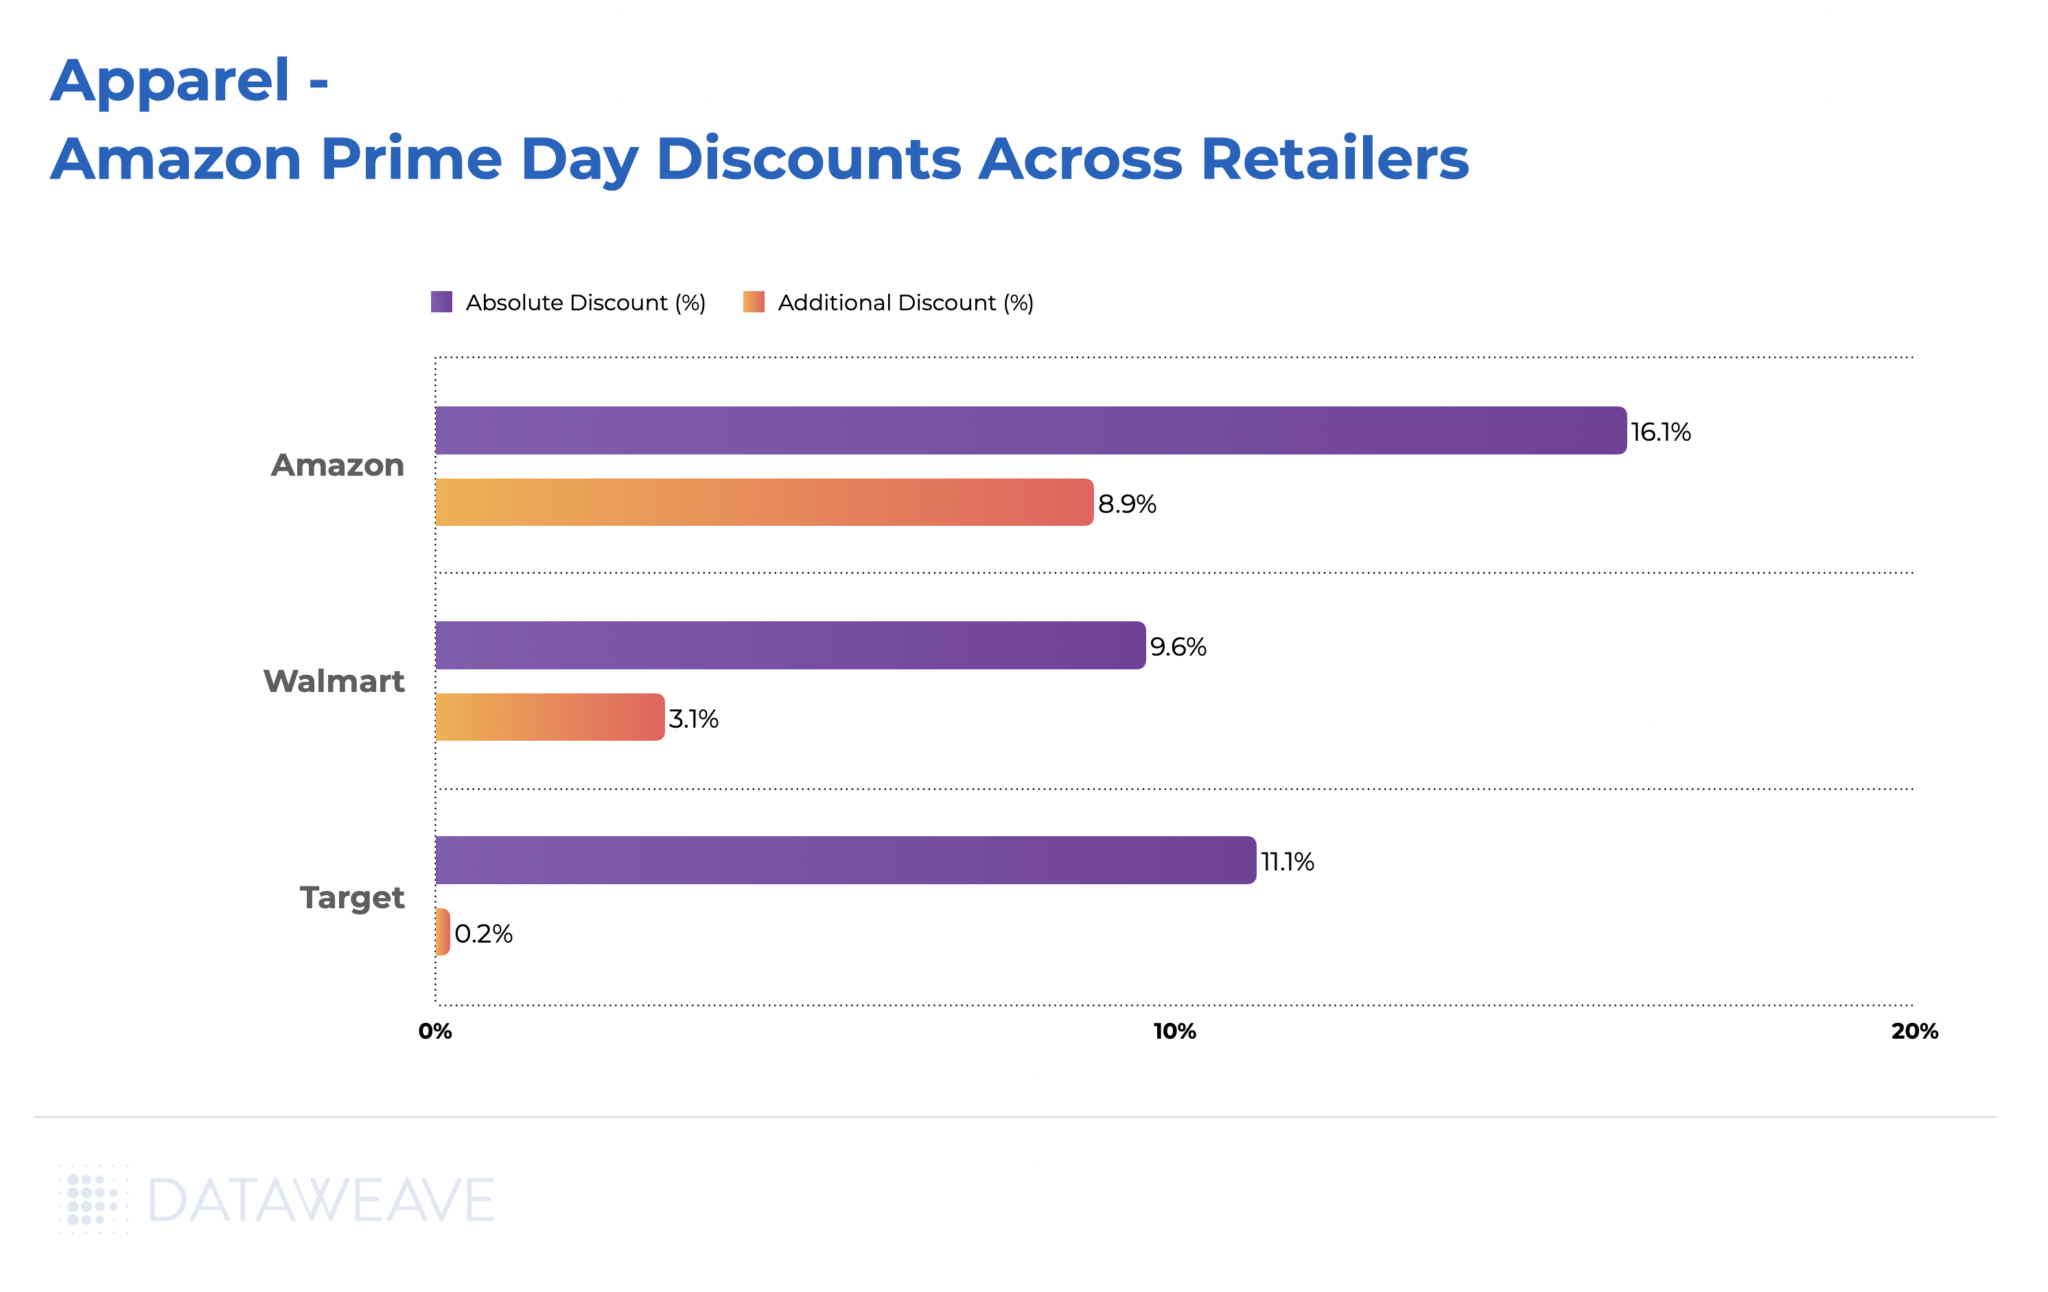
Apparel
Apparel remains a Black Friday staple in the UK and is projected to deliver the strongest year-on-year growth of any UK retail segment this festive season. With clothing accounting for 39% of planned Black Friday purchases, the category represents one of the most hotly contested battlegrounds during the sales period.
Our analysis of 17,063 SKUs, the largest category in our study, reveals interesting patterns across fashion segments that demonstrate both the opportunities and competitive intensity in UK apparel retail.
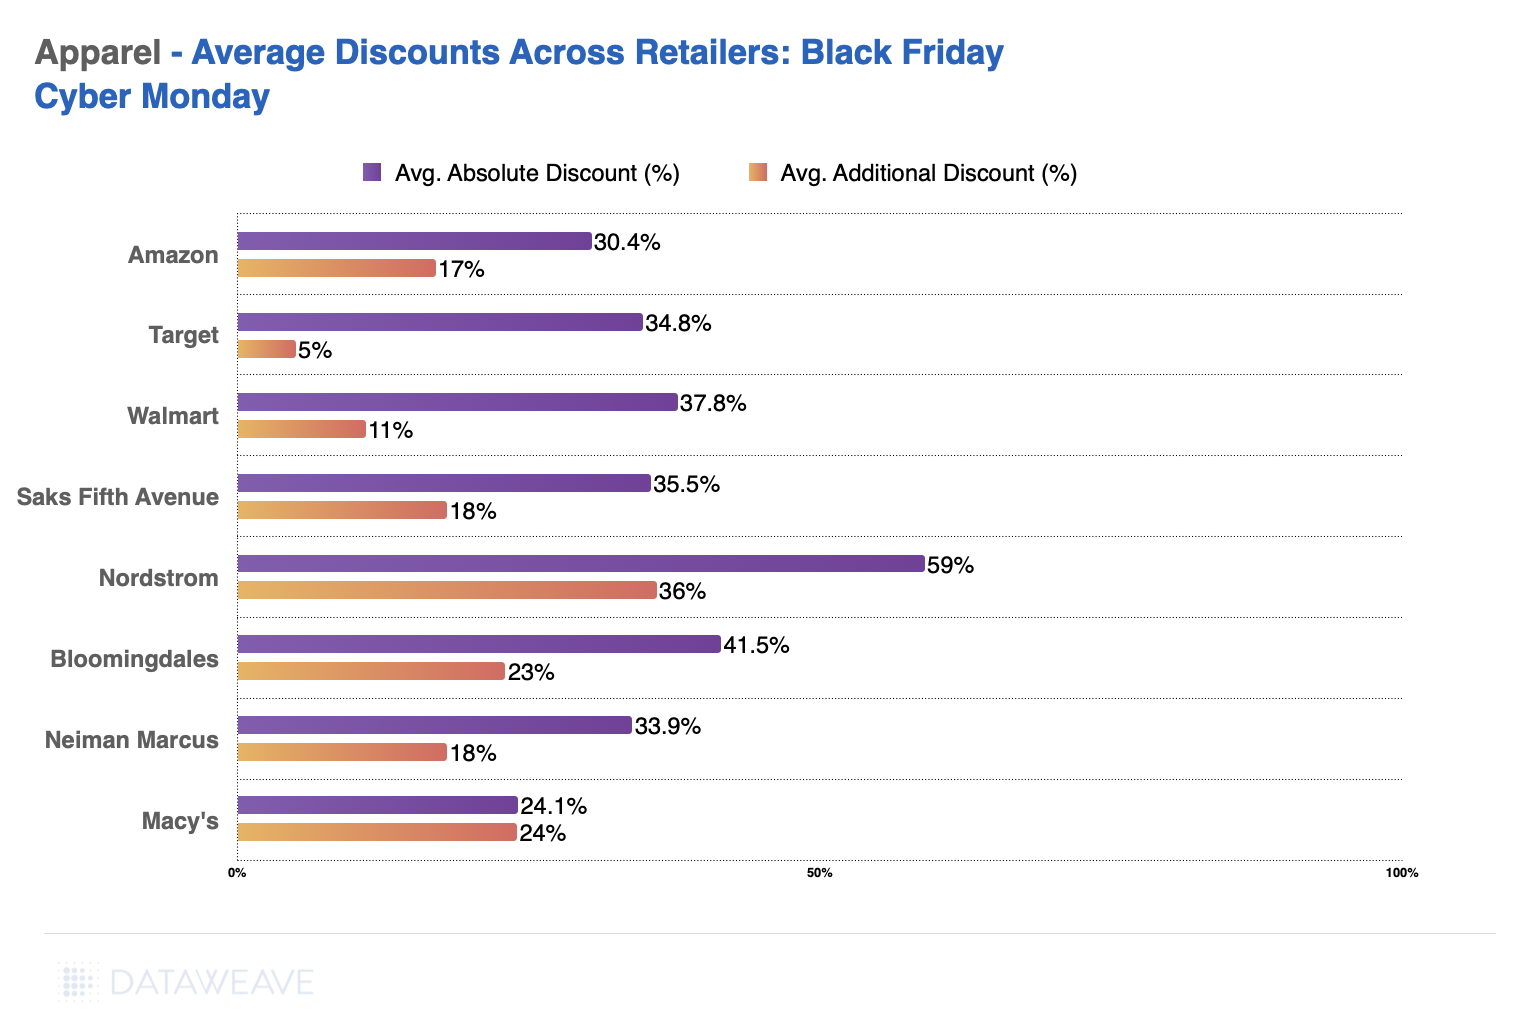
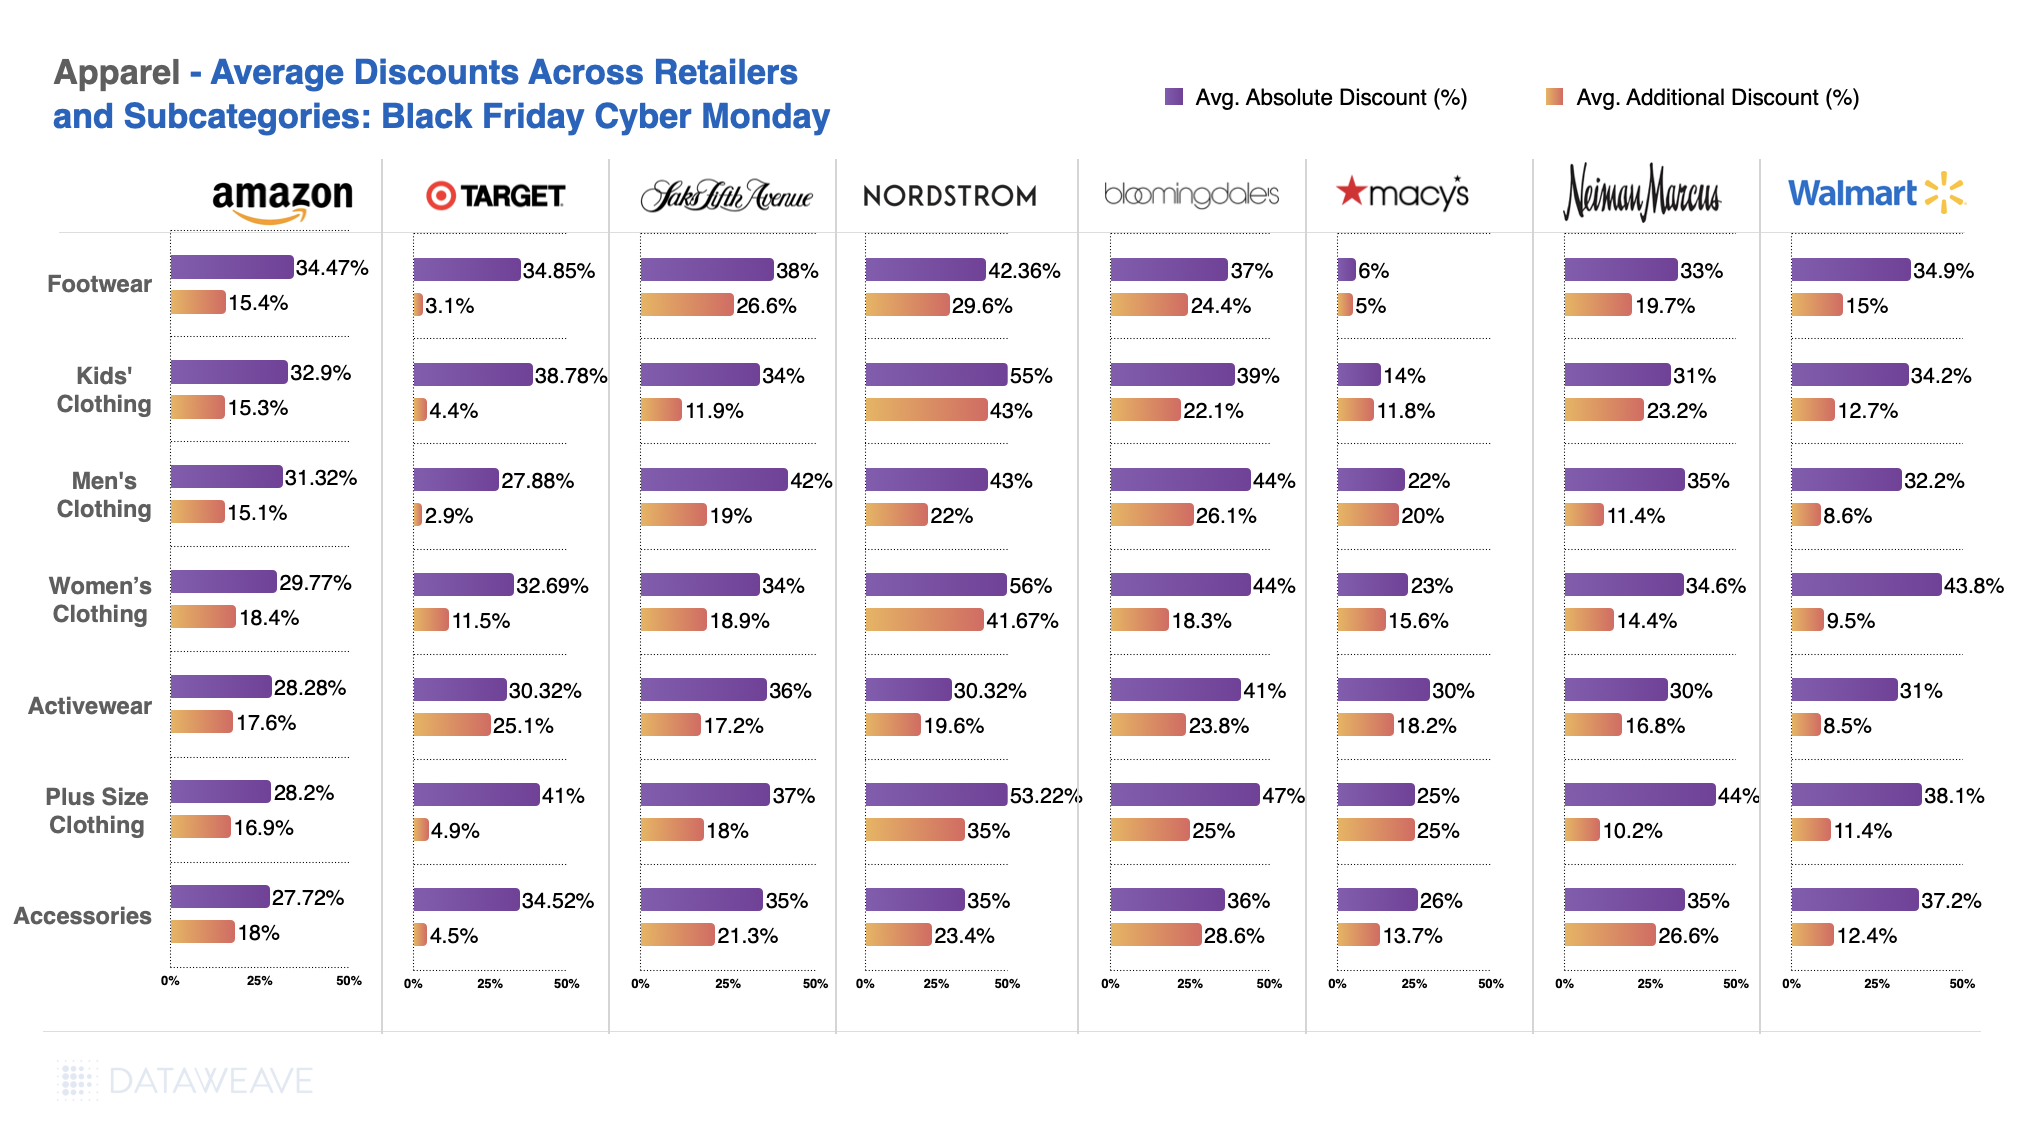
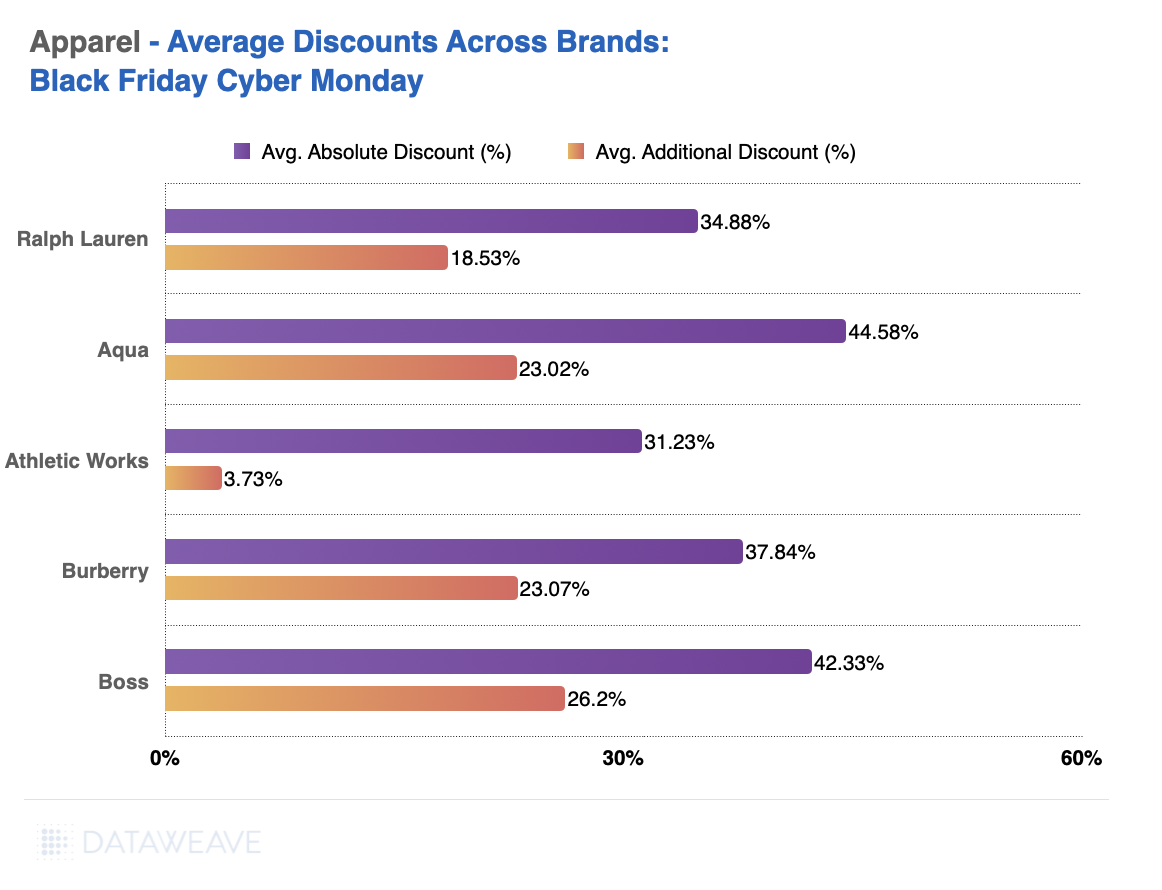
Subcategory Discount Analysis
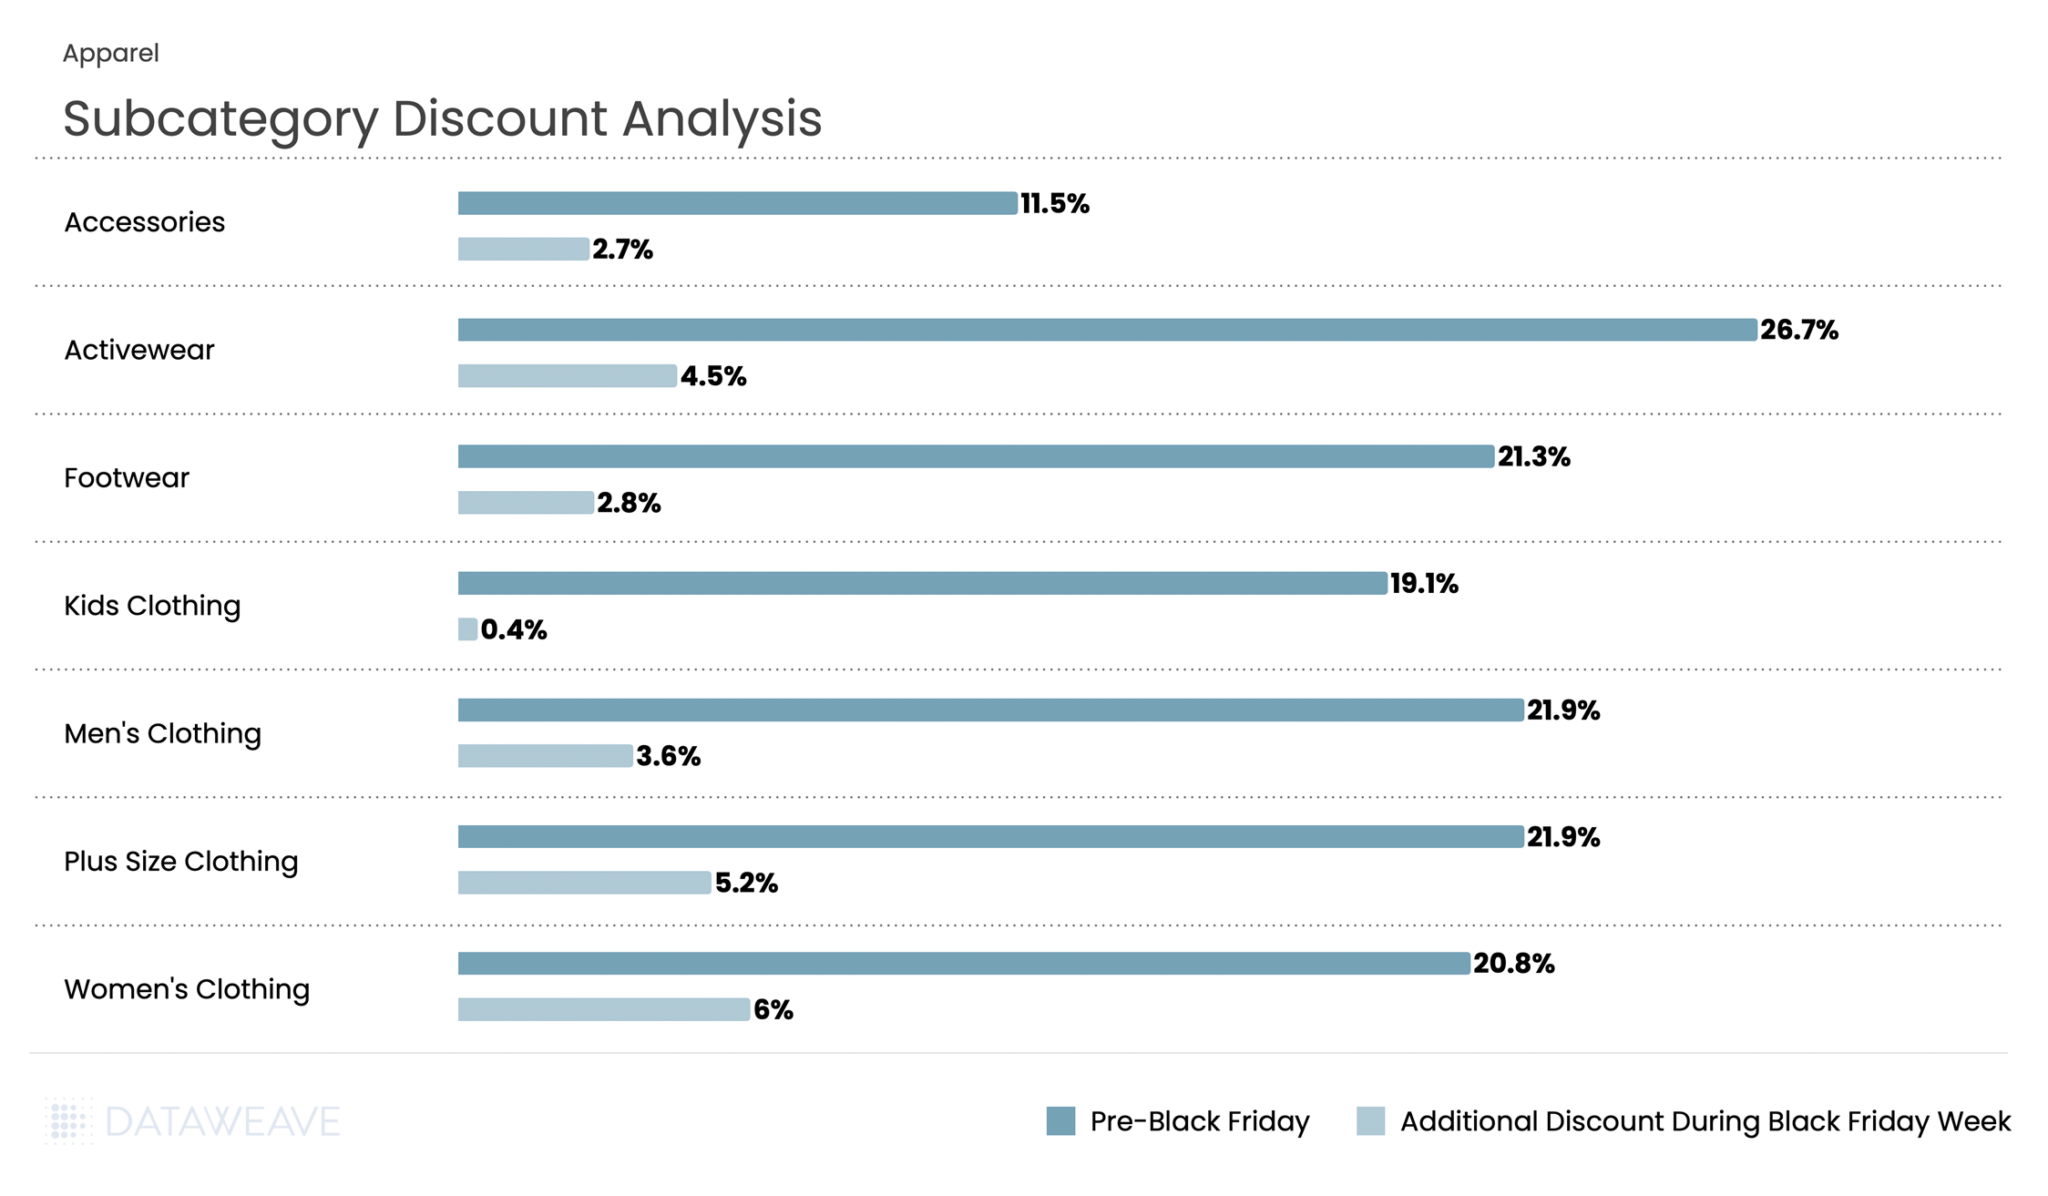
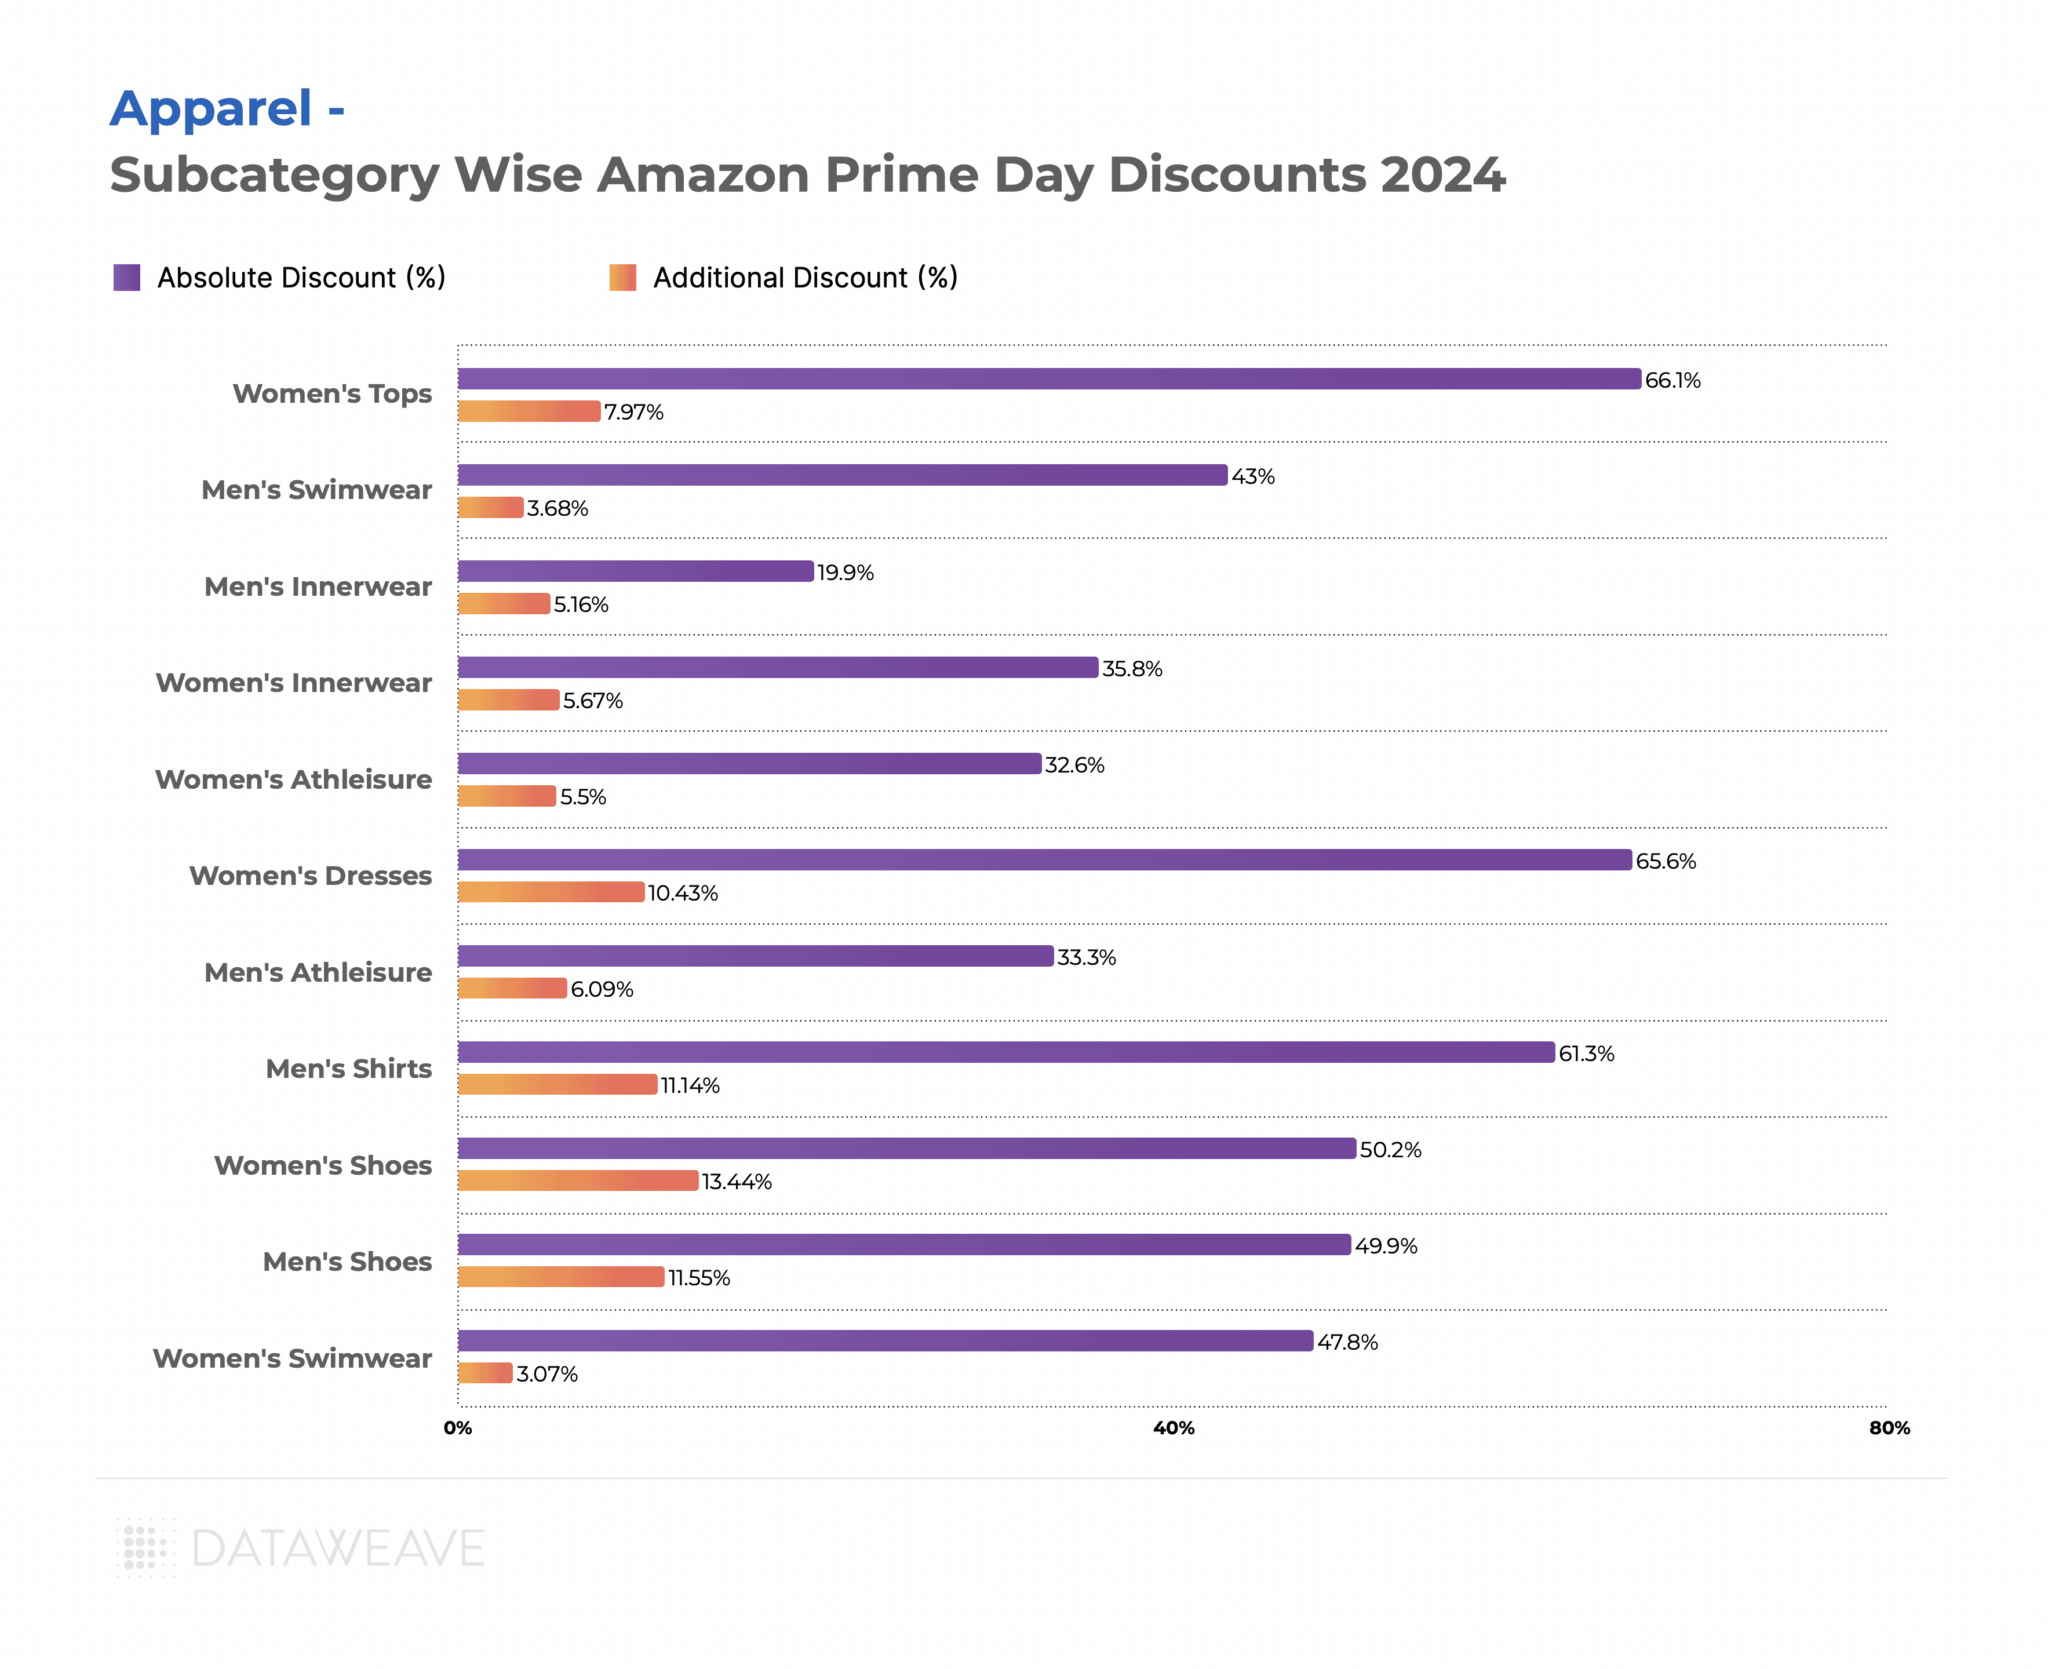
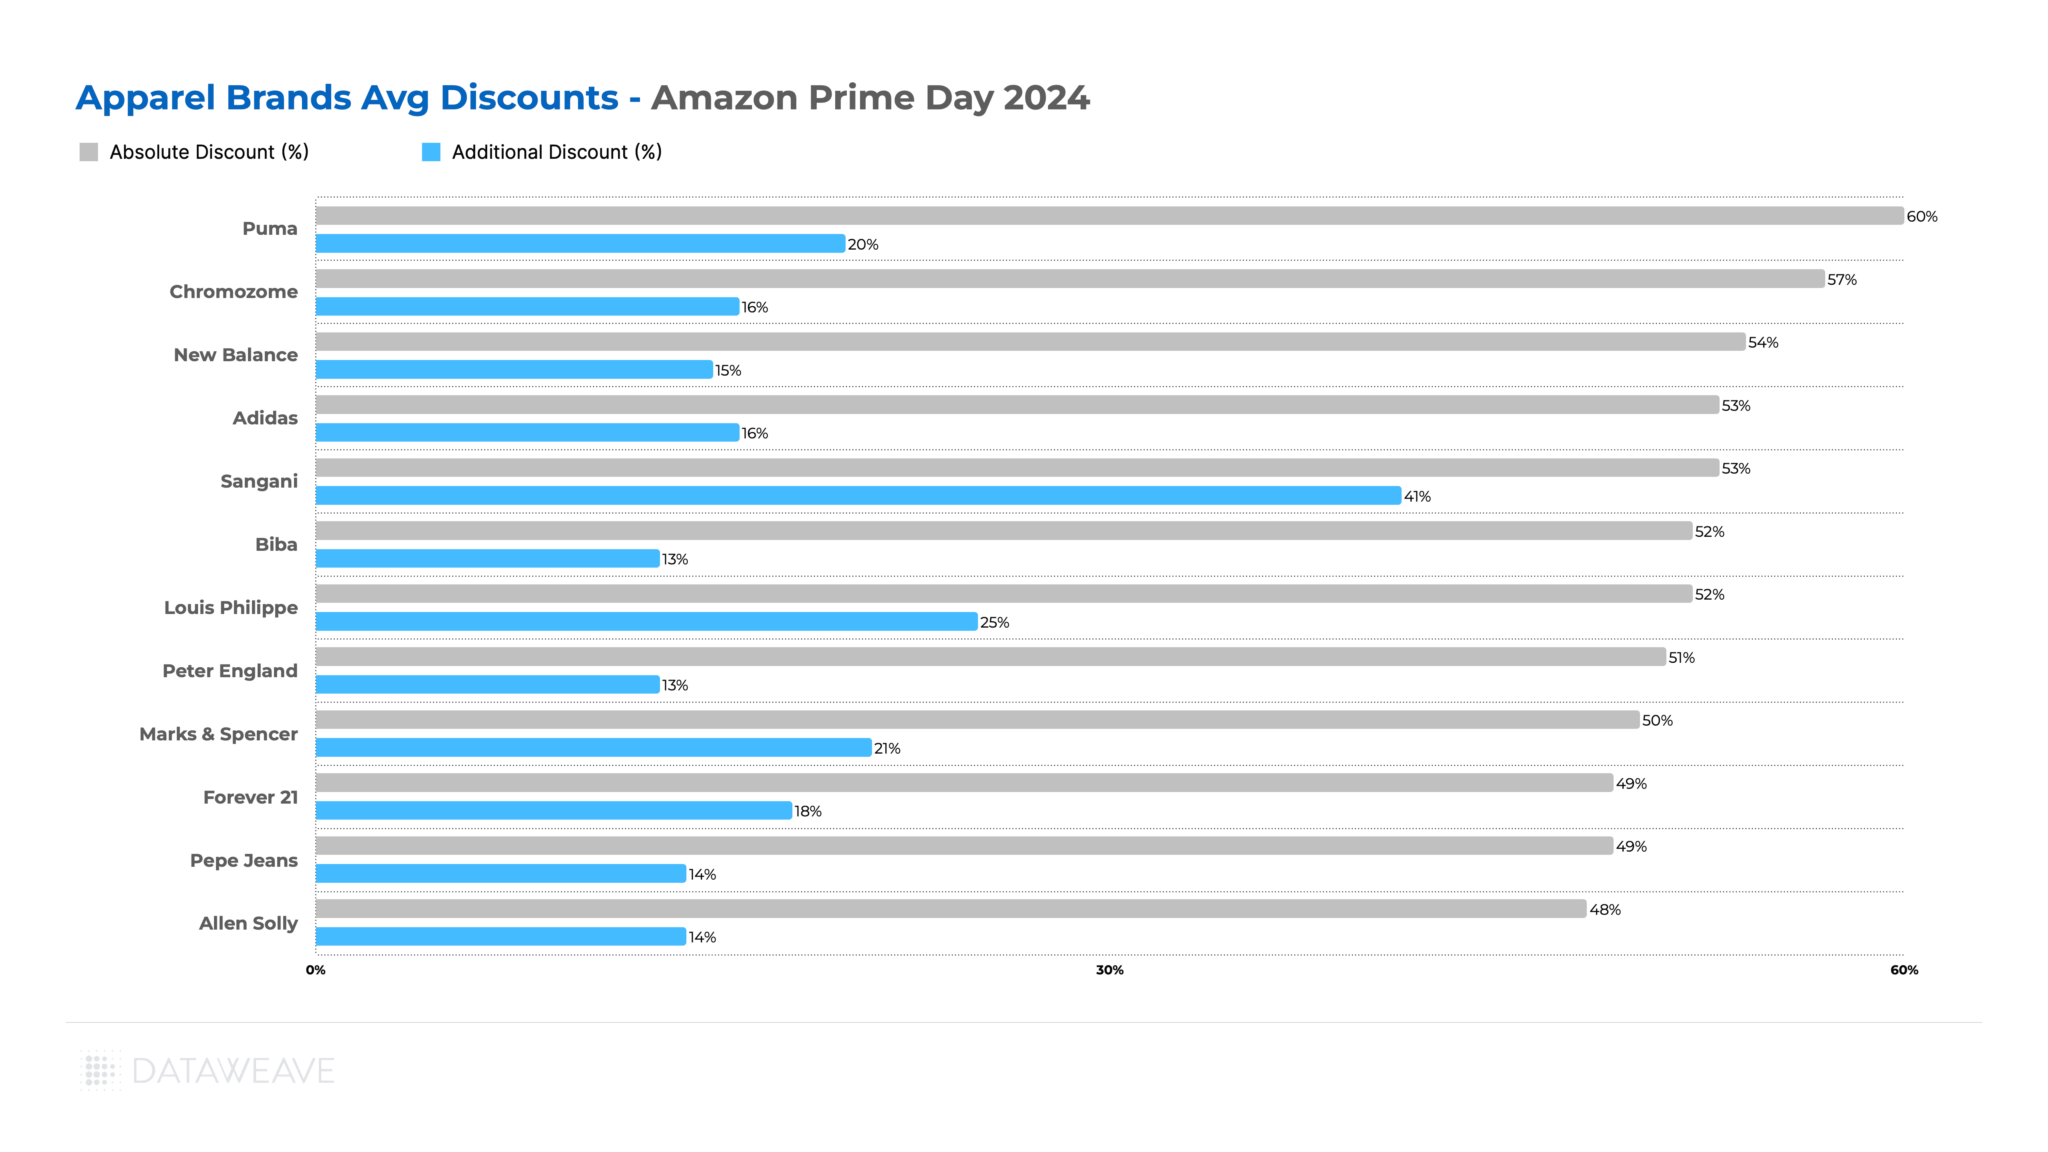
Apparel showed the strongest discounting activity throughout the BFCM period among all categories. Pre-Black Friday discounts averaged 17.2%, with Black Friday Week adding 3.5%, making it one of the most heavily promoted categories.
Activewear led pre-sale discounts at an impressive 26.7%, with an additional 4.5% discount during Black Friday week. Plus Size Clothing and Men’s Clothing tied for second place in pre-sale discounts at 21.9% each. Notably, Plus Size Clothing saw the highest Black Friday Week discount at 5.4%.
Women’s Clothing saw robust discounts throughout, with 20.8% pre-sale and an additional 6% during Black Friday Week (the highest additional discount in the category).
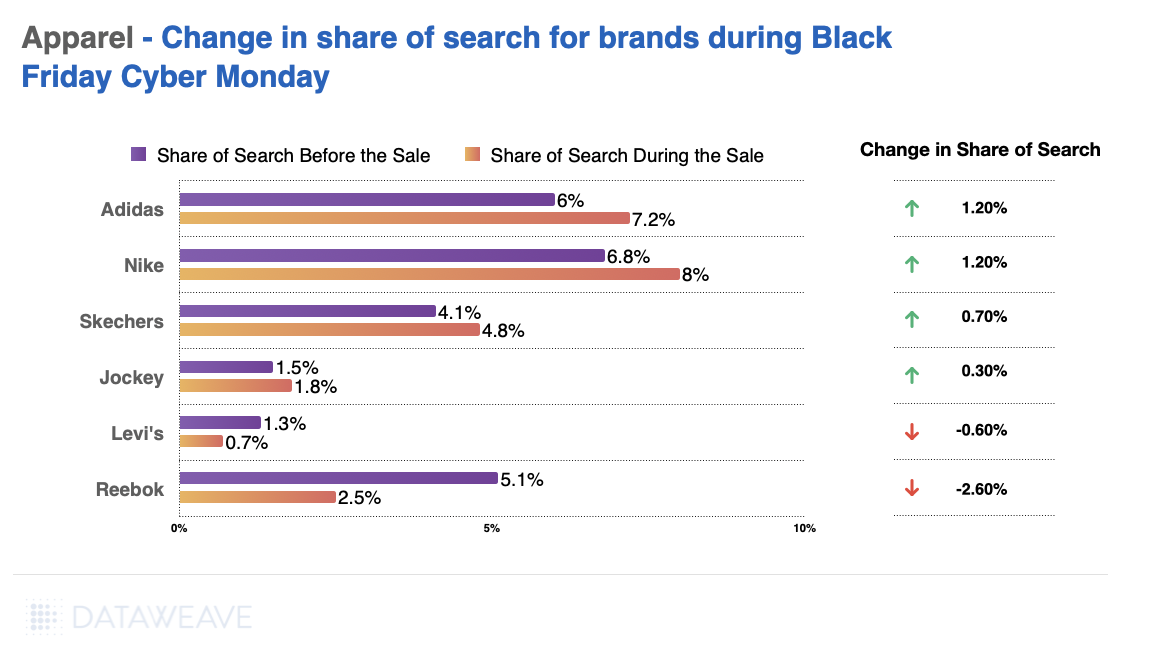
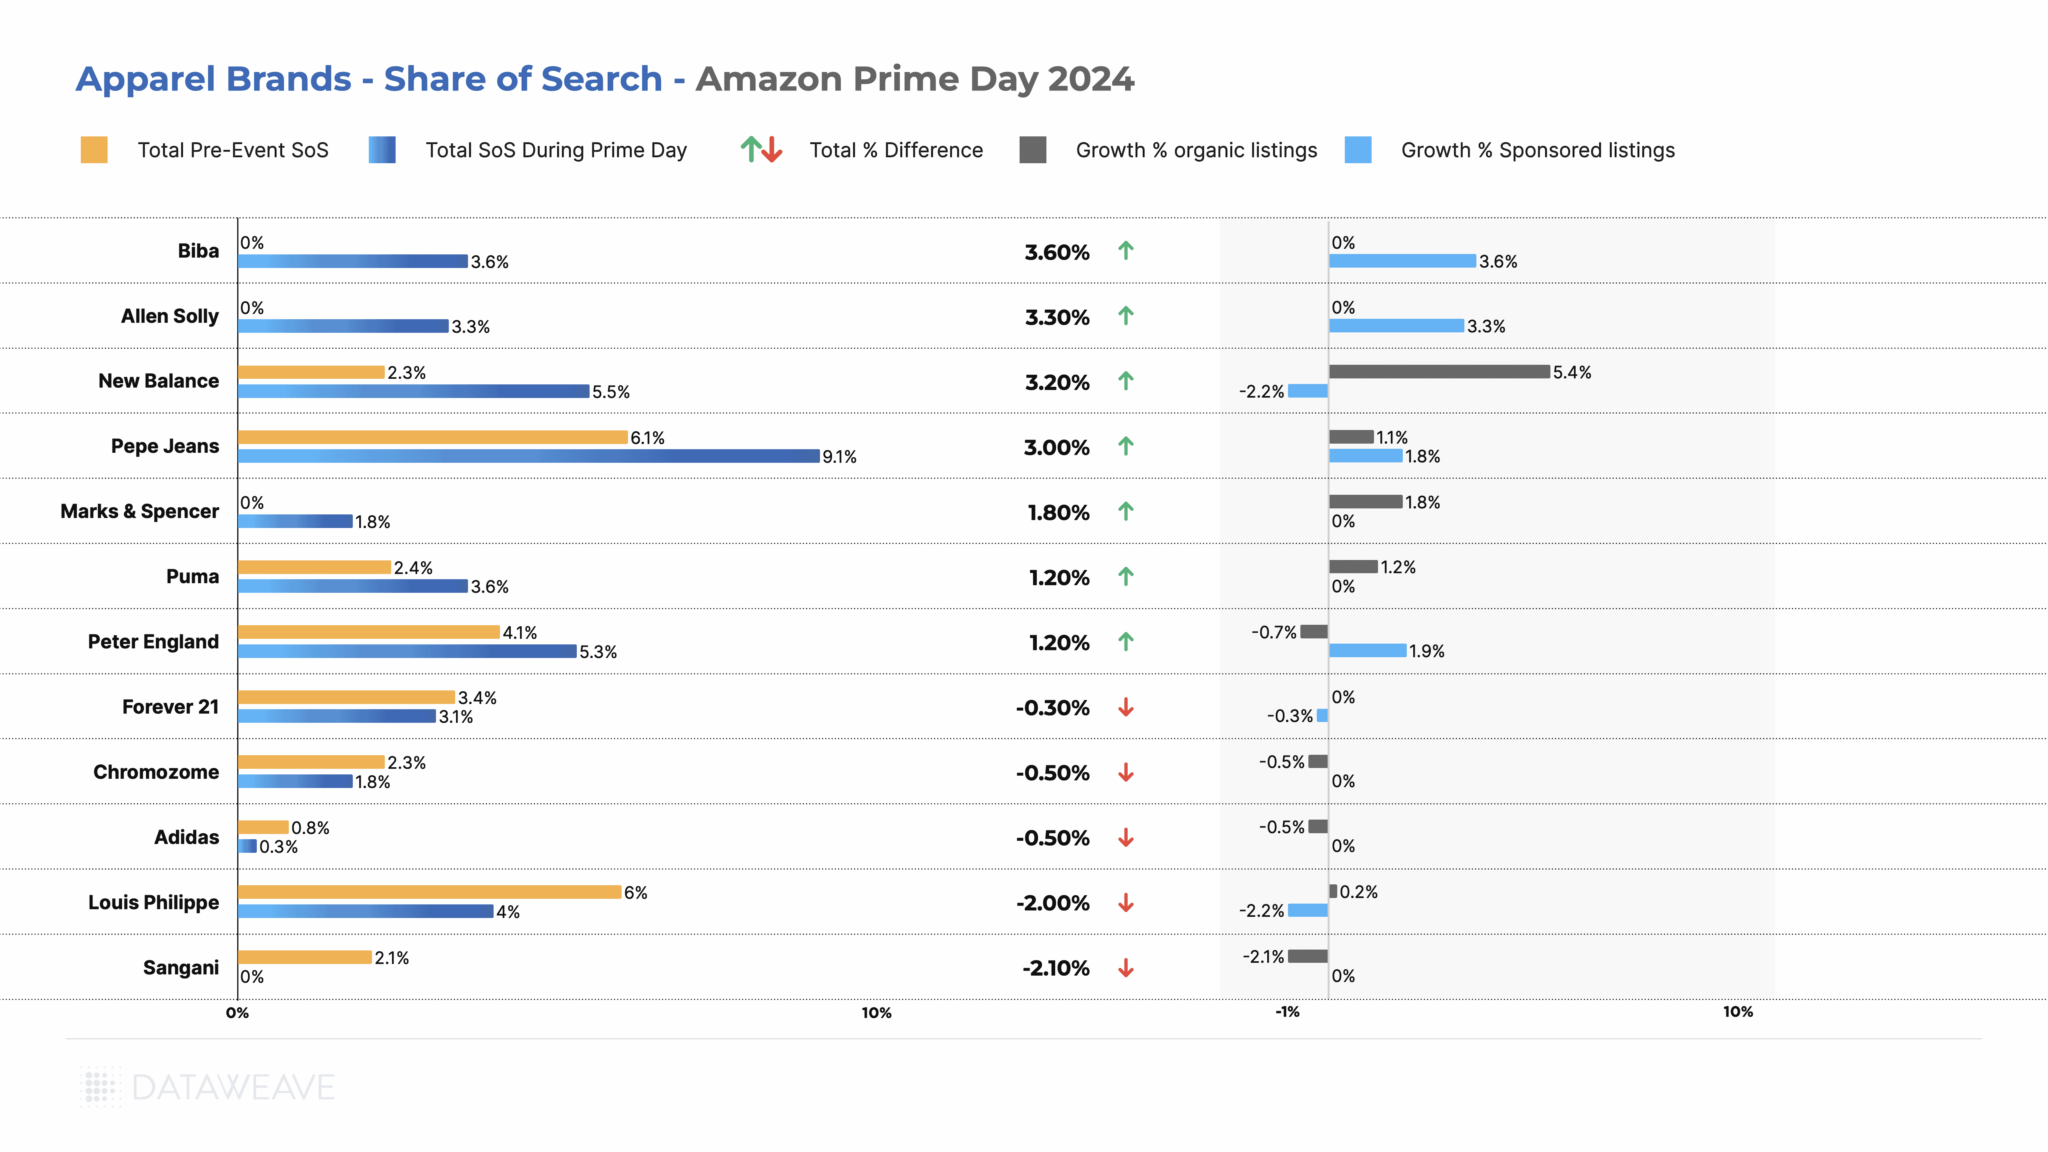
Share of Search: Brand Visibility Trends
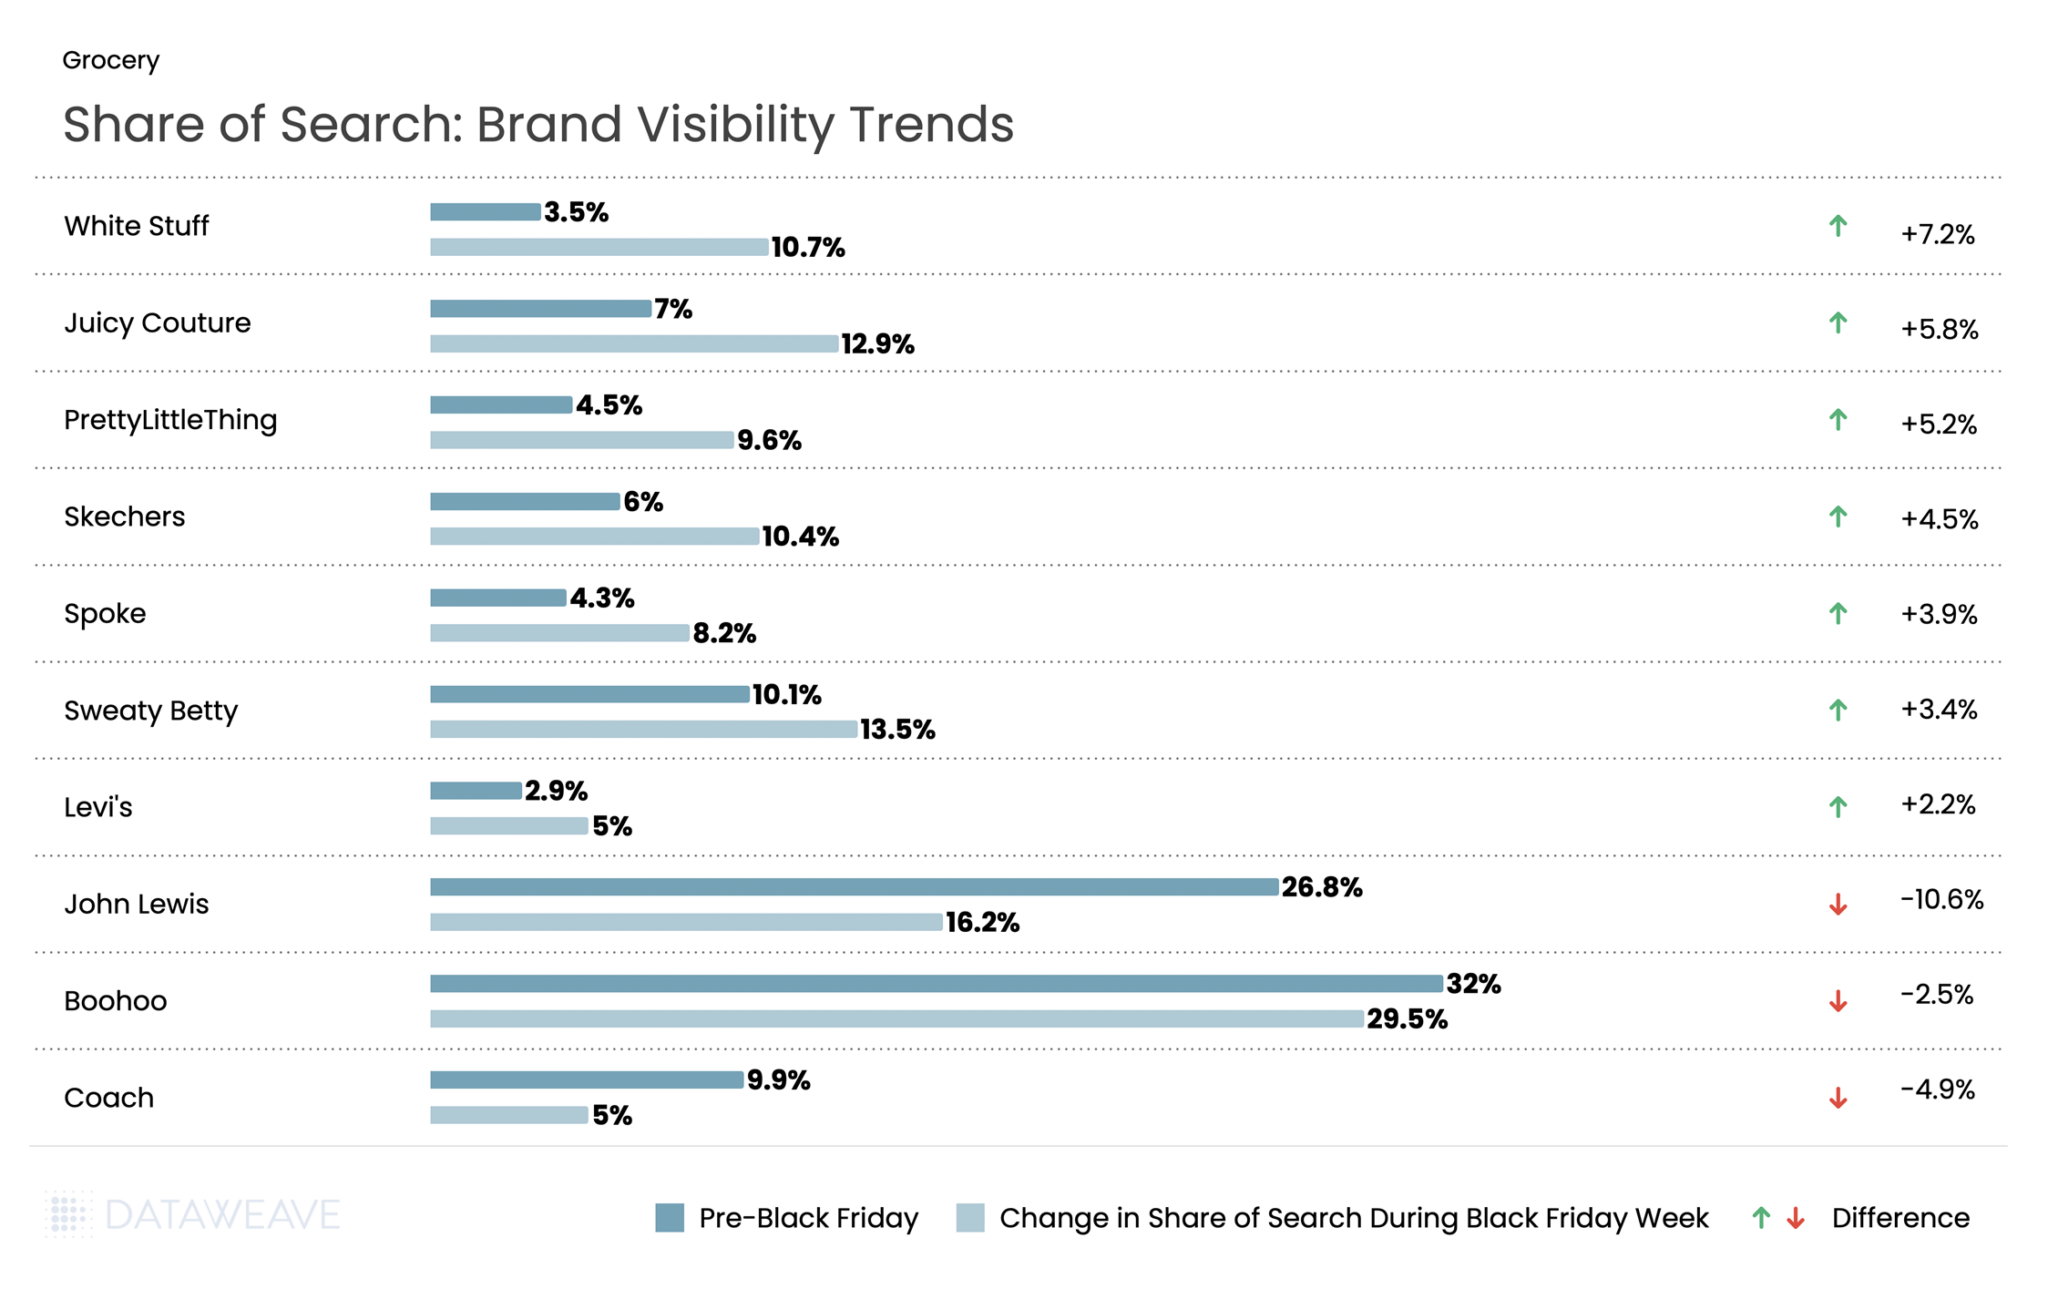
White Stuff, the British lifestyle brand, saw a 7.2% surge in visibility during Black Friday. Y2K fashion made a statement as Juicy Couture jumped 5.8 %. Fast fashion player Pretty Little Thing gained in visibility by 5.2%. Comfort brands performed strongly, with Skechers gaining 4.5% and activewear specialist Sweaty Betty rising 3.4%. Even premium denim brand Levi’s gained ground, increasing share of search by 2.2%.
However, retail giants faced significant visibility challenges. John Lewis saw the steepest decline in the Apparel category, with share of search dropping by 10.6% during Black Friday week. Fast fashion giant Boohoo declined 2.5%. Premium accessory brand Coach’s share fell 4.9%.
The data suggests UK consumers gravitated toward distinctive brands with clear identities during Black Friday, whether heritage British labels, Y2K nostalgia, or comfort-focused specialists, rather than generalist retailers or fast fashion platforms.
Want to understand how DataWeave’s pricing intelligence platform can help your business make data-driven decisions during peak sales events? Contact us to learn more about competitive insights, price intelligence, assortment analytics, content analytics, and digital shelf analytics.
Check out our analysis on Black Friday 2025 Pricing and Discount trends in the USA.
Follow our blog for more insights on retail pricing trends, brand visibility analysis, and data-driven commerce intelligence.