Commerce Is Entering Its Next Chapter
Every major shift in commerce has been driven by data. A century ago, shopkeepers relied on ledgers to track sales. In the supermarket era, loyalty cards and barcodes turned transactions into insights. With the rise of eCommerce, clickstream data and online analytics reshaped how products were merchandised and sold.
Now, we are entering the next chapter: agentic commerce.
In this new paradigm, autonomous AI agents will handle the tasks that once required teams of analysts, merchandisers, and pricing specialists. Imagine an agent that monitors competitor prices across dozens of retailers, recommends adjustments, and pushes updates to a dynamic pricing engine, all in real time. Picture a shopper’s digital assistant scanning marketplaces for the right mix of price, delivery time, and customer reviews before making a purchase on their behalf.
These aren’t distant scenarios. They’re unfolding now. Industry analysts estimate the enterprise AI market at $24 billion in 2024, projected to grow to $155 billion by 2030 at nearly 38% CAGR . Meanwhile, 65% of organizations already use web data for AI and machine learning projects, and 93% plan to increase their budgets for it in 2024. The trajectory is undeniable: the next era of commerce will be built on AI-driven decision-making.
And what fuels those AI-driven decisions? Data. Reliable, structured, timely, and compliant data.
The Data Problem No One Can Ignore
Here’s the paradox: just as data has become most critical, it has also become harder to acquire.
For data and engineering leaders, the challenges are painfully familiar:
- Old school scrapers that collapse whenever a site changes its HTML or introduces new interactivity.
- Constant maintenance cycles, with engineering teams spending 20-40 hours a week debugging, rerunning, and patching scripts.
- Low success rates, with in-house approaches succeeding just 60-70% of the time.
- Complex infrastructure, from managing proxies to retry logic, pulls attention away from higher-value work.
But the costs go far beyond engineering frustration.
For retailers, broken pipelines mean competitive blind spots. A pricing team without reliable visibility into competitor moves can’t respond fast enough, risking lost margin or missed sales. Merchandising teams trying to optimize assortments are left with incomplete data, making poor stocking decisions inevitable.
For brands, unreliable data disrupts visibility into the digital shelf. Products might be misplaced in search rankings, content could be outdated or incomplete, and reviews could signal issues, but without continuous monitoring, those signals are missed until it’s too late.
For AI and ML teams, poor-quality training data means underperforming models. Without clean, consistent, and large-scale inputs, even the most sophisticated algorithms produce flawed predictions.
Finally for consulting firms and research providers, fragile collection systems can compromise credibility. Clients expect robust, evidence-backed recommendations. Data gaps erode trust.
The reality is stark: fragile pipelines don’t just waste engineering hours. They undermine competitive agility, customer experience, and business growth.
Enter the Data Collection API
DataWeave’s Data Collection API is a self-serve, enterprise-scale platform designed to deliver the data foundation today’s enterprises need, and tomorrow’s agentic AI systems will demand.
At its core, the API replaces brittle scrapers and ad hoc tools with a resilient, adaptive, and compliant data acquisition layer. It combines enterprise reliability with retail-specific intelligence to ensure that structured data is always available, accurate, and ready to power critical workflows.
Here’s what makes it different:
- Enterprise-scale throughput: The API can process thousands of URLs in a single batch or handle continuous, high-frequency scrape. Whether you need daily pulses or near real-time monitoring, it scales with you.
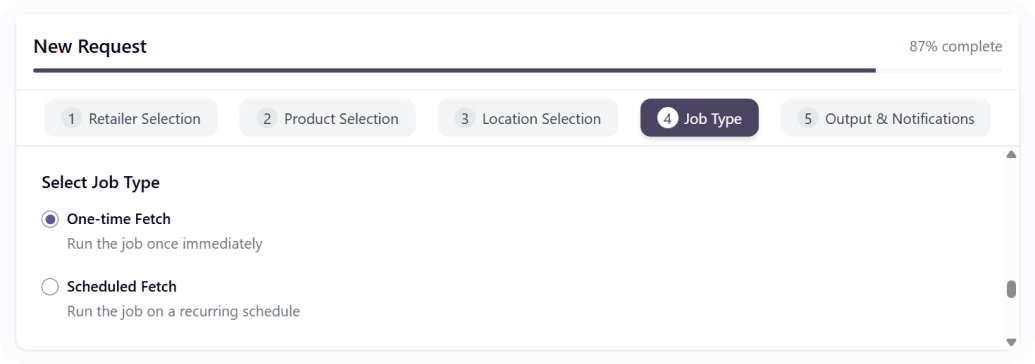
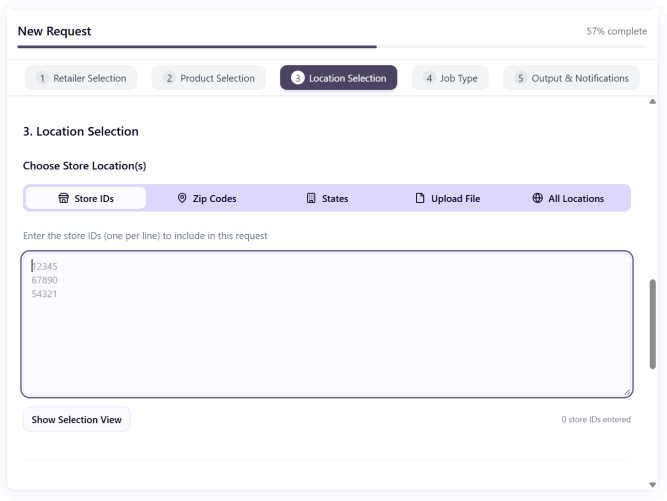
- Flexible access modes: Technical teams can integrate directly into internal workflows via API, while business users can configure jobs through a no-code interface. Everyone gets what they need without bottlenecks.
- Adaptive resilience: As websites evolve, the API adapts automatically. No frantic patching, no firefighting.
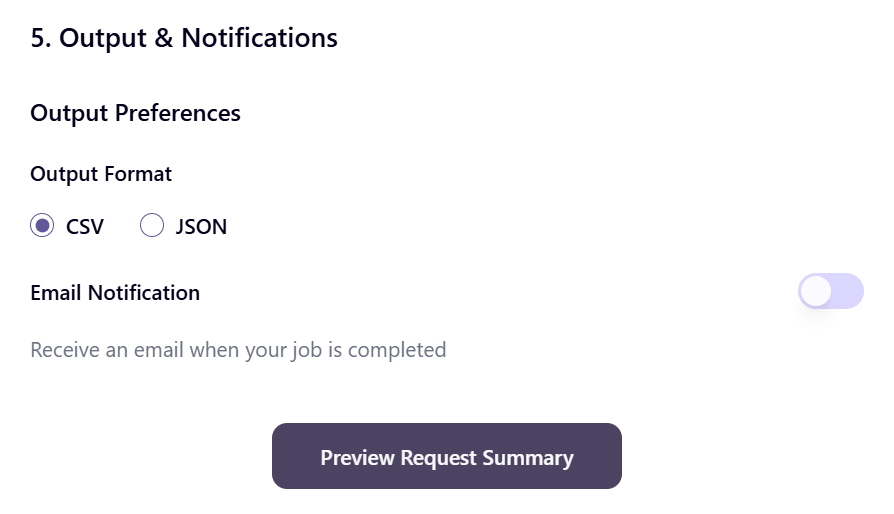
- Structured outputs, your way: Clean JSON, CSV, or WARC formats are delivered directly into your environment – AWS S3, Snowflake, GCP, or wherever your data stack lives.
- Built-in monitoring and self-healing: Automated retries, real-time logs, and usage dashboards keep teams in control without manual oversight.
- Compliance by design: WARC-based archiving and SOC2 alignment ensure data pipelines are auditable, trustworthy, and enterprise-ready.
This isn’t about scraping pages. It’s about creating a reliable data utility, a system that transforms raw web inputs into structured, actionable data streams that enterprises can trust and scale on.
Who It’s Built For (And How They Use It)
The Data Collection API isn’t limited to one role or industry. It’s been designed with multiple stakeholders in mind, each of whom can apply it to solve pressing challenges:
Retailers and Consumer Brands
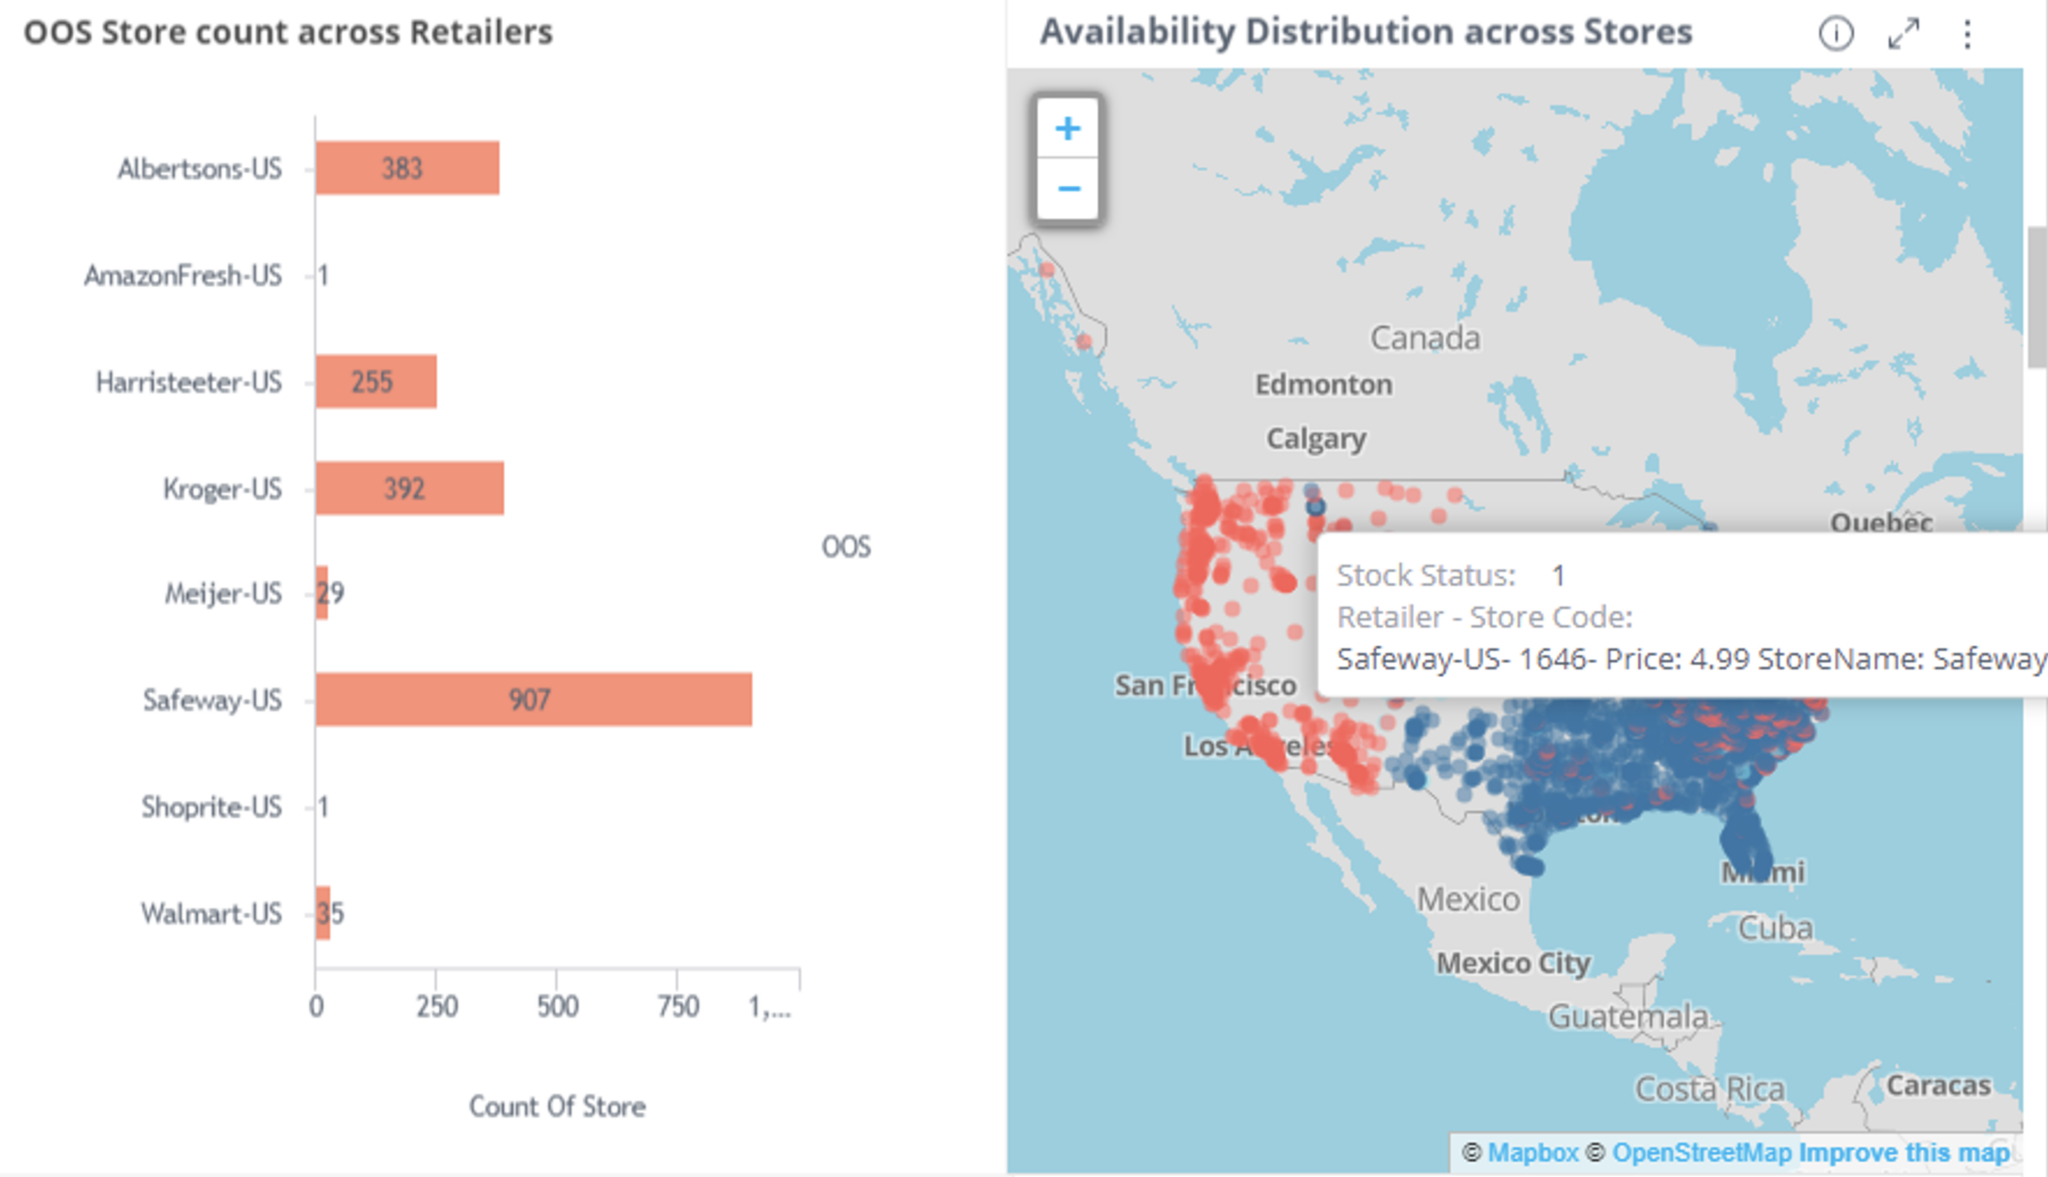
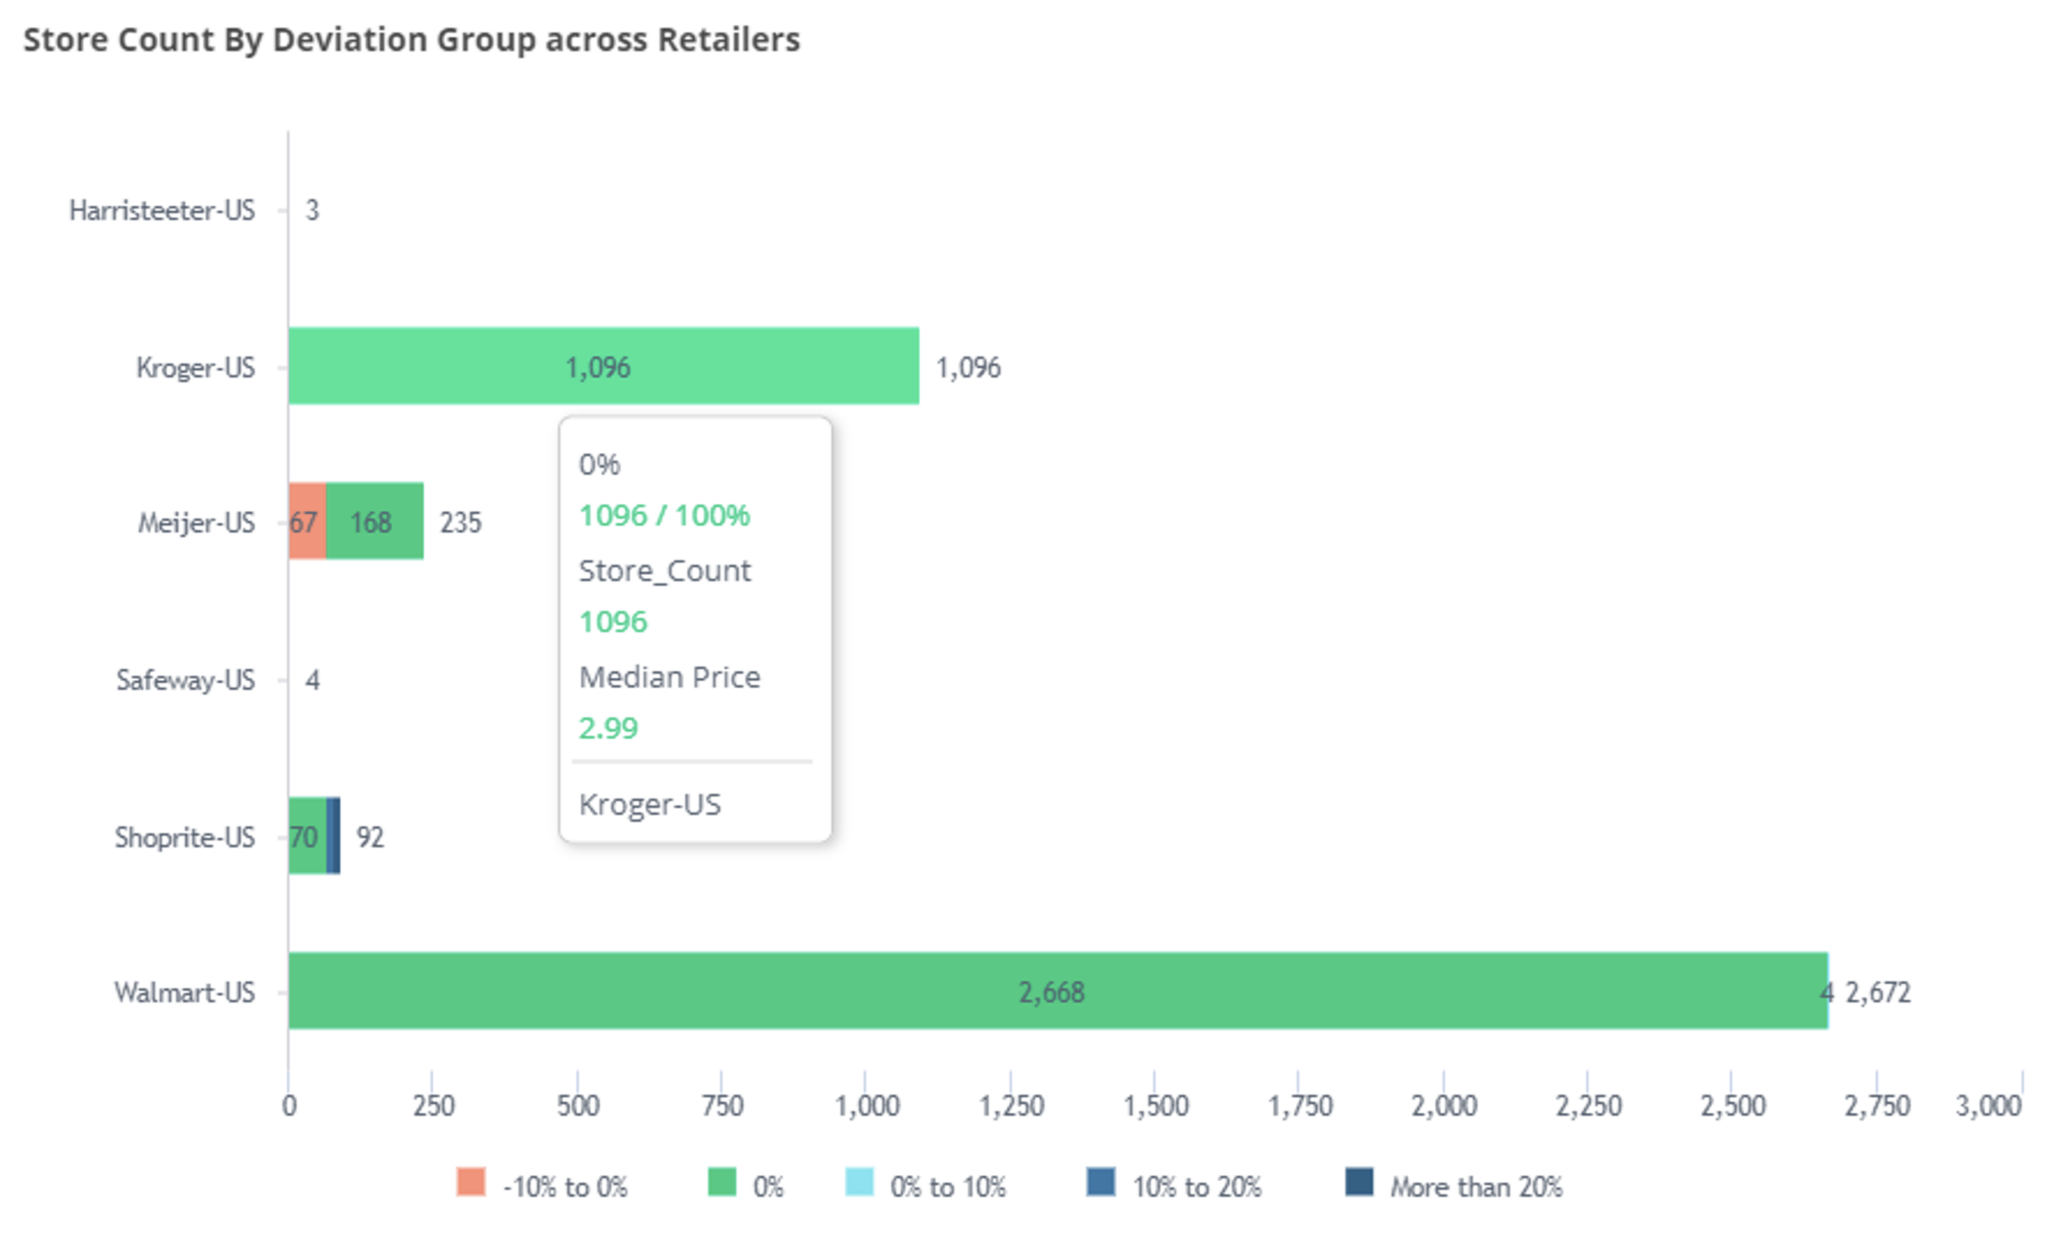
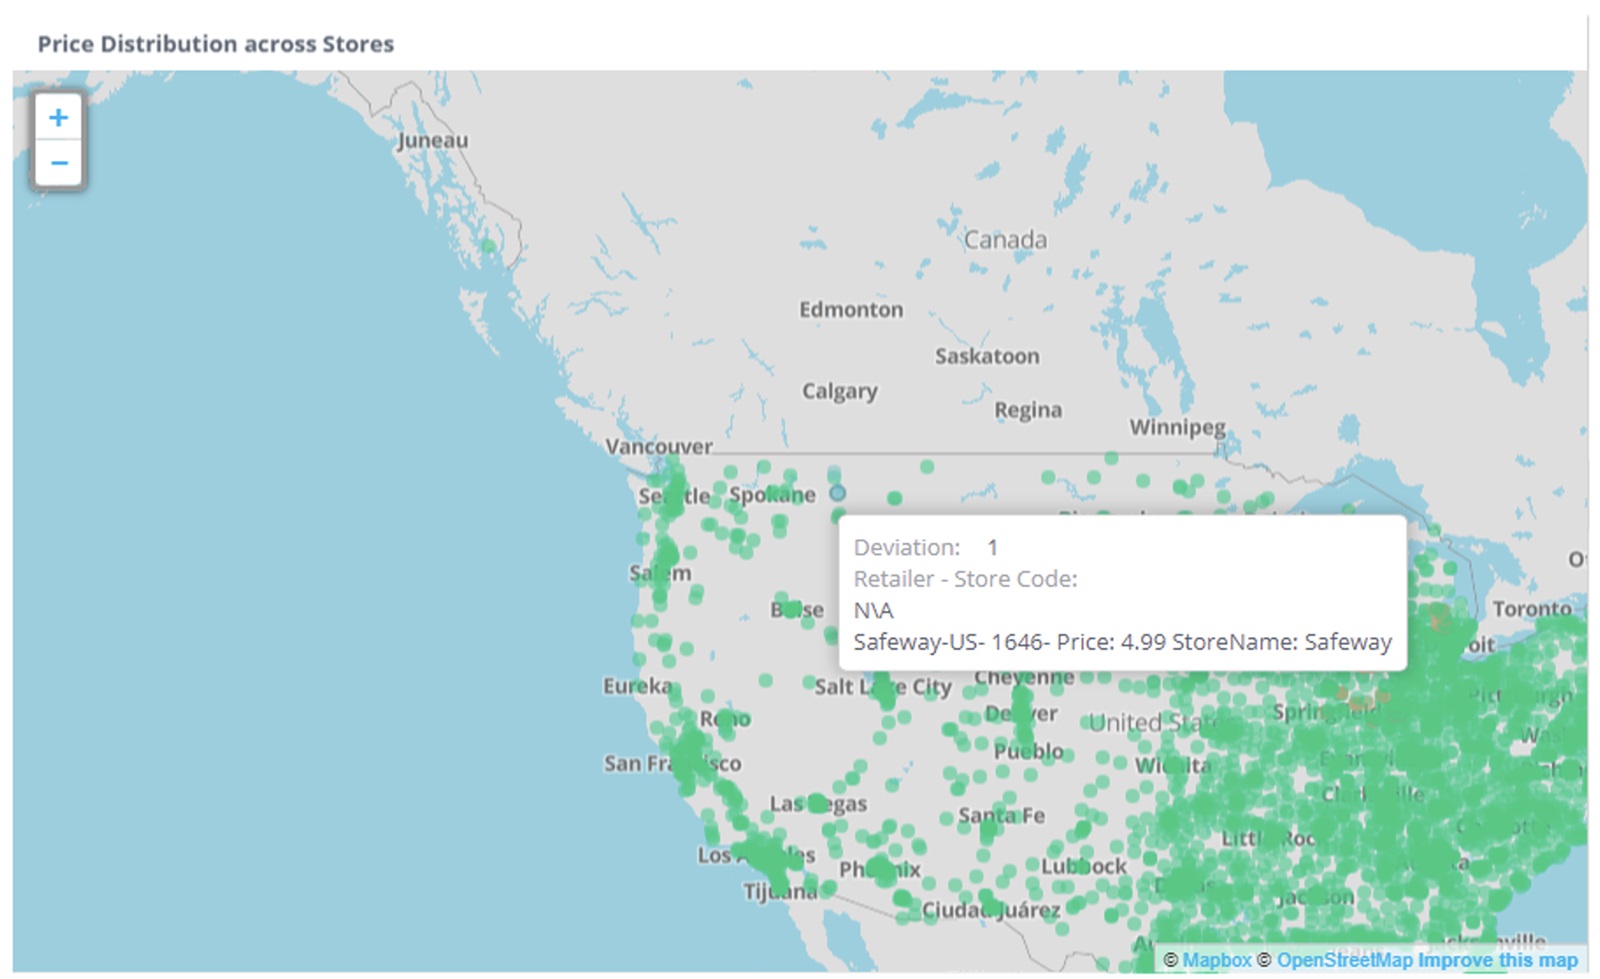
Retailers live and die by competitive awareness. With the API, pricing teams can monitor SKU-level prices and promotions across channels, ensuring they don’t leave margin on the table. Merchandising leaders can track assortment coverage, identifying gaps relative to competitors. Digital shelf teams can measure search rankings, share of voice, and content completeness. The result is faster responses, stronger category performance, and fewer blind spots in shopper experience.
AI & Machine Learning Teams
AI teams depend on data at scale. Whether training a natural language model to understand product descriptions or a computer vision system to analyze images, the Data Collection API delivers the structured, high-quality inputs they need. Reviews, ratings, attributes, and product images can all be captured and delivered at scale. For teams building predictive models, from demand forecasting to personalization, the difference between mediocre and world-class often comes down to input quality. This API ensures AI systems are always learning from the best data available.
Retail Intelligence & Pricing Platforms
Technology providers serving retailers and brands face unforgiving client expectations. Missed SLAs on data delivery can mean churn. By using the Data Collection API as their acquisition layer, platform providers gain enterprise reliability without rebuilding infrastructure from scratch. They can scale seamlessly with client needs while maintaining the integrity of the insights their customers rely on.
Marketing & Advertising Teams
For marketing leaders, competition is visible every time a shopper searches. The API enables teams to track keyword rankings, ad placements, and competitor promotions with consistency. Instead of anecdotal data or partial coverage, marketers get a full picture of their brand’s digital presence and the strategies competitors are using to capture share of voice.
Consulting Firms & Research Providers
Consultancies and market research agencies deliver strategy. But a strategy without evidence is just opinion. The API allows these firms to back every recommendation with structured, large-scale data. Whether advising on pricing, benchmarking performance, or publishing analyst research, firms can deliver trustworthy insights without taking on the cost or distraction of building fragile data pipelines.
The diversity of these use cases demonstrates why the API is a platform for collaboration across industries, ensuring every stakeholder, from engineers to strategists, has the reliable data foundation they need.
Why DataWeave, Why It Matters
Many vendors claim to deliver web data. Few can deliver it at enterprise scale, with commerce-specific expertise, and with proven ROI.
What sets DataWeave apart isn’t just that we provide data; it’s the way we do it, and the outcomes we enable.
- Commerce expertise baked in: With 14+ years of experience powering the world’s leading retailers and brands, DataWeave brings domain-specific intelligence that generic scraping vendors simply can’t. Our schemas are designed for commerce. Our defaults are smarter because they’re informed by retail realities.
- Adaptability without firefighting: Most tools break when websites evolve. Our API adapts automatically, minimizing the need for engineering intervention. Teams stay focused on innovation, not maintenance.
- Accessible to everyone: Whether you’re a senior data engineer automating workflows or a business analyst configuring a quick scrape, the API meets you where you are with both API and no-code interfaces.
- Enterprise-grade trust: Reliability and compliance are built in, not bolted on. With SLA-backed delivery, SOC2 alignment, and audit-ready archiving, the API is trusted by enterprises that can’t afford uncertainty.
This combination makes the Data Collection API not just a technical solution but a strategic partner for enterprises preparing for the age of agentic commerce.
A Foundation for the Future
The Data Collection API is more than an answer to today’s frustrating data problems. It represents a strategic foundation for tomorrow’s growth, designed to scale alongside the increasingly complex demands of commerce in the AI era.
At the heart of DataWeave’s vision is the Unified Commerce Intelligence Cloud, a layered ecosystem that transforms raw digital signals into strategic insights. The Data Collection API is the entry point, the essential first layer that ensures enterprises have a reliable supply of the most important raw material of the digital economy: data.
- Collection: Enterprise-grade acquisition of web data at scale. From product pages and search results to reviews and promotions, enterprises can finally count on continuous, structured inputs without worrying about fragility or failure.
- Processing: Once collected, data is normalized, enriched, and matched across sources. What was once noisy and inconsistent becomes clean, comparable, and immediately actionable.
- Intelligence: On top of this foundation sits advanced analytics, solutions for pricing optimization, assortment planning, promotion tracking, and digital shelf visibility, enabling sharper decisions at the speed of the market.
This progression means enterprises don’t have to transform overnight. Many start small, solving urgent challenges like competitive price tracking or digital shelf monitoring. From there, they can expand naturally into richer intelligence capabilities, knowing that their data foundation is already strong enough to support more ambitious use cases.
And as agentic AI systems begin to take on a larger share of decision-making, the importance of that foundation grows exponentially. These autonomous systems cannot operate effectively without clean, continuous, and contextual data. Without it, even the most sophisticated AI will falter, making poor predictions or incomplete recommendations. With it, they can operate at full capacity, powering dynamic pricing, real-time demand forecasting, and personalized shopping experiences at scale.
The Data Collection API isn’t just about reducing engineering pain today. It’s about preparing enterprises to compete and win in an AI-driven marketplace that never sleeps.
Getting Started
For teams tired of fragile scrapers, this is a chance to reset. For enterprises preparing for the next era of commerce, it’s a chance to build a foundation that can scale with them.
If your teams are still struggling with generic and inflexible data scrapers, request a demo now to see the DataWeave’s Data Collection API in action.